Report of the Committee for Doubling Farmers' Income
331
Ministry of Agriculture & Farmers Welfare Report of the Committee for Doubling Farmers’ Income Volume VIII “Production Enhancement through Productivity Gains” Production & Productivity is linked to Market Inputs, Field Inputs, Farming Practices and Directly Impacts on the Value Realised Document prepared by the Committee for Doubling Farmers’ Income, Department of Agriculture, Cooperation and Farmers’ Welfare, Ministry of Agriculture & Farmers’ Welfare. May - 2018
-
Upload
khangminh22 -
Category
Documents
-
view
0 -
download
0
Transcript of Report of the Committee for Doubling Farmers' Income
Ministry of Agriculture &
Farmers Welfare
Report of the Committee for
Doubling Farmers’ Income
Volume VIII
“Production Enhancement through
Productivity Gains”
Production & Productivity is linked to Market Inputs, Field Inputs,
Farming Practices and Directly Impacts on the Value Realised
Document prepared by the Committee for Doubling Farmers’ Income,
Department of Agriculture, Cooperation and Farmers’ Welfare,
Ministry of Agriculture & Farmers’ Welfare.
May - 2018
Doubling Farmers’ Income – Volume VIII
Production Enhancement through Productivity Gains
i
Foreword
The country has witnessed a series of concerted discussions dealing with the subject of
agriculture. In 1926, the Royal Commission of Agriculture was set up to examine and report
the status of India’s agricultural and rural economy. The Commission made comprehensive
recommendations, in its report submitted in 1928, for the improvement of agrarian economy
as the basis for the welfare and prosperity of India’s rural population. The urban population
was about 11 per cent of the whole, and demand from towns was small in comparison. The
Commission notes, that communication and physical connectivity were sparse and most
villages functioned as self-contained units. The Commission encompassed review of
agriculture in areas which are now part of Pakistan, Bangladesh and Myanmar. The net sown
area in erstwhile British India was reported as 91.85 million hectares and cattle including
buffaloes numbered 151 million. Almost 75 per cent of the cultivated area was under cereals
and pulses, with rice and wheat occupying 46 per cent of the net sown area. The area under
fruits and vegetables was about 2.5 per cent and that under oilseeds and non-food crops was
about 20 per cent. In the ensuing years, as well known, the country underwent vast changes in
its political, economic and social spheres.
Almost 40 years later, free India appointed the National Commission on Agriculture in 1970,
to review the progress of agriculture in the country and make recommendations for its
improvement and modernisation. This Commission released its final report in 1976. It refers to
agriculture as a comprehensive term, which includes crop production together with land and
water management, animal husbandry, fishery and forestry. Agriculture, in 1970 provided
employment to nearly 70 per cent of the working population. The role of agriculture in the
country’s economic development and the principle of growth with social justice, were core to
the discussions. The country was then facing a high population growth rate. After impressive
increase in agricultural production in the first two Five Year Plans, a period of stagnancy set in
and the country suffered a food crisis in the mid-1960s. The report in fifteen parts, suggested
ample focus on increased application of science and technology to enhance production.
Thirty years hence, the National Commission for Farmers was constituted in 2004 to suggest
methods for faster and more inclusive growth for farmers. The Commission made
comprehensive recommendations covering land reforms, soil testing, augmenting water
availability, agriculture productivity, credit and insurance, food security and farmers
competitiveness. In its final report of October 2006, the Commission noted upon ten major
goals which included a minimum net income to farmers, mainstreaming the human and gender
dimension, attention to sustainable livelihoods, fostering youth participation in farming and
post-harvest activities, and brought focus on livelihood security of farmers. The need for a
single market in India to promote farmer-friendly home markets was also emphasised.
The now constituted DFI (Doubling Farmers’ Income) Committee besides all these broad
sectoral aspects, invites farmers’ income into the core of its deliberations and incorporates it as
the fulcrum of its strategy. Agriculture in India today is described by a net sown area of 141
million hectares, with field crops continuing to dominate, as exemplified by 55 per cent of the
area under cereals. However, agriculture has been diversifying over the decades. Horticulture
now accounts for 16 per cent of net sown area. The nation’s livestock population counts at
more than 512 million. However, economic indicators do not show equitable and egalitarian
growth in income of the farmers. The human factor behind agriculture, the farmers, remain in
Doubling Farmers’ Income – Volume VIII
Production Enhancement through Productivity Gains
ii
frequent distress, despite higher productivity and production. The demand for income growth
from farming activity, has also translated into demand for government to procure and provide
suitable returns. In a reorientation of the approach, this Committee suggests self-sustainable
models empowered with improved market linkage as the basis for income growth of farmers.
India today is not only self-sufficient in respect of demand for food, but is also a net exporter
of agri-products occupying seventh position globally. It is one of the top producers of cereals
(wheat & rice), pulses, fruits, vegetables, milk, meat and marine fish. However, there remain
some chinks in the production armoury, when evaluated against nutritional security that is so
important from the perspective of harvesting the demographic dividend of the country. The
country faces deficit of pulses & oilseeds. The availability of fruits & vegetables and milk &
meat & fish has increased, thanks to production gains over the decades, but affordability to a
vast majority, including large number of farmers too, remains a question mark.
The impressive agricultural growth and gains since 1947 stand as a tribute to the farmers’
resilience to multiple challenges and to their grit & determination to serve and secure the
nation’s demand for food and raw material for its agro-industries.
It is an irony, that the very same farmer is now caught in the vortex of more serious challenges.
The average income of an agricultural household during July 2012 to June 2013 was as low as
Rs.6,426, as against its average monthly consumption expenditure of Rs.6,223. As many as
22.50 per cent of the farmers live below official poverty line. Large tracts of arable land have
turned problem soils, becoming acidic, alkaline & saline physico-chemically. Another primary
factor of production, namely, water is also under stress. Climate change is beginning to
challenge the farmer’s ability to adopt coping and adaptation measures that are warranted.
Technology fatigue is manifesting in the form of yield plateaus. India’s yield averages for most
crops at global level do not compare favourably. The costs of cultivation are rising. The
magnitude of food loss and food waste is alarming. The markets do not assure the farmer of
remunerative returns on his produce. In short, sustainability of agricultural growth faces serious
doubt, and agrarian challenge even in the midst of surpluses has emerged as a core concern.
Farmers own land. Land is a powerful asset. And, that such an asset owing class of citizens has
remained poor is a paradox. They face the twin vulnerabilities of risks & uncertainties of
production environment and unpredictability of market forces. Low and fluctuating incomes
are a natural corollary of a farmer under such debilitating circumstances. While cultivation is
boundarised by the land, market need not have such bounds.
Agriculture is the largest enterprise in the country. An enterprise can survive only if it can grow
consistently. And, growth is incumbent upon savings & investment, both of which are a
function of positive net returns from the enterprise. The net returns determine the level of
income of an entrepreneur, farmer in this case.
This explains the rationale behind adopting income enhancement approach to farmers’ welfare.
It is hoped, that the answer to agrarian challenges and realisation of the aim of farmers’ welfare
lies in higher and steady incomes. It is in this context, that the Hon’ble Prime Minister shared
the vision of doubling farmers’ income with the nation at his Bareilly address on 28th February,
2016. Further, recognizing the urgent need for a quick and time-bound transformation of the
Doubling Farmers’ Income – Volume VIII
Production Enhancement through Productivity Gains
iii
vision into reality, a time frame of six years (2016-17 to 2022-23) was delineated as the period
for implementation of a new strategy.
At the basic level, agriculture when defined as an enterprise comprises two segments –
production and post-production. The success of production as of now amounts to half success,
and is therefore not sustainable. Recent agitations of farmers (June-July 2017) in certain parts
of the country demanding higher prices on their produce following record output or scenes of
farmers dumping tractor loads of tomatoes & onions onto the roads or emptying canisters of
milk into drains exemplify neglect of other half segment of agriculture.
No nation can afford to compromise with its farming and farmers. And much less India,
wherein the absolute number of households engaged in agriculture in 2011 (119 million)
outpaced those in 1951 (70 million).Then, there are the landless agricultural labour who
numbered 144.30 million in 2011 as against 27.30 million in 1951. The welfare of this
elephantine size of India’s population is predicated upon a robust agricultural growth strategy,
that is guided by an income enhancement approach.
This Committee on Doubling Farmers’ Income (DFI) draws its official members from various
Ministries / Departments of Government of India, representing the panoply of the complexities
that impact the agricultural system. Members drawn from the civil society with interest in
agriculture and concern for the farmers were appointed by the Government as non-official
members. The DFI Committee has co-opted more than 100 resource persons from across the
country to help it in drafting the Report. These members hail from the world of research,
academics, non-government organisations, farmers’ organisations, professional associations,
trade, industry, commerce, consultancy bodies, policy makers at central & state levels and
many more of various domain strengths. Such a vast canvas as expected has brought in a
kaleidoscope of knowledge, information, wisdom, experience, analysis and unconventionality
to the treatment of the subject. The Committee over the last more than a year since its
constitution vide Government O.M. No. 15-3/2016-FW dated 13th April, 2016 has held
countless number of internal meetings, multiple stakeholder meetings, several conferences &
workshops across the country and benefitted from many such deliberations organised by others,
as also field visits. The call of the Hon’ble Prime Minister to double farmers’ income has
generated so much of positive buzz around the subject, that no day goes without someone
calling on to make a presentation and share views on income doubling strategy. The Committee
has been, therefore, lucky to be fed pro-bono service and advice. To help collage, analyse and
interpret such a cornucopia of inputs, the Committee has adopted three institutes, namely,
NIAP, NCAER and NCCD. The Committee recognizes the services of all these individuals,
institutions & organisations and places on record their service.
Following the declaration of his vision, the Hon’ble Prime Minister also shaped it by
articulating ‘Seven Point Agenda’, and these have offered the much needed hand holding to
the DFI Committee.
The Committee has adopted a basic equation of Economics to draw up its strategy, which says
that net return is a function of gross return minus the cost of production. This throws up three
(3) variables, namely, productivity gains, reduction in cost of cultivation and remunerative
price, on which the Committee has worked its strategy. In doing so, it has drawn lessons from
the past and been influenced by the challenges of the present & the future.
Doubling Farmers’ Income – Volume VIII
Production Enhancement through Productivity Gains
iv
In consequence, the strategy platform is built by the following four (4) concerns:
Sustainability of production
Monetisation of farmers’ produce
Re-strengthening of extension services
Recognizing agriculture as an enterprise and enabling it to operate as such, by
addressing various structural weaknesses.
Notwithstanding the many faces of challenges, India’s agriculture has demonstrated
remarkable progress. It has been principally a contribution of the biological scientists,
supplemented by an incentivizing policy framework. This Committee recognizes their valuable
service in the cause of the farmers. It is now time, and brooks no further delay, for the new
breed of researchers & policy makers with expertise in post-production technology,
organisation and management to take over the baton from the biological scientists, and let the
pressure off them. This will free the resources, as also time for the biological scientists to focus
on new science and technology, that will shift production onto a higher trajectory - one that is
defined by benchmark productivities & sustainability. However, henceforth both production &
marketing shall march together hand in hand, unlike in the past when their role was thought to
be sequential.
This Report is structured through 14 volumes and the layout, as the readers will appreciate, is
a break from the past. It prioritizes post-production interventions inclusive of agri-logistics
(Vol. III) and agricultural marketing (Vol-IV), as also sustainability issues (Vol-V & VI) over
production strategy (Vol. VIII).The readers will, for sure value the layout format as they study
the Report with keenness and diligence. And all other volumes including the one on Extension
and ICT (Vol. XI), that connect the source and sink of technology and knowledge have been
positioned along a particular logic.
The Committee benefited immensely from the DFI Strategy Report of NITI Aayog. Prof.
Ramesh Chand identified seven sources of growth and estimated the desired rates of growth to
achieve the target by 2022-23. The DFI Committee has relied upon these recommendations in
its Report.
There is so much to explain, that not even the license of prose can capture adequately, all that
needs to be said about the complexity & challenges of agriculture and the nuances of an
appropriate strategy for realising the vision of doubling farmers’ income by the year of India’s
75th Independence Day celebrations.
The Committee remains grateful to the Government for trusting it with such an onerous
responsibility. The Committee has been working as per the sound advice and counsel of the
Hon’ble Minister for Agriculture and Farmers’ Welfare, Shri Radha Mohan Singh and Dr. S.K.
Pattanayak, IAS, Secretary of the Department of Agriculture, Cooperation and Farmers’
Welfare. It also hopes, that the Report will serve the purpose for which it was constituted.
12th August, 2017 Ashok Dalwai
Chairman, Committee on
Doubling Farmers’ Income
Doubling Farmers’ Income – Volume VIII
Production Enhancement through Productivity Gains
v
About Volume VIII
The eight volume of the Report of the Committee on Doubling Farmers’ Income (DFI)
examines productivity led production, with perspective that farmers must be able to benefit
from technologies and practices that allow them to create value in a more optimal manner.
Production enhancement, as a result of productivity gains, optimises on resources deployed,
minimises ecological stresses and also reduces per unit cost of production.
This volume discusses these various aspects for the major agricultural sectors. The volume also
highlights that some added benefits from productivity gains. Productivity on crops comes about
from changed cultivation practices, ie., selection of appropriate planting material, applying
optimal inputs for soil and plant health, efficiencies during irrigation and tending phase,
suitable staggering of sowing and harvest, inter-cropping and enhancing the cropping intensity
on land. To achieve this, a wide variety of technology, information, tools and scientific
practices are brought into use. In case of livestock and fisheries sectors, the productivity
enhancement comes from breeding, feeding, health care and other application of animal
sciences. The result of such efforts is the output, such production being optimal to the effort
and resources used.
Productivity enhancement not only adds to production, but can also contribute to release
farmers’ time, land and other resources, freeing these for other productive activities.
Consequently this in turn, can offer the farming enterprise the option to diversify into other
activities in the supply chain. Farm level productivity, therefore can bring additional gains by
allowing the farmers’ enterprise to partake in the marketing activities and capture value the
market led agricultural value system. These secondary, off-field or near-farm activities are also
explained in Volume 3. The gains also bring about the sustainability in farming, across sectors,
and is related to the discussions in earlier Volumes 5 and 6. The important aspects on input
management are detailed in Volume 7. Productivity is therefore intrinsically linked with the
earlier volumes, and the consequent gains in production is directly related to marketing and
value realisation.
This volume touches upon the selected agricultural sectors in various chapters and examine
aspects related to cereals, pulses, oilseeds, horticulture, livestock & fishery, sericulture and
some commercial crops.
Ashok Dalwai
--- --- ---

Doubling Farmers’ Income – Volume VIII
Production Enhancement through Productivity Gains
vii
Doubling Farmers’ Income Volume VIII
“Production Enhancement through
Productivity Gains”
Contents
Foreword ----------------------------------------------------------------------------------------- i
About Volume VIII ----------------------------------------------------------------------------------- v
Setting the Context ---------------------------------------------------------------------------------- 1
REDESIGNING CROP GEOMETRY & COMMODITY MATRIX ................................................................................ 1
0.1. BACKGROUND ........................................................................................................................... 1
0.2. MANDATE OF AGRICULTURE ........................................................................................................ 1
0.3. CHANGING FARMERS’ INCOME FROM SEASONAL TO PERENNIAL ........................................................ 2
0.4. AREA AND VALUE PYRAMID .......................................................................................................... 3
0.5. COMMODITY MATRIX AND SUPPLY DEMAND BALANCE ..................................................................... 5
0.6. YIELD GAPS ............................................................................................................................... 7
0.7. CROPPING INTENSITY ................................................................................................................ 15
0.8. THE CROP GEOMETRY ............................................................................................................... 17
0.8.1. Changing Crop Geometry-------------------------------------------------------------------------------------------- 18
0.8.2. Different scenarios of staple foodgrains production --------------------------------------------------------- 19
0.8.3. Specific Case of Punjab ----------------------------------------------------------------------------------------------- 23
0.9. STATE-WISE LAND USE PATTERN.................................................................................................. 25
Volume VIII-A
Volume VIII-B
Volume VIII-C
Volume VIII-D
Chapter 1 Dairy Sector: Growth Dynamics -------------------------------------------- 39
1.1. ROLE OF DAIRY IN THE ECONOMY ............................................................................................... 39
1.1.1. Contribution to Rural Income -------------------------------------------------------------------------------------- 40
1.1.2. Contribution to Rural Employment ------------------------------------------------------------------------------- 41
1.1.3. Contribution to nutrition--------------------------------------------------------------------------------------------- 41
1.2. CURRENT STATUS OF DAIRY SECTOR ............................................................................................ 42
1.2.1. Scale of Milk Production --------------------------------------------------------------------------------------------- 43
1.2.2. Milk Productivity ------------------------------------------------------------------------------------------------------- 44
1.2.3. Sources of growth in milk production ---------------------------------------------------------------------------- 44
1.2.4. Bovine Population Trends ------------------------------------------------------------------------------------------- 45
1.3. ANNOTATION .......................................................................................................................... 46
Doubling Farmers’ Income – Volume VIII
Production Enhancement through Productivity Gains
viii
Chapter 2 Dairy: Yield Gap and Challenges ------------------------------------------- 48
2.1. MILK YIELD OF DAIRY ANIMALS: INTER-STATE VARIATIONS ............................................................. 48
2.2. DIMENSIONS OF YIELD-GAP AT DISTRICT LEVEL .............................................................................. 50
2.3. PRODUCTIVITY VARIATIONS ACROSS FARMS .................................................................................. 53
2.4. SCOPE OF YIELD ENHANCEMENT ................................................................................................. 54
2.5. CHALLENGES IN YIELD ENHANCEMENT ......................................................................................... 57
2.5.1. Enhancing the Genetic Potential of Animals: ------------------------------------------------------------------ 57
2.5.2. Shortage of Feed and Fodder: -------------------------------------------------------------------------------------- 58
2.5.3. Shortcomings in animal health care services: ------------------------------------------------------------------ 60
2.5.4. Weak Extension Services: -------------------------------------------------------------------------------------------- 61
2.5.5. Low Public Investment in Livestock Sector: --------------------------------------------------------------------- 62
2.6. ANNOTATION .......................................................................................................................... 63
Chapter 3 Economics of Milk Production in India: A Review --------------------- 65
3.1. COST AND RETURNS IN MILK PRODUCTION: REGIONAL ESTIMATES ................................................... 65
3.2. ECONOMIC VIABILITY OF DAIRY FARMING IN DIFFERENT PRODUCTION ENVIRONMENTS ....................... 67
3.3. PROFITABILITY OF DAIRY FARMING AND MILK YIELD ...................................................................... 71
3.4. MARKETING AND PROCESSING OF MILK ........................................................................................ 72
3.5. INTERVENTIONS FOR HIGHER PRICE REALISATION .......................................................................... 73
3.5.1. Strengthening Supply Chain for Efficient Marketing --------------------------------------------------------- 73
3.5.2. Price Fixation of Raw Milk ------------------------------------------------------------------------------------------- 77
3.5.3. Milk Pricing -------------------------------------------------------------------------------------------------------------- 77
3.5.4. Small-scale Value Addition ------------------------------------------------------------------------------------------ 78
3.6. ANNOTATION .......................................................................................................................... 78
Chapter 4 Maximising Income from Buffalo Rearing ------------------------------- 80
4.1. INTRODUCTION ........................................................................................................................ 80
4.2. PROMOTING BUFFALO MEAT INDUSTRY ...................................................................................... 81
4.3. SUPPORTING EXPORT OF BUFFALO MEAT ..................................................................................... 83
4.4. ANNOTATION .......................................................................................................................... 84
Chapter 5 Fodder Development for Dairy --------------------------------------------- 86
5.1. ADOPTION OF PROMISING FORAGES AND VARIETIES FOR DIFFERENT REGIONS .................................... 86
5.2. ROUND THE YEAR FORAGE PRODUCTION FROM ARABLE LANDS ....................................................... 88
5.3. FORAGES FROM DEGRADED LANDS ............................................................................................. 89
5.4. FORAGES FROM COMMUNITY LANDS ........................................................................................... 91
5.5. FORAGES FROM EXISTING ORCHARDS .......................................................................................... 92
5.6. EXPLORING NON-CONVENTIONAL FODDER RESOURCES .................................................................. 92
5.7. AZOLLA- A FEED SUPPLEMENT ................................................................................................... 93
5.8. HYDROPONIC FODDER PRODUCTION: WATER SAVING TECHNOLOGY ................................................ 94
5.9. SILAGE FROM SURPLUS FODDER ................................................................................................. 94
5.10. STRENGTHENING OF QUALITY SEEDS ........................................................................................... 95
5.11. ANNOTATION .......................................................................................................................... 96
Doubling Farmers’ Income – Volume VIII
Production Enhancement through Productivity Gains
ix
Chapter 6 Livestock Promotion: Research & Development Interventions and
Government Initiatives -------------------------------------------------------------------------- 97
6.1. INTRODUCTION ........................................................................................................................ 97
6.2. INTERVENTIONS FOR ANIMAL BREED IMPROVEMENT ...................................................................... 97
6.2.1. Strengthening AI services -------------------------------------------------------------------------------------------- 98
6.2.2. Performance recording and selection --------------------------------------------------------------------------- 100
6.2.3. Promoting Embryo Technology and In-Vitro Fertilization tools ------------------------------------------ 101
6.2.4. Use of Genomic Selection ------------------------------------------------------------------------------------------ 102
6.3. INTERVENTIONS FOR IMPROVEMENT IN ANIMAL NUTRITION.......................................................... 102
6.3.1. Addressing feed-fodder shortages ------------------------------------------------------------------------------- 102
6.3.2. Addressing poor nutritional quality of feed ------------------------------------------------------------------- 106
6.4. PROMOTING BALANCED FEEDING AND SUPPLEMENTATION ........................................................... 108
6.5. INTERVENTIONS FOR IMPROVEMENT OF HEALTH AND MANAGEMENT ............................................. 111
6.5.1. Preventive health care management program --------------------------------------------------------------- 111
6.5.2. Disease reporting, surveillance and diagnosis ---------------------------------------------------------------- 112
6.5.3. Strengthening Infrastructure and Services for Curative Health Care ----------------------------------- 113
6.5.4. Fertility management ----------------------------------------------------------------------------------------------- 114
6.5.5. Propagating scientific dairy farming practices --------------------------------------------------------------- 114
6.6. EXTENSION AND ICT INTERVENTIONS ........................................................................................ 114
6.7. RECENT INSTITUTIONAL INITIATIVES FOR DAIRY AND ANIMAL HUSBANDRY DEVELOPMENT ................. 117
Chapter 7 Dairy Sector: Strategies & Action Points --------------------------------124
Chapter 8 Small Ruminants – National Scenario ------------------------------------135
8.1. OVERALL POPULATION (SHEEP, GOAT, PIGS AND POULTRY) ........................................................... 135
8.1.1. Sheep and Goat ------------------------------------------------------------------------------------------------------- 136
8.1.2. Pigs ----------------------------------------------------------------------------------------------------------------------- 139
8.1.3. Poultry ------------------------------------------------------------------------------------------------------------------- 139
8.2. OWNERSHIP OF LIVESTOCK IN DIFFERENT STATES ........................................................................ 141
8.2.1. Ownership by households ------------------------------------------------------------------------------------------ 141
8.2.2. Non-household and institutional ownership ------------------------------------------------------------------ 143
8.2.3. Major livestock breeds ---------------------------------------------------------------------------------------------- 144
8.3. ANNOTATION ........................................................................................................................ 147
Chapter 9 Small Ruminants & Poultry: Research & Development -------------149
9.1. VARIETIES AND RELEASED DEVELOPED ....................................................................................... 149
9.1.1. Sheep -------------------------------------------------------------------------------------------------------------------- 149
9.1.2. Goat ---------------------------------------------------------------------------------------------------------------------- 150
9.1.3. Pig ------------------------------------------------------------------------------------------------------------------------ 151
9.1.4. Poultry ------------------------------------------------------------------------------------------------------------------- 152
9.2. TRANSFERABLE TECHNOLOGIES DEVELOPED................................................................................ 155
9.2.1. Sheep -------------------------------------------------------------------------------------------------------------------- 155
9.2.2. Goat ---------------------------------------------------------------------------------------------------------------------- 156
9.3. TECHNOLOGIES FOR PROMOTION OF PIGGERY ............................................................................ 159
9.4. TECHNOLOGIES FOR PROMOTION OF POULTRY ............................................................................ 160
Chapter 10 Goat Sector: Status and Vision ---------------------------------------------163
10.1. BACKGROUND ....................................................................................................................... 163
Doubling Farmers’ Income – Volume VIII
Production Enhancement through Productivity Gains
x
10.2. OUTLINE OF GOAT SECTOR ...................................................................................................... 165
10.2.1. Small and marginal goat rearers ----------------------------------------------------------------------------- 166
10.2.2. Traditional supply chain ---------------------------------------------------------------------------------------- 166
10.2.3. Organised goat farming and processing ------------------------------------------------------------------- 167
10.2.4. Availability status of inputs ------------------------------------------------------------------------------------ 168
10.3. MAJOR CHALLENGES .............................................................................................................. 169
10.4. VISION AND RECOMMENDATIONS ............................................................................................. 169
Chapter 11 Sheep Sector: Status and Vision -------------------------------------------171
11.1. BACKGROUND ....................................................................................................................... 171
11.2. OUTLINE OF SHEEP SECTOR ...................................................................................................... 173
11.2.1. Perspective of Indian market for sheep products -------------------------------------------------------- 173
11.2.2. Typology of sheep farmers ------------------------------------------------------------------------------------- 175
11.2.3. Traditional Supply Chain ---------------------------------------------------------------------------------------- 176
11.2.4. Organised sheep farming and processing ------------------------------------------------------------------ 177
11.2.5. Wool trade --------------------------------------------------------------------------------------------------------- 177
11.2.6. Availability situation of inputs and services --------------------------------------------------------------- 178
11.3. GAP IN DEMAND-SUPPLY POSITION ........................................................................................... 179
11.4. MAJOR CHALLENGES .............................................................................................................. 179
11.5. VISION FOR SHEEP .................................................................................................................. 181
Chapter 12 Small Ruminants: Project Economics ------------------------------------183
12.1. SHEEP .................................................................................................................................. 183
12.2. GOAT ................................................................................................................................... 184
12.3. ECONOMICS OF PIG FARMING .................................................................................................. 185
12.4. ECONOMICS OF POULTRY FARMING .......................................................................................... 186
12.5. GOVERNMENT INTERVENTIONS IN SMALL RUMINANTS ................................................................. 188
12.5.1. Genetic Improvement in Sheep and Goat (GISC) --------------------------------------------------------- 189
12.5.2. Animal Husbandry Infrastructure Development Fund (AHIDF) --------------------------------------- 190
12.5.3. Innovative Pig Development Projects for North-East (IPDNE) ---------------------------------------- 190
12.5.4. Innovative Poultry Productivity Project (IPPP) ------------------------------------------------------------ 191
Chapter 13 Marketing of Live Animals and Livestock Produce ------------------193
13.1. BACKGROUND ....................................................................................................................... 193
13.2. LIVESTOCK PRODUCE AND PRODUCTS ......................................................................................... 193
13.3. PRIMARY LIVESTOCK CONSUMPTION ......................................................................................... 195
13.4. STATUS OF MARKETING OF LIVESTOCK COMMODITIES .................................................................. 198
13.4.1. Marketing of live animals -------------------------------------------------------------------------------------- 199
13.4.2. Marketing of livestock products ------------------------------------------------------------------------------ 201
13.4.3. Marketing produce of live animals -------------------------------------------------------------------------- 206
13.5. INTERVENTIONS IN LIVESTOCK MARKETING ................................................................................. 215
13.5.1. NCDFI eMarket - Digitalization of dairy cooperative trade -------------------------------------------- 216
13.5.2. Markets and online trading in livestock and produce--------------------------------------------------- 217
Chapter 14 Small Ruminants: Recommendations and Strategies ---------------219
14.1. STRATEGIES RECOMMENDED TO ENHANCE PRODUCTIVITY ............................................................ 219
14.2. MARKET RECOMMENDATIONS ................................................................................................. 221
14.2.1. Model Agricultural Produce and Livestock Marketing Act, 2017 ------------------------------------ 224
Doubling Farmers’ Income – Volume VIII
Production Enhancement through Productivity Gains
xi
Chapter 15 Fishery Sector: Role and Potential in India ----------------------------229
15.1. BACKGROUND ....................................................................................................................... 229
15.1.1. Indian fisheries resources -------------------------------------------------------------------------------------- 229
15.2. PRODUCTION AND INCOME TRENDS OF CAPTURE FISHERIES .......................................................... 230
15.2.1. Reservoirs fisheries ----------------------------------------------------------------------------------------------- 230
15.2.2. Brackish water fisheries----------------------------------------------------------------------------------------- 232
15.2.3. Marine fisheries --------------------------------------------------------------------------------------------------- 233
15.2.4. An appraisal of income from fishing ------------------------------------------------------------------------- 234
15.3. EXPLORING OPPORTUNITIES TO ENHANCE INCOMES OF FISHER FOLK .............................................. 238
15.3.1. Enhancing efficiency of fishing fleet ------------------------------------------------------------------------- 238
15.3.2. Use of space technology and ICT ----------------------------------------------------------------------------- 239
15.3.3. Dissemination of Potential Fishing Zone (PFZ) advisories to the fishermen: ---------------------- 239
15.3.4. Mari-culture -------------------------------------------------------------------------------------------------------- 239
15.3.5. Open sea cage farming ----------------------------------------------------------------------------------------- 239
15.3.6. Seaweed farming ------------------------------------------------------------------------------------------------- 242
15.3.7. Other promising mari-culture ventures --------------------------------------------------------------------- 243
15.4. HOLISTIC DEVELOPMENT OF THE MARINE FISH SUPPLY CHAIN ......................................................... 243
15.5. ANNOTATION ........................................................................................................................ 244
Chapter 16 Inland Fisheries: Short Term Strategies --------------------------------247
16.1. FRESHWATER AQUACULTURE ................................................................................................... 247
16.2. CARP BREEDING ..................................................................................................................... 248
16.2.1. Rearing of fish seed ---------------------------------------------------------------------------------------------- 249
16.2.2. Minor carps -------------------------------------------------------------------------------------------------------- 250
16.2.3. Costs and returns of carp hatchery in India --------------------------------------------------------------- 250
16.3. MAGUR BREEDING ................................................................................................................. 251
16.4. FRESHWATER PRAWN CULTURE ................................................................................................ 251
16.5. MURREL BREEDING AND CULTURE ............................................................................................ 252
16.6. TILAPIA FARMING ................................................................................................................... 253
16.7. PANGASIUS ........................................................................................................................... 253
16.8. FRESHWATER PEARL CULTURE .................................................................................................. 253
16.9. FRESHWATER ORNAMENTAL FISH CULTURE ................................................................................ 254
16.10. ANNOTATION ........................................................................................................................ 255
Chapter 17 Fisheries: Sectoral and Sub-sectoral Action Plan ---------------------257
17.1. INDIAN FISHERIES – POTENTIAL FOR INCOME GROWTH ................................................................ 257
17.2. SECTORS AND SUB-SECTORS FOR PROMOTION ............................................................................ 257
Chapter 18 Non-farm Fishery Enterprises ---------------------------------------------275
18.1. NON-FARM ACTIVITIES IN THE FISHERIES SECTOR ........................................................................ 275
Chapter 19 Fisheries Marketing ----------------------------------------------------------283
19.1. BACKGROUND ....................................................................................................................... 283
19.1.1. Status of the Fish Processing Industry ---------------------------------------------------------------------- 283
19.1.2. Status of Domestic fish marketing --------------------------------------------------------------------------- 284
19.1.3. Value to Fishermen----------------------------------------------------------------------------------------------- 286
19.2. INSTITUTIONAL SUPPORT FOR FISH MARKETING (DOMESTIC / EXPORTS) ......................................... 286
Doubling Farmers’ Income – Volume VIII
Production Enhancement through Productivity Gains
xii
19.2.1. National Fisheries Development Board --------------------------------------------------------------------- 286
19.2.2. Marine Products Exports Development Authority (MPEDA) ------------------------------------------ 287
19.3. RECENT GOVERNMENT INITIATIVES TO MODERNISE MARKET INFRASTRUCTURE ................................. 288
Chapter 20 Fisheries: Policy Recommendations -------------------------------------291
20.1. MARINE FISHERIES .................................................................................................................. 291
20.2. INLAND FISHERIES ................................................................................................................... 291
20.2.1. Riverine fisheries -------------------------------------------------------------------------------------------------- 291
20.2.2. Reservoir fisheries ------------------------------------------------------------------------------------------------ 291
20.2.3. Freshwater aquaculture ---------------------------------------------------------------------------------------- 292
20.3. BRACKISHWATER AQUACULTURE ............................................................................................... 292
20.4. ADVISORIES ........................................................................................................................... 293
20.4.1. Weather advisories ---------------------------------------------------------------------------------------------- 293
20.4.2. Potential fishing zone advisories ----------------------------------------------------------------------------- 293
20.4.3. Deployment of advanced technologies --------------------------------------------------------------------- 293
20.5. POLICY AND IMPLEMENTATION FOCUS ....................................................................................... 293
Bibliography – Vol VIII-D -----------------------------------------------------------------------295
Annexures -------------------------------------------------------------------------------------297
Index of Tables
Table 0.1 Projected Demand for major food commodities in India ........................................................................ 5 Table 0.2 Current and Projected Output of Agriculture Sector .............................................................................. 6 Table 0.3 Cereals- Inter-state and Intra-state Yield Gap (2014-15) ........................................................................ 8 Table 0.4 Coarse Cereals: inter-state and intra-state Yield Gap (2014-15) ............................................................ 9 Table 0.5 Pulses- Inter-state and Intra-state Yield Gap (2014-15) ....................................................................... 10 Table 0.6 Oilseeds - Inter-state and Intra-state Yield Gap (2014-15) ................................................................... 11 Table 0.7 Commercial Crops - Inter-state and Intra-state Yield Gap (2014-15) .................................................. 12 Table 0.8 Interstate Yield Gap across Major Milk Production States (T.E 2014-15) ........................................... 13 Table 0.9 Interstate Yield Gap across major Meat producing States (2015-16) ................................................... 14 Table 0.10 Existing crop geometry across states (area share to GCA %) ............................................................. 17 Table 0.11 Estimated land which can be released from Wheat Crop ................................................................... 18 Table 0.12 Water use for crop production in different countries (in cubic metres/tonne) .................................... 19 Table 0.13 Ground Water Situation in India (Past 20 Years) ............................................................................... 19 Table 0.14 Rice and Wheat (Area, Production and Yield) ................................................................................... 20 Table 0.15 Average Annual Growth Rate of Production of Selected Food Commodities.................................... 21 Table 0.16 Projected Area, Yield and Production for rice and wheat ................................................................... 22 Table 0.17 Optimistic scenario for rice and wheat production ............................................................................. 22 Table 0.18 District-Wise Ground Water Assessment for Punjab (as on 31.03.2011) ........................................... 23 Table 0.19 State wise land use pattern in India (thousand Hectares, T.E 2014-15) .............................................. 27 Table 1.1 Trends in real value of output (2011-12 prices) .................................................................................... 40 Table 1.2 Species-wise sources of growth in milk production ............................................................................. 45 Table 1.3 Growth trends in bovine Population: 1961-2012 .................................................................................. 45 Table 2.1 Yield-gap at District Level in Selected States ...................................................................................... 50 Table 2.2 Inter-farm differentials in Feeding Pattern and Milk Productivity ....................................................... 54 Table 2.3 Supply, demand and gap of livestock feed and fodder across Rajasthan .............................................. 59 Table 2.4 Public Expenditure on Animal Husbandry and Dairy Development .................................................... 62 Table 3.1 Annual cost and returns from milk production in dynamic production environment. .......................... 68
Doubling Farmers’ Income – Volume VIII
Production Enhancement through Productivity Gains
xiii
Table 3.2 Annual cost and returns from milk production in underdeveloped production environment. .............. 69 Table 4.1 India’s livestock population (nos in million) ........................................................................................ 80 Table 4.2 Estimated bovine stock as on April, 2018 ............................................................................................ 80 Table 5.1 Promising drought tolerating varieties of cultivated fodder and grasses/legumes ................................ 86 Table 6.6.1 Possible routes to increase farmer’s income ...................................................................................... 97 Table 7.1 Regional Strategy Matrix for productivity enhancement of livestock ................................................ 124 Table 8.1 Status of livestock and percentage change over the period................................................................. 135 Table 8.2 Population statistics of sheep & goat .................................................................................................. 136 Table 8.3 Population distribution of poultry by type .......................................................................................... 139 Table 8.4 Status of production and growth rates of egg and meat ...................................................................... 140 Table 8.5 Production status of eggs in top five states ........................................................................................ 141 Table 8.6 Ownership by households ................................................................................................................... 141 Table 8.7 Ownership status of non-households and institutions ......................................................................... 143 Table 8.8 Species-wise major breeds by State .................................................................................................... 144 Table 9.1 Suggested improver breed .................................................................................................................. 150 Table 9.2 Improved chicken varieties available for rural poultry farming ........................................................ 153 Table 10.1 Nutritional components in different meats ....................................................................................... 163 Table 12.1 Doubling the income of Farmers by sheep farming ......................................................................... 183 Table 12.2 Case study of profit in Barbari goats under extensive and strategic management systems .............. 184 Table 12.3 Production and economic characteristics of major goat breeds of India ........................................... 185 Table 12.4 Economics of dual purpose rural chicken (Vanaraja) variety in free range conditions .................... 187 Table 12.5 Economics of egg type rural chicken (Gramapriya) variety in free range conditions....................... 187 Table 13.1 Livestock Population in India (in million) – Livestock Census, 2012 .............................................. 194 Table 13.2 Production of major livestock products – all India ........................................................................... 194 Table 13.3 Export of carabeef and poultry (2016-17) ........................................................................................ 202 Table 13.4 Export of small ruminants, processed meats, casings (2016-17) ...................................................... 202 Table 13.5 Egg wholesale price (monthly average over 5 years) - Rs per 100 pieces ........................................ 210 Table 13.6 Wool Production by animal source (2016-17) .................................................................................. 213 Table 13.7 Raw wool imports by India ............................................................................................................... 214 Table 13.8 Overview of Dairy Auctions on NCDFI eMarket............................................................................ 217 Table 15.1 Status of Indian fisheries resources and its size ................................................................................ 230 Table 15.2 An overview of marine fishery across its sub-sectors in India ......................................................... 234 Table 15.3 Economics of single-day fishing operation - selected craft-gear combinations (per trip), 2015....... 236 Table 15.4 Economics of multi-day fishing operation (2-5 days) - selected craft-gear combinations (per trip), 2015
............................................................................................................................................................................ 237 Table 15.5 Economics of fin fish farming in sea/brackish water cages in India, 2016 ....................................... 240 Table 15.6 Economic viability and financial feasibility indicators for 1 ha seaweed farm ................................ 242 Table 15.7 Economics of rack method of green mussel farming in Padanna, Kerala, 2016 ............................... 244 Table 16.1 Freshwater Aquaculture .................................................................................................................... 247 Table 16.2 Project details of carp breeding ........................................................................................................ 248 Table 16.3 Project details of fish seed rearing .................................................................................................... 249 Table 16.4 Project details of minor carps ........................................................................................................... 250 Table 16.5 Costs and returns of crop hatchery in India ...................................................................................... 251 Table 16.6 Project details of Magur fish ............................................................................................................. 251 Table 16.7 Project details of freshwater prawn culture ...................................................................................... 252 Table 16.8 Project details of murrell fish ........................................................................................................... 252 Table 16.9 Project details of pearl culture .......................................................................................................... 253 Table 16.10 Project details of freshwater ornamental fish .................................................................................. 254 Table 17.1 Action plan for specific sub-sectors of Freshwater Capture Fisheries (excluding coldwater) .......... 258 Table 17.2 Action plan under specific sectors/sub-sectors Marine Fisheries ..................................................... 260 Table 17.3 Action plan for specific sectors/sub-sectors of Freshwater Aquaculture (excluding cold water) ..... 261 Table 17.4 Action plan for specific sectors/sub-sectors of Coldwater Aquaculture ........................................... 266 Table 17.5 Action plan for specific sectors/sub-sectors of Brackishwater Aquaculture ..................................... 268 Table 17.6 Action plan under specific sectors/sub-sectors of Inland Saline Aquaculture .................................. 271
Doubling Farmers’ Income – Volume VIII
Production Enhancement through Productivity Gains
xiv
Table 17.7 Action plan for specific sectors/sub-sectors Mariculture .................................................................. 272 Table 18.1 Fisheries and aquaculture – action plan for non-farming enterprises ............................................... 277 Table 19.1 Quantity of ornamental fish sold in selected markets of India (2015) (In lakhs) ............................. 285
Index of Figures
Figure 0.1 Area and Value Pyramid ....................................................................................................................... 4 Figure 0.2 State-wise cropping intensity (T.E. 2014-15) ...................................................................................... 16 Figure 0.3 Trends in Area, Production and Yield of Rice and Wheat in India ..................................................... 20 Figure 0.4 State wise land use pattern in India (‘000 Hectares, T.E 2014-15) ..................................................... 25 Figure 1.1 Contribution of livestock to agriculture sector: recent trends .............................................................. 39 Figure 1.2 Decadal trends in share of livestock in agriculture GDP (1999-2000 prices) ..................................... 40 Figure 1.3 Share of milk and milk products in monthly per capita food expenditure ........................................... 42 Figure 1.4 Trends in milk production and availability.......................................................................................... 42 Figure 1.5 Species-wise contribution of milk production: 2016-17 ..................................................................... 43 Figure 1.6 Productivity of dairy animals (kg./day) ............................................................................................... 44 Figure 1.7 Population trends of local cattle .......................................................................................................... 46 Figure 2.1 Inter-state Variations in Milk Productivity (TE 2016-17): Crossbred Cows ....................................... 48 Figure 2.2 Inter-state Variations in Milk Productivity (TE 2016-17): Local Cows .............................................. 49 Figure 2.3 Inter-state Variations in Milk Productivity (TE 2016-17): Buffaloes ................................................. 49 Figure 2.4 Lactation Yield of Dairy Animals ....................................................................................................... 56 Figure 2.5 Trends in Input, Output and TFP indices of livestock production in Rajasthan .................................. 57 Figure 2.6 Veterinary Institutions in India: as on 31.03.2017 .............................................................................. 61 Figure 3.1 Cost and Returns in Smallholder Milk Production System in India .................................................... 66 Figure 3.2 Increasing Profit Margin with Higher Milk Yield ............................................................................... 71 Figure 3.3 Marketed surplus and share of organised sector in milk procurement ................................................ 72 Figure 3.4 Composition of dairy products in India (2016-17) .............................................................................. 73 Figure 6.1 Effect of Ration Balancing on Feed Digestibility and Animal Production ....................................... 109 Figure 8.1 No of household enterprises having cattle, buffalo, sheep, goat & pig ............................................. 135 Figure 8.2 Goat population during the period of 1992 - 2012 ............................................................................ 137 Figure 8.3 Species-wise percentage of meat contribution ................................................................................. 138 Figure 8.4 Species-wise percentage contribution of milk .................................................................................. 138 Figure 8.5 Pig population during the period of 1992-2012 ................................................................................. 139 Figure 8.6 Distribution of poultry population (%) .............................................................................................. 140 Figure 10.1 Livestock information – 2018 estimated numbers from e-pashuhaat portal .................................... 165 Figure 10.2 Overview of supply chain in goat meat ........................................................................................... 167 Figure 11.1 Population density of sheep in India ............................................................................................... 171 Figure 11.2 Overview of supply chain in sheep meat ......................................................................................... 176 Figure 13.1 Meat consumption per capita, globally .......................................................................................... 195 Figure 13.2 Meat consumption trends in India (OECD-FAO data) .................................................................... 196 Figure 13.3 Trends in mutton consumption (per capita annual) ......................................................................... 196 Figure 13.4 Trends in chicken consumption (per capita annual) ........................................................................ 197 Figure 13.5 Trends in Egg Consumption (per capita annual) ............................................................................. 197 Figure 13.6 Trends in milk consumption (per capita annual) ............................................................................. 198 Figure 13.7 Trends in milk consumption (per capita annual) ............................................................................. 198 Figure 13.8 Typical marketing chain for livestock farmers ................................................................................ 199 Figure 13.9 Meat production India (million metric tonnes) ................................................................................ 201 Figure 13.10 Meat market share India (Rs '000 crore in 2010) .......................................................................... 204 Figure 13.11 Milk production and corresponding Growth Rate ......................................................................... 206 Figure 13.12 Share in milk production by species (2016-17) ............................................................................. 206 Figure 13.13 Egg production and corresponding Growth Rate .......................................................................... 208 Figure 13.14 Share in egg production – backyard and commercial (2016-17) ................................................... 209
Doubling Farmers’ Income – Volume VIII
Production Enhancement through Productivity Gains
xv
Figure 13.15 Eggs market chain ......................................................................................................................... 210 Figure 13.16 Egg exports from India (numbers in crore eggs) ........................................................................... 211 Figure 13.17 Wool production and corresponding Growth Rate ........................................................................ 213 Figure 15.1 Year-wise growth of fish production ............................................................................................... 229 Figure 19.1 Trends in fish consumption (per capita annual) .............................................................................. 284
Doubling Farmers’ Income – Volume VIII
Production Enhancement through Productivity Gains
1
Setting the Context
Redesigning crop geometry & commodity matrix
Production is the final output resulted from the efforts of farmers. The produce is the fungible material
that a farmer seeks to monetise, for generating returns on the efforts and costs undertaken. The value
realised depends not only on the market demand but also on the productivity achieved in the course of
production. Productivity allows for production at lower per unit cost, and is critical to farmers’ income.
0.1. Background
Assets, tools, labour and capital are the key elements that take material inputs and convert into
agricultural output. Land is the primary asset in case of all terrain-based farming, for field
crops, orchards, plantations, aquaculture, livestock, etc. However, in case of marine fishing,
the primary asset is the maritime ecosystem and the vessels that harvest the produce. The tools
vary across sectors, from simpler hand held implements to industrial scale equipment and high
technology systems like sonars, radar, humidity controllers and sensor based equipment.
Labour includes the individual enterprise dedicated to the core farming activities, by the farmer
and the farming workers. Human capital in agriculture is involved in controls and decision
making and as labour in the activities undertaken. The financial capital cuts across the
operations and plays a critical role in the physical capacity to deploy appropriate tools and
manpower, as well in the necessary inputs that go into farming. The inputs, such as planting
material, water, fertilizer, animal feed, knowledge, etc. are linked to the initial capital available
and the capital generated from monetising the output.
The drivers of income growth for farmers are diversification of farm activities towards high-
value produce, technology up-gradation and modernisation, knowledge based enterprise
development, irrigation (micro-irrigation), each having a multiplier effect in production and
productivity. Value chain optimisation at every level in the integrated supply chain, in
producing and moving the produce from farm to consumers, optimal price realisation for
farmers through competitive markets and improvement in terms of trade are the other factors
that ensure that the productivity at field translates into gainful productivity at income level.
The efficiencies achieved from the synergistic exploitation of all of above, is decisive in the
productivity achieved at farm level. These efficiencies underpin the final cost of production,
the total production achieved, and the reduced stress on man, assets and the ecology. From the
farmers’ perspective, the cost and volume produced are most critical, as this is the wealth that
he/she creates. This wealth is thereafter available to the farmers, to be monetised at prices that
are directly linked to demand. The exchange transacted is the final value realised by the farmer,
and the productivity impacts on the net income achieved.
0.2. Mandate of Agriculture
At Independence, India’s urban population was estimated at 6 crores, and by its 75th
anniversary it is expected to be about 48 crores. With such urbanisation, the ratio of urban
population in the total population has shifted from 15 per cent to nearly 35 per cent. The
Doubling Farmers’ Income – Volume VIII
Production Enhancement through Productivity Gains
2
dependency load on the agricultural sector for food and other materials has, at a minimum,
more than doubled. This has to happen from a fixed land area and depleting resources. Reports
also indicate that by 2030 the urban population may touch 50 per cent. This only reflects that
agriculture, is increasingly and acutely linked to the sustenance and survival of the urban
population. However, this awareness is yet to be fully appreciated by the dependent population.
The globally accepted goal from agriculture, has been to produce more to assure food security.
However, food that contains toxins is not food secure, neither is production that is harming the
ecology sensible. It is time to go beyond the conventional terms of food security and ensure
that food security includes not such quantity but quality of nutrition and quality of production
system. Agriculture, in today’s world, is not just with purpose to produce to sustain life; it has
to produce more from less and in safe manner. In modern day context, the agricultural mandate
needs redefining, entailing food and nutritional security, along with sustainability, thereby
expanding upon the erstwhile production centric mandate.
i. Agriculture has the moral responsibility of meeting food and nutritional security in
consonance with the agro ecological backdrop.
ii. It has to generate gainful employment resulting in income gains to make the farmers
more economically secure.
iii. It has to generate raw material that will directly support agro-processing of food and
non-food products to support secondary agriculture.
iv. It has to support agro-processing industry to produce primary and intermediate goods,
which will feed the manufacturing sector.
v. Agricultural practices need to be on a sustainable basis.
Agriculture has to generate both food and raw material to meet the requirement of modern
society for feed, fibre, fuel and other industrial uses, and in a manner that is sustainable.
0.3. Changing Farmers’ Income from Seasonal to Perennial
Concentration on few cereal crops has reduced profitability, distracted investment, and
dampened growth in the agricultural sector. Agricultural diversification can help to reverse
these trends by making the sector more profitable as it becomes flexible in meeting the local
and international demands and enables poor people to do something new and remunerative yet
within their sphere of competencies and resources.
Diversification is considered a shift of resources from one crop (or livestock) to a larger mix
of crops and livestock, keeping in view the varying nature of risks and expected returns from
each crop/livestock activity and adjusting it in such a way that it leads to optimum portfolio of
income. Diversified farming activities, instead of concentrating on crops alone, can ensure
sustainable income. Agricultural diversification can reduce the risk exposure of farm
households by optimizing income from a range of activities, more stable employment for farm
workers and resources throughout the year.
Doubling Farmers’ Income – Volume VIII
Production Enhancement through Productivity Gains
3
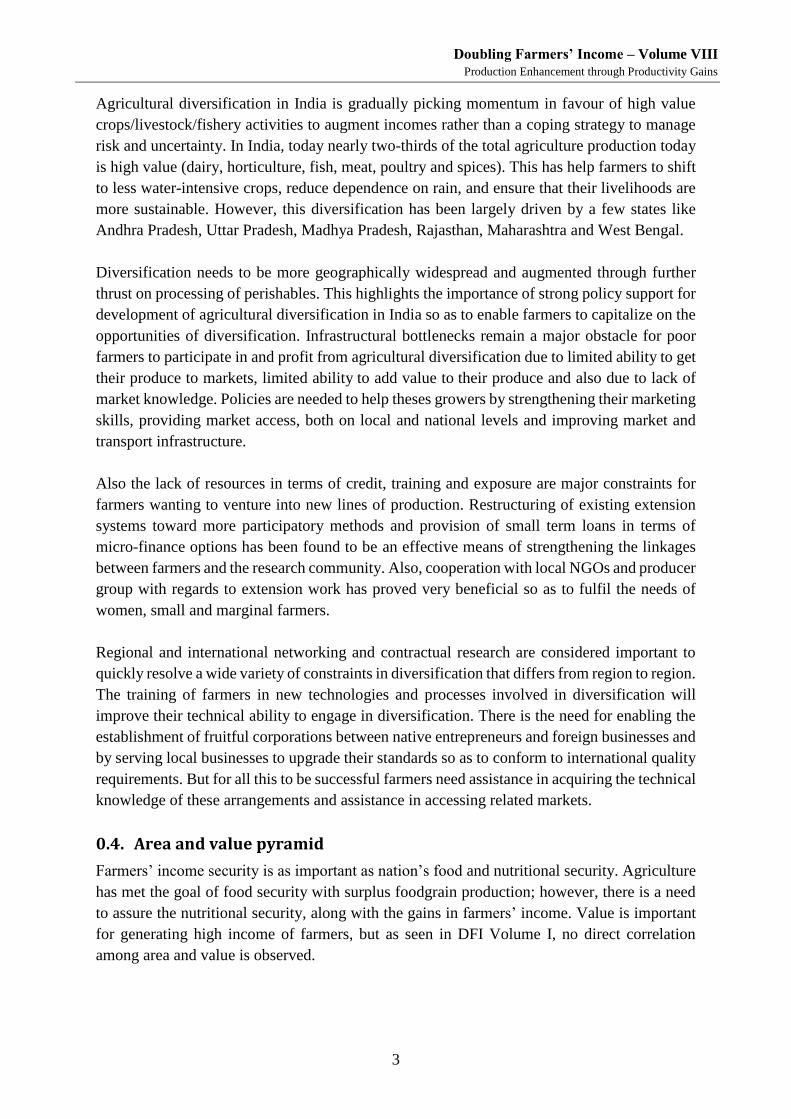
Agricultural diversification in India is gradually picking momentum in favour of high value
crops/livestock/fishery activities to augment incomes rather than a coping strategy to manage
risk and uncertainty. In India, today nearly two-thirds of the total agriculture production today
is high value (dairy, horticulture, fish, meat, poultry and spices). This has help farmers to shift
to less water-intensive crops, reduce dependence on rain, and ensure that their livelihoods are
more sustainable. However, this diversification has been largely driven by a few states like
Andhra Pradesh, Uttar Pradesh, Madhya Pradesh, Rajasthan, Maharashtra and West Bengal.
Diversification needs to be more geographically widespread and augmented through further
thrust on processing of perishables. This highlights the importance of strong policy support for
development of agricultural diversification in India so as to enable farmers to capitalize on the
opportunities of diversification. Infrastructural bottlenecks remain a major obstacle for poor
farmers to participate in and profit from agricultural diversification due to limited ability to get
their produce to markets, limited ability to add value to their produce and also due to lack of
market knowledge. Policies are needed to help theses growers by strengthening their marketing
skills, providing market access, both on local and national levels and improving market and
transport infrastructure.
Also the lack of resources in terms of credit, training and exposure are major constraints for
farmers wanting to venture into new lines of production. Restructuring of existing extension
systems toward more participatory methods and provision of small term loans in terms of
micro-finance options has been found to be an effective means of strengthening the linkages
between farmers and the research community. Also, cooperation with local NGOs and producer
group with regards to extension work has proved very beneficial so as to fulfil the needs of
women, small and marginal farmers.
Regional and international networking and contractual research are considered important to
quickly resolve a wide variety of constraints in diversification that differs from region to region.
The training of farmers in new technologies and processes involved in diversification will
improve their technical ability to engage in diversification. There is the need for enabling the
establishment of fruitful corporations between native entrepreneurs and foreign businesses and
by serving local businesses to upgrade their standards so as to conform to international quality
requirements. But for all this to be successful farmers need assistance in acquiring the technical
knowledge of these arrangements and assistance in accessing related markets.
0.4. Area and value pyramid
Farmers’ income security is as important as nation’s food and nutritional security. Agriculture
has met the goal of food security with surplus foodgrain production; however, there is a need
to assure the nutritional security, along with the gains in farmers’ income. Value is important
for generating high income of farmers, but as seen in DFI Volume I, no direct correlation
among area and value is observed.
Doubling Farmers’ Income – Volume VIII
Production Enhancement through Productivity Gains
4
The value of any agricultural produce depends on a number of factors. In some cases, the
factors include demand linked to administered and allocated values, and in some cases the
terms of trade many not be so favourable, despite untapped demand, such as in case of nutri-
cereals. It would be worthwhile to evaluate the relationship between acreage and value and use
this to plan future actions, to make the most of agricultural assets, outputs and markets.
Certainly, there is need to change the crop cafeteria to suit the ecology and the consumers’
preference, hence ensuring that value is captured across all areas of concern.
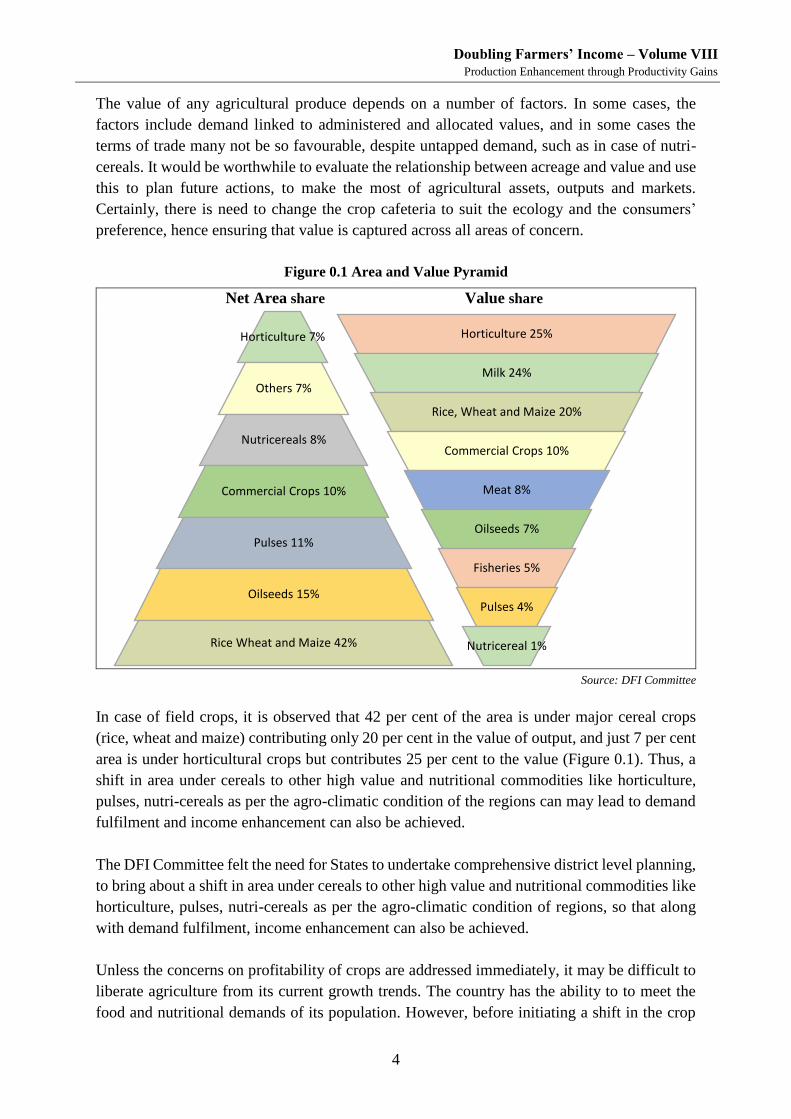
Figure 0.1 Area and Value Pyramid
Net Area share Value share
Source: DFI Committee
In case of field crops, it is observed that 42 per cent of the area is under major cereal crops
(rice, wheat and maize) contributing only 20 per cent in the value of output, and just 7 per cent
area is under horticultural crops but contributes 25 per cent to the value (Figure 0.1). Thus, a
shift in area under cereals to other high value and nutritional commodities like horticulture,
pulses, nutri-cereals as per the agro-climatic condition of the regions can may lead to demand
fulfilment and income enhancement can also be achieved.
The DFI Committee felt the need for States to undertake comprehensive district level planning,
to bring about a shift in area under cereals to other high value and nutritional commodities like
horticulture, pulses, nutri-cereals as per the agro-climatic condition of regions, so that along
with demand fulfilment, income enhancement can also be achieved.
Unless the concerns on profitability of crops are addressed immediately, it may be difficult to
liberate agriculture from its current growth trends. The country has the ability to to meet the
food and nutritional demands of its population. However, before initiating a shift in the crop
Horticulture 25%
Milk 24%
Rice, Wheat and Maize 20%
Commercial Crops 10%
Meat 8%
Oilseeds 7%
Fisheries 5%
Pulses 4%
Nutricereal 1%
Horticulture 7%
Others 7%
Nutricereals 8%
Commercial Crops 10%
Pulses 11%
Oilseeds 15%
Rice Wheat and Maize 42%
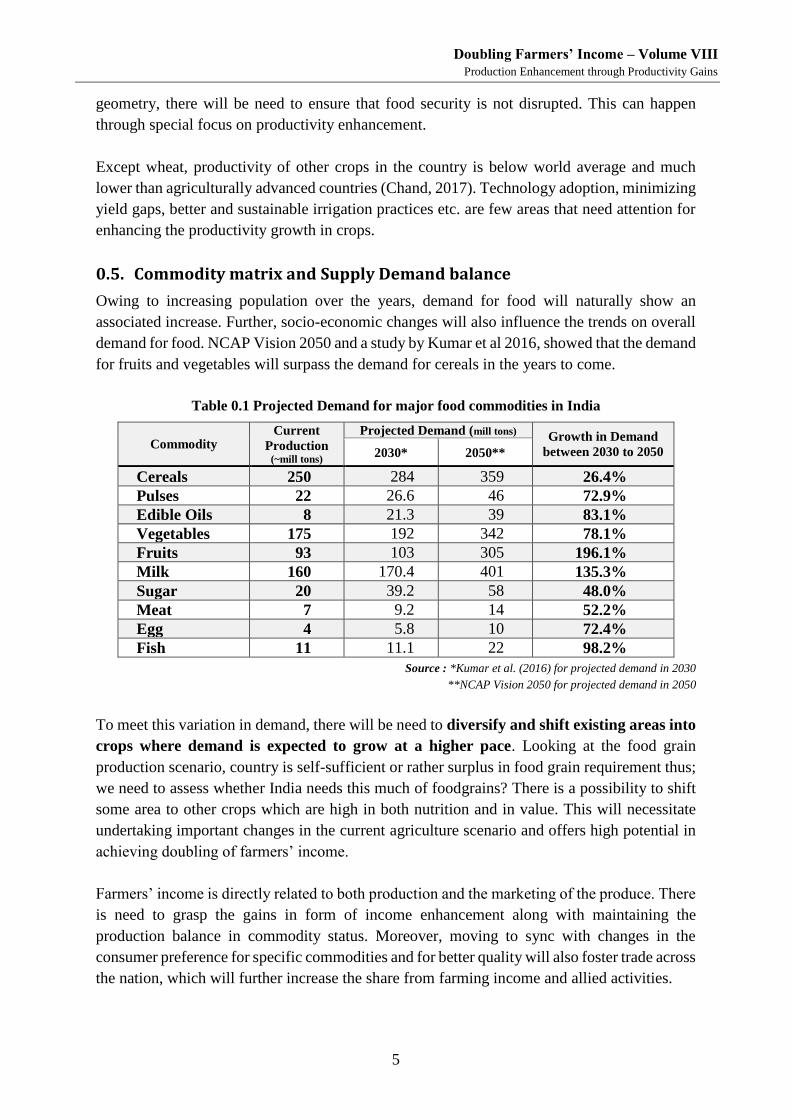
Doubling Farmers’ Income – Volume VIII
Production Enhancement through Productivity Gains
5
geometry, there will be need to ensure that food security is not disrupted. This can happen
through special focus on productivity enhancement.
Except wheat, productivity of other crops in the country is below world average and much
lower than agriculturally advanced countries (Chand, 2017). Technology adoption, minimizing
yield gaps, better and sustainable irrigation practices etc. are few areas that need attention for
enhancing the productivity growth in crops.
0.5. Commodity matrix and Supply Demand balance
Owing to increasing population over the years, demand for food will naturally show an
associated increase. Further, socio-economic changes will also influence the trends on overall
demand for food. NCAP Vision 2050 and a study by Kumar et al 2016, showed that the demand
for fruits and vegetables will surpass the demand for cereals in the years to come.
Table 0.1 Projected Demand for major food commodities in India
Commodity Current
Production (~mill tons)
Projected Demand (mill tons) Growth in Demand
between 2030 to 2050 2030* 2050**
Cereals 250 284 359 26.4%
Pulses 22 26.6 46 72.9%
Edible Oils 8 21.3 39 83.1%
Vegetables 175 192 342 78.1%
Fruits 93 103 305 196.1%
Milk 160 170.4 401 135.3%
Sugar 20 39.2 58 48.0%
Meat 7 9.2 14 52.2%
Egg 4 5.8 10 72.4%
Fish 11 11.1 22 98.2%
Source : *Kumar et al. (2016) for projected demand in 2030
**NCAP Vision 2050 for projected demand in 2050
To meet this variation in demand, there will be need to diversify and shift existing areas into
crops where demand is expected to grow at a higher pace. Looking at the food grain
production scenario, country is self-sufficient or rather surplus in food grain requirement thus;
we need to assess whether India needs this much of foodgrains? There is a possibility to shift
some area to other crops which are high in both nutrition and in value. This will necessitate
undertaking important changes in the current agriculture scenario and offers high potential in
achieving doubling of farmers’ income.
Farmers’ income is directly related to both production and the marketing of the produce. There
is need to grasp the gains in form of income enhancement along with maintaining the
production balance in commodity status. Moreover, moving to sync with changes in the
consumer preference for specific commodities and for better quality will also foster trade across
the nation, which will further increase the share from farming income and allied activities.
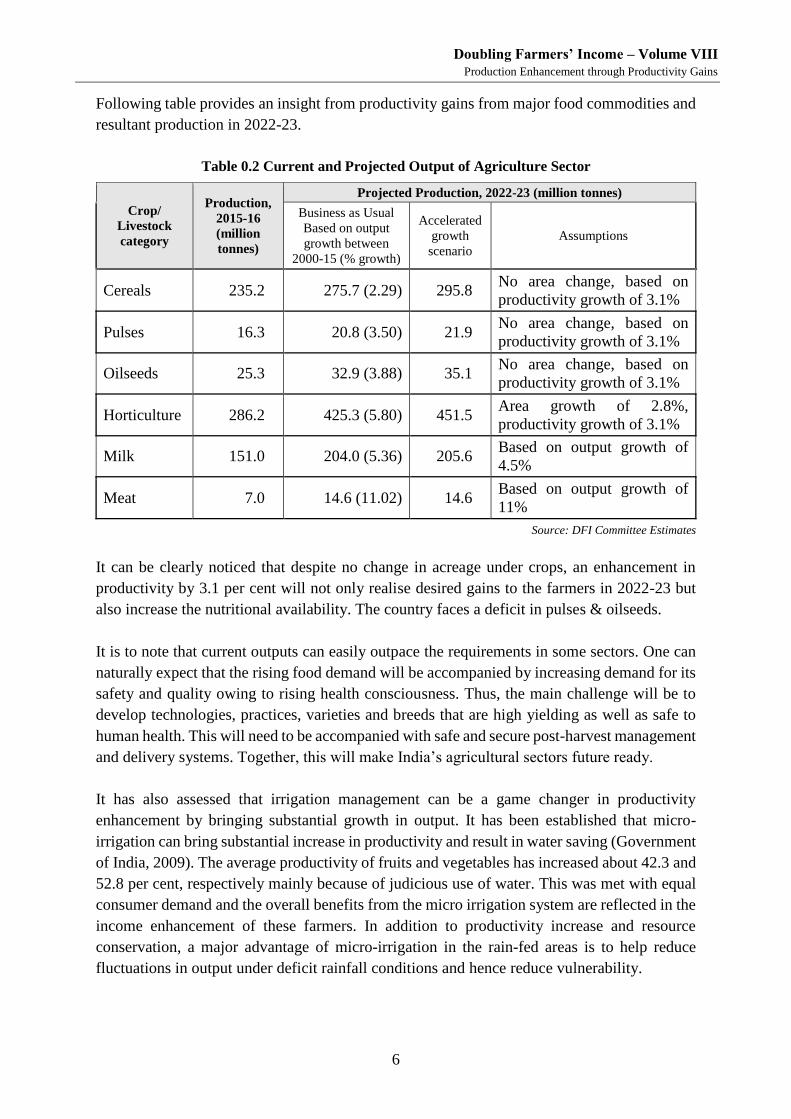
Doubling Farmers’ Income – Volume VIII
Production Enhancement through Productivity Gains
6
Following table provides an insight from productivity gains from major food commodities and
resultant production in 2022-23.
Table 0.2 Current and Projected Output of Agriculture Sector
Crop/
Livestock
category
Production,
2015-16
(million
tonnes)
Projected Production, 2022-23 (million tonnes)
Business as Usual
Based on output
growth between
2000-15 (% growth)
Accelerated
growth
scenario
Assumptions
Cereals 235.2 275.7 (2.29) 295.8 No area change, based on
productivity growth of 3.1%
Pulses 16.3 20.8 (3.50) 21.9 No area change, based on
productivity growth of 3.1%
Oilseeds 25.3 32.9 (3.88) 35.1 No area change, based on
productivity growth of 3.1%
Horticulture 286.2 425.3 (5.80) 451.5 Area growth of 2.8%,
productivity growth of 3.1%
Milk 151.0 204.0 (5.36) 205.6 Based on output growth of
4.5%
Meat 7.0 14.6 (11.02) 14.6 Based on output growth of
11%
Source: DFI Committee Estimates
It can be clearly noticed that despite no change in acreage under crops, an enhancement in
productivity by 3.1 per cent will not only realise desired gains to the farmers in 2022-23 but
also increase the nutritional availability. The country faces a deficit in pulses & oilseeds.
It is to note that current outputs can easily outpace the requirements in some sectors. One can
naturally expect that the rising food demand will be accompanied by increasing demand for its
safety and quality owing to rising health consciousness. Thus, the main challenge will be to
develop technologies, practices, varieties and breeds that are high yielding as well as safe to
human health. This will need to be accompanied with safe and secure post-harvest management
and delivery systems. Together, this will make India’s agricultural sectors future ready.
It has also assessed that irrigation management can be a game changer in productivity
enhancement by bringing substantial growth in output. It has been established that micro-
irrigation can bring substantial increase in productivity and result in water saving (Government
of India, 2009). The average productivity of fruits and vegetables has increased about 42.3 and
52.8 per cent, respectively mainly because of judicious use of water. This was met with equal
consumer demand and the overall benefits from the micro irrigation system are reflected in the
income enhancement of these farmers. In addition to productivity increase and resource
conservation, a major advantage of micro-irrigation in the rain-fed areas is to help reduce
fluctuations in output under deficit rainfall conditions and hence reduce vulnerability.
Doubling Farmers’ Income – Volume VIII
Production Enhancement through Productivity Gains
7
Apart from above mentioned indicators for diversifying and to take a productivity approach,
major requirement will be to evaluate and sync with the agro-climatic conditions. The crop
matrix should be developed in agro-ecological consonance. An overall shift from being
production centric to productivity centric approach is the need of the hour to overcome both
nutritional requirement and value gains.
0.6. Yield gaps
India is largest producer of pulses in the world whereas the second largest producer of paddy,
wheat and sugarcane. India is also an important producer of commercial crops like cotton,
sugarcane and tobacco. But in most of the cases the productivity of various crops in India are
lower than those in the US, Europe and China, because in most of these countries crops are
largely grown in high input management conditions with considerably long growing periods.
A measure of the degree of crop yield potential, the attainable yield and the corresponding yield
gap (the difference between attainable yield and actual yields) is crucial so as to suggest
appropriate policy measures.
There always exists a gap between what is projected as the potential yield of any crop variety
at a research station, and what is produced by the farmers themselves. Several factors are
responsible for theses yield gaps such as physical, biological, socio-economic and institutional
constraints which can be effectively improved through participatory research and government
attention. Thus, it is important to revisit yield gaps in various production systems in India to
estimate existing yield potential across various agro-climatic zones in India.
The clear objective is to ensure that the maximum potential of any crop variety is harvested at
the farmers’ field. Significant yield gaps exist across various crops through different states as
well as within states. Bridging these yield gaps will not only increase crop production but also
helps to improve the efficiency of land and labour use, reduce production cost and add to food
security. The current yield gaps show a lack of transfer of technology, adoption and knowhow
to farmers.
Improving farm yields is important as it can also release land for other productive uses, such
as diversifying into added high value commodities and allow farmers to scale up integrated
farming practices. If a farmer can generate the current output, of say wheat, from lesser share
of his land, some of the same land can be used to take up horticulture or add mushroom,
sericulture, beekeeping or other secondary agricultural activities.
Productivity enhancement requires yield gap minimization between district to state, state to
state and state to nation. These variations in crop yields are related to market accessibility,
purchasing power/income, agricultural work force, and terrain factors, besides water and
fertilizer management. However, closing yield gaps will enhance food self-sufficiency and
enable food security at local, regional, and global scales.
There is immense yield potential at every level which needs to be assessed to minimise these
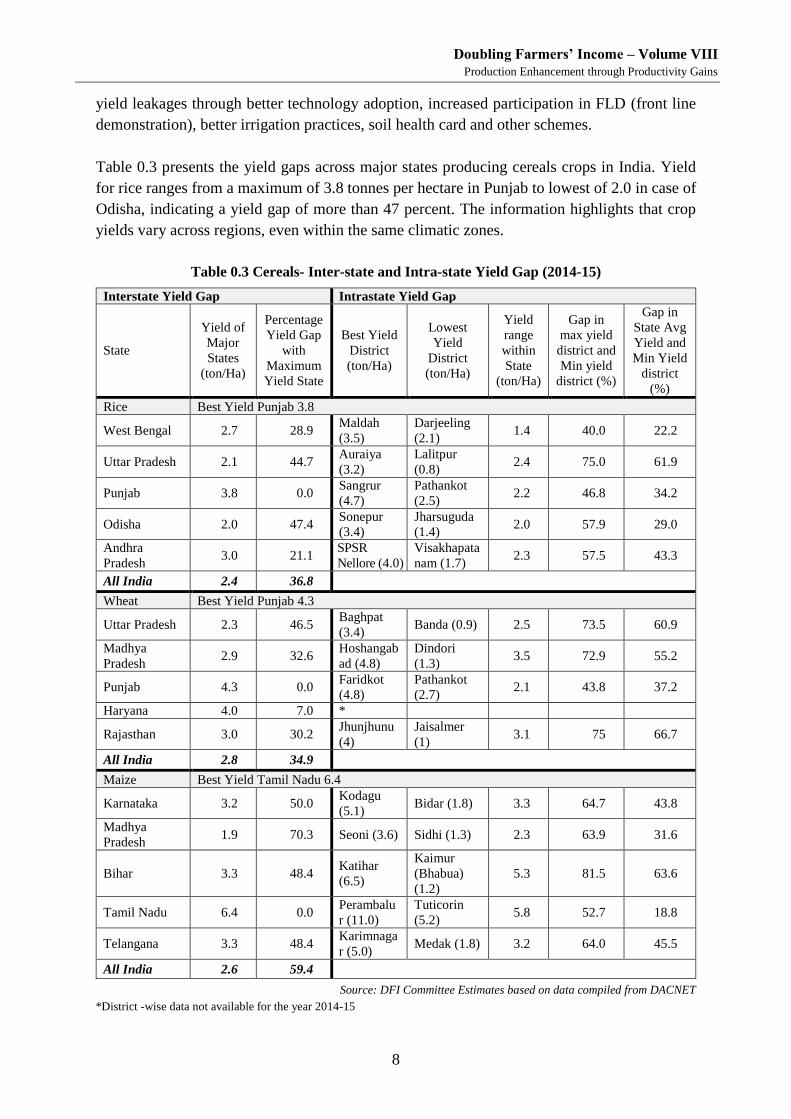
Doubling Farmers’ Income – Volume VIII
Production Enhancement through Productivity Gains
8
yield leakages through better technology adoption, increased participation in FLD (front line
demonstration), better irrigation practices, soil health card and other schemes.
Table 0.3 presents the yield gaps across major states producing cereals crops in India. Yield
for rice ranges from a maximum of 3.8 tonnes per hectare in Punjab to lowest of 2.0 in case of
Odisha, indicating a yield gap of more than 47 percent. The information highlights that crop
yields vary across regions, even within the same climatic zones.
Table 0.3 Cereals- Inter-state and Intra-state Yield Gap (2014-15)
Interstate Yield Gap Intrastate Yield Gap
State
Yield of
Major
States
(ton/Ha)
Percentage
Yield Gap
with
Maximum
Yield State
Best Yield
District
(ton/Ha)
Lowest
Yield
District
(ton/Ha)
Yield
range
within
State
(ton/Ha)
Gap in
max yield
district and
Min yield
district (%)
Gap in
State Avg
Yield and
Min Yield
district
(%)
Rice Best Yield Punjab 3.8
West Bengal 2.7 28.9 Maldah
(3.5)
Darjeeling
(2.1) 1.4 40.0 22.2
Uttar Pradesh 2.1 44.7 Auraiya
(3.2)
Lalitpur
(0.8) 2.4 75.0 61.9
Punjab 3.8 0.0 Sangrur
(4.7)
Pathankot
(2.5) 2.2 46.8 34.2
Odisha 2.0 47.4 Sonepur
(3.4)
Jharsuguda
(1.4) 2.0 57.9 29.0
Andhra
Pradesh 3.0 21.1
SPSR
Nellore (4.0)
Visakhapata
nam (1.7) 2.3 57.5 43.3
All India 2.4 36.8
Wheat Best Yield Punjab 4.3
Uttar Pradesh 2.3 46.5 Baghpat
(3.4) Banda (0.9) 2.5 73.5 60.9
Madhya
Pradesh 2.9 32.6
Hoshangab
ad (4.8)
Dindori
(1.3) 3.5 72.9 55.2
Punjab 4.3 0.0 Faridkot
(4.8)
Pathankot
(2.7) 2.1 43.8 37.2
Haryana 4.0 7.0 *
Rajasthan 3.0 30.2 Jhunjhunu
(4)
Jaisalmer
(1) 3.1 75 66.7
All India 2.8 34.9
Maize Best Yield Tamil Nadu 6.4
Karnataka 3.2 50.0 Kodagu
(5.1) Bidar (1.8) 3.3 64.7 43.8
Madhya
Pradesh 1.9 70.3 Seoni (3.6) Sidhi (1.3) 2.3 63.9 31.6
Bihar 3.3 48.4 Katihar
(6.5)
Kaimur
(Bhabua)
(1.2)
5.3 81.5 63.6
Tamil Nadu 6.4 0.0 Perambalu
r (11.0)
Tuticorin
(5.2) 5.8 52.7 18.8
Telangana 3.3 48.4 Karimnaga
r (5.0) Medak (1.8) 3.2 64.0 45.5
All India 2.6 59.4
Source: DFI Committee Estimates based on data compiled from DACNET
*District -wise data not available for the year 2014-15

Doubling Farmers’ Income – Volume VIII
Production Enhancement through Productivity Gains
9
In case of wheat, the yield varies from a high of 4.3 tonnes per hectare in Punjab to a low of
2.3 in Uttar Pradesh. The yield gap in case of major cereals is maximum in case of maize where
more than 70 percent difference is seen between the states having the lowest and the highest
yield. The table also highlighted large yield gap among the districts in specific states, thus there
is considerable yield gap within states, indicating the scope to increase the yield in future, in
the districts having comparatively lower yields.
Considerable yield gap also exist between major states producing coarse cereals like Jowar and
Bajra where it is more than 64 per cent and as much as 68 per cent respectively.
Table 0.4 Coarse Cereals: inter-state and intra-state Yield Gap (2014-15)
Interstate Yield Gap Intrastate Yield Gap
State
Yield
of
Major
States
(ton/H
a)
Percentag
e Yield
Gap with
Maximum
Yield
State
Best Yield
District
(ton/Ha)
Lowest
Yield
District
(ton/Ha)
Yield
Range
within
State
(ton/Ha)
Gap in
Max yield
district
and Min
yield
district
(%)
Gap in Max
District
Yield and
Avg State
Yield (%)
Gap in
State Avg
Yield and
Min
Yield
district
(%)
Jowar Jowar: Best Yield Madhya Pradesh 1.7
Maharashtra 0.6 64.7 *
Karnataka 1.1 35.3 Davangere
(2.1)
Chamar
ajanagar
(0.4)
1.7 81.0 47.6 63.6
Tamil Nadu 1.5 11.8 Tirunelveli
(4.7)
Tiruppu
r (0.3) 4.4 93.6 68.1 80.0
Rajasthan 0.8 52.9 Rajsamand
(2.1)
Jaisalme
r (0.1) 2.0 95.2 61.9 87.5
Madhya
Pradesh 1.7 0.0
Barwani
(3.3)
Rewa
(0.9) 2.4 72.7 48.5 47.1
All India 0.9 47.1
Bajra Best Yield Uttar Pradesh 1.9
Rajasthan 1.1 42.1
Dholpur
(2.1)
Jaisalme
r (0.1)
2.0 95.2 47.6 90.9
Uttar
Pradesh 1.9 0.0
Kasganj
(3.3)
Allahab
ad (0.7)
2.6 78.8 42.4 63.2
Gujarat 1.7 10.5 *
Haryana 1.7 10.5 *
Maharashtra 0.6 68.4
Jalgaon
(1.2)
Parbhan
i (0.1)
1.1 91.8 50.8 83.3
All India 1.3 31.6
Source: DFI Committee Estimates based on data compiled from DACNET
*District -wise data not available for the year 2014-15
District wise yield gap in maximum in Rajasthan both in case of Jowar and Bajra where it is
around 88 percent in case of Jowar and more than 90 percent in Bajra. Thus there are serious
gaps both at the state level and at the district level which highlights the importance of increasing
yield potential, which if addressed properly could help in achieving the target of increasing
farmers income.
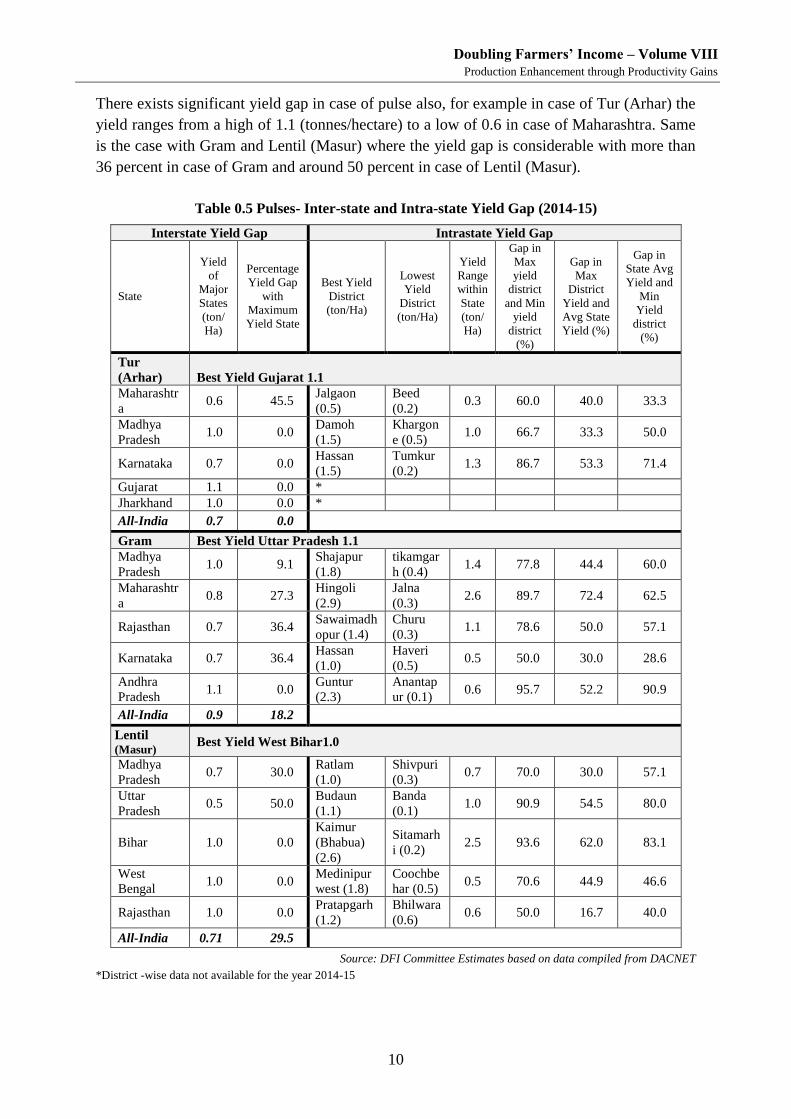
Doubling Farmers’ Income – Volume VIII
Production Enhancement through Productivity Gains
10
There exists significant yield gap in case of pulse also, for example in case of Tur (Arhar) the
yield ranges from a high of 1.1 (tonnes/hectare) to a low of 0.6 in case of Maharashtra. Same
is the case with Gram and Lentil (Masur) where the yield gap is considerable with more than
36 percent in case of Gram and around 50 percent in case of Lentil (Masur).
Table 0.5 Pulses- Inter-state and Intra-state Yield Gap (2014-15)
Interstate Yield Gap Intrastate Yield Gap
State
Yield
of
Major
States
(ton/
Ha)
Percentage
Yield Gap
with
Maximum
Yield State
Best Yield
District
(ton/Ha)
Lowest
Yield
District
(ton/Ha)
Yield
Range
within
State
(ton/
Ha)
Gap in
Max
yield
district
and Min
yield
district
(%)
Gap in
Max
District
Yield and
Avg State
Yield (%)
Gap in
State Avg
Yield and
Min
Yield
district
(%)
Tur
(Arhar) Best Yield Gujarat 1.1
Maharashtr
a 0.6 45.5
Jalgaon
(0.5)
Beed
(0.2) 0.3 60.0 40.0 33.3
Madhya
Pradesh 1.0 0.0
Damoh
(1.5)
Khargon
e (0.5) 1.0 66.7 33.3 50.0
Karnataka 0.7 0.0 Hassan
(1.5)
Tumkur
(0.2) 1.3 86.7 53.3 71.4
Gujarat 1.1 0.0 *
Jharkhand 1.0 0.0 *
All-India 0.7 0.0
Gram Best Yield Uttar Pradesh 1.1
Madhya
Pradesh 1.0 9.1
Shajapur
(1.8)
tikamgar
h (0.4) 1.4 77.8 44.4 60.0
Maharashtr
a 0.8 27.3
Hingoli
(2.9)
Jalna
(0.3) 2.6 89.7 72.4 62.5
Rajasthan 0.7 36.4 Sawaimadh
opur (1.4)
Churu
(0.3) 1.1 78.6 50.0 57.1
Karnataka 0.7 36.4 Hassan
(1.0)
Haveri
(0.5) 0.5 50.0 30.0 28.6
Andhra
Pradesh 1.1 0.0
Guntur
(2.3)
Anantap
ur (0.1) 0.6 95.7 52.2 90.9
All-India 0.9 18.2
Lentil (Masur)
Best Yield West Bihar1.0
Madhya
Pradesh 0.7 30.0
Ratlam
(1.0)
Shivpuri
(0.3) 0.7 70.0 30.0 57.1
Uttar
Pradesh 0.5 50.0
Budaun
(1.1)
Banda
(0.1) 1.0 90.9 54.5 80.0
Bihar 1.0 0.0
Kaimur
(Bhabua)
(2.6)
Sitamarh
i (0.2) 2.5 93.6 62.0 83.1
West
Bengal 1.0 0.0
Medinipur
west (1.8)
Coochbe
har (0.5) 0.5 70.6 44.9 46.6
Rajasthan 1.0 0.0 Pratapgarh
(1.2)
Bhilwara
(0.6) 0.6 50.0 16.7 40.0
All-India 0.71 29.5
Source: DFI Committee Estimates based on data compiled from DACNET
*District -wise data not available for the year 2014-15
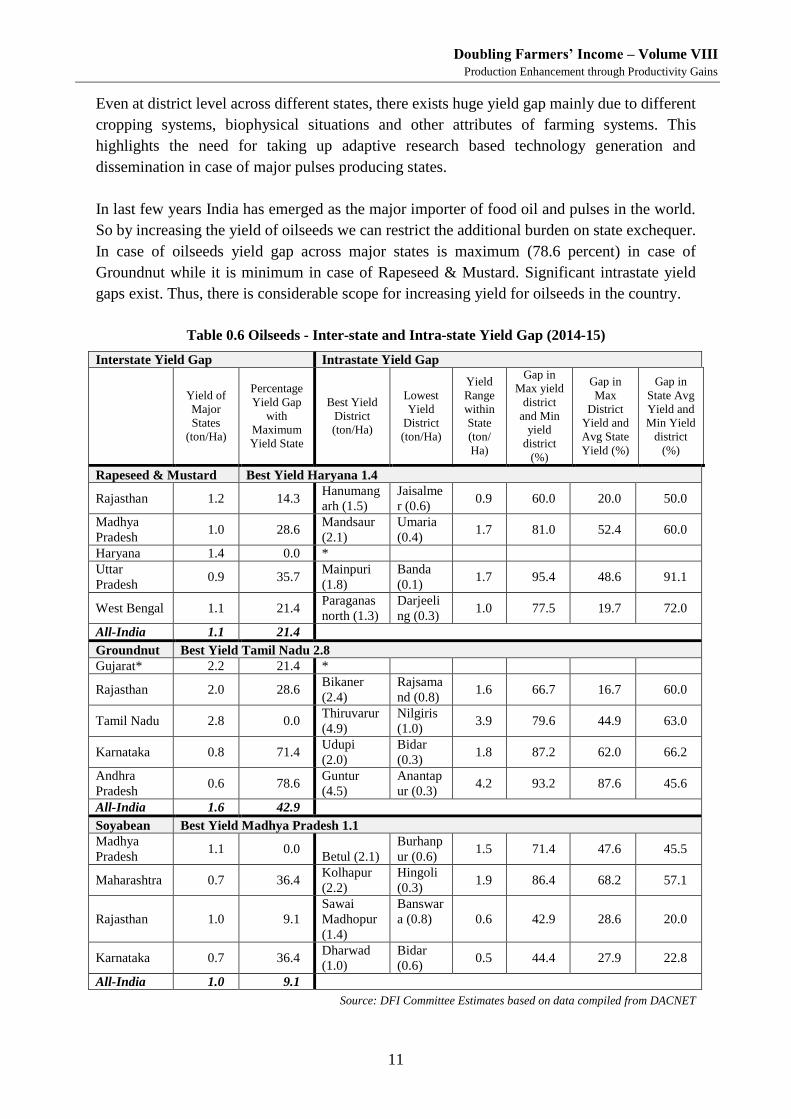
Doubling Farmers’ Income – Volume VIII
Production Enhancement through Productivity Gains
11
Even at district level across different states, there exists huge yield gap mainly due to different
cropping systems, biophysical situations and other attributes of farming systems. This
highlights the need for taking up adaptive research based technology generation and
dissemination in case of major pulses producing states.
In last few years India has emerged as the major importer of food oil and pulses in the world.
So by increasing the yield of oilseeds we can restrict the additional burden on state exchequer.
In case of oilseeds yield gap across major states is maximum (78.6 percent) in case of
Groundnut while it is minimum in case of Rapeseed & Mustard. Significant intrastate yield
gaps exist. Thus, there is considerable scope for increasing yield for oilseeds in the country.
Table 0.6 Oilseeds - Inter-state and Intra-state Yield Gap (2014-15)
Interstate Yield Gap Intrastate Yield Gap
Yield of
Major
States
(ton/Ha)
Percentage
Yield Gap
with
Maximum
Yield State
Best Yield
District
(ton/Ha)
Lowest
Yield
District
(ton/Ha)
Yield
Range
within
State
(ton/
Ha)
Gap in
Max yield
district
and Min
yield
district
(%)
Gap in
Max
District
Yield and
Avg State
Yield (%)
Gap in
State Avg
Yield and
Min Yield
district
(%)
Rapeseed & Mustard Best Yield Haryana 1.4
Rajasthan 1.2 14.3 Hanumang
arh (1.5)
Jaisalme
r (0.6) 0.9 60.0 20.0 50.0
Madhya
Pradesh 1.0 28.6
Mandsaur
(2.1)
Umaria
(0.4) 1.7 81.0 52.4 60.0
Haryana 1.4 0.0 *
Uttar
Pradesh 0.9 35.7
Mainpuri
(1.8)
Banda
(0.1) 1.7 95.4 48.6 91.1
West Bengal 1.1 21.4 Paraganas
north (1.3)
Darjeeli
ng (0.3) 1.0 77.5 19.7 72.0
All-India 1.1 21.4
Groundnut Best Yield Tamil Nadu 2.8
Gujarat* 2.2 21.4 *
Rajasthan 2.0 28.6 Bikaner
(2.4)
Rajsama
nd (0.8) 1.6 66.7 16.7 60.0
Tamil Nadu 2.8 0.0 Thiruvarur
(4.9)
Nilgiris
(1.0) 3.9 79.6 44.9 63.0
Karnataka 0.8 71.4 Udupi
(2.0)
Bidar
(0.3) 1.8 87.2 62.0 66.2
Andhra
Pradesh 0.6 78.6
Guntur
(4.5)
Anantap
ur (0.3) 4.2 93.2 87.6 45.6
All-India 1.6 42.9
Soyabean Best Yield Madhya Pradesh 1.1
Madhya
Pradesh 1.1 0.0
Betul (2.1)
Burhanp
ur (0.6) 1.5 71.4 47.6 45.5
Maharashtra 0.7 36.4 Kolhapur
(2.2)
Hingoli
(0.3) 1.9 86.4 68.2 57.1
Rajasthan 1.0 9.1
Sawai
Madhopur
(1.4)
Banswar
a (0.8) 0.6 42.9 28.6 20.0
Karnataka 0.7 36.4 Dharwad
(1.0)
Bidar
(0.6) 0.5 44.4 27.9 22.8
All-India 1.0 9.1
Source: DFI Committee Estimates based on data compiled from DACNET
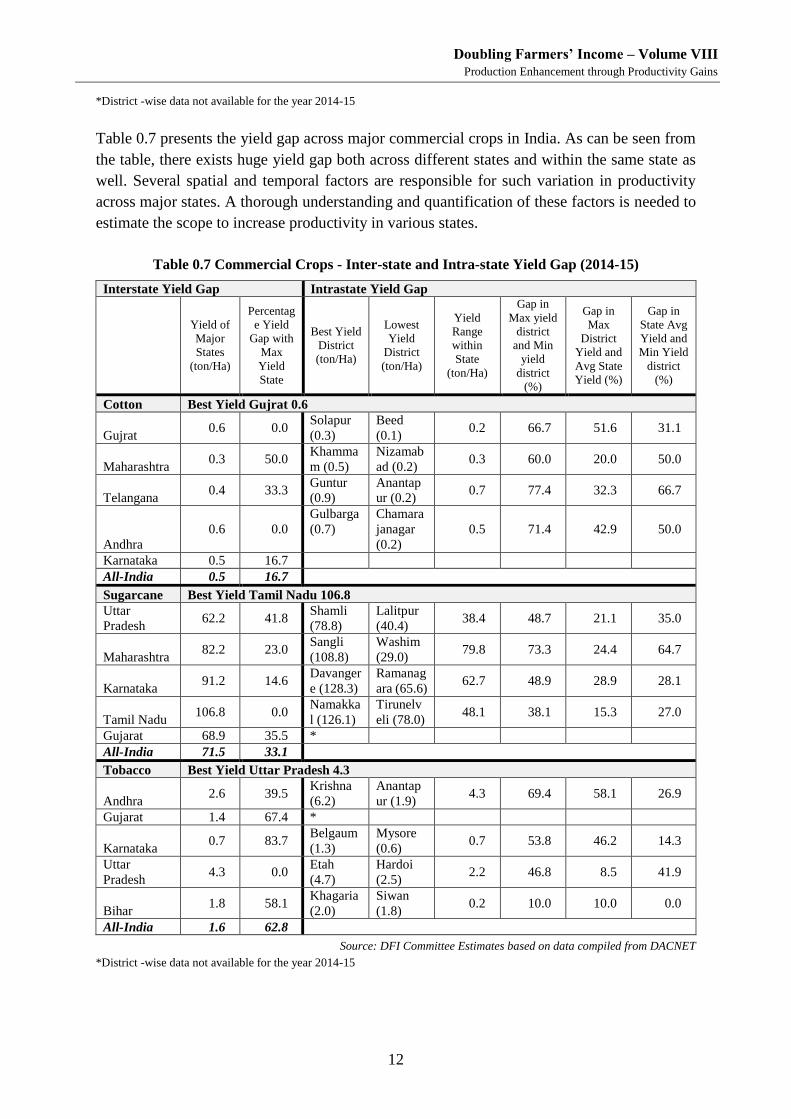
Doubling Farmers’ Income – Volume VIII
Production Enhancement through Productivity Gains
12
*District -wise data not available for the year 2014-15
Table 0.7 presents the yield gap across major commercial crops in India. As can be seen from
the table, there exists huge yield gap both across different states and within the same state as
well. Several spatial and temporal factors are responsible for such variation in productivity
across major states. A thorough understanding and quantification of these factors is needed to
estimate the scope to increase productivity in various states.
Table 0.7 Commercial Crops - Inter-state and Intra-state Yield Gap (2014-15)
Interstate Yield Gap Intrastate Yield Gap
Yield of
Major
States
(ton/Ha)
Percentag
e Yield
Gap with
Max
Yield
State
Best Yield
District
(ton/Ha)
Lowest
Yield
District
(ton/Ha)
Yield
Range
within
State
(ton/Ha)
Gap in
Max yield
district
and Min
yield
district
(%)
Gap in
Max
District
Yield and
Avg State
Yield (%)
Gap in
State Avg
Yield and
Min Yield
district
(%)
Cotton Best Yield Gujrat 0.6
Gujrat 0.6 0.0
Solapur
(0.3)
Beed
(0.1) 0.2 66.7 51.6 31.1
Maharashtra 0.3 50.0
Khamma
m (0.5)
Nizamab
ad (0.2) 0.3 60.0 20.0 50.0
Telangana 0.4 33.3
Guntur
(0.9)
Anantap
ur (0.2) 0.7 77.4 32.3 66.7
Andhra
0.6 0.0
Gulbarga
(0.7)
Chamara
janagar
(0.2)
0.5 71.4 42.9 50.0
Karnataka 0.5 16.7
All-India 0.5 16.7
Sugarcane Best Yield Tamil Nadu 106.8
Uttar
Pradesh 62.2 41.8
Shamli
(78.8)
Lalitpur
(40.4) 38.4 48.7 21.1 35.0
Maharashtra 82.2 23.0
Sangli
(108.8)
Washim
(29.0) 79.8 73.3 24.4 64.7
Karnataka 91.2 14.6
Davanger
e (128.3)
Ramanag
ara (65.6) 62.7 48.9 28.9 28.1
Tamil Nadu 106.8 0.0
Namakka
l (126.1)
Tirunelv
eli (78.0) 48.1 38.1 15.3 27.0
Gujarat 68.9 35.5 *
All-India 71.5 33.1
Tobacco Best Yield Uttar Pradesh 4.3
Andhra 2.6 39.5
Krishna
(6.2)
Anantap
ur (1.9) 4.3 69.4 58.1 26.9
Gujarat 1.4 67.4 *
Karnataka 0.7 83.7
Belgaum
(1.3)
Mysore
(0.6) 0.7 53.8 46.2 14.3
Uttar
Pradesh 4.3 0.0
Etah
(4.7)
Hardoi
(2.5) 2.2 46.8 8.5 41.9
Bihar 1.8 58.1
Khagaria
(2.0)
Siwan
(1.8) 0.2 10.0 10.0 0.0
All-India 1.6 62.8
Source: DFI Committee Estimates based on data compiled from DACNET
*District -wise data not available for the year 2014-15
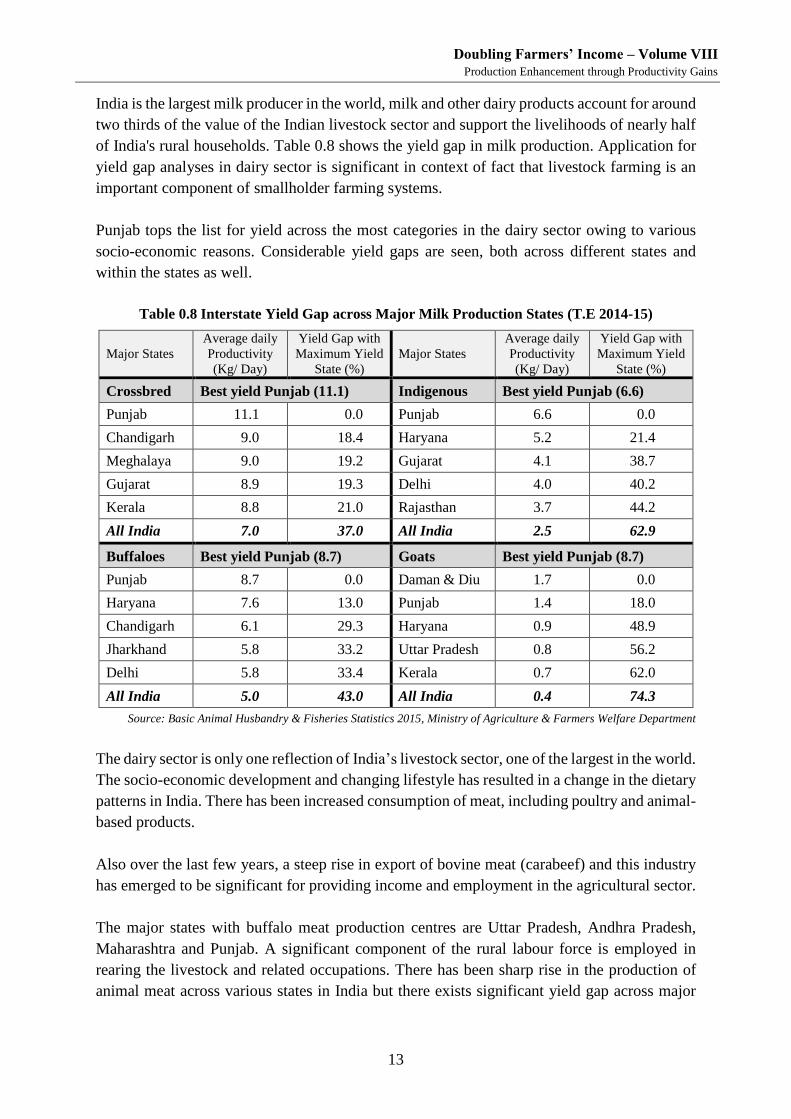
Doubling Farmers’ Income – Volume VIII
Production Enhancement through Productivity Gains
13
India is the largest milk producer in the world, milk and other dairy products account for around
two thirds of the value of the Indian livestock sector and support the livelihoods of nearly half
of India's rural households. Table 0.8 shows the yield gap in milk production. Application for
yield gap analyses in dairy sector is significant in context of fact that livestock farming is an
important component of smallholder farming systems.
Punjab tops the list for yield across the most categories in the dairy sector owing to various
socio-economic reasons. Considerable yield gaps are seen, both across different states and
within the states as well.
Table 0.8 Interstate Yield Gap across Major Milk Production States (T.E 2014-15)
Major States
Average daily
Productivity
(Kg/ Day)
Yield Gap with
Maximum Yield
State (%)
Major States
Average daily
Productivity
(Kg/ Day)
Yield Gap with
Maximum Yield
State (%)
Crossbred Best yield Punjab (11.1) Indigenous Best yield Punjab (6.6)
Punjab 11.1 0.0 Punjab 6.6 0.0
Chandigarh 9.0 18.4 Haryana 5.2 21.4
Meghalaya 9.0 19.2 Gujarat 4.1 38.7
Gujarat 8.9 19.3 Delhi 4.0 40.2
Kerala 8.8 21.0 Rajasthan 3.7 44.2
All India 7.0 37.0 All India 2.5 62.9
Buffaloes Best yield Punjab (8.7) Goats Best yield Punjab (8.7)
Punjab 8.7 0.0 Daman & Diu 1.7 0.0
Haryana 7.6 13.0 Punjab 1.4 18.0
Chandigarh 6.1 29.3 Haryana 0.9 48.9
Jharkhand 5.8 33.2 Uttar Pradesh 0.8 56.2
Delhi 5.8 33.4 Kerala 0.7 62.0
All India 5.0 43.0 All India 0.4 74.3
Source: Basic Animal Husbandry & Fisheries Statistics 2015, Ministry of Agriculture & Farmers Welfare Department
The dairy sector is only one reflection of India’s livestock sector, one of the largest in the world.
The socio-economic development and changing lifestyle has resulted in a change in the dietary
patterns in India. There has been increased consumption of meat, including poultry and animal-
based products.
Also over the last few years, a steep rise in export of bovine meat (carabeef) and this industry
has emerged to be significant for providing income and employment in the agricultural sector.
The major states with buffalo meat production centres are Uttar Pradesh, Andhra Pradesh,
Maharashtra and Punjab. A significant component of the rural labour force is employed in
rearing the livestock and related occupations. There has been sharp rise in the production of
animal meat across various states in India but there exists significant yield gap across major
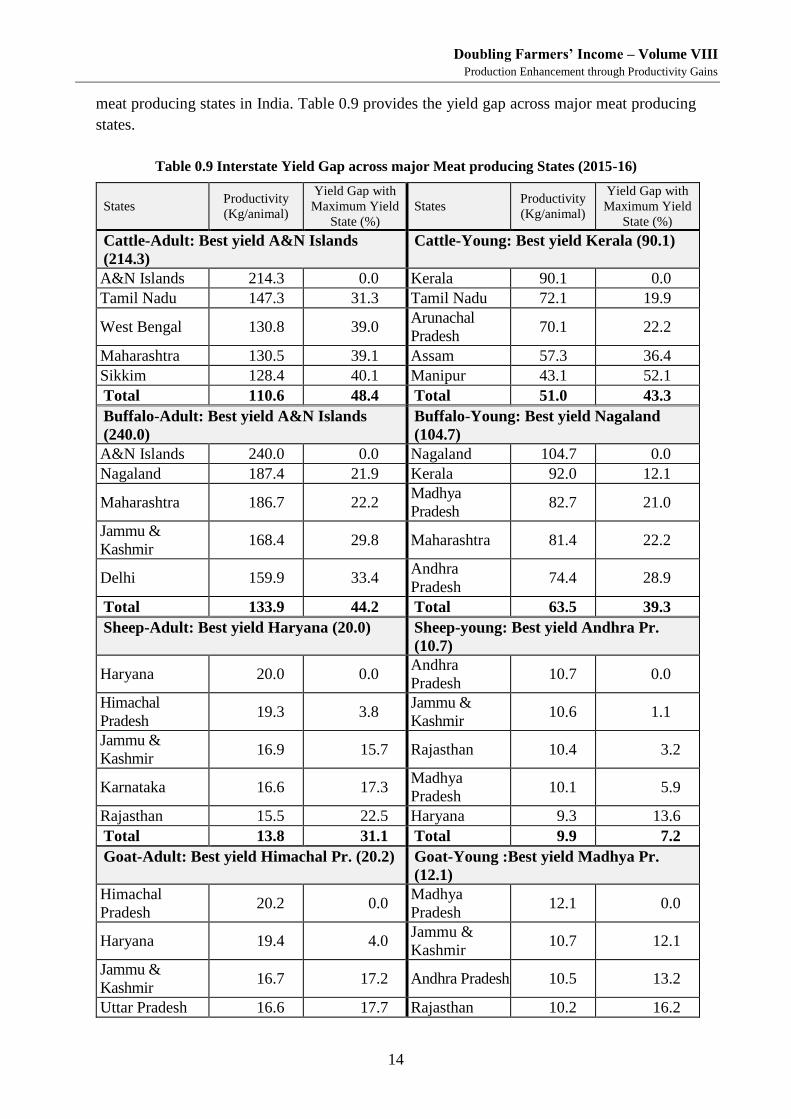
Doubling Farmers’ Income – Volume VIII
Production Enhancement through Productivity Gains
14
meat producing states in India. Table 0.9 provides the yield gap across major meat producing
states.
Table 0.9 Interstate Yield Gap across major Meat producing States (2015-16)
States Productivity
(Kg/animal)
Yield Gap with
Maximum Yield
State (%)
States Productivity
(Kg/animal)
Yield Gap with
Maximum Yield
State (%)
Cattle-Adult: Best yield A&N Islands
(214.3)
Cattle-Young: Best yield Kerala (90.1)
A&N Islands 214.3 0.0 Kerala 90.1 0.0
Tamil Nadu 147.3 31.3 Tamil Nadu 72.1 19.9
West Bengal 130.8 39.0 Arunachal
Pradesh 70.1 22.2
Maharashtra 130.5 39.1 Assam 57.3 36.4
Sikkim 128.4 40.1 Manipur 43.1 52.1
Total 110.6 48.4 Total 51.0 43.3
Buffalo-Adult: Best yield A&N Islands
(240.0)
Buffalo-Young: Best yield Nagaland
(104.7)
A&N Islands 240.0 0.0 Nagaland 104.7 0.0
Nagaland 187.4 21.9 Kerala 92.0 12.1
Maharashtra 186.7 22.2 Madhya
Pradesh 82.7 21.0
Jammu &
Kashmir 168.4 29.8 Maharashtra 81.4 22.2
Delhi 159.9 33.4 Andhra
Pradesh 74.4 28.9
Total 133.9 44.2 Total 63.5 39.3
Sheep-Adult: Best yield Haryana (20.0) Sheep-young: Best yield Andhra Pr.
(10.7)
Haryana 20.0 0.0 Andhra
Pradesh 10.7 0.0
Himachal
Pradesh 19.3 3.8
Jammu &
Kashmir 10.6 1.1
Jammu &
Kashmir 16.9 15.7 Rajasthan 10.4 3.2
Karnataka 16.6 17.3 Madhya
Pradesh 10.1 5.9
Rajasthan 15.5 22.5 Haryana 9.3 13.6
Total 13.8 31.1 Total 9.9 7.2
Goat-Adult: Best yield Himachal Pr. (20.2) Goat-Young :Best yield Madhya Pr.
(12.1)
Himachal
Pradesh 20.2 0.0
Madhya
Pradesh 12.1 0.0
Haryana 19.4 4.0 Jammu &
Kashmir 10.7 12.1
Jammu &
Kashmir 16.7 17.2 Andhra Pradesh 10.5 13.2
Uttar Pradesh 16.6 17.7 Rajasthan 10.2 16.2
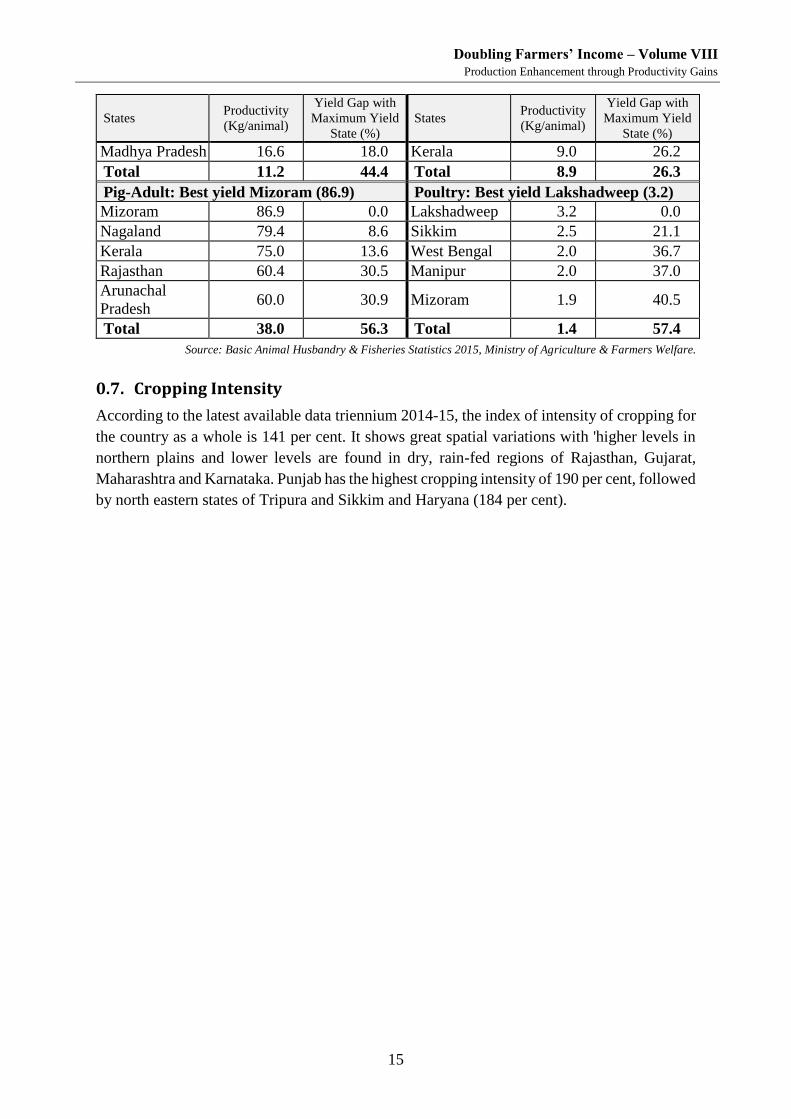
Doubling Farmers’ Income – Volume VIII
Production Enhancement through Productivity Gains
15
States Productivity
(Kg/animal)
Yield Gap with
Maximum Yield
State (%)
States Productivity
(Kg/animal)
Yield Gap with
Maximum Yield
State (%)
Madhya Pradesh 16.6 18.0 Kerala 9.0 26.2
Total 11.2 44.4 Total 8.9 26.3
Pig-Adult: Best yield Mizoram (86.9) Poultry: Best yield Lakshadweep (3.2)
Mizoram 86.9 0.0 Lakshadweep 3.2 0.0
Nagaland 79.4 8.6 Sikkim 2.5 21.1
Kerala 75.0 13.6 West Bengal 2.0 36.7
Rajasthan 60.4 30.5 Manipur 2.0 37.0
Arunachal
Pradesh 60.0 30.9 Mizoram 1.9 40.5
Total 38.0 56.3 Total 1.4 57.4
Source: Basic Animal Husbandry & Fisheries Statistics 2015, Ministry of Agriculture & Farmers Welfare.
0.7. Cropping Intensity
According to the latest available data triennium 2014-15, the index of intensity of cropping for
the country as a whole is 141 per cent. It shows great spatial variations with 'higher levels in
northern plains and lower levels are found in dry, rain-fed regions of Rajasthan, Gujarat,
Maharashtra and Karnataka. Punjab has the highest cropping intensity of 190 per cent, followed
by north eastern states of Tripura and Sikkim and Haryana (184 per cent).
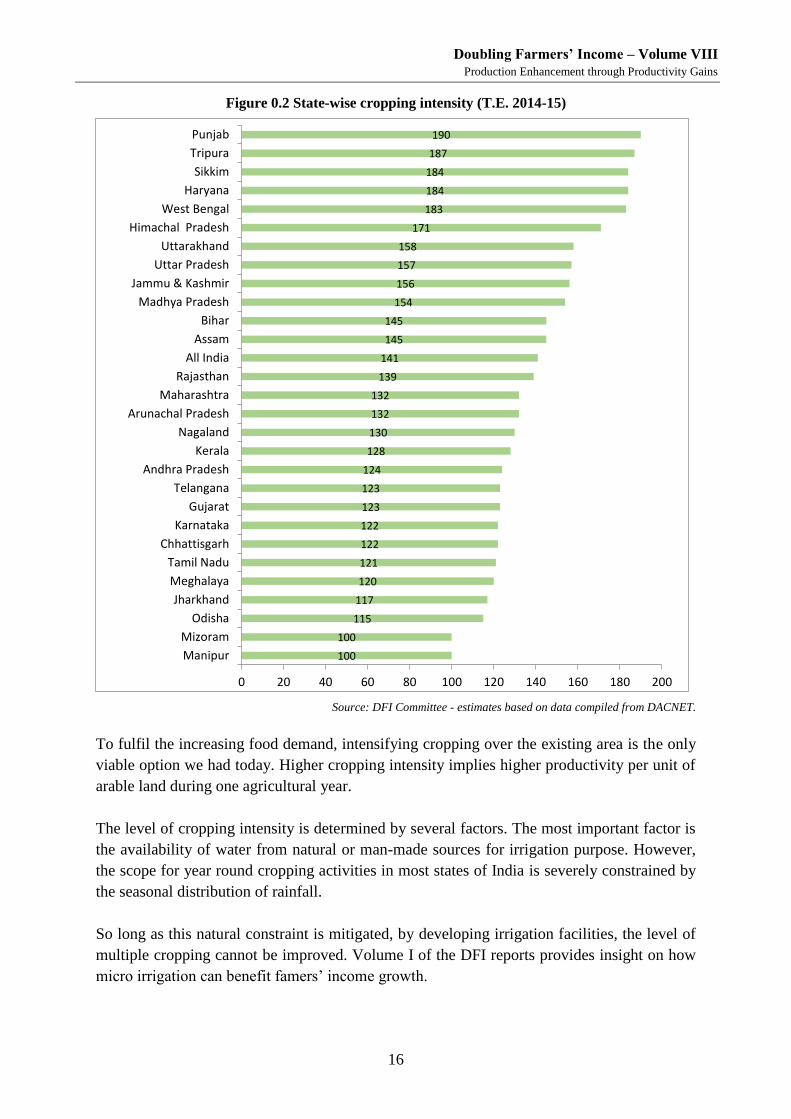
Doubling Farmers’ Income – Volume VIII
Production Enhancement through Productivity Gains
16
Figure 0.2 State-wise cropping intensity (T.E. 2014-15)
Source: DFI Committee - estimates based on data compiled from DACNET.
To fulfil the increasing food demand, intensifying cropping over the existing area is the only
viable option we had today. Higher cropping intensity implies higher productivity per unit of
arable land during one agricultural year.
The level of cropping intensity is determined by several factors. The most important factor is
the availability of water from natural or man-made sources for irrigation purpose. However,
the scope for year round cropping activities in most states of India is severely constrained by
the seasonal distribution of rainfall.
So long as this natural constraint is mitigated, by developing irrigation facilities, the level of
multiple cropping cannot be improved. Volume I of the DFI reports provides insight on how
micro irrigation can benefit famers’ income growth.
100
100
115
117
120
121
122
122
123
123
124
128
130
132
132
139
141
145
145
154
156
157
158
171
183
184
184
187
190
0 20 40 60 80 100 120 140 160 180 200
Manipur
Mizoram
Odisha
Jharkhand
Meghalaya
Tamil Nadu
Chhattisgarh
Karnataka
Gujarat
Telangana
Andhra Pradesh
Kerala
Nagaland
Arunachal Pradesh
Maharashtra
Rajasthan
All India
Assam
Bihar
Madhya Pradesh
Jammu & Kashmir
Uttar Pradesh
Uttarakhand
Himachal Pradesh
West Bengal
Haryana
Sikkim
Tripura
Punjab
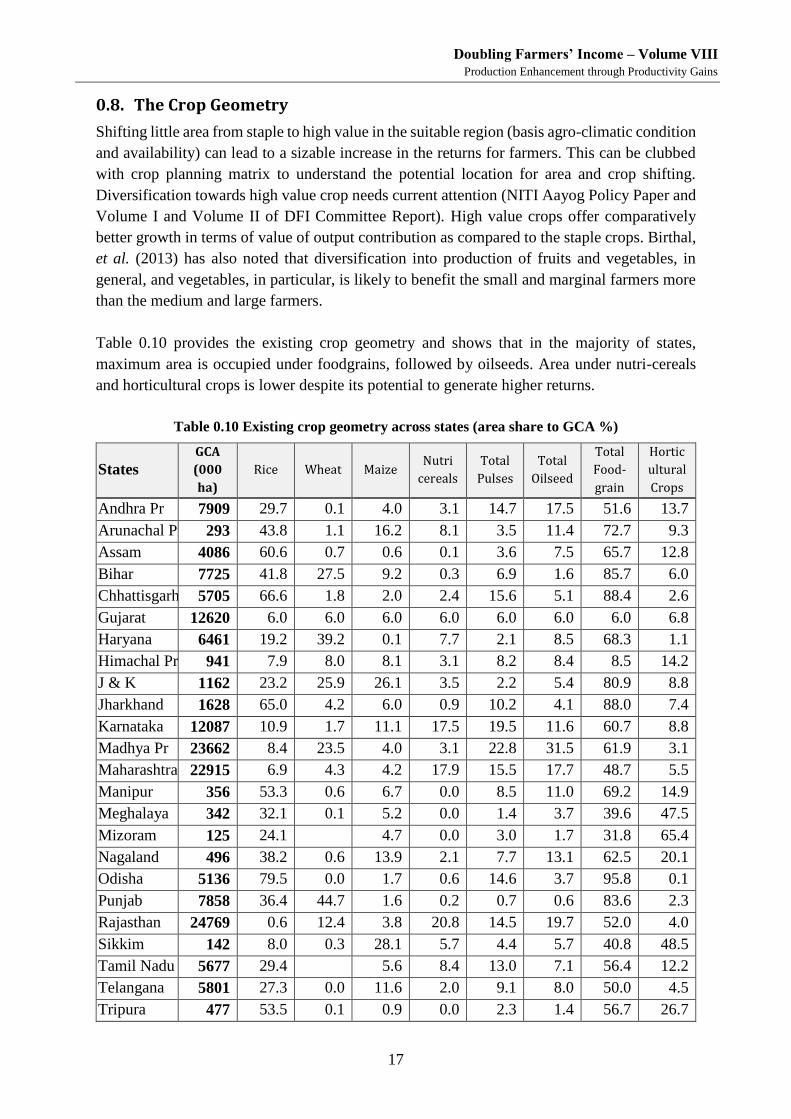
Doubling Farmers’ Income – Volume VIII
Production Enhancement through Productivity Gains
17
0.8. The Crop Geometry
Shifting little area from staple to high value in the suitable region (basis agro-climatic condition
and availability) can lead to a sizable increase in the returns for farmers. This can be clubbed
with crop planning matrix to understand the potential location for area and crop shifting.
Diversification towards high value crop needs current attention (NITI Aayog Policy Paper and
Volume I and Volume II of DFI Committee Report). High value crops offer comparatively
better growth in terms of value of output contribution as compared to the staple crops. Birthal,
et al. (2013) has also noted that diversification into production of fruits and vegetables, in
general, and vegetables, in particular, is likely to benefit the small and marginal farmers more
than the medium and large farmers.
Table 0.10 provides the existing crop geometry and shows that in the majority of states,
maximum area is occupied under foodgrains, followed by oilseeds. Area under nutri-cereals
and horticultural crops is lower despite its potential to generate higher returns.
Table 0.10 Existing crop geometry across states (area share to GCA %)
States
GCA
(000
ha)
Rice Wheat Maize Nutri
cereals
Total
Pulses
Total
Oilseed
Total
Food-
grain
Hortic
ultural
Crops
Andhra Pr 7909 29.7 0.1 4.0 3.1 14.7 17.5 51.6 13.7
Arunachal Pr 293 43.8 1.1 16.2 8.1 3.5 11.4 72.7 9.3
Assam 4086 60.6 0.7 0.6 0.1 3.6 7.5 65.7 12.8
Bihar 7725 41.8 27.5 9.2 0.3 6.9 1.6 85.7 6.0
Chhattisgarh 5705 66.6 1.8 2.0 2.4 15.6 5.1 88.4 2.6
Gujarat 12620 6.0 6.0 6.0 6.0 6.0 6.0 6.0 6.8
Haryana 6461 19.2 39.2 0.1 7.7 2.1 8.5 68.3 1.1
Himachal Pr 941 7.9 8.0 8.1 3.1 8.2 8.4 8.5 14.2
J & K 1162 23.2 25.9 26.1 3.5 2.2 5.4 80.9 8.8
Jharkhand 1628 65.0 4.2 6.0 0.9 10.2 4.1 88.0 7.4
Karnataka 12087 10.9 1.7 11.1 17.5 19.5 11.6 60.7 8.8
Madhya Pr 23662 8.4 23.5 4.0 3.1 22.8 31.5 61.9 3.1
Maharashtra 22915 6.9 4.3 4.2 17.9 15.5 17.7 48.7 5.5
Manipur 356 53.3 0.6 6.7 0.0 8.5 11.0 69.2 14.9
Meghalaya 342 32.1 0.1 5.2 0.0 1.4 3.7 39.6 47.5
Mizoram 125 24.1 4.7 0.0 3.0 1.7 31.8 65.4
Nagaland 496 38.2 0.6 13.9 2.1 7.7 13.1 62.5 20.1
Odisha 5136 79.5 0.0 1.7 0.6 14.6 3.7 95.8 0.1
Punjab 7858 36.4 44.7 1.6 0.2 0.7 0.6 83.6 2.3
Rajasthan 24769 0.6 12.4 3.8 20.8 14.5 19.7 52.0 4.0
Sikkim 142 8.0 0.3 28.1 5.7 4.4 5.7 40.8 48.5
Tamil Nadu 5677 29.4 5.6 8.4 13.0 7.1 56.4 12.2
Telangana 5801 27.3 0.0 11.6 2.0 9.1 8.0 50.0 4.5
Tripura 477 53.5 0.1 0.9 0.0 2.3 1.4 56.7 26.7
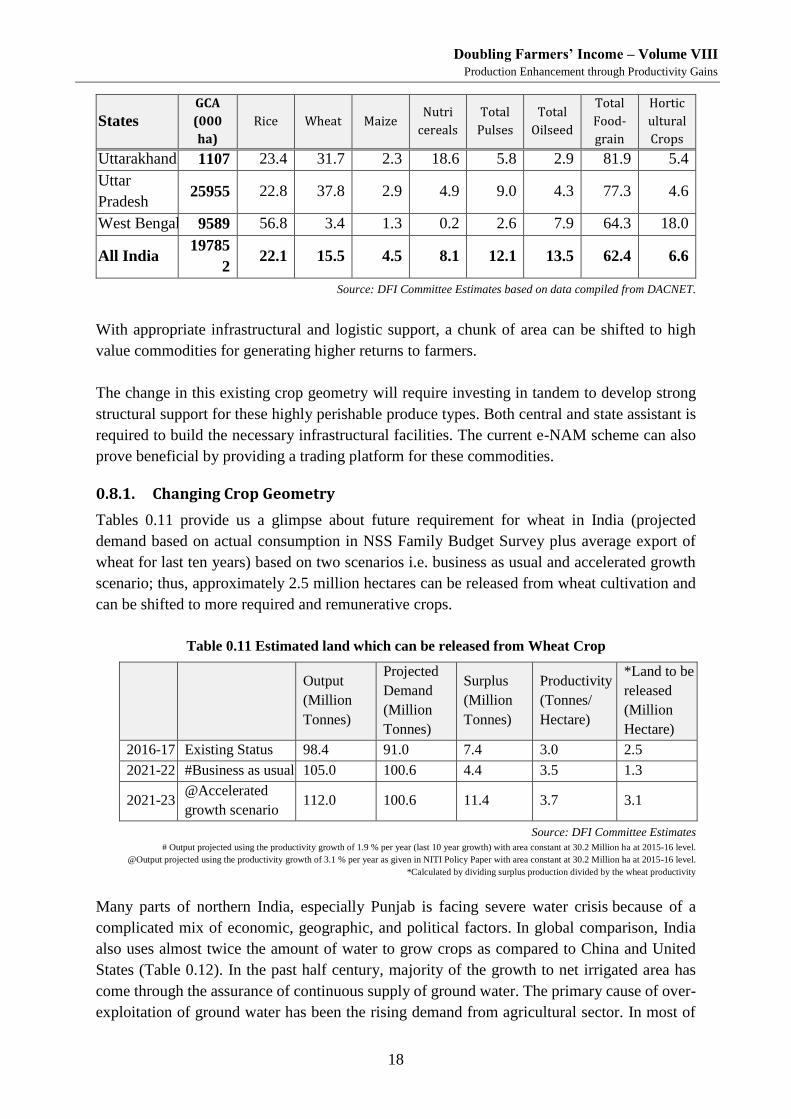
Doubling Farmers’ Income – Volume VIII
Production Enhancement through Productivity Gains
18
States
GCA
(000
ha)
Rice Wheat Maize Nutri
cereals
Total
Pulses
Total
Oilseed
Total
Food-
grain
Hortic
ultural
Crops
Uttarakhand 1107 23.4 31.7 2.3 18.6 5.8 2.9 81.9 5.4
Uttar
Pradesh 25955 22.8 37.8 2.9 4.9 9.0 4.3 77.3 4.6
West Bengal 9589 56.8 3.4 1.3 0.2 2.6 7.9 64.3 18.0
All India 19785
2 22.1 15.5 4.5 8.1 12.1 13.5 62.4 6.6
Source: DFI Committee Estimates based on data compiled from DACNET.
With appropriate infrastructural and logistic support, a chunk of area can be shifted to high
value commodities for generating higher returns to farmers.
The change in this existing crop geometry will require investing in tandem to develop strong
structural support for these highly perishable produce types. Both central and state assistant is
required to build the necessary infrastructural facilities. The current e-NAM scheme can also
prove beneficial by providing a trading platform for these commodities.
0.8.1. Changing Crop Geometry
Tables 0.11 provide us a glimpse about future requirement for wheat in India (projected
demand based on actual consumption in NSS Family Budget Survey plus average export of
wheat for last ten years) based on two scenarios i.e. business as usual and accelerated growth
scenario; thus, approximately 2.5 million hectares can be released from wheat cultivation and
can be shifted to more required and remunerative crops.
Table 0.11 Estimated land which can be released from Wheat Crop
Output
(Million
Tonnes)
Projected
Demand
(Million
Tonnes)
Surplus
(Million
Tonnes)
Productivity
(Tonnes/
Hectare)
*Land to be
released
(Million
Hectare)
2016-17 Existing Status 98.4 91.0 7.4 3.0 2.5
2021-22 #Business as usual 105.0 100.6 4.4 3.5 1.3
2021-23 @Accelerated
growth scenario 112.0 100.6 11.4 3.7 3.1
Source: DFI Committee Estimates
# Output projected using the productivity growth of 1.9 % per year (last 10 year growth) with area constant at 30.2 Million ha at 2015-16 level.
@Output projected using the productivity growth of 3.1 % per year as given in NITI Policy Paper with area constant at 30.2 Million ha at 2015-16 level.
*Calculated by dividing surplus production divided by the wheat productivity
Many parts of northern India, especially Punjab is facing severe water crisis because of a
complicated mix of economic, geographic, and political factors. In global comparison, India
also uses almost twice the amount of water to grow crops as compared to China and United
States (Table 0.12). In the past half century, majority of the growth to net irrigated area has
come through the assurance of continuous supply of ground water. The primary cause of over-
exploitation of ground water has been the rising demand from agricultural sector. In most of
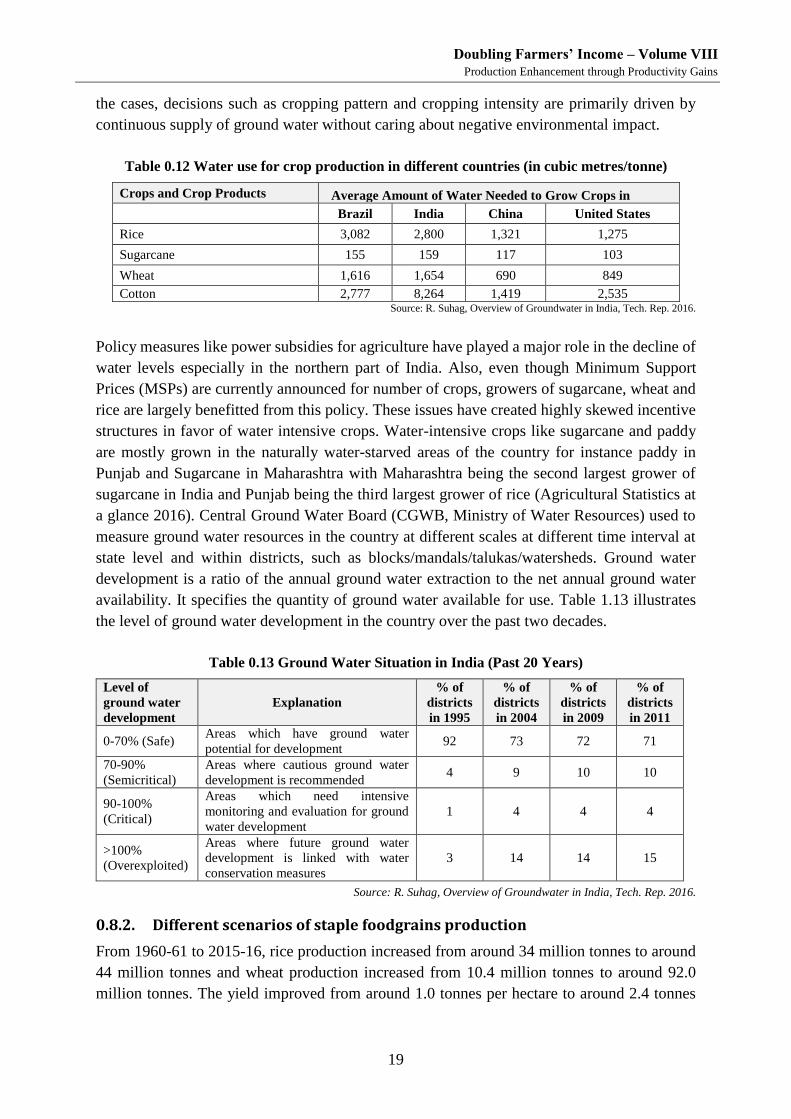
Doubling Farmers’ Income – Volume VIII
Production Enhancement through Productivity Gains
19
the cases, decisions such as cropping pattern and cropping intensity are primarily driven by
continuous supply of ground water without caring about negative environmental impact.
Table 0.12 Water use for crop production in different countries (in cubic metres/tonne)
Crops and Crop Products Average Amount of Water Needed to Grow Crops in Brazil India China United States
Rice 3,082 2,800 1,321 1,275
Sugarcane 155 159 117 103
Wheat 1,616 1,654 690 849
Cotton 2,777 8,264 1,419 2,535 Source: R. Suhag, Overview of Groundwater in India, Tech. Rep. 2016.
Policy measures like power subsidies for agriculture have played a major role in the decline of
water levels especially in the northern part of India. Also, even though Minimum Support
Prices (MSPs) are currently announced for number of crops, growers of sugarcane, wheat and
rice are largely benefitted from this policy. These issues have created highly skewed incentive
structures in favor of water intensive crops. Water-intensive crops like sugarcane and paddy
are mostly grown in the naturally water-starved areas of the country for instance paddy in
Punjab and Sugarcane in Maharashtra with Maharashtra being the second largest grower of
sugarcane in India and Punjab being the third largest grower of rice (Agricultural Statistics at
a glance 2016). Central Ground Water Board (CGWB, Ministry of Water Resources) used to
measure ground water resources in the country at different scales at different time interval at
state level and within districts, such as blocks/mandals/talukas/watersheds. Ground water
development is a ratio of the annual ground water extraction to the net annual ground water
availability. It specifies the quantity of ground water available for use. Table 1.13 illustrates
the level of ground water development in the country over the past two decades.
Table 0.13 Ground Water Situation in India (Past 20 Years)
Level of
ground water
development
Explanation
% of
districts
in 1995
% of
districts
in 2004
% of
districts
in 2009
% of
districts
in 2011
0-70% (Safe) Areas which have ground water
potential for development 92 73 72 71
70-90%
(Semicritical)
Areas where cautious ground water
development is recommended 4 9 10 10
90-100%
(Critical)
Areas which need intensive
monitoring and evaluation for ground
water development
1 4 4 4
>100%
(Overexploited)
Areas where future ground water
development is linked with water
conservation measures
3 14 14 15
Source: R. Suhag, Overview of Groundwater in India, Tech. Rep. 2016.
0.8.2. Different scenarios of staple foodgrains production
From 1960-61 to 2015-16, rice production increased from around 34 million tonnes to around
44 million tonnes and wheat production increased from 10.4 million tonnes to around 92.0
million tonnes. The yield improved from around 1.0 tonnes per hectare to around 2.4 tonnes
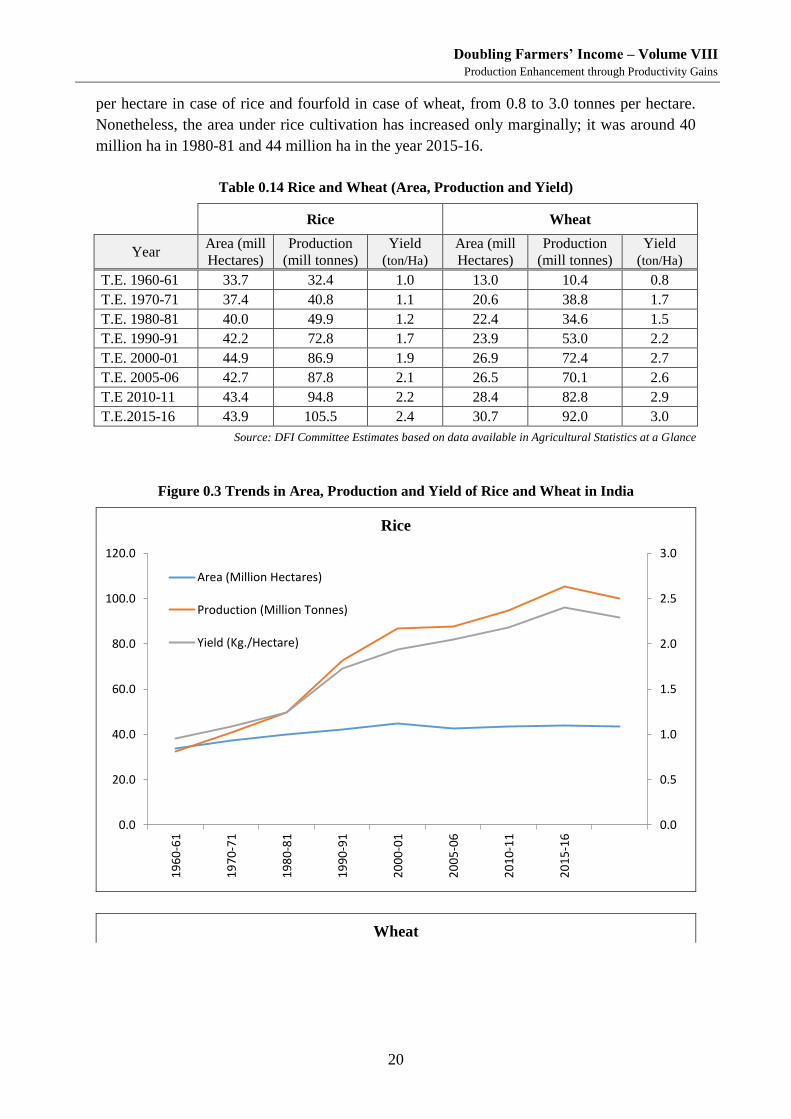
Doubling Farmers’ Income – Volume VIII
Production Enhancement through Productivity Gains
20
per hectare in case of rice and fourfold in case of wheat, from 0.8 to 3.0 tonnes per hectare.
Nonetheless, the area under rice cultivation has increased only marginally; it was around 40
million ha in 1980-81 and 44 million ha in the year 2015-16.
Table 0.14 Rice and Wheat (Area, Production and Yield)
Rice Wheat
Year Area (mill
Hectares) Production
(mill tonnes) Yield
(ton/Ha) Area (mill
Hectares) Production
(mill tonnes) Yield
(ton/Ha)
T.E. 1960-61 33.7 32.4 1.0 13.0 10.4 0.8
T.E. 1970-71 37.4 40.8 1.1 20.6 38.8 1.7
T.E. 1980-81 40.0 49.9 1.2 22.4 34.6 1.5
T.E. 1990-91 42.2 72.8 1.7 23.9 53.0 2.2
T.E. 2000-01 44.9 86.9 1.9 26.9 72.4 2.7
T.E. 2005-06 42.7 87.8 2.1 26.5 70.1 2.6
T.E 2010-11 43.4 94.8 2.2 28.4 82.8 2.9
T.E.2015-16 43.9 105.5 2.4 30.7 92.0 3.0
Source: DFI Committee Estimates based on data available in Agricultural Statistics at a Glance
Figure 0.3 Trends in Area, Production and Yield of Rice and Wheat in India
Rice
Wheat
0.0
0.5
1.0
1.5
2.0
2.5
3.0
0.0
20.0
40.0
60.0
80.0
100.0
120.0
19
60
-61
19
70
-71
19
80
-81
19
90
-91
20
00
-01
20
05
-06
20
10
-11
20
15
-16
Area (Million Hectares)
Production (Million Tonnes)
Yield (Kg./Hectare)
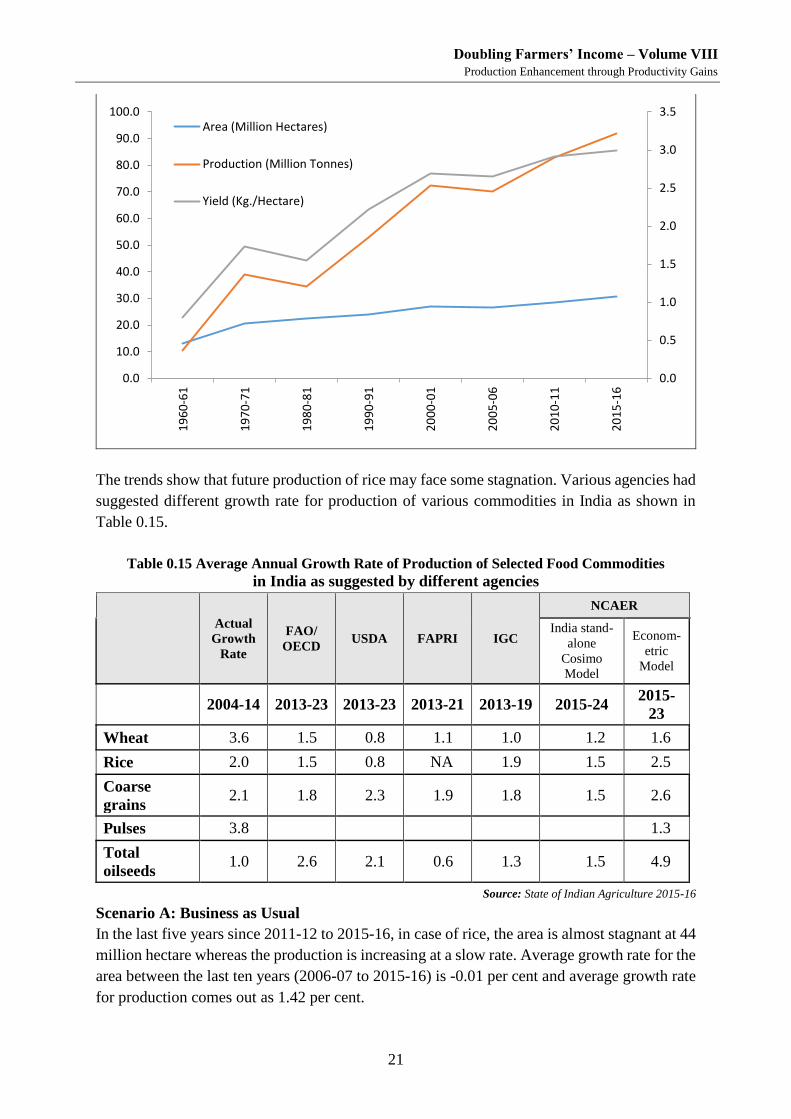
Doubling Farmers’ Income – Volume VIII
Production Enhancement through Productivity Gains
21
The trends show that future production of rice may face some stagnation. Various agencies had
suggested different growth rate for production of various commodities in India as shown in
Table 0.15.
Table 0.15 Average Annual Growth Rate of Production of Selected Food Commodities
in India as suggested by different agencies
Actual
Growth
Rate
FAO/
OECD USDA FAPRI IGC
NCAER
India stand-
alone
Cosimo
Model
Econom-
etric
Model
2004-14 2013-23 2013-23 2013-21 2013-19 2015-24 2015-
23
Wheat 3.6 1.5 0.8 1.1 1.0 1.2 1.6
Rice 2.0 1.5 0.8 NA 1.9 1.5 2.5
Coarse
grains 2.1 1.8 2.3 1.9 1.8 1.5 2.6
Pulses 3.8 1.3
Total
oilseeds 1.0 2.6 2.1 0.6 1.3 1.5 4.9
Source: State of Indian Agriculture 2015-16
Scenario A: Business as Usual
In the last five years since 2011-12 to 2015-16, in case of rice, the area is almost stagnant at 44
million hectare whereas the production is increasing at a slow rate. Average growth rate for the
area between the last ten years (2006-07 to 2015-16) is -0.01 per cent and average growth rate
for production comes out as 1.42 per cent.
0.0
0.5
1.0
1.5
2.0
2.5
3.0
3.5
0.0
10.0
20.0
30.0
40.0
50.0
60.0
70.0
80.0
90.0
100.0
19
60
-61
19
70
-71
19
80
-81
19
90
-91
20
00
-01
20
05
-06
20
10
-11
20
15
-16
Area (Million Hectares)
Production (Million Tonnes)
Yield (Kg./Hectare)
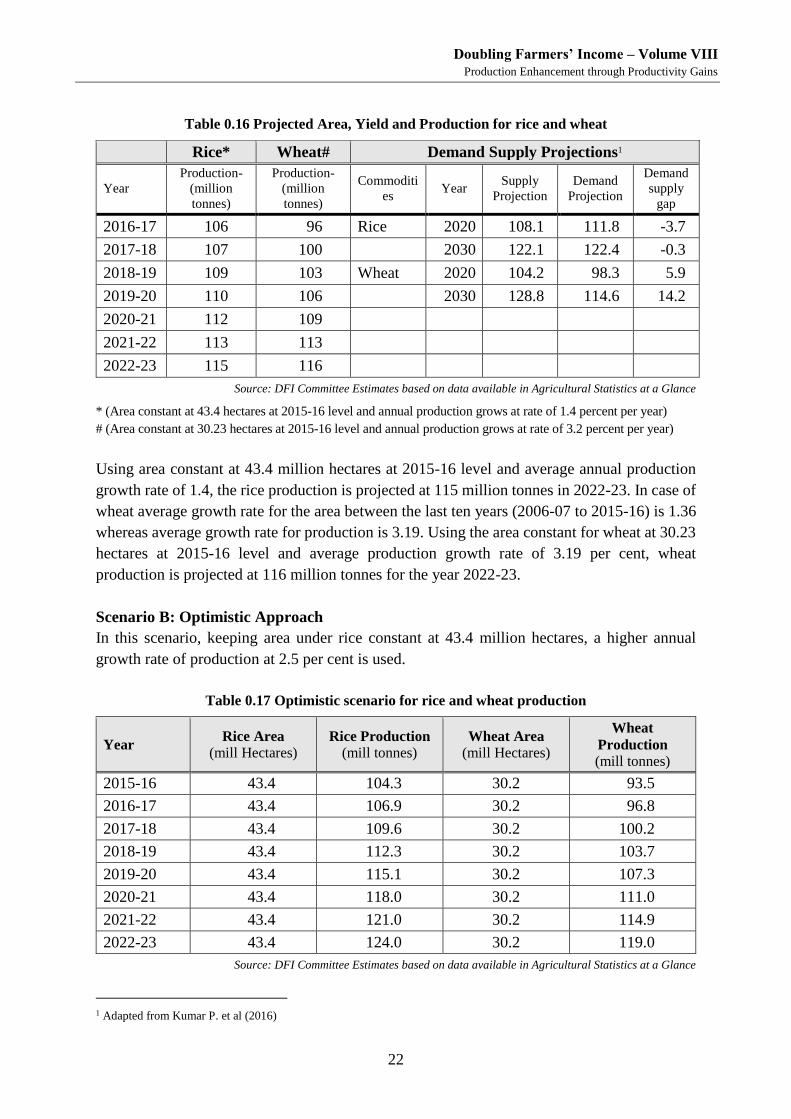
Doubling Farmers’ Income – Volume VIII
Production Enhancement through Productivity Gains
22
Table 0.16 Projected Area, Yield and Production for rice and wheat
Rice* Wheat# Demand Supply Projections1
Year
Production-
(million
tonnes)
Production-
(million
tonnes)
Commoditi
es Year
Supply
Projection
Demand
Projection
Demand
supply
gap
2016-17 106 96 Rice 2020 108.1 111.8 -3.7
2017-18 107 100 2030 122.1 122.4 -0.3
2018-19 109 103 Wheat 2020 104.2 98.3 5.9
2019-20 110 106 2030 128.8 114.6 14.2
2020-21 112 109
2021-22 113 113
2022-23 115 116
Source: DFI Committee Estimates based on data available in Agricultural Statistics at a Glance
* (Area constant at 43.4 hectares at 2015-16 level and annual production grows at rate of 1.4 percent per year)
# (Area constant at 30.23 hectares at 2015-16 level and annual production grows at rate of 3.2 percent per year)
Using area constant at 43.4 million hectares at 2015-16 level and average annual production
growth rate of 1.4, the rice production is projected at 115 million tonnes in 2022-23. In case of
wheat average growth rate for the area between the last ten years (2006-07 to 2015-16) is 1.36
whereas average growth rate for production is 3.19. Using the area constant for wheat at 30.23
hectares at 2015-16 level and average production growth rate of 3.19 per cent, wheat
production is projected at 116 million tonnes for the year 2022-23.
Scenario B: Optimistic Approach
In this scenario, keeping area under rice constant at 43.4 million hectares, a higher annual
growth rate of production at 2.5 per cent is used.
Table 0.17 Optimistic scenario for rice and wheat production
Year Rice Area
(mill Hectares) Rice Production
(mill tonnes) Wheat Area
(mill Hectares)
Wheat
Production
(mill tonnes)
2015-16 43.4 104.3 30.2 93.5
2016-17 43.4 106.9 30.2 96.8
2017-18 43.4 109.6 30.2 100.2
2018-19 43.4 112.3 30.2 103.7
2019-20 43.4 115.1 30.2 107.3
2020-21 43.4 118.0 30.2 111.0
2021-22 43.4 121.0 30.2 114.9
2022-23 43.4 124.0 30.2 119.0
Source: DFI Committee Estimates based on data available in Agricultural Statistics at a Glance
1 Adapted from Kumar P. et al (2016)
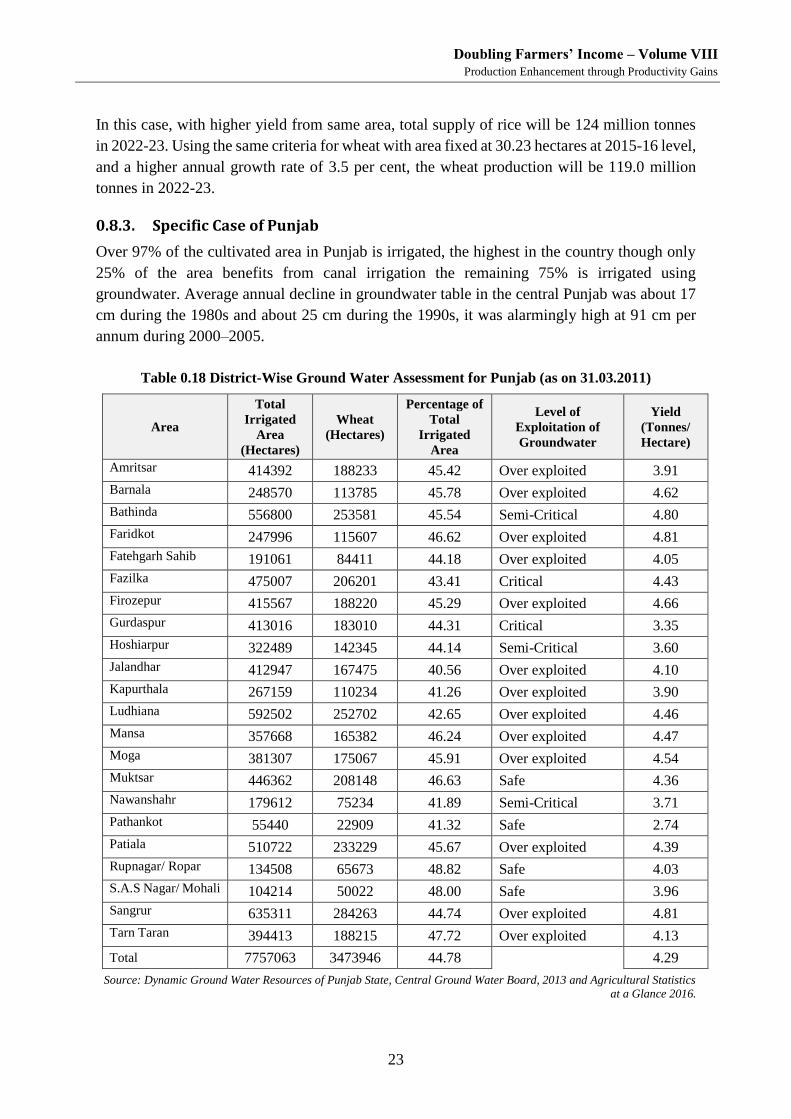
Doubling Farmers’ Income – Volume VIII
Production Enhancement through Productivity Gains
23
In this case, with higher yield from same area, total supply of rice will be 124 million tonnes
in 2022-23. Using the same criteria for wheat with area fixed at 30.23 hectares at 2015-16 level,
and a higher annual growth rate of 3.5 per cent, the wheat production will be 119.0 million
tonnes in 2022-23.
0.8.3. Specific Case of Punjab
Over 97% of the cultivated area in Punjab is irrigated, the highest in the country though only
25% of the area benefits from canal irrigation the remaining 75% is irrigated using
groundwater. Average annual decline in groundwater table in the central Punjab was about 17
cm during the 1980s and about 25 cm during the 1990s, it was alarmingly high at 91 cm per
annum during 2000–2005.
Table 0.18 District-Wise Ground Water Assessment for Punjab (as on 31.03.2011)
Area
Total
Irrigated
Area
(Hectares)
Wheat
(Hectares)
Percentage of
Total
Irrigated
Area
Level of
Exploitation of
Groundwater
Yield
(Tonnes/
Hectare)
Amritsar 414392 188233 45.42 Over exploited 3.91
Barnala 248570 113785 45.78 Over exploited 4.62
Bathinda 556800 253581 45.54 Semi-Critical 4.80
Faridkot 247996 115607 46.62 Over exploited 4.81
Fatehgarh Sahib 191061 84411 44.18 Over exploited 4.05
Fazilka 475007 206201 43.41 Critical 4.43
Firozepur 415567 188220 45.29 Over exploited 4.66
Gurdaspur 413016 183010 44.31 Critical 3.35
Hoshiarpur 322489 142345 44.14 Semi-Critical 3.60
Jalandhar 412947 167475 40.56 Over exploited 4.10
Kapurthala 267159 110234 41.26 Over exploited 3.90
Ludhiana 592502 252702 42.65 Over exploited 4.46
Mansa 357668 165382 46.24 Over exploited 4.47
Moga 381307 175067 45.91 Over exploited 4.54
Muktsar 446362 208148 46.63 Safe 4.36
Nawanshahr 179612 75234 41.89 Semi-Critical 3.71
Pathankot 55440 22909 41.32 Safe 2.74
Patiala 510722 233229 45.67 Over exploited 4.39
Rupnagar/ Ropar 134508 65673 48.82 Safe 4.03
S.A.S Nagar/ Mohali 104214 50022 48.00 Safe 3.96
Sangrur 635311 284263 44.74 Over exploited 4.81
Tarn Taran 394413 188215 47.72 Over exploited 4.13
Total 7757063 3473946 44.78 4.29
Source: Dynamic Ground Water Resources of Punjab State, Central Ground Water Board, 2013 and Agricultural Statistics
at a Glance 2016.
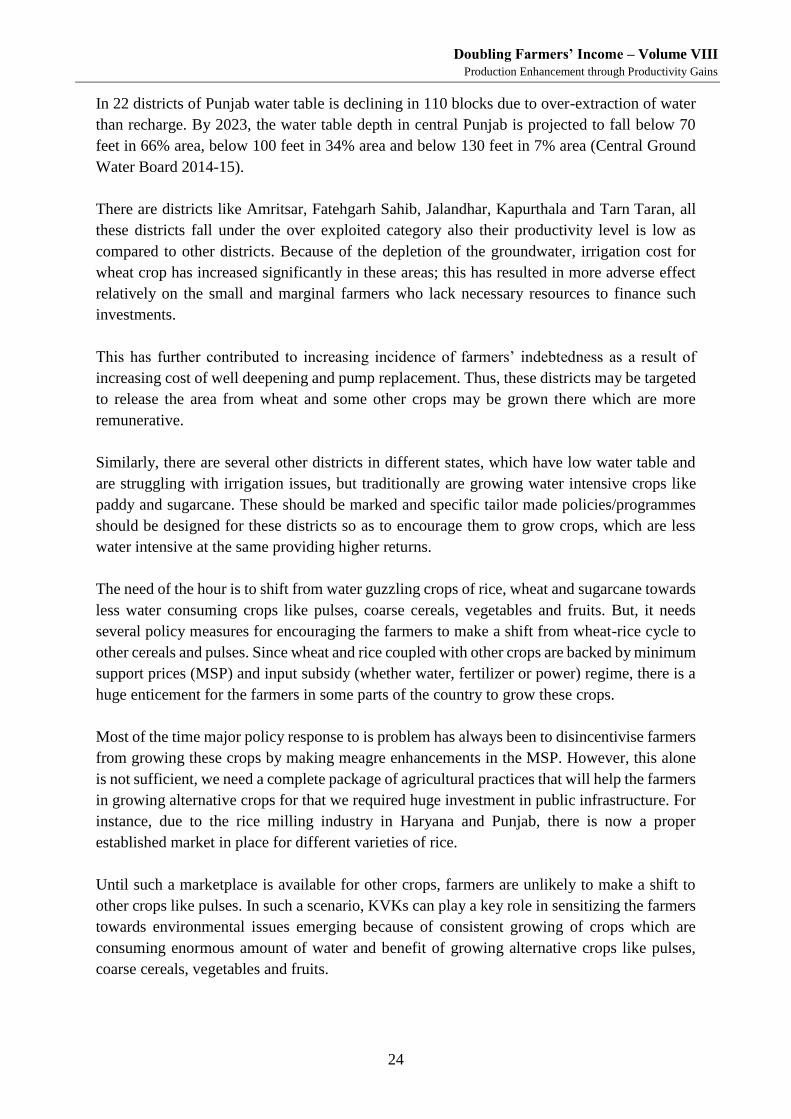
Doubling Farmers’ Income – Volume VIII
Production Enhancement through Productivity Gains
24
In 22 districts of Punjab water table is declining in 110 blocks due to over-extraction of water
than recharge. By 2023, the water table depth in central Punjab is projected to fall below 70
feet in 66% area, below 100 feet in 34% area and below 130 feet in 7% area (Central Ground
Water Board 2014-15).
There are districts like Amritsar, Fatehgarh Sahib, Jalandhar, Kapurthala and Tarn Taran, all
these districts fall under the over exploited category also their productivity level is low as
compared to other districts. Because of the depletion of the groundwater, irrigation cost for
wheat crop has increased significantly in these areas; this has resulted in more adverse effect
relatively on the small and marginal farmers who lack necessary resources to finance such
investments.
This has further contributed to increasing incidence of farmers’ indebtedness as a result of
increasing cost of well deepening and pump replacement. Thus, these districts may be targeted
to release the area from wheat and some other crops may be grown there which are more
remunerative.
Similarly, there are several other districts in different states, which have low water table and
are struggling with irrigation issues, but traditionally are growing water intensive crops like
paddy and sugarcane. These should be marked and specific tailor made policies/programmes
should be designed for these districts so as to encourage them to grow crops, which are less
water intensive at the same providing higher returns.
The need of the hour is to shift from water guzzling crops of rice, wheat and sugarcane towards
less water consuming crops like pulses, coarse cereals, vegetables and fruits. But, it needs
several policy measures for encouraging the farmers to make a shift from wheat-rice cycle to
other cereals and pulses. Since wheat and rice coupled with other crops are backed by minimum
support prices (MSP) and input subsidy (whether water, fertilizer or power) regime, there is a
huge enticement for the farmers in some parts of the country to grow these crops.
Most of the time major policy response to is problem has always been to disincentivise farmers
from growing these crops by making meagre enhancements in the MSP. However, this alone
is not sufficient, we need a complete package of agricultural practices that will help the farmers
in growing alternative crops for that we required huge investment in public infrastructure. For
instance, due to the rice milling industry in Haryana and Punjab, there is now a proper
established market in place for different varieties of rice.
Until such a marketplace is available for other crops, farmers are unlikely to make a shift to
other crops like pulses. In such a scenario, KVKs can play a key role in sensitizing the farmers
towards environmental issues emerging because of consistent growing of crops which are
consuming enormous amount of water and benefit of growing alternative crops like pulses,
coarse cereals, vegetables and fruits.
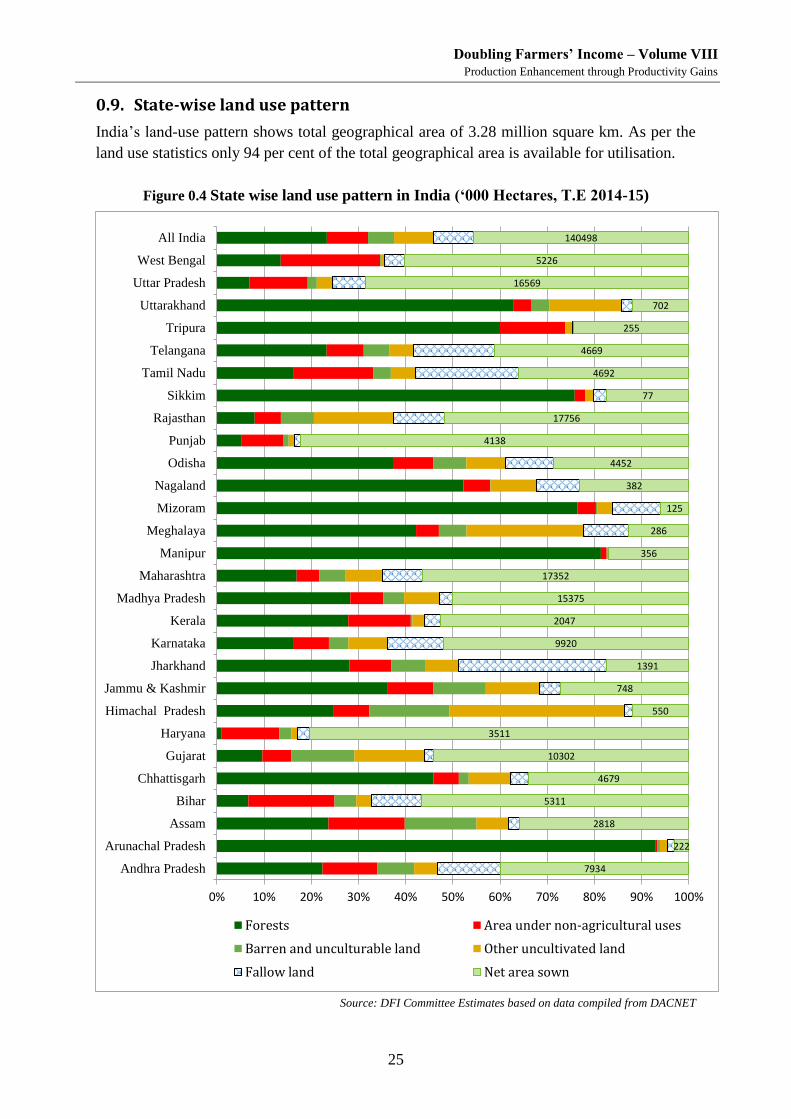
Doubling Farmers’ Income – Volume VIII
Production Enhancement through Productivity Gains
25
0.9. State-wise land use pattern
India’s land-use pattern shows total geographical area of 3.28 million square km. As per the
land use statistics only 94 per cent of the total geographical area is available for utilisation.
Figure 0.4 State wise land use pattern in India (‘000 Hectares, T.E 2014-15)
Source: DFI Committee Estimates based on data compiled from DACNET
7934
222
2818
5311
4679
10302
3511
550
748
1391
9920
2047
15375
17352
356
286
125
382
4452
4138
17756
77
4692
4669
255
702
16569
5226
140498
0% 10% 20% 30% 40% 50% 60% 70% 80% 90% 100%
Andhra Pradesh
Arunachal Pradesh
Assam
Bihar
Chhattisgarh
Gujarat
Haryana
Himachal Pradesh
Jammu & Kashmir
Jharkhand
Karnataka
Kerala
Madhya Pradesh
Maharashtra
Manipur
Meghalaya
Mizoram
Nagaland
Odisha
Punjab
Rajasthan
Sikkim
Tamil Nadu
Telangana
Tripura
Uttarakhand
Uttar Pradesh
West Bengal
All India
Forests Area under non-agricultural uses
Barren and unculturable land Other uncultivated land
Fallow land Net area sown
Doubling Farmers’ Income – Volume VIII
Production Enhancement through Productivity Gains
26
Out of this, 45.5 per cent is net sown area, forest cover is 23 per cent, and 5 per cent is current
fallow land (Table 0.15). This land-use pattern varies across states.
Every state in the country has significant area under culturable waste, and barren and
unculturable land, which comprises 10 per cent as a whole for India. This area can be
judiciously brought under cultivation following intense land management practices.
There is scope to bring culturable waste land under agriculture or by altering the area currently
not fit for cultivation. The latter comprises of area under non-agricultural use, barren and
unculturable land. This land area is unfit for cultivation due to problematic soil conditions like
acidic soil, large treks and mainly is rainfed. Such land can be upgraded to support optimal
crop production. There is need to follow proper land management practises.
In view of mounting pressure on land for numerous purposes, it is necessary to plan appropriate
use of all the available land. This may be done by taking fitting measures to control soil erosion,
desertification, improvements made on irrigation and water and soil conservation. Likewise,
with the help of up-to-date and scientific methods of farming, productivity of land can also be
amplified. All endeavours should be made to strike a balance amongst diverse use of land.
Nutri-cereals are typical to the dry land ecosystem, and play an important role in agricultural
value system, the same as rice and wheat in irrigated areas. In the dry land parts of the country,
nutri-cereals can play a significant role in doubling the farmers’ income while also addressing
concerns on nutrition.
Though income generation through enhancement in the productivity gains during green
revolution has great significance, however, the dry land crops were not able to reap the same
benefit as two staple cereals (rice and wheat).
In case of nutri-cereals productivity enhancement measures must be implemented along with
demand enhancement through value addition so as to achieve objectives. Different policy
measures are needed in order to enhance the productivity potential of millets in India.
Developing innovative supply chain models as market linked value systems, will add to
farmers’ share in consumers’ rupee and increase their income. Creation of farmgate level
primary processing clusters for millets will increase the consumption of millets in the
production zones. Creation of awareness about the health and environmental benefits
associated with consumption of millets will aid demand creation for millets in the country.
Along with doubling farmers’ income in various agro-ecological commodities and cropping
systems the aspect of imparting nutritional security should also has to be considered.
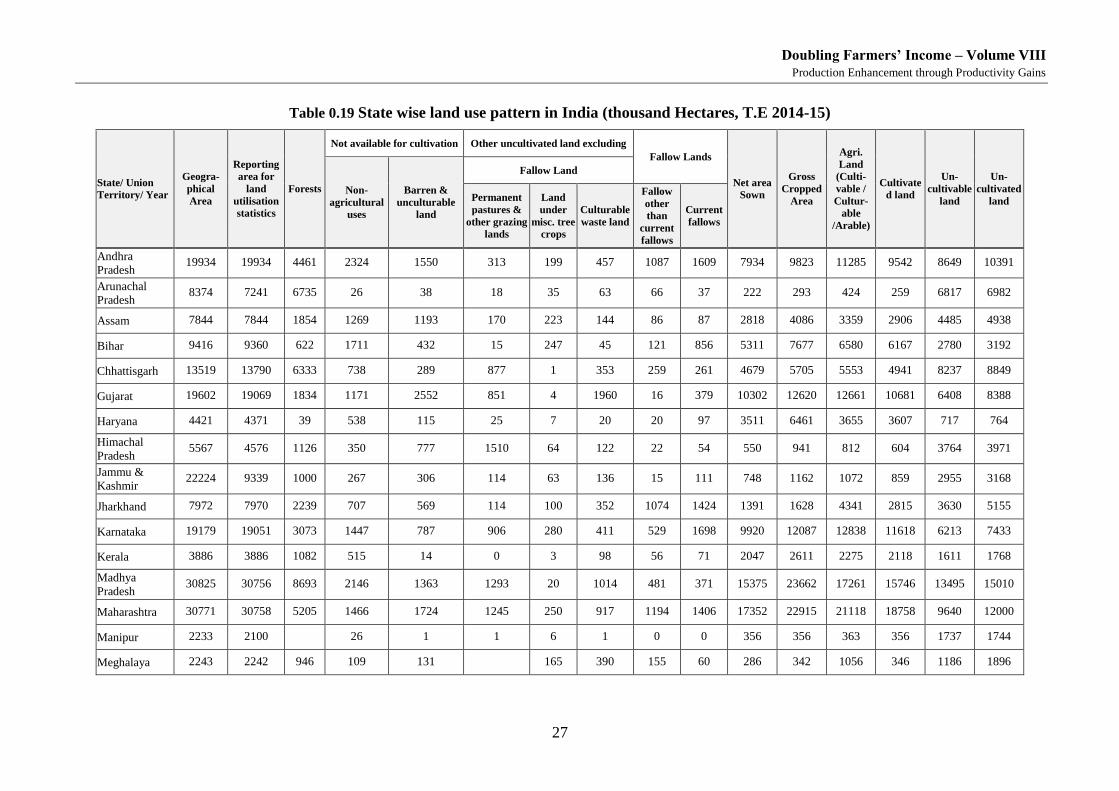
Doubling Farmers’ Income – Volume VIII
Production Enhancement through Productivity Gains
27
Table 0.19 State wise land use pattern in India (thousand Hectares, T.E 2014-15)
State/ Union
Territory/ Year
Geogra-
phical
Area
Reporting
area for
land
utilisation
statistics
Forests
Not available for cultivation Other uncultivated land excluding
Fallow Lands
Net area
Sown
Gross
Cropped
Area
Agri.
Land
(Culti-
vable /
Cultur-
able
/Arable)
Cultivate
d land
Un-
cultivable
land
Un-
cultivated
land Non-
agricultural
uses
Barren &
unculturable
land
Fallow Land
Permanent
pastures &
other grazing
lands
Land
under
misc. tree
crops
Culturable
waste land
Fallow
other
than
current
fallows
Current
fallows
Andhra
Pradesh 19934 19934 4461 2324 1550 313 199 457 1087 1609 7934 9823 11285 9542 8649 10391
Arunachal
Pradesh 8374 7241 6735 26 38 18 35 63 66 37 222 293 424 259 6817 6982
Assam 7844 7844 1854 1269 1193 170 223 144 86 87 2818 4086 3359 2906 4485 4938
Bihar 9416 9360 622 1711 432 15 247 45 121 856 5311 7677 6580 6167 2780 3192
Chhattisgarh 13519 13790 6333 738 289 877 1 353 259 261 4679 5705 5553 4941 8237 8849
Gujarat 19602 19069 1834 1171 2552 851 4 1960 16 379 10302 12620 12661 10681 6408 8388
Haryana 4421 4371 39 538 115 25 7 20 20 97 3511 6461 3655 3607 717 764
Himachal
Pradesh 5567 4576 1126 350 777 1510 64 122 22 54 550 941 812 604 3764 3971
Jammu &
Kashmir 22224 9339 1000 267 306 114 63 136 15 111 748 1162 1072 859 2955 3168
Jharkhand 7972 7970 2239 707 569 114 100 352 1074 1424 1391 1628 4341 2815 3630 5155
Karnataka 19179 19051 3073 1447 787 906 280 411 529 1698 9920 12087 12838 11618 6213 7433
Kerala 3886 3886 1082 515 14 0 3 98 56 71 2047 2611 2275 2118 1611 1768
Madhya
Pradesh 30825 30756 8693 2146 1363 1293 20 1014 481 371 15375 23662 17261 15746 13495 15010
Maharashtra 30771 30758 5205 1466 1724 1245 250 917 1194 1406 17352 22915 21118 18758 9640 12000
Manipur 2233 2100 26 1 1 6 1 0 0 356 356 363 356 1737 1744
Meghalaya 2243 2242 946 109 131 165 390 155 60 286 342 1056 346 1186 1896
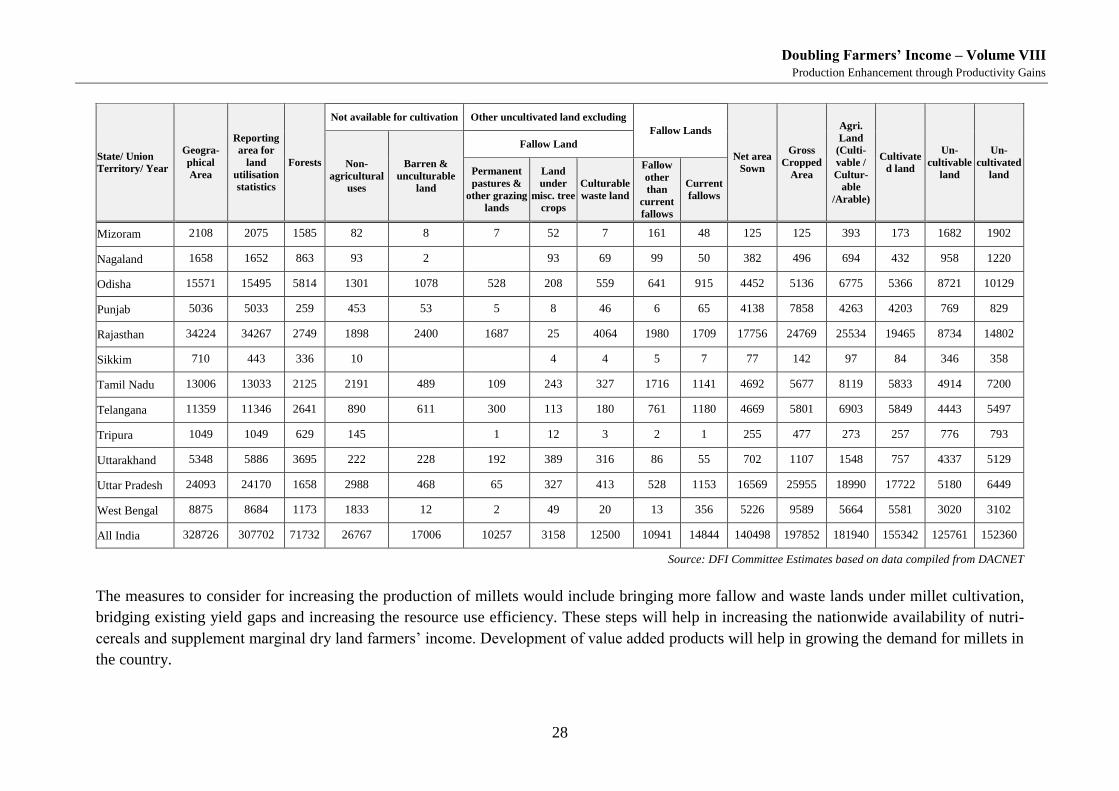
Doubling Farmers’ Income – Volume VIII
Production Enhancement through Productivity Gains
28
State/ Union
Territory/ Year
Geogra-
phical
Area
Reporting
area for
land
utilisation
statistics
Forests
Not available for cultivation Other uncultivated land excluding
Fallow Lands
Net area
Sown
Gross
Cropped
Area
Agri.
Land
(Culti-
vable /
Cultur-
able
/Arable)
Cultivate
d land
Un-
cultivable
land
Un-
cultivated
land Non-
agricultural
uses
Barren &
unculturable
land
Fallow Land
Permanent
pastures &
other grazing
lands
Land
under
misc. tree
crops
Culturable
waste land
Fallow
other
than
current
fallows
Current
fallows
Mizoram 2108 2075 1585 82 8 7 52 7 161 48 125 125 393 173 1682 1902
Nagaland 1658 1652 863 93 2 93 69 99 50 382 496 694 432 958 1220
Odisha 15571 15495 5814 1301 1078 528 208 559 641 915 4452 5136 6775 5366 8721 10129
Punjab 5036 5033 259 453 53 5 8 46 6 65 4138 7858 4263 4203 769 829
Rajasthan 34224 34267 2749 1898 2400 1687 25 4064 1980 1709 17756 24769 25534 19465 8734 14802
Sikkim 710 443 336 10 4 4 5 7 77 142 97 84 346 358
Tamil Nadu 13006 13033 2125 2191 489 109 243 327 1716 1141 4692 5677 8119 5833 4914 7200
Telangana 11359 11346 2641 890 611 300 113 180 761 1180 4669 5801 6903 5849 4443 5497
Tripura 1049 1049 629 145 1 12 3 2 1 255 477 273 257 776 793
Uttarakhand 5348 5886 3695 222 228 192 389 316 86 55 702 1107 1548 757 4337 5129
Uttar Pradesh 24093 24170 1658 2988 468 65 327 413 528 1153 16569 25955 18990 17722 5180 6449
West Bengal 8875 8684 1173 1833 12 2 49 20 13 356 5226 9589 5664 5581 3020 3102
All India 328726 307702 71732 26767 17006 10257 3158 12500 10941 14844 140498 197852 181940 155342 125761 152360
Source: DFI Committee Estimates based on data compiled from DACNET
The measures to consider for increasing the production of millets would include bringing more fallow and waste lands under millet cultivation,
bridging existing yield gaps and increasing the resource use efficiency. These steps will help in increasing the nationwide availability of nutri-
cereals and supplement marginal dry land farmers’ income. Development of value added products will help in growing the demand for millets in
the country.
Volume VIII-A
Cereals: Staple Crops
Rice, Wheat and Maize
Nutri-Cereals, including Millets
Pulses & Oilseeds

Volume VIII-B
Commercial Crops: Cotton, Sugarcane

Volume VIII-C
Horticulture & Sericulture

Doubling Farmers’ Income – Volume VIII
Production Enhancement through Productivity Gains
35
Volume VIII-D
Animal Husbandry: Dairy, Livestock, Fishery

Dairy Sector

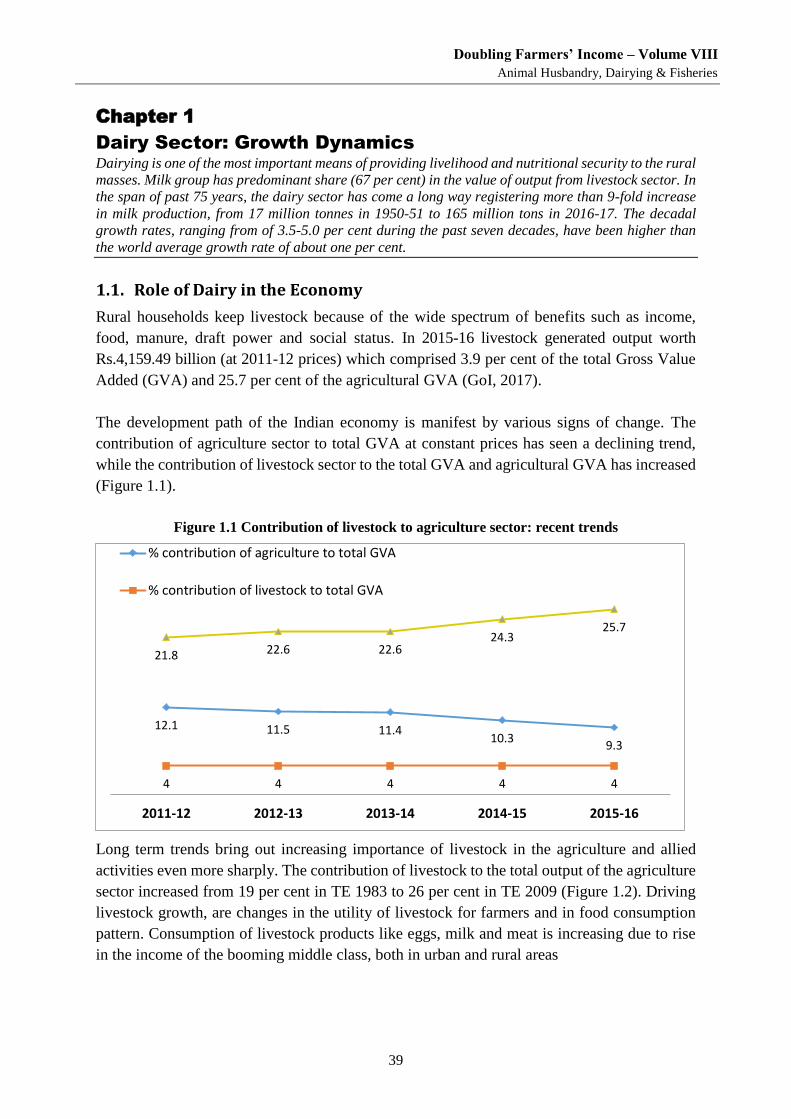
Doubling Farmers’ Income – Volume VIII
Animal Husbandry, Dairying & Fisheries
39
Chapter 1
Dairy Sector: Growth Dynamics Dairying is one of the most important means of providing livelihood and nutritional security to the rural
masses. Milk group has predominant share (67 per cent) in the value of output from livestock sector. In
the span of past 75 years, the dairy sector has come a long way registering more than 9-fold increase
in milk production, from 17 million tonnes in 1950-51 to 165 million tons in 2016-17. The decadal
growth rates, ranging from of 3.5-5.0 per cent during the past seven decades, have been higher than
the world average growth rate of about one per cent.
1.1. Role of Dairy in the Economy
Rural households keep livestock because of the wide spectrum of benefits such as income,
food, manure, draft power and social status. In 2015-16 livestock generated output worth
Rs.4,159.49 billion (at 2011-12 prices) which comprised 3.9 per cent of the total Gross Value
Added (GVA) and 25.7 per cent of the agricultural GVA (GoI, 2017).
The development path of the Indian economy is manifest by various signs of change. The
contribution of agriculture sector to total GVA at constant prices has seen a declining trend,
while the contribution of livestock sector to the total GVA and agricultural GVA has increased
(Figure 1.1).
Figure 1.1 Contribution of livestock to agriculture sector: recent trends
Long term trends bring out increasing importance of livestock in the agriculture and allied
activities even more sharply. The contribution of livestock to the total output of the agriculture
sector increased from 19 per cent in TE 1983 to 26 per cent in TE 2009 (Figure 1.2). Driving
livestock growth, are changes in the utility of livestock for farmers and in food consumption
pattern. Consumption of livestock products like eggs, milk and meat is increasing due to rise
in the income of the booming middle class, both in urban and rural areas
12.1 11.5 11.410.3
9.3
4 4 4 4 4
21.8 22.6 22.624.3
25.7
2011-12 2012-13 2013-14 2014-15 2015-16
% contribution of agriculture to total GVA
% contribution of livestock to total GVA
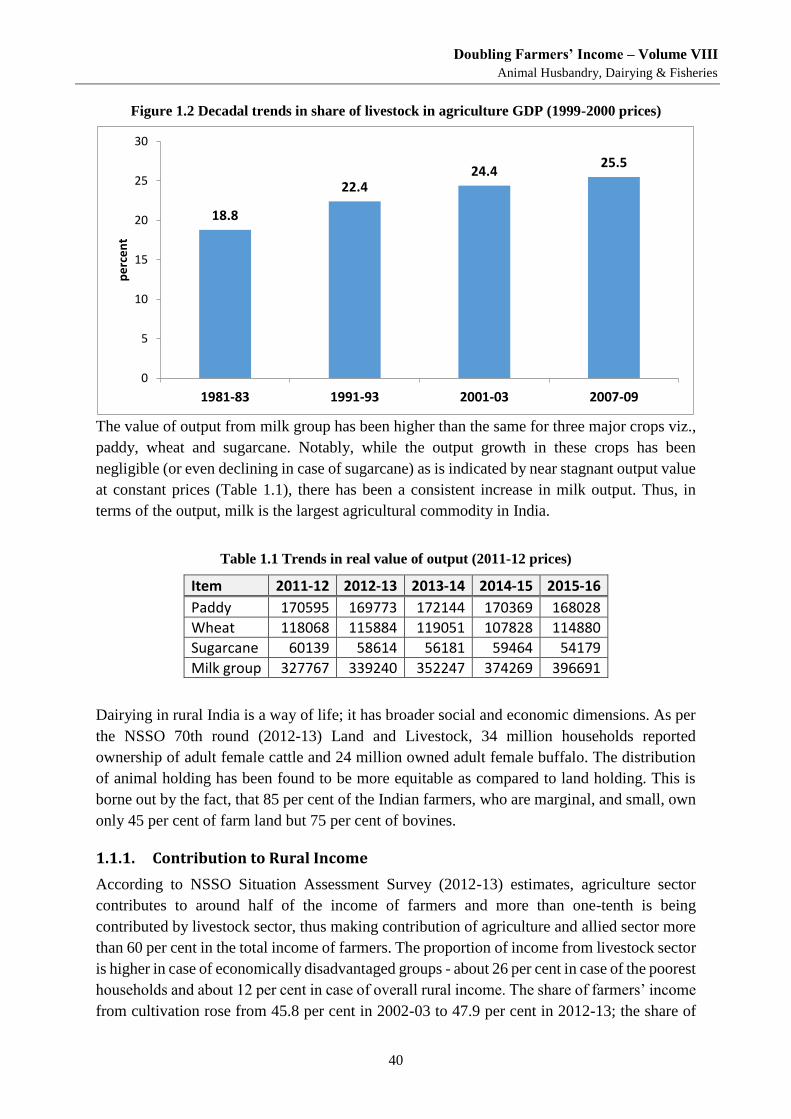
Doubling Farmers’ Income – Volume VIII
Animal Husbandry, Dairying & Fisheries
40
Figure 1.2 Decadal trends in share of livestock in agriculture GDP (1999-2000 prices)
The value of output from milk group has been higher than the same for three major crops viz.,
paddy, wheat and sugarcane. Notably, while the output growth in these crops has been
negligible (or even declining in case of sugarcane) as is indicated by near stagnant output value
at constant prices (Table 1.1), there has been a consistent increase in milk output. Thus, in
terms of the output, milk is the largest agricultural commodity in India.
Table 1.1 Trends in real value of output (2011-12 prices)
Item 2011-12 2012-13 2013-14 2014-15 2015-16
Paddy 170595 169773 172144 170369 168028
Wheat 118068 115884 119051 107828 114880
Sugarcane 60139 58614 56181 59464 54179
Milk group 327767 339240 352247 374269 396691
Dairying in rural India is a way of life; it has broader social and economic dimensions. As per
the NSSO 70th round (2012-13) Land and Livestock, 34 million households reported
ownership of adult female cattle and 24 million owned adult female buffalo. The distribution
of animal holding has been found to be more equitable as compared to land holding. This is
borne out by the fact, that 85 per cent of the Indian farmers, who are marginal, and small, own
only 45 per cent of farm land but 75 per cent of bovines.
1.1.1. Contribution to Rural Income
According to NSSO Situation Assessment Survey (2012-13) estimates, agriculture sector
contributes to around half of the income of farmers and more than one-tenth is being
contributed by livestock sector, thus making contribution of agriculture and allied sector more
than 60 per cent in the total income of farmers. The proportion of income from livestock sector
is higher in case of economically disadvantaged groups - about 26 per cent in case of the poorest
households and about 12 per cent in case of overall rural income. The share of farmers’ income
from cultivation rose from 45.8 per cent in 2002-03 to 47.9 per cent in 2012-13; the share of
18.8
22.424.4
25.5
0
5
10
15
20
25
30
1981-83 1991-93 2001-03 2007-09
pe
rce
nt
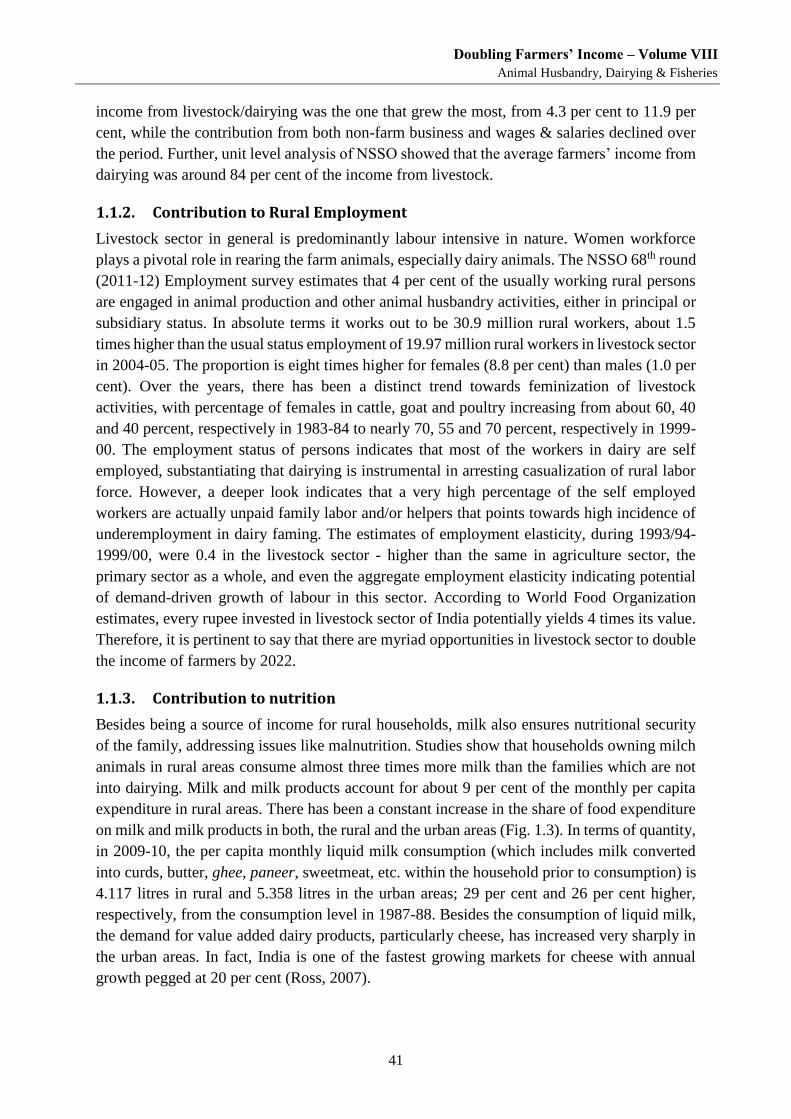
Doubling Farmers’ Income – Volume VIII
Animal Husbandry, Dairying & Fisheries
41
income from livestock/dairying was the one that grew the most, from 4.3 per cent to 11.9 per
cent, while the contribution from both non-farm business and wages & salaries declined over
the period. Further, unit level analysis of NSSO showed that the average farmers’ income from
dairying was around 84 per cent of the income from livestock.
1.1.2. Contribution to Rural Employment
Livestock sector in general is predominantly labour intensive in nature. Women workforce
plays a pivotal role in rearing the farm animals, especially dairy animals. The NSSO 68th round
(2011-12) Employment survey estimates that 4 per cent of the usually working rural persons
are engaged in animal production and other animal husbandry activities, either in principal or
subsidiary status. In absolute terms it works out to be 30.9 million rural workers, about 1.5
times higher than the usual status employment of 19.97 million rural workers in livestock sector
in 2004-05. The proportion is eight times higher for females (8.8 per cent) than males (1.0 per
cent). Over the years, there has been a distinct trend towards feminization of livestock
activities, with percentage of females in cattle, goat and poultry increasing from about 60, 40
and 40 percent, respectively in 1983-84 to nearly 70, 55 and 70 percent, respectively in 1999-
00. The employment status of persons indicates that most of the workers in dairy are self
employed, substantiating that dairying is instrumental in arresting casualization of rural labor
force. However, a deeper look indicates that a very high percentage of the self employed
workers are actually unpaid family labor and/or helpers that points towards high incidence of
underemployment in dairy faming. The estimates of employment elasticity, during 1993/94-
1999/00, were 0.4 in the livestock sector - higher than the same in agriculture sector, the
primary sector as a whole, and even the aggregate employment elasticity indicating potential
of demand-driven growth of labour in this sector. According to World Food Organization
estimates, every rupee invested in livestock sector of India potentially yields 4 times its value.
Therefore, it is pertinent to say that there are myriad opportunities in livestock sector to double
the income of farmers by 2022.
1.1.3. Contribution to nutrition
Besides being a source of income for rural households, milk also ensures nutritional security
of the family, addressing issues like malnutrition. Studies show that households owning milch
animals in rural areas consume almost three times more milk than the families which are not
into dairying. Milk and milk products account for about 9 per cent of the monthly per capita
expenditure in rural areas. There has been a constant increase in the share of food expenditure
on milk and milk products in both, the rural and the urban areas (Fig. 1.3). In terms of quantity,
in 2009-10, the per capita monthly liquid milk consumption (which includes milk converted
into curds, butter, ghee, paneer, sweetmeat, etc. within the household prior to consumption) is
4.117 litres in rural and 5.358 litres in the urban areas; 29 per cent and 26 per cent higher,
respectively, from the consumption level in 1987-88. Besides the consumption of liquid milk,
the demand for value added dairy products, particularly cheese, has increased very sharply in
the urban areas. In fact, India is one of the fastest growing markets for cheese with annual
growth pegged at 20 per cent (Ross, 2007).
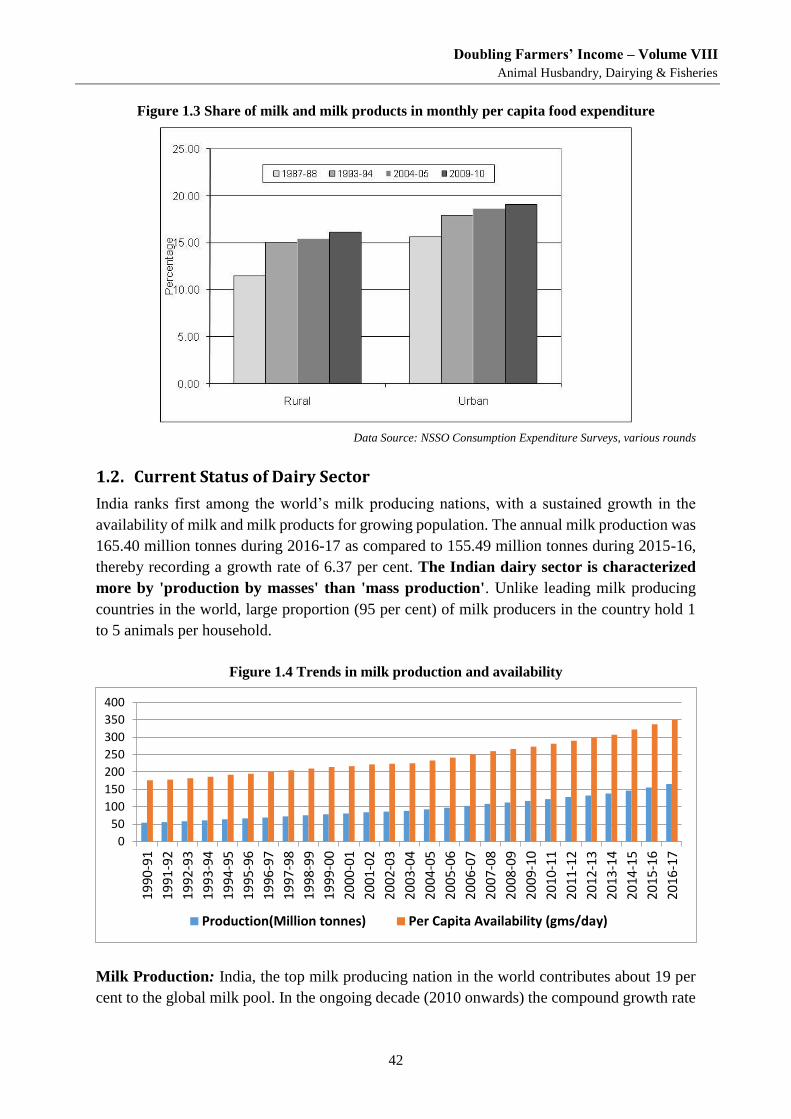
Doubling Farmers’ Income – Volume VIII
Animal Husbandry, Dairying & Fisheries
42
Figure 1.3 Share of milk and milk products in monthly per capita food expenditure
Data Source: NSSO Consumption Expenditure Surveys, various rounds
1.2. Current Status of Dairy Sector
India ranks first among the world’s milk producing nations, with a sustained growth in the
availability of milk and milk products for growing population. The annual milk production was
165.40 million tonnes during 2016-17 as compared to 155.49 million tonnes during 2015-16,
thereby recording a growth rate of 6.37 per cent. The Indian dairy sector is characterized
more by 'production by masses' than 'mass production'. Unlike leading milk producing
countries in the world, large proportion (95 per cent) of milk producers in the country hold 1
to 5 animals per household.
Figure 1.4 Trends in milk production and availability
Milk Production: India, the top milk producing nation in the world contributes about 19 per
cent to the global milk pool. In the ongoing decade (2010 onwards) the compound growth rate
0
50
100
150
200
250
300
350
400
1990
-91
1991
-92
1992
-93
1993
-94
1994
-95
1995
-96
1996
-97
1997
-98
1998
-99
1999
-00
2000
-01
200
1-0
2
2002
-03
2003
-04
2004
-05
2005
-06
2006
-07
2007
-08
2008
-09
2009
-10
2010
-11
2011
-12
2012
-13
2013
-14
2014
-15
2015
-16
2016
-17
Production(Million tonnes) Per Capita Availability (gms/day)
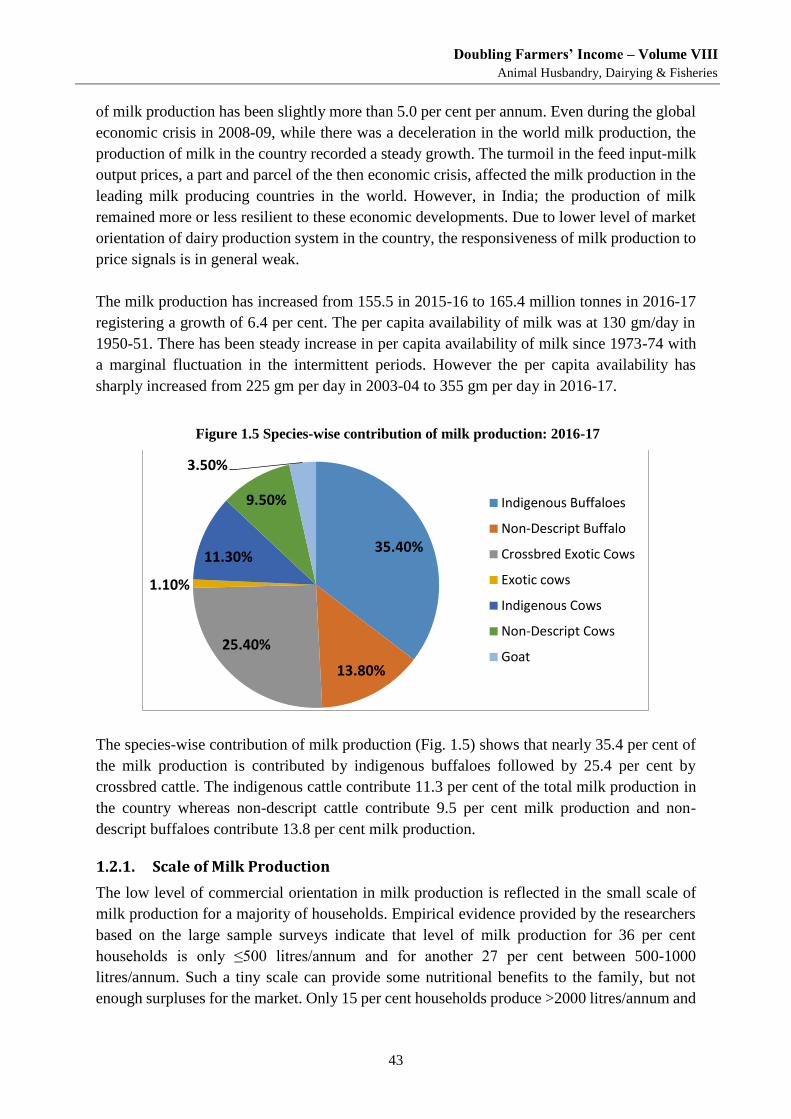
Doubling Farmers’ Income – Volume VIII
Animal Husbandry, Dairying & Fisheries
43
of milk production has been slightly more than 5.0 per cent per annum. Even during the global
economic crisis in 2008-09, while there was a deceleration in the world milk production, the
production of milk in the country recorded a steady growth. The turmoil in the feed input-milk
output prices, a part and parcel of the then economic crisis, affected the milk production in the
leading milk producing countries in the world. However, in India; the production of milk
remained more or less resilient to these economic developments. Due to lower level of market
orientation of dairy production system in the country, the responsiveness of milk production to
price signals is in general weak.
The milk production has increased from 155.5 in 2015-16 to 165.4 million tonnes in 2016-17
registering a growth of 6.4 per cent. The per capita availability of milk was at 130 gm/day in
1950-51. There has been steady increase in per capita availability of milk since 1973-74 with
a marginal fluctuation in the intermittent periods. However the per capita availability has
sharply increased from 225 gm per day in 2003-04 to 355 gm per day in 2016-17.
Figure 1.5 Species-wise contribution of milk production: 2016-17
The species-wise contribution of milk production (Fig. 1.5) shows that nearly 35.4 per cent of
the milk production is contributed by indigenous buffaloes followed by 25.4 per cent by
crossbred cattle. The indigenous cattle contribute 11.3 per cent of the total milk production in
the country whereas non-descript cattle contribute 9.5 per cent milk production and non-
descript buffaloes contribute 13.8 per cent milk production.
1.2.1. Scale of Milk Production
The low level of commercial orientation in milk production is reflected in the small scale of
milk production for a majority of households. Empirical evidence provided by the researchers
based on the large sample surveys indicate that level of milk production for 36 per cent
households is only ≤500 litres/annum and for another 27 per cent between 500-1000
litres/annum. Such a tiny scale can provide some nutritional benefits to the family, but not
enough surpluses for the market. Only 15 per cent households produce >2000 litres/annum and
35.40%
13.80%
25.40%
1.10%
11.30%
9.50%
3.50%
Indigenous Buffaloes
Non-Descript Buffalo
Crossbred Exotic Cows
Exotic cows
Indigenous Cows
Non-Descript Cows
Goat
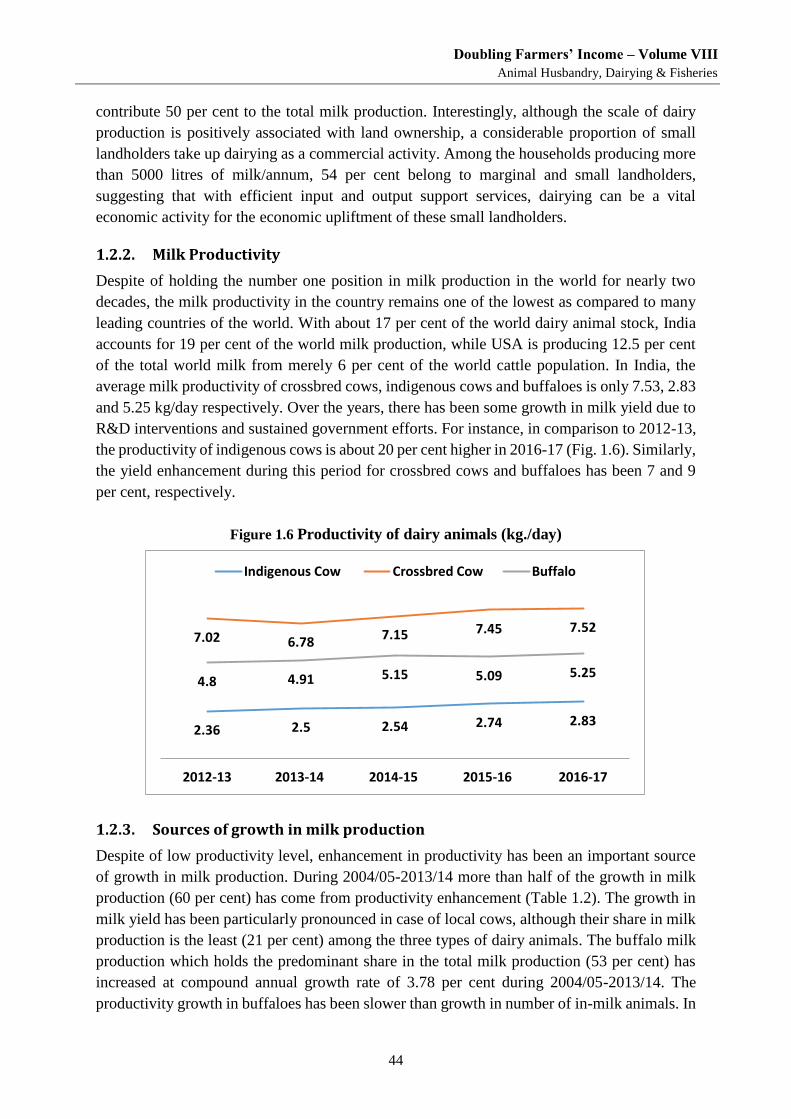
Doubling Farmers’ Income – Volume VIII
Animal Husbandry, Dairying & Fisheries
44
contribute 50 per cent to the total milk production. Interestingly, although the scale of dairy
production is positively associated with land ownership, a considerable proportion of small
landholders take up dairying as a commercial activity. Among the households producing more
than 5000 litres of milk/annum, 54 per cent belong to marginal and small landholders,
suggesting that with efficient input and output support services, dairying can be a vital
economic activity for the economic upliftment of these small landholders.
1.2.2. Milk Productivity
Despite of holding the number one position in milk production in the world for nearly two
decades, the milk productivity in the country remains one of the lowest as compared to many
leading countries of the world. With about 17 per cent of the world dairy animal stock, India
accounts for 19 per cent of the world milk production, while USA is producing 12.5 per cent
of the total world milk from merely 6 per cent of the world cattle population. In India, the
average milk productivity of crossbred cows, indigenous cows and buffaloes is only 7.53, 2.83
and 5.25 kg/day respectively. Over the years, there has been some growth in milk yield due to
R&D interventions and sustained government efforts. For instance, in comparison to 2012-13,
the productivity of indigenous cows is about 20 per cent higher in 2016-17 (Fig. 1.6). Similarly,
the yield enhancement during this period for crossbred cows and buffaloes has been 7 and 9
per cent, respectively.
Figure 1.6 Productivity of dairy animals (kg./day)
1.2.3. Sources of growth in milk production
Despite of low productivity level, enhancement in productivity has been an important source
of growth in milk production. During 2004/05-2013/14 more than half of the growth in milk
production (60 per cent) has come from productivity enhancement (Table 1.2). The growth in
milk yield has been particularly pronounced in case of local cows, although their share in milk
production is the least (21 per cent) among the three types of dairy animals. The buffalo milk
production which holds the predominant share in the total milk production (53 per cent) has
increased at compound annual growth rate of 3.78 per cent during 2004/05-2013/14. The
productivity growth in buffaloes has been slower than growth in number of in-milk animals. In
2.36 2.5 2.54 2.74 2.83
7.02 6.787.15 7.45 7.52
4.8 4.91 5.15 5.09 5.25
2012-13 2013-14 2014-15 2015-16 2016-17
Indigenous Cow Crossbred Cow Buffalo
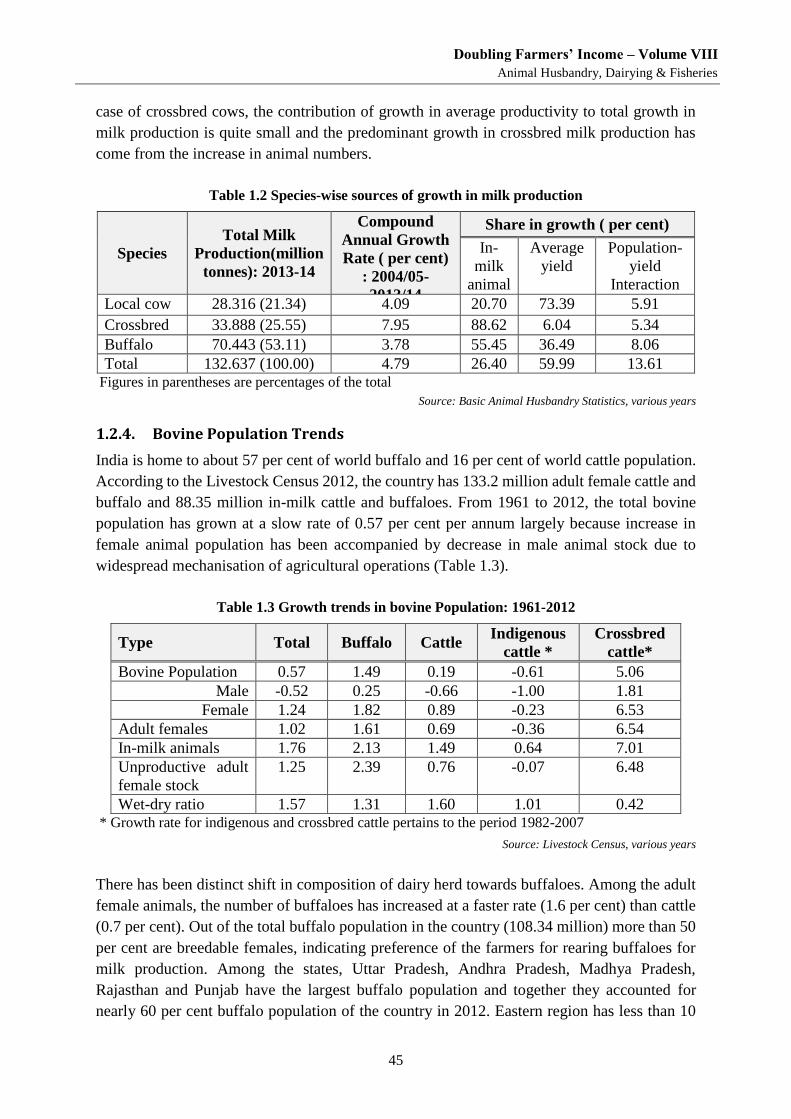
Doubling Farmers’ Income – Volume VIII
Animal Husbandry, Dairying & Fisheries
45
case of crossbred cows, the contribution of growth in average productivity to total growth in
milk production is quite small and the predominant growth in crossbred milk production has
come from the increase in animal numbers.
Table 1.2 Species-wise sources of growth in milk production
Species
Total Milk
Production(million
tonnes): 2013-14
Compound
Annual Growth
Rate ( per cent)
: 2004/05-
2013/14
Share in growth ( per cent)
In-
milk
animal
Average
yield
Population-
yield
Interaction
Local cow 28.316 (21.34) 4.09 20.70 73.39 5.91
Crossbred 33.888 (25.55) 7.95 88.62 6.04 5.34
Buffalo 70.443 (53.11) 3.78 55.45 36.49 8.06
Total 132.637 (100.00) 4.79 26.40 59.99 13.61 Figures in parentheses are percentages of the total
Source: Basic Animal Husbandry Statistics, various years
1.2.4. Bovine Population Trends
India is home to about 57 per cent of world buffalo and 16 per cent of world cattle population.
According to the Livestock Census 2012, the country has 133.2 million adult female cattle and
buffalo and 88.35 million in-milk cattle and buffaloes. From 1961 to 2012, the total bovine
population has grown at a slow rate of 0.57 per cent per annum largely because increase in
female animal population has been accompanied by decrease in male animal stock due to
widespread mechanisation of agricultural operations (Table 1.3).
Table 1.3 Growth trends in bovine Population: 1961-2012
Type Total Buffalo Cattle Indigenous
cattle *
Crossbred
cattle*
Bovine Population 0.57 1.49 0.19 -0.61 5.06
Male -0.52 0.25 -0.66 -1.00 1.81
Female 1.24 1.82 0.89 -0.23 6.53
Adult females 1.02 1.61 0.69 -0.36 6.54
In-milk animals 1.76 2.13 1.49 0.64 7.01
Unproductive adult
female stock
1.25 2.39 0.76 -0.07 6.48
Wet-dry ratio 1.57 1.31 1.60 1.01 0.42 * Growth rate for indigenous and crossbred cattle pertains to the period 1982-2007
Source: Livestock Census, various years
There has been distinct shift in composition of dairy herd towards buffaloes. Among the adult
female animals, the number of buffaloes has increased at a faster rate (1.6 per cent) than cattle
(0.7 per cent). Out of the total buffalo population in the country (108.34 million) more than 50
per cent are breedable females, indicating preference of the farmers for rearing buffaloes for
milk production. Among the states, Uttar Pradesh, Andhra Pradesh, Madhya Pradesh,
Rajasthan and Punjab have the largest buffalo population and together they accounted for
nearly 60 per cent buffalo population of the country in 2012. Eastern region has less than 10
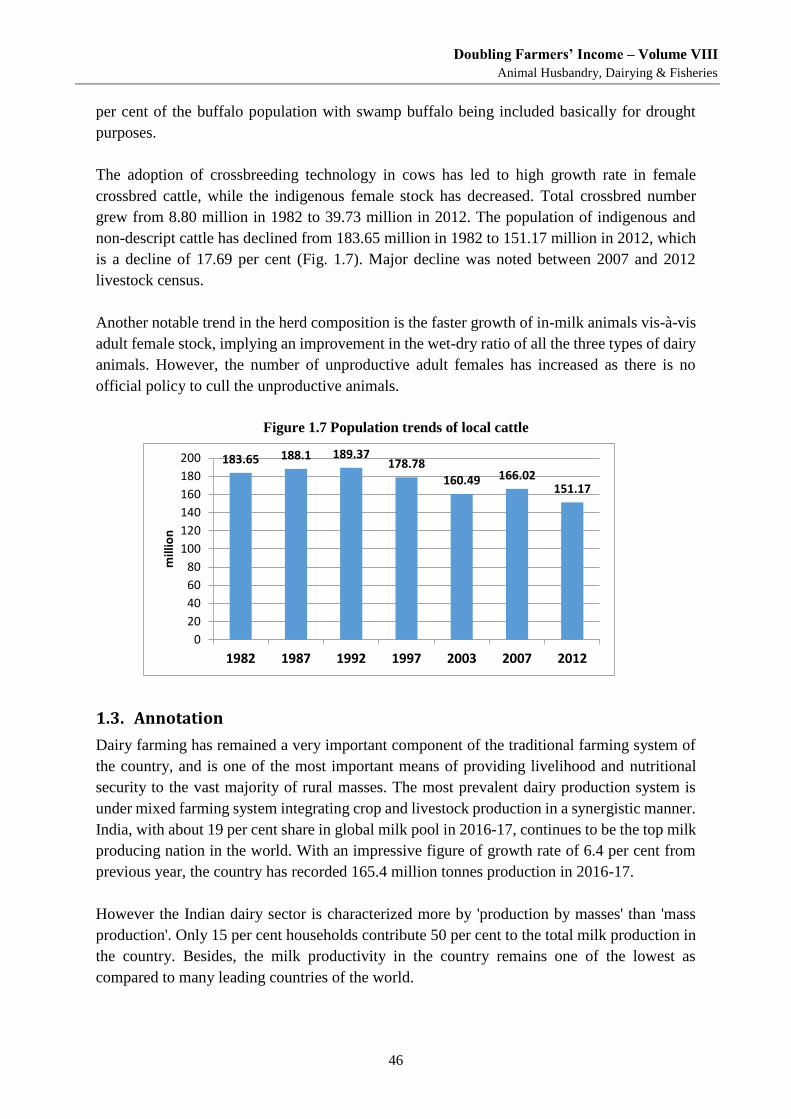
Doubling Farmers’ Income – Volume VIII
Animal Husbandry, Dairying & Fisheries
46
per cent of the buffalo population with swamp buffalo being included basically for drought
purposes.
The adoption of crossbreeding technology in cows has led to high growth rate in female
crossbred cattle, while the indigenous female stock has decreased. Total crossbred number
grew from 8.80 million in 1982 to 39.73 million in 2012. The population of indigenous and
non-descript cattle has declined from 183.65 million in 1982 to 151.17 million in 2012, which
is a decline of 17.69 per cent (Fig. 1.7). Major decline was noted between 2007 and 2012
livestock census.
Another notable trend in the herd composition is the faster growth of in-milk animals vis-à-vis
adult female stock, implying an improvement in the wet-dry ratio of all the three types of dairy
animals. However, the number of unproductive adult females has increased as there is no
official policy to cull the unproductive animals.
Figure 1.7 Population trends of local cattle
1.3. Annotation
Dairy farming has remained a very important component of the traditional farming system of
the country, and is one of the most important means of providing livelihood and nutritional
security to the vast majority of rural masses. The most prevalent dairy production system is
under mixed farming system integrating crop and livestock production in a synergistic manner.
India, with about 19 per cent share in global milk pool in 2016-17, continues to be the top milk
producing nation in the world. With an impressive figure of growth rate of 6.4 per cent from
previous year, the country has recorded 165.4 million tonnes production in 2016-17.
However the Indian dairy sector is characterized more by 'production by masses' than 'mass
production'. Only 15 per cent households contribute 50 per cent to the total milk production in
the country. Besides, the milk productivity in the country remains one of the lowest as
compared to many leading countries of the world.
183.65 188.1 189.37178.78
160.49 166.02151.17
0
20
40
60
80
100
120
140
160
180
200
1982 1987 1992 1997 2003 2007 2012
mill
ion
Doubling Farmers’ Income – Volume VIII
Animal Husbandry, Dairying & Fisheries
47
Despite of low productivity level, enhancement in productivity has been an important source
of growth in milk production. The growth in milk yield has been particularly pronounced in
case of local cows among the three types of dairy animals. Therefore, due attention on the
productivity enhancement of the indigenous cows will be a win-win strategy for enhancing
farmers’ income, as indigenous cows have good adaptation potential to climate stress compared
to buffaloes and crossbreds.
The genetic and technological intervention over the time has also significantly imparted growth
in milk production through shift in the herd composition towards more in-milk animals.
Besides, crossbreeding strategy has led to the faster growth of highly productive crossbred
females. However, considering the resource position of the farmers, which is by and large poor,
it is important that breeds are developed for high milk production that can be reared under the
rugged Indian conditions where fodder scarcity, heat and humidity are a reality.
It is estimated that nationally about 46 per cent of milk output is consumed by producers
themselves and 54 per cent is marketed. The unorganised sector with about 80 per cent share
in total milk production predominates the marketing and processing of milk. In the interest of
economic well-being of the milk producers, it is essential to provide them with greater access
to the organised sector. This would not only ensure remunerative prices to farmers for their
produce but will also encourage more farmers to adopt dairying as a source of livelihood.
Key Extracts
Rearing of dairy animals is an important source of income, employment and nutrition
for the farmers, which makes for technical, infrastructural and policy interventions in
dairy vital for doubling the farmers’ income.
Milk production has shown a steady growth, thus increasing the per capita milk
availability despite of increasing population.
Notwithstanding of low productivity levels, the trends in productivity growth have
been positive particularly for the local cows and buffaloes. In fact, productivity
enhancement has been the major source of growth in milk production from local cattle.
Composition of dairy herd has shifted towards buffalo population. Crossbred adoption
levels have also gone up.
Unorganised sector is the major player in handling the marketed surplus of milk.
Dairy Cooperatives have much wider network than private dairy plants in terms of
membership, but both cooperatives and private have an almost equal share in milk
processing.
It is important to increase the share of organized milk marketing to benefit farmers in
terms of higher monetization.
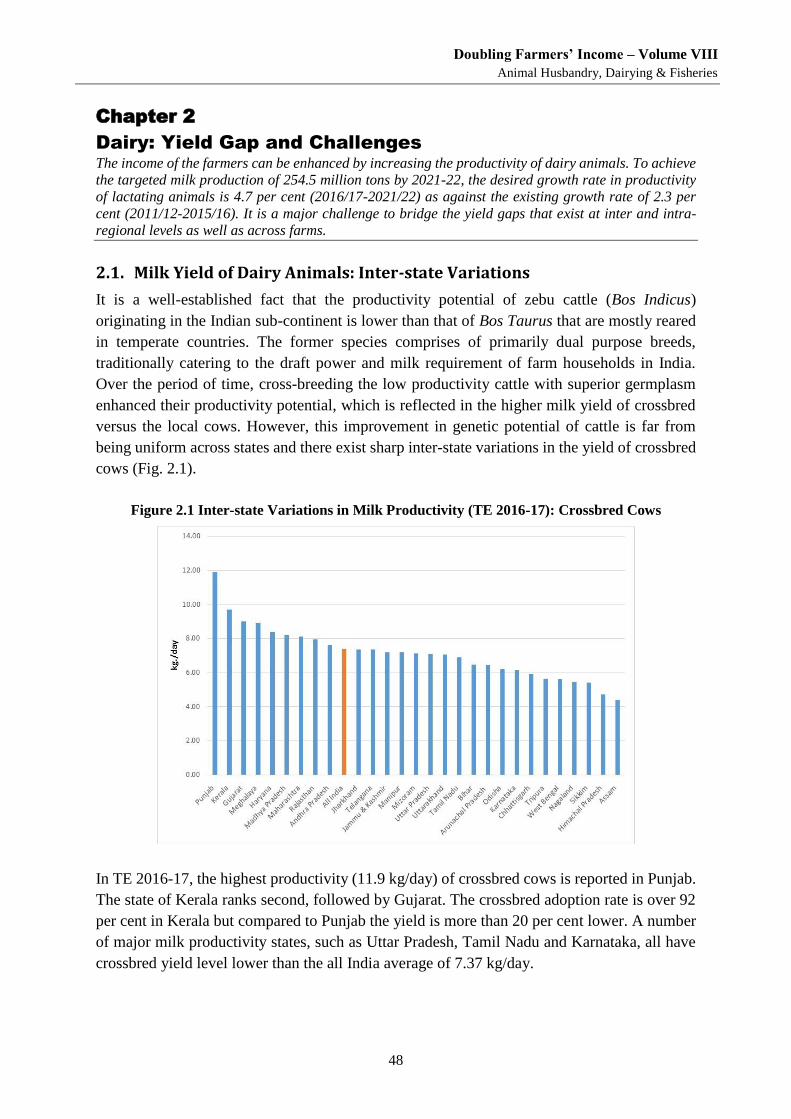
Doubling Farmers’ Income – Volume VIII
Animal Husbandry, Dairying & Fisheries
48
Chapter 2
Dairy: Yield Gap and Challenges The income of the farmers can be enhanced by increasing the productivity of dairy animals. To achieve
the targeted milk production of 254.5 million tons by 2021-22, the desired growth rate in productivity
of lactating animals is 4.7 per cent (2016/17-2021/22) as against the existing growth rate of 2.3 per
cent (2011/12-2015/16). It is a major challenge to bridge the yield gaps that exist at inter and intra-
regional levels as well as across farms.
2.1. Milk Yield of Dairy Animals: Inter-state Variations
It is a well-established fact that the productivity potential of zebu cattle (Bos Indicus)
originating in the Indian sub-continent is lower than that of Bos Taurus that are mostly reared
in temperate countries. The former species comprises of primarily dual purpose breeds,
traditionally catering to the draft power and milk requirement of farm households in India.
Over the period of time, cross-breeding the low productivity cattle with superior germplasm
enhanced their productivity potential, which is reflected in the higher milk yield of crossbred
versus the local cows. However, this improvement in genetic potential of cattle is far from
being uniform across states and there exist sharp inter-state variations in the yield of crossbred
cows (Fig. 2.1).
Figure 2.1 Inter-state Variations in Milk Productivity (TE 2016-17): Crossbred Cows
In TE 2016-17, the highest productivity (11.9 kg/day) of crossbred cows is reported in Punjab.
The state of Kerala ranks second, followed by Gujarat. The crossbred adoption rate is over 92
per cent in Kerala but compared to Punjab the yield is more than 20 per cent lower. A number
of major milk productivity states, such as Uttar Pradesh, Tamil Nadu and Karnataka, all have
crossbred yield level lower than the all India average of 7.37 kg/day.
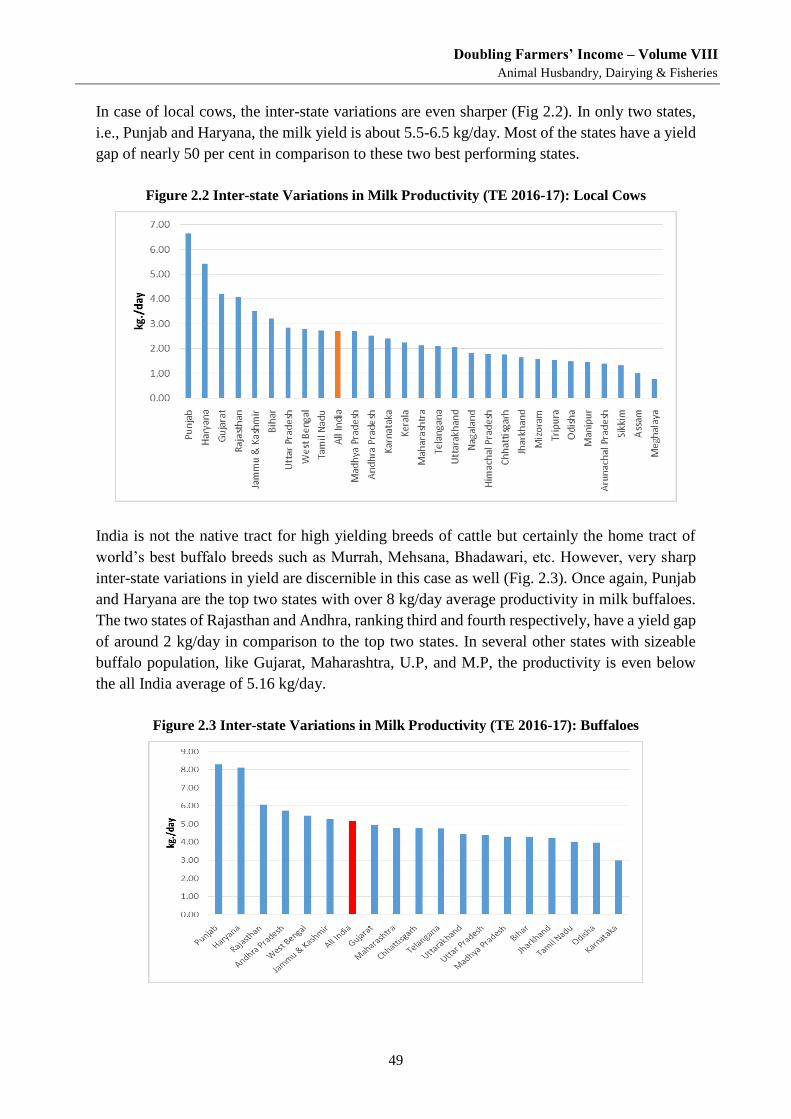
Doubling Farmers’ Income – Volume VIII
Animal Husbandry, Dairying & Fisheries
49
In case of local cows, the inter-state variations are even sharper (Fig 2.2). In only two states,
i.e., Punjab and Haryana, the milk yield is about 5.5-6.5 kg/day. Most of the states have a yield
gap of nearly 50 per cent in comparison to these two best performing states.
Figure 2.2 Inter-state Variations in Milk Productivity (TE 2016-17): Local Cows
India is not the native tract for high yielding breeds of cattle but certainly the home tract of
world’s best buffalo breeds such as Murrah, Mehsana, Bhadawari, etc. However, very sharp
inter-state variations in yield are discernible in this case as well (Fig. 2.3). Once again, Punjab
and Haryana are the top two states with over 8 kg/day average productivity in milk buffaloes.
The two states of Rajasthan and Andhra, ranking third and fourth respectively, have a yield gap
of around 2 kg/day in comparison to the top two states. In several other states with sizeable
buffalo population, like Gujarat, Maharashtra, U.P, and M.P, the productivity is even below
the all India average of 5.16 kg/day.
Figure 2.3 Inter-state Variations in Milk Productivity (TE 2016-17): Buffaloes
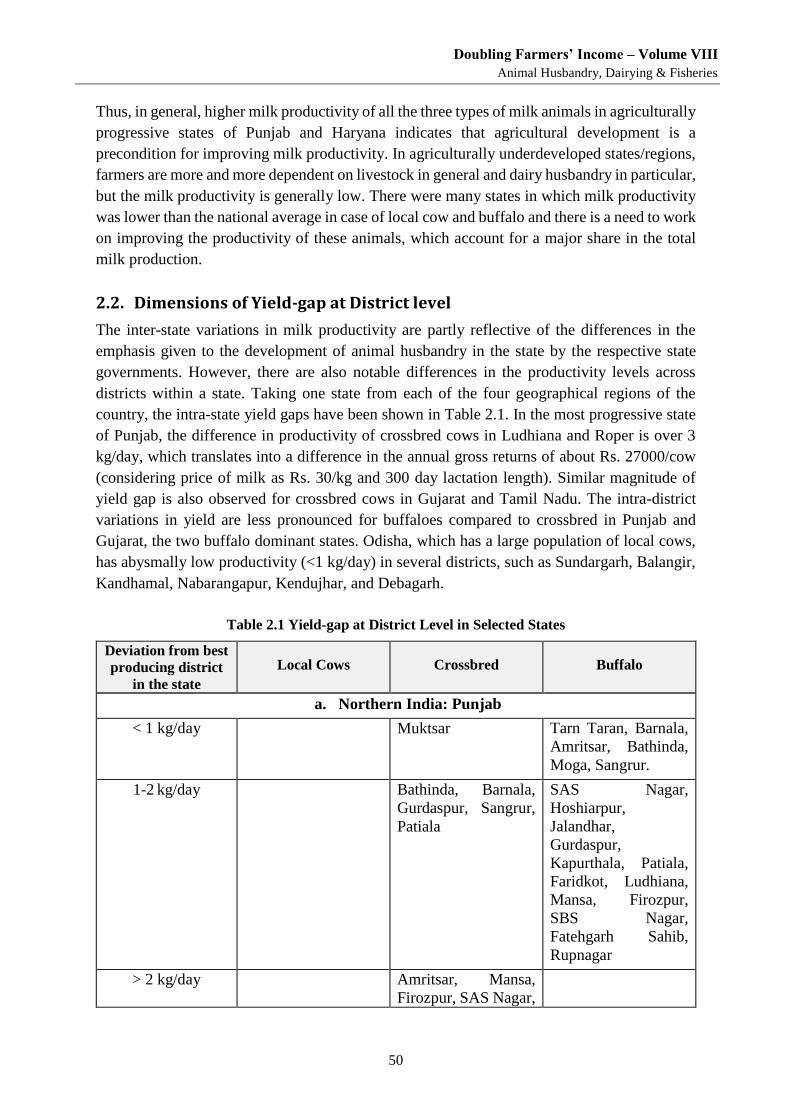
Doubling Farmers’ Income – Volume VIII
Animal Husbandry, Dairying & Fisheries
50
Thus, in general, higher milk productivity of all the three types of milk animals in agriculturally
progressive states of Punjab and Haryana indicates that agricultural development is a
precondition for improving milk productivity. In agriculturally underdeveloped states/regions,
farmers are more and more dependent on livestock in general and dairy husbandry in particular,
but the milk productivity is generally low. There were many states in which milk productivity
was lower than the national average in case of local cow and buffalo and there is a need to work
on improving the productivity of these animals, which account for a major share in the total
milk production.
2.2. Dimensions of Yield-gap at District level
The inter-state variations in milk productivity are partly reflective of the differences in the
emphasis given to the development of animal husbandry in the state by the respective state
governments. However, there are also notable differences in the productivity levels across
districts within a state. Taking one state from each of the four geographical regions of the
country, the intra-state yield gaps have been shown in Table 2.1. In the most progressive state
of Punjab, the difference in productivity of crossbred cows in Ludhiana and Roper is over 3
kg/day, which translates into a difference in the annual gross returns of about Rs. 27000/cow
(considering price of milk as Rs. 30/kg and 300 day lactation length). Similar magnitude of
yield gap is also observed for crossbred cows in Gujarat and Tamil Nadu. The intra-district
variations in yield are less pronounced for buffaloes compared to crossbred in Punjab and
Gujarat, the two buffalo dominant states. Odisha, which has a large population of local cows,
has abysmally low productivity (<1 kg/day) in several districts, such as Sundargarh, Balangir,
Kandhamal, Nabarangapur, Kendujhar, and Debagarh.
Table 2.1 Yield-gap at District Level in Selected States
Deviation from best
producing district
in the state
Local Cows Crossbred Buffalo
a. Northern India: Punjab
< 1 kg/day Muktsar Tarn Taran, Barnala,
Amritsar, Bathinda,
Moga, Sangrur.
1-2 kg/day Bathinda, Barnala,
Gurdaspur, Sangrur,
Patiala
SAS Nagar,
Hoshiarpur,
Jalandhar,
Gurdaspur,
Kapurthala, Patiala,
Faridkot, Ludhiana,
Mansa, Firozpur,
SBS Nagar,
Fatehgarh Sahib,
Rupnagar
> 2 kg/day Amritsar, Mansa,
Firozpur, SAS Nagar,
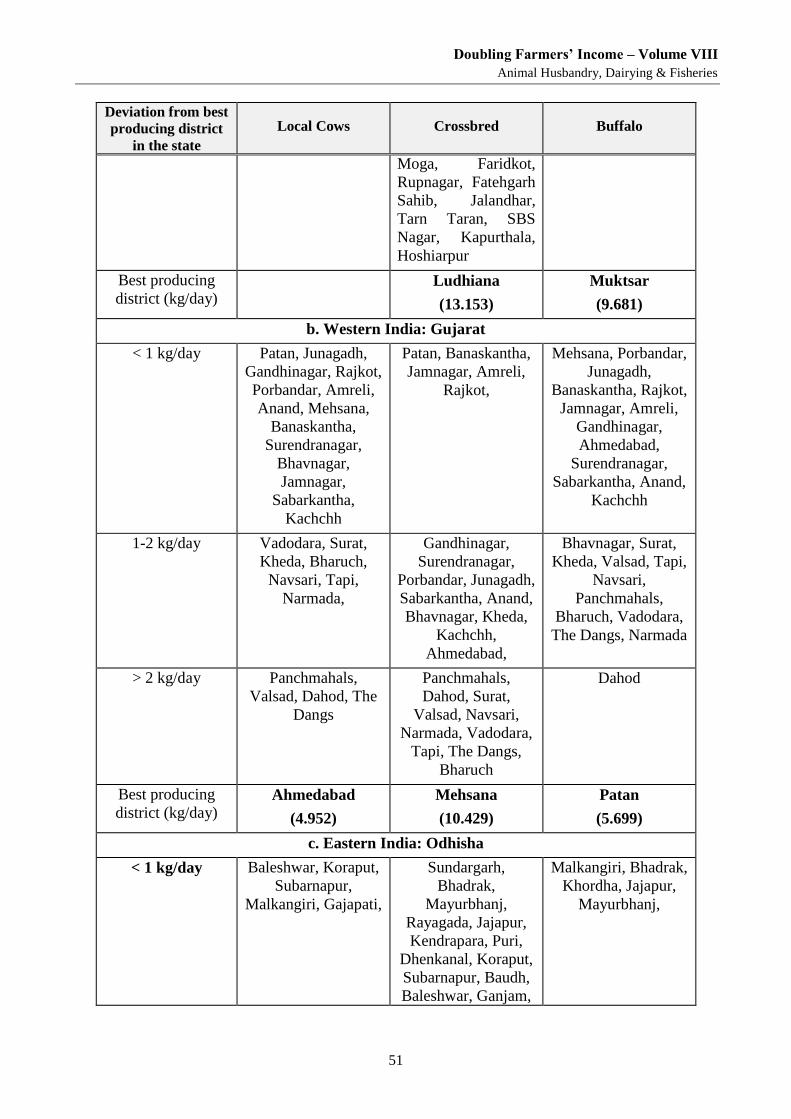
Doubling Farmers’ Income – Volume VIII
Animal Husbandry, Dairying & Fisheries
51
Deviation from best
producing district
in the state
Local Cows Crossbred Buffalo
Moga, Faridkot,
Rupnagar, Fatehgarh
Sahib, Jalandhar,
Tarn Taran, SBS
Nagar, Kapurthala,
Hoshiarpur
Best producing
district (kg/day)
Ludhiana
(13.153)
Muktsar
(9.681)
b. Western India: Gujarat
< 1 kg/day Patan, Junagadh,
Gandhinagar, Rajkot,
Porbandar, Amreli,
Anand, Mehsana,
Banaskantha,
Surendranagar,
Bhavnagar,
Jamnagar,
Sabarkantha,
Kachchh
Patan, Banaskantha,
Jamnagar, Amreli,
Rajkot,
Mehsana, Porbandar,
Junagadh,
Banaskantha, Rajkot,
Jamnagar, Amreli,
Gandhinagar,
Ahmedabad,
Surendranagar,
Sabarkantha, Anand,
Kachchh
1-2 kg/day Vadodara, Surat,
Kheda, Bharuch,
Navsari, Tapi,
Narmada,
Gandhinagar,
Surendranagar,
Porbandar, Junagadh,
Sabarkantha, Anand,
Bhavnagar, Kheda,
Kachchh,
Ahmedabad,
Bhavnagar, Surat,
Kheda, Valsad, Tapi,
Navsari,
Panchmahals,
Bharuch, Vadodara,
The Dangs, Narmada
> 2 kg/day Panchmahals,
Valsad, Dahod, The
Dangs
Panchmahals,
Dahod, Surat,
Valsad, Navsari,
Narmada, Vadodara,
Tapi, The Dangs,
Bharuch
Dahod
Best producing
district (kg/day) Ahmedabad
(4.952)
Mehsana
(10.429)
Patan
(5.699)
c. Eastern India: Odhisha
< 1 kg/day Baleshwar, Koraput,
Subarnapur,
Malkangiri, Gajapati,
Sundargarh,
Bhadrak,
Mayurbhanj,
Rayagada, Jajapur,
Kendrapara, Puri,
Dhenkanal, Koraput,
Subarnapur, Baudh,
Baleshwar, Ganjam,
Malkangiri, Bhadrak,
Khordha, Jajapur,
Mayurbhanj,
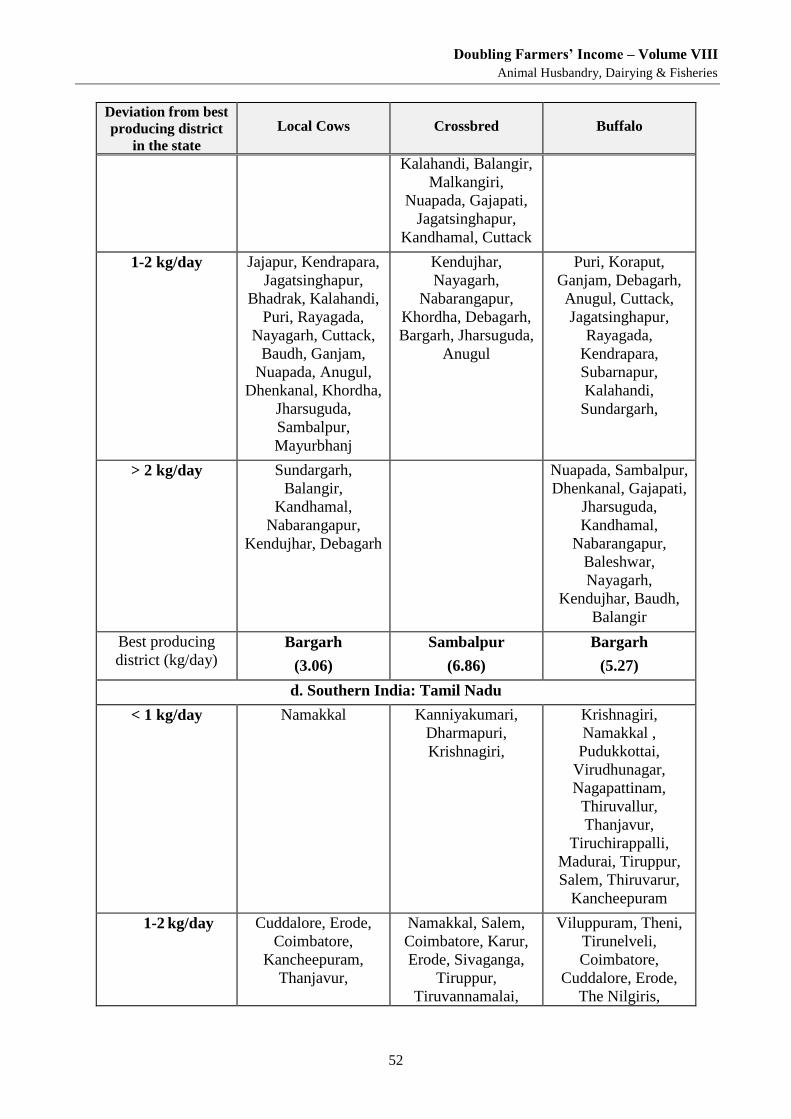
Doubling Farmers’ Income – Volume VIII
Animal Husbandry, Dairying & Fisheries
52
Deviation from best
producing district
in the state
Local Cows Crossbred Buffalo
Kalahandi, Balangir,
Malkangiri,
Nuapada, Gajapati,
Jagatsinghapur,
Kandhamal, Cuttack
1-2 kg/day Jajapur, Kendrapara,
Jagatsinghapur,
Bhadrak, Kalahandi,
Puri, Rayagada,
Nayagarh, Cuttack,
Baudh, Ganjam,
Nuapada, Anugul,
Dhenkanal, Khordha,
Jharsuguda,
Sambalpur,
Mayurbhanj
Kendujhar,
Nayagarh,
Nabarangapur,
Khordha, Debagarh,
Bargarh, Jharsuguda,
Anugul
Puri, Koraput,
Ganjam, Debagarh,
Anugul, Cuttack,
Jagatsinghapur,
Rayagada,
Kendrapara,
Subarnapur,
Kalahandi,
Sundargarh,
> 2 kg/day Sundargarh,
Balangir,
Kandhamal,
Nabarangapur,
Kendujhar, Debagarh
Nuapada, Sambalpur,
Dhenkanal, Gajapati,
Jharsuguda,
Kandhamal,
Nabarangapur,
Baleshwar,
Nayagarh,
Kendujhar, Baudh,
Balangir
Best producing
district (kg/day) Bargarh
(3.06)
Sambalpur
(6.86)
Bargarh
(5.27)
d. Southern India: Tamil Nadu
< 1 kg/day Namakkal Kanniyakumari,
Dharmapuri,
Krishnagiri,
Krishnagiri,
Namakkal ,
Pudukkottai,
Virudhunagar,
Nagapattinam,
Thiruvallur,
Thanjavur,
Tiruchirappalli,
Madurai, Tiruppur,
Salem, Thiruvarur,
Kancheepuram
1-2 kg/day Cuddalore, Erode,
Coimbatore,
Kancheepuram,
Thanjavur,
Namakkal, Salem,
Coimbatore, Karur,
Erode, Sivaganga,
Tiruppur,
Tiruvannamalai,
Viluppuram, Theni,
Tirunelveli,
Coimbatore,
Cuddalore, Erode,
The Nilgiris,
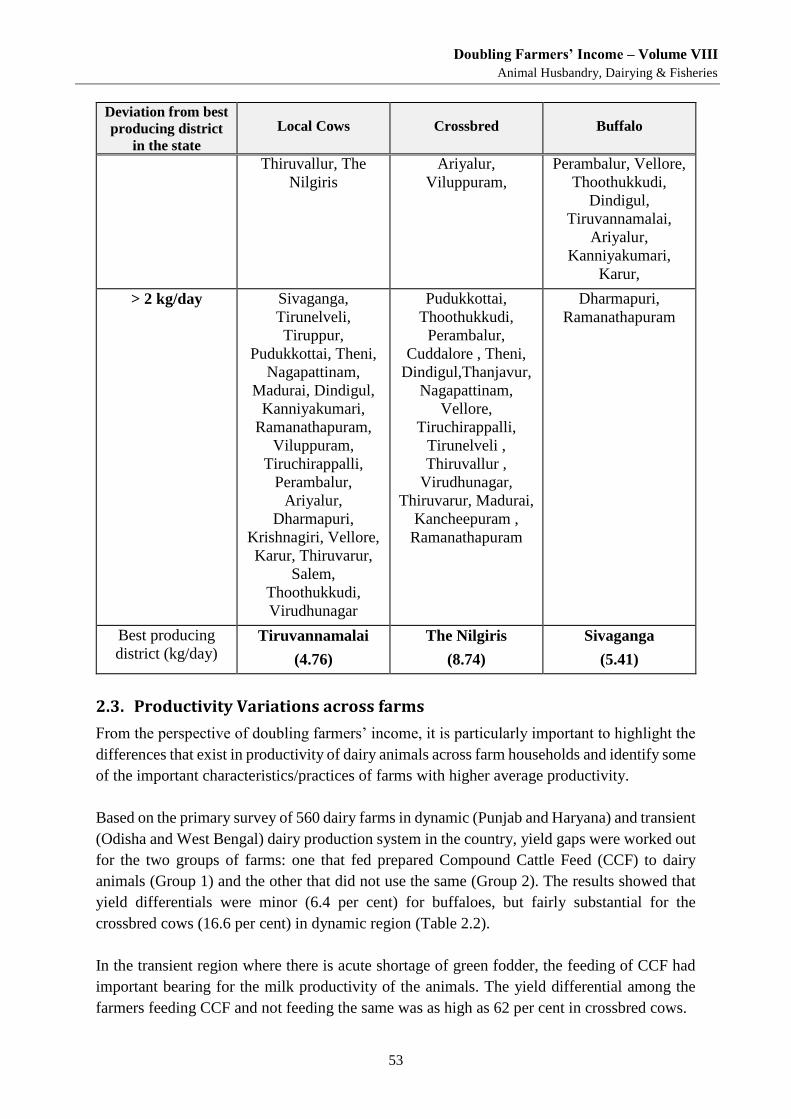
Doubling Farmers’ Income – Volume VIII
Animal Husbandry, Dairying & Fisheries
53
Deviation from best
producing district
in the state
Local Cows Crossbred Buffalo
Thiruvallur, The
Nilgiris
Ariyalur,
Viluppuram,
Perambalur, Vellore,
Thoothukkudi,
Dindigul,
Tiruvannamalai,
Ariyalur,
Kanniyakumari,
Karur,
> 2 kg/day Sivaganga,
Tirunelveli,
Tiruppur,
Pudukkottai, Theni,
Nagapattinam,
Madurai, Dindigul,
Kanniyakumari,
Ramanathapuram,
Viluppuram,
Tiruchirappalli,
Perambalur,
Ariyalur,
Dharmapuri,
Krishnagiri, Vellore,
Karur, Thiruvarur,
Salem,
Thoothukkudi,
Virudhunagar
Pudukkottai,
Thoothukkudi,
Perambalur,
Cuddalore , Theni,
Dindigul,Thanjavur,
Nagapattinam,
Vellore,
Tiruchirappalli,
Tirunelveli ,
Thiruvallur ,
Virudhunagar,
Thiruvarur, Madurai,
Kancheepuram ,
Ramanathapuram
Dharmapuri,
Ramanathapuram
Best producing
district (kg/day) Tiruvannamalai
(4.76)
The Nilgiris
(8.74)
Sivaganga
(5.41)
2.3. Productivity Variations across farms
From the perspective of doubling farmers’ income, it is particularly important to highlight the
differences that exist in productivity of dairy animals across farm households and identify some
of the important characteristics/practices of farms with higher average productivity.
Based on the primary survey of 560 dairy farms in dynamic (Punjab and Haryana) and transient
(Odisha and West Bengal) dairy production system in the country, yield gaps were worked out
for the two groups of farms: one that fed prepared Compound Cattle Feed (CCF) to dairy
animals (Group 1) and the other that did not use the same (Group 2). The results showed that
yield differentials were minor (6.4 per cent) for buffaloes, but fairly substantial for the
crossbred cows (16.6 per cent) in dynamic region (Table 2.2).
In the transient region where there is acute shortage of green fodder, the feeding of CCF had
important bearing for the milk productivity of the animals. The yield differential among the
farmers feeding CCF and not feeding the same was as high as 62 per cent in crossbred cows.
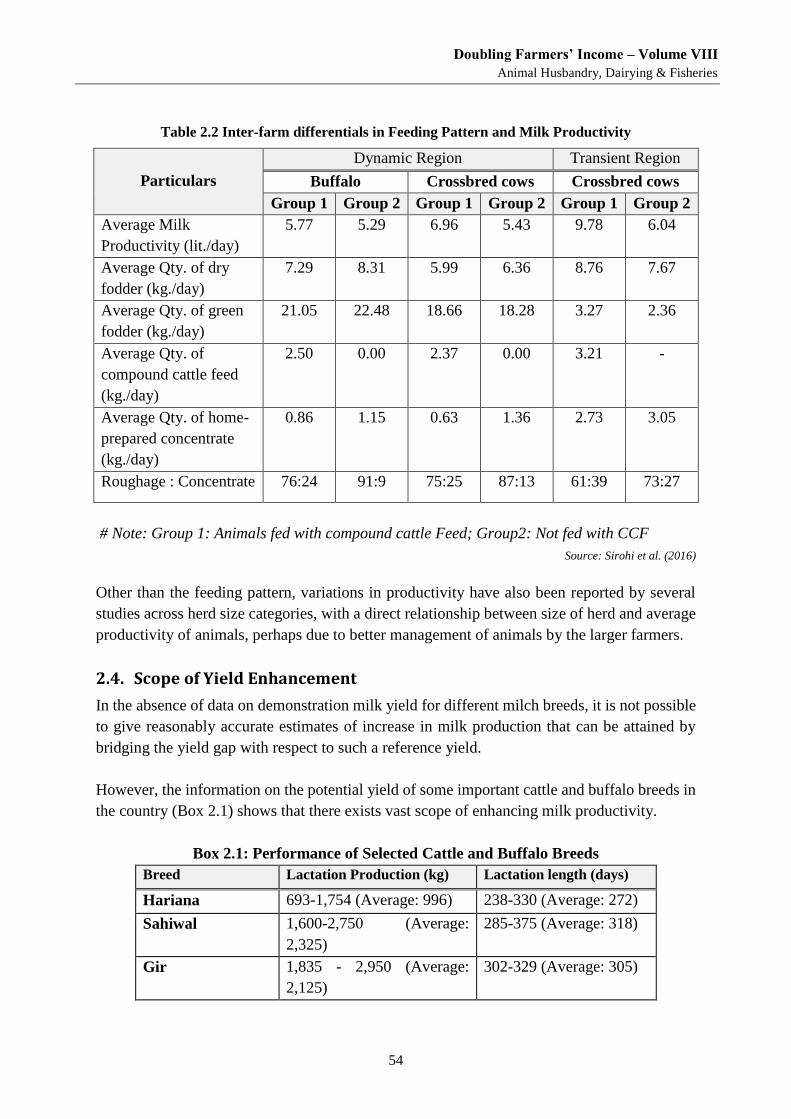
Doubling Farmers’ Income – Volume VIII
Animal Husbandry, Dairying & Fisheries
54
Table 2.2 Inter-farm differentials in Feeding Pattern and Milk Productivity
Particulars
Dynamic Region Transient Region
Buffalo Crossbred cows Crossbred cows
Group 1 Group 2 Group 1 Group 2 Group 1 Group 2
Average Milk
Productivity (lit./day)
5.77 5.29 6.96 5.43 9.78 6.04
Average Qty. of dry
fodder (kg./day)
7.29 8.31 5.99 6.36 8.76 7.67
Average Qty. of green
fodder (kg./day)
21.05 22.48 18.66 18.28 3.27 2.36
Average Qty. of
compound cattle feed
(kg./day)
2.50 0.00 2.37 0.00 3.21 -
Average Qty. of home-
prepared concentrate
(kg./day)
0.86 1.15 0.63 1.36 2.73 3.05
Roughage : Concentrate 76:24 91:9 75:25 87:13 61:39 73:27
# Note: Group 1: Animals fed with compound cattle Feed; Group2: Not fed with CCF
Source: Sirohi et al. (2016)
Other than the feeding pattern, variations in productivity have also been reported by several
studies across herd size categories, with a direct relationship between size of herd and average
productivity of animals, perhaps due to better management of animals by the larger farmers.
2.4. Scope of Yield Enhancement
In the absence of data on demonstration milk yield for different milch breeds, it is not possible
to give reasonably accurate estimates of increase in milk production that can be attained by
bridging the yield gap with respect to such a reference yield.
However, the information on the potential yield of some important cattle and buffalo breeds in
the country (Box 2.1) shows that there exists vast scope of enhancing milk productivity.
Box 2.1: Performance of Selected Cattle and Buffalo Breeds
Breed Lactation Production (kg) Lactation length (days)
Hariana 693-1,754 (Average: 996) 238-330 (Average: 272)
Sahiwal 1,600-2,750 (Average:
2,325)
285-375 (Average: 318)
Gir 1,835 - 2,950 (Average:
2,125)
302-329 (Average: 305)
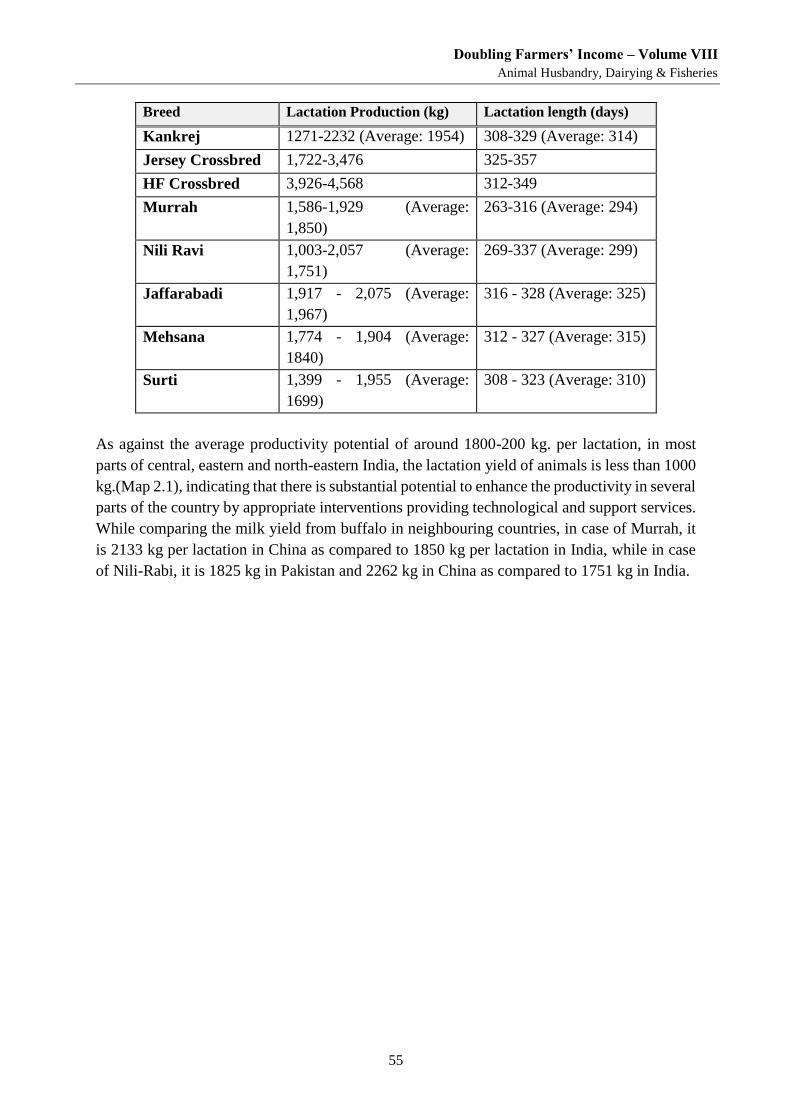
Doubling Farmers’ Income – Volume VIII
Animal Husbandry, Dairying & Fisheries
55
Breed Lactation Production (kg) Lactation length (days)
Kankrej 1271-2232 (Average: 1954) 308-329 (Average: 314)
Jersey Crossbred 1,722-3,476 325-357
HF Crossbred 3,926-4,568 312-349
Murrah 1,586-1,929 (Average:
1,850)
263-316 (Average: 294)
Nili Ravi 1,003-2,057 (Average:
1,751)
269-337 (Average: 299)
Jaffarabadi 1,917 - 2,075 (Average:
1,967)
316 - 328 (Average: 325)
Mehsana 1,774 - 1,904 (Average:
1840)
312 - 327 (Average: 315)
Surti 1,399 - 1,955 (Average:
1699)
308 - 323 (Average: 310)
As against the average productivity potential of around 1800-200 kg. per lactation, in most
parts of central, eastern and north-eastern India, the lactation yield of animals is less than 1000
kg.(Map 2.1), indicating that there is substantial potential to enhance the productivity in several
parts of the country by appropriate interventions providing technological and support services.
While comparing the milk yield from buffalo in neighbouring countries, in case of Murrah, it
is 2133 kg per lactation in China as compared to 1850 kg per lactation in India, while in case
of Nili-Rabi, it is 1825 kg in Pakistan and 2262 kg in China as compared to 1751 kg in India.
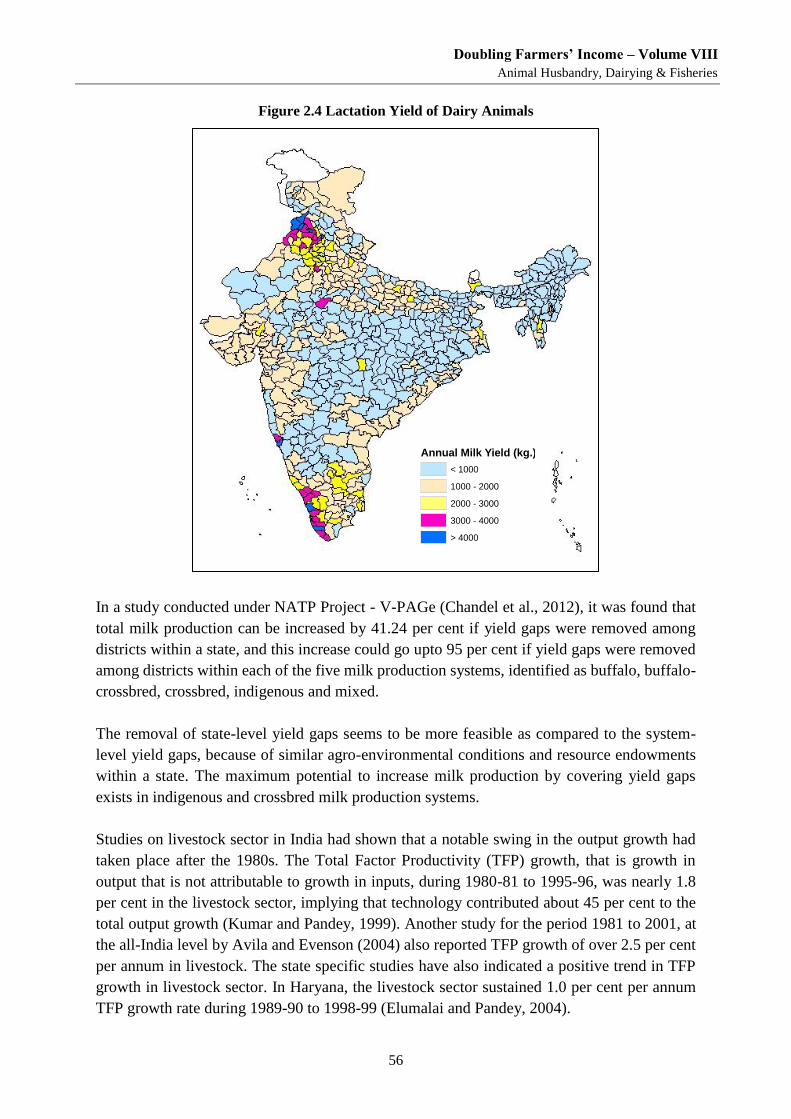
Doubling Farmers’ Income – Volume VIII
Animal Husbandry, Dairying & Fisheries
56
Figure 2.4 Lactation Yield of Dairy Animals
In a study conducted under NATP Project - V-PAGe (Chandel et al., 2012), it was found that
total milk production can be increased by 41.24 per cent if yield gaps were removed among
districts within a state, and this increase could go upto 95 per cent if yield gaps were removed
among districts within each of the five milk production systems, identified as buffalo, buffalo-
crossbred, crossbred, indigenous and mixed.
The removal of state-level yield gaps seems to be more feasible as compared to the system-
level yield gaps, because of similar agro-environmental conditions and resource endowments
within a state. The maximum potential to increase milk production by covering yield gaps
exists in indigenous and crossbred milk production systems.
Studies on livestock sector in India had shown that a notable swing in the output growth had
taken place after the 1980s. The Total Factor Productivity (TFP) growth, that is growth in
output that is not attributable to growth in inputs, during 1980-81 to 1995-96, was nearly 1.8
per cent in the livestock sector, implying that technology contributed about 45 per cent to the
total output growth (Kumar and Pandey, 1999). Another study for the period 1981 to 2001, at
the all-India level by Avila and Evenson (2004) also reported TFP growth of over 2.5 per cent
per annum in livestock. The state specific studies have also indicated a positive trend in TFP
growth in livestock sector. In Haryana, the livestock sector sustained 1.0 per cent per annum
TFP growth rate during 1989-90 to 1998-99 (Elumalai and Pandey, 2004).
Annual Milk Yield (kg.)
< 1000
1000 - 2000
2000 - 3000
3000 - 4000
> 4000
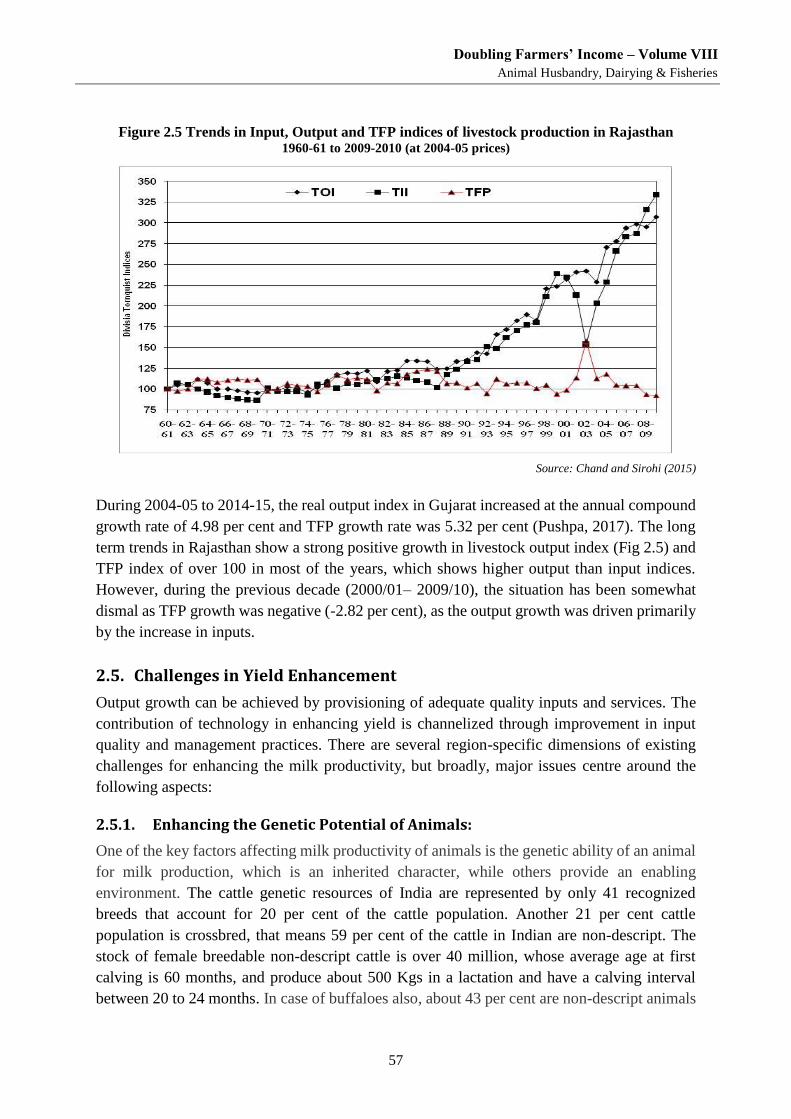
Doubling Farmers’ Income – Volume VIII
Animal Husbandry, Dairying & Fisheries
57
Figure 2.5 Trends in Input, Output and TFP indices of livestock production in Rajasthan 1960-61 to 2009-2010 (at 2004-05 prices)
Source: Chand and Sirohi (2015)
During 2004-05 to 2014-15, the real output index in Gujarat increased at the annual compound
growth rate of 4.98 per cent and TFP growth rate was 5.32 per cent (Pushpa, 2017). The long
term trends in Rajasthan show a strong positive growth in livestock output index (Fig 2.5) and
TFP index of over 100 in most of the years, which shows higher output than input indices.
However, during the previous decade (2000/01– 2009/10), the situation has been somewhat
dismal as TFP growth was negative (-2.82 per cent), as the output growth was driven primarily
by the increase in inputs.
2.5. Challenges in Yield Enhancement
Output growth can be achieved by provisioning of adequate quality inputs and services. The
contribution of technology in enhancing yield is channelized through improvement in input
quality and management practices. There are several region-specific dimensions of existing
challenges for enhancing the milk productivity, but broadly, major issues centre around the
following aspects:
2.5.1. Enhancing the Genetic Potential of Animals:
One of the key factors affecting milk productivity of animals is the genetic ability of an animal
for milk production, which is an inherited character, while others provide an enabling
environment. The cattle genetic resources of India are represented by only 41 recognized
breeds that account for 20 per cent of the cattle population. Another 21 per cent cattle
population is crossbred, that means 59 per cent of the cattle in Indian are non-descript. The
stock of female breedable non-descript cattle is over 40 million, whose average age at first
calving is 60 months, and produce about 500 Kgs in a lactation and have a calving interval
between 20 to 24 months. In case of buffaloes also, about 43 per cent are non-descript animals
Doubling Farmers’ Income – Volume VIII
Animal Husbandry, Dairying & Fisheries
58
with very low genetic potential. The identification of type of animals of local breeds is a critical
challenge for breed improvement programs. There is need to prioritize cattle and buffalo breeds
as per their economic importance. This will be helpful to farmers in order to increase their
income through rearing of livestock and sale of milk, milk products and animals as well.
The breeding bull contributes significantly in enhancing the genetic potential of its progenies
for economically important traits, like milk production, fertility, body conformation etc.
Genetic improvement for a specific trait or group of traits largely depends on how effectively
these traits are recorded and what accuracy of selection is obtained for production of bulls.
Currently, about 3760 bulls are used at various Semen Stations for producing semen with
replacement of about 940 bulls each year. AI is the preferred method for attaining genetic
progress in milch animals. To accelerate the genetic progress, the proportion of milch animals
bred through AI needs to be raised substantially.
Presently, about 30 per cent of the breedable animals are bred through AI and 70 per cent are
bred through natural service. About 102.69 million doses are currently produced annually by
53 semen stations operating in the country. This is sufficient to inseminate 30 per cent of the
breedable animals in the country. However, if at least 60 per cent of the breedable animals are
to be inseminated by 2021-22 then an aggregate of about 209 million quality semen doses of
the required breeds would need to be produced. Not only is the coverage low, but generally the
quality of service provided is also poor.
The conception rates (CR) in most of the regions, by and large, range from 40-49 per cent in
field conditions, although studies in some states show much lower rates. Even on the farm of
the National Dairy Research Institute, the CR in cows (50 per cent) is not much higher than
that achieved in the field. Further, the success rate of AI in buffaloes is about 10 per cent lower
than that in cows, even on organised farms. Studies on factors affecting CR in cattle indicate
that with 90 per cent or more efficiency in four important factors, cow fertility, estrous
detection accuracy, semen fertility and AI technique, the CR can be between 65-70 per cent.
In Indian field conditions also, accurate detection of heat symptoms and stage of oestrus in
animals are reported to be very critical factors affecting the CR in cattle and buffaloes. Every
missed heat is directly related to increased service period which in turn leads to longer inter-
calving interval. Timely heat detection is essential for getting one calf per year. A cow wrongly
detected in heat and inseminated leads to heavy loss in terms of wasteful expenditure. In case
of buffaloes, chances of missing heat are high in summer months. So, buffaloes require extra
attention as compared to cattle regarding heat detection.
2.5.2. Shortage of Feed and Fodder:
Animal feed is the most crucial input in livestock production. Empirical studies in India have
shown that enhancing quality and quantity of feed input has greater impact than breed
improvement on increasing milk productivity. The shortage of feed and fodder is a serious
constraint in increasing the productivity of livestock in India. The assessment of availability of
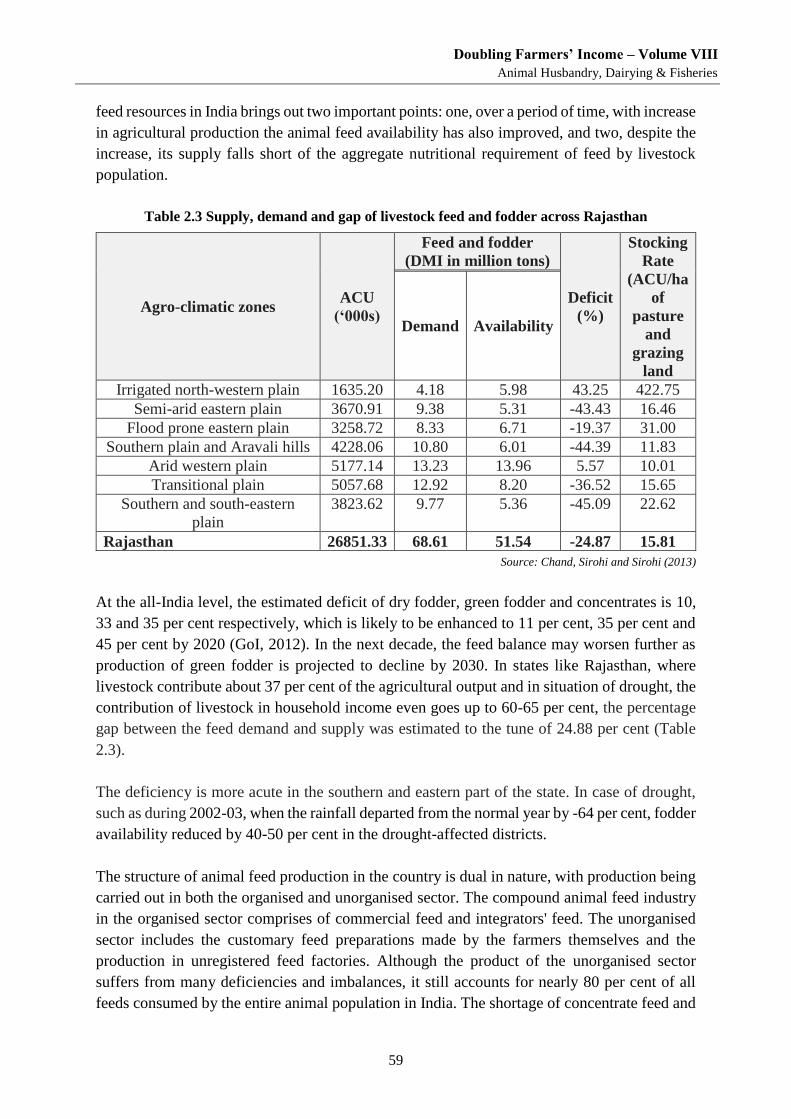
Doubling Farmers’ Income – Volume VIII
Animal Husbandry, Dairying & Fisheries
59
feed resources in India brings out two important points: one, over a period of time, with increase
in agricultural production the animal feed availability has also improved, and two, despite the
increase, its supply falls short of the aggregate nutritional requirement of feed by livestock
population.
Table 2.3 Supply, demand and gap of livestock feed and fodder across Rajasthan
Agro-climatic zones ACU
(‘000s)
Feed and fodder
(DMI in million tons)
Deficit
(%)
Stocking
Rate
(ACU/ha
of
pasture
and
grazing
land
Demand Availability
Irrigated north-western plain 1635.20 4.18 5.98 43.25 422.75
Semi-arid eastern plain 3670.91 9.38 5.31 -43.43 16.46
Flood prone eastern plain 3258.72 8.33 6.71 -19.37 31.00
Southern plain and Aravali hills 4228.06 10.80 6.01 -44.39 11.83
Arid western plain 5177.14 13.23 13.96 5.57 10.01
Transitional plain 5057.68 12.92 8.20 -36.52 15.65
Southern and south-eastern
plain
3823.62 9.77 5.36 -45.09 22.62
Rajasthan 26851.33 68.61 51.54 -24.87 15.81
Source: Chand, Sirohi and Sirohi (2013)
At the all-India level, the estimated deficit of dry fodder, green fodder and concentrates is 10,
33 and 35 per cent respectively, which is likely to be enhanced to 11 per cent, 35 per cent and
45 per cent by 2020 (GoI, 2012). In the next decade, the feed balance may worsen further as
production of green fodder is projected to decline by 2030. In states like Rajasthan, where
livestock contribute about 37 per cent of the agricultural output and in situation of drought, the
contribution of livestock in household income even goes up to 60-65 per cent, the percentage
gap between the feed demand and supply was estimated to the tune of 24.88 per cent (Table
2.3).
The deficiency is more acute in the southern and eastern part of the state. In case of drought,
such as during 2002-03, when the rainfall departed from the normal year by -64 per cent, fodder
availability reduced by 40-50 per cent in the drought-affected districts.
The structure of animal feed production in the country is dual in nature, with production being
carried out in both the organised and unorganised sector. The compound animal feed industry
in the organised sector comprises of commercial feed and integrators' feed. The unorganised
sector includes the customary feed preparations made by the farmers themselves and the
production in unregistered feed factories. Although the product of the unorganised sector
suffers from many deficiencies and imbalances, it still accounts for nearly 80 per cent of all
feeds consumed by the entire animal population in India. The shortage of concentrate feed and
Doubling Farmers’ Income – Volume VIII
Animal Husbandry, Dairying & Fisheries
60
nutritionally poor quality of feed are two key problems that impinge on the productivity growth
in livestock sector in the country.
India ranks at 5th position among 130 major prepared animal feed producing countries. As a
result of the commercial boom in poultry sector, the share of poultry feed sector is dominant,
while cattle feed production is only about 25 per cent (7.5 million tonnes). About half of this
is produced by the dairy cooperatives and government sector and is sold to farmer members
involved in milk production at subsidized rates.
As per the enumeration by the Annual Survey of Industries (ASI), the number of animal feed
manufacturing units in the factory sector have grown from just 76 in 1976-77 to 873 in 2012-
13, registering a compound growth rate of 5.8 per cent per annum. Besides the number of
factories enumerated by ASI, there are large number of unregistered feed manufacturing units.
The major limitation of the industrially manufactured compound cattle feed in India is that it
has proved its value only for high yielding animals but not for the low-yielder due to their
genetic limitations.
2.5.3. Shortcomings in animal health care services:
The animal health services in the country are provided through a network of over 65000
veterinary hospitals/dispensaries and aid centres (comprising stockmen centres and mobile
dispensaries) under the State Animal Husbandry departments (Fig.2.6). In addition, to a limited
extent, some cooperatives, NGOs and private practitioners participate in the provision of these
services. Despite the vast network of veterinary institutions, the incidence of diseases and
epidemics is very high in the country that impinges on the productivity enhancement.
The poor status of animal health stems from the extremely limited attention paid to preventive
health care services and inefficiencies in provision of curative health services. Most of the
government dispensaries, hospitals and AI centres are stationary and are primarily engaged in
providing curative health cover and breeding services. In the case of curative health services,
a large gap also exists between the need and the availability of cow-side animal health service
providers. As a result of this, most farmers resort to cheaper alternatives like engaging quacks,
other untrained personnel or self-medication, which may, many a time, do more harm than
provide a cure.
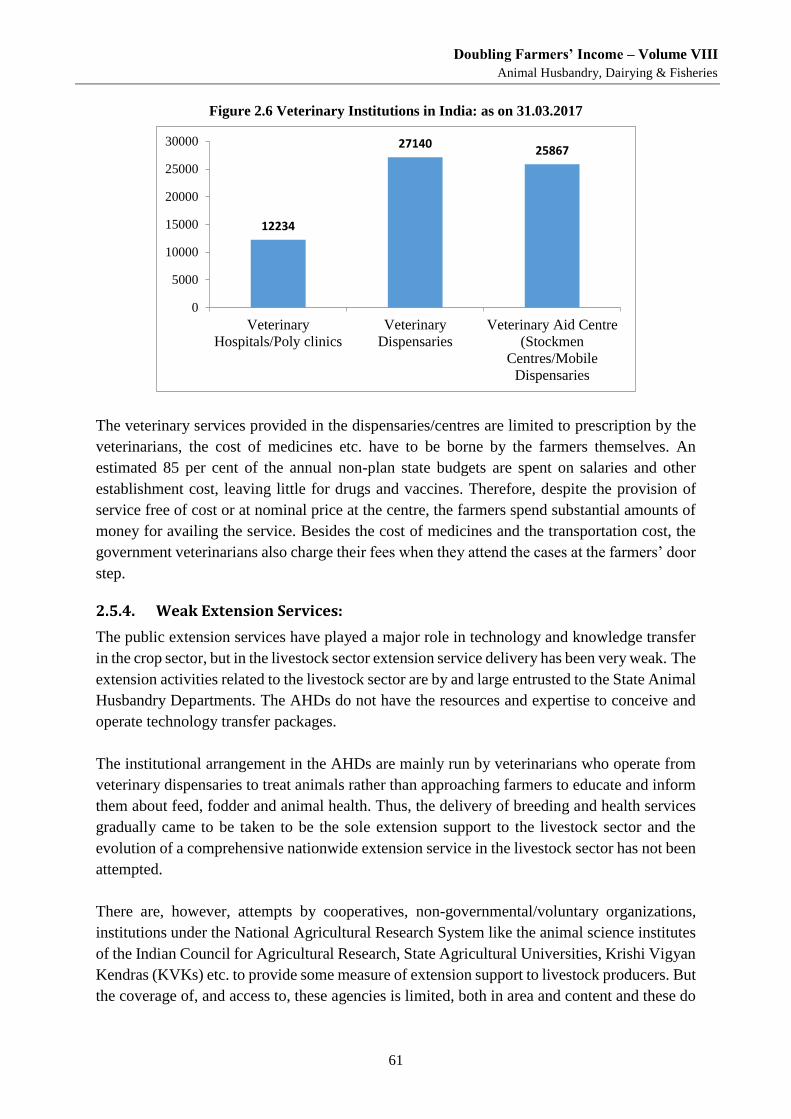
Doubling Farmers’ Income – Volume VIII
Animal Husbandry, Dairying & Fisheries
61
Figure 2.6 Veterinary Institutions in India: as on 31.03.2017
The veterinary services provided in the dispensaries/centres are limited to prescription by the
veterinarians, the cost of medicines etc. have to be borne by the farmers themselves. An
estimated 85 per cent of the annual non-plan state budgets are spent on salaries and other
establishment cost, leaving little for drugs and vaccines. Therefore, despite the provision of
service free of cost or at nominal price at the centre, the farmers spend substantial amounts of
money for availing the service. Besides the cost of medicines and the transportation cost, the
government veterinarians also charge their fees when they attend the cases at the farmers’ door
step.
2.5.4. Weak Extension Services:
The public extension services have played a major role in technology and knowledge transfer
in the crop sector, but in the livestock sector extension service delivery has been very weak. The
extension activities related to the livestock sector are by and large entrusted to the State Animal
Husbandry Departments. The AHDs do not have the resources and expertise to conceive and
operate technology transfer packages.
The institutional arrangement in the AHDs are mainly run by veterinarians who operate from
veterinary dispensaries to treat animals rather than approaching farmers to educate and inform
them about feed, fodder and animal health. Thus, the delivery of breeding and health services
gradually came to be taken to be the sole extension support to the livestock sector and the
evolution of a comprehensive nationwide extension service in the livestock sector has not been
attempted.
There are, however, attempts by cooperatives, non-governmental/voluntary organizations,
institutions under the National Agricultural Research System like the animal science institutes
of the Indian Council for Agricultural Research, State Agricultural Universities, Krishi Vigyan
Kendras (KVKs) etc. to provide some measure of extension support to livestock producers. But
the coverage of, and access to, these agencies is limited, both in area and content and these do
12234
2714025867
0
5000
10000
15000
20000
25000
30000
Veterinary
Hospitals/Poly clinics
Veterinary
Dispensaries
Veterinary Aid Centre
(Stockmen
Centres/Mobile
Dispensaries
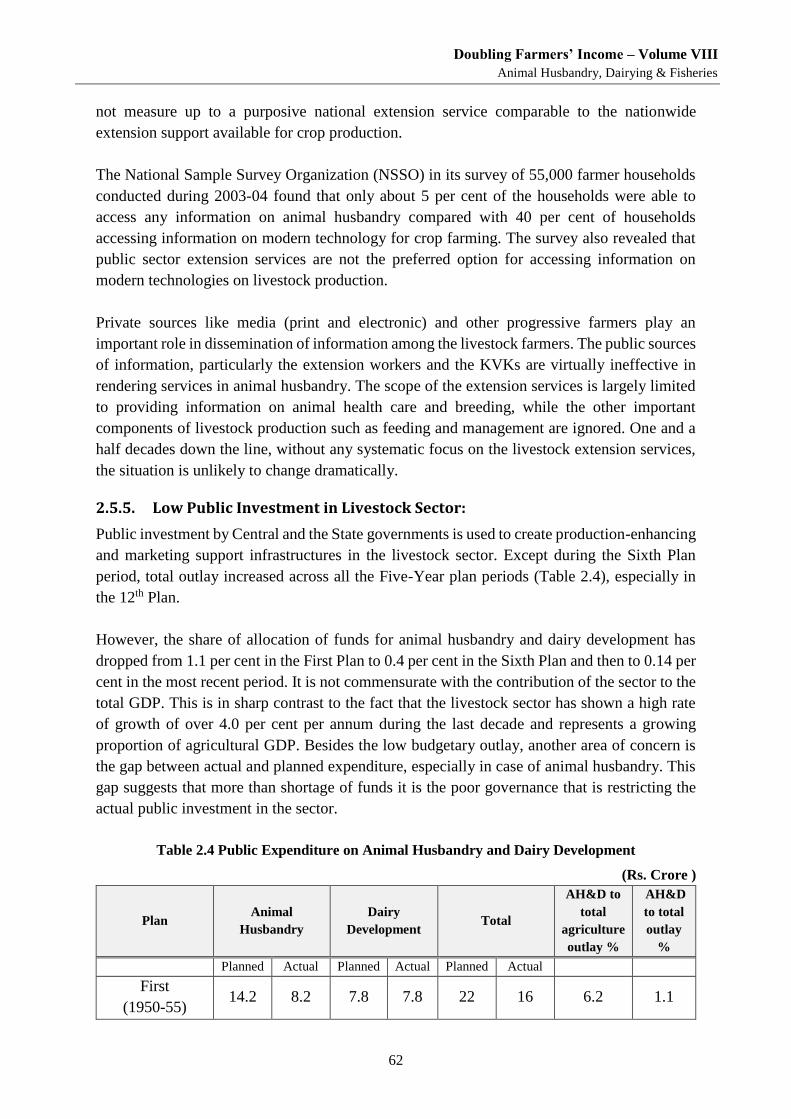
Doubling Farmers’ Income – Volume VIII
Animal Husbandry, Dairying & Fisheries
62
not measure up to a purposive national extension service comparable to the nationwide
extension support available for crop production.
The National Sample Survey Organization (NSSO) in its survey of 55,000 farmer households
conducted during 2003-04 found that only about 5 per cent of the households were able to
access any information on animal husbandry compared with 40 per cent of households
accessing information on modern technology for crop farming. The survey also revealed that
public sector extension services are not the preferred option for accessing information on
modern technologies on livestock production.
Private sources like media (print and electronic) and other progressive farmers play an
important role in dissemination of information among the livestock farmers. The public sources
of information, particularly the extension workers and the KVKs are virtually ineffective in
rendering services in animal husbandry. The scope of the extension services is largely limited
to providing information on animal health care and breeding, while the other important
components of livestock production such as feeding and management are ignored. One and a
half decades down the line, without any systematic focus on the livestock extension services,
the situation is unlikely to change dramatically.
2.5.5. Low Public Investment in Livestock Sector:
Public investment by Central and the State governments is used to create production-enhancing
and marketing support infrastructures in the livestock sector. Except during the Sixth Plan
period, total outlay increased across all the Five-Year plan periods (Table 2.4), especially in
the 12th Plan.
However, the share of allocation of funds for animal husbandry and dairy development has
dropped from 1.1 per cent in the First Plan to 0.4 per cent in the Sixth Plan and then to 0.14 per
cent in the most recent period. It is not commensurate with the contribution of the sector to the
total GDP. This is in sharp contrast to the fact that the livestock sector has shown a high rate
of growth of over 4.0 per cent per annum during the last decade and represents a growing
proportion of agricultural GDP. Besides the low budgetary outlay, another area of concern is
the gap between actual and planned expenditure, especially in case of animal husbandry. This
gap suggests that more than shortage of funds it is the poor governance that is restricting the
actual public investment in the sector.
Table 2.4 Public Expenditure on Animal Husbandry and Dairy Development
(Rs. Crore )
Plan Animal
Husbandry
Dairy
Development Total
AH&D to
total
agriculture
outlay %
AH&D
to total
outlay
%
Planned Actual Planned Actual Planned Actual
First
(1950-55) 14.2 8.2 7.8 7.8 22 16 6.2 1.1
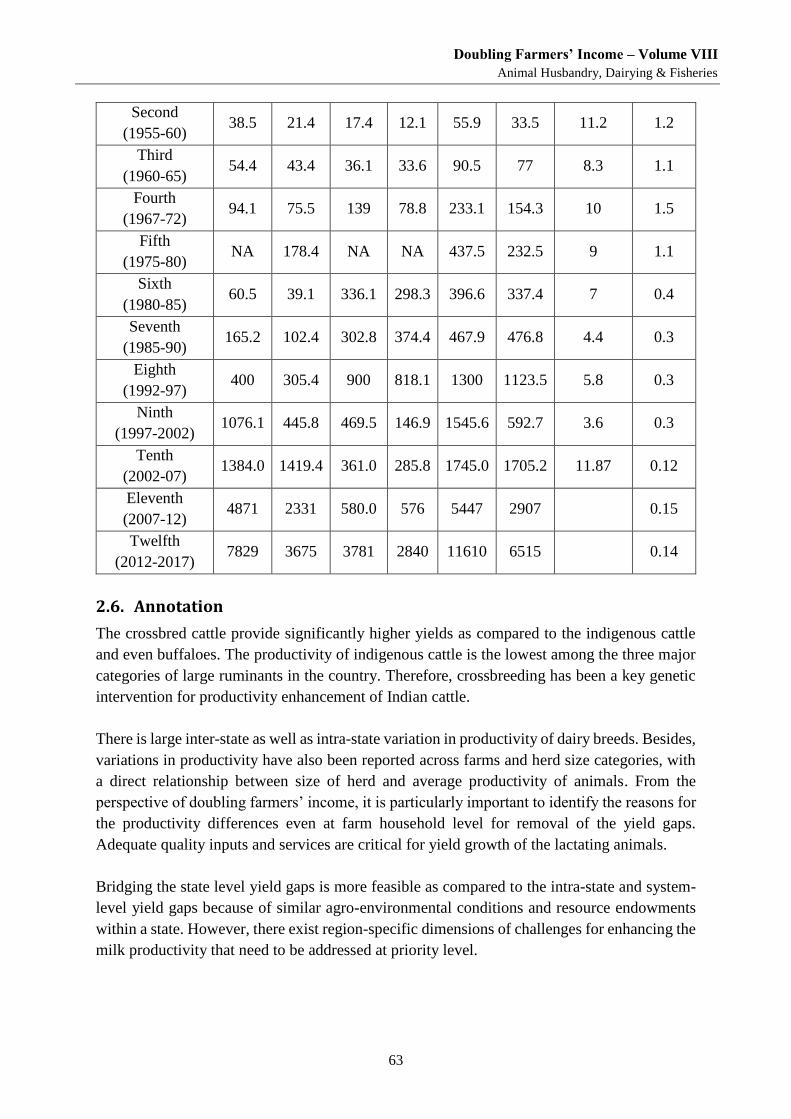
Doubling Farmers’ Income – Volume VIII
Animal Husbandry, Dairying & Fisheries
63
Second
(1955-60) 38.5 21.4 17.4 12.1 55.9 33.5 11.2 1.2
Third
(1960-65) 54.4 43.4 36.1 33.6 90.5 77 8.3 1.1
Fourth
(1967-72) 94.1 75.5 139 78.8 233.1 154.3 10 1.5
Fifth
(1975-80) NA 178.4 NA NA 437.5 232.5 9 1.1
Sixth
(1980-85) 60.5 39.1 336.1 298.3 396.6 337.4 7 0.4
Seventh
(1985-90) 165.2 102.4 302.8 374.4 467.9 476.8 4.4 0.3
Eighth
(1992-97) 400 305.4 900 818.1 1300 1123.5 5.8 0.3
Ninth
(1997-2002) 1076.1 445.8 469.5 146.9 1545.6 592.7 3.6 0.3
Tenth
(2002-07) 1384.0 1419.4 361.0 285.8 1745.0 1705.2 11.87 0.12
Eleventh
(2007-12) 4871 2331 580.0 576 5447 2907 0.15
Twelfth
(2012-2017) 7829 3675 3781 2840 11610 6515 0.14
2.6. Annotation
The crossbred cattle provide significantly higher yields as compared to the indigenous cattle
and even buffaloes. The productivity of indigenous cattle is the lowest among the three major
categories of large ruminants in the country. Therefore, crossbreeding has been a key genetic
intervention for productivity enhancement of Indian cattle.
There is large inter-state as well as intra-state variation in productivity of dairy breeds. Besides,
variations in productivity have also been reported across farms and herd size categories, with
a direct relationship between size of herd and average productivity of animals. From the
perspective of doubling farmers’ income, it is particularly important to identify the reasons for
the productivity differences even at farm household level for removal of the yield gaps.
Adequate quality inputs and services are critical for yield growth of the lactating animals.
Bridging the state level yield gaps is more feasible as compared to the intra-state and system-
level yield gaps because of similar agro-environmental conditions and resource endowments
within a state. However, there exist region-specific dimensions of challenges for enhancing the
milk productivity that need to be addressed at priority level.
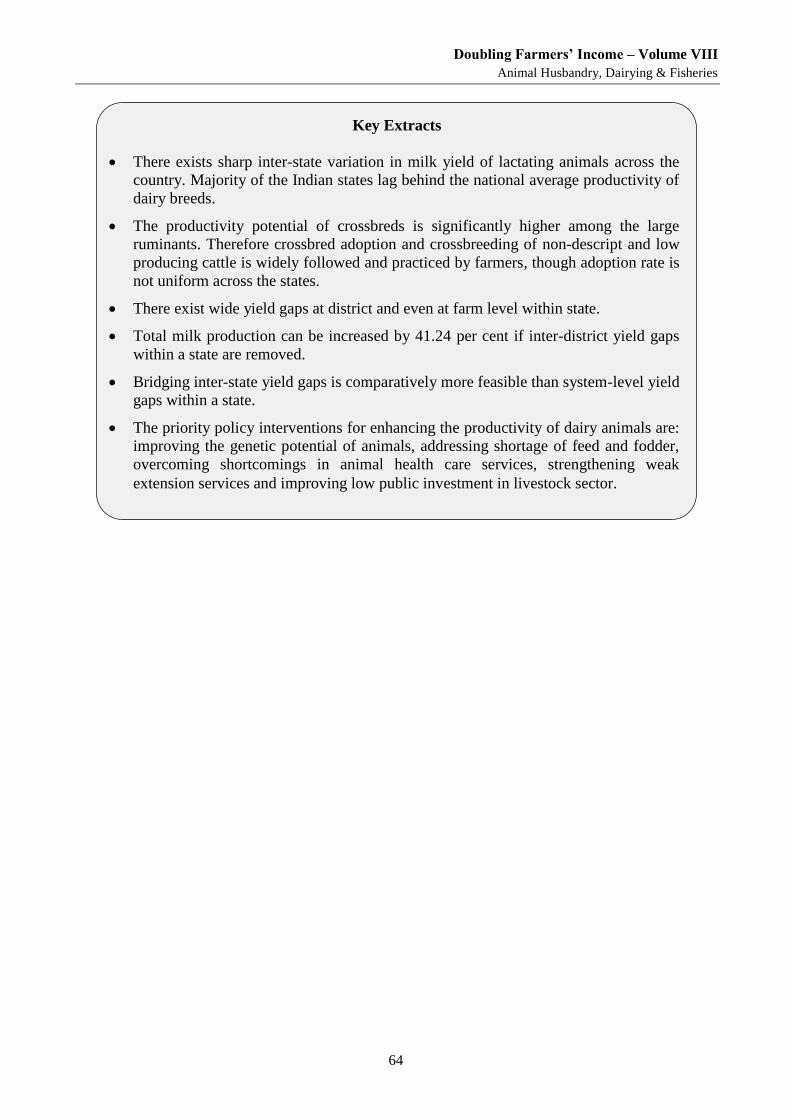
Doubling Farmers’ Income – Volume VIII
Animal Husbandry, Dairying & Fisheries
64
Key Extracts
There exists sharp inter-state variation in milk yield of lactating animals across the
country. Majority of the Indian states lag behind the national average productivity of
dairy breeds.
The productivity potential of crossbreds is significantly higher among the large
ruminants. Therefore crossbred adoption and crossbreeding of non-descript and low
producing cattle is widely followed and practiced by farmers, though adoption rate is
not uniform across the states.
There exist wide yield gaps at district and even at farm level within state.
Total milk production can be increased by 41.24 per cent if inter-district yield gaps
within a state are removed.
Bridging inter-state yield gaps is comparatively more feasible than system-level yield
gaps within a state.
The priority policy interventions for enhancing the productivity of dairy animals are:
improving the genetic potential of animals, addressing shortage of feed and fodder,
overcoming shortcomings in animal health care services, strengthening weak
extension services and improving low public investment in livestock sector.
Doubling Farmers’ Income – Volume VIII
Animal Husbandry, Dairying & Fisheries
65
Chapter 3
Economics of Milk Production in India: A Review The cost estimates of agri-based enterprises in agrarian economy of India are vital for improving the
resource use efficiency of the farm inputs and ensuring remunerative prices to the farmers. Although
dairy continues to be largely subsistence activity incidental to crop production but gradually a subtle
trend towards commercialization of dairy enterprise is setting-in which would be reinforced in the times
to come. The economics of milk production varies widely across the country depending on the type of
production system, breed and market arrangements for sale of milk.
Dairying has traditionally been based on socio-economic and religious considerations in the
country, being undertaken by the farmers as incidental to crop production, not as a commercial
enterprise per se. Despite of largely subsistence nature of the activity, the rearing of dairy
animals has cushioned the rural households from instability in crop production, serving as an
important source of supplementary income for the farm families.
In past four decades, conditioned by the factors such as increase in the productivity of dairy
animals, rapidly rising demand for milk in the urban areas and, greater monetary needs of rural
households to fulfil their growing demand for non-agricultural commodities, improvement in
milk procurement, road infrastructure, etc. there has been buoyancy in the marketed surplus of
milk from the rural areas.
Another change that is gradually taking place is the increase shift from the maintenance of
dairy animals on home grown feed inputs and public goods to purchased feed inputs, due to
the decreasing size of land holding and shrinking common property resource base. The setting-
in of a trend towards commercialisation of dairy enterprise, which would be reinforced in the
times to come, has made today’s dairy farmer vigilant about the economics of milk production,
unlike his predecessor who was not very cautious about the net returns from dairying as several
cost components did not involve out-of-pocket expenses for him.
Several studies have been carried out in various parts of the country on estimation of economics
of milk production. Although, it is well understood that the economics of milk production is
bound to be different with the variations in agro-climatic conditions and would also exhibit
variation from season to season for different species of animals and within each species for
different breeds of animals, yet, the studies do not follow a standardized methodology for cost
estimation, thus, spatial and temporal comparisons of returns from dairying become very
difficult. Nevertheless, a review of some studies, undertaken in past one decade or so, is given
in this Chapter to highlight some important points on economic aspects of milk production in
the country.
3.1. Cost and Returns in Milk Production: Regional Estimates
This section that presents the results of the work carried out by various researchers at different
points of time using methodologies that may not be uniform across studies (Fig. 3.1).
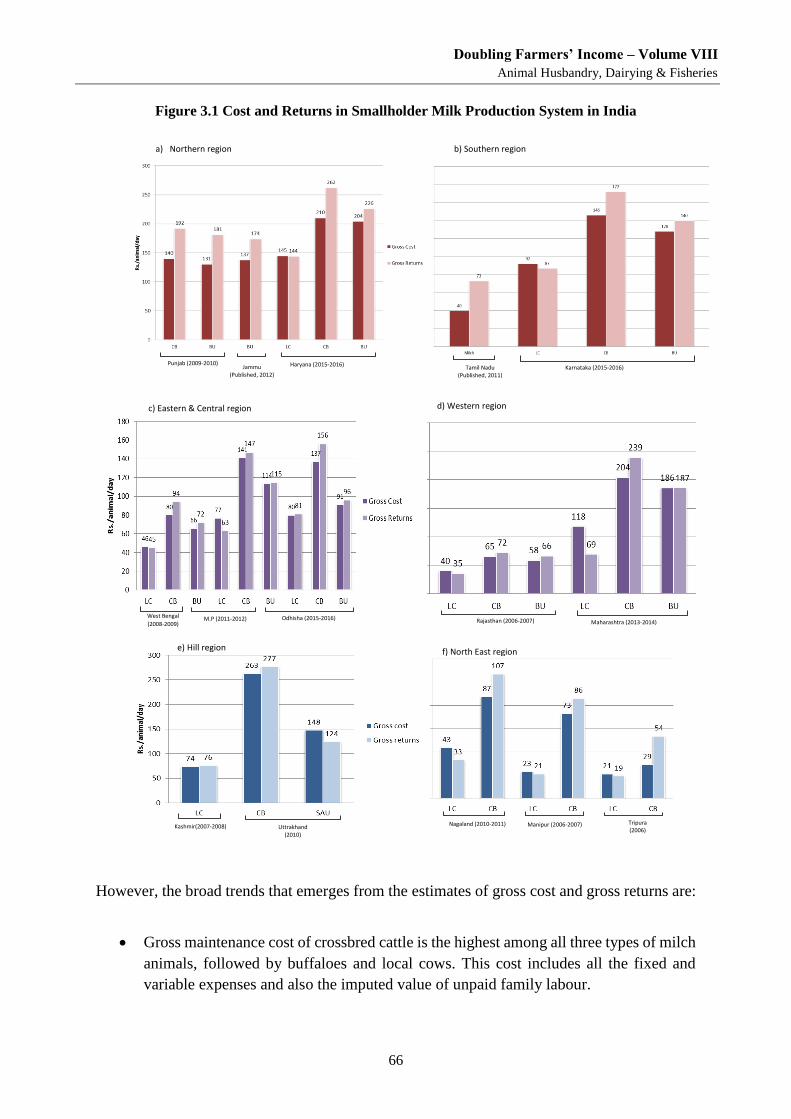
Doubling Farmers’ Income – Volume VIII
Animal Husbandry, Dairying & Fisheries
66
Figure 3.1 Cost and Returns in Smallholder Milk Production System in India
However, the broad trends that emerges from the estimates of gross cost and gross returns are:
Gross maintenance cost of crossbred cattle is the highest among all three types of milch
animals, followed by buffaloes and local cows. This cost includes all the fixed and
variable expenses and also the imputed value of unpaid family labour.
West Bengal
(2008-2009) M.P (2011-2012) Odhisha (2015-2016)
c) Eastern & Central region d) Western region
Rajasthan (2006-2007) Maharashtra (2013-2014)
Punjab (2009-2010) Jammu
(Published, 2012)
pp
Haryana (2015-2016)
a) Northern region
Karnataka (2015-2016)
b) Southern region
Tamil Nadu (Published, 2011)
Kashmir(2007-2008) Uttrakhand (2010)
e) Hill region f) North East region
Nagaland (2010-2011) Manipur (2006-2007) Tripura (2006)
Doubling Farmers’ Income – Volume VIII
Animal Husbandry, Dairying & Fisheries
67
In general, the variable cost accounted for about 80 per cent of the total maintenance
cost and the expenditure on feed and fodder has been the dominant component of the
variable cost.
Gross returns are higher than gross cost in most cases indicating that dairying is a
profitable enterprise in most parts of the country.
Among the two types of native milch animals, viz. buffaloes and local cows, the former
are economically viable in northern, western and parts of southern India.
Local cows are sent for grazing in agriculturally less-developed regions like the north
east, hill region and tribal region of central India and hence their maintenance cost is
lower.
Higher yielding animals are mostly stall fed on home grown feed and fodder. But due
to decreasing size of land holding reliance on purchased feed inputs is increasing.
In case of local cows, despite their lower maintenance cost than buffaloes and
crossbreds, the net returns (difference between gross returns and gross cost) from milk
production in case of local/ non-descript cows are either marginal or even negative in
several areas.
3.2. Economic Viability of Dairy Farming in Different Production Environments2
A comprehensive study on cost of milk production sponsored by the DAHD&F was carried
out simultaneously in nine geographical areas covering three types of dairy production
environments that were characterized on the basis of milk yield, cropped area under fodder,
milk production density and infrastructure status. In this study, methodology for working out
the economics of milk production was standardised in consonance with international norms but
adapted for dairy production system in India.
Dynamic Production Environment is defined as commercially oriented, well-endowed
resource locations for feed and fodder with milch animals of good yield potential. The herd
primarily comprises either buffaloes, buffaloes + crossbreds or only crossbreds. The study
regions were Belt 1–Northern Plains (Moga & Bulandshahr), Belt 2–Gujarat (Anand &
Mehsana), Belt 3–Tamil Nadu (Coimbatore & Trichy).
The gross cost of maintenance of crossbred cows is highest in Northern Plains (Table 3.1),
largely on account of high capital costs. The price of animal is higher in the region as compared
to the other two belts and hence, the capital costs are high. Cost of milk production is more or
less same in Northern India and Gujarat (about Rs 28/litre) and much lower in Tamil Nadu due
to higher yield of the crossbred cows. The cow milk is fetching much better prices in Gujarat
than the other two regions. In Tamil Nadu, despite lower prices, the entrepreneur’s profit
worked out to be Rs 33.50 per animal per day (Rs 1.34/litre), while in Gujarat, the gross returns
2 This section is based on the Sirohi et al. (2015)
Doubling Farmers’ Income – Volume VIII
Animal Husbandry, Dairying & Fisheries
68
from crossbred milk production are just sufficient to cover the operating and capital costs (Rs.
170.40/day), but not the opportunity cost of production (Rs.16.17/day). In Northern India, the
profitability is worse, as only operating costs (Rs.112.18/day) can be covered by the farmers.
In Northern Plains and Gujarat, economic viability of buffalo milk production is not very
encouraging. In Punjab and Western Uttar Pradesh, the economics of milk production is a study
in contrast. Despite the productivity of buffaloes in two areas being similar (5-5-5-8 lit/day),
the operating cost of maintaining a buffalo is nearly twice in Bulandshahr (Rs.162/day) as
compared to Moga (Rs. 86/day). Due to higher gross cost, the cost of buffalo milk production
was nearly Rs 14/litre higher in Western Uttar Pradesh (Rs.36.8/litre) than in Punjab
(Rs.23.2/litre).
Western Uttar Pradesh is largely an unorganised milk market dominated by the vendors and
middlemen. While they charge the consumers Rs 40/litre for buffalo milk, they pay just Rs 24
per litre to the farmer (60 per cent). In comparison, the cooperative and private sector
organisations in Moga provide strong competition to vendors and middlemen and price paid to
farmers is much higher. The net economic margin was Rs 3.50/litre in Moga as against a loss
incurred by farmers in Bulandshahr. Despite cost of milk production being higher (Rs
39.70/litre) in Gujarat region than in Northern region, farmers got a much better price from the
cooperatives and so were able to earn small net economic margin.
Table 3.1 Annual cost and returns from milk production in dynamic production environment.
Particulars
Belt 1: Northern
Plains
Belt 2: Gujarat Belt 3:
Tamil Nadu
Crossbred
cows
Buffaloes Crossbred
cows
Buffaloes Crossbred
cows Gross cost (Rs/day) 189.51 205.48 176.57 149.23 171.95
Gross returns (Rs/day) 140.36 151.01 172.50 150.34 183.80
Cost of milk production
(Rs/litre)
28.49 33.93 28.08 39.66 18.27
Sale price of milk (Rs/litre) 19.57 23.95 27.42 39.69 19.61
Gross margin (Rs/litre) 4.56 0.95 7.70 11.63 6.18
Net margin (Rs/litre) -5.77 -6.35 2.02 5.00 3.78
Net economic margin
(Rs/litre)
-7.95 -9.82 -0.68 0.31 1.34
Note: All estimates at 2012-13 prices.
Underdeveloped Production Environment is basically the low-input and low-output
locations characterised by subsistence holdings, resource poor locations with milch animals of
low production potential and having poor infrastructural support system. There is
predominance of indigenous cattle, maintained largely on common property resources. Three
belts sampled under this were: Belt 1–Northeast (East Khasi Hill & Ri-bho), Belt 2–
Chhattisgarh (Koriya & Surguja), Belt 3–Uttarakhand hills (Almora & Nainital). In the north-
eastern belt, 30 per cent animals in the milch herd are crossbreds. In Chhattisgarh, besides local
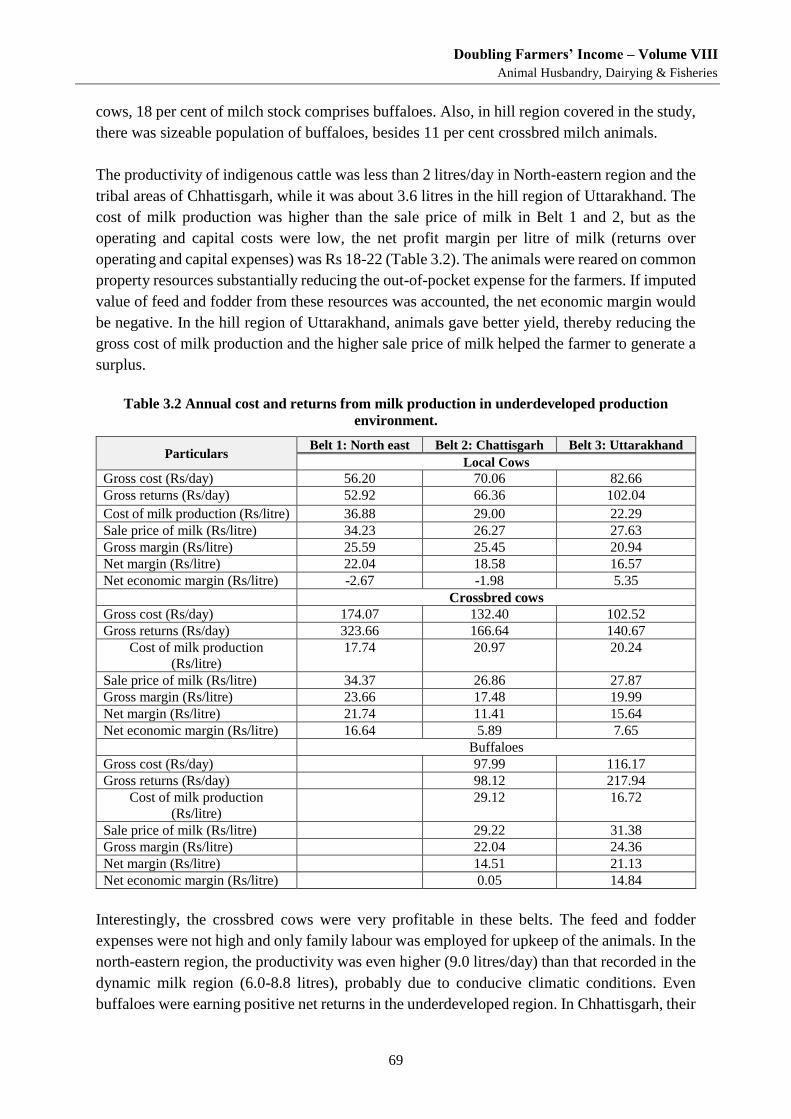
Doubling Farmers’ Income – Volume VIII
Animal Husbandry, Dairying & Fisheries
69
cows, 18 per cent of milch stock comprises buffaloes. Also, in hill region covered in the study,
there was sizeable population of buffaloes, besides 11 per cent crossbred milch animals.
The productivity of indigenous cattle was less than 2 litres/day in North-eastern region and the
tribal areas of Chhattisgarh, while it was about 3.6 litres in the hill region of Uttarakhand. The
cost of milk production was higher than the sale price of milk in Belt 1 and 2, but as the
operating and capital costs were low, the net profit margin per litre of milk (returns over
operating and capital expenses) was Rs 18-22 (Table 3.2). The animals were reared on common
property resources substantially reducing the out-of-pocket expense for the farmers. If imputed
value of feed and fodder from these resources was accounted, the net economic margin would
be negative. In the hill region of Uttarakhand, animals gave better yield, thereby reducing the
gross cost of milk production and the higher sale price of milk helped the farmer to generate a
surplus.
Table 3.2 Annual cost and returns from milk production in underdeveloped production
environment.
Particulars Belt 1: North east Belt 2: Chattisgarh Belt 3: Uttarakhand
Local Cows
Gross cost (Rs/day) 56.20 70.06 82.66
Gross returns (Rs/day) 52.92 66.36 102.04
Cost of milk production (Rs/litre) 36.88 29.00 22.29
Sale price of milk (Rs/litre) 34.23 26.27 27.63
Gross margin (Rs/litre) 25.59 25.45 20.94
Net margin (Rs/litre) 22.04 18.58 16.57
Net economic margin (Rs/litre) -2.67 -1.98 5.35
Crossbred cows
Gross cost (Rs/day) 174.07 132.40 102.52
Gross returns (Rs/day) 323.66 166.64 140.67
Cost of milk production
(Rs/litre)
17.74 20.97 20.24
Sale price of milk (Rs/litre) 34.37 26.86 27.87
Gross margin (Rs/litre) 23.66 17.48 19.99
Net margin (Rs/litre) 21.74 11.41 15.64
Net economic margin (Rs/litre) 16.64 5.89 7.65
Buffaloes
Gross cost (Rs/day) 97.99 116.17
Gross returns (Rs/day) 98.12 217.94
Cost of milk production
(Rs/litre)
29.12 16.72
Sale price of milk (Rs/litre) 29.22 31.38
Gross margin (Rs/litre) 22.04 24.36
Net margin (Rs/litre) 14.51 21.13
Net economic margin (Rs/litre) 0.05 14.84
Interestingly, the crossbred cows were very profitable in these belts. The feed and fodder
expenses were not high and only family labour was employed for upkeep of the animals. In the
north-eastern region, the productivity was even higher (9.0 litres/day) than that recorded in the
dynamic milk region (6.0-8.8 litres), probably due to conducive climatic conditions. Even
buffaloes were earning positive net returns in the underdeveloped region. In Chhattisgarh, their
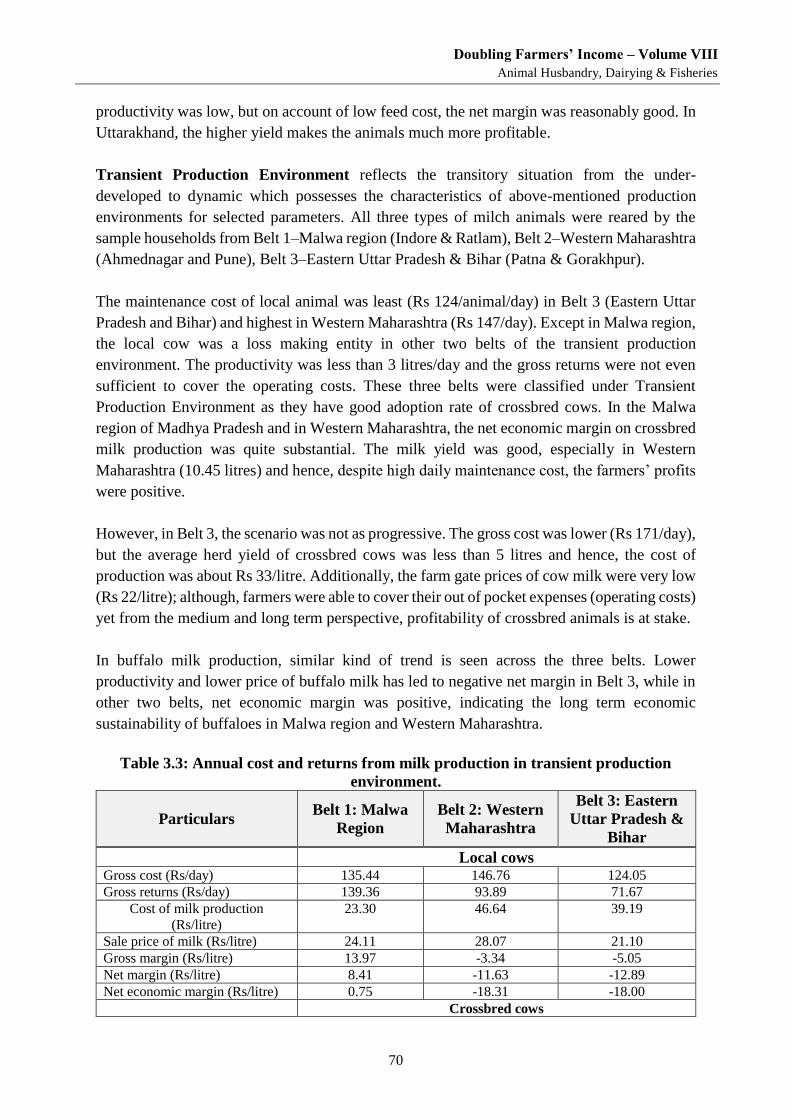
Doubling Farmers’ Income – Volume VIII
Animal Husbandry, Dairying & Fisheries
70
productivity was low, but on account of low feed cost, the net margin was reasonably good. In
Uttarakhand, the higher yield makes the animals much more profitable.
Transient Production Environment reflects the transitory situation from the under-
developed to dynamic which possesses the characteristics of above-mentioned production
environments for selected parameters. All three types of milch animals were reared by the
sample households from Belt 1–Malwa region (Indore & Ratlam), Belt 2–Western Maharashtra
(Ahmednagar and Pune), Belt 3–Eastern Uttar Pradesh & Bihar (Patna & Gorakhpur).
The maintenance cost of local animal was least (Rs 124/animal/day) in Belt 3 (Eastern Uttar
Pradesh and Bihar) and highest in Western Maharashtra (Rs 147/day). Except in Malwa region,
the local cow was a loss making entity in other two belts of the transient production
environment. The productivity was less than 3 litres/day and the gross returns were not even
sufficient to cover the operating costs. These three belts were classified under Transient
Production Environment as they have good adoption rate of crossbred cows. In the Malwa
region of Madhya Pradesh and in Western Maharashtra, the net economic margin on crossbred
milk production was quite substantial. The milk yield was good, especially in Western
Maharashtra (10.45 litres) and hence, despite high daily maintenance cost, the farmers’ profits
were positive.
However, in Belt 3, the scenario was not as progressive. The gross cost was lower (Rs 171/day),
but the average herd yield of crossbred cows was less than 5 litres and hence, the cost of
production was about Rs 33/litre. Additionally, the farm gate prices of cow milk were very low
(Rs 22/litre); although, farmers were able to cover their out of pocket expenses (operating costs)
yet from the medium and long term perspective, profitability of crossbred animals is at stake.
In buffalo milk production, similar kind of trend is seen across the three belts. Lower
productivity and lower price of buffalo milk has led to negative net margin in Belt 3, while in
other two belts, net economic margin was positive, indicating the long term economic
sustainability of buffaloes in Malwa region and Western Maharashtra.
Table 3.3: Annual cost and returns from milk production in transient production
environment.
Particulars Belt 1: Malwa
Region
Belt 2: Western
Maharashtra
Belt 3: Eastern
Uttar Pradesh &
Bihar
Local cows Gross cost (Rs/day) 135.44 146.76 124.05
Gross returns (Rs/day) 139.36 93.89 71.67
Cost of milk production
(Rs/litre)
23.30 46.64 39.19
Sale price of milk (Rs/litre) 24.11 28.07 21.10
Gross margin (Rs/litre) 13.97 -3.34 -5.05
Net margin (Rs/litre) 8.41 -11.63 -12.89
Net economic margin (Rs/litre) 0.75 -18.31 -18.00
Crossbred cows
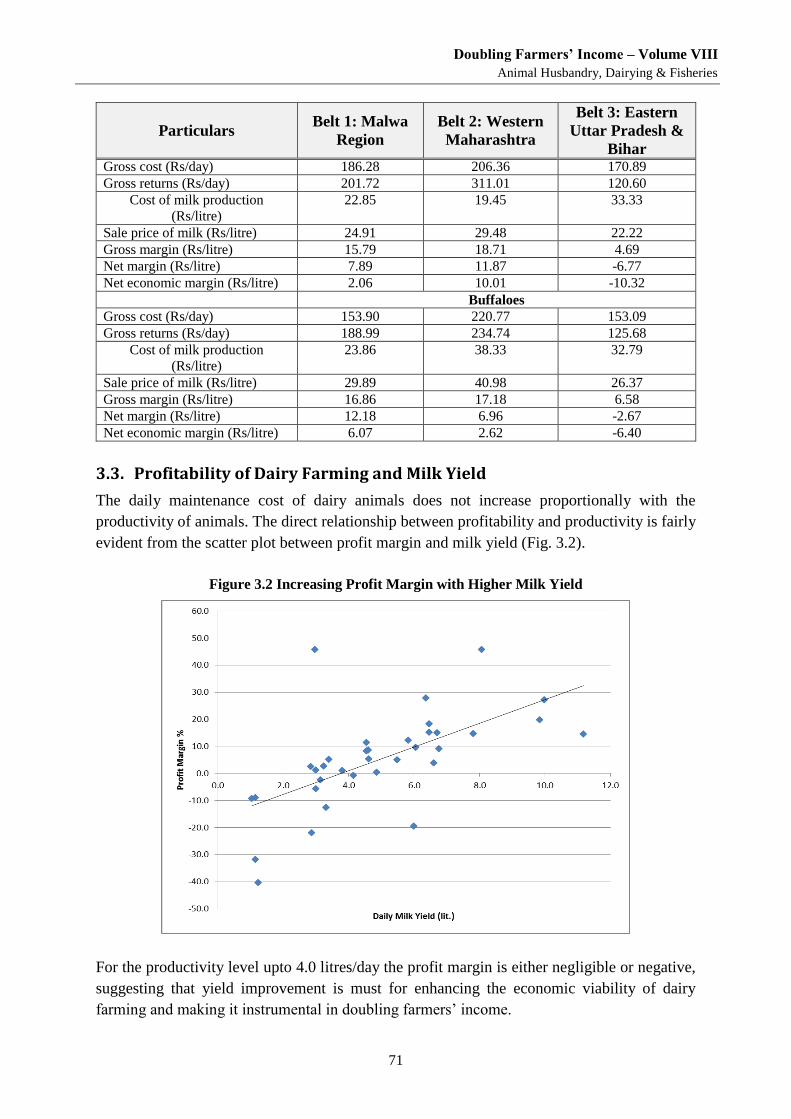
Doubling Farmers’ Income – Volume VIII
Animal Husbandry, Dairying & Fisheries
71
Particulars Belt 1: Malwa
Region
Belt 2: Western
Maharashtra
Belt 3: Eastern
Uttar Pradesh &
Bihar Gross cost (Rs/day) 186.28 206.36 170.89
Gross returns (Rs/day) 201.72 311.01 120.60
Cost of milk production
(Rs/litre)
22.85 19.45 33.33
Sale price of milk (Rs/litre) 24.91 29.48 22.22
Gross margin (Rs/litre) 15.79 18.71 4.69
Net margin (Rs/litre) 7.89 11.87 -6.77
Net economic margin (Rs/litre) 2.06 10.01 -10.32
Buffaloes
Gross cost (Rs/day) 153.90 220.77 153.09
Gross returns (Rs/day) 188.99 234.74 125.68
Cost of milk production
(Rs/litre)
23.86 38.33 32.79
Sale price of milk (Rs/litre) 29.89 40.98 26.37
Gross margin (Rs/litre) 16.86 17.18 6.58
Net margin (Rs/litre) 12.18 6.96 -2.67
Net economic margin (Rs/litre) 6.07 2.62 -6.40
3.3. Profitability of Dairy Farming and Milk Yield
The daily maintenance cost of dairy animals does not increase proportionally with the
productivity of animals. The direct relationship between profitability and productivity is fairly
evident from the scatter plot between profit margin and milk yield (Fig. 3.2).
Figure 3.2 Increasing Profit Margin with Higher Milk Yield
For the productivity level upto 4.0 litres/day the profit margin is either negligible or negative,
suggesting that yield improvement is must for enhancing the economic viability of dairy
farming and making it instrumental in doubling farmers’ income.
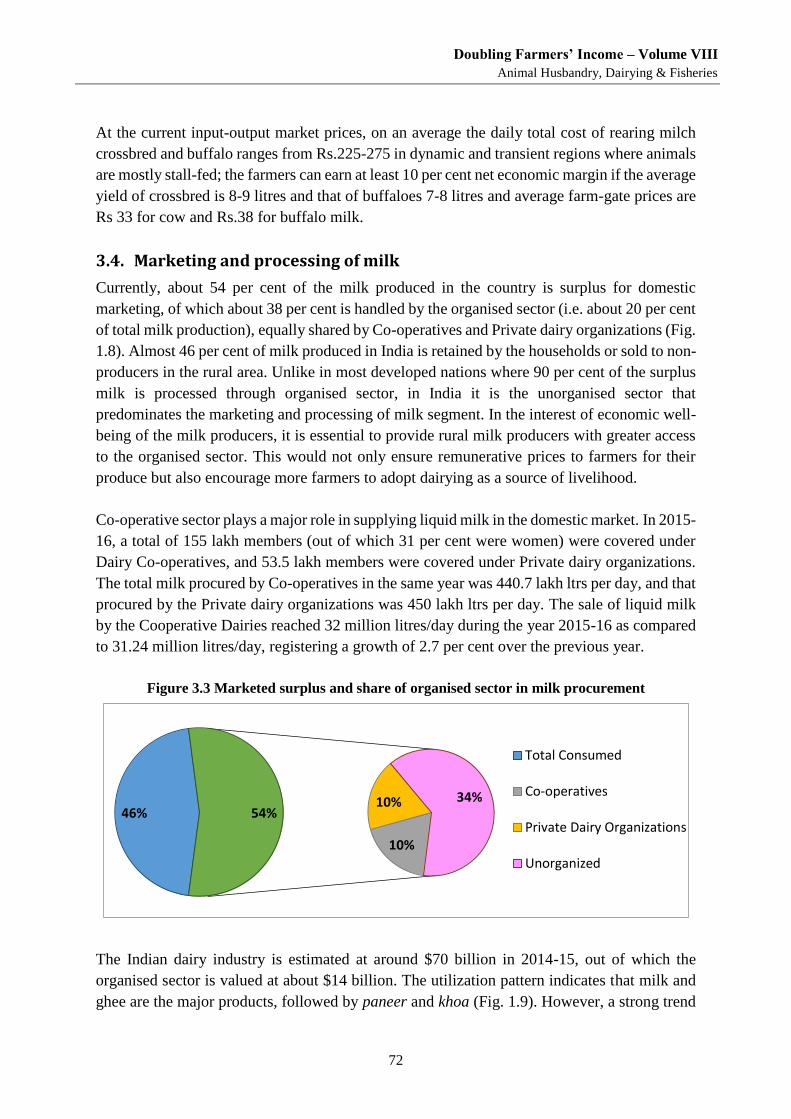
Doubling Farmers’ Income – Volume VIII
Animal Husbandry, Dairying & Fisheries
72
At the current input-output market prices, on an average the daily total cost of rearing milch
crossbred and buffalo ranges from Rs.225-275 in dynamic and transient regions where animals
are mostly stall-fed; the farmers can earn at least 10 per cent net economic margin if the average
yield of crossbred is 8-9 litres and that of buffaloes 7-8 litres and average farm-gate prices are
Rs 33 for cow and Rs.38 for buffalo milk.
3.4. Marketing and processing of milk
Currently, about 54 per cent of the milk produced in the country is surplus for domestic
marketing, of which about 38 per cent is handled by the organised sector (i.e. about 20 per cent
of total milk production), equally shared by Co-operatives and Private dairy organizations (Fig.
1.8). Almost 46 per cent of milk produced in India is retained by the households or sold to non-
producers in the rural area. Unlike in most developed nations where 90 per cent of the surplus
milk is processed through organised sector, in India it is the unorganised sector that
predominates the marketing and processing of milk segment. In the interest of economic well-
being of the milk producers, it is essential to provide rural milk producers with greater access
to the organised sector. This would not only ensure remunerative prices to farmers for their
produce but also encourage more farmers to adopt dairying as a source of livelihood.
Co-operative sector plays a major role in supplying liquid milk in the domestic market. In 2015-
16, a total of 155 lakh members (out of which 31 per cent were women) were covered under
Dairy Co-operatives, and 53.5 lakh members were covered under Private dairy organizations.
The total milk procured by Co-operatives in the same year was 440.7 lakh ltrs per day, and that
procured by the Private dairy organizations was 450 lakh ltrs per day. The sale of liquid milk
by the Cooperative Dairies reached 32 million litres/day during the year 2015-16 as compared
to 31.24 million litres/day, registering a growth of 2.7 per cent over the previous year.
Figure 3.3 Marketed surplus and share of organised sector in milk procurement
The Indian dairy industry is estimated at around $70 billion in 2014-15, out of which the
organised sector is valued at about $14 billion. The utilization pattern indicates that milk and
ghee are the major products, followed by paneer and khoa (Fig. 1.9). However, a strong trend
46%
10%
10% 34%54%
Total Consumed
Co-operatives
Private Dairy Organizations
Unorganized
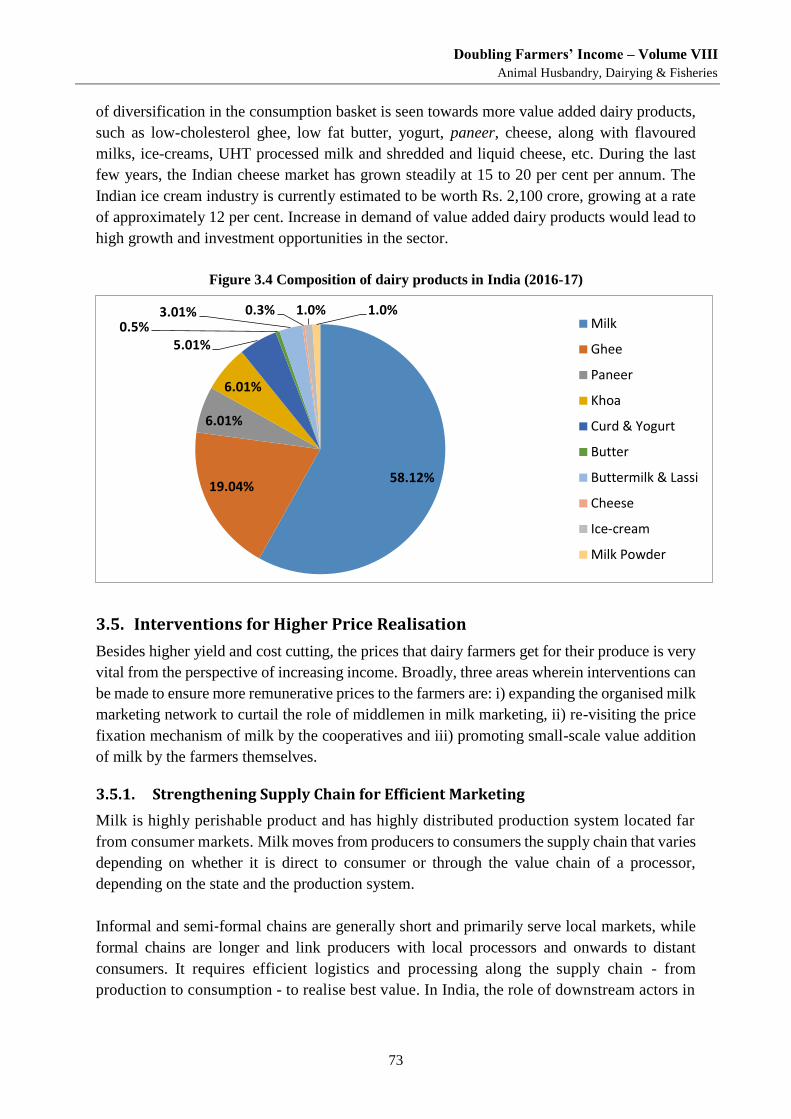
Doubling Farmers’ Income – Volume VIII
Animal Husbandry, Dairying & Fisheries
73
of diversification in the consumption basket is seen towards more value added dairy products,
such as low-cholesterol ghee, low fat butter, yogurt, paneer, cheese, along with flavoured
milks, ice-creams, UHT processed milk and shredded and liquid cheese, etc. During the last
few years, the Indian cheese market has grown steadily at 15 to 20 per cent per annum. The
Indian ice cream industry is currently estimated to be worth Rs. 2,100 crore, growing at a rate
of approximately 12 per cent. Increase in demand of value added dairy products would lead to
high growth and investment opportunities in the sector.
Figure 3.4 Composition of dairy products in India (2016-17)
3.5. Interventions for Higher Price Realisation
Besides higher yield and cost cutting, the prices that dairy farmers get for their produce is very
vital from the perspective of increasing income. Broadly, three areas wherein interventions can
be made to ensure more remunerative prices to the farmers are: i) expanding the organised milk
marketing network to curtail the role of middlemen in milk marketing, ii) re-visiting the price
fixation mechanism of milk by the cooperatives and iii) promoting small-scale value addition
of milk by the farmers themselves.
3.5.1. Strengthening Supply Chain for Efficient Marketing
Milk is highly perishable product and has highly distributed production system located far
from consumer markets. Milk moves from producers to consumers the supply chain that varies
depending on whether it is direct to consumer or through the value chain of a processor,
depending on the state and the production system.
Informal and semi‐formal chains are generally short and primarily serve local markets, while
formal chains are longer and link producers with local processors and onwards to distant
consumers. It requires efficient logistics and processing along the supply chain - from
production to consumption - to realise best value. In India, the role of downstream actors in
58.12%19.04%
6.01%
6.01%
5.01%0.5%
3.01% 0.3% 1.0% 1.0%Milk
Ghee
Paneer
Khoa
Curd & Yogurt
Butter
Buttermilk & Lassi
Cheese
Ice-cream
Milk Powder
Doubling Farmers’ Income – Volume VIII
Animal Husbandry, Dairying & Fisheries
74
the supply chain is even more critical since most milk producers are small, resource poor
and often unable to establish their own linkage with markets, processors and consumers.
Empirical evidence shows that the milk producer’s under the cooperative structure get more
than 70 per cent share in the consumers’ rupee, even without adding the additional gains they
may get from re-distribution of organizational profits, while in case of traditional supply chain
their share is 55-60 per cent, clearly emphasising the need to bring more and more dairy farmers
under the ambit of organised milk marketing network.
Dairy co-operatives have played a significant role in production, marketing and processing of
milk and dairy products, thereby contributing towards livelihood security of the millions of
milk producers in the country. Besides ensuring better realisation of price paid by consumers,
the areas in which the cooperative network is providing inputs/services to the dairy farmers
such as fodder seed, compound cattle feed, mineral mixture, artificial insemination facilities,
veterinary and health care, extension, training etc., the benefits to the farmers have been
realised in terms of better yield of dairy animals, greater employment generation among the
member households and greater technical efficiency in dairy farming. For instance, a
comparative analysis of technical efficiency of cooperative member and non-member dairy
farms in Gujarat indicated that member farmers (83.27 per cent) were more efficient than the
non-member (75.31 per cent) farmers.
Women constitute the major workforce in dairy sector in large parts of the country. The
institutional arrangements such as dairy cooperatives and SHGs have also been instrumental in
empowering women farmers. However, their performance and impact of dairy co-operatives is
not uniformly discernible across the entire length and breadth of the country, partly due to their
skewed concentration in few states from west and south of the country and partly due to host
of socio-economic-political factors.
In the recent past, some alternative models have emerged such as, contract farming, farmers’
producer companies, progressive farmers’ associations, etc. As the private sector emerged in
milk processing and marketing segment, in order to compete with already established
cooperatives, the private enterprises established physical facilities - such as, collection points,
chilling and processing plants, chain governance mechanisms, system of price fixation and
collection of milk, and provision of services to producers.
A few large private dairies, like Nestlé India in Punjab, have developed some variant of contract
farming through which they get an assured supply of milk for their processing facilities. They
also provide producers an assured market for milk, reduced price uncertainty, lower marketing
and transaction costs, and easy access to inputs, technology, credit, and other services. It
adapted many of the principles of cooperatives in its management of contract farming
arrangements.
Doubling Farmers’ Income – Volume VIII
Animal Husbandry, Dairying & Fisheries
75
In Punjab, Progressive Farmers’ Dairy Association (PDFA) has also been instrumental in
strengthening the milk value chain by disseminating information on latest technologies,
importing semen of high genetic potential cattle bulls from USA, providing better technical
and medical support to the member farmers, providing loans to the dairy farmers on low interest
rate by tie up with UCO Bank, providing better milk procurement price to the farmers through
tie-up with MILKFED Punjab. On similar lines, PDFA has also been established in Tamil
Nadu.
Milk Producer Companies has been coming up in a big way in various parts of the country.
Unlike the cooperatives, these organizations have greater business orientation and are
registered under the Companies Act. The success of Milk Producer companies from Rajasthan,
Gujarat, and Andhra Pradesh in integrating the dairy farmer with the processor’s value chain
provides useful learning lessons and replicable models in other regions.
Currently, Dairy cooperative societies along with Producer Companies cover about 1.85
villages. There are about 3.2 lakh villages which have milk production above 200 KgPD
(estimated based on the village wise In-milk population as per LC 2012 and In-milk animal
productivity as per TCD 2015). Thus, there are about 1.35 villages which have potential for
dairying and are yet to be covered by Dairy Cooperatives or Producer Companies. Therefore,
there is need to expand coverage of cooperatives to new uncovered areas so as to bring more
milk producers under the fold of organised sector, thereby providing rural milk producers with
greater access to organised milk processing sector. In states like Uttar Pradesh, Punjab,
Haryana, Madhya Pradesh, Orissa, West Bengal, Bihar, Chhattisgarh and Jharkhand where the
dairy cooperative coverage is moderate or low, a separate set of strategies need to be devised
for increasing milk procurement by dairy cooperatives.
For expanding the coverage of organised milk supply chain, effective implementation and
sustainability of organised supply chain following interventions are required:
Key elements of the Nestle model
– Development of a comprehensive extension system and continuously adding new
knowledge and technology; over 30,000 women in 550 villages have been covered by
a special program because they perform most of the dairy activities;
– Providing high quality feeds and good quality fodder seeds at reasonable prices—about
10 percent of gross cropped area in Punjab is devoted to planted fodder, to which Nestlé
contributed significantly;
– Providing breeding services free and veterinary services and drugs at cost;
– Helping farmers access bank loans and including mandatory insurance to cover risk;
– Collecting milk through commission agents and paying regularly in a transparent
manner based on quality.
Doubling Farmers’ Income – Volume VIII
Animal Husbandry, Dairying & Fisheries
76
Development of feasible business plans: Minimizing the overhead costs towards
formation and operation of producer companies and co-operatives so that greater share
of the profit reaches the producer farmers and their interest in the activity can be
sustained.
While the benefits of producer organizations are clear, there is not much clarity in terms
of choosing the most appropriate structure of the FPOs. Research efforts are required to
guide the farmers on choosing the appropriate legal entity for their producer organization.
For upscaling and replication of existing success stories of group dynamics in various
parts of the country, development of the local persons to provide the leadership roles is
necessary. The producer farmers must have greater say in the management of such
institutions and these agencies must also be galvanized to compete with the local vendors
and run their activity professionally as a profit making entity. In this direction, Small
farmers Agribusiness Consortia Platform recently launched by ICAR should collaborate
with development agencies in the private and public sector. for capacity building of small
famers.
Cooperatives need reforms to enable capital accumulation and representative governance
for improving their sustainability and profitability. Ensuring greater role of women in
various capacities is the key to efficient management of the cooperatives
The cooperatives and SHGs need to secure forward linkages to cover marketing risk
faced by the members farmers.
Encouraging formulation of FPO through
simplification of the process of
registering a FPO, capacity building of
government officials concerned with
FPOs and establishment of a State level
coordination forum of FPOs where
information about FPO productive
potential and produce should be
aggregated and leveraged with various
market players. Issues of sourcing inputs,
credit, technology and market linkages
should be addressed by the forum. The
forum should also look at solutions to HR, financing, capacity building, regulatory
compliance and related challenges.
Investment in cold chain to maintain the quality of processed milk & milk products
delivered from the dairy plant.
Consumer centric strategies and intervention will also be crucial in enhancing the
coverage of organised sector in milk marketing and thus benefiting the producers in a big
way. To improve the consumer perception on consumption of branded safe milk supplied
One of the major reasons that unorganized
sector continues to dominate the liquid milk
market is lack of awareness among consumers
regarding benefits of consuming pasteurised
packed milk.
Public at large perceive loose milk as “fresh”
as opposed to the packed milk. Majority of
liquid milk consumers remain largely ignorant
about hazards of consuming loose milk which
is prone to adulteration and contamination.
The mind-set of the consumers can be
changed through a nationwide awareness
campaign for consumers regarding health and
nutritive benefits of pasteurised milk.
Doubling Farmers’ Income – Volume VIII
Animal Husbandry, Dairying & Fisheries
77
by organised sector, there is a need to undertake brand building and sales promotion
efforts thereby enhancing share of organised sector in the market.
3.5.2. Price Fixation of Raw Milk
With rising purchasing power and increasing health consciousness among people, there exists
wide scope to drive growth of the Indian dairy market through organised sector. With
increasing demand for milk and milk products, technological advancements for product
differentiation and value added products (VAPs) will be crucial in passing on maximum share
of consumer rupee to the producers. Therefore, focus is required for tapping VAP potential of
consumer market along with liquid milk marketing.
3.5.3. Milk Pricing
Remunerative prices to the dairy farmers is the most important incentive for expansion of dairy
sector as an enterprise. At present, the procurement price of milk is determined based on fat
and SNF content of the milk. The two key issues in price fixation that are often a subject of
intense discontentment among the dairy farmers are: i) hidden losses to farmers in present two-
axis pricing policy and ii) not accounting for cost of milk production while fixing procurement
prices.
Although the unorganised sector accounts for the lions share in procuring milk from the dairy
farmers, yet the prices paid by them are not completely de-linked with the procurement prices
paid by the dairy cooperatives. The dairy farmers contend that under the prevailing 60:40 two
axis price fixation formulae of milk, the milk producers supplying pure cow or buffalo milk
get 20-30 per cent less than actually due prices, while those who sell mixed cow and buffalo
milk and/or dilute it with water are able to fetch higher prices. Digital hydro-analysis of milk
purchase transactions of MILKFED Punjab for the month of December 2017 indicated hidden
losses of Rs. 7.61/kg to the dairy plant only due to dilution of milk with water or mixing cow
and buffalo milk. Capacity building efforts among the milk procurement staff are required to
avoid such losses and pass on the benefits of loss avoidance to the dairy farmers.
Regarding linking the procurement price to the cost of milk production there are alternative
view points. Bulk line cost is the method to fix price on the basis of cost of milk production
which reckons that price should cover cost of milk production of 85 percentile farmers. The
approach is contradicted on various accounts such as cost of milk production differs
significantly among regions, seasons and breeds, non-availability of data on cost of milk
production based on standard methodologies, and complexities inherent to dairy sector like
frequent sale and purchase of animal, life time production, etc. Cost based pricing may bring
in inefficiencies as it does not encourage the farmers and researcher to reduce the cost which
goes against the overall welfare of the society in the long run. However, it is important to keep
a track of the cost of milk production to keep a close watch on the profitability of the enterprise.
Hence the suggested policy intervention in this direction is to initiate the estimation of cost and
returns from milk production as a regular scheme by the Government, wherein the estimates
are made as per the standardised methodology at least once in three years.
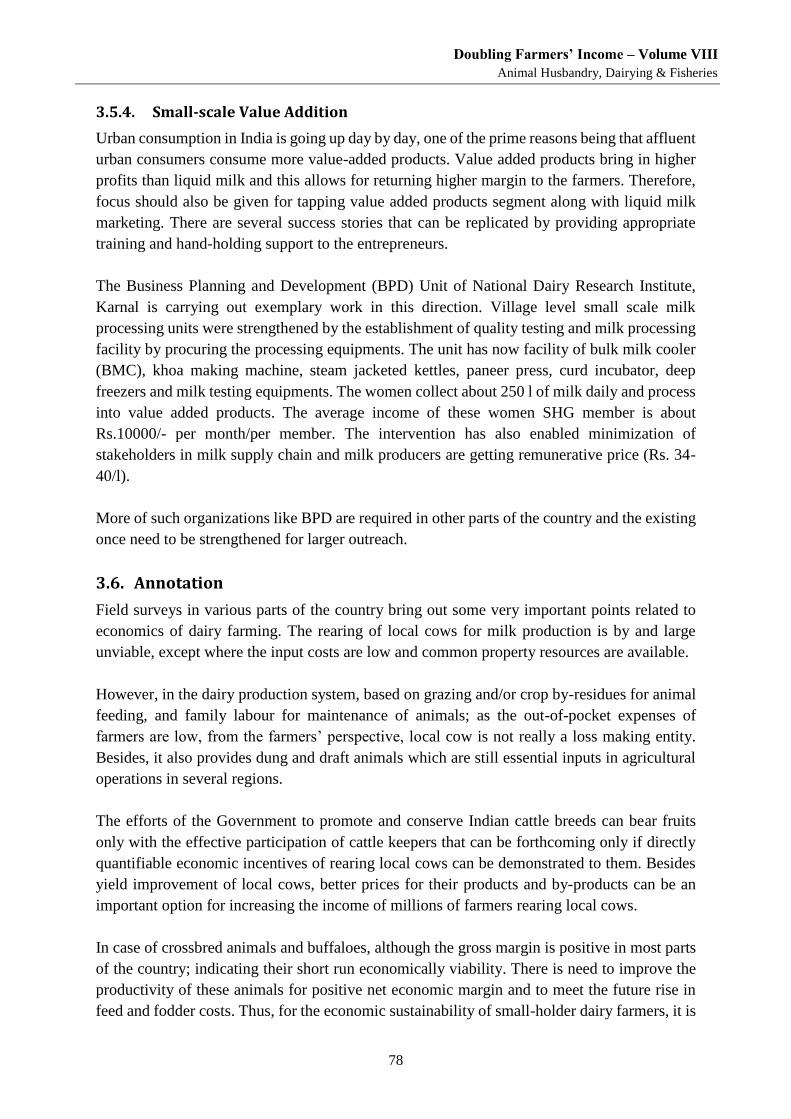
Doubling Farmers’ Income – Volume VIII
Animal Husbandry, Dairying & Fisheries
78
3.5.4. Small-scale Value Addition
Urban consumption in India is going up day by day, one of the prime reasons being that affluent
urban consumers consume more value-added products. Value added products bring in higher
profits than liquid milk and this allows for returning higher margin to the farmers. Therefore,
focus should also be given for tapping value added products segment along with liquid milk
marketing. There are several success stories that can be replicated by providing appropriate
training and hand-holding support to the entrepreneurs.
The Business Planning and Development (BPD) Unit of National Dairy Research Institute,
Karnal is carrying out exemplary work in this direction. Village level small scale milk
processing units were strengthened by the establishment of quality testing and milk processing
facility by procuring the processing equipments. The unit has now facility of bulk milk cooler
(BMC), khoa making machine, steam jacketed kettles, paneer press, curd incubator, deep
freezers and milk testing equipments. The women collect about 250 l of milk daily and process
into value added products. The average income of these women SHG member is about
Rs.10000/- per month/per member. The intervention has also enabled minimization of
stakeholders in milk supply chain and milk producers are getting remunerative price (Rs. 34-
40/l).
More of such organizations like BPD are required in other parts of the country and the existing
once need to be strengthened for larger outreach.
3.6. Annotation
Field surveys in various parts of the country bring out some very important points related to
economics of dairy farming. The rearing of local cows for milk production is by and large
unviable, except where the input costs are low and common property resources are available.
However, in the dairy production system, based on grazing and/or crop by-residues for animal
feeding, and family labour for maintenance of animals; as the out-of-pocket expenses of
farmers are low, from the farmers’ perspective, local cow is not really a loss making entity.
Besides, it also provides dung and draft animals which are still essential inputs in agricultural
operations in several regions.
The efforts of the Government to promote and conserve Indian cattle breeds can bear fruits
only with the effective participation of cattle keepers that can be forthcoming only if directly
quantifiable economic incentives of rearing local cows can be demonstrated to them. Besides
yield improvement of local cows, better prices for their products and by-products can be an
important option for increasing the income of millions of farmers rearing local cows.
In case of crossbred animals and buffaloes, although the gross margin is positive in most parts
of the country; indicating their short run economically viability. There is need to improve the
productivity of these animals for positive net economic margin and to meet the future rise in
feed and fodder costs. Thus, for the economic sustainability of small-holder dairy farmers, it is
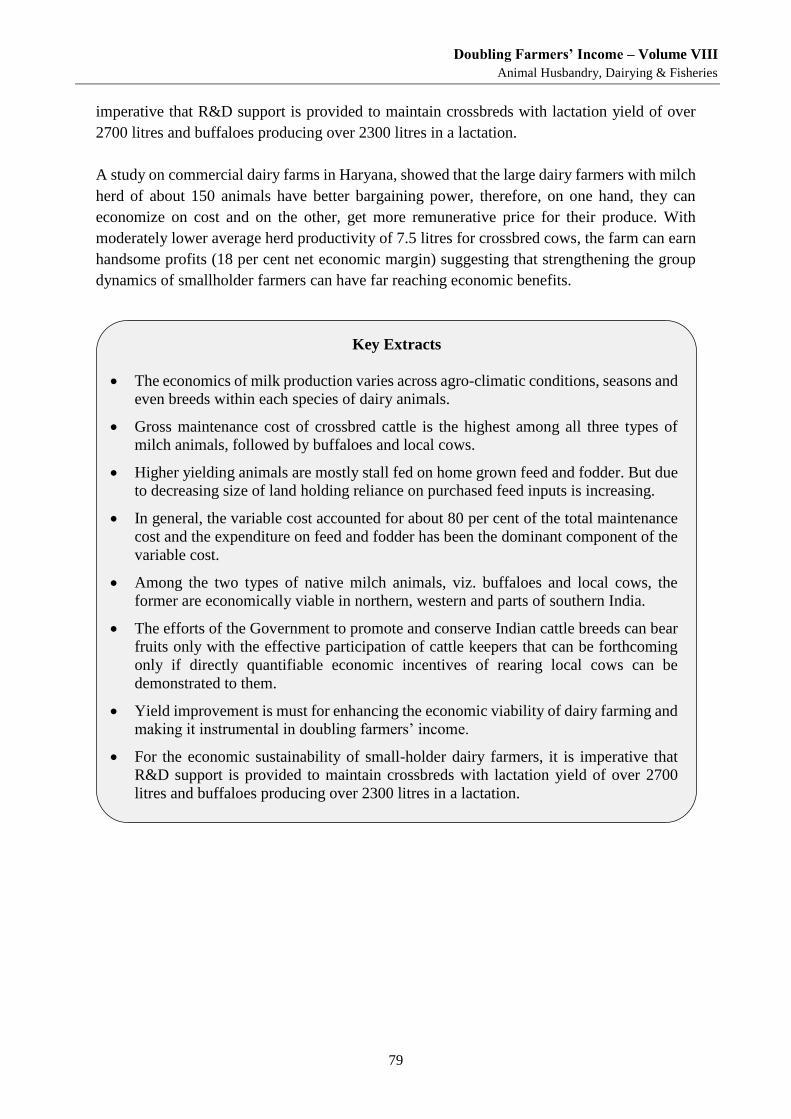
Doubling Farmers’ Income – Volume VIII
Animal Husbandry, Dairying & Fisheries
79
imperative that R&D support is provided to maintain crossbreds with lactation yield of over
2700 litres and buffaloes producing over 2300 litres in a lactation.
A study on commercial dairy farms in Haryana, showed that the large dairy farmers with milch
herd of about 150 animals have better bargaining power, therefore, on one hand, they can
economize on cost and on the other, get more remunerative price for their produce. With
moderately lower average herd productivity of 7.5 litres for crossbred cows, the farm can earn
handsome profits (18 per cent net economic margin) suggesting that strengthening the group
dynamics of smallholder farmers can have far reaching economic benefits.
Key Extracts
The economics of milk production varies across agro-climatic conditions, seasons and
even breeds within each species of dairy animals.
Gross maintenance cost of crossbred cattle is the highest among all three types of
milch animals, followed by buffaloes and local cows.
Higher yielding animals are mostly stall fed on home grown feed and fodder. But due
to decreasing size of land holding reliance on purchased feed inputs is increasing.
In general, the variable cost accounted for about 80 per cent of the total maintenance
cost and the expenditure on feed and fodder has been the dominant component of the
variable cost.
Among the two types of native milch animals, viz. buffaloes and local cows, the
former are economically viable in northern, western and parts of southern India.
The efforts of the Government to promote and conserve Indian cattle breeds can bear
fruits only with the effective participation of cattle keepers that can be forthcoming
only if directly quantifiable economic incentives of rearing local cows can be
demonstrated to them.
Yield improvement is must for enhancing the economic viability of dairy farming and
making it instrumental in doubling farmers’ income.
For the economic sustainability of small-holder dairy farmers, it is imperative that
R&D support is provided to maintain crossbreds with lactation yield of over 2700
litres and buffaloes producing over 2300 litres in a lactation.
Doubling Farmers’ Income – Volume VIII
Animal Husbandry, Dairying & Fisheries
80
Chapter 4
Maximising Income from Buffalo Rearing Of the large ruminants, cattle and buffalo constitute two important domestic animals reared for milk in
India. The country’s dairy industry has achieved major progress putting India at the top globally with
respect to milk production. However, within the country the prices of milk have been fluctuating to the
disadvantage of farmers. This needs to be addressed.
4.1. Introduction
India is host to a large population of cattle and buffaloes. As per Livestock Census, 2012, the
population of cattle stands at 190.90 million and that of buffaloes at 108.70 million.
Table 4.1 India’s livestock population (nos in million)
SN. Type Livestock Census
2012
ePashuhaat
Current
1 Cattle 190.90 188.19
2 Buffaloes 108.70 100.24
3 Goat 135.17 146.45
4 Sheep 65.07 62.11
5 Pigs 10.29 10.74
6 Camels 0.40 0.40
7 Mithun & Yaks 0.35 0.38
8 Horses & Ponies 0.63
9 Donkeys & Mules 0.52
Total 512.06
Source: Livestock Census, 2012 and 2018 estimates ePashuhaat portal
Further, the estimated world bovine stock as of April, 2018 is as in Table 4.2.
Table 4.2 Estimated bovine stock as on April, 2018
SN Country Nos. (in million)
1 India 305.00
2 Brazil 232.35
3 China 96.85
4 US 94.39
5 European Union 88.45
6 Argentina 53.76
7 Australia 25.50
8 Russia 18.38
9 Mexico 16.58
10 Turkey 14.50
11 Uruguay 11.75
Total 1001.84*
Doubling Farmers’ Income – Volume VIII
Animal Husbandry, Dairying & Fisheries
81
*Includes other countries.
Source: US Department of Agriculture
As seen from Table 4.2, India is estimated to have the highest bovine population in the world.
Cattle and buffaloes together have led the white revolution in the country, and with an output
of more than 165 million tons of milk (2017-18), India tops the ranking. While several
measures have been taken to further increase the production and productivity, the price
realization of the output will be critical in incentivizing the dairy farmers to adopt new
technologies and make necessary investments. Unfortunately, the dairy industry is going
through challenges with procurement prices of milk for farmers falling by 25-30 per cent over
the last one year (2017-18). Price support for milk procurement is emerging as one of the
important demands from the farmers from across the country. It may be difficult all the time to
provide additional price support to check market fall and a sustainable option would be to
strengthen post-production environment, which includes processing, agri-logistics and
marketing per se.
An important aspect of agriculture in the context of small and marginal farmers is, that a single
source of income is not adequate to cover all the expenses. Any strategy for enhancing the
farmers’ income needs to tap alternate sources of income, so that the cumulative income of the
farmer increases and supports his welfare.
4.2. Promoting Buffalo Meat Industry
In India, the advantage of buffalo is that it can contribute to the farmers’ income by way of
both milk and meat. Buffalo meat is in effect a by-product of the milk industry as buffaloes are
raised mainly for milk purpose. Farmers rear buffalo till they reach an unproductive age and
thereafter sell them either to traders or at the livestock market. Production of meat in India
increased from 1.9 million MT in 1988-89 to 7.4 million MT in 2016-17. In 2009-10, next to
poultry, goat accounted for the greatest share (17 per cent) of total meat production, while
buffalo's share stood at 14 per cent. However, the share of buffalo meat increased to 19 per
cent in 2016-17, while that of goat decreased to about 14 per cent. This provides some
indications in respect of the increasing demand for buffalo meat in the country. Of the agri-
exports from India, buffalo meat is one of the major items.
India's annual foreign exchange earnings from buffalo meat export went up from Rs. 3,500
crore in 2007-08 to Rs. 27, 000 crore in 2015-16. It is estimated that this sector has the potential
to reach a target of Rs. 40, 000 crore as foreign exchange earnings in the next five years. Buffalo
meat export has experienced a phenomenal growth since the year 2000, when India accounted
for about 5 per cent of the total global trade. By 2015, India emerged as the largest exporter in
the world comprising 21 per cent of the world's carabeef export.
It is estimated that as high as Rs.26,685 crore, which is 60 per cent of total value of carabeef
export in 2015-16 went to farmers as payouts. It is possible to double this by 2022-23 with
appropriate policy interventions. The importance of promoting the trade in buffalo meat
Doubling Farmers’ Income – Volume VIII
Animal Husbandry, Dairying & Fisheries
82
including exports is, that it can provide an additional income to the buffalo farmers by enabling
them to earn 30-40 per cent of the cost of their animal as terminal value once the active
lactation/reproductive age is complete. This lump-sum that the farmers may get can be used
for procuring a new dairy buffalo.
Uttar Pradesh was the highest meat producer among all the states in India, as in 2016-17. Other
major meat producing states in the country are Maharashtra, West Bengal and Andhra Pradesh.
The State of Uttar Pradesh which is India’s largest milk producer is home to more than half of
the country’s 80 numbers of standalone and integrated abattoirs approved by the Agricultural
& Processed Food Products Export Development Authority (APEDA). The State of Uttar
Pradesh accounts for two-thirds of the frozen buffalo meat exports from the country.
Interestingly, most of this meat processing infrastructure in the country has been a private
sector initiative, demonstrating the financial viability of this enterprise.
Integrating the buffalo meat supply chain linkages by eliminating the unnecessary
intermediaries will go a long way in ensuring better remuneration to the farmers. By-products
obtained during slaughter remain unutilised or underutilised causing environmental problems.
The by-products may act as raw materials for allied sectors, like hides for the leather industry,
processed offals for the pharmaceutical & pet food industries, and the inedible by-products for
the poultry feed & lubricant industries. Mainstreaming both the primary produce and meat by-
products value systems, will help farmers to capture optimal value from all of types of output.
There is need for developing and modernising municipal abattoirs and retail outlets for
slaughter and sale of buffalo meat. The Ministry of Food Processing Industries (MOFPI) has
launched a scheme for 'Setting up of new/modernisation of existing Abattoirs' with a view to
ensure scientific and hygienic slaughtering of the animals and supply of quality meat and meat
products. However, the scheme has not been successful throughout the country, especially in
regions with lower throughput which does not justify large investment in modernising the
slaughter houses. For such regions, low-cost model of modern slaughter houses can be adopted.
In states like Uttar Pradesh, meat retail outlets - which were earlier needed to get operating
license from the local municipal authority - are now required to obtain the same from FSDA
as per the FSSAI standards. As such, there has been significant increase in the hygienic and
food safety standards in the buffalo meat retail outlets in such states. There is need for further
intensification and sustaining of implementation of these standards.
There exist disparities in various livestock markets and also the slaughtering fees charged at
abattoirs in various states. In spite of collection of fees for transactions at livestock market by
the local bodies or agricultural marketing committees, these fees are not channelled to develop
infrastructure and improve facilities at these markets. Keeping in view the immense benefit of
such markets, basic amenities for trouble-free marketing should be provided to livestock traders
and farmers. There is need for developing livestock markets on modern lines, with areas for
loading & unloading of animal, space for tying and resting of animals, proper washing &
weighing facilities. It has also been found that in some markets the mandate of compulsory
Doubling Farmers’ Income – Volume VIII
Animal Husbandry, Dairying & Fisheries
83
checking of animals for their healthiness, before they are sold, is not followed diligently. There
is also need for a market intelligence system where the farmer gets to know the fair price
prevalent in various markets.
4.3. Supporting Export of Buffalo Meat
Indian buffalo meat is currently exported to about 70 countries. By region, India exports the
highest share of carabeef to Asia, followed by Middle-east and Africa. As in 2015, Vietnam
was the biggest importer of carabeef from India. Other major importers of Indian buffalo meat
were Egypt, Malaysia, Thailand and Saudi Arabia. This implies that India is yet to gain a
foothold in the domestic market of developed countries in the west, like EU & USA and also
in other countries in Asia and Africa, where buffalo-meat is in great demand. The market access
to the buffalo meat exporters can be further strengthened by suitable interventions. For
example, although India exports the highest share of carabeef to Vietnam, a major share of the
buffalo meat imported from India by Vietnam makes its way to China. Governmental efforts
in helping Indian farmers/exports to gain access to wet (fresh meat) markets in China, Iran,
Philippines and Russia will bring higher gain from export and transfer better returns to the
farmers in contrast to sales made to the processors.
Another major intervention needed is to enable easy export of good quality buffalo hide by
reducing the export duty. The state-of-the-art abattoirs are able to produce quality hide that is
freshly flayed, fleshed, salted and folded for supply to the leather industry. Since there is as
high as 60 per cent duty on export of raw salted hides produced at even APEDA-approved
abattoir, the products are not able to compete in the world market, and the producers are forced
to sell in the domestic markets. The domestic tanneries and leather product manufacturers who
benefit from this are also permitted to import raw hides and skins duty free at two-thirds of the
international price. This, while benefitting the domestic leather industry, is proving to be unfair
to the buffalo farmers. This needs to be addressed appropriately, keeping in mind the viability
of buffalo based dairy farming and the interests of the dairy farmers.
The third aspect relating to promotion of exports relates to controlling Foot and Mouth Disease
(FMD). This is the most important infectious disease of cattle and buffaloes causing an
economic loss within the range of Rs. 12,000-14,000 crore /annum in India (Singh et al., 2013).
The government has made intensive efforts over the years to control the outbreak of this disease
through production of FMD vaccine and launching extensive vaccination campaigns through
public private partnership. If these efforts are further intensified, many states in the country
(except some states in the northern, eastern and north-eastern states) can be declared free from
FMD in the next few years. Freedom from FMD in such states along with establishment of a
robust traceability system will help India gain access to markets in yet unexplored countries.
It is also pertinent that the Government revives and strengthens 'Salvaging and Rearing of Male
Buffalo Calves' Scheme which was earlier launched under the 'National Livestock Mission'.
However, there have been few takers for this scheme. The Federation of Indian Chamber of
Commerce and Industries (FICCI) based on a study carried out in 2013 has shown that only 2
Doubling Farmers’ Income – Volume VIII
Animal Husbandry, Dairying & Fisheries
84
per cent of the farmers surveyed were aware of this scheme. A large number of buffalo calves
coming into the system every year are abandoned and not properly taken care of. It is estimated
that 14 million of the male buffalo calves (below the age of 6 months) die annually due to
improper care. It is further estimated that if these numbers of buffalo calves are salvaged,
buffalo meat export may go up to 18.5 lakh metric tonnes, fetching an export value of Rs.
38,000 crore by 2022-23. The farmers can be incentivised to rear the buffaloes properly till
they attain the age of 23-24 months and are ready for sale to abattoirs. The Department of
Animal Husbandry may therefore examine to revive this scheme. The non-banking financing
corporations (NBFC'S) may also explore the feasibility of providing credit for the purpose.
NABARD may route subsidy to famers by refinancing the loan for them. This would encourage
farmers to consider raising male buffalo calves as a remunerative activity.
It can be recommended with certainty, that offer of a comprehensive policy support to buffalo
meat industry would help in strengthening dairy industry and contribute to realisation of higher
incomes by the buffalo dairy farmers.
4.4. Annotation
Buffalo rearing requires farmer’s care in managing animal health and fodder, and marketing of
the live animals, of milk as the primary produce and of buffalo meat as the terminal produce.
Various by-products such as leather, offal, extracts, etc. are also consumers an income
opportunity for the farmers. To fully support growth in the dairy sector, there is also need to
strengthen the linked meat and by-products industries so that there is an organised market for
all aspects and output from buffalo farming.
While milk is a primary dairy product from buffaloes, it would be useful from the income
perspective to enable the farmer to capture the terminal value of the animal after its productive
life from the animal’s sale for meat purpose. This calls for an efficient marketing system of
live animals and well established buffalo meat industry.
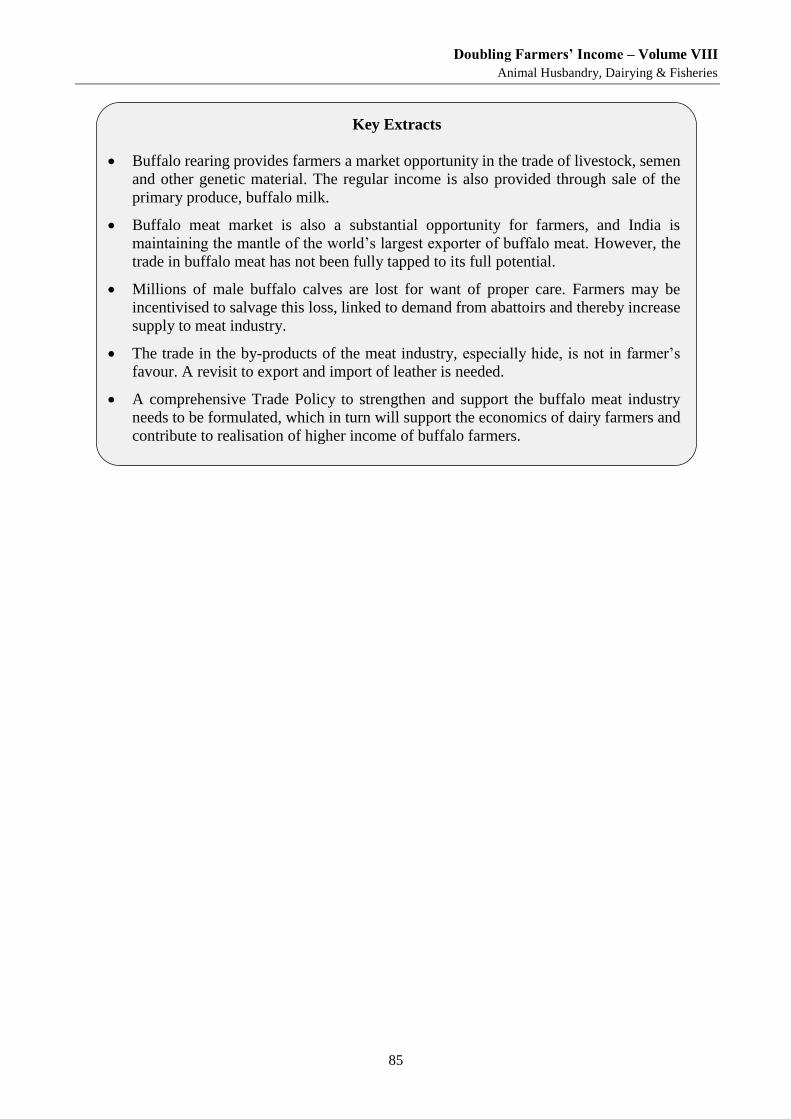
Doubling Farmers’ Income – Volume VIII
Animal Husbandry, Dairying & Fisheries
85
Key Extracts
Buffalo rearing provides farmers a market opportunity in the trade of livestock, semen
and other genetic material. The regular income is also provided through sale of the
primary produce, buffalo milk.
Buffalo meat market is also a substantial opportunity for farmers, and India is
maintaining the mantle of the world’s largest exporter of buffalo meat. However, the
trade in buffalo meat has not been fully tapped to its full potential.
Millions of male buffalo calves are lost for want of proper care. Farmers may be
incentivised to salvage this loss, linked to demand from abattoirs and thereby increase
supply to meat industry.
The trade in the by-products of the meat industry, especially hide, is not in farmer’s
favour. A revisit to export and import of leather is needed.
A comprehensive Trade Policy to strengthen and support the buffalo meat industry
needs to be formulated, which in turn will support the economics of dairy farmers and
contribute to realisation of higher income of buffalo farmers.
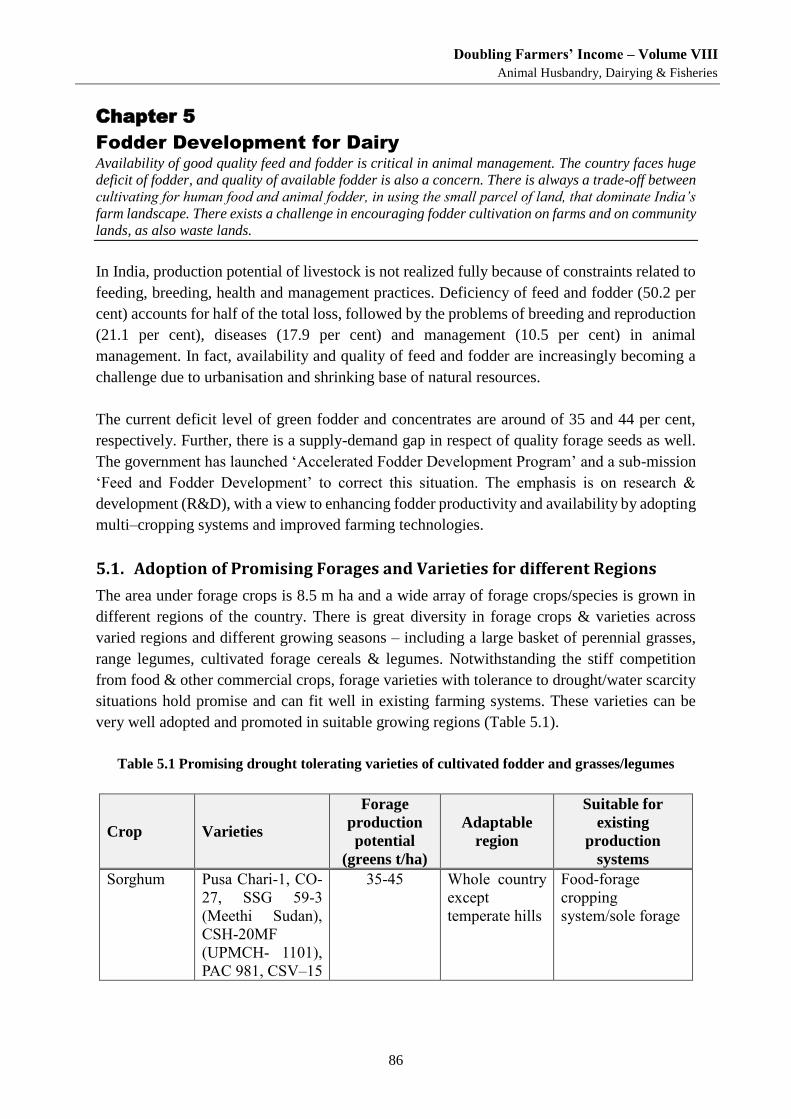
Doubling Farmers’ Income – Volume VIII
Animal Husbandry, Dairying & Fisheries
86
Chapter 5
Fodder Development for Dairy Availability of good quality feed and fodder is critical in animal management. The country faces huge
deficit of fodder, and quality of available fodder is also a concern. There is always a trade-off between
cultivating for human food and animal fodder, in using the small parcel of land, that dominate India’s
farm landscape. There exists a challenge in encouraging fodder cultivation on farms and on community
lands, as also waste lands.
In India, production potential of livestock is not realized fully because of constraints related to
feeding, breeding, health and management practices. Deficiency of feed and fodder (50.2 per
cent) accounts for half of the total loss, followed by the problems of breeding and reproduction
(21.1 per cent), diseases (17.9 per cent) and management (10.5 per cent) in animal
management. In fact, availability and quality of feed and fodder are increasingly becoming a
challenge due to urbanisation and shrinking base of natural resources.
The current deficit level of green fodder and concentrates are around of 35 and 44 per cent,
respectively. Further, there is a supply-demand gap in respect of quality forage seeds as well.
The government has launched ‘Accelerated Fodder Development Program’ and a sub-mission
‘Feed and Fodder Development’ to correct this situation. The emphasis is on research &
development (R&D), with a view to enhancing fodder productivity and availability by adopting
multi–cropping systems and improved farming technologies.
5.1. Adoption of Promising Forages and Varieties for different Regions
The area under forage crops is 8.5 m ha and a wide array of forage crops/species is grown in
different regions of the country. There is great diversity in forage crops & varieties across
varied regions and different growing seasons – including a large basket of perennial grasses,
range legumes, cultivated forage cereals & legumes. Notwithstanding the stiff competition
from food & other commercial crops, forage varieties with tolerance to drought/water scarcity
situations hold promise and can fit well in existing farming systems. These varieties can be
very well adopted and promoted in suitable growing regions (Table 5.1).
Table 5.1 Promising drought tolerating varieties of cultivated fodder and grasses/legumes
Crop Varieties
Forage
production
potential
(greens t/ha)
Adaptable
region
Suitable for
existing
production
systems
Sorghum Pusa Chari-1, CO-
27, SSG 59-3
(Meethi Sudan),
CSH-20MF
(UPMCH- 1101),
PAC 981, CSV–15
35-45 Whole country
except
temperate hills
Food-forage
cropping
system/sole forage
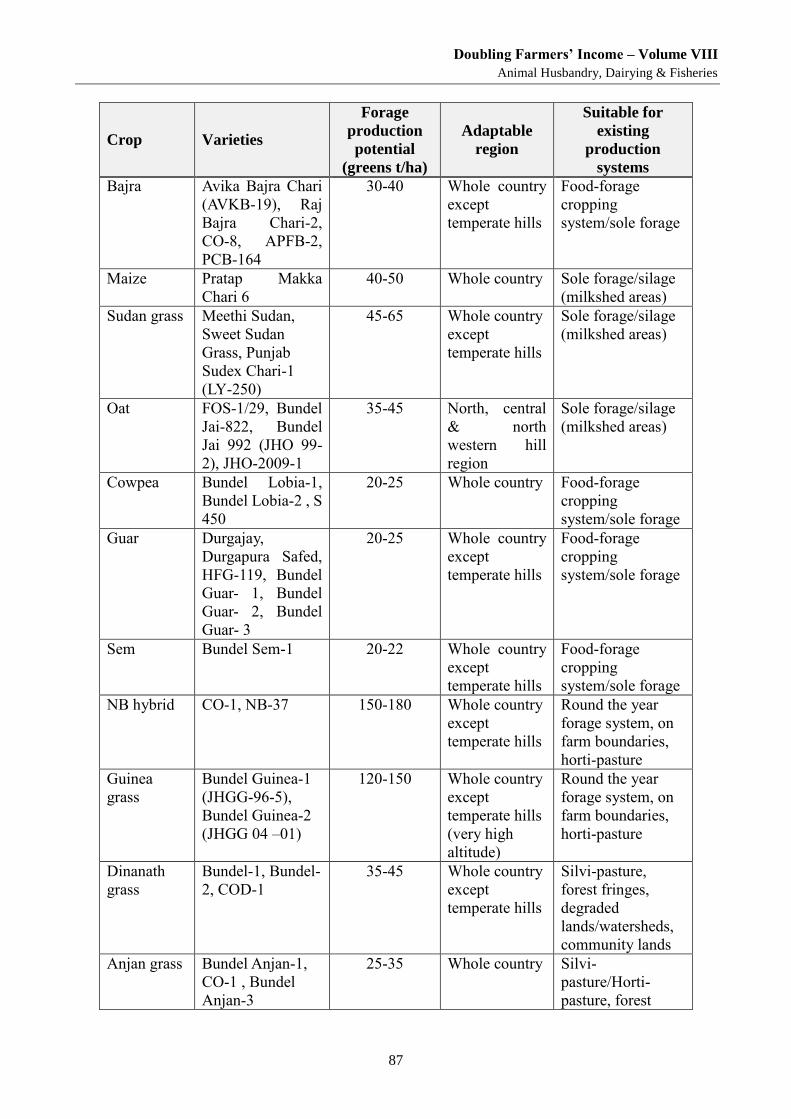
Doubling Farmers’ Income – Volume VIII
Animal Husbandry, Dairying & Fisheries
87
Crop Varieties
Forage
production
potential
(greens t/ha)
Adaptable
region
Suitable for
existing
production
systems
Bajra Avika Bajra Chari
(AVKB-19), Raj
Bajra Chari-2,
CO-8, APFB-2,
PCB-164
30-40 Whole country
except
temperate hills
Food-forage
cropping
system/sole forage
Maize Pratap Makka
Chari 6
40-50 Whole country Sole forage/silage
(milkshed areas)
Sudan grass Meethi Sudan,
Sweet Sudan
Grass, Punjab
Sudex Chari-1
(LY-250)
45-65 Whole country
except
temperate hills
Sole forage/silage
(milkshed areas)
Oat FOS-1/29, Bundel
Jai-822, Bundel
Jai 992 (JHO 99-
2), JHO-2009-1
35-45 North, central
& north
western hill
region
Sole forage/silage
(milkshed areas)
Cowpea Bundel Lobia-1,
Bundel Lobia-2 , S
450
20-25 Whole country Food-forage
cropping
system/sole forage
Guar Durgajay,
Durgapura Safed,
HFG-119, Bundel
Guar- 1, Bundel
Guar- 2, Bundel
Guar- 3
20-25 Whole country
except
temperate hills
Food-forage
cropping
system/sole forage
Sem Bundel Sem-1 20-22 Whole country
except
temperate hills
Food-forage
cropping
system/sole forage
NB hybrid CO-1, NB-37 150-180 Whole country
except
temperate hills
Round the year
forage system, on
farm boundaries,
horti-pasture
Guinea
grass
Bundel Guinea-1
(JHGG-96-5),
Bundel Guinea-2
(JHGG 04 –01)
120-150 Whole country
except
temperate hills
(very high
altitude)
Round the year
forage system, on
farm boundaries,
horti-pasture
Dinanath
grass
Bundel-1, Bundel-
2, COD-1
35-45 Whole country
except
temperate hills
Silvi-pasture,
forest fringes,
degraded
lands/watersheds,
community lands
Anjan grass Bundel Anjan-1,
CO-1 , Bundel
Anjan-3
25-35 Whole country Silvi-
pasture/Horti-
pasture, forest
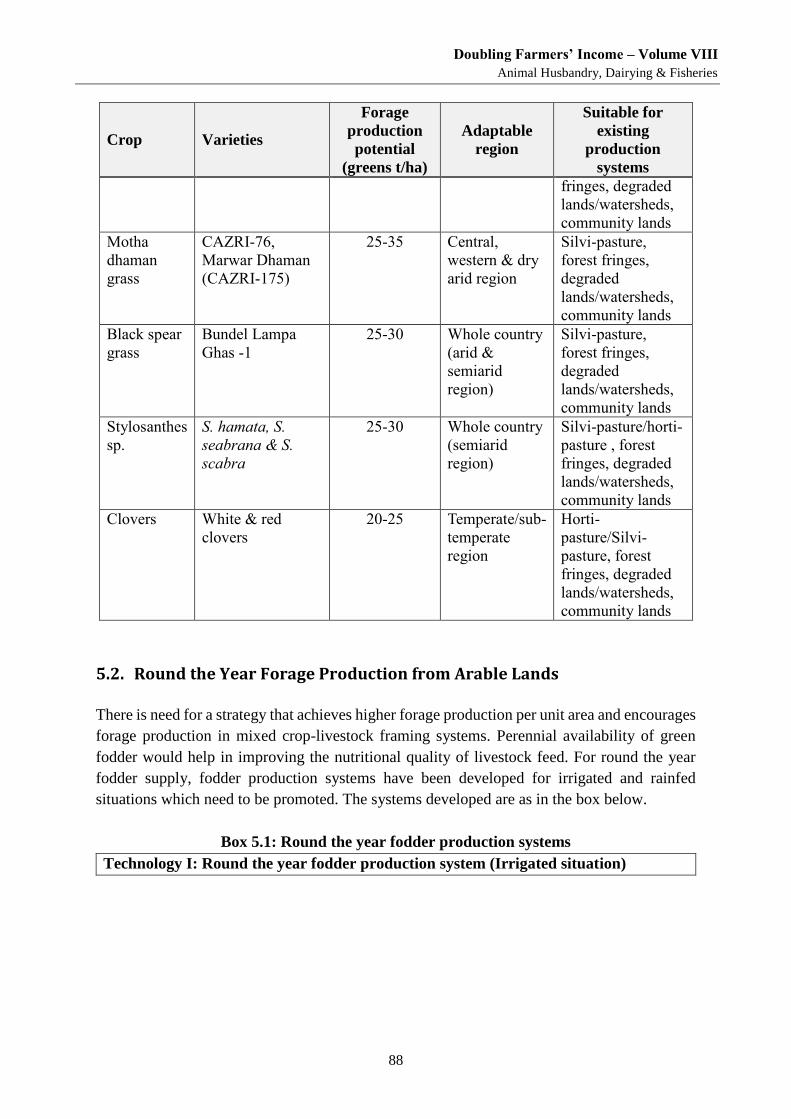
Doubling Farmers’ Income – Volume VIII
Animal Husbandry, Dairying & Fisheries
88
Crop Varieties
Forage
production
potential
(greens t/ha)
Adaptable
region
Suitable for
existing
production
systems
fringes, degraded
lands/watersheds,
community lands
Motha
dhaman
grass
CAZRI-76,
Marwar Dhaman
(CAZRI-175)
25-35 Central,
western & dry
arid region
Silvi-pasture,
forest fringes,
degraded
lands/watersheds,
community lands
Black spear
grass
Bundel Lampa
Ghas -1
25-30 Whole country
(arid &
semiarid
region)
Silvi-pasture,
forest fringes,
degraded
lands/watersheds,
community lands
Stylosanthes
sp.
S. hamata, S.
seabrana & S.
scabra
25-30 Whole country
(semiarid
region)
Silvi-pasture/horti-
pasture , forest
fringes, degraded
lands/watersheds,
community lands
Clovers White & red
clovers
20-25 Temperate/sub-
temperate
region
Horti-
pasture/Silvi-
pasture, forest
fringes, degraded
lands/watersheds,
community lands
5.2. Round the Year Forage Production from Arable Lands
There is need for a strategy that achieves higher forage production per unit area and encourages
forage production in mixed crop-livestock framing systems. Perennial availability of green
fodder would help in improving the nutritional quality of livestock feed. For round the year
fodder supply, fodder production systems have been developed for irrigated and rainfed
situations which need to be promoted. The systems developed are as in the box below.
Box 5.1: Round the year fodder production systems
Technology I: Round the year fodder production system (Irrigated situation)
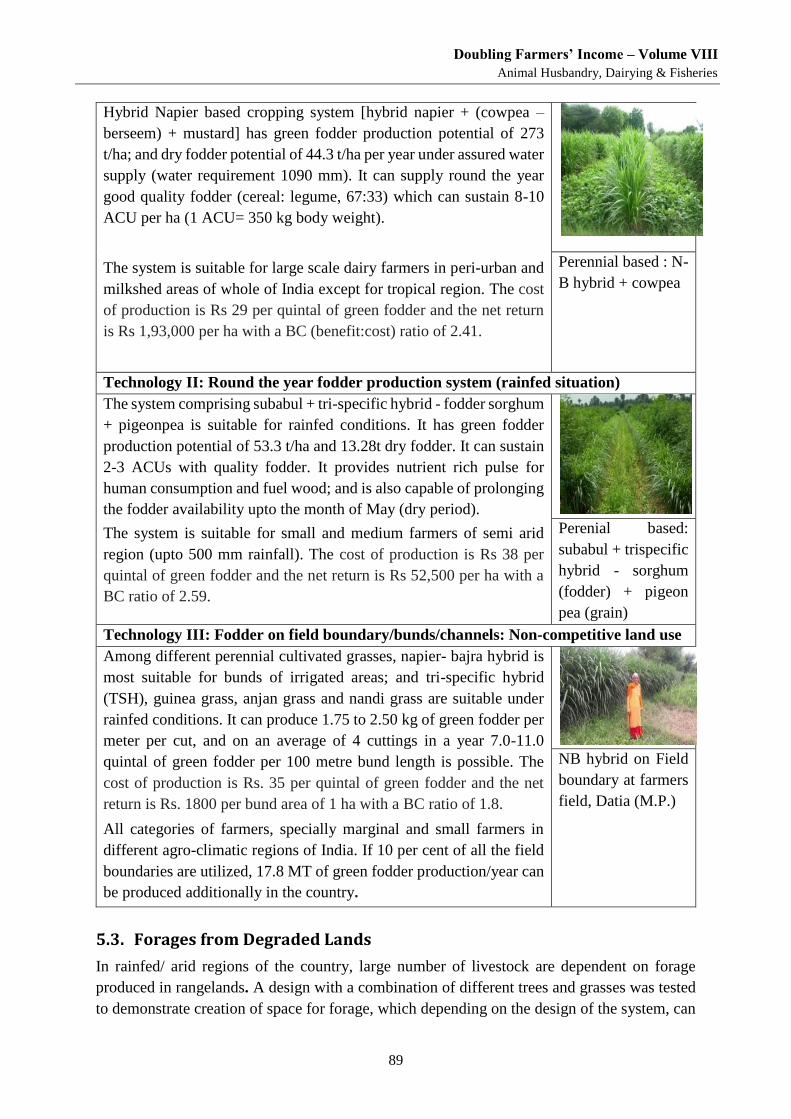
Doubling Farmers’ Income – Volume VIII
Animal Husbandry, Dairying & Fisheries
89
Hybrid Napier based cropping system [hybrid napier + (cowpea –
berseem) + mustard] has green fodder production potential of 273
t/ha; and dry fodder potential of 44.3 t/ha per year under assured water
supply (water requirement 1090 mm). It can supply round the year
good quality fodder (cereal: legume, 67:33) which can sustain 8-10
ACU per ha (1 ACU= 350 kg body weight).
The system is suitable for large scale dairy farmers in peri-urban and
milkshed areas of whole of India except for tropical region. The cost
of production is Rs 29 per quintal of green fodder and the net return
is Rs 1,93,000 per ha with a BC (benefit:cost) ratio of 2.41.
Perennial based : N-
B hybrid + cowpea
Technology II: Round the year fodder production system (rainfed situation)
The system comprising subabul + tri-specific hybrid - fodder sorghum
+ pigeonpea is suitable for rainfed conditions. It has green fodder
production potential of 53.3 t/ha and 13.28t dry fodder. It can sustain
2-3 ACUs with quality fodder. It provides nutrient rich pulse for
human consumption and fuel wood; and is also capable of prolonging
the fodder availability upto the month of May (dry period).
The system is suitable for small and medium farmers of semi arid
region (upto 500 mm rainfall). The cost of production is Rs 38 per
quintal of green fodder and the net return is Rs 52,500 per ha with a
BC ratio of 2.59.
Perenial based:
subabul + trispecific
hybrid - sorghum
(fodder) + pigeon
pea (grain)
Technology III: Fodder on field boundary/bunds/channels: Non-competitive land use
Among different perennial cultivated grasses, napier- bajra hybrid is
most suitable for bunds of irrigated areas; and tri-specific hybrid
(TSH), guinea grass, anjan grass and nandi grass are suitable under
rainfed conditions. It can produce 1.75 to 2.50 kg of green fodder per
meter per cut, and on an average of 4 cuttings in a year 7.0-11.0
quintal of green fodder per 100 metre bund length is possible. The
cost of production is Rs. 35 per quintal of green fodder and the net
return is Rs. 1800 per bund area of 1 ha with a BC ratio of 1.8.
All categories of farmers, specially marginal and small farmers in
different agro-climatic regions of India. If 10 per cent of all the field
boundaries are utilized, 17.8 MT of green fodder production/year can
be produced additionally in the country.
NB hybrid on Field
boundary at farmers
field, Datia (M.P.)
5.3. Forages from Degraded Lands
In rainfed/ arid regions of the country, large number of livestock are dependent on forage
produced in rangelands. A design with a combination of different trees and grasses was tested
to demonstrate creation of space for forage, which depending on the design of the system, can
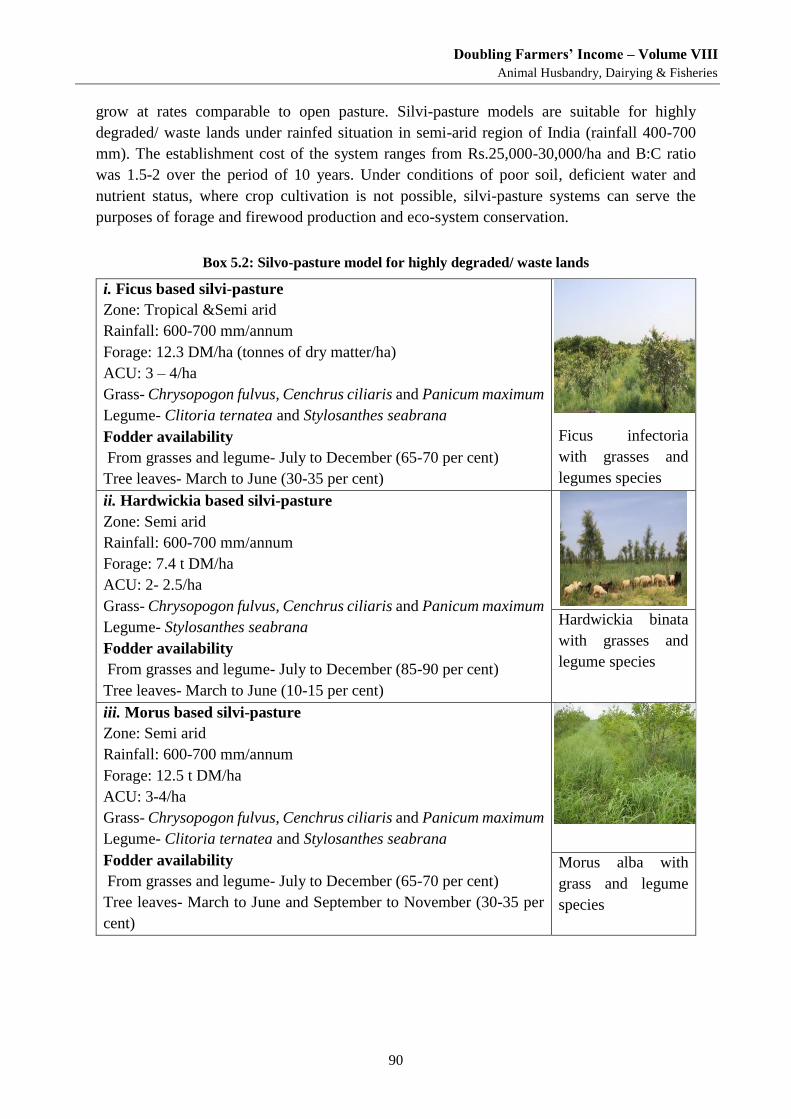
Doubling Farmers’ Income – Volume VIII
Animal Husbandry, Dairying & Fisheries
90
grow at rates comparable to open pasture. Silvi-pasture models are suitable for highly
degraded/ waste lands under rainfed situation in semi-arid region of India (rainfall 400-700
mm). The establishment cost of the system ranges from Rs.25,000-30,000/ha and B:C ratio
was 1.5-2 over the period of 10 years. Under conditions of poor soil, deficient water and
nutrient status, where crop cultivation is not possible, silvi-pasture systems can serve the
purposes of forage and firewood production and eco-system conservation.
Box 5.2: Silvo-pasture model for highly degraded/ waste lands
i. Ficus based silvi-pasture
Zone: Tropical &Semi arid
Rainfall: 600-700 mm/annum
Forage: 12.3 DM/ha (tonnes of dry matter/ha)
ACU: 3 – 4/ha
Grass- Chrysopogon fulvus, Cenchrus ciliaris and Panicum maximum
Legume- Clitoria ternatea and Stylosanthes seabrana
Fodder availability
From grasses and legume- July to December (65-70 per cent)
Tree leaves- March to June (30-35 per cent)
Ficus infectoria
with grasses and
legumes species
ii. Hardwickia based silvi-pasture
Zone: Semi arid
Rainfall: 600-700 mm/annum
Forage: 7.4 t DM/ha
ACU: 2- 2.5/ha
Grass- Chrysopogon fulvus, Cenchrus ciliaris and Panicum maximum
Legume- Stylosanthes seabrana
Fodder availability
From grasses and legume- July to December (85-90 per cent)
Tree leaves- March to June (10-15 per cent)
Hardwickia binata
with grasses and
legume species
iii. Morus based silvi-pasture
Zone: Semi arid
Rainfall: 600-700 mm/annum
Forage: 12.5 t DM/ha
ACU: 3-4/ha
Grass- Chrysopogon fulvus, Cenchrus ciliaris and Panicum maximum
Legume- Clitoria ternatea and Stylosanthes seabrana
Fodder availability
From grasses and legume- July to December (65-70 per cent)
Tree leaves- March to June and September to November (30-35 per
cent)
Morus alba with
grass and legume
species
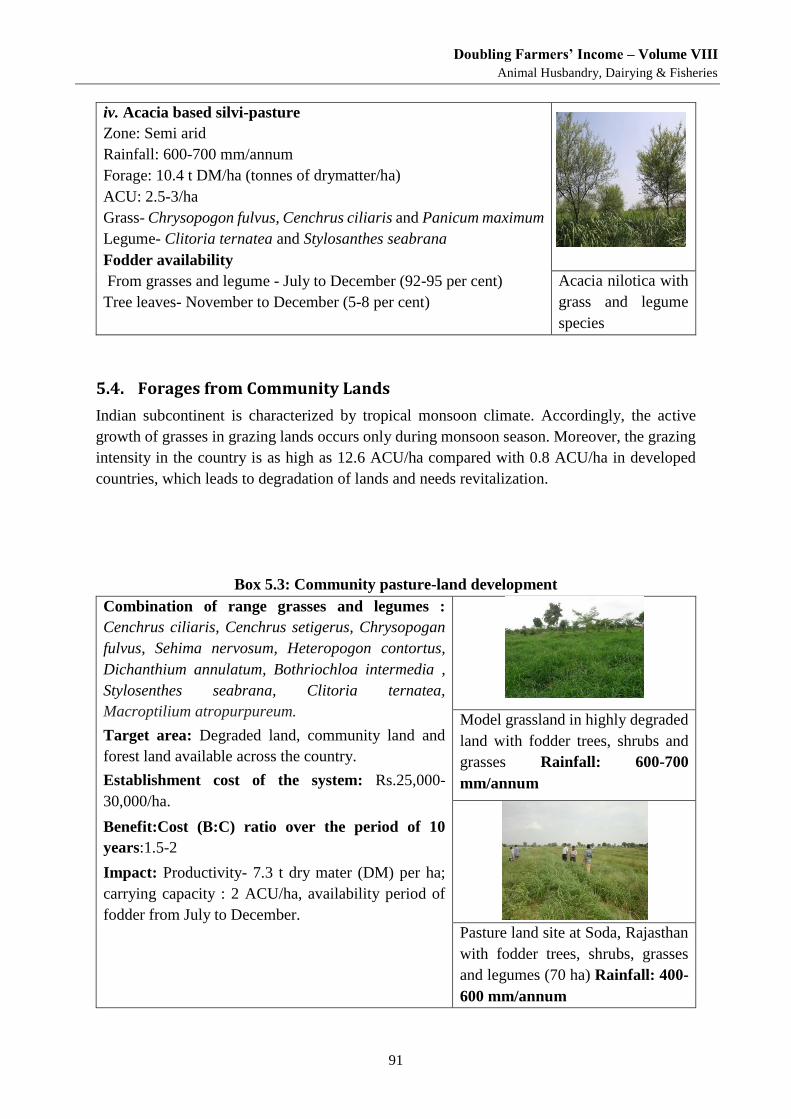
Doubling Farmers’ Income – Volume VIII
Animal Husbandry, Dairying & Fisheries
91
iv. Acacia based silvi-pasture
Zone: Semi arid
Rainfall: 600-700 mm/annum
Forage: 10.4 t DM/ha (tonnes of drymatter/ha)
ACU: 2.5-3/ha
Grass- Chrysopogon fulvus, Cenchrus ciliaris and Panicum maximum
Legume- Clitoria ternatea and Stylosanthes seabrana
Fodder availability
From grasses and legume - July to December (92-95 per cent)
Tree leaves- November to December (5-8 per cent)
Acacia nilotica with
grass and legume
species
5.4. Forages from Community Lands
Indian subcontinent is characterized by tropical monsoon climate. Accordingly, the active
growth of grasses in grazing lands occurs only during monsoon season. Moreover, the grazing
intensity in the country is as high as 12.6 ACU/ha compared with 0.8 ACU/ha in developed
countries, which leads to degradation of lands and needs revitalization.
Box 5.3: Community pasture-land development
Combination of range grasses and legumes :
Cenchrus ciliaris, Cenchrus setigerus, Chrysopogan
fulvus, Sehima nervosum, Heteropogon contortus,
Dichanthium annulatum, Bothriochloa intermedia ,
Stylosenthes seabrana, Clitoria ternatea,
Macroptilium atropurpureum.
Target area: Degraded land, community land and
forest land available across the country.
Establishment cost of the system: Rs.25,000-
30,000/ha.
Benefit:Cost (B:C) ratio over the period of 10
years:1.5-2
Impact: Productivity- 7.3 t dry mater (DM) per ha;
carrying capacity : 2 ACU/ha, availability period of
fodder from July to December.
Model grassland in highly degraded
land with fodder trees, shrubs and
grasses Rainfall: 600-700
mm/annum
Pasture land site at Soda, Rajasthan
with fodder trees, shrubs, grasses
and legumes (70 ha) Rainfall: 400-
600 mm/annum
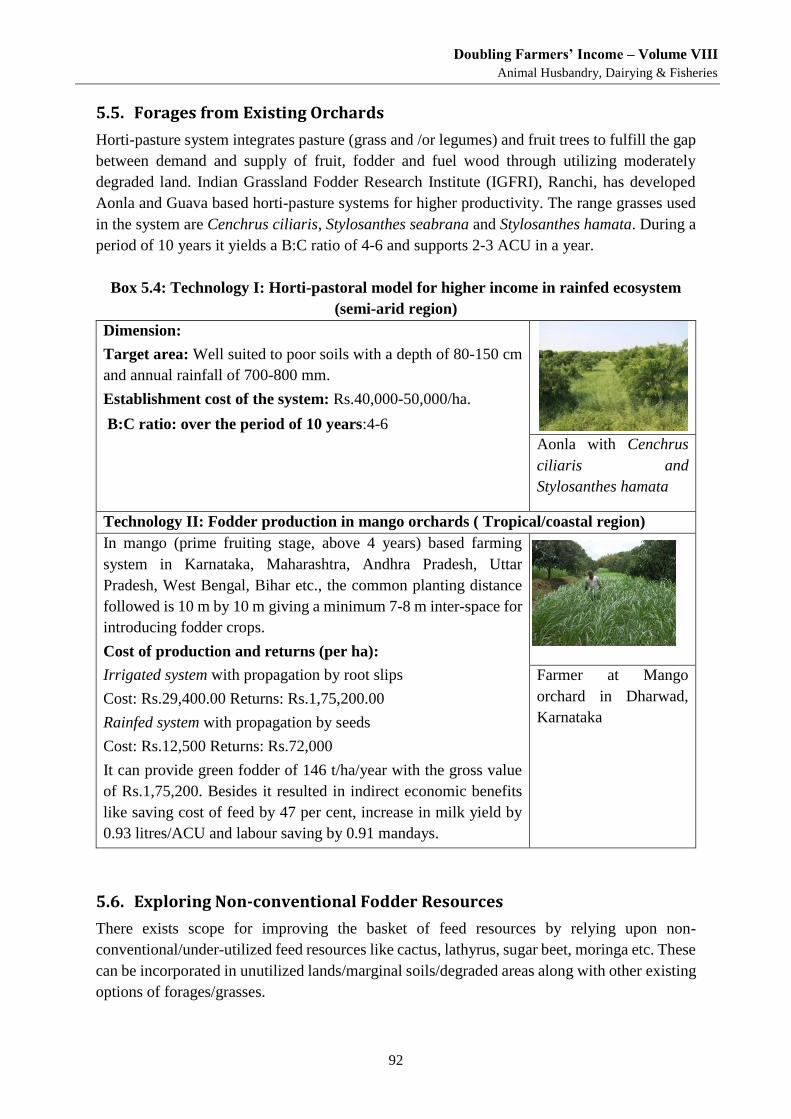
Doubling Farmers’ Income – Volume VIII
Animal Husbandry, Dairying & Fisheries
92
5.5. Forages from Existing Orchards
Horti-pasture system integrates pasture (grass and /or legumes) and fruit trees to fulfill the gap
between demand and supply of fruit, fodder and fuel wood through utilizing moderately
degraded land. Indian Grassland Fodder Research Institute (IGFRI), Ranchi, has developed
Aonla and Guava based horti-pasture systems for higher productivity. The range grasses used
in the system are Cenchrus ciliaris, Stylosanthes seabrana and Stylosanthes hamata. During a
period of 10 years it yields a B:C ratio of 4-6 and supports 2-3 ACU in a year.
Box 5.4: Technology I: Horti-pastoral model for higher income in rainfed ecosystem
(semi-arid region)
Dimension:
Target area: Well suited to poor soils with a depth of 80-150 cm
and annual rainfall of 700-800 mm.
Establishment cost of the system: Rs.40,000-50,000/ha.
B:C ratio: over the period of 10 years:4-6
Aonla with Cenchrus
ciliaris and
Stylosanthes hamata
Technology II: Fodder production in mango orchards ( Tropical/coastal region)
In mango (prime fruiting stage, above 4 years) based farming
system in Karnataka, Maharashtra, Andhra Pradesh, Uttar
Pradesh, West Bengal, Bihar etc., the common planting distance
followed is 10 m by 10 m giving a minimum 7-8 m inter-space for
introducing fodder crops.
Cost of production and returns (per ha):
Irrigated system with propagation by root slips
Cost: Rs.29,400.00 Returns: Rs.1,75,200.00
Rainfed system with propagation by seeds
Cost: Rs.12,500 Returns: Rs.72,000
It can provide green fodder of 146 t/ha/year with the gross value
of Rs.1,75,200. Besides it resulted in indirect economic benefits
like saving cost of feed by 47 per cent, increase in milk yield by
0.93 litres/ACU and labour saving by 0.91 mandays.
Farmer at Mango
orchard in Dharwad,
Karnataka
5.6. Exploring Non-conventional Fodder Resources
There exists scope for improving the basket of feed resources by relying upon non-
conventional/under-utilized feed resources like cactus, lathyrus, sugar beet, moringa etc. These
can be incorporated in unutilized lands/marginal soils/degraded areas along with other existing
options of forages/grasses.
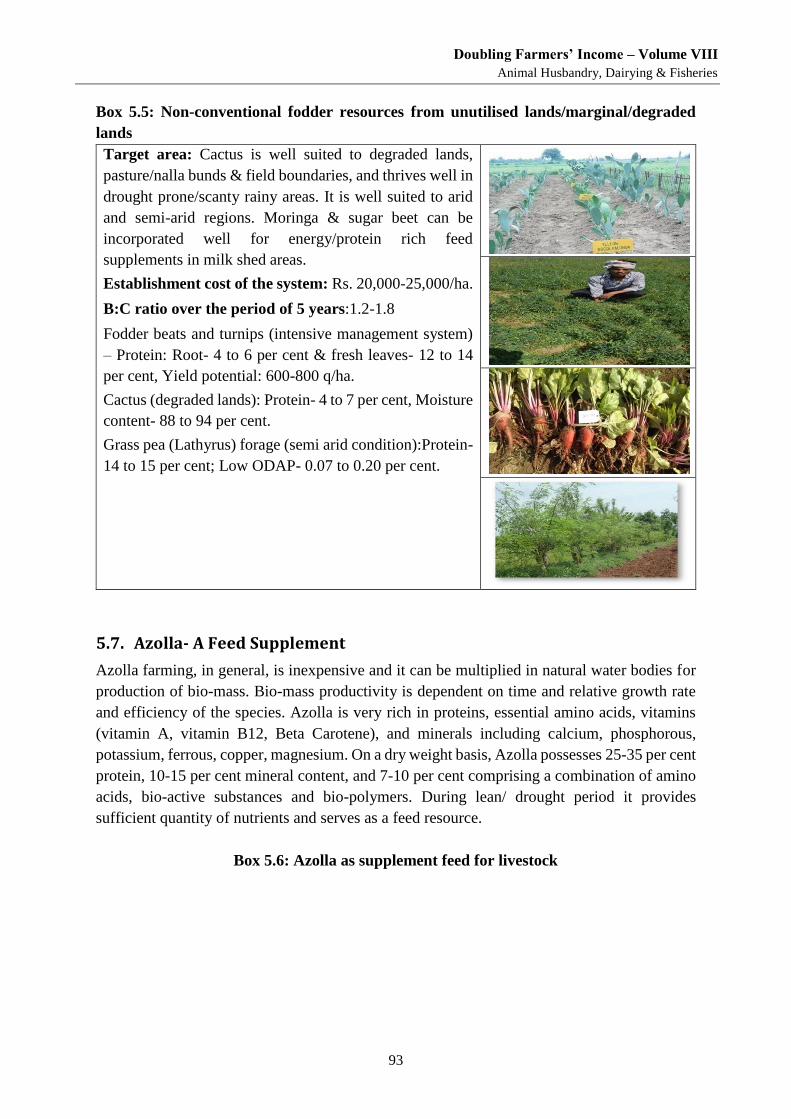
Doubling Farmers’ Income – Volume VIII
Animal Husbandry, Dairying & Fisheries
93
Box 5.5: Non-conventional fodder resources from unutilised lands/marginal/degraded
lands
Target area: Cactus is well suited to degraded lands,
pasture/nalla bunds & field boundaries, and thrives well in
drought prone/scanty rainy areas. It is well suited to arid
and semi-arid regions. Moringa & sugar beet can be
incorporated well for energy/protein rich feed
supplements in milk shed areas.
Establishment cost of the system: Rs. 20,000-25,000/ha.
B:C ratio over the period of 5 years:1.2-1.8
Fodder beats and turnips (intensive management system)
– Protein: Root- 4 to 6 per cent & fresh leaves- 12 to 14
per cent, Yield potential: 600-800 q/ha.
Cactus (degraded lands): Protein- 4 to 7 per cent, Moisture
content- 88 to 94 per cent.
Grass pea (Lathyrus) forage (semi arid condition):Protein-
14 to 15 per cent; Low ODAP- 0.07 to 0.20 per cent.
5.7. Azolla- A Feed Supplement
Azolla farming, in general, is inexpensive and it can be multiplied in natural water bodies for
production of bio-mass. Bio-mass productivity is dependent on time and relative growth rate
and efficiency of the species. Azolla is very rich in proteins, essential amino acids, vitamins
(vitamin A, vitamin B12, Beta Carotene), and minerals including calcium, phosphorous,
potassium, ferrous, copper, magnesium. On a dry weight basis, Azolla possesses 25-35 per cent
protein, 10-15 per cent mineral content, and 7-10 per cent comprising a combination of amino
acids, bio-active substances and bio-polymers. During lean/ drought period it provides
sufficient quantity of nutrients and serves as a feed resource.
Box 5.6: Azolla as supplement feed for livestock
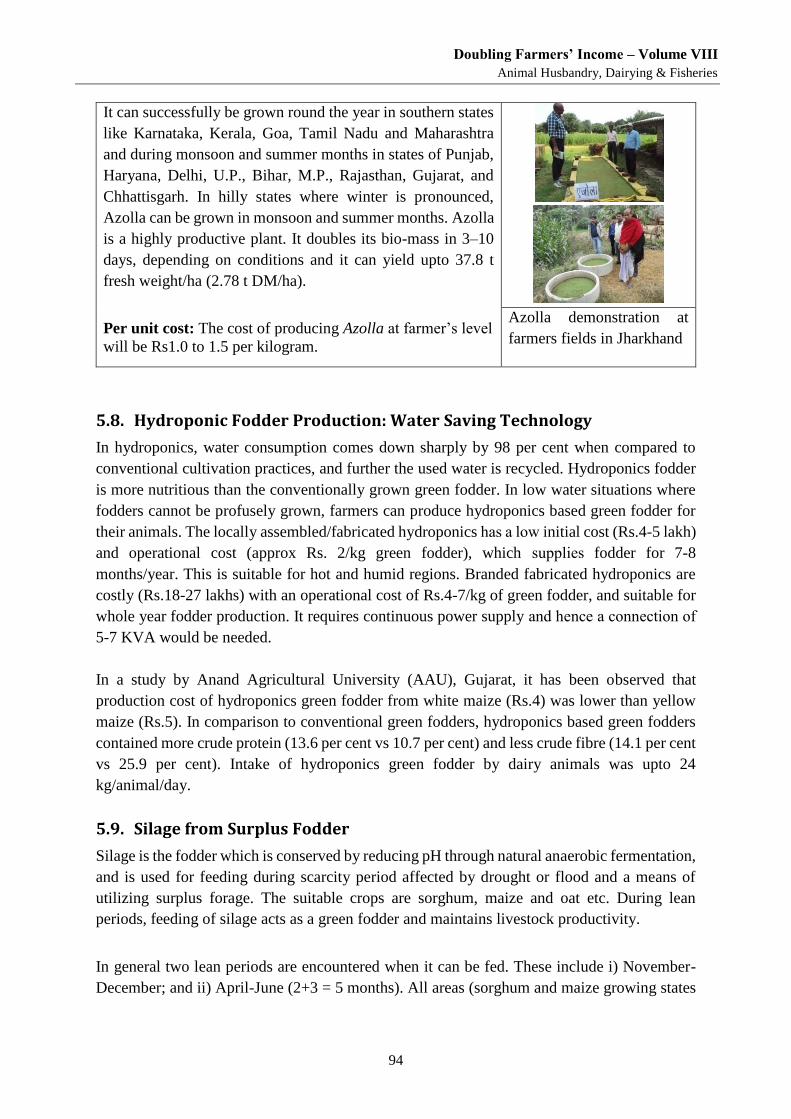
Doubling Farmers’ Income – Volume VIII
Animal Husbandry, Dairying & Fisheries
94
It can successfully be grown round the year in southern states
like Karnataka, Kerala, Goa, Tamil Nadu and Maharashtra
and during monsoon and summer months in states of Punjab,
Haryana, Delhi, U.P., Bihar, M.P., Rajasthan, Gujarat, and
Chhattisgarh. In hilly states where winter is pronounced,
Azolla can be grown in monsoon and summer months. Azolla
is a highly productive plant. It doubles its bio-mass in 3–10
days, depending on conditions and it can yield upto 37.8 t
fresh weight/ha (2.78 t DM/ha).
Per unit cost: The cost of producing Azolla at farmer’s level
will be Rs1.0 to 1.5 per kilogram.
Azolla demonstration at
farmers fields in Jharkhand
5.8. Hydroponic Fodder Production: Water Saving Technology
In hydroponics, water consumption comes down sharply by 98 per cent when compared to
conventional cultivation practices, and further the used water is recycled. Hydroponics fodder
is more nutritious than the conventionally grown green fodder. In low water situations where
fodders cannot be profusely grown, farmers can produce hydroponics based green fodder for
their animals. The locally assembled/fabricated hydroponics has a low initial cost (Rs.4-5 lakh)
and operational cost (approx Rs. 2/kg green fodder), which supplies fodder for 7-8
months/year. This is suitable for hot and humid regions. Branded fabricated hydroponics are
costly (Rs.18-27 lakhs) with an operational cost of Rs.4-7/kg of green fodder, and suitable for
whole year fodder production. It requires continuous power supply and hence a connection of
5-7 KVA would be needed.
In a study by Anand Agricultural University (AAU), Gujarat, it has been observed that
production cost of hydroponics green fodder from white maize (Rs.4) was lower than yellow
maize (Rs.5). In comparison to conventional green fodders, hydroponics based green fodders
contained more crude protein (13.6 per cent vs 10.7 per cent) and less crude fibre (14.1 per cent
vs 25.9 per cent). Intake of hydroponics green fodder by dairy animals was upto 24
kg/animal/day.
5.9. Silage from Surplus Fodder
Silage is the fodder which is conserved by reducing pH through natural anaerobic fermentation,
and is used for feeding during scarcity period affected by drought or flood and a means of
utilizing surplus forage. The suitable crops are sorghum, maize and oat etc. During lean
periods, feeding of silage acts as a green fodder and maintains livestock productivity.
In general two lean periods are encountered when it can be fed. These include i) November-
December; and ii) April-June (2+3 = 5 months). All areas (sorghum and maize growing states
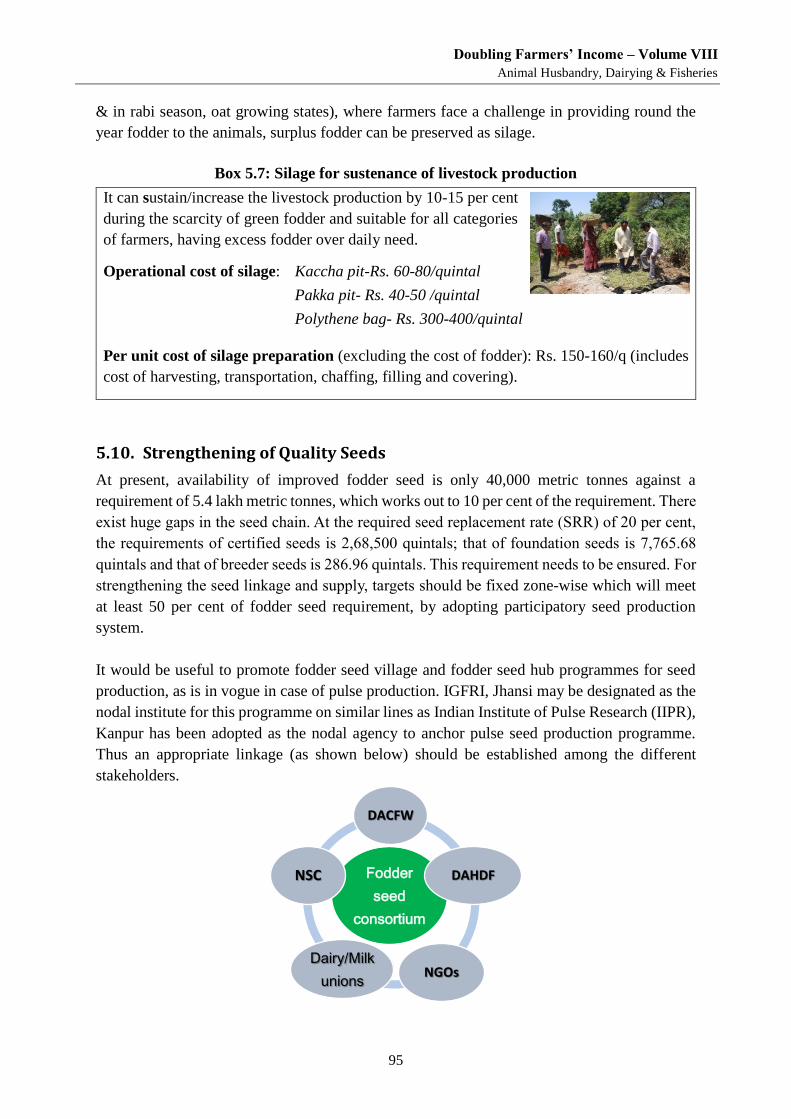
Doubling Farmers’ Income – Volume VIII
Animal Husbandry, Dairying & Fisheries
95
& in rabi season, oat growing states), where farmers face a challenge in providing round the
year fodder to the animals, surplus fodder can be preserved as silage.
Box 5.7: Silage for sustenance of livestock production
It can sustain/increase the livestock production by 10-15 per cent
during the scarcity of green fodder and suitable for all categories
of farmers, having excess fodder over daily need.
Operational cost of silage: Kaccha pit-Rs. 60-80/quintal
Pakka pit- Rs. 40-50 /quintal
Polythene bag- Rs. 300-400/quintal
Per unit cost of silage preparation (excluding the cost of fodder): Rs. 150-160/q (includes
cost of harvesting, transportation, chaffing, filling and covering).
5.10. Strengthening of Quality Seeds
At present, availability of improved fodder seed is only 40,000 metric tonnes against a
requirement of 5.4 lakh metric tonnes, which works out to 10 per cent of the requirement. There
exist huge gaps in the seed chain. At the required seed replacement rate (SRR) of 20 per cent,
the requirements of certified seeds is 2,68,500 quintals; that of foundation seeds is 7,765.68
quintals and that of breeder seeds is 286.96 quintals. This requirement needs to be ensured. For
strengthening the seed linkage and supply, targets should be fixed zone-wise which will meet
at least 50 per cent of fodder seed requirement, by adopting participatory seed production
system.
It would be useful to promote fodder seed village and fodder seed hub programmes for seed
production, as is in vogue in case of pulse production. IGFRI, Jhansi may be designated as the
nodal institute for this programme on similar lines as Indian Institute of Pulse Research (IIPR),
Kanpur has been adopted as the nodal agency to anchor pulse seed production programme.
Thus an appropriate linkage (as shown below) should be established among the different
stakeholders.
Fodder
seed
consortium
DACFW
DAHDF
NGOsDairy/Milk
unions
NSC
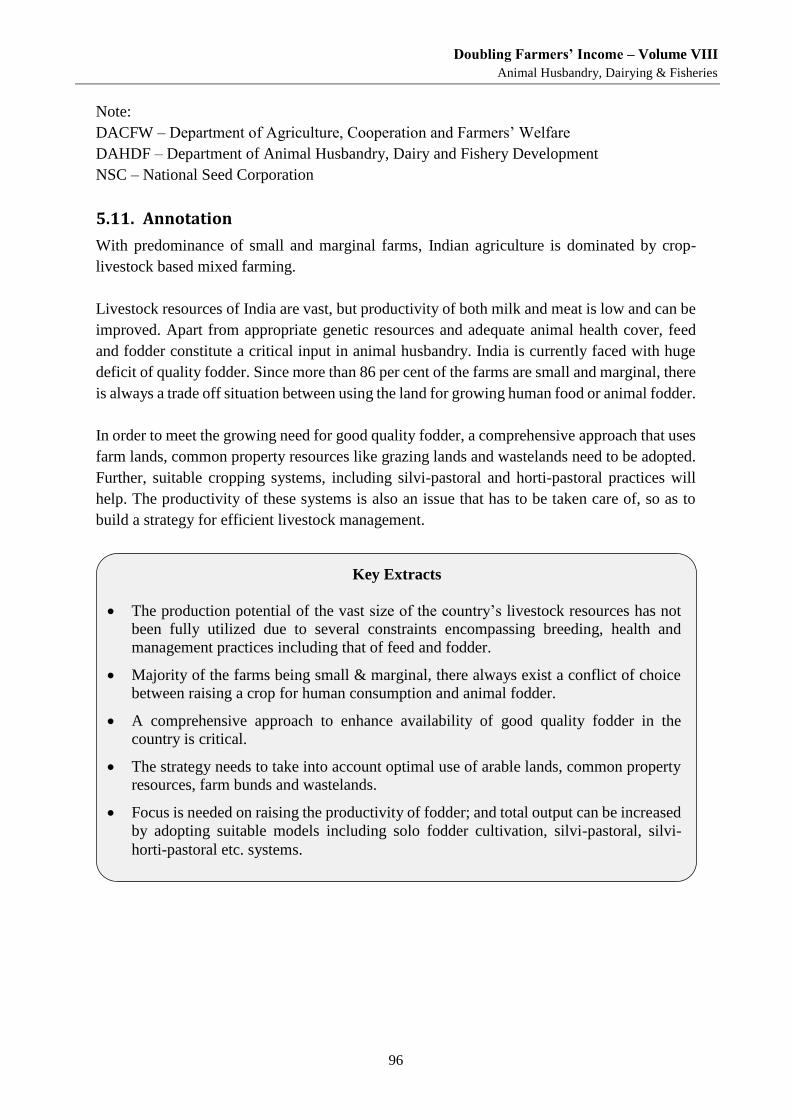
Doubling Farmers’ Income – Volume VIII
Animal Husbandry, Dairying & Fisheries
96
Note:
DACFW – Department of Agriculture, Cooperation and Farmers’ Welfare
DAHDF – Department of Animal Husbandry, Dairy and Fishery Development
NSC – National Seed Corporation
5.11. Annotation
With predominance of small and marginal farms, Indian agriculture is dominated by crop-
livestock based mixed farming.
Livestock resources of India are vast, but productivity of both milk and meat is low and can be
improved. Apart from appropriate genetic resources and adequate animal health cover, feed
and fodder constitute a critical input in animal husbandry. India is currently faced with huge
deficit of quality fodder. Since more than 86 per cent of the farms are small and marginal, there
is always a trade off situation between using the land for growing human food or animal fodder.
In order to meet the growing need for good quality fodder, a comprehensive approach that uses
farm lands, common property resources like grazing lands and wastelands need to be adopted.
Further, suitable cropping systems, including silvi-pastoral and horti-pastoral practices will
help. The productivity of these systems is also an issue that has to be taken care of, so as to
build a strategy for efficient livestock management.
Key Extracts
The production potential of the vast size of the country’s livestock resources has not
been fully utilized due to several constraints encompassing breeding, health and
management practices including that of feed and fodder.
Majority of the farms being small & marginal, there always exist a conflict of choice
between raising a crop for human consumption and animal fodder.
A comprehensive approach to enhance availability of good quality fodder in the
country is critical.
The strategy needs to take into account optimal use of arable lands, common property
resources, farm bunds and wastelands.
Focus is needed on raising the productivity of fodder; and total output can be increased
by adopting suitable models including solo fodder cultivation, silvi-pastoral, silvi-
horti-pastoral etc. systems.
Doubling Farmers’ Income – Volume VIII
Animal Husbandry, Dairying & Fisheries
97
Chapter 6
Livestock Promotion: Research & Development
Interventions and Government Initiatives The extent to which growth in livestock production can be accelerated will depend on how technology,
institutions and policies address constraints facing the livestock sector. Production growth dependent
on larger animal stock is not sustainable in the long run, due to adverse effect on carrying capacity of
land and available resources; hence, future growth in production should essentially come from
improvements in productivity. This will require overcoming feed and fodder scarcity and improvements
in delivery of animal health and breeding services. A key driver of growth and concerted the desired
efforts will be the generation and dissemination of yield-enhancing and yield-saving technologies.
6.1. Introduction
The strategy to enhance farm income from livestock needs to encompass a combination of
several possible routes, viz. enhancing productivity, reducing cost, ensuring better price,
reducing risk and skill development (Table 6.1). These can be achieved through innovations
and interventions based on science and technology, besides adoption of institutional and policy
reforms.
Table 6.6.1 Possible routes to increase farmer’s income
Enhancing Farmers’ Income
Enhance
productivity
Reduce costs Ensure better price
and reduce risk
Skill development
and knowledge
management
Technological
interventions to
bridge yield gap
Improve input
supply
Improve support
services
Improve
infrastructure
Efficient resource
utilisation
Exploit
complementarities
between various
enterprises
Change
institutional
mechanisms
Directly linking
farmers to
markets
Promote value
addition
Diversification
Expand insurance
coverage
Training of farm
households,
especially youth
and women
A multi-pronged strategy encompassing various aspects for dairy production such as breeding,
feeding, health care and management; milk marketing, extension network etc. need to be put
in place for doubling the income of dairy farmers by 2022.
6.2. Interventions for Animal Breed Improvement
Breeding is an important tool to improve desirable attributes in diary animals like milk
production, feed conversion efficiency, growth, reproduction, disease resistance etc. The
interventions in animal breeding that can have visible impact in the shorter run are providing
timely and quality artificial insemination (A.I.) facilities to the farmers that can be achieved
through strengthening of semen stations, expanding the AI coverage and putting in place
systems for effective AI delivery through information driven management. In the longer run
Doubling Farmers’ Income – Volume VIII
Animal Husbandry, Dairying & Fisheries
98
there are several other advanced technological intervention like, Genome selection, Embryo
transfer (ET)/IVF that would be required for sustained breed improvement.
6.2.1. Strengthening AI services
Artificial Insemination (AI) enables use of the semen of a few top bulls of high genetic merit
in a more extensive manner and over a much larger population. Therefore, AI is the preferred
method of attaining genetic progress in any population. Presently about 30 per cent of the
breedable animals are bred through AI and the rest through natural service. Therefore, to
accelerate genetic progress, the proportion of milch animals bred through AI needs to be raised
subsequently.
Production of Quality Semen doses: First important pre-requisite for providing AI services
is the availability of quality semen. During 2015-16, about 102.69 million semen doses were
produced by the existing 53 Semen Stations, out of which about 97.82 million doses were
produced by the 48 semen stations graded A or B which is about 95 per cent of the total semen
doses produced in the country. The production is quite low to meet the requirement of higher
AI coverage. For instance, if at least 60 per cent of the breedable animals are to be inseminated
by 2021-22 then an aggregate of about 209 million quality semen doses of the required breeds
would need to be produced.
Some important aspects related to production of high quality disease free semen doses that
should form an integral part of the strategy to enhance farm income are:
Ensuring that semen is produced only through selected and efficiently managed semen
stations, where trained and dedicated manpower manage these facilities in a
professional manner.
Making it mandatory for the Semen Stations to adopt various Minimum Standard
Protocols, so as to maintain the highest quality standards. Efforts till now have been
more directed towards production of quality semen. To give more thrust to genetic
quality of bulls, the Minimum Standards Protocol should lay more emphasis on genetic
quality of bulls maintained at various semen stations.
Semen stations should work towards maintaining bulls that are produced through
genetic improvement programmes. The Minimum Standards Protocol on semen
production should be modified to give higher weightage for the genetic quality of bulls
maintained and include categories of bulls with "Breeding values/Genomic Breeding
Value" as top priority categories. It is required to create an environment in the country
which would mandate the semen stations to maintain bulls which are produced only
through scientific interventions and delivery quality genetics to farmers.
Close monitoring of bull induction in the Semen Stations, so that only the bulls from
approved sources are inducted. There should be provisions for ensuring that the semen
stations shall generate and publish information on the semen quality of each bull.
Doubling Farmers’ Income – Volume VIII
Animal Husbandry, Dairying & Fisheries
99
Semen Stations should take-up the responsibilities of putting in place bull production
programmes for various breeds, and share the bulls produced such that these
programmes also become sustainable in long run.
Semen Stations should have in place adequate quality assurance systems to consistently
ensure production and supply of high quality doses.
Improving efficacy of service delivery: During the year 2015, there were 1,09,555 AI centers
and 67.02 million AIs were reported in the country (i.e. 51 AI per centre per month). A
scientific approach to delivery of AI services at the doorstep of the milk producer is expected
to result in the animal conceiving with less than two and a half inseminations and without
spread of disease and the production of a genetically superior calf. To achieve even a moderate
rate of conception of 35-40 per cent, the effectiveness of existing AI centres needs to be
improved. There are several factors such as reproductive health and nutritional status of female
animals, proper heat detection, quality of semen, maintenance of cold chain, timely supply of
liquid nitrogen, competence of AI technician, etc. which are major contributors for the success
of artificial insemination. There is need to focus on aspects presented in the paragraph that
follows.
AI service providers need to ensure that AI technicians are trained / re-oriented in
certified/accredited AI training institutes capable of training them in the Standard Operating
Procedure (SOP). The SOPs for AI delivery at the doorstep of the milk producer should include,
importantly, adherence to the Breeding Policy of the state, use of disease free quality semen of
HGM bulls, recording of all events such as animal identification (registration), insemination,
pregnancy diagnosis and calving on an individual animal basis and providing advice on
overcoming mineral and feed deficiency in the animal as they are vital for reproduction and
make available inputs such as area specific mineral mixture, de-worming medicine, mastitis
control kit, etc. There is a need of Multi-Purpose AI technicians in Rural India (MAITRIs).
Widening the AI network: Efforts for any genetic improvement activities of animals would
yield results in desired time frame when large proportion of breedable animals is brought under
Artificial Insemination network. As mentioned earlier, the current AI coverage is around 30
per cent of the breedable animals and it is required to increase it to about 60 per cent of
breedable bovines. Besides catering to the requirement inputs and manpower for expanding the
AI coverage, the other key challenges that need to be overcome are:
Increasing awareness among farmers for adopting AI services through a sustained
campaigning to educate farmers on the advantages of AI encouraging them to adopt it.
Prioritizing cattle and buffalo breeds as per their economic importance. This will be helpful
to farmers in order to increase their income through rearing of livestock and sale of milk,
milk products and animals as well.
Identifying location-specific high quality breeds for breed improvement programs.
Doubling Farmers’ Income – Volume VIII
Animal Husbandry, Dairying & Fisheries
100
An arrangement to control the menace of scrub bulls in villages.
Avoid duplication in area of operation of AI servicing agencies to increase the coverage.
6.2.2. Performance recording and selection
One of the key factors that influences milk productivity of animals is its genetic ability for milk
production, which is an inherited character, while others provide an enabling environment. The
breeding bull contributes significantly in enhancing the genetic potential of its progenies for
economically important traits like milk productivity-production, fertility, body conformation
etc. Therefore, selection of bull mothers and sires for production of next generation of breeding
bulls is the fulcrum of any animal breeding programme.
Genetic improvement for a specific trait or group of traits largely depends on how effectively
these traits are recorded and the accuracy of selection that is obtained for production of bulls.
Data recording is essential for identification of high genetic merit animals. Daily recording of
data on milk yield and other performance traits is required for decision making in dairying for
the benefit of farmer-entrepreneur. It is the data that should drive selection of superior animals
in the breed improvement programs. Except in case of a few institutional organised herds, daily
recording of performance data is not practised under field conditions. Under the smallholder
dairy production system prevalent in the country, and given the acute financial resource
constraint, it is practically a near-to-impossible proposition under field conditions. Under such
a circumstance complete data recording can be replaced by two following ways:
First option is to record only a part of the lactation (known as part-lactation milk yield),
which can be used for the prediction of 305-day lactation milk yield.
Second way is to record milk yield once in a week (weekly) or a fortnight (fortnightly)
or a month (monthly) or a period of two months (bimonthly). Test-day (TD) milk yield
recording at monthly or bimonthly interval is not only convenient but also cost effective
for the prediction of lactational milk yield under field conditions.
The data recording on individual insemination-wise information is also very useful in early
identification of problem in animals, AI technicians (AITs) or quality of semen provided in any
area. The AI network should be empowered with technical manpower that can analyse data,
provide support to AITs and farmers in maintaining herd fertility levels and to evaluate
interventions based on data.
Selection of bulls could be done through methods like pedigree selection and progeny testing.
Progeny Testing (PT) is an internationally established practice to select bulls. However, the
process takes longer period. Hence it is suggested that, young HGM bulls produced through
proven sires and dams selected based on their breeding values be used. This process is called a
"Young Bull/ Sire Programme". HGM bulls of breeds such as Murrah/ upgraded Murrah and
Mehsana breed of buffaloes, Holstein Frisian, Holstein Frisian crossbred, Jersey, Jersey
crossbred of cattle and some of the indigenous breeds like Gir cattle can be produced through
Progeny Testing.
Doubling Farmers’ Income – Volume VIII
Animal Husbandry, Dairying & Fisheries
101
Among some of the breeds (many indigenous breeds), where one cannot practise bull
production through Progeny Tcsting due to non-availability of AI infrastructure, efforts are to
be made to select bulls through Pedigrce Selection (PS). wherein this case, the performance of
bulls is judged on the basis of performance of their parents and grandparents. Indigenous cattle
breeds such as Rathi, Sahiwal, Kankrej, Tharparkar and Hariana and indigenous breeds of
buffalo such as Jaffarabadi, Pandharpuri and Nili-Ravi can be produced through pedigree
selection.
6.2.3. Promoting Embryo Technology and In-Vitro Fertilization tools
There is need for a system of maximum utilization of identified elite cows through Embryo
Transfer (ET)/In-Vitro-Fertilization (IVF). ET technology is used to increase the reproduction
rate of cows and buffaloes. Theoretically, a cow or a buffalo can produce one calf a year that
pulls down its productive rate. A cow or buffalo comes into heat every 21 days and releases
one egg (ovum). If the animal is mated to a bull at the right time during the heat or inseminated
artificially, the egg is fertilized which results into a pregnancy. The animal would deliver a calf
after about 280 days of gestation in cows and 310 days in case of buffaloes. Due to low
reproduction rate, the genetic contribution of cows to next generation is minimal. However, the
bull at the same time (one year) can make about 10,000 cows pregnant and thus contributing
its gene to large number of animals in future population. However, with ET, a cow can produce
5-10 calves in a year. Embryo transfer simply means collection of an embryo from a donor
female and its transfer to the uterus of a recipient female of the same species.
Using the technology, bulls of various indigenous cattle and buffalo breeds may be produced
which may be used for semen production. The Normal Dairy Development Board (NDDB)
started using ET as a tool in 1986 and established for the first time in the country an embryo
transfer technology at Sabarmati Ashram Gaushala, Bidaj, Gujarat. More number of such
facilities should be established in the country. Some important aspects of Embryo Technology
that should be kept in mind are:
Embryo collection and transfer are highly skilled jobs to be performed only by trained
veterinarians.
It requires a sophisticated laboratory, equipments, consumables and biological,
majority of which are not available in the country and need to be imported. Therefore,
it is quite expensive and cost of embryo recovery rates besides the material cost.
Embryo should only be collected from elite donor females whose production is well
above the production of the population and are free from any diseases.
In-Vitro Fertilization is a technology similar to ET. Here Ovum are collected form live elite
animals and are matured, fertilized and developed in laboratory for first seven days. The
developed embryos are transferred to selected recipients. Here like ET, the genetic potential of
recipient animals would not be criterion. However, good health and reproduction parameters
of recipients are very important. If successfully implemented in our country, this technology
Doubling Farmers’ Income – Volume VIII
Animal Husbandry, Dairying & Fisheries
102
will help reducing cost and faster multiplication of elite germplasm. Efforts need to be made
to implement and regularly use this technology in field where performance recording of
animals is undertaken.
6.2.4. Use of Genomic Selection
There are technical limitations like high age at maturity and less recording infrastructure, lack
of infrastructure to store large number of semen etc. that will deter the use of proven bulls for
insemination of cow directly. Hence, all the young bulls inducted in semen stations should be
either sons of proven bulls and dams selected based on Breeding Values or should be sons of
known top bull (based on pedigree) and top recorded cows for full lactation. This approach will
give better reliabilities of bull selection up to 25 per cent. To gain higher reliability of bull
selection, new technologies like genomic selection based on female reference population
should be used.
6.3. Interventions for Improvement in Animal Nutrition
The production potential of livestock in the country is not fully realized because of constraints
related to feeding, breeding, health and management practices. As per an estimate, the
deficiency of feed and fodder accounts for half of the total loss (50.2 per cent), followed by the
problems of breeding and reproduction (21.1 per cent), diseases (17.9 per cent) and
management (10.5 per cent). Livestock productivity cannot be enhanced only by increasing the
genetic potential of bovines. It is equally necessary to improve animal nutrition so that livestock
can produce milk commensurate to their genetic potential. Feed shortage, poor nutritional
quality of feed and imbalanced feeding are the key problems that need to be overcome through
appropriate for enhancing productivity growth in dairy sector.
6.3.1. Addressing feed-fodder shortages
In order to meet the nutritional requirements of animals, the challenge before the researchers
is to increase the bioavailability of the feeds and fodders using chemical, biological and
biotechnological approaches. Also, it is necessary to improve the productivity of the land for
meeting out the feed and fodder requirements from the limited area available for this purpose.
Strengthening crop residue management system: Crop residues, such as rice and wheat straw
and sorghum stover, represent the largest component of animal feed. Prevention measures are
required for stopping wastage of crop residues through burning by strengthening crop residues
management system. It requires creating infrastructure for crop residues collection, baling,
enrichment and storing by introducing most modern machines like mower, reapers, balers,
straw makers, automatic harvesters in villages.
Increasing green fodder production: Presently, green fodder production is coming from
cultivation of fodder crops in 9.1 million hectares of arable land, 10.343 million hectares of
common grazlI1g land/pasture/rangeland and about 69.79 million hectares of forest land. Due
to small size of land holding, the farmers give preference to cultivation of food crops instead
of fodder crops. Detailed strategy to increase the production of green fodder in various regions
Doubling Farmers’ Income – Volume VIII
Animal Husbandry, Dairying & Fisheries
103
and farming systems is outlined in the preceding chapter of this volume; the main points of
which are as follows:
There is great diversity in forage crops comprising perennial grasses, range legumes,
cultivated forage cereals and legumes grown across varied regions and different growing
seasons. There are a number of promising forage varieties with tolerance to drought/water
scarcity situations that need to be promoted in different farming systems.
Promoting cultivation of newly developed and notified varieties/ hybrids of fodder crops,
perennial grasses & legumes and non-conventional/under-utilized feed resources like
cactus, lathyrus, sugar beet, moringa etc. new nutritious crops like Moringa, fodder beet,
azolla.
For round the year fodder supply, fodder production systems have been developed for
irrigated and rainfed situations which need to be promoted.
In arid and semi-arid areas, vast extend of land is lying vacant and is not being used due
to scarcity of water. Silvi-pasture models are suitable for highly degraded/ waste lands
under rainfed situation in semi-arid region of India (rainfall 400-700 mm). Under
conditions of poor soil, deficient water and nutrient status, where crop cultivation is not
possible, silvi-pasture systems can serve the purposes of forage and firewood production
and eco-system conservation.
Development of common grazing land on scientific methods by involving village level
institutions on commercial lines may help to increase availability of green fodder in rural
areas. Some combination of range grasses and legumes that can substanitally improve the
carrying capacity of land for livesttock production are Cenchrus ciliaris, Cenchrus
setigerus, Chrysopogan fulvus, Sehima nervosum, Heteropogon contortus etc..
Promoting hydroponic fodder production in water scarce region. Resource rich farmers
can take to this practice as early adopters.
Promotion of silage making of surplus green fodder produced during rainy season for
feeding during periods of deficit to ensure supply during lean period. This will minimise
wastage. There is a need to propagate cultivation of maize for silage making between Rabi-
Kharif crops in irrigated area to increase the availability of conserved fodder during lean
period. Commercial silage/ hay making can also be promoted to help in increasing farm
income of large farmers.
Strengthening fodder seed production, processing & marketing chain by involving various
stakeholders like NSC, SSC, agriculture department, dairy cooperatives and private sector.
There is huge shortage of quality fodder seed in the country, a critical input to increase the
green fodder yield. Sizeable quantity of fodder seed of berseem is being imported in the
country. States should develop a system to estimate crop wise/ variety wise fodder seed
requirement well in advance and their production arrangement with different seed
production agencies. Enhancing production of fodder seeds in the country will help in
increasing the income of seed growers participating in the programme upto 10-20 per cent
as compared to grains. Further, timely supply of quality fodder seed will help in enhancing
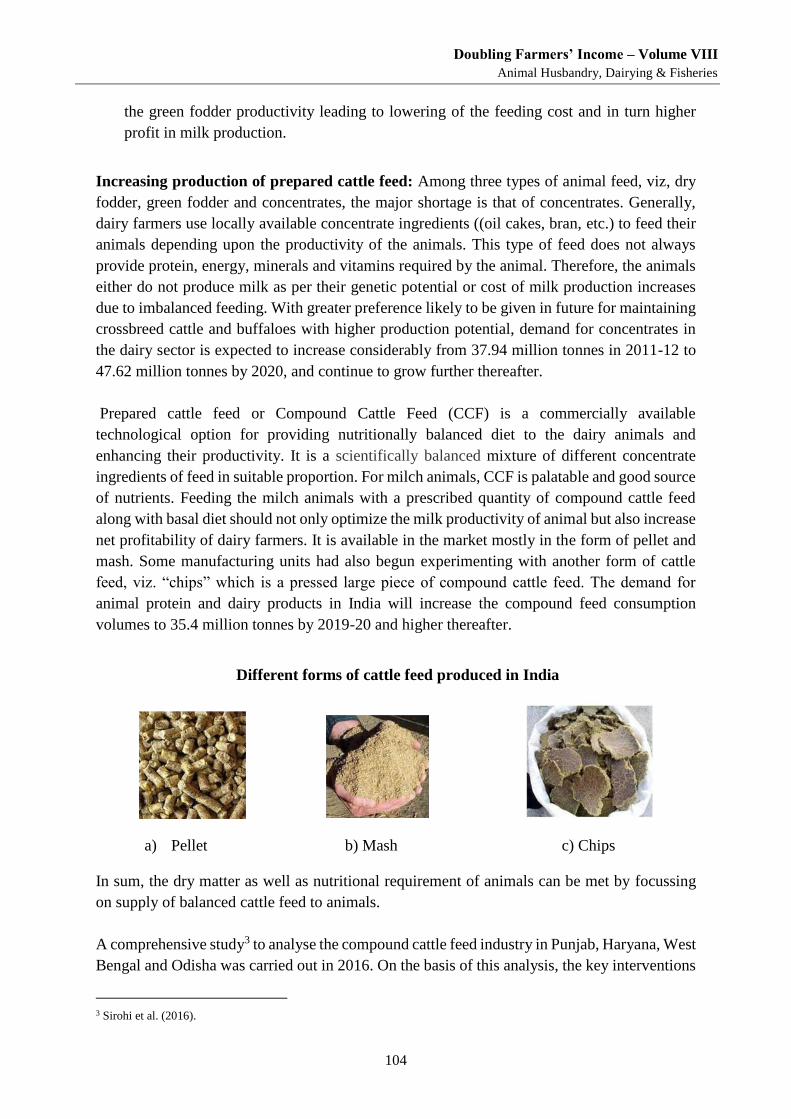
Doubling Farmers’ Income – Volume VIII
Animal Husbandry, Dairying & Fisheries
104
the green fodder productivity leading to lowering of the feeding cost and in turn higher
profit in milk production.
Increasing production of prepared cattle feed: Among three types of animal feed, viz, dry
fodder, green fodder and concentrates, the major shortage is that of concentrates. Generally,
dairy farmers use locally available concentrate ingredients ((oil cakes, bran, etc.) to feed their
animals depending upon the productivity of the animals. This type of feed does not always
provide protein, energy, minerals and vitamins required by the animal. Therefore, the animals
either do not produce milk as per their genetic potential or cost of milk production increases
due to imbalanced feeding. With greater preference likely to be given in future for maintaining
crossbreed cattle and buffaloes with higher production potential, demand for concentrates in
the dairy sector is expected to increase considerably from 37.94 million tonnes in 2011-12 to
47.62 million tonnes by 2020, and continue to grow further thereafter.
Prepared cattle feed or Compound Cattle Feed (CCF) is a commercially available
technological option for providing nutritionally balanced diet to the dairy animals and
enhancing their productivity. It is a scientifically balanced mixture of different concentrate
ingredients of feed in suitable proportion. For milch animals, CCF is palatable and good source
of nutrients. Feeding the milch animals with a prescribed quantity of compound cattle feed
along with basal diet should not only optimize the milk productivity of animal but also increase
net profitability of dairy farmers. It is available in the market mostly in the form of pellet and
mash. Some manufacturing units had also begun experimenting with another form of cattle
feed, viz. “chips” which is a pressed large piece of compound cattle feed. The demand for
animal protein and dairy products in India will increase the compound feed consumption
volumes to 35.4 million tonnes by 2019-20 and higher thereafter.
Different forms of cattle feed produced in India
a) Pellet b) Mash c) Chips
In sum, the dry matter as well as nutritional requirement of animals can be met by focussing
on supply of balanced cattle feed to animals.
A comprehensive study3 to analyse the compound cattle feed industry in Punjab, Haryana, West
Bengal and Odisha was carried out in 2016. On the basis of this analysis, the key interventions
3 Sirohi et al. (2016).
Doubling Farmers’ Income – Volume VIII
Animal Husbandry, Dairying & Fisheries
105
for upgradation, management and development of the cattle feed value chain in the country are
as follows:
Revisiting the export policy on maize, oilseeds/cakes & molasses from time to time, and
rationalizing the taxes, duties and levies imposed on various feed ingredients and
additives for ensuring regular supply of raw material and the supplements at reasonable
prices.
Strengthening the R&D component of the cattle feed, especially through the application
of bio-technology in feed compounding and the use of non-conventional feed resources
in manufactured feed. The declining trend in total factor productivity observed in recent
period also makes it imperative, that further scientific developments in feed
manufacturing technology will ensure higher gains per rupee of cost incurred accrue to
the suppliers and users of compound animal feed.
Take up of compound feed production by the feed mills catering to the nutritional
requirement of animals of different productive potential using market segmentation and
targeting techniques.
Linking small holders to feed value chain through capacity building interventions.
Systematic and planned interventions are required for creating awareness among the
producers and farmers about sound animal nutrition practices, quality and safety.
Developing skill of producers, better quality control services, risk coverage mechanism
and finance to strengthen service needs of the feed value chain.
Bypass protein and fat supplements: Dairy animals have four compartments in its stomach.
The first and the foremost is ‘rumen’ where most of the feed items are degraded. Around 60 to
70 per cent of dietary protein meals fed to animals are degraded into ammonia in the rumen. A
significant part of this ammonia is excreted through urine in the form of urea. Thus, a large
portion of protein from expensive cakes/ meals is wasted. If suitable treatment is given to
dietary protein meals, degradation in the rumen can be minimized. This process or treatment
to protect dietary protein from degradation in rumen is known as bypass protein technology.
These protected meals are digested more efficiently in the small intestine and result in extra
protein being available for milk production. This helps the animal to produce more milk and
of optimum quality.
Locally available protein meals such as rapeseed meal, sunflower meal, groundnut meal, guar
meal and soybean meal can be treated suitably to reduce their degradability in the rumen from
the range of 60-70 per cent to 25-30 per cent, in a specially designed airtight plant. Treated
protein meal can be either fed directly to animals as top feed @ one kg per animal per day or
incorporated in cattle feed @ 25 per cent and this cattle feed can be fed @ 4-5 kg per animal
per day, depending upon the level of milk production. The cost of treatment of protein meals
is Rs. 2.5 to 3.0 per kg but considering the resultant increase in milk yield, it is cost effective.
The post-partum energy requirement of high yielding animals is very high. Under field
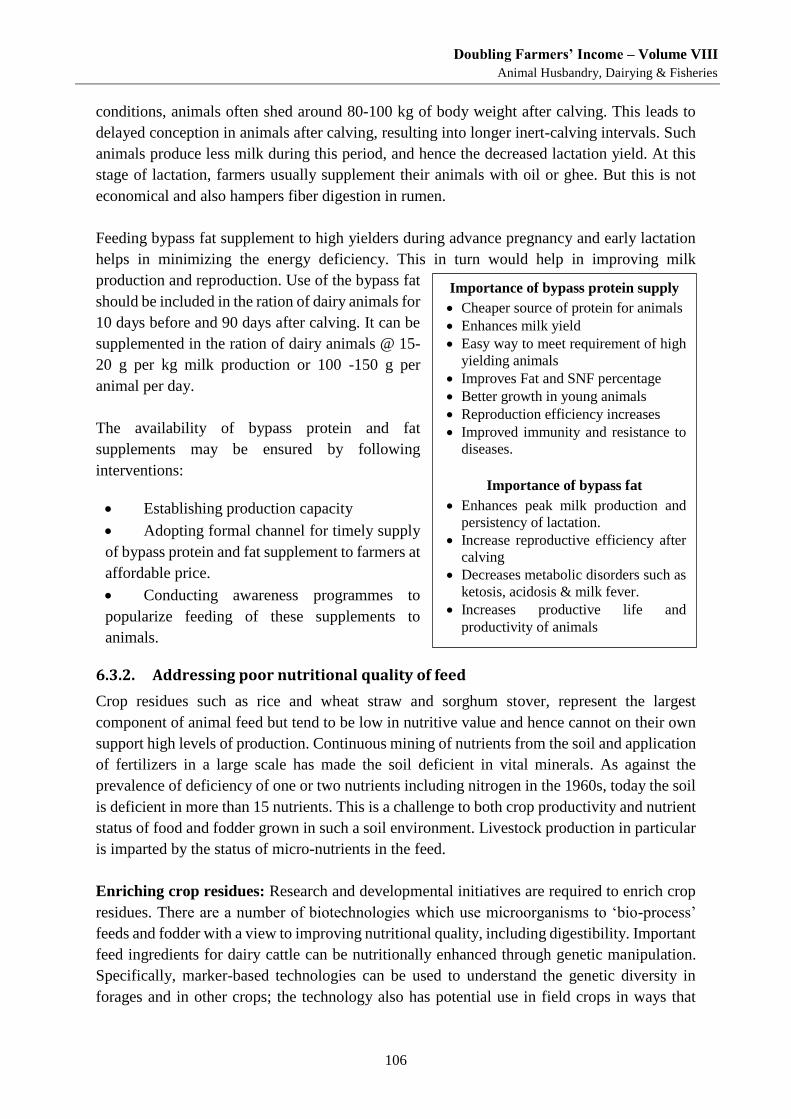
Doubling Farmers’ Income – Volume VIII
Animal Husbandry, Dairying & Fisheries
106
conditions, animals often shed around 80-100 kg of body weight after calving. This leads to
delayed conception in animals after calving, resulting into longer inert-calving intervals. Such
animals produce less milk during this period, and hence the decreased lactation yield. At this
stage of lactation, farmers usually supplement their animals with oil or ghee. But this is not
economical and also hampers fiber digestion in rumen.
Feeding bypass fat supplement to high yielders during advance pregnancy and early lactation
helps in minimizing the energy deficiency. This in turn would help in improving milk
production and reproduction. Use of the bypass fat
should be included in the ration of dairy animals for
10 days before and 90 days after calving. It can be
supplemented in the ration of dairy animals @ 15-
20 g per kg milk production or 100 -150 g per
animal per day.
The availability of bypass protein and fat
supplements may be ensured by following
interventions:
Establishing production capacity
Adopting formal channel for timely supply
of bypass protein and fat supplement to farmers at
affordable price.
Conducting awareness programmes to
popularize feeding of these supplements to
animals.
6.3.2. Addressing poor nutritional quality of feed
Crop residues such as rice and wheat straw and sorghum stover, represent the largest
component of animal feed but tend to be low in nutritive value and hence cannot on their own
support high levels of production. Continuous mining of nutrients from the soil and application
of fertilizers in a large scale has made the soil deficient in vital minerals. As against the
prevalence of deficiency of one or two nutrients including nitrogen in the 1960s, today the soil
is deficient in more than 15 nutrients. This is a challenge to both crop productivity and nutrient
status of food and fodder grown in such a soil environment. Livestock production in particular
is imparted by the status of micro-nutrients in the feed.
Enriching crop residues: Research and developmental initiatives are required to enrich crop
residues. There are a number of biotechnologies which use microorganisms to ‘bio-process’
feeds and fodder with a view to improving nutritional quality, including digestibility. Important
feed ingredients for dairy cattle can be nutritionally enhanced through genetic manipulation.
Specifically, marker-based technologies can be used to understand the genetic diversity in
forages and in other crops; the technology also has potential use in field crops in ways that
Importance of bypass protein supply
Cheaper source of protein for animals
Enhances milk yield
Easy way to meet requirement of high
yielding animals
Improves Fat and SNF percentage
Better growth in young animals
Reproduction efficiency increases
Improved immunity and resistance to
diseases.
Importance of bypass fat
Enhances peak milk production and
persistency of lactation.
Increase reproductive efficiency after
calving
Decreases metabolic disorders such as
ketosis, acidosis & milk fever.
Increases productive life and
productivity of animals
Doubling Farmers’ Income – Volume VIII
Animal Husbandry, Dairying & Fisheries
107
ensure that food yields and qualities are preserved or enhanced while at the same time
improving the feed attributes.
Quality control norms for feed and feed supplements: In India, fodder and feed are not
included in the Schedule under the Essential Commodity Act, 1955, and hence, the possibility
of monitoring the quality of feeds available in the market can at the best be done using the
provisions under the 'Consumer Protection Act, 1986', and ‘The Bureau of Indian Standards
Act’, 1986. Under the relevant sections of the Consumer Protection Act, if any livestock
feed/fish feed being sold in the market is found to be deficient with reference to the prescribed
BIS standard for the said feed, then it may be examined if there is any violation of the above
refereed sections. Under the Bureau of Indian Standards Act, 1986, although it is illegal to use
Standard mark without conforming to the standards, but it is not mandatory for the product to
conform to the BIS standards. Hence, under such weak regulatory mechanism, the
manufacturer not using the BIS mark is clearly out of the purview of both the Acts. As for the
one who is using the mark, first of all, the customer awareness about complaint mechanism for
unsatisfactory goods is very weak and secondly, even if a complaint to this effect is filed, in
absence of a streamlined mechanism of testing it would be very cumbersome to prove the
defect. Thus, all that could be done for quality assurance and safety of compound cattle feed
by the Department of Animal Husbandry, Dairying and Fisheries, Government of India was to
issue an advisory as follows to the various State governments:
“The State Governments may designate officials with the Animal Husbandry Departments
and/ or the Milk Cooperatives for regular collection of samples of branded feed being sold
in the market, get the samples sealed in a transparent manner, and send the samples for
testing against relevant BIS Standards. In case of any deviation from the standards, a
designated official may inform the competent authority to initiate appropriate legal action
in addition to making the farmers aware of the deficiency in the feeds through extension
officials and advertisement / circulars, etc., and a copy of such circular be also sent to
DADF. The concerned manufacturer / supplier may also be informed.” F. No. 2-
35/2009/AHT/FF, Dated 24.01.2013.
The quality of prepared feed is the most important parameter that has far reaching implications,
for the productivity of the animals and economics of milk production, as also for human and
livestock health. Poor quality of feed ingredients of low nutritive value and/or various types of
adulterants such as, groundnut husk, ground rice husk, nonedible oil cakes, maize cobs, saw
dust, marble powder, sand, limestone, etc. are used in the manufactured cattle feed because of
which the benefits to the farmers are not realized and shakes their confidence in more intense
adoption of the product. Additionally, the improper storage and hot and humid weather
conditions may lead to contamination of feedstuffs with mycotoxins. The physical or apparent
effects of mycotoxin range from reduced feed intake and poor conversion ration to a general
inability of an animal to thrive. The problem of mycotoxin does not, however, end in feed or
in reduced animal performance, for many are actually transferred into the milk and hence, are
hazardous for human health. As regards governance of laid out standards in the country, the
Doubling Farmers’ Income – Volume VIII
Animal Husbandry, Dairying & Fisheries
108
BIS standards prescribe that, the marking on the cattle feed bag should indicate the Aflatoxin
B1 content along with providing other information such as crude protein and fibre content,
soluble ash content, etc. However, in practice a lot of deviation from this practice is seen even
while using the BIS Standard mark, particularly in northern & eastern India. The need of the
hour is to establish a tracking and tracing system along the feed supply chain, with provision
for tough BIS standards for animal feed to ensure feed quality and safety. In this direction
useful learning experience can be picked up from the Chinese experience, where the inspection
and monitoring of feed quality and safety is guided by a regulation titled “General Practices
for the Monitoring of Feed Quality and Safety,” 2010. The Department of Animal Husbandry
may find it useful to adopt such a piece of law.
Area Specific Mineral Mixture (ASMM): Under Indian condition, mineral deficiencies in
feed and fodder are quite common. For instance, in Haryana, the status of Zn and Cu deficiency
in berseem fodder is 53.0 and 27.45 per cent; in wheat straw it is 43.7-78.9; Cu deficiency in
paddy straw is 21-35.75 per cent; Zn deficiency in concentrate is 7.1-45.8 per cent; and Cu
deficiency in concentrate is 10-44.4 per cent. Deficiency in the ration of animal impairs
metabolic functions, which affects the growth, milk production and reproduction efficiency in
dairy animals. Quality mineral mixtures is necessary to improve the productivity of milch
animals and semen production performance in dairy bulls. Currently only a few agencies are
producing area specific mineral mixture and the quantity is not sufficient. Availability of
ASMM to farmers may be ensured with following interventions:
Enhance ASMM production capacity by providing necessary infrastructure and other
facilities. The NDDB has carried out mineral mapping for various states/region and accordingly
ASMM formulations have been developed and information is available at NDDB website. This
may be used for establishment of production capacity of area specific mineral mixtures and
promoting use of trace minerals (50 per cent of the total requirement) in the form of chelates.
The National Dairy Research Institute (NDRI) has also developed mineral mixture for lactating
animals, including major and micro minerals, newer trace minerals for northern India. Degcure
mixture for control of Degnala disease in ruminants especially rice straw fed animals, anionic
mineral mixture for reducing post-partum problems in cattle and buffaloes have also been
developed and commercialized to different companies.
Adopting formal channel for timely supply of ASMM at affordable price.
Awareness programme for farmers on benefits of feeding ASMM to animals.
6.4. Promoting Balanced Feeding and Supplementation
Imbalanced feeding practice adversely affects the productivity and health status of animals. It
hampers the growth of young animals delaying the age at first calving. The duration of lactation
length and productive life of cows is shortened for want of adequate nutrition. The deterioration
in the productive and reproductive performance of the animals is detrimental to the economy
of the dairy farmers. While under-feeding restricts production and is detrimental for the health
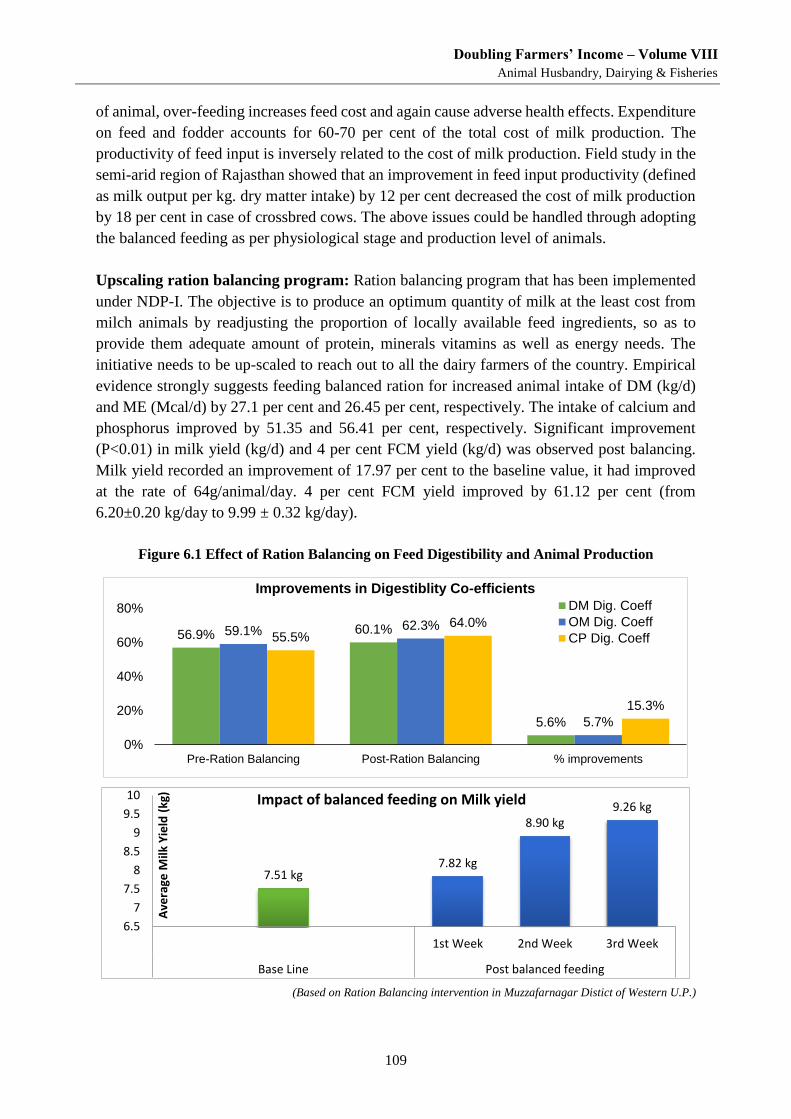
Doubling Farmers’ Income – Volume VIII
Animal Husbandry, Dairying & Fisheries
109
of animal, over-feeding increases feed cost and again cause adverse health effects. Expenditure
on feed and fodder accounts for 60-70 per cent of the total cost of milk production. The
productivity of feed input is inversely related to the cost of milk production. Field study in the
semi-arid region of Rajasthan showed that an improvement in feed input productivity (defined
as milk output per kg. dry matter intake) by 12 per cent decreased the cost of milk production
by 18 per cent in case of crossbred cows. The above issues could be handled through adopting
the balanced feeding as per physiological stage and production level of animals.
Upscaling ration balancing program: Ration balancing program that has been implemented
under NDP-I. The objective is to produce an optimum quantity of milk at the least cost from
milch animals by readjusting the proportion of locally available feed ingredients, so as to
provide them adequate amount of protein, minerals vitamins as well as energy needs. The
initiative needs to be up-scaled to reach out to all the dairy farmers of the country. Empirical
evidence strongly suggests feeding balanced ration for increased animal intake of DM (kg/d)
and ME (Mcal/d) by 27.1 per cent and 26.45 per cent, respectively. The intake of calcium and
phosphorus improved by 51.35 and 56.41 per cent, respectively. Significant improvement
(P<0.01) in milk yield (kg/d) and 4 per cent FCM yield (kg/d) was observed post balancing.
Milk yield recorded an improvement of 17.97 per cent to the baseline value, it had improved
at the rate of 64g/animal/day. 4 per cent FCM yield improved by 61.12 per cent (from
6.20±0.20 kg/day to 9.99 ± 0.32 kg/day).
Figure 6.1 Effect of Ration Balancing on Feed Digestibility and Animal Production
(Based on Ration Balancing intervention in Muzzafarnagar Distict of Western U.P.)
56.9% 60.1%
5.6%
59.1% 62.3%
5.7%
55.5%64.0%
15.3%
0%
20%
40%
60%
80%
Pre-Ration Balancing Post-Ration Balancing % improvements
Improvements in Digestiblity Co-efficients
DM Dig. Coeff
OM Dig. Coeff
CP Dig. Coeff
7.51 kg7.82 kg
8.90 kg9.26 kg
6.5
7
7.5
8
8.5
9
9.5
10
1st Week 2nd Week 3rd Week
Base Line Post balanced feeding
Ave
rage
Milk
Yie
ld (
kg)
Impact of balanced feeding on Milk yield
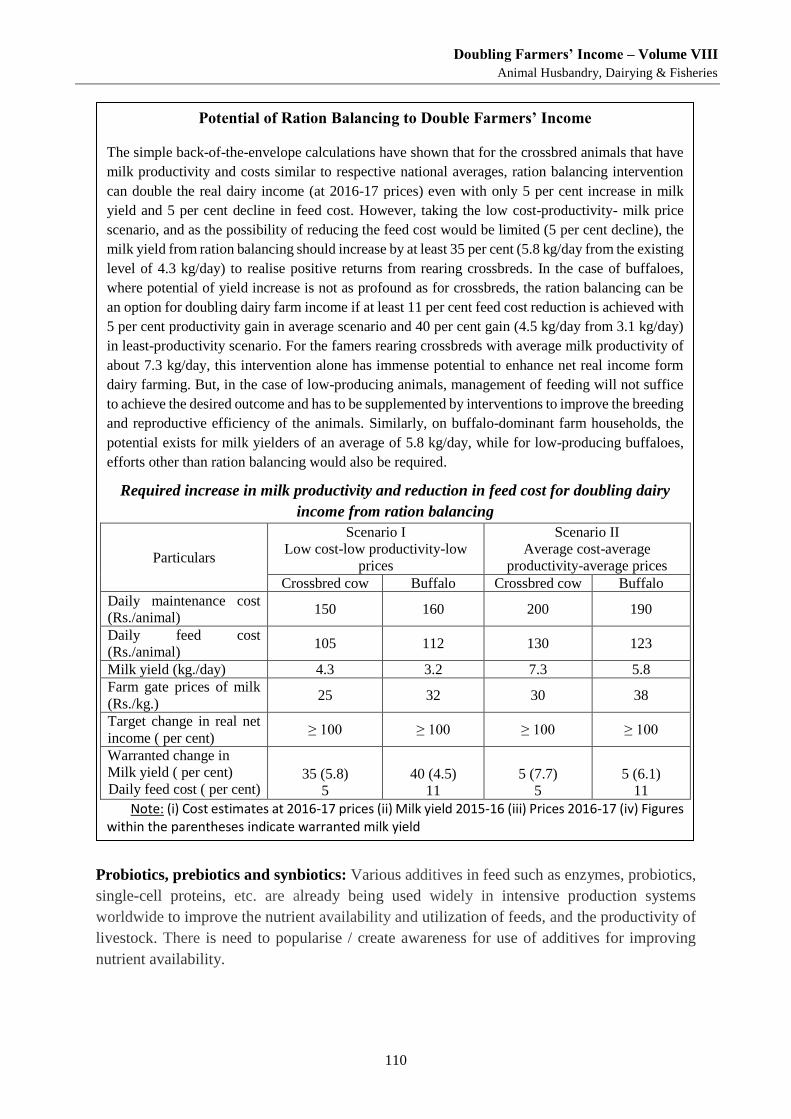
Doubling Farmers’ Income – Volume VIII
Animal Husbandry, Dairying & Fisheries
110
Probiotics, prebiotics and synbiotics: Various additives in feed such as enzymes, probiotics,
single-cell proteins, etc. are already being used widely in intensive production systems
worldwide to improve the nutrient availability and utilization of feeds, and the productivity of
livestock. There is need to popularise / create awareness for use of additives for improving
nutrient availability.
Potential of Ration Balancing to Double Farmers’ Income
The simple back-of-the-envelope calculations have shown that for the crossbred animals that have
milk productivity and costs similar to respective national averages, ration balancing intervention
can double the real dairy income (at 2016-17 prices) even with only 5 per cent increase in milk
yield and 5 per cent decline in feed cost. However, taking the low cost-productivity- milk price
scenario, and as the possibility of reducing the feed cost would be limited (5 per cent decline), the
milk yield from ration balancing should increase by at least 35 per cent (5.8 kg/day from the existing
level of 4.3 kg/day) to realise positive returns from rearing crossbreds. In the case of buffaloes,
where potential of yield increase is not as profound as for crossbreds, the ration balancing can be
an option for doubling dairy farm income if at least 11 per cent feed cost reduction is achieved with
5 per cent productivity gain in average scenario and 40 per cent gain (4.5 kg/day from 3.1 kg/day)
in least-productivity scenario. For the famers rearing crossbreds with average milk productivity of
about 7.3 kg/day, this intervention alone has immense potential to enhance net real income form
dairy farming. But, in the case of low-producing animals, management of feeding will not suffice
to achieve the desired outcome and has to be supplemented by interventions to improve the breeding
and reproductive efficiency of the animals. Similarly, on buffalo-dominant farm households, the
potential exists for milk yielders of an average of 5.8 kg/day, while for low-producing buffaloes,
efforts other than ration balancing would also be required.
Required increase in milk productivity and reduction in feed cost for doubling dairy
income from ration balancing
Particulars
Scenario I Low cost-low productivity-low
prices
Scenario II Average cost-average
productivity-average prices Crossbred cow Buffalo Crossbred cow Buffalo
Daily maintenance cost
(Rs./animal) 150 160 200 190
Daily feed cost
(Rs./animal) 105 112 130 123
Milk yield (kg./day) 4.3 3.2 7.3 5.8 Farm gate prices of milk
(Rs./kg.) 25 32 30 38
Target change in real net
income ( per cent) ≥ 100 ≥ 100 ≥ 100 ≥ 100
Warranted change in Milk yield ( per cent) Daily feed cost ( per cent)
35 (5.8)
5
40 (4.5)
11
5 (7.7)
5
5 (6.1)
11 Note: (i) Cost estimates at 2016-17 prices (ii) Milk yield 2015-16 (iii) Prices 2016-17 (iv) Figures
within the parentheses indicate warranted milk yield
Doubling Farmers’ Income – Volume VIII
Animal Husbandry, Dairying & Fisheries
111
In case of calves, dietary interventions in the form of probiotics, prebiotics and combination of
probiotics and prebiotics (synbiotics) can be very useful for improving calf health. Calf health
is a very critical factor affecting the welfare, production and economics of dairy enterprises.
The gastrointestinal microbial population in new born calves is in transition and extremely
sensitive; hence, sudden changes in diet or environment, disease or other stress can cause
alteration in this microbial system. Microbial imbalances might permit the colonization by
pathogenic and opportunistic bacteria and the appearance of many different syndromes with
deleterious effect on host. Moreover, in calves less than 10-day-old, infection with E. coli and
other microorganisms commonly cause severe diarrhea which leads to high levels of morbidity
and mortality. In older calves, gastrointestinal diseases can determine slower growth and lower
average daily weight gain. For several years, antibiotics have been used to prevent disease and
promote growth, but the negative effects are becoming increasingly serious. Probiotics,
prebiotics and combination of probiotics and prebiotics (synbiotics) came up as good adjuvants
to antibiotics. Probiotic are live microorganisms that act beneficially in the host when
administered orally; microorganism most widely studied includes Lactobacill ispecies.
Prebiotic supplementation may be most effective in times of stress or increased pathogen
exposure throughout the calf’s lifetime.
6.5. Interventions for Improvement of Health and Management
Although selecting dairy animals that are suited to the local environment greatly reduces the
risks to productivity posed by animal health and welfare problems, yet in addition to genetic
interventions and providing balanced nutrition to animals, animal health care and management
are essential. Animal health plays an important role in harnessing the expected production
potential of dairy animals. A diseased animal cannot perform to the expected level. Timely
intervention is therefore pivotal in reducing the economic losses due to diseases. Many young
animals die of disease before they can lactate or reproduce. This lowers the yield and farm
income, increases environmental impacts and decreases farmers’ ability to select the best
breeding stock. A large gap exists between the need and the availability of cow side-animals
health service providers. As a result of this, most farmers resort to cheaper alternatives like
engaging quacks, other untrained personnel or self-medication, which may, many a time, do
more harm than providing a cure. The desired interventions for better health, disease control
and management of dairy animals are discussed below.
6.5.1. Preventive health care management program
Strong immunity, which refers to the power to resist infection, whether natural (innate) or
acquired (as by vaccination) is crucial to maintain health in animal production. Here multiple
tiers of pathogens are continually challenging the health, welfare and productivity of the
animals. Prevention of disease requires a multi-dimensional and holistic programme that takes
into account factors ranging from pathogen exposure level on the farm to optimized animal
immunity. There are two broad categories of activities under preventive health care program—
(i) control and immunization against endemic diseases and (ii) disease diagnosis and
surveillance. Preventive health care infrastructure and services are underfunded in India. Of
the total number of veterinarian and para‐veterinary staff (stock assistants and technicians)
Doubling Farmers’ Income – Volume VIII
Animal Husbandry, Dairying & Fisheries
112
working in the livestock health institutions across the country, less than 5 per cent are engaged
in disease investigation and control. Some of the key elements of preventive health care
program in the country include:
Mass vaccination of animals needs to be organised in campaign mode at village level
for most common diseases like FMD, HS, Thcileriosis, Brucellosis etc., so that
maximum number of animals are covered under health care management programs
within a short span of time.
Worm infection in animals causes significant losses to the farmers. Tapeworms, flukes,
roundworms, and other internal parasites leave hazardous effects on cattle’s overall
health. A regular deworming schedule can control significant parasitic infections.
Deworming of animals at a mass level would serve to reduce the egg load of parasites
in the environment significantly, and reduce the chances of re-infection.
Ticks and other blood sucking parasites are a major source of discomfort to the animals
which seriously affect their productivity. They also act as vector for serious diseases
like babesiosis, anaplasmosis, theileriosis and trypanosomiasis. They are also a source
of newly emerging highly fatal zoonotic diseases like Crimean Congo Haemorrhagic
Fever (CCHF). There is need for cost effective tick control program.
After FMD, mastitis is one of the biggest challenges faced by the dairy farmers. Mastitis
infection causes reduced milk yield in animals and entails high cost of treatment, which
greatly affects the income of farmer. About 85 per cent of the milch animals are owned
by marginal and landless farmers who do not have the resources to treat their animals.
It is imperative that cost effective and farmer friendly mastitis control prevention
programs are propagated on large scale, basically aimed at a three-pronged strategy of
detection and control of sub-clinical mastitis, rationalising usage of antibiotics through
use of alternate medicine systems like ethno-veterinary medicine and management of
chronically infected animals which are usually the source of infection to healthy
animals.
6.5.2. Disease reporting, surveillance and diagnosis
Both under-reporting and lack of reporting of diseases is very common in case of livestock. In
most cases, disease reports are based on clinical symptoms and subjective assessment, lacking
laboratory confirmation. Disease outbreak reports are consolidated manually at the block,
district, and state levels, causing dilution of lots of the information at every stage of
consolidation and transmission; and vital detailed information is often permanently lost. The
information flowing through the system is incomplete, and lacks information inputs from non‐
government agencies, private practitioners, and universities. There is little or no cohesiveness
in handling livestock diseases as a national phenomenon and each state acts with little
interaction with its neighbours. There is an ardent need to take the following measures in this
direction:
Conduct organised national surveys of endemic diseases to properly assess incidence
and prevalence.
Doubling Farmers’ Income – Volume VIII
Animal Husbandry, Dairying & Fisheries
113
An ICT based network for epidemiological surveillance including reporting of diseases
incidence, diagnosis and treatment needs to be put in place integrating different
stakeholders and service providers associated with animal health activities.
Strict implementation of “The Prevention and Control of Infectious and Contagious
Diseases in Animals Act, 2009” by strengthening of check posts and real time update
on the incidence of animal diseases. This would be very important so as to check the
spread of the diseases from one region to another. Quarantine stations need to be
established particularly at interstate borders.
Enhancing the accuracy of disease diagnosis by providing diagnostic kits and trained
manpower at least at taluk level.
6.5.3. Strengthening Infrastructure and Services for Curative Health Care
In case of curative health care services, the quality of service delivery is an important
constraint. Despite a vast institutional network both at the central and state level, the animal
health service delivery system is facing many difficulties. The government continues to be the
primary provider of veterinary services, but current budgetary resources cover mainly the
salaries and benefits of full‐time staff in a vast network of veterinary dispensaries, hospitals,
first aid centres leaving few funds for other recurrent needs—such as, drugs and veterinary
supplies. New approaches are necessary to rationalize and reform the animal health sector:
Government should consider devolving the responsibility of delivering curative
veterinary services to the private and other providers (cooperatives, NGOs, etc.).
Curative services are private goods that can be delivered much more efficiently by non‐
state actors. The government should focus its efforts on providing the public goods—
such as disease surveillance and monitoring, regulation, and creating an enabling
environment for private sector and other players to participate.
There is evidence that livestock producers, are willing to pay for quality services, so
there is an objective basis for cost recovery or private provision of such services
alongside government and other providers, such as NGOs and cooperatives.
Complete privatization of government service delivery in the immediate future may not
be feasible, especially in relatively remote and marginal areas. Even in these areas,
however, the government need not be the only or the dominant player. It will be
desirable to work with non‐government organizations and other stakeholders for
sensitizing the poor communities towards creating the demand for these services,
training community‐based health workers for minor treatments, providing drugs and
supplies on cost in areas where the private distribution network is weak, providing
extension advice related to animal husbandry including feeding practices and shelter
innovations, etc.
Given the current concentration of government veterinary centres in relatively better‐
off areas, reducing government presence in curative service delivery in these areas can
release significant resources for transfer of focus on marginal areas.
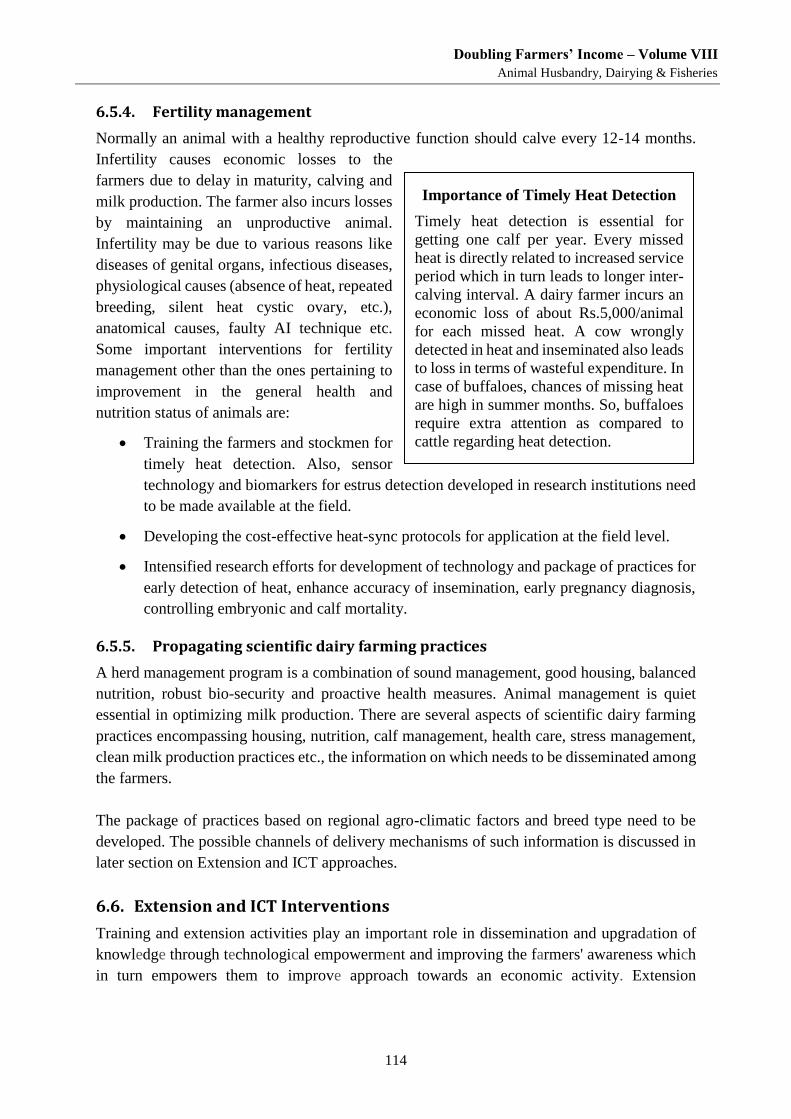
Doubling Farmers’ Income – Volume VIII
Animal Husbandry, Dairying & Fisheries
114
6.5.4. Fertility management
Normally an animal with a healthy reproductive function should calve every 12-14 months.
Infertility causes economic losses to the
farmers due to delay in maturity, calving and
milk production. The farmer also incurs losses
by maintaining an unproductive animal.
Infertility may be due to various reasons like
diseases of genital organs, infectious diseases,
physiological causes (absence of heat, repeated
breeding, silent heat cystic ovary, etc.),
anatomical causes, faulty AI technique etc.
Some important interventions for fertility
management other than the ones pertaining to
improvement in the general health and
nutrition status of animals are:
Training the farmers and stockmen for
timely heat detection. Also, sensor
technology and biomarkers for estrus detection developed in research institutions need
to be made available at the field.
Developing the cost-effective heat-sync protocols for application at the field level.
Intensified research efforts for development of technology and package of practices for
early detection of heat, enhance accuracy of insemination, early pregnancy diagnosis,
controlling embryonic and calf mortality.
6.5.5. Propagating scientific dairy farming practices
A herd management program is a combination of sound management, good housing, balanced
nutrition, robust bio-security and proactive health measures. Animal management is quiet
essential in optimizing milk production. There are several aspects of scientific dairy farming
practices encompassing housing, nutrition, calf management, health care, stress management,
clean milk production practices etc., the information on which needs to be disseminated among
the farmers.
The package of practices based on regional agro-climatic factors and breed type need to be
developed. The possible channels of delivery mechanisms of such information is discussed in
later section on Extension and ICT approaches.
6.6. Extension and ICT Interventions
Training and extension activities play an important role in dissemination and upgradation of
knowledge through technological empowerment and improving the farmers' awareness which
in turn empowers them to improve approach towards an economic activity. Extension
Importance of Timely Heat Detection
Timely heat detection is essential for
getting one calf per year. Every missed
heat is directly related to increased service
period which in turn leads to longer inter-
calving interval. A dairy farmer incurs an
economic loss of about Rs.5,000/animal
for each missed heat. A cow wrongly
detected in heat and inseminated also leads
to loss in terms of wasteful expenditure. In
case of buffaloes, chances of missing heat
are high in summer months. So, buffaloes
require extra attention as compared to
cattle regarding heat detection.
Doubling Farmers’ Income – Volume VIII
Animal Husbandry, Dairying & Fisheries
115
programmes motivate people at field level to participate actively and put efforts in right
direction by efficiently utilizing resources.
Effective delivery of extension services is critical to achieve higher milk productivity.
Currently, less than 1 per cent of the total plan budget for the animal husbandry sector is
allocated for extension activities. Some of the desired interventions required in the field of
extension are:
A team comprising experts/professionals can be formed at village level for providing
dairy extension services. The team may help in imparting good dairy practices among
dairy farmers and in providing assistance to the problems like diseases, feeding,
processing, and marketing and in overall management of dairy farm.
Peer to peer learning among dairy farmers can be effective tool for disseminating best
practices of dairying. There are many progressive farmers who can be resource persons
and can be equipped with Micro Training Centres. MTC aims at creating centres of
learning locally to demonstrate scientific dairy practices through cross learning. It will
be especially very useful for the women who find it challenging to travel long distance
for trainings.
Dedicated training centres for Animal Husbandry activities (Pashu Vigyan Kendra) in
the pattern of Krishi Vigyan Kendra can be initiated for promoting economically viable
dairy (20-30 animals) farms . These centres may demonstrate and train the farmers with
hands on experience in managing the farm with minimum investment on fixed
infrastructure. This intervention may attract rural youths
Collaborative and innovative dairy farming models have a critical role to play. Models
like large scale dairy farms with ownership of cattle remaining with the farmers, model
where large scale dairy farm is the hub & satellite farms are spokes, medium scale dairy
farms with anchor processors, community dairy farms with ‘cow hostel’ models are
some innovations which may give dairy farming system the required scale and at the
same time integrate the small and medium dairy farmers. Public- private partnership
(PPP) models need to be developed for the areas which are yet to be sufficiently
attractive for private investments.
On the model of ASHA worker in health sector, the concept of ‘Pashu Sakhi’ can be
promoted. Locally selected and trained resources can serve as the first point of service
providers in the animal health chain. Pashu Sakhis, can be trained to provide preventive
health services including vaccination initiatives. They can be connected with Veterinary
Dispensaries/Clinics at sub-Taluk level/GP level and further up the hierarchy with
Taluk level Veterinary Hospital.
Effective use of many communication aids in dissemination of knowledge may help
dairy farmers in creating awareness for scientific dairying. Possible use of media for
dissemination are shown below.
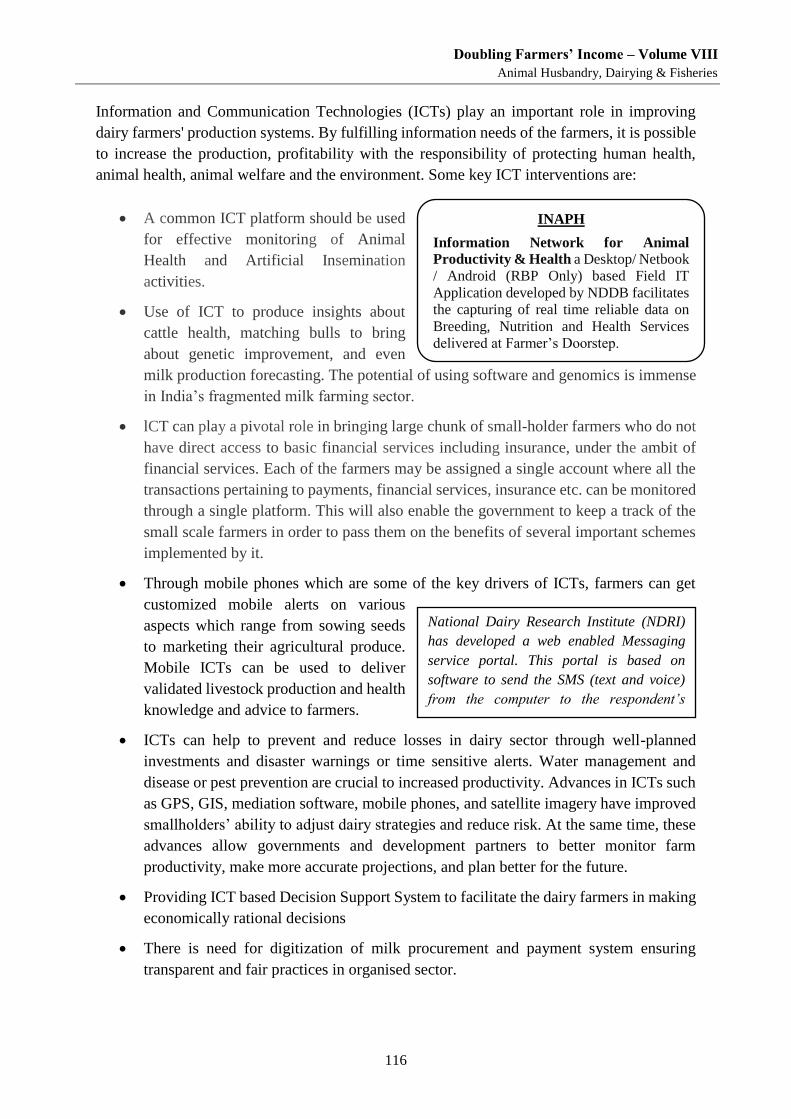
Doubling Farmers’ Income – Volume VIII
Animal Husbandry, Dairying & Fisheries
116
Information and Communication Technologies (ICTs) play an important role in improving
dairy farmers' production systems. By fulfilling information needs of the farmers, it is possible
to increase the production, profitability with the responsibility of protecting human health,
animal health, animal welfare and the environment. Some key ICT interventions are:
A common ICT platform should be used
for effective monitoring of Animal
Health and Artificial Insemination
activities.
Use of ICT to produce insights about
cattle health, matching bulls to bring
about genetic improvement, and even
milk production forecasting. The potential of using software and genomics is immense
in India’s fragmented milk farming sector.
lCT can play a pivotal role in bringing large chunk of small-holder farmers who do not
have direct access to basic financial services including insurance, under the ambit of
financial services. Each of the farmers may be assigned a single account where all the
transactions pertaining to payments, financial services, insurance etc. can be monitored
through a single platform. This will also enable the government to keep a track of the
small scale farmers in order to pass them on the benefits of several important schemes
implemented by it.
Through mobile phones which are some of the key drivers of ICTs, farmers can get
customized mobile alerts on various
aspects which range from sowing seeds
to marketing their agricultural produce.
Mobile ICTs can be used to deliver
validated livestock production and health
knowledge and advice to farmers.
ICTs can help to prevent and reduce losses in dairy sector through well-planned
investments and disaster warnings or time sensitive alerts. Water management and
disease or pest prevention are crucial to increased productivity. Advances in ICTs such
as GPS, GIS, mediation software, mobile phones, and satellite imagery have improved
smallholders’ ability to adjust dairy strategies and reduce risk. At the same time, these
advances allow governments and development partners to better monitor farm
productivity, make more accurate projections, and plan better for the future.
Providing ICT based Decision Support System to facilitate the dairy farmers in making
economically rational decisions
There is need for digitization of milk procurement and payment system ensuring
transparent and fair practices in organised sector.
INAPH
Information Network for Animal
Productivity & Health a Desktop/ Netbook
/ Android (RBP Only) based Field IT
Application developed by NDDB facilitates
the capturing of real time reliable data on
Breeding, Nutrition and Health Services
delivered at Farmer’s Doorstep.
National Dairy Research Institute (NDRI)
has developed a web enabled Messaging
service portal. This portal is based on
software to send the SMS (text and voice)
from the computer to the respondent’s
mobile phone.
Doubling Farmers’ Income – Volume VIII
Animal Husbandry, Dairying & Fisheries
117
At the organisation level, use of lCT can be made to manage data thereby increasing
operational efficiency
Use of advanced ICT tools like Dairy Toolbox, INAPH, DRASTIC, etc. need to be
popularised among dairy farming community for faster and precise information.
6.7. Recent Institutional Initiatives for Dairy and Animal Husbandry Development
There have been several government initiatives for promoting livestock development in the country for
the improvement of production of cattle, goat, sheep, pig and poultry in the country. Schemes and
programs are rolled out viz. various agencies of Central and State Governments, Dairy
Cooperative Federations, NGOs, corporate houses etc. to support dairy development and
animal husbandry in the country. Some of these initiatives are outlined below:
National Livestock Mission: The National Livestock Mission (NLM) commenced from 2014-
15 to cover all the activities required to ensure quantitative and qualitative improvement in
livestock production systems and capacity building of all stakeholders. This Mission is
formulated with the objective of sustainable development of livestock sector, focusing on
improving availability of quality feed and fodder. This mission is implemented in all the states
including the Himalayan state of Sikkim. The Mission has four sub-missions; namely,
Fodder and Feed Development, Livestock Development, Pig Development in North-
Eastern Region and Skill Development, Technology Transfer and Extension.
The second sub-mission on Livestock Development has provisions for productivity
enhancement, entrepreneurship development and employment generation (bankable projects),
strengthening of infrastructure of state farms with respect to modernisation, automation and
bio-security, conservation of threatened breeds, minor livestock development, rural slaughter
houses, fallen animals and livestock insurance.
DRASTIC
Dairy rationing system for tropics is a decision support system tool for planning
dairy feeding under tropical conditions. It gives information on nutritional quality
of available feeds- particularly of the basal ration.
Dairy Toolbox
Developed by ILRI & ICRISAT. It contains simple decision support tools and a
broad range of modular information covering dairy-related topics including
feeding, breeding, health, general management and economics, that can be easily
searched via key-words, accessed and compiled to form customized fact-sheets,
or other extension materials, on a wide range of dairy related topics. It gives
extension workers the opportunity to produce customized extension materials that
meet the real needs of the farmers they serve.
Doubling Farmers’ Income – Volume VIII
Animal Husbandry, Dairying & Fisheries
118
National Programme for Bovine Breeding and Dairy Development (NPBBD) has been
initiated in February 2014 by merging four ongoing schemes of the Department of Animal
Husbandry, Dairying and Fisheries in the dairy sector, viz., National Project for Cattle and
Buffalo Breeding (NPCBB), Intensive Dairy Development Programme (IDDP), Strengthening
Infrastructure for Quality & Clean Milk Production (SIQ & CMP) and Assistance to
Cooperatives (A-C). This has been done with a view to integrating milk production and
dairying activities in a scientific and holistic manner, so as to attain higher levels of milk
production and productivity, to meet the increasing demand for milk in the country. The
Scheme has two components (a) National Programme for Bovine Breeding (NPBB) and (b)
National Programme for Dairy Development (NPDD).
The scheme in implementation emphasis on arranging quality Artificial Insemination services
at farmers’ doorstep; to bring all breedable females under organised breeding through Artificial
Insemination or natural service using germplasm of high genetic merits; to conserve, develop
and proliferate selected indigenous bovine breeds of high socio-economic importance; to
provide quality breeding inputs in breeding tracts of important indigenous breeds so as to
prevent the breeds from deterioration and extinction.
Govt. of India’s Rashtriya Gokul Mission (RGM) is a focussed project under National
Programme for Bovine Breeding and Dairy Development, and had an outlay of Rs 500 crore
for three years from 2014-15 to 2016-17. The Mission also envisages establishment of
integrated cattle development centres, Gokul Grams to develop indigenous breeds including
upto 40 per cent nondescript breeds. It is implemented through State Implementing Agencies
(SIA) viz. Livestock Development Boards. The allocation for the Mission for the period 2017-
18 to 2019-20 is Rs.1012.5 crore.
National Mission on Bovine Productivity: Government of India rolled out National Mission
on Bovine Productivity scheme in November 2016 with the objective to enhance milk
production and productivity of indigenous bovine breeds and thereby making animal
husbandry more remunerative to the farmers. The scheme comprises following components.
- Pashu Sanjivini: Pashu Sanjivini is an animal wellness programme; encompassing
provision of animal health cards (‘Nakul Swasthya Patra’) along with an unique
identification number (UID) for animals in milk and uploading data base. Under the
scheme, as may as 9 crore number of animals in milk are being identified by assigning
UID and further the data is being uploaded in the INAPH database. The Health card
contains information on vaccination, deworming and treatment details.
- Advanced Reproductive Technology: Assisated Reproductive Technique is being
used to improve availibility of disease free indigenous female bovines through sex
sorted technology. The scheme envisages creation of facility for productio of 16 million
doses annually. Under the scheme, 50 embryo transrfer technology labs with In Vitro
Doubling Farmers’ Income – Volume VIII
Animal Husbandry, Dairying & Fisheries
119
Fertlization capacity are being established for exponential multiplication of elite
animals of indigeneous breeds.
- E Pashuhaat: E Pashuhaat is a portal developed for connecting breeders and farmers
of indigeneous breeds regarding availibility of quality bovine germplasm. The
farmners/breeders may sell or purchase ther breeding stock through the portal.
- National Bovine Genomic Centre: National Bovine Genomic Centre has been
established with the objective to increase milk production and productivity of
indigenous cattle. By using genomic selection indigenous bovine breeds can be made
viable within few generations.
National Dairy Plan Phase I is a Central Sector Scheme being implemented by the National
Dairy Development Board (NDDB) through End Implementing Agencies (EIA) for a period of
2011-12 to 2018-19. NDP I is a scientifically planned multi-state initiative. Its various
components are:
- Productivity Enhancement: This component aims at increasing bovine productivity
through a scientific approach to animal breeding and nutrition. The expected results
from the interventions proposed under this Component are many increased milk
production through increased productivity per milk animal, increase in number of in-
milk animals, improved AI conception rates, improved animal nutrition, reduction in
feeding costs per Kg of milk produced and reduction in methane release per Kg of milk
produced by animals covered under Ration Balancing Program (RBP).
- Village based Milk Procurement Systems: Efforts to increase milk production
through increase in productivity would need to be supported by expanding the network
of village based milk procurement systems to collect milk in a fair and transparent
manner and ensure timely payments. Investments in village level infrastructure for milk
collection and bulking such as milk cans, bulk milk coolers for a cluster of villages,
associated weighing and testing equipment and related IT equipment would be made.
The important expected results from the interventions proposed under this initiative are
an increase in the number of additional villages covered and more milk producers
organised into Dairy Cooperative Societies and Milk Producer Institutions. The
organised sector is still small and needs to grow in the interest of farmers.
- Project Management and Learning: The main results expected under this component
are effective coordination of project activities among various EIAs, timely preparation
and implementation of annual plans, regular review and reporting of project progress
and results, a comprehensive and functional project management information system
(MIS) and learning that will support improvement and innovation. Importantly, it will
also facilitate the development of the skills and knowledge of personnel involved in the
implementation of the project and develops capabilities for enhanced capacity building
which would extend beyond the life of the project.
Doubling Farmers’ Income – Volume VIII
Animal Husbandry, Dairying & Fisheries
120
Dairy Entrepreneurship Development Scheme: The Department of Animal Husbandry,
Dairying and Fisheries (DAHD&F), GoI launched a pilot scheme titled “Venture Capital
Scheme for Dairy and Poultry” in the year 2005-06. The main objective of the scheme was to
extend assistance for setting up small dairy farms and other components to bring structural
changes in the dairy sector. During a mid-term evaluation of the scheme, certain
recommendations were made to accelerate the pace of implementation of the scheme.
Taking into account the recommendations of the evaluation study and the representations
received from various quarters including the farmers, state governments and banks, DAHD&F
decided to make some key changes to the scheme, including changing its name to Dairy
Entrepreneurship Development Scheme (DEDS). The revised scheme has come into operation
with effect from 1 September 2010. The objectives of the scheme are to promote setting up of
modern dairy farms for production of clean milk, to encourage heifer calf rearing, thereby
conserving good breeding stock, to bring structural changes in the unorganised sector so that
initial processing of milk can be taken up at the village level itself, to upgrade the quality and
traditional technology to handle milk on a commercial scale and to generate self-employment
and provide infrastructure mainly for unorganised sector. Farmers, individual entrepreneurs,
NGOs, companies, groups of organised and unorganised sectors, etc. Groups of organised
sector include Self-help Groups (SHGs), dairy cooperative societies, milk unions, milk
federations, etc. and they can take advantage of this scheme.
Dairy Processing & Infrastructure Development Fund: Government of India has approved
creation of ‘Dairy Processing & Infrastructure Development Fund (DIDF)’ under Central
Sector Scheme in December 2017. The DIDF with a total investment outlay of Rs. 10,881 crore
comprising Rs. 8004 crore as a loan from National Bank for Agriculture and Rural
Development (NABARD), Rs. 2001 crore as End Borrower’s contribution, Rs. 864 crore as
GoI’s Interest Subvention and Rs. 12 crore by National Dairy Development Board (NDDB)
and National Cooperative Development Corporation (NCDC), on pro rata basis towards
Project Management & Learning. Funding will be in the form of interest bearing loan, which
will flow from NABARD to NDDB/NCDC and in turn to eligible End Borrowers. The
components of the scheme are:
Modernisation & creation of new milk processing facilities
Manufacturing facilities for value added products
Milk Chilling infrastructure
Setting up electronic milk testing equipment
Project management and learning
Any other activity related to the dairy sector targeted to contribute to the objectives
of DIDF, as decided by Government of India in consultation with the stakeholders.
Doubling Farmers’ Income – Volume VIII
Animal Husbandry, Dairying & Fisheries
121
Scheme for establishment of Hi-Tech & Mini Dairy Units: This scheme was approved by
the State of Haryana in its Budget for the year 2017-18 providing a sum of Rs. 10.00 crore.
Haryana state is proud to be the home-tract of one of the best buffalo breeds of the world i.e.
'Murrah'. Buffalo has also been recognized to be the animal of the 21st Century and thus,
systematic improvement of buffaloes for milk production of the country is a necessity.
Strategic Productivity Enhancement Programme (SPEP) initiated by Gujarat Cooperative
Milk Marketing Federation (GCMMF) has been designed with an aim to develop a genetically
improved animal with high productivity. It initiates with the selection of elite animals, to
develop pure bred cows and buffaloes with high genetic potential by adopting Pure Breeding
Programme. This programme comprises three sub programmes which can be implemented
across India with certain objectives like registration of all animals covered under AI,
upgradation and improving productivity of state specific cattle and buffalo breeds, elite/
superior animal identification, registration and breeding with high genetic merit semen, milk
recording of elite/ superior animals for bull mother farm, genetic up gradation of non-descript
animal breeds and calf rearing programme.
GCMMF has already implemented Strategic Calf Rearing Programme with objectives to
achieve reduced age at first calving, inter-calving interval and improved productive life of dairy
animals. The major activities of Calf rearing programme include village awareness programme,
debudding, mass vaccination and deworming, distribution of naval kits/milk replacer / calf
starter/cattle feed and mineral mixture etc. and calf rally.
Other initiatives for the genetic improvement of animals include, establishment of Cattle
Breeding Farms, National Kamadhenu Breeding Centre, Central Herd Registration Scheme
(CHRS) and Central Frozen Semen Production and Training Institute. Seven central cattle
breeding farms have been established for production and supply of high genetic merit bulls of
indigenous breeds (Tharparkar & Red Sindhi cattle breeds and Murrah and Surti buffalo
breeds).
National Kamadhenu Breeding Centers (NKBC) are set up as a Centre of Excellence. A
Nucleus Herd of all the Indigenous Bovine Breeds (41 cattle and 13 Buffaloes) will be
conserved and developed with the aim of enhancing their productivity and upgrading their
genetic makeup. The NKBC will act as repository of germplasm of all indigenous breeds and
supply certified germplasm to the farmers undertaking rearing of indigenous breeds. Under the
CHRS, four units have been established for identification and propagation of indigenous bovine
breeds (Gir, Kankrej, Hariana & Ongole cattle breeds and Murrah, Mehsani, Jaffarabadi and
Surti). The Central Frozen Semen Production and Training Institute is undertaking production
and supply of semen doses of high genetic merit bulls of indigenous breeds (Red Sindhi,
Tharparkar and Murrah buffalo).
In the field of animal nutrition, besides Ration Balancing Program other important initiatives
are Mineral Mapping Programme and Quality Mark. The NDDB has done mineral mapping in
Doubling Farmers’ Income – Volume VIII
Animal Husbandry, Dairying & Fisheries
122
most of the major dairying states to improve both productivity and productive life; and
supplementation of area specific mineral mixture in ration of dairy animals. Also NDDB has
initiated implementation of common ‘Quality Mark’ for various variants of cattle feed and
mineral mixtures manufactured in the cooperative, government/semi-governments sector.
Currently there are no specific regulations to monitor the quality of cattle feed and mineral
mixtures produced and sold in India.
In order to reduce morbidity and mortality, various efforts are made by governments to provide
better health care through Policlinics/Veterinary Hospitals, Dispensaries and First Aid Centres
including Mobile Veterinary Dispensaries. Animal Quarantine and Certification Service
(AQCS) stations are setup to prevent the ingress of dangerous exotic diseases and diseases of
National importance into the country through imported livestock and livestock products.
Zoonosis and one health policy of WHO are also the components of AQCS.
National Veterinary Biological Products Quality Control Centre has been established at
Baghpat, Uttar Pradesh to undertake the quality control and assurance of standard, efficient and
safe veterinary biological in India and to act as a nodal institute to recommend licensing of
veterinary vaccines in the country with a vision to promote healthy and productive livestock in
Indian subcontinent using standard, efficient and safe veterinary biological. One Central and
five Regional Disease Diagnostic Laboratories have been setup in the country by GoI in order
to provide referral services over and above the 250 existing disease diagnostic laboratories.
The Centre for Animal Disease Research and Diagnosis of Indian Veterinary Research
Institute, Izatnagr is functioning as Central Laboratory. National Project on Rinderpest
Surveillance and Monitoring system has been set up with the objective of strengthening the
veterinary services to maintain required vigil to sustain the country’s freedom from Rinderpest
and Contagious Bovine Pleuropneumonia infection secured in May, 2006 and May, 2007
respectively. Under the programme, Surveillance of various animal disease including
Syndromic diseases with more focus on Contagious Bovine Pleuropneumonia and Bovine
Spongiform Encephalopathy are being undertaken in the country to maintain India’s freedom
status from these diseases. Foot & Mouth Disease Control Program is being implemented to
prevent economic losses due to Foot & Mouth Disease and to develop herd immunity in cloven-
footed animals.
National Animal Disease Reporting System (NADRS) is a web based Information Technology
system developed in order to streamline the system of animal disease reporting from the
states/UTs. The main objective of NADRS system is to record and monitor livestock disease
situation in the country with a view to initiate preventive and curative action in a timely and
speedy manner.
There are several developmental agencies that are operating in some states while in others the
outreach is negligible. Funds are received by various agencies for similar activities also. This
leads to duplication of efforts. It is suggested to have effective convergence among all the
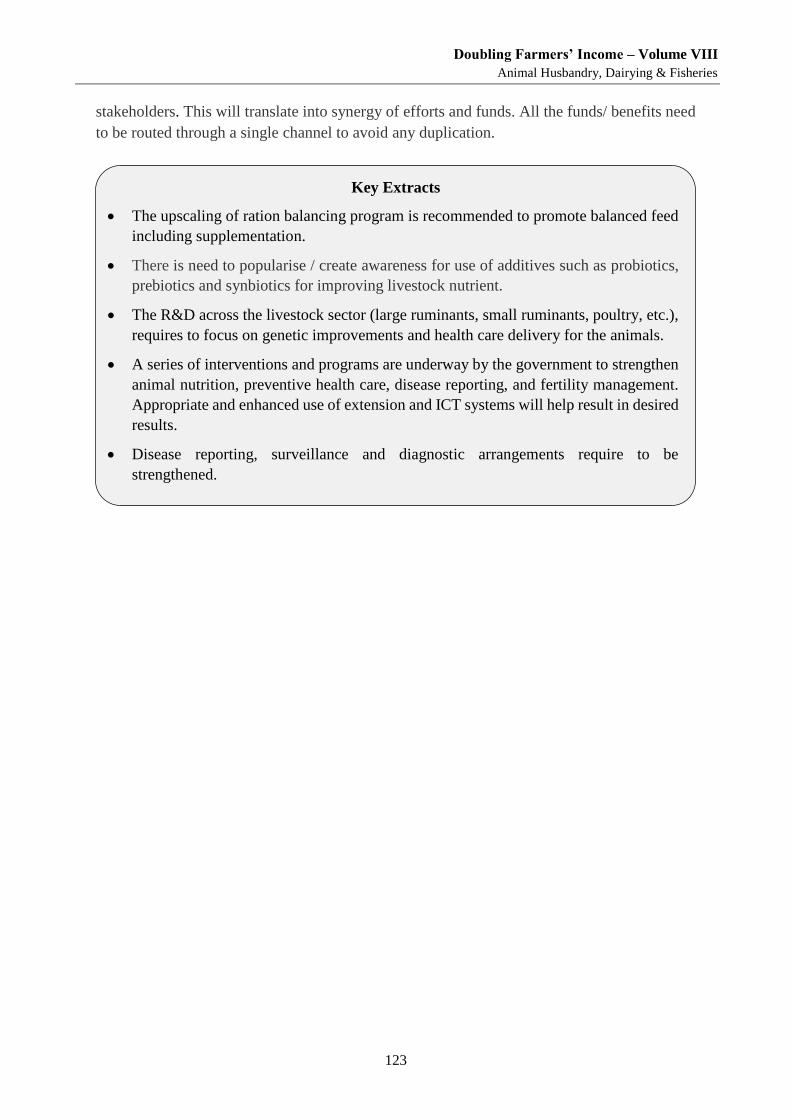
Doubling Farmers’ Income – Volume VIII
Animal Husbandry, Dairying & Fisheries
123
stakeholders. This will translate into synergy of efforts and funds. All the funds/ benefits need
to be routed through a single channel to avoid any duplication.
Key Extracts
The upscaling of ration balancing program is recommended to promote balanced feed
including supplementation.
There is need to popularise / create awareness for use of additives such as probiotics,
prebiotics and synbiotics for improving livestock nutrient.
The R&D across the livestock sector (large ruminants, small ruminants, poultry, etc.),
requires to focus on genetic improvements and health care delivery for the animals.
A series of interventions and programs are underway by the government to strengthen
animal nutrition, preventive health care, disease reporting, and fertility management.
Appropriate and enhanced use of extension and ICT systems will help result in desired
results.
Disease reporting, surveillance and diagnostic arrangements require to be
strengthened.
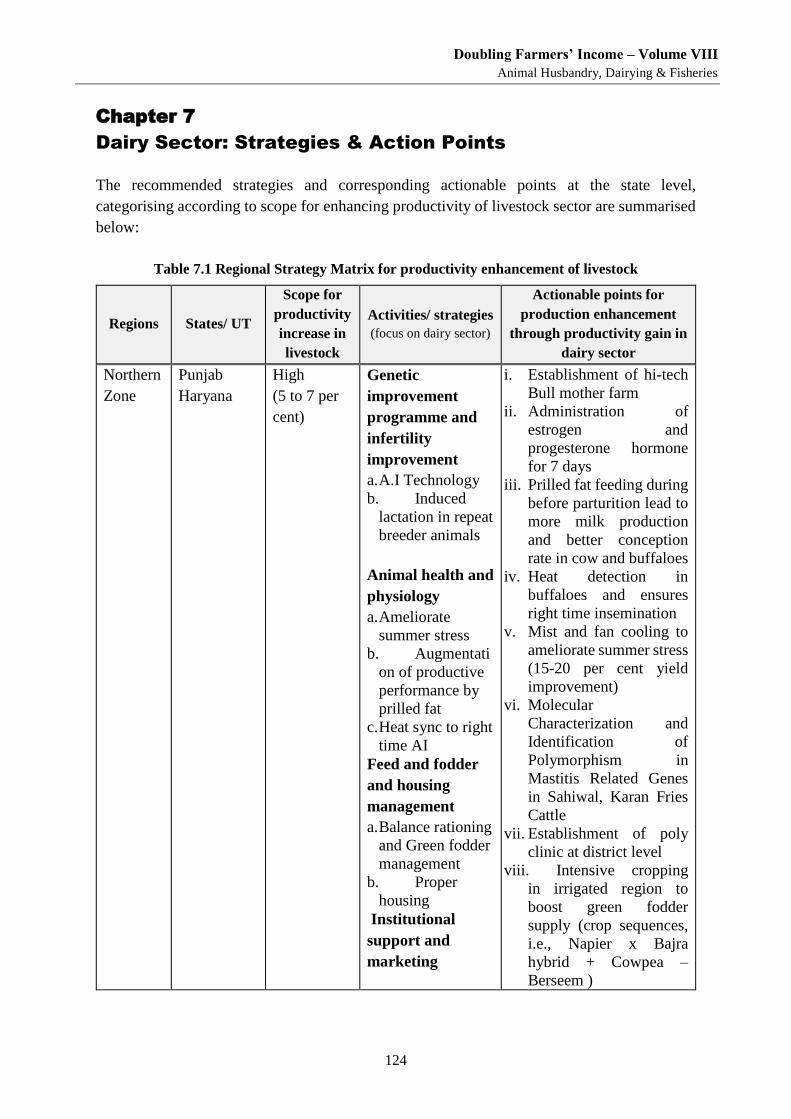
Doubling Farmers’ Income – Volume VIII
Animal Husbandry, Dairying & Fisheries
124
Chapter 7
Dairy Sector: Strategies & Action Points
The recommended strategies and corresponding actionable points at the state level,
categorising according to scope for enhancing productivity of livestock sector are summarised
below:
Table 7.1 Regional Strategy Matrix for productivity enhancement of livestock
Regions States/ UT
Scope for
productivity
increase in
livestock
Activities/ strategies
(focus on dairy sector)
Actionable points for
production enhancement
through productivity gain in
dairy sector
Northern
Zone
Punjab
Haryana
High
(5 to 7 per
cent)
Genetic
improvement
programme and
infertility
improvement
a. A.I Technology
b. Induced
lactation in repeat
breeder animals
Animal health and
physiology
a. Ameliorate
summer stress
b. Augmentati
on of productive
performance by
prilled fat
c. Heat sync to right
time AI
Feed and fodder
and housing
management
a. Balance rationing
and Green fodder
management
b. Proper
housing
Institutional
support and
marketing
i. Establishment of hi-tech
Bull mother farm
ii. Administration of
estrogen and
progesterone hormone
for 7 days
iii. Prilled fat feeding during
before parturition lead to
more milk production
and better conception
rate in cow and buffaloes
iv. Heat detection in
buffaloes and ensures
right time insemination
v. Mist and fan cooling to
ameliorate summer stress
(15-20 per cent yield
improvement)
vi. Molecular
Characterization and
Identification of
Polymorphism in
Mastitis Related Genes
in Sahiwal, Karan Fries
Cattle
vii. Establishment of poly
clinic at district level
viii. Intensive cropping
in irrigated region to
boost green fodder
supply (crop sequences,
i.e., Napier x Bajra
hybrid + Cowpea –
Berseem )
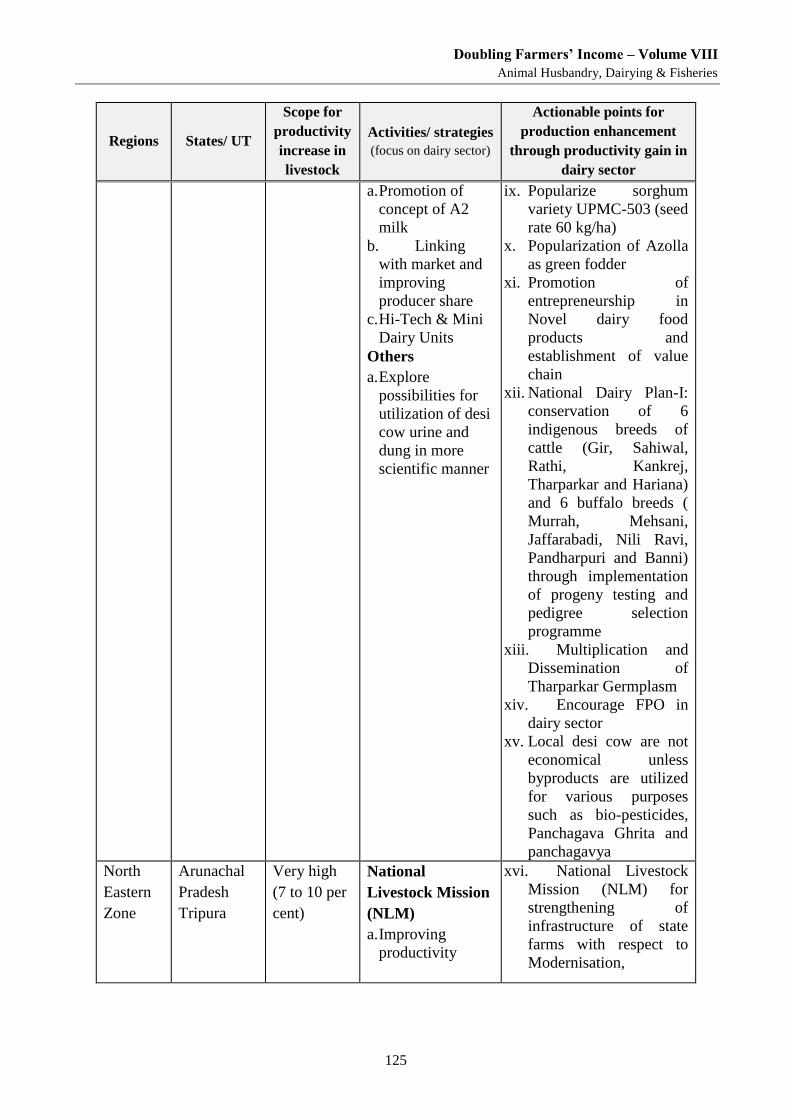
Doubling Farmers’ Income – Volume VIII
Animal Husbandry, Dairying & Fisheries
125
Regions States/ UT
Scope for
productivity
increase in
livestock
Activities/ strategies
(focus on dairy sector)
Actionable points for
production enhancement
through productivity gain in
dairy sector
a. Promotion of
concept of A2
milk
b. Linking
with market and
improving
producer share
c. Hi-Tech & Mini
Dairy Units
Others
a. Explore
possibilities for
utilization of desi
cow urine and
dung in more
scientific manner
ix. Popularize sorghum
variety UPMC-503 (seed
rate 60 kg/ha)
x. Popularization of Azolla
as green fodder
xi. Promotion of
entrepreneurship in
Novel dairy food
products and
establishment of value
chain
xii. National Dairy Plan-I:
conservation of 6
indigenous breeds of
cattle (Gir, Sahiwal,
Rathi, Kankrej,
Tharparkar and Hariana)
and 6 buffalo breeds (
Murrah, Mehsani,
Jaffarabadi, Nili Ravi,
Pandharpuri and Banni)
through implementation
of progeny testing and
pedigree selection
programme
xiii. Multiplication and
Dissemination of
Tharparkar Germplasm
xiv. Encourage FPO in
dairy sector
xv. Local desi cow are not
economical unless
byproducts are utilized
for various purposes
such as bio-pesticides,
Panchagava Ghrita and
panchagavya
North
Eastern
Zone
Arunachal
Pradesh
Tripura
Very high
(7 to 10 per
cent)
National
Livestock Mission
(NLM)
a. Improving
productivity
xvi. National Livestock
Mission (NLM) for
strengthening of
infrastructure of state
farms with respect to
Modernisation,
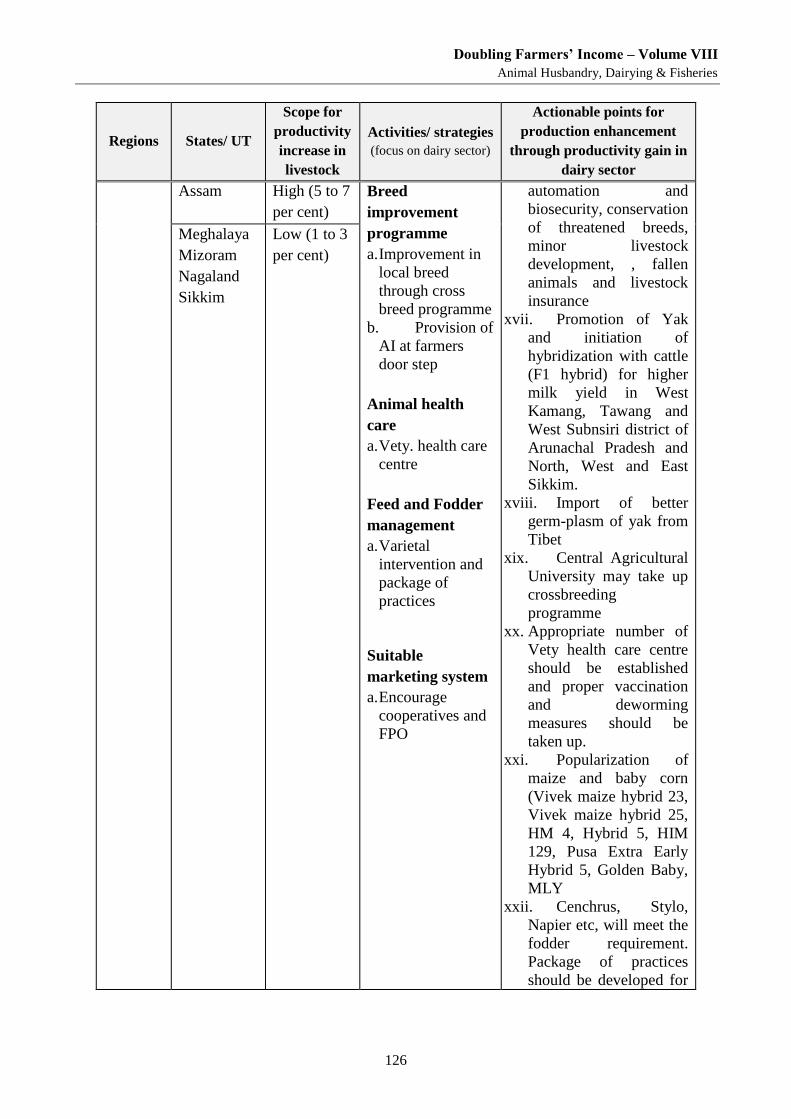
Doubling Farmers’ Income – Volume VIII
Animal Husbandry, Dairying & Fisheries
126
Regions States/ UT
Scope for
productivity
increase in
livestock
Activities/ strategies
(focus on dairy sector)
Actionable points for
production enhancement
through productivity gain in
dairy sector
Assam High (5 to 7
per cent)
Breed
improvement
programme
a. Improvement in
local breed
through cross
breed programme
b. Provision of
AI at farmers
door step
Animal health
care
a. Vety. health care
centre
Feed and Fodder
management
a. Varietal
intervention and
package of
practices
Suitable
marketing system
a. Encourage
cooperatives and
FPO
automation and
biosecurity, conservation
of threatened breeds,
minor livestock
development, , fallen
animals and livestock
insurance
xvii. Promotion of Yak
and initiation of
hybridization with cattle
(F1 hybrid) for higher
milk yield in West
Kamang, Tawang and
West Subnsiri district of
Arunachal Pradesh and
North, West and East
Sikkim.
xviii. Import of better
germ-plasm of yak from
Tibet
xix. Central Agricultural
University may take up
crossbreeding
programme
xx. Appropriate number of
Vety health care centre
should be established
and proper vaccination
and deworming
measures should be
taken up.
xxi. Popularization of
maize and baby corn
(Vivek maize hybrid 23,
Vivek maize hybrid 25,
HM 4, Hybrid 5, HIM
129, Pusa Extra Early
Hybrid 5, Golden Baby,
MLY
xxii. Cenchrus, Stylo,
Napier etc, will meet the
fodder requirement.
Package of practices
should be developed for
Meghalaya
Mizoram
Nagaland
Sikkim
Low (1 to 3
per cent)
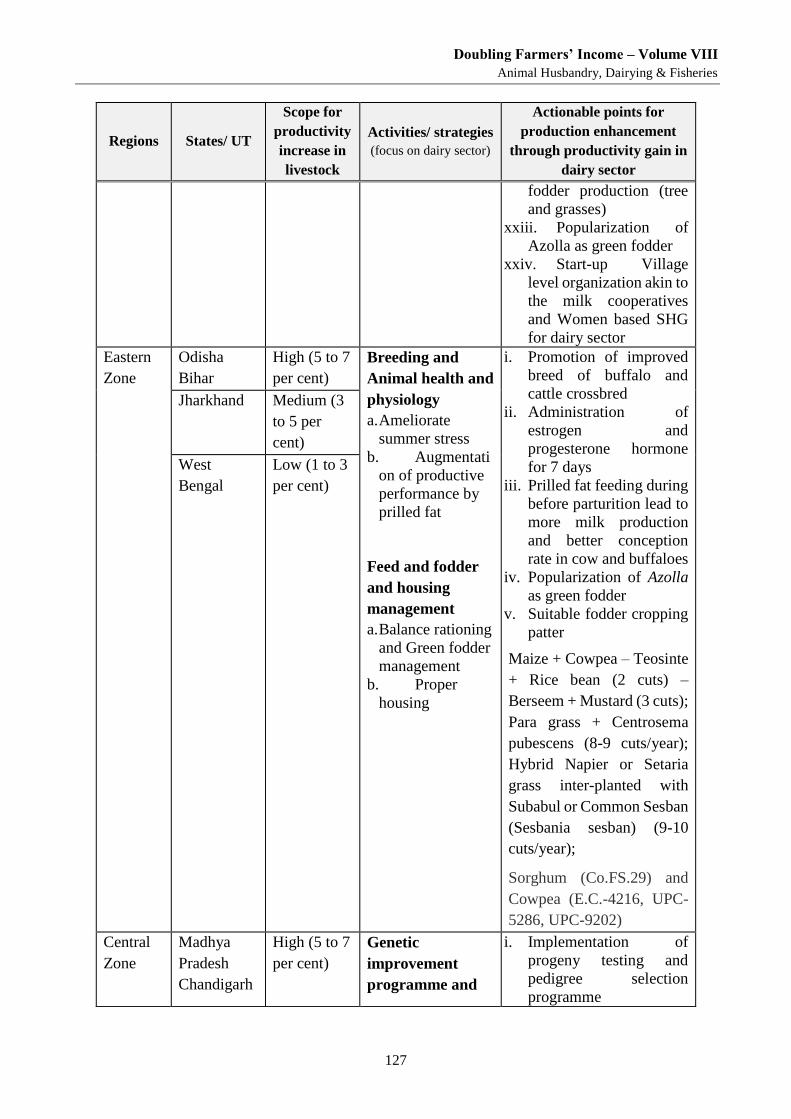
Doubling Farmers’ Income – Volume VIII
Animal Husbandry, Dairying & Fisheries
127
Regions States/ UT
Scope for
productivity
increase in
livestock
Activities/ strategies
(focus on dairy sector)
Actionable points for
production enhancement
through productivity gain in
dairy sector
fodder production (tree
and grasses)
xxiii. Popularization of
Azolla as green fodder
xxiv. Start-up Village
level organization akin to
the milk cooperatives
and Women based SHG
for dairy sector
Eastern
Zone
Odisha
Bihar
High (5 to 7
per cent)
Breeding and
Animal health and
physiology
a. Ameliorate
summer stress
b. Augmentati
on of productive
performance by
prilled fat
Feed and fodder
and housing
management
a. Balance rationing
and Green fodder
management
b. Proper
housing
i. Promotion of improved
breed of buffalo and
cattle crossbred
ii. Administration of
estrogen and
progesterone hormone
for 7 days
iii. Prilled fat feeding during
before parturition lead to
more milk production
and better conception
rate in cow and buffaloes
iv. Popularization of Azolla
as green fodder
v. Suitable fodder cropping
patter
Maize + Cowpea – Teosinte
+ Rice bean (2 cuts) –
Berseem + Mustard (3 cuts);
Para grass + Centrosema
pubescens (8-9 cuts/year);
Hybrid Napier or Setaria
grass inter-planted with
Subabul or Common Sesban
(Sesbania sesban) (9-10
cuts/year);
Sorghum (Co.FS.29) and
Cowpea (E.C.-4216, UPC-
5286, UPC-9202)
Jharkhand
Medium (3
to 5 per
cent)
West
Bengal
Low (1 to 3
per cent)
Central
Zone
Madhya
Pradesh
Chandigarh
High (5 to 7
per cent)
Genetic
improvement
programme and
i. Implementation of
progeny testing and
pedigree selection
programme
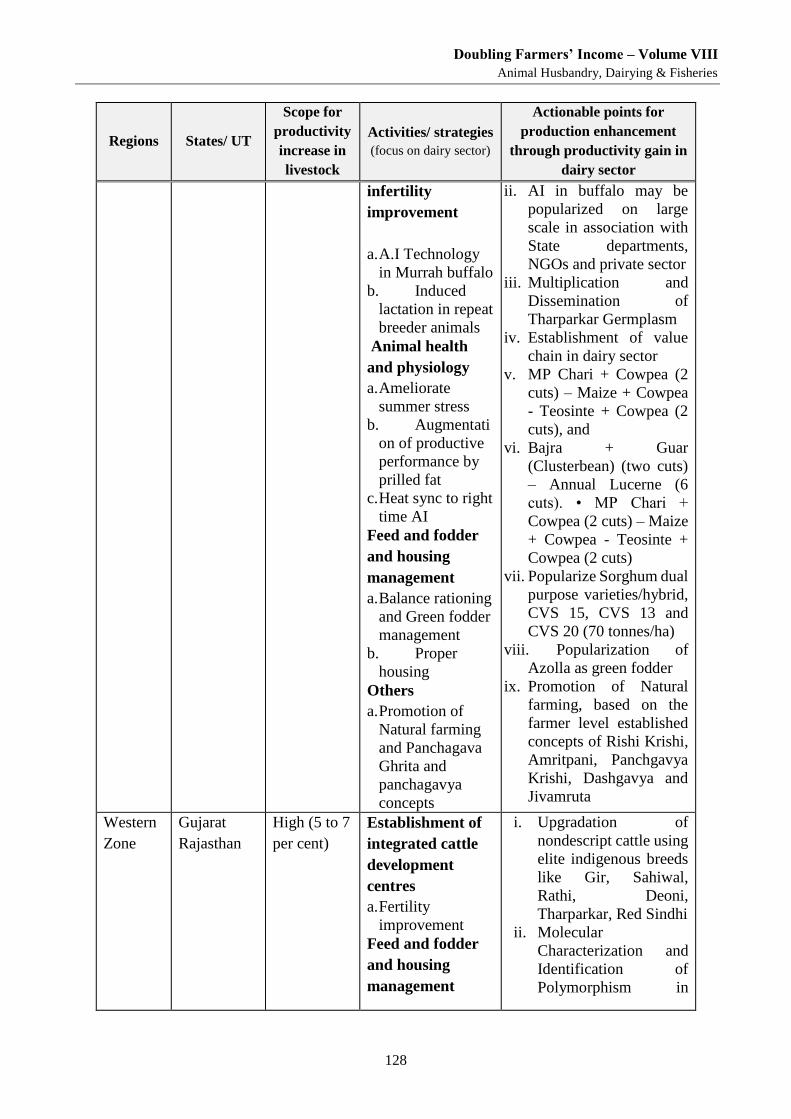
Doubling Farmers’ Income – Volume VIII
Animal Husbandry, Dairying & Fisheries
128
Regions States/ UT
Scope for
productivity
increase in
livestock
Activities/ strategies
(focus on dairy sector)
Actionable points for
production enhancement
through productivity gain in
dairy sector
infertility
improvement
a. A.I Technology
in Murrah buffalo
b. Induced
lactation in repeat
breeder animals
Animal health
and physiology
a. Ameliorate
summer stress
b. Augmentati
on of productive
performance by
prilled fat
c. Heat sync to right
time AI
Feed and fodder
and housing
management
a. Balance rationing
and Green fodder
management
b. Proper
housing
Others
a. Promotion of
Natural farming
and Panchagava
Ghrita and
panchagavya
concepts
ii. AI in buffalo may be
popularized on large
scale in association with
State departments,
NGOs and private sector
iii. Multiplication and
Dissemination of
Tharparkar Germplasm
iv. Establishment of value
chain in dairy sector
v. MP Chari + Cowpea (2
cuts) – Maize + Cowpea
- Teosinte + Cowpea (2
cuts), and
vi. Bajra + Guar
(Clusterbean) (two cuts)
– Annual Lucerne (6
cuts). • MP Chari +
Cowpea (2 cuts) – Maize
+ Cowpea - Teosinte +
Cowpea (2 cuts)
vii. Popularize Sorghum dual
purpose varieties/hybrid,
CVS 15, CVS 13 and
CVS 20 (70 tonnes/ha)
viii. Popularization of
Azolla as green fodder
ix. Promotion of Natural
farming, based on the
farmer level established
concepts of Rishi Krishi,
Amritpani, Panchgavya
Krishi, Dashgavya and
Jivamruta
Western
Zone
Gujarat
Rajasthan
High (5 to 7
per cent)
Establishment of
integrated cattle
development
centres
a. Fertility
improvement
Feed and fodder
and housing
management
i. Upgradation of
nondescript cattle using
elite indigenous breeds
like Gir, Sahiwal,
Rathi, Deoni,
Tharparkar, Red Sindhi
ii. Molecular
Characterization and
Identification of
Polymorphism in
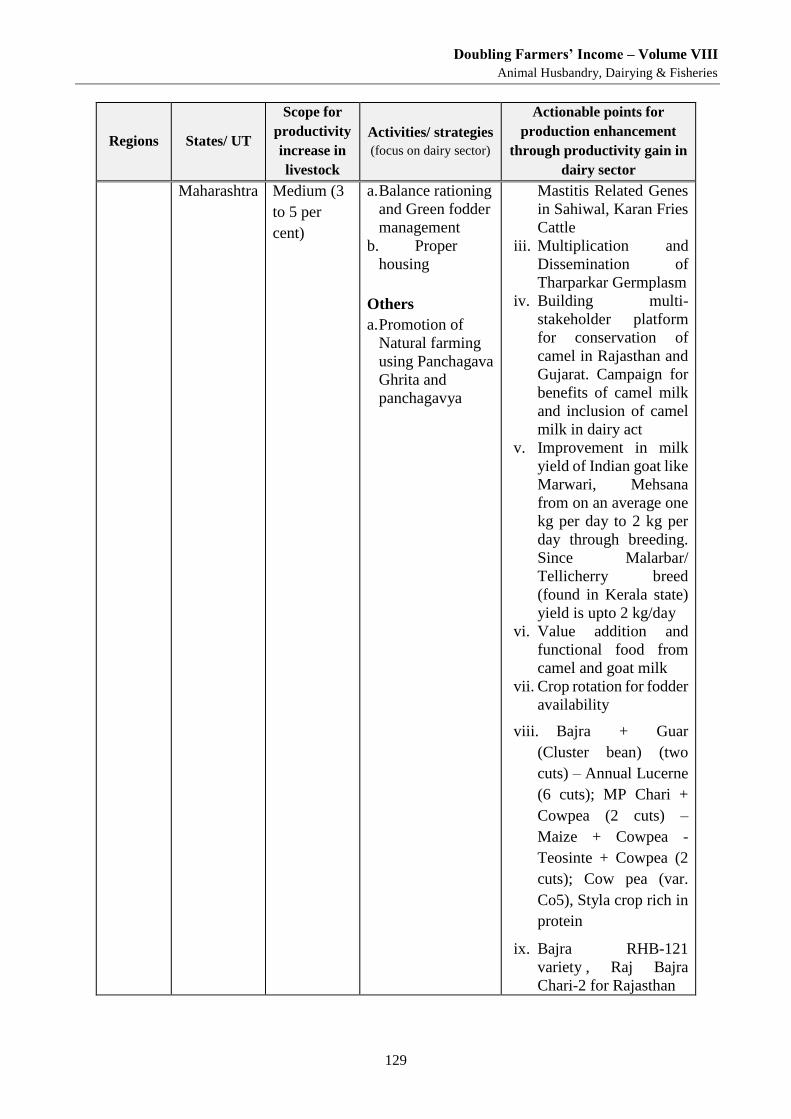
Doubling Farmers’ Income – Volume VIII
Animal Husbandry, Dairying & Fisheries
129
Regions States/ UT
Scope for
productivity
increase in
livestock
Activities/ strategies
(focus on dairy sector)
Actionable points for
production enhancement
through productivity gain in
dairy sector
Maharashtra Medium (3
to 5 per
cent)
a. Balance rationing
and Green fodder
management
b. Proper
housing
Others
a. Promotion of
Natural farming
using Panchagava
Ghrita and
panchagavya
Mastitis Related Genes
in Sahiwal, Karan Fries
Cattle
iii. Multiplication and
Dissemination of
Tharparkar Germplasm
iv. Building multi-
stakeholder platform
for conservation of
camel in Rajasthan and
Gujarat. Campaign for
benefits of camel milk
and inclusion of camel
milk in dairy act
v. Improvement in milk
yield of Indian goat like
Marwari, Mehsana
from on an average one
kg per day to 2 kg per
day through breeding.
Since Malarbar/
Tellicherry breed
(found in Kerala state)
yield is upto 2 kg/day
vi. Value addition and
functional food from
camel and goat milk
vii. Crop rotation for fodder
availability
viii. Bajra + Guar
(Cluster bean) (two
cuts) – Annual Lucerne
(6 cuts); MP Chari +
Cowpea (2 cuts) –
Maize + Cowpea -
Teosinte + Cowpea (2
cuts); Cow pea (var.
Co5), Styla crop rich in
protein
ix. Bajra RHB-121
variety , Raj Bajra
Chari-2 for Rajasthan
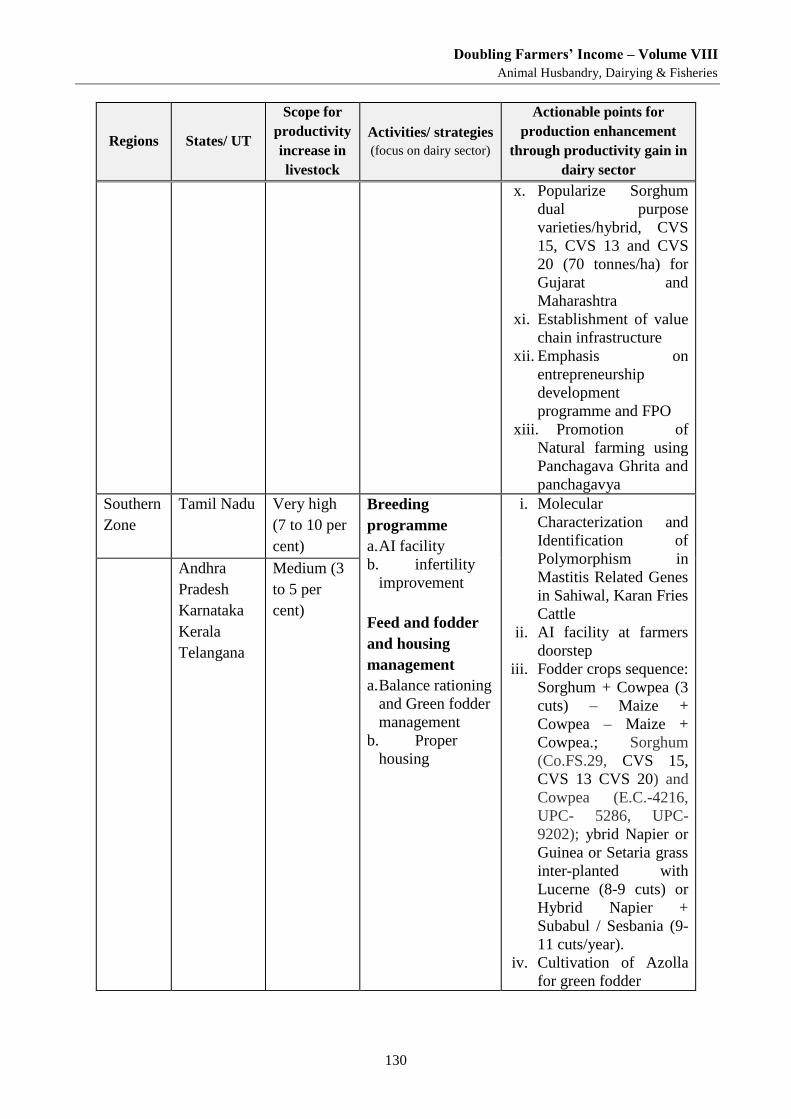
Doubling Farmers’ Income – Volume VIII
Animal Husbandry, Dairying & Fisheries
130
Regions States/ UT
Scope for
productivity
increase in
livestock
Activities/ strategies
(focus on dairy sector)
Actionable points for
production enhancement
through productivity gain in
dairy sector
x. Popularize Sorghum
dual purpose
varieties/hybrid, CVS
15, CVS 13 and CVS
20 (70 tonnes/ha) for
Gujarat and
Maharashtra
xi. Establishment of value
chain infrastructure
xii. Emphasis on
entrepreneurship
development
programme and FPO
xiii. Promotion of
Natural farming using
Panchagava Ghrita and
panchagavya
Southern
Zone
Tamil Nadu
Very high
(7 to 10 per
cent)
Breeding
programme
a. AI facility
b. infertility
improvement
Feed and fodder
and housing
management
a. Balance rationing
and Green fodder
management
b. Proper
housing
i. Molecular
Characterization and
Identification of
Polymorphism in
Mastitis Related Genes
in Sahiwal, Karan Fries
Cattle
ii. AI facility at farmers
doorstep
iii. Fodder crops sequence:
Sorghum + Cowpea (3
cuts) – Maize +
Cowpea – Maize +
Cowpea.; Sorghum
(Co.FS.29, CVS 15,
CVS 13 CVS 20) and
Cowpea (E.C.-4216,
UPC- 5286, UPC-
9202); ybrid Napier or
Guinea or Setaria grass
inter-planted with
Lucerne (8-9 cuts) or
Hybrid Napier +
Subabul / Sesbania (9-
11 cuts/year).
iv. Cultivation of Azolla
for green fodder
Andhra
Pradesh
Karnataka
Kerala
Telangana
Medium (3
to 5 per
cent)
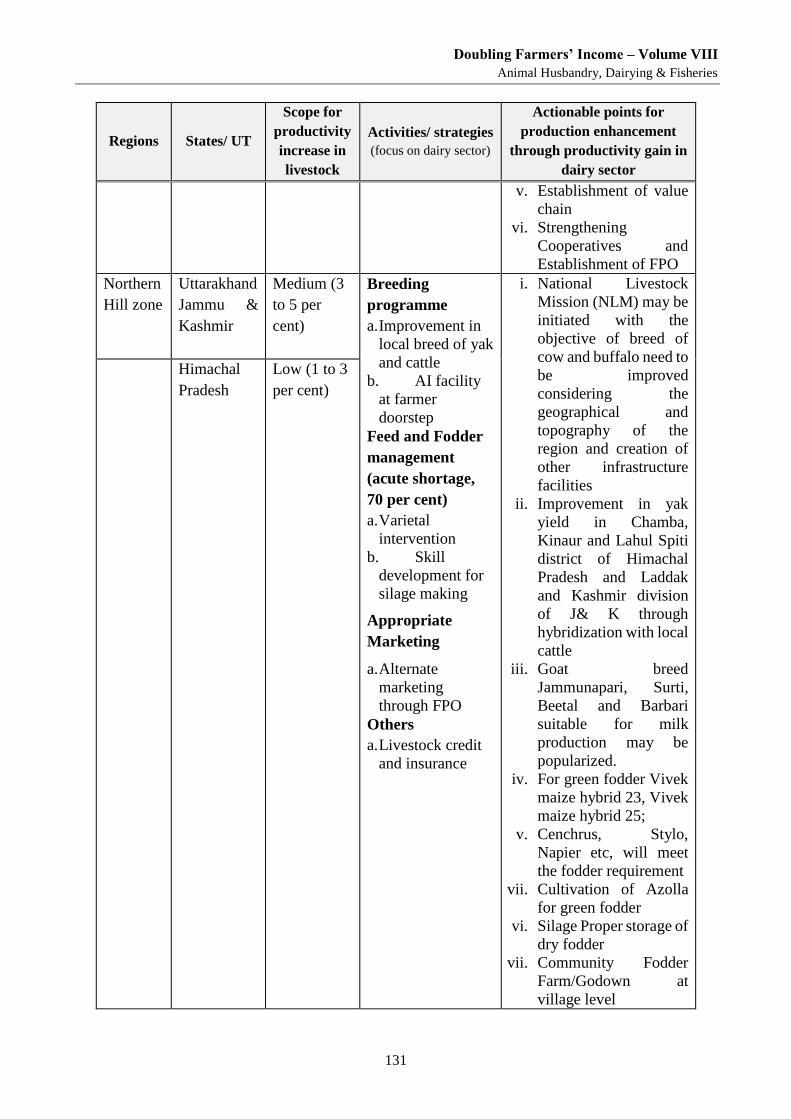
Doubling Farmers’ Income – Volume VIII
Animal Husbandry, Dairying & Fisheries
131
Regions States/ UT
Scope for
productivity
increase in
livestock
Activities/ strategies
(focus on dairy sector)
Actionable points for
production enhancement
through productivity gain in
dairy sector
v. Establishment of value
chain
vi. Strengthening
Cooperatives and
Establishment of FPO
Northern
Hill zone
Uttarakhand
Jammu &
Kashmir
Medium (3
to 5 per
cent)
Breeding
programme
a. Improvement in
local breed of yak
and cattle
b. AI facility
at farmer
doorstep
Feed and Fodder
management
(acute shortage,
70 per cent)
a. Varietal
intervention
b. Skill
development for
silage making
Appropriate
Marketing
a. Alternate
marketing
through FPO
Others
a. Livestock credit
and insurance
i. National Livestock
Mission (NLM) may be
initiated with the
objective of breed of
cow and buffalo need to
be improved
considering the
geographical and
topography of the
region and creation of
other infrastructure
facilities
ii. Improvement in yak
yield in Chamba,
Kinaur and Lahul Spiti
district of Himachal
Pradesh and Laddak
and Kashmir division
of J& K through
hybridization with local
cattle
iii. Goat breed
Jammunapari, Surti,
Beetal and Barbari
suitable for milk
production may be
popularized.
iv. For green fodder Vivek
maize hybrid 23, Vivek
maize hybrid 25;
v. Cenchrus, Stylo,
Napier etc, will meet
the fodder requirement
vii. Cultivation of Azolla
for green fodder
vi. Silage Proper storage of
dry fodder
vii. Community Fodder
Farm/Godown at
village level
Himachal
Pradesh
Low (1 to 3
per cent)
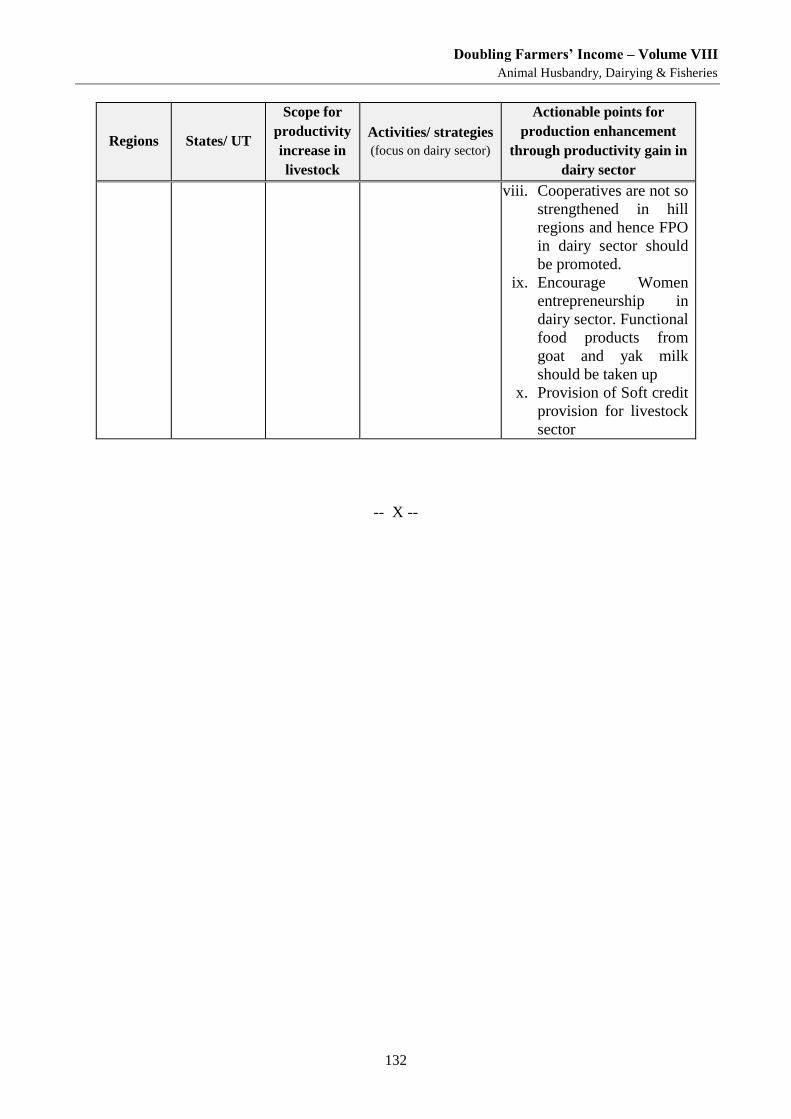
Doubling Farmers’ Income – Volume VIII
Animal Husbandry, Dairying & Fisheries
132
Regions States/ UT
Scope for
productivity
increase in
livestock
Activities/ strategies
(focus on dairy sector)
Actionable points for
production enhancement
through productivity gain in
dairy sector
viii. Cooperatives are not so
strengthened in hill
regions and hence FPO
in dairy sector should
be promoted.
ix. Encourage Women
entrepreneurship in
dairy sector. Functional
food products from
goat and yak milk
should be taken up
x. Provision of Soft credit
provision for livestock
sector
-- X --
Small Ruminants Sector

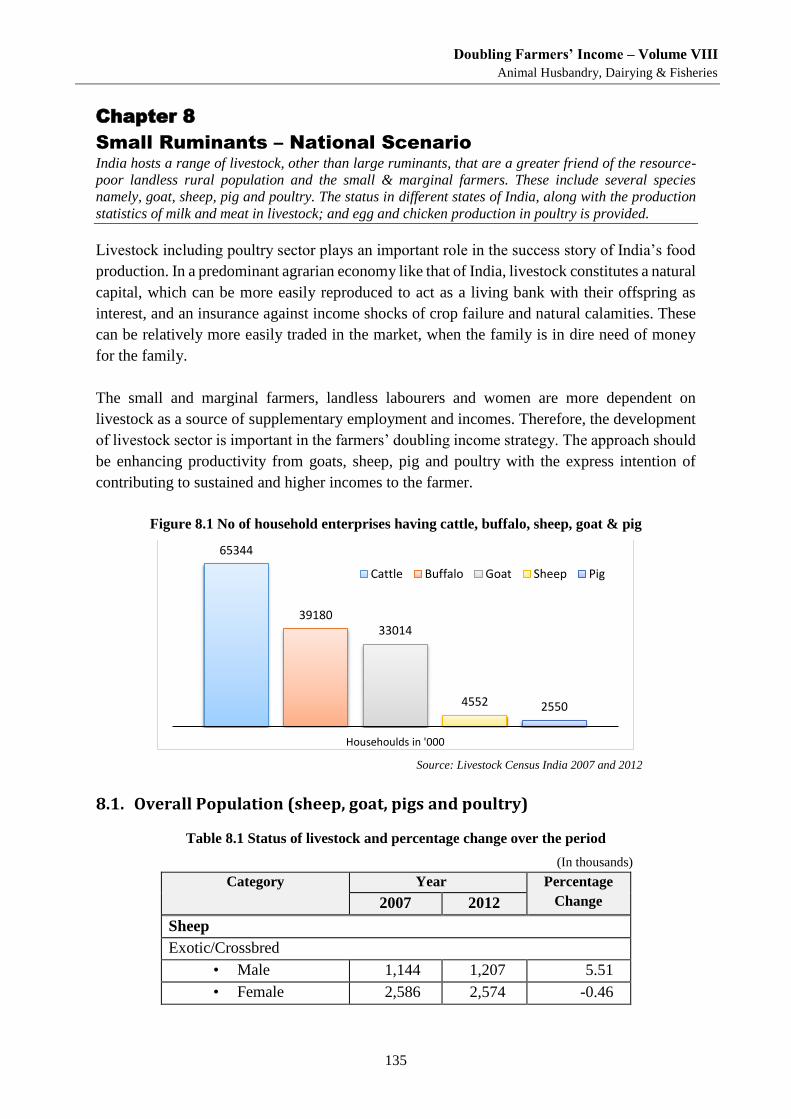
Doubling Farmers’ Income – Volume VIII
Animal Husbandry, Dairying & Fisheries
135
Chapter 8
Small Ruminants – National Scenario India hosts a range of livestock, other than large ruminants, that are a greater friend of the resource-
poor landless rural population and the small & marginal farmers. These include several species
namely, goat, sheep, pig and poultry. The status in different states of India, along with the production
statistics of milk and meat in livestock; and egg and chicken production in poultry is provided.
Livestock including poultry sector plays an important role in the success story of India’s food
production. In a predominant agrarian economy like that of India, livestock constitutes a natural
capital, which can be more easily reproduced to act as a living bank with their offspring as
interest, and an insurance against income shocks of crop failure and natural calamities. These
can be relatively more easily traded in the market, when the family is in dire need of money
for the family.
The small and marginal farmers, landless labourers and women are more dependent on
livestock as a source of supplementary employment and incomes. Therefore, the development
of livestock sector is important in the farmers’ doubling income strategy. The approach should
be enhancing productivity from goats, sheep, pig and poultry with the express intention of
contributing to sustained and higher incomes to the farmer.
Figure 8.1 No of household enterprises having cattle, buffalo, sheep, goat & pig
Source: Livestock Census India 2007 and 2012
8.1. Overall Population (sheep, goat, pigs and poultry)
Table 8.1 Status of livestock and percentage change over the period
(In thousands)
Category Year Percentage
Change 2007 2012
Sheep
Exotic/Crossbred
• Male 1,144 1,207 5.51
• Female 2,586 2,574 -0.46
65344
3918033014
4552 2550
Househoulds in '000
Cattle Buffalo Goat Sheep Pig
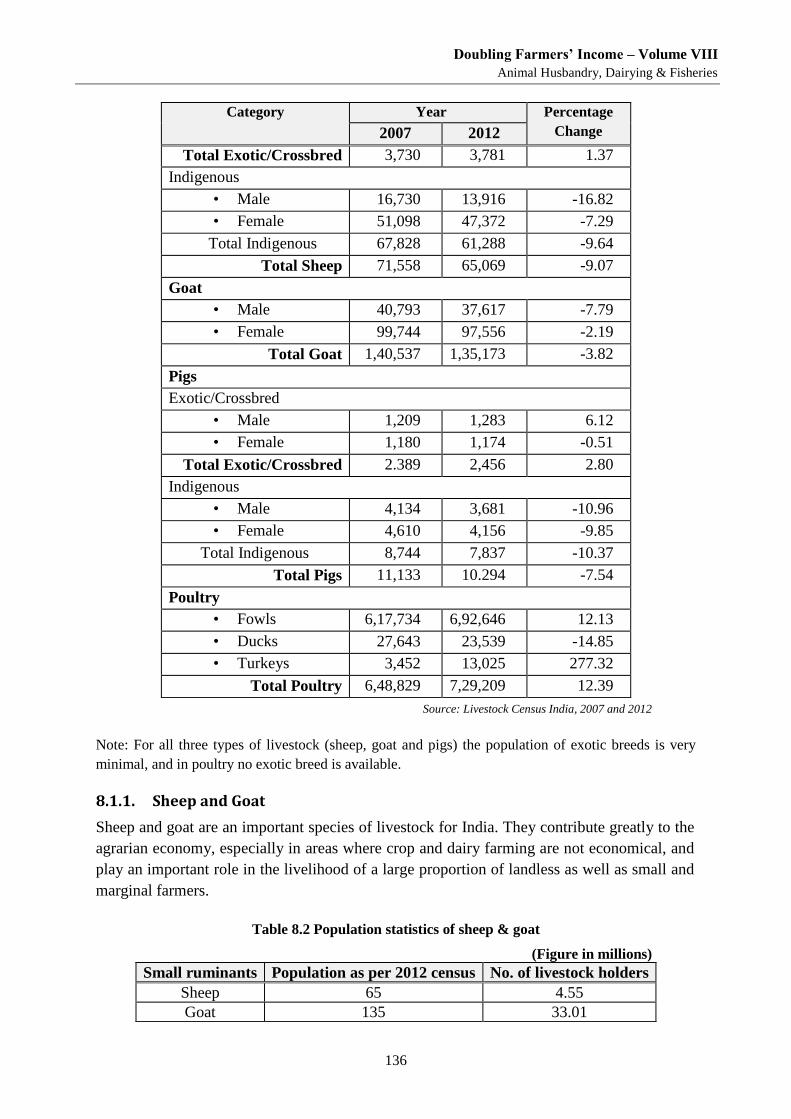
Doubling Farmers’ Income – Volume VIII
Animal Husbandry, Dairying & Fisheries
136
Category Year Percentage
Change 2007 2012
Total Exotic/Crossbred 3,730 3,781 1.37
Indigenous
• Male 16,730 13,916 -16.82
• Female 51,098 47,372 -7.29
Total Indigenous 67,828 61,288 -9.64
Total Sheep 71,558 65,069 -9.07
Goat
• Male 40,793 37,617 -7.79
• Female 99,744 97,556 -2.19
Total Goat 1,40,537 1,35,173 -3.82
Pigs
Exotic/Crossbred
• Male 1,209 1,283 6.12
• Female 1,180 1,174 -0.51
Total Exotic/Crossbred 2.389 2,456 2.80
Indigenous
• Male 4,134 3,681 -10.96
• Female 4,610 4,156 -9.85
Total Indigenous 8,744 7,837 -10.37
Total Pigs 11,133 10.294 -7.54
Poultry
• Fowls 6,17,734 6,92,646 12.13
• Ducks 27,643 23,539 -14.85
• Turkeys 3,452 13,025 277.32
Total Poultry 6,48,829 7,29,209 12.39
Source: Livestock Census India, 2007 and 2012
Note: For all three types of livestock (sheep, goat and pigs) the population of exotic breeds is very
minimal, and in poultry no exotic breed is available.
8.1.1. Sheep and Goat
Sheep and goat are an important species of livestock for India. They contribute greatly to the
agrarian economy, especially in areas where crop and dairy farming are not economical, and
play an important role in the livelihood of a large proportion of landless as well as small and
marginal farmers.
Table 8.2 Population statistics of sheep & goat
(Figure in millions)
Small ruminants Population as per 2012 census No. of livestock holders
Sheep 65 4.55
Goat 135 33.01
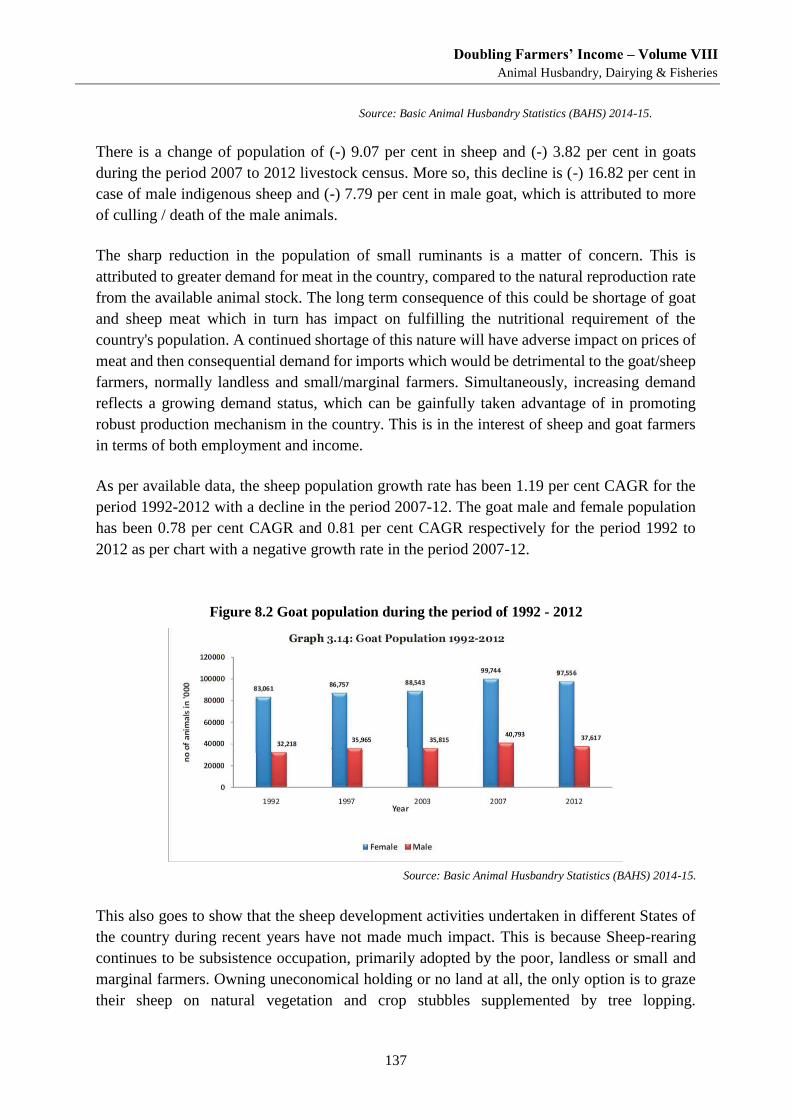
Doubling Farmers’ Income – Volume VIII
Animal Husbandry, Dairying & Fisheries
137
Source: Basic Animal Husbandry Statistics (BAHS) 2014-15.
There is a change of population of (-) 9.07 per cent in sheep and (-) 3.82 per cent in goats
during the period 2007 to 2012 livestock census. More so, this decline is (-) 16.82 per cent in
case of male indigenous sheep and (-) 7.79 per cent in male goat, which is attributed to more
of culling / death of the male animals.
The sharp reduction in the population of small ruminants is a matter of concern. This is
attributed to greater demand for meat in the country, compared to the natural reproduction rate
from the available animal stock. The long term consequence of this could be shortage of goat
and sheep meat which in turn has impact on fulfilling the nutritional requirement of the
country's population. A continued shortage of this nature will have adverse impact on prices of
meat and then consequential demand for imports which would be detrimental to the goat/sheep
farmers, normally landless and small/marginal farmers. Simultaneously, increasing demand
reflects a growing demand status, which can be gainfully taken advantage of in promoting
robust production mechanism in the country. This is in the interest of sheep and goat farmers
in terms of both employment and income.
As per available data, the sheep population growth rate has been 1.19 per cent CAGR for the
period 1992-2012 with a decline in the period 2007-12. The goat male and female population
has been 0.78 per cent CAGR and 0.81 per cent CAGR respectively for the period 1992 to
2012 as per chart with a negative growth rate in the period 2007-12.
Figure 8.2 Goat population during the period of 1992 - 2012
Source: Basic Animal Husbandry Statistics (BAHS) 2014-15.
This also goes to show that the sheep development activities undertaken in different States of
the country during recent years have not made much impact. This is because Sheep-rearing
continues to be subsistence occupation, primarily adopted by the poor, landless or small and
marginal farmers. Owning uneconomical holding or no land at all, the only option is to graze
their sheep on natural vegetation and crop stubbles supplemented by tree lopping.
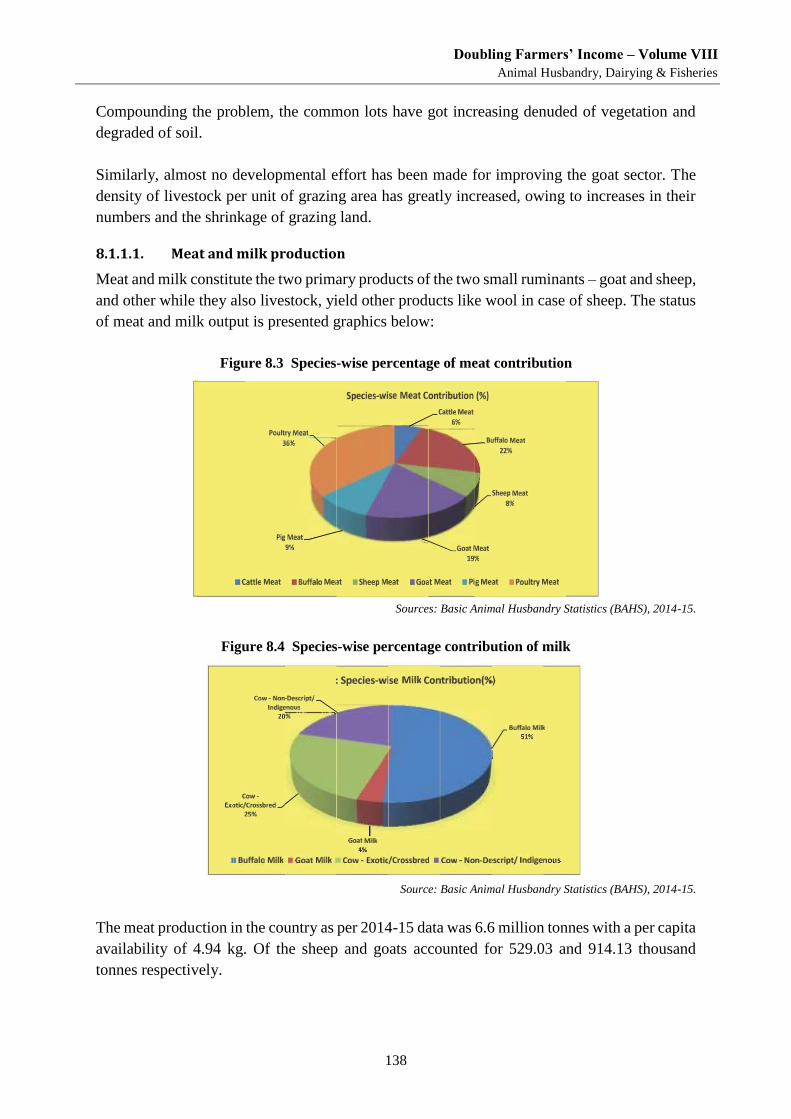
Doubling Farmers’ Income – Volume VIII
Animal Husbandry, Dairying & Fisheries
138
Compounding the problem, the common lots have got increasing denuded of vegetation and
degraded of soil.
Similarly, almost no developmental effort has been made for improving the goat sector. The
density of livestock per unit of grazing area has greatly increased, owing to increases in their
numbers and the shrinkage of grazing land.
8.1.1.1. Meat and milk production
Meat and milk constitute the two primary products of the two small ruminants – goat and sheep,
and other while they also livestock, yield other products like wool in case of sheep. The status
of meat and milk output is presented graphics below:
Figure 8.3 Species-wise percentage of meat contribution
Sources: Basic Animal Husbandry Statistics (BAHS), 2014-15.
Figure 8.4 Species-wise percentage contribution of milk
Source: Basic Animal Husbandry Statistics (BAHS), 2014-15.
The meat production in the country as per 2014-15 data was 6.6 million tonnes with a per capita
availability of 4.94 kg. Of the sheep and goats accounted for 529.03 and 914.13 thousand
tonnes respectively.
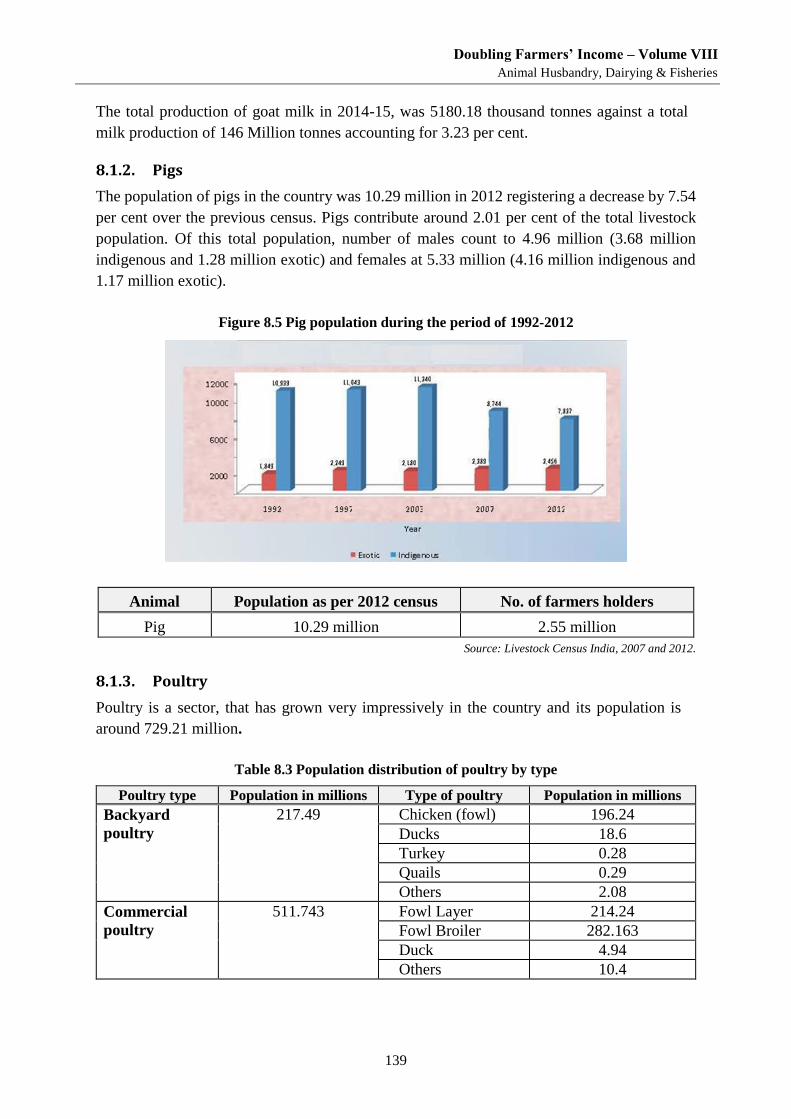
Doubling Farmers’ Income – Volume VIII
Animal Husbandry, Dairying & Fisheries
139
The total production of goat milk in 2014-15, was 5180.18 thousand tonnes against a total
milk production of 146 Million tonnes accounting for 3.23 per cent.
8.1.2. Pigs
The population of pigs in the country was 10.29 million in 2012 registering a decrease by 7.54
per cent over the previous census. Pigs contribute around 2.01 per cent of the total livestock
population. Of this total population, number of males count to 4.96 million (3.68 million
indigenous and 1.28 million exotic) and females at 5.33 million (4.16 million indigenous and
1.17 million exotic).
Figure 8.5 Pig population during the period of 1992-2012
Animal Population as per 2012 census No. of farmers holders
Pig 10.29 million 2.55 million
Source: Livestock Census India, 2007 and 2012.
8.1.3. Poultry
Poultry is a sector, that has grown very impressively in the country and its population is
around 729.21 million.
Table 8.3 Population distribution of poultry by type
Poultry type Population in millions Type of poultry Population in millions
Backyard
poultry
217.49 Chicken (fowl) 196.24
Ducks 18.6
Turkey 0.28
Quails 0.29
Others 2.08
Commercial
poultry
511.743 Fowl Layer 214.24
Fowl Broiler 282.163
Duck 4.94
Others 10.4
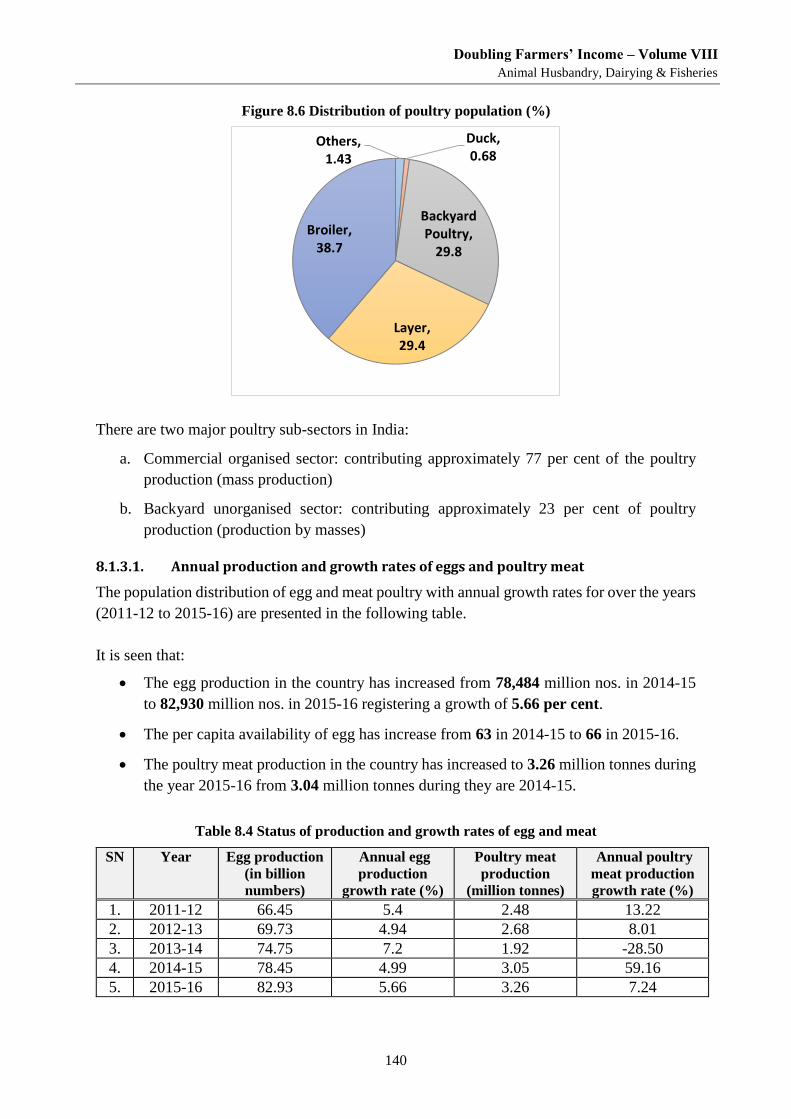
Doubling Farmers’ Income – Volume VIII
Animal Husbandry, Dairying & Fisheries
140
Figure 8.6 Distribution of poultry population (%)
There are two major poultry sub-sectors in India:
a. Commercial organised sector: contributing approximately 77 per cent of the poultry
production (mass production)
b. Backyard unorganised sector: contributing approximately 23 per cent of poultry
production (production by masses)
8.1.3.1. Annual production and growth rates of eggs and poultry meat
The population distribution of egg and meat poultry with annual growth rates for over the years
(2011-12 to 2015-16) are presented in the following table.
It is seen that:
The egg production in the country has increased from 78,484 million nos. in 2014-15
to 82,930 million nos. in 2015-16 registering a growth of 5.66 per cent.
The per capita availability of egg has increase from 63 in 2014-15 to 66 in 2015-16.
The poultry meat production in the country has increased to 3.26 million tonnes during
the year 2015-16 from 3.04 million tonnes during they are 2014-15.
Table 8.4 Status of production and growth rates of egg and meat
SN Year Egg production
(in billion
numbers)
Annual egg
production
growth rate (%)
Poultry meat
production
(million tonnes)
Annual poultry
meat production
growth rate (%)
1. 2011-12 66.45 5.4 2.48 13.22
2. 2012-13 69.73 4.94 2.68 8.01
3. 2013-14 74.75 7.2 1.92 -28.50
4. 2014-15 78.45 4.99 3.05 59.16
5. 2015-16 82.93 5.66 3.26 7.24
Others, 1.43
Duck, 0.68
Backyard Poultry,
29.8
Layer, 29.4
Broiler, 38.7
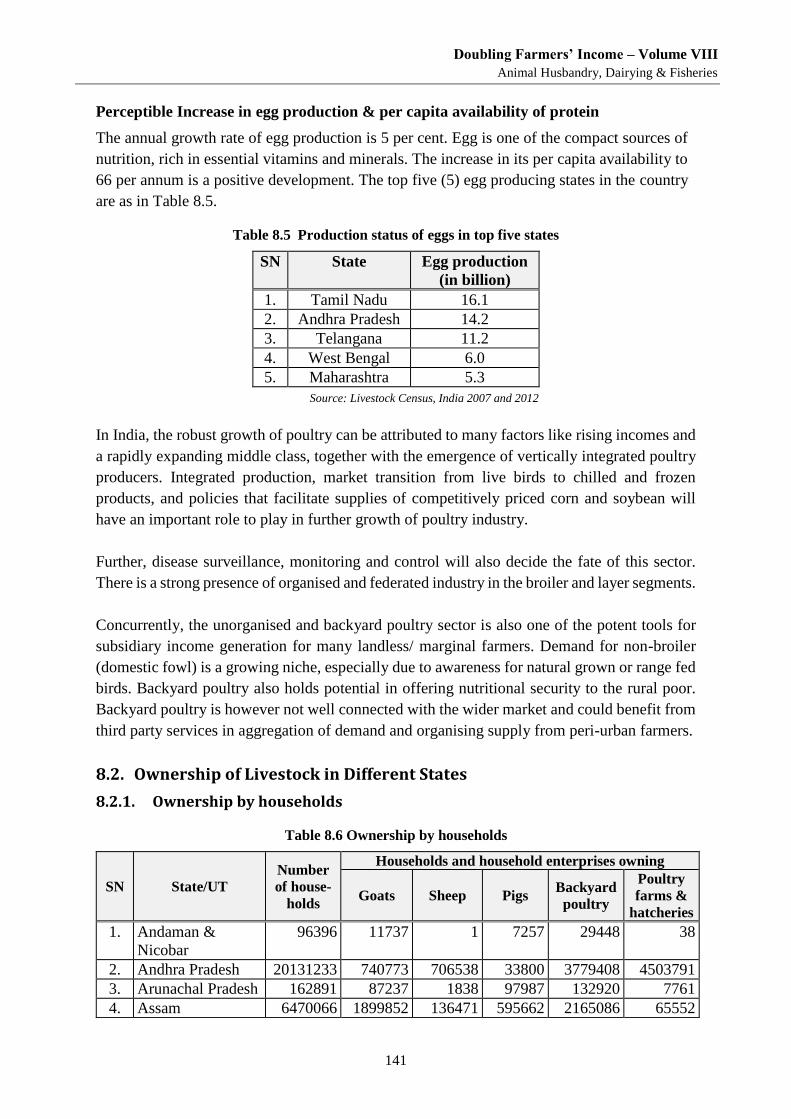
Doubling Farmers’ Income – Volume VIII
Animal Husbandry, Dairying & Fisheries
141
Perceptible Increase in egg production & per capita availability of protein
The annual growth rate of egg production is 5 per cent. Egg is one of the compact sources of
nutrition, rich in essential vitamins and minerals. The increase in its per capita availability to
66 per annum is a positive development. The top five (5) egg producing states in the country
are as in Table 8.5.
Table 8.5 Production status of eggs in top five states
SN State Egg production
(in billion)
1. Tamil Nadu 16.1
2. Andhra Pradesh 14.2
3. Telangana 11.2
4. West Bengal 6.0
5. Maharashtra 5.3
Source: Livestock Census, India 2007 and 2012
In India, the robust growth of poultry can be attributed to many factors like rising incomes and
a rapidly expanding middle class, together with the emergence of vertically integrated poultry
producers. Integrated production, market transition from live birds to chilled and frozen
products, and policies that facilitate supplies of competitively priced corn and soybean will
have an important role to play in further growth of poultry industry.
Further, disease surveillance, monitoring and control will also decide the fate of this sector.
There is a strong presence of organised and federated industry in the broiler and layer segments.
Concurrently, the unorganised and backyard poultry sector is also one of the potent tools for
subsidiary income generation for many landless/ marginal farmers. Demand for non-broiler
(domestic fowl) is a growing niche, especially due to awareness for natural grown or range fed
birds. Backyard poultry also holds potential in offering nutritional security to the rural poor.
Backyard poultry is however not well connected with the wider market and could benefit from
third party services in aggregation of demand and organising supply from peri-urban farmers.
8.2. Ownership of Livestock in Different States
8.2.1. Ownership by households
Table 8.6 Ownership by households
SN State/UT
Number
of house-
holds
Households and household enterprises owning
Goats Sheep Pigs Backyard
poultry
Poultry
farms &
hatcheries
1. Andaman &
Nicobar
96396 11737 1 7257 29448 38
2. Andhra Pradesh 20131233 740773 706538 33800 3779408 4503791
3. Arunachal Pradesh 162891 87237 1838 97987 132920 7761
4. Assam 6470066 1899852 136471 595662 2165086 65552
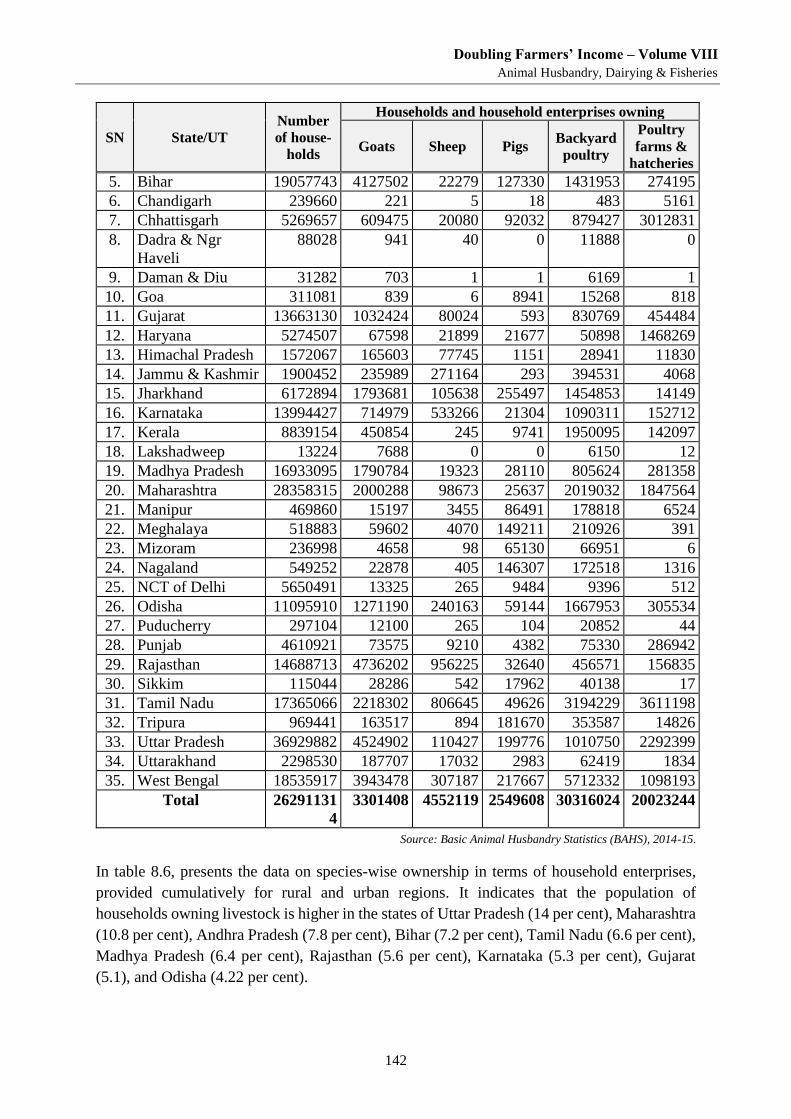
Doubling Farmers’ Income – Volume VIII
Animal Husbandry, Dairying & Fisheries
142
SN State/UT
Number
of house-
holds
Households and household enterprises owning
Goats Sheep Pigs Backyard
poultry
Poultry
farms &
hatcheries
5. Bihar 19057743 4127502 22279 127330 1431953 274195
6. Chandigarh 239660 221 5 18 483 5161
7. Chhattisgarh 5269657 609475 20080 92032 879427 3012831
8. Dadra & Ngr
Haveli
88028 941 40 0 11888 0
9. Daman & Diu 31282 703 1 1 6169 1
10. Goa 311081 839 6 8941 15268 818
11. Gujarat 13663130 1032424 80024 593 830769 454484
12. Haryana 5274507 67598 21899 21677 50898 1468269
13. Himachal Pradesh 1572067 165603 77745 1151 28941 11830
14. Jammu & Kashmir 1900452 235989 271164 293 394531 4068
15. Jharkhand 6172894 1793681 105638 255497 1454853 14149
16. Karnataka 13994427 714979 533266 21304 1090311 152712
17. Kerala 8839154 450854 245 9741 1950095 142097
18. Lakshadweep 13224 7688 0 0 6150 12
19. Madhya Pradesh 16933095 1790784 19323 28110 805624 281358
20. Maharashtra 28358315 2000288 98673 25637 2019032 1847564
21. Manipur 469860 15197 3455 86491 178818 6524
22. Meghalaya 518883 59602 4070 149211 210926 391
23. Mizoram 236998 4658 98 65130 66951 6
24. Nagaland 549252 22878 405 146307 172518 1316
25. NCT of Delhi 5650491 13325 265 9484 9396 512
26. Odisha 11095910 1271190 240163 59144 1667953 305534
27. Puducherry 297104 12100 265 104 20852 44
28. Punjab 4610921 73575 9210 4382 75330 286942
29. Rajasthan 14688713 4736202 956225 32640 456571 156835
30. Sikkim 115044 28286 542 17962 40138 17
31. Tamil Nadu 17365066 2218302 806645 49626 3194229 3611198
32. Tripura 969441 163517 894 181670 353587 14826
33. Uttar Pradesh 36929882 4524902 110427 199776 1010750 2292399
34. Uttarakhand 2298530 187707 17032 2983 62419 1834
35. West Bengal 18535917 3943478 307187 217667 5712332 1098193
Total 26291131
4
3301408 4552119 2549608 30316024 20023244
Source: Basic Animal Husbandry Statistics (BAHS), 2014-15.
In table 8.6, presents the data on species-wise ownership in terms of household enterprises,
provided cumulatively for rural and urban regions. It indicates that the population of
households owning livestock is higher in the states of Uttar Pradesh (14 per cent), Maharashtra
(10.8 per cent), Andhra Pradesh (7.8 per cent), Bihar (7.2 per cent), Tamil Nadu (6.6 per cent),
Madhya Pradesh (6.4 per cent), Rajasthan (5.6 per cent), Karnataka (5.3 per cent), Gujarat
(5.1), and Odisha (4.22 per cent).
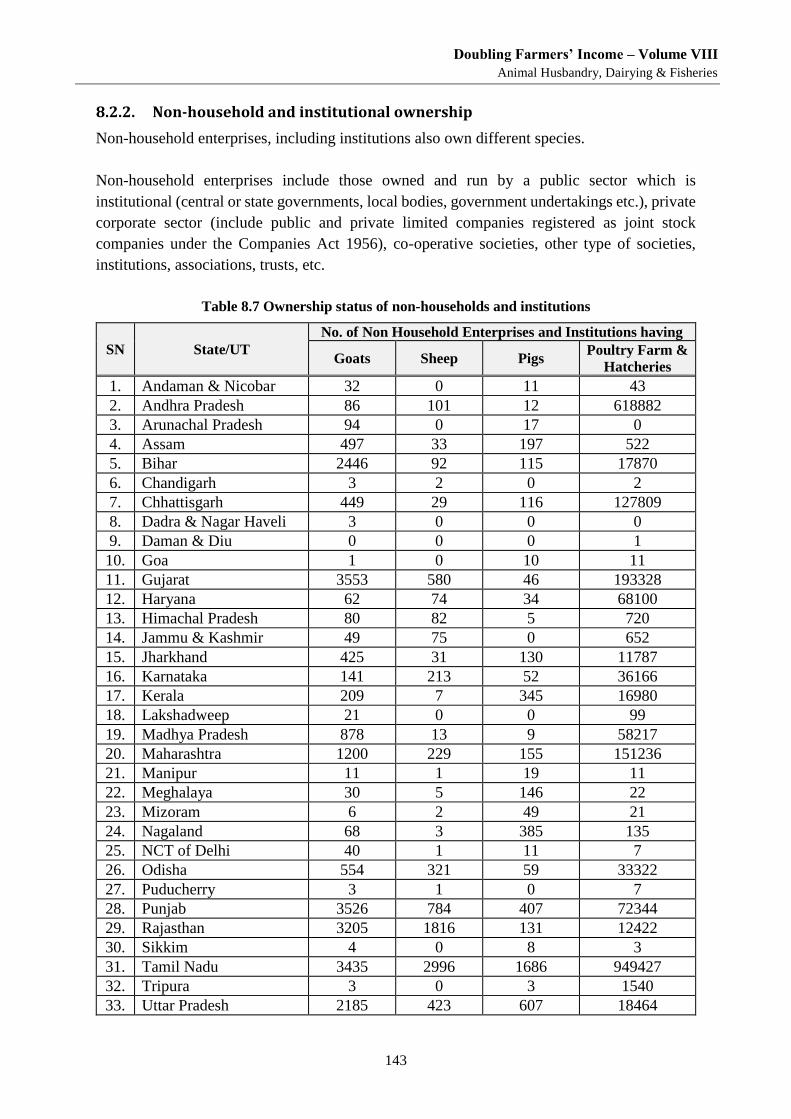
Doubling Farmers’ Income – Volume VIII
Animal Husbandry, Dairying & Fisheries
143
8.2.2. Non-household and institutional ownership
Non-household enterprises, including institutions also own different species.
Non-household enterprises include those owned and run by a public sector which is
institutional (central or state governments, local bodies, government undertakings etc.), private
corporate sector (include public and private limited companies registered as joint stock
companies under the Companies Act 1956), co-operative societies, other type of societies,
institutions, associations, trusts, etc.
Table 8.7 Ownership status of non-households and institutions
SN State/UT
No. of Non Household Enterprises and Institutions having
Goats Sheep Pigs Poultry Farm &
Hatcheries
1. Andaman & Nicobar 32 0 11 43
2. Andhra Pradesh 86 101 12 618882
3. Arunachal Pradesh 94 0 17 0
4. Assam 497 33 197 522
5. Bihar 2446 92 115 17870
6. Chandigarh 3 2 0 2
7. Chhattisgarh 449 29 116 127809
8. Dadra & Nagar Haveli 3 0 0 0
9. Daman & Diu 0 0 0 1
10. Goa 1 0 10 11
11. Gujarat 3553 580 46 193328
12. Haryana 62 74 34 68100
13. Himachal Pradesh 80 82 5 720
14. Jammu & Kashmir 49 75 0 652
15. Jharkhand 425 31 130 11787
16. Karnataka 141 213 52 36166
17. Kerala 209 7 345 16980
18. Lakshadweep 21 0 0 99
19. Madhya Pradesh 878 13 9 58217
20. Maharashtra 1200 229 155 151236
21. Manipur 11 1 19 11
22. Meghalaya 30 5 146 22
23. Mizoram 6 2 49 21
24. Nagaland 68 3 385 135
25. NCT of Delhi 40 1 11 7
26. Odisha 554 321 59 33322
27. Puducherry 3 1 0 7
28. Punjab 3526 784 407 72344
29. Rajasthan 3205 1816 131 12422
30. Sikkim 4 0 8 3
31. Tamil Nadu 3435 2996 1686 949427
32. Tripura 3 0 3 1540
33. Uttar Pradesh 2185 423 607 18464
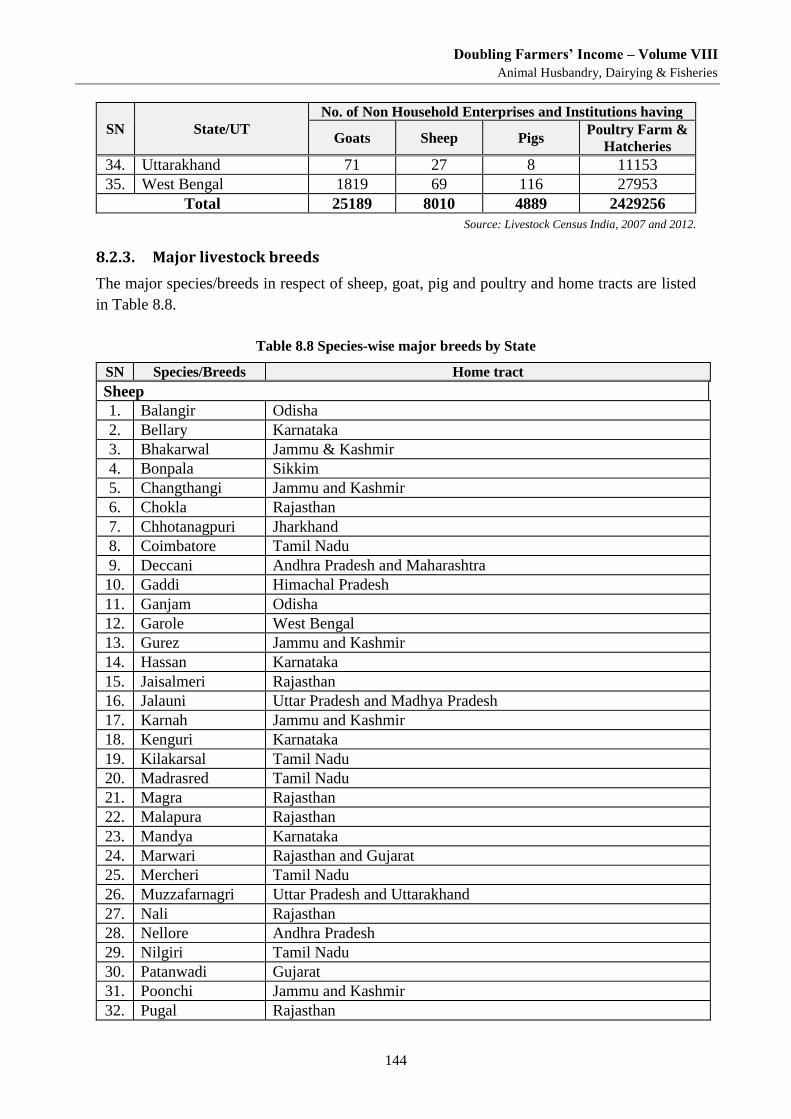
Doubling Farmers’ Income – Volume VIII
Animal Husbandry, Dairying & Fisheries
144
SN State/UT
No. of Non Household Enterprises and Institutions having
Goats Sheep Pigs Poultry Farm &
Hatcheries
34. Uttarakhand 71 27 8 11153
35. West Bengal 1819 69 116 27953
Total 25189 8010 4889 2429256
Source: Livestock Census India, 2007 and 2012.
8.2.3. Major livestock breeds
The major species/breeds in respect of sheep, goat, pig and poultry and home tracts are listed
in Table 8.8.
Table 8.8 Species-wise major breeds by State
SN Species/Breeds Home tract
Sheep
1. Balangir Odisha
2. Bellary Karnataka
3. Bhakarwal Jammu & Kashmir
4. Bonpala Sikkim
5. Changthangi Jammu and Kashmir
6. Chokla Rajasthan
7. Chhotanagpuri Jharkhand
8. Coimbatore Tamil Nadu
9. Deccani Andhra Pradesh and Maharashtra
10. Gaddi Himachal Pradesh
11. Ganjam Odisha
12. Garole West Bengal
13. Gurez Jammu and Kashmir
14. Hassan Karnataka
15. Jaisalmeri Rajasthan
16. Jalauni Uttar Pradesh and Madhya Pradesh
17. Karnah Jammu and Kashmir
18. Kenguri Karnataka
19. Kilakarsal Tamil Nadu
20. Madrasred Tamil Nadu
21. Magra Rajasthan
22. Malapura Rajasthan
23. Mandya Karnataka
24. Marwari Rajasthan and Gujarat
25. Mercheri Tamil Nadu
26. Muzzafarnagri Uttar Pradesh and Uttarakhand
27. Nali Rajasthan
28. Nellore Andhra Pradesh
29. Nilgiri Tamil Nadu
30. Patanwadi Gujarat
31. Poonchi Jammu and Kashmir
32. Pugal Rajasthan
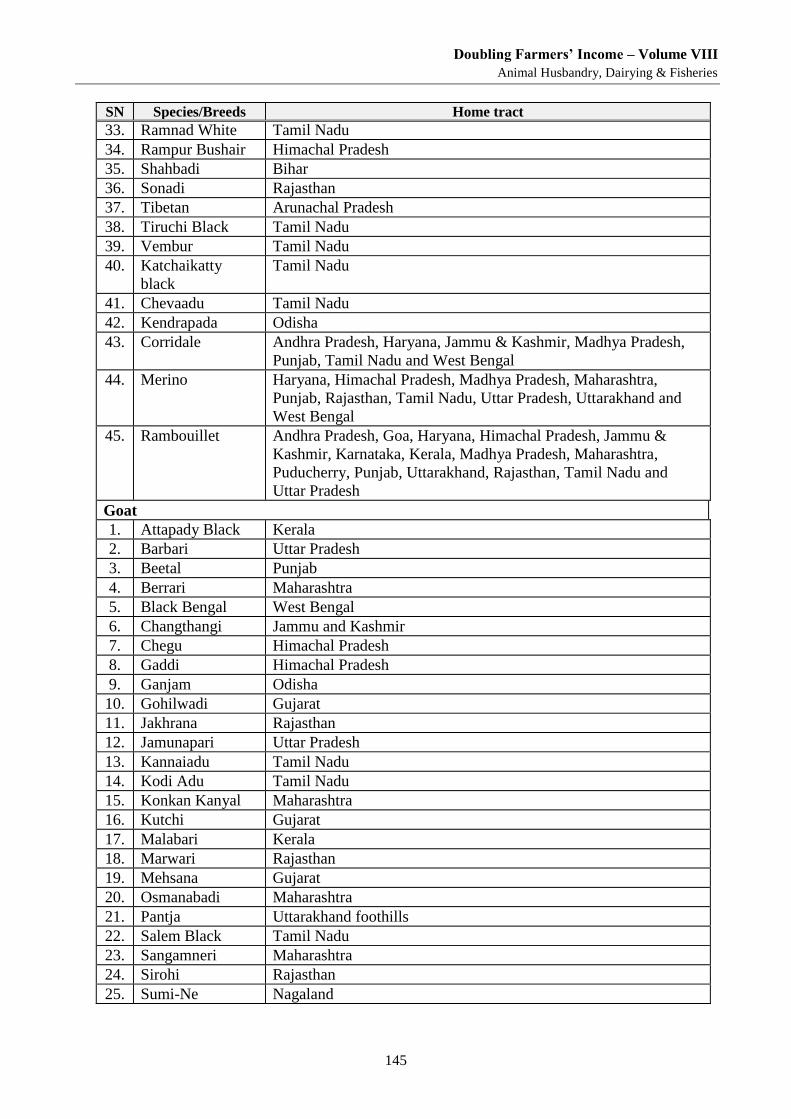
Doubling Farmers’ Income – Volume VIII
Animal Husbandry, Dairying & Fisheries
145
SN Species/Breeds Home tract
33. Ramnad White Tamil Nadu
34. Rampur Bushair Himachal Pradesh
35. Shahbadi Bihar
36. Sonadi Rajasthan
37. Tibetan Arunachal Pradesh
38. Tiruchi Black Tamil Nadu
39. Vembur Tamil Nadu
40. Katchaikatty
black
Tamil Nadu
41. Chevaadu Tamil Nadu
42. Kendrapada Odisha
43. Corridale Andhra Pradesh, Haryana, Jammu & Kashmir, Madhya Pradesh,
Punjab, Tamil Nadu and West Bengal
44. Merino Haryana, Himachal Pradesh, Madhya Pradesh, Maharashtra,
Punjab, Rajasthan, Tamil Nadu, Uttar Pradesh, Uttarakhand and
West Bengal
45. Rambouillet Andhra Pradesh, Goa, Haryana, Himachal Pradesh, Jammu &
Kashmir, Karnataka, Kerala, Madhya Pradesh, Maharashtra,
Puducherry, Punjab, Uttarakhand, Rajasthan, Tamil Nadu and
Uttar Pradesh
Goat
1. Attapady Black Kerala
2. Barbari Uttar Pradesh
3. Beetal Punjab
4. Berrari Maharashtra
5. Black Bengal West Bengal
6. Changthangi Jammu and Kashmir
7. Chegu Himachal Pradesh
8. Gaddi Himachal Pradesh
9. Ganjam Odisha
10. Gohilwadi Gujarat
11. Jakhrana Rajasthan
12. Jamunapari Uttar Pradesh
13. Kannaiadu Tamil Nadu
14. Kodi Adu Tamil Nadu
15. Konkan Kanyal Maharashtra
16. Kutchi Gujarat
17. Malabari Kerala
18. Marwari Rajasthan
19. Mehsana Gujarat
20. Osmanabadi Maharashtra
21. Pantja Uttarakhand foothills
22. Salem Black Tamil Nadu
23. Sangamneri Maharashtra
24. Sirohi Rajasthan
25. Sumi-Ne Nagaland
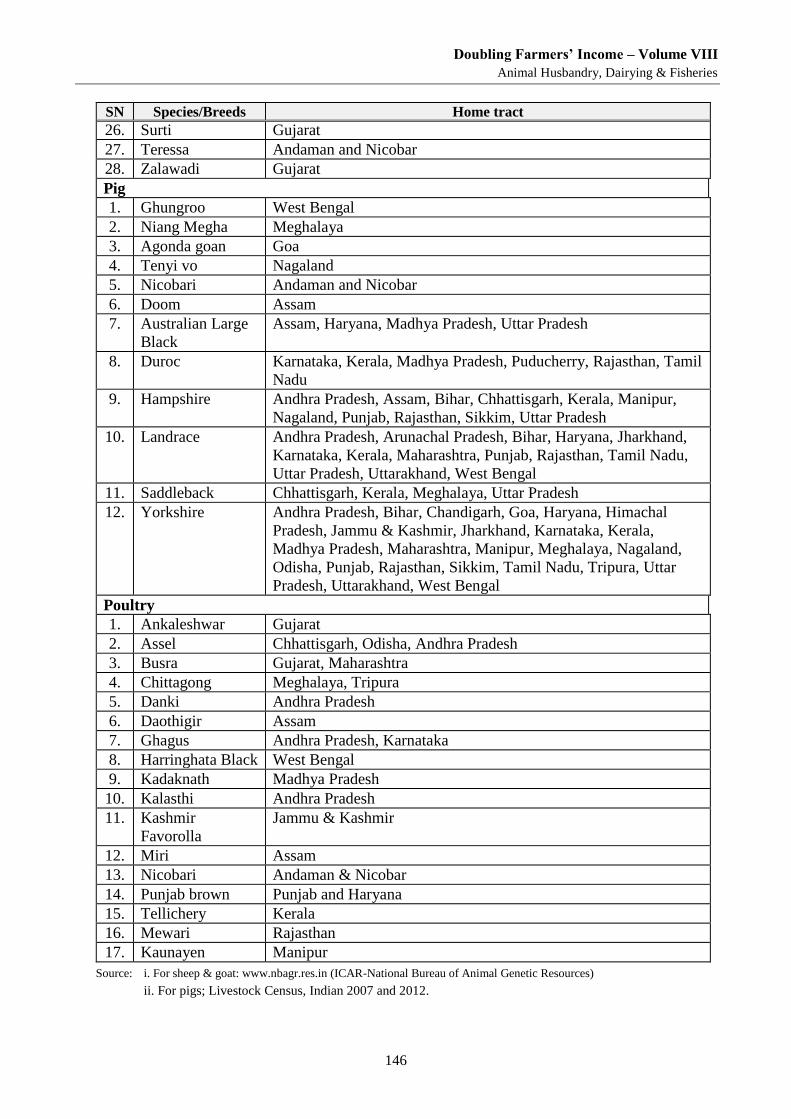
Doubling Farmers’ Income – Volume VIII
Animal Husbandry, Dairying & Fisheries
146
SN Species/Breeds Home tract
26. Surti Gujarat
27. Teressa Andaman and Nicobar
28. Zalawadi Gujarat
Pig
1. Ghungroo West Bengal
2. Niang Megha Meghalaya
3. Agonda goan Goa
4. Tenyi vo Nagaland
5. Nicobari Andaman and Nicobar
6. Doom Assam
7. Australian Large
Black
Assam, Haryana, Madhya Pradesh, Uttar Pradesh
8. Duroc Karnataka, Kerala, Madhya Pradesh, Puducherry, Rajasthan, Tamil
Nadu
9. Hampshire Andhra Pradesh, Assam, Bihar, Chhattisgarh, Kerala, Manipur,
Nagaland, Punjab, Rajasthan, Sikkim, Uttar Pradesh
10. Landrace Andhra Pradesh, Arunachal Pradesh, Bihar, Haryana, Jharkhand,
Karnataka, Kerala, Maharashtra, Punjab, Rajasthan, Tamil Nadu,
Uttar Pradesh, Uttarakhand, West Bengal
11. Saddleback Chhattisgarh, Kerala, Meghalaya, Uttar Pradesh
12. Yorkshire Andhra Pradesh, Bihar, Chandigarh, Goa, Haryana, Himachal
Pradesh, Jammu & Kashmir, Jharkhand, Karnataka, Kerala,
Madhya Pradesh, Maharashtra, Manipur, Meghalaya, Nagaland,
Odisha, Punjab, Rajasthan, Sikkim, Tamil Nadu, Tripura, Uttar
Pradesh, Uttarakhand, West Bengal
Poultry
1. Ankaleshwar Gujarat
2. Assel Chhattisgarh, Odisha, Andhra Pradesh
3. Busra Gujarat, Maharashtra
4. Chittagong Meghalaya, Tripura
5. Danki Andhra Pradesh
6. Daothigir Assam
7. Ghagus Andhra Pradesh, Karnataka
8. Harringhata Black West Bengal
9. Kadaknath Madhya Pradesh
10. Kalasthi Andhra Pradesh
11. Kashmir
Favorolla
Jammu & Kashmir
12. Miri Assam
13. Nicobari Andaman & Nicobar
14. Punjab brown Punjab and Haryana
15. Tellichery Kerala
16. Mewari Rajasthan
17. Kaunayen Manipur
Source: i. For sheep & goat: www.nbagr.res.in (ICAR-National Bureau of Animal Genetic Resources)
ii. For pigs; Livestock Census, Indian 2007 and 2012.
Doubling Farmers’ Income – Volume VIII
Animal Husbandry, Dairying & Fisheries
147
8.3. Annotation
A total of 43 indigenous breeds of sheep are distributed in only 16 States. However, several
states have good number of non-descript sheep. Further, 28 well defined goat breeds are
distributed in 14 States while in other states, non-descript goats and descript goats of
neighbouring states are available. A total of 17 and 6 well defined poultry and pig breeds are
present in 18 states and 6 states respectively. For improvement and increasing farmers’ income
exotic germplasm has been introduced.
Key Extracts
As per Livestock Census, 2012 the population status is represented by 65 million sheep,
135 million goats, 10.29 million pigs and 729.21 million poultry.
The number of households for sheep, goats and pigs were 4.55 million, 33.01 million and
2.55 million respectively.
The trends during last 25 years, indicate that there is a consistent decline in the population
of sheep, goat and pig, whereas poultry population is increasing at a fast pace.
There are total of 28 goat, 45 sheep, 12 pig and 17 poultry breeds available in India.
Of the total meat production in the country, 19 per cent, 8 per cent, 36 per cent and 9 per
cent contribution came from goat, sheep, poultry and pig.

Doubling Farmers’ Income – Volume VIII
Animal Husbandry, Dairying & Fisheries
149
Chapter 9
Small Ruminants & Poultry: Research & Development There have been several scientific interventions made for development of new breeds/varieties in sheep,
goat, pig and poultry as well as for enhancing production of milk, meat, egg and chicken. The potential
technologies are recommended for implementation to increase the profitability of livestock owners.
9.1. Varieties and Released Developed
9.1.1. Sheep
Avishaan Sheep strain was released in Jan 2016 for increasing prolificacy in sheep. It produces
60 per cent twins/triplets in flocks and further produces 40 per cent more body weight in lambs
compared to non-prolific sheep. At present, farmers are getting one lambs per ewe in a year, in
majority of sheep flocks under extensive system. Intogression of Fec B gene in non-prolific
sheep through use of Avishaan rams for breeding purposes will increase twins/triplets in 60
per cent of population that will result in an additional lamb to the farmers from present lamb
production.
Malpura, an indigenous mutton type sheep breed with coarse wool, is well adapted to harsh
climatic conditions of semiarid region. It is found in Jaipur, Tonk and Sawai Madhopur districts
of Rajasthan. Ewes yield 800-1000 milli-litre (ml) milk per day in early lactation. The average
6 month weight was found to be 29.32 kg under improved management practices. Few
extraordinary lambs attain a body weight of >42.00 kg at 6 months of age in semi-intensive
management system. Malpura lambs have better growth efficiency under stall feeding and
attain 33-35 kg body weight at 6 months of age on complete feed.
A cross-breeding programme for improving wool production and quality was initiated at
CSWRI, Avikanagar in 1964-65 involving exotic fine wool breed (Rambouillet) and native
extremely coarse wool breed (Malpura). The half-breds have been pooled and interbred and
the new strain arising out of this base having 50 per cent Rambouillet and 50 per cent Malpura
inheritance has been named as Avikalin (Avi-Sanskrit word for sheep and Kalin- a Persian
word for carpet). Body weights of 2.82, 17.16, 29.91, 33.31 and 37.15 kgs at birth, 3, 6, 9 and
12 months of age respectively have been achieved, in semiarid region. Avikalin sheep produce
about 80 per cent more wool compared to the native Malpura sheep.
Chokla sheep is found in the Shekhawati area of Rajasthan viz., Churu, Jhunjhunu, Sikar,
Nagaur and border area of Jaipur and Bikaner. Chokla is a carpet wool sheep breed. Chokla
lambs attained a body weight of 17.09 kg at 3, 24.80 kg at 6 and 32.22 kg at 12 months of age.
Magra sheep is found in Bikaner, Nagaur, Churu and Jhunjhunu districts of Rajasthan. Magra
sheep has the unique characteristic of lustrous carpet wool. Magra wool has great demand in
the carpet industry because of its lustrous properties. Lambs attained a body weight of 24.0 kg
at six months and 32.0 kg at twelve months.
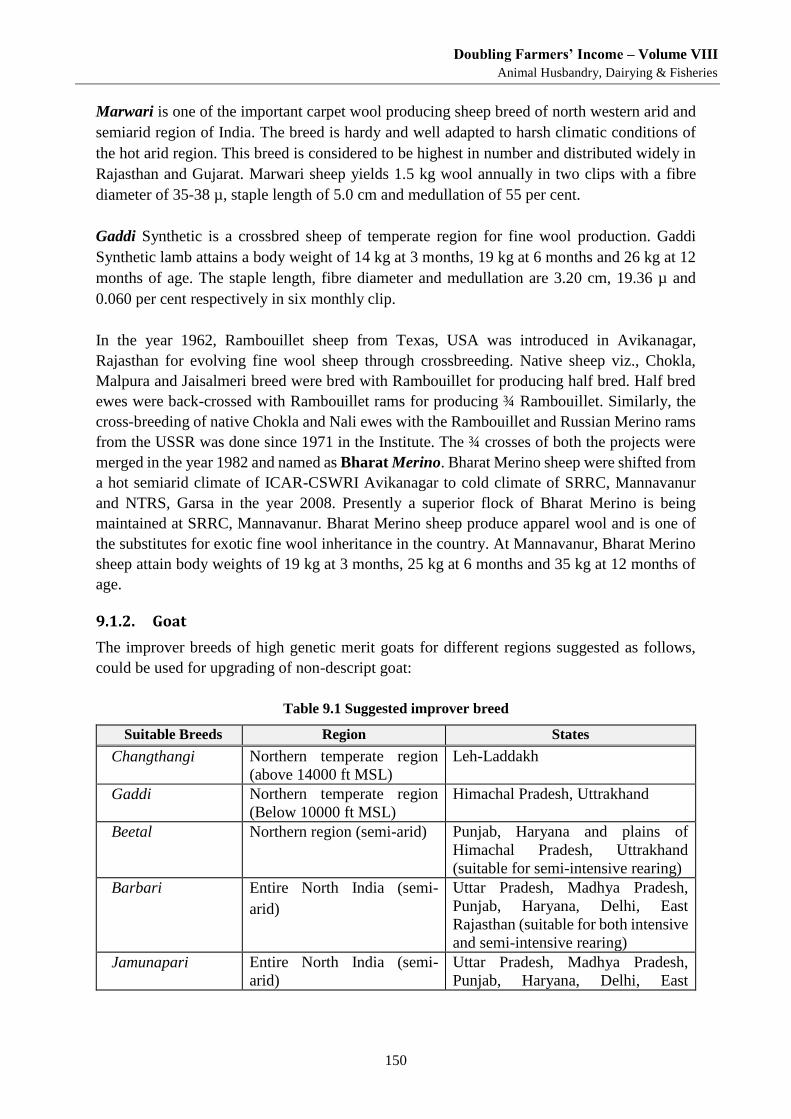
Doubling Farmers’ Income – Volume VIII
Animal Husbandry, Dairying & Fisheries
150
Marwari is one of the important carpet wool producing sheep breed of north western arid and
semiarid region of India. The breed is hardy and well adapted to harsh climatic conditions of
the hot arid region. This breed is considered to be highest in number and distributed widely in
Rajasthan and Gujarat. Marwari sheep yields 1.5 kg wool annually in two clips with a fibre
diameter of 35-38 µ, staple length of 5.0 cm and medullation of 55 per cent.
Gaddi Synthetic is a crossbred sheep of temperate region for fine wool production. Gaddi
Synthetic lamb attains a body weight of 14 kg at 3 months, 19 kg at 6 months and 26 kg at 12
months of age. The staple length, fibre diameter and medullation are 3.20 cm, 19.36 µ and
0.060 per cent respectively in six monthly clip.
In the year 1962, Rambouillet sheep from Texas, USA was introduced in Avikanagar,
Rajasthan for evolving fine wool sheep through crossbreeding. Native sheep viz., Chokla,
Malpura and Jaisalmeri breed were bred with Rambouillet for producing half bred. Half bred
ewes were back-crossed with Rambouillet rams for producing ¾ Rambouillet. Similarly, the
cross-breeding of native Chokla and Nali ewes with the Rambouillet and Russian Merino rams
from the USSR was done since 1971 in the Institute. The ¾ crosses of both the projects were
merged in the year 1982 and named as Bharat Merino. Bharat Merino sheep were shifted from
a hot semiarid climate of ICAR-CSWRI Avikanagar to cold climate of SRRC, Mannavanur
and NTRS, Garsa in the year 2008. Presently a superior flock of Bharat Merino is being
maintained at SRRC, Mannavanur. Bharat Merino sheep produce apparel wool and is one of
the substitutes for exotic fine wool inheritance in the country. At Mannavanur, Bharat Merino
sheep attain body weights of 19 kg at 3 months, 25 kg at 6 months and 35 kg at 12 months of
age.
9.1.2. Goat
The improver breeds of high genetic merit goats for different regions suggested as follows,
could be used for upgrading of non-descript goat:
Table 9.1 Suggested improver breed
Suitable Breeds Region States
Changthangi Northern temperate region
(above 14000 ft MSL)
Leh-Laddakh
Gaddi Northern temperate region
(Below 10000 ft MSL)
Himachal Pradesh, Uttrakhand
Beetal Northern region (semi-arid) Punjab, Haryana and plains of
Himachal Pradesh, Uttrakhand
(suitable for semi-intensive rearing)
Barbari Entire North India (semi-
arid)
Uttar Pradesh, Madhya Pradesh,
Punjab, Haryana, Delhi, East
Rajasthan (suitable for both intensive
and semi-intensive rearing)
Jamunapari Entire North India (semi-
arid)
Uttar Pradesh, Madhya Pradesh,
Punjab, Haryana, Delhi, East
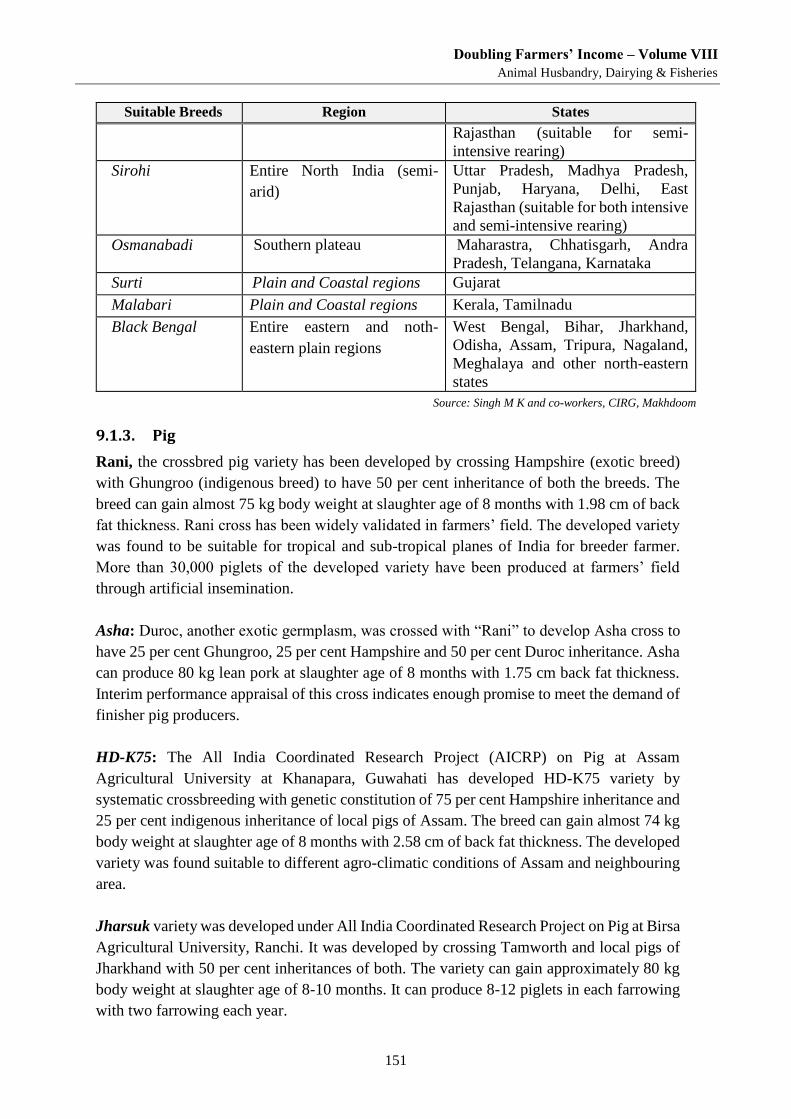
Doubling Farmers’ Income – Volume VIII
Animal Husbandry, Dairying & Fisheries
151
Suitable Breeds Region States
Rajasthan (suitable for semi-
intensive rearing)
Sirohi Entire North India (semi-
arid)
Uttar Pradesh, Madhya Pradesh,
Punjab, Haryana, Delhi, East
Rajasthan (suitable for both intensive
and semi-intensive rearing)
Osmanabadi Southern plateau Maharastra, Chhatisgarh, Andra
Pradesh, Telangana, Karnataka
Surti Plain and Coastal regions Gujarat
Malabari Plain and Coastal regions Kerala, Tamilnadu
Black Bengal Entire eastern and noth-
eastern plain regions
West Bengal, Bihar, Jharkhand,
Odisha, Assam, Tripura, Nagaland,
Meghalaya and other north-eastern
states
Source: Singh M K and co-workers, CIRG, Makhdoom
9.1.3. Pig
Rani, the crossbred pig variety has been developed by crossing Hampshire (exotic breed)
with Ghungroo (indigenous breed) to have 50 per cent inheritance of both the breeds. The
breed can gain almost 75 kg body weight at slaughter age of 8 months with 1.98 cm of back
fat thickness. Rani cross has been widely validated in farmers’ field. The developed variety
was found to be suitable for tropical and sub-tropical planes of India for breeder farmer.
More than 30,000 piglets of the developed variety have been produced at farmers’ field
through artificial insemination.
Asha: Duroc, another exotic germplasm, was crossed with “Rani” to develop Asha cross to
have 25 per cent Ghungroo, 25 per cent Hampshire and 50 per cent Duroc inheritance. Asha
can produce 80 kg lean pork at slaughter age of 8 months with 1.75 cm back fat thickness.
Interim performance appraisal of this cross indicates enough promise to meet the demand of
finisher pig producers.
HD-K75: The All India Coordinated Research Project (AICRP) on Pig at Assam
Agricultural University at Khanapara, Guwahati has developed HD-K75 variety by
systematic crossbreeding with genetic constitution of 75 per cent Hampshire inheritance and
25 per cent indigenous inheritance of local pigs of Assam. The breed can gain almost 74 kg
body weight at slaughter age of 8 months with 2.58 cm of back fat thickness. The developed
variety was found suitable to different agro-climatic conditions of Assam and neighbouring
area.
Jharsuk variety was developed under All India Coordinated Research Project on Pig at Birsa
Agricultural University, Ranchi. It was developed by crossing Tamworth and local pigs of
Jharkhand with 50 per cent inheritances of both. The variety can gain approximately 80 kg
body weight at slaughter age of 8-10 months. It can produce 8-12 piglets in each farrowing
with two farrowing each year.
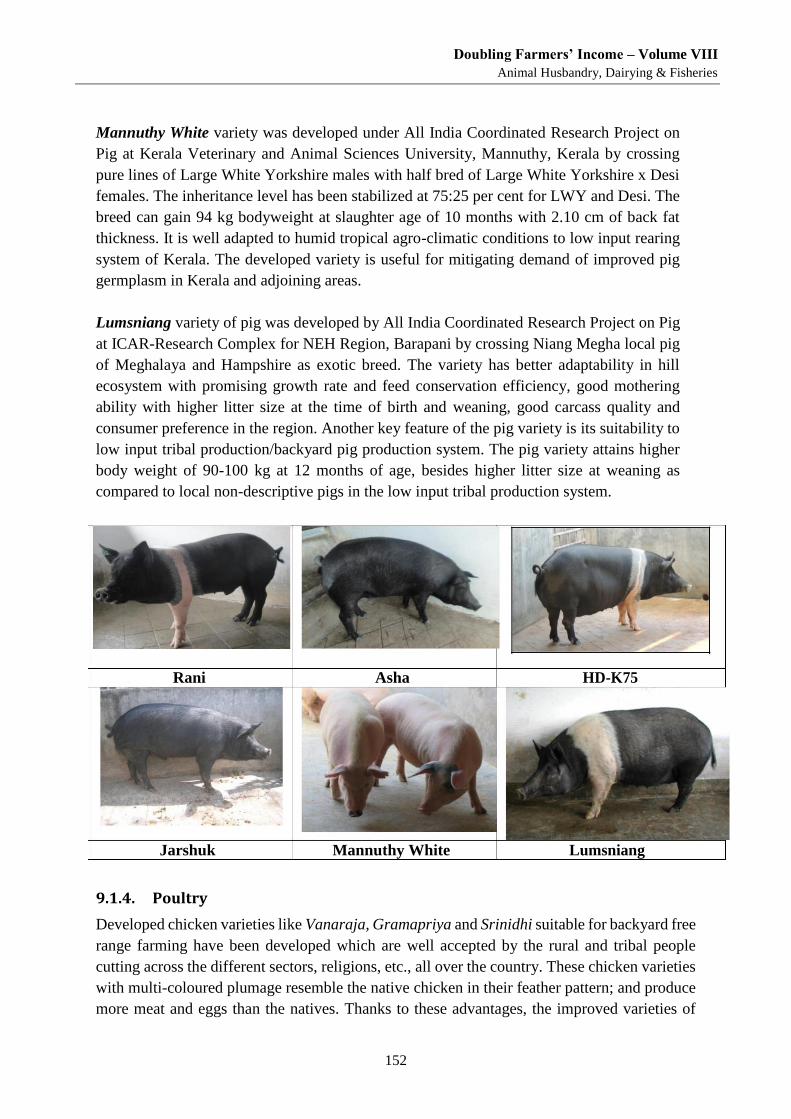
Doubling Farmers’ Income – Volume VIII
Animal Husbandry, Dairying & Fisheries
152
Mannuthy White variety was developed under All India Coordinated Research Project on
Pig at Kerala Veterinary and Animal Sciences University, Mannuthy, Kerala by crossing
pure lines of Large White Yorkshire males with half bred of Large White Yorkshire x Desi
females. The inheritance level has been stabilized at 75:25 per cent for LWY and Desi. The
breed can gain 94 kg bodyweight at slaughter age of 10 months with 2.10 cm of back fat
thickness. It is well adapted to humid tropical agro-climatic conditions to low input rearing
system of Kerala. The developed variety is useful for mitigating demand of improved pig
germplasm in Kerala and adjoining areas.
Lumsniang variety of pig was developed by All India Coordinated Research Project on Pig
at ICAR-Research Complex for NEH Region, Barapani by crossing Niang Megha local pig
of Meghalaya and Hampshire as exotic breed. The variety has better adaptability in hill
ecosystem with promising growth rate and feed conservation efficiency, good mothering
ability with higher litter size at the time of birth and weaning, good carcass quality and
consumer preference in the region. Another key feature of the pig variety is its suitability to
low input tribal production/backyard pig production system. The pig variety attains higher
body weight of 90-100 kg at 12 months of age, besides higher litter size at weaning as
compared to local non-descriptive pigs in the low input tribal production system.
Rani Asha HD-K75
Jarshuk Mannuthy White Lumsniang
9.1.4. Poultry
Developed chicken varieties like Vanaraja, Gramapriya and Srinidhi suitable for backyard free
range farming have been developed which are well accepted by the rural and tribal people
cutting across the different sectors, religions, etc., all over the country. These chicken varieties
with multi-coloured plumage resemble the native chicken in their feather pattern; and produce
more meat and eggs than the natives. Thanks to these advantages, the improved varieties of
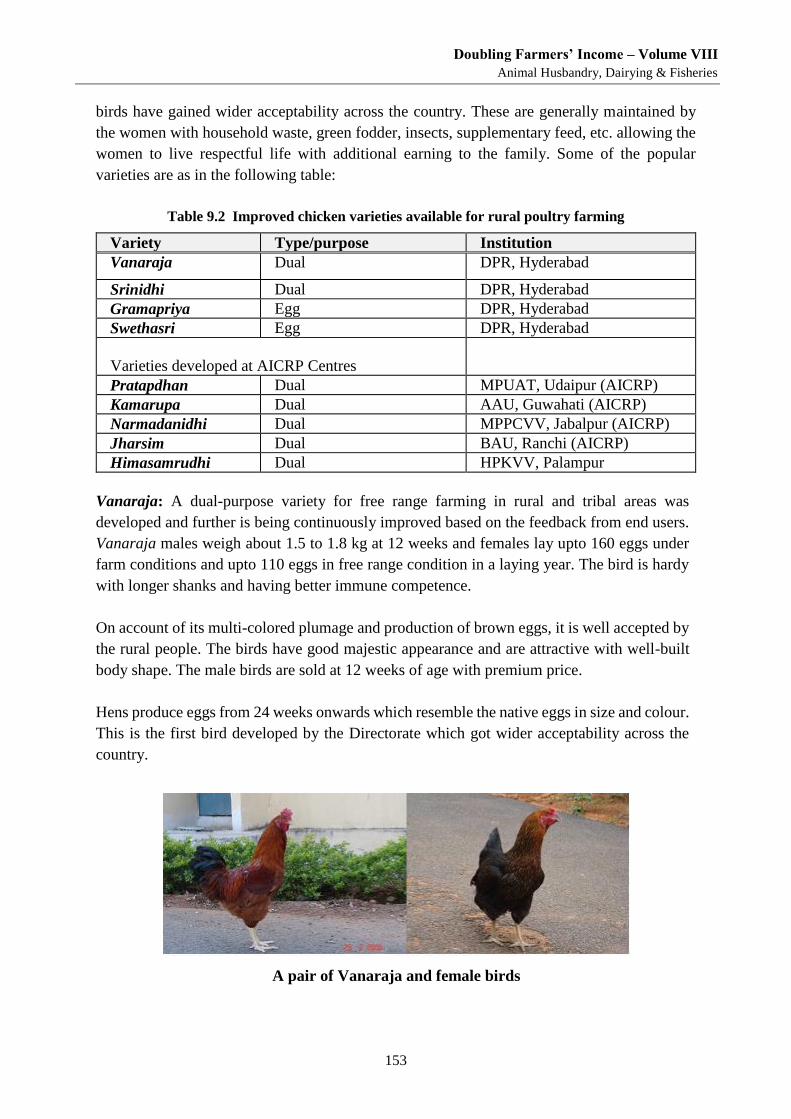
Doubling Farmers’ Income – Volume VIII
Animal Husbandry, Dairying & Fisheries
153
birds have gained wider acceptability across the country. These are generally maintained by
the women with household waste, green fodder, insects, supplementary feed, etc. allowing the
women to live respectful life with additional earning to the family. Some of the popular
varieties are as in the following table:
Table 9.2 Improved chicken varieties available for rural poultry farming
Variety Type/purpose Institution
Vanaraja Dual DPR, Hyderabad
Srinidhi Dual DPR, Hyderabad
Gramapriya Egg DPR, Hyderabad
Swethasri Egg DPR, Hyderabad
Varieties developed at AICRP Centres
Pratapdhan Dual MPUAT, Udaipur (AICRP)
Kamarupa Dual AAU, Guwahati (AICRP)
Narmadanidhi Dual MPPCVV, Jabalpur (AICRP)
Jharsim Dual BAU, Ranchi (AICRP)
Himasamrudhi Dual HPKVV, Palampur
Vanaraja: A dual-purpose variety for free range farming in rural and tribal areas was
developed and further is being continuously improved based on the feedback from end users.
Vanaraja males weigh about 1.5 to 1.8 kg at 12 weeks and females lay upto 160 eggs under
farm conditions and upto 110 eggs in free range condition in a laying year. The bird is hardy
with longer shanks and having better immune competence.
On account of its multi-colored plumage and production of brown eggs, it is well accepted by
the rural people. The birds have good majestic appearance and are attractive with well-built
body shape. The male birds are sold at 12 weeks of age with premium price.
Hens produce eggs from 24 weeks onwards which resemble the native eggs in size and colour.
This is the first bird developed by the Directorate which got wider acceptability across the
country.
A pair of Vanaraja and female birds
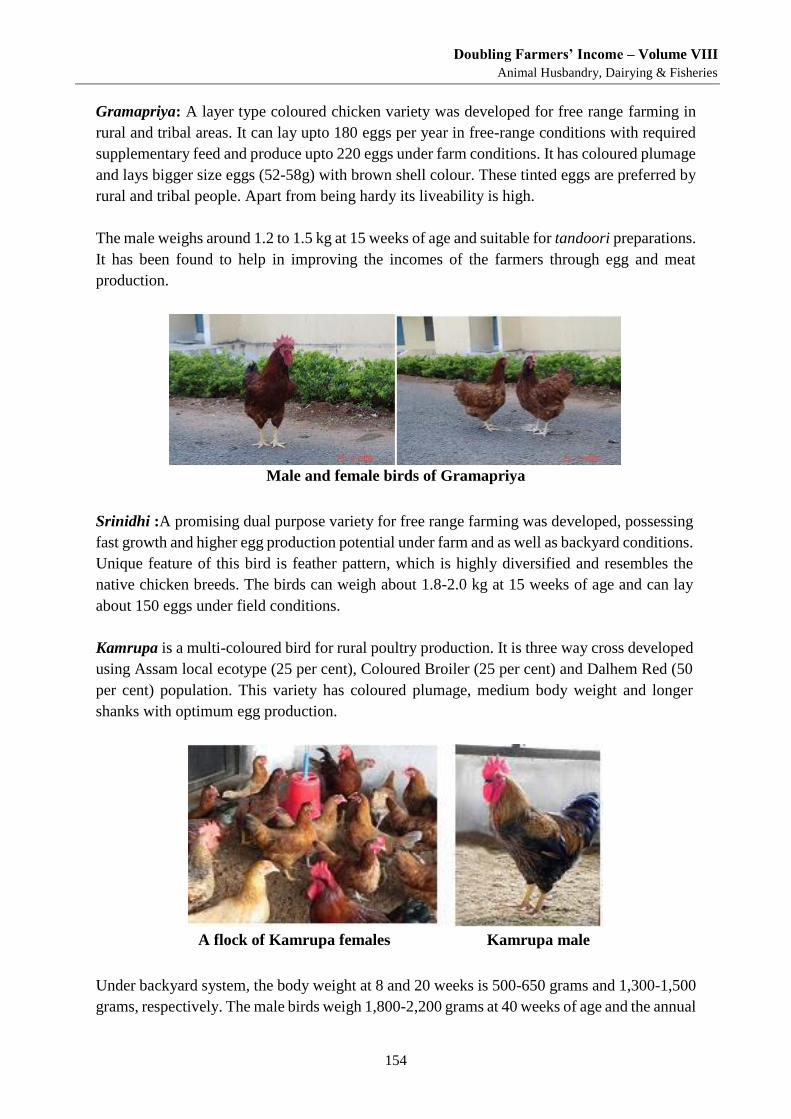
Doubling Farmers’ Income – Volume VIII
Animal Husbandry, Dairying & Fisheries
154
Gramapriya: A layer type coloured chicken variety was developed for free range farming in
rural and tribal areas. It can lay upto 180 eggs per year in free-range conditions with required
supplementary feed and produce upto 220 eggs under farm conditions. It has coloured plumage
and lays bigger size eggs (52-58g) with brown shell colour. These tinted eggs are preferred by
rural and tribal people. Apart from being hardy its liveability is high.
The male weighs around 1.2 to 1.5 kg at 15 weeks of age and suitable for tandoori preparations.
It has been found to help in improving the incomes of the farmers through egg and meat
production.
Male and female birds of Gramapriya
Srinidhi :A promising dual purpose variety for free range farming was developed, possessing
fast growth and higher egg production potential under farm and as well as backyard conditions.
Unique feature of this bird is feather pattern, which is highly diversified and resembles the
native chicken breeds. The birds can weigh about 1.8-2.0 kg at 15 weeks of age and can lay
about 150 eggs under field conditions.
Kamrupa is a multi-coloured bird for rural poultry production. It is three way cross developed
using Assam local ecotype (25 per cent), Coloured Broiler (25 per cent) and Dalhem Red (50
per cent) population. This variety has coloured plumage, medium body weight and longer
shanks with optimum egg production.
A flock of Kamrupa females Kamrupa male
Under backyard system, the body weight at 8 and 20 weeks is 500-650 grams and 1,300-1,500
grams, respectively. The male birds weigh 1,800-2,200 grams at 40 weeks of age and the annual
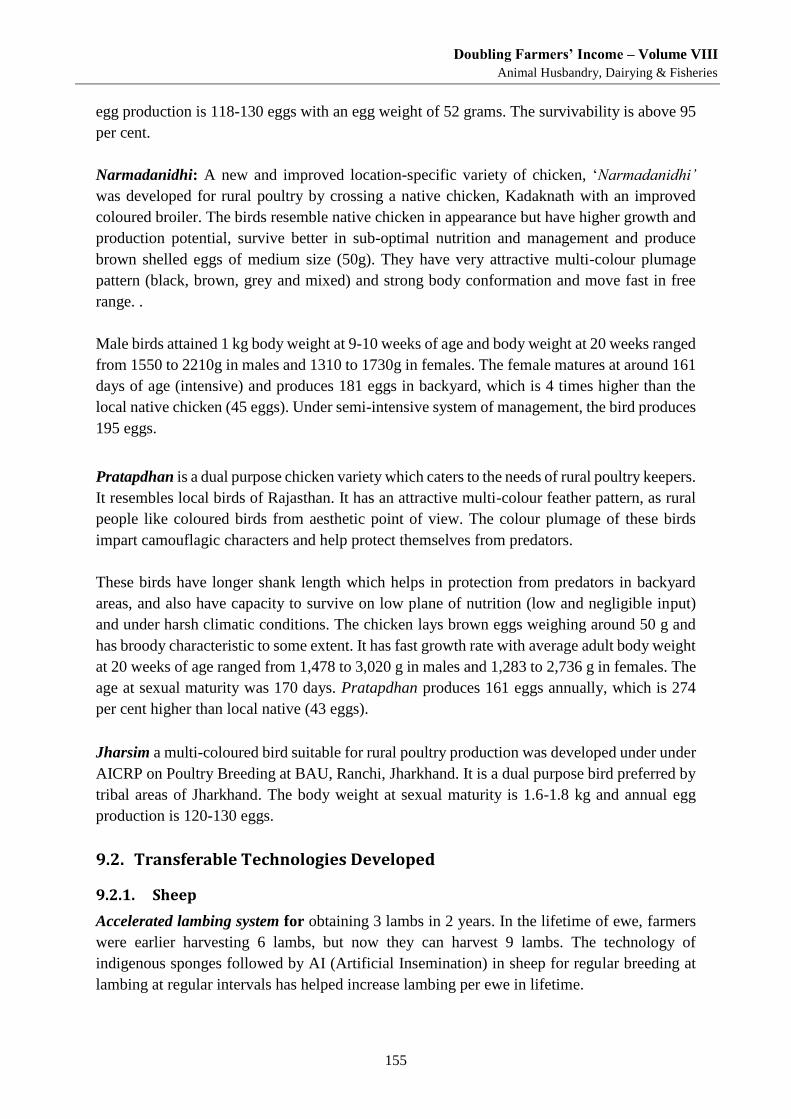
Doubling Farmers’ Income – Volume VIII
Animal Husbandry, Dairying & Fisheries
155
egg production is 118-130 eggs with an egg weight of 52 grams. The survivability is above 95
per cent.
Narmadanidhi: A new and improved location-specific variety of chicken, ‘Narmadanidhi’
was developed for rural poultry by crossing a native chicken, Kadaknath with an improved
coloured broiler. The birds resemble native chicken in appearance but have higher growth and
production potential, survive better in sub-optimal nutrition and management and produce
brown shelled eggs of medium size (50g). They have very attractive multi-colour plumage
pattern (black, brown, grey and mixed) and strong body conformation and move fast in free
range. .
Male birds attained 1 kg body weight at 9-10 weeks of age and body weight at 20 weeks ranged
from 1550 to 2210g in males and 1310 to 1730g in females. The female matures at around 161
days of age (intensive) and produces 181 eggs in backyard, which is 4 times higher than the
local native chicken (45 eggs). Under semi-intensive system of management, the bird produces
195 eggs.
Pratapdhan is a dual purpose chicken variety which caters to the needs of rural poultry keepers.
It resembles local birds of Rajasthan. It has an attractive multi-colour feather pattern, as rural
people like coloured birds from aesthetic point of view. The colour plumage of these birds
impart camouflagic characters and help protect themselves from predators.
These birds have longer shank length which helps in protection from predators in backyard
areas, and also have capacity to survive on low plane of nutrition (low and negligible input)
and under harsh climatic conditions. The chicken lays brown eggs weighing around 50 g and
has broody characteristic to some extent. It has fast growth rate with average adult body weight
at 20 weeks of age ranged from 1,478 to 3,020 g in males and 1,283 to 2,736 g in females. The
age at sexual maturity was 170 days. Pratapdhan produces 161 eggs annually, which is 274
per cent higher than local native (43 eggs).
Jharsim a multi-coloured bird suitable for rural poultry production was developed under under
AICRP on Poultry Breeding at BAU, Ranchi, Jharkhand. It is a dual purpose bird preferred by
tribal areas of Jharkhand. The body weight at sexual maturity is 1.6-1.8 kg and annual egg
production is 120-130 eggs.
9.2. Transferable Technologies Developed
9.2.1. Sheep
Accelerated lambing system for obtaining 3 lambs in 2 years. In the lifetime of ewe, farmers
were earlier harvesting 6 lambs, but now they can harvest 9 lambs. The technology of
indigenous sponges followed by AI (Artificial Insemination) in sheep for regular breeding at
lambing at regular intervals has helped increase lambing per ewe in lifetime.
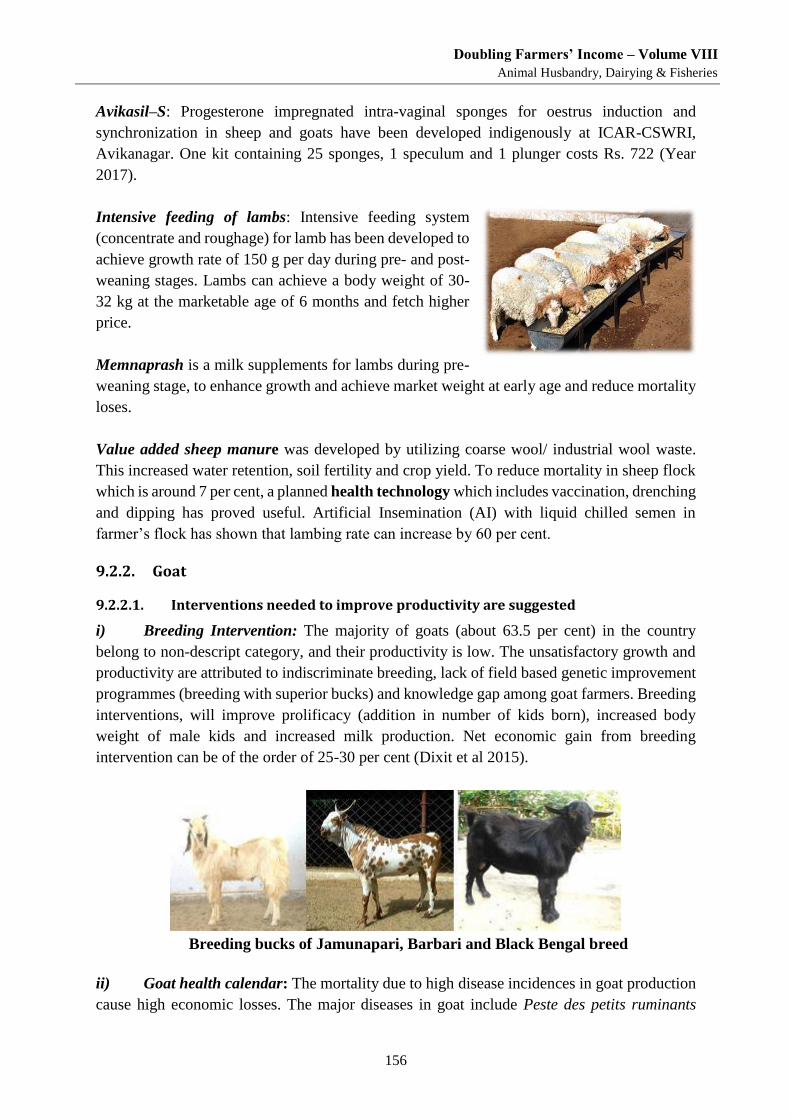
Doubling Farmers’ Income – Volume VIII
Animal Husbandry, Dairying & Fisheries
156
Avikasil–S: Progesterone impregnated intra-vaginal sponges for oestrus induction and
synchronization in sheep and goats have been developed indigenously at ICAR-CSWRI,
Avikanagar. One kit containing 25 sponges, 1 speculum and 1 plunger costs Rs. 722 (Year
2017).
Intensive feeding of lambs: Intensive feeding system
(concentrate and roughage) for lamb has been developed to
achieve growth rate of 150 g per day during pre- and post-
weaning stages. Lambs can achieve a body weight of 30-
32 kg at the marketable age of 6 months and fetch higher
price.
Memnaprash is a milk supplements for lambs during pre-
weaning stage, to enhance growth and achieve market weight at early age and reduce mortality
loses.
Value added sheep manure was developed by utilizing coarse wool/ industrial wool waste.
This increased water retention, soil fertility and crop yield. To reduce mortality in sheep flock
which is around 7 per cent, a planned health technology which includes vaccination, drenching
and dipping has proved useful. Artificial Insemination (AI) with liquid chilled semen in
farmer’s flock has shown that lambing rate can increase by 60 per cent.
9.2.2. Goat
9.2.2.1. Interventions needed to improve productivity are suggested
i) Breeding Intervention: The majority of goats (about 63.5 per cent) in the country
belong to non-descript category, and their productivity is low. The unsatisfactory growth and
productivity are attributed to indiscriminate breeding, lack of field based genetic improvement
programmes (breeding with superior bucks) and knowledge gap among goat farmers. Breeding
interventions, will improve prolificacy (addition in number of kids born), increased body
weight of male kids and increased milk production. Net economic gain from breeding
intervention can be of the order of 25-30 per cent (Dixit et al 2015).
Breeding bucks of Jamunapari, Barbari and Black Bengal breed
ii) Goat health calendar: The mortality due to high disease incidences in goat production
cause high economic losses. The major diseases in goat include Peste des petits ruminants
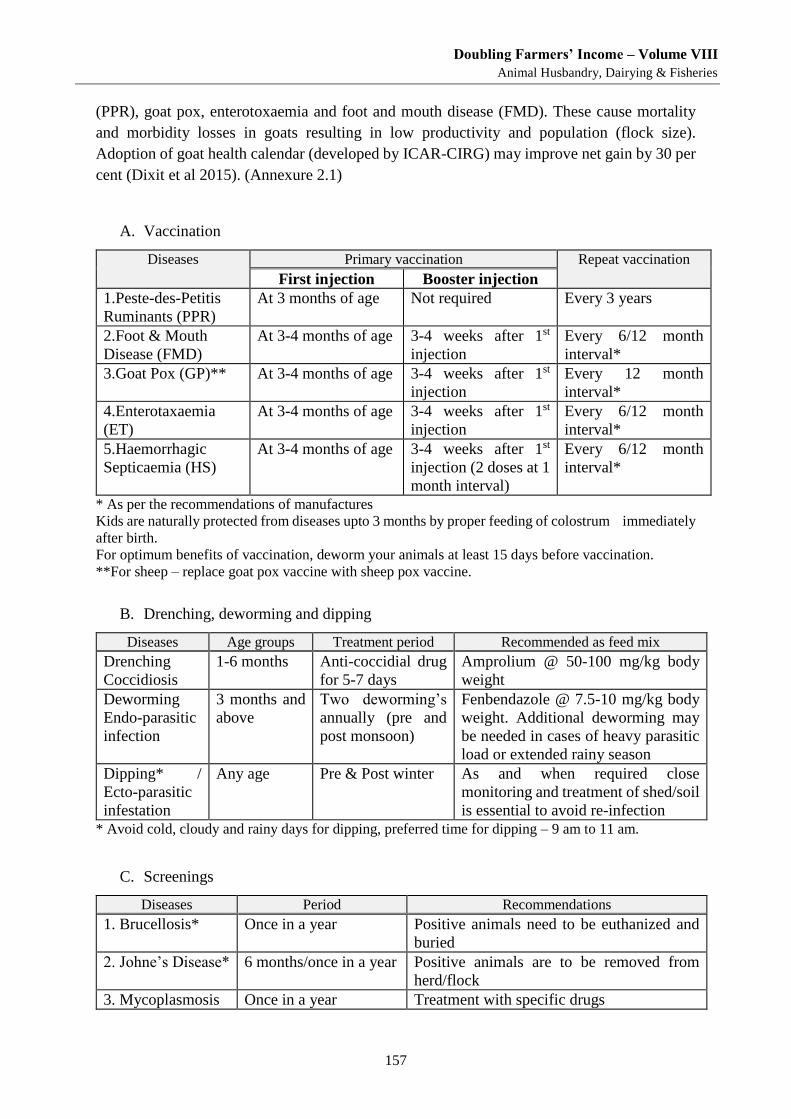
Doubling Farmers’ Income – Volume VIII
Animal Husbandry, Dairying & Fisheries
157
(PPR), goat pox, enterotoxaemia and foot and mouth disease (FMD). These cause mortality
and morbidity losses in goats resulting in low productivity and population (flock size).
Adoption of goat health calendar (developed by ICAR-CIRG) may improve net gain by 30 per
cent (Dixit et al 2015). (Annexure 2.1)
A. Vaccination
Diseases Primary vaccination Repeat vaccination
First injection Booster injection
1.Peste-des-Petitis
Ruminants (PPR)
At 3 months of age Not required Every 3 years
2.Foot & Mouth
Disease (FMD)
At 3-4 months of age 3-4 weeks after 1st
injection
Every 6/12 month
interval*
3.Goat Pox (GP)** At 3-4 months of age 3-4 weeks after 1st
injection
Every 12 month
interval*
4.Enterotaxaemia
(ET)
At 3-4 months of age 3-4 weeks after 1st
injection
Every 6/12 month
interval*
5.Haemorrhagic
Septicaemia (HS)
At 3-4 months of age 3-4 weeks after 1st
injection (2 doses at 1
month interval)
Every 6/12 month
interval*
* As per the recommendations of manufactures
Kids are naturally protected from diseases upto 3 months by proper feeding of colostrum immediately
after birth.
For optimum benefits of vaccination, deworm your animals at least 15 days before vaccination.
**For sheep – replace goat pox vaccine with sheep pox vaccine.
B. Drenching, deworming and dipping
Diseases Age groups Treatment period Recommended as feed mix
Drenching
Coccidiosis
1-6 months Anti-coccidial drug
for 5-7 days
Amprolium @ 50-100 mg/kg body
weight
Deworming
Endo-parasitic
infection
3 months and
above
Two deworming’s
annually (pre and
post monsoon)
Fenbendazole @ 7.5-10 mg/kg body
weight. Additional deworming may
be needed in cases of heavy parasitic
load or extended rainy season
Dipping* /
Ecto-parasitic
infestation
Any age Pre & Post winter As and when required close
monitoring and treatment of shed/soil
is essential to avoid re-infection
* Avoid cold, cloudy and rainy days for dipping, preferred time for dipping – 9 am to 11 am.
C. Screenings
Diseases Period Recommendations
1. Brucellosis* Once in a year Positive animals need to be euthanized and
buried
2. Johne’s Disease* 6 months/once in a year Positive animals are to be removed from
herd/flock
3. Mycoplasmosis Once in a year Treatment with specific drugs
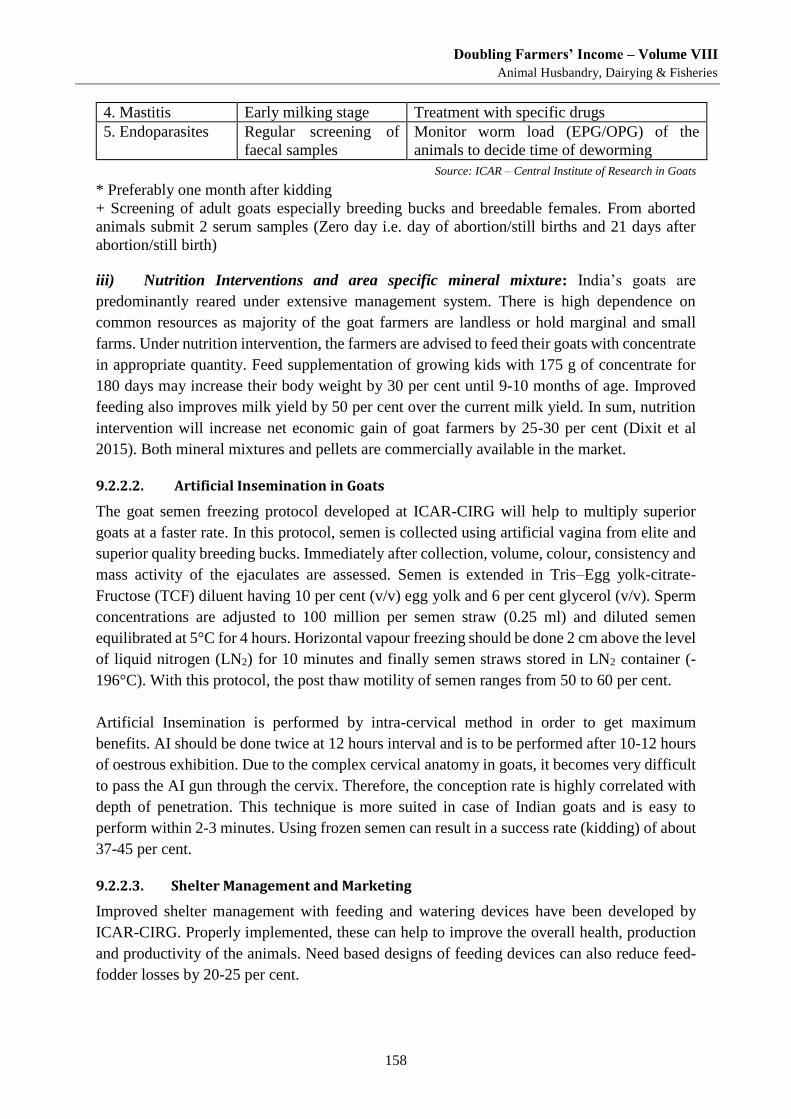
Doubling Farmers’ Income – Volume VIII
Animal Husbandry, Dairying & Fisheries
158
4. Mastitis Early milking stage Treatment with specific drugs
5. Endoparasites Regular screening of
faecal samples
Monitor worm load (EPG/OPG) of the
animals to decide time of deworming
Source: ICAR – Central Institute of Research in Goats
* Preferably one month after kidding
+ Screening of adult goats especially breeding bucks and breedable females. From aborted
animals submit 2 serum samples (Zero day i.e. day of abortion/still births and 21 days after
abortion/still birth)
iii) Nutrition Interventions and area specific mineral mixture: India’s goats are
predominantly reared under extensive management system. There is high dependence on
common resources as majority of the goat farmers are landless or hold marginal and small
farms. Under nutrition intervention, the farmers are advised to feed their goats with concentrate
in appropriate quantity. Feed supplementation of growing kids with 175 g of concentrate for
180 days may increase their body weight by 30 per cent until 9-10 months of age. Improved
feeding also improves milk yield by 50 per cent over the current milk yield. In sum, nutrition
intervention will increase net economic gain of goat farmers by 25-30 per cent (Dixit et al
2015). Both mineral mixtures and pellets are commercially available in the market.
9.2.2.2. Artificial Insemination in Goats
The goat semen freezing protocol developed at ICAR-CIRG will help to multiply superior
goats at a faster rate. In this protocol, semen is collected using artificial vagina from elite and
superior quality breeding bucks. Immediately after collection, volume, colour, consistency and
mass activity of the ejaculates are assessed. Semen is extended in Tris–Egg yolk-citrate-
Fructose (TCF) diluent having 10 per cent (v/v) egg yolk and 6 per cent glycerol (v/v). Sperm
concentrations are adjusted to 100 million per semen straw (0.25 ml) and diluted semen
equilibrated at 5°C for 4 hours. Horizontal vapour freezing should be done 2 cm above the level
of liquid nitrogen (LN2) for 10 minutes and finally semen straws stored in LN2 container (-
196°C). With this protocol, the post thaw motility of semen ranges from 50 to 60 per cent.
Artificial Insemination is performed by intra-cervical method in order to get maximum
benefits. AI should be done twice at 12 hours interval and is to be performed after 10-12 hours
of oestrous exhibition. Due to the complex cervical anatomy in goats, it becomes very difficult
to pass the AI gun through the cervix. Therefore, the conception rate is highly correlated with
depth of penetration. This technique is more suited in case of Indian goats and is easy to
perform within 2-3 minutes. Using frozen semen can result in a success rate (kidding) of about
37-45 per cent.
9.2.2.3. Shelter Management and Marketing
Improved shelter management with feeding and watering devices have been developed by
ICAR-CIRG. Properly implemented, these can help to improve the overall health, production
and productivity of the animals. Need based designs of feeding devices can also reduce feed-
fodder losses by 20-25 per cent.
Doubling Farmers’ Income – Volume VIII
Animal Husbandry, Dairying & Fisheries
159
9.2.2.4. Value Added Products of Goat Meat
While goat meat is already popular, new products have been developed. The processing and
food industry based on goat meat can grow. Some of the possibilities are in Annexure 2.1.
9.3. Technologies for Promotion of Piggery
i) Technology for Artificial Insemination in pigs
The technology of Artificial Insemination (AI) developed offers the most economically viable
method for maintaining genetic variability in a positive direction. The technique involves
standard procedures by which, artificially collected semen from selected healthy boars is
evaluated and diluted in suitable semen extender for preservation at 13-15ºC in order to
inseminate artificially 20 to 30 numbers of sows with more than 80 per cent conception rate.
ii) Comminuted pork products
Technology provides avenues for inactivation of cysticercus larvae in pork, if present while
processing momos and thereby contribute to reduce the incidence of neuro-cysticercosis in
human beings. Many pork products are easily adoptable by small and medium sized
entrepreneurial units and some are discussed below:
Sausage can be produced, even highly seasoned sausages which are generally cooked in hot
water till their internal temperature reaches 70 °C have been developed.
Pork salami is a type of cured sausage consisting of fermented and air-dried pork. During
processing, usually the raw meat mixture ferments for a day, which is then stuffed into either
an edible natural or inedible cellulose casing, and hung to cure. This improves the yield of the
product, nutritive value and shelf life.
Ham slices and pork nuggets have been developed for utilization of a) tough pork from older
pigs; and b) by-products with fortification with non-meat ingredients.
Burger patties are a flattened, usually round, serving of ground pork/ comminuted pork
product. The product has a shelf life of 6 months under frozen storage (-20 °C).
Restructured nuggets are a catch-all term to describe a class of restructured pork made from
smaller pieces of pork fused together by a binding agent. The product has a shelf life of 6
months under frozen storage (-20oC), for utilisation of a) tough pork from older pigs; b)
byproducts; and c) fortification with non-meat ingredients.
Pork pickle: The pickling process provides a simple and least cost method of preservation.
This technology can improve the yield of the product, nutritive value and shelf life and can be
stored at ambient temperature which facilitates its marketing without the cold chain.
Doubling Farmers’ Income – Volume VIII
Animal Husbandry, Dairying & Fisheries
160
Pork soup is a liquid food prepared from meat or vegetable stock combined with various other
ingredients. Technology provides avenues for utilization of remnants of meat remaining in the
bones after deboning process.
Functional pork products - Low fat pork products is simple product for reducing the fat
content which leads to a firmer, rubbery, less juicy product with dark colour. The product has
a shelf life of 6 months under frozen storage (-20 °C). Technology provides avenues for
processing of pork products with health benefits to the consumers.
Pork products with kordoi fruit juice: Has found good consumer acceptability.
9.4. Technologies for promotion of Poultry
The following are the new technologies that need to be promoted: i) Effective alternate feed ingredients for maize and soybean meal have been identified.
Maize could be fully replaced with sorghum, pearl millet or fox-tail millet on weight basis in
broiler diets. In layers, pearl millet and sunflower cake could be used at higher levels (30 per
cent) with reduction in cost of feed. Soybean meal could be replaced with distillery dried grain,
guar meal, cotton seed meal, sunflower cake, til cake, double-zero mustard cake either
completely or to a great extent in commercial broiler diets.
ii) Thermal stress (stress indices) can be reduced by supplementing the diets with certain
herbal compounds, organic trace minerals (Se, Cr, Zn), osmolytes (betaine anhydrous,
potassium chloride), sprouts of millets (sorghum, korra, ragi, bajra) and pulses (green gram,
black gram, wild gram), prebiotics (MOS, FOS, GOS), optimizing essential amino acid (lysine,
total sulphur amino acids, threonine) in chicken reared in open sided poultry houses.
iv) Knock down chicken for myostatin gene developed for improving productivity in birds.
iii) Vaccination schedules: have been developed for controlling two common diseases of
rural poultry, viz. newcastle disease and fowl pox.
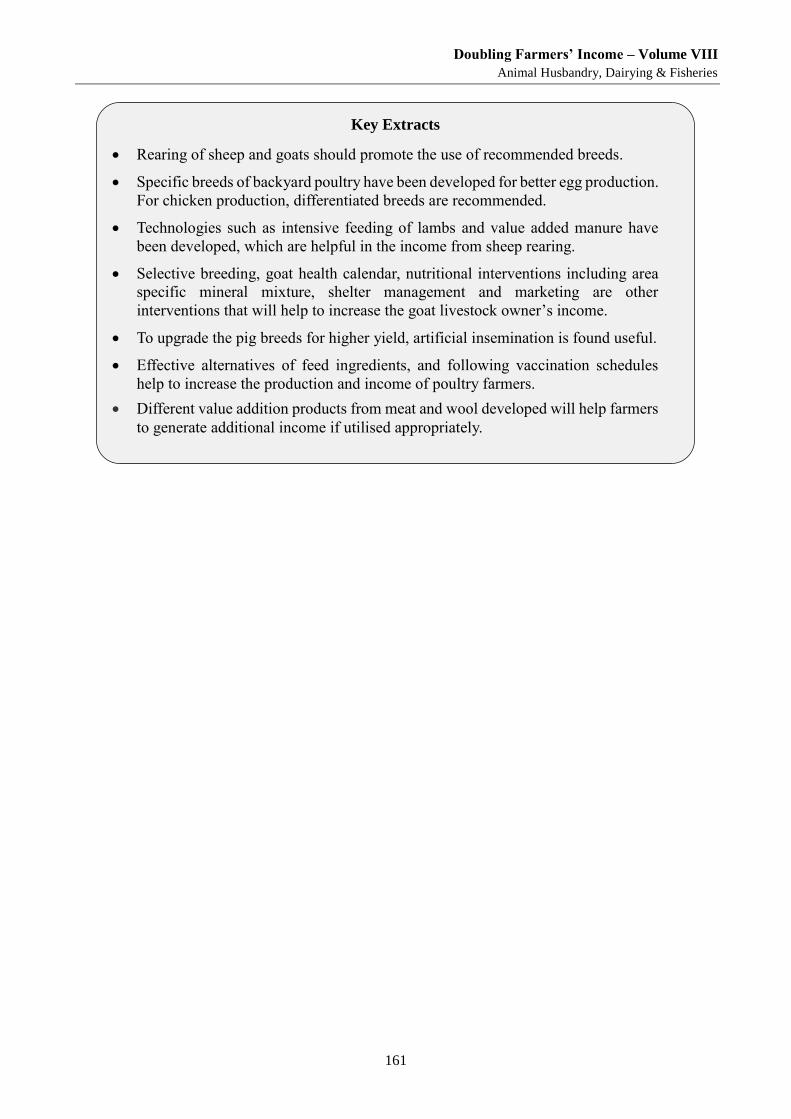
Doubling Farmers’ Income – Volume VIII
Animal Husbandry, Dairying & Fisheries
161
Key Extracts
Rearing of sheep and goats should promote the use of recommended breeds.
Specific breeds of backyard poultry have been developed for better egg production.
For chicken production, differentiated breeds are recommended.
Technologies such as intensive feeding of lambs and value added manure have
been developed, which are helpful in the income from sheep rearing.
Selective breeding, goat health calendar, nutritional interventions including area
specific mineral mixture, shelter management and marketing are other
interventions that will help to increase the goat livestock owner’s income.
To upgrade the pig breeds for higher yield, artificial insemination is found useful.
Effective alternatives of feed ingredients, and following vaccination schedules
help to increase the production and income of poultry farmers.
Different value addition products from meat and wool developed will help farmers
to generate additional income if utilised appropriately.

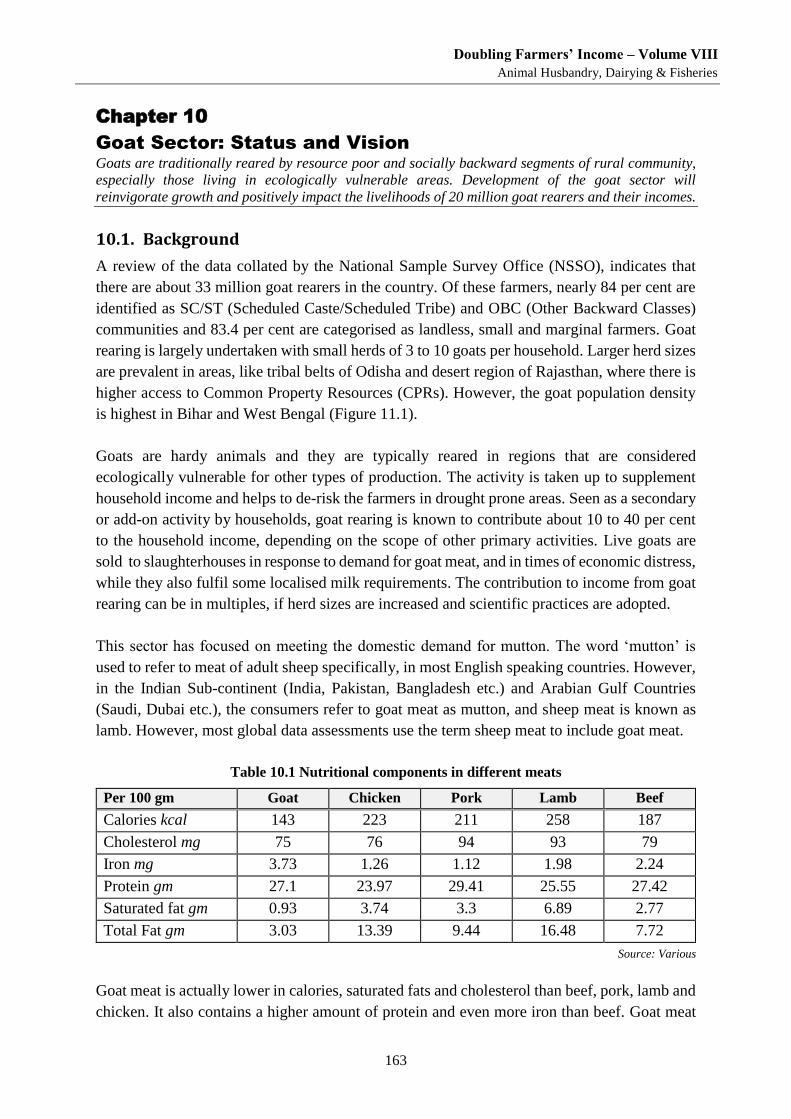
Doubling Farmers’ Income – Volume VIII
Animal Husbandry, Dairying & Fisheries
163
Chapter 10
Goat Sector: Status and Vision Goats are traditionally reared by resource poor and socially backward segments of rural community,
especially those living in ecologically vulnerable areas. Development of the goat sector will
reinvigorate growth and positively impact the livelihoods of 20 million goat rearers and their incomes.
10.1. Background
A review of the data collated by the National Sample Survey Office (NSSO), indicates that
there are about 33 million goat rearers in the country. Of these farmers, nearly 84 per cent are
identified as SC/ST (Scheduled Caste/Scheduled Tribe) and OBC (Other Backward Classes)
communities and 83.4 per cent are categorised as landless, small and marginal farmers. Goat
rearing is largely undertaken with small herds of 3 to 10 goats per household. Larger herd sizes
are prevalent in areas, like tribal belts of Odisha and desert region of Rajasthan, where there is
higher access to Common Property Resources (CPRs). However, the goat population density
is highest in Bihar and West Bengal (Figure 11.1).
Goats are hardy animals and they are typically reared in regions that are considered
ecologically vulnerable for other types of production. The activity is taken up to supplement
household income and helps to de-risk the farmers in drought prone areas. Seen as a secondary
or add-on activity by households, goat rearing is known to contribute about 10 to 40 per cent
to the household income, depending on the scope of other primary activities. Live goats are
sold to slaughterhouses in response to demand for goat meat, and in times of economic distress,
while they also fulfil some localised milk requirements. The contribution to income from goat
rearing can be in multiples, if herd sizes are increased and scientific practices are adopted.
This sector has focused on meeting the domestic demand for mutton. The word ‘mutton’ is
used to refer to meat of adult sheep specifically, in most English speaking countries. However,
in the Indian Sub-continent (India, Pakistan, Bangladesh etc.) and Arabian Gulf Countries
(Saudi, Dubai etc.), the consumers refer to goat meat as mutton, and sheep meat is known as
lamb. However, most global data assessments use the term sheep meat to include goat meat.
Table 10.1 Nutritional components in different meats
Per 100 gm Goat Chicken Pork Lamb Beef
Calories kcal 143 223 211 258 187
Cholesterol mg 75 76 94 93 79
Iron mg 3.73 1.26 1.12 1.98 2.24
Protein gm 27.1 23.97 29.41 25.55 27.42
Saturated fat gm 0.93 3.74 3.3 6.89 2.77
Total Fat gm 3.03 13.39 9.44 16.48 7.72
Source: Various
Goat meat is actually lower in calories, saturated fats and cholesterol than beef, pork, lamb and
chicken. It also contains a higher amount of protein and even more iron than beef. Goat meat
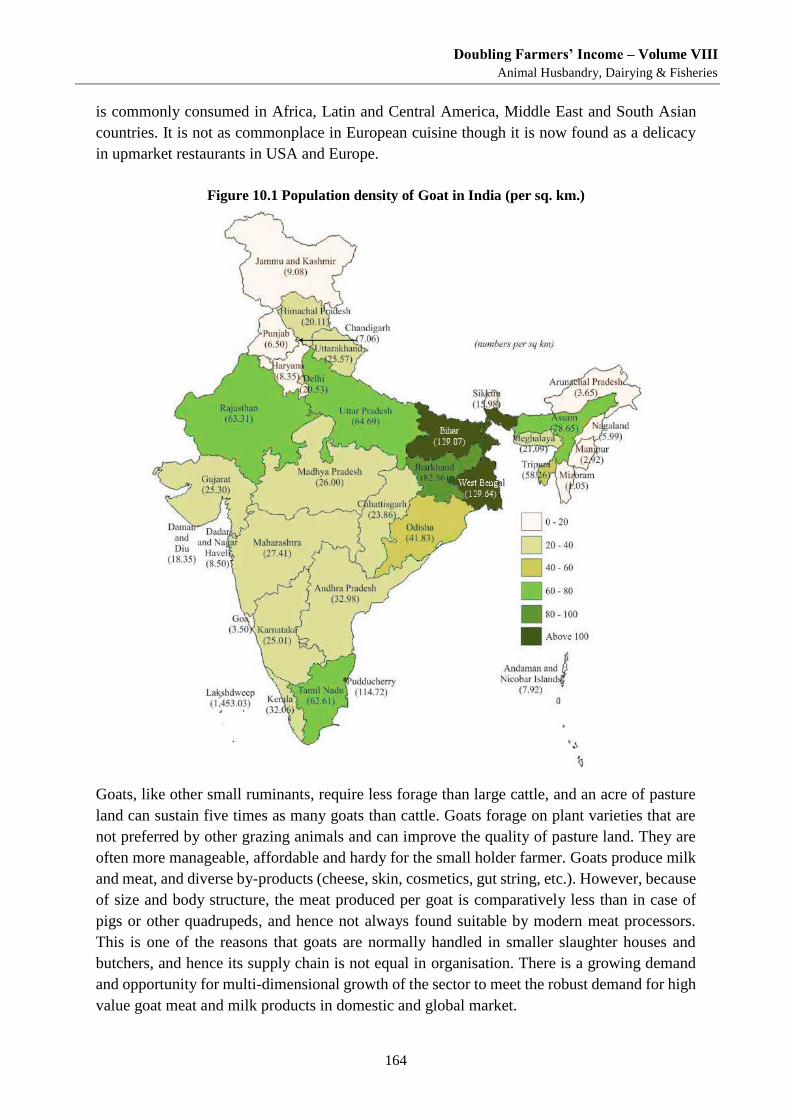
Doubling Farmers’ Income – Volume VIII
Animal Husbandry, Dairying & Fisheries
164
is commonly consumed in Africa, Latin and Central America, Middle East and South Asian
countries. It is not as commonplace in European cuisine though it is now found as a delicacy
in upmarket restaurants in USA and Europe.
Figure 10.1 Population density of Goat in India (per sq. km.)
Goats, like other small ruminants, require less forage than large cattle, and an acre of pasture
land can sustain five times as many goats than cattle. Goats forage on plant varieties that are
not preferred by other grazing animals and can improve the quality of pasture land. They are
often more manageable, affordable and hardy for the small holder farmer. Goats produce milk
and meat, and diverse by-products (cheese, skin, cosmetics, gut string, etc.). However, because
of size and body structure, the meat produced per goat is comparatively less than in case of
pigs or other quadrupeds, and hence not always found suitable by modern meat processors.
This is one of the reasons that goats are normally handled in smaller slaughter houses and
butchers, and hence its supply chain is not equal in organisation. There is a growing demand
and opportunity for multi-dimensional growth of the sector to meet the robust demand for high
value goat meat and milk products in domestic and global market.
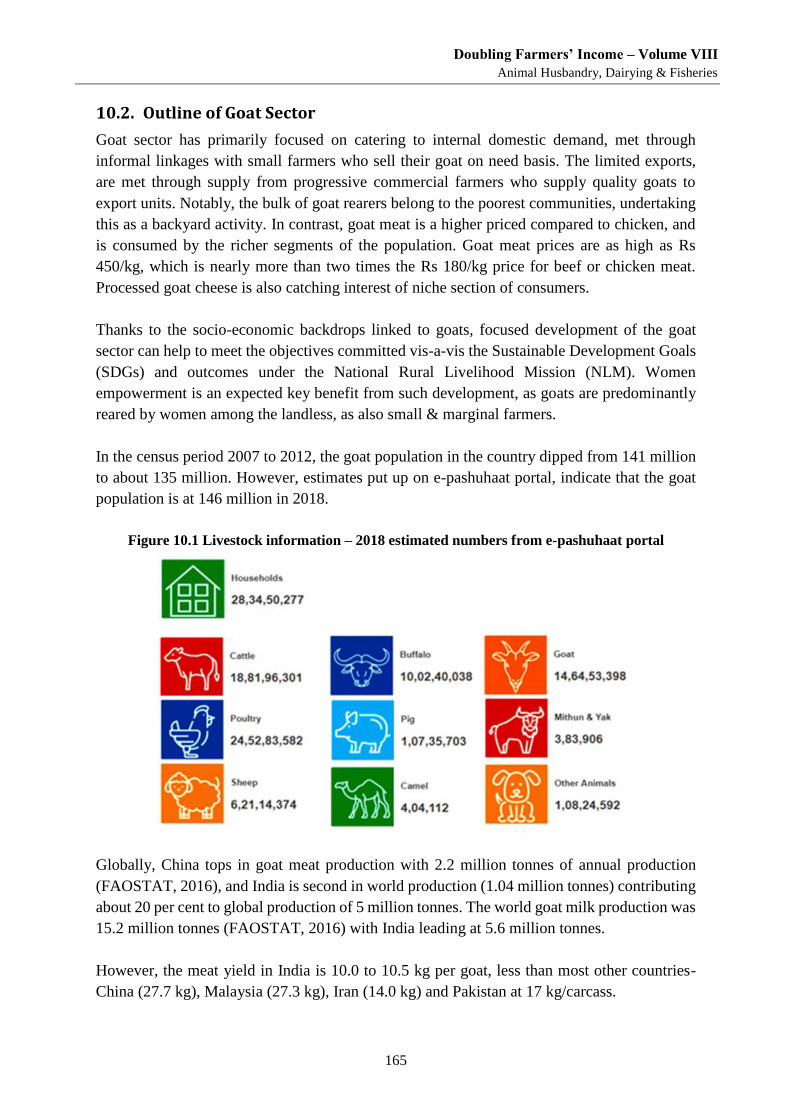
Doubling Farmers’ Income – Volume VIII
Animal Husbandry, Dairying & Fisheries
165
10.2. Outline of Goat Sector
Goat sector has primarily focused on catering to internal domestic demand, met through
informal linkages with small farmers who sell their goat on need basis. The limited exports,
are met through supply from progressive commercial farmers who supply quality goats to
export units. Notably, the bulk of goat rearers belong to the poorest communities, undertaking
this as a backyard activity. In contrast, goat meat is a higher priced compared to chicken, and
is consumed by the richer segments of the population. Goat meat prices are as high as Rs
450/kg, which is nearly more than two times the Rs 180/kg price for beef or chicken meat.
Processed goat cheese is also catching interest of niche section of consumers.
Thanks to the socio-economic backdrops linked to goats, focused development of the goat
sector can help to meet the objectives committed vis-a-vis the Sustainable Development Goals
(SDGs) and outcomes under the National Rural Livelihood Mission (NLM). Women
empowerment is an expected key benefit from such development, as goats are predominantly
reared by women among the landless, as also small & marginal farmers.
In the census period 2007 to 2012, the goat population in the country dipped from 141 million
to about 135 million. However, estimates put up on e-pashuhaat portal, indicate that the goat
population is at 146 million in 2018.
Figure 10.1 Livestock information – 2018 estimated numbers from e-pashuhaat portal
Globally, China tops in goat meat production with 2.2 million tonnes of annual production
(FAOSTAT, 2016), and India is second in world production (1.04 million tonnes) contributing
about 20 per cent to global production of 5 million tonnes. The world goat milk production was
15.2 million tonnes (FAOSTAT, 2016) with India leading at 5.6 million tonnes.
However, the meat yield in India is 10.0 to 10.5 kg per goat, less than most other countries-
China (27.7 kg), Malaysia (27.3 kg), Iran (14.0 kg) and Pakistan at 17 kg/carcass.
Doubling Farmers’ Income – Volume VIII
Animal Husbandry, Dairying & Fisheries
166
10.2.1. Small and marginal goat rearers
Most goat owners are from the poorer section of society and studies indicate that the majority
own less than five goats at any given time. Among such owners, a herd of more than 10 goats
is considered large sized. The goat rearing functions, especially grazing, are mainly handled by
the women and children.
Feed and fodder requirements of goat are mainly met from Common Property Resources
(CPRs). CPRs in dry tropical regions can contribute significantly to the income generation for
the rural poor. CPRs included the village pastures and grazing lands, village forests and
woodlots, protected and un-classed government forests, waste lands, common threshing
grounds, watershed drainage, ponds and tanks, rivers, rivulets, water reservoirs, etc. The
landless households possess relatively lesser number of cattle-variety of livestock and
relatively greater number small ruminants, especially goats.
Goat rearing families tend to retain female stock for replacement and for milk requirements,
and purchase from fellow herders for replacement is also common. The buck is normally sold
for meat as per need and there is little trade in high quality bucks for breeding purposes.
A study undertaken by International Fund for Agricultural Development (IFAD) with the Bill
Melinda Gates (BMG) Foundation on the goat sector, focused on Uttar Pradesh (UP), Bihar
and Odisha, the three states that rank 2nd, 3rd and 10th in goat population, with goat population
density ranging from 41 to 129 per square kilometre. The report brings forth that in UP about
74 per cent of the goat rearers were those who lived below the poverty line and in Odisha and
Bihar this was 90 and 94 per cent respectively. In all three states, 35 to 38 per cent of the goat
rearers saw goat as their main source of income. The average herd size per household was seen
to be small (3-4 goats in Bihar), UP (<5) and Odisha (5-10).
10.2.2. Traditional supply chain
The typical domestic goat supply chain, operates in the informal sector, while the larger
animals are favoured in the supply chain that integrates with the value chain of the organised
meat processing industry.
Various studies have been done at the state and regional levels on the functioning of the goat
value system (the qualitative inputs and the supply chain). The reports indicate that the goat
sector primarily functions along lines of the traditional and disaggregated supply chain, and
there is little organised rearing and marketing of goat products.
Goats are normally marketed by herd owners on need basis, at block or district markets which
may operate once a week. The transactions of farmers is with primary traders and local
butchers, though a few traders from terminal markets may also transact. Market Committees
that manage the market levy a fee on per goat basis which can range from Rs 5 to 15 per goat.
The volume of sale at the primary markets can range from 50 to 200 goats per week. The local
butchers with small requirement of goats on a daily basis, tend to procure directly from rearers
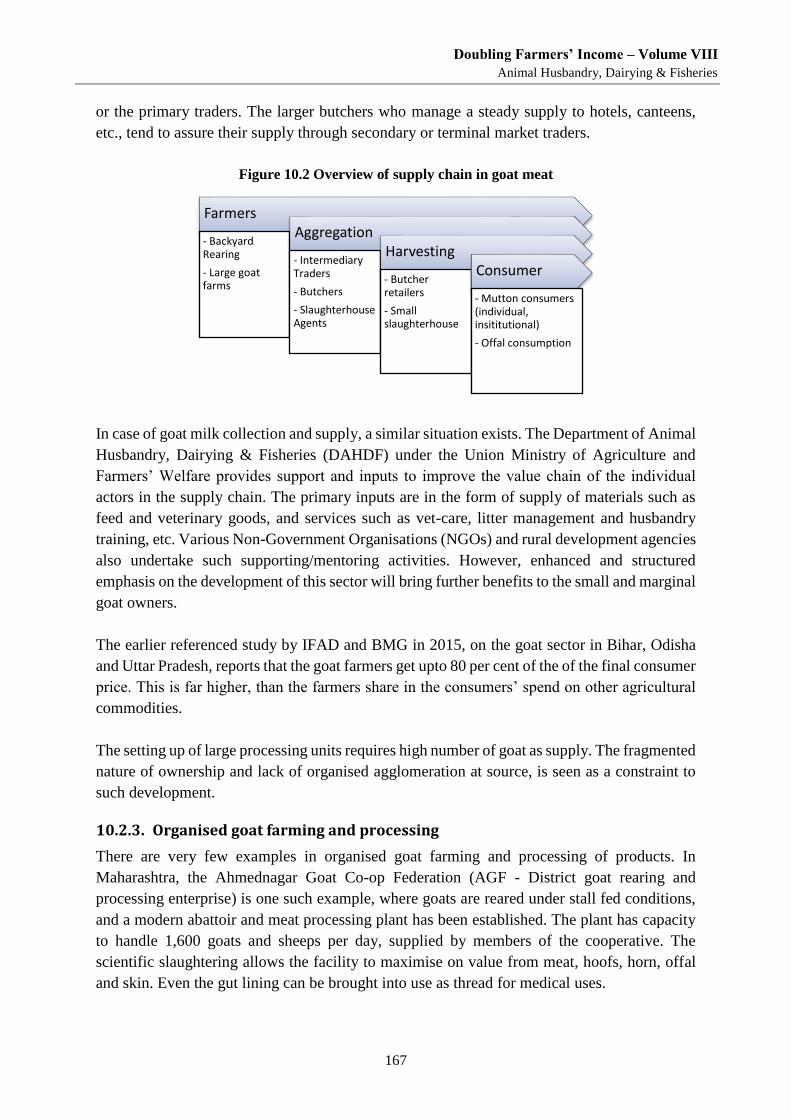
Doubling Farmers’ Income – Volume VIII
Animal Husbandry, Dairying & Fisheries
167
or the primary traders. The larger butchers who manage a steady supply to hotels, canteens,
etc., tend to assure their supply through secondary or terminal market traders.
Figure 10.2 Overview of supply chain in goat meat
In case of goat milk collection and supply, a similar situation exists. The Department of Animal
Husbandry, Dairying & Fisheries (DAHDF) under the Union Ministry of Agriculture and
Farmers’ Welfare provides support and inputs to improve the value chain of the individual
actors in the supply chain. The primary inputs are in the form of supply of materials such as
feed and veterinary goods, and services such as vet-care, litter management and husbandry
training, etc. Various Non-Government Organisations (NGOs) and rural development agencies
also undertake such supporting/mentoring activities. However, enhanced and structured
emphasis on the development of this sector will bring further benefits to the small and marginal
goat owners.
The earlier referenced study by IFAD and BMG in 2015, on the goat sector in Bihar, Odisha
and Uttar Pradesh, reports that the goat farmers get upto 80 per cent of the of the final consumer
price. This is far higher, than the farmers share in the consumers’ spend on other agricultural
commodities.
The setting up of large processing units requires high number of goat as supply. The fragmented
nature of ownership and lack of organised agglomeration at source, is seen as a constraint to
such development.
10.2.3. Organised goat farming and processing
There are very few examples in organised goat farming and processing of products. In
Maharashtra, the Ahmednagar Goat Co-op Federation (AGF - District goat rearing and
processing enterprise) is one such example, where goats are reared under stall fed conditions,
and a modern abattoir and meat processing plant has been established. The plant has capacity
to handle 1,600 goats and sheeps per day, supplied by members of the cooperative. The
scientific slaughtering allows the facility to maximise on value from meat, hoofs, horn, offal
and skin. Even the gut lining can be brought into use as thread for medical uses.
Farmers
- Backyard Rearing
- Large goat farms
Aggregation
- Intermediary Traders
- Butchers
- Slaughterhouse Agents
Harvesting
- Butcher retailers
- Small slaughterhouse
Consumer
- Mutton consumers (individual, insititutional)
- Offal consumption
Doubling Farmers’ Income – Volume VIII
Animal Husbandry, Dairying & Fisheries
168
This kind of organised animal and product handling, helps the local goat rearers with access to
professional management, record keeping and tracking of the progress of each goat, and regular
medical-checks and vaccinations of the goats. The product, including milk and meat, is locally
processed and is of suitable quality for domestic and export markets. However, such organised
goat farming and processing can face social prejudice at times.
Nevertheless, from the perspective of enhancing farmers’ income, especially of those who that
are landless and impoverished, policy attention to ease such an enterprises is recommended.
Such focus will also be eased by establishing village level goat producer organisations of goat
rearers, so as to streamline the process of rearing including health care and in the post-
production phase of marketing.
10.2.4. Availability status of inputs
Branded feed for cattle is sometimes fed to goat in small quantities and feed input sellers are
reportedly available in almost all areas. Goats account for about 1 to 4 per cent of sale of feed
input, and it is usually loose ingredients that are purchased. Medical support is usually available
with local veterinary institute, though supply of vaccines though the state department are
usually lower in comparison to population. At times, curative medicines are purchased from
medical shops, when these are not available with veterinary dispensaries.
Breeding services are not organised and can utilise stray bucks or those selected from own herd
or the buck of other farmer in the village. Breeding stock when sourced elsewhere, need to
transportation over long distances, and the poorer farmers get dissuaded from incurring such
costs. The livestock sale also requires transportation to reach markets. Reports indicate that
illegal payments need to be made to assure the safety of animals during transit. This also
indicates that transporters are not complying with animal transportation rules and not holding
way bills and health certificate of the goats carried. Transportation is an important input cost,
when procuring a new goat or when marketing the goat. The mode of transport, depends on
volume handled, and can vary from motorcycles, tractor trailers, vans, trucks and even buses.
The health and breeding services through a network of veterinary centres, have traditionally
focused on large ruminants. The weak social status of goat herders is reflected in their inability
to express their demands accordingly. Many small ruminants are located in remote areas and
are migratory in nature; and the available services may not reach them. The Krishi Vigyan
Kendras (KVKs) are also expected to focus on goats, and can take up more focused training
and development of goat rearers.
Access to credit is also a challenge, since most goat rearers and traders do not have ample assets
as collateral or the banks do not cater to such backyard farming enterprises. Butchers are also
not able to opt for credit easily. However, launched in May 2017, the Pradhan Mantri Kisan
Sampada Yojana (Scheme for Agro-Marine Processing and Development of Agro-Processing
Clusters) has opened support, aimed at modernising of meat shops and slaughter houses.
Doubling Farmers’ Income – Volume VIII
Animal Husbandry, Dairying & Fisheries
169
10.3. Major Challenges
In comparison to crop sectors, small ruminants, especially goat sector possess esgreater scope
to grow in production since there exists a large demand supply gap. Despite being a strong
contributor to the income and livelihoods of the poorest segments of the society, the sector has
remained largely underinvested and neglected at various levels. With increasing income levels
and changing consumption patterns, the demand for meat/lamb is expected to grow vigorously.
The constraints to growth can be summed up as follows-
i. Absence of organisations of small ruminant keepers: The attention towards
development of goat keepers is limited due to absence of or weak social organisation.
Lacking organisation, they are unable to suitably express their requirements. This also
includes other rights such as access to common grazing land
ii. Disease and mortality rate of goats can be reduced with improved methods of goat
farming, higher level of prophylactic care, vaccines and access to veterinary services.
iii. Breeding stock are not easily identified by goat keepers and they face difficulty in
accessing good quality breeding animals. The shortage of better quality breeds can be
addressed by developing parameters to help identify and provide breeding stock.
iv. Transportation is a major constraint faced by goat farmers, including safe access and
transit of live goats.
v. Poor access and availability of institutional credit makes it difficult for small scale
entrepreneurs with meagre capital assets for collateral security. Furthermore, insurance
for livestock, particularly of small ruminants is largely neglected by insurance
providers. The existing livestock insurance scheme needs a revisit to make it more
farmer-friendly.
vi. Lack of grazing land and goat shelters is also reported from goat rearers in various
regions. Common lands are t developed for such prupose.
Mitigation of these production-centric constraints, will also help to bring greater organisation
in forward linkages with output markets, both domestic and international. The advantages of
lower investment costs, high fertility, easy marketing, and higher social acceptance of goat
meat, goat farming is an ideal option for the rural households.
10.4. Vision and Recommendations
The goat sector directly impacts the landless and marginal population of rural India, and hence
focused development can make meaningful socio-economic impact where it is needed most.
This sector touches the weakest section of society and can not only increase incomes multi-
fold, but also empower the involved women. India already has the second largest goat
population in the world.
Doubling Farmers’ Income – Volume VIII
Animal Husbandry, Dairying & Fisheries
170
The vision for this sector is that it the Indian farmer should become the dominant and organised
source of all goat products, globally. Since the majority of goat rearers are small and marginal,
dependent on goats for income the future development to fulfil the vision should maintain their
stake, and not merely focus on developing commercial entities under single ownership. Village
scale Producer Organisations or Associations will ensure that individual herd owners can
function as a collective, and benefit from greater operational efficiency at different stages of
value chain.
In order to achieve this vision, the strategic roadmap for transforming the goat sector is
enclosed in Annexure A10. The annexure may be referred to for details on the challenges,
recommended plan of action and potential partners under the following heads:
Goat herd size management and
goat housing
Breed development
Goat health services
Goat feeding practices
Goat marketing
Goat processing
Goat extension services
Key Extracts
The demand and supply gaps in goat sector are evident from price differentials between
goat products and other livestock products.
The market opportunity is not fully tapped due to a lack of appropriate attention and
disorganised and fragmented nature of goat sector.
Organising the goat owners into producer organisations, especially at village level can
streamline the rearing and marketing of goat products.
Inter-state coordination and trade promotion will be needed to rapidly scale up the
socio-economic benefits from goat sector.
There is equal opportunity to promote commercial goat farms as well as organised
backyard rearing in the country.
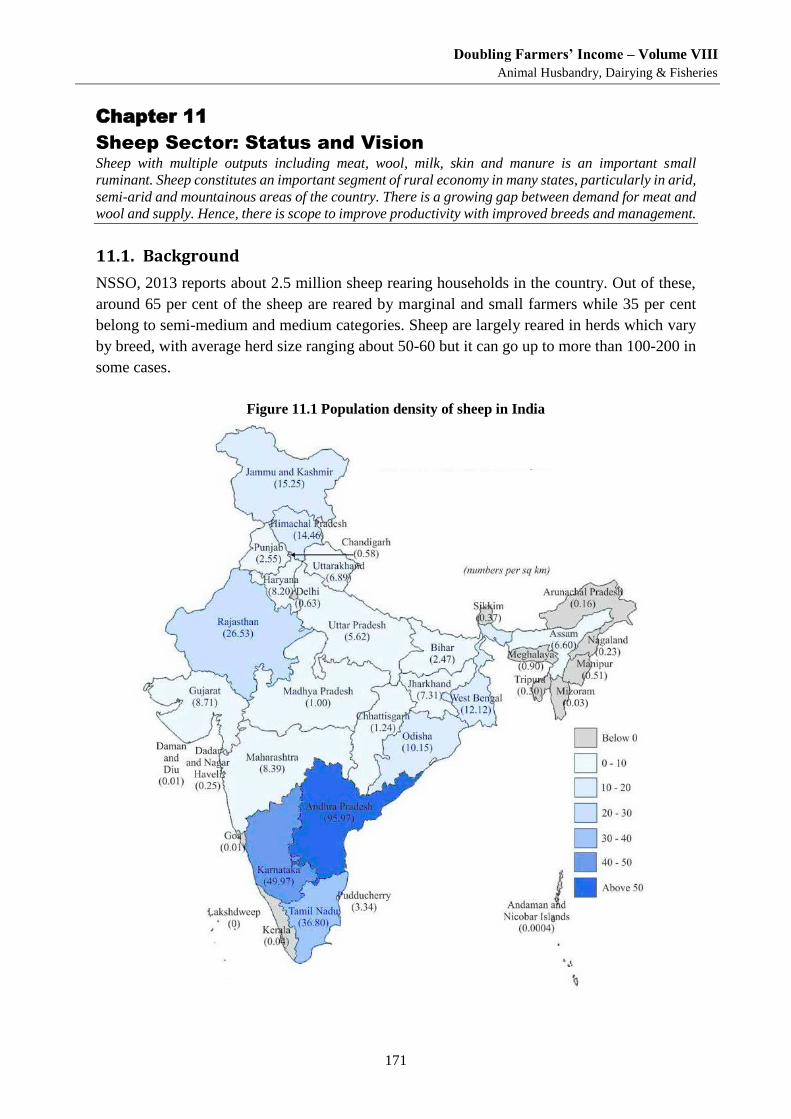
Doubling Farmers’ Income – Volume VIII
Animal Husbandry, Dairying & Fisheries
171
Chapter 11
Sheep Sector: Status and Vision Sheep with multiple outputs including meat, wool, milk, skin and manure is an important small
ruminant. Sheep constitutes an important segment of rural economy in many states, particularly in arid,
semi-arid and mountainous areas of the country. There is a growing gap between demand for meat and
wool and supply. Hence, there is scope to improve productivity with improved breeds and management.
11.1. Background
NSSO, 2013 reports about 2.5 million sheep rearing households in the country. Out of these,
around 65 per cent of the sheep are reared by marginal and small farmers while 35 per cent
belong to semi-medium and medium categories. Sheep are largely reared in herds which vary
by breed, with average herd size ranging about 50-60 but it can go up to more than 100-200 in
some cases.
Figure 11.1 Population density of sheep in India
Doubling Farmers’ Income – Volume VIII
Animal Husbandry, Dairying & Fisheries
172
Sheep have a multi-faceted use by way of wool, meat, milk, skins and manure, and are an
important component of rural economy particularly in the arid, semi-arid and mountainous
areas of the country. It provides a dependable source of income to the shepherds through sale
of wool and animals. Most of the Indian sheep breeds are used for dual purpose, viz. meat and
wool. Sheep rearing is a traditional activity in many parts of the country. It provides gainful
employment and income to the weaker section especially in rural areas. Meat production
contributes about 70-80 per cent and wool contributes only 15-20 per cent to the income of
sheep farmers. The average annual household income from sheep rearing ranges from
Rs.50,000 to Rs.1,00,000 depending on the herd size. This can go up significantly higher in the
case of commercial goat farming or in the case of premium wool as in the case of Jammu &
Kashmir and Himachal Pradesh.
Traditionally, sheep rearing has been the primary source of livelihood for shepherds, who often
belong to distinct communities. Normally sheep-herders have less land than required, and have
to migrate for about 6 months in a year to meet the feed and fodder requirements of their flock.
Sheep are grazed on fallow lands during monsoon and after the Kharif crops are harvested on
stubbles in the harvested fields. Nutrient requirements of these flocks are largely dependent on
the common property resources. The shepherds migrate their flocks over extensive areas within
or even in the neighbouring states. Sheep rearing is thus practised in a diversified manner,
depending upon the region. In Rajasthan, for example, around five lakh sheep are in permanent
migration where the flocks do not return to their home tract at any time of the year.
Sheep meat is more preferred in the certain parts of the country, and competes with goat meat
which is somewhat more costly. There is a small price difference of 10-15 per cent in the price
of sheep meat and goat meat, with the latter at a premium.
The domestic demand for non-vegetarian food in general and for sheep or lamb meat in
particular, is highly income elastic. The demand for non-vegetarian food products is increasing
due to high per capita income growth, urbanization and changes in the taste and preferences of
consumers (Birthal and Rao, 2004). As per NSSO, 2012 6.4 per cent of rural Indians eat
goat/sheep meat, 21.7 per cent eat chicken, 26.5 per cent consume fish, while 29.2 per cent eats
eggs. In urban India, about 10 per cent consume goat/sheep meat, 21 per cent and, 27 per cent
population consuming fish and chicken respectively, and a huge 37.6 per cent of the urban
population eating eggs.
The demand for meat cannot be met from the existing sheep genetic resource reared under
traditional extensive and/migratory production systems. The wider gap in demand and supply
of sheep meat unless bridged will cause sharp rise in price, leading to dependency on import in
future. To combat this situation, a paradigm shift is required in the sheep production from
existing extensive to semi-intensive and commercial system. Thus, inputs are required to
increase life time production, per animal productivity, reproductive and feed efficiencies.
Doubling Farmers’ Income – Volume VIII
Animal Husbandry, Dairying & Fisheries
173
11.2. Outline of Sheep Sector
Of the total sheep population of the world (1173 million heads) Asia and Africa are home to
about 74 per cent of the population with Asia accounting for 44 per cent. The top two leading
countries in sheep population are China and Australia which contributes about 42 per cent of
the total population of the world. India stands at third contributing 12 per cent to the global
population (FAOSTAT, 2016).
As per the Livestock Census 2012, the total sheep in the country was 65.06 million heads
reporting a dip in the population from 71 million heads during the census period 2007. Sheep
population contributes about 12.7 per cent to the total livestock population of the country. Top
five states in sheep population in the country account for more than 80 per cent of sheep
population, and these include Andhra Pradesh, Telangana, Tamil Nadu, Karnataka and
Rajasthan. However, there has been significant decline in the population in these states too.
A major challenge seen in the recent years is a significant decline in herd size owing to decline
in fodder from Common Property Resources (CPRs) driven by changing rainfall patterns.
Additionally, changing socio-economic dynamics with higher income generating
opportunities, and higher enrolment of children going to school, are bringing about a decline
in the migratory pattern.
The overall sheep population in the country has seen a substantive decline of 9.07 per cent over
census period 2007 to 2012. This decline is driven by decreasing productivity of community
pastures, non-availability of proper feed & fodder varieties, decline in traditional involvement
of sheep rearing communities. Climate change is also one of the major factors affecting the
survival of many species, ecosystems and livestock production. Another major reason for the
decline in population cited by some studies emphasized the higher slaughter rate as compared
with rate of reproduction, driven by higher demand, whereby even small lambs are sent for
slaughter.
11.2.1. Perspective of Indian market for sheep products
Sheep rearing, integrated into natural resources is an essential complement of diversification
of livelihoods. Sheep converts naturally available grasses and agriculture residues into meat,
manure and wool. In India sheep are mostly reared for wool and meat. A number of rural based
industries use wool and sheep skin as raw material. In addition to this, sheep manure is an
important source of soil fertility.
Sheep skin and manure constitute important sources of earning, the latter particularly in
southern India. Milk from sheep is of limited importance and that too in very limited areas of
Jammu and Kashmir, Rajasthan and Gujarat. Indian sheep breed are largely wool and meat
breeds.
Doubling Farmers’ Income – Volume VIII
Animal Husbandry, Dairying & Fisheries
174
11.2.1.1. Meat-Milk-Wool production and trade
Meat is a valuable commodity and an important source of protein. The meat availability in
India is only about 15g/person/day against the ICMR (Indian Council of Medical Research)
recommendation of 30g/person/day (Islam et al., 2016). As per FAOSTAT, 2016 the total
sheep meat production in the world was nine million tonnes with China contributing highest
with two million tonnes while India remained at ninth with 0.2 million tonnes of meat
production. There is a discrepancy with the production figures in Basic Animal Husbandry
Report which reported annual production of 0.4 million tonnes for 2015-16. This suggests the
need for data integrity across board so as to develop an accurate roadmap.
As per Basic Animal Husbandry Statistics report, sheep meat production in the country
evidenced a steady increase over the past decade. However, in the recent years, the production
figures show a decline of 8 per cent. In terms of export, the country exported 23,612 tonnes of
sheep and goat meat worth Rs. 8.281 billion during 2014-15 mostly to Middle Eastern countries
(APEDA, 2015). Though the sheep and goat meat are reported jointly for exports, the export
comprises a larger share of lamb and sheep meat, with mutton (goat meat) having lowest share.
The wool production in India was estimated at 48,000 metric tonnes (MT) during 2014-15.
This production figures have largely remained stagnant for the past two decades and also
evidenced a decline of 10 per cent in recent years. The top five states accounts for about 80 per
cent of the total wool production in India- Rajasthan, Karnataka, J&K, Telangana and Gujarat.
The average annual yield of wool is 0.9 kg per sheep, much lower than the world average of
2.4 kg per sheep.
Since indigenous production of fine quality wool required by the organised mill and the
decentralized hosiery sector is very limited, India depends upon imports. Imports have been
mainly from Australia and New Zealand, the major supplier being Australia. New Zealand
wool is being imported mainly for carpet sector for blending it with indigenous wool. Similarly,
for the shoddy sector, import of pre-mutilated woollen/synthetic rags is allowed under Open
Government Licence.
There is a potential to increase required quantity of carpet wool for fulfilling the demand of the
carpet industry. The dominant states for wool industry include Punjab, Haryana, Rajasthan,
Uttar Pradesh, Maharashtra and Gujarat. The state-wise location of woollen units shows, that
it is 40 per cent in Gujarat, 27 per cent in Haryana and 10 per cent in Rajasthan, and 23 per
cent in rest of the states. A few of the larger units are located in Maharashtra, Punjab, U.P.,
Gujarat and West Bengal4.
India does not export raw wool, but does ship intermediate and finished products such as
woollen yarn, fabric, clothing, and carpets, which generally have increased in the last few years
due to price competitiveness. During 2014, in comparison to 2013, overall woollen exports
4 http://woolboard.nic.in/iwi.htm
Doubling Farmers’ Income – Volume VIII
Animal Husbandry, Dairying & Fisheries
175
increased by 10.5 per cent to $1.058 billion. During 2014, yarn and woven fabric exports were
$178.6 million, up by 19.6 per cent. The exports of woollen apparel and clothing in 2014 were
$321.31 million, up by 4.15 per cent. The exports of other textiles of woollen were $5.32
million in 2014, up by 30 percent (NAP, 2017).
The total sheep milk production in the country was 0.2 million tonnes during 2016 which
accounts for 2 per cent of total milk production in the world (FAOSTAT, 2016). China leads
in global milk production with a contribution of 13 per cent. Indian sheep breeds are not
considered as pure milch breeds.
11.2.1.2. Manure
Sheep droppings are good manure for the fields. Sheep manure is low in nitrogen with high
phosphorous & potassium contents which is good for the growth of plant and can be used as
organic mulch.
Sale of sheep manure is an important income generating activity for sheep farmers in many
parts of the country. One of the major examples of such practice comes from various states
across the country, where the semi-nomadic group of pastoralists keep travelling from village
to village. They are invited by the farmers to pen their flock and stay in their farmlands just
before the sowing season. The sheep are made to pen in a farm on the farmer’s request for a
number of days in a fenced area called wada. During the day, the sheep are taken away to graze
in the fields. The fenced areas are shifted from time to time and the sheep droppings provide
manure in the fields. The rearers are paid approximately Rs. 500 per day for this. Sheep manure
proves to be a double benefit, while giving income it also provides the space for penning the
sheep at night.
11.2.2. Typology of sheep farmers
In most parts of the country, the grazing and feeding practices of sheep are taken care of by the
women members, and men are usually involved in marketing. The average herd size per
household varies from region to region and farmer to farmer. For example, the average herd
size in many parts of southern peninsular region of the country ranges between 40-50 with one
or two rams (which depends on the herd size)5. However, in some cases it was noted that some
farmers own around 200-300 sheep of various breeds (SEVA6, 2017).
In cold and arid regions, sheep are reared under semi-intensive production system while in
southern parts of the country they are reared under extensive system, where they rely on
common grazing lands. Financial inputs are much less as compared to other livestock sector.
However, due to decreasing size of the pastoral lands in the country production systems are
getting restricted to backyard where they are fed with various supplements bought from the
local markets.
5 Tamil Nadu Veterinary and Agricultural Sciences University 6 SEVA: Sustainable Agriculture & Environmental Voluntary Action
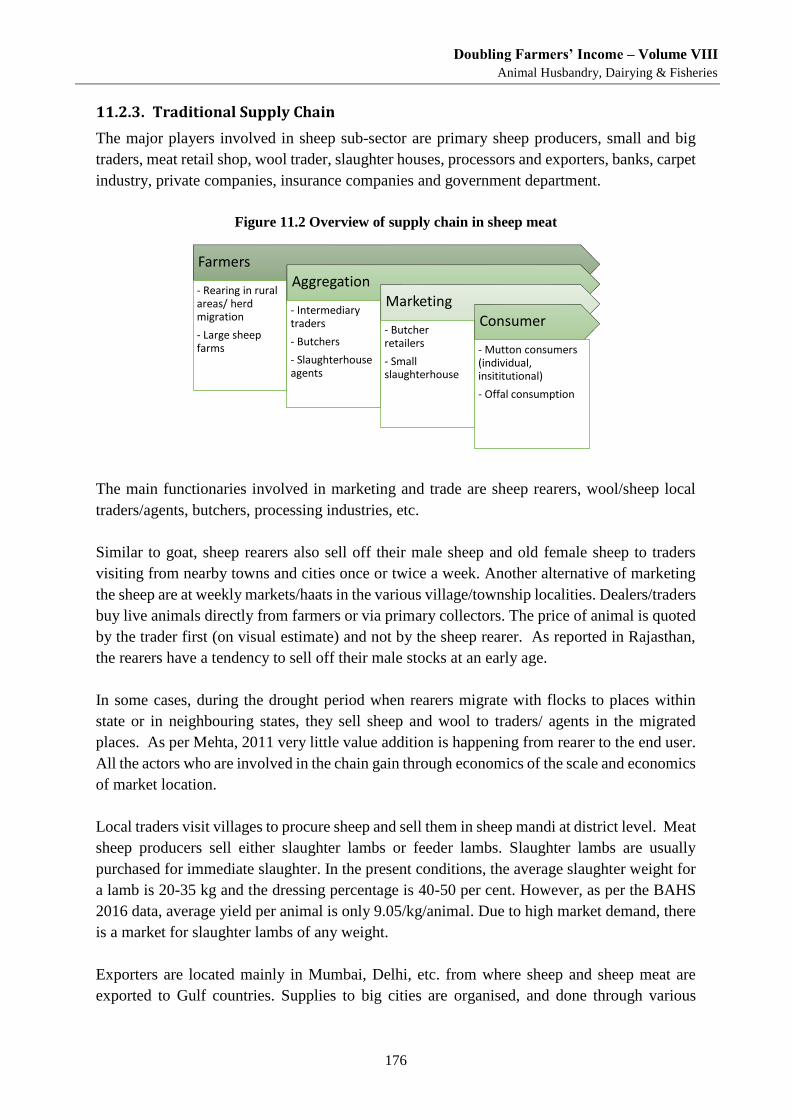
Doubling Farmers’ Income – Volume VIII
Animal Husbandry, Dairying & Fisheries
176
11.2.3. Traditional Supply Chain
The major players involved in sheep sub-sector are primary sheep producers, small and big
traders, meat retail shop, wool trader, slaughter houses, processors and exporters, banks, carpet
industry, private companies, insurance companies and government department.
Figure 11.2 Overview of supply chain in sheep meat
The main functionaries involved in marketing and trade are sheep rearers, wool/sheep local
traders/agents, butchers, processing industries, etc.
Similar to goat, sheep rearers also sell off their male sheep and old female sheep to traders
visiting from nearby towns and cities once or twice a week. Another alternative of marketing
the sheep are at weekly markets/haats in the various village/township localities. Dealers/traders
buy live animals directly from farmers or via primary collectors. The price of animal is quoted
by the trader first (on visual estimate) and not by the sheep rearer. As reported in Rajasthan,
the rearers have a tendency to sell off their male stocks at an early age.
In some cases, during the drought period when rearers migrate with flocks to places within
state or in neighbouring states, they sell sheep and wool to traders/ agents in the migrated
places. As per Mehta, 2011 very little value addition is happening from rearer to the end user.
All the actors who are involved in the chain gain through economics of the scale and economics
of market location.
Local traders visit villages to procure sheep and sell them in sheep mandi at district level. Meat
sheep producers sell either slaughter lambs or feeder lambs. Slaughter lambs are usually
purchased for immediate slaughter. In the present conditions, the average slaughter weight for
a lamb is 20-35 kg and the dressing percentage is 40-50 per cent. However, as per the BAHS
2016 data, average yield per animal is only 9.05/kg/animal. Due to high market demand, there
is a market for slaughter lambs of any weight.
Exporters are located mainly in Mumbai, Delhi, etc. from where sheep and sheep meat are
exported to Gulf countries. Supplies to big cities are organised, and done through various
Farmers
- Rearing in rural areas/ herd migration
- Large sheep farms
Aggregation
- Intermediary traders
- Butchers
- Slaughterhouse agents
Marketing
- Butcher retailers
- Small slaughterhouse
Consumer
- Mutton consumers (individual, insititutional)
- Offal consumption
Doubling Farmers’ Income – Volume VIII
Animal Husbandry, Dairying & Fisheries
177
organisations and associations of traders. The meat is marketed in the retail shops in small
towns and in air conditioned shops in metro towns. In metro towns, shops are licenced to
maintain prescribed hygienic conditions. Similarly, sheep exports to various countries are also
done in a systematic manner which involves careful scrutiny of sheep by veterinary and
medical officers. Concerned authorities certify meat exports.
11.2.4. Organised sheep farming and processing
In the recent years, a number of rural youth are getting involved in setting up commercial sheep
farms. This is an upcoming trend in the country. These commercial farms undertake sheep
rearing in a scientific approach and have also identified alternate channels for marketing of
sheep directly to the processors or traders, bypassing the local traders.
Organised processing of sheep is very limited. Currently, it is reported that there are merely 2
modern abattoirs in the country focusing only on small ruminant processing. They are largely
focusing on processing of sheep as the export demand is mostly for sheep meat. The scientific
slaughtering at scale allows the facilities to maximize on the value generated from by products
including hoofs, horn, offal and skin.
11.2.5. Wool trade
Rajasthan ranks first among wool producing states in India. Breeds of the southern peninsular
and eastern region hardly contribute wool; they are primarily meat-producing sheep.
Wool production in India is divided into four regions (North western arid and semiarid region;
Southern peninsular region; Eastern region; and Northern temperate region) on the basis of the
agro-climatic conditions and the types of sheep available.
There are more than 60 marketing centres (wool mandis) in different states of the country,
where wool is sold in variable quantities. About 50 per cent of the produced wool is brought to
the nearest wool mandis (markets) and sold through open auction. The sheep owners, who
belong to a highly illiterate and economically weaker section of the society and live in remote
areas, still depend, by and large, on local brokers (middlemen) to sell their stock.
Sheep wool is mainly used in carpet industry within various states or in neighbouring states
across the country. Supply channel for Wool in Himalayan Regions (Wani et al., 2014):
Channel-I: Producer → Wool Dealer → Processing Industry of Punjab
Channel-II: Producer → Wool Board → Processing Industry of state
Male sheep tend to produce slightly more wool than female sheep. Shearing is done twice a
year in most of the cases7. As per a few reports it was noted that the shepherds who borrow
from commission agents are bound to sell their wool to them, which means that they forego
the higher returns that could possibly accrue from an open auction in the market. Further, they
7 http://www.fao.org/docrep/004/X6532E/X6532E04.htm
Doubling Farmers’ Income – Volume VIII
Animal Husbandry, Dairying & Fisheries
178
are also required to pay an interest of 2 per cent per month on the outstanding loan. These
factors further diminish the already poor returns that accrue to shepherds (Mehta, 2011).
In states like Rajasthan, the villagers wash and cut the wool and sell to local traders at Rs. 40-
50 per kg. Whereas in some cases rearers hire labour for wool cutting and sell wool without
cleaning and get only Rs. 30-35 per kg. A rearer spends about Rs. 12-14 per sheep on persons
(labour and food) who cuts the wool. The wool reaches mandis (markets) where it is sorted and
graded, processed into yarn to feed the carpet industries across various states. After sorting and
grading, wool is sold for Rs. 60-90 per kg. However, the price of wool varies from state to state
and from breed to breed8.
11.2.6. Availability situation of inputs and services
Sheep husbandry is severely affected by health hazards if infectious diseases like PPR etc. are
not controlled in time. Diseases are the major source of economic loss to the sheep production.
About 15 to 20 per cent of sheep die due to various diseases in India. During the migration,
shepherds face high morbidity and mortality in flocks due to various diseases resulting in
economic loss, as there is no access to medicines and veterinary facilities in the areas of
migration.
The cost on feed supplements is negligible in many parts of the country as they are left to graze
on pastures, paddy fallows, etc. The flocks are grazed in morning and in evening. In some parts,
sheep are fed with maize, barley, wheat, horse gram clover, sesbania leaves, Acacia nilotica
leaves, cluster beans, tender shoot/stems, etc. Water mixed with oil cake is also provided to the
flock.
Grazing and browsing are the main resources to meet the nutrient requirements of small
ruminants in India. However, the area under grazing is steadily decreasing due to increase in
human population, urbanization, pressure on land for growing food and commercial crops to
meet the demands. Further, there is a shortage of dry fodder, green fodder and concentrates to
an extent of 31, 23 and 47 per cents, respectively in meeting the nutritional demands of existing
population, which shows that large gap still exists between requirements and availability of
feed resources in India. Hence, sheep are most often prone to severe nutritional stress which
adversely affects their production performance (NRCM, 2012).
Though most of the disease outbreaks in sheep can be controlled through preventive care, the
coverage of preventive care in the country is limited to a small percentage of animals. The
supply of vaccines, de-worming and medicine facilities are mostly provided by animal
husbandry departments of various states at a very subsidized rates. However, due to limited
manpower and veterinary/outreach centres, the accessibility is limited. In the case of sheep,
which are on migratory route, the outreach of services becomes even more difficult which is
further aggravated by cross-state movement.
8 http://www.mpowerraj.gov.in/
Doubling Farmers’ Income – Volume VIII
Animal Husbandry, Dairying & Fisheries
179
In many cases, the farmers themselves are adept at injecting animals (Mehta, 2011). In rural
parts of Rajasthan, for minor ailments the rearers self-administer drugs to their flocks, and
women are quite used to injecting the animals. It is interesting to note that in Rajasthan,
especially in rural areas, practice of vaccination is generally adopted at the time of migration
of flock or if there is an outbreak in nearby areas (Singh et al., 2018).
In Southern Peninsular Region, total annual expense of vaccines and medicines for a shepherd
for one animal would be in a range of Rs. 50. Ethno-veterinary practices are also undertaken
in rural areas across the country. Many local NGOs and community organisations are involved
in providing veterinary care to the ewes and rams.
11.3. Gap in demand-supply position
Sheep contribute 263 million kg in meat, which is expected to reach 356 million kg by 2030.
The demand for sheep and lamb meat is progressively increasing with economic empowerment
of Indian consumers throughout the country particularly in J&K and Southern States. During
this period, demand for sheep/lamb meat in the country would be 579.5 million kg indicating
a deficit of 37.2 per cent. This is a serious problem, when demand of sheep meat is growing
and import of wool is increasing, the declining activities of sheep husbandry may cause
agrarian distress.
The demand of wool in the country is increasing and woollen industries in the country would
require 296 million kg of wool by 2030. The country’s requirement would not match with the
current production trend, and about 220 million kgs of raw wool will have to be imported from
wool producing countries by 2030. Woollen industry provides employment to about 2.6 million
people and earns more than Rs.5,000 crore of foreign exchange through exports. Sheep
husbandry provides export earnings of Rs.250 crore from meat and animal casing and
processed meat.
Looking into future demand of wool and availability in domestic as well as international
market, it is a challenge to meet the demand of wool in the country. Indian woollen sector
consumes about 50 million kg apparel grade and 100 million kg carpet grade wool. The
requirement of apparel grade wool is met through import from Australia, Russia, UK & USA;
and demand of carpet grade wool is partially met (40 per cent) from domestic market and rest
through import from New Zealand, Argentina, Spain etc. The installed capacity in woollen
industry and consumption of woollen products in India is continuously growing by 1 per cent
per annum, hence the demand of wool would raise in future.
11.4. Major Challenges
The weaknesses of sheep husbandry indicate following factors e.g. shrinkage of grazing
resources, scarcity of water, climate change, poor health management, unorganised marketing
structure for meat & wool, dependence on imported wool, ineffective financial support from
financial institutions, poor risk management strategies, frequent drought and other disaster
Doubling Farmers’ Income – Volume VIII
Animal Husbandry, Dairying & Fisheries
180
which are responsible for deteriorating sheep production in the country. It has been observed
that flock sizes over the period are declining, mainly due to shrinking grazing resources. If this
trend continues, flock size may further reduce to less than 25 per household by the year 2030
in comparison to earlier 100-200.
The challenge arising from probable deficit of meat and wool against the rising domestic
demand can be seen as opportunity, and an appropriate policy adopted to accelerate the growth
of sheep sector in the country. Given the increasing demand for meat and wool, there is an
urgent need to genetically improve these animals through scientific breeding tools to enhance
their productivity. Emphasis on well adapted indigenous breeds, to harness the better adaptive
traits developed through natural selection, is needed.
The constraints to growth can be summed up as follows:
i. The majority of sheep (63 per cent) in India belong to ‘un-described’ (usually referred to
as non-descript) breeds or they are ‘local’ animals not necessarily belonging to a distinct,
‘recognized’ group or breed. There is also a lack of good quality data on small ruminant
numbers, breed population, trends over time and drivers of these trends.
ii. Poor breeding practices due to lack of awareness of scientific breeding practices as well as
inter-mating among available animals is common due to limited availability of high quality
rams. The current pattern of producing low genetic merit animals is due to little selection
process of rams/ewes used for breeding.
iii. In most states, there is a virtual absence of para-veterinary and extension services at the
village level; the government veterinary system reaches only upto the Block level and is
inadequately staffed. The para-vets and community animal health workers have been
trained in veterinary care, however, questions around the sustainability and legality of the
services provided by these trained para-vets and extension workers persist.
iv. Vaccines for major diseases are either not available in adequate numbers, or cold chain
supply systems are not adequately maintained, affecting the efficacy of the product.
v. An erosion of synergies between agriculture and animal husbandry due to an interplay of
various factors, makes small holder rearers’ livelihoods more vulnerable. Factors like loss
of designated grazing lands, closure of forest areas, and diversion of common lands for
other purposes has intensified pressure on available resources, and their degradation.
vi. Encroachment of common lands, and increasing industrialisation have adversely affected
sheep rearing, which used to be a highly productive low-input system, dependent on these
lands for fodder and grazing resources.
vii. Market transactions are non-standardised and unfair trade practices can be observed
because of the ad-hoc nature of the market. Animals are sold on the basis of a visual
estimation of their weight, age and appearance; transactions remain unrecorded and
unreported, resulting in loss of potential taxes/revenue to the government, which could go
towards development of livestock market infrastructure.
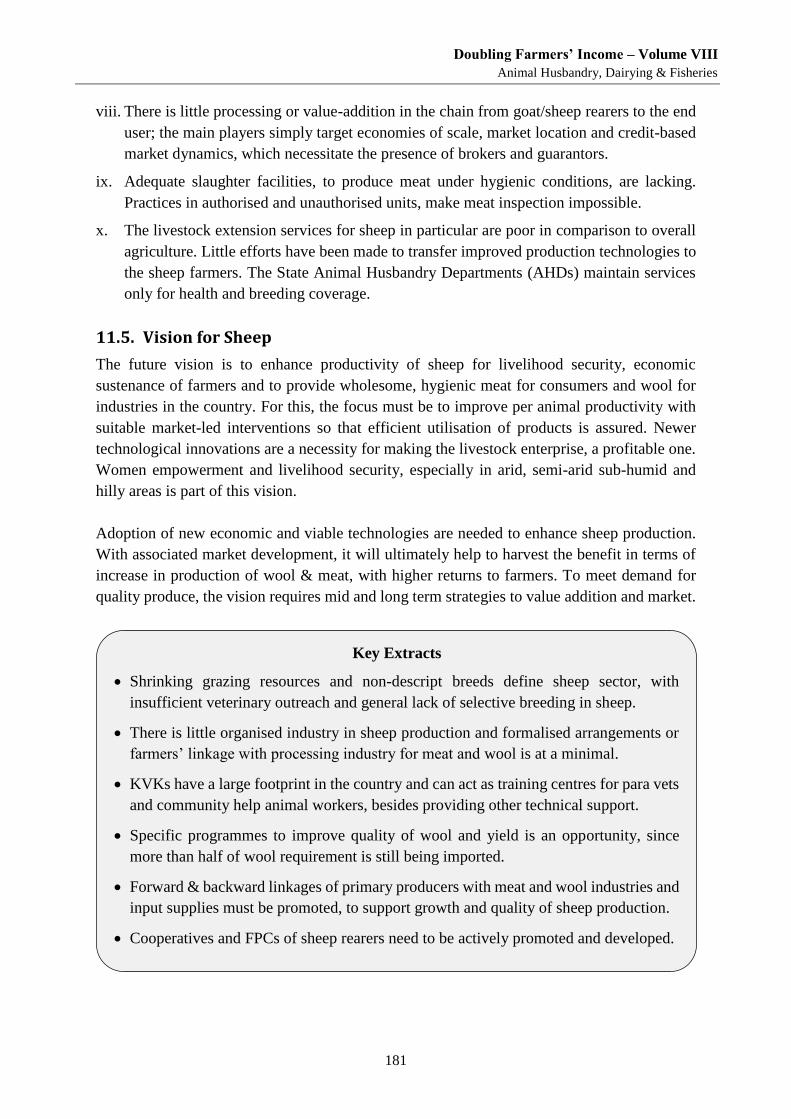
Doubling Farmers’ Income – Volume VIII
Animal Husbandry, Dairying & Fisheries
181
viii. There is little processing or value-addition in the chain from goat/sheep rearers to the end
user; the main players simply target economies of scale, market location and credit-based
market dynamics, which necessitate the presence of brokers and guarantors.
ix. Adequate slaughter facilities, to produce meat under hygienic conditions, are lacking.
Practices in authorised and unauthorised units, make meat inspection impossible.
x. The livestock extension services for sheep in particular are poor in comparison to overall
agriculture. Little efforts have been made to transfer improved production technologies to
the sheep farmers. The State Animal Husbandry Departments (AHDs) maintain services
only for health and breeding coverage.
11.5. Vision for Sheep
The future vision is to enhance productivity of sheep for livelihood security, economic
sustenance of farmers and to provide wholesome, hygienic meat for consumers and wool for
industries in the country. For this, the focus must be to improve per animal productivity with
suitable market-led interventions so that efficient utilisation of products is assured. Newer
technological innovations are a necessity for making the livestock enterprise, a profitable one.
Women empowerment and livelihood security, especially in arid, semi-arid sub-humid and
hilly areas is part of this vision.
Adoption of new economic and viable technologies are needed to enhance sheep production.
With associated market development, it will ultimately help to harvest the benefit in terms of
increase in production of wool & meat, with higher returns to farmers. To meet demand for
quality produce, the vision requires mid and long term strategies to value addition and market.
Key Extracts
Shrinking grazing resources and non-descript breeds define sheep sector, with
insufficient veterinary outreach and general lack of selective breeding in sheep.
There is little organised industry in sheep production and formalised arrangements or
farmers’ linkage with processing industry for meat and wool is at a minimal.
KVKs have a large footprint in the country and can act as training centres for para vets
and community help animal workers, besides providing other technical support.
Specific programmes to improve quality of wool and yield is an opportunity, since
more than half of wool requirement is still being imported.
Forward & backward linkages of primary producers with meat and wool industries and
input supplies must be promoted, to support growth and quality of sheep production.
Cooperatives and FPCs of sheep rearers need to be actively promoted and developed.

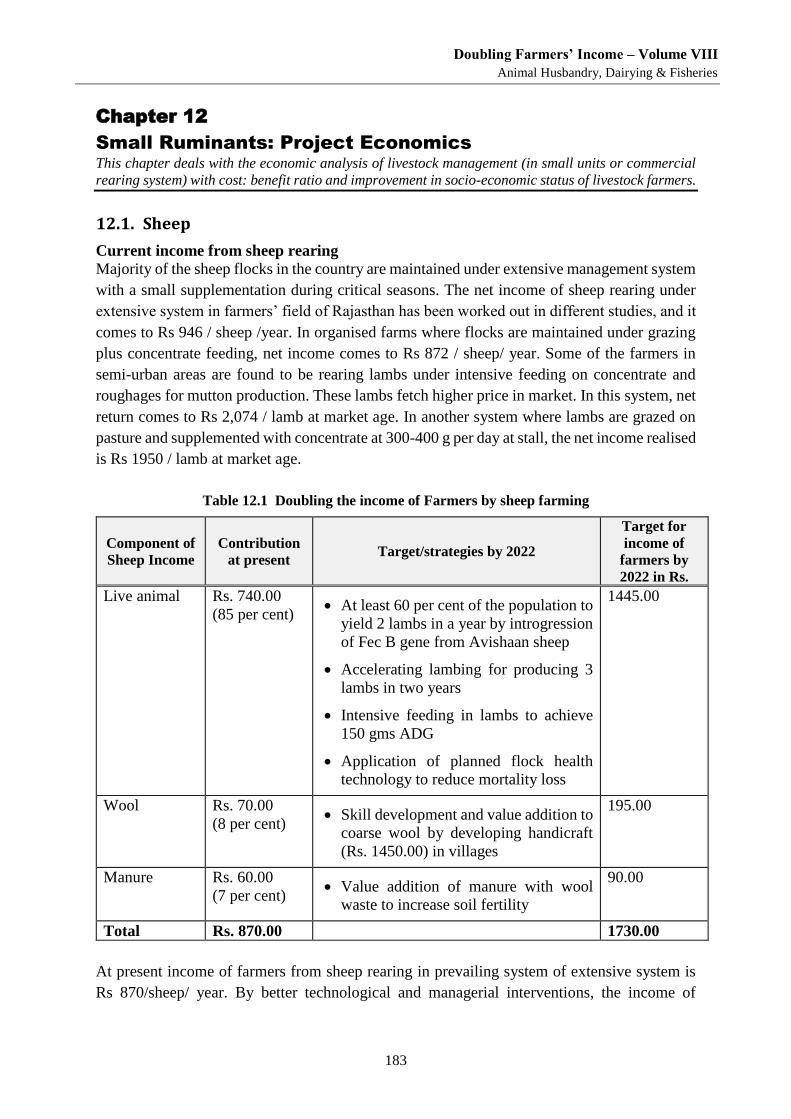
Doubling Farmers’ Income – Volume VIII
Animal Husbandry, Dairying & Fisheries
183
Chapter 12
Small Ruminants: Project Economics This chapter deals with the economic analysis of livestock management (in small units or commercial
rearing system) with cost: benefit ratio and improvement in socio-economic status of livestock farmers.
12.1. Sheep
Current income from sheep rearing
Majority of the sheep flocks in the country are maintained under extensive management system
with a small supplementation during critical seasons. The net income of sheep rearing under
extensive system in farmers’ field of Rajasthan has been worked out in different studies, and it
comes to Rs 946 / sheep /year. In organised farms where flocks are maintained under grazing
plus concentrate feeding, net income comes to Rs 872 / sheep/ year. Some of the farmers in
semi-urban areas are found to be rearing lambs under intensive feeding on concentrate and
roughages for mutton production. These lambs fetch higher price in market. In this system, net
return comes to Rs 2,074 / lamb at market age. In another system where lambs are grazed on
pasture and supplemented with concentrate at 300-400 g per day at stall, the net income realised
is Rs 1950 / lamb at market age.
Table 12.1 Doubling the income of Farmers by sheep farming
Component of
Sheep Income
Contribution
at present Target/strategies by 2022
Target for
income of
farmers by
2022 in Rs.
Live animal Rs. 740.00
(85 per cent) At least 60 per cent of the population to
yield 2 lambs in a year by introgression
of Fec B gene from Avishaan sheep
Accelerating lambing for producing 3
lambs in two years
Intensive feeding in lambs to achieve
150 gms ADG
Application of planned flock health
technology to reduce mortality loss
1445.00
Wool Rs. 70.00
(8 per cent) Skill development and value addition to
coarse wool by developing handicraft
(Rs. 1450.00) in villages
195.00
Manure Rs. 60.00
(7 per cent) Value addition of manure with wool
waste to increase soil fertility
90.00
Total Rs. 870.00 1730.00
At present income of farmers from sheep rearing in prevailing system of extensive system is
Rs 870/sheep/ year. By better technological and managerial interventions, the income of
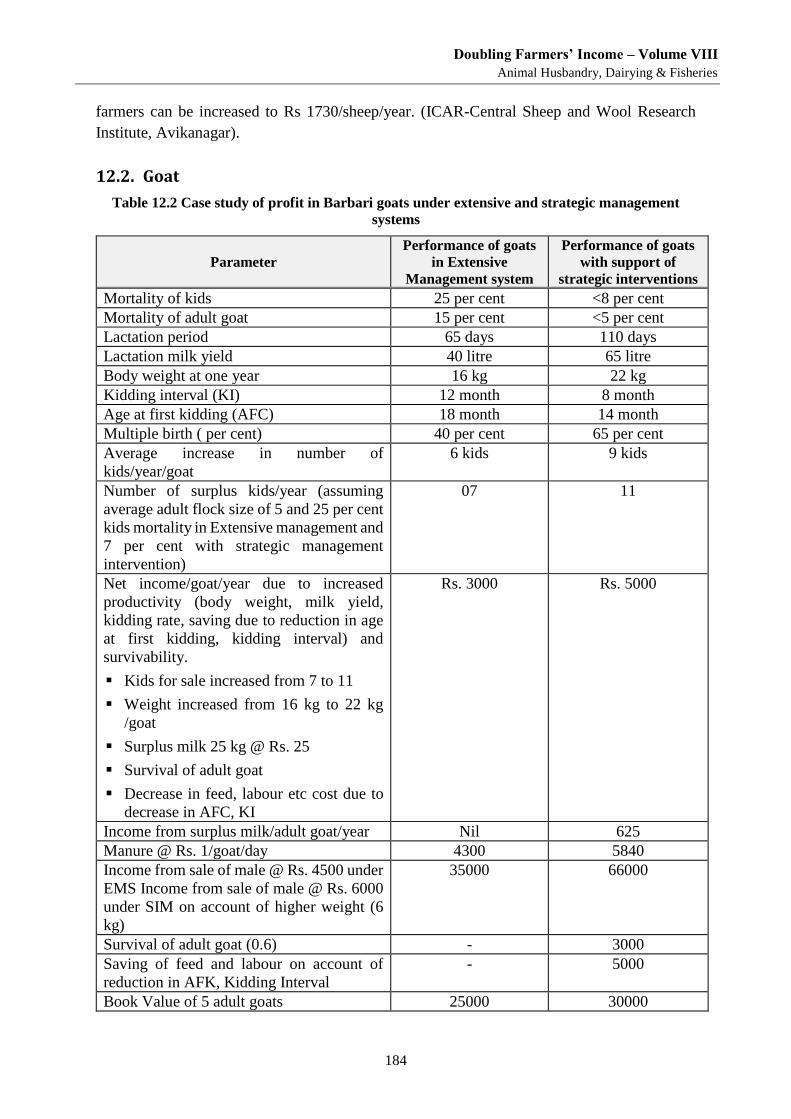
Doubling Farmers’ Income – Volume VIII
Animal Husbandry, Dairying & Fisheries
184
farmers can be increased to Rs 1730/sheep/year. (ICAR-Central Sheep and Wool Research
Institute, Avikanagar).
12.2. Goat
Table 12.2 Case study of profit in Barbari goats under extensive and strategic management
systems
Parameter
Performance of goats
in Extensive
Management system
Performance of goats
with support of
strategic interventions
Mortality of kids 25 per cent <8 per cent
Mortality of adult goat 15 per cent <5 per cent
Lactation period 65 days 110 days
Lactation milk yield 40 litre 65 litre
Body weight at one year 16 kg 22 kg
Kidding interval (KI) 12 month 8 month
Age at first kidding (AFC) 18 month 14 month
Multiple birth ( per cent) 40 per cent 65 per cent
Average increase in number of
kids/year/goat
6 kids 9 kids
Number of surplus kids/year (assuming
average adult flock size of 5 and 25 per cent
kids mortality in Extensive management and
7 per cent with strategic management
intervention)
07 11
Net income/goat/year due to increased
productivity (body weight, milk yield,
kidding rate, saving due to reduction in age
at first kidding, kidding interval) and
survivability.
Kids for sale increased from 7 to 11
Weight increased from 16 kg to 22 kg
/goat
Surplus milk 25 kg @ Rs. 25
Survival of adult goat
Decrease in feed, labour etc cost due to
decrease in AFC, KI
Rs. 3000 Rs. 5000
Income from surplus milk/adult goat/year Nil 625
Manure @ Rs. 1/goat/day 4300 5840
Income from sale of male @ Rs. 4500 under
EMS Income from sale of male @ Rs. 6000
under SIM on account of higher weight (6
kg)
35000 66000
Survival of adult goat (0.6) - 3000
Saving of feed and labour on account of
reduction in AFK, Kidding Interval
- 5000
Book Value of 5 adult goats 25000 30000
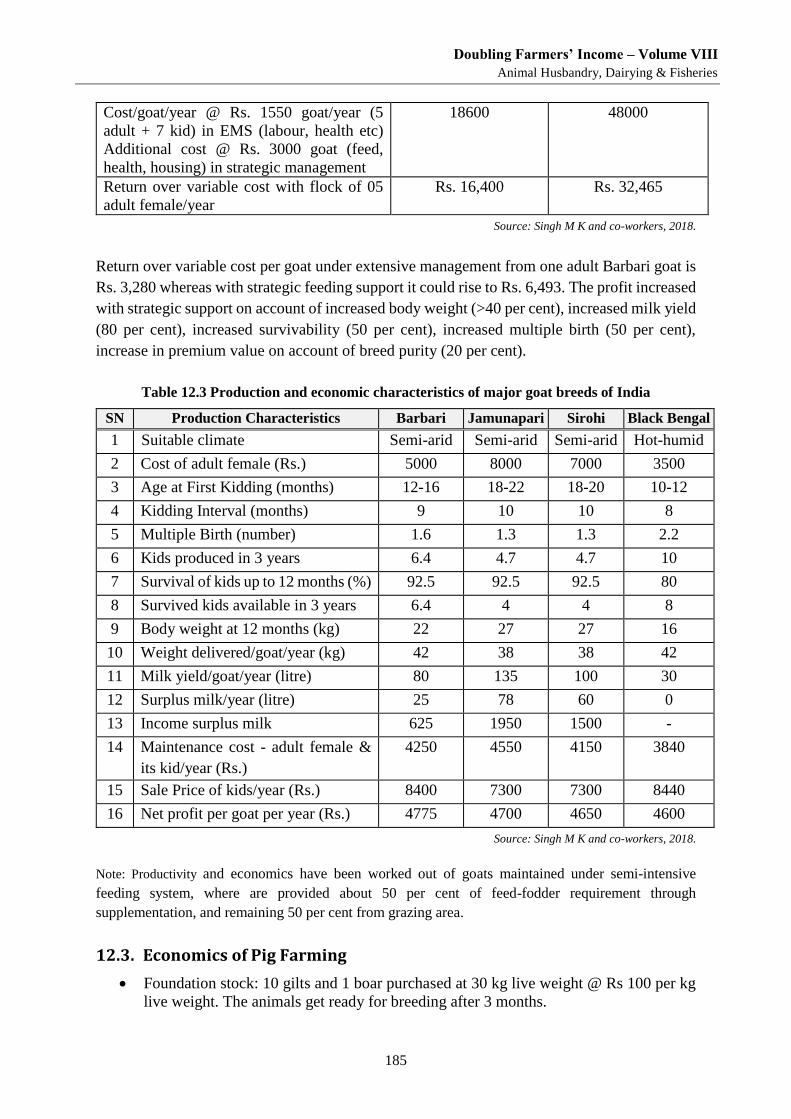
Doubling Farmers’ Income – Volume VIII
Animal Husbandry, Dairying & Fisheries
185
Cost/goat/year @ Rs. 1550 goat/year (5
adult + 7 kid) in EMS (labour, health etc)
Additional cost @ Rs. 3000 goat (feed,
health, housing) in strategic management
18600 48000
Return over variable cost with flock of 05
adult female/year
Rs. 16,400 Rs. 32,465
Source: Singh M K and co-workers, 2018.
Return over variable cost per goat under extensive management from one adult Barbari goat is
Rs. 3,280 whereas with strategic feeding support it could rise to Rs. 6,493. The profit increased
with strategic support on account of increased body weight (>40 per cent), increased milk yield
(80 per cent), increased survivability (50 per cent), increased multiple birth (50 per cent),
increase in premium value on account of breed purity (20 per cent).
Table 12.3 Production and economic characteristics of major goat breeds of India
SN Production Characteristics Barbari Jamunapari Sirohi Black Bengal
1 Suitable climate Semi-arid Semi-arid Semi-arid Hot-humid
2 Cost of adult female (Rs.) 5000 8000 7000 3500
3 Age at First Kidding (months) 12-16 18-22 18-20 10-12
4 Kidding Interval (months) 9 10 10 8
5 Multiple Birth (number) 1.6 1.3 1.3 2.2
6 Kids produced in 3 years 6.4 4.7 4.7 10
7 Survival of kids up to 12 months (%) 92.5 92.5 92.5 80
8 Survived kids available in 3 years 6.4 4 4 8
9 Body weight at 12 months (kg) 22 27 27 16
10 Weight delivered/goat/year (kg) 42 38 38 42
11 Milk yield/goat/year (litre) 80 135 100 30
12 Surplus milk/year (litre) 25 78 60 0
13 Income surplus milk 625 1950 1500 -
14 Maintenance cost - adult female &
its kid/year (Rs.)
4250 4550 4150 3840
15 Sale Price of kids/year (Rs.) 8400 7300 7300 8440
16 Net profit per goat per year (Rs.) 4775 4700 4650 4600
Source: Singh M K and co-workers, 2018.
Note: Productivity and economics have been worked out of goats maintained under semi-intensive
feeding system, where are provided about 50 per cent of feed-fodder requirement through
supplementation, and remaining 50 per cent from grazing area.
12.3. Economics of Pig Farming
Foundation stock: 10 gilts and 1 boar purchased at 30 kg live weight @ Rs 100 per kg
live weight. The animals get ready for breeding after 3 months.
Doubling Farmers’ Income – Volume VIII
Animal Husbandry, Dairying & Fisheries
186
1/3rd of the female are expected to conceive at a time
5 numbers of gilts will be housed in one pen and boars will be housed singly
Feed requirement till puberty @ 1.0 kg/head /day
Feed requirement of breeding boar @ 2.0 kg/head /day
Feed requirement of pregnant sow @ 2.0 kg/head /day
Feed requirement of lactating sow @ 2.5 kg/head /day for the period of 56 days
Feed requirement of sow after weaning for 30 days @ 1.5 kg/head/day
Feed requirement of piglet during suckling period @ 2kg/piglet for 56 days
Cost A. Non-recurring expenditure
Cost of foundation stock : Rs. 33,000
Cost of house : Rs. 88,500.00
Miscellaneous Cost : 5,500/- (Rs.500/animals)
Cost B. Variable cost
Cost of feed: Rs. 1,86,000.00 (using 60 per cent concentrate and 40 per cent locally
available unconventional feed material
Labour cost: self
Vaccination and medicine : Rs. 4,000.00
Total Cost (A + B) : Rs. 3,17,000.00
Returns: Sale of piglets in 1st year : 6,00,000.00 (20 piglets per pig per year
@ Rs.3000.00/per piglet)
Gross Income (Total Returns –Recurring : Rs. 2,83,000.00
Expenditure)
(Source: ICAR – National Research Centre on Pig)
12.4. Economics of Poultry Farming
An economic analysis was carried out for the rural improved chicken germplasm aimed for
dual purpose (Vanaraja) and egg type (Gramapriya) birds. The cost analysis was done
considering cost of day old chick, rearing expenses for feed and health care, body weight of
the bird at market age, number of eggs produced under free range conditions.
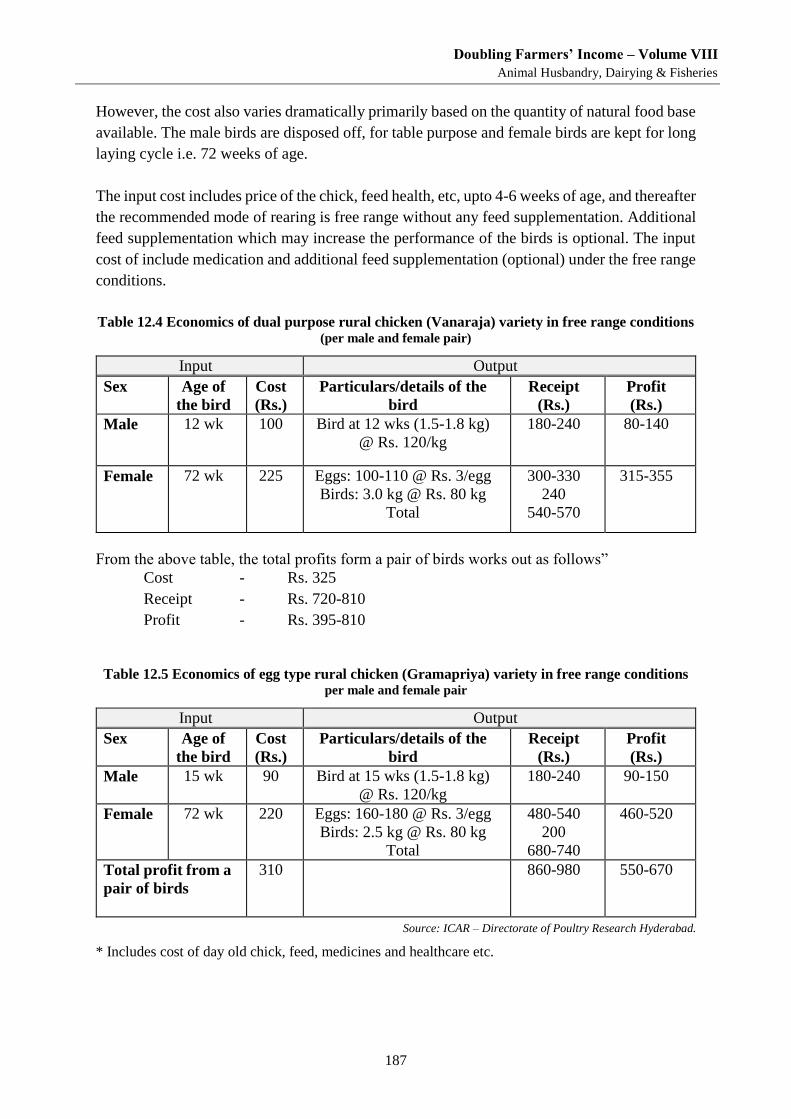
Doubling Farmers’ Income – Volume VIII
Animal Husbandry, Dairying & Fisheries
187
However, the cost also varies dramatically primarily based on the quantity of natural food base
available. The male birds are disposed off, for table purpose and female birds are kept for long
laying cycle i.e. 72 weeks of age.
The input cost includes price of the chick, feed health, etc, upto 4-6 weeks of age, and thereafter
the recommended mode of rearing is free range without any feed supplementation. Additional
feed supplementation which may increase the performance of the birds is optional. The input
cost of include medication and additional feed supplementation (optional) under the free range
conditions.
Table 12.4 Economics of dual purpose rural chicken (Vanaraja) variety in free range conditions (per male and female pair)
Input Output
Sex Age of
the bird
Cost
(Rs.)
Particulars/details of the
bird
Receipt
(Rs.)
Profit
(Rs.)
Male 12 wk 100 Bird at 12 wks (1.5-1.8 kg)
@ Rs. 120/kg
180-240 80-140
Female 72 wk 225 Eggs: 100-110 @ Rs. 3/egg
Birds: 3.0 kg @ Rs. 80 kg
Total
300-330
240
540-570
315-355
From the above table, the total profits form a pair of birds works out as follows”
Cost - Rs. 325
Receipt - Rs. 720-810
Profit - Rs. 395-810
Table 12.5 Economics of egg type rural chicken (Gramapriya) variety in free range conditions per male and female pair
Input Output
Sex Age of
the bird
Cost
(Rs.)
Particulars/details of the
bird
Receipt
(Rs.)
Profit
(Rs.)
Male 15 wk 90 Bird at 15 wks (1.5-1.8 kg)
@ Rs. 120/kg
180-240 90-150
Female 72 wk 220 Eggs: 160-180 @ Rs. 3/egg
Birds: 2.5 kg @ Rs. 80 kg
Total
480-540
200
680-740
460-520
Total profit from a
pair of birds
310 860-980 550-670
Source: ICAR – Directorate of Poultry Research Hyderabad.
* Includes cost of day old chick, feed, medicines and healthcare etc.
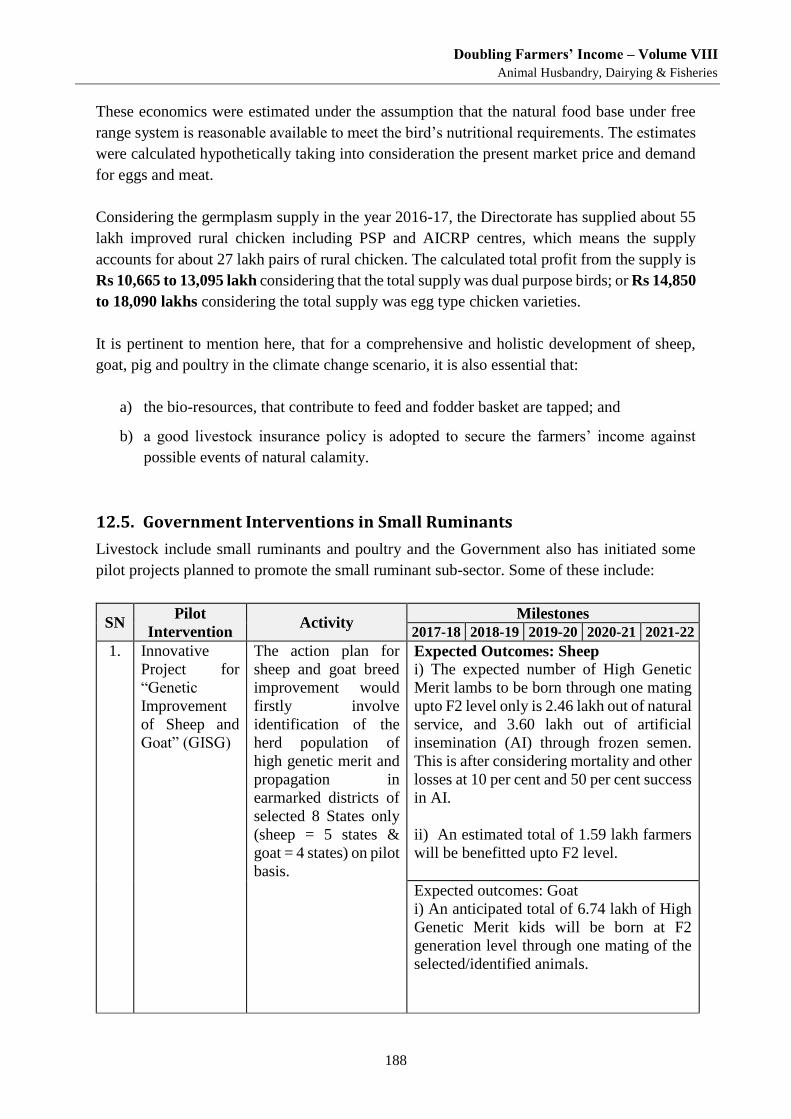
Doubling Farmers’ Income – Volume VIII
Animal Husbandry, Dairying & Fisheries
188
These economics were estimated under the assumption that the natural food base under free
range system is reasonable available to meet the bird’s nutritional requirements. The estimates
were calculated hypothetically taking into consideration the present market price and demand
for eggs and meat.
Considering the germplasm supply in the year 2016-17, the Directorate has supplied about 55
lakh improved rural chicken including PSP and AICRP centres, which means the supply
accounts for about 27 lakh pairs of rural chicken. The calculated total profit from the supply is
Rs 10,665 to 13,095 lakh considering that the total supply was dual purpose birds; or Rs 14,850
to 18,090 lakhs considering the total supply was egg type chicken varieties.
It is pertinent to mention here, that for a comprehensive and holistic development of sheep,
goat, pig and poultry in the climate change scenario, it is also essential that:
a) the bio-resources, that contribute to feed and fodder basket are tapped; and
b) a good livestock insurance policy is adopted to secure the farmers’ income against
possible events of natural calamity.
12.5. Government Interventions in Small Ruminants
Livestock include small ruminants and poultry and the Government also has initiated some
pilot projects planned to promote the small ruminant sub-sector. Some of these include:
SN Pilot
Intervention Activity
Milestones
2017-18 2018-19 2019-20 2020-21 2021-22
1. Innovative
Project for
“Genetic
Improvement
of Sheep and
Goat” (GISG)
The action plan for
sheep and goat breed
improvement would
firstly involve
identification of the
herd population of
high genetic merit and
propagation in
earmarked districts of
selected 8 States only
(sheep = 5 states &
goat = 4 states) on pilot
basis.
Expected Outcomes: Sheep
i) The expected number of High Genetic
Merit lambs to be born through one mating
upto F2 level only is 2.46 lakh out of natural
service, and 3.60 lakh out of artificial
insemination (AI) through frozen semen.
This is after considering mortality and other
losses at 10 per cent and 50 per cent success
in AI.
ii) An estimated total of 1.59 lakh farmers
will be benefitted upto F2 level.
Expected outcomes: Goat
i) An anticipated total of 6.74 lakh of High
Genetic Merit kids will be born at F2
generation level through one mating of the
selected/identified animals.
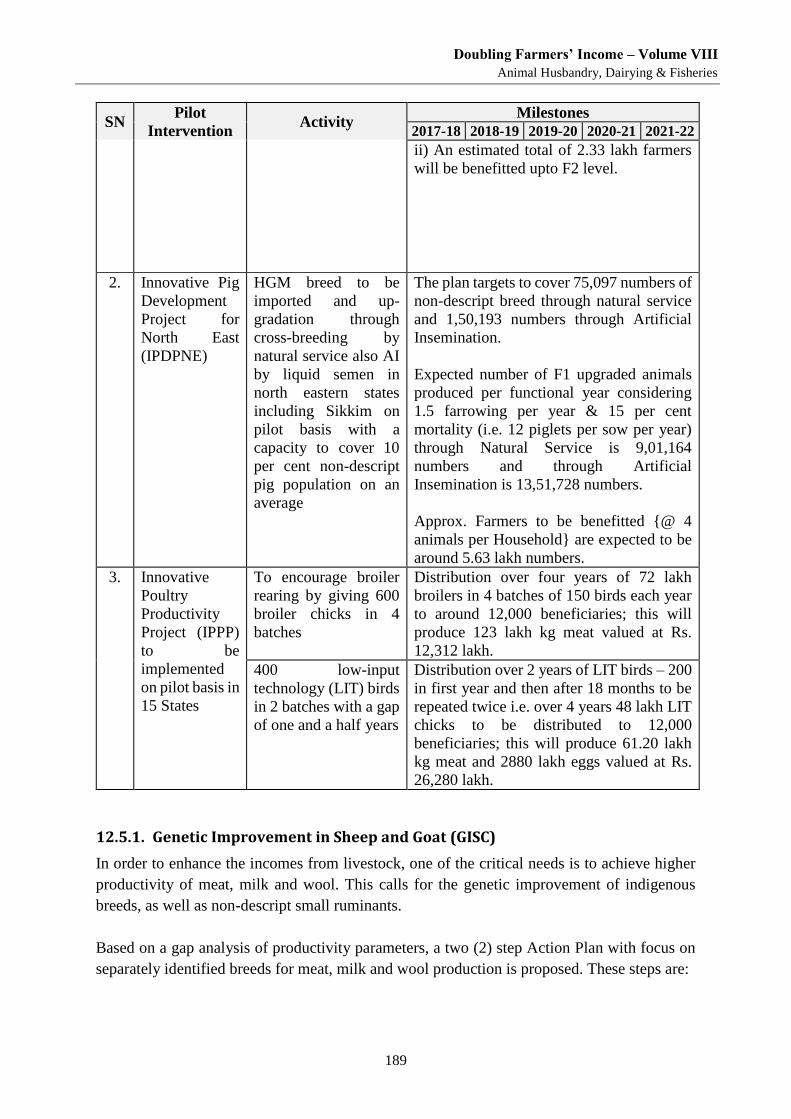
Doubling Farmers’ Income – Volume VIII
Animal Husbandry, Dairying & Fisheries
189
SN Pilot
Intervention Activity
Milestones
2017-18 2018-19 2019-20 2020-21 2021-22
ii) An estimated total of 2.33 lakh farmers
will be benefitted upto F2 level.
2. Innovative Pig
Development
Project for
North East
(IPDPNE)
HGM breed to be
imported and up-
gradation through
cross-breeding by
natural service also AI
by liquid semen in
north eastern states
including Sikkim on
pilot basis with a
capacity to cover 10
per cent non-descript
pig population on an
average
The plan targets to cover 75,097 numbers of
non-descript breed through natural service
and 1,50,193 numbers through Artificial
Insemination.
Expected number of F1 upgraded animals
produced per functional year considering
1.5 farrowing per year & 15 per cent
mortality (i.e. 12 piglets per sow per year)
through Natural Service is 9,01,164
numbers and through Artificial
Insemination is 13,51,728 numbers.
Approx. Farmers to be benefitted {@ 4
animals per Household} are expected to be
around 5.63 lakh numbers.
3. Innovative
Poultry
Productivity
Project (IPPP)
to be
implemented
on pilot basis in
15 States
To encourage broiler
rearing by giving 600
broiler chicks in 4
batches
Distribution over four years of 72 lakh
broilers in 4 batches of 150 birds each year
to around 12,000 beneficiaries; this will
produce 123 lakh kg meat valued at Rs.
12,312 lakh.
400 low-input
technology (LIT) birds
in 2 batches with a gap
of one and a half years
Distribution over 2 years of LIT birds – 200
in first year and then after 18 months to be
repeated twice i.e. over 4 years 48 lakh LIT
chicks to be distributed to 12,000
beneficiaries; this will produce 61.20 lakh
kg meat and 2880 lakh eggs valued at Rs.
26,280 lakh.
12.5.1. Genetic Improvement in Sheep and Goat (GISC)
In order to enhance the incomes from livestock, one of the critical needs is to achieve higher
productivity of meat, milk and wool. This calls for the genetic improvement of indigenous
breeds, as well as non-descript small ruminants.
Based on a gap analysis of productivity parameters, a two (2) step Action Plan with focus on
separately identified breeds for meat, milk and wool production is proposed. These steps are:
Doubling Farmers’ Income – Volume VIII
Animal Husbandry, Dairying & Fisheries
190
i. Genetic improvement of identified indigenous descript breeds of sheep and goat
through selective breeding for better yielding breed stock for meat, milk and wool.
ii. Genetic improvement of non-descript breeds from existing improved descript
indigenous breeds.
Accordingly, a breeding plan has been formulated to fulfil the twin goals for Genetic
Improvement in Sheep and Goat. This must be implemented in a comprehensive manner.
12.5.2. Animal Husbandry Infrastructure Development Fund (AHIDF)
The infrastructure needs of the animal husbandry sector including sheep, goat, poultry and
piggery gets a big push with the Union Budget, 2018 announcement of creating a Corpus Fund
of the size of Rs. 2,450 crore. The objectives of AHIDF are to address the inadequacy of animal
husbandry infrastructure at different levels with financial leveraging for:
doubling of farmers income; and
increasing availability and accessibility to protein-rich food to the young population.
Proposed activities:
• Establishment / strengthening of livestock breeding farms, poultry breeding farms,
poultry hatcheries.
• Establishment/strengthening of semen stations for goat, sheep and pig
• Establishment/strengthening of Skill Training Institutes (with residential facility),
• Establishment/strengthening of feed mixing units, by-pass protein units, fodder block
making unit, veterinary healthcare centers, dispensaries, biological units for healthcare
• Catering to the need for upgrading the forward linkages like livestock and livestock
product markets, retail outlets, cold-chain connectivity, etc.
12.5.3. Innovative Pig Development Projects for North-East (IPDNE)
Piggery is a popular activity, with no social taboo in the north eastern states including Sikkim.
However, this sector has not been able to flourish as an enterprise, since it is mainly the non-
descript breeds having low productivity rate, that are reared. The efforts to introduce exotic
germplasm have not met success as yet, and indiscriminate breeding among animals of inferior
quality has continued. Inbreeding has become common. Further, quality animals have ended
up in slaughter houses. In order to check this negative trend, and provide an impetus to piggery,
a sub-mission, “Innovative Pig Development Project for North East (IPDPNE)” has been rolled
out under the ‘National Livestock Mission (NLM)’.
As per Census 2012, the population of the pigs in the country is 10.29 million numbers, which
was a decrease by 7.54 per cent over the previous Census. Pigs account for 2.01 per cent of
the total livestock population of the country. Of the total pig population, number of males are
Doubling Farmers’ Income – Volume VIII
Animal Husbandry, Dairying & Fisheries
191
4.96 million (4.68 million indigenous and 1.28 million exotic) and 5.33 million are females
(4.16 million indigenous and 1.17 million exotic).
The meat production in the country (from all sources) as per 2014-15 data was 6.6 million tons
with a per capita availability of 4.94 kg. Of this, pig contributed 9 per cent with a total meat
production of 4.64 lakh tonnes.
The challenges of this sector lie in bridging the gap that exists between the current low
productivity index of the Indian breeds and the potential growth rate and mature weight. The
objective of IPDPNE is to increase the pig meat production and to increase the income of the
pig rearing farmer /entrepreneur/NGO/Cooperative Society, etc. This is envisaged to be
achieved by importing and incorporating superior germplasm of high genetic merit.
The components of this initiative include strengthening of pig breeding farmers, import of
germplasm, support breeding programmes, propagate reproductive technologies, and health
cover. Appropriate measurable outcomes, including income growth of farmers, may be
developed and monitored.
12.5.4. Innovative Poultry Productivity Project (IPPP)
Private Industry and NABARD generally encourage economically large scale poultry which
are viable/bankable projects. However, these remain beyond the reach of the small and
marginal farmers and resource poor, and they need to be supported. Accordingly special focus
maybe provisioned to upscale small poultry farmers and develop suitbale linkages with larger
processing industry.
Presently, under National Livestock Mission (NLM), there exists a scheme called, ‘Rural
Backyard Poultry Development (RBPD)’, which covers Below Poverty Line (BPL) families to
enable them to gain supplementary income and nutritional support. Under RBPD, chicks/birds
suitable for raising in the backyard are reared in the mother units, for upto four (4) weeks, and
are then distributed to the beneficiaries spread over at least two batches.
It is possible to move incrementally from this subsistence model of backyard poultry farming
to an entrepreneur model comprising 200-400 birds. In case of low-input technology (LIT)
birds, it would be possible to later upscale to 1,000-2,000 birds for larger scale poultry farming.
A similar model is also feasible in case of broilers, where small scale broilers set up initially
can be scaled up to commercial scale. It would help to promote small scale broiler in a cluster
mode. This would help in providing various services, including market linkages in an efficient
manner.
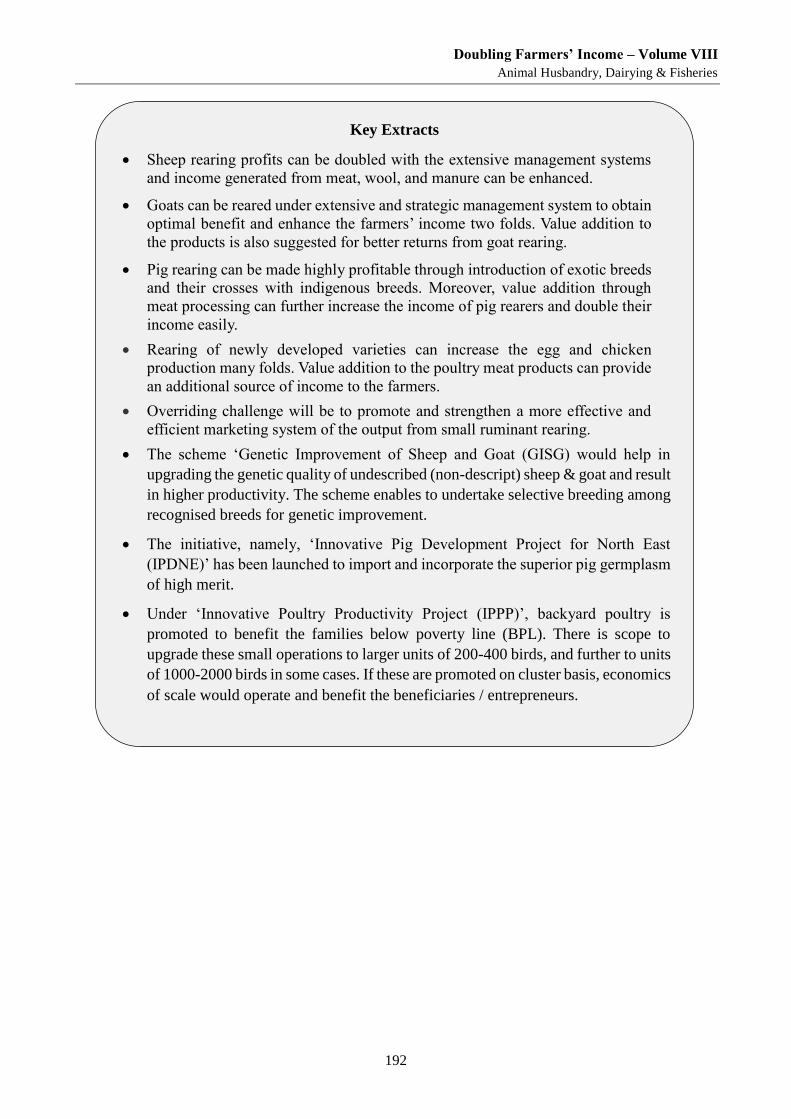
Doubling Farmers’ Income – Volume VIII
Animal Husbandry, Dairying & Fisheries
192
Key Extracts
Sheep rearing profits can be doubled with the extensive management systems
and income generated from meat, wool, and manure can be enhanced.
Goats can be reared under extensive and strategic management system to obtain
optimal benefit and enhance the farmers’ income two folds. Value addition to
the products is also suggested for better returns from goat rearing.
Pig rearing can be made highly profitable through introduction of exotic breeds
and their crosses with indigenous breeds. Moreover, value addition through
meat processing can further increase the income of pig rearers and double their
income easily.
Rearing of newly developed varieties can increase the egg and chicken
production many folds. Value addition to the poultry meat products can provide
an additional source of income to the farmers.
Overriding challenge will be to promote and strengthen a more effective and
efficient marketing system of the output from small ruminant rearing.
The scheme ‘Genetic Improvement of Sheep and Goat (GISG) would help in
upgrading the genetic quality of undescribed (non-descript) sheep & goat and result
in higher productivity. The scheme enables to undertake selective breeding among
recognised breeds for genetic improvement.
The initiative, namely, ‘Innovative Pig Development Project for North East
(IPDNE)’ has been launched to import and incorporate the superior pig germplasm
of high merit.
Under ‘Innovative Poultry Productivity Project (IPPP)’, backyard poultry is
promoted to benefit the families below poverty line (BPL). There is scope to
upgrade these small operations to larger units of 200-400 birds, and further to units
of 1000-2000 birds in some cases. If these are promoted on cluster basis, economics
of scale would operate and benefit the beneficiaries / entrepreneurs.
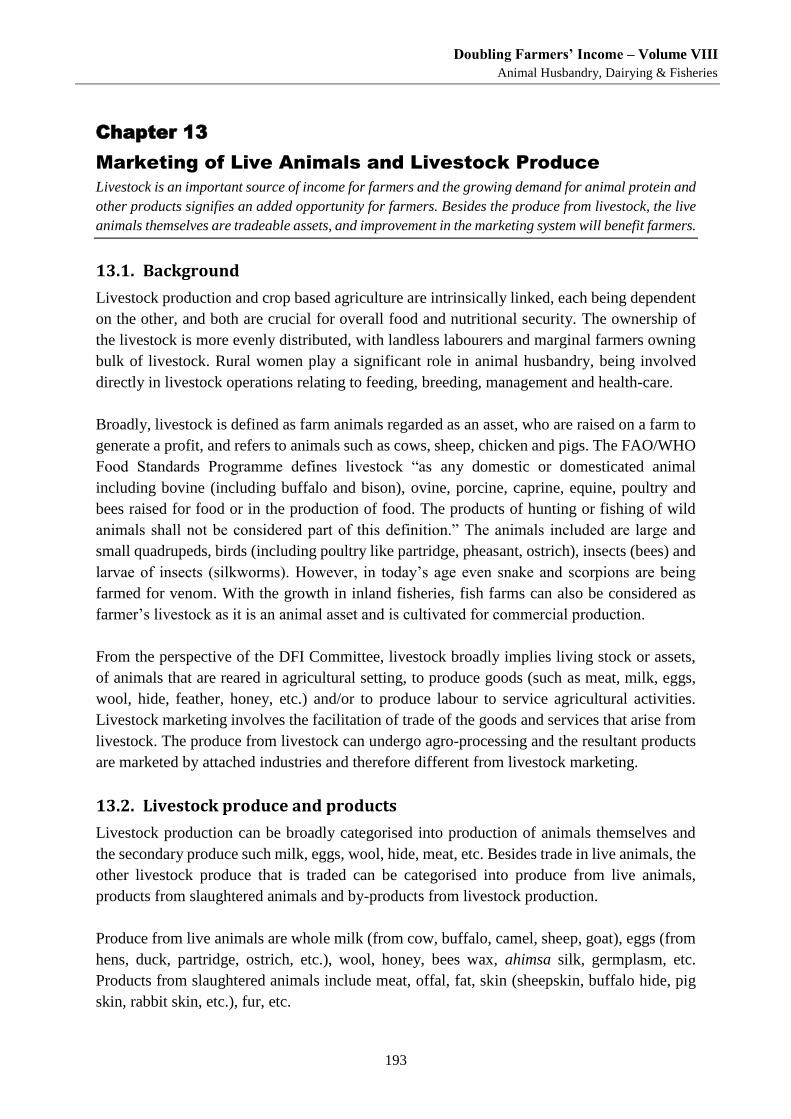
Doubling Farmers’ Income – Volume VIII
Animal Husbandry, Dairying & Fisheries
193
Chapter 13
Marketing of Live Animals and Livestock Produce
Livestock is an important source of income for farmers and the growing demand for animal protein and
other products signifies an added opportunity for farmers. Besides the produce from livestock, the live
animals themselves are tradeable assets, and improvement in the marketing system will benefit farmers.
13.1. Background
Livestock production and crop based agriculture are intrinsically linked, each being dependent
on the other, and both are crucial for overall food and nutritional security. The ownership of
the livestock is more evenly distributed, with landless labourers and marginal farmers owning
bulk of livestock. Rural women play a significant role in animal husbandry, being involved
directly in livestock operations relating to feeding, breeding, management and health-care.
Broadly, livestock is defined as farm animals regarded as an asset, who are raised on a farm to
generate a profit, and refers to animals such as cows, sheep, chicken and pigs. The FAO/WHO
Food Standards Programme defines livestock “as any domestic or domesticated animal
including bovine (including buffalo and bison), ovine, porcine, caprine, equine, poultry and
bees raised for food or in the production of food. The products of hunting or fishing of wild
animals shall not be considered part of this definition.” The animals included are large and
small quadrupeds, birds (including poultry like partridge, pheasant, ostrich), insects (bees) and
larvae of insects (silkworms). However, in today’s age even snake and scorpions are being
farmed for venom. With the growth in inland fisheries, fish farms can also be considered as
farmer’s livestock as it is an animal asset and is cultivated for commercial production.
From the perspective of the DFI Committee, livestock broadly implies living stock or assets,
of animals that are reared in agricultural setting, to produce goods (such as meat, milk, eggs,
wool, hide, feather, honey, etc.) and/or to produce labour to service agricultural activities.
Livestock marketing involves the facilitation of trade of the goods and services that arise from
livestock. The produce from livestock can undergo agro-processing and the resultant products
are marketed by attached industries and therefore different from livestock marketing.
13.2. Livestock produce and products
Livestock production can be broadly categorised into production of animals themselves and
the secondary produce such milk, eggs, wool, hide, meat, etc. Besides trade in live animals, the
other livestock produce that is traded can be categorised into produce from live animals,
products from slaughtered animals and by-products from livestock production.
Produce from live animals are whole milk (from cow, buffalo, camel, sheep, goat), eggs (from
hens, duck, partridge, ostrich, etc.), wool, honey, bees wax, ahimsa silk, germplasm, etc.
Products from slaughtered animals include meat, offal, fat, skin (sheepskin, buffalo hide, pig
skin, rabbit skin, etc.), fur, etc.
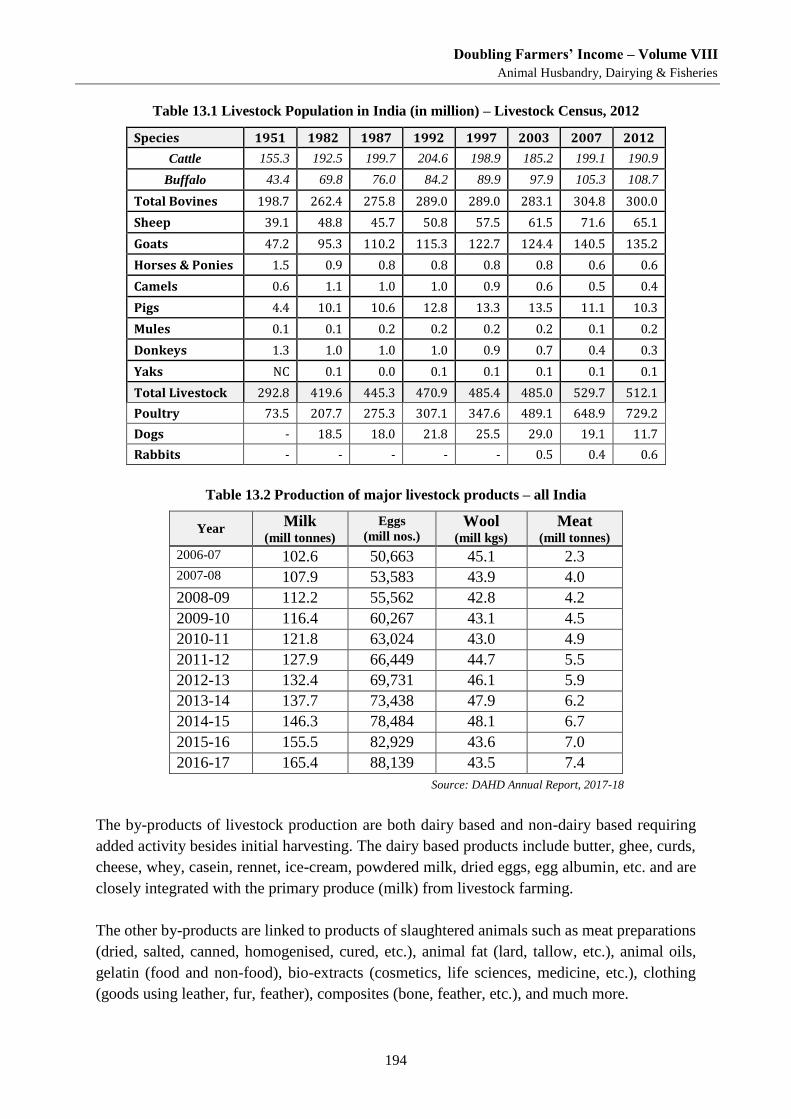
Doubling Farmers’ Income – Volume VIII
Animal Husbandry, Dairying & Fisheries
194
Table 13.1 Livestock Population in India (in million) – Livestock Census, 2012
Species 1951 1982 1987 1992 1997 2003 2007 2012
Cattle 155.3 192.5 199.7 204.6 198.9 185.2 199.1 190.9
Buffalo 43.4 69.8 76.0 84.2 89.9 97.9 105.3 108.7
Total Bovines 198.7 262.4 275.8 289.0 289.0 283.1 304.8 300.0
Sheep 39.1 48.8 45.7 50.8 57.5 61.5 71.6 65.1
Goats 47.2 95.3 110.2 115.3 122.7 124.4 140.5 135.2
Horses & Ponies 1.5 0.9 0.8 0.8 0.8 0.8 0.6 0.6
Camels 0.6 1.1 1.0 1.0 0.9 0.6 0.5 0.4
Pigs 4.4 10.1 10.6 12.8 13.3 13.5 11.1 10.3
Mules 0.1 0.1 0.2 0.2 0.2 0.2 0.1 0.2
Donkeys 1.3 1.0 1.0 1.0 0.9 0.7 0.4 0.3
Yaks NC 0.1 0.0 0.1 0.1 0.1 0.1 0.1
Total Livestock 292.8 419.6 445.3 470.9 485.4 485.0 529.7 512.1
Poultry 73.5 207.7 275.3 307.1 347.6 489.1 648.9 729.2
Dogs - 18.5 18.0 21.8 25.5 29.0 19.1 11.7
Rabbits - - - - - 0.5 0.4 0.6
Table 13.2 Production of major livestock products – all India
Year Milk
(mill tonnes) Eggs
(mill nos.) Wool
(mill kgs) Meat
(mill tonnes) 2006-07 102.6 50,663 45.1 2.3
2007-08 107.9 53,583 43.9 4.0
2008-09 112.2 55,562 42.8 4.2
2009-10 116.4 60,267 43.1 4.5
2010-11 121.8 63,024 43.0 4.9
2011-12 127.9 66,449 44.7 5.5
2012-13 132.4 69,731 46.1 5.9
2013-14 137.7 73,438 47.9 6.2
2014-15 146.3 78,484 48.1 6.7
2015-16 155.5 82,929 43.6 7.0
2016-17 165.4 88,139 43.5 7.4
Source: DAHD Annual Report, 2017-18
The by-products of livestock production are both dairy based and non-dairy based requiring
added activity besides initial harvesting. The dairy based products include butter, ghee, curds,
cheese, whey, casein, rennet, ice-cream, powdered milk, dried eggs, egg albumin, etc. and are
closely integrated with the primary produce (milk) from livestock farming.
The other by-products are linked to products of slaughtered animals such as meat preparations
(dried, salted, canned, homogenised, cured, etc.), animal fat (lard, tallow, etc.), animal oils,
gelatin (food and non-food), bio-extracts (cosmetics, life sciences, medicine, etc.), clothing
(goods using leather, fur, feather), composites (bone, feather, etc.), and much more.
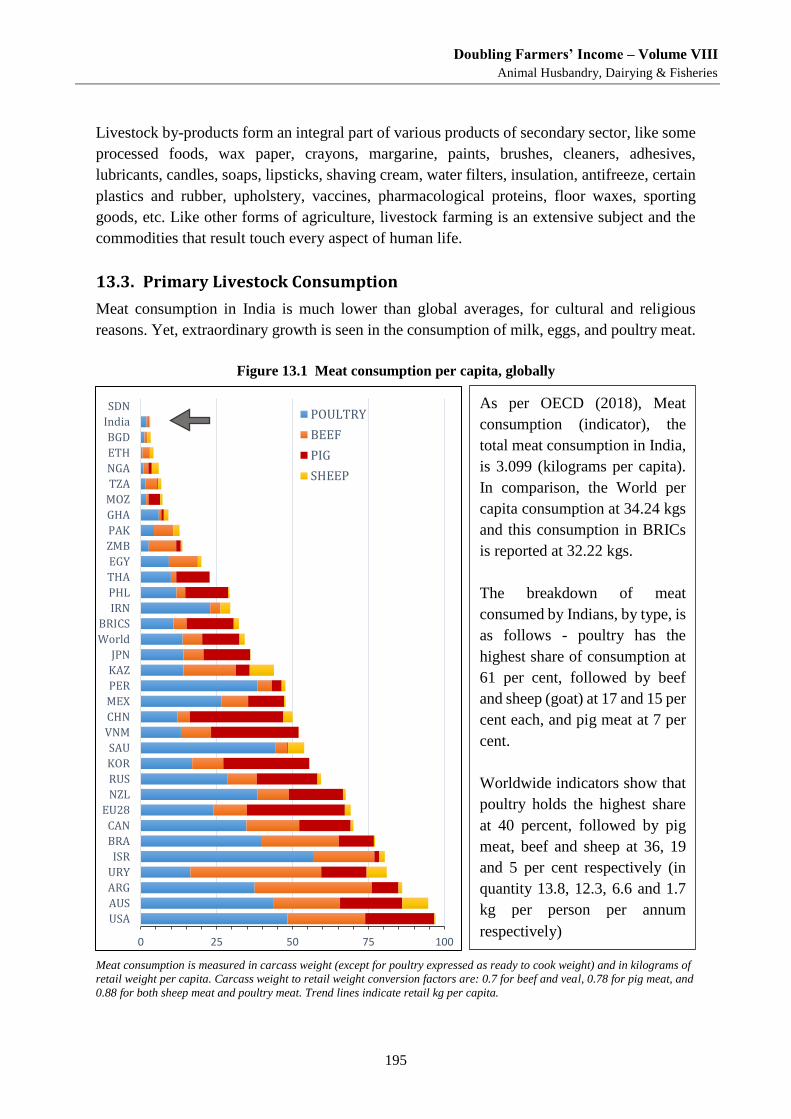
Doubling Farmers’ Income – Volume VIII
Animal Husbandry, Dairying & Fisheries
195
Livestock by-products form an integral part of various products of secondary sector, like some
processed foods, wax paper, crayons, margarine, paints, brushes, cleaners, adhesives,
lubricants, candles, soaps, lipsticks, shaving cream, water filters, insulation, antifreeze, certain
plastics and rubber, upholstery, vaccines, pharmacological proteins, floor waxes, sporting
goods, etc. Like other forms of agriculture, livestock farming is an extensive subject and the
commodities that result touch every aspect of human life.
13.3. Primary Livestock Consumption
Meat consumption in India is much lower than global averages, for cultural and religious
reasons. Yet, extraordinary growth is seen in the consumption of milk, eggs, and poultry meat.
Figure 13.1 Meat consumption per capita, globally
Meat consumption is measured in carcass weight (except for poultry expressed as ready to cook weight) and in kilograms of
retail weight per capita. Carcass weight to retail weight conversion factors are: 0.7 for beef and veal, 0.78 for pig meat, and
0.88 for both sheep meat and poultry meat. Trend lines indicate retail kg per capita.
0 25 50 75 100
USA
AUS
ARG
URY
ISR
BRA
CAN
EU28
NZL
RUS
KOR
SAU
VNM
CHN
MEX
PER
KAZ
JPN
World
BRICS
IRN
PHL
THA
EGY
ZMB
PAK
GHA
MOZ
TZA
NGA
ETH
BGD
India
SDNPOULTRY
BEEF
PIG
SHEEP
As per OECD (2018), Meat
consumption (indicator), the
total meat consumption in India,
is 3.099 (kilograms per capita).
In comparison, the World per
capita consumption at 34.24 kgs
and this consumption in BRICs
is reported at 32.22 kgs.
The breakdown of meat
consumed by Indians, by type, is
as follows - poultry has the
highest share of consumption at
61 per cent, followed by beef
and sheep (goat) at 17 and 15 per
cent each, and pig meat at 7 per
cent.
Worldwide indicators show that
poultry holds the highest share
at 40 percent, followed by pig
meat, beef and sheep at 36, 19
and 5 per cent respectively (in
quantity 13.8, 12.3, 6.6 and 1.7
kg per person per annum
respectively)
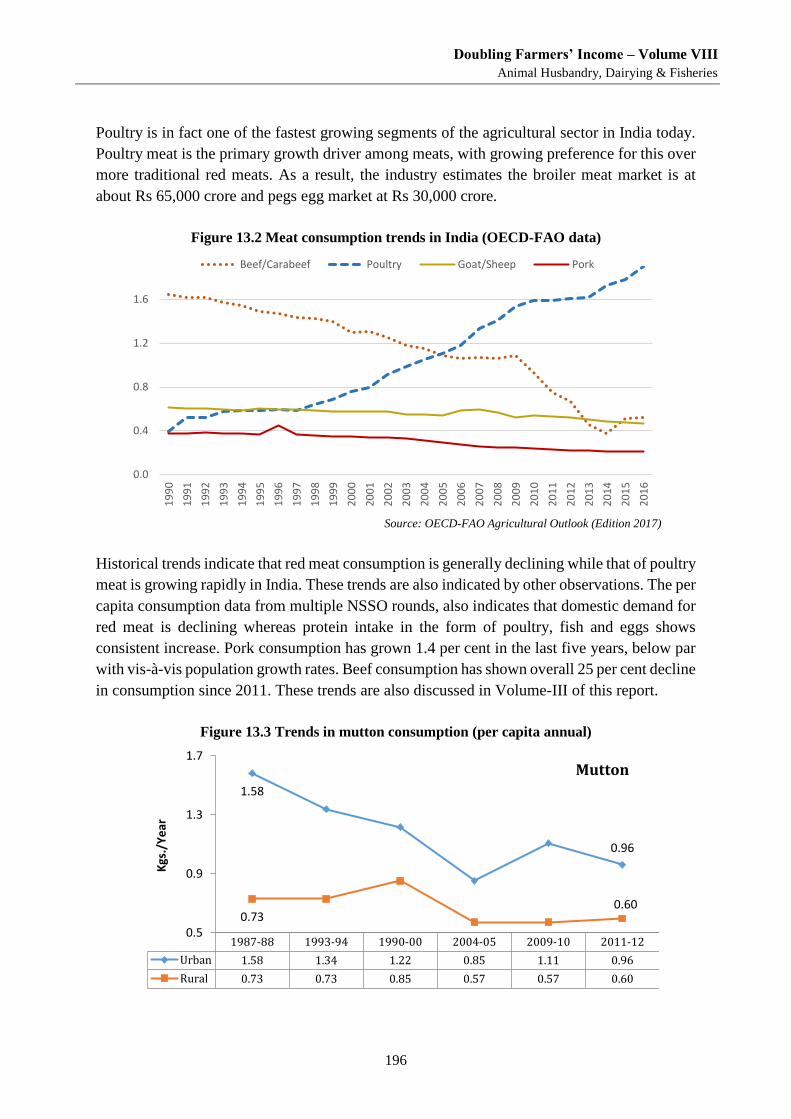
Doubling Farmers’ Income – Volume VIII
Animal Husbandry, Dairying & Fisheries
196
Poultry is in fact one of the fastest growing segments of the agricultural sector in India today.
Poultry meat is the primary growth driver among meats, with growing preference for this over
more traditional red meats. As a result, the industry estimates the broiler meat market is at
about Rs 65,000 crore and pegs egg market at Rs 30,000 crore.
Figure 13.2 Meat consumption trends in India (OECD-FAO data)
Source: OECD-FAO Agricultural Outlook (Edition 2017)
Historical trends indicate that red meat consumption is generally declining while that of poultry
meat is growing rapidly in India. These trends are also indicated by other observations. The per
capita consumption data from multiple NSSO rounds, also indicates that domestic demand for
red meat is declining whereas protein intake in the form of poultry, fish and eggs shows
consistent increase. Pork consumption has grown 1.4 per cent in the last five years, below par
with vis-à-vis population growth rates. Beef consumption has shown overall 25 per cent decline
in consumption since 2011. These trends are also discussed in Volume-III of this report.
Figure 13.3 Trends in mutton consumption (per capita annual)
0.0
0.4
0.8
1.2
1.6
19
90
19
91
19
92
19
93
19
94
19
95
19
96
19
97
19
98
19
99
20
00
20
01
20
02
20
03
20
04
20
05
20
06
20
07
20
08
20
09
20
10
20
11
20
12
20
13
20
14
20
15
20
16
Beef/Carabeef Poultry Goat/Sheep Pork
1987-88 1993-94 1990-00 2004-05 2009-10 2011-12
Urban 1.58 1.34 1.22 0.85 1.11 0.96
Rural 0.73 0.73 0.85 0.57 0.57 0.60
1.58
0.96
0.730.60
0.5
0.9
1.3
1.7
Kgs
./Y
ear
Mutton
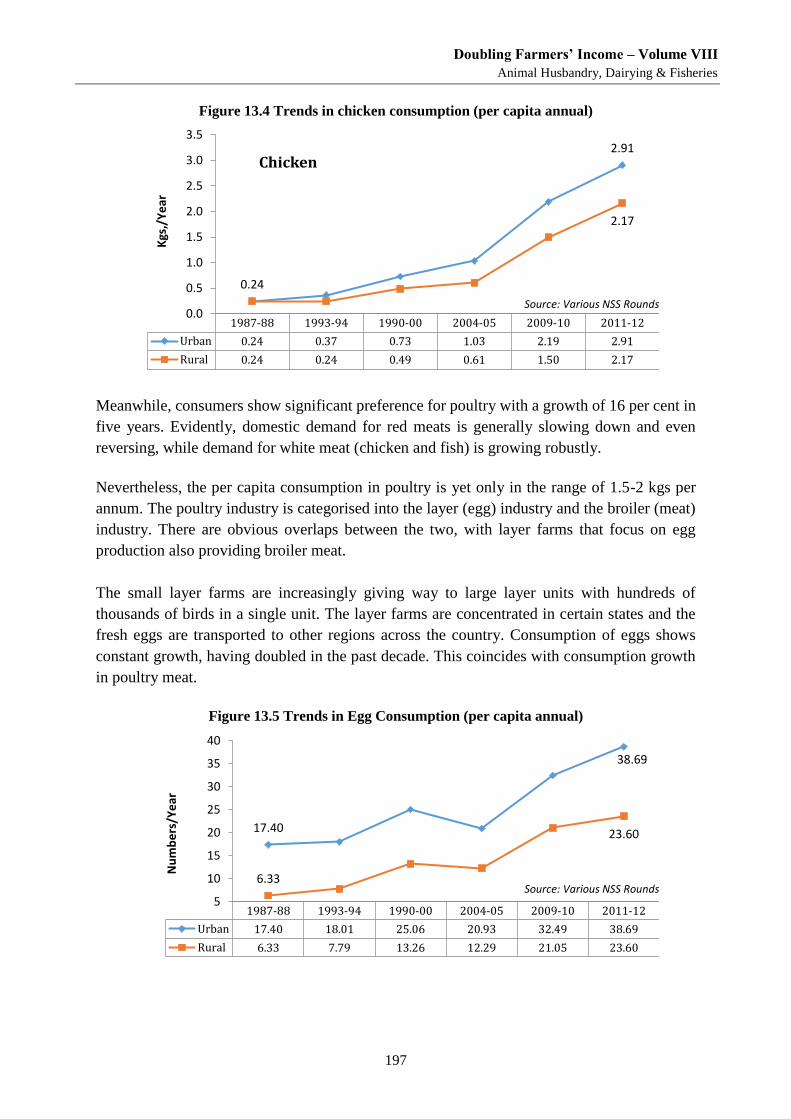
Doubling Farmers’ Income – Volume VIII
Animal Husbandry, Dairying & Fisheries
197
Figure 13.4 Trends in chicken consumption (per capita annual)
Meanwhile, consumers show significant preference for poultry with a growth of 16 per cent in
five years. Evidently, domestic demand for red meats is generally slowing down and even
reversing, while demand for white meat (chicken and fish) is growing robustly.
Nevertheless, the per capita consumption in poultry is yet only in the range of 1.5-2 kgs per
annum. The poultry industry is categorised into the layer (egg) industry and the broiler (meat)
industry. There are obvious overlaps between the two, with layer farms that focus on egg
production also providing broiler meat.
The small layer farms are increasingly giving way to large layer units with hundreds of
thousands of birds in a single unit. The layer farms are concentrated in certain states and the
fresh eggs are transported to other regions across the country. Consumption of eggs shows
constant growth, having doubled in the past decade. This coincides with consumption growth
in poultry meat.
Figure 13.5 Trends in Egg Consumption (per capita annual)
1987-88 1993-94 1990-00 2004-05 2009-10 2011-12
Urban 0.24 0.37 0.73 1.03 2.19 2.91
Rural 0.24 0.24 0.49 0.61 1.50 2.17
0.24
2.91
2.17
0.0
0.5
1.0
1.5
2.0
2.5
3.0
3.5
Kgs
,/Y
ear
Chicken
Source: Various NSS Rounds
1987-88 1993-94 1990-00 2004-05 2009-10 2011-12
Urban 17.40 18.01 25.06 20.93 32.49 38.69
Rural 6.33 7.79 13.26 12.29 21.05 23.60
17.40
38.69
6.33
23.60
5
10
15
20
25
30
35
40
Nu
mb
ers
/Ye
ar
Source: Various NSS Rounds
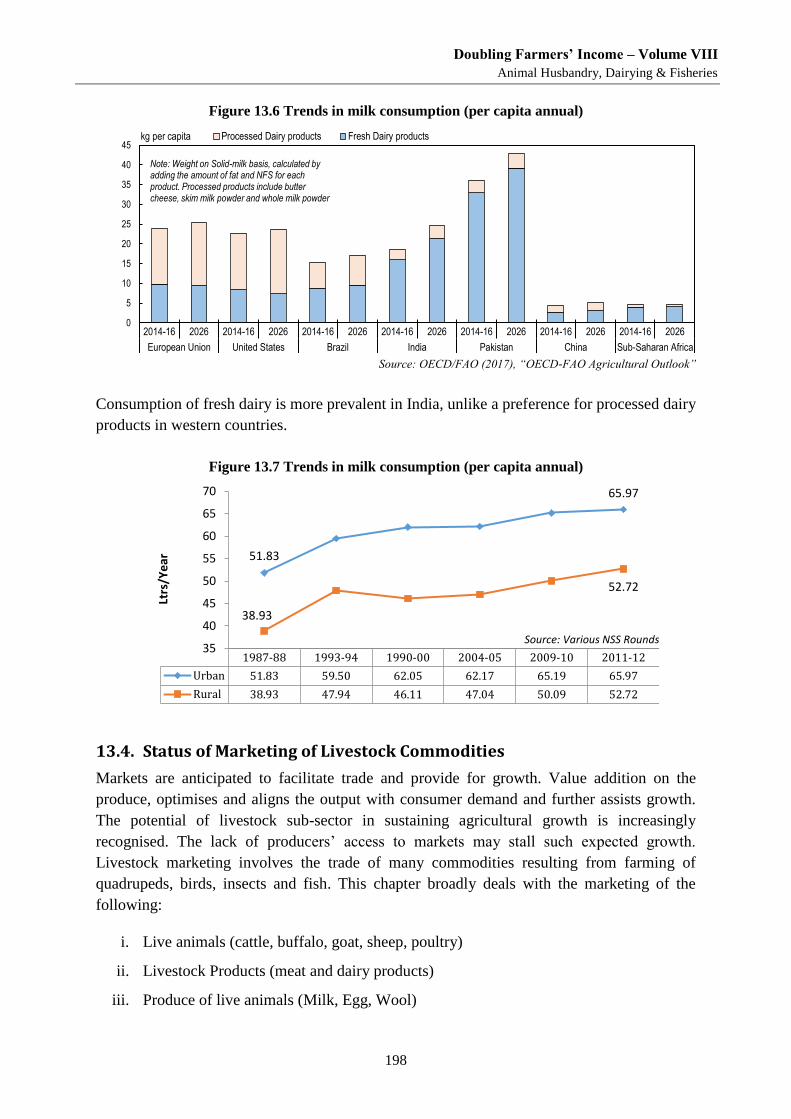
Doubling Farmers’ Income – Volume VIII
Animal Husbandry, Dairying & Fisheries
198
Figure 13.6 Trends in milk consumption (per capita annual)
Source: OECD/FAO (2017), “OECD-FAO Agricultural Outlook”
Consumption of fresh dairy is more prevalent in India, unlike a preference for processed dairy
products in western countries.
Figure 13.7 Trends in milk consumption (per capita annual)
13.4. Status of Marketing of Livestock Commodities
Markets are anticipated to facilitate trade and provide for growth. Value addition on the
produce, optimises and aligns the output with consumer demand and further assists growth.
The potential of livestock sub-sector in sustaining agricultural growth is increasingly
recognised. The lack of producers’ access to markets may stall such expected growth.
Livestock marketing involves the trade of many commodities resulting from farming of
quadrupeds, birds, insects and fish. This chapter broadly deals with the marketing of the
following:
i. Live animals (cattle, buffalo, goat, sheep, poultry)
ii. Livestock Products (meat and dairy products)
iii. Produce of live animals (Milk, Egg, Wool)
0
5
10
15
20
25
30
35
40
45
2014-16 2026 2014-16 2026 2014-16 2026 2014-16 2026 2014-16 2026 2014-16 2026 2014-16 2026
European Union United States Brazil India Pakistan China Sub-Saharan Africa
kg per capita Processed Dairy products Fresh Dairy products
Note: Weight on Solid-milk basis, calculated by adding the amount of fat and NFS for each product. Processed products include butter cheese, skim milk powder and whole milk powder
1987-88 1993-94 1990-00 2004-05 2009-10 2011-12
Urban 51.83 59.50 62.05 62.17 65.19 65.97
Rural 38.93 47.94 46.11 47.04 50.09 52.72
51.83
65.97
38.93
52.72
35
40
45
50
55
60
65
70
Ltrs
/Ye
ar
Source: Various NSS Rounds
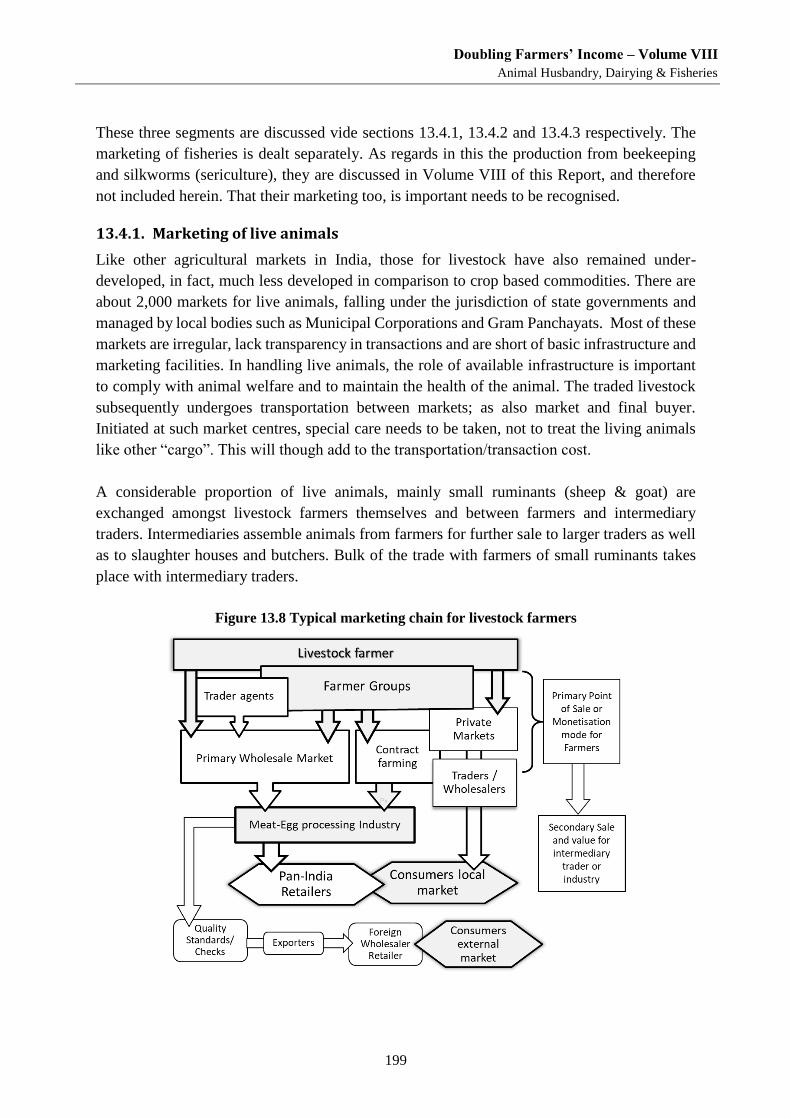
Doubling Farmers’ Income – Volume VIII
Animal Husbandry, Dairying & Fisheries
199
These three segments are discussed vide sections 13.4.1, 13.4.2 and 13.4.3 respectively. The
marketing of fisheries is dealt separately. As regards in this the production from beekeeping
and silkworms (sericulture), they are discussed in Volume VIII of this Report, and therefore
not included herein. That their marketing too, is important needs to be recognised.
13.4.1. Marketing of live animals
Like other agricultural markets in India, those for livestock have also remained under-
developed, in fact, much less developed in comparison to crop based commodities. There are
about 2,000 markets for live animals, falling under the jurisdiction of state governments and
managed by local bodies such as Municipal Corporations and Gram Panchayats. Most of these
markets are irregular, lack transparency in transactions and are short of basic infrastructure and
marketing facilities. In handling live animals, the role of available infrastructure is important
to comply with animal welfare and to maintain the health of the animal. The traded livestock
subsequently undergoes transportation between markets; as also market and final buyer.
Initiated at such market centres, special care needs to be taken, not to treat the living animals
like other “cargo”. This will though add to the transportation/transaction cost.
A considerable proportion of live animals, mainly small ruminants (sheep & goat) are
exchanged amongst livestock farmers themselves and between farmers and intermediary
traders. Intermediaries assemble animals from farmers for further sale to larger traders as well
as to slaughter houses and butchers. Bulk of the trade with farmers of small ruminants takes
place with intermediary traders.
Figure 13.8 Typical marketing chain for livestock farmers
Doubling Farmers’ Income – Volume VIII
Animal Husbandry, Dairying & Fisheries
200
Large livestock farmers generally are able to directly access the organised markets for sale.
Sometimes, small producers assemble their produce to sell collectively to large buyers.
Butchers-cum-retailers in small towns too procure live animals directly from producers. Unlike
in case of fruits and vegetable farmers, direct sales to end-consumers are rare.
There are a number of reasons for low participation of livestock producers in markets. The
marketed surplus is often small, while markets for live animals are thin, irregular and often at
far distance from the production centres. These escalate the cost of transportation and
associated activities like housing for animals, and the opportunity cost of time. Further, lack of
basic facilities in markets, for producers as well as animals also discourages producers to bring
their animals to the markets. Most livestock produced by smallholder farmers are marketed by
non-farming entrepreneurs, who operating as a marketing chain, collect, pool and distribute the
livestock products to processing industry and wholesale buyers.
Ease of livestock movement, including the documentation to ensure safe transit, is also an
aspect that livestock markets are expected to facilitate. Prices of live animals, especially
ruminants, are negotiated by buyers and sellers, taking into consideration the animal
characteristics, such as age, body weight and structure, appearance, breed, yield and health
status. However, no harmonised standard of the identified parameters is uniformly applied.
Marketing of poultry live birds is similar, though more organised, where the producers have
integrated their output into the supply chain of the poultry processing industry. Bulk of trade
in live broilers and eggs takes place between producers and traders, directly or indirectly
through commission agents, in designated markets or at the farm gates. Retail traders procure
broilers either directly from producers or from wholesale traders. Direct sale between producers
and consumers/retail traders is comparatively limited. In some states, poultry co-operatives
also facilitate marketing, but on a limited scale.
Live poultry markets can range from local markets at a community or district level that open
intermittently and may only sell a few dozen live birds in a day, to large wholesale markets
with a daily throughput of thousands of poultry, where hundreds of birds are sold, slaughtered
and butchered on a daily basis. Poultry marketing, is undergoing significant transformation in
major producing regions. Contract farming in poultry has emerged big taking poultry down the
path of industrial farming. Producers associations like Broiler Producers Marketing
Association (BROMARK) set the daily harvest prices depending on the market.
The majority of domestic consumers prefer poultry meat from small butchers, and reports
indicate that more than 90 per cent of chicken is sold freshly butchered at retail level. This
allows smallholding farmers to continue trade in the live animals with small town butchers and
wet market retailers. Smallholder farm enterprises have organised themselves to undertake
direct marketing of chicken and eggs into adjoining cities (Volume III, 3.2-A), resulting in
income growth. In these cases, peri-urban poultry farmers have opportunity to capture a larger
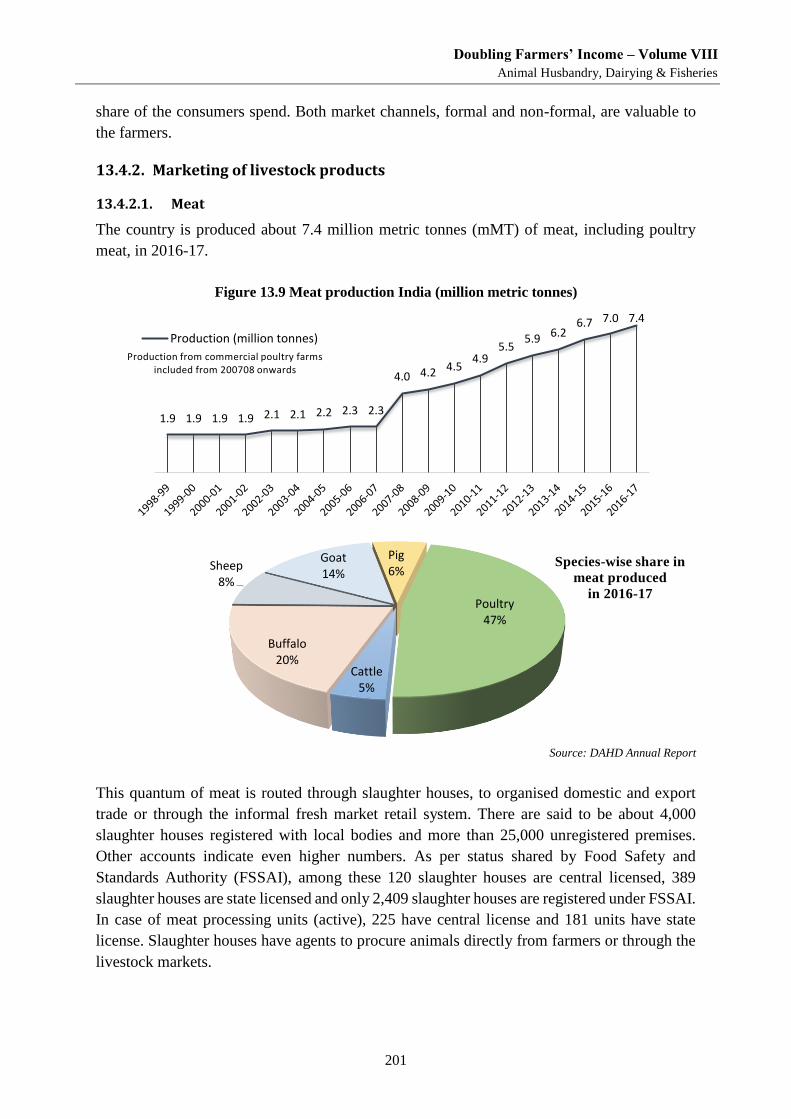
Doubling Farmers’ Income – Volume VIII
Animal Husbandry, Dairying & Fisheries
201
share of the consumers spend. Both market channels, formal and non-formal, are valuable to
the farmers.
13.4.2. Marketing of livestock products
13.4.2.1. Meat
The country is produced about 7.4 million metric tonnes (mMT) of meat, including poultry
meat, in 2016-17.
Figure 13.9 Meat production India (million metric tonnes)
Source: DAHD Annual Report
This quantum of meat is routed through slaughter houses, to organised domestic and export
trade or through the informal fresh market retail system. There are said to be about 4,000
slaughter houses registered with local bodies and more than 25,000 unregistered premises.
Other accounts indicate even higher numbers. As per status shared by Food Safety and
Standards Authority (FSSAI), among these 120 slaughter houses are central licensed, 389
slaughter houses are state licensed and only 2,409 slaughter houses are registered under FSSAI.
In case of meat processing units (active), 225 have central license and 181 units have state
license. Slaughter houses have agents to procure animals directly from farmers or through the
livestock markets.
1.9 1.9 1.9 1.9 2.1 2.1 2.2 2.3 2.3
4.0 4.2 4.54.9
5.55.9 6.2
6.7 7.0 7.4
Production from commercial poultry farmsincluded from 200708 onwards
Production (million tonnes)
Cattle5%
Buffalo20%
Sheep8%
Goat14%
Pig6%
Poultry47%
Species-wise share in
meat produced
in 2016-17
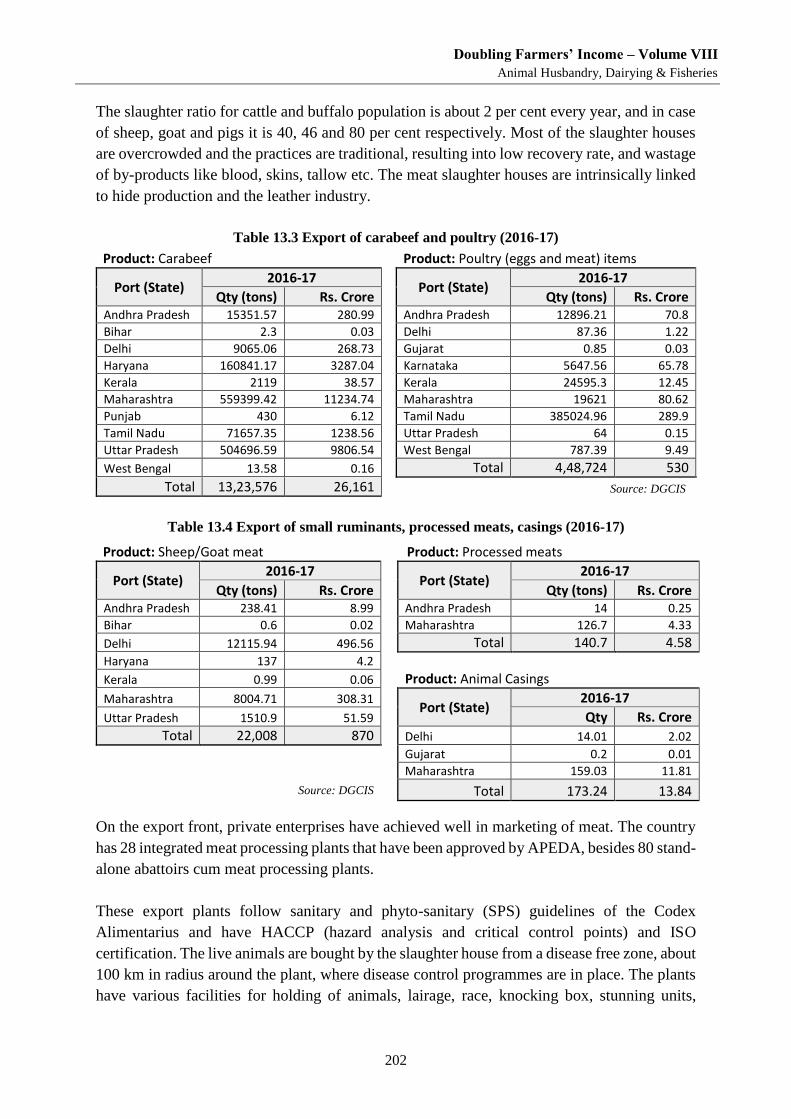
Doubling Farmers’ Income – Volume VIII
Animal Husbandry, Dairying & Fisheries
202
The slaughter ratio for cattle and buffalo population is about 2 per cent every year, and in case
of sheep, goat and pigs it is 40, 46 and 80 per cent respectively. Most of the slaughter houses
are overcrowded and the practices are traditional, resulting into low recovery rate, and wastage
of by-products like blood, skins, tallow etc. The meat slaughter houses are intrinsically linked
to hide production and the leather industry.
Table 13.3 Export of carabeef and poultry (2016-17)
Product: Carabeef Product: Poultry (eggs and meat) items
Port (State) 2016-17 Port (State)
2016-17 Qty (tons) Rs. Crore Qty (tons) Rs. Crore
Andhra Pradesh 15351.57 280.99 Andhra Pradesh 12896.21 70.8
Bihar 2.3 0.03 Delhi 87.36 1.22
Delhi 9065.06 268.73 Gujarat 0.85 0.03
Haryana 160841.17 3287.04 Karnataka 5647.56 65.78
Kerala 2119 38.57 Kerala 24595.3 12.45
Maharashtra 559399.42 11234.74 Maharashtra 19621 80.62
Punjab 430 6.12 Tamil Nadu 385024.96 289.9
Tamil Nadu 71657.35 1238.56 Uttar Pradesh 64 0.15
Uttar Pradesh 504696.59 9806.54 West Bengal 787.39 9.49
West Bengal 13.58 0.16 Total 4,48,724 530 Total 13,23,576 26,161 Source: DGCIS
Table 13.4 Export of small ruminants, processed meats, casings (2016-17)
Product: Sheep/Goat meat Product: Processed meats
Port (State) 2016-17 Port (State)
2016-17 Qty (tons) Rs. Crore Qty (tons) Rs. Crore
Andhra Pradesh 238.41 8.99 Andhra Pradesh 14 0.25
Bihar 0.6 0.02 Maharashtra 126.7 4.33
Delhi 12115.94 496.56 Total 140.7 4.58 Haryana 137 4.2 Kerala 0.99 0.06 Product: Animal Casings Maharashtra 8004.71 308.31 Port (State)
2016-17 Uttar Pradesh 1510.9 51.59 Qty Rs. Crore
Total 22,008 870 Delhi 14.01 2.02
Gujarat 0.2 0.01
Maharashtra 159.03 11.81
Source: DGCIS Total 173.24 13.84
On the export front, private enterprises have achieved well in marketing of meat. The country
has 28 integrated meat processing plants that have been approved by APEDA, besides 80 stand-
alone abattoirs cum meat processing plants.
These export plants follow sanitary and phyto-sanitary (SPS) guidelines of the Codex
Alimentarius and have HACCP (hazard analysis and critical control points) and ISO
certification. The live animals are bought by the slaughter house from a disease free zone, about
100 km in radius around the plant, where disease control programmes are in place. The plants
have various facilities for holding of animals, lairage, race, knocking box, stunning units,
Doubling Farmers’ Income – Volume VIII
Animal Husbandry, Dairying & Fisheries
203
abbatoir with slaughter line, de-boning, chilling freezing, packaging and cold storage. Facilities
for by-product processing, effluent treatment, bio-methanation, rendering, etc. are also
incorporated. The animals, bought at the local livestock markets, are first tagged to ensure
traceability and transported as per guidelines of Society for Prevention of Cruelty to Animals
(SPCA) Act, 1960 and Bureaus of Indian Standards (BIS), 2007 Standards to take care of
animal welfare. Standard Operating Procedures (SOPs) are followed, including those required
by importing countries. After slaughter and skinning, the carcass is chilled and then de-boned
or cut before being packed and subjected to refrigerated processes before the frozen meat enters
the cold-chain for market linkage. All the integrated plants have separate line for handling
small ruminants (sheep, goat). The meat from most of the small ruminants meat is exported to
Gulf region. The frozen meat is loaded onto refrigerated containers, maintained at -18°C to -
20°C, for onward connectivity to importing countries through seaports or airports.
India, as of now holds the top position in beef exports, albeit carabeef (buffalo meat), over a
few years, indicating a well-established marketing and supply chain network. However, the
domestic marketing system does not demonstrate equal quality and standardisation in these
products. India's exports of animal meat products include buffalo meat (USD 3.9 billion),
sheep/goat meat (USD 130 million), poultry products (USD 79.5 million), animal casing (USD
2.1 million), processed meat (USD 0.69 million). The main markets for Indian buffalo meat
and other animal products are Vietnam, Malaysia, Iraq, Algeria, Egypt, Indonesia and UAE.
Poultry products go to Oman, Saudi Arabia, Indonesia, Russia and Maldives.
The status in meat exports indicates, that further development can be undertaken to capture a
larger share of world markets, thereby providing more income generating opportunity to the
local farmers. Having demonstrated the capability to maintain standards through large export
presence, the improvement in domestic marketing is also feasible, and is largely related to
lower per capita demand for meat, among the lowest in the world. Meat exports are affected by
health concerns and the indiscriminate use of anti-biotics is a major challenge, especially in
poultry. India is also one of the biggest consumers of agricultural antibiotics, accounting for 3
per cent of global consumption. Though antibiotics aid in intensive food production, their
uncontrolled use on farms is a concern. In India, standards for tolerance of antibiotic residues
in poultry are yet to be adopted, although such standards do exist for seafood.
Poultry market is currently dominated by meat of broiler birds, whereas earlier chicken
implied “spent hens” or male birds. Broiler birds made inroads into India around 1975, when
hatcheries imported the parents of the hybrid broilers. The breeding operations started in Delhi,
and hatcheries sold day-old chicks to farmers who raised them and sold to traders. Live broilers
have tender meat and are more efficient, and became a food entity within 10 years. Movement
of parent stock, hatching eggs, day-old chicks initiated the broiler growing everywhere and
later concentrated in South India. Live broilers are typically not transported for long distances.
Further development in domestic meat markets, from the farmers’ income perspective, will be
demand led. However, interventions for food safety by the health ministry, are expected to have
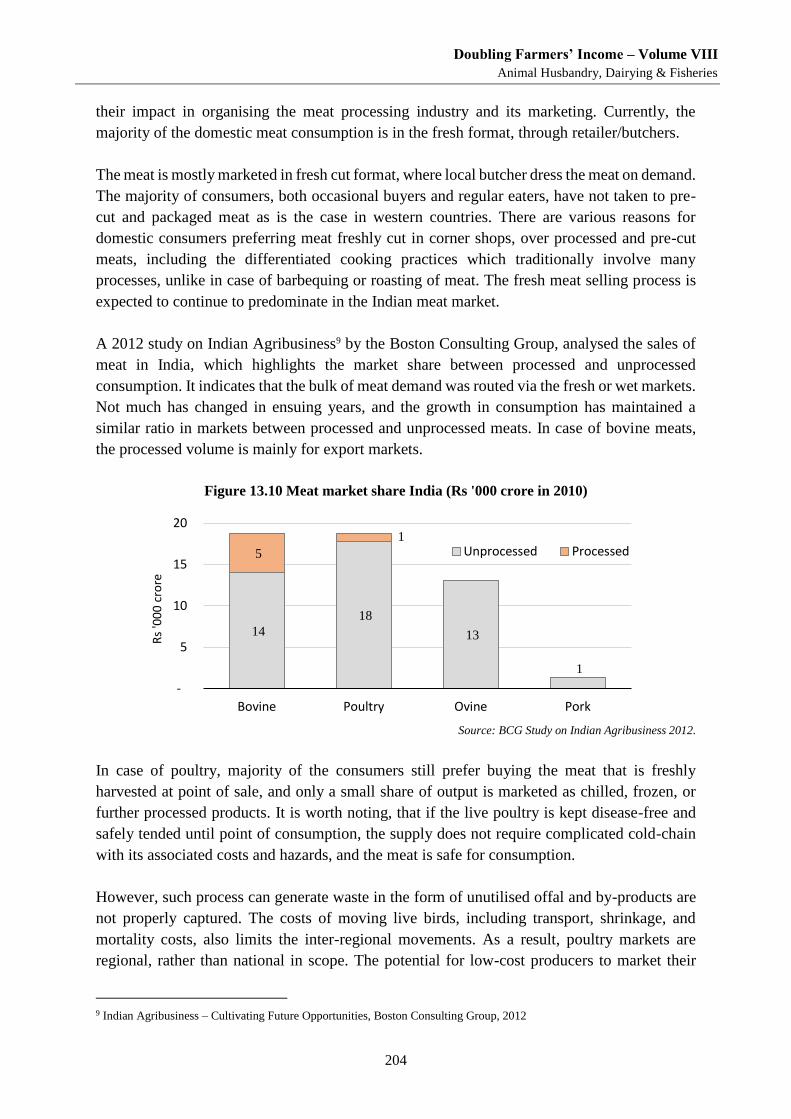
Doubling Farmers’ Income – Volume VIII
Animal Husbandry, Dairying & Fisheries
204
their impact in organising the meat processing industry and its marketing. Currently, the
majority of the domestic meat consumption is in the fresh format, through retailer/butchers.
The meat is mostly marketed in fresh cut format, where local butcher dress the meat on demand.
The majority of consumers, both occasional buyers and regular eaters, have not taken to pre-
cut and packaged meat as is the case in western countries. There are various reasons for
domestic consumers preferring meat freshly cut in corner shops, over processed and pre-cut
meats, including the differentiated cooking practices which traditionally involve many
processes, unlike in case of barbequing or roasting of meat. The fresh meat selling process is
expected to continue to predominate in the Indian meat market.
A 2012 study on Indian Agribusiness9 by the Boston Consulting Group, analysed the sales of
meat in India, which highlights the market share between processed and unprocessed
consumption. It indicates that the bulk of meat demand was routed via the fresh or wet markets.
Not much has changed in ensuing years, and the growth in consumption has maintained a
similar ratio in markets between processed and unprocessed meats. In case of bovine meats,
the processed volume is mainly for export markets.
Figure 13.10 Meat market share India (Rs '000 crore in 2010)
Source: BCG Study on Indian Agribusiness 2012.
In case of poultry, majority of the consumers still prefer buying the meat that is freshly
harvested at point of sale, and only a small share of output is marketed as chilled, frozen, or
further processed products. It is worth noting, that if the live poultry is kept disease-free and
safely tended until point of consumption, the supply does not require complicated cold-chain
with its associated costs and hazards, and the meat is safe for consumption.
However, such process can generate waste in the form of unutilised offal and by-products are
not properly captured. The costs of moving live birds, including transport, shrinkage, and
mortality costs, also limits the inter-regional movements. As a result, poultry markets are
regional, rather than national in scope. The potential for low-cost producers to market their
9 Indian Agribusiness – Cultivating Future Opportunities, Boston Consulting Group, 2012
14
18
13
1
5
1
-
5
10
15
20
Bovine Poultry Ovine Pork
Rs
'00
0 c
rore
Unprocessed Processed
Doubling Farmers’ Income – Volume VIII
Animal Husbandry, Dairying & Fisheries
205
product in higher priced markets is limited and this is captured by interventions by the industrial
sector.
The lowering of costs and marketed prices can further ramp up demand from consumers. This
increase in demand, would be beneficial to the farmers who can then safely scale up production.
However, the poultry industry is one of the most organised and a recent report by ICRA in
March 2018 indicates, that the broiler volume growth is intentionally kept at lower levels by
the organised players, to control the supply and ensure reasonable broiler realisations. This
strategy might be restraining from faster growth in domestic consumption; and given the easy
acceptability of chicken meat, domestic demand would get a fillip from lower prices, and result
in far greater volumes in sales, which would bring down fixed costs in the overall supply chain.
Though many projections suggest, that over time the Indian consumer might eventually opt to
shift consumption from unprocessed to processed meat, the ground reality of current consumer
preference cannot be disregarded. Therefore, to the immediate benefit of farmers, organising
the supply chain into the fresh or unprocessed market is important. Farmers should be enabled
to capture a greater share of the existing trade, rather than await a long term shift in
consumption habits and growth in demand.
The current demand-supply gap in the meat processing industry is largely attributed to the
capital involved in maintaining cold chain temperatures. Large capital is also required for
processing and preservation of meat, which results in higher costs, and sellers having to spike
up the price of the meat. Food safety concerns are sometimes used to justify such options.
However, provided the live animal and harvested carcass is kept hygienic, the fresh meat is
safe for the short term. Fast selling cycles ensure that stock is not held for long and the meat is
normally harvested and replenished on a daily basis.
About five to six per cent of poultry meat is sold in processed form, of which only about one
per cent undergoes processing into value-added products (ready-to-eat/ready-to-cook).
However, for farmers, the growing demand for poultry meat is an opportunity to scale up
volumes into their existing markets. The poultry market is expanding, as there are very few
social barriers for consuming poultry meat and also because of it being relatively more
affordable than other meats.
In such a market situation, the informal status of markets with regionally limited supply lines,
is an opportunity for start-ups to initiate differentiated online marketing and local delivery
services. Instead of developing long distance supply systems, the start-up entrepreneurs can
organise the steady demand from urban centres to provide a service to both farmer and
consumer, by linking source with nearby demand for fresh meat.
This is seen in growing use of ICT platforms, to streamline the marketing channel of many
perishable foods. Farmers with small land-holding can grow broilers on contractual
arrangements for a company, which can reach the housewife directly to supply the chicken,
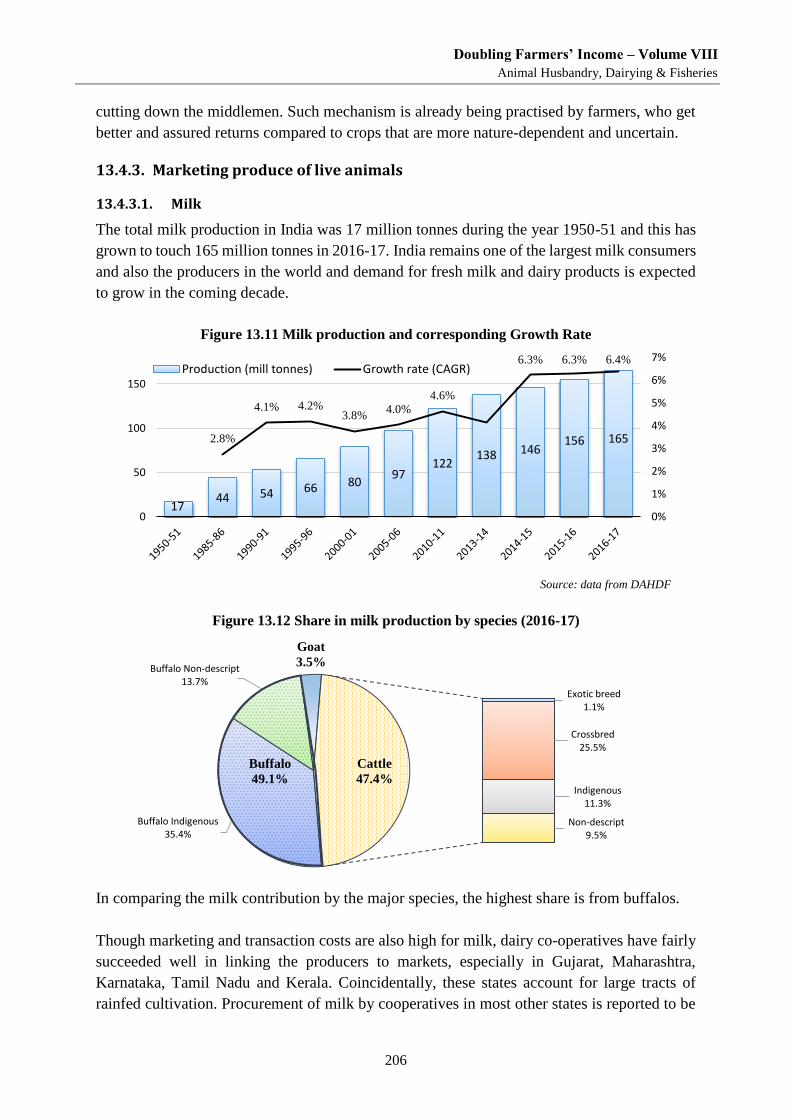
Doubling Farmers’ Income – Volume VIII
Animal Husbandry, Dairying & Fisheries
206
cutting down the middlemen. Such mechanism is already being practised by farmers, who get
better and assured returns compared to crops that are more nature-dependent and uncertain.
13.4.3. Marketing produce of live animals
13.4.3.1. Milk
The total milk production in India was 17 million tonnes during the year 1950-51 and this has
grown to touch 165 million tonnes in 2016-17. India remains one of the largest milk consumers
and also the producers in the world and demand for fresh milk and dairy products is expected
to grow in the coming decade.
Figure 13.11 Milk production and corresponding Growth Rate
Source: data from DAHDF
Figure 13.12 Share in milk production by species (2016-17)
In comparing the milk contribution by the major species, the highest share is from buffalos.
Though marketing and transaction costs are also high for milk, dairy co-operatives have fairly
succeeded well in linking the producers to markets, especially in Gujarat, Maharashtra,
Karnataka, Tamil Nadu and Kerala. Coincidentally, these states account for large tracts of
rainfed cultivation. Procurement of milk by cooperatives in most other states is reported to be
1744 54 66 80
97122
138 146156 1652.8%
4.1% 4.2%3.8%
4.0%
4.6%
6.3% 6.3% 6.4%
0%
1%
2%
3%
4%
5%
6%
7%
0
50
100
150Production (mill tonnes) Growth rate (CAGR)
Exotic breed1.1%
Crossbred25.5%
Indigenous11.3%
Non-descript9.5%
Buffalo Indigenous35.4%
Buffalo Non-descript13.7%
Goat
3.5%
Cattle
47.4%
Buffalo
49.1%
Doubling Farmers’ Income – Volume VIII
Animal Husbandry, Dairying & Fisheries
207
less than 7 per cent of the milk produced. The private sector has a larger presence than
cooperatives in Uttar Pradesh, Punjab and Haryana, and these states account for more than 50
per cent of the private dairy processing plants. These were the states, where dairy cooperatives
had not developed during the pre-reform period. With the launch of economic liberalisation in
1991 in the country, diary sector too was opened up to private sector. It appears that in states
where no robust cooperatives enlisted, private sector grew up appreciably.
Being a homogenous produce, milk supply is readily organised through establishing pooling
points or collection centres, to thereafter communicate it in most economical way to consumers,
including processing factories (see Volume III, 4.6.2). Dairy cooperatives, as well as private
sector processors, have adopted this aggregation and supply model, establishing many hub-
spoke sourcing and delivery systems. The linking of milk producers to domestic markets, has
acted as a stimulant to growth. A good supply chain network and growing demand also protects
the Indian farmer from global price crashes, as observed in 2015-16. Milk and dairy products
hold cultural significance in the Indian diet and a large portion of the population is lacto-
vegetarian. The demand for milk and dairy products is income-responsive, and growth in per
capita income is expected to increase demand for milk and milk products. Projections indicate,
that by 2025 the production of milk in India will cross 200 million tons per annum, implying a
growth of over 30 per cent over the average of annual production in 2013-2015. All other
countries are expected to enhance their milk production by 2025, with growth ranging from 1
to 29 per cent (average growth of 13 per cent) over their 2013-2015 production average. As
there continues demand for milk and dairy products from consumers, the sector will benefit
most from productivity increase by expanding its network of milk collection centres.
Domestic demand is primarily centred on fresh milk, and some value added products such as
powdered milk is a result of milk surplus being converted into long term storable format. Indian
milk economy is worth Rs. 5 lakh crore, growing at 15 to 16 per cent per annum, of which the
processed milk economy is estimated at Rs. 80,000 crore. As per the annual report (2015-16)
of National Dairy Development Board (NDDB), almost 80 per cent of the milk procured by
cooperatives is marketed as liquid milk. In 2015-16, the dairy cooperatives collectively
procured 15.58 million tonnes of milk, of which liquid milk marketing stood at 12.08 million
tonnes (an increase of around 2.73 per cent over the previous year).
The post-production activities for milk are well exemplified in the supply chain model
deployed. The model includes provision of village level pooling/collection points which initiate
the post-production market linkage. The pooling points are strengthened by supporting village
level capital items like bulk milk coolers, milk cans, etc. This system has resulted in greater
transparency and fairness in milk procurement, as well as improvement in quality of milk. In
this same sector, private companies also exist and compete with farmers. The competition has
also brought greater transparency and economic benefits to the farmers.
Private sector found an entry into this segment only after 1991, when the country embarked
upon economic liberalisation. Till then the dairy sector was cooperative-sector, protected from
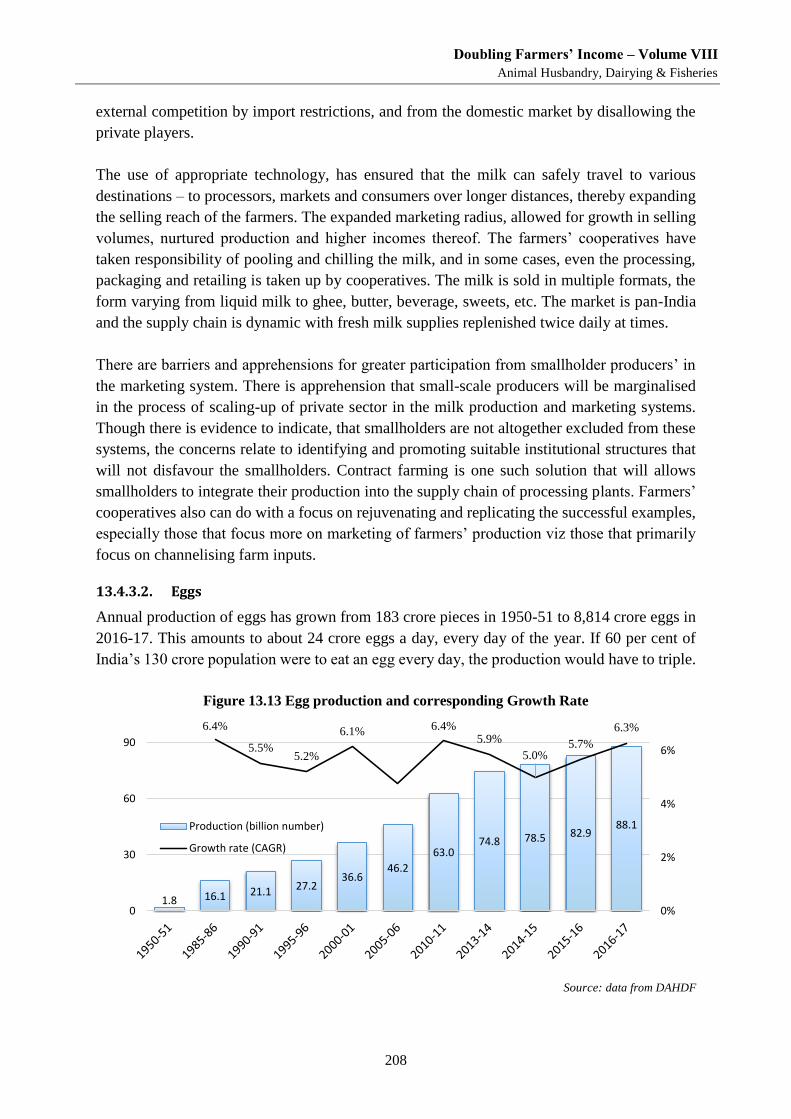
Doubling Farmers’ Income – Volume VIII
Animal Husbandry, Dairying & Fisheries
208
external competition by import restrictions, and from the domestic market by disallowing the
private players.
The use of appropriate technology, has ensured that the milk can safely travel to various
destinations – to processors, markets and consumers over longer distances, thereby expanding
the selling reach of the farmers. The expanded marketing radius, allowed for growth in selling
volumes, nurtured production and higher incomes thereof. The farmers’ cooperatives have
taken responsibility of pooling and chilling the milk, and in some cases, even the processing,
packaging and retailing is taken up by cooperatives. The milk is sold in multiple formats, the
form varying from liquid milk to ghee, butter, beverage, sweets, etc. The market is pan-India
and the supply chain is dynamic with fresh milk supplies replenished twice daily at times.
There are barriers and apprehensions for greater participation from smallholder producers’ in
the marketing system. There is apprehension that small-scale producers will be marginalised
in the process of scaling-up of private sector in the milk production and marketing systems.
Though there is evidence to indicate, that smallholders are not altogether excluded from these
systems, the concerns relate to identifying and promoting suitable institutional structures that
will not disfavour the smallholders. Contract farming is one such solution that will allows
smallholders to integrate their production into the supply chain of processing plants. Farmers’
cooperatives also can do with a focus on rejuvenating and replicating the successful examples,
especially those that focus more on marketing of farmers’ production viz those that primarily
focus on channelising farm inputs.
13.4.3.2. Eggs
Annual production of eggs has grown from 183 crore pieces in 1950-51 to 8,814 crore eggs in
2016-17. This amounts to about 24 crore eggs a day, every day of the year. If 60 per cent of
India’s 130 crore population were to eat an egg every day, the production would have to triple.
Figure 13.13 Egg production and corresponding Growth Rate
Source: data from DAHDF
1.8 16.1 21.1 27.236.6
46.2
63.074.8 78.5 82.9
88.1
6.4%
5.5%5.2%
6.1% 6.4%5.9%
5.0%5.7%
6.3%
0%
2%
4%
6%
0
30
60
90
Production (billion number)
Growth rate (CAGR)
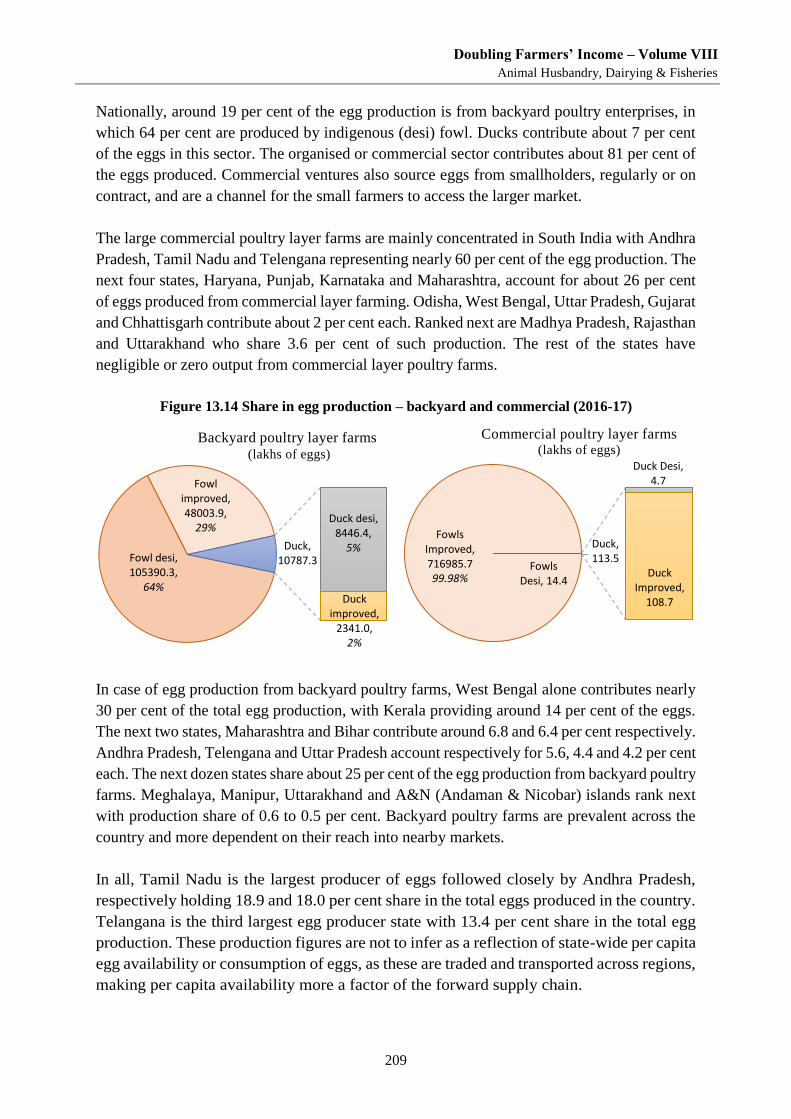
Doubling Farmers’ Income – Volume VIII
Animal Husbandry, Dairying & Fisheries
209
Nationally, around 19 per cent of the egg production is from backyard poultry enterprises, in
which 64 per cent are produced by indigenous (desi) fowl. Ducks contribute about 7 per cent
of the eggs in this sector. The organised or commercial sector contributes about 81 per cent of
the eggs produced. Commercial ventures also source eggs from smallholders, regularly or on
contract, and are a channel for the small farmers to access the larger market.
The large commercial poultry layer farms are mainly concentrated in South India with Andhra
Pradesh, Tamil Nadu and Telengana representing nearly 60 per cent of the egg production. The
next four states, Haryana, Punjab, Karnataka and Maharashtra, account for about 26 per cent
of eggs produced from commercial layer farming. Odisha, West Bengal, Uttar Pradesh, Gujarat
and Chhattisgarh contribute about 2 per cent each. Ranked next are Madhya Pradesh, Rajasthan
and Uttarakhand who share 3.6 per cent of such production. The rest of the states have
negligible or zero output from commercial layer poultry farms.
Figure 13.14 Share in egg production – backyard and commercial (2016-17)
In case of egg production from backyard poultry farms, West Bengal alone contributes nearly
30 per cent of the total egg production, with Kerala providing around 14 per cent of the eggs.
The next two states, Maharashtra and Bihar contribute around 6.8 and 6.4 per cent respectively.
Andhra Pradesh, Telengana and Uttar Pradesh account respectively for 5.6, 4.4 and 4.2 per cent
each. The next dozen states share about 25 per cent of the egg production from backyard poultry
farms. Meghalaya, Manipur, Uttarakhand and A&N (Andaman & Nicobar) islands rank next
with production share of 0.6 to 0.5 per cent. Backyard poultry farms are prevalent across the
country and more dependent on their reach into nearby markets.
In all, Tamil Nadu is the largest producer of eggs followed closely by Andhra Pradesh,
respectively holding 18.9 and 18.0 per cent share in the total eggs produced in the country.
Telangana is the third largest egg producer state with 13.4 per cent share in the total egg
production. These production figures are not to infer as a reflection of state-wide per capita
egg availability or consumption of eggs, as these are traded and transported across regions,
making per capita availability more a factor of the forward supply chain.
Fowl desi, 105390.3,
64%
Fowl improved, 48003.9,
29%Duck desi,
8446.4, 5%
Duck improved,
2341.0, 2%
Duck, 10787.3
Backyard poultry layer farms(lakhs of eggs)
Fowls Desi, 14.4
Fowls Improved, 716985.799.98%
Duck Desi, 4.7
Duck Improved,
108.7
Duck, 113.5
Commercial poultry layer farms(lakhs of eggs)
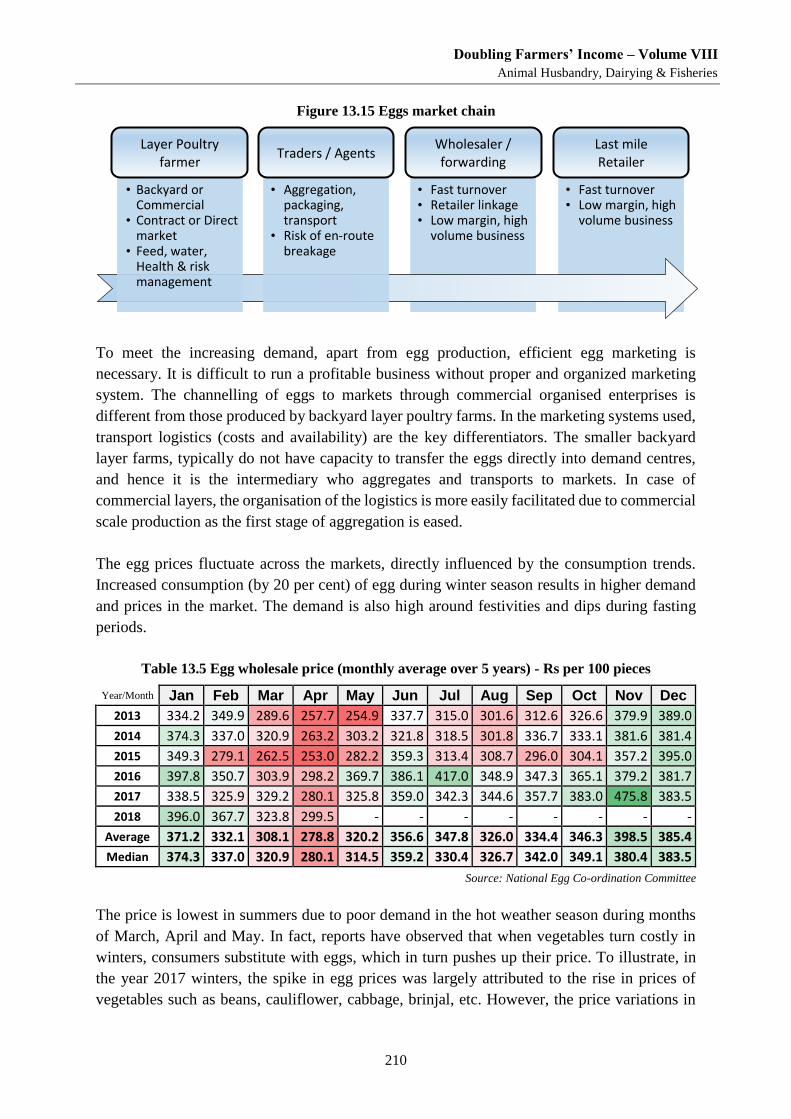
Doubling Farmers’ Income – Volume VIII
Animal Husbandry, Dairying & Fisheries
210
Figure 13.15 Eggs market chain
To meet the increasing demand, apart from egg production, efficient egg marketing is
necessary. It is difficult to run a profitable business without proper and organized marketing
system. The channelling of eggs to markets through commercial organised enterprises is
different from those produced by backyard layer poultry farms. In the marketing systems used,
transport logistics (costs and availability) are the key differentiators. The smaller backyard
layer farms, typically do not have capacity to transfer the eggs directly into demand centres,
and hence it is the intermediary who aggregates and transports to markets. In case of
commercial layers, the organisation of the logistics is more easily facilitated due to commercial
scale production as the first stage of aggregation is eased.
The egg prices fluctuate across the markets, directly influenced by the consumption trends.
Increased consumption (by 20 per cent) of egg during winter season results in higher demand
and prices in the market. The demand is also high around festivities and dips during fasting
periods.
Table 13.5 Egg wholesale price (monthly average over 5 years) - Rs per 100 pieces
Year/Month Jan Feb Mar Apr May Jun Jul Aug Sep Oct Nov Dec
2013 334.2 349.9 289.6 257.7 254.9 337.7 315.0 301.6 312.6 326.6 379.9 389.0 2014 374.3 337.0 320.9 263.2 303.2 321.8 318.5 301.8 336.7 333.1 381.6 381.4 2015 349.3 279.1 262.5 253.0 282.2 359.3 313.4 308.7 296.0 304.1 357.2 395.0 2016 397.8 350.7 303.9 298.2 369.7 386.1 417.0 348.9 347.3 365.1 379.2 381.7 2017 338.5 325.9 329.2 280.1 325.8 359.0 342.3 344.6 357.7 383.0 475.8 383.5 2018 396.0 367.7 323.8 299.5 - - - - - - - -
Average 371.2 332.1 308.1 278.8 320.2 356.6 347.8 326.0 334.4 346.3 398.5 385.4 Median 374.3 337.0 320.9 280.1 314.5 359.2 330.4 326.7 342.0 349.1 380.4 383.5
Source: National Egg Co-ordination Committee
The price is lowest in summers due to poor demand in the hot weather season during months
of March, April and May. In fact, reports have observed that when vegetables turn costly in
winters, consumers substitute with eggs, which in turn pushes up their price. To illustrate, in
the year 2017 winters, the spike in egg prices was largely attributed to the rise in prices of
vegetables such as beans, cauliflower, cabbage, brinjal, etc. However, the price variations in
• Fast turnover • Retailer linkage • Low margin, high
volume business
• Fast turnover • Low margin, high
volume business
Wholesaler / forwarding
Last mile Retailer
• Aggregation, packaging, transport
• Risk of en-route breakage
• Backyard or Commercial
• Contract or Direct market
• Feed, water, Health & risk management
Traders / Agents Layer Poultry
farmer
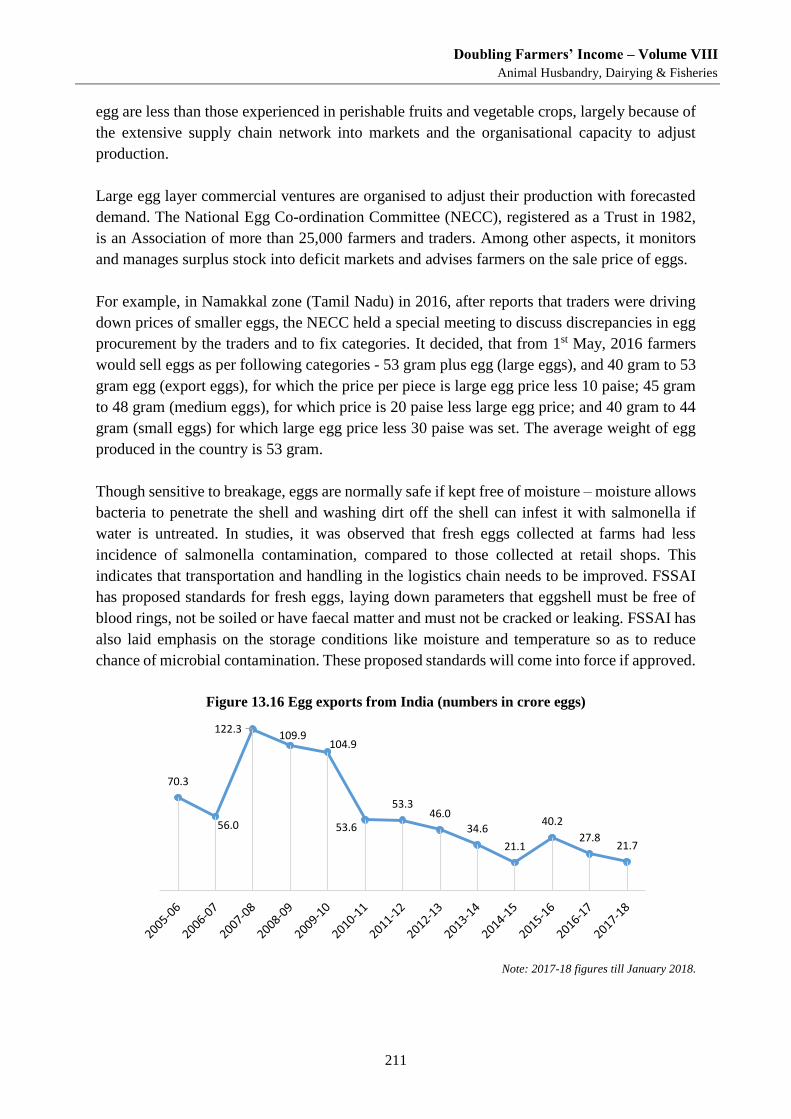
Doubling Farmers’ Income – Volume VIII
Animal Husbandry, Dairying & Fisheries
211
egg are less than those experienced in perishable fruits and vegetable crops, largely because of
the extensive supply chain network into markets and the organisational capacity to adjust
production.
Large egg layer commercial ventures are organised to adjust their production with forecasted
demand. The National Egg Co-ordination Committee (NECC), registered as a Trust in 1982,
is an Association of more than 25,000 farmers and traders. Among other aspects, it monitors
and manages surplus stock into deficit markets and advises farmers on the sale price of eggs.
For example, in Namakkal zone (Tamil Nadu) in 2016, after reports that traders were driving
down prices of smaller eggs, the NECC held a special meeting to discuss discrepancies in egg
procurement by the traders and to fix categories. It decided, that from 1st May, 2016 farmers
would sell eggs as per following categories - 53 gram plus egg (large eggs), and 40 gram to 53
gram egg (export eggs), for which the price per piece is large egg price less 10 paise; 45 gram
to 48 gram (medium eggs), for which price is 20 paise less large egg price; and 40 gram to 44
gram (small eggs) for which large egg price less 30 paise was set. The average weight of egg
produced in the country is 53 gram.
Though sensitive to breakage, eggs are normally safe if kept free of moisture – moisture allows
bacteria to penetrate the shell and washing dirt off the shell can infest it with salmonella if
water is untreated. In studies, it was observed that fresh eggs collected at farms had less
incidence of salmonella contamination, compared to those collected at retail shops. This
indicates that transportation and handling in the logistics chain needs to be improved. FSSAI
has proposed standards for fresh eggs, laying down parameters that eggshell must be free of
blood rings, not be soiled or have faecal matter and must not be cracked or leaking. FSSAI has
also laid emphasis on the storage conditions like moisture and temperature so as to reduce
chance of microbial contamination. These proposed standards will come into force if approved.
Figure 13.16 Egg exports from India (numbers in crore eggs)
Note: 2017-18 figures till January 2018.
70.3
56.0
122.3109.9
104.9
53.6
53.346.0
34.6
21.1
40.2
27.821.7
Doubling Farmers’ Income – Volume VIII
Animal Husbandry, Dairying & Fisheries
212
On the export front, a downwards trend is seen. India mainly exports table eggs, egg white
powder & egg yolk powder. The bulk of exports is as eggs & egg powder to Afghanistan,
Angola, Bahrain, Comoros, Congo, Cote D'Ivoire, Gambia, Hong Kong, Indonesia, Iran,
Kenya, Lebanon, Liberia, Malaysia, Maldives, Mozambique, Nepal, Nigeria, Oman,
Philippines, Russia, Saudi Arabia, Singapore, South Africa, Sri Lanka, Sudan, Taiwan,
Tajikistan, Tanzania, Thailand, UAE, Vietnam.
Exports are affected by factors such as bird flu and other food safety and health concerns,
besides other international trade dynamics. In revenue terms, India is among the top fifteen
exporters of shell eggs though in terms of total export volume, the ranking is higher. Improved
terms of trade of exported shell eggs will help farmers. However, the domestic consumer is an
immediate and growing market opportunity.
On an average, eggs sold to domestic consumer are laid about 10 days to two weeks earlier. In
summers, the eggs can stay saleable for another week or two without refrigeration, and upto a
month or more in winters in the northern markets.
Traditionally in India, eggs are perceived as commodity products, with little or no
differentiation in terms of quality. Reports indicate that sale of eggs through modern retail
formats have no impact to those sold through traditional formats. Eggs are purchased from the
neighbourhood groceries, and these are highly dependent for supply on the regularity and
efficiency of the logistics. The produce from backyard layer poultry farms can have a far shorter
market cycle if farmers organise delivery to nearby towns and cities.
Egg marketing is an opportunity for social entrepreneurs and start-ups. Sourcing from
smallholder famers and organising the supply into homes, retailers and institutional buyers will
benefit the farmers and facilitate safe supply to buyers.
Branded and speciality eggs are slowly picking up in market and are projected to be richer in
proteins, contain less fat and are picked from bio-layer farms. With attractive packaging and
promise of a healthier proposition, these eggs command a premium over ordinary eggs. These
enriched and low-fat branded eggs are becoming a staple choice of some families, as income
levels and health consciousness rise.
13.4.3.3. Wool
India is the seventh-largest producer of wool in the world with a global production share of
nearly 1.8 per cent. More than 80 per cent of the country’s wool is produced in the states of
Rajasthan (32.9%), Jammu & Kashmir (16.7%), Karnataka (15.1%), Telengana (10.7%) and
Gujarat (5.2%). Raw wool production grew steadily from 27.5 million kgs in 1950-51 and
peaked during 2002-03 at 50.5 million kgs (50,500 tonnes).
The wool is supplied to the woollen industry, which is mainly concentrated in Punjab which
alone accounts for about 35 per cent of wool production units, followed by Maharashtra and
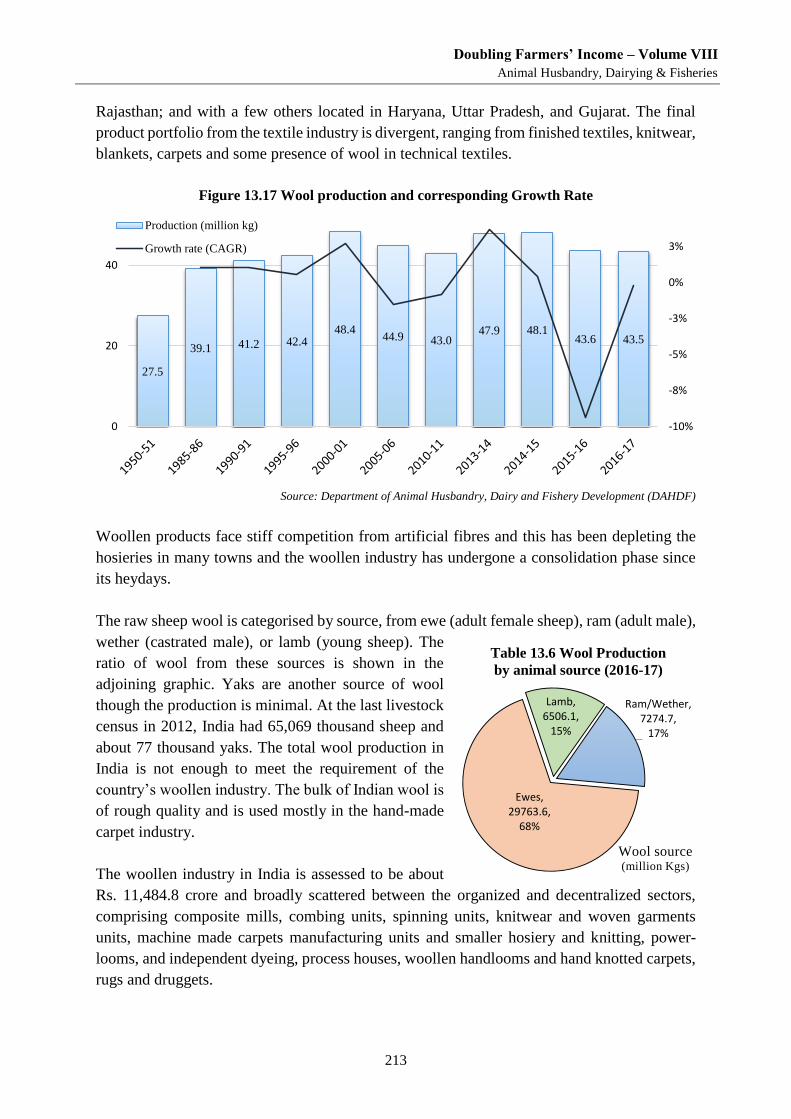
Doubling Farmers’ Income – Volume VIII
Animal Husbandry, Dairying & Fisheries
213
Rajasthan; and with a few others located in Haryana, Uttar Pradesh, and Gujarat. The final
product portfolio from the textile industry is divergent, ranging from finished textiles, knitwear,
blankets, carpets and some presence of wool in technical textiles.
Figure 13.17 Wool production and corresponding Growth Rate
Source: Department of Animal Husbandry, Dairy and Fishery Development (DAHDF)
Woollen products face stiff competition from artificial fibres and this has been depleting the
hosieries in many towns and the woollen industry has undergone a consolidation phase since
its heydays.
The raw sheep wool is categorised by source, from ewe (adult female sheep), ram (adult male),
wether (castrated male), or lamb (young sheep). The
ratio of wool from these sources is shown in the
adjoining graphic. Yaks are another source of wool
though the production is minimal. At the last livestock
census in 2012, India had 65,069 thousand sheep and
about 77 thousand yaks. The total wool production in
India is not enough to meet the requirement of the
country’s woollen industry. The bulk of Indian wool is
of rough quality and is used mostly in the hand-made
carpet industry.
The woollen industry in India is assessed to be about
Rs. 11,484.8 crore and broadly scattered between the organized and decentralized sectors,
comprising composite mills, combing units, spinning units, knitwear and woven garments
units, machine made carpets manufacturing units and smaller hosiery and knitting, power-
looms, and independent dyeing, process houses, woollen handlooms and hand knotted carpets,
rugs and druggets.
27.5
39.1 41.2 42.448.4
44.9 43.047.9 48.1
43.6 43.5
-10%
-8%
-5%
-3%
0%
3%
0
20
40
Production (million kg)
Growth rate (CAGR)
Table 13.6 Wool Production
by animal source (2016-17)
Ram/Wether, 7274.7,
17%
Ewes, 29763.6,
68%
Lamb, 6506.1,
15%
Wool source(million Kgs)
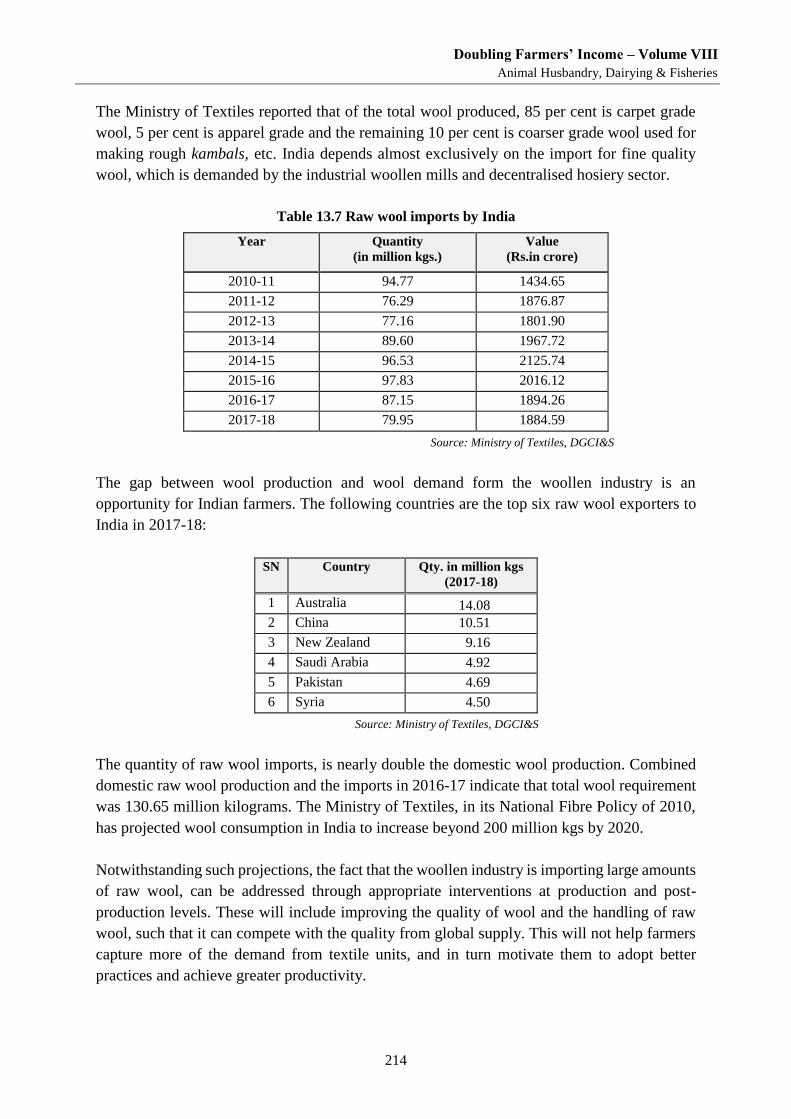
Doubling Farmers’ Income – Volume VIII
Animal Husbandry, Dairying & Fisheries
214
The Ministry of Textiles reported that of the total wool produced, 85 per cent is carpet grade
wool, 5 per cent is apparel grade and the remaining 10 per cent is coarser grade wool used for
making rough kambals, etc. India depends almost exclusively on the import for fine quality
wool, which is demanded by the industrial woollen mills and decentralised hosiery sector.
Table 13.7 Raw wool imports by India
Year Quantity
(in million kgs.)
Value
(Rs.in crore)
2010-11 94.77 1434.65
2011-12 76.29 1876.87
2012-13 77.16 1801.90
2013-14 89.60 1967.72
2014-15 96.53 2125.74
2015-16 97.83 2016.12
2016-17 87.15 1894.26
2017-18 79.95 1884.59
Source: Ministry of Textiles, DGCI&S
The gap between wool production and wool demand form the woollen industry is an
opportunity for Indian farmers. The following countries are the top six raw wool exporters to
India in 2017-18:
SN Country Qty. in million kgs
(2017-18)
1 Australia 14.08
2 China 10.51
3 New Zealand 9.16
4 Saudi Arabia 4.92
5 Pakistan 4.69
6 Syria 4.50
Source: Ministry of Textiles, DGCI&S
The quantity of raw wool imports, is nearly double the domestic wool production. Combined
domestic raw wool production and the imports in 2016-17 indicate that total wool requirement
was 130.65 million kilograms. The Ministry of Textiles, in its National Fibre Policy of 2010,
has projected wool consumption in India to increase beyond 200 million kgs by 2020.
Notwithstanding such projections, the fact that the woollen industry is importing large amounts
of raw wool, can be addressed through appropriate interventions at production and post-
production levels. These will include improving the quality of wool and the handling of raw
wool, such that it can compete with the quality from global supply. This will not help farmers
capture more of the demand from textile units, and in turn motivate them to adopt better
practices and achieve greater productivity.
Doubling Farmers’ Income – Volume VIII
Animal Husbandry, Dairying & Fisheries
215
The constraints faced by wool sector can be summarised as follows:
Low priority of state governments in development of wool sector.
Shortage of pasture land, forcing breeders to migrate their flock from one area to
another throughout the year.
Piecemeal value capture by the sheep breeders i.e. from sale of raw wool, live sheep,
manure, milk, mutton, skin, etc., without reaping full benefit from value capture across
all possible outputs.
Inadequate production of specialty fibres i.e. pashmina goat wool, angora rabbit wool,
etc. and low productivity per animal.
Lack of contract farming and associated motivation to adopt modern methods of
animal management, machine shearing of sheep, washing & grading of raw wool etc.
(a Model Contract & Servicing Act, can be expected to support contracts in this area).
Inadequate raw wool marketing facilities and infrastructure.
Ineffective role of state wool marketing organisations in wool producing states.
The weakest link after wool production is primarily the marketing of wool. The wool marketing
is essentially in the hands of private wool merchants and traders. The wool producers do not
have the benefit of organized market of wool available. The prices of wool have been widely
fluctuating, and in real terms there has been hardly any increase in the price of wool in last
decade.
To bring greater focus on marketing of raw wool, the Ministry of Textiles has introduced a new
scheme, namely, Wool Marketing Scheme (WMS) in all major wool producing states to
support greater procurement of wool on remunerative price by creation of Revolving Fund for
Marketing of Wool. Another activities supported are operation of e-portal for auction of wool,
formation of wool producers’ societies, financial assistance to strengthening infrastructure
required for marketing of existing wool mandi/grading centres (storage halls, auction facility,
testing platform etc.). A financial provision of Rs. 10 crore has been made under this scheme
for implementation for the years from 2017-18 to 2019-20.
13.5. Interventions in Livestock Marketing
Marketing is typically associated with production and productivity of livestock, the latter
affecting the economics or cost of production. These aspects, including making available
grazing lands, breed and feed improvements, better rearing practices, etc. are dealt with in
Volume VIII-D of this Report. At this stage of development in livestock farming, it is
imperative that eased access to markets, standardisation of market parameters, health and safety
of livestock, bio-security of animals and humans, and overall ease of business in the post-
production cycle, are taken care of.
Doubling Farmers’ Income – Volume VIII
Animal Husbandry, Dairying & Fisheries
216
Livestock marketing involves trade in live animals as well as commerce in the produce from
live animals. When managing living animals, their welfare is to be facilitated, as much as
hygiene and safety of produce and products from the livestock.
The live animals are traded between farmers, largely for purpose of breeding and farm labour,
or to build on existing livestock assets. The trade of live animals also occurs between farmers
or their intermediaries with meat processing factories, who optimise on the meat as their
primary product and feed leather, blood, feathers and other by-products to other industries.
Live animals are also bought by local wet market butchers and retailers. As bulk of livestock
owners are smallholder farmers, a primary intervention will be to facilitate the grouping and
transport of their assets to wholesale buyers. Such organisation is also envisaged for crops,
through the Gramin Agri-Markets (GrAMs), which are discussed in Volume IV of this Report
under the nomenclature of Primary Retail Agricultural Markets (PRAMs).
Production enhancing policies have pushed economies of scale on feed and production, but the
output marketing systems have not been given suitable focus. Markets have remained informal
and at times exploitative of small producers. This demotivates them from adopting modern
practices and new technologies. Easing of market access and connectivity will benefit the large
number of small livestock owners.
The country has no authentic market for quality, disease-free germplasm in the form of i)
sperm; ii) embryos; iii) calves; iv) heifer; and v) adult bovines. As such, poor quality of
germplasm with unknown genetic is sold in unorganised markets. This is of importance if
indigenous breeds are to be refined and promoted.
13.5.1. NCDFI eMarket - Digitalization of dairy cooperative trade
The National Cooperative Dairy Federation of India, has its primary objective to facilitate
the working of dairy cooperatives through coordination, networking and advocacy. It
supports 27 state milk federations comprising of 218 District/Tehsil processing unions
that incorporate about 1.73 lakh primary village societies that focus on milk production
and collection. Among its major activities, is coordination of milk and dairy product
supplies, arranged on contractual terms, to the Ministry of Defence, functioning as a ‘carry
& forwarding agent’ for frozen semen doses, and coordinating the sale of dairy
commodities and procurement of agri-commodities through its eMarket.
The NCDFI eMarket was developed, with technical support of NCDEX, designed to
facilitate fair market price discovery, to overcome time consuming tender procedures
and to bring in faster processes while having wider participation and transparency in the
process. This eMarket exemplifies the role of market platforms that need to be further
strengthened to help to balance the demand and supply gaps at a national level.
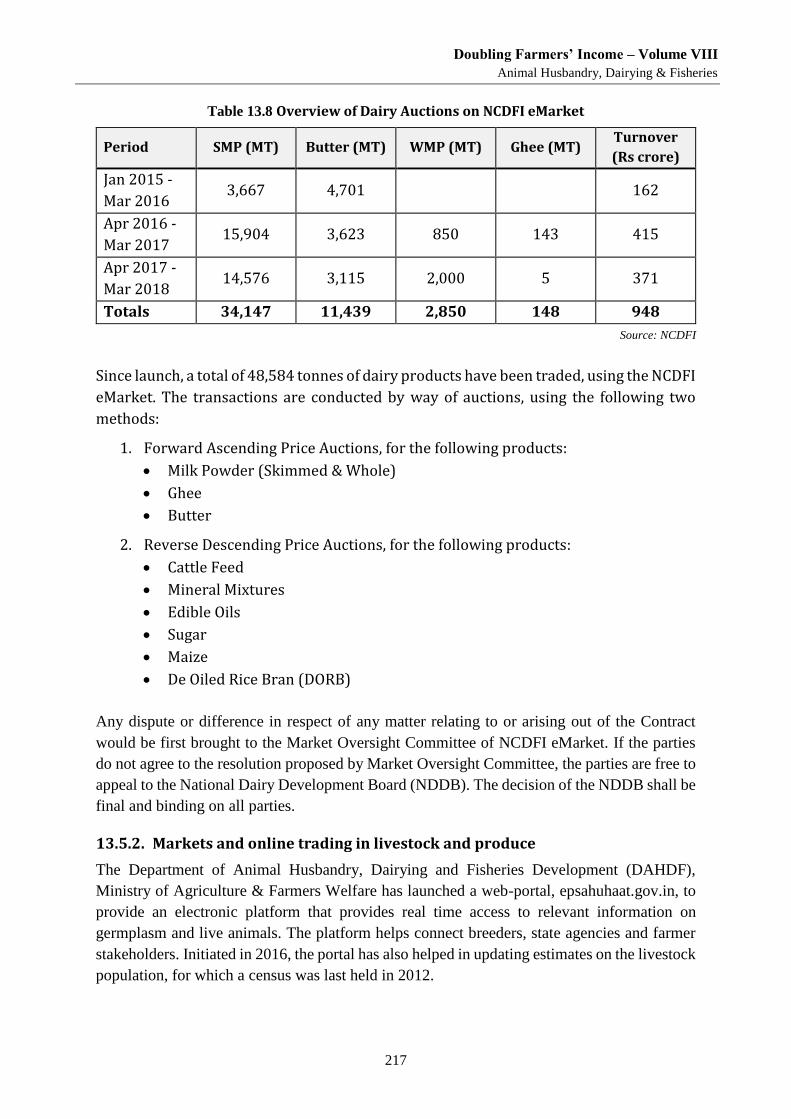
Doubling Farmers’ Income – Volume VIII
Animal Husbandry, Dairying & Fisheries
217
Table 13.8 Overview of Dairy Auctions on NCDFI eMarket
Period SMP (MT) Butter (MT) WMP (MT) Ghee (MT) Turnover
(Rs crore)
Jan 2015 -
Mar 2016 3,667 4,701 162
Apr 2016 -
Mar 2017 15,904 3,623 850 143 415
Apr 2017 -
Mar 2018 14,576 3,115 2,000 5 371
Totals 34,147 11,439 2,850 148 948
Source: NCDFI
Since launch, a total of 48,584 tonnes of dairy products have been traded, using the NCDFI
eMarket. The transactions are conducted by way of auctions, using the following two
methods:
1. Forward Ascending Price Auctions, for the following products:
Milk Powder (Skimmed & Whole)
Ghee
Butter
2. Reverse Descending Price Auctions, for the following products:
Cattle Feed
Mineral Mixtures
Edible Oils
Sugar
Maize
De Oiled Rice Bran (DORB)
Any dispute or difference in respect of any matter relating to or arising out of the Contract
would be first brought to the Market Oversight Committee of NCDFI eMarket. If the parties
do not agree to the resolution proposed by Market Oversight Committee, the parties are free to
appeal to the National Dairy Development Board (NDDB). The decision of the NDDB shall be
final and binding on all parties.
13.5.2. Markets and online trading in livestock and produce
The Department of Animal Husbandry, Dairying and Fisheries Development (DAHDF),
Ministry of Agriculture & Farmers Welfare has launched a web-portal, epsahuhaat.gov.in, to
provide an electronic platform that provides real time access to relevant information on
germplasm and live animals. The platform helps connect breeders, state agencies and farmer
stakeholders. Initiated in 2016, the portal has also helped in updating estimates on the livestock
population, for which a census was last held in 2012.
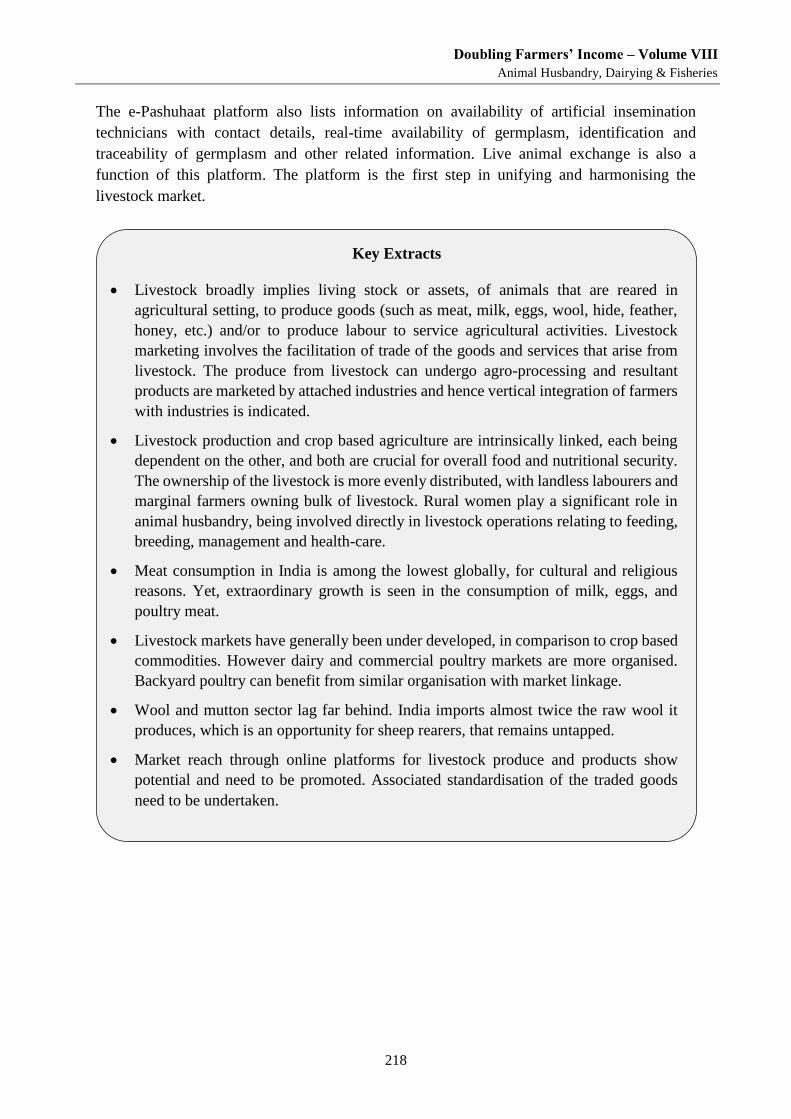
Doubling Farmers’ Income – Volume VIII
Animal Husbandry, Dairying & Fisheries
218
The e-Pashuhaat platform also lists information on availability of artificial insemination
technicians with contact details, real-time availability of germplasm, identification and
traceability of germplasm and other related information. Live animal exchange is also a
function of this platform. The platform is the first step in unifying and harmonising the
livestock market.
Key Extracts
Livestock broadly implies living stock or assets, of animals that are reared in
agricultural setting, to produce goods (such as meat, milk, eggs, wool, hide, feather,
honey, etc.) and/or to produce labour to service agricultural activities. Livestock
marketing involves the facilitation of trade of the goods and services that arise from
livestock. The produce from livestock can undergo agro-processing and resultant
products are marketed by attached industries and hence vertical integration of farmers
with industries is indicated.
Livestock production and crop based agriculture are intrinsically linked, each being
dependent on the other, and both are crucial for overall food and nutritional security.
The ownership of the livestock is more evenly distributed, with landless labourers and
marginal farmers owning bulk of livestock. Rural women play a significant role in
animal husbandry, being involved directly in livestock operations relating to feeding,
breeding, management and health-care.
Meat consumption in India is among the lowest globally, for cultural and religious
reasons. Yet, extraordinary growth is seen in the consumption of milk, eggs, and
poultry meat.
Livestock markets have generally been under developed, in comparison to crop based
commodities. However dairy and commercial poultry markets are more organised.
Backyard poultry can benefit from similar organisation with market linkage.
Wool and mutton sector lag far behind. India imports almost twice the raw wool it
produces, which is an opportunity for sheep rearers, that remains untapped.
Market reach through online platforms for livestock produce and products show
potential and need to be promoted. Associated standardisation of the traded goods
need to be undertaken.
Doubling Farmers’ Income – Volume VIII
Animal Husbandry, Dairying & Fisheries
219
Chapter 14
Small Ruminants: Recommendations and Strategies Small ruminant farmers remain underdeveloped. This chapters lays out broad recommendations and
strategies with special focus on small ruminant livestock sector.
14.1. Strategies Recommended to Enhance Productivity
i. To enhance the feed, fodder production and pasture development an efficient and
integrated land use management system which includes better utilisation of wastelands and
CPRs through proven silvi-pastoral system/agri-silvi-pastoral system needs to be encouraged.
State AHDs and forest department can come together to adapt and implement such models in
an appropriate manner, balancing the economic needs and ecological demands.
ii. Livestock production is mainly dependent on crop residues and by-products as major
components of animal feed. Therefore, fodder enrichment will facilitate for better utilisation
and enhancement of productivity. Government initiative to control burning of wheat/paddy
straw and making available straw bailing machines provided to various states, will also help to
supply these crop straws to adjoining states for enhancing livestock productivity.
iii. Strengthening of existing infrastructure of veterinary institutions, laboratories,
diagnostic centres, education and training to increase indigenous wool production through
adoption of integrated approach optimizing nutritional and management inputs with adequate
disease control measures.
iv. A sound breeding policy for small ruminants at state level can be developed, keeping
in mind the needs of various states due to presence of different breeds, to ensure breed
improvement and to develop better quality breeding rams. Genetic improvement can be
achieved by selection of rams of high genetic merit for breeding and also incentivising the
owners so that the select high genetic merit rams/bucks are not sold for slaughter but used for
natural or AI service as required.
v. As sheep rearing is a nomadic practice at large, support to these sheep rearers can be
provided in terms of better health services. Mobile veterinary clinics can be promoted across
various regions in the country to cover important migratory routes of these flocks. These units
can be made available 24x7 with the presence of trained veterinarian and a support staff.
vi. Overall productivity of sheep can be increased to improve income of farmers through
introduction of prolific sheep in the flock of farmers, by accelerating lambing system, grazing
with concentrate supplementation, etc. Proper guidelines can be prepared by State AHDs to
ensure the implementation these techniques.
vii. Krishi Vigyan Kendras (KVKs) are present in every district across the country for
technical support, which can act as training centres for para vets with the support of AHDs.
However, the staff strength with professional education in veterinary sciences at the KVKs
needs to be strengthened.
viii. Trained para-vets and community animal health workers, have demonstrated their
worth in last mile service delivery in many states across the country. There is a need to
Doubling Farmers’ Income – Volume VIII
Animal Husbandry, Dairying & Fisheries
220
recognise them through official/legal framework across the country.
ix. The funds allocated for veterinary services for small ruminant sector must be enhanced,
keeping priority focus on providing support to rearers with small herds. Funds should be
allocated to develop and maintain cold chain infrastructure for vaccines and biological products
to ensure the last mile delivery.
x. Village communities are involved in goat and sheep rearing. The development of
Village Producer Organisations (VPOs), comprising the goat/sheep rearers of each village can
be promoted. The VPOs can be formalised as cooperatives or companies, to induct professional
management, in line with crop sector and be given the same fiscal and financial benefits as in
case of FPOs.
xi. The small ruminant rearers in form of collectives, as VPOs (as Cooperatives or FPCs)
can retain independent ownership of goats, while bringing in better organisation in production.
This will bring suitable empowerment to access credit and veterinary inputs as a collective.
Where livestock keeper organisations already exist, they should be strengthened. Shelter
facility for goats may be provided at village level.
xii. The VPOs of small ruminants can be provided financial and material support to
maintain and develop Common Property Resources (CPRs) at village level. This will motivate
gram panchayats to address tenure rights for developing CPRs and bring stakeholder attention
to regeneration of such depleted land. Waste land and non-arable land can be developed for
stall fed rearing systems.
xiii. The entrepreneurship in sheep farming can be encouraged by providing more leverage
in funding through Entrepreneurship Development and Employment Generation component of
the National Livestock Mission. Under RKVY-RAFTAAR, funds are available for promoting
enterprise and incubation centres. The educated youth, who have been showing inclination
towards sheep farming can be supported.
xiv. Various organisations, including multilateral organisations and NGOs are involved in
the development of the small ruminant sector across the country, covering all aspects of sheep
supply chain. Such organisations can be supported to act as service providers and support these
producer organisations and cooperatives for better health coverage and for extension services.
Focused outcome linked support to such actors by the government can help ensure better
coverage and result from such services.
xv. A knowledge sharing platform should be formed at centre and state level comprising
representatives from Animal Husbandry Department, Watershed, Research Institutes,
Veterinary Colleges, Rural Development Department, Forest Department, Panchayati Raj
Institutions, and private sector actors linked to small ruminants production.
xvi. A comprehensive “Small Ruminant Policy” at national level should be developed as a
model for states to adopt and implement. This should cover all aspects – breed development,
training of para vets, disease mapping and reporting along with disease control, marketing
regulations, food quality and safety regulations along with strong implementation of policies.
Such a policy needs to be formulated with the help of various departments namely animal
Doubling Farmers’ Income – Volume VIII
Animal Husbandry, Dairying & Fisheries
221
husbandry, forest, rural development, food processing, textile, etc. The policy can include
mechanism for inter-state coordination (neighbouring states) to fix migratory routes, standard
of care and hygiene during migration.
xvii. The KVK’s can establish free training and subsidised veterinary services for small
ruminants. KVKs can become a source of knowledge and breeding. The various records
including birth, health, medical, mortality, weighing, vaccination, etc. can be maintained at
KVKs. Selection of rams/bucks of high genetic merit for breeding and incentivising the owners
so that selected high genetic merit bucks are not sold for slaughter but used for natural or AI
service can be undertaken.
xviii. The higher share of women involvement, also justifies developing of women goat rearer
groups & associations, and women farmer friends dedicated for goat sector. The women groups
can be empowered to take decisions on goat rearing matters.
xix. Migration of sheep rearers is adverse to their socio-economic and educational interests.
It causes disruption in families affecting the women left behind, and discourages education of
the children who are also taken along by the elders. From the society’s egalitarian perspective,
a paradigm shift in sheep rearing is necessary from migration to stall-fed system. This calls for
focussed attention to strengthening of feed and fodder resources, besides other support systems.
xx. Upgrading of infrastructure facilities for small ruminants care, by the Department of
Animal Husbandry, such as for inputs, goat shelter, distribution, and livestock marketing could
be coordinated with SAMPADA scheme of the Ministry of Food Processing, so that production
is suitably aligned with development of processing industry.
14.2. Market Recommendations
To fully facilitate livestock transactions, the first step will require organising and modernising
the existing livestock market places to safeguard the living animals, to minimise their suffering
and thereby securing their imminent health and their ability to resist disease. This warrants
appropriate focus on livestock market infrastructure. It is recommended that livestock markets
be developed so that-
i. Forward & backward linkages of primary producers with meat and wool industries and
input supplies would accelerate the growth of sheep production and enhance the income of
farmers. Specific commodity zones including disease free as well as marketing zone for
developing internationally competitive production with hygienic and quality meat and wool
would facilitate the development of sheep husbandry in future.
ii. Development of local markets as gathering and selling points for livestock fully
equipped with infrastructural facilities would help. These markets/mandis can be facilitated
and monitored by local public sector authorities or by public and private both.
iii. The bio-security at the physical markets is improved. This will reduce risk of disease
spreading from one animal to the other, or from animals to human. Live poultry markets are
frequently implicated in zoonotic transmission of avian flu from birds to humans.
Doubling Farmers’ Income – Volume VIII
Animal Husbandry, Dairying & Fisheries
222
iv. The Department of Animal Husbandry, Dairying and Fisheries Development in
coordination with the recently set up Intersectoral Coordination Committee and the Core
Working Group on Anti-microbial Resistance (NAP-AMR) 2017-2021, is to develop suitable
protocols at animal markets to maximise animal and human safety at the live animal markets.
It should also intervene on indiscriminate use of antibiotics.
v. Proper standards should be implemented at live animal markets, such as providing for
non-porous or tile floors and walls, segregation of animals, sufficient potable water for animals,
feed and fodder, washing system and covered drains, liquid waste treatment systems,
handwashing and sanitation facilities for traders and farmers, separate entry and exit gates for
vehicles bringing animals, etc. No retail activity or slaughtering should be allowed inside
premises of wholesale live markets
vi. Tagging of animals at live markets to ensure traceability will improve the marketing
system and aid in food safety implementation. No wild animals must be sold at markets. The
accuracy of tagging can be ensured by adopting technologies like RFID, micro-chips etc.
vii. Premises for quadrupeds and ruminants should be developed to separate them from bird
markets. Shade and water availability (troughs, etc.) should be made mandatory for live animal
at the markets.
viii. Rodent and insect control programs and systems must be in place and rigorously
monitored.
ix. Safe disposal of dead animals must be built into the marketing mechanism, including a
dead animal testing and reporting system.
x. A complete list of live animal market infrastructure and facilities may be circulated and
markets should be jointly inspected, regularly with producer associations, state government
and central government officers.
xi. India’s development story in livestock is replete with eased mobility of animals across
the country. Cross-regional movement of live animals (quadrupeds and poultry) is essential
and the transport of live animals from their breeding grounds to markets and processors should
be facilitated. Relevant documentation to allow unhindered inter-state passage is required.
xii. Livestock transportation of small ruminants can be exempted from in-transit
inspections, if within four hours travel radius. Inspections may be implemented at final
destination or at loading point.
xiii. An inter-departmental committee, headed by Animal Husbandry Department in each
state may be formed to explore convergence in policies/programmes with other concerned
departments including related issues faced by the transporters.
xiv. Organised sheep and goat rearing should be linked to attracting investment in proximity
located modern processing and abbatoir units, who can function as a suitable market channel
Doubling Farmers’ Income – Volume VIII
Animal Husbandry, Dairying & Fisheries
223
for goat milk and meat products.
xv. Trade policy must attend to supporting and promoting the supply of meat, milk, cheese,
wool and other products from small ruminants to meet global demand.
xvi. Prices of live animals, especially ruminants, are negotiated by taking into consideration
the characteristics, such as age, body weight and structure, appearance, breed, yield and health
status of the animal. These parameters need to be standardised, as far as practical, to streamline
the market transactions.
xvii. Wool markets can be improved by providing modern shearing facilities. Similar
facilities can be developed at specialised GrAMs (proposed for development) in sheep rearing
areas. The shearing tools and raw wool handling can be provisioned as service option at these
GrAMs, besides subsequent e-marketing to the woollen industry. Clean wool handling will
protect the quality of wool and help meet some of the demands from industry. Speciality wool
development can also be undertaken, since wool from rabbits and yaks is mostly in hand of
small and marginal farmers.
xviii. The DAHDF, Ministry of Agriculture & Farmers Welfare had four Regional
Directorates for poultry development with various farms and units. In 2003, all the poultry
units of the central government were restructured into Central Poultry Development
Organisations. The development however, is still largely focused on production side and
marketing is not directly addressed. The National Action Plan for Egg & Poultry-2022, also
needs to focus on market development and marketing to the benefit of small holder farmers.
Commensurate market development will avoid the situation as in crops, where surplus
production has had to be supported through government procurement. Given the higher
perishable nature of eggs and poultry meat, an efficient marketing system supported by needed
agri-logistics is a sine-qua-non.
xix. Livestock export is normally not in live animals (live animal trade is on the decline),
but mainly is in the form of meat and other products. There is considerable scope to increase
buffalo meat exports due to its price competitiveness and huge production potential. Such trade
also supports the important hide and leather industry. Efforts need to be made to remove
bottlenecks to further growth in such trade.
xx. Export of meat from small ruminants is limited, largely due to higher domestic demand.
However, the demand from existing markets for goat meat from Gulf countries can be
developed further. Domestic demand for poultry is also high, and a priority would be to
improve the market network and access of backyard poultry farmers into niche peri-urban
markets, especially for traditionally reared desi fowl and duck meat.
xxi. Modernisation of milk collection points and rejuvenation of cooperatives is necessary.
Imports and private sector dairy plants have competed with cooperatives, since removal of
quantitative restrictions and de-monopolisation of imports post the liberalisation of Indian
Economy rolled out in 1991. The competition is healthy, as it has helped build new products
Doubling Farmers’ Income – Volume VIII
Animal Husbandry, Dairying & Fisheries
224
and capabilities. However, capacity building and greater technology support can be provisioned
for cooperatives and farmer producer groups.
xxii. Most livestock development programs are focused on on-production side and setting
up infrastructure. At the same time, concerted effort are needed to strengthen the output supply
from small and marginal farmers, to link them with markets and bulk buyers. This will require
developing back-end operations for small farmers to aggregate their poultry, small ruminants
and efficiently connect onwards with markets. Existing trade in this activity can be modernised
with the necessary infrastructure if client farmers of existing traders are provided equity or
other sharing mechanism in the service.
xxiii. The processing industry has been developed to an extent where the units are not always
acting to the benefit of farmers. Policies and government support should be linked to
demonstrable measures of economic growth leading to the doubling of farmers’ income.
xxiv. Trade in livestock by-products needs to be promoted. With a large livestock population
and growing meat, egg and dairy industry, various by-products like extracts, bone char, hair,
hide, enzymes, and many more are generated. These items have not caught active attention on
development front. These possess value and capture of this value is important from the
perspective of generating additional income to the livestock farmers.
xxv. Livestock sector will benefit by organising a division on livestock marketing under the
Department of Animal Husbandry, Dairying and Fisheries Development. The focus on
infrastructure development can include parameters to ensure that the infrastructure is brought
to use to benefit income growth in small farmers.
xxvi. Marketing lessons from NDDB can be transferred to small ruminant sector. The
existing Sheep and Wool Cooperatives and their state level Federations need financial and
managerial strengthening.
xxvii. The Model Agriculture Produce and Livestock Marketing (Promotion and Facilitation)
Act, 2017 released by the central government enables development of different types of
markets for livestock in both public & private sectors. The states should promote these markets
in the interest of livestock farmers including small ruminants.
xxviii. The Model Contract Farming and Services Act, 2018 enables involvement of private
sector across the value chain. The states should find it useful to legislate appropriate State Acts.
14.2.1. Model Agricultural Produce and Livestock Marketing Act, 2017
The Model APLM Act, 2017 is described in Volume IV of this Report. Designed to include
livestock marketing and as a promotion and facilitation Act, and states need to adopt the
principles in a progressive manner. The Model APLM Act, 2017 has forward looking and
facilitative provisions for the integration of processors, exporters, bulk buyers, end users, etc.
with farmers. In convergence with the subsequent Model Contract Farming and Services Act,
Doubling Farmers’ Income – Volume VIII
Animal Husbandry, Dairying & Fisheries
225
the agricultural marketing environment will be developed in a more inclusive, competitive
fashion with the desired of “ease of doing agri-business”.
The Model APLM Act, 2017 is recommended for the States to adopt, to initiate greater and
relevant marketing changes in agriculture and to encourage a single national agricultural
market, including for livestock. Government policies with objective of doubling farmers’
income should be driven with overriding purpose to promote ease of doing agri-business.
Key Extracts
States need to adopt the Model Agriculture Produce and Livestock Marketing
(Promotion & Facilitation) Act, 2018 and legislate their provisions of law on priority.
The Model Act supports promoting sheep, goat, poultry and piggery markets.
Biosecurity of livestock markets needs to be improved with focus on modernisation
of the market infrastructure, in line with scientific segregation of live animals,
complying with animal cruelty laws, and minimise zoonotic spread of disease.
Livestock farmers transact in live animals and primary produce, such as milk, eggs,
meat and wool. Each aspect of these valuable outputs need to be promoted to bring
appropriate and substantive benefits to the farmer producer.
Cross-regional movement of live animals (quadrupeds and poultry) is essential and
the transport of live animals from their breeding grounds to markets and processors
should be facilitated. Ease of doing agri-business should be the driving factor.
The National Action Plan for Egg & Poultry-2022, may also focus on market
development and marketing to the benefit of small holder farmers.
Policies and government support to processing industry should be linked to
demonstrable measures of economic growth and to the doubling of farmers’ income.
Trade in livestock by-products needs to be promoted. With a large livestock
population and growing meat, egg and dairy industry, various by-products like
extracts, bone char, hair, hide, enzymes, and more are generated. These items have
not caught active attention on development front.
Livestock sector will benefit by organising a division on livestock marketing under
the Department of Animal Husbandry, Dairying and Fisheries Development. The
focus on infrastructure development can include parameters to ensure that the
infrastructure is brought to use to benefit income growth in small farmers.


Fisheries Sector

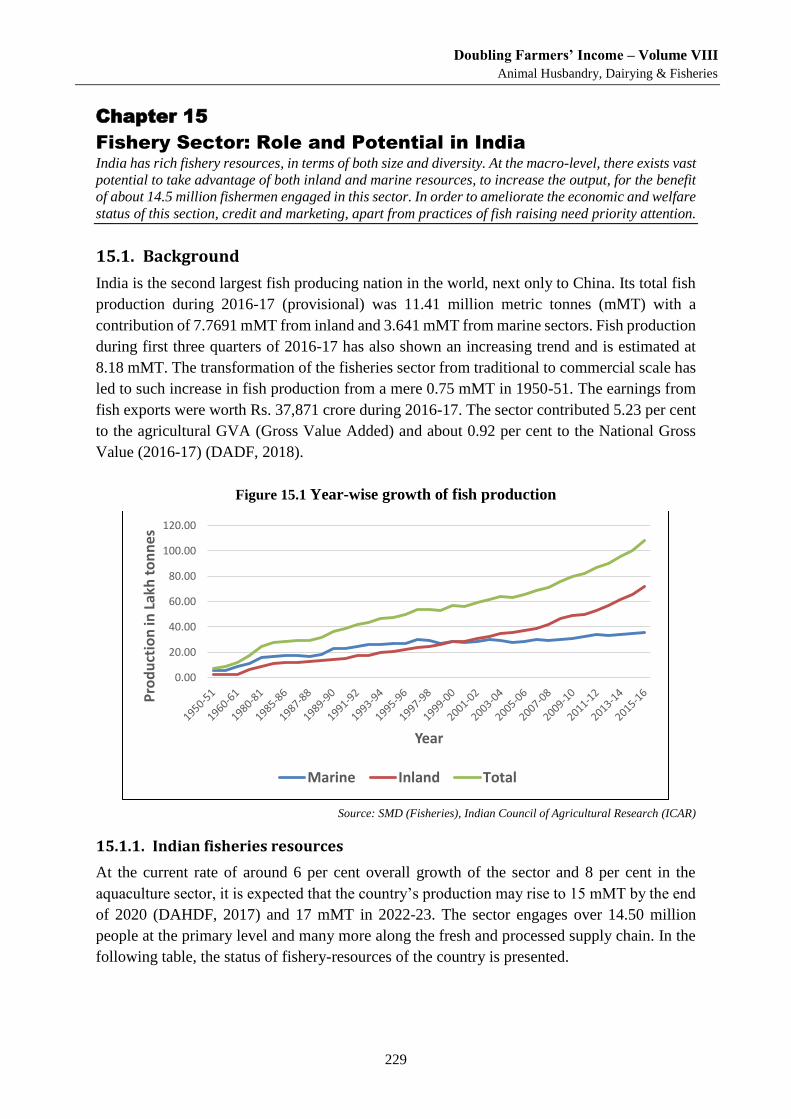
Doubling Farmers’ Income – Volume VIII
Animal Husbandry, Dairying & Fisheries
229
Chapter 15
Fishery Sector: Role and Potential in India India has rich fishery resources, in terms of both size and diversity. At the macro-level, there exists vast
potential to take advantage of both inland and marine resources, to increase the output, for the benefit
of about 14.5 million fishermen engaged in this sector. In order to ameliorate the economic and welfare
status of this section, credit and marketing, apart from practices of fish raising need priority attention.
15.1. Background
India is the second largest fish producing nation in the world, next only to China. Its total fish
production during 2016-17 (provisional) was 11.41 million metric tonnes (mMT) with a
contribution of 7.7691 mMT from inland and 3.641 mMT from marine sectors. Fish production
during first three quarters of 2016-17 has also shown an increasing trend and is estimated at
8.18 mMT. The transformation of the fisheries sector from traditional to commercial scale has
led to such increase in fish production from a mere 0.75 mMT in 1950-51. The earnings from
fish exports were worth Rs. 37,871 crore during 2016-17. The sector contributed 5.23 per cent
to the agricultural GVA (Gross Value Added) and about 0.92 per cent to the National Gross
Value (2016-17) (DADF, 2018).
Figure 15.1 Year-wise growth of fish production
Source: SMD (Fisheries), Indian Council of Agricultural Research (ICAR)
15.1.1. Indian fisheries resources
At the current rate of around 6 per cent overall growth of the sector and 8 per cent in the
aquaculture sector, it is expected that the country’s production may rise to 15 mMT by the end
of 2020 (DAHDF, 2017) and 17 mMT in 2022-23. The sector engages over 14.50 million
people at the primary level and many more along the fresh and processed supply chain. In the
following table, the status of fishery-resources of the country is presented.
0.00
20.00
40.00
60.00
80.00
100.00
120.00
Pro
du
ctio
n in
Lak
h t
on
nes
Year
Marine Inland Total
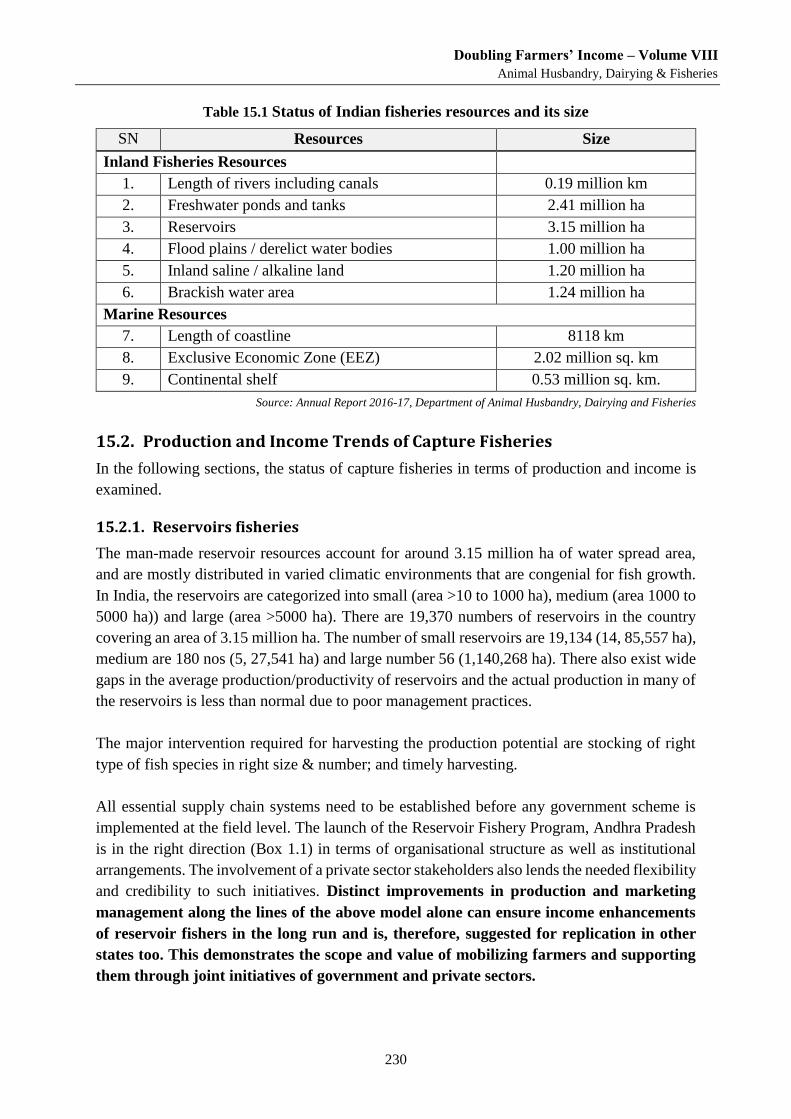
Doubling Farmers’ Income – Volume VIII
Animal Husbandry, Dairying & Fisheries
230
Table 15.1 Status of Indian fisheries resources and its size
SN Resources Size
Inland Fisheries Resources
1. Length of rivers including canals 0.19 million km
2. Freshwater ponds and tanks 2.41 million ha
3. Reservoirs 3.15 million ha
4. Flood plains / derelict water bodies 1.00 million ha
5. Inland saline / alkaline land 1.20 million ha
6. Brackish water area 1.24 million ha
Marine Resources
7. Length of coastline 8118 km
8. Exclusive Economic Zone (EEZ) 2.02 million sq. km
9. Continental shelf 0.53 million sq. km.
Source: Annual Report 2016-17, Department of Animal Husbandry, Dairying and Fisheries
15.2. Production and Income Trends of Capture Fisheries
In the following sections, the status of capture fisheries in terms of production and income is
examined.
15.2.1. Reservoirs fisheries
The man-made reservoir resources account for around 3.15 million ha of water spread area,
and are mostly distributed in varied climatic environments that are congenial for fish growth.
In India, the reservoirs are categorized into small (area >10 to 1000 ha), medium (area 1000 to
5000 ha)) and large (area >5000 ha). There are 19,370 numbers of reservoirs in the country
covering an area of 3.15 million ha. The number of small reservoirs are 19,134 (14, 85,557 ha),
medium are 180 nos (5, 27,541 ha) and large number 56 (1,140,268 ha). There also exist wide
gaps in the average production/productivity of reservoirs and the actual production in many of
the reservoirs is less than normal due to poor management practices.
The major intervention required for harvesting the production potential are stocking of right
type of fish species in right size & number; and timely harvesting.
All essential supply chain systems need to be established before any government scheme is
implemented at the field level. The launch of the Reservoir Fishery Program, Andhra Pradesh
is in the right direction (Box 1.1) in terms of organisational structure as well as institutional
arrangements. The involvement of a private sector stakeholders also lends the needed flexibility
and credibility to such initiatives. Distinct improvements in production and marketing
management along the lines of the above model alone can ensure income enhancements
of reservoir fishers in the long run and is, therefore, suggested for replication in other
states too. This demonstrates the scope and value of mobilizing farmers and supporting
them through joint initiatives of government and private sectors.
Doubling Farmers’ Income – Volume VIII
Animal Husbandry, Dairying & Fisheries
231
Box 1.1: Reservoir Fishery Program, Andhra Pradesh
Box 1.2. Maharashtra Experience – Cage Culture
Riverine fisheries need to be re-organised on the lines of successful implementation at a few
places (Box 1.2 – case of Maharashtra). The country is bestowed with vast and varied hill
fishery resources which are spread over the Himalayan and Peninsular regions, in the upland
rivers, streams, high and low altitude natural lakes and reservoirs. The riverine systems
comprise streams and rivers with a length of around 8,243 km; 20,500 ha. spread of natural
lakes; 50,000 ha of reservoirs - both natural and manmade; and 2,500 ha. of brackish water
The Department of Fisheries, Government of Andhra Pradesh and Tata Trust are
implementing a reservoir fishery program in ten (10) selected districts of Andhra
Pradesh. This program has a multi-stakeholder engagement besides the State Fishery
Department. Existing fisheries cooperatives at installed cage locations are responsible
for entire operation and management. Such a vision requires self-governed and
institutionally sustainable cooperatives. All such cooperatives are catered to with
capacity building engagement and support services, to adhere to institutional norms
and practices of producer organisation. All new technical advancements and support
systems like hatchery, nursery, feeding system, logistics development support etc. are
also provided at these locations. Community based fishery resource units regularly
engage with farmers, women SHG and fishery cooperatives.
At present, Maharashtra has just around 10 cages at irrigation dams located at Dimbhe,
Ujani, Panshet and Vangani, and other projects promoted by government, private,
fishermen co-operatives and NGOs.
The fish is reared in a high-density controlled environment; and weight, feed and
growth parameters are monitored on a real-time basis. Around 5,000-7,000 fingerlings
are released in one tank and they grow upto 1 kg, ensuring that each cage can produce
around five tonnes of fish. If even 50 cages are promoted in a reservoir, 250 tons of
fish can be harvested annually.
The state government seeks to boost productivity of fish farming in open reservoirs.
Maharashtra records 4 lakh metric tonnes (LMT) of marine fish production and 1.5
LMT of inland fish production. During 2014-15, the state's contribution in marine,
inland and total fish production (provisional) of India was 13.1 per cent, 2.2 per cent
and 6 per cent, respectively, according to the Economic Survey of Maharashtra 2015-
16. In 2014-15, Maharashtra exported 1.52 LMT fish worth Rs. 4,273 crore.
According to Govt. of India statistics, fish production has increased from 0.75 mMt in
1950-51 to 10.79 mMt (provisional) in 2016-17.
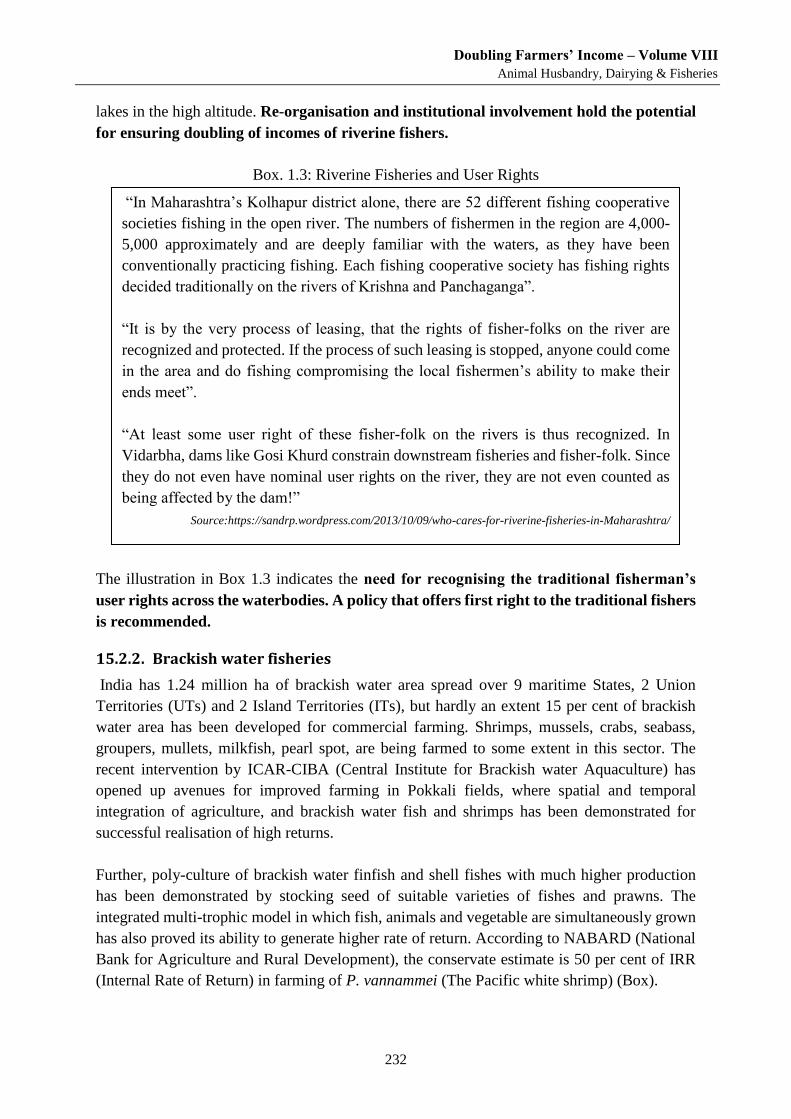
Doubling Farmers’ Income – Volume VIII
Animal Husbandry, Dairying & Fisheries
232
lakes in the high altitude. Re-organisation and institutional involvement hold the potential
for ensuring doubling of incomes of riverine fishers.
Box. 1.3: Riverine Fisheries and User Rights
The illustration in Box 1.3 indicates the need for recognising the traditional fisherman’s
user rights across the waterbodies. A policy that offers first right to the traditional fishers
is recommended.
15.2.2. Brackish water fisheries
India has 1.24 million ha of brackish water area spread over 9 maritime States, 2 Union
Territories (UTs) and 2 Island Territories (ITs), but hardly an extent 15 per cent of brackish
water area has been developed for commercial farming. Shrimps, mussels, crabs, seabass,
groupers, mullets, milkfish, pearl spot, are being farmed to some extent in this sector. The
recent intervention by ICAR-CIBA (Central Institute for Brackish water Aquaculture) has
opened up avenues for improved farming in Pokkali fields, where spatial and temporal
integration of agriculture, and brackish water fish and shrimps has been demonstrated for
successful realisation of high returns.
Further, poly-culture of brackish water finfish and shell fishes with much higher production
has been demonstrated by stocking seed of suitable varieties of fishes and prawns. The
integrated multi-trophic model in which fish, animals and vegetable are simultaneously grown
has also proved its ability to generate higher rate of return. According to NABARD (National
Bank for Agriculture and Rural Development), the conservate estimate is 50 per cent of IRR
(Internal Rate of Return) in farming of P. vannammei (The Pacific white shrimp) (Box).
“In Maharashtra’s Kolhapur district alone, there are 52 different fishing cooperative
societies fishing in the open river. The numbers of fishermen in the region are 4,000-
5,000 approximately and are deeply familiar with the waters, as they have been
conventionally practicing fishing. Each fishing cooperative society has fishing rights
decided traditionally on the rivers of Krishna and Panchaganga”.
“It is by the very process of leasing, that the rights of fisher-folks on the river are
recognized and protected. If the process of such leasing is stopped, anyone could come
in the area and do fishing compromising the local fishermen’s ability to make their
ends meet”.
“At least some user right of these fisher-folk on the rivers is thus recognized. In
Vidarbha, dams like Gosi Khurd constrain downstream fisheries and fisher-folk. Since
they do not even have nominal user rights on the river, they are not even counted as
being affected by the dam!”
Source:https://sandrp.wordpress.com/2013/10/09/who-cares-for-riverine-fisheries-in-Maharashtra/
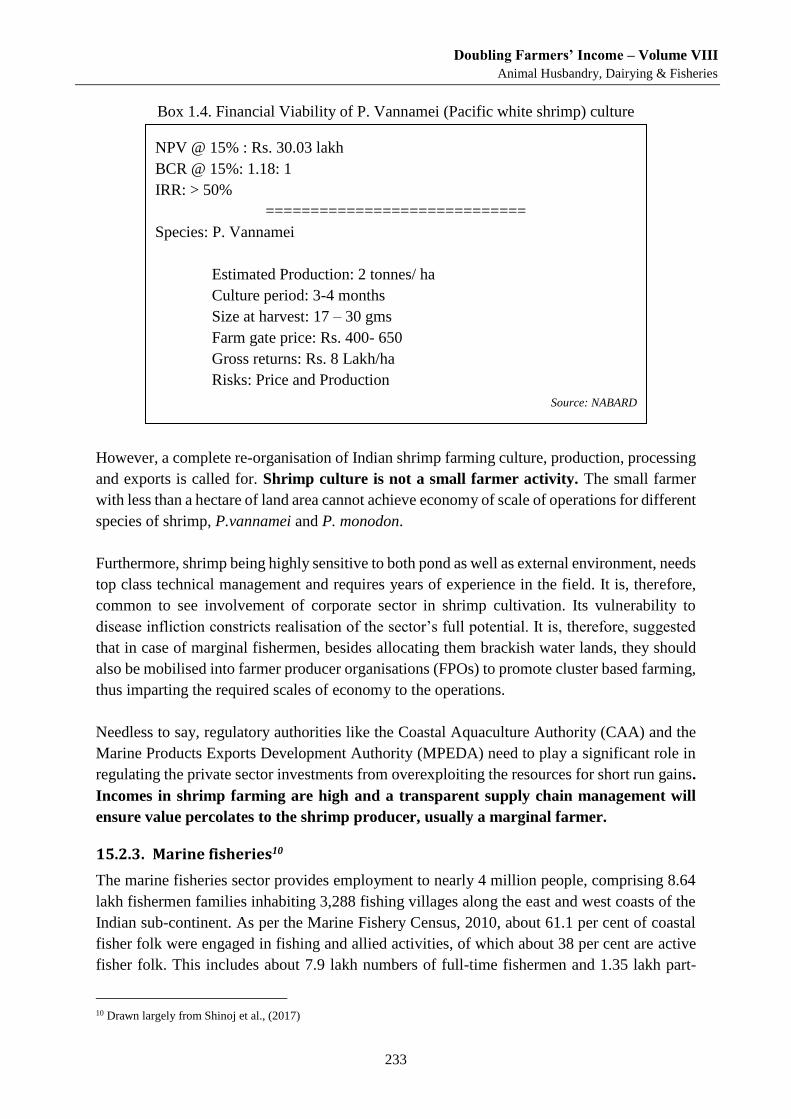
Doubling Farmers’ Income – Volume VIII
Animal Husbandry, Dairying & Fisheries
233
Box 1.4. Financial Viability of P. Vannamei (Pacific white shrimp) culture
However, a complete re-organisation of Indian shrimp farming culture, production, processing
and exports is called for. Shrimp culture is not a small farmer activity. The small farmer
with less than a hectare of land area cannot achieve economy of scale of operations for different
species of shrimp, P.vannamei and P. monodon.
Furthermore, shrimp being highly sensitive to both pond as well as external environment, needs
top class technical management and requires years of experience in the field. It is, therefore,
common to see involvement of corporate sector in shrimp cultivation. Its vulnerability to
disease infliction constricts realisation of the sector’s full potential. It is, therefore, suggested
that in case of marginal fishermen, besides allocating them brackish water lands, they should
also be mobilised into farmer producer organisations (FPOs) to promote cluster based farming,
thus imparting the required scales of economy to the operations.
Needless to say, regulatory authorities like the Coastal Aquaculture Authority (CAA) and the
Marine Products Exports Development Authority (MPEDA) need to play a significant role in
regulating the private sector investments from overexploiting the resources for short run gains.
Incomes in shrimp farming are high and a transparent supply chain management will
ensure value percolates to the shrimp producer, usually a marginal farmer.
15.2.3. Marine fisheries10
The marine fisheries sector provides employment to nearly 4 million people, comprising 8.64
lakh fishermen families inhabiting 3,288 fishing villages along the east and west coasts of the
Indian sub-continent. As per the Marine Fishery Census, 2010, about 61.1 per cent of coastal
fisher folk were engaged in fishing and allied activities, of which about 38 per cent are active
fisher folk. This includes about 7.9 lakh numbers of full-time fishermen and 1.35 lakh part-
10 Drawn largely from Shinoj et al., (2017)
NPV @ 15% : Rs. 30.03 lakh
BCR @ 15%: 1.18: 1
IRR: > 50%
=============================
Species: P. Vannamei
Estimated Production: 2 tonnes/ ha
Culture period: 3-4 months
Size at harvest: 17 – 30 gms
Farm gate price: Rs. 400- 650
Gross returns: Rs. 8 Lakh/ha
Risks: Price and Production
Source: NABARD
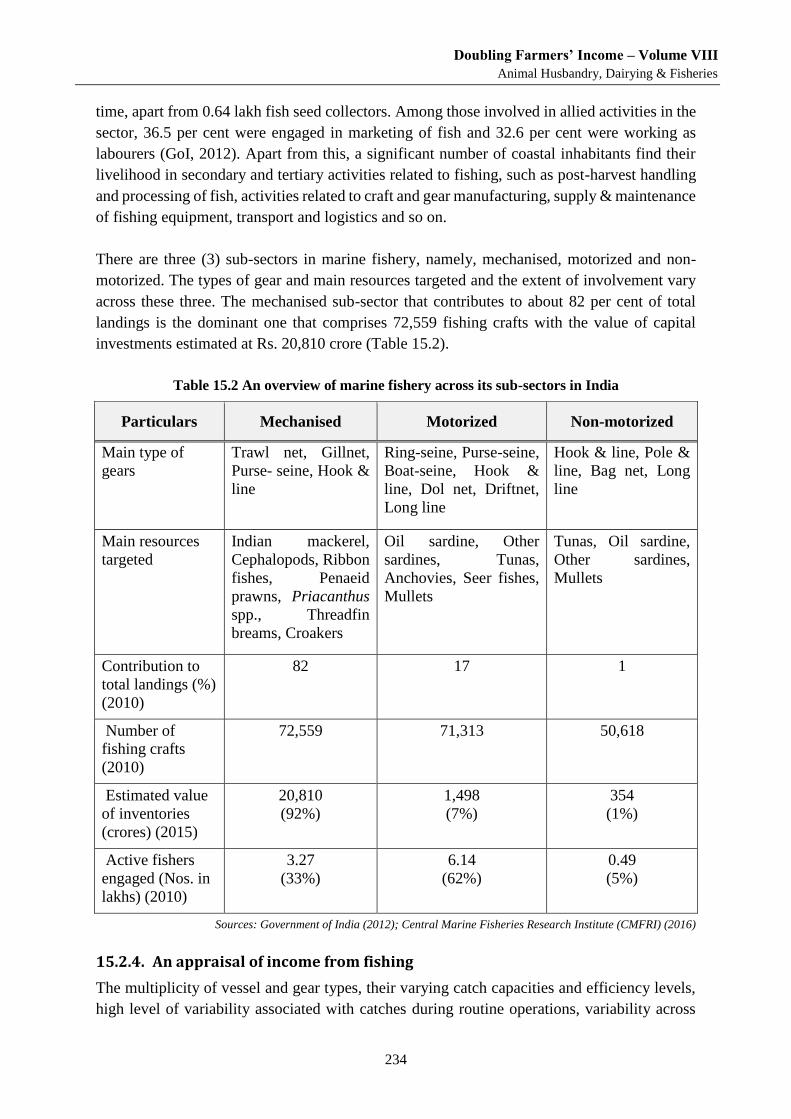
Doubling Farmers’ Income – Volume VIII
Animal Husbandry, Dairying & Fisheries
234
time, apart from 0.64 lakh fish seed collectors. Among those involved in allied activities in the
sector, 36.5 per cent were engaged in marketing of fish and 32.6 per cent were working as
labourers (GoI, 2012). Apart from this, a significant number of coastal inhabitants find their
livelihood in secondary and tertiary activities related to fishing, such as post-harvest handling
and processing of fish, activities related to craft and gear manufacturing, supply & maintenance
of fishing equipment, transport and logistics and so on.
There are three (3) sub-sectors in marine fishery, namely, mechanised, motorized and non-
motorized. The types of gear and main resources targeted and the extent of involvement vary
across these three. The mechanised sub-sector that contributes to about 82 per cent of total
landings is the dominant one that comprises 72,559 fishing crafts with the value of capital
investments estimated at Rs. 20,810 crore (Table 15.2).
Table 15.2 An overview of marine fishery across its sub-sectors in India
Particulars Mechanised Motorized Non-motorized
Main type of
gears
Trawl net, Gillnet,
Purse- seine, Hook &
line
Ring-seine, Purse-seine,
Boat-seine, Hook &
line, Dol net, Driftnet,
Long line
Hook & line, Pole &
line, Bag net, Long
line
Main resources
targeted
Indian mackerel,
Cephalopods, Ribbon
fishes, Penaeid
prawns, Priacanthus
spp., Threadfin
breams, Croakers
Oil sardine, Other
sardines, Tunas,
Anchovies, Seer fishes,
Mullets
Tunas, Oil sardine,
Other sardines,
Mullets
Contribution to
total landings (%)
(2010)
82 17 1
Number of
fishing crafts
(2010)
72,559 71,313 50,618
Estimated value
of inventories
(crores) (2015)
20,810
(92%)
1,498
(7%)
354
(1%)
Active fishers
engaged (Nos. in
lakhs) (2010)
3.27
(33%)
6.14
(62%)
0.49
(5%)
Sources: Government of India (2012); Central Marine Fisheries Research Institute (CMFRI) (2016)
15.2.4. An appraisal of income from fishing
The multiplicity of vessel and gear types, their varying catch capacities and efficiency levels,
high level of variability associated with catches during routine operations, variability across
Doubling Farmers’ Income – Volume VIII
Animal Husbandry, Dairying & Fisheries
235
seasons, heterogeneity in resources and the volatility in prices they command under different
market conditions add to the complexity of marine fishing. It is difficult, therefore, to arrive at
a figure that represents income from marine fishing in realistic terms.
The economics of single-day fishing with respect to a few selected craft-gear combinations
in seven maritime states is presented in Table 15.3. The estimates of net operating income and
incomes of vessel crew varied widely across craft-gear categories and states. While the
mechanised trawl-net and purse-seine operations (purse seining in Maharashtra is now banned
but still continues clandestinely) in Maharashtra fetched as high as Rs. 51,575 and Rs. 50,333
respectively on an average; and non-motorized gillnet operations in Andhra Pradesh returned
only Rs. 729 per trip (Narayanakumar et al., 2016).
Similarly, net operating incomes from motorized mini-trawl in Andhra Pradesh (Rs. 867/trip)
and mechanised gillnet in Gujarat (Rs. 862/trip) were also among the lowest. The lay system
of wage sharing (McConnel and Price, 2006) is followed in all the states under consideration,
wherein, the crew were remunerated with a share of revenues or share of revenues less the
costs. Nevertheless, high level of variability in shares is noticed across regions, with the highest
in Tamil Nadu (60-75% of gross revenue) and Kerala (50-60%), and the least in Odisha (12-
20%).
Accordingly, the estimated crew share per person also varies considerably, and it is highest
(Rs. 4,497/trip) for mechanised trawl operations in Kerala, followed by motorized purse-
seining in Maharashtra. On the other hand, the income earned by a crew member in non-
motorized gillnet in Andhra Pradesh is low at Rs. 117/trip on an average. The crew wages of
motorized mini-trawler in Andhra Pradesh (Rs. 300/trip), motorized gillnet in Odisha (Rs. 314/
trip) and mechanised gillnet in Gujarat (Rs. 390/trip) are also quite low indicating the
vulnerability of the labour force that is dependent on these vessels for livelihood.
The incomes from various craft-gear combinations engaged in multi-day fishing operations
(2-5 days) for the selected states are presented in Table 15.4. Compared to single-day
operations, the operating costs, gross revenue and net operating incomes are higher in most
cases considered. The highest net operating income is observed in the case of multi-day trawl
fishing in Kerala with an average estimate of Rs. 3,48,016 /trip of 2-5 days. This was followed
by mechanised trawl fishing in Maharashtra (Rs.1,84,126/trip) and Karnataka (Rs. 1,71,315).
Among all, the least net income is earned by motorized hook and line fishing in Odisha with
an average of Rs. 498/trip. The craft-gear combinations such as mechanised purse-seine in
Maharashtra, mechanised gillnet in Gujarat and Andhra Pradesh yielded modest net incomes
ranging from Rs. 11,000 to Rs. 16,000 per trip. The crew share per person is the highest from
mechanised gillnetting in Gujarat (Rs. 19,055), closely followed by mechanised trawling in
Kerala (Rs. 18,733) and Karnataka (Rs 17,982).
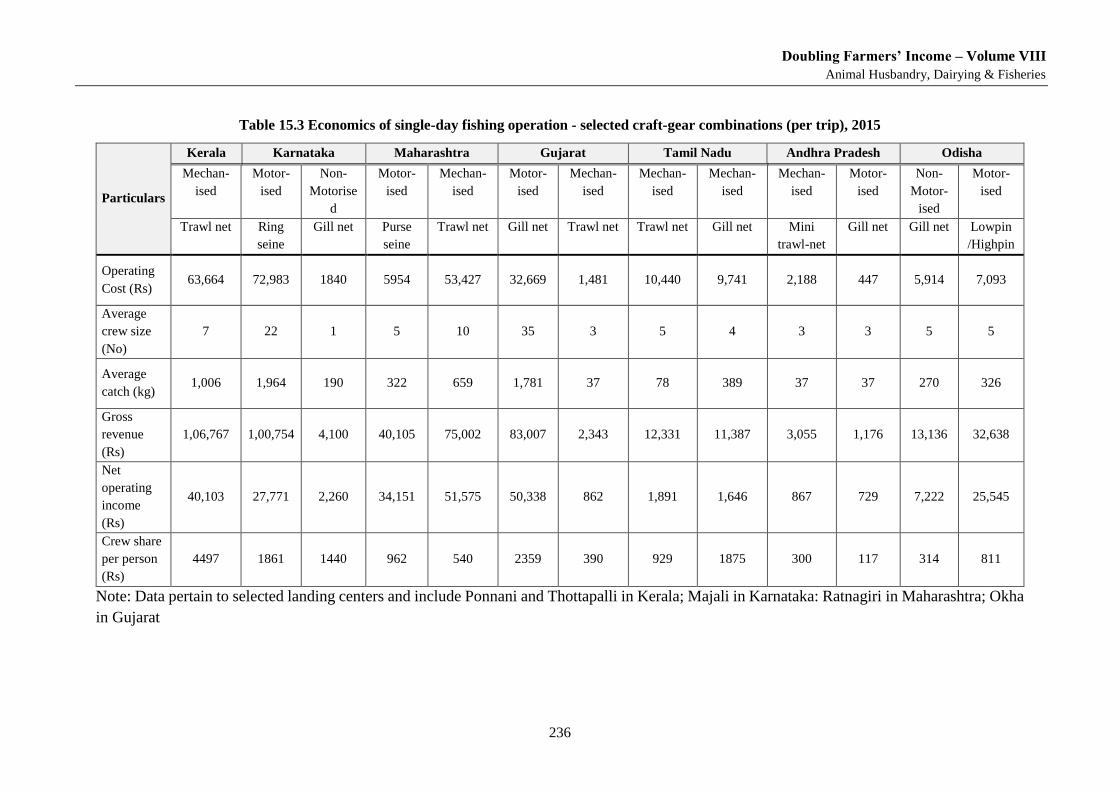
Doubling Farmers’ Income – Volume VIII
Animal Husbandry, Dairying & Fisheries
236
Table 15.3 Economics of single-day fishing operation - selected craft-gear combinations (per trip), 2015
Particulars
Kerala Karnataka Maharashtra Gujarat Tamil Nadu Andhra Pradesh Odisha
Mechan-
ised
Motor-
ised
Non-
Motorise
d
Motor-
ised
Mechan-
ised
Motor-
ised
Mechan-
ised
Mechan-
ised
Mechan-
ised
Mechan-
ised
Motor-
ised
Non-
Motor-
ised
Motor-
ised
Trawl net Ring
seine
Gill net Purse
seine
Trawl net Gill net Trawl net Trawl net Gill net Mini
trawl-net
Gill net Gill net Lowpin
/Highpin
Operating
Cost (Rs) 63,664 72,983 1840 5954 53,427 32,669 1,481 10,440 9,741 2,188 447 5,914 7,093
Average
crew size
(No)
7 22 1 5 10 35 3 5 4 3 3 5 5
Average
catch (kg) 1,006 1,964 190 322 659 1,781 37 78 389 37 37 270 326
Gross
revenue
(Rs)
1,06,767 1,00,754 4,100 40,105 75,002 83,007 2,343 12,331 11,387 3,055 1,176 13,136 32,638
Net
operating
income
(Rs)
40,103 27,771 2,260 34,151 51,575 50,338 862 1,891 1,646 867 729 7,222 25,545
Crew share
per person
(Rs)
4497 1861 1440 962 540 2359 390 929 1875 300 117 314 811
Note: Data pertain to selected landing centers and include Ponnani and Thottapalli in Kerala; Majali in Karnataka: Ratnagiri in Maharashtra; Okha
in Gujarat
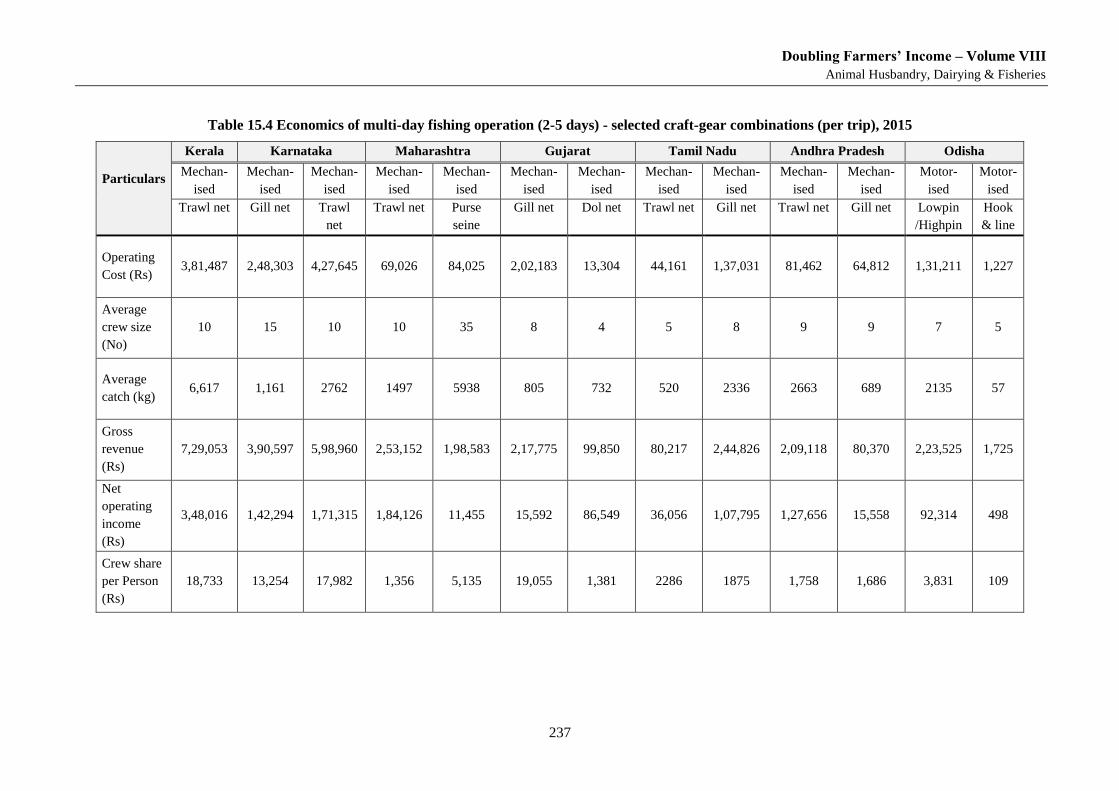
Doubling Farmers’ Income – Volume VIII
Animal Husbandry, Dairying & Fisheries
237
Table 15.4 Economics of multi-day fishing operation (2-5 days) - selected craft-gear combinations (per trip), 2015
Particulars
Kerala Karnataka Maharashtra Gujarat Tamil Nadu Andhra Pradesh Odisha
Mechan-
ised
Mechan-
ised
Mechan-
ised
Mechan-
ised
Mechan-
ised
Mechan-
ised
Mechan-
ised
Mechan-
ised
Mechan-
ised
Mechan-
ised
Mechan-
ised
Motor-
ised
Motor-
ised
Trawl net Gill net Trawl
net
Trawl net Purse
seine
Gill net Dol net Trawl net Gill net Trawl net Gill net Lowpin
/Highpin
Hook
& line
Operating
Cost (Rs) 3,81,487 2,48,303 4,27,645 69,026 84,025 2,02,183 13,304 44,161 1,37,031 81,462 64,812 1,31,211 1,227
Average
crew size
(No)
10 15 10 10 35 8 4 5 8 9 9 7 5
Average
catch (kg) 6,617 1,161 2762 1497 5938 805 732 520 2336 2663 689 2135 57
Gross
revenue
(Rs)
7,29,053 3,90,597 5,98,960 2,53,152 1,98,583 2,17,775 99,850 80,217 2,44,826 2,09,118 80,370 2,23,525 1,725
Net
operating
income
(Rs)
3,48,016 1,42,294 1,71,315 1,84,126 11,455 15,592 86,549 36,056 1,07,795 1,27,656 15,558 92,314 498
Crew share
per Person
(Rs)
18,733 13,254 17,982 1,356 5,135 19,055 1,381 2286 1875 1,758 1,686 3,831 109
Doubling Farmers’ Income – Volume VIII
Animal Husbandry, Dairying & Fisheries
238
Methods such as mechanised trawling, gillnetting, purse-seining and motorized low pin/high
pin are found to yield impressive returns, for both the boat owners and the crew. However,
there were several other cases, particularly under motorized and non-motorized sectors, that
yielded modest incomes supporting only subsistence levels of living. Nearly 67 per cent of
active fishers belong to the non-mechanised sector, majority of whom operate under
subsistence level. Further, per trip incomes, as outlined above, give only partial understanding
of the earnings of a fisherman. This is because, fishing in the sea depends a lot on factors such
as weather conditions, season of fishing, stock of major fishes and so on.
The number of actual fishing days for a mechanised fishing boat generally range from 200 to
250 annually, after taking due account of closed seasons, off seasons, period of maintenance
of vessel and gear, religious holidays, etc. (Najmudeen and Sathiadhas, 2007; Geetha et al.,
2014). Certain vessels such as mechanised purse seine boats fish only for 90-120 days a year.
Even in the case of non-motorized vessels, the maximum number of fishing days is limited to
250-280 days (Sathiadhas, 1997). Therefore, the average per day income of a fisher is much
lower than what the above estimates give. Moreover, to consider income per trip as the
foremost variable that determines the standard of living of a fisherman would be
misleading.
Unlike in many other sectors, fishermen face high level of vulnerabilities in their day-to-day
life. Being coastal dwellers, fishermen are highly exposed to the vagaries of extreme climatic
events which add to the risks associated with their routine fishing activities. Further, ownership
of productive assets such as land and livestock is comparatively lower among fishermen mostly
living in the coastal settlements. Therefore, the majority of fishermen live with perpetual
income vulnerability with little opportunities to generate supplementary income through any
alternative source.
15.3. Exploring Opportunities to Enhance Incomes of Fisher Folk
15.3.1. Enhancing efficiency of fishing fleet
Enhancing the efficiency of existing fishing fleet through suitable conversion and up-
gradation, together with introduction of improved crafts and fishing gears could prove
useful in bringing about profitable and responsible fishing in marine waters. These
could include navigation and position monitoring systems, sonar to locate shoals,
upgraded maintenance and repair facilities, and other need based systems in
consultation with local fleets.
Low-cost fuel-efficient and solar power-operated fishing vessels designed and
developed by ICAR-CIFT (Central Institute of Fisheries Technology), together with
improved fishing gears such as juvenile excluder, semi-pelagic trawl system, short-
body shrimp trawl and cut-away top belly shrimp trawl could help the fishers in
efficient use of inputs and thereby cut costs. The technologies also help in minimising
catching of juvenile fish and selective harvesting of fish.
Doubling Farmers’ Income – Volume VIII
Animal Husbandry, Dairying & Fisheries
239
15.3.2. Use of space technology and ICT
Recent advances, particularly in the field of space science and information technology can be
effectively utilized for improving the efficiency of fishing in India, thereby driving up incomes
of the fishers.
15.3.3. Dissemination of Potential Fishing Zone (PFZ) advisories to the fishermen:
The Portal, m@krishi launched by CMFRI (Central Marine Fisheries Institute) in partnership
with INCOIS, Hyderabad and Tata Consultancy Service (TCS) for the fishermen of
Maharashtra is an excellent example that can be emulated by others too. Based on a survey
conducted by the CMFRI on Maharashtra coast, it is estimated that adoption of m@krishi
service has resulted in 30-40 per cent increase in fish catch and 30 per cent saving in fuel costs
(Singh and Singh, 2016). Another study by George et al. (2011) in Andaman and Nicobar
islands for selected craft types has indicated increase in fishing revenues by 40-50 per cent
through adoption of PFZ advisories. Similarly, measures such as spatial planning of marine
and coastal habitats covering major fishing grounds, using advanced GIS mapping tools as well
as robust vessel monitoring system (VMS) could ensure efficient fishing operations besides
enabling fool proof monitoring, controlling and surveillance (MCS) as well as enhanced
security across the coastline.
15.3.4. Mari-culture
Mari-culture, i.e., culture of marine organisms under controlled conditions in sea, has immense
potential to meet the growing demand for fish. Some of the promising mari-culture options
include open sea cage farming, sea weed farming, integrated multi-tropic aquaculture (IMTA),
mussel and oyster culture, ornamental fish production and pearl culture.
The lack of a comprehensive policy is a major lacuna in tapping the potential of mari-culture
ventures, such as sea cage farming in the country. It is anticipated, that with the availability of
favourable policy guidelines for utilization of coastal waters and increased private investments,
the enterprise has scope to expand in the coming days.
The areas of focus include development of a leasing policy, demarcation of potential mari-
culture sites along the Indian coasts on a GIS platform, measures to strengthen seed and feed
supply for mari-culture ventures, guidelines for development of infrastructure and supply
chains for brood stock management, and large scale seed production of prospective fish and
shell fish species (George et al., 2017). Some of the promising mari-culture ventures that have
considerable potential to augment income of coastal fisher folk are elaborated in the following
paragraphs.
15.3.5. Open sea cage farming
Open sea cage farming is a promising venture for prospective entrepreneurs to realise high net
returns through culture of high-value marine fish species in the open sea. Open sea farming is
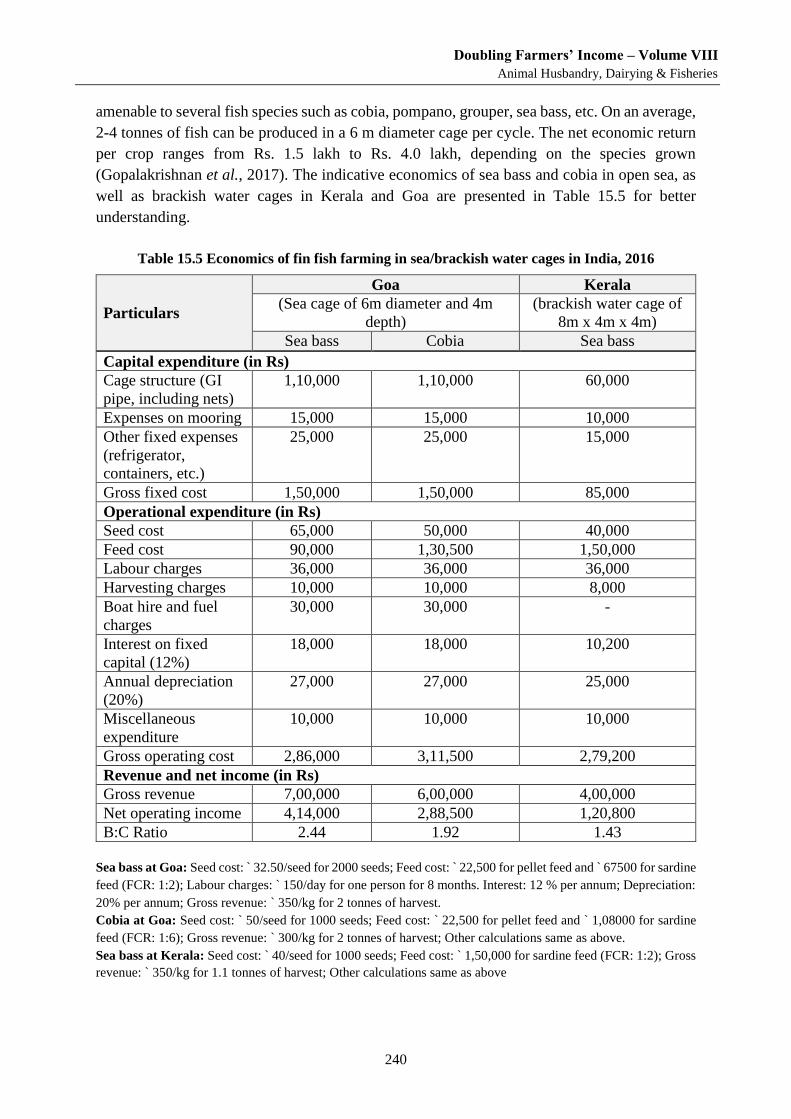
Doubling Farmers’ Income – Volume VIII
Animal Husbandry, Dairying & Fisheries
240
amenable to several fish species such as cobia, pompano, grouper, sea bass, etc. On an average,
2-4 tonnes of fish can be produced in a 6 m diameter cage per cycle. The net economic return
per crop ranges from Rs. 1.5 lakh to Rs. 4.0 lakh, depending on the species grown
(Gopalakrishnan et al., 2017). The indicative economics of sea bass and cobia in open sea, as
well as brackish water cages in Kerala and Goa are presented in Table 15.5 for better
understanding.
Table 15.5 Economics of fin fish farming in sea/brackish water cages in India, 2016
Particulars
Goa Kerala
(Sea cage of 6m diameter and 4m
depth)
(brackish water cage of
8m x 4m x 4m)
Sea bass Cobia Sea bass
Capital expenditure (in Rs)
Cage structure (GI
pipe, including nets)
1,10,000 1,10,000 60,000
Expenses on mooring 15,000 15,000 10,000
Other fixed expenses
(refrigerator,
containers, etc.)
25,000 25,000 15,000
Gross fixed cost 1,50,000 1,50,000 85,000
Operational expenditure (in Rs)
Seed cost 65,000 50,000 40,000
Feed cost 90,000 1,30,500 1,50,000
Labour charges 36,000 36,000 36,000
Harvesting charges 10,000 10,000 8,000
Boat hire and fuel
charges
30,000 30,000 -
Interest on fixed
capital (12%)
18,000 18,000 10,200
Annual depreciation
(20%)
27,000 27,000 25,000
Miscellaneous
expenditure
10,000 10,000 10,000
Gross operating cost 2,86,000 3,11,500 2,79,200
Revenue and net income (in Rs)
Gross revenue 7,00,000 6,00,000 4,00,000
Net operating income 4,14,000 2,88,500 1,20,800
B:C Ratio 2.44 1.92 1.43
Sea bass at Goa: Seed cost: ̀ 32.50/seed for 2000 seeds; Feed cost: ̀ 22,500 for pellet feed and ̀ 67500 for sardine
feed (FCR: 1:2); Labour charges: ` 150/day for one person for 8 months. Interest: 12 % per annum; Depreciation:
20% per annum; Gross revenue: ` 350/kg for 2 tonnes of harvest. Cobia at Goa: Seed cost: ` 50/seed for 1000 seeds; Feed cost: ` 22,500 for pellet feed and ` 1,08000 for sardine
feed (FCR: 1:6); Gross revenue: ` 300/kg for 2 tonnes of harvest; Other calculations same as above. Sea bass at Kerala: Seed cost: ` 40/seed for 1000 seeds; Feed cost: ` 1,50,000 for sardine feed (FCR: 1:2); Gross
revenue: ` 350/kg for 1.1 tonnes of harvest; Other calculations same as above
Doubling Farmers’ Income – Volume VIII
Animal Husbandry, Dairying & Fisheries
241
With successful demonstrations along the maritime states, cage farming has started gaining
momentum in various states of India. Several farmer groups and development agencies in the
coastal regions are actively contemplating to take up cage farming in the near future.
Box 1.5. Sea Cage Fish Culture
Box 1.6. Open Sea Cage Farming
The conventional fishing does not hold out much promise for the future, as the fish
stock in the open sea is depleting and pollution is killing it in the near shore area.
The Andhra Pradesh State Government is promoting cage fish culture among the
traditional sea faring fishermen (November 2015). Under the programme, each fisher-
folk family is given more than one cage at subsidy, and the Government provides the
initial seedlings and feed. The family is able to harvest the fully grown fish in six
months or so, depending on the type of fish.
This enables a fisher-folk family earn close to Rs. 5 lakh per annum as against Rs.
50,000 per annum prior to this intervention. However, cage culture cannot be taken up
at every location, as the conditions have to be suitable. Some places like Rushikonda
and Ramakrishna beaches are well suited to a few types of fish culture.
The Central Marine Fisheries Research Institute’s (CMFRI) open sea cage farming
model in Gujarat has received national recognition, with a fisherman associated with
the institute bagging the Pandit Deen Dayal Upadhyay Antoyodaya Krishi Puraskar
instituted by ICAR in the year 2016.
The regional centre of CMFRI provided cages and technical guidance to the co-
operative society in Veraval to take to the farming as an alternate livelihood option for
Siddi tribes in the region. The Centre also offered the community a farming
demonstration, training and hands-on exposure, under the Tribal Sub Plan outlay of the
Institute.
For success of the venture, the Institute has been supporting the farming group
financially and technically every year since 2011. The sea cage farm, which is regarded
as one of the largest commercial sea farms in the country, comprised 22 galvanised iron
cages of 6 m diameter. The farmers were empowered to operate the farm by themselves,
and they obtained four crops of lobsters and cobia, realising a quality livelihood.
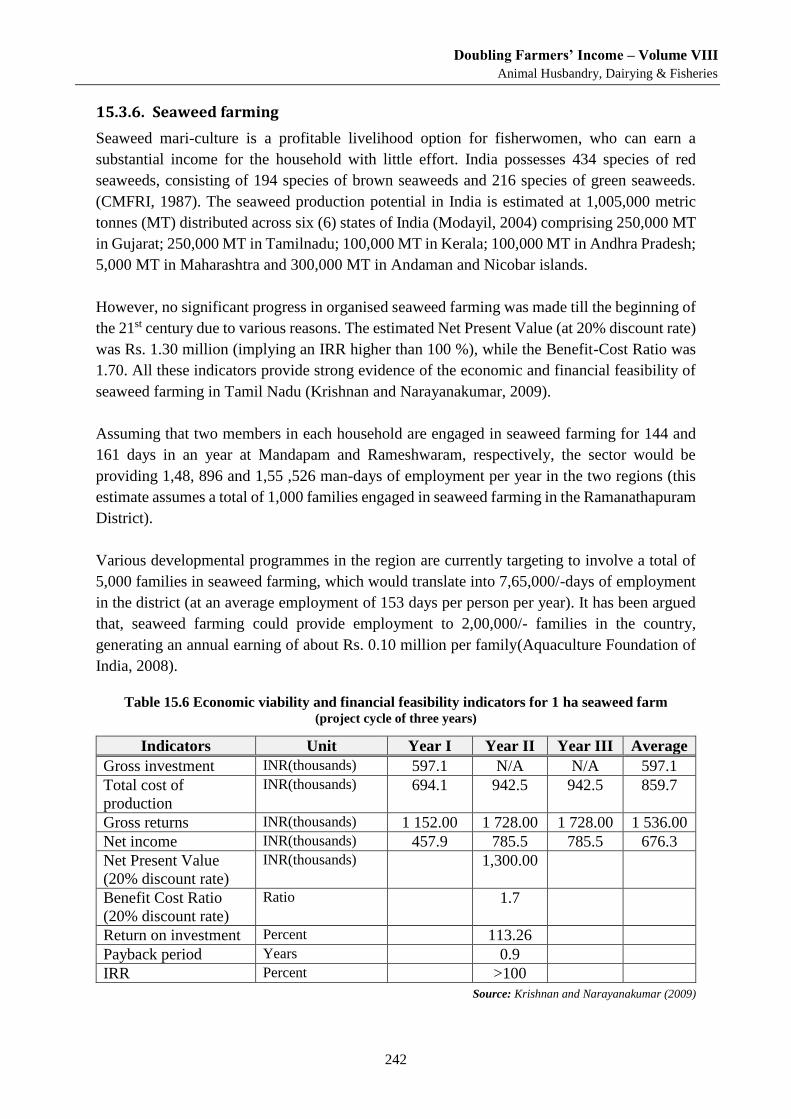
Doubling Farmers’ Income – Volume VIII
Animal Husbandry, Dairying & Fisheries
242
15.3.6. Seaweed farming
Seaweed mari-culture is a profitable livelihood option for fisherwomen, who can earn a
substantial income for the household with little effort. India possesses 434 species of red
seaweeds, consisting of 194 species of brown seaweeds and 216 species of green seaweeds.
(CMFRI, 1987). The seaweed production potential in India is estimated at 1,005,000 metric
tonnes (MT) distributed across six (6) states of India (Modayil, 2004) comprising 250,000 MT
in Gujarat; 250,000 MT in Tamilnadu; 100,000 MT in Kerala; 100,000 MT in Andhra Pradesh;
5,000 MT in Maharashtra and 300,000 MT in Andaman and Nicobar islands.
However, no significant progress in organised seaweed farming was made till the beginning of
the 21st century due to various reasons. The estimated Net Present Value (at 20% discount rate)
was Rs. 1.30 million (implying an IRR higher than 100 %), while the Benefit-Cost Ratio was
1.70. All these indicators provide strong evidence of the economic and financial feasibility of
seaweed farming in Tamil Nadu (Krishnan and Narayanakumar, 2009).
Assuming that two members in each household are engaged in seaweed farming for 144 and
161 days in an year at Mandapam and Rameshwaram, respectively, the sector would be
providing 1,48, 896 and 1,55 ,526 man-days of employment per year in the two regions (this
estimate assumes a total of 1,000 families engaged in seaweed farming in the Ramanathapuram
District).
Various developmental programmes in the region are currently targeting to involve a total of
5,000 families in seaweed farming, which would translate into 7,65,000/-days of employment
in the district (at an average employment of 153 days per person per year). It has been argued
that, seaweed farming could provide employment to 2,00,000/- families in the country,
generating an annual earning of about Rs. 0.10 million per family(Aquaculture Foundation of
India, 2008).
Table 15.6 Economic viability and financial feasibility indicators for 1 ha seaweed farm (project cycle of three years)
Indicators Unit Year I Year II Year III Average
Gross investment INR(thousands) 597.1 N/A N/A 597.1
Total cost of
production
INR(thousands) 694.1 942.5 942.5 859.7
Gross returns INR(thousands) 1 152.00 1 728.00 1 728.00 1 536.00
Net income INR(thousands) 457.9 785.5 785.5 676.3
Net Present Value
(20% discount rate)
INR(thousands)
1,300.00
Benefit Cost Ratio
(20% discount rate)
Ratio
1.7
Return on investment Percent
113.26
Payback period Years
0.9
IRR Percent
>100
Source: Krishnan and Narayanakumar (2009)
Doubling Farmers’ Income – Volume VIII
Animal Husbandry, Dairying & Fisheries
243
15.3.7. Other promising mari-culture ventures
Culture of mussel and oyster has gradually spread across the backwater belts of Kerala,
Karnataka, Goa and Maharashtra owing to their high profitability. A number of methods such
as stake culture, on-bottom culture, long-line culture, raft culture, rack culture, etc. are followed
in mussel and oyster farming.
Over 1,000 farmers are practising rack culture of green mussel in the Padanna estuary areas in
Kasargod, which is contributing three-fourths of green mussel production in India
(Mohammed, 2015). A net return of about Rs. 88,000 per unit of 200 seeded strings can be
obtained through rack method of green mussel farming in this region (Table 15.6). Though
technology for mussel and oyster farming is fairly well established, as in case of most other
agricultural produce, what remains lacking is the adequate marketing and processing
infrastructure.
Other promising mari-culture avenues include ornamental fish farming and pearl culture for
which technology has been perfected by now. Larger number of entrepreneurs may be
encouraged to take up these ventures by providing technological, financial, marketing as well
as logistical support.
15.4. Holistic development of the marine fish supply chain
Various modern infrastructure and equipment play an important role in the fish supply chain,
even more so than in conventional farming systems. A wide array of logistics infrastructure
development can be initiated in the marine fisheries sector, so that the fish and fishery products
reach the consumer in good quality. Considerable investment needs to be made in the sector to
modernise cold chains in fishing boats, as also along main links in the supply chain including
reefers transportation, small retail outlets, retail carrier vehicles, and in small scale fish
handling and fish processing units.
Fisher folk are traditional communities that form entire villages. This makes village level
secondary activities feasible, including fish handling, processing and blast freezing units. The
fishing villages can be developed as village producer organisations (VPOs), with specific need
based secondary units, GrAMs (Gramin Agri-Markets) as fish handling and transport units, net
repair and boat maintenance facilities, as well as mariculture and other land based fishing
businesses.
Quality control of marketed fish is another major concern in the context of strengthening the
supply chains. In recent times, concerns have been raised in various quarters over the quality
of fish marketed. With rapid increase in fish demand, which remains unmatched by capacity of
the domestic supply chain, the widespread use of unauthorized preservatives and other harmful
chemicals has been reported across the country.
In this context, it would be relevant to set up fish quality certification units in every major
harbour/fish landing centre/wholesale market so that not only the fish landed but also those
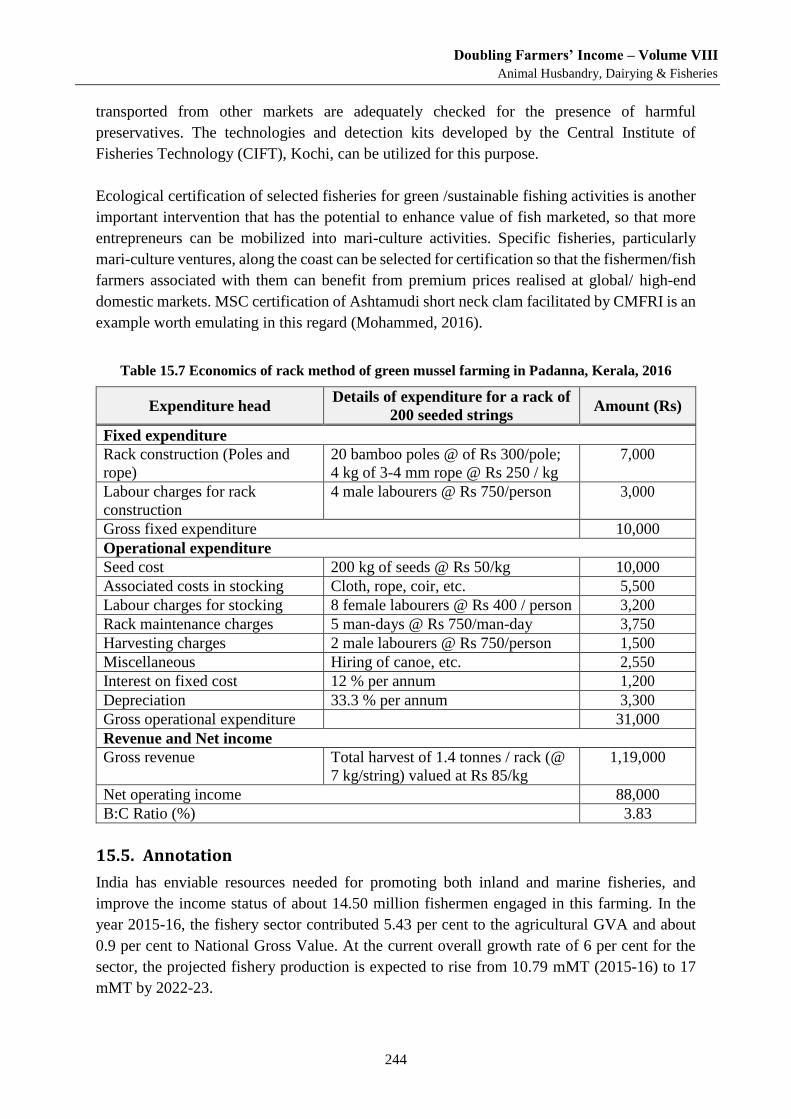
Doubling Farmers’ Income – Volume VIII
Animal Husbandry, Dairying & Fisheries
244
transported from other markets are adequately checked for the presence of harmful
preservatives. The technologies and detection kits developed by the Central Institute of
Fisheries Technology (CIFT), Kochi, can be utilized for this purpose.
Ecological certification of selected fisheries for green /sustainable fishing activities is another
important intervention that has the potential to enhance value of fish marketed, so that more
entrepreneurs can be mobilized into mari-culture activities. Specific fisheries, particularly
mari-culture ventures, along the coast can be selected for certification so that the fishermen/fish
farmers associated with them can benefit from premium prices realised at global/ high-end
domestic markets. MSC certification of Ashtamudi short neck clam facilitated by CMFRI is an
example worth emulating in this regard (Mohammed, 2016).
Table 15.7 Economics of rack method of green mussel farming in Padanna, Kerala, 2016
Expenditure head Details of expenditure for a rack of
200 seeded strings Amount (Rs)
Fixed expenditure
Rack construction (Poles and
rope)
20 bamboo poles @ of Rs 300/pole;
4 kg of 3-4 mm rope @ Rs 250 / kg
7,000
Labour charges for rack
construction
4 male labourers @ Rs 750/person 3,000
Gross fixed expenditure 10,000
Operational expenditure
Seed cost 200 kg of seeds @ Rs 50/kg 10,000
Associated costs in stocking Cloth, rope, coir, etc. 5,500
Labour charges for stocking 8 female labourers @ Rs 400 / person 3,200
Rack maintenance charges 5 man-days @ Rs 750/man-day 3,750
Harvesting charges 2 male labourers @ Rs 750/person 1,500
Miscellaneous Hiring of canoe, etc. 2,550
Interest on fixed cost 12 % per annum 1,200
Depreciation 33.3 % per annum 3,300
Gross operational expenditure 31,000
Revenue and Net income
Gross revenue Total harvest of 1.4 tonnes / rack (@
7 kg/string) valued at Rs 85/kg
1,19,000
Net operating income 88,000
B:C Ratio (%) 3.83
15.5. Annotation
India has enviable resources needed for promoting both inland and marine fisheries, and
improve the income status of about 14.50 million fishermen engaged in this farming. In the
year 2015-16, the fishery sector contributed 5.43 per cent to the agricultural GVA and about
0.9 per cent to National Gross Value. At the current overall growth rate of 6 per cent for the
sector, the projected fishery production is expected to rise from 10.79 mMT (2015-16) to 17
mMT by 2022-23.
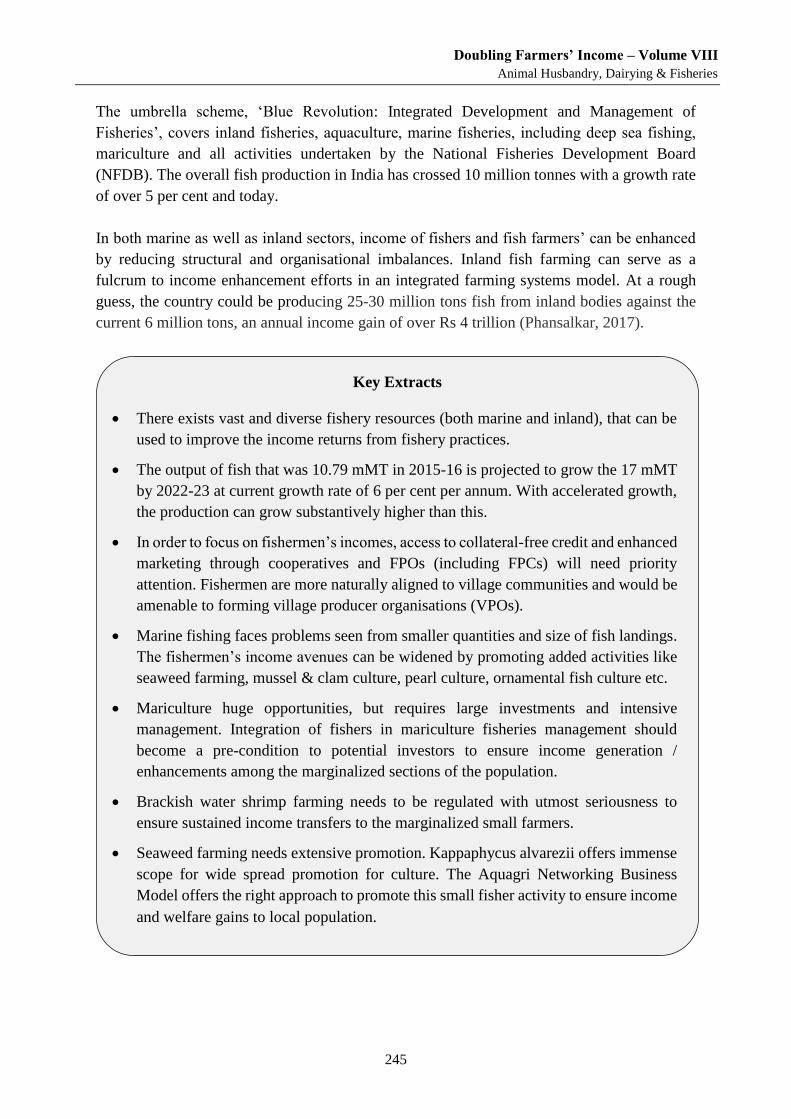
Doubling Farmers’ Income – Volume VIII
Animal Husbandry, Dairying & Fisheries
245
The umbrella scheme, ‘Blue Revolution: Integrated Development and Management of
Fisheries’, covers inland fisheries, aquaculture, marine fisheries, including deep sea fishing,
mariculture and all activities undertaken by the National Fisheries Development Board
(NFDB). The overall fish production in India has crossed 10 million tonnes with a growth rate
of over 5 per cent and today.
In both marine as well as inland sectors, income of fishers and fish farmers’ can be enhanced
by reducing structural and organisational imbalances. Inland fish farming can serve as a
fulcrum to income enhancement efforts in an integrated farming systems model. At a rough
guess, the country could be producing 25-30 million tons fish from inland bodies against the
current 6 million tons, an annual income gain of over Rs 4 trillion (Phansalkar, 2017).
Key Extracts
There exists vast and diverse fishery resources (both marine and inland), that can be
used to improve the income returns from fishery practices.
The output of fish that was 10.79 mMT in 2015-16 is projected to grow the 17 mMT
by 2022-23 at current growth rate of 6 per cent per annum. With accelerated growth,
the production can grow substantively higher than this.
In order to focus on fishermen’s incomes, access to collateral-free credit and enhanced
marketing through cooperatives and FPOs (including FPCs) will need priority
attention. Fishermen are more naturally aligned to village communities and would be
amenable to forming village producer organisations (VPOs).
Marine fishing faces problems seen from smaller quantities and size of fish landings.
The fishermen’s income avenues can be widened by promoting added activities like
seaweed farming, mussel & clam culture, pearl culture, ornamental fish culture etc.
Mariculture huge opportunities, but requires large investments and intensive
management. Integration of fishers in mariculture fisheries management should
become a pre-condition to potential investors to ensure income generation /
enhancements among the marginalized sections of the population.
Brackish water shrimp farming needs to be regulated with utmost seriousness to
ensure sustained income transfers to the marginalized small farmers.
Seaweed farming needs extensive promotion. Kappaphycus alvarezii offers immense
scope for wide spread promotion for culture. The Aquagri Networking Business
Model offers the right approach to promote this small fisher activity to ensure income
and welfare gains to local population.

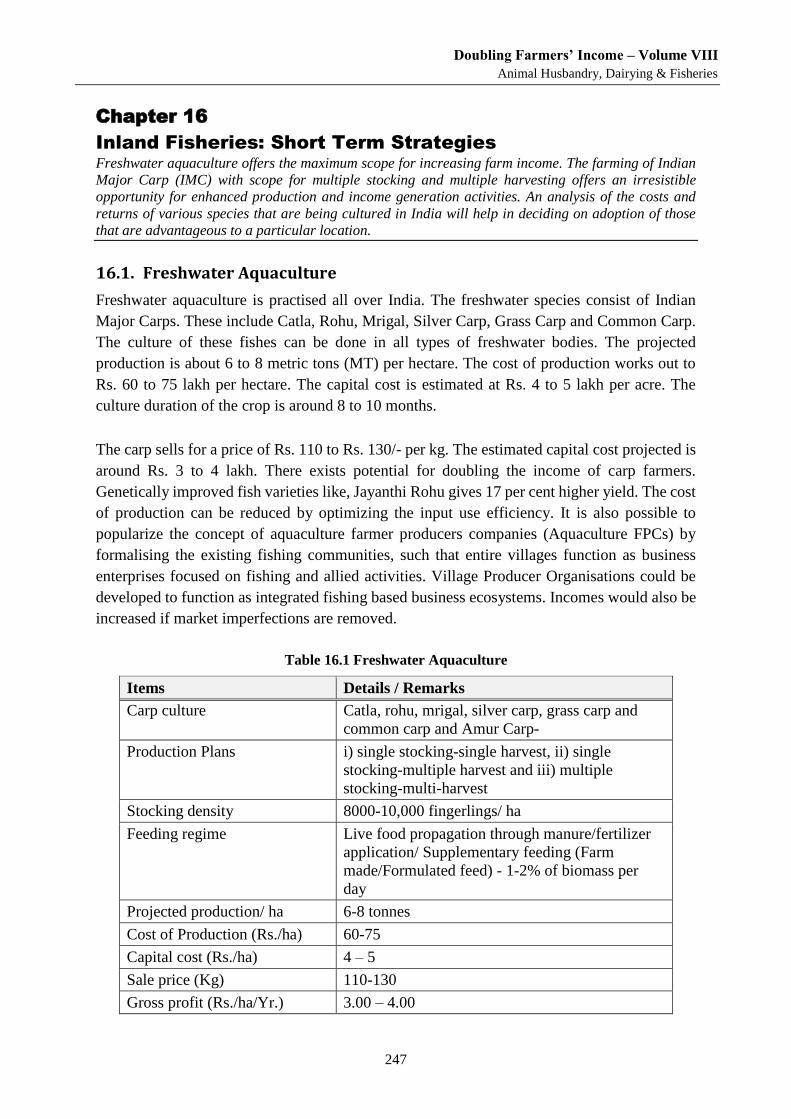
Doubling Farmers’ Income – Volume VIII
Animal Husbandry, Dairying & Fisheries
247
Chapter 16
Inland Fisheries: Short Term Strategies Freshwater aquaculture offers the maximum scope for increasing farm income. The farming of Indian
Major Carp (IMC) with scope for multiple stocking and multiple harvesting offers an irresistible
opportunity for enhanced production and income generation activities. An analysis of the costs and
returns of various species that are being cultured in India will help in deciding on adoption of those
that are advantageous to a particular location.
16.1. Freshwater Aquaculture
Freshwater aquaculture is practised all over India. The freshwater species consist of Indian
Major Carps. These include Catla, Rohu, Mrigal, Silver Carp, Grass Carp and Common Carp.
The culture of these fishes can be done in all types of freshwater bodies. The projected
production is about 6 to 8 metric tons (MT) per hectare. The cost of production works out to
Rs. 60 to 75 lakh per hectare. The capital cost is estimated at Rs. 4 to 5 lakh per acre. The
culture duration of the crop is around 8 to 10 months.
The carp sells for a price of Rs. 110 to Rs. 130/- per kg. The estimated capital cost projected is
around Rs. 3 to 4 lakh. There exists potential for doubling the income of carp farmers.
Genetically improved fish varieties like, Jayanthi Rohu gives 17 per cent higher yield. The cost
of production can be reduced by optimizing the input use efficiency. It is also possible to
popularize the concept of aquaculture farmer producers companies (Aquaculture FPCs) by
formalising the existing fishing communities, such that entire villages function as business
enterprises focused on fishing and allied activities. Village Producer Organisations could be
developed to function as integrated fishing based business ecosystems. Incomes would also be
increased if market imperfections are removed.
Table 16.1 Freshwater Aquaculture
Items Details / Remarks
Carp culture Catla, rohu, mrigal, silver carp, grass carp and
common carp and Amur Carp-
Production Plans i) single stocking-single harvest, ii) single
stocking-multiple harvest and iii) multiple
stocking-multi-harvest
Stocking density 8000-10,000 fingerlings/ ha
Feeding regime Live food propagation through manure/fertilizer
application/ Supplementary feeding (Farm
made/Formulated feed) - 1-2% of biomass per
day
Projected production/ ha 6-8 tonnes
Cost of Production (Rs./ha) 60-75
Capital cost (Rs./ha) 4 – 5
Sale price (Kg) 110-130
Gross profit (Rs./ha/Yr.) 3.00 – 4.00
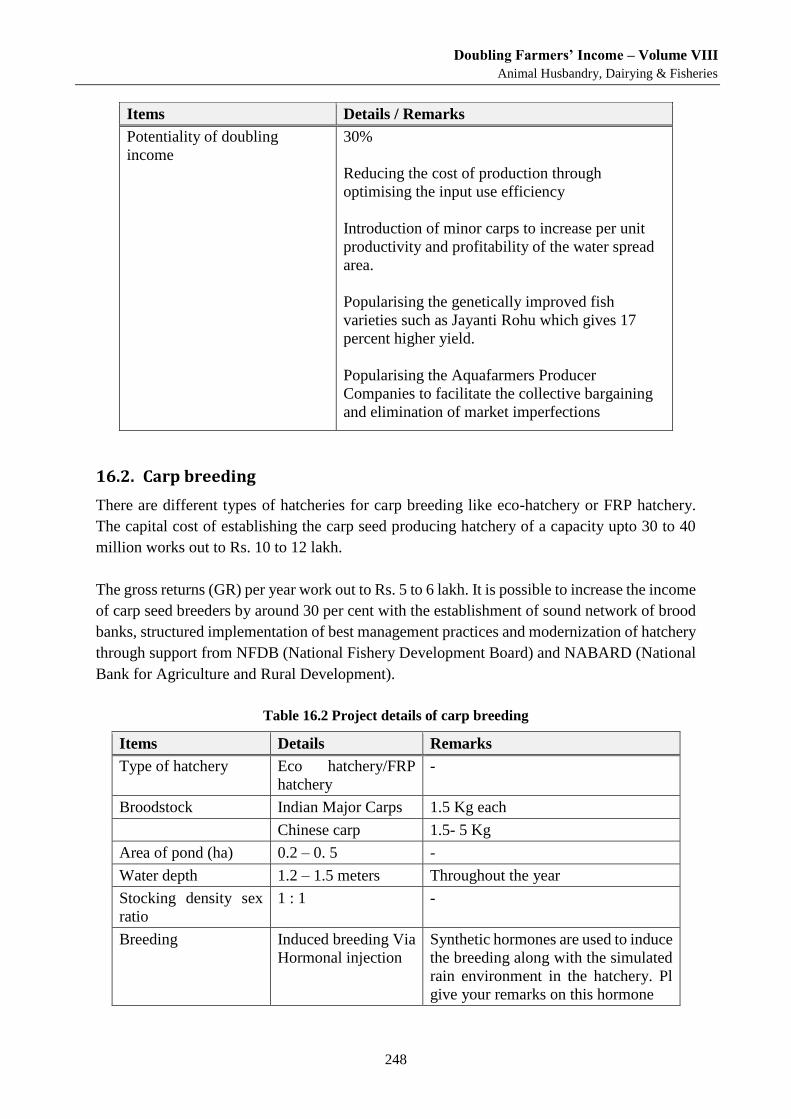
Doubling Farmers’ Income – Volume VIII
Animal Husbandry, Dairying & Fisheries
248
Items Details / Remarks
Potentiality of doubling
income
30%
Reducing the cost of production through
optimising the input use efficiency
Introduction of minor carps to increase per unit
productivity and profitability of the water spread
area.
Popularising the genetically improved fish
varieties such as Jayanti Rohu which gives 17
percent higher yield.
Popularising the Aquafarmers Producer
Companies to facilitate the collective bargaining
and elimination of market imperfections
16.2. Carp breeding
There are different types of hatcheries for carp breeding like eco-hatchery or FRP hatchery.
The capital cost of establishing the carp seed producing hatchery of a capacity upto 30 to 40
million works out to Rs. 10 to 12 lakh.
The gross returns (GR) per year work out to Rs. 5 to 6 lakh. It is possible to increase the income
of carp seed breeders by around 30 per cent with the establishment of sound network of brood
banks, structured implementation of best management practices and modernization of hatchery
through support from NFDB (National Fishery Development Board) and NABARD (National
Bank for Agriculture and Rural Development).
Table 16.2 Project details of carp breeding
Items Details Remarks
Type of hatchery Eco hatchery/FRP
hatchery
-
Broodstock Indian Major Carps 1.5 Kg each
Chinese carp 1.5- 5 Kg
Area of pond (ha) 0.2 – 0. 5 -
Water depth 1.2 – 1.5 meters Throughout the year
Stocking density sex
ratio
1 : 1 -
Breeding Induced breeding Via
Hormonal injection
Synthetic hormones are used to induce
the breeding along with the simulated
rain environment in the hatchery. Pl
give your remarks on this hormone
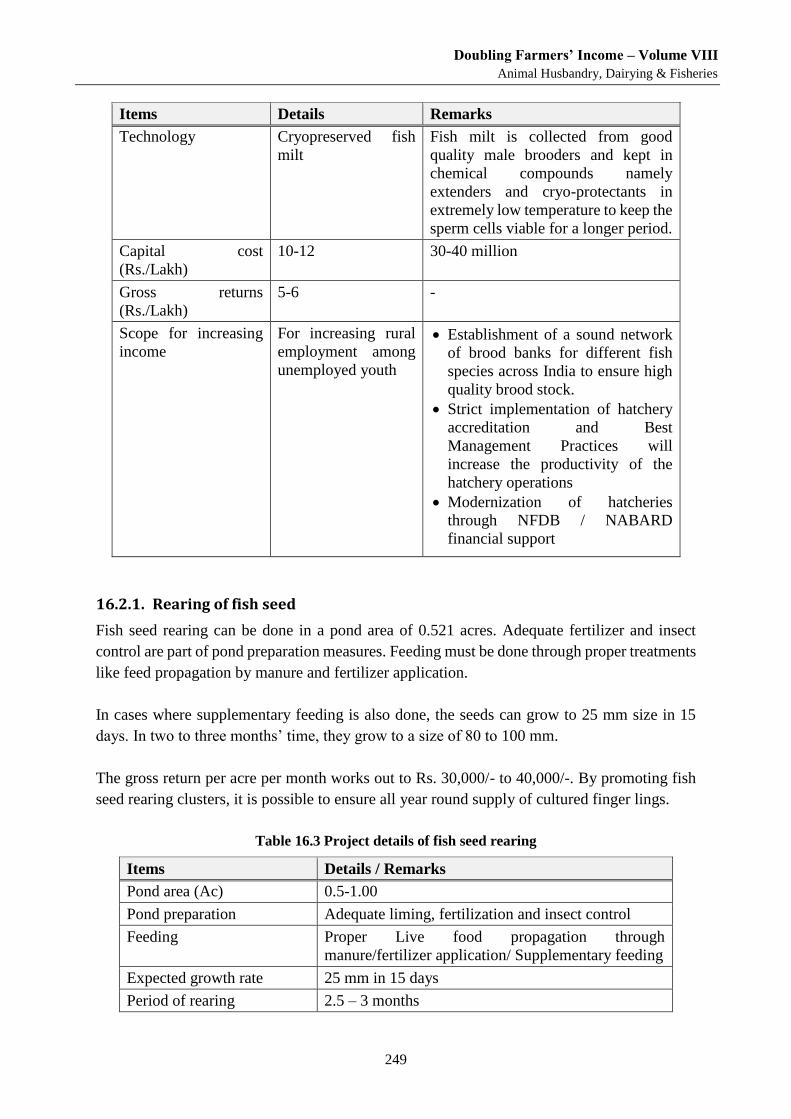
Doubling Farmers’ Income – Volume VIII
Animal Husbandry, Dairying & Fisheries
249
Items Details Remarks
Technology Cryopreserved fish
milt
Fish milt is collected from good
quality male brooders and kept in
chemical compounds namely
extenders and cryo-protectants in
extremely low temperature to keep the
sperm cells viable for a longer period.
Capital cost
(Rs./Lakh)
10-12 30-40 million
Gross returns
(Rs./Lakh)
5-6 -
Scope for increasing
income
For increasing rural
employment among
unemployed youth
Establishment of a sound network
of brood banks for different fish
species across India to ensure high
quality brood stock.
Strict implementation of hatchery
accreditation and Best
Management Practices will
increase the productivity of the
hatchery operations
Modernization of hatcheries
through NFDB / NABARD
financial support
16.2.1. Rearing of fish seed
Fish seed rearing can be done in a pond area of 0.521 acres. Adequate fertilizer and insect
control are part of pond preparation measures. Feeding must be done through proper treatments
like feed propagation by manure and fertilizer application.
In cases where supplementary feeding is also done, the seeds can grow to 25 mm size in 15
days. In two to three months’ time, they grow to a size of 80 to 100 mm.
The gross return per acre per month works out to Rs. 30,000/- to 40,000/-. By promoting fish
seed rearing clusters, it is possible to ensure all year round supply of cultured finger lings.
Table 16.3 Project details of fish seed rearing
Items Details / Remarks
Pond area (Ac) 0.5-1.00
Pond preparation Adequate liming, fertilization and insect control
Feeding Proper Live food propagation through
manure/fertilizer application/ Supplementary feeding
Expected growth rate 25 mm in 15 days
Period of rearing 2.5 – 3 months
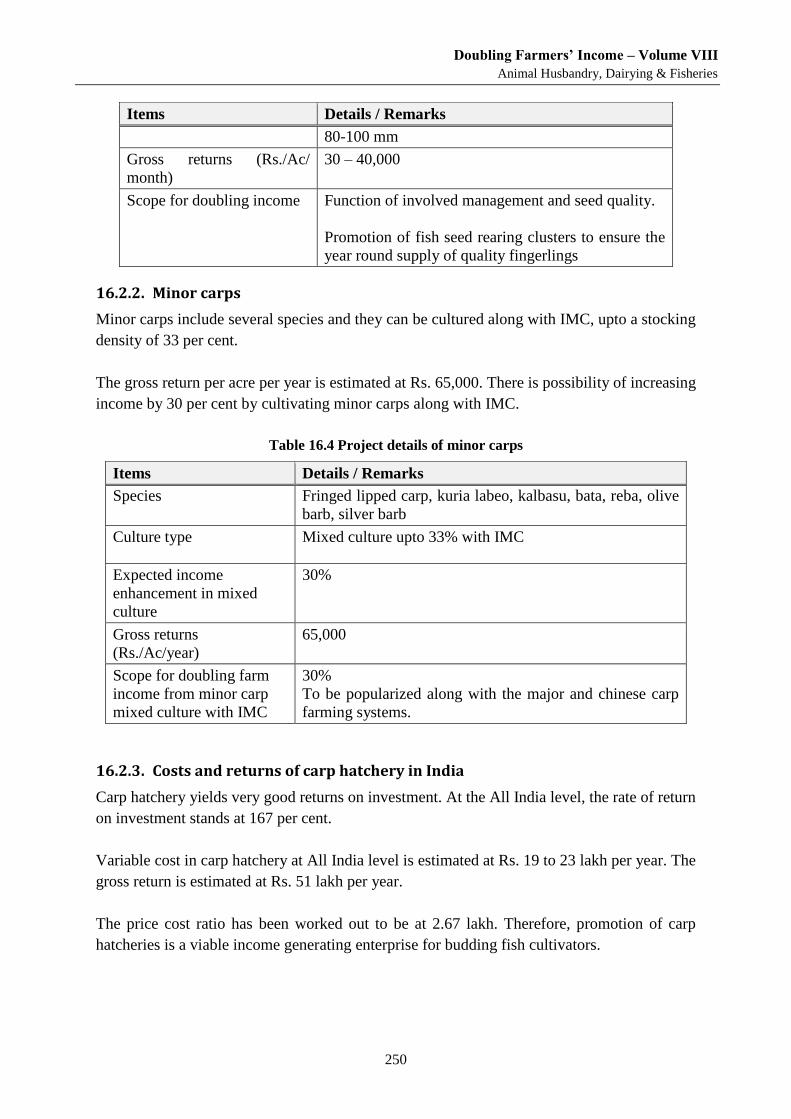
Doubling Farmers’ Income – Volume VIII
Animal Husbandry, Dairying & Fisheries
250
Items Details / Remarks
80-100 mm
Gross returns (Rs./Ac/
month)
30 – 40,000
Scope for doubling income Function of involved management and seed quality.
Promotion of fish seed rearing clusters to ensure the
year round supply of quality fingerlings
16.2.2. Minor carps
Minor carps include several species and they can be cultured along with IMC, upto a stocking
density of 33 per cent.
The gross return per acre per year is estimated at Rs. 65,000. There is possibility of increasing
income by 30 per cent by cultivating minor carps along with IMC.
Table 16.4 Project details of minor carps
Items Details / Remarks
Species Fringed lipped carp, kuria labeo, kalbasu, bata, reba, olive
barb, silver barb
Culture type Mixed culture upto 33% with IMC
Expected income
enhancement in mixed
culture
30%
Gross returns
(Rs./Ac/year)
65,000
Scope for doubling farm
income from minor carp
mixed culture with IMC
30%
To be popularized along with the major and chinese carp
farming systems.
16.2.3. Costs and returns of carp hatchery in India
Carp hatchery yields very good returns on investment. At the All India level, the rate of return
on investment stands at 167 per cent.
Variable cost in carp hatchery at All India level is estimated at Rs. 19 to 23 lakh per year. The
gross return is estimated at Rs. 51 lakh per year.
The price cost ratio has been worked out to be at 2.67 lakh. Therefore, promotion of carp
hatcheries is a viable income generating enterprise for budding fish cultivators.
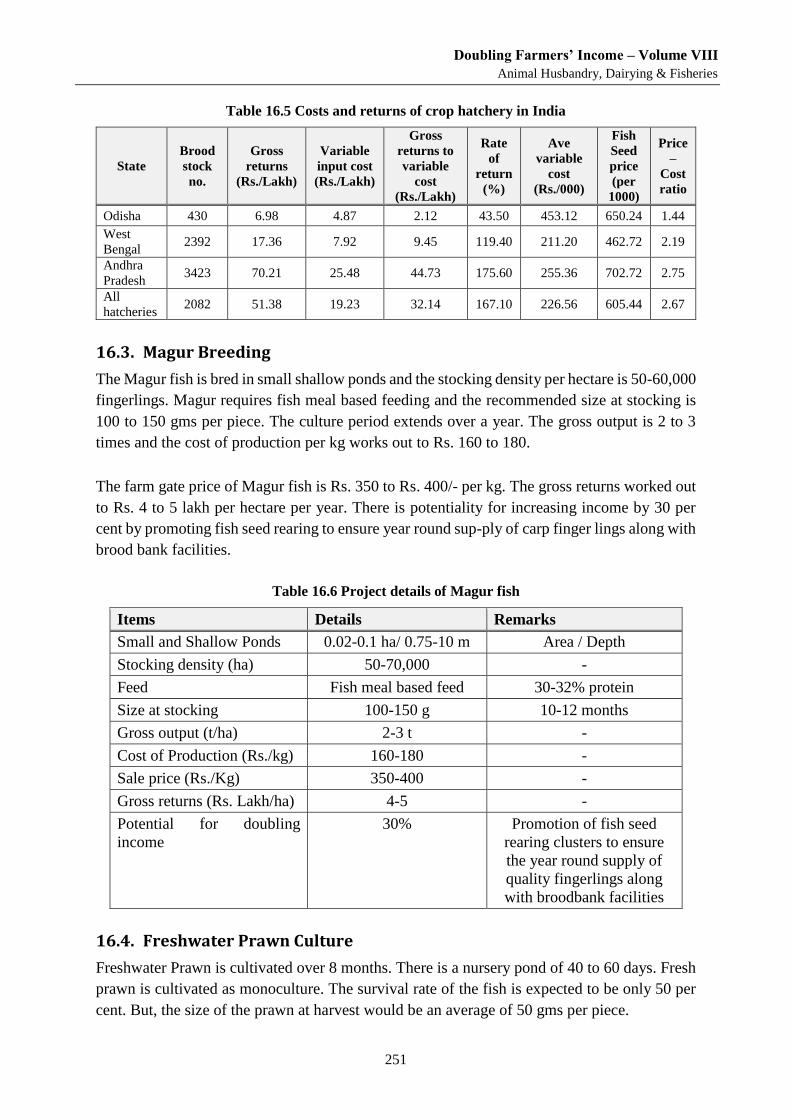
Doubling Farmers’ Income – Volume VIII
Animal Husbandry, Dairying & Fisheries
251
Table 16.5 Costs and returns of crop hatchery in India
State
Brood
stock
no.
Gross
returns
(Rs./Lakh)
Variable
input cost
(Rs./Lakh)
Gross
returns to
variable
cost
(Rs./Lakh)
Rate
of
return
(%)
Ave
variable
cost
(Rs./000)
Fish
Seed
price
(per
1000)
Price
–
Cost
ratio
Odisha 430 6.98 4.87 2.12 43.50 453.12 650.24 1.44
West
Bengal 2392 17.36 7.92 9.45 119.40 211.20 462.72 2.19
Andhra
Pradesh 3423 70.21 25.48 44.73 175.60 255.36 702.72 2.75
All
hatcheries 2082 51.38 19.23 32.14 167.10 226.56 605.44 2.67
16.3. Magur Breeding
The Magur fish is bred in small shallow ponds and the stocking density per hectare is 50-60,000
fingerlings. Magur requires fish meal based feeding and the recommended size at stocking is
100 to 150 gms per piece. The culture period extends over a year. The gross output is 2 to 3
times and the cost of production per kg works out to Rs. 160 to 180.
The farm gate price of Magur fish is Rs. 350 to Rs. 400/- per kg. The gross returns worked out
to Rs. 4 to 5 lakh per hectare per year. There is potentiality for increasing income by 30 per
cent by promoting fish seed rearing to ensure year round sup-ply of carp finger lings along with
brood bank facilities.
Table 16.6 Project details of Magur fish
Items Details Remarks
Small and Shallow Ponds 0.02-0.1 ha/ 0.75-10 m Area / Depth
Stocking density (ha) 50-70,000 -
Feed Fish meal based feed 30-32% protein
Size at stocking 100-150 g 10-12 months
Gross output (t/ha) 2-3 t -
Cost of Production (Rs./kg) 160-180 -
Sale price (Rs./Kg) 350-400 -
Gross returns (Rs. Lakh/ha) 4-5 -
Potential for doubling
income
30% Promotion of fish seed
rearing clusters to ensure
the year round supply of
quality fingerlings along
with broodbank facilities
16.4. Freshwater Prawn Culture
Freshwater Prawn is cultivated over 8 months. There is a nursery pond of 40 to 60 days. Fresh
prawn is cultivated as monoculture. The survival rate of the fish is expected to be only 50 per
cent. But, the size of the prawn at harvest would be an average of 50 gms per piece.
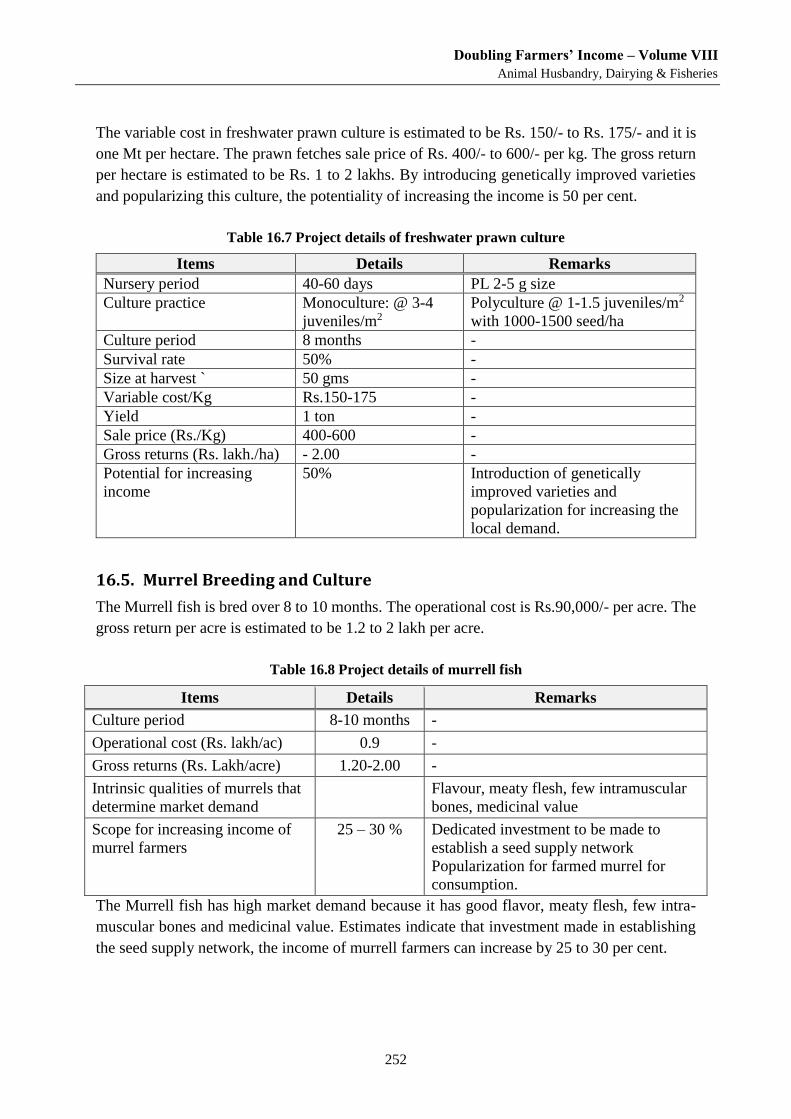
Doubling Farmers’ Income – Volume VIII
Animal Husbandry, Dairying & Fisheries
252
The variable cost in freshwater prawn culture is estimated to be Rs. 150/- to Rs. 175/- and it is
one Mt per hectare. The prawn fetches sale price of Rs. 400/- to 600/- per kg. The gross return
per hectare is estimated to be Rs. 1 to 2 lakhs. By introducing genetically improved varieties
and popularizing this culture, the potentiality of increasing the income is 50 per cent.
Table 16.7 Project details of freshwater prawn culture
Items Details Remarks
Nursery period 40-60 days PL 2-5 g size
Culture practice Monoculture: @ 3-4
juveniles/m2
Polyculture @ 1-1.5 juveniles/m2
with 1000-1500 seed/ha
Culture period 8 months -
Survival rate 50% -
Size at harvest ` 50 gms -
Variable cost/Kg Rs.150-175 -
Yield 1 ton -
Sale price (Rs./Kg) 400-600 -
Gross returns (Rs. lakh./ha) - 2.00 -
Potential for increasing
income
50% Introduction of genetically
improved varieties and
popularization for increasing the
local demand.
16.5. Murrel Breeding and Culture
The Murrell fish is bred over 8 to 10 months. The operational cost is Rs.90,000/- per acre. The
gross return per acre is estimated to be 1.2 to 2 lakh per acre.
Table 16.8 Project details of murrell fish
Items Details Remarks
Culture period 8-10 months -
Operational cost (Rs. lakh/ac) 0.9 -
Gross returns (Rs. Lakh/acre) 1.20-2.00 -
Intrinsic qualities of murrels that
determine market demand
Flavour, meaty flesh, few intramuscular
bones, medicinal value
Scope for increasing income of
murrel farmers
25 – 30 % Dedicated investment to be made to
establish a seed supply network
Popularization for farmed murrel for
consumption.
The Murrell fish has high market demand because it has good flavor, meaty flesh, few intra-
muscular bones and medicinal value. Estimates indicate that investment made in establishing
the seed supply network, the income of murrell farmers can increase by 25 to 30 per cent.
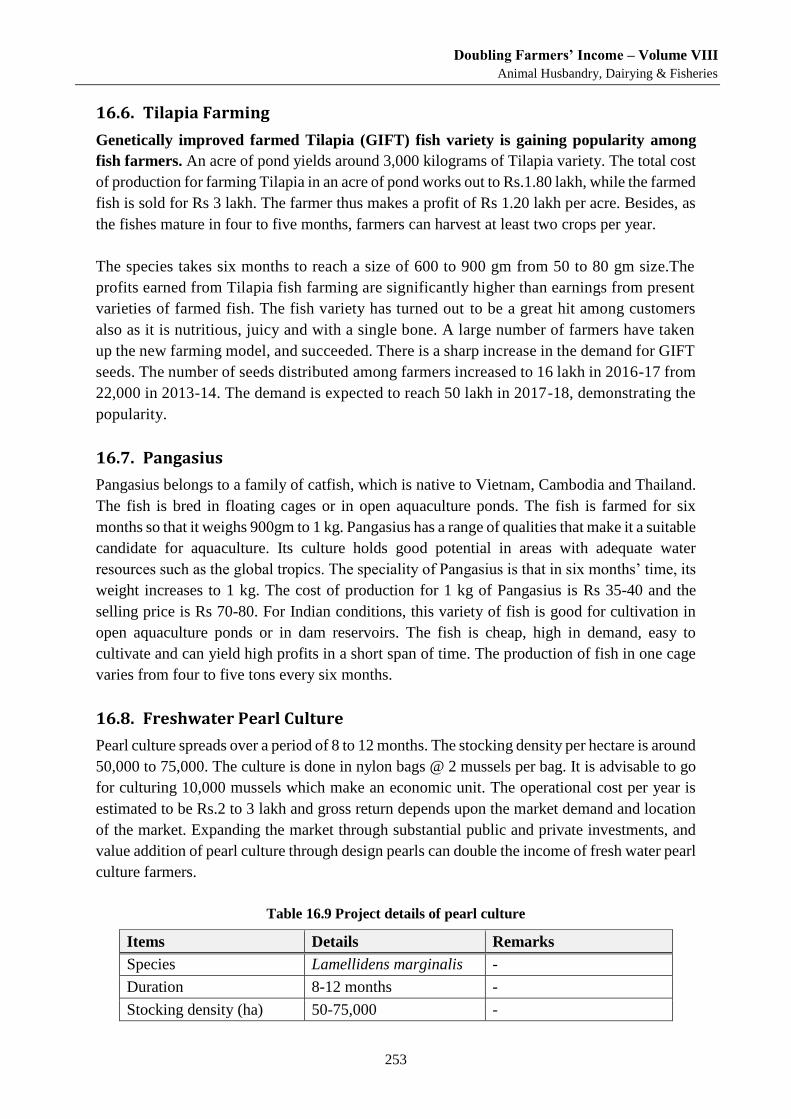
Doubling Farmers’ Income – Volume VIII
Animal Husbandry, Dairying & Fisheries
253
16.6. Tilapia Farming
Genetically improved farmed Tilapia (GIFT) fish variety is gaining popularity among
fish farmers. An acre of pond yields around 3,000 kilograms of Tilapia variety. The total cost
of production for farming Tilapia in an acre of pond works out to Rs.1.80 lakh, while the farmed
fish is sold for Rs 3 lakh. The farmer thus makes a profit of Rs 1.20 lakh per acre. Besides, as
the fishes mature in four to five months, farmers can harvest at least two crops per year.
The species takes six months to reach a size of 600 to 900 gm from 50 to 80 gm size.The
profits earned from Tilapia fish farming are significantly higher than earnings from present
varieties of farmed fish. The fish variety has turned out to be a great hit among customers
also as it is nutritious, juicy and with a single bone. A large number of farmers have taken
up the new farming model, and succeeded. There is a sharp increase in the demand for GIFT
seeds. The number of seeds distributed among farmers increased to 16 lakh in 2016-17 from
22,000 in 2013-14. The demand is expected to reach 50 lakh in 2017-18, demonstrating the
popularity.
16.7. Pangasius
Pangasius belongs to a family of catfish, which is native to Vietnam, Cambodia and Thailand.
The fish is bred in floating cages or in open aquaculture ponds. The fish is farmed for six
months so that it weighs 900gm to 1 kg. Pangasius has a range of qualities that make it a suitable
candidate for aquaculture. Its culture holds good potential in areas with adequate water
resources such as the global tropics. The speciality of Pangasius is that in six months’ time, its
weight increases to 1 kg. The cost of production for 1 kg of Pangasius is Rs 35-40 and the
selling price is Rs 70-80. For Indian conditions, this variety of fish is good for cultivation in
open aquaculture ponds or in dam reservoirs. The fish is cheap, high in demand, easy to
cultivate and can yield high profits in a short span of time. The production of fish in one cage
varies from four to five tons every six months.
16.8. Freshwater Pearl Culture
Pearl culture spreads over a period of 8 to 12 months. The stocking density per hectare is around
50,000 to 75,000. The culture is done in nylon bags @ 2 mussels per bag. It is advisable to go
for culturing 10,000 mussels which make an economic unit. The operational cost per year is
estimated to be Rs.2 to 3 lakh and gross return depends upon the market demand and location
of the market. Expanding the market through substantial public and private investments, and
value addition of pearl culture through design pearls can double the income of fresh water pearl
culture farmers.
Table 16.9 Project details of pearl culture
Items Details Remarks
Species Lamellidens marginalis -
Duration 8-12 months -
Stocking density (ha) 50-75,000 -
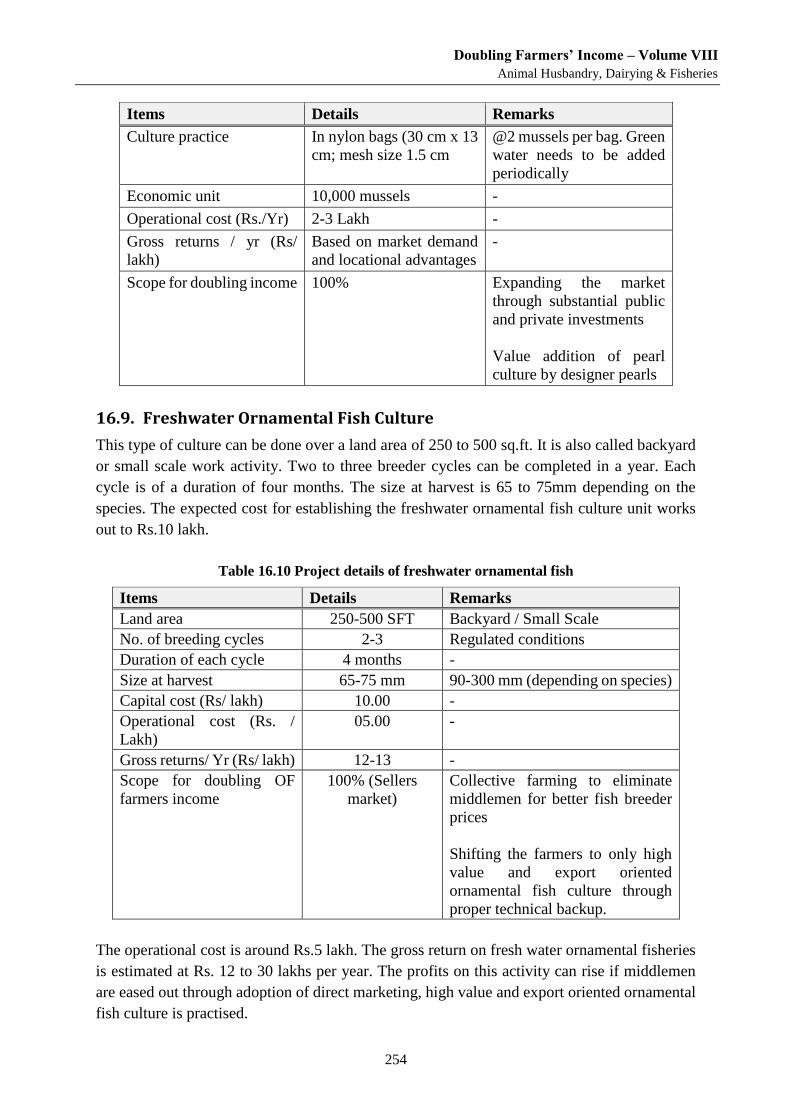
Doubling Farmers’ Income – Volume VIII
Animal Husbandry, Dairying & Fisheries
254
Items Details Remarks
Culture practice In nylon bags (30 cm x 13
cm; mesh size 1.5 cm
@2 mussels per bag. Green
water needs to be added
periodically
Economic unit 10,000 mussels -
Operational cost (Rs./Yr) 2-3 Lakh -
Gross returns / yr (Rs/
lakh)
Based on market demand
and locational advantages
-
Scope for doubling income 100% Expanding the market
through substantial public
and private investments
Value addition of pearl
culture by designer pearls
16.9. Freshwater Ornamental Fish Culture
This type of culture can be done over a land area of 250 to 500 sq.ft. It is also called backyard
or small scale work activity. Two to three breeder cycles can be completed in a year. Each
cycle is of a duration of four months. The size at harvest is 65 to 75mm depending on the
species. The expected cost for establishing the freshwater ornamental fish culture unit works
out to Rs.10 lakh.
Table 16.10 Project details of freshwater ornamental fish
Items Details Remarks
Land area 250-500 SFT Backyard / Small Scale
No. of breeding cycles 2-3 Regulated conditions
Duration of each cycle 4 months -
Size at harvest 65-75 mm 90-300 mm (depending on species)
Capital cost (Rs/ lakh) 10.00 -
Operational cost (Rs. /
Lakh)
05.00 -
Gross returns/ Yr (Rs/ lakh) 12-13 -
Scope for doubling OF
farmers income
100% (Sellers
market)
Collective farming to eliminate
middlemen for better fish breeder
prices
Shifting the farmers to only high
value and export oriented
ornamental fish culture through
proper technical backup.
The operational cost is around Rs.5 lakh. The gross return on fresh water ornamental fisheries
is estimated at Rs. 12 to 30 lakhs per year. The profits on this activity can rise if middlemen
are eased out through adoption of direct marketing, high value and export oriented ornamental
fish culture is practised.
Doubling Farmers’ Income – Volume VIII
Animal Husbandry, Dairying & Fisheries
255
16.10. Annotation
India is geographically poised to be the world leader in the fisheries sector. Being the largest
peninsula in the world, with its vast coastline of 7,517 km and EEZ (Exclusive Economic Zone)
of 200 nautical miles, network of lakes, rivers and numerous other inland water bodies, it can
easily surpass any other nation in fish production.
The demand for fish is increasing and it has become necessary to increase species
diversification in aquaculture by including more species for increasing the output and to suit
consumer demand. Inland fisheries and aquaculture are poised for a big break. With the right
economic, institutional and technical support, this sub-sector can play a key role in
strengthening of IFS (integrated farming system) practices and income enhancement
opportunities for the farmers.
Key Extracts
Inland fisheries offer the best opportunity for growth in employment, income and
farmer welfare, not only by production for domestic markets but also for exports
Freshwater aquaculture requires an overhaul of supply chain management. Broodstock
holdings, hatchery production of seeds, quality feed, efficient management and a copy
book style marketing model are required to ensure consistent and enhanced income.
Marketing is inexplicably wired to operational finance at the field level. The role of
the local traders and commission agents needs to be eliminated or integrated with
farmers, to help achieve growth potential and higher share to farmers in the returns.
Long distance marketing of freshwater fishes is fraught with malpractices which needs
to be addressed on priority.

Doubling Farmers’ Income – Volume VIII
Animal Husbandry, Dairying & Fisheries
257
Chapter 17
Fisheries: Sectoral and Sub-sectoral Action Plan This chapter is devoted to presenting the sub-sectors of fisheries at a glance. Various sub-sectors under
fisheries provide scope for enterprises. Towards this, it would help in examining the present status and
growth potential by regions. By identifying the gaps and preparing an integrated action plan to bridge
the same, the growth potential can be realised. The action plan needs to include technologies,
developmental initiatives and policy interventions.
17.1. Indian Fisheries – Potential for Income Growth
As already brought out in chapter 1, India the largest peninsula, which also enjoys vastness of
geography and water bodies, as also diversity of agro-climates possesses impressive potential
for realising higher fish output. On account of the scope, which the country enjoys in respect
of both marine and inland fisheries, interventions can be made for promoting different types of
fishery based enterprises. The large number of fishers in the country will stand to benefit from
a technology based, scientifically managed, financially supported and market facilitated
production initiatives.
17.2. Sectors and Sub-sectors for Promotion
The diverse set of sectors and sub-sectors, possible in the country can be delineated as follows:
i. Freshwater capture fisheries (excluding cold-water) (Table.17.1)
ii. Marine fisheries (Table 17.2)
iii. Freshwater aquaculture (excluding cold-water) (Table 17.3)
iv. Coldwater aquaculture (Table 17.4)
v. Brackish water aquaculture (Table 17.5)
vi. Inland saline aquaculture (Table 17.6)
vii. Mariculture (Table 17.7)
The above mentioned sectors and sub-sectors have been analysed in terms of current status so
as to identify the existing gaps, and interventions needed to realise the growth potential. The
action plan needed to make this possible has also been suggested, and it has to be
comprehensive by addressing the following:
Developmental activities
Technological intervention
Policy support
In order to enable a clear, well delineated and focused intervention, the action plan has been
presented in a tabular form. For each of the sectors/sub-sectors indicated in 3.2 above, the table
numbers shown against each of them may be referred to.
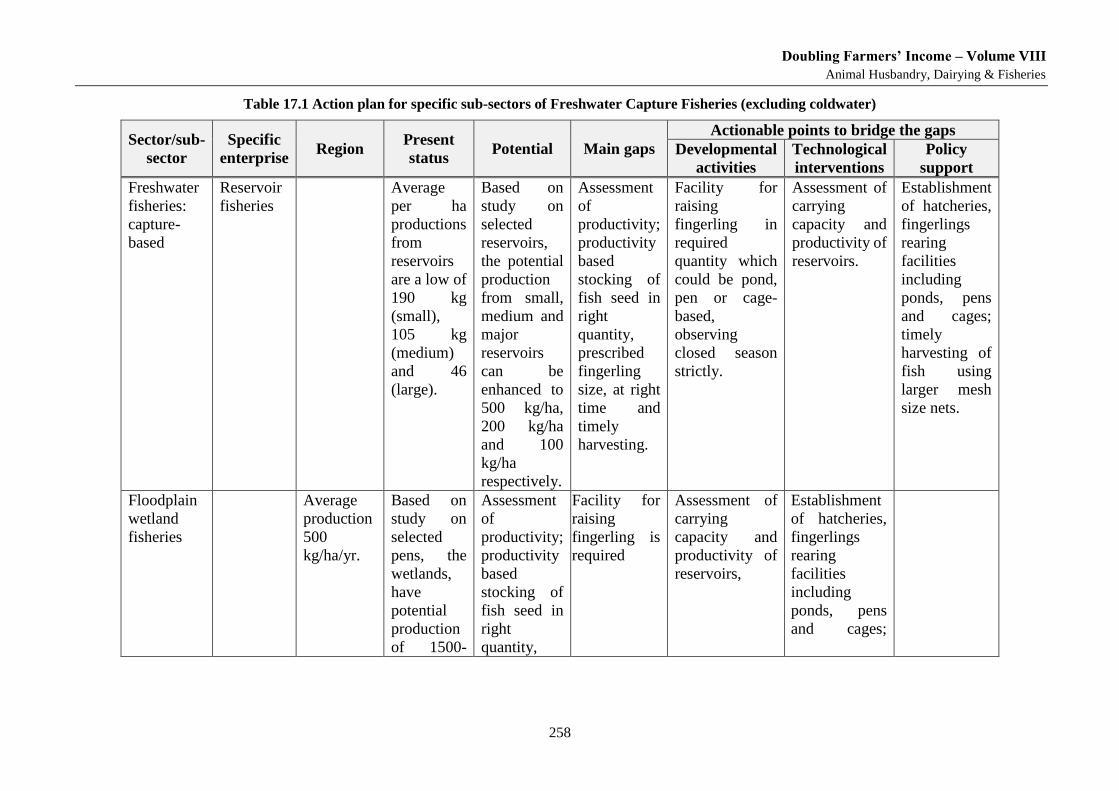
Doubling Farmers’ Income – Volume VIII
Animal Husbandry, Dairying & Fisheries
258
Table 17.1 Action plan for specific sub-sectors of Freshwater Capture Fisheries (excluding coldwater)
Sector/sub-
sector
Specific
enterprise Region
Present
status Potential Main gaps
Actionable points to bridge the gaps
Developmental
activities
Technological
interventions
Policy
support
Freshwater
fisheries:
capture-
based
Reservoir
fisheries
Average
per ha
productions
from
reservoirs
are a low of
190 kg
(small),
105 kg
(medium)
and 46
(large).
Based on
study on
selected
reservoirs,
the potential
production
from small,
medium and
major
reservoirs
can be
enhanced to
500 kg/ha,
200 kg/ha
and 100
kg/ha
respectively.
Assessment
of
productivity;
productivity
based
stocking of
fish seed in
right
quantity,
prescribed
fingerling
size, at right
time and
timely
harvesting.
Facility for
raising
fingerling in
required
quantity which
could be pond,
pen or cage-
based,
observing
closed season
strictly.
Assessment of
carrying
capacity and
productivity of
reservoirs.
Establishment
of hatcheries,
fingerlings
rearing
facilities
including
ponds, pens
and cages;
timely
harvesting of
fish using
larger mesh
size nets.
Floodplain
wetland
fisheries
Average
production
500
kg/ha/yr.
Based on
study on
selected
pens, the
wetlands,
have
potential
production
of 1500-
Assessment
of
productivity;
productivity
based
stocking of
fish seed in
right
quantity,
Facility for
raising
fingerling is
required
Assessment of
carrying
capacity and
productivity of
reservoirs,
Establishment
of hatcheries,
fingerlings
rearing
facilities
including
ponds, pens
and cages;
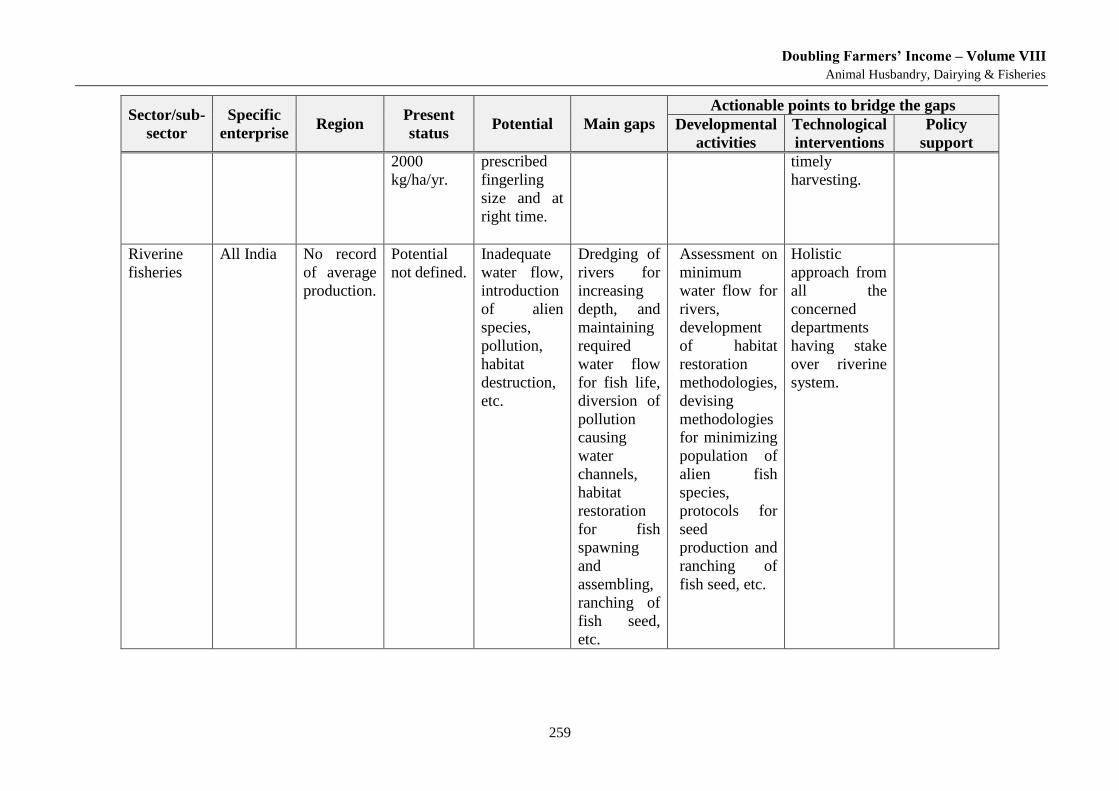
Doubling Farmers’ Income – Volume VIII
Animal Husbandry, Dairying & Fisheries
259
Sector/sub-
sector
Specific
enterprise Region
Present
status Potential Main gaps
Actionable points to bridge the gaps
Developmental
activities
Technological
interventions
Policy
support
2000
kg/ha/yr.
prescribed
fingerling
size and at
right time.
timely
harvesting.
Riverine
fisheries
All India No record
of average
production.
Potential
not defined.
Inadequate
water flow,
introduction
of alien
species,
pollution,
habitat
destruction,
etc.
Dredging of
rivers for
increasing
depth, and
maintaining
required
water flow
for fish life,
diversion of
pollution
causing
water
channels,
habitat
restoration
for fish
spawning
and
assembling,
ranching of
fish seed,
etc.
Assessment on
minimum
water flow for
rivers,
development
of habitat
restoration
methodologies,
devising
methodologies
for minimizing
population of
alien fish
species,
protocols for
seed
production and
ranching of
fish seed, etc.
Holistic
approach from
all the
concerned
departments
having stake
over riverine
system.
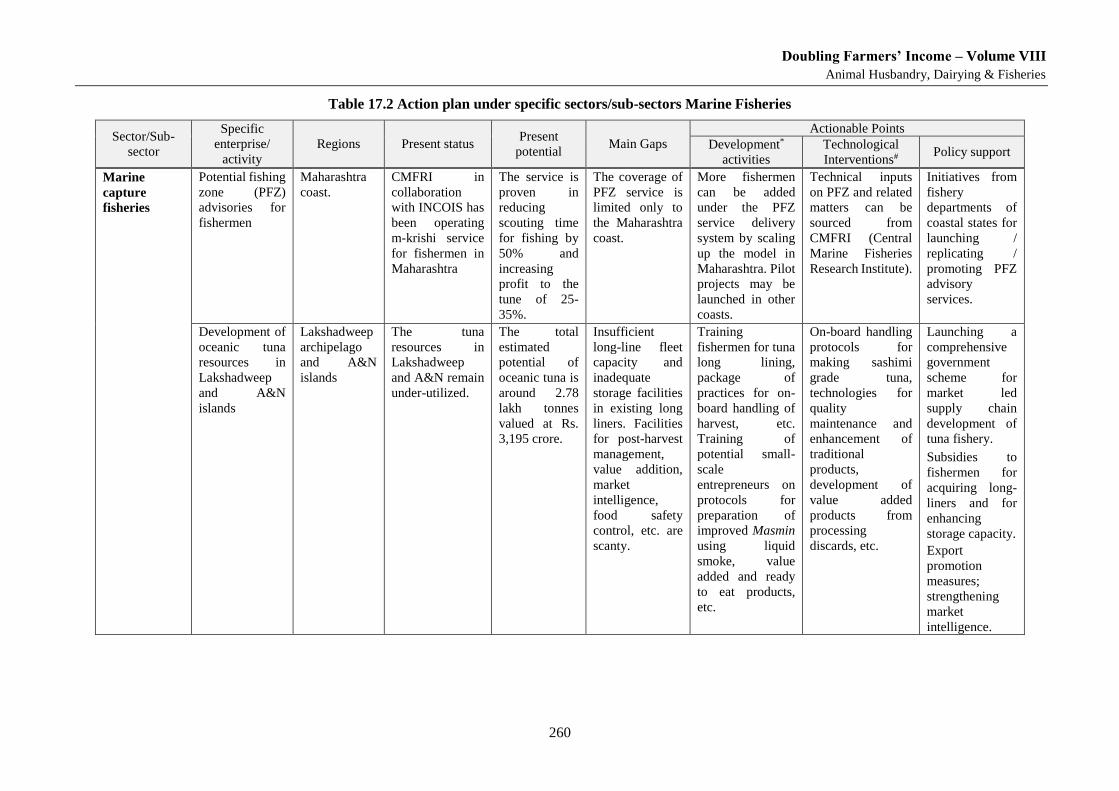
Doubling Farmers’ Income – Volume VIII
Animal Husbandry, Dairying & Fisheries
260
Table 17.2 Action plan under specific sectors/sub-sectors Marine Fisheries
Sector/Sub-
sector
Specific
enterprise/
activity
Regions Present status Present
potential Main Gaps
Actionable Points
Development*
activities
Technological
Interventions# Policy support
Marine
capture
fisheries
Potential fishing
zone (PFZ)
advisories for
fishermen
Maharashtra
coast.
CMFRI in
collaboration
with INCOIS has
been operating
m-krishi service
for fishermen in
Maharashtra
The service is
proven in
reducing
scouting time
for fishing by
50% and
increasing
profit to the
tune of 25-
35%.
The coverage of
PFZ service is
limited only to
the Maharashtra
coast.
More fishermen
can be added
under the PFZ
service delivery
system by scaling
up the model in
Maharashtra. Pilot
projects may be
launched in other
coasts.
Technical inputs
on PFZ and related
matters can be
sourced from
CMFRI (Central
Marine Fisheries
Research Institute).
Initiatives from
fishery
departments of
coastal states for
launching /
replicating /
promoting PFZ
advisory
services.
Development of
oceanic tuna
resources in
Lakshadweep
and A&N
islands
Lakshadweep
archipelago
and A&N
islands
The tuna
resources in
Lakshadweep
and A&N remain
under-utilized.
The total
estimated
potential of
oceanic tuna is
around 2.78
lakh tonnes
valued at Rs.
3,195 crore.
Insufficient
long-line fleet
capacity and
inadequate
storage facilities
in existing long
liners. Facilities
for post-harvest
management,
value addition,
market
intelligence,
food safety
control, etc. are
scanty.
Training
fishermen for tuna
long lining,
package of
practices for on-
board handling of
harvest, etc.
Training of
potential small-
scale
entrepreneurs on
protocols for
preparation of
improved Masmin
using liquid
smoke, value
added and ready
to eat products,
etc.
On-board handling
protocols for
making sashimi
grade tuna,
technologies for
quality
maintenance and
enhancement of
traditional
products,
development of
value added
products from
processing
discards, etc.
Launching a
comprehensive
government
scheme for
market led
supply chain
development of
tuna fishery.
Subsidies to
fishermen for
acquiring long-
liners and for
enhancing
storage capacity.
Export
promotion
measures;
strengthening
market
intelligence.
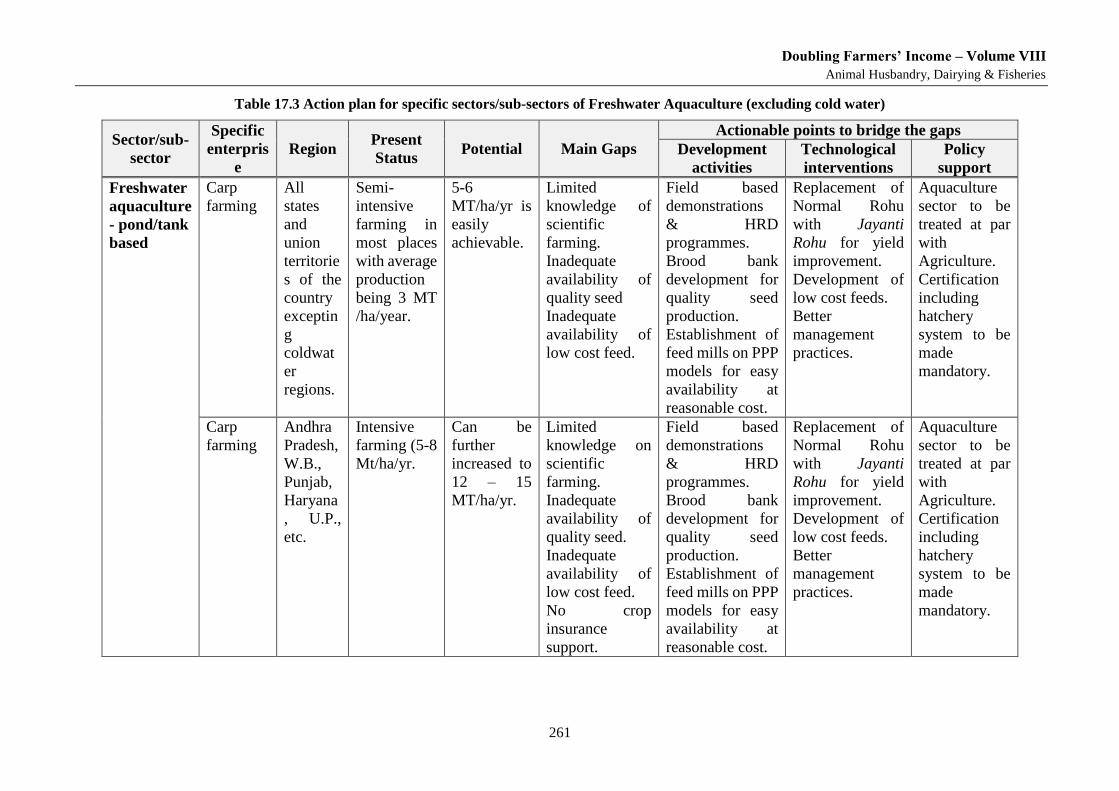
Doubling Farmers’ Income – Volume VIII
Animal Husbandry, Dairying & Fisheries
261
Table 17.3 Action plan for specific sectors/sub-sectors of Freshwater Aquaculture (excluding cold water)
Sector/sub-
sector
Specific
enterpris
e
Region Present
Status Potential Main Gaps
Actionable points to bridge the gaps
Development
activities
Technological
interventions
Policy
support
Freshwater
aquaculture
- pond/tank
based
Carp
farming
All
states
and
union
territorie
s of the
country
exceptin
g
coldwat
er
regions.
Semi-
intensive
farming in
most places
with average
production
being 3 MT
/ha/year.
5-6
MT/ha/yr is
easily
achievable.
Limited
knowledge of
scientific
farming.
Inadequate
availability of
quality seed
Inadequate
availability of
low cost feed.
Field based
demonstrations
& HRD
programmes.
Brood bank
development for
quality seed
production.
Establishment of
feed mills on PPP
models for easy
availability at
reasonable cost.
Replacement of
Normal Rohu
with Jayanti
Rohu for yield
improvement.
Development of
low cost feeds.
Better
management
practices.
Aquaculture
sector to be
treated at par
with
Agriculture.
Certification
including
hatchery
system to be
made
mandatory.
Carp
farming
Andhra
Pradesh,
W.B.,
Punjab,
Haryana
, U.P.,
etc.
Intensive
farming (5-8
Mt/ha/yr.
Can be
further
increased to
12 – 15
MT/ha/yr.
Limited
knowledge on
scientific
farming.
Inadequate
availability of
quality seed.
Inadequate
availability of
low cost feed.
No crop
insurance
support.
Field based
demonstrations
& HRD
programmes.
Brood bank
development for
quality seed
production.
Establishment of
feed mills on PPP
models for easy
availability at
reasonable cost.
Replacement of
Normal Rohu
with Jayanti
Rohu for yield
improvement.
Development of
low cost feeds.
Better
management
practices.
Aquaculture
sector to be
treated at par
with
Agriculture.
Certification
including
hatchery
system to be
made
mandatory.

Doubling Farmers’ Income – Volume VIII
Animal Husbandry, Dairying & Fisheries
262
Sector/sub-
sector
Specific
enterpris
e
Region Present
Status Potential Main Gaps
Actionable points to bridge the gaps
Development
activities
Technological
interventions
Policy
support
Carp
hatchery
All
states
exceptin
g cold
water
areas.
Some states
are self-
sufficient
but still
many states
import seed
from other
states. No
consideratio
n on quality
seed
production
for higher
survival and
growth.
Well-
developed
indigenous
technology
existed in
the country
and seed can
be produced
in the
desired
quantities
within all
the states.
Guidelines
for
improveme
nt of quality
seed
production
already
defined.
The states
deficient in seed
production are
not actively
participating in
seed production
process.
Poor quality
brood stock.
Improper brood
management
practices
Develop more
hatcheries in the
states deficient in
seed production.
Human resource
development for
transfer of new
technology.
Brood
improvement
through genetic
and nutritional
interventions
(genetically
improved brood
stock, carp brood
feed like
CIFABROOD.
Seed
certification
of hatcheries
to be made
mandatory.
Ornamen
tal Fish
farming
All state
with a
tropical
climate.
Activities
limited to
mainly
metro cities
such as
Chennai,
Potential for
expansion in
most of the
states with
tropical
climate.
Lack of quality
brood stock.
Lack of feed.
Lack of
technical
knowledge.
Human resource
development for
transfer of new
technology.
Standardization
of breeding and
seed production
technology of
important
Popularizatio
n of public
aquarium.
Prevention of
trade of
Indigenous

Doubling Farmers’ Income – Volume VIII
Animal Husbandry, Dairying & Fisheries
263
Sector/sub-
sector
Specific
enterpris
e
Region Present
Status Potential Main Gaps
Actionable points to bridge the gaps
Development
activities
Technological
interventions
Policy
support
Kolkata,
Mumbai,
Kerala.
Lack of trained
manpower.
Establishment of
marketing
channels.
Establishment of
infrastructure.
ornamental
fishes.
Development of
low cost feed.
wild stock of
ornamental
fishes.
Catfish
farming
South &
Eastern
India.
Scattered
Small scale
farming
except for
Pangasius.
Potential to
expand to
few south,
eastern &
Central
Indian
States.
Lack of quality
seed.
Lack of
technical
knowledge.
Human resource
development for
transfer of new
technology.
Post-harvest
value addition for
Pangasius.
Development of
better
management
practices.
Development of
low cost fish
feed.
Policy for
long term
lease of water
bodies.
More focus on
cage culture
of Pangasius.
Air
breathing
fish
breeding
& culture
(Murrel
&
Anabas).
Eastern
& South
India
(Telenga
na, A.P.,
West
Bengal).
Limited
scale (new
emerging
sector).
Potential for
expansion
of culture
area.
Lack of quality
seed.
Lack of
technical
knowledge.
Establishment of
hatcheries.
Human resource
development for
transfer of new
technology.
Post-harvest
value addition.
Development of
suitable feed &
health
management
practices.
Introduction
of Govt.
scheme for
encouraging
the
entrepreneurs.
Freshwater
aquaculture
from open
waters:
culture-
Cage
culture in
reservoirs
All India Growing
very well in
Jharkhand
and
Chhattisgar
h; and well
Farming of
catfish
(Pangasius)-
4-6
MT/ha/yr,
mass Carp
Lack of
adoption by
other states,
shortage of feed
mills and
availability of
All states having
medium and
large size
reservoirs should
introduce cage
culture in their
Gaps in hatchery
seed production
of catfish that are
suitable for cage
farming may be
identified for
Establishment
of hatcheries
of pangasius
and carps,
funding
support for
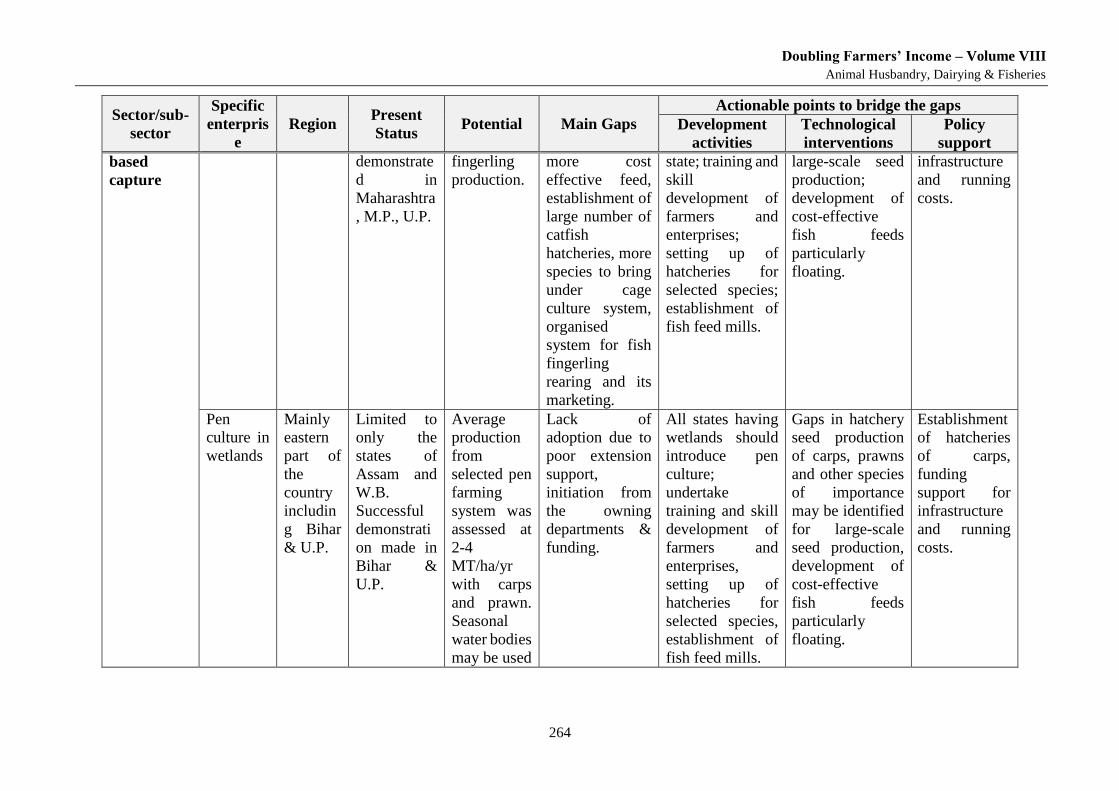
Doubling Farmers’ Income – Volume VIII
Animal Husbandry, Dairying & Fisheries
264
Sector/sub-
sector
Specific
enterpris
e
Region Present
Status Potential Main Gaps
Actionable points to bridge the gaps
Development
activities
Technological
interventions
Policy
support
based
capture
demonstrate
d in
Maharashtra
, M.P., U.P.
fingerling
production.
more cost
effective feed,
establishment of
large number of
catfish
hatcheries, more
species to bring
under cage
culture system,
organised
system for fish
fingerling
rearing and its
marketing.
state; training and
skill
development of
farmers and
enterprises;
setting up of
hatcheries for
selected species;
establishment of
fish feed mills.
large-scale seed
production;
development of
cost-effective
fish feeds
particularly
floating.
infrastructure
and running
costs.
Pen
culture in
wetlands
Mainly
eastern
part of
the
country
includin
g Bihar
& U.P.
Limited to
only the
states of
Assam and
W.B.
Successful
demonstrati
on made in
Bihar &
U.P.
Average
production
from
selected pen
farming
system was
assessed at
2-4
MT/ha/yr
with carps
and prawn.
Seasonal
water bodies
may be used
Lack of
adoption due to
poor extension
support,
initiation from
the owning
departments &
funding.
All states having
wetlands should
introduce pen
culture;
undertake
training and skill
development of
farmers and
enterprises,
setting up of
hatcheries for
selected species,
establishment of
fish feed mills.
Gaps in hatchery
seed production
of carps, prawns
and other species
of importance
may be identified
for large-scale
seed production,
development of
cost-effective
fish feeds
particularly
floating.
Establishment
of hatcheries
of carps,
funding
support for
infrastructure
and running
costs.
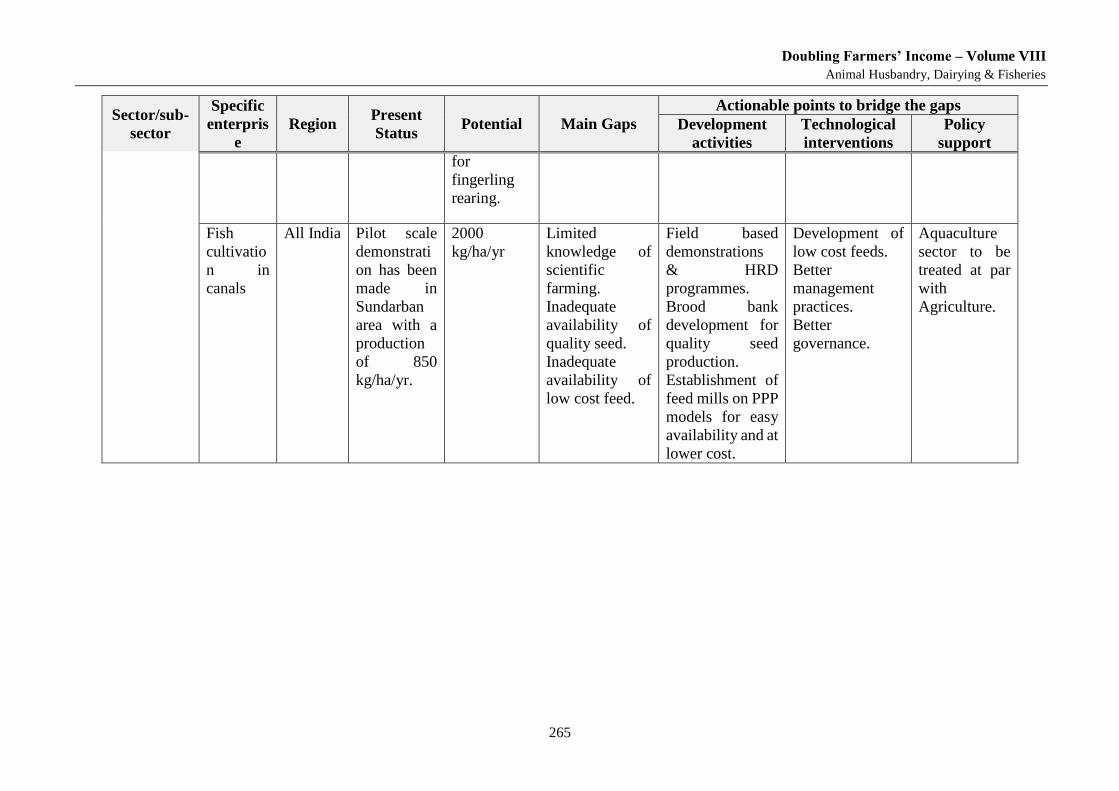
Doubling Farmers’ Income – Volume VIII
Animal Husbandry, Dairying & Fisheries
265
Sector/sub-
sector
Specific
enterpris
e
Region Present
Status Potential Main Gaps
Actionable points to bridge the gaps
Development
activities
Technological
interventions
Policy
support
for
fingerling
rearing.
Fish
cultivatio
n in
canals
All India Pilot scale
demonstrati
on has been
made in
Sundarban
area with a
production
of 850
kg/ha/yr.
2000
kg/ha/yr
Limited
knowledge of
scientific
farming.
Inadequate
availability of
quality seed.
Inadequate
availability of
low cost feed.
Field based
demonstrations
& HRD
programmes.
Brood bank
development for
quality seed
production.
Establishment of
feed mills on PPP
models for easy
availability and at
lower cost.
Development of
low cost feeds.
Better
management
practices.
Better
governance.
Aquaculture
sector to be
treated at par
with
Agriculture.
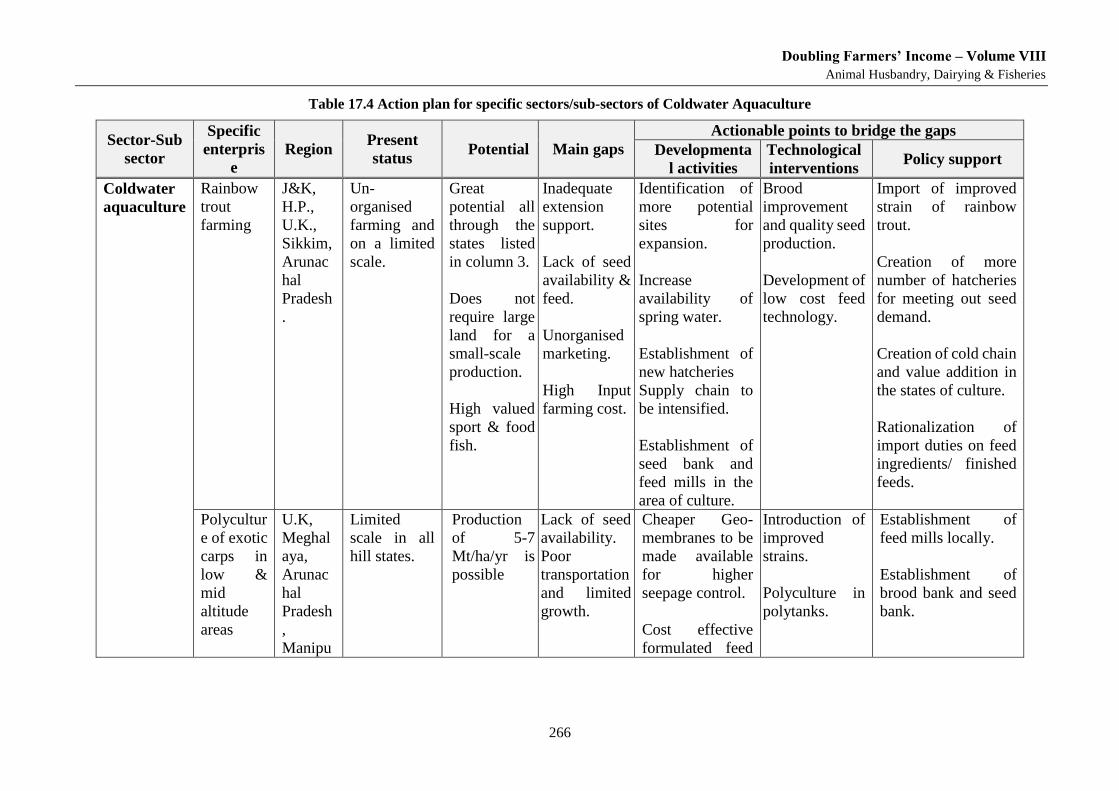
Doubling Farmers’ Income – Volume VIII
Animal Husbandry, Dairying & Fisheries
266
Table 17.4 Action plan for specific sectors/sub-sectors of Coldwater Aquaculture
Sector-Sub
sector
Specific
enterpris
e
Region Present
status Potential Main gaps
Actionable points to bridge the gaps
Developmenta
l activities
Technological
interventions Policy support
Coldwater
aquaculture
Rainbow
trout
farming
J&K,
H.P.,
U.K.,
Sikkim,
Arunac
hal
Pradesh
.
Un-
organised
farming and
on a limited
scale.
Great
potential all
through the
states listed
in column 3.
Does not
require large
land for a
small-scale
production.
High valued
sport & food
fish.
Inadequate
extension
support.
Lack of seed
availability &
feed.
Unorganised
marketing.
High Input
farming cost.
Identification of
more potential
sites for
expansion.
Increase
availability of
spring water.
Establishment of
new hatcheries
Supply chain to
be intensified.
Establishment of
seed bank and
feed mills in the
area of culture.
Brood
improvement
and quality seed
production.
Development of
low cost feed
technology.
Import of improved
strain of rainbow
trout.
Creation of more
number of hatcheries
for meeting out seed
demand.
Creation of cold chain
and value addition in
the states of culture.
Rationalization of
import duties on feed
ingredients/ finished
feeds.
Polycultur
e of exotic
carps in
low &
mid
altitude
areas
U.K,
Meghal
aya,
Arunac
hal
Pradesh
,
Manipu
Limited
scale in all
hill states.
Production
of 5-7
Mt/ha/yr is
possible
Lack of seed
availability.
Poor
transportation
and limited
growth.
Cheaper Geo-
membranes to be
made available
for higher
seepage control.
Cost effective
formulated feed
Introduction of
improved
strains.
Polyculture in
polytanks.
Establishment of
feed mills locally.
Establishment of
brood bank and seed
bank.
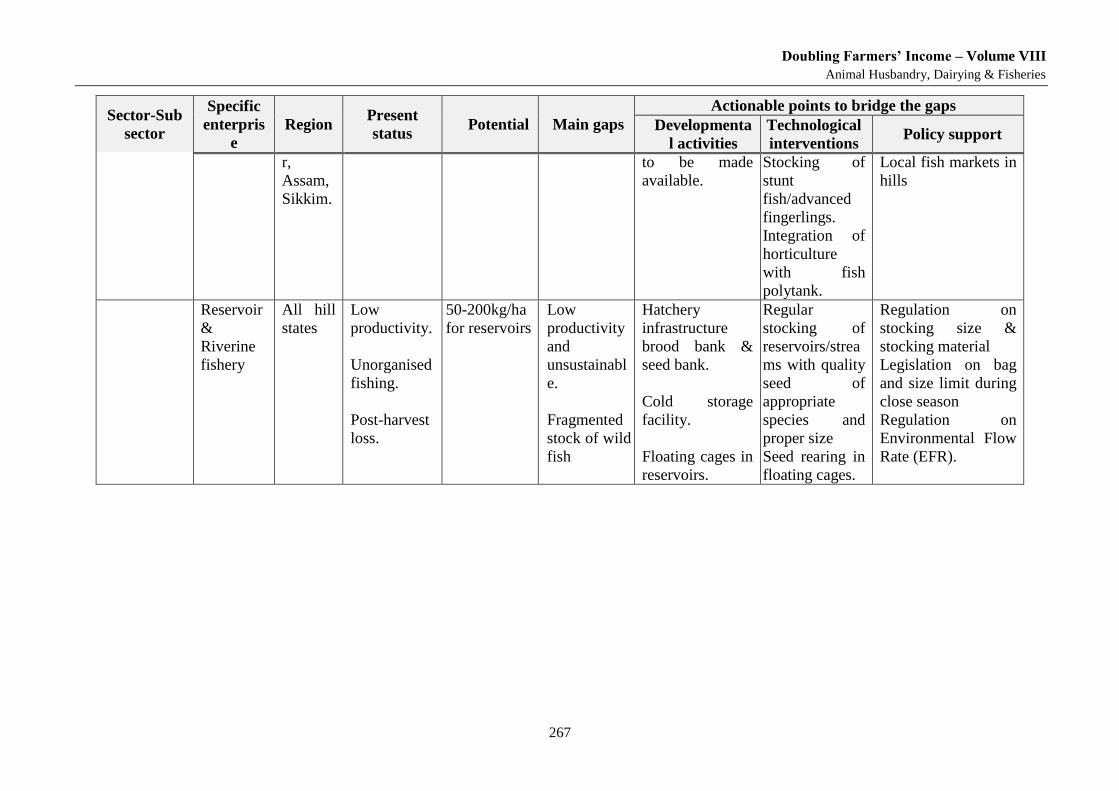
Doubling Farmers’ Income – Volume VIII
Animal Husbandry, Dairying & Fisheries
267
Sector-Sub
sector
Specific
enterpris
e
Region Present
status Potential Main gaps
Actionable points to bridge the gaps
Developmenta
l activities
Technological
interventions Policy support
r,
Assam,
Sikkim.
to be made
available.
Stocking of
stunt
fish/advanced
fingerlings.
Integration of
horticulture
with fish
polytank.
Local fish markets in
hills
Reservoir
&
Riverine
fishery
All hill
states
Low
productivity.
Unorganised
fishing.
Post-harvest
loss.
50-200kg/ha
for reservoirs
Low
productivity
and
unsustainabl
e.
Fragmented
stock of wild
fish
Hatchery
infrastructure
brood bank &
seed bank.
Cold storage
facility.
Floating cages in
reservoirs.
Regular
stocking of
reservoirs/strea
ms with quality
seed of
appropriate
species and
proper size
Seed rearing in
floating cages.
Regulation on
stocking size &
stocking material
Legislation on bag
and size limit during
close season
Regulation on
Environmental Flow
Rate (EFR).
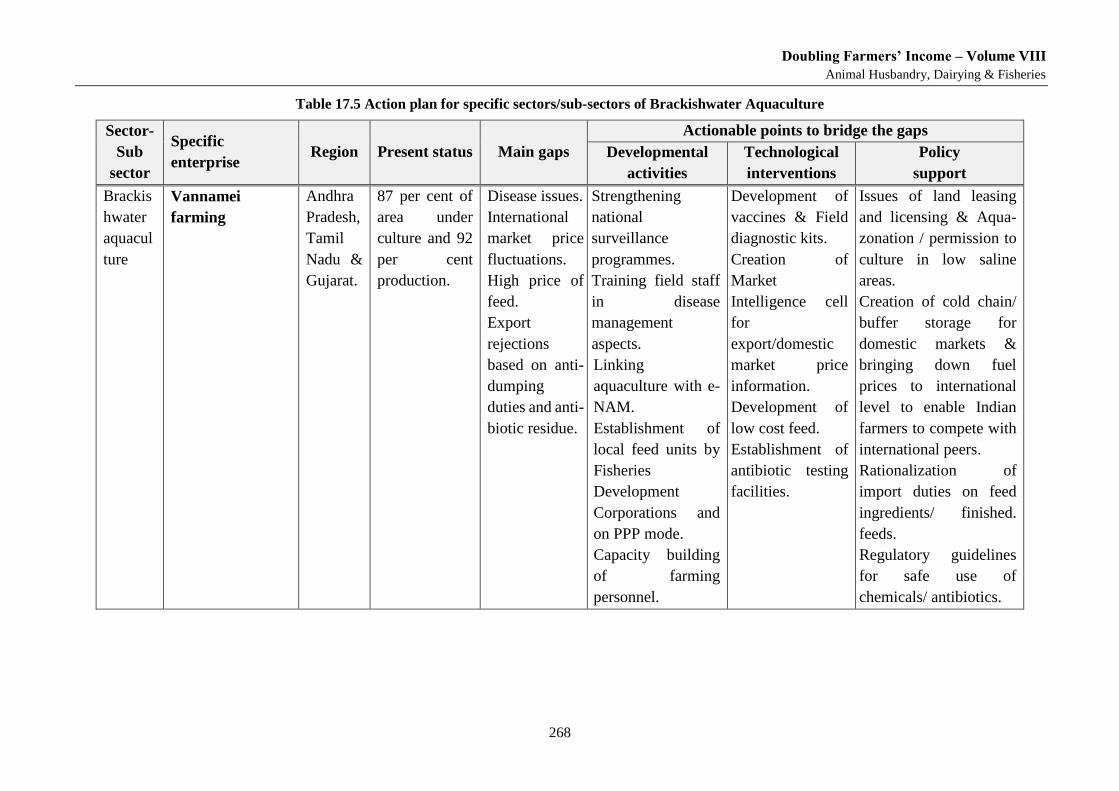
Doubling Farmers’ Income – Volume VIII
Animal Husbandry, Dairying & Fisheries
268
Table 17.5 Action plan for specific sectors/sub-sectors of Brackishwater Aquaculture
Sector-
Sub
sector
Specific
enterprise Region Present status Main gaps
Actionable points to bridge the gaps
Developmental
activities
Technological
interventions
Policy
support
Brackis
hwater
aquacul
ture
Vannamei
farming
Andhra
Pradesh,
Tamil
Nadu &
Gujarat.
87 per cent of
area under
culture and 92
per cent
production.
Disease issues.
International
market price
fluctuations.
High price of
feed.
Export
rejections
based on anti-
dumping
duties and anti-
biotic residue.
Strengthening
national
surveillance
programmes.
Training field staff
in disease
management
aspects.
Linking
aquaculture with e-
NAM.
Establishment of
local feed units by
Fisheries
Development
Corporations and
on PPP mode.
Capacity building
of farming
personnel.
Development of
vaccines & Field
diagnostic kits.
Creation of
Market
Intelligence cell
for
export/domestic
market price
information.
Development of
low cost feed.
Establishment of
antibiotic testing
facilities.
Issues of land leasing
and licensing & Aqua-
zonation / permission to
culture in low saline
areas.
Creation of cold chain/
buffer storage for
domestic markets &
bringing down fuel
prices to international
level to enable Indian
farmers to compete with
international peers.
Rationalization of
import duties on feed
ingredients/ finished.
feeds.
Regulatory guidelines
for safe use of
chemicals/ antibiotics.
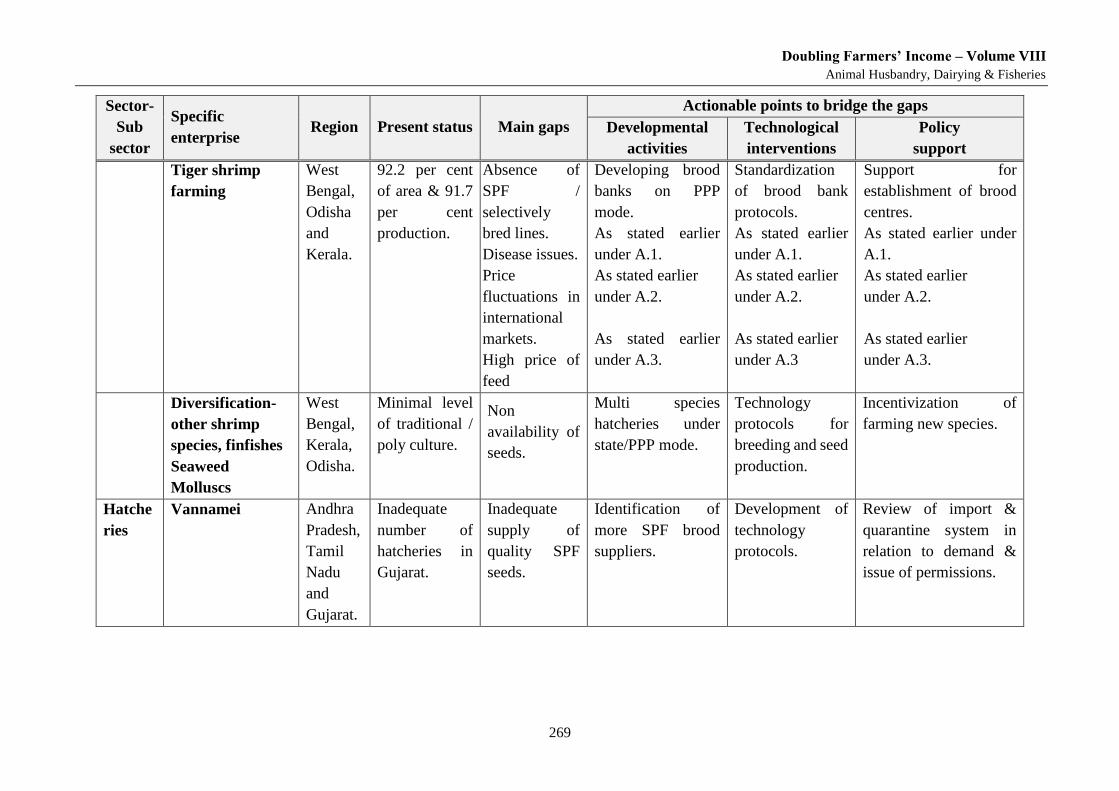
Doubling Farmers’ Income – Volume VIII
Animal Husbandry, Dairying & Fisheries
269
Sector-
Sub
sector
Specific
enterprise Region Present status Main gaps
Actionable points to bridge the gaps
Developmental
activities
Technological
interventions
Policy
support
Tiger shrimp
farming
West
Bengal,
Odisha
and
Kerala.
92.2 per cent
of area & 91.7
per cent
production.
Absence of
SPF /
selectively
bred lines.
Disease issues.
Price
fluctuations in
international
markets.
High price of
feed
Developing brood
banks on PPP
mode.
As stated earlier
under A.1.
As stated earlier
under A.2.
As stated earlier
under A.3.
Standardization
of brood bank
protocols.
As stated earlier
under A.1.
As stated earlier
under A.2.
As stated earlier
under A.3
Support for
establishment of brood
centres.
As stated earlier under
A.1.
As stated earlier
under A.2.
As stated earlier
under A.3.
Diversification-
other shrimp
species, finfishes
Seaweed
Molluscs
West
Bengal,
Kerala,
Odisha.
Minimal level
of traditional /
poly culture.
Non
availability of
seeds.
Multi species
hatcheries under
state/PPP mode.
Technology
protocols for
breeding and seed
production.
Incentivization of
farming new species.
Hatche
ries
Vannamei Andhra
Pradesh,
Tamil
Nadu
and
Gujarat.
Inadequate
number of
hatcheries in
Gujarat.
Inadequate
supply of
quality SPF
seeds.
Identification of
more SPF brood
suppliers.
Development of
technology
protocols.
Review of import &
quarantine system in
relation to demand &
issue of permissions.
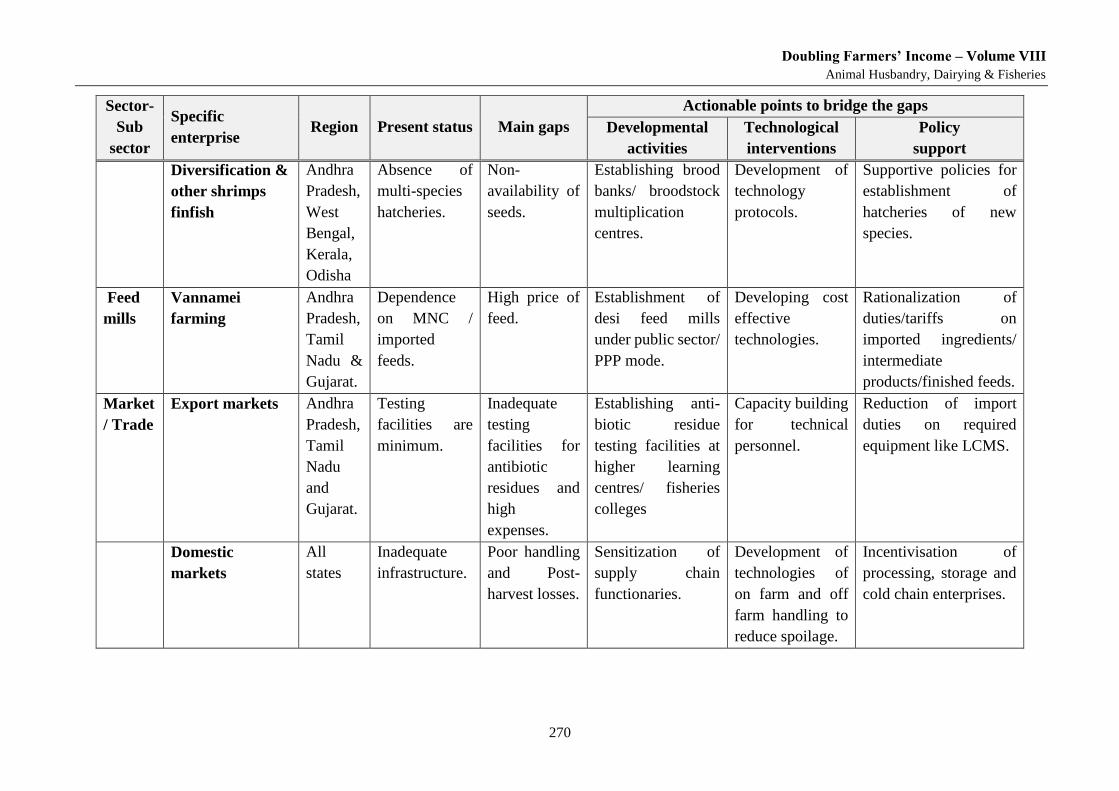
Doubling Farmers’ Income – Volume VIII
Animal Husbandry, Dairying & Fisheries
270
Sector-
Sub
sector
Specific
enterprise Region Present status Main gaps
Actionable points to bridge the gaps
Developmental
activities
Technological
interventions
Policy
support
Diversification &
other shrimps
finfish
Andhra
Pradesh,
West
Bengal,
Kerala,
Odisha
Absence of
multi-species
hatcheries.
Non-
availability of
seeds.
Establishing brood
banks/ broodstock
multiplication
centres.
Development of
technology
protocols.
Supportive policies for
establishment of
hatcheries of new
species.
Feed
mills
Vannamei
farming
Andhra
Pradesh,
Tamil
Nadu &
Gujarat.
Dependence
on MNC /
imported
feeds.
High price of
feed.
Establishment of
desi feed mills
under public sector/
PPP mode.
Developing cost
effective
technologies.
Rationalization of
duties/tariffs on
imported ingredients/
intermediate
products/finished feeds.
Market
/ Trade
Export markets Andhra
Pradesh,
Tamil
Nadu
and
Gujarat.
Testing
facilities are
minimum.
Inadequate
testing
facilities for
antibiotic
residues and
high
expenses.
Establishing anti-
biotic residue
testing facilities at
higher learning
centres/ fisheries
colleges
Capacity building
for technical
personnel.
Reduction of import
duties on required
equipment like LCMS.
Domestic
markets
All
states
Inadequate
infrastructure.
Poor handling
and Post-
harvest losses.
Sensitization of
supply chain
functionaries.
Development of
technologies of
on farm and off
farm handling to
reduce spoilage.
Incentivisation of
processing, storage and
cold chain enterprises.
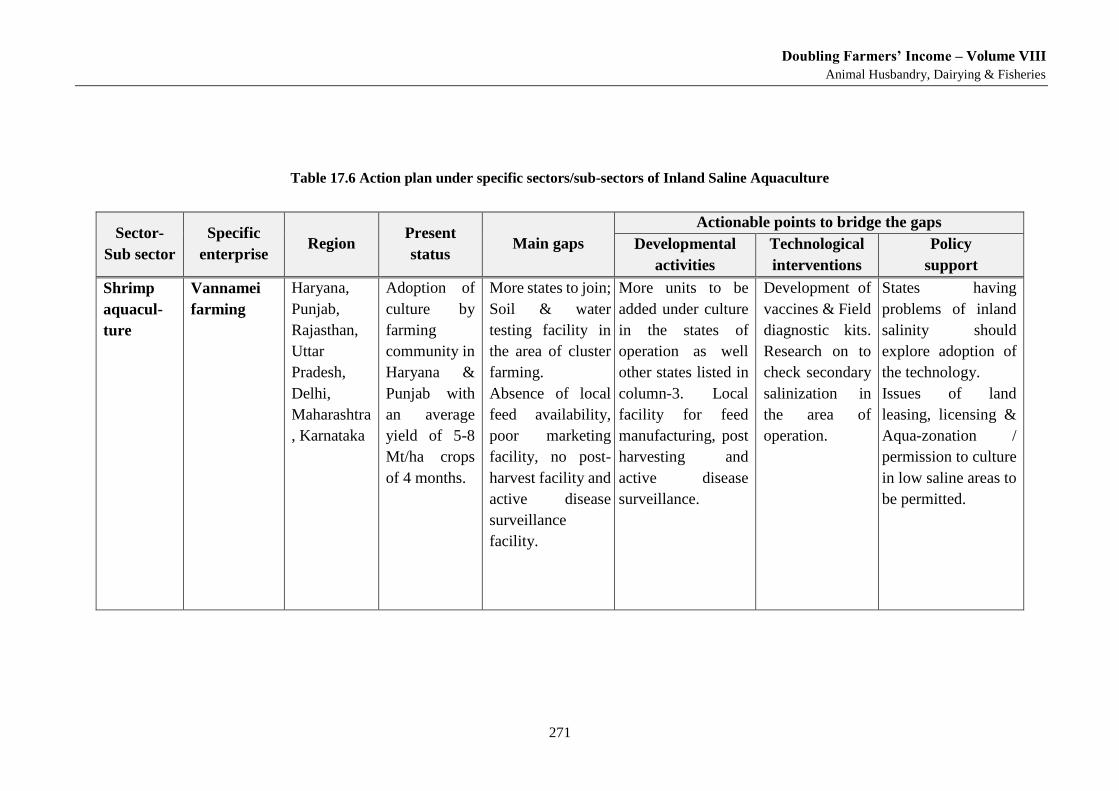
Doubling Farmers’ Income – Volume VIII
Animal Husbandry, Dairying & Fisheries
271
Table 17.6 Action plan under specific sectors/sub-sectors of Inland Saline Aquaculture
Sector-
Sub sector
Specific
enterprise Region
Present
status Main gaps
Actionable points to bridge the gaps
Developmental
activities
Technological
interventions
Policy
support
Shrimp
aquacul-
ture
Vannamei
farming
Haryana,
Punjab,
Rajasthan,
Uttar
Pradesh,
Delhi,
Maharashtra
, Karnataka
Adoption of
culture by
farming
community in
Haryana &
Punjab with
an average
yield of 5-8
Mt/ha crops
of 4 months.
More states to join;
Soil & water
testing facility in
the area of cluster
farming.
Absence of local
feed availability,
poor marketing
facility, no post-
harvest facility and
active disease
surveillance
facility.
More units to be
added under culture
in the states of
operation as well
other states listed in
column-3. Local
facility for feed
manufacturing, post
harvesting and
active disease
surveillance.
Development of
vaccines & Field
diagnostic kits.
Research on to
check secondary
salinization in
the area of
operation.
States having
problems of inland
salinity should
explore adoption of
the technology.
Issues of land
leasing, licensing &
Aqua-zonation /
permission to culture
in low saline areas to
be permitted.
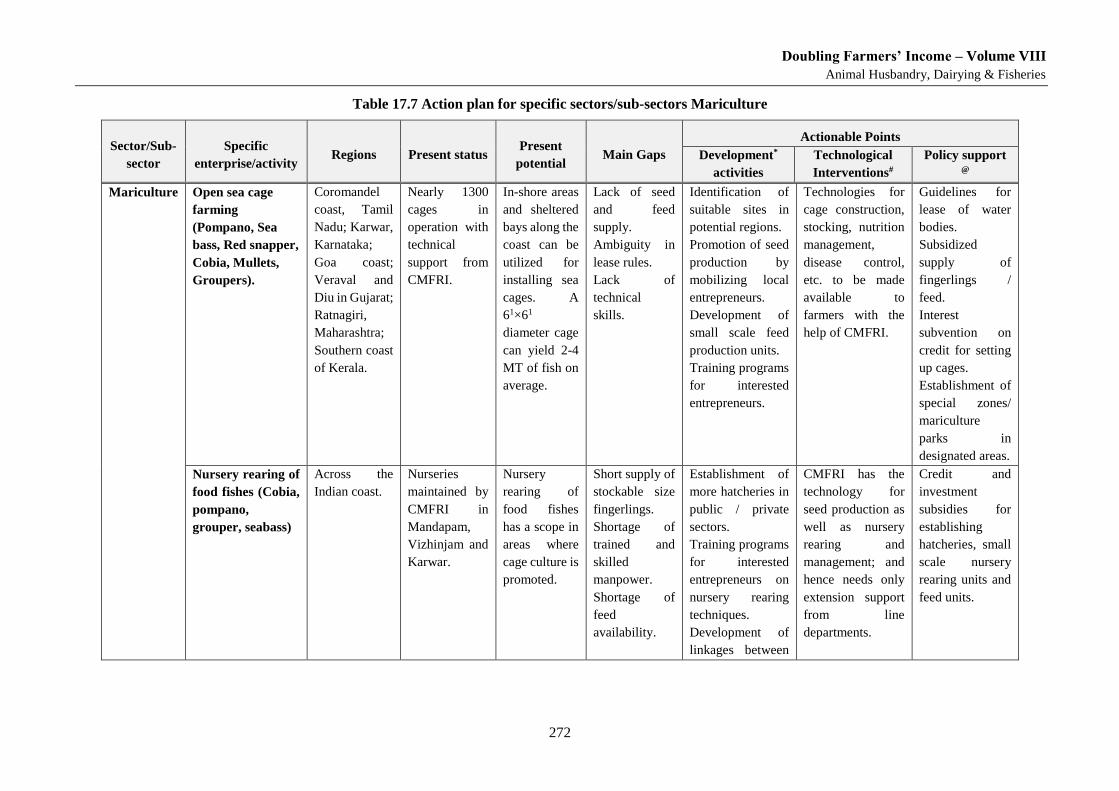
Doubling Farmers’ Income – Volume VIII
Animal Husbandry, Dairying & Fisheries
272
Table 17.7 Action plan for specific sectors/sub-sectors Mariculture
Sector/Sub-
sector
Specific
enterprise/activity Regions Present status
Present
potential Main Gaps
Actionable Points
Development*
activities
Technological
Interventions#
Policy support @
Mariculture Open sea cage
farming
(Pompano, Sea
bass, Red snapper,
Cobia, Mullets,
Groupers).
Coromandel
coast, Tamil
Nadu; Karwar,
Karnataka;
Goa coast;
Veraval and
Diu in Gujarat;
Ratnagiri,
Maharashtra;
Southern coast
of Kerala.
Nearly 1300
cages in
operation with
technical
support from
CMFRI.
In-shore areas
and sheltered
bays along the
coast can be
utilized for
installing sea
cages. A
61×61
diameter cage
can yield 2-4
MT of fish on
average.
Lack of seed
and feed
supply.
Ambiguity in
lease rules.
Lack of
technical
skills.
Identification of
suitable sites in
potential regions.
Promotion of seed
production by
mobilizing local
entrepreneurs.
Development of
small scale feed
production units.
Training programs
for interested
entrepreneurs.
Technologies for
cage construction,
stocking, nutrition
management,
disease control,
etc. to be made
available to
farmers with the
help of CMFRI.
Guidelines for
lease of water
bodies.
Subsidized
supply of
fingerlings /
feed.
Interest
subvention on
credit for setting
up cages.
Establishment of
special zones/
mariculture
parks in
designated areas.
Nursery rearing of
food fishes (Cobia,
pompano,
grouper, seabass)
Across the
Indian coast.
Nurseries
maintained by
CMFRI in
Mandapam,
Vizhinjam and
Karwar.
Nursery
rearing of
food fishes
has a scope in
areas where
cage culture is
promoted.
Short supply of
stockable size
fingerlings.
Shortage of
trained and
skilled
manpower.
Shortage of
feed
availability.
Establishment of
more hatcheries in
public / private
sectors.
Training programs
for interested
entrepreneurs on
nursery rearing
techniques.
Development of
linkages between
CMFRI has the
technology for
seed production as
well as nursery
rearing and
management; and
hence needs only
extension support
from line
departments.
Credit and
investment
subsidies for
establishing
hatcheries, small
scale nursery
rearing units and
feed units.
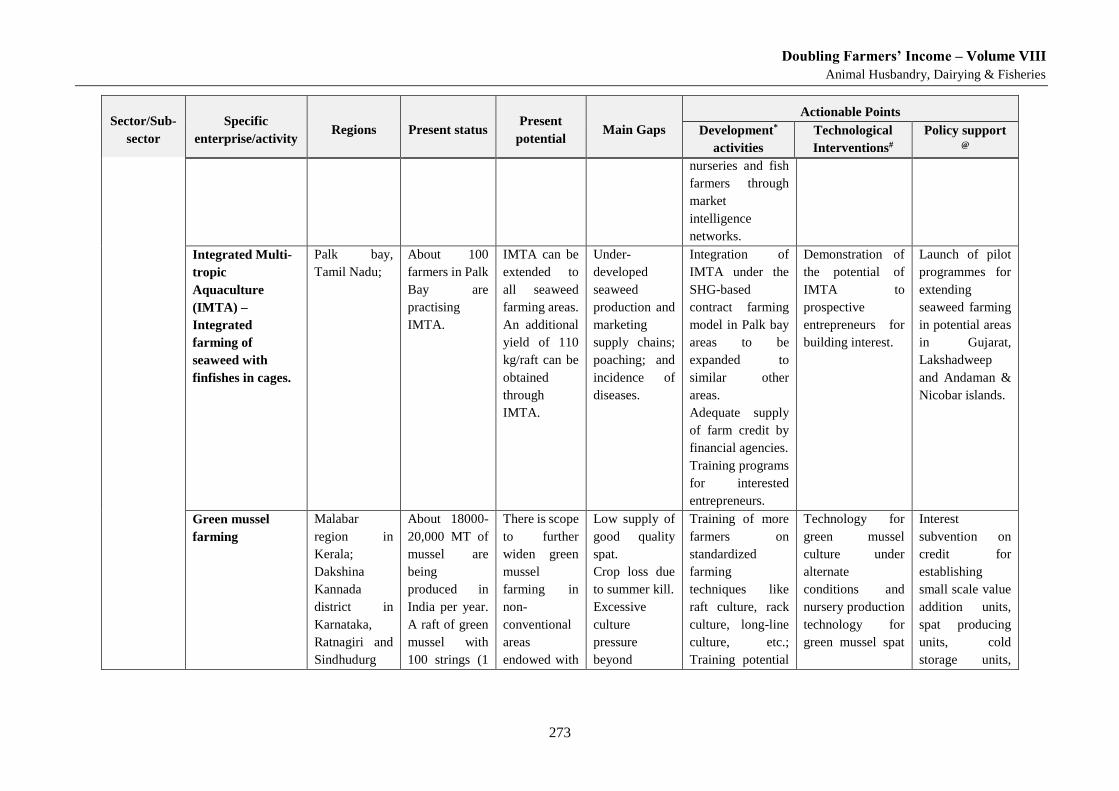
Doubling Farmers’ Income – Volume VIII
Animal Husbandry, Dairying & Fisheries
273
Sector/Sub-
sector
Specific
enterprise/activity Regions Present status
Present
potential Main Gaps
Actionable Points
Development*
activities
Technological
Interventions#
Policy support @
nurseries and fish
farmers through
market
intelligence
networks.
Integrated Multi-
tropic
Aquaculture
(IMTA) –
Integrated
farming of
seaweed with
finfishes in cages.
Palk bay,
Tamil Nadu;
About 100
farmers in Palk
Bay are
practising
IMTA.
IMTA can be
extended to
all seaweed
farming areas.
An additional
yield of 110
kg/raft can be
obtained
through
IMTA.
Under-
developed
seaweed
production and
marketing
supply chains;
poaching; and
incidence of
diseases.
Integration of
IMTA under the
SHG-based
contract farming
model in Palk bay
areas to be
expanded to
similar other
areas.
Adequate supply
of farm credit by
financial agencies.
Training programs
for interested
entrepreneurs.
Demonstration of
the potential of
IMTA to
prospective
entrepreneurs for
building interest.
Launch of pilot
programmes for
extending
seaweed farming
in potential areas
in Gujarat,
Lakshadweep
and Andaman &
Nicobar islands.
Green mussel
farming
Malabar
region in
Kerala;
Dakshina
Kannada
district in
Karnataka,
Ratnagiri and
Sindhudurg
About 18000-
20,000 MT of
mussel are
being
produced in
India per year.
A raft of green
mussel with
100 strings (1
There is scope
to further
widen green
mussel
farming in
non-
conventional
areas
endowed with
Low supply of
good quality
spat.
Crop loss due
to summer kill.
Excessive
culture
pressure
beyond
Training of more
farmers on
standardized
farming
techniques like
raft culture, rack
culture, long-line
culture, etc.;
Training potential
Technology for
green mussel
culture under
alternate
conditions and
nursery production
technology for
green mussel spat
Interest
subvention on
credit for
establishing
small scale value
addition units,
spat producing
units, cold
storage units,
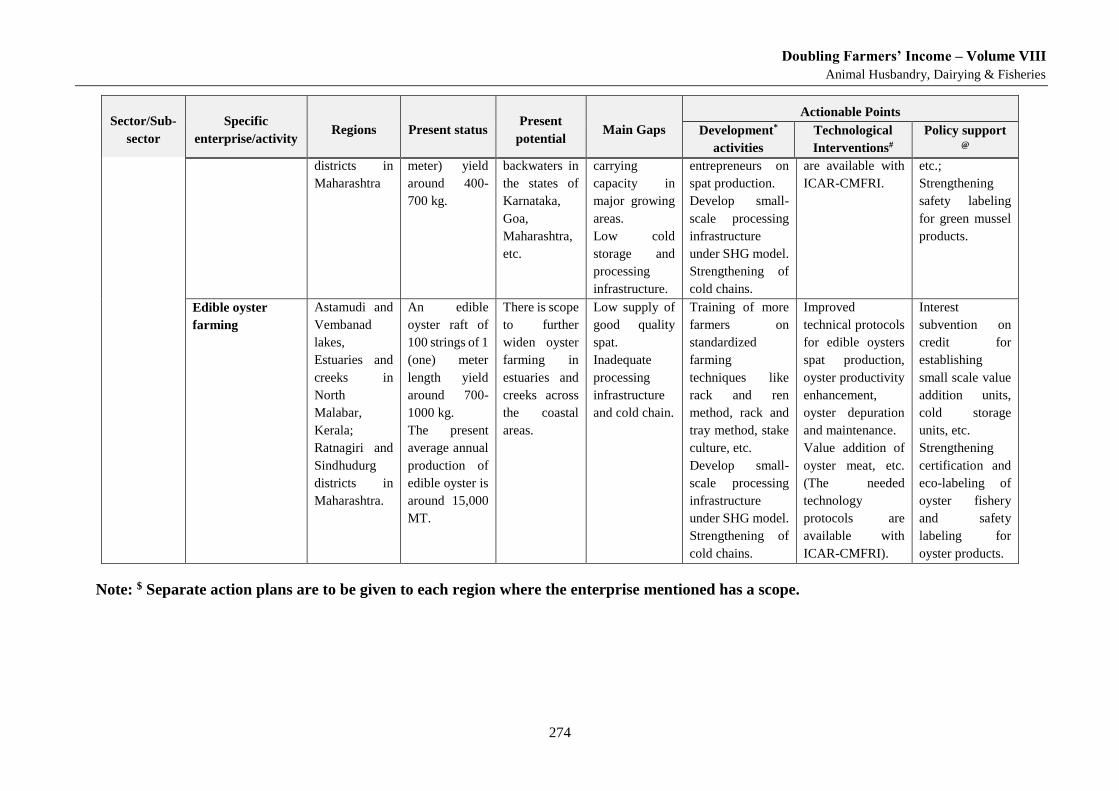
Doubling Farmers’ Income – Volume VIII
Animal Husbandry, Dairying & Fisheries
274
Sector/Sub-
sector
Specific
enterprise/activity Regions Present status
Present
potential Main Gaps
Actionable Points
Development*
activities
Technological
Interventions#
Policy support @
districts in
Maharashtra
meter) yield
around 400-
700 kg.
backwaters in
the states of
Karnataka,
Goa,
Maharashtra,
etc.
carrying
capacity in
major growing
areas.
Low cold
storage and
processing
infrastructure.
entrepreneurs on
spat production.
Develop small-
scale processing
infrastructure
under SHG model.
Strengthening of
cold chains.
are available with
ICAR-CMFRI.
etc.;
Strengthening
safety labeling
for green mussel
products.
Edible oyster
farming
Astamudi and
Vembanad
lakes,
Estuaries and
creeks in
North
Malabar,
Kerala;
Ratnagiri and
Sindhudurg
districts in
Maharashtra.
An edible
oyster raft of
100 strings of 1
(one) meter
length yield
around 700-
1000 kg.
The present
average annual
production of
edible oyster is
around 15,000
MT.
There is scope
to further
widen oyster
farming in
estuaries and
creeks across
the coastal
areas.
Low supply of
good quality
spat.
Inadequate
processing
infrastructure
and cold chain.
Training of more
farmers on
standardized
farming
techniques like
rack and ren
method, rack and
tray method, stake
culture, etc.
Develop small-
scale processing
infrastructure
under SHG model.
Strengthening of
cold chains.
Improved
technical protocols
for edible oysters
spat production,
oyster productivity
enhancement,
oyster depuration
and maintenance.
Value addition of
oyster meat, etc.
(The needed
technology
protocols are
available with
ICAR-CMFRI).
Interest
subvention on
credit for
establishing
small scale value
addition units,
cold storage
units, etc.
Strengthening
certification and
eco-labeling of
oyster fishery
and safety
labeling for
oyster products.
Note: $ Separate action plans are to be given to each region where the enterprise mentioned has a scope.
Doubling Farmers’ Income – Volume VIII
Animal Husbandry, Dairying & Fisheries
275
Chapter 18
Non-farm Fishery Enterprises It is well recognised, that farmers under different sub-sectors of the agricultural economy need to be
offered multiple sources of incomes, as returns from the primary agricultural source may not always
be sustained or adequate. This approach can also serve as an instrument of risk management, for small
& marginal farmers (including fish farmers) who dominate the agricultural structure. Fishery sector
too, provides scope for several such opportunities for gainful engagement and additional incomes.
18.1. Non-farm Activities in the Fisheries Sector
The structure of the rural economy too has been undergoing a change in India along with its
overall economy. The farm and non-farm sectors, the two components of the rural economy,
have been undergoing a structural change through diversification of activities, and on account
of higher opportunities available for employment and income generation.
Similar to other rural economic sectors, there are a number of avenues for promoting non-farm
activities in the fisheries and aquaculture domain. These include harvesting of fish, marketing,
processing, value-addition, manufacture and mending of fishing nets, boat repairing & building
etc. these are all in the nature of support services, that will aid the primary profession of fishing.
These supplement or/and complement the primary fishing activity by facilitating minimization
of input costs and maximization of output and income.
Many of the low cost technologies in the field of fisheries & aquaculture and at harvest & post-
harvest stages are simple, easy-to-adopt, low in capital intensity, economically viable, as also
socially and ecologically acceptable.
These are seen to have already found favour with as alternate and or off-season activities
generating for them additional income through value addition. The activities include fish waste
utilization for fish products, fish & poultry feed, fodder and high quality manure; low-cost fish
processing equipment such as solar driers, smoking kiln, fish de-boner, fish de-scalar, insulated
containers for fresh fish transportation etc.
These offer better returns on investment, additional opportunities for employment generation,
avenues for self-employment, and scope for establishment of small enterprises, helping thereby
overall socio-economic and livelihood empowerment of fish farmers.
Non-farm income (NFI) plays an important role in reducing rural poverty by supplementing
primary sources of incomes; and creating effective demand for goods and services besides
reducing migration of people to urban areas.
Expansion of NFI activities may provide two opportunities of (i) increasing the scale of the
existing activities; and (ii) increasing the multiplicity of activities. Whereas, the former is
helpful mostly in increasing the scope for absorbing larger number of labour, the later provides
options for adding a number of related high value activities for higher income generation.
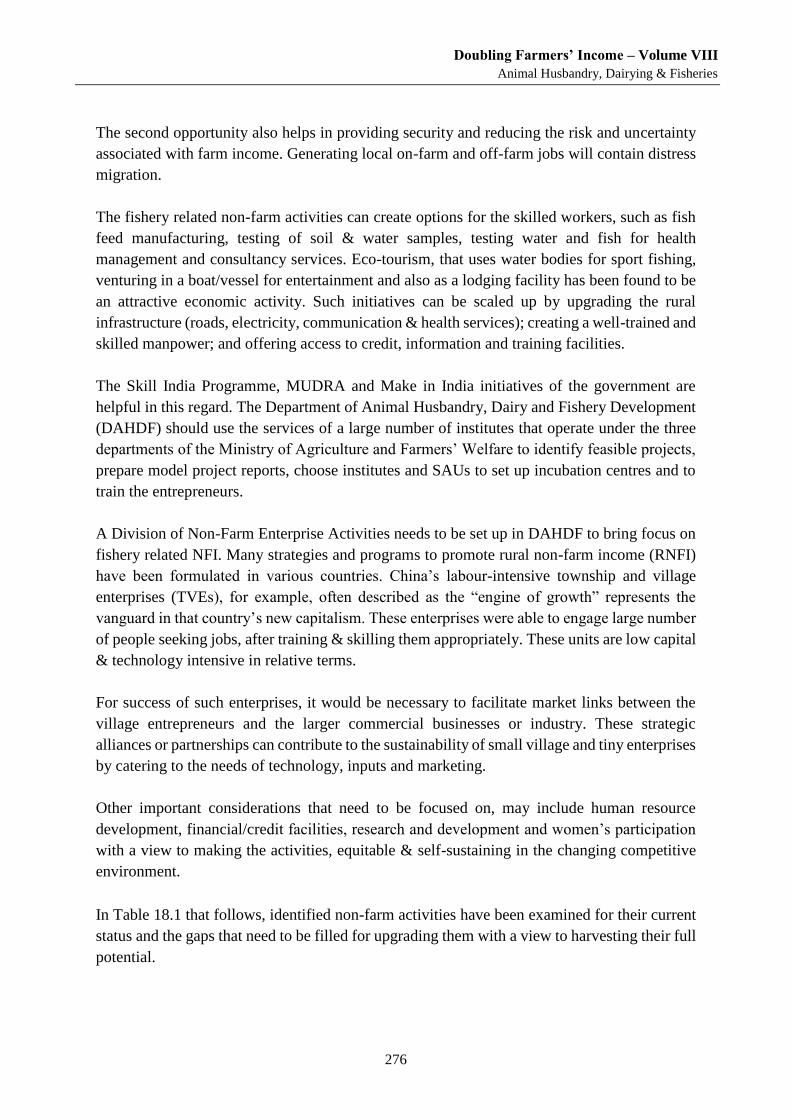
Doubling Farmers’ Income – Volume VIII
Animal Husbandry, Dairying & Fisheries
276
The second opportunity also helps in providing security and reducing the risk and uncertainty
associated with farm income. Generating local on-farm and off-farm jobs will contain distress
migration.
The fishery related non-farm activities can create options for the skilled workers, such as fish
feed manufacturing, testing of soil & water samples, testing water and fish for health
management and consultancy services. Eco-tourism, that uses water bodies for sport fishing,
venturing in a boat/vessel for entertainment and also as a lodging facility has been found to be
an attractive economic activity. Such initiatives can be scaled up by upgrading the rural
infrastructure (roads, electricity, communication & health services); creating a well-trained and
skilled manpower; and offering access to credit, information and training facilities.
The Skill India Programme, MUDRA and Make in India initiatives of the government are
helpful in this regard. The Department of Animal Husbandry, Dairy and Fishery Development
(DAHDF) should use the services of a large number of institutes that operate under the three
departments of the Ministry of Agriculture and Farmers’ Welfare to identify feasible projects,
prepare model project reports, choose institutes and SAUs to set up incubation centres and to
train the entrepreneurs.
A Division of Non-Farm Enterprise Activities needs to be set up in DAHDF to bring focus on
fishery related NFI. Many strategies and programs to promote rural non-farm income (RNFI)
have been formulated in various countries. China’s labour-intensive township and village
enterprises (TVEs), for example, often described as the “engine of growth” represents the
vanguard in that country’s new capitalism. These enterprises were able to engage large number
of people seeking jobs, after training & skilling them appropriately. These units are low capital
& technology intensive in relative terms.
For success of such enterprises, it would be necessary to facilitate market links between the
village entrepreneurs and the larger commercial businesses or industry. These strategic
alliances or partnerships can contribute to the sustainability of small village and tiny enterprises
by catering to the needs of technology, inputs and marketing.
Other important considerations that need to be focused on, may include human resource
development, financial/credit facilities, research and development and women’s participation
with a view to making the activities, equitable & self-sustaining in the changing competitive
environment.
In Table 18.1 that follows, identified non-farm activities have been examined for their current
status and the gaps that need to be filled for upgrading them with a view to harvesting their full
potential.
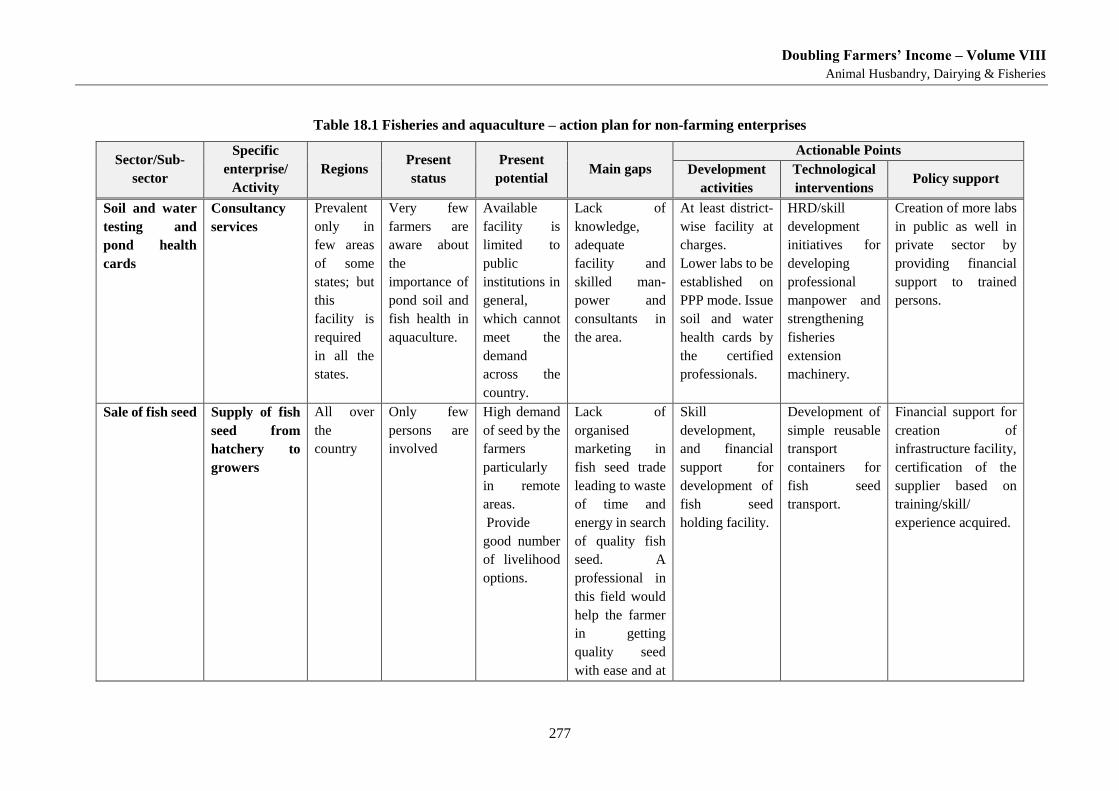
Doubling Farmers’ Income – Volume VIII
Animal Husbandry, Dairying & Fisheries
277
Table 18.1 Fisheries and aquaculture – action plan for non-farming enterprises
Sector/Sub-
sector
Specific
enterprise/
Activity
Regions Present
status
Present
potential Main gaps
Actionable Points
Development
activities
Technological
interventions Policy support
Soil and water
testing and
pond health
cards
Consultancy
services
Prevalent
only in
few areas
of some
states; but
this
facility is
required
in all the
states.
Very few
farmers are
aware about
the
importance of
pond soil and
fish health in
aquaculture.
Available
facility is
limited to
public
institutions in
general,
which cannot
meet the
demand
across the
country.
Lack of
knowledge,
adequate
facility and
skilled man-
power and
consultants in
the area.
At least district-
wise facility at
charges.
Lower labs to be
established on
PPP mode. Issue
soil and water
health cards by
the certified
professionals.
HRD/skill
development
initiatives for
developing
professional
manpower and
strengthening
fisheries
extension
machinery.
Creation of more labs
in public as well in
private sector by
providing financial
support to trained
persons.
Sale of fish seed Supply of fish
seed from
hatchery to
growers
All over
the
country
Only few
persons are
involved
High demand
of seed by the
farmers
particularly
in remote
areas.
Provide
good number
of livelihood
options.
Lack of
organised
marketing in
fish seed trade
leading to waste
of time and
energy in search
of quality fish
seed. A
professional in
this field would
help the farmer
in getting
quality seed
with ease and at
Skill
development,
and financial
support for
development of
fish seed
holding facility.
Development of
simple reusable
transport
containers for
fish seed
transport.
Financial support for
creation of
infrastructure facility,
certification of the
supplier based on
training/skill/
experience acquired.
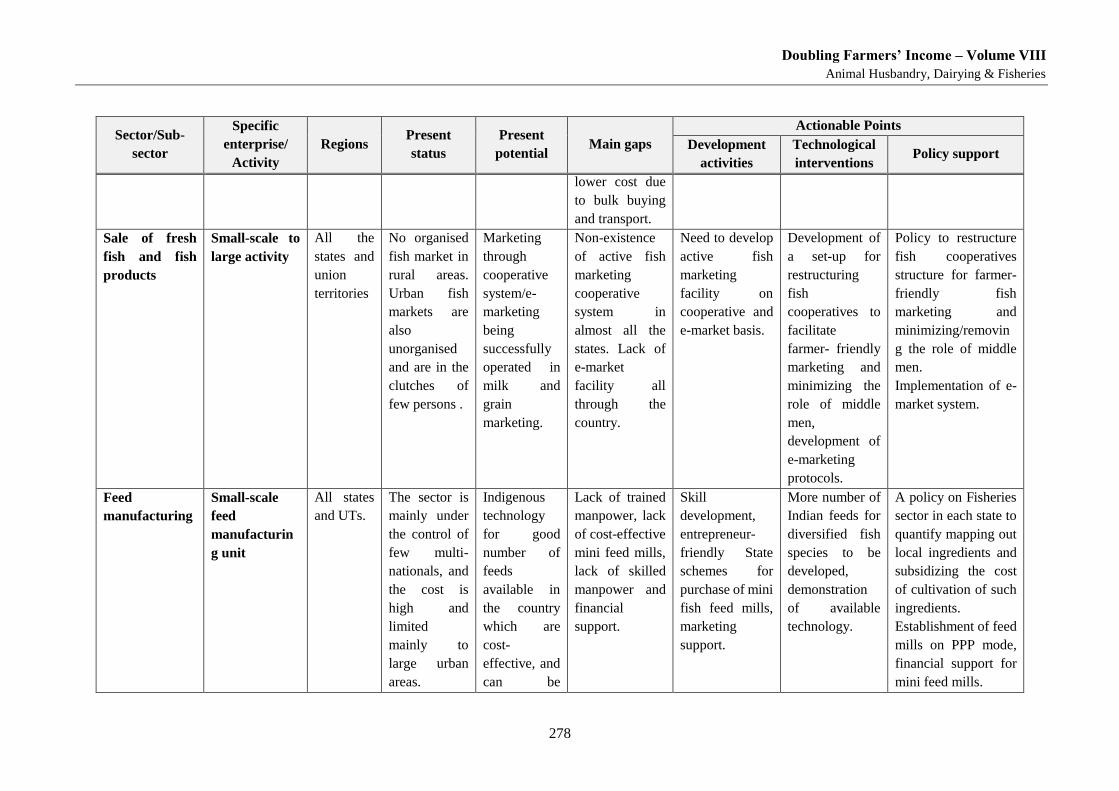
Doubling Farmers’ Income – Volume VIII
Animal Husbandry, Dairying & Fisheries
278
Sector/Sub-
sector
Specific
enterprise/
Activity
Regions Present
status
Present
potential Main gaps
Actionable Points
Development
activities
Technological
interventions Policy support
lower cost due
to bulk buying
and transport.
Sale of fresh
fish and fish
products
Small-scale to
large activity
All the
states and
union
territories
No organised
fish market in
rural areas.
Urban fish
markets are
also
unorganised
and are in the
clutches of
few persons .
Marketing
through
cooperative
system/e-
marketing
being
successfully
operated in
milk and
grain
marketing.
Non-existence
of active fish
marketing
cooperative
system in
almost all the
states. Lack of
e-market
facility all
through the
country.
Need to develop
active fish
marketing
facility on
cooperative and
e-market basis.
Development of
a set-up for
restructuring
fish
cooperatives to
facilitate
farmer- friendly
marketing and
minimizing the
role of middle
men,
development of
e-marketing
protocols.
Policy to restructure
fish cooperatives
structure for farmer-
friendly fish
marketing and
minimizing/removin
g the role of middle
men.
Implementation of e-
market system.
Feed
manufacturing
Small-scale
feed
manufacturin
g unit
All states
and UTs.
The sector is
mainly under
the control of
few multi-
nationals, and
the cost is
high and
limited
mainly to
large urban
areas.
Indigenous
technology
for good
number of
feeds
available in
the country
which are
cost-
effective, and
can be
Lack of trained
manpower, lack
of cost-effective
mini feed mills,
lack of skilled
manpower and
financial
support.
Skill
development,
entrepreneur-
friendly State
schemes for
purchase of mini
fish feed mills,
marketing
support.
More number of
Indian feeds for
diversified fish
species to be
developed,
demonstration
of available
technology.
A policy on Fisheries
sector in each state to
quantify mapping out
local ingredients and
subsidizing the cost
of cultivation of such
ingredients.
Establishment of feed
mills on PPP mode,
financial support for
mini feed mills.
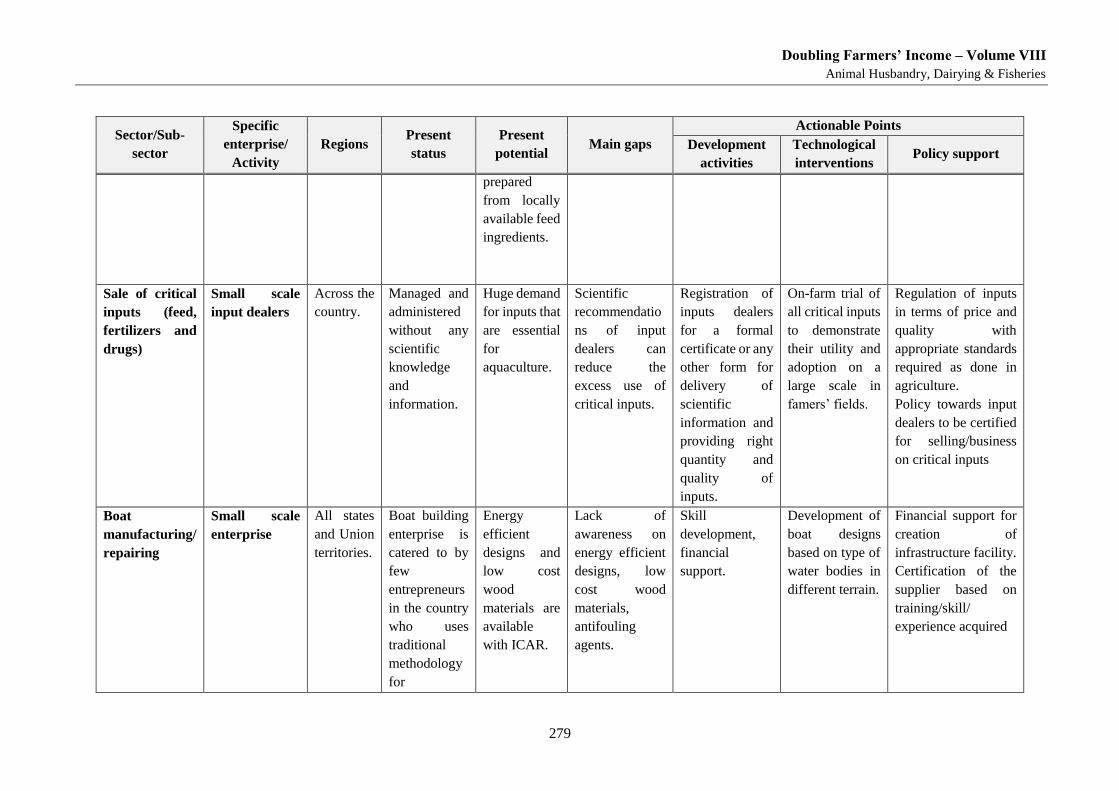
Doubling Farmers’ Income – Volume VIII
Animal Husbandry, Dairying & Fisheries
279
Sector/Sub-
sector
Specific
enterprise/
Activity
Regions Present
status
Present
potential Main gaps
Actionable Points
Development
activities
Technological
interventions Policy support
prepared
from locally
available feed
ingredients.
Sale of critical
inputs (feed,
fertilizers and
drugs)
Small scale
input dealers
Across the
country.
Managed and
administered
without any
scientific
knowledge
and
information.
Huge demand
for inputs that
are essential
for
aquaculture.
Scientific
recommendatio
ns of input
dealers can
reduce the
excess use of
critical inputs.
Registration of
inputs dealers
for a formal
certificate or any
other form for
delivery of
scientific
information and
providing right
quantity and
quality of
inputs.
On-farm trial of
all critical inputs
to demonstrate
their utility and
adoption on a
large scale in
famers’ fields.
Regulation of inputs
in terms of price and
quality with
appropriate standards
required as done in
agriculture.
Policy towards input
dealers to be certified
for selling/business
on critical inputs
Boat
manufacturing/
repairing
Small scale
enterprise
All states
and Union
territories.
Boat building
enterprise is
catered to by
few
entrepreneurs
in the country
who uses
traditional
methodology
for
Energy
efficient
designs and
low cost
wood
materials are
available
with ICAR.
Lack of
awareness on
energy efficient
designs, low
cost wood
materials,
antifouling
agents.
Skill
development,
financial
support.
Development of
boat designs
based on type of
water bodies in
different terrain.
Financial support for
creation of
infrastructure facility.
Certification of the
supplier based on
training/skill/
experience acquired
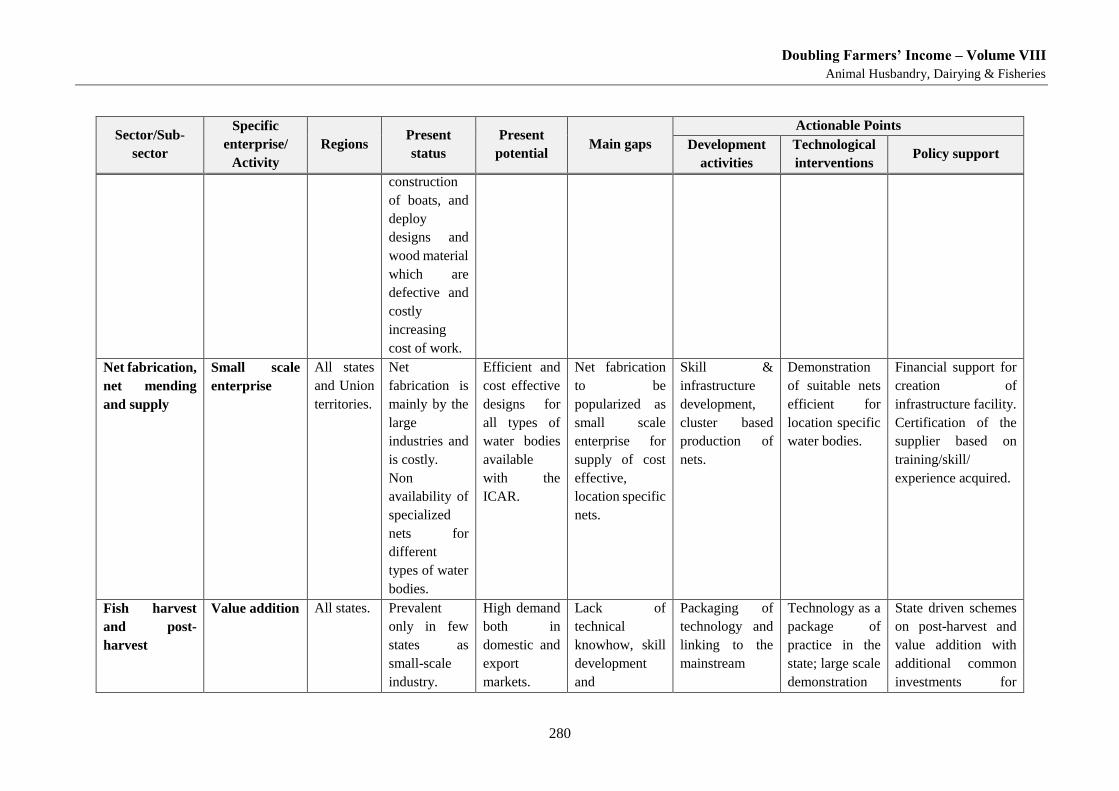
Doubling Farmers’ Income – Volume VIII
Animal Husbandry, Dairying & Fisheries
280
Sector/Sub-
sector
Specific
enterprise/
Activity
Regions Present
status
Present
potential Main gaps
Actionable Points
Development
activities
Technological
interventions Policy support
construction
of boats, and
deploy
designs and
wood material
which are
defective and
costly
increasing
cost of work.
Net fabrication,
net mending
and supply
Small scale
enterprise
All states
and Union
territories.
Net
fabrication is
mainly by the
large
industries and
is costly.
Non
availability of
specialized
nets for
different
types of water
bodies.
Efficient and
cost effective
designs for
all types of
water bodies
available
with the
ICAR.
Net fabrication
to be
popularized as
small scale
enterprise for
supply of cost
effective,
location specific
nets.
Skill &
infrastructure
development,
cluster based
production of
nets.
Demonstration
of suitable nets
efficient for
location specific
water bodies.
Financial support for
creation of
infrastructure facility.
Certification of the
supplier based on
training/skill/
experience acquired.
Fish harvest
and post-
harvest
Value addition
All states.
Prevalent
only in few
states as
small-scale
industry.
High demand
both in
domestic and
export
markets.
Lack of
technical
knowhow, skill
development
and
Packaging of
technology and
linking to the
mainstream
Technology as a
package of
practice in the
state; large scale
demonstration
State driven schemes
on post-harvest and
value addition with
additional common
investments for
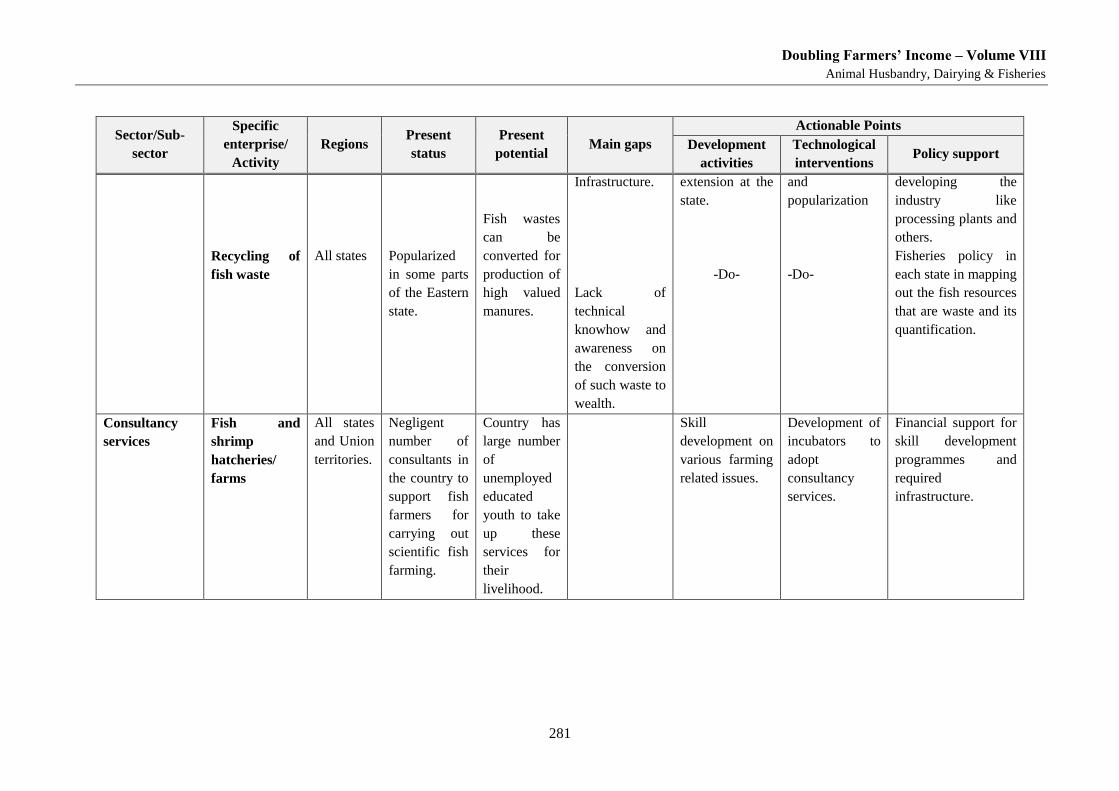
Doubling Farmers’ Income – Volume VIII
Animal Husbandry, Dairying & Fisheries
281
Sector/Sub-
sector
Specific
enterprise/
Activity
Regions Present
status
Present
potential Main gaps
Actionable Points
Development
activities
Technological
interventions Policy support
Recycling of
fish waste
All states
Popularized
in some parts
of the Eastern
state.
Fish wastes
can be
converted for
production of
high valued
manures.
Infrastructure.
Lack of
technical
knowhow and
awareness on
the conversion
of such waste to
wealth.
extension at the
state.
-Do-
and
popularization
-Do-
developing the
industry like
processing plants and
others.
Fisheries policy in
each state in mapping
out the fish resources
that are waste and its
quantification.
Consultancy
services
Fish and
shrimp
hatcheries/
farms
All states
and Union
territories.
Negligent
number of
consultants in
the country to
support fish
farmers for
carrying out
scientific fish
farming.
Country has
large number
of
unemployed
educated
youth to take
up these
services for
their
livelihood.
Skill
development on
various farming
related issues.
Development of
incubators to
adopt
consultancy
services.
Financial support for
skill development
programmes and
required
infrastructure.

Doubling Farmers’ Income – Volume VIII
Animal Husbandry, Dairying & Fisheries
283
Chapter 19
Fisheries Marketing Fisheries has been well supported by institutional agencies since independence. This has resulted in
creditable export volumes fish and fishery products, forming the backbone of agricultural exports from
the country. In direct contrast, domestic fish marketing is highly unorganised and inefficient and leaves
much to be desired. Yet, domestic demand is the mainstay of fish marketing and needs improving.
19.1. Background
The many dictionaries broadly define livestock as farm animals regarded as an asset, who are
raised on a farm to generate a profit, such as cows, sheep, chicken and pigs. In today’s age even
snake and scorpions are being farmed for venom. With the growth in inland fisheries, fish farms
can also be considered as farmer’s livestock as it is an animal asset and is cultivated for
commercial production.
Fish and fish products have presently emerged as the largest group in agricultural exports of
India, with 995.1 thousand tonnes in terms of quantity and 5.4 million US dollars in value. This
accounts for around 10 per cent of the total exports of the country and nearly 20 per cent of the
agricultural exports. More than 50 different types of fish and shellfish products are exported to
75 countries around the world.
On the domestic front, fish marketing system is working on traditional and informal patterns,
mostly run by private traders, lacking modern facilities and involving a large number of
intermediaries between producer and consumer. All this reduces the marketing efficiency and
fisherman’s share in consumer’s rupee. Though domestic fish marketing holds a great potential,
it is still vastly disorganised and unregulated. In most of the cases physical facilities and
infrastructure in all types of fish markets are far from satisfactory.
19.1.1. Status of the Fish Processing Industry
The fish processing industry in India is focused on exports and appears well developed. Out of
the 625 registered exporters, 380 are manufacturer exporters and 240 are merchant exporters.
The fish processing industry consists of 215 ice plants, 481 shrimp peeling plants, 371 freezing
plants, 495 cold storage units, 7 canning plants, 16 fish meal plants, 11 surumi plants and 1
agar-agar production units. Of the sea food processing plants about 95 per cent are concentrated
in 20 major clusters in 9 states. HACCP certification is mandatory and all the sea food
processing plants are HACCP complaint. About 15 per cent of the total fish landed is used for
the export of fishery products.
Generally, the fish passes through several intermediaries from the landing centre or fish farms
to the consumer, through a network of wholesale, major, minor retail, roadside markets, etc.
The intermediaries provide different services of head loading, icing, packing, transporting,
processing and preservation. Value added activity happens at the level of primary level through
sorting, grading, cleaning, icing and packing of fish. Normally fish is graded and sorted
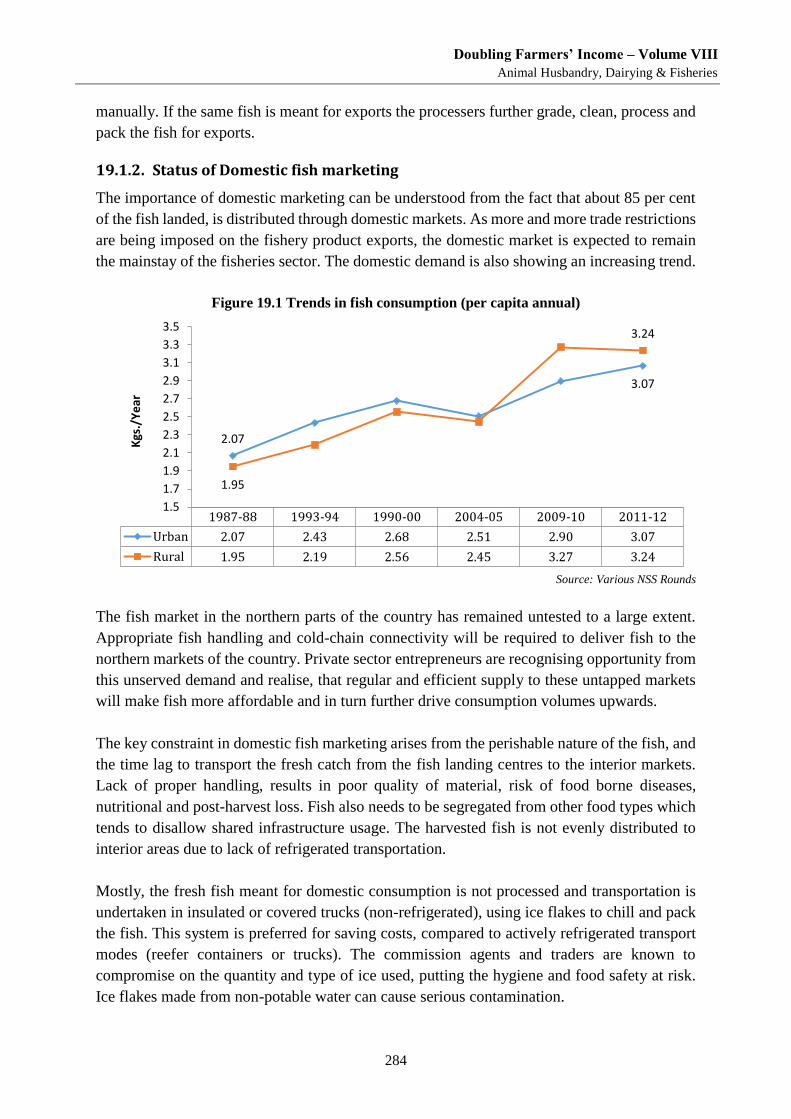
Doubling Farmers’ Income – Volume VIII
Animal Husbandry, Dairying & Fisheries
284
manually. If the same fish is meant for exports the processers further grade, clean, process and
pack the fish for exports.
19.1.2. Status of Domestic fish marketing
The importance of domestic marketing can be understood from the fact that about 85 per cent
of the fish landed, is distributed through domestic markets. As more and more trade restrictions
are being imposed on the fishery product exports, the domestic market is expected to remain
the mainstay of the fisheries sector. The domestic demand is also showing an increasing trend.
Figure 19.1 Trends in fish consumption (per capita annual)
Source: Various NSS Rounds
The fish market in the northern parts of the country has remained untested to a large extent.
Appropriate fish handling and cold-chain connectivity will be required to deliver fish to the
northern markets of the country. Private sector entrepreneurs are recognising opportunity from
this unserved demand and realise, that regular and efficient supply to these untapped markets
will make fish more affordable and in turn further drive consumption volumes upwards.
The key constraint in domestic fish marketing arises from the perishable nature of the fish, and
the time lag to transport the fresh catch from the fish landing centres to the interior markets.
Lack of proper handling, results in poor quality of material, risk of food borne diseases,
nutritional and post-harvest loss. Fish also needs to be segregated from other food types which
tends to disallow shared infrastructure usage. The harvested fish is not evenly distributed to
interior areas due to lack of refrigerated transportation.
Mostly, the fresh fish meant for domestic consumption is not processed and transportation is
undertaken in insulated or covered trucks (non-refrigerated), using ice flakes to chill and pack
the fish. This system is preferred for saving costs, compared to actively refrigerated transport
modes (reefer containers or trucks). The commission agents and traders are known to
compromise on the quantity and type of ice used, putting the hygiene and food safety at risk.
Ice flakes made from non-potable water can cause serious contamination.
1987-88 1993-94 1990-00 2004-05 2009-10 2011-12
Urban 2.07 2.43 2.68 2.51 2.90 3.07
Rural 1.95 2.19 2.56 2.45 3.27 3.24
2.07
3.07
1.95
3.24
1.5
1.7
1.9
2.1
2.3
2.5
2.7
2.9
3.1
3.3
3.5
Kgs
./Y
ear
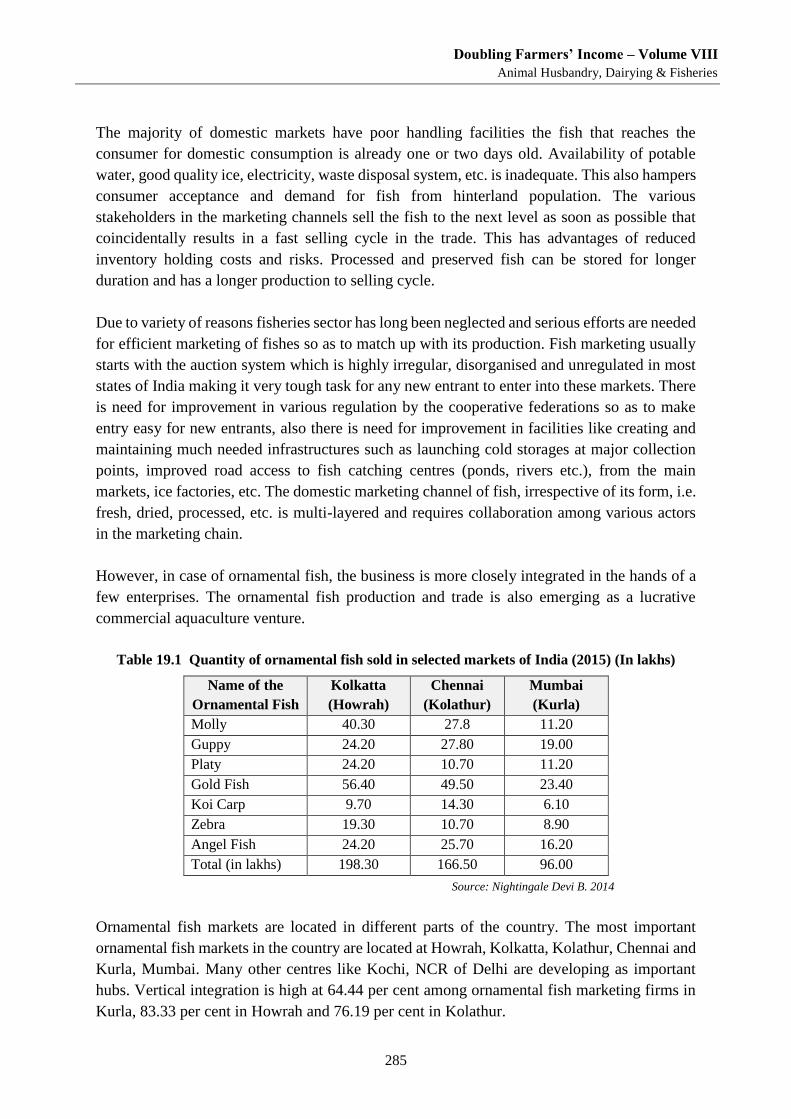
Doubling Farmers’ Income – Volume VIII
Animal Husbandry, Dairying & Fisheries
285
The majority of domestic markets have poor handling facilities the fish that reaches the
consumer for domestic consumption is already one or two days old. Availability of potable
water, good quality ice, electricity, waste disposal system, etc. is inadequate. This also hampers
consumer acceptance and demand for fish from hinterland population. The various
stakeholders in the marketing channels sell the fish to the next level as soon as possible that
coincidentally results in a fast selling cycle in the trade. This has advantages of reduced
inventory holding costs and risks. Processed and preserved fish can be stored for longer
duration and has a longer production to selling cycle.
Due to variety of reasons fisheries sector has long been neglected and serious efforts are needed
for efficient marketing of fishes so as to match up with its production. Fish marketing usually
starts with the auction system which is highly irregular, disorganised and unregulated in most
states of India making it very tough task for any new entrant to enter into these markets. There
is need for improvement in various regulation by the cooperative federations so as to make
entry easy for new entrants, also there is need for improvement in facilities like creating and
maintaining much needed infrastructures such as launching cold storages at major collection
points, improved road access to fish catching centres (ponds, rivers etc.), from the main
markets, ice factories, etc. The domestic marketing channel of fish, irrespective of its form, i.e.
fresh, dried, processed, etc. is multi-layered and requires collaboration among various actors
in the marketing chain.
However, in case of ornamental fish, the business is more closely integrated in the hands of a
few enterprises. The ornamental fish production and trade is also emerging as a lucrative
commercial aquaculture venture.
Table 19.1 Quantity of ornamental fish sold in selected markets of India (2015) (In lakhs)
Name of the
Ornamental Fish
Kolkatta
(Howrah)
Chennai
(Kolathur)
Mumbai
(Kurla)
Molly 40.30 27.8 11.20
Guppy 24.20 27.80 19.00
Platy 24.20 10.70 11.20
Gold Fish 56.40 49.50 23.40
Koi Carp 9.70 14.30 6.10
Zebra 19.30 10.70 8.90
Angel Fish 24.20 25.70 16.20
Total (in lakhs) 198.30 166.50 96.00
Source: Nightingale Devi B. 2014
Ornamental fish markets are located in different parts of the country. The most important
ornamental fish markets in the country are located at Howrah, Kolkatta, Kolathur, Chennai and
Kurla, Mumbai. Many other centres like Kochi, NCR of Delhi are developing as important
hubs. Vertical integration is high at 64.44 per cent among ornamental fish marketing firms in
Kurla, 83.33 per cent in Howrah and 76.19 per cent in Kolathur.
Doubling Farmers’ Income – Volume VIII
Animal Husbandry, Dairying & Fisheries
286
Vertical integration essentially implies that the firms are performing more than one function at
a time, in the marketing process. The firms in these markets work as wholesalers, commission
agents, retailers and post production service agents of ornamental fishes. The extent of
horizontal integration in selected ornamental fish markets was negligible at 6.64 per cent which
indicated that the number of firms having a spread of outlets performing the same function was
almost negligible. The vertical integration also concentrates market power in the hands of a
few firms; the top three account for 10.6, 8.5 and 9.8 per cent of total ornamental fish
transactions respectively. The extent of concentration of market power indicates a lower degree
of market freedom.
19.1.3. Value to Fishermen
As in case of all perishable produce, the farmer or fisher, has little time to evacuate the harvest,
and without any market connectivity services, has to sell off the produce at first instance to the
local agents. The price discovery therefore is made on the basis of incoming daily catch and
demand that is monopolised by the commission agents. Therefore, the fish farmers are obliged
to take the price offered by the commission agents who in turn can delay payments by as many
as 6 months to 1 year. Such delays can bind the farmers in a debt trap.
Marketing services in the form of refrigerated connectivity with the up country consumers is
lacking and would empower the fishing community with a seller’s choice. Such marketing
services would also help them capture a greater share of the final wholesale value at terminal
markets.
19.2. Institutional Support for Fish Marketing (Domestic / Exports)
19.2.1. National Fisheries Development Board
The National Fisheries Development Board (NFDB), established in 2006 under the
administrative control of the Department of Animal Husbandry, Dairying & Fisheries, works
to enhance fish production and productivity in the country and to coordinate fishery
development in an integrated and holistic manner.
A wide range of fishery development activities are supported through state governments and
implementing agencies. This include, intensive aquaculture in ponds and tanks, culture based
capture fisheries in reservoirs, coastal aquaculture, mariculture, sea weed cultivation,
establishing infrastructure like fishing harbours and fish landing centres, fishing dressing
centres, solar drying of fish, domestic marketing, fish processing, ornamental fisheries, etc.
Capacity building of fishermen and fish farmers is also being supported. NFDB activities are
overseen by its Governing Body, chaired by the Union Minister of Agriculture and Farmers
Welfare. The Executive committee, has the Secretary of the Department of Animal Husbandry,
Dairying and Fisheries as its Chairman, provides the general superintendence, direction and
the control of the affairs and functions of the Board.
Doubling Farmers’ Income – Volume VIII
Animal Husbandry, Dairying & Fisheries
287
In the backdrop of the above, the following areas have been identified for the development of
domestic fish marketing system in the country:
• Modernisation of wholesale markets
• Cold-chain and hygienic retail outlets of varying levels
The retail outlets are an important link in the domestic marketing system. It is only through
retail markets and the fish is traded to the outlets to reach the actual consumer. The quality of
fish that reaches the retail end, is effected by the conditions of the wholesale markets and
connecting cold-chain logistics.
The main drawback of the retail market is that the fish reaches for distribution is in poor quality
due to weakness that exist in the wholesale handling, storage and transportation. Initial freezing
and refrigerated transport to safely connect the primary producer to the domestic consumer in
the system is necessary. Apart from a dynamic cold-chain, provision of other amenities like
hygienic retail outlets for merchandising, are required.
Schemes under rural development for promoting women and weaker sections in domestic fish
marketing are also undertaken by NFDB.
19.2.2. Marine Products Exports Development Authority (MPEDA)
The erstwhile Marine Products Export Promotion Council established by the Government of
India in September 1961 was converged in to MPEDA on 24-August-1972, by an act of the
Parliament. MPEDA is given the mandate to promote the marine products industry with special
reference to exports from the country.
The organisation is envisaged to take all actions to develop and augment the resources required
for promoting the exports of “all varieties of fishery products known commercially as shrimp,
prawn, lobster, crab, fish, shell-fish, other aquatic animals or plants or part thereof and any
other products which the authority may, by notification in the Gazette of India, declare to be
marine products for the purposes of (the) Act”.
The Act empowers MPEDA to regulate exports of marine products and take all measures
required for ensuring sustained, quality seafood exports from the country. MPEDA is given the
authority to prescribe for itself any matters, which the future might require, for protecting and
augmenting the seafood exports from the country. It is also empowered to carry out inspection
of marine products, its raw material, fixing standards, specifications, and training as well as
take all necessary steps for marketing the seafood overseas.
MPEDA is the nodal agency for the holistic development of seafood industry in India to realise
its full export potential. Based on the recommendations of MPEDA, Government of India
notified new standards for fishing vessels, storage premises, processing plants and
conveyances. MPEDA’s focus is mainly on market promotion, capture fisheries, culture
Doubling Farmers’ Income – Volume VIII
Animal Husbandry, Dairying & Fisheries
288
fisheries, processing infrastructure & value addition, quality control, research and
development.
MPEDA activities include:
Registration of infrastructural facilities for seafood export trade.
Collection and dissemination of trade information and the promotion of Indian marine
products in overseas markets.
Implementation of schemes vital to the industry by extending assistance for
infrastructure development for better preservation and modernised processing.
Promotion of aquaculture for augmenting export production through development of
hatcheries, new farms, diversification of species and technology upgradation
Promotion of deep-sea fishing projects through test fishing, joint ventures and up
gradation & installation of equipments to increase the efficiency of fishing.
To carry out inspection of marine products, its raw material, fixing standards and
specifications, training, regulating as well as to take all necessary steps for maintaining
the quality of seafood that are marketed overseas.
Impart trainings to fishermen, fish processing workers, aquaculture farmers and other
stake holders in the respective fields related to fisheries.
Conduct research and development for the aquaculture of aquatic species having export
potential through Rajiv Gandhi Centre for Aquaculture (RGCA).
Conduct extension and awareness activities, trainings etc through Network for Fish
Quality Management and Sustainable Fishing (NETFISH) & National Centre for
Sustainable Aquaculture (NaCSA).
MPEDA also launched the Fish Exchange Portal’, http://fishexchange.mpeda.gov.in, to
enhance the export trade between registered seafood exporters of India and buyers abroad. The
portal provides a platform for buyers across the globe to interact and source the ‘Irresistible
Seafood from Incredible India’ from the registered exporters under this Authority. The portal
also features latest and updated information on world’s and India’s seafood trade statistics,
production information and price trends, for the users to refer and understand the market
scenario. It is loaded with directory of Indian seafood exporters, country profiles, regulatory,
and tariff information, standards, notifications, information on upcoming business events / fairs
etc. so that it will act like a ‘one stop shop’ for the trade needs.
19.3. Recent Government initiatives to modernise market infrastructure
The various fiscal and financial incentives by the government is listed in chapter 5 of Volume
III of this Report. The Integrated National Fisheries Action Plan envisages facilities for
reduction of post-harvest loss and to increase market accessibility for consumers.
Doubling Farmers’ Income – Volume VIII
Animal Husbandry, Dairying & Fisheries
289
Pursuant to the announcement in the 2017 Budget, the Dairy Infrastructure Development Fund
(DIDF) of. Rs. 11,700 crore was set up as a corpus fund under NABARD, for modernisation
of obsolete infrastructure with the cooperatives over next 3 years.
Thereafter the 2018 Union Budget, announced setting up a Fisheries and Aquaculture
Infrastructure Development Fund (FAIDF) for fisheries sector and an Animal Husbandry
Infrastructure Development Fund (AHIDF) for financing infrastructure requirement of animal
husbandry sector. A provision of Rs 7,522.48 crore has been made for the establishment
of FAIDF. The total corpus of these two new funds would be about Rs 10,000 crore.
This is expected this will help in developing infrastructure in farms located in remote locations
and well as in enabling market connectivity from fish farms to domestic and international
consumers.
Key Extracts
Fisheries sector has received sustained government support to increase production and
has also garnered private initiatives and grown. However, market and marketing
development has been largely left to the devices of cooperatives and private sector.
Small fishers have to rely on multi-layered market chain to supply the domestic market
which leads to inefficiencies and lower value share for farmers. .
Unlike horticultural produce, fish requires to undergo food processing to fully capture
consumer demand in hinterland cities. Focus on fish processing industries for domestic
market should be a priority area.
Domestic fish markets remain the mainstay of fishers and hinterland demand is not
fully tested due to insufficient cold-chain connectivity. The growth potential for fresh
fish in domestic markets is somewhat hindered due to quality concerns. There is need
to strategically focus on upgrading and scaling up the marketing and logistics network,
to meet and amplify such domestic demand.

Doubling Farmers’ Income – Volume VIII
Animal Husbandry, Dairying & Fisheries
291
Chapter 20
Fisheries: Policy Recommendations Based on examination and deliberations of the fishery sector from different angles, in the percentage
chapters, some important policy recommendations emerge. Adoption would help in imparting greater
stability and robustness to the sector.
20.1. Marine fisheries
i. The fleet strength of marine fishing vessels needs to be reduced as recommended by
the National Policy on Marine Fisheries, 2017 in order to reduce fishing pressure and
to optimize income from marine fisheries. Sustainability is important.
ii. It is necessary to promote off-shore and near-shore alternative employment
opportunities for the fishers during the fishing ban period to sustain their livelihood,
and also enhance their annual incomes from different sources. The alternatives for
gainful engagement include seaweed farming, mussel and clam culture, pearl culture,
marine ornamental fish culture etc.
iii. Cage culture needs to be promoted by attracting foreign direct investment (FDI) by
professional & experienced corporates. It must be ensured, that local stakeholders gain
from such investments in terms of income and welfare.
iv. In a business-as-usual scenario, the ocean is expected to contain one tonne of plastic for
every three tonnes of fish by 2025, and by 2050, there will be more plastic than fish [by
weight] in the seas. The fishers (marine) could be trained in collection and recycling
and in making the best use of the collected plastic for supplementing their income.
20.2. Inland fisheries
20.2.1. Riverine fisheries
i. Leasing polices for use of rivers for fishing must be streamlined. Cooperatives have to
be strengthened in riverine fisheries. The Kolhapur (Maharashtra) model deserves to
be replicated across the country for increased landings and income.
ii. Recreational fisheries need to be promoted by professional and experienced angling
associations in cooperation with State departments of fisheries. This can generate new
income for local stakeholders in hill areas.
20.2.2. Reservoir fisheries
i. Lease rights for reservoir cooperatives need to be strengthened with specified user
rights.
ii. Cage culture in reservoirs needs to be promoted for increased production and income.
iii. The Andhra Pradesh model (with TATA Trust) for improving the performance of
reservoir fisheries may be considered for replication across the country
Doubling Farmers’ Income – Volume VIII
Animal Husbandry, Dairying & Fisheries
292
20.2.3. Freshwater aquaculture
i. Freshwater aquaculture needs to be promoted as a national activity under “Blue
Revolution: Integrated Development and Management of Fisheries’, the umbrella
scheme of NFDB (National Fisheries Development Board). Substantial enhancement
in income of farmers and fishers’ can be achieved.
ii. Specific freshwater culture activities like freshwater ornamental fisheries and
freshwater pearl culture need to be given special attention in terms of funds and
extension support for popularisation of such enterprises.
iii. When credit needs of the fish farmers are not met from formal sources, a dependency
is created with local traders, which binds farmers in an unequal relationship. The
fishermen be offered credit without collateral and also ensuring timely dispersal. This
will enable them to sell their produce at the right place at the right price of their volition.
iv. An efficient and effective market structure for fishery crop and products is necessary
and deserves highest attention.
20.3. Brackishwater aquaculture
i. Shrimp farming needs to be regulated intensely. Shrimp farming is a delicate farming
activity that requires high technical and management skills. The current model of
leasing out fallow government lands to marginalised sections of the population cannot
yield sustained and substantial gains - neither economic nor social unless modelled in
a collective way. Shrimp farming requires high technology and management skills that
can be (considered for) obtained via FDI from experienced companies. The only rider
that needs to be placed is the need for these companies to involve local stakeholders in
the income generation process. One way of doing it is to lease out potential sites to the
landless & weaker sections, and organise them into VPOs/FPOs, which can then engage
themselves with Companies / Corporates for professional management. Contract
farming arrangement can facilitate such an arrangement.
ii. Marketing needs to be streamlined to provide steady prices and income for the farmers.
Shrimp is essentially an export product and is subject to regulation of WTO and
volatility of international trade. The issue of anti- dumping duties keeps raising its head
periodically. This needs intervention at appropriate level.
iii. Brackish water fish culture like Asian Seabass, Cobia should be handled by technically
competent and highly skilled management personnel, and is not a small farmer activity.
Yet, the involvement of local stakeholders in off-shore corporate fish farming needs to
be ensured for the economic and welfare gains of the local stakeholders. Further, as
suggested above FPO model will offer strength to fishermen.
iv. Tilapia and Pangasius can be promoted as an income earning activity in brackish water
areas. The fish has high market potential and is hardy.
Doubling Farmers’ Income – Volume VIII
Animal Husbandry, Dairying & Fisheries
293
20.4. Advisories
20.4.1. Weather advisories
i. Fishermen are exposed to high degree of weather truancies, particularly in case of
marine fishing. This risk can be addressed by using weather forecast system.
ii. Weather advisories shared in real time will be highly useful.
20.4.2. Potential fishing zone advisories
A Portal, m@krishi developed by CMFRI has demonstrated, that the fishermen along
Maharashtra coast benefitted from enhanced fish catch (by 30-40 per cent) and savings
in fuel (by 30 per cent). Such facility should be made available to all the fishermen
along the entire coastline of India.
20.4.3. Deployment of advanced technologies
Deployment of GIS mapping technology and wholesome adoption of vessel monitoring
system (VMS) will enhance operational efficiency in fishing and enable monitoring,
control and surveillance.
20.5. Policy and Implementation Focus
i. Active development of fishing village communities into Village Producer
Organisations, as companies so as to enable modern organisation, credit, investment
and partnerships with allied industries. The VPOs could also facilitate the formalising
of village level equipment hiring, maintenance and repairs, as well as output handling.
The village scale organisations could be structured as companies or cooperatives.
ii. A Division called ‘Division of Non-farm Enterprise Activities’ may be created in the
DAHDFD, with a mandate to promote all such secondary actions and activities relating
to dairy, livestock, poultry, fishery & aquaculture. It is necessary to promote fishery
related non-farm income generating activities, for which several opportunities are
available.
-- X --

Doubling Farmers’ Income – Volume VIII
Animal Husbandry, Dairying & Fisheries
295
Bibliography – Vol VIII-D
Annual Reports of DAHDF – 2016-17 and 2017-18
Aquaculture Economics and Management, 12(2): 130-144
Building a Vibrant Goat Sector: Approach Paper for Vision 2030 - BMGF, IFAD, Department of
Animal Husbandry Dairying and Fisheries, MoAFW, GOI
Gittinger, J. P. 1982. Economic analysis of agricultural projects. The John Hopkins University Press,
2nd edn. Baltimore, London.
Kaliaperumal, N., Kalimuthu, S. and Ramalingam, J. R. 2004. Present scenario of seaweed exploitation
and industry in India. Seaweed Res.Utiln., 26: 47-53.
Krishnan, M. and Narayanakumar, R. 2009. Socio-economic dimensions of seaweed farming in India,
Consultancy Report, Personal Services Agreement, FAO of UN, Rome, p. 103.
Livestock Census-2012, All India Report – GoI
Modayil, M. J. 2004. How to increase marine fish production.Fishing Chimes, 28(1): 14-16.
Padilla, J. E. and Lampe, H. C. 1989. The economics of seaweed farming in the Philippines, Naga, The
ICLARM Quarterly 12(3): 3-5.
Phansalkar Sanjiv (2017) Indian gear up for blue revolution, Village Square, January 11.
Public-private-producer partnerships (4Ps) in small ruminant value chain development in India - IFAD
and the Bill & Melinda Gates Foundation
Rao, G. Syda, and Kumar R. Narayana 2008. An economic analysis of land based production of marine
pearls in India.
Sathiadhas, R., Najmudeen, T. M. and Sangeetha Prathap 2009. Break-even analysis and profitability
of Aquaculture Practices in India. Asian Fish. Sci., 22: 667-680.
Shang, Y. C. 1976. Economic aspects of Gracilaria culture in Taiwan. Aquaculture, 8: 1-7
Shang, Y. C. 1981. Aquaculture Economics: basic concepts and methods of analysis. Westview, Press,
Boulderview, Colorado
Shinoj Parappurathu*, Grinson George, R. Narayanakumar, N. Aswathy, C. Ramachandran and A.
Gopalakrishnan (2017), Priorities and Strategies to Boost Incomes of Marine Fisher Folk in
India, Agricultural Economics Research Review,Vol. 30, 2017 pp 205-216
Small ruminant value chain in India: opportunities and constraints, 2017 - Indian Journal of Economics
and Development, M Chakraborty, D. Gupta
Tisdell, C. 1972. The Microeconomics: the theory of economic allocation. John Wiley and Sons,
Sydney, 247 pp

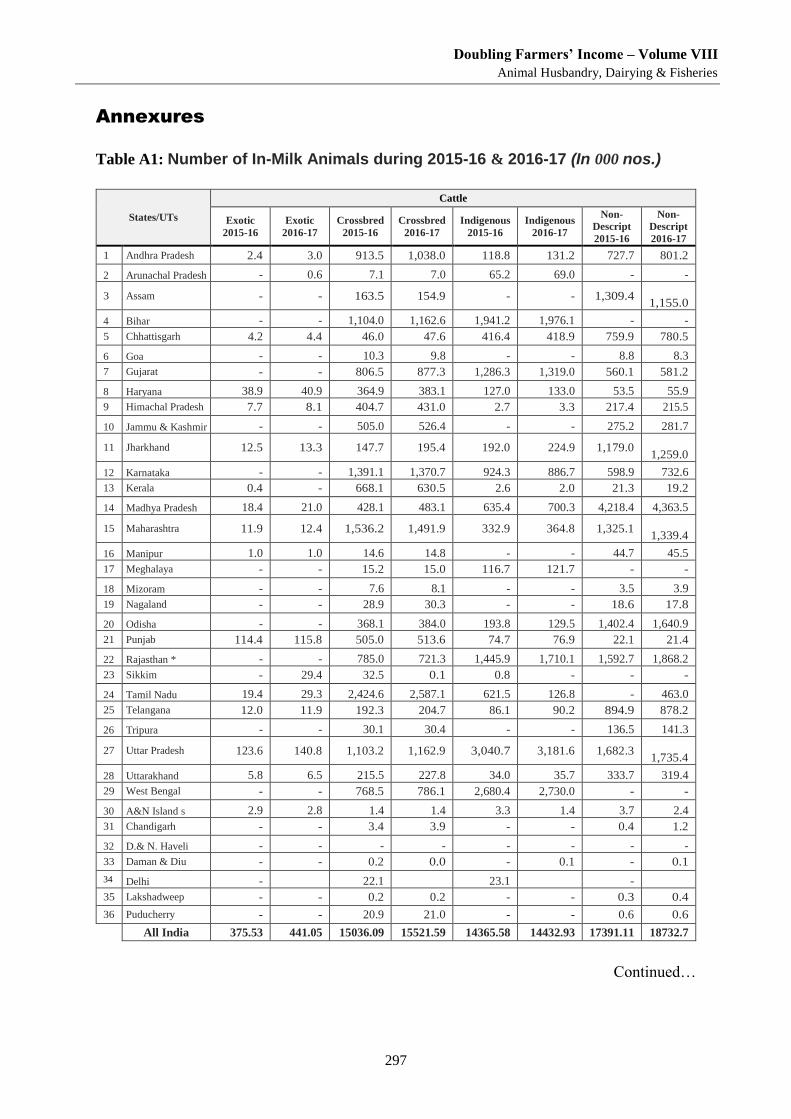
Doubling Farmers’ Income – Volume VIII
Animal Husbandry, Dairying & Fisheries
297
Annexures
Table A1: Number of In-Milk Animals during 2015-16 & 2016-17 (In 000 nos.)
States/UTs
Cattle
Exotic
2015-16
Exotic
2016-17
Crossbred
2015-16
Crossbred
2016-17
Indigenous
2015-16
Indigenous
2016-17
Non-
Descript
2015-16
Non-
Descript
2016-17
1 Andhra Pradesh 2.4 3.0 913.5 1,038.0 118.8 131.2 727.7 801.2
2 Arunachal Pradesh - 0.6 7.1 7.0 65.2 69.0 - -
3 Assam - - 163.5 154.9 - - 1,309.4
1,155.0
4 Bihar - - 1,104.0 1,162.6 1,941.2 1,976.1 - -
5 Chhattisgarh 4.2 4.4 46.0 47.6 416.4 418.9 759.9 780.5
6 Goa - - 10.3 9.8 - - 8.8 8.3
7 Gujarat - - 806.5 877.3 1,286.3 1,319.0 560.1 581.2
8 Haryana 38.9 40.9 364.9 383.1 127.0 133.0 53.5 55.9
9 Himachal Pradesh 7.7 8.1 404.7 431.0 2.7 3.3 217.4 215.5
10 Jammu & Kashmir - - 505.0 526.4 - - 275.2 281.7
11 Jharkhand 12.5 13.3 147.7 195.4 192.0 224.9 1,179.0
1,259.0
12 Karnataka - - 1,391.1 1,370.7 924.3 886.7 598.9 732.6
13 Kerala 0.4 - 668.1 630.5 2.6 2.0 21.3 19.2
14 Madhya Pradesh 18.4 21.0 428.1 483.1 635.4 700.3 4,218.4 4,363.5
15 Maharashtra 11.9 12.4 1,536.2 1,491.9 332.9 364.8 1,325.1
1,339.4
16 Manipur 1.0 1.0 14.6 14.8 - - 44.7 45.5
17 Meghalaya - - 15.2 15.0 116.7 121.7 - -
18 Mizoram - - 7.6 8.1 - - 3.5 3.9
19 Nagaland - - 28.9 30.3 - - 18.6 17.8
20 Odisha - - 368.1 384.0 193.8 129.5 1,402.4 1,640.9
21 Punjab 114.4 115.8 505.0 513.6 74.7 76.9 22.1 21.4
22 Rajasthan * - - 785.0 721.3 1,445.9 1,710.1 1,592.7 1,868.2
23 Sikkim - 29.4 32.5 0.1 0.8 - - -
24 Tamil Nadu 19.4 29.3 2,424.6 2,587.1 621.5 126.8 - 463.0
25 Telangana 12.0 11.9 192.3 204.7 86.1 90.2 894.9 878.2
26 Tripura - - 30.1 30.4 - - 136.5 141.3
27 Uttar Pradesh 123.6 140.8 1,103.2 1,162.9 3,040.7 3,181.6 1,682.3
1,735.4
28 Uttarakhand 5.8 6.5 215.5 227.8 34.0 35.7 333.7 319.4
29 West Bengal - - 768.5 786.1 2,680.4 2,730.0 - -
30 A&N Island s 2.9 2.8 1.4 1.4 3.3 1.4 3.7 2.4
31 Chandigarh - - 3.4 3.9 - - 0.4 1.2
32 D.& N. Haveli - - - - - - - -
33 Daman & Diu - - 0.2 0.0 - 0.1 - 0.1
34 Delhi - 22.1 23.1 -
35 Lakshadweep - - 0.2 0.2 - - 0.3 0.4
36 Puducherry - - 20.9 21.0 - - 0.6 0.6
All India 375.53 441.05 15036.09 15521.59 14365.58 14432.93 17391.11 18732.7
Continued…
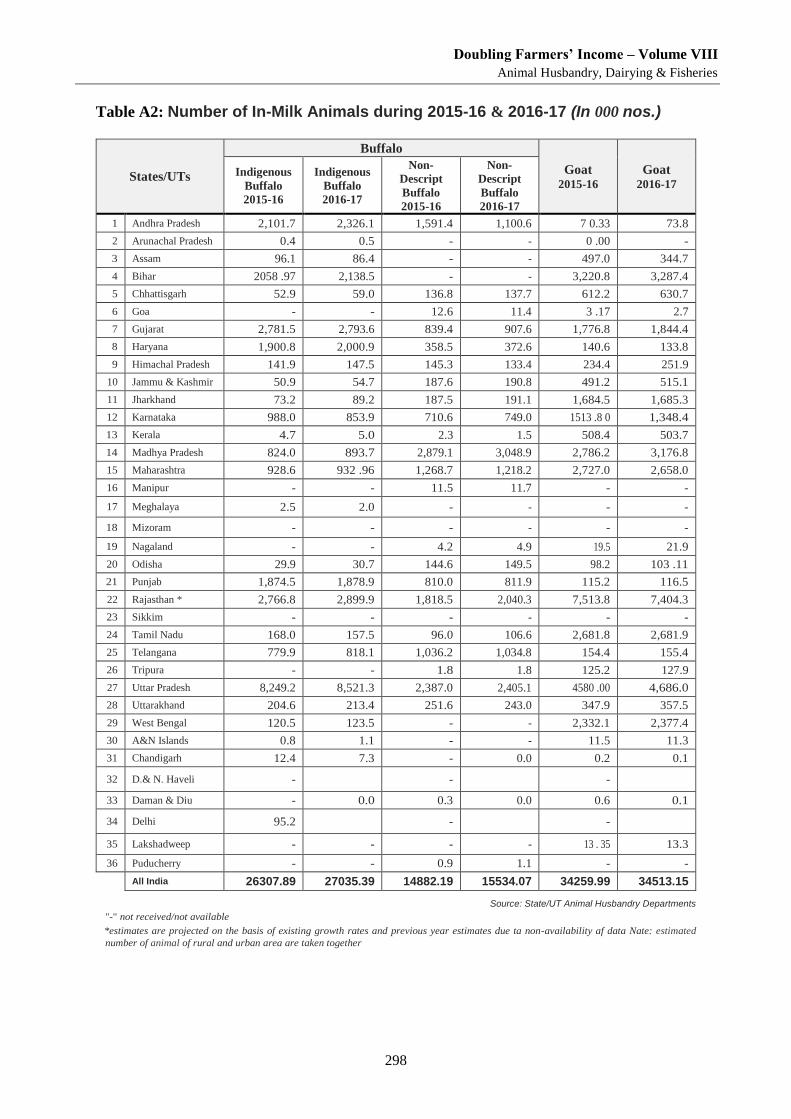
Doubling Farmers’ Income – Volume VIII
Animal Husbandry, Dairying & Fisheries
298
Table A2: Number of In-Milk Animals during 2015-16 & 2016-17 (In 000 nos.)
States/UTs
Buffalo
Goat 2015-16
Goat 2016-17
Indigenous
Buffalo
2015-16
Indigenous
Buffalo
2016-17
Non-
Descript
Buffalo
2015-16
Non-
Descript
Buffalo
2016-17
1 Andhra Pradesh 2,101.7 2,326.1 1,591.4 1,100.6 7 0.33 73.8
2 Arunachal Pradesh 0.4 0.5 - - 0 .00 -
3 Assam 96.1 86.4 - - 497.0 344.7
4 Bihar 2058 .97 2,138.5 - - 3,220.8 3,287.4
5 Chhattisgarh 52.9 59.0 136.8 137.7 612.2 630.7
6 Goa - - 12.6 11.4 3 .17 2.7
7 Gujarat 2,781.5 2,793.6 839.4 907.6 1,776.8 1,844.4
8 Haryana 1,900.8 2,000.9 358.5 372.6 140.6 133.8
9 Himachal Pradesh 141.9 147.5 145.3 133.4 234.4 251.9
10 Jammu & Kashmir 50.9 54.7 187.6 190.8 491.2 515.1
11 Jharkhand 73.2 89.2 187.5 191.1 1,684.5 1,685.3
12 Karnataka 988.0 853.9 710.6 749.0 1513 .8 0 1,348.4
13 Kerala 4.7 5.0 2.3 1.5 508.4 503.7
14 Madhya Pradesh 824.0 893.7 2,879.1 3,048.9 2,786.2 3,176.8
15 Maharashtra 928.6 932 .96 1,268.7 1,218.2 2,727.0 2,658.0
16 Manipur - - 11.5 11.7 - -
17 Meghalaya 2.5 2.0 - - - -
18 Mizoram - - - - - -
19 Nagaland - - 4.2 4.9 19.5 21.9
20 Odisha 29.9 30.7 144.6 149.5 98.2 103 .11
21 Punjab 1,874.5 1,878.9 810.0 811.9 115.2 116.5
22 Rajasthan * 2,766.8 2,899.9 1,818.5 2,040.3 7,513.8 7,404.3
23 Sikkim - - - - - -
24 Tamil Nadu 168.0 157.5 96.0 106.6 2,681.8 2,681.9
25 Telangana 779.9 818.1 1,036.2 1,034.8 154.4 155.4
26 Tripura - - 1.8 1.8 125.2 127.9
27 Uttar Pradesh 8,249.2 8,521.3 2,387.0 2,405.1 4580 .00 4,686.0
28 Uttarakhand 204.6 213.4 251.6 243.0 347.9 357.5
29 West Bengal 120.5 123.5 - - 2,332.1 2,377.4
30 A&N Islands 0.8 1.1 - - 11.5 11.3
31 Chandigarh 12.4 7.3 - 0.0 0.2 0.1
32 D.& N. Haveli - - -
33 Daman & Diu - 0.0 0.3 0.0 0.6 0.1
34 Delhi 95.2 - -
35 Lakshadweep - - - - 13 . 35 13.3
36 Puducherry - - 0.9 1.1 - -
All India 26307.89 27035.39 14882.19 15534.07 34259.99 34513.15
Source: State/UT Animal Husbandry Departments "-" not received/not available
*estimates are projected on the basis of existing growth rates and previous year estimates due ta non-availability af data Nate: estimated
number of animal of rural and urban area are taken together
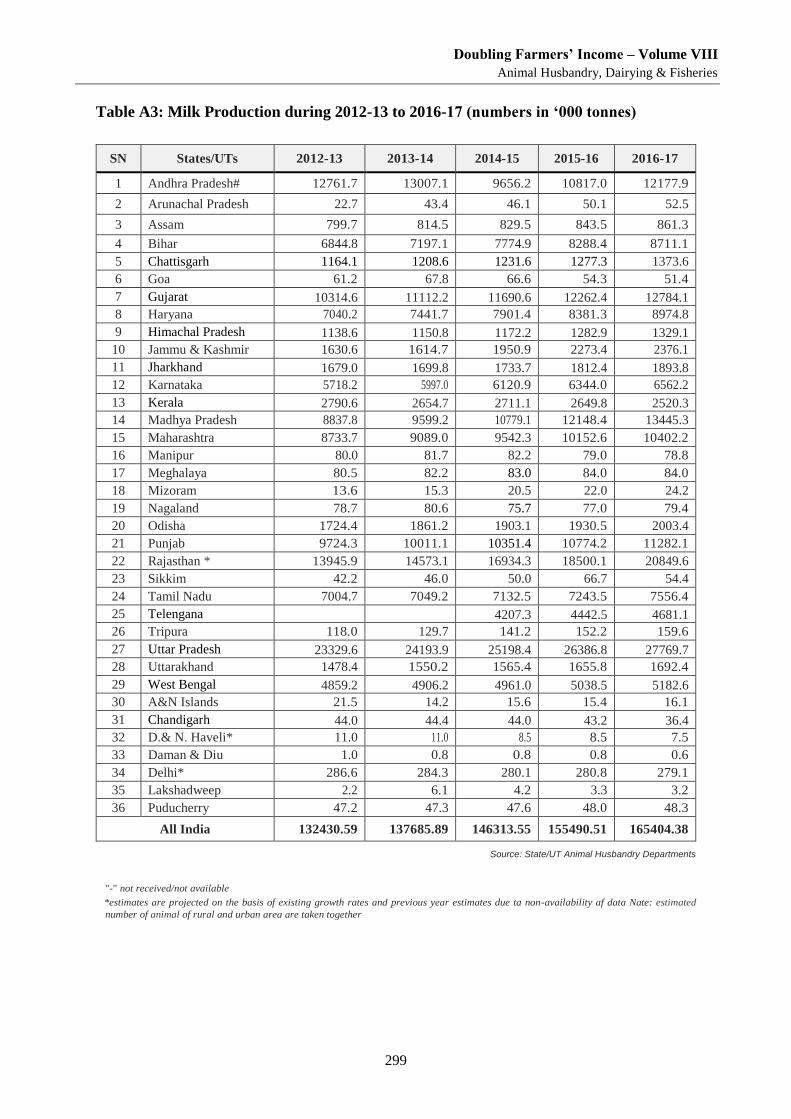
Doubling Farmers’ Income – Volume VIII
Animal Husbandry, Dairying & Fisheries
299
Table A3: Milk Production during 2012-13 to 2016-17 (numbers in ‘000 tonnes)
SN States/UTs 2012-13 2013-14 2014-15 2015-16 2016-17
1 Andhra Pradesh# 12761.7 13007.1 9656.2 10817.0 12177.9
2 Arunachal Pradesh 22.7 43.4 46.1 50.1 52.5
3 Assam 799.7 814.5 829.5 843.5 861.3
4 Bihar 6844.8 7197.1 7774.9 8288.4 8711.1
5 Chattisgarh 1164.1 1208.6 1231.6 1277.3 1373.6
6 Goa 61.2 67.8 66.6 54.3 51.4
7 Gujarat 10314.6 11112.2 11690.6 12262.4 12784.1
8 Haryana 7040.2 7441.7 7901.4 8381.3 8974.8
9 Himachal Pradesh 1138.6 1150.8 1172.2 1282.9 1329.1
10 Jammu & Kashmir 1630.6 1614.7 1950.9 2273.4 2376.1
11 Jharkhand 1679.0 1699.8 1733.7 1812.4 1893.8
12 Karnataka 5718.2 5997.0 6120.9 6344.0 6562.2
13 Kerala 2790.6 2654.7 2711.1 2649.8 2520.3
14 Madhya Pradesh 8837.8 9599.2 10779.1 12148.4 13445.3
15 Maharashtra 8733.7 9089.0 9542.3 10152.6 10402.2
16 Manipur 80.0 81.7 82.2 79.0 78.8
17 Meghalaya 80.5 82.2 83.0 84.0 84.0
18 Mizoram 13.6 15.3 20.5 22.0 24.2
19 Nagaland 78.7 80.6 75.7 77.0 79.4
20 Odisha 1724.4 1861.2 1903.1 1930.5 2003.4
21 Punjab 9724.3 10011.1 10351.4 10774.2 11282.1
22 Rajasthan * 13945.9 14573.1 16934.3 18500.1 20849.6
23 Sikkim 42.2 46.0 50.0 66.7 54.4
24 Tamil Nadu 7004.7 7049.2 7132.5 7243.5 7556.4
25 Telengana 4207.3 4442.5 4681.1
26 Tripura 118.0 129.7 141.2 152.2 159.6
27 Uttar Pradesh 23329.6 24193.9 25198.4 26386.8 27769.7
28 Uttarakhand 1478.4 1550.2 1565.4 1655.8 1692.4
29 West Bengal 4859.2 4906.2 4961.0 5038.5 5182.6
30 A&N Islands 21.5 14.2 15.6 15.4 16.1
31 Chandigarh 44.0 44.4 44.0 43.2 36.4
32 D.& N. Haveli* 11.0 11.0 8.5 8.5 7.5
33 Daman & Diu 1.0 0.8 0.8 0.8 0.6
34 Delhi* 286.6 284.3 280.1 280.8 279.1
35 Lakshadweep 2.2 6.1 4.2 3.3 3.2
36 Puducherry 47.2 47.3 47.6 48.0 48.3
All India 132430.59 137685.89 146313.55 155490.51 165404.38
Source: State/UT Animal Husbandry Departments
"-" not received/not available
*estimates are projected on the basis of existing growth rates and previous year estimates due ta non-availability af data Nate: estimated
number of animal of rural and urban area are taken together
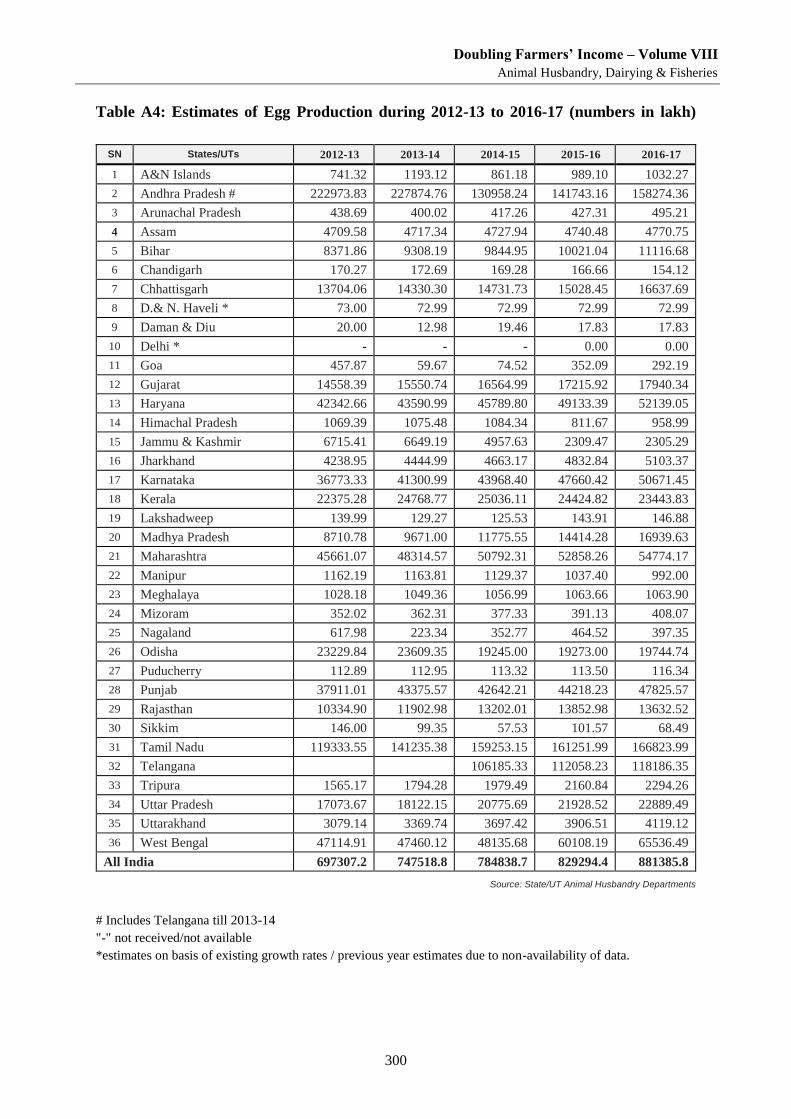
Doubling Farmers’ Income – Volume VIII
Animal Husbandry, Dairying & Fisheries
300
Table A4: Estimates of Egg Production during 2012-13 to 2016-17 (numbers in lakh)
SN States/UTs 2012-13 2013-14 2014-15 2015-16 2016-17
1 A&N Islands 741.32 1193.12 861.18 989.10 1032.27
2 Andhra Pradesh # 222973.83 227874.76 130958.24 141743.16 158274.36
3 Arunachal Pradesh 438.69 400.02 417.26 427.31 495.21
4 Assam 4709.58 4717.34 4727.94 4740.48 4770.75
5 Bihar 8371.86 9308.19 9844.95 10021.04 11116.68
6 Chandigarh 170.27 172.69 169.28 166.66 154.12
7 Chhattisgarh 13704.06 14330.30 14731.73 15028.45 16637.69
8 D.& N. Haveli * 73.00 72.99 72.99 72.99 72.99
9 Daman & Diu 20.00 12.98 19.46 17.83 17.83
10 Delhi * - - - 0.00 0.00
11 Goa 457.87 59.67 74.52 352.09 292.19
12 Gujarat 14558.39 15550.74 16564.99 17215.92 17940.34
13 Haryana 42342.66 43590.99 45789.80 49133.39 52139.05
14 Himachal Pradesh 1069.39 1075.48 1084.34 811.67 958.99
15 Jammu & Kashmir 6715.41 6649.19 4957.63 2309.47 2305.29
16 Jharkhand 4238.95 4444.99 4663.17 4832.84 5103.37
17 Karnataka 36773.33 41300.99 43968.40 47660.42 50671.45
18 Kerala 22375.28 24768.77 25036.11 24424.82 23443.83
19 Lakshadweep 139.99 129.27 125.53 143.91 146.88
20 Madhya Pradesh 8710.78 9671.00 11775.55 14414.28 16939.63
21 Maharashtra 45661.07 48314.57 50792.31 52858.26 54774.17
22 Manipur 1162.19 1163.81 1129.37 1037.40 992.00
23 Meghalaya 1028.18 1049.36 1056.99 1063.66 1063.90
24 Mizoram 352.02 362.31 377.33 391.13 408.07
25 Nagaland 617.98 223.34 352.77 464.52 397.35
26 Odisha 23229.84 23609.35 19245.00 19273.00 19744.74
27 Puducherry 112.89 112.95 113.32 113.50 116.34
28 Punjab 37911.01 43375.57 42642.21 44218.23 47825.57
29 Rajasthan 10334.90 11902.98 13202.01 13852.98 13632.52
30 Sikkim 146.00 99.35 57.53 101.57 68.49
31 Tamil Nadu 119333.55 141235.38 159253.15 161251.99 166823.99
32 Telangana 106185.33 112058.23 118186.35
33 Tripura 1565.17 1794.28 1979.49 2160.84 2294.26
34 Uttar Pradesh 17073.67 18122.15 20775.69 21928.52 22889.49
35 Uttarakhand 3079.14 3369.74 3697.42 3906.51 4119.12
36 West Bengal 47114.91 47460.12 48135.68 60108.19 65536.49
All India 697307.2 747518.8 784838.7 829294.4 881385.8
Source: State/UT Animal Husbandry Departments
# Includes Telangana till 2013-14
"-" not received/not available
*estimates on basis of existing growth rates / previous year estimates due to non-availability of data.
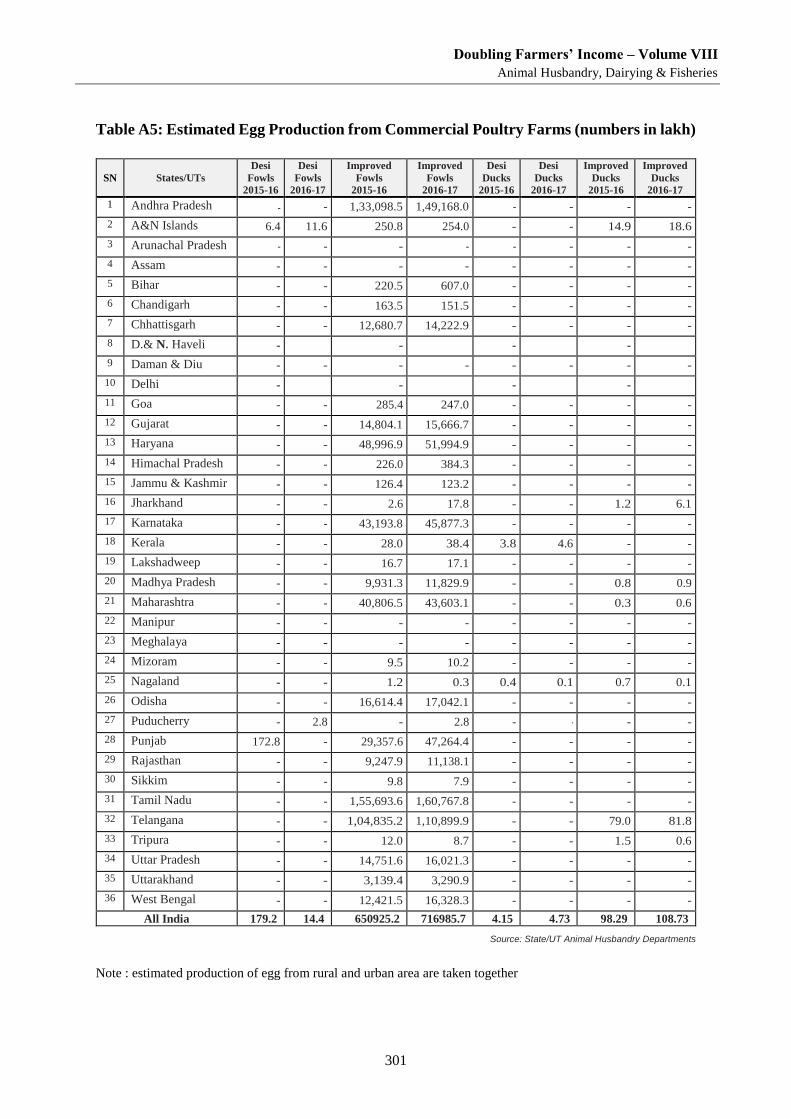
Doubling Farmers’ Income – Volume VIII
Animal Husbandry, Dairying & Fisheries
301
Table A5: Estimated Egg Production from Commercial Poultry Farms (numbers in lakh)
SN States/UTs
Desi
Fowls
2015-16
Desi
Fowls
2016-17
Improved
Fowls
2015-16
Improved
Fowls
2016-17
Desi
Ducks
2015-16
Desi
Ducks
2016-17
Improved
Ducks
2015-16
Improved
Ducks
2016-17
1 Andhra Pradesh - - 1,33,098.5 1,49,168.0 - - - -
2 A&N Islands 6.4 11.6 250.8 254.0 - - 14.9 18.6
3 Arunachal Pradesh - - - - - - - -
4 Assam - - - - - - - -
5 Bihar - - 220.5 607.0 - - - -
6 Chandigarh - - 163.5 151.5 - - - -
7 Chhattisgarh - - 12,680.7 14,222.9 - - - -
8 D.& N. Haveli - - - -
9 Daman & Diu - - - - - - - -
10 Delhi - - - -
11 Goa - - 285.4 247.0 - - - -
12 Gujarat - - 14,804.1 15,666.7 - - - -
13 Haryana - - 48,996.9 51,994.9 - - - -
14 Himachal Pradesh - - 226.0 384.3 - - - -
15 Jammu & Kashmir - - 126.4 123.2 - - - -
16 Jharkhand - - 2.6 17.8 - - 1.2 6.1
17 Karnataka - - 43,193.8 45,877.3 - - - -
18 Kerala - - 28.0 38.4 3.8 4.6 - -
19 Lakshadweep - - 16.7 17.1 - - - -
20 Madhya Pradesh - - 9,931.3 11,829.9 - - 0.8 0.9
21 Maharashtra - - 40,806.5 43,603.1 - - 0.3 0.6
22 Manipur - - - - - - - -
23 Meghalaya - - - - - - - -
24 Mizoram - - 9.5 10.2 - - - -
25 Nagaland - - 1.2 0.3 0.4 0.1 0.7 0.1
26 Odisha - - 16,614.4 17,042.1 - - - -
27 Puducherry - 2.8 - 2.8 - - - -
28 Punjab 172.8 - 29,357.6 47,264.4 - - - -
29 Rajasthan - - 9,247.9 11,138.1 - - - -
30 Sikkim - - 9.8 7.9 - - - -
31 Tamil Nadu - - 1,55,693.6 1,60,767.8 - - - -
32 Telangana - - 1,04,835.2 1,10,899.9 - - 79.0 81.8
33 Tripura - - 12.0 8.7 - - 1.5 0.6
34 Uttar Pradesh - - 14,751.6 16,021.3 - - - -
35 Uttarakhand - - 3,139.4 3,290.9 - - - -
36 West Bengal - - 12,421.5 16,328.3 - - - -
All India 179.2 14.4 650925.2 716985.7 4.15 4.73 98.29 108.73
Source: State/UT Animal Husbandry Departments
Note : estimated production of egg from rural and urban area are taken together
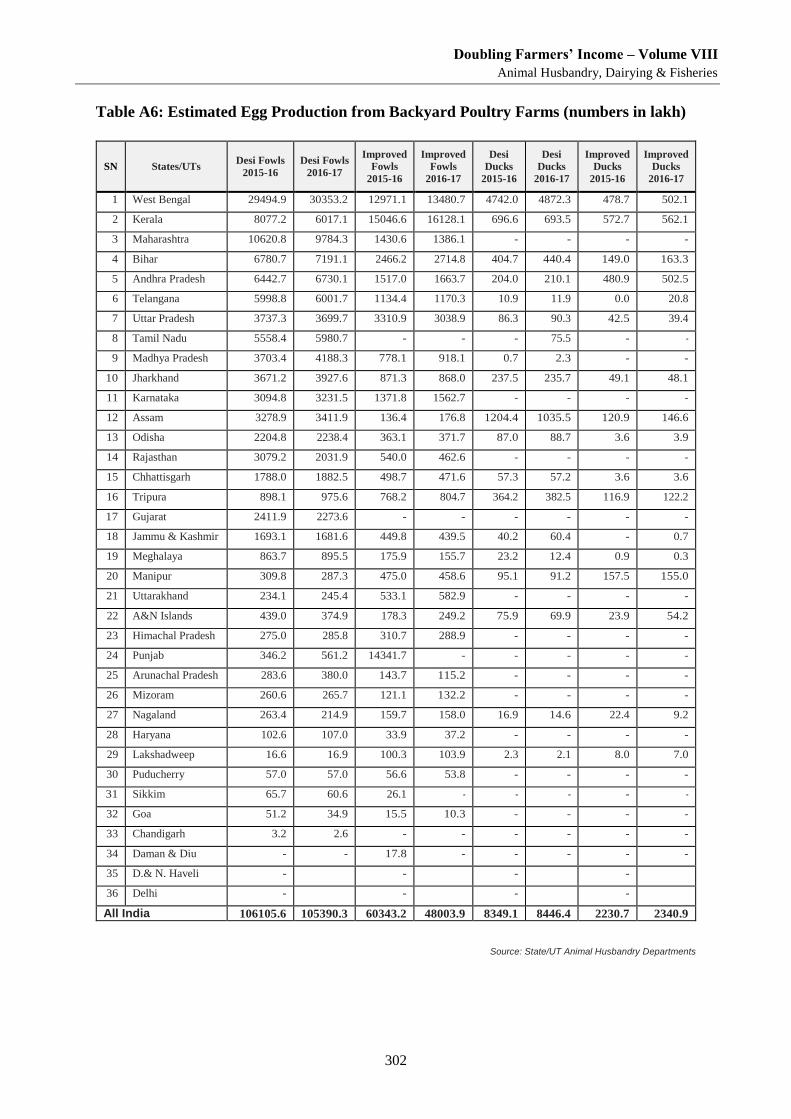
Doubling Farmers’ Income – Volume VIII
Animal Husbandry, Dairying & Fisheries
302
Table A6: Estimated Egg Production from Backyard Poultry Farms (numbers in lakh)
SN States/UTs Desi Fowls
2015-16
Desi Fowls
2016-17
Improved
Fowls
2015-16
Improved
Fowls
2016-17
Desi
Ducks
2015-16
Desi
Ducks
2016-17
Improved
Ducks
2015-16
Improved
Ducks
2016-17
1 West Bengal 29494.9 30353.2 12971.1 13480.7 4742.0 4872.3 478.7 502.1
2 Kerala 8077.2 6017.1 15046.6 16128.1 696.6 693.5 572.7 562.1
3 Maharashtra 10620.8 9784.3 1430.6 1386.1 - - - -
4 Bihar 6780.7 7191.1 2466.2 2714.8 404.7 440.4 149.0 163.3
5 Andhra Pradesh 6442.7 6730.1 1517.0 1663.7 204.0 210.1 480.9 502.5
6 Telangana 5998.8 6001.7 1134.4 1170.3 10.9 11.9 0.0 20.8
7 Uttar Pradesh 3737.3 3699.7 3310.9 3038.9 86.3 90.3 42.5 39.4
8 Tamil Nadu 5558.4 5980.7 - - - 75.5 - -
9 Madhya Pradesh 3703.4 4188.3 778.1 918.1 0.7 2.3 - -
10 Jharkhand 3671.2 3927.6 871.3 868.0 237.5 235.7 49.1 48.1
11 Karnataka 3094.8 3231.5 1371.8 1562.7 - - - -
12 Assam 3278.9 3411.9 136.4 176.8 1204.4 1035.5 120.9 146.6
13 Odisha 2204.8 2238.4 363.1 371.7 87.0 88.7 3.6 3.9
14 Rajasthan 3079.2 2031.9 540.0 462.6 - - - -
15 Chhattisgarh 1788.0 1882.5 498.7 471.6 57.3 57.2 3.6 3.6
16 Tripura 898.1 975.6 768.2 804.7 364.2 382.5 116.9 122.2
17 Gujarat 2411.9 2273.6 - - - - - -
18 Jammu & Kashmir 1693.1 1681.6 449.8 439.5 40.2 60.4 - 0.7
19 Meghalaya 863.7 895.5 175.9 155.7 23.2 12.4 0.9 0.3
20 Manipur 309.8 287.3 475.0 458.6 95.1 91.2 157.5 155.0
21 Uttarakhand 234.1 245.4 533.1 582.9 - - - -
22 A&N Islands 439.0 374.9 178.3 249.2 75.9 69.9 23.9 54.2
23 Himachal Pradesh 275.0 285.8 310.7 288.9 - - - -
24 Punjab 346.2 561.2 14341.7 - - - - -
25 Arunachal Pradesh 283.6 380.0 143.7 115.2 - - - -
26 Mizoram 260.6 265.7 121.1 132.2 - - - -
27 Nagaland 263.4 214.9 159.7 158.0 16.9 14.6 22.4 9.2
28 Haryana 102.6 107.0 33.9 37.2 - - - -
29 Lakshadweep 16.6 16.9 100.3 103.9 2.3 2.1 8.0 7.0
30 Puducherry 57.0 57.0 56.6 53.8 - - - -
31 Sikkim 65.7 60.6 26.1 - - - - -
32 Goa 51.2 34.9 15.5 10.3 - - - -
33 Chandigarh 3.2 2.6 - - - - - -
34 Daman & Diu - - 17.8 - - - - -
35 D.& N. Haveli - - - -
36 Delhi - - - -
All India 106105.6 105390.3 60343.2 48003.9 8349.1 8446.4 2230.7 2340.9
Source: State/UT Animal Husbandry Departments
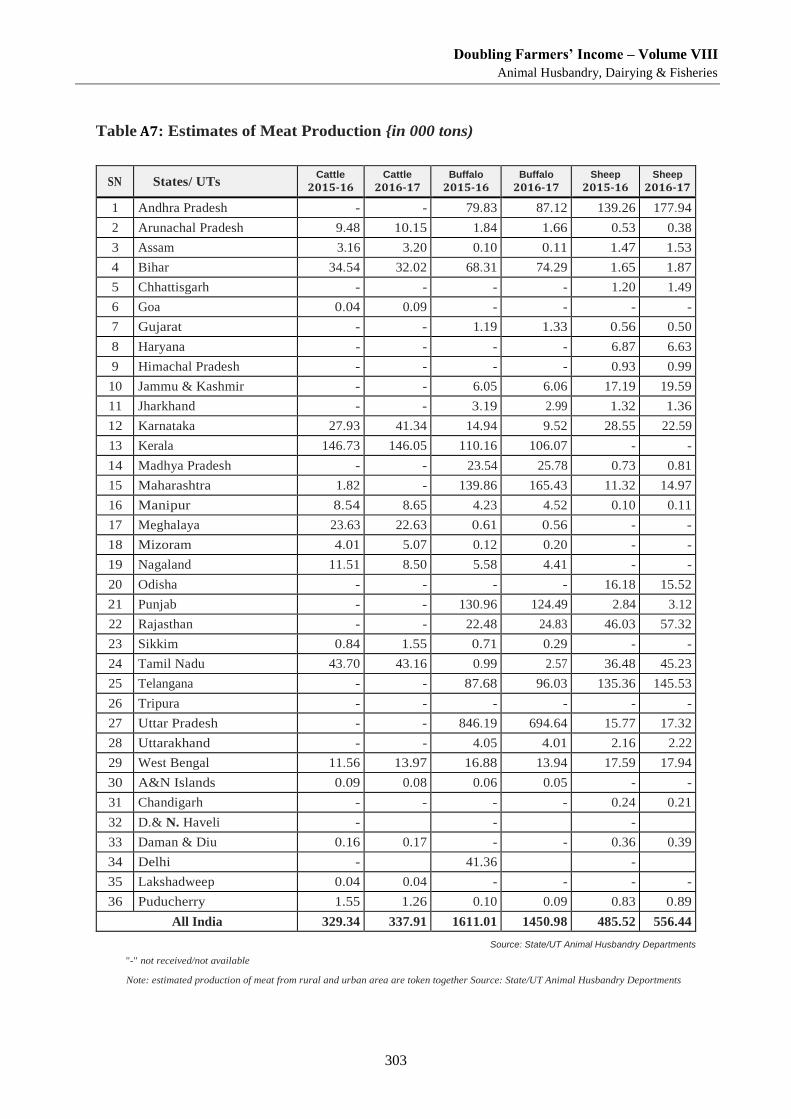
Doubling Farmers’ Income – Volume VIII
Animal Husbandry, Dairying & Fisheries
303
Table A7: Estimates of Meat Production {in 000 tons)
SN States/ UTs Cattle
2015-16 Cattle
2016-17 Buffalo
2015-16 Buffalo
2016-17 Sheep
2015-16 Sheep
2016-17
1 Andhra Pradesh - - 79.83 87.12 139.26 177.94
2 Arunachal Pradesh 9.48 10.15 1.84 1.66 0.53 0.38
3 Assam 3.16 3.20 0.10 0.11 1.47 1.53
4 Bihar 34.54 32.02 68.31 74.29 1.65 1.87
5 Chhattisgarh - - - - 1.20 1.49
6 Goa 0.04 0.09 - - - -
7 Gujarat - - 1.19 1.33 0.56 0.50
8 Haryana - - - - 6.87 6.63
9 Himachal Pradesh - - - - 0.93 0.99
10 Jammu & Kashmir - - 6.05 6.06 17.19 19.59
11 Jharkhand - - 3.19 2.99 1.32 1.36
12 Karnataka 27.93 41.34 14.94 9.52 28.55 22.59
13 Kerala 146.73 146.05 110.16 106.07 - -
14 Madhya Pradesh - - 23.54 25.78 0.73 0.81
15 Maharashtra 1.82 - 139.86 165.43 11.32 14.97
16 Manipur 8.54 8.65 4.23 4.52 0.10 0.11
17 Meghalaya 23.63 22.63 0.61 0.56 - -
18 Mizoram 4.01 5.07 0.12 0.20 - -
19 Nagaland 11.51 8.50 5.58 4.41 - -
20 Odisha - - - - 16.18 15.52
21 Punjab - - 130.96 124.49 2.84 3.12
22 Rajasthan - - 22.48 24.83 46.03 57.32
23 Sikkim 0.84 1.55 0.71 0.29 - -
24 Tamil Nadu 43.70 43.16 0.99 2.57 36.48 45.23
25 Telangana - - 87.68 96.03 135.36 145.53
26 Tripura - - - - - -
27 Uttar Pradesh - - 846.19 694.64 15.77 17.32
28 Uttarakhand - - 4.05 4.01 2.16 2.22
29 West Bengal 11.56 13.97 16.88 13.94 17.59 17.94
30 A&N Islands 0.09 0.08 0.06 0.05 - -
31 Chandigarh - - - - 0.24 0.21
32 D.& N. Haveli - - -
33 Daman & Diu 0.16 0.17 - - 0.36 0.39
34 Delhi - 41.36 -
35 Lakshadweep 0.04 0.04 - - - -
36 Puducherry 1.55 1.26 0.10 0.09 0.83 0.89
All India 329.34 337.91 1611.01 1450.98 485.52 556.44
Source: State/UT Animal Husbandry Departments
"-" not received/not available
Note: estimated production of meat from rural and urban area are token together Source: State/UT Animal Husbandry Deportments
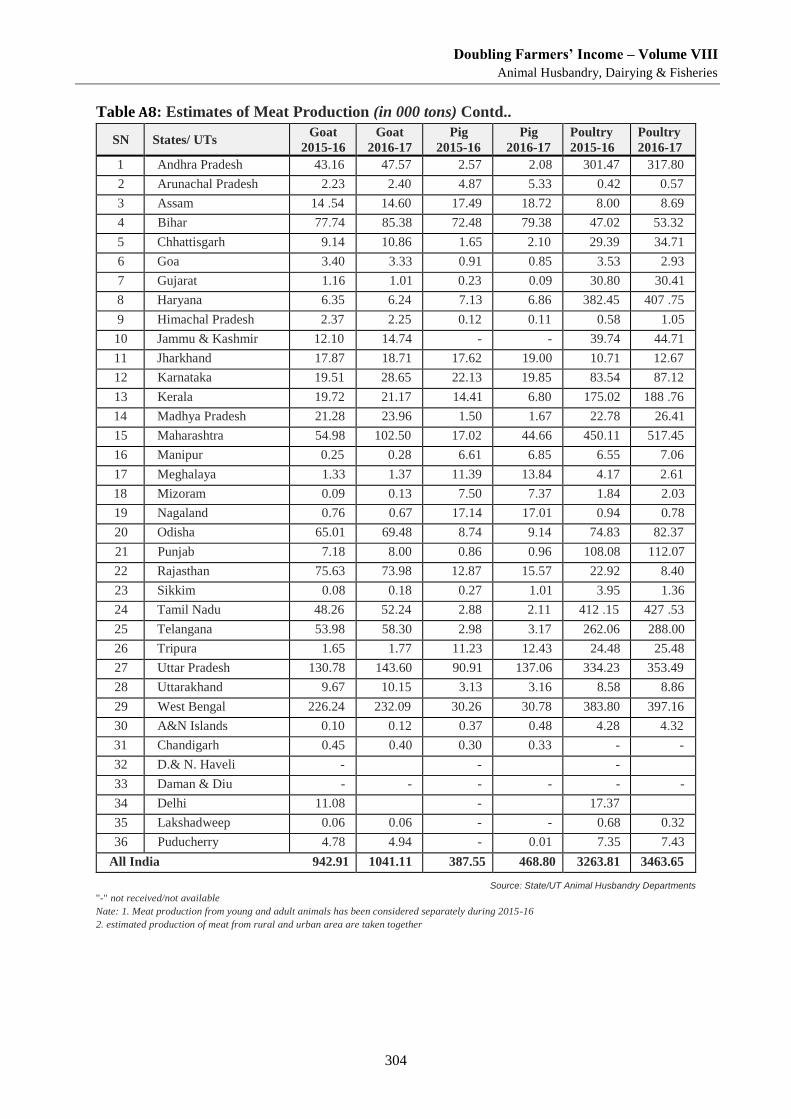
Doubling Farmers’ Income – Volume VIII
Animal Husbandry, Dairying & Fisheries
304
Table A8: Estimates of Meat Production (in 000 tons) Contd..
SN States/ UTs Goat
2015-16
Goat
2016-17
Pig
2015-16
Pig
2016-17
Poultry
2015-16
Poultry
2016-17
1 Andhra Pradesh 43.16 47.57 2.57 2.08 301.47 317.80
2 Arunachal Pradesh 2.23 2.40 4.87 5.33 0.42 0.57
3 Assam 14 .54 14.60 17.49 18.72 8.00 8.69
4 Bihar 77.74 85.38 72.48 79.38 47.02 53.32
5 Chhattisgarh 9.14 10.86 1.65 2.10 29.39 34.71
6 Goa 3.40 3.33 0.91 0.85 3.53 2.93
7 Gujarat 1.16 1.01 0.23 0.09 30.80 30.41
8 Haryana 6.35 6.24 7.13 6.86 382.45 407 .75
9 Himachal Pradesh 2.37 2.25 0.12 0.11 0.58 1.05
10 Jammu & Kashmir 12.10 14.74 - - 39.74 44.71
11 Jharkhand 17.87 18.71 17.62 19.00 10.71 12.67
12 Karnataka 19.51 28.65 22.13 19.85 83.54 87.12
13 Kerala 19.72 21.17 14.41 6.80 175.02 188 .76
14 Madhya Pradesh 21.28 23.96 1.50 1.67 22.78 26.41
15 Maharashtra 54.98 102.50 17.02 44.66 450.11 517.45
16 Manipur 0.25 0.28 6.61 6.85 6.55 7.06
17 Meghalaya 1.33 1.37 11.39 13.84 4.17 2.61
18 Mizoram 0.09 0.13 7.50 7.37 1.84 2.03
19 Nagaland 0.76 0.67 17.14 17.01 0.94 0.78
20 Odisha 65.01 69.48 8.74 9.14 74.83 82.37
21 Punjab 7.18 8.00 0.86 0.96 108.08 112.07
22 Rajasthan 75.63 73.98 12.87 15.57 22.92 8.40
23 Sikkim 0.08 0.18 0.27 1.01 3.95 1.36
24 Tamil Nadu 48.26 52.24 2.88 2.11 412 .15 427 .53
25 Telangana 53.98 58.30 2.98 3.17 262.06 288.00
26 Tripura 1.65 1.77 11.23 12.43 24.48 25.48
27 Uttar Pradesh 130.78 143.60 90.91 137.06 334.23 353.49
28 Uttarakhand 9.67 10.15 3.13 3.16 8.58 8.86
29 West Bengal 226.24 232.09 30.26 30.78 383.80 397.16
30 A&N Islands 0.10 0.12 0.37 0.48 4.28 4.32
31 Chandigarh 0.45 0.40 0.30 0.33 - -
32 D.& N. Haveli - - -
33 Daman & Diu - - - - - -
34 Delhi 11.08 - 17.37
35 Lakshadweep 0.06 0.06 - - 0.68 0.32
36 Puducherry 4.78 4.94 - 0.01 7.35 7.43
All India 942.91 1041.11 387.55 468.80 3263.81 3463.65
Source: State/UT Animal Husbandry Departments
"-" not received/not available
Nate: 1. Meat production from young and adult animals has been considered separately during 2015-16
2. estimated production of meat from rural and urban area are taken together
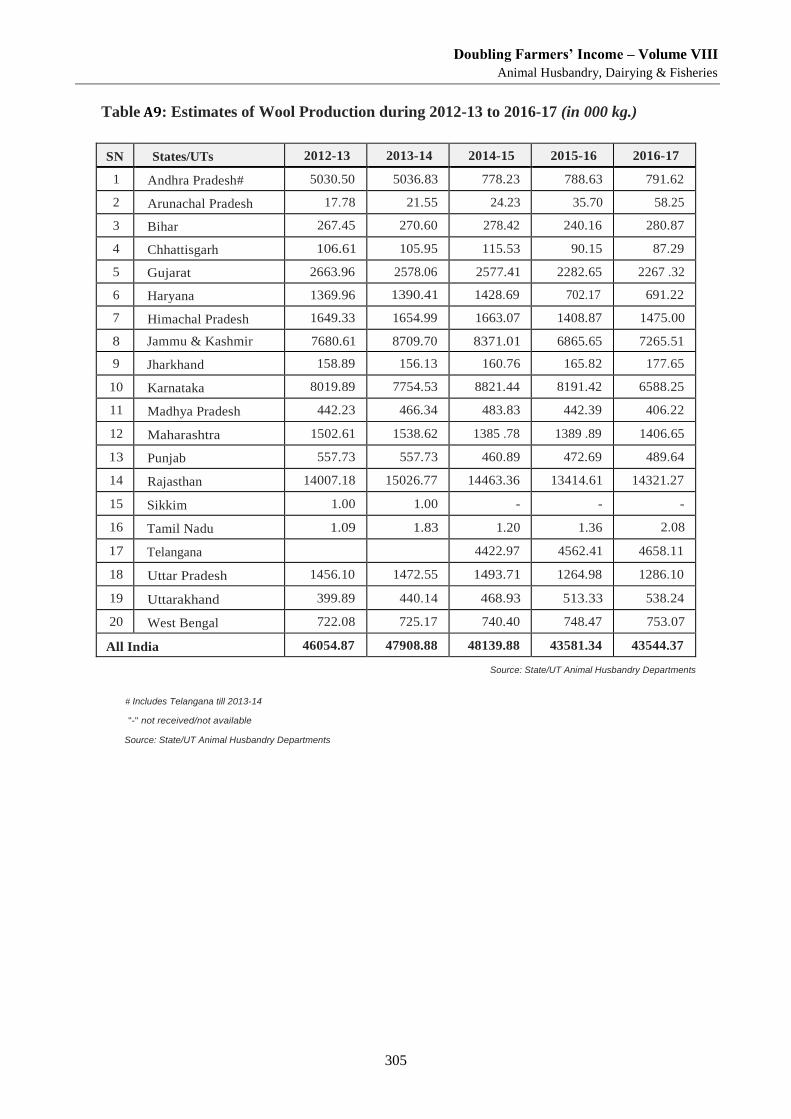
Doubling Farmers’ Income – Volume VIII
Animal Husbandry, Dairying & Fisheries
305
Table A9: Estimates of Wool Production during 2012-13 to 2016-17 (in 000 kg.)
SN States/UTs 2012-13 2013-14 2014-15 2015-16 2016-17
1 Andhra Pradesh# 5030.50 5036.83 778.23 788.63 791.62
2 Arunachal Pradesh 17.78 21.55 24.23 35.70 58.25
3 Bihar 267.45 270.60 278.42 240.16 280.87
4 Chhattisgarh 106.61 105.95 115.53 90.15 87.29
5 Gujarat 2663.96 2578.06 2577.41 2282.65 2267 .32
6 Haryana 1369.96 1390.41 1428.69 702.17 691.22
7 Himachal Pradesh 1649.33 1654.99 1663.07 1408.87 1475.00
8 Jammu & Kashmir 7680.61 8709.70 8371.01 6865.65 7265.51
9 Jharkhand 158.89 156.13 160.76 165.82 177.65
10 Karnataka 8019.89 7754.53 8821.44 8191.42 6588.25
11 Madhya Pradesh 442.23 466.34 483.83 442.39 406.22
12 Maharashtra 1502.61 1538.62 1385 .78 1389 .89 1406.65
13 Punjab 557.73 557.73 460.89 472.69 489.64
14 Rajasthan 14007.18 15026.77 14463.36 13414.61 14321.27
15 Sikkim 1.00 1.00 - - -
16 Tamil Nadu 1.09 1.83 1.20 1.36 2.08
17 Telangana 4422.97 4562.41 4658.11
18 Uttar Pradesh 1456.10 1472.55 1493.71 1264.98 1286.10
19 Uttarakhand 399.89 440.14 468.93 513.33 538.24
20 West Bengal 722.08 725.17 740.40 748.47 753.07
All India 46054.87 47908.88 48139.88 43581.34 43544.37
Source: State/UT Animal Husbandry Departments
# Includes Telangana till 2013-14
"-" not received/not available
Source: State/UT Animal Husbandry Departments
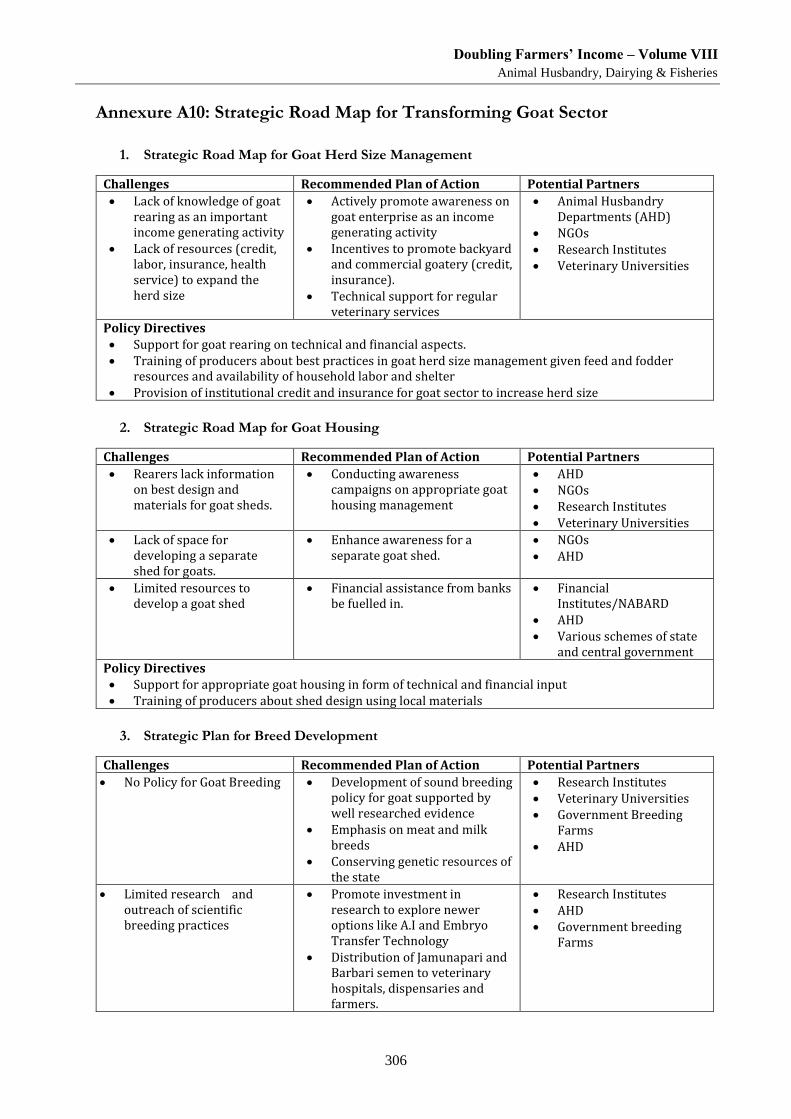
Doubling Farmers’ Income – Volume VIII
Animal Husbandry, Dairying & Fisheries
306
Annexure A10: Strategic Road Map for Transforming Goat Sector
1. Strategic Road Map for Goat Herd Size Management
Challenges Recommended Plan of Action Potential Partners
Lack of knowledge of goat rearing as an important income generating activity
Lack of resources (credit, labor, insurance, health service) to expand the herd size
Actively promote awareness on goat enterprise as an income generating activity
Incentives to promote backyard and commercial goatery (credit, insurance).
Technical support for regular veterinary services
Animal Husbandry Departments (AHD)
NGOs Research Institutes Veterinary Universities
Policy Directives Support for goat rearing on technical and financial aspects. Training of producers about best practices in goat herd size management given feed and fodder
resources and availability of household labor and shelter Provision of institutional credit and insurance for goat sector to increase herd size
2. Strategic Road Map for Goat Housing
Challenges Recommended Plan of Action Potential Partners
Rearers lack information on best design and materials for goat sheds.
Conducting awareness campaigns on appropriate goat housing management
AHD NGOs Research Institutes Veterinary Universities
Lack of space for developing a separate shed for goats.
Enhance awareness for a separate goat shed.
NGOs AHD
Limited resources to develop a goat shed
Financial assistance from banks be fuelled in.
Financial Institutes/NABARD
AHD Various schemes of state
and central government Policy Directives Support for appropriate goat housing in form of technical and financial input Training of producers about shed design using local materials
3. Strategic Plan for Breed Development
Challenges Recommended Plan of Action Potential Partners
No Policy for Goat Breeding Development of sound breeding policy for goat supported by well researched evidence
Emphasis on meat and milk breeds
Conserving genetic resources of the state
Research Institutes Veterinary Universities Government Breeding
Farms AHD
Limited research and outreach of scientific breeding practices
Promote investment in research to explore newer options like A.I and Embryo Transfer Technology
Distribution of Jamunapari and Barbari semen to veterinary hospitals, dispensaries and farmers.
Research Institutes AHD Government breeding
Farms
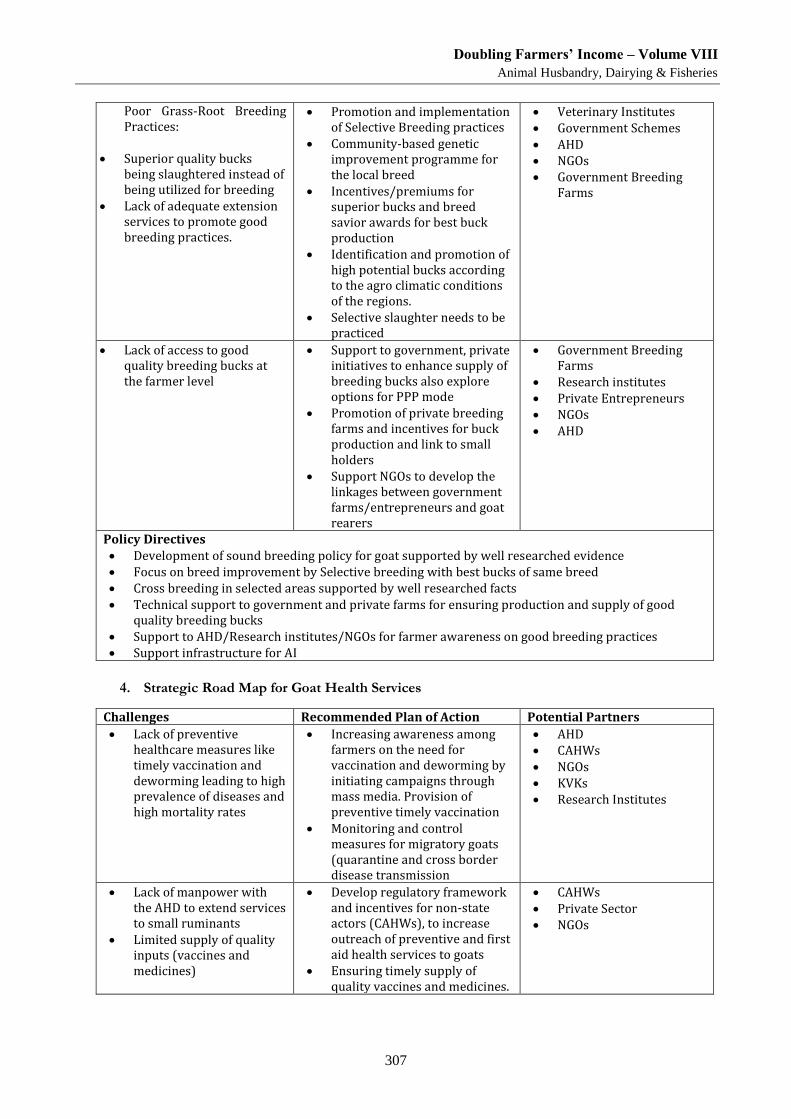
Doubling Farmers’ Income – Volume VIII
Animal Husbandry, Dairying & Fisheries
307
Poor Grass-Root Breeding Practices:
Superior quality bucks being slaughtered instead of being utilized for breeding
Lack of adequate extension services to promote good breeding practices.
Promotion and implementation of Selective Breeding practices
Community-based genetic improvement programme for the local breed
Incentives/premiums for superior bucks and breed savior awards for best buck production
Identification and promotion of high potential bucks according to the agro climatic conditions of the regions.
Selective slaughter needs to be practiced
Veterinary Institutes Government Schemes AHD NGOs Government Breeding
Farms
Lack of access to good quality breeding bucks at the farmer level
Support to government, private initiatives to enhance supply of breeding bucks also explore options for PPP mode
Promotion of private breeding farms and incentives for buck production and link to small holders
Support NGOs to develop the linkages between government farms/entrepreneurs and goat rearers
Government Breeding Farms
Research institutes Private Entrepreneurs NGOs AHD
Policy Directives Development of sound breeding policy for goat supported by well researched evidence Focus on breed improvement by Selective breeding with best bucks of same breed Cross breeding in selected areas supported by well researched facts Technical support to government and private farms for ensuring production and supply of good
quality breeding bucks Support to AHD/Research institutes/NGOs for farmer awareness on good breeding practices Support infrastructure for AI
4. Strategic Road Map for Goat Health Services
Challenges Recommended Plan of Action Potential Partners
Lack of preventive healthcare measures like timely vaccination and deworming leading to high prevalence of diseases and high mortality rates
Increasing awareness among farmers on the need for vaccination and deworming by initiating campaigns through mass media. Provision of preventive timely vaccination
Monitoring and control measures for migratory goats (quarantine and cross border disease transmission
AHD CAHWs NGOs KVKs Research Institutes
Lack of manpower with the AHD to extend services to small ruminants
Limited supply of quality inputs (vaccines and medicines)
Develop regulatory framework and incentives for non-state actors (CAHWs), to increase outreach of preventive and first aid health services to goats
Ensuring timely supply of quality vaccines and medicines.
CAHWs Private Sector NGOs
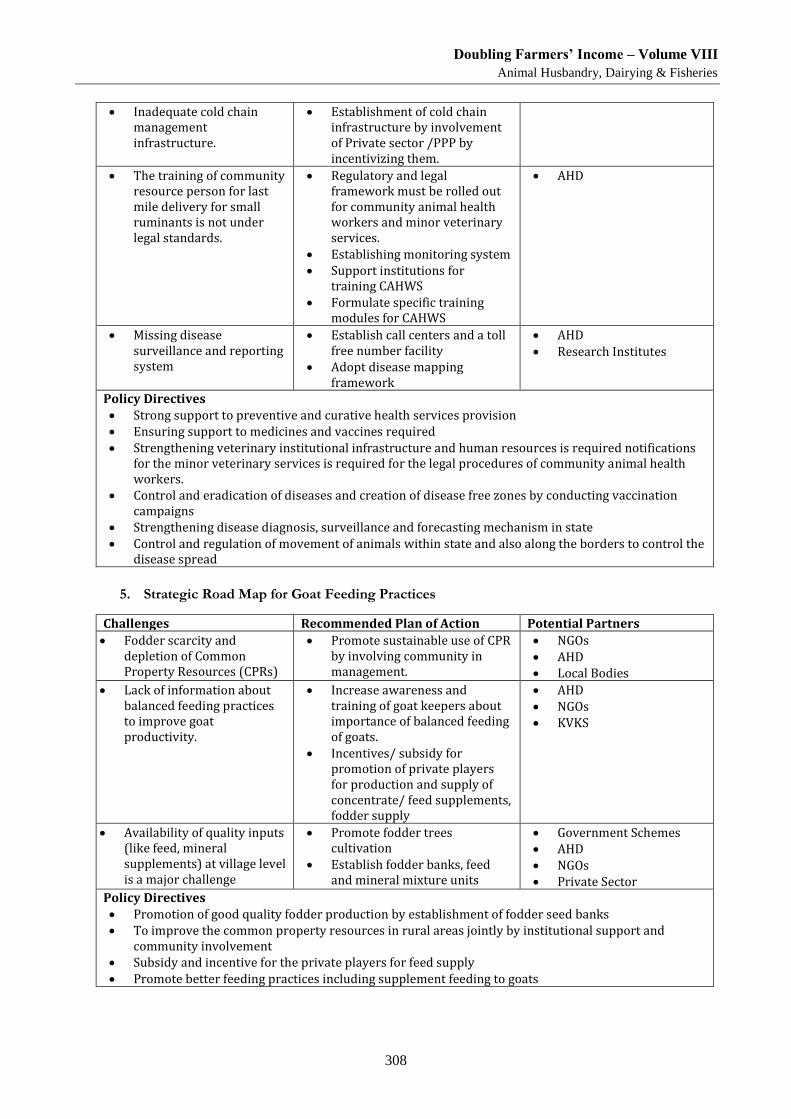
Doubling Farmers’ Income – Volume VIII
Animal Husbandry, Dairying & Fisheries
308
Inadequate cold chain management infrastructure.
Establishment of cold chain infrastructure by involvement of Private sector /PPP by incentivizing them.
The training of community resource person for last mile delivery for small ruminants is not under legal standards.
Regulatory and legal framework must be rolled out for community animal health workers and minor veterinary services.
Establishing monitoring system Support institutions for
training CAHWS Formulate specific training
modules for CAHWS
AHD
Missing disease surveillance and reporting system
Establish call centers and a toll free number facility
Adopt disease mapping framework
AHD Research Institutes
Policy Directives Strong support to preventive and curative health services provision Ensuring support to medicines and vaccines required Strengthening veterinary institutional infrastructure and human resources is required notifications
for the minor veterinary services is required for the legal procedures of community animal health workers.
Control and eradication of diseases and creation of disease free zones by conducting vaccination campaigns
Strengthening disease diagnosis, surveillance and forecasting mechanism in state Control and regulation of movement of animals within state and also along the borders to control the
disease spread
5. Strategic Road Map for Goat Feeding Practices
Challenges Recommended Plan of Action Potential Partners
Fodder scarcity and depletion of Common Property Resources (CPRs)
Promote sustainable use of CPR by involving community in management.
NGOs AHD Local Bodies
Lack of information about balanced feeding practices to improve goat productivity.
Increase awareness and training of goat keepers about importance of balanced feeding of goats.
Incentives/ subsidy for promotion of private players for production and supply of concentrate/ feed supplements, fodder supply
AHD NGOs KVKS
Availability of quality inputs (like feed, mineral supplements) at village level is a major challenge
Promote fodder trees cultivation
Establish fodder banks, feed and mineral mixture units
Government Schemes AHD NGOs Private Sector
Policy Directives Promotion of good quality fodder production by establishment of fodder seed banks To improve the common property resources in rural areas jointly by institutional support and
community involvement Subsidy and incentive for the private players for feed supply Promote better feeding practices including supplement feeding to goats
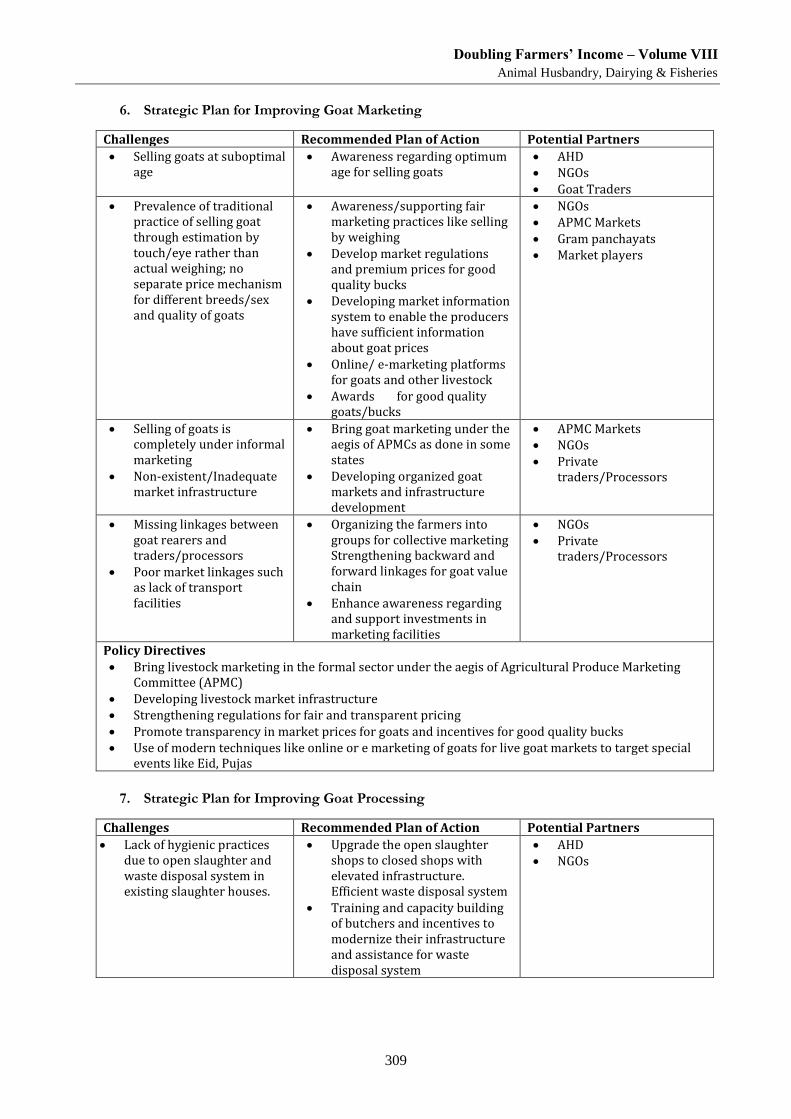
Doubling Farmers’ Income – Volume VIII
Animal Husbandry, Dairying & Fisheries
309
6. Strategic Plan for Improving Goat Marketing
Challenges Recommended Plan of Action Potential Partners
Selling goats at suboptimal age
Awareness regarding optimum age for selling goats
AHD NGOs Goat Traders
Prevalence of traditional practice of selling goat through estimation by touch/eye rather than actual weighing; no separate price mechanism for different breeds/sex and quality of goats
Awareness/supporting fair marketing practices like selling by weighing
Develop market regulations and premium prices for good quality bucks
Developing market information system to enable the producers have sufficient information about goat prices
Online/ e-marketing platforms for goats and other livestock
Awards for good quality goats/bucks
NGOs APMC Markets Gram panchayats Market players
Selling of goats is completely under informal marketing
Non-existent/Inadequate market infrastructure
Bring goat marketing under the aegis of APMCs as done in some states
Developing organized goat markets and infrastructure development
APMC Markets NGOs Private
traders/Processors
Missing linkages between goat rearers and traders/processors
Poor market linkages such as lack of transport facilities
Organizing the farmers into groups for collective marketing Strengthening backward and forward linkages for goat value chain
Enhance awareness regarding and support investments in marketing facilities
NGOs Private
traders/Processors
Policy Directives Bring livestock marketing in the formal sector under the aegis of Agricultural Produce Marketing
Committee (APMC) Developing livestock market infrastructure Strengthening regulations for fair and transparent pricing Promote transparency in market prices for goats and incentives for good quality bucks Use of modern techniques like online or e marketing of goats for live goat markets to target special
events like Eid, Pujas
7. Strategic Plan for Improving Goat Processing
Challenges Recommended Plan of Action Potential Partners
Lack of hygienic practices due to open slaughter and waste disposal system in existing slaughter houses.
Upgrade the open slaughter shops to closed shops with elevated infrastructure. Efficient waste disposal system
Training and capacity building of butchers and incentives to modernize their infrastructure and assistance for waste disposal system
AHD NGOs
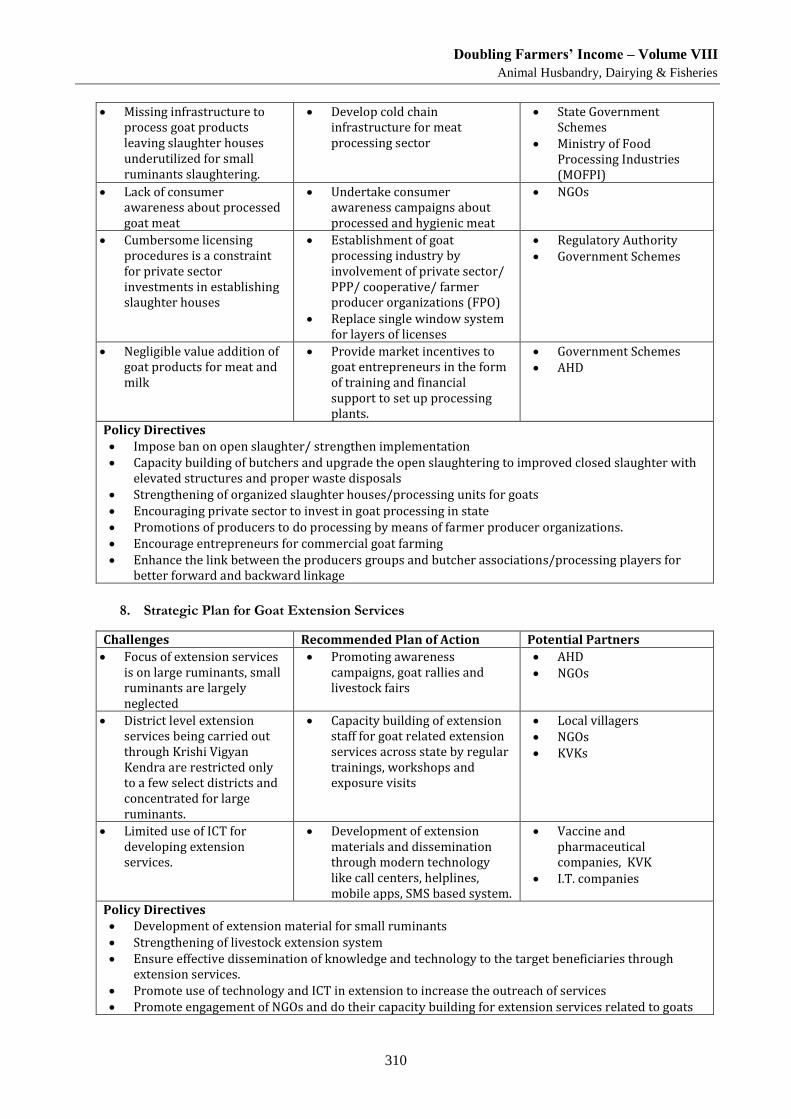
Doubling Farmers’ Income – Volume VIII
Animal Husbandry, Dairying & Fisheries
310
Missing infrastructure to process goat products leaving slaughter houses underutilized for small ruminants slaughtering.
Develop cold chain infrastructure for meat processing sector
State Government Schemes
Ministry of Food Processing Industries (MOFPI)
Lack of consumer awareness about processed goat meat
Undertake consumer awareness campaigns about processed and hygienic meat
NGOs
Cumbersome licensing procedures is a constraint for private sector investments in establishing slaughter houses
Establishment of goat processing industry by involvement of private sector/ PPP/ cooperative/ farmer producer organizations (FPO)
Replace single window system for layers of licenses
Regulatory Authority Government Schemes
Negligible value addition of goat products for meat and milk
Provide market incentives to goat entrepreneurs in the form of training and financial support to set up processing plants.
Government Schemes AHD
Policy Directives Impose ban on open slaughter/ strengthen implementation Capacity building of butchers and upgrade the open slaughtering to improved closed slaughter with
elevated structures and proper waste disposals Strengthening of organized slaughter houses/processing units for goats Encouraging private sector to invest in goat processing in state Promotions of producers to do processing by means of farmer producer organizations. Encourage entrepreneurs for commercial goat farming Enhance the link between the producers groups and butcher associations/processing players for
better forward and backward linkage
8. Strategic Plan for Goat Extension Services
Challenges Recommended Plan of Action Potential Partners
Focus of extension services is on large ruminants, small ruminants are largely neglected
Promoting awareness campaigns, goat rallies and livestock fairs
AHD NGOs
District level extension services being carried out through Krishi Vigyan Kendra are restricted only to a few select districts and concentrated for large ruminants.
Capacity building of extension staff for goat related extension services across state by regular trainings, workshops and exposure visits
Local villagers NGOs KVKs
Limited use of ICT for developing extension services.
Development of extension materials and dissemination through modern technology like call centers, helplines, mobile apps, SMS based system.
Vaccine and pharmaceutical companies, KVK
I.T. companies
Policy Directives Development of extension material for small ruminants Strengthening of livestock extension system Ensure effective dissemination of knowledge and technology to the target beneficiaries through
extension services. Promote use of technology and ICT in extension to increase the outreach of services Promote engagement of NGOs and do their capacity building for extension services related to goats
Doubling Farmers’ Income – Volume VIII
Animal Husbandry, Dairying & Fisheries
311
Annexure A11: Migratory Sheep Rearing in Northern Karantaka – Delineation of
Constraints11
Sheep in India is traditionally maintained under extensive range management employing self
or family labour on degraded public land, forest land and stubble (grazing on cropped land after
harvesting). India ranks third in sheep and goat population (Livestock census, 2012). Sheep
plays an important role in the livelihood of small & marginal farmers and agricultural labourers,
as the small ruminants (sheep & goat) generate additional incomes, especially in the arid/semi-
arid and mountainous areas, where crop and/or dairy farming are/is not economical. It not only
provides the farmers food and nutritional security, but also acts as a mobile bank during their
financial crisis. Sheep are traditionally raised under two systems: stationary and migratory
systems. Migratory sheep rearing is common among the economically weaker sections of
shepherd community, and is a traditional practice of some of the shepherd families.
Sheep are traditionally reared by pastoral communities of the area in different states - Andhra
Pradesh, Telangana, Maharashtra Karnataka and Rajasthan. These communities rearing sheep
have a strong and synergistic relationship with farmers along the traditional migratory routes,
where their sheep flocks are penned on farmers’ fields, helping in maintaining and improving
the soil fertility. However, there are very few research studies on sheep farming by migratory
shepherds.
The present study was conducted by the authors in 2017-18 in parts of northern Karnataka to
understand a gamut of issues including gender perspectives among migratory shepherd
families. The issues on which the study focused included socio-economic profile nature &
types of problems, level of knowledge, and participation in various activities during migration,
etc.
The study brought out, that migratory sheep rearing takes two forms – semi-migration; and
permanent migration. In case of semi- migration, men migrate for 6-7 months from
November to May of the following year, which is linked to the onset of dry season and
withering of surface vegetation; and the termination is based on the onset of monsoon.
In case of permanent migration, the whole family including women and children migrate and
are continuously on move for many years. In both types of migration, it was seen that usually
3-4 families move together which helps for easy management & security, besides facilitating
sharing of flock management, whenever some need to visit their village or elsewhere on
important works.
11 Dr. Annapurna Kalal, Associate Professor, Department of Extension and Communication Management, College of
Community Science, UAS, Dharwad; Dr. Shobha Nagnur, Professor and Head, Department of Extension and Communication
Management, College of Community Science, UAS, Dharwad; and Dr. V.S. Kulkarni, Professor and Head, Department of
Animal Sciences, UAS, Dharwad
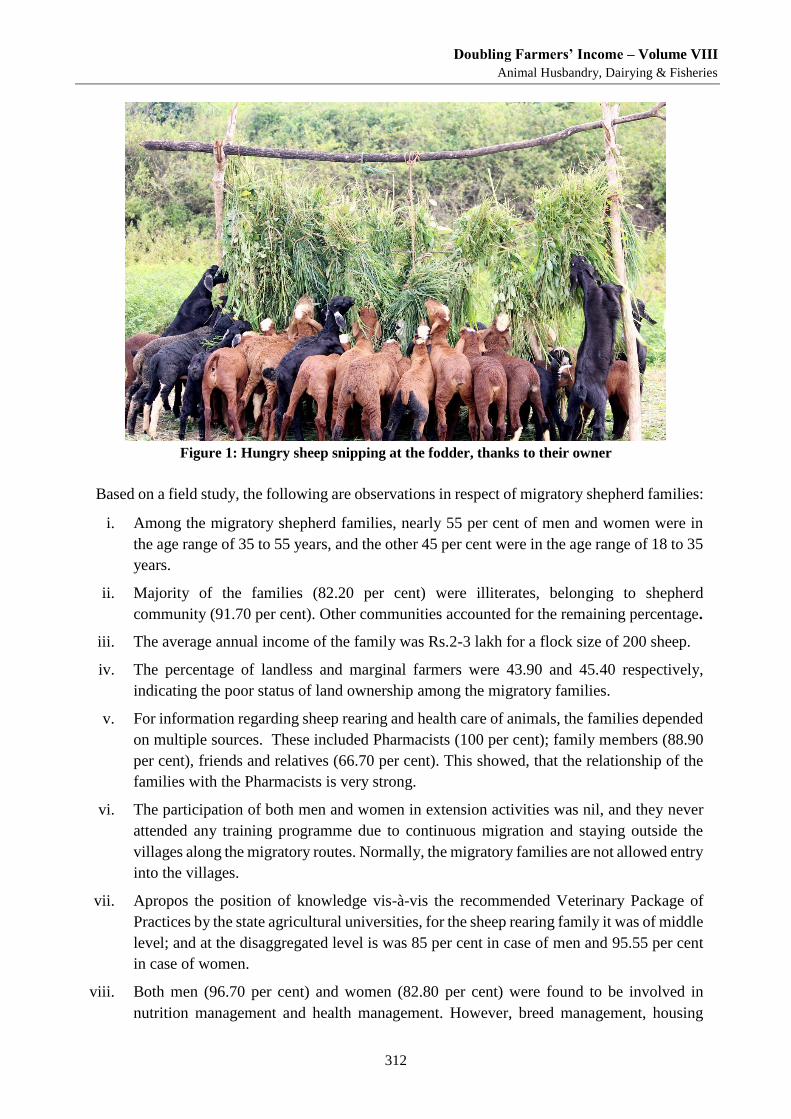
Doubling Farmers’ Income – Volume VIII
Animal Husbandry, Dairying & Fisheries
312
Figure 1: Hungry sheep snipping at the fodder, thanks to their owner
Based on a field study, the following are observations in respect of migratory shepherd families:
i. Among the migratory shepherd families, nearly 55 per cent of men and women were in
the age range of 35 to 55 years, and the other 45 per cent were in the age range of 18 to 35
years.
ii. Majority of the families (82.20 per cent) were illiterates, belonging to shepherd
community (91.70 per cent). Other communities accounted for the remaining percentage.
iii. The average annual income of the family was Rs.2-3 lakh for a flock size of 200 sheep.
iv. The percentage of landless and marginal farmers were 43.90 and 45.40 respectively,
indicating the poor status of land ownership among the migratory families.
v. For information regarding sheep rearing and health care of animals, the families depended
on multiple sources. These included Pharmacists (100 per cent); family members (88.90
per cent), friends and relatives (66.70 per cent). This showed, that the relationship of the
families with the Pharmacists is very strong.
vi. The participation of both men and women in extension activities was nil, and they never
attended any training programme due to continuous migration and staying outside the
villages along the migratory routes. Normally, the migratory families are not allowed entry
into the villages.
vii. Apropos the position of knowledge vis-à-vis the recommended Veterinary Package of
Practices by the state agricultural universities, for the sheep rearing family it was of middle
level; and at the disaggregated level is was 85 per cent in case of men and 95.55 per cent
in case of women.
viii. Both men (96.70 per cent) and women (82.80 per cent) were found to be involved in
nutrition management and health management. However, breed management, housing
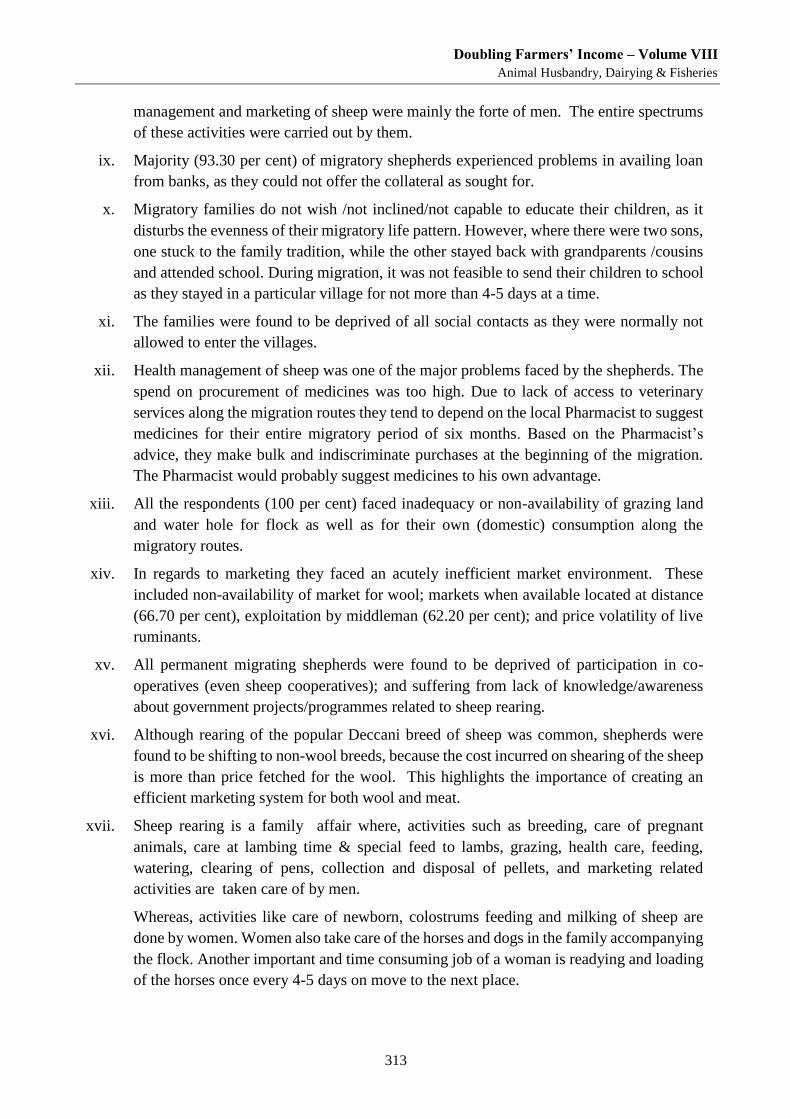
Doubling Farmers’ Income – Volume VIII
Animal Husbandry, Dairying & Fisheries
313
management and marketing of sheep were mainly the forte of men. The entire spectrums
of these activities were carried out by them.
ix. Majority (93.30 per cent) of migratory shepherds experienced problems in availing loan
from banks, as they could not offer the collateral as sought for.
x. Migratory families do not wish /not inclined/not capable to educate their children, as it
disturbs the evenness of their migratory life pattern. However, where there were two sons,
one stuck to the family tradition, while the other stayed back with grandparents /cousins
and attended school. During migration, it was not feasible to send their children to school
as they stayed in a particular village for not more than 4-5 days at a time.
xi. The families were found to be deprived of all social contacts as they were normally not
allowed to enter the villages.
xii. Health management of sheep was one of the major problems faced by the shepherds. The
spend on procurement of medicines was too high. Due to lack of access to veterinary
services along the migration routes they tend to depend on the local Pharmacist to suggest
medicines for their entire migratory period of six months. Based on the Pharmacist’s
advice, they make bulk and indiscriminate purchases at the beginning of the migration.
The Pharmacist would probably suggest medicines to his own advantage.
xiii. All the respondents (100 per cent) faced inadequacy or non-availability of grazing land
and water hole for flock as well as for their own (domestic) consumption along the
migratory routes.
xiv. In regards to marketing they faced an acutely inefficient market environment. These
included non-availability of market for wool; markets when available located at distance
(66.70 per cent), exploitation by middleman (62.20 per cent); and price volatility of live
ruminants.
xv. All permanent migrating shepherds were found to be deprived of participation in co-
operatives (even sheep cooperatives); and suffering from lack of knowledge/awareness
about government projects/programmes related to sheep rearing.
xvi. Although rearing of the popular Deccani breed of sheep was common, shepherds were
found to be shifting to non-wool breeds, because the cost incurred on shearing of the sheep
is more than price fetched for the wool. This highlights the importance of creating an
efficient marketing system for both wool and meat.
xvii. Sheep rearing is a family affair where, activities such as breeding, care of pregnant
animals, care at lambing time & special feed to lambs, grazing, health care, feeding,
watering, clearing of pens, collection and disposal of pellets, and marketing related
activities are taken care of by men.
Whereas, activities like care of newborn, colostrums feeding and milking of sheep are
done by women. Women also take care of the horses and dogs in the family accompanying
the flock. Another important and time consuming job of a woman is readying and loading
of the horses once every 4-5 days on move to the next place.
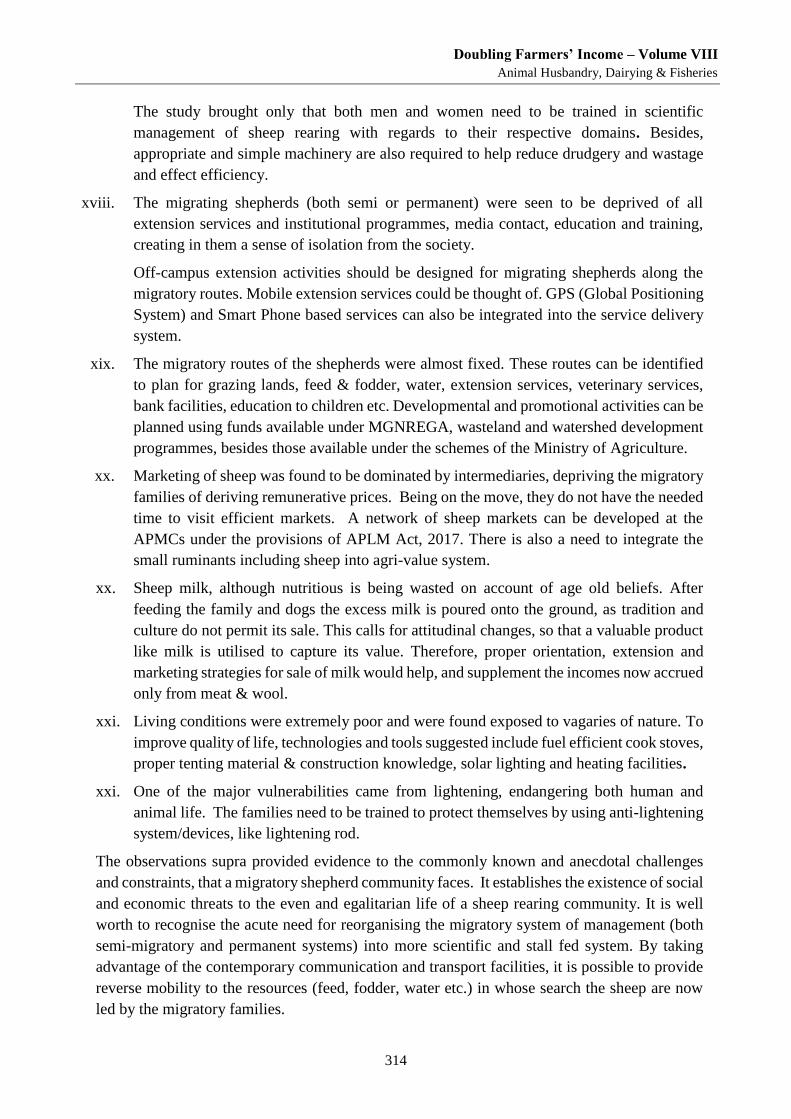
Doubling Farmers’ Income – Volume VIII
Animal Husbandry, Dairying & Fisheries
314
The study brought only that both men and women need to be trained in scientific
management of sheep rearing with regards to their respective domains. Besides,
appropriate and simple machinery are also required to help reduce drudgery and wastage
and effect efficiency.
xviii. The migrating shepherds (both semi or permanent) were seen to be deprived of all
extension services and institutional programmes, media contact, education and training,
creating in them a sense of isolation from the society.
Off-campus extension activities should be designed for migrating shepherds along the
migratory routes. Mobile extension services could be thought of. GPS (Global Positioning
System) and Smart Phone based services can also be integrated into the service delivery
system.
xix. The migratory routes of the shepherds were almost fixed. These routes can be identified
to plan for grazing lands, feed & fodder, water, extension services, veterinary services,
bank facilities, education to children etc. Developmental and promotional activities can be
planned using funds available under MGNREGA, wasteland and watershed development
programmes, besides those available under the schemes of the Ministry of Agriculture.
xx. Marketing of sheep was found to be dominated by intermediaries, depriving the migratory
families of deriving remunerative prices. Being on the move, they do not have the needed
time to visit efficient markets. A network of sheep markets can be developed at the
APMCs under the provisions of APLM Act, 2017. There is also a need to integrate the
small ruminants including sheep into agri-value system.
xx. Sheep milk, although nutritious is being wasted on account of age old beliefs. After
feeding the family and dogs the excess milk is poured onto the ground, as tradition and
culture do not permit its sale. This calls for attitudinal changes, so that a valuable product
like milk is utilised to capture its value. Therefore, proper orientation, extension and
marketing strategies for sale of milk would help, and supplement the incomes now accrued
only from meat & wool.
xxi. Living conditions were extremely poor and were found exposed to vagaries of nature. To
improve quality of life, technologies and tools suggested include fuel efficient cook stoves,
proper tenting material & construction knowledge, solar lighting and heating facilities.
xxi. One of the major vulnerabilities came from lightening, endangering both human and
animal life. The families need to be trained to protect themselves by using anti-lightening
system/devices, like lightening rod.
The observations supra provided evidence to the commonly known and anecdotal challenges
and constraints, that a migratory shepherd community faces. It establishes the existence of social
and economic threats to the even and egalitarian life of a sheep rearing community. It is well
worth to recognise the acute need for reorganising the migratory system of management (both
semi-migratory and permanent systems) into more scientific and stall fed system. By taking
advantage of the contemporary communication and transport facilities, it is possible to provide
reverse mobility to the resources (feed, fodder, water etc.) in whose search the sheep are now
led by the migratory families.
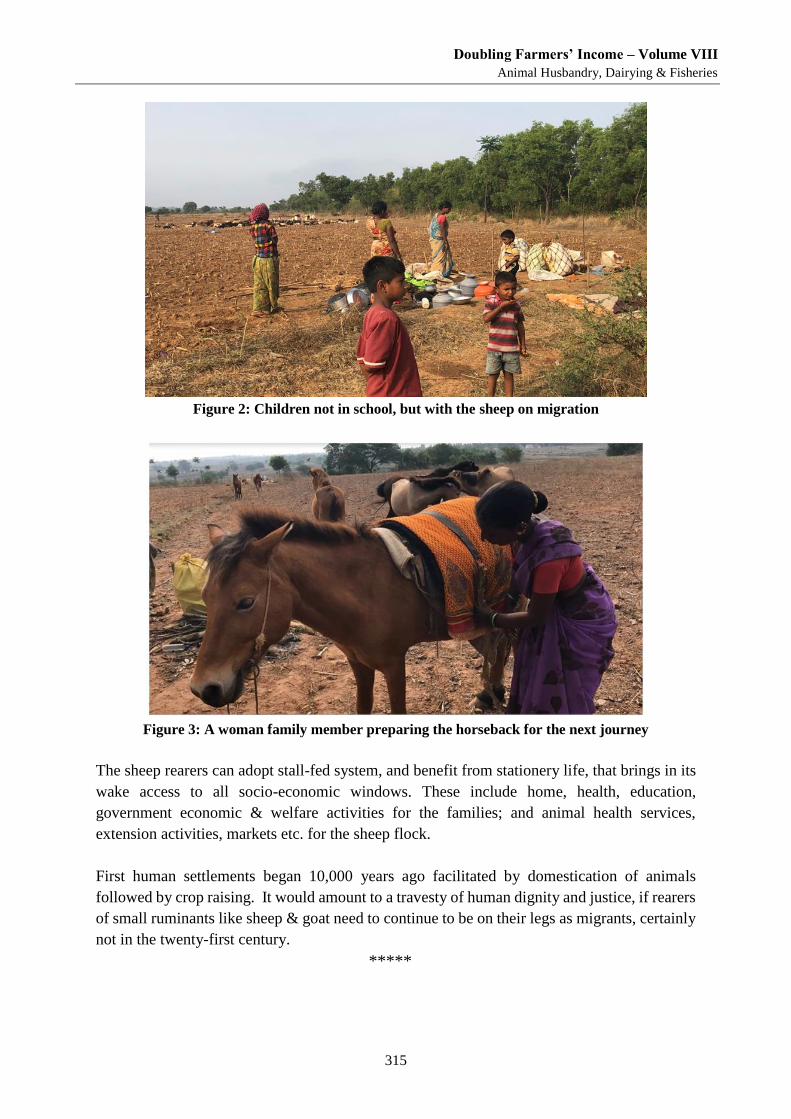
Doubling Farmers’ Income – Volume VIII
Animal Husbandry, Dairying & Fisheries
315
Figure 2: Children not in school, but with the sheep on migration
Figure 3: A woman family member preparing the horseback for the next journey
The sheep rearers can adopt stall-fed system, and benefit from stationery life, that brings in its
wake access to all socio-economic windows. These include home, health, education,
government economic & welfare activities for the families; and animal health services,
extension activities, markets etc. for the sheep flock.
First human settlements began 10,000 years ago facilitated by domestication of animals
followed by crop raising. It would amount to a travesty of human dignity and justice, if rearers
of small ruminants like sheep & goat need to continue to be on their legs as migrants, certainly
not in the twenty-first century.
*****