Report No 2 of 2017 - Public Sector Undertakings Telangana
152
-
Upload
khangminh22 -
Category
Documents
-
view
2 -
download
0
Transcript of Report No 2 of 2017 - Public Sector Undertakings Telangana


Report of the
Comptroller and Auditor General of India
on
Public Sector Undertakings
for the year ended March 2016
Government of Telangana
Report No. 2 of 2017

i
TABLE OF CONTENTS
SUBJECT Reference to
Paragraph(s) Page(s)
Preface … v
Overview … vii-xii
Chapter I
FUNCTIONING OF STATE PUBLIC SECTOR UNDERTAKINGS
Introduction 1.1 1-2
Accountability framework 1.2 2-3
Statutory Audit 1.3 3
Role of Government and Legislature 1.4 3-4
Stake of Government of Telangana 1.5 4
Investment in State PSUs 1.6 and 1.7 4-5
Special support and returns during the year 1.8 5-6
Reconciliation with Finance Accounts 1.9 6-7
Arrears in finalisation of accounts 1.10 to 1.12 7-9
Placement of Separate Audit Reports 1.13 9
Impact of non-finalisation of accounts 1.14 9
Performance of PSUs as per their latest finalised accounts 1.15 to 1.18 9-11
Winding up of non-working PSUs 1.19 and 1.20 11-12
Comments on Accounts 1.21 and 1.22 12-13
Response of the Government to Audit 1.23 13
Follow up action on Audit Reports 1.24 14-15
Discussion of Audit Reports by the Committee on Public
Undertakings (COPU) 1.25 15
Compliance to Reports of COPU 1.26 16
Coverage of this Report 1.27 16
Chapter II
PERFORMANCE AUDIT RELATING TO GOVERNMENT COMPANY
Northern Power Distribution Company of Telangana Limited
Functioning of Northern Power Distribution Company of
Telangana Limited 2 19-64
Chapter III
COMPLIANCE AUDIT OBSERVATIONS
GOVERNMENT COMPANIES
Telangana State Industrial Infrastructure Corporation Limited
Investments of Telangana State Industrial Infrastructure
Corporation Limited in Special Purpose Vehicles (SPVs) and
Joint Ventures (JVs)
3.1 67-79
ii
TABLE OF CONTENTS
SUBJECT Reference to
Paragraph(s) Page(s)
Loss of revenue of ` 4 crore due to non-recovery of the cost
of land as per the Allotment Regulations 3.2 79-80
Southern Power Distribution Company of Telangana Limited
Release of Power Connection, Tariff and Billing to
Information Technology firms 3.3 80-86
Extension of undue benefit to M/s Golden Jubilee Hotels
Limited - Loss of revenue of ` 1.70 crore 3.4 86-87
The Singareni Collieries Company Limited
Unfruitful expenditure of ` 1.16 crore 3.5 88-89
Extra expenditure of ` 44.14 crore on diversion of NTR
canal under Jalagam Vengala Rao Open Cast project, beyond
its requirement
3.6 89-90
Telangana State Power Generation Corporation Limited
Extension of undue favour to a contractor of Balance of
Plant (BOP) works resulted in avoidable additional
expenditure of ` 2.12 crore 3.7 90-91
STATUTORY CORPORATION
Telangana State Road Transport Corporation
Failure to conduct a periodical census of buses led to
extension of undue benefit of ` 52.40 lakh to the agent by
way of short recovery of license fee towards display of the
advertisement on buses
3.8 92-93
ANNEXURES 97-128
GLOSSARY 131-132
iii
List of Annexures
Annexure
No. Subject Page(s)
1.1(a) Statement showing investments made by the State Government in
PSUs (exclusive to state only) whose accounts are in arrears 97-98
1.1(b) Statement showing investments made by the State Government in
PSUs (under demerger) whose accounts are in arrears 99
1.1(c) Statement showing investments made by the State Government in
PSUs (formed due to demerger) whose accounts are in arrears 100-102
1.2(a)
Summarised financial position and working results of PSUs
(exclusive to State only) as per their latest finalised financial
statements/accounts
103-104
1.2(b)
Summarised financial position and working results of PSUs
(under demerger) as per their latest finalised financial
statements/accounts
105-107
1.2(c)
Summarised financial position and working results of PSUs
(formed due to demerger) as per their latest finalised financial
statements/accounts
108-112
2.1 Statement showing the status of failed DTRs 113-114
2.2 Statement showing capital work orders issued, closed during the
year and pending closure for the period 2012-13 to 2015-16 115
2.3
Year wise details of categories for which tariffs were higher than
the maximum allowed as per norms and additional burden on
those categories
116
3.1 Statement showing total investment of TSIIC Limited as on
31 March 2016 117
3.2 Statement showing investment of TSIIC Limited as on
31 March 2016 covered in audit 118
3.3 (a) Irregular extension of power concession to Commercial units
established in IT infrastructure companies 119-120
3.3 (b) Extension of power concession to IT/ITES firms without
assessing the load of other than IT/ITES activities in the premises 121
3.4 Conversion of category to non-IT/ non-ITES companies 122
3.5 Conversion of category of services without obtaining relevant
documents 123
3.6 Conversion of category of second and subsequent units
established within 100 KMs 124
3.7 Extension of power concession to HT consumer (due to sale)
without fresh CCITI certificate 125

iv
List of Annexures
Annexure
No. Subject Page(s)
3.8 Conversion of category of IT/ITES units before expiry of one
year 126
3.9 Statement showing the short realisation of license fee from the
contractor owing to non-conducting of census of buses 127-128

v
Preface
This report deals with results of audit of Government Companies and
Statutory Corporations for the year ended March 2016.
The accounts of the Government Companies (including Companies deemed to
be Government Companies as per the provision of the Companies Act) are
audited by the Comptroller and Auditor General of India (CAG) under the
provisions of Section 619 of the Companies Act 1956 and Section 139 and
143 of the Companies Act 2013. The accounts certified by the Statutory
Auditors (Chartered Accountants) appointed by the CAG under the
Companies Act are subject to supplementary audit by officers of the CAG and
the CAG gives his comments or supplements the reports of the Statutory
Auditors. In addition, these Companies are also subject to test audit by the
CAG.
Reports in relation to the accounts of a Government Company or Statutory
Corporation are submitted to the Government of Telangana by CAG for laying
before the State Legislature of Telangana under the provisions of Section 19-A
of the Comptroller and Auditor General’s (Duties, Powers and Conditions of
Service) Act, 1971.
CAG is sole auditor for one Statutory Corporation, i.e., Telangana State Road
Transport Corporation.
The instances mentioned in this Report are those, which came to notice in
course of test audit for the period 2015-16 as well as those which came to
notice in earlier years, but could not be reported in previous Audit Reports.
Matters relating to the period subsequent to 2015-16 have also been included,
wherever necessary.
The audit has been conducted in conformity with the Auditing Standards
issued by the Comptroller and Auditor General of India.

vii
OVERVIEW
1. Functioning of State Public Sector Undertakings
As on 31 March 2016 there were 67 PSUs, falling under audit purview. Out of
these, 40 Working PSUs pertain exclusively to Telangana (11 of previous
year; 1 newly incorporated and 28 formed due to bifurcation of the State), five
PSUs are under demerger and the remaining 22 are Non-working PSUs (yet to
be bifurcated). As on 31 March 2016, the investment (capital & long term
loans) in 67 PSUs was ` 43,051.95 crore. During 2015-16, total outgo from
the budget of the State of Telangana was ` 17,838.66 crore for working PSUs
exclusive to Telangana and those formed due to bifurcation of the State and
` 3.93 crore for five PSUs under demerger.
(Chapter I)
2. Performance Audit relating to Government Company
Northern Power Distribution Company of Telangana Limited (TSNPDCL)
functions under the administrative control of Department of Energy,
Government of Telangana with its registered office at Warangal. The
Company is the license holder for distribution of power in five districts/circles
of Telangana. As on 31 March 2016, the Company had a distribution network
of 2.16 lakh Circuit Kilo Meters (CKM) of lines (33/11 Kilo Volts (KV) and
Low Tension (LT)), 1,106 Sub-stations, 1,507 Power Transformers (PTR) and
2,42,539 Distribution Transformers (DTR) of various capacities.
A Performance Audit on Functioning of Northern Power Distribution
Company of Telangana Limited along with IT Audit of Billing Systems was conducted. Important audit findings are enumerated below:
The Company had not prepared annual plans for creation of network to
meet the projected demand. Due to inadequate planning, there was
shortfall in investment during 2011-12, 2014-15 and 2015-16 compared to
the amounts sanctioned by State Electricity Regulatory Commission
(SERC) for creation of distribution network. The shortfall in investment
during the five year period covered in audit was ` 752.04 crore.
The Company had achieved only 56.25 per cent of conversion of
agricultural services under High Voltage Distribution System Scheme
(HVDS) and the objective of reduction in distribution losses was not
achieved. The Company had not assessed the requirement of Capacitor
banks periodically.
The Company allowed maximum load losses of 245 watts for 15 kVA
Distribution Transformers (DTRs) against the maximum limit allowed
(230 watts) for 16 kVA transformers. The energy loss additionally allowed
on the 7160 DTRs of 15 kVA capacity procured (2011-16), works out to
0.94 MU per year (i.e. ` 58.19 lakh, considering the Average Cost of
Supply as ` 6.19 per unit).
The Company had not assessed the aggregate score each year as per the
criteria specified in the National Electricity Fund (Interest Subsidy)
scheme and failed to claim interest subsidy amounting to ` 2.50 crore.
viii
The Company failed to adhere to the agricultural sales volume approved
by SERC in the Tariff Orders and also did not claim the cost of additional
units supplied to the agricultural consumers from the Government,
resulting in loss of ` 1,077.27 crore during 2011-12 to 2015-16.
As per Financial Restructuring Plan (FRP), the bonds issued by the
Company were to be taken over by the State Government in two to five
years. The Government had not taken over these bonds even after lapse of
over three years (July 2016).
The percentage of distribution losses was higher than the norm fixed by
SERC in all the years. Due to failure in implementation of loss reduction
measures effectively, the Company suffered loss amounting to
` 194.27 crore (2011-16).
Due to failure to establish the required information systems, the Company
could not submit the proposals under Multi Year Tariff and avail of the
benefits. The loss of the Company increased from ` 33.78 crore
(2013-14) to ` 1,348.21 crore (2014-15) mainly due to adoption of Tariff
Order of 2013-14 for 2014-15.
The Company did not limit the cross subsidy to the suggested levels even
beyond the target year (2010-11) and the financial impact on categories
for which tariff was higher than the maximum allowed as per norm works
out to ` 909.37 crore (2011-15).
The Company failed to recover additional expenditure of ` 98.91 crore,
incurred beyond budget estimates due to increase in the number of
Distribution Transformer failures, employee cost, administrative and
general expenses during 2013-14, by filing true-up petition.
The Company had neither collected the subsidy of ` 693.23 crore (2014-
15 and 2015-16) nor implemented the full cost recovery tariff. The
Company claimed ` 2,398.81 crore (2014-15) against ` 2,555.28 crore
subsidy approved by SERC, resulting in short claim of ` 156.47 crore.
Additional subsidy of ` 130.14 crore approved by SERC (2014-15) was
also not claimed. The Company paid ` 1.01 crore as Delayed Payment
Surcharge to the Generating Stations (2015-16) due to non-receipt of
subsidy from the Government.
Arrears of revenue of ` 1,232 crore (31 March 2016) included
` 820.89 crore pending from the Government Departments/ Local Bodies
and ` 249.03 crore pending from other live services.
The Company had not ensured supply for seven hours a day to all
agriculture feeders and the Government also had not monitored the supply,
though the subsidy was paid for supply of electricity for seven hours a day.
As supply was less than six hours a day for a majority of the feeders in
many circles, out of the subsidy of ` 8,237.63 crore paid by the
Government (2011-16), about ` 1,176.80 crore (1/7th of the subsidy) was
not spent on fulfilment of the objective of the Government of supplying
free power for seven hours to the agricultural consumers.
Though SERC had directed (March 2015) the Company to prepare safety
improvement plan for four year period 2015-19 relating to distribution
ix
network and file the report with the Commission by 31 August 2015, the
Company has yet to chalk out the plan. Despite allocation of special
appropriation amount for improving the safety of distribution network by
SERC, the actual expenditure incurred on safety was not accounted for
under a separate accounting head.
IT Audit of Billing Systems
The Energy Billing System (EBS) for billing of LT consumers was
developed by the Company in-house in 2013. As at the end of July 2016,
the data pertaining to LT consumers, other than those in Restructured-
Accelerated Power Development & Reforms Programme (R-APDRP) was
maintained in the Energy Billing System (EBS). The HT consumer data
was maintained in the Metering, Billing and Collection (MBC) module
developed under R-APDRP.
Though the Company was utilising IT applications like Energy Billing
System (EBS), Metering, Billing and Collection (MBC), System
Applications Products (SAP), Enterprise Resource Planning (ERP) etc. for
managing its various operations, it is yet to formulate and document a
formal IT policy and a long/medium-term IT strategy. The Company does
not have an approved Information Security Policy for protection of its
application/database.
Absence of interface between SAP ERP and High Tension (HT) billing
system resulted in duplication of works and scope for errors which may
affect the integrity of the databases. There was no interface between the
three billing systems viz. MBC, EBS (LT) and EBS (Agriculture) utilised
for billing of various consumers.
The billing of temporary HT service connections was done manually till
they were regularised and were not routed through the HT billing
application (MBC), resulting in lack of completeness of the database. As
the application had also not provided for capturing the minimum
agreement period, based on which demand would be raised, the Company
had to manually verify and raise demand. The application had not provided
for automatic calculation of surcharge in respect of Security Deposits,
which were to be paid within 30 days from the date of intimation.
For Low Tension (LT) category-III consumers, energy charges, fixed
charges and Time of Day charges were manually calculated and then
entered into EBS. During annual review of Security Deposit, previous data
was replaced with current data. Thus historical data was not available in
the system. Application was also incorrectly designed to generate the first
bill from the date of supply to the date of bill in spite of previous manual
bills resulting in excess demand on the consumers.
The Company had not migrated the billing data available in legacy system
into EBS. The legacy applications were not installed in any of the systems
available in the Company.
The field definitions were incorrect and were coupled with lack of proper
input validations, thereby, leaving scope for errors.
x
In respect of data pertaining to Security Deposit of HT consumers, there
was a difference of ` 5.06 crore between two applications i.e. SAP and
MBC.
The interest on Security Deposit of ` 2.57 crore to 43 HT consumers (Bills
stopped consumers) was not credited.
The Company did not have any approved Backup Policy and had not
prepared any business continuity plan or a disaster recovery plan. There
was no training policy for the employees for utilising the IT billing systems.
(Chapter II)
3. Compliance Audit Observations
Compliance audit observations included in this Report highlight
deficiencies in the management of PSUs, which resulted in financial
implications. The irregularities pointed out are broadly of the following
nature:
Loss of ` 36.77 crore in 10 cases due to non-compliance with rules,
directives, procedures, terms and conditions of contracts.
(Paragraphs 3.1.3.7, 3.1.3.8, 3.1.3.9, 3.2, 3.3.2.4, 3.3.2.5, 3.3.2.6, 3.4, 3.7
and 3.8)
Loss of ` 313.29 crore in nine cases due to not safeguarding the financial
interest of the concerned organisation.
(Paragraphs 3.1.3.1, 3.1.3.2, 3.1.3.3, 3.1.3.4, 3.1.3.5, 3.3.2.1, 3.3.2.2, 3.3.2.3
and 3.6)
Loss of ` 1.16 crore in one case due to defective/ deficient planning.
(Paragraph 3.5)
Gist of some of the important audit observations is given below:
Telangana State Industrial Infrastructure Corporation Limited
The Company had made investments of ` 572.53 crore (1994-2015) in two
JVs and 12 SPVs, of which audit covered two JVs and eight SPVs.
The Company had invested ` 79.27 crore in two JVs (` 59.01 crore) and eight
SPVs (` 20.26 crore) during the period 1994-2015 either in the form of cash or
land and expected to receive return in the form of dividends, lease premium
and lease rentals.
The rate of return on investment in one JV (K. Raheja IT Park Private Limited,
Hyderabad) was low (0.43 per cent per annum).
Apart from equity, the Company had contributed 109.36 acres of land
(` 54.68 crore) to the JV Company. On the ground of proper implementation
of the project, the JV Company was demerged and land was transferred (97.21
acres) to the demerged companies. The balance land (12.15 acres) was
transferred to Non-IT/ITES sister companies of M/s Raheja Group, at a rate
lesser than the rate fixed by the Price Fixation Committee and without
consulting the Company (APIIC). This had resulted in loss of ` 73.75 crore.

xi
There was no return on the investments made by the Company in eight SPVs.
These included loss of Investment in HITVEL (` 1.93 crore); loss of equity
investment and Project Development Cost in Nano Tech Silicon India (NTSI)
(` 56.98 lakh); loss of Equity of ` 25.00 lakh in Pattancheru Enviro Tech
Limited (PETL).
To promote the Semiconductor industry for setting up of a manufacturing unit
for wafer fabrication etc. and to develop as FAB City (fabrication facility),
“FAB City SPV (India) Private Limited” was incorporated (May 2006). The
investments made by the Company in FAB City was not productive and
resulted in blocking of ` 78.56 crore. There was undue favour to
M/s SemIndia FAB City Private Limited (` 22.61 crore) due to non-collection
of lease premium, lease rentals and duties. Due to deviation from the
guidelines, there was undue benefit in allotment of land to M/s ILFS Waste
Management and Urban Services Limited in FAB City (` 1.32 crore)
(Paragraph 3.1)
The allotment of land of one acre to the Bank of Baroda, at a concessional
rate, ignoring specific provision of the Company's Allotment Regulations,
applicable to the Scheduled Banks, had resulted in loss of revenue of
` 4 crore.
(Paragraph 3.2)
Southern Power Distribution Company of Telangana Limited
The Information and Communication Technology (ICT) policy of the
erstwhile Government of Andhra Pradesh inter-alia included the incentive of
concessional power tariff i.e. Industrial power tariff (Category-I) to the
Information Technology (IT)/Information Technology Enabled Services
(ITES) units, which was less than Commercial tariff (Category-II).
This benefit was extended to commercial units like hotels, restaurants, shops,
hospitals, banks etc. located in the premises of IT, Infrastructure companies
and IT/ITES firms i.e. for non-IT activities. The Company had converted the
entire premises to HT category-I, without restricting it to 60 per cent area
prescribed for core IT activity in the IT policy or verifying the actual
consumption of electricity for non-IT activity. This had resulted in loss of
revenue of ` 50.35 crore. Power concession was extended to firms whose
activities were not related to IT/ITES, due to which the Company suffered loss
of revenue of ` 10.96 crore.
Though seven IT firms had not submitted the relevant documents in
support of their category (HT-I) to Detection of Pilferage of Energy (DPE)
wing of the Company, these continued to avail of the concessional power
tariff, which resulted in loss of revenue of ` 30.17 crore. Power concession
was extended to second and subsequent units, though not established 100
KMs away from the first unit, in deviation from the IT policy, which
resulted in loss of revenue of ` 18.07 crore. Extension of concessional
power tariff was done without obtaining a fresh Consultative Committee on
Information Technology Industry (CCITI) certificate from the new
occupant/firm (due to sale/purchase), resulting in loss of revenue of
` 5.55 crore. Extension of Concessional power tariff before completion of

xii
one year of commercial operation, against the ICT Policy, resulted in loss
of revenue of ` 1.98 crore.
There was no monitoring mechanism and conversion of category from HT-II
to HT-I was done without any time limit. The burden of concessional power
tariff was entirely borne by the Company without any subsidy from the
Government.
(Paragraph 3.3)
The deferment of second phase supply of power to M/s Golden Jubilee Hotels
Limited (consumer) beyond six months, against the Company's guidelines and
without levying minimum charges, as specified in the Tariff Order, resulted in
extension of undue benefit of ` 1.70 crore to the consumer.
(Paragraph 3.4)
The Singareni Collieries Company Limited
The Company, without ensuring the possibility of acquiring the private land,
went ahead with the publication of Draft Notification and Draft Declaration
for the proposed Indaram Opencast Mine and incurred an expenditure of
` 1.16 crore towards publication charges. As no award was made within the
prescribed period, the proceedings for acquisition of land lapsed and the
expenditure was rendered unfruitful.
(Paragraph 3.5)
The Company incurred extra expenditure of ` 44.14 crore over the original
estimates, due to clubbing of the alternate canal to NTR canal with
Indirasagar-Rudramkota Lift Irrigation Canal for a length of 28 KMs, against
the diversion of only 4.76 KM, required for its mining activities.
(Paragraph 3.6)
Telangana State Power Generation Corporation Limited did not initiate
action on the contractor for the defect in the Turbine Generator (TG) building
(Stage-I Kakatiya Thermal Power Plant (KTPP)), as per the terms and
conditions of the contract. Extension of undue favour to the contractor of
Balance of Plant (BOP) works resulted in avoidable additional expenditure of
` 2.12 crore towards purchase of Electronically Operated Travelling Type
(EOT) crane (Stage-II KTPP).
(Paragraph 3.7)
Telangana State Road Transport Corporation had not conducted periodical
census of buses as per the Agreement with the agent for display of
advertisement on buses. Due to this, the agent paid license fees on the reduced
number of buses. This had resulted in undue benefit of ` 52.40 lakh to the
agent by way of short recovery of license fees.
(Paragraph 3.8)
(Chapter III)

Chapter I
1. Functioning of State Public Sector Undertakings
1.1 Introduction
The State Public Sector Undertakings (PSUs) consist of State Government
Companies and Statutory Corporations which are established to carry out
activities of a commercial nature keeping in view the welfare of the people.
The AP Reorganisation Act, 2014 came into effect from 2nd
June 2014 which
bifurcated the erstwhile Composite State of Andhra Pradesh and Telangana
State was formed on the same day. In Telangana, the State PSUs occupy an
important place in the state economy. The accounts of these PSUs are subject
to supplementary audit conducted by Comptroller and Auditor General of
India (CAG) as per the provisions of Section 143 of the Companies Act, 2013
and audit of Statutory Corporations is governed by their respective
legislations.
This is the second Audit Report of the Telangana State after bifurcation of
the erstwhile Composite State of Andhra Pradesh.
As per the above Act, the assets and liabilities relating to the PSUs of the
erstwhile Composite State of Andhra Pradesh, where such undertakings or
parts thereof are exclusively located in, or their operations are confined to a
local area, shall pass to the State in which that area is included, irrespective of
the location of the Headquarters1.
The assets and liabilities of PSUs which had interstate operations shall have to
be apportioned between the two States2 as under:
(a) The operational units of the undertaking shall be apportioned between
the two successor States on location basis; and
(b) The headquarters of the undertaking shall be apportioned between the
two successor States on the basis of population ratio.
As per the Reorganisation Act, 2014, 33 PSUs having interstate operations
were to be demerged. However, only 25 Government Companies and three
Statutory Corporations were functionally bifurcated but the transfer of assets
and liabilities is yet to be finalised.
Twenty-two Non-working Companies (except Andhra Pradesh Dairy
Development Corporation Limited) were not included in the Schedule Nine of
the Reorganisation Act, 2014. This aspect requires special attention. Assets
and Liabilities of these Companies are also yet to be bifurcated between the
two States.
In Telangana State, there were 67 PSUs as on 31st March 2016 including one
new Company formed during the year.
1.1 Of these, none of the PSUs was listed on the stock exchange(s). During the
year 2015-16, one new PSU (Telangana Drinking Water Supply Corporation
1 PSUs coming under Telangana State are referred as PSUs.
2 PSUs having interstate operations are referred as PSUs under demerger
Report No. 2 of 2017 (Public Sector Undertakings)
2
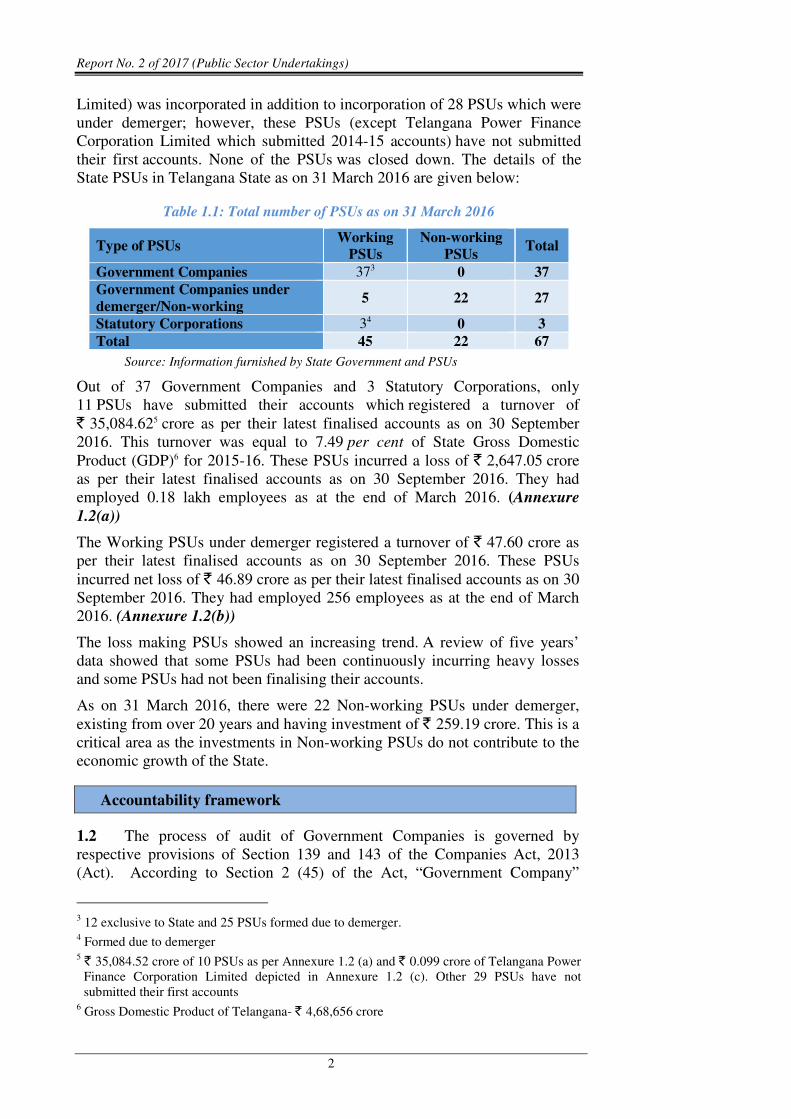
Limited) was incorporated in addition to incorporation of 28 PSUs which were
under demerger; however, these PSUs (except Telangana Power Finance
Corporation Limited which submitted 2014-15 accounts) have not submitted
their first accounts. None of the PSUs was closed down. The details of the
State PSUs in Telangana State as on 31 March 2016 are given below:
Table 1.1: Total number of PSUs as on 31 March 2016
Type of PSUs Working
PSUs
Non-working
PSUs Total
Government Companies 373 0 37
Government Companies under
demerger/Non-working 5 22 27
Statutory Corporations 34 0 3
Total 45 22 67
Source: Information furnished by State Government and PSUs
Out of 37 Government Companies and 3 Statutory Corporations, only
11 PSUs have submitted their accounts which registered a turnover of
` 35,084.625 crore as per their latest finalised accounts as on 30 September
2016. This turnover was equal to 7.49 per cent of State Gross Domestic
Product (GDP)6 for 2015-16. These PSUs incurred a loss of ` 2,647.05 crore
as per their latest finalised accounts as on 30 September 2016. They had
employed 0.18 lakh employees as at the end of March 2016. (Annexure
1.2(a))
The Working PSUs under demerger registered a turnover of ` 47.60 crore as
per their latest finalised accounts as on 30 September 2016. These PSUs
incurred net loss of ` 46.89 crore as per their latest finalised accounts as on 30
September 2016. They had employed 256 employees as at the end of March
2016. (Annexure 1.2(b))
The loss making PSUs showed an increasing trend. A review of five years’
data showed that some PSUs had been continuously incurring heavy losses
and some PSUs had not been finalising their accounts.
As on 31 March 2016, there were 22 Non-working PSUs under demerger,
existing from over 20 years and having investment of ` 259.19 crore. This is a
critical area as the investments in Non-working PSUs do not contribute to the
economic growth of the State.
Accountability framework
1.2 The process of audit of Government Companies is governed by
respective provisions of Section 139 and 143 of the Companies Act, 2013
(Act). According to Section 2 (45) of the Act, “Government Company”
3 12 exclusive to State and 25 PSUs formed due to demerger.
4 Formed due to demerger
5 ` 35,084.52 crore of 10 PSUs as per Annexure 1.2 (a) and ` 0.099 crore of Telangana Power
Finance Corporation Limited depicted in Annexure 1.2 (c). Other 29 PSUs have not
submitted their first accounts 6 Gross Domestic Product of Telangana- ` 4,68,656 crore

Chapter I-Functioning of State Public Sector Undertakings
3
means any Company in which not less than fifty one per cent of the paid-up
share capital is held by the Central Government, or by any State Government
or Governments, or partly by the Central Government and partly by one or
more State Governments, and includes a Company which is a subsidiary
Company of such Government Company.
Further, as per sub-section 7 of Section 143 of the Act, the CAG may, in case
of any Company covered under sub-section (5) or sub-section (7) of Section
139, if considered necessary, by an order, cause test audit to be conducted of
the accounts of such Company and the provisions of Section 19 A of the
Comptroller and Auditor General’s (Duties, Powers and Conditions of
Service) Act, 1971 shall apply to the report of such test Audit. Thus, a
Government Company or any other Company owned or controlled, directly or
indirectly, by the Central Government, or by any State Government or
Governments or partly by Central Government and partly by one or more
State Governments is subject to audit by the CAG. An audit of the financial
statements of a Company in respect of the financial years that commenced on
or before 31 March 2014 continue to be governed by the provisions of the
Companies Act, 1956.
Statutory Audit
1.3 The Statutory Auditors appointed by the CAG under Section 139 of
the Companies Act, 2013, conduct audit of accounts of the Government
Companies and submit their report thereon in accordance with Section 143 of
the Companies Act, 2013.
The CAG plays an oversight role by monitoring the performance of the
Statutory Auditors with the overall objective that the Statutory Auditors
discharge the functions assigned to them properly and effectively. This
function is discharged by exercising the power
• to issue directions to the Statutory Auditors under Section 143(5) of
the Companies Act, 2013, and
• to supplement or comment upon the Statutory Auditor’s report under
Section 143 (6) of the Companies Act, 2013.
Audit of Statutory Corporations is governed by their respective legislations.
Out of the three Statutory Corporations, CAG is the sole auditor for Telangana
State Road Transport Corporation. The audit of Telangana State Warehousing
Corporation and Telangana State Financial Corporation is conducted by
Chartered Accountants and Supplementary audit by CAG.
Role of Government and Legislature
1.4 The State Government exercises control over the affairs of these PSUs
through its administrative departments. The Chief Executive and Directors to
the Board are appointed by the Government.
The State Legislature also monitors the accounting and utilisation of
Government investment in the PSUs. For this, the Annual Reports, together
with the Statutory Auditors’ Reports and comments of the CAG, in respect of
State Government Companies and Separate Audit Reports in case of Statutory
Report No. 2 of 2017 (Public Sector Undertakings)
4
Corporations, are to be placed before the Legislature under Section 394 of the
Companies Act or as stipulated in the respective Acts. The Audit Reports of
CAG are submitted to the Government under Section 19A of the CAG’s
(Duties, Powers and Conditions of Service) Act, 1971.
Stake of Government of Telangana
1.5 The State Government has a significant financial stake in these PSUs.
This stake is of mainly three types:
• Share Capital and Loans- In addition to the Share Capital
Contribution, State Government also provides financial assistance by
way of loans to the PSUs from time to time.
• Special Financial Support- State Government provides budgetary
support by way of grants and subsidies to the PSUs, as and when
required.
• Guarantees- State Government also guarantees the repayment of loans
with interest availed of by the PSUs from Financial Institutions.
Investment in State PSUs
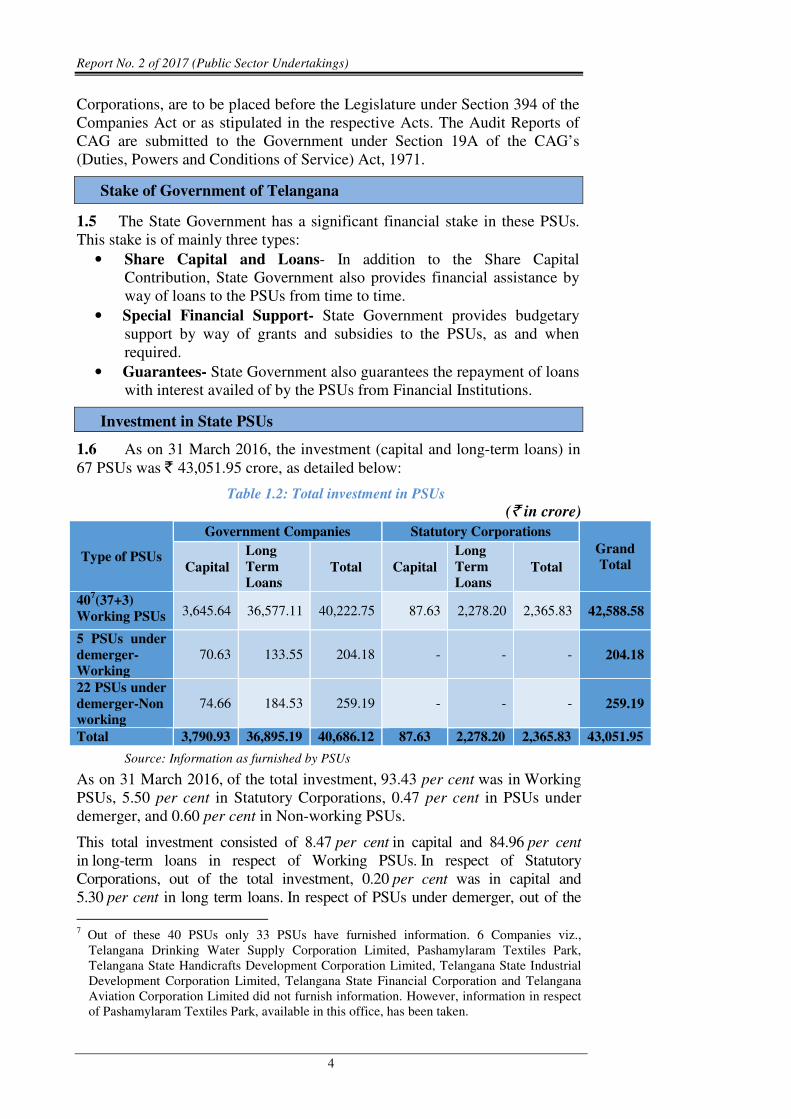
1.6 As on 31 March 2016, the investment (capital and long-term loans) in
67 PSUs was ` 43,051.95 crore, as detailed below:
Table 1.2: Total investment in PSUs
(` in crore)
Type of PSUs
Government Companies Statutory Corporations
Grand
Total Capital
Long
Term
Loans Total Capital
Long
Term
Loans Total
407(37+3)
Working PSUs 3,645.64 36,577.11 40,222.75 87.63 2,278.20 2,365.83 42,588.58
5 PSUs under
demerger-
Working
70.63 133.55 204.18 - - - 204.18
22 PSUs under
demerger-Non
working
74.66 184.53 259.19 - - - 259.19
Total 3,790.93 36,895.19 40,686.12 87.63 2,278.20 2,365.83 43,051.95
Source: Information as furnished by PSUs
As on 31 March 2016, of the total investment, 93.43 per cent was in Working
PSUs, 5.50 per cent in Statutory Corporations, 0.47 per cent in PSUs under
demerger, and 0.60 per cent in Non-working PSUs.
This total investment consisted of 8.47 per cent in capital and 84.96 per cent
in long-term loans in respect of Working PSUs. In respect of Statutory
Corporations, out of the total investment, 0.20 per cent was in capital and
5.30 per cent in long term loans. In respect of PSUs under demerger, out of the
7 Out of these 40 PSUs only 33 PSUs have furnished information. 6 Companies viz.,
Telangana Drinking Water Supply Corporation Limited, Pashamylaram Textiles Park,
Telangana State Handicrafts Development Corporation Limited, Telangana State Industrial
Development Corporation Limited, Telangana State Financial Corporation and Telangana
Aviation Corporation Limited did not furnish information. However, information in respect
of Pashamylaram Textiles Park, available in this office, has been taken.

Chapter I-Functioning of State Public Sector Undertakings
5
total investment, 0.16 per cent was in capital and 0.31 per cent in long-term loans.
In respect of Non-working PSUs, out of the total investment, 0.17 per cent was in
capital and 0.43 per cent in long term loans as on 31 March 2016.
1.7 The sector-wise summary of investments in the Working PSUs
(including Statutory Corporations) as on 31 March 2016 is given below:
Table 1.3: Sector-wise investment in PSUs
(` in crore)
Name of Sector Working
PSUs
Statutory
Corporations
Non-
working
PSUs
PSUs
under
demerger
Investment
Power 29,127.87 -- -- -- 29,127.87
Manufacturing 5,998.27 -- 202.41 104.52 6,305.20
Finance 2,355.25 -- 23.57 6.33 2,385.15
Miscellaneous 0.25 -- -- 4.88 5.13
Service 1,866.53 2,359.16 1.13 -- 4,226.82
Infrastructure 862.88 -- -- 88.45 951.33
Agriculture &
Allied
11.70 6.67 32.08 -- 50.45
Total 40,222.75 2,365.83 259.19 204.18 43,051.95
Source: Information as furnished by PSUs
Special support and returns during the year
1.8 The State Government provides financial support to PSUs in various
forms through annual budget. The summarised details of budgetary outgo
towards equity, loans, grants/ subsidies, loans written off and interest waived
in respect of Working PSUs and PSUs under demerger for the year ended
2015-16, are as follows:
Table 1.4: Details regarding budgetary support to PSUs
(` in crore)
Sl.
No. Particulars
2015-16
408Working PSUs
5 PSUs under
demerger
No. of
PSUs Amount
No. of
PSUs Amount
1 Equity capital outgo from budget 11 530.92 5 0.00
2 Loans given from budget 8 6,991.16 5 0.00
3 Grants/Subsidy given from budget 12 10,316.58 5 3.93
4 Total Outgo 17,838.66 3.93
5 Interest/Penal interest written off 0 0.00 0 0.00
6 Guarantees issued 1 646.16 0 0.00
7 Guarantee Commitment 5 10,422.77 0 0.00
8 Total Outgo of 129 PSUs from Sl.
No.4 above
5,438.31
Source: Information as furnished by PSUs
8 Out of these 40 PSUs only 33 PSUs have furnished information.
9 12 Companies that were included in Telangana as per previous report have only been taken
for comparison in the chart. Also, newly formed companies do not have five years data for
comparison.

Report No. 2 of 2017 (Public Sector Undertakings)
6
Chart 1.1: Budgetary outgo towards Equity, Loans and Grants/Subsidies
4,637.12 4,904.84
7,033.30
4,264.48
5,438.31
1,000.00
2,000.00
3,000.00
4,000.00
5,000.00
6,000.00
7,000.00
8,000.00
9,000.00
10,000.00
Budgetary outgo towards Equity, Loans and Grants/Subsidies
Budgetary support by the State Government in respect of 12 PSUs (exclusive
to State) increased from ` 4,264.48 crore in 2014-15 to ` 5,438.31 crore
during 2015-16. However, overall budgetary support increased from
` 11,382.12 crore during 2014-15 to ` 17,842.59 crore in 2015-16.
In order to enable PSUs to obtain financial assistance from Banks and
Financial Institutions, State Government gives guarantees subject to the limits
prescribed by the Constitution of India, for which, guarantee fee is charged.
This fee varies from 0.25 per cent to one per cent as decided by the State
Government, depending upon the loanees. The guarantee commitment
decreased from ` 15,249.52 crore in 2014-15 to ` 10,422.77 crore in 2015-16
in respect of all PSUs, including PSUs under demerger. There
were four10 PSU’s which did not pay guarantee fee/commission during the
year and the accumulated outstanding guarantee fee/commission thereagainst
was ` 6.25 crore (31 March 2016).
Reconciliation with Finance Accounts
1.9 The figures in respect of equity, loans and guarantees outstanding as
per records of State PSUs should agree with that of the figures appearing in
the Finance Accounts of the State. In case the figures do not agree, the PSUs
concerned and the Finance Department should carry out reconciliation of
differences. The position in this regard as on 31 March 2016 was as follows:
Table 1.5: Equity, loans, guarantees outstanding as per Finance Accounts
vis-a-vis records of PSUs (` in crore)
Outstanding
in respect of
Amount as per Finance
Accounts
Amount as per
records of PSUs # Difference
(A)
No. of
Companies** (B) (A)-(B)
Equity 885.41 1 885.60 - 0.19
10
Southern Power Distribution Company of Telangana Limited ` 3.63 crore (exclusive to
State), The Nizam Sugars Limited ` 51.04 lakh, New and Renewable Energy Development
Corporation of Andhra Pradesh Limited ` 3 lakh, Andhra Pradesh State Financial
Corporation ` 2.08 crore (yet to be bifurcated between the States)

Chapter I-Functioning of State Public Sector Undertakings
7
Outstanding
in respect of
Amount as per Finance
Accounts
Amount as per
records of PSUs # Difference
(A)
No. of
Companies** (B) (A)-(B)
Loans 10.78 1 35.95 - 25.17
Guarantees 21,063.71 8 2,663.59 18,400.12
Source: Finance Accounts and Information as furnished by PSUs
# Information as furnished by PSUs
** Information received for these Companies only.
Audit observed that there were differences in respect of 10 PSUs (Information
in respect of other PSUs is awaited) and some of the differences were pending
reconciliation since long. The matter was taken up (October 2016) with the
State Government and replies are awaited. The Government and the PSUs
should take concrete steps to reconcile the differences in a time-bound
manner.
Arrears in finalisation of accounts
1.10 The financial statements of the Companies for every financial year are
required to be finalised within six months from the end of the relevant
financial year i.e. by September end in accordance with the provisions of
Section 96 (1) of the Companies Act. Failure to do so may attract penal
provisions under Section 99 of the Companies Act. Similarly, in case of
Statutory Corporations, their accounts are finalised, audited and presented to
the Legislature as per the provisions of their respective Acts.
Table 1.6 provides the details of progress made by working PSUs in
finalisation of accounts as on 30 September 2016.
Table 1.6: Position relating to finalisation of accounts of working PSUs
S. No. Particulars 2015-16@Working PSUs
PSUs
exclusive to
State11
Formed due
to demerger12
PSUs under
demerger13
Statutory
Corporations Total
1. Number of Working PSUs 12 25 5 3 45
2. Number of accounts finalised
during the year 6 1# 3 0 10
3. Number of accounts in arrears 26 32 18 3 79
4. Average arrears per PSU (3/1) 2.16 1.28 3.6 1 1.75
5. Number of Working PSUs
with arrears in accounts 9 25 4 3 41
6. Extent of arrears 1 to 7 years 2 years 1 to 14 years 1 year 1 to 14
years
Source: As compiled by O/o AG (E&RSA) Andhra Pradesh and Telangana;
@ Position up to September 2016
# Telangana Power Finance Corporation Limited - supplementary audit on accounts of 2014-15 done
during current year.
11 Statement showing investments made by State Government in PSUs (exclusive to state) whose
accounts are in arrears (Annexure 1.1(a)) 12 Statement showing investments made by State Government in PSUs (formed due to demerger) whose
accounts are in arrears (Annexure 1.1(c)) 13 Statement showing investments made by State Government in PSUs (under demerger) whose
accounts are in arrears (Annexure 1.1(b))

Report No. 2 of 2017 (Public Sector Undertakings)
8
It can be observed from the above that as on 30th
September, 2016:
� Twenty six accounts pertaining to nine PSUs (exclusive to State) were
in arrears
� All the accounts of 25 PSUs (excluding Statutory Corporations)
formed due to demerger, were in arrears.
In respect of PSUs under demerger except for The Nizam Sugars Limited,
18 accounts of other four PSUs are in arrears. As regards Statutory
Corporations, accounts of all the three PSUs are in arrears.
Further, the extent of arrears ranged from one to 14 years in respect of PSUs
under demerger. It is pertinent to mention here that APMDC-SCCL Suliyari
Coal Company Limited and AP Tribal Power Corporation Limited have not
submitted their 1st Accounts since their formation (2013-14 and 2002-03
respectively). The 24 PSUs formed due to demerger, also did not furnish their
first accounts.
The Administrative Departments have the responsibility to oversee the
activities of these entities and to ensure that the accounts are finalised and
adopted by these PSUs within the stipulated period. The arrears of accounts
continued to exist though the Departments concerned were informed annually.
1.11 The State Government had invested ` 4,260.39 crore in Equity, Loans
and Grants in the PSUs (Exclusive to State) for which accounts had not been
finalised, as detailed in Annexure 1.1(a).
The State Government had also invested ` 1,479.44 crore in Equity, Loans
and Grants in PSUs (formed due to demerger) for which accounts had not
been finalised, as detailed in Annexure 1.1(c).
The State Government had invested ` 16.76 crore towards Grants in respect of
two PSUs which were under demerger during the years for which accounts
had not been finalised, as detailed in Annexure 1.1 (b).
In the absence of finalisation of accounts and their subsequent audit, it could
not be assessed whether the investments and expenditure incurred have been
properly accounted for and whether the purpose for which the
amounts were invested was achieved or not. Thus, Government’s investment
in such PSUs remained outside the control of State Legislature.
1.12 In addition to the above, as on 30 September 2016, there were arrears
in finalisation of accounts by Non-working PSUs. Out of the 22 Non-working
PSUs, 10 were in the process of liquidation whose accounts were in arrears for
2 to 14 years. Of the remaining 12 Non-working PSUs, all had arrears of
accounts.
Table 1.7: Position relating to arrears of accounts in respect of Non-working PSUs
No. of Non-
working Companies
Period for which accounts
were in arrears
No. of years for which
accounts were in arrears
10 2 to 14 years In the process of liquidation
12 Information not available --
Source: Information as furnished by Official Liquidator

Chapter I-Functioning of State Public Sector Undertakings
9
In respect of Non-working PSUs, letters were addressed (September 2015,
July 2016 and reminder October 2016) to the Public Enterprises Department
of State Government. The reply was awaited (December 2016).
Placement of Separate Audit Reports
1.13 The position depicted in Table 1.8 shows the status of placement of
Separate Audit Reports (SARs) issued by the CAG (up to 30 September 2016)
on the accounts of the Statutory Corporations, in the Legislature.
Table 1.8: Status of placement of SARs in Legislature
Sl.
No.
Name of Statutory
Corporation
Year up to
which SARs
placed in
Legislature
Year for which SARs not placed in
Legislature
Year of
SAR
Date of issue to the
Government/Present
Status
1. Telangana State
Financial Corporation
Accounts have not been submitted to AG.
(December 2016)
2.
Telangana State
Warehousing
Corporation
3. Telangana State Road
Transport Corporation
Source: Information as furnished by PSUs concerned.
Impact of non-finalisation of accounts
1.14 The delay in finalisation of accounts pointed out above (para 1.10 to
1.12), may also result in risk of fraud and leakage of public money apart from
violation of the provisions of the relevant Statutes. In view of the above state
of arrears of accounts, the actual contribution of PSUs to the State GDP for the
year 2015-16, could not be ascertained and their contribution to the State
exchequer was also not reported to the State Legislature.
Performance of PSUs as per their latest finalised accounts
1.15 The financial position and working results of Working PSUs
(Telangana State) and PSUs under demerger and Statutory Corporations are
detailed in Annexure 1.2 (a)14, Annexure 1.2(b)15 and Annexure 1.2(c)16.
A ratio of PSUs’ turnover to the State GDP shows the extent of PSUs’
activities in the State economy. Table 1.9 provides the details of State working
PSUs’ turnover and State GDP for the year ended 31 March 2016.
14
PSUs exclusive to State 15
PSUs under demerger 16
PSUs formed due to demerger of PSUs
Report No. 2 of 2017 (Public Sector Undertakings)
10
Table 1.9: Details of Working PSUs’ turnover vis-a-vis State GDP
(`̀̀̀ in crore)
Particulars 2015-16
Working PSUs PSUs
under
demerger
Statutory
Corporations PSUs
(Exclusive
to State)
formed due
to
demerger17
Turnover 35,084.52 0.10 47.60 Accounts not
submitted
Telangana
State GDP 4,68,656 --
Not
applicable --
Percentage of
turnover to State
GDP
7.49 -- -- --
Net profit(+)/loss (-) -2,647.05 -- -46.89 --
Source: As per latest finalised Annual Accounts of PSUs
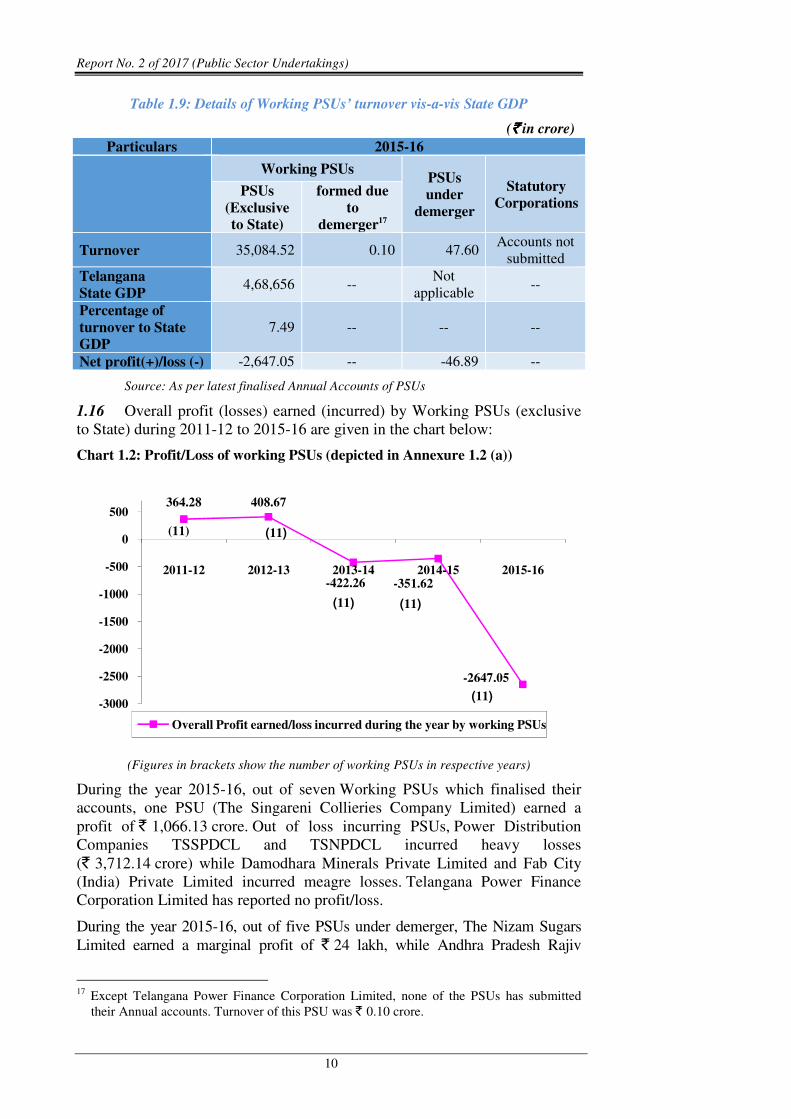
1.16 Overall profit (losses) earned (incurred) by Working PSUs (exclusive
to State) during 2011-12 to 2015-16 are given in the chart below:
Chart 1.2: Profit/Loss of working PSUs (depicted in Annexure 1.2 (a))
364.28 408.67
-422.26 -351.62
-2647.05
-3000
-2500
-2000
-1500
-1000
-500
0
500
2011-12 2012-13 2013-14 2014-15 2015-16
Overall Profit earned/loss incurred during the year by working PSUs
(11) (11)
(11) (11)
(11)
(Figures in brackets show the number of working PSUs in respective years)
During the year 2015-16, out of seven Working PSUs which finalised their
accounts, one PSU (The Singareni Collieries Company Limited) earned a
profit of ` 1,066.13 crore. Out of loss incurring PSUs, Power Distribution
Companies TSSPDCL and TSNPDCL incurred heavy losses
(` 3,712.14 crore) while Damodhara Minerals Private Limited and Fab City
(India) Private Limited incurred meagre losses. Telangana Power Finance
Corporation Limited has reported no profit/loss.
During the year 2015-16, out of five PSUs under demerger, The Nizam Sugars
Limited earned a marginal profit of ` 24 lakh, while Andhra Pradesh Rajiv
17
Except Telangana Power Finance Corporation Limited, none of the PSUs has submitted
their Annual accounts. Turnover of this PSU was ` 0.10 crore.

Chapter I-Functioning of State Public Sector Undertakings
11
Swagruha Corporation Limited and Infrastructure Corporation of Andhra Pradesh
Limited incurred losses of ` 45.78 crore and ` 1.55 crore respectively. Andhra
Pradesh Tribal Power Company Limited has not yet submitted its accounts.
1.17 Some other key parameters of PSUs are given below.
Table 1.10: Key Parameters of Working PSUs and PSUs under demerger
(`̀̀̀ in crore)
Particulars 2015-16
Working PSUs
(Exclusive to
State)
Working PSUs
formed due to
demerger (including
Statutory
Corporations)18
PSUs under
demerger
Return on
capital employed -1,449.92 0.00 -4.16
Debt 15,155.44 3.67 56.05
Turnover19 35,084.52 0.10 47.60
Debt/ Turnover
Ratio 0.43 -- 1.18
Interest
Payments20 1,197.13 0.00 6.90
Accumulated
Profits / (losses) -12,462.42 -- -233.66
Source: As per the latest finalised Annual Accounts of PSUs
1.18 As per their latest finalised accounts, 12 Working PSUs incurred an
aggregate loss of ` 2,647.05 crore.
As per their latest finalised accounts, five PSUs under demerger incurred an
aggregate loss of ` 46.89 crore. Further, two PSUs (The Singareni Collieries
Company Limited and Telangana State Warehousing Corporation Limited)
declared a dividend of ` 133.32 crore.
Winding up of Non-working PSUs
1.19 There were 22 Non-working PSUs (22 Companies and Nil Statutory
Corporations) as on 31 March 2016. Of these, 10 PSUs have commenced
liquidation process. The number of Non-working Companies as on 31st March
2016 is given below.
Table 1.11: Non-working PSUs
Particulars 2015-16
No. of Non-working Companies 22
No. of Non-working Corporations 0
Total 22
Source: As compiled by O/o AG (E&RSA), Andhra Pradesh and Telangana;
18
Except Telangana Power Finance Corporation Limited, none of the remaining 27 PSUs
have submitted their Annual accounts. 19
Turnover of working PSUs as per their latest finalised accounts as of 30 September 2016 20
Includes PSUs who have finalised their accounts till September 2016.
Report No. 2 of 2017 (Public Sector Undertakings)
12
Since the Non-working PSUs had not been contributing to the State economy
and meeting their intended objectives, these PSUs need to be considered either
for closure or revival. During 2015-16, three Non-working PSUs incurred an
expenditure of ` 0.42 crore towards establishment. The information was not
furnished by the other Non-working PSUs. The entire expenditure was met
from the interest earned on FDRs kept with various scheduled banks, rents
collected and provisions written back.
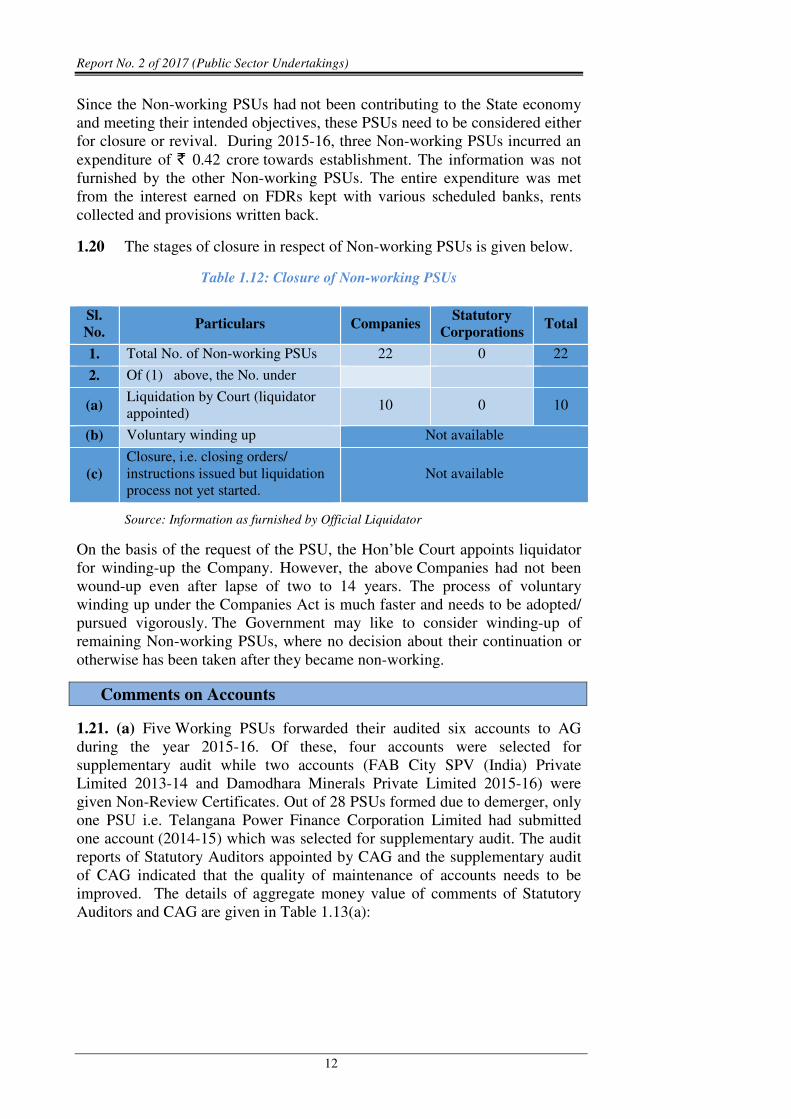
1.20 The stages of closure in respect of Non-working PSUs is given below.
Table 1.12: Closure of Non-working PSUs
Source: Information as furnished by Official Liquidator
On the basis of the request of the PSU, the Hon’ble Court appoints liquidator
for winding-up the Company. However, the above Companies had not been
wound-up even after lapse of two to 14 years. The process of voluntary
winding up under the Companies Act is much faster and needs to be adopted/
pursued vigorously. The Government may like to consider winding-up of
remaining Non-working PSUs, where no decision about their continuation or
otherwise has been taken after they became non-working.
Comments on Accounts
1.21. (a) Five Working PSUs forwarded their audited six accounts to AG
during the year 2015-16. Of these, four accounts were selected for
supplementary audit while two accounts (FAB City SPV (India) Private
Limited 2013-14 and Damodhara Minerals Private Limited 2015-16) were
given Non-Review Certificates. Out of 28 PSUs formed due to demerger, only
one PSU i.e. Telangana Power Finance Corporation Limited had submitted
one account (2014-15) which was selected for supplementary audit. The audit
reports of Statutory Auditors appointed by CAG and the supplementary audit
of CAG indicated that the quality of maintenance of accounts needs to be
improved. The details of aggregate money value of comments of Statutory
Auditors and CAG are given in Table 1.13(a):
Sl.
No. Particulars Companies
Statutory
Corporations Total
1. Total No. of Non-working PSUs 22 0 22
2. Of (1) above, the No. under
(a) Liquidation by Court (liquidator
appointed) 10 0 10
(b) Voluntary winding up Not available
(c)
Closure, i.e. closing orders/
instructions issued but liquidation
process not yet started.
Not available

Chapter I-Functioning of State Public Sector Undertakings
13
Table 1.13 (a): Impact of audit comments on Working PSUs
(` ` ` ` in crore)
Sl. No. Particulars 2015-16
No. of accounts Amount
1. Decrease in profit 1 266.06
2. Increase in loss 02 479.78
3. Non-disclosure of
material facts
04@ 3,269.38
4. Errors of classification 04@ 1,424.78
Source: As per comments issued by the CAG and Statutory Auditors
@ includes comments on Telangana State Power Finance Corporation Limited which is one of
the 28 PSUs formed due to demerger (2014-15 accounts).
1.21. (b) Three PSUs under demerger forwarded three audited accounts to
AG during the year 2015-16. All of these were selected for supplementary
audit. The audit reports of Statutory Auditors appointed by CAG and the
supplementary audit of CAG indicated that the quality of maintenance of
accounts needs to be improved. The details of impact of audit comments of
Statutory Auditors and CAG are given below:
Table 1.13 (b): Impact of audit comments on PSUs under demerger
(` in crore)
Sl. No. Particulars 2015-16
No. of accounts Amount
1. Decrease in profit 01 0.19
2. Increase in loss 0 0.00
3. Non-disclosure of
material facts
0 0.00
4. Errors of classification 0 0.00
Source: As per comments issued by the CAG and Statutory Auditors
During the year, the Statutory Auditors have given disclaimer opinion in
respect of internal financial control aspects of The Singareni Collieries
Company Limited and qualified opinion in respect of TSNPDCL and
TSSPDCL. Adverse certificates were not given for any accounts.
1.22 None of the three working Statutory Corporations submitted their
accounts to AG during the year 2015-16.
Response of the Government to Audit
Performance Audits and Paragraphs
1.23 For the Report of the Comptroller and Auditor General of India for the
year ended 31 March 2016, one Performance Audit and eight audit paragraphs
were issued to the Additional Chief Secretaries/Principal Secretaries of the
respective Departments with the request to furnish replies within six weeks.
However, replies in respect of five compliance audit paragraphs were awaited
from the State Government (December 2016).

Report No. 2 of 2017 (Public Sector Undertakings)
14
Follow up action on Audit Reports
Replies outstanding
1.24 The Report of the Comptroller and Auditor General (CAG) of India
represents the culmination of the process of audit scrutiny. It is, therefore,
necessary that they elicit appropriate and timely response from the executive.
The Finance Department, erstwhile Government of Andhra Pradesh had issued
(June 2004) instructions to all Administrative Departments to submit
replies/explanatory notes to paragraphs/reviews included in the Audit Reports
of the CAG of India within a period of three months of their presentation in the
Legislature, in the prescribed format without waiting for any questionnaires
from the COPU.
Table No.1.14: Explanatory notes not received (as on 30 September 2016)
Year of the
Audit Report
(Commercial
/PSU)
Date of
placement of
Audit Report
in the State
Legislature
Total Performance
audits (PAs) and
Paragraphs in the
Audit Report
Number of PAs/ Paragraphs for
which explanatory notes were
not received
Exclusive to
State Common
PAs Para-
graphs PAs
Para-
graphs PAs
Para-
graphs
1992-93 29-03-1994 7 29 0 0 0 0
1993-94 28-04-1995 6 19 0 0 0 0
1995-96 19-03-1997 5 23 0 0 0 2
1996-97 19-03-1998 6 23 0 0 0 0
1997-98 11-03-1999 6 23 0 0 0 7
1998-99 03-04-2000 4 25 0 1 0 5
1999-00 31-03-2001 6 18 0 0 2 6
2000-01 30-03-2002 4 17 0 0 1 1
2001-02 31-03-2003 3 20 0 0 0 0
2002-03 24-07-2004 3 13 0 0 0 2
2003-04 31-03-2005 2 19 0 0 1 0
2004-05 27-03-2006 2 21 0 0 1 1
2005-06 31-03-2007 4 19 0 1 1 1
2006-07 28-03-2008 5 24 0 0 2 6
2007-08 05-12-2008 3 22 0 0 1 0
2008-09 30-03-2010 3 24 0 0 1 6
2009-10 29-03-2011 3 18 0 0 0 0
2010-11 29-03-2012 3 22 0 0 0 9
2011-12 21-06-2013 2 6 0 0 2 4
2012-13 06-09-2014 2 9 0 1 2 2
2013-14 26-03-2015 2 5 0 1 1 2
2014-15 30-03-2016 1 3 1 3 0 0
Total 82 402 1 7 15 54
Source: As compiled by O/o AG (E&RSA), Andhra Pradesh and Telangana
From the above, it could be seen that out of 484 Performance
Audits/Paragraphs, explanatory notes to 77 Performance Audits/Paragraphs in

Chapter I-Functioning of State Public Sector Undertakings
15
respect of 1021 departments, which were commented upon, were awaited
(September 2016).
Discussion of Audit Reports by the Committee on Public
Undertakings (COPU)
1.25 The status as on 30 September 2016 of Performance Audits and
paragraphs that appeared in Audit Reports (PSUs) and were discussed by the
Committee on Public Undertakings (COPU), is as under:
Table No.1.15: Performance Audits/Paragraphs that appeared in Audit Reports
vis-a-vis discussed as on 30 September 2016
Year of the Audit
Report
(Commercial/PSU)
Number of Performance Audits/ Paragraphs
Appeared in Audit Report Paras discussed
PAs Paragraphs PAs Paragraphs
1992-93 7 29 6 29
1993-94 6 19 5 19
1995-96 5 23 3 18
1996-97 6 23 3 22
1997-98 6 23 2 10
1998-99 4 25 0 14
1999-00 6 18 1 7
2000-01 4 17 1 15
2001-02 3 20 0 13
2002-03 3 13 3 10
2003-04 2 19 0 8
2004-05 2 21 0 14
2005-06 4 19 0 11
2006-07 5 24 1 5
2007-08 3 22 1 9
2008-09 3 24 1 7
2009-10 3 18 1 7
2010-11 3 22 0 3
2011-12 2 6 0 0
2012-13 2 9 0 0
2013-14 2 5 0 0
2014-15 1 3 0 0
Total 82 402 28 221
Source: As compiled by O/o AG (E&RSA) Andhra Pradesh and Telangana
21
1. Industries & Commerce 2. Irrigation and Command Area Development (CAD)
3. Revenue 4. Animal Husbandry 5. Energy 6. Agriculture & Co-operation 7. Transport,
Road & Buildings 8. Housing, 9. Youth Advancement, Tourism and Culture and
10. Municipal Administration & Urban Development

Report No. 2 of 2017 (Public Sector Undertakings)
16
Compliance to Reports of Committee on Public Undertakings (COPU)
1.26 Action Taken Notes (ATNs) in respect of 333 paragraphs pertaining to
48 Reports of the COPU presented in the State Legislature between April 1983
to March 2007 had not been received (September 2016). The details are
indicated below:
Table No.1.16: Compliance to COPU Reports
Year of the
COPU
Report
Total
number of
COPU
Reports
Total no. of
recommendations
in COPU Report
No. of
recommendations
where ATNs not
received
1983-84 1 3 3
1990-91 1 4 4
1991-92 5 160 100
1993-94 5 177 97
1995-96 3 33 17
1996-97 2 38 24
1998-99 2 16 16
2000-01 13 110 43
2001-02 1 1 0
2002-03 1 24 0
2004-05 9 66 5
2004-06 1 14 0
2006-07 4 25 24
Total 48 671 333
Note: The above information pertains to erstwhile composite State of Andhra Pradesh.
Source: As compiled by O/o AG (E&RSA), Andhra Pradesh and Telangana
These reports of COPU contained recommendations in respect of paragraphs
pertaining to 1222 departments, which appeared in the Reports of the CAG of
India for the years 1983-84 to 2006-07.
It is recommended that the Government may ensure: (a) submission of replies
to IRs/explanatory Notes/ draft paragraphs/ Performance Audits and ATNs on
the recommendations of COPU, as per the prescribed time schedule;
(b) recovery of loss/ outstanding advances/ overpayments within the
prescribed period; and (c) revamping of the system of responding to audit
observations.
Coverage of this Report
1.27. This Report contains one Performance Audit on Functioning of
Northern Power Distribution Company of Telangana Limited (TSNPDCL)
along with Information Technology audit on Billing Systems in TSNPDCL
and eight paragraphs involving ` 5,962.97 crore.
22
1. Industries & Commerce 2. Irrigation and Command Area Development (CAD)
3. Revenue 4. Animal Husbandry 5. Energy 6. Agriculture & Co-operation 7. Transport,
Road & Buildings 8. Forest, 9. Housing, 10. Youth Advancement, Tourism and Culture,
11. Municipal Administration & Urban Development and 12. General Administration.
CHAPTER II
PERFORMANCE AUDIT RELATING TO GOVERNMENT COMPANY
Functioning of Northern Power Distribution Company of Telangana Limited


Chapter II
Performance Audit relating to Government Company
2. Functioning of Northern Power Distribution Company of Telangana
Limited
Executive Summary
Introduction
Northern Power Distribution Company of Telangana Limited (TSNPDCL)
functions under the administrative control of Department of Energy,
Government of Telangana with its registered office at Warangal. The
Company is the license holder for distribution of power in five districts/circles
of Telangana. The total share capital of the Company amounting to
` 274.76 crore is held by the Government of Telangana.
As on 31 March 2016, the Company had a distribution network of 2.16 lakh
Circuit Kilo Meters (CKM) of lines (33/11 Kilo Volts (KV) and Low Tension
(LT)), 1,106 Sub-stations, 1,507 Power Transformers (PTR) and 2,42,539
Distribution Transformers (DTR) of various capacities.
Distribution Network Planning and Execution
The Company had not prepared annual plans for creation of network to meet
the projected demand. Due to inadequate planning, there was shortfall in
investment during 2011-12, 2014-15 and 2015-16 compared to the amounts
sanctioned by SERC for creation of distribution network. The shortfall in
investment during the five year period covered in audit was ` 752.04 crore.
The Company had achieved only 56.25 per cent of conversion of agricultural
services under HVDS Scheme and the objective of reduction in distribution
losses was not achieved.
The Company had not assessed the requirement of Capacitor banks
periodically.
The Company allowed maximum load losses of 245 watts for 15 kVA DTRs as
against the maximum limit allowed (230 watts) for 16 kVA transformers. The
energy loss additionally allowed on the 7160 DTRs of 15 kVA capacity
procured (2011-16), works out to 0.94 MU per year (i.e. ` 58.19 lakh,
considering the Average Cost of Supply as ` 6.19 per unit).
Implementation of Projects/ Schemes
The Company had not assessed the aggregate score each year as per the
criteria specified in the National Electricity Fund (Interest Subsidy) scheme
and failed to claim interest subsidy amounting to ` 2.50 crore.
The Company failed to adhere to the agricultural sales volume approved by
SERC in the Tariff Orders and also did not claim the cost of additional units
Report No. 2 of 2017 (Public Sector Undertakings)
20
supplied to agricultural consumers from the Government, resulting in loss of
` 1,077.27 crore (2011-12 to 2015-16).
As per Financial Restructuring Plan (FRP), the bonds issued by the Company
were to be taken over by the State Government in two to five years. The
Government had not taken over these bonds even after lapse of over three
years (July 2016).
Operational efficiency
The percentage of distribution losses was higher than the norm fixed by SERC
in all the years. The difference in losses allowed by SERC and actual losses
increased from year to year. Due to failure in implementation of loss
reduction measures effectively, the Company suffered loss to the tune of
` 194.27 crore (2011-16).
The rate of failure of DTRs was on higher side in all the Circles except two
Circles. The Company had incurred an expenditure of ` 105.03 crore on
repairs to DTRs (2011-16), of which ` 6.78 crore was incurred on DTRs failed
in excess of the norm.
Billing and Collection efficiency
Due to inability to establish required information systems, the Company could
not submit the proposals under Multi Year Tariff and avail of the benefits. The
loss of the Company increased from ` 33.78 crore (2013-14) to
` 1348.21 crore (2014-15) mainly due to adoption of tariff order of 2013-14
for 2014-15.
The Company did not limit the cross subsidy to the suggested levels even
beyond the target year (2010-11) and the financial impact on categories for
which tariff was higher than the maximum allowed as per norm works out to
` 909.37 crore (2011-15).
The Company failed to recover additional expenditure of ` 98.91 crore,
incurred beyond budget estimates due to increase in number of DTR failures,
employee cost, administrative and general expenses during 2013-14, by filing
true-up petition.
The Company could not collect subsidy of ` 693.23 crore (2014-15 and
2015-16) nor could implement the full cost recovery tariff. The Company
claimed ` 2,398.81 crore (2014-15) against ` 2,555.28 crore subsidy
approved by SERC, resulting in short claim of ` 156.47 crore. Additional
subsidy of ` 130.14 crore approved by SERC (2014-15) was also not claimed.
The Company paid ` 1.01 crore as Delayed Payment Surcharge to the
Generating Stations (2015-16) due to non-receipt of subsidy from the
Government.
Arrears of revenue of ` 1,232 crore (31 March 2016) included
` 820.89 crore pending from the Government Departments/ Local Bodies and
` 249.03 crore pending from other live services.
Chapter II-Performance Audit relating to Government Company
21
The Company had not taken initiative to install prepaid meters for
Government departments.
Consumer Satisfaction and Redressal of Grievances
The Company had not ensured supply of free power for seven hours a day to
all agriculture feeders and the Government also had not monitored the supply
though the subsidy was paid for supply for seven hours a day. As supply was
less than six hours a day for majority of the feeders in many circles, out of
subsidy of ` 8,237.63 crore paid by the Government (2011-16), about
` 1,176.80 crore (1/7th of the subsidy) was not spent on fulfilment of the
objective of Government of supplying free power for seven hours to
agricultural consumers.
Though SERC directed (March 2015) the Company to prepare safety
improvement plan for four year period 2015-19 relating to distribution
network and file the report with the Commission by 31 August 2015, the
Company is yet to chalk out the plan. Despite allocation of special
appropriation amount for improving the safety of distribution network by
SERC, the actual expenditure incurred on safety was not accounted for under
a separate accounting head.
IT Audit on Billing Systems of TSNPDCL
Billing Applications
The Energy Billing System (EBS) for billing of Low Tension (LT) consumers
was developed by the Company in-house in 2013. As at the end of July 2016,
the data pertaining to LT consumers, other than those in Restructured
Accelerated Power Development and Reforms Programme (R-APDRP) was
maintained in the EBS while the data pertaining to agricultural consumers
was maintained in a separate EBS. The High Tension (HT) consumer data was
maintained in the Metering, Billing and Collection (MBC) module developed
under R-APDRP.
Lack of formulated and documented IT and Security Policies
Though the Company was utilising various IT applications for managing its
operations, it is yet to formulate and document a formal IT policy and a
long/medium-term IT strategy. Further, the Company does not have an
approved Information Security Policy for protection of its
application/database.
Lack of interface between various IT Applications
Absence of interface between SAP ERP and HT billing system resulted in
duplication of works and scope for errors which may affect the integrity of the
databases. There was no interface between the three billing systems viz.,
MBC, EBS (LT) and EBS (Agriculture) utilised for billing of various
categories of consumers.
Report No. 2 of 2017 (Public Sector Undertakings)
22
Lack of functionalities resulting in manual interventions
HT Billing
Some of the cases include :-Manual billing of Temporary connections till their
regularisation without routing through the HT billing application (MBC);
Failure to capture the minimum agreement period based on which demand
would be raised for such minimum period; Failure to provide for automatic
calculation of surcharge in respect of Security Deposits (SD) receivable from
consumers.
LT Billing
For LT category III consumers, energy charges, fixed charges and Time of
Day charges were manually calculated and then entered into EBS; Lack of
facility to maintain the historical data pertaining to annual review of SD;
Incorrect designing of application resulting in generation of first bill from the
date of supply to the date of bill, in spite of previous manual bills, resulting in
excess demand on the consumers.
Legacy billing data
The Company had not migrated the billing data available in legacy system
into EBS. The legacy applications were not installed in any systems available
in the Company. Further, there were no records to indicate that the migrated
data from legacy HT billing system to the MBC system was verified and
certified to be error-free.
Design errors in MBC Master Tables
The field definitions were incorrect and were coupled with lack of proper
input validations giving scope for errors.
Other findings:
There was a difference of ` 5.06 crore in the SD balances of the HT
consumers between SAP ERP (financial accounts of the Company) and HT
billing application.
Interest of ` 2.57 crore on SDs of 43 HT bill-stopped consumers was not
credited.
The Company neither had a password policy nor change management
controls.
The Company did not have any approved Backup Policy and had not prepared
any business continuity plan or a disaster recovery plan. There was no
training policy for the employees for utilising the IT billing systems.

Chapter II-Performance Audit relating to Government Company
23
2.1 Introduction
Consequent to the AP Reorganisation Act, 2014, distribution network in the
State of Telangana is carried out by two distribution companies (DISCOMs)
viz., Northern Power Distribution Company of Telangana Limited,
(TSNPDCL) and Southern Power Distribution Company of Telangana
Limited, (TSSPDCL). TSNPDCL (Company) functions under the
administrative control of Department of Energy, Government of Telangana
with registered office at Warangal. The Company is the license holder for
distribution of power in the five districts/ circles23
of Telangana. The total
share capital of the Company amounting to ` 274.76 crore, is held by the
Government of Telangana.
The Distribution sector is the most important link in the power sector value
chain, which channelises the revenue realisation to provide overall stability to
the sector. The sale of energy by the Company increased from 10,243.92
Million Units (MU) in 2011-12 to 11,565.70 MU in 2015-16, registering a
growth of 12.90 per cent during the five year period 2011-16. As on 31 March
2016, the Company had a distribution network of 2.16 lakh Circuit
Kilometres24
(CKM) of lines (33/11 Kilo Volts (KV) and Low Tension (LT)),
1,106 Sub-stations, 1,507 Power Transformers (PTR) and 2,42,539
Distribution Transformers (DTR) of various capacities. The turnover of the
Company increased from ` 5,433.08 crore in 2011-12 to ` 7,632.13 crore in
2015-16, registering a growth of 40.48 per cent during the period 2011-16.
The financial position of the Company deteriorated from a profit of
` 3.20 crore in 2011-12 to a loss of ` 1,010.08 crore in 2015-16. The
cumulative loss of the Company as on 31 March 2016 was ` 5,895 crore. The
losses were mainly due to higher power purchase cost, making provision for
doubtful receivables from the State Government and higher distribution losses,
as discussed in Paragraphs 2.6.2.3, 2.6.2.4 and 2.6.3.1. The reasons for the
losses in 2014-15 were higher cost of operation and non-recovery thereof, due
to adoption of Tariff Order of 2013-14 for 2014-15 also. The tariff proposal
submitted for 2014-15 was not approved due to elections, State bifurcation and
reduction in subsidy from Government, as discussed in Paragraphs 2.6.4.1 and
2.6.4.5.
23
Warangal, Khammam, Karimnagar, Adilabad and Nizamabad 24
Circuit Kilometre (CKM) is the product of the number of lines and the length in Kilometre

Report No. 2 of 2017 (Public Sector Undertakings)
24
2.2 Organisation Chart
The Organisation structure of the Company is detailed below:
2.3 Scope & Methodology of Audit
The Performance Audit covers the performance of the Company during the
period from 2011-12 to 2015-16. The Performance Audit mainly deals with
network planning and execution, implementation of central schemes, supply of
power to consumers including agriculture consumers, billing and collection
efficiency, financial management, consumer satisfaction and safety.
The audit methodology adopted for the Performance Audit include:
i) Scrutiny of records at registered office at Warangal and all the five
circle offices;
ii) Examination of agenda and minutes of the Board meetings; and
iii) Interaction with the Audited entity and analysis of the data with
reference to audit criteria.
2.4 Audit Objectives
The objectives of Performance Audit were to assess:
� adequacy of distribution network and award of works contracts for
establishing distribution network in an economic and effective manner;
� whether the Schemes/ Projects were implemented efficiently and
effectively;
� operational efficiency in curtailing of sub-transmission and distribution
losses;
� billing and collection efficiency of revenue from consumers; and
� whether a system was in place to ascertain the consumer satisfaction
and redressal of grievances.

Chapter II-Performance Audit relating to Government Company
25
2.5 Audit Criteria
2.5.1 The audit criteria considered for achievement of these audit objectives were:
� The Electricity Act, 2003, the National Electricity Policy, 2005 and the
schemes sponsored by Ministry of Power (MoP), Government of India
(GoI).
� The guidelines and other directions issued by Ministry of Power, State
Electricity Regulatory Commission (SERC), State Government.
� Norms fixed by various agencies25
with regard to operational activities.
� Agenda and minutes of the meeting of the Board of Directors of the
Company
� Standard procedures for award of contracts with reference to the
principles of economy and effectiveness, norms for technical and non-
technical losses.
2.5.2 The audit objectives and criteria were explained to the Company
during the Entry Conference held on 6 June 2016. The Exit Conference was
held on 26 October 2016 to discuss the audit findings. The replies of the
Government to the audit findings have been considered while finalising the
Report.
The Information Technology (IT) policy of the Company, general controls,
application controls, design deficiencies, input controls and validation checks
and internal controls in IT system were examined and the observations have
been included separately.
Acknowledgement
Audit acknowledges and appreciates the co-operation and assistance extended
by the officers and the Management of the Company at various stages of
conducting the Performance Audit.
2.6 Audit Findings
2.6.1 Distribution Network Planning and Execution
The Distribution Companies in the State are required to prepare long term/
annual plans for creation of infrastructural facilities26
, for efficient distribution
of electricity so as to cover maximum population in the State. Besides,
DISCOMs are also required to upkeep the existing network and expand the
distribution network keeping in view the growth in demand. The planning and
execution of network expansion and upkeep of the existing network were
examined and findings are discussed below:
2.6.1.1 Shortfall in investment in distribution network
The Company had prepared a Corporate Plan for the five year period from
2012-13 to 2016-17. The demand projected in the five year plan and the actual
supply (input units) during the period is indicated in Table 2.1.
25
CERC, SERC, MoP and the State Government 26
Load growth & network strengthening, addition of substations, PTRs, DTRs etc.

Report No. 2 of 2017 (Public Sector Undertakings)
26
Table 2.1: Projected Demand and actual supply of electricity
Year Projected Demand
(MU)
Actual Supply
(input units in MU)
Percentage of
shortfall
2012-13 12,248.62 11,165 8.85
2013-14 12,843.74 11,868 7.60
2014-15 13,438.86 12,802 4.74
2015-16 14,033.98 13,270 5.44
2016-17 14,629.10 Not Available27 Not Available
Source: Five Year Corporate Plan 2012-13 to 2016-17
As can be observed from the above table, there was shortfall in actual supply
compared to the projected demand in all the years as the Company had not
prepared any annual plans for creation of network to meet the projected
demand. Against the amounts sanctioned by SERC in the wheeling tariff for
creation and upkeep of network, the actual investments made during 2011-12
to 2015-16 were as indicated below:
Table 2.2: Actual investments for upkeep of network
(` in crore)
Year 2011-12 2012-13 2013-14 2014-15 2015-16 Total
Sanctioned by
SERC
474.22 298.56 287.88 709.00 983.00 2,752.66
Actual
investment
313.90 383.59 312.50 334.28 656.35 2,000.62
Shortfall -160.32 85.03 24.62 -374.72 -326.65 752.04
Source: SERC Orders for Wheeling Tariff and Financial Statements
From the above table, Audit observed that though the investment was more
than the amounts sanctioned by SERC during 2012-13 and 2013-14, there
was shortfall in investment during 2011-12, 2014-15 and 2015-16. The
shortfall in investment during the five year period covered in audit worked out
to ` 752.04 crore.
Audit observed that due to lack of planning the Company could not utilise the
amounts sanctioned for creation of distribution network. Thus, the consumers
were deprived of corresponding benefit through better network/ services.
SERC also observed (March 2015) that DISCOMs could not achieve the loss
reduction trajectory as prescribed for the Control period28
due to non-
utilisation of sanctioned investments.
The Government accepted and agreed during the Exit Conference to
implement year-wise plans for investment as per the approvals of SERC.
2.6.1.2 Adequacy of transformation capacity
A Transformer is a static device installed for stepping up or stepping down
voltage in transmission and distribution of electricity. The energy received at
high voltage (132 KV, 66 KV, 33 KV) from primary sub-stations of the
Transmission Companies is transformed to lower voltage (11 KV) at 33/11
27
Not available as the period is not completed. 28
Control Period is a multi-year period fixed by the Commission from time to time, usually
five years, for which the principles of determination of revenue requirement will be fixed.
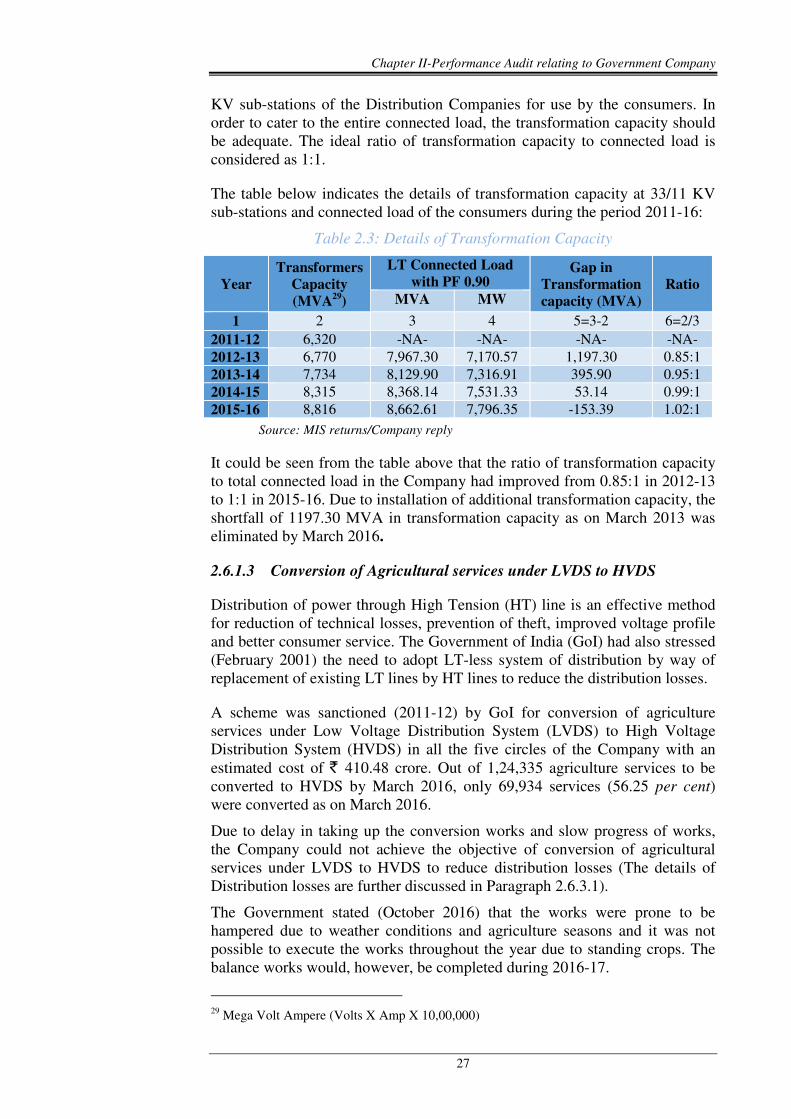
Chapter II-Performance Audit relating to Government Company
27
KV sub-stations of the Distribution Companies for use by the consumers. In
order to cater to the entire connected load, the transformation capacity should
be adequate. The ideal ratio of transformation capacity to connected load is
considered as 1:1.
The table below indicates the details of transformation capacity at 33/11 KV
sub-stations and connected load of the consumers during the period 2011-16:
Table 2.3: Details of Transformation Capacity
Year
Transformers
Capacity
(MVA29
)
LT Connected Load
with PF 0.90 Gap in
Transformation
capacity (MVA)
Ratio MVA MW
1 2 3 4 5=3-2 6=2/3
2011-12 6,320 -NA- -NA- -NA- -NA-
2012-13 6,770 7,967.30 7,170.57 1,197.30 0.85:1
2013-14 7,734 8,129.90 7,316.91 395.90 0.95:1
2014-15 8,315 8,368.14 7,531.33 53.14 0.99:1
2015-16 8,816 8,662.61 7,796.35 -153.39 1.02:1
Source: MIS returns/Company reply
It could be seen from the table above that the ratio of transformation capacity
to total connected load in the Company had improved from 0.85:1 in 2012-13
to 1:1 in 2015-16. Due to installation of additional transformation capacity, the
shortfall of 1197.30 MVA in transformation capacity as on March 2013 was
eliminated by March 2016.
2.6.1.3 Conversion of Agricultural services under LVDS to HVDS
Distribution of power through High Tension (HT) line is an effective method
for reduction of technical losses, prevention of theft, improved voltage profile
and better consumer service. The Government of India (GoI) had also stressed
(February 2001) the need to adopt LT-less system of distribution by way of
replacement of existing LT lines by HT lines to reduce the distribution losses.
A scheme was sanctioned (2011-12) by GoI for conversion of agriculture
services under Low Voltage Distribution System (LVDS) to High Voltage
Distribution System (HVDS) in all the five circles of the Company with an
estimated cost of ` 410.48 crore. Out of 1,24,335 agriculture services to be
converted to HVDS by March 2016, only 69,934 services (56.25 per cent)
were converted as on March 2016.
Due to delay in taking up the conversion works and slow progress of works,
the Company could not achieve the objective of conversion of agricultural
services under LVDS to HVDS to reduce distribution losses (The details of
Distribution losses are further discussed in Paragraph 2.6.3.1).
The Government stated (October 2016) that the works were prone to be
hampered due to weather conditions and agriculture seasons and it was not
possible to execute the works throughout the year due to standing crops. The
balance works would, however, be completed during 2016-17.
29
Mega Volt Ampere (Volts X Amp X 10,00,000)

Report No. 2 of 2017 (Public Sector Undertakings)
28
The fact remained that the scheme sanctioned during 2011-12 was not
completed till the date of audit.
2.6.1.4 Adequacy of capacitor banks
Capacitor banks improve power factor30
by regulating the current flow and
voltage. In the event of voltage falling below normal, sufficient capacity of
capacitor banks, if provided in the system, improve the voltage profile and
reduce dissipation of energy, thereby saving energy. The Company had
estimated the savings at the rate of ` 2 lakh (approx.) per one capacitor of
1 Million Volt Ampere Reactive (MVAR) per year.
As per the APERC Grid Code (3.5.12.5) 2014 as adopted by TSERC,
DISCOMs should install capacitors at various locations of the distribution
system so that the power factor at the interface with State Transmission Utility
(STU) is not less than 90 per cent.
As on 31 March 2014, the Company had 490 MVAR capacity of capacitor
banks. The Company had assessed requirement (October 2014) of additional
579 MVAR capacity capacitor banks, against which 442 MVAR capacity
capacitor banks (76.34 per cent) were installed.
Audit observed that the Company had not assessed the requirement of
capacitor banks during the period from 2011-12 to 2013-14. The additional
capacity assessed during October, 2014 was also not installed, which resulted
in shortage of 137 MVAR capacity as on March, 2015. The savings foregone
per year worked out to ` 2.74 crore.
Further, the Company had assessed (2015-16) the requirement of 1641 MVAR
capacity capacitor banks to meet nine hour per day power supply to agriculture
sector. However, the company had installed only 242 MVAR capacity
capacitor banks in 2015-16 and 1399 MVAR capacity capacitor banks were
yet to be installed (March 2016).
The Government stated (October 2016) that as per the present policy of the
Government, nine hours' supply was extended in two spells. Hence, the total agricultural load would not affect the sub-stations at a time and the required
capacity of capacitors was not as per the estimated 1641 MVAR. However,
the capacitor banks were being planned in a phased manner, as per
requirement.
2.6.1.5 Procurement of distribution transformers of non-standard ratings
(15 kVA)
As per REC specifications, guidelines of Central Electricity Authority (CEA)
and Bureau of Indian Standards (BIS), the Standard Ratings of single phase
distribution transformers (DTR) shall be 5, 10, 16 and 25 kilovolt ampere
(kVA). The full load loss allowed for 16 kVA DTR as per the specifications
approved by the Committee,31
set up to finalise the specifications for single
30
ratio of Active power (KW) to apparent power (KVA) 31
Committee (December 2006) headed by GM (T&D) of REC with members from CEA,
CPRI, REC, NTPC, Power Grid, NHPC, DVC, UPPCL, MSEB, APTRANSCO, BSEB and
WBSEB.

Chapter II-Performance Audit relating to Government Company
29
phase DTRs, was 230 watts. The load losses specified were maximum
allowable.
Audit observed that the Company had procured 7160 DTRs of 15 kVA
capacity during 2011-16, which were not of standard rating as per the
specifications/ guidelines/ standards. A further review of the specifications of
these DTRs showed that the Company had allowed maximum load losses of
245 watts, which was higher than the maximum limit allowed (230 watts) for
16 kVA transformers.
Apart from load losses, other parameters viz., the limits for temperature rise
over ambient temperature were also fixed32
at higher than the limits in the
specifications33
approved by the Committee. Higher temperature rise over
ambient temperature increases the risk of failure of transformers during
summer months.
Thus, with the procurement of 7160 transformers (15 KVA), the permissible
energy loss additionally allowed, worked out to 0.94 MU34
per year (i.e.
` 58.19 lakh, considering the Average Cost of Supply as ` 6.19 per unit) and
resulted in higher distribution losses.
During the Exit conference, the Joint Secretary (Energy) directed the
Company to carry out the cost benefit analysis and consider the audit point,
while procuring DTRs.
2.6.2 Implementation of Projects/ Schemes
In order to make quality power available to all sections of the society and to
improve the power sector in the country, Ministry of Power and the State
Government have announced various schemes/ projects viz., National
Electricity Fund (Interest subsidy) Scheme (NEF), Pump-set Energisation
Scheme, Decentralized Distributed Generation (DDG), Financial
Restructuring Plan (FRP) Scheme, High Voltage Distribution System
(HVDS), Restructured Accelerated Power Development & Reforms
Programme (R-APDRP), Rajiv Gandhi Grameen Vidyutikaran Yojana
(RGGVY) from time to time. The Performance Audit of implementation of
RGGVY and R-APDRP were covered in the CAG’s Report for the years 2013
and 2016, respectively. The schemes and projects taken up by the Company
during the last five years except RGGVY and R-APDRP were reviewed and
the findings are discussed below:
2.6.2.1 National Electricity Fund
Government of India had introduced National Electricity Fund (Interest
subsidy) Scheme (NEF) (March 2012) to promote capital investment in
distribution sector and provided interest subsidy ranging from three to five per
cent on the loans taken by public and private power utilities for execution of
various capital works. The Ministry of Power had constituted (February 2012)
a Steering Committee for ensuring effective implementation of the scheme.
32
45 degrees C and 40 degrees C when measured by resistance and thermometer respectively. 33
40 degrees C and 35 degrees C when measured by resistance and thermometer respectively. 34
((245-230) watts*24 hours*365 days*7160 DTRs)/1000
Report No. 2 of 2017 (Public Sector Undertakings)
30
The scheme was applicable for the works taken up during 2012-13 and
2013-14.
Based on the aggregate score as per the parameters of the scheme, the
Company would be entitled to interest subsidy ranging from three to five
per cent. For availing of interest subsidy, the Company was required to submit
details of loan disbursement and actual interest paid, for approval of the
Steering Committee. The interest subsidy was to be explicitly indicated in the
Aggregate Revenue Requirement (ARR) so as to pass on the benefits to the
consumers.
Audit observed that the Company had not assessed the aggregate score each
year as per the criteria specified in the scheme. Considering the lowest score
(35 to 50) under the scheme, the Company was entitled to subsidy of three
per cent on interest rate. Due to failure of the Company to claim interest
subsidy, the consumers were deprived of the benefit of interest subsidy
amounting to ` 2.50 crore, calculated on loan outstanding at the beginning of
each year during 2012-16.
The Government stated (October 2016) that the score as per the criteria
specified in NEF scheme was not calculated so far as a major part of the loan
amounts were drawn during 2015 and the interest subsidy would be claimed
after completion of works.
The reply was not acceptable as completion of works was not a prerequisite
for claiming interest subsidy under the scheme. The Company had not
assessed the aggregate score each year as per the criteria specified in the NEF
scheme and had not claimed the interest subsidy. Besides, there was no system
in place for tracking the score as specified in the scheme to claim the benefits.
During the Exit conference, the Joint Secretary (Energy) accepted the audit
observation and directed the Company to develop a proper system.
2.6.2.2 Delay in availing loans from REC for pump set energisation works
The Company had received sanction from REC during August 2014 to June
2015 for financial assistance of ` 116.18 crore for pump-set energisation
works. The works were to be completed within 24 months from the date of
disbursement of first installment. However, reimbursement claims submitted
within a period of one month after the scheme period will be considered for
release.
The Company had completed execution of works in few areas covered under
the above sanctions during 2013-15, i.e. before obtaining the sanction of loan
from REC. As per Clause 5(c) of sanction letter of REC, works completed
within one year prior to issue of sanction letter were admissible for
reimbursement. As such, the Company was entitled to claim reimbursement of
90 per cent of the cost of these works as soon as sanction letter was received.
However, reimbursement was claimed only in December 2015 i.e. after a
delay of nine months from the date of sanction. Due to delay in filing the
claims, an amount of ` 2.51 crore towards works completed before March
2015, could not be realised promptly on completion of works.
Chapter II-Performance Audit relating to Government Company
31
The Government stated (October 2016) that due to non-availability of
10 per cent contribution of the Company, the schemes were not formulated in
time.
This indicated the failure of the Company in mobilisation of funds through
effective realisation of its receivables from consumers, Government and other
sources, as discussed in Paragraph 2.6.4.
2.6.2.3 Supply of free power to agricultural consumers
As per the decision of the State Government, free power supply is extended to
agricultural consumers for seven hours a day and the shortfall in revenue on
account of free power is to be paid by the State Government in the form of
subsidy.
During the period 2011-12 to 2015-16, supply of power to agricultural
consumers had increased from 4,432.63 MU in 2011-12 to 4,671.95 MU in
2015-16 and the number of connections had increased from 9,22,913 to
10,57,774.
A Paragraph (No.3.3) on ‘Tariff Subsidy to Agricultural Consumers’ covering
the period 2011-14 was included in the CAG’s Audit Report No.4 of 2015.
Audit observations on various deficiencies in supply of power to consumers
and recovery of subsidy from Government during the period 2011-16 are
discussed below:
Estimate of agriculture consumption
The Company, while filing its ARR with SERC, estimates the supply of power
to agriculture consumers. After detailed scrutiny, SERC fixed the quantum of
supply to be made to the agriculture consumers. Accordingly, subsidy would
be paid by the State Government.
In view of uncertainty with regard to actual agricultural consumption due to
lack of agricultural metering, overall power deficit scenario and severe
criticism from public that the projection of agricultural sales filed by the
Company was too high, SERC did not accept the estimates of the Company
and approved the agriculture sales volume at much lower level compared to
the estimates submitted in all the years from 2011-12 to 2015-16. The
Company had to adhere to the agricultural sales volume approved by SERC in
the Tariff Orders as no provision exists for additional sales to agriculture
consumers for whom supply was made at subsidised rates.
The estimates of sale of energy to agriculture consumers, sales quantity
approved by SERC, actual sales and its impact on the Company is indicated in
the Table 2.4.
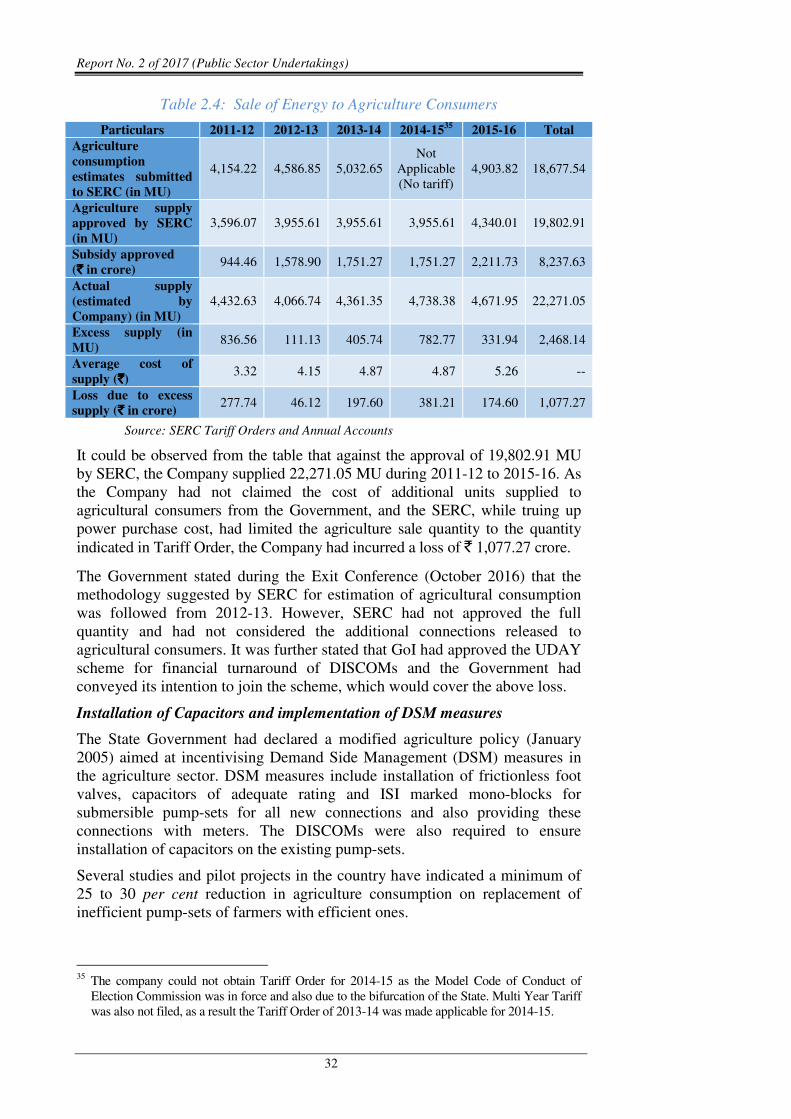
Report No. 2 of 2017 (Public Sector Undertakings)
32
Table 2.4: Sale of Energy to Agriculture Consumers
Particulars 2011-12 2012-13 2013-14 2014-1535
2015-16 Total
Agriculture
consumption
estimates submitted
to SERC (in MU)
4,154.22 4,586.85 5,032.65
Not
Applicable
(No tariff)
4,903.82 18,677.54
Agriculture supply
approved by SERC
(in MU)
3,596.07 3,955.61 3,955.61 3,955.61 4,340.01 19,802.91
Subsidy approved
(`̀̀̀ in crore) 944.46 1,578.90 1,751.27 1,751.27 2,211.73 8,237.63
Actual supply
(estimated by
Company) (in MU)
4,432.63 4,066.74 4,361.35 4,738.38 4,671.95 22,271.05
Excess supply (in
MU) 836.56 111.13 405.74 782.77 331.94 2,468.14
Average cost of
supply (`̀̀̀) 3.32 4.15 4.87 4.87 5.26 --
Loss due to excess
supply (`̀̀̀ in crore) 277.74 46.12 197.60 381.21 174.60 1,077.27
Source: SERC Tariff Orders and Annual Accounts
It could be observed from the table that against the approval of 19,802.91 MU
by SERC, the Company supplied 22,271.05 MU during 2011-12 to 2015-16. As
the Company had not claimed the cost of additional units supplied to
agricultural consumers from the Government, and the SERC, while truing up
power purchase cost, had limited the agriculture sale quantity to the quantity
indicated in Tariff Order, the Company had incurred a loss of ` 1,077.27 crore.
The Government stated during the Exit Conference (October 2016) that the
methodology suggested by SERC for estimation of agricultural consumption
was followed from 2012-13. However, SERC had not approved the full
quantity and had not considered the additional connections released to
agricultural consumers. It was further stated that GoI had approved the UDAY
scheme for financial turnaround of DISCOMs and the Government had
conveyed its intention to join the scheme, which would cover the above loss.
Installation of Capacitors and implementation of DSM measures
The State Government had declared a modified agriculture policy (January
2005) aimed at incentivising Demand Side Management (DSM) measures in
the agriculture sector. DSM measures include installation of frictionless foot
valves, capacitors of adequate rating and ISI marked mono-blocks for
submersible pump-sets for all new connections and also providing these
connections with meters. The DISCOMs were also required to ensure
installation of capacitors on the existing pump-sets.
Several studies and pilot projects in the country have indicated a minimum of
25 to 30 per cent reduction in agriculture consumption on replacement of
inefficient pump-sets of farmers with efficient ones.
35
The company could not obtain Tariff Order for 2014-15 as the Model Code of Conduct of
Election Commission was in force and also due to the bifurcation of the State. Multi Year Tariff
was also not filed, as a result the Tariff Order of 2013-14 was made applicable for 2014-15.
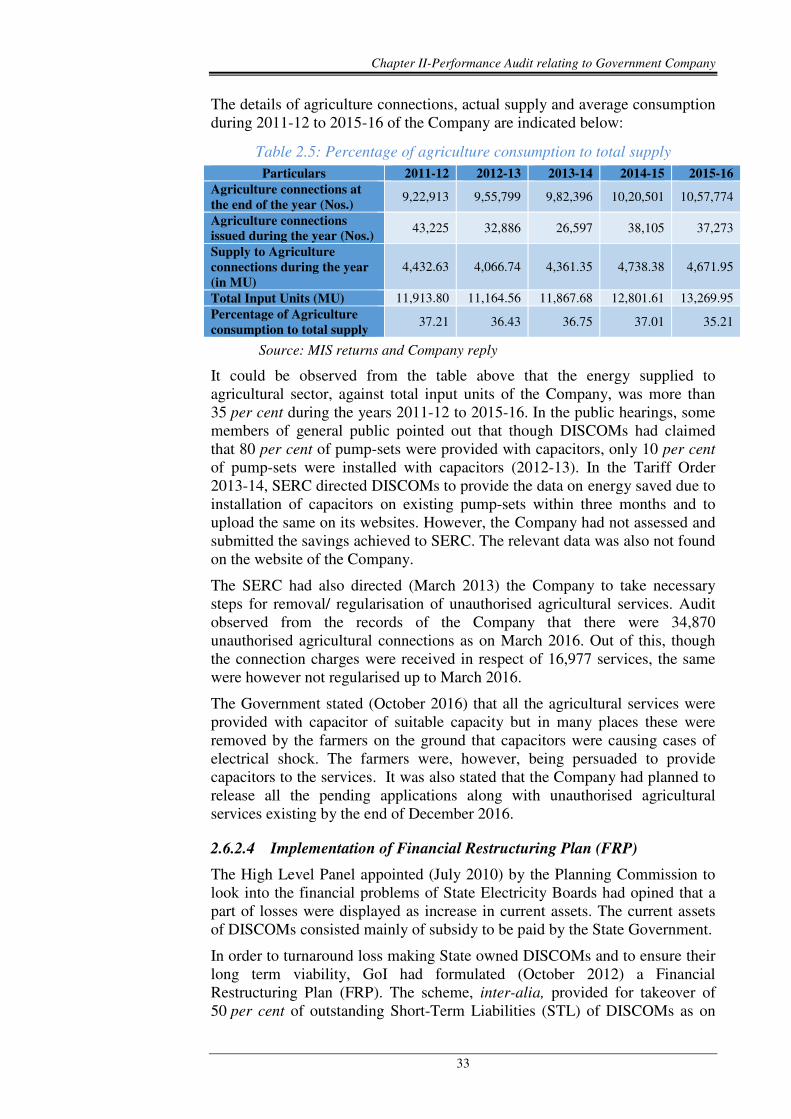
Chapter II-Performance Audit relating to Government Company
33
The details of agriculture connections, actual supply and average consumption
during 2011-12 to 2015-16 of the Company are indicated below:
Table 2.5: Percentage of agriculture consumption to total supply
Particulars 2011-12 2012-13 2013-14 2014-15 2015-16
Agriculture connections at
the end of the year (Nos.) 9,22,913 9,55,799 9,82,396 10,20,501 10,57,774
Agriculture connections
issued during the year (Nos.) 43,225 32,886 26,597 38,105 37,273
Supply to Agriculture
connections during the year
(in MU)
4,432.63 4,066.74 4,361.35 4,738.38 4,671.95
Total Input Units (MU) 11,913.80 11,164.56 11,867.68 12,801.61 13,269.95
Percentage of Agriculture
consumption to total supply 37.21 36.43 36.75 37.01 35.21
Source: MIS returns and Company reply
It could be observed from the table above that the energy supplied to
agricultural sector, against total input units of the Company, was more than
35 per cent during the years 2011-12 to 2015-16. In the public hearings, some
members of general public pointed out that though DISCOMs had claimed
that 80 per cent of pump-sets were provided with capacitors, only 10 per cent
of pump-sets were installed with capacitors (2012-13). In the Tariff Order
2013-14, SERC directed DISCOMs to provide the data on energy saved due to
installation of capacitors on existing pump-sets within three months and to
upload the same on its websites. However, the Company had not assessed and
submitted the savings achieved to SERC. The relevant data was also not found
on the website of the Company.
The SERC had also directed (March 2013) the Company to take necessary
steps for removal/ regularisation of unauthorised agricultural services. Audit
observed from the records of the Company that there were 34,870
unauthorised agricultural connections as on March 2016. Out of this, though
the connection charges were received in respect of 16,977 services, the same
were however not regularised up to March 2016.
The Government stated (October 2016) that all the agricultural services were
provided with capacitor of suitable capacity but in many places these were
removed by the farmers on the ground that capacitors were causing cases of
electrical shock. The farmers were, however, being persuaded to provide
capacitors to the services. It was also stated that the Company had planned to
release all the pending applications along with unauthorised agricultural
services existing by the end of December 2016.
2.6.2.4 Implementation of Financial Restructuring Plan (FRP)
The High Level Panel appointed (July 2010) by the Planning Commission to
look into the financial problems of State Electricity Boards had opined that a
part of losses were displayed as increase in current assets. The current assets
of DISCOMs consisted mainly of subsidy to be paid by the State Government.
In order to turnaround loss making State owned DISCOMs and to ensure their
long term viability, GoI had formulated (October 2012) a Financial
Restructuring Plan (FRP). The scheme, inter-alia, provided for takeover of
50 per cent of outstanding Short-Term Liabilities (STL) of DISCOMs as on
Report No. 2 of 2017 (Public Sector Undertakings)
34
31 March 2012 by the State Government, which would be converted into
bonds. The remaining 50 per cent of STL was to be rescheduled by the lenders
with moratorium of three years on principal. The repayment of principal and
interest would be guaranteed by the State Government. The Company had
short term loans of ` 2,495 crore accumulated due to procurement of
additional power beyond SERC approved quantities. The State Government
agreed (November 2013) to assume liability of ` 1,270 crore of the Company
as on 31 March 2013. As per the FRP scheme, in-principle approval of SERC
was to be obtained before implementation. The important observations in
implementation of the scheme are as follows:
� Delay in implementation of FRP Scheme
The FRP scheme was to be implemented by December 2012 by adopting the
financial figure as on 31 March 2012. The support under the scheme would be
available to the DISCOMS having accumulated losses and facing difficulty in
financing operational losses.
However, the Company decided to treat the receivables from State
Government as bad debts, only in their accounts for 2012-13 and adopted the
same for the above purpose. Therefore, the Company obtained approval of
MoP for extension of time and also for adopting the financial figures of
2012-13. The State Government decided to participate in the scheme in April
2013 and approved the scheme in January 2014. Accordingly, as per approval
of the Board, the Company issued bonds in three series (February to May
2014). The series 1 was issued (3 February 2014) at coupon rate of
9.95 per cent, while series 2 and 3 were issued (28 March 2014 and 30 May
2014 respectively) at a coupon rate of 10 per cent. Due to delay in
implementation of the scheme, the coupon rate had increased from
9.30 per cent (estimated in June 2013) to 9.95 per cent in 2014. This had
resulted in additional expenditure of ` 8.89 crore per annum to the State
Government.
The Company stated (October 2016) that the scheme was implemented from
16 January 2014 after receipt of approval of State Government (10 January
2014).
However, due to delay in implementing the scheme, the Company had to issue
bonds at higher rate.
� Non-Initiation of proposal for takeover of bonds by State
Government
As per FRP scheme, the bonds were to be taken over by the State Government
in two to five years. Though the Government had indicated that it would take
over the bonds over a period of four years, the Government had not started the
process of taking over these bonds even after lapse of more than three years
(July 2016). As the Company is accounting the bonds as its liability, the
financial ratios, terms of loans and interest rates applicable to the Company
were adversely affected. Further, the Company obtained adhoc cash credit of
` 80 crore from State Bank of Hyderabad at high interest rate of
12.95 per cent to service the debt on behalf of the State Government, thereby
deteriorating its financial condition.
Chapter II-Performance Audit relating to Government Company
35
During the Exit conference (October 2016), the Joint Secretary (Energy)
directed the Company to submit the proposal for takeover of bonds, well in
advance of finalisation of the budget.
� Non-achievement of Expected outcomes
Contrary to expected outcome of financial turnaround and long term viability,
FRP scheme worked counterproductive to the Company as the State
Government did not honour its commitments making the Company treat the
dues from the Government as bad debt, thereby wiping out its entire net worth.
Due to non-fulfilment of responsibilities under the scheme by the Company
and the State Government, the objectives and expected outcomes of the
scheme were not achieved as discussed below:
• Non-obtaining the approval of SERC for FRP scheme
The Company had not obtained approval of SERC for
implementation of FRP scheme and the reasons for the same were
not on record. Due to this, SERC did not consider interest of
` 140.87 crore on rescheduled loan in the ARR for 2015-16. As
such, the Company could not recover the interest of ` 140.87 crore
through tariff.
• Non-enactment of Model State Electricity Distribution
Management Responsibility Bill
In order to ensure achievement of the operational and financial
parameters prescribed in the FRP, the State Governments were to
enact Model State Electricity Distribution Management
Responsibility Bill within twelve months from the date of
circulation of Model Legislation by the Ministry of Power.
Model Legislation to be enacted by the State Government had been
circulated by the Ministry of Power in September 2013. The FRP
also provided for nomination of lenders representative on the Board
of Directors of the Company.
Audit observed that the Company had not initiated any action for
enactment of the Act and for nomination of lenders representatives
on the Board by the State Government.
During the Exit conference, the Joint Secretary (Energy) directed
the Company to move the proposal to nominate lenders
representative on the Board.
• Non-assessment and claiming of incentive under Transitional
Finance Mechanism
As per Transitional Finance Mechanism (TFM) under the FRP
scheme, annual verification of the performance/ achievements of the
DISCOMs had to be done through a third party appointed by
Central Electricity Authority (CEA) for release of incentive from
Government of India. Audit observed that CEA is yet to appoint a
third party for annual verification of performance for the period
2012-13 to 2014-15. As such, the Company had not assessed the
incentive eligible under TFM.
Report No. 2 of 2017 (Public Sector Undertakings)
36
Similarly, the scheme also provided reimbursement support of
25 per cent of principal repayment of bonds issued by the Company
and taken over by State Government. However, the State
Government was yet to take over the bonds.
The Government stated (October 2016) that as per TFM, annual
verification of the performance/ achievements of the Company had
to be done through a third party appointed by CEA for release of
incentive and the CEA is yet to appoint a third party.
The reply was not acceptable as the claims for incentive had to be
first submitted by the Company/State to CEA to avail of the benefits
under TFM, which were available during 2013-14 to 2015-16.
• Non-inclusion of private sector in State distribution network
The FRP scheme envisaged involvement of private sector in State
distribution network through franchisee arrangement or any other
mode of private participation to be prepared by the DISCOMs
within a year and submitted to Central Electricity Authority (CEA)
for approval. It was observed that no action was taken by the
Company in this regard.
The Government stated (October 2016) that Manning and
Maintenance works were outsourced by the Company. It was also
stated that inclusion of private sector in Distribution network might
not be feasible in view of heavy subsidies involved.
However, non engagement of private sector in distribution is not in
conformity with the FRP scheme.
• Non-installation of meters/ prepaid meters
In order to ensure billing on actual consumption and to reduce
AT&C36 losses, the scheme provided for installation of prepaid
meters by 31 March 2013 for all Government consumers and large
consumers (1 MW and above) where defaults had occurred and a
time bound plan for metering of all categories of consumers was to
be put in place and submitted to the Central Level Monitoring
Committee (CLMC) through State Level Monitoring Committee
(SLMC). It was observed that neither prepaid meters were installed,
nor were targets fixed for conversion of unmetered connections.
The Government stated (October 2016) that procurement and
installation of prepaid meters were in progress.
• Non-functioning of Monitoring Committee
State Level Monitoring Committee with C&MD of the Company as a
member was set up (January 2013) by the State Government for
monitoring/ review of the progress on quarterly basis till turnaround of
the Company. Audit observed that SLMC had met only once
(21 December 2013) so far to review the progress.
36
Aggregate Technical and Commercial

Chapter II-Performance Audit relating to Government Company
37
During the Exit conference the Joint Secretary (Energy) had
directed the Company to take initiative to conduct the meetings.
� Ujwal Discom Assurance Yojana (UDAY) scheme
Government of India had launched UDAY scheme in November 2015 to
improve the operational and financial efficiency of the State DISCOMs. Under
UDAY scheme, State Government would take over 75 per cent of the debt of
DISCOMs as on 30 September 2015, over a period of two years. The State
Government accorded in-principle approval to the scheme. The MoU was
signed by Ministry of Power and the Company (January 2017). As per the
timelines fixed for achieving the targeted activities of the scheme, compulsory
feeder metering was to be completed by June 2016. However, no feeder
meters were installed till date (July 2016).
2.6.3 Operational Efficiency
The operational performance of the DISCOMs was judged on the basis of
availability of adequate power for distribution, adequacy and reliability of
distribution network, minimizing line losses, detection of theft of electricity
etc. The deficiencies observed in the Company are discussed below.
2.6.3.1 Distribution losses in excess of SERC norms
The losses at 33 KV stage are termed as sub-transmission losses while those at
11 KV and below are termed as distribution losses. The losses occur mainly on
two accounts i.e. technical and commercial. Technical losses occur due to
inherent character of the equipment used for transmitting and distributing
power and resistance in conductors through which energy is transmitted from
one place to another. On the other hand, commercial losses occur due to theft
of energy, defective meters, unmetered supply etc.
State Electricity Regulatory Commission determines the maximum percentage
of energy losses and considers the same while determining the distribution
tariff for the respective year. The energy losses beyond the percentage allowed
by SERC are not to be passed on to the consumer and have to be borne by the
DISCOMs. Various incentives/ grants under centrally sponsored schemes
were also based on achievement of specified reduction in energy losses. Thus,
it was imperative for the Company to keep energy losses below the level
approved by SERC.
The table below indicates sub-transmission and distribution losses with
reference to percentage of loss allowed by SERC during 2011-12 to 2015-16.
Table 2.6: Distribution losses
Sl.
No. Particulars 2011-12 2012-13 2013-14 2014-15 2015-16
37
1 Energy Purchased
(MU) 11,913.80 11,164.56 11,867.68 12,811.53 13,269.95
2 Energy sold (MU) 10,243.93 9,671.61 10,287.00 11,104.80 11,565.70
3 Energy losses (MU)
(1-2) 1,669.87 1,492.95 1,580.68 1,706.73 1,704.25
37
In the Tariff Order for 2015-16 different energy losses were adopted for supplies at different
voltage. The energy loss units allowed as per SERC were adopted.
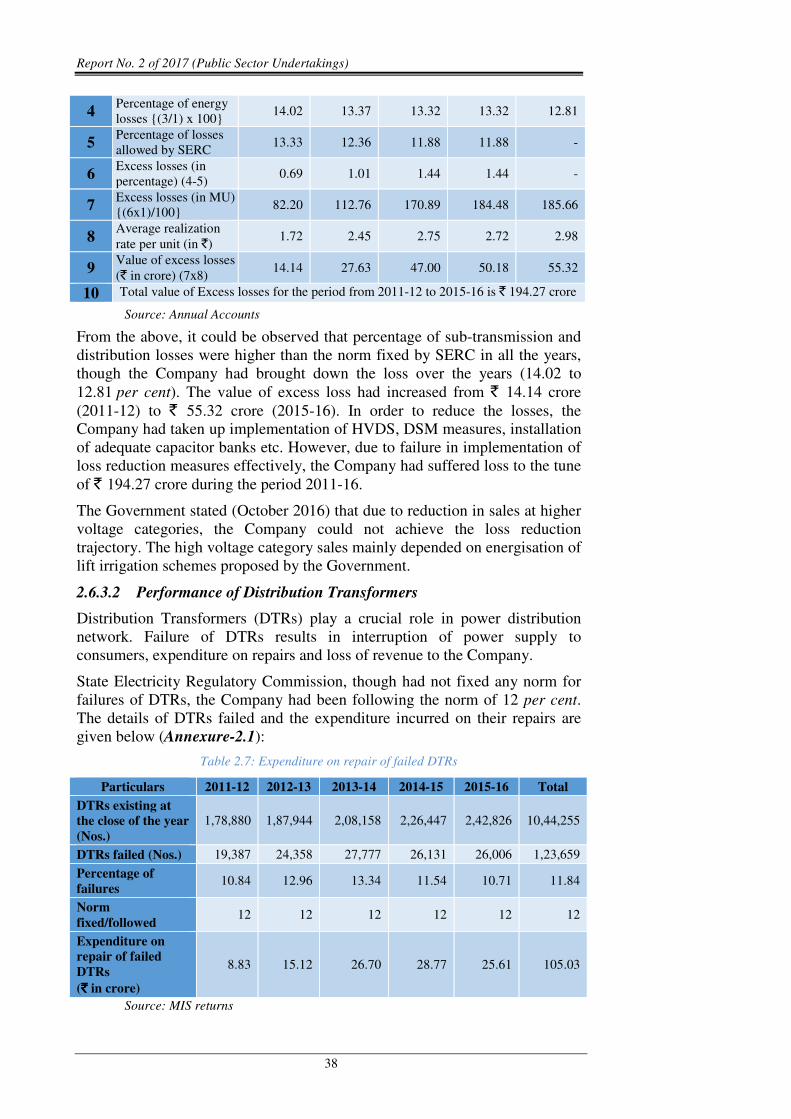
Report No. 2 of 2017 (Public Sector Undertakings)
38
4 Percentage of energy
losses {(3/1) x 100} 14.02 13.37 13.32 13.32 12.81
5 Percentage of losses
allowed by SERC 13.33 12.36 11.88 11.88 -
6 Excess losses (in
percentage) (4-5) 0.69 1.01 1.44 1.44 -
7 Excess losses (in MU)
{(6x1)/100} 82.20 112.76 170.89 184.48 185.66
8 Average realization
rate per unit (in `) 1.72 2.45 2.75 2.72 2.98
9 Value of excess losses
(` in crore) (7x8) 14.14 27.63 47.00 50.18 55.32
10 Total value of Excess losses for the period from 2011-12 to 2015-16 is ` 194.27 crore
Source: Annual Accounts
From the above, it could be observed that percentage of sub-transmission and
distribution losses were higher than the norm fixed by SERC in all the years,
though the Company had brought down the loss over the years (14.02 to
12.81 per cent). The value of excess loss had increased from ` 14.14 crore
(2011-12) to ` 55.32 crore (2015-16). In order to reduce the losses, the
Company had taken up implementation of HVDS, DSM measures, installation
of adequate capacitor banks etc. However, due to failure in implementation of
loss reduction measures effectively, the Company had suffered loss to the tune
of ` 194.27 crore during the period 2011-16.
The Government stated (October 2016) that due to reduction in sales at higher
voltage categories, the Company could not achieve the loss reduction
trajectory. The high voltage category sales mainly depended on energisation of
lift irrigation schemes proposed by the Government.
2.6.3.2 Performance of Distribution Transformers
Distribution Transformers (DTRs) play a crucial role in power distribution
network. Failure of DTRs results in interruption of power supply to
consumers, expenditure on repairs and loss of revenue to the Company.
State Electricity Regulatory Commission, though had not fixed any norm for
failures of DTRs, the Company had been following the norm of 12 per cent.
The details of DTRs failed and the expenditure incurred on their repairs are
given below (Annexure-2.1):
Table 2.7: Expenditure on repair of failed DTRs
Particulars 2011-12 2012-13 2013-14 2014-15 2015-16 Total
DTRs existing at
the close of the year
(Nos.)
1,78,880 1,87,944 2,08,158 2,26,447 2,42,826 10,44,255
DTRs failed (Nos.) 19,387 24,358 27,777 26,131 26,006 1,23,659
Percentage of
failures 10.84 12.96 13.34 11.54 10.71 11.84
Norm
fixed/followed 12 12 12 12 12 12
Expenditure on
repair of failed
DTRs
(`̀̀̀ in crore)
8.83 15.12 26.70 28.77 25.61 105.03
Source: MIS returns

Chapter II-Performance Audit relating to Government Company
39
It could be observed from the Annexure-2.1 that the rate of failure of DTRs
was on higher side in all the Circles except Karimnagar and Nizamabad
Circles. The percentage of failure ranged from 13.64 to 16.74 in Adilabad
Circle, 11.32 to 15.87 in Warangal Circle and 11.10 to 15.18 in Khammam
Circle during the review period. However, except 2012-13 and 2013-14, the
failure of DTR was within 12 per cent. The Company had incurred
expenditure of ` 105.03 crore on repairs to DTRs during the review period, of
which ` 6.78 crore was incurred on DTRs failed in excess of the internal norm
fixed by the Company.
The reasons for the failure of DTRs in 2015-16 were line faults
(65.05 per cent), overloading (25.24 per cent) and lack of maintenance
(9.86 per cent) which were preventable with proper monitoring and
rectification of line faults.
The Government stated (October 2016) that the Company gradually reduced
the failure rate and the rate was above the norm during 2012-13 and 2013-14
as drought conditions prevailed in those years. It was also stated that the
Company was making efforts to restrict the failure of DTRs within the
prescribed norm.
However, the Company had not installed sufficient DTRs to provide relief to
the overloaded DTRs.
2.6.3.3 Non-maintenance of required rolling stock of DTRs
The Company is required to maintain healthy DTRs as rolling stock for
ensuring replacement of failed DTRs. The norm followed by the Company for
maintaining rolling stock was four per cent of total DTRs. The rolling stock
required as per norm and the actual rolling stock maintained by the Company
during the last five years is indicated below:
Table 2.8: Surplus / shortage of Rolling stock of DTRs
Year Total
DTRs
Rolling stock as
per norm of 4
per cent
Actual Rolling
stock
Surplus/
Shortage
2011-12 1,78,880 7,155 7,592 +437
2012-13 1,87,944 7,518 7,947 +429
2013-14 2,08,158 8,326 8,233 -93
2014-15 2,26,447 9,058 8,089 -969
2015-16 2,42,826 9,713 8,840 -873
Source: MIS returns
It could be observed from the above that the Company had not maintained the
required rolling stock during the years 2013-16, and shortage was
10.70 per cent and 8.99 per cent of the norm in 2014-15 and 2015-16
respectively. Further, the data relating to time taken for replacement of failed
DTRs was not maintained in the field. In order to avoid shortage of DTRs in
replacing failed DTRs, the Company should maintain the required rolling
stock.
The Government stated (October 2016) that failure of DTRs was more during
certain seasons. The complaints were received telephonically and were
Report No. 2 of 2017 (Public Sector Undertakings)
40
recorded in the system, but details of time taken for replacement were not
captured in the system.
2.6.3.4 Delay in completion of works and closure of work orders
As per provisions of Electricity Department Manual, all work orders
completed or in-progress should be closed up to 31 March and, in the case of
capital-works-in-progress and maintenance works for next year, fresh work
orders should be issued.
Audit observed that the work orders issued for execution of various works in
the Company were not being closed at the end of the year. The work orders
were kept open for long periods, in many cases for more than five years due to
non-completion of works within scheduled period, delay in returning of
balance unused material to stores, right of way problems in the field and non-
availability of matching material in the stores. The details of capital work
orders issued, closed during the year and pending closure at the end of the year
for the period from 2012-13 to 2015-16 are indicated in the Annexure-2.2.
Audit observed that:
� The number of work orders pending for closure had increased from 13,008
(` 319 crore) as on March 2013 to 18,318 (` 580 crore) as on March 2016.
Out of total 18,318 pending capital work orders, 3097 work orders
(` 141 crore) were pending for more than one year and 768 work orders
(` 46 crore) were pending for more than two years.
� Delay in closure of work orders resulted in non-capitalisation of assets and
non-charging of depreciation, besides non-inclusion of depreciation in
ARR for realisation through Retail Tariff.
� The Audit Committee of the Company had recommended (December
2013) to close all the work orders pending for more than one year in which
the assets were already put to use. However, it was observed that there
were 84 work orders pending for closure for which works were completed
and put to use.
� There were 389 work orders relating to service connections pending for
closure as on 31 March 2016 valued at ` 5.54 crore. Non-closure of work
orders relating to service connections resulted in delay in realisation of
revenue to the Company.
The Government stated (October 2016) that the main reasons for not closing
the work orders was non-availability of required materials at stores and long
duration of schemes like HVDS, R-APDRP etc. It was also mentioned that
action was being taken to close the work orders and bring the same to a
minimum level by pursuing vigorously.
2.6.4 Billing and Collection Efficiency
One of the major aims and objectives of the National Electricity Policy, 2005
was ensuring financial turnaround and commercial viability of Power sector.
The financial viability of the DISCOMs are generally influenced by various
factors such as:
Chapter II-Performance Audit relating to Government Company
41
� Timely revision of tariff;
� Adequacy of revision of tariff to cover cost of operation;
� Timely release of assured subsidy by the Government;
� Cross subsidisation policy of the Government; and
� Proper billing and collection.
The deficiencies observed by audit are discussed in the following paragraphs.
2.6.4.1 Non-filing of retail tariff proposals under Multi Year Tariff (MYT)
framework
State Electricity Regulatory Commission had introduced Multi Year Tariff
framework (five years) in 2005, based on which the Company had to file its
ARR proposals with SERC for determination of tariff for Wheeling and Retail
sale of electricity. The Company, however, expressed its inability to project
ARR for five years under Multi Year Tariff (for retail tariff) on the ground that
reasonable prediction of their revenue requirement could not be made due to
uncertainties surrounding lift irrigation schemes, policy uncertainties and
Power Purchase Agreements pending finalisation with a few generating
stations. Accordingly, SERC allowed the Company to file annual ARRs.
Multi Year Tariff could have obviated the time, effort and uncertainty of
getting Annual Tariff Orders. In view of applicability of model code of
conduct of Election Commission and reorganisation of State, the Company
could not obtain annual Tariff Order for 2014-15. The Company had not
submitted the revised ARR for the remaining period of 2014-15 after
formation of Telangana State. In the absence of Tariff Order for 2014-15, the
Company had to follow the Tariff Order of 2013-14 for 2014-15 also.
Audit observed that due to its inability to establish required information
systems, the Company could not submit the proposals under MYT and avail of
the benefits. The loss of the Company had increased from ` 33.78 crore during
2013-14 to ` 1,348.21 crore during 2014-15, mainly due to adoption of Tariff
Order of 2013-14 for 2014-15.
The Government stated (October 2016) that MYT proposals could not be
submitted due to difficulties in assessing the availability of power.
Government also informed that after implementation of UDAY scheme, it
would be submitted quarterly.
The reply was not acceptable, as SERC had suggested MYT tariff after
considering all issues involved. Adoption of MYT by the Company would
have avoided the adoption of previous year's tariff (2013-14) for 2014-15, and
the loss of revenue could have also been reduced.
2.6.4.2 Shortfall in supply of power to subsidised categories
The Company failed in meeting the supply estimates in all the years during
2011-12 to 2015-16. The shortfall in supply was more in LT category where
most of the supply was to rural areas. Audit observed that the shortfall in
supply was more in the categories where the Government pays subsidy based
on estimates. It was seen that against SERC approved supply of 12,491 MU to
LT-I category, the Company supplied 11,765 MU only during 2011-16 and
thus availed excess subsidy of ` 170.13 crore.

Report No. 2 of 2017 (Public Sector Undertakings)
42
The Government stated (October 2016) that if all the subsidised categories
including agricultural category were considered, the supplies would have
exceeded the SERC approved limits; hence no excess subsidy was claimed.
However, the Company should ensure supplies to all categories as per the
quantum approved by SERC. Further, the quantum of supply attributed to
agricultural category by the Company was only an estimation which was not
accepted by SERC.
2.6.4.3 Cross subsidy beyond the norms suggested by National Tariff
Policy
Section 61 of the Electricity Act, 2003, stipulates that tariff should
progressively reflect the Cost of Supply of electricity and also reduce cross
subsidy in a manner specified by the appropriate commission. The National
Tariff Policy (NTP) envisaged that tariff for all categories should range within
plus or minus 20 per cent of the Average Cost of Supply (ACS) by the year
2010-11.
In the tariff proposals submitted to SERC for approval, the Company had
proposed tariff which were beyond the limits allowed as per NTP. A review of
the tariff orders for the last five years showed that the tariff fixed for majority
of the categories was beyond the limits as given below:
Table 2.9: Details of Tariff fixed
Year
ACS
(in
paise)
Lower
limit
(in
paise)
Upper
limit
(in
paise)
Total
categories
in Tariff
Order
Categories for which the Tariff
is fixed
less than
the
minimum
more than
the
maximum
within
the
limits
2011-12 382 306 458 75 31 16 28
2012-13 471 377 565 101 42 23 36
2013-14 551 441 661 86 23 22 41
2014-15 551 441 661 86 23 22 41
2015-16 619 495 743 87 30 12 45
Source: SERC Tariff Orders
Audit observed that the Company did not limit the cross subsidy to the
suggested levels even beyond the target year (2010-11) and the tariff charged
to certain categories reached 189 per cent38
of the ACS. The financial impact
on categories for which tariff was higher than the maximum allowed as per
norm, worked out to ` 909.37 crore during 2011-15 (Annexure-2.3).
The Government stated (October 2016) that all efforts were being made to
adhere to the guidelines.
2.6.4.4 Non-filing of additional expenditure through true-up with SERC
Due to increase in number of DTR failures, employee cost, administrative and
general expenses, the Repair & Maintenance budget of the Company for 2013-
14 was enhanced by ` 98.91 crore. The Board accorded sanction for additional
38
As against the ACS of 619 paise per unit for the year 2015-16, the tariff for Advertisement
Hoardings Category was 1170 paise per unit which was 189 per cent of ACS.
Chapter II-Performance Audit relating to Government Company
43
budget and directed the Company to recover the additional expenditure by
filing true-up petition.
However, the Company had not claimed the additional expenditure incurred
through true-up petition on the plea that accumulated losses in the Balance
Sheet were covered under FRP scheme. This has resulted in avoidable loss of
` 98.91 crore.
The Government stated (October 2016) that the Company had not filed the
true up proposals for 1st & 2
nd control periods in view of the intention
conveyed by the Government to join UDAY scheme as the loss would be
absorbed by the UDAY scheme.
2.6.4.5 Non receipt of Subsidy from the State Government.
State Electricity Regulatory Commission approves the ARR taking into
account subsidy to be released by the State Government, failing which rates
contained in the full cost recovery tariff would be operative. The subsidy
amount as indicated in the Tariff Order, must be paid by the State Government
in monthly installments, in advance.
Audit observed that:
� The Company had received the subsidy as indicated in the tariff orders for
the years 2011-12 to 2013-14. However, for the years 2014-15 and
2015-16, though the Company had claimed subsidy of ` 5,932.21 crore, it
received only ` 5,238.98 crore. The Company could neither collect the
balance subsidy (` 693.23 crore) nor implement the full cost recovery
tariff. Non-compliance with tariff orders by the Company had resulted in
loss of ` 693.23 crore.
� In respect of 2014-15, the Company was entitled to claim ` 2,555.28 crore
towards subsidy as approved by SERC. However, the Company had
claimed ` 2,398.81 crore only, resulting in short claim of ` 156.47 crore.
� The Company had claimed subsidy as per Tariff Order of SERC i.e. at
` 202.45 crore per month for April and May 2014 and at ` 199.39 crore
per month from June 2014 (reduced due to transfer of seven Mandals to
Andhra Pradesh) but did not claim additional subsidy of ` 130.14 crore,
approved later by SERC (May 2013). This had resulted in loss of
` 130.14 crore.
� Due to non-receipt of subsidy from the Government, the Company was
forced to defer the payments to the Generation Companies, resulting in
payment of Delayed Payment Surcharge (DPS) at 15 to 18 per cent per
annum. The Company had paid ` 1.01 crore as DPS to the Generating
Stations during 2015-16.
The Government stated (October 2016) that the subsidy was paid in full for
the year 2013-14. For the balance subsidy relating to 2015-16, Government
Order (GO) was issued. In respect of 2014-15, the amount agreed as per GO
was paid to the Company.
The reply was not acceptable as the Company had adopted Tariff Order for
2013-14 for 2014-15 and against the entitled subsidy amount approved by
Report No. 2 of 2017 (Public Sector Undertakings)
44
SERC of ` 2,555.28 crore, an amount of ` 2,398.81 crore only was received,
leaving a shortfall of ` 156.47 crore.
2.6.4.6 Arrears of Revenue
As per SERC directions, DISCOMs had to make all out efforts to ensure
timely collection of dues from the Government/ Local Bodies without
allowing arrears to build up. SERC had further opined that installation of
prepaid meters would act as one of the mechanisms to reduce/ eliminate delays
in payment of outstanding bills and arrears by Government Departments.
A review of arrears of revenue showed that an amount of ` 1,232 crore39
was
pending for recovery as on 31 March 2016. Out of this, ` 820.89 crore was
pending from the Government Departments/ Local Bodies and ` 249.03 crore
was pending from other live services.
A further test-check of HT consumers with arrears of more than ` 10 lakh as
on 31 May 2016 showed that an amount of ` 65.85 crore was pending for
recovery from 64 consumers against which the Company was holding security
deposit of ` 12.49 crore only and there was no security for the balance amount
of ` 53.35 crore. The above consumers were under ‘D’ list (Disconnection list)
for more than one year. However, contrary to the provisions of General Terms
and Conditions of Supply (GTCS), supply was not disconnected. The
Company had also not taken any initiative to install prepaid meters for the
Government Departments (July 2016). Therefore, the Company should ensure
prompt realisation of arrears by implementing GTCS and directions of SERC.
During the Exit conference, the Joint Secretary (Energy) directed the
Company to speed up the process of installation of prepaid meters to avoid
accumulation of arrears and enable prompt realisation of revenue.
2.6.4.7 Non-realisation of dues from Government towards subsidy for
Scheduled Tribe (ST) consumers
The State Government had taken a policy decision (July 2013) to provide free
power to the Scheduled Caste/Scheduled Tribe (SC/ST) beneficiaries who are
residing in SC/ST housing colonies and whose consumption was less than 50
units per month. The arrears of electricity charges as on 31 March 2012 would
be paid in two installments in 2013-14 and 2014-15. In respect of monthly
payments, DISCOMs were to furnish detailed consumption particulars of each
beneficiary in SC/ST colonies whose monthly consumption was below 50
units to Social Welfare Department. It was seen that the Company had
receivables of ` 32.13 crore and ` 70.86 crore as on March 2013 and March
2016 respectively in respect of ST consumers.
SERC had directed (Tariff Order 2013-14 and 2015-16) that the Company
should make all out efforts to ensure timely collection of dues from the
Government Departments/ Local Bodies without allowing arrears to build up
and take necessary steps as per the GTCS.
Though the dues relating to SC consumers were received, the dues in respect
of ST consumers amounting to ` 71.45 crore to the end of April 2016 were not
39
LT consumers: ` 995.64 crore and HT consumers: ` 236.36 crore.
Chapter II-Performance Audit relating to Government Company
45
received resulting in blocking up of funds. Though the Company is pursuing
the issue with Tribal Welfare Department, the amount is yet to be realised
(October 2016).
The Government stated (October 2016) that efforts were being made to release
the budget for payment of dues of ST consumers from Tribal Welfare
Department.
2.6.4.8 Adoption of kWh units instead of kVAh units for levy of Electricity
Duty (ED) on HT consumers
SERC approved kVAh billing system from 2011-12 for all HT Consumers and
LT Consumers for whom Trivector meters have been provided. Accordingly,
the Company is charging energy charges based on consumption of electricity
measured in kVAh.
As per the State Electricity Duty Act, 1939, every licensee in the State is to
pay every month to the State Government a duty at the rate of six paise per
unit of energy sold except on the sales made to the Government of India for its
consumption or on sales to Railways.
Audit observed that though the Company had switched over to kVAh-based
billing (2011-12) and measuring the units in terms of kVAh, it was collecting
the electricity duty on kWh units. The kVAh-based billing drives the
consumer to reach unity power factor. The kVAh units will be higher than
kWh units wherever power factor is less than one. As measurement of energy
consumption was changed to kVAh, the ED was to be levied on kVAh units
instead of kWh units.
Non-adoption of kVAh units for levy of ED during 2011-16 had resulted in
loss of revenue of ` 6.34 crore to the Government and undue benefit to the HT
consumers.
The Government stated (October 2016) that as per GTCS, unit means kWH
(indicated by the energy meter) and hence there was no deviation in billing ED.
The reply was not acceptable as SERC had approved kVAh billing system
from 2011-12 for all HT consumers. Further, ED Act provided for levy of ED
on energy sold and kVAh being used as the unit of measurement for billing,
ED should have been levied on kVAh.
2.6.4.9 Arrears of Additional Consumption Deposit from HT and LT services
High Tension/ Low Tension consumers should at all times maintain an amount
equivalent to consumption charges (i.e. demand charges and energy charges
etc., as applicable) of two months or three months as security during the
Agreement period. Subject to billing periods of three months/ two months as
specified in SERC Regulation No.6 of 2004, the adequacy of the amount of
Consumption Deposit (CD) in respect of consumers shall be reviewed by the
Company, generally once in every year (preferably after revision of tariff for
the respective year) based on the average consumption for the period
representing 12 months from April to March of the previous year. After such
review, Additional Consumption Deposit (ACD) would be demanded in case
of shortfall and refunded in case of excess.
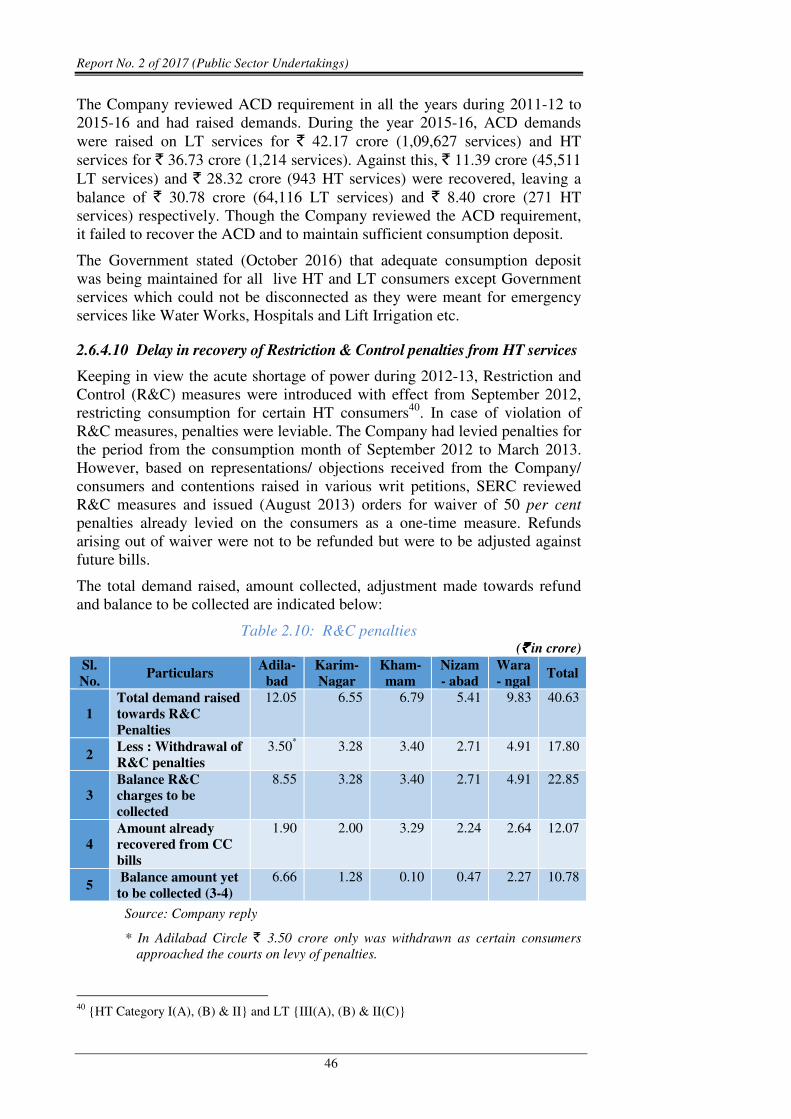
Report No. 2 of 2017 (Public Sector Undertakings)
46
The Company reviewed ACD requirement in all the years during 2011-12 to
2015-16 and had raised demands. During the year 2015-16, ACD demands
were raised on LT services for ` 42.17 crore (1,09,627 services) and HT
services for ` 36.73 crore (1,214 services). Against this, ` 11.39 crore (45,511
LT services) and ` 28.32 crore (943 HT services) were recovered, leaving a
balance of ` 30.78 crore (64,116 LT services) and ` 8.40 crore (271 HT
services) respectively. Though the Company reviewed the ACD requirement,
it failed to recover the ACD and to maintain sufficient consumption deposit.
The Government stated (October 2016) that adequate consumption deposit
was being maintained for all live HT and LT consumers except Government
services which could not be disconnected as they were meant for emergency
services like Water Works, Hospitals and Lift Irrigation etc.
2.6.4.10 Delay in recovery of Restriction & Control penalties from HT services
Keeping in view the acute shortage of power during 2012-13, Restriction and
Control (R&C) measures were introduced with effect from September 2012,
restricting consumption for certain HT consumers40
. In case of violation of
R&C measures, penalties were leviable. The Company had levied penalties for
the period from the consumption month of September 2012 to March 2013.
However, based on representations/ objections received from the Company/
consumers and contentions raised in various writ petitions, SERC reviewed
R&C measures and issued (August 2013) orders for waiver of 50 per cent
penalties already levied on the consumers as a one-time measure. Refunds
arising out of waiver were not to be refunded but were to be adjusted against
future bills.
The total demand raised, amount collected, adjustment made towards refund
and balance to be collected are indicated below:
Table 2.10: R&C penalties (`̀̀̀ in crore)
Sl.
No. Particulars
Adila-
bad
Karim-
Nagar
Kham-
mam
Nizam
- abad
Wara
- ngal Total
1
Total demand raised
towards R&C
Penalties
12.05 6.55 6.79 5.41 9.83 40.63
2 Less : Withdrawal of
R&C penalties
3.50*
3.28 3.40 2.71 4.91 17.80
3
Balance R&C
charges to be
collected
8.55 3.28 3.40 2.71 4.91 22.85
4
Amount already
recovered from CC
bills
1.90 2.00 3.29 2.24 2.64 12.07
5 Balance amount yet
to be collected (3-4)
6.66 1.28 0.10 0.47 2.27 10.78
Source: Company reply
* In Adilabad Circle ` 3.50 crore only was withdrawn as certain consumers
approached the courts on levy of penalties.
40
{HT Category I(A), (B) & II} and LT {III(A), (B) & II(C)}

Chapter II-Performance Audit relating to Government Company
47
It could be observed from the table that even after waiver of 50 per cent
penalties and adjustments/ recoveries, an amount of ` 10.78 crore was yet to
be recovered from 199 HT consumers. Considering cases where bills stopped
(22 cases: ` 0.26 crore), under disconnection (16 cases: ` 0.31 crore) and
under legal dispute (6 cases: ` 5.76 crore), an amount of ` 4.45 crore was
pending for recovery from 155 live services since September 2013.
The Government stated (October 2016) that after formation of Telangana
State, a representation was submitted by the industrialists to the State
Government for waiver of penalties levied on industries as part of
encouragement to the industries and the final decision was awaited.
2.6.4.11 Non-recovery of assessed amounts from theft of energy cases
A vigilance team of the Company, headed by an Officer of the rank of
Additional Superintendent of Police, was entrusted with the work of
conducting raids for checking the premises of the consumers to detect theft/
pilferage of energy cases.
The raids conducted by Vigilance Wing, theft/ pilferages cases detected,
amount assessed/ realised etc. are indicated below:
Table 2.11: Unrealised amount in pilferage cases
Year
Consumers
as at the
end of the
year
Raids
conducted
Pilferage
cases
detected
Assessed
amount
Amount
realised
Unrealised
amount
Percentage
of
unrealised
amount ` in crore
2011-12 44,76,781 1,02,893 12,513 3.66 2.06 1.60 43.72
2012-13 46,74,437 1,13,134 12,618 4.66 2.81 1.85 39.48
2013-14 48,84,013 1,18,571 14,451 6.43 3.77 2.67 41.52
2014-15 50,34,446 1,56,247 16,571 6.20 3.71 2.49 40.16
2015-16 51,78,054 1,48,313 16,120 5.95 5.12 0.83 13.95
Total 72,273 26.90 17.47 9.43 35.06
Source: MIS returns
For realisation of assessed amounts in pilferage/ theft cases, Disconnection
List (D-lists) were being issued to field offices for disconnection of services
and follow up action. However, due to ineffective implementation of D-Lists,
the arrears accumulated to ` 9.43 crore at the end of 2015-16.
The Government stated (October 2016) that review meetings were conducted
to improve realisation of assessed amounts. The unrealised amounts were on
decreasing trend from 2011-12.
2.6.5 Consumer Satisfaction and Redressal of Grievances
One of the key elements of the Power Sector Reforms was to protect the
interest of the consumers and ensure better service to them. The consumers
often face problems relating to supply of power such as non-availability of the
distribution system for release of new connections or extension of connected
load, frequent tripping of lines and/or transformers and improper metering and
billing.
Report No. 2 of 2017 (Public Sector Undertakings)
48
2.6.5.1 Non-supply of power to agricultural consumers for seven hours a day
The policy of the State Government is to provide free power to eligible
agriculture consumers for seven hours a day. Accordingly, the ARR proposals
were based on the assumption of seven hours supply. The cost of supply and
subsidy payable by the State Government were also estimated, based on seven
hours supply.
During public hearings on tariff proposals, several consumers and other
stakeholders expressed concern that the Company had not supplied electricity
for the promised seven hours continuously throughout the year.
Though the Company estimated the supplies to agriculture consumers
exceeding the quantum of units approved by SERC, on review of records of
supply made (day wise) to the agriculture feeders in five circles during
January 2016 to March 2016, it was observed that supplies were not made for
seven hours a day.
Audit observed that Warangal, Adilabad and Karimnagar circles had 646, 367
and 834 agriculture feeders respectively during the period January 2016 to
March 2016. These circles had never supplied power to agriculture feeders for
seven hours a day during the entire 91 day period verified in audit. The
Khammam circle which had 325 feeders, supplied power for six hours a day or
less in all the days in January, February and upto 20 March 2016.
The Company had not ensured supply for seven hours a day to all agriculture
feeders uniformly and the Government also had not monitored the supply for
seven hours a day, though the subsidy was paid for supply of the same. As
supply was less than six hours a day for majority of the feeders in many
circles, out of the subsidy of ` 8,237.63 crore paid by the Government during
last five years (2011-16), about ` 1,176.80 crore (1/7th
of the subsidy) was not
spent on fulfillment of the objective of Government of supplying free power
for seven hours to agricultural consumers.
The Government stated (October 2016) that there were occasions where
supply exceeded seven hours which compensated for the short supply in other
circles. It was further stated that the program of solar power to agricultural
connections was under implementation which would ease the problem.
The reply was not acceptable as the Company had extended power for seven
hours only to a few feeders in Nizamabad circle while, in other circles, the
supply was less than seven hours.
2.6.5.2 Redressal of complaints from Consumers
The Company has a Consumer Care Centre (CCC) facility for resolving the
complaints of the consumers relating to fuse off, overhead line/ cable
breakdown or underground cable breakdown, DTR failures, transfer of
ownership, re-connection of supply, wrong bills/ back bills, meter complaints
etc. In case the complaints are not resolved, the consumers can approach
Consumer Grievance Redressal Forum (CGRF) established by the Company
under Sub- Section (5) of Section 42 of the Electricity Act, 2003. Presently the
Forum is catering to the consumers of five circles.
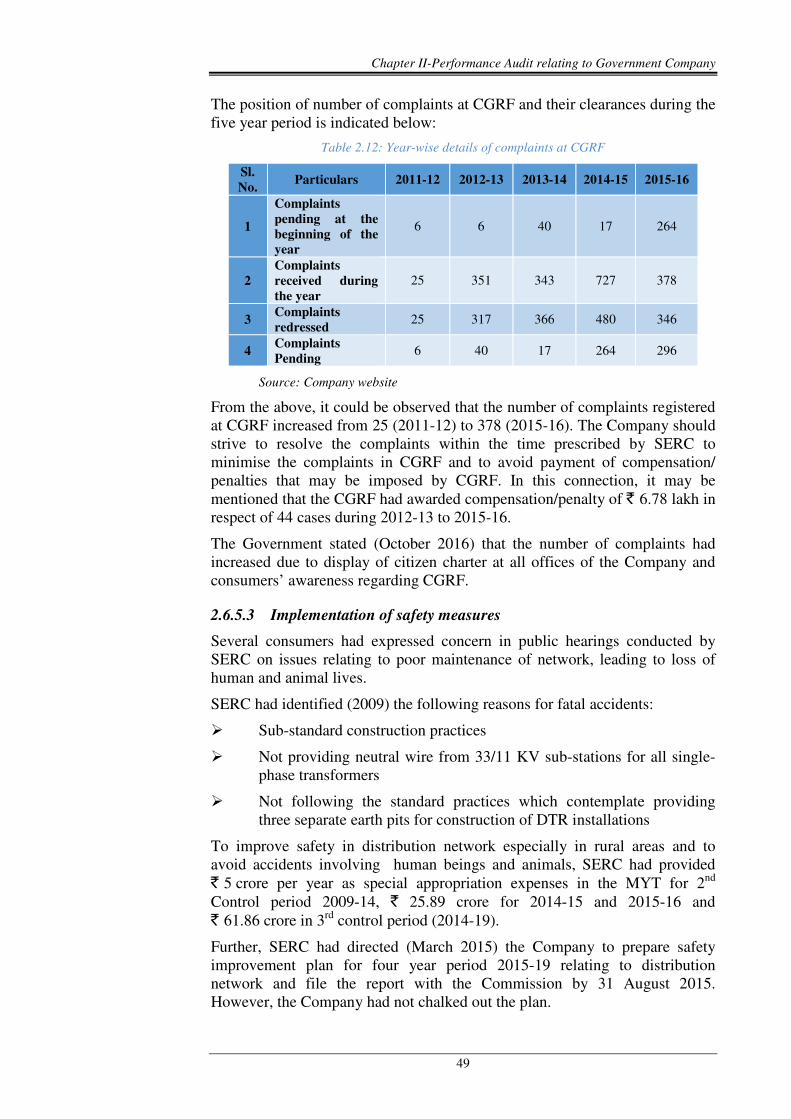
Chapter II-Performance Audit relating to Government Company
49
The position of number of complaints at CGRF and their clearances during the
five year period is indicated below:
Table 2.12: Year-wise details of complaints at CGRF
Sl.
No. Particulars 2011-12 2012-13 2013-14 2014-15 2015-16
1
Complaints
pending at the
beginning of the
year
6 6 40 17 264
2
Complaints
received during
the year
25 351 343 727 378
3 Complaints
redressed 25 317 366 480 346
4 Complaints
Pending 6 40 17 264 296
Source: Company website
From the above, it could be observed that the number of complaints registered
at CGRF increased from 25 (2011-12) to 378 (2015-16). The Company should
strive to resolve the complaints within the time prescribed by SERC to
minimise the complaints in CGRF and to avoid payment of compensation/
penalties that may be imposed by CGRF. In this connection, it may be
mentioned that the CGRF had awarded compensation/penalty of ` 6.78 lakh in
respect of 44 cases during 2012-13 to 2015-16.
The Government stated (October 2016) that the number of complaints had
increased due to display of citizen charter at all offices of the Company and
consumers’ awareness regarding CGRF.
2.6.5.3 Implementation of safety measures
Several consumers had expressed concern in public hearings conducted by
SERC on issues relating to poor maintenance of network, leading to loss of
human and animal lives.
SERC had identified (2009) the following reasons for fatal accidents:
� Sub-standard construction practices
� Not providing neutral wire from 33/11 KV sub-stations for all single-
phase transformers
� Not following the standard practices which contemplate providing
three separate earth pits for construction of DTR installations
To improve safety in distribution network especially in rural areas and to
avoid accidents involving human beings and animals, SERC had provided
` 5 crore per year as special appropriation expenses in the MYT for 2nd
Control period 2009-14, ` 25.89 crore for 2014-15 and 2015-16 and
` 61.86 crore in 3rd
control period (2014-19).
Further, SERC had directed (March 2015) the Company to prepare safety
improvement plan for four year period 2015-19 relating to distribution
network and file the report with the Commission by 31 August 2015.
However, the Company had not chalked out the plan.
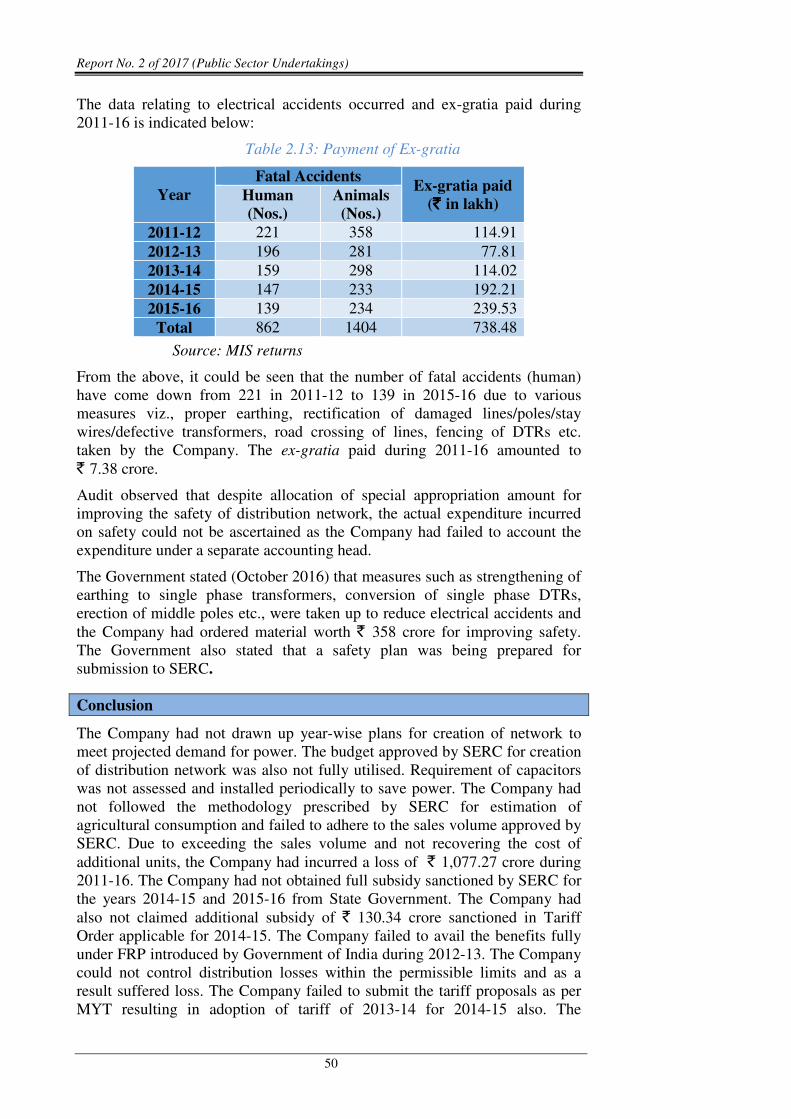
Report No. 2 of 2017 (Public Sector Undertakings)
50
The data relating to electrical accidents occurred and ex-gratia paid during
2011-16 is indicated below:
Table 2.13: Payment of Ex-gratia
Year
Fatal Accidents Ex-gratia paid
(` ` ` ` in lakh) Human
(Nos.)
Animals
(Nos.)
2011-12 221 358 114.91
2012-13 196 281 77.81
2013-14 159 298 114.02
2014-15 147 233 192.21
2015-16 139 234 239.53
Total 862 1404 738.48
Source: MIS returns
From the above, it could be seen that the number of fatal accidents (human)
have come down from 221 in 2011-12 to 139 in 2015-16 due to various
measures viz., proper earthing, rectification of damaged lines/poles/stay
wires/defective transformers, road crossing of lines, fencing of DTRs etc.
taken by the Company. The ex-gratia paid during 2011-16 amounted to
` 7.38 crore.
Audit observed that despite allocation of special appropriation amount for
improving the safety of distribution network, the actual expenditure incurred
on safety could not be ascertained as the Company had failed to account the
expenditure under a separate accounting head.
The Government stated (October 2016) that measures such as strengthening of
earthing to single phase transformers, conversion of single phase DTRs,
erection of middle poles etc., were taken up to reduce electrical accidents and
the Company had ordered material worth ` 358 crore for improving safety.
The Government also stated that a safety plan was being prepared for
submission to SERC.
Conclusion
The Company had not drawn up year-wise plans for creation of network to
meet projected demand for power. The budget approved by SERC for creation
of distribution network was also not fully utilised. Requirement of capacitors
was not assessed and installed periodically to save power. The Company had
not followed the methodology prescribed by SERC for estimation of
agricultural consumption and failed to adhere to the sales volume approved by
SERC. Due to exceeding the sales volume and not recovering the cost of
additional units, the Company had incurred a loss of ` 1,077.27 crore during
2011-16. The Company had not obtained full subsidy sanctioned by SERC for
the years 2014-15 and 2015-16 from State Government. The Company had
also not claimed additional subsidy of ` 130.34 crore sanctioned in Tariff
Order applicable for 2014-15. The Company failed to avail the benefits fully
under FRP introduced by Government of India during 2012-13. The Company
could not control distribution losses within the permissible limits and as a
result suffered loss. The Company failed to submit the tariff proposals as per
MYT resulting in adoption of tariff of 2013-14 for 2014-15 also. The
Chapter II-Performance Audit relating to Government Company
51
Company failed to meet the supply estimates in all the years. Despite
allocation of special appropriation amount by SERC for improving the safety
of distribution network, the Company had not prepared safety plans. Due to
delay in redressal of grievances to the satisfaction of consumers, the
complaints registered at CGRF have increased from 25 in 2011-12 to 378 in
2015-16.
Recommendations
The Company may consider:
� preparing annual plans for development of distribution network and
for utilisation of the amount approved by SERC;
� periodical assessment and installation of capacitor banks to save
energy;
� adhering to the sales volume approved in Tariff Order, recovery of
subsidy from the State Government as per Tariff Orders and
implementation of full cost tariff in the event of non-receipt of full
subsidy;
� adhering to the terms and conditions of Projects/ Schemes of Central
and State Governments to derive the intended benefits;
� preparation of plans for improving the safety of distribution network
and accounting the expenditure under a separate accounting head to
monitor the investment on safety.
Information Technology Audit Report on Billing Systems in Northern
Power Distribution Company of Telangana Limited (TSNPDCL)
2.7 Introduction
Electricity consumers are divided into two broad categories i.e. High Tension41
(HT) consumers and Low Tension42 (LT) consumers. HT and LT consumers
are further classified into various categories as per the provisions of the Tariff
Orders issued by the concerned State Electricity Regulatory Commission
(SERC) from time to time.
Electricity distribution network in the State of Telangana is governed by two
Distribution Companies (DISCOMS) viz., Northern Power Distribution
Company of Telangana Limited (TSNPDCL) and Southern Power Distribution
Company of Telangana Limited (TSSPDCL). TSNPDCL (Company) was
incorporated in March 2000 and caters to the needs of 51.78 lakh (HT-
0.03 lakh and LT-51.75 lakh) consumers as at the end of March 2016 in the
41
High Tension consumer means a consumer (other than those of LT III industrial categories)
with a contracted load of 70 kVA and above and/ or having a contracted load exceeding 56
kW/ 75 HP. For LT-III industrial category having contracted load more than 100 HP, HT
tariffs are applicable
42 Low Tension consumer means a consumer with a contracted load of 56 kW/ 75 HP and
below except for LT-III category which has a threshold of 75 kW/ 100 HP.

Report No. 2 of 2017 (Public Sector Undertakings)
52
northern districts of Telangana viz., Warangal, Khammam, Karimnagar,
Adilabad and Nizamabad districts.
2.8 Organisational Setup
The Company functions under the administrative control of Department of
Energy, Government of Telangana. General Manager (IT), who heads the IT
Department, reports to the Chief General Manager (Projects) and is assisted by
a Senior Accounts Officer at Corporate Office. While the billing of LT
consumers is the responsibility of the Assistant Accounts Officers at
Electricity Revenue Offices (EROs), billing of HT consumers is done by
Senior Accounts Officer (HT) at each circle office.
2.9 Billing Applications
Energy Billing System (EBS) (LT Consumers)
Prior to introduction of Energy Billing System (EBS) (at a cost of
` 6.68 crore), the LT consumers were billed through Private Accounting
Agencies (PAAs) who maintained the data in different formats like simple text
format, dbase files or excel sheets, based on their convenience. EBS, which
brought the billing of all LT consumers on one platform, was developed in-
house in the year 2013 in Oracle 11g as distributed processing system placed
on IBM P750 servers having AIX 6.1 Operating System with windows based
desktops at EROs acting as clients.
As at the end of July 2016, the data pertaining to LT consumers, other than
those in R-APDRP towns, is maintained in the EBS. The data pertaining to the
previous month is uploaded to the spot billing machines which is then used to
generate bills for the current month based on the current month consumption.
The billing information and the payment information are processed at the Data
Centre located in the Corporate Office at Warangal to update the consumer
ledgers.
EBS (Agricultural Consumers)
The software was developed in-house on Sun Solaris 8 Operating System with
Oracle 7 database and Oracle Forms V4 as back-end and front-end
respectively and Pro*C as programming language.
The billing information pertaining to agricultural consumers (LT-V category)
is fed by the EROs and is then sent to the Circle Office concerned. The same
is processed by the Circle Office and the generated bills are sent to the
consumers by the EROs.
Metering, Billing and Collection (MBC) Module (HT Consumers)
The HT consumer data is maintained along with the data pertaining to LT
consumers covered under Restructured Accelerated Power Development and
Reforms Programme (R-APDRP) in a Data Centre located at Hyderabad in the
Metering, Billing and Collection (MBC) module developed under R-APDRP.
The billing module is an application with centralised processing at the Data
Centre and decentralised data feeding at Circle Offices. The processed bills are
then sent to the consumers. A database architecture diagram of these billing
applications is shown below:

Chapter II-Performance Audit relating to Government Company
53
2.10 Scope of Audit and Audit Methodology
The results of an IT audit on the HT billing systems of the Company was
earlier included in the Commercial Audit Report, Government of Andhra
Pradesh for the year ended 31 March 2007.
During the present Audit, sample billing data from the databases of LT, HT
and Agricultural consumers for the period from 2011-12 to 2015-16 were
analysed using CAATs43 during the period April to August 2016. The results
of queries on the databases were cross-verified with physical records at Circle
Offices/EROs to evaluate the adequacy of IT controls as well as to identify
loss/ leakage of revenue and to examine comprehensiveness of the System.
Sample Selection
There are five44 Circle Offices, 23 Division Offices and 48 EROs spread over
five districts. Among 45 EROs45 (in these five Circles) where EBS is in use,
10 EROs (two offices from each circle) were selected using simple random
sampling technique. Out of the total of 51.75 lakh consumers as at the end of
March 2016, the sample selected works out to 17.18 lakh consumers
(33.20 per cent). Further, the billing data of all 2516 HT consumers (to the end
of March 2016) was covered in Audit.
2.11 Audit Objectives
The objectives of the Audit were to see whether
� the Company prepared and implemented IT Policy;
� the IT application for billing implemented by the Company was
economical, efficient and effectively addresses business needs and
compliance requirements;
� effective internal controls exist to ensure data integrity, safety and
business continuity;
� effective controls exist in asset creation/usage, outsourcing and
training aspects.
43
Computer Assisted Audit Techniques 44
Adilabad, Karimnagar, Khammam, Nizamabad, Warangal Circles 45
All consumers of 3 EROs out of the total 48 EROs were covered under R-APDRP.
Report No. 2 of 2017 (Public Sector Undertakings)
54
2.12 Audit Criteria
The audit criteria adopted for ensuring the achievement of audit objectives
were:
� Provisions of Electricity Act, 2003, the National Electricity Policy and
the schemes sponsored by Ministry of Power;
� Tariff Orders issued by SERCs of Andhra Pradesh and Telangana
States;
� Guidelines and directions issued by Ministry of Power, SERCs, State
Government;
� Norms fixed by various agencies with regard to operational activities;
� Adherence to directions issued by Information Technology &
Communications Department vide G. O. RT. No. 268, dated 08 August
2008 for implementation of e-governance projects in PSUs/
Government Departments/ Agencies.
The audit objectives and criteria were explained to the Company during the
Entry Conference (6 June 2016). The replies of the Government furnished
during the Exit Conference (26 October 2016) have been considered while
finalizing the Report.
Acknowledgement
Audit acknowledges and appreciates the co-operation and assistance extended
by the officers and the Management of the Company at various stages of
conducting the Information Technology Audit.
2.13 Audit Findings
2.13.1 Lack of formulated and documented IT and Security Policies
As per the guidelines issued (August 2008) by the erstwhile Government of
Andhra Pradesh (Unified), all Departments/ PSUs were to develop an IT
vision and a road map identifying various objectives and services to be
provided, milestones to be achieved etc., within a fixed time frame. However,
the Company had neither framed a road map nor formed a Steering Committee
to guide the development of IT assets till date (August 2016).
Though the Company was utilising IT applications like EBS, MBC, SAP ERP
etc., for managing its various operations, it is yet to formulate and document a
formal IT policy and a long/ medium-term IT strategy incorporating the time
frame, key performance indicators and cost benefit analysis for developing
and integrating these applications, resulting in duplication of work as detailed
in Para 2.13.3 infra. This indicates lack of strategic planning in effectively
using IT. Further, the Company does not have an approved Information
Security Policy for protection of its application/ database as well as the data
residing therein as detailed in Para 2.13.22.
In this context, a reference is also invited to Para no. 2.5.6 of the ‘Review on
HT billing’ in erstwhile APNPDCL and erstwhile APCPDCL (included in the
CAG’s Audit Report, Commercial, Government of Andhra Pradesh for the

Chapter II-Performance Audit relating to Government Company
55
year ended 31 March 2007) wherein similar comment was included, from
which it is evident that the Company did not take any action for the last nine
years.
The Government accepted (October 2016) the audit observations and stated
that suitable policies would be formulated.
2.13.2 Lack of Blueprints
The Company had not prepared System Requirement Specifications and User
Requirement Specifications for its in-house developed “Energy Billing
Software” used for billing of LT and agricultural services. Non-preparation of
these blueprints would pose a hindrance in making systematic changes in the
software as and when needed. Detailed objectives of the software and its
achievement could not be verified in Audit.
The Government accepted (October 2016) the audit observation.
2.13.3 Lack of interface between various IT Applications
The Company is utilising SAP ERP for accounting purposes and HT billing
system (MBC) for billing of HT consumers. Individual ledger accounts were
created in SAP for each of the HT consumers while lumpsum totals were
maintained for all LT consumers as a single ledger account.
Audit observed that though the bills were being generated in the HT billing
system based on the meter readings fed into the system, the data has to be
manually downloaded and then uploaded into SAP due to lack of interface
between the SAP ERP and the HT billing system. Further, the data pertaining
to payments received from the HT consumers was manually fed for each of
the consumer in MBC and SAP separately. Thus, absence of interface between
SAP ERP and HT billing system resulted in duplication of work as well as
scope for errors (as detailed in Para 2.13.10), which might adversely affect the
integrity of the databases.
Further, it was also observed that there was no interface between the three
billing systems viz., MBC, EBS (LT) and EBS (Agri) utilised for billing of
various categories of consumers, which would hinder generation of
consolidated MIS from these applications.
The Government accepted (October 2016) the audit observation and stated that
an interface between HT billing system and SAP is under development.
2.13.4 Lack of functionalities resulting in manual interventions
Audit verified the records of the Circle Offices and EROs and observed that
certain billing components were excluded from the softwares, necessitating
manual calculations/ interference, thereby affecting the integrity of the system
and completeness of the databases as detailed below:
2.13.4.1 HT Billing
1. Temporary HT service connections were being billed manually till
they were regularised and not routed through the HT billing application
(MBC) resulting in lack of completeness of the database.
2. Though the data pertaining to the consumers including the date of
agreement was included in the application, the application did not
Report No. 2 of 2017 (Public Sector Undertakings)
56
provide for capturing the minimum agreement period, based on which
demand could be raised for such minimum period, in case of deration
of contracted load/ termination before the expiry of the agreement. Due
to non-provision of this functionality, the Company had to manually
verify and raise demand in such cases.
3. As per the Regulation No. 6 of 2004, consumers who fail to remit the
Security Deposit (SD) within 30 days from the date of intimation
thereof, have to pay a surcharge of 18 per cent per annum on such
amounts. Though the data pertaining to the amount of Security Deposit
due from the consumer was available in the system, the application did
not provide for automatic calculation of the surcharge and was
manually calculated and uploaded to the system.
4. The Application did not provide for revision of bills of the open access
consumers46 through the system. The bills were manually revised and
the subsequent bill was adjusted through a Journal Entry. However, the
other parameters like units billed etc., were not revised, thus, affecting
the integrity of the data utilised for review of adequacy of SDs held.
5. In case of seasonal consumers who utilise power for their main plant
during the off-season period, the billing system did not provide for
automatic revision of the previous bills and raising of subsequent
demand by disallowing the concession available for seasonal
consumers.
6. The legacy HT billing application did not provide for billing of HT
services on proportionate basis for new consumers, due to which bills
for the first month from the date of supply were prepared manually.
This lack of functionality was not addressed in the new application
also.
Further, the new MBC billing system was incorrectly designed to
generate the first bill from the date of supply to the date of bill, thus,
inflating the bill. This necessitated manual withdrawal of the excess
amounts for every such first bill. Similar was the case with the first bill
of the consumers who were converted from LT III (Industrial) to HT
category.
7. Provision for inclusion of assessed amounts in malpractice or theft
cases was not provided in the system.
As the above changes were being recorded by way of posting a Rectification
Journal Entry due to lack of required functionalities, the database continued to
depict the old and incorrect data and did not show the revised billing
particulars (meter data etc.,) except for the amounts, wherever revised. As a
result, the reports generated would be incorrect and the database would
continue to carry the incorrect data. As manual processing results in lesser
transparency and may lead to errors, the above processes need to be
automated.
46
Consumers utilising the distribution system of the Company for receiving the supply of
electricity from a party other than the Company
Chapter II-Performance Audit relating to Government Company
57
2.13.4.2 EBS (LT Billing)
1. In case of billing of LT category-III consumers with a contracted load
of 75KW/100 HP and above, the energy charges, fixed charges and
Time of Day (TOD) charges were manually calculated and then
entered into EBS through in-house computer’s EBS login giving scope
for errors.
2. Whenever the adequacy of SD of the consumers was reviewed
annually, previous SD review data was replaced with the current data
due to which historical data was not available in the application.
Further, the application neither provided for levy of penal interest on
additional SD demanded but not paid by the consumers nor facilitated
manual posting of such interest. These shortcomings hindered the
ability of the Company to review the payment history of the consumers
in respect of SD in addition to undue benefit to the consumers and loss
to the Company due to non-levy of penal interest.
3. Manual revision of bills was necessitated due to incorrect logic for
calculation of adequacy of SDs from new consumers for whom
previous 12 months data was not available.
4. The application was incorrectly designed to generate the first bill from
the date of supply to the date of the bill, thus, resulting in excess
demand on the consumers. However, these bills were not manually
reviewed to verify the accuracy of the bill and to withdraw excess
amounts as done in HT billing.
The Government accepted (October 2016) the audit observations and stated
that the Company would provide suitable modifications to the software.
2.13.5 Non-migration of legacy billing data
Audit observed that the billing data pertaining to LT consumers is available in
EBS from the date of implementation of EBS only i.e., April/ December 2013.
This indicated that the Company had not migrated the billing data available in
the legacy system into the new application. Further, it was also observed that
the legacy applications were not installed in any systems available in the
Company, due to which the Company cannot verify the past history of the
consumers.
The Government stated (October 2016) that historical data of legacy LT
billing systems would be migrated in due course.
2.13.6 Verification of balances on migration
Though the data in the legacy HT billing system was migrated to the MBC
system, there were no records to indicate that the migrated data was verified
and certified to be error-free.
The Government replied (October 2016) that the data was migrated after
thorough verification.
However, no documents were furnished in support of the reply.
Report No. 2 of 2017 (Public Sector Undertakings)
58
2.13.7 Usage of Production Environment for testing in MBC
It is an industry standard practice to test the changes to software in test
environment before migrating to production environment to mitigate the
probable bugs as well as to ensure that the reliability and integrity of the
existing data is not affected. A review of the master tables of the MBC showed
that the master tables contained few test consumers, which reflected the fact
that the production server is also used for testing, instead of migrating the new
features after testing in test environment.
The Government stated (October 2016) that testing was done in stages before
moving to production.
However, fact remained that the production database had test data which
indicated failure in segregation of testing and production databases.
2.13.8 Design Errors in MBC Master Tables
A review of the structure of the MBC master tables showed that the field
definitions were incorrect, and were coupled with lack of proper input
validations which gave scope for errors. For instance, Mobile number of
SC No. KMM899 was only of 9 digits (excluding the prefix 0) instead of
minimum 10 digits. These errors could have been avoided by preparation of
the blueprints as mentioned at Para 2.13.2 supra.
The Government accepted (October 2016) the audit observation and stated that
action would be taken to rectify the errors.
2.13.9 Failure to control dues from consumers exceeding their Security
Deposits
HT consumers of the Company should maintain SD equivalent to two months
of their average consumption of the previous year. A review of the records at
the end of March 2016 showed that the Company allowed accumulation of
dues of 508 HT consumers amounting to ` 201.19 crore, though they
maintained a SD of only ` 36.12 crore i.e., an excess of ` 165.07 crore, which
in turn is equivalent to 9.15 times of the existing SD of these consumers.
Though a default by these consumers would lead to financial loss to the
Company, the system was not designed to generate alerts whenever the dues
of a consumer crossed SD by a predetermined threshold limit.
The Government accepted (October 2016) the audit observation and stated that
the above 508 consumers pertained to Government services and mostly
Emergency services and that efforts were being made for realization of dues.
2.13.10 Variations between Financial (SAP) and Consumer Ledgers
(MBC)
The Company is maintaining financial data of the HT consumers in SAP while
maintaining the billing data in MBC i.e., HT billing application. A comparison
of the data pertaining to SDs in both the applications showed that there was a
difference of ` 5.06 crore between the two applications at the end of March
2016, rendering the database undependable.
The Government accepted (October 2016) the audit observation and stated that
these differences pertained to period prior to implementation of SAP and that
efforts would be made to reconcile the differences.
Chapter II-Performance Audit relating to Government Company
59
2.13.11 Incorrect levy of Electricity Duty
A review of the billing data of the HT consumers showed that the application
is incorrectly designed to levy Electricity Duty (ED) on the kWh units instead
of kVAh units, as detailed in Para No. 2.6.4.8. Further, in case of consumers
whose consumption was less than the minimum demand, the ED was levied
only on the actual units consumed and not on the minimum units billed which
was in deviation to the provisions of APED Act.
The Government stated (October 2016) that ED was levied on kWh units as
GTCS defined “unit” as kWh.
The reply is not acceptable as the GTCS defined a unit as kWh units indicated
by the energy meter for billing purpose while ED Act provided for levy of ED
on energy sold. As kVAh is being used as the unit of measurement for billing,
ED should be levied on kVAh.
2.13.12 Non-review of Security Deposits of Seasonal Industries as per
Regulations
As per the provisions of Regulation No. 6 of 2004 (clause 8), the adequacy of
the SD of seasonal industries is to be reviewed twice during the year, once
before the commencement of the declared season and again after the
completion of the season. It was, however, observed in Audit that the
Company was reviewing the adequacy of the SD of its 265 seasonal
consumers only once a year along with other consumers which is against the
SERC Regulations.
The Government agreed (October 2016) to make necessary changes to the
software.
2.13.13 Failure to credit Interest on Security Deposits (ISD) of Bill-stopped
Consumers
An analysis of the interest given to the consumers on their SD for the year
2015-16 showed that the Company had not credited interest on SDs (ISD) of
` 2.57 crore to 43 HT consumers whose bills were under ‘BILL STOP’ status
in the month of April 2015. However, as the clause 7 of Regulation 6 of 2004
which govern the ISD does not differentiate between the regular and bill-
stopped consumers, the action of the Company was incorrect.
The Government stated (October 2016) that security deposit along with
interest thereon, would be adjusted at the time of termination of service.
The reply is not tenable as the Regulations stipulated that the ISD should be
credited every year.
2.13.14 Non recovery of full cost tariff from consumers
A reference is invited to Para 2.6.4.5 wherein the non-receipt of subsidy from
the State Government was commented upon. As per the tariff orders, the
subsidy was to be received in advance every month, failing which SERC rates
contained in the full cost recovery tariff (FCRT) would be operative. In this
context, it was observed that though the Company had not received the entire
subsidy for the years 2014-15 and 2015-16 as per the tariff orders, it could not
recover the FCRT from the consumers as the billing applications did not have
the functionality to recover FCRT in such eventualities.
Report No. 2 of 2017 (Public Sector Undertakings)
60
The Government replied (October 2016) that the release of pending subsidy
from Government is being pursued by the Company.
The reply is not tenable as the Company failed to provide necessary
functionalities in the billing system to adhere to the instructions of the SERC.
2.13.15 Incomplete Data in Master Tables
A review of the data in the consumer master tables of all the three billing
applications viz., MBC (HT Billing), EBS (LT Billing) and EBS (Agriculture)
showed that the data capturing was incomplete in various columns like
address, email ID, phone number etc.
The Government replied (October 2016) that the missing data would be
collected and updated in the database.
2.13.16 Delay in Spot Billing of LT consumers
A review of the billing of the consumers showed that there was a considerable
time lag between two consecutive bills in both monthly and bi-monthly
billing. For instance, analysis of ledger data of Jagityal ERO for the month of
April 2011 revealed that billing in 70,148 records out of 86,494
bi-monthly records and 14,626 out of 16,562 monthly records was delayed by
4 to 59 days and 4 to 29 days respectively. This delay in spot billing was also
continued even after implementation of EBS as indicated by delay in
23,66,794 cases (20.52 per cent) out of 115,38,595 total monthly/ bimonthly
spot billings of the ten test-checked EROs during the period from May 2013 to
March 2016. As the delay in spot billing results in shifting of the consumers to
a different slab category based on their average consumption, there is a scope
of loss to either consumer or to the Company.
The Government replied (October 2016) that the delays were avoided during
the current year and that a new software is implemented to avoid loss to the
consumer on account of shifting to higher slab due to delay in billing.
2.13.17 Failure to adhere to guidelines of SERC
An analysis of the billing data of Agriculture consumers showed that the
Company had not adhered to the guidelines issued by SERC in its tariff orders
as detailed below:
1. SERC vide Para No. 4.1 of Regulation No. 5 of 2004, directed the
Company to issue all bills at a periodicity of not more than two months. Audit,
however, observed that billing of Agriculture (free) consumers, from whom
only customer charges were recoverable, was done only once in six months.
2. Though the tariff orders prescribed different tariffs for different groups of
agricultural consumers based on various parameters47, the same were not
captured in the application, thereby requiring manual intervention and giving
scope for bias and errors.
3. Though all new agricultural connections were to be given only with meters
and after implementation of Demand Side Management (DSM) measures like
frictionless foot valve, capacitor of adequate rating, HDPE or RPVC piping at
47
Land holdings and number of connections held by the agricultural consumer along with the
data on the second crop grown

Chapter II-Performance Audit relating to Government Company
61
suction and/ or delivery and ISI marked mono-block or submersible pump-
sets, out of the 1,33,692 free agricultural connections issued during the period
of Audit i.e., April 2011 to March 2016, only 59,894 connections were
provided with meters. However, readings were not captured in the application
even from these meters.
Further, a test check of the records of Warangal Circle showed that 18,511
consumers released during the period under review were without DSM
measures. Audit, however, could not verify similar cases in other four Circles
as necessary data was not captured in the relevant tables.
The Government replied (October 2016) that these services pertain to
unmetered free agricultural services from which only customer charges are
collected and that all free services were released only after installation of DSM
measures.
The reply is not acceptable as Warangal Circle data showed that new
agricultural services were released without DSM measures. Further, issue of
free agricultural connections without meters and issue of bills at six-monthly
intervals were against the instructions of SERC.
2.13.18 Billing on the basis of incomplete data
The Company levied additional tariff on HT and LT III consumers (with load
above 100 HP) for consumption between 6 pm to 10 pm of everyday as TOD
Charges. Audit observed that though TOD charges were correctly levied on
HT consumers as per the actual data obtained from the meters, the same were
levied at one-sixth of the month’s consumption from LT III consumers due to
lack of TOD readings. Thus, the Company resorted to billing of LT III
consumers on the basis of incomplete data which rendered its billing
inaccurate.
The Government replied (October 2016) that TOD is not applicable to LT
services.
Audit observed that HT tariff is applied to LT III consumers with load more
than 100 HP as per the tariff approved by ERC which included TOD charges.
As such, levy of TOD on these LT consumers on approximation due to non-
availability of compatible tri-vector meters, rendered billing inaccurate and
unreliable.
2.13.19 Weak user authentication
Passwords are used as a mechanism for user identification, authentication and
non-repudiation. It was observed that the Company neither had password
policy approved by competent authority nor enforced any restrictions on
password usage by the users/ administrators. Therefore, there was a risk of
unauthorized access and data modification that could not be traced.
The Government stated (October 2016) that password policy would be
formulated.
2.13.20 Lack of Backup Policy
The Company did not have any approved Backup Policy. Though the
Management stated that backups were taken on daily basis and maintained for
20 days in addition to the backups taken on monthly basis before and after
Report No. 2 of 2017 (Public Sector Undertakings)
62
processing of the ledger, a verification of the backups available with the
Company showed that the Company was having only weekend backups and
not daily backups. Further, the Company could not produce any record to
show that the backups taken at any point of time were actually tested to review
its ability to recover data in case of any eventuality.
The Government accepted (October 2016) the audit observation and stated that
a backup policy would be formulated.
2.13.21 Deficiencies in Change Management Controls
Modifications made to both master data and the application to accommodate
the changes in business rules were not documented. This was evident from the
fact that the Management had not maintained any records to indicate that the
HT bills generated were test-checked by higher authorities whenever there was
a revision in tariff. In this connection, a reference is invited to Para no. 2.5.8 of
the Review on HT billing in erstwhile APNPDCL and erstwhile APCPDCL
(included in the CAG’s Audit Report, Commercial, Government of Andhra
Pradesh for the year ended 31 March 2007) wherein similar comment on
failure to test check the HT bills was included. Further, a formal policy for
authorising changes made and for testing their accuracy did not exist.
The Government accepted (October 2016) the audit observation and stated that
change management procedures would be formulated. It was also stated
(October 2016) that the bills were test checked across all categories and that
records would be maintained in future to substantiate the same.
2.13.22 Lack of Data Security
2.13.22.1 Though the Finance Wing of the Company, after implementation of
EBS, instructed the EROs to submit the legacy data to the IT wing, the same
was retained with the PAAs, which is a security lapse on part of the Company
in maintaining its data. Being the data owner, it was the responsibility of the
Company to keep the data, which is critical and confidential, under its control
rather than leaving it in the hands of outsourced service providers.
The Government stated (October 2016) that legacy data is being obtained.
2.13.22.2 Further, it was seen in Audit that the HT billing data was
maintained by a third party in a Data Centre at Hyderabad along with the data
of another DISCOM viz., APSPDCL. The data given to the Audit for analysis
included data pertaining to APSPDCL which signifies the fact that the data
was not segregated and maintained properly at the Data Centre.
The Government stated (October 2016) that HT billing data is presently
maintained in a separate server.
2.13.23 Lack of ‘Business Continuity and Disaster Recovery Plan’
The billing system being mission critical for the Company, would impact its
revenue earning capacity substantially if the consumer bills are not generated
on time. The Company, however, had not prepared any business continuity
plan, outlining the action to be undertaken immediately after a disaster and to
effectively ensure that information processing capability can be resumed at the
earliest. It did not have a disaster recovery plan outlining identities of
Chapter II-Performance Audit relating to Government Company
63
personnel, their roles/ responsibilities and plan/ procedure to support such a
critical IT system in the event of a failure.
The Government accepted (October 2016) the audit observation and stated that
a suitable DR plan would be formulated.
2.13.24 Non-availability of the Source Code with Company
Though the MBC billing software developed under the R-APDRP project is
owned by the Company, the source code of the software is yet to be obtained
from the implementing agency (M/s TCS Limited). In the absence of the
source code with the Company, Audit could not verify the adherence to the
guidelines of SERC regarding adjustment of the payments received against
arrears/ current dues and annual review of SDs of the consumers.
The Government accepted (October 2016) the audit observation and stated that
the source code would be obtained.
2.13.25 Lack of protection from Viruses and Trojans
An analysis of the systems available at EROs where EBS (LT) was installed
showed that anti-virus solutions were not installed thus exposing the systems
to risk from viruses and trojans.
The Government stated (October 2016) that anti-virus solutions were deployed
on all desktops.
However, Audit observed that anti-virus applications were not available in
some of the test checked offices.
2.13.26 Lack of documented Training Policy
Audit observed that the Company did not have any training policy for the
employees utilising IT billing systems and that none of the users of EBS at
two offices48 were trained till date. Further, the Company did not have any
records to indicate that there was an approved evaluation and review
mechanism regarding the effectiveness of the trainings imparted to its staff
and its utilisation.
The Government accepted (October 2016) the audit observation and stated that
training policy would be formulated.
Conclusion
The Company was utilising three billing systems for billing of its HT, LT and
Agricultural consumers. In spite of specific instructions from the State
Government to develop an IT vision/ road map, the Company had not even
developed an IT policy/ strategy to guide its IT activities due to which there
was no interface between the IT applications resulting in duplication of work.
Further, the Security Deposit balances maintained in the HT billing system
differed from those recorded in the books of accounts. Manual processing of
several activities resulted in lesser transparency and gave scope for errors. In
spite of availability of suitable functionalities in the HT billing application, the
Company resorted to manual calculations, thereby affecting the integrity of the
48
Narasampet and Hanmakonda (Rural) EROs

Report No. 2 of 2017 (Public Sector Undertakings)
64
system and completeness of the database. The systems were vulnerable to
internal as well as external attacks due to poor controls.
Recommendations
The Company should:
� formulate and document IT and backup policies;
� formulate and implement a comprehensive Business Continuity
Plan;
� include all activities of the billing process in the applications to
reduce dependence on manual processing and attendant errors
creeping into the system;
� integrate the IT applications to prevent duplication of work and
scope for errors;
� formulate and implement a comprehensive security policy to
safeguard IT assets and fix the existing vulnerabilities; and
� build appropriate IT controls for data integrity and reliability.
CHAPTER III
COMPLIANCE AUDIT OBSERVATIONS


67
3. COMPLIANCE AUDIT OBSERVATIONS
GOVERNMENT COMPANIES
Telangana State Industrial Infrastructure Corporation Limited
3.1 Investments of Telangana State Industrial Infrastructure
Corporation Limited in Special Purpose Vehicles (SPVs) and
Joint Ventures (JVs)
3.1.1 Introduction
Andhra Pradesh Industrial Infrastructure Corporation Limited (APIIC) was
incorporated in September 1973 as a wholly owned undertaking of the
Government of Andhra Pradesh (GoAP). The APIIC was bifurcated (02 June
2014) into Andhra Pradesh Industrial Infrastructure Corporation Limited and
Telangana State Industrial Infrastructure Corporation Limited as per AP
Reorganization Act, 2014. Telangana State Industrial Infrastructure
Corporation Limited (TSIIC) (Company) was incorporated on 4 September
2014 with an authorised capital of ` 10 crore and paid up capital of
` 6.82 crore. The Assets and Liabilities were duly apportioned between
Andhra Pradesh and Telangana States as per AP Reorganisation Act, 2014 and
the Demerger Scheme was submitted to the Expert Committee of Government
of India whose approval is awaited. The accounts of TSIIC for the period from
4 September 2014 are yet to be finalised.
The main objectives of the Company are to provide industrial infrastructure
through development of industrial areas and employment generation. The
Company converts/ develops the earmarked/ allotted land into industrial plots
i.e. builds industrial sheds and provides common facilities like internal roads,
water, power, street lighting etc. The Company also undertakes execution of
industrial infrastructure projects like sector specific Special Economic Zones
(SEZ), Multipurpose SEZs, Information Technology (IT) / Information
Technology Enabled Services (ITES) SEZs etc. and projects under Public
Private Participation (PPP) model through establishment of Special Purpose
Vehicles (SPVs) / Joint Ventures (JVs) on its own, as well as those entrusted
to it by the State Government and Government of India.
3.1.2 Organisation Structure
The Management of the Company is vested with Board of Directors (Board)
headed by a Chairman and two Directors including the Vice Chairman &
Managing Director (VC&MD). The VC&MD is the Chief Executive of the
Company and is assisted by one Executive Director and three functional
heads (i) General Manager (Engineering), (ii) General Manager (Asset
Management/ Projects) and (iii) General Manager (Personnel &
Administration) and Chief Engineer at Head Office with six Zonal Managers
at field level.
Chapter III
Report No. 2 of 2017 (Public Sector Undertakings)
68
Audit was conducted to verify whether the objectives of infrastructure
creation, industrial development and employment generation were achieved;
the investments of ` 572.53 crore made by the Company in SPVs/ JVs
(Annexure-3.1) yielded expected return; the rules, regulations and decisions,
orders and guidelines of the erstwhile Government of Andhra Pradesh and
present Government of Telangana, TSIIC and Government of India were
complied with and the terms and conditions of Agreements/ MoUs with
developers/ Government were adhered to.
3.1.3 Audit Findings
Investments in SPVs and JVs
The Company had invested ` 79.27 crore in two JVs (` 59.01 crore) and eight
SPVs (` 20.26 crore) during the period 1994-2015 either in the form of cash
or land and expected to receive return in the form of dividends, lease premium
and lease rentals. The Company had also made investments of ` 493.26 crore
in four SPVs (covered in AR (Commercial) No.4 of March 2011). Out of two
JVs and eight SPVs as on 31 March 2016, two JVs and three SPVs are
working, three SPVs are defunct and two SPVs are incomplete. The details of
investment, the status of JVs/ SPVs i.e. working, non-working (defunct) and
projects not completed and Return on Investment are given in Annexure-3.2.
The Company had made an investment of ` 59.01 crore by way of cash/ land
in two JVs. The investment of ` 1.98 crore was made in one JV (L&T Infocity
Limited) in the form of land in the year 1997 for which the Company received
dividend of ` 42.80 crore during the period 1997 to 2016 and which yielded a
Rate of Return of 113.76 per cent per annum. However, in respect of the other
JV (K. Raheja IT Park (Hyderabad) Private Limited), though an investment of
` 57.03 crore was made by the Company, the Return on Investment was
` 2.95 crore (0.43 per cent per annum) for the period 2004 to 2016. This is
further discussed in Para 3.1.3.1.
The Company had invested a total ` 20.26 crore in all eight SPVs by way of
cash/ land. The investment in the eight SPVs did not yield any return due to
non-implementation of projects, companies becoming defunct and incomplete
implementation of projects. The detailed audit observations are given in
subsequent paragraphs.
Investments in JVs
3.1.3.1 Unauthorized sale of land to Non-IT sister companies by the JV
Company - K. Raheja IT Park (Hyderabad) Private Limited
(KRITPL) - Loss of ` 73.75 crore
The erstwhile GoAP had entered (June 2002) into a Memorandum of
Understanding (MoU) with a private limited company49 to develop and
construct complexes for development of Information Technology (IT) and IT
Enabled Services (ITES) Companies in 115 acres (Approx.) of land, under
49
K. Raheja Corporation Private Limited, Mumbai
Chapter III-Compliance Audit Observations
69
Mindspace Cyberabad Project at Madhapur, Hyderabad with an investment of
over ` 600 crore.
Subsequently, Memorandum of Agreement (MoA) for development of the
above Project in an area of 109.36 acres was entered into (May 2003) between
the erstwhile Government of Andhra Pradesh and the private limited company.
For this purpose, a Joint Venture company50 was incorporated on 02 June
2003. The JV partners, K. Raheja Corporation Private Limited and APIIC,
contributed to the equity share capital of ` 1.00 crore (` 89 lakh/- (89 per cent)
and ` 11 lakh (11 per cent), respectively). The JV Agreement between APIIC
and the JV Company was executed on 23 August 2003 according to which the
project was to be completed in 10 years from the date of Agreement.
Apart from equity, the Company contributed 109.36 acres of land valued at
` 54.68 crore (` 50 lakh per acre) to the JV Company for this project. Four
Development Agreements were entered into between December 2003 to June
2004 and the land was transferred to the JV Company. Government of Andhra
Pradesh, Department of Information Technology and Communications had
directed (11 August 2003) that the development was to be carried out in four
phases for which four separate Development Agreements were entered into.
On completion of development, the built up area, undivided interest in land
and plotted area of land, if any, was to be transferred jointly by APIIC and the
JV Company to the final owners.
Subsequently, KRITPL, on the ground of proper implementation, requested
the Company (18 October 2006) for permission to demerge the original
company into:-
Raheja IT Park (Hyderabad) Private Limited (M/s KRITPL)
Sundew Properties Private Limited
Intime Properties Private Limited
The above proposal of JV Company was submitted by APIIC to the
Government (16 November 2006). The Government conveyed (10 January
2007) to APIIC that it had no objection to the proposal of APIIC and advised
the Company to suggest a suitable supplementary Memorandum of Agreement
to be entered into by Government with the above companies. The Government
further stated that the original JV company should be wholly and solely
responsible to the Government, irrespective of division of the capital among
the three successor companies and also required to comply with other terms
and conditions of the main Memorandum of Agreement (19 May 2003).
Audit observed that:
The erstwhile Government of Andhra Pradesh, without adopting any
tender process, had identified M/s K. Raheja Corporation Private
Limited, Mumbai to develop and construct complexes for IT and ITES
50
K. Raheja IT Park (Hyderabad) Private Limited (KRITPL).
Report No. 2 of 2017 (Public Sector Undertakings)
70
Companies on the ground that they had experience and expertise in the
construction, retailing and hospitality industry.
While the Government approved "in principle" the demerger of JV into
three companies and directed APIIC to submit draft Supplementary
Memorandum of Agreement to the Government which had to be
signed by the Government and the three demerged companies, the
same was not submitted to the Government by APIIC even after the
lapse of nine years. In the absence of supplementary agreement, the
Government / APIIC were not in a position to ensure compliance with
the terms and conditions envisaged in Memorandum of Agreement and
also directions of the Government which would have formed part of
the supplementary agreement.
After demerger, the JV Company transferred 97.21 acres out of 109.36
acres to demerged companies (September 2006 - March 2007) and sold
the balance 12.15 acres to Non IT / ITES sister companies of Raheja
Group viz., Trion Properties Limited - Inorbit Mall (7.6 acres) and
Chalet Hotels Private Limited-Westin Hotel (4.55 acres) at ` 1.5 crore
per acre, for a total consideration of ` 18.23 crore, without consulting
the APIIC. However, as per rate fixed by the Price Fixation Committee
(PFC), constituted by the VC & MD, the cost of 12.15 acres of land
was ` 73.75 crore (` 6.07 crore per acre) as on 31 March 2007.
However, the JV Company had sold the land without the knowledge of
the Company and also ignored the rate fixed by the PFC in violation of
Government directions (11 August 2003). Further, no money was
received by the Company out of the sale proceeds from the JV partner,
resulting in loss to the Government/APIIC to the tune of ` 73.75 crore.
Though the General Administration (Vigilance and Enforcement)
Department had conducted enquiry on the irregularities in the
execution of the Mind Space Cyberabad Project and submitted its
report to Government (28 July 2011), the same was not finalised till
the date of audit.
Investments in SPVs
3.1.3.2 Loss of investment of ` 1.93 crore in HITVEL
M/s Hyderabad Information Technology Venture Enterprises Limited
(HITVEL), an Asset Management Company51, was started (31 March 1998) as
a subsidiary of Andhra Pradesh Industrial Development Corporation Limited
(APIDC) with an authorized capital of ` 25.00 lakh for managing the
Hyderabad Information Technology Venture Capital Fund (HIVE) as per
Government directions (31 March 1998). It was later converted into a Joint
Sector Company as per Government directions (03 November 1999) with the
participation of SIDBI, APIDC and APIIC.
51
Company that invests in clients' pooled funds into securities with specific financial
objectives
Chapter III-Compliance Audit Observations
71
Against the proposed corpus for HIVE Fund of ` 15.00 crore, contribution of
` 13.75 crore was released by SIDBI, APIDC and APIIC collectively (SIDBI
` 6.25 crore, APIDC ` 5.00 crore and APIIC ` 2.50 crore).
Audit observed that:
Out of ` 13.75 crore, HITVEL had invested ` 10.05 crore in seven
companies during the period from 2001-05 and refunded
` 2.27 crore to the contributors52. The balance amount of ` 1.43 crore
was not refunded to the contributors till date (October 2016).
HITVEL had received offers for buy back of the shares in all seven
companies during 2006 to 2014 but no disinvestment was made till
date. As per the status report of investment in seven companies
available with HITVEL, five out of the seven companies were non-
working companies and only two were working. In respect of one
company, the promoter was absconding.
HITVEL had failed to comply with statutory requirements of filing the
financial statements for the year 2011-14 with the Registrar of
Companies. Despite this, the Board of Directors including the
Company had not taken any action to ensure compliance with the
provisions of the Companies Act.
Thus, considering the contribution of ` 2.50 crore made by the Company and
refunded an amount of ` 0.57 crore by HITVEL, the balance investment of
` 1.93 crore made by the Company did not yield any return and resulted in
loss of the investment. The Management of the Company, as a contributor,
had also not taken any action to recover its investment of ` 1.93 crore.
3.1.3.3 Non-implementation of Project NANO TECH SILICON INDIA
(NTSI) - Loss of equity investment and Project Development Cost
– ` 56.98 lakh
The Government of Andhra Pradesh had entered into a Memorandum of
Understanding (MoU) (06 December 2004) with Intellect Inc, a South Korean
firm as a lead promoter for setting up the first semiconductor manufacturing
unit in FAB City in Hyderabad.
As per the Government directions (17 March 2005):
APIIC had to provide 50 acres of land on lease basis for a period of 30
years free of cost, infrastructure support of roads to the site, 40 MW
power supply, 10 Million Litres per Day (MLD) of water to the FAB
facility and meet the interest costs on loan raised for the construction
of FAB facility to a maximum extent of ` 35 crore per annum for a
period of 10 years.
52
Refunded to SIDBI ` 0.55 crore, APIDC ` 1.15 crore, APIIC ` 0.57 crore, making the net
investment of ` 5.77 crore, ` 3.85 crore and ` 1.93 crore respectively.

Report No. 2 of 2017 (Public Sector Undertakings)
72
APIIC was nominated as a Nodal Agency with the following
conditions:
APIIC was to subscribe to equity not exceeding ` 50.29 lakh on
reimbursement basis from IT&C Department.
APIIC was to get a project report prepared by an experienced
consultant in the semiconductor industry for an amount not
exceeding US $ 21,000 and the same was to be reimbursed by the
IT& C Department.
A share subscription agreement was entered (17 March 2005) into between the
lead promoter, APIIC and a third party (Mr. D. Jai Ramesh, CMD of M/s Vijai
Electricals Limited). The investment pattern was ` 1.41 crore by the lead
promoter, ` 47.08 lakh by the Company and ` 47.08 lakh by the third party
towards equity capital. A SPV, NANO TECH SILICON INDIA (NTSI) was
incorporated on 25 April 2005 with an authorised capital of ` 2.50 crore. NTSI
failed to attract investors for the proposed unit as it required huge investment
and no promoter showed interest in setting up such industries. The SPV did
not start its business as envisaged in Share Subscription Agreement
(Clause 16.1) and became defunct. The whereabouts of the private promoter
was not known to the Company.
The GoAP had directed (August 2009) the Company to cancel the share
subscription agreement, MoU and the concessions extended to the SPV and
take back the possession of land as the promoter had failed to fulfil his
commitment to bring finance53 (US $ 370 million) and also failed to start its
operations.
Audit observed that:
The Company had made a provision of ` 47.08 lakh towards loss of
investment in the accounts for the year 2013-14. Hence the investment
of ` 56.98 lakh made by the Company towards equity (` 47.08 lakh)
and project development cost (` 9.90 lakh) was a loss.
No efforts were made by the Company to trace the whereabouts of the
promoter.
The Company had no record/details in respect of capital contributed by
the private promoters.
Thus, failure of the Company to exercise due diligence while selecting the
partners before investment and absence of internal control mechanism to
monitor the activities of NTSI for establishment of semiconductor
manufacturing unit had resulted in loss of investment of ` 56.98 lakh.
The Management in its reply stated (27 February 2016) that the amounts
invested were on reimbursement basis as per Government directions
(17 March 2005).
53
US $ 80.00 million of foreign equity, US $ 70.00 million of non-debt financing from captive
customers and US $ 220.0 million of debt financing from multinational finance institutes.
Chapter III-Compliance Audit Observations
73
The reply should be viewed in the light of the fact that the Company had not
submitted (March 2016) its claim even after 11 years for reimbursement of its
investment made in 2005, though the Company had incurred a loss of
` 56.98 lakh.
3.1.3.4 Lack of monitoring resulted in loss of Equity of ` 25.00 lakh in
SPV- Pattancheru Enviro Tech Limited
The APIIC had floated Pattancheru Enviro Tech Limited (PETL), a SPV
Company in the year 1989 for establishment of a Common Effluent Treatment
Plant for treating the industrial effluents emanating from Patancheru industrial
belt. The APIIC had invested ` 25 lakh towards equity (2,50,000 shares of
` 10/- each) in the SPV. The Company had allotted 5.96 acres of land to
PETL, constructed sheds and provided necessary infrastructure in the year
1994. The plant had started its operations in 1994 and is functional as on date.
Audit observed that:
Though the Company had invested equity share of ` 25 lakh in the
SPV, no physical document such as share certificate etc. was available
with the Company.
Though the Common Effluent Treatment plant had started its
operations in 1994, the Company had not received any dividend on the
investment of ` 25 lakh made in the SPV and no follow up action was
taken by the Company for payment of dividend.
Investments In FAB City
3.1.3.5 Unproductive investment on infrastructure development in FAB
City SPV (India) Private Limited resulting in blockage of
` 78.56 crore and undue favour to M/s SemIndia FAB City
Private Limited of ` 22.61 crore due to non collection of lease
premium, lease rentals and duties
The Government of Andhra Pradesh had entered into a MoU with
M/s SemIndia Inc., USA, an Anchor Industry54 on 16 February 2006 to
promote the Semiconductor Industry in the earmarked 1200 acres of land for
setting up of a manufacturing unit for wafer fabrication etc. and to develop as
FAB City (fabrication facility). The MoU stipulated (Clause 1(a)) that the
primary obligation of SemIndia was to establish the Project in the FAB City
and to arrange finance in the range of US $ 1.5 to US $ 3 billion over a period
of four to five years. In pursuance of the MoU, GoAP had issued a GO
(28 April 2007) as per which SemIndia was to establish the project in the
FAB City, which should house Fab(s) (units) and had investments over a
period of five years in Phases as given below:
54
Anchor Industry means a central source of support and stability. In the present context, it
brings entrepreneurs for establishment of units to promote semiconductor industry.

Report No. 2 of 2017 (Public Sector Undertakings)
74
Phase-I: US $ 75 million for Assembling, Testing, Marking and Packing
(ATMP) with an employment potential of 2000 within 18 months from the
date of allotment of land.
Phase-II: US $ 750 million, semiconductor chip manufacturing with an
employment potential of 1000 within three years from the date of allotment of
land.
Phase-III: US $ 2.25 billion, for an advanced Semiconductor plant with an
employment potential of 5000 within five to seven years from the date of
allotment of land.
Accordingly, “FAB City SPV (India) Private Limited” was incorporated on
02 May 2006 under the Companies Act, 1956 with an authorised capital of
` 5.00 lakh.
Out of 1200 acres of earmarked land for FAB City, an area of 1,075 acres in
Srinagar and Raviryal villages of Ranga Reddy district was notified by
Government of India under sector specific SEZ vide Notifications dated
15 January 2007, 13 December 2007 and 10 July 2009 for extension of certain
incentives/concessions to M/s SemIndia for implementing the project.
Out of 1,075 acres of land notified for SEZ, APIIC had allotted 401.108 acres
to 16 units (284.04 acres to 9 units and 117.068 acres to 7 units) during the
period from 2007 to 2011.
However, the land allotted to seven units (117.068 acres) was subsequently
cancelled and the possession of the land was taken back by the Company as
the units had not come up. Further, GoAP had cancelled/withdrawn the
incentives/concessions and other benefits (09 February 2010) given to
M/s SemIndia FAB City SPV (India) Private Limited due to poor
implementation of the project.
APIIC had also allotted 100 acres (20 June 2007), out of the 1,200 acres, to
M/s SemIndia FAB City Private Limited (a unit sponsored by M/s SemIndia
Inc., USA the anchor industry) under SEZ. For this, Lease Deed was executed
(25 June 2007) between M/s SemIndia FAB Private Limited and M/s FAB
City SPV (India) Private Limited. However, the unit (M/s SemIndia FAB
Private Limited) had occupied only 22 acres out of 100 acres of land and did
not implement the project. Due to non-implementation of the project, GoAP
had cancelled (09 February 2010) allotment of unused land of 78 acres in FAB
City and permitted APIIC to fix lease rentals at two per cent per acre per
annum on the remaining land cost.
Audit observed that:
FAB City SPV (India) Private Limited
The project was not implemented as envisaged in MoU. The response
from the entrepreneurs was poor. The Company received a return of
32.40 per cent between 2007 and 2016. Despite providing all
infrastructure by the Company, M/s SemIndia could not attract
entrepreneurs against the earmarked land of 1200 acres as envisaged in
Chapter III-Compliance Audit Observations
75
MoU. This indicates that investments were made by the Company
without due diligence.
The Company had acquired 1,249.14 acres land at the cost of
` 18.25 crore and had incurred ` 97.97 crore towards development of
infrastructure, electrical works, laying of roads and water supply etc.,
during the period 2006-07 to 2015-16. Against total investment of
` 116.22 crore, the Company received only ` 37.67 crore (Lease
premium ` 36.63 crore, Lease rentals ` l.03 crore) apart from Security
Deposit of ` 1.63 crore.
M/s SemIndia FAB City Private Limited
The SPV did not fulfill any of the obligations of bringing investment
and creating employment in the three Phases as per Clause 1(a) of MoU
(February 2006) and as prescribed in GO (April 2007). There was no progress
in construction of buildings on the land, except for semi finished construction/
shed on the allotted land.
A Lease of 66 years was given for ` one per acre per annum though the
lease period for other allottees was only 33 years. The Company had neither
collected the lease premium of ` 20 crore and lease rental of ` 1.80 crore
(2 per cent on lease premium for nine years from 2006-07 to 2015-16) on the
allotted land of 100 acres nor taken back the possession of land. Non-
implementation of the project resulted in undue favour to M/s SemIndia FAB
City Private Limited amounting to ` 21.80 crore.
Due to non-implementation of the project, the Development
Commissioner, Visakhapatnam SEZ ordered (31 December 2014)
M/s SemIndia FAB City Private Limited to pay back the exemptions availed
of on the Central excise duties for the goods procured for the project (viz.
cement, steel etc.) to the tune of ` 66.69 lakh. Due to non-payment of the
same within the stipulated period (14 January 2015), the unit was liable to pay
` 81.22 lakh including interest of 18 per cent on the duty exempted
(15 January 2015 to 31 March 2016). Non-payment of the above amount
would result in loss to the Government.
M/s SemIndia FAB City Private Limited had neither submitted details
of financial closure for implementation of the project, nor the Company
insisted for the same as required in GO (28 April 2007).
M/s SemIndia FAB City Private Limited had mortgaged 100 acres of
land and raised ` 100 crore loan from the SBI (June 2009). The SBI initiated
e-auction of the land to recover its dues and the matter is subjudice. The Lease
Deed (Clause 9) permitted the allottee to obtain loans from the banks and
other financial institutions. It was observed that the Company was not aware
of the grant of loan of ` 100 crore by SBI till the receipt of e-auction notice.
The fact that the loan was taken without obtaining No Objection Certificate
(NOC) from the Company indicates absence of suitable clause in the
Allotment Regulations of the Company for safeguarding its interests.
However, the Regulations were suitably amended in the revised Regulations
(October 2012) wherein consent of the Company is required.
Report No. 2 of 2017 (Public Sector Undertakings)
76
The Management in its initial reply (December 2015/February 2016) stated
that the TSIIC had revised the layout of FAB city and had proposed these
lands (part of the FAB city) as E-City for better use. It was also stated that an
amount of ` 21.93 lakh towards lease rentals was yet to be received from
FAB City SPV. Further, it was stated that the Company had filed
WP No.16355 of 2015 against the SBI and others and the matter was pending
in the Court. However, the reply was silent on the undue benefit extended to
M/s SemIndia FAB City Private Limited. The land was entangled in litigation
due to non-incorporation of specific clause in the Lease Deed regarding
consent of the Company in the form of No Objection Certificate before
obtaining loans to safeguard the interest of the Company. Further, the
Company had also invested an amount of ` 116.22 crore without conducting
any proper feasibility study. The reply is also silent on the unproductive
expenditure of ` 78.56 crore. Besides, lack of internal control and monitoring
mechanism had also resulted in loss of ` 22.61 crore besides non-achievement
of the targeted objective.
3.1.3.6 Undue benefit of ` 1.32 crore in allotment of land by deviation
from guidelines - M/s ILFS Waste Management and Urban
Services Limited, in FAB City
The Company had allotted five acres of land in FAB City SEZ at Raviryal
Village, Maheshwaram Mandal, RR District on "as is where is basis" to
M/s ILFS Waste Management and Urban Services Limited (ILFS), to establish
a Common Effluent Treatment Plant (CETP), on lease basis for a period of
33 years. The Lease Deed was executed on 28 October 2009 between the
Company and ILFS. As per prescribed land allotment guidelines (20 May
2008), the Company was to charge lease premium of ` 20 lakh per acre and
lease rentals of ` one lakh per acre per annum.
Audit observed that the Company had allotted five acres of land to ILFS for
establishment and operation of CETP on Build Own and Operate (BOO) basis
to facilitate the Member Industries of FAB City SEZ without payment of lease
premium, which had resulted in loss of ` one crore (5 acres x ` 20 lakh per
acre) to the Company. Similarly, the Company had levied lease rentals of
` 10,000 per acre, instead of ` one lakh per acre, and received ` 3.23 lakh for
five acres which had resulted in short recovery of ` 32.00 lakh for the period
from 2009 to 2016.
The Management in its reply (February 2016) stated that to facilitate a
Common Effluent Plant in the park, the proposal of ILFS was considered and
land was allotted (five acres) on soft lease terms and there was no loss
incurred by the Company.
The reply of the Management was not acceptable as no such “soft lease” term
was mentioned either in the Lease Deed or in the allotment regulations. Thus,
the Company had incurred loss of revenue of ` 1.32 crore due to non-
collection of lease premium and short recovery of lease rental in violation of
allotment guidelines and extended undue benefit to the ILFS.
Chapter III-Compliance Audit Observations
77
3.1.3.7 Delay in implementation of Semiconductor project
(M/s Embedded IT Solutions (India) Private Limited) in FAB
City and non-levy of penalty and non-recovery of lease rentals -
Loss of ` 33.50 lakh
The Company had allotted 10.02 acres of land on lease for 33 years to
M/s Embedded IT Solutions (India) Private Limited, for setting up a
Semiconductor & PCB manufacturing unit in FAB City and a Lease Deed was
executed (14 July 2008). The land was handed over to the allottee on the same
day.
As per Clause 3 (i) of the Lease Deed, the allottee was to commence
construction on the site within six months, complete the work in not later than
18 months and commence production within 24 months.
Audit observed that:
Though the project was not set up within 24 months as envisaged in
the Lease Deed, the Company did not give notice for non-completion
of the project even after the expiry of 24 months (July 2010). The
Company granted extension of time till December 2013, based on the
request of allottee (November 2012), i.e. after expiry of two years from
scheduled date of completion. Though the Company had levied penalty
of ` 28.06 lakh at the rate of seven per cent on the prevailing land cost
for delay as per the provisions of the allotment rules, the same was not
recovered from the allottee, till the date of audit.
As per terms 1 (c) of the Lease Deed, lease rental at the rate of
two per cent per annum per acre on 50 per cent of the lease premium
(` 20 lakh per acre per annum) was payable which worked out to
` two lakh per annum. Lease rentals were in arrears from July 2013 to
March 2016 which worked out to ` 5.44 lakh. The Company had not
taken action under Revenue Recovery Act, as per Clause 3 (b) of the
Lease Deed, to recover the arrears.
3.1.3.8 Non-recovery of penalty - FAB City - M/s XL Telecom & Energy
Limited - Loss of ` 1.18 crore
The Government of India had issued Notification (13 December 2007) for setting
up and developing Sector Specific Special Economic Zone over the identified
area under FAB City and, accordingly, the GoAP, Industries & Commerce
Department had also issued orders (21 February 2008 & 01 March 2008).
Based on Government Notifications, the Company had allotted land
(Plot No. 36) measuring 50 acres in FAB City SEZ at Raviryal Village,
Maheswaram Mandal, RR District to M/s XL Telecom & Energy Limited
(XL Telecom) on "as is where is basis" to establish manufacturing unit for
Solar Photovoltaic Cells and Solar Photovoltaic Modules on lease. The lease
was for a period of 66 years with a lease premium of ` 20 lakh per acre. The
Company received (13 March 2008) a total lease premium of ` 10 crore and
Security Deposit of ` 30,000, equivalent to six years rent (annual rent of
` 100/- per acre per annum). Possession of the land was taken by the XL
Report No. 2 of 2017 (Public Sector Undertakings)
78
Telecom on 13 March 2008 and the Lease Deed was executed on
10 June 2008.
Audit observed that:
Out of 50 acres of land allotted, the Company had utilised 25 acres.
Another 15 acres though developed was lying unutilised. The Board
decided to levy penalty for the 15 acres land but M/s XL Telecom had
requested the Company for waiver of penalty. The Board agreed to
waive the penalty on the developed but not utilised land of 15 acres,
based on the recommendations of Extension of Time (EOT)
Committee. The decision of waiver of penalty of ` 48.03 lakh on
15 acres of land developed and not utilised was not in order as the
Company should have levied penalty in view of the delay in
implementation of the project as per Allotment Regulations.
The Board had also decided to levy penalty on 10 acres (proposed to
be surrendered by the XL Telecom) at 7.5 per cent of land cost which
worked out to ` 69.97 lakh. The Company had neither initiated any
action to recover the penalty of ` 69.97 lakh nor taken back the
possession of 10 acres of unutilised land.
The SPV Company had obtained demand loan of ` 40 crore
(22 November 2007) as project finance by depositing the Lease Deed
with Bank of India, as security for the credit facilities sanctioned.
Though the Lease Deed was registered on 10 June 2008, the demand
loan was sanctioned by the Bank on 22 November 2007 itself, and the
amount was disbursed without submission of registered Lease Deed.
Though the Lease Deed (Clause 8), permitted the allottee to obtain
loans from banks and other financial institutions, the Company should
have incorporated specific clause regarding prior consent of the
Company in the form of No Objection Certificate before obtaining
such loans, to safeguard the interests of the Company.
The Company had incurred total revenue loss of ` 1.18 crore due to non-
collection of penalty for 25 acres of land and extended undue benefit to the
allottee.
Others
3.1.3.9 Irregular appointment of Consultants
The Company had appointed seven Consultants and sought study reports,
Due-diligence Reports, Opinions on financial Impact on Restructuring Plan
and Demerger/ Effect on share of IIC for the JVs/SPVs, for which an amount
of ` 49.50 lakh was paid.
Audit observed that:
As per CVC guidelines (January 1983), the appointment of Consultants
was not to be made arbitrarily or on adhoc basis. Each enterprise was
to prepare its own instructions and procedure duly approved by Board

Chapter III-Compliance Audit Observations
79
for appointment of Consultants. Audit observed that the Company had
not prescribed its own instructions or procedures for appointment of
Consultants. The appointment of Consultants was done on nomination
basis, in violation of CVC guidelines.
In the absence of any clear clause in the JV/SPV agreement regarding
sharing of fees of Consultants, the Company could not recover the
expenditure incurred on Consultants from the JV/SPVs and thus had to
bear the entire expenditure amounting to ` 49.50 lakh.
Out of the seven Consultants, payments were made to five Consultants.
The details of payments were not available with the Company in
respect of two Consultants nominated to seek opinion on EMAAR
Projects.
Though the payment was made to the Consultant (M/s Feed Back
Ventures) for CBD Towers (Development of Trade Towers and
Business Distribution Project), the report of the same was not available
with the Company. Thus, apart from bearing the expenditure, the
Company was unable to get the benefit of the consultancy service.
Conclusion
The objective of the Government was to make use of unutilised/surplus land
available in the State to support industrial growth and generate employment
through the Company and its JV/SPV partners. However, the intended
objective of JV and SPVs for setting up of projects and employment
generation could not be achieved due to:
Non-conducting of feasibility studies on the projects proposed before
entering into MoUs with the Developers.
Absence of monitoring by the Company on industrial growth and
employment generation by the respective SPVs as assured in MoUs.
Non-conducting of periodical review to assess the financial position/
activities/progress made by the SPVs/JVs.
Thus, the investments made by the Company in one JV was low while it was
nil in respect of all the eight SPVs.
3.2 Loss of revenue of ` 4 crore due to non-recovery of the cost of
land as per the Allotment Regulations
The allotment of land of one acre to Bank of Baroda at concessional rate,
ignoring specific provision of the Company's Allotment Regulations,
applicable to Scheduled Banks, resulted in loss of revenue of ` 4 crore
Telangana Industrial Infrastructure Corporation Limited (TSIIC) (Company)
have prescribed Allotment Regulations for allotment of land. Based on an
application from Bank of Baroda (allottee), the allotment of land of one acre
(4,000 Sq. meters) in Gachibowli, Hyderabad for establishment of Bank's
Disaster Recovery Centre, was approved by the State Level Allotment
Committee (7 November 2012), subject to fixation of land cost. The Company

Report No. 2 of 2017 (Public Sector Undertakings)
80
provisionally allotted (27 November 2012) the land to construct building for
Bank's Disaster Recovery Centre as the allottee had paid (January 2013) the
provisional cost of land of ` 8.00 crore, at the rate of ` 20,000 per Sq. meter.
The Price Fixation & Infrastructure Committee (PF&IC), in their meeting held
in February 2013, fixed the cost of land as ` 20,000 per Sq. meter. However,
as per Clause 15.3 (a) of the APIIC Allotment Regulations, for allotment of
land to Scheduled Banks, 1.5 times of the land cost fixed by the PF&IC is to
be recovered. Therefore, in this case, the amount to be recovered was
` 12.00 crore at the rate of ` 30,000 per Sq. meter.
Accordingly, the Company asked the allottee to pay the balance amount of
` 4 crore55. However, instead of paying the balance amount, the allottee stated
that as per the discussions held with the Company earlier, the land cost would
be the same as that fixed by the PF&IC. Consequently, the Company entered
into an agreement (September 2013) at the rate of ` 20,000 per Sq. meter
without insisting for difference amount of ` 4 crore.
It was observed in Audit that the Company ignored Regulation No. 15.3 (a) of
the Allotment Regulations relating to recovery of 1.5 times of land value from
Scheduled Banks (April 2013) and agreed to the request of the allottee for a
lesser amount. The reasons and the grounds on which the Allotment
Regulations were ignored were not on record.
Thus, failure of the Company to allot the land to the allottee without adhering
to the provisions of the Allotment Regulations led to loss of ` 4 crore.
The Management in its initial reply (October 2014) had stated that since the
allottee had proposed utilising the entire allotted area of 4000 Sq. meters for
IT purpose i.e., Disaster Recovery Centre, the land cost as fixed by PF&IC
was adopted as per the Allotment Regulations, 2012. It was also stated that the
action taken by the Company was in accordance with the guidelines and no
loss was caused to the Company on allotment of land.
The reply of the Management was not tenable as the principal business of the
allottee was banking and not Information Technology. However, the Company
treated Bank of Baroda as an IT company and allotted land at concessional
rate by ignoring the specific provision in the Allotment Regulations applicable
to Scheduled Banks, resulting in a loss of ` 4 crore.
Southern Power Distribution Company of Telangana Limited
3.3 Release of Power Connection, Tariff and Billing to Information
Technology Firms
3.3.1 Introduction
In order to make the State a leading destination for investments in Information
& Communications Technology (ICT), the erstwhile Government of Andhra
Pradesh had declared its ICT policy in May 1999, later revised in June 2002,
March 2005 and August 2010. The policy inter-alia included the incentive of
55
(4,000 Sq. meters x 1.5 times x ` 20,000 per Sq. meter minus ` 8.00 crore already paid)
Chapter III-Compliance Audit Observations
81
concessional power tariff i.e. Industrial power tariff (Category I) to the
Information Technology (IT)/ Information Technology Enabled Services
(ITES) units, which was less than Commercial tariff (Category II).
The incentives were administered by a High Level Coordination Committee
called Consultative Committee on Information Technology Industry (CCITI)
which included, among other Members, CMD, Southern Power Distribution
Company of Telangana Limited (TSSPDCL) (erstwhile Central Power
Distribution Company of Andhra Pradesh Limited (APCPDCL)). The IT
Companies, intending to avail of the concessional power, were to apply to the
IT&C Department of the GoAP along with copies of Power bills,
Memorandum and Articles of Association, Annual Reports etc. The
applications were considered and approved by the CCITI after which the
IT &C Department issued a certificate stating that the incentives may be given
to the IT/ ITES units as per eligibility. The IT companies then claimed the
benefit of concessional tariff under Category HT-I from TSSPDCL.
The Management of the Company is vested in Board of Directors (Board)
comprising three functional Directors and the Company is headed by a
Chairman & Managing Director.
There were 114 IT Parks/ IT Infrastructure/ IT firms under the jurisdiction of
TSSPDCL and their category was converted to HT-I. Out of these, a sample of
80 IT Companies was selected for review. The audit methodology included
scrutiny of records of Category conversions, electricity bills of IT/ ITES units
and websites of the respective services/ consumers.
3.3.2 Audit findings
3.3.2.1 Undue benefit of ` 50.35 crore to commercial units located in the
premises of I.T. Infrastructure companies and IT/ ITES firms
The IT Infrastructure Companies/ Software Technology Parks were given a
single High Tension (HT) connection initially under HT category-II
(Commercial) by the Company. However, on the approval of CCITI and based
on certificate issued by IT&C Department, the category was subsequently
converted to HT-I (Industrial).
As per the operational guidelines of ICT policies, the notified IT Parks/ IT
campuses were to provide 60 per cent of the net developable/ usable area for
IT activities and 40 per cent area for other amenities56
.
As per the SERC tariff orders, the electricity supply to Industries categorized
under HT category-I was not to include Shops, Business Houses, Offices,
Public Buildings, Hospitals, Hotels, Hostels, Choultries, Restaurants, Clubs,
Theatres, Cinemas, Printing Presses, etc., and other similar premises.
Audit observed that eight IT infrastructure companies and six IT/ ITES firms
had Hotels, Restaurants, Shops, Hospitals, Banks, ATMs, Recreation Centres
56
such as housing/ club house/recreation center, shopping center, school and other support
activities, service area like water supply system, drainage and sewerage, electric power,
other utilities.

Report No. 2 of 2017 (Public Sector Undertakings)
82
etc. in their premises, which fell under non IT activities. The Company had,
however, converted (Annexures 3.3(a) & 3.3(b)) these services from HT-II
(Commercial) to HT-I (Industrial) category, i.e. the entire premises, without
restricting the same to 60 per cent prescribed for core IT activity, as per the
policy, or verifying the actual consumption of electricity for the purpose of IT
activity and non-IT activity.
As a result, the 40 per cent area meant for activities other than IT i.e., hotels,
restaurants, recreation centres etc. were also extended the concessional tariff,
which was not in line with the policy guidelines and the SERC approved
Tariff Order. In the absence of clear demarcation and separate billing for non-
IT activity, the Company incurred loss of revenue of ` 50.35 crore
(Annexures 3.3(a) & 3.3(b)) and extended undue benefits to IT Infrastructure
Companies/ IT & ITES firms. As the Company has not been conducting
periodical inspections/ maintaining any record for consumption of power for
IT and non-IT purposes, audit worked out the loss of revenue considering
60 per cent of consumption for IT purpose and 40 per cent for non-IT purpose.
On this being pointed out by audit (February 2016), the Company inspected
(18 March 2016) one such service (hotel) and found that the hotel had been
availing of the concessional power tariff. The Company reconverted the
service back to HT category II (Commercial) (May 2016), duly back billing
for an amount of ` 51.97 lakh for one year only as permissible as per SERC
Tariff Orders, though the back billing was to be made from July 2004 to May
2016 (12 years). Had the Company verified/ examined the activities of the
establishments housed in the IT infrastructure Companies before conversion of
the category and monitored them effectively from time to time, it would not
have foregone the revenue of ` 2.84 crore (July 2004 to May 2016) in this
case alone.
The Management replied (October 2016) that although as per Tariff Order,
Shops, Hotels and Restaurants were mentioned in other than industrial
category, it would not be made applicable to the Hotels/ Restaurants/
Recreations centre built in 40 per cent area of IT park, as they were meant for
use by the staff working in the IT/ITES organisations for their recreation
purpose.
The Management's contention was not acceptable as the Government directive
did not specify the extension of concessional power tariff to commercial units
or amenities established within the IT firms. The certificate only indicated the
conversion of category as per eligibility and did not specify that the non-IT
activities are eligible for concession tariff under HT-I category. The Company
in its own financial interest should have identified the non-IT activities
housed in the IT infrastructure/ IT firms and billed them accordingly, as per
the approved Tariff Order, which categorically included shops, hotels etc.
under HT category II.
While making a comparative study, it was observed that in the Karnataka State IT
policy, commercial activities in the IT firms were not allowed concessional tariff.
Further, the ITE&C Department (October 2016) also, while endorsing the
views of the Management, agreed to set up an institutional mechanism soon to
Chapter III-Compliance Audit Observations
83
ensure usage of electricity in a manner balancing the growth of IT industry
and also check the misuse of electricity under concessional category.
3.3.2.2 Undue benefit of ` 10.96 crore due to extension of power
concession to non- IT/ non-ITES companies
As per the ICT policy, IT Industry means and includes Information
Technology (IT), Information Technology Enabled Services (ITES) and
Hardware (non-hazardous) Manufacturing (IT Hardware & Electronics) units/
companies. IT/ ITES units/ companies include IT software, IT services and IT
Enabled Services/ BPO/Animation & Gaming/ Digital Entertainment and IT
Engineering Services companies. However, on scrutiny of records of the
Company, it was observed that two firms were extended the concessional
power tariff, though not related to IT/ ITES activities as seen from their
websites viz., Financial and investment advisory service and registered office
resulting in extension of undue benefit of ` 10.96 crore (Annexure 3.4).
The Management replied (October 2016) that the conversion of these
Companies were done on the basis of CCITI certificate.
The ITE&C Department replied (October 2016) that scope of technical
services was far beyond the conventional software development. Thus, all
these companies were IT companies.
The reply was not acceptable. Satyam Computers Services Limited which
housed its registered office in that premises is not involved in any IT activity.
Similarly, IQ Information Systems Private Limited, is a financial services
company and not an IT Company. Hence, these units should not be solely
considered as software development companies for the purpose of concessional
tariff. Thus, the Company had extended undue benefit of ` 10.96 crore.
3.3.2.3 Undue benefit of ` 30.17 crore due to Conversion of category of
services without obtaining relevant documents
The Detection of Pilferage of Energy (DPE) wing of the Company
visits/inspects consumers' premises to check cases of pilferage, if any. During
inspection, DPE had directed (December 2011) eight HT-I, IT consumers to
submit certain documents/certificates within two and half months, indicating
the firms' nature of operations, Annual reports etc., for verification. The IT
consumers were also cautioned that if they fail to submit the relevant
documents, the concessional power tariff would be withdrawn and duly back
billed from the date of release of the service.
Audit observed that the Company had withdrawn the concessional power tariff
and re-converted (2012) only one service (HDN-670) to category II, duly back
billing for an amount of ` 96.27 lakh for one year. There was no document on
record to show that the Company had further pursued the matter in respect of
the remaining seven cases (Annexure 3.5). The Company continued to bill
these services at concessional power tariff and thereby suffered loss of
revenue of ` 30.17 crore.

Report No. 2 of 2017 (Public Sector Undertakings)
84
The Management replied (October 2016) that the required documents called
for were submitted subsequently after which the category was converted.
The reply was not acceptable as the audit observation was on calling for the
documents at the time of inspection of the converted services by DPE and not
about the documents submitted at the time of initial conversion.
3.3.2.4 Undue benefit of ` 18.07 crore due to extension of power
concession to second and subsequent units though not established
100 KMs away from first unit
As per ICT policy for 2005-10 (March 2005), the existing IT Industry units in
Andhra Pradesh commencing operations at a new location within the State,
should be 100 KMs away from the existing location, for being treated as a new
unit, to be eligible for the incentives under the policy.
It was observed from the billing address/ locations of the services that in
respect of four IT units, though the second and subsequent units were
established within the radius of 100 KMs, the Company had extended the
benefit of concessional power tariff to these IT units and thereby suffered loss
of revenue of ` 18.07 crore (Annexure 3.6).
The Management replied (October 2016) that it was the decision of the IT&C
Department to allow the IT Industries within 100 KMs range of its first unit, in
view of the advantages of having more IT Companies which would generate
employment, revenue etc. to the State Government.
The IT&C Department replied (October 2016) that the then Government‟s
decision to extend power category conversion was to anchor these companies in
Hyderabad and ensure seamless operations which would generate employment
and contribute to the State economy. Hence, their applications were not
considered as separate units but treated as expansion of the same unit.
The reply was not acceptable as the IT policy intended to make available the
IT benefits to all the citizens in the State, especially those in rural areas and
living in poverty, whereas the Company had extended the concessional power
tariff to multiple units of same firm located within 100 KMs radius in
deviation of the ICT policy and ignoring its own financial interests, which
resulted in loss of revenue of `18.07 crore.
3.3.2.5 Extension of undue benefit of ` 5.55 crore to HT consumers (due
to sale) without a fresh CCITI certificate
As per the CCITI certificate, the concessional power tariff is granted to the
Company subject to the condition that the service should be in the name
mentioned in the certificate only. However, it was observed that in respect of
two cases, the Company had recorded the change of the consumers' names,
due to sale/ purchase of the respective premises/ firm, in its records, but had
continued the billing at concessional power tariff without obtaining a fresh
certificate from CCITI. The improper extension of concession resulted in
undue benefit of ` 5.55 crore (Annexure 3.7) to the HT consumer.

Chapter III-Compliance Audit Observations
85
The Management replied (October 2016) that the Company had changed the
name of the consumers based on certificate from the Ministry of Company
Affairs (MCA), Government of India.
The reply was not acceptable as the Company had not adhered to the ICT
policy wherein concessional tariff was to be granted only to the firm named in
the certificate. The Company without insisting for fresh certificate from CCITI
extended the concessional tariff to the new occupants of the premises.
The ITE&C Department (October 2016) accepted the audit observation and
stated that permission from CCITI should have been obtained by the new
occupants.
3.3.2.6 Approval of concessional tariff of ` 1.98 crore before expiry of
one year of operation
As per the ICT Policy, the CCITI is to consider the applications of all IT
companies for concessional power tariff after one year from the date of
commencement of commercial operations. However, it was observed that, in
nine cases, the CCITI had approved and IT&CD had certified the conversion
of category even before completion of one year of release of service. The
certificate was accepted by the Company without making any reference to
either CCITI or IT&CD. The Company thus incurred loss of revenue of
` 1.98 crore (Annexure 3.8).
The Management replied (October 2016) that the CCITI had got single
window power to grant incentives. Hence, reference to either CCITI or
IT&CD for conversion of category did not arise.
The IT&C Department replied (October 2016) that in view of job
opportunities being created, the then Government might have considered
extending all incentives/ subsidies to help these large MNCs to establish their
operations and create technology ecosystem in the State.
The above replies were not acceptable as CCITI's power to extend incentives
should not be in violation of ICT policy and against the financial interests of
the Company.
3.3.2.7 Absence of monitoring mechanism
The Company, after receipt of eligibility certificate, normally conducts a
preliminary inspection of the services, before conversion to concessional
power tariff. However, it was observed that preliminary inspections were
conducted in a routine manner and without specifying the extent of utilization
of area for IT as well as non-IT activities in the premises. Once the certificate
was issued, the service was converted to HT category I without any time
limit57
and without any periodical inspections to identify cases of change in
occupancy, activity etc. Though the concessional power tariff was extended as
per the Government policy, the burden of concessional power tariff was borne
entirely by the Company without any subsidy from the Government. At
57
Power subsidy of ` 1/- per unit given by the Maharashtra State to IT companies was
restricted to three years period only in their IT policy

Report No. 2 of 2017 (Public Sector Undertakings)
86
IT&CD level also there was no monitoring mechanism. Once the certificate
for grant of concessional power tariff was issued, it was continued year after
year without any periodical verification of the activities of the firm and other
commitments such as employment generation etc., made by the IT firms.
The Management replied (October 2016) that the Company was concerned
with the eligibility certificate issued by the CCITI of IT&C Department, based
on which these firms were billed as per approved tariff. No periodical reports
were required as tariff conversion was done on the basis of CCITI certificate.
However, while agreeing with the views of audit, the ITE&C Department
(October 2016), stated that the Government, along with TSSPDCL, would set
up an institutional mechanism to ensure usage of electricity in a manner
balancing the growth of IT Industry and also check the mis-utilisation/
pilferage of electricity under concessional category.
Conclusion
The erstwhile GoAP, to attract the investments into IT sector in the State had
announced concessional power supply under its ICT policy. However, audit
observed that due to lack of coordination and failure to periodically inspect the
establishments, some of the ineligible units continued to avail of the benefit of
concessional power resulting in loss to the Company. The Company, without
verification of relevant documents/ certificates, such as the firms' nature of
operations, Annual reports etc., allowed the units to continue to avail of the
concessional power. The Company allowed some of the units to avail of
concessional power even after sale/ purchase of the unit without obtaining a
fresh certificate from CCITI by the new unit, as required in the policy. The
second and subsequent units of some of the firms, which were established
within 100 KMs of the first unit, were also allowed to avail of concessional
power in deviation to the ICT policy. In some cases, the conversion of
category was done even before completion of one year of release of service,
though as per the policy the same would be considered only after one year of
commercial operation.
3.4 Extension of undue benefit to M/s Golden Jubilee Hotels Limited
- Loss of revenue of ` 1.70 crore
Deferment of second phase supply of power to M/s Golden Jubilee Hotels
Limited (consumer) beyond six months, against the Company's
guidelines and without levying minimum charges as specified in the Tariff
Order resulted in extension of an undue benefit of ` 1.70 crore to the
consumer
Southern Power Distribution Company of Telangana Limited (Company) had
sanctioned power supply under HT category II (Commercial Service) to
M/s Golden Jubilee Hotels Limited, Hyderabad (consumer), with a Contracted
Maximum Demand of 5,000 KVA (July 2011) to be issued in two phases, viz.,
2,600 KVA to be released in the first phase while the remaining 2,400 KVA
were to be released in December 2013 (second phase). The first phase was
released upon conclusion of HT Agreement with the Company (February
Chapter III-Compliance Audit Observations
87
2013) with a minimum period of Agreement of two years i.e., up to January
2015. On request of the consumer, the second phase was deferred and later
released in December 2015, instead of December 2013.
Audit observed that the General Terms and Conditions of Supply (GTCS)
(Clause 5.9.2.1 and 5.9.4.3), as approved by the AP Electricity Regulatory
Commission (APERC), specified the procedure to be followed for the
commencement of supply of power to the consumers and for release of power
in a phased manner, respectively. According to Clause 5.9.2.1, after receipt of
development and supervision charges etc. from the consumer and concluding
HT agreement, the Company should make arrangements to supply electricity
by issuing a notice indicating that it was ready to provide supply. If the
consumer failed to avail of supply within the three months‟ notice period, he
should pay monthly minimum charges and fixed charges as specified in Tariff
Order from the date of expiry of the three months.
The scheduled second phase supply (December 2013) in this case was within
the period of the agreement. As per GTCS Clause 5.9.2.1, as the consumer had
failed to avail of second phase supply as per the agreement, the Company
should have collected monthly minimum charges and/or fixed charges as per
the Tariff Order for the period from January 2014 to November 2015 as the
consumer availed of the supply from December 2015. The Company had
issued guidelines (September 2009) indicating that in cases where initial
supply was released, rescheduling of remaining phases can be considered for
a period not exceeding six months for each phase. In the instant case, even
considering the Company's guidelines, the Company should have collected
monthly minimum charges from July 2014 to November 2015. Non-collection
of minimum charges as per the provisions of GTCS had resulted in extension
of undue benefit of ` 1.70 crore 58 to the consumer.
The Government replied (November 2016) that wherever representation was
received for postponement of unreleased phase, the same was considered as
per the internal circulars issued by the Company (September 2009).
The reply was not acceptable as the Company had not adhered to its own
internal guidelines (September 2009), according to which deferment was
allowed for a period not exceeding six months for each phase i.e. up to June
2014 in this case, whereas the extension was granted up to November 2015.
Thus, deferring the phased supply for a period exceeding six months from July
2014 had led to an extension of undue advantage to the consumer which resulted
in loss of ` 1.70 crore to the Company (calculated as per Tariff Orders for the
years 2014-15 and 2015-16 for a period from July 2014 to November 2015).
58
Demand charges: 80% x 2400 KVA = 1920 x ` 350 (Tariff) x 9 months = ` 60.48 lakh + Energy charges: 48000
KVAH x ` 6.28 (Tariff) x 9 months (July 2014 to March 2015) = ` 27.13 lakh. Total (A): ` 87.61 lakh
Demand charges: 80% x 2400 KVA=1920 x ` 370 (Tariff) x 8 months= ` 56.83 lakh + Energy charges 48000
KVAH x ` 6.6 (Tariff) x 8 months (April 2015 to November 2015) = ` 25.34 lakh. Total (B): ` 82.17 lakh
(A)+(B)= ` 169.8 lakh i.e. ` 1.70 crore
Report No. 2 of 2017 (Public Sector Undertakings)
88
The Singareni Collieries Company Limited
3.5 Unfruitful expenditure of ` 1.16 crore
The Company without ensuring the possibility of acquiring the private
land, went ahead with the publication of Draft Notification and Draft
Declaration for the proposed Indaram Opencast Mine and incurred an
expenditure of ` 1.16 crore towards publication charges. However, the
land acquisition was kept in abeyance due to stiff resistance from the
villagers, resulting in avoidable expenditure.
The Singareni Collieries Company Limited (SCCL) (Company) had proposed
to take up Indaram Opencast Mine. The Feasibility Report for the Project was
approved by SCCL Board on 23 February 2007 for a rated capacity of
1.2 Million Tonnes per annum at an initial capital investment of
` 91.20 crore. For this purpose, the total requirement of land was 798.08 Ha,
out of which private land of 726.46 Ha, valued at ` 21.79 crore, was to be
acquired. As a part of the land acquisition process, the Environmental Public
Hearing was held on 3 September 2007 in which the villagers requested the
Company to change the dump yard position of the proposed Opencast Mine
and refrain from acquiring agricultural fields to the extent possible. The
majority of the land owners also opposed setting up of Opencast Mine. The
Company accepted (December 2007) their suggestions to shift the over burden
dump yard to Company‟s own land. The Draft Notifications (DN) and Draft
Declarations (DD) for the acquisition of land (Tekumatla, Indaram,
Kanchanapalli villages) were issued (between 22 May 2008 and 29 May
2009). The Company incurred expenditure of ` 1.16 crore towards
publication charges. However, the Company decided (December 2009) to
keep the land acquisition in abeyance due to stiff resistance from the villagers
against Opencast Mine.
It was observed in audit that the Company, without ensuring the possibility of
acquiring the private land, went ahead with publishing the DN and DD. As per
the Land Acquisition Act, the award of land should be made within a period of
two years from the date of publication of declaration and if no award is made
within that period, the entire proceedings for acquisition of land shall lapse. In
this case, the land acquisition process could not be completed within the
stipulated period of two years (ending May 2011). Thus, the decision of the
Company to go for publication of DN and DD without ascertaining the
possibility of acquiring land led to unfruitful expenditure of ` 1.16 crore.
The Government replied (December 2016) that the process of Publication of
Draft Notification and Draft Declaration in local newspapers was initiated
incurring an expenditure of ` 1.16 crore in anticipation of land acquisition
and gaining time for early commencement of project. Repeated attempts made
by the Company for land acquisition did not yield results and, subsequently,
the entire Feasibility Report of Indaram project was redesigned (April 2016)
and the land requirement brought down from 798.08 Ha to 617.58 Ha. It was
further stated that the project was being scheduled to be grounded at the
earliest.

Chapter III-Compliance Audit Observations
89
However, the fact remained that the Company went ahead with the publication
of DN and DD without ascertaining the possibility of acquiring land, thereby
rendering the expenditure of ` 1.16 crore unfruitful.
3.6 Extra expenditure of ` 44.14 crore on diversion of NTR canal under
Jalagam Vengala Rao Open Cast project, beyond its requirement.
Extra expenditure of ` 44.14 crore over the original estimates due to
clubbing of NTR canal with Indirasagar-Rudramkota Lift Irrigation
Canal, as against the diversion required by the Company for a length of
4.76 KM for its mining activities, which was unrelated and beyond the
scope of the project
The Singareni Collieries Company Limited (SCCL) (Company) took up
Sathupally Open Cast (OC) Project (December 2002) to meet the future
demand of coal. A part of the NTR canal was passing over the proposed
mining operations from Sathupally OC (renamed as Jalagam Vengala Rao
Open Cast Project-I (JVR OCP-I and Extension Project)) from KM 8 to
KM 12.76. Hence, the canal had to be diverted away from the coal bearing
area for a length of 4.76 KM to facilitate an extraction of nearly 11.05 Million
Tonnes of coal valued at ` 1502.80 crore. Based on the detailed estimate of
` 21.69 crore for diversion of the NTR canal, submitted by the Irrigation
Department, Government of Andhra Pradesh (GoAP) had accorded
administrative sanction for ` 21.69 crore (December 2005) for excavation of
an alternative canal to NTR canal and requested SCCL to deposit the entire
amount to commence the work.
The Government of Andhra Pradesh had subsequently decided (March 2008)
to club the proposed alternative canal to NTR canal with Indirasagar–
Rudramkota Lift Irrigation Canal (IRLIC) as they were running parallel to
each other from KM 28 to KM 56. Considering merger of alternate canal with
NTR canal and IRLIC, detailed designs and revision in Schedule of Standard
Rates (SSR), the cost estimates were revised by the Irrigation Department
several times from December 2005 (` 21.69 crore) to October 2013
(` 145.52 crore). Out of the estimated amount of ` 145.52 crore, SCCL‟s
share was worked out at ` 65.83 crore and the same was paid by SCCL (upto
March 2014). The Company at no stage contested the increase in cost of the
project or obtained any concrete assurance regarding completion of the
project.
The work of canal diversion was entrusted by Irrigation Department to a
contractor (November 2007) for completion within 24 months and the work
was completed in April 2016, after delay of more than six years.
It was observed in audit that:
The estimated cost of diversion of NTR canal (KM 8 to KM 12.76)
was revised several times during the period 2005 to 2013. The increase in cost
of project/SCCL share was due to merging of the proposed alternate canal
with IRLIC from KM 28 to KM 56. The length of diversion was thus for
28 KMs against the required 4.76 KMs. Further, since the clubbing of canals
Report No. 2 of 2017 (Public Sector Undertakings)
90
was totally unrelated to SCCL and had no bearing on the original work of
diversion of NTR canal, payments made by the Company for the additional
length was not justified.
The Company also had made an interest free advance amounting to
` 48.95 crore (July 2010) to the Irrigation Department as directed by the
Government, considering the urgency of the work connected to production of
JVR OCP-I Expansion mine. The advance sought by the Irrigation Department
was based on the assurance that the work would be completed by March 2011.
However, the work was completed after almost six years (23 April 2016)
which delayed the extraction of nearly 11.05 Million Tonnes of coal.
Thus, payments made by the Company over and above its requirements
resulted in extra expenditure of ` 44.14 crore (` 65.83 crore - ` 21.69 crore).
The Management in reply stated (October 2016) that the work was delayed
due to clubbing of canals which necessitated revision of estimates, design,
scarcity of sand and delay in getting approval (R&B dept.) for designs for road
over-bridge required in the works etc.
The reply of the Management is silent about release of payments by the
Company for the extended lengths of the alternate canal which was unrelated
to the Company. The NTR canal diversion would have been completed much
earlier as per original schedule and well within the funds already paid, had it
not been clubbed with other irrigation works. Thus, the Company incurred an
avoidable extra expenditure of ` 44.14 crore, over and above the original
estimate.
Telangana State Power Generation Corporation Limited
3.7 Extension of undue favour to a contractor of Balance of Plant (BOP)
works resulted in avoidable additional expenditure of ` 2.12 crore
Action was not initiated on the contractor for the defect in the TG
building (Stage I KTPP), as per the terms and conditions of the contract.
The unintended favour to the contractor of BOP works resulted in
avoidable additional expenditure to the tune of ` 2.12 crore for purchase
of crane (Stage II KTPP)
The erstwhile Andhra Pradesh Power Generation Corporation Limited
(Company) placed three Purchase Orders (POs) amounting to ` 694.86 crore
in November 2006 on M/s BGR Energy Systems Limited (Contractor) for
Supply (` 458.34 crore), Erection (` 18.39 crore) and Balance of Plant (BOP)
(` 218.13 crore) for execution of Stage-I of Kakatiya Thermal Power Plant
(KTPP), (1x500 MW), now under the purview of Telangana State Power
Generation Corporation Limited.
On achieving Commercial Operation Date (14 September 2010), the Company
took over (20 March 2013) the entire BOP package of Stage-I. As per Clause 14
of the PO for Warranty, the Bank Guarantee for ` 69.49 crore (10 per cent of the
contract price) was obtained from the contractor, which had a validity of
Chapter III-Compliance Audit Observations
91
12 months from the date of taking over of the entire BOP packages including a
claim period of six months over and above the validity i.e. up to 20 September
2014.
In the meantime, for construction of Stage II of KTPP, adjacent to Stage I, i.e.
capacity addition of 1x600 MW, orders were placed on M/s BHEL Limited
(October 2008) for Boiler, Turbine and Generator and on M/s Tecpro Systems
Limited (October 2010) for BOP works i.e. civil works, erection and
installation.
While the Stage-II works were in progress (December 2011), in order to
reduce the project cost of Stage-II, the Company planned to extend the
Electronically Operated Travelling Type (EOT) crane of Stage I to Stage-II.
The civil drawings relating to the Turbine Generator (TG) building of Stage II
were approved by M/s Tecpro from M/s Desein (Consulting Engineers). While
taking up the Civil works, it was observed that there was a skew in the TG
building axes of Stage-I. The Coordinates provided in the approved drawings
(Stage II) and the "as built" Coordinates of Stage I TG building were not
matching. The skew did not affect the movement of existing crane in Stage-I,
but if extended to Stage-II would lead to a swing in the lifting of main
equipments like Turbine, Generator plant etc. Due to this the Company
decided and purchased (August 2012) a new EOT crane at a cost of
` 2.12 crore for TG Building of Stage II.
Audit observed that though the Company had identified (February 2012) the
skew in Stage I, no action was initiated against the contractor as per the terms
of the contract. However, the Company called for explanation from the
officials and it was concluded that the skew was due to laxity in inspection and
failure in monitoring the work in the TG building (KTPP/Stage I).
As per Clause 5 of the terms and conditions of contract of Stage I, balance
10 per cent of the contract price was to be made after ascertaining satisfactory
performance of civil works and fulfilling all contractual obligations. Despite
the defect in workmanship of the contractor, the Company did not invoke the
Bank Guarantee (Clause 14), though this was available with it. This resulted in
extension of undue benefit to the contractor of BOP works to the tune of
` 2.12 crore.
The Management accepted (January 2016) the fact that there was a skew in
center line of the TG building and indicated that it had called for explanation
(November 2013) from the concerned officials of the Company and, after
seeking explanations, imposed punishment of „Censure‟ (January 2015). It
was further stated that since the variation in the structure had not affected the
operation of EOT crane and as the future expansion of KTPP Stage I and
utilization of the crane for Stage II was not mentioned in the BOP contract, the
contractor could not be held responsible.
However, no action was initiated against the contractor as per the terms and
conditions of the contract despite the defect in the construction of Stage I. The
reply was silent regarding the reasons for not invoking the BG which was
available with the Company, when the defect in the TG building was observed.

Report No. 2 of 2017 (Public Sector Undertakings)
92
STATUTORY CORPORATION
Telangana State Road Transport Corporation
3.8 Failure to conduct a periodical census of buses led to extension of
undue benefit of ` 52.40 lakh to the agent by way of short recovery of
license fee towards display of the advertisement on buses
Corporation had not conducted periodical census of buses as per the
Agreement with the agent for display of advertisement on buses. Due to
this, the agent reduced the number of buses for payment of license fee and
the same was accepted by the Corporation. This had resulted in undue
benefit of ` 52.40 lakh to the agent by way of short recovery of license fees
The Andhra Pradesh State Road Transport Corporation (Corporation) entered
into an agreement (July 2012) with M/s Uni Ads Limited (agent) for display of
advertisements on all buses, including hired buses (excluding buses purchased
under JNNURM Scheme) held by the depots falling under the jurisdiction of
Secunderabad Region for a period of five years commencing from 1st June
2012 (now under Telangana State Road Transport Corporation). At the time of
the commencement of the agreement, the number of buses was mutually
reckoned at 1,145. According to the terms and conditions of the agreement,
the agent was to pay (i) license fee at the rate of ` 1,250 for 1st and 2
nd years,
` 1,612 for 3rd
year and ` 2,015 for 4th
and 5th
years per bus per month
(ii) additional license fee at the agreed rates on the buses newly added after the
commencement of the agreement period and (iii) the Corporation was to
conduct a census of buses once in every four months and intimate the agent
the number of buses and the amount of license fee payable for the next four
months.
However, the Corporation did not conduct the periodical census of buses as
per agreement. The agent intimated (December 2012) the Corporation of his
intention to pay licence fee duly reckoning the number of buses held by depots
of Secunderabad Region at 1,145 up to October 2012 and 1,050 buses for a
further period, based on their survey. The Corporation, however, neither took
any action on the agent‟s letter nor counted the total number of buses held and
accepted payment of license fee on 1,050 buses from November 2012 to till
date (March 2016).
Meanwhile, Audit had pointed out (February 2014) that the agent had reduced
the number of buses for calculation and remittance of license fees owing to non-
conducting of a census by the Corporation which was causing loss of revenue.
The Corporation later conducted a census in February 2015 (for the period from
June 2012 to February 2014) and in October 2015 (for the period from March
2014 to August 2015), i.e. after a delay of one year after being pointed out by
Audit. Based on this census, the Corporation observed that the number of buses
were actually more (ranging from 1,121 to 1,201 buses) than the buses for
which the contractor had paid the license fee (Annexure 3.9). The Corporation
accordingly asked the agent to deposit the shortfall amount of ` 52.40 lakh
(October 2015) but the same was yet to be received.
Chapter III-Compliance Audit Observations
93
It was observed that the Corporation did not conduct periodical census as per the agreement. Though the agent had addressed the Corporation (December 2012) on the issue of reduction of buses, the Corporation accepted the license fee on the reduced number of buses without verification.
Thus, failure of the Corporation to conduct periodical census as per the terms of the agreement and acceptance of the licence fee paid by the agent on the lesser number of buses, led to an undue benefit of ` 52.40 lakh to the agent (up to March 2016) (Annexure 3.9) and corresponding loss to the Corporation.
The Government (January 2017), while confirming that reconciliation of buses had to be done at every four months to arrive at the monthly license fee payable for the next four months and communicate the same to the advertisement contractor to pay the revised license fee (Clause 5 of the agreement), stated that this was not done due to lack of awareness in the Regions where advertisement contracts were dealt with subsequent to decentralisation in 2011. It was further stated that now efforts were being made to realise the dues and in case the agent failed to pay the outstanding dues, the same would be adjusted from the Security Deposit available with the Corporation.
Hyderabad
The (LATA MALLIKARJUNA)
Accountant General (Economic & Revenue Sector Audit)
Andhra Pradesh and Telangana
Countersigned
New Delhi
The (SHASHI KANT SHARMA)
Comptroller and Auditor General of India

ANNEXURES


Annexures
97
Annexure 1.1(a)
Statement showing investments made by State Government in PSUs (exclusive to state only) whose accounts are in
arrears
(Referred to in paragraph 1.11)
(Figures in Columns 4 & 6 to 8 are ` ` ` ` in crore)
Sl.
No. Sector and name of Company
Year upto
which
account
finalised
Paid up
Capital
Period of
accounts
pending
finalisation
Investment made by State Government
during the year of which accounts are in
arrears
Equity Loans Grants
1 2 3 4 5 6 7 8
WORKING GOVERNMENT COMPANIES
AGRICULTURE AND ALLIED
INFRASTRUCTURE
1
FAB City SPV (India) Private
Limited (Subsidiary to APIIC
w.e.f. 19-07-2007)
2013-14 0.01 2014-15 0.00 0.00 0.00
2015-16 0.00 0.00 0.00
2 Pashamylaram Textiles Park 2008-09 0.05 2009-10 NA NA NA
2010-11 NA NA NA
2011-12 0.00 0.00 0.00
2012-13 0.00 0.00 0.00
2013-14 0.00 0.00 0.00
2014-15 0.00 0.00 0.00
2015-16 NA NA NA
3 eCity Manufacturing Cluster
Limited 2013-14 0.01 2014-15 0.00 0.00 0.00
2015-16 0.00 0.00 0.00
4 Maheshwaram Science Park
Private Limited 2013-14 0.01 2014-15 0.00 0.00 0.00
2015-16 0.00 0.00 0.00
5 Hyderabad Growth Corridor
Limited 2010-11 0.15 2011-12 0.00 331.50 0.00
2012-13 0.00 0.00 0.00
2013-14 0.00 348.53 0.00
2014-15 0.00 322.23 0.00
2015-16 0.00 156.00 0.00
Sub total 0.23 0.00 1158.26 0.00
MANUFACTURING
6 APMDC-SCCL Suliyari Coal
Company Limited
First
Accounts
not
submitted
2013-14 NA NA NA
2014-15 NA NA NA
2015-16 NA NA NA
7 Telangana Drinking Water
Supply Corporation Limited
First
Accounts
not
submitted
NA 2015-16 NA NA NA
8 Hyderabad Metro Rail Limited 2012-13 0.57 2013-14 0.00 0.00 2500.00
2014-15 0.00 0.00 424.67
2015-16 0.00 177.46 0.00
Sub total 0.57 0.00 177.46 2924.67
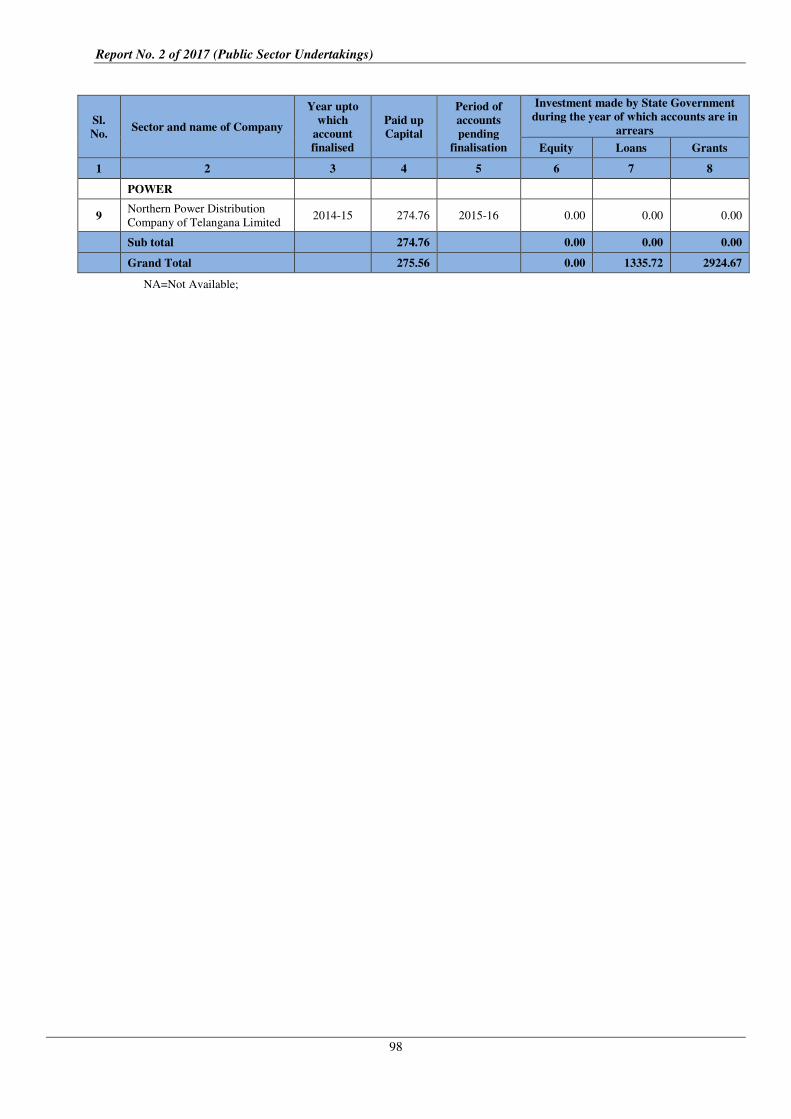
Report No. 2 of 2017 (Public Sector Undertakings)
98
Sl.
No. Sector and name of Company
Year upto
which
account
finalised
Paid up
Capital
Period of
accounts
pending
finalisation
Investment made by State Government
during the year of which accounts are in
arrears
Equity Loans Grants
1 2 3 4 5 6 7 8
POWER
9 Northern Power Distribution
Company of Telangana Limited 2014-15 274.76 2015-16 0.00 0.00 0.00
Sub total 274.76 0.00 0.00 0.00
Grand Total 275.56 0.00 1335.72 2924.67
NA=Not Available;
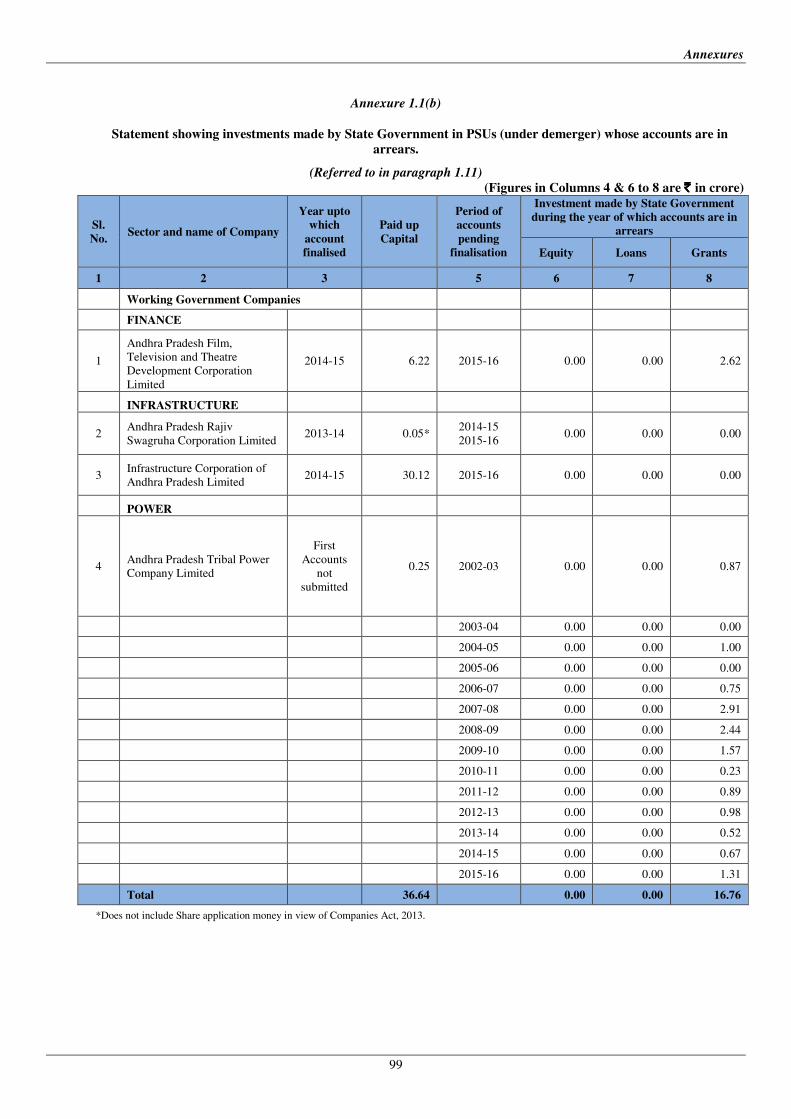
Annexures
99
Annexure 1.1(b)
Statement showing investments made by State Government in PSUs (under demerger) whose accounts are in
arrears.
(Referred to in paragraph 1.11)
(Figures in Columns 4 & 6 to 8 are ` ` ` ` in crore)
Sl.
No. Sector and name of Company
Year upto
which
account
finalised
Paid up
Capital
Period of
accounts
pending
finalisation
Investment made by State Government
during the year of which accounts are in
arrears
Equity Loans Grants
1 2 3 5 6 7 8
Working Government Companies
FINANCE
1
Andhra Pradesh Film,
Television and Theatre
Development Corporation
Limited
2014-15 6.22 2015-16 0.00 0.00 2.62
INFRASTRUCTURE
2 Andhra Pradesh Rajiv
Swagruha Corporation Limited 2013-14 0.05*
2014-15
2015-16 0.00 0.00 0.00
3 Infrastructure Corporation of
Andhra Pradesh Limited 2014-15 30.12 2015-16 0.00 0.00 0.00
POWER
4 Andhra Pradesh Tribal Power
Company Limited
First
Accounts
not
submitted
0.25 2002-03 0.00 0.00 0.87
2003-04 0.00 0.00 0.00
2004-05 0.00 0.00 1.00
2005-06 0.00 0.00 0.00
2006-07 0.00 0.00 0.75
2007-08 0.00 0.00 2.91
2008-09 0.00 0.00 2.44
2009-10 0.00 0.00 1.57
2010-11 0.00 0.00 0.23
2011-12 0.00 0.00 0.89
2012-13 0.00 0.00 0.98
2013-14 0.00 0.00 0.52
2014-15 0.00 0.00 0.67
2015-16 0.00 0.00 1.31
Total 36.64 0.00 0.00 16.76
*Does not include Share application money in view of Companies Act, 2013.
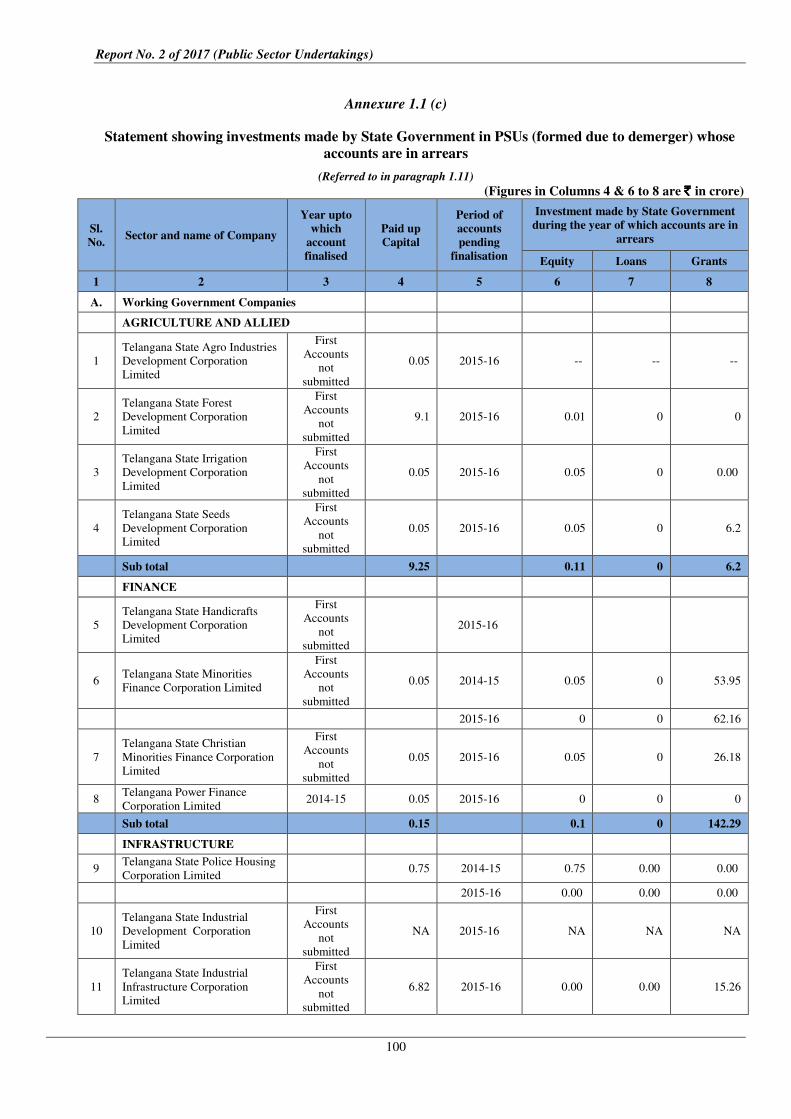
Report No. 2 of 2017 (Public Sector Undertakings)
100
Annexure 1.1 (c)
Statement showing investments made by State Government in PSUs (formed due to demerger) whose
accounts are in arrears
(Referred to in paragraph 1.11)
(Figures in Columns 4 & 6 to 8 are ` ` ` ` in crore)
Sl.
No. Sector and name of Company
Year upto
which
account
finalised
Paid up
Capital
Period of
accounts
pending
finalisation
Investment made by State Government
during the year of which accounts are in
arrears
Equity Loans Grants
1 2 3 4 5 6 7 8
A. Working Government Companies
AGRICULTURE AND ALLIED
1
Telangana State Agro Industries
Development Corporation
Limited
First
Accounts
not
submitted
0.05 2015-16 -- -- --
2
Telangana State Forest
Development Corporation
Limited
First
Accounts
not
submitted
9.1 2015-16 0.01 0 0
3
Telangana State Irrigation
Development Corporation
Limited
First
Accounts
not
submitted
0.05 2015-16 0.05 0 0.00
4
Telangana State Seeds
Development Corporation
Limited
First
Accounts
not
submitted
0.05 2015-16 0.05 0 6.2
Sub total 9.25 0.11 0 6.2
FINANCE
5
Telangana State Handicrafts
Development Corporation
Limited
First
Accounts
not
submitted
2015-16
6 Telangana State Minorities
Finance Corporation Limited
First
Accounts
not
submitted
0.05 2014-15 0.05 0 53.95
2015-16 0 0 62.16
7
Telangana State Christian
Minorities Finance Corporation
Limited
First
Accounts
not
submitted
0.05 2015-16 0.05 0 26.18
8 Telangana Power Finance
Corporation Limited 2014-15 0.05 2015-16 0 0 0
Sub total 0.15 0.1 0 142.29
INFRASTRUCTURE
9 Telangana State Police Housing
Corporation Limited 0.75 2014-15 0.75 0.00 0.00
2015-16 0.00 0.00 0.00
10
Telangana State Industrial
Development Corporation
Limited
First
Accounts
not
submitted
NA 2015-16 NA NA NA
11
Telangana State Industrial
Infrastructure Corporation
Limited
First
Accounts
not
submitted
6.82 2015-16 0.00 0.00 15.26

Annexures
101
Sl.
No. Sector and name of Company
Year upto
which
account
finalised
Paid up
Capital
Period of
accounts
pending
finalisation
Investment made by State Government
during the year of which accounts are in
arrears
Equity Loans Grants
1 2 3 4 5 6 7 8
12 Telangana State Housing
Corporation Limited
First
Accounts
not
submitted
2015-16
13
Telangana Urban Finance
Industrial Infrastructure
Corporation Limited
First
Accounts
not
submitted
0.05 2014-15 0.05 0 206.52
2015-16 0 0 2.75
14 Telangana Aviation Corporation
Limited
First
Accounts
not
submitted
Sub total 7.62 0.8 0 224.53
MANUFACTURING
15 Telangana State Beverages
Corporation Limited
First
Accounts
not
submitted
0.05 2014-15
2015-16 0.00 0.00 58.56
16
Telangana State Leather
Industries Promotion
Corporation Limited
First
Accounts
not
submitted
1.63 2015-16 0.82 0.00 0.00
17
Telangana State Mineral
Development Corporation
Limited
First
Accounts
not
submitted
0.05 2015-16 0.00 0.00 0.00
Sub total 1.73 0.82 0.00 58.56
SERVICES
18 Telangana State Civil Supplies
Corporation Limited
First
Accounts
not
submitted
0.10 2015-16 0.00 0.00 0.00
19 Telangana State Trade
Promotion Corporation Limited
First
Accounts
not
submitted
0.01 2015-16 0.00 0.00 0.00
20 Telangana State Technology
Services Limited
First
Accounts
not
submitted
0.05 2015-16 0.05 0.00 0.00
21
Telangana State Tourism
Development Corporation
Limited
First
Accounts
not
submitted
2.48 2014-15 1.57 0.00 1.46
2015-16 1.00 0.00 16.24
Sub total 2.64 2.62 0.00 17.70
POWER
22 Transmission Corporation of
Telangana Limited
First
Accounts
not
submitted
2014-15
0.05 2015-16 0.00 0.00 0.00
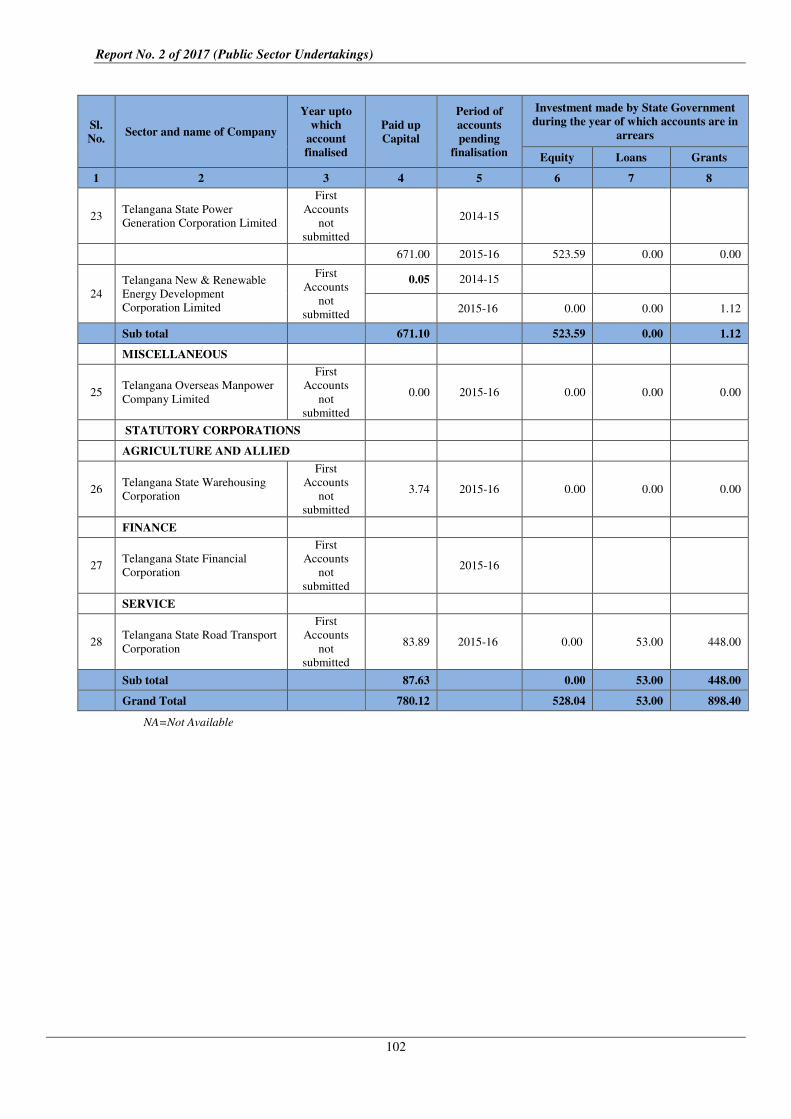
Report No. 2 of 2017 (Public Sector Undertakings)
102
Sl.
No. Sector and name of Company
Year upto
which
account
finalised
Paid up
Capital
Period of
accounts
pending
finalisation
Investment made by State Government
during the year of which accounts are in
arrears
Equity Loans Grants
1 2 3 4 5 6 7 8
23 Telangana State Power
Generation Corporation Limited
First
Accounts
not
submitted
2014-15
671.00 2015-16 523.59 0.00 0.00
24
Telangana New & Renewable
Energy Development
Corporation Limited
First
Accounts
not
submitted
0.05 2014-15
2015-16 0.00 0.00 1.12
Sub total 671.10 523.59 0.00 1.12
MISCELLANEOUS
25 Telangana Overseas Manpower
Company Limited
First
Accounts
not
submitted
0.00 2015-16 0.00 0.00 0.00
STATUTORY CORPORATIONS
AGRICULTURE AND ALLIED
26 Telangana State Warehousing
Corporation
First
Accounts
not
submitted
3.74 2015-16 0.00 0.00 0.00
FINANCE
27 Telangana State Financial
Corporation
First
Accounts
not
submitted
2015-16
SERVICE
28 Telangana State Road Transport
Corporation
First
Accounts
not
submitted
83.89 2015-16 0.00 53.00 448.00
Sub total 87.63 0.00 53.00 448.00
Grand Total 780.12 528.04 53.00 898.40
NA=Not Available

An
nex
ure
s
10
3
An
nex
ure
1.2
(a)
Su
mm
ari
sed
fin
an
cial
posi
tion
an
d w
ork
ing r
esu
lts
of
PS
Us
(excl
usi
ve
to s
tate
on
ly)
as
per
th
eir
late
st f
inali
sed
fin
an
cial
state
men
ts/a
ccou
nts
(Ref
erre
d t
o i
n p
ara
gra
ph
1.1
5)
(F
igu
res
in C
olu
mn
s 5 t
o 1
2 a
re ` ` ` ` i
n c
rore
)
Sl.
No.
Sec
tor
/ n
am
e of
the
Co
mp
an
y
Per
iod
of
acc
ou
nts
Yea
r in
wh
ich
acc
ou
nts
fin
ali
sed
Paid
-up
cap
ital
Loa
ns
ou
tsta
nd
ing
at
the
en
d
of
yea
r
Acc
um
ula
ted
profi
t(+
)/
loss
(-)
Tu
rn
over
Net
profi
t
(+)
/
loss
(-)
Net
im
pact
of
Au
dit
com
men
ts
Cap
ital
em
plo
yed
Ret
urn
on
cap
ital
em
plo
yed
Per
cen
tag
e
of
retu
rn
on
cap
ital
em
plo
yed
Man
pow
er
1
2
3
4
5
6
7
8
9
10
11
12
13
14
W
ork
ing
Go
ver
nm
en
t C
om
pa
nie
s
IN
FR
AS
TR
UC
TU
RE
1
Fab
Cit
y S
PV
(In
dia
) P
rivat
e
Lim
ited
. 2
013
-14
20
16
-17
0.0
1
0.0
0
-1.1
8
0.9
1
-1.0
7
0.0
0
-1.1
2
-1.0
7
95
.54
0
2
Pas
ham
yla
ram
Texti
les
Par
k
20
08
-09
20
14
-15
0.0
5
0.0
0
0.1
2
0.0
0
0.0
6
0.0
0
0.1
7
0.0
6
35
.29
2
3
E-C
ity M
anu
fact
uri
ng C
lust
er
Lim
ited
2
013
-14
20
14
-15
0.0
1
0.0
0
0.0
0
0.0
0
0.0
0
0.0
0
0.0
1
0.0
0
0.0
0
0
4
Mah
esh
war
am
Sci
ence
Par
k
Lim
ited
2
013
-14
20
14
-15
0.0
1
0.0
0
0.0
0
0.0
0
0.0
0
0.0
0
0.0
1
0.0
0
0.0
0
0
5
Hyd
erab
ad G
row
th C
orr
ido
r
Lim
ited
2
010
-11
20
15
-16
0.1
5
0.0
0
-3.7
3
0.3
9
-0.0
2
-3
.58
-0.0
2
0.5
6
49
S
ub
tota
l
0
.23
0.0
0
-4.7
9
1.3
0
-1.0
3
0.0
0
-4.5
1
-1.0
3
5
1
M
AN
UF
AC
TU
RIN
G
6
AP
MD
C-S
CC
L S
uli
yar
i C
oal
Co
mp
any L
imit
ed
Fir
st
Acco
un
ts
no
t
sub
mit
ted
7
Dam
od
ara
Min
eral
s P
rivat
e
Lim
ited
2
015
-16
20
16
-17
0.0
4
0.0
0
-0.0
9
0.0
0
-0.0
1
0.0
0
-0.0
5
-0.0
1
20
.00
0
8
Th
e S
ingar
eni
Co
llie
ries
Co
mp
any L
imit
ed
20
15
-16
20
16
-17
17
33
.20
39
56
.43
30
49
.75
12
71
1.1
8
10
66
.13
-163
.00
87
39
.38
11
06
.94
12
.67
S
ub
tota
l
1
733
.24
39
56
.43
30
49
.66
12
71
1.1
8
10
66
.12
-163
.00
87
39
.33
11
06
.93
0
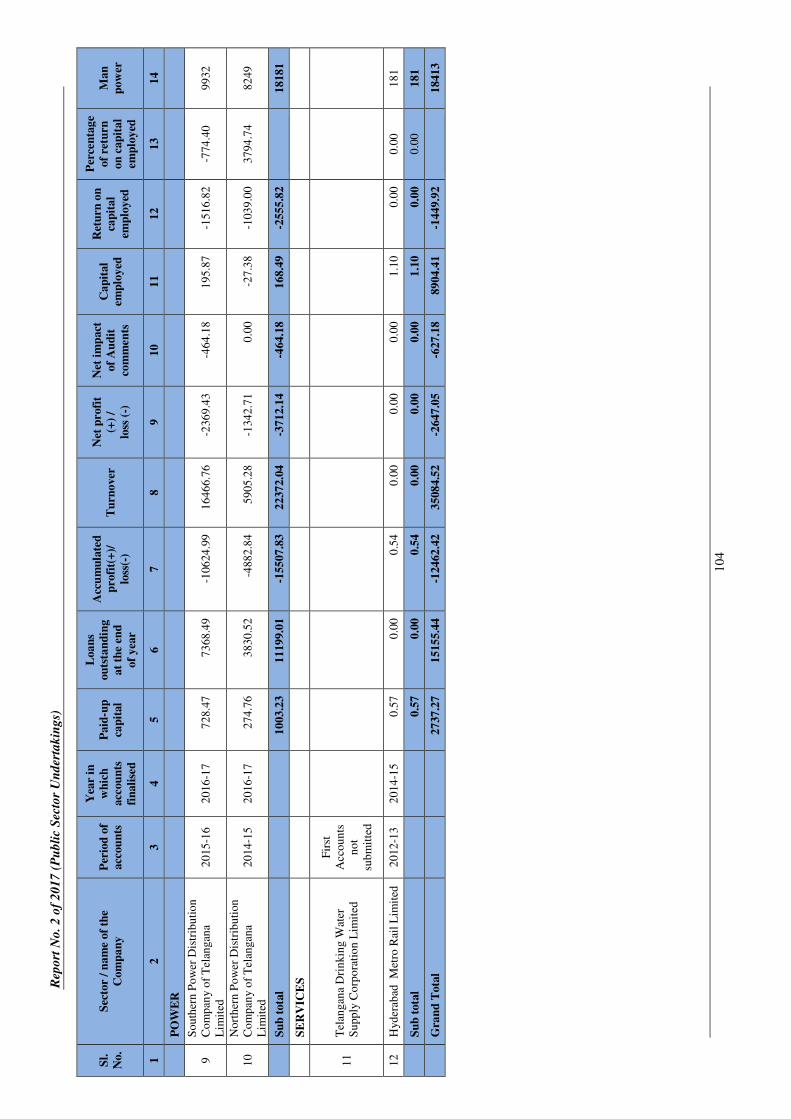
Rep
ort
No
. 2
of
20
17
(P
ub
lic
Sec
tor
Un
der
tak
ing
s)
10
4
Sl.
No.
Sec
tor
/ n
am
e of
the
Co
mp
an
y
Per
iod
of
acc
ou
nts
Yea
r in
wh
ich
acc
ou
nts
fin
ali
sed
Paid
-up
cap
ital
Loa
ns
ou
tsta
nd
ing
at
the
en
d
of
yea
r
Acc
um
ula
ted
profi
t(+
)/
loss
(-)
Tu
rn
over
Net
profi
t
(+)
/
loss
(-)
Net
im
pact
of
Au
dit
com
men
ts
Cap
ital
em
plo
yed
Ret
urn
on
cap
ital
em
plo
yed
Per
cen
tag
e
of
retu
rn
on
cap
ital
em
plo
yed
Man
pow
er
1
2
3
4
5
6
7
8
9
10
11
12
13
14
P
OW
ER
9
So
uth
ern
Po
wer
Dis
trib
uti
on
Co
mp
any o
f T
elan
gan
a
Lim
ited
20
15
-16
20
16
-17
72
8.4
7
73
68
.49
-106
24
.99
16
46
6.7
6
-236
9.4
3
-464
.18
19
5.8
7
-151
6.8
2
-774
.40
99
32
10
No
rth
ern
Po
wer
Dis
trib
uti
on
Co
mp
any o
f T
elan
gan
a
Lim
ited
20
14
-15
20
16
-17
27
4.7
6
38
30
.52
-488
2.8
4
59
05
.28
-134
2.7
1
0.0
0
-27
.38
-103
9.0
0
37
94
.74
82
49
S
ub
tota
l
1
003
.23
11
19
9.0
1
-155
07
.83
22
37
2.0
4
-371
2.1
4
-464
.18
16
8.4
9
-255
5.8
2
1
818
1
S
ER
VIC
ES
11
Tel
ang
ana
Dri
nkin
g W
ater
Su
pp
ly C
orp
ora
tio
n L
imit
ed
Fir
st
Acco
un
ts
no
t
sub
mit
ted
12
Hyd
erab
ad
Met
ro R
ail
Lim
ited
2
012
-13
20
14
-15
0.5
7
0.0
0
0.5
4
0.0
0
0.0
0
0.0
0
1.1
0
0.0
0
0.0
0
18
1
S
ub
tota
l
0
.57
0.0
0
0.5
4
0.0
0
0.0
0
0.0
0
1.1
0
0.0
0
0.0
0
18
1
G
ran
d T
ota
l
2
737
.27
15
15
5.4
4
-124
62
.42
35
08
4.5
2
-264
7.0
5
-627
.18
89
04
.41
-144
9.9
2
1
841
3

An
nex
ure
s
10
5
An
nex
ure
1.2
(b)
Su
mm
ari
sed
fin
an
cia
l p
osi
tio
n a
nd
wo
rkin
g r
esu
lts
of
PS
Us
(un
der
dem
erger
) as
per
th
eir
late
st f
inali
sed
fin
an
cial
state
men
ts/a
ccou
nts
(Ref
erre
d t
o i
n p
ara
gra
ph
1.1
5)
(Fig
ure
s in
Colu
mn
s 5 t
o 1
2 a
re `̀̀̀
in
cro
re)
Sl.
No.
Sec
tor
/ n
am
e of
the
Co
mp
an
y
Per
iod
of
acc
ou
nts
Yea
r in
wh
ich
acc
ou
nts
fin
ali
sed
Paid
-up
cap
ital
Loa
ns
ou
tsta
nd
ing
at
the
en
d
of
yea
r
Acc
um
ula
ted
profi
t(+
)/
loss
(-)
Tu
rn
over
N
et p
rofi
t
(+)/
loss
(-)
Net
im
pact
of
Au
dit
com
men
ts
Cap
ital
em
plo
yed
Ret
urn
on
cap
ital
em
plo
yed
Per
cen
tag
e
of
retu
rn
on
cap
ital
em
plo
yed
Man
pow
er
1
2
3
4
5
6
7
8
9
10
11
12
13
14
A.
WO
RK
ING
GO
VE
RN
ME
NT
CO
MP
AN
IES
1
An
dh
ra P
rad
esh
Fil
m,
Tel
evis
ion
an
d T
hea
tre
Dev
elo
pm
ent
Co
rpo
rati
on
Lim
ited
20
14
-15
20
15
-16
6.2
2
0.1
0
2.1
0
5.6
3
0.2
0
1.0
1
8.4
2
0.0
2
0.2
8
25
2
An
dh
ra P
rad
esh
Raj
iv
Sw
agru
ha
Co
rpo
rati
on
Lim
ited
20
13
-14
20
14
-15
0.0
5
0.0
0
9.3
0
41
.71
-45
.78
Acco
un
ts
un
der
fin
alis
atio
n
9.3
5
-9.7
7
-104
.49
16
6
3
Th
e N
izam
Su
gar
s L
imit
ed
20
15
-16
20
16
-17
34
.00
55
.95
-241
.24
0.0
0
0.2
4
0.0
0
-149
.67
7.1
4
-4.7
7
S
ub
Tota
l
4
0.2
7
56
.05
-229
.84
47
.34
-45
.34
1.0
1
-131
.90
-2.6
1
1
91
M
ISC
EL
LA
NE
OU
S
4
An
dh
ra P
rad
esh
Tri
bal
Po
wer
Co
mp
any L
imit
ed
Fir
st
Acco
un
ts
no
t
sub
mit
ted
0.0
0
0.0
0
0.0
0
0.0
0
0.0
0
0.0
0
0.0
0
0.0
0
5
S
ub
Tota
l
0
.00
0.0
0
0.0
0
0.0
0
0.0
0
0.0
0
0.0
0
0.0
0
5
IN
FR
AS
TR
UC
TU
RE
5
Infr
astr
uct
ure
Co
rpo
rati
on
of
An
dh
ra P
rad
esh
Lim
ited
2
014
-15
20
15
-16
30
.12
0.0
0
-3.8
2
0.2
6
-1.5
5
0.0
0
26
.30
-1.5
5
-5.8
9
60
S
ub
Tota
l
3
0.1
2
0.0
0
-3.8
2
0.2
6
-1.5
5
0.0
0
26
.30
-1.5
5
6
0
G
ran
d T
ota
l A
7
0.3
9
56
.05
-233
.66
47
.60
-46
.89
1.0
1
-105
.60
-4.1
6
2
56
B
NO
N-W
OR
KIN
G C
OM
PA
NIE
S
A
GR
ICU
LT
UR
E A
ND
AL
LIE
D
1
An
dh
ra P
rad
esh
Fis
her
ies
Co
rpora
tion
Lim
ited
1-4
-02
to
9-5
-02
4
.67
8.6
7
-21
.75
0.0
0
0.0
0
0.0
0
-7.2
4
0.0
0
0.0
0
2
Pro
dd
utu
r M
ilk F
oo
ds
Lim
ited
1
983
-84
19
90
-91
1.9
6
0.0
0
0.0
0
0.0
0
0.0
0
0.0
0
0.0
0
0.0
0
0.0
0
8

Rep
ort
No
. 2
of
20
17
(P
ub
lic
Sec
tor
Un
der
tak
ing
s)
10
6
Sl.
No.
Sec
tor
/ n
am
e of
the
Co
mp
an
y
Per
iod
of
acc
ou
nts
Yea
r in
wh
ich
acc
ou
nts
fin
ali
sed
Paid
-up
cap
ital
Loa
ns
ou
tsta
nd
ing
at
the
en
d
of
yea
r
Acc
um
ula
ted
profi
t(+
)/
loss
(-)
Tu
rn
over
N
et p
rofi
t
(+)/
loss
(-)
Net
im
pact
of
Au
dit
com
men
ts
Cap
ital
em
plo
yed
Ret
urn
on
cap
ital
em
plo
yed
Per
cen
tag
e
of
retu
rn
on
cap
ital
em
plo
yed
Man
pow
er
1
2
3
4
5
6
7
8
9
10
11
12
13
14
3
An
dh
ra P
rad
esh
Dai
ry
Dev
elo
pm
ent
Co
rpo
rati
on
Lim
ited
20
13
-14
(14
M)
20
14
-15
15
.00
0.0
0
-5.2
4
0.0
0
0.0
0
0.0
0
9.7
6
0.0
0
0.0
0
F
INA
NC
ING
4
A.P
Sm
all
Sca
le I
nd
ust
rial
Dev
elo
pm
ent
Co
rpo
rati
on
Lim
ited
2
001
-02
20
03
-04
9.6
2
13
.92
-20
.03
0.0
2
2.1
8
0.0
0
2.9
3
2.1
8
74
.40
5
An
dh
ra P
rad
esh
To
uri
sm
Fin
ance
Lim
ited
2
002
-03
20
04
-05
2.0
0
0.0
0
0.0
7
0.1
1
0.1
1
0.0
0
2.0
5
0.1
1
5.3
7
M
AN
UF
AC
TU
RIN
G
6
All
wyn
Au
to L
imit
ed
19
94
-95
0
.15
14
.45
-13
.54
0.0
0
-6.4
6
0.0
0
-2.9
7
-6.4
6
21
7.5
1
7
All
wyn
Wat
ches
Lim
ited
1
998
-99
20
02
-03
0.1
5
64
.93
-248
.70
13
.00
-70
.69
0.0
0
95
.75
-70
.69
-73
.83
8
An
dh
ra P
rad
esh
Ele
ctro
nic
s
Dev
elo
pm
ent
Co
rpo
rati
on
Lim
ited
2
002
-03
20
06
-07
12
.72
0.6
8
-10
.74
0.0
0
-0.7
5
0.0
0
3.6
8
-0.7
5
-20
.38
9
An
dh
ra P
rad
esh
Sco
ote
rs
Lim
ited
1
992
-93
19
93
-94
11
.11
11
.19
-34
.49
0.0
0
-3.7
0
0.0
0
-3.7
9
-3.7
0
97
.63
10
An
dh
ra P
rad
esh
Ste
els
Lim
ited
(S
) 1
991
-92
19
93
-94
2.0
3
2.1
2
-6.5
1
0.0
0
-2.0
9
0.0
0
-2.5
1
-2.0
9
83
.27
11
Ap
tro
nix
Co
mm
un
icat
ion
s
Lim
ited
(S
)
0
.00
0.0
0
0.0
0
0.0
0
0.0
0
0.0
0
0.0
0
0.0
0
0.0
0
12
Hyd
erab
ad C
hem
ical
s an
d
Fer
tili
zers
Lim
ited
(S
) 1
984
-85
19
86
-87
0.7
8
8.2
5
-0.6
3
0.0
0
0.6
2
0.0
0
-1.3
4
0.6
2
-46
.27
13
Mar
ine
and C
om
mu
nic
atio
n
Ele
ctro
nic
s (I
nd
ia)
Lim
ited
(S
) 1
992
-93
19
94
-95
1.8
9
4.7
7
-4.2
1
0.0
0
-4.7
0
0.0
0
7.2
3
-4.7
0
-65
.01
14
Rep
ub
lic
Fo
rge
Co
mp
any
Lim
ited
1
991
-92
19
93
-94
7.7
7
54
.77
-23
.41
0.0
0
-3.2
4
0.0
0
8.8
2
-3.2
4
-36
.73
15
So
uth
ern
Tra
nsf
orm
ers
and
Ele
ctri
cals
Lim
ited
(S
) 1
993
-94
19
96
-97
0.5
8
0.7
8
-5.7
8
0.0
0
-0.5
7
0.0
0
-1.4
5
-0.5
7
39
.31
16
An
dh
ra P
rad
esh
Au
tom
ob
ile
Tyre
s &
Tu
bes
Lim
ited
1
992
-93
NA
0
.75
0.0
0
-0.7
7
0.0
0
0.0
0
0.0
0
0.0
0
0.0
0
0.0
0
17
Go
lko
nd
a A
bra
sives
Lim
ited
1
997
-98
NA
0
.55
0.0
0
-7.4
4
0.0
0
-0.0
1
0.0
0
0.0
0
-0.0
1
0.0
0
18
Kri
shi
En
gin
eeri
ng L
imit
ed
19
84
-85
NA
0
.52
0.0
0
-3.5
4
0.0
0
-0.5
2
0.0
0
0.0
0
-0.5
2
0.0
0
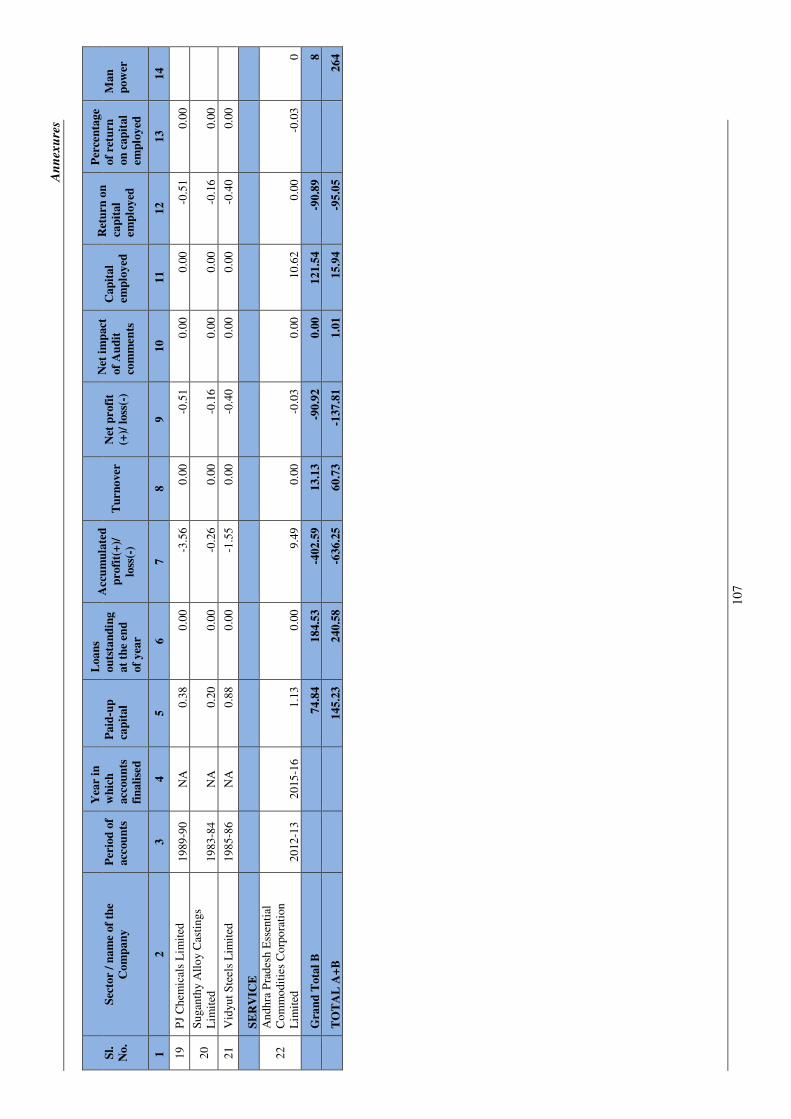
An
nex
ure
s
10
7
Sl.
No.
Sec
tor
/ n
am
e of
the
Co
mp
an
y
Per
iod
of
acc
ou
nts
Yea
r in
wh
ich
acc
ou
nts
fin
ali
sed
Paid
-up
cap
ital
Loa
ns
ou
tsta
nd
ing
at
the
en
d
of
yea
r
Acc
um
ula
ted
profi
t(+
)/
loss
(-)
Tu
rn
over
N
et p
rofi
t
(+)/
loss
(-)
Net
im
pact
of
Au
dit
com
men
ts
Cap
ital
em
plo
yed
Ret
urn
on
cap
ital
em
plo
yed
Per
cen
tag
e
of
retu
rn
on
cap
ital
em
plo
yed
Man
pow
er
1
2
3
4
5
6
7
8
9
10
11
12
13
14
19
PJ
Ch
emic
als
Lim
ited
1
989
-90
NA
0
.38
0.0
0
-3.5
6
0.0
0
-0.5
1
0.0
0
0.0
0
-0.5
1
0.0
0
20
Su
gan
thy A
llo
y C
asti
ngs
Lim
ited
1
983
-84
NA
0
.20
0.0
0
-0.2
6
0.0
0
-0.1
6
0.0
0
0.0
0
-0.1
6
0.0
0
21
Vid
yu
t S
teel
s L
imit
ed
19
85
-86
NA
0
.88
0.0
0
-1.5
5
0.0
0
-0.4
0
0.0
0
0.0
0
-0.4
0
0.0
0
S
ER
VIC
E
22
An
dh
ra P
rad
esh
Ess
enti
al
Co
mm
od
itie
s C
orp
ora
tion
Lim
ited
2
012
-13
20
15
-16
1.1
3
0.0
0
9.4
9
0.0
0
-0.0
3
0.0
0
10
.62
0.0
0
-0.0
3
0
G
ran
d T
ota
l B
7
4.8
4
18
4.5
3
-402
.59
13
.13
-90
.92
0.0
0
12
1.5
4
-90
.89
8
T
OT
AL
A+
B
14
5.2
3
24
0.5
8
-636
.25
60
.73
-137
.81
1.0
1
15
.94
-95
.05
2
64
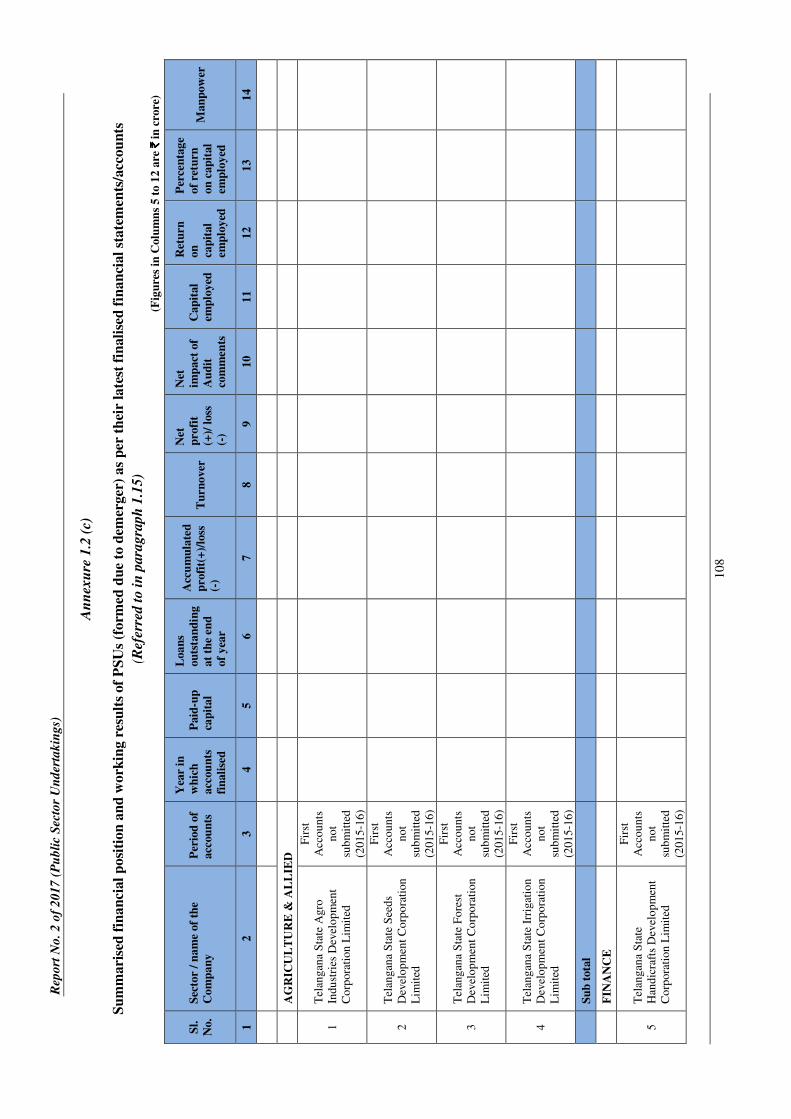
Rep
ort
No
. 2
of
20
17
(P
ub
lic
Sec
tor
Un
der
tak
ing
s)
10
8
An
nex
ure
1.2
(c)
Su
mm
ari
sed
fin
an
cial
posi
tion
an
d w
ork
ing r
esu
lts
of
PS
Us
(form
ed d
ue
to d
emer
ger
) as
per
th
eir
late
st f
inali
sed
fin
an
cial
state
men
ts/a
ccou
nts
(Ref
erre
d t
o i
n p
ara
gra
ph
1.1
5)
(Fig
ure
s in
Colu
mn
s 5
to 1
2 a
re `̀̀̀
in
cro
re)
Sl.
No.
Sec
tor
/ n
am
e of
the
Co
mp
an
y
Per
iod
of
acc
ou
nts
Yea
r in
wh
ich
acc
ou
nts
fin
ali
sed
Paid
-up
cap
ital
Loa
ns
ou
tsta
nd
ing
at
the
en
d
of
yea
r
Acc
um
ula
ted
profi
t(+
)/lo
ss
(-)
Tu
rn
over
Net
profi
t
(+)/
loss
(-)
Net
imp
act
of
Au
dit
com
men
ts
Cap
ital
em
plo
yed
Ret
urn
on
cap
ital
em
plo
yed
Per
cen
tag
e
of
retu
rn
on
cap
ital
em
plo
yed
Man
pow
er
1
2
3
4
5
6
7
8
9
10
11
12
13
14
A
GR
ICU
LT
UR
E &
AL
LIE
D
1
Tel
ang
ana
Sta
te A
gro
Indu
stri
es D
evel
op
men
t
Co
rpora
tion
Lim
ited
Fir
st
Acco
un
ts
no
t
sub
mit
ted
(201
5-1
6)
2
Tel
ang
ana
Sta
te S
eed
s
Dev
elo
pm
ent
Co
rpo
rati
on
Lim
ited
Fir
st
Acco
un
ts
no
t
sub
mit
ted
(201
5-1
6)
3
Tel
ang
ana
Sta
te F
ore
st
Dev
elo
pm
ent
Co
rpo
rati
on
Lim
ited
Fir
st
Acco
un
ts
no
t
sub
mit
ted
(201
5-1
6)
4
Tel
ang
ana
Sta
te I
rrig
atio
n
Dev
elo
pm
ent
Co
rpo
rati
on
Lim
ited
Fir
st
Acco
un
ts
no
t
sub
mit
ted
(201
5-1
6)
S
ub
tota
l
F
INA
NC
E
5
Tel
ang
ana
Sta
te
Han
dic
raft
s D
evel
op
men
t
Co
rpora
tion
Lim
ited
Fir
st
Acco
un
ts
no
t
sub
mit
ted
(201
5-1
6)

An
nex
ure
s
10
9
Sl.
No.
Sec
tor
/ n
am
e of
the
Co
mp
an
y
Per
iod
of
acc
ou
nts
Yea
r in
wh
ich
acc
ou
nts
fin
ali
sed
Paid
-up
cap
ital
Loa
ns
ou
tsta
nd
ing
at
the
en
d
of
yea
r
Acc
um
ula
ted
profi
t(+
)/lo
ss
(-)
Tu
rn
over
Net
profi
t
(+)/
loss
(-)
Net
imp
act
of
Au
dit
com
men
ts
Cap
ital
em
plo
yed
Ret
urn
on
cap
ital
em
plo
yed
Per
cen
tag
e
of
retu
rn
on
cap
ital
em
plo
yed
Man
pow
er
1
2
3
4
5
6
7
8
9
10
11
12
13
14
6
Tel
ang
ana
Sta
te M
ino
riti
es
Fin
ance
Co
rpo
rati
on
Lim
ited
Fir
st
Acco
un
ts
no
t
sub
mit
ted
(201
5-1
6)
7
Tel
ang
ana
Sta
te C
hri
stia
n
Min
ori
ties
Fin
ance
Co
rpora
tion
Lim
ited
Fir
st
Acco
un
ts
no
t
sub
mit
ted
(201
5-1
6)
8
Tel
ang
ana
Po
wer
Fin
ance
Co
rpora
tion
Lim
ited
2
014
-15
20
16
-17
0.0
5
3.6
7
0.0
0
0.0
99
0.0
0
0.0
0
3.7
1
0.0
0
S
ub
tota
l
0
.05
3.6
7
0.0
0
0.0
99
0.0
0
0.0
0
3.7
1
0.0
0
IN
FR
AS
TR
UC
TU
RE
9
Tel
ang
ana
Sta
te P
oli
ce
Ho
usi
ng C
orp
ora
tion
Lim
ited
Fir
st
Acco
un
ts
no
t
sub
mit
ted
(201
5-1
6)
10
Tel
ang
ana
Sta
te I
ndu
stri
al
Dev
elo
pm
ent
Co
rpo
rati
on
Lim
ited
Fir
st
Acco
un
ts
no
t
sub
mit
ted
(201
5-1
6)
11
Tel
ang
ana
Sta
te I
ndu
stri
al
Infr
astr
uct
ure
Co
rpo
rati
on
Lim
ited
Fir
st
Acco
un
ts
no
t
sub
mit
ted
(201
5-1
6)
12
Tel
ang
ana
Sta
te H
ou
sin
g
Co
rpora
tion
Lim
ited
Fir
st
Acco
un
ts
no
t
sub
mit
ted
(201
5-1
6)
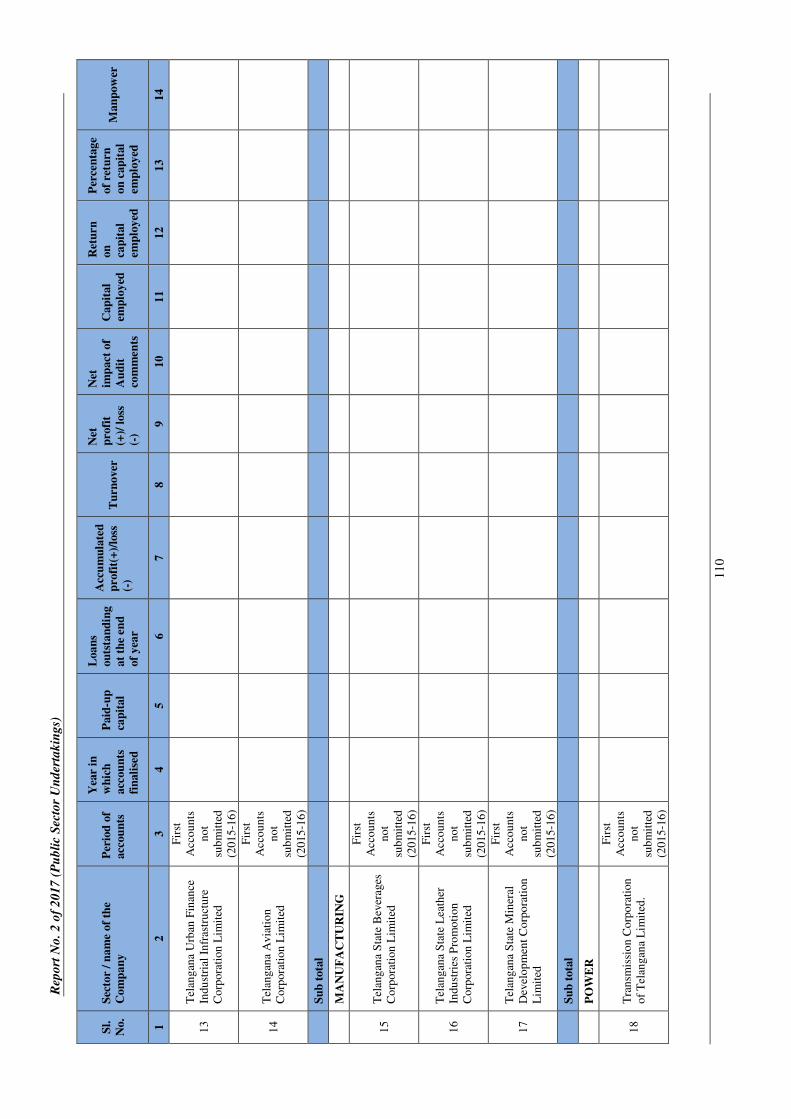
Rep
ort
No
. 2
of
20
17
(P
ub
lic
Sec
tor
Un
der
tak
ing
s)
11
0
Sl.
No.
Sec
tor
/ n
am
e of
the
Co
mp
an
y
Per
iod
of
acc
ou
nts
Yea
r in
wh
ich
acc
ou
nts
fin
ali
sed
Paid
-up
cap
ital
Loa
ns
ou
tsta
nd
ing
at
the
en
d
of
yea
r
Acc
um
ula
ted
profi
t(+
)/lo
ss
(-)
Tu
rn
over
Net
profi
t
(+)/
loss
(-)
Net
imp
act
of
Au
dit
com
men
ts
Cap
ital
em
plo
yed
Ret
urn
on
cap
ital
em
plo
yed
Per
cen
tag
e
of
retu
rn
on
cap
ital
em
plo
yed
Man
pow
er
1
2
3
4
5
6
7
8
9
10
11
12
13
14
13
Tel
ang
ana
Urb
an F
inan
ce
Indu
stri
al I
nfr
astr
uct
ure
Co
rpora
tion
Lim
ited
Fir
st
Acco
un
ts
no
t
sub
mit
ted
(201
5-1
6)
14
Tel
ang
ana
Avia
tio
n
Co
rpora
tion
Lim
ited
Fir
st
Acco
un
ts
no
t
sub
mit
ted
(201
5-1
6)
S
ub
tota
l
M
AN
UF
AC
TU
RIN
G
15
Tel
ang
ana
Sta
te B
ever
ages
Co
rpora
tion
Lim
ited
Fir
st
Acco
un
ts
no
t
sub
mit
ted
(201
5-1
6)
16
Tel
ang
ana
Sta
te L
eath
er
Indu
stri
es P
rom
oti
on
Co
rpora
tion
Lim
ited
Fir
st
Acco
un
ts
no
t
sub
mit
ted
(201
5-1
6)
17
Tel
ang
ana
Sta
te M
iner
al
Dev
elo
pm
ent
Co
rpo
rati
on
Lim
ited
Fir
st
Acco
un
ts
no
t
sub
mit
ted
(201
5-1
6)
S
ub
tota
l
P
OW
ER
18
Tra
nsm
issi
on
Co
rpo
rati
on
of
Tel
ang
ana
Lim
ited
.
Fir
st
Acco
un
ts
no
t
sub
mit
ted
(201
5-1
6)

An
nex
ure
s
11
1
Sl.
No.
Sec
tor
/ n
am
e of
the
Co
mp
an
y
Per
iod
of
acc
ou
nts
Yea
r in
wh
ich
acc
ou
nts
fin
ali
sed
Paid
-up
cap
ital
Loa
ns
ou
tsta
nd
ing
at
the
en
d
of
yea
r
Acc
um
ula
ted
profi
t(+
)/lo
ss
(-)
Tu
rn
over
Net
profi
t
(+)/
loss
(-)
Net
imp
act
of
Au
dit
com
men
ts
Cap
ital
em
plo
yed
Ret
urn
on
cap
ital
em
plo
yed
Per
cen
tag
e
of
retu
rn
on
cap
ital
em
plo
yed
Man
pow
er
1
2
3
4
5
6
7
8
9
10
11
12
13
14
19
Tel
ang
ana
Po
wer
Gen
erat
ion
Co
rpo
rati
on
Lim
ited
.
Fir
st
Acco
un
ts
no
t
sub
mit
ted
(201
5-1
6)
20
Tel
ang
ana
New
&
Ren
ewab
le E
ner
gy
Dev
elo
pm
ent
Co
rpo
rati
on
Lim
ited
Fir
st
Acco
un
ts
no
t
sub
mit
ted
(201
5-1
6)
S
ub
tota
l
S
ER
VIC
ES
21
Tel
ang
ana
Sta
te C
ivil
Su
pp
lies
Co
rpo
rati
on
Lim
ited
Fir
st
Acco
un
ts
no
t
sub
mit
ted
(201
5-1
6)
22
Tel
ang
ana
Sta
te T
rad
e
Pro
mo
tio
n C
orp
ora
tio
n
Lim
ited
Fir
st
Acco
un
ts
no
t
sub
mit
ted
(201
5-1
6)
23
Tel
ang
ana
Sta
te
Tec
hn
olo
gy S
ervic
es
Lim
ited
Fir
st
Acco
un
ts
no
t
sub
mit
ted
(201
5-1
6)
24
Tel
ang
ana
Sta
te T
ou
rism
Dev
elo
pm
ent
Co
rpo
rati
on
Lim
ited
Fir
st
Acco
un
ts
no
t
sub
mit
ted
(201
5-1
6)
25
Tel
ang
ana
Over
seas
Man
po
wer
Co
mp
any
Lim
ited
.
Fir
st
Acco
un
ts
no
t
sub
mit
ted
(201
5-1
6)
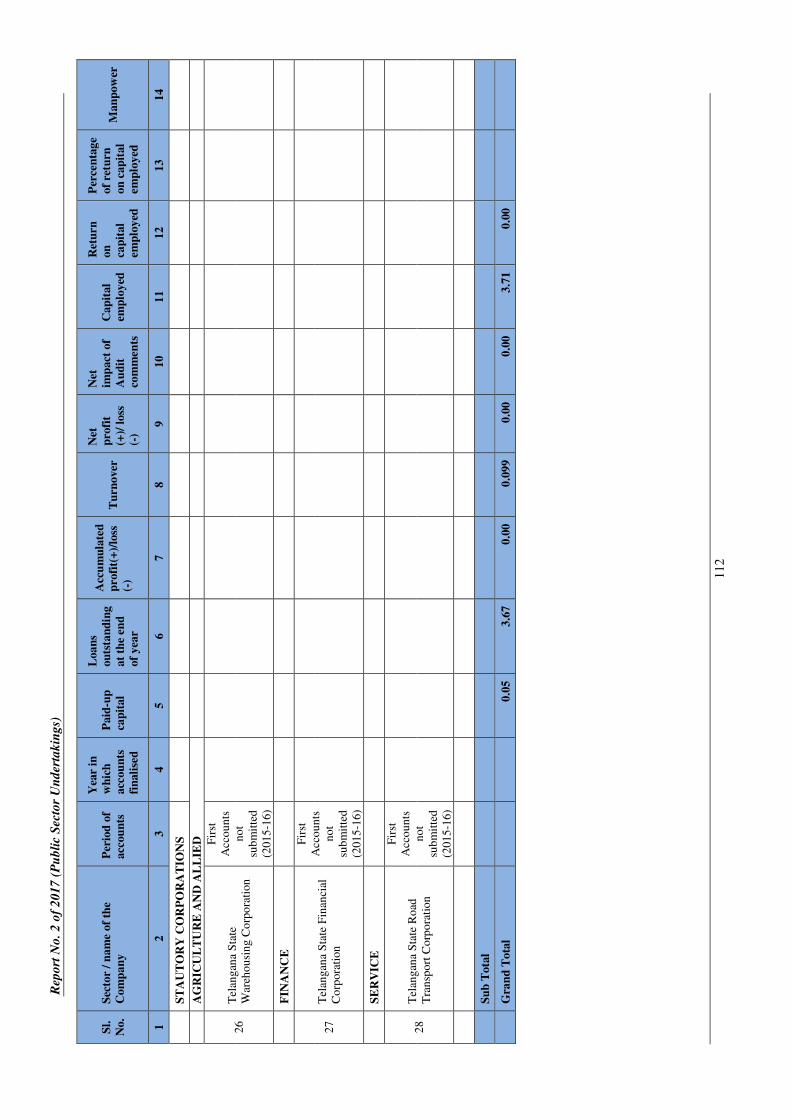
Rep
ort
No
. 2
of
20
17
(P
ub
lic
Sec
tor
Un
der
tak
ing
s)
11
2
Sl.
No.
Sec
tor
/ n
am
e of
the
Co
mp
an
y
Per
iod
of
acc
ou
nts
Yea
r in
wh
ich
acc
ou
nts
fin
ali
sed
Paid
-up
cap
ital
Loa
ns
ou
tsta
nd
ing
at
the
en
d
of
yea
r
Acc
um
ula
ted
profi
t(+
)/lo
ss
(-)
Tu
rn
over
Net
profi
t
(+)/
loss
(-)
Net
imp
act
of
Au
dit
com
men
ts
Cap
ital
em
plo
yed
Ret
urn
on
cap
ital
em
plo
yed
Per
cen
tag
e
of
retu
rn
on
cap
ital
em
plo
yed
Man
pow
er
1
2
3
4
5
6
7
8
9
10
11
12
13
14
S
TA
UT
OR
Y C
OR
PO
RA
TIO
NS
A
GR
ICU
LT
UR
E A
ND
AL
LIE
D
26
Tel
ang
ana
Sta
te
War
eho
usi
ng C
orp
ora
tion
Fir
st
Acco
un
ts
no
t
sub
mit
ted
(201
5-1
6)
F
INA
NC
E
27
Tel
ang
ana
Sta
te F
inan
cial
Co
rpora
tion
Fir
st
Acco
un
ts
no
t
sub
mit
ted
(201
5-1
6)
S
ER
VIC
E
28
Tel
ang
ana
Sta
te R
oad
Tra
nsp
ort
Co
rpo
rati
on
Fir
st
Acco
un
ts
no
t
sub
mit
ted
(201
5-1
6)
S
ub
Tota
l
G
ran
d T
ota
l
0
.05
3.6
7
0.0
0
0.0
99
0.0
0
0.0
0
3.7
1
0.0
0
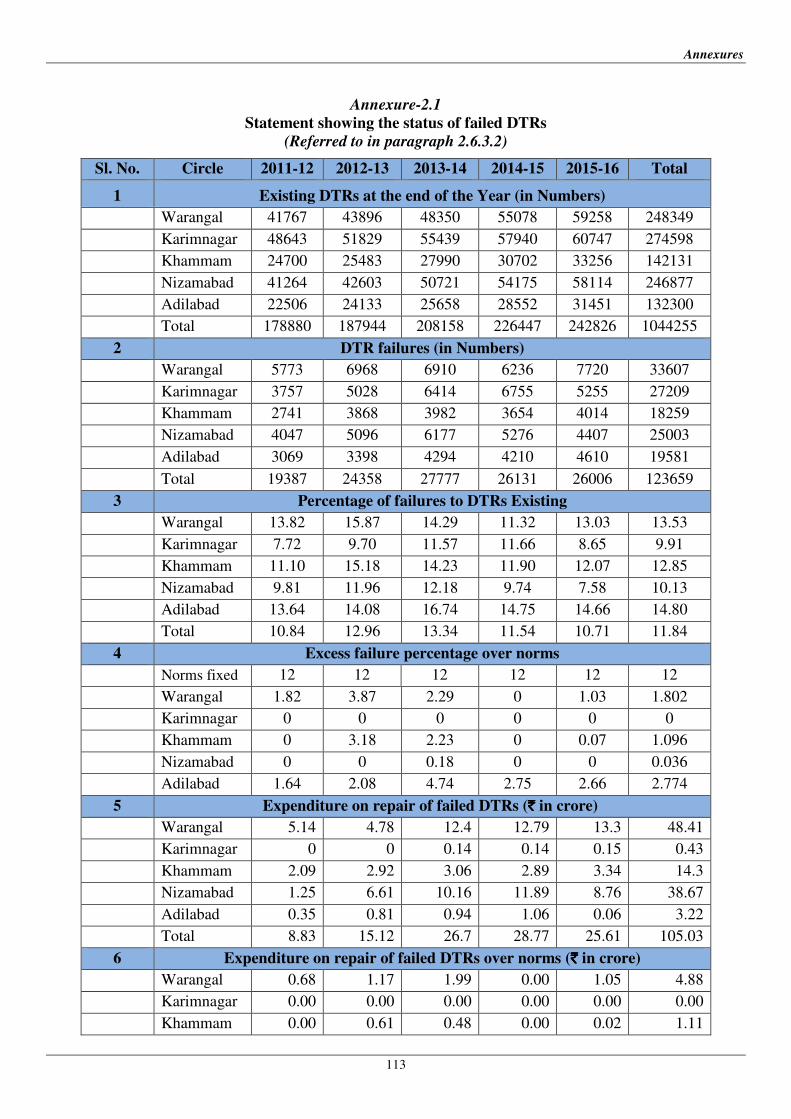
Annexures
113
Annexure-2.1
Statement showing the status of failed DTRs
(Referred to in paragraph 2.6.3.2)
Sl. No. Circle 2011-12 2012-13 2013-14 2014-15 2015-16 Total
1 Existing DTRs at the end of the Year (in Numbers)
Warangal 41767 43896 48350 55078 59258 248349
Karimnagar 48643 51829 55439 57940 60747 274598
Khammam 24700 25483 27990 30702 33256 142131
Nizamabad 41264 42603 50721 54175 58114 246877
Adilabad 22506 24133 25658 28552 31451 132300
Total 178880 187944 208158 226447 242826 1044255
2 DTR failures (in Numbers)
Warangal 5773 6968 6910 6236 7720 33607
Karimnagar 3757 5028 6414 6755 5255 27209
Khammam 2741 3868 3982 3654 4014 18259
Nizamabad 4047 5096 6177 5276 4407 25003
Adilabad 3069 3398 4294 4210 4610 19581
Total 19387 24358 27777 26131 26006 123659
3 Percentage of failures to DTRs Existing
Warangal 13.82 15.87 14.29 11.32 13.03 13.53
Karimnagar 7.72 9.70 11.57 11.66 8.65 9.91
Khammam 11.10 15.18 14.23 11.90 12.07 12.85
Nizamabad 9.81 11.96 12.18 9.74 7.58 10.13
Adilabad 13.64 14.08 16.74 14.75 14.66 14.80
Total 10.84 12.96 13.34 11.54 10.71 11.84
4 Excess failure percentage over norms
Norms fixed 12 12 12 12 12 12
Warangal 1.82 3.87 2.29 0 1.03 1.802
Karimnagar 0 0 0 0 0 0
Khammam 0 3.18 2.23 0 0.07 1.096
Nizamabad 0 0 0.18 0 0 0.036
Adilabad 1.64 2.08 4.74 2.75 2.66 2.774
5 Expenditure on repair of failed DTRs (`̀̀̀ in crore)
Warangal 5.14 4.78 12.4 12.79 13.3 48.41
Karimnagar 0 0 0.14 0.14 0.15 0.43
Khammam 2.09 2.92 3.06 2.89 3.34 14.3
Nizamabad 1.25 6.61 10.16 11.89 8.76 38.67
Adilabad 0.35 0.81 0.94 1.06 0.06 3.22
Total 8.83 15.12 26.7 28.77 25.61 105.03
6 Expenditure on repair of failed DTRs over norms (`̀̀̀ in crore)
Warangal 0.68 1.17 1.99 0.00 1.05 4.88
Karimnagar 0.00 0.00 0.00 0.00 0.00 0.00
Khammam 0.00 0.61 0.48 0.00 0.02 1.11

Report No. 2 of 2017 (Public Sector Undertakings)
114
Nizamabad 0.00 0.00 0.15 0.00 0.00 0.15
Adilabad 0.04 0.12 0.27 0.20 0.01 0.64
Total 0.72 1.90 2.88 0.20 1.08 6.78
Source: Company records

Annexures
115
Annexure-2.2
Statement showing capital work orders issued, closed during the year and pending
closure for the period 2012-13 to 2015-16
(Referred to in paragraph 2.6.3.4)
Particulars 2012-13 2013-14 2014-15 2015-16
Nos. `̀̀̀ in lakh Nos. `̀̀̀ in lakh Nos. `̀̀̀ in lakh Nos. `̀̀̀ in lakh
Opening balance 10859 23176 13008 31945 11363 30645 13730 27938
Released during the
year 12904 37017 13585 34068 16989 36442 19990 67781
Closed to end of
the year 10755 28248 15230 35367 14622 39149 15402 37717
Closing balance 13008 31945 11363 30645 13730 27938 18318 58002
Age-wise position of Work Orders pending closure
<6 months 7721 10681 7509 13552 8414 12314 11346 26401
>6 and < 12 months 2402 6990 1060 2874 2695 4444 3107 12913
1 Year and above 2381 10450 2042 10630 2175 6215 3097 14097
2 Years and above 504 3824 752 3590 446 4965 768 4591
Total 13008 31945 11363 30645 13730 27938 18318 58002
Source: MIS reports of the Company
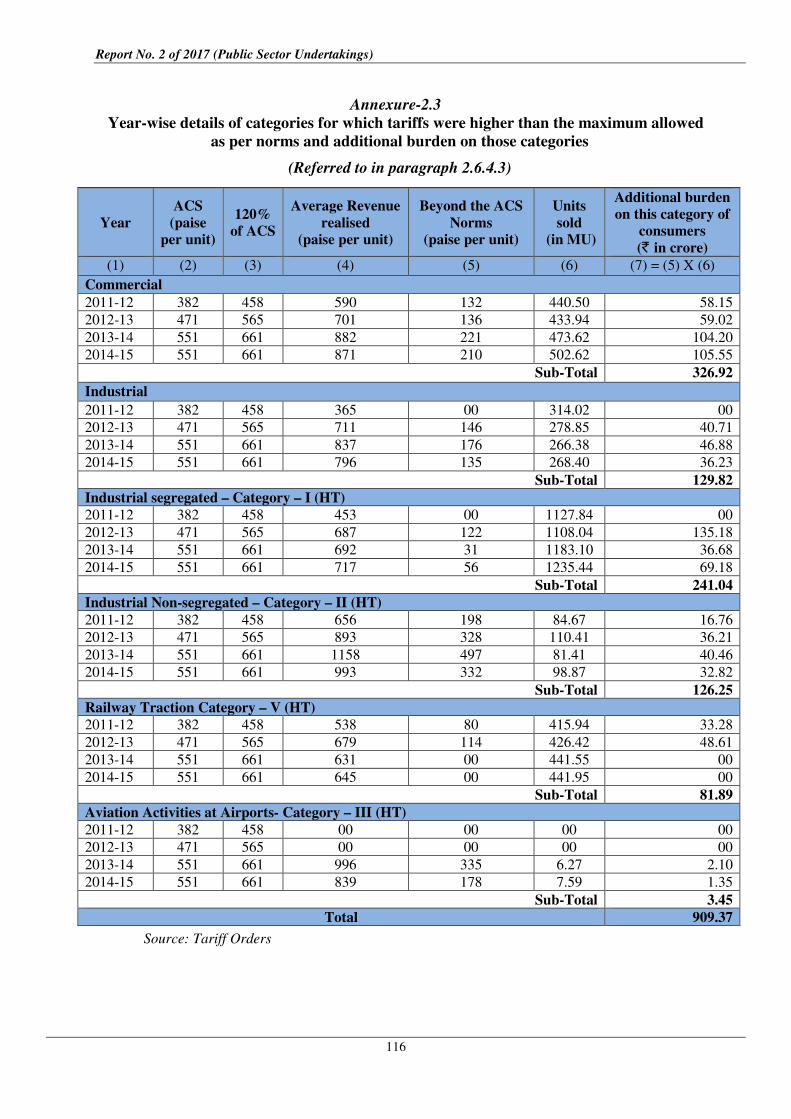
Report No. 2 of 2017 (Public Sector Undertakings)
116
Annexure-2.3
Year-wise details of categories for which tariffs were higher than the maximum allowed
as per norms and additional burden on those categories
(Referred to in paragraph 2.6.4.3)
Year
ACS
(paise
per unit)
120%
of ACS
Average Revenue
realised
(paise per unit)
Beyond the ACS
Norms
(paise per unit)
Units
sold
(in MU)
Additional burden
on this category of
consumers
(` in crore)
(1) (2) (3) (4) (5) (6) (7) = (5) X (6)
Commercial
2011-12 382 458 590 132 440.50 58.15
2012-13 471 565 701 136 433.94 59.02
2013-14 551 661 882 221 473.62 104.20
2014-15 551 661 871 210 502.62 105.55
Sub-Total 326.92
Industrial
2011-12 382 458 365 00 314.02 00
2012-13 471 565 711 146 278.85 40.71
2013-14 551 661 837 176 266.38 46.88
2014-15 551 661 796 135 268.40 36.23
Sub-Total 129.82
Industrial segregated – Category – I (HT)
2011-12 382 458 453 00 1127.84 00
2012-13 471 565 687 122 1108.04 135.18
2013-14 551 661 692 31 1183.10 36.68
2014-15 551 661 717 56 1235.44 69.18
Sub-Total 241.04
Industrial Non-segregated – Category – II (HT)
2011-12 382 458 656 198 84.67 16.76
2012-13 471 565 893 328 110.41 36.21
2013-14 551 661 1158 497 81.41 40.46
2014-15 551 661 993 332 98.87 32.82
Sub-Total 126.25
Railway Traction Category – V (HT)
2011-12 382 458 538 80 415.94 33.28
2012-13 471 565 679 114 426.42 48.61
2013-14 551 661 631 00 441.55 00
2014-15 551 661 645 00 441.95 00
Sub-Total 81.89
Aviation Activities at Airports- Category – III (HT)
2011-12 382 458 00 00 00 00
2012-13 471 565 00 00 00 00
2013-14 551 661 996 335 6.27 2.10
2014-15 551 661 839 178 7.59 1.35
Sub-Total 3.45
Total 909.37
Source: Tariff Orders
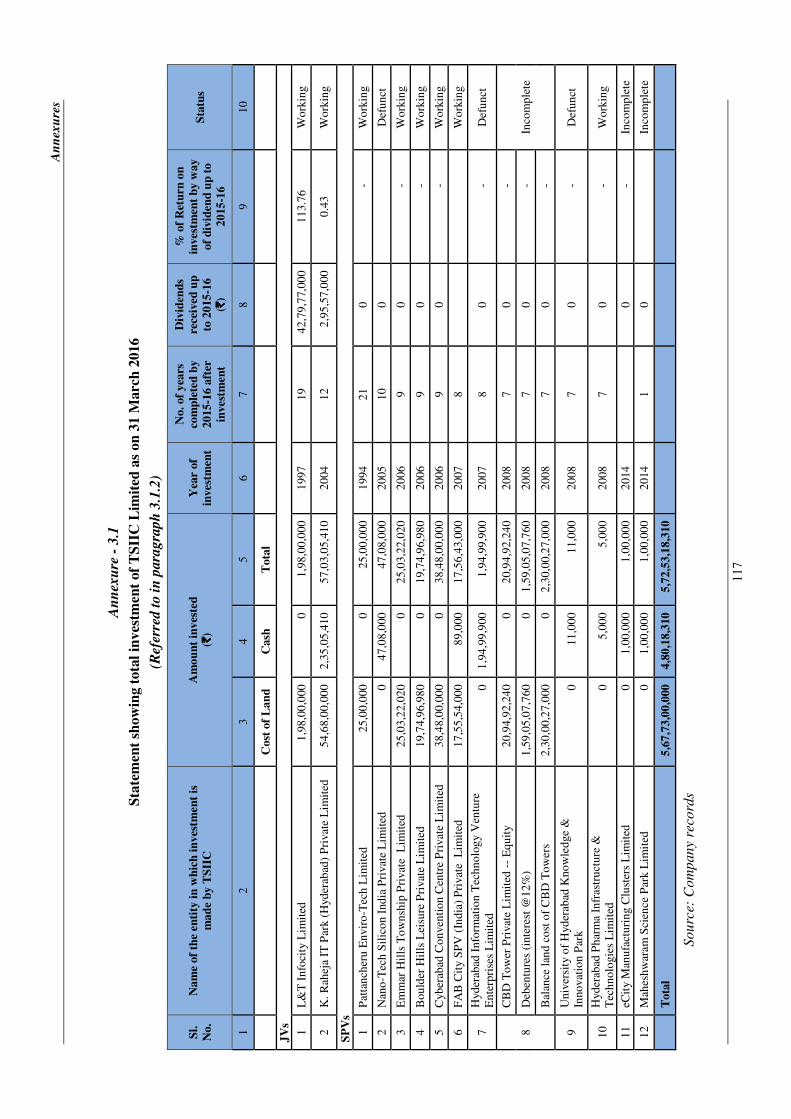
An
nex
ure
s
11
7
An
nex
ure
- 3
.1
Sta
tem
ent
show
ing t
ota
l in
ves
tmen
t of
TS
IIC
Lim
ited
as
on
31 M
arc
h 2
016
(Ref
erre
d t
o i
n p
ara
gra
ph
3.1
.2)
Sl.
No.
Na
me
of
the
en
tity
in
wh
ich
in
ves
tmen
t is
ma
de
by
TS
IIC
Am
ou
nt
inv
este
d
(`̀̀̀)
Yea
r of
invest
men
t
No.
of
yea
rs
com
ple
ted
by
20
15
-16
aft
er
invest
men
t
Div
iden
ds
rece
ived
up
to 2
015
-16
(`̀̀̀)
% o
f R
etu
rn
on
invest
men
t b
y w
ay
of
div
iden
d u
p t
o
20
15
-16
Sta
tus
1
2
3
4
5
6
7
8
9
10
Cost
of
La
nd
C
ash
T
ota
l
JV
s
1
L&
T I
nfo
city
Lim
ited
1
,98
,00
,000
0
1,9
8,0
0,0
00
19
97
19
42
,79
,77,0
00
11
3.7
6
Wo
rkin
g
2
K.
Rah
eja
IT P
ark (
Hyd
erab
ad)
Pri
vat
e L
imit
ed
54
,68
,00,0
00
2,3
5,0
5,4
10
57
,03
,05,4
10
20
04
12
2,9
5,5
7,0
00
0.4
3
Wo
rkin
g
SP
Vs
1
Pat
tan
cher
u E
nvir
o-T
ech
Lim
ited
2
5,0
0,0
00
0
25
,00
,000
19
94
21
0
-
Wo
rkin
g
2
Nan
o-T
ech
Sil
ico
n I
nd
ia P
rivat
e L
imit
ed
0
47
,08
,000
47
,08
,000
20
05
10
0
D
efu
nct
3
Em
mar
Hil
ls T
ow
nsh
ip P
rivat
e L
imit
ed
25
,03
,22,0
20
0
25
,03
,22,0
20
20
06
9
0
-
Wo
rkin
g
4
Bo
uld
er H
ills
Lei
sure
Pri
vat
e L
imit
ed
19
,74
,96,9
80
0
19
,74
,96,9
80
20
06
9
0
-
Wo
rkin
g
5
Cyb
erab
ad C
on
ven
tio
n C
entr
e P
rivat
e L
imit
ed
38
,48
,00,0
00
0
38
,48
,00,0
00
20
06
9
0
-
Wo
rkin
g
6
FA
B C
ity S
PV
(In
dia
) P
rivat
e L
imit
ed
17
,55
,54,0
00
89
,000
17
,56
,43,0
00
20
07
8
Wo
rkin
g
7
Hyd
erab
ad I
nfo
rmat
ion
Tec
hn
olo
gy V
entu
re
En
terp
rise
s L
imit
ed
0
1,9
4,9
9,9
00
1,9
4,9
9,9
00
20
07
8
0
-
Def
un
ct
8
CB
D T
ow
er P
rivat
e L
imit
ed -
- E
qu
ity
20
,94
,92,2
40
0
20
,94
,92,2
40
20
08
7
0
-
Inco
mp
lete
D
eben
ture
s (i
nte
rest
@1
2%
) 1
,59
,05
,07
,760
0
1,5
9,0
5,0
7,7
60
20
08
7
0
-
Bal
ance
lan
d c
ost
of
CB
D T
ow
ers
2,3
0,0
0,2
7,0
00
0
2,3
0,0
0,2
7,0
00
20
08
7
0
-
9
Un
iver
sity
of
Hyd
erab
ad K
no
wle
dge
&
Inno
vat
ion
Par
k
0
11
,000
11
,000
20
08
7
0
-
Def
un
ct
10
Hyd
erab
ad P
har
ma
Infr
ast
ruct
ure
&
Tec
hn
olo
gie
s L
imit
ed
0
5,0
00
5,0
00
20
08
7
0
-
Wo
rkin
g
11
eCit
y M
anu
fact
uri
ng C
lust
ers
Lim
ited
0
1
,00
,00
0
1,0
0,0
00
20
14
0
-
Inco
mp
lete
12
Mah
esh
war
am
Sci
ence
Par
k L
imit
ed
0
1,0
0,0
00
1,0
0,0
00
20
14
1
0
In
com
ple
te
T
ota
l 5
,67
,73
,00
,000
4,8
0,1
8,3
10
5,7
2,5
3,1
8,3
10
Sourc
e: C
om
pany
reco
rds
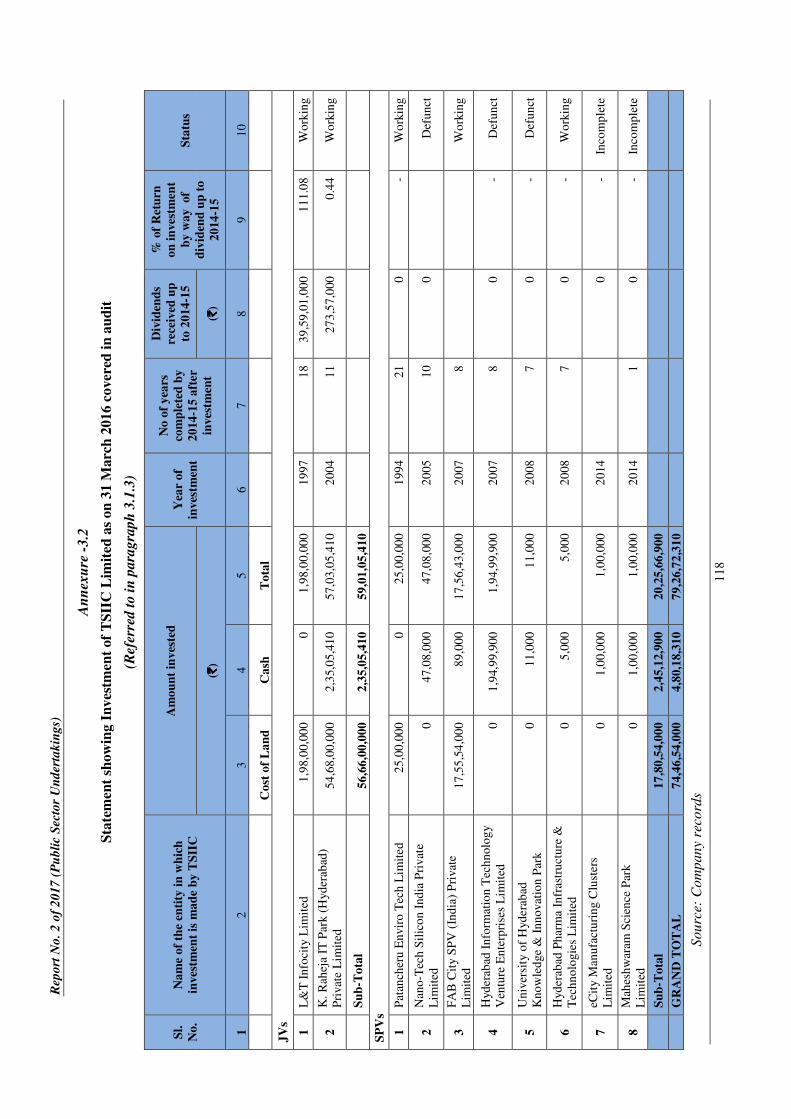
Rep
ort
No
. 2
of
20
17
(P
ub
lic
Sec
tor
Un
der
tak
ing
s)
11
8
An
nex
ure
-3.2
Sta
tem
ent
show
ing I
nves
tmen
t of
TS
IIC
Lim
ited
as
on
31 M
arc
h 2
016 c
over
ed i
n a
ud
it
(Ref
erre
d t
o i
n p
ara
gra
ph
3.1
.3)
Sl.
No
.
Na
me
of
the
enti
ty i
n w
hic
h
inves
tmen
t is
ma
de
by
TS
IIC
Am
ou
nt
inves
ted
Y
ear
of
inves
tmen
t
No
of
yea
rs
com
ple
ted
by
20
14
-15
aft
er
inves
tmen
t
Div
iden
ds
rece
ived
up
to 2
014
-15
% o
f R
etu
rn
on
in
ves
tmen
t
by
wa
y of
div
iden
d u
p t
o
20
14
-15
Sta
tus
(`̀̀̀)
(`̀̀̀)
1
2
3
4
5
6
7
8
9
10
Co
st o
f L
an
d
Ca
sh
To
tal
JV
s
1
L&
T I
nfo
city
Lim
ited
1
,98,0
0,0
00
0
1,9
8,0
0,0
00
19
97
18
39
,59
,01
,00
0
11
1.0
8
Wo
rkin
g
2
K.
Rah
eja
IT P
ark (
Hyd
erab
ad)
Pri
vat
e L
imit
ed
54
,68
,00
,00
0
2,3
5,0
5,4
10
57
,03
,05
,41
0
20
04
11
27
3,5
7,0
00
0.4
4
Wo
rkin
g
S
ub
-To
tal
56
,66
,00
,00
0
2,3
5,0
5,4
10
59
,01
,05
,41
0
SP
Vs
1
Pat
anch
eru
En
vir
o T
ech
Lim
ited
2
5,0
0,0
00
0
25
,00
,00
0
19
94
21
0
- W
ork
ing
2
Nan
o-T
ech
Sil
ico
n I
nd
ia P
riv
ate
Lim
ited
0
4
7,0
8,0
00
47
,08
,00
0
20
05
10
0
D
efu
nct
3
FA
B C
ity S
PV
(In
dia
) P
rivat
e
Lim
ited
1
7,5
5,5
4,0
00
89
,00
0
17
,56
,43
,00
0
20
07
8
Wo
rkin
g
4
Hyd
era
bad
In
form
atio
n T
ech
nolo
gy
Ven
ture
En
terp
rise
s L
imit
ed
0
1,9
4,9
9,9
00
1,9
4,9
9,9
00
20
07
8
0
- D
efu
nct
5
Un
iver
sity
of
Hyd
era
bad
Kn
ow
led
ge
& I
nn
ovat
ion
Par
k
0
11
,00
0
11
,00
0
20
08
7
0
- D
efu
nct
6
Hyd
era
bad
Ph
arm
a In
fras
tru
ctu
re &
Tec
hn
olo
gie
s L
imit
ed
0
5,0
00
5,0
00
20
08
7
0
- W
ork
ing
7
eCit
y M
anu
fact
uri
ng C
lust
ers
Lim
ited
0
1
,00,0
00
1,0
0,0
00
20
14
0
-
Inco
mp
lete
8
Mah
esh
war
am S
cien
ce P
ark
Lim
ited
0
1
,00,0
00
1,0
0,0
00
20
14
1
0
- In
com
ple
te
S
ub
-To
tal
17
,80
,54
,00
0
2,4
5,1
2,9
00
20
,25
,66
,90
0
G
RA
ND
TO
TA
L
74
,46
,54
,00
0
4,8
0,1
8,3
10
79
,26
,72
,31
0
Sourc
e: C
om
pany
reco
rds

An
nex
ure
s
11
9
An
nex
ure
- 3
.3(a
)
Irre
gu
lar
exte
nsi
on
of
pow
er C
on
cess
ion
to C
om
mer
cial
un
its
esta
bli
shed
in
IT
in
frast
ruct
ure
co
mp
an
ies
(Ref
erre
d t
o i
n p
ara
gra
ph
3.3
.2.1
)
( `̀̀̀ i
n c
rore
)
Sl.
No.
Ser
vic
e
No.
Na
me
of
con
sum
er
Natu
re o
f C
om
mer
cial
esta
bli
shm
ent
Date
of
con
ver
sion
Per
iod
du
rin
g
wh
ich
con
cess
ion
al
tari
ff e
xte
nd
ed
Loss
of
Rev
enu
e d
ue
to b
illi
ng u
nd
er
HT
-I
1
HD
N-1
353
In
tim
e P
roper
ties
Pri
vat
e L
imit
ed
Kid
de
India
L
td.
(UT
C
Fir
e &
sa
fety
),
a
man
ufa
cture
r of
fire
pro
tect
ion
syst
ems
and
a
food c
ourt
(M
elti
ng P
oin
t),
Am
azon,
Sta
te B
ank
of
Hyder
abad
, C
ross
word
29-0
9-2
012
29-1
0-2
012 t
o
31-0
3-2
016
3.3
5
2
HD
N-8
42
L
&T
In
fo c
ity
Asc
endas
Lim
ited
Ban
ks
(Kar
ur
Vysy
a B
ank,
HD
FC
B
ank,
Ax
is
Ban
k,
Cit
y B
ank),
Hea
lth
clu
b,
hote
ls,
rest
aura
nts
,
recr
eati
on c
lub
21-0
7-2
004
21-0
7-2
004 t
o
31-0
3-2
016
3.3
6
3
HD
N-1
765
S
alar
puri
a P
roper
ties
Pri
vat
e L
imit
ed
Buil
din
g
conta
inin
g
thre
e fl
oo
rs
for
par
kin
g,
bad
min
ton an
d cr
icket
co
urt
s, bas
ket
bal
l, ta
ble
tennis
, bil
liar
ds,
gym
wit
h s
how
ers,
caf
eter
ia w
ith
LC
D T
Vs,
Ban
k A
TM
s
07-0
3-2
014
07-0
3-2
014 t
o
31-0
3-2
016
0.4
4
HD
N-6
93
V
anen
burg
IT
Par
k
Pri
vat
e L
imit
ed
Mult
i bra
nd f
ood c
ourt
s (D
om
inos,
Roti
&M
ore
,
Die
tcet
era
Yum
my a
nd w
angs)
, R
etai
l st
ore
(E
uro
Fas
hio
ns,
Gro
cers
), C
onti
nen
tal
Hosp
ital
s, H
ealt
h
'n' G
low
, g
ym
nas
ium
24-0
1-2
001
04-0
4-2
002 t
o
31-0
3-2
016
11.5
6
5
HD
N-7
17
L&
T I
nfo
cit
y
Lim
ited
, C
yb
er
Gat
eway-2
A
Foods,
B
aker
s, B
anks,
co
ffee
bar
, Ju
ice
centr
e,
educa
tional
ce
ntr
es,
Ban
ks
and
AT
Ms
(Vysy
a,
ICIC
I B
ank,
Andhra
Ban
k a
nd O
BC
)
09-1
0-2
001
04-0
4-2
002 t
o
31-0
3-2
016
6.4
7
6
HD
N-7
63
L&
T I
nfo
cit
y
Lim
ited
, C
yb
er
Gat
eway-2
B
Ban
ks,
co
ffee
bar
, M
obil
e S
tore
s (A
irte
l,
Vodaf
one)
11-1
0-2
002
11-1
0-2
002 t
o
31-0
3-2
016
4.8
9

Rep
ort
No
. 2
of
20
17
(P
ub
lic
Sec
tor
Un
der
tak
ing
s)
12
0
Sl.
No.
Ser
vic
e
No.
Na
me
of
con
sum
er
Natu
re o
f C
om
mer
cial
esta
bli
shm
ent
Date
of
con
ver
sion
Per
iod
du
rin
g
wh
ich
con
cess
ion
al
tari
ff e
xte
nd
ed
Loss
of
Rev
enu
e d
ue
to b
illi
ng u
nd
er
HT
-I
7
HD
N-1
016
K. R
ahej
a IT
Par
k
(Hyder
abad
) P
rivat
e
Lim
ited
Pre
mie
r K
inder
C
are
serv
ice,
S
ow
edan
e
Dev
eloper
, ca
fete
ria
(Red
ch
illi
),
Val
ue
add
ed
Know
led
ge
Ser
vic
e,
Vai
shnav
i C
orp
ora
tion
Pri
vat
e L
imit
ed,
CB
RE
S
outh
A
sia
Pri
vat
e
Lim
ited
(co
nsu
ltan
ts)
14-1
2-2
007
14-1
2-2
007 t
o
31-0
3-2
016
3.3
6
8
HD
N-9
74
K. R
ahej
a IT
Par
k
(Hyder
abad
) P
rivat
e
Lim
ited
ICIC
I B
ank,
Coff
ee D
ay,
Bro
ad M
ind P
rop
erti
es
Pri
vat
e L
imit
ed
03-0
7-2
006
03-0
7-2
006 t
o
31-0
3-2
016
4.8
2
T
ota
l 38.2
1
Sourc
e: C
om
pany
reco
rds
/ w
ebsi
te a
nd r
espec
tive
IT
com
pany
web
site
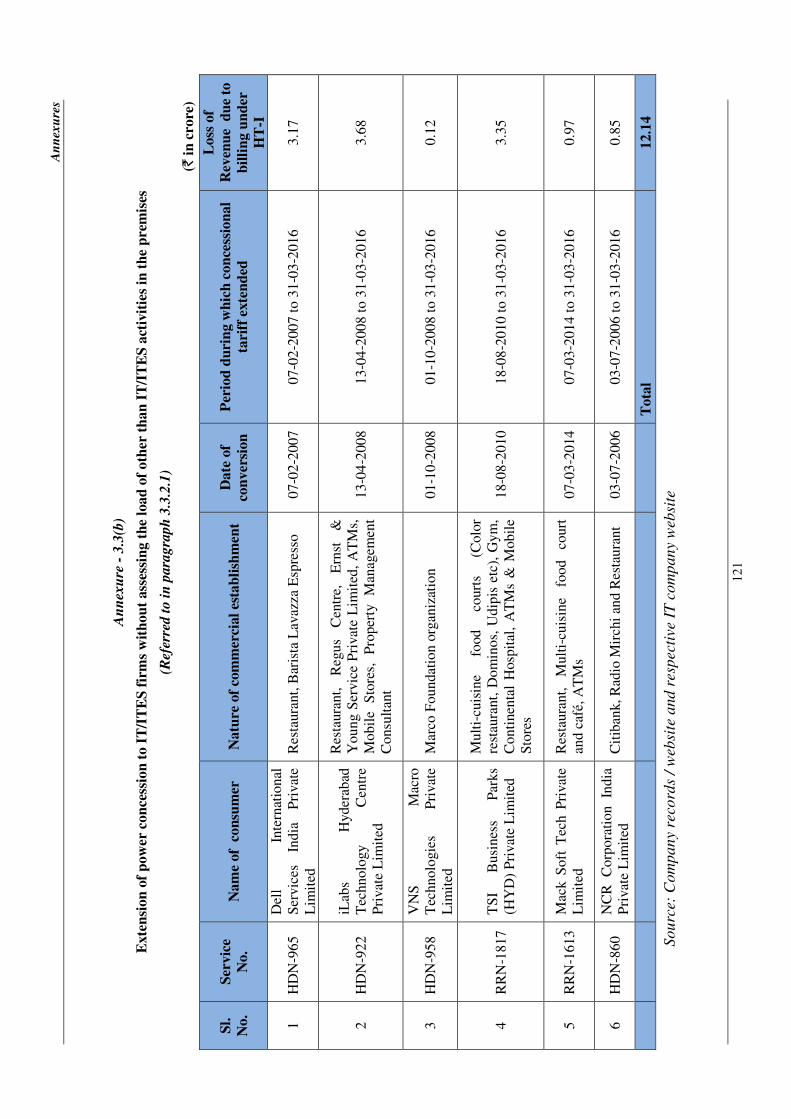
An
nex
ure
s
12
1
An
nex
ure
- 3
.3(b
)
Exte
nsi
on
of
pow
er c
on
cess
ion
to I
T/I
TE
S f
irm
s w
ith
ou
t ass
essi
ng t
he
load
of
oth
er t
han
IT
/IT
ES
act
ivit
ies
in t
he
pre
mis
es
(Ref
erre
d t
o i
n p
ara
gra
ph
3.3
.2.1
)
(` i
n c
rore
)
Sl.
No.
Ser
vic
e
No.
Nam
e of
con
sum
er
Natu
re o
f co
mm
erci
al
esta
bli
shm
ent
Date
of
con
ver
sion
Per
iod
du
rin
g w
hic
h c
on
cess
ion
al
tari
ff e
xte
nd
ed
Loss
of
Rev
enu
e d
ue
to
bil
lin
g u
nd
er
HT
-I
1
HD
N-9
65
Del
l In
tern
atio
nal
Ser
vic
es
India
P
rivat
e
Lim
ited
Res
taura
nt,
Bar
ista
Lav
azza
Esp
ress
o
07-0
2-2
007
07-0
2-2
007 t
o 3
1-0
3-2
016
3.1
7
2
HD
N-9
22
iLab
s H
yder
abad
Tec
hnolo
gy
Cen
tre
Pri
vat
e L
imit
ed
Res
taura
nt,
R
egus
Cen
tre,
E
rnst
&
Young S
ervic
e P
rivat
e L
imit
ed,
AT
Ms,
Mobil
e S
tore
s,
Pro
per
ty
Man
agem
ent
Consu
ltan
t
13-0
4-2
008
13-0
4-2
008 t
o 3
1-0
3-2
016
3.6
8
3
HD
N-9
58
VN
S
Mac
ro
Tec
hnolo
gie
s P
rivat
e
Lim
ited
Mar
co F
oundat
ion o
rgan
izat
ion
01-1
0-2
008
01-1
0-2
008 t
o 3
1-0
3-2
016
0.1
2
4
RR
N-1
817
TS
I B
usi
nes
s P
arks
(HY
D)
Pri
vat
e L
imit
ed
Mult
i-cu
isin
e fo
od
court
s (C
olo
r
rest
aura
nt,
Dom
inos,
Udip
is e
tc),
Gym
,
Conti
nen
tal
Hosp
ital
, A
TM
s &
Mobil
e
Sto
res
18-0
8-2
010
18-0
8-2
010 t
o 3
1-0
3-2
016
3.3
5
5
RR
N-1
613
Mac
k S
oft
Tec
h P
rivat
e
Lim
ited
Res
taura
nt,
M
ult
i-cu
isin
e fo
od
court
and c
afé,
AT
Ms
07-0
3-2
014
07-0
3-2
014 t
o 3
1-0
3-2
016
0.9
7
6
HD
N-8
60
N
CR
C
orp
ora
tion
India
Pri
vat
e L
imit
ed
Cit
iban
k, R
adio
Mir
chi
and R
esta
ura
nt
03-0
7-2
006
03-0
7-2
006 t
o 3
1-0
3-2
016
0.8
5
T
ota
l 12.1
4
Sourc
e: C
om
pany
reco
rds
/ w
ebsi
te a
nd r
espec
tive
IT
com
pany
web
site
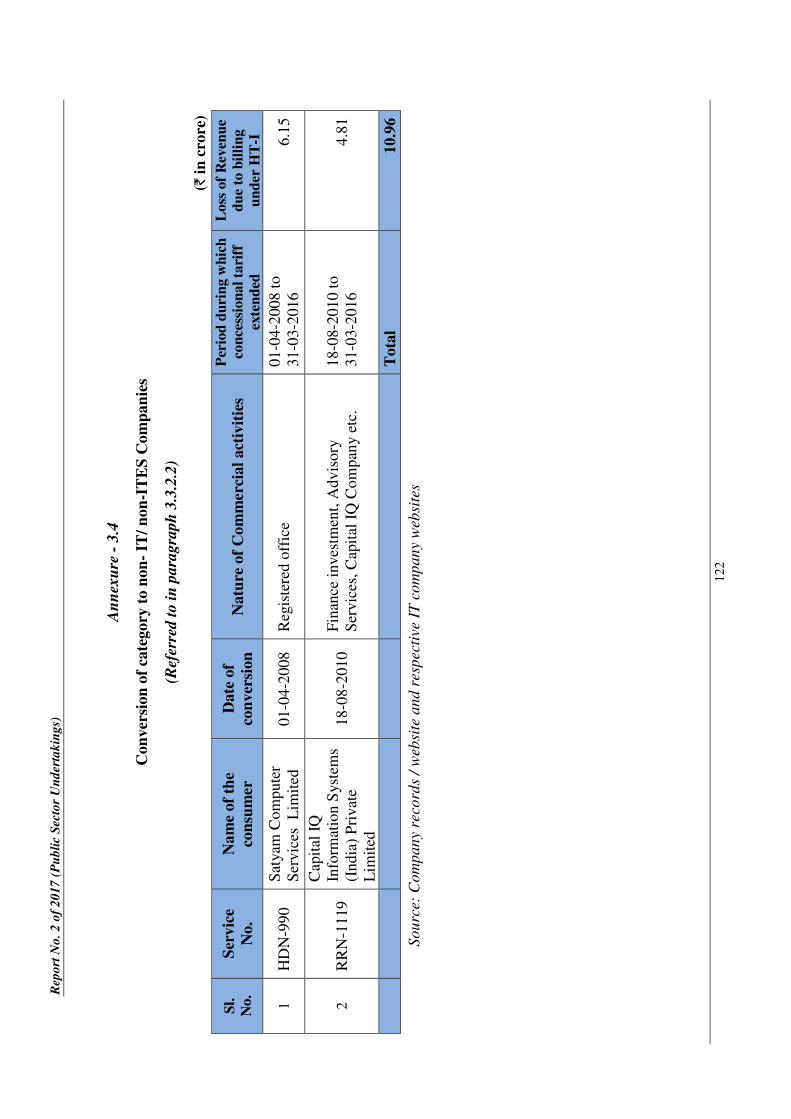
Rep
ort
No
. 2
of
20
17
(P
ub
lic
Sec
tor
Un
der
tak
ing
s)
12
2
An
nex
ure
- 3
.4
Con
ver
sion
of
cate
gory
to n
on
- IT
/ n
on
-IT
ES
Com
pan
ies
(Ref
erre
d t
o i
n p
ara
gra
ph
3.3
.2.2
)
( ` i
n c
rore
)
Sl.
No.
Ser
vic
e
No.
Na
me
of
the
con
sum
er
Date
of
con
ver
sion
N
atu
re o
f C
om
mer
cial
act
ivit
ies
Per
iod
du
rin
g w
hic
h
con
cess
ion
al
tari
ff
exte
nd
ed
Loss
of
Rev
enu
e
du
e to
bil
lin
g
un
der
HT
-I
1
HD
N-9
90
S
atyam
Com
pute
r
Ser
vic
es
Lim
ited
01-0
4-2
008
R
egis
tere
d o
ffic
e
01-0
4-2
008 t
o
31-0
3-2
016
6.1
5
2
RR
N-1
119
Cap
ital
IQ
Info
rmat
ion S
yst
ems
(India
) P
rivat
e
Lim
ited
18-0
8-2
010
F
inan
ce i
nves
tmen
t, A
dv
isory
Ser
vic
es, C
apit
al I
Q C
om
pan
y e
tc.
18-0
8-2
010 t
o
31-0
3-2
016
4.8
1
T
ota
l 10.9
6
Sourc
e: C
om
pany
reco
rds
/ w
ebsi
te a
nd r
espec
tive
IT
com
pany
web
site
s
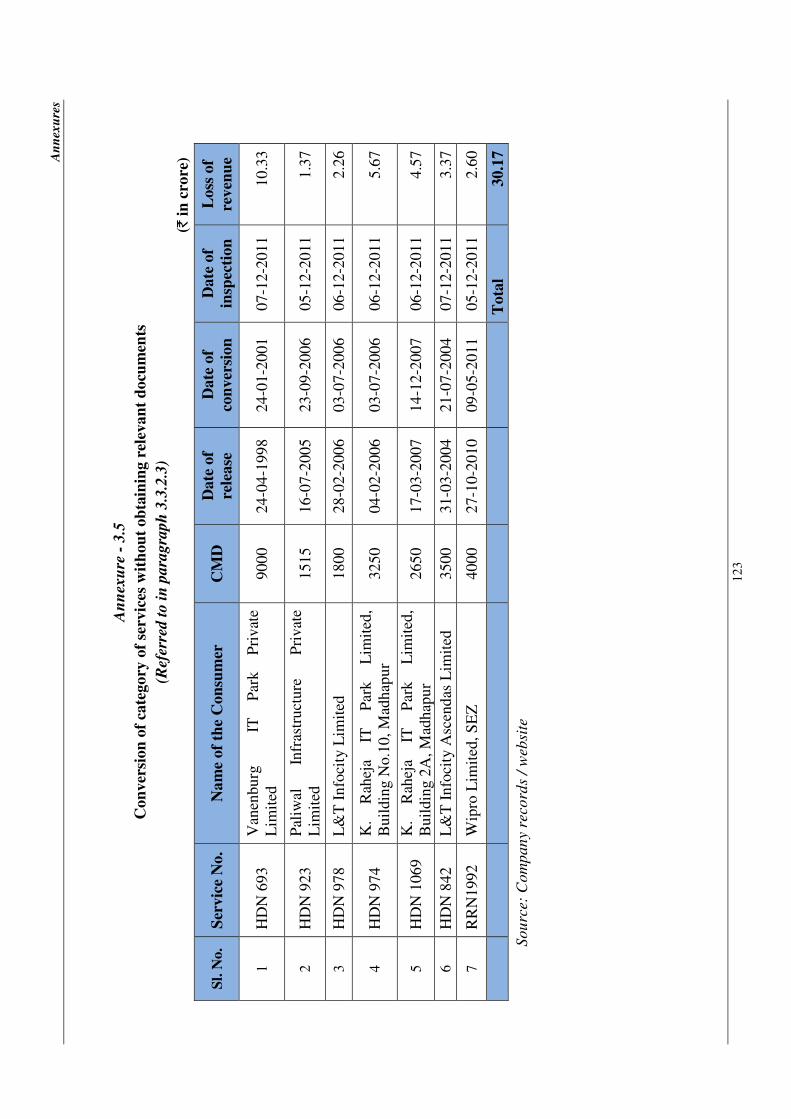
An
nex
ure
s
12
3
An
nex
ure
- 3
.5
Con
ver
sion
of
cate
gory
of
serv
ices
wit
hou
t ob
tain
ing r
elev
an
t d
ocu
men
ts
(Ref
erre
d t
o i
n p
ara
gra
ph
3.3
.2.3
)
(` i
n c
rore
)
Sl.
No.
Ser
vic
e N
o.
Na
me
of
the
Con
sum
er
CM
D
Date
of
rele
ase
Date
of
con
ver
sion
Date
of
insp
ecti
on
Loss
of
reven
ue
1
HD
N 6
93
V
anen
burg
IT
Par
k
Pri
vat
e
Lim
ited
9000
24-0
4-1
998
24-0
1-2
001
07-1
2-2
011
10.3
3
2
HD
N 9
23
P
aliw
al
Infr
astr
uct
ure
P
rivat
e
Lim
ited
1515
16-0
7-2
005
23-0
9-2
006
05-1
2-2
011
1.3
7
3
HD
N 9
78
L
&T
In
foci
ty L
imit
ed
1800
28-0
2-2
006
03-0
7-2
006
06-1
2-2
011
2.2
6
4
HD
N 9
74
K
. R
ahej
a IT
P
ark
L
imit
ed,
Buil
din
g N
o.1
0, M
adhap
ur
3250
04-0
2-2
006
03-0
7-2
006
06-1
2-2
011
5.6
7
5
HD
N 1
069
K
. R
ahej
a IT
P
ark
L
imit
ed,
Buil
din
g 2
A, M
adhap
ur
2650
17-0
3-2
007
14-1
2-2
007
06-1
2-2
011
4.5
7
6
HD
N 8
42
L
&T
In
foci
ty A
scen
das
Lim
ited
3500
31-0
3-2
004
21-0
7-2
004
07-1
2-2
011
3.3
7
7
RR
N1992
Wip
ro L
imit
ed, S
EZ
4000
27-1
0-2
010
09-0
5-2
011
05-1
2-2
011
2.6
0
Tota
l 30.1
7
Sourc
e: C
om
pany
reco
rds
/ w
ebsi
te

Rep
ort
No
. 2
of
20
17
(P
ub
lic
Sec
tor
Un
der
tak
ing
s)
12
4
An
nex
ure
- 3
.6
Con
ver
sion
of
cate
gory
of
seco
nd
an
d s
ub
seq
uen
t u
nit
s es
tab
lish
ed w
ith
in 1
00 K
Ms
(Ref
erre
d t
o i
n p
ara
gra
ph
3.3
.2.4
)
(` i
n c
rore
)
Sl.
No.
Ser
vic
e N
o.
Nam
e of
the
firm
A
dd
ress
D
ate
of
rele
ase
D
ate
of
con
ver
sion
L
oss
of
reven
ue
(`)`)`)`)
1
HD
N807
(1st U
nit
)
Tat
a C
onsu
ltan
cy
Ser
vic
es L
imit
ed
Plo
t N
o.1
, S
y. N
o.6
4/2
, M
adhap
ur,
Hyder
abad
17-1
0-2
003
el
igib
le
2
RR
N1366
Tat
a C
onsu
ltan
cy
Ser
vic
es L
imit
ed
Pre
mis
es N
o. 2-5
6/1
/36,S
Y.N
O. 26, G
achib
ow
li,
Ser
ilin
gam
pal
ly (
M),
R.R
. D
istr
ict
18-0
5-2
007
18-1
1-2
008
7.2
3
3
HD
N874
(1st U
nit
)
Pal
iwal
Infr
astr
uct
ure
(Pri
vat
e) L
imit
ed
Blo
ck “
A”
Plo
t N
o. 14 &
15, H
i-te
ch C
ity l
ayout
Sy. N
o. 64 (
P),
Mad
hap
ur,
Hyder
abad
24-1
0-2
004
el
igib
le
4
HD
N893
(2nd U
nit
)
Pal
iwal
Infr
astr
uct
ure
(Pri
vat
e) L
imit
ed
Blo
ck “
B”
Plo
t N
o. 14 &
15, H
i-te
ch C
ity l
ayout
Sy N
o. 64 (
P),
Mad
hap
ur,
Hyder
abad
15-0
2-2
005
23-0
9-2
006
3.3
5
5
HD
N923
(3
rd U
nit
)
Pal
iwal
Infr
astr
uct
ure
(Pri
vat
e) L
imit
ed
Blo
ck “
C”
Plo
t N
o. 14 &
15, H
i-te
ch C
ity l
ayout
Sy. N
o. 64 (
P),
Mad
hap
ur,
Hyder
abad
16-0
7-2
005
23-0
9-2
006
3.1
2
6
HD
N906
M/s
. K
. R
ahej
a IT
Par
k
(Pri
vat
e) L
imit
ed.
Bld
g N
o.1
B, S
y N
o.6
4, (P
art)
Hi-
Tec
h C
ity, M
indsp
ace,
Mad
hap
ur,
Hyder
abad
. 12-0
4-2
005
el
igib
le
7
HD
N988
M/s
. K
. R
ahej
a IT
Par
k
(Pri
vat
e) L
imit
ed.
Bld
g N
o.1
(A),
Sy.N
o.6
4(P
), N
ear
VS
NL
Lay
out,
Mad
hap
ur,
Hyder
abad
18-0
4-2
006
14-1
2-2
007
4.3
7
T
ota
l 18.0
7
Sourc
e: C
om
pany
reco
rds/
web
site
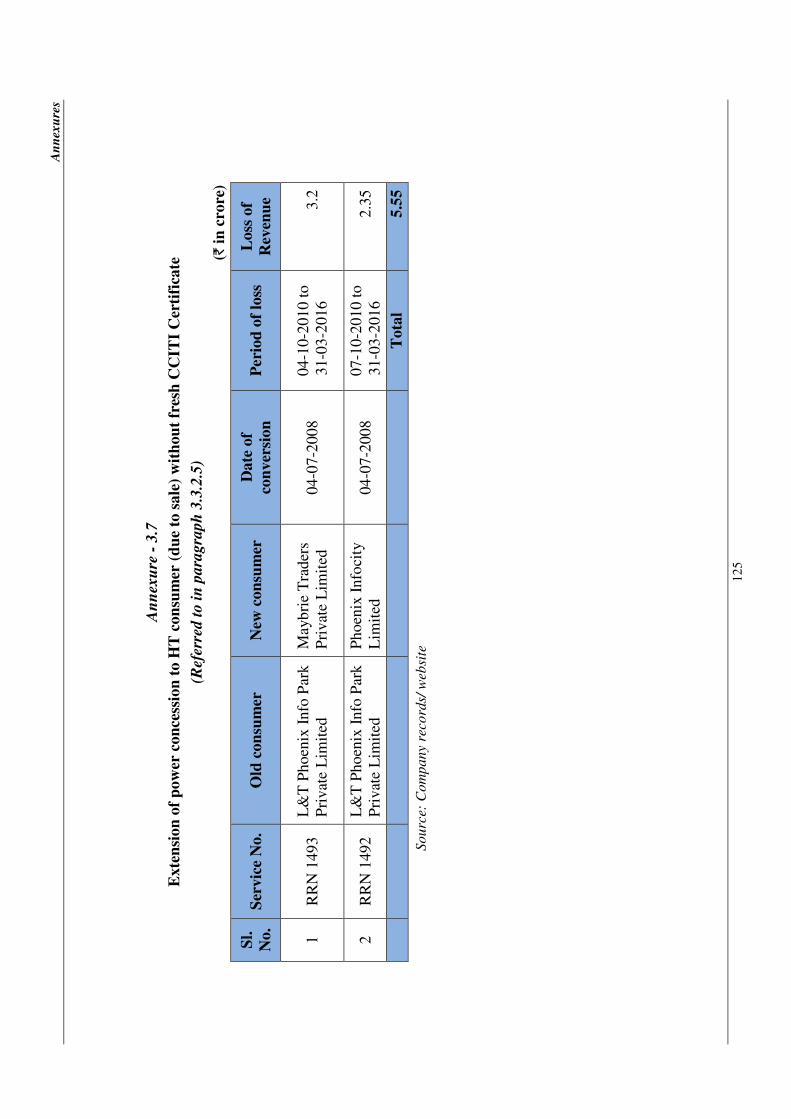
An
nex
ure
s
12
5
An
nex
ure
- 3
.7
Exte
nsi
on
of
pow
er c
on
cess
ion
to H
T c
on
sum
er (
du
e to
sale
) w
ith
ou
t fr
esh
CC
ITI
Cer
tifi
cate
(Ref
erre
d t
o i
n p
ara
gra
ph
3.3
.2.5
)
( `
in
cro
re)
Sl.
No.
Ser
vic
e N
o.
Old
con
sum
er
New
con
sum
er
Date
of
con
ver
sion
P
erio
d o
f lo
ss
Loss
of
Rev
enu
e
1
RR
N 1
493
L&
T P
hoen
ix I
nfo
Par
k
Pri
vat
e L
imit
ed
May
bri
e T
rader
s
Pri
vat
e L
imit
ed
04-0
7-2
008
04-1
0-2
010 t
o
31-0
3-2
016
3.2
2
RR
N 1
492
L&
T P
hoen
ix I
nfo
Par
k
Pri
vat
e L
imit
ed
Phoen
ix I
nfo
city
Lim
ited
04-0
7-2
008
07-1
0-2
010 t
o
31-0
3-2
016
2.3
5
T
ota
l 5.5
5
Sourc
e: C
om
pany
reco
rds/
web
site
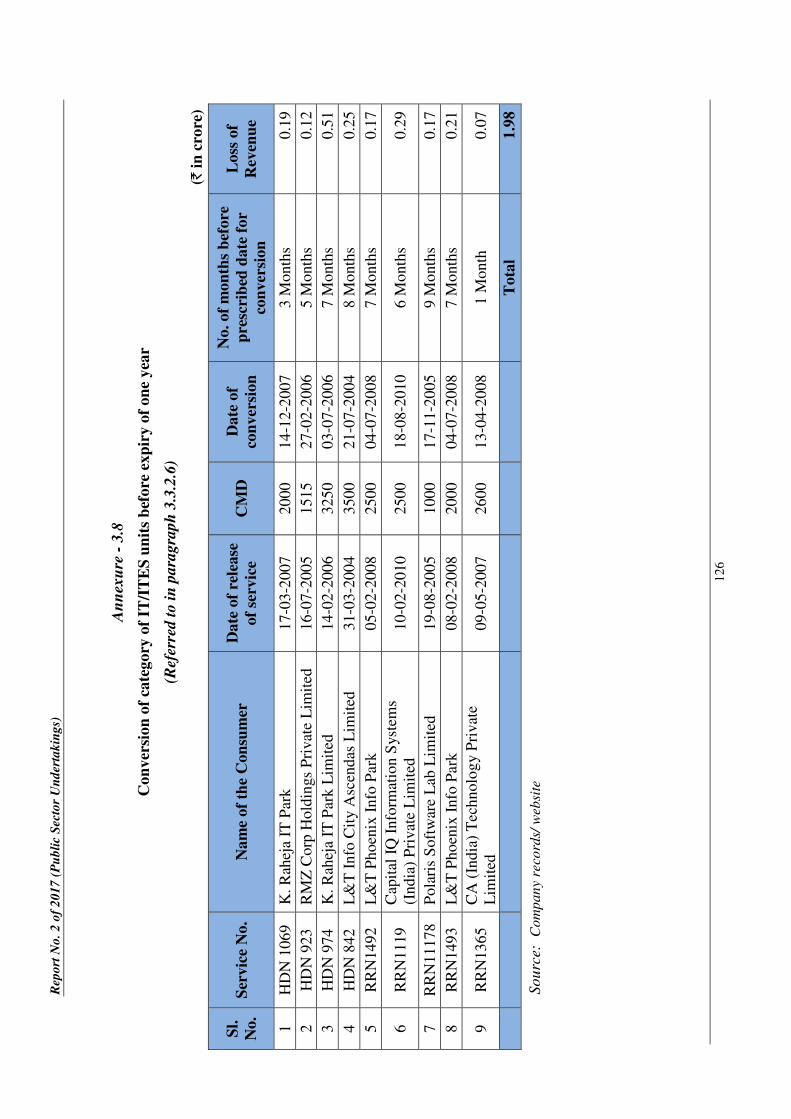
Rep
ort
No
. 2
of
20
17
(P
ub
lic
Sec
tor
Un
der
tak
ing
s)
12
6
An
nex
ure
- 3
.8
Con
ver
sion
of
cate
gory
of
IT/I
TE
S u
nit
s b
efore
exp
iry o
f on
e yea
r
(Ref
erre
d t
o i
n p
ara
gra
ph
3.3
.2.6
)
(` i
n c
rore
)
Sl.
No.
Ser
vic
e N
o.
Na
me
of
the
Con
sum
er
Date
of
rele
ase
of
serv
ice
CM
D
Date
of
con
ver
sion
No. of
mon
ths
bef
ore
pre
scri
bed
date
for
con
ver
sion
Loss
of
Rev
enu
e
1
HD
N 1
069
K
. R
ahej
a IT
Par
k
17-0
3-2
007
2000
14-1
2-2
007
3 M
onth
s 0.1
9
2
HD
N 9
23
R
MZ
Corp
Hold
ings
Pri
vat
e L
imit
ed
16-0
7-2
005
1515
27-0
2-2
006
5 M
onth
s 0.1
2
3
HD
N 9
74
K
. R
ahej
a IT
Par
k L
imit
ed
14-0
2-2
006
3250
03-0
7-2
006
7 M
onth
s 0.5
1
4
HD
N 8
42
L
&T
In
fo C
ity A
scen
das
Lim
ited
31-0
3-2
004
3500
21-0
7-2
004
8 M
onth
s 0.2
5
5
RR
N1492
L&
T P
hoen
ix I
nfo
Par
k
05-0
2-2
008
2500
04-0
7-2
008
7 M
onth
s 0.1
7
6
RR
N1119
Cap
ital
IQ
Info
rmat
ion S
yst
ems
(India
) P
rivat
e L
imit
ed
10-0
2-2
010
2500
18-0
8-2
010
6 M
onth
s 0.2
9
7
RR
N11178
Pola
ris
Soft
war
e L
ab L
imit
ed
19-0
8-2
005
1000
17-1
1-2
005
9 M
onth
s 0.1
7
8
RR
N1493
L&
T P
hoen
ix I
nfo
Par
k
08-0
2-2
008
2000
04-0
7-2
008
7 M
onth
s 0.2
1
9
RR
N1365
CA
(In
dia
) T
echnolo
gy P
rivat
e
Lim
ited
09-0
5-2
007
2600
13-0
4-2
008
1 M
onth
0.0
7
Tota
l 1.9
8
Sourc
e:
Com
pany
reco
rds/
web
site

An
nex
ure
s
12
7
An
nex
ure
- 3
.9
Sta
tem
ent
show
ing t
he
short
rea
lisa
tion
of
lice
nse
fee
fro
m t
he
con
tra
ctor
ow
ing t
o n
on
-con
du
ctin
g o
f ce
nsu
s of
bu
ses
(Ref
erre
d t
o i
n p
ara
gra
ph
3.8
)
Mon
th/
Yea
r
No. of
bu
ses
as
per
cen
sus
work
ed o
ut
by
the
Corp
ora
tion
an
d
com
mu
nic
ate
d t
o t
he
agen
t
No. of
bu
ses
act
uall
y
reck
on
ed b
y t
he
agen
t
Sh
ort
fall
Lic
ense
fee
payab
le p
er
bu
s p
er m
on
th
(`)
Sh
ort
fall
am
ou
nt
(`)
1
2
3
4=
2-3
5
6=
4X
5
June
2012
1145
1145
0
1250
0
July
2012
1145
1145
0
1250
0
August
2012
1145
1145
0
1250
0
Sep
tem
ber
2012
1145
1145
0
1250
0
Oct
ober
2012
1027
1145
-118
1250
-147500
Novem
ber
2012
1028
1050
-22
1250
-27500
Dec
ember
2012
1028
1050
-22
1250
-27500
Januar
y 2
013
1031
1050
-19
1250
-23750
Feb
ruar
y 2
013
1019
1050
-31
1250
-38750
Mar
ch 2
013
1019
1050
-31
1250
-38750
Apri
l 2013
1022
1050
-28
1250
-35000
May
2013
1150
1050
100
1250
125000
June
2013
1175
1050
125
1250
156250
July
2013
1201
1050
151
1250
188750
August
2013
1196
1050
146
1250
182500
Sep
tem
ber
2013
1191
1050
141
1250
176250
Oct
ober
2013
1178
1050
128
1250
160000
Novem
ber
2013
1196
1050
146
1250
182500
Dec
ember
2013
1188
1050
138
1250
172500
Januar
y 2
014
1190
1050
140
1250
175000
Feb
ruar
y 2
014
1193
1050
143
1250
178750
Mar
ch 2
014
1191
1050
141
1250
176250
Apri
l 2014
1175
1050
125
1250
156250

Rep
ort
No
. 2
of
20
17
(P
ub
lic
Sec
tor
Un
der
tak
ing
s)
12
8
Mon
th/
Yea
r
No. of
bu
ses
as
per
cen
sus
work
ed o
ut
by
the
Corp
ora
tion
an
d
com
mu
nic
ate
d t
o t
he
agen
t
No. of
bu
ses
act
uall
y
reck
on
ed b
y t
he
agen
t
Sh
ort
fall
Lic
ense
fee
payab
le p
er
bu
s p
er m
on
th
(`)
Sh
ort
fall
am
ou
nt
(`)
1
2
3
4=
2-3
5
6=
4X
5
May
2014
1173
1050
123
1250
153750
June
2014
1167
1050
117
1250
146250
July
2014
1165
1050
115
1612
185380
August
2014
1161
1050
111
1612
178932
Sep
tem
ber
2014
1153
1050
103
1612
166036
Oct
ober
2014
1141
1050
91
1612
146692
Novem
ber
2014
1140
1050
90
1612
145080
Dec
ember
2014
1138
1050
88
1612
141856
Januar
y 2
015
1133
1050
83
1612
133796
Feb
ruar
y 2
015
1140
1050
90
1612
145080
Mar
ch 2
015
1150
1050
100
1612
161200
Apri
l 2015
1160
1050
110
1612
177320
May
2015
1157
1050
107
1612
172484
June
2015
1153
1050
103
2015
207545
July
2015
1121
1050
71
2015
143065
August
2015
1121
1050
71
2015
143065
Sep
tem
ber
2015
1121
1050
71
2015
143065
Oct
ober
2015
1121
1050
71
2015
143065
Novem
ber
-2015
1121
1050
71
2015
143065
Dec
ember
2015
1121
1050
71
2015
143065
Januar
y 2
016
1121
1050
71
2015
143065
Feb
ruar
y 2
016
1121
1050
71
2015
143065
Mar
ch 2
016
1121
1050
71
2015
143065
T
ota
l 5240236
Sourc
e: C
ensu
s re
port
of
the
Corp
ora
tion
GLOSSARY

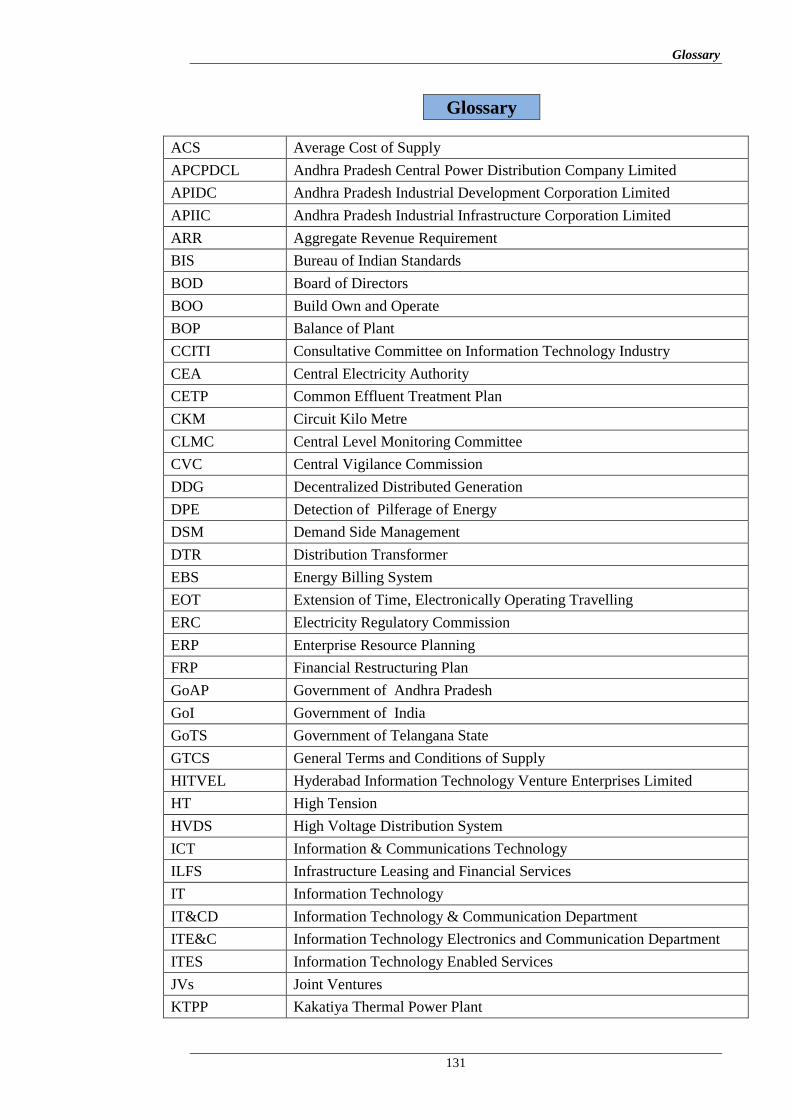
Glossary
131
Glossary
ACS Average Cost of Supply
APCPDCL Andhra Pradesh Central Power Distribution Company Limited
APIDC Andhra Pradesh Industrial Development Corporation Limited
APIIC Andhra Pradesh Industrial Infrastructure Corporation Limited
ARR Aggregate Revenue Requirement
BIS Bureau of Indian Standards
BOD Board of Directors
BOO Build Own and Operate
BOP Balance of Plant
CCITI Consultative Committee on Information Technology Industry
CEA Central Electricity Authority
CETP Common Effluent Treatment Plan
CKM Circuit Kilo Metre
CLMC Central Level Monitoring Committee
CVC Central Vigilance Commission
DDG Decentralized Distributed Generation
DPE Detection of Pilferage of Energy
DSM Demand Side Management
DTR Distribution Transformer
EBS Energy Billing System
EOT Extension of Time, Electronically Operating Travelling
ERC Electricity Regulatory Commission
ERP Enterprise Resource Planning
FRP Financial Restructuring Plan
GoAP Government of Andhra Pradesh
GoI Government of India
GoTS Government of Telangana State
GTCS General Terms and Conditions of Supply
HITVEL Hyderabad Information Technology Venture Enterprises Limited
HT High Tension
HVDS High Voltage Distribution System
ICT Information & Communications Technology
ILFS Infrastructure Leasing and Financial Services
IT Information Technology
IT&CD Information Technology & Communication Department
ITE&C Information Technology Electronics and Communication Department
ITES Information Technology Enabled Services
JVs Joint Ventures
KTPP Kakatiya Thermal Power Plant
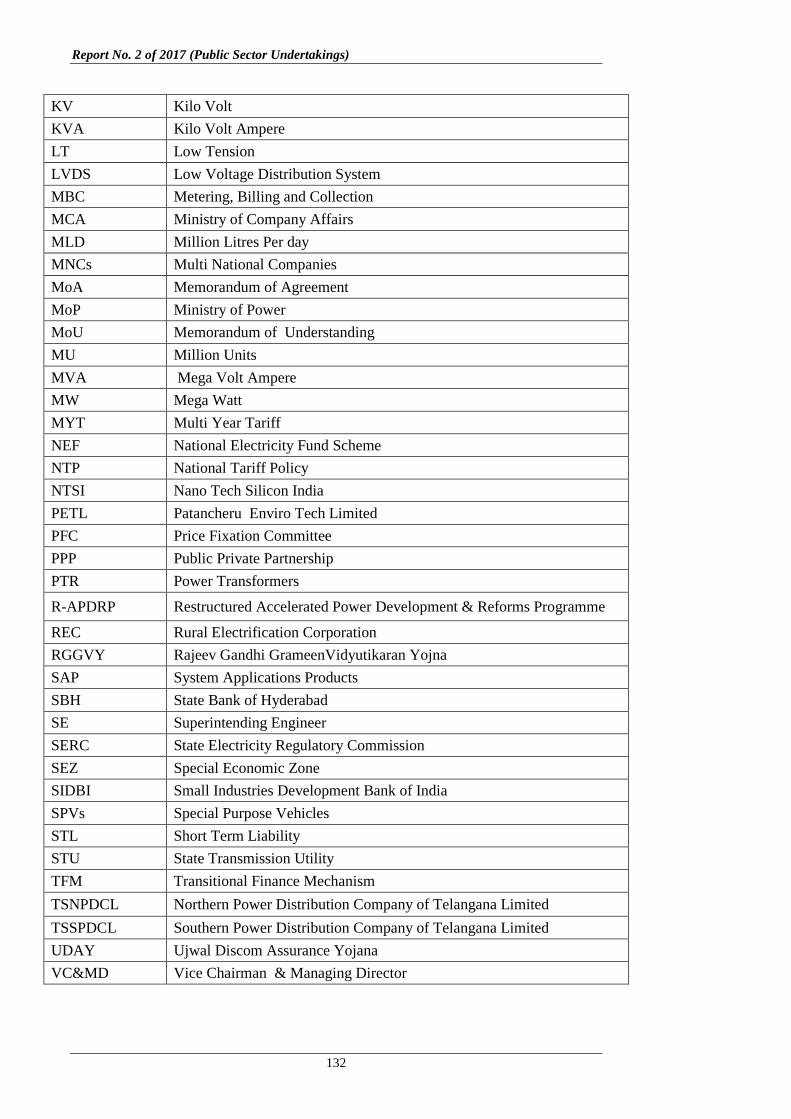
Report No. 2 of 2017 (Public Sector Undertakings)
132
KV Kilo Volt
KVA Kilo Volt Ampere
LT Low Tension
LVDS Low Voltage Distribution System
MBC Metering, Billing and Collection
MCA Ministry of Company Affairs
MLD Million Litres Per day
MNCs Multi National Companies
MoA Memorandum of Agreement
MoP Ministry of Power
MoU Memorandum of Understanding
MU Million Units
MVA Mega Volt Ampere
MW Mega Watt
MYT Multi Year Tariff
NEF National Electricity Fund Scheme
NTP National Tariff Policy
NTSI Nano Tech Silicon India
PETL Patancheru Enviro Tech Limited
PFC Price Fixation Committee
PPP Public Private Partnership
PTR Power Transformers
R-APDRP Restructured Accelerated Power Development & Reforms Programme
REC Rural Electrification Corporation
RGGVY Rajeev Gandhi GrameenVidyutikaran Yojna
SAP System Applications Products
SBH State Bank of Hyderabad
SE Superintending Engineer
SERC State Electricity Regulatory Commission
SEZ Special Economic Zone
SIDBI Small Industries Development Bank of India
SPVs Special Purpose Vehicles
STL Short Term Liability
STU State Transmission Utility
TFM Transitional Finance Mechanism
TSNPDCL Northern Power Distribution Company of Telangana Limited
TSSPDCL Southern Power Distribution Company of Telangana Limited
UDAY Ujwal Discom Assurance Yojana
VC&MD Vice Chairman & Managing Director


©
COMPTROLLER AND AUDITOR GENERAL OF INDIA
2017
www.cag.gov.in