Report Name:India Grain and Feed Update - January 2022
10
THIS REPORT CONTAINS ASSESSMENTS OF COMMODITY AND TRADE ISSUES MADE BY USDA STAFF AND NOT NECESSARILY STATEMENTS OF OFFICIAL U.S. GOVERNMENT POLICY Voluntary Report – Voluntary - Public Distribution Date: January 10, 2022 Report Number: IN2022-0002 Report Name: India Grain and Feed Update - January 2022 Country: India Post: New Delhi Report Category: Agriculture in the Economy, Grain and Feed, Agricultural Situation, Agriculture in the News, Policy and Program Announcements, SP1 - Expand International Marketing Opportunities, SP2 - Prevent or Resolve Barriers to Trade that Hinder U.S. Food and Agricultural Exports Prepared By: Santosh K. Singh, Senior Agricultural Specialist and Mariano J. Beillard, Senior Regional Agricultural Attaché Approved By: Mariano Beillard, Senior Regional Agricultural Attaché Report Highlights: On November 24, 2021, the Indian government approved the extension of the additional free food grains scheme through March 31, 2022. With this extension, an additional 16 million metric tons (MMT) of grains will be released from government stocks. FAS New Delhi (Post) is raising the market year (MY) 2021/2022 consumption estimate to 100.3 MMT on the expected higher offtake of wheat under the free food grains scheme. Post's MY 2021/2022 wheat exports estimate is raised to 6.5 MMT due to strong export demand combined with competitive Indian wheat prices in the neighboring markets. Post's MY 2021/2022 wheat ending stocks number is revised lower to 23 million metric tons.
-
Upload
khangminh22 -
Category
Documents
-
view
1 -
download
0
Transcript of Report Name:India Grain and Feed Update - January 2022

THIS REPORT CONTAINS ASSESSMENTS OF COMMODITY AND TRADE ISSUES MADE BY USDA STAFF AND NOT NECESSARILY STATEMENTS OF OFFICIAL U.S. GOVERNMENT POLICY
Voluntary Report – Voluntary - Public Distribution Date: January 10, 2022
Report Number: IN2022-0002
Report Name: India Grain and Feed Update - January 2022
Country: India
Post: New Delhi
Report Category: Agriculture in the Economy, Grain and Feed, Agricultural Situation, Agriculture in the
News, Policy and Program Announcements, SP1 - Expand International Marketing Opportunities, SP2 - Prevent
or Resolve Barriers to Trade that Hinder U.S. Food and Agricultural Exports
Prepared By: Santosh K. Singh, Senior Agricultural Specialist and Mariano J. Beillard, Senior Regional
Agricultural Attaché
Approved By: Mariano Beillard, Senior Regional Agricultural Attaché
Report Highlights:
On November 24, 2021, the Indian government approved the extension of the additional free food grains
scheme through March 31, 2022. With this extension, an additional 16 million metric tons (MMT) of grains will
be released from government stocks. FAS New Delhi (Post) is raising the market year (MY) 2021/2022
consumption estimate to 100.3 MMT on the expected higher offtake of wheat under the free food grains
scheme. Post's MY 2021/2022 wheat exports estimate is raised to 6.5 MMT due to strong export demand
combined with competitive Indian wheat prices in the neighboring markets. Post's MY 2021/2022 wheat ending
stocks number is revised lower to 23 million metric tons.

Page 2 of 10
GENERAL INFORMATION:
PLANTING UPDATE
Progress Steady Despite a Delayed Kharif Harvest: The late withdrawal of the 2021 Southwest monsoon
delayed the 2021 kharif (fall harvested) crop harvest. However, the rabi season (winter sown, spring harvested)
crop plantings are progressing well thanks to adequate soil moisture conditions and irrigation water availability.
The Ministry of Agriculture and Farmers’ Welfare (MOAFW) estimates total area sown through December 12,
2021, at 63.5 million hectares, up by 1 million hectares compared to last year’s 62.5 million hectares. Despite
the 2021 Southwest monsoon’s 1-2 week delay this past October 2021, plantings recovered in November
picking up the pace of plantings through December. Oilseed plantings in the current rabi season are ahead of
last year’s, supported by high vegetable oil prices during the second half of calendar year (CY) 2021.
FAS New Delhi’s (Post) market sources report that farmers in the largely rainfed (partially irrigated) areas are
shifting area away from pulses, coarse grains, and wheat to oilseeds (rapeseed and mustard seed). Rice plantings
lagged compared to the previous year because of late season rains in October/ November, that delayed the
harvest in the coastal and eastern Indian states. Rice plantings are anticipated to recover in January 2022.
Table 1: India, Rabi Crop Planting (million hectares), Indian Crop Year (July-June)
Crop ICY 2020/2021
(Progressive Planting - Dec 31, 2020) ICY 2021/2022
(Progressive Planting - Dec 31, 2021) Wheat 32.91 32.59
Rice 1.51 1.41
Coarse Cereals 4.62 4.51
Pulses 15.40 15.26
Oilseeds 8.06 9.71
TOTAL 62.50 63.47
Source: Ministry of Agriculture and Farmers’ Welfare.
0.00
10.00
20.00
30.00
40.00
50.00
60.00
70.00
12-Nov 19-Nov 26-Nov 3-Dec 10-Dec 17-Dec 24-Dec 31-Dec
Are
a i
n M
illi
on
Hec
tare
s
Week Ending
Figure 1. India: Progress of Rabi Crop Planting
Indian Crop Year (ICY) (July-June)
ICY 2020/21 ICY 2021/22
Page 3 of 10
Field sources report that most crop plantings are over, except for late winter planted rice in coastal India. Wheat
plantings are just marginally behind those of last year’s, with growers again benefitting from assured rates of
return thanks to the Indian government’s guaranteed minimum support price (MSP) procurement operation in
the major growing states. Wheat yields remain stable under irrigated conditions compared to those of other
crops.
Benefitting from adequate soil moisture and temperature, the winter planted rabi crops are progressing well.
However, temperature and precipitation in the January-March months will be critical for good yield realization.
GOVERNMENT EXTENDS ADDITIONAL FREE FOOD GRAINS SCHEME THROUGH MARCH 2022
On November 24, 2021, India’s Union Cabinet approved the extension of the scheme that provides 5 kilograms
(kg) of food grains per month free of cost for the beneficiaries under the National Food Security Act (NFSA)
for the period running December 2021 to March 2022. This allocation of 5 kg of free food grains per person is
in addition to the existing allocation of 5 kg per month under the NFSA to beneficiaries (estimated at 800
million) at highly subsidized prices (India rupees [INR] 2/kg for wheat and INR 3/kg for rice).1 The government
is estimating that 16.3 MMT of additional food grains from government stocks will be distributed under the
scheme; this represents an additional food subsidy outlay of INR 533.5 billion ($7.2 billion).
This announcement heralds the fifth phase (November 2021-March 2022) of the government’s scheme (relief
measure) since the initial launch back in March 2020 under the backdrop of the COVID-19 national lockdown.
Phase 1 ran April-June 2020, followed by Phase 2 that ran July-November 2020. The government subsequently
launched two additional phases in 2021 – Phase 3 (May-June) and Phase 4 (July-November). The government
estimates that some 54.9 MMT of food grains (out of the total allocation of 60 MMT) has been distributed in
the first four phases of the scheme. Market sources expect continued heavy offtake of food grains against the
allocation of 16.3 MMT under the Phase 5 of the scheme (see, GAIN-INDIA -IN2021-0059- COVID-19 in
India – Weekly Food Retail Update and GAIN-INDIA -IN2021-0082- Grain and Feed Update-July 2021).
1 India’s population is approximately 1.3 3billion (Central Intelligence Agency, July 2021 estimate).

Page 4 of 10
COMMODITIES:
RICE
Table 2. India: Commodity, Rice Milled - Production, Supply and Distribution (PSD)
(Area in Thousand Hectares, Quantity in Thousand Metric Tons, Yield in MT/Hectare)
Rice, Milled 2019/2020 2020/2021 2021/2022
Market Year Begins Oct 2019 Oct 2020 Oct 2021
India USDA
Official New Post
USDA
Official New Post
USDA
Official New Post
Area Harvested (1000 HA) 43662 43662 45000 45000 45500 45500
Beginning Stocks (1000 MT) 29500 29500 33900 33900 36000 37200
Milled Production (1000 MT) 118870 118870 122270 122270 125000 124000
Rough Production (1000 MT) 178323 178323 183423 183423 187519 186019
Milling Rate (.9999) (1000 MT) 6666 6666 6666 6666 6666 6666
MY Imports (1000 MT) 0 0 0 0 0 0
TY Imports (1000 MT) 0 0 0 0 0 0
TY Imp. from U.S. (1000 MT) 0 0 0 0 0 0
Total Supply (1000 MT) 148370 148370 156170 156170 161000 161200
MY Exports (1000 MT) 12520 12520 20165 20427 19000 19000
TY Exports (1000 MT) 14577 14577 20200 20600 18000 18000
Consumption & Residual (1000MT) 101950 101950 100005 98543 103500 103700
Ending Stocks (1000 MT) 33900 33900 36000 37200 38500 38500
Total Distribution (1000 MT) 148370 148370 156170 156170 161000 161200
Yield (Rough) (MT/HA) 4.0842 4.0842 4.0761 4.0761 4.1213 4.0883
(1000 HA), (1000 MT), (MT/HA)
MY = Marketing Year, begins with the month listed at the top of each column.
TY = Trade Year, which for rice, milled begins in January for all countries. TY 2021/2022 = January 2022 - December 2022.
PRODUCTION
FAS New Delhi forecasts India’s rice (milled) production in MY 2021/2022 (October-September) marginally
lower at 124 MMT on reported losses resulting from untimely rains in October-November 2021 during the
harvest. Field sources in the major rice production states inform that rice yields are coming in lower than
initially expected. Lower yields are being attributed to ill-timed rains rolling in as the crop was ready for
harvesting, causing field losses. Improved rabi planting prospects will help to offset expected kharif rice losses.
Post estimates MY 2021/2022 rice production to remain unchanged at 124 MMT, a volume that includes 106
MMT of kharif rice and 18 MMT of rabi rice (see, GAIN-INDIA -IN2021-0129- Grain and Feed Update-
October 2021).
Procurement Slightly Lags Behind Last Year’s Volume: Government MSP rice procurement in MY
2021/2022 (through December 31, 2021) is estimated at 32.2 MMT, just slightly lower than the previous year’s
volume.
Procurement in the northern Indian states of Punjab and Haryana finalized by mid-December 2021. The slightly
lower procurement figures are due to lower harvest volumes in those two rice production states. However, rice
procurement in the other producer states remains ongoing and expected to continue throughout February 2022.

Page 5 of 10
Table 3. India: Government Procurement of Milled Rice by State (million metric tons)
State MY 2019/2020 MY 2020/2021 MY 2020/2021 MY 2021/2022
Oct-Sept Oct-Sept Oct 1-Dec 31 Oct 1-Dec 31
Punjab 10.88 13.59 13.59 12.52
Andhra Pradesh 5.53 5.67 0.97 0.69
Telangana 7.45 9.45 2.75 4.03
Chhattisgarh 5.05 4.67 3.16 3.56
Odisha 4.80 5.26 1.33 0.81
Haryana 4.31 3.79 3.79 3.71
Uttar Pradesh 3.79 4.48 3.25 2.77
West Bengal 1.84 1.89 0.00 0.27
Madhya Pradesh 1.74 2.50 1.53 1.38
Tamil Nadu 2.20 3.05 0.38 0.46
Others 4.23 5.73 1.50 2.01
TOTAL 51.83 60.08 32.25 32.20
Source: Food Corporation of India.
A record harvest, along with weak open market prices resulting from the extension of the free food grains
scheme (benefitting two-thirds of the population), MSP procurement for kharif and rabi rice crops in India’s
producer states is strong. Procurement in MY 2021/2022 will surpass last year’s record 60 MMT volume.
Prices Ease as Arrivals Gain: Domestic prices eased in December 2021 with the new kharif rice crop’s arrival.
Source: Agriculture Marketing Information Network, MOAFW, and FAS New Delhi office research.
Procurement for un-milled paddy rice is set at the MSP of INR 19,400 ($262)/MT, up compared to last year’s
INR 18,800 ($254)/MT, bolstering domestic prices. Procurement will run through February 2022. Market prices
in the latter half of the year will depend on export demand and the government’s subsidized rice release policy.
14,000
16,000
18,000
20,000
22,000
24,000
26,000
28,000
30,000
32,000
34,000
36,000
Ru
pee
s p
er m
etri
c to
n
Figure 2. India: National Average Monthly Prices for Common Rice

Page 6 of 10
EXPORTS
MY 2020/2021 Exports Raised: Based on the latest official provisional trade figures, Post estimates MY
2020/2021 rice exports slightly higher at 20.4 MMT; CY 2020 exports are estimated at 20.6 million metric tons.
Assuming no significant changes in the price parity for Indian rice compared to rice from other origins, MY
2021/2022 rice exports are forecast to remain unchanged at 19 MMT on more-than-sufficient domestic supplies.
Source: Ministry of Commerce and Industry and FAS New Delhi office research.
Provisional official trade figures estimate MY 2020/2021 (October-September) rice exports at a record 20.4
MMT, including 16.2 MMT coarse grain non-basmati rice and 4.2 MMT long-grain basmati rice. Large MY
2020/2021 export volumes were driven by shipments of coarse grain rice to the major export markets. Price
competitive Indian rice exports outperformed rice from other origins. Provisional official figures estimate rice
exports in CY 2021 (January-November) at 19.3 million metric tons. With year’s end official trade figures
unavailable, trade sources place December 2021 exports at 1.3 MMT, taking to 20.7 MMT CY 2021 exports.
ENDING STOCKS RAISED/CONSUMPTION LOWERED
MY 2020/2021 Ending Stocks: Based on official rice stocks estimate and information on private trade stocks,
Post’s MY 2020/2021 ending stocks figure is raised to 37.2 million metric tons. The Food Corporation of India
estimates for October 1, 2021, place government rice stocks at 34.8 MMT, which includes 25.33 MMT of
milled rice and 14.07 MMT of un-milled paddy rice (or 9.42 MMT milled rice equivalent). Market sources
report an estimated 2.4 MMT of rice stocks as being held by the private trade at the end of the market year.
This volume will help meet export commitments for 45-50 days until the new crop rice is available for milling
and exports. Post is consequently raising the MY 2020/2021 ending stocks figure to 37.2 million metric tons.
MY 2020/2021 Consumption: Post is revising down its MY 2020/2021 consumption estimate to 98.5 MMT to
account for higher exports and ending stocks numbers.
0
200
400
600
800
1,000
1,200
1,400
1,600
1,800
2,000
2,200
2,400
2,600
Th
ou
san
d M
etri
c T
on
s
Figure 3. India: Monthly Exports of Rice
Non-basmati Basmati

Page 7 of 10
WHEAT
Table 4. India: Commodity, Wheat - Production, Supply and Distribution
(Area in Thousand Hectares, Quantity in Thousand Metric Tons, Yield in MT/Hectare)
Wheat 2019/2020 2020/2021 2021/2022
Market Year Begins Apr 2019 Apr 2020 Apr 2021
India USDA
Official New Post
USDA
Official New Post
USDA
Official New Post
Area Harvested (1000 HA) 29319 29313 31357 31357 31615 31615
Beginning Stocks (1000 MT) 16992 16992 24700 24700 27800 27300
Production (1000 MT) 103600 103600 107860 107860 109520 109520
MY Imports (1000 MT) 20 20 18 18 25 20
TY Imports (1000 MT) 20 20 18 18 25 20
TY Imp. from U.S. (1000 MT) 0 0 0 0 0 0
Total Supply (1000 MT) 120612 120612 132578 132578 137345 136840
MY Exports (1000 MT) 509 509 2561 2561 5250 6500
TY Exports (1000 MT) 595 595 3597 3597 5500 6750
Feed and Residual (1000 MT) 6000 6000 6500 6500 7000 7000
FSI Consumption (1000 MT) 89403 89403 95717 96217 97250 100340
Total Consumption (1000 MT) 95403 95403 102217 102717 104250 107340
Ending Stocks (1000 MT) 24700 24700 27800 27300 27845 23000
Total Distribution (1000 MT) 120612 120612 132578 132578 137345 136840
Yield (MT/HA) 3.5335 3.5343 3.4397 3.4397 3.4642 3.4642
(1000 HA), (1000 MT), (MT/HA)
MY = Marketing Year, begins with the month listed at the top of each column
TY = Trade Year, which for wheat begins in July for all countries. TY 2021/2022 = July 2021 - June 2022
PRODUCTION
MY 2021/2022 Production Unchanged: Post estimate MY 2021/2022 wheat production unchanged at a record
109.5 MMT based on the prevailing market conditions. Despite strong exports, local prices in the major
producing states continue to hover around the government procurement prices (MSP).2
MY 2022/2023 Wheat Planting Steady: The Ministry of Agriculture and Farmers’ Welfare’s latest rabi
(winter planted) crop planting report estimates planting of the upcoming wheat crop through December 31,
2022, at 32.59 million hectares compared to 32.91 million hectares at the same time last year. Planting has
finalized in the major production states, except for some late sown areas in Uttar Pradesh and Bihar where it
will continue through the second week of January. Marginally lower plant has been reported in most states as
farmers shifted some area to oilseeds.
Despite plantings being delayed by 1-2 weeks, planting conditions turned favorable in the major wheat growing
states. Plantings have benefitted from adequate soil moisture conditions and irrigation water availability due to
rains in October-November 2021. Wheat’s standing is progressing well under adequate soil moisture and
2 Open market prices typically increase after the major marketing season (April-July) is over, with market prices absorbing the
carrying costs. However, this year’s prices in the production states remain stagnant, which suggests significant surplus in the open
market resulting from the forecast record harvest.
Page 8 of 10
favorable low temperature conditions. Low temperature and regular scattered rains in January, and extended
winter conditions through March will help boost yield prospects. Early summer conditions in March, along with
untimely rains in March-April during the grain setting and harvest stage may affect the yield prospects.
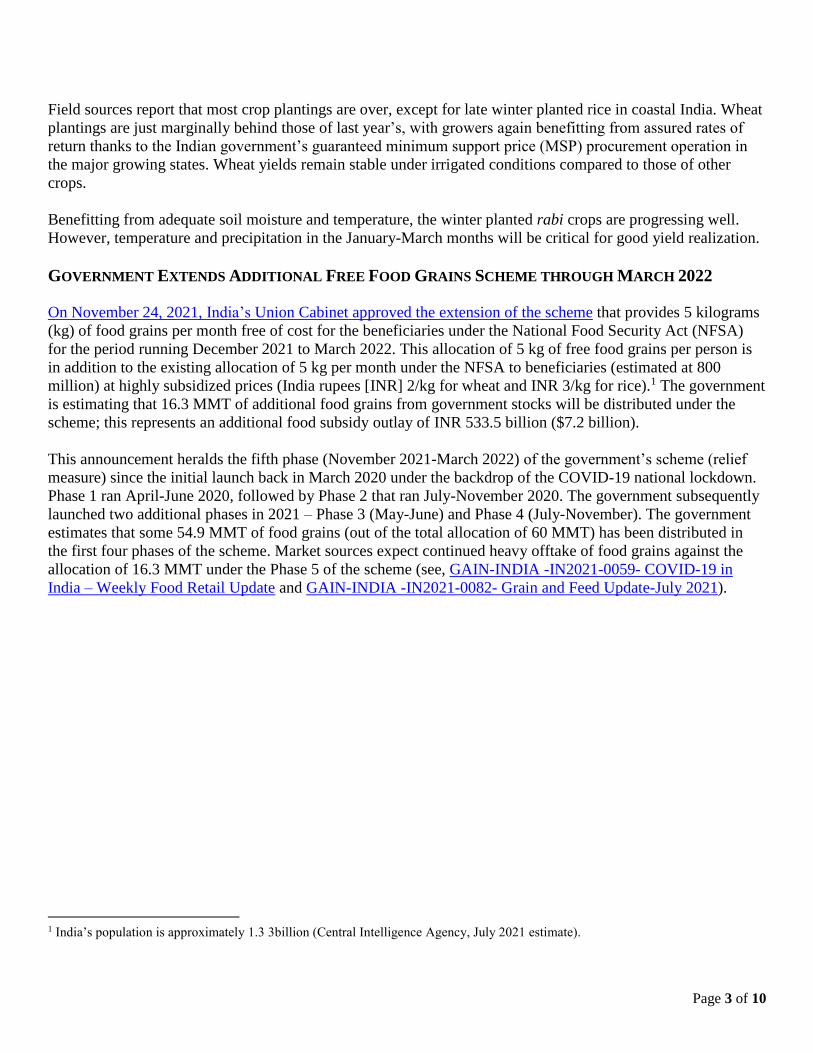
Prices Steady: Despite continued strong export demand, domestic wheat prices have remained relatively steady
in the recent months due to the supply of ‘subsidized’ government wheat under the open market sales.
Prices are expected to remain steady in the coming months on continued supply of additional free wheat
through end of the marketing year. Market sources report increased offtake of government wheat under the open
market sales available to the millers at the reserve price of INR 21,500 ($290)/MT for auction sales across India
(see, GAIN-INDIA -IN2021-0082- Grain and Feed Update-July 2021). With surplus grain stocks and prospects
for continued strong procurement of the kharif rice, the Indian government is likely to continue to release
additional wheat to millers, which will keep domestic prices under control.
Source: Agriculture Marketing Information Network, MoAFW, and FAS New Delhi office research.
EXPORTS
MY 2021/2022 Exports Raised: FAS New Delhi estimates MY 2021/2022 wheat exports higher to 6.5 MMT
based on the current strong export demand and relatively competitive Indian wheat prices in the neighboring
markets. Provisional official trade figures estimate MY 2021/2022 exports for April through November 2021 at
4.1 MMT, going to Bangladesh, Sri Lanka, Nepal, the Middle East, and South Asian countries. While the
official figures for December are not available, trade sources report wheat exports in December at around 800-
900 thousand metric tons. Indian wheat is highly price competitive in the neighboring markets thanks to
relatively lower domestic prices and freight costs.
Assuming current price parity to continue and expected steady domestic prices on more-than-sufficient supplies,
wheat exports should remain strong in the last quarter of the marketing year. MY 2021/2022 wheat and wheat
8,0009,000
10,00011,00012,00013,00014,00015,00016,00017,00018,00019,00020,00021,00022,00023,00024,000
Ru
pee
s p
er m
etri
c to
n
Figure 4. India: National Average Monthly Prices for Wheat

Page 9 of 10
product exports are likely to reach 6.5 MMT, which include 6 MMT of wheat and 0.5 MMT of wheat products
(wheat equivalent).3
ENDING STOCKS LOWERED/CONSUMPTION RAISED
Ending Stocks Lowered: Post is revising down the MY 2021/2022 ending stocks figure to 23 million metric
tons. The revision is based on new official wheat stocks estimates and expected higher offtake of wheat with the
government now extending the 5 kg free food grains scheme through March 2022. Based on the official
government wheat stocks estimate for April 1, 2021 (Food Corporation of India), the MY 2020/2021 ending
stock figure is estimated at 27.3 million metric tons. Based on the official government wheat stocks estimate for
April 1, 2021 (Food Corporation of India), the MY 2020/2021 ending stock figure is estimated at 27.3 million
metric tons.
The Food Corporation of India estimates December 1, 2021, government held wheat stocks at 37.85 million
metric tons. With the government extending the additional free food grains scheme through March 2022, market
sources expect continued strong offtake of government wheat stocks in December 2021 through March 2022, at
a rate of 4 MMT per month. Government MY 2021/2022 wheat ending stocks as a result are likely to be drawn
down to below 22 million metric tons. With exporters holding onto stocks of 1 MMT to meet their export
commitment for the next 45-50 days, MY 2021/2022 ending stocks are estimated in the 23 MMT range.
MY 2021/2022 Consumption Raised: Post’s consumption estimate is raised higher to 100.3 MMT to account
for the expected higher offtake of wheat under the free food grains scheme.
3 Exports of wheat flour and of other processed wheat products are converted by a multiplicative factor into wheat equivalent for
production, supply, and distribution (PSD) accounting.

Page 10 of 10
CORN
Table 5. India: Commodity, Corn - Production, Supply and Distribution
(Area in Thousand Hectares, Quantity in Thousand Metric Tons, Yield in MT/Hectare)
Corn 2019/2020 2020/2021 2021/2022
Market Year Begins Nov 2019 Nov 2020 Nov 2021
India USDA
Official New Post
USDA
Official New Post
USDA
Official New Post
Area Harvested (1000 HA) 9569 9569 9865 9865 9700 9700
Beginning Stocks (1000 MT) 1346 1346 1863 1854 1923 2074
Production (1000 MT) 28766 28766 31510 31510 30000 30000
MY Imports (1000 MT) 327 327 50 50 300 300
TY Imports (1000 MT) 341 341 50 50 300 300
TY Imp. from U.S. (1000 MT) 2 2 0 0 0 0
Total Supply (1000 MT) 30439 30439 33423 33414 32223 32374
MY Exports (1000 MT) 1376 1385 3750 3590 2500 2500
TY Exports (1000 MT) 1125 1132 3677 3677 2500 2500
Feed and Residual (1000 MT) 16000 16000 16250 16250 17200 17200
FSI Consumption (1000 MT) 11200 11200 11500 11500 11400 11400
Total Consumption (1000 MT) 27200 27200 27750 27750 28600 28600
Ending Stocks (1000 MT) 1863 1854 1923 2074 1123 1274
Total Distribution (1000 MT) 30439 30439 33423 33414 32223 32374
Yield (MT/HA) 3.0062 3.0062 3.1941 3.1941 3.0928 3.0928
(1000 HA), (1000 MT), (MT/HA)
MY = Marketing Year, begins with the month listed at the top of each column
TY = Trade Year, which for corn begins in October for all countries. TY 2021/2022 = October 2021 - September 2022
EXPORTS
Exports Revised: Based on the latest official trade figures derived from trade data monitor, MY 2019/2020
exports are raised marginally to 1.39 MMT and MY 2020/2021 exports lowered to 3.59 million metric tons.
Ending Stocks Adjusted: Ending stocks have been adjusted to reflect the changes in the export estimates.
Attachments:
No Attachments.