
REPORT FUEL POLICY COMMITTEE - DSpace@GIPE
156
REPORT OF THE FUEL POLICY COMMITTEE INDIA 1974
-
Upload
khangminh22 -
Category
Documents
-
view
0 -
download
0
Transcript of REPORT FUEL POLICY COMMITTEE - DSpace@GIPE
REPORT
OF THE
FUEL POLICY COMMITTEE
INDIA 1974
. SXJN~~ (i) Chairman's letter forwarding the Report
(ii) Names of Chairman and Mez&bers of Fuel Policy Committee
(iij) Nam~ of tho Secretariat of Fnel.Policy Com.mitteo
(itt) Abbreviations. ••
lAPl'BB
I In~uotion ·~
n Trench in Energy Consumption
m Foreoast of Energy Demand -IV Fuel Resourcea cf India" · .. -
V Regional D~bution cf De~d for Energy
VI Perspective of Long Term Energy Problems
Vll Coal Policy • • . . . • •
vm Oil Policy .• • ,
IX Polley for Power Sector • • • • '
X Policy for Energy Supply to Domestic Sector
XI Costa and Prieeo in Energy Sector • • • ,
Xll Teclmology Plan for Energy Seotor.
Xm Summary ofReoom.Dlendati~
\ .....
... ANNEX TABlES AND TECHNIC.U. NOTF.S
ANNu TABLR ·,
U-1 Sector-Wise COllS11Dl~tion of Commercial Energy for the Periqd·I953-M to 1970-71 ••
II-2 Total Consumption of cO~cial Energy FUol-wi!Jo in Original U~it:.s • ' _ • • •
ll-3 Total Consumption. of C..."'mmeroio.l Ene~ Fuel-w~ in. Million Tonnes of Coal Replacement
ll-4 Coal Consumption Di.rectandlndireot·.
U-G Electricity Generation and Co~pt~ou . • ; ·
ID-1 Coal Requiremtllits of Thermal ~ower Stations (1978-79, 1983--S4 & 1990-91)
ID·2 Estimated Demand for· Coking Coal and Blendable Coal in India in 1978-79, 1983·84 and 1990.91
Xll·l · Extraote from Chapter VI. of tbe Power Economy Committee Study Group Report IV on Rural Electrification , •
.. ' .
ll-1 Conversion Factors uaed for Aggregaf;ion of Energy Measnres
ll-2 R~on Modela Relat~g Enei-gy Reouiremente to Varlous Expla11Atory Variables
. VID-1 Refining Capacity. Hydro-Craoking Capacity and Ftrtilizer FeedRtoclc Choices-A Mathematical Pro-g:rammiDg Approach • • • . . • · • . .. . .. • • • • • . • .
Jture. the '-to those e varia· · '<mtain.·
· · ·e~om-..!~nr
X ··'
1-3
4-10
11-22
23-33
34--37
38-42
43---59
60-73
74-90
91-97
98-104
105--113
114-125
1:!6--130
131
131
131
131
132
132
133-13-J:
135-136
136
137-138
f t
. 'lV
"¥: h d n. unless major new discoveries come up and possibilities of subs!ih r itt e other fuels materialise on a substantial scale. V{_e noted that ~~e f a~e d{finite indications in this direction, ·they wen: not. likely to be dectst:Vj: e seventies As there were strong reasons to believe that energy would. J.>OSe
:e;ious probl~m from the balance of payments angle if ce_rtain bard ~eciSl~~s ·re not adopted at the right time, we argued that the. maxt!Dum el;fe~tlve u_tlli~
ltion of domestic energy resources should form a. bas1c desideratum_ m design· mg a national fuel policy. On this basis the Comtnlttee sugges~ed vanous mea~s for substituting coal for oil in areas where on tecbno-economtc grounds substi· tution was justifiable.
5. These recommendations were kept in view. in. preparing_ the. Draft Ftfth Five Year Plan. The Draft Fifth Five Year Plan mdtcates a (hrec!lonal change in the pattern of utilisation of different fuel resources. by econonucally accept· .able curbs on the rate of growth of oil consumption w)lile pl~)lqiqg for expand· ed production of coal and electric power. '
6. The dramatic increase in the price of oil in October 1973 made it im· perative that we re-examine our earlier studies. Studies done by ,the 'Fuel Policy Committee in the middle of 1973 on the. substitution of coal for 'oil in different sectors of the economy were made on the assumption that the· price of oil would be around $ 5 per barrel by the end of the seventies. This was in keeping with the projections made by noted international authorities with the exception ·of Professor Adelman, who went to the extent of predicting a fall in prices. I,t is clear from Adelman's recent study that if the rules of the. game' in the wdtili oil industry conformed to standard economic criteria as discussed in standard tex books, his conclusions could be defended without violence to· data. But it 'is a rna jor act of abstraction and a somewhat unwarranted one to' assume that the oil industry could be treated in isolation from a whole set of socio-political factors. The present energy crisis arises out of a very sudden increase .in the price of oil products to levels which were not predicted in any . study by. any country. The movement of oil prices in the international market itself is an in· teresting study. Given the dizzy heights to which oil prices have soared today, there is a common tendency to lose sight of a certain perspective. Oil represents one commodity whose price went down steadily over a period of 15. years. For example the market price of light Arabian crude was $ 1.93 per barrel in .. 1955 and it was $ 1.3.0 per barrel in 1970. Even in January 1972, it :was still lower
than the 1955 price. But from then on, it bas increased today to over $ 11 per barrel within a period of 24 months. The price upto October 15, 1973, was around. $ 3 per barrel only. Can this movement in prices be explained by a sudden spurt of demand or a sudden fall in production? At this stage, it is extremely hazardous to make any guesses in this respect since the problem, as mentioned previously, possesses important cbaracteris~cs which are not purely economic in nature. ·
7. While the direction of the change in the energy substitution policies sugg~sted in Part I of the Report is invariant to the likely changes in the 'price of oil products, the pace of inter-fuel substitution bas to be determined with reference t? the relative price of fuels. At prices of $ 12 per barrel of oil delivered at Indtan ports ":"'e find that a¥ the uses of oil except those in the transport sector can be substituted _for by mdigenous fuel, namely, coal or· coal-based energy forms. For example, m !h;: household sector the use of kerosene for lighting can be repla~d by electnCJty. The use of kerosene for cooking can be replaced by coal gas m the case of densely populated urban areas and soft coke in small towns and some rural areas. In industry for .all beating requirements coal becom:s the pr;:ferre~ fuel. For. lifting water, electricity becomes· more advantageous r::lative to diesel :otl. In the case of 'transport, the movement of bulk commodities over long distances by rail becomes preferable to road movement even if ~e e':pected volume of traffic is low. But it will not be realistic to. assume . tllat
· ~il pnce~ will continue at the present level upto 1990-91 as possibilities pf' prouc~ng 011. at a very low .cost ranging from 15 Cents a ,barrel to,$ 4 a baue1 11re
avail~ble m a large number of countries in the world, given the time to explore ~r 0)f an_f dlv
1elop the oil fields. It would, therefore. appear that whil~ ,direc
ona .Y 01. WI have to be replaced by other fuel forms, which are more abun-dant m this country, we have to be ~:xtfetnely careful regarding the type and
PIWFESSOR S. CHAKRAVARTI,
/\,/ember, Planning Commission and
c;_hairmmz, Fuel Policy CommiJtee.
Dear Shri Malaviya,
PLANNING COMMISSION.
New Dntm~ Augu.\·t 22, 1974.
_The ~uel Polic~ Co!lmlilt~c has aut•IJOrisl•d me to sumhit to }'On this Report deahng wtth the policy tssues 10 regard to fuels, covering the period upto 1990· 91. ~ou may recall that Part I of the Report (Fuel Policy for the Seventies). submitted to the Government on May 16, 1972. dealt with the Fifth Five Year
. Plan period only1
• Subsequent to the submission or Part J of the Report. there hav~ been ~everal. cha~1ges. in the economic situation within the country and in the mtcrnatwnal situatiOn In regard to the supply and price of oil. The perspective of growth of the economy outlined in the earlier Government documents has been changed to some extent in the Draft Fifth Five Year Plan. The Committee had, therefore, to re-examine several of its prcvinu.'l conclusions and revise its recommendutions appropriately. The present Report is based on a comprc· hensive re-examination of all issues and should be taken a~ the final Report of the Committee and not as a sequel to Part I.
2. In order to properly plnn for meeting the energy demand. it is essential thnt we assess and forecast the future demand as accurately as possihle. The fact that sectors producing energy in primary or secondary forms involve very long gestation periods extending over 5 to 10 years or even longer makes it impcralive that we project demand over a J 5 to 20 year period for evolving an appropriate energy production plan. In the nature or the case. such a forecast involves that a number of assumptions be made about the rate nnd pattern of growth of the economy. the technology of energy production :md energy utilization and about possible directional changes in consumer preferences. While in regard to the rate and pt~ttern of economic growth the Committee was guided by the perspective growth of the economy given in the Draft Fifth Five Year Plnn. in regard to other factors. the Committee h:td to make it!. own jud~emcnt based on the study of the past trends in our country. information relating to similarly placed countries and from various puhlishcd materials regarding pos'ii· ble technological shifts in future.
3. The Committee has given several demand forecasts for different forms of fuels. which take into account fcasihle inter-fuel suhstitution possibilities even when the aggregate energy requirement may n·main conc;tant. The projection of aggregate enertzy requiremcut-. as wdl as those pertaining to specific fuel form~ nnJSt be judged as dimensimw/ hypothest>.~ rather than as rigid numhers. The main thrust of the Report and of the ddincratinn\ of the Committee has been to evolve an appropriatr policy mix for the L"ncrgy sectors for the period upto 1990-91. We are of the opinion that our policy (undusions are likely to remain invariant with respect to a fairly wide range o( alternative growth rates. even though specific numerical projections may need to be kept under con.;tant review.
4. In forecasting energy consumption in terms of different fuel forme;, it is necessary to t:..ke into account possible shifts in tcchnolo~y in different sectors of the economy as well as in the relative costs of different fuel~ over time. While
·submitting Part I of the Fuel Policy Committee Report in May 1972. we drew the altention of the Government to the fact that crude oil prices which were once predicted to come down si¥J1ificantly had in fact hardened a great deal during the early seventies. In view of the desire of the oil exporting countric~ to make the most out of their e:'(hausting a'\sets. it was anticipated that the prices \\'<>Uid
(iii)
v.
extent of substitution that we adopt, especially those involving very maJor m· · vestment outlays .. ·
8. Given the uncertainty regarding the level of oil prices in the future, the areas and extent of substitution of oil by· coal will have to be limited to those options whose worthwhileness remains largely unaltered for any probable varia· tion in prices. We believe' that 'the recommendations of the Committee contain· ed in this Report satisfy this 'criterion. The pace of inter-fuel substitution recommended by the Committee is' based on our judgement regarding the gestation periods involved in converting oil, using facilities to those. using alternate fuels to satisfy. the,·substitution •requirements and the organisational constraints in effecting the inter-fuel shifts. The .recommendations made are mostly invariant to possible changes in the pil·. price and are feasible of implementation if they 11re implemented as a whole, taking note of their inter dependence. The directions in which a coherent fuel 'policy should move are clearer now ·than ever before md it will not be prudent ,to delay the implementation of any of these recommendations, if they are, otherwise acceptable, in, the hope of pos·sible changes in the supply and price of oil. ' ·'
9. Our· analysis' contained" in· the Repdrt establishes beyond any reasonable doubt 'that coal should be considered the primary source of energy to the country. The ·coal resources of India. inspite 'of the ·quality being poor and their unevenness in gedgraphica!•dispersal· represe'nt 'the most valuable and reliable source of energy' to the. economy. ln"order that this potential advantage is fully exploited · seyeral actions are urgently· called for. While the primary knowledge about our coal resources· is· adequate;' detailed information on the nature of the depositS is inadequate an<l 'tHis,' is proving' to be a hindrance to expanding coal production quickly.· The' arrangements ·for. the transportation of coal have proved to be very much snort Of our needs and llnless an integrated plan for production and its transport are • draym .tiP' am! synchronised' investments are made in coal and transport sectors, 'there is likely to· be ·severe' Strains on the energy sector. While several suggestions .such as pit head generation of power and production of fertilizer in the J,llidst ,of ~,;oa.\, fields .. have ,J:leen .made to economize on coal transport, there will still be)arge.demand ~or coal in places away from the centres of coal producti0n, Trahsportation by: _rail J:!y increasing qu,antities of coal will be unavoidable upto the end of the period considered in· the Report. It is, therefore, necessary to examil).e the; techniques and procedures of coal transport and devise ways which .will ~.nable the transportation of adequate quantities in the most economic manner, Coal, mining .. methods which , will lead to extraction of a larger share. of coal in' the ground thii.Jl. what is being done now will have to be .devised. The methods of beneficiating ~oal to improve the quality and. facilitate their economic utiliza\iori will 'have to be· devised. In view of the importance
... of, coal in thy energy plans of the.' country, .we, have given very detailed consi· deration to the, issues conne,cted with. coal production. transport; and utilisation ,and a .~arge' number of i:ecowmendatiqns have: been made in these areas.
. 10. Our oil resources.' as . knowit today are very'' insufficient to meet our needs. But there are: some ·indications· .that we may find more of ·on and natu.ral
··gas particularly the latter. Every . effort shpuld be ma(!e to step· up ·such produc, tion, on shore as well as off shore. and· approl?riate ·surveys in advance using
geophysical and other· sensing ·devices should . be 'und.ertaken~the policies out· 'lined for reducilig the rates of growth· of ; oil consump\io~ in future may not require any ~ajor revisions. 'Even. co1Jntrie,s. ;which arc; endowed with abundant
• oil reserves like Iran are'canvassmg the ·'VIew that oil s)lould be used as raw material for high value· chemicals instead of 'being burnt as n1ere fuel. The use of oil for any ·purpose in the country will have. to be . decided in future with reference· to tlie price at whkh we. can get alternative fuels to be used in place 'of oil. ,, It is. therefore, important that the policy measures suggested in the Report for reduction of the use of oil in several sectors should be given urgent attention. The extent fP. whiCh ~he u,se .9f oil c9uld be reduced was examined
· by. the Committee carc;fully: The suggestions ;made are based on the consensus regarding' the extent':to·. w~ic~ .. such reduptio,ns are feas~ble. They are ~ased to
··'some extent' on the subJeCtive.)udgement of the members of the Comm1ttee, regarding the organisatiomil and technplogical improvements that can be achieved
· within the appropriate time span to 'bring !I bout recluctioll in the use of oil in ' '~· ' . '' l('. ' ' ' ' .
vi
· · ' · t f 1 'Ifwe"are sectors y.-hich have become accus~omed to ~hdilfls~~~s co~vf~~r~·J i~~ay' 1\ecome faced w1th :~~~c~efu~e P~~:n~; ~ubrtif':~~ of 0~ by. other fl~els t<_> rates higher · ~~~~sst~r%se indicated in this Report. The specific estimates gt~en m the ~epo~ should be treated as "normal" estimates based on the as~ump,tion ~h~t ~~e. ,qver all rate of rowth in the economy is going t~ be accordmg W anti~Jpa~J,on ~ontained here.gln the short-run, SJ2l:cial m~asw:es may, therefore, nee~ to be, ~d?pt-cd to tide over exceptionally difficult situations, .
. 11 The Committee has endea~oured to. integrate the po~icies ~egarding fuel and s~pply of feedstock for fertilizerS' as fert!lizer. · ~roductJon · :will· !be a :;erj im ortant activity calling for the use of material which could be 'us7d as · ue · · w: are convinced that in .future· at the relative price of co~I. and _011 assumed
, in our studies coal should be the primary feedstock for fertilizerS"lll1'the COl;lntry. Oil refineries will always have some residual heavy•en~· ·products wh1c~
. could be used as a feedstock. It is 'al~o fe~t that a greater ~se ,of •second.ar,Y>ipro _
. cessing to convert the heavy-end fraCtions m a refinery to htgher •Value ltgh~ ~ro ducts will be more rational for us. ' .. · ·. 1
' • · i'·· · ·
12. We have erred on .the side of caution in .assessil!g ele,ctricity cdemand as a shortage of electricity will be difficult to remedy by_ any 1 sho~ t~rm: · rt;~edial measures. However, in translating the power requtr~ments .mto • j:al?ac~ty for power generation to be created, the Com~ttee _has tned to ·.tnclude m. Its calculations a factor reflecting increased e~~Ien~y, m th_e., operatto.n . o.f., po~er generation and transmission systems. Electricity IS . a , htghly . captl~l-mtenS)~e source of energy. A country like ours with a serious. shortage •.of. c;~ptta\ ~an ill afford to neglect the possibilities of ca_Pital saying th~t may ,.be available m. Jhe pqwer sector. Taking note of the relative ments of _different methods_.l!f, ge)jl:ration the Committee has suggested that more atteJ;~tiOn should ·be, ,paid; to' hyde! power .geJ;~er.ation i~ the Sixt~ Five Year Plan and. that nuclear .po~e1i 1 Jl~n«ra~ tion based on thonum-plutomum cycle should be ~.traduced . at lea~t, ,, II) '·the
'. Seventl;l Five Year Plan. ·
" 13. The supply of fuels. to tne aomestic sector in our country' presents a number of special problems. The percentage' of non-commercial fuels '•used' in the · domestic sector though large is slowly getting reduced. (it will be.· abOut 80• per cent in 1978~79 and 60 per cent. in 1990-91). Out:' calculation show that
·the' quantity of non-commercial fuels used which has'.been increasing gradui!IIY ''·over time; wiii reach a peak during the early years of tlie Sixth Five Year Plan
anci ·will decrease· slowing from then on. But the' magnitude of"fire\voolt, used · will continue to· be so large compared to the availability of the r~sources. Qlat there is likely to be serious repercussions in regard to the conservation of forests and the consequential. ecological problems. Informed judgement sugges~ ·that \he extraction of about 120 million tonnes of fuels from forests as of today is much beyond the. level of ·fuels that could be extracted without serious impairinent to our forest wealth. This fact and the divergence between sociaJ 'and private costs of , using forests fuels underline the· need to take-up measures for. S'Upply of in'creased quantities of commercial fuels at appropriate, prices to ,the. poor!'~~· ~.ec
. tiot\s of the. rural community and for increasing the availability of ,.firewood .. by 'takinl! up well-conceived s,chemes of low cost afforestation. Though. the. benefits :of u~tng cowdu_ng a,s' a, manure are well-recognised today, ·increasing. quantl,ties of dung.~re beJ,ng used as.a domestic·fuel.Gobar.Gas l'lants provide. a, means of explmting the fuel as v:ell.,as the plant nutrient potential of dung and, .. th~refore, deserve greatet attention. Though the t!ltal quantitative contribution .of gol>ar gas pl_ants ~o ~oe fuel need~ o_f the domesti: s~r, even . on very .optimistic; expec!a\1ons, ts ll~ely to ~e limJted, the contribution of gobar. gas plants to, other socml pen~fits like_ .nutrient production. an~ pollution ,abatement have. prompted the Committee to strongly. ,recommend. an. mtensified campaign, to populanse •. the use o,f go bar gas ... , . ,
' ' •·· 1- ' ·! J • ,, .,,
:· 1~. The problem of energy supply to rural as ,well as urban areas ~as im· p.ltcatJOns for ecology ~nd environmental .pollution .. Data. relating. tP Jx>llution costs and .cost of pollution control are, as yet, meagre .in tndia. The . Committee could, therefore, make no specific ,recommen~ations in t!lis regarcl. :Qut it; 1i$ .. our ~ope that as and.v:hen.the pro~lems of pollution become significp,npn apy,ar~a.or mdustry. the specific Issues w!IJ be examined and appropriate m~s\lres :taken,
Vll
. 15. We hav_e analysed the possibilities of deriving energy from non-conventional sou~ces hke g~o-t~ermal energy, tidal power. solar power. etc. It is felt tha~ the l•kely contnbution of energy from these sources will be insignificant dunng the period covered by this Report.
16. It is weU known that there is a growing imbalance between the resource base of our economy and the drift of modern technological developments in the energy se~tor as observed so far. The international research and development efforts until recently were directed towards improving the methods of utilisation of fuels and feedstock which were in short supply in the country. Inspite of the new thrust in research and development towards the use of coal and other fuels it is necessary that we should ourselves undertake research and development effort, which would enable a more rational use "of our resources. A technology plan has, therefore, been· suggested in this Report.
17. The Committee has been fuUy conscious of the fact that energy is one of the several inputs required to ensure the desired rate of economic growth. The availability of energy is a necessary but not ·a sufficient condition to sustained economic growth. Economic growth can be achieved only when the availability of energy is matched by adequate supply of other inputs. A meaningful energy plant in the economy should be an intergal part. of the national plan reHecting fully its objectives and &trategies. ·The Committee has endeavoured to draw up the recommendations for a coherent energy policy which it considers to be in consonance with the objectives and policies of the government. We have suggested certain organisational arrangements like the setting up of Energy Board which . will ensure the integration of energy plan with the national plan not only at the stage of drafting these plans but at every stage of their imple· mentations. ·
18. The Committee is conscio·us of the fact that our recommendations are fairly numerous and amongst- themselves cover a very wide range of issues. This is of course only natural since the problems pertaining to energy sector are in· evitably ·complex and are often interdependent. We would, therefore, request that our recommendations ·should be viewed in a coordinated manner. If they are found acceptable, we hope that necessary actions in these areas :will be initiated and "pursued with utmost expedition.
19 .. I w~uld like to take this opportunity of expressing my gratitud~ to members of the Committee who not merely tendered very· valuable suggestions in their own areas of specialization but throughout the deliberations kept in view the overaU implications of formulating an appropriate energy pol!cy on consonance with our. fundamental objectives and constraints. :I'h.e Committee through· out received very valuable assistance fr~n~ the Secretariat. I would. h?wever, like to place on record my deep appreciation of. the work done by Shri T. ~Sankar, Secretary of the Committee, who brought to bear on the p~oblems his comprehensive grasp of the empirical and analytical aspects of the Issues dealt with in the Report and thus contributed in a very substantial measure to the formulation and completion of this Report.
With kind regards.
Shri K. D. Malaviya, Mini;ter of Steel & Mines, NEW DELHI •.
Yours sincerely
(S. CHAKRAVARTY)
1.
2.
3.
4.
5.
6.
7.
8.
9.
10.
~I.
CHAIRMAN AND MEMBERS OF THE FUEL POLICY COMMITTEE ON THE DATE OF FINALISATION OF THE REPORT
' Pror. S Chakravarty
Dr. M. G. Krishn&
Dr. A. Lahiri
Dr. Kirit S. Parikh
Shri V.N. Meckoni
Shri B. Lall
Shri Basiklal Wor&h
Shri B. G. llaheudr11
Shrl N. Tata Ran]
Shri N. N. Tandon
Shri T. L. S&nkar . .
. .
..
• • 0 ..
..
C.hairman
.llember
Aleml>u
Memh<r
Jlember
.Vember
Membu
Meml><r
.lleml>er (in plaoe or Vice Chairman
CWPC)
Member
Secrelary
\ j
\'
I
n1 r :11 1''' 1 I ( )! i<J'I II'' I 1111 ·I()(',J 11£1,11!~ (1~/. //f/;.Jiljf I l;i'·· .:. li·l ill /ll!l/.i"ll/;.'11 !tl d/0 .1.!1
,·, ... ; ... ,,_, ··11 .l 'J •. !
. I <'" .,.111i . ;{I _I
,,, .I .. I ~ 1'
·:. I :J ;-.
•' 'N ·t t;,;i,~~J.! 1
,; ·, '• I;, ! ',.
,. I 1< f- 11', I , .', . :' t ',.
•, ·n , I . ~
. '
' .
•
·.
SECRETARIAT OF FUEL POLICY COMlvliTIEE 1, Shri T. L. Sankar Socreta~y
2. Shri G. V. G. Raman U ,wJer St.e:>dary
a. Sbri l'rit.i Pal Se,.ior Re.~earri1 Q_Iftu.r
4. Shri S. N. ll~agwa.u •• li. Shri V. Vikrama.n .. 6. Shri Prakash Chandra. •• .. • • 7. Shri B. K. Sinha. •• 8. Shti B. R. Bha.lla .. 9. Shri I. V. Soor.ma. Research Au~a11t
10. Shri P. Ramaswamy •• 11. Miss Parve:ili Cha.wla ., 12. Shri K . R. Jain .. 13. Shri C. B. Gupta " 14. Shri R. Cbet-al ., 15. Shri S. N. B~erjee ..
(ix)
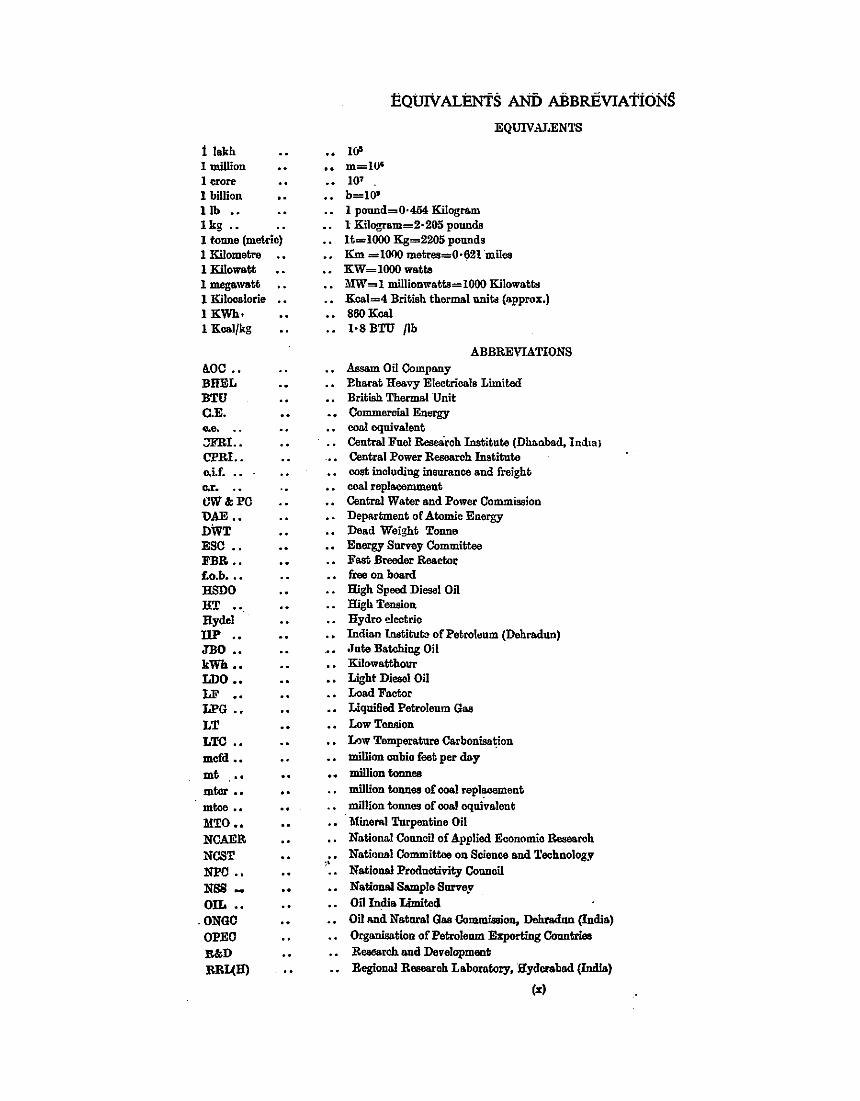
1 lakh 1 million 1crore 1 billion lib •• 1 kg •• 1 tonne (metric) 1 Kilometre 1 Kilowatt 1 megawatt 1 Kilocalorie 1KWh• 1 Kcal/kg
!I.OC •• BHEL BTU C.E. e.e. . . :JFRI .. CPR! •. o.i.f . .. o.r. . . CW &PC l>AE •• DWT ESC •. FBR •• f.o.b ••• HSDO HT •• Hydel DP .• JBO .. kWh .. LDO •• LF •• Ll'G .• LT LTC .• mcfd ••
mt .•• mtcr •• mtoe •• MTO •• NCAER NCST Nl'C .. NBSOIL ••
.ONGO OPEO It&D RBI.( H)
10' m=l01
107 -
b=10' 1 pound=0·4M Kilogram l Kilogram=2·205 pounds lt=1000 Kg=2205 pounds
EQUIVAJ..ENl'S
Km =1000 metres=0·621 miles KW=1000 watts MW=1 millionwatts=1000 Kilowatts Kcal=4 British thermal unit. (3pprox.) 860Koel 1·8 BTU Jib
ABBREVIATIONS Assam Oil Company Eh&rat Heavy Electricals Limited British Thermal Unit Commercial Enorgy coa.J equivalent Central Fuel B.ese8roh Institute (Dhanbad, lndml Central Power Research Institute cost including insurance and freight coal replacemment Central Water and Power Commission Department of Atomic Energy Dead Weight Tonne Enorgy Survey Committee Fast Breedsr R.e&ctor free on board High Speed Diesel Oil lligh Tension Hydro electric Indian Institut<> of Petroleum (Dehr&dun) .Jute Batching Oil Kilowa.ttbour Light Diesel Oil Load Factor Liqui6ed Petroleum Gas Low Tension ll>w Temperature Ca.rbonisa~ion million oubio feet per d&y million tonnee million tonnes of ooal replacement million tonnes of ooa.J equivalent Tl1ineml Turpentine Oil National Council of Applied Economic R.esesrch
• • National Committee on Science and Technology ,. Nationa.J Productivity Council National Sample Survey Oil Judi& Limited Oillldld Natnml Gas Commission, Dchr&dnn (India) Organisation of Petroleum Exporting Countries Reoearch and Development Regiona.J Research I.aboratory, .ilyderabed (Indla)
(:<)
CHAPTER I
INTRODUCTION
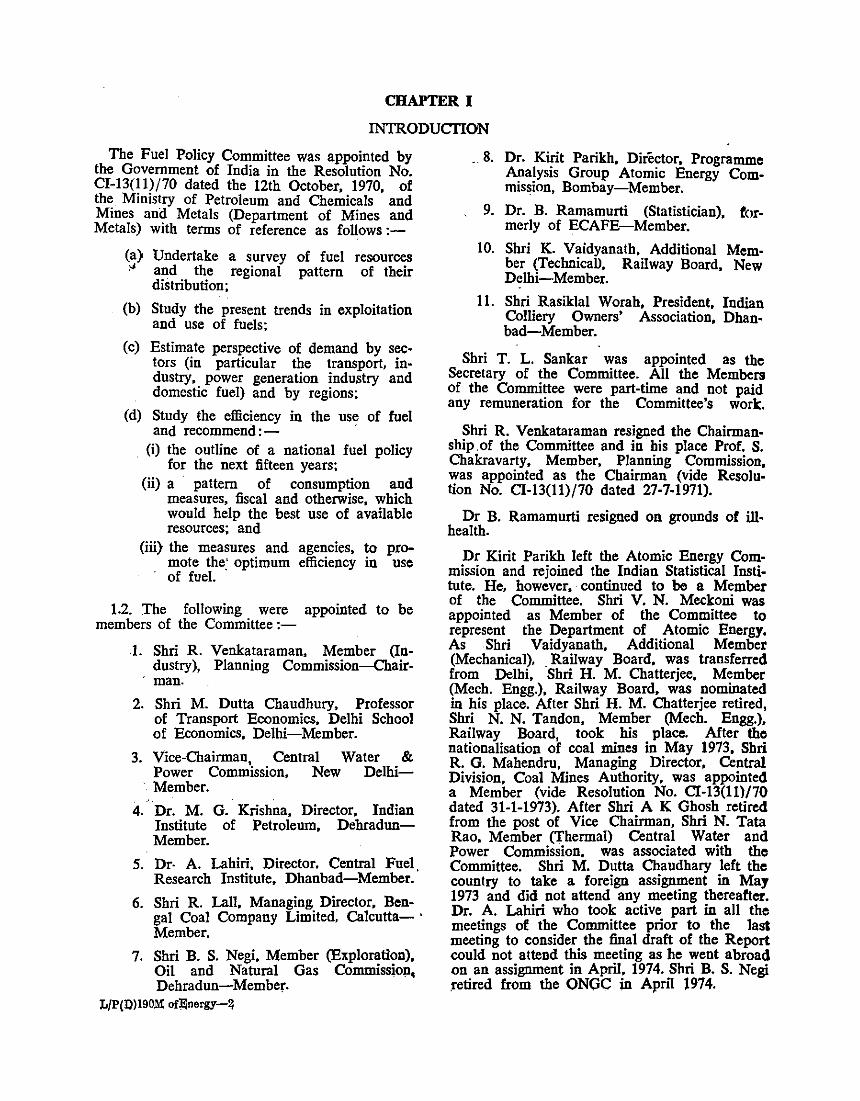
The Fuel Policy Committee was appointed by the Government of India in the Resolution No. CI-13(11)/70 dated the 12th October, 1970, of the. Ministry of Petroleum and Chemicals and Mines and Metals (Department of Mines and Metals) with terms of reference as follows:-
(a)
" Undertake a survey and the regional distribution;
of fuel resources pattern of their
(b) Study the present trends in exploitation and use of fuels;
(c) Estimate perspective of demand by sectors (in particular the transport, industry, power generation indu,stry and domestic fuel) and by regions;
(d) Study the efficiency in the use of fuel and recommend:- ·
(i) the outline of a national fuel policy for the next fifteen years;
(ii) a pattern of consumption and measures, fiscal and otherwise, which would help the best use of available resources; and
(iii) the measures and agencies, to promote the: optimum efficiency in use of fuel.
1.2. The following were appointed to be members of the Committee:-
1. Shri R. Venkataraman, Member (Industry), Planning Commission-Chairman.
2. Shri M. Dutta Chaudhury, Professor of Transport Economics, Delhi School of Economics, Delhi-Member.
3. Vice-Chairman, Central Water & Power Commission, New Delhi-Member.
4. Dr. M. G. Krishna, Director, Indian Institute of Petroleum, DehradunMember.
5. Dr· A. Lahiri, Director. Central Fuel Research Institute, Dhanbad-Member.
6. Shri R. Lall, Managing Director, Bengal Coal Company Limited, Calcutta- · Member.
7. Shri B. S. Negi, Member (Exploration), Oil and Natural Gas Commissio!l, Dehradun-Member.
L/P(D)l90M of]lnergy-~
_ 8. Dr. Kirit Parikh, Director, Programme Analysis Group Atomic Energy Commission, Bombay-Member.
9. Dr. B. Ramamurti (Statistician), formerly of ECAFE-Member.
10. Shri K. Vaidyanath, Additional Member (TechnicaD, Railway Board, New Delhi-Member.
II. Shri Rasiklal Worah, President, Indian Colliery Owners' Association, Dhanbad-Member.
Shri T. L. Sankar was appointed as the Secretary of the Committee. All the Members of the Committee were part-time and not paid any remuneration for the Committee's work.
Shri R. Venkataraman resigned the Chairmanship .of the Committee and in his place Prof. S. Chakravarty, Member, Planning Commission, was appointed as the Chairman (vide Resolution No. CI-13(11)/70 dated 27-7-1971).
Dr B. Ramamurti resigned on grounds of ill· health.
Dr Kirit Parikh left the Atomic Energy Commission and rejoined the Indian Statistical Institute. He, however, continued to be a Member of the Committee. Shri V. N. Meckoni was appointed as Member of the Committee to represent the Department of Atomic Energy. As Shri Vaidyanath, Additional Member (Mechanical), . Railway Board, was transferred from Delhi, Shri H. M. Chatterjee, Member (Mech. Engg.), Railway Board, was nominated in his place. After Shri H. M. Chatterjee retired, Shri N. N. Tandon, Member (Mech. Engg.), Railway Board, took his place. After the nationalisation of coal mines in May 1973, Shri R. G. Mahendru, Managing Director, Central Division, Coal Mines Authority, was appointed a Member (vide Resolution No. CI-13(11)/70 dated 31-1-1973). After Shri A K Ghosh retired from the post of Vice Chairman, Shri N. Tata Rao, Member (Thermal) Central Water and Power Commission, was associated with the Committee. Shri M. Dutta Chaudhary left the country to take a foreign assignment in May 1973 and did not attend any meeting thereafter. Dr. A. Lahiri who took active part in all the meetings of the Committee prior to the last meeting to consider the final draft of the Report could not attend this meeting as he went abroad on an assignment in April, 1974. Shri B. S. Negi retired from the ONOC in April 1974.
1:1. At its meeting on 25·11·1970, the Com· mittee had set up four Working Groups to study different aspects of the fuel policy such as :-
. (i) Energy consumption in' the past . and estimates of future ·demands for .fuel;
(ii) Trends ui the relationship between the level of fuel consumption and the levels of different economic activities;
(iii) Relative costs of different fuels;
(iv) Factors influencing the selection of . particular fuels and probable trends in
fuel consumption taking note of tech· nological shifts industry-wise;
(v) Designing an Analytica1 framework.
The different Working Groups were assisted in their work by the Secretariat of the Fuel Policy Committee consisting of the Secretary and Under Secretary (whose services were often available only part-time due. to their being drafted for other Government work), 4 Senior Research Officers, 8 Investigators /Assistants, 3 Clerks and 3 Stenographers. The staff of the Secretariat was augmented through thll part-time association of the two Consultants for some time. In addition, the Committee received help on specific points from the different Divisions of the Planning Commission and from officers of the National Committee on Science and Technology, Department of Mines and Indian Institute of Petroleum. . ·
1.4. The Committee was originally requited to submit its Report within 12 months but due to delays in obtaining staff for the Committee's work and in the appointment of a Chairmall after the resignation of Shri R. Venkatraman. the Committee could start its work in earnest only in the latter half of 1971. Since it was felt that the Committee's studies would take time and . investment decisions had to ·be taken urgently by the Government With regard to the Fifth Plan programme in the energy sector, a quick study was made of the "Fuel Policy for the Seventies" and Part I of the Committee's Report covering the period upto 1978-79 was submitted to Government in May 1972. . The ltl;ldies. made in that Report were based on the perspective plan for 1978-79 incorporated in. the Fourth Five Year Plan. Part· I of the Committee's Report has to be viewed with reference to these targets of economic and industrial growth. This Report was considered by the :variou,g Departments of the Government concerned iii framing the. Fifth Five Year. Plan pro~.
1.5. it was realised by the middl~. of 1972-73 that there will be substantial slippages in achievement of Fourth Plan targets and. that the pers- · pective for the Fifth Plan envisaged earlier would have to be revised. The. Committee, therefore, felt that any studies by it in isolation
2
from the Fifth Plan targets would not bo reliable and decided to wait for the Draft Fifth Plan to be finalised by the Government The
. · finalisation took place in November, 1973.
In the meantime, in order to effect economy in expenditure, the Committee's staff strength was gradually reduced and by 31-8-1973, the whole Secretariat· staff had been disbanded. The work was thereafter carried out part time by some of the officers who were earlier in the Secretariat of the Committee but were workina full time as officers of the Project Appraisal Division of the Planning Commission and the Department of Mines. The first drafts of the different chapters and the Committee's Report were got ready by the middle of 1973 and were considered by the Committee at its meeting held in June, 1973 and July, 1973. Before these drafts could be revised in the light of the discus· sious at the Committee's meetings there was significant development in the international oil situation as a consequence of the Middle Bast conflict in October, 1973. Subsequently, fn December, 1973, a further steeii increase in oil prices . took place as a result of which the estimates regarding the demand for oil products
·and the policy to be followed With regard to their use had to be revised. The Final Report of the Committee has taken note of the developments in. the oil producing countries and their impact in so far as the Fuel Policy of India is concerned and has attempted to suggest · a pattern of fuel consumption for the future.
1.6. The Fuei Policy Committee held in aU 14 meetings including the first meeting at which the various tasks before the Committee were analysed, 4 meetings for finalising Part I of the Report and 9 meetings for considering the Final Report.
A. The studies made by· the Committee i1_1cluded inter-alia the following . main topics. VIZ.
(a) Trends in the consumption of cii«erent fuels state-Wise. industry-wise, its relationship with various economic indicators like national income, industrial production etc.
(b) The projection of total demand for energy and for the different fuela both commercial and ·non-commercial till 1990-91.
(c) Assessment of the different fuel resources available in the country including energy sources which are yet to be exploited and extent of their avail-ability. ·
(d) Regional distribution of energy con• sumption.
( (e) .Cost of transport of energy in ~erent · •fuel forms and by difte~~ ~~~ Qf ~port. .
(f) Relative cost of railway traction. (g) Cost of production of different fuels. (h) Relative economics of transporting
coal and transmission of .energy.
1.8. The optimisation studies made by the Committee included a model which would enable consideration of all the factors simultaneously in working out the levels .of supply of different fuels ·which ~would ·minimise the total economics of meeting· the demand for fuel and fertilizer. A system study to determine the optimal level of nuclear ·power generation was carried out. Another . specific study made by the Committee at the request of the Department of Mines was regarding the economics of expanding the power station at Neyveli involving the opening of. a second mine cut vis-a-vis transporting of coal froin Singareni to power station. near Madras.
1.9. As mentioned earlier the Committee had a very small Secretariat which functioned effec-
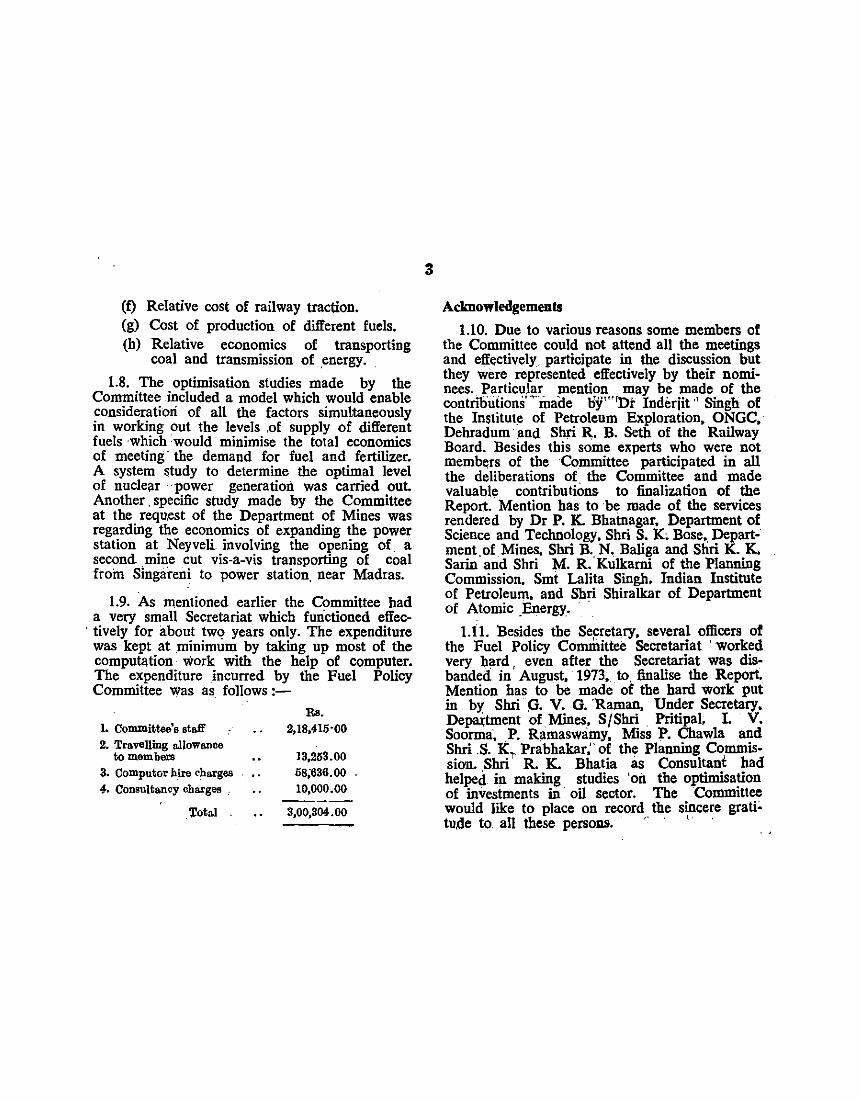
. tively for about twq years only. The expenditure was kept at .minimum by taking up most of the computation work with the help of computer. The expenditure incurred by the Fuel Policy Committee was as follows :-
Ia Committee's sta.ft' 2. Travelling o.llowance
to members 3. Computor hire. charges 4. Consultancy charges ,
.Total
Rs. 2,18,415·00
13,253.00 58;636.00 10,000.00
3,00,304.00
3
Acknowledgements
1.10. Due to various reasons some members of the Committee could not attend all the meetings and effectively. participate in the discussion but they were represented effectively by their nominees. Particu.Iar mention may be made of the contnoutions""inade ll:Y'"'Dt Indi:rjit ·• Singh of the Institute of Petroleum Exploration, ONGC, · Dehradum · and Shri R. B. Seth of the Railway Board. Besides this some experts who were not members of the Committee participated in all the deliberations of the Committee and made valuable contributions to finalization of the Report. Mention has to be made of the services rendered by Dr P. K. Bhai:nagar, Department of Science and Technology, Shri S. K, Bose, Department of Mines, Shri B. N. Baliga and Shri K. K. Sarin· and Shri M. R.'Kulkarni of the Planning Commission. Smt Lalita Singh, Indian Institute of Petroleum. and Shri Shiralkar of Department of Atomic .Energy. · ·
1.11. Besides the Secretary, several officers of the Fuel Policy Committee secretariat ' worked very hard , even after the Secre.tariat was dis~ banded in August, 1973, . to. finalise the Report. Mention has to be made of the hard work put in by · Shri (j. V. G. 'Raman, Under Secretary, Depaitment ofMines, S{Shri . Pritipal. I. V. Soorma·. P. Ramaswamy, Miss P. Chawla and Shri ,S. K, Prabhakar; of the Planning Commission. Shri R. K. Bhatia as Consultant had helped in making studies 'on the optimisa~on of investments in · oil sector. The Comm1ttee would like to place on record the sincere grati~ tude to. all these persons. · · ·· · '· · ..
CHAPTER ll
TRENDS IN ENERGY CONSUMPTION
Commercial and non-commercial energy sources . 2.1. The most important fact about thecenergy
situatioir in India is that nearly ha1f bf the total' energy consumed in the country· comes' from non-commercial sources. The bulk . of the noncommercial supplies is consumed in rural :areas and is obtained from vegetable waste products, firewood, and cowdung each: of which has 'better alternative uses from the ·national 'point of view. In addition, mechanical energy derived· from· animal power and manpower used for' drawing water and ploughing is also used in· significant quantity. No records of the quantum of · such utilisation are available. It is, however, doubtless that the share of non-commercial energy in the total energy consumption has been declining ov~r the past two decades.
2.2. A careful analysis .· , of the trends in consumption . qf energx in·· the la,st two decades would provide a good basis for forecasting the energy requirements of the future. As the data on the consumption of non-commercia\ energy has not been compiled in a systematic . manner annually, it has to be computed from certain norms of consumption calculated for different years . .We shall start with a deta'iled analysis of the commercial energy consumption and reserve the analysis of non-comniercialehergy, GOnsump-tion to the end. · · .. : '
Primary and Secondary forms of Energy
}2.3. Commercial energy can be divided into two forms, primary and secondary. The primacy forms of energy are those which are used in the form in which they are available in nature, while secondary forms of energy are produced by transformation of the primary forms. lil India primary . form of energy is provided principally by coal and petroleum produ~ while electricity generated from coal or oil i1 the principal secondary form of energy. Othe1 forms of primary energy like solar energy an( geo-thermal energy have no practical significanc1 at present. A part of electricity is also to b1 treated as a primary source in-as-much as ill production is based on the use of material! which are not themselves fuels. Hydro electricit) and nuclear electricity could therefore be consi dered as primary energy sources. Hydro elec tricity forms an importan.t component. of Iota electric energy consumed to Ind1a, wh1le nuclea1 electricity is only a small contributory sectm so far. The secondary form of energy is principally electricity generated by the use of coal.
The oil based electricity generation is quantitativeiy insignificant. Gas derived from coal or oil is also. considered as secondary form of energy. For analysing trends in energy .consumption, it is found useful to concentrate on thr~ major categories of energy sources--:o?al, _oil and electricity. An analysis of . electnc1ty. Wlt!J. respect to. different sources of 1ts productwn lS also necessary and this bas_ been dealt with in Chapter IX. Common unit or' measurement of enefiY
2.4. ·For purposes of aggregating the quantities of energy obtained from different energy so"!rces it iS necessary to adopt a common u,111t of measurement. · . Different countries and different agencies have been adopting different common units.. Coal equivalent tonne is the most commonly used aggregate measure in various international studies. With the emergence of oil as; the major source of energy in developed countries, oil equivalent tonne is being adopted as: a common unit in· some developed countries. Brit the United Nations is still using coal equivalent:· tonne as the unit of measure in the · statistics: compiled for all countries; Coal equivalent tonne' expresses the beat content (kilo calories) of each• fuel in terms of the heat content of an average· tonne of indigenous coal. The calorific value of" Indian coal varies from 6700_kcaljkg in the case' of selected A & B Grade coal to around 4000' kcal/kg for upgraded coal. We have used throughout the study, 5000 kcal/kg as the average h~at content of lndia11 coal. As the thermal value of oil products is about 10,000 kcal/kg, one tonne of oil is expressed as 2 coal equivalent tonnes in this measure.
2.5. The Energy Survey Committee* which made the ·first serious attempt to study the trends in energy consumption had adopted the coal
_ replacement tonne as the common measure. The justification was that the coal replacement tonne gives the amount of coal that would have been needed in the economy if no other source of energy were available. This measure takes note of not only the quantity of heat value available in the different fuels used but also of the varying efficiency in . the appliances employed· In other words. the coal replacement measure indicates the amount of coal that would be needed to substitute the other fuels taking account of th_e ~fficiencies involved in typical cases of subs!JtuttOn. For example, while the use of one tonne of fuel oil for raising heat in industries can be substituted by the use of two tonnes of coal the use of one tonne of high speed di~~l ojJ bi tb.~
~The report of the ~nerzy, Surve.y of India. C'A)'fl'!.~ittoo, Government of India., 1 00~. . . 4
Railways for the same ·haulage would requ,ire 9 tonnes of coal. One tonne of fuel oil will, therefore, be. measured as two coal replacement tonnes, while one tonne of HSDO will be measured as .9 · coill .. repiacement tonnes. The other m,ethod ·used' is to express all the heat value · in different· fuels in kilo-calories. As the efficiency of the use of coal in different sectors/industries increases over time, the coal replacement ratios should be revised from time to time. In the power sector, for example, the coal replacement ratio will change rapidly over time as a result of the increased efficiency of the boilers used in the modem power plants. But if we change the replacement ratios over time to allow for the increased efficiency of use, the figures in different periods of commercial energy consumption may not be strictly comparable. Therefore, the · coal replacement term in this Report is used only for purposes of giving a common measurement for convenience of aggregation and should not· be taken as indicating the coal required for replacing a unit of any particular fuel at any given point of time. Such .substitution needs in terms, of coal
. will have to be worked out with reference to the sector where substitu,tion is to be attempted and the time at which such substitution will take place. It should be noted that while adopting other aggregate measures like coal equivalent or kilo calorie, for mea~uring the hyde! and nuclear power in terms of the common units of measurement, some consideration of the efficiency of the use of coal or oil in power stations becomes unavoidable. All the available measures for aggrega- . tion of energy have this limitation. No one measurement is inherently superior to any other and .the choice between different measures . will depend on the purposes for which such aggregation of energy consumption is made. For inter/ national comparisons it is essential ·· that the measurement should be in coal equivalent' ter!ns,
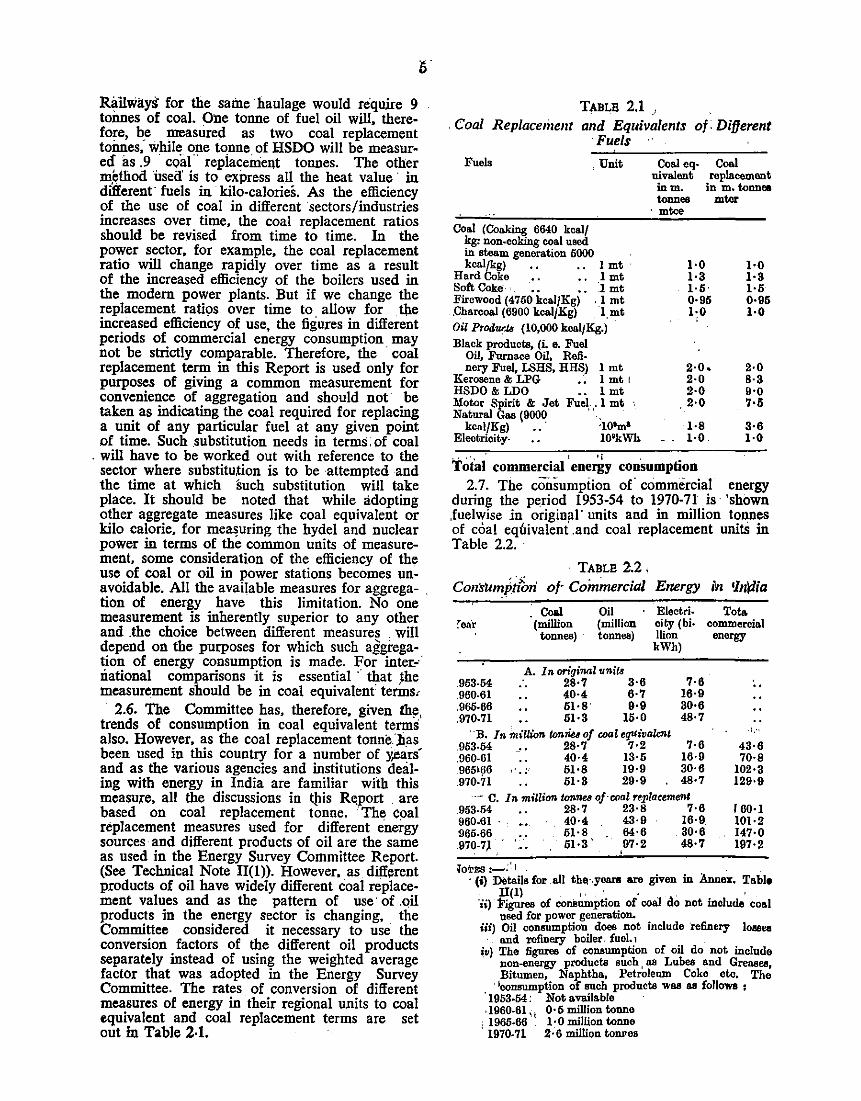
2.6. The Committee has, therefore, given th!l, trends of consumption in coal equivalent terms also. However, as the coal replacement tonne.]Jas been used in this country for a number of y,ears' and as the various agencies and institutions dealing with energy in India are familiar with this measure. all the discussions in Qtis Report . are based on coal replacement tonne. The C()al replacement measures used for different energy sources· and different products of oil are the same as used in the Energy Survey Committee Report. (See Technical Note II(l)). However. as different products of oil have widely different coal replacement values and as the pattern of use· of .oil products in the energy sector is changing, the Committee considered it necessary to use .the conversion factors of the different oil products separately instead of using the weighted average factor that was adopted in the Energy Survey Committee. The rates of conversion of different measures of energy in their regional units to coal equivalent and coal replacement terms are set out in Table 2·1.
TABLE 2.1 _, . Coal Rep/ace1iJent and Equivalents of. Different
·Fuels
Fuels . Unit Coa.l eq· uivalent inm. tonneo
Coa.l roplacement
in m. tonnee mtor
Coa.l (Cooking 6640 kcalf kg: non-coking coal uaed in Bteam generation 6000 . kcaljkg) • • • . I mt
Hard Coke • . • . I mt Soft Cok.- • • . :I mt Firewood (4760 kca.lfKg) , l mt ,Charcoa.l (6900 kca.lfKg) 1, mt Oil Prodw-J.B (10,000 kca.lfKg.) Black products, (i. e. Fuel
Oil, Furnace Oil, Refi· nery Fuel, LSHS, HHS) 1 mt
Kerosene & LPG . ·. I mt 1
HSDO & LDO . . 1 mt Motor Spirit &: Jet Fuel, ,• 1 mt Natura.! Gaa (9000 .
kcal/Kg) · ·101m• Electricity- 10'kWh
· mtce
1·0 1·3 1·5· 0·95 1·0 '
2·0 .. 2·0 2·0
'2·0
1·8 1·0
" ''' ' I lj '
Total commercial energy consumption
1·0 1·3 1·5 0·95 1·0
2·0 8·3 9·0 Nl
3·6 1·0
2.7. The consumption of commercial energy during the period 1953-54 to 1970-71 is 'shown ,fuelwise in original' units and in million tonnes of coal equivaleni.and coal replacement unitS in Table 2.2.
· TABLE 2.2, Cons'Umptfon· of' Commercial Energy in 'ln'r:lia
963-64 960-6I .966-66 .970-71
: Coal (million
tonnes)
Oil (million tonnes)
A. In on'ginal units . 28·7 3·6
40·4 6·7 51·8 9·9 51·3 16·0
Electri. city (hi· Ilion
kWh)
7·6 16•9 30·6 48·7
··B. In miUion tonnu of coal equivalent .963-64 28·7 7·2 7·6 .960-61 40·4 I3·5 16·9 965>66 ' .. · 51·8 I9·9 30·6 .970-'ll 51·3 29·9 48·7
--- C. In million tonnes of· coal replaceme:n'
Tota commercial energy
i,·•
43·6 70·8
102·3 129·9
.953-64 28·7 23·8 7·6 160·1 960-0I . . 40·4 43·9 I6·9 10I·2 965-66 61·8. 64·6 30·6 147·0 .970·7~ 61·3' 07·2 48·7 197·2
ilOTEB :__.;' 1 • · · (i) Details for .a.ll thQ·.yeara are given in Anne:r. Table
ll(ll . '' . . ' . . ' 'ii) Figures of consumption of coal do not include coal
used for power generation. iii) Oil consumption does not include 'refinery loesea
· and refinery boiler fuel. o . iv) The figures of consumption of oil do not include
non-energy products such , aa Lubes and Greasea, Bitumen, Naphtha, Pctrolemn Coke etc. The
· lconsumption of such products was as follows ; '1963-64: Not available ·1960-61 q 0·5 million tonne
, 1966-66 1· 0 million tonne ' 1970-71 2·6 million towes
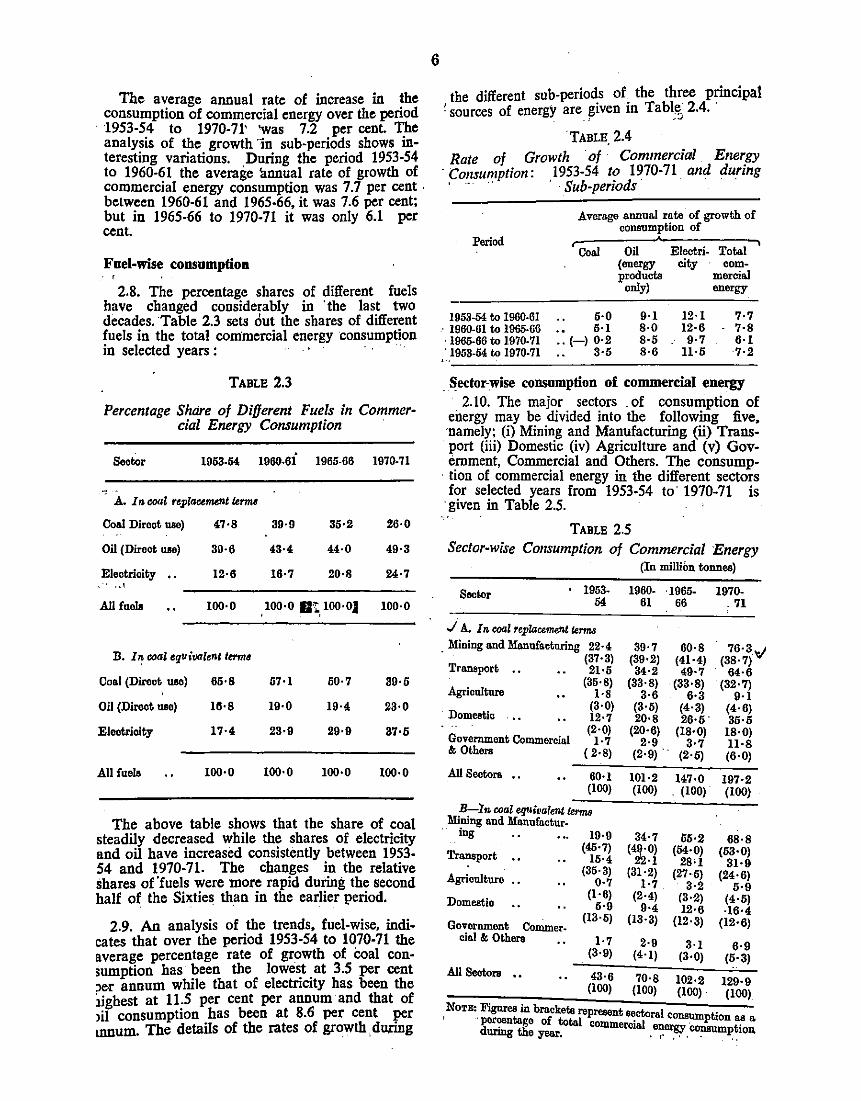
The average annual rate of increase in the consumption of commercial energy over the period
· 1953-54 to 1970-71' 'Was 7.2 per cent. The analysis of the growth ·1n sub-periods shows interesting variations. During the period 1953-54 to 1960-61 the average 'annual rate of growth of commercial energy consumption was 7.7 per cent · between 1960-61 and 1965-66, it was 7.6 per cent; but in 1965-66 to 1970-71 it was only 6.1 per cent.
Fuel-wise consumption
2.8. The percentage shares of different fuels have changed considerably in ·the last two decades. ·Table 2.3 sets out the shares of different fuels in the total commercial energy consumption in selected years : ·
TABLE 2.3
Percentage Shtire of Different Fuels in Commercial Energy Consumption
Sector 1953-54 1960-6i 1965-66 1970-71
.A. In coal r<plaumdlt t.rnt4
Co•l Direct use) 47·8 39·9 35·2 26·0
Oil (Direct use) 39·6 43·4 44·0 49·3
Electrioity .. 12·6 16·7 20·8 24·7 ... All fuel& 100·0 , 100·0 fit, 100·0) 100·0
B. I~ coal equivalent term•
Coal (Direct use) 65·8 57·1 50·7 39·5
Oil (Direct use) 1ft·8 19·0 19·4 23·0
Eleotrioity 17·4 23·9 29·9 37·6
All fuel& 100·0 100•0 100•0 100·0
The above table shows that the share of coal steadily decreased while the shares of electricity and oil have increased consistently between 1953-54 and 1970-71. The changes in the relative shares of'fuels were more rapid during the second half of the Sixties than in the earlier period. . . .
2.9. An analysis of the trends, fuel-wise, indicates that over the period 1953-54 to 1070-71 the average percentage rate of growth of eoal consumption has· been the lowest at 3.5 per cent per annum while that of electricity has been the :lighest at ll.S per cent per annum and that of >il consumption has been at 8.6 per cent per umum. The details of the rates of growth, du.ring
6
the different sub-periods of the three principal ' sources of energy are given in Tablt;_ 2.4. ·
. --TABLE,2.4
Rate of Growth ·of Commercial Energy - r:;o~1su~ption: 1953-54 to 1970-71 and during
· Sub-periods · · · ·
Average annua.l rate of .growth of consumption of
Period Coal Oil
(energy produota
only)
1953-54 to 1960-61 5·0 9·1 ' 1960-61 to 1966-66 • • 6·1 8·0
1965-66 to 1970-71 .. (-) 0·2 8·6 .:1953-54 to 1970-71 .. 3·6 8·6
Eleotri- Total city com~
mercia! energy
12·1 7·7 12·6 7·8 9·7 6·1
11·6 7·2
_ Sector-wise consumption of commercial energy 2.10. The major sectors . of consumption of
energy may be divided into the following five, ·namely; (i) Mining and Manufacturing (ii) Transport (iii) Domestic (iv) Agriculture and (v) Government, Commercial and Others. The consump-
. tion of commercial energy in the different sectors for selected years from 1953-54 to' 1970-71 is
·given in Table 2.5.
TABLE 2.5 Sector-wise Consumption of Commercial Energy
(In million tonnes)
Sector • 1953- 1960- ·I 065- 1970-54 6! 66 .71
All Seotora •.
B-1n coal equivalent t.rms Mining and Manufactur.
· ing 19·9 (45·7)
15·4 (35· 3)
0·7 (1·6)
5·9 (13·5)
Government Con:imer.
Transport ••
Agriculture ••
Domestic
cia! & Others 1·7 (3-9)
39·7 60·8 (39·2) (41·4) 34·2 49·7
(33·8) . (33·8) 3·6 6·3
(3·5) (4·3) 20·8 26•6'
(20·6) (18·0) 2·9 3·7
(2·9) '- (2·6)
101·2 147·0 (100) . (100).
34·7 56·2 <4J20l (54·0)
·I 28;1 (31·2) (27·5)
1·7 3·2 (2·4) (3·2)
9·4 12·6 (13·3) (12·3)
2·9 3·1 (4·1) (3·0)
76·3~:~ (38·7)
64·6 (32·7)
9·1 (4·6) 35·5
18·0) ll·8 (6·0)
197·2 (100)
68·8 (63·0)
31·9 (24·6)
6·9 (4·6) ·16·4
(12·6)
6·9 (6·3)
All Seotora •• 43·6 70·8 102·2 129·9 (100) (100) (100) . (100)
NoTE: Figures in brackets represent aecto I . ' · porcentago of total "a] ra co~ptxon as a
d . th commero1 energy consumption urmg eyesr. 'r· .·' .
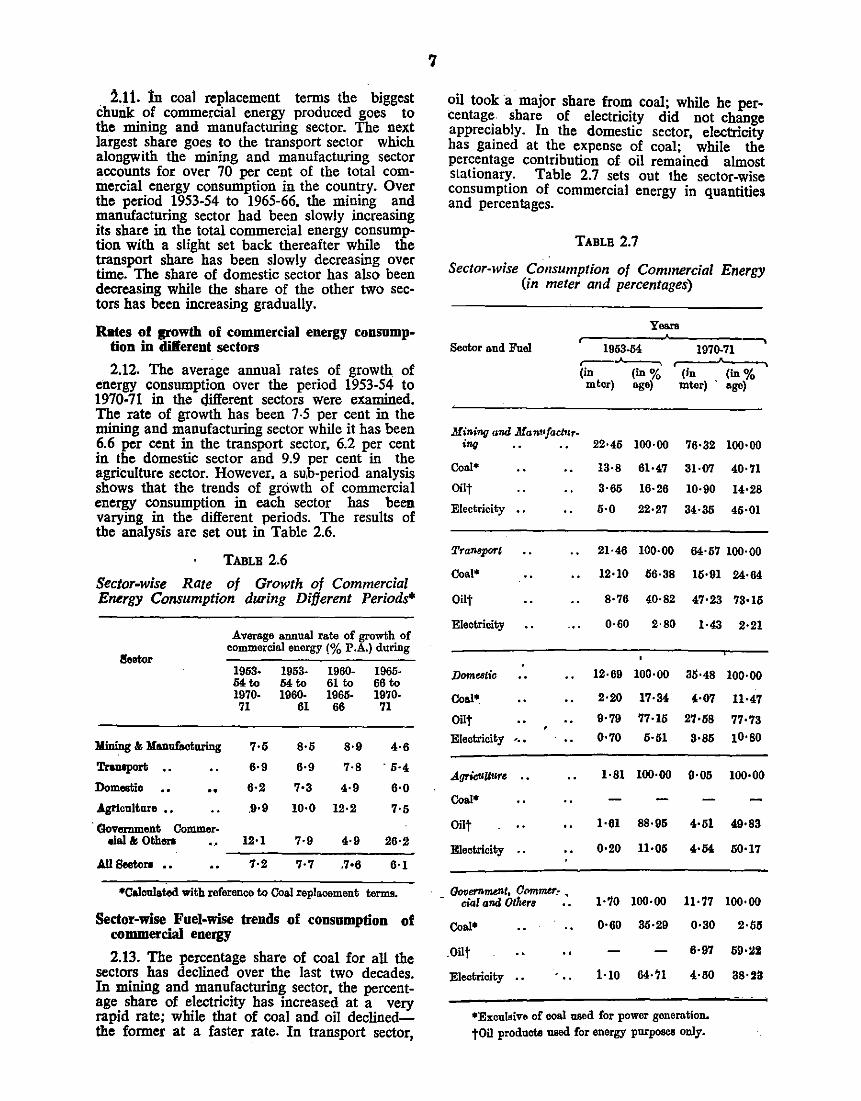
2.11. 1n coal replacement terms the biggest chunk of commercial energy produced goes to the mining and manufacturing sector. The next largest share goes to the transport sector which alongwith the mining and manufacturing sector accounts for over 70 per cent of the total commercial energy consumption in the country. Over the period 1953-54 to 1965-66, the mining and manufacturing sector had been slowly increasing its share in the total commercial energy consumption with a slight set back thereafter while the transport share has been slowly decreasing over time. The share of domestic sector has also been decreasing while the share of the other two sectors has been increasing gradually.
Rates of powth of commercial energy consumption in dil'erent sectors
2.12. The average annual rates of growth of energy consumption over the period 1953-54 to 1970-71 in the different sectors were examined. The rate of growth has been 7-5 per cent in the mining and manufacturing sector while it has been 6.6 per cent in the transport sector, 6.2 per cent in the domestic sector and 9.9 per cent in the agriculture sector. However, a su,b-period analysis shows that the trends of growth of commercial energy consumption in each sector has been varying in the different periods. The results of the analysis are set out in Table 2.6.
TABLB 2.6
Sector-wise Rate of Growth of Commercial Energy Consumption during Different Periods*
Average annual rate of growth of commercial energy(% P.A.) during
l!leotor 1953· 1953· 1960· 1965· 54 to 54 to 61 to 66 to 1970· 1960- 1965- 1970-71 61 66 71
:Mining & Manufacturing 7·5 8·5 8·9 4·6
Traolport .. 6·9 6·9 7·8 . 5·4
Domeetio .. 6·2 7•3 4·9 6·0
Agriculture •• .9·9 10·0 12·2 7·5
· Government Cammer-olal & Oth11r1 .. 12·1 7·9 4·9 26·2
AUBeetora .. 7·2 7·7 .7•6 6·1
•Calculated with reference to Coal replaoement terms.
Sector-wise Fuel-wise trends of consumption of commercial energy
2.13. The percentage share of coal for all the sectors has declined over the last two decades. In mining and manufacturing sector, the percentage share of electricity has increased at a very rapid rate; while that of coal and oil declinedthe former at a faster rate. In transport sector,
7
oil took a major share from coal; while he percentage. share of electricity did not change appreciably. In the domestic sector, electricity has gained at the expense of coal; while the percentage contribution of. oil remained almost stationary. Table 2.7 sets out the sector-wise consumption of commercial energy in quantities and percentages.
TABLE 2.7
Sector-wise Consumption of Commercial Energy (in meter and percentages)
Years
Sector and Fuel r-------~-------~
Mining and Manufaclur-i11{1
Coal•
Oilt
Electricity
Transporl
Coal*
Oilt
Electricity
Domestic
Coal*
Oilt
Electricity
AgrioUUUre
Coal•
Oiit
Electricity
'·.
Government. 0Pmmtf': .. cia! and Otlrers
Coal•
.Oilt .. Electricity
1953-54 1970-71 r---.>.---, (in (in % (in (in % mtcr) age) mter) · age)
22·45 100·00 76·32 100·00
13·8 61·47 31·07 40·71
3·65 16·26 10•90 14·28
6·0 22·27 34·35 45·01
21·46 100·00 54·57 100·00
12•10 56·38 15•91 24·64
8·76 40·82 47•23 73·15
0·60 2·80 1·43 2·21
12·69 100·00 35•48 100·00
2·20 17·34 4·07 11·47
9•79 77·16 27·58 77•73 0·70 5·51 3•85 10•80
1·81 100·00 9·05 100·00
1·61 88·95 4·51 49•83
0•20 11·05 4·54 50•17
1·10 100·00 11·77 100·00
0·60 35·29 0·30
6·97
1·10 54·?1 4·60
2·58
59·lli
38·2~
•Exculsive of coal used. for power generation. tOil prodnete 11liOd Cor energy purpose& only.
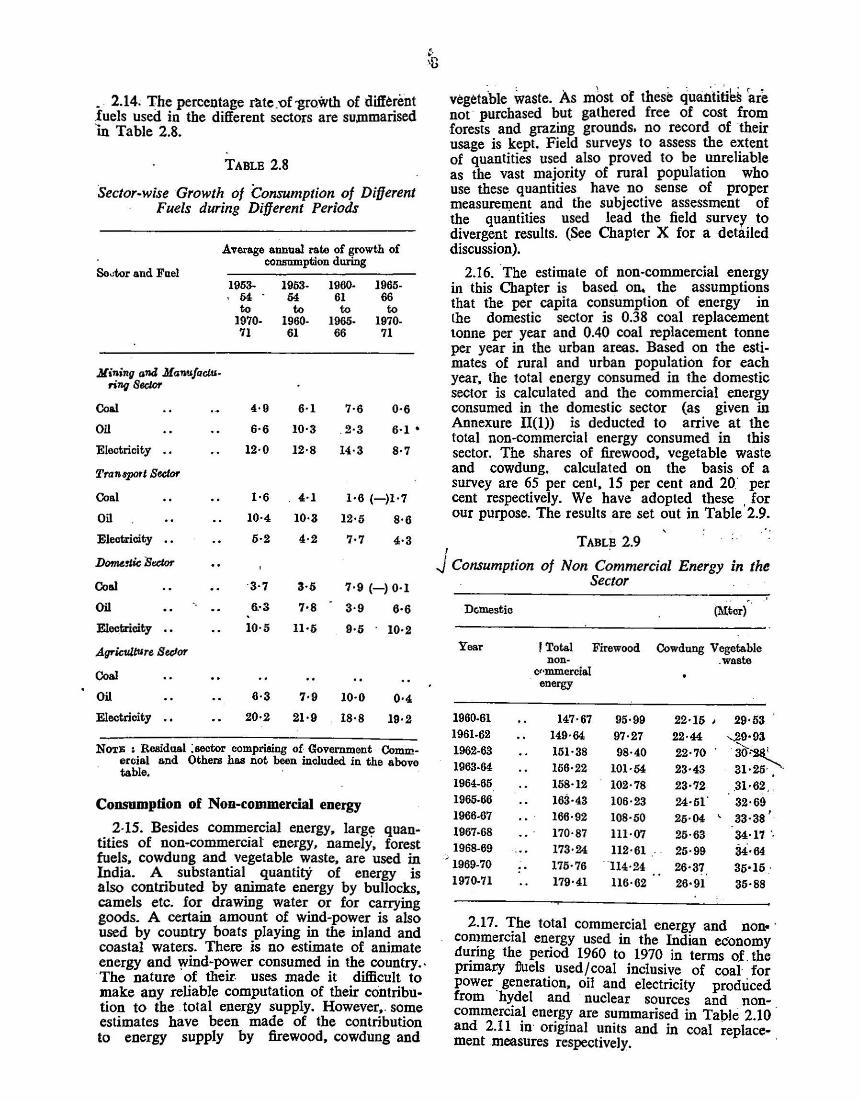
. . 2.14. ~he percentage r~te:of-gro:wth of diffe!ent .fuels used in the different sectors are su.mmansed In Table 2.8.
TABLE 2.8
Sector-wise Growth of Consumption of Different · Fuels during Different Periods
So..:tor and Fuel
.Min;ng and Manufactu-ring Beeler
Coal
Oil
Electricity .•
Tran&pMt Sector
Coal
Oil
Electricity ••
Dome!tic Se.ctor
Coal
Oil
Electricity ••
Agriculture Sedor
Coal
Oil
Electricity
Average annual rate of growth of consumption during
1953-, M .
to 1970-71
4· 9
6·6
12·0
1·6
10·4
5·2
·3·7
6.·3
10·5
1953-M to
1960-61
6·1
10·3
12·8
4·1
10·3
4·2
3·5
7·8
11·5
1960-61 to
1965-66
7·6
. 2·3
14·3
1965-66 to
1970-71
0·6
6·1 •
8·7
1·6 (-)1 ·7
12·5 8·6
7·7 4·3
7·9 (-) 0·1
3·9 6·6
9·5 10·2
6·3 7·9 10·0 0·4
20·2 21·9 18·8 19·2
NOTr; : Residual :sector compriSing of Government · Comm· ercial and Others has not been included in the above table.
Consumption of Non-commercial energy
2-15. Besides commercial energy, larg~ quantities of non-commercial energy, namely, forest fuels, cowdung and vegetable waste, are used in India. A substantial quantitY of energy is also contributed by animate energy by bullocks, camels etc. for drawing water or for carrying goods. A certain amount of wind-power is also used by country boats playing in the inland and coastal waters. There is no estimate of animate energy and wind-power consumed in the country .. ·The nature ·of their. uses made it difficult to make any reliable computation of their ccintribution to the . total energy supply. However,. some estimates have been made of the contribution to energy supply by firewood, cowdung and
I
vegetibte ~aste. As mbst of thes~ quantitlb~ rare not · purchased but gathered free of cost fro!? .forests and grazing grounds. no record of therr usage is kept. Field surveys to assess the e~tent of quantities used also proved to be ~nrehable as the vast majority of rural population who use these quantities have no sense of proper measurement and the subjective assessment of the quantities used lead the field surve:r. to divergent results. (See Chapter X for a detailed discussion).
2.16. ·The estimate of non-commercial en~rgy in this Chapter is based on. . the assumptio1;1s that the per capita consumption of energy m the domestic sector is 0.38 coal replacement tonne per year and 0.40 coal replacement tonll:e per year in the urban areas. Based on the estimates of rural and urban population for each year, the total energy consumed in th~ domestic sector is calculated and the commercial energy consumed in the domestic sector (as given in Annexure Il(l)) is deducted to arrive at the total non-commercial energy consumed in this sector. The shares of firewood, vegetable waste and cowdung, calculated on the basis of a survey are 65 per cent, 15 per cent and 20· per cent respectively. We have adopted these , for our purpose. The results are set out in Table 2.9.
TABL~ 2.9
J Consumption of Non Commercial Energy in the . Sector .
·DGmestic (Mtcr)
Year ! Total Firewood Cowdung V egctable non- .waste
c<·mmercial energy
1960-61 147·67 95·99 22•15 I 29·53 1961-62 149·64 97·27 22·44 --.29·93 1962-63 151·38 98·40 22·70 so-~ 1963-64 156·22 101·54 23·43 31·25· . >
1964-65 158·12 102·78 23·72 .31·6~ . ' 1965-66 163·43 106·23 24-51" 32·69 1966-67 .. 166·92 108·50 25·04 ' 33·38 ' 1967-68 170·87 111·07 25·63 34·17 ·. 1968-69 : .. 173·24 112·61 25·99 34·64
) 1969-70 175·76 ""114·24 26·37 35·15 . 1970-71 179·41 116·62 26·91 35·88
2.17. The total commercial energy and noD<> · commercial energy used in the Indian economy during the period 1960 to 1970 in terms oi. the primacy fuels used/coal inclusive of coal for power generation, oil and electricity produced from "hydel and nu~lear sources and .non· commercial energy are summarised in Table 2.10 · and 2.11 in· original units and in coal replace· ment measures respectively. · ·
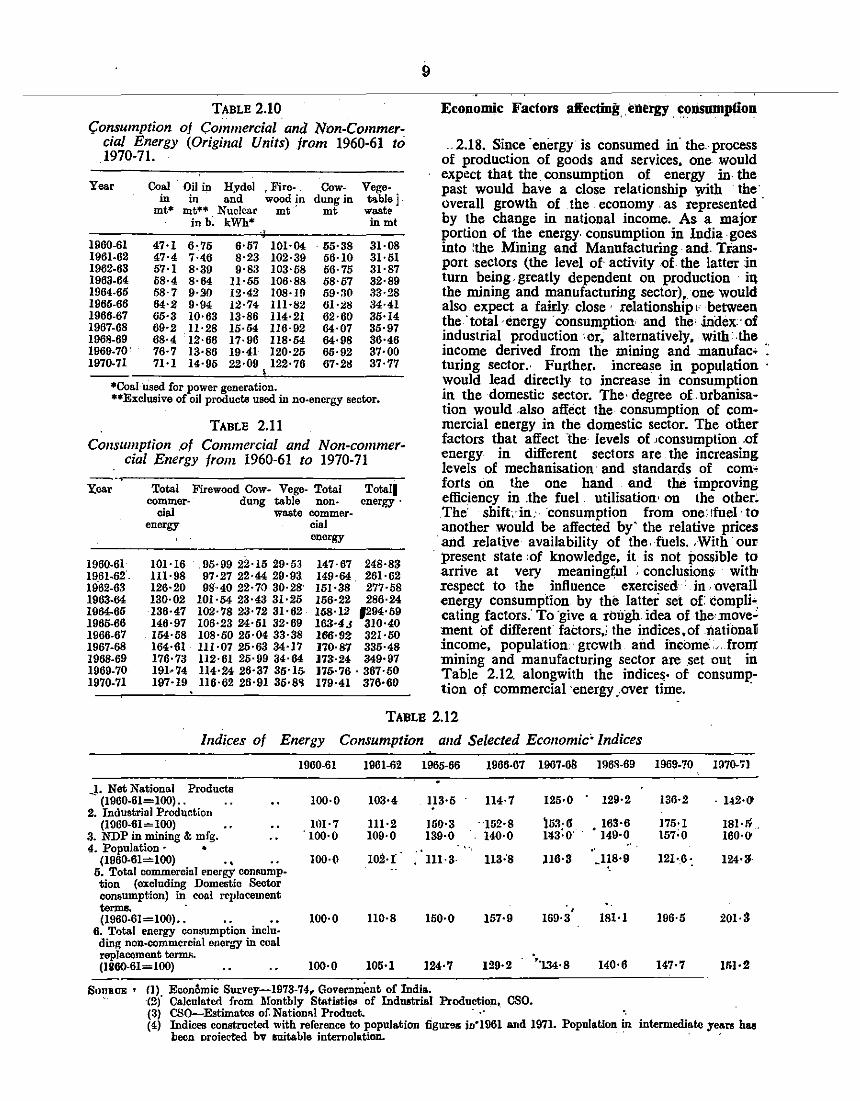
TABLE 2.10 (:onsumption of Commercial and Nrm-Commer
cial Energy (Original Units) from 1960-61 to 1970-71.
Year
1960-61 1961-62 1962-63 1963-64 1964.65 1965-66 1966-67 1967-68 1968-69 ' 1969-70' 1970-71
Coal · Oil in Hyde! , Fire- , in in and wood in
mt* mt** Nuclear mt ' in b: kWh*
47·1 6·.76 6·67 101·04 47·4 7·46 8·23 102·39 57·1 8·39 9·83 103·58 58·4 8·64 11·55 106·88 58·7 9·i!l 12·42 108· 19 64·2 9·94 12·74 111 ·82 65·3 10·63 13·86 114·21 69·.2 11·28 15·54 116·92 68·4 12·66 17·96 118·54 76·7 13·86 19·41 120·25 71·1 14·95 22·09 122·76
'
Cowdung in
mt
55·38 56·10 56·75 58·57 59·30 61·28 62·60 04·07 64·98 65·92 67·28
Vege~blej waste in mt
31·08 31·51 31·87 32·89 33·28 34·41 35·14 35·97 36·46 37·00 37·77
*Coal Used for power generation. ••Exclusive of oil products used in no-energy sector.
TABLE 2.11
Coi!SIIIIIption .of Commercial and Non-commer-cial Energy from 1960-61 to 1970-71
Year Total Firewood Cow- Vege- Total Totall commer- dung table non- energy·
cia! waste commer-energy cial
energy
1960-61 101·16 .95·99 22·15 29·63 147·67 248·83 1961-62'. 111·98 97·27 22·44 29·93 149·64. 261·62 1962-63 126·20 98'·40 22·70 30·28' 161 ·38 277·58 1963-64 130·02 101·54 23·43 31·25 156·22 286·24 1964-65 136·47 102·78 23·72 31·62 158·12 1294· 59 1965-66 146·97 106·23 24·51 32·69 163·4J 310·40 1966-67 164·58 108·50 25·04 33·38 166·92 321·50 1967-68 164·61 111·07 25·63 34·17 110·87 335·48 1968-69 176·73 112·61 26·99 34·64 173·24 349·97 1969-70 191•74 114·24 26·37 35·15 115· 76 . 367' 60 1970-71 197·19 116·62 26·91 35·8~ 179·41 376·60
Economic Factors affecting_ . energy . consumption
.. 2.18. Since ·energy is consumed in. the. process of production of goods and services, one would expect that the. consumption of energy in- the past would have a close relationship with the· overall growth of the economy . as represented · by the change in national income. As a major portion of the energy. consumption in Indi!l goes into :the Mining and Manufacturing. and. Transport sectors (the level of activity of the latter in turn being. greatly dependent on production · iq the mining and manufacturing sector), one would also expect a fairly close · relationship" between the ·total· energy ·consumption· and the· -index:· of industrial production :or, alternatively •. with· -the income derived from the mining and .manufac• : turing sector.· Further. increase in population · would lead direclly to increase in consumption in the domestic sector. The· degree of. urbanisation would .also affect the consumption of commercial energy in the domestic sector. The other factors that affect 'the· levels of ;consumption .of energy in different sectors are the increasing levels of mechanisation· and standards of com• forts on the one hand and the improving efficiency in ,the fuel . utilisation• on the other: .The' shiftc·in:· ·consumption from one•tfuel ·to another would be affected by' the relative prices and Ielative availability of the, fuels .. With our
· present state :of knowledge, it is not possible to arrive at very meaning(ul ; conclusions• witb respect to the influence exercised in . overall energy consumption by the latter set of: compli•. eating factors: To ·give a rough. idea of the• move~ ment of different factors,; the indices.of nationa{ income, population .. grcwth and. income::~. from mining and manufacturing sector are .set out in Table 2.12. alongwith the indices· of consumption of commercial 'energy ,over time. ·
TABLB 2.12
Indi.ces of Energy Consumption and Selected Economic' Indices
1960-61 1961-62 1965·66 1966-67 1967-68 1968-69 1969-70 1970..71
_J. Net National Products (1960·61=100) .. 100·0 103·4 ll3·5 114·7 125•0 129·2 136·2 ' 142·0'
2. Industrial Production (1960.61=100) 101·7 ll1·2 150·3 "152·8 ~53; If 163·6 175·1 181·& '
3. NDP in mining & mfg. . 100·0 109·0 139·0 140·0 1~3·0' . 140·0 \57;0 160·0' 4. Population · • .. •'
(1960·61="100) •• 100·0 102·l 1ll·3- 113'8 ]16·3 .ll8·9 121·,6: 124·:f 6. Totn.l commercial Pnergy commmp-tion (excluding Domestic Sector consumption) in co~l rCJJlncement tol1lll!. ' (1960-61=100) •.
6. Total energy consumption inclu· ding non·commercial energy in coal
100·0 llO·S 150·0 157·9 169·3 18J.l 196·5 201·3
replacement termA. (1860·61=100) 100·0 105·1 124·7 129·2 • •. 134·8 140·6 147·7 1nl·2
SonaOE ' (]) EconOmic Sur.vey-1973-74,. Governm'ent of India. C2f Calculated from Monthly Statist.ios of Indmtrial Production, CSO. (3) CSO-Estimatcs of Nation•! Product. · •. (4) Indices conetrucWI with reference to population figures in'1961 and 1971. Populal<ion in intermediate yean hao
been Droiected bv BUit&ble internolation. · · · ·
ti9. A study of the movement of the different indices indicates that the movements of indices of national income and the indices of total energy consumption .(including non-commercial energy) is very closely correlated, while · the indices of total commercial energy consumption (excluding domestic sectoral consumption) move very closely with the indices of income from mining and manufacturing sector. The · Energy SurYey Committee had concluded on the basis of the data ·relating to the year 1953-54 to 1961· 62 .that there was close correlation between the growth in the indices of national income and total energy consumption as well as between the indices of industrial production and .total commercial energy .consumption. The observations relating to .the period 19.60-61 to 1970-71 reveal that such correlation still continues; the movement of indices of industrial production is not closely correlated to the movement of total commercial energy consumption; but the index of income derived from mining and . manufacturing sector is more closely correlated to com· mercia! energy consumption. The rate of growth ip. consumption of total energy as well as commercial energy was lower during the second half of the Sixties on account of· the significantly lower rate of growth of industrial production during the period. Industrial production increased at the rate of 8.1 per cent during the first half of the Sixties but decreased to 3.9 per cent in the second half. The indices of industrial production include mining and major part of the manufacturing sector covered by the Factories Act, 1948; but excludes from its purview pro· duction from · establishments below the factory level. Besides the ·usual limitations attaching to the indices of industrial production, the index
1o
that is currently used (namely; 1960= 100) does not seem to adequately reflect the pattern and
. growth of the sector during the· latter years of the decade of the Sixties due to structural shifts within the sector. Normally. the estimate of income from the mining and manufacturing sector-JS not considered a very safe explanatory vari-· able as it includes income from small-scale establishments which are computed from scanty data. However. for the purposes of explaining energy consumption, the index of income from mining and manufacturing sector appears to be a more appropriate one.
Regression analysis
2.20. The statistical regression of energy consumption (global as well as sectoral) on the activity levels of the economy as a whole and on the sectoral level was attempted. It was found that there was significant correlation between total commercial energy and national in· come a& well as total commercial energy and income from mining and manufacturing sectors and index of inaustrial production. The regres" sion models are set out in Technical Note II (2) appended. ~egression of total commercial energy on national income gives an r" of 0.975 indicating that a high proportion of the total variation in energy consumption is explained by national income. The index of industrial production seems to be the best explanatory variable since r' is the highest and the standard error is the lowest, but there seems to be auto-correlation. · . As national income as an explanatory variable avoids the need to make assumptions regarding sectoral growth rates, it has been used for projecting the future demand for commercial energy.
CHAPTER. nt FORECAST OF ENERGY DEMAND
3.1. The level of demand for energy in .fu!!!te would be determined mainly by the · pafe . of_ economic growth. FaCtors like changes in ilitersectoral groWih rates, efficiencies in the use of energy in different sectors and the shifts in usage due to improvements in technology or. due to new technologies within various sectors of the economy would also affect the level . of energy demand to some extent. The inherent unpredictability in the latter factors makes the task of forecasting energy demand a hazardous one. While this is so, the long gestation* involved in the energy industries makes it imperative that reasonably reliable predictions of longterm energy demand have to be attempted, if adequate arrangements are to be made to ensure that the required quantity of energy is available. This explains the enormous efforts made in almost all developed countries to periodically forecast long run energy demand.
3.2. Energy demand can be forecast either by an extra-pQ_latio]L9_Uh~ _past trends_i_!l_energy consumption, or by using r!!gression __ m.od~s ":'hich ·cor~elaJe .!_h~ ..P!Ist le_y~ls _ o! en_ergy con~umllon willi the past levels of economic _acllvity
. or by adopting an "end-use" ·approach where the energy consumption norms for various categories of consumption are determined and. the
· likely demand for each consumer category . in 'future is computed with reference to the level of activity in each consuming sector consistent with the assumption regarding the overall tate of growth. All the three methods have been used by the Fuel Policy Committee in arriving at a reasonable forecast of energy demand for the period upto 1990-91.
. Trend method
3.3. The ·trend method provides a reliable means of forecasting energy demand only in the case of developed market economies which ·are .in the stage of stable growth. In developing economies where the rates of growth are deter'rnined by planning apparatus with a view to -bringing about ,structural changes in the economy, the past levels of energy consumption cannot provide a basi~ for determining tHe future levels of demand fot energy. In India. at certain
c'times !n the past, the rates C?f growth of consumptiOn of different fue1& were constrained by transport availability or the .availability of fuels. This implies yet another limitation on the use of the trend method for forecasting . energy demand. · · ·
3.4. As indicated in Chapter II, the rate. of , c<!ns,U!pption of . total commercial energy in lndia increased by 7.8 per cent per annum during 1960-61 to 1965-66 whereas it declined to 6.1 per cent per annum during 1965-66 to 1970-71. During the same sub-periods, electricity_
, .. cons1,1mption changed from an average growth , rate of 12.6 per cent per year in the first sub
period to 9.3 per cent per annum in the second sub-period; in the case of coal, the rate of gro\Vth_ot<:<Jnsumptioq__changed fr_om 5 per cent per annum to (minus)- 0.2 per cenv per annum.
· The part trends like these cangot provide a basis for .forecas!ing energy dema9d in .future years. -
Regession method
.. 3.5 . .In the 'Indian context regression method which 'makes"use of· the observed past relationship between .. the rate of consumption of energy and other indices of economic_ growth appears 1 to be a reliable guide to determined ·the future ;
_rates . of growth. and. Ji!!ttem of consumption of · ·energy. In Chapter. II, a survey has been made ,Of ;the . reg~ssion models which were .studied by
· the Committee. Though some of the. more elabo' 'rate . multiple regression' models are · marginally ~-uJlllrior ,in explaining .the past data of' consumptic:m; these have been. discarded for purposes of forecasting as the Committee felt that there are no reliable ways of accurately . projecting the various explanatory variables used in these medols. A simple re_gression model. which explains the relatwnsl:lfp between eiiergf'consiimption and national il!come_!lpJlel!I's_Jg_ pe~ on the ,whole, . more useful as a tool for forecastin~
. energy demand from this one index alone would meter about the future level of economic activity is the desired rate of growth of national income, Committee felt that an attempt to derive· the
, energy; .. demand from this ·one· index alonewould have greater acceptability. The Chapter on the perspective of growth of the Indian economy given in the Draft Fifth Five Year Plan sets out the . desired rate of growth 61' national income for the period beyond the Fifth Plan at 6 per cent. per annum, The Committee took .this as
. exogenously ·stipulated and derived the con. sumption requirements · of dilferent fuels and total commercial .e9-.ergy , frpm " this by using regression models. ·
3.6. The regression models used for this pur· pose are indicated in Chapt_ef. JJ.. It may be recalled that the regression equations relating to
*Almost all energy industries have ,:testation over 4 yea.rs; a coal mine or an oil field takes about 4.6 yeam for its oonstrnction dovelo}'ment, _a th•rmal plant about 4-o years, •>nclear plant 5-7 years and hyde( power station 8-10 years. ·
,-- ., -,, ,.-, 1 •1 •
11
12
consumption of total commercii!( energy· tir national income as well as equations which relate the consumption of coal. oil and electricity specifically to national income Vfere _consi-
dered to be valid and statistically significant.
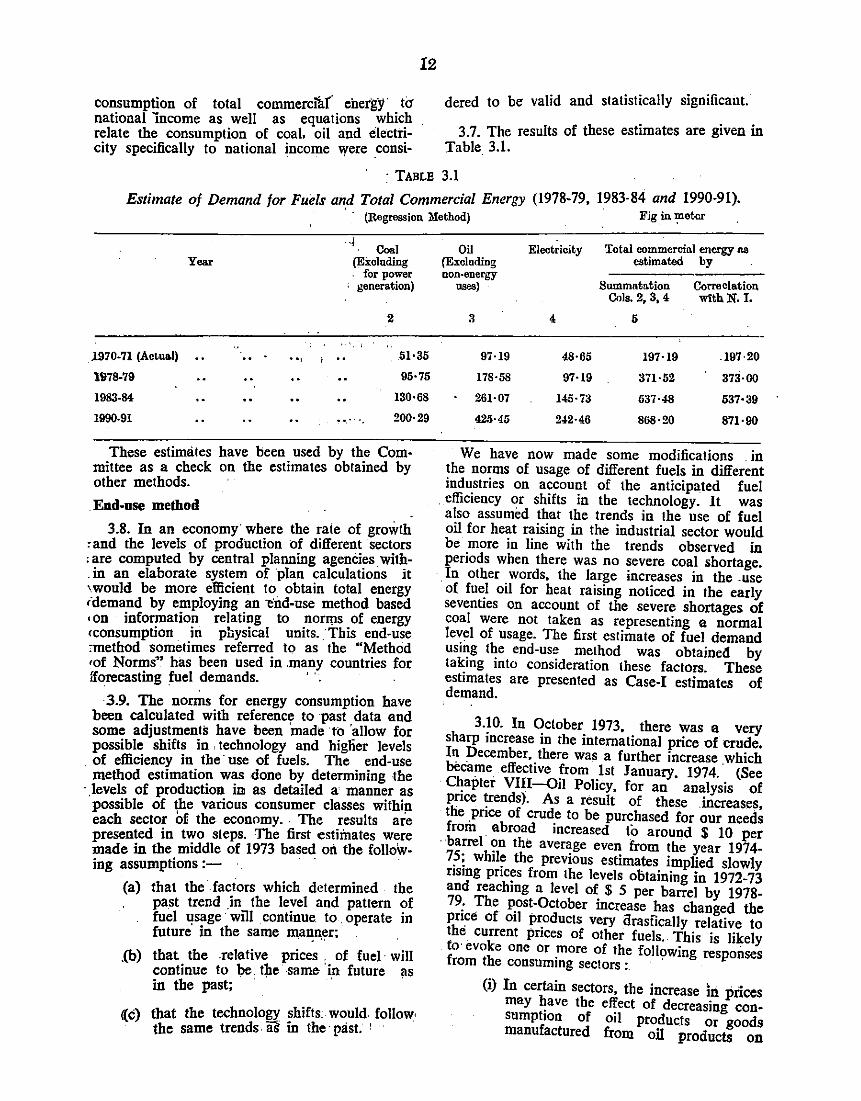
3.7. The results of these estimates are given in Table 3.1.
:TABLE 3.1
Estimate of Demand for Fuels and Total Commercial Energy (1978-79, 1983·84 and 1990-91). ' · (Regression Method) . Fig in ~etcr .
1970-71 (Actual)
1978-79
1983-84
1990-91
Year
.. ,
-~ Coal
(Excluding for power
generation)
2
51•35
95·75
130•68
200·29
These estimates have been used by the Committee as a check on the estimates obtained by other methods.
IWmd-use method 3.8. In an economy· where the rate of growth
, and the levels of production of different sectors , are computed by central planning agenCies with. in an elaborate system of plan calculations it 'would be more efficient to obtain total energy <demand by employing an end-use method based • on information relating to norms of energy <consumption in physical units .. This end-use :method sometimes referred to as the "Method •of Norms" has been used in .many countries for fforecasting fuel demands. · ·
3.9. The norms for energy consumption have been calculated with reference to past data and some adjustments have been 'made to 'allow for possible shifts in , technology and higfier levels
. of efficiency in the· use of fuels. The end-use method estimation was done by determining the
· . levels of production in as detailed a manner as possible of ~e various consumer classes withip. each sector of the economy .. The results are presented in two steps. The first estimates were made in the middle of I 973 based oil the following assumptions :-
(a) that the· factors which determined the past trend .in the level and pattern of fuel I!Sage will . continue. to .. operate in future in the same manner;
. . '' .(b) that the .relative prices , of fuel· will
continue to be. the· same in future as in the past; · · · ·
({c) that tbe technology shifts;. would. follow· the same trends as' in the· past. ' ·
Oil Electricity Total commercial energy ns (Excluding estimated by non·energy
uses) Summntation Cone elation Cola. 2, 3, 4 WithN. I.
3 4 5
97·19 48·65 197·19 .197·20
178·58 97·19 371·52 37:i·OO
261·07 145·73 537·48 537·39
42.'H5 242·46 868·20 871·90
We have now made some modifications . in the norms of usage of different fuels in different industries on account of the anticipated fuel
. efficiency or shifts in the technology. It was also assumed that the trends in the use of fuel oil for heat raising in the industrial sector would be more in line with the trends observed in periods when there was no severe coal shortage.
·.In other words, the large increases in the .use of fuc:I oil for heat raising noticed in the early seventies on account of the severe shortages of coal were not taken as representing a normal level of usage. The first estimate of fuel demand using the end-use method was obtained by taking into consideration these factors. These estimates are presented as Case-I estimates of demand.
3.~0. In ~ctober. 1973, there was a very sharp mcrease m the mtemational.price of crude. In December, there was a further increase which became effective from 1st January. 1974. · (See C~apter VIII-oil Policy. for an analysis of pnce ~ends). As a result of these .increases, the pnce of crude to be purchased for our needs from . abroad increased to around $ 10 per
· barrel ?n the average even from the year 1974-7?! wh1I7 the previous estimates implied slowly nsmg pnc:s frorn the levels obtaining in 1972-73 and reachmg a level of $ 5 per barrel by 1978-79: The P_ost-October increase has changed the pnce of oil products very arasiically relative to the current prices of other fuels. This is likely to· evoke one or more of the following responses from the consuming sectors :. · ·
(i) In certain sectors, the increase ln prices may ~ave the ef!ect of decreasing consumptJon of o1l products or goods manufactured from oil products on
account of a significant price elasticity of demand.
~ ' . (ii) There may· be 'an increase in the effi-
. ciency of the use of petroleum products' whicq will lead to the norms of consumption of petroleum. products being altered. ·
'(iii) In sectors ·where petroleum products ' • are substitutable by other fuel forms,
there will be a tendency towards an increasing use of other fuels in place of petroleum products.
3.11. The Committee tried to examine these trends and based on such an examination. has drawn two other estimates which can be taken as two alternative levels of fuels demand which may be needed to sustain the same rate of economic growth as in the initial estimate. These· have been des·crib'ed as Case-II; Case-III esti'' mates. Together with the initial estimates referred to as Case-1, we have three sets ·of. estimates. The assumptions on which the three alternative estimates hav·e been made are as follows :
Case !-assumptions are as set, out in para 3.9 above.
Case 11-,-is an intermediate level between Case-1 and .Case-III.
Case III-represents the level of fuel demands on Jhe assumption tliat (i) the level of economic growth upto 1990-91· will be the same as in Case-I: (ii) · the relative· prices of oil products and other fuels will continue to be the .. same as in the first quarter of 1974, and , ·(iii) . the measures indicated in this Report for. increasing fuel efficiency and for substituting oil products by other fuels in areas, which are identified as viable: and desirable· on techno-economic considerations. are implemented fully by the Government. · · ·
3.12. In the following paragraphs, Case-! estimates are .first presented .in detail with ~n indication of the basis of the estimates; Case-IT and Case-ill are stated with details of the fuel efficiency increase and · inter-fuel substitution assumed. The . combined statements of fuel demand in Case-1, Case-II and Case-ill are
· presented at the end.
Coal demand ·
3,13 .. In· the- end-use method for ...furecasting the demand for each_fueLJhe sectors which con~ sumeSignificirit(jt.iantities of tTie filer 'inques-tion-have been selected. Care has been taken to evaluate the consumption norms for . each industry with reference to past data and modified, wherever' necessary, with reference to possible future developments. In deriving the quantities
of production , an~cipated . in respect ,of each industry in different years in the future. we have · relied on estimates given in the Chapter of the Draft, Fifth F~ve: Year Plan and balances work, ed out,by .the Perspective Planning Division of the ,Pianqing Commission as well as the Reports of '~The; Task Forces" which were formed to study the. needs ·A~, the different industries during the, ,Fifth Plan,* ,
In the case of coal the following major. user categories were 1 examined for · determining their specific consumption : .
' L Steel, Jndustry. 2:; Railways. · · 3. Electricity (Thermal) <ector. : ~- Cemenflndu.stry.'
" ' . .
.5. ' Fertilizer, Industry. '6. Paper arid Paper ·Boards Industry.~
. · ,7. ,<:;q\tml.Textiles Industry. 8~ Glass Industry. 9. Jute fndustry. . ', '" . ' '
; 10 .. Refr~ctories Industry. 11. Sugar ~ndustry. 12. Heavy Chemicals Industry.
--!3. Brick Burning Industry. . ~4~ ,Spft:,c~ke Manufacture for domestic. use.
. . ' . . ' . 3.14. Of these items, I to 5, 13 and 14 are
more important .than the rest in terms of quan· tities consumed. Steel industry, Railways and power .. ,sector. between them account for over 6(). per cent of-the demand~ In the case of steel in· dustry, tli.e demand for coal was estimated from the levels of hot .metal production required to achieve the levels of finished steel indicated as the desired output level in the Draft Fifth Plan (Vol. !-Chapter I). The estimates also took into consideration the future improvements in the technology of the steel industry and the quantity of coal that would be required and the extent of_ coal washing needed. (See Annex Table ill(l} and Chapter VII for• a discussion of this}. The Railways will slowly reduce the stock of steam locomotives and the demand for coal for the Railways is ·estimated from the programme of requirements of steam-locos implied in the Railway plans. These estimates are in agreement with the judgement of the Railway authorities. The demand for coal from the power sector depends on the demand for electrical energy and the likely contribution of electricity from other sources of power generation like hydel and nuclear .. The estimate was derived from a study of the power sector as a whole (see Chapter IX). This estimate also took into account the expect. ed increase in the efficiency of use coal in the power sector on account of the large unit size
•These estimates ¢ye the prod~cti~ Ievel~ in differet~t ill,~ustries ' "''~ l9BHs, · ·fqr ~~90·91, the Co!\\llll~t~ baa made it'! own asses51Jlont of pOSSible !'rodu~1on, , • ,; · · . ,
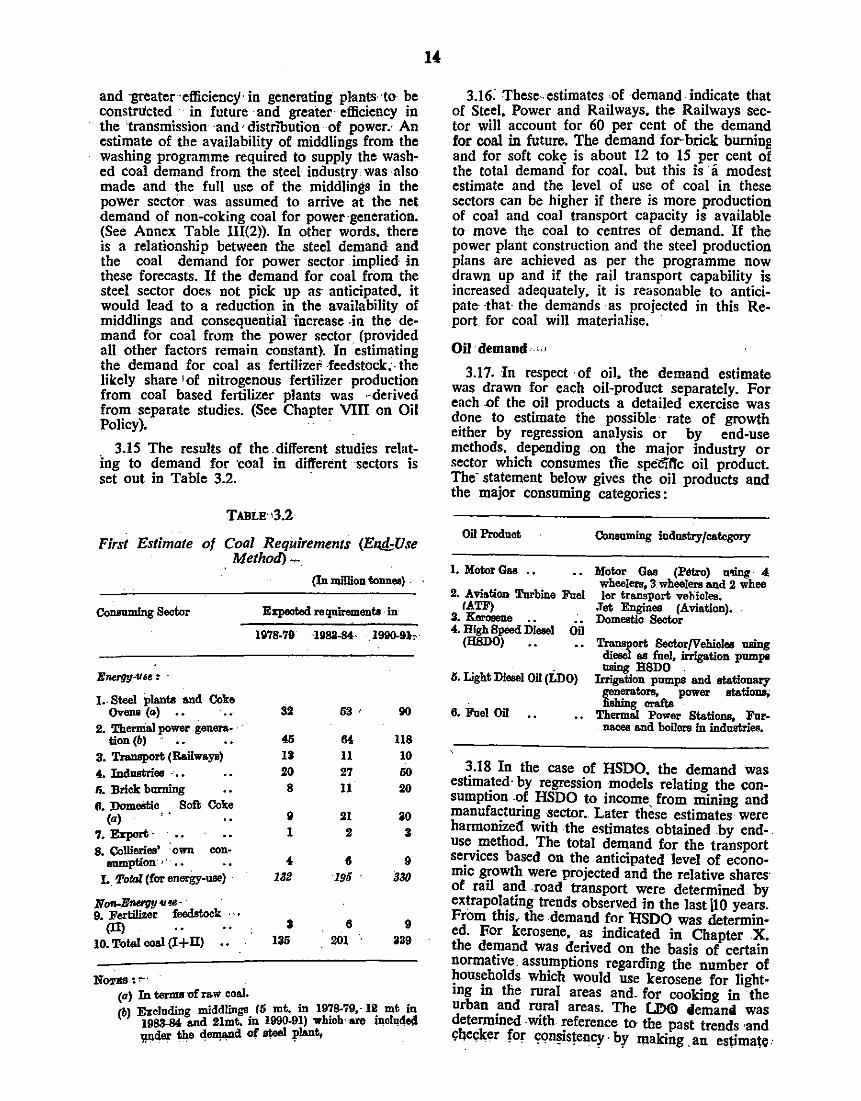
and -greater ·efficiency· in generating plant5 to be constructed · · in future ·and greater efficiency in the ·transmission ·and, distn"buti'on of power.· An estimate of the availability of middlings from the washing programme required to supply the washed coal demand from the steel industry was also made and the full use of the middlings in the power sector was assumed to arrive at the net demand of non-coking coal for power·generation. (See Annex Table lll(2)). In other words. there is a relationship between the steel demand and the coal demand for power sector implied· in these forecasts. If the demand for coal from the steel sector does not pick up as· anticipated, it would lead to a reduction in the availability of middlings and consequential·increase .in the demand for coal from the power sector, (provided all other factors remain constant). In estimating the demand for coal as fertilizer ·feedstock;. the likely share 'of nitrogenous fertilizer production from coal based fertilizer plants was ,derived from separate studies. (See Chapter VIII on Oil Policy). · ·
3.15 The results of the .different studies relating to demand for 'Coal in different · sectors is set out in Table 3.2.
TABi.J!·'3.2
First Estimate of Coal Requirements (Ettd;Use Method)~.
(In million tonnea) .
Conoumlng Sector Expected requirements in
Energy·U·· : ..
1 •. Steel plants and Coke Ovens (a) .. 32 63' go
2. Themial power genera-tion (b) 45 M 118
3.~(Bailwa~) II II 10 4. Industries · •• 20 27 60
t;. Brick burning 8 II 20
6. Domestic Soil; Coke (a) '. II 21 ao
7. E%port- I 2 3 8. Collieries' ·own con-
oumption· , .•• 4 8 9 L. Potol (for energy-use) · 1311 196 ' 330
Non-Bmrgy .,.,_- . 9. Fertilizer feedstock · · , s 6 9 (II) 10. Total ooal (l+ll) 136 201 339
NOTliS ',.. (a) In termaofraw coal. (b) E:rcloding middlings (6 mt. in 1978-79,-12 mt in
1983-84 and 21mt. in 1990-91) whioh· are il!olo4e4 Wider the 40ll:!l!D-d of sf.eel ~!ant,
3.16; These .. estimates of demand indicate that of Steel, Power and Railways, the Railways sector will account for 60 per cent of the demand for coal in future. The demand for-brick burnins and for soft cok~ is about 12 to 15 per cent of the total demand for coal. but this is ·a modest estimate and the level of use of coal in these sectors can be higher if there is more production of coal and coal transport capacity is available to move the coal to centres of demand. If the power plant construction and the steel production plans are achieved as per the programme now drawn up and if the rail transport capability is increased adequately, it is reasonable to anticipate ·that the demands ·as projected in this Report for coal will materialise.
Oil· demand'· •· •
3.17. In respect of oil, the demand estimate was drawn for each oil-product separately. For each .of the oil products a detailed exercise was done to estimate the possible rate of growth either by regression analysis or by end-use methods. depending .on the major industry or sector which consumes tlie spe"Cltlc oil product. The- statement below gives the oil products and the major consuming categories:
Oil Produat
I. Motor Gss .•
2. Aviation Turbine Fuel IATF)
3. Kerosene •• 4. High Bpesd Dfeael on
(HSDO) ·
6. Light Dlessl Oil (LDO)
6. Fuel Oil
Consuming ind1JIItryfoategory
Motor Gas (Petro) u'!ing 4 wheelers, 3 wheelers and 2 whee )er transport ve}·doles.
.Tst Eogines (Aviation). Domestio Sector
Transport SeatorfVehioles using dieael as fuel, irrigation pumpa using HSDO
Irrigation pumps and stationary generators, power stations; fishing or&fts
Thermal Power Stations, Fornaoeo and boilers in industrieo.
~.18 In the case of HSDO, the demand was estima_ted · by regression models relating the consumption .o_f HSDO to income. from mining and manufactunng sector .. Later these estimates· were harmonizell with the estimates obtained .by enduse _method. The total demand for the transport se!"'1ces based on the anticipated level of economic 8!'owth were projected and the relative shares· of rail a~d .road transport were determined by extrapol~ting trends observ.ed in the last 110 years. From th1s .. the demand for HSDO was determined. For kerosene, as indicated in Chapter .X, the demand was derived on the basis of certain normative. assu.mptions regarding the number of ~ous~holds wh1ch would use kerosene for lightmg m the rural areas and. for cooking in the urban _and f!!ral areas. The L100) tlemani was determmed ·With :eference to· the past trends ·and c;:4ec;ker for c;:qn~1stency · b;Y making . an estimate ·
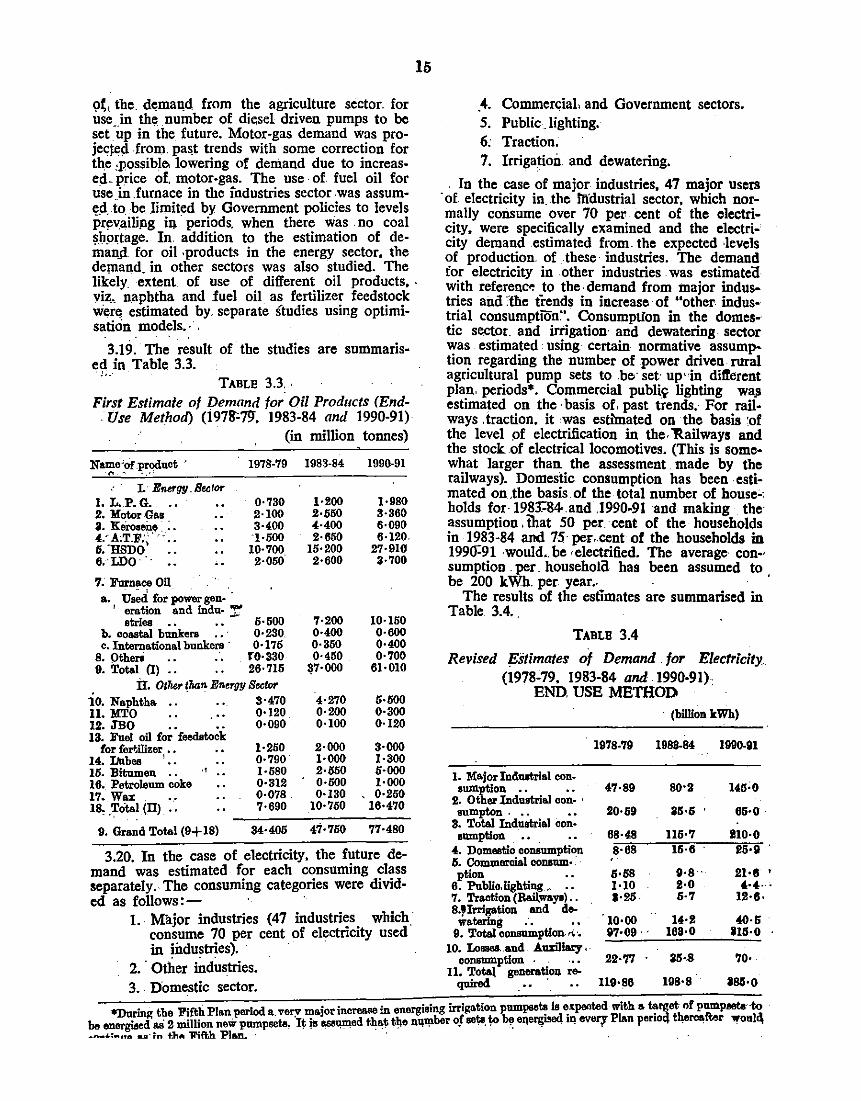
15
\lt, the. dcmai!d from the agriculture sector. for use in the number of diesel driven pumps to be set ·up in the future. Motor-gas demand was projected .from. past trends with some correc~ion for the ,possible. lowering of demand due to m~reased. price of. motor-gas. The use· of fuel ml for use in .furnace in the industries sector .was assumed .to _be limited by Government policies to levels pr~v.aili~g in · periods. when there was . no coal ~b.Qrtage. ln. addition to the estimation of deman_ll for oil -product~ in the energy sector, the demand in other sectors was also studied. The likely extent of use of different oil products, . viz._ naphtha and fuel oil a~ fe!lilize~ feeds~oc~ were estimated by. separate studtes usmg opttmtsation models. · .
3.19. · Th~ r~sult of the studies are summarised in Table 3.3. ',!,_·
TABLE 3.3. ·
First Estimate of Demand for Oil Products (End. Use Method) (i97~79'. 1983-84 and 1990-91)
(in million tonnes)
Na.me :or product · 1978-79 1983-84 1990-91 "
.. L· g,.,gg.Bect<>r
I. L.P.G •. 0·730 1·200 1·980 2. Motor Gas 2·100 2·550 3·360 a. Kei-oseD.o : : . 3·400 4·400 6·090 4:A;T.F:;. ·- •• '1•500 2·650 6·120. 6. 'HSDO_ •. 10·700 15·200 27·910 e.·LDo· . . 2·050 2·600 3·700
7. Fcrnace ou - ' a. Used for power gen· ·
~ ero.tion and indu- '!': 5·500 7·200 10·150 stries
b. coastal hunkers 0·230. 0·400 0·600 c. International bunke~ · 0·175 0·350 0·400
8. Othen ro-s3o 0·450 0·700 9. Total (I) .• 26·715 ~7·000 61·010
ir. OtT~er !l'lan Emrgy Sector -io. Naphth& .. 3·470 4·270 5·500 ll.:M'TO 0•120 0·200 0·300 12. JBO 0·090 0·100 0·120 13. Fuel oU fo~ ·feedstock
1·250 2·000 3·000 for iert.J.Iizer .. 14. llnbes ' 0·790 1·000 1·300 15. Bitumen
,, 1·580 2·550 5·000 16. Petroleum coke 0·312 0·500 1·000 17. W...: 0·078 0·130 0·250 •.•
7·690 10·750 16·470 18. Total (ll) .. . •,
9. Grnd Total (9+18) 34·405 47·750 77·480
3.20. In the case of electricity, the f~ture demand was estimated for each consummg class separately. The consuming categories were divid-ed as follows:- ·
1.. Major industries (47 industri:s. which. consume 70 per cent of electrictty used in industries). ·
2. -Other ~dustries. 3 .. n·omestic sector.
.4. Commercial, and Government sectors. 5. Public _lighting. 6: Traction. 7. Irrigation and dewatering.
In the case of major industries, 47 major users ·of electricity in. the lll:dustrial sector, which normally consume over 70 pel'. cent of the electricity. were specifically examined and the electricity demand estimated from. the expected ·levels of production. of these· industries. The demand for electricity in other industries was estimateil with referenc" to the· demand from major industries and :The trends in increase · of "other industrial consumptiOn:•. Consumption in the domes-· tic sector. and irrigation· and dewatering sector was estimated using ·certain normative assump-tion regarding the number of power driven rural agricultural pump sets to .be· set· up"in dilferent plan. periods*. Commercial public; lighting wa.11 estimated on the ·basis of, past trends.- For railways . traction. it was estimated on the basis :of the level of electrification in the. ltailways and the stock of electrical locomotives. (This is somewhat larger than the assessment made by the railways). Domestic consumption has been . estimated on .the basis of the total number of house": holds for-1981=84< and .1990-91 and making . the· assumption . That 50 per cent of the households in 1983-84 and 7S per .. cent <>f the households in 1990:91 -would .. be ·electrified. The average con-· sumption . per. househola has been assumed to . be 200 kWh. per year.. · ·
The results of the estimates are summarised in Table 3.4.
TABLE 3.4
Revised Estimates of Demand . for Electricity_ (1978-79. 1983-84 and 1990-91)
END. USE METHOD · (billion kWh)
I. M&jor Ind118trial con. ownptlon • • • •
2. Other lnd118tri&l con- · sumpton. .. . ••
3. Total Indnstri&l con· aumptlon
. 1978-79 1988-84
"·89 80·ll
20·59 35•5
68·48 115·7 8·68 16·6
5·58 ll·8 ·
1990-81
145;0
65·0.
110·0 26•9
21·8 '
4. Domestic conSumption 6. Commercial cclllliDl· · · ption
6. PuhUo.Ughtlng, 1·10 li·O 4., ... 7. Tr&Ction (R&il.wayo) •• 8.,1rrigation and dew&tering .-. • •
9. Total C0ll811111ptlon. "• 10. Losses, .and Auxiliary •
oolllliDlptlon . . ... 11. Total generatloll re-
quired .
1·25
'10·00 ll7·09.'
22·77
ll9•86
5·7 12·6·
14·2 40·5 168·0 1111·0
35·-8 70·
198·8 IBG•O
• · · · • · lgation pumpseta is e<pented with a target of pump-· -to *During the P!ft~ Pion period a. very1t":'"l0< mc'f""t.L mt t':.n"!!':b!r~f sets to he eqergi!ed iq every Plan perio4 t~roal't!!r '!'Oolc\ be energised as 2 mill! on new pumpseta~ . ~ ~e ~~ .. . ·~+e ..... ., . .. · . . -·· . . _
_ ......_4.;,,, .... ..a· In t.'hA lrift.h Phm. · - · ·
.Acljnstments fer mcreased oil prices 3.21. As already indicated, the more . than
·three-fold increase in the international pnce of crude and oil produ.cts. has changed the relative price of oil and other fuelS; Thi~ may lead !O eithe.r reduction. in the consumption of certmn oii products due to price elasticity of demand or due. to. increased efficiency of use of fuels or substituiton -,of petroleum products by other forms. But the switch over •to other fuels 'in place of petroleum products' would not genera!!t._ ~-possil.>le· in all cases and further woUld be liiDJted by ~a) the avatmiility •of other fuels; (~) gestation jperiod involved in increasing production of other fuels to meet· the increased demand due:•to sub:stitution; (c) oy the· availability of investment :funds required to produce· the other fuels in place •Of 1oil., and the investments required for adopting equipment to use coal and. other fuels in place .of .oil; and (d) relative price ·of fuels in future.
· 3.22!-Theoretically, it. should be possible to cal<eulate the effect of the price increase ·for each -oil· product separdtely-kerosene and motor-gas care the principal petroleum products whose price .elasticity hf · demand ·may be .significant. There are-. however. no reliajlle es.timates of price elasticity ·of demand. It. mig)lt be questionable also to· apply ihe results of arty study on price elasticity of demand tpade with ·refert<nce to marginal changes ·in price to the 'ne\1'{ · sitqation where the price changes have been' yecy large. It might also be questionable to lise any such results for projecting the demand for periods extending over two' decades,' It' is~ 'fherefore,' not feasible to revise demands on the basis of price elasticity studies.
16.
3.23. On account of the -increased· price of oil products there is . a growing, awareness among consumers ab~ut ~h~ ... efficiency of use· of fuel in general and petroleum· products, in particular. Several tecb,nical committees have examined the possibility of improving efficiency of fuel use. These committees have held the view that a 10\ per cent savings could be eft'ected in the use of HSDO in the transport sector by proper maintenance! of vehicles. by adopting fuel calibration systems and by more optimal design of the body of the vehicles and by • following good driving practices. We can. therefore. adopt 10 per· cent reduction in. the total demand ·of HSDO obtained by using the end-use method as •, maximum possible reduction due t? efficiency of investment in' the transport sector: .. In the. case of· fuel oil also. increased efficiency is possible by setting 11imple methods like pre-heating of .the fllmace oil and by ,modificatimis' of the burning equipment. Since the estimates have been based on certafn measures relating to restricted. use of fuel oil. no specific allowance· nee4 be 11.1ade in the estimates of demand for fuel oil which might arise due to more efficien't'use. . . .,,
. ! ' . .
3.24. Inter-fuel substituiton can be predicted with some degree of reliability only when we
have relative prices and different technologies that may be available in ,future for adoption in different sectors. In practice, it is found difficult to forecast any price of oil as the possible longterm price. The estimates of long-term price ·of crude vary from $4-5 per barrel· to $ 11-12 barrel. We have taken for the limited purpose of assessing the· possible substitutions ' that would take place in the economy, a price of roughly $ 10 per barrel as the expected long-term price. Even if the realised price exceeds or- falls below · the $ 10 per barrel by a certain margin. the sub-
. stitution possibilities envisaged here wonld still remain favotirable for the national economy. Based oru this price, it was found that the most advantageous substitution is in the . use of "'coal in place of fuel oil in furnaces and boilers .in industries sector where two tonnes of coal can replace one tonne of oil with minor modifica-' tions of the equipment available. It was found that substitution of electricity for energising power sets would be preferable in the use of LDO or HSDO provided the investments for extending the power connections are contained at the present level. The use. of soft coke in place of kerosene is also a desirable shift. In the transport sector, moving commodities over long distances by the Railways is more economical than movement by road. The use of coal·for production of fertilizer is more economical thaD the use of fuel oil or naphtha. However, the heavy ends which would be obtained as joint product in the refineries should. then be subjected to secondary processing to produce more of light and middle distillates. Even when this is done, certain quantity of residual fuel would be left in secoomlary processing which is also fuel oil though of an 'inferior' quality. This inferior oil should be used for fertilize].'! · production. There will therefore be a certain amount of JlertiliZer product\Qn based ·on the : use of fuel oil in each Plan period. (See Chapter . VIII on Oil Policy).
3.25 Though all these substitutions are desirable and could be achieved, the institutional and resource constraints will limit the pace of sub-.. stitution in the riear future. We have used our·' judgement to ·determine the extent of possible substitution if the best efforts are put forward for achieving the. inter-fuel substitutions which are· desirable on techno-economic grounds. Th~se levels represent Case-III of the demand estimates. An intermediate level is also forecast which represents achievement of about . 50 . per cent of the substitution that could be achieved with the best possible efforts. However, even in Case-III. ·we have not taken into account further savings in oil consumption which may be possible, if the composition of industrial production is significantly altered away from. energy intensive industries. For doing this, it would be necessary to assume a strategy of industrial growth sharply at variance with our current formulation. Furthermore. we •have not assumed,.·~ ..
'the use of administrative machinery-sue);! a~
17
large scale rationing for limiting the consumption of <iii .products in arriving at. our estimate of oil demand. The aggregate . oil demand corresponding .to Case-Ill should· not therefore be interpreted ·as representing. any sort of a . minimum esti-
. mate . .It represents the likely order of demand that may be expected to materialise, if the appropriate-inter-filet substitutions. are pursued vigci~ rously, with ·pr.oduct composition and delivery sysJem remaining the same.
·3.26. Depending on the effiCiency ·of'fhe efforts taken to achieve· the ·'desirable 'inter-fuel substitution; the •demand• may lie anywhere between Case-I i and' Case-III. But Case-II has been presented as a ·level representing what is possible of achievement under most ·of the foreseeable set of 'conditions. ln"'the subsequent chapters relating to the ·policy · issues · regarding specific fuels, we refer tp Case-IT as the normal case. Bu~ .'our recommendations are that efforts should be mad¢ to' bring the dema!ld in line witli the estimates made •in Case-III. · ·
The details· of the assumptions on which Caselli ani!- Case-TI are based, are dealt with sector-wise below. · ,; :: ' · · · D~mestic sector . .. . . '· .
3;27. ·Kerosene· is used in the domestic sector for lighting and for cooking. In ol.lr first estimates (Case-I( thf!' l!:erosene demand tor lighting .is as~umed to dec,Fqse in future due to the ·greater u~e of electri<;ity.' But the use. of kerosene for cd8kirig increases ·over time ·on account of. urbanisation and the increasing difficulties in the rural ' areas to' obtain' cheaper ·non-commercial fuel~.
· We -have· assumed in making the estimates (Case-1) 'that 25 per cenn>f the urban households will use· kerosene ·for·lighting 'in 1978-79 :and that this' 'percentage wilT fall to fO per cent in 1990-9t. In the case "of :;:ural areas, the kerosene is assumed to be used in 60 per cent of the house- -holds in 1978-7~. and tl>is get reduced ~o ~5 per cent by 1990c9L For Case-Til estimates. the substitution''' of kerosene by electricity for lightipg postulated for 1990:91 is assumed as' the.level to be reached even by 1983-84. In the case of cooking, the percentage- of-rural households ·using kerosene hai been assumed to be 10 per cent, ' 15 per cent and 25 per cent and urban households as 30 ·per cent.' 50 per cent and 70 per cent in !978-.7~. 1983-8f and 1990-91 respective-.. ly. ln the case of cookmg. the 'levels of. increas-, ed ,tisage assumed for .1983-84 ·is anticipated to be ·achieved only in '1990-91. The increased demand 'for other cooking fuels ;·is assumed 'to be. met by making available greater amount of soft coke. Based ·on this, the requirements r of kero-· sene are· reduced in the domestic· sector· ana ari , · equivalenfamount of electricity for Jighling purposes· and sort 'coke 'for .. cooking purposes is· allowed for. Case,ll represents nn intermediate level between Case-J ancl Case-III estimates. Aj!riculfura! sector • · . · , ; .
3.28. In the agricultural sector, HSDO and LDO am used for lifting water by !rrij:atioq
"';:! P(D)l90Mof E•ergy-.3
pumps, and for running tractor's and for agricultural machines and equipme~t. .In view of the increased oil prices. there shoUld be a shift from HSDO and LDO to electricity. for runni'lg irrigation pumps. The other uses cannot be ,.;ubstituted 'economically .. The number of· diesel pump-
. sets in operation is estimated to be 1.5 .million in 1973-74 in Case-1 estimates. It was assumed that the diesel pumps wouTalncrease by 0.5 million pumpsets per year. In Case-III. we assume that the annual increase in diesel pumpsets would only be 0.1 million pumpsets upto 1978-79 and thereafter the stock of diesel pumps will· not increase. Case-11· is derived as the intermediate level between Case-1 and Case-III.
!i.
Industrial sedom .I
3.29. The fuel oil usea for Fieat raising can be economically substituted by coal except under very special circumstances and in the case of speCific industries.· In Glse-III · we assume that the Case-I estimate· of furnace oil will be 'reduced by a· further 25 per cent by a· larger number of units now 'using furnace oil switching over · to the use of coal. After 1978-79, an annual in- · crease of 4 per cent per year has been assumed · upto 1990-91. Case-II is obtained as the average of Case-1 and ·case-III. ·.. ·. · · : · .<.. ·
Transport sector ·3.30. In' the transport sector, 'motorgas is used
iri road :transport for private cars. taxis. three wheeler and two. wheeler vehicles and a small fraction ·of commercial vehicles. HSDO is used by commercial vehicles and by the railways. A TF is used for air transport • services. Fuel oil is used by inland and coastal ships and intema-· tional shipping transport. (A small portion. of LDO is used . in ships and small . fishing crafts but it is so small that it has not been separately considered\.
As a result ·of price· increase, motorgas consumption has come down steepTy m the current year itself. In future the number of cars to be
• · added to the. stock every year may decrease slowly. After a few years. the net additions to the stock ·each year may be Jess than the additions previously anticipated and the consumption per vehicle is also likely to be Jess than in the past , · (as indicated by the consumption level now observed after motorgas price hikes). Taking these into account in Case-III it has been assumed that the rate of growth· of motorgas consumption may be 2 per cent per year Jess than the rate assumed in the original forecast. It may be necessary to resort to fiscal measures to reduce the' motorgas . demand. Case-II is obtained . as the average of Case-1 and Case-III. ·
3.3 t In the case of commercial traffic in Case· I we have assumed a· declining trend in the perc~ntage share of the railways in the freight traffic This· was 83 per cent ifil960·61 and also ha; come down to· 70 per cent in 1973-74. Extrapolating the tre!ldS, it was assumed in the first
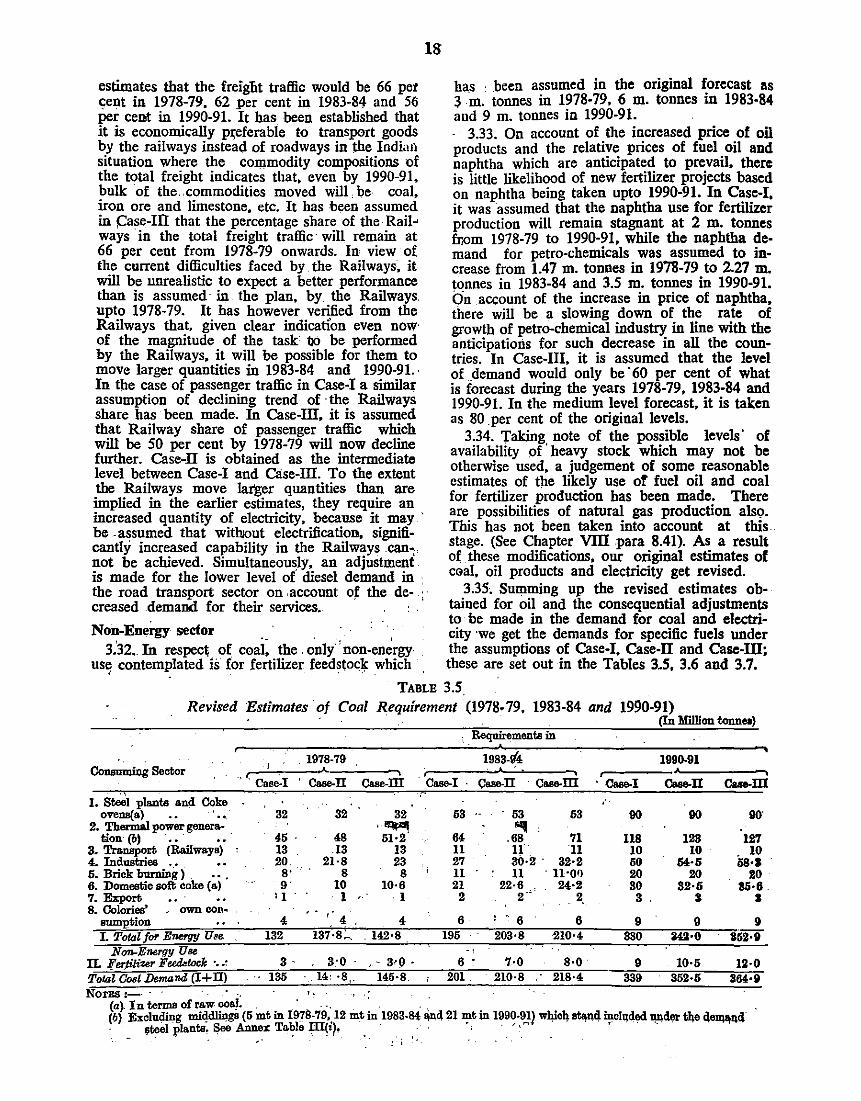
lS
estimates that fhe freigli.t traffic would be 66 pet cent in 1978-79. 62 per cent in 1983-84 and 56 per cent in 1990-91. It bas been established fbat it is economically p~;eferable to transport goods by the railways instead of roadways in the Indiali situation where the COJPmodity compositions of the total freight indicates that, even by 1990-91, bulk of the .. commodities moved will. be coal, iron ore and limestone. etc. It has been assumed in j:ase-Ifi that the percentage share of the Rail• ways in the total freight traffic· will remain at 66 per cent from 1978-79 onwards. In· view of the current difficulties faced by the Railways, it will be unrealistic to expect a better performance fhan is assumed· in the plan, by fhe Railways. up to 1978-79. It has however verified from fhe Railways that. given clear indication even now· of the magnitude of fhe task to be performed by fbe Railways, it will be possible for fhem to move larger quantities in 1983-84 and 1990-91. · In t)le case of passenger traffic in Case-I a sinillar assumption of declining trend of · fhe Railways share has been made. In Case-ill, it is assumed that Railway share of passenger traffic which will be 50 per cent by 1978-79 will now decline furfher. Case-IT is obtained as fhe intermediate level between Case-I and Case-ill. To the extent fhe Railways move larger quantities than are implied in fhe earlier estimates, they require an increased quantity of electricity, because it may · be . assumed that witbiout electrification. significantly increased capability in the Railways .can,. not be achieved. Simultaneously, an adjustment is made for fhe lower level of' diesel demand in : the road transport sector on . account of the de- : · creased demand for their services.
has . .been assumed in the original forecast as 3 m. tonnes in 1978-79, 6 m. tonnes in 1983-84 and 9 m. tonnes in 1990-91. . . 3.33. On account of the increased price of oil products and the relative prices of fuel oil and naphtha which are anticipated to prevail, there is little likelihood of new fertilizer projects based on naphtha being taken upto 1990-91. In Case-I, it was assumed that the naphtha use for fertilizer production will remain stagnant at 2 m. tonnes fr.om 1978-79 to 1990-91, while the naphtha demand for petro-chemicals was assumed to increase from 1.47 m. tonnes in 1978-79 to 2.27 m. tonnes in 1983-84 and 3.5 m. tonnes in 1990-91. On .account of the increase in price of naphtha, there will be a slowing down of the rate of growth of petro-chemical industry in line with the anticipations for such decrease in all the conntries. In Case-III, it is assumed that the level of . demand would only be· 60 per cent of what is forecast during the years 1978-79, 1983-84 and 1990-91. In the medium level forecast, it is taken as 80 per cent of the original levels.
3.34. Taking note of the possible levels' of availability of ' heavy stock which may not be otherwise used, a judgement of some reasonable estimates of f)1e likely use or fuel oil and coal for fertilizer production bas been made. There are possibilities of natural gas production also. This bas not been taken into account at this stage. (See Chapter VIII para 8.41). As a result of . these . modifications, our original estimates of c()al, oil products and electricity get revised.
3.35, Summing up the revised estimates ob· tained for oil and the consequential adjustments to· be made in the demand for coal and electri·
Non-Eneigy sector city ·we get the demands for specific fuels nnder 3.'32. In respec~ of coai: the. o'ruy·'non-en~rgy . the assumptions of Case-I, Case-II and Case-III;
us~ contemplated is for fertilizer feedstoc~ which these are set out in the Tables 3.5, 3.6 and 3.7.
TABLE 3.5. Revised Estimates of Coal Requirement (1978-79, 1983-84 and 1990-91)
· (In Million tonnea)
i . RequireJ.IlentB in
. 1978-79 1983-14 1990.91 Consuming Sector
·ease-l Case-IT Case-ill Case-!. Case-IT ·case-ill . Case-! Case-IT Cue-ill
I. S~I plants and Coke .. ovens( a) ... 32 32 32 63 .. . 63 63 90 90 go·
2. Thermal power genera- '"P! "" tion (b) · · 45 . 48 61·2 64 .68 71 118 128 12'7 3. Transport (Railways) 13 13 13 11 11 11 10 10 10 4. Industries .. • 20 21·8 23 27 30·2 . 32·2 60 64·6 68·1 6. Brick burning ) 8' 8 8 11 11 · n·on 20 20 !0 6. Domestic soft; coke (a) 9 10 10·6 21 22·6 24·2 so 82·5 35·6 7. Export '1 . . I ,. ·1 2 2" 2, 3. 3 I 8. Colories' . own con .. ,_. 4
sumption 4 4 6 ' ' 6 6 9 9 !I I. Total for E-w Uu 132 137·8:... . 142·8 196 203·8 210·4 sso 142·0 352·11
Nqn..Energy Use IL li'ufili"-r F..O..tock • •• : 3 - 3·0 . ,-3-!l· 6 • 7·0 8·0 9 10·5 12·0 Totnl Cost Demand (I+Il) .. 135 .. 14• ·8 . 145·8. 201. 210·8 218·4 339 352·5 364·11 Nol'ES :-· . ., '· · , ·. .
(a} In terms of raw ooa!. . · . ... . . , (b) Excluding mi4<Jlli!gs (5 mt in 1978-79,,12 mt in 1983-84 and 21 '!'tin 199?·9}} wl!ic~ Btt!nd ~lqded l!llder t~e cl•lllllllcl
~el plants. See Annex Table JI1~•)• · . · · · . . ..
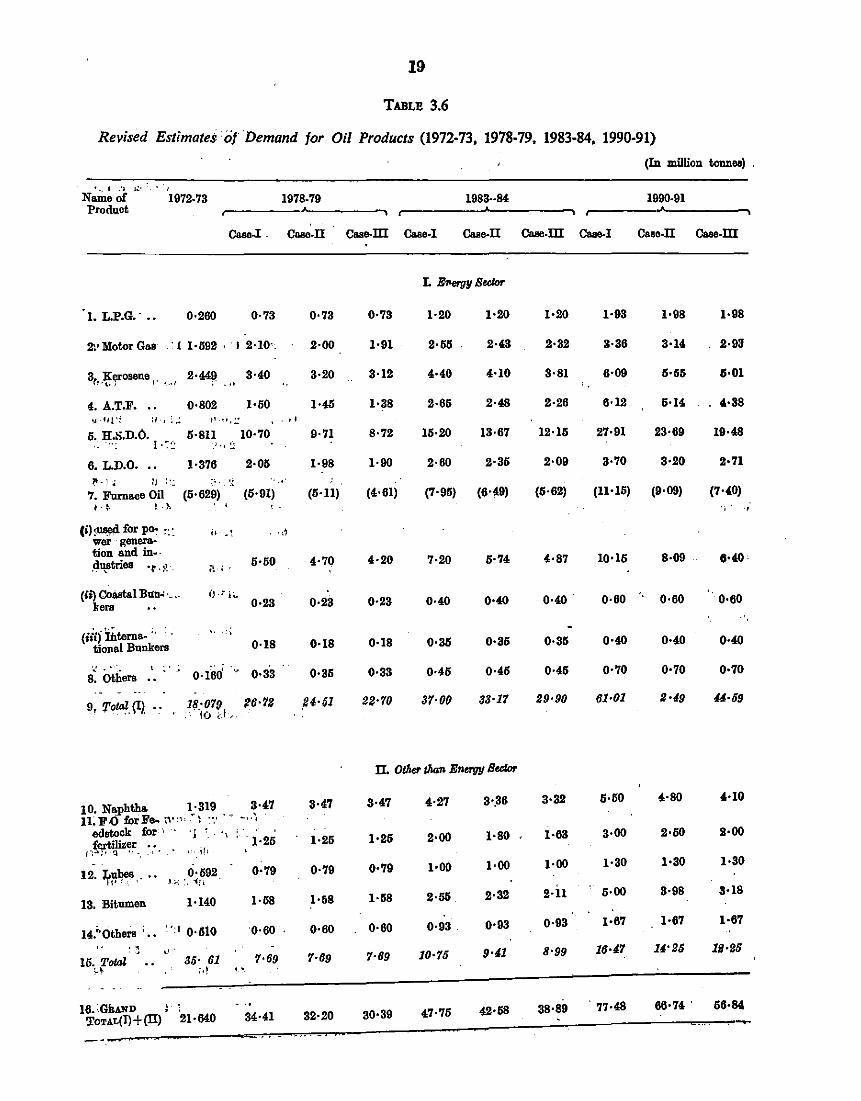
19
TABLE 3.6
Revised Estimates of Demand for Oil Products (1972-73, 1978-79, 1983-84, 1990-91)
(In million tonn80) .
'·- f .'> "' ' Nome of 1972-73 1978-79 1983--84 1990-91 Product
Caso-I. c ..... IT Case-ill Case-1 Case-IT ea.o.m Case-1 Case-IT ea.o-m
L E....-gy St<IM
I. L.P.G. · 0·260 0·73 0·73 0·73 1·20 1·20 1·20 1·93 1·98 1·98
2\•Motor Gas ·I 1·592 · I 2·10·. 2·00 1·91 2·55 2·43 2•32 3·36 3•14 2·93
3(! -~~QS8U8 ! , , ·'I 2-44? 3·40 3·20 3·12 4•40 4·10 3·81 6·09 6·55 15·01 ·''
4. A.T.F. .. 0·802 1·50 1·46 1·38 2·65 2·48 2·26 6·12 6·14 4·38 •J ·'H •: :1 ' ; ,:; t'-!1,:: . ,,
5. H.S.D.O. 6·8ll 10·70 9·71 8·72 16·20 13·67 12·15 27·91 23·69 19·43 . -... , ..... _J ., ~
6. L.D.O. -. 1·376 2·06 1·98 1·90 2·60 2·36 2·09 3·70 3•20 2·71
~-! :4 " ::..: ·.·· ~~ .. ,.
7. Furnace Oil (6·629) (5·91) (5·11) (4·61) (7·95) (6·49) (6·62) (11·16) (9·09) (7·40)
' .. ! .}. '
(illused for p<>: ": " ·' . ,j
wer genera-tion and m ... .c:l~triea ·.r. ~~ . il ' .
5•60 4·70 4·20 7·20 6·74 4•87 10•15 8·09 8·40
(ii} Coastal Bun• · _ _. iJ-ri~ 0·60 '· 0·60 '·
kera 0·23 0·23 0•23 0·40 0·40 0·40 0·60
(iii) Thtema- " · " ~ ~ -;
tional Bunkers 0·18 0·18 0·18 0·315 0•36 0·315 0•40 0•40 0·40
., , ... ' 8: Others .. " .
o-100' ., 0•33 0·35 0•33 0·46 0·46 0·46 0·70 0•70 0·70
.. - .. 9, 'fotal. (1). • . 18:079 f6·7:1 _24·51 22·70 37·00 33·17 29·90 61·01 2·49 44·69
. : 10 ;.J-..
IT. Other than Enorgy St<IM
10. NI!Phtha 1·319 3·47 3·47 3·47 4·27 3·.36 3·32 5·60 4·80 4·10
u;FO for Fe-"''" _r ~ '',' .. -•·1
edstook for·, · . j ~- . '\ 1·26 2·00 1·80 1·63 3·00 2·60 li·OO ~~~,liZ~· .. :. '1·26 1·25
" . i! ~
12. Ttl!~· .. 0·592 0·79 0·79 0·79 1·00 1·00 1·00 1·30 1·30 1·30
1:.-::. i!i
13. Bitumen 1·140 1·58 1·58 1·58 2·55. 2·32 2·11 6·00 3·98 3·18
14.00thera ' •• .'':I 0·310 '0•60 0·60 0·60 0•93 0•93 0·93 1·67 1·67 1·67
" ... 8·99 16•47 J4•26 19·25 16. Total 35· 61 7·69 7·69 7·69 10·75 9·41
q ;,! ...
16.'-GiwiD 34·41 32·20 30·39 47·75 42·58 38·89 77·43 66•7!l . 66·M
To.•AL(I) +(II) 21·MO -~
-~ ... - ..
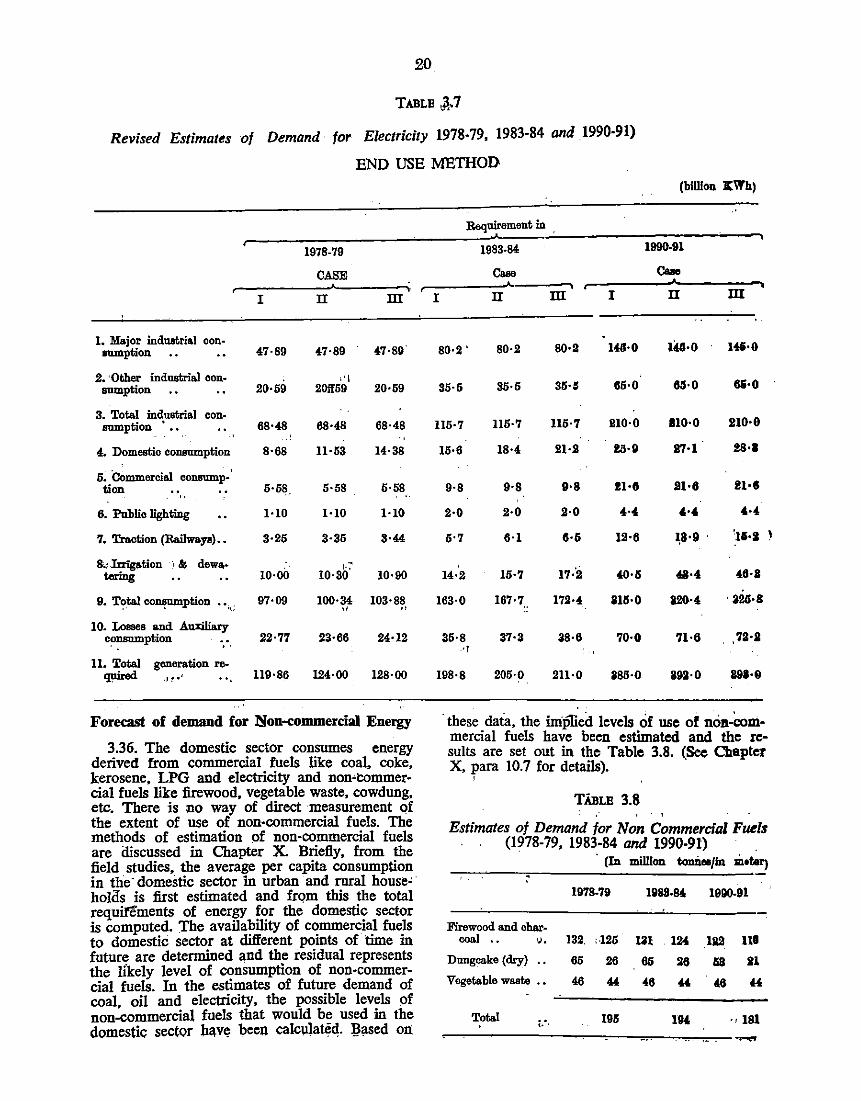
20
TABLE ;}..7
Revised Estimates of Demand· for Electricity 1978-79, 1983-84 and 1990-91)
END USE METHOD
1978-79
CASE
I n m
I. Major indll!trial oon-anmption 47-89 ~7-89 ~7·80'
2. ·other industrial con· •'I aumption 20·69 201f59 20·69
3. Total ind,ustrial con-68·48 68·48 68·48 anmption ..
4. Domestic consumption 8·68 ll·63 14·38
5. Commercial oonsump-tion .. 6·58 5·68 5·58 .. . .
6. Pnblio lighting 1·10 1·10 1·10
7. Traction (Railwayo) •• 3·26 3·35 3·44
8.,lrrigation ·, &: dewa. 10·00
!·:' tering 10·30 10·90
9. T?tal oo~ption ... ,, 97·09 100·34 103·88 " "
10. Losses and Au>:iliary ~ption 22·77 23·66 24·12
U. Tots! generation re-quired ,, ~ •' 119·86 124·00 128·00
Forecast of demand for Non-commercial Energy
3.36. The domestic sector consumes energy derived from commercial fuels like coal, coke, kerosene, LPG and electricity and non•tommercial fuels like firewood, vegetable waste, cowdung, etc. There is no way of direct measurement of the extent of use of non-commercial fuels. The methods of estimation of non-commercial fuels are discussed in Chapter X. Briefly, from the field studies, the average per capita consumption in the· domestic sector in urban and rural house' bolas is first estimated and from this the total requirements of energy for the domestic sector is computed. The availability of commercial fuels to domestiC sector at different points of time in future are determined and the residual represents the likely level of consumption of non-commercial fuels. In the estimates of future demand of coal, oil and electricity, the possible levels of non-commercial fuels that would be used in the domestic sector hav~ been calc\llate<!. ~ased on
(billion lt'IYb)
Requirement in ,
1983-84 1990-91
c .... Cllllo
I n m I n m
80·2. 80·2 so-a 1411·0 I (G-o Hi•O
35·6 85·6 31H 65·0 611•0 6&·0
116·7 116·7 ll6·7 810•0 110·0 210·0
15·6 18·4 l!I·ll !3·11 87·1 !8•1
9·8 9·8 9•8 11·8 l!l•6 1!1·11
2·0 2·0 2·0 4·4 ,., ,.~
5•7 6·1 8·5 12·6 ~8-9 . '11•1 l
14·2 15·7 17:2 ~-5 4.8·4. 46·8
163·0 167·7 .. 17ll·4 815·0 820·4 . 320·8 -
36·8 37·3 38·6 70·0 71·6 ' '7ll·ll •I
198·8 205·0 2ll·O 186·0 892·0 891·8
. these data, the imPlied levels of use of ncia-eommercial fuels have been estimated and the results are set out in the Table 3.8. (See Chapter X, para 10.7 for details).
' TABLE 3.8
' ' Estimates of Demand for Non Commercial Fuels
(1978-79, 1983-84 and 1990-91) . (In million toniloaJin m•tAtl')
1978-79 1888-84 1990-91
Firewood and ohar-coal .. v • 132. <·125 Ial . 124 1112 Ill
Dnngoake (dry) .. 65 26 66 26 158 Ill
Vegetable waste •• 46 " 46 " " 44
Total 195 ., 181 '
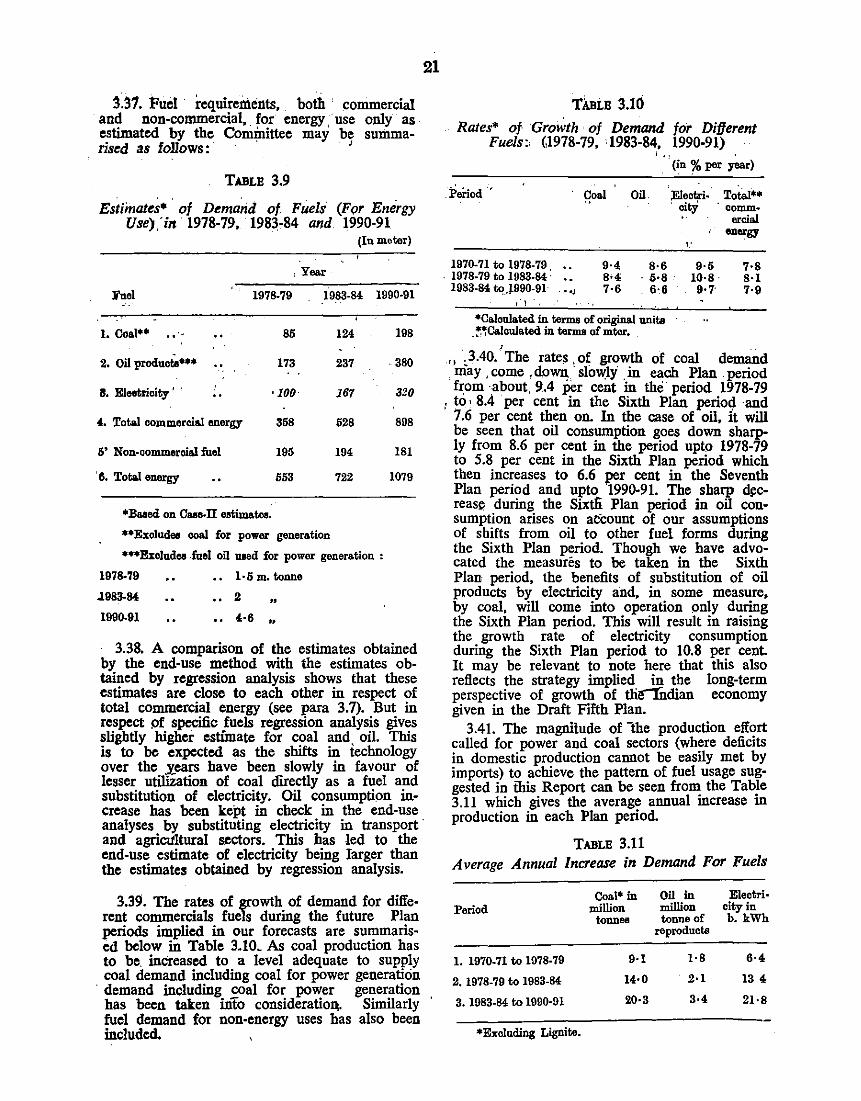
3.37. Fuel · requirements, both ' commercial and non-commercial, . for energy , use only as estimated by the Committee may be summa-rised as follows : · · '
TABLE 3.9
Estimates* of Demaria of Fuels (For Energy Use):in · 1978-79, 198~-84 and. 1990-91
(In meter)
. Year
l'uel 1978-79 1983-84 1990-91
1. Coat•• •• ·-
2. Oil produoto•••
B. Eleetricity ' .
4. Total commercial energy
5' Non-commercial fuel
'8. Total energy
•Based on Case-IT eotimateo.
85
173
•100
358
195
lili3
124
237
167
528
194
722
**Exoludea coal for power generation
•••ExoJudee .fuel oil uaed for power generation :
1978-79 1·1i m. tonne
~983-84
1990-91
2 "
198
380
320
898
181
1079
21
3.38. A comparison of the estimates obtained by the end-use method with the estimates obtained by regression analysis shows that these estimates are close to each other in respect of total commercial energy (see para 3. 7). But in respect pf specific fuels regression analysis gives slightly higher estimate for coal and, oil. This is to be expected as the shifts in technology over the years have been slowly in favour of lesser utilization of coal directly as a fuel and substitution of electricity. Oil consumption increase has been kept in check in the end-use analyses by substituting electricity in transport -and agricttltural sectors. This has led to the end-use estimate of electricity being larger than the estimates obtained by regression analysis.
3.39. The rates of growth of demand for different commercials fuels during the future Plan periods implied in our forecasts are summarised below in Table 3.10. As coal production has to be increased to a level adequate to supply coal demand including coal for power generation
· demand including coal for power generation has been taken into consideratio~. Similarly fuel demand for non-energy uses has also been included.
TABLE 3.10 Rates* of- Growth · of Demand for Different
Fuels:• G1978-79, 1983-84, 1990-91) l ' ~
(in % per year)
1970-71 to 1978-79 . 1978-79 to 1983-84 ·
1983-84 toJ990-91 ... , ,·,.
Coal
9·4 8•4 7·6
Oil
8·6 - li·8 - 6·.6
*Caloulated in terms of original unite . ~.-:Calculated in terms of mtor.
' '
Eleotri- Total•• 'citY comm·
ercial energy
\'
9·5 7·8 10·8. 8·1 9·7· 7·9
,, .3.40. The rates ,of growth of coal demand , nia y , come , down,, slow;ly . in each Plan period from about. 9.4 per cent in the period 1978-79
. to • 8.4 per cent in the Sixth Plan perio4 -and ' 7.6 per cent then on. In the case of oil, it will
be seen that oil consumption goes down sharply from 8.6 per cent in the period upto 1978-79 to 5.8 per cent in the Sixth Plan period which then increases to 6.6 ~r cent in the Seventh Plan period and upto 1990-91. The sharp ds:creas~ during the Sixtfi Plan period in oil consumption arises on aC:count of our assumptions of shifts from oil to other fuel forms during the Sixth Plan period. Though we have advocated the measures to be taken in the Sixth Plan period, the benefits of substitution of oil products by electricity and, in some measure, by coal, will come into operation only during the Sixth Plan period. This will result in raising the growth rate of electricity consumption during the Sixth Plan period to 10.8 per cent It may be relevant to note here that this also reflects the strategy implied in the long-term perspective of growth of tliemdian economy given in the Draft Fifth Plan.
3.41. The magnitude of -the production effort called for power and coal sectors (wh~re deficits in domestic production cannot be easily met by imports) to achieve the pattern of fuel usage suggested in ibis Report can be seen frOID; the Tab}e 3.11 which gives the average annual mcrease m production in each Plan period.
TABLE 3.11 Average Annual Increase in Demand For Fuels
Coal• in Oil in Electri· Period million million city in
tonnes tonne of b. kWh reproducts
1. 1970-71 to 1978-79 9·1 1·8 6·4
2. 1978-79 to 1983-84 14·0 2·1 13 4
3. 1983-84 to 1990-91 20·3 3·4 21·8
•Excluding Lignite.
3.42. It is relevant to note that the increases ~ the per year addition to production of coal. oll products and electricity will slowly increase over time inspite of the reduction in the rates of growth in oil noticed in the Sixth Plan period. The production per year will of course increase gradually each year, if adequate advance action is taken in the energy sector. But Table 3.11 bas been given to highlight the magnitude of the tasks which will be cast on coal, oil and electricity indlJSt!ies iii.· future.
3.43. The estimates given in this Report are in the nature of conditional statements and they are derived from the rate of growth of the economy, the structure of ·tbe economy and structure of the industries as fOreseen now. The estimates for 1978-79 do not reflect any large variations in the demand for oil products as a measure· of economy in the use of oil and some substitution of oil products for power generation and for heat raising in industnes by coal bas already been
assumed in the first .. estimates •. Given. th~ liiilita• tions on inc~aSing c:Oat' and ,tieCtricity: the Committee did not thinlC: it reali~c; to forecast. any severe reduction iD the use of .oil:: ;but it should, be noted that the Committee . hils not exainined the possibilities ot curbing. elitist consumption of selected oil products by · administrative action. But the alternative patterns of usage suggested. in this Report will mean a .saving of about 5 ·ln. toones in 19~84 and U ttL tonn~ iD 1990-91. If all the measures suggested in fhe Report are taken, the pattern of usage of oil products will come to be closer to Case-ill where, by 1990-91, about 21 m. tonnes of oil produCts could, be saved. It is worth reiterating here that excepting for some quantities of energy which can be reduced by giving up a measure of comfort..red.uction in the use of a particular fuel will mean an increase in quantity of another fueL It is. therefore necessar1· to note that the patterns of usage of Case-I; 'Clise-11 and Case-m should be treat-ed as different patterns of fuel usage. · ·
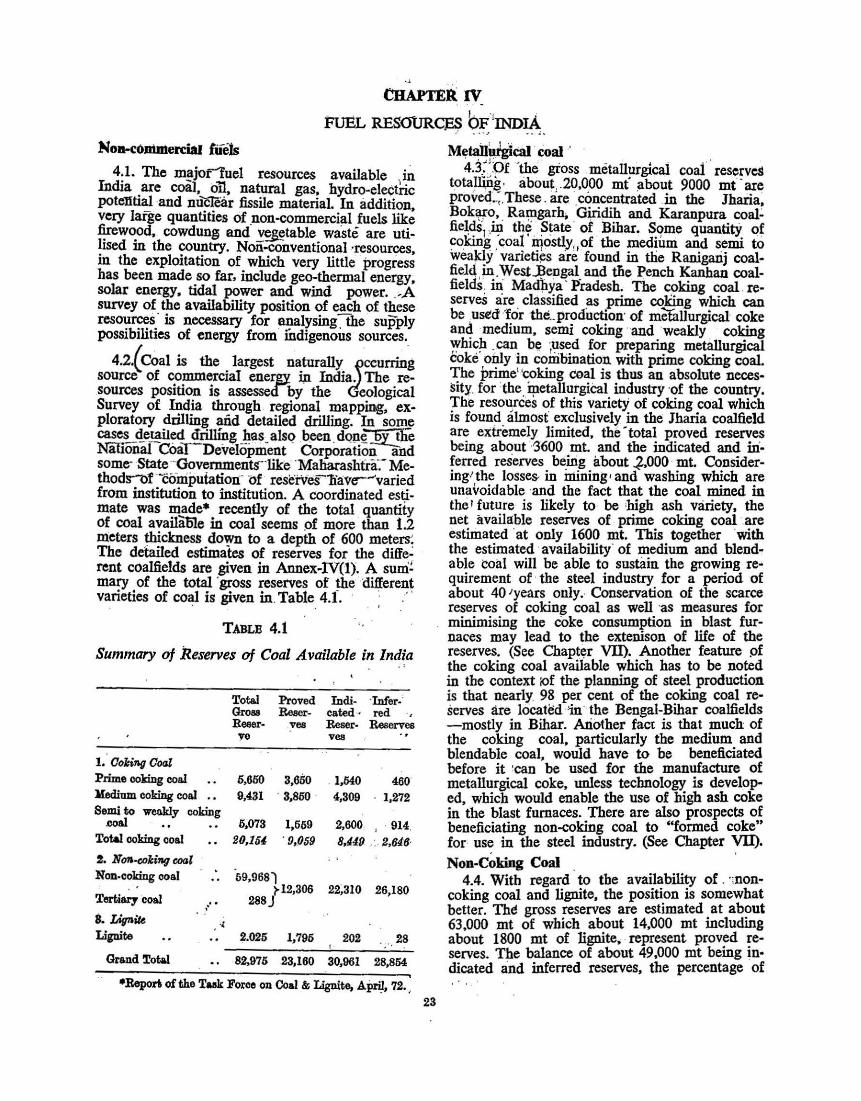
F'UEL RESotJR.CES bF.1INDIA .) ~ .. ~ . . ;. ~
4:1. The m~jorluel resources available )~ lnd1a . are coal. o~. na~l gas~ hydro-electric potellti~ ·and n~ear fissile matenal. In addition, very large quantities of _non -commercial fuels like ~w~d. cowdung and v~table waste are utilised m the country. Non-conventional ·resources in the exploitation of which very little progres; has been made .so far. include geo-thermal energy, solar energy. tidal power and wind PQWer . . -A survey or ~e availability position of each of these reso~~~s. IS necessary for el}alysing~the supply possibilities of energy from indigenous sources.
4.2.( Coal is the largest naturally ~-ceurring source of commercial ener~ in India. The resources position is assessea by. the eological Survey of ~d~a ~ough regional mapping, exploratory drilling and detailed drilling. In some case~c!_e_!!il~ cT~g P.as_alsq .~n. dQp.~ ..1?1_!he Nifional Coil Development Corporation and some· ·State ··-oovernments-·like ·Maharasht:riC Methods-of ·coiripuiation of resetves1iave--'varied from institution to institution. A coordinated estimate was made* recently of the total quantity of coal availaiD.e in coal seems of more than 1 2 meters ~ckness . do!'Jl to a depth of 600 mete~ The detailed estimates of reserves for the diffe~ rent coalfields are given in Annex-IV(l). A sum! mary of the total 'gross reserves of the ·different varieties of co~I is given in. Table 4.f. ·. · ·
TABLB 4.1 ' ·
Summary of Reserves of Coal Available in India
Total Proved Groaa Reser-Reser- ves ye
1. Ooiing Coal 5,650 3,600 9,431 . 3,850 .
Prime ooking coal lfedium cokiDg coal •• Semi to weo.kly coking
.coal • • • • 5,073 1,559 . 9,_059 Total coking coal • • 20,164
2. Ntm-uiking coal Non-coking coal
Tertiary coal
8. Lignite Lignite
,.: . -~
69,9681 ~12,306
288J
1,795
, ,
Indi- ·Infer·' eated • red ·, Reser· Reserves ves
. 1,540 460" 4,309 . 1,272
2,600 ' . 914. 8,449 . :. 2,646·
22~310 26,180
202 .. 28 ·-
Grand Total • . 82,975 23,160 30,961 28,854
•Bepori of the Task Force on Coal & Lignite, Apri!, 72. , 23
M~tailu~cal . coal ·· 4.3~):>f 'the · gioss . metall_!Jrgicai coa1 . reserves
totaJ.lijl~ · about1.20.0_00 mt ~bout 9000 mCare proved_,_These . are _concentrated .in the Jharia~ Bok~~· . Ra~garh,_ . Gjpdi~ and Karanpura coal~ fie~~s1 ,J.Y . th~ .. ~tate of Bihar. S<?me quantitY of ~okm~ .~oa~ ~()stlyi,of the ~ed~um aD;d semi to wealdy vaneti~s are found m the Raruganj coalfield, in .West)3engal and tOe Pench Kanhan coalfieldS: i~ Madltya · Fradesh. The coking coal . reserves are . classified _as prime coJcing which can be , ustd ··for the_ production· of metallurgical· coke an~ medium. semi coking ·and weakly coking ~ht~p ~_can. b~ ;~_SC:d ~or p~pa~g meta)lurgical coke ob.ly m combmation With prune coking coal. The prime' 'coking coal is thus an absolute necessity. for :the_ ~etallurgiCal industry ·of the country. !he reso~rc'es of this ~ariety of coking coal which zs found_ almost exclusively in the Jharia coalfield are extremely limited. the· total proved reserves being about ·-'3600 mt. and the indicated and iJi. ferred re5erves bei.rig about ~.000 · mt. Considering.',the losses- in D:tining • and washing which are un~voidable ·and the fact that the coal mined in the ' future is likely to be <high ash variety, the net available reserves of prime coking coal · are estimated ·at only 1600 mt. This together ·with the estimated · availability. of medium and blend· able coal will be able to sustain the growing requirement of · the steel industry for a period of about 40 ' years only.- Conservation of the scarce reserves of coking coal as well ·as measures for minimising the eoke consumption in blast furnaces may lead to the extenison of life of the reserves. (See Chapt¥r VII). Another feature 9f the coking coal available which has to be noted in the context ;of the planning of steel production is that nearly 98 per cent of the coking coal reserves are lOca.ted ·in· the Bengal-Bihar coalfields -mostly in Bihar. Ariother faet is that much of the coking coal, particularly the medium and blendable coal, would have to be beneficiated before it ·can be used for the manufacture of metallurgical coke, unless technology is developed. which would enable the use of high ash coke in the blast furnaces. There are also prospects of beneficiating non-coking coal to "formed coke" for· nse in the steel industry. (See Chapter Vll).
Non-Coking Coal . 4.4. With regard to the availability of . ·;non
coking coal and lignite, the position is somewhat better. The gross reserves are estimated at about 63.000 mt of which about 14.000 mt including about 1800 mt of lignite, -represent proved reserves. The balance of about 49,000 mt being in· dicated and inferred reserves, the percentage . of
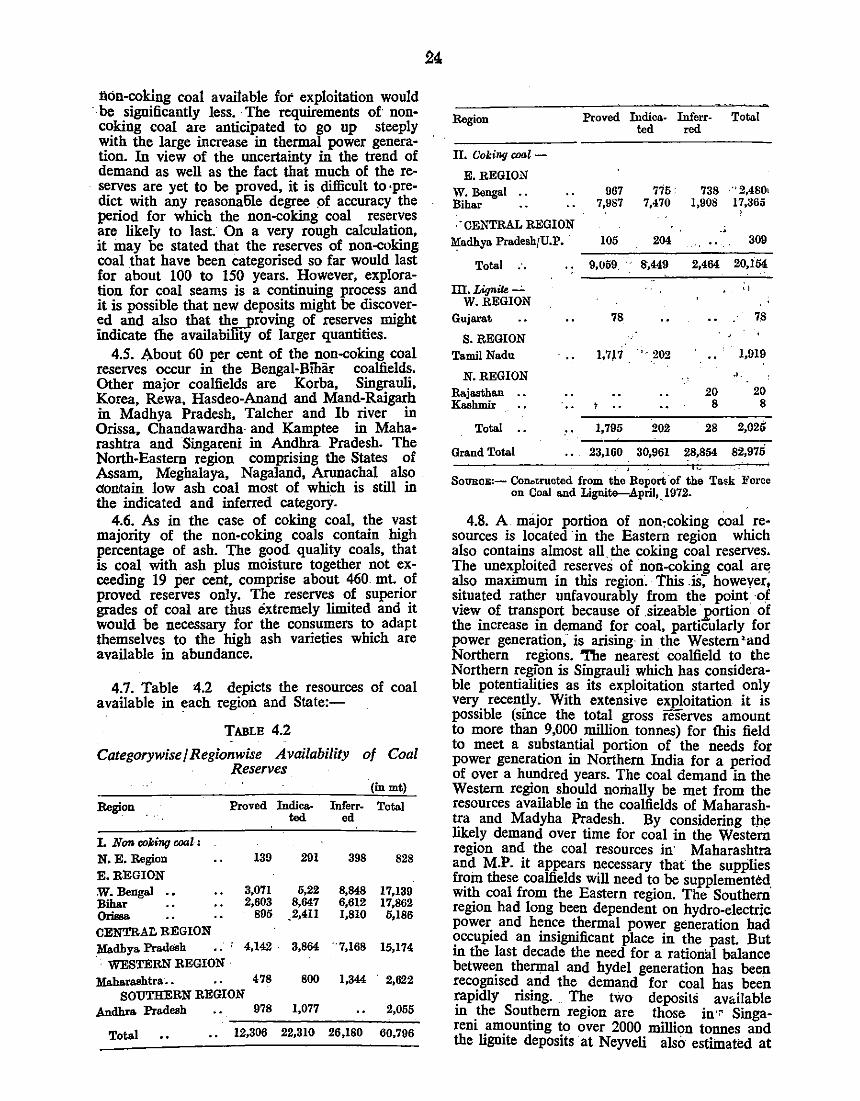
liOn-coking coal available for exploitation would · be significantly less. The requirements of noncoking coal are anticipated to go up steeply with the large increase in thermal power generation. In view of the uncertainty in the trend of demand as well as the fact that much of the reserves are yet to be proved, it is difficult to ·predict with any reasona6Ie degree pf accuracy the period for which the non-coking coal reserves are likefy to last. On a very rough calculation, it may be stated that the reserVes of non-coking coal that have been categorised so far would last for about 100 to 150 years. However, exploration for coal seams is a continuing process and it is possible that new deposits might be discovered and also that th~roving of reserves might indicate the availability of larger quantities.
4.5. A.bout 60 per cent of the non-coking coal reserves occur in the Bengal-Bihar coalfields. Other major coalfields are Korba, Singrauli, Korea, Rewa, Hasdeo-Anand and Mand-Raigarh in Madhya Pradesh, Talcher and Ib river in Orissa, Chandawardha· and Kamptee in Maharashtra and Singareni in Andhra Pradesh. The North-Eastern region comprising the States of Assam, Meghalaya, Nagaland, Arunachal also aoilltain low ash coal most of which is still in the indicated and inferred category.
4.6. As in the case of coking coal, the vast majority of the non-coking coals contain high percentage of ash. The good quality coals. that is coal with ash plus moisture together not exceeamg 19 per cent, comprise about 460 mt. . of proved reserves only. The reserves of supenor grades of coal are thus extremely limited and it would be necessary for the consumers to adapt themselves to the high ash varieties which are available in abundance.
4.7. Table 4.2 depicts the resources of coal available in each region and State:-
TABLB 4.2
Categorywise f Regionwise Availability of Coal Reserves
Region
I. Non coking coal:
N. E. Region E. REGION W.llengal .• Bihar Oriss& CENTRAr. REGION
(in mt)
Proved Indica- Inferr- Total
139
3,071 2,603
895
ted ed
291
5,22 8,647
,2,411
398
8,848 6,612 1,810
828
17,139 17,862 5,186
Madhya Pradeah 4,142 · 3,864 ··7,168 15,174 . · WESTERN REGION Ma.haroshtra.. 478 800 1,344 2,622
SOUTHERN REGION Andhm Pradesh 978 1,077 2,055
Total 12,306 22,310 26,180 60,796
24.
Region Proved Indica- Inferr- Total ted red
II. Coking cool -
E. REGION W. Bengal .. 967 775 738 ,''2,4S0t Bihar 7,987 7,~70 1,908 17,365
' ·.CENTRAL REGION '.
Madhya PradeshfU.P. 105 204 309
Total .. .. 9,059 8,449 2,464 20,164
III. Lignite ...:. •I
W.REGION Gujarat 78 78
S.REGION Tamil Nadu 1,7p ·,, 202 1,919
N.REGION " J.
Rajasthan .. 20 20 Kashmir t .. 8 8
Total .. 1,795 202 28 2,025
Grand Total .. 23,160 30,961 28,854 82,975
SoUBoE:- Con.o~ruoted from the Report ·or the Task Force on Coal and Lignit&-April,_l972.
4.8. A major portion of non7coking coal resources is located ·in the Eastern region which also contains almost all. the coking coal reserves. The unexploited reserves of non-coking coal are also maximum in this region: This .iS: howeyer, situated rather unfavourably from the point. ·of view of transport because of .sizeable ~rtion of the increase in demand for coal, particularly for power generation,- is arising· in the Western •and Northern regions. 'The nearest coalfield to the Northern region is Singrauli ~hich has considerable potentialities as its exploitation started only very recently. With extensive exploitation it is possible (since the total gross reserves amount to more than 9,000 million tonnes) for fuis field to meet a substantial portion of the needs for power generation in Northern India for a period of over a hundred years. The coal demand in the Western region should nomally be met from the resources available in the coalfields of Maharashtra and Madyha Pradesh. By considering t}l~ likely demand over time for coal in the Western region and the coal resources in· Maharashtra and M.P. it appears necessary that the supplies froin these coalfields will need to be supplemented with coal from the Eastern region. The Southern· region had long been dependent on hydro-electric power and hence thermal power generation had ?ccupied an insignificant place in the past. But m the last decade the need for a rational balance between then;nal and hyde! generation has been recognised and the demand for coal has been ~pidly rising. The two deposits av<tilable m the Southern region are those in'" Singareni amounting to over 2000 million tonnes and the lignite deposits at Neyveli also estiinated at
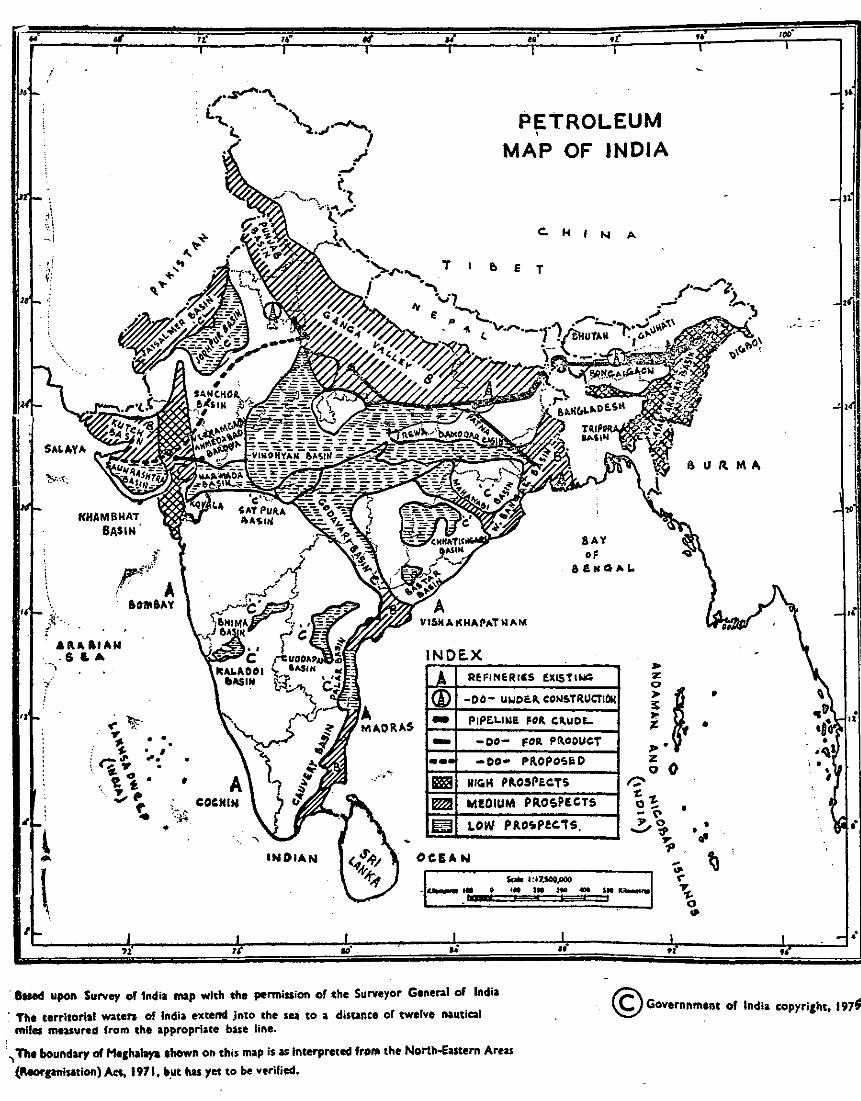
. ' f.:
'·
KHAMBHAT BASIN.
}:· ' .11\AaiAN
.s ~· ·~,
t ...
\ INDIAN
PETROLEUM '
MAP OF INDIA
T e. e T
VtliHA t<HAP"T H"M
INOE.X
A REFif'IERtCS ~XISTI~
(!) -DO- uwoe.A. CONSTRUCTION - PiPE.LINII. FOA. CA.UD'-- -oo- FOR PII.OOUCT ..... -oo- PR.OPCI<O&D
IB!l!l NIGH PI\05PECTS
~ M!DIUM PA.OSP!CTS
~ LOW PI\0'-P!C'TS.
, ... C'
&U/lMA
\ ...
· Sued upon Survey of 1ndia map with the permission of the Surveyor General of India
· The territorial watera of India extend jnto the sea to a distance or twelve nautical miles measured from the appropriate base line.
© Governnment of India copyricht, 1971
, The boundary of Me&halaya ehowft on this map is as Interpreted from the North-Eastern Areas
(1\eorpnbation) A6, 1971, ll.ut hu yet to be verified.
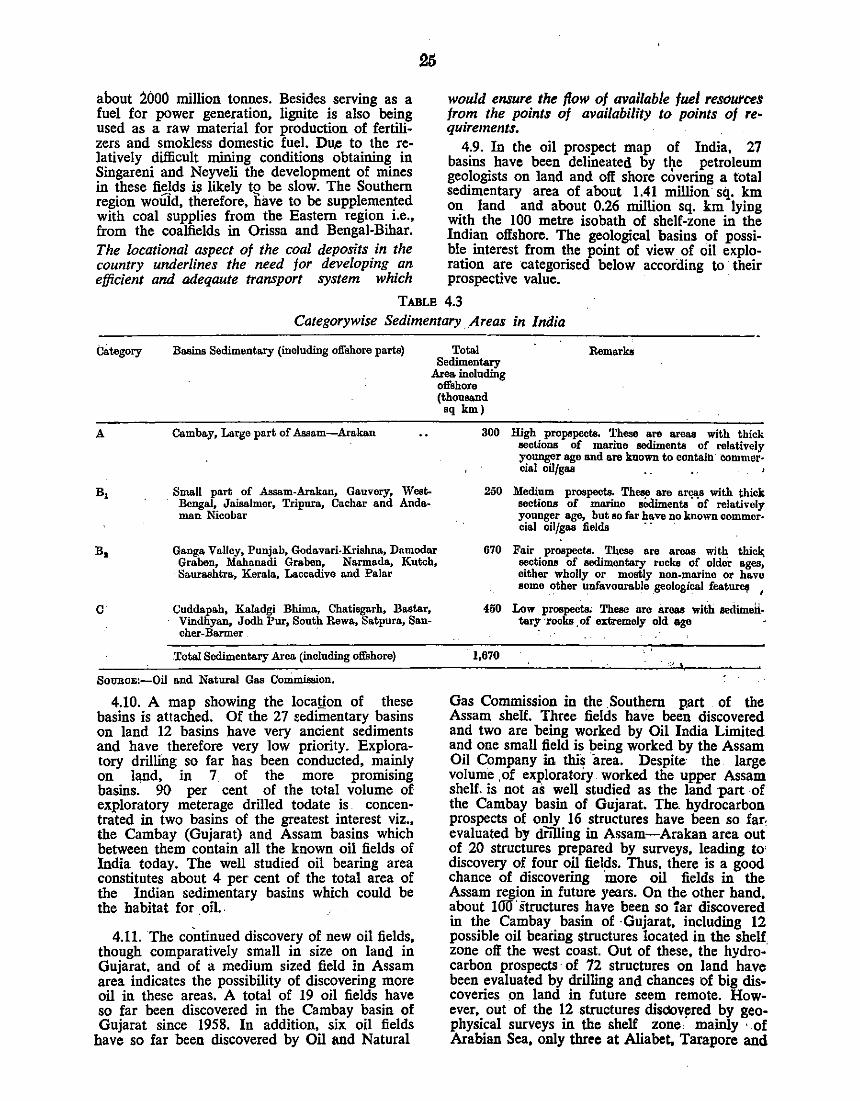
about 2000 million tonnes. Besides serving as a fuel for power generation, lignite is also being used as a raw material for production of fertilizers and smokless domestic fuel. Du,e to the relatively difficult mining conditions obtaining in Singareni and Neyveli the development of mines in these fields is likely to be slow. The Southern region wowd, therefore, have to be supplemented with coal supplies from the Eastern region i.e., from the coalfields in Orissa and Bengal-Bihar. The locational aspect of the coal deposits in the country underlines the need for developing an efficient and adeqaute transport system which
TABLE
would ensure the flow of available fuel resources from the points of availability to points of requirements.
4.9. In the oil prospect map of India, 27 basins have been delineated by the petroleum geologists on land and off shore covering a total sedimentary area of about 1.41 million sq. km on land and about 0.26 million sq. km lying with the 100 metre isobath of shelf-zone in the Indian offshore. The geological basins of possible interest from the point of view of oil exploration are categorised below according to · their prospective value.
4.3 Categorywise Sedimentary .Areas in India
category Basins Sedimentary (including offshore parte) Total Sedimentary
Area including offshore (thoul!&lld
Remarks
A
B,
c
Camba.y, Large part of .Assam-Arakan
Small part of Assam-Arakan, Gauvery, WestBengal, Jai.salmer, Tripura, Cachar and Andaman Nieobar
Ganga Valley, Punjab, Godavari-Krishna, Damodar Graben, Mahanadi Graben, Narmada, Kutch,
· Saurashtra, Kerala, Laccadive and Palar
Cuddapa.h, Kaladgi Bhimo., Chatisgarh, llast.a.r, Vindhyan, JodhPur, South Rewa, Satpura, San-cher-Barmer ·
Total Sedimentary Area (including offshore)
SounoE:-Oil and Natural Gaa Couinrlsaion.
4.10. A map showing the locayon of these basins is attached. Of the 27 ~edimentary basins on land 12 basins have very ancient sediments and have therefore very low priority. Exploratory drilling so far has been conducted, mainly on la,nd, in 7 of the more promising basins. 90 per cent of the total volume of exploratory meterage drilled todate is concentrated in two basins of the greatest interest viz., the Cambay (Gujarat) and Assam basins which between them contain all the known oil fields of India today. The well studied oil bearing area constitutes about 4 per cent of the total area of the Indian sedimentary basins which could be the habitat for .on ..
4.11. The continued discovery of new oil fields, though comparatively small in size on land in Gujarat, and of a medium sized field in Assam area indicates the possibility of discovering more oil in these areas. A total of 19 oil fields have so far been discovered in the Cambay basin of Gujarat since 1958. In addition, six oil fields
have so far been discovered by Oil and Natural
•q km)
300
250
High propopecta. These are areas witb thick sections of marine sediments of relatively younger age and are known to contain· ·oommer· cia! oilfgas
Medium prospects. Th~ are &fQI\S with ~hick sections of marine sCdimenta of relath•ely younger age, but so far have no known aommcr· cia! oilfgas fields · · ·
670 Fair prospects. These are areas with thic~ sections of sedimentary rocks of older ages, either whoJiy or mostly non-mo.rine or have some -~ther 1~nfavourable _geological featur~
1
450 Low prospects; These are areas wiih BC<iimeiJ.. tary ·rocks. of extremely old age
1,670
Gas Commission in the .Southern p.art of the Assam shelf. Three fields have been discovered and two are being worked by Oil India Limited and one small field is being worked by the Assam Oil Company in thiS area. Despite the large volume . of exploratory worked the upper Assam shelf. is not as well studied as the land Jlart of the Cambay basin of Gujarat. The. hydrocarbon prospects of only 16 structures have been so far, evaluated by drilling in Assam-Arakan area out of 20 structures prepared by surveys, leading to• discovery of four oil fields. Thus, there is a good chance of discovering more oil fields in the Assam region in future years. On the other hand, about IOU. structures have been so tar discovered in the Cambay basin of ·Gujarat, including 12 possible oil beating structures located in the shelf zone off the west coast. Out of these, the hydro_. carbon prospects· of 72 structures on land have been evaluated by drilling and chances of big discoveries on land in future seem remote. However,. out of the ~2 structures disdovjlred by geophysical surveys m the shelf zone mainly · of Arabian Sea, only three at Aliabet, Tarapore and

Bombay. High· have been partly ·explored by drilling till ,recent;.;. The first. well drilling at Bombay High sffucture has penetrated many promis~ ing oil. and ~s bearing layers. But the potential of the structure has to be studied with reference to a few more holes to be drilled and through trial ,prqduction over .a period . of time. It is as yet too premature to· make ·any forecast of the likely production from this structure. The Committee, therefore, di\1. 1;10t co.nsider it desirable to revise. the assumptions regarding production of crude from Indian ol'lfield~· J;lllide pri«;>J to the findings at Bombay High. . ... ' ·
4.12. The proved reserves of crude oil anq natural gas are shown in Table .4.4.
TABLE 4.4
Reserves of Crude and Natural Gas
Gnjarat
Total
Crude Oil (In million
tonnes) .. 56·38
n·4G · ''"
127·84.
Natura!Gas , (In million Cu· . bic Metres)
19·66
. 42·82
62·48
SoUBcx:- Indian Petroleum and Chemicals Statistics;·1972. ' ·'•
Kecent explorauons within the country (e.g., in 'fripura and13ombay High,.;ueas) and ,in concessions operated abroad (e.g., certain Persian Gulf areas in the middle east) hold promise of discovery of -gas··in substantial quantities .which may increase several fold the availability of natural gas to India.
' 4.13. In the fifti:\ Five Year Plan pdtlocl,, the Oil and Natural Gas Cominission ·l;Jas arawn. up plans to prove recoverable oil reserves to thr extent of 64 mt inclusive of 5 mf. to be discovered. and proved in the offshore areas:· This is e~at~ ed to enable <JNGC to· achieve ·and sustain a production of 8 mt. of 'oif per year iii '1978-79 .. The forecast of proving of reserves and . produc-· tion is contingent· on the' level cif explora~ion and development work done by. ONGC being atleast as intensive as indicated "in the Fifth Five· Year Plan prdgramine. The Oil India Ltd. which is exploiting the"oil·fields in Assam has' an· exploration programme whic~· 'would enable them to 'reach and maintain a production of about 3 · mt. of crude per year'by 1978-79. The All India production of etude· will, therefore; ,be about 12 mt by 1978-79 including offshdte ' productiolj. There is likely to be variations between what l.S expected and what is achieved. ' · · ·
4.14.- 'For the period beyond .19'78-79 detailed· studies have not been made: .freliminacy, studies;
26
however, indicate that if adequate funds are ntade available for. exploration activities, recoverable resources of about 130 mt. could be established in 5. years and ONGC's oil production alone can be about 13 mt !>x ~83-84. It is reasonable, therefore, to-rorecaSi a production rate of about 15 mt of oil per year by 1983-84. These projections...of oil production and reserves likely to be added are essentially pn:ignastic estimates of statistical nature based on experience and skill gained so far exp~esed in terms of oil reserves dis-covered per metre drilled. .
4.1:5. ln order that these forecasts are realised in future the following steps may have to- be taken:
(i) Expedite the exploratory drilling in the Bombay High region.
(ii) Undertake a large volume of exploration drilling operations in the Tripura and Cachar areas and in the SouthEestem border of the Upper Brahmaputra Valley .
(iii) Re-survey some already explored portion of the Cambay basin and the Upper Brahmaputra valley region of the Assam-Arakan Basin. using sophisticated geophysical techniques, and intensive exploration drilling nperations in such portions. to locate additional traps in particular stratigraphics which might have been missea in the course of the exploration work conducted earlier.
(iv) Extend the exploration· operaflons to the portions of the Cambay basin and the Upper . Brahmaputra Valley region of the Assam-Arakan Basin which had not been explorea so far. ·
(v) Conduct extensive seismic surveys iJ;1 all the areas and follow up the results by drilling of exploration wells. Priority to 'be assigned to the continental shelf in
. the Arabian Sea adjoining the area al-ready covered, the continental shelf area south of Sunderbans and the continental
. . shelf area of the Andaman Islands .. ·
(vi) Test by deep drilling alreadx ·known structures in the Shiwalak Toot hill belt of fammu and 'Xasnmir, Putljab aQ.d Himachal Pradesh. · ·
(vii) Intensify the exploration work, including seismic surveys and-drilling operations, in the Ganga valley in. West Bengal, Saurashtra and J aisa1mer area. . · .
(viii) Intensify the exploration work, including ~ommencement of exploration drilling, m tlle1lrnd are-a of Andaman & Nicobar Islands.
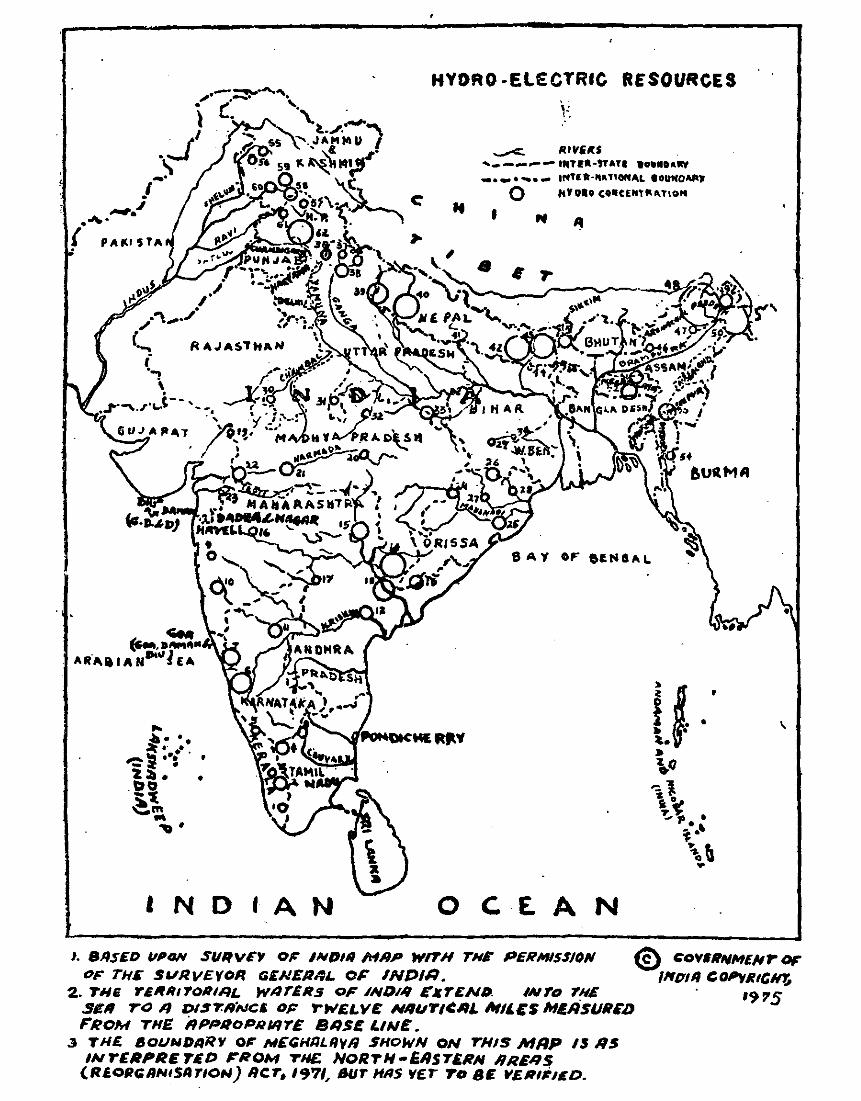
HYDRO -ELECTRIC RESOURCES
''· __..c:. IHV,II:S
, ___ ,__IM't•A .. UAfl •o••••Rt -• .- • .._.- UIITit-"ATtON~L eoutCOAitJ
0 II YOlO CO-CENTIOO.TION
... ~ ...
:It ·- • ,...~ .. : .. -~ . 2:11. .l:ta -"t ~m ... ,.
•
INDIAN
.. f
•
8 AY OF at.NIAL
0 C E AN
I. 8RS£D 1/Pti/V SUIIVG'I 0~ INDIA MIIP WITH THE P£11/111/SS/ON OF TH6 SVRV£VOR GENER~L 0~ INDIR.
2. TilE r£1fRt70RI~L WAT£115 OF iNDNI EJtT£N~. INt'tJ TN£
® f:tJV/6/INMEitr ~ /lfQt/1 t:.OP'tlliCHJ;
.!1611 TO Jfl DI$7:/I"NCI. OF TWELV£ Nlll.l'ri~RL ltt"ES MERSUfi£/J FROM THE HPPIIOPRIIIT£ BIIS£ LIN£.
3 'r'H£ aoUNDtfRV 0~ /rl£tiHfiLIIVR SHOWN ON THIS MRP 1$ RS INTERPRETED ~110M THE. NORTH•SIISTERN RRE.qs
(R!OiltiiiHtSRTIOI>J) Rcr. I'J71, /JUT HilS V£T 'roBE .-£111ii£D.
. ''"5
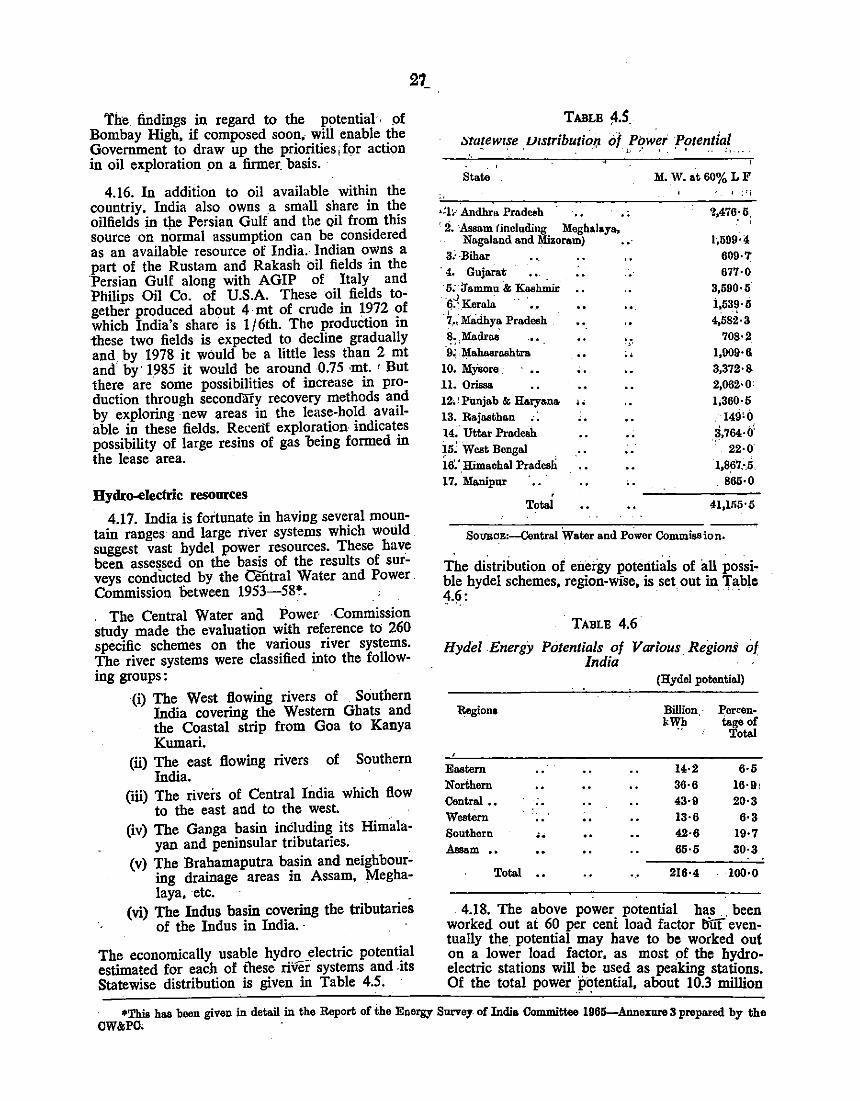
The. findings in regard to the potential · of Bombay High, if composed soon, will enable the Government to draw up the priorities, for action in oil exploration on a firmer. basis.
4.16. In addition to oil available within the countriy, India also owns a small share in the oilfields in the Persian Gulf and the oil from this source on normal assumption can be considered as an available resource of India. Indian owns a part of the Rustam and Rakash oil fields in the 'Persian Gulf along with AGIP of Italy and Philips Oil Co. of U.S.A. These oil fields together produced about 4 · mt of crude in 1~72 ?f which India's share is I/6th. The productton m these two fields is expected to decline gradually and. by 1978 it would be a little less than 2 mt and by'l985 it would be around 0.75 ·mt. 'But there are some possibilities of increase in production through seconoary recovery methods a~d by exploring new areas in the Ieas~-ho~d ~Vallable in these fields. Recent exploratiOn mdtcates possibility of large resins of gas being formed in the lease area.
Hydr~lectric resources
27_
4.17. India is fortunate in having several mountain ranges and large n'ver systems which would suggest vast hyde! power resources. These have been assessed on the basis of the results of surveys conducted by the central Water and Power. Commission lietween 1953-58*. ,
. The Central Water ana Power· Commission study made the evaluation with reference to 260 specific schemes on the various river systems. The river systems were classified into the following groups:
(i) The West flowing rivers of Southern India covering the Western Ghats and the Coastal strip from Goa to Kanya Kumari.
(ii) The east flowing rivers of Southern India.
(iii) The rivers of Central India which flow to the east and to the west. . .
(iv) The Ganga basin including its Himala-yan and peninsular tributaries. .
(v) The Brahamaputra basin and neighbouring drainage areas in Assam, Meghalaya, etc. .
(vi) The Indus basin covering the tributaries of the Indus in India. · . ·
The economically usable hydro electric potential estimated for each of these river systems and .its Statewise distribution is given in Table 4.5.
TABLE ~tS
::;tatewrse . Vrstributiol;l of Power Potential L· ,• '.' o. •• !o ,.
State ;,
•:1v Andhra Prad .. h ' 2. ·Assam (including Meghalaya.
Nagaland and Mizoram) 3i-Bihar
· 4. Gujarat · 5; Jammu & Kas~ -~~Keral~
.'l '- .
7,. Madhya Pradesh s~ ,Madras· ·9; ,Mahaarashtra
10. M;Ysore · 11. Orissa 12•' Pnojab & Haryana " 13. Rajasthan : ~ 14. Uttar Pradesh 15; West Bengal l6:'.Himaohal Pradesh 17. Manipnr
' Total
.. · .. ·
. ,. ;.
..
M. W. at60% LF '<'!
~.476:5.
1,599·4 609·7 677·0
3,590·5 i,53~·5 4,582·3
708·2 . 1,909·6 3,372·8 2,062•0• 1,360·5
·149'0 ~.764·0'
22·0 1,8_67.:.5 '865·0
SouacE:-Central Water and Power Commission.
The di~tribution of energy poteriti~ls of all possible hyde! schemes, region-wise, is set out in Table 1~: ...
. TABLE 4.6
Hyd'el Energy Potentials of Various. RegionS of India
'Regiona
E .. tern Northern Central •• Western Southern •• Assam
Total ·.·
(Hyde! potential)
Billion. Pereen-kWh tage of
Total
14·2 6·5 36·6 16·9: 43·9 20·3 13·6 6·3 42·6 19·7 65·5 30·3
216·4 100·0
4.18. The above power potential has .. been worked out at 60 per ceni load factor bUr eventually the. potential may have to be worked out on a lower load factor, as most of the hydroelectric stations will be used as peaking stations. Of the total power p~tential, about 10.3 million
· •This has been given in detail in the Report of the Energy Survey of India Committee 1965-Annexnre 8 prepared by the CW&PO• ·
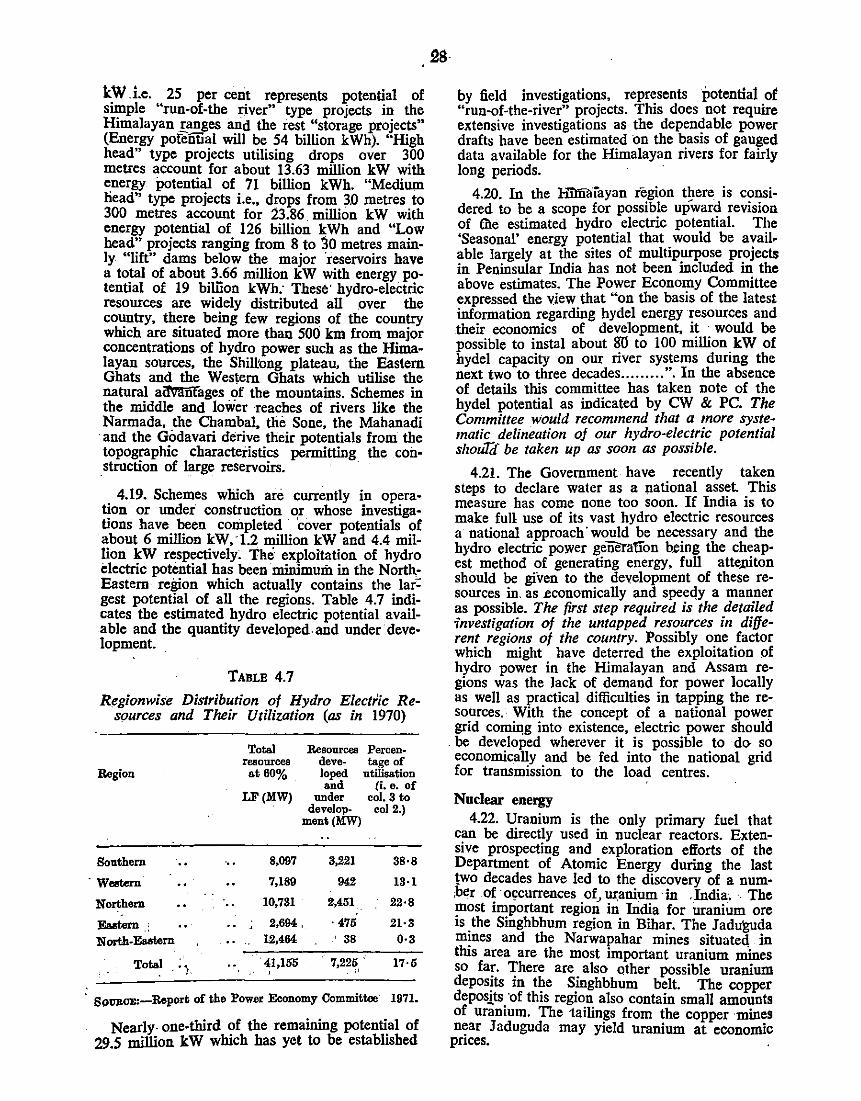
~ W .i.e. 25 per cent represents potential of s~ple "run-of-the river" type projects in the Himalayan !_anges and the rest "storage projects" (Energy pofefffial will be 54 billion kWh). ''High head" type projects utilising drops over 300 metres account for about 13.63 million kW with energy potential of 71 billion kWh. "Medium head" type projects i.e., drops from 30 metres to 300 metres account for 23.86 million kW with energy potential of 126 billion kWh and "Low head" projects ranging from 8 to 30 metres mainly "lift" dams below the major ·reservoirs have a to~l of about. 3,:66 million kW with energy potential of 19 bJliion kWh: These· hydro-electric resources are widely distributed all .over the co~try. th~re being few regions of the country which are .situated more than 500 km from major concentrations of hydro power such as the Himalayan sources, the Shifrong plateau, the Eastern Ghats and the Western G.hats which utilise the natural ai!Vlrnrages of the mountains. Schemes in the middle and lower ·reaches of rivers like the Narmada. the Chambal, the Sone, the Mahanadi
·and the G_odavari derive their potentials from the topo~phic characteristics permitting the con-struction of large reservoirs. · ·
. 4.19. Schemes which arci currently in operat~on . or under construction ~r whose investigations have. ~een complete~ cover potentials of about 6 million kW,-1.2 IDlllion kW and 4.4 million ~W res~vely~ The exploitation of hydro electric potential has been minimum in the NorthEastern region which actually contains the Jar': gest potential of all the regions. Table 4.7 indicates the estimated. hydro electric potential available and the quantity developed.and under development.
TABLE 4.7
Regionwise Distribution of Hydro Electric Resources and Their Utilization (as in 1970)
Region
Southern
. Western
Northern
Eastern .. North-Eaatem
Total . ; i
...
Total Resources Percen-resources deve- tage of at 60% . loped utilisation
.and (i.e. of LF(MW) under col. 3 to
develop- col 2.) ment(MW)
8,097 3,221 38·8
7,189 942 13·1
10,781 2,451 22·8
2,694. . 475 21·3 12,464 ' 38 0·3
. 41,155 . 7,225 . 17·5 '
SoUROE:-Report of the Power Economy CommittAle 1971.
Nearly. one-third of the remaining potential of 29.5 million kW which has yet to be established
28
by field investigations, represents potential of "run-of-the-river" projects. This does not require extensive investigations as the dependable power drafts have been estimated on the basis of gauged data available for the Himalayan rivers for fairly long periods. ·
4.20. In the Himaiayan region there is considered to be a scope for possible upward revision of file estimated hydro electric potential. The 'Seasonal' energy potential that would be avail. able largely at the sites of multipurpose projects in Peninsular India has not been included in the above estimates. The Power Economy Committee expressed the view that "on the basis of the latest information regarding hyde! energy resources and their economics of development, it · would be possible to instal about 80 to 100 million kW of hyde! capacity on our river systems during the next two to three decades ......... ". In the absence of details this committee has taken note of the hyde! potential as indicated by CW & PC. The Committee would recommend that a more systematic delineation of our hydro-electric potential shoti[{[ be taken up as soon as possible.
4.21. The Government have recently taken steps to declare water as a national asset This measure has come none too soon. If India is to make full use of its vast hydro electric resources a national approach· would be necessary and the hydro electric power generation being the cheapest method of generating energy. full atte.xrlton should be given to the development of these resources in. as .economically and spee<Jy a manner as possible. The first step required is the detailed investigation of the untapped resources in different regions of the country. Possibly one factor which might have deterred the exploitation of hydro power in the Himalayan and Assam regions was the lack of demand for power locally as well as practical difficulties in tapping the reso~rces. · ~it~ the concept of a national power gnd comll!g mto existence, electric power should
. be dev~loped wherever it is possible to do so econoiDlcally and be fed into the national grid for transmission to the load centres.
Nuclear energy 4.22. Uranium is the only primary fuel that
c~n be directly used in nuclear reactors. ExtenSIVe prospecting and exploration efforts of the Depanment of Atomic Energy during the last two decades have led to the discovery of a num~er o~ o~currences ofJ w:ani:um in . India. ·. The ~OSt II~portant region in India for uranium ore Is .the Smghbhum region in Bihar. The Jaduguda m~es and the Narwapahar mines situated in this area are the most important uranium mines so fa~. ~here are also other possible uranium depos~ts . m ~e SJ.nghbhum belt. The copper depos.1ts of this regiOn also contain small amounts of uranium. The tailings from the copper mines n:ar Jaduguda may yield uranium at economic pnces.
/!4.23. The reasonably well assured uranium resources in India .are about 22,000 Te U,O, with an additional inferred reserves of 24,000 Te U,O,. Uranium mined in India is slightly more expensive than in many other COl!ntries, since the uranium c.OJ1Centration in the ore is relatively low in India. !fowever, this is not of any grave consequence as . the fuel cost forms only a small component of the total unit energy cost from a nuclear power station.
'.'4.24. The Government have already initiated' a nuclear power programme. based on natural uranium fuelled and heavy water moderated and cooled reactors. Except f(Jr the first nuclear power station of 400 MW at Tarapur which requires enriched uranium as fuel, all· use natural uranium as fuel. At present 600 MW nuclear generating capacity is in operation in Maharashtra{Gujarat and Rajasthan. another 640 MW is under construction in Rajasthan and Tamil Nadu and the Construction of a 440 MW power . station in Uttar Pra<l.esh is about to start. As these first generation power stations would need a loading of about 4 kg of uranium per kW installed for 30 years of operation, the presently proved and inferred uranium resources in India would support only about 10,000 MW of installed nuclear capacity based on the current type of nuclear reactors. Moreover, out of. the 120. kg uranium that will be loaded every year per MW of installed nuclear capacity about 2 kg only will be actually consumed in the reactor and 0.5 kg· of plutonium will be produced. The. rest of the uranium cannot be used as such in the present type of nuclear reactors. Nevertheless. the plutonium produced in these reactors and the discharged (i.e., used) uranium, could be used in fast breeder reactors which are being developed in India and are expected to• be in commercia:! operation before the end of the next decade. Once these fast breeder reactors come on line by 1985-~90, they· will produce more plutonium than·., they· would burn. and then the uranium resources available in India would be able to support about 600,000 to 10.00,000 MW of installed capacity for a life time of 30 years. Thus the potentially available energy from the presently' known uranium deposits in India would amount to about 120 x 10' to 200 X 10' billion kWh of electricity.
.,.4.25. Thorium reserves in ·India are the largest in the world and are estimated at about 4,50.000 tonnes. Besides. the. fast breeder reactors would be .able to produce fissile Uranium-. 233 from thorium ·that is abundantly available in India. Afl;er the fast breeder reactors passed on thorium are introduced, there will be virtually no. limit to the capability to generate electricity from. the resources point of view, as a total of about 2.4 x 10' billion kWh of energy will be
29
potentially available from the known thorium resources.
•Non~onveofiolllll SOIIrce8 of eDI!IJ1
4.26. This term is used to cover sources of e~ergy such as ~olar energy, Geo-thermal energy, T1dal power, Wmd power and Chemical sources. As would be seen from the assessment made in the following paras, these sources would be of negligible value in the next few _years, as a source of supply. fo~ the. country's energy needs, though R &; D m Identified areas of application holds considerable promise. · ·
Solar energy ·
4:2~. ~e an~ua~ average intensity of solar' r~d1at1on m lnd1a IS 600 calories per square centimetre per day. As the radiation is intermittent and yaria'E!le in its availability. the typical clear sky mtens1ty has been estimated at I kW per s9uare metre of which one-half is' from visible light, most of the balance near infra-red-radiation and a very small amoimt of ultra violet radiation. Tapping of solar· energy can be effected either' through flat. plate• collectors or focussing ~ollectors. All practical solar energy systems now m use are of the flat. plate variety. Materials cos~ an~ _operating 'problems. arc stated to . ~ commg. m the way of focussmg · systems being used Widely. The popular applications of solar energy are solar evaporation in the salt--industry· '!ate~ heating, desa.lination of water through dis~ tillat10n, solar drYJng,· solar cells.· Other fields '!here ~<ilar ell:e~gy. can be applied are refrigeration, a1.r · cond1tiorung, ·water pumping, cooking, conversion through plants into liquid and solid transportable fuels. In India, research has been ~on~uc~ed O? the use of solar energy in several mstJtutiOns like: ·
(i). Centra! Building Research Institute , Roorkee. which has designed a flat plat~
solar . energy collector and solar water heaters; · · '· · · •
(ii) Central Salt and Marine Chemicals Rc. search Institute,· Bbavnagar, which is · c!>nducting investigation on solar radia-·
' tion, solar :distillaiton. solar ponds etc.; (iii)' Def~ce. Laboratory, JoCihpur, where an
e9u1prue!lt for treating living space at h1gh altitudes, solal" stills, solar water heaters and hot boxes ·have been deve-loped; · · · ·
· (iv) Solid Stite'Physics Laboratory' (SSPL), · wb_ere the W?rk on solar cells such as
Silicon, Gallium Cells and Telleurium 'Cells is. underway: · ·· •
(v) Auroville . School· . ·of Environmental . Stu!!ies at Pondicherry. where a project
. of Natur~} Energy based · Eco-bouse"
*T~is seotion hM been prepare<\ with ~~~o co~oper~tlon of the Secretariat 9f the '!'Totioq•l Comm<t~e"" s. ci.enco •nd,_ - 1eehnolo'{y, ~--1 --,
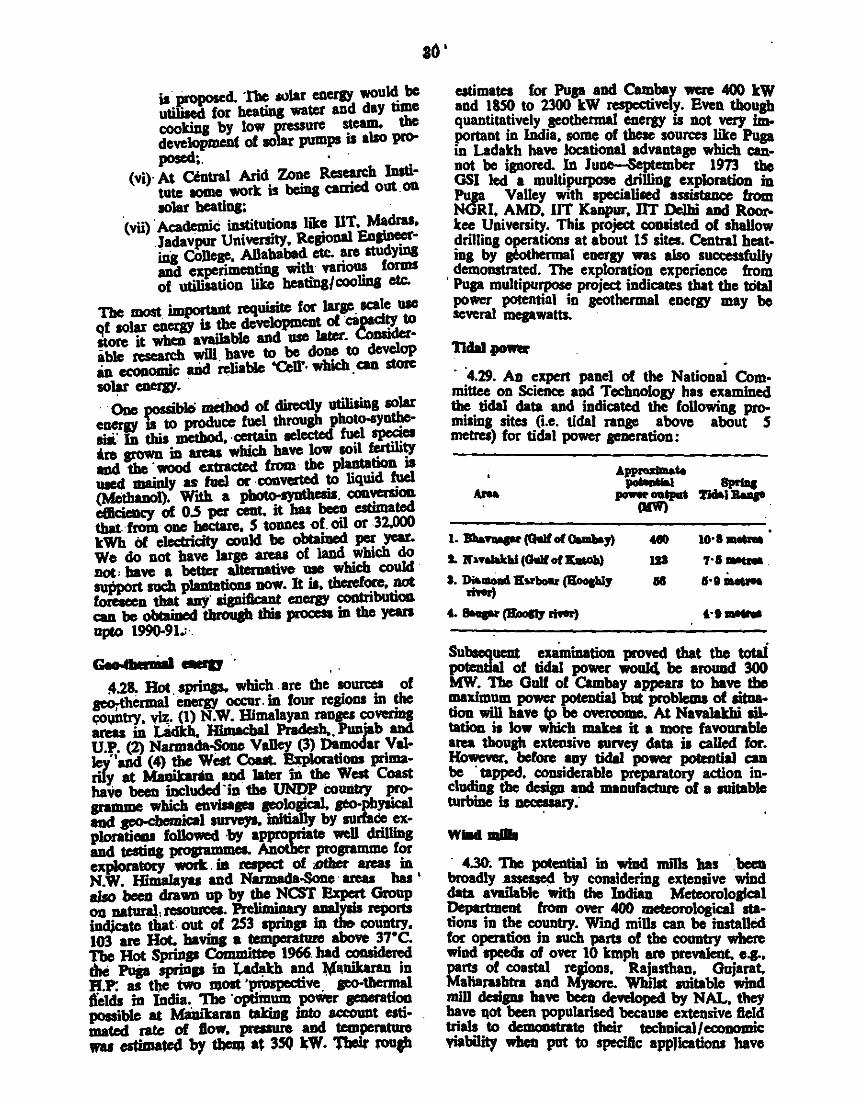
is· proposed. 'l'bc 111>lar eneraY woul~ be utiliaecl for beating water and day tJJDe cookiJJs by low pressure ~ the developmeDf of solar pumps a also pro----'· .. A-•·
(vi)· At. central Arid Zone Research Institute some work is beiDa c:aaied out on solar beatin&:
·(vii) Academic institu~ons Iik~ UT. Madru. Jadavpur Univemty, Reponal Eoglnr:«iDS College, .Allahaba~ etc. ~ studyllll and experimenting With vanoua forms of utilisation like heatina/ cooliog etc.
Tbe most important requisite for large_ ~e uae qf solar energy is the development of ca~ to store it wheD availab1o and use later. Considerable research will. have to be done to develop aa economic aDd reliable 'CeD'· wblc:h. can store solar eoeqy. · · 0oe ~b!O mdhod of directly utilising solar energy a to produce fuel through photo-ay~ aiti.: In this method. ·cerWD aelec:ted ~1 ~ea ire grown in areas which have low so1l ~~ and the ·wood extracted from the plantatiOn II uec1 mainly as fuel or converted !0 liquid ~ (Metlwlol). With a pboto-ayotheiiS. CODventOil etliciellcy of o.s per cent. it baa bee1l estimated that from one hectare. S toooea of. oil or 32.000 kWh of elec:tridty could be obtained per year. We do not have 1arJO areaa of laod which do DOt, have a better alteroative use which could· support such plantatiooa now. It is, tberef<!re. !10* foraeen tbat any· aipiflcaut eDeraY c:ootributioll can be obtained tbrouah this process in the yean UpfD 1990-91.;·.
Gee ,_,.... D . . . 4.28. Hot $pliDp. which . are the soun:es of
,e0;-theruw · eDeraY occ:ur. in four regions in the c;o~try. ~. (1) N.W. Himalayan ranaes ~verills areas in L&dkh, Him•cbal Pradesh.. PuoJ&b and U.P. (2) Narmada..SOUO Valley (3) Damodar Valley'' and (4) the West Coast. Exploratiooa primarily at MaDikarm and later in the West Coast haYti been iDc:1uded 'in tho UNDP C:Olllitl)' programme which eovisa&e~ polosical. po-pbyaiad llld ~ survey~, iDitia1ly by audaee exploratieDI followed ·by appropriate well drilliDs and teatin& programmes. Another programme for exploratory wort. in respect of ;Dt&er areas in N.W. Himalayas and Narmada-&me ·areas baa ' ako beeD drawn up by the NCST Bxpert Group on utural resoUR:eL Pre1imiDary analysis reports indjcate that: out of 253 spriop in til& country, 103 are Hot. haviDJ a temperatwe above 37•c. The Hot Spriop Committee 1966llld cooaidered the PuP spriop in J,.a~ and '¥11niJwao in H.P: as the iwo Jl)oat • p•ospective geo-tllermal ll'elda in India. The ·optiinum poftr seoeration possible at Maaikarao taking into accooot estimated rate of flow, pressure and temperature .,... esUmatect b7 tbeiQ a~ 350 ~w. 1'beil' fOUP
ao· estimates for Pup and Cambay were 400 ltW and 1850 to 2300 kW respectively. Even though quantitatively pothermal eoefl)' is not very important in India, some of these sources like Pup in Ladakh have locational advantage wbich cannot be ipored. In Juoe--8eptember 1973 tbe GSI led a multipurpose drillin& exploration in Pup Valley with specialised allistaoce from NGRI, AMD, liT Kaupur, IlT Delhi and Roorkee University. This project consisted of shallow drilling operations at about IS sites. Central heatins by 1¢otbermal energy was also suc:cessfully demonstrated. The exploration experience from
· Pup multipurpose project indicates that the tDt:al power potential in geothermal energy may be several megawatts.
11clal {IO'ftr
· ·4.29. An expen panel of the National Committee on Science and Technology has examined the tidal data and indicated the following promislog sites (i.e. tidal range above about S metres) for tidal power aezaeration:
t .• _... (Qalf of Oamb&J)
I. JI'>Yal&kld (Otolf of~
S. »;.IIIODil Kvboar (BoociiiJ mer)
•· a...- (JiooC1J mer)
App,.,,.,•te I h 'hi ................
(IIW)
=ueot eximioation proved that the totai of tidal power woulcl be aroUIId 300
MW. The Gulf of Cambay appears to have the Ullximum power potential but problema of situation will have to be overcome. At. NavaJalthi liltation it low which makes it a more favourable area though extensive au"ey data is caUed for. Ho'!Cver, before any tidal power poteotial can be tapped. c:ooaiderable preparatory action iocluclios the desip and mauufac:ture of a suitable turbine is nec:eaary:
Wllldllllll
· 4.». The potential in wind mills has · .beea broadly .a~ by c:onalderiog extensive wind data available with the IDdiau Meteoroloafcal Depattmeot from Oftr 400 meteorological stations in the couotry. Wmd miDa can be installed for operation in such parts of the coUDtry where wind speeds of over 10 kmph are orevaleot. e.g., parts of coastal regious, Rajasthan, Gujarat. Maliaruhtra and M)'IOre. Whilst suitable wind mill desisns have been developed by NAL. they lllve 11ot been popularised because extensive field trials to demoostrate their technical/ ecooomic viabilitJ when pot to speciftc applicatiooa have
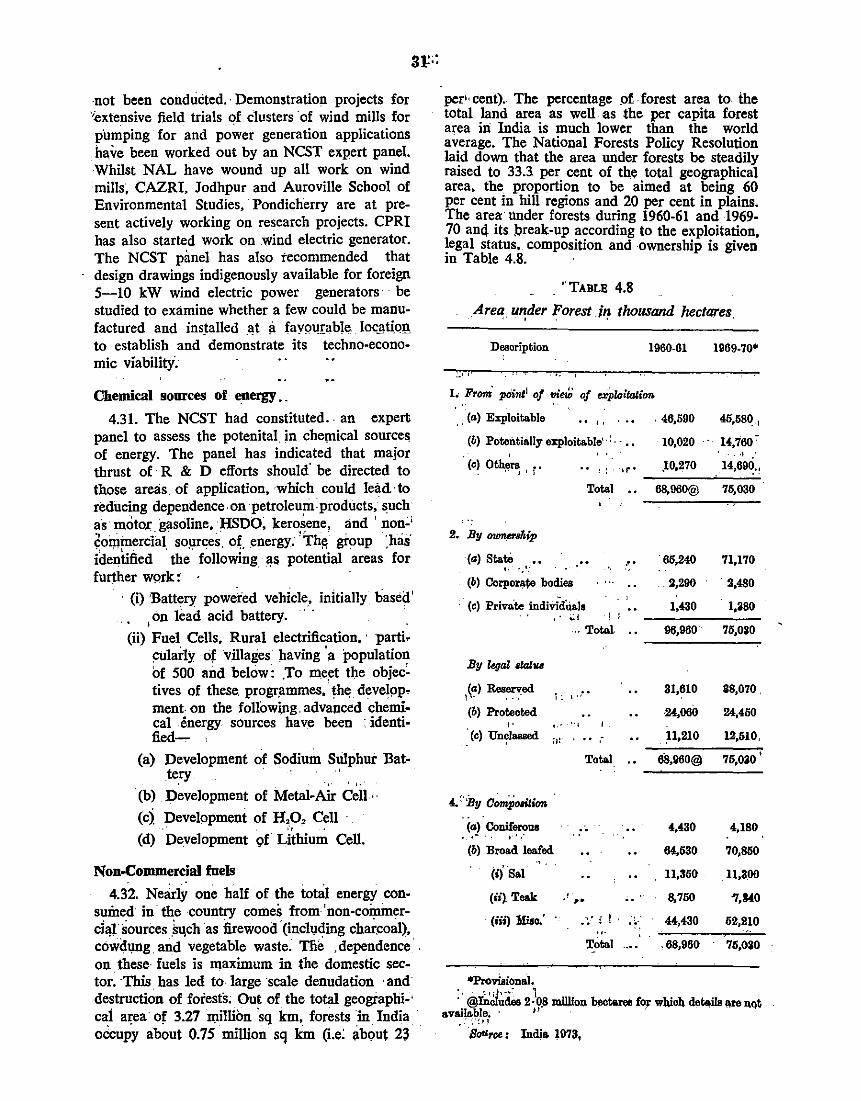
-not been conducted.· Demonstration projects for ·-extensive field trials of clusters -of wind mills for p'umping for and power generation applications . have been worked out by an NCST expert panel. Whilst NAL have wound up all work on wind mills, CAZRI, Jodhpur and Auroville School of Environmental Studies, Pondicherry are at present actively working on research projects. CPR! bas also started work on wind electric generator. The NCST pimel bas also recommended that design drawings indigenously available for foreign 5-10 kW wind electric power generators· be studied to examine whether a few could be manufactured and ins~alled _l!t ;i fay<:m.rable locj\ti_o~ to establish and demonstrate its techno-economic viability'.
Chemical sources of energy._
4.31. The NCST had constituted .. an expert panel to assess the potenital. in chemical sources of energy. The panel bas indicated that major thrust of · R & D efforts should' be directed to those areas. of application, which could lead to reducing dependence-on petroleum: products, such as· moto.r:. gasoline, · HSDO; kerosene, and ' non~' ~OI)l~ercial_ so:urces. ot energy. 'Th~ gtoup :has· identified the following __ as potential areas for further wprk ~ ·
· ' (i) ·Battery powefed vehicle, initially based' on lead acid battery. · · ·
' (ii) Fuel Cells, Rural electrification, · parti. ~ularly of villages having 'a population of 500 and below: ,To m.eet the objec~ tives of these. progrilmmes, thedevelop. ment- on the followi,ng. advanced chemical energy sources have been : identified-,-
(a) Development of Sodium Srilphur Bat-_te_ry · ., ' ...
(b) Development of Metal-Air Cell ..
(c) Development of H,p, Cell . ;, - .
(d) Development 9f Lithium Cell.
Non-Commercial fuels . - -
4.32. Nearly one half of the total energy con-smiled in the country comes from 'non-coininercil!l ~ources .~qch ·as firewood (inclvding charcmil), cowd1,mg and vegetable waste. Tlie , dependence on these fuels is maximum in the domestic sector. ·This bas led to large scale denudation -and destruction of forests; Out of the total geogiaphi-· c~ a~ea of 3.27 n;~illion 'sq km,_ forests _in India occupy about 0.75 million sq km (i.e: ab<;>ut 23
per•· cent) .. The percentage of -forest area to the total land area as well as the per capita forest area in India is much lower than the world average. The National Forests Policy Resolution laid down that the area under forests be steadily raised to 33.3. per cent of th.e total geographical area, the. proportion to be aimed at being 60 per cent in hill regions and 20 per cent in plains. The area: under forests during 1960-61 and 1969-70 anq its preak-up according to the exploitation, legal status, composition and -ownership is given in Table 4.8.
'TABLE 4.8
Area under Forest .in thousand hectares I - I . ' . ' •
Description
:.• ,. ·- '
. (a) Exploitable .. . ' . .. (b) Potentially exploitable'·:·- ••
' (c) Ot!J.e~ , r. .. . .
Total
2. By own..-•kip
(a) State ,, . •· (b) Corporate bodies ' ...
- (c) Private indiVidiialo .. ~I :
.. TotaL
By legal •lal-.s
(a) Reserved ' . . . '• l: , .. (b) Protected ,. j,- -''1
(c) Un~lassed ;,: .. .· Total
--(a) Coniferous . .- ' ..... (b) Broad leafed
., . (i} Sal
(ii} Teak ••
,, . ..
, .
:
..
..
· (iii) Miso.' -'~· i l . . •
Total
*Provisional.
1960-61 1969-70°
. 46,590 45,580.,
10,020 14,760' ·•
.10,270 14,6~.~
68,960@ 75,030
. 65,240 71,170
2,290 . 2,480
1,430 1,380
96,960 75,030
31,610 38,070.
-24,060 24,450
11,210 12,510.
68,V60@ 75,030.
4,430 4,180
64,530 70,650
11,350 11,300
8,750 ·7,1140
44,430 52,210
• 68,960 76,030
: · @y;;~j~;k 2 lo.8 milllon beotareo fo~ whioil det.lils 11re IIQt avail&ble. ' J' ·
. ·;-~n
·saurco: India 1973,
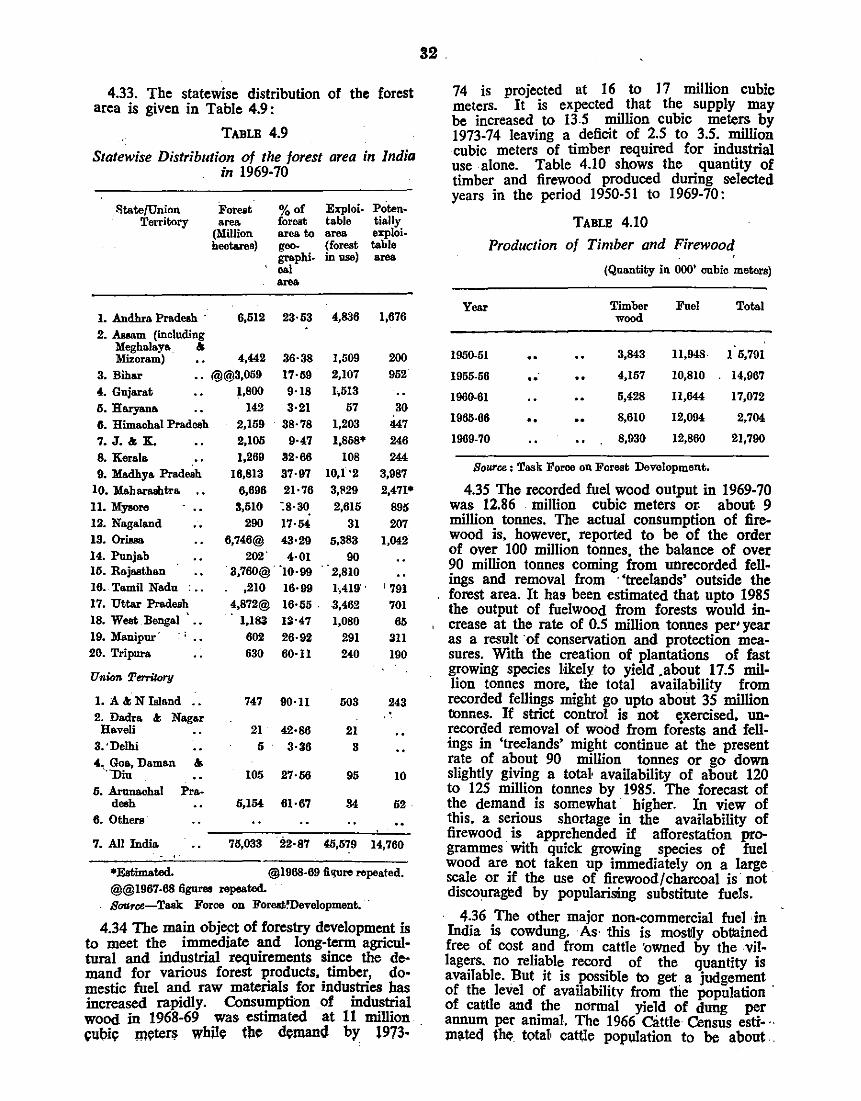
4.33. The statewise distribution of the forest area is given in Table 4.9:
TABLE 4.9
Statewise Distribution of the forest area in India in 1969-70
State/Union ' Territory
Foreat area
(Million hectares)
%of foreat area to geographioal are&
Exploitable area (forest in uae)
Potentially exploitable area
I. Andhra Pradesh · 6,512 23· 53 4,836 1,676
2. Asoam (including Meghalaya & Mizoram)
3. Bihar
4,442
•• @@3,059 36·38 17·59 9·18 3·21
38·78
4. Gnjarat ll. Haryaua G. Himachal Pradesh 7. J. & K. 8. Kerala 9. Madhya Pradesh
Io. Mabarashtra .• ll.Myoore 12. Nagaland IS. Ori.osa 14. Punjab Ill. Rajasthan I6. Tamil Nadu I7. Uttar Pradesh I8. West Bengal •• I9. Manipur · ' 20. Tripura
Union Territory
I. A & N Island 2. Dadra & Nagar
Haveli s.·Delhi 4. Goa, Daman &
'·-niu _
5. Arunaobal Pradesh
6. Othera
1,800 142
2,159 2,105 1,269
16,813 6,696
9·47 32·66 37·97 21·76
3,510 :8-30 290 17·M
6,746@ 43·29 202' 4·01
. 3,760@. '10·99
,210 16·99 4,872@ 16·55 .
I,l83 I3·47 602 26·92 630 60·11
747 90-ll
21 42·86 5 3·36
105 27·56
5,1M 61·67
1,509 2,107 1,513
57 I,203 I,858*
108 10,1 "2
3,~29
2,615
3I 5,383
90 2,810 1-,419'.
-3,462 1,080
291 240
503
21
3
95
S4
200 952
30 447 246 244
3,987 2,471*
895 207
1,042
'791 701 65
3ll 190
243
10
52.
7. All India 76,033 22·87 45,579 14,760
•Estimated. @1968-69 fi'!1lre repeated. @@1967-68 figures repeated. Souroe-Task Force on Forest~Development. ·
4.34 The main object of forestry development is to meet the immediate and long-term agricultural and industrial requirements since the de· mand for various forest products, timber, do· mestic fuel and raw materials for industries has increased rapidly. Consumption of industrial wood in 1968-69 was estimated at 11 million ~ubi~ m<:ter~ whUQ the d<:man<J by 1973·
32
74 is projected at 16 to I 1 million cubic meters. It is expected that the supply may be increased to 13.5 million cubic meters by 1973-74 leaving a deficit of 2.5 to 3.5. million cubic meters of timbet' I'eqUired for industrial use alone. Table 4.10 shows the quantity of timber and firewood produced during selected years in the period 1950-51 to 1969-70:
TABLE 4.10
Production of Timber and Firewood
(Quantity in 000' oubio meters)
Year Timbsr Fuel Total wood
1950-51 .. 3,843 11,948· 1 5,791
1955-56 •• .. 4,157 10,810 14,967
1960-61 5,428 ll,644 17,072
1965-66 .. 8,610 12,094 2,704
1969-70 8,930 12,860 21,790
Source: Task Foroe on Forest Development.
4.35 The recorded fuel wood output in 1969-70 was 12.86 . million cubic meters or. about 9 million tonnes. The actual consumption of firewood is, however, reported to be of the order of over 100 million tonnes, the balance of over 90 million tonnes coming from unrecorded fell· ings and removal from · 'treelands' outside the forest area. It has been estimated that upto 1985 the output of fuelwood from forests would increase at the rate of 0.5 million tonnes per• year as a result ·of conservation and protection measures. With the creation of plantations of fast growing species likely to yield .about 17.5 mil· lion tonnes more, the total availability from recorded fellings might go upto about 35 million tonnes. If strict control is not ~xercised, unrecorded removal of wood from forests and fellings in 'treelands' might continue at the present rate of about 90 million tonnes or go down slightly giving a total> availability of about 120 to 125 million tonnes by 1985. The forecast of the demand is somewhat higher. In view of this. a serious shortage in the availability of firewood is apprehended if afforestation programmes ·with quick growing species of fuel wood are not taken up immediately on a large . scale or if the use of firewood I charcoal is not discouraged by popularisting substitute fuels.
4.36 The other major non-commercial fuel ·in India is cowdung. As· this is mostlly obtlained free of cost and from cattle 'owned by the villagers. no reliable record of the quantity is available. But it is possible to get a judgement of the level of availability from tlie population · of cattle and the normal yield of dung per annum per animal. The 1966 cattle Census esti- .. mated the total> cattle population to be about .
33
230 million animals. An NCAER study has projected the level of cattle population as 280 million numbers by 1975-76. Taking the 1966 popu-. lation of cattle and the assessment made by field studies that the !lVerage yield ofr.~ dung per day per animal as 2 kg, (10 kg wetaung) the,,annual yield can be estimated tq be 170 million tonnes of dry dung. It is, however, neces~. sary to note that only 10 per cent of the cattle population is stabled anc~ the rest of the animals are left astray in the forests and fields most of the time. It is difficult, therefore, to estimate t)Jil quantity of dry dung that coula be recovered for use, The level of consumption of dung in 1965 is 61 million tonnes.< 50 per ·cent of dung production may be taken as. the limiting level of possible use. · ' ··
4.37 In the case of vegetable waste such as rawdust, paddyhusk. coconut shells. bagasse,
dry leaves etc., a)s(), there is not likely to be any availability constraint in view of the projected increase in agricultural output. However, bagasse which is one of the vegetable waste products most-. widely used as fuel both in the domestic secror as well as in' industries like sugar mills; .,hljs got a lJ1UCh better use, as a raw material foi:. paper .manufacture. :The availability. of dry bagasse \s estimated at 14 per cent. of the total : qWjl)tity of sugarcane crushed. About ' 130- ;J11illiqn ,tonnes of sugarcane is ,grown now of which at least 100 million. tonnes, iS crushed for, sugar, -khandsari' or.· jaggery manufacfure. · Availabiiity ot b~gga.S&e may be assumed as l4 milliort 'i:orinell, , In ·view of the need to divert , baggasse for. in!lus~al use, this ljeS<?urce is not ' to.,be ~unte!l upon: for fuer purpose, There are · nq.. reco_ rds to.,~~~w the quantit>: of other vel!etalile.•wastes· tli.3t• would :be available.
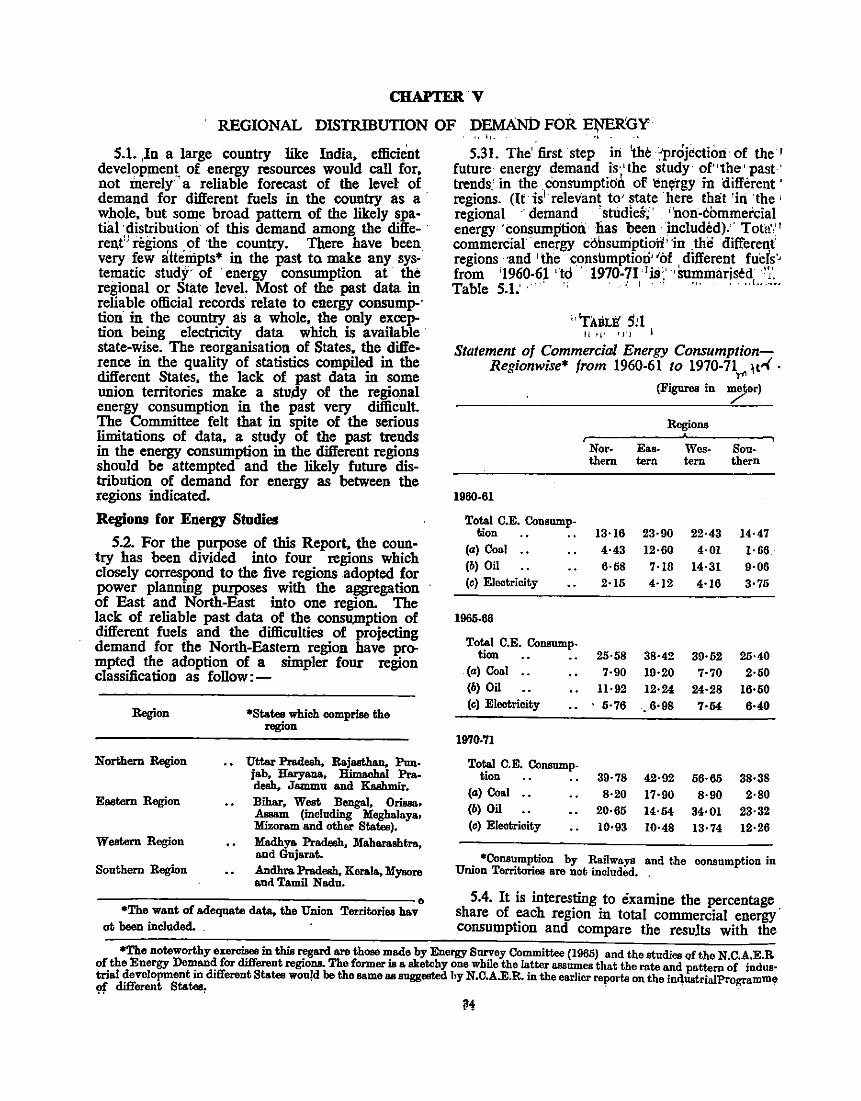
CHAPTER V
REGIONAL DISTRIBUTION OF DEMAND FOR EJ%R'GY
5.1. ,In a large country like India, efficient development of energy resources would call for, not merely a reliable forecast of the level of demand for different fuels in the country as a · whole, but some broad pattern of the likely spatial distribution of this demand among the diffe- · ren.t" regions of ·the country. There have been very few attempts* in the past ta make any sys-' tematic study' of · energy consumption at the regional or State level. Most of the past data in reliable official records relate to energy consump-· tion in the country as a whole, the only exception being electricity data which is available state-wise. The reorganisation of States, the difference in the quality of statistics compiled in the different States, the lack of past data in some union territories make a stully of the regional energy consumption in the past very difficult. The Committee felt that in spite of the serious limitations of data, a study of the past trends in the energy consumption in the different regions should be attempted and the likely future distribution of demand for energy as between the regions indicated.
Regioos for Energy Studies
5.2. For the purpose of this Report, the country has been divided into four regions which closely correspond to the five regions adopted for power planning purposes with the aggregation of East and North-East into one region. The lack of reliable past data of the consu,mption of different fuels and the difficulties of projecting demand for the North-Eastern region have prompted the adoption of a simpler four region classification as follow:-
Region
Northern Region
Eastern Region
Western Region
Southern Region
*States which oomprise the region
Uttar Pradesh, Rajasthan, Pun. jab, Haryana, Himachal Pradesh, Jammu and Kybmir.
Bihar, West Bengal, Orissa, Assam (including Meghalaya. Mizoram and other States). Madhya Pradesh, Maharashtra, and Gujarat. Andhra Pradesh, Kerala, Mysore aud Tamil Nadu.
-------------------------------------e *The want of adequate data, the Union Territories hav
ot been included. .
<1 l1. ·•
5.31. The' first step i.rt the ;projection of the ' future energy demand is" the study· of'•the' past· trends.' in the ci>nsumptitJ~ of 'en~'rgy in different ' regions. (It is'relevan~ to• state here that 'in 'the' regional ·· demand · .sttidie5;' "non-commercial energy ·consumption. has been· included):' Tota'i 1
commercial energy c<lhsuniption' 'in .the different regions ·and 1 the conslimptiori"i>f different fu'efs·~ from '1960·61 'td' 1970-71 'iS'.' ··!rummarised ··:·. Table 5.1.' ... · ·: ' 1 ., "' •· .. I .......
1' TAiiLi!' S:1
I!,!!' I)") I
Statement of Commercial Energy Consumption--Regionwise* from 1960-61 to 1970-71 w< · ,.,
(Figures in ~or)
Regions
Nor· Eaa. Wcs. Sou-them tern tern thern
1960-61
Total C.E. Consump-tion 13·16 23·90 22·43 14·47
(a) Coal .. 4·43 12·60 4·01 1·66. (b) Oil 6·58 7·18 14·31 9·06 (c) Electricity 2·15 4·12 4·16 3·75
1965-66
Total C.E. Consump-tion 25·58 38·42 39·52 25·40
(a) Coal .. 7·90 10·20 7·70 2·50 (b) Oil ll·92 12·24 24·28 16·50 (c) Elootricity .. . 5·76 6·98 7·54 6·40
1970-71
Total C.E. Consump. tion 39·78 42·92 56·65 38·38
(a) Coal .. 8·20 17·90 8·90 2·80 (b) Oil 20·65 14·54 34·01 23·32 (c) Eleatricity 10·93 10·48 13·74 12·26
. *Con~mp_tion by Railways and the consumption in Uruon Temtones are not included.
5.4. It is interesting to examine the percentage share of c;ach region in total commercial energy· consumptiOn and compare the results with the
*The noteworthy exe~ in this ~ard are those made by Energy Survey Committee (1965) and the studies of the N.C.A.E.R or. the Energy De~an~ for different reg~ons. The former iB a sketchy one while the l~tter assumes that the rate and pattern of indus· trial development m d1fferent States would be the same aa suggested l>y N.C.A.E.R. m the earlier reporta on the induatria!Programme ~ different States, -
~i
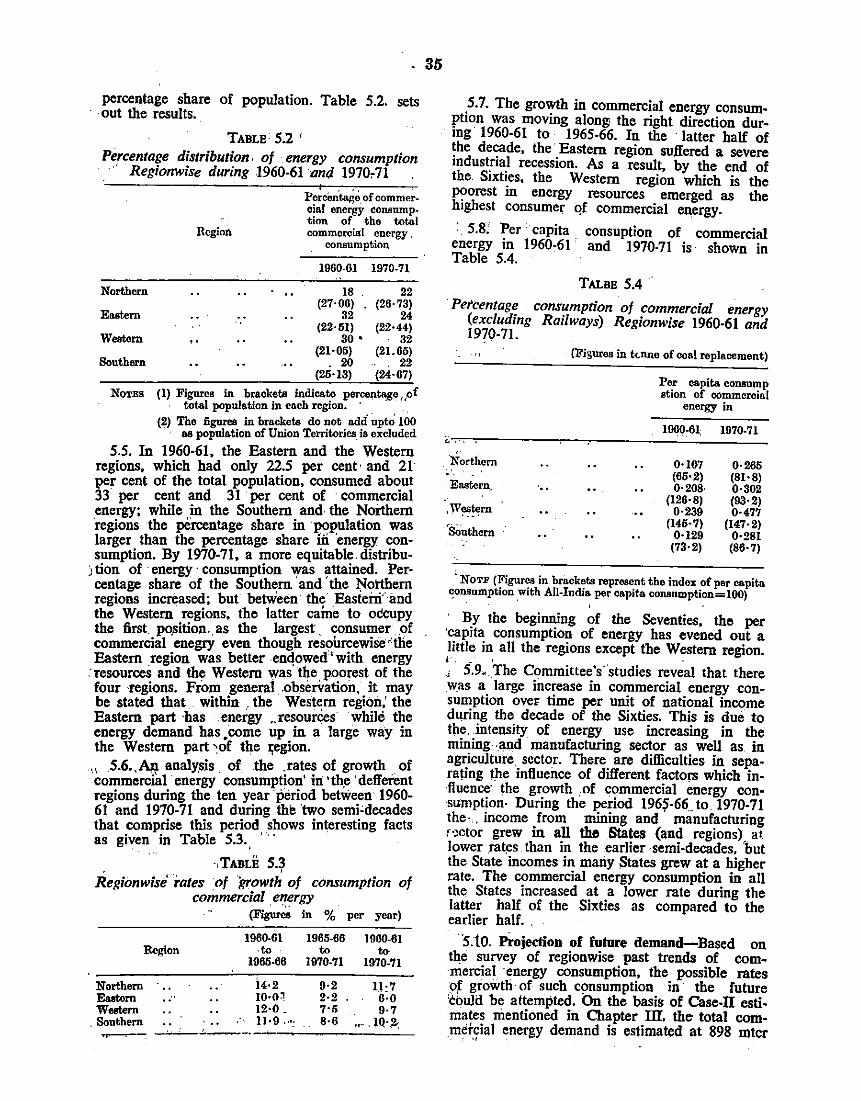
. 35
percentage share of population. Table 5.2. sets " "out the results.
TABLE 5.2' Percentage distribution. of energy consumption
Regionwise during 1960-61 and 1970c71
Northern
EOBtern
Western
Sou them
Region
Pcrc8J{~6. of commercial energy consumption of the total commercial energy.
consumption
1960-61 1970-71
18 (27·06)
32 (22·51)
30 • (21·05)
- 20 (25·13)
22 (26·73)
24 (22·44)
32 (21.65)
" 22 (24·67)
NoTES (1) Figures in braokets indicate percentage .,of . total population in each region. · . . ,
(2) The iiguree in brackets do not ndd upto 100 · as population of Union Territories is excluded
5.5. In 1960-61, the Eastern and the Western regions which had only 22.5 per cent · and 2 t per cen't of the total population, consumed a~ut 33 per cent and 31 "per cent of " commercial energy; while ,in the Southern. and the ~orthern "regions the percentage share m population was larger than the percentage share iii 'energy consumption. By 1970-71, a I_DOre equitabl~" distribu
"• tion of "energy " consumption was attamed. Per-" centage share of the South~rn 'and 'the ~ot:fuern regions increased; but between" th~ Eastern" and the Western regions, the latter came to occupy the first pesition .. as the largest_ 90nsui_Der. "9f commercial enegry even though reso.u~ewJSe •the Eastern region was better em!?wed w1th · energy
"·resources and the Western was the. p~orest. of the four "regions. From general .observation,. 1t ,may be stated that. within . the Western regton, the Eastern part "has energy ~ resourees while the energy demand has .come up. in a large way in the Western part ~of the ~eg~on.
, , "5.6., ~ analY,sis " of "the , rat,e~ of growth "of commercial energy consumption 111 'th_e 'defferent regions during the ten year period between 1960-61 and 1970-71 and during the two semi'decades that comprise this period shows interesting facts as given in Table 5.3.,
-,TABLE 5.3 Regionwise' rates of "irrowth of consumption of
commercial 'e"!!rgy (Figures in % per year)
1960-61 1965-66 1960-61 Region ·to to to
1965-66 1970-71 1970-71
Northern l4·2 9·2 11:7 Eaorom .. 10·0' 2·2 6·0 Western 12·0- 7·5 9·7
, Southern ... ll•9 ... , 8·6 JQ·,2c ~- ~--·--'-
5.7. The growth in commercial energy consumption was moving along the right direction during 1960-61 to· 1965-66. In the "latter half of the decade, the Eastern region suffered a severe industrial recession. As a result, by the end of the Sixties, the Western region which is the poorest in energy resources emerged as the highest consumer of commercial energy.
: 5.8: Per capita consuption of commercial energy in 1960-61 • and 1970-71 is" shown in Table 5.4.
TALBE 5.4
"Percentage consumption of commercial energy (excluding Railways) Regionwise 1960-61 and 1970-71.
- "
(, .. , '
-E..tern" .. •"
,W~~rn
'southern
(Figures in t<.nne of ooal replacement)
Per capita consump stion of· commercial
energy in
1960-61, 1970-71
0·107 (65·2) 0·208·
(126·8) 0·239
(145·7) 0·129
(73·2)
0·265 (81·8) 0·302 (93·2) 0·477
(147·2) 0•281 (86·7)
~ NoTF (Figures in br8.ckets represent tho index of per capita ~onsu~ption _with AU-India. per capita consnmption=IOO)
·· By the begimting of the Seventies, the per 'capita consumption of energy has evened out a little in all the regions except the Western region. i': - ' ' • . , 5.9 •. The Committee's studies reveal that there was a large increase in commercial energy consumption over time per unit of national income during the decade of the Sixties. This is due to tpe, .intensity of energy use increasing in the mining "and manufactllring sector as well as. in agriculture" sector. There are difficulties in separating the infiuence of different factors which in"fluence· the growth ,of commercial energy consumption- During the period 196S-66 .. to. 1970-71 the ... income from mining and manufacruring r·~ctor grew in all the States (and regions), at. lower rates than in. the earlier semi-decades, but the State 'incomes in mariy States grew at a higher rate. The commercial energy consumption in all the States- increased at a lower rate during the latter half of the Sixties as compared to the earlier half ..
·5.10. Pi-ojection of future demand-Based on the survey of regionwise past trends of commercial energy consumption, the possible rates of growtli" of such consumption in the future 'thuld be attempted. bn the basis of Case-IT estimates mentioned in Chapter m. the total comme+cial energy demand is estimated at 898 mtcr '· ., .
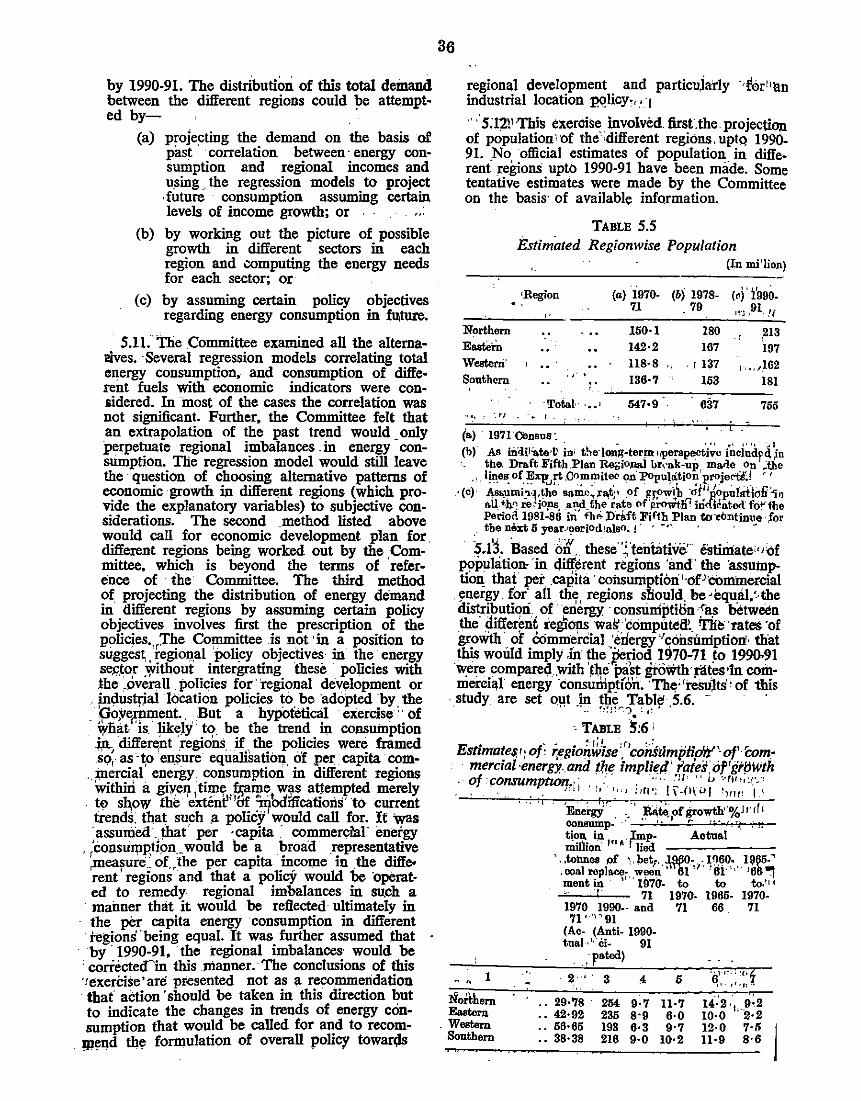
by 1990-91. The distribution of this total demand between the different regions could be attempt-ed by-- . ·
(a) projecting the demand on the basis of past · correlation between· energy consumption and regional incomes and using __ the regression models to project . future - consumption assuming certain levels of income growth; or . ·
(b) by working out the picture of possible growth in different sectors in each region and oomputing the energy needs for each sector; or
(c) by assuming certain policy objectives regarding energy consumption in fu.ture.
5.11. The .Committee examined all the alternai!ives. ·Several regression models correlating total energy consumption, and consumption of different fuels with economic indicators were considered. In -most of the cases the correlation was not significant. Further, the Committee felt that an extrapolation of the past trend would _only perpetuate regional imbalances .in energy consumption. The regression model would still leave the · question of choosing alternative patterns of economic growth in different regions (which provide the explanatory variables) to subjective considerations. The second _method listed above would call for economic development plan for. different regions being worked out by the Committee, which is beyond the terms of ·reference of -_ the Committee. The third method of projecting the distribution of energy demand in different regions by assuming certain policy objectives involves first the prescription of the policies .. ,The Committee .is not 'in a position to stigges~ tegion,al 'policy objectives in the energy se.c.tor jlithout intergrating these · policies with !he ,overall . policies for· 'regional development or
. industrjal location policies to be ·adopted 'by the __ GO;veAtment. . . But a · hyp(>teticai exercise : ' of
\\lfiat'is ·likely· to_ be the trend in consumption W., diffen;nt 'regions_. if. the policies were framed so, as -~o ell$Ure equaliSatio11. of per capita com-
, )nercial energy. consumption in different regions 'withiri a giyen ,time game was attempted merely
. to sb,ow th~ 'exten~"of ;Dbdllications· to current trends. that such .a policy' would call for. It was assumed .. !hat' per ~capita ~ commerclar imergy
, ;consuJllptipn _would be a broad representative ,m~ure .. of_,the per capita income in _the different regions and that a policy would be ·operated to remedy regional imbalances in such a
· manner that it would be reflected ultimately in · the per capita energy consumption in different · tegions''being equal. It was further assumed that
· by · 1990-91, the regional imbalances· would be : coriecteain this manner.· The conclusions of this ·!exeri:ise'are presented not as a recommendation · that' action ·should be taken in this direction but to indicate the changes in trends of energy consumption that would be called for and to recom-
. m~lld th~ formulation of overall policy towar<ls
36
regional development and particularly · •f()rhlln industrial location P,<llicy., _. 1
·-· : 5:12!1 'This exercise involved. first'. the projection of population··of the'<different ·regions. uptQ .1990-91. .No ·official estimates of population in different re~ons upto 1990-91 have been miide. Some tentative estimates were made by the Committee on the basis· of available information.
Northern Eastern Western· Southern
'
TABLE 5.5 Estimated Regionwise Population
(In mi'lion)
1Region . ' (a) 1970- (b) 1978- (oJ' i'990-71 79 l!".l ,91, !f ,. 150·1 180
·' ,213 142·2 167 197 ll8·8 '• . r 137 r ,,,"1_162 136·7 153 181
... Total• -.. • 547•9 6:i7 755
"Jf . - .. f . .. (a) 1971C8nsua:
• . • -· '" ~· ~" q J I (b) As mdil'ate·V io• the·Jong-tern>•iper&pective includpd.io
the. Draft Fifth .Plan Re0io~ bM>k-up ma<le on .tbe lines-of Erp rt .Commite<:- on Popull:itiOn 1projectS:f .. '
·(c) .A_ ~~,;mi:>_·:~,th~ ... ~.~~a,t;• _of ~r.>,;t\, ar:·~~pufatldfiio o.U +.))0 .reo:-jons and the rate of l!rowth'l indlcatect: foV flle Peiioii 1981:86 ili' fh-' DrMt Fifth Plan w-.ontinue. tor the n&rt5 yea.r-'oeriod•also. J' ' -"' • - ~
~.ll Based Bi. these"~'teritative:· estiiD:ate'''Of ~pulation- in qjfferent regions 'and' the assumption that pet .capita· col!stunptii>ri'·of'(:()minercial
, ~nergy for all the regions sHould. be•equal/-the distri~utiqn 'of . erierw. . c~nsuniption ·:a.s betwetn the differrnt reg~~ wa~. computed'._ Tlie ·rates ·of growth of eommerCial 'eriergy''oorisimiptiOn· that
this woUld imply ·Jit ~e ~!?e~oq 1_970-71 ~o 199().91 were compareq_With the ~st groW!h·rates•ln commercial energy ·consuD:ip~lo'n. 'Th~; 'results' • of this study are set o11t Jn !.J.l.~, Ta~JI: .5.6. - ·
•• . . •" ') • • I•
c TABLE 5;6 i
Esrima~es r ~ of ~egio~Wise : 'co~dn:zptipil'' ot: 'Com· mercral·energy. and ffre rmpluul rates, of'grfjWth of :consumptlOlr~~· ~ ..... . ·u- "u · ... w,.:~·~-, • - . .. • ' J;JJ r ~, 1_"' : .. r1'; I\-0\'Vf !)fJI~ I.\
- " I
Noftbem Eastern
. Western Southern
'" ' 'En.;,gy ... " R&te.ofgrowth'"',(,ll'ffl consump~ .· ,, r ' ~ ··~ • ·~ ••
tion in }mp- Aotual niillion: Jn ~ · lied
·_ .. talmes pf ·,."et1 .. ~o-.... ~n.so, •. 1~05-" .ooalreplace; ,ween "'ill·' ·61'' '66.,
. ment in 1 19'70- to to to,tt t
. 71 1970- 1965- 1970-1970 1990-· and 71 66 71 71 <•'l"91
(Ac, (Anti- 1990-tna.l-· 11 Ci~ 91
. , pated)
·2 '. 3 4
.. 29·'18 . 254 9·7
.. 42·92 235 8•9
.. 56·65 193 6·3
.. 38·38 216 9·0
5 '6' ,., '·<·f ,,. •''11"'
o-r--ll·7 u::2. 9•2 6·0 10·0. 1'"2·2 9·7 12·0 7·5
10•2 Il·9 8·6 l
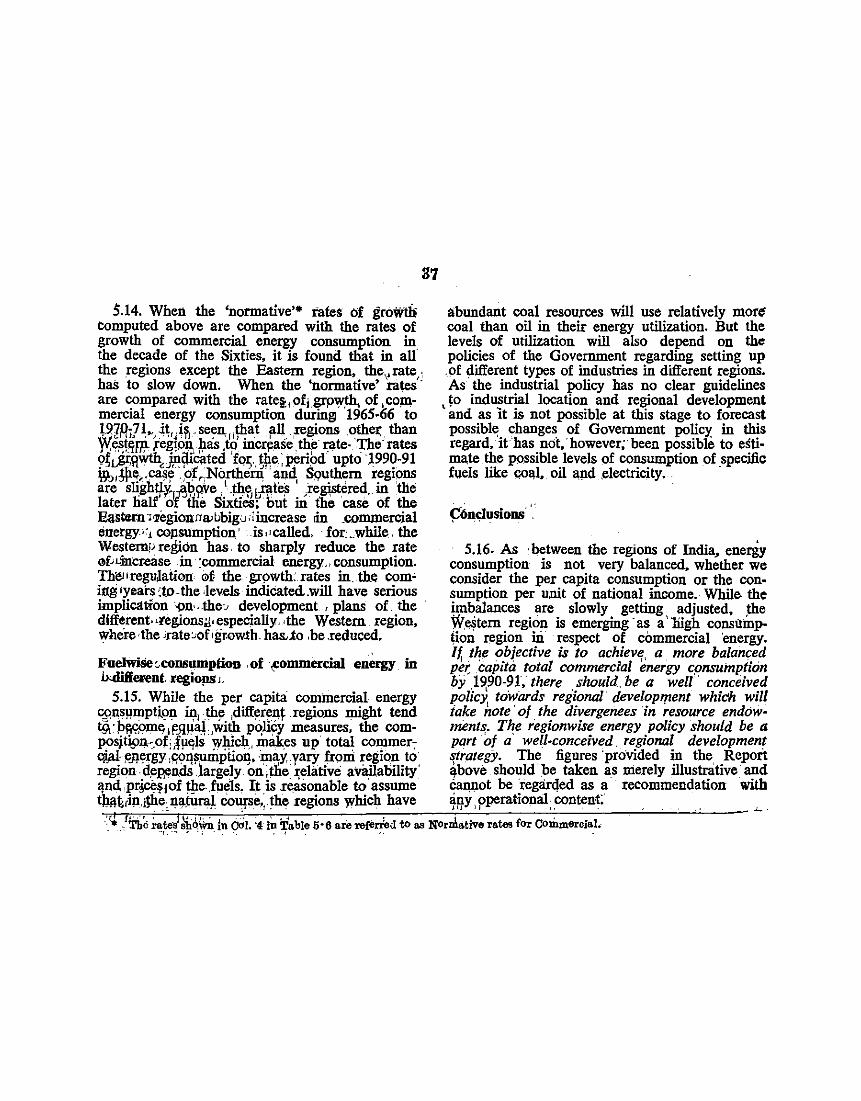
37
abundant coal resou.rces will use relatively more" coal than oil in their energy utilization. But the levels of utilization will also depend on the policies of the Government regarding setting up .of different types of industries in different regions. As the industrial policy has no clear guidelines ~o industrial location and regional development
'and as it is not possible at this stage to forecast possibl~ changes of Government policy in this regard, it has not,' however; been possible to estimate the possible levels of consumption of specific fuels like C0!\1, oil !!!ld ~:lectricity. ·
~on~usions '
5.14. When the 'normative•• rates of growth Computed above are compared with the rates of growth of commercial energy consumption in the decade of the Sixties, it is found that in all the regions except the Eastern region, the" rate : has to slow down. When the 'normative' rates'· are compared with the rate§:, ofi grp'?l1h, of, co:mmercial energy consumption during 1965-66 to ~1miJl,_.)~.,i~,.seen,,,~_ .at f!ll,,regions othe~;_ than JY,e,~tliff.l ,re~o~, pasdtp mcrFase . ~e ra,te· The· rates <>!JP;\lwtlu,ndicate foz;. !JI,e.,penod upto .1990-91 W,,~e,.ca~e-;of,Northem 'and SQuthem regions are slighY,.~.~l?.~ve , 1 t4r, ~t~ ' ,~egjstered .. in the later half o'Ctlie Sixties; but in the case of the Eastern 'J<regionn a; bbigu d increase lin .commercial energy-''1 copsumption' · iso•called, · for: .. while. the Westemp reli;ion has to sharply reduce the rate 5.16. As , between the regions of India, eneriY Gf-Lincr~se in :commercial energy,, consumption. consumption is not very balanced, whether we TlieJt reguJation- <i>~ the grpwth: rates in. the com' consider the per capita consumption or the con-ing1yeal:s :to-the.levels indicated.will have serious sumption per unit of national income. While the implication -on-;.thec development , plans of, the imbalances are slowly getting adjusted, ~e difftrent.cregions;;•especially. •the Western region, W~tem region is emerging ·as a''liigh consump-where·theirateo0figrowth.has-.to .be.reduced. (ion region in respect of commercial 'energy .
. · If, the o.biective is to achjevlf, a . more ba/an~ed Fuelwi8e ~corummption . of ,commercial energy in pe~ captta total commercral energy c_onsuinptwn b-difiCI'ent.l'egio!JSL - by l990-9l; there should. be a well conceived
5.15. While the per capita cominercial energy polic~ towards regional developf!1ent which will "Pns!lmpti,on iJ;I, the, ,!liff~r~llt .regions might tend iake hote ·of the divergenees in resource endow~ tg,·p~fi!>!IICltFJl!la\"wtth p~li~y measures, the com- ments. The regionwise energy policy should be a posjll9lkOfiJ!lfllS W-!\ich,, makes up total commer7 part of a· well-conceived, regional development $11lJ!.~rgy ,qgq~_umptioq, may.vary froni region to strategy. The figures ·proVided in the Report region dppends largely onithe; ~elative avhllability' ~bove should be taken as merely illustrative and !jnd, ,pr~ce~1of $e.fue1s, It is ~sonable to·assume cannot be regarded as a ·recommendation with t)J.~t;,in @le, n(j.tura~ COUfSe., the regions which have ~RY, pperational ,Content: ~~~·~-~~~~·~~~----~----~~--~~~~~--~~~----~ -:'~ rn.;, ~ateJ ,li,cl_\i.n in Oil. '4 in Table 5•6 aie rererieJ to as Nornlatlve rates for COmmercial.
'1.'-• ' ", ' I '•

CHAPTER IV
PERSPECTiVE OF LONG ENERGY PROBLEMS
f:nergy Plan and National ~evelopme_nt Plan
6.1. The preceding chapters have described past trends in energy consumption in India, the relationship between energy consumption and indices of economic growth, the likely demand for energy and demand for specific fuels in the coming years upto 1990·91, the energy resources available in the country and the regionwise supply and demand ·position.
Energy Consumption
6.2. If we take the period from 1953-54 to 1970-71 total energy consumption increased from 193.5 million tonnes of coal replacement to 376.6 million tonnes. The share of non-commercial energy in total energy used declined from 17.5 per cent in 1953-54 to 48.5 per cent in 1970-71. The pattern of growth in the energy section outlined ill this Report would take total energy consumption to 1079 million tonnes of coal replacement in 1990-91. Of this the consumption of non-commercial fuels would be only 181 million tonnes of coal replacement i.e, 16.8 per cent. In per capita terms, total energy consumption iii India will increase from 0.509 tonne in 1953-54 and 0.676 tonne ill 197o-71 to 1.439 tonne ill 1990-91, ill terms of commercial energy consuption along, per capita consumption would illcrease from 0.158 tonne in 1953-54 and 0.361 tonne ill 1970-71 to 1,200 tonnes by 1990-91. It is relevant to note that this figure understates the total energy utililized in the country as the large quantity of animal power still used ill India for providing motive power is completely left out in these calculations.
Basic directions of energy policy 6.3. While a review of the fuel policy is essen
tial to decide from time to time the magnitude of the production efforts required and the investment decisions called for, the studies of the Committee have brought out some fundamental direction of fuel policy which may remain invariant under most of the likely developments ill the future. It would be useful to recount these even at tbis stage. ·
6.4. We can glean the trends ill energy consumption beyond 1990-91 by tracing the factors which affect the quantity and composition of energy consumption. In a modem economy energy · is used mainly for the following purposes:-
...,(1) heat raising · (2) lighting . (3) the provision of motive power and
J (4) electrolysis 38
Th~ demand for the first three purposes arises in house-ho1ds. ·industrial enterprises,- transport undertakings an4 commercial enterpris~s. Tli~ demand for the last mentioned purpose JS restricted fo,:a limited clas~ of .'industrial enterprises. · · · ·. Jj J • I ' ·~J ' -' • •
'. 6.5 In •India. :the household deniand for energy fd heat raising arises mainly for the purposes of cooking· and · lighting. The total quantum of energy demand for cooking may not rise much faster than the rate of growth of food consumption; ·but the preferred sources of energy for this purpos7 may chang7 as the ~nomy d~vel~ps. For· mstance;: With growmg urbamsation, electricity. ;gas .of· kerosene will tend to replace non-commercial fuels like cowdung and firewood as the source of energy for cooking. The .bulk of this urbanisation would probably have worked itself ou.t, by 1990~91.
; '6:6. Homeliold demand for energy for lighting may well have a higher income elasticity than the demand for energ'y for cooking. In this case too one :can expe9t .a gradual change jn the preferred sources of energy for. this purpose-mainly a substitution· of ejectricity ·for kerosene. Here also, most of the structural changes in energy demand would .have been effected by 1990-91. Even by 1990-91 a substantial portion of the rural households may still have incomes which will make them dependent almost entirely on fuels ~~ch could be obtained at no private cost. Bu,t utilisatiOn of such fuels unless properly regulated will have very high social cost· In order to reduce the social costs a number of institutional arrangements and research efforts have to be undertaken to ensure that the optimal utilisation of local~y available fuel resources (vegetable waste, ammal dung. solar energy etc.) is evolved. Suitable measures may have to be taken up in this direction even from now as indicated in Chapters X and XII.
6.7. Household demand for energy for motive power may also be. highly income-elastic. AI?llrt fr.om anything else, the growth in the urbamsa· tion will ceteris panibus tend to increase demand on this count. However, with rising incomes there may be a substitution of inanimate for animate energy e.g., as would arise in the switchover from bicycles to scooters. But the level of demand on this<count would depend greatly on govem~ental policy with ~espect to the private oper:tt!On of vehicles, the Importance attached to public transport the location of offices and factories with res· pect' to residences etc. If the right policies are· followed. India will not experience the sort of burst in energy demand on this cou;~~.t that was
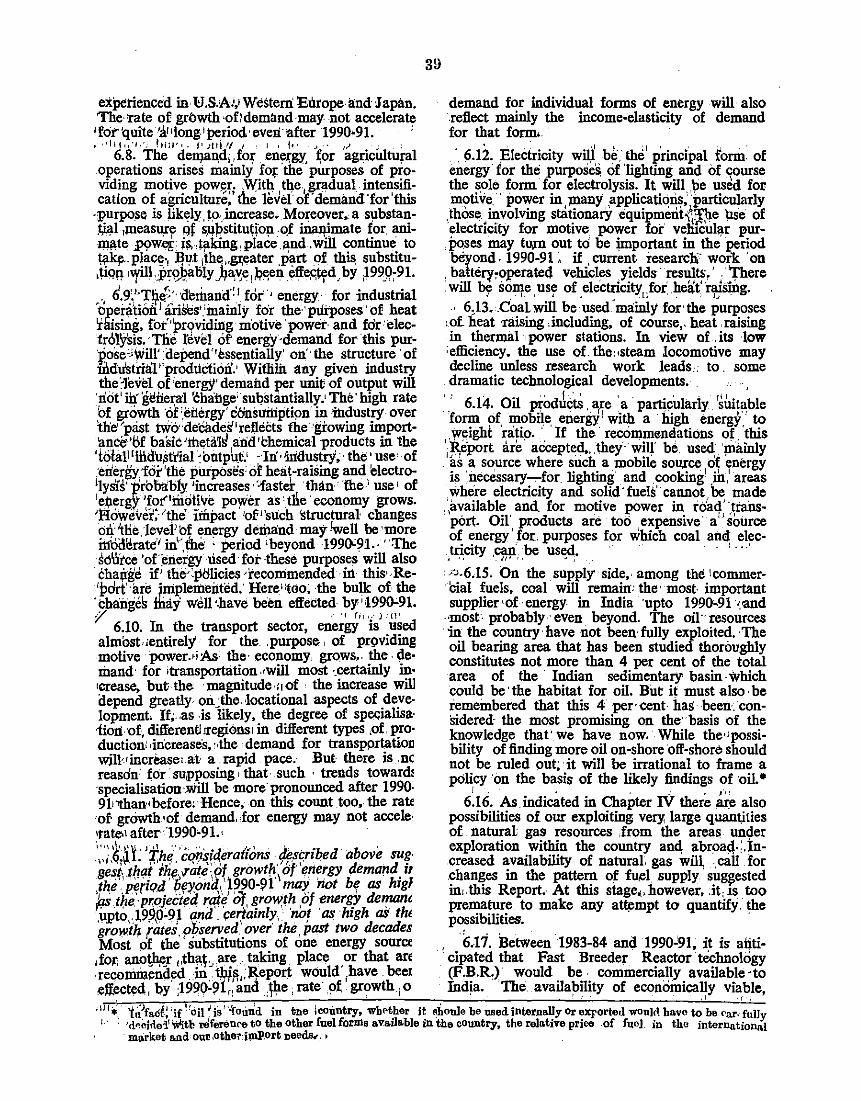
experienced in'B.S.!A:i,' Western EW:ope·and Japan. The· rate of growth ·of/demand ·may not accelerate 'for quite 'i"long1period·everfafter 1990•91. ' 1 ,rlq,·f,', hill'•. f' ;td .1/ I ~ I • I•• J ·• Jl ~ :
6.8. The dell)lln,di, fm; . ene~gy; ~or agricilltural operations arises mainly fof'. the purposes of pro· vid!ng motiv~ pow% Wit~,t4e,jp11dual ~te~s~cation of agnculture, the level of demand for this
-purpose is.).ikely. (p.,increase • .Mo~eover, a substanW!l,measurr qf sp)>stitu~!o1u:~f inaJ!imate for. animf\te Jl9We,J; j~.tjlking,place and .will continue to \;lkp.. plac~-, ~u.t 1the .. ~ater .~rt of this substitu.~<?P, ~~L_pr~blyfia;~e 1 ~en elfestyd,by ,199"Q:91.
. , 6.9;'·Th~> dethana~ 1 for · energy· for industrial o~e~ti6ii 1 ~nses'~~ainly f~r the·'plfrposes <?f heat 'tlrism.g, for''pr(/VIdmg motive power· and for'elec'trolysis .. The revel of energy ·demand for this pur'pose-i\Vill' depend''i:ssentially' on'·the structure· of mdu'stria'l''prodtiction.' Witliiil any given industry thdevel of 'energy' demahd per unit of output will not' fu.' geiie~a:l 'Change' sul)stantially.' The' high rate bf growth ·or '.energy' eonsuitiptipn in 'industry over 'the"past two·decadeS''rel;lects tne··gtowing import· 'ance'of basiC'ittt#i~ alid'bhemical products in the 'total! tfiid'u~tl'ial ~bntput• ·In· 'ilidustry; · the· use• of :energy •for 'the purposes of heat -raising and electro-1ly. sis' prb!Y.ibly.· . 'increases· '-faste~ ·than '•th. e·' use' of 'eiJ.erg)T 'fo(1ittotive po}'l"er as tll.e ·economy grows. 'l.'Iowever:·'t)le' unpact 'of''slich structural changes ol:j:·'tlielevel'bf c;n~;~rgy demand may !well be·more iif6dl!rate·1 in''.ihe • period •beyond 199()<:91.· ''The solli'ce •onnergy tised for these purposes will also
' chairge if' the· :pCJlicies ·recommended ·in this· .. Re'pdrt'·are iDiplemerited:Here.''teo; the bulk of· the ·changes fully' well ·.have been effected by' •199().:.91. .y .· '! fii<•').'[J'
6.10. In the transport sector, energy is used almbst.Jentirely' for the .. purpose, of pr<:>viding motive power.•i:As• the· economy. grows,. the· de· riland· for >transportation .•will most -.certainly in· 'crease, but the magnitude · n of · the increase will depend greatly. on~the ·locational aspects of development lf;,.as . is likely, the degree of specialisa· 1ioli· ·of differentl Jregi<insr in different types ,of pro· ductioni oincreases, ··the 'demand for transpprtatioD wjlJ:.•increase;.at a. rapid pace. But there is .nc reasdn fdr ·supposing' that , such · trends toward! ·specialisation ·.Will be more· pronounced after 1990-91;1fuan,before:·Hence, on this count too, the ratf
•or growth ,of demand . .for energy may not accele· •rate>' after.-1990•91.·. ·
·,::;.~~~t ·~~~,'cqh's.(d._eraiions if.¢sfribea· above su!f· cesMfla.t t~~ ..rate·, of. growt~; of e~~rgy demand. " ,the .IJi!riod /Jrrr,on~ .. J990-91 ~ not bif as hrgl E_ t/:le. ·pr,0jei:ted ~~e Of, l[ro~th ,of enerCl denwm ,upto,.~9?,0·9~ a.nd. (:e~tamly, nor as high as thl growih rates, p~serv_ed _over the' past two decades Most of the substitutions of one energy soura
'for. ano!AAr ,th~hare ' taking place 'or that arc ·reqoniiaend~d in, th,i,!iJ;l~.epo~ would ,have. bee1 ¢fected, bY :1990·9,1;, and Jhe 1 rate· pt gr?wth 1 o
39
demand for individual forms of energy will also .reflect mainly the income-elasticity of demand for that fOI'In. · ·
·. 6.12. Electricity wm'. b~. th~' principal form of energy for the purpose& of 'lighting and of ~urse the sole form for electrolysis. It will. be used for motive. · power in ;many applications, particularly .those}~volving stit~onazy equipmerit~\':The ilse of electriCity for mottve power for veliicull).r purj>Qses may tu1n out td be jmportant in the period beyond. 1990-91 ~ if current research' work ·on
. baherr,operated vehicles yields· results.' ·.There • will 1>¢ so111.e. us~ of _electrlcityufor .heat' r~g .
.. 6)3 •. Coal will be used.mainl}' for·the purposes ,of. heat ·raising ,including, of course,. heat .raising in thermal 'power stations. In view of .its low 'efficiency. the use of. the, .steam locomotive may decline unless research work leads.·: to . some
. dramatic technological developments. , '' . ,, !,'' ' ' . (il
. ~ 6.14. Oil products ,aJe a part\¥ularly sui!\Jble fo~ pf, 'P-?bile. energy· with a ·high energy, to wetght ratio. · If the recommendations of this
',¥fpor:t are accepted,, they will be. used jll~inly as a source where such a mobile sou,rce of energy is :necessary~for lighting . and cooking' .ih:.' areas where electricity and solid- fuels'· caunot be made
',available and, for motive power in r~d''trans. p6rt. Oil' products are too expensive a" source of energy ' for. purposes for which coal and elec-tricity .can be used. · · " .. · ·
j '' ' "' '. • ;
;>.6.15. On the supply side,· among the 'commer· bial fuels, coal will remain: •the · most- important supplier 'Of energy in India ·upto 1990',91 ~and
··most'· probably· even beyond. The oil·· resources in the country·have not been· fully exploited. ·The oil bearing area that has ·been studied thoroughly constitutes not more than 4 per cent of the total area of the · Indian sedimentary· basin· which could be· the habitat for oil. But it must also· be remembered that this 4 per. cent. has been:. considered· the most promising on the· basis of the knowledge that· we have now.· While the•'possi· bility of finding more oil on-shore off-shore should not be ruled out; it will be irrational to frame a pOlicy on the basis of the likely findings of ·oiL •
I . . , ' : ' J• ~
6.16. As.indicated in Chapter IV there~ also possibilities of our exploiting ve~ large quant,ities of natural gas resources .from the areas um,ler exploration within the country and, abr0aq1;,Jn. creased availability of natural, gas wil~ . call for changes in the pattern o~ fu~:I supply suggested in, this Report. At this stage;, however, jt ,is too premature to make any at~mpt to quantifY. the possibilities.
6.ri. 'Between 1983-84 and 1990"91, it is anticipated that Fast Breeder Reactor te'chriology (F.B.R,) would be . commercially available ·to India. 'The. availability of economically viable,
• . • . . · ; r 11 · ,
'111* · i~~fa.Cf-! ~if !roil~ iS '_'·fotiUd in t:ne I coUntry, WbP.t.her i~ ~honle be used.intern~y or ';XJ'Orted won)~. have to be-!'ar: fully 1·' 'd~cirlei1 W'itb- r8ferenre to the other fuel forms available iD the country, the relative pr1ce .of fuoJ. m tho international
. mt\rket and OUt! ,othei";i~.ort Deeds.-. •

rofi1lliercia1 scale :Fast Breeder !Reactors -,in ·the country would introduce a new_'element in the energy supply situation which has- not been fully taken note of in our, Report. Given the very large resources of thorium and tli(i. definite possibility of. · accumulating significant quantities of 'plutonium· in the country by 1!)90; India would 'be' poised for ·11 very fast growth of nucledr: power poduction when · PBR technology is commerciali8ed. ;the Department' of Atomic I;!nergy- has drawn, up plans to increase nuclear powergeneratiori: capacity. from 1900 MW in 1983-1!4 to
·8623 MW in 1990-9-- ·of this 6620 MW will be 'b:lsed on· tlie . 'first generation heavy water 'reactors of the' kind !Which· are already' being built while 2,000· MW will be.•based con Fast Breeder -Reactor technology which -is: :under • development. The· Committee would. welcome ,such ·rapid in-crease in "Unclear power-. generation,, especially, power generation 'based on ·FBR:·-•technology as in the years beyond 1990-91.- It will be very diflicult to meet the _ power reqUirement without adequate support of supply from FBRs. If the pattern of supply of fuels recommended _in'this Report materialise by 1990-91, almost the 'entire hyde) potential would have been exploited· and coal productio~ would have reached a level _that there would ·be ·severe limitations to further rapid increase in its production; if no ,large :oil reserves are discovered by then in India, the' incremental ·demand for ·energy · beyond 1990-91 would have to be met by 'IIuclear pdwer ·generation. This would be possible only if :FBR technology for ·commercial~.-operations· is _,available by -then. In- view -of ·this-, Committee , would strongly recommend that adequate effort shouuld be put in developing this ·technology based -on the use of thorium from:now on .. c
· 6.18. The other , energy resources, which are not commercially utilised in significant quantities anywhere in the . :world ·\mt wh..ich are. talked about: with great hopes, are geothermal energy, solar energy, wind powc;r. tidal .. power ·and che-
-mica! sources-of-energy. The Committee examined carefully. the- status of ·work and . the likely contribution· that could ·be obtained ,from these sources. The total energy available from tidal
· power and' the ge"ot4etmal ·energy that could be tapped on the basis ·of the• present technology appears to be insignificant. Similarly,: the contribution•·of wind power- is- 1likely- tO' be small even if a very large number of Wind-mills are set "up
· in the- country. - There are- grave ·uncertainties regarding' the- commercial Juse of. solar:energy for industrial ·needs.· The -Committee therefore felt that by 1990-91, the contribution: from these non-commercial, energy .. sources is ,not likely to be significant enough; ,to bt; ta~en note. ?f in di_scussing the energy ,supply sztuation. But!m. certam specific- .locations,' these- non-commercial energy forms may have some relevance.' 'The Committee. has, therefore. recommended th_e. ~up port for,. all research and development '•actlvztze_s .connected •
with the utilisation of non-conventronal energy
40
for.ms. cBey\)nd 1990-91, there .may lbe possillil -ties ·of. energy. which appear . the only non-con solar, energy owhich . ,appear .cthe only non-con mercia) sources of energy which could contribu1 to supplies in a csubstantial way.
Minimisation of Energy Cost ' ' I ;_ ,j
6.19.~ Upto the early seventies, all over th 'world 'the "trend -was not only to ·plan -for adc quate energy· supplies .. but -to ·provide -it at min mum·,. of cost. "Minimisatign of energy cost w~ one of the primary objective .of energy plannin ~n many _<;ountries but the shortages and UI ~rtainties. PI .oil availability . d11ring . the; last fe, 3\e.ars has, shifted to emphasis in energy plannin to ~~uting t):le adequacy of fuels more than th reduction of energy cost. In the coming yea1 when, the oil sit11ation in the inte(national markc settles down,,to .. normal conditions, ,there \Yi again)Je a· renewed emphasis on minimisati()n c energy co~.;1~ India) -production is .to be. com ,petitive . in ,the jnternational market, we . shoulr ensure" that our planning for energy i.Qdustrie and operation,.Qf,these industries are comparabl
.. in-e!ficien~y,to that obtaining .in other countrie: , The, Committee -has _emphasised .throughout th ·<Report , tl;te,.need; f9r ~ost minimisation. An_ investments 1made .in the energy sector . whicl
.. wquld produce-high cost energy and which woul< ,have_ ;p[(lquctiye.Jifeibeyond 1990-91 will make i . )lery -.diffitrult- to reduce the overall . cost .of. energ production.,-Hence.,however; rurgent. be the com
·,pulsion .of ,theoll!Jrrent. situation, .. we should .no ~_commit- ourselves irrevocably to such· high .cos investments. · .• ,'
· Li(J>20; There are--indications that a number o ~echriological deyelopments in the coming decad1 'will reduce the transportation cost of energy. Un ~ess,we arecalert.-and adopt . .the most modem anc 'the J•most-·optima1 technologies for. transportin1 energy; the, cost of energy to the consumer iJ India· is likely <to. be. higher than· .the. cost else ·where. ·In·- a. country -Of. continentaL dimension 11ike -ours with coal. resources situated mostly. i1 the' Eastern. and Central regions and hyde! powe content rated· -mostly in the Northern region, there will -be need to ·transmit .energy in·. the form o electricity coverlong distances .. Tcansmission cost. could be reduced by adopting ·higher transmis· sion._.voltage_,.as. well. as (he. newer .technologie• like . DC . trQIISmission or $ransmission . througl cxyqgepic : . conductors, .. (iquid-filled conducto" etf\· E.eseqrcl:z .•. and development .in this areG ~-liQuid_ be J.aken,,up ev.e11 from. now. on, if we ar1 ta .ensure. the_ supply of. power at economic rate! t9.,1h~- consumer,· ifl the years;,beyond 1990-91.
,: .~:21_. f'\not~er ·lllaj~.;.,.probleirl in energy trans· portat10n .,wh1ch will ~on~ue to,- be of -interest beyondc 1990,91 is the ·transport of coal tcHiiffe· rent ,·SlJpply,. .points. In. view. of .. tbe continued diffi~ulties lin transporting .coal,- a number of suggestiOns hav~' been•·made for: transporting coal,
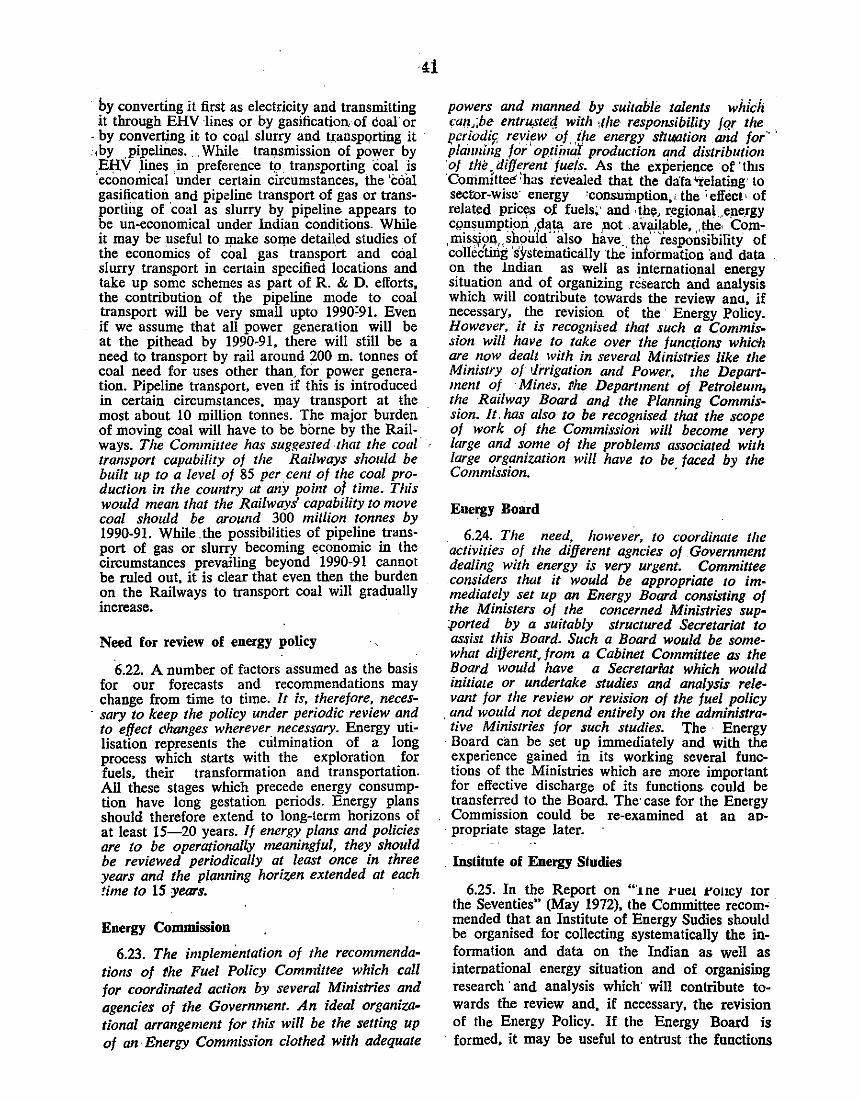
by converting it first as electricity and transmitting it through EHV lines or by gasification of coal or
- by converting it to coal slurry and t(ansporting it :, by . pipelines ... While tral}smission of power by .El!V .lines . in preference t9 transporting coal is ·economical ·.under certain circumstances, the 'coal gasification and pipeline transport of gas or transporting of 'coal as slurry by pipeline appears to be un-economical under Indian conditions. While it may be useful to make some detailed studies of the econoffiics of coal gas - transport and caal slurry transport in certain specified locations and take up some schemes as part of R. & D. efforts, the contribution of the pipeline mode to coal transport will be very small upto 1990=91. Even if we assume that all power generation will be at the pithead by 1990-91, there will still be a need to transport by rail around 200 m. tonnes of coal need for uses other than. for power generation. Pipeline transport, even if this is introduced in certain circumstances, l!lay transport at the most about 10 million tonnes. The major burden of moving coal will have to be borne by the Railways. The Committee has suggested -that the coal· transport capability of the Railways should be built up to a level of 85 per cem of the coal production in the country at any point of time. This would mean that the Railways capability to move coal should be around 300 million tonnes by 1990-91. While. the possibilities of pipeline transport of gas or slurry becoming economic in the circumstances prevailing beyond 1990-91 cannot be ruled out, it is clear that even then the burden on the Railways to transport coal will gradually increase.
Need for review of energy policy
6.22. A number of factors assumed as the basis for our forecasts and recommendations may change from time to time. It is, therefore, neces-
. sary to keep the policy under periodic review and to effect changes wherever necessary. Energy uti.lisation represents the culmination of a long process which starts with the exploration for fuels, their transformation and transportation. All these stages which precede energy consumption have long gestation periods. Energy plans should therefore extend to long-term horizons of at least 15-20 years. If energy plans and policies are to be operational/JJ meaningful, they should be reviewed periodically at least once in three years and the planning horizen extended at each time to 15 years.
Energy Commission
6.23. The implementation of the recommendations of the Fuel Policy Committee which call for coordinated action by several Ministries and agencies of the Government. An ideal organizational arrangement for this will be the setting up of an· Energy Commission clothed with adequate
powers and manned by suitable talents which ca~t,ibe entru,ste"tj with :1/te responsibility jqr the I?r:riodi9< revif!W . of. ,the energy sitllilltion and for' ' planning for optiinaT production and distribution of the. different fuels. As the experience of · thts Committee' :has revealed that the data 'telating to sector-wis~· energy •consumption,: the ; effect• of related pncys of, fuels;· and ·th~;, region<~Le_ne.rgy cgnsumption ,dati\ are not . available, . the- Com,miss,i?~,s~ouid''al.so have .. the' responsibility of collectilig systematically the inlormation and data . on the Indian as well as international energy situation and of organizing research and analysis which will contribute towards the review ana, if necessary, the revision of the · Energy Policy. However, it is recognised that such a Commission will have to take over the func{ions whiC'h are now dealt with in several Ministries like the Ministry of <.Irrigation and Power, the Department of ·Mines, Phe Deparllnent of Petroleum, the Railway Board and the Planning Commission. It. has also to be recognised that the scope of work of the Commission will become very large and some of the problems associated with large organization will have to be faced by the Commission. ·
Energy Board
6.24. The need, however, to coordinate the activitie.;· of the different agncies of Government dealing with energy is very urgent. Committee considers that it would be appropriate to immediately set up an Energy Board consisting of the Ministers of the concerned Ministries sup:ported by a suitably structured Secretariat to assist this Board. Such a Board would be somewhat different, from a Cabinet Committee as the Board would have a Secretarrat which would initiate or undertake studies and analysis relevant for the review or re11ision of the fuel policy
. and would not depend entirely on the administrative Ministries for such studies. l'he · Energy
, Board can be set up immediately and with the experience gained in its working several functions of the Ministries which are more important for effective discharge of its functions could be transferred to the Board. The· case for the Energy Commission could be re-examined at an ap-
. propriate stage later.
. lnslitnte of Energy Studies
6.25. In the Report on "'1ne .I:'Ue! t'oucy tor the Seventies" (May 1972), the Committee recom" mended that an Institute of Energy Sudies should be organised for collecting systematically the information and data on the Indian as well as international energy situation and of organising research ·and analysis which· will contribnte towards the review and, if necessary, the revision of the Energy Policy. If the Energy Board is
· formed, it may be useful to entrust the functions

{lf the suggested Institute of Energy Studies to 'tl1e IlcnirC:I. ·ft should be noted that we · have severa( lnstitutions in the eountry which are eV~)l DOW. eilgaged _in_ certain _aspects of energy production and utilization. Whether a separate Institute of Energy Studies is set up or the proposed-EJzergy 'Board takes up the work, the workfng o{t!ie -agency entrusted with Energy· studies,
42
_,:zould be oriented more towards the ·arranging for the studies to be conducted by different i~titutions wzd agencies in existence now and 'coordinating the research projects. Any attempt to centralise tlze research efforts relating to' energy problems wlzic.'z extent over a very large area of economics. science and teclmolog_v under a single
. institutinn may prove counter-productive. ·
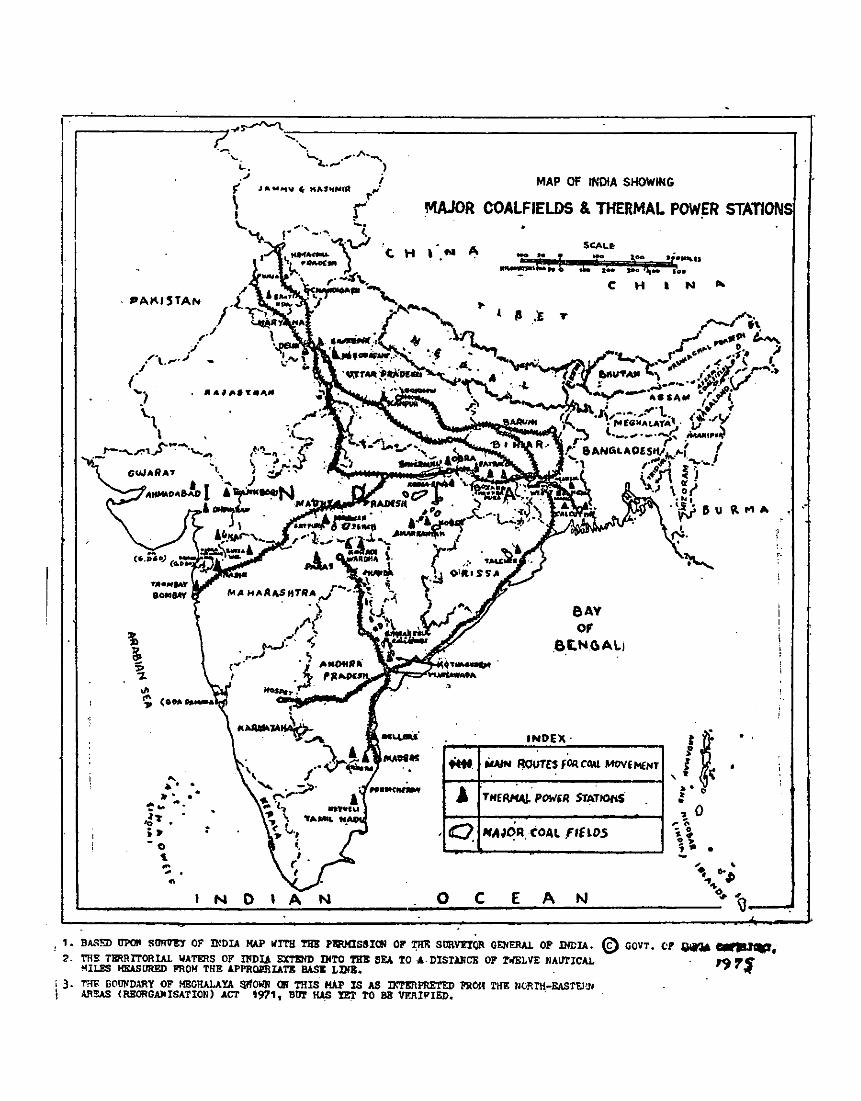
I
,. .. ,,..'1:'.,1\ ..
N D I
MAP OF INDIA SHOWI+IG
MAJ()R COALFIELDS & THERMAL POW~R
C.Hl.MA SCAL• = l.OO .; • ..._..,
1C 2- ,.~~~ ~~- 1o•
·'
. . .... ' ,Q
C H l N ""
,. I II .• 'E ...
6AY OF
6t.NGAI.i
INDEll ·
liwN ~TEHC!RCD.ol MOVEMENT
THE~ POWiR SfATIOII$
llfo4JOR. COAL fiELOS
A N
'i l :. c • ~0 , .
- 0
·~ ~ ~ . -
'•
' ..
•
•
, 1, BAS!m .UPOII SIJRVEY OF I!IDIA IW' ~IT!! !'!lB PliR!IlSSial OP' ~ Slll\vriQII G!:I<EIW. OP INDIA. €) GOVT. Cl' fl,lll'» CllfiiUGIP, 2. 'l'IIE TERRITORIAL WATERS OF IIIDU SXTB!IIl IIITO TH1I SF.\ TO A· DISUJICli OF 7'oiELVE llAIIriC.U. I<),.~
~ILI!S I!!Wll!RED FROM THE APPROI!llATK IWlK LIIIE. ,/f
i 3. Tffi' EOUIJDARY OF MBGIIALAYA $.1'101111 (!I THIS KAP IS AS Drl'EllPRE'l'ED 1'510!1 THE llORfH-EASTEJ~I ! AR!!:AS (RBORGAJOISATION) ACT t971, 8ll'l' HAS nT TO BB VF.J\li'IE!>. .
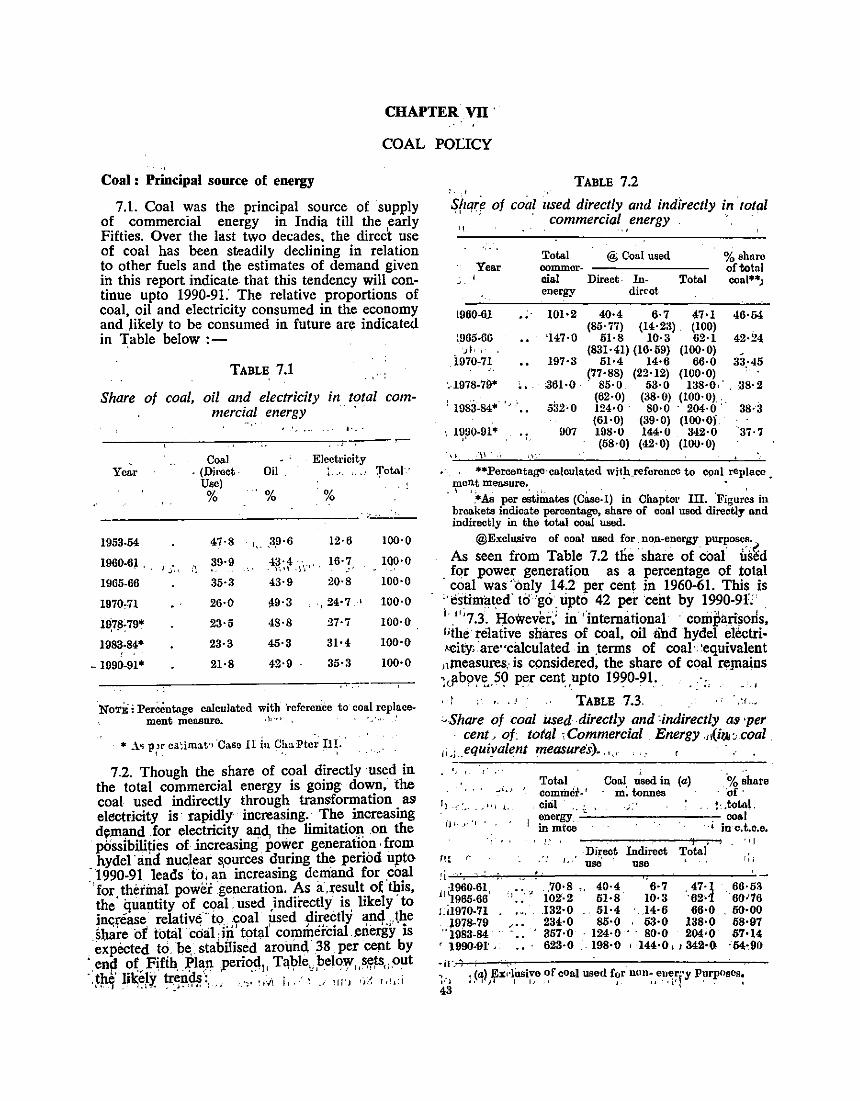
CHAPTER VII .
COAL POLICY
Coal : Principal source of energy
7.1. Coal was the principal source of supply of commercial energy in India till the early Fifties. Over the last two decades, the direct use of coal has been steadily declining in relation to other fuels and the estimates of demand given in this report indicate that this tendency will continue upto 1990-91: The relative proportions of coal, oil and electricity consumed in the economy and likely to be consumed in future are indicated in Table below :-
TABLE 7.1
Share of coal, oil and electricity in total commercial energy
1· ..
Coal • · Year . (J)irect · Oil .
El~ctricity 1-' .•. ,, ... 'fotal·:
Use) % '% %
----------,---· .. _ .. __ . -
1953-54 47·8 ... ,3,9·6 12·6 100·0
1960-6) ' . I,;., :"~ 39·9 _4~}.)··y 16·y. 100·0
1965-66 35·3 43·9 20·8 100·0
1970,'71 . 26·0 ~9·3 ·~ 24•7 ,I 100·0
1978-79* 23·5 48·8 27·7 100·0 '''
1983-84* 23·3 45·3 31·4 100·0
' -1990-91* 21·8 42·9 35·3 100·0
.NoTE: PerOOntnge calculated with 'referenCe to coal replace-ment meo.sure. · l• ·• • • • '
· • ·Ac; pJr cs:-ima.t'l ·ca.se II in Chn.·Pter ~II·.· ! '· '
7.2. Though the share of coal directly ·used in the total commercial energy is going down, the coal used indirectly through transformation as electricity is rapidly increasing. The increasing d~mand .for electricity and, the limitatio~ .on the p(issibilities of increasing. pow~r generatl?n ·from hydel' and nucJear s,ources dunng the penod upto
-1990-91 leads to, an increasing demand for coal ''for therinal power generation. As a .result of this, the· quantity of coal used indirectly is likely to increase relative' to. coal used .directly anq .,(he shlire of total cda] iii' total commerCial ~riergy is expected to. l>e. stabilised around 38 pe]: cept by
·en~ ?tFi.fih, ,Pl~ll ,Peri~<l1 , T<\l;>le,}Jelow,,,~~,,out ·.the likely trends: ...... _,.;\_ 1·, .- · ~ _,.. 111 -J ~-,;J, ,,•,:i
' • J . . ''' ·• • ~·' " .. ' •
TABLE 7.2 :. ·' Sf!Gre of coal z',_yed directly and indi'rectly in total
· · commercial energy . ··. · I 1 , "
'·•.
Year '
1960-61
1965-66 ,, ' i970,7l
·.-1978-79*
' ws:i-84•
', 1990-91* •'
~.
•,'
,_
Total @ Coal used commer-cial Direct- In-energy dirl'ot
101•2 40·4 6·7 (85· 77) (14·23)
'147·0 51·8 10·3 (831·41) (16·59)
197·3 51·4 14·6 (77·88) (22·12)
361·0. 85·0 53·0
532·0 (62·0) (38·0) 124·0 80·0 (61·0) (39·0)
907 198·0 144·0 (58·0) (42·0)
Torol
47·1 (100) 62·1
(100·0) 66·0
(100·0)
% sltnro oftotnl coai**J
46·54
42·24
33:45
138·0•' ' 38·2 (100·0) '
204·0' 38·3 (100·0)
342·0 '37·7 (100·0)
"' ,"\\ . 'I "' • . *•PercentagQ·calculatcd wi1~-~forcnce to coni rcplncc.
ment measure. · -I '· . ' ·'- ' ' . '
.*As per estimates (Caso-1) in Chapter ill. Figures in brC'.akets indicate percentage, share of coal used directly and indirectly in the wrol ccal used.
@Exclusive of coal used for. non-energy purposes.
As seen from Table 7.2 tlie ·share of coal i:i~~d . for power generation as a percentage of total
coal was 'only 14.2 per cent in 1960-61. This is ''estimated- tel' go 'tipto 42 per ·cent by 1990-9f:' 1 -";7.3. However.' in 'international ·· comparisocls, '%e relative shares of coal, oil iind hyde! electri'city;'are"calculated in .terms of coa!·.'equivalent ,,measures.- is considered, the share of coal reJDains 1cflbpy~,.59 per cent,upto 1990-91.. . ·c _ , I ~ ; . :I, ' } TABLE 7.3. ~share of coal used directly and :indirectly as •per
cent- of. total :Commercial . Energy ."(iiJo :· coal 11 ,; .. equivalent measure's) • . , . ,
iJ '. '- 'I
ru r
!i . Jl il960-6l,
1965-66 Li1970-7l . J978-79 ,, 1983-84 ' 1990-91' '
'1'' ...
...
Torol Coal, ,;sed in (a) -% share cOni:m.Cr- 1
• m. tonnes - ·"r · chi) "c' .. lc.iorol. energy -=----------•. coal in mtco · m c. t.o.e.
Direct Indirect Total' .,,
.'! !. ' use use r,; . ' ,70·8 " 40·4 6·7 47·~ 66·53
lOZ'2 51·8 10·3 ·.62•1 '60'76 .. .132-0 51·4 ' .14·6 66·0 - 50-00
234·0 85·0 53·0 138·0 58·97 357·0 ' 124·0 • - 80·0 204·0 67•14 623•0 , · 198•0 I 144•0' I 342•0, '54•.90
-11'.4~---i--.....,-----'----------~-
-:r) ; .(~) }~x;\Usi~.e ~f con.] use~ r?.r non: .en.~~fY. P~r~oscs~ 43
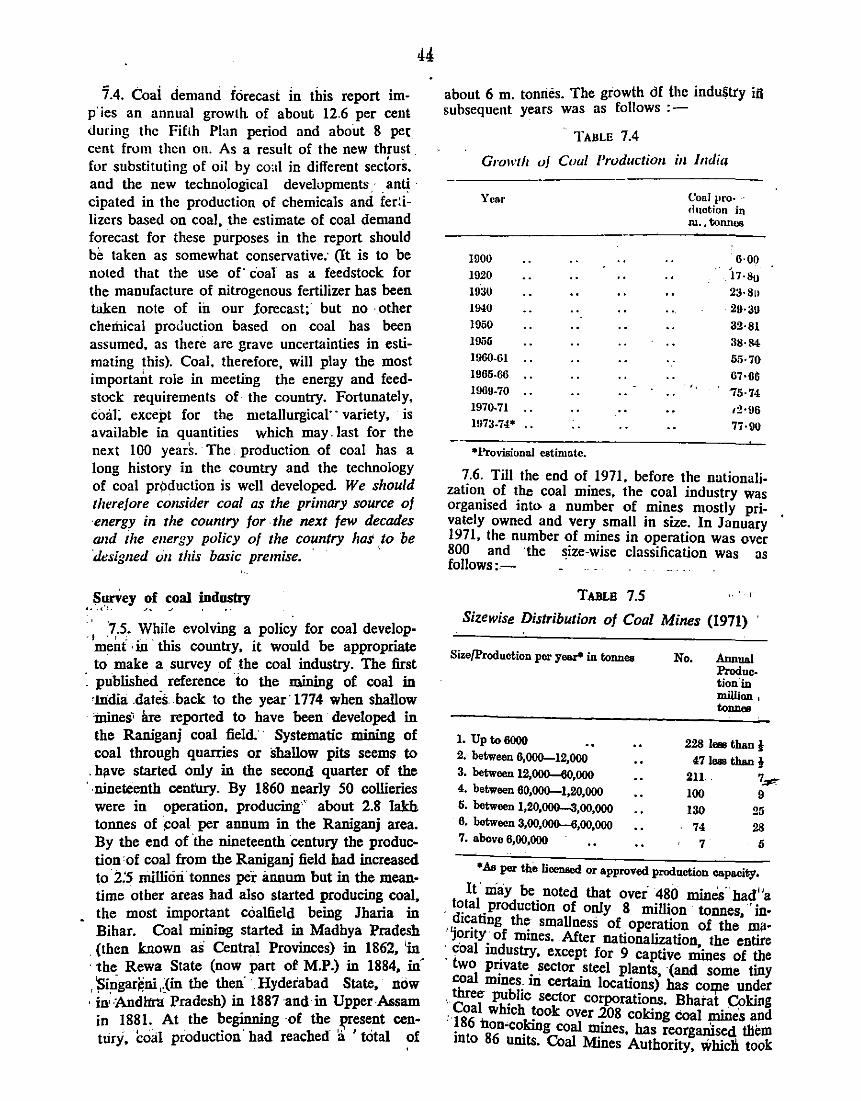
'i.4. Coai demand forecast in this report imP· ies an annual growth of about 12.6 per cent during the Fifth Plan period and about 8 pet cent from then on. As a result of the new thrust . .. fur substituting of oil by coat in different sectors. and the new technological developments: anti · cipated in the production of chemicals and fer:iIizcrs based on coal, the estimate of coal demand forecast for these purposes in the report should be taken as somewhat conservative: (It is to be noted that the use of· coal as a feedstock for the manufacture of nitrogenous fertilizer has been taken note of in our iorecast; · but no ·other chemical production based on coal has been assumed, as there are grave uncertainties in estimating this). Coal, therefore, will play the most important rule in meeting the energy and feedstock requirements of the country. Fortunately, coal; except for the metallurgical·· variety, is available in quantities which may. last for the next 100 years. The production of coal has a long history in the country and the technology of coal production is well developed. We should therefore consider coal as the primary source of ·energy in the country for . the next few decades and ihe energy policy of the country has to be 'dt:signed o/1 this basic premise. '
sw-Vey of coal industry ._, -<-L -'• - .J
· · '7.5. While evolving a policy for coal develop-'m~nt ·in · this country, it would be appropriate to make a survey of the coal industry. The first
·_ published reference io the mining of coal in •llidia .dates. back to the year 1774 when shallow
. mines' are reported to have been developed in the Raniganj coal field. · Systematic mining of coal through quarries or sballow pits seems to
. hjive started only in the second quarter of the · nineteenth century. By 1860 nearly 50 collieries
were in operation, producing'' about 2.8 lakh tonnes of ~oal per annum in the Raniganj area. By the end of 'the nineteenth ·century the production 'Of coal from the Raniganj field bad increased to i:s million tonnes per annum but in the meantime other areas had also started producing coal, the most important coalfield being Jharia in Bihar. Coal mining started in Madhya Pradesh
. (then known as Central Provinces) in 1862, fu · the Rewa State (now part of M.P.) in 1884, m . 'sii)gar~ni ,.(in the then· Hyderabad State, now : in;·:Andl1ri Pradesh) in 1887 and·in Upper Alisam in 1881. At the beginning of the !?resent century, coal production' had reached a . tOtal ~f
about 6 m. tonnes. The growth df the indu§try id subsequent years was as follows :-
.. TABLE 7.4
Growth v/ Coal Production ill lndil1
Year
1900 1920 1930 1940 1950 19ii5
1960-61 .• 1965-66 .. 1969-70
1970-71 •.
1973-74* .•
• Provisional estimate.
Coni pro· · tinction in m .. tonncs
6·00 h-su 23·811
2D·3U 32·81 38·84
55·70 67·66
. '• 15·74 d·96 77·90
7.6. Till the end of 1971, before the nationalization_ of t_he coal mines, the coal industry was orgamsed mto- a number of mines mostly privately owned and very small in size. In January 1971, the number of mines in operation was over 800 and the size-wise classification was as follows:-
TABLE 7.5
Sizewise Distribution of Coal Mines (1971) ·
Size/Production per y...,.. in tonneo
1. Up to 6000
2. between 6,000-12,000 3. between 12,000-60,000 4. between 60,000-1,20,000 6. between 1,20,000-3,00,000 6. between 3,oo,O<J0..-6,oo,ooo 7. above 6,00,000
No. Annual Production·in million , tonnes
228 l<BI than l 4710811 than!
211. . 7-""' 100 9 130 25
. 74 28 7 6
*As per tho licensed or approved production capacity.
It' may be noted that over 480 mincis'bad"a . !~tal _production of only 8 million tonnes, ·in· , 'j~IC!!ting th~ smallness of operation of the rna· _ OIItY. of mmes. After nationalization, the entire . coal m~ustry, except for 9 captive mines of the
two p~vate. sector steel plants, (and some tiny coal mmes, 1n certain locations) has co.qte under
, three pu~hc sector corporations. Bhai'at Coking : Coal which !ook over 208 coking coal mines and ~ 86 non-co!dng coal ~ines. has reorgamsed tbem mto 86 umts. Coal Mines Authority, whicll. took
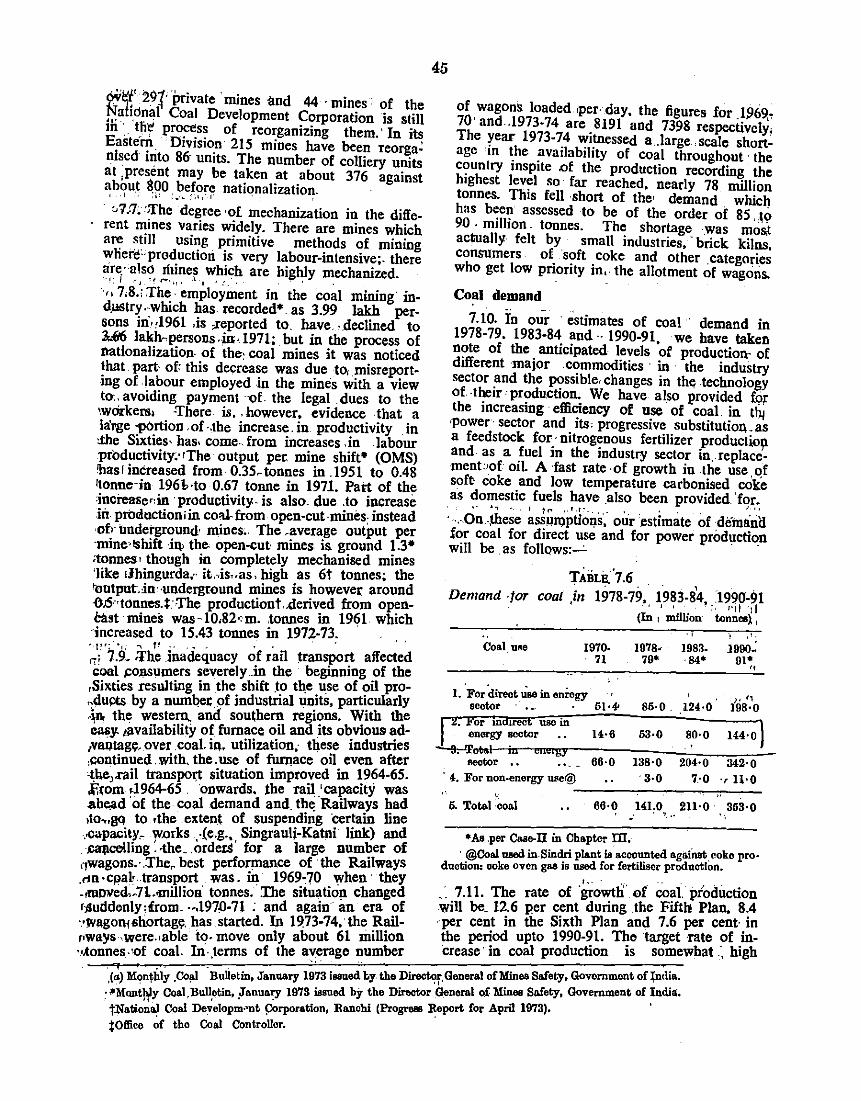
6¥~' 29fprivate ·mines and 44 · mines of the f4:~fid~al Coal Development Corporation is still tli .. IIi~ pr~s~ of reorganizing them.· In its Easter~. · DIV!sJO_n 215 mines have been reorga: nlsed mto 86· un1ts. The number of colliery units at ,present may be taken at about 376 against abou.t ~00 before nationalization.
I ·I " d' .' .-~ ~ ;1 ,·.I" · ,
· o7,7, •!fhe degree •of mechanization in the different ~ines varies widely. There are mines which an; still usi~g. ~rimitive methods of mining wliere·· pro~uctton 1s very labour-intensive;. there a,nyn.~so. ~~.~ne~ ,w_h}ch are highly mechanized . . , 7,8.; The· employment in the coal mining· ind.ustr~ ·:Which ~as recorded*. as 3.99 Iakh persons ID•rl961 oiS ,reported tO. have. -.declined to 3:.~ lakh-.persons .jnd971; but in the process of nationalization. of the: coal mines it was noticed ~hat part· of: this decrease was due to, misreportmg oUabour employed in the mines with a view to:. avoiding payment ·uf the legal .dues to the \Wcickenh ·There is, . however, evidence that a lal'ge y<>_rtion , of -.the increase. in productivity . in ~e SJXttes· has. come._ from increases .in .labour productivity.· •The ·output per mine shift• (OMS) 'has I increased from· 0.35ctonnes in .1951 to 0.48 ltonne·in 196lrto 0.67 tonne in 1971. Part of the inci'ease"in ·productivity. is also. due .. to increase in. proc!uctioniin co'~~.- from. open-cut-mines. instead ·of,. tmdei'ground• mines,. The .average output per ·mine,IShift ill> the open-cu~ mines is ground 1.3• <tonnes • though in completely mechanised mines 'like iJhingurda.-· it.-.is .. as, high as 6t tonnes; the 'outputAn· ·underground mines is however around .OJ5••tonnes.tThe productiont.derived from opencast. mines was·l0,82<m .. tonnes in 1961 which ·increased to 15.43 tonnes in 1972-73. · •,p•; .• , : "' fl . . . ~ " • . ,.,; 7.9. :rhe .inadequacy of rail transport affected cool ,CO,IlSumers severely .in the beginning of the
,Sixties resulting in the shift ~o tQe use of oil pro,,dupts by a numbet .of industrial units, particularly -~n. the western.. and southern regions. With the easy. tavailability of furnace oil and its obvious ad-1Va~Jtage. over .coal. in. utilization,- these industries ,continued. with, the. use of furnace oil even after 'l;he,.rail transpoJ;t situation improved in 1964-65. .f.rom .1964-65 . onwards. the rail 'capacity was ab~d ·of the coal demand and. th~ ·Railways had ,to,.gq to rtbe extent of suspending ·certain line . .ca-pacity" y.r.orks .,-(e.g., Singraulj-Katni link) and . .ca:~~celling. -the_ .orders' for a large number of ,1wagons.·.The, best performance of ·the Railways . rtn·cpalr transport. was. in 1969,70 when· they -rfliDNed,.7J, . .glillioa· tonnes. The situation changed r)9uddenly:irom. -~197,0-71 : and again an era of ··W&goni shortag\l. bas started. In 19.73-74. the Railnways .were .• able to. move only about 61 million ·•.tonnes. •of coal. fu .. terms of the ayerage number
45
of wagons loaded •per· day, the ligures for 1.969-70' and .1973-74 are. 8191 and 7398 respectively; The rear 1973-74 Witnessed a,.Jarge.,scale short~ age m ~he ;BVailability . of coal throughout · the C<;mntry msp1te .of the production recording the h1ghest lev~! so far reached, nearly 78 million tonnes. This fell short of the• demand which has b~e1_1 assessed to be of the order of 85 , 10 90 · m1lhon . tonnes. The shortage was moil actually felt by small imlustries, ·brick kilns, consumers of. ·s?ft . coke and other .categories who get low pnonty m, the allotment of wagons.
Coal demand
1.10. i'n our · estimates of coat · demand in 1978-79. 1983-84 and .. 1990-91 we have taken n?te of the. anticipated levels 'of production- of different ·major .c~mmodities · in · the industry sector _and the JX?SSible. changes in the .technology of -the1r 'production. We have also provided for the increasing effi~ency of use of coal. in tti.j •power · sector and 1ts' progressive substitution,. as a feedstock for.·nitrog~nous fertilizer producticll and. as a _fuel m the mdustry sector in .. replacement:>of 01!. A fast rate· of growth in the use of sof~ coke and low temperature carbonised roke as domestic fuels have .also been provided 'for.
' ,. ~., "• I t !" ,, I ,f• _. , . , , , _ • J. o,
· ·,·.On.-~ese assumptiol)s·, our ·estimate of deto!inll for coal for direct use and for power production will be as follows:-'- · ·
TABLil.'7.6 Demand -for coat ,in 1978-79, 1983-8'4, 1990'-91
• ' ' I -:, ('II '!I (In , million· tonnes} ,
.. Coal use 1970· 1978- 1983- 1990~
71 79• ·84• 91• ,,
I. .For direct ~ in enlogy sector · ' 51·.{1
l' ,, 85·0. 124·0 198·0
I 2. F'or mdll'Cct u.so in
1 energy sector .. 14·6 53·0 80·0 144·0
~obll-;·~mmmr~~~~~~·~~=-~ eector .. 66·0 138·0 204·0 342·0
· 4. For non-energy W!e@ · 3·0 7.·0 ·r 11·0 c ----,----,---,-.,..,,.--
5. Total coal 66·0 141.0 2ll·O 353·0 ......
•As .per Case-U in Chaptor m . · @Coallllled in.Sindri plant is accounted against. coke pro·
duction: ooke oven gas is used for fertiliser production . f,. . . .
. . 7.11. The rate of ·growth. of coal production will be. 12.6 per cent during .the Fiftb Plan, 8.4 ·per cent in the Sixth Plan and 7.6 per cent· in the period upto 1990-91. Tho target rate of increase· in coal production is somewhat .', high
J~) Mon~bly .Coal . Bulletin, January 1973 loaned by. the D~. General of Mines Safety, Govcrnmont of~dia. :~Mont)lly Coai,Bullfttin, ,Janua':'Y 1973 iseued by the Director General of Mines Safety, Government of India. t.National Coal Developm·'llt ~rporation, Ranohi (Progreso Report for April 1973). ' tOffice ~f tbe Coal Controller. ·
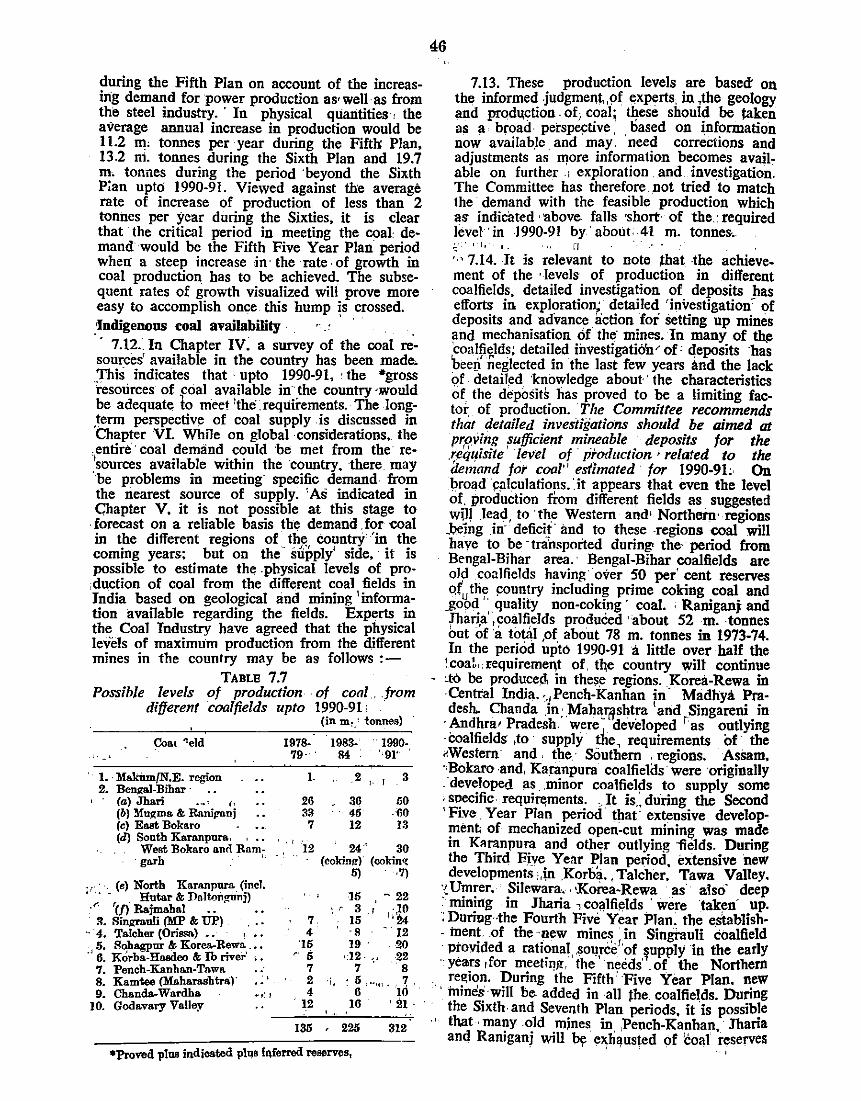
during the Fifth Plan on account of the increasing demand for power production as• well as from the steel industry. · In physical quantities , the average annual increase in production would be 11.2 m, tonnes per ·year during the Fift~ Plan, 13.2 ni. tonnes during the Sixth Plan and 19.7 m. tonnes during the period ·beyond the Sixth P;an upto 1990-91. Viewed against the average rate of increase of production of Jess than 2 tonnes per year during the Sixties, it is clear that the critical period in meeting the coal demand would be the Fifth Five Year Plan period when a steep increase ,jn · the ·rate· of growth in coal production has to be achieved. The subsequent rates of growth visualized will prove more easy to accomplish once this hump is crossed.
. ' •Indigenons coal availability ·• ·
' ' · 7.12.·. In Chapter IV, a survey of the coal re-sources' available in the country has been made. This indicates that · upto 1990-91, • the •gross ·tesotirces of coal available in .. the country ·would be adequate l:o meet 'the .requirements. The longterm perspective of coal supply is discussed in 'Chapter VI. While on global considerations, the .entire· coal demand could ·be met from the re.'sources available within the country. there. may ··be problems in meeting specific demand- from the nearest source of supply. 'As indicated in Chapter V. it is not possible at this stage to
. forecast on a reliable basis the demand . for ·coal in the different regions of· the country' 'in the coming years; but on the .. slipply' side, · it is possible to estimate the .physical levels of pro;duction of coal from the different coal fields in India based on geological lind mining 'information available regarding the fields. Experts in the Coal Industry have agreed that the physical levels of maximum production from the different mines in the country may be as follows :-
TABLE 7.7 Possible levels of production . of coal., from
different coalfields upto 1990-91;
Coat "eld l. -'
' I. · MakumfN.E. region 2. Ben~l-Biha.r ·
(a) Jh&ri -··' ,, (b) Mu~ms & Ranij!'anj (c) E&St Bok&ro (d) South Karanpura, . • .
West Bokaro and Ram-·garb . · I;
; r·.: _ (•) North Karanpura (incl. Hut&r & Dnltongimj)
-'· 'en· Rajmab&I .. :1. Singrauli (MP & UP) . . .
- 4. Talcher (Ori..,.) .. , . 5. Sohagpur & Korea-Rewa . , • ·' 6. Korha-Hasdeo & lb river' · ••
7. Pench-KanhAn-Tn.wa. 8. Kamtee (Maharashtra)" 9. Chand.&-Wardha. .,: 1
I 0. Godavary Valley
(in m~.' tonnes)
I978- I983- . I990-79· . 84 '•91'
. I. 2 f .. J 3
26 36 50 33 45 -60 7 I2 13
. " 12 24 30 (eokinl!) (cokin<t
5) •7)
15 ' - 22 •, c 3 ,I ·JO
7 I5 1'24 4 ' ·8 12
I5 I9 . . 20 5 ·12-,, 22 7 7 . 8 2 ·i .. 5 , .... ,.} ~. 4 •. 6 10
' 12 16 ' 21 . I -•·
I35 , 225 312
*ProV'ed plus indicated plqs !qferred reserves,
46
7.13. These production levels are based on the informed judgment, ,pf experts, in ,the geology and prodl!ction. of; coal; tl).ese should be taken as !I broad- perspe~tive .. based on ~formation now availab.le. and may. need corrections and adjustments as more information becomes avail, able on further :, exploration . and investigation. The Committee has therefore. not tried to match the demand with the feasible production which as indicated ·above falls ·short· of 'the.: required level' in -1990-91 by about. 41 m. tonnes. .:: , 1 • J o I • f/
:,, 7.14. It is relevant to note that. -the achievement of the · .Jevels of production in different coalfields, detailed investigation of deposits has efforts in exploratioor detailed 'investigationc of deposits and advance action for setting up mines and mechanisation of the· mines. In many of thp 'coalfields; detailed investigation' of: deposits has beer!' iieglected in the last few years imd the Jack of. detailed ·knowledge about·· the characteristics of the &posits has proved to be a limiting factor, of production. The Committee recommends that detailed invesiigations should be aimed at prRv~nf: ~ufficient mi'!eable . deposits for the .~eqf.!ISlle level of productron ' related to the demand for coal" estimated for 1990-91:- On broad !=alculatiops.: it appears that even the level of. production fi:om different fields as suggested will lead, to ·the Western and• Northern· regions _being .in· deficit. and to these -regions coal will haye to be -trinsported during< the· period from Bengal-Bihar area.· Bengal-Bihar coalfields are ol~ coalfields having over :SO per' cent reserves of the !!Ountry including prime coking coal and
.J!,o'/Jd '· . quality non-coking · coal. ; Raniganj and ]baria' ,coalfields produeed 'about 52 m. -tonnes out of a total of about 78 m. tonnes in 1973-74. In the period upto 1990-91 a little over half the
! coat. requirement of. tile country will continue :.to be produce~, in these regions. _Korea-Rewa in -Central Jndia ... ,Pench-Kanhan in" Madhya Pradesh. Chanda ,in; Mah~1f1Shtra 'and Singareni. in
· Andhra' Pradesh. were, developed 1 as outlymg -coalfields ,to supply the, requirements of the "Western and , the.· Southern . regions. Assam, ··Bokaro -and, Karanpura coalfields· were ·originally . ·developed as .. minor coalfiel~s to supply some . specific- requi~ments. .. It is .. during the Second 'Five . Year Plan period that· extensive. development of mechanized open~cut mining was made in Karanpura and other outlying, "'fields. During the Third Five Year Plan period, extensive new development~ ;,jn ,Korba. , Talcher, Tawa Valley.
-~Umrer. SilewaJ1!,., •Korea-Rewa as· aiso· deep ~-mining • in Jharia TCOalfieldS ' Were taken' Up. : During··the Fourth Five. Year Plan. the establish- tnent .of the ·new mines ·in Singrnuti coalfield · ptoYided a rational .so]Jrcclof ~upply in the early .. years , for meeting, 'the' needs' of the Northern
. region. During 'the Fifth' Fiv~ Year Plan. new · · !nines ·will be added in all the coalfie~ds. During
the Sixth- and Seventh Plan periods, it is possible that ·many .old mjnes in .PeJ;Ich-Kanhan _· Jharia and Raniganj will by ellli~usted of 'coal 'reserves
'
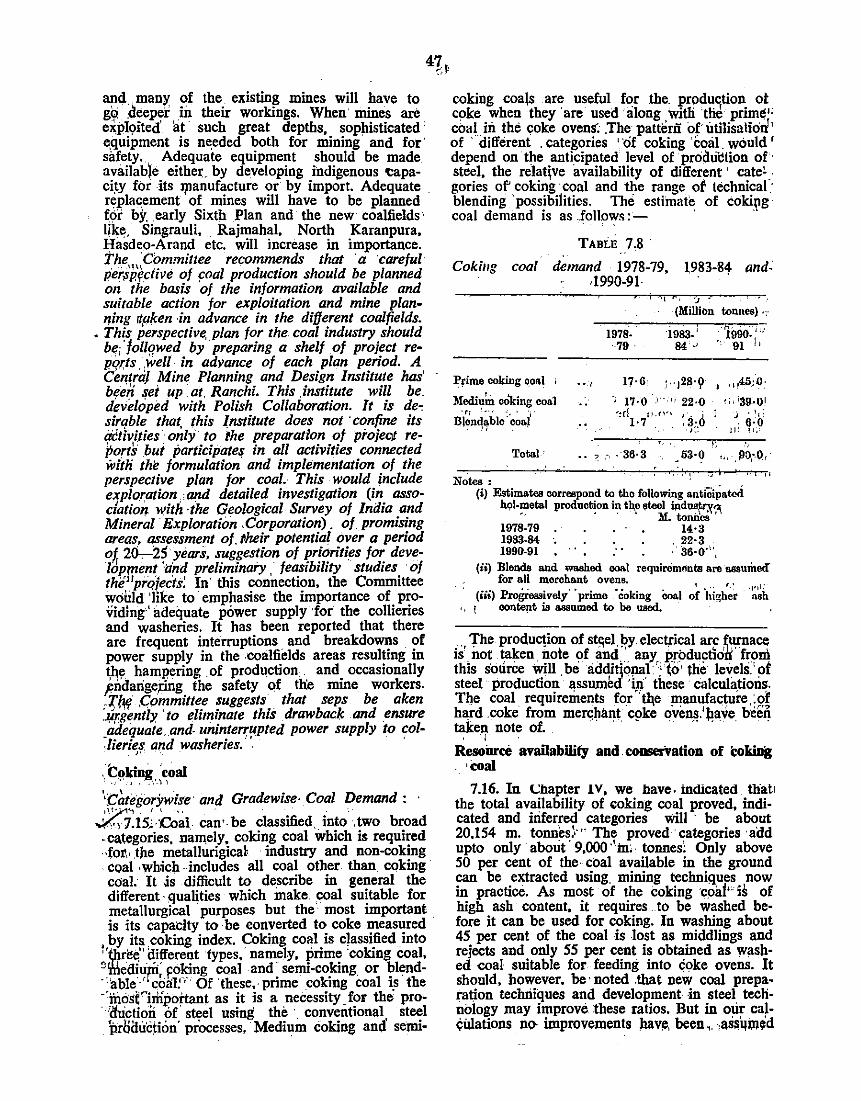
~d. 1man~ ?f the_. existin~ mines will have to go .. aeeper m thetr workings. When mines are eJ\1>~9ited' a~. such great depths, sophisticated ' e,qutpment ts ne,eded both for mining and for· safety .. _ Adequate equipment should be made availab)e either. by developing indigenous 'Capaci~y for its manufacture or by import. Adequate replacement 'of mines will have to be planned for by, early Sixth Plan and the new coalfields • like, Singrauli, Rajmahal, North Karanpura, I:Iasde()~Arand etc. will increase in importance. Tlz_e,"C~mmittee recommends that a ·carefuZ. per,rp,Ftctlve of fOal production should be planned on the basis of the information available and suitable action for exploitation and mine plan'ling 1t,aken ·in advance in the different coalfields.
- Th(~ perspective,. plan for the coal industry should be; JOllf?wed by preparing a shelf of project repq~;ts .. well in advance of each plan period. A Cef!trcij Mine Planning and Design Institute has' bf!en set up at. Ranchi. This .institute will be. developed with Polish Collaboration. It is de, sirqble that, this Institute does not ·confine its dttivities only to the preparation of projeCJ reports but participate~ in all activities connected with the formulation and implementation of the perspective plan for coal. This would include explo~ation, and detailed investigation (in association with ·the Geological Survey of India and Mineral Exploration .Corporation). of promising areas, assessment of. their potential over a period ofr 20-,--25' years, suggestion of priorities for developrr_ent 'and preliminai'y . feasibility . studies . of the 1pr(/jects! In' this connection, the Committee woiild 'like to· emphasise the importance of providing-' adequate power supply •for the collieries and washeries. It has been reported that there are frequent interruptions and breakdowns of power supply in the .coalfields areas resulting in tq~ ha111Rf:ring of production . and occasionally )lndarigepng the safety of . tl1e mine workers. .. 7};w .Committee suggests that seps be aken :ur.gently ·to eliminate this drawback and ensure adequate. and- uninterrupted power supply to col-
:ueries and washeries. ". · .' J• ·I
·• t~ki~. :coal ,, ...... , '•'C~tegorjrwise · and Gradewise· Coal Demand : ·
Zi:15;_,0;~1- can· be classified. into ,two broad -categories, na111ely, coking coal which is required -ofor, .. the metallurigical ·industry and non-coking . coal •wh3c}! --includes all coal other than. coking· coal .. It ,is difficult to describe in general the different· qualities which make. _coal suitable for metallurgical ·purposes but the most important is its capacity to be converted to coke measured ·
, by its coking index. Coking coal is classifiedinto ~_'tbrefQ.iffere~t types, namely, prim~ ·coking coal, "'Medm~, Foking c()al and semi-coking or blend·:·able'' coal!'. Of 'these.- prime coking coal is the ·'mosCirlipoitant as it is a necessity for the pro. ''c'lrictioii 6( steel using the . conventional steel priJauc_tion· prOcesses, Medium coking and semi-
coking coals are useful for the. production ot coke when they ·are used 'along with trn! prim¢" coal)n the coke ovens; .The pattern of utilisalionh of · different . categories '·of coking 'coal. would' depend on the anticipated level of proilul:!tion of'· steel, the relative availability of different ' cate' . gories of' coking coal and the range ot lechnicai'_· blending ·possibilities. The estimate of coki1,1g coal demand is as .~ollows:- · ,
TABLE 7,8 . . . . Cokiilg coal demand 1978-79, 1983-84 and:
·1990-91 'I '.J •
(Million tonnes) .,.
~fime coking ~oal 1
lledin~ co'king co&1 . r; , • ., '. , ·,,
lllondablo ·coal .. 'i ..
••.1
1978---79.
ios3-: 84'·.;
,.
199o~· j u
91 ! '
Total .. , ..... 36·3 _53·0 .... ~o,-o,
Notes: (i) Estimates correspond to tho following antliiipatcd
hQI-metal production in tb,e \~!eel indnot.•;v"' ... . . ' M. to;;;[.S'"
1978-79 . 14·3 1933-84 ·• . 22·3 1990-91 • . . . '36·0''',
., ,,
(ii) Blends and washed ooal requirOmnnts are as:suritetf for all merchant ovens. I r• 1, 1•
(iii) Progfeaaively' ·prime .'Coking Ooa.l of 't~i..,.h~r '~h • , t oonte~t is assumed to be used. !'
, ., The produ~ion of st~e1. ~y elect,rical arf ~urnace IS not taken note of and any prbductioD' from this source ":ill . be adqi~op.al •; (0' the levelli:' ()f steel production assumed 'ui these calculations. TIJe coal requirements for'.!Qe manufacture :ol htakl\fd ~coke frofm men;hant cgke oven~.'l!ave b~e4
ennoteo., , . r Resoiirce availability and _ co-vation of coking . ·eoal
7.16. In Chapter IV, we have. indicated that! the total availability of ~oking coal proved, indicated and inferred categories Will , be about 20,154 m. tonnes>·· The proved categories ·add upto only abm.it' 9,000 '1ln; · tonnes: Only above 50 per cent of the- coal available in the ground can be extracted using, mining techniques now in practice. As most of the coking ·c()ai" is of high ash content, it requires to be washed before it can be used for coking. In washing about 45 per cent of the coal is lost as middlings and rejects and only 55 per cent is obtained as washed roal suitable for feeding into ¢oke ovens. It should. however, be· noted .that new coal preparation techniques and development -in steel technology may improve :these ratios. Bnt in out cal¢Uiations no· improvements hav~ .. been •. ,as~\jm\id
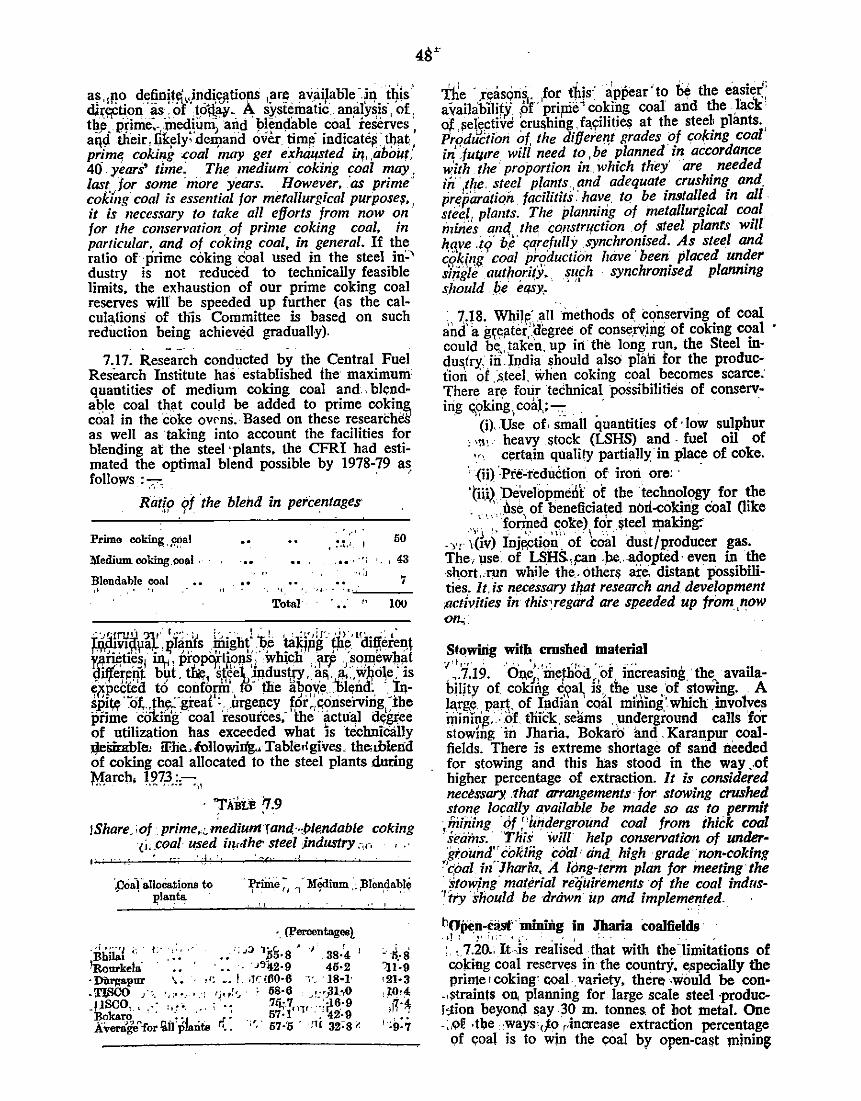
a~, ,no d~~nit\1' Y,irid~~tii:>ns ,Jlrl! !lvai1able )q il}is' d.i~~tion as. of to'ltll¥- A systematic analysis·. of. tl!_~·: ppme:. meqjlim; and 'Jl!~nl!able coal' reserVes ·• aql! their' fik~ly· d~and over. tim!i indic~te~ .. t!Ja~' primt; coki~g coal may get exhaltsted Ill, ,about; 40. years' time; The medium· coking coal may. last, .for some ·more years. . However, 'as primecoking coal is essential for metallurgical purpose!f, , it is necessary to take all efforts from now on· for the conservation. of prime coking coal, in particular, and of coking coal, in general. If the ratio of ·prime coking coal used in the sreel in~' dustry is not reduced to technically feasible limi~. the exhaustion of our prime coking coal reserves wiff be speeded up further (as the calculation!i of this Committee is based on such reduction being achieved gradua11y).
-7.17. Research conducred by the Central Fuel
Research Institute has established the maximum quantities of medium coking coal and . blend· a~Ie coal that could . be added to prime co kin~ coal in the coke ovrns. Based on these researches as well as mking into account the facilities for blending at the steel ·plants, the CFRI had estimated the optimal blend possible by 1978-79 as. follows :-:::;-; · ·
Ratio of the blend in percentages •IJ . J . •
Prime coking, .. ~al
Medium colting. coal .
.. ',-•.
, ~-V I ...... ·•;
50
•. ' 43 ... Blendable coal
···l 7 ... , "
., ,, . ····~: __ _ Total
,, 100
tv~~~- 'r~n'fs hngli{'Q~ Ui~\"'r ihe'"(mrei~n f,J!~tie~, %~ propo/tf.opsj' which p~rfo '·so~ewb~t C;!ifferFift bJ,lt. ~1 sMet3pdus~. a~ ~ .~l!<* .'is e,wected to conform. fo the abo~e :'blend: · l11· ~~!w -~~ .t~7~·gi:eat': .~rgency. for~;c.onsc::rvirig,:,the pnme coicing coal resources, the actual dt;gJ;-ee of utilization has exceeded what is technically JJeSimbiru iFheAollowin'g;.. Tableri gives" the; .blend of coking coal allocated to the steel plan~ during March, 1973:.-.... - -·~·-'-· '1\
· 'TAite "J.9 '
!Share. 'of: prime.cmediumTand,-.,/;J/endable coking (i' .coal ~ed il~-r,the· steel ,industry,-,., , ..
·.co,;r&uociations to • ' J,>lanta
•. (Peroontagesl
:iihili.:l ;; . I. .~: •• 'iJ~ 1iiS•8' I 38.'4 I
'ROurke!& · .. · J542·9 45·2 ·Dilrgapur \. ,,, •• I •1'<60·6 Y. ·J8·1· -TlSCO )·-.. •,;··~ -,_.r 'j•,~·j · 58·6 _..L·;flhO _psco, , ._·· ,,, .... , ... 14;7,1, .... ·'6:9 Bo~- . . . 57 ·1 .. ' '42· 9 ·~ro ..
1 .r.
AVerl(¥for.il'pa:riis 0 •• ·;.-_· 57·'5 · ·Jll 32:-s~o
,. ' t
c 5-8 ~1--9 •21·3 .10·4 ,,n I :9:7
Tlie . ,t!;aSQri~ .. ,for t~js: ~pJ?ear'to be the ea.sie< avaihibilit,Y or pripie' cokirig coal and the lack Of., ~e~ctive ~ru&hing, fa.~lities at the steel; plan~., Pr[!duCiion ?f. the dif/eren,t grades of co/cmg coal in futwe wzll need to, be planned m accordance with the. proportion in which they' are needed ih · the. steel plants , and adequate crushing and. pre~'aratiqn facilitits ·have. tq be in!!tal/ed in all . steel. plants. The planning of metallurgical coal milies am~ the construction of steel plants will h,q,ve ,i(/ b,e· c;a,rcfull~synchror:ised. As steel and cglf,(l!(: coal P.'.f!ductwn have been. placed unqer single autho_nty. .. ~l!fh . synchromsed plannmg should . b,e eqsy.
;, 7,~8. Whil(~ll methods 0~ ~qnserving .of coal and a g~~f!ter;.~egree. of conse.rn.pg of cokmg ~a! could b<;,taken. up n'i the long run, the Steel mdu~trx, .iii. India should also plan for the production of .:S.teel. when coking coal becomes scarce. There are four technical ·possibilities of conserving %lking; co~l,; c:: . . -. .
(i) . .Use of, small quantities of ·low sulphur , , 11 , heavy ~tock (LSHS) and . fuel oil of "' C!:rtain quality partially in plac_e of coke.
\ {ii) ··Pre"tedu6tion of iron ore: · · tiii) De'velopmeilt of the technology for the . . ' l'lse of beneficiated norl-coking c'oal Oike ,. ·. ·' fori'ned coke) for steel making:- · l' ~ ~' ·. ,_. . 1\:. ,· . \ -.. ', '.. . ', •
.,., \{IV) Inj~;<:tiQn. of coal dust/producer gas. The, use. of L~HS.,pan .~_.adopted· even in the sl1ort,.n~n while the .. other~ aie. dismnt possibilities, It, is necessary tljat research and development ;activities in this~ regard are speeded up from,now on.;
Stowirig with cmshed material 'I' I r·r· : ·' · · '.• ! : '11 • • ·- ·~ . ,.7,19. O~;~,e1; ineptod)>f increasing_· tbeo availa· bi]jty of coking ~.?a~ is, the .. ';l~e .~f ~ow!"g .. A la,rge part, of Ind1an coal m1rung. which . mvo1ves minin,g ... Of. tliicK:, seams . ,underground calls for stowing ·in Jharia. Bokaro and . Karan pur coalfields. There is extreme shortage of sand needed for stowing and this bas stood in the way ,.of higher percenrnge of extraction. It is considered necessary .that arrangements for stowing crushed stone locally available be made so as to permit
;fiifning qf :'underground coal from thick coal seants.. This will help conservation of under· 'gf.ouiur i:okiiig coal' dnd high grade non·coking ~·e,oal in'Jharfa, A long-term plan for meeting the stow,ing mat.erial requirements of the coal indus-
1try ·should be ·drawn up and impleme7Jted. ·
h(J~n-casf lnining in Jharia coalfields. . If 1 ~· r 1 ;- , "., . • ,
1 •. . , _
; ,7.20.;It,is realised that with the-Iimimtions of co!dng coal reserves in the countrY, e,specially the prime • coking· coaL variety, there .would be con·
.,$tJ:aints on. planning for large scale steel ·producT,;tion beyond say 30 m. tonnes of hot meml. One .;,of -tl;ie -ways• 0to ,.increase extraction percenmge
of c;oal is to win the coal by open-cast minins
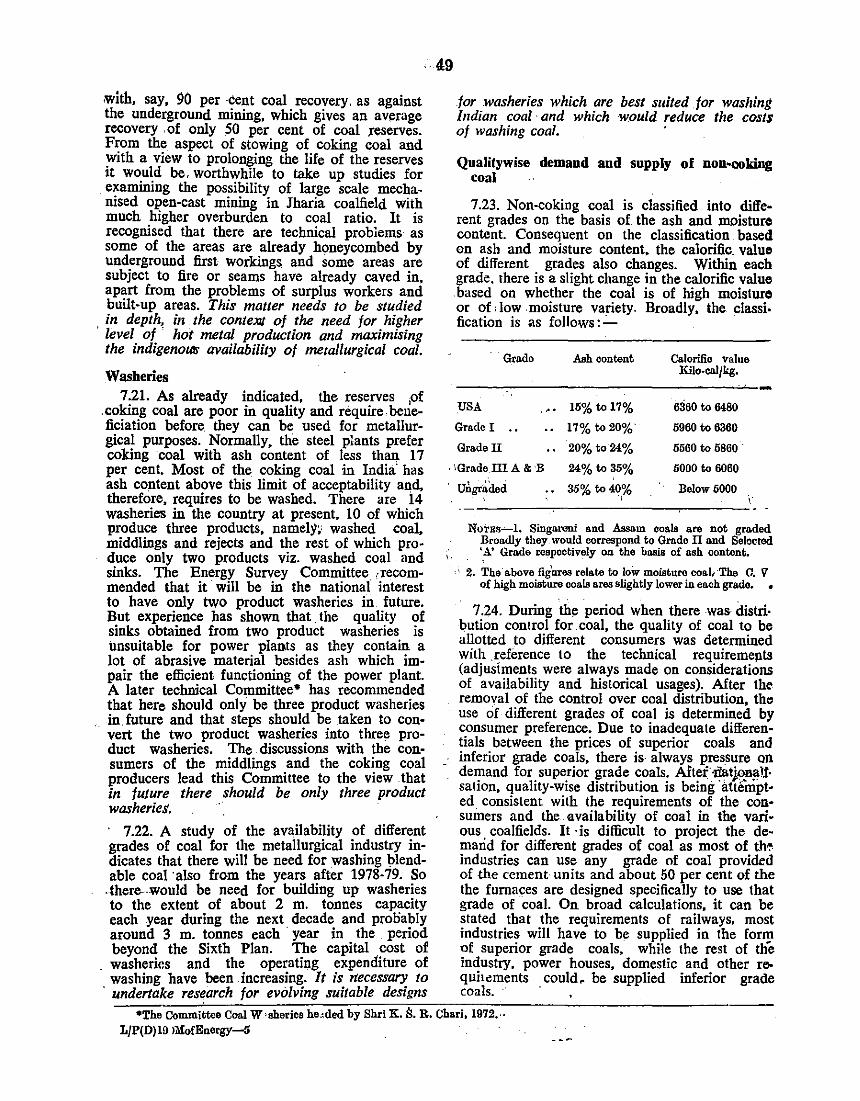
'49
:with, say, 90 per ·Cent coal recovery. as against the underground mining, which gives an average recovery of only 50 per cent of coal reserves. From the aspect of stowing of coking coal and with a view to prolonging the life of the reserves it would be, worthwhile to take up .studies for examining the possibility of large scale mechanised open-cast mining in Jharia coalfield with much higher overburden to coal ratio. It is recognised that there are technical problems as some of the areas are already honeycombed by underground first workings and some areas are subject to fire or seams have already caved in, apart from the problems of surplus workers and built-up areas. This matter needs to be studied
, in depth, in the conteJOI of the need for higher level of · hot metal production and maximising the indigenouts availability of metallurgical coal.
Washeries 7.21. As already indicated, the reserves ,of
.coking coal are poor in quality and require.beueficiation before they can be used for metallurgical purposes. Normally, the steel plants prefer coking coal with ash content of less than 17 per cent. Most of the coking coal in India' has ash content above this limit of acceptability and, therefore, requires to be washed. There are 14 washeries in the .country at present, 10 of which produce three products, namely~· washed coal, middlings and rejects and the rest of which produce only two products viz. washed coal and sinks. The Energy Survey Committee , recommended that it will be in the national interest to have only two product washeries in future. But experience has shown that the quality of sinks obtained from two product washeries is unsuitable for power plants as they contain a lot of abrasive material besides ash which impair the efficient functioning of the power plant. A later technical Committee• has recommended that here should only be three product washeries in. future and that steps should be taken to convert the two product washeries into three product washeries. The discussions with the consumers of the middlings and the coking coal producers lead this Committee to the view that in future there should be only three product washeries. ·
· 7.22. A study of the availability of different grades of coal for the metallurgical industry indicates that there will be need for washing !:>lendable coal ·also from the years after 1978-79. So
.there-would be need for building up washeries to the extent of about 2 m. tonnes capacity each year during the next decade and proliably around 3 m. tonnes each · year in the period beyond the Sixth Plan. The capital cost of washerir.s and the operating expenditure of washing have been increasing. It is necessary to
· undertake research for evolving suitable designs
for washeries which are best suited for washing Indian coal · and which would reduce the costs of washing coal.
Qualitywise demand and supply of non•ooking coal
7.23. Non-coking coal is classified into diffe· rent grades on the basis of the ash and moisture content. Consequent on the classification based on ash and moisture content. the calorific. value of different grades also changes. Within each grade. there is a slight change in the calorific value . based on whether the coal is of high moisture or of • low moisture variety. Broadly, the classi· fication is as follows:.:_
Grade Ash content Calorific val11e Kilo-ca!Jkg.
----~~----~----------~-USA
Grade I
Gradel!
· '•Grade.III A & B
' Utigr~ded
_. 15% to 17%
17% to 20%"
20% to24%
24%to35%
35% to40_%
636o to 6480
5960 to 6360
5560 to 5860 "
5000 to 6060
Below 5000 ·,. --------~----------~-------
Noi'Es-1. Singaroni and Assam coals are not graded Broadly they would correspond to Grade II and Selected ',A' Grade rcspcot~vely 011 the basis of ash content.
1 2. The· above fig'a.res relate to loW moisture co&IJ ·The C. V of high moisture coals ares slightly lower io. each grade. •
7 .24. During th~ period when there was. distri· bution control for coal, the quality of coal to be allotted to different consumers was determined with .reference to the technical requireme11ts (adjustments were always made on considerations of availability and historical usages). After the removal of the control over coal distribution, tho use of different grades of coal is determined by consumer preference. Due to inadequate differen· tials between the prices of superior coals and inferior grade coals, there is· always pressure on demand for superior grade coals. Aftefilatj.o,n!ll!· sat ion, quality-wise distribution is being "attempt• ed consistent with the requirements of the con· somers and the. availability of coal in the vari· ous coalfields. It ·is difficult to project the de· marid for different grades of coal as most of th~ industries can use any grade of coal provided of the cement units and about 50 per cent of the the furnaces are designed specifically to use that grade of coal. On broad calculations, it can be stated that the requirements of railways, most industries will have to be supplied in the form of superior grade coals, while the rest of tlie industry. power houses, domestic and other roquh~ments could. be supplied inferior grade coals.
*The Committee Coal W•aheriea he,ded by ShriK. S. R. Chari,1972 ... L/P(D)19 JMofEnergy-5
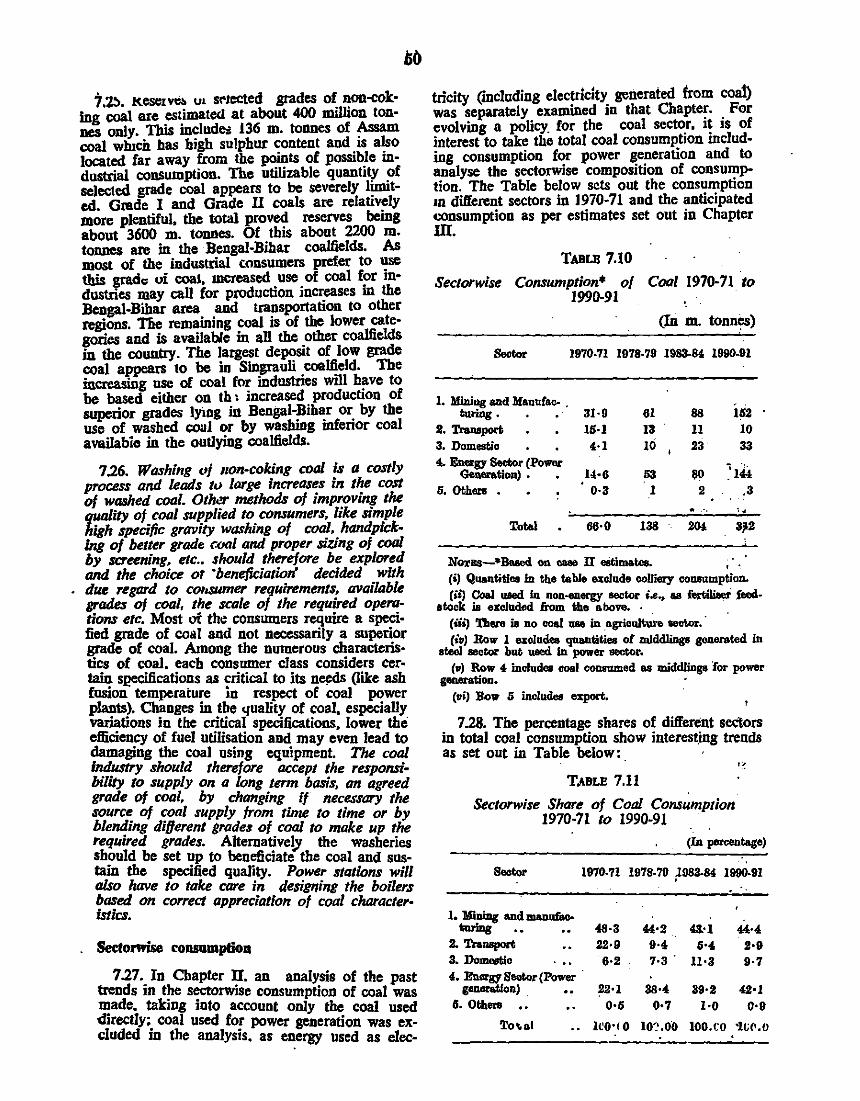
7.~. Kesc:xvlib u1 srJected grades of non-cok· ing coal are estimated at about 400 million ton· nes only. This include:J J36 m. tonnes of Assam coal which has high sulphur content and is also located far away from the points of possible in· dustrial consumption. The utilizable quantity of selected grade coal appears to be severely limit· ed. Gmde I and Grade ll coals are relatively more plentiful, the total proved reserves being about 3600 m. tonnes. Of this about 2200 m. tonnes are in the Bengal-Bihar coalfields. As most of the industrial consumers prefer to use this grade oi coal, mcreased use of coal for in· dustries may call for production increases in the Bengal-Bihar area and transportation to other regions. Tile remaining coal is of the lower categories and is available in all the other coalfields in the country. The largest deposit of low grade coal appears to be in Singrauli coalfield. The increasing use of coal for industries will have to be based either on th : increased production of superior grades lying in Bengal-Bihar or by the use of washed coal or by washing inferior coal availabie in the outlying coalfields.
7.26. Washing (•i 110n-coking cool is a costly process and leads tv Iorge increases in the cost of washed coal. Other methods of improving the quality of coal supplied to consumers, like simple high specific gravity washing of coal, handpicking of better grade C'.oal and proper sizing of cool by screening, etc.. should therefore be explored and the choice ot • beneficiatiolf decided with due regard to cot.sumer requirements, available grades of coal, the scale of the required operations etc. Most of tho: consumers require a specified grade of coal and not necessarily a superior grade of coal. Among the numerous characteristics of coal. each consumer class considers certain sl!CCifications as critical to its n~ds (like ash fusion temperaiure in respect of coal power plants). Changes in the <JUality of coal, especially variations in the critical specifications, lower the efficiency of fuel utilisation and may even lead to damaging the coal using equipment. The coal industry should therefore accept the responsi· bility to supply on a long term basis, an agreed grade of coal, by changing if necessary the source of coal supply from time to time or by blending different grades o/ coal to make up the required grades. AltemativeJy the washeries should be set up to beneficiate the coal and sustain the specified quality. Power stations will also have to take core in desicni111! the boilers based on correct appreciation of coal character· istics.
Sec:tonrise consumption
7.27 •. In Chapter ~· an analysis of the past trends m the sectoiWISe consumption of coal was ll!ade. taking into account ouly the coal used -directly; coal used for power generation was excluded in the analysis, as energy used as clec-
tricity (including electricity generated hom coa1) was separately examined in that Chapte~. For evolving a policy. for the coal sector, It is of interest to take the total coal consumption including consumption for power generation and to analyse the sectorwise composition of consumption. The Table below sets out the consumption m different sectors in 1970-71 and the anticipated consumption as per estimates set out in Chapter In.
TABLll 7.10
Sectorwise Consumption* of Coal 1970-71 to 1990-91
(In m. tonnes)
Sector 1970-71 1978-79 1983-84. 1990-91
I. Miniog and Manufac- . turing. 31·9 61 88 Ui2
2. Transpon 15·1 Ill li 10 3. Domestic ol·l 10 .23 33 ol. Eruqy Sector (PoWlll'
Geilert.tion) • • 14·6 53 .90 1
144 . 6. Others . 0·3 1 2 .3 . ·,
Total 66·0 138 201. 3jl2
NorBS-•Baoed on ...., II .Stimateo. , , (i) Quantitleo in the table 8llclude aoUiOIY co118UD1ption. (ii) Coal uoed In non-energy sector o.e., as fertiliaei feed.
stock is excluded from the above. · (iii) Thete is no coal use in agricul~ sectm. · (io) Bow 1 ezaludea quantitieo of middliDgs generated in
steel sector but used In power sector. (•) Row ol includeo coal conaumed as middlings for power
~tion. · (oi) Bow 6 includes e"Port.
7.28. The percentage shares of different sectors in total coal consumption show interest.ing trends as set out in Table below: . ·
T.~BLI! 7.11
Sectorwise Share of Coal Consumption 1970-71 to 1990-91
·~
(ba percentage)
Sector 1970-71 1978-79 ~983-84. 1990-91
1. Milling and manufac. turing •• .. 48·3 44•2 43.·1 «·4
.2. TraDBpOtt .22·9 9·4 6·4 2·9 3. Domestic ... 6·2 ' 7·3 11•3 9·7 4. Energy Sector (Power
ganaration) . .. .22•1 38·4 39·2 42·1 6. Others .. 0•6 0•7 1·0 0•9
To\al .. 1CO•f 0 10'!,00 100.to ·1tr.o

The share of total coal used in the mining and manufacturing sectors will continue to be around 45 per cent throughout the next two decades. The share of the energy sector will rise very rapidly in the next five -years and at a slower rate from then on. The share of the transport sector in the total coal will taper off very rapidly.
. The factors which infiu.ence these trends deserve careful consideration.
Use of coal in power sector ~.29. The electrical energy anticipated to be
denved from coal-based thermal power stations and the likely requirements of coal for generating that power are set out in Table below :
TABLB 7.12 Coal Requirements of the Power Sector
Eatimated Total You
1 -•as 1972-73° 1978-79 1983-84 1990-91
Power genera-tionfrom ooal based power planta (b. kWh)
2
35 74
lUi 224
0Proviaioual.
ooal demand
(m. tonne•)
3
19·6 53 80
144
Of (3) the likely supply of
Coal Middlings (m.) (m.
tonnes) tonnes)
4 5·
17·6 2 48 5 68 12
125 21
The demand for _coal for power generation may almost double in the next five years and may increase by a lower factor in the VI Plan. The share of middlings in the total coal consumed in the power sector may increase from 10 per cent in 1978-79 to 15 per cent by 1983-84 and continue at a little over this level thereafter.
51
7.30. Power sector will be the most important coal using sector in the economy in the coming years. The new developments in the power generation technology like large unit sizes of generating plants and the setting up of thermal power stations with a battery of generating plants at one site will call for the movement of large quantities of coal to a few consumption points. As an illustration, a power plant with 1000 MW capacity may require 3 million tonnes of coa_l per year; in other words. the power station will
. have to receive nearly 10,000 tonnes of coal per day. Such large movements to one destination will require detailed planning of the supply, years ahead of the requirements. The arrangements for supply of coal to large power stations should not only ensure the synchronised development of the coal mine and the power plant but also the setting up efficient handling systems at the mine site and the power station. Coal Fields Linkage Committee. recently established by the Government to examine and approve the specific coal supply points for each major consumer,
should consider the loading tirrangemenis at each end and give suitable .suggestions. The Electricity Boards which operate the power stations should give greater attention to the problems of coal handling and storage; optimal stock levels for each plant should be worked out with reference to the source of coal supply, its distance from the power plant, reliability of the rail-link, the seasonal variations in these factors, etc. In re· cent years the failure of the monsoon and the consequential reduction in the supply of energy from hydel system necessitated greater utilisation of the thermal system. At this stage the arrangements for coal supply proved inadequate which led to serious difficulties. In the coming years, when power sector will consume a very large share of total .coal, even small seasonal variations in the demand of coal will all'ect the coal supply to other sectors; coal industry cannot meet any sudden increases in coal demand without seriously curtailing supplies to other sectors. This difficulty may be mitigated to some extent by building up adequate stocks in the major power stations to meet the increased demands in the drought years. As indi_cated in Chapter IX. the preparation of coal wi\1, increase the efficiency of· fuel usage in power stations by about -10 per cent. It is also important to note that it may not be possible to supply large quantities like 3 mil· lion tonnes annually for a number of years from the same mines without variation in quality. In the major power plallts it would be useful to have arrangements for sizing, blending and preparation of coal before it is fed into the boilers so that the possible changes in quality of coal received, are taken care of.
7.31. Qualitywise, thermal power stations would have to consume as far as possible high ash coal or washery middlings. The power plants also have to use more elaborate material handling system, ash disposal system etc. It is, therefore, necessary that power plants should be given adequate price incentives to use the low grade coal. This is of particular significance in the pricing of "middling". The power projects based on the use of middlings are dependent on the level of utilisation of the washery for adequate middling supply and the power plants have to use this middling, even though relatively superior grade of coal may be available in the area. It is necessary therefore to have a suitable pricing poli~y for the USI' of middlings for power generation, if such use is to increase as estimated in the Report to about 21 million tonnes by 1990-91.
7:32. The supply of middlings to the power stations depends on the level of utilisation of the washeries which, in turn, would depend· on the demand for washed coal from the steel ind~stries. The estimates of the availability of middlings have been made with reference to certain assumed levels of steel production. If there· is any shortfall in steel production. there is bound to _be reduction in the availability of middlings .. It IS, therefore, important that the construction
of power plants based on middlings and steel plants is synchronised. Even if the plants come into operation simultaneously, there may be fluctuations in the .demand for coking coal. It may. therefore, be desirable to keep certain alternative sources of supply of inferior grade coals in the nearest possible source to serve as a contingent source pf supply.
'
.52
7.33. A region-wise analysis of the demand for coal for power generation indicates that the southern and the ~western regions will be short of coal supplies from their regions. It is difficult to forecast the region-wise requirements (Jf coal for power generation at different points of time in future. Broadly speaking, the northern region will be dependent heavily on the hyde! power stations supported by a system of thermal power stations .. The best source . .of supply of coal for power stations to north India would be Singrauli coalfields •. the large scale development of which is planned; but the development of Singrauli coalfields is not likely to keep pace with the qemand from power stations in the northern region. There is need, therefore, to increase the transport capacity from the Karanpura coalfields to north India. For the western region, the coalfields of Tawa Valley, · Pench-Kanhan, Korea-Rewa, Korba. Chanda, Kamptee and Umrer will be the convenient sources of supply. Of these. a large deposit with possibilities of open-cut mining is available in Korba. In addition, the coalfields of Hasdeo-Arand Raigarh etc. in Madhya Pradesh will have to be developed to meet the requirements of the western region power stations in the S~th _and Seventh Plan periods. Another possibility IS the movement of coal by ships along the coast from the Bengal-Bihar. region to power stations to be located at port sites in the western region. Careful planning for such power stations will have to be drawn up in advance of the Sixth Plan so that optimal transport arrangements could be planned. The southern region has Singareni coalfields and lignite deposits at Neyveli to provide the major fuel requirements for power ge~eration. Only one-fourth of the 2000 m. tonnes pf gross reserves of Singareni have been proved. There is need for proving more reserve b_y taking up detailed investigations of the depoSits, as early as possible in the Fifth Plan so as to provi~e ·the basis . for plan~g power plants for meeting the requuements m the Sixth Plan and the Seventh Plan. A number of examinations of the power requirements of the southern region l~a~ us to t~e ~onclusion. that development of ligmte ~epos1ts m Neyveh should be expedited
. to provide the fuel for thermal stations in the deep south. It may be noted that the southern region is fast exhausting the easy Tesources ·of hyde! pow~r and _has to go in for large hyde! power stations With . long gestations or a few micro hyde! power stations with minor contribution to energy requirements. There is therefore ne~ to plan for inc~eas.ed _productio~ of Singa~ rem coal and Neyveli Ligmte. Even then, consi-
dering the requirements for _other.·u~~;s aiso, t!Jete is a case for movement of . coal Jr>Hn .. Bei;~galBihar to southern region. It may be •necessary to examine the feasibility of setting .up power plants in southern region based . on coal from . Bengal. · Taking an overall view of power reqwrements and coal supply feasibility, it is ;clear th~t meaningful plans for thermal .power, _generatwn. have to be drawn up from now on. m a ·C'!ord!nate~ manner with the plans for coal prodl!Ctwn m th1s region. As the requirements of .power seet_or f!re fairly well established, the detaile.d · investigatiOn for coal mines to supply the ,·eqUirements ?f the power stations should be taken on .hand unme-diately · · · '
. Coal for mining and ruanufucturing sector 7.3.4. The requirements.'of steel industry_: have
already been disc1:1ssed in p~ragrap_hs re~attng to coking coal. The important ~dustrles USI?g noncoking coal are cement, · tex~e~. · p~per, · sugar. chemicals; jute, etc. The (~rttlizer D1~1:fstry has so far been using coal for steam raismg only. But during the Fifth Plan period, three fertiliz~r plants at Korba, Talcher and Rama~undam will Iequire coal as feedsto_ck .. In the _esWO.at_'<__Q[_Qe-
. mand we have taken note of the incre:jse in demand' from the major industries--including-the demand for coal as feedstock for nitrogenous fertilizer. The forecast. of demand ha~ :maile some marginal adjustments for the ·shifts. in, the
. technology of manufacture of. cement anti :·some improvements in efficiency ~n the other:· md~stries. Most of these industnes can use mfenor grades of coal; but , industr/es'like glass and certain chemical ind·ustries- 'll,nd some ·of the cement. units will require :~ilper-ior grades.; ?f· coal as the temperature to be ra,i~ed in these umts !Day be very high. It is. diffic~lt .. to. ~stimate regi?~wise demand for co·aJ for mdustnal uses. ln4IV1-dual industries;· except the cement plants a'nl:i the fertilizers plants. will :Iequire rdatively small quantities ·of cpa! as compared to the . po.y.:er plants. There is another category o~ ind_ustr.lal
. consumption of coal. namely. the bocM'kiln mdustry which will require cpa! for a large .D~inber of kilns all over the country, and each of. these consumers will require a small quantity. It' is in this context that the planning of coal dumps assumes importance. 'The dumps wi!l enaqle .~he individual · industries to . operate with lower mventory of coal without endangering 'tl\e security of supplies. The majo~ ·regions of coal demand for industrial use are fairly well ·known.· The cities of Bombay, Calcutta.' Madras. Ahmedabad, Patiala/Ludhiana·, Hyderabhd, Bang<~lore, Kanpur are examples of the industrial towns where there will be an· . increasing demand for coal for industrial use. lf coal requirements for the industrial consumers, which )Viii ihcrease. over time. is to be met satisfactorizy, coal .dump. will have to be set ·up in all the "'major .·industrial regions. · · ·. · , .,
7.35. It may be noted, that movement' to· .the coal dumps should also be supplemented by the
movement directl}l' ·to large consumers which can be plaiined -without reducing the efficiency of coal movement by rail. There would be a five-fold. increase in the next two decades in the requirement of cfoal for mining. and manufacturing sectots and this would call for detailed planning from now on and the locational policies regarding industries should be · consistent with the plants for -the production and movement of coal.
·,·
Coal," for transport sector l. • - \ ' • ' J '
'1'.96;•-Historieally, railways' .. were the largest single consumer of coal, but with the increasing intensity of traffic on. the railway system, steam locomotives have lost their advantage to diesel a}ld·, electric .locomotives. which can run faster ap.ct,. can haul.greater loads per train. The studies indicate that except on rail routes where the annual tr<1ffic is less than 5 m. tonnes, it would be uneconomic · to use the steam locos. It is, therefore, unavoidable that the use of coal in the·railway system would be slowly reduced .. (Optimisation of the traction with different modes of traction is discussed separately later). The steam locomotive fleet of the Indian Railways··in-·1990-91 is expected· to consist of about 5500 locos i.e. about 60 per cent oC1lhe existing number. The coal demand at that time would be about 10 m. tonnes: 'As the railway requirements ofcoal will get reduced from now on, tilll990·91, there is no; ·need to draw up special plans for ensuring the supply of coal to the railways.
t·· . . . · 7.37. Some quantities of coal are used for steamer serviCes· 'in the Ganga-Brahmaputra water-b11sed system. With the increased trade and co'riunerce between India and Bangladesh. this traffic :is likely to grow. But the quantities of coal will continue to be relatively small and, as this region is very near the coalfields, no special plans need to be drawn up for this purpose.
Coal for domestic sector
7.38. The domestic sector will require coal in aU its raw.forms to. be processed as a smokeless solid fuel or gas. The demand for soft coke' is kept under severe constraints by the lack of availability· of soft ·coke at the consumer. end. Since lhe pressure on ·forest fields and kerosene has to be' reduced,··the supply of coal to the domestic sector has to 'be increased. As calculated in this Report; the supply of coal to the domestic sector wilL;be more than tlouble in the Fifth and the Sixth ·Plan periods, and from then on, will increase at- a somewhat -lower· rate, . · .r;, ) - ' . . • .
53
be produced. The Committee had recommended in the report on the Fuel Policy for the Seventies that action should be taken to set up two low temperature carbonization plants and it is gratifying to note that action is being taken to set up two plants-one at Singareni and the other near Calcutta. In the context of the current oil situation, more units based on the LTC process may have to be set up. But throughout the period upto 1990-91, a major portion of the domestic coal requirements will have to be met by using the low grade coking coal which is available in the BengalBihar region. This will lead to an increase in the demand for railway movement of domestic coal from Bengal-Bihar to various parts of the country since the success of all efforts to supply soft coke to the domestic sector will depend on the capability of the railway system to move coal from Bengal-Bihar. The Committee would therefore recommend a careful plan to be drawn up for increased movement of soft coke from the BengalBihar. region to the urban centres in the country.
,(·Exports v . 7.40. Indian coal with its high .ash content has
a handicap in competing with coal from other coal exporting countries. The countries which are geographically near to India and are poor in energy resources, would be dependent on export· ed coal from India. However, the increasing pollution consciousness in different countries may increase the demand and the fact for Indian coal which has a very low content of sulphur; this may, in course of time, help in developing an export market for Indian coal. We·have esti· mated a somewhat modest export possibility of only 3 m. tonnes by 1990-91, This should be taken as a lower limit and · separate plans for opening up export-based coal mines near the ports of Haldia and Paradeep may be drawn up; and possibilities of exporting this coal to Bangladesh and Burma and countries in the Pacific region will have to be separately considered without affecting. domestic requirements.
I General problems of the coal indnstry
7.41. The coal industry as a whole has certain general problems which require very careful examination. These are-
(l)
(2)
(3) (4)
Problems relating to increasing productivity in the coal mines; Developing the transport capacity for coal move!J1ent; Beneficiation of coal to gas; and Equipment supplies for coal production.
/i Productivity . . . ~_:t;7.39. Most· of.- the- processes of conversion of CR&kto smokeless ~olid fuel with relatively lower ~JJ,VAstment •costs,-ate based on the use of coking COlli> though of lower grades. Non-coking coal can .also be processed. :by adopting the low temperature carboni2;ation, process which will require .higher. level of investment per unit of soft coke tothc;
r 7.42. Productivity' in. the mines is normally measured in terms of "output per manshift" (OMS). The OMS in mines will vary throughogt
<;ountry -with the extent qf mechanizatioq . . .
adopted in India. In the early days of the coal industry in India, the mines were mostly nonmechanized and underground where production was based on primitive methods. The productivity in the mines was very low. But with the increasing mechanization in the mines, there has been steady increase in the OMS. The new mines which are opened up as Open-cast mines are based on the use of sophisticated machines like draglines, excavators, shovels and dumpers· which give high productivity. In the new mines which are proposed to be opened, the output per manshift is around 0.8 tonnes per manshift in underground mines and about 4.5 tonnes in open-cast. The steady increase in the OMS of underground mines and open-cast mines and the toflll coal industry can be seen from the Table below:-
TABLE 7.13
Trend of output per manshift in coal mines
Year
1951 1956 1961 1966 1971 1972
O.M.S. of all persona in
Below Open Below All in the ground cast ground mines
and open cast
0·58 0·54 0·57 0·35 0·61 0·52 0·60 0·39 0·66 0·64 0·65 0·4(1 0·76 0·99 0·79 0·56
0·95 0·67 0·94 0·66
Bou:aC11-Statistica of Mines in India (for yeare upto 1966) and Monthly Coal Bulletin for 1971 and 1972, both published by Director General of Minea Safety.
54
. !t is noteworthy that inspite of the low productiVIty of around 0.6 tonnes per man shift, the wage cost of Indian coal is low and this makes the coal produced in India at the pit-mouth among the cheapest in the world. A discussion on the productivity and wage cost and th~ principles of production cost may be seen in Chapter XI. It is of the utmost importance thai if the coal production in the country is to go up at the rapid rate envisaged in this report productivity in the coal mining industry must increase. It will not be meaningful to compare the productivity in India as a whole with the productivity of the coal industry in other conn• tries when the mixture of technology used in coal production in our country is different from that of the other countries. But it would be valid to compare the production in specific mines · proposed for opening up now with the· productivity in similar mines in other. countries which also used the same kind of equipment. An ana• lysis of the new coal mining. proposals indicate$ that the anticipated output per man shift in these ~mpare$ favourably with that of the mines of
a similar kind elsewhere; but an expost facto analysis of the mines which have been opened up during the Third and Fourth Plan periods shows that in very few mines the OMS has come up to the levels anticipated in the project reports. The reason for this is poor utilization of machines. While the labour force engaged in the mine is often in excess of the anticipated labour force, the machine utilization is very low compared to the projections made at the time of approving the mine proposals. The following Table sets out the expected and actual· utilization of coal mining equipment in a major coal producing company.
TABLE 7.14
Expected and actual utilization of certain items of coal mining machinery in a major .coal producing company.
Item of Equipment
A. 0pen-ctJ81 Ef[Utpmem I. Shovels •• 2. Draglineo •• 3. Dumpere •• 4. Dozere .• 5. Coal haulers 6. Drills .. • • 7. Overall weighted avarage
Expected Actual utiliza- utiliza-tion (All tion 19'/1 percentage ofllhift houre)
60·1 M·• 77·2 ·1·2 88·7 18·8 •1-11 !11·8 52·6 15·8 60·0 20·6 4'·5 21·4
B· Underground Ef[Uipm<nJ (face machinery)
1. Shuttle care .. 2. Loadere . 3. Coal cutting maohineo
Percen• tage of total• nnmher opara· tion
71 71 86
*Expected productivity of these machinea and the actual realization are not available.
7.43. Almost all the mines proposed for de· riving additional production are mechanised mines. The production per man or production per machine in these mines can be realised as per the anticipation only if the machines arc properly maintained and used and the labour is adequately trained in the use and maintenance of these machines. The mechanization of mines wiU have to be accompanied by trainins of tho . mining labour to use these machines. In tho past, part of the labour used in mines, especially the .privately owned mines, were contract labour who were not given the benefits which were le!ally due to coal mine workers. With the nationalization of the mines, all the workers will receive tbeir le~l dt~es. Mo~e9ye~, lowcrin$ gf tttodgc~i·

vity will lead to huge losses to the coal industry which. ·could be made up only by increasing the-cost of coal to the consumer. The Committe would therefore like to emphasise the importance of increasing productivity in the coal industry and would recommend that proper steps should immediately be initiated /or the optimal use and maintenance of machines and for training .coal mine workers in the use and maintenance of the equipment.
Coal lransport.
7.44. Cpa! can be transported by railways, roadways, water routes, inland and coastal pipelines and rope ways. The selection of the specific mode of transport for coal will depend on the characteristics of the consuming industry, its distance from 'tlte supplying coal mine, the characteristics of the terrain between the point of supply and the point of consumption and the relative cost of the different modes of transport as paid by, the consumer. In India so far, the coall prQduction has been. from numerous coal mines
1.
each producing small quantities; and the consumers, except the steel industry, have been rela- I lively small consumers. The emergence of large i power stating fertilizer factories and cement fac_tories and the possible organization of coal dumps would increase the demand at specific points to quantities over a million tonnes. Similarly, after the nationalization of the industry, a number of coal mines are being combined to form large production units. oTbis would call for changes in the modes of procedure and transport so far practised . for moving coal in India.
7.45. The studies made by the Committee indicate · that. the railways constitute the most economic way of moving coal for most of the consuming classes and consumer locations in India. CoaL transport in this country has been dependent on the railways for the carriage of about 85 per cent of the total despatches a!ld will continue to be dependent on it for a major percentage in the future. This would entail a gigantic task for the railways which would be called upon. by 1990-91 to move about four ~~es the quantity of coal now transported. The sttmg of super-thermal power stations in the coalfields and the development of alternative means of transport like coastal shipping. inland waterwars etc: .are designed to lessen the strain on the railways. But the quantity of coal that could be used at the coalfield or moved by means other th~n. rail will always remain small. We reiterate that adequate attention should be paid to rail transport planning in regard to development _of
· additional line· capacity, yard capacity and S!K· milling and communication which would faclli· tate· speedier turn-over of wqgons as well .as au(?mentation of wagon fleet. Thts would requtre substantial investments in the next two plan periods as the lead time required is considerable. The· collieries .have also an important role to play by maximising th~ rn<:>YI?!D~nt 9f coal' in
block rakes moving from single loading points to single destinations and mechanisation of load· ing and unloading in all large output and consumption centres, modifying siding layouts to facilitate quick loading and speeding.
7.46. Planning for coal moveiru:nt cannot be done in the light of broad directions of movement. Recent experience shows that even if the railway track capacity is adequate in certain directions, the limitations on the railway track capacity from the mine to the main rail load centres and the capacities from the main track to the consumer point have made it difficnlt to increase the quantity of coal that is to be mo'!ed by the railways. Detailed plans for transporting the required quantities from the pit-mouth to the consuming centres have to be formulated. Such plan should also give adequate attention to the optimal loading and unloading at the two_ ends. As indicated, since more than 50 per cent of the coal will have to be produced in the Bengal• Bihar area and as inter-regional movement will be required from the eastern region to all the other three regions of the country, the su<:ce;9s in achieving the required coal. move~ent by rai!· ways will depen~ largely on mcreasm!l th~ faci· lilies for Joadmg and transportation m the Bengal-Bihar area and for moving coal across well known bottlenecks in the railway system like Mughalsarai. Waltair, the Section over the Western ghats. etc. The Committee would recommended that serious consideration should be given to the problems of- coal movement in the Bengal-Bihar area and for removal of the factors which is not the capacity for Bengal/ Bihar and . movement in specific sections towards northern, western and the southern regions.
7.47. The Committee examined in detail the possibility of ~sing altema_tive m?des of transport, besides ratlways. and m the light of tec~oeconomic analysis, would rank the followmg modes in the order of their importance :-
1. Coastal shipping. 2. Roadways. 3. Ropeways. 4. Inland water; and 5. Slurry Pipelines.
Coastal shippin& 7.48. The cost studies of moying of coal by
coastal shipping from Bengal-B1har to the southem and western ports indicate that . under certain conditions, it can be as economtcal ~ movement by railways inspite of the fact that m all cases of coal movement by sea .. coal has to be first taken by rail from coal mmes to tho ports in . the eastern coast, namely .. CalcuttaT Haldia. Jnspite of the fact that Ind~an coa~ line is triangular in shape and the btgger sb!ps have to go around the island of Ceylon which makes the distal\~~ {l"om places frqm tlt,e c:a3t

56
.:oast to west coast much longer than the distance overland, rail-cum-sea route can be as ~conomical as _rail. Currently. the costs of carrymg coal by rail-cum-sea route from Bengal-Bihar to Madras or to Bombay or. Kandla are higher than the costs of carrying it by the all rail route due to the small size of ships used and the delays at Calcutta port for loading and at the receiving port for unloading. The total cost of transport by sea falls into three elements (i) s!Jips' internal ~ost rt:sulting directly from operations of the shtp whtle at sea and while at the ports for collecting or unloading coal;, (ii) port costs and (iii) the cargo costs which relate to loading and unloading of the cargo. Of these the internal costs while the· ship is at the port has 0e largest weight at present. When the ship's Ioadmg and unloading time is reduced from 9 · days at Calcutta and 8 days at Madras to two days at ·Calcutta and to 3 days at Madras the cost of carrying coal gets reduced by one-third. The completion of the Haldia port for coal handling facilities is expected to reduce the loading time at the eastern ports to about 2 days. Studies . were made assuming the loading time at Haldia port as 3 days and unloading time at Bombay or Madras as 2. · These indicated . that costs o£ carrying coal by rail-cum-sea will compare favourably with the costs of carrying coal by al~ rail route. Taking:- note of these factors. the Fifth Five Year Plan envisages an increase in· the movement of coal by coastal ships by 5 m. tonnes by 1978-79. There are possibilities of increasing this in the years beyond 1978-79. The quantities to be moved by sea wonld depend· on the point at which the demand develops and the-capacity of the rail system. But it is·reasonable to anticipate that there will be need for increasing the quantities of coal to be moved by sea over the entire period up to I 990-91. This would call for developing unloading facilities at specific points in the southern and western codsts where power stations or other coal consuming industries or coal dumps might be set up.
Roads 7.49. Road movement of coal has been in
creasing in the last few years as a result of the shortfall in the planned movement of coal by rail. But cost studies indicate that for short leads for consumers whose specific demand may be small,· the movement of coal by ·road will. be economical compared to the movement by ·rail.· · The. increasing., demand for soft coke anticipated in the rei>ort will also increase the use o(. roadways for moving coal. The setting up of coal dumps in major industrial areas will call for coordinated planning for movement of coal from the dumps to the consumer points by road alongwith the plans for moving coal from tfte mines ~" the dumps, · ·
Ropeways
7.50. Ropeway transport of coal is used at present where the conditions are favourable such as ,from a colliery to a nearby washery. or power house. It will continue to have this limited utility in such areas especially where the terrain is unsuitable for other means of transport. Ropeway transport cannot have large scale application as the cost of transport is generall'Y higher than that by rail.
Coal Slurry pipeline
7.51. The conversion of solid fuel or coal into slurry and its transportation hydraulically through pipeline is one of the possible alternate means of transporting coal so as to provide some relief to the overburdened railways. This mode of transport is best suited for the thermal power stations and some specific 'bulk consumers whose need_ for fuel is fairly large and constant.
The advantages in the transportation of coal in slurry form through pipeline are as follows :-
• (i) Pipeline can be laid through mountains, deserts, rivers etc.
(ii) Fewer personnel required for erection, operation and maintenance.
(iii) As moving machines are located in pumping and boosting stations, the system is reliable and safe.
(iv) Loss of coal during transit is eliminated and the dust problem is minimised. The deterioration during transit is also pre-vented. -
(v) Railway sidings, coal dumping and coal · storage are eliminated.
.. (vi) In mining .industry, it has facilitated adoption of hydraulic mining and transport which has reduced accident rates and dust hazards.
.. (vii) Hydraulic transportation is possible in . · ·all weather conditions; and
(viii) Capital and operating costs for power .. plants designed to handle- pipeline coal
are less. .
A good deal of .research· on hydraulic transportation: of coal has been done in different countries of the world. IIi India, the first study of this mode of transport was. made by the World Bank Study Team on Coal Transport in 1964 for two specific locations. The study revealed . that the cost was unecoMmic as compared to. cost of movement by. rail, IIi general, however, the larger the pipeline, .the more the quantity of coal despatched. Accordingly, as both the. operating and investmen\,_cost -per tonne might decrease with the in· creased_ capacity, the. coal slurry pipeline would apJ).Car. to be more suitable for large size or super
thertp!!l power stations. Jt wpul4, tfwftore, seem
57.;
desirable that the Central Water and Power Commission should conduct a feasibility study for the transportation of coal by pipeline ·for a super thermal power station of more than. 1,000 MW capacity. Singrauli-Delhi pipeline may be an ideal case for such a study both for the urgent need of power- supply in North India, which is increasing in volume. While conducting this study, the railways should indicate their plans as to the extent upto which they can develop rail transport facilities to meet the corresponding demand for coal for the above power station from Sil!.grauli.
Inland 'waterways
7.52. One of the main advantages of an Inland Waterways system is that normally it is considered that there is practically no investment for the "permanent way". Coal is a bulky material and its transport by Inland Waterways is reported to be economical in certain foreign countries. In India. the only waterway system which offers possibility for the transport of coal is the river Ganga. The principal problem in the use of the Ganga river system is that the major coalfields are situated at a distance of about 200 kilo meters from the logical loading points on the river thus involving the movement of coal by road in addition to the river movement. The characteristics of the river. such as the . channel depth. vary considerably from season to season. · The World Bank Study Team on Coal Transport
.. had made a cost study in 1963-64 and found that the cost to the economy of transporting coal to Allahabad was very much higher than the corresponding cosf by rail· transport. The Inland Water Transport Committee had made a study in 1968 and worked out the cost at a lower figure: The difference was largely due to the fact that the latter study assumed a higher speed and also a higher capacity for the barges. In order to supplement the available rail capacity for the movement of coal to northern India, it would be useful to make a careful study of the techno-economic feasibility of transport by river to /Selected towns like V aranasi, Allahabad etc. We would. however, emphasise that for the scheme ro be successful, large scale river training schemes will have to be taken in hand and a mavigable -channel marked throughout the course; Aids for ni~?ht navi~?ation may also have to be· provided if the turn-round-time has to be kept within economic limits.
Gasification of coal · . 7.53:· Gasification of coal and its supply by
pipeli1:ui . to consumers has been a~vo_cated from time to. time with a view to ach1evmg one or more- of the following objectives:-
. (~t reducti~~ in the dependence- on rail-. , ways for . movement of energy. or for
reduction of the .cost of coallmovement; .
"(ii) supply a number· of forms of fuels to consumers who are reluctant to use coal which is a dirty fuel;
(iii) substitution use of fuel oil for kerosene whose use involves heavy foreign exchange expenditure and thus reduction
, in the cost to the economy of fuels; . (iv) mitigating the problems of pollution.
7.54. The consumers' preference for a fuel will depend on the relative cost to the consumer of ·different fuels including the cost of storage, cost of convenience and the cost of the discomforts in using certain fuels and the cost of ap· pliances for using the different fuels. In the national interest, the substitution of fuels has been• ·considered -in the light of the cost to the nation of supplying the different fuel forms. Gasification of coal can be achieved by converting coal by several gasification techniques available to form gas of low therinal value, normally called the low BTU* gas with the thermal value of about 400-450 BTU per standard cubic foot (scftl. An enriched gas of about 900-1,100 BTU per standard cubic foot called Substitute Nl\tural Gas (SNG) can also be produced.
7.55. SNG manufacture calls for more sophisticated· technology and is not normally resorted to unless required by circumstances. When gas has to -be carried over long_ distances, pipeline cos.t depends on the volume of gas to be transported and. as such. SNG which has more than ?t ·times thermal- value per unit volume of gas 1s preferred. Under other circumstarices normally low BTU gas technology is adopted~ The standard size of equipment today is normally considered to be having capacity of 100 m. scft per day which will consume about 1 m. tonnes of coal· per year. Under Indian conditions (at 1973-74 prices). plant of this size will cost about Rs. 60 crores. It may be recalled that the investment for extracting a million tonnes of coal will be about Rs. 10 to 12 crores.
7.56. Gasification· is; therefore. a: costly process and fixed charges. for the production of gas are about· 75 per cent ··of the cost of coal gas; The cost· of· coal gas increases the cost per unit of heat by about 4-5 times as compared· to tbe cost of coal; Generally'. industrial consumers who can consume -coal directly will be reluctant to ·use gas. at such, a high cost M the higher cost of gas will rtot be off -set under normal· circumstances by' the convenience involved in . using ·gas, instead of solid coal. The investment cost for production.,'of gas of one "Unit of heat value is not significantly different even if SNG process is adopted. Tl)ough 100 m. eft. of SNG. gives over 2-! times the heat value as compared to lOO m";.ft. of:,low·B;rU gas,' th'e· investment~ cost. of SNG plant is also about 2-!"times the cost of -a similar' size low BTU gas plant. The pipeline· cost when· compared to the cost of .
*Thls is sometimes referre~ to "' in~ermedhto BTU gas to dilf"erentiate it from ~a.s of lower BTU, say, 220 BTU per ¢"t,

transporting coal by rail also becomes uneconomic unless the gas. to be transported is in very large quantities (several times larger than the 100 m. eft. per day size examined). Such large volumes of gas can be consumed only. in the industry sector or power sector· and these sectors are unlikely to prefer coal gas in place of solid coal in view of the four-to-five fold increase in the price pertherm of energy when it is obtained in the·· form of gas. Domestic consumers prefer a clean and convenient fuel even if it is considerably costly compared to other fuels; but the consumption needs of households in India are very low per household as spare heating is not required in this country as in Europe and other western nations. A city of a million households or nearly 5 million people can be served with domestic coal gas of 100 m. scft per day.
7.57. It is to be noted that the use of coal gas in house-holds will call for additional private investments in the form of pipelines within the household, meter for measuring the gas supply and appliances for burning gas. These are likely to be over Rs 650 per household. Public investment in laying the pipelines to the households is likely to cost around Rs. 500 per household even when the density of population is 10,000 'per sq. mile and all the households in the locality are forced to take gas connections. It is, therefore, difficult to foresee any large size gas plants located at the pithead transporting gas for industrial or domestic users far away from cities; but in major cities like Bombay and Calcutta, gas plants located near the cities with smaller capacities may be a viable proposition . .
58
7.58. However, several improvements are being developed in coal gasification technology which may reduce the cost of gasification. Simul-· taneously, research and development is being done on the use of gas and steam (dual cycle) in thermal power station using .low BTU gas which will increase the thermal efficiency of power stations. As the work on these developments gets commercialised. there may be a case for gasification of coal for use in large thermal power stations using gas steam dual cycle. Coal gasification is also of interest to India as fertilizer production based on coal is a viable proposition under Indian conditions and such production involves gasification of coal as a preliminary step. · Research and development should, therefore, be continued on the techno-economic aspects of gasi· fication and speCific possibilities should be investigated for using poor quality coal for ·gasification and for use in industrial locaitons.
Machlnery requirements
7.59. The method of extraction of coal depends upon various geological factors. mainly the thickness of the overburden and of the coal seam. Due to historical reasons the major part of the produ~ion of co~l in ~dia (about 83 per cent)
comes from underground mines. The proportion of open-cast mines is bound to increase significantly in the future with the development of coal mines in the outlying coalfields where the surface area of the coalfields is relatively free from roads, railway lines and buildings. Open-cast mines have the following advantages over under-ground mines:-
(i) they can attain capacity production in about 4 years as compared to 6 years for shallow underground mines and 10-12 years from underground mines;
(ii) the capital investment is comparable to that of shallow underground mines but significantly less than that of deep underground mines.
(iii) mu,ch higher productivity is possible through the deployment of heavy earthmoving machinery.
(iv) 80 to 90 per cent recovery of the coal in situ is possible as against 50-60 per cent in underground mines.
(v) cost of production is likely to be cheaper.
(vi) hazards of accidents due to gas explo-sion are minimised.
As against these several advantages, one disadvantage today is that the current capacity of indigenouS' industry to supply large size earth moving equipment like draglines, shovels and dumpers is inadequate to meet the demand arising out of the contemplated very large increase in coal production. It is, therefore necessary for the Government to take steps to expand the indigenous capacity for heavy earth moving equipment. While doing so, it would be useful to standardise the design at an optimum level of utilising capacity for each equipment.
7.60. With regard to underground m.mmg equipment. it is stated that the capacity available at the Mining and Allied Machinery Corporation, Durgapur and various private manufacturers 'is adequate 1Jo meet current needs except for certain pieces of sophisticated equipment. We repeat the suggestion made in our first repori that ti Committee of representatives of the concerned Departments and organisations should make an assessment of the indigenous capacity for the manufacture of coal mining machinery. suggest increases in capacity and fix import requirements for the period till the indigenous capacity catches up with the demand. This Committte or a group of technical experts nominated by it should devote itself to the task of standardising the equipment to be obtained for the future programme of production. It may be. made obligatory for the equipment manufacturers to produce a certain quantity of spares for the machines every year. to avoid the con'tinuance of the situation where indigenous equipm~f1t is idle for l}'ant of spare!(.
7.61. Moreover, as already stated. where the production of the required quantity of coal is possible by means of different tecliiJ.ologies with varying levels of machinery, the selection of the optimal technology should be made on economic grounds using appropriate weightages for machine utilisation under Indian conditions and for the availability of abundant labour force. It. however, appears that since the production increase particularly of coal for thermal power generation is so large, extensive use of machines is inevitable especially in the coming decade.
Lignite 7.62. Lignite as a mineral is a semi-formed
coal having lower calorific value and inferior to bituminous coal. The average calorific value of lignite is about 2.800 k. cal./kg. It has a high percentage of moisture (about 50 per cent) but the ash content is very low (3 to 4 per cent). Lignite can be used as a fuel for power generation as well as for the production of briquettes for domestic use. It has also got a more valuable use for the production of urea. The biggest deposit of lignite in India occurs at Neyveli in Tamil Nadu. The proved reserves amount to over 1, 700 m. tonnes and the gross reserves to about 1,900 m. tonnes. Small. deposits of lignite are also found in Gujarat, Rajasthan and Jammu and Kashmir. Large scale utilization of lignite takes place at Neyveli. The scheme as originally sanctioned envisaged the following:-
(i) mining of 3.5 m. tonnes of lignite per annum;
(ii) generation of 250 MW of power:
(iii) fertilizer scheme to produce 1,52,000 tonnes of urea:
(iv) manufacture of 7 .20.0~0 tonn~s . of lignite briquettes and their carbomsation to produce 3,80,000 tonnes of carbonised briquettes: and
(v) clay washing scheme.
59
During the Third Plan. expansion of the power station from 250 MW to 400 MW and the matching expansion of the mine from 3.5 to ?.5 m. tonnes were approved. A further~ expansiOn of the power statio'!- from 400 MW t_? 600 MW with balancing eqmpment for the mt'!-e ~o produce about 6 to 6.5 m. tonnes of l~gntte was approved for the Fourth Plan. Expenence has, however. shown that the highest production that has been achieved so far has been only ~.28 m. toffiles in 1969-70. Since then, the production bas
gone down and the report of the Expert Committee submitted in March, 1973, has assessed the present capacity of the mine at 3.6 m. tonnes only. The Expert Committee has also suggested the procurement of certain mining equipment valued at about Rs. 11.6 crores to achieve a pro· duction of 4.5 m. tonnes of lignite. This quantity will not be sufficient to meet the full require· ments of the 600 MW power station and the fertilizer and briquetting plants. This Committee made a detailed study of the economics of power generation at Neyveli vis-a-vis the alternative of generating power at Singareni and transmitting it to the Tamil Nadu grid and transporting coal from Singareni and generating power at Ennore near Madras. The Committee has come to the conclusion that on economics alone. the generation of power based on Neyveli Lignite is justified. This Committee, therefore, strongly recommends that the second mine-cut at Neyveli be taken up to meet the power and fuel requirements of the region. ·
7.63. Since adequate depo~ts (nearly 2,000 m. tonnes), the bulk of which .have been. proved, are available at Neyveli, it would be possible to plan a production of 20 m. tonnes per annum of lignite in due course. Lignite has value not only as a fuel but also as a feedstock for the manu· facture of fertilizer. Considering the needs of the region, we feel that a balance should be struck to meet . the requirements for fertilizer production and for po,wer generation. The success of Leco as a domestic fuel justifies the expansion of the briquetting and carbonisation plant also to meet the domestic fuel requirements of Tamil Nadu. Kamataka and Kerala. Tentatively, we are estimating the lignite requirements of the power sector at 14 m. tonnes and the fertilizer feedstock and briquetting needs at 6 m. tonnes by 1990-91.
7.64. The- mining of lignite requires special equipments which are "custom built". It is understood that the · possibilities of manufacturing bucket wheel excavators, indigenously, are being examined. This examination should be speeded up and the manufacture of the required number of excavators taken- up in a coordinated manner.
7.65. The financial investment in the lignite mine is quite heavy. lnspite of the heavy invest• ment, the Committee strongly recommends the openin~ up of additional mines at Neyveli and increasing- the production to an optimal level of about 20 m. tonnes for the full utilisation of thWI -fuel tesource which has a tremendous locational advantage.-
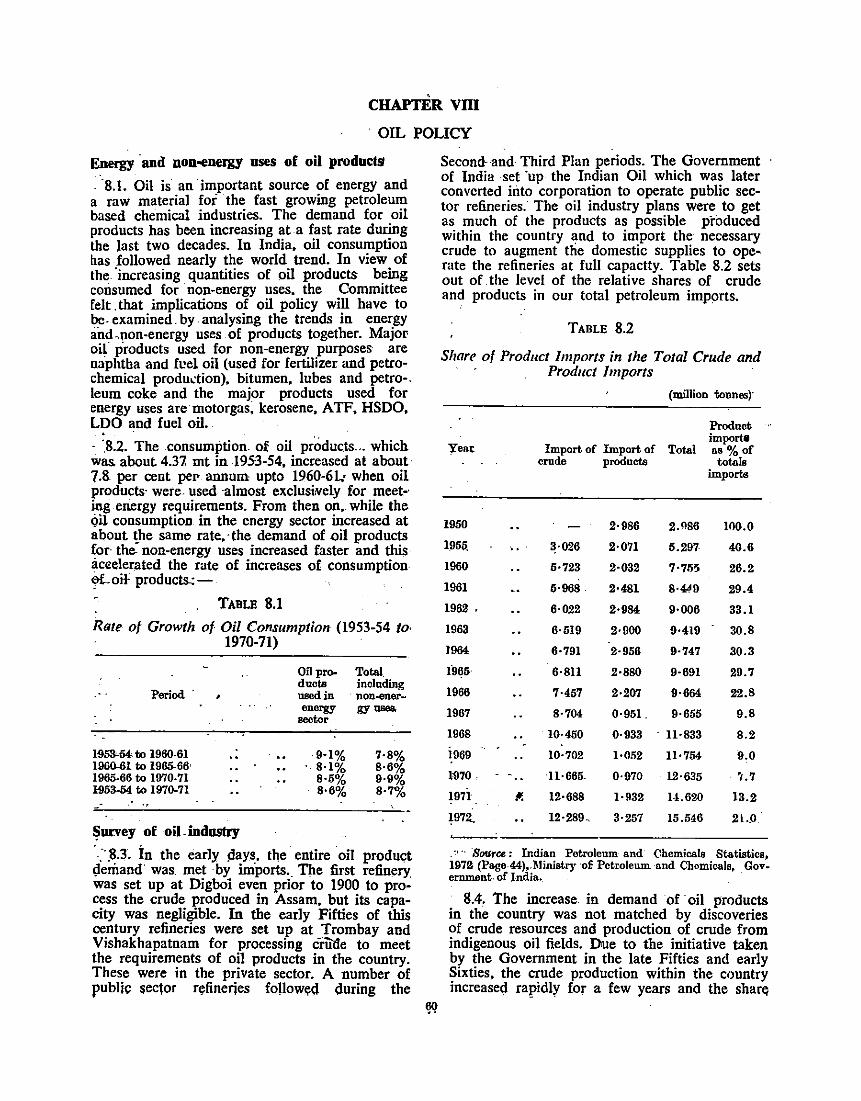
ciiAP'I'ER vm OIL POLICY
Energy -and non-energy uses of oil products
-8.1. Oil is an important source of energy and a raw material for the fast growing petroleum based chemical industries. The demand for oil products has been increasing at a fast rate during the last two decades. In India. oil consumption has followed nearly the world trend. In view of the 'increasing quantities of oil products being consumed for non-energy uses. the C1>mmittee felt_ that implications of oil policy will have to be. examined_ by- analysing the trends in energy and,non-energy uses .of products together. Major oil" products used for non-energy purposes· are naphtha and fuel oil (used for fertilizer and petro· chemical produ.:tion). bitumen, lubes and petro·. leum coke and the major products used for energy uses are motorgas; kerosene, ATF, HSDO. LDO and fuel oil.
· ·.8.2. The consumption. of oil products ... which was. about 4.37. mt in -195-3-54, increased at about 7.& per cent per> annum upto 1960-611 when oil products- were. used -almost exclusively for meet~· ing energy requirements. From then on •. while the (Ill consumption in the energy sector increased at a flout ~he same rate.· the demand of oil products for- the non-energy uses increased faster and this aceelerated the rate of increases of consumption ~oil- products~-
TABLE 8.1
Rate of Growth of Oil Consumption (1953-54 to-1970-71)
Period -
1jj5~54; to 1960-61 1960-61 to 1965-66· 1965-66 to 1970-71 1953-54 to 1970-71 -·
~ur.vey of oil-industry
Oil pro· ducts nsedin energy
sector
·9·1% 8·1% 8·5% 8·6%
Total inclnding non-ener-gy use&
7·8% 8·6% 9·9% 8·7",{,
:- _8.3. In the early !lays, the entire oil product demand· was. met by iniports. _ T!Ie first refinery was set up at Digboi even prior to 1900 to pro· cess the crude produced in Assam, but its capa· city was negligible. In the early Fifties of this century refineries were set up at Trombay and Vishakhapatnam for processing crUde to meet the requirements of oil products in the country. These were in the private sector. A number of public sector rc;fineries followed during the
Second--and· Third Plan periods. The Government of India set 'up the Indian Oil which was later converted into corporation to operate public sector refineries. The oil industry plans were to get as much of the products as possible produced within the country and to import the necessary crude to augment the domestic supplies to ope· rate the refineries at full capactty. Table 8.2 sets out of the level of the relative shares of crude and products in our total petroleum imports.
TABLE 8.2
Share of Product Imports in the Total Crude and Product Imports
Ye~
1950
1951;
1960
1961
1962 '
1963
1954
1965
1966
1967
1968
1969
l970 .·
1971
1972,
-...
Import of Import of ern de prod nets
2·986
~-026 2·071
5·723 2·032
5·968. 2·481
6·022 2·984
6·519 2·900
6·791 2·956
6·811 2·880
7·457 2·207
8·704 0·951_
10·450 0·933
10·702 1·052
ll·665- 0·970
12·688 1·932
12·289 .. 3·257
(million tonnes)·
Prod net
Total import a as%of totals
importa
2.<186 100.0
5.297 40.6
7·755 26.2
8·4<!9 29.4
9·006 33.1
9·419 30.8
9·747 30.3
9·691 29.7
9·654 22.8
9·655 9.8
. ll·833 8.2
11·754 9.0
12·635 . •t. 7
1-1.620 13.2
15.546 2l..O
_ :' ·· ·source; Indian Petroleum- and Chemicals Statistics, 197B (Page-44J,,Mjnistry ·o£ Petroleum -and Chomicals, Gov. ernment. of India._
8.4. The increase. in demand of ·oil products in the country was not matched by discoveries of crude resources and production of crude from indigenous oil fields. Due to the initiative taken by the Government in the late Fifties and early Sixties, the crude production within the country increased rapidly for a few years and the share;
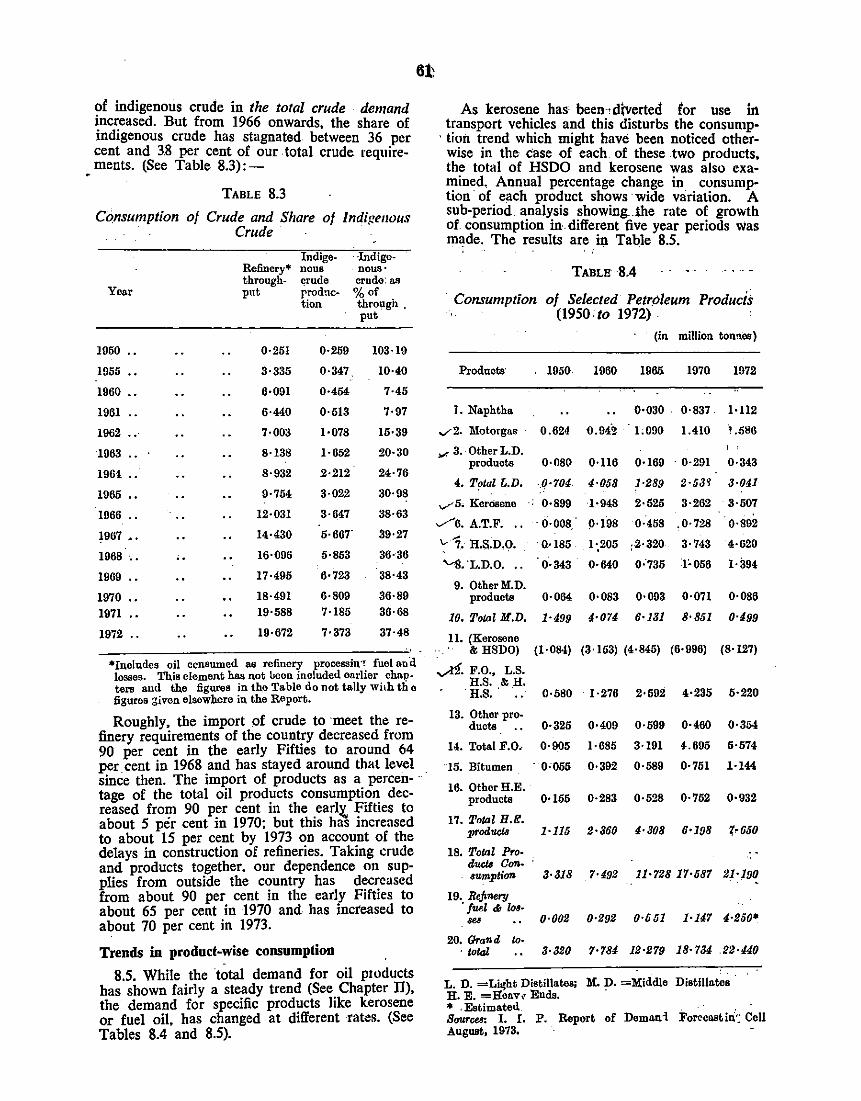
o£ indigenous crude in the total crude demand increased. But from 1966 onwards, the share of indigenous crude has stagnated between 36 per cent and 3.8 per cent of our total crude requirements. (See Table 8.3):-
TABLE 8.3
Consumption of Crude and Share of Indigenous Crude·
Indige- ·Indigo-Refinery• no us nous·
Year through- crude crude: as put rrodnc- %of
tion through , put
1950 .. 0·251 0·259 103·19
1955 •• 3·335 0-347 10·40
1960 .. 6·091 0·454 7·45
1961 .. 6·440 0·513 7·97
1962 ... 7·003 1·078 15·39
1963 .. 8·138 1·052 20-30
1961 .. 8·932 2·212 24·76
1965 .. 9·754 3·022 30·98
1966 .. 12·031 3·047 38·63
1967 •• 14·430 5·667' 39·27
1968 .. .. 16·096 5·853 36·36
1969 17·495 6·723 38·43
1970 .. 18-491 6·809 36·89
1971 19·588 7·185 36·68
1972 .. 19·672 7·373 37·48
*Includes oil ccnsumed as refinery processin'! fuel an·d · losses. This clement has not been included earlier chBIJ· ters and the figures in tho Table do not tally Wiih th c figures given elsewhere in the Report.
Roughly, the import of crude to ·meet the refinery requirements of the country decreased from 90 per cent in the early Fifties to around 64 per cent in 1968 and has stayed around that level _ since then. The import of products as a percen- · tage of the total oil products consumption decreased from 90 per cent in the earl:t, Fifties to about 5 per cent in 1970; but this has increased to about 15 per cent by 1973 on account of the delays in construction of refineries. Taking crude and products together. our dependence on supplies from outside the country has decreased from about 90 per cent in the early Fifties to about 65 per cent in 1970 and has increased to about 70 per cent in 1973.
Trends in product-wise consumption
8.5. While the total demand for oil products has shown fairly a steady trend (See Chapter II), the demand for specific products like kerosene or fuel oil, has changed at different rates. (See Tables 8.4 and 8.5).
As kerosene has been-, d{verted lor use in transport vehicles and this disturbs the consump-
, tion trend which might have been noticed otherwise in the case of each of these two products, the total of HSDO and kerosene was also examined, Annual percentage change in consumption· of each product shows ·wide variation. A sub-period analysis showing the rate of growth of consumption in. different five year periods was made. The results are in Tat>le 8.5.
- -TABLE' -8.4
· Consumption of Selected Petroleum Producis (1950 to 1972) .
(in million tonnoa)
Prodaots· 1950 1960 1965 1970 1972
I. Naphtha 0•030 . 0·837 1·112
..,..-2. Motorga• - 0.624 0.942 1:090 1.410 !.586
v. 3. Other L.D. products 0·080 0·116 0·169 · 0·291 0·343
4. Total L.D. -.0·701 4·058 1·289 2·53~ 3·041
v5• Kerdsene 0·899 1·948 2·525 3·262 3·507
/6. A.T.F ... - 0·008 !J.l98 0·458 .0·728 0·892
':' 7, H.S.D,O. ·0·185 1·,205 ,2·320 3·743 4·620
"-'S. 'L,D.O. .. 0·343 0·640 0'735 1'056 1·394
9. Other M.D. products 0·064 0·083 0·093 0·071 0·086
10. Tow! M.D. 1·499 4·074 6·131 8·851 0·499
11. (Kerosene & HSDO) (1·084) (3·153) (4·845) (6·996) (8·127)
yci. F.O., L.S. H.S. &H.
. H.S.- - 0·580 1·276 2•592 4·235 5·220
13. Other pro-ducts 0·325 0·409 0·599 0·460 0·354
14. Tot&! F.O, 0·905 1·685 3·191 4.095 5·574
·15. Bitumen · 0'055 0·392 0·589 0·751 1·144
16. Other H.E. products 0·155 0·283 0·528 0·752 0·932
17. Tow! H.rt. produclB 1·115 2·360 1·308 6•198 ~-650
18. Tow! ProduclB Con. ...npnon 3·318 7·492 11·728 17·587 21·!9~
19. Refinery -fml ~ ws-... 0·002 0·292 0·651 1·U7 4·250*
20. Gran tl to-- total 3·320 7·784 12·279 18· 734 22·440
L. D. =Li~ht Distillates; M. D. =Middle Distillates H. E. =Heav,• Ends. * . Estimated Sources: I. I. P. Report of Doman-! ForecllBtir{: Cell August, 1973.
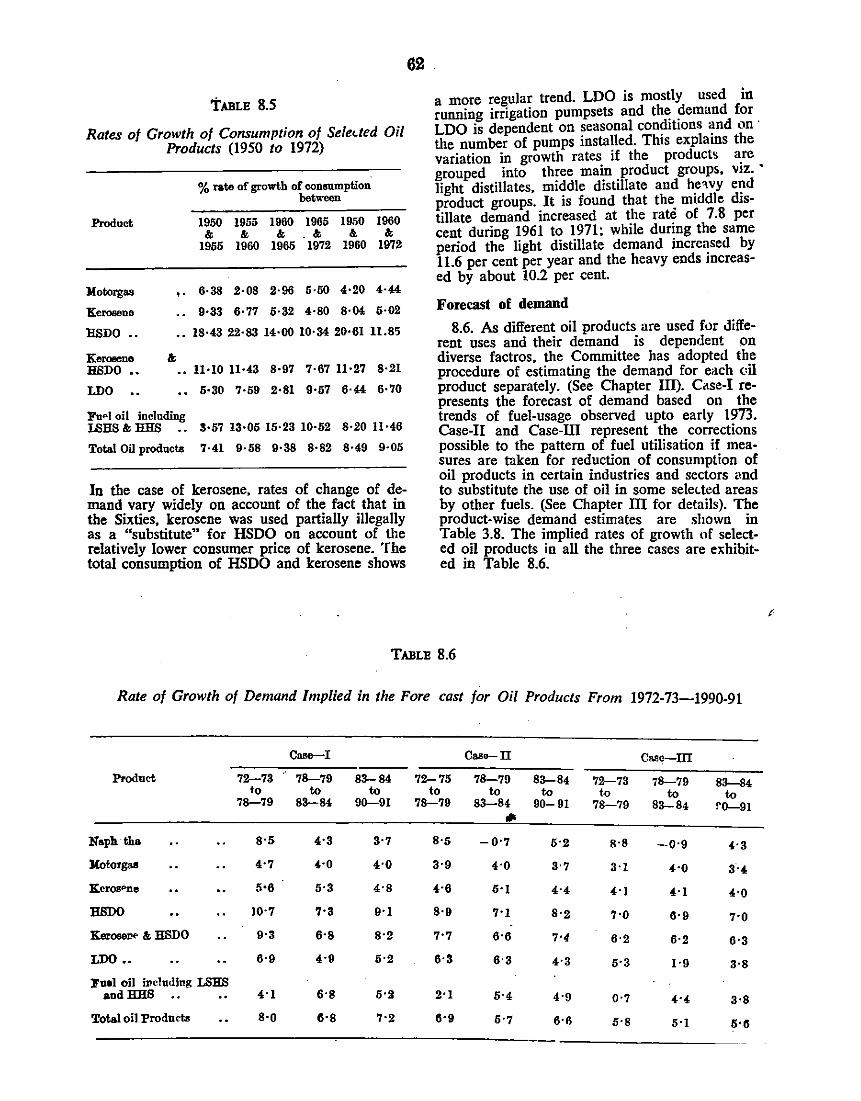
TABLE 8.5
Rates of Growth of Consumption of Sele<ted Oil Products (1950 to 1972)
Product
llotorgas
Kerosene
HSDO ••
Kerosene & HSDO ••
LDO
..
..
% rate of growth of collliUlllption between
1950 1955 & &
1955 1960
6·38 2·08
9·33 6·77
1960 1965 1950 1960 & . & & &
1965 1972 1960 1972
2·96 5·60 4·20 4·44
5·32 4·80 8·04 5·02
•• 18·43 22·83 14·00 10·34 20•61 11.85
•• 11·10 11·43 8·97 7·67 11·27 8·21
5·30 7·59 2•81 9·57 6·44 6·70
Fuel oil including LSHS & HHS 3·57 13·05 15·23 10·52 8·20 ll·46
Total Oil products 7·41 9·58 9·38 8·82 8·49 9·05
In the case of kerosene, rates of change of demand vary widely on account of the fact that in the Sixties, kerosene was used partially illegally as a "substitute" for HSDO on account of the relatively lower consumer price of kerosene. The total consumption of HSDO and kerosene shows
62
a more regular trend. LDO is mostly used in running irrigation pumpsets and th~ ~emand for LDO is dependent on seasonal con~1t10ns ~nd on · the number of pumps installed. Th1s explams the variation in growth rates if the product~ 3:re grouped into three main product groups, VIZ. • light distillates. middle distillate and h_e'lvy e1_1d product groups. It is found that the middle distillate demand increased at the rate of 7.8 per cent during 1961 to 1971; while during the same period the light distillate demand increased by 11.6 per cent per year and the heavy ends increased by about 10.2 per cent.
Forecast of demand
8.6. As different oil products are used for Jifferent uses and their demand is dependent on diverse factros, the Committee has adopted the procedure of estimating the demand for each dl product separately. (See Chapter Ill). Case-1 represents the forecast of demand based on the trends of fuel-usage observed upto early 19'13. Case-11 and Case-III represent the corrections possible to the pattern of fuel utilisation if measures are taken for reduction of consumption of oil products in certain industries and sectors and to substitute the use of oil in some sele~ted areas by other fuels. (See Chapter ill for details). The product-wise demand estimates are shown in Table 3.8. The implied rates of growth of selected oil products in all the three cases are exhibited in Table 8.6.
TABLE 8.6
Rate of Growth of Demand Implied in the Fore cast for Oil Products From 1972-73-1990-91
c...,_ I Case- II CMc-m
Product 7~73 78--79 83-84 72-75 78-79 83-84 7~73 78-79 83--84 to to to to to to to to to 78--79 83-84 90-91 78-79 83-84 90-91 78-79 83-84 r0-91 ,. Naph tba 8·5 4•3 3·7 8·5 -0·7 5•2 s·8 -0·9 4•3
llotorgas 4•7 4•0 4•0 3·9 4•0 3·7 3·1 •·o 3·4
KerosPDe 5•6 5·3 4•8 4·6 5•1 4•4 4•1 4·1 4·0
H8DO 10·7 7·3 9•1 8·9 7•1 8·2 7·0 6·9 7·0 Kerose~• & HSDO 9·3 6·8 8•2 7•7 6·6 7·4 6·2 6·2 6·3 LDO .. 6·9 4·9 5•2 6·3 6·3 4•3 5•3 1·9 3·8 J'no1 oil i~cluding LSHS
andBHS 4•1 6·8 5·!1 2•1 5•4 4·9 0·7 4•4 3·8 Total oil Prodncts 8·0 6·8 7·2 6·9 5·7 6·6 5·8 5•1 5•6
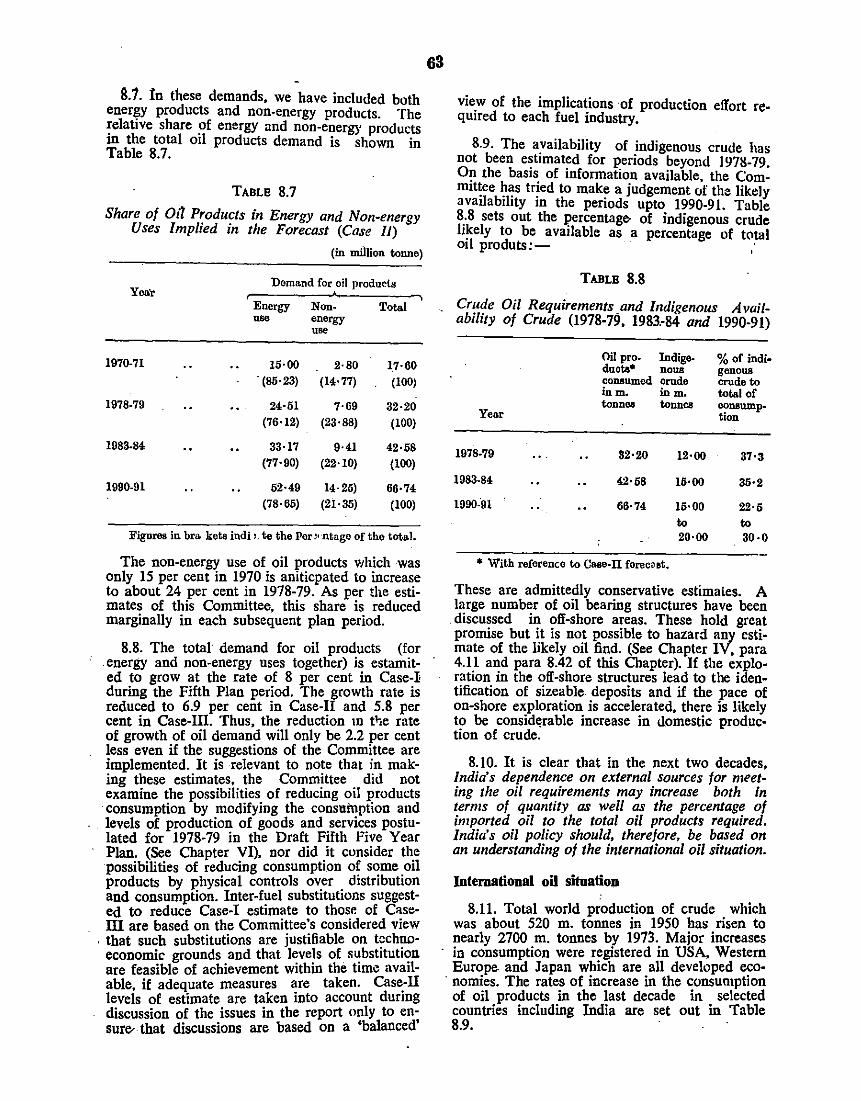
8.7. tn these demands, we have included both ener~y products and non-energy products. The !elat1ve share ?f energy and non-energy products m the total 011 products demand is shown in Table 8.7.
TABLE 8.7
Share of Oil Products in Energy and Non-energy Uses Implied in the Forecast (Case 11)
(in million tonne)
Yea'r Demand for oil produeis
63
vie_w of the implications of production effort required to each fuel industry.
8.9. The availability of indigenous crude has not been e~timat~d for periods beyond 1978-79. 0!1 the basis of mformation available, the Commtt~ee ~~s tr!ed to make a judgement of the likely availability m the periods upto 1990-9 L Table 8.8 sets out the percentage- of indigenous crude li~ely to be available as a percentage of total 01! produts:- ·
TABLE 8.8
Energy use
Non~ energy use
Total Crude Oil Requirements and Indigenous Availability of Crude (1978-79, 1983.-84 and 1990-91)
1970-71 15·00 2·80 1.7·60 '(85·23) (14·77) (100)
1978-79 24·61 7·69 32·20 (76·12) (23·88) (100)
1983-84 33·17 9·41 42·58 (77·90) (22·10) (100)
1990-91 62·49 14·25) 66·74 (78·65) (21·35) (100)
Figures in bra. kots ittdi '. te the Por ,. ·ntago of the total.
The non-energy use of oil products which was only 15 per cent in 1970 is aniticpated to increase to about 24 per cent in 1978-79. As per the estimates of this Committee, this share is reduced marginally in each subsequent plan period.
8.8. The total demand for oil products (for . energy and non-energy uses together) is estamited to grow at the rate of 8 per cent in Case-l during the Fifth Plan period. The growth rate is reduced to 6.9 per cent in Case-II and 5.8. per cent in Case-III. Thus, the reduction m tl;e rate of growth of oil demand will only be 2.2 per cent less even if the suggestions of the Committee are implemented. It is relevant to note that in making these estimates, the Committee did not examine the possibilities of reducing oil products consumption by modifying the consltinption and levels of production of goods and services postulated for 1978-79 in the Draft Fifth Five Year Plan. (See Chapter VI). nor did it consider the possibilities of reducing consumption of some oil products by physical controls over distribution and consumption. Inter-fuel substitutions suggested to reduce Case-! estimate to those of Caseill are based on the Committee's considered view
. that such substitutions are justifiable on technoeconomic grounds and that levels of substitution are feasible of achievement within the time available, if adequate measures are taken. Case-II levels of estimate are taken into account during discussion of the issues in the report only to ensurer that discussions are based on a 'balanced'
Year
1978-79
1983-84
1990.'91
Oil pro- Indige-duota• nous consumed crude inm. in m. tonnes tonnes
32·20
42·58
66·74
12·00
16•00
15·00 to 20·00
* With reference to Case-IT forecoat.
%of indi· genous crude to total of consump· tion
37·3
36·2
22·5 to 30·0
These are admittedly conservative estimates. A large number of oil bearing structure~ have been discussed in off-shore areas. These hold great promise but it is not possible to hazard any estimate of the likely oil find. (See Chapter IV, para 4.1.1 a~d para 8.42 of this Chapter). If the exploratiOn Ill the off-shore structures lead to the identification of sizeable deposits and if the pace of on-shore exploration is accelerated, there is likely to be consid~rable increase in domestic production of crude.
8.10. It is clear that in the next two decades, India's dependence on external sources for meeting the oil requirements may increase both in terms of quantity as well as the percentage of imported oil to the total oil products required. India's oil policy should, therefore, be based on an understanding of the international oil situation.
International oil situatioo
8.11. Total world production of crude which was about 520 m. tonnes in 1950 has risen to nearly 2700 m. tonnes by 1973. Major increases in consumption were registered in USA, Western Europe and Japan which are all developed eco-
. nomies. The rates of increase in the consumption of oil products in the last decade in selected countries including India are set out in Table 8.9.
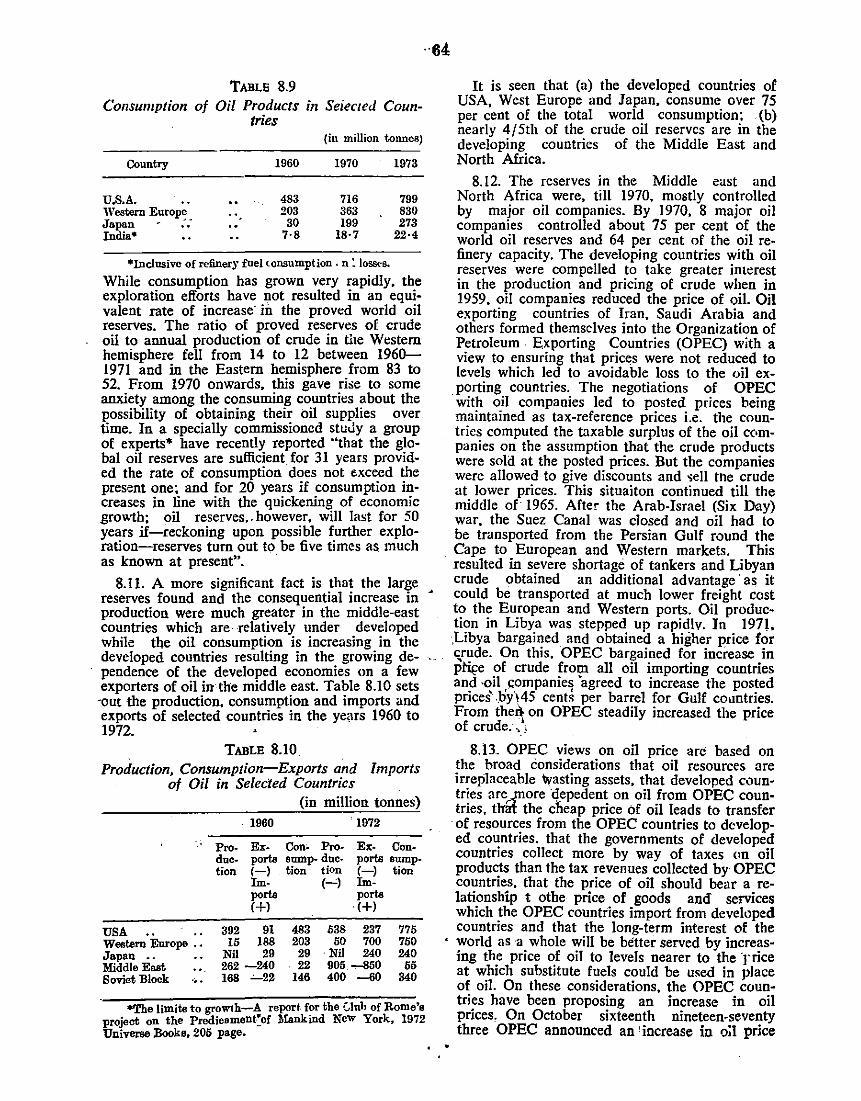
TABLE 8.9 Consumption of Oil Products in SeieCLed Coun
tries (in million tonncs)
Country 1960 1970 1973
U.S.A. 483 716 799 Western Europe 203 363 830 Japan ·· 30 199 273 India• 7·8 18·7 22·4
*Inclusive of refinery fUellonsumption . n: Ioss,·s.
While consumption has grown very rapidly. the exploration efforts have not resulted in an equivalent rate of increase· in the proved world oil reserves. The ratio of proved reserves of crude oil to annual production of crude in the Western hemisphere fell from 14 to 12 between 1960-1971 and in the Eastern hemisphere from 83 to 52. From 1970 onwards, this gave rise to some anxiety among the consuming countries about the possibility of obtaining their oil supplies over time. In a specially commissioned study a group of experts* have recently reported "that the global oil reserves are sufficient for 31 years provided the rate of consumption does not e.xceed the present one; and for 20 years if consumption increases in line with the quickening of economic growth: oil reserves .. however, will last for 50 years if-reckoning upon possible further exploration-reserves tum out to be five times as much as known at present".
8.11. A more significant fact is that the large reserves found and the consequential increase in • production were much greater in the middle-east countries which are· relatively under developed while the oil consumption is increasing in the developed countries resulting in the growing dependence of the developed economies on a few exporters of oil in the middle east. Table 8.10 sets ·out the production, consumption and imports and exports of selected countries in the ye<us 1960 to 1972.
TABLE 8.10 Production, Consumption-Exports and Imports
of Oil in Selected Countries
1960
._. Pro- Exports (-) Imports C+l
USA Western Europe .• Japan --Middle East .. Soviet Block ....
duetion
392 15
Nil
91 188 29
262 -240 168 -'--22
(in million tonnes}
Con' Prosump- duction tion
(--')
483 538 203 50 29 Nil
. 1972
Ex- Conports sump(-) tion Im-ports
·(+)
237 775 700 750 240 240
22 905 -850 55 146 400 -60 340
- *The limite: to growth-~ report. f?r the~·:.Inh of Rome~s project on the Predieoment_of Mankmd New York, 1912 Universe :Books, 205 page.
It is seen that (a} the developed countries of USA, West Europe and Japan, consume over 75 per cent of the total world consumption: (b) nearly 4/5th of the crude oil reserves are in the developing countries of the Middle East and North Africa.
8.12. The reserves in the Middle east and North Africa were, till 1970. mostly controlled by major oil companies. By 1970. 8 major oil companies controlled about 75 per cent of the world oil reserves and 64 per cent of the oil refinery capacity. The developing countries with oil reserves were compelled to take greater interest in the production and pricing of crude when in 1959, oil companies reduced the price of oil. Oil exporting countries of Iran, Saudi Arabia and others formed themselves into the Organization of Petroleum Exporting Countries (OPEC} with a view to ensuring that prict<s were not reduced to levels which led to avoidable loss to the oil exporting countries. The negotiations of OPEC with oil companies led to posted prices being maintained as tax-reference prices i.e. the countries computed the taxable surplus of the oil companies on the assumption that the crude products were sold at the posted prices. But the companies were allowed to give discounts and ~ell tne crude at lower prices. This situaiton continued till the middle of 1965. After the Arab-Israel (Six Day} war. the Suez Canal was closed and oil had to be transported from the Persian Gulf round the Cape to European and Western markets. This resulted in severe shortage of tankers and libyan crude obtained an additional advantage· as it could be transported at much lower freight cost to the European and Western ports. Oil production in Libya was stepped up rapidlv. In 197l. ,Libya bargained and obtained a higher price for crude. On this. OPEC bargained for increase in pli{:e of crude from all oil importing countries and -oil ~ompanies 'agreed to increase the posted prices J)y\45 cents per barrel for Gulf countries. From then on OPEC steadily increased the price of crude.,\
8.13. OPEC views on oil price arc based on the broad considerations that oil resources are irreplaceable wasting assets, that developed countries are,~ore depedent on oil from OPEC countries. tlrlit the cheap price of oil leads to transfer
·of resources from the OPEC countries to developed countries. that the governments of developed countries collect more by way of taxes (>D oil products than the tax revenues collected by OPEC countries. that the price of oil should bear a relationship t othe price of goods and services which the OPEC countries import from developed countries and that the long-term interest of the world as a whole will be better served by increasing the price of oil to levels nearer to the ·rrice at which substitute fuels could be used in place of oil. On these considerations. the OPEC countries have been proposing an increase in oil prices, On October sixteenth nineteen-seventy three 0 PEC announced an ' increase in oa price

that -:v~s nearly doubled compared to the p:ices prevmlmg before October 16 .. This sudden increase was followed by a further increase in December, 1973. The movement of price of oil to the consumer can be seen from the Table helow:-
TABLE 8.11 l'osted Price and Market Price of Aga Jari
(Light) Crude in $ per Barrel
Estimated arms
Posted length Year price: price Discounts
1958 .. 2·04 1·79 0·25 1959 .. 1·86. 1·56 0·30 1960 .. '1·78 1.43 0·35 1963 .. 1·78 1·:l8 0·10 1969 .. 1·79 1·29 0·50 1971 (After Tehran Feb.
Agreement) . . · .. . 2·17 1·70 0·47 1971 (Tripoli June Agree.
ment) _ .. 2·27· 1·79 0·48 1972 (After Geneva Agree·
mont) . . . . 2·47 1·89 0·58 1973 (After Oct. 16th) 5·12 5·12 1974 (with effect from 1st
January} 11·63 11·65
8.14. In order to analyse the trend in oil prices and in ptices of manufactures, a time series of the price relatives of oil and manufacturers has been· attempted. Such a comparison ne.:essarily involves certain assumptions which should be taken to indicate only the broad magnitude of the price relative. (See Table 8.12):-
TABLE 8.12 Price Relatives of Oil Manufacturers
1953 •• 1954 .. 1957 .. 1958 .. 1959 .. 1960 .• 1961 .. 1962 .. 1963 .. 1964 .. 1965 .. 1966 .. 1967 .. 1968 .. 1969 .. 1970 .. 1971 .. 1972 .. 1973 .• ...
Unit value: · world manu· factures
Iran Iran Petroleum Petro-Arms leum{ length world price mo.nufa.c-
.- tures Base: 1953-100
1954 .. .100
100 97·9
104·3 103·2
.. 103·2 105·3 106·4 106·4 106·4 107·4 110·6 112·8 113·8 113·8 . 117·0 124·5 131·9 142·6 168·1
N.A. :. 100
93,7 93·7 81W,. 74·9 74·9 73·6 72·3 68·9 63·9 68·9 68·ll 67·6. 66·5 65·4 91·4 99·9
281·6
102:i 89·8 90·8 79·1 71·1
. '70·4. .69·2; 68.·0 64'2" 62·3 61·1 60·5 59·4 56·8 52·5 69·3 68·3
167·5
Source : Col. (I) Derived from U.N. data. Col. (2) Obtained from index Nos. derived from
Indian Petroleum and Chemicals Statistics. Col: (3) Derived from Cols. 1 & 2.
L/P(D)190MofEnorgy-6 .
65
The price relatives of crude to manufactures dec· reased gradually upto 1970 and from then on, increaseu slowly upto 1973; but October 1973 price change announced by OPEC made a very big difference to the price relatives. The fmther increase made in December with effect from January 1974 has increased the price relatives still further. But. the prices of manufactures, metals and other commodities have been increasing very rapidly during the last few months of the year 1974. In this very fluid situation it would be unrealistic to construct any set of price rela· tives for 1974. Given these facts, it is difficult to forecast any trends regarding the future price of oil. The inter-relationship between oil prices and the prices of otl].er commodities and manufactures ar~ such that it will take some time for prices of crude to settle down. It is only at this stage that some long-term projection of prices could be attempted.
8.15. Inspite of the uncertainties in the price situation, it will be reasonable to assume that the prices of crude" in the international market will be high compared to the prices prevailing in 1972 or early 1973. The period of low oil price which began in 1959 may be considered to have ended with 1973 and. the return of tl)e price to that level cannot be anticipated in normal circumstances.
8.16. Besides prices, a change is taking place in the ownership and structure of the world oil in· dustry. The long period of control of. the cil re· sources by the oil companies. is being replaced by a system of control exercised primarily by the oil exporting countries and the oil companies. The oil exparting countries' share of total oil products in the world is increasing Cln account 01 participation agreements entered into by the OPEC countries with the oil companies operat· ing in their countries. • · ·
Oil Policy for India 8.17. The oil policy for our country will have
to be based on the perspective that oil prices are likely to prevail at aA significantly higher level than those anticipated in early 1973 and that India's dependence on import of oil is likely to continue right upto 1990-91 and that it would be very difficult for the country to meet 'the increasing needs of oil imports without causing serious balance. of payment problems. The oil policy should, therefore, be designed with the specific objectives of (a) reducing the quantity of oil products to be imported to sustain the desired level of economic activity by either substituting oil consumption by other fuels or by increasing the indigenous production of crude; (b) reducing the (otal foreign exchange expenditure by undertaking such measures as to produce the needed quantities of various .oil products at the lowest possiblif cost to the economy; and (c) improving the security of supplies of crude" and oil products required from sources outside. the country. The reduction of the quantity of oil products requir-
• may be attained by changing the final pattern
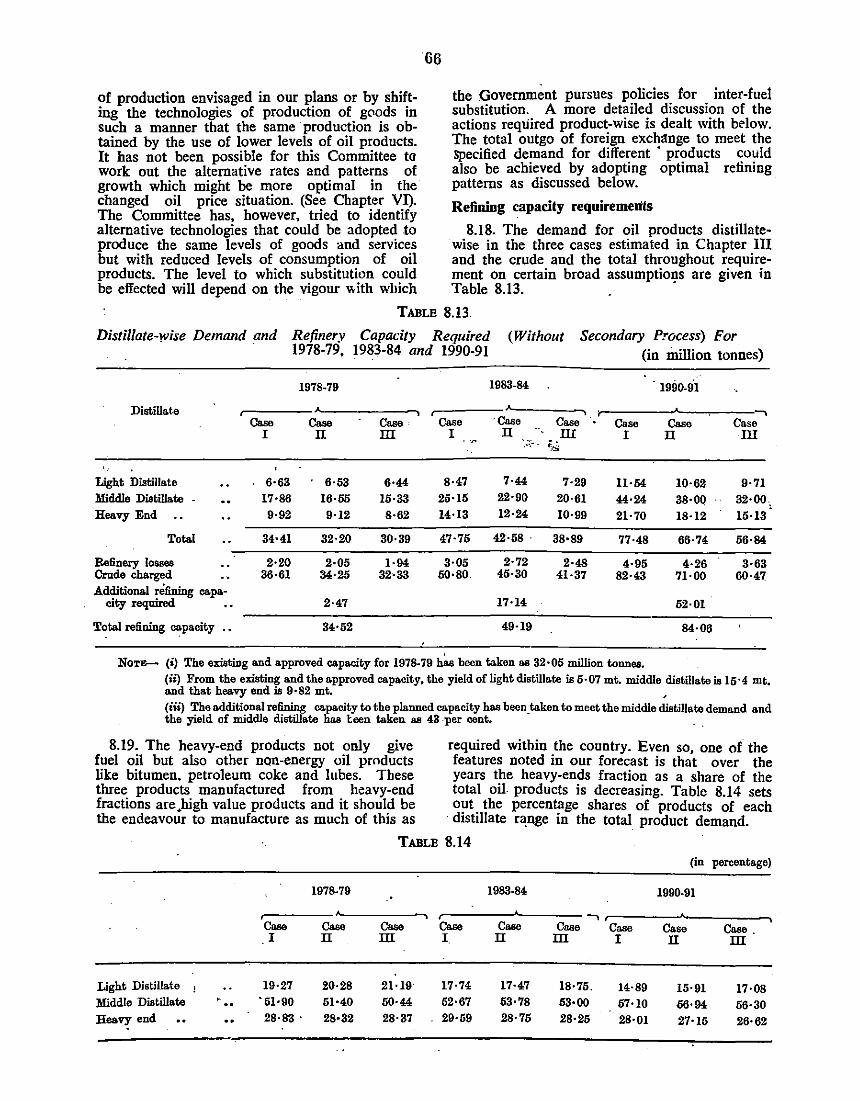
of production envisaged in our plans or by shifting the technologies of production of goods in such a manner that the same production is obtained by the use of lower levels of oil products. It has not been possible for this Committee ta work out the alternative rates and patterns of growth which might be more optimal in the changed oil price situation. (See Chapter VI). The Committee bas, however, tried to identify
66
the Government pursues policies for inter-fuel substitution. A more detailed discussion of the actions required product-wise is dealt with below. The total outgo of foreign exchange to meet the Specified demand for different • products could also be achieved by adopting optimal refining patterns as discussed below.
Refining capacity requirements
alternative technologies that could be adopted to 8.18. The demand for oil products distillate-produce the same levels of goods and services wise in the three cases estimated in Chapter III but with reduced levels of consumption of oil and the crude and the total throughout require-products. The level to which substitution could ment on certain broad assumptions are given in be effected will depend on the vigour v.itb which Table 8.13. . ·
TABLE 8.13
Distillate-wise Demand and Refinery Capacity (Without Secondary Process) For Required 1978-79, 1983-84 and 1990-91 (in Dilllion tonnes)
1978-79 1983-84 1990-91
Distillate -. Case Case Case Case ·Coso Case Case Case Case
I n m I n m I n Ill .•.. ~. ;.i
Light Distillate 6·63 6·53 6·44 8·47 7·44 7·29 ll·54 10·62 9·71 Middle Distillate 17•86 16·55 15·33 25·15 22·90 20·61 44·24 38·00 32·00 Heavy End 9·92 9·12 8·62 14·13 12·24 10·99 21·70 18·12 15·13
Total 34·41 32·20 30·39 47·75 42·58. 38•89 77·48 66·74 56·84
Refinery losses 2·20 2·05 1·94 3·05 2·72 2·48 4·95 4·26 3·63 Crude charged 36·61 34·25 32·33 50·80 45·30 41·37 82·43 71·00 60·47 Additional refining capa-
city required 2·47 17·14 52·01
Total refining capacity .• 34·52 49·19 84·06
NOTE- (i) The existing and approved capacity for 1978-79 ~been taken 88 32·05 million tonnes. (ii) From the existing and the approved capacity, the yield of light distillate is 5·07 mt. middle distillate is 15·4 mt. and that heavy end is 9·82 mt. • (iii) The additional refining capacity to the planned capacity hBB becnteken to meet the middle distillate demand and the yield of middle distillate hB8 teen taken as 43 .per cent. . .
8.19. The heavy-end products not only give fuel oil but also other non-energy oil prnducts like bitumen. petroleum coke and lubes. These three products manufactured from heavy-end fractions are.high value products and it should be the endeavour to manufacture as much of this as
required within the country. Even so, one of the features noted in our forecast is that over the years the heavy-ends fraction as a share of the total oil products is decreasing. Table 8.14 sets o~t. the percen~ge shares of products of each
· distillate r'\nge m the total product demand.
TABLE 8.14
Light Distillate 1 Middle Distillate Heavy end
1978-79
Case Case I n
19·27 20·28 '51·90 51·40 28·83 . 28•32
. c ... m
21·19 50·44 28·37
Case I
17·74 52·67 29·59
1983-84
c ... n
17·47 53·78 28·75
-. Case m
18·75. 53•00 28·25
Case I
14·89 57·10 28·01
(in
1990-91
Case n
15·91 56·94 27·15
percentage)
Case. m
17·08 56·30 26·62
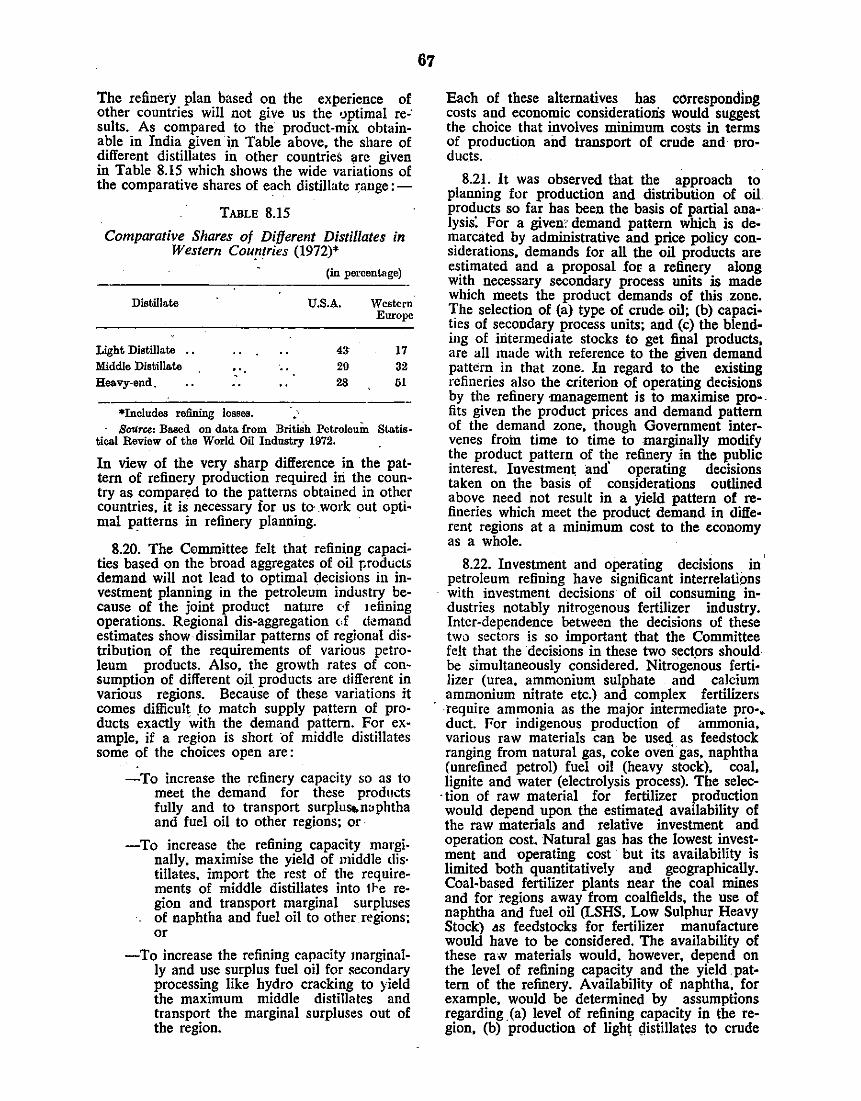
The refinery plan based on the experience of other countries will not give us the uptimal re-· suits. As compared to the product-mix obtainable in India given in Table above, the share of different distillates in other countries ~re given in Table 8.15 which shows the wide variations of the comparative shares of each distillate ~ange:-
TABLE 8.15
Comparative Shares of Different Distillates in Western Courztries (1972)*
(in percentage)
Distillate U.S.A. \Vestern Europe
Light Distillate .. 43 17 Middle Distillate ... 20 32 Heavy-end. 28 51
*Includes refining losses. Source: Based on da.tn. from British Pctroleuin Statis
tical Review of the World Oil Indnstry 1972.
In view of the very sharp difference in the pattern of refinery production required iri the country as compared to the patterns obtained in other countries, it is necessary for us to· .work out optimal p~tterns in refinery planning.
8.20. The C!'lmmittee felt that refining capacities based on the broad aggregates of oil products demand will not lead to optimal decisions in investment planning in the petroleum industry because of the joint product nature c·f telining operations. Regional dis-aggregation d ckmand estimates show dissimilar patterns of regional distribution of the requirements of various petroleum products. Also, the growth rates of consumption of different oil products are different in various regions. Because of these variations it comes difficult .to match supply pattern of products exactly with the demand pattern. For example, if a region is short ·of middle distillates some of the choices open are:
-To increase the refinery capacity so as to meet the demand for these products fully and to transport surplus..n~phtha and fuel oil to other regions; or·
-To increase the refining capacity marginally. maximise the yield of middle dis· tillates. import the rest of the requirements of middle distillates into t,..e region and transport marginal surpluses of naphtha and fuel oil to other regions; or
-To increase the refining capacity marginally and use surplus fuel oil for secondary processing like hydro cracking to yield the maximum middle distillates and transport the marginal surpluses out of the region.
67
Each of these alternatives has corresponding costs and economic considerations would suggest the choice that involves mininmm costs in terms of production and transport of crude and· oroducts.
8.21. It was observed that the approach to planning for production and clistribution of oil products so far has been the basis of partial analysis: For a given; demand pattern which is demarcated by administrative and price policy considerations, demands for all the oil products are estimated and a proposal for a refinery along with necessary secondary process units is made which meets the product demands of this zone. The selection of (a) type of crude oil; (b) capaci· ties of secondary process units; and (c) the blend· ing of intermediate stocks to get final products, are all made with reference to the given demand pattern in that zone. In regard to the existing refineries also the criterion of operating decisions by the refinery management is to maximise pro·. fits given the product prices and demand pattern of the demand zone, though Government intervenes froin time to time to marginally modify the product pattern of the refinery in the public interest. Investment. and' operating decisions taken on the basis of considerations outlined above need not result in a yield pattern of refineries which meet the product demand in dilfe· rent regions at a mininium cost to the c:conomy as a whole.
8.22. Investment and operating decisions in ' petroleum refining have significant interrelations with investment decisions of oil consuming industries notably nitrogenous fertilizer industry. Inter-dependence between the decisions of these two sectors is so important that the Committee felt that the decisions in these two sectors should be · simultaneously considered. Nitrogenous fertilizer (urea, ammonium sulphate and calcium ammonium nitrate etc.) and complex fertilizers tequire ammonia as the major intermediate pro-•. duct. For indigenous production of ammonia, various raw materials can be used as feedstock ranging from natural gas, coke oven gas, naphtha (unrefined petrol) fuel oil (heavy stock), coal, lignite and water (electrolysis process). The selec-
. tion of raw material for fertilizer production would depend upon the estimated availability of the raw materials and relative investment and operation cost. Natural gas has the lowest investment and operating cost · but its availability is limited both quantitatively and geographically. Coal-based fertilizer plants near the coal mines and for regions away from coalfields, the use of naphtha and fuel oil (LSHS, Low Sulphur Heavy Stock) AS feedstocks for fertilizer manufacture would have to be considered. The availability of these raw materials would. however, depend on the level of refining capacity and the yield . pat· tern of the refinery. Availability of naphtha, for example. would be determined by assumptions regarding. (a) level of refining capacity in the region, (b) production of ligh~ distillates to crude
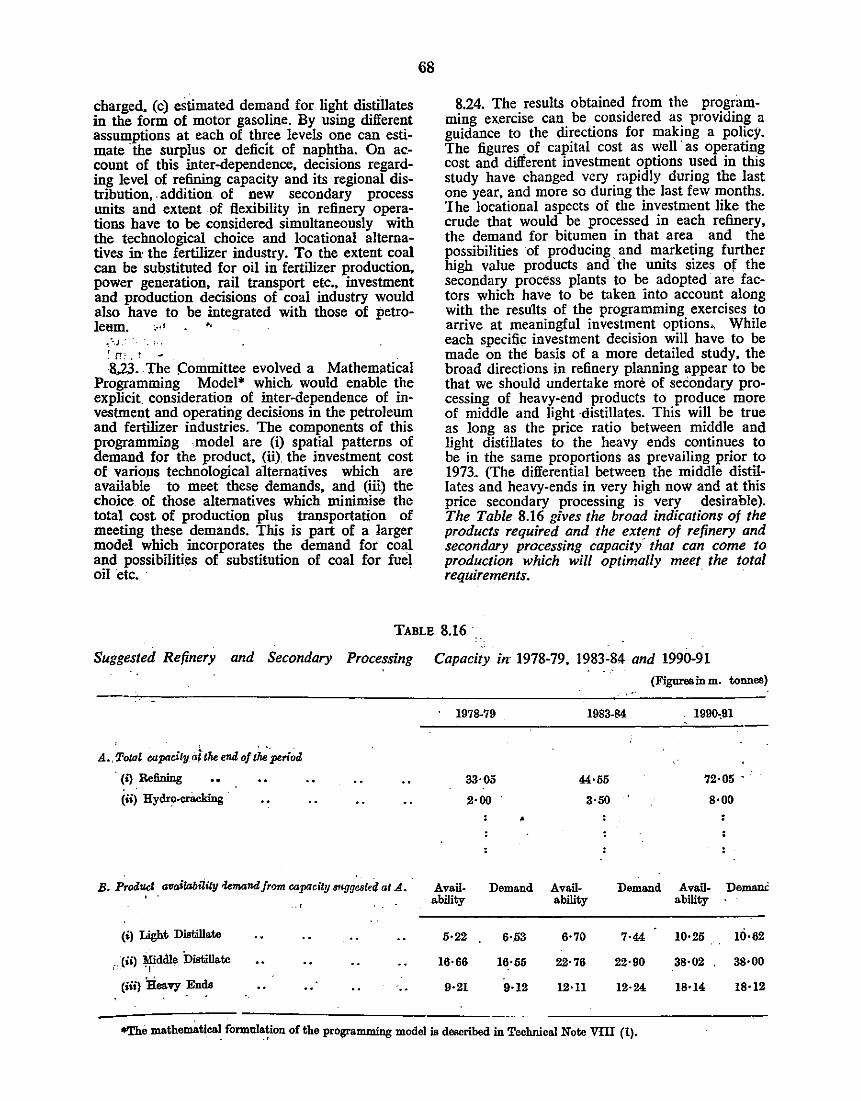
charged. (c) estimated demand for light distillates in the form of motor gasoline. By using different assumptions at each of three levels one can estimate ·the surplus or deficit of naphtha. On account of this inter-dependence, decisions regarding level of refining capacity and its regional distribution, . addition of new secondary process units and extent of flexibility in refinery operations have to be considered simultaneously with the technological choice and locational alternatives in• the fertilizer industry. To the extent coal can be suostituted for oil in fertilizer production, power generation, rail transport etc .. investment and production decisions of coal industry would also have to be integrated with those of petro-leum. ~·~~ ,.,
~ ··.) . . ' r:.: . r ·8.23 .. The Committee evolved a Mathematical
Programming Model* which would enable the explicit. consideration of inter-dependence of investment and operating decisions in the petroleum and fertilizer industries. The components of this programming · model are (i) spatial patterns of demand for the product, (ii) the investment cost of vario.us technological alternatives which are available to meet these demands, and (iii) the choice. of those alternatives which minimise the total cost of production plus transportation of meeting these demands. This is part of a larger model which incorporates the demand for coal and possibilities of substitution of coal for fuel oil etc. ·
68
8.24. The results obtained from the programming exercise can be considered as providing a guidance to the directions for making a policy. The figures . of capital cost as well ·as operating cost and different investment options used in this study have changed very rapidly during the last one year, and more so during the last few months. The locational aspects of the investment like the crude that would be processed in each refinery, the demand for bitumen in that area and the possibilities of producing and marketing further high value products and ·the units sizes Of the secondary process plants to be adopted· are factors which have to be taken into account along with the results of the programming exercises to arrive at meaningful investment options" While each specific investment decision will have to be made on the basis of a more detailed study. the broad directions in refinery planning appear to be that we should undertake more of secondary processing of heavy-end products to produce more of middle and light ·distillates. This will be true as long as the price ratio between middle and light distillates to the heavy ends continues to be in the same proportions as prevailing prior to 1973. (The differential between the middle distillates and heavy-ends in very high now and at this price secondary processing is very desirable). The Table 8.16 gives the broad indications of the products required and _the extent of refinery and secondary processing capacity' that can come to production which will optimally meet the total requirements. ·
TABLE 8.16.
Suggested Refinery and Secondary Processing Capacity in 1978-79, 1983-84 and 1990-91
A. ~otnl capacify at U.. end of tkperiod
' ( i) Refining - •
(ii) Hydro-cr8cking ·
B. Prod~. a•ailabiiity .Umand from capacity tmgg~V.~ at .t!. .. (i) Light Distillate
,.. (ii) ~ddle Distillate
(iii) Heavy En~ ..
1978-79
33·05
2·00
•
Avail· Demand ability
5·22 6·.53
16·66 16·55
9·21 9·12
(Figures in m. tonnes)
1983-84
44·55
3·50
Avail-ability
6·70
22·76
12·11
Demand
7·44
22·90
12·24
1990,91
72·05 .. ·
8•00
Avail- De mane ability
10•25 10·62
38·02 38•00
18•14 18·12
*The mathematical formula~ion of the programming model is described in Technical Note VIII (1).
. 8.25. Th~ re.sults show that secondary processmg capactty m terms of hydrocracking may have to be increased to about 8 million tonnes by 1990-91. But these should be taken only as broad indications. Other processes like catalytic .cracking and coking may be of greater advantage under certain circumstances. The Committee would recommend that in each Plan period, there showd be a very careful examination of the refinery locations, the product-mix required in each refinery the extent of secondary processing to be established and the feedstock choices for the fertilizer industry should be examined by considering these options simultaneously, if necessary with the help of programming . models.
. '[he Committee feels that substantial economies in _ investment and crude import costs could be
•'achieved by proper investment decision in t1le petroleum an(i, fertili;;er industry. Minimizing the· foreign exchange requirements
to meet the oil. demand 8.26 .. Given a level of demand for oil products,
the net expenditure in foreign exchange required to supply these could be minimized by (a) increasing the quantitiy of oil productS within the country by increasing the. crude production which can be achieved either by intensifying oil exploration activities or by developing on ·a commer
. cia! scale, the technology of converting coal to oil, and (b) by reducing the cost in terms 'of foreign exchange for a unit of crude·· or product delivered to· the country. Oil exploration in India
8·.27. -The option of converting coal to oil does not appear to hold any bright promise till the teohnology is .adequately. developed.' (See Chapter XII). :Intensifying oil exploration/ activities is, therefore, an urgent need. The potential oil resources of the country, the· activities of_ the oil exploration agencies and, the success achieved so far have been analysed in Chapter IV. This anacovers only 4% · of total . potential oil bearing iovers only 4% of total potential oil bearing area .. The expimditure on oil exploration so far is less than Rs. 400 crores. The cost of develping the oil wells in India and producing crude, based on an experienoe ·so far is quite favnurable if oil- is valued at the price of imported crude even if the prices as in· early. 1973. are coosideted. At the present price of crude in the international market, oil exploration in India is an .economically viable ··activity even if the risks are rated high. The results of the recent drilling at Bombay High have added urgency to the oil exploration.· activities. All evidence points towards the need for ·speeding up exploration activities particularly in the· off-shore areas and selected on-shore areas. There are various ways of expanding exploration· activities. India should carefully consider the options available, expedite oil exploration activities and draw up a polic.v which will-not onl:y be an advantage in the short-run
t.9
but also be consistent with our long-term deve· lopment strategies. To begin with, there is urgent need to augment the capabilities of the ONGC by providing them with more 'modern equipment, like deep drilling equipment and seismic exploration vessels and off-shore rigs, training out men in new technologies of exploration. ·' ''
There are also possibilities of developing oil resources in the -Middle East countries in colla· boration with the Government of those countries. Based on the compleillentaries of the resource endowments of India and the oil exporting countries, meaningful bilateral arrangements . under which India can participate in· crude production in the Middle East countries, could be explored . . . /,,
Reducing the cost of oil ~ort '· 8.28. The delivered cost .of crude to India •
would consist of the price paid for the crude at the exporting port and the cost of the · ocean transport to bring it to India and the cost of handling at the port. There are significant economies to be obtained by using the large size vessels for import of crude and by adopting optimal handling methods. It appears· that importing of crude in very large crude carriers and unloading them in off-shore terminals _would be of greater advantage than the construction of new port facilities to bring in larger vessels. There should be a proper matching of the size of vessels acquired by the Indian Shipping Companies, the type of the ports developed and the location <i[ refineries. It ~ necessary to undertake systems studies on these ·to ensure that optimal decisions are taken regarding the long-term . development of ports and shipping and refineries ,in India ..
8.29. The net foreign exchange expendittire' on account of oil imports could also: be reduced --by stepping'up the export of certain high value oil. products like lubes, solvents and petroleum wiix
· '· which are made out of the low value heary-end fraction. As oil demand in the country increases the unit size of oil refineries will increase and this will provide· opportunities for' taking Up the manufacture of high value products · on' scales which would make their production international· Iy competitive. But' it is necessary to note_ that in pursuing such 'expor( investment option~. India will have to compete with very large mtemational oil companies and the long-term dem!lild and supply ·situation will be subject to ; several · uncertainties. While ·the potential for export of ·oil products should be kept in view; adequate .care should be taken to analyse the long-term prospects for the product before invest"\entor,· tions are approved, · ·
,. Security of supplies _ ··:, : ,. · '.,..
8.30. Some of the measures alieady discussed like increasing exploration activities, · increa~ing crude carrying capabilities of the India~ Shipping industry etc. wil~ in_crease tbe security of supply
of oil to India. Besides this, with a view to providing an insurance against short-run breakdown in the supply of crude to the country, there is need for building up a stock of crude within the country. In the countries of European Economic Community (EEC), the suggestion to build up 90 days' stock is being vigorously pursued. As the cost of maintaining stocks is . very large, we should explore various ways of building up our stocks consistent with our resources.
Product-wise policy implications
8.31. As oil is consumed invariably as a refined product, measures which are to be adopted as part of the oil policy should be designed with reference to each important oil product separately. The important oil products are Naphtha, Motorgas, Kerosene, HSDO and LDO, Fuel Oil including LSHS and HHS. It would be useful to review the use of these important oil product~.
Naphtha
8.32. Naphtha and motorgas constitute the important products in the light distillate range in a refinery. The yield of Naphtha and motorgas within the possible total yield of both of these can be adjusted. In other words, more of Naphtha can he produced at the cost of motorgas and vice versa. The consumers of these products fall in different categories. Naphtha is used as a feedstock. for the IIIanufacture of fertilizer and petrochemicals; while motorgas is used for propelling motorgas drive~ _vehicles. The demand for naphtha for the fertilizer and petro-chemical units in operation and under construction would add upto 3.47. millio_n tonnes by 1978-79. At the present relative pnces of naphtha, fuel oil and coal, no naphtha based new fertilizer project is likely to !'e _un~ertaken. The ~ifth Five Year Plan gives mdication that there IS likely to be no new investments in petro-chemical industries. Investments, if made in the Sixth Plan, the projects may be completed only by 1983-84. We have therefore not taken note of any possibilities of increased naphtha consumption right·upto 1983-84 from the !evels .reached in 1978-79. In fact, increase in efficiency of use of naJ?htha. in fert~lizer industry as well as petro-chemicals 1s possible in the col!lltry and in view of this the total naphtha reqwrements may go down marginally. But by 1983-84 there will be some more plants in the petro-chemical sector using naphtha and its de~d may go up. As seen from the refining capa':Ity al!d. pattern . suggested for different years, bght distillates Will be in short supply right upto 1990-91. Naphtha_ dem_and will have to be regulated _by proP_er llcensmg of fertilizer and petrochemical proJects. It will be necessary to price th~ naphtha produced within the country appropnately and not to '!'ake it cheap. Motorgas de~and has been proJected to increase at a rate sbg~tly lower than 4 per cent throughout this perzo_d. The qemand fa!' motorgas has been shown elastic to pnces and. If at any time th\l demand
70
for motorgas increases beyond the rate anticipated, it will be possible to regulate it by suitable fiscal measures.
Kerosene and HSDO 8.33. The past trends in the. consumption of
kerosene and HSDO give some misleading results as there has been diversion of kerosene for use in transport. An analysis of the growth of consumption of kerosene and HSDO together shows that in the last twelve years from 1960 to 1972, it increased at the rate of 8.2 per cent. The estimates made in this Report (Case-11) would imply a growth of 7.7 per cent of kerosene and HSDO combined in the period between 1972-73 to 1978-79, which will be reduced to about 6.6 per cent in the VI Plan period and increase later to about 7.4 per cent in the VII Plan period and beyond. The management of demand of kerosene and HSDO will be the most important element of Oil Policy. The Committee in its Report "Fuel Policy for the Seventies"-May 1972, had recommended that "efforts should be made to bring kerosene and HSDO prices as near as possible either by increasing the price of kerosene or by reducing the·price of HSDO". This has now been done. If at any time it becomes necessary to tax the consumer of HSDO and kerosene at different rates, tax should be levied on the consumers of HSDO by suitable levies on other products which they use along with HSDO like lyres, tubes or spare-parts for diesel driven vehicles than by increasing duties on HSDO as such which will re-introduce a difference in the prices of HSDO and of kerosene. Besides, the levies on materials like tyres, tubes or spare-parts used by diesel consumers who are dependent on the extent of use of diesel there can also be ·a levy which can be collected along with the road tax that is collected on vehicles. In view of the diversion of kerosene to other use, the Committee would strongly urge that the price of HSDO and kerosene should continue to be kept at par with each other by increasing or decreasing the tax on these together whenever there is a need for a price revision. · _
8.34. When the prices of diesel and crude were brought to the same level, the extent of registered officially computed HSDO consumption and kerosene consumption will be quite different from what has been observed in the past. Oil industry estimated that consumption of kerosene will go ~own by 4.5 per cent followed by an equivalent mcrease in HSDO consumption. The experience in the last few months indicates that kerosene consumption has not gone down by this extent. The Committee, has, therefore, taken away 30 Per cent from kerosene consumption and added it to HSDO to get the assumed base level consumption of HSDO in 1972-73. In view of the ~ncertainties regarding the base level consumption of HSDO and kerosene it is not very useful to make a comparison of the rates of growth of HSDO and kerosene separately, with those im-plied ill the forecast. ·
8.35. •Our estimate for HSDO has been maqe in quantitative terms for tbe year 1978-79, 1983-" 84 and 1990-91 and tbese tally witb tbe likely availability of vehicles in the respective years. In arriving at Case-11 estimates, we have assumed tbat beyopd 1978-79, the rate of growtb of road transport is assumed to be lower than in the previous years and that this can be achieved by more efficiel!t management of the Railways . and proper coordination of road and rail transport. If this is to be achieved in the Sixth Plan period, organizational and operational improvements have to be introduced in the railways even during the Fifth Five Year Plan. Management of HSDO demand to the levels · indicated in this
. Report is possible only by proper formulation of a transport policy which will coordinate the road .and railway transport in an optimal manner. The Committee would recommend that immediate action should. b.e taken in this regard. Long distance movement of commodities by road should be discouraged; while simultaneously increasing the
· capability of the railway transport. Containerisation and introduction of door-to-door service by
· the railways are some of the procedural measures · that could be adopted to make them discharge efficient transport of certain commodities which are mo~ed increasingly by roadways now.
Diesel traction in railways · ·
.71
8.3.6. The Committee has tried to examine. · whether the use of diesel for tradition in the rail
ways could be reduced. The study brings out that the .selection of the optimal mode of traction. as among, steam, diesel or electricity will depend on the density of traffic prevailing on particular sections; the profile of growth of traffic on tbe sections and the topographical conditions. Other factors like· c9ntinuity of· mode of traction and the relative pi-ice of coal and oil and electricity also have a bearing on tbe results. The major . problem in maki11g a study to work out the 9pti- . mal mix of coal, diesel, electrical traction is the lack of data to project the traffic density along the various routes in tbe railways based on forecasts of the regional pattern of growth. and the pattern of commodity movemenmts. The first outline of tbc Corporate Plan of the Indian Railways has been drawn up only recently and this does not contain the pattern of commodity movement. Making a partial analysis, it is found that diesel traction is better tban steam traction on routes where the density of traffic is more than 4 to 5 million tonnes. The efficiency of energy utilisation in a steam loco is 7 to 12 per cent compared· to about 28 to 30 per cent in the diesel engine. The operational costs of steam locos ~re also higher on account of. the need to prov1de
. stoppages for watering facili?es etc. T~ere is. a ·large stock of steam locos Wlth the Indian Railways in which the investment has already been . made and the continuance of this traction is 1'10re economical than replacing them with newly obtained diesel electric ]ocos in areas w~ere the
traffic conditions on a particular route do not call for an increase in tbe number of trains to be moved. Introduction of tbe diesel traction or electric traction on a line increases tbe number 1>f trains which could be moved along the back on account of tbe increased speed ·of tbe diesel locos. The operational costs are also lower than in tbe case of steam locos and lower still in tbe case of electric locos but tbe investment costs are higher in the case of electric traction . Given tbese facts, it is clear that steam locomotive have to be preferred only on lines where tbe density of traffic is low and diesel traction lines where the density is higher but not adequate to justify the investment required for introducing electric traction. .
1
8.37. The mix of steam, diesel and electric traction which should minimise tbe total cost of ·moving a given level of traffic will depend on tbe density of traffic on tbe different lines and tbe terrain of the land. In tbe absence of data regarding commodities, origin, destination, details of freight etc. only broad judgement of the likely trends could be made. The traffic routes from Delhi to Calcutta, Delhi to Bombay, Bombay to Calcutta and Madras to Delhi account for 14 per cent of tbe total route kilometerage but tbey carry
· 50 per cent of the total frieght traffic. The rate of growth of traffic on tbese lines has also been steadily increasing. Sinlilarly, tbe sub-urban routes around metropolitan towns have very high traffic density which has also been increasing rapidly. The rail transport requirements in tbe steel-coal belt area has also increased considerably. It is clear that these routes should be electrified as expeditiously as. possible. The railways have already drawn up plans iii tbis direction. It has been estimated by the railways that 1800,
· 3000 and 4000 Km will be electrified during the Fifth, Sixth and the Seventh Plan periods, which would take the total electrification to 12,800 Kms. With electrification of track increasing to that extent, it is anticipated that the railways can maintain the stock of diesel locomotives at a constant level of about 2,600 and the consumption of diesel at 0.8 mt. per year from then on. In other words, diesel consumption which was 0.5
.mt in 1970-71 will increase to 0.8 mt by 1978-79 and staY at that level from then on. Though the stock of diesel locomotives will remain the same from 1978-79 onwards, the area$ in. which they operate will change from time to time. The diesel
· · traction will be introduced in the areas where the . steam traciton will be unable to handle the increasing load traffic but electricity could not be extended for want of adequate traffic. The Committee considered this plan to be a reasonable one, as upto 1978-79, the pace of electrification camiot be increased and tbe increasing traffic loads. can be carried by introducing diesel locos only. However, the extent of goods to be moved by electric traction as per our estimates indicat• ed in Chapter ill will be somewhat higher. The Committee's estimates of demand of electricity
for transport is, therefore, considerably higher than the estimates made by the railways. . :·
L.D.O.
8.38. LDO is used for running irrigation pumpsets for lifting water and for running fishing crafts and as a support fuel in certain thermal power stations. The estimates of demand imply a 6.3 per cent growth during 1972-73 to 1978-79 and .35 per cent in the Sixth Plan and about 4.5 per cent from then on. The reduction in the rate of growth in the Sixth Plan is dependent on the increased pace of rural electrification and extending electricity to most of the pumpsets.· 'This should be done in a phased manner to ensure first that in each electrified village all the pumpsets should ,be electrified. instead of energizing only a few pumpsets. This will bring down tile requirement of public investment for reducing oil consumption in the agricultural sector. fhe procedures now followed for electrification . of wells in villages and the procedures of extendmg financial assistance to farmers for setting up electrical pumpsets should be suitably modified to ensure that almost all pumpsets in any village which is electrified, obtain electrical connection and operate on electricity only. Surveys show that a large percentage of . farmers · with electrical pumpsets also keep diesel pumps for .standby operations and use them frequently on account of the frequent failures of electricity in the rural areas. The improvement in the efficiency of operation of rural power supply will have a salutary effect in reducing the consumption of .oil.
Fuel C!il
72
8.39. Fuel oil is one oil product whose consumption can be severely restricted without affecting the level of economic activity provided the substitute indigenous fuel namely, coal, is made available to the consumer in adequate quantity. · · As discussed 'earlier naphtha wo~ld be in great .. • shortage and a large portion · of our fertilizer needs may have to be met by production based on fuel oil. Fuel oil is a valuable raw material for the production of high cost petroleum products which have either a good export potential or serve as import substitutes. Large quantities of fuel oil should, therefore; be earmarked for production of high value products like lubes, bitumen, petroleum .coke and wax. There is a strong · case for curbing the use of fuel oil. Technologically, about 70 per cent industries where fuel oil is used, can switch over to coal and about 2 to
· 2.2 tonnes Of coal can substitute I tonne of fuel oil. In earlier periods fuel oil demand was below the level of its availability. The oil companies and even the Government had undertaken prr>motional measures for the use of fuel oil. Currentlv. the case for the use of fuel oil rests almost entirely on the non-availability of coal and the unreliable nature ·of its supply to the industries. If
these deficiencies in the coal distribuiton sy~t:-m are remedied, there is great scope for· curtailmg the use of fuel oil. All efforts should, therefore, be made to prevent any new industry from taking up the use of fuel oil if it ·can use coal. The Committee would, therefore, recommend that even at the stage of licensing new industrie~, _the use of fuel oil in furnaces should be prolub1ted .and the nationalised coal industry should be asked to take immediate steps to set up coal dumps in all the industrial centres. of the country from where, the industrialists could collect their . coal requirements.
8.40. Another large· ~ector using fuel oil· in increasing quantities is the thermal power ~ector. Though the main fuel in the power. generating ... stations is coal, a certain amount of 011 has to be · used du~ing the start-up of the plants as ·Nel~ as at times when the load on the thermal stations goes below a particular level. The previous de- ' sign of the small boilers was such that the .oil support became necessary only when the load on the thermal stations was below 30 per cent of its capability. Newer designs ·seem to call for oil support even when the load on the statiOfl: is around 50 per cent. Some of the power statton engineers are claiming that oil support becomes necessary even when the load is as high as 70 per cent. Considering the very large increase in thermal power generation· in the coming decade, the Committee would recommend that the Government should take immediate steps to improve the desit?n of indigenous .thermal equipment with the specific objectives or reducing the technologi· cal requirements of oil . in the thermal plants.
Fertilizer production based on oil prodods
8.41. The major industries which use oil products for non-energy purposes are fertilizer and petro-chemical industries. , Nitrogenous fertilizer can be produced by using either natural gas, naphtha, fuel oil or the coal as the feedstock. ~he choice of feedstock would depend on the relative availability and the price of fe~dstocks and the investment and operating costs · of producing a unit of fertilizer, using the different feedstocks. The Committee, as indicated earlier; tried to identify the optimal level of use of different feedstocks in the economy keeping in view the refinery capacities and the demand for different oil products. The exercises using a programming model* indicate that the use. of naphtha for fertilizer production will not lead to overall economy. Fuel oil becomes the preferred feedstock as long as the price of crude is around $ 7 per barrel. If current prices of coal and crude are considered, coal is indicated as the prefered feed- · stock for fertilizer production. If the fuel oil production in the refineries is in excess of the demand for fuel oil needed for energy use, it should be subjected to secondary processing to get more of middle distillates products like diesel or kerosene.
----------------------------------
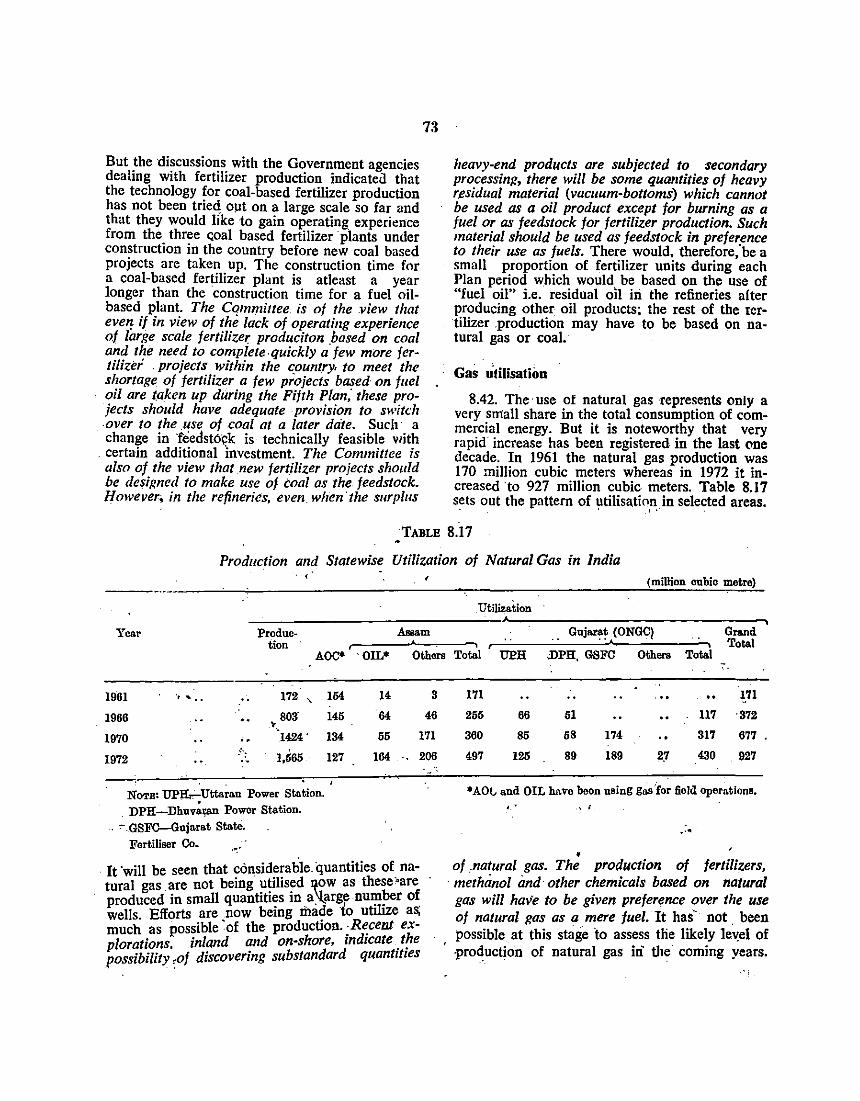
But the discussions with the Government agencies dealing with fertilizer production indicated that the technology for coal-based fertilizer production has not been tried opt on a large scale so far and that they would like to gain operating experience from the three c;oal based fertilizer plants under construction in the country before new coal based projects are taken up. The construction time for a coal-based fertilizer plant is atleast a year longer than the construction time for a fuel oilbased plant. The Committee. is of the .view that eve'! if in view of the lack of operating experience of large scale fertilizer produciton .based on coal and the need to complete.quickly a few more fertilizer . projects within the country. to meet the shortage of fertilizer a few projects based on fuel oil are taken up during the Fifth Plan; these projects should have adequate provision to switch .over to the .use of coal at a later date. Such· a
· change in 'feedstock is technically feasible with . certain additional !nvestment. The Committee is also of the view that new fertilizer projects should be desi11ned to make use oj coal as the feedstock. However; in the refineries, even. when ·the surplus
73
heavy-end products are subjected to secondary processinR, there will be some quantities of heavy residual material (vacuum-bottoms) which cannot be used as a oil product except for burning as a fuel or as feedstock for fertilizer production. Such material should be used as feedstock in prefer_ence to their use as fuels. There would, therefore, be a small proportion of fertilizer units during each Plan period which would be based on the use of "fuel oil" i.e. residual oil in the refineries alter producing other oil products; the rest of the rertilizer .production may have to be based on natural gas or coal.
Gas Jtilisation
8:42. The· use of natural gas represents only a very small share in the total consumption of commercial energy. But it is noteworthy that very rapid increase has been registered in the last one decade. In 1961 the natural gas production was 170 million cubic meters whereas in 1972 it increased 'to 927 million cubic meters. Table 8.17 sets out the pattern of utilisatiflnin selected areas. . ' . .
TABLE 8.17
Production and Statewise Utilization of Natural Gas in India
Year Produc- Assam tion
AOC* ·oiL• Others
1961 ..... 172 '
154 14 3
sa3· 145 64 46 ... 1966
1970 1424' 134 55 171
1972 .~-: 1,565.
NoTE' UPEk-Uttaran Power Station. . DPH-Dhuv;J;ail Power Station.
.. "". GSFC--Gujarat State. Fertiliser Co. . ..
127 154 .. 206
. It ·wm be seen that considerable. quantities of natural gas . are not being ~~lis~d JlOW as these •are produced in small quantities m a ll..argr nu~~er of wells. Efforts are .now being ma?e to utilize as; much as possible .of the production. ;R~celll explorations. inland and on-shore, md1cate . t~e possibility ,of discovering substandard quantities
(million cubic metre)
Utilization
. . Gujarat (ONGC) Grand Total
Total UPH .DPH. GSFC Others Total ,.
171 171
255 66 51 117 ·372
360 85 58 174 317 677
497 125 89 189 2J 430 . 927
*AOl, and OIL have been using gas 'for field operations. 4 • , I
• of .. natural gas. The production of fertilizers,
. methanol and other chemicals based on natural gas will have to be given preference over the use of natural gas as a mere fuel. It has· not . been possible at this stage to assess the likely. le~el of ·proQ.uction of natural gas iii t)le coming years.

CHAPTER IX
POLICY FOR POWER SECTOR
9.1. Electricity is an important constituent of commercial energy consumed in India. Due to
· the versatility of its use the rate of growth of consumption of electricity in this country has been the highest among the growth rates of consumption for the various fuels. As electricity can be produced from different sources, namely, coal, oil, nuclear fuels or hyde! potential, the choice of technology for production of electricity will have. an effect on the demand for other fuels in the country. The choice of technology for power generation will depend on a number of complex techno-eonomic factors which would be discussed later in the Chapter.
Trend in power consnmption and generation
9.2. The generation of electricity from 1960-61 to 1971-72 and the projected level of demand in 1978-79. 1983.-84 and 1990-91 are set out in Table 9.1.
TABLE 9.1
Electricity Generation-1960-6.1 to 1990-9i
1960-61 196&-66 1971-72
- 1978-79 (Projected) 1983-84 (Projected) 1990-91 (Projected)
. -...
Indices of Fnel Consnmpfion
(in million KWhrs)
20123 :-. 36825
66384 124000
205000 392000
9.3. The indices of consumption of difffferent fuels is given in Table 9.2.
TABLE 9.2
Indices of Consumption of coal, oil & electricity • (1960-61= 100)
·year Coal . Oil• Eleotri-.• city
1960-61 ;· ·100 100 100 196&-66 128 159 181
127 245 . ~ ·:
288 1970..71 1973-74 199 316 355 1978-79 341 478 618 1983-84 606 632 1023 1990-91 ' .. 847 990 1968
Nole : *This includes oil products used in the non-energy sector, .
9.4. In Chapter II, the relative rates of growth in c~msumption of electricity and other fuels have been discussed. The average annual rate of growth of generation of electricity during 1953-54 to 1960-61 was 10.7 per cent while from 1960-61 to 1965-66 it was 12.85 per cent but from 1965- · 66 to 1971-72 it was 10.35 per cent. In the period after 1971-72 there were severe physical constraints on power generation and its rate of growth in 1972-73 was about 5 per cent. Our forecasts imply that during the Fifth and the Sixth Plan period and upto. ~983-84 the average annual growth rate of electriCity generation would be 10.7 per cent. The figures obtained by diffe
. rent methods of· forecasting indicated a decreasing trend in the annual rate of power require-ments over time. But in keeping with the policy of restricting the use of oil products, the Committee felt that electricity generation requirements should be suitably increased so as to provide for the assumed increased consumption of electricity in place of oiL in transport, agriculture and domestic sectors.
9.5. The levels of power generation forecast in this Report is capable of fulfilling the following targets of power consumption:
-by 1990-91 all urban households and 70 per cent of rural households in the ceuntry will be provided with electricity for lighting purposes; - . · ·
-the number of agricultural pumpsets operated by electricity will increase from 2.5 million in 1973-74 to about 12 million by 1990-91;
-the per capita consumption would increase on an· annual average tate of 9.0 per cent during the period 1973-74 to 1990-91 and· reach . a level ·of 447 kWh in 1990-91.
. 9 .6 .. The per capita consumption of electricity m India from 1960-61 to 1990-91 are set out in Table 9.3 • . .
TABLE 9.3 · Per Capita Consumption of Electricity (1960-61
to 1990-91)
Year 1960-61 1965-66 1970-71 1973-74 •. 1978-79 •• 1983-84 •• 1990-91 .•
74
. ...
Per capita consumption (kWh)
38·2 61·83 89·76
103·22 . • ·• 173·40
253·00 447'00
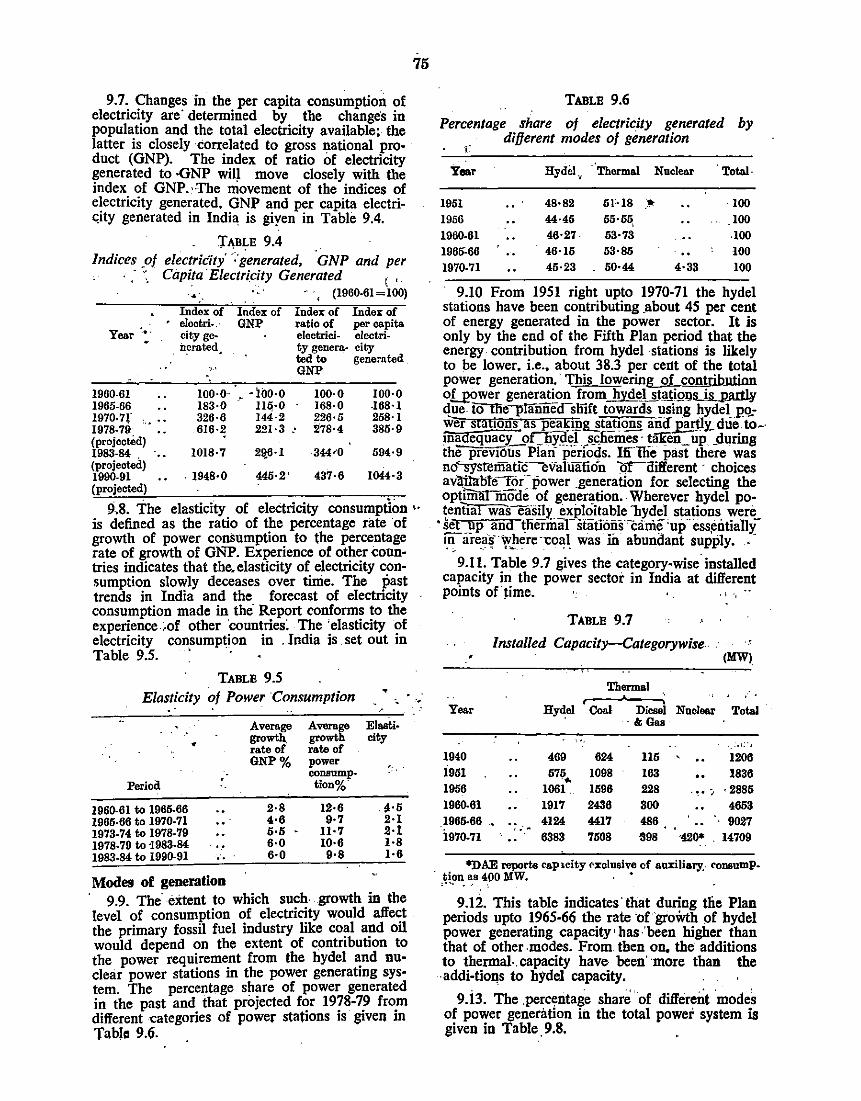
9.7. Changes in the per capita consu~ption of electricity are· determined by the changes in population and the total electricity available; the latter is closely correlated to gross national product (GNP). The index of ratio of electricity generated to -GNP wil). move closely with the index of GNP.:."fhe movement of the indices of electricity generated. GNP and per capita electri<;ity generated in Indil\ is giyen in Table 9.4.
TABLE 9.4 Indices _of electricity' :·generated, GNP and per
· " Capita 'Electricity Generated 1
,
Year·_..
1960-61 1965-66 1970-7!' ... 1978-79 (projected) 1983-84 . (projected) 1990-91 (projected)
.• . • . . - . ' (1960-61=l00)
Index of elootri .. · city gohero. ted.
'J·'
·.
Index of GNP
100·0·. - iOO·O 183·0 ~ llq·O 326·6 144·2
Index of Index of ratio of per capita electrici- electrity genera- city ted to generated. GNP
616·2 221·3 :
100·0 168·0 226·5 278·4
100·0 U8·1 258·1 385·9
1018·1 594·9
. 1948·0 445·2' 437·6 1044·3
75
9.8. The elasticity of electricity consumption '" is defined as the ratio of the percentage rate ·of growth of power consumption to the percentage rate of growth of GNP. Experience ot other conntries indicates that the. elasticity of electricity consumption slowly deceases over tinie. The past trends in India and the forecast of electricity consumption made in the Report conforms to the experience.,of other countries~ The ·elasticity of electricity con~umption in . India is set out in Table 9.5. . · •
TABLE 9.5 Elasticity of Power ·consumption •
• Average Average Elasti·
• growth growth city rate of rate of GNP% power .
consum.p-Period tion%·
1960-61 to 1965-66 2·8 12·6 ~-5
1965-66 to 1970-71 4·6 9·7 2·1 1973-74 to 1978-79 5·5 11·7 2·1 1978-79 to ·1983-84 6·0 10·6 1·8 1983-84 to 1990-91 ... 6·0 9·8 1·6
Modes of generation 9.9. The. extent to which such .. growth in the
level of consumption of electricity would affect the primary fossil fuel industry like coal and oil would depend on the extent of contribution to the power requirement from the hyde! and nuclear power stations in the power generating system. The percentage sh~re of power generated in the past and that proJected fC?r 19?8·7? fro_m different categories of power statiOns IS gJVen m Table 9.6.
.•
TABLE 9.6
Percentage share of electricity generated by different modes of gimeration
r Year Hyde!, .·Thermal Nuclear Total·
1951 48·82 51'·18 ~-- 100 1956 44·45 55·55
'' 100
1960-61 46·27· 53·73 100 1965"-66 46·15 53·85 100 1970-71 45·23 50·44 4·33 100
9.10 From 1951 right upto 1970-71 the hyde! stations have been contributing _about 45 per cent of energy generated in the power sector. It is only by the end of the Fifth Plan period that the energy. contribution from hyde! ·stations is likely to be lower. i.e., about 38.3 per cent of the total power generation.· This lowering of contribution ouower generation from hydc~lJta..tions is partcy d,Ee i0tllti--plli'i1Deosh1ft towards !JSing hydel pQ.wer stauons as peaJi'l!!~t!!lJ~ ana Eartly_ due to-· medeq uacy_.9C: hy~I~I _ s_~;liemes · tffin _up _during the previOus Plan" periods. Ifi"llie past there was no~stemauc-evaluation Qra'rll'erent · choices av'l!illrbteroi~ power _generation for selecting the op~_iiiln-niode of gener~tion .. Wherever hydel po· tentml was easil;r. exploitable 'hydei stations were
• set up and tfieniiantauoiis'canie·up"essentiallylnareas· where--coal was iii abunilant supply. . · . ;,- -.- ~ . ...__- ..
9.11. Table 9.7 gives the category-wise. installed capacity in the power sector in India at different points o(lime. . , ·,
TABLE 9.7
Installed Capacity-Categorywise. ., • (MW)
Thermal ,, . .. . Year Hyde! Coal Diesel Nuclear Total
·&Gas
,;·,
1940 469 624 ll5 1206 1951 575 .. 1098 163 1836 1956 1061 1596 228 . ~. ' '2885 1960-61 1917 2436 300 4653 1965-66 -
0 ~ .... 4124 4417 486 9027 1970-71 6383 7508 1198 ·420* 14709
*DAE reporte <'aplcity (>Xclusive cf au:i1iary,. C'OnsnmP-. ~!on as 400 MW. •
9.12. This table indicates· that during the Plan periods upto 1965-66 the rate of groWth of hyde! power generating capacity' has -'been higher than that of other .modes. From then on, the additions to thermal-. capacity have been' ·more than the -addi-tioi!S to h}>del capacity.
9.i3. The .percentage share' of differe~t modes of power generation in the total power system is given in Table. 9.8. .
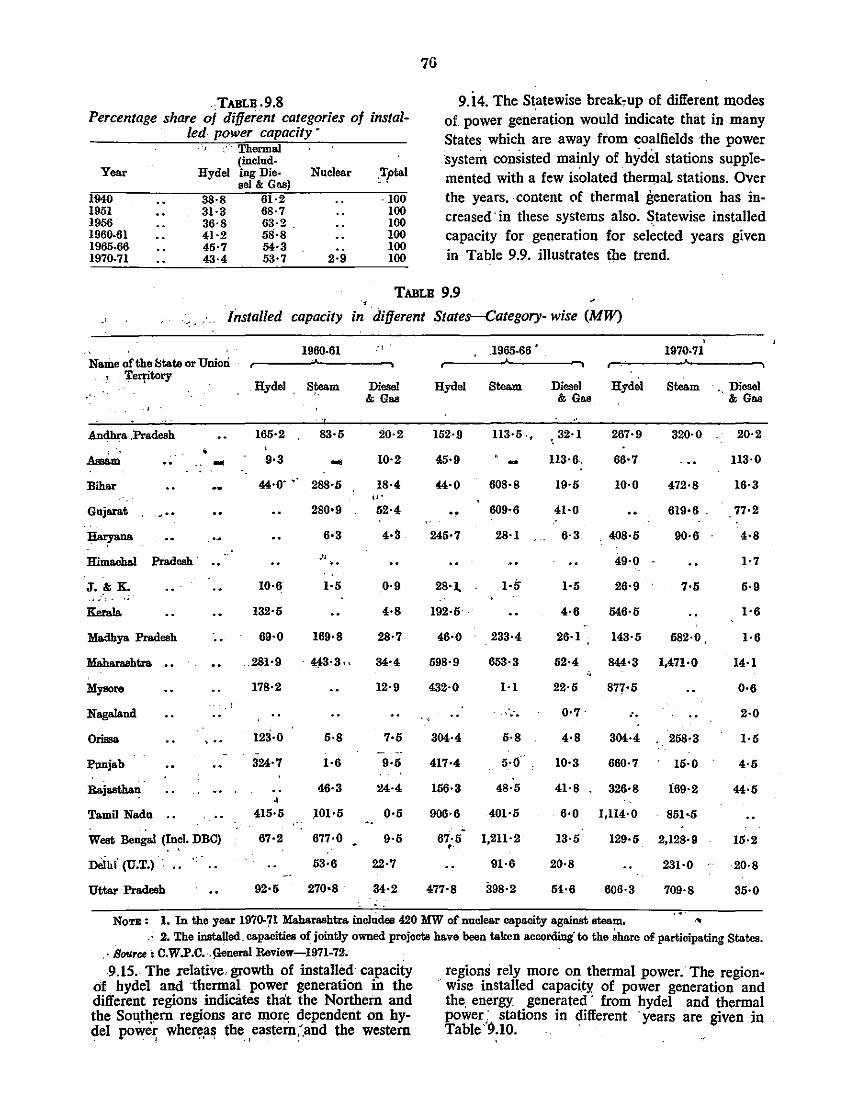
7G
TABLB.9.8 9.i4. The Statewise break,up of different modes Percentage share oj different categories of instal- of power generation would indicate that in many
led power capacity • States which are away from coalfields the power ."·J" Thermal
·system consisted mai,nly of hyde! stations supple-(includ-Year Hydel ing Die· Nuclear l,otal mented with a few isolated theri1lal stations. Over sol & Gas)
1940 38·8 61·2 -100 the years. content of thermal generation has in-1951 31·3 68·7 100 creased· in these systems also. ~tatewise installed 1956 36·8 63·2 . 100 1960-61 41·2 58·8 100 capacity for generation for selected years given 1965-66 45·7 54·3 100
in Table 9.9. illustrates tbe trend. 1970-71 43·4 53·7 2·9 100
TABLE 9.9 .,
·> Installed capacity in different States-Category- wise (MW)
• 1960-61 :! . . 1965-66 ° 1970-71
Name of the !;tate or Uoiori
' Terptory Hydel. St:eam Diesel Hydel Steam Diesel Hydel Steam · .. Diesel
& Gas & Gas & Gas
Andhra .Pradesh 165·2 83·5 20·2 152·9 ll3·5 ., 32·1 267·9 320·0 20·2
~..; • .. ... 9·3 ... 10·2 45·9 - 113·6. 66·7 113·0
Bihar 44•0' 0 288·li 18·4 44·0 608·8 19·5 10·0 472·8 16·3 ,,. Gujarat -·· 280•9 52·4 609·6 41·0 619·6 .. 77·2
~ 6·3 4·3 245•7 28·1 6·3 408·5 90·6 4·8
Himachal Pradesh. ·'' 49·0 1·7 • 0
J. & K. .. 10·6 1·5 0·9 28<1. 1·5 1·5 26·9 7·5 5·9
Kerala 132·5 4·8 192·5 . 4·6 546·5 1·6
Madhya Pradesh 69·0 169·8 28·7 46·0 233·4 26·1 143·5 582·0. 1·6
Mahareshtra . 281·9 ··~·3 .. 34·4 598·9 653·3 52·4 844•3 1,471·0 14·1 .. Myaore 178·2 12·9 432·0 1·1 22·5 877·5 0·6
Nagaland .. ... 0·7 . ... 2·0
OriBsa ' .. 12S·O 5·8 7•5 304·4 5·8 4·8 304·4 258·3 1·5
Pnnjab 324·7 1·6 9·5 417·4 5·0 10·3 660·7 15·0 4·5
Rail"'lhan 46·3 l!4·4 156·3 48·5 41·8 326·8 169·2 44·5 •
Tamil Nadn 415·5 101·5 0·5 906·6 401·5 6·0 1,ll4·0 851·5
West Bengal (Incl. DBC) 67·2 677·0 9·5 67·5 1,211·2 13·5 129·5 2,128·9 15·2 . . • Dclhi (U.T.) . ·:· 53·6 22·7 91·6 20·8 231·0 20·8
Uttar Pradesh 92·5 270•8 34·2 477·8 398·2 51·6 606·3 709·8 35·0
Non : 1. In the year 1970.71 Maharashtra includes 420 MW of nuclear capacity against steam. " .• 2. The installed.capacities of jointly owned projects have been taken according' to the ~hare ofpartioipating States •
. · Souru: C.W.P.C.·.~neral Review-1971-72.
9.15. The relative. growth of installed· capacity of hydel and ·thermal power generation in the different regions indicates that the Northern and the Sol\tl!em regions are mor~ dependent on bydel powe~ where!!~ the_ , eastem.~.and the western
regions rely more on thermal power. The region-.· wise installed capacity of power generation and
the. energy generated · from hyde! and thermal power; stations in different ·years are given in Table· 9.10. . .
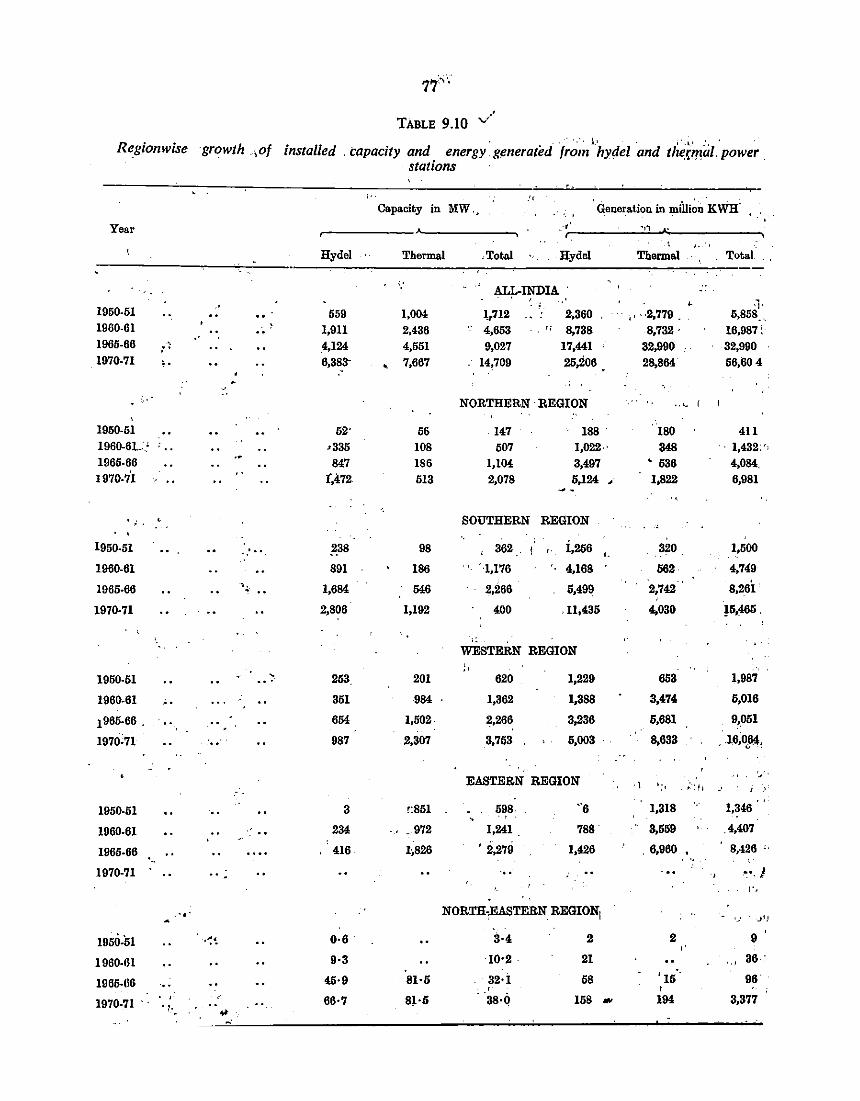
TABLE 9.10 "/
Regionwise growth .,of installed . '' 1.• '' ,l_• :' '
. capacity and energy generated from hyde! and th~rmal. power stations ·
(•· !<
Capacity in MW .• ' '
G_ene~ation in million KWH'
Year ._.,, .,, ,.
Hyde! Thermal .TotDJ Hyde! Thermal Total
'.' ALL-INDIA • ·l' 1950-51 559 1,004 1_,712 2,360 . i' .. 2,779 .. 5,8li8"
1960-61 . . 1,9II 2,436 4,653 . . <; 8,738 8,732 . 16,987: 1965-66 '
.. _4,124 4,551 9,027 17,441 32,990 32,990
1970-71 ; 0 6,383' '
7,667 14,709 25,206 28,864 56,604
-· NORTHERN ·REGION .. c f
1950-51 52• 56 147 .
188 . 180 411 1960-61,.:' •335 108 507 1,022·· 348 '- 1,432: ., 1965-66 647 186 1,10{ 3,497 • 536 4,084, 1970-71 .. r,472 513 2,078 5,124 ' 1,822 6,981
.. SOUTHERN REGION
1950-51 ... ·- -~38 98 362. ,. 1,256 '-
320 1,500
1960-61 891 186 . -1,176 4,168 562 4,749 ., .
1,664 546 2,266 5,499 2,742 " 8,26i. 1965-66 .,, .. '
1970-71 2,806 1,192 400 'll;435 4,030 !5,465'
.. ' '. l: .. WESTERN REGION • ·'
1950-51 ' 253 201 620 1,229 653 1,987 ... 1960-61 351 984 1,362 1,388 3,474 5,016
1965-66 . .. 654 1,502- 2,266 3,236 5,681 9,051
1970'71 .. .. 987 2,307 3,753 6,003 8,633 .l6,0064,
EASTERN REGION ,j,.
\ ';. . ;-. fl ) ' 1950-61 3 !:861 698 ··a 1,318 1,346
1960-61 234 'J .. 972 1,241 788 3,559 ,4,407 .. 1965-66 416 1;826 ' 2,279 1,426 . 6,960 . 8,426 ,,
. . .. 1970-71 ...
' ~-. I r·.
· ..•. NORTH.,EASTERN REGION, . . ' ,_. . Jl!
.. ··-=~ 0·6- 3·4 2 2 9 1950-51 ,.
1960-61 9·3 10•2 . 21 '" as.·
1965-116 45·9 81·5 32•1 58 '15 96' < '
1970-71 . -< 66·7 81·5 as-o 158 ,., 194 3,377 ..
"1· . ... -
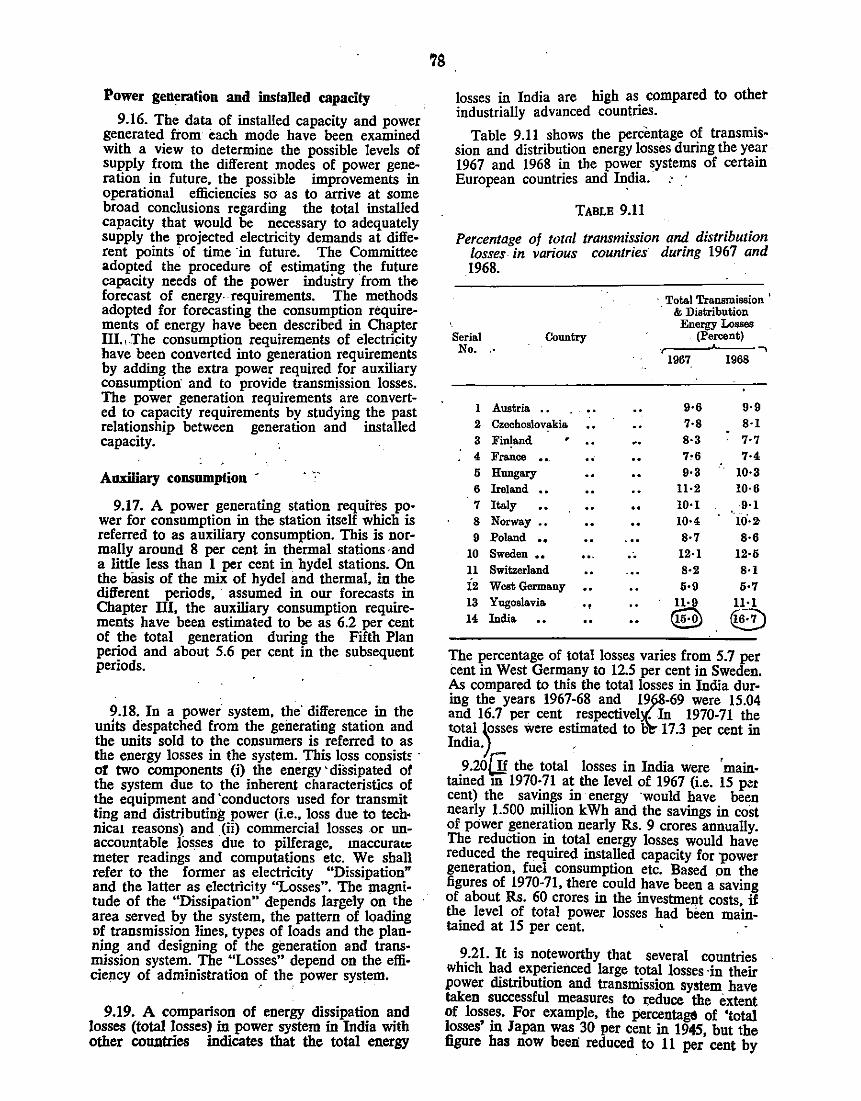
Power generation and installed capacity
9.16. The data of installed capacity and power generated from each mode have been examined with a view to determine the possible levels of supply from the different modes of power generation in future, the possible improvements in operational efficiencies so as to arrive at some broad conclusions regarding the total installed capacity that would be necessary to adequately supply the projected electricity demands at different points ·of time ·in future. The Committee adopted the procedure of estimating . the future capacity needs of the power industry from the forecast of energy. requirements. The methods adopted for forecasting the consumption requirements of energy have been described in Chapter llLThe consumption requirements of electricity have been converted into generation requirements by adding the extra power required for auxiliary consumption: and to provide transmission losses. The power generation requirements are converted to capacity requirements by studying the past relationship between generation and installed capacity.
Auxiliary consnmption -
9.17. A power generating station requites power for consumption in the station itself which is referred to as auxiliary consumption. This is normally around 8 per cent in thermal stations· and a little Jess than 1 per cent in hyde! stations. On the basis of the mix of hyde! and thermal, in the different periods, · assumed in our forecasts in Chapter Ill, the auxiliary consumption requirements have been estimated to be as 6.2 per cent of the total generation during the Fifth Plan period and about 5.6 per cent in the subsequent periods.
9.18. In a power system, the' difference in the units despatched from the generating station and the units sold to the consumers is referred to as the energy losses in the system. This Joss consist~ · or two components (i) the energy ·dissipated of the system due to the inherent characteristics of the equipment and 'conductors used for transmit ting and distributintl power (i.e., loss due to tech· nica1 reasons) and (ii) commercial losses or unaccountable losses due to pilferage, maccurat.e meter readings and computations etc. We shall refer to the former as electricity "Dissipation" and the latter as electricity "Losses". The magnitude of the "Dissipation" depends largely on the area served by the system, the pattern of loading of transmission lines, types of loads and the planning and designing of the generation and transmission system. The "Losses" depend on the efficiency of administration O.f the power system.
9.19. A comparison of energy dissipation and losses (total losses) in power system in Iildia with other countries indicates that the total energy
7S
losses in India are high as compared to other industrially advanced countries.
Table 9.11 shows the percentage of transmission and distribution energy losses during the year 1967 and 1968 in the power systems of certain European countries and In_dia. · ·
TABLE 9.11
Percentage of total transmission and distribution losses in various countries· during 1967 and 1968.
Serial No •.•
Country
I Austria .. 2 Czechoslov~kia
3 Finland 4 France .. 5 Hungary 6 Ireland .. 7 Italy 8 Norway .. 9 Poland ..
10 Sweden •• II Switzerland 12 Weat Germany 13 Yugoslavia •• 14 India
, Total Transmission ' & Distribution
Energy Losses (Percent)
r-----'--..., 1967 1968
9·6 9·9 7·8 8·1 8·3 7·7 7,6 7·4 9·3 10·3
11·2 10·6 10·1 9·1 10·4 Hl·2 8·7 8·6 12·1 12·5 8·2 8·1 5·9 5·7
11·9 11·1
9 8 The percentage of total losses varies from 5.7 per cent in West Germany to 12.5 per cent in Sweden. As compared to this the total losses in India during the years 1967-68 and 1~-69 were 15.04 and 16.7 per cent respective! . In 1970-71 the total \osses were estimated to IJ 17.3 per cent in India) _
9.20W the total losses in India were 'main· tained m 1970-71 at the level of 1967 (i.e. 15 p~r cent) the savings in energy ·would have been nearly 1.500 million kWh and the savings in cost of power generation nearly Rs. 9 crores annually. The reduction in total energy losses would have reduced the required installed capacity for power generation, fuel consumption etc. Based pn the figures of 1970-71, there could have been a saving of about Rs. 60 crores in the investment costs if the level of total power losses had been ma'in-tained at 15 per cent. '
9.21. It is noteworthy that several countries which had experienced large total losses ·in their power distribution and transmission system have taken successful measures to ~:educe the extent of lo~s:s. For example, the percentag& of 'total losses m Japan was 30 per cent in 1945, but the figure has now been: reduced to 11 per cent by
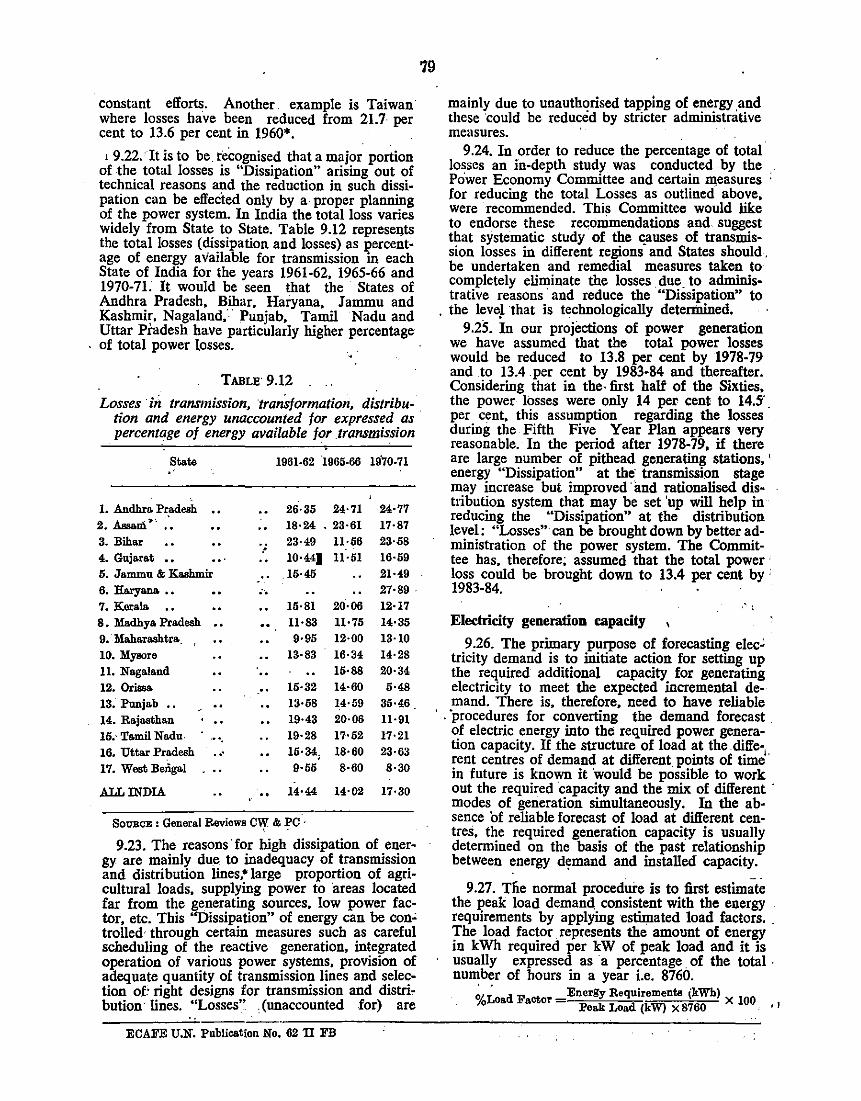
constant efforts. Another example is Taiwan· where losses have been reduced from 21.7· per cent to 13.6 per cent in 1960*. .
I 9.22. It iS tO be recognised that a major pOrtiOn of the total losses is "Dissipation" arising out of technical reasons and the reduction in such dissipation can be effected only by a proper planning of the power system. In India the total loss varies widely from State to State. Table 9.12 represeqts the tota1Iosses (dissipation and losses) as percentage of energy available for transmission in each State of India for the years 1961-62, 1965-66 and 1970-71. It would be seen that the States of Andhra Pradesh, Bihar, Hacyana, Jammu and Kashmir, Nagaland; · Punjab, Tamil Nadu and Uttar Pradesh have particularly higher percentage of total power l.osses. .
TABLE 9.12
Losses ·iii transmission, transtormation, distribution and energy unaccounted for expressed as percentage of energy available for .transmission
State 1961-62 1965-66 1970-71 •'
1. Andhra Pr,adesh 26·35 24·71 24·77 2. Assam •· 18·24 • 23·61 17·87 3. Bihar 23·49 11·56 23·58 4. Gnjarat 10·441 11·51 16·59 5. Jammu & Kashmir .15·45 21·49 6. Haryana •• .... 27·89 . 7. Kerala 15·81 20·06 12·17 8. Madhya Pradesh 11·83 11·75 14·35 9. Mabare.shtra. 9·95 12·00 13·10 10. Myaore 13·83 16·34 14·28 11. Nagaland 15·88 20·34 12. Orissa .. 15·32 14·60 5·48 13. Punjab •• 13·58 14·59 35·46 14. Rajasthan 19·43 20·06 11·91 15.· Tamil Nadu. ·• ·. 19·28 17·52 17·21 16. Uttar Pradesh ... 15·34, 18·60 23·63 17. West Bengal 9·55 8·60 8·30
ALL INDIA 14·44 14·02 17·30
SotmCE : General Reviews C\Y & PC ·
9.23. The reasons for high dissipation of energy are mainly due to inadequacy of transmission and distribution lines: large proportion of agricultural loads, supplying power to ·areas located far from the generating sources, low power factor, etc. This "Dissipation" of energy can be con" trolled· through certain measures such as careful scheduling of the reactive generation, integrated operation of various power systems, provision of adequate quantity of transmission lines and selection of: right designs for transmission and distribution· lines. "Losses" , (unaccounted for) are
79
mainly due to unauthorised tapping of energy and these could be reduced by stricter administrative measures.
9 .24. In order to reduce the percentage of total losses an in-depth study was conducted by the Power Economy Committee and certain 111easures for reducing the total Losses as outlined above, were recommended. This Committee would like to endorse these rec:onimendations and. suggest that systematic study of the <;_auses of transmission losses in different regions and States should. be undertaken and remedial measures taken to· completely eliminate the losses .due. to administrative reasons· and reduce the "Dissipation" to
. the level that is technologically determined, 9.25. In our projections of power generation
we have assumed that the total power losses would be reduced to 13.8 per cent by 1978-79 and to 13.4. per cent by 1983-84 and thereafter. Considering that in the· first half of the Sixties, the power losses were only 14 per cent to 14.5'. per cent, this assumption regarding the losses during the Fifth Five Year Plan appears very reasonable. In the period after 1978-79, if there are large number of pithead generating stations, ' energy "Dissipation" at the· transmission stage may increase but improved· and rationalised distribution system that may be set 'up will help in reducing the "Dissipation" at the distribution level: "Losses" can be brought down by better administration of the power system. The COmmittee has, therefore; assumed that the total power · loss could be brought down to 13.4 per cent by : 1983-84.
Electricity generation capacity
9 .26. The primary purpose of forecasting elec~ tricity demand is to initiate action for setting up the required additional capacity for generating electricity to meet the expected incremental demand. There is, therefore, need to have reliable
· . "procedures for converting the demand forecast of electric energy into the required power generation capacity. If the structure of load at the different centres of demand at different. points of time'· in future is known it ·would be possible to work out the required capacity and the mix of different ' modes of generation simultaneously. In the absence of reliable forecast of load at different centres, the required generation capaciW is usually determined on the basis of the past relationship between energy d~mand and installed capacity.
9.27. Tlie normal procediri-e is to first estima-t~ the peak load demand, consistent with the energy requirements by applying estimated load factors .. The load factor represents the amount of energy in kWh required per kW of peak load and it is usually expressed as a percentage . of the total . number of hours in a year i.e. 8760.
%Load Factor Energy Requirements ikWh)
l'ea.k Load (kW) X 8760 X 100 ' I
--~--------------~~------------~----~ ECAFE U.N. Publication No. 62 11 FB
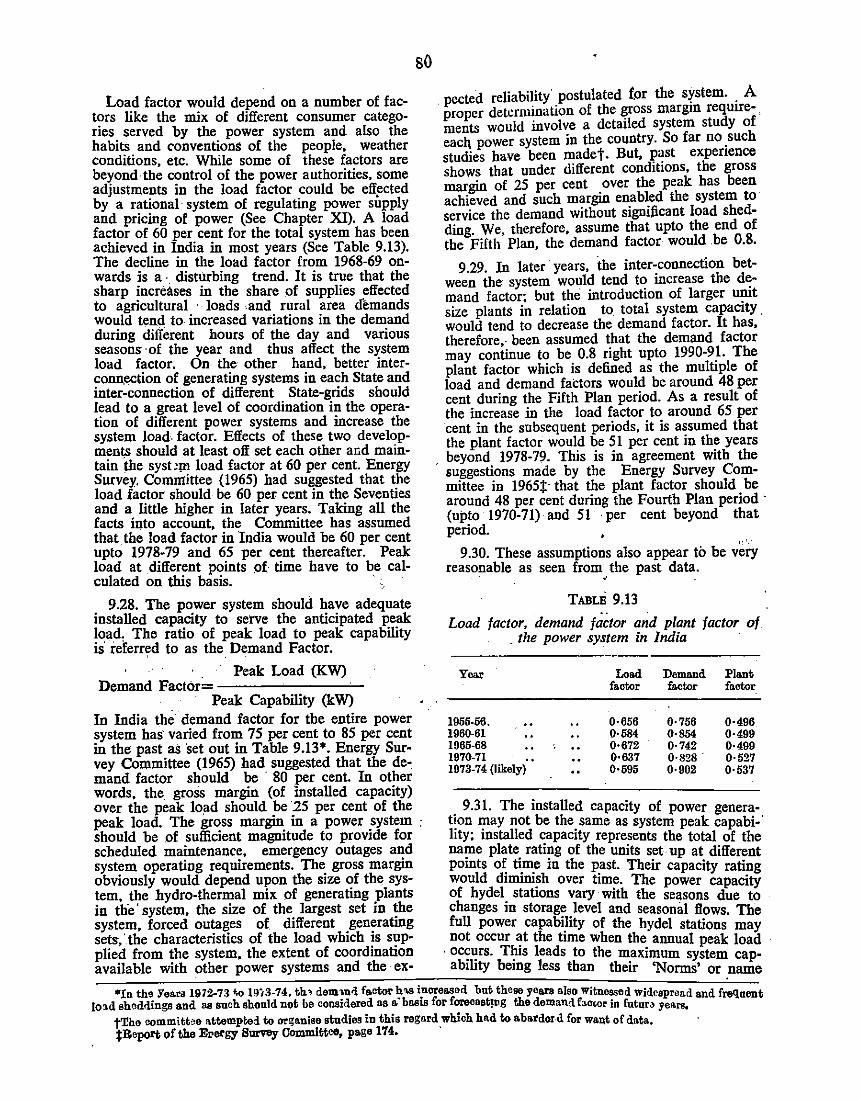
Load factor would depend on a number of factors like the mix of different consumer categories served by the power system and also the habits and conventions of the people, weather conditions, etc. While some of these factors are beyond the control of the power authorities, some adjustments in the load factor could be eff_!!cted by a rational· system of regulating power supply and pricing of power (See Chapter XI). A load factor of 60 per cent for the total system has been achieved in India in most years (See Table 9.13). The decline in the load factor from 1968-69 onwards is a . disturbing trend. It is true that the sharp increases in the share of supplies effected to agricultural · loads .and rural area demands would tend to increased variations in the demand during different hours of the day and various seasons ·of the year and thus affect the system load factor. On the other hand, better interconnection of generating systems in each State and inter-connection of different State-grids should lead to a great level of coordination in the operation of different power systems and increase the system load. factor. Effects of these two developments should at least off set each other and maintain ·the syst 'Ill load factor at 60 per cent. Energy Survey, Collllllittee (1965) had suggested that the load factor should be 60 per cent in the Seventies and a little higher in later years. Taking all the facts into account, the Committee has assumed that the load factor in India would be 60 per cent upto 1978-79 and 65 per cent thereafter. Peak load at different points of time have to be cal-culated on this basis. ·
9.28. The power system should have adequate installed capacity to serve the anticipated peak load. The ratio of peak load to peak capability is· referr~d to as the Demand Factor.
Peak Load (KW) Demand Factor=---~----'--
Peak Capability (kW)
so
In India the demand factor for the entire power system has· varied from 75 per cent to 85 per cent in the past as ·set out in Table 9.13*. Energy Survey Committee (1965) had suggested that the de-. mand factor should be · 80 per cent. In other words, the. groSs margin (of installed capacity) over the peak lo.ad should be 25 per cent of the peak load. The gross margin in a power system : should be of sufficient magnitude to provide for scheduled maintenance, emergency outages and system operating requirements. The gross margin obviously would depend upon the size of the system. the hydro-thermal mix: of generating plants in th'e' system, the size of the largest set in the system, forced outages of different gen~rating sets '.the characteristics of the load which ts supplied from the system, the ex:tent of coordination available with other power systems and the· ex:-
. pected reliability postulated (or the s:rstem .. A proper determination of the ~oss margm requrrements would involve a detatled system study of eacn power system in the country. So far no _such studies have been madet. But, J?~St ex:penence shows that under different condttlons, the gross margin of 25 per cent . over the peak has been achieved and such margm enabled the system to service the demand without signiJicant load shedding. We, therefore, assume that upto the end of the Fifth Plan, the demand factor would .be 0.8.
9.29. In later years, the inter-connection between the system would tend to increase the d~mand factor; but the introduction of larger u!llt size plants in relation to total system capactty . would tend to decrease the demand factor. It has, therefore,· been assumed that the demand factor may continue to be 0.8 right upto 1990-9_1. The plant factor which is defined as the multiple of load and demand factors would be around 48 per cent during the Fifth Plan period. As a result of the increase in the load factor to around 65 per cent in the subsequent periods, it is assumed that the plant factor would be 51 per cent in the years
. beyond 1978-79. This is in agreement with the suggestions made by the Energy Survey Committee in 1965:j:· that the plant factor should be around 48 per cent during the Fourth Plan period ' (upto 1970-71) and 51 ·per cent beyond that period.
9.30. These assumptions also appear to be very reasonable as seen from the past data. . .
TABLE 9.13
Load factor, demand factor and plant factor of . the power system in India
Year Load Demand Plant factor factor factor
1955-56, .. 0·656 0·756 0·496 1960-61 0·584 0·654 0·499 1965-68 0·672 0·742 0·499 1970-71 0·637 0·828. 0·527 1973-74 (likely) 0·595 0·902 0·537
9.31. The installed capacity of power generation may not be the same as system peak capabi-· lity; installed capacity represents the total of the name plate rating of the units set up at different points of time in the past. Their capacity rating would diminish over time. The power capacity of hyde! stations vary· with the seasons due to changes in storage level and seasonal flows. The full power capability of the hyde! stations may not occur at the time when the annual peak load
· occ;:~rs. T~is leads to the max:imum system capability bemg less than their 'Nonns' or name
*In th• Yeara 1972-73 t.o l9i3-74, th• dem>nd factor h'\8 i.noreased bat these years also Witnessed widespread and fre<!aent Io::~.d shodrlings and as such should not be considered as a.·baats for forecastJtlg the demand bclior in futuN years,
tThe oommittee attempte:l to or~anise studies in this regard which had to abardor-d for want of data. tBeport of the Etoergy Survey Committee, page 174. ·
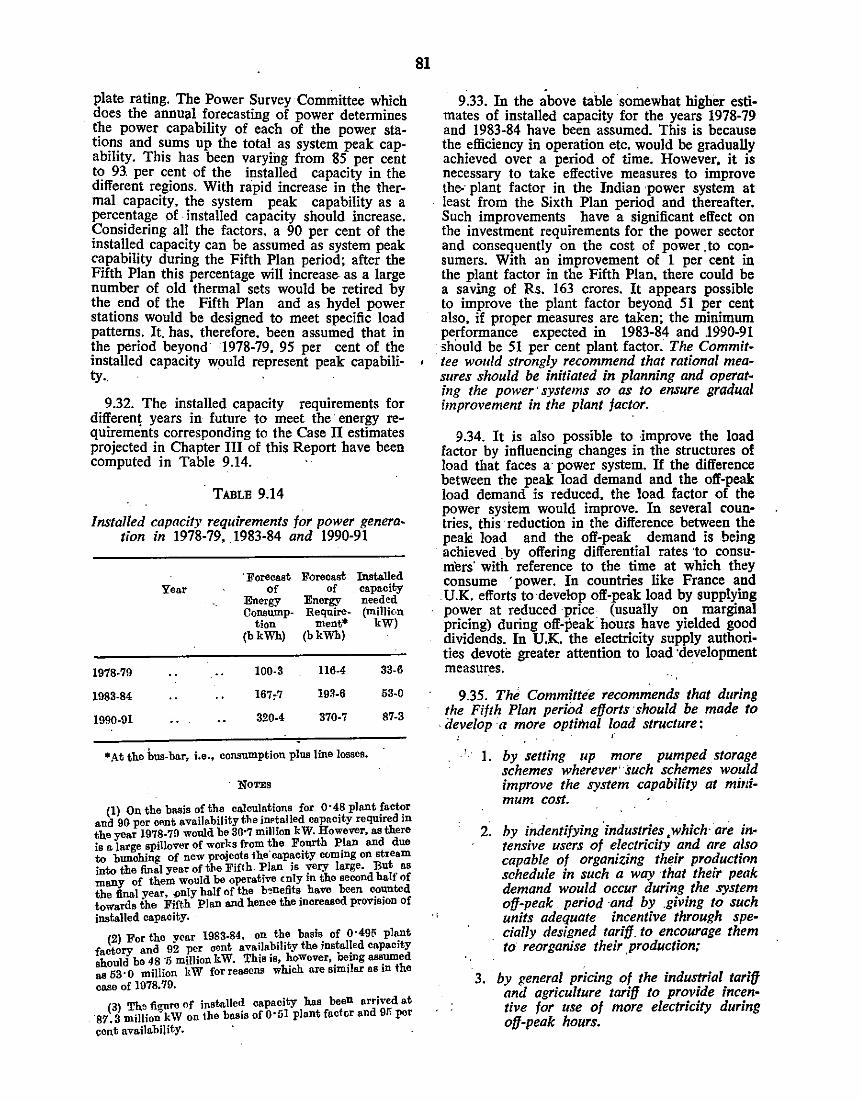
plate rating. The Power Survey Committee which does the annual forecasting of power determines the power capability of each of the power stations and sums up the total as system peak capability. This has been varying from 85 per cent to 93. per cent of the installed capacity in the different regions. With nipid increase in the thermal capacity, the system peak capability as a percentage of . installed capacity should increase. Considering all the factors, a 90 per cent of the installed capacity can be assumed as system peak capability during the Fifth Plan period; after the Fifth Plan this percentage will increas~ as a large number of old thermal sets would be retired by the end of the Fifth Plan and as hyde] power stations would be designed to meet specific load patterns. It. has, therefore. been assumed that in the period beyond· 1978-79, 95 per cent of the installed capacity would represent peak capabili-ty. .
9 .32. The installed capacity requirements for different years in future to meet the · energy requirements corresponding to the Case II estimates projected in Chapter III of this Report have been computed in Table 9~14.
TABLE 9.14
Installed capacity requirements for power generation in 1978-79, ,1983-84 and 1990-91
'Forecast Forecast Installed Year of of capacity
Energy Energy need~d Conswnp· Require- (million
tion ment* kW) (bkWh) (bkWh)
1978·79 100·3 116·4 33.6
1983·84 167,7 193-6 53-0
1990-91 320-4 370-7 87-3
•At the. bus-bar, i.e., consumption plus line losses.
· NoTEs
(1) On the basis of the calculations for 0·4.8 plant fa~r and 90 per cent availability tlle in~talled capacity requJred m the year 1978-79 would be 30·7 mi1Jion kW. However, as there is a large spillover of works from the Fourt.h Plan and due to bunching of new pro.jeots ihe· capacity ot:~ming on stream into the final year ofthe Fifth Plan is yery large. But. as many of them would be operative cnly m the second halt of the final year, ~nly half of the b•nefits_ haw been "!'~ted towards the Fifth Plan and hence the mcreased proVJBIOD of installed capacity.
(2) For the year 1983-84, on the bnsis of 0·49[< pl~nt f: tory and 92 per c..,nt ava.ilabi1ity t,he installed capacJty sb.~uld be 48 ·5 million kW. This is, ~owever, .~ing ass_umed 88
53•0 million l;:W forreas<Jns which are BIIDilar as 1n the cnse o£1978.79.
(3) The firrnro of installed capacity has been arrived at '87 .3 millio;kW on the basis of O·I;I plant factc.r and 91i por cent availability. ·
81
.,
9.33. In the above table somewhat higher estimates of installed capacity for the years 1978-79 and 1983-84 have been assumed. This is because the efficiency in operation etc. would be gradually achieved over a period of time. However, it is necessary to take effective measures to improve the-· plant factor in the Indian power system at least from the Sixth Plan period and thereafter. Such improvements have a significant effect on the investment requirements for the power sector and consequently on the cost of power .to consumers. With an improvement of 1 per cent in the plant factor in the Fifth Plan, there could be a saving of Rs. 163 crores. It appears possible to improve the plant factor beyond 51 per cent also, if proper measures are taken; the minimum performance expected in 1983-84 and 1990-91 should be 51 per cent plant factor. The Committee would strongly recommend that rational measures should be initiated in planning and operat· ing the power· systems so as to ensure gradual improvement in the plant factor.
9.34. It is also possible to ·improve the load factor by influencing changes in the structures of load that faces a· power system. If the difference between the peak load demand and the off-peak load demand is reduced, the load factor of the power system would improve. In several countries, this reduction in the difference between the peale load and the off-peak demand is .being achieved . by offering differential rates to consumers· with reference to the time at which they consume ·power. In countries like France and U.K. efforts to develop off-peak load by supplying power at reduced price (usually on marginal pricing) during off-peak hours have yielded goo~ dividends. In U.K. the electricity supply authonties devote greater attention to load ·development measures.
9.35. The Committee recommends that during the Fifth Plan period efforts should be made to
. develop ·a more optimal load structure: '
. '· · 1. by setting up more pumped storage schemes wherever' such schemes would improve the system capability at minimum cost.
2. by ii-ulentifying 'industries. which· are in· tensive users of electricity and are also capable of organizing their production schedule in such a way that their peak demand would occur during the system off-peak period ·and by .giving to such units adequate incentive through specially designed tariff. to encourage them to reorganise their .Production;
3. ·by general pricing of the industrial tariff and agriculture tariff to provide incentive for use of more electricity during off-peak hours.
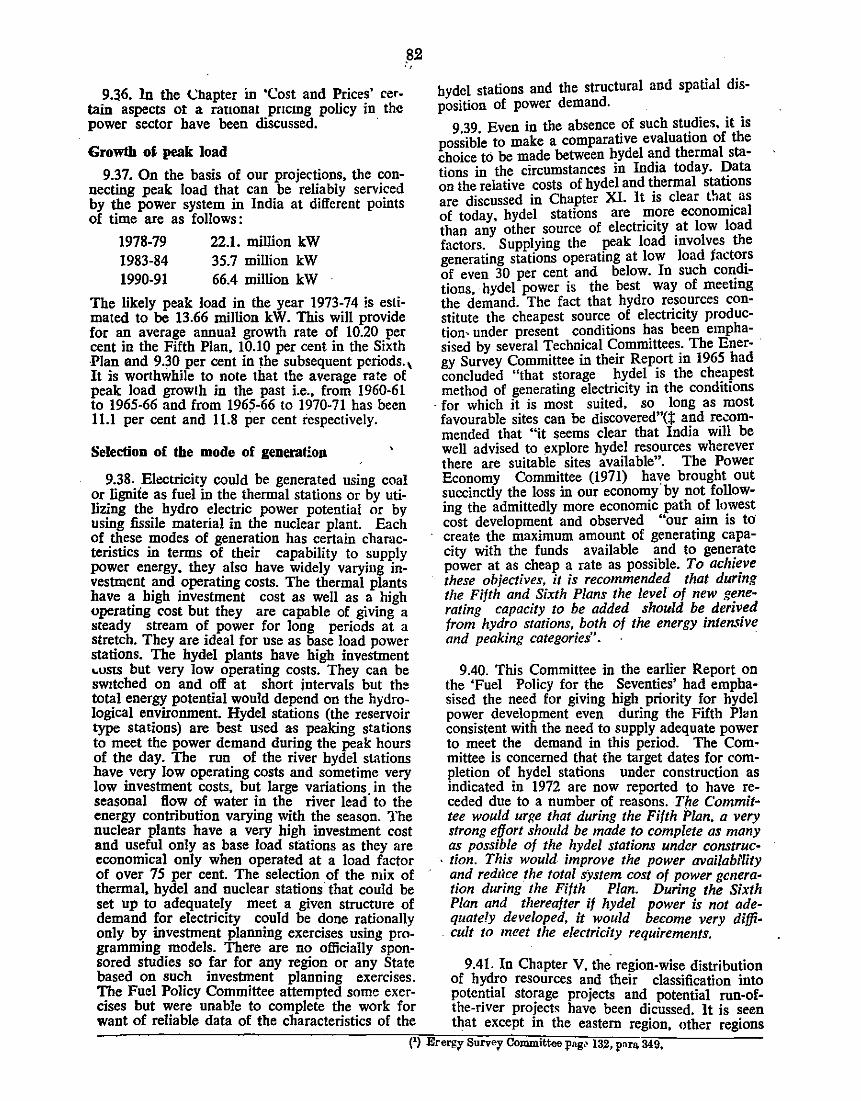
9.36. In the Chapter in 'Cost and Prices' certain aspects ot a ranonar pncmg policy in the power sector have been discussed. ·
Growth o~ peak load
9.37. On the basis of our projections, the connecting peak load that can be reliably serviced by the power system in India at different points of time are as follows :
1978-79 1983-84 1990-91
22.1. million kW 35.7 million kW 66.4 million kW
,82 .,
The likely peak load in the year 1973-74 is estimated to be 13.66 million kW. This will provide for an average annual growth rate of 10.20 per cent in the Fifth Plan, 10.10 per cent in the Sixth -Plan and 9.30 per cent in the subsequent periods., It is worthwhile to note that the average rate of peak load growth in the past i.e., from 1960-61 to 1965-66 and from 1965-66 to 1970-71 has been 11.1 per cent and 11.8 per cent respectively.
Selection of the mode of generation
9.38. Electricity could be generated using coal or lignite as fuel in the thermal stations or by utilizing the hydro electric power potential or by using fissile material in the nuclear plant. Each of these modes of generation has certain characteristics in terms of their capability to supply power energy, they also have widely varying investment and operating costs. The thermal plants have a high investment cost as well as a high operating cost but they are capable of giving a steady stream of power for long periods at a stretch. They are ideal for use as base load power stations. The hyde! plants have high investment .. osts but very low operating costs. They can be sWitched on and off at short intervals but the total energy potential would depend on the hydrological environment. Hyde! stations (the reservoir type stations) are best used as peaking stations to meet the power demand during the peak hours of the day. The run of the river hyde! stations have very low operating costs and sometime very low investment costs, but large variations. in the seasonal flow of water in the river lead to the energy contribution varying with the season. The nuclear plants have a very high investment cost and useful only as base load stations as they are economical only when operated at a load factor of over 75 per cent. The selection of the mix of thermal, hyde[ and nuclear stations that could be set up to adequately meet a given structure of demand for electricity could be done rationally only by investment planning exercises using programming models. There are no officially spon-
bydel stations and the structural and spatidl disposition of power demand.
9.39. Even in the absence _of such st~dies. it is possible to make a comparative evaluation of the choice to be made between hydel and thermal stations in the circumstances in India today. I?ata on the relative costs of bydel and thermal stations are discussed in Chapter XI. It is clear t!lat. as of today hydel stations are more economtcal than any other source of electricity _at low load factors. Supplying the peak load mvolv~s the generating stations operating at low load factors of even 30 per cent and below. In such co~ditions, ·hyde[ power is the best way of meeting the demand. The fact that hydro resources constitute the cheapest source of electricity production- under present conditions has been emphasised by several Technical Committees. The Ener- · gy Survey Committee in their Report in 1965 had concluded "that storage hyde[ is the cheapest method of generating electricity in the conditions
· for which it is most suited, so long as most favourable sites can be discovered"(:!: and recommended that "it seems clear that India will be well advised to explore hyde! resources wherever there are suitable sites available". The Power Economy Committee (1971) have brought out succinctly the loss in our economy by not following the admittedly more economic path of lowest cost development and observed "our aim is t<i create the maximum amount of generating capacity with the funds available and to generate power at as cheap a rate as possible. To achieve these objectives, it is recommended that during the Fifth and Sixth Plans the level of new generating capacity to be added should be derived from hydro stations, both of the energy intensive and peaking categories".
9.40. This Committee in the earlier Report on the 'Fuel Policy for the Seventies' had emphasised the need for giving hlgh priority for hyde! power development even during the Fifth Plan consistent with the need to supply adequate power to meet the demand in this period. The Committee is concerned that the target dates for completion of bydel stations under construction as indicated in 1972 are now reported to have receded due to a number of reasons. The Commit· tee would urge that during the Fifth Plan. a very strong effort should be made to complete as many as possible of the hyde/ stations under construe-
. tion. This would improve the power avai/abi'lity and redzlce the total system cost of power generation during the Fifth Plan. During the Sixth Plan and thereafter if hyde/ power is not adequately developed, it would become very diffi-
. cult to meet the electricity requirements.
sored studies so far for any region or any State 9.41. In Chapter V, the region-wise distribution based on such investment planning exercises. of hydro resources and their classification into The Fuel Policy Committee attempted some exer- pote'!tial sto~age projects and_ potential run-of-cises but were unable to complete the work for the-nver proJects have been dzcussed. It is seen want of reliable data of the characteristics of the that except in the eastern region, other regions
(1
) Erergy Survey Committee l'"8•' l32,l'nr~ 349,
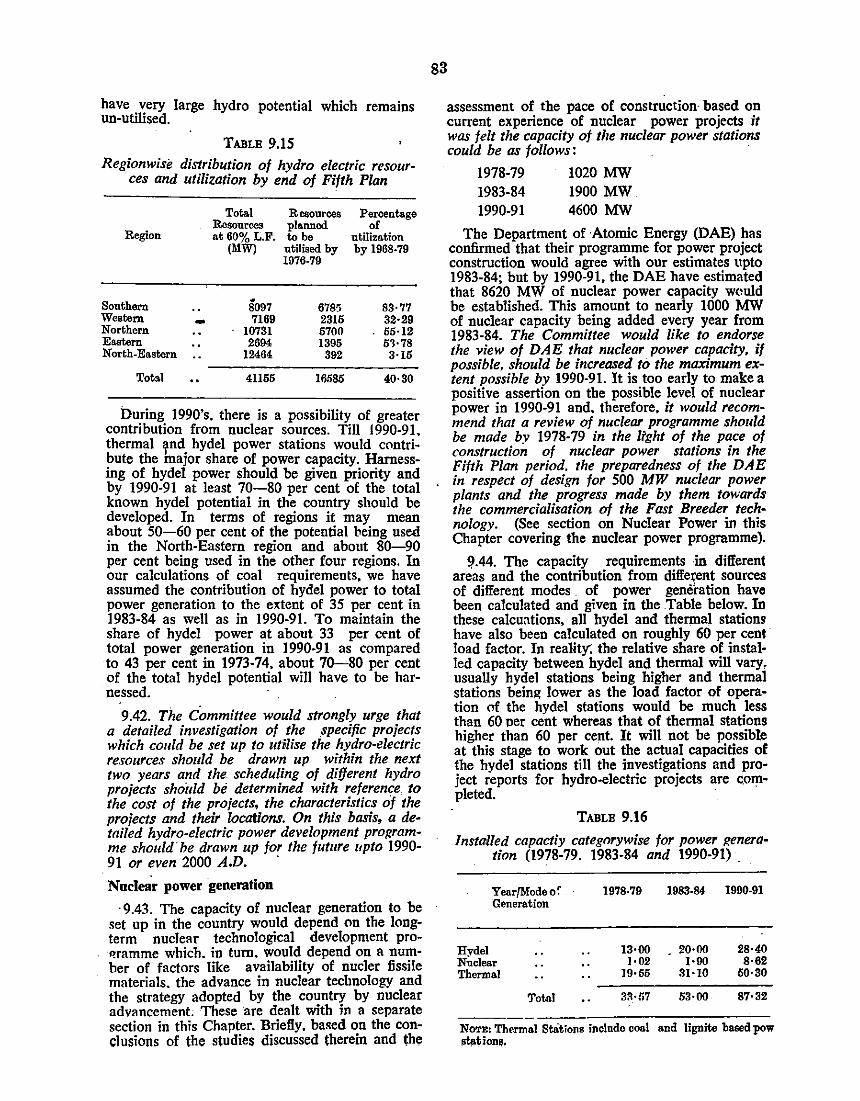
have very large hydro potential which remains on-utilised.
TABLE 9.15
Regionwise distribution of hydro electric resources and utilization by end of Fifth Plan
Region
Southern Western Northern Ea.atom North-Eastern
Tot• I
-..
Total Resources at60% L.F.
(MW)
so97 7169
10731 2694
12464
41155
Resources planned to be utilised by 1976-79
6785 2315 5700 1395
392
16585
Percentage of
utilization by 1968-79
83·77 32·29 55·12 5~·78 3·15
40·30
During 1990's. there is a possibility of greater contribution from nuclear sources. Till 1990-91. thermal 'nd hyde! power stations would cClntribute the major share of power capacity. Harnessing of hyde! power should be given priority and by 1990-91 at least 70-80 per cent of the total known hyde! potential in the country should be developed. In terms of regions it may mean about 50-60 per cent of the potential being used in the North-Eastern region and about 80-90 per cent being used in the other four regions. In our calculations of coal requirements, we have assumed the contribution of hyde! power to total power generation to the extent of 35 per cent in 1983-84 as well as in 1990-91. To maintain the share of hyde! power at about 33 per c~nt of total power generation in 1990-91 as compared to 43 per cent in 1973-74, about 70-80 per cent of the total hyde! potential will have to be harnessed.
9.42. The Committee would strongly urge that a detailed investigation of the specific projects which could be set up to utilise the hydro-electric resources should be drawn up within the next two years and the scheduling of different hydro projects shoitld be determined with reference to the cost of the projects, the characteristics of the projects and their locations. On thls basis, a de· tailed hydro-electric power development propramme should' be drawn up for the future 11pto 1990-91 or even 2000 A.D. ·
Nuclear power generation
· 9.43. The capacity of nuclear generation to be set up in the country would depend on the longterm nuclear technological development prot?ramme which. in tum, would depend on a number of factors like availability of nucler fissile materials. the advance in nuclear technology and the strategy adopted by the country by nuclear advancement; These 'are dealt with in a separate section in this Chapter. Briefly, based on the conclusions of the studies discussed therein and the
83
assessment of the pace of construction· based on current experience of nuclear power projects it was felt the capacity of the nuclear power stations could be as follows :
1978-79 1020 MW 1983-84 1900 MW 1990-91 4600 MW
The Department of Atomic Energy (DAB) has confirmed that their programme for power project construction would agree with our estimates upto 1983-84; but by 1990-91, the DAB have estimated that 8620 MW of nuclear power capacity wcmld be established. This amount to nearly 1000 MW of nuclear capacity being added every year from 1983-84. The Committee would like to endorse the view of DAE that nuclear power capacity, if possible, should be increased to the maximum extent possible by 1990-91. It is too early to make a positive assertion on the possible level of nuclear power in 1990-91 and. therefore, it would recommend that a review of nuclear programme should be made by 1978-79 in the light of the pace of construction of nuclear power stations in the Fifth Plan period. the preparedness of the DAE in respect of design for 500 MW nuclear power plants and the progress made by them towards the commercialisation of the Fast Breeder technology. (See section on Nuclear Power in this Chapter covering the nuclear power programme).
9,.44. The capacity requirements in different areas and the contribution from diffe~ent sources of different modes of power generation have been calculated and given in the .Table below. In these calcuations, all hydel and thermal stations have also been calculated on roughly 60 per cent· load factor. In reality: the relative share of instal· led capacity between hyde! and thermal will vary, usually hyde! stations being higher and thermal stations being lower as the load factor of operation of the hydel stations would be much less than 60 oer cent whereas that of thermal stations higher than 60 per cent. It will not be possible at this stage to work out the actual capacities of the hyde! stations till the investigations and project reports for hydro-electric projects are c.ompleted.
TABLE 9.16
Installed capactiy categorywise for power f(eneration (1978-79. 1983-84 and 1990-91) .
YearfModeo~ Generation
Hydol Nuclear Thermal
Toto!
1978-79
13·00 1·02
19·55
1983-94
. 20·00 1·90
31·10
53·00
1990-91
28•40 8·62
50·30
87·32
NOTE: Thermal Stations include coal and lignite based pow $tion~.
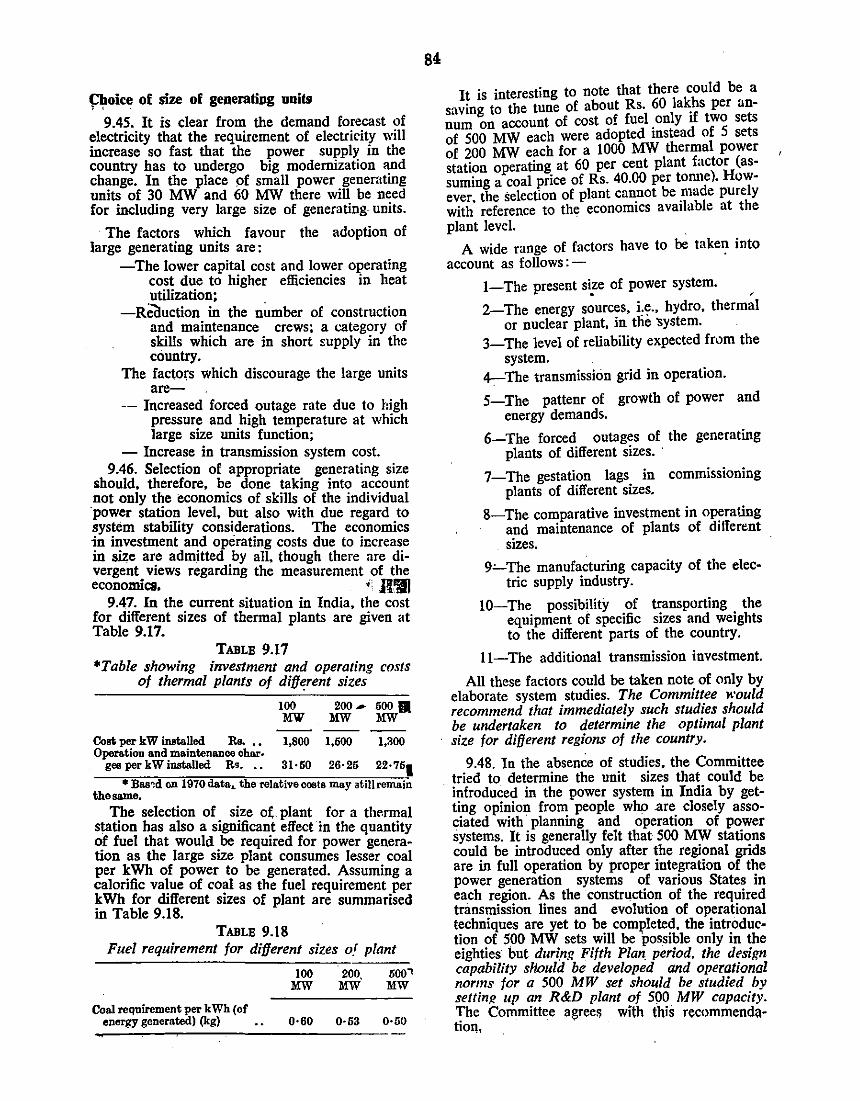
~oice of size of generafulg units
9.45. It is clear from the demand forecast of electricity that the requirement of electricity will increase so fast that the power supply in the country has to undergo big modernization and change. In the place of small power generating units of 30 MW and 60 MW there will be need for including very large size of generating units.
· The factors which favour the adoption of large generating units are:
-The lower capital cost and lower operating cost due to higher efficiencies in heat utilization;
-Reauction in the n~mber of construction and maintenance crews; a category of skills which are in short supply in the country.
The facto~s which discourage the large units are-
-- Increased forced outage rate due to high pressure and high temperature at which large size units function;
- Increase in transmission system cost. 9.46. Selection of appropriate generating size
should. therefore, be done taking into account not only the economics of skills of the individual ·power station level, but also with due regard to system stability considerations. The economics in investment and operating costs due to increase in size are admitted by all, though there are divergent views regarding the measurement of the economics. . ; Jl'iil
9.47. In the current situation in India, the cost for different sizes of thermal plants are given at Table 9.17.
TABLE 9.17 *Table showing investment and operating costs
of thermal plants of difft:rent sizes
100 2oo * 5oo 11 MW MW MW
Cool; per kW installed Rs. • • 1,800 1,500 1,300 Operation and maintenance char·
ges per kW installed Rs. •• 31·50 26·25 22·751
• Bas-:d on 1970 data&. the relative costs may at ill remain the same.
The selection of size o( plant for a the-rmal station has also a significant effectin the quantity of fuel that would be required for power generation as the large size plant consumes lesser coal per kWh of power to be generated. Assuming a calorific va~ue of co~! as the fuel requirement per kWh for different SIZes of plant are summarised in Table 9.18.
TABLE 9.18 Fuel requirement for different sizes of plant
Coal requirement per kWh (of energy generated) (kg)
100 20~ 500' MW MW MW
0·60 0·53 0·50
84
It is interesting to note that there could be a saving to the tune of about Rs. 60 la~hs per annum on account of cost of fuel only If two sets of 500 MW each were adopted instead of 5 sets of 200 MW each for a 1000 MW thermal power station operating at 60 per cent plant factor (assuming a coal price of Rs. 40.00 per tonne). However, the selection of plant can_not be _made purely with reference to the economiCS avatlable at the plant level.
A wide range of factors have to be take~ into account as follows:-
1-The present size of power system. . ' 2-The energy sources, i,e., hydro, thermal
or nuclear plant, in tlie 'System. 3-The level of reliability expected from the
system. ~The transmission grid in operation.
5-The pattenr of growth of power and energy demands.
6-The forced outages of the generating plants of different sizes. ·
7-The gestation lags in commissioning plants of different sizes.
8-The comparative investment in operating and maintenance of plants of different sizes.
9-'-The manufacturing capacity of the elec· tric supply industry.
10-The possibility of transporting the equipment of specific sizes and weights to the different parts of the country.
11-The additional transmission investment.
All these factors could be taken note of only by elaborate system studies. The Committee would recommend that immediately such studies should be undertaken to determine the optimal plant size for different regions of the country.
9 .48. In the absence of studies, the Committee tried to determine the unit sizes that could be
· introduced in the power system in India by getting opinion from people who are closely associated with planning and operation of power systems. It is generally felt that 500 MW stations could be introduced only after the regional grids are in full operation by proper integration of the power generation systems of various States in each region. As the construction of the required transmission lines and evolution of operational techniques are yet to be comJ,Jleted, the introduction of 500 MW sets will be possible only in the eighties but dur~ng Fifth Plan period, the design capability sHould be developed and operational norms for a 500 MW set should be studied bv settin~ up an R&D plant of 500 MW capacity. ~he Committee agrees with this recommenda· ttoQ,
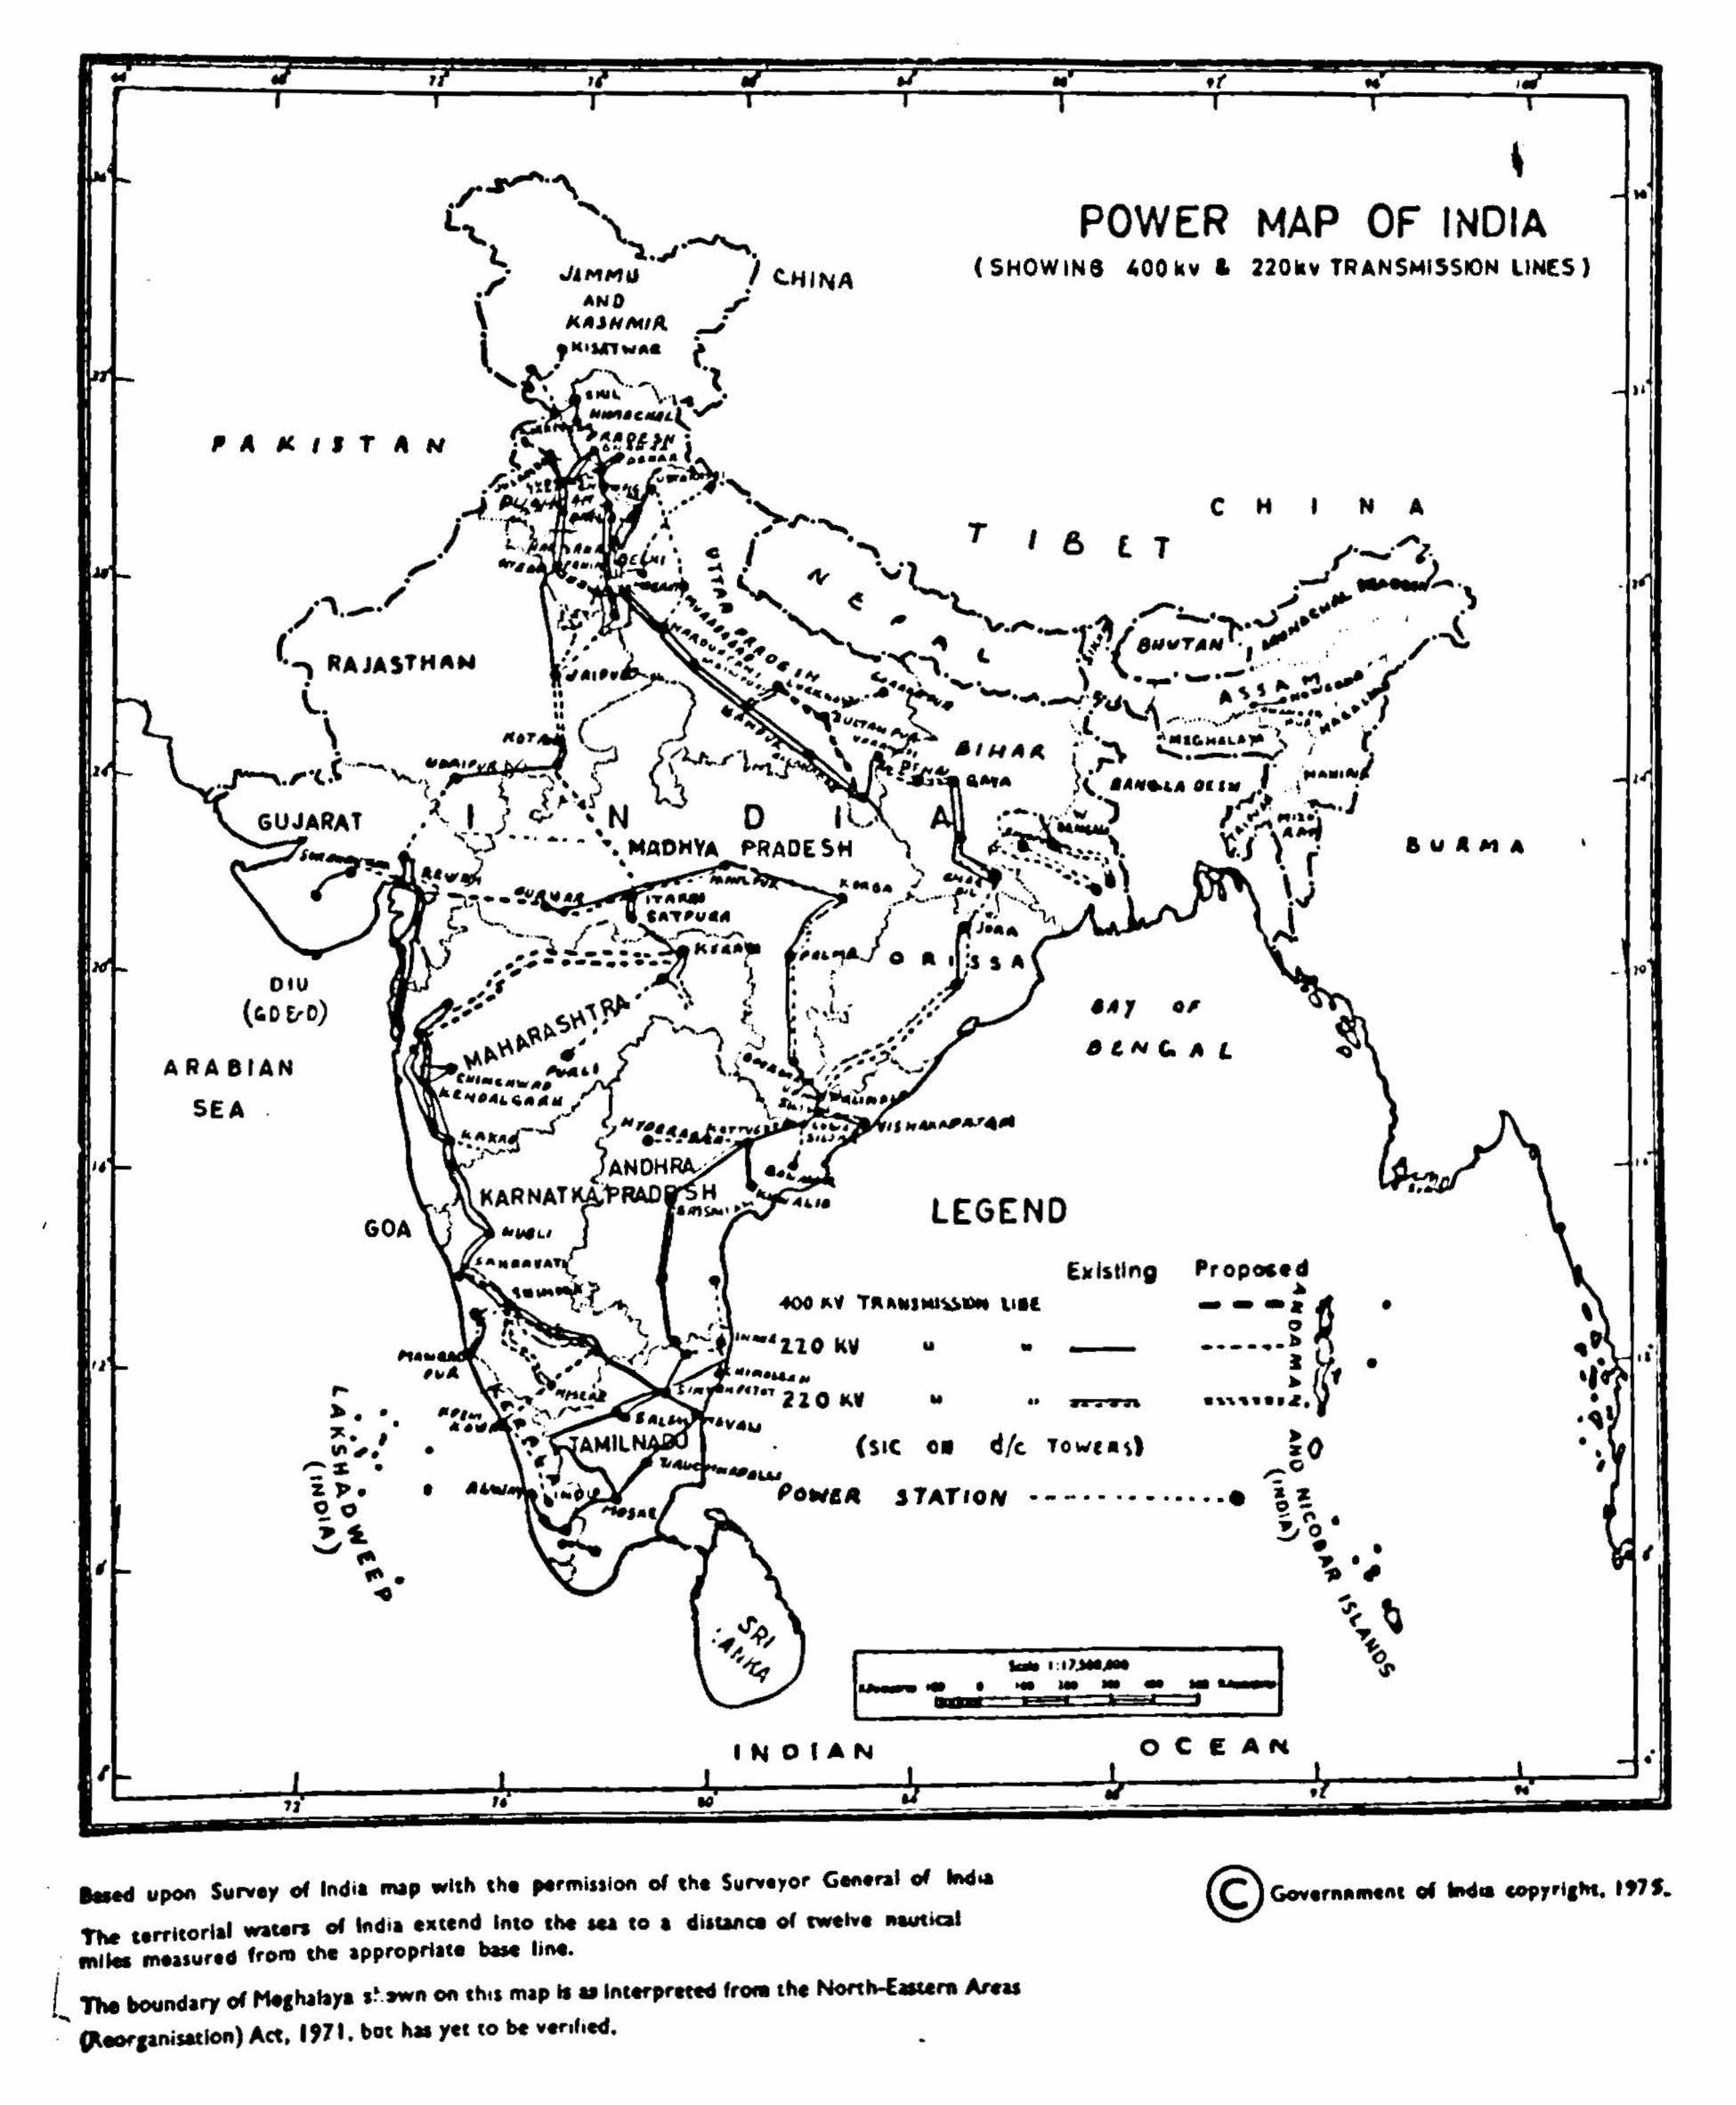
I
\ POWER MAP OF INDIA
(SHOW INS 400 kv & 220kv TRANS ... ISSK)N UN£5)
I'A ll.IITAH
OIU
(c.D vD)
ARABfAN
SEA .
/Jt,N c;.,. L
GOA t<ARNAT LEGEND
,... ,. . . • ~. , "',. ,_ s. • -
u
.. • •
•
•• . ......
Prop~•d ~ ---· 0
~ ........ a
to ,..o
• ., .
z. ~. oo • POWIIt STATION • -- ••.•••••••• -
·~ o--~~ ~ ..
fl'. ~
.... " ... •
INDIAN
upon Surwe1 of India map with the permissiOft of the Suneyor Gefteral of lftd.a
Tht territorial wac.rs of India extend Into the 111 to a cliaca~tc. of cwehe ~kat . lftlies measuncl from the appropri1te bare li~.
- C" • !IO • • ~ '4t
.. !J 1:17.* .... ..... • • .. •a J u
:
0 C E AN
/ the boundary of ~~~laya ~~-~n Oft thts m1p .. u Interpreted ftOM the NonMII"m Anu .... · ~aoraanisatlon) Act. I '71. bat h• yet to be vertfiecl. •
'
• ,,· • ·~ •
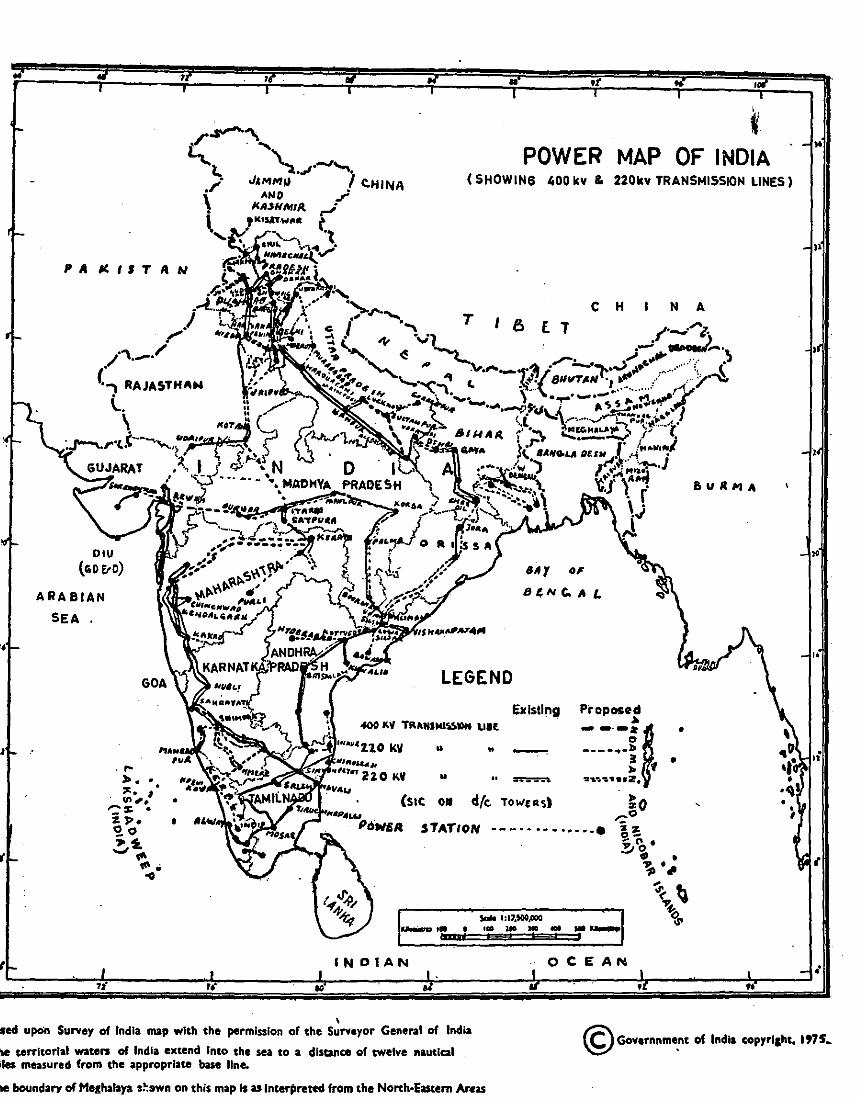
f POWER MAP OF INDIA
(SHOW INS 400 kv & 220kv TRANSMISSION LINES)
I'AI(fJTAN
C H N A
DIU
(GO ErD)
ARABIAN
SEA .
.... ~ .. :~~:.. '. 1/1 '• ,..... :s: •
i J'• I oo ;~ -..J"' ....
-o
T I 6 [. T
LEGEND Existing
.. .. u .. -·- -··
(Sit o• d/c. TOW(R~)
STATIOfll ·--··········•
1-·r · .. or-1 INDIAN OCEAN
\
&UliMA
hsed upon SuNoy of India map with the permission of the Sunoyor General of India
The territorial watel'l of India extend Into the sea to a dlsunce of twelve ftautlal miles measured from the appropriate base line.
© Governnme_nt of India copyrlcht, tns.
The boundary of Meghalaya •~:own on this map Is u Interpreted from the North·Eastem Areas
Choice of location of power planfs
9.49. In addition to the choice of type of po"~r stations, the loc<~tion of the power ~Lation.> 1s also very important. Considering the rcquirem·~nts of power in the near future, the size of thermal power stations will have to be neccss.uily reblively big. of the order of 1000 MW each. St;.ttions of this magnitude will need about 3-4 million tennes of co<ll per annum. i\1ovement of such h.1rge quantities of coal in the wntext of the uillil:ulties we are experiencing even now for the movement of comparatively small quantities of coal to power stations from the pit-heads wo uJJ pose formidable op.:rat ·otwl problems inclL:d ug that of heavy investment on the railway system. Moreover. since the availa •>k reserves of good I.JUality coal a :·c scverdy J.m ' ted, power gcneral ion will necessarily ha,·c to be based on inkrim quality c0al with relatively high ash contcut • nJ luw calorific value. The ash content of o~1r Cllals and of the middlings tha t may have to be u~ed may be of the order of 35-40 per cent. This would mean additional load on the rail tran-;port. Sc\'c· rat studies have been carried out to investigate the relative economics of power gener.1tion at load centres vis-a-vis at pitheads. Thcst! investi· gations show that for a 1000 MW plant. even when it is assumed that the railway operations would improve significantly and that the movement of coal to the load centres will be carried out on unit train basis. the pithead generation and transmission of power l1> load centr.?<: is still slightly more economical than to transportation of coal to power plants at load centres. Furthermore, location of power stations of this dimension at load centres which may be densdy populated v.ill expose a large number of people to pollution. The Committee, therefore, feels that in the ovew/1 interest of the economy and environmemal COII· sideratiom·. more and more of Slll'h powl'r st11tions should be /ocll!ed at pit-heads. Dl'penclin~ 011 the lo<·a/ conditions, hmn·ver, construction of flOh er SlcltiOIIS at Joad CCIItrcs Cl/11 be COttsit/tn•d 011
merits as a special case.
Transmiss!on and load despah:hing stations
9.50. In any power generation and distribution organi7ation. the maximum economies are attained only by the proper designing of the powl.!r system and by the integrated operation <Jf the system as a whole. As power requirements of each consumer of power vary at e~ch moment of time. the integrated operation enables the diverse needs to be md ~t the lowest cost. Proper connection of different generating sy o; t.::ms and the generating stations with load centres through a rationally designed transmission system C:lp:.! t'lle of meeting the transmission requireml!nts fully is as important as having ad~quatc generatillg capacity. The recent trippings in the transmiso;ion systems at different places in the country have brought out the urgency for more attention to be paid to transmission system.
~-Sl. Thl! investments in transmi.\sion in lM ~ountry app~!ar to be mad..:quate to ~nsure pro· p..:r ~~~tnbuUon ot power anli rational o~r~•tilln of the generating sysh:m. Even in the early years of the hfth Plan when there will be some k•~:~lis· cu shortages of power. th.:re wiU be power sta· lions whi~h cannot be (lperated at full load uue to lad. of transmis:,ion lacilitics.
9.52. There are enormous advantages in ra· tionally dcsigtung a transmtssion system keeping in view the demand over time at dtlfcrcnt pointl of consumption. In other countries. tll.tra high voltage transmission already in opcr<~tion and bulk transfer of power through D.C. transmission hl~s is al"o being practised. In our country. the lirst 400 kv line will come into operation in Uttar Pradesh in the year 1975-76. There is need for greater attention being paid to transmission plannmg anu operation o{ transmission lines.
9 .53. The great advantages of the large elcctri\.ily system could be fully reaped only if there is an integralt:d operation of all the generating stations. At the moment. the State Ekctridty Boards are the owners of the generating st<~tions and the generation optimilation is being done strictly with reference to the stations within the control of ea<.:h Electricity Board. Some measures towards r.:gional operation have been introduced in the Southern Zont: with the setting up of the Load Despatch Centre. under the au-.pi<.:es of the Sout:lt:rn Regional Electricity Board. The Gov• ernml.!nt have acceptt:d, in principle, the scheme nf integrating th.; op.:rations of the Electricity Uoard in each region. Load despatch !!l<ltions h.1 v~ oeen proposed in each region and the hoard· ware required for the same are being procured. But important questions relating to integrated operation like the conditions under which interState power flows could be charged on a wnti• nuuus ba ~ is and the pnx:ec.Jurcs lor ~baring short· agt:s etc., have still to be worked out.
9 .54. The Commitlee ..,·ou/d very stronglv urr:~ that the .KIJ<'m('S for Jt'tlill.f! up of regimw/ gritls · w1d regimw/ load dt•spr.Jtc:h centres ~hould ~ vigorously pursued; l·imultaneously procedure$ for the intecrc1ted planning and operation of power systems bused on syl'ltm J·tudies ~hottld b~ i11troduc:ed.
Rural ElectrificlAtioD
9.55. Ele~triHcation of ,, village not only add~ to the productive capa<.:itics of the f;.ermers but also brings "ith it social. civil anti d\)mc.:~tic amenities &~Od has a salutary p .. ychologtcal etkct on the rural people who !!tart having a feel of the mGdl!rn age. Its availability stimuktte, the growth and ellpansion of agro-ba~ed sm_all ~nd medium scale rural crafts and mdustne1 like pottery. weaving. wood work, ric~.:, flour :wd oil
Cholce ot location of power plants
9:49. In additio!J to the choice of type of power statiOns, the locatlon of the power stations is also very important. Considering the requirements of power in the near future, the size of thermal power stations will have to be necessarily relatively big, of the order of 1000 MW each. Stations of this magnitude will need about 3-4 million tcnnes of coal per annum. Movement of such large quantities of coal in the context of the difficulties we are experiencing even now for the movement of comparatively small quantities of coal to pow~r stations from the pit-heads would pose formidable operatiOnal problems incluuing that of heavy investment on the railway system. Moreover, since the available reserves of good quality coal are severely lim:ted, power generation will
. necessarily have to be based on inferior quality coal with relatively high ash . content <·nd low calorific value. The ash content of oar coals and of the middlings that may have to be used may · be of the order of 35-40 per cent. This would mean additional load on the rail transport. Several studies have been carried out to investigate the relative . economics of power generation at load centres vis-a-vis at pitheads. These investigations show that for a 1000 MW plant, even when it is assumed that the railway operations would improve significantly and that the movement of coal to the load centres will be carried out on unit train basis, the pithead generation and transmission of power to load centr~s is still slightly more economical than to transportation of coal to power plants at load centres. Furthermore, lo~ation of power stations of this dimension at load centres which may be densely populated will expose a large number of people to pollution. The Committee, therefore, feels that in the overall interest of the economy and environmemal considerations. more and more of such power stations should be located at pit-heads. Depending on the local conditions, however, construction of power stations at load centres can be considered on
· merits as a special case.
Transmission and load despatching stations
9.50. In any power generation and distribution organization, the maximum economies are attained only by the proper designing of the power system and by the integrated operation of the system as a whole. As power requirements of each consumer of power vary at each moment of time, the integrated operation enables 'the diverse needs to be met at the lowest cost. Proper connection of different generating systems and the generating stations with load centres through a rationally designed transmission system capable of meeting the transmission requirements fully is as important as having adequate generating capacity. The recent ,trippings in the transmission systems at different places in the country have brought out the urgency for more attention to be paid to transmission system.
9.51. The investnients in transmission In the country appear to be inadequate to ensure proper distribution of power and rational operation of the generating system. Even in the early years of the Fifth Plan when there will be some localised shortages of power, there will be power stations which cannot be operated at full load due to lack of transmission facilities.
9.52. There are enormous advantages in rationally designing a transmission system keeping in view the demand over time at different pointa of consumption. In other countries, extra high voltage transmission already in operation and bulk transfer of power through D.C. transmission lines is also being practised. In our country, the first 400 kv line will come into operation in Uttar Pradesh in the year 1975-76. There is need for greater attention being paid to transmission planning and operation of transmission lines.
. 9 .53. The great advantages of the large electricity system could be fully reaped only if there is an integrated operation of all the generating stations. At the moment, the State Electricity Boards are the owners of the generating stations and the generation optimization is being done strictly with reference to the stations within the control of each Electricity. Board. Some measures towards regional operation have been introduced in the Southern Zone with the setting up of the Load Despatch Centre, under the auspices of the Southern Regional Electricity Board. The Government have accepted, in principle, the scheme of integrating the operations of the Electricity Board in each region. Load· despatch stations have been proposed 'in each region and the hardware required for the same are being procured. But important questions relating to integrated operation like the conditions under which interState power flows could be charged on a continuous basis and the procedures for sharing shortages etc., have still to be worked out.
9.54. The Committee would very strongly urge that the schemes for setting up of regional grids ·and regional load despatch centres should b~ vigorously pursued; simultaneously procedures for the integrated planning and operation of power systems based on system studies should be introduced.
Rural Eledrlficatiou
9.55. Electrification of a village not only adds to the productive capacities of the farmers but also brings with it social, civil and dome~tic amenities and has a salutary psychological effect on the rural people who start having a feel of the modem age. Its availability stimulates the growth and expansion of agro-ba~ed sm!lll ~nd medium scale rural crafts and mdustnea hke pottery, weaving, wood work, rice, flour and ()i~
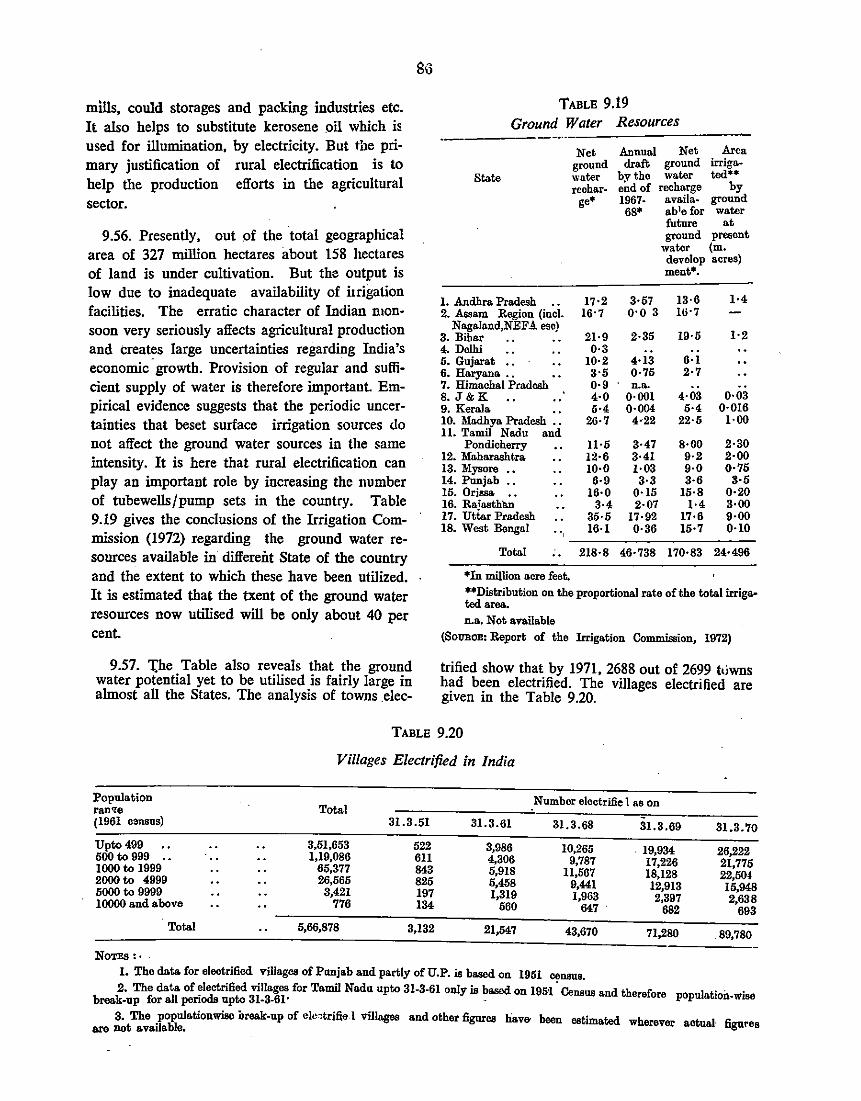
mills, could storages and packing industries etc. It also helps to substitute kerosene .oil which is used for illumination, by electricity. But the pri· mary justification of rural electrification is to help the production efforts in the agricultural sector.
9.56. Presently, out of the ·total geographical area of 327 million hectares about 158 hectares of land is under cultivation. But the output is low due to inadequate availability of ilrigation facilities. The erratic character of Indian monsoon very seriously affects agricultural production and creates large uncertainties regarding India's economic-growth. Provision of regular and sufficient supply of water is therefore ilnportant. Empirical evidence suggests that the periodic uncertainties that beset surface irrigation sources do not affect the ground water sources in the same intensity. It is here that rural electrification can play an ilnportant role by increasing the number of tubewellsfpump sets in the country. Table 9.19 gives the conclusions of the Irrigation Commission (1972) regarding the ground water resources available in different State of the country and the extent to which these have been utilized. It is estimated that the txent of the ground water resources now utilised will be ouly about 40 per cent.
9.57. 'l;he Table also reveals that the ground water potential yet to be utilised is fairly large in almost all the States. The analysis of towns .elec-
SG
TABLE 9.19 Ground Water Resources
State
I. Andhra Pradesh .. 2. Assoon Region (incl.
Nagaland,NEFA eso) 3. Bihar 4. Delhi 5. Gujarat •. 6. Haryana .• 7. Himachal Pradesh 8. J&K 9. Kera.Ja. IO. Madhya Pradesh .. 11. Tamil Nadu and
Pondicherry I2. Maharashtra I3. Mysore .• I4. Pnnjab .• 15. Ori!S& .• I6. Ra;asthlm I7. Uttar Pradesh
Net ground water rechar-
ge•
I7·2 I6·7
2I·9 0·3
I0·2 3·5 0·9 4·0 5·4
26·7
11·5 I2·6 IO·O 6·9
I6·0 3·4
35·5
Annual Net Area draft ground irriga.
by the water ted** ei:td of recharge by 1967- a.vaila- ground 68* ab1e for water
3·57 o·o 3
2·35
4·I3 0·75 n.a.
O·OOI 0·004 4·22
3·47 3·4I I·03 3·3
O·I5 2·07
I7·92
future at ground present
water (m. develop acres) ment*.
I3·6 16·7
I9·5
6·I 2·7 ..
4·03 5·4
22·5
8·00 9·2 9·0 3·6
I5·8 I·4
I7·6
I·4
I·2
0·03 0·016
I·OO
2·30 2·00 0·75
I8. West Bengal
Total
I6·I 0·36 I5·7
8·5 0·20 3·00 9·00 0·10
··, ---------:-:-2I8·8 46·738 I70·83 24·496
*In million acre feet. **Distribution on the proportional rate of the total irrigated area. .
n.a. Not available
(SoURCE: Report of the Irrigation Commission, I972)
trifled show that by 1971, 2688 out of 2699 t<iwns had been electrified. The villages electrified are given in the Table 9.20.
TABLE 9.20
Villages Electrified in India
Population Total
Number electrifie 1 as on ran~te
(I96I oansus) 31.3.5I 31.3.6I 3I.3.68 3I.3.69 3I.3.70
Upto499 3,5I,653 522 3,986 I0,265 . I9,934 26,222 500 to 999 .. I,I9,086 611 4,306 9,787 I7,226 2I,775 IOOO to I999 65,377 843 5,9I8 11,567 I8,I28 22,504 2000 to 4999 26,565 825 5,458 9,44I I2,9I3 I5,948 5000 to 9999 3,42I I97 I,3I9 I,963 2,397 2,638 IOOOO and above 776 I34 560 647 . 682 693 Total 5,66,878 3,I32 2I,547 43,670 71,280 89,780
NoTES:· . I. Tbe data for electrified villages of Panjab and partly of U.P. is baaed on I95I census.
2. Tbe data of electrified villages for Tamil Nada upto 3I-3-6I ouly is baaed on I95i' Ceuaus and therefore population-wise break-up for all periods apto 3I·3-6I· -
3. Tbe populationwise oreak-up of eleotritie.l villngea and other fignres hav& been estimated wherever actual· figures are not available.
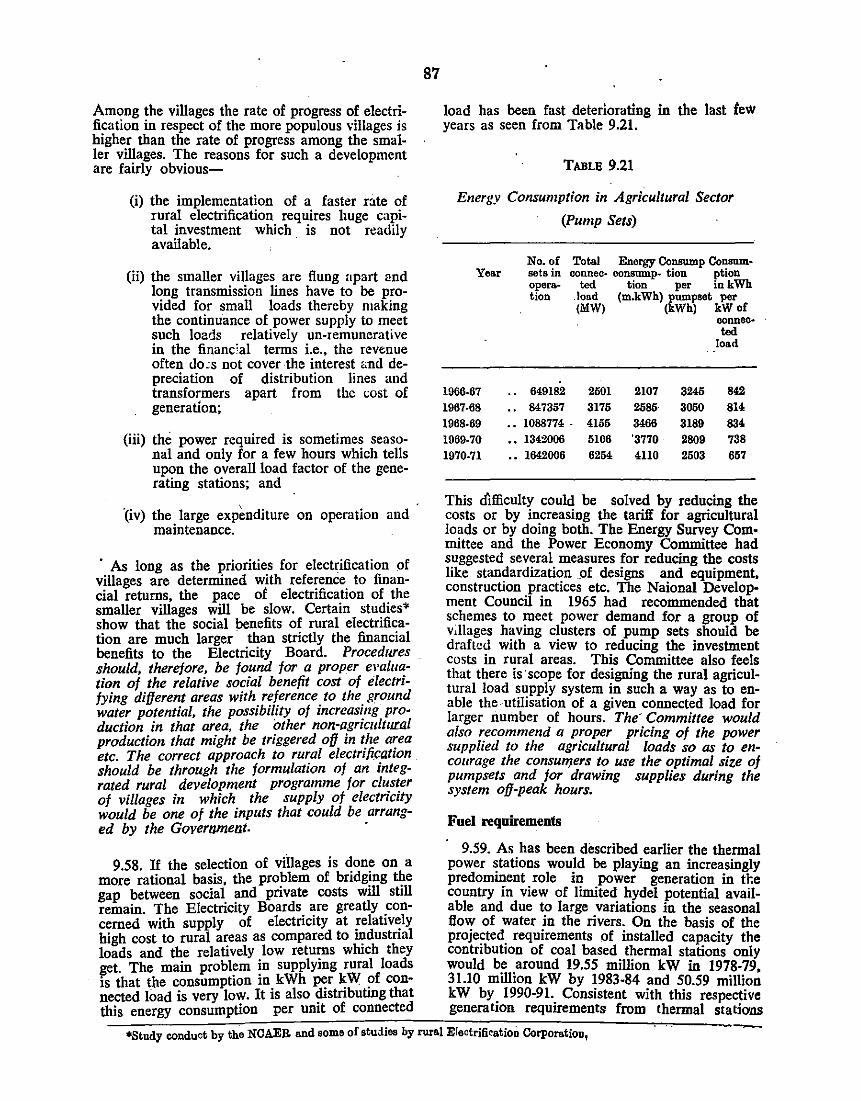
Among the villages the rate of progress of electrification in respect of the more populous villages is higher than the rate of progress among the smaller villages. The reasons for such a development are fairly obvious- .
(i) the implementation of a faster rate of rural electrification requires huge capital investment which is not readily available. ·
(ii) the smaller villages are flung apart and long transmission lines have to be provided for small loads thereby making the continuance of power supply to meet such loads relatively un-remunerative in the financ;al terms i.e., the revenue often do:s not cover the interest &nd depreciation of distribution lines and transformers apart from the cost of generation;
(iii) the power required is sometimes seasonal and only for a few hours which tells upon the overall load factor of the generating stations; and
' ·(iv) the large expenditure on operation and maintenance.
· As long as the priorities for electrification of villages are determined with reference to fmancial returns, the pace of electrification of the smaller villages will be slow. Certain studies* show that the social benefits of rural electrification are much larger · than strictly the financial benefits to the Electricity Board. Procedures should, therefore, be found for a proper emluation of the relative social benefit cost of electrifying different areas with reference to the ground water potential, the possibility of increasing production in that area, the other non-agricultural production that might be triggered off in the area etc. The correct approach to rural electrification should be through the formulation of an integrated rural development programme for cluster of villages in which the supply of electricity would be one of the inputs that could be arrang-ed by the Government. ·
9.58. If the selection of villages is done on a more rational basis, the problem of bridging the gap between social and private costs will still remain. The Electricity Boards are greatly concerned with supply of electricity at !elativ~ly high cost to rural areas as compared to mdustnal loads and the relatively low returns which they get. The main problem in supplying rural loads is that the consumption in kWh per kW of connected load is very low. It is also distributing that this energy consumption per unit of connected
87
load has been fast deteriorating in the last few years as seen from Table 9.21.
TABLE 9.21
Energy Consumption in Agricultural Sector
(Pump Sets)
Year
1966-67 .. 1967-68
No. of sets in operation
649182 847357
Total Energy Consump Consnm· conneo- oonsump- tion ption
ted tion per in kWh .load (m.kWh) pumpset per (MW) (kWh) kW of
2501 2107 3175 2585
3240
3000
conn eo· ted
load
842 814
1968-69 .. 1088774 . 4155 3466 3189 884
1969-70 •• 13420o.5 5106 '3770 2809 738
1970-71 .. 1642006 6264 4110 2503 657
This difficulty could be solved by reducing the costs or by increasing the tariff for agricultural loads or by doing both. The Energy Survey Committee and the Power Economy Committee had suggested several measures for reducing the costs like standardization of designs and equipment, construction practices etc. The N aional Development Council in 1965 had recommended that schemes to meet power demand for a group of v,llages having clusters of pump sets should be drafted with a view to reducing the investment costs in rural areas. This Committee also feels that there is· scope for designing the rural agricultural load supply system in such a way as to enable the utilisation of a given connected load for larger number of hours. The' Committee would also recommend a proper pricing of the power supplied to the agricultural loads so as to encourage the consu11Jers to use the optimal size of pumpsets and for drawing supplies during the system off-peak hours.
Fuel requirements
9.59. As has been described earlier the thermal power ~lations would be playing an increasingly predomment role in power generation in t!;e country in view of Iinlited hyde! potential available and due to large variations in the seasonal flow of water in the rivers. On the basis of the proje~ted. requirements of installed capacity the contnbutton of coal based thermal stations only would be around 19.55 million kW in 1978·79 3l.IO million kW by 1983-84 and 50.59 millio~ kW by. 1990-91.. Consistent with this respective generatiOn requrrements from thermal statiO'DS
•Study conduct by the NCAER and some of studies by rural Electrjficatioo Corporation,

would be 69,121 and 231.5 billion kWh. But, this would dep.end upon the efficient use of generating capacity and the thermal efficiency at which the power stations operate.
In order to cut down the cost of fuel and also to conserve the natural resources of coal, as far as possible, it is very important to ensure that the thermal power stations operate at an efficiency level as high as possible. It has been observed that the number of thermal power stations operating at lower thermal efficiencies has progressively reduced while tbe number of those operating at slightly higher efficiencies has gone up. This shift could mostly be attributed to the advancement in technology and the installation of plants with modem design and higher capacity having better efficiency level in the recent past.
At present the manufacturing capacity in this country of a thermal unit is limited to 200/250 MW which is further expected to rise in the coming years. In other advanced countries units of 500 MW or even 1000 MW size are in. operation. Keeping this. in view, in our study we have assumed that most of the new power stations proposed to be set up till the Sixth Plan end i.e., upto 1983-84 would have units of size 200/250 MW and thereafter upto 1990-91 the new units installed would be of 500 MW each.
To generate electricity from coal based thermal power stations, availability of fuel becomes one of the most important factors. The estimates of coal requirements by thermal stations could be worked out by segregating the use of plant depending upon its size as consumption rates greatly vary• among different power stations according to both the type of boilers, pressure and temperature maintained and of course the quality of coal used. However, due to lack of availability of necessary data it has been assumed in our study that the thermal power station· in operation at present would continue to consume the same quantity of coal upto 1990-91 as much they are· consuming to-day. The1 new capacity to be added would consist of bigger units with better thermal efficiencies and the coal consumption rate would consequently go down. Keeping this in view and based on the Case-II estimates projected in Chapter III of this Report the coal· requirements (including middlings for the years 1978-79, 1983-84 and 1990-91 have been worked out as 53, 80 and 144 million tonnes respectively, as set out in Table 9.22. (For details refer Appendix Table· ill-! of Chapter III of this Report). Since the bulk of the coal consumed in thermal power stations is of inferior qua1ity having low calorific value and high ash content, necessary. margins have been provided to the actual requirements on this account. Further, in order to ensure that the coal requirements are fully met in 1978-79. the coal demand calculations are based on contnoution of thermal power stations to energy generation as 79 billion kWh instead of the actual contribution of 69 billion kWh.
88
Captive power generation
In all the above calculations, it has been assumed that the total power requirements. would be met through the public utility system ouly. In iew of the prevailing s~ortag~s of powe~ a~d at mes due to interruptions m the contmmty of ower supply, there is a tendency to have cap-
tive power plants. Th~se captive pow~r p_lants being of smaller capacity would entail higher costs of installation besides working on low efficiency rate as the kWh per kW utilization per annum would be low in a large number of industries. This Committee feels that in the overall national interest and in order to achieve t/ze
· power target through the limited resources· available, setting up of such captive plallts should not be encouraged except in cases where process steam requirements have to be met and in the process saving incidental power generation is possible. Efforts should be made to increase the ~apacity of the power utility system to meet all the demands with high reliability.
Nuclear power programme
9.60. In the first stage of India's nuclear power programme, power stations based on thermal reactors have been planned. These reactors can either be light water reactors (like Tarapur Atomic Power Station) or heavy water reactor (as has been put up at Rana Pratap Sagar). The light water reactor uses enriched uranium as fuel whereas heavy water reactor uses natural' uranium as fuel. Both these reactors produce plutonium as a by-product. The second stage of our nuclear power programme is based on Fast Breeder Reactor (FBR) which would enable us to fully utilize the uranium resources as well as exploit our vast thorium reserves. A FBR uses either plutonium or U-233 (both are fissile materials) as fuel. In. addition either depleted uranium or thorium is put into .it. A FBR produce, in addition to power, more plutonium (if depleted uranium has been used) or U-233 (if thorium is used) than what has been consumed. It is necessary for us to have sufficiently large capacity of thermal reactors which would produce large quantities of plutonium before we could go in for the breeder reactors. The breeder reactor system is a self-sustaining system as it produces more fuel than is consumed.
Current Stains of nuclear programme
9.61. At the movement total nuclear installed ca~ac!ty in operation in the country is 600 MW. Th1s mcludes 400 MW Tarapur Atomic Power Station and 200 MW Unit I of the Rajasthan Atomic Power Station. In addition, 200 MW Unit II of Rajasthan Atomic Power Station and 2x200 MW Madras Atomic Power Station are under construction. Work has also started on the fourth Atomic Power Station (2X200 MW) at Narora. The ·following table gives the expected dates of completion of the various projects on which work has commenced.
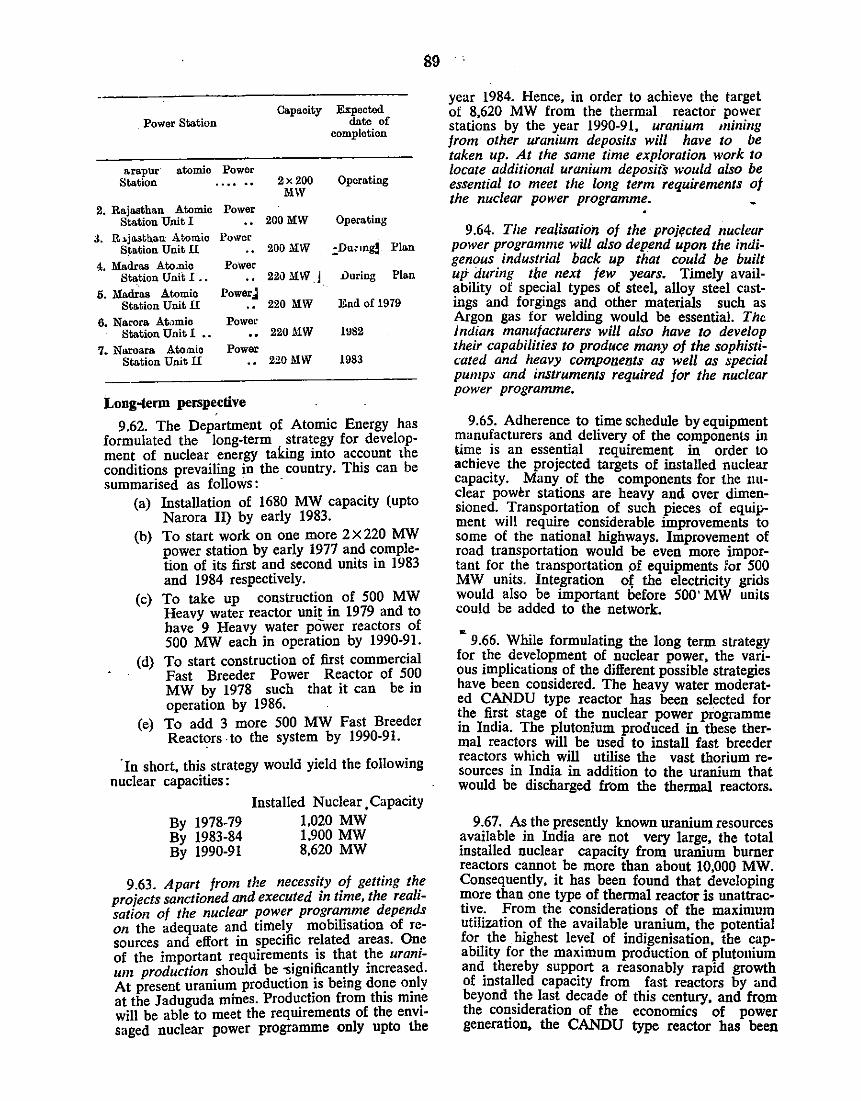
Capacity Expected Power Station date of
completion
n.rapur atomic Power Station 2x200 Operating
MW
2. Rajasthan Atomic Power Station Unit I 200MW Operating
3. RJ.ja.st.han: Atomic Power S~ation Unit II 200MW .:Dunng! Plan
4. Madras Ato.nio Power Station Unit I .. 22BIW.j .Uuring Plan
5. Madras Atomio Power.l Station Unit II 220 MW End of 1979
6. Narora Atomio PoweL' Station Unit I •• 220MW 1U82
7. Na.roara Atom.io Power Station Unit II 220MW 1983
Long-term perspective
9 .62. The Department of Atomic Energy has formulated the long-term strategy for development of nuclear energy taking into account the conditions prevailing in the country. This can be summarised as follows: -
(a) Installation of 1680 MW capacity (upto Narora II) by early 1983.
(b) To start work on one more 2X220 MW power station by early 1977 and completion of its first and second units in 1983 and 1984 respectively.
(c) To take up construction of 500 MW Heavy water reactor uni~ in 1979 and to have 9 Heavy water power reactors of 500 MW each in operation by 1990-91.
(d) To start construction of first commercial Fast Breeder Power Reactor of 500 MW by 1978 such that it can be in operation by 1986.
(e) To add 3 more 500 MW Fast Breeder Reactors -to the system by 1990-91.
·In short, this strategy would yield the following nuclear capacities:
By 1978-79 By 1983-84 By 1990-91
Installed Nuclear, Capacity 1.020 MW 1.900 MW 8,620 MW
89
9.63. Apart from the necessity of getting the projects sanctioned and executed in time, the realisation of the nuclear power programme depends on the adequate and tirnely mobilisation of resources and effort in specific related areas. One of the important requireme~ts. is that ~he uranium production should be -s1gmficantly mcreased. At present uranium production is being done only at the Jaduguda mines. Production from this mine will be able to meet the requirements of the envisaged nuclear power programme only upto the
year 1984. Hence, in order to achieve the target of 8,620 MW from the thermal reactor power stations by the year 1990-91, uranium mining from other uranium deposits will have to be taken up. At the same time exploration work to locate additional uranium deposits would also be essential to meet the long term requirements of the nuclear power programme. _
9.64. The realisation of the projected tJuclear power programme will also depend upon the indigenous industrial back up that could be built up- during tbe next jew years. Timely avail~bility of special types of steel, alloy steel castmgs and forgmgs and other materials such as Argon gas for welding would be essential. The J ndian manufacturers will also have to develop their capabilities to produce many of the sophisticated and heavy components as well as special pumps and instruments required for the nuclear power programme.
9.65. Adherence to time schedule by equipment manufacturers and delivery of the components in time is an essential requirement in order to achieve the projected targets of installed nuclear capacity. Many of the components for the nuclear power stations are heavy and over dimensioned. Transportation of such pieces of equipment will require considerable improvements to some of the national highways. Improvement of road transportation would be even more important for .the transportation of equipments ior 500 MW umts. Inte.gration o{ the electricity grids would also be 11Dportant before 500' MW units could be added to the network.
" 9.66. While formulating the long term strategy for the development of nuclear power, the various implications of the different possible strategies have been considered. The heavy water moderated CANDU type reactor has been selected for !he fir~t stage of th~ nuclear power programme tn lnd1a. The plutoruum produced in these thermal reactors will be used to install fast breeder reactors which will utilise the vast thorium resources in India in addition to the uranium that would be discharged from the thermal reactors.
9.67. As the presently known uranium resources ~vailable in India are not very large, the total mstalled nuclear capacity from uranium burner reactors cannot be more than about 10,000 MW. Consequently, it has been found that developing more than one type of thermal reactor is unattractive. From the considerations of the maximum utilization. of the available uranium, the potential fo~ _the h1ghest level of indigenisation, tbe capability for the maximum production of plutonium and thereby support a reasonably rapid growth of installed capacity from fast reactors by and beyond t~e la~t decade of this century, and fro_m the constderat1on of the economics of power generation, the CANDU type reactor has been
found to be the best suited among all the uranium burner reactors, under the conditions prevailing in India.
9.68. Considering the uranium availability and the industrial capability, the Committee has felt that it will be prudent to aim at adding about 4720 MW from CANDU reactors by 1990-91 in addition to the nuclear power stations that are under operation or construction now. In addition to this, the CANDU power programme will generate adequate plutonium to install about 2,000 MW from fast breeder reactors by 1990-91, thereby making the total installed nuclear capacity by· 1990-91 to be about 8,620 MW.
90
9.69. In the absence of reliable data to determine the optimal level of nuclear power generation capacity that is to be established between 1983-84 and 1990-91, the Committee has felt that it would be prudent to assume a constructive estimate of 4000 MW. This is essentially a risk minimisation approach, as this assumption would lead to greater preparedness in the coal production and thermal generation. The Committee would recommend that if possible, the nuclear capacity should be increased in the years beyond 1983-84. This should be based on a reappraisal of the nuclear power programme on the lines suggested above.
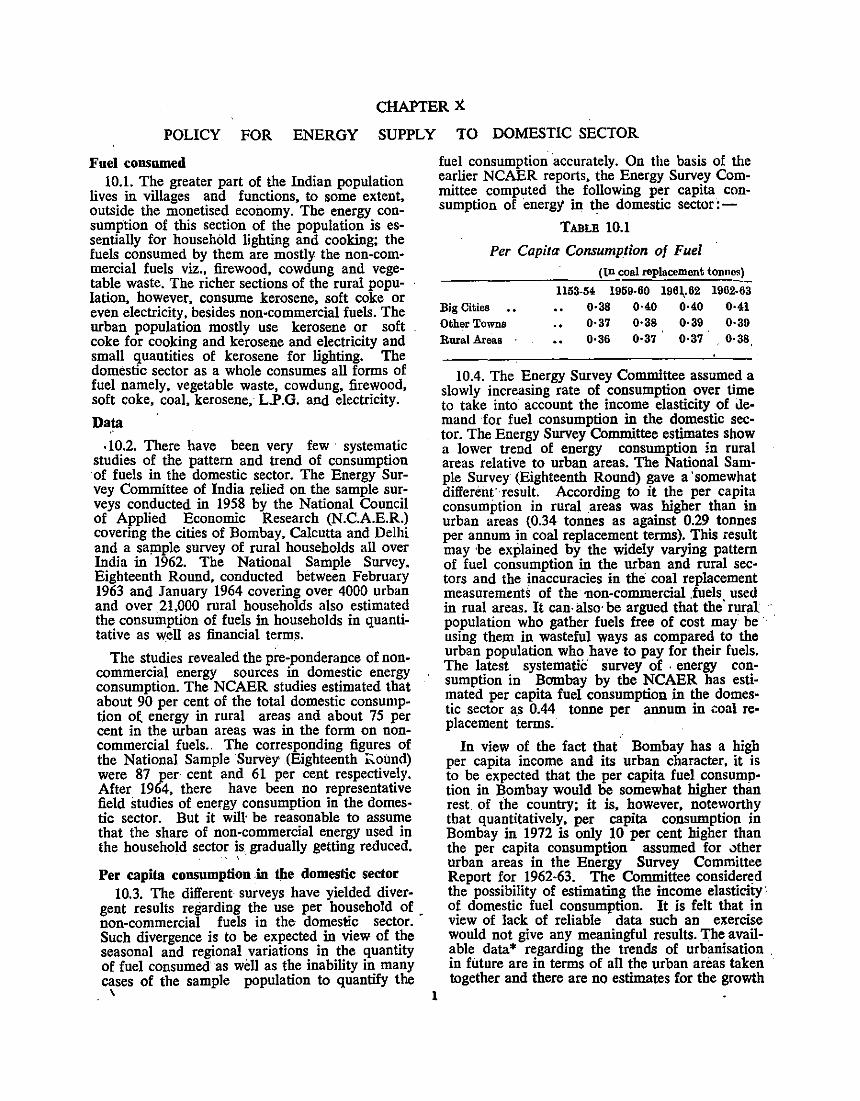
CHAPTER X
POLICY FOR ENERGY SUPPLY TO DOMESTIC SECTOR
Fuel consumed 10.1. The greater part of the Indian population
lives in villages and functions, to some extent, outside the monetised economy. The energy consumption of this section of the population is essentially for household lighting and cooking; the fuels consumed by them are mostly the non-commercial fuels viz., firewood, cowdung and vegetable waste. The richer sections of the rural population, however. consume kerosene, soft coke or even electricity, besides non-commercial fuels. The urban population mostly use kerosene or soft coke for cooking and kerosene and electricity and small quantities of kerosene for lighting. The domestic sector as a whole consumes all forms of fuel namely, vegetable waste, cowdung, firewood, soft coke, coal, kerosene, L.P.G. and electricity.
Data
.10.2. There have been very few · systematic studies of the pattern and trend of consumption of fuels in the domestic sector. The Energy Survey Committee of India relied on the sample surveys conducted in 1958 by the National Council of Applied Economic Research (N.C.A.E.R.) covering the cities of Bombay, Calcutta and Delhi and a sa!llple survey of rural households all over India in 1962. The National Sample Survey, Eighteenth Round, conducted between February 1963 and January 1964 covering over 4000 urban and over 21,000 rural households also estimated the consumption of fuels in households in quantitative as well as financial terms.
The studies revealed the pre-ponderance of noncommercial energy sources in domestic energy consumption. The NCAER studies estimated that about 90 per cent of the total domestic consumption o( energy in rural areas and about 75 per cent in the urban areas was in the form on noncommercial fuels.. The corresponding figures of the National Sample Survey- (Eighteenth ;::;.ound) were 87 per cent and 61 per cent respectively. After 1964, there have been no representative field studies of energy consumption in the domestic sector. But it will· be reasonable to assume that the share of non-commercial energy used in the household sector is gradually getting reduced.
Per capita consumption .in the domestic sector 10.3. The different surveys have yielded diver
gent results regarding the use per household of _ non-commercial fuels in the domestic sector. Such divergence is to be expected in view of the seasonal and regional variations in the quantity of fuel consumed as well as the inability in many cases of the sample population to quantify the
' 1
fuel consumption 'accurately. On the basis of the earlier NCAER reports, the Energy Survey Committee computed the following per capita consumption of energy in the domestic sector:-
TABLE 10.1
Per Capita Consumption of Fuel
Big Cities Other Towns Rural Aroas ·
(In coal replacement tonnos)
1153·54 1959·60 196~.62 1962.63 0·38 0·40 0·40 0·41 0·37 0·38 0·39 0·39 0·36 0·37 . 0·37 . 0·38,
10.4. The Energy Survey Committee assumed a slowly increasing rate of consumption over time to take into account the income elasticity of Jemand for fuel consumption in the domestic sector. The Energy Survey Committee estimates show a lower trend of energy consumption in rural areas relative to urban areas. The National Sample Survey (Eighteenth Round) gave a 'somewhat different· result. According to it the per capita consumption in rural areas was higher than in urban areas (0.34 tonnes as against 0.29 tonnes per annum in coal replacement terms). This result may ·be explained by the widely varying pattern of fuel consumption in the urban and rural sectors and the inaccuracies in the coal replacement measurements of the non-commercial .fuels used in rual areas. It can· also· be argued that the' rural · population who gather fuels free of cost may be · using them in wasteful ways as compared to the urban population who have to pay for their fuels. The latest systematic survey of . energy consumption in Bombay by the NCAER has estimated per capita fuel consumption in the domestic sector a.s 0.44 tonne per annum in coal replacement terms.
In view of the fact that· Bombay has a high per capita income and its urban character, it is to be expected that the per capita fuel consumption in Bombay would be somewhat higher than rest. of the country; it is, however, noteworthy that quantitatively, per capita consumption in Bombay in 1972 is only 10 per cent higher than the per capita consumption assumed for Jther urban areas in the Energy Survey Committee Report for 1962-63. The Committee considered the possibility of estimating the income elasticity· of domestic fuel consumption. It is felt that in view of lack of reliable data such an exercise would not give any meaningful results. The available data* regarding the trends of urbanisation . in future are in terms of all the urban areas taken together and there are no estimates for the growth
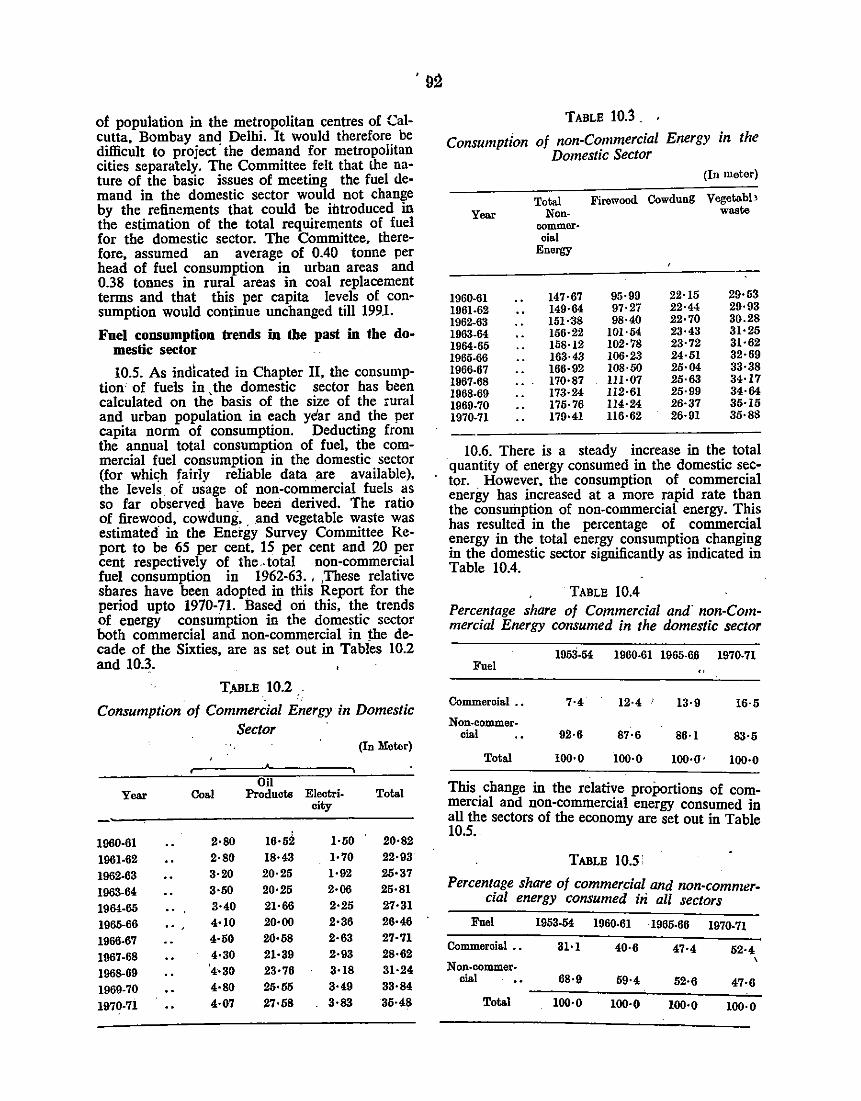
of population in the metropolitan centres of Calcutta, Bombay and Delhi. It would therefore_ be difficult to project the demand for metropohtan cities separately. The Committee felt that lhe nature of the basic issues of meeting the fuel clemand in the domestic sector would not change by the refinements that could be introduced in the estimation of the total requirements of fuel for the domestic sector. The Committee, therefore, assumed an average of 0.40 tonne per head of fuel consumption in urban areas and 0.38 tonnes in rural areas in coal replacement terms and that this per capita levels of consumption would continue unchanged till 1991.
Fuel consumption trends in the past in the do-mestic sector
10.5. As indicated in Chapter II, the consumption· of fuels in the domestic sector has been calculated on the basis of the size of the rural and urban population in ~ach year anq the per capita norm of consumption. Deductmg from the annual total consumption of fuel, the commercial fuel consumption in the domestic. sector (for whic;h fairly reliable data are . avatlable), the levels. of usage of non-com?lercml fuels ~s so far observed have beeri denved. The ratio of firewood, cowdung, .. and vegetable ~aste was estimated· in the Energy Survey Committee Report to be 65 per cent. 15 per cent and 20 ~er cent respectively of the .. total non-commer<:ml fuel consumption in 1962-63. , ,These relative shares have been adopted in this Report for the period upto 1970-71. Based ori this, the. trends of energy consumption in the domestic sector both commercial and non-commercial in the decade of the Sixties, are as set out in Tables 10.2 and 10.3.
T,o\BLE 10.2 ..
Consumption· of Commercial Energy· in Domestic Sector
(In Meter)
Oil Year Coal Products Electri- Total
city
1960-61 2·80 16·52 1·50 20·82
1961-62 2·80 18·43 1·70 22·93
1962-63 3·20 20·25 1·92 25•37
1963-64 3·50 20·25 2·05 25·81
1964-65 3·40 21·66 2·25 27·31
1965-66 ... 4·10 20•00 2•36 26·46
1966-67 4·50 20·58 2·63 27·71
1967-68 4·30 21·39 2·93 28·62
1968-69 4·30 23·76 3•18 31·24
1969-70 4·80 25·55 3·49 33·84
1970-71 4·07 27·58 3·83 35·48
TABLE 10.3. ·
Consumption of non-Commercial Energy in the Domestic Sector
Year
1960-61 1961-62 1962-63 1963-54 1954-65 1965-66 1966-67 1967-68 1968-69 1969-70 1970-71
Total Non-
commer-cial
Energy
147·67 149·64 151·38 156·22 158·12 163·43 166·92 170·87 173·24 175·76 179·41
Firewood
95·99 97·27 98·40
101·54 102·78 106·23 108·50 111·07 112·61 114·24 116·62
(In meter)
Cowdung Vcgetabl> waste
22·15 29·53 22·44 29·93 22·70 30.28 23·43 31·25 23·72 31·62 24·51 32·69 25·04 33·38 25·63 34·17 25·99 34·64 26·37 35·15 26·91 35·88
10.6. There is a steady increase in the total quantity of energy consumed ~n the domestic s~ctor. However. the consumption of commerctal energy has increased at a more ~apid rate tha_n the conswilption of non-commercial energy. T~Is has resulted in the percentage of commerCial energy in the total energy consumption changing in the domestic sector significantly as indicated in Table 10.4.
TABLE 10.4 Percentage share of Commercial and' non-Commercial Energy consumed in the domestic sector
Fuel
Commercial ..
Non-commercial
Total
1953-54 1960-61 1965-66 1970-71
7·4
92·6
100·0
12·4
87·6
100·0
13·9
86·1
100·U•
16·5
83·5
100·0
This change in the relative proportions of commercial and non-commercial energy consumed in all the sectors of the economy are set out in Table 10.5.
TABLE 10.5:
Percentage share of commercial and non-commercial energy consumed in all sectors
Fuel 1953-54 1960-61 1965-66 1970-71
Commeroial .. 31·1 40·6 47·4 52·4 N on-commer·
oial 68·9 59·4 52·6 47·6
Total 100·0 100·0 100·0 100·0
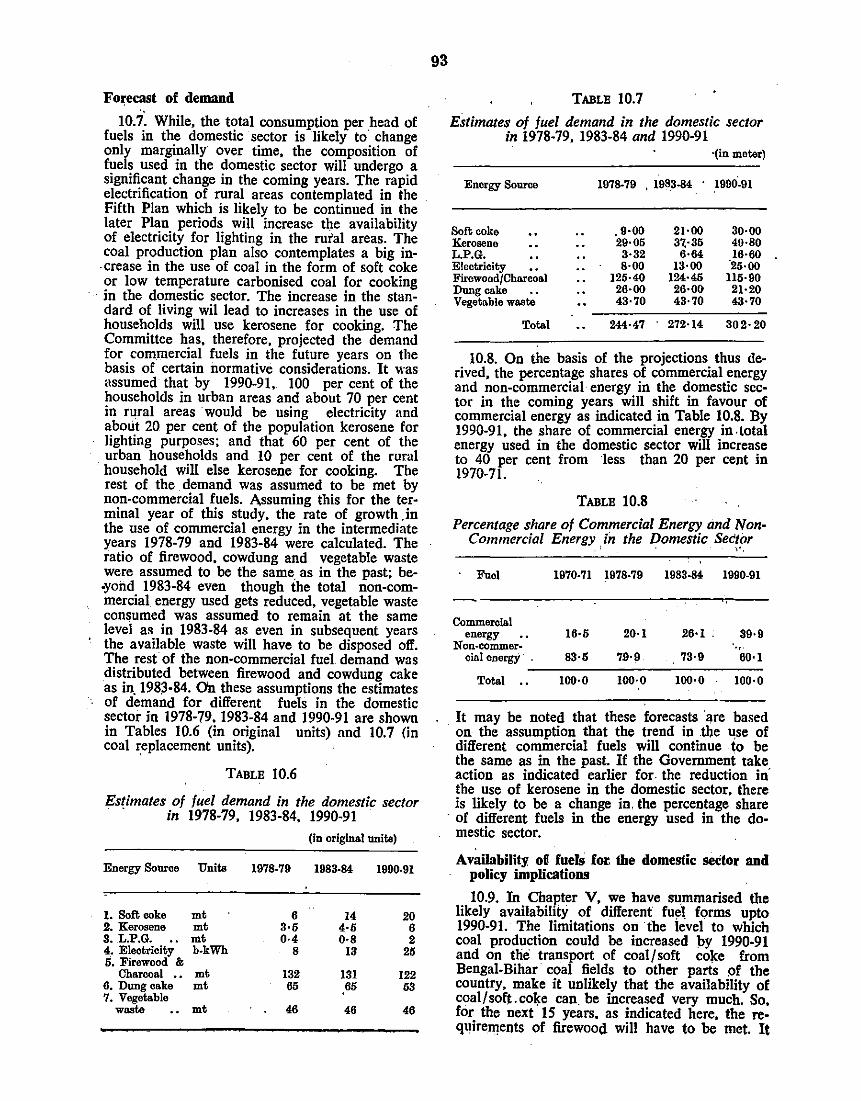
Forecast of demand .,
10.7. While, the total consumption per head of fuels in the domestic sector is likely to change only marginally· over time, the composition of fuels used in the domestic sector will undergo a significant change in the coming years. The rapid electrification of rural areas contemplated in the Fifth Plan which is likely to be continued in the later Plan periods will increase the availability of electricity for lighting in the rural areas. The coal production plan also contemplates a big in
·Crease in the use of coal in the form of soft coke or low temperature carbonised coal for cooking in the domestic sector. The increase in the standard of living wil lead to increases in the use of households will use kerosene for cooking. The Committee has, therefore, projected the demand for commercial fuels in the future years on the basis of certain normative considerations. It was assumed that by 1990-91, 100 per cent of the households in urban areas and about 70 per cent in rural areas ·would be using electricity and about 20 per cent of the population kerosene for lighting purposes; and that 60 per cent of the urban households and 10 per cent of the rural household will else kerosene for cooking. The rest of the demand was assumed to be met by non-commercial fuels. Assuming this for the terminal year of this study, the rate of growth .in the use of commercial energy in the intermediate years 1978-79 and 1983-84 were calculated. The ratio of firewood, cowdung and vegetable waste were assumed to be the same. as in the past; be-yond 1983-84 even though the total non-commercial energy used gets reduced, vegetable waste consumed was assumed to remain at the same level as in 1983-84 as even in subsequent years the available waste will have to be disposed off. The rest of the non-commercial fuel demand was distributed between firewood and cowdung cake as in. 1983-84. On these assumptions the estimates of demand for different fuels in the domestic sector in 1978-79. 1983-84 and 1990-91 are shown in Tables 10.6 (in original units) and 10.7 (in coal ~eplacement units).
TABLE 10.6
Estimates of fuel demand in the domestic sector · · in 1978-79, 1983-84, 1990-91
(in original nnita)
Energy Source Units 1978-79 1983-84 1990-91
1. Soft coke mt 6 14 20 2. Kerosene mt 3·5 4·5 6 3. L.P.G. mt 0·4 0·8 2 4. Electricity b-kWh 8 13 25 5. Firewood &
Charcoal .. mt 132 131 122 6. Dung cake mt 65 65 53 7. Vegetable
waste mt 46 46 46
93
TABLE 10.7
Estimates of fuel demand in the domestic sector in 1978-79, 1983-84 and 1990-91
·(in meter)
Energy Source 1978-79 . 1983-84 1990-91
Soft coke . 9·00 21·00 30·00 Kerosene 29·05 37.·35 49·80 L.P.G. 3·32 6·64 16·60 Electricity 8·00 13·00 '25·00 FirowoodfCharcoal 125·40 124·45 115·90 Dung cake 26·00 26·00 21·20 Vegetable waste 43·70 43·70 43·70
Total 244·47 272·14 302·20
10.8. On the basis of the projections thus derived, the percentage shares of commercial energy and non-commercial energy in the domestic sector in the coming years will shift in favour of commercial energy as indicated in Table 10.8. By 1990-91, the share of commercial energy in.total energy used in the domestic sector will increase to 40 per cent from less than 20 per cent in 1970-71.
TABLE 10.8
Percentage share of Commercial Energy and NonCommercial Energy in the Domestic Sector
' . )",
. Fnel 1970-71 1978-79 1983-84 1990-91
Commercial energy 16·5 20·1 26·1 . 39·9
Non-commer- ., cial energy · . 83·5 79·9 73·9 60·1
Total .. 100·0 100·0 100·0 100·0
It may be noted that these forecasts ·!Ire based · on the assumption that the trend in tbe ~se of
different commercial fuels will continue to be the same as in the past. If the Government take. action as indicated earlier for. the reduction in the use of kerosene in the domestic sector. there is likely to be a change in. the percentage share
· of different fuels in the energy used in the domestic sector.
Availability ol fuels for. the domestic sector and policy implications
10.9. lh Chapter V, we have s~mmarised the likely availability of different fu~\ forms upto 1990-91. The limitations on the level to which coal production could be increased l:>y 1990-91 and on the transport of coal/soft co!ce from Bengal-Bihar coal fields to other parts of the country, make it unlikely that the availability of coal/soft.co~e can. be increased very much. So, for the next 15 years, as indicated here, the requirell)ents of firewood will have to be met. It
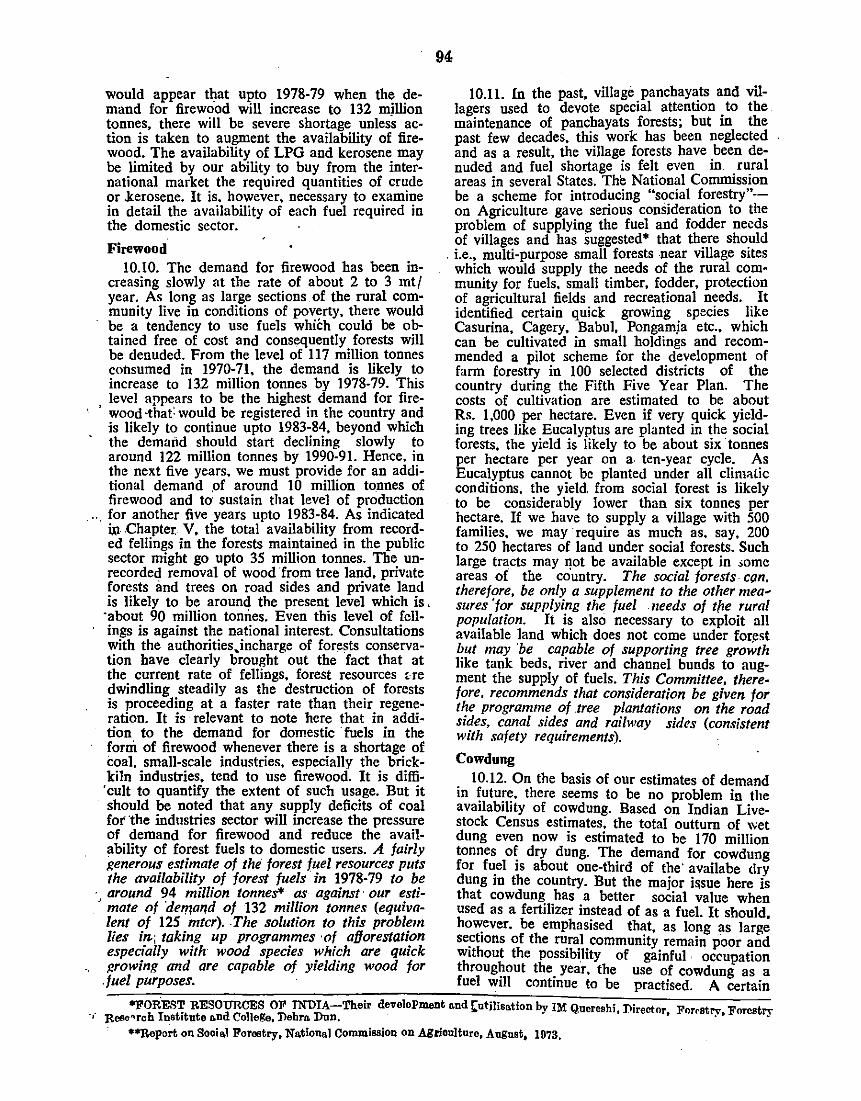
would appear that upto 1978-79 when the demand for firewood will increase to 132 mjllion tonnes, there will be severe shortage unless action is taken to augment the availability of fire· wood. The availability of LPG and kerosene may be limited by our ability to buy from the international market the required quantities of crude or .kerosene. It is. however, necessary to examine in detail the availability of each fuel required in the domestic sector.
Firewood 10.10. The demand for firewood has been in
creasing slowly at the rate of about 2 to 3 mt/ year. As long as large sections. of the rural com· munity live in conditions of poverty. there would be a tendency to use fuels which could be o btained free of cost and consequently forests will be denuded. From the level of 117 million tonnes consumed in 1970-71, the demand is likely to increase to 132 million tonnes by 1978-79. This level appears to be the highest demand for firewood ·thaf would be registered in the country and is likely to continue upto 1983-84, beyond which the demand should start declining slowly to around 122 million tonnes by 1990-91. Hence. in the next five years. we must provide for an additional demand of around 10 million tonnes of firewood and to: sustain that level of production
... , for another five years upto 1983-84. As indicated i.n Chapter V, the total availability from record· ed fellings in the forests maintained in the public sector might go upto 35 million tonnes. The unrecorded removal of wood 'from tree land. private forests imd trees on road sides and private land is likely to be around the present level which is ,
·about 90 million tomies. Even this level of Ceilings is against the national interest. Consultations with the authorities,incharge of forests conservation have clearly brought out the fact that at the current rate of fellings, forest resources ae dwindling steadily as the destruction of forests is proceeding at a faster rate than their regeneration. It is relevant to note here that in addition to the demand for domestic ·fuels in the form of firewood whenever there is a shortage of coal, small-scale industries, especially the brickkiln industries, tend to use firewood. It is diffi-, cult to quantify the extent of such usage. But it should be noted that any supply deficits of coal for the industries sector will increase the pressure of demand for firewood and reduce the availability of forest fuels to domestic users. A fairly generous estimate of the· forest fuel resources puts the availability of forest fuels in 1978-79 to be around 94 million tonnes* as against· our esti-
' mate of 'demal'!d of 132 million tonnes (equivalent of 125 mtcr) .. The solution to this problem lies in; taking up programmes ·of afforestation especially with wood species which are quick growing and are capable of yielding wood for
. fuel purposes.
94
10.11. In the past, village panchayats and villagers used to devote special attention . to the maintenance of panchayats forests; but m the past few decades, this work has been neglected and as a result, the village forests have .been de· nuded and fuel shortage is felt even m. rural areas in several States. The National Commission be a scheme for introducing "social forestry"on Agriculture gave serious consideration to the problem of supplying the fuel and fodder needs of villages and has suggested* that th~re sho!lid
. i.e., multi-purpose small forests .near village s1tes which would supply the needs of the rural community for fuels, small timber, fo_dder, protection of agricultural fields and recreatiOnal needs. It identified certain quick growing species like Casurina, Cagery, Babul, Pongamja etc., which can be cultivated in small holdings and recommended a pilot scheme for the development of farm forestry in 100 selected districts of the country during the Fifth Five Year Plan. The costs of cultivation are estimated to be about Rs. 1,000 per hectare. Even if very quick yielding trees like Eucalyptus are planted in the social forests, the yield is likely to be about six· tonnes per hectare per year on a. ten-year cycle. As Eucalyptus cannot be planted under all climatic conditions, the yield from social forest is likely to be considerably lower than six tonnes per hectare. If we have to supply a village with 500 families, we may require as much as. say, 200 to 250 hectares of land under social forests. Such large tracts may not be available except in .some areas of the co'untry. The social forests· ccm. therefore, be only a supplement to the other mea~ sures 'for supplying the fuel needs of tfze rural population. It is also necessary to exploit all available land which does not come under for)!st but may 'be capable of supporting tree growth like tank beds, river and channel bunds to augment the supply of fuels. This Committee, therefore, recommends that consideration be given for the programme of .tree plantations on the road sides, canal sides and railway sides (consistent with safety requirements).
Cowdung
10.12. On the basis of our estimates of demand in future, there seems to be no problem in tlte availability of cowdung. Based on Indian Livestock Census estimates, the total outtum of wet dung even now is estimated to be 170 million tonnes of dry dung. The demand for cowdung for fuel is about one-third of the' availabe dry dung in the country. But the major i~sue here is that cowdung has a better social value when used as a fertilizer instead of as a fuel. It should, ho~ever. be emphasised th~t. as long as large se.cttons of the ru_rll;l. commumty_ remain poor and Without the possibility of gamful , occupation throughout the year, the use of cowdung as a fuel will continue to be practised. A certain
"l"OREST RESOURCES OF INDIA-Their develoPment and !:utilisation by IM Qucreshi, Director, Forostrv, Forestry ·,- Rcso'~rch Institute o.nd College, Debra Dun. ·
•*Rcporl on Social Poreetry, National Commission on A.Brionlture, August. 1973,
amount of dung cake will always be used in the domestic sector for lighting fires in the hearths and for the ·proper regulation of the flame obtained by burning of wood.
Gobar Gas plants provide the means of using both the heat value in cowdung as well as the nutrient value. Gobar Gas plants have popularised by the Khadi & Village Industries Commission as a means of improving the village economy by using local resources. They consist essentially of making a slurry of cowdung and collecting the
.gases produced through fermentation. The gas consists mostly of methane leaving behind organic material with high nutrient value. The Commission has been extending financial assista:nce in the form. of loans and grants as well as technical advice in the construction of these plants. About 7,000 such plants have so far been constructed. A techno-economic appraisal* of the plants was made some years back of Gobar Gas plant. It shows that, on strict economic analysis, gobar gas would be justified for use in all States in India. except Assam, J&K. Madhya Pradesh and Orissa. which have comparatively better forest resources. A Group under the National Committee on Science and Technology examined the various possibilities for improving the design of the Gobar Gas plant. reducing its construction cost and improving the performance of the plant, especially during the winter months when the gas production goes down. The Committee has made useful sugg_estions which, if implemented, will reduce the cost of the Gobar Gas plants. · The economic case for the use of Gobar Gas plants has been strengthened further by the recent large increase in the international price of synthetic nitrogenous fertilizers. Considering the current and the possible prices of nitrogenous fertilizers and fuels for use in the domestic sector. it is reasonable to anticipate that Gobar Gas plants . are likely to become more popular. The Committee appreciates the enormous administrative difficulties likely to be encountered in popularizing the scheme and has, therefore, not taken note of any additional contribution to domestic supply of fuels from Gobar Gas plants. It is relevant to note that one Gobar Gas plant (household size) will produce fuel equivalent to only about 1.0 to 1.2 tonnes of soft coke. Even if a very large number of Gobar Gas plants were . bulit in the next two decades, the energy contribution to the domestic sector will be ·a very small percentage of the total requirements*. But the Committee would strongly recommend that all efforts should be made to intensify the popularization of the scheme at least in selected areas where the pattern of ownership of cattle :will help In its eaSY implementation in view of the social
. benefits' of the nutrient production, pollution · abatement ec. possible from these plants ..
!)5
Other waste of animal and human origin
10.13. Besides cowdung, there are other waste materials like human excreta which can also provide the basis for production of gas for use in the domestic sector for heating purposes. There is a full scale night soil digester in Ernakulam capable of meeting the fuel requirements of 20.000 people. At the village level, there is one in Maharashtra State. But these units are not economically viable and there are various taboos attached to the use of these materials. The Committee, therefore, does not foresee any significant contribution to the fuel supply from these sources.
Vegetable waste 10.14. Waste material of plant origin has con
tributed a significant share to the fuel needs of the rural community. Bagasse which is now used as a fuel is capable of beiqg used as the raw material for the manufacture of paper and gives a better social return as an industrial raw material than as a fuel. Similarly. straw and stovers of crops are used as roughages for cattle feeds and should, therefore, be used as such instead of as fuel. But all other waste material has to be disposed of only as fuel. The Committee bas, therefore, assumed that even when the need for
· non-commercial fuels in the economy goes down, the level of usage of vegetable waste upto 1990-91 will continue to be the same as in 1983-84.
Soft coke 10.15. The level of 'use of soft coke is limited,
on the one hand, by the emphasis on convenience laid by domestic consumers in the urban areas and the aftluent sections of the rural community and, on the other hand, by private cost involved in the purchase of soft coke as against vegetable waste or cowdung which is obtained practically free of cost by the poorer sections of the rural community. Any effort at popularizing soft coke use will have to depend heavily on the fea,ibility of reducing the price of soft coke at the consumer end. In States like West Bengal. Bihar and Uttar Pradesh, which are not very far from the area of production of soft coke. it may be possible to induce people to use soft coke made in bhattas without any subsidy provided adequate supply of soft coke is assured. But in. the last five years, soft coke consumption has shown a declining trend from the peak level of 3.2 million tonnes in 1969-70. This is on account of the low priority given for movement of soft coke in the railway system and the increasing difficulties experienced in moving soft coke 'by rail. The bhatta method of production of soft coke calls for the use of coking coal, at least of the lowest grades available. But methods are available for the conversion of even non-coldng coal to somkeless domestic heating fuel by using low temperature carbonization process. Two variations of
*Note : If two million gobn.r gns Plants were constructed by 1990-91, their outPut Will be less than 2 por cent of domestio fuel requirements.
this process have been developed in the CFRI at Dhanbad and RRL at Hyderabad. A plant designed to carponize about 900 tonnes of coal which will produce about 550 tonnes of coke per day and serve the needs of over 8 lakhs of population, or 1.6 lakhs households, would require an investment of nearly Rs. 10 crores. The investment in coke production to meet the requirements of one household will work to nearly Rs. 1,200; the coke produced will cost Rs. 250 per tonne at the point of production. If the coke could be sold at the price, the plant is commerciaUy viable. The economics of the plant improves with the extent of by-product recovery; but by-products can be recovered economically only when the plant is large, say, abqut three times the size discussed. Such aprocess can be used near coalfields and the coke distributed from central production points and, even at the high level of prices of other fuels prevailing now, the products of this unit can be sold only in highly urbanized centres*.
96
CFRI has .also developed smaller plants like moving bed carbonisers which can be based to supply the requirements of smaller towns. But these processes require coking coal although of an inferior grade. The Committee woud like to emphasise the importance of developing cheap solid domestic fuels which can be used in small towns as well as in rural areas by sections of the population who use firewood now. The Committee would therefore urge that the possibilities of setting up plants for the manufacture of solid domestic fuel to suit the requirements of different sizes of urban centres ·should be studied further, with reference to coal available in the nearby• _ Coalfield. The possibility of reilucing· the cost of soft coke to the consumer by subsidizing the transport and trading margins on ~oft coke or by· raising the required .funds by way of surcharge on the price of kerosene, should be examined. This additional taxation on kerosene and the subsidy on soft coke will have the effect of
• balancing social benefits and private benefits that arise in the ·use· of kerosene which depends on imported raw material and of soft coke which depends on indigenous raw materials. The Committee has taken a somewhat cautious view about the level of soft .. coke that may be used in the economy; . but it 7ecommends that all efforts -should be made to increase the level as high as possible. '
Town gas
cities. A cost-benefi.t analysis of supplying .co~l gas as a domestic fuel to .substitut~ kerosene IJ?d!· cates that this is economtcal only m metropohtan areas, especially those where the ~opula!ion d<:n· sity is very high and where there IS an. mdustnal demand for gas in addition to domestic demand (Please see Chapter VII).
Kerosene 10.17. Kerosene has proved to be the mo~t
popular among the fuels used in the domcs~1c sector in view of its convenience of use. lnspJte of the price prevailing upto 1973, kerosene was cheaper than the other f~els avai!able. for. use in the domestic sector. The mcrease m pnce m 1974 has made the price of kerosene somewhat higher than the price of an equivalent quantity of other commercial fuels like soft coke or charcoal. But on account of its greater convenience of usage, kerosene will continue to be a popular fuel. The demand for kerosene can be controlled only by proper distributive arrangements. In our estimates. we have assumed that the trends in the use of kerosene will continue to be the same as in the past unless controlled by the Government. Even on this assumption, the share· of kerosene in the total oil products used in the economy will be only 7.5 per cent in 1978-79, 6.5 per cent in 1983-84 and 5.3 per cent in 1990-91. The replacement of kerosene by other fuels in the domestic sector would depend primarily on the availability of other fuels. It is reasonable to assume that in big cities like Bombay or Calcutta, only coal gas can replace the use of kerosene; while, in the rural areas, the sections of the population, who would have normally switched over from firewood to koresene, can be persuaded to use soft coke, provided its price is lower and its availability is better than that of kerosene.
LPG
1 0.18. Liquified petroleum gas is ·one of the light end products in the· refinery and its availability ranges from 1.5 to 2.5 per cent.depending'on the measures .used for reducing refinery losses and refinery fuel consumption. In our Report. the use of LPG has been estimated on the basis of its availability from domestic refineries. If. on account of the measures recommended in this Report, the level of oil used is reduced and the refining capacity operating in the country is also reduced. the availability of LPG· will go <lown and to that extent. this need has to be met by substitute fuels.
1 0.16 .. The cost of ~etting up gas production Electricity unit and the djstpbution pipelines from the gas · 10.19, The rapid electrification of villages ·has works. to the households would call for an invest- been ·accepted as a policy by the Government
· . ment of about Rs. 2,000 to Rs. 2,500 per family with a view to upgradin~ the quality of life in inclusive of the private cost. of installing the gas the villages and to make it possible for rural in-meter. gas oven. etc., even in densely populated dustries and agriculture to function efficiently. In
~------~~------------~-*AR mentioned earlier in'Cha.pter VIJ, the Committee in its Report on 'the Fue Policy for the Seventh•s recflmcnded the setting up of two l .. TC plants, one at Calcutta and one ncar Hyderabad. The Government have approved these two proposals recentlY!
. I
the estimates of the use of electricity, it is assumed that by 1990-91, 100 per cent of the urban areas. and 90 per cent of the rural areas would be electr!h_ed; but. th~ number of households using electriCity for lighting in the rural areas has been assumed to be 70 per cent, compared with 100 per ce.nt of. the households _in the urban areas. On thi~ basis, the share of electricity used in the ~omesl:lc sector to. the total electricity consumed m the econom~ will be 8.94 per cent in 1978-79, 9.55 per cent m 1983-84 ·and· 8.22 per cent in 1990-91. However, the committee would like to emphasise tpe i~crea~ed social benefits possible if rural _cle~trificatton IS undertaken with adequate orgamsattonal and procedural improvements so as to ensure that maximum number of households ~r~ ekctrified in each village to which electricity !S elr:tended. In th~ absence of such improvements, mspite of large mvestments in rural electrification, only a section of the population is benefited.
Efficiency lnlprovement 10.20. Studies by the CFRI have shown that
· the oven and other cooking appliances used in the domestic sector using firewood and soft coke do not have design characteristics which would optimize the use of fuels. Even small improvements in the design of the domestic chulla will i~cr_ease the efficiency by 10 to 15 per cent.
. Similarly, the work done at the Indian Institute of. Petroleum has shown that kerosene using appliances can also be improved in their designs so as to increase their efficient:y, Considering the large !.hare of energy used in the domestic sector, th,e social gains as well as private gains to be obtamed by improving the efficiency of utilisation of fuels in the domestic sector would be enormous. 1'he Committee would therefore recommend that r.esearch and development should be undertaken on the optimisation of . the design of the chulla and other appliances used in the domestic
97
sector and aiso other administrative action taken to ensure that the appliances marketed conform to those design requirements.
Major implicatioDS of policy
10.21. From the discussion above, it is clear that the present trend of increasing pressure on non-commercial fuels for meeting the fuel needs of the domestic sector is likely to wane from 1978-79. The level of usage of non-commercial fuels is likely to stay at a plateau for the next five years upto 1983-84. But this expectation is based on .the assumption that the commercial fuels will be made available in increasing quantities as indicated in the forecast. The supply of soft coke to the levels anticipated will depend not only on the setting up of production facilities but also on the provision of transport .facilities and procedures for transportation which will enable an uninterrupted supply of these fuels to hundreds of ·thousands of supply points. It is also noteworthy that even if the quantities of commercial fuels are available, the financial capability of the, consl!mers to use these fuels in preference to fuels which they may obtain free of private · cost, is likely ·to be limited unless relative prices are properly regulated and the income redistribution proceeds at a fast pace. The low income level of the rural population is likely to be a constrain 01i. the widespread use of electricity for ·domestic purposes as contemplated_ in this Report. The Committee would like to draw attention to the fact that the problem of substitution of non-commercial fuels by commercial fuel il'l the domestic sector has to be considered with due regard to the overall economic implications of the use of different fuels in this sector and the pricing and distribution policies should be based 011 a full understanding of the social cost of the use of different fuels.
CHAPTER:Xl
COSTS AND PRICES IN ENERGY SECTOR
Cost to the Economy
Various aspects of production and utilization of different fuels in the economy have been considered with due regard 'to their 'costs of production within the country or cost of obtaining them. from abroad. By their very nature, coal, oil and hyde! resources occur in environments which differ widely from one another. Consequently, costs of producing fuels and· conve~ them to useable forms vary widely.
11.2. Prices at ·which fuels are made available to • the consumers are determined by the costs of pro·
duction, transport and . trade mar~. scarcity values, taxes and S!Jbsidies on these fuels. The level of taxes is usually design~ with referente
• to several objectives like increasing Government revenues, encouraging production from sources which V:,ould otherwise be abandoned or remain untapped, ~iscouraging ·the use of fuels which are in scarce supply, etc. On account of the interaction of these factors, the change in the con,sumer. prices of fuels over time will not depend solely on the changes in the cost of production of the fuels.
Past trends in energy .prices
I1.3. In India, as in many other countries, there has always been an urge for public intervention to ensure that prices of energy are kept at as low a level as possible. It is common experience in many countries that the rate of increase of fuel prices is lower than the rate of in· crease of prices of other commodities whose prices are determined by market forces without intervention by the Government. The· data for the Sixties indicate that in India the change in the index of prices of fuels was less pronounced than changes in the index of prices of all commodities, food articles or of industrial raw materials. Table 11.1 bears this out:-
98
.TABLE 11.1
Index Numbers of Wholesale Prices (1960-61 to 1970·71)
' . Year
1960-61 1961-62 1962-63 196•-54 1954-65 1965-66 1966-67 1967-68 1968-69 1969-70
1970-71'
All Food c ommodi- articles tioa
100·0 100·2 104·0 ll0·4 122·5 131·9 150·2 167·6 165·7 171·9
181·5
(Base: 1960-61=100)
Item
IndUBtrial Fools- • raw ma- power, terials light
and lubricants
100·0 100·0 100·0 100·2 98·1 101·8 105·6 95·9 105·1 ll6·6 93·2 120·0 135·5 ll3·7 122·5 144·7 130·3 126·3 171·3 155·4 136·9 203·0 153.4 144·6 197·1 154·3 151·3 197·0 176·7 157·9
201·1 193·5 154·7
_11.4. A ~tudy of the relative movement of pnces of d1fferent fuels during the Sixties show! that the rate of increase in the price of electricity has been lower than that of coal. Among oil products, the rate of increase in the price of diesel has been lower than that of petrol (motorgas). See Table 11.2 below:-
T.~BLE 11.2
Index Numbers of Wholesale Prices of Selected ~uels in lndia-(1960-6! to 1970-71)
Period
1961-62 1962-63 1963-64 1964-65 1965-66 1966-67 1967-68 1968-69 1969-70 1970-71
AU commodities
100·00 • • 100·24 • • 108·15 •• 122·06 • • 131·89
152·84' •. 159·94 . • 165·40 •• 171·50
181·10
Coal
100·0 104·9 112·2 116·3 121·1!. 128·5 147·9 168·2 166·0 167·9
(1961-62-100)
OIL Elec- r----'---,
tricity Petrol Diesel oil"
100·0 109·0 115·1 119·6 124·jl. 137·3 138·5 143·3 143·9 150·2
100·0 101·9 120·2 120·6 127·Q. 131·5 144·5 148·6 160·0 175·5
100·0 102·1 108·9 109·3 110·~ 119·~ . 119·3 121·7 122·8 121·1
NOTE: Index numbers of Wholesale prices of other 0 il products ~e nat pnhliahed.. -
.:. '11.5. A proper price policy for the fuels will have to be based on an adequate appreciation of the production cost of each fuel over time. The price policy should take into account the interests of the producer, the consumer and the nation. _From the point of view of the producer, a sound system of prices should give the incentive to pro' duce the required quantities of energy and should assure its regular production at the minimum of ,cost by putting pressure on the management to 'select optimal projects and operate them elliciently. The relative price of fuels of different qualities should be such as to enable the pro
.. dpction of different qualities of fuels in the required quantities and prevent the wasteful ·pro·
· duction of fuels which are in scarce supply. The ,,price policy should also enable the industry to 1 undertake and implement a long-term policy of explor&tion and technical research to improve the ellicien~y of production and transformation of energy. From the consumer point of view, the price system should provide the energy at the
·lowest possible costs, encourage him to use 1he type ~f J:Dergy that best suits his particular needs and en~ourage the use of fuels whose supply is
·relatively abundant and discourage consumption' of fuels which are relatively scarce. From the
.·national point of view, the fuel prices should en-
. sure that the pattern of use of fuels is in . keeping with the optimal pattern of production determined with reference to the Iong.teJIII availability of .fuels and their costs.
,. :
· I 1.6~. In practice; a price system cannot work ~ually satisfactorily from all points of view. Many ·of the problems of the energy situation in India appear to be due to price poliCies in the fuel sector which have been concerned, possibly . ' to an excessive extent with one individual func-tion of the policy namely that of supplying con·
. sumers with energy at the lowest possible costs. As a result, production of sufficient quantities ':>f fuels bas suffered, and the country has also been increasingly dep,endent on external sources of supply. In future, in designing a rational price policy .for the energy sector, appropriate attention should be paid to all the three functions re· fcrred to earlier.
I f. 7. While the procedures for price determin&tion will vary with the nature of the fuel in-
dustry for whose products the price is to be fix. ed, the Committee feels that the Government should indicate a reasonable rate of return to be fixed for the fuel industries as a whole which
· would serve as a guideline for any committee ' . which is entrusted with the task of price fixation
for any fuel. There bas been significant variation in the rate of return allowed by different commit· tees in the past. Taking note of the objectives of a rational price policy in the energy sector. Energy Survey Committee (1965) had suggested that the fuel industries should yield a return of at least 10 per cent on the investment. This Committee would like to endorse the view of the Energy Survey, Committee. The price fixed for any fuel, coal, oil or electricity should be such that the particular fuel industry, as a whole, is enabled to earn a return of at least 10 per cent on the investment made in the industry.
Price policy for the coal sector
i 1.8. In . any coalfield, in the normal course, · the more easily mineable deposits are exploited first, leaving the deposits available at greater depths and occurring under more difficult n•ining conditions to be exploi~ed later. This would lead to progressively increasing cost of mining coal. However, as only a very small fraction of the total deposits available in the country has so far been exploited, inspite of the increasing level of coal production, the costs of inining have not increased significantly. Cost of coal production has been analysed by several committees which were set up to enquire into the production costs and fix a reasonable price for coal. After examin· ing various possibilities, all the committees start· ing with the Coal Price Revision Committee in 1958 had decided to fix the price on a 'cost plus' basis where the "plus" factor. was expected to reflect a fait margin of profit. For determining costs of products, data were collected by team• of cost accountants for the Coal Price Revision Committee in respect of 63 collieries which were selected in consultation with 'the industry. Analysis revealed that there were wide variations in the costs of production even among collieries which were located very close to each other. Even when the elements of costs were · disaggregated, these elements of costs could not be correlated with factors which are normally c_onsidered to deter· mine the cost like the size of collieries, depth at which coal is mined etc. It was also noticed that
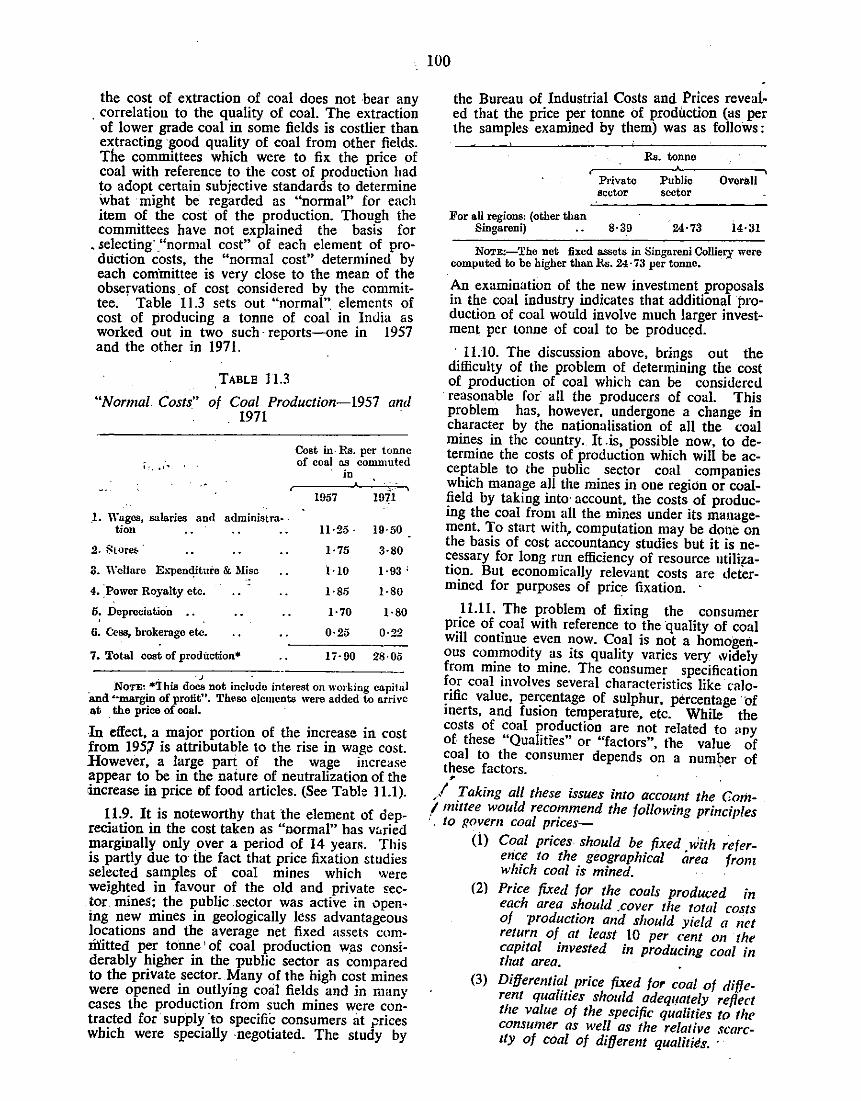
the cost of extraction of coal does not -bear any . correlation to the quality of coal. The extraction
Qf lower grade coal in some fields is costlier than extracting good quality of coal from other fields. The committees which were to fix the price of coal with reference to the cost of production had to adopt certain subjective standards to determine what might be regarded as "normal" for each item of the cost of the production. Though the committees have not explained the basis for
• selecting· ."normal cost" of each element . of pro· dliction costs, the "normal cost" determmed by each committee is very close to the mean of the observations of cost considered by the committee. · Table ·11.3 sets out "normal". elements of cost of producing a tonne of coal in Imlia as worked out in two such· reports-one in 1957 and the other in 197 I.
TABLE 11.3
"Normal. Costs" of Coal Production-1957 and 1971
.. '~
.1. "'ages, salaries and administra- · tion
2. 8toreE- ·
4. :Power Royalty etc.
6; DcprcciatioD ..
6. Cc.ss, brokerage etc.
7. Total cost of prodUction*
Cost in· Ra. per tonne of coal as commuted
in
1957 1911
ll·25. 19·50
1·75 3·80
l·!O 1·93'
1·85 1·80
1·70 1·80
0·25 0·22
17·90 28·05
'J .
NoTE: *'ihis does not include interest on working capitUI 'and £-margin of profit". These elements were added to arri\'C at the price of coal.
In effect, a major portion of the increase in cost from 195;7 is attributable to the rise in wage cost. However, a large part of the wage increase appear to be in the nature of neutralization of the increase in price of food articles. {See Table 11.1).
11.9. It is noteworthy that the element of depreciation in the cost taken as "normal" has %ried marginally only over a period of 14 years. This is partly due to the fact that price fixation studies selected samples of coal mines which were weighted in favour of the old and private sec. tor. mines; the public .sector was active in opening new mines in geologically Jess advantageous locations and the average net fixed asset~ comrilltted per tonne' of coal production w.as considerably higher in the public sector as compared to the private sector. Many of the high cost mines were opened in outlying emil fields and in many cases the production from such mines were contracted for supply 'to specific consumers at prices which were specially -negotiated. The study by
100
the Bureau of Industrial Costs and Prices revealed that the price per tonne of production (as per the samples examined by them) was as follows :
Ra. tonne
Private Public Overall sector sector
For aU regions: (othet· than Singarcni) 8 · 39 24·73 14·31
NoTE:-The net fixed assets in Singnreni Colliery were computed to be higher than Rs. 24 · 73 per tonne.
An examination of the new investment proposals in the coal industry indicates that additional production of coal would involve much larger investment per tonne of coal to be produced.
· 1 L1 0. The discussion above, brings out the difficulty of the problem of determining the cost of production of coal which can be considered
· reasonable for all the producers of coal. This problem has, however, undergone a change in character by the nationalisation of all the coal mines in the country. It. is, possible now, to determine the costs of production which will be acceptable to the public sector coal companies which manage all the mines in one region or coalfield by taking into account, the costs of producing the coal from all the mines under its management. To start with, computation may be done on the basis of cost accountancy studies but it is necessary for long run efficiency of resource utilization. ~ut economically relevant costs are determined for purposes of price fixation. ·
11.11. The problem of fixing the consumer p~ice of ~oal with reference to the quality of coal will contmue even now. Coal is not a homogenous con:'modity ~s its quality varies very .videly from mme to mme. The consumer specification for coal involves several characteristics like calo~ific value, per~entage of sulphur, percentage ·of merts, and fusion temperature, etc. While the costs of coal production are not related to any of these "Qualities" or "factors", the value of coal to the consumer depends on a number of these factors. ' . .
J Taking all these issues into account the Com/ mittee would reco~nmend the following principles ' . to ROvem coal pnces- .
{1) Coal prices. should be fixed with ~eferetice to the geographical area franz which coal is mined.
(2) Price fixed for the coals produced in each area should .cover the total costs of production and should yield a net return of at least 10 per cent on the capital invested in producing coal in that area. .
(3) Differential price fixed for coal of different qualities should adeq11ately reflect the value of the specific qualities to the consumer as well as the relative scarcIty of coal of different qualities. · ·
11.12. Operationally, the determination of coal price on these principles could. be done by ndopt.ing the following procedure: Coal mines in India can be divided jnto certain geographical groups, each group consisting of one or more coalfields. The price of coal in each area could be determined with reference to the cost of producing coal to the required level in that area. As the Government or the Coal Company draws plans in advance for attaining specified levels of production in each' of the coalfields, the production plans would be. available for each coalfield from which the cost of producing coal can be determined. If all the full details of the production plan are not available at the time of price fixation, this can be done by selecting a "representative mine"· in the coalfield which will set the trend of costs of production of coal in that field during the period for which the price will be in operation. This cost can be called the "bench mark". cost: the average selling price of all the coal froin the area should be fixed to assure yield of net return of at least 10 per cent on the invested capital after meeting the "bench mark" costs.
11.13. "Bench. Mark" price will apply to the coal of the quality which is produced in the la_rgest quantity in. the area. All coal produced m the area could be arranged in price groups with reference to the price and quality coal of befl:ch mark. The price groupings could be made wtth reference to, the following:-
!-Calorific value. 2-Ash content. 3-Moisture content. 4----Sulphur content. · 5-Content of other impurities like grid,
; abrasive material etc. 6-Size of coal. '·
Depending on the ·value of the different _characteristics of coal to the consumer. a premmm or a rebate could be allowed on different qualities of coal with reference to the price and quality of the bench mark coal. Over and above this, for taking into account the rapidly exhaustible quality of certa4t types of coal, a penalty value for s~arciW of coal of certain qualities could be added. Point values could be worked out for each of these factors.
r· . . 11.14, In fixing the point value and in deter
mining the price groupings. it should he ensured that the total coal sold as per the schedule of prices determined in the coalfield should giv~ a minimum return of 10 per cent on the capttal invested in coal production in the field as a whole.
11.15. As ~uch p!jce fixation will be done V.:ith re.f~.rence. t(l t1w production propose? for a pertod of 5 years, it will .r"!l~e !he co~l .mdustry co.nscious of its responstbthty m achtevmg production at certain costs. Its failure in this regard will lead to 11' loss; while improvement achieved in
IOl
actual implementation of the projects will in~· crease the profits. The period for which the price should be fixed will depend on different circum• stance's but if stability is envisaged in the level of wages . and prices of inputs, it~hould be possible to fix the price for at least 'l:/3 years at a time.' In times of abnormal inflation, it will be necessary to link the price of coal to certain indices like wage costs or costs of major inputs. Such price fixation while defining the· responsibility of' coal industry as indicated above, would also enable the coal consuming industries to project their cost of production on a reasonable basis. •·
.. . '/ . Price policy for the oil secto~ · ·
11.16. As indicated in Chapter VIIi. India's production of crude from indigenous sources will be adequate to meet only part of the demand for such products. The rest has to be obtained from other countries either in the form of crude or in the form of products. When crude is obtained. it has to be refined 'l;>efore u.se and .the process of refining gives rise to a. set of joint pro-, ducts. These products fall into three main cate·· gories, namely, the light ,distillate products, the middle distillate .products and the . heavy!nds. Each of these main categories can• be split into sub-categories. and by blending with other pro~ucts or by addition of additives, they are con-. verted to petroleum products with specifications. which conform to specific consu111er needs. ,
11.17. Each refinery attempts to adjust its' production to conform to the pattern of demand for products that it has to serve. In the United States where the demand for motor gasoline forms a high proportion of the total oil products' demand, the refineries tend to. maximise the yield of motor gasoline in the refineries. In certain countries, where demand for fuel oil is high as compared. to other products. as in Japan, the refineries maximise the yield of heavyends. In countries like India, where the rna jor share of · demand comprises diesel oil and kerosene which are middle distillates, the production pattern· of the refineries is normally geared to maximise the yield of middle distillates. (See Chapter VIIO. In a re· finery it is possible to adjust to a great extent the production levels of the products within each main cate_gory without major investment ·costs. But decre~sing the proportion of the heavier products and increasing the share of lighter products will call for investments in equipment which can crack the heavier products into lighter ones. The yield of even the main categories using the same equipment will depend on some. extent on the quality of the crude which is· processed in the refinery. Certain crudes which yield on straight distillation, a larger proportion of light ends are referred to as light crudes whereas those \\ hich yield a larger proportion of heavyends are called heavy crudes. Due to the international pattern of demand for different products there is relatively. a larger demand for light crudes and in international market light crudes 'command higher

102
prices*. The changing price of oil in the international market gives rise to the problem of fixing a proper price for crude that is produced within the country. As long as international price of crude was relatively low, as in the period prior to October 1973, the crude produced in India was priced with reference to the international plice. After the sudden multi-fold increase in price after O.ctober 1973, Government have fixed the price of crude at a relatively low level as compared to the price of crude in the internation<)l market and has proposed to collect a surcharge on indigenous crude which will be used to finance a Petroleum Development Fund. Even with the addition of the surcharge, the price of indigenous crude has been kept at a level significantly lower than the price of similar quality crude in the international market. The Committee considers that the producer price of crude produced in India should at least be equal to the long-term cost of producing crude in India and the difference between such a price and the prevailng international market price at any point of time should be collected by the Government as a tax. In effect, the refineries should get Indian crude at prices equal to the international price of similar crude. Fixing the ex-refinery price of Indian crude lower than the international, would involve subsidizing the consumption of oil products. Vnless the case for it is examined with reference to the classes of people who consume oil products, it is not rational to subsidise the price of crude, especially when any subsidy that is considered desirable for a section of the oil product consumers can be made available by suitable adjustments in taxes and subsidies on that particular product ..
11.18. Given the quality of crude and the mix of products that are to be obtained from the crude, the investment requirements for a ,efinery and its operating cost can be determined. There are international "norms" regarding the investment and operating costs for converting a standard quality of crude to a given productt. It is, therefore, possible to relate the cost of oil products to the cost of the crude and later allow a reasonable rate of return to the refinery industry and fix the producer price of each oil product. In almost all countries, taxes on oil provide large revenues to the Government as the oil product~ are among the goods which are heavily t~xed. The consumer price of a product is made up of the producer price, taxes and the trade and transport margin. The . price fixation of oil products could therefore be made on the basis of a study of the pattern of demand to which a refinery bas to cater, the required investment and operational cost and the crude prices and the product price could be linked to the price of crude. But for a number of reasons set out by them, the Oil PriCes Committee:!: had decided to fix the producer price of each product on par with the import .price. The
*Ot\er f<J. 1torslike sulp·1ut" ~ntent also afFe~ the pri1~ or crude sillD.ificn.ntl).
tlifelson,s r4tin~ is an example of such norms.
price ·of each product relevan~ to a . crude price on a particular _day was. determmed w1tl1 referenc,e, to the international pnce of such products and, the product prices were ~lowed to be,. ~h<wged, · with reference to changes m the crude pnce .. The latter changes were determined on the baszs of the formula that for every chan_ge of · 10.0 U.S. cents per barrel in the crude pnce, t~er~ would be 4 per cent change in the l'r?duct pn~e. The international .price of pro~ucts m ~elation . tP, crude price has been varymg from time t.9 tu:ne and in effect the import parity was noJ; m~mtam:, ed over time, by the adoption of the pnce for,' mula followed in India. , , , .
'-.f "
I 1.19. In the coming years when India is _likely to produce most of the products b? refinmg of. crude within the country, the Commzttee does not. see any particular advantage in maintaining th~ "price parity" formula for fixing _ex-refinery prices. As in any other country, the pnce ~f products at the refinery level could be fixed wtth reference to the cost of producing tbat product after attaining a reasonable return to the refiner. However, in the case of a refinery, as prcoducts are produced jointly. there is the problem of I ~nocation of production costs as between the rliffe•·' rent products. A number of methods have been' adopted for pricing the joint products in several industries. Similar methods could be adopted ·for the oil industry also, The prices could be fixed· in such a way that the refiners get an ex-refinery price for different products which, taken as a whole, cover the cost of inputs, the cost o~ refining and allow a reasonable profit on the mvestments ·made in refineries. It is possible ·tO determine with reference to a standard .crude, the costs of processing by straight dfstillation. ·The costs of further processing to increase the share of any particular product in the product mix, will be different with each product. Using these cost data. it would be possible to determine the index of production costs of diff~rent products. Such indices along with the crude price could be served as the basis of determining the ex-refinery price of the various products,
·'t
1 1.20. The price at the retail level will lta~e' to be fixed by imposing taxes or subsidies over the refinery · price and adding the transport and trade margins. Depending on the objectives of the Government, namely. whether it should encourage or discourage the use of a' particular product. and judgement cf the Government of the subsidy to be given to the consuming sector, Government ·could vary the taxes and subsidies from time to time. Government have recentlv appointed a Committee to go into· the pricing of oil products. At this staf(e, the Committee wouTd like only to SU!(f(est that there should be. a serious examination of the need to continue the import parity formula · for product pricing and · to
f There have been 3 rep<rts so far-(l) Taln~dar Committee Report; (2) Damle Committee )leport; (3) RluW Commi
ttee Report,
evaluate other possible methods of fixing prices which will best ~ubserve the national interest.
Price policy for the power sector
11.21. Some implication of a rational price system for the power sector with reference to the quantum and intensity of their power consumption by different classes of consumers have been dealt with in Chapter IX of this Report. Tbe committees which have examined the pricing of power in India have all recommended that the revenues collected by the Electricity Boards by sale of power should be adequate to cover all the. costs and should allow a fair return on the investments · made on power generation, transmission and distribution. The report of the Committee on the Working of the State Electricity Board, 1964, (Venkataraman Committee) had suggested than the tariff should be so fixed that the gross collection covers all the recurring costs and leaves a return of 11 per cent on the investment made by the Electricity Board. This Committee had examined the question with reference to the Electricity (Supply) Act and suggested that this 11 per cent should be distributed as 1 t per cent towards electricity duty, t per cent towards general reserve, 6 per cent towards interest charges aud 3 per cent as net profit. On a comparable basis, the rate of return sqggested by the Venkataraman Committee for electricity is lower than the rate of return suggested here for the coal industry. However, the rate of return is well below the minimum of 9 per cent. The actual return on investment made in the electricity industry is substantially less than even 9 per cent. The report of the Finance Commission 1973, which examin-
. ed the finances of the State Electricity Board during Fourth Five Year Plan has stated: "Despite this all round awareness of the need to achieve certain minimum rates of return on investments made in power projects, the working results of State Electricity Boards, far from registering any improvement, have suffered set-back during the curr_s:nt Plan period. The forecasts furnished by the State Governments point to no significant improvement in the standards of performance of State Electricity Boards in financial terms in the Fifth Plan period. Taking all State Electricity Boards together, while their revenue receipts would have increased from Rs 387 crores in 1969-70 to Rs. 692 crores in 1973-74 reflecting the growth in generation and sale of power and revision of tariff, their net surplus, after setting on revenue expenditure and obligatory transfers to depreciation fund, would have declined from 4.2 per cent to 3.3 per cent on the capital basis. The rate of return will more or less be nf the same order during the forecast period". This Committee would like to emphasise that the inadequate returns from electricity industry will seriously affect the power programme and recommend strongly that the electricity tariff should immediately be revised in all the Stat_es so as to give the rates of return as suggeste"d by the
103
Venkataraman Committee. In fact,. the Committee. would like. to recommend that the returns on .in~estment in electricity should be 10 per cent in keeping with the rates of return expected from other energy producing,. industries. The basis of pric(ng suggested here should be· applicable not only, to State Electricity Boards but also to other power generating agencies like the Department of Atomic ·Energy; Central. Electricity Authority, DVC etc.·· ·
H.22. The determination of 'the relative price of supplying power· to various categories of consumers and for the same 1 class of consumers during different seasons of the year and for diJferent parts: of the day calls for a close· analysis. The system ef pricing power uniformly through-· out the year will not lead to optimal utilization of the power system capability. A given installed capacity utilized at high load factors will bring down the total cost of generation. No consumer however will require power of the same intensity throughout year, or even throughout a day. There are specific periods during which most of the consumers would prefer to draw their electricity requirements if the price of electricity is the same at all times. Supplying electricity during the peak hours, therefore, would involve a higher cost than supplying electricity during the off-peak hours. To some extent, the divergence in the c<•&1: of power generation for peak supply and off-peak supply could be reduced by designing an optimal power generating system with due regard lo the structure Of the load that faces the system. Even then, the difference in the cost of supplying the requirements during the peak hours of the day or during the peak season in a year would be significantly higher than the supplies to be met during other parts of the year or the day. The Committee will, therefore, recommend that the l electricity tariff should be designed so as to dis- I criminate adequately between the use of powerl during the peak periods and during , off-peak 1
periods. As the difference in 'the peak demand; and off-peak demand is very large in this coun- \ try, the tariff should include a penalty for use of power during the peak hours so that atleast 1
1 over a period of time the load curves of demand 1
are flattened to a more reasonable level. This .: would bring about substantial savings in the in-: vestment cost in the power sector. l
11,23. There are often suggestions for subsidizing the cost of power to particular consumer categories with a view to enable them to produce, more of certain products or to reduce their costs of production. In the industrial sector, such suggestions are mostly in respect of industries which are intensive users of energy like steel, aluminium, fertilizers and electro-metallurgical industries. The case for a subsidy should be carefully examined in each case to see whether such a subsidy is really called for. The Committee is of the view that there is generally no case for subsidizin[! the cost of power supply to any industry. As most of the intensive energy users will operate at a very high power factor aQ\l
load factor, the cost of supplying power to them would be relatively lower than the cost of supplying power to other industries whose consumption is less intensive. While fixing the orice of power supply to such power intensive industries, the fact of the lower cost of supplying such needs should certainly be taken into account; but there appears to be no case of going beyond this !'nd give a subsidy 'to any of these industries. In the agri~ulture set;tor, power rates have been kept very lo_w during t)le initial period of planned development; this should be considered as a promotional tariff operated during a period when the use of power in agriculture was a very · small fraction of the total power supply to all sectors of the economy and when the Government was keen on promoting a larger use of power in the
104
agriculture sector. At present when the demand for power from the agriculture sector is a substantial portion of the total demand and when there is no longer any need for a promotiollJll campaign to encourage the use of power in the agricultural sector (except perhaps in certain selected pockets in the country), the tariffs in· troduced earlier need correction. The Committee would strongly recommend that the agricultural loads should be charged with due regard to the cost of supplying power to the agriculture sector. At the same time, all measures should be taken
· to bring about a better utilization of the connected loads in the agricultural sector (like roastering of agricultural loads) which would enable the reduction of the cost of power supply to the agri
. culturists.
CHAPTER XU
TECHNOL<?GY PLAN. FOR ENERGY SECTOR
12.1. The en.ergy sect~r extends to so many · fuel forms. thelf production. transformation and utili~;ttian that there are vast areas where research and development work can be undertaken. But in a country like ours with limited resources of men and materials for R. & D. work efforts in· research and development should be ~riented towards solving specific problems which are relevant to our country. The priorities for action in
. R. & D. should be determined with reference to the nature of the problem. the cl\ances • of our solving 'the problem, the results of efforts undertaken on similar problems in this country and abroad so far and the constraints on resources available for R. & D. work.
;C 12.2. The important problems in the energy sector identified in this Report are the followi•ng:-
-resource-wise India is very inadequately provided with oil reserves and coking coal required for metallurgical indus.. tries; but fairly adequately endowed with non-coking coal resources;
-'the non-coking coal resources are poor in quality and their beneficiation and tr1rns
. port involve heavy cost; ~nearly half of the energy needs of the
· country are still obtained in the form of non-commercial fuels and the con- . tinned use of these nan-commercial fuels will lead to heavy social costs,· but the shift from non-commercial to commercial fuels is possible only if cheap commercial fuel substitutes could be
· provided to the rural poor: ~within th~ ~ountry the distribution of fuel
·· resources as between the regions is somewhat uneven and energy transportation involves, heavy costs. · ·
"-...ti.3. I·n the light of these, the research and &'velopment efforts should be directed towards:
. -increasing the efficiency of use of fuels; ·· . _:_making ec.onomically efficient use of lower
grade coal wherever it can be used; ~improving the technology for the use of
. · coal/ coke in areas where oil products are used at present;
-developing techniques for the ~nomic trll'nsfer of energy over long dtstances;
-developillg new technologies for production of cheap commercial fuels for use in the domestic sector:
,-developing mining techniques· for improving the efficiency and reducing cost:
__:_developing new sources of energy to supplement the fossil fuel supplies.
. \
Increasing the efficiency of nse of fnels in all sectors · ·. l.
12.4. There are i•ndications that without any large shifts in the technology ·of fuel utilisation, l~Q"ge savings of energy can be effected by reducing the fuel required per unit of output in a number of indw;tries by adoption of more efficient methods· and procedures of use. As early as 1962. the Government of India obtained the services of two experts from the National Fuel Efficiency Service . of U.K. whose findings indicate 'that in many factories 15 per cent saving in fuel consumption was possible arid in some the saving could be as high as. 50 per cent. Some of the micro-level studies undertaken by the National Productivity Council through its Fuel Efficiency Service reinforce the findings of these experts. There are numerous instances where the choice of fuel has been made without due regard to national considerations. Often a particular fuel is chosen on the advice of suppliers of ·equipment without serious considerations of the fi·nancial~let alone the economic implications of the choice, as the element of fuel cost is often only
• a small fraction of the total production cost. It is necessary therefore that the choice of fuel by each industry should be done with regard to technical and national interests. The two objec-
, lives of ensuring that the optimal choice of fuels is made and the optimum use of fuel is made efficiently in the industries should be achieved by having a National Fuel Efficiency Service. A study conducted by the National Committee on Science and Technology bas indicated that such a service which essentially requires trained fuel experts would not suffer for want of necessary technically qualified personnel. The Committee therefore recommends that a Natibnal Fuel Efficiency Service should be organised a searly as possible. The Service should also be armed with adequate authority to ensure that their considered views on selection of fuels and on the level of effi(:iency to be achieved in the use of fuels is accepted by the fuel_ Cf:!ltiumers. . ·
'llli12.5. The National Fuel Efficiency Service can 'be organised either as a central agency extend· ing its activities to all r!(gions and all sectors of the ·industry or by forming separate .regional or industry-wise Fuel Efficiency· Services. Whatever be the ortlanization. there is need to involve in
105
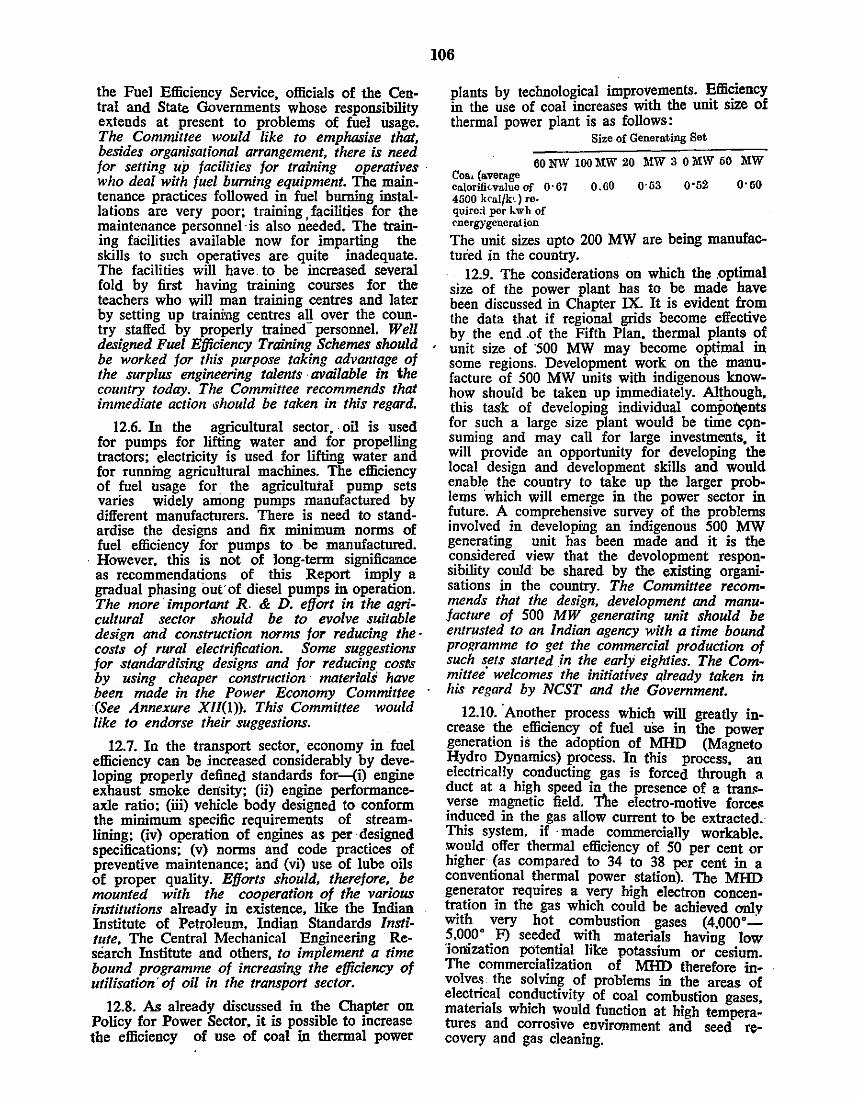
the Fuel Efficiency Service, officials of the Central and State Governments whose responsibility extends at present to problems of fuel usage. The Committee would like to emphasise that, besides organisational arrangement, there is need for setting up facilities for training operatives · who deal with fuel burning equipment. The maintenance practices followed in fuel burning installations are very poor; training facilities for the mainte-nance personneHs also needed. The training facilities available now for imparting the skills to such operatives are quite inadequate. The facilities will have. to be increased several fold by first having training courses for the teachers who will man training centres and later by setting up training centres all over the country staffed by properly trained- personnel. Well designed Fuel Efficiency Training Schemes should be worked for this purpose taking advantage of the surplus engineering talents , available in the country today. The Committee recommends that immediate action .rhould be taken in this regard.
12.6. In the agricultural sector, ·oil is used for pumps for lifting water and for propelling tractors; electricity is used for lifting water and for running agricultural machines. The efficiency of fuel usage for the agricultural pump sets varies widely among pumps manufactured by different manufacturers. There is need to standardise the designs and fix minimum norms of fuel efficiency for pumps to be manufactured.
· However, this is not of long-term signifi= as recommendations of this Report imply a gradual phasing out' of diesel pumps in operation. The more ·important R. & D. effort in the agricultural sector should be to evolve suitable design and construction norms for reducing the· costs of rural electrification. Some suggestions for standardising designs and for reducing costs by using cheaper construction · materials have been made in the Power Economy Committee (See Annexure X/1(1)). This Committee would like to endorse their suggestions.
12.7. In the transport sector, economy in fuel efficiency can be increased considerably by developing properly defined standards for-{i) engine exhaust smoke density; (ii) engine performanceaxle ratio; (iii) vehicle body designed to conform the minimum specific requirements of streamlining; (iv) operation of engines as per· designed specifications; (v) norms and code practices of preventive maintenance; and (vi) use of lube oils of proper quality. Efforts should, therefore, be mounted with the cooperation of the various institutions already in existence, like the Indian Institute of Petroleum, Indian Standards Institute, The Central Mechanical Engineering Research Institute and others, to implement a time bound programme of increasing the efficiency of utilisation' of oil in the transport sector.
12.8. As already discussed in the Chapter on Policy for Power Sector, it is possible to increase the efficiency of use of coal in thermal power
106
plants by technological improvements. Efficiency in the use of coal increases with the unit size of thermal power plant is as follows:
Size of Generating Set
60NW IOOMW 20 ~IW 3 OMW 50 MW Coa, (average calorili<value of O· 67 0.60 0·53 0•52 O· 50 4500 k<al/k:.) re-quired per 1 ... w h of <'nergygencre.t ion
The unit sizes upto 200 MW are being manufactured in the countrY.
12,9. The considerations on which the .optimal size of the power plant has to be made have been discussed in Chapter IX. It is evident from the data that if regional grids become effective by the end .of the Fifth Plan, thermal plants of unit size of ·500 MW may become optimal in some regions. Development work on the manu- · facture of 500 MW units with indigenous knowhow should be taken up immediately. Although, this task of developing individual compoJ\enls for such a large size plant would be time C9nsuming and may caU for large investments, it will provide an opportunity for developing the local design and development skills and would enable the countrY to take up the larger problems which will emerge in the power sector in future. A comprehensive survey of the problems involved in developi-ng an indigenous 500 MW generating unit has been made and it is the c.o~dered view that the development responStb!Jity <:Ould be shared by the existing organisatiOns m the countrY. The Committee recommends that the design, development and manufacture of 500 MW generating unit should be entrusted to an Indian agency with a time bound prof?ramme to get the commercial production of such s_ets started in the early eighties. The Committee welcomes the initiatives already taken in his regard by NCST and the Government.
12.10. 'Another process which will greatly increase the efficiency of fuel u5e in the power generation is the adoption of MHD (Magneto Hydr? Dynamics) process. In this process, an electncally conducting gas is forced through a duct at a high speed in the presence of a tran.•verse magnetic field. The electro-motive force.• incl:uced in the. gas allow current to be extracted. This system. 1f ·made commercially workable. w:ould offer thermal efficiency of 50 per cent or htgher· (as compared to 34 to 38 per cent in a conventional thermal power station). The MHD generator requires a very high electron concentr:ttion in the gas which could be achieved anlv WJth • very hot co~bustion gases (4.000"-· .?·0~0 • F) seeded_ WJ~h materials having low toliiJzation po!~tial hke potassium or cesium. The commercialization of MHD therefore in· volve~ the solvin~ . of problems in the areas of electn.cal co~ductiVJty of coal combustion gases, matenals whtch would function at high temperatures and corrosive environment and seed recovery and gas cleaning.
107
· • l_z:IL Thoug~ th~ fundamental problems. re- • mam 'Unsolved msp1te of. the efforts of very competent research groups m several countries foi: over ·a decade, several groups in U.S.A., U.K., Japan and USSR are still continuing their efforts. U.S:S._R. has al!eady set up a plant of 25 MW· capacity operatmg on . natural gas which is reporte~ to be working satisfactorily. In order to mv~st1gate the potential of MHD generation in Indm,. a study team of experts was set up by NCST which has recommended a ten-year programme of developmeont work in this area in three phases, namely:-"1'.
(a) to conduct laboratory scale experiments at the leve,J of 2 MW size for developing
· · necessary scientific and technical skills and experience;
(b) to design and set up a 25 MW MHD prototype plant; and .
,(c) to develop design capability for a full ' scale commercial plant in the ra·nge of
500-1,000 MW.
' 12.12. Development work on MHD may prove to be a very costly and time consuming effort. While agreeing with the strategy implied in the NCST recommendation for mounting a serious R. & -D. effort of developing MHD process in . Jmji(l, the Committee would like to emph(lsize the need to concentrate work on laboratory and higher scale in the critical areas, 6Specially those connected with the use of our high ash coals for fuel gas production and review the progress periodi· cally before embarking on installation of higher capacity MHD units.
' -12.13. It is relevant to note that several other methods of increasing fuel efficiency in power geoneration like the combined gas-turbine system operating on clean low calorific value coal gas are also under examination. In other countries :iluidised bed technology ,aJso provides aroute for increasing the efficiency of fuel utilization in power generation by 5 per cent (i.e., reductiO'll in fuel requirement by 6 to 15 per cent as compared to a conventional thermal station). Besides, flui·· dised bed technology promises to be a very efficient way of utilising our low grade coal. This process consists of combustion of coal at a tem· Perature of 800 • -900 • C in a fluidised bed operating at an elevated pressure and in direct contact with the heat transfer tubes. The energy in the hot compressed product of combustion is utilised for driving both gas and steam turbines. The proce~s is viewed with great interest in other countries. in view of the ability of the boiler to 'fix' sulphur and thus prevent air pollution.*
~"Teohnolo·rical anrl Economic Feasibility of Advanced power Cycles" by F. L. Robinson and Sigmonds, Lewis and Crober; United Aircraft Research Laboratories to National Airl'ollution Control Admn, December, 1970
The Committee would recommend that Research a'!d Development in the areas relating to combmed · !JaY turbine-steam turbine plants which w~'!ld . mcr~ase the overall efficiency of coal '!tzllsa!wn m thermal power stations should be mtenszfied. (See Chapter Vll on gasification of coal).
R & D to conserve coking coal
12.14. ln Chapter V the likely demand and resource availability in respect of coking coal have been discussed. As we have large reserves of economically exploitable iron ore and as the ~ation'~ · need. of iron and steel will keep on mcreasmg, the problem of conservibg our coking coal is a•n urgent one. While immediate steps for blending of prime coking CIOal (which is critically short) with medium and semi-coking coals {which are available in relatively Jarger quantities) and adoption of new steel melting technologies like fuel injection and oxygen lancing will help in extending the resources to a
. slightly longer period, the long term solution will depend on the development of a technology ~:? convert non-coking coals to coal with properties which can be used in metallurgical industries. Several processes for this are under development in various countries. The formed coke process which has been developed in Central Fuel Re· search Institute shows good promise. Pilot plant stage work has been completed and a semi-commercial plant has also been approved. t This project should be treated as an R. & D. project and the products manufactured in this project should be subject to intensive trials in blast fur. nances. The Committee recommends that a timeb(Jund 'progr(lmme for- the development of the formea coke process based on non-coking coals from different coalfields of India should be drawn up and the project carefully followed up. Besides conserving the coking· coal reserves. the development of formed coke for commercial use in the steel industry would enable the dispersal of the steel melting capacity in the country as our iron ore reserves and non-coking coal reserves are more widely dispersed than our coking coal reserves.
Secondary conversion processes in on industry
12.15. As indicated earlier (See Chapter VDl) India's requirement of oil products will be rising rapidly even if measures for curbing the demand in several areas suggested in this Report were implemented. One of the results of the oil policy suggested in this Report would be that the consumption of oil products in sectors where it can be replaced by coal would be severely restricted;
t This wd recommenll.ed in our earlier Report "Fuel Policy for tbe Seventies" Mnv 1972 and t.ne project wo.s appro· ved in August, 1973. • .
:108
as such• areas pertain mostly to the use of fuel oil,' the pattern of consumption of oil products that ·would emerge would imply a relatively larger rate of growth of . the middle distiilates and light ends than the heavy ends. The programming exercises based on the current rela· tive price of crude and oil products indicate that it would be economically sensible, in the coming ye1rs, to undertake secondary processing of heavy ends to convert these to middle distillates andfor light ends. For this, both hydro-cracker and catalytic cracking can be used. While cata· lytic cracking process has been in use in the country, we. have no experience in operating hydro-cracking plants. The Committee feels that i!ll ;the Fifth, Plan and thereafter .India will have to adopt , large scale secondary processing of heavy end products i•n the refinery by adopting either hydro-cracking or catalytic cracking. Both technologies have their relevance and the choice would depend on the products in demand and the· cost~ of hydrogen production in the area. It is necessary that these technologies now obtained from abroad should be developed further in the country. There IS scope for modifying the pro- • cess to suit the specific needs .of our country in future. It is necessary that ·development work on hydro-cracking be, speeded up so that 'the design.· ing. manufacture . of suitable catalysts, CO'Ill'itruction and efficiellt operation of secondary processing plants could be managed with. indigenous skills .. c
Utilization of natnral gas
. 12.16. As indicated in Chapter IV, the chances of finding large quantities of natural gas in areas under lease in ·other countries is bright. In the event of India resorting to import of LNG and using it as a source of chemicals and/or energy, certain' technological preparations are necessary in the country. Inputs in this regard shquld be examined even •now and suitable R. & D. efforts taken to cope with the tasks if the country were to face such a situation.
f Conversion of coal to oil
I 12.17. The increasing price of crude oil from the Middle East and the diminishing ratio of proved reserves to total crude consumption has revived . the inter~:st in all developed countries iq \he commercialisatiop of converting coal to oil. Coal-oil converi;ion was a technological possibility known' ,for a lo~g'. time. Basically dfre~t cpnv~rsion of coal. to m\ 1s a pro~lem of addition of hydrogen and 'removal of merts such as as]l. oxygen. nitrogen and sulphur. Coal contains on an average 5 per cent hydrogen ~~ against ~2 per cent in crude oil and upto 17 per ~nt. m various other petroleum products. A denvatlve of· coal distillation viz. tar produced ·.at lower temperatures bas approximately 8 p~r cent of hydrogen which is the nearest to crude and relatively easy to convert to oil products. The chemi-
• cal structure of ·coal however is complicated and the molecules are large compared to those in oil. Therefore, the addition of hydrogen has to be done simultaneously with the splitting of the coal molecules. This could be achieved only in ·the presence of suitable catalysts at a very high pressure (250 to 500 atmosphere). Several coal hydrogenation processes are under investigation in developed countries. An alternative route to oil products is by the versatile 'Fischer ; Tropsch Synthesis' method. In this process, it is not coal but carbon monoxide and hydrogen produced by steam-oxygen gasification of coal (exactly as in the case of fertilizer production) are reacted over a catalyst upto a pressure of l)bout 30 atmosphere~ The gas has to be· eJ(tremely pure. Depending on the conditions and catalyst used, it is ·pos,ible to produce a wide range of hydro· carbons 'and chemicals.
12.18. Though several organizations have been doing research and development work for a number of years the only commercial scale plant to produce oil from coal is operated by Sasol in the Republic of South Africa. This plant is based on the Fischer Tropsch process and its important products are gasoline, diesel fuels and waxes. During the Second World War, Germany produced 4 million tonnes of oil by the bydrogenati(ln . of coal and tar; after the war, these
· plants were first adapted to process petrolc:um residues and later even the adapted units were abandoned gradually as they became unecono-• . . m!C.
12.19. At different periods, the Government of India have investigated the ·feasibility of production of oil from coaL At the instance of late Sir J. C. Ghosh. M/s. Koppers Corporation of US~ a~d · M/ s~ Lurgi had carried out separate stud1es m 1948. The results of these studies indicated that possibly the optimum results conld ·he obtained by combining hydrogenation with 'Fischer Tropsch Synthesis'. A site was chosen i•n the. Raniganj coalfield for production of domestic coke, hydrogenation of tar and F.T. Synthesis us!ng the· char fines. The project enVIsaged an 1nvestment of $ 7.2 million in 1949
. for production of 150,000 tonnes of tar hydro. genation and chemical products annually. But
the investment was deferred. In 1955 another Committee· again under Dr. Ghosh, went into the problem of conversion of coal to oil taking into consideration the changed ·pattern. of' demand for ~il products. In the e_arlier studies, aviation gasohne and motor gasohne were primary objectives,_ In the 1955 study, middle distillates became the prima~ ·objective. The Committee came to the c.onclu~mn that ~ombination of tar bydrogenahon w1th don:'est1c coke production could be the most ecanom1c approach. Again investment was deferred. In 1958. CFRI made a further study of the problems of. coal conversion and updated t~e _Ghosh Comm1ttee data. The conclusions wer~ s1m1lar tQ those of 1955.
12.20. CFRI. undertook research in the Sixties OJ?- hydrogenation of Assam coal. Assam coal With low. ash content , was found to be the most amenable to ~y~~ogenation. In 1969, CFRI prepared ~ feasJbJI1ty study on. the potentiality of convc:rs10n of Assam coal to· oil products and chem1cals by hyd~ogenation .. .Although the pro- . cesses. are not basically very different from those use~ m Germany during .the War. there are· ~ajor changes i~ appro~ch, product patterns ll'lld scale of equipment m view of major developm~nts i'!- high-pressure technology, gas compressiOn and othe~ fields of engineering and tc:c~nology. The eshmated cost under Indian condihons range between Rs. !50 crores. to Rs. 250 c_rores for a~ annual capacity of about 1.5 milhon tonnes. of oil products with varying degrees of sec~ndary processing of products. but without umts for conversion of chemicals further downstream. Efforts to initiate work to produce oil from coal have been pursued ·for over two decades even in our own country, though nothing concrete ~as ~o far C<?me ~ut of this. Every time. the queshon IS exammed m a somewhat limited perspective and action is deferred when the final picture of the task and its . dimensions are realised. I! is necessary that in the context of the latest revzew of our energy situation, the rising den'land for oil products, the limited success in our oil exploration efforts and the increasing
·price as well as insecurity of -obtain inn oil from the. international market, a well •thoui?tout lon~tetm programme for development of coal-oil conversion technology should be drawn up. This should be based on a review of the ·success achieved in following the diverse routes for coal·oi/ conversion by various a~encies in other coun·trie.> as well as in our country and the product ·mix •that would b'e relevant to our long-term den'land and supply situation in respect of'· oil products.
12_.21. The ·basic implications of the various posliilile technologies on ·coal-oil conversion have to be kept in view. The simplest and possibly the lowest investment route for conversion of coal ·to oil is pyrolysis i.e. hydrogenation of tar. But · the . production 'of 'tar. in adequate quantities would prove ,a great, hurdle in adopting this proCeSS. Conversion of tar to oil is approximately 80 per cent by weight (and 100 per cent by volume). 'I'o get a11e million tonne of oil by this route. we require 1.25 mt. of tar. Distillation of coal in any of the. known processes produces
,pnly 8 to 12 per cent of tar, the higher figure b.eing. cTaimed for. certain new processes developed abroad. To get -1.2 mt. of tar,' over 10 mt. capacity for ·coal carbonisation and the develop-ment of market' for the coke bas to precede the :estublishriieht of .. h. dpacity of one. million tonne. .of . oil production .based on pyrolysis of tar. In~-, vestment req~ired ·for carbonisation of one million torines of co,al may be nearly Rs. 30 crores. 'rhe process by itself therefore is n,ot liktily to
ioii
be of any significance in the next two decades in supplementing of oil availability. .
.!2.22. Coal hydrogenation .can be effected in two ways-:- ·
(a) by solvent refining of coal with minimum hydrogenation, yielding ll'll ash and ~ulphur free heavy end oil products or
. (b) pressure hydrogenation of coal (variation of Berjius or Pott-Boche process) already studied by CFRI and advocated for Assam coals.
The former process has been studied in U.S. mostly to obtain pollution. free fuel for power stations.. ·
The process investigated by CFRI involves the conversia11 of 2 to 3 tonnes of coal to a tonne of liquid fuels. Here the major element of the in vestment costs are those for producing hydrog~n ami for setting up pressure vessels. The process ;ilso calls for good quality coals with ash ~ontcnt n.1t ~xcccding 15 per cent with low oxy~ g~n. ~nd mo1stu~e content amt h~ving as much Vltnmte as poss1ble. Assam coals and next the Raniganj coals are found to be the most suitable. .Other ,<;oal~.· t~ough no'~ 'imp<>ssibb to be~ hydrogenated wtll mvolvc h1gher co;ts due to lower conversion yields. · .
' ·'' Fischer Tropsch process has · the advantage
that it . can use even inferior grade coals containing 30-35 per cent ash. Over 70· per cent •of the iiiVestment costs are for generation and purification of synthesis gas. But the ·process would require 5.6 tonnes of coal··per tonne of liquid product (inclusive of coal for power generation, it may require 8 ,to 9 tonnes). The process is also a heavy consumer of water. The capital costs for F.T. process plants may be of the same order as the coal hydrogenation pla~t but recurring costs are likely to be higher in the case of F.T. process which may be to some extent compensated by the quality and versatility of th(l products obtainable in the F.T. process. ·
•-\ ' . . 12.22. In the absence of experie11ce on com:
mercia! scale operations in any place _(other than South Africa) and the uncertainties regarding several parameters of production, it. would be difficult to hazard a guess ·as to when and at what price . of crude. the coal-oil processes would become economical in India. It is. however, likely. that some of the newly developed pro·cess for ca11version ·of coal to oil .may soon prove economical if the present high prices ' crude oil continue. In any case; as a measure "" security for a country like ilndia with a large potential demand of petroleum . products, there is an ·urgent need to make a beginning as soon as possible for installing a reasanably sized unit for conversion of -coal to liquid products, The 'studies also indicate that coal to oil pr6cess
either by J?'ischer Tropsch Synthesis or by coal hy":ro~enauon . can be made more attractive by desigrung a suitable product-mix with a substan-. tial part in. the form of chemicals of high unit value. It is relevant to note that the National Coal Board, U.K., had worked out early in 1973 a proposal for a "Coal-Plex"-concept that would convert coal into fuels and chemical feed· stocks. Steps should, therefore, be taken- to create indigenous process and design capabilities and for training of per1>onnel in all the promising coa_l-oil conversion processes, namely, hydrogenauon through laboratory and pilot plant studies on an adequate scale. The Committee is, therefore, of the opinion that studies should be made of the different product patterns possible using • various coal-oil conversion technologies now available using different 'lndian coals and keeping in view the demand for the products. Demonstration plants and pilot plants of critical size should be set up to study alternative product pattern and product yield ratios and to ascertain the optimum combination of design parameters for a full size commercial plant that would suit the Indian conditions. Considering the amount of money and effort spent on the development of this technology in different developed countries, we should conciously select the areas where the R. & D. effort, in :India make meaningful contribution. As there are a number of research and educational organisations engaged in the
··study of different aspects of chemistry, metallurgy, catalyst technology and high pressure technology which could make a contribution to thiis ef!ort, the Committee recommends that a competent group should pe formed to select possible areas for future work, assign this work to diffdent organisations and to monitor the entire R. & D. effort in this direction.
Coal gasification technology · 12.23. The possibility of using coal gas in place
of fuel oil in industries and in place of kerosene used in the domestic sector has been examined on several occasions. In India, we have made some progress in the use of coal (via coal gas) in place· of oil products as feedstock for the nitrogenous fertilizer industry. The use of coal gas in the domestic sector has not become economically viable on account of the need to supply coal gas as a pipeline gas to each household (coal gas cannot be bottled like LPG and transported). The investment costs on the pipeline are so large that unless the volume of gas required is also large, the cost of coal-gas at the consumer end becomes comparatively higher than the costs of other fuel forms. The lack of demand for space heating. as in other developed countries, makes the domestic demand ~or coal gas rather viable (compared to the size of a commercially viable coal gas plant) even in big cities. However, in places like Bombay, which are separated from the nearest coalfields by the Western Ghats which increase the cost of the movement of coal by rail, there may be a case for transporting coal
llo
gas by pipeline, provided full advantage of such economies as are available in coal gas transportation could be derived by converting a large number of oil-product users to the use of coal. Coal can be gasified into Synthetic Natural Gas (SNG), on the pithead and transported as gas to Bombay where all the energy users like Industry, Power Houses and Domestic consumers could be made ·to use SNG as a primary fuel for all their e-nergy needs. This could become economical in. the eighties if planning is done from now on. The adoption of this possibility will depend on our developing SNG gasification and transportation techniques suitable for Indian coal and conditions. The number of gasification techniques like Hygas, Bigas and Synthene proces •• etc., have been developed in other countries. ·we should make an evaluation of the suitability of these processes in the ,Indian conditions and develop the particular gasification route that
·would be to our best advantage. The Committee therefore recommends that R: & D. work on coal gasification and pipeline transport of coal gas should be undertaken from now on. (See Chapter V'll on gasification of coal).
f R & D for. domestic sector fuel supply
12.24. In the domestic sector the long-term need of energy can be met at the minimum social cost by increasing the efficiency of fuel utilisation in the domestic hearth, by reducing the · level of use of oil products as well as forest fuels and substituting- in their place cheap domestic fuels derived .from coal. studies conducted by the Indian Institute of Petroleum and the Central Fuel Research Institute indicate that significant economies are possible in the consumption of kerosene or soft coke in the domestic sector by merely changing the design parameters of the cooking appliances currently used. In view of the very large quantities of commercial fuels as well as non-commercial fuels used in the domesic sector, it ~ neces.rary to imme.diately chalk out a comprehensive programme for intensive development work in the optimisation of design of cooking and heating appliances manufactured in the country. This programme should be implemented by a Group consisting of the Indian Institute of Petroleum, Central Fuel Research Institute, Indian Standards Institution and representatives of the manufacturers of domestic appliances.
12.25. The substitution of kerosene by coal is possible if coal is refined to a solid domestic fuel or gasified and supplied as pipeline gas or converted into a liquid. TM possibilities of use of coal gas in the domestic sector ha~ been discussed earlier. The substitution of kerosene by soli_d d()mestic fuel IJ?ay not be possible in metropolitan areas and highly urbanised areas where the consumer preference may be for fuel on tap
. like gas or more . convenient fuel forms merely liquid fuels. There is· scope for supplying a large
:·111
·number of cansumers in small urban towns with solid smokeless fuel in place of kerosen~ or fire~ wood or charcoaL Several methods of producing s.olid domestic smokeless fuels have been studied in CFRI and Regional Research Laboratory, Hyderabad. Basically. these processes involve carbonisation of coal whereby· the volatiles are removed from coal. The economics of the plant improves with the extent of bye-product recovery during carbonisation but the scale ecO'llomy of bye-product recovery is such that this can be considered only in plants which carbonise about 1,000 tonnes of coal per day producing about 660 tonnes ot domestic coke. Such a level of production can supply the fuel needs of over 9 lakh population. A plant of this size with mini-. mal bye-product recovery will cost nearly Rs. 12 crores and the cost of production of coke based on coal at Rs. 60 per toone will be nearly Rs. 250 per tonne. The investment requirements for a low temperature carbonisation plant to supply the requirements of one family . will be arou'!ld Rs. 650. The two processes developed by the Central Fuel Research Institute and Regional Research Laboratory, Hyderabad, differ somewhat as the former is heated both externally and
. internally whereas the latter is totally an internal heating process. The Regional Research Laboratory, Hyderabad, process gives only solid smokefess fuels while Central Fuel Research Institute process gives only solid yields both solid fuels and gas. The Committee feels that both these processes are relevant in the Indian context ai¥l that the choice of the process should depend .on the requirements of a particular city or area and the quality of coal available. But the economics of these units are such that at least during the Fifth and the Sixth Plan periods, they could be used only to supply the needs of major cities with the population of over one million. ·
12.26., The Committee would like to empha-. sise the importance of developing processes .for
production of cheap domestic fuels which can be used in smaller towns as well as in rural areas by sections of the population which today use non-commercial fuels. A number of processes
. have been evolved by the CFRI like the "moving bed · devolatizer" and "volatised coke J1Iocess'' and "briquet. curing process".. . The plant size based on this process may be about 100 tonnes of coal throughout a day and the cost of supplying the needs of· ane family might come down to nearly Rs. 150 but these are based on the ·use of coals with low caking index. These processes are suitable for towns with a population
· of around one lakh, especially those which are '·near the coalfields where such coal is available.
R & D in saving oil in power sector 12.27. In the power sector, the use <;>f oil as
. an auxiliary fuel for coal based geneJC&ting plant is increasi•ng. In these plants. •fuel oil or LDO is required as an auxiliary fuel whenever there is need to light-up the boiler, suppo~ the flame
during the low load operations and to stabilise the flame when there are variations in the quality of coal. The possibilities of reducing the oil requirements by better load scheduling have been discussed in Chapter IX. Research and Development must be taken up to evolve boiler designs which will avoid the use of oil support even wizen the load on the boiler is as low as 20 to 30 per cent of its capacity. It also appears possible to use a coal gasification or a producer gas plant in conjunction witho the thermal plmt so
. that gas could be used in place of oil whenever there is need for an auxiliary fuel support. Suitable design and process flow have to be developed for using coal gas in place of oil as auxiliary fuel.
R & D to save oil in industries sector
12.28. In respect of industrial boilers, there is need for developi!llg package tluidised bed-boilers to be used in small industries who now use fuel oil in view of its compactness of design and convenience. This work can be taken up by the Public Sector power equipment manufacturers like BHEL in collaboratian with the CFRI and CMERI.
R & D in nuclear power technology
. 12.29. The most promising long-term solution to the problem of depletion of fossil fuels appears to be the development of a commercial scale fast breeder reactor (FBR). Nuclear power plants are based on the use of heat generated while splitting the atom. But the fissile materialnatural &ubstances which readily undergo fission like· Uranium 235-are known to be available in limited quantities only. The solution to the shortage of •fissile material is to have nuclear reactors which simultaneously "breed" or produce fissile material while consuming some fissile material. Even the nuclear reactors · of the kinds now operated produce fissle material viz., plutonium. But, in a Fast Breeder. Reactor, the qu~tity of fissile. material produced will be larger than the fissile material consumed. This is achieved by using a fuel which contains both fissile material (like U-235 or plutonium) and fertile material (like thorium) and making the fuel react .under conditions in which an adqeuate number of neuttans are released which react with the fertile ma~ial and produce fissile material which more than replaces the fissile material lost in the first reaction. India is richly endowed with thorium. Once we have adequate stock of plutonium and the t~chnology of FBR based on the use of thorium-plutonium fuel is available, we should have no shortage of indigenous nuclear fuels for a number of decades. Therefore, the strategy of our nuclear programme to produce plutonium in the heavywater type reactors which could later be. used with thorium in FBRs is the appropriate one for the country. :rhe Committee is aware of
the large problems of construction materials, antipollution devices and safety devices and canstruction costs which are yet to be resolved before FBR's could be commercially operated. Even so, considerihg that very large investments are being made in U.S.A .. U.K., Germany and Japan, besides India, on the development of commercially viable FBR's, it is i•ndicative of the genera( expectation that the . difficulties in the construction of FBR's will be resolved very soon.
12.30. The Commirtee will, ·however, emphasise that the real success of our nuclear programme lies in developing our FBR as early as possible. The time-bound programme outlined in the nuclear plan for the· seventies has not progressed as per the earlier expectatians. We should not draw up a revised programme in the light of the experience gained so far and emphasise in the programme the development of FBR as central to our nuclear strategy. The Committee also recognizes the fact that once the Fast Breeder Reactor is developed, the possibilty of constructing the Fast Breeder power stations will depend on the availability of plutanium, which is produced in the first generation heavywater power stations. This makes it desirable to build an adequate number of heavy water power stations before fast 'breeders can pjck up momentum.
Energy from waste products
12.31.. Technical literature published abroad points to the possibility of production of useful energy and fuels through the efficient disposal of urban waste by incineration or exidation techniques or by pyrolysis. But adequate research has not been done in India to make an evaluation of the commercial possibilities of this process. It is necessary now to take up this work in view also of the several social advantages ob-
-tainable by the disopsal of waste products.
The concept of multiple use of cowdung ~o pro-. duce fuel in the form of Metha'lle gas simultaneously with high quality manure _by m~ans of Gobar Gas Plant has been known m India for more than 30 years but the use has been in!rl'bited by (a) high cost of the plant; and (b) m-cali'venience in its maintenance. -
The gobar-gas plants now in use, produce about 13 standard cubic feet of gas of about 550 BTU /Sc ft. from the use of dry dung from one animal. The cost of a· plant capable of using the dung from five animals is reported to be Rs. )500 per plant.
R & D work on the following problems are necessary to make the use of Gobar Gas Plants more ecanomical:-
· (1) to work out better and cheaper plant designs using, wherever possible. local or easily available matenals;
(2} to evolve cheaper designs and materials · for gas hol<fers and to improve the effi
ciency of burners;
h2 (3) to evolve ·more effective techniques ef
maintenance; (4) to understand fermentatian chemistry ·
and conditions which influence greater and preferential generation of Methll:fie and microbial action so as to devise means of i•ncreasing gas production and mainlaining gas production during win:er whe!l microbial activity tends to be slow. '/
R & D in non-conventional energy forms
, 12.32. A number of energy sources, which have not been considered of any practical signific~rnce as sources of supply of enery to mankind, have recently acquired importance in view of their renewabiltty, pollution· fr<!'e production possibility and, more recently, tJ:Ie very high increases in oil prices. The more Important among the non-conventional energy sources are solar energy, geothermal energy, wind power, tidal power and chemical energy. The energy obtained from these sources except under very special conditions and in limited quantities appears to be comparatively of much higher cost. Even in the foreseeable future-upto 1990-91 covered in this · Report-the possibilities of any of these energy sources contributing any significant share of our energy needs appear remote. Even so these energy forms are likely to acauire practical signilicance
. sometime in future and it is therefore desirable that research and development in these areas are kept up in the country.
R & D on solar energy
12.33. The special merit of solar energy over other energy form lies in the fact that it is abundantly available all over the country and that it is inexhaustible. But this energy is available in a very dilute form-the average intensity of solar radiation is around 600 calories per square ·centimeter in India. If this energy is to be used for purposes for which fossil fuels or electricity are now used, solar energy as available should be concentrated by using collectors and concentrators: The high cost of solar energy in any usable. forms, is due to the cost involved in setting up the collectors and concentrators and in . adjusting their position to enable them to get the best impact of the· solar radiation throughout the day and in all seasons of the year.
12.34. R & D in India may be concentrated on-
. (a) the . development of thin-film technology to produce cooled surfaces which could be used as collectors and concentrators of solar radiation, thus reducing the costs. .
(bJ the po~sibi/ities of using ·solar . ei'U!rgy to convert animal waste, agricultural waste and algae into gaseous fuels aiUl methane • .

113
(c) developing low cost solar water heaters. (d) developing solar distillation and de
salination units for use in arid rural areas. .
(e) developing techniques for , the . optimal use of solar energy for aryilig and · sto" rage of grain, WOOd flHrl hnu nH-f air• . 'conditioning.
~ .. ~~~ ~ g~o."~ermal en~rgY '':1~.11.5: .Ge'?thern!al; energy has only limited
possibililles 1m •India (See Chapter IV). Tht: deve· lopment -work relevanb•to•·our country appears to be the setting up small capacity. steam turbines a.t 1 /?lJga_. or ~ther centres, where geothermal expi'orations'·are· hearing completion, so as to en- .· abl\l, Cf!ll~ct,ion of ,ope~ational. details.
R 4G D for IJSiog .wiPd power.
''12~36:. Wihd~j;iowei:' utilisation· has only limited possibilities ·in India. (See Chapter IV). However, fiittliet' ;development work for installing ' windmills' i'n 'c11lster fon:hs · fdr"pul))p:ing and power generation is recommended, as it wonld enable the· collection of cost data required to evaluate the possibilities.· of, wind-power utilisation. Development of 5 to •10 kW wind electricity genera-tors could also. f?e taken· up in India; · ·
R IJG u tor using tidal power J ' i ' ...
12.37. The data on the extent of useful energy that could be obtained from tidal power and the costs involved in utilising this is inadequate at present. The. only further work that could be recommended at this stage is the collection of more data on tidal movements and the prepara- · tion ·of 'feasibility reports with regard to specific . coastal locations.
R & D for chemical sources of energy
12.38. There are possibilities of developing · battery powered light,. vehicles. This ·project can be successful only through the·adoption·of all the latest technological advances and not by the mere replacement of existing petrol engine by an electric powerpack. Development work on this is recommended,
12.39. The electrification of villages which have sparse population, say below 500, and are remote from other villages has proved to be prohibitively costly and such villages have remained unelectrified so far. Such villages can utilise fuel-cells to
, (J_btain their power needs. As fuel cell technology is still not adequately developed, further work on this will be of use .
Priorities in the technology plan '' '
· · 12.40. Though research and development is possible in. a number of areas as discussed above,. the importance to be given .to specific· problems and. the priorities to be assigned will depend on the likely benefit cost ratios of the different R & D options and the magnitude. of energy supply saving o~;:, substitution that is possible in each option. The data available on the costs of different options and even of the state of the· arts in each area is so inadequate that the Committee could not make any meaningful· comparison of the possible benefit cost ratib of the different op· tions and assign priorities. In a broad qualitative sense, we agree that the. development of nonconventional energy forms is unlikely to provide any large measure of energy supply in the next two decades. Among the other options, the important. ones are the following:
1. Development of Fast Breader Reactor. . 2. Development of Boiler Designs to reduce
· oil consumption in Thermal power generation plants.
3. Fluidised bed technology I Development of Commercial power generating plants based on this.
4. Development of SNG production and transport technologies suitable· for Indian conditions. ·
5. Development of technologies for manufacture of cheap smokeless fuels for use in the domestic sector.
It is of course nece~ary to have a competent group to coordinate the R & · D efforts in the energy sector which will ·keep under review the progress registered in the different areas and adjust the priorities from time to time to enable the b~t results to be obtained.
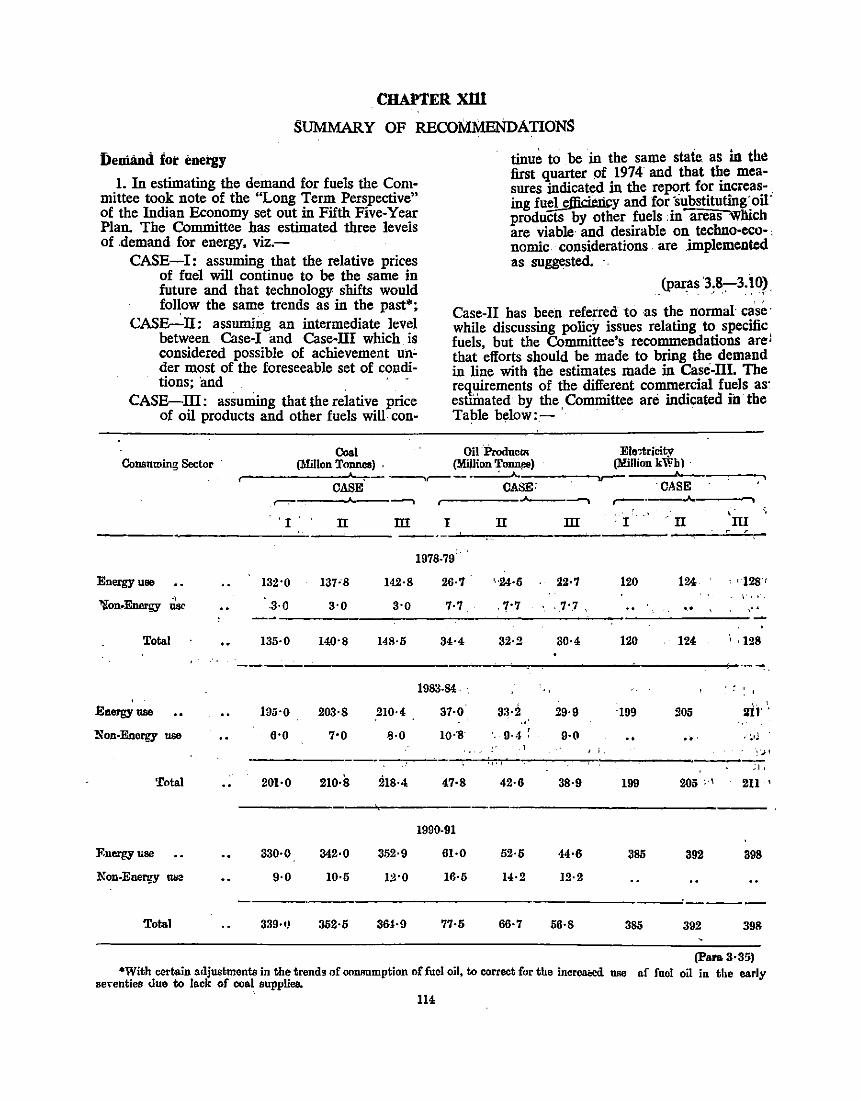
CHAPTERXlll
SUMMARY OF RECOMMENDATIONS
fienilind for energy 1. In estimating the demand for fuels the Com
mittee took note of the "Long Term Perspective" of the Indian Economy set out in Fifth Five-Year Plan. The Committee has estimated three levels of .demand for energy, viz.-
CASE-I: assuming that the relative prices of fuel will continue to be the same in future and that technology shifts would follow the same trends as in the past*;
cASs--:.n: assuming an intermediate level between Case-! and Case-ill which is considered possible of achievement under most of the foreseeable set of condi-tions; 'and . . ·
CASE-ill: assuniing that the relative price of oil products and other fuels will con-
tinu~ to be in the same state. as in the first quarter pf 1974 and that the measures indicated in the report for increas- , ing fuel efficiency and for ·substituting' oil' products by other fuels :in areas Which are viable .and desirable on techno-ceo- , nomic considerations are .implemented as suggested. · .
(paras 3.8-3.10) . ' ~ •' '' : , ..
Case-II has been referred to as the normal ca'se · while discussing policy issues relating to specific fuels but the Committee's recommendations are: that 'efforts should be made to bring the demand in line with the estimates made in Case-ill. The requirements of the different commercial fuels as· esumated by the Committee are indicated iil' the Table bc;low:- ·
Coal Oil Produc"' Elo::tricity Consuming Sector · (Millon Tonnea) , (M.illion ToiiJl!lO) (Million kWb l ·
r-------A....,-. ----,,.---._____:_A..:.....:.. ____ ..--~·----CASE CASE: ·cASE . ..------------. _........, ,..--·--J...------.
. , I . IT m m ·I ·n 'rri
:. '
1978-79
Energy use 132•0 137•8 142·8 26·1 •·24·5 22·1 120 124 . I 128'1
'lion,Energy ·0
.3·0 3·0 7·7 '7•7 .. 1·.7 . usc 3·0 \'' .. .. ...
Total 135·0 140·8 148·5 34·4 32·!! 30·4 120 124 ; ·128
1983-84 .. : ' ' 205 :rir '. '
33·2 Eaeri!Y use las·o 203·8 210·4 37·0 29·9 199 ' ·•'
Non-Energy use 6·0 7•0 8·0 10·'8 ·.' ·g .. j. ~ 9·0 .. . -.. ' --~d
' i. ~ . .; I
Total
F.neTSY lise
Non-Enel'l!_y """
Total
201·0
330·0
9·0
210-8
342·0
10·5
352·5
218·4
352·9
12•0
3fH·9
47•8
1990-91
61·0
16·5
77·5
.,.,
42·6
52·5
14·2
66·7
--~ l '
38·9 199 205 ~.' 2ll
385 392 398
12·2
56·8 385 392 398
(Para 3·35) *With certain adjustments in the trend! of OOilRtlmption of fuel oil, to correct for the increaeed use a.f fuol oil in the early
se•enties uno to lack of ooal. supplies. ll4
'
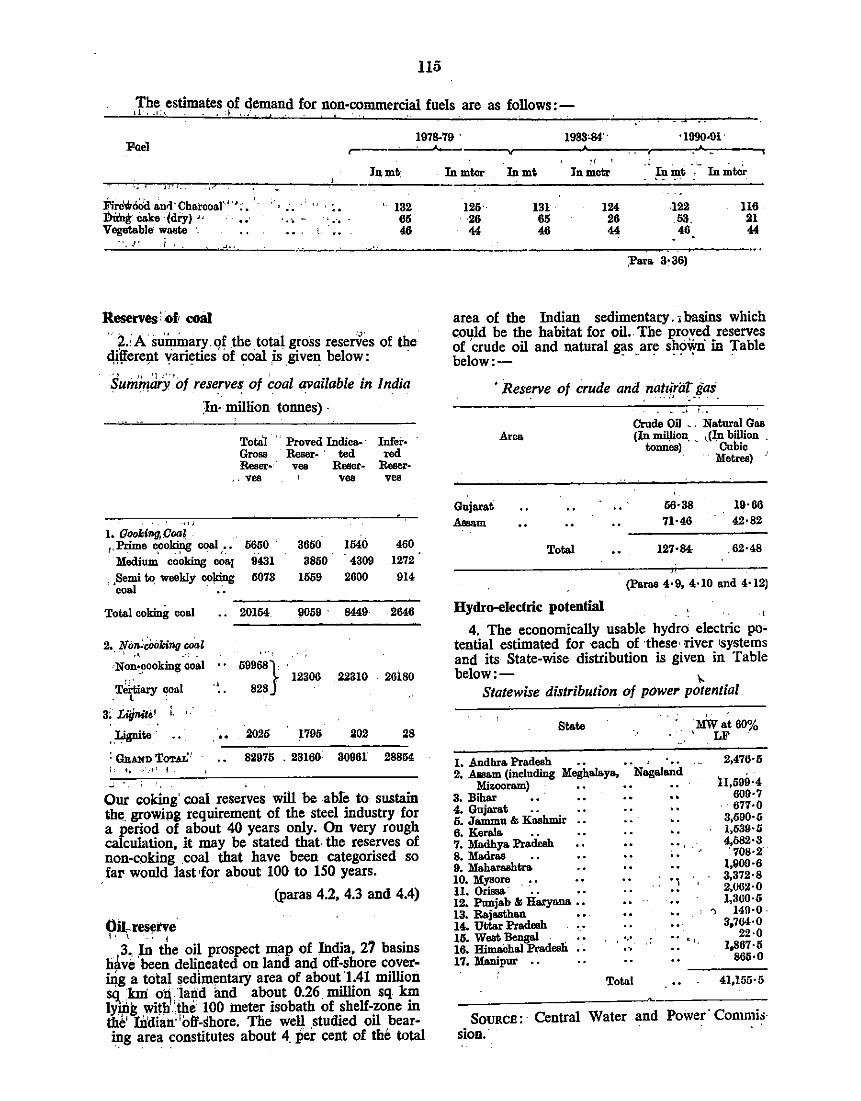
115
The. estimates of <jemand for non-commercial fuels are as follows :-d •. r,, . . •.. 1 •.• ·. . . .. . , , . . .
1978-79 . 1983'114'. •1990-l!I· · l'ael ,-
Jnmt: -~~-,,~.-~ .. -.--•. ~--~------~--
" . :. 132 ·.-. - 65
Firewodd ~ntJ·charcoat0 ' 1 ;. '·
:DUng cake ldcy) '. • • V eget&ble waote 46
. ·. I' 1 ... . ...
Reserves' 'of coal . 7-; A suininary qf ,the total gross rese~es of the 4!!fereJ1t 'Vari~ties of coal ,is _given below: ·
Summdi.Y ·of reserves of ~oal available in India ·- . . .
:In• million tonnes) ·
Total ' Gross Reser·
Proved JndicaRcser· · ted vee Rescr-
, . vee vea
·d)
1. (looking, .Coal , , Prime ~okipg coal , .' •
. 5650 ·. 3650 1540
Medium cooking co&J 9431 3850 4309
.• Semi to w~kly oo)<ing 5073 1559 2600 coal · .~
Total coking coal . . 20154 . 9059. 8449
2. Non:.;,;,oklng coal ''I.;. .·:- ,,., :Non~~ooking coal 59968} .
12300 22310 Tertiary coal
.. 828
.. · l :
a; Liifnile' L '·
,Lignite. .. 2025 1795 202
: GnAlfD TOT.oL' 82975 . 23160 30961 ,, '· ,·_.p I.
Infer· Ted
Rcser-vce
460 1272 914
2546
. 26180
28
28854
Out 1:0king' coal reserves will be abfe to sustain tbe. growjpg requirement of the steel industry for a period of about 40 years only. On very rough calculation, it may be stated that. the reserves of non-coking .coal that have been categorised so far would last •for about 100 to 150 years.
(paras 4.2, 4.3 and 4.4)
Oil-reserve · I • \ , - : I
3, .. In the oil prospect map of lildia, 27 basins h~ve been delineated on land and off-shore coveriJlg a total sedimentary area of about 1.41 million ~ km: o'~ )and and about 0.26. million sq km ly¢g with ·,the 100 meter isobath of shelf-zone in thi:' Iildian·'off-shore. The well .studied oil bearing area constitutes about 4. per cent of the total
,, ' - c .Jnmtor Jnmt Jnmctr ;rn~t ; Jnmtci-
125· 131 124 -122 116 . ·26 65 26 .53. 21
44 46 44 46 44
~am 3·36)
area of the Indian sedimentary. • baains which could be the habitat for oil. The proved reserves of crude oil and natural gas are shown in Table below:- - - · ·- · ·
' Reserve of crude and nattiriit gas . ... ' . . . . .
Gujarat
Assam
Area
Total
Hydro-electric potential
• • .i ! .•
Crude Oil • : Natural Gna (Jn mil)ion. _ ,(Jn billion .
tonnce) Cnbio , · · Metrce) ·
56·38 71·46
127·84
19·66 42·82
62·48
(Paras 4·9, 4·10 and 4·12)
4. The economically usable hydro electric po• tential estimated for each of these' :river 'Systems and its State-wise distribution is given in Table below:- "
Statewise distribution of powel' potential
State
1. Andbra Pradceb ' 2. Assam (including Meghalaya, Nagaland
Mizooram) 3. Bihar 4. Gujarat 0. Jammu & Kasbmjr
6. Kerala
·ru:wat60% . ' LF
7. Madhya. Pradceb : • , 8. Madraa
2,476·6
ll,590·4 609·7 677·0
3,600·6 1,539·5 4,582·3 . 708·2
1,909·6 3,372·8 2,062·0 1,360·6
9. Maharaabtra 10. MyBore "1 ll. Orissa' 12. PuDjab & Harya.na •• 13. Rajaetban 14. Uttar Pradceb 15. Wcet Bengal . . •·• ••• , . 16. Himachal Pradceb .-. 17. MaDipur
Total
0 140·0. 3.764·0
22·0 1,867·5
865·0
41,155·5
SouRCE: · Central Water and Power· Commi.>· sion.·
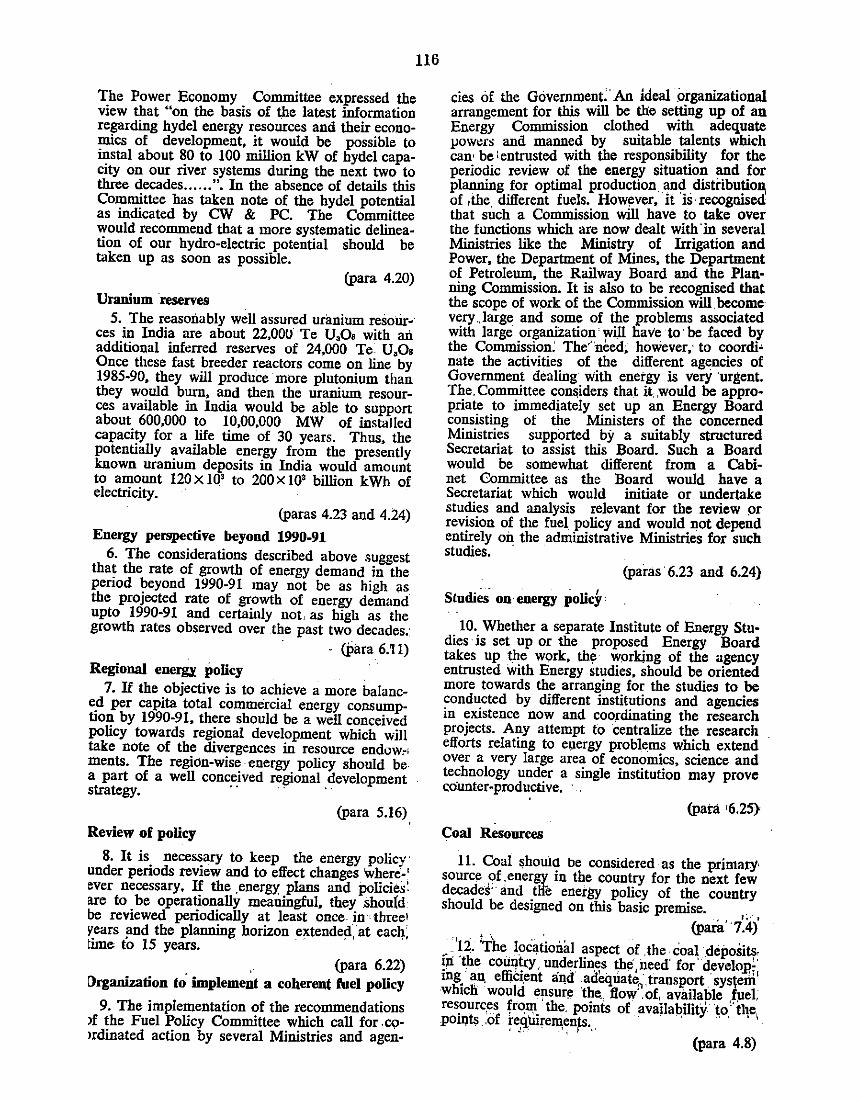
116
The Power Economy Committee expressed the view that "on the basis of the latest information regarding hydel energy resotirces and their economics of development, it would be possible to instal about 80 to 100 million kW of hydel capacity on our river systems during the next two to three decades ...... ". In the absence of details this Committee has taken note of the hydel potential as indicated by CW & PC. The Committee would recommend that a more systematic delineation of our hydro-electric potential should be taken up as soon as possible.
(para 4.20)
Uranium reserves 5. The reasonably well assured urimium resolir
ces in India are about 22,000 Te U,Os with ali additional inferred reserves of 24,000 Te U,Os Once these fast breeder reactors come on line by 1985-90, they will produce more plutonium than they would burn, and then the uranium resources available in India would be able to support about 600,000 to 10,00,000 MW of installed capacity for a life time of 30 years. Thus the potentially available energy from the pres~ntly known uranium deposits in India would amount to amount 120 X 10' to 200 x 10' billion kWh of electricity. ·
(paras 4.23 and 4.24)
Energy perspective beyond 1990-91 6. The considerations described above suggest
tha~ the rate of growth of energy demand in the penod beyond 1990-91 may not be as high as the projected rate of growth of energy demand upto 1990-91 and certainly not, as high as the growth rates observed over the past two decades.:
- <Para 6.11) Regional ene~ policy
7. If the objective is to achieve a more balance_d per capita total commercial energy consumption by 1990-91, there should be a well conceived policy towards regional development which will take note of the divergences in resource endow,, ments. The region-wise energy policy should be a part of a well conceived regional development strategy. -· · · · ·
(para 5.16) Review of policy
8. It is. neces~ary to keep the energy policy · under penods revtew and to effect changes where-.' ever necessary, If the . energy plans and policies: are to be operationally meaningful, they .Shou(d be reviewed periodically at least once in • three! ~ears :md the planning horizon extended, at eacQ.; time to 15 years.
. , (para 6.22) [)rganization to implement a coherent fuel policy
9. The implementation of the recommendations >f the Fuel Policy Committee which call for -CI>>rdinated action by several Ministries and agen-
cies of the Govenunent:. An ideal .organizational arrangement for this will be the setting up of an Energy Commission clothed with adequate vowers and manned by suitable talents which can• be lentrusted with the responsibility for the periodic review of the energy situation and for planning for optimal production and disti:ibution, of ,the. different fuels. However, it 'is· recognised that such a Commission will have to take over the functions which are now dealt with· in several Ministries like the Ministry of Irrigation and Power, the Department of Mines, the Department of Petroleum, the Railway Board and the Planning Commission. It is also to be recognised that the scope of work of the Commission will. become very .. large and some of the problems associated witll large organization' will have to· be faced by the Commission: The·' need; however; to coordi• nate the activities of the different agencies of Govenunent dealing With energy is very ·urgent. The. Committee considers that it, ,would be appropriate to immedjately set up an Energy Board consisting of tile Ministers of the concerned Ministries supported by a suitably structured Secretariat to assist this Board. Such a Board would be somewhat different from a Cabinet Committee as the Board would have a Secretariat which would initiate or undertake studies and analysis relevant for the review pr revision of tlte fuel policy and would not depend entirely on the administrative Ministries for such studies. ·
(paras · 6.23 and 6.24) - -- - - I
Studies on· energy policy •
10. Whether a separate Institute of Energy Studies · is set up or tile proposed Energy Board takes up the work, th~ wprkjng of the agency entrusted witll Energy studies, should be oriented more towards tile arranging for the studies to be ~ond~cted by different institutions and agencies m eXIstence now and coordinating the research projects. Any attempt to centralize the research efforts relating to e!]ergy problems which extend over a very large area of economics, science and technology under a single institution may prove c:oilnter-productive. ·
(pata •6.25}
Coal Resources
11. Coal shoula be considered as the primary· source ,of, energy in the country for the next few decades· and tile energy policy of the country should be designed on this basic premise.
,;.-I
• . . (para' 7.4) . 'I . ; \ ,. -
.- . ~2. Thejocational aspect of the coal deposits. !n the couq~ry, u~dc;rlin~s the', need' for' develo.P.i; mg_ an, effict,ent at1d adequate
0 transport system
which would e!lsure the., flow· .of, available fuel, res_ourc,es ~ro~ the. points of availability to •· the POll!ts .of reqwrements. · · .. · · 1
' ~. ' . ', I ''
(para 4.8)
13. As the prime coking coal resources may get exhaust~d in about,40 .years' time.and the medium coking coal·· after · · some : more time~ it' is
: necessary that 'all,efforts are taken from -now on fer ~he conservation. of, prime ·coking coal, in
· particular, and of coking coal, in general. .
117
" (para 7.16)
· · .14. Detailed investigations should .b~ ai~ed at .. pr<?.~iding sufficient mineable dep0slts. for the. re.quisJte level of production related: f.\), the demand for coal estimated for 1990·91. · · · · (para 7.14) __ .• ..., Production planning · -,·,. 15 .. A ~areful perspective .. 0f,coal production
, .sho~ld b.s: pi;JilJle~-on tb,~ basis-of the information ,;aya!la~le !!Dd ~w!;a~le, action, Jor, explqitation land mme plannmg taken in advance in the diffe-rent coalfields. This perspective plan. should be follo~Ad :by preparing a"shelf of _project reports well m advance of. each plan period .. The recently set up Central· Mine Planning .. and Design Insti-. tutc;. should .participate in· all, activities, connected with th~ formulation :and)mplemep!:iitlon of the
.•. perspective plan' for coal including exploration and investigation (in association with the Geological Sur:very of lndi~ .and ¥iaeFal Explora.tion Corporation) of pronusmg areas· assessment of
. t~ir P?tential <?Ve~. a period of 20. to 25 years, s_ugj:eStiqn of ,P~,?ntles. f,?r development and preli!Dmary feas1 b1hty studte.s of the projects .. , :
(para 7.14)
16 .. Steps should be taken urgently to .~nsure ade9u~te and uninte~rupted power supply to the collienes and washenes.
- _(para 7.14) . ' '~ .
-::17-~ PIOdiii:tioil: of. the ·different iirades of ;oking · coal m • future Will need to· be- planned in accord·ance with the proportiorr in: which they are needed in the steel plants and adequate crushing and preparation facilities have to be installed in all 'steel plants. In future, the planning of metallurgical coal mines and the construction -of. , steel plants should be carefully synchronised. · ·.
- ' (para 7.17)
c':'al conservation
:. l8. There are 'several technical 'p~ssibilities of cO)lserving coking coal. 'It. is necessary· that research and 'development . activities in < tliis regard are speeded up ftom now on. ·'
(para 7.18)
.- 19. The possibility. of · projecting .i~rge scale mechanised open• cast mines in Jharia coalfield with much higher over-burden to coal ratio needs to be~ studied in depth.
(para 7.20) 20. Arrangement for stowing qushed-· ·.stone
locally available should be made so as to permit l!n<lergrqiiJld milling of c;:oal Jrom .thick seams.
'(para 7.19)
'::oal preparation
21:· In future, there should be only three pro-duct washeries. · · · ·
(para 7.21)
22. It is"'iiecessary to uu'dertake research for evolving suitabl.e designs for washeries which are best suited for washing _Indian coal and which woulc;l :reduce the cost of washing. .
.;,. .. (para 7.22)
23. · In future, there will be need to wash even non-.c,?king coaL. AS .the .washing .of non-coking coal IS a costly· .proc~ss; . other ,methods of im-. •PJOVing the,quality ot~oallike simple high specific gravity !Wilslling, hand picking of better grades and prqpeF sizing by -screening etc .. should be ex- . ,plored and the choice of beneficiation· decided 'with' due regard to consumer requirements, available grades .of coal; the scale · of the required ~~~~~ '
(para 7.26)
, 14. The coal industry should accept . the. responsibility to supply on a long-term basis. the required grade of coal,' if necessary,' by changing the source of coal supply from time to time or by blending different grades pf coal to make up the required grades. · · · ·
(para 7.26)
'Coal !flr ·power, generation
25 .. The Link~ge Committee should consider the loading arrangements at each end and give suitable .suggestions for loading, and. unloading as part of tbe linkage. . - - . ": ' (pad 7.30)
26. The. Electricity Boards should give greater attention to 'the problems of coal .handling and storage; optimal stocki levels for each plant should•:be worked · out with reference to the source of coal supply, its distance from the
. power plant, reliability of the rail link, the seasonal variations in these factors and in the de-mand. ' '''
(par.a 7 .30)
' 27. Irl the major 'poweiplants, if would be desirable to have arrangements for sizing and pre
,paration of coal before feeding into the boilers as 'this would make it possible to deal with possible changes in the quality of coal received.
, (para 7.30)
· :-28. It is necessary to have a suitable pricing policy for the use of middlings for power gene
. ration •. if such use is to increase as estimated in ·:he Report. to about 21 ·million tonnes by 1990-
. (para 7.31)
.29. Meaninllful plants foi: ther'mal power generation have to be drawn up from now on in a coordinated manner with the plans for coal, production, especially in respect of the southern region.: The· detailed investigation for coal mines
118
to- sllpply the requirements of the ,power stations shlllild lie 'taken in hand immediately.
· (para 7.33)
CoalDumps _for industrial consamers.
30. If the increasing coal requirements of the industrial constimers is to be met satisfactorily, coal dumps will have to be set up in all the major industrial regions.
(para 7.34)
· 31. The setting up of coal dumps in major industrial areas will call for coordinated planning for movement of. coal from the dumps to the consume.r 'points .'by ·road · _alongwith' the plans for moving c<ial from the mmes to the dumps.
· · · (para 7 .49)
· 32. A five,fold increase in the next two decades in the requirement of coal for industries calls for detailed industrial location planning from now on and the. locational plans regarding industries should' be ·consistent with the plans for the pro-duction and movement of coal.
(para 7.35)
Coal for the domestic sector
: · 33;. A plan should be drawn up for increased movement of soft coke from the Bengal-Bihar region to' the urban ct;ntres in the country.
· (para 7 .39)
' Coal foi: ap9rts
- 34. Separate plans for opening up export-based coal mines near the ports of Haldia and Paradeep may 'be 'drawn up, and possibilities of exporting this coa! to Bangladesh and Burma and ·countries in· the· Pacific region will have to be considered without affecting domestic requirements.
(para 7.40)
Productivity
35. Studies should be initiated immediately for the optimal ,use and maintenance of machines and for· training coal mines workers in the use and maintenance . of equipment.
.. (para 7.43)
Transport
36. The studies made by the Committee indi·cate that, ·Railways constitute the most economic way of moving ·coal for most of the consuming classes and consumer locations in India. Adequate· attention should be paid to rail transport planning in regard to development of additional line capacity, yard capacity and signalling and communication which would facilitate . speedier tum-round .. of wagons as well as augmentation of the wagon fleet. ·.
(para 7.45)
•37;, Sgriqi!J!;.cdp§jderation should be giyen to the probl~~~4?f coal movement in the Bengal-
'Bihar area and for. removaL of the: factors. which limit the capacity. in the Bengal-B1har region for
. movement in- specific sections toward.s • .the, nor. them, western and southern regions.
(para · 7~46)
38. the Central Water and Power Commission should prepare a feas~bili~y ·study for the trans•portation ·of coal by pipeline for. a super ·the~al power station of more than 1,000 MW capacity.
(para 7;51)
Use of , inland waterways .
39. It would be useful to make a careful study of . the techno-economic feasibility of transport by river to selected townslike v~si:·Allahabad etc. We would; however, emphasise that<: for the scheme to be successful, large scale nver training schemes will have to be takes''in hand and a navigable channel marked· throughout the course. Aids for night navigation -~ay als~ ~ave to be provided if ~e t!IJ:J?-·round-time has--to be kept within economic limits. ·
· · (para 7 .52)
Coal gasification
40. It is difficult to foresee any large sizi:- gas plants located at th~ . pithead transporting ga~ _for industrial .or- domestic- users far away from Cities; but in, major cities like Bombay and Calcutta. gas plants located .near the cities With ~mailer capacities ma:Y 15e a • viable proposition.
· · (par~ 7.57)
41. Research and development should be con·tinued on the. teclni.o-econornic , aspects o~ gasification and specific, p<issibilities should be investigated for using po.ot quality coal for gasification
" and for use . in industrial locations · (para 7.58)
Machinery.
.;42.tA Committee of representatives of the concerned Departments and organisation~ ~ould make an assessment of the' ' indigenous ·capacity for the manufacture; of . ~al- mining! lllliChinery, suggest increases in cap'!city and .fix, jlnport requirements for: ,the , periOd till1$e :indigenous capacity catches . .up1wi,t4: the pemand .. This, ComIni,l;t~;e should also take up the task of standardising the equipment. It may be made obligatory
·• for ~he. equiJ?ment manufacturers to ~roduce a certam quantity of spares for: the machmes every year.
(par'a 7 .60)
Choice of technology
43. The selection ·of :the..: optimal'· lechriology shQ;Uld be made on economic grounds using appropriate weightages for machine utilisation un•

119
dei Iridian conditions and forthe1availability of f\bUI)~ant, labour force. ·
(para 7.61)
L' 'te ~-· ·, 44.' It. is strongly re<;ommei:u:ied that the second
mine .cut· at Neyveli be taken up and the capacity oli:the-. power plant be increased to., 800 MW. ·.
(pw;a 7.62)
45. The possibility of manufactu~ing · bucket .whecl~:excavators in the country should be examined and the manufacture of the required num.be~' b{ excavators'taken up in a coordinated man-, ' " ' ' '' " ; . ' . . ' . ner. :. .J
(par!!, 7.64) ' '
~. n' ... • ~ . . . 46. In' view .of the. location of Neyveli lignite
.. ,lepnsit in relation to other ·fuel sources, inspite of 'the heavy investment. the Committee is inclin
-ed to recommend the opel)ing. of .ad,dition111 mines ,atf Neyveli and •inq-easing tl}s production, 11;>, .a ~eve! tOLabou& 20 mt.~ .
Gpara . 7 .65)
OIL
Oil Polic~·-. _ 147. India's Oil Policy should be based on an
' understanding ~of the 'fut~mationahlil situation. ''lt" shon!d'b¢ designed with'the speCific 'abjectives of: " ·. · · · · ·
; (a) reducing the quantity of oil ,products to ·. be 1 importe-d; ·.
: {i?) ,nid~~lng the, total foreign exchange ex' , , ; penditure, and
(c) improving the· security of supplies of , crude. l},~d .oil ,prodqcts;,requi{edrfrom so~c#~.ou~sid~.''the,,~ounyr; ; . · . . .
(paras 8.10, .and:8.17)
Pit, Ei
120
of secondary process to be established and the feedstock choice in the fertilizer industry.
(para 8.25)
. Oil products supplies and pricing
53. While the potential for export of oil pro-· ducts should be kept in view, adequate care should be taken' to analyse the long-term prospects for the product before investment options are approved.
• , , r
(para 8.29)
Naphtha
54. Since light distillates will be in short supply right upto 1990-91, Naphtha demand will have to be regulated by proper licensing of fertilizer and petrochemicals projects and it will be necessary to price the naphtha product within the country appropriately.
(para 8.32)
,HSDQ
55. The price of HSDO and kerosene should ,continue to be kept at par. with each other. If, at any time, it becomes necessary to tax the <onsomers of HSDO and kerosene at different rates tax should be levied mi the consumers of HSOO by suitable levies on other products which they use like tyres, tubes or spare parts. . . · . ·
(para 8.39)
Road-Rail coordination
56. The Committee recommends that imme--~diate action be taken to coordinate the road and
rail transport in an optimal manner in order to manage the HSDO demand·.to•fevels indicated in the report. Long distance movement of commodities by road should be discouraged while simultaneously increasing the capability of rail trans-port. '· "
(para 8.~5)
DieseHzation in railways
57. It has be~n estimated ·that I.soo; 3,000 and ,. 4,000 Km of railway track will be electrified dur
ing_ the Fifth, Sixth and the Seventh Plan periods, which would take the total electrification to 12,800 Kms. With electrification of track increasing to that e~teJ:!t. it is anticipated that the. railways can mamtam the stock of diesel locomotives at a constant level of about 2,600 (whi~;h will be reached by 1978-79) and the · constlmption of diesel at 0.8 mt per year from then on. In othCI' wC'rds, diesel consumption which was 0.5 mt in 1970-71 will increase to 0.8 mt by 1978-79 and stay at that level from then on. Though the stock of diesel locomotives will remain the same from 1~78-79 onwards. ~he areas in which they operate wdl change from time·to time. The diesel traction will be introduced in the areas where the steam traction will be unable to bandle the increasint~
load .traffic but. electricity c9,uld .not be; .. ex~epded for want of adequate traffic,, . ~,._, , , . ..._
· wara '8:31J
Fnel Oil .
58. Fuel oil being a valuable raw mate~i~i' to~ the production of high' cost petroleum ; ploducts which have good e:qlbrt potential or· cnn: serve •as import substitutes; large quantities of· it: should be' earmarked for the production of high value products like lubes, bitumen, petroleum coke and wax. .. · ·
. ' (para • 8.39)
59. The eoinmittre ~ecommends that even'at'tll~ stage of licensing new industries, the us~' of' fiie) .oil in .furnaces should be prohibited and the nationalised coal industry should be asked to take immediate §teps to set up fOal dumps iq all the industri;d, cc;ntres l ofth~· COUfllf.Y~ ,. . "8. :
.: ,lnarl} .~9) .~,, .• H!j'
60. The Coin~ittee recommends tliatthe•6overnm~nt shoUld take 'immediate· steps tO-· improve the design of indigenous thermal 'equipment· •with 'the speciffc objective of reducing the technological requirements of oil in the thermal plants.
' · (para 8.40)
Coal and fuel oil as fertilizer fleedStocif·'iln'l lill .r : : • ·! ,.J ~Ji~.··,ti~ 'l"·rin'l· !ir r · ri ''i \:
61. ;rbe Committee. is of t,he view PJat ne"l"fprtilizer projectS should ,be de'si~ed, ~(). uia~e u~e . ~f coal as the feedstock. However, in the refineries. even when. the surplus heavy-end products ·are subjected 'to" secondary processing, .. there' will be some quantities of heavy residu11l material which
. ~an not be used fo.~. aJ1}f purpos~. ,e:;~cept for burnmg a~ a feedstock ~or f~~ilizcet: prod~ct_ion. Such matenal should be used as feedstock' m prefer-
., ·ence ta their· use as fuels.·;,
· The Coml!l,ittee is ; ~f 1ihe liflew ··that even if in view of ~~~ lack· of operaMg 'experience of large scale fertiliZer production based on coal and th~: · need to complete quickly a few more fertilizer project;;. within the co~try to rll~e~ thl!'1!hort3ge of fertilizer a _fe.w . pro)~, )>a sed ,on iqel oil are ,taken up dunng thtl-;F!fth· ~. ~Ian.,,these prqjects should have adequ11te. proviSion , to swi~b .over , to the use of cqal at_ a Ia.ter da~.' · . ·. · : ' ' ·,
:. ,(pa1a ::Ml> · . 62. Recent eXplorations, inianlf · and oh-S1ib~e indica_tc: 'the possibility of discoverinlf ·substanfiai quantities of natural gas. The production of ferti-
. lizers, metl)an?l and ~th~r -~~mi~ls _ basecf on natural gas will have to be given pryf~rence· over the use of natural gas a mere filet.
ELECTRICITV
Installed capacifi : . I ':.td J : ~
. 63 .. 'The--ins~IIea-,,, capaCity, ,requirements for different years 1n future to meet the; energy re·
quirements corresponding to the, .Case-II estimates are indicated below: , ' , ., I• .J '
-Installed. capacity • requirements for' power· gener~-. lion in 1978-79, 1983-84 and, 1990-91
.;Year
1978-79 1983-IW · 1990-91 . .l.IJ'."
·Forecast of Forecast of ·.Installed energy energy cdpacity
consump~ require· needed lion (b kWh) ment (b kWh)
. '
100·3 . 167·7 . 320·4
'116·4 193·6 370·7
(mkW)
33·6 53·0 87·3
''• at thB1 ba.a-ba.r~1.o ., cOnsumptioD plusline-'IOBBCS. l f.!.'': I :. ', • •
!121
.NOTB:· -(1) On_ the bBBiB of the calculations for 0·48 plant factor and 90 per cent availability the installed capaeity·required in the year 1978-79 would be 30·7 million kW. However, as there is alarg8 spillover of worke from the Fo"!""h Plan and due to bunching of new projects the capaciy coming on stream into the final year of the Fifth plan is very largo. But as . many of them would be operative only in the I!OCOnd half of the final year, only half of the benefits ,have been eounted towardS the Fifth Plan and heme •thtt· • •increased provision of installed· capacity. 'i2)'Po'r the year 1983-84, on the basis of 0·495 plant· factor and 92 per cent availability the installed capacity should be 48·6 m kW, This is, however,
, being 88Bumed as 53·0 m kW forreBBons whioh are olmilar 88 in the case ofl978-79. •
. (3) Th~ siure of installed Capcity hBB been arrived at 87'8 mkW on the basis of 0·51 plant factor and 95 per cent availability. ' c '
{para 9.32)
· .Power system plimning • ...... "l!' i '
64. The Committee would strongly recommend .that rational measures should be initiated in
I • • • planmng and operatmg the power systems so as to ensure gradual improvement in the plant factors of o~ration of. power system.
Hydro-electricity
66. In. order to achieve the objective .of maxi mising the generating capacity with the fund available and to generate cheap power, it is rc commended that ·during the Fifth' and Sixth Plan the level of new generating capacity to ·be· adde• should be derived from hydro stations, both o the em;rgy intensive and pc;aking categories.
{p~ua 9.3S
67 .. The C.ommittee would 'urge that during t!J Fifth .Plan, ii very strong effort should. be mad to complete as many as possible of the hyd~ stations under construction .
{para 9.4(
: 68. The Committee would str9ngly urge that a . detailed investigation of the, specific projects which could be set up to utilise Ute hydro-electtic resources should be drawn up ·within the next two years and the scheduling of different hydro projects should be determined with reference ·tO the cost of the projects, the characteristics of the projects and their locations. On this basis, a de!ailed hydro-electric power development pro-. gramme should be drawn up for the future upto 1990-91 or even 2.000 A.D.
:(para 9.42)
Nuclear power
69. Tlie capacity of the nuclear power stations is estimated to be as follows:- ·
1978-79 1983-84
,, 1020MW 1900MW
1990-91 8620 MW
The Committee would like tci end~rse , ih~ view of DAB that nuclear power capacity, if possible, should be increased to the maximum extent possible by 1990-91. It would recommend that a review of nuclear programme should be made by 1978-79 in the light of the pace of construction of nuclear power stations in the Fifth Plan. period, the preparedness of the DAB in respect of desings for 500 MW nuclear power plants. and !he progress made by them towards the commercialisation of the Fast Breeder technology.
I • - • ,
Source-wise possible ·generating capacities has been suggested as follows :- · "
(Million kW)
Year/ Mode of generation
- 1978-79 1083-~ . .. 1990-9~
Hyde! . 13·00 20·00 28·40 Nuclear 1·02 1·90 8·62
Thermal 19·55 31·10 50·30 .,.
Total . 33·57 53'•00 ,• . 87·32
NOTB: -Thermal statio\]B includo ooal ;;nd 'lignite b..;.d · power stations, ·
Plant size
70. The Committee would recommend that immediate studies should be . undertaken to determine the optimal plant size for~ different regions of the. country. · · ·
. (para ·.9.47)
71. During Fifth Plan period, the desigJ! capability should be developed and operational
).orms for a 500 Nf.W, set should be studied by >setting up an R & D plant of 500 MW capac:~ty.
(para · 9 .48) '
.Loaltions
172. The Committee feels that in the overall interest of the economy and environmental considentions niore and tnore of such power stations should be located at pit-heads. Depending on the local conditions, however, construction· of power stations at · load centres can be considered on merits as a special case. · '
(para 9.49)
· Transmission
73. The Committee would very strongly urge that the schemes for setting up of regional. grids and regional load despatch centres shorild be
: vigorously pursued;. · si.wultaneo\!sly procedures for the integrated· planning and · operation . of power systems based on system studies _~hould be introdm,:ed. .. ' .. "I
warl)).54)
Rural ·elec~cation ..
. 74, Procedures: should b~ found for a proper evaluation of the relative social . be!)efit cost of electrifying diffeT~m( .are.as ~ ~!h' reference to the
. ground water potential., the' pos~ibility of_ increas-.i!,lg production .in that ania. the other norl,agrictiltllr<!f production c.t,hlt; ~igh~ 1le' tfii$ered off in the. area etc, The. correct appro;t)h. to rural elec
. t'rification should be through the formulation of an int<;~rate~ rur~f.deve!opment ·programme. for clusters' of VIllages in WhiCh the SUpply of elecfricity .would be. one,of the inputs arranged by the Government.
(para 9:57)
122
75. The Committee recommends a proper pricing policy for the power supplies to the agricui- ' tural loads so as to encourage tlie consumers to use the optimal size- of -pumpsets and for drawing supplies during the system off-peak hours.
(para 9.58)
76. The Committee would -recommend that rural electrification should be pursued ··on lines which would ensure the electrificatipn of almost all 'houses in the villages to which electricity is · ~xtem;l~d.
(para 10.19)
Captive power generation
77. The Committee feels that in the overall . ·national>irtterest and in order •to"achi.we thellatget through' the .. liinited resources\ avnilable, the . setting .up of captive power stations should I!Ot be' encouraged. · Efforts should be made to ID• crease the capacity of the power utility· •system to i:neet all the demands 'with' high reliability.
· · ' (para 9.59)
Nuclear power programme .
· 78. Apart from the necessity of getting the prQjects sanctioned and executed in time, the. , rc:;ili,sation of the nuclear power programme depends on uranium. production. Uranium . mining . from other' u.~anium ~eposits will_ have to ~ wken" up. At the same: time exploration work . , to · locate additional uranium . .deposits would also .be essential to nieet the long-term requirements of the nuclear power programme. ; ' . I ·" IJ?ara 9.63)
79. The realisation·· of th~ projected · nuclear power programme :~m also' depend ,u).io~ the indigenous industrial. back up that ,could .be bnilt up during the next few year.s. The Indian manufacturers ·Will have. to develop' their capabilities to produce many of the sophisticated any heavy components as well ilS special pumps and instruqJents required for the nuclear power pr!Jgramme.
' I·. ., · (para 9 .64)
. , 80. The committee would 'recommend that, if possible, the nuclear capacity should be increased in the years beyond }983-84. This ,shquld. be based on a re-appr;tisal of the nuclear power
· progra.mme on the' lines suggested.' . ' • .... ' n (pa'ta 9 .69)
' • • I• • o
i>OME$'PC!SECTOR''• Firewood
81. A fairly generous. estimate of the, ,.JQ~ASt ~uel resources puts the availability of 'forest fuels iii 1978-79 to''be .around•94:mt at;t.agaihsti:<lour estimate of demand ofG 132 iilt (equivalent of '125 mtcr). The solution to this probiem· lies in taking up· programmes of .afforestation especially, with wood :species which are. qnick gr<>wing and are capable of yielding :wood f9r fu~l purposes.
(parl! ;10.10)
. :82, The. soc;\ai fore~ts can be .a, supplement to 1 the other ,measures for. sppP:lying the fuel needs r.Of the .roral,;P,!>P!ilatiq~'-L 1'fhe <;oJii~~ee recom! m~nd~ tj!at .con.s1derat1~p ·'be. grv~1l'.~or the pro,gra111me of .tree. plantation on. the , 'road sides l!anat. sides·. and railwa:{:sides to''increase th~ availabilitY. ~of fi~ewg?d.:' · · · '
(~ara 10.11) Co:w Dung
. ; 83. TJi~··cominittee would'st~onglfrecommend that aU e;:lforts ~hould be made to intensify the
123
;pqp~lii,Ii!i~;~tion.,of '.Gobar Gas Plants' in suitable areas '"']jere the pattern of ownership of' cattle will help in its easy il;nplementation in ·view of th~ ,social benefits of ·the nutrient production, pollution abatement etc., possible from these plants.·
(para 10.12) :Soft coke
· 84. The Committee urges that the possibility o( se):,ti!Jg up plants for the _manufacture of solid domestic fuel to suit the requirements of different ·urban .centres should be studied further.
(para 10.15)
. · ISS. c•The possibility of reducing the cost of soft coke to the consumer by subsidising the · trans
.. port •lllld trading margins or by raising the. re,quired f11nds through a surcharge on the prjce of k~rpsene should be examined. ·. · · .
·· ' · · · · · (para 10.15) ,, • 86.r.The Committee recommends that all efforts
sbould· be, made to increase the level of usage of soft coke as high as possible. ·
(para 10.15)
iEtfu:i~
,,; ~;7, •. ':Ib~,Co®nittee j:econimends that Research ,;tq(l"PevelG>pment should be undertaken on. the d~ign of heating appli,an~s in the domestic ,sec.tllr find also qther .administrative action be taken tp. ensure that the appliances marketed conform to the design requirements.
. (para · 10.20)
MajOr· ~He~~'tioos ·: : C '' ·; i ' I · • ·• I • •
:,; 88, ,The Committee ~wpuld like to draw attention .to ·the fact that the problem of substitution of non-commercial fuels by commecria1 fuels in the J;l!kmlestic sector has to be considered with .due ,regard to the .overall economic .impli~tions Qf the', .use ,of different fuels in this sector and the · · Vricing and. distribution policies should be based, on a full u.nderst!lvding of the soci11l .cost 'of tile·· ilse of different fuels. · · ·
(para 10.21)
COS'fS. ~ _PJ:l-1~ .
~~ ~~tl!c~ , 89:rA·'}ll'opet> price policy for the fuels wil~
.have to be -based on . an adequate appreciation of, the production cost of each ·fuel over time. The price policy should take irtto account the interest , of the producer, the consumer end the nation.
(para 11.5) 1·"·90. The·•€ommittee feels .. that:the Government •should indicate' Ia <reasonable rate of return to t·bellfu~:ed for the•fuel· industries as a whole which .would serve·• as a guideline for any· Committee -\vhicb •is· entrusted with the task of price-fixation 'for~::JijcY• fu~l.
(para 11.7)
91: The Corinnittee would like to endorse the view, taking note of the objectives of a rational price policy in the energy sector,· that the price fixed for any fuel, coal, oil or electricity should
'be such that the particular fuel industry, as u . whole, is enabled to earn a return of at least 10 ·:~,er d:nt on the investment made in the industry. · ., • (p~ra 11.7) Prite. Policy for coal sector
92.. · The Committee would recommend the' fol- ' lowing principles to govern coal prices : ~
(1) Coal prices should be fixed with reference to the geographical area · from which ·coal is mined. ''
' '(2) Price fixed for the · coals proaucea m each area should cover the total costs of production. and. should ·yield a.: net return of .at least ')0 per cent on the capital invested in producing .coal in that area.
(3r Differential price fixed for coal of different qualities should adequately r~flect the value of the specific .qualities to· the consumer as well. as the relative. scarcity
, pf coal of (lifferent qualities. (para 11.11) ,, .
'Price Policy for ,oil sector
93: The Committe{ considers that the producer price ot crud~Lproduced in, Iudia. should at least .be . equal .to the long-term cost' of produc:ing crude in I:rldia: and· the difference between "s!lch a price and the prevailing'.international market price at any point of time shoul.d be cpllected by the· Government' as· a tax. In effect, tl)e · refineries_ should get Indian crude at prices equal to the international, price of similar crude. ' . . . '·' ' ..
(p;tra ,lhl 7)
94. The 'committee considers that there is no particular advantage. in maintaining the "price parity" formula for fiXing·· ex-refinery prices, in view of producing most of the products by re-
. fining of crude within the country, in the coming years.
(para 11.19)
95. The Committee would like to suggest that there should be. a serious .. examination of the need to. continue the import- parity formula. for product .pricing and .to. eValuate otlie,r. possible methods of fi,Qpg .prices which wi!J besf subserve the .national interest. . · · ' '· ·
'(para , ~ 1.20)
Price poncy for power sector
96. The Committee would like to emphasise the inadequate returns · ftoni" electricity' industry will seriously affect the' power prowamme and recommend strongly tliat the electricity tariff• should immediately be ·revised iii all the States so as tc>-·gi.Ye the rates of return as suggested by the Venkataraman Committee. The Committee would
124
like to recommend that the returns on invest-".'ment in electricity should be 10 per cent in keep
ing with .the rates of return expected from other energy producing industries. The basis of pricing suggested here should be applicable no~ only to State Electricity Boards but.. also to ·other . power generating agencies lik€? the Departl!lent of Atomic Energy, Central Electricity Authority, DVC etc.
· ·(pata .11.21)
97.' The Committee recommends' that •the- electricity tariff should be designed so as tq disi.:Pin'li· nate adequately between the use of pow~r .during the peak periods and during off-peak; periods. As the difference in th,e peak demand and off-peak demand is very large jn this country. the tariff should include a penalty for use of power during .the peak hours so that at least over a period of time the load curves of' dell!f!ncj we fl~ttened tO a more reasonable Jevl;l.. Thts would bnng about .substantial savings in the investment cost in the power sector.
· (para 11.22)
98 ... The Committee is o~ the view that there is generally no case for subsidizing· the cost of power sqpply to any industry. · .. (para 11.23)
99. The Committee considers that the tariffs introduced earlier need correction, ·in view of the fact that at present when Jh!;. demand for power from the agriculture sector is. a substantial .portion of the total demand . and' when there is no longer any need for a p~{)motiotia,l ,. :campaign to encourage,.the use of power in' the agricult)lral sector (except perhaps_ in certain selected pockets in the country). The. Committee would strongly recommend that the agricultural ,loads shauld be charged with .due regard tq. the .cqst .of supplying power . to the' agricultural 8ector. At the same time, all measures should be taken to bring about a better utilization of the connected loads in the agricultural. sector (like roa~tering of agricultJlral loads) whiCh would ,enable·the /it)duction;of the cost o~ power supply to ~be agriculturi~ts
(para .:I 1.23)
TECHNOLOGY Fuel efficiency ·
100. The. Committee recommends· that' ·a . National Fuel Efficiency . Service with l:entres at the regional sector and industry levels a11d armed with adeqaute authority to. ensure . that· . their
. views on selection of fuels· and on the level of efficiency are accepted by the consumers. should be instituted as early as ·possible.- ·
.~para 12.4j
. 101. The. Committee ~ould like. to emphasise that, . besides· organisational anangements, there is need for·setting up facilities for training: operatives w)Jo deal witb fuel burning equipment.
(para. J2.5)
• J
102. A .~ell-design_ed f~eJ. ~cien~y. ~~inJns scheme should be worked O\lt tirimedtately, iliidhg advantage of the silrplus engln_eerjn~JaJ~ts ~vail-able in the countrY tciclay. . . .
. . . '@i(il)2,S)
Reduction in ioveslment cu••• ' 'I 03. ·suitable design and construcuon norms for reducing the costs of rural electrificlltion•and for mecrting, the. agricultu.ral P.l!~l'~ets ~hould be evolved. · ..
(para 12.6) '' '. "J ••
104. Efforts should ·be ·mounted with rthe··cooperation of .the various institutions to implement a time-bound programme of increasing the efficiency- of utilisation or< oiHn: the'ltransport sec-tor: · ·
(para 12.7) • ' ' • " •• : • _' '1 • ":'.
!OS. The Committee recommends. that the design, d~velopmeti.t 'and· manufacttiie of SOO MW genera'ting unit should be entrusted to an Indian agency with it time-bound programme to get the commerciill production• of •such ··sets· started in the early Eighties. · · ·
(para 129)
106. While agreeing with the stra~gy .. ~in'lplied in the NCS'I;' .. r~commendation .for; l!lounting a setious R :.& D· effort,for. deve10J?ing MliD proces$ in India, the Committee· w6uld like id' empl)asis~ the need. to~;'c~ncent~a'~t: W<?r~·L '.Hrs(~ on laboratory and htgher scale m' 1the · cntical lireas.
' I' I . • · J .~I'', . ,
(para, ~2.12)
107; The Committee would recommend that resea~h and devel?pment iAJh!}.~'lrijMi r'f@,@.l8, to combmed gas turbme-steam turlime p!ants whtch 'Would increase' tlie overall' efficiency· of coal utilisation in therrlml :power 1 •stations should 1 bel in-· tensified .. , · · ·· · · ··
•(para >12.13)
. ) b~~ . Research anq developmelit niu~t ·b~~ken up to evolve boilers designs which. ,will. avot~ the ,us~ of oil· support;:even 1.wpen Jh,e'1o~c,t~n, the botler is as low as 20 to 30· per ,cent ,Pf.),t~ f:~pa-City. •
'para 12.27)
Conservation of coking coal
109. The Committee recommendidhat' ii timebound programme for theri development .. ' of a
·_formed co~e process bqsed. on· :non-coking coal~ ·should be· drawn up and the project should be carefully followed.• · · · . . ..
, (para ·12.14)
Secondary conversion processes . . • ' 11 0.' Development work; Olh . hydrO' cracking should be speeded up.·sm •. that 'the 1 designing. manufacture·. of suitable. catalystsj IJOlllitt'Jlction and .efficienboperation oof secondaey, ptoocssing plants' could be managed with,indigeiloUSrl skill-1.
· ' (p-ata·l2.15)
125
Conversion of coal to oil
111. It is necessary that in the context of the latest review ?f our energy situation, the rising demand for OJ! products, the limited success in our qil_exp!?ratio~ efforts ;m!i ~he iJ;Icreasing p~ice as we!J as msecunty of obtammg OJ! from the international market, a well thoughtout long-term' programme for development. of coal,oil conversion technology should be drawn up. This should be based on a review of the success >lchieved in following the diverse routes· for coal-oil conve:sion by various agencies in ·other countries, .as well as in: our country and the product mix thr.t would be relevant· to our long-term demand and supply situation 'in respect of oil products. ·
· (para 12.20) i12. ·A competent group should be formed ·
to "Select possible. areas for future work, assign thi~ work to different organisations and to moni-
. tor the entire R & D effort in coal-to-oil conver-' sion technology.
(para 12.22) ' • • ·.; ·I
Coal ga~ificahon
113. The Committee recommends tltat R & D work on coal ·gasification and pipeline transport of coal gas should be undertaken from now.
" . (para 12.23) 114. It is necessary to immediately chalk out
a comprehensive· 'programme for intensive deve"'·: lopment work in the optimization of design of cooking and heating appliances manufactured in the count~y,
Non-conventional energy torms
115. Research and development in the areas of non-conventional energy .sh<;mld be kept 1UP.: ,,
~Jal·~~ -· 116. 'R '&"Di on solar. energy 'in India may be COI\Ce,1ltr,<jtc;d :On'-c . , . .. •·
·• (a) the dev~lopment of •thin-film tec!mology, to produce cooled surfaces which could be used as collectors and concentrators of solar radiation, thus reducing the costs;
(b) the possibilities of using solar energy to con vert animal waste, agricultural waste and algae into gaseous fuels and me· thane. ;i
(c) developing low cost solar water hel
.uJ developing solar distillation <•nd des · nation units for use in arid rural ant
:e) developing tehniques for the_ optimal~ of .solar energy for drying and stm;o: of grain, wood and hay and air-coni! tioning.
· (para 12.34)
Tidal power 117. The collection of more data on tid~'~
moveme.nts and the prepa_ration of feasibi~ity r~ ports Wtth regard to spectfic coastal locations 1 recommended. I
(para 12.37'
Chemical sources of energy
118._ .Development work on battery poweredi light vehicles is recommended. . · " '
(pora 12.38)
11~. Further work on Fuel Cell Technology for use 'in remote villages will be of use.
(para 12.3. I
Priorities
120. Among the other options the important ones are the following:
· (1) Development of Fast Breeder Reactor. · (2) Development of Boiler Designs to re:
duce oil consumption in thermal powc~ generation plants. ., ..
(3) .F_ luidised bed ·,technology /Developme~ · ,,, of .commerCial .powe.r generating, plan~
based on this. (4) Development of···sNG production and
'transport ' technologies · · suitable for 'lndian•conditions. ·
(5) Development of technologies !or manufactllre of cheap smok~less fuels for use in .the domestic . secto{. , ·
:, (para 12.40)
Coordination of R & D elforts in energy sector
121. It is of course necessary to have a competent group to coordinate the R & D efforts in
·the energy sector which will keep under review the progress registered in the differ!)nt areas and adjust the priorities from time to time to enable the best results to be obtained.
(para 12.40)
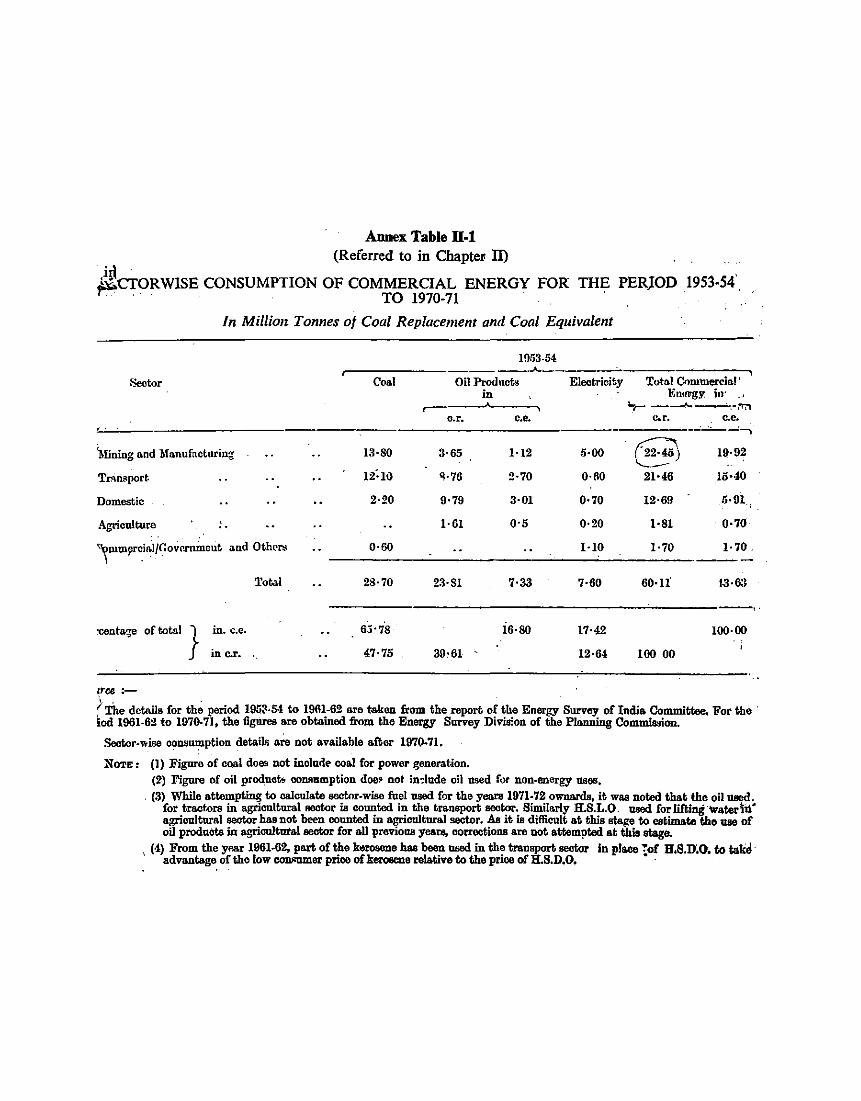
Annex Table ll-1 (Referred to in Chapter m . . ..
~CfORWISE CONSUMPTION OF COMMERCIAL ENERGY FOR THE PERJOD 1953-54' · . · · TO 1970-71 . . .
In Million Tonnes of Coal Replacement and Coal Equivalent
Sector
~Uning and Manufncluring
"Tcimport
Domestic
Agriculture
\{)mmerCiS:IJC:oVr.mincut a.nd Othl'I't5 \ ,- . . .
Total
·centa~e of total } in. c.c.
in c.r. . .
lrce :-
Coal
13·80
12:10
2·20
0·60
28·70
6;)•78
47·75
1053-54 _.J<.
Oil Products Electricity in
,.--o.r. c. e.
3·65 1·12 5·00
~·76 2·70 0·60
9·79 3·01 0·70
1·61 0·5 0·20
1·10
23·81 7·33 7·60
16·80 17·42
39,61 ' 12·6!
Totn.l Connnercial' l'.tuwgy: io· .,_ ---"- ----.---;...,-,.....,
c.r. .... ...., ~ 19·92 '----
21·46 15•·10
12·69 5·91 ..
1·81 . 0·70
1·70 1·70.
60·ll' 1-3·6:1
100·00
100 00
)The details for the period 19ii~·5·l to 1961-62 are taken from the report of the Energy Survey of India Committee. For the · iod 1961-62 to 1970.71, the ilgures are obtained frnm the Energy Survey Division of the Planning Commission.
Seetor-wise oousumption details are not available s.ll;or 1970-71.
NOTE: (I) Fignre of ooal doeo not inolnde coal for powor generation. (2) Figure of oil prod.uo~ oDD.Rll.mption does; not in-:lude oil used fcn non-energy uses .
. (3) While attampting to oalonlata sector-wise fuel nsed for the years 1971-72 owns.rds, it was noted that the oil used. for tractors in agricnltnral oeotor ia counted in the transport seotor. Similarly H.S.L.O. nsed for lifting watarln" agrionltnral seotorhasnot been counted in agrionltnral sector. As it ia difficult at this stage to estimate tho use of oil products in agrionltuta.! seotor for aU p~ous years, corrections are not attampted at this stage.
(4) From the yA&r 1961-62, part of the kerosene has been nsed in the transport seotor in place ~of H.S.D.O. to take, ' advantage of the low OOIIIOlDier prioe of keroeeile relative to the prioe of H.S.D.O. • ·
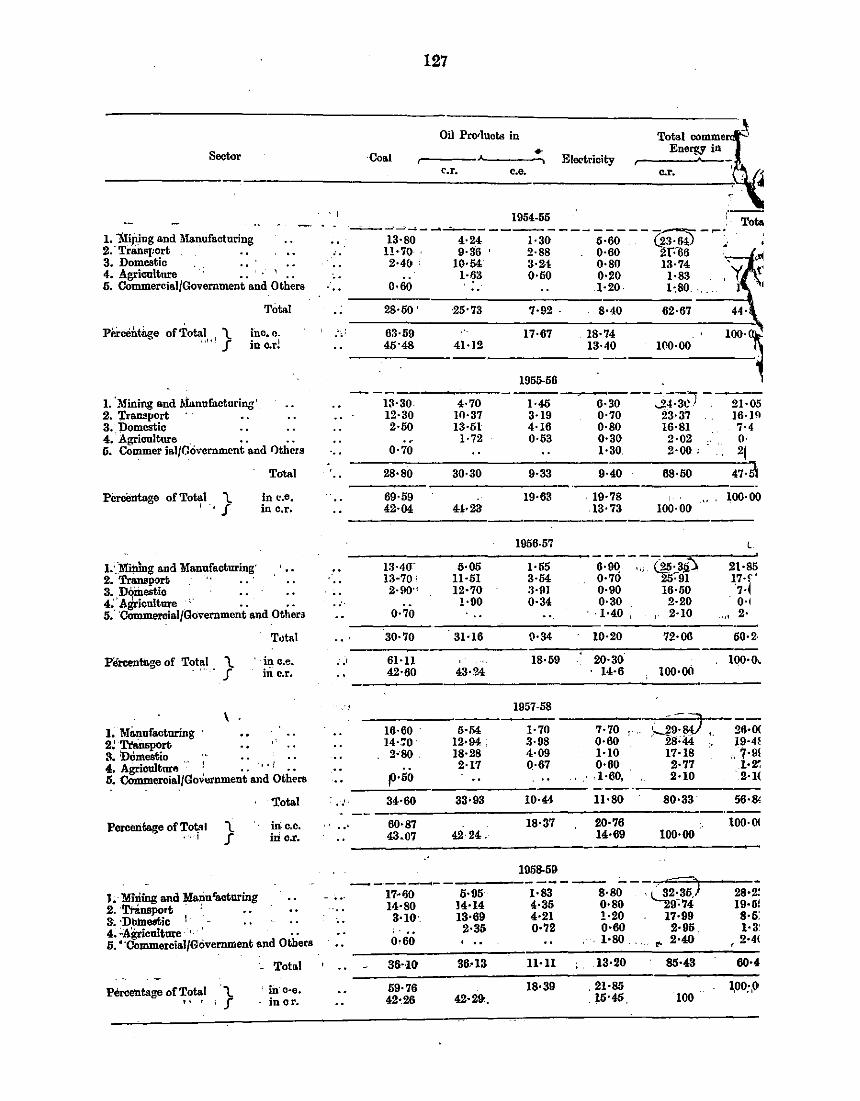
127
Oil Pwluots in ~-~ Sector ·Coal .. Energy in
Electricity ,.----J'---c.r. c.e. c.r. : : 4
c
, I 1954-55 .·--' Tota
1. _l!iping and Manufacturing -----13~8-;-- · 4-u---1.3;---5-lio---cg;:~ --: 2. TramqJort _ .. '. 1!•70 ' 9·36 ' 2·88 ' 0·60 i!r-66 ' 3. Domestic . . . . . . . 2·40. 10·54 3·21 0·80 13·74 4. Agricultnre · .. ' · ' .. .. 1·63 0·50 0·20 1·83 5. Commercial/Government and Others 0·60 1·20· 1·.80. I
Total 28·50' ·25·73 7·92. 8·40 62·67
PP.rceUfuge ofTotal '\. inc. c. '·· 63·59 17·67 . 18·74 100-~ .,,r I • I 45•48 41·12 13·40 100·00 m c.r.
1955-56
I. 'Mining and Manufacturing' 13·30 4·70 1·45 6·30 }4-3.:~- 21·05 2. TrBC!!pOrt ' ' 12·30 10·37 3·19 0·70 23·37 16·1" 3. DOmestic 2·50 13·51 4·16 0·80 16·81 7·4 4. Agriculture . • . . . 1·72 0·53 0·30 2·02 0· 5. Commer iaiJOOvcrnment and 0thcrs -.. 0·70 1·30. 2·00 l 2~
Total 28·80 30·30 9·33 9·40 68·50 47·;;\
Percentage of Total '\. in c.e. 69·59 19·63 . 19·78 I 100·00 (·~I in o.r. 42·04 41·23 13·73 100·00
1956-57 l ----CM:.3ii') 1:)>linlng a.nd Manufacturing' 13·4Cr 5·05 1·55 6·90 .. ;. 21·85
2. Transport '· 13·70' 11·51 3·54 0·70 25·91 17·<'· 3. Domestic .. 2·90'' 12·70 3·91 0·90 16·50 7-l 4~.'AJiriculture . ~= . .: : :: .. ·· !·00 0·34 0·30 2·20 0·1 5. 'Commercial/Government and Othera 0·70 '' 1·40' 2·10 ,, 2·
Total 30·70 31·16 0·34 10·20 72·00 50·2·
Percentage of T'?t~l . '\. i~ c.e. __ ,
61-ll 18·59 20·30 100·0.. f in c.r. 42·60 43·24 14·6 100·00
','! 1957-58 \ (_g;gJ' 1; 1\Ji.nufacturing 16·60 . 5·54 1·70 7·70 !' ,. 26·0(
2~ Tninsport 14·.70 . 12•94. 3·98 0·60 28·44 19·4! 3. 'Domestic 2·80 . 18·28 4·09 1·10 17·18 .. 7·9l 4. Agnoulture ·· : .. • · I .. 2·17 0:67 0·60 2·77 1·2~
5, (JommeroialfGov..,nment and Others j0·50 '. .1·60, 2·10 2·1(
Total .. , 34·60 33•93 10·41 l1·80 80·33 56·8<
PercentB!!e ofTot,•l '\. inc.c. " ... 60·87 18·37 20·76 100· ()( ····1 f iri c.r. 43-07 42 24. 14·69 100·00
1958-59 -------- ----- -~' 1.· 'Mi~ing and ¥a~n"actnring 17--60 6·95· 1·83 8·80 28•2!
2. ·Tninsport · •. 14·80 !4·14 4·35 0•80 9'74 19·51
3c ·DblDeotio ' .. 3·10· 13·69 4·21 1·20 17·1!9 8-5:
4. cAgriculture ' ' .. ; ... 2·35 0·72 0•60 2·95. 1·3' 5. • 'CommerciaJJGOvernment and Others 0·60 ' 00 '1·80.' ... 2·40 2·4(
- Total 36--10 36.-13 ll·ll 13·20 85·43 60•4
Percentage of Total l.. ' in· c·e. 59·76 18•39 '21·85 ~00;,01
" ' •J in or. 42•.28 42·2U., . 15·45. 100
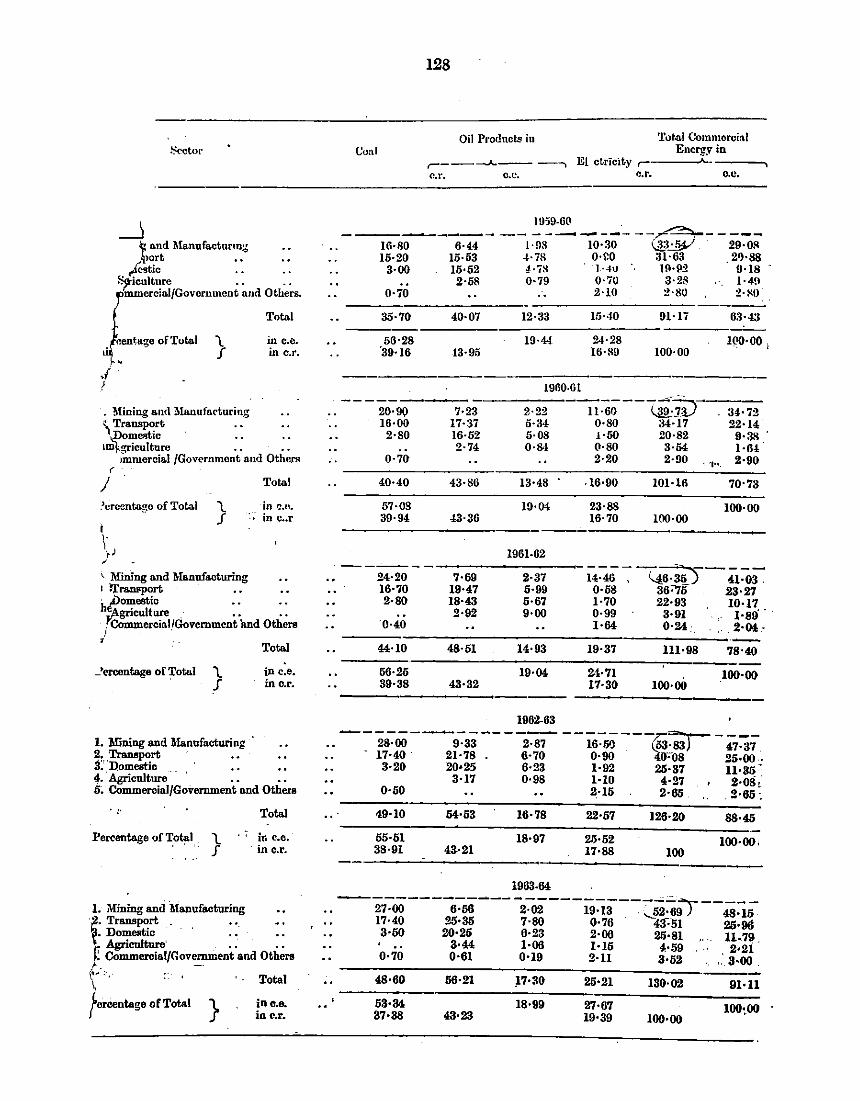
&-ctor
_j lOft , , , , J and Ma.nufactnrmg
stic . . . . S;sficulture . . . . )mmercialfGovornmcnt aud Others.
J Total
centage of Total Lf in c.e. in c.r.
' . .{ !
. ~fining and ManufnC"turing \ TraW!por~
,Jlomestic lm~.griculture . . . .
Jmruercia.IJGovf.'rnment and Othen; (
J Total
.'c'rccntu.gc of Tota.l }
'-. Mining and Manufacturing
in ~.(~. ·- in c .. r
1 n:ra.Dl'Jlort • • • • ht?omestic . . . . ~griculture . • • • • . Commercia.) /Government knd Others I .
• _•ercentage of ';rotul l.
I
1. Mining aod Manufacturing 2. Tl:aooport :!:'Domestic . 4. Agriculture
Total
in c.e. in o.r.
o. Commercial/Government and Others
',. Tot.al
Percentage of ~otal. . } · ' in c.e. in c.r.
1. Mining and ~iaoufacturing t· Transport _ • •.· .•. ~· Dome.rliic · . . . . lr Agriculture' • • . .• 1; CommercialfGovermi>ent and Others '-
~~~otago of~o~l Total
} in c.e.. io c.r.
Coal
16·80 15·20
3·00
0·70
35·70
56·28 "39·16
20·9\) 16·00
2·80
0-7()
40·40
57·03 39·94
-----24·20 16·70 2·80
'0·40
44·10
56·26 39·38
128
Oil Products iu
.-----.A.-- -..... EL ctricity r c.r. o.c. o.r.
Tot.al Commercial Energy in
----, o.c.
1959-60 .
--------------~-----6·44 l-OS 10·30 \:'!:!~ 29·0.q
15·53 4·78 o-r.o 31·63 2~·88 15·52 4··7M 1·4V 19·P2 9·18 2·5S 0·79 0·70 3·2.q 1·~!1
2·10 ~-80 ~- ~0
40·07 12·33 15--10 91·17 63·43
19·4-1 U·28 1~0·00 I l6·RD 100·00 13·95
1960-61
7·23 2·22 11·60 ~JlJ 34·72 17·37 5·34 0·80 34·17 22·14 16·52 5·08 1·60 20·82 9·38 2·74 0·81 0·80 3·54 1·6!
2·20 2·90 ~ 'I• • . 2·90
43·86 13·48 -16·90 101·16 70•73
19·04 23·88 100·00 43·36 16·70 100·00
1961-62
i4~~ ~~-;i!-J-41:03" 7·69 2·37 19·47 5·99 0·58 36:>J'5 .23·27 18·43 5·67 1·70 22·93 10·17 2·92 9·00 0·99 3·91 1·81i ..
1·64 0·34: 2·()4-
48·51 14·93 19·37 111·98 78·40
19·04 2-1·71 100·00 43·32 17·30 100·00
1962-63
-~-;;00--9--:-33-- -2-:s-7 --~s-:-oo---(53~'0;3-)-- 47:"37. 17·40 · 21·78 • 6·70 o-oo 4o:-o8 25·00. 3·20 20•25 6·23 1·92 26·37 11·35"
3·17 o-98 1-10 4·27 2-os; 0·50 2.·15 2·65 . 2·65 -.
19·10
55·51 38·91
53·34 37·88
54· 53 16·78
18•97 4a-21
43·23
22·67
25·52 17·88
27·67 19•39
126·20
100
100·00 100:00
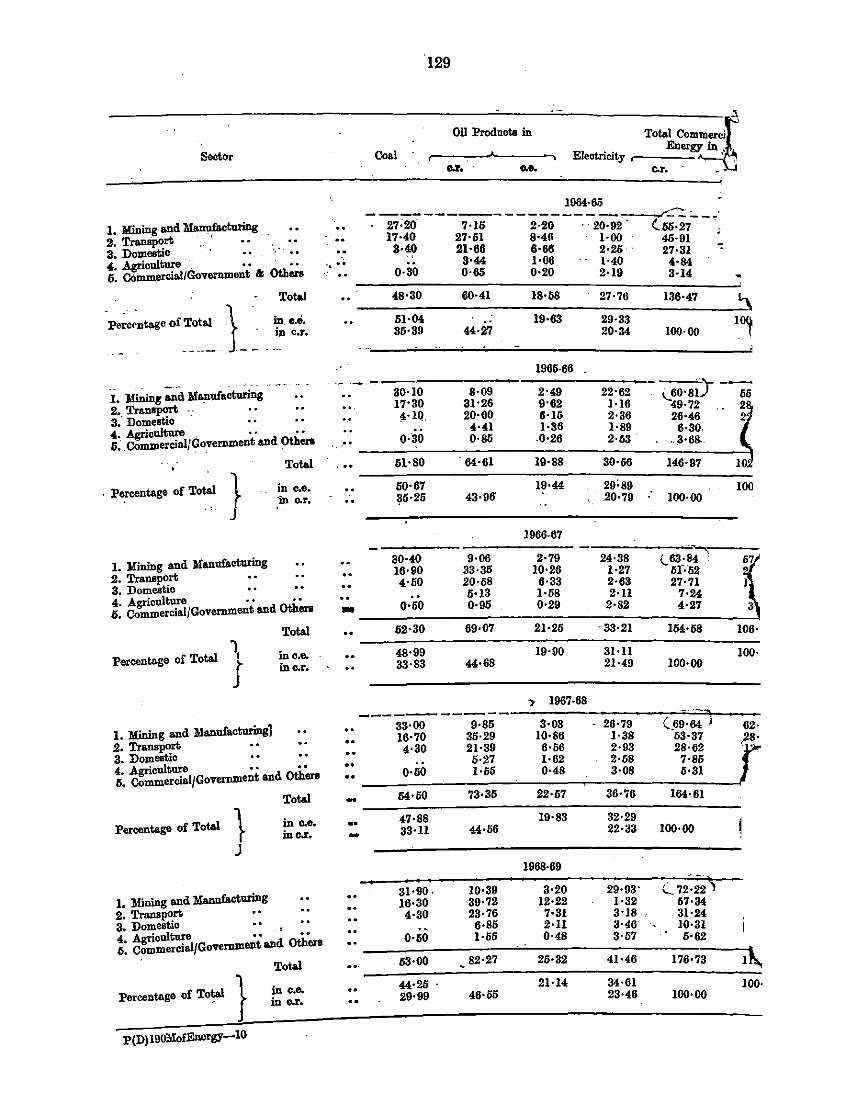
129
Oil Produota in -·~ Seotor Coal Energy in
Electricity .. ~ c.r. o.e. c.r. . - ~ .
1064·65 -------------------~'--·'
1. Mining and Manufacturing . 27·20 7·15 2·20 .. 20·92. (55·27. . ' 2. TranSport . ' •• 17·40 27·61 8·4~ . 1·00 . 46·91 • 3. Domeetic · 3·40 21·66 6·66 2·25 27·31 " 4. Agriculture • • · •• ·~ .. 3·44 1•06 1·40 4·84 5. Commercial/Government & Otboro 0·30 0·65 0•20 2·19 3·14
Total 48·30 60·41 18•68 27·76 136·47 3 ~ Percentage of Total in. c.e. 61·04 19·63 29·33 1,
t~ in c.r. 36·39 44·27 20·34 100·00
1966-66 .· -- ------ - .:_60·8~) --; i. :&fu.in~; ~d Manufacturing 30·10 8·09 2·49 22•62
2 •. Tran~ .. 17•30 31·26 9•62 1·16 ~9·72 2
3. Domestic 4•10. 20·00 6·16 2·36 26·46 2
4. Agriculture • • • • 4·41 1·86 1·89 6·30.
6 •. Commercial/Government and Othero .. 0·30 0·86 .0•26 2·63. ..3·68.
Total 6I·80 '64·61 19·88 30·66 146·97
. Percentage of Total } in c.e. 60·67 19·44 29;89 100 ·m o.r. ~6·26 43·96 20·79 100·00
.1.
1966-67
1. Yining and Manufacturing 30·40 9·06 2·79 24·38 •'"""';
(_63·84
2. Transport 16·90 33·36 10·26 1·27 or· 52
3. Domestic 4·60 20·68 6·33 2·63 27·71
4. Agriculture • • • • 6•13 1·68 2·1l 7·24
6. Commercial/Government and Othero .. 0·60 0·95 0·29 2·82 4·27
Total 62·30 69·07 21·26 ·33·21 164·68 106·
Percentage of Total 1, in a.e. 48·99 19·90 31•11 100·
J inc.r. 33·83 44·68 21·49 100·00
')' 1967-68 -----------1. Mining and :ManufaoturingJ
33·00 9·86 3·03 26·79 (.69·64 I 62·
2. Transport .. 16·70 36·29 10·86 1·38 63·37 28·
4·30 21·39 6·66 2·93 28·62 <.
3. Domeetic 6·27 1·62 2·68 7·86 4. Agriculture • • .. .. 5. CommercialJGovernment and Other• .. 0·60 1·66 0·48 3·08 6•31
Total - 64·60 73·36 22·67 36·76 164·61
Percentage of Total 1 in o.e. .. 47·88 19·83 32·29
in o.r. - 33·ll 44·66 22·33 100·00
J 1968·69
1. :Mining and :Mannfacturing 31·90. 10·39 3·20 29·93' (_ 72·22-, 16·30 39·72 12·22 1·32 67·34
2. Transport 4·30 23•76 7•31 3·18 31·24 a. Domestio 6·85 2·11 3·46 10·31 4. Agriculture • • ' • • 0·60 1·66 0·48 3·67 6·62 6. CommerciaiJGovemment and Othero
Total 63·00 82·27 26·32 41·46 176•73 1~
Percentage of To?"~ } in c.e. 44·25 . 21·14 34·61 100·
in o.r. 29·99 46·65 23·46 100·00
P(D)l90MofEnorgy-10
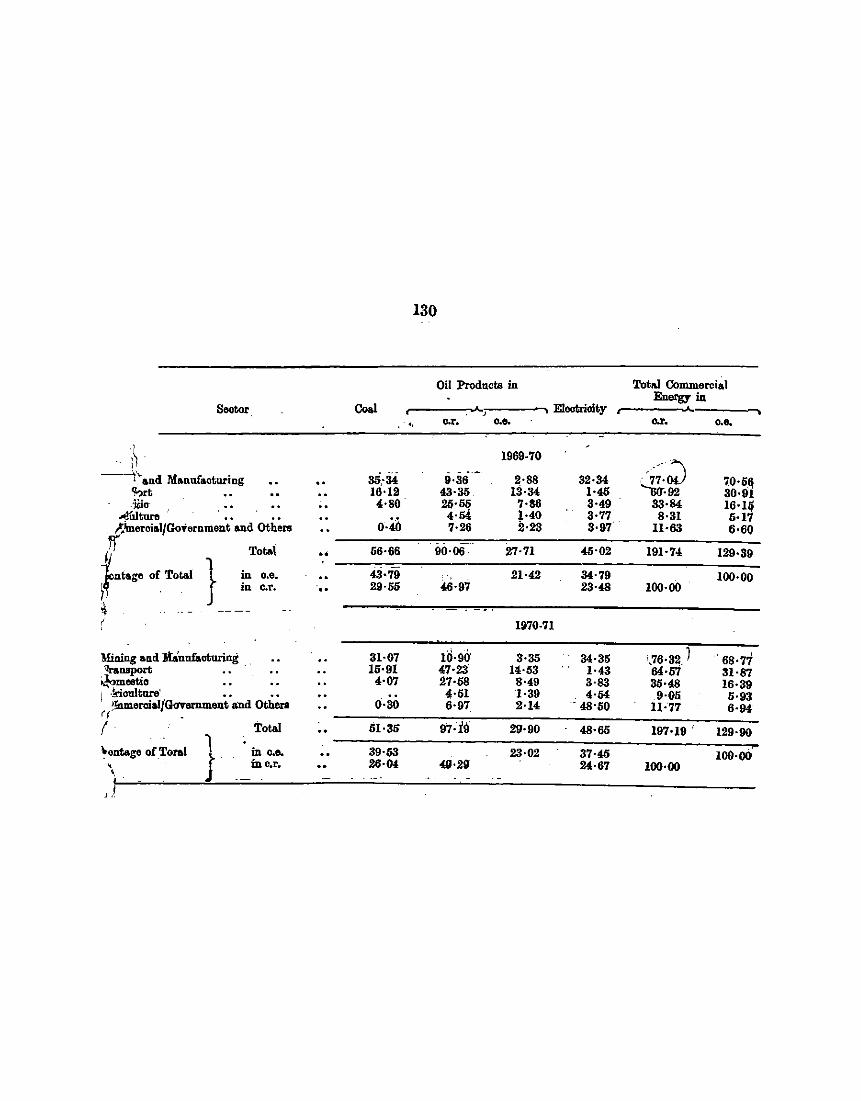
130
Oil Products in Tot..! Commercial
Sector Coal Electrioity Energy in
. - .. o.r • .... o.r • o.e.
.. :\ 1969-70
'7;·.~ ---\"'and Manufacturing 85:34 9·36 2·88 32·34 70·56 'l?rt 16·12 43·85 1:i·34 1·45 'ilir·92 30·1H ·Jiio- 4·80 2/i·5q 7·86 3·49 83·84 i6·1~
.-.!Uiture 4·54 1·40 3·77 8·31 5·1 .);.imeroialJGoVornment and Others O·tO 7·26 2·23 8·97 11·63 6·60
/l Total .. 56·66 90·06 27·71 45·02 191·74 129·39
tntage of Total } in o.e. 43·79 21·42 34·79 100·00 I 0 . in C.T. 29·55 46·97 23·46 100·00
~ 1970-71
Mining and lta'nnfaoturing . 0 31·07 10· 9Qo 3·35 34·35 ',76·320 J 0 68·77
"raDBpOrt 16·91 47·23° 1~·53 1·43 64-67 31·87 ~meotio •• 4·07 27·58 8·49 3·83 85·46 16·39
I • ltureo 4·51 1·39 4·54 .9·05 5·9:i I ·3"10U • • 0. Jnmeroial/Go'vornment an.d Othero 0·30 6·97 2·14 - 48•50 11·77 6·94 (( .
( Total 61·36 97-i9 29·90 48·66 197·19 ' 129·90
\outage ofToral l in o.e. 39·63 23·02 37·45 100·00°
' .t in c.r. 26·01. ·9·211 ~-67 100·00 '0
' .I
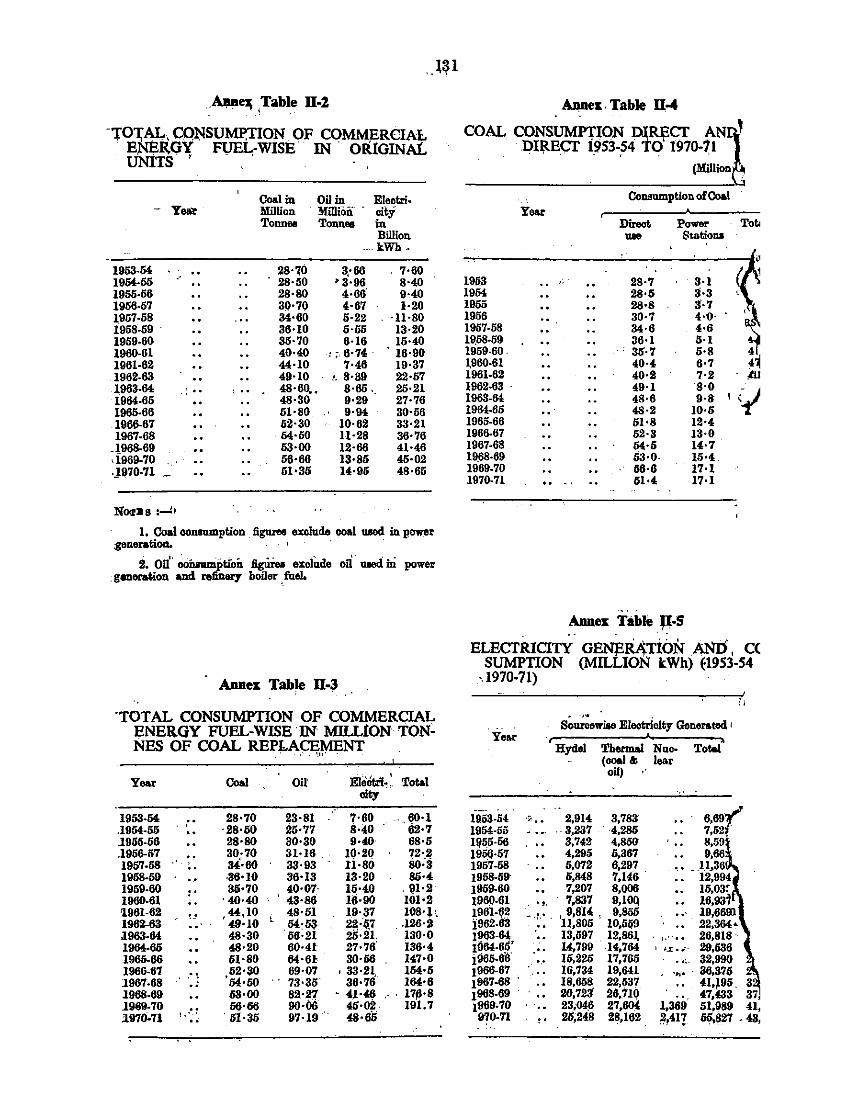
~ell Table ll-1 - ! - .
-'fOl;AL, CQli!SU~ION. OF COMMERCIAL ENaR.G1(' FUEI.,-WISE IN . ORlGINAl. UNITS
- y.....,
1953-M 1954-56 1956-56 1956-57 1957-58 1958-59 . 1959-60 1960-61 1961-62 1962-53 1963-64 1964-65 1965-66 1966-67 1967-68
.1968-69 ·l969-70 .. .JQ70-71 -
N0!1!:8S :-JI
: .. \ ..
Coal in Million Tonnea
Oil in · Million
Tonnea
Electricity in Billion
--kWh.
28·70 . 28·50
28·80 30·70 34·60 36·10 35·70 40·40 44·10 49·10 48·60.. 48·30 51·80 52·30 M·50 53·00 56·66 51•35
3·66 >3·96
4·66 4·67 5·22 5·56 6·16
'; 6·74. 7·48
!. 8·39 8·65. 9·29 9·64
10·62 11·28 12·66 13•85 14·95
7·60 8·40 9·40 1·20
. ·11·80 13·20 15·40
. 16·90 19·37 22·57 25·21 27·76 30·56 33·21 36·76 41·46 45·02 48·65
1, Coal oo1181111lption figureo exclude ooal used in power generatioa. · •
i. on' . .;..nnmptiOii Dgtireo exclude on . u..d hi power . generation and "'fin817 boiler ,_fuel.
Alme:.: Table ll-~
'TOTAL CONSUMPfiON OF COMMERCIAL ENERGY FUEL-WISE IN MILLlON TON· NBS OF COAL REPL-ACEMENT ... ,.
Year Coal Oil Er' .. ' ectn,,. Total oity
1953-M . '
28•70 23·81 7·60 .60·1 .1954-55 ·28·50 25·'17 8·40 62·7 .1955-56 28•80 30•30 9·40 68·5 .1956-57 .. 30·70 31·16 . 10·2Q 72·2 1957-58 .. ' 34·60 33·93 ll·80 so:a 1958-59 .. ·36•10 36·13 13·20 85·4 1959-60 35·70 40·07· 15·40 . 91·.2 1960-61 ·40·40 ' 43·86 16·90 101•2 '1961-62 ·- f 44:,10 48·51 19·37 IOS•lt 1962-63 4ll-10 ' 54-5$ 22;11.7 .. 126-ll 1963-64 48·30 . 56:21 26-21 . 130·0 1964-65 48·20 60·41 27·76' 136·4 1965-65 51·80 64·6! 30·66 147·0 1966-67 . '
,52·ao 69·07 '33·21, 1M•5 H67-68 .. 54·60 .. 73·35 36·76 164•6 l96S-69 6S·OO 82·27 - 41·~ •' . 1711·8 1969-70
1 '.~ : 56·66 90·00 45·02 191.7
19'10-71 . 51·35 11'1·19 48·66
. .
COAL CONSUMPTION DIRECf ANl · .DI~Ecr ·.·953-54. to' 197()..~1
(1l(;)lion .
CoD811111ption oi'Coal Year
Direot Power uae Statiou
1953 28·7 3·1 19M 28•5 3·3 1956 28•8 3·7
~ 1956 .. 30·7 4·0· 1957-58 34·6 4•6 1~58-59 36·1 li-1 1959-60 . . ' 35"·7 5·8 ~960-61 40·4 6·7 1961-62 40·2 7·2 ,til 1962-63 . 49·1 8·0
I (1) 1963-64 48·6 9·S 1964-65 48·2 10·5 1965-66 51•8 12·4 1966-67 52·3 13·0 1967-68 M·5 14·7 19.68-69 6:1·0· 15•4. 1969-70 66·6 17·1 1970-71 51·4 17•1
... Aline:.: Table p-s
.- . . . ' ' . ~ ' '
ELECTRICITY GENJ!R4TION AND, C< SUMPfiON (MILLION k:Wh) €1953·54
·.1970-71)
! j
Yea.r Sourcewise Electricity Generated •
Hyde! Thermal Nuc- Tot.! (ooal "' lear
oil)
1953-5' .:;. .. 2,914 3,783' 6,69 19M-55 . 3,237 . 4,285 7,62. 1955-56 3~742 4,866 8,59 1966·57 4,295 0.367 9,66 1957-58 .. 5,072 6,297 . •.• _11,36 1958-59- 5,848 7,146 12,994 1959-60 7,207 8,006 15,03!" 196Q-61 .. '· . 7,837 9,10(1 1il,93i
~~~:~ - .~.· . ' 9,81' ' 9,855 ... 19;66111 11,805 10,51i11 .22,3644
1963-~ 13,597 . 12,86~ ' ..... 26,818. Ifi84-6 I .. 14,799 14,764 I ~.!, • ... 29,586 ili65-6ll' . , 15,226 17,765 .·.: . 32,990 1966-67 16,734 19,641 - ..• , . . 36,376 1967-68 ' 18,658 22,637 41,~95. 3 t968-69 20,723 26,710 ... 47,433 37 1969-70 .. 23;046 27,604 1,369 51,989 41, 11'10-71 26,248 28,162 ~,41! 55,827 . 43,
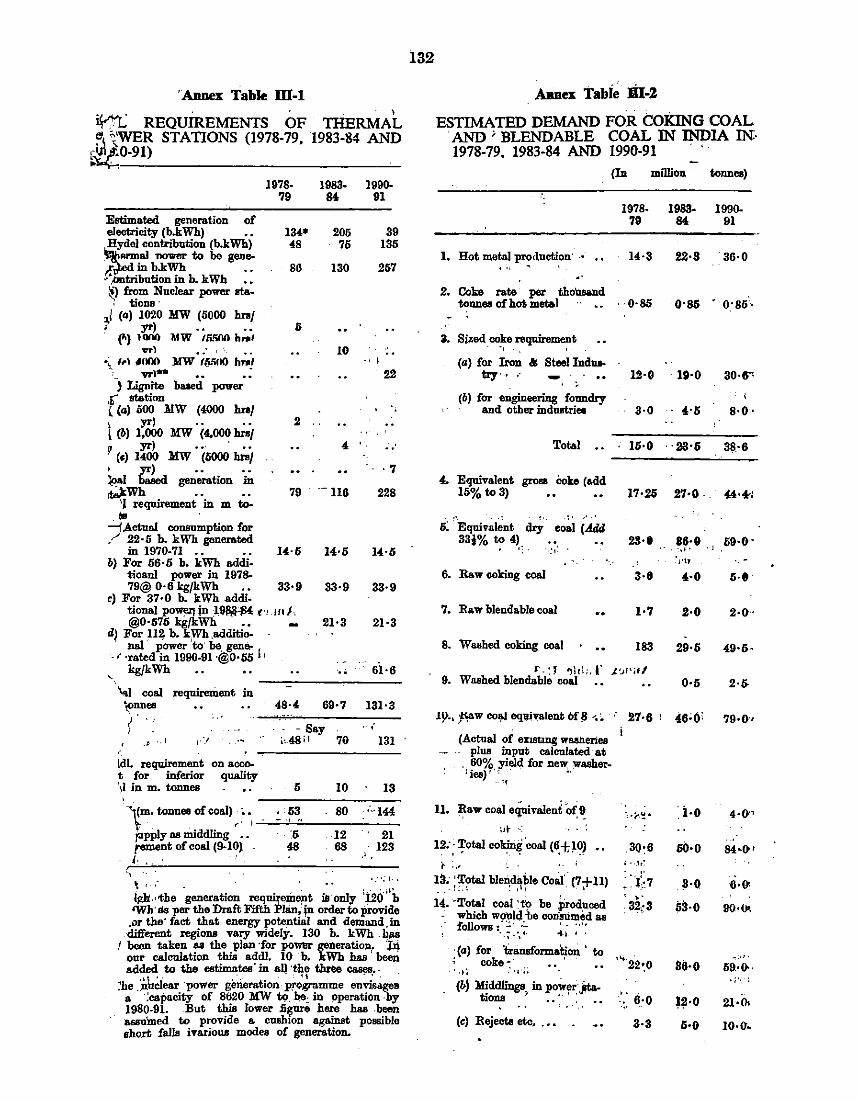
'Annex Table ffi-1
~ REQUIREMENTS OF THERMAL ~~ ".'WER STATIONS (1978-79, 1983-84 AND
l-1J1 0-91) . .
1078- 1083- 1090-?9 84 91
Estimatro generation of electricity (b.kWh) Hyde! contribution (b.kWh)
AnDal """"" to be gene-!.' _in ~.k~ • -' ,ontribntion m b. kWh •• ~) from Nuclear power Ita-, tiona·
~/ (a) 1020 liW (5000 hnf ' yr) .• -·
('>) lOili) MW lli.'iOII brol vrl ~.
.. ~ /,.\ "WlO lfW f,lj.."if)() hnf "' vrl.. --, Lignite baled power
C station [ (a) 600 l!W (4000 hnf
I (b) 1:ol>o MW · (4,ooo ~, ' C•l 1~ llW . (5000 ~/ • yr) l<!aJ based generation in
~~qnirement ·in m t,;..
"' --j Actual consumption for / 22·5 b. kWh generatro
in 1970-71 --b) For 56·5 b. kWh addi
tioanl power in 1978-79@ 0·6 kgfkWh ••
r) For 37·0 b. kWh addi
134* 48
86
5
2
206 75
130
10
79 - --u6
14·5
33·9 33·9
tional poWUJjn :1.9111!~ t"J!I1J. @0·575 kgfkWh -. -
a) For ll2 b. kWh ,additio-21·3
. nal · power 'to• be_ gen&-'·rated in 1990-91·@0·55 I'
' kgfkWh • '-oJ coal reqnireulent in
.I .. I ~-·/ ' . ,.,
ldl. requirement on accot for inferior quality ·~ in m. tonnea
... 48-4, 69·7
. -Say i~48il 70
5 10
39 135
257
.. ,
·7
228
14·5
33·9
21·3
' 61·6
131·3
. ' 131
13
53 80 '--144
"5 12
1m. tonnee of coal))-,-'-~'-"----_;_ __
ppply 88 middling • -rement of coal (9-10} .
21 48 -68 . 123
I·. . . ''·· • .' •: j •• " '. ; ..
~li-·the .generation requirement ill only 'i2o·''i, 'Wh' as per the Draft Fifth Plan, jn order to provide .or the" fact that energy potential and demand.in different regions vary widely. 130 b. kWh . hJul
,I been taken aa the plan ·for poWllr generation. "Jli our calcnl&tion this add!. 10 b. kWh has' been ad~ to the estimates' in all ·t~? three ~- . .
~he . huclear power generation programme envisages a ·:capacity of 8620 MW to. be: in operation -by 1980-91. But this lower jjgnrs here has .been assu'incd to provide a cushion against possible short falls iTarious modes of generation.
132
.Aimex Tabie Ji.I-2
ESTIMATED DEMAND FOR COKING COAL AND ' BLENDABLE COAL IN INDIA IN· 1978-79, 1983-84 AND 1990-91 . '·
(In million tonnes)
1978-79
1, Hot metal pr?duction· -• • • 14·3
.. 2. Coke rate per thoilaand
tonneoofhotmetel -- •. --0·85
3. Sized coke requirement ' rl 0
(a) for Iron a: Steel Ind111o try·· .- -
' -:. (b) for engineering foundry
and other industriN
Tote! ••
4. Equivalent groa ooke (add 15% to3)
o: 'Eqniv~l~nt ax;:. eo:.i (A_:U 33i% to 4) ·- -· ·:' -:/
6. Raw coking coal
?. Raw blendable coal
8. W88hed coking coal
12·0
3·0
15·0
17·.20
23·1
3·8
1·7
183
r-1 J .,11!;. r .t.'.Jf'"' 9. W88hed blendable coal
1983- 1990-84 91
22·8 36·0
o·s5 · o·85'·
IG·O 30·6"'
.. 4,•5 8·0·
. ·23·5 38.·6
2?•0- 44,-4,-:
86·0 ., 59·0· ·,)'
: J'tl ·.-4,-0 5-t
2·0 2·0·
29·5 49·5·
0·5 2·5
ljl., f';'W col!-! eq~'!'Blent Of 8 < • !>.1·6 ' 46;0; ?9•0''
(Actual of en&liiDg wSShenes .. plus input calculated at
.. 60% yield for new washer-1iee)''' ,',_· · ~-
ll. Raw coal eclmvaleni Of, 9_ ~~r ~:
12::~otal cokin{coal (6+,~0) . ' - . ' "'
r : .• .. ;
13. ;;r'~ blen,~~le Coal (7;t-lll
14. ·Tote! coal:~ be l;roduced - which would ile con'!llmed as · follows:'"' .c '- ... ,
·,~ .•,~ -t-1- I
:(a) for "transformat!on ' to ~.,; coke;.,.;; ••. ••
(b-) lfiddliDgs. in power .,¢&-tiona ' •• :· ' : ••
(c) Rejects etc, .••
·, ...... '!. · i-o 4·0'"'
30:6 60-o 84 ... 0 1
; . __ ,.~
·1::7 S·Q 6·~ ' '. -32,:3 53-o 90·0.
•"f·2·2~0 sil-o -:·•.
59.•0<· •I'•, ' ..
... 6_·0 ~2·0 21·0.
3·3 5-0 10·0·
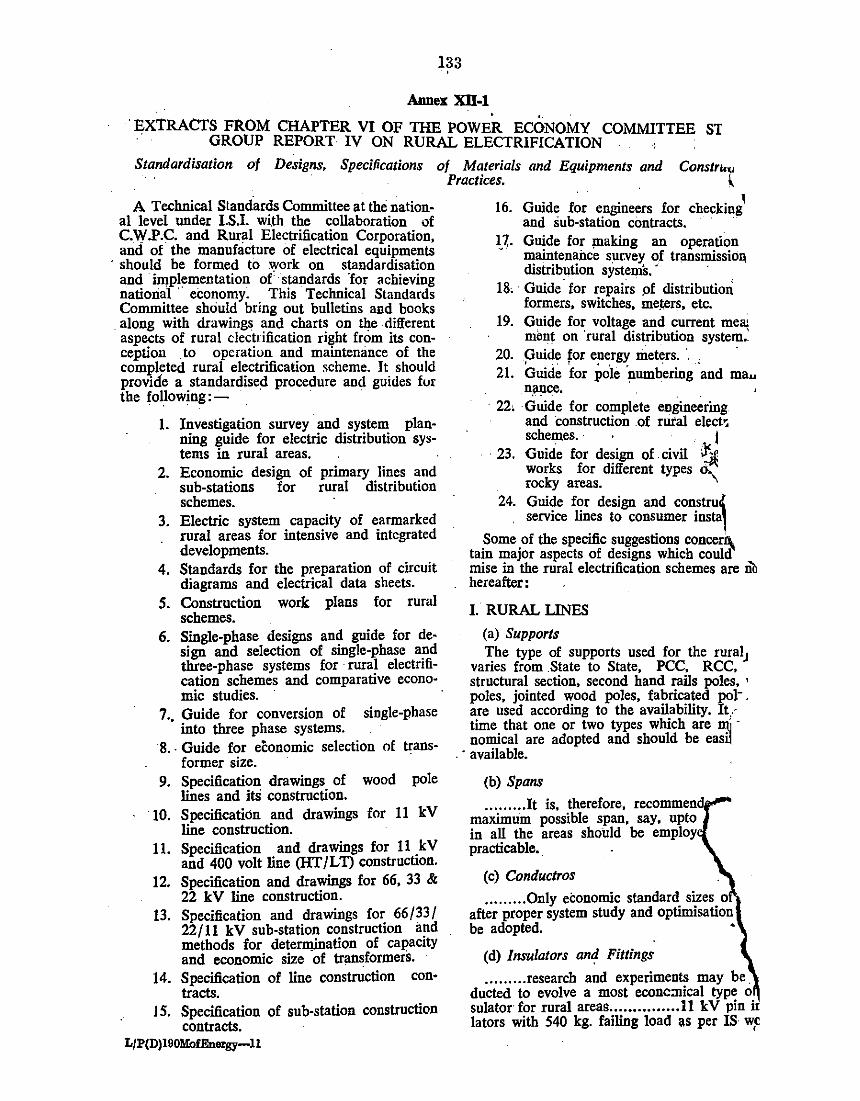
133 '
Annex Xll-1
'EXTRACTS FROM CHAPTER VI OF THE POWER ECONOMY COMMITTEE ST GROUP REPORT IV ON RURAL ELECTRIFICATION . ·. •
Standardisation of Designs, Specifications of Materials and Equipments and Constru" · Practices. I.
A Technical Standards Committee at the national level under I.S.I. with the collaboration of C.W .P.C. and Rural Electrification Corporation, and of the manufacture of electrical equipments
· should be formed to 'I}'Ork on standardisation and implementation of· standards 'for achieving national · economy. This Technical Standards Committee should bring out bulletins and books
. along with drawings and charts on t11e different aspects of rural electrification right from its conception . to operation and maintenance of the completed rural electrification scheme. Jt should provide a standardised procedure and guides for the following:- · . · ·
l. Investigation survey and system planriing guide for electric distribution systems in rural areas.
2. Economic design of primary lines and sub-stations for rural distribution schemes.
3. Electric system capacity of earmarked rural areas for intensive and integrated developments.
4. Standards for the preparation of circuit diagrams and electrical data sheets.
5. Construction work plans for rural schemes.
6. Single-phase designs and guide for design and selection of single-phase and three-phase systems for ·rural electrification schemes and comparative economic studies.
7 .• Guide for conversion of single-phase into three phase systems.
8 .. Guide for economic selection of transformer size.
9. Specification drawings of wood pole lines and its construction.
10. Specification and drawings for 11 kV line construction.
11. Specification and drawings for 11 kV and 400 volt line (liT /LT) construction.
12. Specification and drawings for 66, 33 & 22 k V line construction.
13. Specification and drawings for 66/33/ 22/11 kV sub-station construction and methods for determination of capacity and economic size ·of transformers.
14. Specification of line construction contracts.
J 5. Specification of sub-station construction contracts.
L/P(D)l90MofEnergy-ll
16. Guide for engineers for checking1
and sub-station contracts. · · ~7,. Guide for !flaking an operation
maintenance sur.vey of transmissioq distribution system&. · ·
18, · Guide· for repairs pf distribution formers, switches, meters, etc.
19. Guide for voltage and current me~ mlmt on ·rural distribution system ..
20. .Guide for energy meters. ·. . f ,, I , , , ·· ·•
21. Guide for pole numbering and mau n!lllce.
· 22, Guide for complete engineering and construction .of rural elect~ schemes. · · · l
· 23. Guide for design of . civil ~ works for different types a..; rocky areas.
24. Guide for design and constru< . service lines to consumer insta1
Some of the specific suggestions concer~ tain major aspects of designs which could mise in the rural electrification schemes are Dli hereafter:
1 RURAL LINES
(a) Supports The type of supports used for the rural J
varies from .State to State, PCC. RCC, structural section, second hand rails poles. ' poles, jointed wood poles, fabricated pol·. are used according to the availability. It,· time that one or two types which are l!1j -nomical are adopted and should be easil
. · available.
(b) Spans
.. ....... It is, therefore, recommen maximum possible span, say, upto in all the areas should be employ practicable •.
(c) Conductros
.. ....... Only economic standard sizes o · after proper system study and optimisation be adopted. •
(d) Insulators and Fittings
......... researCh and experiments may be. dueled to evolve a most econc:nical type o sulator· for rural areas ............... ll kV pin ir lators with 540 kg. failing load as per IS w~
v-~, f ~- ·.}As regards disc insulators, insulators with ~ilm strength of 4500 kg as per IS specifie ~;. would be sufficient. ~nd Others.
~ j-f/0.4 kV SUB-STATION
The following suggestions 'are made in this gard: " (a) Some State Electricity Boards ai:e using
economical · type of · gang-operating switches. These switches are at present being made for a rating of 200 amperes. The full load current of a 100 kVA transformer at 11 kV is about 5.5 amperes; of course, the fault current will be much higher ........ , The State Elec-tricity Boards may install some percentage 'of the sub-stations with the simplified gang-operating switches as above
· and ·. gain experience, The method can then be further extended. "
cQmission of 11 kV IightD.ing arresters !;;,'j:Om . transformers, sub-stations tipto 50 .
134
kVA in all the regions and upto 100 KVA in areas with low isoceraunic level. Instead arresters may be installed only at strategic points. ' '
(c) Use of transformers with low iron loss and high copper loss. This will help in keeping the -losses low as the load factor
ds very low in rural areas.
(d) ........ .it was decided that the use· of 25 kVA 50/63 kVA. and 100 kVA transformers should be standardised as this would help in considerable reduction of manufacturing costs.
(e) installation of transformers of capacities ' . to match with the anticipated loads in
on! y the next 2 to 3 years and a voiding installation of large capacity ~ansfor- · mers as far as possible. ·
(f) The low tension switch should be installed oil the sub-station .structure itself to economise on the length of low tension cables. 1 . ·
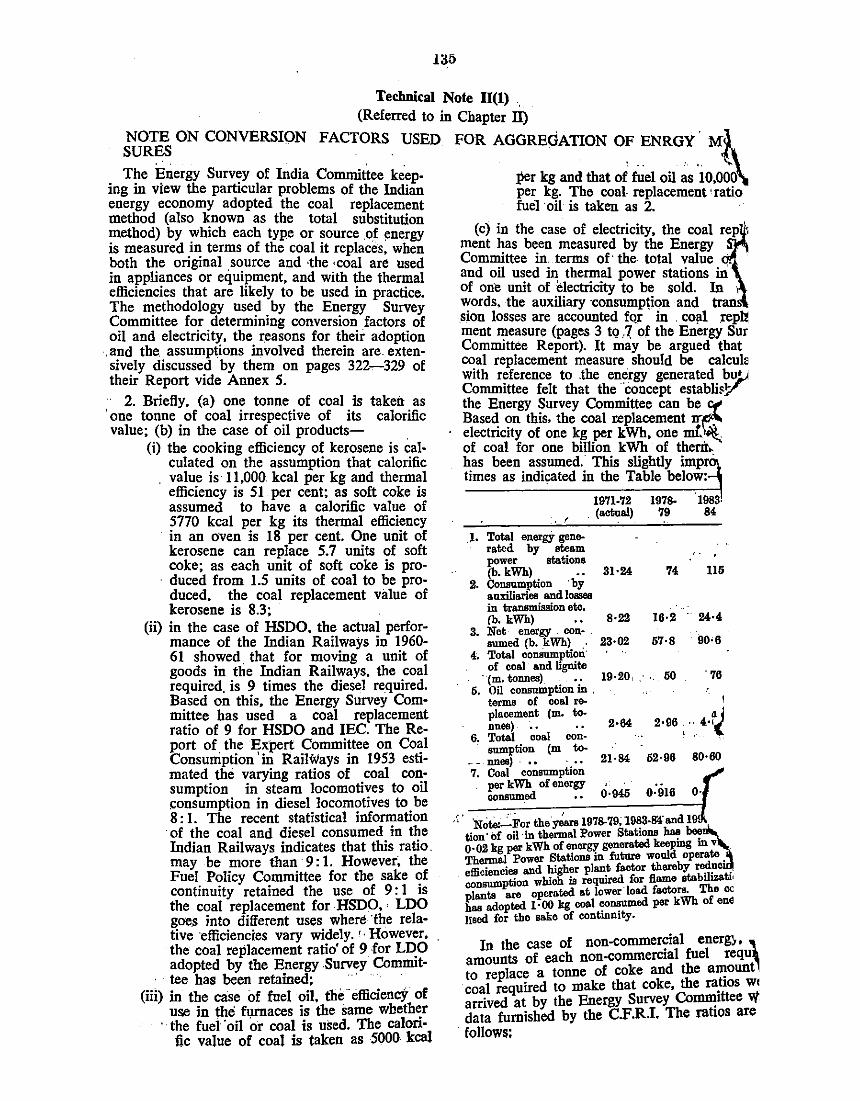
135
Technical Note 11(1) . (Referred to in Chapter ri.)
~~~ON CONVERSION FACTORS USED FOR AGGREGATION O~.ENRGY.· M}..
The Energy Survey of India Committee keep- per kg and that of fuel oil as 10.0~~ ing in view the particular problems of the Indian per kg. The coaJ. replacement· ratio energy economy adopted the coal replacement -· fuel ·oil is taken as 2. · method (also known as the total substitution method) by which each type or source .of ~nergy is measured in terms of the coal it replaces, when both the original source and ·the •coal are used in appliances or equipment, and with the thermal efficiencies that are likely to be used in practice. The methodology used by the Energy Survey Committee for determining conversion factors of oil and electricity, the reasons for their adoption
·.and the .. assumptions involved therein are. extensively discussed by them on pages 322~329 of their Report vide Annex 5.
2. Briefly, (a) one tonne of coal is taken as 'one tonne of coal irrespective of its calorific value; (b) in the case of oil products-
(i) the cooking efficiency of kerosene is calculated on the assumption that calorific
. value is 11,000. kcal per kg and thermal efficiency is 51 per cent; as soft coke is assumed to have a calorific value of 5770 kcal per kg its thermal efficiency in an oven is 18 per cent. One unit of kerosene can replace 5.7 units of soft coke; as each unit of soft coke is pro-
. duced from 1.5 units of coal to be produced, the coal replacement value of kerosene is 8.3;
(ii) in the case of HSDO, the actual performance of the Indian Railways in 1960-61 showed. that for moving a unit of goods in the Indian Railways, the coal required, is 9 times the diesel required. Based on this, the Energy Survey Committee has used a coal replacement ratio of 9 for HSDO and IEC. The Re· port of the Expert Committee on Coal Consumption 'in Railways in 1953 estimated the varying ratios of coal consumption in steam locomotives to oil consumption in diesel locomotives to be 8: I. The recent statistical information
·of the coal and diesel consumed in the Indian Railways indicates that this ratio. may be more than · 9: I. However~ the Fuel .Policy Committee for the sake of continuity retained the use of 9: I is the coal replacement for HSDO, • LDO goe.s into different uses where 'the relative ·efficiencies vary widely. '• However, the coal replacement ratio' of 9 .for LDO adopted by the Energy .Survey Commit· tee has been retained; .. ·
(iii) in the case of fuel oil. the ·efficiencY of us.e in the furnaces is the same whether
' the fuei' oil or coal is used. The calorific value of coal is taken as 5000 kcal
(c) in the case of electricity, the coal rep \ ment has been measured by the Energy Committee in. terms of· the. total value and oil used in thermal power stations in of one unit of electricity to be sold. In words, the auxiliary ·consumption and tran .sion losses are accounted fqr · in . co!ll rep~ ment measure (pages 3 tQ _.7, of the Energy Sur Committee Report). It may be argued that coal replacement measure should be calcula with reference to .the energy generated bu!J Committee felt that the "concept establi~V the Energy Survey Committee can befl Based on this. the coal replacement rr electricity of one kg per kWh, one mt ~ of coal for one billion kWh of thent.. has been assumed.· This slightly impr · times as indicated in the Table below:
. (
.l• Total energy generated by steam
1971-72 . (actual)
1978-79
power stations (b. kWh) .. 31·24 74 115
2. Consumption ·by auxiliaries and !oases in transmission eta. (b. kWh) ..
3. Net energy . con· . sumed (b. kWh) .
4·. Total conSumptiori· of coal and lignite
· (m. tonnes) . .. 5. Oil consumption in .
terms of coal replacement (m. toones) .. ..
6. Total coal consumption (m to-
-- nnee) ·.. · .. 7. Coal consumption
per kWh of energy oonsumed ••
8·22
23·02
19·20, .'
2·64 .. 21·64
' 0·945
16·2 24·4
57·8 90•6
50 '76
I
2·96." 4·~ I '
52·96 80·60
o.'9J6
,(' 'NotA....::_ For tbe y~ 1978-79; 1983-!r4'and I tion'Of oil·in·therm.al Power Stations~~~ 0·02 kg per kWh of energy generated keepmg m v Thermal Power Statione in future would operate . efficiencies and higher plant factor thereby ~~ . consumption whioh is required for flame stab1hzati1
plants are operated at lower losd factors. The cc hos adopted 1·00 kg cool consumed per kWh of en~ !ised for tbo eake of continnity.
In the case of non-commercial energ), ~ amounts of each non-commercial fuel requ to replace a tonne of coke and the a~ount coal required to make that coke, the ra_hos we arrived at by the Energy Survey Co~ttee W data furnished by the C.F.R.I. The ratios are follows:
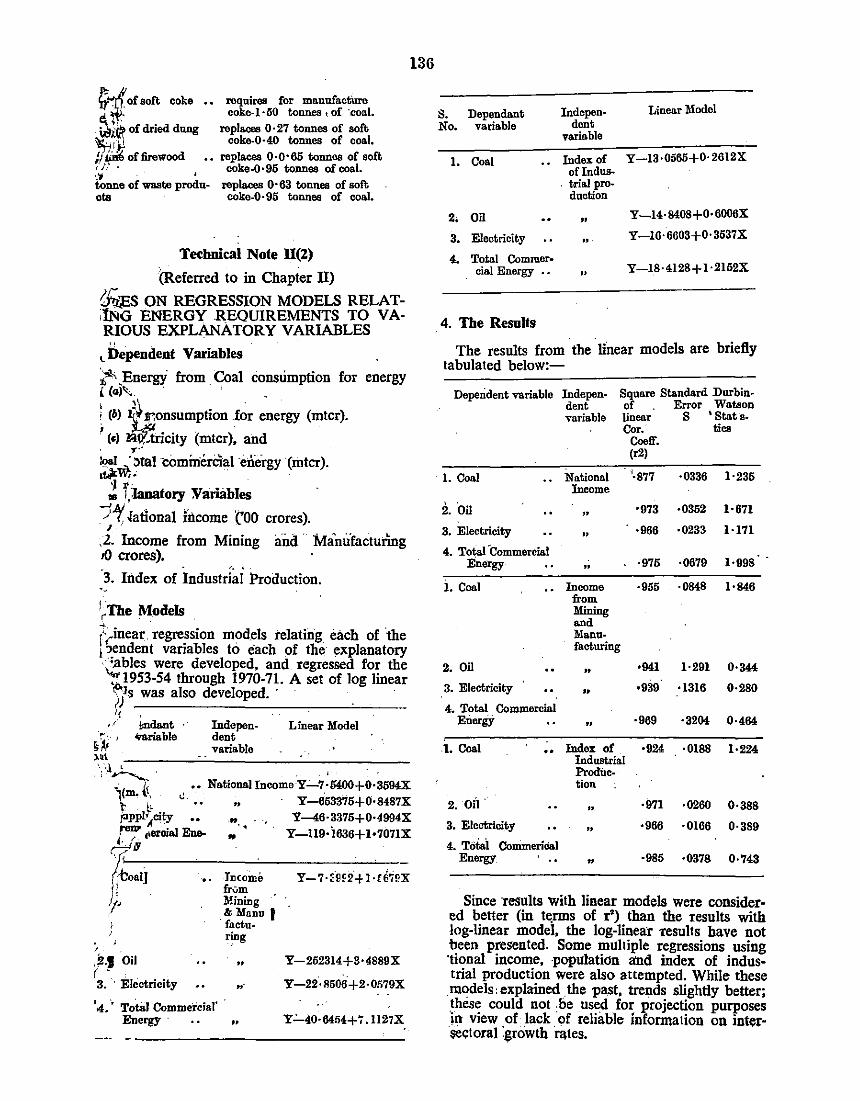
~or soft coke . • requires for manufactUre ~ *' coke-I· 50 tonnea t of ·_coal.
. \dl.~ of dried dung replaces 0 · 27 tonnes of soft ~~~ coke-0·40 tonnes of cos!. ;;lift{, of firewood •• replaces 0·0·65 tonnes of soft • ll · ooke-0•95 tonnes of coal. •.'J . I
tonne of waste produ- replaces 0·63 tonnes of soft ots coke-0·95 tonnes of coal.
Teebnical Note ll(2)
(Referred to in Chapter ll)
~ ON REGRESSION MODELS RELATilNG ENERGY REQUIREMENTS TO VARIOUS EXPLANATORY VARIABLES
cl>ependent Variables
i"". Energy from Coal consumption for energy ( {a)". . , ' '\ . ' (b) :i(:J Jr,onsum.ption .for energy (mtcr). i 'L1<1 . · (•) !W,.tricity (mtcr), and ..,.-i<>al .,..,.':>tal c(Jminercial ·energy (rntcr). ,f#w;. ~ f.;Ianatory Ya:riables
-::1-o/, ~atlonal fucome too crores). ' . ) •. Income from Mining and .. Manufacturing ,Q crores).
· 3. Index of Industri~i Production. ·-I 'rTbe Models
(-,inear regre~sion mod.els relating each of :the 1 :J_endent vanables to each of the explanatory ··'.abies were developed, and regressed for the ~1953-54 through 1970-71. A set of log linear )/s was also developed. ·
I( ... Indepen-·!"·.·, dent
o.ll variable
!;ndant ,· wrisble
Lin ear Model
136
':~1~-.--. ---'-------'-------. · /, •• National!ncome Y'-7·5400+0·3594X 'J(m. \I, '
\- ,, "· ., Y-653375+0·8487X f'PPl~city •• ., Y-6·3375+0·4994X I"""' "ereial Ene- ., . • Y-119• i636+1•7071X ~a
·~oal] );
J)-
i . ~~-1 Oil ( . . 3. · Electricity
Jncoine frvm :Mining ' & Manu 1
· factu-"!"g
..
... • 4. ·~ TotBJ-Commeicial' ·
Energy · .,
Y-7·~~f2+ l·lG7PX
Y-252314+8·4889X
Y-22·R50a+2·01i79X
y.:..40·6454+7 .1127X
S. Dependant No. variable
Indepen· Linear Modo! dent
variable
1. Coal Indexof Y-13·0565+0·26l2X of Indus-
. trial pro-duction
2• Oil .. Y-14·8408+0·6006X
3. Electricity .. 1:--16·6603+0·3537X
4. Total Commer-Y-18·4128+1·2152X cial Energy .. ..
4. Tbe Resnlts
The results from ·the linear models are briefly tabulated below:-
Dependent variable
1. Coal
2. Oil
3. Electricity
4. Total 'commercial Energy
1. Coal
2. Oil
3. Electricity
4. Total Commercial Energy
I. Coal ..
2. Oil.
3. Eleotrici~y
4. Toia\ Commeridal Energy
Independent -variable
Square Standard Durbin-of . Error Watson
National Income
..
.. ..
In eo me from Mining and Manufacturing
..
.. ..
Index of
linear S \ Stat ·a-Cor. tics
Coell' • (r2)
. '·877
·973
·966
·975
·955
•939
·969
•924
·0336
·0352
·0233
•0679
·0848
1·291
·1316
·3204
·0188
1·235
1·671
1·171
1·998
1·848
0·344
0·280
0·464
1·224 Industrial Produc-tion
.. ·971 ·0260 0·388
.. ·966 ·0166 0·389
.. ·985 ·0378 0·743
Since yesults with linear models were considered better (in t~rms of r•) than the results with log-linear model, the log-linea:r 1:esults have not been presented. Some multiple regressions using 'tional income, ·population a'nd index of indus· trial production were also attempted. While these models: explained the past, trel).ds slightly better; these could not .be used for projection purposes Jn view _of lack. of reliable information on inter· sectoral .growth rates.
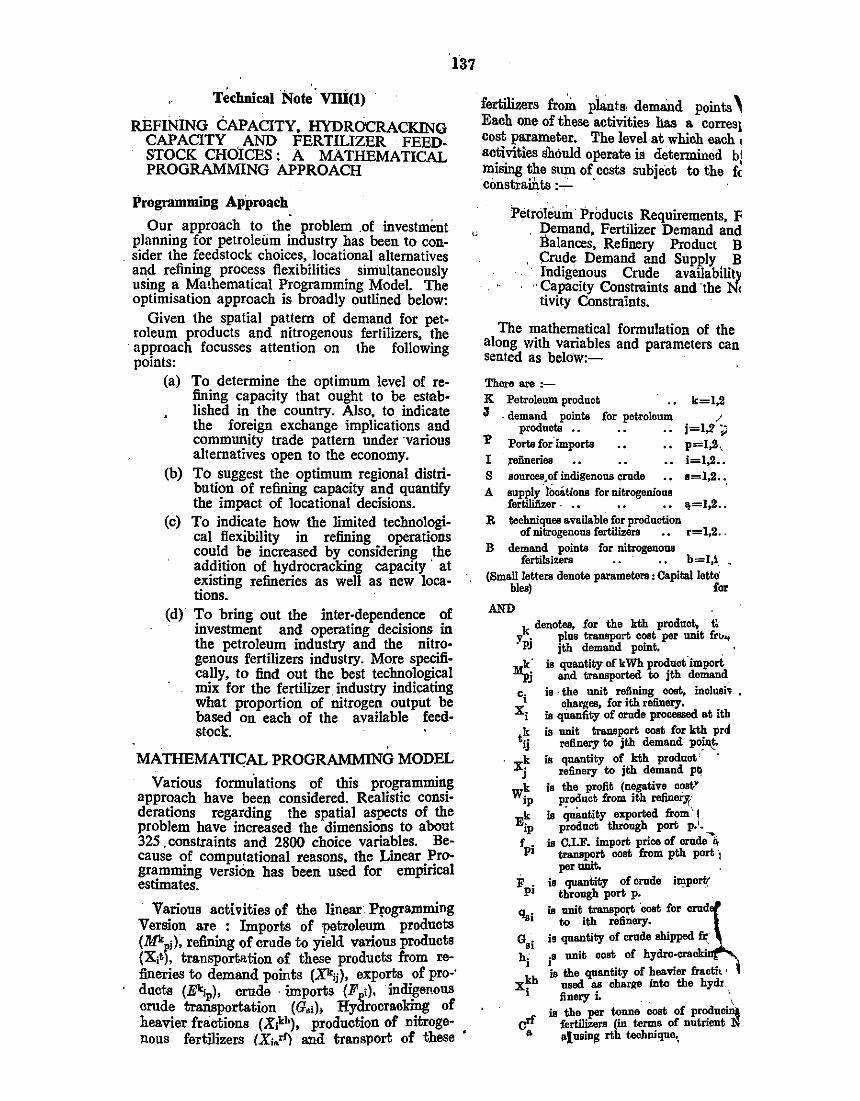
Technical Note· vni(l)
REFINING CAPACITY, HYDROCRACKING CAPACITY AND. FERTILIZER FEEDSTOCK CHOICES: A MATHEMATICAL PROGRAMMING APPROACH
Programming Approach
Our approach to the problem .of investment planning for petroleum industry has been to consider the feedstock choices, locational alternatives and refining process fiexibilities simultaneously using a Mathematical Programming Model. The optimisation approach is broadly outlined below:
Given the spatial pattern of demand for petroleum products and nitrogenous fertilizers, the
·approach focusses attention on the following points:
(a) To determine the optimum level of refining capacity that ought to be established in the country. Also, to indicate the foreign exchange implications and community trade pattern under ·various alternatives open to the economy.
(b) To suggest the optimum regional distribution of refining capacity and quantify the impact of locational decisions.
(c) To indicate how the limited technological flexibility in refining operations could be increased by considering the addition of hydrocracking capacity · at existing refineries as well as new locations.
137
(d) To bring out the inter-dependence of investment and operating decisions in the petroleum industry and the nitrogenous fertilizers industry. More specifically, to find out the best technological mix for the fertilizer industry indicating what proportion of nitrogen output be based on each of the available feedstock.
MATHEMATIGAL PROGRAMMING MODEL
Various formulations of this programming approach have been considered. Realistic considerations regarding the spatial aspects of the problem have increased the dimensions to about 325 . constraints and 2800 choice variables. Because of computational reasons, the Linear Programming version has been used for empirical estimates.
Various activities of the linear.Pfogramming Version are : Imports of petroleum products (.Mk il• refining of crude to yield various products (X;~), transportation of these products from refineries to demand points (Xk;i), exports of pro-· ducts (E~p), crude · imports (F ;), indigenous crude transportation (G,;); Hyarocraclring of heavier fractions (X;kh), production of nitroge· nous fertilizers {X;.rl) and transport of these
fertilizers fro;n plants, demand points' Each one of these activities has a corres1 cost parameter. The level at which each , activities should operate is determined bl mising the sum of ccsts Sllbject to the f~ ci>nstramts :- ·
Petnileum · Products Requirements, F . Demand, Fertilizer Demand and
Balances, Refinery Product B Crude Demand and Supply B Indigenous Crude availabilicy
· ··Capacity Constmints and "the Nc tivity Constraints.
The mathematical formulation of the along with variables and parameters can sented as below:- ·
There are:-K Petroleum product • • k=l,2 3 . demand point.. for petroleum /
product.. • • • • j=l,2 ; 1! Porta for. import.. • • p=l,2-, I )'Oiineriea i=l,2 .. S sources~of indigenous crude s=l,2 . .. A eupply ·liio&tions for nitrogenious
fertililizer. • • ~=1,2 •• R techniques available for production
ofnitrogeuoue fertilizers •• r=l,2 •. B demand point.. for nitrogeuons
fertilaizere • • • • b=l,l (Small letters denote parametere : Capital Jette
blee) for
AND k denotes, for the ktb product, 1>
v . plus transport coet per unit frv~ · PJ jth demand point. k" is quantity of kWh product. import
Mj;j and traneported to jth demand ci is ·the unit refining cost, inclusi~ .
charges, for ith refinery. xi is quanfity of crude proceased at ith
is unit transport cost for kth prd refinery to jth demand po~.
is quantity of ktb product' refinery to jth demand p~
is the profit (negative coat" product from ith refiner:w
is q~tity exportad from' 1 product through port p ••
is C.I.F. import price of crude ~4 traueport coat from pth port 1 per unit.
is quantity of crude importr through port p.
is unit tranepoJ,"t "coat for om~ qsi to ith refinery.
is quantity of crude shipped ~ .s unit coat of hydro·cra · ;,. the quantity of heavier fracti< · 1
uaed as charge into the hydl. finery i. ·l
is the per tonne cost of produ~ fertilizers (in terms of nutrient N ~[using rtb technique.,
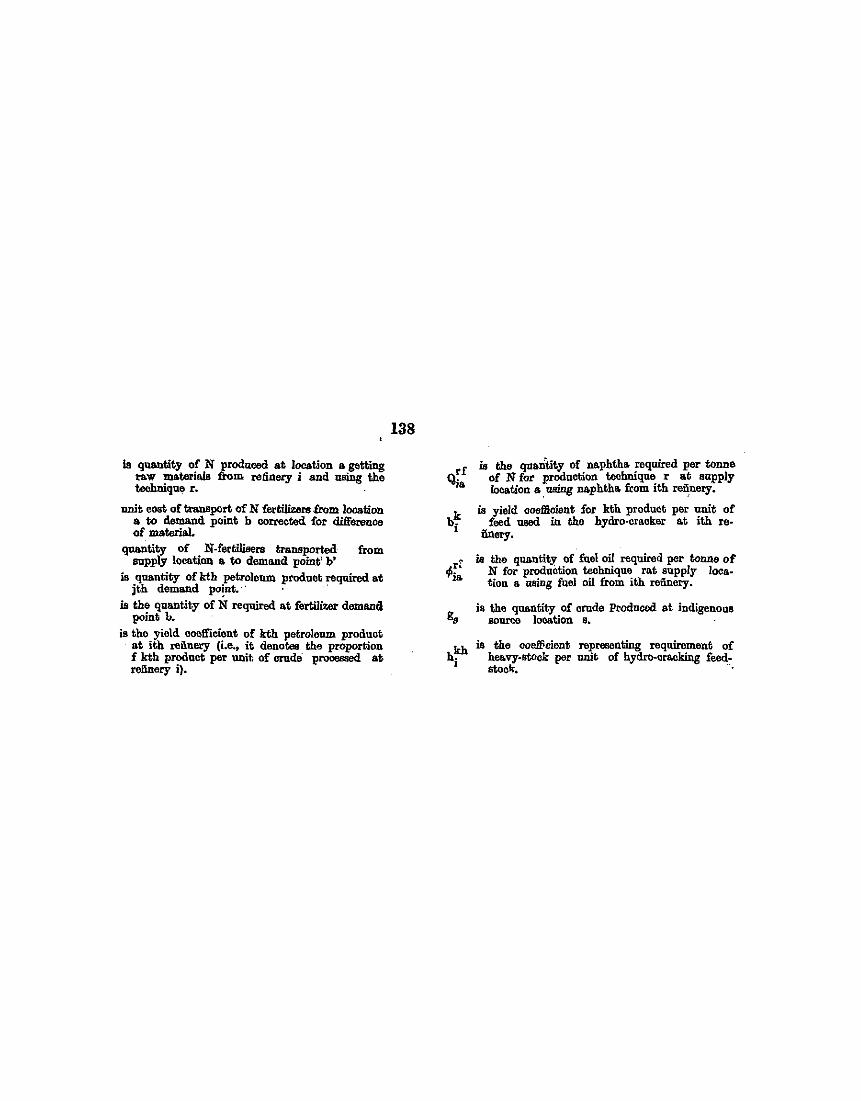
is quantity of N produced at location a getting raw materials from refinery i and using the teohnique r.
anit coot of transport of N fertilizers !rom location a to demand point b corrected for difference of material.
quantity of N-fertilisers tr&DBpOrted from mpply location a to demand point' b'
is qaa.ntity of kth petrolenm product required at jth demand po!nt. · · · ·
is the quantity of N required a.t fertilizer demand point 1..
is the yield coefficient of kth petroleum product at ith refinery (i.e., it denotes the proportion f kth product per unit of crnde precessed at refinery i).
138
b~ 1
h~ 1
is the qcaritity of naphtha required per tonne of N for production technique r at supply location a. using naphtha from ith refinery.
is yield oosffioient for kth product per anit of feed used in the hydro-cracker at ith re
finery.
is the quantity of fuel oil required per tonne ot N for production technique rat supply location a l1lling fuel oil from ith refinery.
is the quantity of crude Produced at indigenous source location s.
is the coo!Fcient representing requirement of heavy-stock per unit of hydro-cracking feedstoc~. ·.
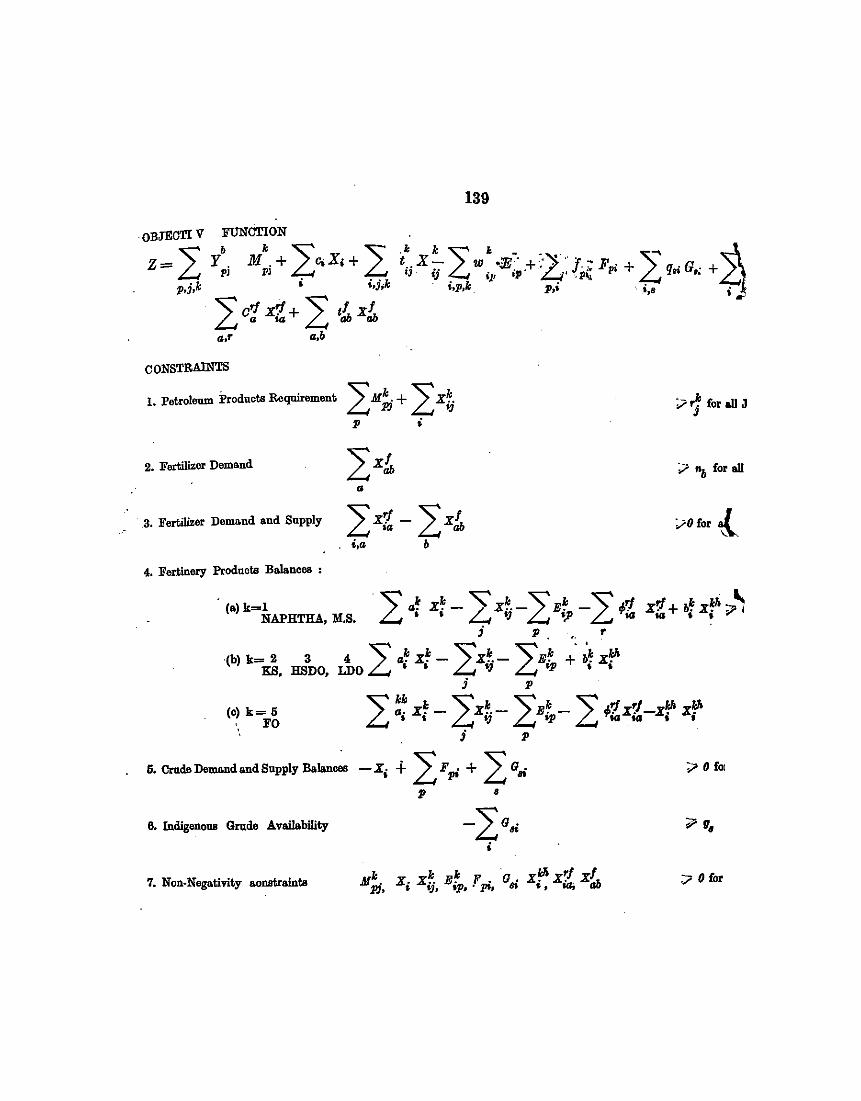
139
CONSTRAINTS
1. Petroleum Products Requirement 2: M~ + LX~ ;.n: for all J
p •
2. Fertilizer Demand L X Jn ;? "b for all
" 3. Fertilizer Demand and Supply L xz - L x[n ;?Ofor {
. i,a b
4. Fertinery Products Balancea :
(a) k=l . """ .. ~ X~ - >>~·-""" E~ -""" ;~/ xrf +bh'f> ~ ~ NAPHTHA, M.S. ~ 1 t SJ L, '.P ~ 1(1 1(1 • I
i p . ,
(b) k= 2 3 4 """ a~ X~ - """X~ - """E~ + b~ xlf> KS, HSDO, LDO ~ • • L ., ~ •P • •
j p
(o) k = 5 """ ~ x~ - """x~.- """E~ - """ ;'1 x~l -xlf> xlf> FO ~·'~OJ ~•P ~ ...... t •
i p
5. Crude Demand and Supply Balanoea -X; + L F pi + L G,; ;:;> 0 fOJ
p •
6. [ndigenons Gmde Availability
7. Non-Negativity aonstr&ints M~ x. x~. E~ F . a. xlf> x~l x!r, pj, t 'J• •P· . ps, 81 I ' ta;
:;;; 0 for