Renewables - An Overview
78
Renewables – An Overview Ameer Abdulhussain Planning Analyst Oman Power & Water Procurement Company
-
Upload
strathclyde -
Category
Documents
-
view
0 -
download
0
Transcript of Renewables - An Overview

Renewables – An Overview
Ameer AbdulhussainPlanning Analyst
Oman Power & Water Procurement Company

Content
•What are “Renewables”?•Why is there so much concern ?
•When did all this start ?•How can renewables be utilized ?
•Who & Where is it currently being utilized ?

What are “Renewables”?
•Refers to sources of energy that are continuously replenished on a human timescale.
•Conversion of the energy that is produced from these renewables sources into an alternate, useful form.
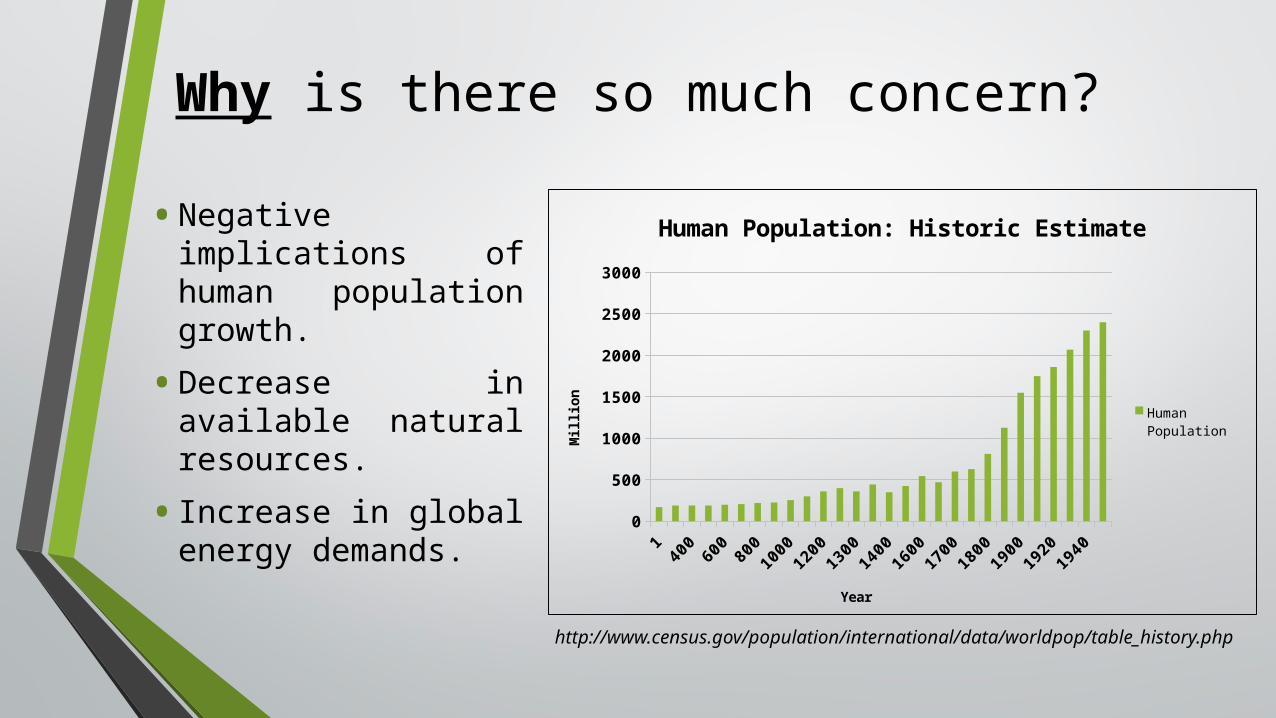
Why is there so much concern?
•Negative implications of human population growth.
•Decrease in available natural resources.
•Increase in global energy demands. 1
4006008001000120013001400160017001800190019201940
0
500
1000
1500
2000
2500
3000
Human Population: Historic Estimate
Human Population
YearMillion
http://www.census.gov/population/international/data/worldpop/table_history.php

1950 1966 1982 1998 2014 2030 2046 2062 2078 20940
5
10
15
20
25
Human Population: Future Projection
World Population
YearBillion
http://esa.un.org/wpp/Excel-Data/population.htm
•If no change to current trend is made with regards to growth in human population, estimates set a figure at 20 billion people by 2100, and increase of 13 billion people in less than 90 years.
Increase in Human Population

Decrease in available resources
• Disappearance of Lake Chad, Nigeria since 1973.
• Most recent Google Earth image of Lake Chad, taken on the 29th of November, 2013.

Decrease in available resources

Increase in global energy consumption
1980198219841986198819901992199419961998200020022004200620082010
02,0004,0006,0008,000
10,00012,00014,00016,00018,00020,000
Electrical Energy Consumption: Historic Estimate
Electrical Energy Consumption
Year
Tril
lion
kW
h
U.S Energy Information Administration: International Energy Statistics

Increase in global energy consumption
2010 2015 2020 2025 2030 2035 20400
5000
10000
15000
20000
25000
30000
35000
40000
45000Electrical Energy Consumption: Future
Projections
Electrical Energy Consumption
Year
Tril
lion
kWh
U.S Energy Information Administration: International Energy Outlook 2013
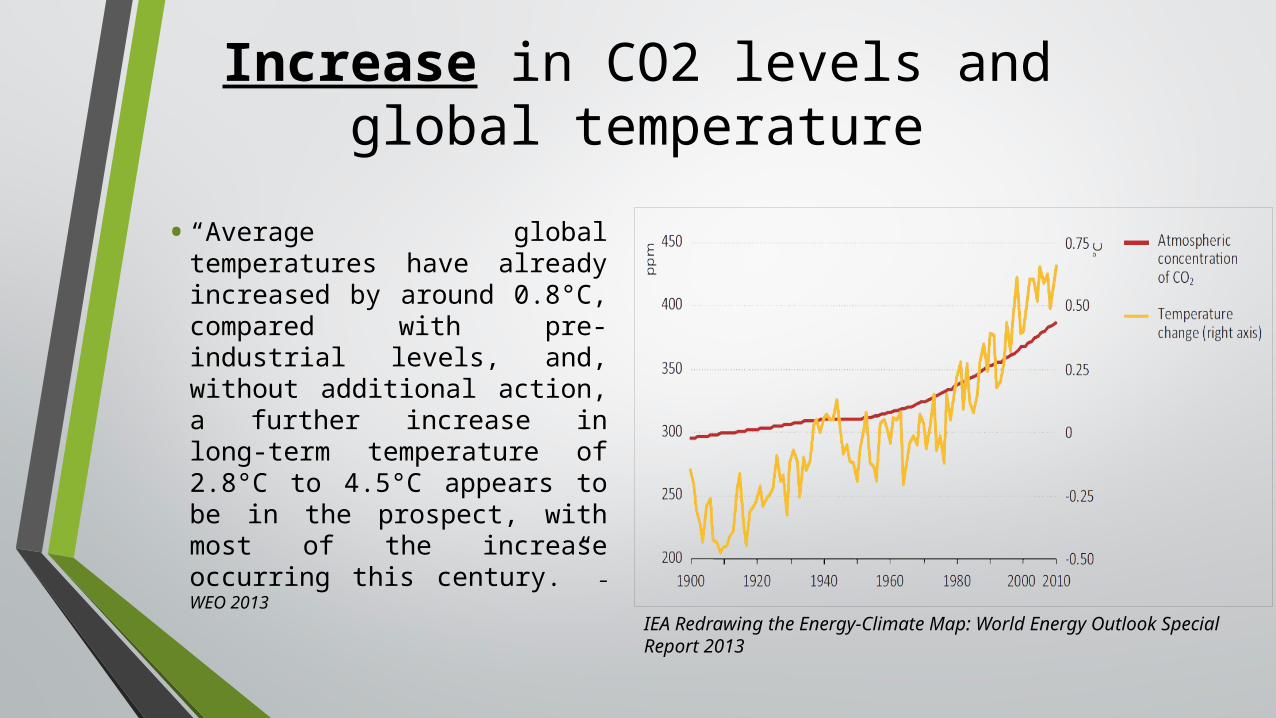
Increase in CO2 levels and global temperature
•“Average global temperatures have already increased by around 0.8°C, compared with pre-industrial levels, and, without additional action, a further increase in long-term temperature of 2.8°C to 4.5°C appears to be in the prospect, with most of the increase occurring this century.” – WEO 2013
IEA Redrawing the Energy-Climate Map: World Energy Outlook Special Report 2013
When did all this start?
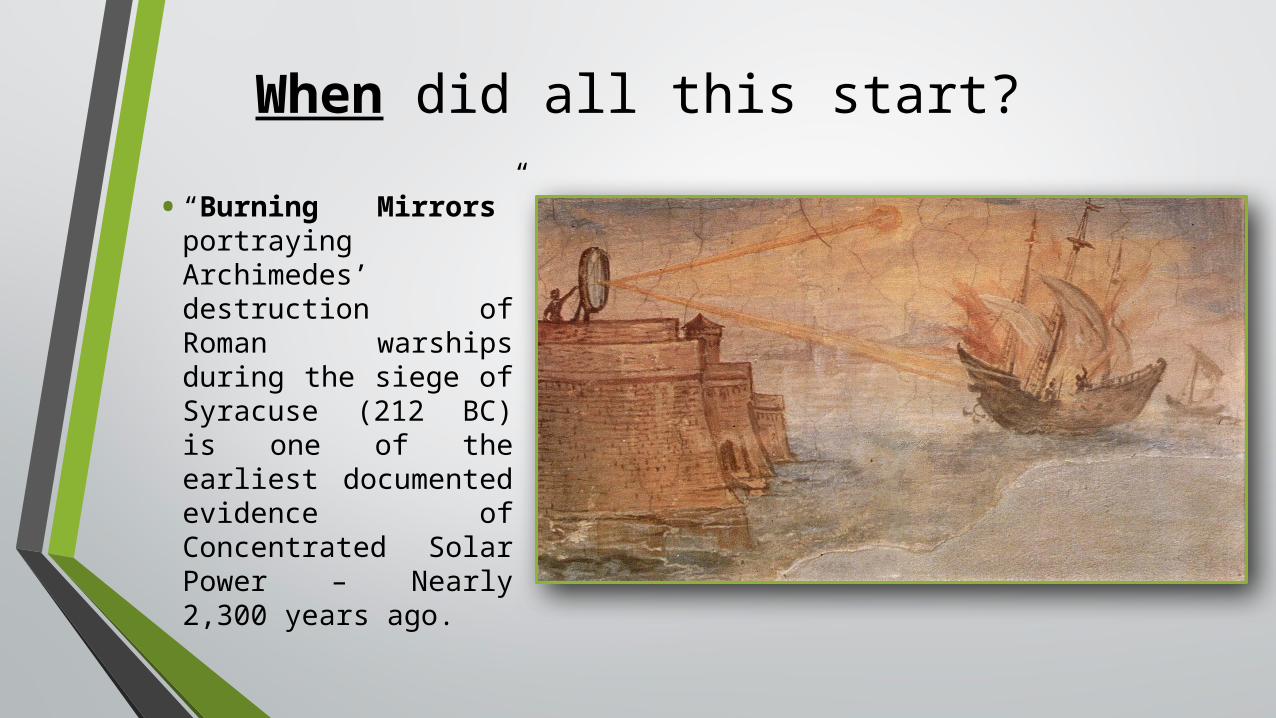
•“Burning Mirrors” portraying Archimedes’ destruction of Roman warships during the siege of Syracuse (212 BC) is one of the earliest documented evidence of Concentrated Solar Power – Nearly 2,300 years ago.

When did all this start?
• 3rd Century BC: Europeans harness water energy to power mills with mechanical energy.
• 500-900 AD: Earliest evidence of windmill design and is Persian in origin.
http://en.wikipedia.org/wiki/Water_wheel#Types
http://telosnet.com/wind/early.html
From Space to Earth (1999): The Story of Solar Electricity by John Perlin
• 1878: Inventor Augustin Mouchot’s solar reflector drove a steam engine at the University Exposition in Paris.
How can renewables be utilized?
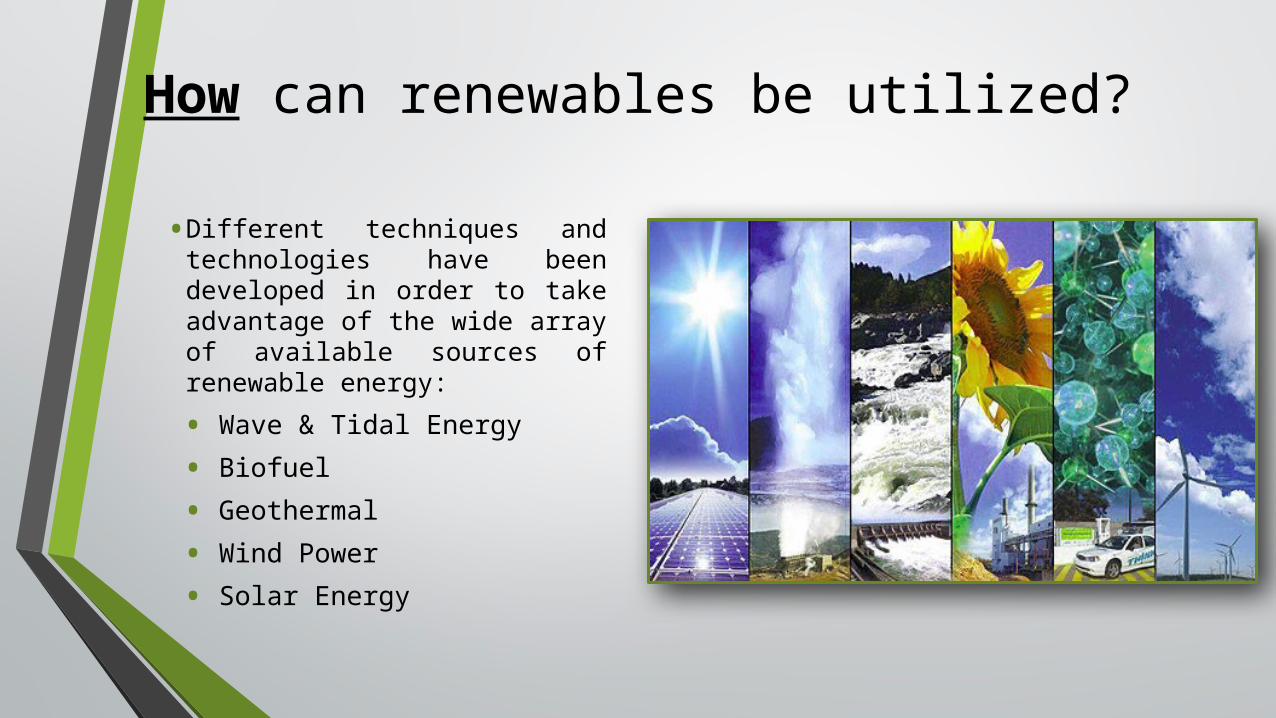
•Different techniques and technologies have been developed in order to take advantage of the wide array of available sources of renewable energy:• Wave & Tidal Energy• Biofuel• Geothermal• Wind Power• Solar Energy

Wave & Tidal Energy• Form of “hydropower” that converts the kinetic energy, that accompanies the movement of water currents in waves and tidal movements, into useful electrical energy.
Free-Flow Underwater Turbine
Pelamis “sea snake”

ProsConsistent powerPollution freeLow operating costsMinimal visual impactEfficientShoreline protection
Wave & Tidal Energy

ConsDevice breakdownHigh initial costsMarine life affectedReduced sea usage
Wave & Tidal Energy

Biofuel
•Biofuel is a fuel that contains energy from recent carbon fixations, such as that which occurs in plants and microalgae.
•Fuels are made by biomass (biological material derived from living, or recently living organisms) conversion.

Biofuel
•Ethanol:• Bioalcohol produced by fermenting
wheat, corn, or sugar.
•Biodiesel:• Produced from oils or fats and is
a liquid similar in composition to fossil/mineral diesel.
•Methane:• Biogas produced by the process of
anaerobic digestion of organic material by anaerobe.

Biofuel
ProsCheap feedstockBiodegradableReady to useEconomic benefitsGHG reductions

Biofuel
ConsGellingHigh costFood pricesFood shortagesWater use

Geothermal
Geothermal Energy Association: Geothermal Basics: Q&A
•Tapping into and converting heat (thermal energy) radiating from the center of the Earth in order to generate electrical energy.
•Temperatures close to the center of the Earth (roughly 6,400 km deep), hover around 5,500˚C – about as hot as the sun’s surface.

Geothermal
•Scientists estimate that 42 million megawatts (MW) of power flow from Earth’s interior.
•It is expected remain for billions of years to come.
U.S Energy Information Administration: International Energy Statistics
05,000,000
10,000,00015,000,00020,000,00025,000,00030,000,00035,000,00040,000,00045,000,000 42,000,000
5,066,765.00200,000
Electrical Capacity in MW
Geothermal ReservesGlobal Installed CapacityInstalled Capacity in the Middle East
MW

Geothermal•Four different ways to utilize geothermal energy to produce electricity:
1. Flash:High-pressure geo-thermal water separates into steam and water as it rises from the depth and pressure drops. The steam and liquid are separated in surface vessel in the plant called a steam separator. The steam is delivered to a steam turbine while the water is injected back into the reservoir.

Geothermal
2. Dry Steam:Steam alone is produced directly from the geothermal reservoir and is used to run the steam turbine that power the generator.

Geothermal
3. Binary:Can be used to generate electricity from geothermal resources lower than 150˚C by using the geothermal water to heat another liquid called a working fluid which boils at a lower temperature than water. When the working fluid vaporizes, the expanding force associated to is, is then diverted to the steam turbine.

Geothermal
4. Flash/Binary:Geothermal fluid is flashed to a mixture of steam and liquid in a steam separator. The steam is fed to a turbine as in a flash-steam generator, while the separated liquid is fed to a binary cycle generator.

Geothermal
ProsHigh availabilityHigh replenishment rateNot subject to fluctuationsCan provide base load
120 MW Nesjavellir Geothermal Power Plant in Iceland

Geothermal
ConsLocation-specificMay release harmful gasesHigh installation CostsCan run out of steam
60 MW Krafla Geothermal Station in Iceland
Wind Power
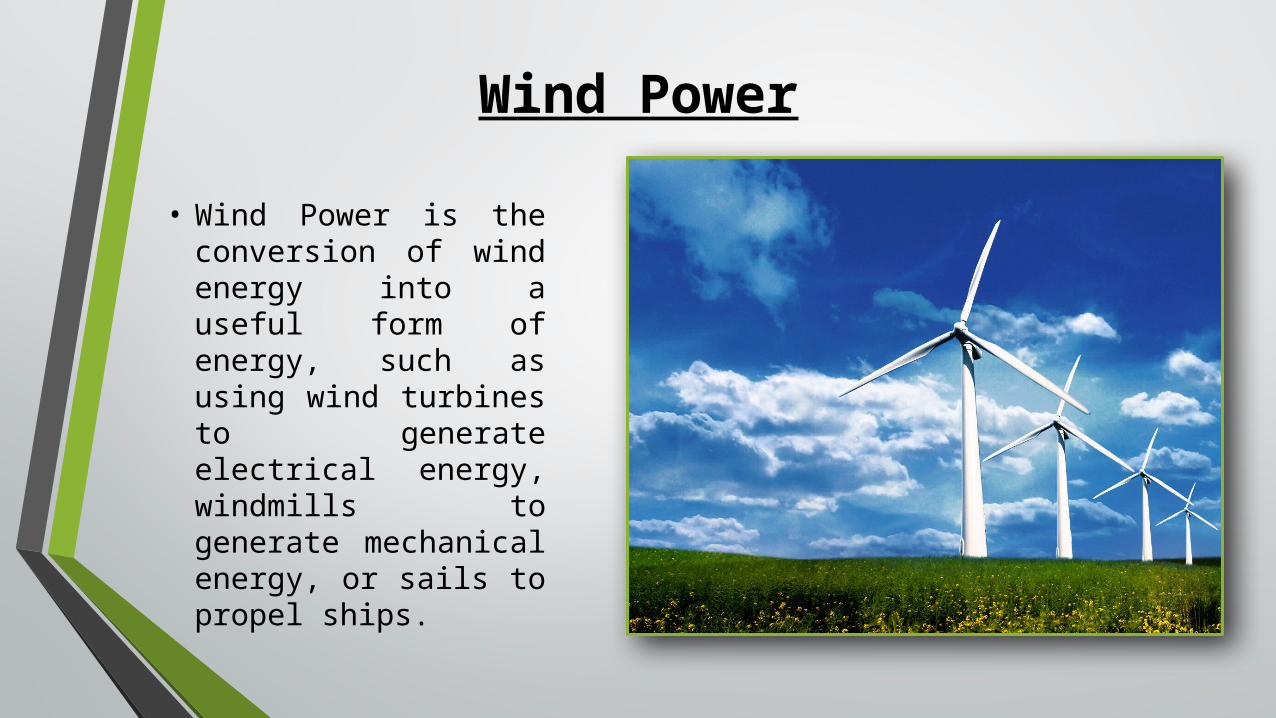
• Wind Power is the conversion of wind energy into a useful form of energy, such as using wind turbines to generate electrical energy, windmills to generate mechanical energy, or sails to propel ships.

Wind Power
• Researches calculated the maximum theoretical potential of wind power worldwide, taking into account the effects that numerous wind turbine would have on surface temperatures, water vapor, atmospheric circulations. Global distribution of annual average onshore wind power potential (w/m2)
for 2006• Concluded that the saturation wind power potential is greater than 250 terawatts globally and 80 TW over land coastal ocean areas at 100 meters in the air.

Wind Turbine Anatomy• Blade.
• Shaped like airplane wings and use the principle of lift to turn wind energy into mechanical energy. Can be as long as 150 feet.
• Rotor.• Central hub in which the
blades are connected to.• Brakes.
• Mechanical brake – used as a parking brake for maintenance or to control rotation of blades during high winds.
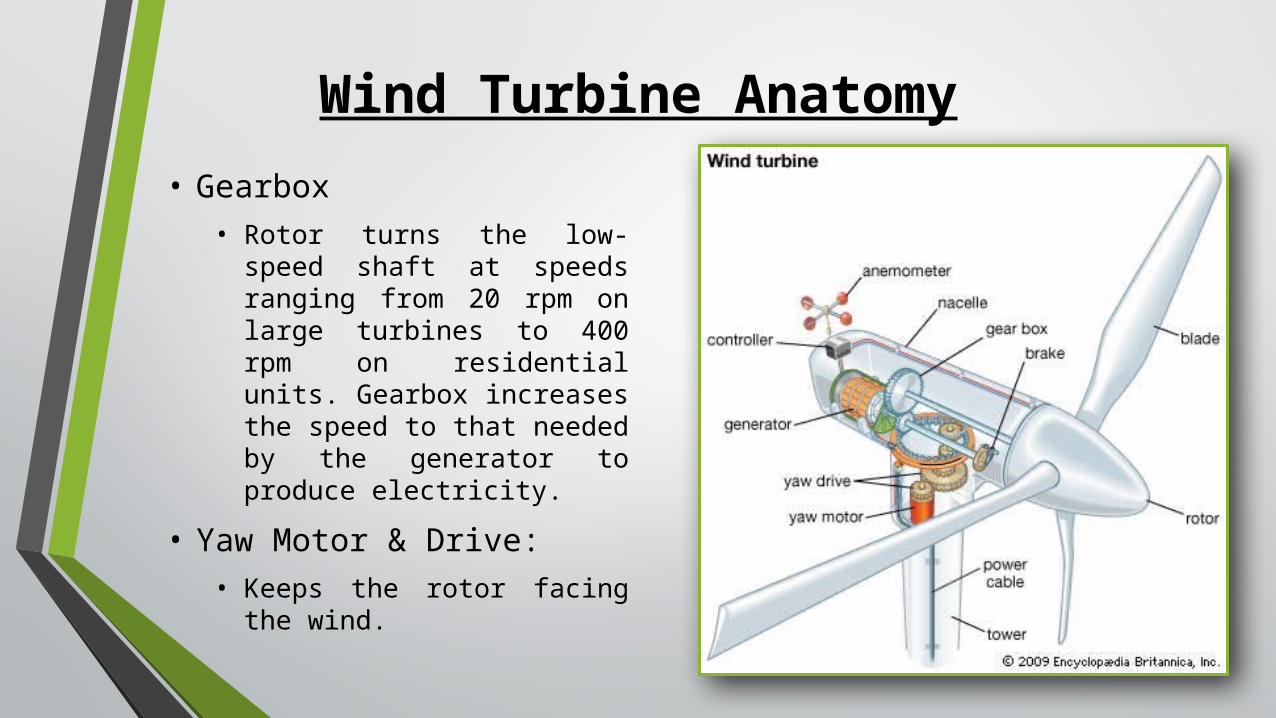
Wind Turbine Anatomy• Gearbox
• Rotor turns the low-speed shaft at speeds ranging from 20 rpm on large turbines to 400 rpm on residential units. Gearbox increases the speed to that needed by the generator to produce electricity.
• Yaw Motor & Drive:• Keeps the rotor facing the wind.
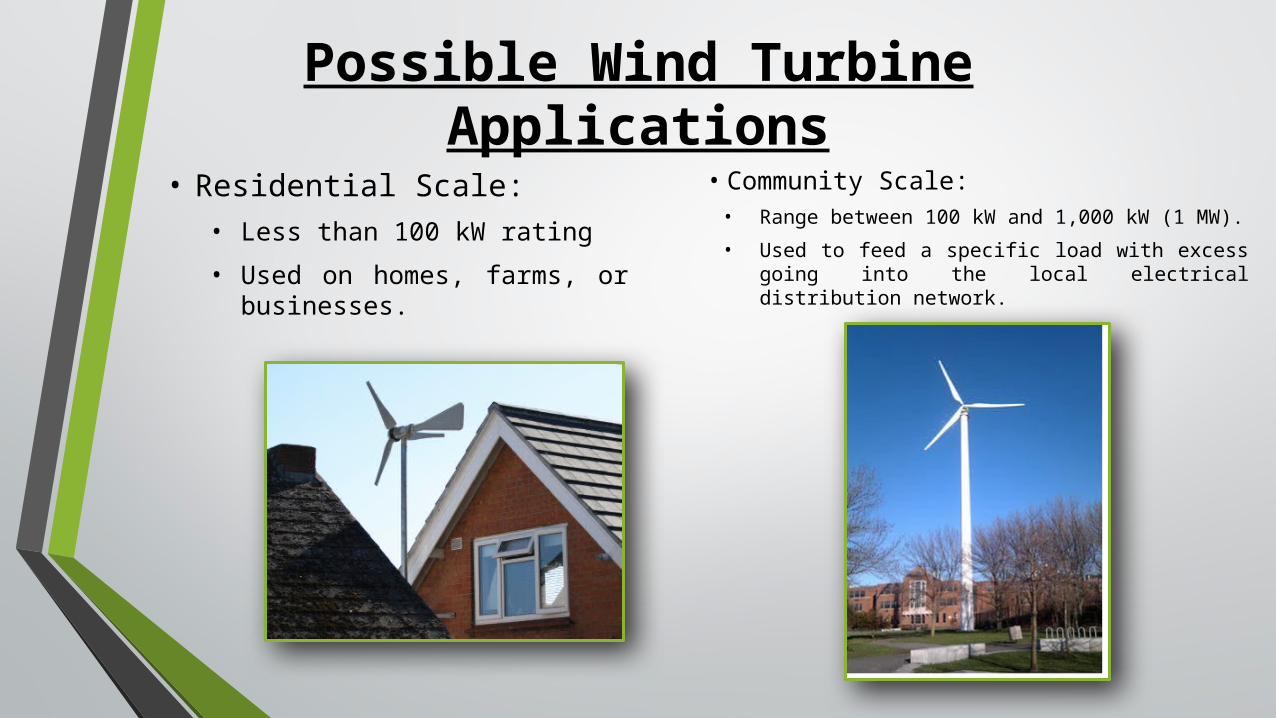
Possible Wind Turbine Applications
• Residential Scale:• Less than 100 kW rating• Used on homes, farms, or
businesses.
• Community Scale:• Range between 100 kW and 1,000 kW (1 MW).• Used to feed a specific load with excess
going into the local electrical distribution network.
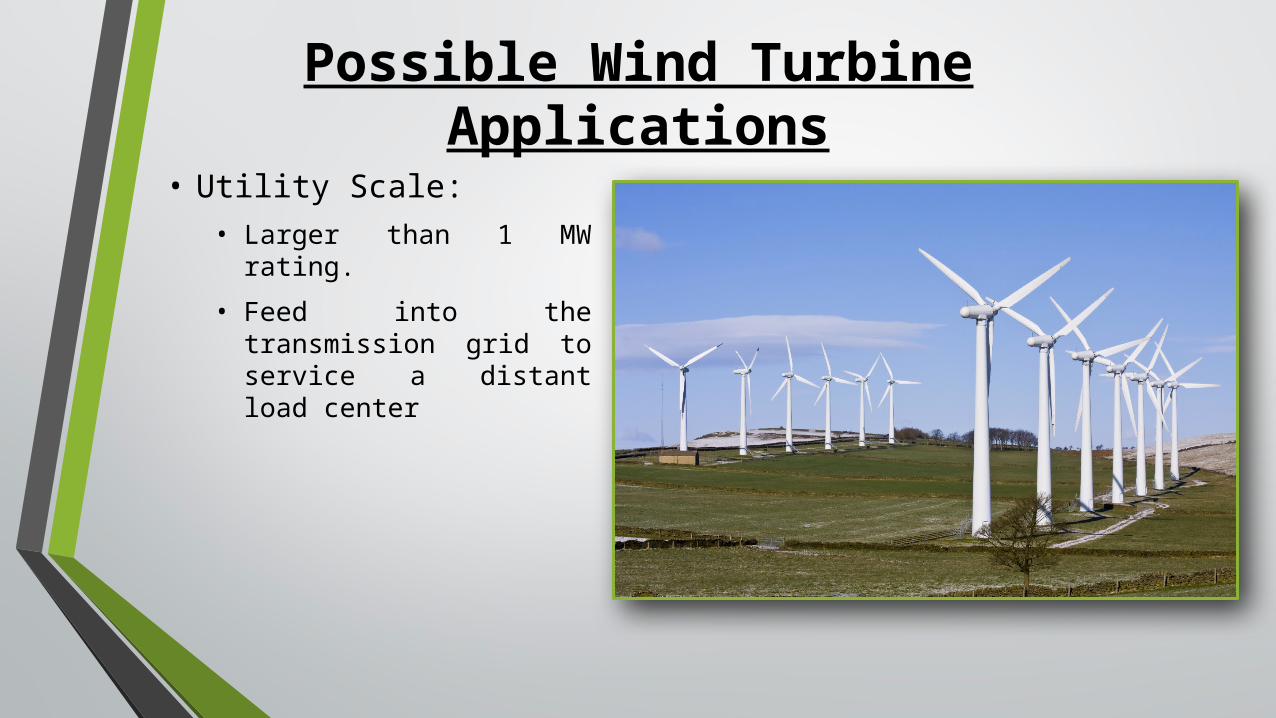
Possible Wind Turbine Applications
• Utility Scale:• Larger than 1 MW rating.
• Feed into the transmission grid to service a distant load center
Wind Power
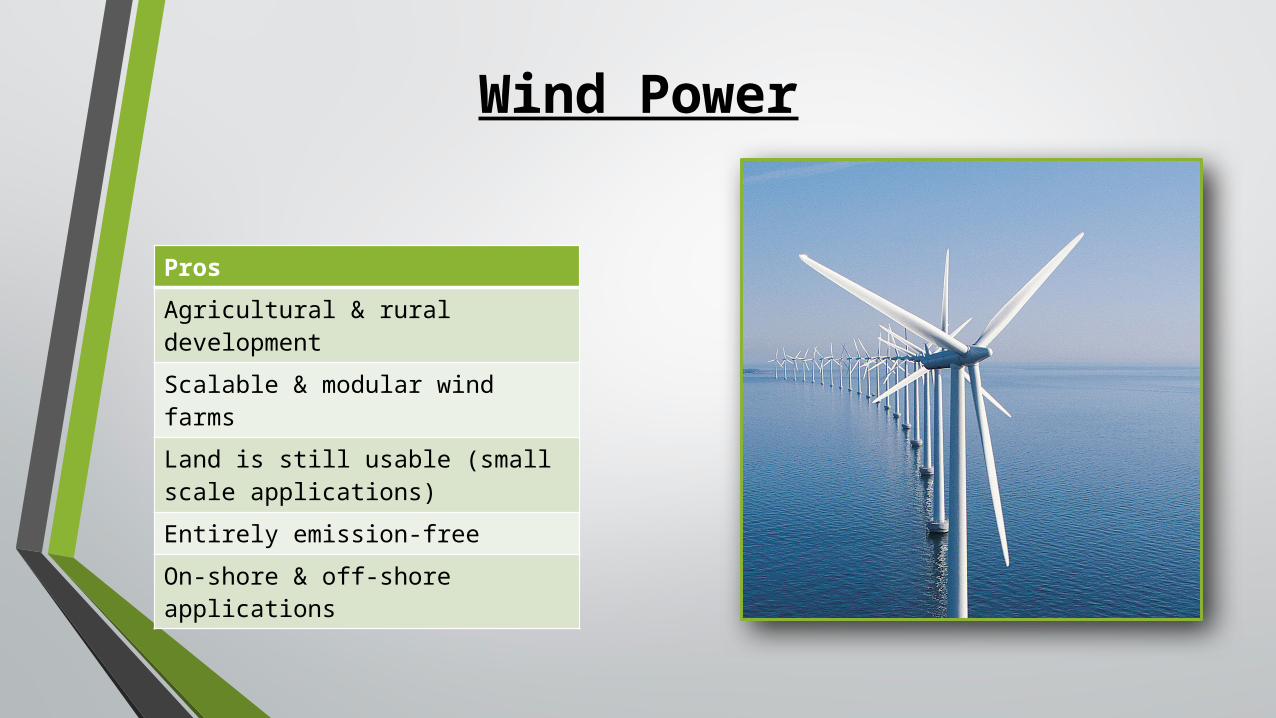
ProsAgricultural & rural developmentScalable & modular wind farmsLand is still usable (small scale applications)Entirely emission-freeOn-shore & off-shore applications

Wind Power
ConsLocation-specificUnpredictable outputProne to damage by lightening strikesPossible noise pollutionPossible danger to birds

Solar Power• Solar Power is the conversion of sunlight into electricity, either directly using photovoltaic (PV), or indirectly using concentrated solar power.
• A third method exists and combines both direct and indirect into concentrated photovoltaic.
• Solar Desalination is another way of utilizing solar energy.

Solar Energy• Scientists estimate that the amount of solar energy that hits the earth in one hour is about the same amount the entire human population consumes annually, roughly 3,850,000 exajoules (1.08 x 10^21 watthours).
• The upper atmosphere receives an additional 30% of that. The additional 30% is reflected back into space and never reaches the Earth’s surface.

Solar Radiation Components• Direct Normal Irradiation (DNI): radiation from the sun that reaches the Earth without scattering.
• Diffuse Horizontal Irradiation (DHI): radiation that is scattered by the atmosphere and clouds.
• Global Horizontal Irradiation (GHI): represents the sum of the diffuse and direct irradiation.

•While applications of Solar Technology depends on solar radiation overall, each type of radiation has a higher effect on the efficiency of a certain type of technology:• Concentrating Solar Technologies:• Direct solar radiation is the primary
consideration in the performance of concentrating solar technologies.
• Advantages:• Potential to develop into high
efficiency-low cost options
• Some technologies are compatible with commercial thermal energy storage technologies, providing dispatchability.
Solar Tower Solar Trough
Solar Technologies

• Flat Plate Photovoltaic (“PV”) Technologies:• This technology is widely used in
areas of low annual average DNI and relatively higher GHI as it can use diffuse solar energy. This allows it to maintain output even in cloudy areas with low direct resource.
• Competing considerations in areas of higher resource as thin film modules perform better in hot environment associated with high direct resource. However, thin film module also require large collectors due to low efficiency and tracking systems can be too expensive for large collectors.
Single Axis Tracking
Mounting System
Fixed Tilt Mounting System
Solar Technologies

Photovoltaics (“PV”)• Photovoltaic cells (solar panels) are made of silicone, a semi-conductor.
• When solar panels are exposed to sunlight, it absorbs some of the sun’s light and knocks free electrons from the silicone bonds.
• Useful electric current is made by manipulating the flow of the electrons.

PV Assembly
• Benefits of the modular assembly of PV is that the potential capacity of a plant/PV installation is limited only by the geographic land available.

Photovoltaics
ProsAutonomously operated with no noise generationMinimum operations & maintenance costsIdeal for distributed power generationSolar peak power generation coincides with peak capacity demand

Photovoltaics
ConsLimited efficiency levelsProduces direct currentInability to store energy on a large scaleInterrupted generation during cloudy days
40 MW Waldpolenz, Germany.

Concentrated Solar Power (CSP)• There are different approaches when utilizing solar energy via CSP:• Solar Tower:
• Directs solar energy via mirrors to the top of a tower that contains water that is heated by the solar energy to produce steam that runs a steam turbine.
• Ability to use both air-cooled and water-cooled systems.
11MW PS10 project near Seville, Spain.

Concentrated Solar Power (CSP)• Solar Trough:
• Solar thermal collector that is curved into a parabola. The solar energy collected is aimed at a focal point where it is absorbed by thermal oil running through an absorber tube.
• The hot oil runs through a heat exchanger to boil water which produces steam to run a steam turbine.
Solar Parabolic Trough.

Concentrated Solar Power (CSP)• Dish Stirling:
• Consists of stand-alone parabolic reflector that concentrates light onto a receiver positioned at the reflector’s focal point.
• Tracks the sun along two-axis.
• Working fluid in the receiver is heated and then used by a Stirling Engine to generate power.
300 MW Solar thermal Plant in California.

Concentrated Solar Power
ProsThermal storage capabilitiesModular systemLow operating costsHigh efficiency
100 MW Shams 1, Abu Dhabi.

Concentrated Solar Power
ConsIntermittentConsiderable amount of space requiredLocation dependentWater requirements
19.9 MW Gemasolar Array Concentrated Solar Plant, Spain.

Solar Desalination• Solar Desalination is a technique to desalinate water using solar energy.
• The choice application depends upon the capacity output desired. Other considerations include the amount of radiation expected, weather conditions and space available.
Low capacity Solar Still.
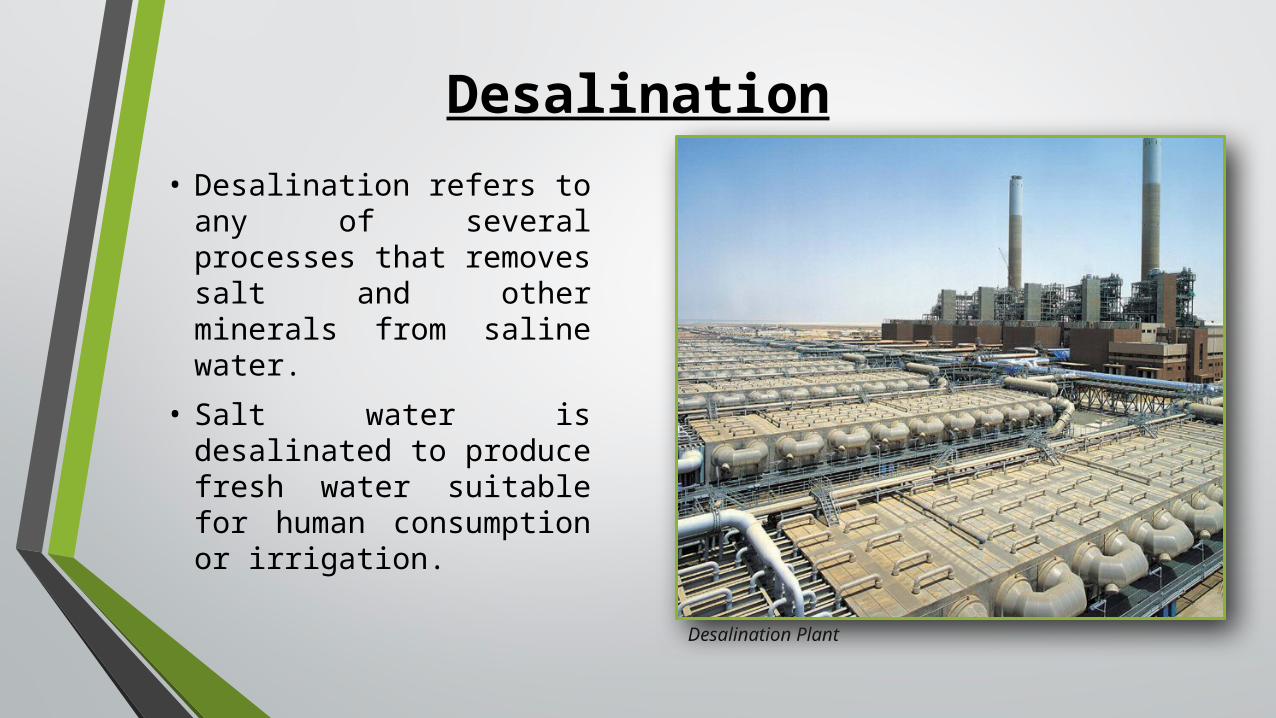
Desalination• Desalination refers to any of several processes that removes salt and other minerals from saline water.
• Salt water is desalinated to produce fresh water suitable for human consumption or irrigation.
Desalination Plant

Conventional Desalination Technologies
• Multi-Stage Flashing (MSF):• Heats sea-water using steam and flows into a vessel called a stage.
Vacuum is applied to this stage which effectively lowers the boiling point water, and when the heated water is introduced to this low-pressure stage, it boils immediately, or “flashes”.
• This continues on for multiple stages.
Desalination Plant

Conventional Desalination Technologies
• Multi-Effect Desalination (MED):• MED, like the MSF process, takes places in a series of vessels (effects)
maintained at decreasing pressure/temperature levels.• Seawater is sprayed onto the outer surface of the evaporator tubes in a
thin film to promote rapid boiling and evaporation, and to avoid scaling.
Desalination Plant

Conventional Desalination Technologies
• Reverse Osmosis (RO):• Osmosis is a natural process where is a semipermeable membrane is placed between two solutions with different salt concentrations, both at the same pressure, a diffusion from the less saline toward the more concentrated solution is produced, following the natural tendency to level the concentration of both solutions.
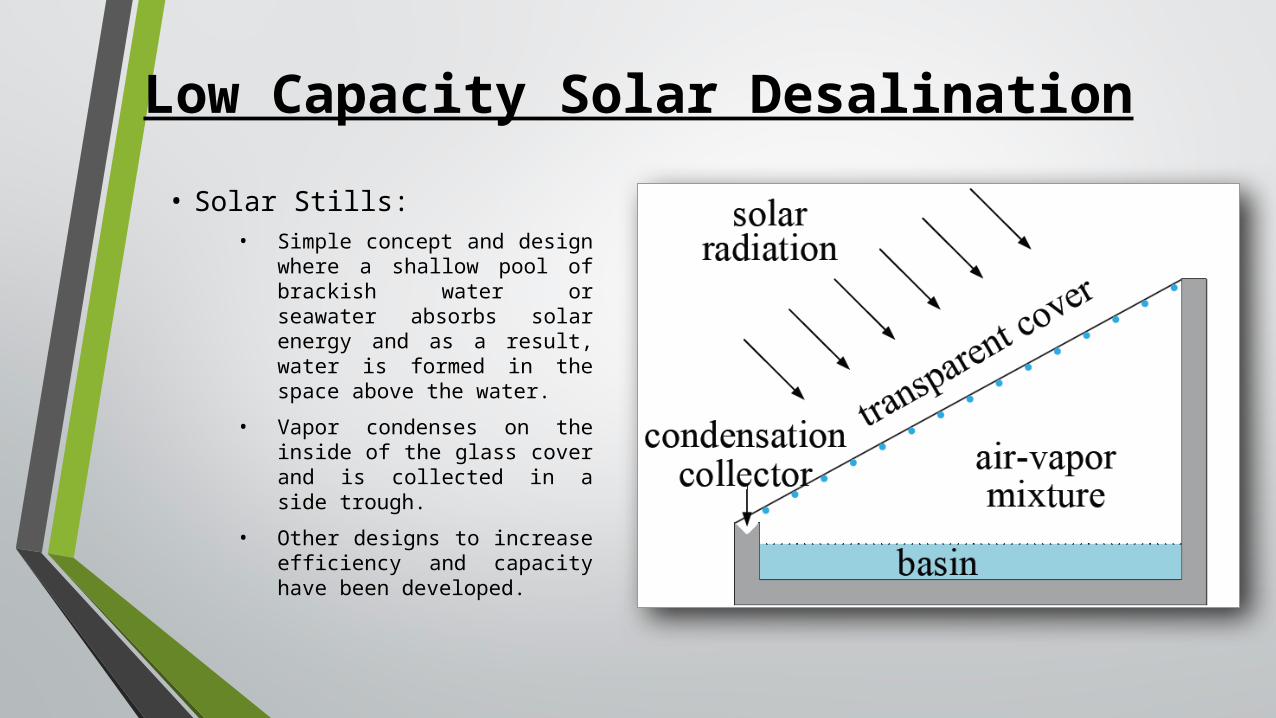
Low Capacity Solar Desalination• Solar Stills:
• Simple concept and design where a shallow pool of brackish water or seawater absorbs solar energy and as a result, water is formed in the space above the water.
• Vapor condenses on the inside of the glass cover and is collected in a side trough.
• Other designs to increase efficiency and capacity have been developed.

Low Capacity Solar Desalination
ProsSimple designAffordable investmentProven technology
ConsRelatively low efficiencyHigh ground area demandLimited system capacity
40 liter/day, Operating since 2006 in Cuba.

High Capacity Solar Desalination
• PV/RO Coupling:• Electrical energy produced
by PV is used to run the high pressure pumps needed for the RO plant.
• While two configurations exists: Stand alone PV-RO plants, & Grid connected PV-RO plants. The latter has the benefits of relying on the electrical grid during night-time & interruptions in solar availability.
40 m3/day, PV-RO: KSAR- GHILÈNE, Tunisia.
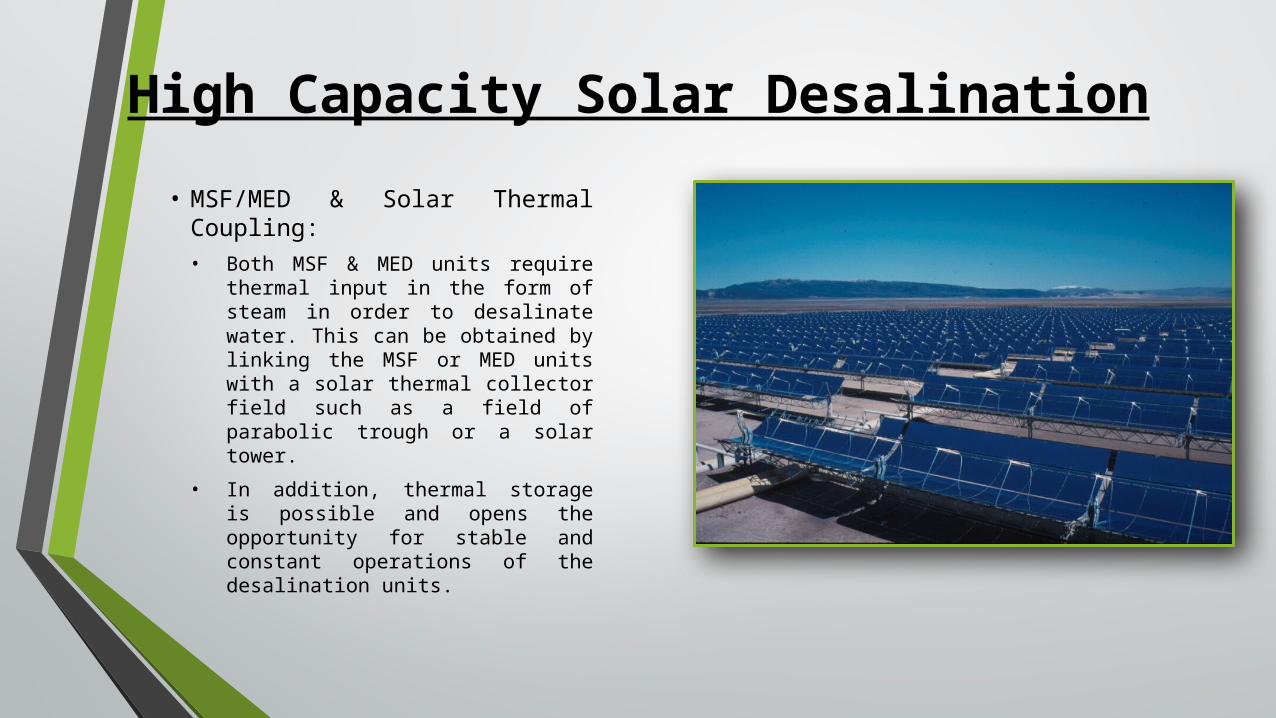
High Capacity Solar Desalination• MSF/MED & Solar Thermal Coupling:• Both MSF & MED units require
thermal input in the form of steam in order to desalinate water. This can be obtained by linking the MSF or MED units with a solar thermal collector field such as a field of parabolic trough or a solar tower.
• In addition, thermal storage is possible and opens the opportunity for stable and constant operations of the desalination units.

Who & where is it currently being utilized?
• Wave Power:• Aguçadoura Wave Farm
• World’s first wave farm• Located west of Porto,
Portugal.• Came into operations in
2008.• 3x750 kW Pelmis units.• 5 km off-shore.• Site no longer operational
due to financial collapse of the project company during the global economic crisis.

Wave Power• E.ON Project at the European Marine Energy Center• Located off the west coast
of the Orkney mainland, Scotland.
• Phase 1 came into operations in 2010.
• First phase: 1x750 kW Pelmis unit.
• 2 km off-shore.• Phase 2 could see an
expansion to 50 MW with up to 66 units.

Tidal Power• Rance Tidal Power Station
• Located at the mouth of the Rance River, in Brittany, France.
• Oldest and second largest tidal power station.
• Came into operations in November, 1966.
• 24x10 MW turbines installed.
• The facility is also a tourist attraction as is attracted 40,000 visitors in 2011.
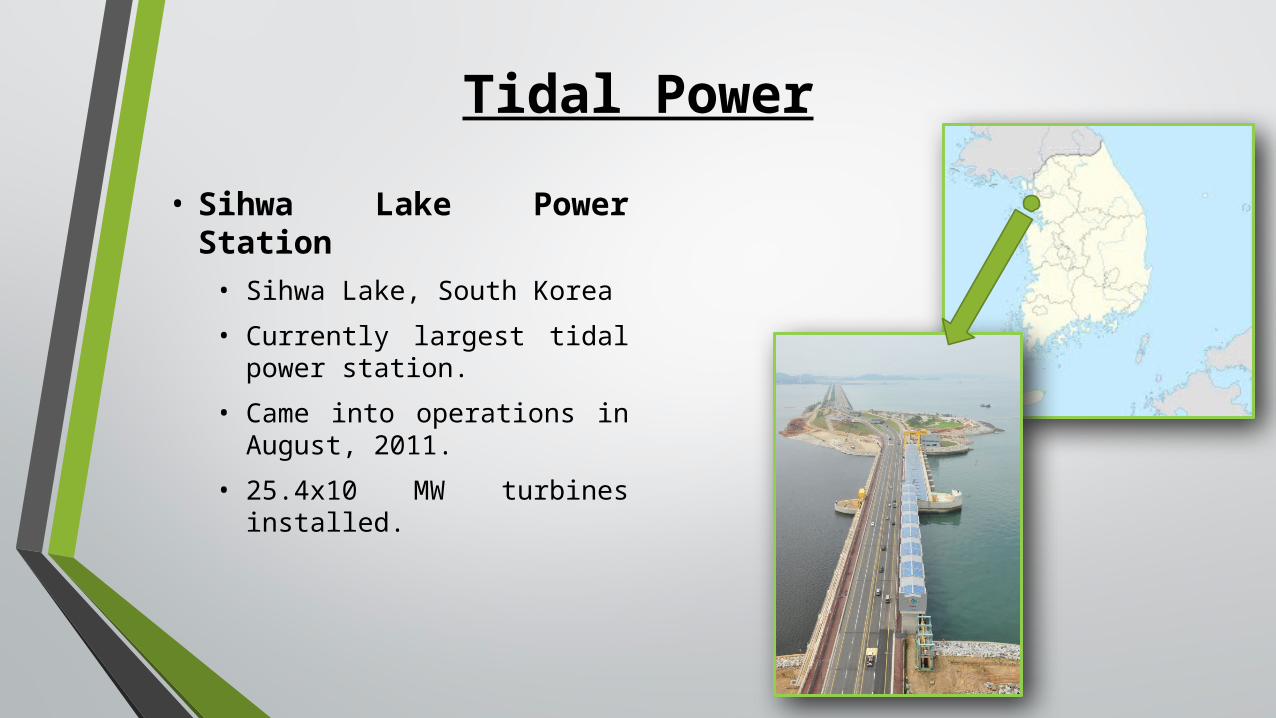
Tidal Power• Sihwa Lake Power Station• Sihwa Lake, South Korea• Currently largest tidal power station.
• Came into operations in August, 2011.
• 25.4x10 MW turbines installed.

Biofuel• Brazil
• Was the top producer of ethanol fuel until 2005.
• In 2009, Brazil produced 35.9% of the world’s total ethanol used as fuel.
• Produced first car with an ethanol engine in 1978 and the airplane engine running on ethanol in 2005.
• Country average for 100% Ethanol Fuel (E100) in 2008 was at 1.51 Brazilian Reals/liter = 0.249 R.O/liter

Biofuel• United States
• Overtook Brazil and became the worlds largest producer of ethanol in 2005.
• Steep growth in twenty-first century ethanol consumption was driven by federal legislation aimed to reduce oil consumption and enhance energy security.
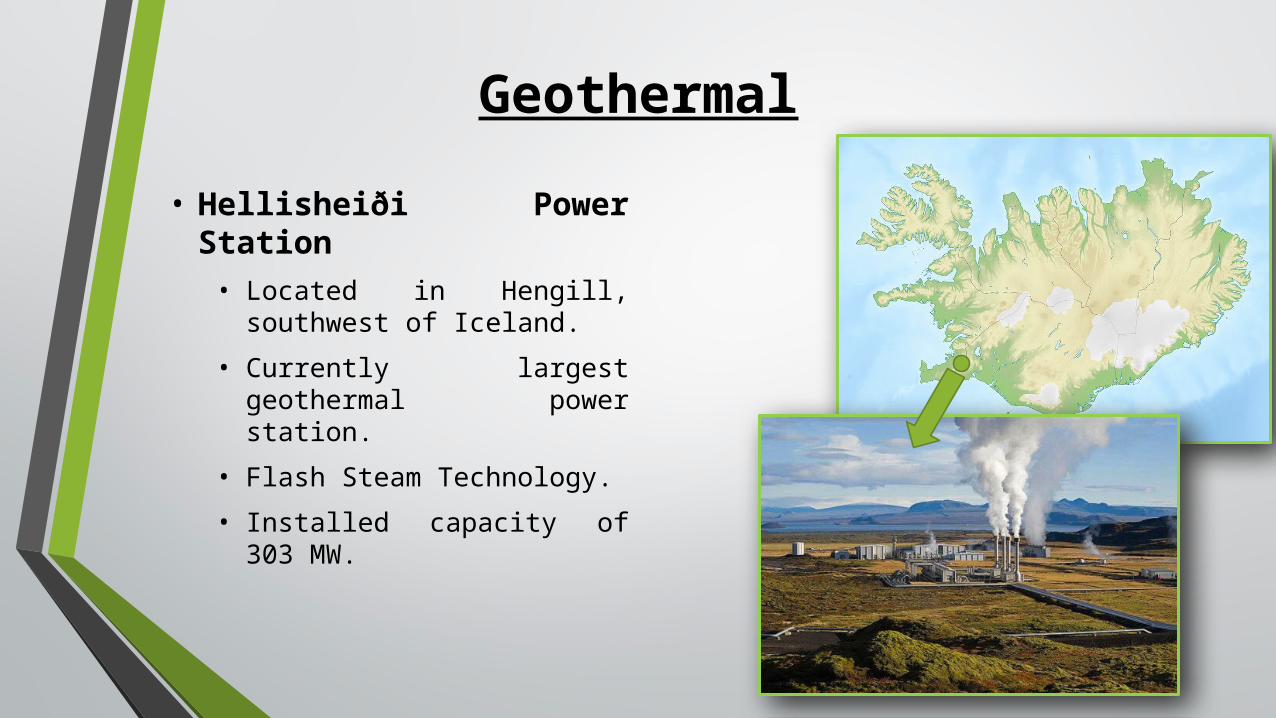
Geothermal• Hellisheiði Power Station• Located in Hengill, southwest of Iceland.
• Currently largest geothermal power station.
• Flash Steam Technology.• Installed capacity of 303 MW.

Geothermal• Malitbog Geothermal Power Station• Located in Malitbog, in the Philippines.
• Second largest geothermal power plant.
• Installed capacity of 232.5 MW.

Wind Power• Alta Wind Energy Center• Located in Tehachapi Pass, California, United States.
• Largest on-shore wind farm.
• Combined installed capacity of 1,320 MW.
• 490 turbines of different sizes currently installed.

Wind Power• London Array
• Located in Thames Estuary, United Kingdom.
• Located more than 20 kilometers off the coast.
• Largest off-shore wind farm.
• Combined installed capacity of 1,000 MW.
• 341 turbines currently installed.

Solar Power• California Valley Solar Valley• Located in northeast of
California Valley, United States
• Current PV site with largest installed capacity.
• 250 MW of installed capacity.• 749,088 PV panels installed.• 1,500 acres of land used for
solar arrays, substation, and facility buildings.

Solar Power• Solar Energy Generating Systems• Located in California,
United States.• Largest solar thermal
energy generating facility in the world.
• 354 MW of installed capacity at 3 different locations.
• 936,384 units of parabolic troughs installed.
• Uses a total land area of 1,600 acres.

• Rural Areas Electricity Company (RAEC) Pilot Projects:• A total of five small-scale pilot projects are at various different stages of development. This is done as part of renewable energy strategy being spearheaded by the Authority for Electricity Regulation.
Local renewable energy applications
Location Technology CapacityAl Mazyonah Solar PV 304 kWMasirah Island Wind Power 500 kWSaih Al Khairat Wind Power 4.2 MWHaima Solar 100 kWAl Mathfa Solar PV 28 kW

• Oman Power & Water Procurement Company (OPWP):• OPWP has set as part of it’s future expansion of generation plants a 200 MW solar plant to be potentially operational by 2017.
• OPWP is currently collecting data from two solar monitoring stations. These two locations (Adam and Manah) were selected as a result of a site selection study.
Local renewable energy applications

How does our solar data compare globally?-Germany
Location Type Project Name Size Avg. Annual DNI
Avg. Annual GHI
Brandenburg-Briest
Solar PV
Brandenburg-Briest
91 MW 2.53 2.73
Finowfurt Solar PV
Finow Tower 84.5 MW
2.56 2.72
Meuro Solar PV
Senftenberg II/III
78 MW 2.58 2.76
DNI GHI02468
Oman - Germany Comparison
Adam Manah Brandenburg-BriestFinowfurt Meuro
Kwh/
m2/d
ay
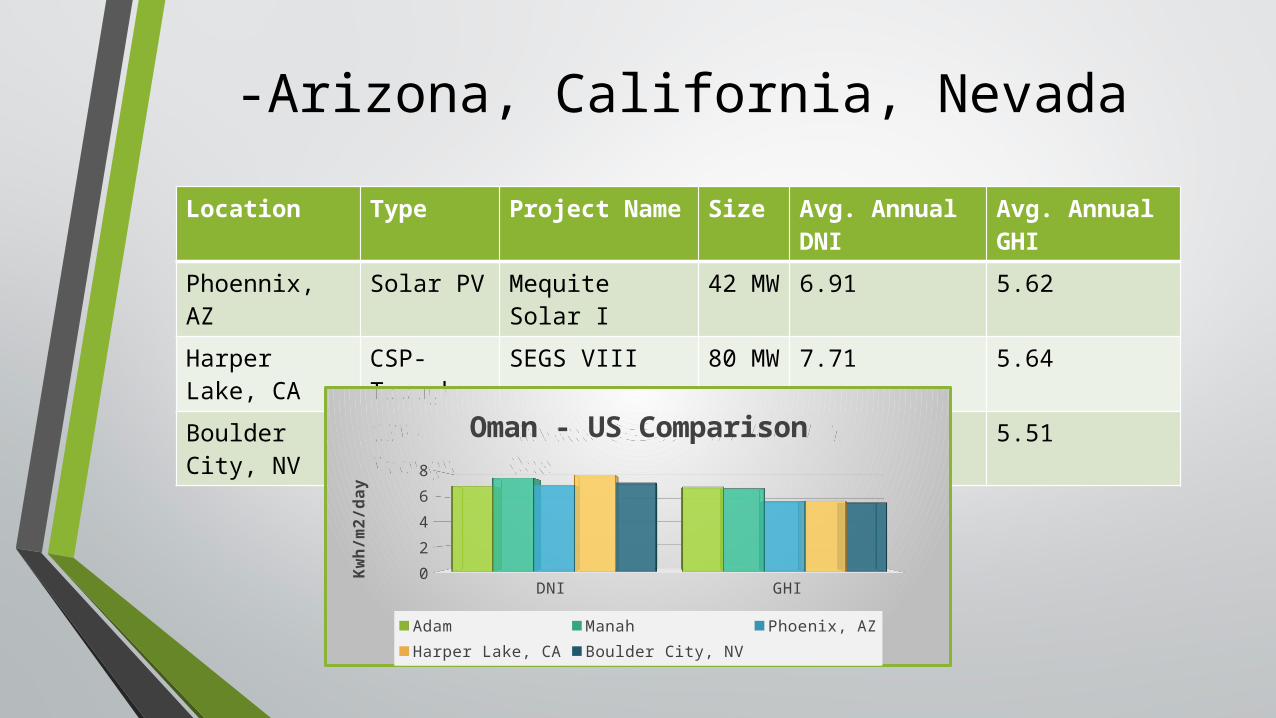
-Arizona, California, NevadaLocation Type Project Name Size Avg. Annual
DNIAvg. Annual GHI
Phoennix, AZ
Solar PV Mequite Solar I
42 MW 6.91 5.62
Harper Lake, CA
CSP-Trough
SEGS VIII 80 MW 7.71 5.64
Boulder City, NV
CSP-Trough
Nevada Solar One
64 MW 7.1 5.51
DNI GHI02468
Oman - US Comparison
Adam Manah Phoenix, AZHarper Lake, CA Boulder City, NV
Kwh/
m2/d
ay

Local renewable energy applications
• Solar Enhanced Oil Recovery (EOR) project:• PDO & Glasspoint.• Located in Amal West field
in southern Oman.• 7 MW solar thermal plant
able to generate 50 tones of steam per day that feeds directly into existing PDO EOR operations.
• Enclosed-parabolic troughs system.

PDO & Glasspoint EOR

Thank you for your attention !