Removal of Brilliant Green Dye from Aqueous Solutions Using Home Made Activated Carbons
12
Tatiana Calvete 1 Eder C. Lima 1 Natali F. Cardoso 1 Silvio L. P. Dias 1 Emerson S. Ribeiro 2 1 Institute of Chemistry, Federal University of Rio Grande do Sul, UFRGS, Porto Alegre, RS, Brazil 2 Institute of Chemistry, Federal University of Rio de Janeiro, UFRJ, Rio de Janeiro, RJ, Brazil Research Article Removal of Brilliant Green Dye from Aqueous Solutions Using Home Made Activated Carbons Activated carbon materials were prepared from the Brazilian pine-fruit shell (Araucaria angustifolia) by chemically activated carbon (CAC) and chemically and physically acti- vated carbon (CPAC), and tested as adsorbents for the removal of brilliant green (BG) dye from aqueous effluents. The mixed activation process leads to increases in the specific surface area, average porous volume, and average porous diameter of the adsorbent CPAC when compared to CAC. The effects of shaking time, adsorbent dosage and pH on the adsorption capacity were studied. BG uptake was favorable at pH values ranging from 2.0 to 10.0 for both CAC and CPAC. The contact time required to obtain the equilibrium using CAC and CPAC as adsorbents was 4 h at 298 K, respectively. The fractionary-order kinetic model provided the best fit to experimental data compared with other models. Equilibrium data were better fit to the Sips and Redlich-Peterson isotherm models using CAC and CPAC as adsorbents. The enthalpy and entropy of adsorption of BG were obtained from adsorption experiments ranging from 298 to 323 K. Keywords: Activated carbon; Adsorption; Brilliant green; Nonlinear isotherms Received: January 19, 2010; revised: March 12, 2010; accepted: March 31, 2010 DOI: 10.1002/clen.201000027 1 Introduction Dyes are a kind of organic compound with a complex aromatic molecular structure that can bring bright and firm color to other substances. However, the complex aromatic molecular structures of dyes make them more stable and more difficult to biodegrade [1, 2]. The extensive use of dyes in different kinds of industries often poses pollution problems in the form of colored wastewater discharged into environmental water bodies [3]. The most efficient method for the removal of synthetic dyes from aqueous effluents is the adsorption procedure [4–6]. This process transfers the dye species from the water effluent to a solid phase thereby keeping the effluent volume to a minimum [7–9]. Subsequently, the adsorbent can be regenerated or stored in a dry place without direct contact with the environment [5–9]. Activated carbon is the most employed adsorbent for toxic species removal from aqueous effluents because of well-developed pore structures and a high internal surface area that leads to its excellent adsorption properties [10, 11]. Besides these physical characteristics, the adsorption capacity is also dependent on the source of organic material employed for the production of the activated carbon [10– 13], as well as the experimental conditions employed in the acti- vation processes [11]. Activated carbon can be prepared using a variety of chemical [14] and physical [15] activation methods and in some cases using a combination of both types of methods [16]. Chemical activation is the process where the carbon precursor material is firstly treated with aqueous solutions of dehydrating agents such as H 3 PO 4 , ZnCl 2 ,H 2 SO 4 , and KOH. Afterward, the carbon material is dried at 373–393 K to eliminate the water. In a subsequent step, the chemi- cally treated carbon material is heated between 673 and 1073 K under nitrogen atmosphere [11, 17]. The physical activation consists of a thermal treatment of previously carbonized material with suitable oxidizing gases, such as air at temperatures in the range of 623–823 or 1073–1373 K using steam and/or carbon dioxide [11, 15]. In recent years, a considerable number of studies have focused on low cost alternative materials for the production of activated car- bons from agricultural wastes such as, cherry stones [12], coconut shell [13, 16, 18–20], rice husk [19], coffee beans [21], corn grain [22], bamboo [23, 24], gingelly (sesame) [25], cotton [25], seed shells [25], apricot stones [26], nutshell [27], oil-palm fiber [28], and vine shoots [29]. In the present work, the use of Brazilian pine-fruit shell (Araucaria angustifolia syn. A. brasiliensis) is proposed as a precursor for the preparation of activated carbon materials by chemical (CAC) and the combination of chemical and physical activation method (CPAC). These adsorbents were successfully used to remove the brilliant green (BG) dye from aqueous solutions. BG is an organic dye belong- ing to the triphenylmethane family. It has extensively been used to dye silk and wool. Due to its large application for coloring special textile fibers, there is a constant interest in removing it from aque- ous solutions (Uses of brilliant green: www.britannica.com/ EBchecked/topic/79627/brilliant-green, accessed March 11th, 2010). Correspondence: Professor E. C. Lima, Institute of Chemistry, Federal University of Rio Grande do Sul, UFRGS, Av. Bento Gonc ¸alves 9500, Caixa Postal 15003, CEP 91501-970, Porto Alegre, RS, Brazil. E-mail: [email protected]; [email protected] Abbreviations: BG, brilliant green; SEM, scanning electron microscopy. CLEAN – Soil, Air, Water 2010, 38 (5–6), 521–532 521 ß 2010 WILEY-VCH Verlag GmbH & Co. KGaA, Weinheim www.clean-journal.com
-
Upload
independent -
Category
Documents
-
view
0 -
download
0
Transcript of Removal of Brilliant Green Dye from Aqueous Solutions Using Home Made Activated Carbons
Tatiana Calvete1
Eder C. Lima1
Natali F. Cardoso1
Silvio L. P. Dias1
Emerson S. Ribeiro2
1Institute of Chemistry, Federal
University of Rio Grande do Sul,
UFRGS, Porto Alegre, RS, Brazil2Institute of Chemistry, Federal
University of Rio de Janeiro, UFRJ,
Rio de Janeiro, RJ, Brazil
Research Article
Removal of Brilliant Green Dye from AqueousSolutions Using Home Made Activated Carbons
Activated carbon materials were prepared from the Brazilian pine-fruit shell (Araucaria
angustifolia) by chemically activated carbon (CAC) and chemically and physically acti-
vated carbon (CPAC), and tested as adsorbents for the removal of brilliant green (BG) dye
from aqueous effluents. The mixed activation process leads to increases in the specific
surface area, average porous volume, and average porous diameter of the adsorbent
CPAC when compared to CAC. The effects of shaking time, adsorbent dosage and pH on
the adsorption capacity were studied. BG uptake was favorable at pH values ranging
from 2.0 to 10.0 for both CAC and CPAC. The contact time required to obtain the
equilibrium using CAC and CPAC as adsorbents was 4 h at 298 K, respectively. The
fractionary-order kinetic model provided the best fit to experimental data compared
with other models. Equilibrium data were better fit to the Sips and Redlich-Peterson
isotherm models using CAC and CPAC as adsorbents. The enthalpy and entropy of
adsorption of BG were obtained from adsorption experiments ranging from 298 to
323 K.
Keywords: Activated carbon; Adsorption; Brilliant green; Nonlinear isotherms
Received: January 19, 2010; revised: March 12, 2010; accepted: March 31, 2010
DOI: 10.1002/clen.201000027
1 Introduction
Dyes are a kind of organic compound with a complex aromatic
molecular structure that can bring bright and firm color to other
substances. However, the complex aromatic molecular structures of
dyes make them more stable and more difficult to biodegrade [1, 2].
The extensive use of dyes in different kinds of industries often poses
pollution problems in the form of colored wastewater discharged
into environmental water bodies [3].
The most efficient method for the removal of synthetic dyes from
aqueous effluents is the adsorption procedure [4–6]. This process
transfers the dye species from the water effluent to a solid phase
thereby keeping the effluent volume to a minimum [7–9].
Subsequently, the adsorbent can be regenerated or stored in a dry
place without direct contact with the environment [5–9].
Activated carbon is the most employed adsorbent for toxic species
removal from aqueous effluents because of well-developed pore
structures and a high internal surface area that leads to its excellent
adsorption properties [10, 11]. Besides these physical characteristics,
the adsorption capacity is also dependent on the source of organic
material employed for the production of the activated carbon [10–
13], as well as the experimental conditions employed in the acti-
vation processes [11].
Activated carbon can be prepared using a variety of chemical [14]
and physical [15] activation methods and in some cases using a
combination of both types of methods [16]. Chemical activation is
the process where the carbon precursor material is firstly treated
with aqueous solutions of dehydrating agents such as H3PO4,
ZnCl2, H2SO4, and KOH. Afterward, the carbon material is dried at
373–393 K to eliminate the water. In a subsequent step, the chemi-
cally treated carbon material is heated between 673 and 1073 K
under nitrogen atmosphere [11, 17]. The physical activation consists
of a thermal treatment of previously carbonized material with
suitable oxidizing gases, such as air at temperatures in the range
of 623–823 or 1073–1373 K using steam and/or carbon dioxide
[11, 15].
In recent years, a considerable number of studies have focused on
low cost alternative materials for the production of activated car-
bons from agricultural wastes such as, cherry stones [12], coconut
shell [13, 16, 18–20], rice husk [19], coffee beans [21], corn grain [22],
bamboo [23, 24], gingelly (sesame) [25], cotton [25], seed shells [25],
apricot stones [26], nutshell [27], oil-palm fiber [28], and vine shoots
[29].
In the present work, the use of Brazilian pine-fruit shell (Araucaria
angustifolia syn. A. brasiliensis) is proposed as a precursor for the
preparation of activated carbon materials by chemical (CAC) and
the combination of chemical and physical activationmethod (CPAC).
These adsorbents were successfully used to remove the brilliant
green (BG) dye from aqueous solutions. BG is an organic dye belong-
ing to the triphenylmethane family. It has extensively been used to
dye silk and wool. Due to its large application for coloring special
textile fibers, there is a constant interest in removing it from aque-
ous solutions (Uses of brilliant green: www.britannica.com/
EBchecked/topic/79627/brilliant-green, accessed March 11th, 2010).
Correspondence: Professor E. C. Lima, Institute of Chemistry, FederalUniversity of Rio Grande do Sul, UFRGS, Av. Bento Goncalves 9500, CaixaPostal 15003, CEP 91501-970, Porto Alegre, RS, Brazil.E-mail: [email protected]; [email protected]
Abbreviations: BG, brilliant green; SEM, scanning electron microscopy.
CLEAN – Soil, Air, Water 2010, 38 (5–6), 521–532 521
� 2010 WILEY-VCH Verlag GmbH & Co. KGaA, Weinheim www.clean-journal.com
Equilibrium, kinetic, and thermodynamic data of the adsorption
process of the dye onto the adsorbents were investigated.
2 Materials and Methods
2.1 Solutions and Reagents
De-ionized water was used throughout the experiments for all
solution preparations. BG, also known as Basic Green 1 (C.I.
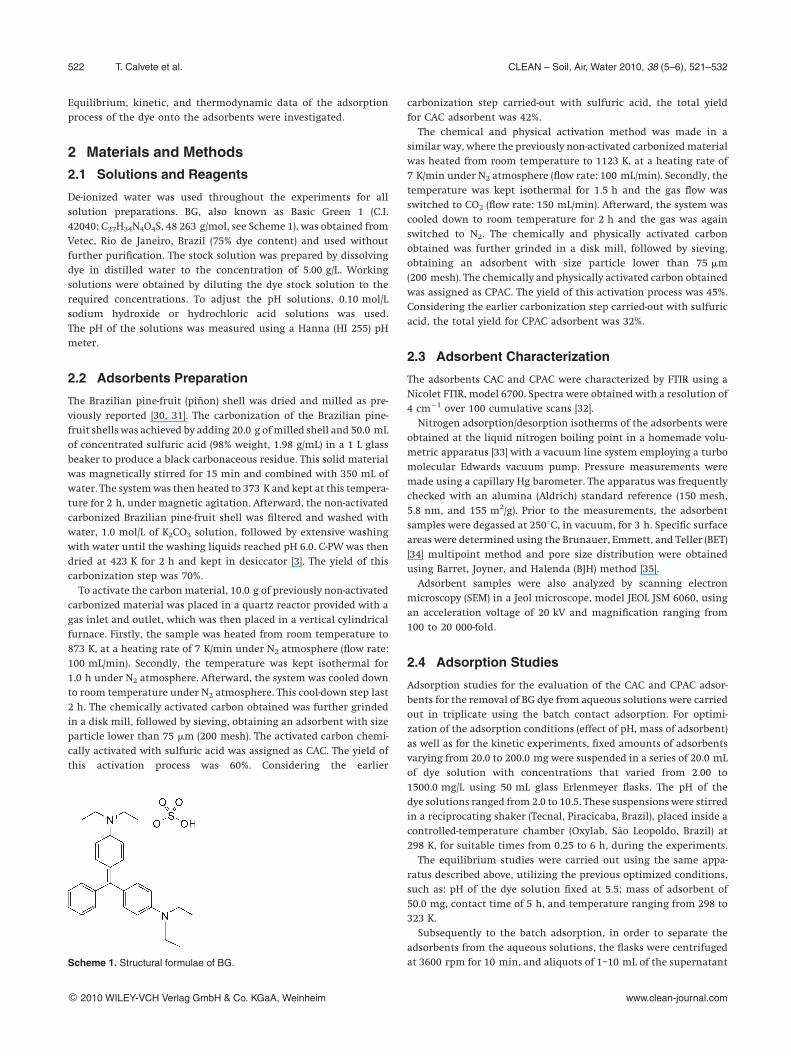
42040; C27H34N4O4S, 48 263 g/mol, see Scheme 1), was obtained from
Vetec, Rio de Janeiro, Brazil (75% dye content) and used without
further purification. The stock solution was prepared by dissolving
dye in distilled water to the concentration of 5.00 g/L. Working
solutions were obtained by diluting the dye stock solution to the
required concentrations. To adjust the pH solutions, 0.10 mol/L
sodium hydroxide or hydrochloric acid solutions was used.
The pH of the solutions was measured using a Hanna (HI 255) pH
meter.
2.2 Adsorbents Preparation
The Brazilian pine-fruit (pinon) shell was dried and milled as pre-
viously reported [30, 31]. The carbonization of the Brazilian pine-
fruit shells was achieved by adding 20.0 g ofmilled shell and 50.0 mL
of concentrated sulfuric acid (98% weight, 1.98 g/mL) in a 1 L glass
beaker to produce a black carbonaceous residue. This solid material
was magnetically stirred for 15 min and combined with 350 mL of
water. The systemwas then heated to 373 K and kept at this tempera-
ture for 2 h, under magnetic agitation. Afterward, the non-activated
carbonized Brazilian pine-fruit shell was filtered and washed with
water, 1.0 mol/L of K2CO3 solution, followed by extensive washing
with water until the washing liquids reached pH 6.0. C-PW was then
dried at 423 K for 2 h and kept in desiccator [3]. The yield of this
carbonization step was 70%.
To activate the carbonmaterial, 10.0 g of previously non-activated
carbonized material was placed in a quartz reactor provided with a
gas inlet and outlet, which was then placed in a vertical cylindrical
furnace. Firstly, the sample was heated from room temperature to
873 K, at a heating rate of 7 K/min under N2 atmosphere (flow rate:
100 mL/min). Secondly, the temperature was kept isothermal for
1.0 h under N2 atmosphere. Afterward, the system was cooled down
to room temperature under N2 atmosphere. This cool-down step last
2 h. The chemically activated carbon obtained was further grinded
in a disk mill, followed by sieving, obtaining an adsorbent with size
particle lower than 75 mm (200 mesh). The activated carbon chemi-
cally activated with sulfuric acid was assigned as CAC. The yield of
this activation process was 60%. Considering the earlier
carbonization step carried-out with sulfuric acid, the total yield
for CAC adsorbent was 42%.
The chemical and physical activation method was made in a
similar way, where the previously non-activated carbonizedmaterial
was heated from room temperature to 1123 K, at a heating rate of
7 K/min under N2 atmosphere (flow rate: 100 mL/min). Secondly, the
temperature was kept isothermal for 1.5 h and the gas flow was
switched to CO2 (flow rate: 150 mL/min). Afterward, the system was
cooled down to room temperature for 2 h and the gas was again
switched to N2. The chemically and physically activated carbon
obtained was further grinded in a disk mill, followed by sieving,
obtaining an adsorbent with size particle lower than 75 mm
(200 mesh). The chemically and physically activated carbon obtained
was assigned as CPAC. The yield of this activation process was 45%.
Considering the earlier carbonization step carried-out with sulfuric
acid, the total yield for CPAC adsorbent was 32%.
2.3 Adsorbent Characterization
The adsorbents CAC and CPAC were characterized by FTIR using a
Nicolet FTIR, model 6700. Spectra were obtained with a resolution of
4 cm�1 over 100 cumulative scans [32].
Nitrogen adsorption/desorption isotherms of the adsorbents were
obtained at the liquid nitrogen boiling point in a homemade volu-
metric apparatus [33] with a vacuum line system employing a turbo
molecular Edwards vacuum pump. Pressure measurements were
made using a capillary Hg barometer. The apparatus was frequently
checked with an alumina (Aldrich) standard reference (150 mesh,
5.8 nm, and 155 m2/g). Prior to the measurements, the adsorbent
samples were degassed at 2508C, in vacuum, for 3 h. Specific surface
areas were determined using the Brunauer, Emmett, and Teller (BET)
[34] multipoint method and pore size distribution were obtained
using Barret, Joyner, and Halenda (BJH) method [35].
Adsorbent samples were also analyzed by scanning electron
microscopy (SEM) in a Jeol microscope, model JEOL JSM 6060, using
an acceleration voltage of 20 kV and magnification ranging from
100 to 20 000-fold.
2.4 Adsorption Studies
Adsorption studies for the evaluation of the CAC and CPAC adsor-
bents for the removal of BG dye from aqueous solutions were carried
out in triplicate using the batch contact adsorption. For optimi-
zation of the adsorption conditions (effect of pH, mass of adsorbent)
as well as for the kinetic experiments, fixed amounts of adsorbents
varying from 20.0 to 200.0 mg were suspended in a series of 20.0 mL
of dye solution with concentrations that varied from 2.00 to
1500.0 mg/L using 50 mL glass Erlenmeyer flasks. The pH of the
dye solutions ranged from 2.0 to 10.5. These suspensions were stirred
in a reciprocating shaker (Tecnal, Piracicaba, Brazil), placed inside a
controlled-temperature chamber (Oxylab, Sao Leopoldo, Brazil) at
298 K, for suitable times from 0.25 to 6 h, during the experiments.
The equilibrium studies were carried out using the same appa-
ratus described above, utilizing the previous optimized conditions,
such as: pH of the dye solution fixed at 5.5; mass of adsorbent of
50.0 mg, contact time of 5 h, and temperature ranging from 298 to
323 K.
Subsequently to the batch adsorption, in order to separate the
adsorbents from the aqueous solutions, the flasks were centrifuged
at 3600 rpm for 10 min, and aliquots of 1–10 mL of the supernatantScheme 1. Structural formulae of BG.
522 T. Calvete et al. CLEAN – Soil, Air, Water 2010, 38 (5–6), 521–532
� 2010 WILEY-VCH Verlag GmbH & Co. KGaA, Weinheim www.clean-journal.com

were properly dilutedwith water. The final concentrations of the dye
remaining in the solutions were determined by visible spectropho-
tometry, using a Femto spectrophotometer provided with optical-
glass cells. Absorbance measurements were made at the maximum
wavelength of BG which was 621 nm. The BG detection limit using
the spectrophotometric method, determined according to IUPAC
[36], was 0.18 mg/L. The amount of the dye uptake and percentage
of the removal of dye by the adsorbents was calculated by applying
the Eqs. (1) and (2), respectively:
q ¼ Co � Cfð Þm
V (1)
%Removal ¼ 100Co � Cfð Þ
Co(2)
where q is the amount of dye taken up by the adsorbents (mg/g); Cothe initial BG concentration put in contact with the adsorbent
(mg/L), Cf the dye concentration (mg/L) after the batch adsorption
procedure, V the volume of dye solution (L) put in contact with the
adsorbent, and m is the mass (g) of the adsorbent.
2.5 Kinetic and Equilibrium Models
2.5.1 Equilibrium Isotherms
Avrami, pseudo first-order, pseudo second-order, Elovich and intra-
particle diffusion model kinetic equations are given in Tab. 1 [37].
Langmuir, Freundlich, Sips, and Redlich-Peterson isotherm
equations are given in Tab. 2 [38].
2.6 Statistical Evaluation of the Kinetic and
Isotherm Parameters
Kinetic and equilibrium models were fit employing the nonlinear
fitting method using the nonlinear fitting facilities of the software
Microcal Origin 7.0. In addition, models were also evaluated by an
error function [39] that measures the differences in the amount of
dye taken up by the adsorbent predicted by the models and the
actual q measured experimentally.
Ferrorð%Þ ¼ 100�ffiffiffiffiffiffiffiffiffiffiffiffiffiffiffiffiffiffiffiffiffiffiffiffiffiffiffiffiffiffiffiffiffiffiffiffiffiffiffiffiffiffiffiffiffiffiffiffiffiffiffiffiffiffiffiffiffiffiffiffiffiffiffiffiffiXni
qi;exp � qi;model
qi;exp
� �2 1
n� p
� �s(3)
where qi,model is the value of q predicted by the fittedmodel and qi,expis the value of q measured experimentally, and n is the number of
experiments performed and p is the number of fitted parameters.
3 Results and Discussion
3.1 Characterization of the Adsorbents
FTIR technique was used to examine the surface groups of adsor-
bents (CAC and CPAC and to identify the groups responsible for dye
adsorption. Infrared spectra of the adsorbents and dye-loaded
adsorbent samples, before and after the adsorption process, were
recorded in the range 4000–400 cm�1 (Fig. 1). As previously observed
for a fly ash adsorbent [40] after the adsorption procedure, the
functional groups that interacted with the dye suffered a shift to
lower wavenumbers.
Table 1. Kinetic adsorption models.
Kinetic model Non-linear equation
Avrami qt ¼ qe{1 � exp[�(kAV t)]nAV }Pseudo-first order qt ¼ qe[1 � exp(�kf t)]
Pseudo second order qt ¼ksq
2et
1þ qekst
ho ¼ ks q2e
initial sorption rate
Elovich qt ¼1
blnðabÞ þ 1
blnðtÞ
Intra-particle diffusion qt ¼ kidffiffit
pþ C
Figure 1. (A) FTIR for CAC; (B) FTIR for CPAC.
Table 2. Isotherm models.
Isotherm model Equation
Langmuir qe ¼QmaxKLCe1þ KLCe
Freundlich qe ¼ KFC1=nFe
Sips qe ¼QmaxKSC
1=nse
1þ KSC1=nse
Redlich-Peterson qe ¼KRPCe
1þ aRPCge
where 0 � g � 1
CLEAN – Soil, Air, Water 2010, 38 (5–6), 521–532 Removal of Brilliant Green Dye from Aqueous Solutions 523
� 2010 WILEY-VCH Verlag GmbH & Co. KGaA, Weinheim www.clean-journal.com

Figure 1A) shows the FTIR vibrational spectra of the activated
carbon prepared from Brazilian pine-fruit shell chemically activated
with sulfuric acid (CAC) before the adsorption and loaded with the
dye BG (CAC þ BG) after the adsorption. The intense absorption
bands at 3434 and 3430 cm�1 are assigned to O–H bond stretching,
before and after adsorption, respectively [39, 41, 42]. The two CH2
stretching bands at 2922 and 2852 cm�1 are assigned to asymmetric
and symmetric stretching of CH2 groups [41] which present the
same wavenumbers before and after the adsorption, indicating that
these groups did not participate in the adsorption process. Sharp
intense peaks observed at 1629 and 1626 cm�1, before and after
absorption, respectively, are assigned to the aromatic C––C ring
stretch [41, 42]. In addition, there are several small bands and
shoulders in the range of 1600–1400 cm�1 that are assigned to ring
modes of the aromatic rings [41]. The wavenumbers of these
bands were not different before and after the adsorption procedure.
Bands ranging from 1122 to 1036 and 1111 to 1023 cm�1 before
and after adsorption, respectively, are assigned to C–O stretching
vibrations of lignin [42]. FTIR results indicate that the CAC
activated carbon does not completely destroy all the chemical
functions of the original biomaterial without chemical treatment,
as previously reported [3, 39]. Besides, the interaction of the dye
with the CAC adsorbent should occur with the O–H bonds of
lignin groups as well as by interaction with the aromatic rings of
the CAC.
The activated carbon prepared from Brazilian pine fruit-shell
activated by the mixture of chemical and physical activation pro-
cesses (CPAC) presents absorption bands at 3434 and 3430 cm�1 are
assigned to O–H bond stretching, before and after adsorption,
respectively [41], indicating that this group plays a role on the
adsorption of the BG dye. The two CH2 stretching bands at 2925
and 2854 cm�1 are assigned to asymmetric and symmetric stretch-
ing of CH2 groups, respectively [41], which present the same wave-
numbers before and after the adsorption, indicating that these
groups did not participate of the adsorption process, as also observed
for CAC adsorbent. Small bands at 1730 and 1722 cm�1, before and
after absorption, respectively, are assigned to carbonyl groups of
carboxylic acid, which are usually found in lignin materials [41, 42].
Bands ranging from 1620 to 1400 and 1689 to 1395 cm�1 before and
after absorption, respectively are assigned to C––C of aromatic rings.
The shifts of these bands to lower wavenumbers after the adsorption
of the dye indicate that the mechanism of interaction of the BG
dye with the activated carbon CPAC should also occur by the p–p
interaction of the dyewith the aromatic rings of the activated carbon
[43], besides the interaction with its functional groups (carboxylate,
OH). In addition, strong bands of 1105 and 1098 cm�1, before and
after adsorption, respectively, confirm the presence of C–O bond
(Fig. 1B)) [41] reinforcing the interaction of the dye with carboxylate
groups.
Scanning electron micrographs of CAC (Figs. 2A) and B)) and CPAC
(Figs. 2C) and D)) show the some differences of these materials. Both
CAC and CPACmaterials seem to have high surface areas, presenting
subdivided pieces of carbon. Although both CAC and CPAC adsor-
bents were milled and sieved after their activation process, the
pieces of carbon seem to have large size for the CAC adsorbent
material when compared to CPAC material. Probably the treatment
to higher temperatures and also submitting the carbon material to
CO2 atmosphere is responsible for originating smaller carbon pieces
of CPAC material. Therefore, it would be expected that CPAC adsor-
bent would be more effective as adsorbent for BG removal from
aqueous solutions.
Physical and chemical properties of CAC and CPAC are presented in
Tab.3.Thecombinationofchemicalandphysicalactivationprocess for
preparation of CPAC adsorbent, lead to best textural properties when
compared with CAC which was activated only by chemical activation.
The specific surface area of CPAC increased by 37.7%, the average pore
volumeincreasedby16.3%and theaverageporediameter increasedby
18.4%, when compared to CAC material. These textural parameters
suggest that CPAC could present a better performance comparedwith
CAC as adsorbent to remove dyes from aqueous solutions, as reported
previously [3, 9, 44]. In addition these textural properties are in agree-
ment with the SEM data discussed above.
Figure 2. (A) SEM for CAC with magnification of 1000�; (B) SEM for CAC with magnification of 2000�; (C) SEM for CPAC with magnification of 1000�;(D) SEM for CPAC with magnification of 2000�.
524 T. Calvete et al. CLEAN – Soil, Air, Water 2010, 38 (5–6), 521–532
� 2010 WILEY-VCH Verlag GmbH & Co. KGaA, Weinheim www.clean-journal.com

3.2 Effects of Acidity on Adsorption
Effects of initial pH on percentage of removal of BG dye using CAC
and CPAC adsorbents were evaluated within the pH range between 2
and 10.5 (see Fig 3). On the contrary of several already published
results using activated carbon [10] the dye amount adsorbed per unit
of mass was practically constant, with differences lower than 1.3 and
1.4%, for CAC and CPAC adsorbents, respectively, for pH values
ranging from 2.0 to 10.5. This behavior is in agreement with the
FTIR results discussed above, suggesting that the adsorption
mechanism should not be electrostatic, as usually reported in the
literature for several dyes using different adsorbents [3, 5, 7, 10, 44].
Otherwise, the adsorption should takes place by the interaction of
the dye with the aromatic rings of the activated carbon [43]. This
behavior is very important from the removal point of view, since
there is no need for pH adjustments for removing the BG dye using
CAC and CPAC adsorbents. In addition, to confirm that the adsorp-
tion does not depends on the electrostatic attraction of the dye by
the adsorbent, the final pH of the solutions, after the adsorption was
measured. The variation of pH was lower than 0.05, which are not
significant. These experiments reinforce the hypothesis that the
mechanism of adsorption of BG using CAC and CPAC as adsorbent
is not electrostatic attraction.
Taking into account that the pH of contaminated industrial efflu-
ent is near to 5.5–6.0 values, in the further experiments, the pH value
was fixed at 5.5.
3.3 Adsorbent Dosage
The study of adsorbent dosages for the removal of the dye from
aqueous solution was carried out using quantities of CAC and CPAC
adsorbents ranging from 20.0 to 200.0 mg and fixing the volume and
initial dye concentration at 20.0 mL and 300.0 mg/L, respectively.
The highest amount of dye removal was attained for adsorbent
masses of at least 50.0 mg of each adsorbent (Fig. 4). For adsorbent
Table 3. Physical properties of the adsorbents.
Specific surface area – BET (m2/g)
CAC 1035CPAC 1425Average pore volume (cm3/g)CAC 0.43CPAC 0.50BJH Average pore diameter (nm)CAC 4.90CPAC 5.80
Figure 3.Effect of initial pH on the adsorption of BGdye using: CAC (A) andCPAC (B) as adsorbents. Conditions: mass of adsorbent 40.0 mg; time ofcontact 4 h; T 298 K; initial dye concentration 250 mg/L.
Figure 4.Adsorbent dosage.&, %BG removal;�, amount adsorbed pergram (q). CAC (A); and CPAC (B). Conditions: Initial dye concentration300 mg/L; time of contact 4 h; pH 5.5; temperature 298 K.
CLEAN – Soil, Air, Water 2010, 38 (5–6), 521–532 Removal of Brilliant Green Dye from Aqueous Solutions 525
� 2010 WILEY-VCH Verlag GmbH & Co. KGaA, Weinheim www.clean-journal.com

quantities higher than these values, the dye removal remained
almost constant (see Fig. 4). Increases in the percentage of the
dye removal with adsorbent masses could be attributed to
increases in the adsorbent surface areas, augmenting the number
of adsorption sites available for adsorption, as already reported in
several papers [3, 9, 10, 44, 45]. On the other hand, the increase in
the adsorbent mass promotes a remarkable decrease in the
amount of dye uptake per gram of adsorbent (q) (see Fig. 4), an
Figure 5.Kineticmodels for the adsorption of BG.&, CAC;�, CPAC. (A) CAC300 mg/L; (B)CAC600 mg/L; (C) CPAC300 mg/L; (D) CPAC600 mg/L; (E) CAC 300 mg/L; (F) CAC 600 mg/L; (G) CPAC 300 mg/L; (H) CPAC 600 mg/L. Conditions:mass of adsorbent 50.0 mg; pH 5.5; temperature298 K.
526 T. Calvete et al. CLEAN – Soil, Air, Water 2010, 38 (5–6), 521–532
� 2010 WILEY-VCH Verlag GmbH & Co. KGaA, Weinheim www.clean-journal.com

effect that can be mathematically explained by combining the
Eqs. (1) and (2):
q ¼ %RemovalCoV
100m(4)
As observed in the Eq. (4), the amount of dye uptake (q) and the
mass of adsorbent (m) are inversely proportional. For a fixed dye
percentage removal, the increase in adsorbent mass leads to a
decrease in q values, since the volume (V) and initial dye concen-
trations (Co) are always fixed. These values clearly indicate that the
adsorbent mass must be fixed at 50.0 mg, which is the mass that
corresponds to the minimum amount of adsorbent that leads to
constant dye removal. Adsorbent masses were, therefore, fixed at
50.0 mg for both CAC and CPAC.
Table 4. Kinetic parameters for BG removal using CAC and CPAC as adsorbents. Conditions: temperature was fixed at 298 K; pH 5.5; adsorbent mass
50.0 mg.
CAC CPAC
300.0 mg/L 600.0 mg/L 300.0 mg/L 600.0 mg/L
Fractionary orderkAV (h�1) 0.5216 0.5413 0.7225 0.7307qe (mg/g) 100.8 214.3 112.8 234.2nAV 1.775 1.750 1.462 1.476Adjusted R2 1.000 1.000 1.000 1.000Ferror 1.13 1.71 1.04 0.197Pseudo-first orderkf (h
�1) 0.4623 0.4861 0.6944 0.7042qe (mg/g) 108.8 229.8 116.4 241.6Adjusted R2 0.9661 0.9671 0.9830 0.9822Ferror 91.5 85.4 32.2 31.6Pseudo-second orderks (g/mg/h) 0.00281 0.00145 0.00521 0.00257qe (mg/g) 144.1 300.8 141.6 293.1ho (mg/g/h) 58.34 131.2 104.5 220.8Adjusted R2 0.9470 0.9468 0.9578 0.9561Ferror 105 99.0 43.6 42.9Elovicha (mg/g/h) 116.6 256.7 196.2 413.4b (g/mg) 0.02975 0.01415 0.03072 0.01486Adjusted R2 0.9494 0.9494 0.9434 0.9405Ferror 74.7 60.3 22.2 22.7Intra-particle diffusionki,1 (mg/g/h0.5)a) 71.1 158.5 85.9 190.8
a) First stage.
Table 5. Isotherm parameters for BG adsorption, usingCAC andCPACas adsorbents. Conditions: adsorbent mass of 50.0 mg; pH fixed at 5.5; and using a
contact time of 5 h.
CAC CPAC
298 K 303 K 308 K 313 K 318 K 323 K 298 K 303 K 308 K 313 K 318 K 323 K
LangmuirQmax (mg/g) 219.1 216.1 217.5 212.8 212.0 211.7 263.4 284.3 283.6 292.7 295.5 298.5KL (L/g) 0.4766 0.6665 0.6662 0.9252 1.017 1.103 8.717 7.121 23.91 19.97 29.21 37.85Adjusted R2 0.9534 0.9318 0.9343 0.8912 0.8304 0.7519 0.8347 0.8765 0.8951 0.8820 0.8684 0.8728Ferror 5.96 11.0 23.0 21.9 24.4 25.6 10.95 9.62 6.11 4.97 4.42 3.25FreundlichKF ((mg/g(mg/L)�1/nF) 112.8 110.7 111.2 116.2 123.1 128.9 190.6 202.0 208.9 225.7 237.5 251.3nF 6.452 6.239 6.224 6.754 7.542 8.253 11.29 10.57 11.79 14.72 17.25 22.09Adjusted R2 0.9435 0.9439 0.9447 0.9525 0.9575 0.9599 0.9519 0.9519 0.8929 0.9172 0.9370 0.9534Ferror 6.94 10.2 19.5 12.7 10.1 8.22 6.19 12.60 9.64 5.23 3.62 2.17SipsQmax (mg/g) 250.7 255.4 259.8 263.9 270.4 273.9 307.3 313.0 317.4 323.9 331.8 335.8KSððg =LÞ�1=nS Þ 0.5601 0.6213 0.6850 0.7575 0.8372 0.9131 1.851 2.100 2.384 2.715 2.905 3.320nS 1.755 1.932 2.111 2.409 2.809 3.125 2.874 2.091 2.600 2.869 3.433 4.131Adjusted R2 0.9999 1.000 1.000 1.000 0.9999 1.000 0.9999 0.9999 1.000 1.000 0.9999 1.000Ferror 0.21 0.13 0.21 0.12 0.22 0.11 0.30 0.15 0.04 0.08 0.13 0.04Redlich-PetersonKRP (L/g) 190.8 333.1 825.7 1271 2451 3677 6486 3863 10015 9854 16249 23980aRP (mg/L)�g 1.226 2.290 6.134 9.275 17.40 25.08 30.93 16.42 41.58 39.10 62.97 89.83g 0.9189 0.9041 0.8860 0.8927 0.9010 0.9112 0.9362 0.9456 0.9529 0.9598 0.9631 0.9701Adjusted R2 0.9980 0.9962 0.9919 0.9939 0.9956 0.9979 0.9927 0.9922 0.9964 0.9967 0.9977 0.9984Ferror 1.15 2.26 4.24 2.57 1.71 1.01 2.00 1.91 1.08 0.80 0.56 0.35
CLEAN – Soil, Air, Water 2010, 38 (5–6), 521–532 Removal of Brilliant Green Dye from Aqueous Solutions 527
� 2010 WILEY-VCH Verlag GmbH & Co. KGaA, Weinheim www.clean-journal.com

3.4 Kinetic Studies
Adsorption kinetic studies are important in the treatment of aque-
ous effluents because they provide valuable information on the
mechanism of the adsorption process [44].
It is important to point out that the initial BG concentrations
employed during the kinetic studies are relatively high (300.0 and
600.0 mg/L) when compared with other studies reported in the
literature [1, 5, 7, 9]. Both CAC and CPAC have very high adsorption
capacities and adsorb practically all BG when initial adsorbate con-
centrations are lower than 200 mg/L. In order to study the mecha-
nism of dye adsorption, kinetic data were fit using the four kinetic
models depicted in Tab. 1 (Figs. 5A–D).
As can be seen, only the Avrami fractionary kinetic model showed
the best fit, presenting low error function values and also high
adjusted R2 values, for the two initial concentration levels of the
dye with both adsorbents. The lower the error function is, the lower
will be the difference of the q calculated by the model from the
experimentally measured q [39]. Additionally, it was verified that the
qe values found in the fractionary-order were closer to the exper-
imental qe values, when compared with all other kinetic models.
These results indicate that the fractionary-order kinetic model
should explain the adsorption process of BG taken up by the CAC
and CPAC adsorbents.
The Avrami kinetic equation has been successfully employed to
explain several kinetic processes of different adsorbents and
Figure 6. Isotherm models for BG adsorption on CAC and CPAC adsorbents, using batch contact adsorption procedure. Conditions: adsorbent mass of50.0 mg; pH fixed at 5.5; and using a contact time 5 h.
528 T. Calvete et al. CLEAN – Soil, Air, Water 2010, 38 (5–6), 521–532
� 2010 WILEY-VCH Verlag GmbH & Co. KGaA, Weinheim www.clean-journal.com

adsorbates [1, 3, 9, 10, 37, 38, 44, 46, 47]. The Avrami exponent (nAV) is
a fractionary number related with the possible changes of the
adsorption mechanism that takes place during the adsorption pro-
cess [46, 47]. Instead of following only an integer-kinetic order, the
mechanism adsorption could followmultiple kinetic orders that are
changed during the contact of the adsorbate with the adsorbent
(47, 48). nAV is a resultant of the multiple kinetic order of the
adsorption procedure.
Since kinetic results fit very well to the fractionary kinetic model
(Avrami model) for the BG dye using CAC and CPAC adsorbents
(Tab. 4 and Fig. 5), the intra-particle diffusion model (38) was used
to verify the influence of mass transfer resistance on the binding of
BG to both adsorbents (Tab. 4 and Figs. 5E–H). The intra-particle
diffusion constant, kid (mg/g h0.5) (Tab. 1), can be obtained from
the slope of the plot of qt (uptake at any time, mg/g) versus the
square root of time. Figures 5E–H show the plots of qt versus t1/2, with
multi-linearity for the BG dye using CAC and CPAC adsorbents. These
results imply that the adsorption processes involve more than one
single kinetic stage (or adsorption rate) [37]. For instance, the adsor-
ption process exhibits two stages, which can be attributed to two
linear parts (Figs. 5E–H). The first linear part can be attributed to
intra-particle diffusion, which causes a delay in the process (38). The
second stage is the diffusion through smaller pores, which is fol-
lowed by the establishment of equilibrium [37].
It was observed in Figs. 5A–D that theminimum contact time of BG
with the adsorbents to reach the equilibrationwas about 4.0 h, using
CAC and CPAC as adsorbents, respectively (Figs. 5A–D).
3.5 Equilibrium Studies
An adsorption isotherm describes the relationship between the
amount of adsorbate taken up by the adsorbent and the adsorbate
concentration remaining in solution. There are several equations for
analyzing experimental adsorption equilibrium data. The equation
parameters of these equilibrium models often provide some insight
into the adsorption mechanism, the surface properties and affinity
of the adsorbent. In this work, the Langmuir, Freundlich, Sips, and
Redlich-Peterson isotherm models were tested [38]
The isotherms of adsorption of BG on the two adsorbents were
carried out from 298 to 323 K, using the best experimental con-
ditions described previously (Tab. 5 and Fig. 6). Considering that for a
good fitting of a nonlinear model, the Ferror values should be �3.0%
[38, 39]. Based on this confident limit value for Ferror, for both
adsorbents, the isotherm parameters obtained for Langmuir, and
Freundlich have no physical meaning, because the amount adsorbed
(q) fitted by the models present an average difference higher than
3.0% of the actual qmeasured. Based on the Ferror values analysis the
isotherm models that were well fitted for all temperatures (298–
323 K) and both adsorbents were the Sips and the Redlich-Peterson
isothermmodels, being the Ferror values of Sipsmodel lower than the
Ferror values of Redlich-Peterson isotherm model.
Based on the Sips isotherm model, the maximum amounts of BG
uptake were 273.9 and 335.8 mg/g for CAC and CPAC, respectively.
These values indicate that these adsorbents are good adsorbents for
BG removal from aqueous solutions.
3.6 Thermodynamic Studies
Thermodynamic parameters related to the adsorption process, i.e.,
Gibb’s free energy change (DG8, kJ/mol), enthalpy change (DH8, kJ/mol),
and entropy change (DS8, J/mol/K) are determined by the following
equations:
DGo ¼ DHo � TDSo (5)
DGo ¼ �RTlnðKÞ (6)
The combination of Eqs. (5) and (6) gives:
lnðKÞ ¼ DSo
R� DHo
R
1
T(7)
where R is the universal gas constant (8.314 J/K mol), T the absolute
temperature (Kelvin), and K represents the equilibrium adsorption
constants of the isotherm fits (KS – Sips equilibrium constant, which
must be converted to SI units, by using the molecular mass of the
dye) obtained from the isotherm plots. DH8 and DS8 values can be
calculated from the slope and intercept of the linear plot of lnK
versus 1/T.
The thermodynamic results are depicted on Tab. 6. Taking into
account that the Langmuir isotherm parameters were not confident
at 3% level for temperature range (298–323 K) using both the adsor-
bents (CAC and CPAC), the thermodynamic parameters were only
obtained using the values of Sips equilibrium constant (KS). The
adjusted R2 values of the linear fit were at least 0.99, indicating that
the values of enthalpy and entropy calculated for both adsorbents
Table 6. Thermodynamic parameters of the adsorption of BG on CAC and CPAC adsorbents. Conditions: adsorbent mass of 50.0 mg; pH fixed at 5.5; and
using a contact time of 5 h.
Temperature (K)
298 303 308 313 318 323
CACKL (L/mol) 2.703�105 2.999�105 3.306�105 3.656�105 4.040�105 4.407�105DG (kJ/mol) �30.99 �31.77 �32.54 �33.33 �34.13 �34.90DH8 (kJ/mol) 15.73 – – – – –DS8 (kJ/K mol) 0.157 – – – – –Adjusted R2 0.9998 – – – – –CPACKL (L/mol) 8.935�105 1.013�106 1.151�106 1.311�106 1.442�106 1.602�106DG (kJ/mol) �33.95 �34.84 �35.74 �36.66 �37.49 �38.37DH8 (kJ/mol) 18.80 – – – – –DS8 (kJ/K mol) 0.177 – – – – –Adjusted R2 0.9983 – – – – –
CLEAN – Soil, Air, Water 2010, 38 (5–6), 521–532 Removal of Brilliant Green Dye from Aqueous Solutions 529
� 2010 WILEY-VCH Verlag GmbH & Co. KGaA, Weinheim www.clean-journal.com
are fairly confident. In addition, the magnitude of enthalpy is con-
sistent with a physical interaction of an adsorbent with an adsorbate
as already reported in the literature [48, 49]. Enthalpy changes (DH8)indicate that adsorption followed endothermic processes. Negative
values of DG indicate that the BG reactive dye adsorption by CAC and
CPAC adsorbents is a spontaneous and favorable process for all
studied temperatures. The positive values of DS8 confirm a high
preference of BG molecules for the carbon surface of CAC and
CPAC and also suggest the possibility of some structural changes
or readjustments in the dye-carbon adsorption complex [49]. Besides,
it is consistent with the dehydration of dye molecule before its
adsorption to carbon surface, and the releases of these water mol-
ecules to the bulk solution.
The increase in the adsorption capacities of CAC and CPAC at
higher temperatures may be attributed to the enhanced mobility
and penetration of dye molecules within the adsorbent porous
structures by overcoming the activation energy barrier and enhanc-
ing the rate of intra-particle diffusion [48, 49].
4 Conclusions
Activated carbon materials prepared from the Brazilian pine-fruit
shell (A. angustifolia) by chemical (CAC) and by the combination of
chemical and physical activation (CPAC) are good alternative adsor-
bents to remove BG dye from aqueous solutions. Both adsorbents
interact with the dye at the solid/liquid interface when suspended in
water. The best conditions were established with respect to pH and
contact time to saturate the available sites located on the adsorbent
surface. Five kinetic models were used to adjust the adsorption and
the best fit was the Avrami (fractionary-order) kinetic model; how-
ever, the intra-particle diffusion model gave two linear regions,
which suggested that the adsorption can also be followed by
multiple adsorption rates. The maximum adsorption capacities
were 273.9 and 335.8 mg/g for CAC and CPAC, respectively. The
increased adsorption capacity of CPAC could be related to the
improvement on the textural characteristics (specific surface area,
average pore volume, average pore diameter) of the material after
the combination of chemical and physical activation process. On the
other hand CAC is activated carbon prepared only by chemical
activation.
Thermodynamic parameters of adsorption (DH8;DS8 andDG8) were
calculated. Increases in the adsorption temperature lead to increases
in the amount adsorbed, indicating that the adsorption of BG onCAC
and CPAC follows endothermic processes.
5 Nomenclatures
aRP the Redlich-Peterson constants (mg/L)�g
C constant related with the thickness of boundary layer (mg/g)
Cf dye concentration at ending of the adsorption (mg/L)
Ce dye concentration at the equilibrium (mg/L)
Co initial dye concentration put in contact with the adsorbent
(mg/L)
dq differential of q
g dimensionless exponent of Redlich-Peterson equation
ho the initial sorption rate (mg/g/h) of pseudo-second order
equation
kAV is the Avrami kinetic constant (h�1)
kf the pseudo-first order rate constant (h�1)
KF the Freundlich equilibrium constant (mg/g (mg/L)�1/nF)
kid the intra-particle diffusion rate constant (mg/g/h0.5)
KL the Langmuir equilibrium constant (L/mg)
KRP the Redlich-Peterson equilibrium constant (L/g)
KS the Sips equilibrium constant (mg/L)�1/ns
ks the pseudo-second order rate constant (g/mg h)
m mass of adsorbent (g)
nAV is a fractionary reaction order (Avrami) which can be related
to the adsorption mechanism
nF dimensionless exponent of the Freundlich equation
nS dimensionless exponent of the Sips equation
q amount adsorbed of the dye by the adsorbent (mg/g)
qe amount adsorbate adsorbed at the equilibrium (mg/g)
Qmax the maximum adsorption capacity of the adsorbent (mg/g)
qt amount of adsorbate adsorbed at time (mg/g)
t time of contact (h)
V volume of dye solution put in contact with the adsorbent (L)
a the initial adsorption rate (mg/g/h) of the Elovich Equation
b Elovich constant related to the extent of surface coverage and
also to the activation energy involved in chemisorption (g/mg)
Acknowledgments
The authors are grateful to Ministerio de Ciencia e Tecnologia (MCT),
to Conselho Nacional de Desenvolvimento Cientıfico e Tecnologico
(CNPq), for financial support and fellowships. We are also grateful to
Centro deMicroscopia Eletronica (CME-UFRGS) for the use of the SEM
microscope.
The authors have declared no conflict of interest.
References
[1] B. Royer, N. F. Cardoso, E. C. Lima, T. R. Macedo, C. Airoldi, Sodic andAcidic Crystalline Lamellar Magadiite Adsorbents for Removal ofMethylene Blue from Aqueous Solutions. Kinetic and EquilibriumStudies, Sep. Sci. Technol. 2010, 45, 129–141.
[2] S. Wang, H. T. Li, Kinetic Modelling and Mechanism of DyeAdsorption on Unburned Carbon, Dyes Pigm. 2007, 72, 308–314.
[3] B. Royer, N. F. Cardoso, E. C. Lima, J. C. P. Vaghetti, N. M. Simon, T.Calvete, R. C. Veses, Applications of Brazilian-Pine Fruit Shell inNatural and Carbonized Forms as Adsorbents to Removal ofMethylene Blue from Aqueous Solutions – Kinetic andEquilibrium Study, J. Hazard. Mater. 2009, 164, 1213–1222.
[4] F. A. Pavan, S. L. P. Dias, E. C. Lima, E. V. Benvenutti, Removal ofCongo Red from Aqueous Solution by Anilinepropylsilica Xerogel,Dyes Pigm. 2008, 76, 64–69.
[5] B. Royer, E. C. Lima, N. F. Cardoso, T. Calvete, R. E. Bruns, StatisticalDesign of Experiments for Optimization of Batch AdsorptionConditions for Removal of Reactive Red 194 Textile Dye fromAqueous Effluents, Chem. Eng. Commun. 2010, 197, 775–790.
[6] V. K. Gupta, I. A. Suhas, Application of Low-cost Adsorbents for DyeRemoval – A Review, J. Environ. Manage. 2009, 90, 2313–2342.
[7] F. A. Pavan, Y. Gushikem, A. S. Mazzocato, S. L. P. Dias, E. C. Lima,Statistical Design of Experiments as a Tool for Optimizing the BatchConditions to Methylene Blue Biosorption on Yellow Passion Fruitand Mandarin Peels, Dyes Pigm. 2007, 72, 256–266.
[8] S. Wang, Z. H. Zhu, Effects of Acidic Treatment of Activated Carbonson Dye Adsorption, Dyes Pigm. 2007, 75, 306–314.
[9] B. Royer, N. F. Cardoso, E. C. Lima, V. S. O. Ruiz, T. R. Macedo, C.Airoldi, Organofunctionalized Kenyaite for Dye Removal fromAqueous Solution, J. Colloid Interface Sci. 2009, 336, 398–405.
530 T. Calvete et al. CLEAN – Soil, Air, Water 2010, 38 (5–6), 521–532
� 2010 WILEY-VCH Verlag GmbH & Co. KGaA, Weinheim www.clean-journal.com

[10] T. Calvete, E. C. Lima, N. F. Cardoso, S. L. P. Dias, F. A. Pavan,Application of Carbon Adsorbents Prepared from the Brazilian-Pine Fruit Shell for Removal of Procion Red MX 3B from AqueousSolution – Kinetic, Equilibrium, and Thermodynamic Studies, Chem.Eng. J. 2009, 155, 627–636.
[11] H. Marsh, F. R. Reinoso, Activated Carbon, Elsevier, Amsterdam 2006,pp. 554.
[12] M. Olivares-Marın, C. Fernandez-Gonzalez, A. Macıas-Garcıa, V.Gomez-Serrano, Preparation of Activated Carbons from CherryStones by Activation with Potassium Hydroxide, Appl. Surf. Sci.2006, 252, 5980–5983.
[13] I. A. W. Tan, A. L. Ahmad, B. H. Hameed, Adsorption of Basic Dye onHigh-surface-area Activated Carbon Prepared from Coconut Husk:Equilibrium, Kinetic and Thermodynamic Studies, J. Hazard. Mater.2008, 154, 337–346.
[14] A. N. A. El-Hendawy, An Insight into the KOH Activation MechanismThrough the Production of Microporous Activated Carbon for theRemoval of Pb2þ Cations, Appl. Surf. Sci. 2009, 255, 3723–3730.
[15] W. Li, K. Yang, J. Peng, L. Zhang, S. Guo, H. Xia, Effects ofCarbonization Temperatures on Characteristics of Porosity inCoconut Shell Chars and Activated Carbons Derived fromCarbonized Coconut Shell Chars, Ind. Crops Prod. 2008, 28, 190–198.
[16] A. S. Albero, J. S. Albero, A. S. Escribano, F. R. Reinoso, EthanolRemoval Using Activated Carbon: Effect of Porous Structure andSurface Chemistry, Microporous Mesoporous Mater. 2009, 120, 62–68.
[17] P. C. C. Faria, J. J. M. Orfao, J. L. Figueiredo, M. F. R. Pereira,Adsorption of Aromatic Compounds from the Biodegradation ofAzo Dyes on Activated Carbon, Appl. Surf. Sci. 2008, 254, 3497–3503.
[18] D. Mohan, K. P. Singh, S. Sinha, D. Gosh, Removal of PyridineDerivatives from Aqueous Solution by Activated CarbonsDeveloped from Agricultural Waste Materials, Carbon 2005, 43,1680–1693.
[19] D. Mohan, K. P. Singh, V. K. Singh, Wastewater Treatment Using LowCost Activated Carbons Derived from Agricultural Byproducts – ACase Study, J. Hazard. Mater. 2008, 152, 1045–1053.
[20] F. S. Vieira, A. R. Cestari, I. F. Gimenez, N. L. V. Carreno, L. S. Barreto,Kinetic and Calorimetric Study of the Adsorption of Dyes onMesoporous Activated Carbon Prepared from Coconut Coir Dust,J. Colloid Interface Sci. 2006, 298, 515–522.
[21] A. A. Nunes, A. S. Franca, L. S. Oliveira, Activated Carbons fromWaste Biomass: An Alternative Use for Biodiesel Production SolidResidues, Bioresour. Technol. 2009, 100, 1786–1792.
[22] M. S. Balathanigaimani, W. G. Shim, K. H. Park, J. W. Lee, H. Moon,Effects of Structural and Surface Energetic Heterogeneity Propertiesof Novel Corn Grain-based Activated Carbons on Dye Adsorption,Microporous Mesoporous Mater. 2009, 118, 232–238.
[23] A. W. M. Ip, J. P. Barford, G. McKay, Production and Comparison ofHigh Surface Area Bamboo Derived Active Carbons, Bioresour.Technol. 2008, 99, 8909–8916.
[24] L. S. Chan, W. H. Cheung, G. McKay, Adsorption of Acid Dyes byBamboo Derived Activated Carbon, Desalination 2008, 218, 304–312.
[25] N. Thinakaran, P. Panneerselvam, P. Baskaralingam, D. Elango, S.Sivanesan, Equilibrium and Kinetic Studies on the Removal of AcidRed 114 from Aqueous Solutions Using Activated Carbons Preparedfrom Seed Shells, J. Hazard. Mater. 2008, 158, 142–150.
[26] E. Demirbas, M. Kobya, M. T. Sulak, Adsorption Kinetics of a BasicDye from Aqueous Solutions onto Apricot Stone Activated Carbon,Bioresour. Technol. 2008, 99, 5368–5373.
[27] Y. Guo, D. A. Rockstraw, Physicochemical Properties of CarbonsPrepared from Pecan Shell by Phosphoric Acid Activation,Bioresour. Technol. 2007, 98, 1513–1521.
[28] B. H. Hameed, I. A. W. Tan, A. L. Ahmad, Optimization of Basic DyeRemoval by Oil Palm Fibre-based Activated Carbon Using ResponseSurface Methodology, J. Hazard. Mater. 2008, 158, 324–332.
[29] B. Corcho-Corral, M. Olivares-Marın, C. Fernandez-Gonzalez, V.Gomez-Serrano, A. Macıas-Garcıa, Preparation and TexturalCharacterisation of Activated Carbon from Vine Shoots (Vitis vini-fera) by H3PO4-Chemical Activation, Appl. Surf. Sci. 2006, 252, 5961–5966.
[30] J. L. Brasil, R. R. Ev, C. D. Milcharek, L. C. Martins, F. A. Pavan, A. A. dosSantos, Jr, S. L. P. Dias, et al., Statistical Design of Experiments as aTool for Optimizing the Batch Conditions to Cr(VI) Biosorption onAraucaria angustifolia Wastes, J. Hazard. Mater. 2006, 133, 143–153.
[31] E. C. Lima, B. Royer, J. C. P. Vaghetti, J. L. Brasil, N. M. Simon, A. A. dosSantos, Jr, F. A. Pavan, et al., Adsorption of Cu(II) on Araucariaangustifolia Wastes: Determination of the Optimal Conditions byStatistic Design of Experiments, J. Hazard. Mater. 2007, 140, 211–220.
[32] C. G. Passos, F. Ribaski, N. M. Simon, A. A. dos Santos, Jr, J. C. P.Vaghetti, E. V. Benvenutti, E. C. Lima, Use of Statistical Design ofExperiments to Evaluate the Sorption Capacity of 7-Amine-4-aza-heptylsilica and 10-Amine-4-azadecylsilica for Cu(II), Pb(II) and Fe(III)Adsorption, J. Colloid Interface Sci. 2006, 302, 396–407.
[33] L. T. Arenas, J. C. P. Vaghetti, C. C. Moro, E. C. Lima, E. V. Benvenutti,T. M. H. Costa, Dabco/Silica Sol-gel Hybrid Material. The Influence ofthe Morphology on the CdCl2 Adsorption Capacity, Mater. Lett. 2004,58, 895–898.
[34] L. T. Arenas, E. C. Lima, A. A. dos Santos, Jr, J. C. P. Vaghetti, T. M. H.Costa, E. V. Benvenutti, Use of Statistical Design of Experiments toEvaluate the Sorption Capacity of 1,4-Diazoniabicycle[2.2.2]octane/Silica Chloride for Cr(VI) Adsorption, Colloids Surf., A 2007, 297, 240–248.
[35] R. A. Jacques, R. Bernardi, M. Caovila, E. C. Lima, F. A. Pavan, J. C. P.Vaghetti, C. Airoldi, Removal of Cu(II), Fe(III) and Cr(III) fromAqueous Solution by Aniline Grafted Silica Gel, Sep. Sci. Technol.2007, 42, 591–609.
[36] E. C. Lima, P. G. Fenga, J. R. Romero, W. F. de Giovani,Electrochemical Behaviour of [Ru(4,40 -Me2bpy)2(PPh3)(H2O)](ClO4)2in Homogeneous Solution and Incorporated into Carbon PasteElectrodes. Application to Oxidation of Benzylic Compounds,Polyhedron 1998, 17, 313–318.
[37] J. C. P. Vaghetti, E. C. Lima, B. Royer, N. F. Cardoso, B. Martins, T.Calvete, Pecan Nutshell as Biosorbent to Remove Toxic Metals fromAqueous Solution, Sep. Sci. Technol. 2009, 44, 615–644.
[38] J. C. P. Vaghetti, E. C. Lima, B. Royer, B. M. da Cunha, N. F. Cardoso,J. L. Brasil, S. L. P. Dias, Pecan Nutshell as Biosorbent to RemoveCu(II), Mn(II) and Pb(II) from Aqueous Solutions, J. Hazard. Mater.2009, 162, 270–280.
[39] J. C. P. Vaghetti, E. C. Lima, B. Royer, J. L. Brasil, B. M. da Cunha, N. M.Simon, N. F. Cardoso, C. P. Z. Norena, Application of Brazilian-PineFruit Coat as a Biosorbent to Removal of Cr(VI) from AqueousSolution. Kinetics and Equilibrium Study, Biochem. Eng. J. 2008, 42,67–76.
[40] S. Kara, C. Aydiner, E. Demirbas, M. Kobya, N. Dizge, Modeling theEffects of Adsorbent Dose and Particle Size on the Adsorption ofReactive Textile Dyes by Fly Ash, Desalination 2007, 212, 282–293.
[41] B. Smith, Infrared Spectral Interpretation – A Systematic Approach, CRCPress, Boca Raton 1999, p. 265.
[42] F. A. Pavan, I. S. Lima, E. C. Lima, C. Airoldi, Y. Gushikem, Use ofPonkan Mandarin Peels as Biosorbent for Toxic Metals Uptake fromAqueous Solutions, J. Hazard. Mater. 2006, 137, 527–533.
[43] W. Zhang, Z. Xu, B. Pan, C. Hong, K. Jia, P. Jiang, Q. Zhang, B. Pan,Equilibrium and Heat of Adsorption of Diethyl Phthalate onHeterogeneous Adsorbents, J. Colloid Interface Sci. 2008, 325,41–47.
[44] E. C. Lima, B. Royer, J. C. P. Vaghetti, N. M. Simon, B. M. da Cunha, F.A. Pavan, E. V. Benvenutti, et al., Application of Brazilian-pine FruitCoat as a Biosorbent to Removal of Reactive Red 194 Textile Dyefrom Aqueous Solution. Kinetics and Equilibrium Study, J. Hazard.Mater. 2008, 155, 536–550.
[45] N. T. Abdel-Ghani, A. K. Hegazy, G. A. El-Chaghaby, E. C. Lima,Factorial Experimental Design for Biosorption of Iron and ZincUsing Typha domingensis Phytomass, Desalination 2009, 249, 343–347.
[46] E. C. N. Lopes, F. S. C. dos Anjos, E. F. S. Vieira, A. R. Cestari, AnAlternative Avrami Equation to Evaluate Kinetic Parameters of theInteraction of Hg(II) with Thin Chitosan Membranes, J. ColloidInterface Sci. 2003, 263, 542–547.
[47] A. R. Cestari, E. F. S. Vieira, A. G. P. dos Santos, J. A. Mota, V. P. deAlmeida, Adsorption of Anionic Dyes on Chitosan Beads. 1. The
CLEAN – Soil, Air, Water 2010, 38 (5–6), 521–532 Removal of Brilliant Green Dye from Aqueous Solutions 531
� 2010 WILEY-VCH Verlag GmbH & Co. KGaA, Weinheim www.clean-journal.com

Influence of the Chemical Structures of Dyes and Temperature onthe Adsorption Kinetics, J. Colloid Interface Sci. 2004, 280, 380–386.
[48] P. Leechart, W. Nakbanpote, P. Thiravetyan, Application of ‘Waste’Wood-shaving Bottom Ash for Adsorption of Azo Reactive Dye, J.Environ. Manage. 2009, 90, 912–920.
[49] D. D. Asouhidou, K. S. Triantafyllidis, N. K. Lazaridis, K. A. Matis, S. S.Kim, T. J. Pinnavaia, Sorption of Reactive Dyes from AqueousSolutions by Ordered Hexagonal and DisorderedMesoporous Carbons, Microporous Mesoporous Mater. 2009, 117, 257–267.
532 T. Calvete et al. CLEAN – Soil, Air, Water 2010, 38 (5–6), 521–532
� 2010 WILEY-VCH Verlag GmbH & Co. KGaA, Weinheim www.clean-journal.com