Remote Sensing At Kerkenes: Combining Geophysical and Other Methods Kerkenes'de Uzaktan Algilama:...
14
Yerbilimleri, 29 (2), 87–100 Hacettepe Üniversitesi Yerbilimleri Uygulama ve Araştırma Merkezi Dergisi Journal of the Earth Sciences Application and Research Centre of Hacettepe University Remote Sensing At Kerkenes: Combining Geophysical and Other Methods Kerkenes’de Uzaktan Algılama: Jeofizik ve Diğer Yöntemlerin Birleştirilmesi Nurdan ATALAN ÇAYIREZMEZ 1 , Pınar ERTEPINAR KAYMAKÇI 2 , Geoffrey D. SUMMERS 3 ¹ Ministry of Culture and Tourism of Turkish Republic, General Directorate for Cultural Properties and Museums, Ulus, ANKARA ² Department of Geological Engineering, Middle East Technical University, ANKARA ³ Settlement Archaeology Graduate Program, Institute of Social Sciences, Middle East Technical University, ANKARA Geliş (received) : 11 Nisan (April) 2008 Kabul (accepted) : 28 Temmuz (July) 2008 ABSTRACT Kerkenes, which lies to the south of Sorgun in the province of Yozgat is the location of the largest Iron Age capital in Central Anatolia. The low mountain is a granitic batholith with perennial water seeping from fissures. Buildings were mostly timber framed with granite used for foundations. The city was short-lived, being founded around 600 BCE and destroyed by fire, probably by Croesus King of Lydia, in the 540s. Thus, there is only one building level. These three factors (granite, a single building level and intense burning) make this ancient city an ideal choice for a program of remote sensing. The current period of investigation began in 1993 since when there have been an- nual campaigns. Remote sensing methods have included, from the top down, satellite imagery, photography from a manned hot air balloon, aerial photography from a tethered blimp, close contour differential Global Positioning System (GPS) survey, and geophysical survey. This paper first presents remote sensing methods that were compared along a 140 m test strip at Kerkenes. Gradi- ometer and electric resistance surveys, conducted over the test area at different times, were compared with close contour differential GPS and aerial photographs of the same area. Results are evaluated in terms of both archae- ology and expenditure of resources is made while a concluding section looks at the utility of combining remote sensing survey results in a Geographic Information System (GIS). At Kerkenes it is seen that the electric resistance survey gives better results than gradiometer survey, however it is slower and can only be conducted in spring. It is also found that GPS survey gives more detailed topographic details than the aerial photographs. GIS provides excellent tools for the management of the data for archaeological sites similar to Kerkenes. Keywords: Archaeology, electric resistance, geophysics, GIS, GPS, gradiometer, Kerkenes. ÖZ Yozgat iline bağlı Sorgun ilçesinin güneyinde bulunan Kerkenes, Orta Anadolu’da Demir Çağı’nın en büyük antik yerleşkesidir. Yerleşkenin bulunduğu granit kütlesi, çatlaklarından bütün yıl boyunca su sızan bir batolittir. Yerleşke- deki binalar genellikle granit temelli olup ahşap üst örgüden oluşmaktadır. Antik kent M.Ö. 600 civarında kurulmuş olup, olasılıkla Lidya Kralı Krezüs tarafından M.Ö. 540’larda bir yangın sonucu tahrip olmuştur. Bu nedenle tek yerleşim katı bulunmaktadır. Bu üç faktör (yapı malzemesi olarak granit kullanılmış olması, şehrin tek bir seviyeden N. Atalan Çayırezmez E-mail: [email protected]
-
Upload
independent -
Category
Documents
-
view
8 -
download
0
Transcript of Remote Sensing At Kerkenes: Combining Geophysical and Other Methods Kerkenes'de Uzaktan Algilama:...
Yerbilimleri, 29 (2), 87–100Hacettepe Üniversitesi Yerbilimleri Uygulama ve Araştırma Merkezi DergisiJournal of the Earth Sciences Application and Research Centre of Hacettepe University
Remote Sensing At Kerkenes: Combining Geophysical and Other Methods
Kerkenes’de Uzaktan Algılama: Jeofizik ve Diğer Yöntemlerin Birleştirilmesi
Nurdan ATALAN ÇAYIREZMEZ1, Pınar ERTEPINAR KAYMAKÇI2, Geoffrey D. SUMMERS3
¹ Ministry of Culture and Tourism of Turkish Republic, General Directorate for Cultural Properties and Museums, Ulus, ANKARA
² Department of Geological Engineering, Middle East Technical University, ANKARA
³ Settlement Archaeology Graduate Program, Institute of Social Sciences, Middle East Technical University, ANKARA
Geliş (received) : 11 Nisan (April) 2008 Kabul (accepted) : 28 Temmuz (July) 2008
ABSTRACT
Kerkenes, which lies to the south of Sorgun in the province of Yozgat is the location of the largest Iron Age capital in Central Anatolia. The low mountain is a granitic batholith with perennial water seeping from fissures. Buildings were mostly timber framed with granite used for foundations. The city was short-lived, being founded around 600 BCE and destroyed by fire, probably by Croesus King of Lydia, in the 540s. Thus, there is only one building level. These three factors (granite, a single building level and intense burning) make this ancient city an ideal choice for a program of remote sensing. The current period of investigation began in 1993 since when there have been an-nual campaigns. Remote sensing methods have included, from the top down, satellite imagery, photography from a manned hot air balloon, aerial photography from a tethered blimp, close contour differential Global Positioning
System (GPS) survey, and geophysical survey. This paper first presents remote sensing methods that were compared along a 140 m test strip at Kerkenes. Gradi-ometer and electric resistance surveys, conducted over the test area at different times, were compared with close contour differential GPS and aerial photographs of the same area. Results are evaluated in terms of both archae-ology and expenditure of resources is made while a concluding section looks at the utility of combining remote sensing survey results in a Geographic Information System (GIS). At Kerkenes it is seen that the electric resistance survey gives better results than gradiometer survey, however it is slower and can only be conducted in spring. It is also found that GPS survey gives more detailed topographic details than the aerial photographs. GIS provides excellent tools for the management of the data for archaeological sites similar to Kerkenes.
Keywords: Archaeology, electric resistance, geophysics, GIS, GPS, gradiometer, Kerkenes.
ÖZ
Yozgat iline bağlı Sorgun ilçesinin güneyinde bulunan Kerkenes, Orta Anadolu’da Demir Çağı’nın en büyük antik yerleşkesidir. Yerleşkenin bulunduğu granit kütlesi, çatlaklarından bütün yıl boyunca su sızan bir batolittir. Yerleşke-deki binalar genellikle granit temelli olup ahşap üst örgüden oluşmaktadır. Antik kent M.Ö. 600 civarında kurulmuş olup, olasılıkla Lidya Kralı Krezüs tarafından M.Ö. 540’larda bir yangın sonucu tahrip olmuştur. Bu nedenle tek yerleşim katı bulunmaktadır. Bu üç faktör (yapı malzemesi olarak granit kullanılmış olması, şehrin tek bir seviyeden
N. Atalan ÇayırezmezE-mail: [email protected]
INTRODUCTION
Archaeology started with the collection of antiq-uities and people in search of valuable objects started digging archaeological sites. Mapping and excavation techniques were improved with the introduction of theoretical studies which were followed by scientific surveys and excava-tions. However, destruction caused by archaeo-logical excavations and, in the second half of the twentieth century, mechanized alteration of landscapes on a large scale called for other solu-tions. These necessities led to the development of remote sensing techniques for archaeology that included the introduction of aerial photog-raphy, satellite imagery, a variety of geophysical methods and GIS. These techniques offer the archaeologist non-destructive opportunities to find answers for specific questions.
Surface or near-surface features-usually upper-most 1-2 m in archaeology- can be measured with remote sensing techniques (Kwamme, 2003). Kerkenes is the good example such a site, because most of the archaeological re-mains are less than 1 m.
At Kerkenes a combination of aerial photogra-phy with a blimp and manned hot air balloon, close contour differential GPS survey and flux-gate gradiometer survey of the entire 2.5 km2 walled city has been complimented by more restricted electric resistance survey. The pur-pose has been to provide a plan of the entire city so as to permit urban analyses using GIS
tools while also creating simulations for public outreach and education.
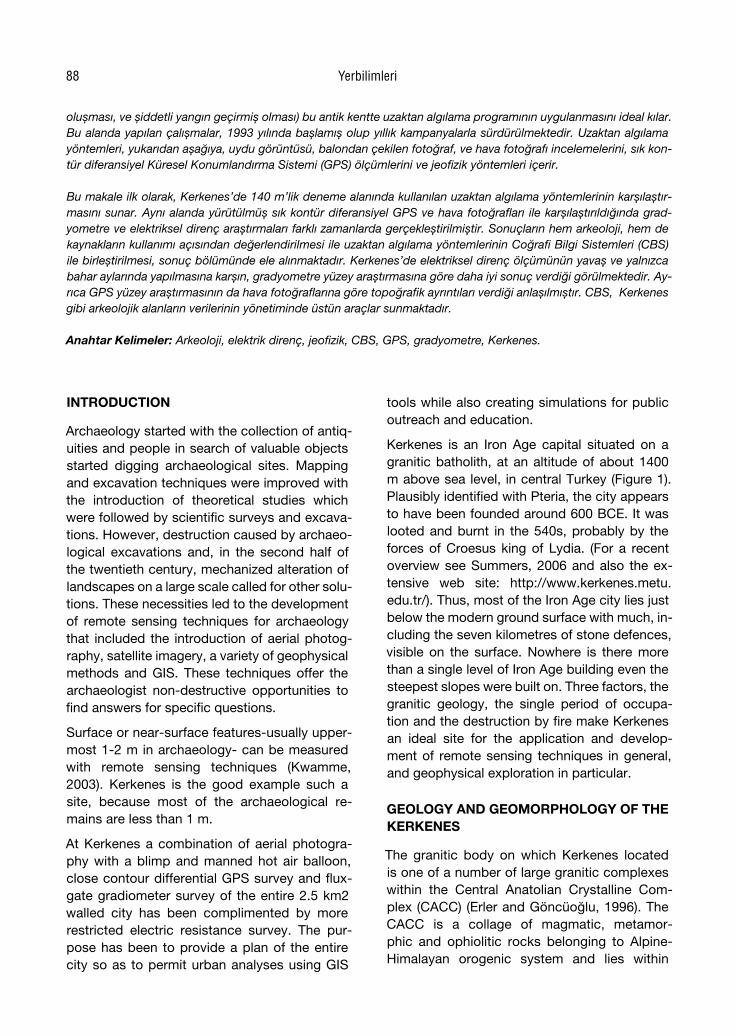
Kerkenes is an Iron Age capital situated on a granitic batholith, at an altitude of about 1400 m above sea level, in central Turkey (Figure 1). Plausibly identified with Pteria, the city appears to have been founded around 600 BCE. It was looted and burnt in the 540s, probably by the forces of Croesus king of Lydia. (For a recent overview see Summers, 2006 and also the ex-tensive web site: http://www.kerkenes.metu.edu.tr/). Thus, most of the Iron Age city lies just below the modern ground surface with much, in-cluding the seven kilometres of stone defences, visible on the surface. Nowhere is there more than a single level of Iron Age building even the steepest slopes were built on. Three factors, the granitic geology, the single period of occupa-tion and the destruction by fire make Kerkenes an ideal site for the application and develop-ment of remote sensing techniques in general, and geophysical exploration in particular.
GEOLOGY AND GEOMORPHOLOGY OF THE KERKENES
The granitic body on which Kerkenes located is one of a number of large granitic complexes within the Central Anatolian Crystalline Com-plex (CACC) (Erler and Göncüoğlu, 1996). The CACC is a collage of magmatic, metamor-phic and ophiolitic rocks belonging to Alpine-Himalayan orogenic system and lies within
oluşması, ve şiddetli yangın geçirmiş olması) bu antik kentte uzaktan algılama programının uygulanmasını ideal kılar. Bu alanda yapılan çalışmalar, 1993 yılında başlamış olup yıllık kampanyalarla sürdürülmektedir. Uzaktan algılama yöntemleri, yukarıdan aşağıya, uydu görüntüsü, balondan çekilen fotoğraf, ve hava fotoğrafı incelemelerini, sık kon-tür diferansiyel Küresel Konumlandırma Sistemi (GPS) ölçümlerini ve jeofizik yöntemleri içerir.
Bu makale ilk olarak, Kerkenes’de 140 m’lik deneme alanında kullanılan uzaktan algılama yöntemlerinin karşılaştır-masını sunar. Aynı alanda yürütülmüş sık kontür diferansiyel GPS ve hava fotoğrafları ile karşılaştırıldığında grad-yometre ve elektriksel direnç araştırmaları farklı zamanlarda gerçekleştirilmiştir. Sonuçların hem arkeoloji, hem de kaynakların kullanımı açısından değerlendirilmesi ile uzaktan algılama yöntemlerinin Coğrafi Bilgi Sistemleri (CBS) ile birleştirilmesi, sonuç bölümünde ele alınmaktadır. Kerkenes’de elektriksel direnç ölçümünün yavaş ve yalnızca bahar aylarında yapılmasına karşın, gradyometre yüzey araştırmasına göre daha iyi sonuç verdiği görülmektedir. Ay-rıca GPS yüzey araştırmasının da hava fotoğraflarına göre topoğrafik ayrıntıları verdiği anlaşılmıştır. CBS, Kerkenes gibi arkeolojik alanların verilerinin yönetiminde üstün araçlar sunmaktadır.
Anahtar Kelimeler: Arkeoloji, elektrik direnç, jeofizik, CBS, GPS, gradyometre, Kerkenes.
Yerbilimleri88
the Kırıkkale, Yozgat, Kırşehir, Sivas, Nevşehir, Kayseri and Niğde area. The CACC can be divided into three principal lithological units; Central Anatolian metamorphics, Central Ana-
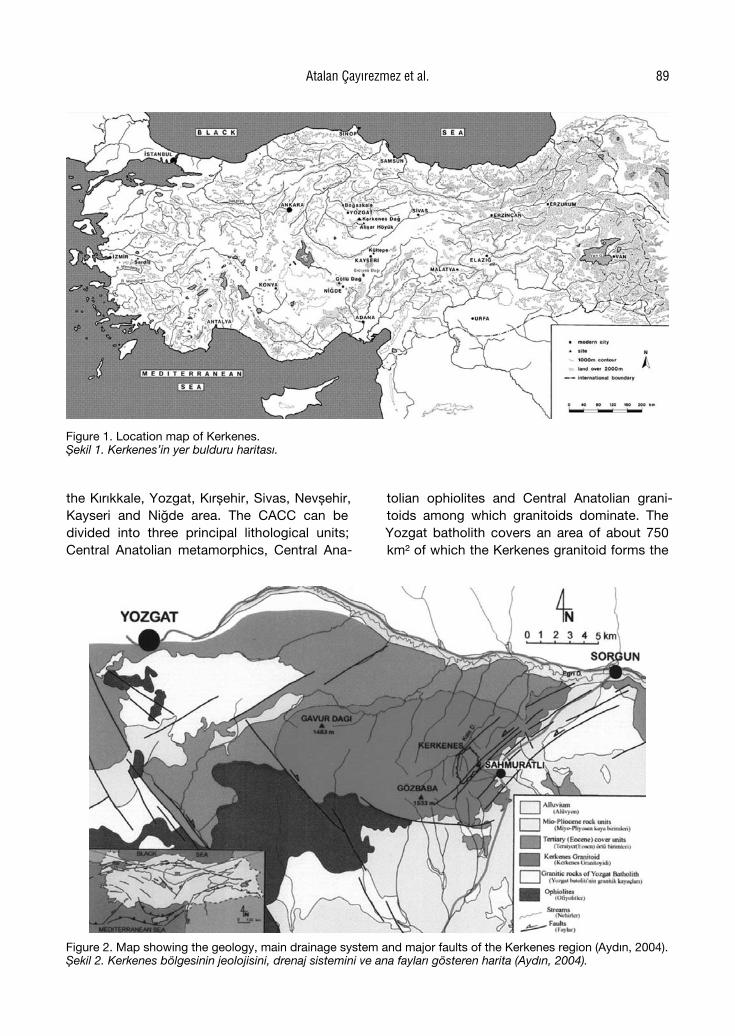
tolian ophiolites and Central Anatolian grani-toids among which granitoids dominate. The Yozgat batholith covers an area of about 750 km² of which the Kerkenes granitoid forms the
Figure 1. Location map of Kerkenes.Şekil 1. Kerkenes’in yer bulduru haritası.
Figure 2. Map showing the geology, main drainage system and major faults of the Kerkenes region (Aydın, 2004).Şekil 2. Kerkenes bölgesinin jeolojisini, drenaj sistemini ve ana fayları gösteren harita (Aydın, 2004).
Atalan Çayırezmez et al. 89
northeastern subunit covering an area of about 130 km² (Figure 2) (Demirel, 2004; Erler and Göncüoğlu, 1996). The topographic relief and distribution of rock units in the region are con-trolled mainly by northeast-southwest trending faults. As granitoids are relatively more resistant to erosion they form highlands while the low-lands are underlain by the Upper Cretaceous ophiolitic rocks and Tertiary sedimentary units. The formation of a very steep slope on the east-ern edge of the Kerkenes batholith is due to a dip-slip fault zone caused by differential verti-cal displacement. The southwest-facing terrain where the ancient city is located has a gentler slope which is incised by surface run-off and small gullies. The lower areas are covered by residual soil formed from weathering of the granite. Small scale faults and systematic joint patterns cause to secondary porosity and per-meability of the batholith along which ground water percolates to the surface, thus providing water resources for the ancient city. Altered granite forms the main storage for subsurface water (Erler and Göncüoğlu, 1996).
AN OVERVIEW OF REMOTE SENSING AT KERKENES
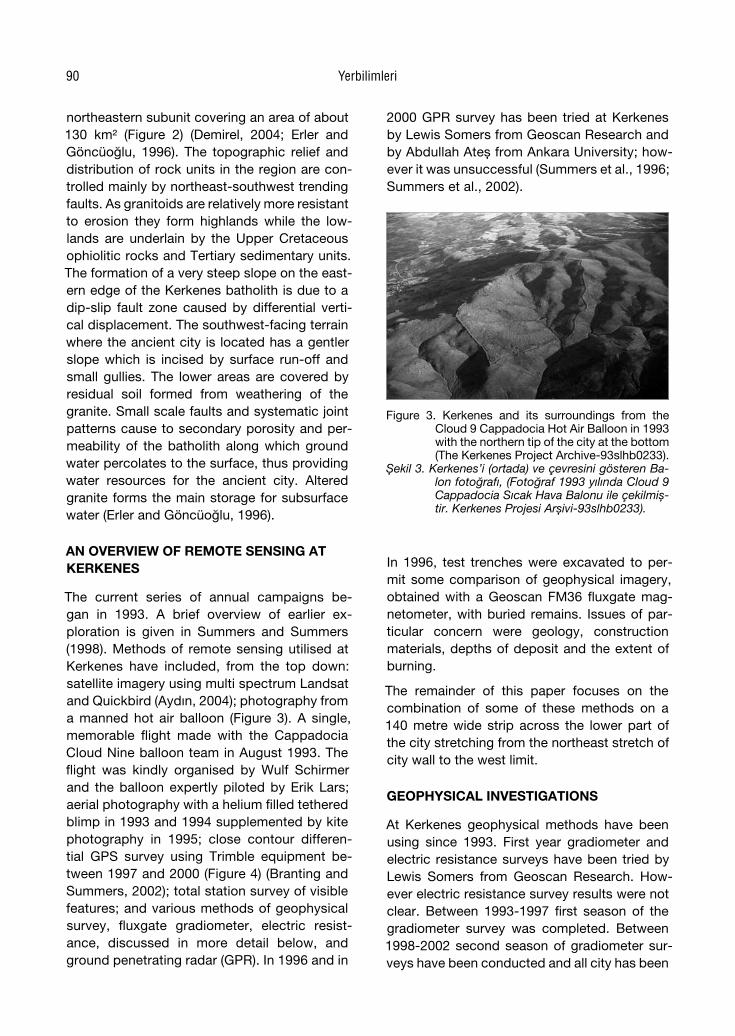
The current series of annual campaigns be-gan in 1993. A brief overview of earlier ex-ploration is given in Summers and Summers (1998). Methods of remote sensing utilised at Kerkenes have included, from the top down: satellite imagery using multi spectrum Landsat and Quickbird (Aydın, 2004); photography from a manned hot air balloon (Figure 3). A single, memorable flight made with the Cappadocia Cloud Nine balloon team in August 1993. The flight was kindly organised by Wulf Schirmer and the balloon expertly piloted by Erik Lars; aerial photography with a helium filled tethered blimp in 1993 and 1994 supplemented by kite photography in 1995; close contour differen-tial GPS survey using Trimble equipment be-tween 1997 and 2000 (Figure 4) (Branting and Summers, 2002); total station survey of visible features; and various methods of geophysical survey, fluxgate gradiometer, electric resist-ance, discussed in more detail below, and ground penetrating radar (GPR). In 1996 and in
2000 GPR survey has been tried at Kerkenes by Lewis Somers from Geoscan Research and by Abdullah Ateş from Ankara University; how-ever it was unsuccessful (Summers et al., 1996; Summers et al., 2002).
Figure 3. Kerkenes and its surroundings from the Cloud 9 Cappadocia Hot Air Balloon in 1993 with the northern tip of the city at the bottom (The Kerkenes Project Archive-93slhb0233).
Şekil 3. Kerkenes’i (ortada) ve çevresini gösteren Ba-lon fotoğrafı, (Fotoğraf 1993 yılında Cloud 9 Cappadocia Sıcak Hava Balonu ile çekilmiş-tir. Kerkenes Projesi Arşivi-93slhb0233).
In 1996, test trenches were excavated to per-mit some comparison of geophysical imagery, obtained with a Geoscan FM36 fluxgate mag-netometer, with buried remains. Issues of par-ticular concern were geology, construction materials, depths of deposit and the extent of burning.
The remainder of this paper focuses on the combination of some of these methods on a 140 metre wide strip across the lower part of the city stretching from the northeast stretch of city wall to the west limit.
GEOPHYSICAL INVESTIGATIONS
At Kerkenes geophysical methods have been using since 1993. First year gradiometer and electric resistance surveys have been tried by Lewis Somers from Geoscan Research. How-ever electric resistance survey results were not clear. Between 1993-1997 first season of the gradiometer survey was completed. Between 1998-2002 second season of gradiometer sur-veys have been conducted and all city has been
Yerbilimleri90
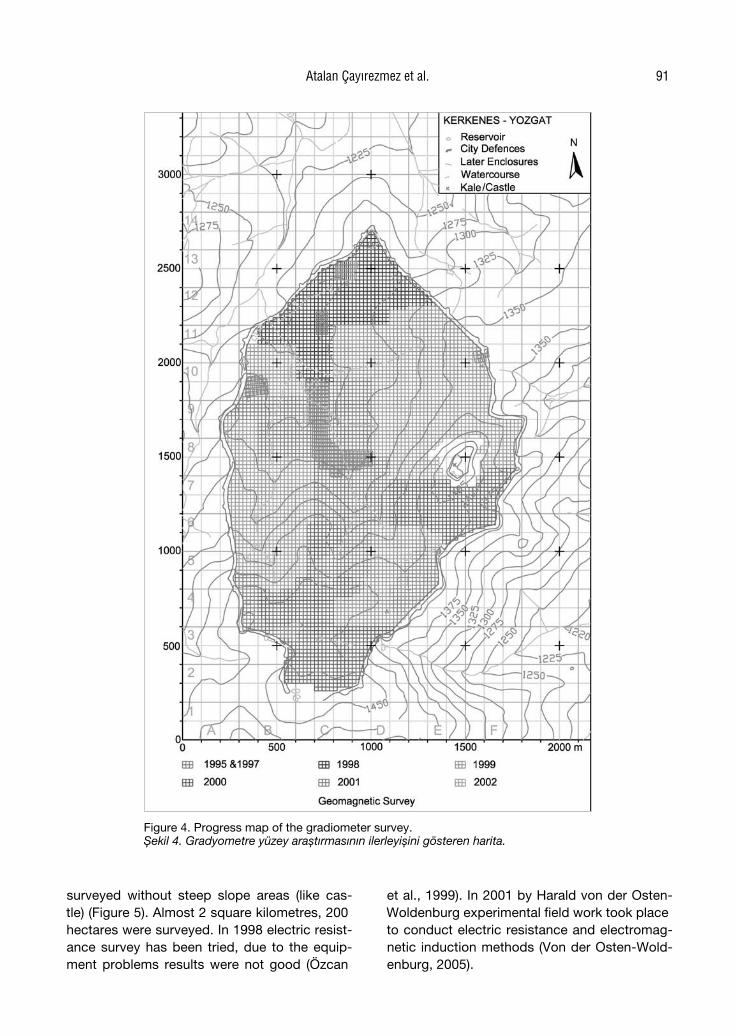
surveyed without steep slope areas (like cas-tle) (Figure 5). Almost 2 square kilometres, 200 hectares were surveyed. In 1998 electric resist-ance survey has been tried, due to the equip-ment problems results were not good (Özcan
et al., 1999). In 2001 by Harald von der Osten-Woldenburg experimental field work took place to conduct electric resistance and electromag-netic induction methods (Von der Osten-Wold-enburg, 2005).
Figure 4. Progress map of the gradiometer survey. Şekil 4. Gradyometre yüzey araştırmasının ilerleyişini gösteren harita.
Atalan Çayırezmez et al. 91
Data collections standards have been created by geophysicists for gradiometer and electric resistance survey at Kerkenes. Field forms were prepared for each 20x20 m grid to be filled in by trained team members. Data col-
lection was by teams trained workmen some of whom also learnt to download data and print out raw data on a daily basis. In this pa-per gradiometer and electric resistance survey results will be compared with GPS and aerial
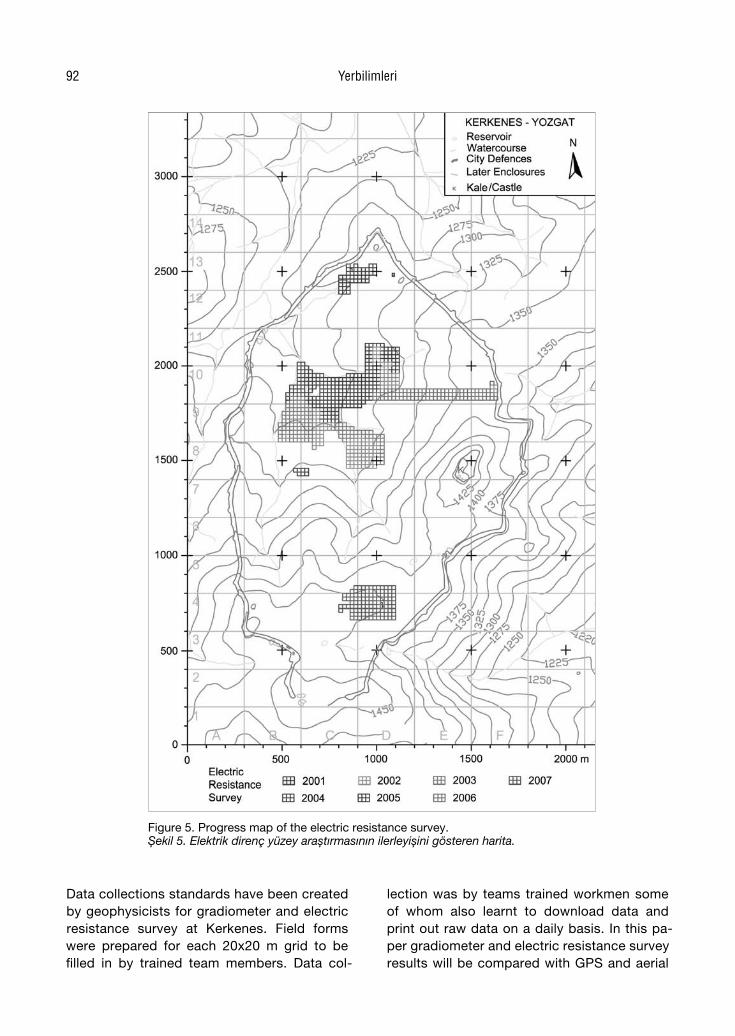
Figure 5. Progress map of the electric resistance survey.Şekil 5. Elektrik direnç yüzey araştırmasının ilerleyişini gösteren harita.
Yerbilimleri92
photographs of 140 meter long test strip (Fig-ures 7 and 8).
In this paper, gradiometer and electric resist-ance survey results will be compared with GPS and aerial photographs of a 140 meter long test strip (Figures 7 and 8).
Fluxgate Gradiometer Survey
Fluxgate gradiometer survey is a well devel-oped method for the recognition of subsurface cultural features on certain types of archaeo-logical site. The method measures local anoma-lies in the magnetic field of the earth which may be caused by natural and manmade features. The Geoscan FM36 Fluxgate gradiometer can measure up to eight readings per meter, col-lects data quickly and is easy to use (Karadut, 2002).
Magnetic anomalies within archaeological sites measured with gradiometer. In archaeological sites firing of the soil or firing of the artifacts can intensify the magnetic field that owing to thermoremanent magnetism (Kwamme, 2003). The destruction of the Kerkenes by fire makes Kerkenes an ideal site for gradiometer survey.
Although survey at Kerkenes began in 1993, most was done between 1998 and 2002 (see Figure 5). Steep slopes, rock outcrops, stone
strewn surfaces and vegetation made the FM 36 an ideal choice. It is probable that the new gen-eration of Geoscan machines would increase overall efficiency of data collection in the field by some 50%. Once Lewis Somers of Geoscan Research had determined the most appropriate sampling strategy for Kerkenes, balancing the need for speed and the difficulties of manag-ing huge data sets on the one hand with quality of data collection and clarity of imagery on the other, and had given basic training to key team members, local workmen were trained to con-duct the survey, download data, print out work sheets and even to make composite images. Much of this was done under the stern and ever watchful eye of an expert. On a good day it was possible to survey forty grids by working in two shifts. Using two machines in a single shift gave the same result and permitted improved man-agement of the data. At Kerkenes data was col-
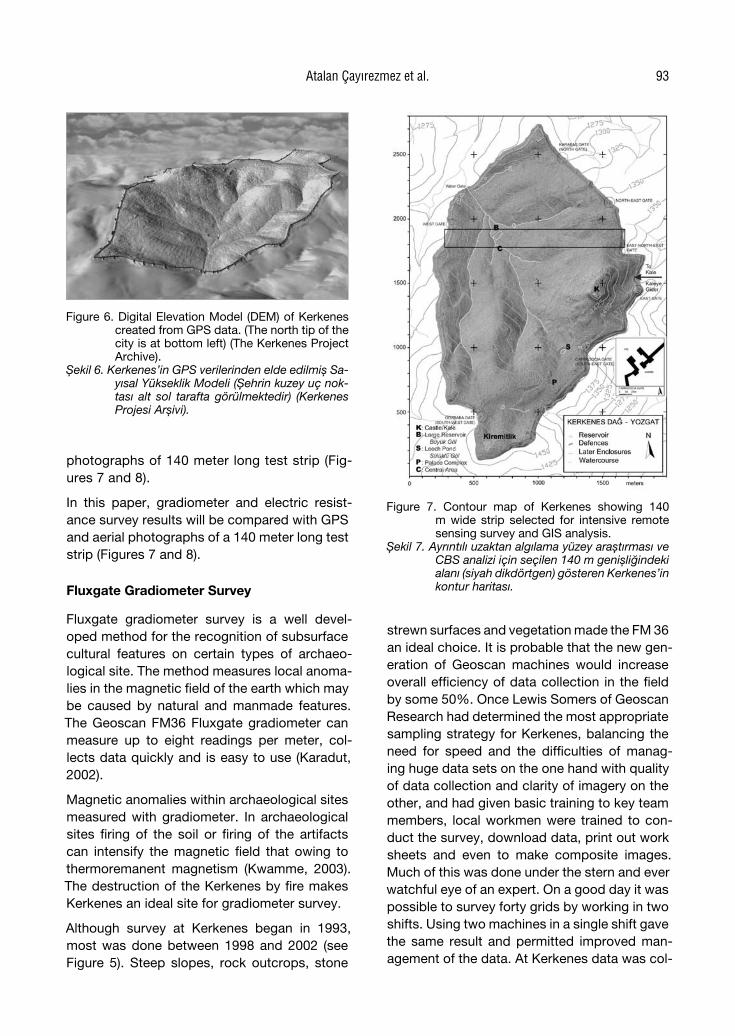
Figure 6. Digital Elevation Model (DEM) of Kerkenes created from GPS data. (The north tip of the city is at bottom left) (The Kerkenes Project Archive).
Şekil 6. Kerkenes’in GPS verilerinden elde edilmiş Sa-yısal Yükseklik Modeli (Şehrin kuzey uç nok-tası alt sol tarafta görülmektedir) (Kerkenes Projesi Arşivi).
Figure 7. Contour map of Kerkenes showing 140 m wide strip selected for intensive remote sensing survey and GIS analysis.
Şekil 7. Ayrıntılı uzaktan algılama yüzey araştırması ve CBS analizi için seçilen 140 m genişliğindeki alanı (siyah dikdörtgen) gösteren Kerkenes’in kontur haritası.
Atalan Çayırezmez et al. 93
lected in 20 x 20 m grids at a density of four readings per metre at one metre traverse inter-vals, while trial grids were surveyed with much higher sampling strategies. The starting point was the South-western corner of each grid with data collected from south to north in zigzag mode. The entire city except the rocky acropo-lis, with its later castle, was surveyed by this method. Downloading and pre-processing was done in Geoplot 3.0 software using the zero mean traverse function to eliminate the zigzag effect. In order to smooth the composite files the data was interpolated. According to the dif-ferent site characteristics at Kerkenes different data ranges were acquired in each area so that different clipping ranges were required to re-move noise. For example, ±10nT, ±20nT were chosen for the geologically and archaeologically quiet areas, ±30nT and ±45nT were chosen for noisy areas. In Geoplot 3.0 composite files were rotated 270 degrees clockwise to get North at the top. The small composite files were then ex-ported from Geoplot 3.0 to Surfer 8.x software as text files and combined in Surfer due to the
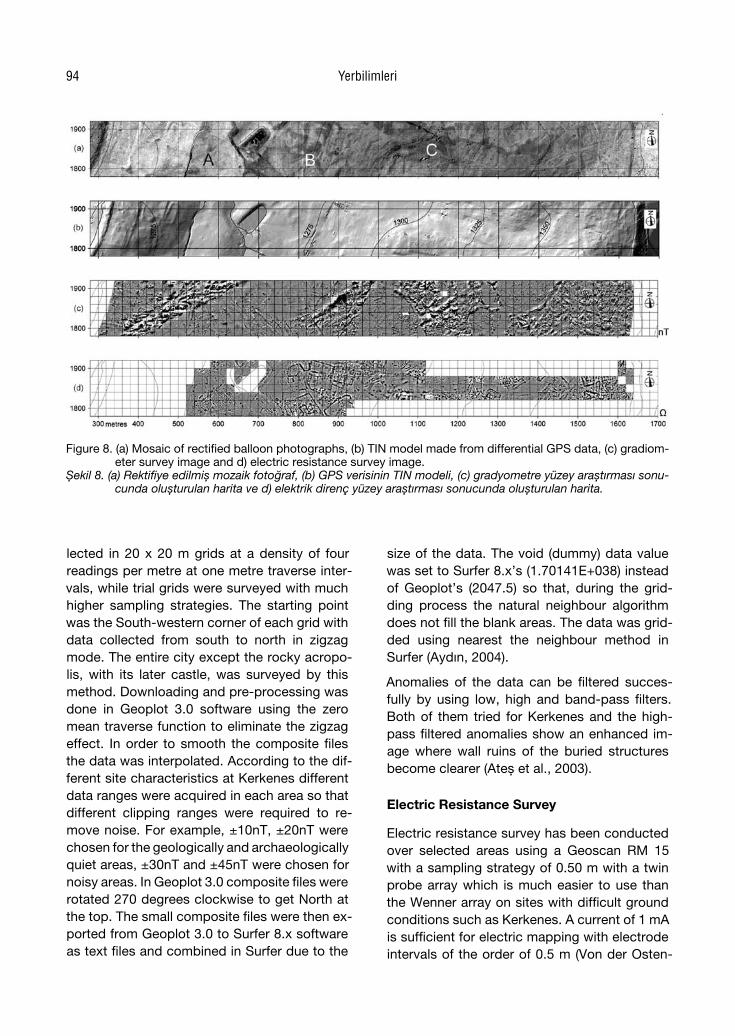
Figure 8. (a) Mosaic of rectified balloon photographs, (b) TIN model made from differential GPS data, (c) gradiom-eter survey image and d) electric resistance survey image.
Şekil 8. (a) Rektifiye edilmiş mozaik fotoğraf, (b) GPS verisinin TIN modeli, (c) gradyometre yüzey araştırması sonu-cunda oluşturulan harita ve d) elektrik direnç yüzey araştırması sonucunda oluşturulan harita.
size of the data. The void (dummy) data value was set to Surfer 8.x’s (1.70141E+038) instead of Geoplot’s (2047.5) so that, during the grid-ding process the natural neighbour algorithm does not fill the blank areas. The data was grid-ded using nearest the neighbour method in Surfer (Aydın, 2004).
Anomalies of the data can be filtered succes-fully by using low, high and band-pass filters. Both of them tried for Kerkenes and the high-pass filtered anomalies show an enhanced im-age where wall ruins of the buried structures become clearer (Ateş et al., 2003).
Electric Resistance Survey
Electric resistance survey has been conducted over selected areas using a Geoscan RM 15 with a sampling strategy of 0.50 m with a twin probe array which is much easier to use than the Wenner array on sites with difficult ground conditions such as Kerkenes. A current of 1 mA is sufficient for electric mapping with electrode intervals of the order of 0.5 m (Von der Osten-
Yerbilimleri94
Woldenburg, 2005). Downloading and pre-processing was done in Geoplot 3.0 software and data exported to Surfer 8.x.
Because most of the cultural deposits at Kerkenes are no more than 1m in depth results have been good, making continuation of this survey worthwhile despite the relatively slow progress (compare Figures 5 and 6). Where the surface is strewn with stones tumble or preserved wall tops extra-long mobile probes permit the frame to straddle protruding rocks. There might be some advantage in redesign-ing the frame for such circumstances. Electric resistance survey is restricted to a few weeks each spring, after the last snow, which can fall late in April, and before the surface dries out, usually in early June. Water resources are insuf-ficient for the employment overhead irrigation to dampen soil in advance of survey.
Surface Simulations
A three-dimensional simulation of the surface was produced by Trimble GPS equipment be-tween 1997 and 2000 (Summers et al., 2002) (see Figure 6). It was possible to simultaneously em-ploy three mobile receivers with one base station. Workmen collected some 1,400,000 individual readings (Branting and Summers, 2002). It has been possible to combine, or mosaic, and rectify photographs taken from both a manned hot air balloon and from a tethered blimp. These photo-graphic images can then be draped over the dig-ital elevation model (DEM) so as to create simula-tions of the surface. Interpretation of geophysical images should be combined with verification on the ground (ground-truthing) so that buried cul-tural features can be identified with the greatest possible confidence. GIS software permits the enhancement of features, and linear features such as walls in particular. CAD applications al-low the creation of architectural reconstructions while GIS makes virtual reality possible.
THE TEST STRIP
In 2006, 60x140 m line running down the steep north-eastern slope of the city, from the defen-sive wall to the central sector (Figures 7 and 8), was selected for electric resistance survey. The
primary aim was to compare and integrate the results of resistance and gradiometer survey over a variety of terrains with a range of geomor-phological, geological and hydrological features. A secondary aim was to test the hypothesis, based on surface observation and gradiometer imagery, that there were indeed built structures on the very steep slopes which were little dif-ferent to those seen on more level urban areas within the site. An overall objective was to de-velop future remote sensing research strategies at Kerkenes as well as to experiment with GIS analysis and virtual reality reconstructions.
COMPARISON OF THE METHODS
Combination of DTMs derived from close con-tour GPS survey with balloon-borne photography permit the accurate mapping of archaeological features visible on the surface. Useful results can only be achieved, however, by with verification and observation on the ground to identify such cultural and natural features as city defences, streets, buildings and compounds, streams, gul-lies, ponds, outcrops bedrock and vegetation.
Imagery derived from gradiometer and resist-ance reveals buried archaeological and natural features, sometimes with outstanding clarity. Generally at Kerkenes magnetic survey results are clearer where there is subsoil overlying the bedrock. While all of the factors influencing the clarity of the magnetic imagery are not fully un-derstood, and there is room for geophysical re-search here, it is clear that the intensity of the burning is a major factor. Resistance imagery, on the other hand, is largely controlled by changes in the water content of natural and built features as well as of subsoil and bedrock. The burnt material generally has lower water content and therefore displays higher resistance, while loose wall footings and fractured bed rock has higher water content thus lower resistance. However, systematic fractures within the bed rock results in anisotropy in the resistance values which is great value for the purpose of archaeological mapping. For example, the area denoted by “A” in Figure 8a shows a buried structure on the magnetic image (Figures 8 and 9) which can-not be seen on either the DEM (Figure 8b) or
Atalan Çayırezmez et al. 95
the aerial photograph (Figure 8a). In addition, some buildings that can be seen on the magne-tometer image are more clearly depicted on the resistance image. Further, area “B” shows the enclosure wall of an urban block that is evident on both the aerial photograph and the gradi-ometer image, although the geometries and fine details are seen with more clarity on the resistance map. Area “C” provides an example in which structures that cannot be seen in the gradiometer data because of background noise from the underlying geology are visible on the resistance map.
In summary, at Kerkenes the resistance im-age is usually clearer than the magnetic. This is especially true where bedrock lies close to the surface. Assiduous study of the imagery re-veals, however, that there are very few if any features appear on the resistance which cannot be made out on the magnetic. Aerial photog-raphy is often of considerable help in interpre-tation of the geophysical imagery while close contour GPS data permits transformation of remote sensing imagery into three-dimensional simulations.
REMOTE SENSING AND GIS ANALYSIS OF KERKENES DATA
Image Enhancement
Images obtained from the geophysical sur-
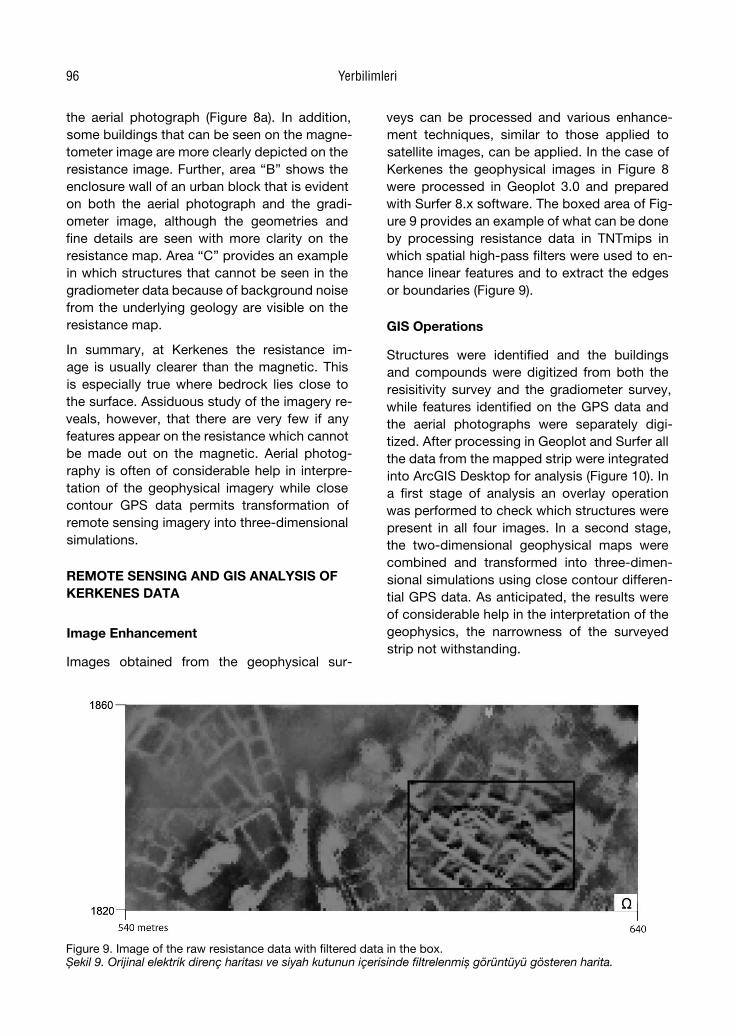
veys can be processed and various enhance-ment techniques, similar to those applied to satellite images, can be applied. In the case of Kerkenes the geophysical images in Figure 8 were processed in Geoplot 3.0 and prepared with Surfer 8.x software. The boxed area of Fig-ure 9 provides an example of what can be done by processing resistance data in TNTmips in which spatial high-pass filters were used to en-hance linear features and to extract the edges or boundaries (Figure 9).
GIS Operations
Structures were identified and the buildings and compounds were digitized from both the resisitivity survey and the gradiometer survey, while features identified on the GPS data and the aerial photographs were separately digi-tized. After processing in Geoplot and Surfer all the data from the mapped strip were integrated into ArcGIS Desktop for analysis (Figure 10). In a first stage of analysis an overlay operation was performed to check which structures were present in all four images. In a second stage, the two-dimensional geophysical maps were combined and transformed into three-dimen-sional simulations using close contour differen-tial GPS data. As anticipated, the results were of considerable help in the interpretation of the geophysics, the narrowness of the surveyed strip not withstanding.
Figure 9. Image of the raw resistance data with filtered data in the box.Şekil 9. Orijinal elektrik direnç haritası ve siyah kutunun içerisinde filtrelenmiş görüntüyü gösteren harita.
Yerbilimleri96
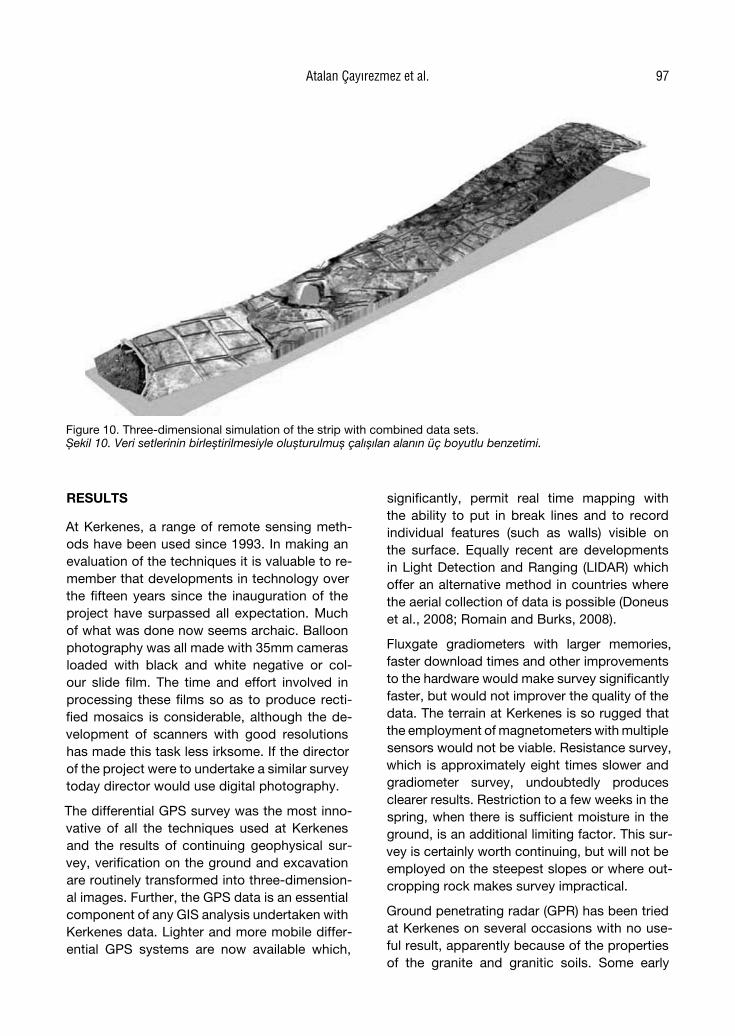
Figure 10. Three-dimensional simulation of the strip with combined data sets.Şekil 10. Veri setlerinin birleştirilmesiyle oluşturulmuş çalışılan alanın üç boyutlu benzetimi.
RESULTS
At Kerkenes, a range of remote sensing meth-ods have been used since 1993. In making an evaluation of the techniques it is valuable to re-member that developments in technology over the fifteen years since the inauguration of the project have surpassed all expectation. Much of what was done now seems archaic. Balloon photography was all made with 35mm cameras loaded with black and white negative or col-our slide film. The time and effort involved in processing these films so as to produce recti-fied mosaics is considerable, although the de-velopment of scanners with good resolutions has made this task less irksome. If the director of the project were to undertake a similar survey today director would use digital photography.
The differential GPS survey was the most inno-vative of all the techniques used at Kerkenes and the results of continuing geophysical sur-vey, verification on the ground and excavation are routinely transformed into three-dimension-al images. Further, the GPS data is an essential component of any GIS analysis undertaken with Kerkenes data. Lighter and more mobile differ-ential GPS systems are now available which,
significantly, permit real time mapping with the ability to put in break lines and to record individual features (such as walls) visible on the surface. Equally recent are developments in Light Detection and Ranging (LIDAR) which offer an alternative method in countries where the aerial collection of data is possible (Doneus et al., 2008; Romain and Burks, 2008).
Fluxgate gradiometers with larger memories, faster download times and other improvements to the hardware would make survey significantly faster, but would not improver the quality of the data. The terrain at Kerkenes is so rugged that the employment of magnetometers with multiple sensors would not be viable. Resistance survey, which is approximately eight times slower and gradiometer survey, undoubtedly produces clearer results. Restriction to a few weeks in the spring, when there is sufficient moisture in the ground, is an additional limiting factor. This sur-vey is certainly worth continuing, but will not be employed on the steepest slopes or where out-cropping rock makes survey impractical.
Ground penetrating radar (GPR) has been tried at Kerkenes on several occasions with no use-ful result, apparently because of the properties of the granite and granitic soils. Some early
Atalan Çayırezmez et al. 97
experiments with electromagnetic magnetic induction were very promising (Von der Os-ten-Woldenburg, 2005), making this method a promising one for the future as machines de-signed specifically for archaeological prospec-tion become available.
In 1996, test trenches were dug at various loca-tions within the city specifically in order to verify and clarify the geophysical results. These sond-ages, together with more recent excavations designed principally for other purposes, have demonstrated the veracity of the imagery.
CONCLUSIONS
The results of geomagnetic and resistance sur-vey combined with close contour differential GPS survey, balloon photography and verifica-tion on the ground permit the recognition of bur-ied structures and features with varying degrees of clarity over very large areas. It is thus becom-ing possible to create virtual reality simulations of urban sectors in ways that will permit the ap-plication of analytical GIS programs (Branting et al., 2007). Aspects of the urban dynamics of this ancient capital currently under investiga-tion include Transportation GIS (Branting 2004); relations between topography, geology, hydrol-ogy and the line chosen for the city defences (Atalan Çayırezmez, 2006); aspects of urban planning and population estimation (Summers 2007; Summers and Summers 2006).
Results of this approach are permitting archae-ologists to approach some ancient cities; those that are short-lived do not lie beneath deep overburden, in entirely new ways. Creation of three-dimensional simulations raises new types of questions and allows the identification of new problems that can be approached by the com-bined application of old techniques, e.g. exca-vation, and new methods, e.g. GIS analysis. On these on sites like Kerkenes archaeologists are no longer asking geophysicists to show them where to dig. Rather, analysis of remote sens-ing data is throwing out new challenges to ar-chaeologists.
It is appropriate here to offer some comments on the combination of these data sets in a GIS. The graphic images that GIS make it possible
to produce are impressive. Such imagery is of great importance in disseminating the results of archaeological investigation to a broad public as well as to students and colleagues, and in-deed to funding bodies. Whether it is necessary to use GIS in order to produce such graphic imagery is not, however, clear. A trained graph-ic artist supervised by an archaeologist can do much in programs such as Surfer 8.x and Autodesk 3ds Max. If the time, expertise and effort expending in putting these kinds of data bases into a GIS is to justified there has to be analytical or archaeological results beyond the convenience of having everything archived in the same system, although for a long-term research program such as that at Kerkenes a single archive is in itself an achievement of worth. One major problem, probably the major problem, is that in order to enter data into a GIS in forms that make it possible run analysis there has to be considerable interpretation of the remote sensing imagery. Enclosed spaces (rooms, buildings, courtyards) have to have four sides, to take the most obvious example. Kerkenes team run the risk of proving the obvi-ous, or of confirming rather testing interpreta-tions. On the other hand, the very processes of interpretation involved creating GIS data bases provide many new insights and raise a host of new questions. If both hardware and software are to continue to develop at the same rate over the ensuing years there is great reason for opti-mism over the future prospects of remote sens-ing combined with GIS analysis of short-lived urban sites.
ACKNOWLEDGEMENTS
Of the many individuals who have made con-tributions to this research we would especially thank Dr. Scott Branting from The Center for Ancient Middle Eastern Landscapes (CAMEL) at the Oriental Institute, Françoise Summers from Middle East Technical University, Lewis Somers from Geoscan Research, Nahide Aydın, David Monsees, and Tuna Kalaycı. The results from the 2006 survey which form the core of this paper were obtained through grants from Toreador Turkey, the Archaeocommunity Foun-dation, John Kelly Consulting Inc. and the Jou-
Yerbilimleri98
kowsky Family Foundation. Research facilities at Kerkenes owe much to the Erdoğan Mustafa Akdağ Eğitim Kültür Vakfi and Yibitaş Yozgat Cimento. Complete acknowledgments to team members, sponsors and collaborating institu-tions are to be found on the back cover of the annual Kerkenes News.
REFERENCES
Atalan Çayırezmez, N., 2006. Relationships bet-ween topography and Kerkenes (Tur-key), A GIS analysis. MSc Thesis, Midd-le East Technical University, Ankara (unpublished).
Ateş, A., Erdem, E., Bilim, F. ve Aydın, N., 2003. Magnetic enhancement over buried fe-atures in Kerkenes Mountain, Yozgat, Turkey. Journal of the Balkan Geoph-ysical Society, 6, 137-142.
Aydın, Z.N., 2004. The application of multi-sensor remote sensing techniques in archaeology. MSc Thesis, University of Mississippi, Mississippi (unpublished).
Branting, S., 2004. Iron Age pedestrians at Ker-kenes Dağ: an archaeological GIS-T approach to movement and transporta-tion. PhD Thesis, The University at Buf-falo, SUNY (unpublished).
Branting, S., and Summers, G., 2002. Modeling terrain: the Global Positioning System (GPS) survey at Kerkenes, Turkey. Anti-quity, 76, 639-640.
Branting, S., Wu, Y., Srikrishnan R., and Alta-weel, M.R., 2007. SHULGI: A geospa-tial tool for modeling human movement and interaction. Proceedings of the Agent 2007 Conference on Complex In-teraction and Social Emergence, ANL/DIS-07-2, M.J. North, C.M. Macal, and D.L. Sallach (eds.), Argonne National Laboratory, Argonne, Illinois, pp. 475-487.
Demirel, S., 2004. Origin and significance of a quartz-tourmaline breccia zone within the Central Anatolian Crystalline Comp-lex, Turkey. MSc Thesis, Middle East Technical University, Ankara, Turkey (unpublished).
Doneus, M., Brise, C., Fera, M., and Janner, M., 2008. Archaeological prospection of forested areas using full-waveform air-borne laser scanning. Journal of Archa-eological Science, 35 (4), 882-893.
Erler, A., and Göncüoğlu, M.C., 1996. Geolo-gic and tectonic setting of the Yozgat batholith, Northern Central Anatolian Crystalline Complex, Turkey. Internatio-nal Geology Review, 38, 714-726.
Karadut, E., 2002. Kerkenes (Yozgat) sahasın-da arkeolojik amaçlı jeofizik çalışmalar, Yüksek Lisans Tezi, Ankara Üniversitesi, Ankara (yayımlanmamış).
Kwamme, K.L., 2003. Terrestrial remote sensing in archaeology, http://www.cast.uark.edu/%7Ekkvamme/Class-archprosp/Kwamme-Terrestrial_Remote_Sensing.pdf, 23.07.2008.
Özcan, M., Çağlar, D., Summers, G.D., Sum-mers, F., and Stronach, D., 1999. Re-port on the 1999 season at Kerkenes Dağ, http://www.kerkenes.metu.edu.tr/kerk1/11prelim/1999/english/ urban.htm, 29.07.2008.
Romain, W.F., and Burks, J., 2008. LiDAR analy-ses of prehistoric earthworks in Ross County, Ohio. http://www.ohioarchae-ology.org/joomla/index, 24.03.2008.
Summers, G.D., 2006. Aspects of material cul-ture at the Iron Age capital on the Ker-kenes Dağ in Central Anatolia. Ancient Near Eastern Studies, 43, 164-202.
Summers, G.D., 2007. Public spaces and large halls at Kerkenes. Anatolian Iron Ages 6: The Proceedings of the 6th Anatoli-an Iron Ages Colloquium at Eskişehir, A. Çilingiroğlu and A. Sagona (eds.), Pee-ters Press, Leuven, pp. 245-263.
Summers, G.D., Summers, M.E.F., Baturayoğlu, N., Harmanşah, Ö., and McIntosh, E.R., 1996. “The Kerkenes Dağ survey, an in-terim report”. Anatolian Studies, XLVI, 201-234.
Summers, G.D., and Summers, F., 1998. The Kerkenes Project, Ancient Anatolia. An-cient Anatolia, R. Matthews (ed.), BIAA, London, pp. 177-194.
Atalan Çayırezmez et al. 99

Summers, G., and Summers, F., 2006. Aspects of urban design at the Iron Age city on the Kerkenes Dağ as revealed by ge-ophysical survey. Anatolia Antiqua, 14, 71-88.
Summers, G.D., Summers, F., Stronach, D., and Özcan, M., 2002. “Kerkenes Dağı Pro-jesi 2000”, 23. Kazi Sonuçlari Toplantısı 1.Cilt, Ankara, 439-448.
Von der Osten-Woldenburg, H., 2005. Appli-cations of Ground-Penetrating Radar, magnetic and electrical mapping, and electromagnetic induction methods in archaeological investigations. http://www.archaeogeophysics.info/pdf.html, 21.07.2008.
Yerbilimleri100