Reliability of MRI-derived measurements of human cerebral cortical thickness: The effects of field...
15
Reliability of MRI-derived measurements of human cerebral cortical thickness: The effects of field strength, scanner upgrade and manufacturer Xiao Han, a,b Jorge Jovicich, a,b David Salat, a,b Andre van der Kouwe, a,b Brian Quinn, a,b Silvester Czanner, a,b Evelina Busa, a,b Jenni Pacheco, a,b Marilyn Albert, d,e Ronald Killiany, f Paul Maguire, g Diana Rosas, a,b,c Nikos Makris, a,b,h Anders Dale, i Bradford Dickerson, a,c,d,j,1 and Bruce Fischl, a,b,k, * ,1 a Athinoula A. Martinos Center for Biomedical Imaging, Massachusetts General Hospital and Harvard Medical School, Boston, MA 02129, USA b Department of Radiology, Massachusetts General Hospital and Harvard Medical School, Boston, MA 02129, USA c Department of Neurology, Massachusetts General Hospital and Harvard Medical School, Boston, MA 02129, USA d Gerontology Research Unit/Department of Psychiatry, Massachusetts General Hospital and Harvard Medical School, Boston, MA 02129, USA e Department of Neurology, Johns Hopkins University School of Medicine, Baltimore, MD 21288, USA f Department of Anatomy and Neurobiology, Boston University School of Medicine, Boston, MA 02215, USA g Pfizer Global Research and Development, Groton, CT 06340, USA h Center for Morphometric Analysis, Massachusetts General Hospital, Boston, MA 02129, USA i University of California San Diego, CA 92093, USA j Division of Cognitive and Behavioral Neurology, Department of Neurology, Brigham and Women’s Hospital, Boston, MA 02115, USA k CSAIL, MIT, Cambridge, MA 02142, USA Received 21 October 2005; revised 17 February 2006; accepted 27 February 2006 Available online 2 May 2006 In vivo MRI-derived measurements of human cerebral cortex thickness are providing novel insights into normal and abnormal neuroanatomy, but little is known about their reliability. We investigated how the reliability of cortical thickness measurements is affected by MRI instrument-related factors, including scanner field strength, manufac- turer, upgrade and pulse sequence. Several data processing factors were also studied. Two test –retest data sets were analyzed: 1) 15 healthy older subjects scanned four times at 2-week intervals on three scanners; 2) 5 subjects scanned before and after a major scanner upgrade. Within-scanner variability of global cortical thickness measurements was <0.03 mm, and the point-wise standard deviation of measurement error was approximately 0.12 mm. Variability was 0.15 mm and 0.17 mm in average, respectively, for cross-scanner (Siemens/GE) and cross-field strength (1.5 T/3 T) comparisons. Scanner upgrade did not increase variability nor introduce bias. Measurements across field strength, however, were slightly biased (thicker at 3 T). The number of (single vs. multiple averaged) acquisitions had a negligible effect on reliability, but the use of a different pulse sequence had a larger impact, as did different parameters employed in data processing. Sample size estimates indicate that regional cortical thickness difference of 0.2 mm between two different groups could be identified with as few as 7 subjects per group, and a difference of 0.1 mm could be detected with 26 subjects per group. These results demonstrate that MRI-derived cortical thickness measures are highly reliable when MRI instrument and data process- ing factors are controlled but that it is important to consider these factors in the design of multi-site or longitudinal studies, such as clinical drug trials. D 2006 Elsevier Inc. All rights reserved. Keywords: Cortical thickness; Structural MRI; Cerebral cortex; Morphology Introduction Techniques that enable the in vivo MRI-derived quantitative measurement of properties of the human cerebral cortex, such as thickness, are beginning to demonstrate important potential applications in basic and clinical neuroscience. Changes in the gray matter that makes up the cortical sheet are manifested in normal aging (Jack et al., 1997; Salat et al., 1999, 2004; Sowell et al., 2003, 2004), Alzheimer’s disease (Dickerson et al., 2001; 1053-8119/$ - see front matter D 2006 Elsevier Inc. All rights reserved. doi:10.1016/j.neuroimage.2006.02.051 * Corresponding author. Department of Radiology, NMR Center, Massa- chusetts General Hospital, 149 Thirteenth Street, Rm. 2301, Charlestown, MA 02129, USA. Fax: +1 617 726 7422. E-mail address: [email protected] (B. Fischl). 1 These authors contributed equally to this work. Available online on ScienceDirect (www.sciencedirect.com). www.elsevier.com/locate/ynimg NeuroImage 32 (2006) 180 – 194
-
Upload
independent -
Category
Documents
-
view
2 -
download
0
Transcript of Reliability of MRI-derived measurements of human cerebral cortical thickness: The effects of field...
www.elsevier.com/locate/ynimg
NeuroImage 32 (2006) 180 – 194
Reliability of MRI-derived measurements of human cerebral cortical
thickness: The effects of field strength, scanner upgrade
and manufacturer
Xiao Han,a,b Jorge Jovicich,a,b David Salat,a,b Andre van der Kouwe,a,b Brian Quinn,a,b
Silvester Czanner,a,b Evelina Busa,a,b Jenni Pacheco,a,b Marilyn Albert,d,e Ronald Killiany,f
Paul Maguire,g Diana Rosas,a,b,c Nikos Makris,a,b,h Anders Dale, i
Bradford Dickerson,a,c,d,j,1 and Bruce Fischl,a,b,k,*,1
aAthinoula A. Martinos Center for Biomedical Imaging, Massachusetts General Hospital and Harvard Medical School, Boston, MA 02129, USAbDepartment of Radiology, Massachusetts General Hospital and Harvard Medical School, Boston, MA 02129, USAcDepartment of Neurology, Massachusetts General Hospital and Harvard Medical School, Boston, MA 02129, USAdGerontology Research Unit/Department of Psychiatry, Massachusetts General Hospital and Harvard Medical School, Boston, MA 02129, USAeDepartment of Neurology, Johns Hopkins University School of Medicine, Baltimore, MD 21288, USAfDepartment of Anatomy and Neurobiology, Boston University School of Medicine, Boston, MA 02215, USAgPfizer Global Research and Development, Groton, CT 06340, USAhCenter for Morphometric Analysis, Massachusetts General Hospital, Boston, MA 02129, USAiUniversity of California San Diego, CA 92093, USAjDivision of Cognitive and Behavioral Neurology, Department of Neurology, Brigham and Women’s Hospital, Boston, MA 02115, USAkCSAIL, MIT, Cambridge, MA 02142, USA
Received 21 October 2005; revised 17 February 2006; accepted 27 February 2006
Available online 2 May 2006
In vivo MRI-derived measurements of human cerebral cortex thickness
are providing novel insights into normal and abnormal neuroanatomy,
but little is known about their reliability. We investigated how the
reliability of cortical thickness measurements is affected by MRI
instrument-related factors, including scanner field strength, manufac-
turer, upgrade and pulse sequence. Several data processing factors
were also studied. Two test–retest data sets were analyzed: 1) 15
healthy older subjects scanned four times at 2-week intervals on three
scanners; 2) 5 subjects scanned before and after a major scanner
upgrade. Within-scanner variability of global cortical thickness
measurements was <0.03 mm, and the point-wise standard deviation
of measurement error was approximately 0.12 mm. Variability was
0.15 mm and 0.17 mm in average, respectively, for cross-scanner
(Siemens/GE) and cross-field strength (1.5 T/3 T) comparisons.
Scanner upgrade did not increase variability nor introduce bias.
Measurements across field strength, however, were slightly biased
(thicker at 3 T). The number of (single vs. multiple averaged)
acquisitions had a negligible effect on reliability, but the use of a
1053-8119/$ - see front matter D 2006 Elsevier Inc. All rights reserved.
doi:10.1016/j.neuroimage.2006.02.051
* Corresponding author. Department of Radiology, NMR Center, Massa-
chusetts General Hospital, 149 Thirteenth Street, Rm. 2301, Charlestown,
MA 02129, USA. Fax: +1 617 726 7422.
E-mail address: [email protected] (B. Fischl).1 These authors contributed equally to this work.
Available online on ScienceDirect (www.sciencedirect.com).
different pulse sequence had a larger impact, as did different
parameters employed in data processing. Sample size estimates indicate
that regional cortical thickness difference of 0.2 mm between two
different groups could be identified with as few as 7 subjects per group,
and a difference of 0.1 mm could be detected with 26 subjects per
group. These results demonstrate that MRI-derived cortical thickness
measures are highly reliable when MRI instrument and data process-
ing factors are controlled but that it is important to consider these
factors in the design of multi-site or longitudinal studies, such as
clinical drug trials.
D 2006 Elsevier Inc. All rights reserved.
Keywords: Cortical thickness; Structural MRI; Cerebral cortex; Morphology
Introduction
Techniques that enable the in vivo MRI-derived quantitative
measurement of properties of the human cerebral cortex, such as
thickness, are beginning to demonstrate important potential
applications in basic and clinical neuroscience. Changes in the
gray matter that makes up the cortical sheet are manifested in
normal aging (Jack et al., 1997; Salat et al., 1999, 2004; Sowell et
al., 2003, 2004), Alzheimer’s disease (Dickerson et al., 2001;
X. Han et al. / NeuroImage 32 (2006) 180–194 181
Thompson et al., 2003; Lerch et al., 2005), Huntington’s disease
(Rosas et al., 2002), corticobasal degeneration (Boeve et al., 1999),
amyotrophic lateral sclerosis (Kiernan and Hudson, 1994), multiple
sclerosis (Sailer et al., in press) and schizophrenia (Thompson et
al., 2001; Kuperberg et al., 2003; Narr et al., 2005). Progressive
thinning of the cortex follows a disease-specific regional pattern in
certain diseases, such as Alzheimer’s disease (Thompson et al.,
2003); thus, in vivo cortical thickness measures could be useful as
a biomarker of the evolution of the disease. Longitudinal imaging-
based biomarkers of disease progression will likely be of great
utility in evaluating the efficacy of disease-modifying therapies
(Dickerson and Sperling, 2005).
Measurement of cortical thickness from MRI data is a non-
trivial task. Manual thickness measurements are difficult to obtain
due to the highly convoluted nature of the cortex. It can take a
trained anatomist several days to manually label a high-resolution
set of MR brain images, and even this labor-intensive procedure
allows only the measurement of cortical volume, not cortical
thickness, because the cortical thickness is a property that can only
be properly measured if the location and orientation of both the
gray/white and pial surfaces are known. To facilitate automatic
thickness measurement, many computerized methods have been
proposed in the literature for segmenting the cortex and finding the
cortical surfaces from MRI data (Dale et al., 1999; Joshi et al.,
1999; MacDonald et al., 1999; Xu et al., 1999; Zeng et al., 1999;
Van Essen et al., 2001; Shattuck and Leahy, 2002; Sowell et al.,
2003; Barta et al., 2005; Han et al., 2005a).
Although the validation of MRI-derived cortical thickness
measurements has been performed against regional manual
measurements derived from both in vivo and post-mortem brain
scans (Rosas et al., 2002; Kuperberg et al., 2003; Salat et al.,
2004), the reliability of measures of this fundamental morphomet-
ric property of the brain has received relatively little systematic
investigation (Fischl and Dale, 2000; Rosas et al., 2002; Kuperberg
et al., 2003; Sowell et al., 2004; Lerch and Evans, 2005). Most of
these studies approach reliability by comparing thickness measure-
ments across different subjects or by performing repeated scans on
a few subjects acquired within the same scan session or within very
short scan intervals (for example, the subjects were removed from
the scanner and then scanned again in 5 min (Sowell et al., 2004)).
This approach may greatly underestimate the sources of variability
within and between studies.
Variability in MRI-derived morphometric measures may result
from subject-related factors, such as hydration status (Walters et
al., 2001), instrument-related factors, such as field strength,
scanner manufacturer or pulse sequence, or data-processing-related
factors, including not only software package but also the
parameters chosen for analysis. All of these factors may contribute
to differences between typical cross-sectional studies (e.g., when
interpreting differences between two studies of patients with
Alzheimer’s disease vs. controls scanned at a single time point
on one scanner). Longitudinal studies of normal development,
aging or disease progression face additional challenges associated
with both subject-related factors as well as instrument-related
factors (e.g., major scanner upgrades). For multi-site studies, it is
critical to understand and adjust for instrument-related differences
between sites, such as scanner manufacturer, field strength and
other hardware components. Finally, longitudinal multi-center
studies, such as the Alzheimer’s Disease Neuroimaging Initiative,
must contend with all of these factors while attempting to detect
subtle effects. Thus, detailed quantitative data regarding the degree
to which each of the factors outlined above contribute to variability
in cortical thickness (and other measures) could be very helpful for
both study design and interpretation. Unfortunately, little work in
this area has been performed.
Specifically, it is not yet clear how cortical thickness measures
vary as a function of MRI instrument-related factors, such as
field strength, scanner manufacturer and scanner software and
hardware upgrades. Knowledge of the degree to which different
MRI instrument-related factors affect the reliability of cortical
thickness measures is essential for the interpretation of these
measures in basic and clinical neuroscientific studies. Further-
more, this knowledge is critical if cortical thickness measures are
to find applications as biomarkers in clinical trials of putative
treatments for neurodegenerative or other neuropsychiatric
diseases.
We undertook this study to evaluate the reliability of a cortical
thickness measurement method both within and across different
scanner platforms and field strengths, with the goal of quantita-
tively identifying the factors that are the greatest contributors to
cortical thickness variability. Two groups of test–retest data sets
were acquired and analyzed. In the first data set, 15 healthy older
subjects were scanned four times at 2-week intervals on three
different scanner platforms (test scan on Siemens Sonata 1.5 T, re-
test scan on Siemens Sonata 1.5 T, cross-site scan on GE Signa 1.5
T, cross-field-strength scan on Siemens Trio 3 T). Older
participants were studied so that anatomical variability related to
atrophy and age-related signal changes was represented. The 2-
week interval was chosen so that elements of variability related to
subject hydration status and minor instrument drift would be
included, which may be artificially minimized when the test– retest
interval is several min to ¨1 day. First, the test– retest reliability of
cortical thickness measurements was investigated from the two
Siemens Sonata sessions. Next, analyses were performed on the
effects of various instrument-related factors, including: a) different
MR manufacturer (Siemens vs. GE); b) different field strength (1.5
T vs. 3 T); c) different pulse sequences (MPRAGE versus multiple
flip angle, multi-echo FLASH); d) different number of data
acquisitions (one MPRAGE vs. two averaged MPRAGE acquis-
itions). Finally, effects of several data processing-related factors
were analyzed, including: a) different levels of spatial smoothing of
the raw thickness maps; and b) different processing schemes
(cross-sectional versus longitudinal).
The second data set consisted of 5 healthy younger subjects
scanned repeatedly before and after a major scanner upgrade, with
the goal of evaluating the reliability of thickness measurements in
longitudinal studies that contend with scanner upgrades.
In this study, thickness measurements were performed using
the FreeSurfer software package, which is an automated method
for cortical surface reconstruction and thickness computation.
Although comparison with other thickness measurement methods
is beyond the scope of this paper, the effects of several aspects of
the processing system within FreeSurfer were studied as noted
above.
Materials and methods
Data acquisition
Two groups of test– retest data sets were acquired and analyzed
to characterize the reliability of cortical thickness estimation.
X. Han et al. / NeuroImage 32 (2006) 180–194182
The first group of test–retest data consists of MRI scans
acquired from 15 healthy older subjects (age between 66 and 81
years; mean: 69.5 years; SD: 4.8 years. 8 males, 7 females). All
participants provided informed consent in accordance with the
Human Research Committee of Massachusetts General Hospital.
Each subject underwent 4 scan sessions at 2-week intervals (two of
the subjects were each missing one scan session), including two
sessions on a Siemens 1.5 T Sonata scanner (Siemens Medical
Solutions, Erlangen, Germany), one on a Siemens 3 T Trio scanner
and one on a GE 1.5 T Signa scanner (General Electric,
Milwaukee, WI).
For each Siemens scan session, the acquisition included two
MPRAGE volumes (190 Hz/pixel, flip angle = 7-, 1.5 T: TR/TE/
TI = 2.73 s/3.44 ms/1 s, 3 T: TR/TE/TI = 2.53 s/3.25 ms/1.1 s) and
two multi-echo multi flip angle (30- and 5-) fast low-angle shot
(FLASH) volumes (651 Hz/pixel, TR = 20 ms, TE = (1.8 + 1.82 *
n) ms, n = 0, . . ., 7; both for 1.5 T and 3 T). In each GE session,
only the two MPRAGE volumes were acquired, but no multi-echo
FLASH (MEF). Acquisition time for MPRAGE and MEF
sequences was roughly the same and about 8 min each. All scans
were 3D sagittal acquisitions with 128 contiguous slices (imaging
matrix = 256 � 192, in-plane resolution = 1 mm, slice thickness =
1.33 mm). In each Siemens scan session, the acquisitions were
automatically aligned to a standardized anatomical atlas to ensure
consistent slice prescription across scans (Van der Kouwe et al.,
2005; Benner et al., in press).
In the second group of test– retest data, 5 healthy volunteers (34 T3 years of age; 1 male, 4 females) were each scanned four times,
twice before and twice after anMRI scanner upgrade (within 1 week
for the repeated scans on the same scanner and the total time span
was about 6 weeks). The upgrade was from a Siemens Magnetom
Sonata to a Magnetom Avanto, which included the following major
changes: a) main magnet (both are 1.5 T, Avanto’s length is 150 cm,
Sonata’s is 160 cm), (b) gradient system (Avanto coils are more
linear, Sonata 40 mT/m at 200 T/m/s, Avanto 45 mT/m at 200 T/m/
s), c) head RF coil (circularly polarized on Sonata, 12 channels in
Avanto) and d) software upgrade. During each of the four scan
sessions, two MPRAGE volumes were acquired for each subject
with the same sequence parameter settings as theMPRAGE scans in
the first group. This second group of data is used to evaluate the
thickness measurement reliability with respect to changes in scanner
platform and also the measurement reliability before and after the
scanner upgrade.
Cortical surface reconstruction and cortical thickness
measurement
Reconstruction of the cortical surfaces was performed using the
FreeSurfer toolkit (which is freely available to the research com-
munity through the website http://www.surfer.nmr.mgh.harvard.
edu/). This suite of methods was initially proposed in 1999 (Dale et
al., 1999; Fischl et al., 1999a) and has undergone several important
improvements over the years (Fischl et al., 1999b, 2001, 2002;
Segonne et al., 2004).With these updates, the current method is fully
automated. All the surface reconstruction results reported in this
paper were generated using the fully automated processing pipeline,
and no manual intervention was involved.
In FreeSurfer, when multiple acquisitions of the same pulse
sequence are available for the same subject in each scan session,
they are usually simply averaged after motion correction to
generate a single volume with better signal-to-noise ratio (SNR)
(the effect of number of acquisitions on thickness measurement
reliability is also investigated in this study). The multiple volumes
from the MEF sequence, however, have very different contrast
properties due to the different flip angle settings. Thus, a weighted
average is adopted instead. The weighting coefficients (a unit
vector of length 16) were pre-computed using a set of 11 MEF
scans that have complete manual labeling for gray matter (GM) and
white matter (GM). An optimal weighting was first computed for
each data set based on the principle of linear discriminant analysis
(Duda et al., 2001), with the objective to maximize the contrast-to-
noise-ratio (CNR) between GM and WM. The weighting vectors
from the 11 training data sets were then averaged to get the final
weighting coefficients that are used for the processing of new MEF
data.
Cortical thickness estimates in this study are computed as
follows. For each point on the gray/white surface, the shortest
distance to the pial surface is first computed. Next, for each point
on the pial surface, the shortest distance to the gray/white surface is
found, and the cortical thickness at that location is set to the
average of these two values. Other thickness computation methods
have been reported (Jones et al., 2000; Yezzi and Prince, 2003), but
comparing their effects on the thickness reliability is outside the
scope of this paper. We refer interested readers to Lerch and Evans
(2005) for one such comparison.
Evaluation of thickness measurement reliability
Reliability (or reproducibility) of cortical thickness measure-
ments was evaluated by comparing within subject thickness values
between scan sessions. For example, using the within subject
repeated MPRAGE scans from the first group of subjects, the
measurement reliability can be evaluated either within the same
scanner platform (using the two Sonata scans), or across different
scanner platform (one Sonata and one Signa scan), or across dif-
ferent field strength (one Sonata and one Trio scan), or across both
scanner platform and field strength (one Signa and one Trio scan).
In this study, both global and local thickness measurement
reliability is evaluated, with the focus being on the latter. The
global evaluation is performed by computing the global mean
thickness value across the whole cortex for each subject and
evaluating its reliability across difference scan sessions. To
evaluate the error in local thickness measurements, surface point
correspondence must be built to find thickness measurements at
homologous cortical locations. The gray/white surface is used as
reference to establish surface point correspondence since the gray/
white surfaces are in general insensitive to atrophy, which could
otherwise confound the alignment procedure.
Although each gray/white surface was mapped to the same
surface atlas and their spherical coordinates can be used to find
point correspondence between one surface and another, variations
in the nonlinear surface registration or morphing often give rise to
extra noise in the computed thickness difference or error map.
Instead, a simpler linear registration is adopted to perform the intra-
subject surface alignment, and surface point correspondence is then
built according to their Euclidean distance in the registered space
(typically, the maximal distance is less than 5 mm, and the mean
and standard deviation of the absolute Euclidean distances are both
less than 0.3 mm). The linear registration is computed using the
FLIRT linear registration tool (Jenkinson et al., 2002). The
volumetric registration matrix is then applied to the corresponding
surfaces. It is found that, for registering surfaces across different
X. Han et al. / NeuroImage 32 (2006) 180–194 183
scan sessions of the same subject, the linear registration is
sufficient and more robust than a nonlinear registration, which
has an unnecessarily large number of degrees of freedom for this
case. The nonlinear surface morphing is still necessary, however, in
order to align thickness or thickness difference maps across
different subjects for the computation of group-wise statistics. It
should be noted that perfect surface node correspondence cannot
be guaranteed and the computed thickness variability may include
contributions from the surface registration error. Surface registra-
tion error, however, is unlikely to contribute significantly to the
thickness variability measure, and its effect is further reduced if the
raw thickness map is smoothed.
After the thickness difference maps have been computed for
each subject and surface correspondence built across the group of
subjects using the nonlinear surface morphing, the mean and
standard deviation of the thickness differences can be computed at
each location of the surface atlas over the group of subjects to
evaluate the local thickness measurement variability. The relation-
ship between the statistics of the thickness differences and the
measurement variability (standard deviation of the measurement
error) is worth some explanation. Assume that the measurement
error can be modeled by a normal distribution N(0,re2) with zero
mean (that is, unbiased) and standard deviation re. Note that the
standard deviation re is a direct characterization of measurement
variability that is often used in hypothesis testing and statistical
power analysis. Given two measurements X and Y of the same
thickness value l (e.g., from two repeated scans of the same
subject), under the above assumption, X and Y both follow a
normal distribution of N(l,re2). From probability theory, their
difference Z(= X � Y) follows a normal distribution of N(0,2re2).
Clearly, given multiple observation of the difference Z at each
homologous cortical location (each subject provides one such
observation), its standard deviation rZ can be estimated, which in
turn gives an estimate of the standard deviation of the measurement
error according to the relationship re ¼ rZ=ffiffiffi2p
.
Another simpler statistic, used in this study, is the mean value
of the absolute differences, E(|Z|), computed at each surface atlas
location. Through simple derivation, it can be obtained that
E jZjð Þ ¼ 2re=ffiffiffipp¼ 1:128re. We chose E(|Z|) because it is more
intuitive and can be interpreted as the mean measurement error and
also because the estimation of means is more robust than the
estimation of variance when sample sizes are small. We drop the
factor of 1.128 when reporting the results, but keep in mind that it
gives a slight overestimation of the measurement variability. In the
Results section, maps of E(|Z|) will be presented to show the
spatial pattern of measurement error. Note that, if the measurement
noise is biased (i.e., having a non-zero mean (), E(|Z|) is still a
good approximation of re as long as ( N re, but the overestimate is
further increased.
Effect of smoothing on thickness measurement reliability
Note that, in the application of cortical thickness measurements
for neuroscience studies, it is often necessary to perform spatial
smoothing of the raw thickness maps (Fischl and Dale, 2000;
Rosas et al., 2002; Kuperberg et al., 2003; Chung et al., 2005;
Lerch and Evans, 2005; Narr et al., 2005). The smoothing reduces
noise in the thickness measurements and increases the sensitivity
and validity of statistical analysis (Chung et al., 2005; Lerch and
Evans, 2005). The tradeoff is the reduction in the spatial resolution
of the smoothed thickness maps. In this study, the effect of
different levels of spatial smoothing on the thickness reliability is
also evaluated. The results can be used as a guide for users to
choose the optimal smoothing when applying the thickness
measurement method in practice.
Similar to a previous approach (Fischl and Dale, 2000),
smoothing of the raw thickness maps is performed intrinsically
on the surface tessellation using an iterative nearest-neighbor
averaging procedure. At each iteration, the thickness value at a
surface vertex is replaced by the average of the values at its
immediate neighbors and at its own location. This procedure
simulates the solution of a linear diffusion equation on the surface
mesh and as such approximates a Gaussian smoothing kernel on
the surface mesh. The total amount of smoothing is determined by
the total number of iterations. A conservative approximation for
the equivalent Gaussian kernel size is r VffiffiffiffiffiffiffiffiffiNDxp
, where N is the
number of iterations and Dx is the average vertex spacing. In the
surface reconstruction results, a typical surface mesh contains
about 120K vertices and the vertex spacing is less than 1 mm.
From empirical simulation, it was found that N iterations of local
averaging can be well approximated by a surface-based Gaussian
filter of kernel size r ¼ffiffiffiffiffiffiffiffiffiffiffiffi2N=p
p. This relationship is used
throughout the presentation of the experimental results.
Effect of number of acquisitions on thickness measurement
reliability
The MPRAGE scans from the first group of 15 subjects are
used to study the effect of different number of image acquisitions
on the thickness measurement reliability. For this purpose, cortical
surface reconstruction and thickness measurement are also
computed using only a single MPRAGE volume from each scan
session. The thickness measurement reliability is then compared to
the results when using the average of two MPRAGE volumes
(which is the default approach).
Effect of different processing schemes on thickness measurement
reliability
The surface reconstruction and thickness estimation procedure
described above was designed for the processing of individual
scans, and it is thus not optimal for the processing of longitudinal
data (scans obtained at multiple time points from each subject). We
also designed a longitudinal processing scheme that aims to
incorporate the subject-wise correlation of longitudinal data into
the processing stream in order to further reduce the measurement
noise. Its performance in thickness measurement reliability is also
evaluated and compared to the original cross-sectional method.
The longitudinal scheme differs from the original procedure in
three major steps: preprocessing, intensity normalization and
surface deformation. Assuming that a series of scans of the same
subject are obtained at different time points, the data from time
point one is first processed using the original procedure. For the
processing of later time points, the three major steps mentioned
above are modified. First, a linear registration is computed between
the image volume of a later time point and that of the first time
point. Note that the volume itself is not transformed, but only the
registration matrix is stored and will be used in later steps. Second,
at the intensity normalization step, instead of re-computing the
WM control points, the control points (automatically computed)
from time point one are mapped to the current volume using the
previously computed linear registration, which are then used to
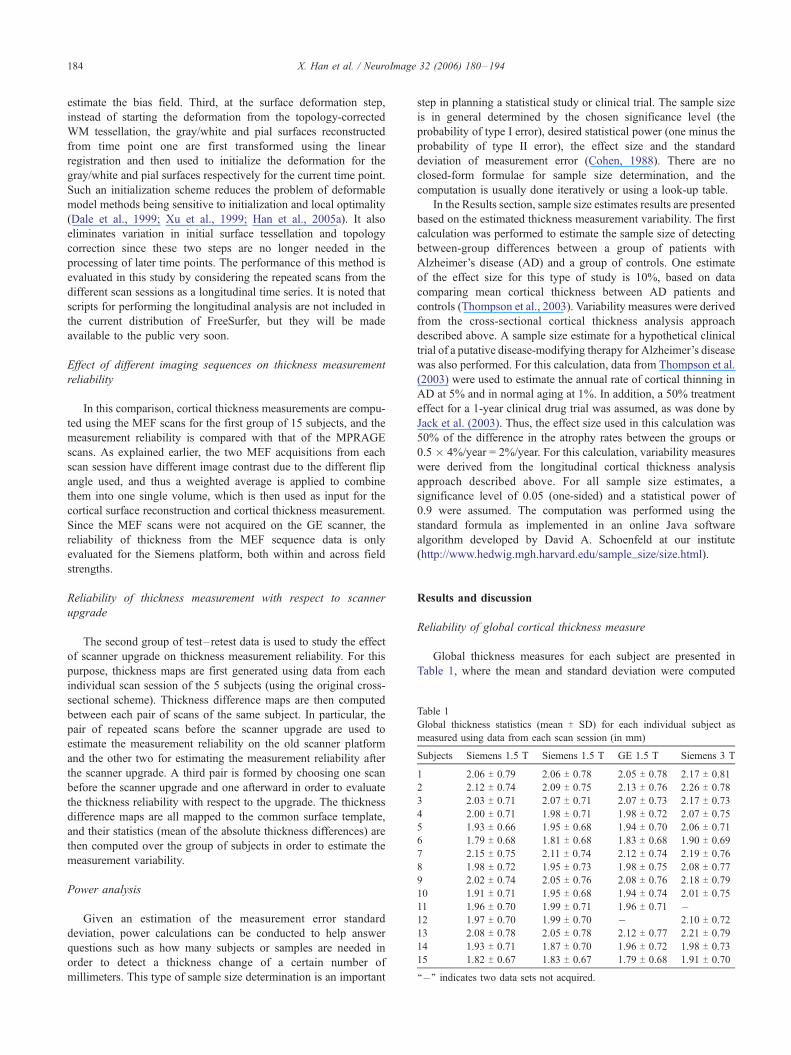
Table 1
Global thickness statistics (mean T SD) for each individual subject as
measured using data from each scan session (in mm)
Subjects Siemens 1.5 T Siemens 1.5 T GE 1.5 T Siemens 3 T
1 2.06 T 0.79 2.06 T 0.78 2.05 T 0.78 2.17 T 0.81
2 2.12 T 0.74 2.09 T 0.75 2.13 T 0.76 2.26 T 0.78
3 2.03 T 0.71 2.07 T 0.71 2.07 T 0.73 2.17 T 0.73
4 2.00 T 0.71 1.98 T 0.71 1.98 T 0.72 2.07 T 0.75
5 1.93 T 0.66 1.95 T 0.68 1.94 T 0.70 2.06 T 0.71
6 1.79 T 0.68 1.81 T 0.68 1.83 T 0.68 1.90 T 0.69
7 2.15 T 0.75 2.11 T 0.74 2.12 T 0.74 2.19 T 0.76
8 1.98 T 0.72 1.95 T 0.73 1.98 T 0.75 2.08 T 0.77
9 2.02 T 0.74 2.05 T 0.76 2.08 T 0.76 2.18 T 0.79
10 1.91 T 0.71 1.95 T 0.68 1.94 T 0.74 2.01 T 0.75
11 1.96 T 0.70 1.99 T 0.71 1.96 T 0.71 �12 1.97 T 0.70 1.99 T 0.70 � 2.10 T 0.72
13 2.08 T 0.78 2.05 T 0.78 2.12 T 0.77 2.21 T 0.79
14 1.93 T 0.71 1.87 T 0.70 1.96 T 0.72 1.98 T 0.73
15 1.82 T 0.67 1.83 T 0.67 1.79 T 0.68 1.91 T 0.70
‘‘�’’ indicates two data sets not acquired.
X. Han et al. / NeuroImage 32 (2006) 180–194184
estimate the bias field. Third, at the surface deformation step,
instead of starting the deformation from the topology-corrected
WM tessellation, the gray/white and pial surfaces reconstructed
from time point one are first transformed using the linear
registration and then used to initialize the deformation for the
gray/white and pial surfaces respectively for the current time point.
Such an initialization scheme reduces the problem of deformable
model methods being sensitive to initialization and local optimality
(Dale et al., 1999; Xu et al., 1999; Han et al., 2005a). It also
eliminates variation in initial surface tessellation and topology
correction since these two steps are no longer needed in the
processing of later time points. The performance of this method is
evaluated in this study by considering the repeated scans from the
different scan sessions as a longitudinal time series. It is noted that
scripts for performing the longitudinal analysis are not included in
the current distribution of FreeSurfer, but they will be made
available to the public very soon.
Effect of different imaging sequences on thickness measurement
reliability
In this comparison, cortical thickness measurements are compu-
ted using the MEF scans for the first group of 15 subjects, and the
measurement reliability is compared with that of the MPRAGE
scans. As explained earlier, the two MEF acquisitions from each
scan session have different image contrast due to the different flip
angle used, and thus a weighted average is applied to combine
them into one single volume, which is then used as input for the
cortical surface reconstruction and cortical thickness measurement.
Since the MEF scans were not acquired on the GE scanner, the
reliability of thickness from the MEF sequence data is only
evaluated for the Siemens platform, both within and across field
strengths.
Reliability of thickness measurement with respect to scanner
upgrade
The second group of test– retest data is used to study the effect
of scanner upgrade on thickness measurement reliability. For this
purpose, thickness maps are first generated using data from each
individual scan session of the 5 subjects (using the original cross-
sectional scheme). Thickness difference maps are then computed
between each pair of scans of the same subject. In particular, the
pair of repeated scans before the scanner upgrade are used to
estimate the measurement reliability on the old scanner platform
and the other two for estimating the measurement reliability after
the scanner upgrade. A third pair is formed by choosing one scan
before the scanner upgrade and one afterward in order to evaluate
the thickness reliability with respect to the upgrade. The thickness
difference maps are all mapped to the common surface template,
and their statistics (mean of the absolute thickness differences) are
then computed over the group of subjects in order to estimate the
measurement variability.
Power analysis
Given an estimation of the measurement error standard
deviation, power calculations can be conducted to help answer
questions such as how many subjects or samples are needed in
order to detect a thickness change of a certain number of
millimeters. This type of sample size determination is an important
step in planning a statistical study or clinical trial. The sample size
is in general determined by the chosen significance level (the
probability of type I error), desired statistical power (one minus the
probability of type II error), the effect size and the standard
deviation of measurement error (Cohen, 1988). There are no
closed-form formulae for sample size determination, and the
computation is usually done iteratively or using a look-up table.
In the Results section, sample size estimates results are presented
based on the estimated thickness measurement variability. The first
calculation was performed to estimate the sample size of detecting
between-group differences between a group of patients with
Alzheimer’s disease (AD) and a group of controls. One estimate
of the effect size for this type of study is 10%, based on data
comparing mean cortical thickness between AD patients and
controls (Thompson et al., 2003). Variability measures were derived
from the cross-sectional cortical thickness analysis approach
described above. A sample size estimate for a hypothetical clinical
trial of a putative disease-modifying therapy for Alzheimer’s disease
was also performed. For this calculation, data from Thompson et al.
(2003) were used to estimate the annual rate of cortical thinning in
AD at 5% and in normal aging at 1%. In addition, a 50% treatment
effect for a 1-year clinical drug trial was assumed, as was done by
Jack et al. (2003). Thus, the effect size used in this calculation was
50% of the difference in the atrophy rates between the groups or
0.5 � 4%/year = 2%/year. For this calculation, variability measures
were derived from the longitudinal cortical thickness analysis
approach described above. For all sample size estimates, a
significance level of 0.05 (one-sided) and a statistical power of
0.9 were assumed. The computation was performed using the
standard formula as implemented in an online Java software
algorithm developed by David A. Schoenfeld at our institute
(http://www.hedwig.mgh.harvard.edu/sample_size/size.html).
Results and discussion
Reliability of global cortical thickness measure
Global thickness measures for each subject are presented in
Table 1, where the mean and standard deviation were computed
X. Han et al. / NeuroImage 32 (2006) 180–194 185
over the whole cortical surface combining left and right hemi-
spheres. Overall, the range of cortical thickness values is similar
for each individual subject across different scan sessions. The
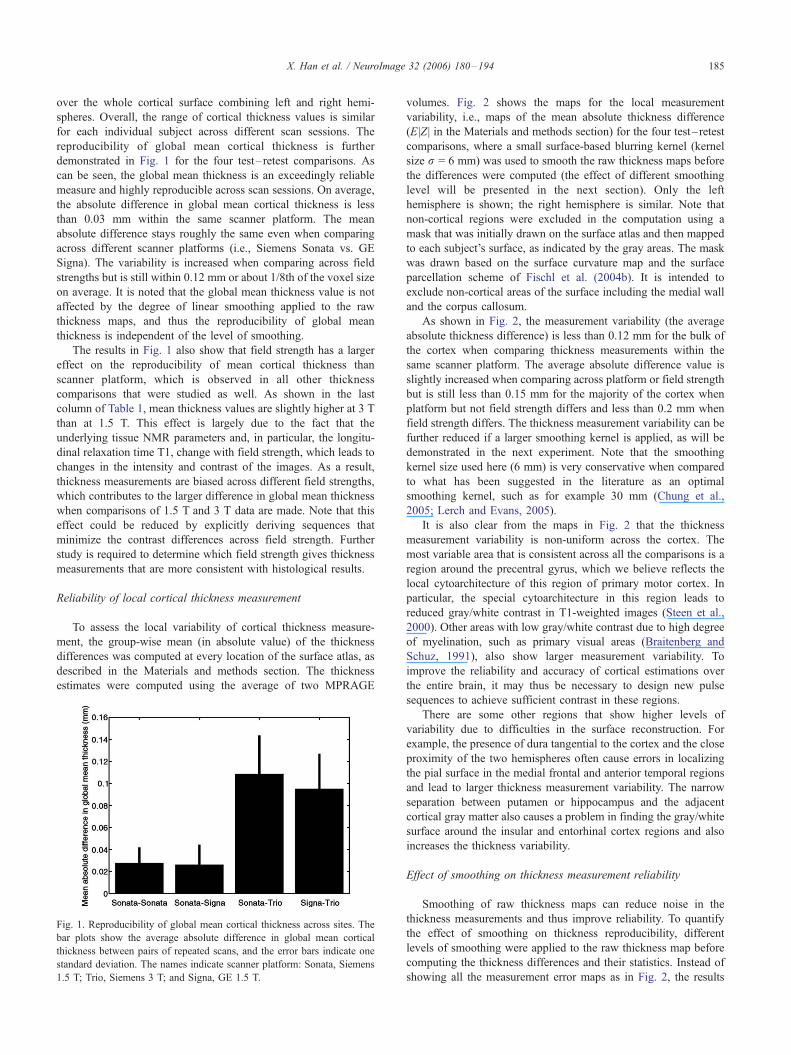
reproducibility of global mean cortical thickness is further
demonstrated in Fig. 1 for the four test–retest comparisons. As
can be seen, the global mean thickness is an exceedingly reliable
measure and highly reproducible across scan sessions. On average,
the absolute difference in global mean cortical thickness is less
than 0.03 mm within the same scanner platform. The mean
absolute difference stays roughly the same even when comparing
across different scanner platforms (i.e., Siemens Sonata vs. GE
Signa). The variability is increased when comparing across field
strengths but is still within 0.12 mm or about 1/8th of the voxel size
on average. It is noted that the global mean thickness value is not
affected by the degree of linear smoothing applied to the raw
thickness maps, and thus the reproducibility of global mean
thickness is independent of the level of smoothing.
The results in Fig. 1 also show that field strength has a larger
effect on the reproducibility of mean cortical thickness than
scanner platform, which is observed in all other thickness
comparisons that were studied as well. As shown in the last
column of Table 1, mean thickness values are slightly higher at 3 T
than at 1.5 T. This effect is largely due to the fact that the
underlying tissue NMR parameters and, in particular, the longitu-
dinal relaxation time T1, change with field strength, which leads to
changes in the intensity and contrast of the images. As a result,
thickness measurements are biased across different field strengths,
which contributes to the larger difference in global mean thickness
when comparisons of 1.5 T and 3 T data are made. Note that this
effect could be reduced by explicitly deriving sequences that
minimize the contrast differences across field strength. Further
study is required to determine which field strength gives thickness
measurements that are more consistent with histological results.
Reliability of local cortical thickness measurement
To assess the local variability of cortical thickness measure-
ment, the group-wise mean (in absolute value) of the thickness
differences was computed at every location of the surface atlas, as
described in the Materials and methods section. The thickness
estimates were computed using the average of two MPRAGE
Fig. 1. Reproducibility of global mean cortical thickness across sites. The
bar plots show the average absolute difference in global mean cortical
thickness between pairs of repeated scans, and the error bars indicate one
standard deviation. The names indicate scanner platform: Sonata, Siemens
1.5 T; Trio, Siemens 3 T; and Signa, GE 1.5 T.
volumes. Fig. 2 shows the maps for the local measurement
variability, i.e., maps of the mean absolute thickness difference
(E |Z| in the Materials and methods section) for the four test– retest
comparisons, where a small surface-based blurring kernel (kernel
size r = 6 mm) was used to smooth the raw thickness maps before
the differences were computed (the effect of different smoothing
level will be presented in the next section). Only the left
hemisphere is shown; the right hemisphere is similar. Note that
non-cortical regions were excluded in the computation using a
mask that was initially drawn on the surface atlas and then mapped
to each subject’s surface, as indicated by the gray areas. The mask
was drawn based on the surface curvature map and the surface
parcellation scheme of Fischl et al. (2004b). It is intended to
exclude non-cortical areas of the surface including the medial wall
and the corpus callosum.
As shown in Fig. 2, the measurement variability (the average
absolute thickness difference) is less than 0.12 mm for the bulk of
the cortex when comparing thickness measurements within the
same scanner platform. The average absolute difference value is
slightly increased when comparing across platform or field strength
but is still less than 0.15 mm for the majority of the cortex when
platform but not field strength differs and less than 0.2 mm when
field strength differs. The thickness measurement variability can be
further reduced if a larger smoothing kernel is applied, as will be
demonstrated in the next experiment. Note that the smoothing
kernel size used here (6 mm) is very conservative when compared
to what has been suggested in the literature as an optimal
smoothing kernel, such as for example 30 mm (Chung et al.,
2005; Lerch and Evans, 2005).
It is also clear from the maps in Fig. 2 that the thickness
measurement variability is non-uniform across the cortex. The
most variable area that is consistent across all the comparisons is a
region around the precentral gyrus, which we believe reflects the
local cytoarchitecture of this region of primary motor cortex. In
particular, the special cytoarchitecture in this region leads to
reduced gray/white contrast in T1-weighted images (Steen et al.,
2000). Other areas with low gray/white contrast due to high degree
of myelination, such as primary visual areas (Braitenberg and
Schuz, 1991), also show larger measurement variability. To
improve the reliability and accuracy of cortical estimations over
the entire brain, it may thus be necessary to design new pulse
sequences to achieve sufficient contrast in these regions.
There are some other regions that show higher levels of
variability due to difficulties in the surface reconstruction. For
example, the presence of dura tangential to the cortex and the close
proximity of the two hemispheres often cause errors in localizing
the pial surface in the medial frontal and anterior temporal regions
and lead to larger thickness measurement variability. The narrow
separation between putamen or hippocampus and the adjacent
cortical gray matter also causes a problem in finding the gray/white
surface around the insular and entorhinal cortex regions and also
increases the thickness variability.
Effect of smoothing on thickness measurement reliability
Smoothing of raw thickness maps can reduce noise in the
thickness measurements and thus improve reliability. To quantify
the effect of smoothing on thickness reproducibility, different
levels of smoothing were applied to the raw thickness map before
computing the thickness differences and their statistics. Instead of
showing all the measurement error maps as in Fig. 2, the results
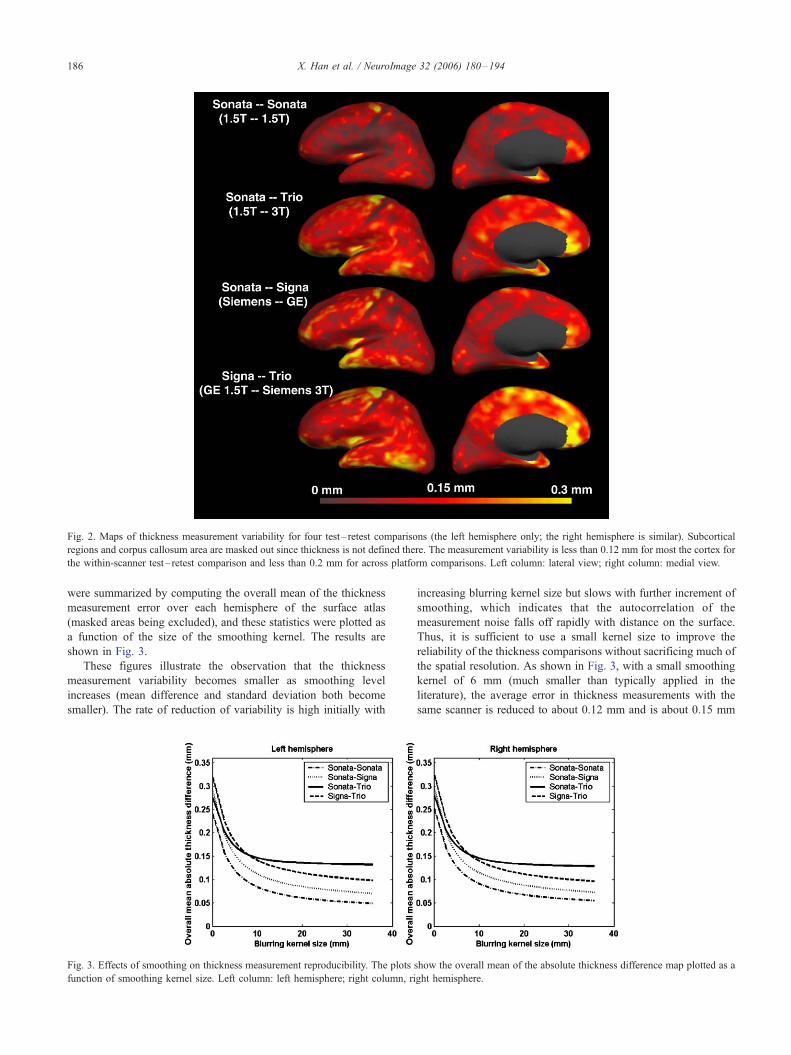
Fig. 2. Maps of thickness measurement variability for four test – retest comparisons (the left hemisphere only; the right hemisphere is similar). Subcortical
regions and corpus callosum area are masked out since thickness is not defined there. The measurement variability is less than 0.12 mm for most the cortex for
the within-scanner test – retest comparison and less than 0.2 mm for across platform comparisons. Left column: lateral view; right column: medial view.
X. Han et al. / NeuroImage 32 (2006) 180–194186
were summarized by computing the overall mean of the thickness
measurement error over each hemisphere of the surface atlas
(masked areas being excluded), and these statistics were plotted as
a function of the size of the smoothing kernel. The results are
shown in Fig. 3.
These figures illustrate the observation that the thickness
measurement variability becomes smaller as smoothing level
increases (mean difference and standard deviation both become
smaller). The rate of reduction of variability is high initially with
Fig. 3. Effects of smoothing on thickness measurement reproducibility. The plots
function of smoothing kernel size. Left column: left hemisphere; right column, ri
increasing blurring kernel size but slows with further increment of
smoothing, which indicates that the autocorrelation of the
measurement noise falls off rapidly with distance on the surface.
Thus, it is sufficient to use a small kernel size to improve the
reliability of the thickness comparisons without sacrificing much of
the spatial resolution. As shown in Fig. 3, with a small smoothing
kernel of 6 mm (much smaller than typically applied in the
literature), the average error in thickness measurements with the
same scanner is reduced to about 0.12 mm and is about 0.15 mm
show the overall mean of the absolute thickness difference map plotted as a
ght hemisphere.
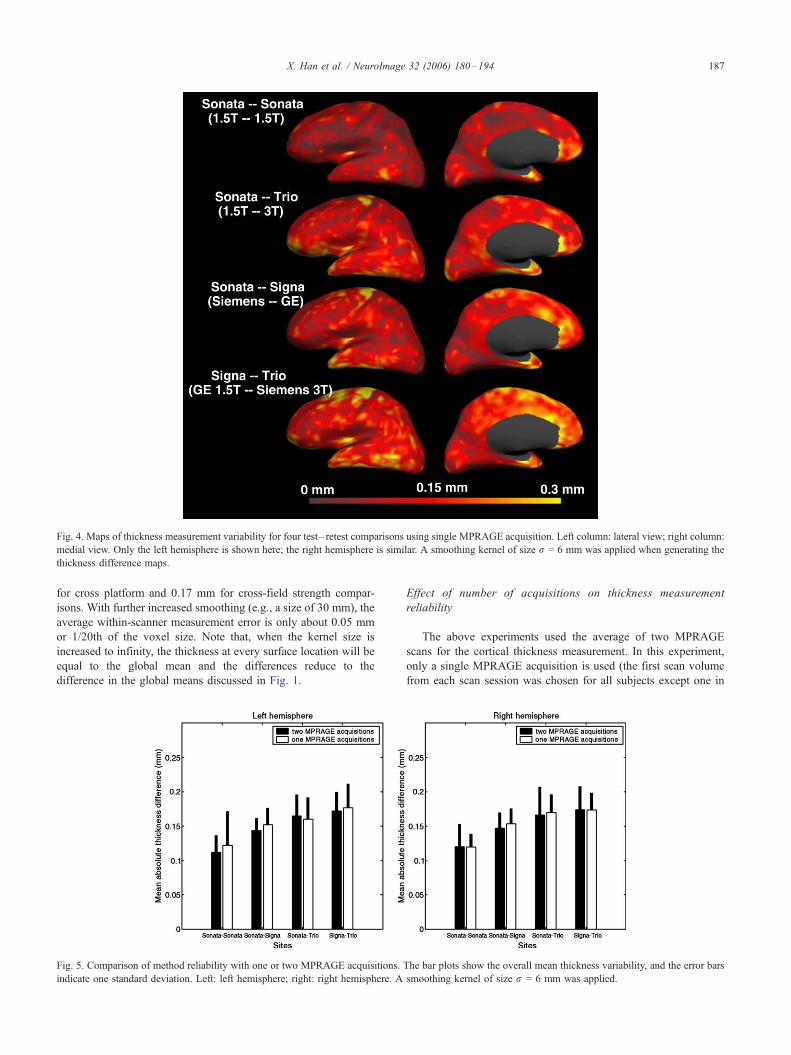
Fig. 4. Maps of thickness measurement variability for four test – retest comparisons using single MPRAGE acquisition. Left column: lateral view; right column:
medial view. Only the left hemisphere is shown here; the right hemisphere is similar. A smoothing kernel of size r = 6 mm was applied when generating the
thickness difference maps.
X. Han et al. / NeuroImage 32 (2006) 180–194 187
for cross platform and 0.17 mm for cross-field strength compar-
isons. With further increased smoothing (e.g., a size of 30 mm), the
average within-scanner measurement error is only about 0.05 mm
or 1/20th of the voxel size. Note that, when the kernel size is
increased to infinity, the thickness at every surface location will be
equal to the global mean and the differences reduce to the
difference in the global means discussed in Fig. 1.
Fig. 5. Comparison of method reliability with one or two MPRAGE acquisitions.
indicate one standard deviation. Left: left hemisphere; right: right hemisphere. A
Effect of number of acquisitions on thickness measurement
reliability
The above experiments used the average of two MPRAGE
scans for the cortical thickness measurement. In this experiment,
only a single MPRAGE acquisition is used (the first scan volume
from each scan session was chosen for all subjects except one in
The bar plots show the overall mean thickness variability, and the error bars
smoothing kernel of size r = 6 mm was applied.
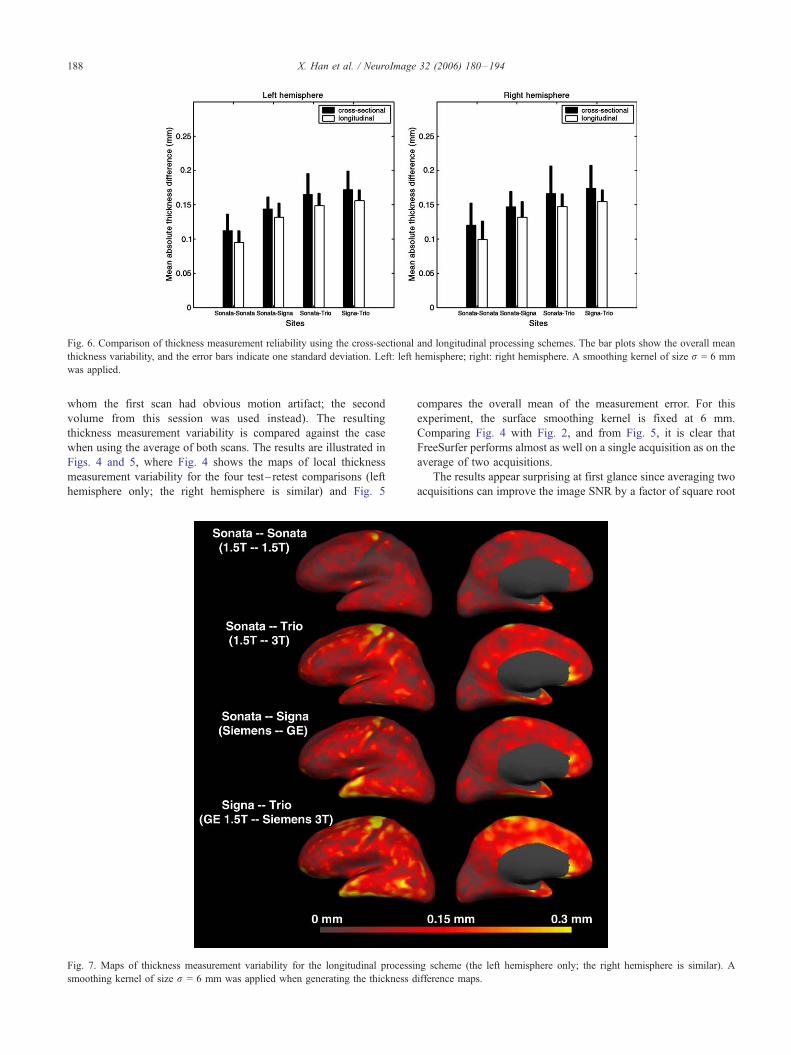
Fig. 6. Comparison of thickness measurement reliability using the cross-sectional and longitudinal processing schemes. The bar plots show the overall mean
thickness variability, and the error bars indicate one standard deviation. Left: left hemisphere; right: right hemisphere. A smoothing kernel of size r = 6 mm
was applied.
X. Han et al. / NeuroImage 32 (2006) 180–194188
whom the first scan had obvious motion artifact; the second
volume from this session was used instead). The resulting
thickness measurement variability is compared against the case
when using the average of both scans. The results are illustrated in
Figs. 4 and 5, where Fig. 4 shows the maps of local thickness
measurement variability for the four test–retest comparisons (left
hemisphere only; the right hemisphere is similar) and Fig. 5
Fig. 7. Maps of thickness measurement variability for the longitudinal processi
smoothing kernel of size r = 6 mm was applied when generating the thickness d
compares the overall mean of the measurement error. For this
experiment, the surface smoothing kernel is fixed at 6 mm.
Comparing Fig. 4 with Fig. 2, and from Fig. 5, it is clear that
FreeSurfer performs almost as well on a single acquisition as on the
average of two acquisitions.
The results appear surprising at first glance since averaging two
acquisitions can improve the image SNR by a factor of square root
ng scheme (the left hemisphere only; the right hemisphere is similar). A
ifference maps.
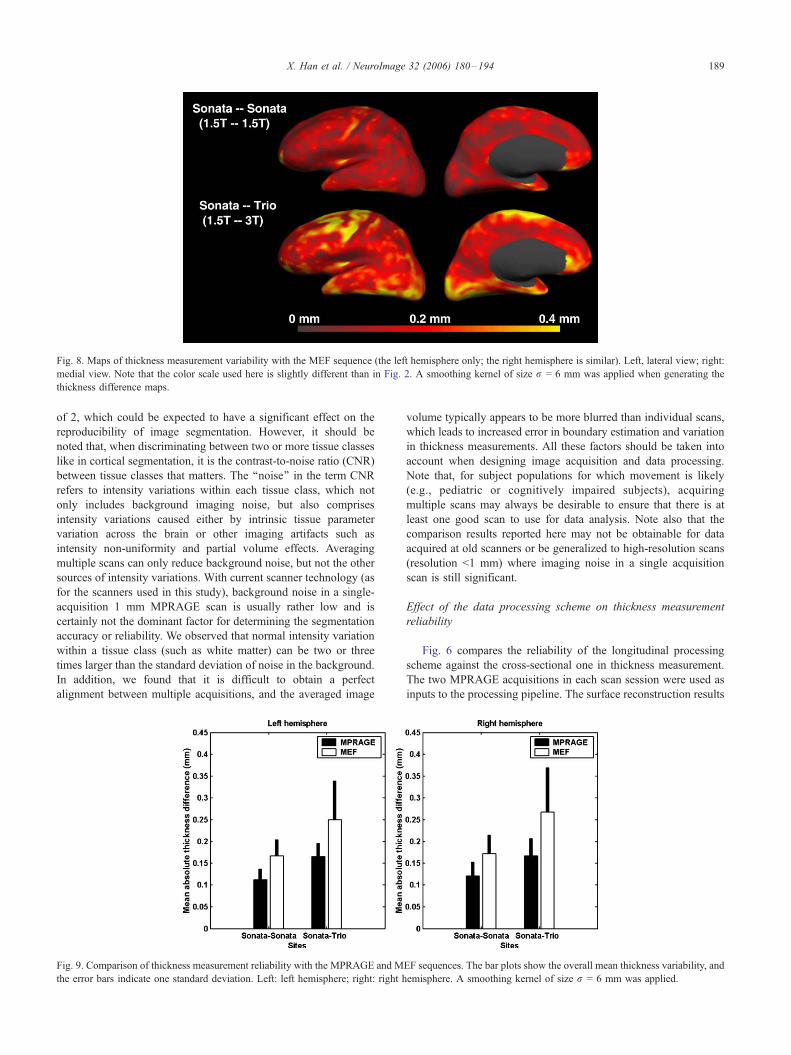
Fig. 8. Maps of thickness measurement variability with the MEF sequence (the left hemisphere only; the right hemisphere is similar). Left, lateral view; right:
medial view. Note that the color scale used here is slightly different than in Fig. 2. A smoothing kernel of size r = 6 mm was applied when generating the
thickness difference maps.
X. Han et al. / NeuroImage 32 (2006) 180–194 189
of 2, which could be expected to have a significant effect on the
reproducibility of image segmentation. However, it should be
noted that, when discriminating between two or more tissue classes
like in cortical segmentation, it is the contrast-to-noise ratio (CNR)
between tissue classes that matters. The ‘‘noise’’ in the term CNR
refers to intensity variations within each tissue class, which not
only includes background imaging noise, but also comprises
intensity variations caused either by intrinsic tissue parameter
variation across the brain or other imaging artifacts such as
intensity non-uniformity and partial volume effects. Averaging
multiple scans can only reduce background noise, but not the other
sources of intensity variations. With current scanner technology (as
for the scanners used in this study), background noise in a single-
acquisition 1 mm MPRAGE scan is usually rather low and is
certainly not the dominant factor for determining the segmentation
accuracy or reliability. We observed that normal intensity variation
within a tissue class (such as white matter) can be two or three
times larger than the standard deviation of noise in the background.
In addition, we found that it is difficult to obtain a perfect
alignment between multiple acquisitions, and the averaged image
Fig. 9. Comparison of thickness measurement reliability with the MPRAGE and M
the error bars indicate one standard deviation. Left: left hemisphere; right: right h
volume typically appears to be more blurred than individual scans,
which leads to increased error in boundary estimation and variation
in thickness measurements. All these factors should be taken into
account when designing image acquisition and data processing.
Note that, for subject populations for which movement is likely
(e.g., pediatric or cognitively impaired subjects), acquiring
multiple scans may always be desirable to ensure that there is at
least one good scan to use for data analysis. Note also that the
comparison results reported here may not be obtainable for data
acquired at old scanners or be generalized to high-resolution scans
(resolution <1 mm) where imaging noise in a single acquisition
scan is still significant.
Effect of the data processing scheme on thickness measurement
reliability
Fig. 6 compares the reliability of the longitudinal processing
scheme against the cross-sectional one in thickness measurement.
The two MPRAGE acquisitions in each scan session were used as
inputs to the processing pipeline. The surface reconstruction results
EF sequences. The bar plots show the overall mean thickness variability, and
emisphere. A smoothing kernel of size r = 6 mm was applied.
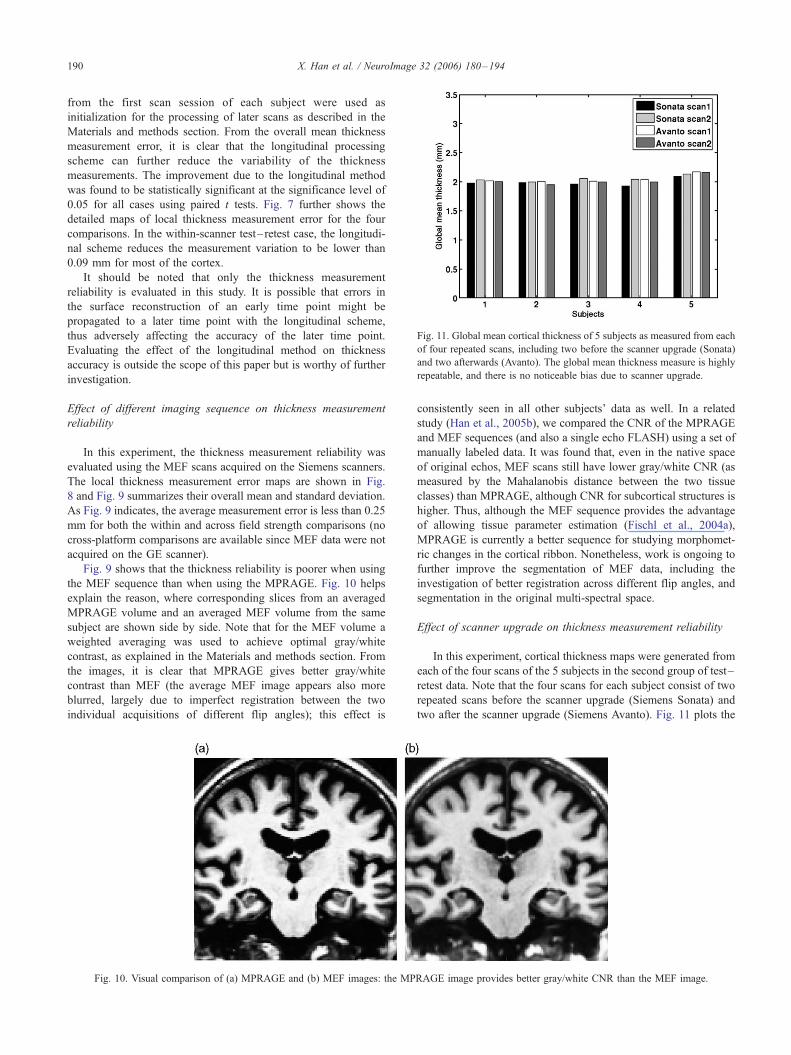
Fig. 11. Global mean cortical thickness of 5 subjects as measured from each
of four repeated scans, including two before the scanner upgrade (Sonata)
and two afterwards (Avanto). The global mean thickness measure is highly
repeatable, and there is no noticeable bias due to scanner upgrade.
X. Han et al. / NeuroImage 32 (2006) 180–194190
from the first scan session of each subject were used as
initialization for the processing of later scans as described in the
Materials and methods section. From the overall mean thickness
measurement error, it is clear that the longitudinal processing
scheme can further reduce the variability of the thickness
measurements. The improvement due to the longitudinal method
was found to be statistically significant at the significance level of
0.05 for all cases using paired t tests. Fig. 7 further shows the
detailed maps of local thickness measurement error for the four
comparisons. In the within-scanner test– retest case, the longitudi-
nal scheme reduces the measurement variation to be lower than
0.09 mm for most of the cortex.
It should be noted that only the thickness measurement
reliability is evaluated in this study. It is possible that errors in
the surface reconstruction of an early time point might be
propagated to a later time point with the longitudinal scheme,
thus adversely affecting the accuracy of the later time point.
Evaluating the effect of the longitudinal method on thickness
accuracy is outside the scope of this paper but is worthy of further
investigation.
Effect of different imaging sequence on thickness measurement
reliability
In this experiment, the thickness measurement reliability was
evaluated using the MEF scans acquired on the Siemens scanners.
The local thickness measurement error maps are shown in Fig.
8 and Fig. 9 summarizes their overall mean and standard deviation.
As Fig. 9 indicates, the average measurement error is less than 0.25
mm for both the within and across field strength comparisons (no
cross-platform comparisons are available since MEF data were not
acquired on the GE scanner).
Fig. 9 shows that the thickness reliability is poorer when using
the MEF sequence than when using the MPRAGE. Fig. 10 helps
explain the reason, where corresponding slices from an averaged
MPRAGE volume and an averaged MEF volume from the same
subject are shown side by side. Note that for the MEF volume a
weighted averaging was used to achieve optimal gray/white
contrast, as explained in the Materials and methods section. From
the images, it is clear that MPRAGE gives better gray/white
contrast than MEF (the average MEF image appears also more
blurred, largely due to imperfect registration between the two
individual acquisitions of different flip angles); this effect is
Fig. 10. Visual comparison of (a) MPRAGE and (b) MEF images: the MP
consistently seen in all other subjects’ data as well. In a related
study (Han et al., 2005b), we compared the CNR of the MPRAGE
and MEF sequences (and also a single echo FLASH) using a set of
manually labeled data. It was found that, even in the native space
of original echos, MEF scans still have lower gray/white CNR (as
measured by the Mahalanobis distance between the two tissue
classes) than MPRAGE, although CNR for subcortical structures is
higher. Thus, although the MEF sequence provides the advantage
of allowing tissue parameter estimation (Fischl et al., 2004a),
MPRAGE is currently a better sequence for studying morphomet-
ric changes in the cortical ribbon. Nonetheless, work is ongoing to
further improve the segmentation of MEF data, including the
investigation of better registration across different flip angles, and
segmentation in the original multi-spectral space.
Effect of scanner upgrade on thickness measurement reliability
In this experiment, cortical thickness maps were generated from
each of the four scans of the 5 subjects in the second group of test–
retest data. Note that the four scans for each subject consist of two
repeated scans before the scanner upgrade (Siemens Sonata) and
two after the scanner upgrade (Siemens Avanto). Fig. 11 plots the
RAGE image provides better gray/white CNR than the MEF image.
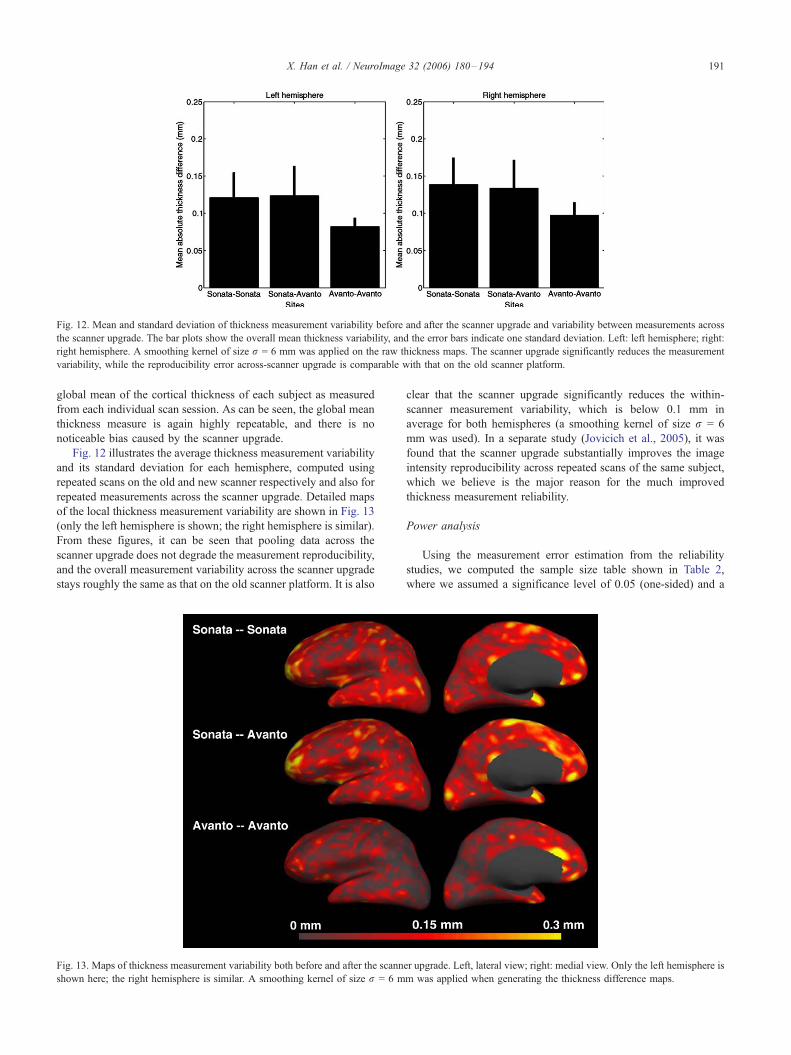
Fig. 12. Mean and standard deviation of thickness measurement variability before and after the scanner upgrade and variability between measurements across
the scanner upgrade. The bar plots show the overall mean thickness variability, and the error bars indicate one standard deviation. Left: left hemisphere; right:
right hemisphere. A smoothing kernel of size r = 6 mm was applied on the raw thickness maps. The scanner upgrade significantly reduces the measurement
variability, while the reproducibility error across-scanner upgrade is comparable with that on the old scanner platform.
X. Han et al. / NeuroImage 32 (2006) 180–194 191
global mean of the cortical thickness of each subject as measured
from each individual scan session. As can be seen, the global mean
thickness measure is again highly repeatable, and there is no
noticeable bias caused by the scanner upgrade.
Fig. 12 illustrates the average thickness measurement variability
and its standard deviation for each hemisphere, computed using
repeated scans on the old and new scanner respectively and also for
repeated measurements across the scanner upgrade. Detailed maps
of the local thickness measurement variability are shown in Fig. 13
(only the left hemisphere is shown; the right hemisphere is similar).
From these figures, it can be seen that pooling data across the
scanner upgrade does not degrade the measurement reproducibility,
and the overall measurement variability across the scanner upgrade
stays roughly the same as that on the old scanner platform. It is also
Fig. 13. Maps of thickness measurement variability both before and after the scann
shown here; the right hemisphere is similar. A smoothing kernel of size r = 6 m
clear that the scanner upgrade significantly reduces the within-
scanner measurement variability, which is below 0.1 mm in
average for both hemispheres (a smoothing kernel of size r = 6
mm was used). In a separate study (Jovicich et al., 2005), it was
found that the scanner upgrade substantially improves the image
intensity reproducibility across repeated scans of the same subject,
which we believe is the major reason for the much improved
thickness measurement reliability.
Power analysis
Using the measurement error estimation from the reliability
studies, we computed the sample size table shown in Table 2,
where we assumed a significance level of 0.05 (one-sided) and a
er upgrade. Left, lateral view; right: medial view. Only the left hemisphere is
m was applied when generating the thickness difference maps.
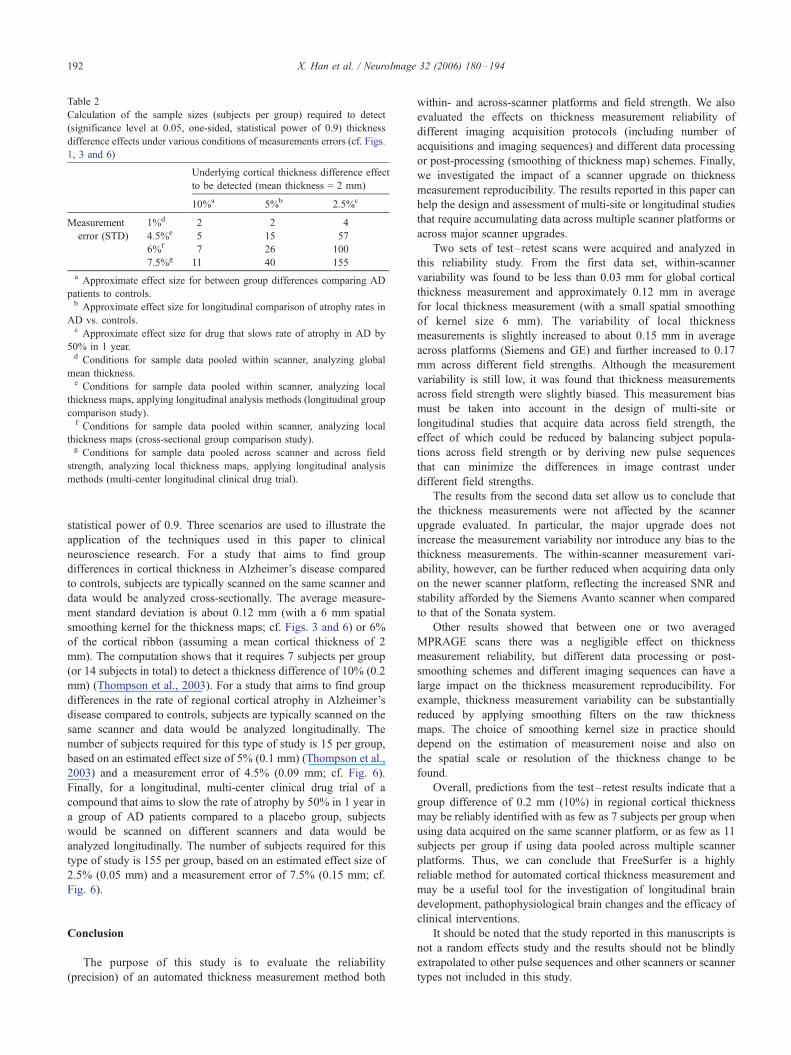
Table 2
Calculation of the sample sizes (subjects per group) required to detect
(significance level at 0.05, one-sided, statistical power of 0.9) thickness
difference effects under various conditions of measurements errors (cf. Figs.
1, 3 and 6)
Underlying cortical thickness difference effect
to be detected (mean thickness = 2 mm)
10%a 5%b 2.5%c
Measurement
error (STD)
1%d 2 2 4
4.5%e 5 15 57
6%f 7 26 100
7.5%g 11 40 155
a Approximate effect size for between group differences comparing AD
patients to controls.b Approximate effect size for longitudinal comparison of atrophy rates in
AD vs. controls.c Approximate effect size for drug that slows rate of atrophy in AD by
50% in 1 year.d Conditions for sample data pooled within scanner, analyzing global
mean thickness.e Conditions for sample data pooled within scanner, analyzing local
thickness maps, applying longitudinal analysis methods (longitudinal group
comparison study).f Conditions for sample data pooled within scanner, analyzing local
thickness maps (cross-sectional group comparison study).g Conditions for sample data pooled across scanner and across field
strength, analyzing local thickness maps, applying longitudinal analysis
methods (multi-center longitudinal clinical drug trial).
X. Han et al. / NeuroImage 32 (2006) 180–194192
statistical power of 0.9. Three scenarios are used to illustrate the
application of the techniques used in this paper to clinical
neuroscience research. For a study that aims to find group
differences in cortical thickness in Alzheimer’s disease compared
to controls, subjects are typically scanned on the same scanner and
data would be analyzed cross-sectionally. The average measure-
ment standard deviation is about 0.12 mm (with a 6 mm spatial
smoothing kernel for the thickness maps; cf. Figs. 3 and 6) or 6%
of the cortical ribbon (assuming a mean cortical thickness of 2
mm). The computation shows that it requires 7 subjects per group
(or 14 subjects in total) to detect a thickness difference of 10% (0.2
mm) (Thompson et al., 2003). For a study that aims to find group
differences in the rate of regional cortical atrophy in Alzheimer’s
disease compared to controls, subjects are typically scanned on the
same scanner and data would be analyzed longitudinally. The
number of subjects required for this type of study is 15 per group,
based on an estimated effect size of 5% (0.1 mm) (Thompson et al.,
2003) and a measurement error of 4.5% (0.09 mm; cf. Fig. 6).
Finally, for a longitudinal, multi-center clinical drug trial of a
compound that aims to slow the rate of atrophy by 50% in 1 year in
a group of AD patients compared to a placebo group, subjects
would be scanned on different scanners and data would be
analyzed longitudinally. The number of subjects required for this
type of study is 155 per group, based on an estimated effect size of
2.5% (0.05 mm) and a measurement error of 7.5% (0.15 mm; cf.
Fig. 6).
Conclusion
The purpose of this study is to evaluate the reliability
(precision) of an automated thickness measurement method both
within- and across-scanner platforms and field strength. We also
evaluated the effects on thickness measurement reliability of
different imaging acquisition protocols (including number of
acquisitions and imaging sequences) and different data processing
or post-processing (smoothing of thickness map) schemes. Finally,
we investigated the impact of a scanner upgrade on thickness
measurement reproducibility. The results reported in this paper can
help the design and assessment of multi-site or longitudinal studies
that require accumulating data across multiple scanner platforms or
across major scanner upgrades.
Two sets of test–retest scans were acquired and analyzed in
this reliability study. From the first data set, within-scanner
variability was found to be less than 0.03 mm for global cortical
thickness measurement and approximately 0.12 mm in average
for local thickness measurement (with a small spatial smoothing
of kernel size 6 mm). The variability of local thickness
measurements is slightly increased to about 0.15 mm in average
across platforms (Siemens and GE) and further increased to 0.17
mm across different field strengths. Although the measurement
variability is still low, it was found that thickness measurements
across field strength were slightly biased. This measurement bias
must be taken into account in the design of multi-site or
longitudinal studies that acquire data across field strength, the
effect of which could be reduced by balancing subject popula-
tions across field strength or by deriving new pulse sequences
that can minimize the differences in image contrast under
different field strengths.
The results from the second data set allow us to conclude that
the thickness measurements were not affected by the scanner
upgrade evaluated. In particular, the major upgrade does not
increase the measurement variability nor introduce any bias to the
thickness measurements. The within-scanner measurement vari-
ability, however, can be further reduced when acquiring data only
on the newer scanner platform, reflecting the increased SNR and
stability afforded by the Siemens Avanto scanner when compared
to that of the Sonata system.
Other results showed that between one or two averaged
MPRAGE scans there was a negligible effect on thickness
measurement reliability, but different data processing or post-
smoothing schemes and different imaging sequences can have a
large impact on the thickness measurement reproducibility. For
example, thickness measurement variability can be substantially
reduced by applying smoothing filters on the raw thickness
maps. The choice of smoothing kernel size in practice should
depend on the estimation of measurement noise and also on
the spatial scale or resolution of the thickness change to be
found.
Overall, predictions from the test– retest results indicate that a
group difference of 0.2 mm (10%) in regional cortical thickness
may be reliably identified with as few as 7 subjects per group when
using data acquired on the same scanner platform, or as few as 11
subjects per group if using data pooled across multiple scanner
platforms. Thus, we can conclude that FreeSurfer is a highly
reliable method for automated cortical thickness measurement and
may be a useful tool for the investigation of longitudinal brain
development, pathophysiological brain changes and the efficacy of
clinical interventions.
It should be noted that the study reported in this manuscripts is
not a random effects study and the results should not be blindly
extrapolated to other pulse sequences and other scanners or scanner
types not included in this study.
X. Han et al. / NeuroImage 32 (2006) 180–194 193
Acknowledgments
This research was supported by the following grants: a) NCRR
Morphometry Biomedical Informatics Research Network (U24
RR021382), b) NCRR P41-RR14075 and RO1-RR16594-01A1, c)
Pfizer Inc., d) the NIA (K23-AG22509 and P01-AG04953) and e)
the MIND Institute.
References
Barta, P., Miller, M.I., Qiu, A., 2005. A stochastic model for studying the
laminar structure of cortex from MRI. IEEE Trans. Med. Imag. 24,
728–742.
Benner, T., Wisco, J.J., van der Kouwe, A., Fischl, B., Vangel, M.G.,
Hochberg, F.H., Sorensen, A.G., in press. Comparison of manual and
automatic slice positioning of brain MR images. Radiology.
Boeve, B.F., Maraganore, D.M., Parisi, J.E., Ahlskog, J., Graff-Radford, N.,
Caselli, R., Dickson, D., Kokmen, E., Peterson, R., 1999. Pathologic
heterogeneity in clinically diagnosed corticobasal degeneration. Neu-
rology 53, 795–800.
Braitenberg, V., Schuz, A., 1991. Anatomy of the Cortex. Springer-Verlag,
Berlin.
Chung, M.K., Robbins, S.M., Dalton, K.M., Davidson, R.J., Alexander,
A.L., Evans, A.C., 2005. Cortical thickness analysis in autism with heat
kernel smoothing. NeuroImage 25, 1256–1265.
Cohen, J., 1988. Statistical Power Analysis for the Behavioral Sciences.
Lawerence Erlbaum Assoc.
Dale, A.M., Fischl, B., Sereno, M.I., 1999. Cortical surface-based analysis:
I. Segmentation and surface reconstruction. NeuroImage 9, 179–194.
Dickerson, B.C., Sperling, R.A., 2005. Neuroimaging biomarkers for
clinical trials of disease-modifying therapies in Alzheimer’s disease.
NeuroRx 2, 348–360.
Dickerson, B., Goncharova, I., Sullivan, M.P., Forchetti, C., Wilson, R.,
Bennett, D.A., Beckett, L.A., deToledo-Morrell, L., 2001. MRI-derived
entorhinal and hippocampal atrophy in incipient and very mild
Alzheimer’s disease. Neurobiol. Aging 22, 747–754.
Duda, R.O., Hart, P.E., Stork, D.G., 2001. Pattern Classification, 2nd edR
Wiley, New York.
Fischl, B., Dale, A.M., 2000. Measuring the thickness of the human
cerebral cortex from magnetic resonance images. Proc. Natl. Acad. Sci.
U. S. A. 97, 11050–11055.
Fischl, B., Sereno, M.I., Dale, A.M., 1999a. Cortical surface-based
analysis: II. Inflation, flattening, and a surface-based coordinate system.
NeuroImage 9, 195–207.
Fischl, B., Sereno, M.I., Tootell, R.B., Dale, A.M., 1999b. High-resolution
intersubject averaging and a coordinate system for the cortical surface.
Hum. Brain Mapp. 8, 272–284.
Fischl, B., Liu, A., Dale, A.M., 2001. Automated manifold surgery:
constructing geometrically accurate and topologically correct models of
the human cerebral cortex. IEEE Trans. Med. Imag. 20, 70–80.
Fischl, B., Salat, D.H., Busa, E., Albert, M., Dieterich, M., Haselgrove, C.,
van der Kouwe, A., Killiany, R., Kennedy, D., Klaveness, S., Montillo,
A., Makris, N., Rosen, B., Dale, A.M., 2002. Whole brain segmenta-
tion: automated labeling of neuroanatomical structures in the human
brain. Neuron 33, 341–355.
Fischl, B., Salat, D., Van der Kouwe, A., Makris, N., Segonne, F., Quinn,
B.T., Dale, A., 2004a. Sequence-independent segmentation of magnetic
resonance images. NeuroImage 23, 69–84.
Fischl, B., Van der Kouwe, A., Destrieux, C., Halgren, E., Segonne, F.,
Salat, D., Busa, E., Seidman, L., Goldstein, J., Kennedy, D., Caviness,
V.S., Makris, N., Rosen, B., Dale, A., 2004b. Automatically parcellating
the human cerebral cortex. Cereb. Cortex 14, 11–22.
Han, X., Pham, D.L., Tosun, D., Rettmann, M.E., Xu, C., Prince, J.L.,
2005a. CRUISE: cortical reconstruction using implicit surface evolu-
tion. NeuroImage 23, 997–1012.
Han, X., Jovicich, J., Salat, D., Van der Kouwe, A., Dickerson, B., Quinn,
B.T., Rosas, H.D., Makris, N., Dale, A., Fischl, B., 2005b. CNR
comparison of three pulse sequences for structural MR brain imaging.
NeuroImage Human Brain Mapping Conference, Toronto, CA.
Jack Jr., C.R., Petersen, R.C., Xu, Y.C., Waring, S.C., O’Brien, P.C.,
Tangalos, E.G., Smith, G.E., Ivnik, R.J., Kokmen, E., 1997. Medial
temporal atrophy on MRI in normal aging and very mild Alzheimer’s
disease. Neurology 49, 786–794.
Jack Jr., C.R., Slomkowski, M., Gracon, S., Hoover, T.M., Felmlee, J.P.,
Stewart, K., Xu, Y., Shiung, M., O’Brien, P.C., Cha, R., Knopman, D.,
Peterson, R.C., 2003. MRI as a biomarker of disease progression in a
therapeutic trial of milameline for AD. Neurology 60, 253–260.
Jenkinson, M., Bannister, P., Brady, M., Smith, S., 2002. Improved
optimization for the robust and accurate linear registration and motion
correction of brain images. NeuroImage 17, 825–841.
Jones, S.E., Buchbinder, B.R., Aharon, I., 2000. Three-dimensional
mapping of cortical thickness using Laplacian’s equation. Hum. Brain
Mapp. 11, 12–32.
Joshi, M., Cui, J., Doolittle, K., Joshi, S., Essen, D., Wang, L., Miller, M.L.,
1999. Brain segmentation and the generation of cortical surfaces.
NeuroImage 9, 461–476.
Jovicich, J., Czanner, S., Greve, D.N., Pacheco, J., Busa, E., Van der
Kouwe, A., Morphometry, B.I.R.N., Fischl, B., 2005. Test– retest
reliability reproducibility assessments for longitudinal studies: quanti-
fying MRI system upgrade effects. ISMRM Scientific Meeting. Miami,
FL.
Kiernan, J.A., Hudson, A.J., 1994. Frontal lobe atrophy in motor neuron
diseases. Brain 117, 747–757.
Kuperberg, G.R., Broome, M., McGuire, P.K., David, A.S., Eddy, M.,
Ozawa, F., Goff, D., West, W.C., Williams, S.C.R., Van der Kouwe,
A., Salat, D., Dale, A., Fischl, B., 2003. Regionally localized thinning
of the cerebral cortex in schizophrenia. Arch. Gen. Psychiatry 60,
878–888.
Lerch, J.P., Evans, A.C., 2005. Cortical thickness analysis examined
through power analysis and a population simulation. NeuroImage 24,
163–173.
Lerch, J.P., Pruessner, J.C., Zijdenbos, A., Hampel, H., Teipel, S.J.,
Evans, A.C., 2005. Focal decline of cortical thickness in Alzheimer’s
disease identified by computational neuroanatomy. Cereb. Cortex 15,
955–1001.
MacDonald, D., Kabani, N., Avis, D., Evans, A.C., 1999. Automated 3-D
extraction of inner and outer surfaces of cerebral cortex from MRI.
NeuroImage 12, 340–356.
Narr, K.L., Bilder, R.M., Toga, A.W., Woods, R.P., R.D., E., Szeszko,
P.R., Robinson, D., Sevy, S., Gunduz-Bruce, H., Wang, Y.-P.,
Deluca, H., Thompson, P., 2005. Mapping cortical thickness and
gray matter concentration in first episode schizophrenia. Cereb.
Cortex 15, 708–719.
Rosas, H.D., Liu, A.K., Hersch, S., Glessner, M., Ferrante, R.J., Salat, D.H.,
van der Kouwe, A., Jenkins, B.G., Dale, A.M., Fischl, B., 2002.
Regional and progressive thinning of the cortical ribbon in Huntington’s
disease. Neurology 58, 695–701.
Sailer, M., Fischl, B., Salat, D., Tempelmann, C., Schonfeld, M., Busa, E.,
Bodammer, N., Heinze, H., Dale, A., in press. Focal thinning of the
cerebral cortex in multiple sclerosis. Brain.
Salat, D.H., Kaye, J.A., Janowsky, J.S., 1999. Prefrontal gray and white
matter volumes in healthy aging and Alzheimer disease. Arch. Neurol.
56, 338–344.
Salat, D., Buckner, R.L., Snyder, A.Z., Greve, D.N., Desikan, R.S., Busa,
E., Morris, J.C., Dale, A., Fischl, B., 2004. Thinning of the cerebral
cortex in aging. Cereb. Cortex 14, 721–730.
Segonne, F., Dale, A., Busa, E., Glessner, M., Salat, D., Hahn, H.K., Fischl,
B., 2004. A hybrid approach to the skull stripping problem in MRI.
NeuroImage 22, 1060–1075.
Shattuck, D.W., Leahy, R.M., 2002. BrainSuite: an automated cortical
surface identification tool. Med. Image Anal. 6, 129–142.
Sowell, E.R., Peterson, B.S., Thompson, P., Welcome, S.E., Henkenius,
X. Han et al. / NeuroImage 32 (2006) 180–194194
A.L., Toga, A.W., 2003. Mapping cortical changes across the human
life span. Nat. Neurosci. 6, 309–315.
Sowell, E.R., Thompson, P., Leonard, C.M., Welcome, S.E., Kan, E., Toga,
A.W., 2004. Longitudinal mapping of cortical thickness and brain
growth in normal children. J. Neurosci. 24, 8223–8231.
Steen, R.G., Reddick, W.E., Ogg, R.J., 2000. More than meets the eye:
significant regional heterogeneity in human cortical T1. Magn. Reson.
Imaging 18, 361–368.
Thompson, P., Vidal, C.N., Giedd, J.N., Gochman, P., Blumenthal, J.,
Nicolson, R., Toga, A.W., Rapoport, J.L., 2001. Mapping adolescent
brain change reveals dynamic wave of accelerated gray matter loss in
very early onset schizophrenia. Proc. Natl. Acad. Sci. U. S. A. 98,
11650–11655.
Thompson, P., Hayashi, K.M., Zubicaray, G., Janke, A.L., Rose, S.E.,
Semple, J., Herman, D., Hong, M.S., Dittmer, S.S., Doddrell, D.M.,
Toga, A.W., 2003. Dynamics of gray matter loss in Alzheimer’s disease.
J. Neurosci. 23, 994–1005.
Van der Kouwe, A., Benner, T., Fischl, B., Schmitt, F., Salat, D., Harder,
M., Sorensen, A.G., Dale, A., 2005. On-line automatic slice positioning
for brain MR imaging. NeuroImage 27, 222–230.
van Essen, D.C., Dickson, J., Harwell, J., Hanlon, D., Anderson,
C.H., Drury, H.A., 2001. An integrated software system for surface-
based analyses of cerebral cortex. J. Am. Med. Inform. Assoc. 8,
443–459.
Walters, R.J.C., Fox, N.C., Crum, W.R., Taube, D., Thomas, D.J., 2001.
Hemodialysis and cerebral edema. Nephron 87, 143–147.
Xu, C., Pham, D.L., Rettmann, M.E., Yu, D.N., Prince, J.L., 1999.
Reconstruction of the human cerebral cortex from magnetic resonance
images. IEEE Trans. Med. Imag. 18, 467–480.
Yezzi, A., Prince, J.L., 2003. An Eulerian PDE approach for computing
tissue thickness. IEEE Trans. Med. Imag. 22, 1332–1339.
Zeng, X., Staib, L.H., Schultz, R.T., Duncan, J.S., 1999. Segmentation and
measurement of the cortex from 3D MR images using coupled surfaces
propagation. IEEE Trans. Med. Imag. 18, 100–111.