![Substituted dibenzo[ c,h]cinnolines: topoisomerase I-targeting anticancer agents](https://static.fdokumen.com/doc/165x107/631871c065e4a6af370f5e52/substituted-dibenzo-chcinnolines-topoisomerase-i-targeting-anticancer-agents.jpg)
Substituted dibenzo[ c,h]cinnolines: topoisomerase I-targeting anticancer agents
Upload
khangminh22Category
view
5download
0
“Relevance of transcription to
topoisomerase II-mediated cancer
treatments”
Dissertation
submitted to attain the academic degree
“Doctor of Natural Sciences”
(Dr. rer. nat.)
at the department of Biology
of the Johannes Gutenberg University Mainz
Piyush More
born on 25.04.1992 in Dehuroad, Maharashtra, India
Mainz, 22.03.2019

Dean:
1. Reviewer:
2. Reviewer:
Day of the oral examination: 03.05.2019

i
Table of Contents
Lists of figures ............................................................................................................................... iii
List of tables .................................................................................................................................... v
List of abbreviations ...................................................................................................................... vi
1 Summary .................................................................................................................................. 1
2 Zusammenfassung ................................................................................................................... 2
3 Introduction ............................................................................................................................. 4
3.1 Cancer chemotherapy ....................................................................................................... 4
3.2 Topoisomerase II as cancer targets .................................................................................. 7
3.3 Gene expression and drug response ............................................................................... 11
3.4 Acute Myeloid Leukemia ............................................................................................... 12
4 Materials and methods ........................................................................................................... 15
4.1 Cell culture and drugs .................................................................................................... 15
4.2 Cell viability assay ......................................................................................................... 16
4.3 Annexin V apoptosis assay ............................................................................................ 17
4.4 RNA-Seq: RNA extraction and library preparation ....................................................... 18
4.5 RNA-Seq: Analysis ........................................................................................................ 18
4.6 Weighted gene co-expression network analysis (WGCNA) .......................................... 19
4.7 Identification of mediators among etoposide-evoked gene expression changes ............ 19
4.8 Prediction of etoposide emulators .................................................................................. 20
4.9 Driver validation using inhibitors .................................................................................. 21
4.10 Driver validation using sh/siRNA-mediated gene knockdown .................................. 21
4.11 DNA damage measurement using flow cytometry..................................................... 22
4.12 TCGA survival analysis.............................................................................................. 23
4.13 Statistical analysis....................................................................................................... 23
5 Results ................................................................................................................................... 24
5.1 Etoposide-mediated cytotoxicity in HTETOP is TOP2A-dependent ............................ 24
5.2 Etoposide-evoked specific gene repressions in HTETOP cell line ................................ 25
5.3 Etoposide predominantly represses the high-expressing genes in HTETOP cell line ... 28
5.4 Etoposide evokes specific GEC in other cancer entities ................................................ 30
5.5 Prediction and validation of mediators of etoposide cytotoxicity in HTETOP cell line 33

ii
5.6 Identifying transcriptional modulators and effectors of etoposide in AML: Pipeline
overview .................................................................................................................................... 37
5.7 AML cell lines are differentially sensitive to etoposide treatment ................................ 39
5.8 Modulators of etoposide synergize AML cell lines to drug ........................................... 45
5.9 Etoposide-repressed essential genes contribute to cytotoxicity in AML lines .............. 55
5.10 Emulators are cytotoxic and synergize with etoposide .............................................. 63
5.11 Etoposide-driver combinations exert cytotoxicity without increasing DNA damage 74
5.12 Drivers of etoposide cytotoxicity form unfavorable prognostic markers in AML
patients 75
6 Discussion .............................................................................................................................. 78
6.1 Gene expression changes-mediated cytotoxicity of etoposide ....................................... 79
6.2 Mediators as standalone targets for etoposide replacement ........................................... 80
6.3 Modulators for overcoming drug resistance................................................................... 82
6.4 Rational combination partners using etoposide-like emulators ..................................... 84
6.5 Potential application to AML and other cancers ............................................................ 85
6.6 Limitations and perspective ........................................................................................... 86
7 References ............................................................................................................................. 88
8 Appendix ............................................................................................................................... 93

iii
Lists of figures Fig. 3.2.1: Pictorial representation of topoisomerase II (TOP2) poisoning by etoposide and its
consequences................................................................................................................................... 9
Fig. 5.1.1: HTETOP cell viability in response to TOP2 poisons ................................................. 25
Fig. 5.2.1: Effect of etoposide on gene expression in HTETOP cells .......................................... 26
Fig. 5.2.2: Effect of doxorubicin on gene expression in HTETOP cells ...................................... 27
Fig. 5.2.3: TOP2A-dependent gene expression changes after etoposide and doxorubicin treatments
of HTETOP cells........................................................................................................................... 28
Fig. 5.3.1: Predominance of gene repression after treatment with etoposide and doxorubicin in
HTETOP cells ............................................................................................................................... 30
Fig. 5.5.1: Expression of etoposide-mediator in cancer tissues .................................................... 34
Fig. 5.5.2: Optimization of cell numbers and siRNA concentration for knockdown in HTETOP
cell line .......................................................................................................................................... 36
Fig. 5.5.3: Effect of knockdown of the mediators of etoposide cytotoxicity on cell viability and
etoposide sensitization using WST-8 cell viability assay ............................................................. 37
Fig. 5.6.1: Pipeline to identify transcriptional drivers of etoposide in AML ............................... 38
Fig. 5.7.1: WST8-based concentration dependent effect of etoposide on survival of AML cell lines
after 6 hours treatment .................................................................................................................. 40
Fig. 5.7.2: WST8-based concentration dependent effect of etoposide on survival of AML cell lines
after 24 hours treatment ................................................................................................................ 41
Fig. 5.7.3: Percentage of apoptotic AML cells in response to etoposide treatment ..................... 44
Fig. 5.8.1: WGCNA consensus network analysis......................................................................... 53
Fig. 5.8.2: Gene Ontology analysis for etoposide-modulators ..................................................... 53
Fig. 5.8.3: Modulators gene expression correlation with etoposide sensitivity ........................... 54
Fig. 5.8.4: Synergy of modulators with etoposide in AML cells. ................................................ 55
Fig. 5.9.1: Etoposide-evoked changes in the expression of co-regulating genes ......................... 57
Fig. 5.9.2: Etoposide-evoked gene expression changes (GEC) in AML ...................................... 58
Fig. 5.9.3: Scatterplot of etoposide-evoked differentially expressed genes in F-36P cell line,
arranged according to essentiality for survival ............................................................................. 60
Fig. 5.9.4: Experimental validation of putative essential mediators shortlisted in Fig. 5.9.3. ..... 61
Fig. 5.9.5: Contribution of mediators in AML cell killing using inhibitors. ................................ 63
Fig. 5.9.6: Contribution of mediators in AML cell killing using shRNA-mediated knockdown . 63
Fig. 5.10.1: AML cell viability in response to emulators ............................................................. 73
Fig. 5.10.2: Synergy of emulators with etoposide in AML cells .................................................. 74
Fig. 5.10.3: Viability of HL-60 cells after shRNA-mediated gene knockdown of the etoposide-
contrary emulator ROCK1 ............................................................................................................ 74
Fig. 5.11.1: DNA damage after etoposide treatment in combination with its cytotoxicity drivers
....................................................................................................................................................... 75
Fig. 5.12.1: Relevance of etoposide cytotoxicity drivers in AML patients .................................. 76
Fig. 5.12.2: Kaplan–Meier plot representing survival analysis for cancer patients with low or high
expression of BIRC5 and PLK1, obtained from The Human Protein Atlas resource ................... 77

iv
Fig. 5.12.3: Kaplan–Meier plot representing survival analysis for cancer patients with low or high
expression of ROCK1 and PLK1, obtained from The Human Protein Atlas resource ................. 78

v
List of tables
Table 3.1.1: Overview of the number of drugs approved for each cancer type ............................. 6
Table 3.2.1: Overview of the topoisomerase II (TOP2) poisons used in clinic ........................... 10
Table 5.4.1: Effect of etoposide on gene expression in various cancer cell lines ........................ 31
Table 5.4.2: Overview of the etoposide-evoked gene expression changes (GEC) overlapping in 5
or more cancer cell lines ............................................................................................................... 32
Table 5.5.1: Selected mediators among etoposide-evoked gene expression changes (GEC) and
putative upstream regulators in HTETOP cell line ....................................................................... 34
Table 5.7.1: Culture conditions and etoposide response by all investigated AML cell lines ...... 42
Table 5.8.1: Pathways corresponding to co-expressing gene clusters in untreated AML cell lines
....................................................................................................................................................... 46
Table 5.8.2: Pathways corresponding to co-expressing gene clusters in etoposide-treated AML
cell lines ........................................................................................................................................ 48
Table 5.8.3: Overview of the drivers of etoposide cytotoxicity in AML cells ............................ 55
Table 5.9.1: Numbers and percentages of etoposide-evoked inducing and repressing gene
expression changes (GEC) in all investigated AML cell lines ..................................................... 58
Table 5.9.2: Numbers and percentages of predicted essential genes using Project Achilles (PAch)
among all etoposide-evoked gene expression changes (GEC) ..................................................... 59
Table 5.10.1: Emulators (gene knockdowns) evoking gene expression changes (GEC) either
similar (etoposide-like) or opposite (etoposide-contrary) to those evoked by etoposide ............. 64
Table 5.10.2: Emulators (drug treatments) evoking gene expression changes (GEC) either similar
(etoposide-like) or opposite (etoposide-contrary) to those evoked by etoposide ......................... 66

vi
List of abbreviations
Abbreviation Explanation
AML Acute Myeloid Leukemia
CI Combination Index
CLUE CMAP and LINCS Unified Environment
CMap Connectivity Map
DAVID Database for Annotation, Visualization, and Integrated Discovery
DMEM Dulbecco’s Modified Eagle’s Medium
DMSO Dimethyl Sulfoxide
FDR False Discovery Rate
FITC Fluorescein isothiocyanate
GEC Gene Expression Changes
GEL Gene Expression Levels
GEO Gene Expression Omnibus
GEPIA Gene Expression Profiling Interactive Analysis
GTEx The Genotype-Tissue Expression
HDAC Histone Deacetylase
IC50 Inhibitory Concentration 50
IPA Ingenuity Pathway Analysis
MLL Mixed Lineage Leukemia
mTOR Mechanistic Target of Rapamycin
MTT 3-(4,5-Dimethylthiazol-2-Yl)-2,5-Diphenyltetrazolium Bromide
PAch Project Achilles
PBS Phosphate-Buffered Saline
PI Propidium Iodide
ROS Reactive Oxygen Species
shRNA short hairpin RNA
siRNA small interfering RNA
TCGA The Cancer Genome Atlas
TET Tetracycline
TOP2 Topoisomerase II
TOP2A Topoisomerase II alpha
TOP2B Topoisomerase II beta
TPM Transcripts per million
WGCNA Weighted gene co-expression analysis
WST [2-(2-methoxy-4-nitrophenyl)-3-(4-nitrophenyl)-5-(2,4-disulfophenyl)-2H-
tetrazolium, monosodium salt

1 Summary
1 Summary
Cancer treatments with classic cytotoxic drugs are constrained by the resistance of cancer cells
and indiscriminate toxicity towards normal cells. They are gradually being replaced by the drugs
and molecules targeting cancer-specific molecules and processes. However, only a few of such
targeted drugs provide clinical benefits compared to cost-effective classical drugs. Herein, I
investigated an unexplored approach of improving the efficacy of the classical anti-cancer drug
etoposide. I hypothesized that the response to etoposide, a widely used topoisomerase II poison,
can be safely enhanced by considering treatment-evoked gene expression changes. To this end, I
analyzed the basal transcriptomes and etoposide-evoked transcriptional changes in fibrosarcoma
and acute myeloid leukemia (AML) cell lines. Using two parallel approaches of co-regulation
within gene expression networks and essentiality for cancer cell survival, I identified and validated
druggable drivers of etoposide cytotoxicity. Drivers with pre-treatment expression modulating the
etoposide cytotoxicity (e.g. BIRC5 and PARP9) synergized with etoposide. Drivers essential for
cancer cell survival and repressed after etoposide treatment (e.g. PFKP and PLK1) contributed to
its cytotoxicity by evoking cell death. Drivers with etoposide-like gene expression changes (e.g.
ANLN and MYC) synergized with etoposide as well as exhibited standalone cytotoxicity.
Altogether, both pre-treatment gene expression levels and treatment-evoked gene expression
changes drive the etoposide cytotoxicity. These drivers could be targeted to potentially replace
etoposide or to enhance its efficacy. This approach can further be used to identify replacements
and rational combination partners of other classical anti-cancer drugs interfering with gene
expression.

2 Zusammenfassung
2 Zusammenfassung
Die Wirksamkeit von Krebsbehandlungen mit klassischen Zytostatika wird durch Resistenzen und
Toxizitäten eingeschränkt. Die klassischen Zytostatika werden daher nach und nach durch
Medikamente ersetzt, die auf krebsspezifische Moleküle und Prozesse abzielen. Im Vergleich zu
kostengünstigen klassischen Medikamenten bieten jedoch nur wenige dieser zielgerichteten
Arzneimittel klinische Vorteile. Im Verlauf dieser Arbeit versuchte ich, die Wirksamkeit des
klassischen Antikrebsmedikaments Etoposid zu verbessern. Ich stellte die Hypothese auf, dass die
Antwort auf Etoposid, ein weit verbreitetes Topoisomerase-II-Gift, gesteigert werden kann, wenn
die durch die Behandlung hervorgerufenen Genexpressionsänderungen berücksichtigt werden. Zu
diesem Zweck analysierte ich die basalen Transkriptome sowie die durch Etoposid
hervorgerufenen transkriptionellen Veränderungen in Zelllinien des Fibrosarkoms und der akuten
myeloischen Leukämie (AML). Mit zwei parallelen Ansätzen, d.h. der Ko-Regulation innerhalb
von Genexpressionsnetzwerken und der essenziellen Bedeutung für das Überleben von
Krebszellen, identifizierte und validierte ich therapeutische Zielmoleküle welche die Etoposid-
Zytotoxizität verstärken. „Drivers“, deren Expression vor der Behandlung die Etoposid-
Zytotoxizität beeinflussten (z. B. BIRC5 und PARP9), wirkten mit Etoposid synergistisch.
„Drivers“, die für das Überleben von Krebszellen essentiell waren und nach einer Etoposid-
Behandlung reprimiert wurden (z. B. PFKP und PLK1), verstärkten dessen Zytotoxizität durch
Zelltod. „Drivers“, die Etoposid-ähnliche Genexpressionsänderungen hervorriefen (z. B. ANLN
und MYC) wirkten synergistisch mit Etoposid und zeigten eigenständige Zytotoxizität.
Zusammengefasst steuern sowohl die Genexpressionsniveaus vor der Behandlung als auch die
durch die Behandlung hervorgerufenen Genexpressionsänderungen die Zytotoxizität von
Etoposid. Diese „Drivers“ könnten gezielt genutzt werden, um Etoposid zu ersetzen oder seine

3 Zusammenfassung
Wirksamkeit zu steigern. Darüber hinaus könnten mit dieser Herangehensweise Alternativen
sowie Kombinationen für andere klassischen Krebsmedikamente identifiziert werden, die die
Genexpression beeinflussen.

4 Introduction
3 Introduction
Most classic anticancer drugs are indiscriminately toxic towards both cancerous and normal
dividing cells due to the interference with the fundamental cellular processes of DNA metabolism
or mitosis. They are therefore gradually being replaced by drugs targeting molecules and processes
more specific to cancer cells. For example, the identification of the bcr-abl fusion protein expressed
exclusively in chronic monomyelocytic leukemia led to the development of the well-tolerated
inhibitor imatinib (An, Tiwari et al. 2010). The development of this and of many other new
anticancer drugs has been driven by advances in the understanding of tumor biology. In coming
years, the cancer chemotherapy is most likely to be tailored to individual patients. However,
development and approval of drugs targeting such individual targets will take several years. Even
more, such targeted drugs often confer rather modest clinical benefits and they remain out-of-reach
to most patients because of high cost (Schilsky and Schnipper 2018).
An alternative approach of finding and targeting cancer-specific effectors of cytotoxic drugs has
not been explored. Cytotoxic drugs display a remarkable sensitivity towards particular cancer
entities (e.g. cis-platinum is effective against solid tumors like NSCLC, testicular cancer or ovarian
cancer, but not against hematological cancers). This work explores the sensitivity-relevant
transcriptional drivers of clinically used cytotoxic drugs to understand the basis of selective
sensitivity and to further enhance it.
3.1 Cancer chemotherapy
Cancer remains one of the major health concerns worldwide. It is second-leading cause of death
with 18.1 million new cases and 9.6 million deaths in 2018 globally (Bray, Jacques et al. 2018,
Siegel, Miller et al. 2018). Several factors contribute to increased cancer prevalence, including

5 Introduction
aging population, as well as environmental and lifestyle changes. This is especially evident in
rapidly developing countries which display a shift from poverty-associated cancers to lifestyle-
associated cancers (Kanavos 2006).
The complexity of cancer in terms of genetic constitution, combined with variability in response
to chemotherapeutic drugs, make treating them particularly challenging (Hanahan and Weinberg
2011). These variabilities are often observed within a single cancer entity. Cancer treatment
strategies include surgery, radiotherapy, chemotherapy, and immunotherapy. Surgery is the ideal
treatment for solid tumors detected at an early stage. For large tumors the radiotherapy provides
an alternative for surgery (Urruticoechea, Alemany et al. 2010). However, both of these
approaches are employed for local therapies. Chemotherapy is the preferred treatment for
advanced solid tumors and for hematological malignancies.
There are various classes of clinically used anticancer drugs including alkylating agents, antibiotics
and antimetabolites, topoisomerase inhibitors, and mitosis inhibitors. Unlike local treatments,
chemotherapy is not restricted to particular site, but rather targets proliferating cells. Hence,
chemotherapeutic drugs are indiscriminately toxic towards cancer cells as well as normal dividing
cells including hair follicles, gastrointestinal epithelial cells, and bone marrow cells. This results
in numerous side effects, including, among others, hair loss, stomach ulcers, and anemia, in the
patients receiving chemotherapy, restricting their applicability.
There are numerous of drugs approved for each cancer type, which are either cytotoxic or targeted
towards specific cancer entities (Table 3.1.1) (Sun, Wei et al. 2017).

6 Introduction
Table 3.1.1: Overview of the number of drugs approved for each cancer type (Sun, Wei et al. 2017).
Cancer Number of
cytotoxic drugs
Number of
targeted drugs
Total
number of
drugs
Leukemia 24 16 40
Lymphoma 14 14 28
Breast cancer 13 14 27
Lung cancer 10 7 17
Prostate cancer 3 12 15
Ovarian cancer 10 2 12
Melanoma 1 10 11
Colorectal cancer 5 5 10
Kidney cancer 2 8 10
Stomach cancer 5 5 10
Brain cancer 6 2 8
Multiple myeloma 3 5 8
Pancreatic cancer 5 3 8
Testicular cancer 6 0 6
Head and neck cancer 3 2 5
Sarcoma 3 2 5
Bladder cancer 4 0 4
Thyroid cancer 1 3 4
Bone cancer 2 1 3
Basal cell carcinoma 0 2 2
Cervical cancer 2 0 2
Gestational trophoblastic disease 2 0 2
Adrenal cortical carcinoma 1 0 1
Choriocarcinoma 1 0 1
Esophageal cancer 0 1 1
Gastroenteropancreatic
neuroendocrine tumor 0 1 1
Kaposi’s sarcoma 0 1 1
Liver cancer 0 1 1
Mesothelioma 1 0 1
Myelofibrosis 0 1 1
Penile cancer 1 0 1
Retinoblastoma 1 0 1
Vulvar cancer 1 0 1

7 Introduction
Even with current advancements and availability of number of drugs (Table 3.1.1), most patients
with advanced cancers still exhibit poor prognosis, mostly because of residual cancer cells. And
hence there is great need to improve the standard treatment regimen. Hence, there is ever-growing
research to identify new potent drugs as well as to utilize alternative strategies such as
immunotherapy (Zhang and Chen 2018). However, there are not many efforts addressing the
efficacy and safety of existing chemotherapeutic drugs which are very potent despite lacking the
cancer cell specificity. This is especially crucial considering increasing number of targeted drugs
which are applicable to ever smaller cohort of patients (Arbiser 2007, Widakowich, de Castro et
al. 2007). There are two ways of addressing this. First, replace these non-specific drugs with drugs
targeting molecules and processes more specific to cancer cells. Second, combine existing
chemotherapeutic drugs with synergistic partners to reduce their dosage and, hence, side-effects.
3.2 Topoisomerase II as cancer targets
Topoisomerase II (TOP2) poisons constitute one of the widely used and successful classes of anti-
cancer drugs (Nitiss 2009). Unfortunately, due to the involvement of TOP2 in such fundamental
cellular processes as DNA replication and transcription, its poisoning affects both cancerous and
normal cells, including non-dividing ones. Thus, in addition to the transient bone marrow toxicity,
TOP2 poisons cause irreversible side-effects such as secondary leukemia due to chromosomal
rearrangements (Pendleton, Lindsey et al. 2014), and cardiotoxicity (McGowan, Chung et al.
2017).
DNA topoisomerases are the essential enzymes involved in the processes such as replication and
transcription. Human DNA topoisomerases consist of three types including type IA (TOP3A and
TOP3B), type IB (TOP1 and TOP1MT), and type IIA (TOP2A and TOP2B). Monomeric type I
enzymes catalyze DNA single-stand breaks, while dimeric type II enzymes catalyze DNA-double

8 Introduction
strand breaks to relieve the topological strain (Pommier 2013). These enzymes resolve higher order
DNA structure through two trans-esterification steps. The first trans-esterification step creates an
DNA adduct, which generates TOP2-DNA cleavable complex causing the topological change. The
second trans-esterification step re-seals the break. This process has extensively been exploited in
cancer chemotherapy. TOP2 poisoning has been utilized in the clinic for more than 50 years as
first-line therapy for blood as well as solid cancers (Marinello, Delcuratolo et al. 2018).
Topoisomerase II (TOP2) poisons constitute one of the widely used and successful classes of anti-
cancer drugs (Nitiss 2009, Pommier, Sun et al. 2016). The main TOP2 poison classes include
anthracyclines, camptothecins, and epipodophyllotoxins. TOP2 poisons, such as
epipodophyllotoxin etoposide, target the short-lived TOP2-DNA cleavable complex and prevent
the re-ligation of transient DSBs. This generates high number of TOP2-associated DSBs, which
trigger apoptosis (Nitiss 2009, Pommier, Leo et al. 2010). The process of TOP2 poisoning by
etoposide is depicted in Fig. 3.2.1.

9 Introduction
Fig. 3.2.1: Pictorial representation of topoisomerase II (TOP2) poisoning by etoposide and its consequences.
TOP2 poisons constitute one of the most important anti-cancer drugs. They are used in managing
almost all types of chemotherapy-responsive cancers. Clinically used and approved TOP2 poisons
are listed in the Table 3.1.1.

10 Introduction
Table 3.2.1: Overview of the topoisomerase II (TOP2) poisons used in clinic (Cowell and Austin 2012, Chemocare
2019).
Class Drug Use
Acridine Amsacrine Acute adult leukemia, Lymphoma
Benzo[c]phenanthridine alkaloid NK314 Adult T-cell leukemia-lymphoma
Anthracenedione Mitoxantrone Breast cancer, Leukemia, Non-Hodgkin lymphoma
Anthracyclines
Daunorubicin Acute myeloid leukemia, Acute lymphoblastic leukemia,
Acute promyelocytic leukemia
Doxorubicin
Acute lymphoblastic leukemia, Acute myeloid leukemia,
Bone sarcoma, Breast cancer, Endometrial cancer, Gastric
cancer, Head and neck cancer, Hodgkin and non-Hodgkin
lymphoma, Liver cancer, Kidney cancer, Multiple myeloma,
Neuroblastoma, Ovarian cancer, Small cell lung cancer, Soft
tissue sarcoma, Thyomas, Thyroid cancer, Transitional cell
bladder cancer, Uterine sarcoma, Wilms' tumor,
Waldenstrom macroglobulinemia
Epirubicin Breast cancer
Idarubicin Acute lymphoblastic leukemia, Acute myeloid leukemia,
Chronic myelogenous leukemia
Camptothecins Irinotecan Metastatic colon or rectal cancer
Topotecan Lung cancer, Ovarian cancer
Epipodophyllotoxins Etoposide
Acute myeloid leukemia, Bladder cancer, Hodgkin's and
non-Hodgkin's lymphoma, Kaposi's sarcoma, Lung cancer,
Prostate cancer, Stomach cancer, Testicular cancer, Uterine
cancer, Wilm's tumor
Teniposide Acute lymphocytic leukemia (in children)
Quinolones Voreloxin Acute myeloid leukemia
Clearly, doxorubicin and etoposide are the TOP2 poisons most widely used against cancers,
especially against hematological ones. The anti-cancer activity of doxorubicin is additionally
contributed to by DNA intercalation and generation of reactive oxygen species, and hence not
limited to TOP2 poisoning (Thorn, Oshiro et al. 2011). Because of wide applicability to a number
of cancer types and specificity for TOP2, I have focused on etoposide.
Etoposide is synthesized from podophyllotoxin isolated from Podophyllum peltatum rhizome. It
targets the type IIA topoisomerases TOP2A and TOP2B. Its clinical use is limited by the

11 Introduction
indiscriminate toxicity towards normal cells. Etoposide causes secondary leukemia due to
chromosomal rearrangements (Pendleton, Lindsey et al. 2014), usually a translocation of the mixed
lineage leukemia (MLL) gene on the chromosome 11q23. Clearly, there is a need to optimize
etoposide-regimens to reduce such chromosomal rearrangements.
3.3 Gene expression and drug response
Ever-decreasing cost of genomic profiling has allowed for high-throughput profiling of cancer
cells. This has elevated our understanding of tumor growth, progression, and response and driven
the development of many targeted therapeutics. During the last decade, there have been several
efforts to associate the base line transcriptomic levels and mutation profiles with the response to
cytotoxic drugs (Whyte and Holbeck 2006, Zhang, Wang et al. 2015, Vural, Simon et al. 2018).
The basal expression of some genes has been linked to the drug resistance (Robert, Vekris et al.
2004). A well-characterized explanation of etoposide resistance is the overexpression of MRP1
(encoded by ABCC1) (Legrand, Zittoun et al. 1999, Benyahia, Huguet et al. 2004). However, this
and other identified targets have failed to make significant clinical impact.
Considering the dynamic nature of the cells, there have been few efforts addressing the
transcriptomic profiles generated by drug treatments. Recently, drug-evoked gene expression
changes (GEC) have been investigated using network analysis of cellular perturbation profiles
(Rees, Seashore-Ludlow et al. 2016). Further, drug-evoked GEC, have been utilized to investigate
mechanism and downstream pathways of drug treatments (Iorio, Tagliaferri et al. 2009, Woo,
Shimoni et al. 2015). Currently, there are a few ongoing big-data initiatives generating
transcriptomic changes caused by drug treatments, including Connectivity Map (CMap) from the
Broad Institute. Such resources could be implemented in drug discovery pipelines to facilitate
target identification based on drug-evoked GEC.

12 Introduction
Considering the role of TOP2A in transcription, I hypothesized that TOP2 poisoning with
etoposide could evoke specific GEC across various cancer cell lines. I planned to investigate such
TOP2A-dependent GEC using an engineered fibrosarcoma cell line (HTETOP) with inducible
repression of TOP2A. I next planned to explore the etoposide-evoked GEC for treatment
optimization in the cancer entity AML, described in following section.
3.4 Acute Myeloid Leukemia
Acute myeloid leukemia (AML) is a type of blood neoplasm characterized by numerous genomic
alterations (such as FLT3, NPM1, RUNX1, and IDH1 & 2). AML accounts for 80% of leukemia
cases in adult patients with 5-year survival rate of 24% (De Kouchkovsky and Abdul-Hay 2016,
Pearsall, Lincz et al. 2018). Chemotherapy is the main form AML management (Dombret and
Gardin 2016). Cytarabine and daunorubicin, or idarubicin or mitoxantrone, or sometimes
cladribine are preferentially utilized for the induction therapy to destroy most of the bone marrow
cells. However, such intensive therapy is not tolerable to older patients (Ossenkoppele and
Lowenberg 2015). Furthermore, treatment strategies for relapsed AML are not yet clearly defined.
MEC regimen (mitoxantrone in combination with etoposide and cytarabine) is one of the common
regimens used for relapsed AML. However, it is associated with increased side-effects in AML
patients (Ramos, Mo et al. 2015, Thol, Schlenk et al. 2015). Hence, there is a need to improve
efficacy and reduce the toxicity of these treatment regimens. To this end, the classical
chemotherapeutics in AML are gradually being supplemented by drugs targeting molecules and
processes more specific to cancer cells. For example, midostaurin and enasidenib can be nowadays
added to standard chemotherapeutic regimens (Stein, DiNardo et al. 2017, Stone, Mandrekar et al.
2017). However, this option is reserved for patients carrying specific mutations in the protein
targets of these drugs, FLT3 and IDH2, respectively.

13 Introduction
I chose AML as a cancer model, since it is frequently treated with etoposide, especially for relapsed
AML (Dombret and Gardin 2016). This work explores the alternative and largely untested
approach of fine-tuning approved etoposide-based therapies by combining them with already
approved or experimental drugs. I reasoned that,
• etoposide-driven changes in the expression and activity of specific proteins mediate, at
least in part, etoposide’s cell killing effects and
• drugs targeting some of these mediators will be already available for testing as combination
treatments.
Apoptosis resulting from etoposide-driven DNA damage is accompanied by considerable gene
expression changes of unexplored consequences (E. Jeong et al., 2018; Troester, Hoadley, Parker,
& Perou, 2004). I assessed etoposide-driven gene expression changes by comparing pre-and post-
treatment cell transcriptomes. I also considered the impact of prior-to-treatment gene expression
levels on the response to etoposide across AML cell lines. Here, I reasoned that, in addition to
expression changes, the response to etoposide is likely to be affected by pre-existing levels of
proteins modulating its effects. I intended to enrich for drivers as opposed by bystanders of
etoposide cytotoxicity using two parallel approaches. Firstly, I focused on genes co-regulated
within networks and additionally correlating with etoposide cytotoxicity. Genes involved in such
networks are more likely to be involved in etoposide response compared to genes taken
individually (Langfelder and Horvath 2008, Li, Zhou et al. 2018). Secondly, I focused on
individual, but essential genes, i.e. on those reducing the survival of each of the AML cell lines
investigated when knocked down using shRNA (Tsherniak, Vazquez et al. 2017). Here I
considered that tumor growth and metastasis are driven only by a fraction of the accompanying
molecular changes and assumed a similar relationship for etoposide response and gene expression

14 Introduction
levels. Among drivers thus identified, I differentiated between modulators, mediators, and
emulators of etoposide response. Etoposide modulators are genes, whose expression correlates
with etoposide cytotoxicity, but remains unchanged upon treatment. Etoposide mediators are genes
that convey cytotoxicity via etoposide-driven changes in their expression levels. Etoposide
emulators are upstream gene modulations and other drugs that evoke gene expression profiles
resembling those evoked by etoposide.
To distinguish between cytotoxicity drives from bystanders, I developed two parallel approaches.
Firstly, I considered the network of genes co-regulated across AML cell lines. The reason was
such genes are more likely to be enriched for etoposide-relevant biological processes compared to
individual genes (Langfelder and Horvath 2008, Li, Zhou et al. 2018). Secondly, to distinguish
between mediators and bystanders of etoposide cytotoxicity among etoposide-evoked GEC, I
considered each gene’s essentiality (Tsherniak et al., 2017) for cell survival in each individual
AML cell line. Because of unavailability of HTETOP essentiality data, another approach,
considering high pre-treatment expression, involvement in cancer-related processes, and
comparative high expression in cancer tissues, was developed to define essentiality. I hypothesized
that the modulators could be targeted to enhance the efficacy of etoposide, while effectors could
be investigated for their involvement in the cytotoxicity.

15 Materials and methods
4 Materials and methods
4.1 Cell culture and drugs
HTETOP cell line was kindly provided by Dr. Andy Porter (Imperial College London, UK). It was
cultured in DMEM media (Sigma Aldrich, Germany) supplemented with 10% FCS, 20 mM
HEPES buffer, 1 mM sodium pyruvate, and antibiotics as reported before (Carpenter and Porter
2004). HTETOP cells were maintained at 37°C and 10% CO2. Tetracycline (TET) at 1 µg/ml was
added to cells resulting in >95% TOP2A mRNA and protein repression (Yan, Deng et al. 2009).
Acute Myeloid Leukemia (AML) cell lines HL-60, MOLM-13, MONO-MAC-6, MV-4-11, NB-
4, NOMO-1, OCI-AML3, and THP-1 were obtained from Dr. Thomas Kindler, University Medical
Center, Mainz. Three additional AML cell lines (F-36P, KASUMI-1, and OCI-AML2) were
purchased from Deutsche Sammlung von Mikroorganismen und Zellkulturen (DSMZ, Germany).
Cell lines were maintained at 37° C and 5% CO2 in appropriate media (Table 5.7.1). 293T cells
were cultured in DMEM (Gibco, Germany) along with 10% FBS (Biochrom, Germany). Cell lines
were routinely verified for mycoplasma contamination using Venor®GeM Mycoplasma Detection
Kit (Sigma-Aldrich, Germany). Cell lines were authenticated by Multiplexion, Germany. The
inhibitors were purchased from Abcam (UK), Biozol (Germany), and Santa Cruz Biotechnology
(US).

16 Materials and methods
4.2 Cell viability assay
1800 cells (in 100 µL media) were seeded in 96 well plates and incubated overnight at 37° C in
10% CO2 incubator, followed by tetracycline treatment (2 µg/mL in 100 µL media) and incubated
for 24 hours to knock down the TOP2A expression. Media was then replaced, and the cells were
treated with different concentrations of etoposide and doxorubicin for 24 and 48 hours. After the

17 Materials and methods
treatment, 20 µL MTT were added and cells were incubated for 4 hours at 37° C followed by
addition of solubilization buffer and then incubated overnight in dark. Absorbance was measured
at 570 nm. Cell viability in response to drug treatment was calculated considering the absorbance
of DMSO treated cells as 100% cell viability.
The viability of AML cell lines in response to etoposide treatment was monitored using WST-8
cell viability kit (PromoKine, German). All AML cell lines were seeded (1 X 10⁴ cells per well)
in a 96-well plate and incubated overnight. Cells were then treated for 24 hours with various
concentrations of etoposide (0.02, 0.05, 0.1, 0.2, 0.37, 0.78, 1.56, 3.13, 6.25, 12.5, 25, 50 µM).,
after the treatment with etoposide, 10% WST-8 reagent was added to the cells. After 1-4 hours
incubation in the dark at room temperature, absorbance was measured at 450 nm using Spectramax
iD3 (Molecular Devices, US) spectrometer. Absorbance from the DMSO-treated cells (vehicle
control) was considered as 100% cell viability and used to calculate percentage cell viability after
etoposide treatment.
4.3 Annexin V apoptosis assay
The flow cytometry-based apoptosis detection was performed using FITC Annexin V apoptosis
detection kit I (BD Biosciences). 2 X 10⁵ cells/mL were seeded in a 6-well plate and incubated
overnight. Cells were then treated with cell line-specific etoposide IC50 concentrations, derived
from the cell viability assay, for 24 hours, washed twice with ice-cold PBS, and resuspended in
binding buffer (1 X 10⁶ cells/ml). Thereafter, 100 µL of cell suspension (1 X 10⁵ cells) was
transferred to a new tube, followed by addition of 5 µL each of Annexin V and PI staining solution
(FITC Annexin V apoptosis detection kit I, BD Biosciences). Cells were then gently vortexed and
incubated in dark for 15 minutes at room temperature. 400 µL of binding buffer was then added to
the cells and analyzed using BD Accuri C6 flow cytometer (BD Biosciences, US).

18 Materials and methods
4.4 RNA-Seq: RNA extraction and library preparation
The gene expression profiles in untreated and etoposide-treated AML and HTETOP cell lines were
determined by RNA sequencing. 1 X 10⁶ cells per well were seeded in a 6 well plate containing 5
mL of the media. Cells were incubated overnight and then treated for 24 hours with etoposide at
cell line-specific IC50 concentrations (for AML cell lines) or at 20 µM concentration (for HTETOP
cell line). HTETOP cell line was separately treated with doxorubicin at 1 µM concentration for 24
hours in presence and absence of TOP2A. For HTETOP cell line, only one biological replicate
was generated. AML cells from 3 wells were then pooled together and total RNA was isolated
using TriFast, peqGOLD total RNA kit and DNase I Digest kit (VWR PEQLAB GmbH, Germany)
according to manufacturer's instructions. The quality and integrity of the extracted RNA was
examined using a 2100 Bioanalyzer (Agilent technologies). Samples were sequenced by Illumina
HiSeq 2000 using TruSeq stranded mRNA HT sample prep kit. RNA quality analysis, library
preparation and sequencing was performed by the Genomics Core Facility at the Institute of
Molecular Biology (IMB, Mainz, Germany). The targeted sequencing depth was 30 million reads
(for AML) or 50 million reads (for HTETOP). HTETOP samples were generated and sequenced
at the Star Seq GmbH (Germany) by Dr. Shiwei Deng (University Medical Center, Mainz).
4.5 RNA-Seq: Analysis
The quality of raw sequencing reads was assessed using FastQC (Babraham Bioinformatics,
Cambridge, UK). These reads were then mapped to the human reference genome (gencode release
25 GRCh38.p7) using the STAR aligner (v2.5.3a) (Dobin, Davis et al. 2013), with the option "--
quantMode GeneCounts" to count the number of reads mapped per gene. Quality of the expression
data was assessed using NOISeq (v2.20.0) (Tarazona, Furio-Tari et al. 2015) R package (R Core
Team 2014). The differential gene expression analysis was then performed using edgeR (v3.20.1)

19 Materials and methods
(Robinson, McCarthy et al. 2010). Genes with fold-change higher than 2 and false discovery rate
(FDR) below 0.05 were considered as differentially expressed. The R script used in this analysis
is appended.
4.6 Weighted gene co-expression network analysis (WGCNA)
To identify modulators and mediators of etoposide sensitivity, weighted gene co-expression
network analysis (WGCNA) was performed using basal gene expression in AML cell lines prior
and after etoposide treatment. The resulting co-regulated networks were compared to identify
genes (a) co-regulated only before treatment, (b) co-regulated only after treatment, and (c)
unaffected by treatment. Gene Ontology analysis was performed for identified networks using the
Database for Annotation, Visualization and Integrated Discovery (DAVID,
https://david.ncifcrf.gov/). Cell line specific expression levels of co-regulated genes unaffected by
treatment were correlated with cell-specific etoposide IC50 concentrations by Pearson correlation
statistics using the WGCNA package in R (Langfelder and Horvath 2008). The co-regulated genes
with positive and negative correlation with etoposide IC50 were selected for Gene Ontology
analysis using DAVID.
4.7 Identification of mediators among etoposide-evoked gene expression changes
The Project Achilles (PAch) (Cowley, Weir et al. 2014) dataset was utilized to retrieve genes most
likely to be essential for AML cell survival. PAch investigated the effect of more than 11k shRNA-
mediated individual gene knockdowns on cell survival in 501 cancer cell lines, including all AML
cell lines used in the present study. Genes with negative DEMETER scores (defined in a previous
study (Tsherniak, Vazquez et al. 2017)) were considered essential for cancer cell survival. Genes
essential for 6 or more AML cell lines as well as differentially expressed after etoposide treatment
were considered potential essential mediators and validated experimentally. To identify mediators

20 Materials and methods
of etoposide cytotoxicity in HTETOP cell line different approach was utilized because of
unavailability of essentiality data from PAch. The genes highly expressed in HTETOP and
repressed after etoposide treatment were selected. Gene Ontology analysis was performed using
Ingenuity Pathway Analysis (IPA, Qiagen Inc.,
https://www.qiagenbioinformatics.com/products/ingenuitypathway-analysis) to restrict the
repressing GEC to the pathways involved in cancer and cell proliferation. For quantifying the
gene expression in normal tissues, transcript per million (TPM) data was downloaded for 33
normal tissues from GTEx. For cancer tissues, fragments per kilobase million (FPKM) data was
retrieved for 29 cancer tissues from The Cancer Genome Atlas (TCGA). FPKM was then
converted to TPM and the average expression was compared to normal tissues using R. The genes
with high expression in cancer tissues were selected and were further screened for their etoposide-
evoked repression in other cancer cell lines obtained from Gene Expression Omnibus (GEO).
Furthermore, the putative upstream regulators of etoposide-evoked GEC in HTETOP were
identified using IPA and Connectivity Map (CMap).
4.8 Prediction of etoposide emulators
Emulators, i.e. gene modulations and compounds that evoke GEC similar to those following
etoposides, were identified using the CMap (Subramanian, Narayan et al. 2017). CMap provides
changes in the expression of 1000 genes following gene perturbations and treatments with
numerous small-molecule compounds. These genes and drugs were identified by uploading the
top 300 overlapping etoposide-evoked GEC (150 up- and 150 down-regulated) from AML and
HTETOP cell lines to CMap via the CLUE platform (CMap and LINCS Unified Environment).

21 Materials and methods
4.9 Driver validation using inhibitors
The inhibitors against the selected drivers were identified using the GeneCards (Ben-Ari Fuchs,
Lieder et al. 2016), IUPHAR/BPS guide to pharmacology (Alexander, Fabbro et al. 2017), and
CMap (Subramanian, Narayan et al. 2017) resources. These drivers were then validated using
WST-8 cell viability assay. AML cell lines were treated for 24 hours with 1 nM, 100 nM, and 10
µM of each inhibitor alone, as well as in combinations with cell-specific IC25 concentrations of
etoposide, followed by WST-8 cell viability assay. Percentage cell viability compared to vehicle-
treated cells, taken as 100%, was calculated for single and combination treatments. For
combination treatment screening, the synergy was defined as per-response additivity approach
(Foucquier and Guedj 2015). The combination index (CI) was calculated as CI =EA+EB
EAB, where EA
is the effect of inhibitor A, EB is the effect of etoposide and EAB is the effect of combination of
inhibitor A and etoposide. CI < 1 was considered as synergy with etoposide, while CI > 1 was
considered as antagonism, and CI = 1 was considered as additive effect.
4.10 Driver validation using sh/siRNA-mediated gene knockdown
siRNA sequences targeting the gene of interest in HTETOP cells were selected using Project
Achilles (PAch) database. The shRNA target sequences with highest consistency scores and lowest
p-value were selected. The targets of these sequences were verified using online siRNA-Check
tool developed by Genomics and Bioinformatics Group, LMP, CCR, National Cancer Institute.
siRNAs were then synthesized using Sigma custom oligo service. HTETOP cells were then
transfected with 10 nM siRNA for 24 hours using JetPrime transfection reagent. WST-8-based cell
viability assay was performed 24 hours after transfection to evaluate the effect of gene knockdown
on cell viability. The gene knockdown was monitored using SYBR green qPCR. Primers used in
this work are listed in Appendix table 2.

22 Materials and methods
To investigate the effect of individual gene knockdowns on AML cell survival, Viral Shah
(University Medical Center Mainz) cloned shRNA targeting BCL2A1, IGFIR, and ROCK1 into
Tet-pLKO.1-puro vector (kindly provided by Dimitri Wiederschain, Novartis Institutes for
BioMedical Research, Cambridge, MA). shRNA sequences were obtained from the PAch resource
and were synthesized by Sigma-Aldrich, along with RHS4743 expressing scrambled shRNA
(supplementary data S1 Table 2). Lentiviral particles were generated by co-transfecting psPAX2,
pMD2.G along with previously generated shRNA expressing vectors into 293T cells. Transfection
was carried out using TransIT (Mirus) as per the manufacturer’s instructions. To achieve stable
transduction, AML cell lines were seeded 1 X 10⁶ in a 6-well plate, with each virus supernatant in
presence of 5 µg/mL polybrene and spin-infected at 2500 rpm at 32°C for 1 and 45 hours.
Following 16 hours incubation at 37°C, cells were supplemented with 1-2 µg/mL puromycin
(Sigma-Aldrich, Germany). Furthermore, to induce knockdown of the indicated drivers, 5 X 10⁵
cells per well were seeded in 6-well cell culture plates. The knockdown was then induced by
treating the cells with doxycycline (200 ng/mL) and cell viability was measured after 24, 48, and
72 hours using the WST-8 assay. The effect of shRNA-mediated gene knockdown on cell viability
was calculated by comparing doxycycline-untreated and -treated cells.
4.11 DNA damage measurement using flow cytometry
To compare the amount of DNA damage caused by etoposide alone and in combination with other
drugs, the levels of phosphorylated H2A.X in HL-60 cells were measured using flow cytometry.
The fixed HL-60 cells were stained using the H2A.X phosphorylation assay kit (Merck, Germany)
according to manufacturer’s instructions. In short, 5 X 10⁵ HL-60 cells were seeded per well in a
6-well plate and incubated overnight. Cells were treated for 24 hours with IC25 concentration of
etoposide alone and in combination with other drugs. Next, cells were harvested and washed with

23 Materials and methods
PBS followed by fixation. Cells were then stained with either FITC-conjugated anti-phospho-
Histone H2A.X (Ser139) or with the negative control mouse IgG-FITC conjugate for 20 minutes
on ice. The amount of H2A.X was then measured using BD Accuri flow cytometer. The data was
then analyzed using FlowJo software (v10).
4.12 TCGA survival analysis
The raw gene expression counts for 151 AML patients were retrieved from TCGA through the
Broad GDAC Firehose, along with the clinical data, using the R package RTCGAToolbox (v2.8.0)
(Samur 2014). Univariate survival analysis compared the groups with high expression (above
median) and low expression (below median) of selected drivers. p-values for Kaplan-Meier plots
were calculated using Log-rank test. The comparison between gene expression in AML patients
and normal blood samples was performed using Gene Expression Profiling Interactive Analysis
(GEPIA) web server (Tang, Li et al. 2017).
4.13 Statistical analysis
Unless otherwise specified, the experiments reflect 3 biological replicates. Data was analyzed
using R language packages and GraphPad Prism software (v7). Graphs were plotted as mean ±
SD. The etoposide IC50 concentrations were calculated using GraphPad Prism software by fitting
the dose response curve by non-linear regression. Shapiro-Wilk test was performed to determine
normal distribution for parametric tests. Two-way ANOVA with Benjamini and Hochberg FDR
correction was performed to identify inhibitors with significant cytotoxicity (Benjamini and
Hochberg 1995). Mann-Whitney test was performed to identify significant expression change
between resistant and sensitive AML cell lines.

24 Results
5 Results
5.1 Etoposide-mediated cytotoxicity in HTETOP is TOP2A-dependent
To investigate the dependency of TOP2A for etoposide-evoked GEC, it was crucial to examine
TOP2A-specific cytotoxicity of etoposide. To this end, HTETOP cells were treated with different
concentrations of etoposide and doxorubicin for 24 and 48 hours, in the presence and absence of
TOP2A. The cell viability was measured using MTT assay. As seen in Fig. 5.1.1, both etoposide
and doxorubicin exhibited dose-dependent cytotoxicity in HTETOP cell line in the presence of
TOP2A. However, TOP2A knockdown by tetracycline (TET) treatment inhibited etoposide-
mediated cytotoxicity (Fig. 5.1.1A and B). On the other hand, TOP2A knockdown had no effect
on doxorubicin-mediated cytotoxicity (Fig. 5.1.1C and D). This is consistent with the known
mechanism of action of these two drugs, where doxorubicin, in addition to TOP2 poisoning, exerts
its cytotoxic potential through direct intercalation with the DNA, as well as through damage to the
mitochondria by means of oxidative stress (ROS generation), and on the other side etoposide being
solely dependent on TOP2 poisoning. The results demonstrate that, in absence of TOP2A,
etoposide is very little cytotoxic. Its remaining cytotoxicity most likely results from TOP2B
poisoning.

25 Results
Fig. 5.1.1: HTETOP cell viability in response to TOP2 poisons. MTT-based cell viability assay in HTETOP cell
line after treatment with topoisomerase-II (TOP2) poisons etoposide (A and B) and doxorubicin (C and D) after 24
and 48 hours. Data are represented as mean values ± SD.
5.2 Etoposide-evoked specific gene repressions in HTETOP cell line
HTETOP cell line was sequenced by mRNA sequencing before and after 20 µM etoposide or 1
µM doxorubicin treatment by Dr. Shiwei Deng (University Medical Center, Mainz). After
processing for the quality control step using FastQC, the paired-end sequencing data was mapped
to reference genome (hg38) using HISAT2 (version 2.0.4). The count for mapped reads were
generated using htseq-count (version 0.6.1) and then DESeq2 was used to identify gene expression
changes following the etoposide treatment. As shown in Fig. 5.2.1, etoposide-evoked gene

26 Results
repressions accounted for 65% of all GEC. On the other hand, doxorubicin-evoked gene inductions
accounted for 57% of all GEC (Fig. 5.2.2). Furthermore, doxorubicin evoked more GEC (4861)
compared to etoposide (859) (Fig. 5.2.3A).
Fig. 5.2.1: Effect of etoposide on gene expression in HTETOP cells. Volcano plot representing gene expression
changes (GEC) in HTETOP cells following etoposide treatment (20 µM) for 24 hours.

27 Results
Fig. 5.2.2: Effect of doxorubicin on gene expression in HTETOP cells. Volcano plot representing gene expression
changes (GEC) in HTETOP cells following doxorubicin treatment (1µM) for 24 hours.
I further compared the effect of TOP2A availability on GEC evoked by etoposide and doxorubicin.
As observed with the cytotoxicity (Fig. 5.1.1), etoposide-evoked GEC were TOP2A dependent,
while absence of TOP2A did not have high impact on doxorubicin-evoked GEC. In the absence
of TOP2A, etoposide-evoked GEC reduced from 859 to 91 (Fig. 5.2.3C). There were 425 TOP2A-
dependent GEC evoked by etoposide and 112 evoked by doxorubicin (Fig. 5.2.3D). This reflects
that, unlike with doxorubicin, a majority of etoposide-evoked GEC are mediated by TOP2A
poisoning.

28 Results
Fig. 5.2.3: TOP2A-dependent gene expression changes after etoposide and doxorubicin treatments of HTETOP
cells. (A) Comparison of gene expression changes (GEC) after doxorubicin and etoposide treatment, (B) and (C)
represent the numbers of GEC after doxorubicin and etoposide treatment respectively, in presence and absence of
TOP2A, (D) comparison of TOP2A-dependent GEC after doxorubicin and etoposide treatments.
5.3 Etoposide predominantly represses the high-expressing genes in HTETOP cell
line
To understand the mechanism of etoposide-evoked TOP2A-dependent gene repression, the basal
gene expression level (GEL) in HTETOP cells was investigated. I quantified transcripts per million
(TPM) from mapped RNA-Seq counts. To correlate TOP2 poisoning-related GEC as a function of
GEL, I divided all expressed genes into 3 categories according to their TPM values. Next, a density
graph of all TPM values was plotted to define expressed genes. Then quantile approach was

29 Results
followed to define low, average and high expressing genes. Considering the role of TOP2A in
transcriptional regulation, I compared etoposide-evoked GEC of high and low expressing genes as
a function of TOP2A enrichment. High expressing genes were preferentially repressed after both
doxorubicin and etoposide treatment. When considered at the entire transcriptome level, 22%
(1067) of genes with high basal GEL were repressed after doxorubicin treatment (Fig. 5.3.1A)
compared to 0.6% (28) of genes with low basal GEL (Fig. 5.3.1B) in the presence of TOP2A. The
absence of TOP2A did not have significant impact on doxorubicin-mediated repression of genes
with high basal GEL. Similarly, 6% (289) of genes with high basal GEL were repressed after
etoposide treatment (Fig. 5.3.1C) compared to 0.15% (7) of genes with low basal GEL (Fig.
5.3.1D) in presence of TOP2A. As expected, the absence of TOP2A reduced etoposide-mediated
repression of the genes with high basal GEL from 6% (289) to 0.15% (7).
(+)
TO
P2A
(-)
TO
P2A
0
1 0
2 0
3 0
Pe
rc
en
tag
e o
f
hig
h e
xp
re
ss
ed
ge
ne
s
R e p re s s e d
In d u c e d
(+)
TO
P2A
(-)
TO
P2A
0 .0
0 .5
1 .0
1 .5
Pe
rc
en
tag
e o
f
low
ex
pre
ss
ed
ge
ne
s
R e p re s s e d
In d u c e d
(+)
TO
P2A
(-)
TO
P2A
0
2
4
6
8
Pe
rc
en
tag
e o
f
hig
h e
xp
re
ss
ed
ge
ne
s
R e p re s s e d
In d u c e d
(+)
TO
P2A
(-)
TO
P2A
0 .0
0 .5
1 .0
1 .5
Pe
rc
en
tag
e o
f
low
ex
pre
ss
ed
ge
ne
s
R e p re s s e d
In d u c e d
A B
C D

30 Results
Fig. 5.3.1: Predominance of gene repression after treatment with etoposide and doxorubicin in HTETOP cells.
Percentage of high (A) and low (B) expressing genes from HTETOP cells differentially expressed after doxorubicin
treatment in presence and absence of TOP2A. Percentage of high (C) and low (D) expressing genes differentially
expressed after etoposide treatment in presence and absence of TOP2A.
The predominance of gene repressions among high expressing genes is in agreement with the role
of TOP2A in transcription. Some of the repressing GEC could contribute to cell killing effect of
etoposide, especially repressions in genes essential for survival.
5.4 Etoposide evokes specific GEC in other cancer entities
To validate the findings from HTETOP cell line in other cancer entities, I obtained etoposide-
evoked GEC from GEO and CMap. There were 14 cell lines representing 8 cancer types (Table
5.4.1). Out of these 14 cell lines, 6 cell lines exhibited predominance of etoposide-evoked
repressing GEC, which could contribute in cell killing. However, all these cell lines had been
treated with different etoposide concentrations for different timepoints.

31 Results
Table 5.4.1: Effect of etoposide on gene expression in various cancer cell lines. Overview of etoposide-evoked
gene expression changes (GEC) in the cell lines representing different cancer entities obtained from GEO and
connectivity Map (CMap).
Cancer
type Cell line Source
Accession
number
Etoposide
concentra
tion (µM)
Treatm
ent time
(hours)
Numbers
of
induced
genes (%)
Numbers
of
repressed
genes (%)
AML HL-60 Connectivity
Map - 7 6 185 (59%) 127 (41%)
B cell
lymphoma
OCI-Ly3 GEO GSE60408 IC20 24 56 (1%) 5478
(99%)
OCI-Ly7 GEO GSE60409 IC20 24 351 (64%) 198 (36%)
U-2932 GEO GSE60410 IC20 24 280 (49%) 291 (51%)
Breast
cancer
HME-CC GEO GSE1647 10 12 439 (54%) 380 (46%)
MCF-7 GEO GSE1648 40 12 56 (43%) 74 (57%)
ME-16-C GEO GSE1649 20 12 101 (49%) 107 (51%)
ZR-75-1 GEO GSE1650 30 12 308 (31%) 681 (69%)
Burkitt’s
lymphoma Ramos GEO GSE23169 20 6 624 (34%)
1218
(66%)
Colorectal
cancer
HCT-116 GEO GSE71980 20 - 3016
(51%)
2844
(49%)
SW-620 GEO GSE33624 60 2 897 (58%) 661 (42%)
Fibrosarco
ma HT-1080 GEO GSE59368 3 24 245 (47%) 281 (53%)
Histiocytic
lymphoma U-937 GEO GSE66660 0.4 48 359 (76%) 115 (24%)
Melanoma MelJuSo GEO GSE33624 60 2 516 (78%) 144 (22%)
Prostate
cancer PC-3
Connectivity
Map - 7 6 14 (56%) 11 (44%)
After comparing the etoposide-evoked GEC from all cancer cell lines obtained from GEO, CMap,
and from my experiment in HTETOP, I identified overlapping GEC among these cell lines. BTG2
(NGF-inducible anti-proliferative protein PC3) was induced in 8, while PLK1 (polo-like kinase 1)
was repressed in 10 cancer cell lines after etoposide treatment (

32 Results
Table 5.4.2A and B).
Table 5.4.2: Overview of the etoposide-evoked gene expression changes (GEC) overlapping in 5 or more cancer
cell lines. (A) Etoposide-evoked inducing GEC (B) Etoposide-evoked repressing GEC (top 22 shown).
A B
Etoposide-
induced genes
Number
of cell
lines
Etoposide-
repressed genes
Number of
cell lines
BTG2 8 PLK1 10
ATF3 7 CDC20 9
CDKN1A 7 CENPE 9
CD86 6 PSRC1 8
GDXR 6 ASPM 7
GDF15 6 BUB1 7
IFI6 6 CCNB1 7
RETSAT 6 CENPF 7
SESN1 6 DLGAP5 7
SLAMF7 6 HMMR 7
TP53I3 6 MKI67 7
ACTA2 5 STAG1 7
ANKRA2 5 SYNCRIP 7
CEACAM1 5 TOP2A 7
CYFIP2 5 AURKA 6
FAS 5 BIRC5 6
FUCA1 5 BUB1B 6
GAA 5 CCNB2 6
GADD45A 5 CCNF 6
JUN 5 DIAPH3 6
SFN 5 DPYD 6
TP53INP1 5 KIF4A 6

33 Results
5.5 Prediction and validation of mediators of etoposide cytotoxicity in HTETOP cell
line
I restricted the prediction to the etoposide-evoked genes repressions because of their predominance
in HTETOP cell line. To define essential gene repressions, I first selected the genes with high basal
GEL and subsequent repression after etoposide treatment (289 genes). These genes were then
restricted to 53 genes based on pathways involved in cancer and cell proliferation, using IPA.
Then, the GEC from other cancer cell lines was used to select genes which are repressed in multiple
cancer cell lines. Finally, gene expression for selected genes were compared in normal and cancer
tissues to select essential gene repressions. Fig. 5.5.1 represents an example of DLGAP5
expression across normal and cancer tissues. DLGAP5 and other selected genes had higher average
expression in cancer tissues compared to normal tissues.

34 Results
Fig. 5.5.1: Expression of etoposide-mediator in cancer tissues. Boxplot representing average DLGAP5 expression
across 33 normal tissues obtained from GTEx and 29 cancer tissues obtained from TCGA.
IPA and CLUE resources provided the putative upstream regulators modulating etoposide-evoked
GEC in HTETOP cell line. Altogether, I selected 14 predicted essential repressing GEC and 6
putative upstream regulators from IPA and CLUE (Table 5.5.1). All the identified targets were
knocked down using siRNA-mediated transfection. The siRNA sequences are listed in Appendix
table 1. The knockdown was confirmed by SYBR green qPCR using target specific primers.
Table 5.5.1: Selected mediators among etoposide-evoked gene expression changes (GEC) and putative
upstream regulators in HTETOP cell line. Log2FC represents fold change from RNA-Seq experiments after the
etoposide treatment. Comparison with other cancer cell lines is based obtained from gene expression omnibus (GEO)
and connectivity map (CMap).

35 Results
Gene
symbol
Log2FC
(HTETOP)
Number of
cancer cell lines
gene repressed
in
Cancer cell lines gene repressed in
Etoposide-repressed genes with high expression in HTETOP
CDC20 -1.6 9 HCT-116, HL-60, HT-1080, HTETOP, MCF-7,
OCI-Ly3, Ramos, U-2932, ZR-75-1
CDK6 -1.7 3 HME-CC, HTETOP, OCI-Ly3
CENPF -1.6 7 HCT-116, HL-60, HT-1080, HTETOP, MCF-7,
OCI-Ly3, ZR-75-1
DLGAP5 -1.2 7 HCT116, HL-60, HT-1080, HTETOP, MCF-7,
OCI-Ly-3, ZR-75-1
FOSL1 -1.2 2 HTETOP, Ramos
HMGA2 -1.6 1 HTETOP
IGF2BP
1 -1.1 2 HTETOP, OCI-Ly3
KIF20A -1.2 5 HCT-116, HL-60, HTETOP, MCF-7, OCI-Ly3
MCM6 -1.2 6 HCT-116, HT-1080, HTETOP, MelJuSo, OCI-
Ly3, ZR-75-1
NCAPD2 -1.4 4 HCT-116, HTETOP, OCI-Ly3, ZR-75-1
PFKP -1.2 2 HTETOP, OCI-Ly3
PLAU -1.4 2 HME-CC, HTETOP
SLC7A5 -1.3 3 HME-CC, HTETOP, OCI-Ly3
TPX2 -1.1 6 HCT-116, HT-1080, HTETOP, MCF-7, OCI-
Ly3, ZR-75-1
Upstream regulators (Ingenuity)
ANLN -1.3 5 HCT-116, HT-1080, HTETOP, OCI-Ly3, ZR-
75-1
FOXM1 -1.4 3 HCT-116, HT-1080, HTETOP
Gene knockdowns evoking etoposide-like GEC (emulators)
MED1 - 1 ZR-75-1
RPA2 - 1 HCT-116
TOPBP1 - 1 HCT-116
YWHAH - 2 ZR-75-1
To achieve optimal gene knockdown, I optimized the cell seeding density and siRNA
concentration. I selected the density of 5000 cells in as 96-well plate and 10nM siRNA
concentration, as these parameters show minimum effect of scrambled sequence transfection on
cell viability (Fig. 5.5.2).

36 Results
Fig. 5.5.2: Optimization of cell numbers and siRNA concentration for knockdown in HTETOP cell line.
Next, I measured the percentage of viable cells after knocking down all the selected targets using
siRNA. In addition, I also investigated the effects of knockdown on etoposide sensitization by
etoposide treatment at IC50 concentration for 24 hours after the siRNA transfection for 24 hours.
As shown in Fig. 5.5.3, the knockdown of the predicted essential GEC PFKP and PLAU and of
the putative upstream regulator ANLN exerted cytotoxic response in HTETOP cell line. However,
no target sensitized cells to etoposide treatment.

37 Results
Fig. 5.5.3: Effect of knockdown of the mediators of etoposide cytotoxicity on cell viability and etoposide
sensitization using WST-8 cell viability assay. Predicted mediators of etoposide cytotoxicity were knocked down
using siRNA for 24 hours. Percentage cell viability compared to untransfected cells, taken as 100%, was calculated
and Mann-Whitney statistical test was performed using GraphPad Prism software (v7) to identify significant gene
knockdowns compared to scrambled (SCR) sequence. (*q value < 0.05).
5.6 Identifying transcriptional modulators and effectors of etoposide in AML: Pipeline
overview
To identify drugs that could supplement or replace etoposide, I determined, analyzed, and
functionally verified gene expression profiles prior and after etoposide treatment (Fig. 5.6.1).
Since multiple AML cell lines were available in contrast to HTETOP, an approach different from
the one described for HTETOP cell line was developed to facilitate identification of etoposide
cytotoxicity drivers. Two parallel approaches were followed. First, I identified networks of co-
expressing genes (step 1). Genes derived from co-expressing networks, whose co-regulation was
unaffected by etoposide and whose expression correlated with etoposide IC50 were defined as
potential modulators of etoposide cytotoxicity (step 2). Second, among the etoposide-evoked GEC
(step 3), the essential genes were identified by applying PAch-derived survival essentiality filter
(step 4). Putative etoposide emulators, i.e. gene modulations and drugs that cause GEC either
similar or contrary to those evoked by etoposide, were identified using CMap (step 5). Putative

38 Results
modulators, effectors and emulators thus identified were further scrutinized regarding biological
function, relevance to a majority of AML cell lines, inhibitor availability, and subjected to
functional validation.
Fig. 5.6.1: Pipeline to identify transcriptional drivers of etoposide in AML. Step 1 and 2 represent quantification
of genome-wide gene expression levels (GEL) prior and after etoposide treatment respectively, followed by co-
expression network construction in step 3 and 4. Step 5 corresponds to comparison of co-expressing gene clusters
before and after treatment to identify differentially co-expressed genes (DCG). Gene expression changes (GEC) from
step 6 were utilized to identify GEC essential for survival (step 7) and etoposide-like or -contrary transcriptional
drivers (step 8).

39 Results
5.7 AML cell lines are differentially sensitive to etoposide treatment
I investigated the response of 11 AML cell lines to 6 or 24 hours of etoposide treatment (0.02 – 50
µM) using WST-8 cell viability assay. Most of the cell lines did not respond sufficiently to 6-hour
etoposide treatment (Fig. 5.7.1). Hence, the experiment was proceeded with 24 hours treatment,
which revealed differential response by AML cell lines (Fig. 5.7.2). The IC50 concentrations varied
from 0.3 µM, for the most sensitive cell line OCI-AML2, to 99 µM, for the most resistant cell line
F-36P (
Table 5.7.1).
Cell lines RRID AML
classification
Growth
medium
Fetal calf
serum
(heat
inactivated)
Supplements Growth
condition
Etoposide IC50
(µM)
Etoposide
IC25
(µM)
F-36P CVCL_2037 AML M6
RPMI 1640
20%
10 ng/ml
granulocyte-
macrophhage
colony
stimulating
factor
37° C, 5% CO2
98.81 25.96
HL-60 CVCL_0002 AML M3 10% - 0.74 0.48
KASUMI-1 CVCL_0589 AML M2 20% - 6.80 1.43
MOLM-13 CVCL_2119 AML M5 10% - 0.39 0.12
MONO-
MAC-6 CVCL_1426 AML M5 10%
MEM Non-
essential
amino-acid
solution,
100mM Na-
pyruvate,
10µg/mL
human insulin
4.39 2.34
MV-4-11 CVCL_0064 AML M5 10% - 1.33 0.36
NB-4 CVCL_0005 AML M3 10% - 0.50 0.25
NOMO-1 CVCL_1609 AML M5 10% - 1.65 0.95
OCI-AML2 CVCL_1619 AML M4 alpha-MEM
20% - 0.29 0.16
OCI-AML3 CVCL_1844 AML M4 20% - 1.00 0.58
THP-1 CVCL_0006 AML M5 RPMI 1640 10% - 1.01 0.63

40 Results
-8 -7 -6 -5 -4
0
5 0
1 0 0
1 5 0
E to p o s id e c o n c e n tra t io n s (L o g [M ])
Pe
rc
en
tag
e c
ell
via
bil
ity
F -3 6 P
H L -6 0
K a s u m i-1
M O L M -1 3
M O N O -M A C -6
M V -4 -1 1
N B -4
N O M O -1
O C I-A M L 2
O C I-A M L 3
T H P -1
C e ll v ia b il ity in re s p o n s e to e to p o s id e tre a tm e n t (6 h o u rs )
Fig. 5.7.1: WST8-based concentration dependent effect of etoposide on survival of AML cell lines after 6 hours
treatment. Percentage cell viability compared to vehicle-treated cells, taken as 100%, was calculated. Dose response
curve was generated by fitting the data by non-linear regression using GraphPad Prism software (v7). Values represent
mean ± SD from 3 biological replicates.

41 Results
-8 -7 -6 -5 -4
0
5 0
1 0 0
1 5 0
E to p o s id e c o n c e n tra t io n s (L o g [M ])
Pe
rc
en
tag
e c
ell
via
bil
ity
F -3 6 P
H L -6 0
K a s u m i-1
M O L M -1 3
M O N O -M A C -6
M V -4 -1 1
N B -4
N O M O -1
O C I-A M L 2
O C I-A M L 3
T H P -1
C e ll v ia b ility in re s p o n s e to e to p o s id e tre a tm e n t (2 4 h o u rs )
Fig. 5.7.2: WST8-based concentration dependent effect of etoposide on survival of AML cell lines after 24 hours
treatment. Percentage cell viability compared to vehicle-treated cells, taken as 100%, was calculated. Dose response
curve was generated by fitting the data by non-linear regression using GraphPad Prism software (v7). Values represent
mean ± SD from 3 biological replicates.

42 Results
Table 5.7.1: Culture conditions and etoposide response by all investigated AML cell lines. Etoposide IC50 and IC25 concentrations were derived using GraphPad
Prism software (v7) by fitting the dose response curve by non-linear regression. RRID of the cell lines were obtained from the Resource Identification Portal.
Cell lines RRID AML
classification
Growth
medium
Fetal calf
serum
(heat
inactivated)
Supplements Growth
condition
Etoposide IC50
(µM)
Etoposide
IC25 (µM)
F-36P CVCL_2037 AML M6
RPMI 1640
20%
10 ng/ml
granulocyte-
macrophhage
colony
stimulating
factor
37° C, 5% CO2
98.81 25.96
HL-60 CVCL_0002 AML M3 10% - 0.74 0.48
KASUMI-1 CVCL_0589 AML M2 20% - 6.80 1.43
MOLM-13 CVCL_2119 AML M5 10% - 0.39 0.12
MONO-
MAC-6 CVCL_1426 AML M5 10%
MEM Non-
essential
amino-acid
solution,
100mM Na-
pyruvate,
10µg/mL
human insulin
4.39 2.34
MV-4-11 CVCL_0064 AML M5 10% - 1.33 0.36
NB-4 CVCL_0005 AML M3 10% - 0.50 0.25
NOMO-1 CVCL_1609 AML M5 10% - 1.65 0.95
OCI-AML2 CVCL_1619 AML M4 alpha-MEM
20% - 0.29 0.16
OCI-AML3 CVCL_1844 AML M4 20% - 1.00 0.58
THP-1 CVCL_0006 AML M5 RPMI 1640 10% - 1.01 0.63

43 Results
These IC50 concentrations were derived from WST8-based cell viability assay, which measures
the metabolic activity of cells. Cellular dehydrogenases reduce WST-8 to water soluble formazan,
whose level corresponds to viability of cells. This approach might leave out the metabolically
inactive, but live cells. Hence, WST-derived IC50 concentrations were validated for apoptosis using
flow cytometric measurements of Annexin V-FITC stained AML cell lines treated with cell-
specific IC50 concentrations of etoposide. I expected 50% apoptosis with etoposide treatment at
cell-specific IC50 concentrations. I observed 19 – 51% apoptosis after etoposide treatment (Fig.
5.7.3).

44 Results
Fig. 5.7.3: Percentage of apoptotic AML cells in response to etoposide treatment. Different AML cell lines were
treated with IC25 concentrations of etoposide for 24 hours, followed by Annexin-FITC and PI staining and detection
by flow cytometry. Quadrant LL represents healthy cells, LR represents early apoptotic cells, and UR represents late
apoptotic cells.

45 Results
5.8 Modulators of etoposide synergize AML cell lines to drug
To identify modulators of etoposide whose expression correlate with etoposide response, all AML
cell lines were treated with cell-specific IC50 concentrations of etoposide for 24 hours to obtain
similar cytotoxicity levels. The RNA-Seq data from etoposide-treated OCI-AML2 cells was
discarded, because it failed in the quality control of raw RNA sequences. Using WGCNA, I
identified genes co-regulated in all 11 untreated AML cell lines, as well as in the remaining 10
etoposide-treated cell lines. I identified the genes co-regulated in untreated cell lines as well as in
etoposide-treated AML cell lines. The co-regulated genes found only in untreated cells comprise
cell proliferation, transcription, apoptosis, and others (Table 5.8.1). The genes co-regulated only
in networks newly formed after etoposide treatment regulate, among others, transcription, response
to DNA damage, and DNA repair (Table 5.8.2).

46 Results
Table 5.8.1: Pathways corresponding to co-expressing gene clusters in untreated AML cell lines. WGCNA
analysis was performed to identify gene clusters co-regulated in untreated AML cell lines. These clusters were
annotated for biological processes using DAVID. Modules from last column (color names) represent identified
clusters. Terms highlighted in bold type are etoposide-treatment related processes.
Term Counts PValue Module names
GO:0006351~transcription, DNA-templated 19 0.01 darkolivegreen
GO:0000122~negative regulation of transcription from RNA
polymerase II promoter 12 0.01 orange
GO:0000122~negative regulation of transcription from RNA
polymerase II promoter 11 0.00 darkolivegreen
GO:0045892~negative regulation of transcription, DNA-
templated 10 0.01 orange
GO:0051301~cell division 9 0.03 salmon
GO:0006915~apoptotic process 8 0.02 darkolivegreen
GO:0008380~RNA splicing 8 0.00 orange
GO:0000398~mRNA splicing, via spliceosome 8 0.00 orange
GO:0007067~mitotic nuclear division 8 0.02 salmon
GO:0016032~viral process 8 0.04 salmon
GO:0000086~G2/M transition of mitotic cell cycle 7 0.00 orange
GO:0043123~positive regulation of I-kappaB kinase/NF-
kappaB signaling 7 0.01 salmon
GO:0015031~protein transport 7 0.02 steelblue
GO:0008285~negative regulation of cell proliferation 6 0.04 darkolivegreen
GO:0006406~mRNA export from nucleus 6 0.00 orange
GO:0051092~positive regulation of NF-kappaB transcription
factor activity 6 0.01 salmon
GO:0007050~cell cycle arrest 6 0.02 salmon
GO:0050852~T cell receptor signaling pathway 6 0.02 salmon
GO:0098609~cell-cell adhesion 5 0.04 darkolivegreen
GO:0010629~negative regulation of gene expression 5 0.02 orange
GO:0006888~ER to Golgi vesicle-mediated transport 5 0.03 orange
GO:0090090~negative regulation of canonical Wnt signaling
pathway 5 0.03 orange
GO:0006397~mRNA processing 5 0.04 orange
GO:0018105~peptidyl-serine phosphorylation 5 0.04 salmon
GO:0010629~negative regulation of gene expression 5 0.00 skyblue3
GO:0006890~retrograde vesicle-mediated transport, Golgi to
ER 5 0.00 steelblue
GO:0031124~mRNA 3'-end processing 4 0.01 orange
GO:0006405~RNA export from nucleus 4 0.01 orange
GO:0032091~negative regulation of protein binding 4 0.01 orange
GO:0006369~termination of RNA polymerase II transcription 4 0.01 orange
GO:0016569~covalent chromatin modification 4 0.04 orange

47 Results
GO:0070507~regulation of microtubule cytoskeleton
organization 4 0.00 salmon
GO:0007249~I-kappaB kinase/NF-kappaB signaling 4 0.03 salmon
GO:0071456~cellular response to hypoxia 4 0.01 skyblue3
GO:0018105~peptidyl-serine phosphorylation 4 0.02 skyblue3
GO:0042787~protein ubiquitination involved in ubiquitin-
dependent protein catabolic process 4 0.05 steelblue
GO:0048593~camera-type eye morphogenesis 3 0.00 darkolivegreen
GO:0007052~mitotic spindle organization 3 0.02 orange
GO:0000381~regulation of alternative mRNA splicing, via
spliceosome 3 0.03 orange
GO:0010501~RNA secondary structure unwinding 3 0.04 orange
GO:0014067~negative regulation of phosphatidylinositol 3-
kinase signaling 3 0.00 salmon
GO:0032006~regulation of TOR signaling 3 0.01 salmon
GO:0030214~hyaluronan catabolic process 3 0.01 salmon
GO:0021542~dentate gyrus development 3 0.01 salmon
GO:0070423~nucleotide-binding oligomerization domain
containing signaling pathway 3 0.03 salmon
GO:2001238~positive regulation of extrinsic apoptotic
signaling pathway 3 0.03 salmon
GO:0046627~negative regulation of insulin receptor
signaling pathway 3 0.04 salmon
GO:0010803~regulation of tumor necrosis factor-mediated
signaling pathway 3 0.04 salmon
GO:0032480~negative regulation of type I interferon
production 3 0.04 salmon
GO:0070555~response to interleukin-1 3 0.05 salmon
GO:0051321~meiotic cell cycle 3 0.05 salmon
GO:0007018~microtubule-based movement 3 0.04 skyblue3
GO:0045931~positive regulation of mitotic cell cycle 3 0.01 steelblue
GO:0007595~lactation 3 0.02 steelblue
GO:0060337~type I interferon signaling pathway 3 0.05 steelblue
GO:0061484~hematopoietic stem cell homeostasis 2 0.02 Dark
olivegreen
GO:0071929~alpha-tubulin acetylation 2 0.02 salmon
GO:0090140~regulation of mitochondrial fission 2 0.03 steelblue
GO:0019885~antigen processing and presentation of
endogenous peptide antigen via MHC class I 2 0.04 steelblue
GO:0051988~regulation of attachment of spindle
microtubules to kinetochore 2 0.04 steelblue

48 Results
Table 5.8.2: Pathways corresponding to co-expressing gene clusters in etoposide-treated AML cell lines.
WGCNA analysis was performed to identify gene clusters co-regulated in etoposide-treated AML cell lines. These
clusters were annotated for biological processes using DAVID. Modules from last column (color names) represent
identified clusters. Terms highlighted in bold type are etoposide-treatment related processes.
Term Count PValue Modules
GO:0006351~transcription, DNA-templated 61 0.00 tan
GO:0006355~regulation of transcription, DNA-templated 52 0.00 tan
GO:0006351~transcription, DNA-templated 40 0.05 magenta
GO:0006355~regulation of transcription, DNA-templated 32 0.05 magenta
GO:0006351~transcription, DNA-templated 23 0.02 royalblue
GO:0000122~negative regulation of transcription from RNA
polymerase II promoter 22 0.00 magenta
GO:0006364~rRNA processing 20 0.00 magenta
GO:0051301~cell division 19 0.00 tan
GO:0006260~DNA replication 17 0.00 tan
GO:0007067~mitotic nuclear division 17 0.00 tan
GO:0051301~cell division 14 0.00 magenta
GO:0006281~DNA repair 13 0.00 tan
GO:0006468~protein phosphorylation 12 0.00 Light yellow
GO:0007062~sister chromatid cohesion 11 0.00 tan
GO:0000398~mRNA splicing, via spliceosome 11 0.00 tan
GO:0042384~cilium assembly 9 0.00 magenta
GO:0060271~cilium morphogenesis 9 0.00 magenta
GO:0000722~telomere maintenance via recombination 9 0.00 tan
GO:0000082~G1/S transition of mitotic cell cycle 9 0.00 tan
GO:0006974~cellular response to DNA damage stimulus 9 0.02 tan
GO:0006281~DNA repair 8 0.00 Royal blue
GO:0006888~ER to Golgi vesicle-mediated transport 8 0.01 tan
GO:0098609~cell-cell adhesion 7 0.01 Dark red
GO:0010501~RNA secondary structure unwinding 7 0.00 magenta
GO:0070126~mitochondrial translational termination 7 0.00 magenta
GO:0016569~covalent chromatin modification 7 0.00 royalblue
GO:0008380~RNA splicing 7 0.00 royalblue
GO:0051301~cell division 7 0.04 royalblue
GO:0007059~chromosome segregation 7 0.00 tan
GO:0000724~double-strand break repair via homologous
recombination 7 0.00 tan
GO:1901796~regulation of signal transduction by p53 class
mediator 7 0.01 tan
GO:0000086~G2/M transition of mitotic cell cycle 7 0.02 tan
GO:0006888~ER to Golgi vesicle-mediated transport 6 0.00 darkred
GO:0070125~mitochondrial translational elongation 6 0.00 ivory
GO:0070126~mitochondrial translational termination 6 0.00 ivory
GO:0070125~mitochondrial translational elongation 6 0.01 magenta
GO:0090263~positive regulation of canonical Wnt signaling
pathway 6 0.04 magenta

49 Results
GO:0042787~protein ubiquitination involved in ubiquitin-
dependent protein catabolic process 6 0.00 royalblue
GO:0007067~mitotic nuclear division 6 0.03 royalblue
GO:0006271~DNA strand elongation involved in DNA
replication 6 0.00 tan
GO:0000731~DNA synthesis involved in DNA repair 6 0.00 tan
GO:0006302~double-strand break repair 6 0.00 tan
GO:0019886~antigen processing and presentation of exogenous
peptide antigen via MHC class II 5 0.00 darkred
GO:0000209~protein polyubiquitination 5 0.04 darkred
GO:0001701~in utero embryonic development 5 0.04 darkred
GO:0006364~rRNA processing 5 0.00 ivory
GO:0006412~translation 5 0.01 ivory
GO:0038061~NIK/NF-kappaB signaling 5 0.02 magenta
GO:0051436~negative regulation of ubiquitin-protein ligase
activity involved in mitotic cell cycle 5 0.02 magenta
GO:0051437~positive regulation of ubiquitin-protein ligase
activity involved in regulation of mitotic cell cycle transition 5 0.03 magenta
GO:0031145~anaphase-promoting complex-dependent
catabolic process 5 0.03 magenta
GO:0006368~transcription elongation from RNA polymerase II
promoter 5 0.04 magenta
GO:0006364~rRNA processing 5 0.03 orange
GO:0007062~sister chromatid cohesion 5 0.01 royalblue
GO:0006511~ubiquitin-dependent protein catabolic process 5 0.04 royalblue
GO:0006270~DNA replication initiation 5 0.00 tan
GO:0042769~DNA damage response, detection of DNA
damage 5 0.00 tan
GO:0019985~translesion synthesis 5 0.00 tan
GO:0034080~CENP-A containing nucleosome assembly 5 0.00 tan
GO:0043966~histone H3 acetylation 5 0.00 tan
GO:0030307~positive regulation of cell growth 5 0.04 tan
GO:0051436~negative regulation of ubiquitin-protein ligase
activity involved in mitotic cell cycle 4 0.01 darkred
GO:0051437~positive regulation of ubiquitin-protein ligase
activity involved in regulation of mitotic cell cycle transition 4 0.01 darkred
GO:0031145~anaphase-promoting complex-dependent
catabolic process 4 0.02 darkred
GO:0030521~androgen receptor signaling pathway 4 0.00 lightyellow
GO:0006446~regulation of translational initiation 4 0.02 magenta
GO:0001541~ovarian follicle development 4 0.03 magenta
GO:0075733~intracellular transport of virus 4 0.04 magenta
GO:0006521~regulation of cellular amino acid metabolic
process 4 0.04 magenta
GO:0030150~protein import into mitochondrial matrix 4 0.00 orange
GO:0032508~DNA duplex unwinding 4 0.00 royalblue

50 Results
GO:0006310~DNA recombination 4 0.02 royalblue
GO:0006338~chromatin remodeling 4 0.02 royalblue
GO:0000083~regulation of transcription involved in G1/S
transition of mitotic cell cycle 4 0.01 tan
GO:0000732~strand displacement 4 0.01 tan
GO:0006139~nucleobase-containing compound metabolic
process 4 0.04 tan
GO:0009725~response to hormone 3 0.04 lightyellow
GO:0007566~embryo implantation 3 0.04 lightyellow
GO:0070936~protein K48-linked ubiquitination 3 0.05 lightyellow
GO:0001522~pseudouridine synthesis 3 0.02 magenta
GO:0030490~maturation of SSU-rRNA 3 0.02 magenta
GO:0000470~maturation of LSU-rRNA 3 0.02 magenta
GO:0042771~intrinsic apoptotic signaling pathway in
response to DNA damage by p53 class mediator 3 0.01 orange
GO:0043124~negative regulation of I-kappaB kinase/NF-
kappaB signaling 3 0.02 orange
GO:0031124~mRNA 3'-end processing 3 0.05 royalblue
GO:0046600~negative regulation of centriole replication 3 0.00 tan
GO:0006269~DNA replication, synthesis of RNA primer 3 0.00 tan
GO:0006884~cell volume homeostasis 3 0.01 tan
GO:0031571~mitotic G1 DNA damage checkpoint 3 0.01 tan
GO:0071732~cellular response to nitric oxide 3 0.02 tan
GO:0007099~centriole replication 3 0.02 tan
GO:0042276~error-prone translesion synthesis 3 0.03 tan
GO:0007091~metaphase/anaphase transition of mitotic cell
cycle 2 0.03 darkred
GO:0031325~positive regulation of cellular metabolic process 2 0.03 darkred
GO:0032042~mitochondrial DNA metabolic process 2 0.03 lightyellow
GO:0009299~mRNA transcription 2 0.04 lightyellow
GO:0000472~endonucleolytic cleavage to generate mature 5'-
end of SSU-rRNA from (SSU-rRNA, 5.8S rRNA, LSU-rRNA) 2 0.04 magenta
GO:0042347~negative regulation of NF-kappaB import into
nucleus 2 0.06 orange
GO:0032877~positive regulation of DNA endoreduplication 2 0.03 tan
GO:0043009~chordate embryonic development 2 0.05 tan
By comparing pre- and post-treatment networks, I identified and analyzed genes with co-regulation
unaffected by the treatment (Fig. 5.8.1A and B). In the figure, color names highlighted in bold
type on y-axis are the clusters uniquely present in either untreated or etoposide-treated AML cell
lines. I further analyzed the gene clusters unaffected by the treatment. The 24 treatment-unaffected

51 Results
clusters comprised 5711 genes. The genes with expression levels correlating with etoposide
response were involved in processes such as apoptosis, proteasomal catabolism, response to DNA
damage, and DNA repair. The 71 genes correlating positively (p < 0.05, Pearson’s r > |0.5|, S1
Table 5) with etoposide IC50 concentrations were considered putative assisting modulators; the
909 negatively correlating ones as putative impeding modulators. Among them, I identified the
previously reported modulators SLFN11 (Zoppoli, Regairaz et al. 2012, Rees, Seashore-Ludlow
et al. 2016) and SMARCA4 (Lee, Celik et al. 2018) whose expression correlated with etoposide
sensitivity.

52 Results

53 Results
Fig. 5.8.1: WGCNA consensus network analysis. (A) Comparison of co-expression modules identified in untreated
AML cell lines with consensus network (present in both untreated and etoposide-treated AML cell lines). (B)
Comparison of co-expression modules identified in etoposide-treated AML cell lines with consensus network (present
in both untreated and etoposide-treated AML cell lines). Color names on X- and Y-axis represent individual co-
expressing modules and the number next to module represent total number of co-expressing genes identified in that
particular module. Numbers in the heatmap represent number of genes common to consensus network on the X-axis,
while the number of genes to extreme right (common to Cons grey module) are the co-expressing genes unique to
untreated AML cells.
Fig. 5.8.2: Gene Ontology analysis for etoposide-modulators. Top 20 biological processes for the co-expressed
genes from the consensus network negatively correlating with etoposide sensitivity. The scale represents number of
genes enriched for individual biological processes. Processes previously linked to etoposide are shown in bold type.
The putative impeding modulators BIRC5 and PARP9 (correlation is shown in Fig. 5.8.3) were
selected for experimental validation using chemical inhibitors against their protein products
because of their involvement in apoptosis regulation and in double strand break repair,
respectively. NOTCH1 (Fig. 5.8.3) was selected for experimental validation to confirm its putative

54 Results
etoposide-assisting activity. AML cell lines were treated for 24 hours with 3 concentrations (0.001
µM, 0.1 µM, and 10 µM) of chemical inhibitors alone, as well as in combination with cell line-
specific IC25 concentrations of etoposide. The BIRC5 inhibitor GDC-0152 and the PARP inhibitor
nicotinamide exhibited effects synergistic or additive to etoposide in 9 and 10 cell lines,
respectively. The NOTCH1 inhibitor LY-3039478 antagonized with etoposide in 8 out of 11 AML
cell lines (Fig. 5.8.4, Table 5.8.3, and Appendix table 5). Stand-alone cytotoxicity was observed
in OCI-AML3 cells following BIRC5 inhibition and in two cell lines following NOTCH1
inhibition (Table 5.8.3 and Appendix table 4). In summary, all putative modulators investigated
were confirmed by chemical inhibitors.
Fig. 5.8.3: Modulators gene expression correlation with etoposide sensitivity. Pearson correlations between the
pre-treatment basal gene expression level of the impeding modulators BIRC5 and PARP9 and of the assisting
modulator NOTCH1 with etoposide sensitivity across AML cell lines.

55 Results
Fig. 5.8.4: Synergy of modulators with etoposide in AML cells. Combination index (CI; see Methods section 4.9
for details) for the cytotoxicity following treatment with IC25 concentrations of etoposide with inhibitors targeting the
impeding modulators BIRC5 and PARP9 and the assisting modulator NOTCH1. CI < 1: synergism, CI = 1: additivity,
and CI > 1: antagonism.
Driver type Targets (inhibitors)
Stand-alone
cytotoxicity (no. of cell
lines)
Synergy/additivity with
etoposide (no. of cell
lines)
Modulators
NOTCH1 (LY-3039478) 2 2
BIRC5 (GDC-0152) 1 9
PARP9 (Nicotinamide) 0 10
Mediators
BCL2A1 (Sabutoclax) 11 1
PRKCH (Sotrastaurin) 7 3
PLK1 (Volasertib) 11 1
IGF1R (GSK-
1838705A) 9 2
Emulators
MYC (TWS-119) 10 2
mTORi (Rapamycin) 7 6
HDACi (Vorinostat) 9 9
ROCK1 (Rockout) 3 7 Table 5.8.3: Overview of the drivers of etoposide cytotoxicity in AML cells. The drivers exhibiting stand-alone
cytotoxicity in at least 6 AML cell lines are highlighted in light grey, drivers synergizing with etoposide in at least 6
AML cell lines in dark grey.
5.9 Etoposide-repressed essential genes contribute to cytotoxicity in AML lines
I next analyzed co-regulated genes correlating with the etoposide IC50 concentrations, but
transcriptionally altered by etoposide treatment. The correlated genes BRD4, MATL1, and MYC

56 Results
were involved in the clusters of genes co-regulated only in untreated AML cell lines; the correlated
gene SIRT1 was present in the co-expression network detected only after etoposide treatment.
BRD4 and MYC were transcriptionally repressed, while MALT1 and SIRT1 were transcriptionally
induced by etoposide in the less responsive AML cell lines (supplementary Fig. 3). However, all
of them, except MYC, were predicted to be essential in only 4 AML cell lines. Therefore, I next
analyzed and functionally verified etoposide-driven GEC at the level of individual genes.

57 Results
Fig. 5.9.1: Etoposide-evoked changes in the expression of co-regulating genes. Cell lines F-36P, KASUMI-1, and
MONO-MAC-6 with highest etoposide IC50 concentrations were considered as resistant, while remaining AML cell
lines were considered as etoposide-responsive. (A) and (B) targets BRD4 and MYC respectively repressed after
etoposide treatment in resistant cell lines, (C) and (D) targets MALT1 and SIRT1 respectively induced after etoposide
treatment in resistant cell lines. Fold change was calculated by comparing TMM-normalized counts after and before
etoposide treatment for respective drivers. Mann-Whitney test was performed to identify significant fold change across
two groups. (* and ** represents q value < 0.05 and 0.01 respectively).
The differential gene expression analysis using edgeR revealed that inductions accounted for the
majority of etoposide treatment-driven changes in the gene expression (Fig. 5.9.2 and Table 5.9.1).

58 Results
On average, etoposide evoked 81% of gene inductions in AML cell lines after treatment with cell
specific IC50 concentrations for 24 hours.
Fig. 5.9.2: Etoposide-evoked gene expression changes (GEC) in AML. Volcano plot representing (GEC) in F-36P
cell line in response to etoposide treatment at IC50 concentration for 24 hours.
Table 5.9.1: Numbers and percentages of etoposide-evoked inducing and repressing gene expression changes
(GEC) in all investigated AML cell lines. Differentially expressed genes were identify by comparing RNA-Seq gene
counts from untreated and etoposide-treated AML cell lines using edgeR software.
Cell lines Numbers of gene
expression changes
Numbers of induced
genes (%)
Numbers of repressed
genes (%)
F36-P 4615 3882 (84.1) 733 (15.9)
HL-60 1007 875 (86.9) 132 (13.1)
KASUMI-1 3558 2874 (80.8) 684 (19.2)
MOLM-13 1643 1284 (78.2) 359 (21.9)
MONO-
MAC-6 1788 1307 (73.1) 481 (26.9)
MV-4-11 2091 1883 (90.1) 208 (10.0)
NB-4 2383 1965 (82.5) 418 (17.5)
NOMO-1 1679 1177 (70.1) 502 (29.9)
OCI-AML3 1215 1028 (84.6) 187 (15.4)
THP-1 1278 1050 (82.2) 228 (17.8)

59 Results
Essentiality analysis suggested that, on average, about 33% of etoposide-driven changes could
have reduced AML cell survival (Table 5.9.2). An example of GEC grouped according to
essentiality in F-36P cell line is shown in Fig. 5.9.3.
Table 5.9.2: Numbers and percentages of predicted essential genes using Project Achilles (PAch) among all
etoposide-evoked gene expression changes (GEC).
Cell lines
Numbers of
etoposide-
evoked GEC
Number of
predicted
essential genes
(%)
Etoposide-
repressed predicted
essential genes (%)
Etoposide-induced
predicted essential
genes (%)
F-36P 4615 1447 (31.3) 239 (16.5) 1208 (83.5)
HL-60 1007 348 (34.6) 45 (12.9) 303 (87.1)
KASUMI-
1 3558 1234 (34.7) 227 (18.4) 1007 (81.6)
MOLM-
13 1643 549 (33.4) 118 (21.5) 431 (78.5)
MONO-
MAC-6 1788 602 (33.7) 144 (23.9) 458 (76.1)
MV-4-11 2091 702 (33.6) 63 (9) 639 (91)
NB-4 2383 762 (32) 128 (16.8) 634 (83.2)
NOMO-1 1679 580 (34.5) 156 (26.9) 424 (73.1)
OCI-
AML3 1215 416 (34.2) 55 (13.2) 361 (86.8)
THP-1 1278 417 (32.6) 71 (17) 346 (83)

60 Results
Fig. 5.9.3: Scatterplot of etoposide-evoked differentially expressed genes in F-36P cell line, arranged according
to essentiality for survival. DEMETER score < 0 signifies essentiality. The genes essential for tumor cell survival
and differentially expressed after etoposide treatment were considered as putative essential mediators. The mediators
shortlisted for experimental validation (BCL2A1, IGF1R, PLK1, and PRKCH) are depicted in larger font. Other gene
names are random examples taken from the entire gene set.
I selected IGF1R for experimental validation, since it was essential for 7 AML cell lines and
repressed in 4 AML cell lines after etoposide treatment (Fig. 5.9.4). Likewise, PLK1, was essential
as well as repressed in 4 AML cell lines (Fig. 5.9.4). I pursued PLK1 because it exhibited highest
essentiality for the least etoposide-sensitive F-36P cell line (Fig. 5.9.3). BCL2A1 and PRKCH were
selected because of their predicted essentiality for 6 AML cell lines each, and because they were
induced by etoposide in 9 and 6 AML cell lines, respectively (Fig. 5.9.4).

61 Results
I then treated all AML cell lines with the inhibitors of the protein products of these genes alone,
as well as in combination with IC25 concentrations of etoposide. The inhibitors targeting the protein
products of BCL2A1 and PLK1 exerted standalone cytotoxicity in all AML cell lines, while the
IGF1R inhibitor and the PKC inhibitor exhibited cytotoxicity in 9 and 7 AML cell lines,
respectively (Fig. 5.9.4, Fig. 5.9.5, and Table 5.8.3). Inhibition of BCL2A1 and PLK1 synergized
with etoposide in MOLM-13 and NB-4 cell lines, respectively. Inhibition of PRKCH and IGF1R
exhibited synergy with etoposide in 2 AML cell lines each (Table 5.8.3 and Appendix table 5).
Fig. 5.9.4: Experimental validation of putative essential mediators shortlisted in Fig. 5.9.3. Cell viability was
assessed by WST-8 assay after treatment with inhibitors targeting protein products of shortlisted drivers. Filled
symbols represent predicted essentiality for survival in individual AML cell lines. Circles around the symbols
represent experimentally confirmed cytotoxicity.

62 Results

63 Results
Fig. 5.9.5: Contribution of mediators in AML cell killing using inhibitors. Percentage cell viability in response to
(A) sabutoclax (BCL2 inhibitor), (B) GSK-1838705A (IGF1R inhibitor), (C) volasertib (PLK1 inhibitor), and (D)
sotrastaurin (PRKCH inhibitor) treatment respectively for 24 hours. Percentage cell viability compared to vehicle-
treated control, taken as 100%, was calculated. Two-way ANOVA with Benjamini and Hochberg FDR test was
performed to quantify significant difference. Data are represented as mean values ± SD and derived from 3 biological
replicates. (* p-value < 0.05).
I additionally investigated, in HL-60 cells, the cytotoxic effects of the essential mediators BCL2A1
and IGF1R using shRNA-mediated knockdown. Knockdown of the mediator IGF1R was cytotoxic
to HL-60 cells. (Fig. 5.9.6).
Fig. 5.9.6: Contribution of mediators in AML cell killing using shRNA-mediated knockdown. Viability of HL-
60 cells after shRNA-mediated gene knockdown of essential mediators BCL2A1 and IGF1R for 24, 48, and 72 hours.
Percentage cell viability compared to untransduced cells, taken as 100%, was calculated. Mann-Whitney test was
performed to identify significant change in the viability. (** represents q value < 0.01). Data are represented as mean
values ± SD and derived from 3 biological replicates.
5.10 Emulators are cytotoxic and synergize with etoposide
Using the CMap resource, I identified gene modulations and drugs that cause GEC either similar
or contrary to those evoked by etoposide. There were 32 gene knockdowns and 76 drugs whose
application led to etoposide-like GEC. They were referred to as putative etoposide-like emulators.
The majority of the drugs belonged to the classes mTOR inhibition, topoisomerase inhibition, and
Un
tran
sd
uced
cells
Scra
mb
led
sh
RN
AB
CL
2A
1
IGF
1R
0
5 0
1 0 0
Pe
rc
en
tag
e c
ell
via
bil
ity
2 4 h o u rs
4 8 h o u rs
7 2 h o u rs
**

64 Results
HDAC inhibition. I also identified 12 drugs evoking opposite GEC, which are referred to as
putative etoposide-contrary emulators (Table 5.10.1 and Table 5.10.2).
Table 5.10.1: Emulators (gene knockdowns) evoking gene expression changes (GEC) either similar (etoposide-
like) or opposite (etoposide-contrary) to those evoked by etoposide. Emulators were identified by uploading top
300 etoposide-evoked GEC overlapping in 10 AML cell lines to Connectivity Map (CMap) resource. The connectivity
score ranging from -100 to 100 depicts the fraction of reference genes exhibiting similarity with the query. Emulators
with connectivity score greater than |90| were considered as significant.
Etoposide-like emulators (gene knockdowns)
ID Target Connectivity score
CGS001-6240 RRM1 99.66
CGS001-4609 MYC 99.14
CGS001-1027 CDKN1B 98.15
CGS001-4998 ORC1 97.18
CGS001-4067 LYN 97.04
CGS001-1666 DECR1 96.86
CGS001-3815 KIT 96.73
CGS001-4199 ME1 96.33
CGS001-11331 PHB2 95.7
CGS001-29890 RBM15B 95.25
CGS001-9020 MAP3K14 94.59
CGS001-5373 PMM2 94.51
CGS001-3226 HOXC10 94.22
CGS001-5591 PRKDC 93.49
CGS001-998 CDC42 93.31
CGS001-291 SLC25A4 93.26
CGS001-2852 GPER 92.76
CGS001-4191 MDH2 92.52
CGS001-2872 MKNK2 92.35
CGS001-5245 PHB 91.58
CGS001-5690 PSMB2 91.49
CGS001-5770 PTPN1 91.43
CGS001-2355 FOSL2 91.26
CGS001-10247 HRSP12 91.08
CGS001-2581 GALC 90.52
CGS001-11245 GPR176 90.44
CGS001-4792 NFKBIA 90.44
CGS001-5184 PEPD 90.41
CGS001-79724 ZNF768 90.4
CGS001-64116 SLC39A8 90.21
CGS001-63933 CCDC90A 90.15
CGS001-4143 MAT1A 90.04

65 Results
Etoposide-contrary emulators (gene
knockdowns)
CGS001-64805 P2RY12 -97.83
CGS001-2153 F5 -95.66
CGS001-1622 DBI -95.5
CGS001-25805 BAMBI -94.21
CGS001-4312 MMP1 -92.97
CGS001-136 ADORA2B -92.66
CGS001-57819 LSM2 -92.39
CGS001-79796 ALG9 -92.37
CGS001-991 CDC20 -92.27
CGS001-7535 ZAP70 -91.91
CGS001-25925 ZNF521 -91.68
CGS001-6046 BRD2 -91.6
CGS001-6478 SIAH2 -90.91
CGS001-9128 PRPF4 -90.81
CGS001-7132 TNFRSF1A -90.63
CGS001-9575 CLOCK -90.34
CGS001-83593 RASSF5 -90.31

66 Results
Table 5.10.2: Emulators (drug treatments) evoking gene expression changes (GEC) either similar (etoposide-like) or opposite (etoposide-contrary) to
those evoked by etoposide. Emulators were identified by uploading top 300 etoposide-evoked GEC overlapping in 10 AML cell lines to Connectivity Map (CMap)
resource. The connectivity score ranging from -100 to 100 depicts the fraction of reference genes exhibiting similarity with the query. Emulators with connectivity
score greater than |90| were considered as significant.
Etoposide-like emulators (drug treatment)
ID Drug Drug target Drug class
Connectivity
score
BRD-
A62025033 temsirolimus MTOR, PTEN
MTOR inhibitor
96.06
BRD-
K68174511 torin-2 MTOR 94.2
BRD-
K69932463 AZD-8055 MTOR 91.51
BRD-
A45498368 WYE-125132 MTOR, PIK3CA 91.3
BRD-
K77008974 WYE-354 MTOR 90.52
BRD-
A79768653 sirolimus MTOR, FKBP1A, CCR5, FGF2 93.94
BRD-
K84937637 sirolimus MTOR, FKBP1A, CCR5, FGF2 93.47
BRD-
A75409952 wortmannin
PIK3CA, PIK3CG, PLK1, ATM, ATR, MTOR, PI4KA,
PI4KB, PIK3CD, PIK3R1, PLK3, PRKDC 95.03
BRD-
K06750613 GSK-1059615 PIK3CA, PIK3CG 97.99
BRD-
K12184916 NVP-BEZ235 MTOR, PIK3CA, PIK3CG, PIK3CD, ATR, PIK3CB 90.56
BRD-
A36630025 SN-38 TOP1
Topoisomerase inhibitor
97.88
BRD-
K98490050 amsacrine TOP2A, KCNH2 97.84
BRD-
K56334280 amonafide TOP2A, TOP2B 96.72
BRD-
A35588707 teniposide TOP2A, CYP3A5 96.42

67 Results
BRD-
K37798499 etoposide TOP2A, CYP2E1, CYP3A5, TOP2B 93.68
BRD-
K08547377 irinotecan TOP1, CYP3A5, TOP1MT 91.08
BRD-
K85985071 ellipticine TOP2A, TOP2B 90.54
BRD-
A71390734 idarubicin TOP2A 98.49
BRD-
A52530684 doxorubicin TOP2A 97.24
BRD-
A18419789 etoposide TOP2A, CYP2E1, CYP3A5, TOP2B 94.59
BRD-
K52522949 NCH-51
HDAC1, HDAC10, HDAC11, HDAC2, HDAC3,
HDAC4, HDAC5, HDAC6, HDAC7, HDAC8, HDAC9
HDAC inhibitor
96.18
BRD-
K81418486 vorinostat
HDAC1, HDAC2, HDAC3, HDAC6, HDAC8, HDAC10,
HDAC11, HDAC5, HDAC9 93.6
BRD-
K77908580 entinostat HDAC1, HDAC2, HDAC3, HDAC9 92.85
BRD-
K74733595
APHA-compound-
8 HDAC8 91.88
BRD-
K13169950 NSC-3852 HDAC1 91.72
BRD-
K16485616 mocetinostat HDAC1, HDAC2, HDAC3, HDAC11 91.51
BRD-
K64606589 apicidin
HDAC1, HDAC10, HDAC11, HDAC2, HDAC3,
HDAC4, HDAC5, HDAC6, HDAC7, HDAC8, HDAC9 90.53
BRD-
K68336408
tyrphostin-AG-
1478 EGFR, MAPK14
EGFR inhibitor
93.44
BRD-
K85606544 neratinib EGFR, ERBB2, ERBB4, KDR 92.27
BRD-
U25771771 WZ-4-145 CSF1R, DDR1, EGFR, PDGFRA, TIE1 91.63
BRD-
K50168500 canertinib EGFR, ERBB2, ERBB4, AKT1 91.2
BRD-
A25687296 emetine RPS2 Protein synthesis inhibitor
96.9

68 Results
BRD-
A28970875 puromycin
NHP2L1, RPL10L, RPL11, RPL13A, RPL15, RPL19,
RPL23, RPL23A, RPL26L1, RPL3, RPL37, RPL8,
RSL24D1 95.88
BRD-
K76674262 homoharringtonine RPL3 95.2
BRD-
K80348542 cephaeline RPS2 94.76
BRD-
K15108141 gemcitabine RRM1, CMPK1, RRM2, TYMS
Ribonucleotide reductase inhibitor
97.28
BRD-
K33106058 cytarabine POLB, POLA1 96.48
BRD-
A82371568 clofarabine RRM1, POLA1, RRM2, SLC22A8 96.35
BRD-
K50836978 purvalanol-a
CDK1, CDK2, CDK4, CDK5, CCND1, CCNE1,
CSNK1G3, RPS6KA1, SRC CDK inhibitor
97.58
BRD-
K07762753 aminopurvalanol-a CDK1, CDK2, CDK5, CDK6 96.96
BRD-
K31542390 mycophenolic-acid IMPDH1, IMPDH2 IMPDH inhibitor
97.57
BRD-
K92428153
mycophenolate-
mofetil IMPDH1, IMPDH2, HCAR2 90.42
BRD-
A49680073 cucurbitacin-i JAK2, STAT3 JAK-STAT inhibitor
97.96
BRD-
A28105619 cucurbitacin-i JAK2, STAT3 95.86
BRD-
A15079084
phorbol-12-
myristate-13-
acetate CD4, KCNT2, PRKCA, TRPV4 PKC activator 97.25
BRD-
A52650764 ingenol PRKCD, PRKCE 95.15
BRD-
A89434049 sarmentogenin ATP1A1 ATPase inhibitor 91.79
BRD-
K51018020 VAMA-37 PRKDC
DNA dependent protein kinase
inhibitor 92.46
BRD-
A48237631 mitomycin-c DNA synthesis inhibitor 94.44

69 Results
BRD-
K13646352 midostaurin
FLT3, KIT, CCNB1, FLT1, KDR, PDGFRB, PRKCA,
PRKCG, VEGFA
FLT3 inhibitor, PDGFR/KIT
inhibitor, PKC inhibitor, VEGFR
inhibitor 96.9
BRD-
A81772229 simvastatin HMGCR, CYP2C8, CYP3A4, CYP3A5, ITGB2 HMGCR inhibitor 93.91
BRD-
K13049116 BMS-754807 IGF1R, AKT1 IGF-1 inhibitor 94.69
BRD-
K47983010 BX-795
PDPK1, CDK2, CHEK1, GSK3B, IKBKE, KDR, PDK1,
TBK1 IKK inhibitor 98.8
BRD-
A11678676 wortmannin
PIK3CA, PIK3CG, PLK1, ATM, ATR, MTOR, PI4KA,
PI4KB, PIK3CD, PIK3R1, PLK3, PRKDC PI3K inhibitor 97.02
BRD-
K82823804 SA-792987 WEE1 PKC inhibitor 98.3
BRD-
K87343924 wortmannin
PIK3CA, PIK3CG, PLK1, ATM, ATR, MTOR, PI4KA,
PI4KB, PIK3CD, PIK3R1, PLK3, PRKDC - 98.5
BRD-
M86331534
pyrvinium-
pamoate AR - 96.6
BRD-
K30677119 PP-30 RAF1 - 96.14
BRD-
K03067624 emetine RPS2 - 95.87
BRD-
A24643465 homoharringtonine RPL3 - 95.63
BRD-
A55484088 BNTX OPRD1, OPRK1, OPRM1 - 95.38
BRD-
K91370081 anisomycin
NHP2L1, RPL10L, RPL11, RPL13A, RPL15, RPL19,
RPL23, RPL23A, RPL26L1, RPL3, RPL37, RPL8,
RSL24D1 - 94.36
BRD-
K61829047 7b-cis XPO1 - 94.35
BRD-
A19248578 latrunculin-b ACTA1, MKL1, SPIRE2 - 94.34
BRD-
K74402642 NSC-632839 USP2, USP7, SENP2, USP1 - 94.33
BRD-
K37392901 NSC-632839 USP2, USP7, SENP2, USP1 - 94.2

70 Results
BRD-
K36007650 puromycin
NHP2L1, RPL10L, RPL11, RPL13A, RPL15, RPL19,
RPL23, RPL23A, RPL26L1, RPL3, RPL37, RPL8,
RSL24D1 - 94.01
BRD-
U86922168 QL-XII-47 BMX, BTK - 93.74
BRD-
K67439147 SIB-1893 GRM5, GRM4 - 93.65
BRD-
K17140735 SCH-79797 F2R - 93.26
BRD-
A50737080 CGK-733 ATM, ATR - 92.59
BRD-
K14821540 FCCP - 91.53
BRD-
K28907958 CD-437 RARG - 91.36
BRD-
K89930444 AG-592 - 91.02
BRD-
K73610817 BRD-K73610817 - 90.76
BRD-
K30351863 BRD-K30351863 APEX1 - 90
Etoposide-contrary emulators (drug treatment)
BRD-
K23875128
RHO-kinase-
inhibitor-
III[rockout]
IMPDH2, ROCK1 - -98.78
BRD-
A35108200 dexamethasone
ANXA1, CYP3A4, CYP3A5, NOS2, NR0B1, NR3C1,
NR3C2 Glucocorticoid receptor agonist -97.76
BRD-
A69951442 dexamethasone
ANXA1, CYP3A4, CYP3A5, NOS2, NR0B1, NR3C1,
NR3C2 -97.65
BRD-
K89687904 PKCbeta-inhibitor PRKCB - -96.99
BRD-
K32107296 temozolomide TOP2A Topoisomerase inhibitor -94.48
BRD-
A68631409 evodiamine TRPV1 - -94.22

71 Results
BRD-
K32536677 AGK-2 SIRT2 - -93.98
BRD-
A14985772 ascorbyl-palmitate - -93.73
BRD-
K59184148 SB-216763 GSK3B, CCNA2, CDK2, GSK3A Glycogen synthase kinase inhibitor -93.31
BRD-
K59222562 BRD-K59222562 CLK1, CLK4, DYRK1A, DYRK1B - -91.84
BRD-
K01638814 rilmenidine NISCH Imidazoline ligand -91.2
BRD-
K98372770 L-2167 PPARD - -90.8

72 Results
I then measured cell viability in AML cell lines treated with inhibitors targeting the protein
products of selected putative etoposide-like emulators individually, as well as in combination with
etoposide (IC25 concentrations) for 24 hours. Targeting of the etoposide-like emulator MYC with
TWS-119 led to cytotoxicity in all AML cell lines except MONO-MAC-6 (Fig. 5.10.1A and Table
5.8.3). Similarly, inhibition of etoposide-like emulators mTOR with rapamycin and of HDAC with
vorinostat evoked cell death in in 9 and 6 AML cell lines, respectively (Fig. 5.10.1B and C, and
Table 5.8.3). Interestingly, vorinostat and rapamycin also exhibited synergy or additivity with
etoposide in 9 and 6 AML cell lines, respectively (Table 5.8.3, Appendix table 4, and Appendix
table 5).
The etoposide-contrary emulator ROCK1 also synergized or exhibited additivity with etoposide in
7 out of 11 AML cell lines, when inhibited with rockout. Inhibition of ROCK1 was cytotoxic in
only 3 AML cell lines (Table 5.8.3 and Appendix table 4). The target specificity of rockout was
confirmed by demonstrating cytotoxicity in HL-60 cells upon shRNA-mediated knockdown of
ROCK1 (Fig. 5.10.3).

73 Results
Fig. 5.10.1: AML cell viability in response to emulators. Percentage of cell viability in response to an inhibitor of
the etoposide-like transcriptional driver (A) MYC, (B) rapamycin (mTOR inhibitor), and (C) vorinostat (HDAC
inhibitor) respectively after 24 hours treatment. Percentage cell viability compared to vehicle-treated control, taken as
100%, was calculated. Two-way ANOVA with Benjamini and Hochberg FDR test was performed to quantify
significant difference. Data are represented as mean values ± SD and derived from 3 biological replicates. (* p-value
< 0.05).

74 Results
Fig. 5.10.2: Synergy of emulators with etoposide in AML cells. Combination index of etoposide treatment with
protein inhibitor targeting the etoposide-like transcriptional drivers MYC, vorinostat, and rapamycin. CI < 1:
synergism, CI = 1 (dotted line): additivity, CI > 1: antagonism.
Fig. 5.10.3: Viability of HL-60 cells after shRNA-mediated gene knockdown of the etoposide-contrary emulator
ROCK1. Percentage cell viability compared to untransduced cells, taken as 100%, was calculated. Mann-Whitney test
was performed to identify significant change in the viability. (** represents q value < 0.01). Data are represented as
mean values ± SD and derived from 3 biological replicates.
5.11 Etoposide-driver combinations exert cytotoxicity without increasing DNA damage
To investigate the safety of the identified combinations of etoposide with other drugs, their effect
on DNA damage in HL-60 cell line was investigated. I measured the FITC-conjugated Anti-
Un
tran
sd
uced
cells
Scra
mb
led
sh
RN
AR
OC
K1
0
5 0
1 0 0
Pe
rc
en
tag
e c
ell
via
bil
ity
2 4 h o u rs
4 8 h o u rs
7 2 h o u rs
** **

75 Results
phospho H2A.X-labelled HL-60 cells by flow cytometry before and after the treatment with
etoposide, alone or in combination with other inhibitors for 24 hours. Etoposide caused, as an
effect of TOP2-poisoning, DNA damage in 45% of cells when treated at IC25 concentration. None
of the investigated etoposide-combinations elevated the amount of DNA damage in comparison to
etoposide alone (Fig. 5.11.1). Furthermore, the BIR inhibitor GDC-0152 increased the cytotoxicity
in combination with etoposide, while reducing the amount of DNA damage in comparison to
etoposide alone.
Un
treate
d c
ells
Eto
po
sid
e
Vo
r in
osta
t
Vo
r in
osta
t + e
top
osid
e
Rap
am
ycin
Rap
am
ycin
+ e
top
osid
e
GD
C-0
152
GD
C-0
152 +
eto
po
sid
e
Nic
ot i
nam
ide
Nic
ot i
nam
ide +
eto
po
sid
e
Ro
cko
ut
Ro
cko
ut
+ e
top
osid
e
0
1 0
2 0
3 0
4 0
5 0
0
2 0
4 0
6 0
8 0
1 0 0
Pe
rc
en
tag
e
H2
AX
po
sit
ive
ce
lls
Pe
rc
en
tag
e c
ell d
ea
th
****
**
Fig. 5.11.1: DNA damage after etoposide treatment in combination with its cytotoxicity drivers. Bar plot
representing percentage of phospho-H2A.X positive cells counted using flow cytometry and percentage cell death
after treatment with different inhibitors alone as well as in combination with IC25 concentration of etoposide in HL-
60 cell line. Mann-Whitney test was performed using GraphPad Prism software to identify significant effect compared
to etoposide alone.
5.12 Drivers of etoposide cytotoxicity form unfavorable prognostic markers in AML
patients
To assess the clinical relevance of identified drivers, I inspected the gene expression and clinical
data for 173 patients from TCGA and compared with gene expression in 30 normal blood samples

76 Results
from GTEx. The analysis revealed an association between high expression of BCL2A1 and PARP9
with poor survival in AML patients (Fig. 5.12.1A and B). Furthermore, these genes were highly
expressed in AML patients compared to healthy individuals (Fig. 5.12.1C and D).
Fig. 5.12.1: Relevance of etoposide cytotoxicity drivers in AML patients. Basal expression of (A) BCL2A1 and (B)
PARP9 respectively in AML and normal blood cells using the RNA-Seq data from TCGA and GTEx. Kaplan–Meier
plot representing survival analysis of the AML patients with high and low expression of (A) BCL2A1 and (B) PARP9
respectively, obtained from TCGA.
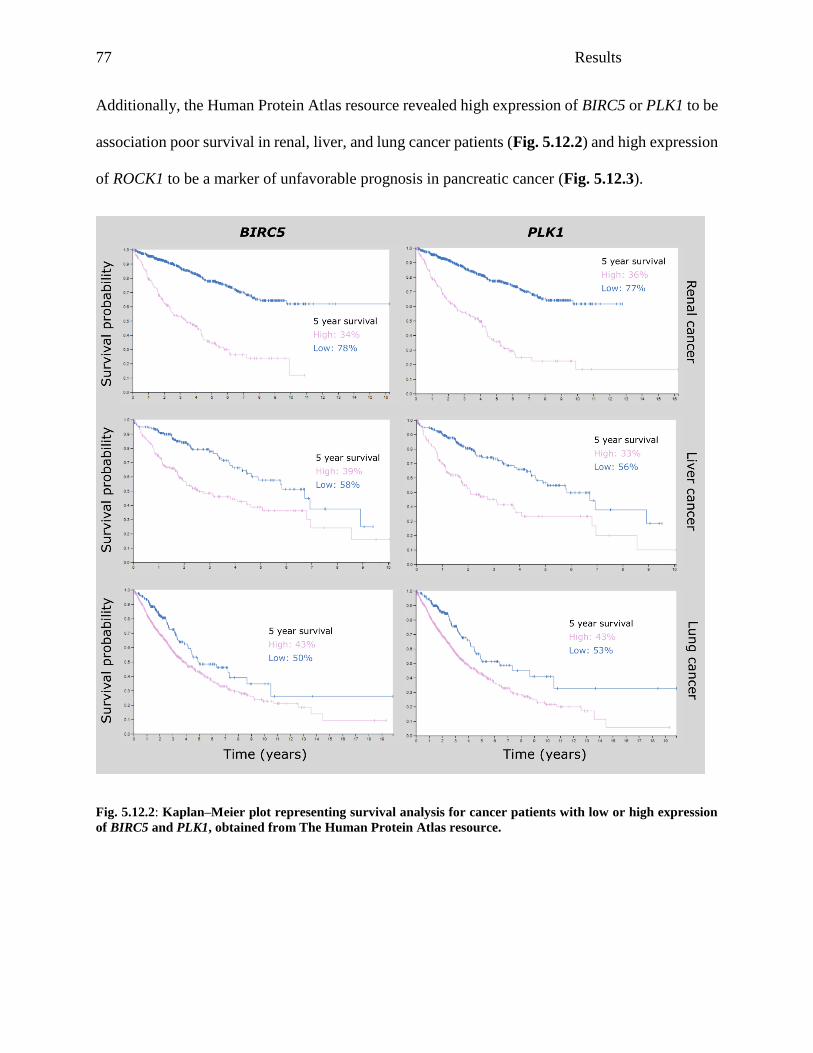
77 Results
Additionally, the Human Protein Atlas resource revealed high expression of BIRC5 or PLK1 to be
association poor survival in renal, liver, and lung cancer patients (Fig. 5.12.2) and high expression
of ROCK1 to be a marker of unfavorable prognosis in pancreatic cancer (Fig. 5.12.3).
Fig. 5.12.2: Kaplan–Meier plot representing survival analysis for cancer patients with low or high expression
of BIRC5 and PLK1, obtained from The Human Protein Atlas resource.

78 Discussion
Fig. 5.12.3: Kaplan–Meier plot representing survival analysis for cancer patients with low or high expression
of ROCK1 and PLK1, obtained from The Human Protein Atlas resource.
6 Discussion
In this work, I demonstrate that etoposide kills cancer cells depending on expression levels of
driver genes, some of which it modulates. This effect is distinct from the etoposide concentration-
driven increase in DNA double stranded breaks (Smart, Halicka et al. 2008). Targeting these
drivers genetically or pharmacologically mimics or augments the response to etoposide, indicating
a potential for clinical exploration. The pipeline used to discover drivers of etoposide cytotoxicity
is applicable to other TOP2 inhibitors and to cytotoxic drugs in general.
Furthermore, using HTETOP cell line model, I found the TOP2A dependency of etoposide for
cytotoxic response. Both TOP2 poisons, doxorubicin and etoposide, inhibit re-ligation of transient
DSB, which triggers cell death. However, the dependency of etoposide for TOP2A was striking.
Doxorubicin poisons TOP2 as well as intercalates into DNA. Doxorubicin is oxidized to
semiquinone and then converted back to original state generating reactive oxygen species (ROS)
in the process. ROS generates oxidative stress and contributes to DNA damage and apoptosis. This
pathway is most likely upregulated after doxorubicin treatment in the absence of TOP2A,

79 Discussion
overruling the need of TOP2A for cytotoxic response (Thorn, Oshiro et al. 2011). On the other
hand, etoposide seems to exert its action predominantly via TOP2A poisoning.
Altogether, this work demonstrates that:
• Modulators synergized with etoposide
• Mediators exhibited standalone cytotoxicity
• Emulators exhibited standalone cytotoxicity and synergized with etoposide
These drivers of etoposide cytotoxicity have been exploited to enhance the efficacy of etoposide.
6.1 Gene expression changes-mediated cytotoxicity of etoposide
Since the response of cancer cells to TOP2 poisons is variable, attempts have been made to explain
it via pre-treatment gene expression levels (Zoppoli, Regairaz et al. 2012, Reinhold, Varma et al.
2015, Yadav, Gopalacharyulu et al. 2015, Liu, Yang et al. 2016, Sun, Zhang et al. 2016). SLFN11
(Zoppoli, Regairaz et al. 2012, Rees, Seashore-Ludlow et al. 2016) and SMARCA4 (Lee, Celik et
al. 2018), re-discovered in this study, have been identified as modulators of TOP2 poisons,
including etoposide, but failed to make clinical impact. Treatment-driven GEC have been likewise
reported (Woo, Shimoni et al. 2015, Huang, Hsieh et al. 2018), but not explored for optimizing
response to TOP2 poisons. I considered both pre-treatment gene expression levels and drug-
evoked changes, as a surrogate of pre- and post-treatment protein expression levels. Post-treatment
transcriptomes turned out to be particularly important, since they were essential for the discovery
of most of the functionally confirmed drivers (i.e. of all mediators and emulators).
Most of the etoposide-evoked GEC were likely secondary, judging from the predominance of gene
inductions over reductions. Indeed, only expression reductions can be expected to arise directly
from DNA damage within regulatory or coding gene sequences. This is well reflected in a

80 Discussion
HTETOP cell model, where predominance of gene repression was observed. However, I could not
confirm the etoposide-evoked predominance of gene repression in other cancer cell lines, including
a panel of AML cell lines, as well as in other cells lines obtained from GEO, except in OCI-Ly3
(B-cell lymphoma). The explanation for this observation could be variable etoposide
concentrations and treatment times in GEO set of cell lines. The HTETOP cell line was treated
with 20 µM of etoposide (IC50 being 7.7 µM) for 24 hours. None of the cell line from GEO set
was treated with comparable concentration and time-points. Furthermore, HTETOP is an
engineered cell line derived from fibrosarcoma HT-1080 cell line, with artificially high TOP2A
expression (Carpenter and Porter 2004). Hence, the predominance of repressing GEC after
etoposide treatment seems to be a specific attribute of HTETOP cell line. Etoposide treatment
generates limited numbers of DSB foci (Roos and Kaina 2013), which could have been reflected
in lower number of gene repressions in other cancer cell lines. The predominance of gene
inductions in other cancer cell lines is most likely resulted from secondary effectors of etoposide.
Nevertheless, these GEC could themselves contribute to cytotoxicity, especially repressions in the
oncogenic targets and inductions in the tumor repressor targets. Considering off-target effects of
classical anti-cancer drugs, such essential GEC could provide effective alternative for targeted
cancer therapies. Analysis of etoposide-treated HTETOP cell line revealed majority of etoposide-
evoked gene repressions to be involved in cancer and cell proliferation processes, indicating their
repression could be exploited as a potential therapeutic strategy.
6.2 Mediators as standalone targets for etoposide replacement
The mediators PFKP and PLAU reduced the viability of HTETOP cells when suppressed using
siRNA. PFKP (phosphofructokinase) catalyzes the initial step of glycolysis by phosphorylating D-
fructose 6-phosphate to fructose 1,6-bisphosphate. Many cancer cell types depend on glycolysis

81 Discussion
rather than more efficient oxidative phosphorylation for energy metabolism because of hypoxic
environment and mutations in the mitochondrial DNA (Ganapathy-Kanniappan & Geschwind,
2013). Hence, targeting the enzymes involved in glycolytic processes provides an effective
strategy for managing tumor growth (Zheng, 2012). In consistent with this, PFKP is highly
expressed in HTETOP and its high expression is associated with poor survival of liver cancer and
head and neck cancer patients (Uhlén et al., 2015).
PLAU (plasminogen activator, urokinase) is a serine protease responsible for tumor migration
because of its function in degrading the extracellular matrix. I found PLAU overexpressed in
HTETOP cell line and its overexpression reduced the survival in pancreatic, head and neck, renal,
and lung cancer patients, most likely contributing to secondary tumors at different sites. Reduction
in the cell viability of HTETOP cell line after PLAU knockdown suggests its utility as an alternate
target for therapy.
Other investigated mediators of etoposide cytotoxicity in AML cell lines also represent critical
processes in cancer survival and were confirmed to be essential. B-cell lymphoma 2-related protein
A1 (BCL2A1) is a member of BCL2 family proteins having anti-apoptotic function (Vogler 2012).
BCL2A1 expression is frequently deregulated in many types of cancers, including overexpression
in AML patients. Insulin-like growth factor receptor 1 (IGF1R), a tyrosine kinase receptor,
augment the cell proliferation and it’s use as anti-cancer target in combination with other
chemotherapeutic drugs is under investigation (Chen and Sharon 2013). Polo-like kinase 1 (PLK1)
plays critical role during mitosis (Brandwein 2015). I predicted PLK1 to be essential for 4 AML
survival. Interestingly, PLK1 inhibition was cytotoxic in all 11 AML cell lines. This suggests that
targets derived from small sample size can even be applicable for large cohort. Protein kinase c
eta (PRKCH) in involved many cellular processes including cell proliferation and differentiation.

82 Discussion
It is required for maintaining hematopoietic stem cell function. PRKCH is highly expressed in
leukemia and its high expression is associated with poor prognosis in AML patients (Porter and
Magee 2017).
These mediators exhibited synergy with etoposide only in 2 out of 11 AML cell lines each. Similar
results were obtained using HTETOP cell line. None of the knockdowns sensitized the HTETOP
cell line to etoposide treatment in combination experiment. This may be due to different pathways
governing the cytotoxicity getting triggered after treatment with inhibitors compared to etoposide.
AML cells are likely to be committed to the dominant response pathway triggered either by
essential mediator or by etoposide. Altogether, results confirmed the contribution of etoposide-
evoked GEC to its anti-cancer activity. Such essential mediators could even replace the classical
anti-cancer drugs because of their specificity. These specific targets could replicate the cytotoxicity
of non-specific anti-cancer drugs with less side-effects.
6.3 Modulators for overcoming drug resistance
The comparison of co-expression networks before and after etoposide-treatment identified the
etoposide-relevant biological processes such as response to DNA damage, DNA repair, and
apoptosis regulation to be affected by the treatment. The potential negative modulators
investigated in detail, BIRC5 and PARP9, sensitized AML cell lines to etoposide treatment.
BIRC5, also known as survivin, is a member of inhibitor of apoptosis family. It is involved in cell
proliferation and apoptosis inhibition, and frequently overexpressed in cancer cells (Tanaka,
Iwamoto et al. 2000). The results demonstrated the involvement of BIRC5 in etoposide resistance
by AML cell lines as confirmed by increased etoposide sensitivity in combination with survivin
inhibitor. Several clinical trials are undergoing to evaluate effectiveness of survivin inhibitors in
combination with idarubicin and cytarabine (NCT00620321 and NCT01398462). The other

83 Discussion
investigated negative modulator, PARP9 (also abbreviated as ARTD9 or BAL1), plays a role in cell
migration (Aguiar, Yakushijin et al. 2000). The high expression of catalytically inactive PARP9
is associated with upregulated cell motility. The experiments using nicotinamide, NAD and NADP
pre-cursor and PARP inhibitor, revealed either etoposide-synergy or additive effects in 10 out of
11 investigated AML cell lines. As nicotinamide is not a selective inhibitor of PARP9, further
investigation using shRNA-mediated PARP9 knockdown in HL-60 cell line revealed essentiality
for cell survival. Furthermore, high expression of PARP9 is associated with poor survival of AML
patients. PARP inhibitors are currently being investigate in AML patients in combination with
TOP1 poison topotecan (NCT03289910 and NCT00588991). Altogether, the results indicated the
essential role of PARP9 for AML cell survival and a role in DNA damage response inferred by
etoposide-synergy in AML cell lines. I also investigated NOTCH1 as a positive modulator of
etoposide cytotoxicity with high expression in the etoposide-responsive AML cell lines. As
expected, treatment with Notch inhibitor did not exert cytotoxicity or etoposide synergy.
Interestingly, Notch inhibition in F-36P cell line further reduced the etoposide cytotoxicity of this
cell line.
Using this approach, I re-discovered the etoposide cytotoxicity modulators SLFN11 (Zoppoli,
Regairaz et al. 2012, Rees, Seashore-Ludlow et al. 2016) and SMARCA4 (Lee, Celik et al. 2018),
reported previously, correlating with etoposide sensitivity. However, the predicted effector targets
MYC, BRD4, and SIRT1 were enriched only after integrating the etoposide-evoked GEC,
confirming their additional value for predicting the sensitivity-relevant modulators. MALT1
(Mucosa Associated Lymphoid Tissue Lymphoma Translocation Gene 1) enhances BCL10-
mediated NF-KB activation, triggering the proliferating and anti-apoptotic program (Hadian and
Krappmann 2011). I observed MALT1 induction after etoposide treatment in the AML cell lines

84 Discussion
less responsive to etoposide treatment, especially in the most resistant F-36P cell line. SIRT1
(Sirtuin 1) enhances the DNA damage repair by deacetylating the repair proteins TP53 and Ku70
(Jeong, Juhn et al. 2007). I observed SIRT1 induction in the AML cell lines less responsive to
etoposide treatment. Altogether, these results suggest the efficient repair and apoptosis regulation
to be key processes for differential etoposide response in the investigated AML cell lines.
Furthermore, results also suggest involvement of epigenetic regulation enhancing the DNA repair
processes and could be the possible mechanism for the observed synergy with etoposide and a
HDAC inhibitor vorinostat. Inhibiting such targets, those affect the downstream pathways of
etoposide, can provide effective strategy to overcome resistance to this drug.
6.4 Rational combination partners using etoposide-like emulators
After confirming the respective etoposide-synergy and cytotoxicity of modulators and mediators
of etoposide cytotoxicity, I hypothesized that the next-generation etoposide-combinations can be
designed using etoposide-evoked GEC. The CMap resource (Subramanian, Narayan et al. 2017)
provided other specific targets as well as drugs which evoke GEC either similar (etoposide-like
emulators) or opposite (etoposide-contrary emulators) to those evoked by etoposide. I expected
that etoposide-like emulators could exert etoposide-like cytotoxic response and etoposide-contrary
emulators could synergize with etoposide, hypothesizing that such targets would induce the genes
which are direct or indirect targets of etoposide. Interestingly, along with other TOP2 poisons, I
identified mTOR and HDAC inhibitors as etoposide-like emulators. This analysis surprisingly
identified, along with other topoisomerase inhibitors, class of HDAC inhibitor and mTOR
inhibitors evoking GEC similar to those evoked by etoposide. The etoposide-synergy with HDAC
(Thurn, Thomas et al. 2011) and mTOR inhibitors (Xu, Thompson et al. 2005) is well documented
and undergoing clinical trials, which I confirmed in AML using vorinostat and rapamycin. Due to

85 Discussion
the interaction of TOP2 with HDAC1 and 2 (Montecucco, Zanetta et al. 2015), etoposide-evoked
DNA double-strand breaks could affect the chromatin architecture. This could be plausible
explanation for similar GEC after treatment with etoposide and HDAC inhibitor, as well as the
basis for synergy.
6.5 Potential application to AML and other cancers
Etoposide effects can be clearly optimized by targeting drivers of its toxicity, but how relevant is
this strategy to AML management? AML accounts for 80% of leukemia cases in adult patients and
have poor prognosis in patients (De Kouchkovsky and Abdul-Hay 2016, Pearsall, Lincz et al.
2018). Chemotherapy is the major form of treatment for AML management (Dombret and Gardin
2016). However, treatment strategies for relapsed AML are not yet clearly defined. MEC regimen
(mitoxantrone in combination with etoposide and cytarabine) is one of the common regimens used
for relapsed AML. However, it is associated with increased side-effects in AML patients (Ramos,
Mo et al. 2015, Thol, Schlenk et al. 2015). Hence, there is a need to improve efficacy and reduce
the toxicity of these treatment regimens. Similar needs exist for other etoposide applications, such
as testicular, prostate and small cell lung cancer.
Interestingly, some of the drivers investigated in this work have been or are currently undergoing
testing. This provides an additional validation of our approach. Supplementing etoposide with the
inhibitor of its emulator mTOR with rapamycin has already been shown to reduce the survival of
cancer cells in a mouse model of AML (Xu, Thompson et al. 2005). A phase II trial for managing
high-risk AML patients with rapamycin in combination with MEC regimen is ongoing
(NCT02583893). The etoposide-synergy with HDAC is currently undergoing testing for AML
(NCT02553460). Due to the interaction of TOP2 with HDAC1 and 2, etoposide-evoked DNA
double strand breaks could affect the chromatin architecture (Montecucco, Zanetta et al. 2015).

86 Discussion
Interestingly, we observed etoposide-evoked induction in SIRT1. It is evident that SIRT1 induction
synergizes with HDAC inhibition (Scuto, Kirschbaum et al. 2013). This is in agreement with the
observed etoposide-evoked induction of SIRT1 and its observed synergy with vorinostat.
Improved clinical outcomes in AML patients have been already reported for the PLK1 inhibitor
volasertib (Kobayashi, Yamauchi et al. 2015) and a Phase III trial is ongoing (NCT01721876).
Strikingly, PLK1 inhibition with volasertib was cytotoxic in all 11 AML cell lines. This suggests
that cytotoxicity drivers can be efficient beyond the cohort subset in which they were detected.
Inhibition of IGF1R has been found to be efficacious together with etoposide and cisplatin in
small-cell lung cancer (Ellis, Shepherd et al. 2014) and further clinical trials are undergoing with
other drugs and cancer types.
This work also tries to address the most common drawback of chemotherapy – side effects. The
use of DNA damaging drugs, including etoposide, is associated with increased risk of secondary
leukemia because of chromosomal aberrations (Ezoe, 2012; Kollmannsberger et al., 1998). Hence,
it is crucial to formulate the combination partners which don’t raise the risk further. My primary
investigation using DSB marker gH2A.X revealed that none of the combination partners elevated
the DNA damage compared to etoposide alone. Moreover, the inhibitor GDC-0152 targeting BIR
protein reduced the amount of DNA damage caused by etoposide alone. GDC-0152 targets the
anti-apoptotic BIR family proteins and hence most likely triggers the apoptotic pathways
effectively in combination with etoposide.
6.6 Limitations and perspective
Utilizing etoposide-evoked GEC, I have demonstrated a unique pipeline to identify its specific
targets and combination partners. However, this has certain limitations and caveats, beginning with
the assumption of gene expression reflecting protein expression. While this assumption is

87 Discussion
generally true, the expression and activity levels of some proteins are regulated without changes
in the RNA expression level. Nevertheless, all potential drivers selected for validation displayed
standalone toxicity or modified that of etoposide. Altogether, using transcriptome data is
sufficiently sensitive and specific to detect and confirm cytotoxicity drivers worth further
exploration in animal models and in the clinic.
Furthermore, it seems that some drivers serve as markers of, additional, undetected drivers. For
example, inhibiting the etoposide modulator BCL2A1 with sabutoclax caused cytotoxicity in all
AML cells. In contrast, a shRNA-mediated knockdown of BCL2A1 in HL-60 cells had no effect.
Additional members of the Bcl2 family may have contributed to the effect of sabutoclax, a pan-
Bcl2 inhibitor. shRNA-mediated knockdowns did confirm the specific involvements of IGF1R
and ROCK1. On the other hand, results using chemical inhibitors are clinically more relevant.
Especially drivers like BCL2A1 and PARP9, which showed relevance for AML patients, exhibit
high potential and are currently under clinical investigation. Nevertheless, if possible, putative
drivers should undergo verification both by genetic and pharmacological means.
Even though drug evoked GEC are found to be ideal for retrospective identification of cytotoxicity
drivers, they are impossible to obtain in advance from cancer patients. However, it would be
possible to model these GEC by applying machine learning to high throughput genomics data. The
next generation CMap is an example of such efforts, which extrapolate the genome-wide GEC
based-on expression change in 1000 genes using machine learning. Considering numerous
ongoing big data initiatives including Cancer Cell Line Encyclopedia (CCLE), Genomics of Drug
Sensitivity in Cancer (GDSC), Connectivity Map (CMap), project DREAM, and Cancer Target
Discovery and Development (CTD2), the drug-evoked changes could be predicted in patient
beforehand to optimize the treatment for maximum efficacy with least side-effects.

88 References
7 References
Aguiar, R. C., Y. Yakushijin, S. Kharbanda, R. Salgia, J. A. Fletcher and M. A. Shipp (2000). "BAL is a novel risk-
related gene in diffuse large B-cell lymphomas that enhances cellular migration." Blood 96(13): 4328-4334.
Alexander, S. P., D. Fabbro, E. Kelly, N. V. Marrion, J. A. Peters, E. Faccenda, S. D. Harding, A. J. Pawson, J. L.
Sharman, C. Southan, J. A. Davies and C. Collaborators (2017). "THE CONCISE GUIDE TO PHARMACOLOGY
2017/18: Enzymes." Br J Pharmacol 174 Suppl 1: S272-S359.
An, X., A. K. Tiwari, Y. Sun, P. R. Ding, C. R. Ashby, Jr. and Z. S. Chen (2010). "BCR-ABL tyrosine kinase inhibitors
in the treatment of Philadelphia chromosome positive chronic myeloid leukemia: a review." Leuk Res 34(10): 1255-
1268.
Arbiser, J. L. (2007). "Why targeted therapy hasn't worked in advanced cancer." J Clin Invest 117(10): 2762-2765.
Ben-Ari Fuchs, S., I. Lieder, G. Stelzer, Y. Mazor, E. Buzhor, S. Kaplan, Y. Bogoch, I. Plaschkes, A. Shitrit, N.
Rappaport, A. Kohn, R. Edgar, L. Shenhav, M. Safran, D. Lancet, Y. Guan-Golan, D. Warshawsky and R. Shtrichman
(2016). "GeneAnalytics: An Integrative Gene Set Analysis Tool for Next Generation Sequencing, RNAseq and
Microarray Data." OMICS 20(3): 139-151.
Benjamini, Y. and Y. Hochberg (1995). "Controlling the False Discovery Rate - a Practical and Powerful Approach
to Multiple Testing." Journal of the Royal Statistical Society Series B-Statistical Methodology 57(1): 289-300.
Benyahia, B., S. Huguet, X. Decleves, K. Mokhtari, E. Criniere, J. F. Bernaudin, J. M. Scherrmann and J. Y. Delattre
(2004). "Multidrug resistance-associated protein MRP1 expression in human gliomas: chemosensitization to
vincristine and etoposide by indomethacin in human glioma cell lines overexpressing MRP1." J Neurooncol 66(1-2):
65-70.
Brandwein, J. M. (2015). "Targeting polo-like kinase 1 in acute myeloid leukemia." Ther Adv Hematol 6(2): 80-87.
Bray, F., F. Jacques, S. Isabelle, Siegel, R. L., Torre, L. A. and A. Jemal (2018). "Global Cancer Statistics 2018:
GLOBOCAN Estimates of Incidence and Mortality Worldwide for 36 Cancers in 185 Countries." CA: A Cancer
Journal for Clinicians.
Carpenter, A. J. and A. C. Porter (2004). "Construction, characterization, and complementation of a conditional-lethal
DNA topoisomerase IIalpha mutant human cell line." Mol Biol Cell 15(12): 5700-5711.
Chemocare. (2019). "Chemocare." Retrieved 15.02.2019, from http://chemocare.com/default.aspx.
Chen, H. X. and E. Sharon (2013). "IGF-1R as an anti-cancer target--trials and tribulations." Chin J Cancer 32(5):
242-252.
Cowell, I. G. and C. A. Austin (2012). "Mechanism of generation of therapy related leukemia in response to anti-
topoisomerase II agents." Int J Environ Res Public Health 9(6): 2075-2091.
De Kouchkovsky, I. and M. Abdul-Hay (2016). "'Acute myeloid leukemia: a comprehensive review and 2016 update'."
Blood Cancer J 6(7): e441.
Dobin, A., C. A. Davis, F. Schlesinger, J. Drenkow, C. Zaleski, S. Jha, P. Batut, M. Chaisson and T. R. Gingeras
(2013). "STAR: ultrafast universal RNA-seq aligner." Bioinformatics 29(1): 15-21.
Dombret, H. and C. Gardin (2016). "An update of current treatments for adult acute myeloid leukemia." Blood 127(1):
53-61.

89 References
Ellis, P. M., F. A. Shepherd, S. A. Laurie, G. D. Goss, M. Olivo, J. Powers, L. Seymour and P. A. Bradbury (2014).
"NCIC CTG IND.190 phase I trial of dalotuzumab (MK-0646) in combination with cisplatin and etoposide in
extensive-stage small-cell lung cancer." J Thorac Oncol 9(3): 410-413.
Foucquier, J. and M. Guedj (2015). "Analysis of drug combinations: current methodological landscape." Pharmacol
Res Perspect 3(3): e00149.
Hadian, K. and D. Krappmann (2011). "Signals from the nucleus: activation of NF-kappaB by cytosolic ATM in the
DNA damage response." Sci Signal 4(156): pe2.
Hanahan, D. and R. A. Weinberg (2011). "Hallmarks of cancer: the next generation." Cell 144(5): 646-674.
Huang, C. T., C. H. Hsieh, Y. J. Oyang, H. C. Huang and H. F. Juan (2018). "A Large-Scale Gene Expression Intensity-
Based Similarity Metric for Drug Repositioning." iScience 7: 40-52.
Iorio, F., R. Tagliaferri and D. di Bernardo (2009). "Identifying network of drug mode of action by gene expression
profiling." J Comput Biol 16(2): 241-251.
Jeong, J., K. Juhn, H. Lee, S. H. Kim, B. H. Min, K. M. Lee, M. H. Cho, G. H. Park and K. H. Lee (2007). "SIRT1
promotes DNA repair activity and deacetylation of Ku70." Exp Mol Med 39(1): 8-13.
Kanavos, P. (2006). "The rising burden of cancer in the developing world." Ann Oncol 17 Suppl 8: viii15-viii23.
Kobayashi, Y., T. Yamauchi, H. Kiyoi, T. Sakura, T. Hata, K. Ando, A. Watabe, A. Harada, T. Taube, Y. Miyazaki
and T. Naoe (2015). "Phase I trial of volasertib, a Polo-like kinase inhibitor, in Japanese patients with acute myeloid
leukemia." Cancer Sci 106(11): 1590-1595.
Langfelder, P. and S. Horvath (2008). "WGCNA: an R package for weighted correlation network analysis." BMC
Bioinformatics 9: 559.
Lee, S. I., S. Celik, B. A. Logsdon, S. M. Lundberg, T. J. Martins, V. G. Oehler, E. H. Estey, C. P. Miller, S. Chien,
J. Dai, A. Saxena, C. A. Blau and P. S. Becker (2018). "A machine learning approach to integrate big data for precision
medicine in acute myeloid leukemia." Nat Commun 9(1): 42.
Legrand, O., R. Zittoun and J. P. Marie (1999). "Role of MRP1 in multidrug resistance in acute myeloid leukemia."
Leukemia 13(4): 578-584.
Li, J., D. Zhou, W. Qiu, Y. Shi, J. J. Yang, S. Chen, Q. Wang and H. Pan (2018). "Application of Weighted Gene Co-
expression Network Analysis for Data from Paired Design." Sci Rep 8(1): 622.
Liu, X., J. Yang, Y. Zhang, Y. Fang, F. Wang, J. Wang, X. Zheng and J. Yang (2016). "A systematic study on drug-
response associated genes using baseline gene expressions of the Cancer Cell Line Encyclopedia." Sci Rep 6: 22811.
Marinello, J., M. Delcuratolo and G. Capranico (2018). "Anthracyclines as Topoisomerase II Poisons: From Early
Studies to New Perspectives." Int J Mol Sci 19(11).
McGowan, J. V., R. Chung, A. Maulik, I. Piotrowska, J. M. Walker and D. M. Yellon (2017). "Anthracycline
Chemotherapy and Cardiotoxicity." Cardiovasc Drugs Ther 31(1): 63-75.
Montecucco, A., F. Zanetta and G. Biamonti (2015). "Molecular mechanisms of etoposide." EXCLI J 14: 95-108.
Nitiss, J. L. (2009). "Targeting DNA topoisomerase II in cancer chemotherapy." Nat Rev Cancer 9(5): 338-350.
Ossenkoppele, G. and B. Lowenberg (2015). "How I treat the older patient with acute myeloid leukemia." Blood
125(5): 767-774.
Pearsall, E. A., L. F. Lincz and K. A. Skelding (2018). "The Role of DNA Repair Pathways in AML
Chemosensitivity." Curr Drug Targets 19(10): 1205-1219.

90 References
Pendleton, M., R. H. Lindsey, Jr., C. A. Felix, D. Grimwade and N. Osheroff (2014). "Topoisomerase II and
leukemia." Ann N Y Acad Sci 1310: 98-110.
Pommier, Y. (2013). "Drugging topoisomerases: lessons and challenges." ACS Chem Biol 8(1): 82-95.
Pommier, Y., E. Leo, H. Zhang and C. Marchand (2010). "DNA topoisomerases and their poisoning by anticancer
and antibacterial drugs." Chem Biol 17(5): 421-433.
Pommier, Y., Y. Sun, S. N. Huang and J. L. Nitiss (2016). "Roles of eukaryotic topoisomerases in transcription,
replication and genomic stability." Nat Rev Mol Cell Biol 17(11): 703-721.
Porter, S. N. and J. A. Magee (2017). "PRKCH regulates hematopoietic stem cell function and predicts poor prognosis
in acute myeloid leukemia." Exp Hematol 53: 43-47.
R Core Team (2014). "R: A language and environment for statistical computing." R Foundation for Statistical
Computing, Vienna, Austria.
Ramos, N. R., C. C. Mo, J. E. Karp and C. S. Hourigan (2015). "Current Approaches in the Treatment of Relapsed
and Refractory Acute Myeloid Leukemia." J Clin Med 4(4): 665-695.
Rees, M. G., B. Seashore-Ludlow, J. H. Cheah, D. J. Adams, E. V. Price, S. Gill, S. Javaid, M. E. Coletti, V. L. Jones,
N. E. Bodycombe, C. K. Soule, B. Alexander, A. Li, P. Montgomery, J. D. Kotz, C. S. Hon, B. Munoz, T. Liefeld, V.
Dancik, D. A. Haber, C. B. Clish, J. A. Bittker, M. Palmer, B. K. Wagner, P. A. Clemons, A. F. Shamji and S. L.
Schreiber (2016). "Correlating chemical sensitivity and basal gene expression reveals mechanism of action." Nat
Chem Biol 12(2): 109-116.
Reinhold, W. C., S. Varma, V. N. Rajapakse, A. Luna, F. G. Sousa, K. W. Kohn and Y. G. Pommier (2015). "Using
drug response data to identify molecular effectors, and molecular "omic" data to identify candidate drugs in cancer."
Hum Genet 134(1): 3-11.
Robert, J., A. Vekris, P. Pourquier and J. Bonnet (2004). "Predicting drug response based on gene expression." Crit
Rev Oncol Hematol 51(3): 205-227.
Robinson, M. D., D. J. McCarthy and G. K. Smyth (2010). "edgeR: a Bioconductor package for differential expression
analysis of digital gene expression data." Bioinformatics 26(1): 139-140.
Roos, W. P. and B. Kaina (2013). DNA damage-induced cell death: From specific DNA lesions to the DNA damage
response and apoptosis. Cancer Letters, Elsevier. 332: 237-248.
Samur, M. K. (2014). "RTCGAToolbox: a new tool for exporting TCGA Firehose data." PLoS One 9(9): e106397.
Schilsky, R. L. and L. E. Schnipper (2018). "Hans Christian Andersen and the Value of New Cancer Treatments." J
Natl Cancer Inst 110(5): 441-442.
Scuto, A., M. Kirschbaum, R. Buettner, M. Kujawski, J. M. Cermak, P. Atadja and R. Jove (2013). "SIRT1 activation
enhances HDAC inhibition-mediated upregulation of GADD45G by repressing the binding of NF-kappaB/STAT3
complex to its promoter in malignant lymphoid cells." Cell Death Dis 4: e635.
Siegel, R. L., K. D. Miller and A. Jemal (2018). "Cancer statistics, 2018." CA: A Cancer Journal for Clinicians 68(1):
7-30.
Smart, D. J., H. D. Halicka, G. Schmuck, F. Traganos, Z. Darzynkiewicz and G. M. Williams (2008). "Assessment of
DNA double-strand breaks and gammaH2AX induced by the topoisomerase II poisons etoposide and mitoxantrone."
Mutat Res 641(1-2): 43-47.
Stein, E. M., C. D. DiNardo, D. A. Pollyea, A. T. Fathi, G. J. Roboz, J. K. Altman, R. M. Stone, D. J. DeAngelo, R.
L. Levine, I. W. Flinn, H. M. Kantarjian, R. Collins, M. R. Patel, A. E. Frankel, A. Stein, M. A. Sekeres, R. T. Swords,
B. C. Medeiros, C. Willekens, P. Vyas, A. Tosolini, Q. Xu, R. D. Knight, K. E. Yen, S. Agresta, S. de Botton and M.

91 References
S. Tallman (2017). "Enasidenib in mutant IDH2 relapsed or refractory acute myeloid leukemia." Blood 130(6): 722-
731.
Stone, R. M., S. J. Mandrekar, B. L. Sanford, K. Laumann, S. Geyer, C. D. Bloomfield, C. Thiede, T. W. Prior, K.
Dohner, G. Marcucci, F. Lo-Coco, R. B. Klisovic, A. Wei, J. Sierra, M. A. Sanz, J. M. Brandwein, T. de Witte, D.
Niederwieser, F. R. Appelbaum, B. C. Medeiros, M. S. Tallman, J. Krauter, R. F. Schlenk, A. Ganser, H. Serve, G.
Ehninger, S. Amadori, R. A. Larson and H. Dohner (2017). "Midostaurin plus Chemotherapy for Acute Myeloid
Leukemia with a FLT3 Mutation." N Engl J Med 377(5): 454-464.
Subramanian, A., R. Narayan, S. M. Corsello, D. D. Peck, T. E. Natoli, X. Lu, J. Gould, J. F. Davis, A. A. Tubelli, J.
K. Asiedu, D. L. Lahr, J. E. Hirschman, Z. Liu, M. Donahue, B. Julian, M. Khan, D. Wadden, I. C. Smith, D. Lam,
A. Liberzon, C. Toder, M. Bagul, M. Orzechowski, O. M. Enache, F. Piccioni, S. A. Johnson, N. J. Lyons, A. H.
Berger, A. F. Shamji, A. N. Brooks, A. Vrcic, C. Flynn, J. Rosains, D. Y. Takeda, R. Hu, D. Davison, J. Lamb, K.
Ardlie, L. Hogstrom, P. Greenside, N. S. Gray, P. A. Clemons, S. Silver, X. Wu, W. N. Zhao, W. Read-Button, X.
Wu, S. J. Haggarty, L. V. Ronco, J. S. Boehm, S. L. Schreiber, J. G. Doench, J. A. Bittker, D. E. Root, B. Wong and
T. R. Golub (2017). "A Next Generation Connectivity Map: L1000 Platform and the First 1,000,000 Profiles." Cell
171(6): 1437-1452 e1417.
Sun, J., Q. Wei, Y. Zhou, J. Wang, Q. Liu and H. Xu (2017). "A systematic analysis of FDA-approved anticancer
drugs." BMC Syst Biol 11(Suppl 5): 87.
Sun, Y., W. Zhang, Y. Chen, Q. Ma, J. Wei and Q. Liu (2016). "Identifying anti-cancer drug response related genes
using an integrative analysis of transcriptomic and genomic variations with cell line-based drug perturbations."
Oncotarget 7(8): 9404-9419.
Tanaka, K., S. Iwamoto, G. Gon, T. Nohara, M. Iwamoto and N. Tanigawa (2000). "Expression of survivin and its
relationship to loss of apoptosis in breast carcinomas." Clin Cancer Res 6(1): 127-134.
Tang, Z., C. Li, B. Kang, G. Gao, C. Li and Z. Zhang (2017). "GEPIA: a web server for cancer and normal gene
expression profiling and interactive analyses." Nucleic Acids Res 45(W1): W98-W102.
Tarazona, S., P. Furio-Tari, D. Turra, A. D. Pietro, M. J. Nueda, A. Ferrer and A. Conesa (2015). "Data quality aware
analysis of differential expression in RNA-seq with NOISeq R/Bioc package." Nucleic Acids Res 43(21): e140.
Thol, F., R. F. Schlenk, M. Heuser and A. Ganser (2015). "How I treat refractory and early relapsed acute myeloid
leukemia." Blood 126(3): 319-327.
Thorn, C. F., C. Oshiro, S. Marsh, T. Hernandez-Boussard, H. McLeod, T. E. Klein and R. B. Altman (2011).
"Doxorubicin pathways: Pharmacodynamics and adverse effects." Pharmacogenetics and Genomics 21(7): 440-446.
Thorn, C. F., C. Oshiro, S. Marsh, T. Hernandez-Boussard, H. McLeod, T. E. Klein and R. B. Altman (2011).
"Doxorubicin pathways: pharmacodynamics and adverse effects." Pharmacogenet Genomics 21(7): 440-446.
Thurn, K. T., S. Thomas, A. Moore and P. N. Munster (2011). "Rational therapeutic combinations with histone
deacetylase inhibitors for the treatment of cancer." Future Oncol 7(2): 263-283.
Tsherniak, A., F. Vazquez, P. G. Montgomery, B. A. Weir, G. Kryukov, G. S. Cowley, S. Gill, W. F. Harrington, S.
Pantel, J. M. Krill-Burger, R. M. Meyers, L. Ali, A. Goodale, Y. Lee, G. Jiang, J. Hsiao, W. F. J. Gerath, S. Howell,
E. Merkel, M. Ghandi, L. A. Garraway, D. E. Root, T. R. Golub, J. S. Boehm and W. C. Hahn (2017). "Defining a
Cancer Dependency Map." Cell 170(3): 564-576 e516.
Urruticoechea, A., R. Alemany, J. Balart, A. Villanueva, F. Vinals and G. Capella (2010). "Recent advances in cancer
therapy: an overview." Curr Pharm Des 16(1): 3-10.
Vogler, M. (2012). "BCL2A1: the underdog in the BCL2 family." Cell Death Differ 19(1): 67-74.

92 References
Vural, S., R. Simon and J. Krushkal (2018). "Correlation of gene expression and associated mutation profiles of
APOBEC3A, APOBEC3B, REV1, UNG, and FHIT with chemosensitivity of cancer cell lines to drug treatment."
Hum Genomics 12(1): 20.
Whyte, D. B. and S. L. Holbeck (2006). "Correlation of PIK3Ca mutations with gene expression and drug sensitivity
in NCI-60 cell lines." Biochem Biophys Res Commun 340(2): 469-475.
Widakowich, C., G. de Castro, Jr., E. de Azambuja, P. Dinh and A. Awada (2007). "Review: side effects of approved
molecular targeted therapies in solid cancers." Oncologist 12(12): 1443-1455.
Woo, J. H., Y. Shimoni, W. S. Yang, P. Subramaniam, A. Iyer, P. Nicoletti, M. Rodriguez Martinez, G. Lopez, M.
Mattioli, R. Realubit, C. Karan, B. R. Stockwell, M. Bansal and A. Califano (2015). "Elucidating Compound
Mechanism of Action by Network Perturbation Analysis." Cell 162(2): 441-451.
Woo, J. H., Y. Shimoni, W. S. Yang, P. Subramaniam, A. Iyer, P. Nicoletti, M. Rodríguez Martínez, G. López, M.
Mattioli, R. Realubit, C. Karan, B. R. Stockwell, M. Bansal and A. Califano (2015). "Elucidating Compound
Mechanism of Action by Network Perturbation Analysis." Cell 162(2): 441-451.
Xu, Q., J. E. Thompson and M. Carroll (2005). "mTOR regulates cell survival after etoposide treatment in primary
AML cells." Blood 106(13): 4261-4268.
Yadav, B., P. Gopalacharyulu, T. Pemovska, S. A. Khan, A. Szwajda, J. Tang, K. Wennerberg and T. Aittokallio
(2015). "From drug response profiling to target addiction scoring in cancer cell models." Dis Model Mech 8(10):
1255-1264.
Yan, T., S. Deng, A. Metzger, U. Godtel-Armbrust, A. C. Porter and L. Wojnowski (2009). "Topoisomerase II{alpha}-
dependent and -independent apoptotic effects of dexrazoxane and doxorubicin." Mol Cancer Ther 8(5): 1075-1085.
Zhang, H. and J. Chen (2018). "Current status and future directions of cancer immunotherapy." J Cancer 9(10): 1773-
1781.
Zhang, N., H. Wang, Y. Fang, J. Wang, X. Zheng and X. S. Liu (2015). "Predicting Anticancer Drug Responses Using
a Dual-Layer Integrated Cell Line-Drug Network Model." PLoS Comput Biol 11(9): e1004498.
Zoppoli, G., M. Regairaz, E. Leo, W. C. Reinhold, S. Varma, A. Ballestrero, J. H. Doroshow and Y. Pommier (2012).
"Putative DNA/RNA helicase Schlafen-11 (SLFN11) sensitizes cancer cells to DNA-damaging agents." Proc Natl
Acad Sci U S A 109(37): 15030-15035.

93 Appendix
8 Appendix
Appendix table 1: All siRNAs sequences used in this work. The Project Achilles (PAch) database was used to identify
siRNA targeting selected mediator genes.
Target siRNA sequence
ANLN UGCUGGAGCGAACCCGUGCC
CDC20 ACAGAGGAUAUAUAUUCCCC
CDK6 AGUUCAGAUGUUGAUCAACU
DLGAP5 GAUGUUCGAGCAAUCCGACC
FOXM1 AUAGCCUAUCCAACAUCCAG
IGF2B CACCACUGCCGUCUCACUCU
KIF20A CCCCUGCCGUCAUGUCGCAA
MCM6 GAGUUUACCCUUACCUGUGU
MED1 UAAGCUUGUGCGUCAAGUCA
NCAPD2 CACGUUCUGCUAGUUCUGUC
PFKP CGUCCCCGCCGAUCACACAC
RPA2 GCCGCCGGCUCCCCCGUAUG
SLC7A5 UACAGCGGCCUCUUUGCCUA
TOPBP1 UGUCUUUGAUCACCUCAAAA
TPX2 AUUGUCACACCUUUGAAACC
YWHAH AAGCGACCUCUGCUAAGUAG

94 Appendix
Appendix table 2: List of primers used for gene expression quantification using SYBR green qPCR.
Gene 5' - 3' 3' - 5'
ANLN TCTGACATTCACTACTACATTTACTCTGC GCCATGACTGAAGAATGAATGTTG
BCL2A1 CAGGAGAATGGATAAGGCAAA CCAGCCAGATTTAGGTTCAAA
BIRC5 CCACCGCATCTCTACATTCA TATGTTCCTCTATGGGGTCG
CDC20 GGCACCAGTGATCGACACATTCGCAT GCCATAGCCTCAGGGTCTCATCTGCT
CDK6 TGGAGACCTTCGAGCACC CACTCCAGGCTCTGGAACTT
CENPF TACTGAGTTTGAGCCAGAGGGACT CATGGTTGTTCTTCGCAGGATAT
DLGAP5 GGAAGACCTGCCAAAAATGTAG TGTGCCAAAATTTCTTTTGTTG
FOSL1 GGGCATGTTCCGACACTT CCACTCATGGTGTTGATGCT
FOXM1 GGAGGCAGCGACAGGTTAAGG GTTGATGGCGAATTGTATCATGG
HDAC6 TGGCTATTGCATGTTCAACC TCGAAGGTGAACTGTGTTCCT
HMGA2 AAGTTGTTCAGAAGAAGCCTGCTCA TGGAAAGACCATGGCAATACAGAAT
IGF1R GCCACTACTACTATGCCGGTG GTGCATCCTTGGAGCATCT
IGF2BP1 GCGGCCAGTTCTTGGTCAA TTGGGCACCGAATGTTCAATC
KIF20A CTACAAGCACCCAAGGACTCTT AGATGGAGAAGCGAATGTTTG
MCM6 TGGTGGCATCAATGGTCATG TTAAGGAGGCTTTGGGAGCA
MED1 TGCGTCAAGTCATGGAGAAG CCACTGGCACTGAGATGAGA
NCAPD2 TGGAGGGGTGAATCAGTATGT GCGGGATACCACTTTTATCAGG
PARP9 GCAAAGAGGTCCAAGATGCT CCTCACACATCTCTTCCACGT
PFKP GCATGGGTATCTACGTGGGG CTCTGCGATGTTTGAGCCTC
PLAU CACGCAAGGGGAGATGAA ACAGCATTTTGGTGGTGACTT
ROCK1 AAAGAAAGGATGGAGGATGAAGT TGTAACAACAGCCGCTTATTTG
RPA2 GCACCTTCTCAAGCCGAAAA CAGCTGACATATAGTACAGGGCACAA
SLC7A5 GCTGGTGTACGTGCTGACC GCCCAGGTGATAGTTCCCG
TOPBP1 TGTGACCCTTTTAGTGGCGTT CTTGGGACACATGGCTGG
TPX2 CCAGACCTTGCCCTACTAAGATT AATGTGGCACAGGTTGAGC
YWHAH CGCTATGAAGGCGGTGAC TGCTAATGACCCTCCAGGAA

95 Appendix
Appendix figure 1: Mean quality scores for all RNA-Seq raw reads from AML cell lines.
Appendix figure 2: GC content in the raw RNA-Seq reads from AML cell lines.

96 Appendix
Appendix table 3: Percentage of reads mapped to the human reference genome hg38.
Sample Name % Aligned Million Aligned
F36P_CTR_1 87.70% 21
F36P_CTR_2 87.30% 21.4
F36P_CTR_3 88.50% 22.6
F36P_ETP_2 87.70% 21
F36P_ETP_3 88.50% 21.9
HL60_CTR_1 87.30% 22.9
HL60_CTR_2 87.00% 22.8
HL60_CTR_3 87.00% 20.8
HL60_ETP_1 87.30% 21
HL60_ETP_2 86.90% 21.2
HL60_ETP_3 86.70% 23
KASUMI1_CTR_1 87.20% 23.8
KASUMI1_CTR_2 87.00% 23.1
KASUMI1_CTR_3 86.60% 21.9
KASUMI1_ETP_1 86.80% 24.7
KASUMI1_ETP_2 85.50% 23
KASUMI1_ETP_3 86.40% 23.5
MOLM13_CTR_1 87.20% 22.9
MOLM13_CTR_2 86.90% 22.6
MOLM13_CTR_3 87.10% 22.7
MOLM13_ETP_1 85.20% 20.5
MOLM13_ETP_2 85.60% 22.5
MOLM13_ETP_3 85.40% 22.5
MONOMAC6_CTR_1 89.10% 23
MONOMAC6_CTR_2 88.90% 23.6
MONOMAC6_CTR_3 89.00% 24
MONOMAC6_ETP_1 88.50% 24.4
MONOMAC6_ETP_2 88.20% 23.3
MONOMAC6_ETP_3 88.50% 24.9
MV411_CTR_1 88.00% 22.7
MV411_CTR_2 87.90% 20.9
MV411_CTR_3 88.00% 22.9
MV411_ETP_3 87.90% 26.2
NB4_CTR_1 88.70% 23.9
NB4_CTR_2 88.30% 22.1
NB4_CTR_3 87.80% 21.1
NB4_ETP_1 87.60% 24.2
NB4_ETP_2 87.10% 22.5
NB4_ETP_3 86.90% 22.8
NOMO1_CTR_1 88.20% 22.7
NOMO1_CTR_2 88.00% 23.5

97 Appendix
NOMO1_CTR_3 88.10% 21.5
NOMO1_ETP_1 88.10% 21.8
NOMO1_ETP_2 88.00% 22.1
NOMO1_ETP_3 88.40% 22.2
OCIAML2_CTR_1 87.70% 23.8
OCIAML2_CTR_2 87.70% 22
OCIAML2_CTR_3 87.40% 22.2
OCIAML2_ETP_3 87.50% 21.2
OCIAML3_CTR_1 89.00% 23.1
OCIAML3_CTR_2 88.80% 22.8
OCIAML3_CTR_3 88.60% 23.8
OCIAML3_ETP_1 89.00% 24.1
OCIAML3_ETP_2 89.00% 25.2
OCIAML3_ETP_3 88.80% 24.8
THP1_CTR_1 88.00% 22
THP1_CTR_2 87.10% 22.7
THP1_CTR_3 87.60% 21.8
THP1_ETP_1 88.00% 23.8
THP1_ETP_2 87.40% 22.3
THP1_ETP_3 87.30% 24.3

98 Appendix
Appendix table 4: Standalone cytotoxicity of the drugs inhibiting selected drivers in AML cell line. Cells were treated with 3 concentrations of each drug for 24 hours. Two-way
ANOVA with Benjamini and Hochberg FDR correction test was performed to determine significant standalone cytotoxicity
Drug
(driver)
Treatment
concentratio
n (µM)
Mean
differenc
e
q value
F-36P HL-60 KASUMI
-1
MOLM
-13
MONO
-MAC-6
MV-4-
11 NB-4
NOMO
-1
OCI-
AML2
OCI-
AML3 THP-1
GDC-0152
(BIRC5)
10 10.68 0.9717 0.4994 0.5955 0.8723 0.8661 0.3159 0.2301 0.6627 0.2204 0.0408 0.1738
0.1 1.532 0.9717 0.5612 0.5955 0.7171 0.8943 0.8857 0.2777 0.9505 0.3106 0.0408 0.9151
0.001 -1.963 0.9717 0.83 0.8623 0.7191 0.8943 0.7337 0.8791 0.8579 0.12 0.0291 0.7585
GSK-
1838705A
(IGF1R)
10 85.3 <0.000
1
<0.000
1 <0.0001 0.1719 0.3331
<0.000
1
<0.000
1 <0.0001
<0.000
1
<0.000
1
<0.000
1
0.1 4.08 0.9717 0.0041 0.5574 0.9473 0.8661 0.7337 0.7725 0.3015 0.2204 0.0169 0.9515
0.001 3.502 0.9717 0.5541 0.6986 0.8 0.8661 0.7515 0.9004 0.4933 0.537 0.0549 0.719
LY-3039478
(NOTCH1)
10 -2.693 0.9717 0.4994 0.7399 0.7171 0.8661 0.9605 0.0652 0.5825 0.796 0.0108 0.719
0.1 1.129 0.9717 0.2832 0.6941 0.7171 0.8661 0.9124 0.0306 0.5421 0.8944 0.0096 0.719
0.001 -4.146 0.9717 0.1466 0.7682 0.7519 0.8661 0.906 0.602 0.4933 0.8298 0.0035 0.719
Nicotinamid
e (PARP9)
10 -4.48 0.9717 0.5399 0.5955 0.7171 0.8661 0.7337 0.7725 0.9576 0.9715 0.2969 0.7856
0.1 -6.55 0.9717 0.4416 0.5955 0.7191 0.8943 0.9605 0.8871 0.8015 0.5624 0.742 0.719
0.001 -8.173 0.9717 0.9966 0.5574 0.6617 0.8661 0.7337 0.1449 0.7631 0.3182 0.7829 0.9151
Rapamycin
(mTOR)
10 9.511 0.9717 <0.000
1 0.0065 0.2481 0.8661 0.6897 0.0198 0.0375
<0.000
1
<0.000
1 0.0006
0.1 3.771 0.9717 0.0003 0.0205 0.7036 0.8943 0.7337 0.2301 0.3861 0.1208 <0.000
1 0.719
0.001 7.931 0.9717 0.0091 0.0602 0.7225 0.8661 0.9605 0.2056 0.3695 0.1273 <0.000
1 0.719
Rockout
(ROCK1)
10 1.961 0.9717 0.0663 0.59 0.7876 0.8661 0.9558 0.1748 0.3015 0.0264 0.0062 0.0255
0.1 -6.848 0.9717 0.8752 0.5955 0.7171 0.8943 0.9693 0.3002 0.9576 0.0104 0.3993 0.719
0.001 1.646 0.9717 0.6357 0.5574 0.5752 0.8661 0.9605 0.8791 0.9576 0.0264 0.0266 0.719
Sabutoclax
(BCL2A1)
10 42.76 0.0007 <0.000
1 <0.0001 0.0192 0.0003
<0.000
1
<0.000
1 <0.0001
<0.000
1
<0.000
1
<0.000
1
0.1 -1.232 0.9717 0.6357 0.8634 0.8073 0.8943 0.8636 0.1748 0.5421 0.9976 0.1612 0.719
0.001 -5.607 0.9717 0.5052 0.5955 0.7171 0.8661 0.7941 0.2301 0.6471 0.9887 0.0744 0.1215
Sotrastaurin
(PRKCH)
10 29.98 0.0292 <0.000
1 <0.0001 0.0109 0.7467 0.0008 0.1748 0.3861
<0.000
1
<0.000
1 0.9594
0.1 6.969 0.9717 0.6734 0.5955 0.9699 0.8661 0.5377 0.7543 0.86 0.001 0.0549 0.719
0.001 6.241 0.9717 0.7203 0.5574 0.7171 0.8661 0.5377 0.7725 0.8579 0.0375 0.0549 0.9151
TWS-119
(MYC)
10 31.54 0.0233 <0.000
1 <0.0001 0.0087 0.2445
<0.000
1
<0.000
1 <0.0001
<0.000
1
<0.000
1 0.0152
0.1 -1.689 0.9717 0.83 0.0277 0.8723 0.8661 0.906 0.8791 0.8579 0.2239 0.0928 0.9594
0.001 1.202 0.9717 0.83 0.5955 0.8723 0.8661 0.8857 0.8791 0.9649 0.6895 0.1425 0.719

99 Appendix
Volasertib
(PLK1)
10 83.03 <0.000
1
<0.000
1 <0.0001 0.0008 <0.0001
<0.000
1
<0.000
1 <0.0001
<0.000
1
<0.000
1
<0.000
1
0.1 21.08 0.255 <0.000
1 <0.0001 0.0192 0.8661 0.0001
<0.000
1 <0.0001
<0.000
1
<0.000
1 0.1596
0.001 14.07 0.8191 0.0149 0.9294 0.2001 0.8661 0.7337 0.8791 0.0015 0.4652 <0.000
1 0.719
Vorinostat
(HDAC)
10 64.95 <0.000
1
<0.000
1 <0.0001 0.0225 0.9508
<0.000
1
<0.000
1 0.0089
<0.000
1
<0.000
1 0.1596
0.1 -9.609 0.9717 0.0177 0.7682 0.5752 0.8661 0.7674 0.997 0.9649 0.8731 0.9865 0.906
0.001 -7.394 0.9717 0.3912 0.9294 0.4114 0.8661 0.906 0.8791 0.7631 0.9388 0.9865 0.719

100 Appendix
Appendix table 5: Synergy with etoposide of the drugs inhibiting selected drivers in AML cell line. Cells were treated with 3 concentrations of each drug in combination with IC25
concentration of etoposide for 24 hours. Combination index (CI) was calculated to determine either synergistic (CI<1), additive (CI=1), or antagonist (CI>1) effects.
Drug
(driver)
Treatment
concentration
(µM)
Combination index (CI)
F-
36P
HL-
60 KASUMI-1
MOLM-
13
MONO-
MAC-6
MV-
4-11
NB-
4 NOMO-1
OCI-
AML2
OCI-
AML3
THP-
1
GDC-0152
(BIRC5)
10 0.7 0.9 1.1 0.9 1.0 1.4 0.9 1.4 1.3 1.3 1.2 0.1 0.7 0.9 1.1 0.8 0.8 1.2 1.0 1.0 1.1 1.3 0.8
0.001 0.8 0.7 1.0 0.7 0.8 1.2 1.0 0.8 1.0 1.2 0.8
GSK-
1838705A
(IGF1R)
10 1.4 1.0 1.2 1.4 1.3 1.6 0.5 1.3 1.3 1.5 0.8
0.1 1.2 1.4 1.1 1.2 1.4 1.3 0.9 1.2 1.4 1.4 0.7
0.001 1.3 1.5 1.5 1.1 1.3 1.4 1.2 1.3 1.4 1.6 1.2
LY-3039478
(NOTCH1)
10 3.2 1.2 1.3 0.7 1.3 1.3 1.0 1.3 1.1 1.6 1.3 0.1 1.3 1.2 1.2 0.8 1.1 1.2 1.8 1.3 1.1 1.5 1.3
0.001 10.3 1.3 1.3 0.8 1.1 1.5 1.2 1.3 1.1 1.7 0.8
Nicotinamide
(PARP9)
10 1.0 1.0 1.2 0.9 1.5 1.9 1.2 2.3 1.3 1.2 1.0
0.1 0.8 1.1 1.2 0.8 1.1 0.6 0.7 1.4 0.9 1.0 0.9
0.001 0.6 1.1 1.0 0.8 1.3 0.6 0.7 0.9 0.9 1.0 0.8
Rapamycin
(mTOR)
10 1.8 1.3 1.6 0.9 1.4 0.5 1.2 1.4 1.5 1.3 1.1 0.1 1.1 1.6 1.6 0.9 1.1 1.0 2.3 1.1 1.5 1.2 0.9
0.001 1.9 1.4 1.4 1.1 1.0 0.8 1.0 0.9 1.1 1.3 1.1
Rockout
(ROCK1)
10 1.0 0.9 1.2 0.7 0.8 0.7 1.2 0.8 1.4 1.4 1.1 0.1 1.2 0.7 1.3 1.1 0.9 0.5 1.3 0.7 1.4 1.6 1.0
0.001 1.1 1.0 1.3 0.6 1.0 0.7 1.5 1.1 1.3 1.5 1.3
Sabutoclax
(BCL2A1)
10 - 1.1 1.8 0.8 1.2 1.4 1.5 1.4 1.1 1.6 1.7 0.1 - 1.3 1.5 0.9 1.1 1.3 1.5 1.7 1.3 1.4 1.6
0.001 1.2 1.5 1.6 1.3 1.5 1.4 1.3 1.4 1.6 1.6 1.3
Sotrastaurin
(PRKCH)
10 1.4 1.1 1.2 0.9 1.3 1.4 1.5 1.4 1.4 1.3 0.8
0.1 1.1 1.0 1.2 0.7 1.0 1.5 1.1 1.1 1.5 1.3 0.8
0.001 1.3 1.5 1.5 1.2 1.2 1.3 1.2 0.8 1.2 1.6 0.6
TWS-119
(MYC)
10 1.6 0.9 1.4 1.1 1.4 1.2 1.0 1.1 1.4 1.4 0.8
0.1 4.3 1.3 1.5 1.2 1.4 1.2 1.7 1.4 1.6 1.3 1.1 0.001 4.4 2.8 1.6 1.3 1.4 1.5 1.9 3.6 1.6 2.1 1.4
Volasertib
(PLK1)
10 20.1 1.3 1.1 1.2 1.4 2.6 0.5 3.0 1.7 1.5 1.2 0.1 2.8 2.3 2.0 2.0 2.0 15.2 2.0 5.2 1.8 3.0 1.4
0.001 1.3 1.4 1.6 1.2 1.4 1.2 1.2 1.3 1.3 1.4 1.4
Vorinostat
(HDAC)
10 1.3 1.1 1.1 0.7 1.7 0.6 0.7 1.1 0.9 0.9 0.9
0.1 0.9 1.1 1.1 0.6 1.1 0.5 0.5 0.7 1.1 0.8 0.7
0.001 1.1 1.4 1.5 1.1 0.6 1.2 1.1 0.7 1.2 1.2 0.8

101 Appendix
R script developed in this work for comprehensive analysis of RNA-Seq data
#' ---
#' title: "AML_VP16_RNA-Seq-2017_edgeR"
#' author: "Piyush More"
#' date: "September 1st, 2017"
#' output: html_document
#' ---
library(edgeR)
library(Homo.sapiens)
setwd("/media/piyush/372429ff-0d6e-45d6-b529-527e3fb69028/RNA-
seq/AML_IMB_2017/Analysis/STAR/Gene_counts/edgeR")
# Read individual count files (.tab) into edgeR
files <- dir(pattern="*\\.tab$")
# Remove OCIAML2 samples
files <- files[ !grepl("OCIAML2", files) ]
# While loading counts define the groups
RG <- readDGE(files, columns = c(1,2), sep = " ", group = rep(1:20, times = 1, length.out = 60, each = 3))
rownames(RG$samples) <-
c("F36P_CTR_1","F36P_CTR_2","F36P_CTR_3","F36P_VP16_1","F36P_VP16_2","F36P_VP16_3","HL60_CTR
_1","HL60_CTR_2","HL60_CTR_3","HL60_VP16_1","HL60_VP16_2","HL60_VP16_3","Kasumi1_CTR_1","Ka
sumi1_CTR_2","Kasumi1_CTR_3","Kasumi1_VP16_1","Kasumi1_VP16_2","Kasumi1_VP16_3","MOLM13_CT
R_1","MOLM13_CTR_2","MOLM13_CTR_3","MOLM13_VP16_1","MOLM13_VP16_2","MOLM13_VP16_3",
"MONOMAC6_CTR_1","MONOMAC6_CTR_2","MONOMAC6_CTR_3","MONOMAC6_VP16_1","MONOMA
C6_VP16_2","MONOMAC6_VP16_3","MV411_CTR_1","MV411_CTR_2","MV411_CTR_3","MV411_VP16_1
","MV411_VP16_2","MV411_VP16_3","NB4_CTR_1","NB4_CTR_2","NB4_CTR_3","NB4_VP16_1","NB4_VP
16_2","NB4_VP16_3","NOMO1_CTR_1","NOMO1_CTR_2","NOMO1_CTR_3","NOMO1_VP16_1","NOMO1_
VP16_2","NOMO1_VP16_3","OCIAML3_CTR_1","OCIAML3_CTR_2","OCIAML3_CTR_3","OCIAML3_VP1
6_1","OCIAML3_VP16_2","OCIAML3_VP16_3","THP1_CTR_1","THP1_CTR_2","THP1_CTR_3","THP1_VP1
6_1","THP1_VP16_2","THP1_VP16_3")
colnames(RG$counts) <-
c("F36P_CTR_1","F36P_CTR_2","F36P_CTR_3","F36P_VP16_1","F36P_VP16_2","F36P_VP16_3","HL60_CTR
_1","HL60_CTR_2","HL60_CTR_3","HL60_VP16_1","HL60_VP16_2","HL60_VP16_3","Kasumi1_CTR_1","Ka
sumi1_CTR_2","Kasumi1_CTR_3","Kasumi1_VP16_1","Kasumi1_VP16_2","Kasumi1_VP16_3","MOLM13_CT
R_1","MOLM13_CTR_2","MOLM13_CTR_3","MOLM13_VP16_1","MOLM13_VP16_2","MOLM13_VP16_3",
"MONOMAC6_CTR_1","MONOMAC6_CTR_2","MONOMAC6_CTR_3","MONOMAC6_VP16_1","MONOMA
C6_VP16_2","MONOMAC6_VP16_3","MV411_CTR_1","MV411_CTR_2","MV411_CTR_3","MV411_VP16_1
","MV411_VP16_2","MV411_VP16_3","NB4_CTR_1","NB4_CTR_2","NB4_CTR_3","NB4_VP16_1","NB4_VP
16_2","NB4_VP16_3","NOMO1_CTR_1","NOMO1_CTR_2","NOMO1_CTR_3","NOMO1_VP16_1","NOMO1_
VP16_2","NOMO1_VP16_3","OCIAML3_CTR_1","OCIAML3_CTR_2","OCIAML3_CTR_3","OCIAML3_VP1
6_1","OCIAML3_VP16_2","OCIAML3_VP16_3","THP1_CTR_1","THP1_CTR_2","THP1_CTR_3","THP1_VP1
6_1","THP1_VP16_2","THP1_VP16_3")
RG$samples
View(RG$counts)
# Add gene annotation to the DGEList object
geneid <- row.names(RG)

102 Appendix
geneid <- substr(geneid, 1, 15)
head(geneid)
genes <- select(Homo.sapiens, keys=geneid, columns=c("ENTREZID", "SYMBOL", "TXCHROM",
"DEFINITION", "OMIM"), keytype="ENSEMBL")
head(genes)
genes <- genes[!duplicated(genes$ENSEMBL),]
head(genes)
RG$genes <- genes
y <- RG
library("DESeq2")
library("edgeR")
library("hexbin")
library("latticeExtra")
library("vsn")
library("gplots")
library("RColorBrewer")
library("topGO")
library("gplots")
library("genefilter")
library("rtracklayer")
library("xtable")
library("GO.db")
library("goseq")
library("GenomicFeatures")
library("pathview")
library("NMF")
library("pheatmap")
library("GOplot")
library(knitr)
library("pcaExplorer")
library(DT)
library(ideal)
library("dplyr")
# Filter low counts: 3 are the minimum numbers of samples in each group and CPM 1 corresponds to counts of 6-7
keep <- rowSums(cpm(y)>1) >= 3
# Recalculate the library size
y <- y[keep, , keep.lib.sizes=FALSE]
# Create design for glm edgeR
group <- factor(y$samples$group)
group
levels(y$samples$group)
design <- model.matrix(~0+group, data=y$samples)
design
# DESeq object
samplesDesign <- read.csv("/media/piyush/372429ff-0d6e-45d6-b529-527e3fb69028/RNA-
seq/AML_IMB_2017/Analysis/STAR/Gene_counts/DESeq2/sampleDesign_New2.csv", sep = ",", header = T,
stringsAsFactors = F)
dds <- DESeqDataSetFromMatrix(y$counts ,samplesDesign, design = ~ celltype + condition)
colnames(dds) <- samplesDesign$sampleID

103 Appendix
dds <- DESeq(dds)
# Variance stabilizing transformation
dds <- estimateSizeFactors(dds)
baseMean <- rowMeans(counts(dds, normalized=TRUE))
sum(baseMean > 1)
idx <- sample(which(baseMean > 5), 1000)
dds.sub <- dds[idx, ]
dds.sub <- estimateDispersions(dds.sub)
dispersionFunction(dds) <- dispersionFunction(dds.sub)
vsd <- varianceStabilizingTransformation(dds, blind=FALSE)
colnames(vsd) <-
c("F36P_CTR_1","F36P_CTR_2","F36P_CTR_3","F36P_VP16_1","F36P_VP16_2","F36P_VP16_3","HL60_CTR
_1","HL60_CTR_2","HL60_CTR_3","HL60_VP16_1","HL60_VP16_2","HL60_VP16_3","Kasumi1_CTR_1","Ka
sumi1_CTR_2","Kasumi1_CTR_3","Kasumi1_VP16_1","Kasumi1_VP16_2","Kasumi1_VP16_3","MOLM13_CT
R_1","MOLM13_CTR_2","MOLM13_CTR_3","MOLM13_VP16_1","MOLM13_VP16_2","MOLM13_VP16_3",
"MONOMAC6_CTR_1","MONOMAC6_CTR_2","MONOMAC6_CTR_3","MONOMAC6_VP16_1","MONOMA
C6_VP16_2","MONOMAC6_VP16_3","MV411_CTR_1","MV411_CTR_2","MV411_CTR_3","MV411_VP16_1
","MV411_VP16_2","MV411_VP16_3","NB4_CTR_1","NB4_CTR_2","NB4_CTR_3","NB4_VP16_1","NB4_VP
16_2","NB4_VP16_3","NOMO1_CTR_1","NOMO1_CTR_2","NOMO1_CTR_3","NOMO1_VP16_1","NOMO1_
VP16_2","NOMO1_VP16_3","OCIAML3_CTR_1","OCIAML3_CTR_2","OCIAML3_CTR_3","OCIAML3_VP1
6_1","OCIAML3_VP16_2","OCIAML3_VP16_3","THP1_CTR_1","THP1_CTR_2","THP1_CTR_3","THP1_VP1
6_1","THP1_VP16_2","THP1_VP16_3")
library(pheatmap)
pheatmap(as.matrix(dist(t(assay(vsd)))))
dev.print(pdf, './edgeR_Results/AML-global_pheatmap.pdf', width = 12, height = 12)
library(pcaExplorer)
pcaplot(vsd, title = "pcaplot - global", ellipse = F)
dev.print(pdf, './edgeR_Results/AML_pca_global.pdf', width = 12, height = 12)
pcaplot(vsd, intgroup = "celltype", title = "pcaplot celltype - global", ellipse = F)
dev.print(pdf, './edgeR_Results/AML_pca_global_celltype.pdf', width = 12, height = 12)
# Sample distances
sampleDists <- dist( t( assay(vsd) ) )
library("gplots")
library("RColorBrewer")
sampleDistMatrix <- as.matrix( sampleDists )
rownames(sampleDistMatrix) <- colnames(y$counts)
colors <- colorRampPalette( rev(brewer.pal(9, "Blues")) )(255)
hc <- hclust(sampleDists)
heatmap.2( sampleDistMatrix, Rowv=as.dendrogram(hc),
symm=TRUE, trace="none", col=colors,
margins=c(2,10), labCol=FALSE )
dev.print(pdf, './edgeR_Results/AML-global_heatmap.pdf', width = 12, height = 12)
# PCA plot
z <- plotPCA(vsd, intgroup = "condition")
nudge <- position_nudge(y = 2)
z + geom_label(aes(label = name), position = nudge)
dev.print(pdf, './edgeR_Results/AML_pca.pdf', width = 12, height = 12)
(data <- plotPCA(vsd, intgroup = "condition", returnData=TRUE))
percentVar <- round(100 * attr(data, "percentVar"))
library("ggplot2")

104 Appendix
qplot(PC1, PC2, color=condition, shape=name, data=data) +
xlab(paste0("PC1: ",percentVar[1],"% variance")) +
ylab(paste0("PC2: ",percentVar[2],"% variance"))
# Calculate library normalization factor
y <- calcNormFactors(y)
# MDS plot to identify outliers
plotMDS(y, col = rainbow(22))
dev.print(pdf, './edgeR_Results/AML-global_MDS_plot.pdf', width = 12, height = 12)
y <- estimateDisp(y, design)
plotMeanVar(y, show.tagwise.vars = TRUE, NBline = TRUE)
dev.print(pdf, './edgeR_Results/AML-global_mean_var.pdf')
plotBCV(y)
dev.print(pdf, './edgeR_Results/AML-global_BCV.pdf', width = 12, height = 12)
fit <- glmFit(y, design)
# Make all contrasts together
my.contrasts <- makeContrasts(f36p=group2-group1, hl60=group4-group3, kasumi1=group6-group5,
molm13=group8-group7, monomac6=group10-group9, mv411=group12-group11, nb4=group14-group13,
nomo1=group16-group15, ociaml3=group18-group17, thp1=group20-group19, levels = design)
my.contrasts
my.contrasts2 <- makeContrasts(resistant=group2-group8, resistant.ctr=group1-group7, levels = design)
my.contrasts2
# Differential expression
f36p.vp16.VS.ctr <- glmLRT(fit, contrast = my.contrasts[,"f36p"])
hl60.vp16.VS.ctr <- glmLRT(fit, contrast = my.contrasts[,"hl60"])
kasumi1.vp16.VS.ctr <- glmLRT(fit, contrast = my.contrasts[,"kasumi1"])
molm13.vp16.VS.ctr <- glmLRT(fit, contrast = my.contrasts[,"molm13"])
monomac6.vp16.VS.ctr <- glmLRT(fit, contrast = my.contrasts[,"monomac6"])
mv411.vp16.VS.ctr <- glmLRT(fit, contrast = my.contrasts[,"mv411"])
nb4.vp16.VS.ctr <- glmLRT(fit, contrast = my.contrasts[,"nb4"])
nomo1.vp16.VS.ctr <- glmLRT(fit, contrast = my.contrasts[,"nomo1"])
ociaml3.vp16.VS.ctr <- glmLRT(fit, contrast = my.contrasts[,"ociaml3"])
thp1.vp16.VS.ctr <- glmLRT(fit, contrast = my.contrasts[,"thp1"])
f36p.vp16.VS.molm13.vp16 <- glmLRT(fit, contrast = my.contrasts2[,"resistant"])
f36p.VS.molm13.ctr <- glmLRT(fit, contrast = my.contrasts2[,"resistant.ctr"])
# Filter top DEG according to FDR
res_f36p.vp16.VS.ctr <- topTags(f36p.vp16.VS.ctr, n = nrow(f36p.vp16.VS.ctr), sort.by = "PValue", p.value = 0.05)
res_hl60.vp16.VS.ctr <- topTags(hl60.vp16.VS.ctr, n = nrow(hl60.vp16.VS.ctr), sort.by = "PValue", p.value = 0.05)
res_kasumi1.vp16.VS.ctr <- topTags(kasumi1.vp16.VS.ctr, n = nrow(kasumi1.vp16.VS.ctr), sort.by = "PValue",
p.value = 0.05)
res_molm13.vp16.VS.ctr <- topTags(molm13.vp16.VS.ctr, n = nrow(molm13.vp16.VS.ctr), sort.by = "PValue",
p.value = 0.05)
res_monomac6.vp16.VS.ctr <- topTags(monomac6.vp16.VS.ctr, n = nrow(monomac6.vp16.VS.ctr), sort.by =
"PValue", p.value = 0.05)
res_mv411.vp16.VS.ctr <- topTags(mv411.vp16.VS.ctr, n = nrow(mv411.vp16.VS.ctr), sort.by = "PValue", p.value
= 0.05)
res_nb4.vp16.VS.ctr <- topTags(nb4.vp16.VS.ctr, n = nrow(nb4.vp16.VS.ctr), sort.by = "PValue", p.value = 0.05)
res_nomo1.vp16.VS.ctr <- topTags(nomo1.vp16.VS.ctr, n = nrow(nomo1.vp16.VS.ctr), sort.by = "PValue", p.value
= 0.05)
res_ociaml3.vp16.VS.ctr <- topTags(ociaml3.vp16.VS.ctr, n = nrow(ociaml3.vp16.VS.ctr), sort.by = "PValue",
p.value = 0.05)
res_thp1.vp16.VS.ctr <- topTags(thp1.vp16.VS.ctr, n = nrow(thp1.vp16.VS.ctr), sort.by = "PValue", p.value = 0.05)

105 Appendix
res_f36p.vp16.VS.molm13.vp16 <- topTags(f36p.vp16.VS.molm13.vp16, n = nrow(f36p.vp16.VS.molm13.vp16),
sort.by = "PValue", p.value = 0.05)
res_f36p.VS.molm13.ctr <- topTags(f36p.VS.molm13.ctr, n = nrow(f36p.VS.molm13.ctr), sort.by = "PValue",
p.value = 0.05)
# Filter DEG with logFC >= |1|
keep_f36p <- abs(res_f36p.vp16.VS.ctr$table$logFC) >= 1
res_f36p.vp16.VS.ctr <- res_f36p.vp16.VS.ctr[keep_f36p, ]
keep_hl60 <- abs(res_hl60.vp16.VS.ctr$table$logFC) >= 1
res_hl60.vp16.VS.ctr <- res_hl60.vp16.VS.ctr[keep_hl60, ]
keep_kasumi1 <- abs(res_kasumi1.vp16.VS.ctr$table$logFC) >= 1
res_kasumi1.vp16.VS.ctr <- res_kasumi1.vp16.VS.ctr[keep_kasumi1, ]
keep_molm13 <- abs(res_molm13.vp16.VS.ctr$table$logFC) >= 1
res_molm13.vp16.VS.ctr <- res_molm13.vp16.VS.ctr[keep_molm13, ]
keep_monomac6 <- abs(res_monomac6.vp16.VS.ctr$table$logFC) >= 1
res_monomac6.vp16.VS.ctr <- res_monomac6.vp16.VS.ctr[keep_monomac6, ]
keep_mv411 <- abs(res_mv411.vp16.VS.ctr$table$logFC) >= 1
res_mv411.vp16.VS.ctr <- res_mv411.vp16.VS.ctr[keep_mv411, ]
keep_nb4 <- abs(res_nb4.vp16.VS.ctr$table$logFC) >= 1
res_nb4.vp16.VS.ctr <- res_nb4.vp16.VS.ctr[keep_nb4, ]
keep_nomo1 <- abs(res_nomo1.vp16.VS.ctr$table$logFC) >= 1
res_nomo1.vp16.VS.ctr <- res_nomo1.vp16.VS.ctr[keep_nomo1, ]
keep_ociaml3 <- abs(res_ociaml3.vp16.VS.ctr$table$logFC) >= 1
res_ociaml3.vp16.VS.ctr <- res_ociaml3.vp16.VS.ctr[keep_ociaml3, ]
keep_thp1 <- abs(res_thp1.vp16.VS.ctr$table$logFC) >= 1
res_thp1.vp16.VS.ctr <- res_thp1.vp16.VS.ctr[keep_thp1, ]
keep_resistant <- abs(res_f36p.vp16.VS.molm13.vp16$table$logFC) >= 1
res_f36p.vp16.VS.molm13.vp16 <- res_f36p.vp16.VS.molm13.vp16[keep_resistant, ]
keep_resistant.ctr <- abs(res_f36p.VS.molm13.ctr$table$logFC) >= 1
res_f36p.VS.molm13.ctr <- res_f36p.VS.molm13.ctr[keep_resistant.ctr, ]
plotMD(f36p.vp16.VS.ctr)
abline(h=c(-1, 1), col="blue")
dev.print(pdf, 'f36p_MD_plot.pdf')
plotMD(hl60.vp16.VS.ctr)
abline(h=c(-1, 1), col="blue")
dev.print(pdf, 'hl60_MD_plot.pdf')
plotMD(kasumi1.vp16.VS.ctr)
abline(h=c(-1, 1), col="blue")
dev.print(pdf, 'kasumi1_MD_plot.pdf')
plotMD(molm13.vp16.VS.ctr)
abline(h=c(-1, 1), col="blue")
dev.print(pdf, 'molm13_MD_plot.pdf')
plotMD(monomac6.vp16.VS.ctr)
abline(h=c(-1, 1), col="blue")
dev.print(pdf, 'monomac6_MD_plot.pdf')
plotMD(mv411.vp16.VS.ctr)
abline(h=c(-1, 1), col="blue")
dev.print(pdf, 'mv411_MD_plot.pdf')
plotMD(nb4.vp16.VS.ctr)
abline(h=c(-1, 1), col="blue")
dev.print(pdf, 'nb4_MD_plot.pdf')
plotMD(nomo1.vp16.VS.ctr)
abline(h=c(-1, 1), col="blue")
dev.print(pdf, 'nomo1_MD_plot.pdf')
plotMD(ociaml3.vp16.VS.ctr)
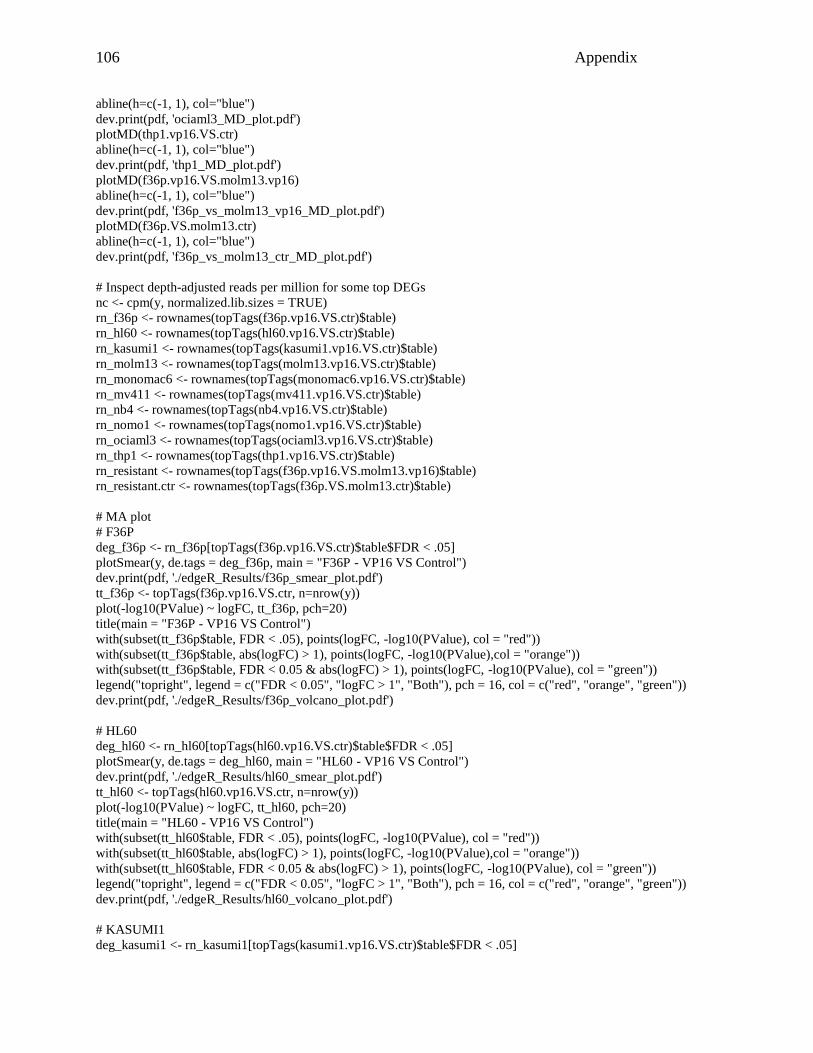
106 Appendix
abline(h=c(-1, 1), col="blue")
dev.print(pdf, 'ociaml3_MD_plot.pdf')
plotMD(thp1.vp16.VS.ctr)
abline(h=c(-1, 1), col="blue")
dev.print(pdf, 'thp1_MD_plot.pdf')
plotMD(f36p.vp16.VS.molm13.vp16)
abline(h=c(-1, 1), col="blue")
dev.print(pdf, 'f36p_vs_molm13_vp16_MD_plot.pdf')
plotMD(f36p.VS.molm13.ctr)
abline(h=c(-1, 1), col="blue")
dev.print(pdf, 'f36p_vs_molm13_ctr_MD_plot.pdf')
# Inspect depth-adjusted reads per million for some top DEGs
nc <- cpm(y, normalized.lib.sizes = TRUE)
rn_f36p <- rownames(topTags(f36p.vp16.VS.ctr)$table)
rn_hl60 <- rownames(topTags(hl60.vp16.VS.ctr)$table)
rn_kasumi1 <- rownames(topTags(kasumi1.vp16.VS.ctr)$table)
rn_molm13 <- rownames(topTags(molm13.vp16.VS.ctr)$table)
rn_monomac6 <- rownames(topTags(monomac6.vp16.VS.ctr)$table)
rn_mv411 <- rownames(topTags(mv411.vp16.VS.ctr)$table)
rn_nb4 <- rownames(topTags(nb4.vp16.VS.ctr)$table)
rn_nomo1 <- rownames(topTags(nomo1.vp16.VS.ctr)$table)
rn_ociaml3 <- rownames(topTags(ociaml3.vp16.VS.ctr)$table)
rn_thp1 <- rownames(topTags(thp1.vp16.VS.ctr)$table)
rn_resistant <- rownames(topTags(f36p.vp16.VS.molm13.vp16)$table)
rn_resistant.ctr <- rownames(topTags(f36p.VS.molm13.ctr)$table)
# MA plot
# F36P
deg_f36p <- rn_f36p[topTags(f36p.vp16.VS.ctr)$table$FDR < .05]
plotSmear(y, de.tags = deg_f36p, main = "F36P - VP16 VS Control")
dev.print(pdf, './edgeR_Results/f36p_smear_plot.pdf')
tt_f36p <- topTags(f36p.vp16.VS.ctr, n=nrow(y))
plot(-log10(PValue) ~ logFC, tt_f36p, pch=20)
title(main = "F36P - VP16 VS Control")
with(subset(tt_f36p$table, FDR < .05), points(logFC, -log10(PValue), col = "red"))
with(subset(tt_f36p$table, abs(logFC) > 1), points(logFC, -log10(PValue),col = "orange"))
with(subset(tt_f36p$table, FDR < 0.05 & abs(logFC) > 1), points(logFC, -log10(PValue), col = "green"))
legend("topright", legend = c("FDR < 0.05", "logFC > 1", "Both"), pch = 16, col = c("red", "orange", "green"))
dev.print(pdf, './edgeR_Results/f36p_volcano_plot.pdf')
# HL60
deg_hl60 <- rn_hl60[topTags(hl60.vp16.VS.ctr)$table$FDR < .05]
plotSmear(y, de.tags = deg_hl60, main = "HL60 - VP16 VS Control")
dev.print(pdf, './edgeR_Results/hl60_smear_plot.pdf')
tt_hl60 <- topTags(hl60.vp16.VS.ctr, n=nrow(y))
plot(-log10(PValue) ~ logFC, tt_hl60, pch=20)
title(main = "HL60 - VP16 VS Control")
with(subset(tt_hl60$table, FDR < .05), points(logFC, -log10(PValue), col = "red"))
with(subset(tt_hl60$table, abs(logFC) > 1), points(logFC, -log10(PValue),col = "orange"))
with(subset(tt_hl60$table, FDR < 0.05 & abs(logFC) > 1), points(logFC, -log10(PValue), col = "green"))
legend("topright", legend = c("FDR < 0.05", "logFC > 1", "Both"), pch = 16, col = c("red", "orange", "green"))
dev.print(pdf, './edgeR_Results/hl60_volcano_plot.pdf')
# KASUMI1
deg_kasumi1 <- rn_kasumi1[topTags(kasumi1.vp16.VS.ctr)$table$FDR < .05]

107 Appendix
plotSmear(y, de.tags = deg_kasumi1, main = "KASUMI1 - VP16 VS Control")
dev.print(pdf, './edgeR_Results/kasumi1_smear_plot.pdf')
tt_kasumi1 <- topTags(kasumi1.vp16.VS.ctr, n=nrow(y))
plot(-log10(PValue) ~ logFC, tt_kasumi1, pch=20)
title(main = "KASUMI1 - VP16 VS Control")
with(subset(tt_kasumi1$table, FDR < .05), points(logFC, -log10(PValue), col = "red"))
with(subset(tt_kasumi1$table, abs(logFC) > 1), points(logFC, -log10(PValue),col = "orange"))
with(subset(tt_kasumi1$table, FDR < 0.05 & abs(logFC) > 1), points(logFC, -log10(PValue), col = "green"))
legend("topright", legend = c("FDR < 0.05", "logFC > 1", "Both"), pch = 16, col = c("red", "orange", "green"))
dev.print(pdf, './edgeR_Results/kasumi1_volcano_plot.pdf')
# MOLM13
deg_molm13 <- rn_molm13[topTags(molm13.vp16.VS.ctr)$table$FDR < .05]
plotSmear(y, de.tags = deg_molm13, main = "MOLM13 - VP16 VS Control")
dev.print(pdf, './edgeR_Results/molm13_smear_plot.pdf')
tt_molm13 <- topTags(molm13.vp16.VS.ctr, n=nrow(y))
plot(-log10(PValue) ~ logFC, tt_molm13, pch=20)
title(main = "MOLM13 - VP16 VS Control")
with(subset(tt_molm13$table, FDR < .05), points(logFC, -log10(PValue), col = "red"))
with(subset(tt_molm13$table, abs(logFC) > 1), points(logFC, -log10(PValue),col = "orange"))
with(subset(tt_molm13$table, FDR < 0.05 & abs(logFC) > 1), points(logFC, -log10(PValue), col = "green"))
legend("topright", legend = c("FDR < 0.05", "logFC > 1", "Both"), pch = 16, col = c("red", "orange", "green"))
dev.print(pdf, './edgeR_Results/molm13_volcano_plot.pdf')
# MONOMAC6
deg_monomac6 <- rn_monomac6[topTags(monomac6.vp16.VS.ctr)$table$FDR < .05]
plotSmear(y, de.tags = deg_monomac6, main = "MONOMAC6 - VP16 VS Control")
dev.print(pdf, './edgeR_Results/monomac6_smear_plot.pdf')
tt_monomac6 <- topTags(monomac6.vp16.VS.ctr, n=nrow(y))
plot(-log10(PValue) ~ logFC, tt_monomac6, pch=20)
title(main = "MONOMAC6 - VP16 VS Control")
with(subset(tt_monomac6$table, FDR < .05), points(logFC, -log10(PValue), col = "red"))
with(subset(tt_monomac6$table, abs(logFC) > 1), points(logFC, -log10(PValue),col = "orange"))
with(subset(tt_monomac6$table, FDR < 0.05 & abs(logFC) > 1), points(logFC, -log10(PValue), col = "green"))
legend("topright", legend = c("FDR < 0.05", "logFC > 1", "Both"), pch = 16, col = c("red", "orange", "green"))
dev.print(pdf, './edgeR_Results/monomac6_volcano_plot.pdf')
# MV411
deg_mv411 <- rn_mv411[topTags(mv411.vp16.VS.ctr)$table$FDR < .05]
plotSmear(y, de.tags = deg_mv411, main = "MV411 - VP16 VS Control")
dev.print(pdf, './edgeR_Results/mv411_smear_plot.pdf')
tt_mv411 <- topTags(mv411.vp16.VS.ctr, n=nrow(y))
plot(-log10(PValue) ~ logFC, tt_mv411, pch=20)
title(main = "MV411 - VP16 VS Control")
with(subset(tt_mv411$table, FDR < .05), points(logFC, -log10(PValue), col = "red"))
with(subset(tt_mv411$table, abs(logFC) > 1), points(logFC, -log10(PValue),col = "orange"))
with(subset(tt_mv411$table, FDR < 0.05 & abs(logFC) > 1), points(logFC, -log10(PValue), col = "green"))
legend("topright", legend = c("FDR < 0.05", "logFC > 1", "Both"), pch = 16, col = c("red", "orange", "green"))
dev.print(pdf, './edgeR_Results/mv411_volcano_plot.pdf')
# NB4
deg_nb4 <- rn_nb4[topTags(nb4.vp16.VS.ctr)$table$FDR < .05]
plotSmear(y, de.tags = deg_nb4, main = "NB4 - VP16 VS Control")
dev.print(pdf, './edgeR_Results/nb4_smear_plot.pdf')
tt_nb4 <- topTags(nb4.vp16.VS.ctr, n=nrow(y))
plot(-log10(PValue) ~ logFC, tt_nb4, pch=20)

108 Appendix
title(main = "NB4 - VP16 VS Control")
with(subset(tt_nb4$table, FDR < .05), points(logFC, -log10(PValue), col = "red"))
with(subset(tt_nb4$table, abs(logFC) > 1), points(logFC, -log10(PValue),col = "orange"))
with(subset(tt_nb4$table, FDR < 0.05 & abs(logFC) > 1), points(logFC, -log10(PValue), col = "green"))
legend("topright", legend = c("FDR < 0.05", "logFC > 1", "Both"), pch = 16, col = c("red", "orange", "green"))
dev.print(pdf, './edgeR_Results/nb4_volcano_plot.pdf')
# NOMO1
deg_nomo1 <- rn_nomo1[topTags(nomo1.vp16.VS.ctr)$table$FDR < .05]
plotSmear(y, de.tags = deg_nomo1, main = "NOMO1 - VP16 VS Control")
dev.print(pdf, './edgeR_Results/nomo1_smear_plot.pdf')
tt_nomo1 <- topTags(nomo1.vp16.VS.ctr, n=nrow(y))
plot(-log10(PValue) ~ logFC, tt_nomo1, pch=20)
title(main = "NOMO1 - VP16 VS Control")
with(subset(tt_nomo1$table, FDR < .05), points(logFC, -log10(PValue), col = "red"))
with(subset(tt_nomo1$table, abs(logFC) > 1), points(logFC, -log10(PValue),col = "orange"))
with(subset(tt_nomo1$table, FDR < 0.05 & abs(logFC) > 1), points(logFC, -log10(PValue), col = "green"))
legend("topright", legend = c("FDR < 0.05", "logFC > 1", "Both"), pch = 16, col = c("red", "orange", "green"))
dev.print(pdf, './edgeR_Results/nomo1_volcano_plot.pdf')
# OCIAML3
deg_ociaml3 <- rn_ociaml3[topTags(ociaml3.vp16.VS.ctr)$table$FDR < .05]
plotSmear(y, de.tags = deg_ociaml3, main = "OCIAML3 - VP16 VS Control")
dev.print(pdf, './edgeR_Results/ociaml3_smear_plot.pdf')
tt_ociaml3 <- topTags(ociaml3.vp16.VS.ctr, n=nrow(y))
plot(-log10(PValue) ~ logFC, tt_ociaml3, pch=20)
title(main = "OCIAML3 - VP16 VS Control")
with(subset(tt_ociaml3$table, FDR < .05), points(logFC, -log10(PValue), col = "red"))
with(subset(tt_ociaml3$table, abs(logFC) > 1), points(logFC, -log10(PValue),col = "orange"))
with(subset(tt_ociaml3$table, FDR < 0.05 & abs(logFC) > 1), points(logFC, -log10(PValue), col = "green"))
legend("topright", legend = c("FDR < 0.05", "logFC > 1", "Both"), pch = 16, col = c("red", "orange", "green"))
dev.print(pdf, './edgeR_Results/ociaml3_volcano_plot.pdf')
# THP1
deg_thp1 <- rn_thp1[topTags(thp1.vp16.VS.ctr)$table$FDR < .05]
plotSmear(y, de.tags = deg_thp1, main = "THP1 - VP16 VS Control")
dev.print(pdf, './edgeR_Results/thp1_smear_plot.pdf')
tt_thp1 <- topTags(thp1.vp16.VS.ctr, n=nrow(y))
plot(-log10(PValue) ~ logFC, tt_thp1, pch=20)
title(main = "THP1 - VP16 VS Control")
with(subset(tt_thp1$table, FDR < .05), points(logFC, -log10(PValue), col = "red"))
with(subset(tt_thp1$table, abs(logFC) > 1), points(logFC, -log10(PValue),col = "orange"))
with(subset(tt_thp1$table, FDR < 0.05 & abs(logFC) > 1), points(logFC, -log10(PValue), col = "green"))
legend("topright", legend = c("FDR < 0.05", "logFC > 1", "Both"), pch = 16, col = c("red", "orange", "green"))
dev.print(pdf, './edgeR_Results/thp1_volcano_plot.pdf')
# F36P VS MOLM13 VP16
deg_resistant <- rn_resistant[topTags(f36p.vp16.VS.molm13.vp16)$table$FDR < .05]
plotSmear(y, de.tags = deg_resistant, main = "F36P VP16 VS MOLM13 VP16")
dev.print(pdf, './edgeR_Results/f36p-vp16_VS_mol13-vp16_smear_plot.pdf')
tt_resistant <- topTags(f36p.vp16.VS.molm13.vp16, n=nrow(y))
plot(-log10(PValue) ~ logFC, tt_resistant, pch=20)
title(main = "F36P VP16 VS MOLM13 VP16")
with(subset(tt_resistant$table, FDR < .05), points(logFC, -log10(PValue), col = "red"))
with(subset(tt_resistant$table, abs(logFC) > 1), points(logFC, -log10(PValue),col = "orange"))
with(subset(tt_resistant$table, FDR < 0.05 & abs(logFC) > 1), points(logFC, -log10(PValue), col = "green"))

109 Appendix
legend("topright", legend = c("FDR < 0.05", "logFC > 1", "Both"), pch = 16, col = c("red", "orange", "green"))
dev.print(pdf, './edgeR_Results/f36p-vp16_VS_molm13-vp16_volcano_plot.pdf')
# F36P VS MOLM13 CTR
deg_resistant.ctr <- rn_resistant[topTags(f36p.VS.molm13.ctr)$table$FDR < .05]
plotSmear(y, de.tags = deg_resistant.ctr, main = "F36P VP16 VS MOLM13 CTR")
dev.print(pdf, './edgeR_Results/f36p-vp16_VS_mol13-ctr_smear_plot.pdf')
tt_resistant.ctr <- topTags(f36p.VS.molm13.ctr, n=nrow(y))
plot(-log10(PValue) ~ logFC, tt_resistant.ctr, pch=20)
title(main = "F36P VP16 VS MOLM13 CTR")
with(subset(tt_resistant.ctr$table, FDR < .05), points(logFC, -log10(PValue), col = "red"))
with(subset(tt_resistant.ctr$table, abs(logFC) > 1), points(logFC, -log10(PValue),col = "orange"))
with(subset(tt_resistant.ctr$table, FDR < 0.05 & abs(logFC) > 1), points(logFC, -log10(PValue), col = "green"))
legend("topright", legend = c("FDR < 0.05", "logFC > 1", "Both"), pch = 16, col = c("red", "orange", "green"))
dev.print(pdf, './edgeR_Results/f36p_VS_molm13-ctr_volcano_plot.pdf')
# Create result table
# Define functions to create links
createLinkGO <- function(val) {
sprintf('<a href="http://amigo.geneontology.org/amigo/term/%s" target="_blank" class="btn btn-
primary">%s</a>',val,val)
}
createLinkENS <- function(val, species="Homo_sapiens") {
paste0('<a href="http://www.ensembl.org/',species,'/Gene/Summary?g=',val,'" target="_blank" class="btn btn-
primary">',val,'</a>')
}
createLinkGeneSymbol <- function(val) {
paste0('<a href="http://www.genecards.org/cgi-bin/carddisp.pl?gene=',val,'" target="_blank" class="btn btn-
primary">',val,'</a>')
}
# Create tables
# F36P
tbl_res_f36p.vp16.VS.ctr <- res_f36p.vp16.VS.ctr$table
etbl_res_f36p.vp16.VS.ctr <- tbl_res_f36p.vp16.VS.ctr
etbl_res_f36p.vp16.VS.ctr$ENSEMBL <- createLinkENS(etbl_res_f36p.vp16.VS.ctr$ENSEMBL, species =
"Homo_sapiens")
etbl_res_f36p.vp16.VS.ctr$SYMBOL <- createLinkGeneSymbol(etbl_res_f36p.vp16.VS.ctr$SYMBOL)
datatable(etbl_res_f36p.vp16.VS.ctr, caption = "F36P - VP16 vs Control, DE genes", escape=F)
write.table(tbl_res_f36p.vp16.VS.ctr, "./edgeR_Results/DEG_Table_f36p.txt", sep = "\t", row.names = F)
# HL60
tbl_res_hl60.vp16.VS.ctr <- res_hl60.vp16.VS.ctr$table
etbl_res_hl60.vp16.VS.ctr <- tbl_res_hl60.vp16.VS.ctr
etbl_res_hl60.vp16.VS.ctr$ENSEMBL <- createLinkENS(etbl_res_hl60.vp16.VS.ctr$ENSEMBL, species =
"Homo_sapiens")
etbl_res_hl60.vp16.VS.ctr$SYMBOL <- createLinkGeneSymbol(etbl_res_hl60.vp16.VS.ctr$SYMBOL)
datatable(etbl_res_hl60.vp16.VS.ctr, caption = "HL60 - VP16 vs Control, DE genes", escape=F)
write.table(tbl_res_hl60.vp16.VS.ctr, "./edgeR_Results/DEG_Table_hl60.txt", sep = "\t", row.names = F)
# KASUMI1
tbl_res_kasumi1.vp16.VS.ctr <- res_kasumi1.vp16.VS.ctr$table
etbl_res_kasumi1.vp16.VS.ctr <- tbl_res_kasumi1.vp16.VS.ctr

110 Appendix
etbl_res_kasumi1.vp16.VS.ctr$ENSEMBL <- createLinkENS(etbl_res_kasumi1.vp16.VS.ctr$ENSEMBL, species =
"Homo_sapiens")
etbl_res_kasumi1.vp16.VS.ctr$SYMBOL <- createLinkGeneSymbol(etbl_res_kasumi1.vp16.VS.ctr$SYMBOL)
datatable(etbl_res_kasumi1.vp16.VS.ctr, caption = "KASUMI1 - VP16 vs Control, DE genes", escape=F)
write.table(tbl_res_kasumi1.vp16.VS.ctr, "./edgeR_Results/DEG_Table_kasumi1.txt", sep = "\t", row.names = F)
# MOLM13
tbl_res_molm13.vp16.VS.ctr <- res_molm13.vp16.VS.ctr$table
etbl_res_molm13.vp16.VS.ctr <- tbl_res_molm13.vp16.VS.ctr
etbl_res_molm13.vp16.VS.ctr$ENSEMBL <- createLinkENS(etbl_res_molm13.vp16.VS.ctr$ENSEMBL, species =
"Homo_sapiens")
etbl_res_molm13.vp16.VS.ctr$SYMBOL <- createLinkGeneSymbol(etbl_res_molm13.vp16.VS.ctr$SYMBOL)
datatable(etbl_res_molm13.vp16.VS.ctr, caption = "MOLM13 - VP16 vs Control, DE genes", escape=F)
write.table(tbl_res_molm13.vp16.VS.ctr, "./edgeR_Results/DEG_Table_molm13.txt", sep = "\t", row.names = F)
# MONOMAC6
tbl_res_monomac6.vp16.VS.ctr <- res_monomac6.vp16.VS.ctr$table
etbl_res_monomac6.vp16.VS.ctr <- tbl_res_monomac6.vp16.VS.ctr
etbl_res_monomac6.vp16.VS.ctr$ENSEMBL <- createLinkENS(etbl_res_monomac6.vp16.VS.ctr$ENSEMBL,
species = "Homo_sapiens")
etbl_res_monomac6.vp16.VS.ctr$SYMBOL <-
createLinkGeneSymbol(etbl_res_monomac6.vp16.VS.ctr$SYMBOL)
datatable(etbl_res_monomac6.vp16.VS.ctr, caption = "MONOMAC6 - VP16 vs Control, DE genes", escape=F)
write.table(tbl_res_monomac6.vp16.VS.ctr, "./edgeR_Results/DEG_Table_monomac6.txt", sep = "\t", row.names =
F)
# MV411
tbl_res_mv411.vp16.VS.ctr <- res_mv411.vp16.VS.ctr$table
etbl_res_mv411.vp16.VS.ctr <- tbl_res_mv411.vp16.VS.ctr
etbl_res_mv411.vp16.VS.ctr$ENSEMBL <- createLinkENS(etbl_res_mv411.vp16.VS.ctr$ENSEMBL, species =
"Homo_sapiens")
etbl_res_mv411.vp16.VS.ctr$SYMBOL <- createLinkGeneSymbol(etbl_res_mv411.vp16.VS.ctr$SYMBOL)
datatable(etbl_res_mv411.vp16.VS.ctr, caption = "MV411 - VP16 vs Control, DE genes", escape=F)
write.table(tbl_res_mv411.vp16.VS.ctr, "./edgeR_Results/DEG_Table_mv411.txt", sep = "\t", row.names = F)
# NB4
tbl_res_nb4.vp16.VS.ctr <- res_nb4.vp16.VS.ctr$table
etbl_res_nb4.vp16.VS.ctr <- tbl_res_nb4.vp16.VS.ctr
etbl_res_nb4.vp16.VS.ctr$ENSEMBL <- createLinkENS(etbl_res_nb4.vp16.VS.ctr$ENSEMBL, species =
"Homo_sapiens")
etbl_res_nb4.vp16.VS.ctr$SYMBOL <- createLinkGeneSymbol(etbl_res_nb4.vp16.VS.ctr$SYMBOL)
datatable(etbl_res_nb4.vp16.VS.ctr, caption = "NB4 - VP16 vs Control, DE genes", escape=F)
write.table(tbl_res_nb4.vp16.VS.ctr, "./edgeR_Results/DEG_Table_nb4.txt", sep = "\t", row.names = F)
# NOMO1
tbl_res_nomo1.vp16.VS.ctr <- res_nomo1.vp16.VS.ctr$table
etbl_res_nomo1.vp16.VS.ctr <- tbl_res_nomo1.vp16.VS.ctr
etbl_res_nomo1.vp16.VS.ctr$ENSEMBL <- createLinkENS(etbl_res_nomo1.vp16.VS.ctr$ENSEMBL, species =
"Homo_sapiens")
etbl_res_nomo1.vp16.VS.ctr$SYMBOL <- createLinkGeneSymbol(etbl_res_nomo1.vp16.VS.ctr$SYMBOL)
datatable(etbl_res_nomo1.vp16.VS.ctr, caption = "NOMO1 - VP16 vs Control, DE genes", escape=F)
write.table(tbl_res_nomo1.vp16.VS.ctr, "./edgeR_Results/DEG_Table_nomo1.txt", sep = "\t", row.names = F)
# OCIAML3
tbl_res_ociaml3.vp16.VS.ctr <- res_ociaml3.vp16.VS.ctr$table
etbl_res_ociaml3.vp16.VS.ctr <- tbl_res_ociaml3.vp16.VS.ctr

111 Appendix
etbl_res_ociaml3.vp16.VS.ctr$ENSEMBL <- createLinkENS(etbl_res_ociaml3.vp16.VS.ctr$ENSEMBL, species =
"Homo_sapiens")
etbl_res_ociaml3.vp16.VS.ctr$SYMBOL <- createLinkGeneSymbol(etbl_res_ociaml3.vp16.VS.ctr$SYMBOL)
datatable(etbl_res_ociaml3.vp16.VS.ctr, caption = "OCIAML3 - VP16 vs Control, DE genes", escape=F)
write.table(tbl_res_ociaml3.vp16.VS.ctr, "./edgeR_Results/DEG_Table_ociaml3.txt", sep = "\t", row.names = F)
# THP1
tbl_res_thp1.vp16.VS.ctr <- res_thp1.vp16.VS.ctr$table
etbl_res_thp1.vp16.VS.ctr <- tbl_res_thp1.vp16.VS.ctr
etbl_res_thp1.vp16.VS.ctr$ENSEMBL <- createLinkENS(etbl_res_thp1.vp16.VS.ctr$ENSEMBL, species =
"Homo_sapiens")
etbl_res_thp1.vp16.VS.ctr$SYMBOL <- createLinkGeneSymbol(etbl_res_thp1.vp16.VS.ctr$SYMBOL)
datatable(etbl_res_thp1.vp16.VS.ctr, caption = "THP1 - VP16 vs Control, DE genes", escape=F)
write.table(tbl_res_thp1.vp16.VS.ctr, "./edgeR_Results/DEG_Table_thp1.txt", sep = "\t", row.names = F)
# F36P VS MOLM13 VP16
tbl_res_f36p.vp16.VS.molm13.vp16 <- res_f36p.vp16.VS.molm13.vp16$table
etbl_res_f36p.vp16.VS.molm13.vp16 <- tbl_res_f36p.vp16.VS.molm13.vp16
etbl_res_f36p.vp16.VS.molm13.vp16$ENSEMBL <-
createLinkENS(etbl_res_f36p.vp16.VS.molm13.vp16$ENSEMBL, species = "Homo_sapiens")
etbl_res_f36p.vp16.VS.molm13.vp16$SYMBOL <-
createLinkGeneSymbol(etbl_res_f36p.vp16.VS.molm13.vp16$SYMBOL)
datatable(etbl_res_f36p.vp16.VS.molm13.vp16, caption = "F36P VS MOLM13 VP16, DE genes", escape=F)
write.table(tbl_res_f36p.vp16.VS.molm13.vp16, "./edgeR_Results/DEG_Table_f36p-vp16_VS-molm13-vp16.txt",
sep = "\t", row.names = F)
# F36P VS MOLM13 CTR
tbl_res_f36p.VS.molm13.ctr <- res_f36p.VS.molm13.ctr$table
etbl_res_f36p.VS.molm13.ctr <- tbl_res_f36p.VS.molm13.ctr
etbl_res_f36p.VS.molm13.ctr$ENSEMBL <- createLinkENS(etbl_res_f36p.VS.molm13.ctr$ENSEMBL, species =
"Homo_sapiens")
etbl_res_f36p.VS.molm13.ctr$SYMBOL <- createLinkGeneSymbol(etbl_res_f36p.VS.molm13.ctr$SYMBOL)
datatable(etbl_res_f36p.VS.molm13.ctr, caption = "F36P VS MOLM13 Control, DE genes", escape=F)
write.table(tbl_res_f36p.VS.molm13.ctr, "./edgeR_Results/DEG_Table_f36p_VS-molm13-ctr.txt", sep = "\t",
row.names = F)
# Functional interpretation
# Create annotation file
annoHuman <- import("/media/piyush/372429ff-0d6e-45d6-b529-527e3fb69028/RNA-
seq/AML_IMB_2017/Analysis/STAR/NOISeq/Gencode_v25_GRCh38.p7/gencode.v25.annotation.gtf")
cm2=data.frame(ensid=mcols(annoHuman)$gene_id,fromgtf=mcols(annoHuman)$gene_name,stringsAsFactors =
FALSE)
cm2 <- cm2[!duplicated(cm2),]
rownames(cm2) <- cm2$ensid
anno_df <- data.frame(gene_id = rownames(dds), stringsAsFactors = F)
anno_df$gene_name <- cm2$fromgtf[match(anno_df$gene_id,rownames(cm2))]
rownames(anno_df) <- anno_df$gene_id
head(anno_df)
# Create list of universally expressed genes
expressedInAssay <- (rowSums(assay(dds))>0)
geneUniverseExprENS <- rownames(dds)[expressedInAssay]
geneUniverseExpr <- anno_df$gene_name[match(geneUniverseExprENS,anno_df$gene_id)]

112 Appendix
# Use topGOtable to annotate DEGs for biological processesGObps_f36p.vp16.VS.ctr <- topGOtable(DEgenes =
res_f36p.vp16.VS.ctr$table$SYMBOL, BGgenes = geneUniverseExpr, ontology = "BP", geneID = "symbol",
addGeneToTerms = TRUE, mapping = "org.Hs.eg.db")
# F36P
GObps_f36p.vp16.VS.ctr <- topGOtable(DEgenes = res_f36p.vp16.VS.ctr$table$SYMBOL, BGgenes =
geneUniverseExpr, ontology = "BP", geneID = "symbol", addGeneToTerms = TRUE, mapping = "org.Hs.eg.db")
eGObps_f36p.vp16.VS.ctr <- GObps_f36p.vp16.VS.ctr
eGObps_f36p.vp16.VS.ctr$GO.ID <- createLinkGO(eGObps_f36p.vp16.VS.ctr$GO.ID)
eGObps_f36p.vp16.VS.ctr %>% datatable(caption = "topGO - Biological processes enriched in DE genes - F36P-
VP16 vs Control", options = list(pageLength = 20),escape = FALSE)
write.table(GObps_f36p.vp16.VS.ctr, "./edgeR_Results/topGO_BP_f36p_vp16_VS_ctr.txt", sep = "\t", row.names
= F)
# HL60
GObps_hl60.vp16.VS.ctr <- topGOtable(DEgenes = res_hl60.vp16.VS.ctr$table$SYMBOL, BGgenes =
geneUniverseExpr, ontology = "BP", geneID = "symbol", addGeneToTerms = TRUE, mapping = "org.Hs.eg.db")
eGObps_hl60.vp16.VS.ctr <- GObps_hl60.vp16.VS.ctr
eGObps_hl60.vp16.VS.ctr$GO.ID <- createLinkGO(eGObps_hl60.vp16.VS.ctr$GO.ID)
eGObps_hl60.vp16.VS.ctr %>% datatable(caption = "topGO - Biological processes enriched in DE genes - HL60-
VP16 vs Control", options = list(pageLength = 20),escape = FALSE)
write.table(GObps_hl60.vp16.VS.ctr, "./edgeR_Results/topGO_BP_hl60_vp16_VS_ctr.txt", sep = "\t", row.names =
F)
# KASUMI1
GObps_kasumi1.vp16.VS.ctr <- topGOtable(DEgenes = res_kasumi1.vp16.VS.ctr$table$SYMBOL, BGgenes =
geneUniverseExpr, ontology = "BP", geneID = "symbol", addGeneToTerms = TRUE, mapping = "org.Hs.eg.db")
eGObps_kasumi1.vp16.VS.ctr <- GObps_kasumi1.vp16.VS.ctr
eGObps_kasumi1.vp16.VS.ctr$GO.ID <- createLinkGO(eGObps_kasumi1.vp16.VS.ctr$GO.ID)
eGObps_kasumi1.vp16.VS.ctr %>% datatable(caption = "topGO - Biological processes enriched in DE genes -
KASUMI1- VP16 vs Control", options = list(pageLength = 20),escape = FALSE)
write.table(GObps_kasumi1.vp16.VS.ctr, "./edgeR_Results/topGO_BP_kasumi1_vp16_VS_ctr.txt", sep = "\t",
row.names = F)
# MOLM13
GObps_molm13.vp16.VS.ctr <- topGOtable(DEgenes = res_molm13.vp16.VS.ctr$table$SYMBOL, BGgenes =
geneUniverseExpr, ontology = "BP", geneID = "symbol", addGeneToTerms = TRUE, mapping = "org.Hs.eg.db")
eGObps_molm13.vp16.VS.ctr <- GObps_molm13.vp16.VS.ctr
eGObps_molm13.vp16.VS.ctr$GO.ID <- createLinkGO(eGObps_molm13.vp16.VS.ctr$GO.ID)
eGObps_molm13.vp16.VS.ctr %>% datatable(caption = "topGO - Biological processes enriched in DE genes -
MOLM13- VP16 vs Control", options = list(pageLength = 20),escape = FALSE)
write.table(GObps_molm13.vp16.VS.ctr, "./edgeR_Results/topGO_BP_molm13_vp16_VS_ctr.txt", sep = "\t",
row.names = F)
# MONOMAC6
GObps_monomac6.vp16.VS.ctr <- topGOtable(DEgenes = res_monomac6.vp16.VS.ctr$table$SYMBOL, BGgenes
= geneUniverseExpr, ontology = "BP", geneID = "symbol", addGeneToTerms = TRUE, mapping = "org.Hs.eg.db")
eGObps_monomac6.vp16.VS.ctr <- GObps_monomac6.vp16.VS.ctr
eGObps_monomac6.vp16.VS.ctr$GO.ID <- createLinkGO(eGObps_monomac6.vp16.VS.ctr$GO.ID)
eGObps_monomac6.vp16.VS.ctr %>% datatable(caption = "topGO - Biological processes enriched in DE genes -
MONOMAC6- VP16 vs Control", options = list(pageLength = 20),escape = FALSE)
write.table(GObps_monomac6.vp16.VS.ctr, "./edgeR_Results/topGO_BP_monomac6_vp16_VS_ctr.txt", sep = "\t",
row.names = F)
# MV411
GObps_mv411.vp16.VS.ctr <- topGOtable(DEgenes = res_mv411.vp16.VS.ctr$table$SYMBOL, BGgenes =
geneUniverseExpr, ontology = "BP", geneID = "symbol", addGeneToTerms = TRUE, mapping = "org.Hs.eg.db")

113 Appendix
eGObps_mv411.vp16.VS.ctr <- GObps_mv411.vp16.VS.ctr
eGObps_mv411.vp16.VS.ctr$GO.ID <- createLinkGO(eGObps_mv411.vp16.VS.ctr$GO.ID)
eGObps_mv411.vp16.VS.ctr %>% datatable(caption = "topGO - Biological processes enriched in DE genes -
MV411- VP16 vs Control", options = list(pageLength = 20),escape = FALSE)
write.table(GObps_mv411.vp16.VS.ctr, "./edgeR_Results/topGO_BP_mv411_vp16_VS_ctr.txt", sep = "\t",
row.names = F)
# NB4
GObps_nb4.vp16.VS.ctr <- topGOtable(DEgenes = res_nb4.vp16.VS.ctr$table$SYMBOL, BGgenes =
geneUniverseExpr, ontology = "BP", geneID = "symbol", addGeneToTerms = TRUE, mapping = "org.Hs.eg.db")
eGObps_nb4.vp16.VS.ctr <- GObps_nb4.vp16.VS.ctr
eGObps_nb4.vp16.VS.ctr$GO.ID <- createLinkGO(eGObps_nb4.vp16.VS.ctr$GO.ID)
eGObps_nb4.vp16.VS.ctr %>% datatable(caption = "topGO - Biological processes enriched in DE genes - NB4-
VP16 vs Control", options = list(pageLength = 20),escape = FALSE)
write.table(GObps_nb4.vp16.VS.ctr, "./edgeR_Results/topGO_BP_nb4_vp16_VS_ctr.txt", sep = "\t", row.names =
F)
# NOMO1
GObps_nomo1.vp16.VS.ctr <- topGOtable(DEgenes = res_nomo1.vp16.VS.ctr$table$SYMBOL, BGgenes =
geneUniverseExpr, ontology = "BP", geneID = "symbol", addGeneToTerms = TRUE, mapping = "org.Hs.eg.db")
eGObps_nomo1.vp16.VS.ctr <- GObps_nomo1.vp16.VS.ctr
eGObps_nomo1.vp16.VS.ctr$GO.ID <- createLinkGO(eGObps_nomo1.vp16.VS.ctr$GO.ID)
eGObps_nomo1.vp16.VS.ctr %>% datatable(caption = "topGO - Biological processes enriched in DE genes -
NOMO1- VP16 vs Control", options = list(pageLength = 20),escape = FALSE)
write.table(GObps_nomo1.vp16.VS.ctr, "./edgeR_Results/topGO_BP_nomo1_vp16_VS_ctr.txt", sep = "\t",
row.names = F)
# OCIAML3
GObps_ociaml3.vp16.VS.ctr <- topGOtable(DEgenes = res_ociaml3.vp16.VS.ctr$table$SYMBOL, BGgenes =
geneUniverseExpr, ontology = "BP", geneID = "symbol", addGeneToTerms = TRUE, mapping = "org.Hs.eg.db")
eGObps_ociaml3.vp16.VS.ctr <- GObps_ociaml3.vp16.VS.ctr
eGObps_ociaml3.vp16.VS.ctr$GO.ID <- createLinkGO(eGObps_ociaml3.vp16.VS.ctr$GO.ID)
eGObps_ociaml3.vp16.VS.ctr %>% datatable(caption = "topGO - Biological processes enriched in DE genes -
OCIAML3- VP16 vs Control", options = list(pageLength = 20),escape = FALSE)
write.table(GObps_ociaml3.vp16.VS.ctr, "./edgeR_Results/topGO_BP_ociaml3_vp16_VS_ctr.txt", sep = "\t",
row.names = F)
# THP1
GObps_thp1.vp16.VS.ctr <- topGOtable(DEgenes = res_thp1.vp16.VS.ctr$table$SYMBOL, BGgenes =
geneUniverseExpr, ontology = "BP", geneID = "symbol", addGeneToTerms = TRUE, mapping = "org.Hs.eg.db")
eGObps_thp1.vp16.VS.ctr <- GObps_thp1.vp16.VS.ctr
eGObps_thp1.vp16.VS.ctr$GO.ID <- createLinkGO(eGObps_thp1.vp16.VS.ctr$GO.ID)
eGObps_thp1.vp16.VS.ctr %>% datatable(caption = "topGO - Biological processes enriched in DE genes - THP1-
VP16 vs Control", options = list(pageLength = 20),escape = FALSE)
write.table(GObps_thp1.vp16.VS.ctr, "./edgeR_Results/topGO_BP_thp1_vp16_VS_ctr.txt", sep = "\t", row.names =
F)
# F36P VS MOLM13 VP16
GObps_f36p.vp16.VS.molm13.vp16 <- topGOtable(DEgenes = res_f36p.vp16.VS.molm13.vp16$table$SYMBOL,
BGgenes = geneUniverseExpr, ontology = "BP", geneID = "symbol", addGeneToTerms = TRUE, mapping =
"org.Hs.eg.db")
eGObps_f36p.vp16.VS.molm13.vp16 <- GObps_f36p.vp16.VS.molm13.vp16
eGObps_f36p.vp16.VS.molm13.vp16$GO.ID <- createLinkGO(eGObps_f36p.vp16.VS.molm13.vp16$GO.ID)
eGObps_f36p.vp16.VS.molm13.vp16 %>% datatable(caption = "topGO - Biological processes enriched in DE
genes - F36P-VP16 VS MOLM13-VP16", options = list(pageLength = 20),escape = FALSE)

114 Appendix
write.table(GObps_f36p.vp16.VS.molm13.vp16, "./edgeR_Results/topGO_BP_f36p-vp16_VS_molm13-vp16.txt",
sep = "\t", row.names = F)
# F36P VS MOLM13 CTR
GObps_f36p.VS.molm13.ctr <- topGOtable(DEgenes = res_f36p.VS.molm13.ctr$table$SYMBOL, BGgenes =
geneUniverseExpr, ontology = "BP", geneID = "symbol", addGeneToTerms = TRUE, mapping = "org.Hs.eg.db")
eGObps_f36p.VS.molm13.ctr <- GObps_f36p.VS.molm13.ctr
eGObps_f36p.VS.molm13.ctr$GO.ID <- createLinkGO(eGObps_f36p.VS.molm13.ctr$GO.ID)
eGObps_f36p.VS.molm13.ctr %>% datatable(caption = "topGO - Biological processes enriched in DE genes - F36P
VS MOLM13 Control", options = list(pageLength = 20),escape = FALSE)
write.table(GObps_f36p.VS.molm13.ctr, "./edgeR_Results/topGO_BP_f36p_VS_molm13-control.txt", sep = "\t",
row.names = F)
# remove NA values in ENTREZ and SYMBOL field
deg_table_f36p <- data.frame(tbl_res_f36p.vp16.VS.ctr[complete.cases(tbl_res_f36p.vp16.VS.ctr[,2:3]),])
deg_table_hl60 <- data.frame(tbl_res_hl60.vp16.VS.ctr[complete.cases(tbl_res_hl60.vp16.VS.ctr[,2:3]),])
deg_table_kasumi1 <-
data.frame(tbl_res_kasumi1.vp16.VS.ctr[complete.cases(tbl_res_kasumi1.vp16.VS.ctr[,2:3]),])
deg_table_molm13 <-
data.frame(tbl_res_molm13.vp16.VS.ctr[complete.cases(tbl_res_molm13.vp16.VS.ctr[,2:3]),])
deg_table_monomac6 <-
data.frame(tbl_res_monomac6.vp16.VS.ctr[complete.cases(tbl_res_monomac6.vp16.VS.ctr[,2:3]),])
deg_table_mv411 <- data.frame(tbl_res_mv411.vp16.VS.ctr[complete.cases(tbl_res_mv411.vp16.VS.ctr[,2:3]),])
deg_table_nb4 <- data.frame(tbl_res_nb4.vp16.VS.ctr[complete.cases(tbl_res_nb4.vp16.VS.ctr[,2:3]),])
deg_table_nomo1 <- data.frame(tbl_res_nomo1.vp16.VS.ctr[complete.cases(tbl_res_nomo1.vp16.VS.ctr[,2:3]),])
deg_table_ociaml3 <- data.frame(tbl_res_ociaml3.vp16.VS.ctr[complete.cases(tbl_res_ociaml3.vp16.VS.ctr[,2:3]),])
deg_table_thp1 <- data.frame(tbl_res_thp1.vp16.VS.ctr[complete.cases(tbl_res_thp1.vp16.VS.ctr[,2:3]),])
# DEG statistics
deg_stat <- data.frame("Total_DEG" = c(length(deg_table_f36p$SYMBOL), length(deg_table_hl60$SYMBOL),
length(deg_table_kasumi1$SYMBOL), length(deg_table_molm13$SYMBOL),
length(deg_table_monomac6$SYMBOL), length(deg_table_mv411$SYMBOL), length(deg_table_nb4$SYMBOL),
length(deg_table_nomo1$SYMBOL), length(deg_table_ociaml3$SYMBOL), length(deg_table_thp1$SYMBOL)),
"UP" = c(length(which(deg_table_f36p$logFC >= 1)), length(which(deg_table_hl60$logFC >= 1)),
length(which(deg_table_kasumi1$logFC >= 1)), length(which(deg_table_molm13$logFC >= 1)),
length(which(deg_table_monomac6$logFC >= 1)), length(which(deg_table_mv411$logFC >= 1)),
length(which(deg_table_nb4$logFC >= 1)), length(which(deg_table_nomo1$logFC >= 1)),
length(which(deg_table_ociaml3$logFC >= 1)), length(which(deg_table_thp1$logFC >= 1))), "DOWN" =
c(length(which(deg_table_f36p$logFC <= 1)), length(which(deg_table_hl60$logFC <= 1)),
length(which(deg_table_kasumi1$logFC <= 1)), length(which(deg_table_molm13$logFC <= 1)),
length(which(deg_table_monomac6$logFC <= 1)), length(which(deg_table_mv411$logFC <= 1)),
length(which(deg_table_nb4$logFC <= 1)), length(which(deg_table_nomo1$logFC <= 1)),
length(which(deg_table_ociaml3$logFC <= 1)), length(which(deg_table_thp1$logFC <= 1))))
deg_stat$"%_Up" <- round(((deg_stat$UP / deg_stat$Total_DEG) * 100), digits = 2)
deg_stat$"%_Down" <- round(((deg_stat$DOWN / deg_stat$Total_DEG) * 100), digits = 2)
rownames(deg_stat) <- c("F36-P", "HL-60", "KASUMI-1", "MOLM-13", "MONO-MAC-6", "MV-4-11", "NB-4",
"NOMO-1", "OCI-AML3", "THP-1")
deg_stat$"VP16-IC50 (µM)" <- c(98.81, 0.74, 6.80, 0.39, 4.39, 1.33, 0.50, 1.65, 1.00, 1.01)
deg_stat %>% datatable(caption = "DEG statistics (VP16 VS Control)", escape = F)
deg_table_UP_f36p <- data.frame(deg_table_f36p[which(deg_table_f36p$logFC >= 1),])
deg_table_DOWN_f36p <- data.frame(deg_table_f36p[which(deg_table_f36p$logFC <= 1),])
deg_table_UP_hl60 <- data.frame(deg_table_hl60[which(deg_table_hl60$logFC >= 1),])
deg_table_DOWN_hl60 <- data.frame(deg_table_hl60[which(deg_table_hl60$logFC <= 1),])
deg_table_UP_kasumi1 <- data.frame(deg_table_kasumi1[which(deg_table_kasumi1$logFC >= 1),])
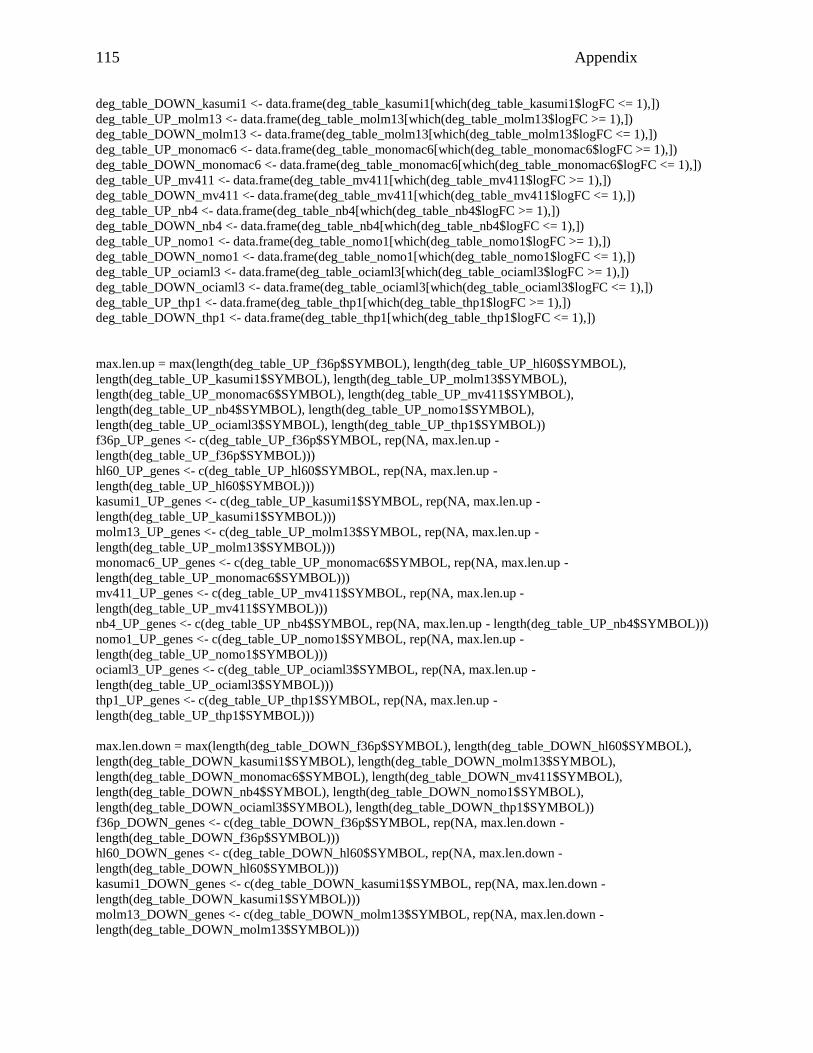
115 Appendix
deg_table_DOWN_kasumi1 <- data.frame(deg_table_kasumi1[which(deg_table_kasumi1$logFC <= 1),])
deg_table_UP_molm13 <- data.frame(deg_table_molm13[which(deg_table_molm13$logFC >= 1),])
deg_table_DOWN_molm13 <- data.frame(deg_table_molm13[which(deg_table_molm13$logFC <= 1),])
deg_table_UP_monomac6 <- data.frame(deg_table_monomac6[which(deg_table_monomac6$logFC >= 1),])
deg_table_DOWN_monomac6 <- data.frame(deg_table_monomac6[which(deg_table_monomac6$logFC <= 1),])
deg_table_UP_mv411 <- data.frame(deg_table_mv411[which(deg_table_mv411$logFC >= 1),])
deg_table_DOWN_mv411 <- data.frame(deg_table_mv411[which(deg_table_mv411$logFC <= 1),])
deg_table_UP_nb4 <- data.frame(deg_table_nb4[which(deg_table_nb4$logFC >= 1),])
deg_table_DOWN_nb4 <- data.frame(deg_table_nb4[which(deg_table_nb4$logFC <= 1),])
deg_table_UP_nomo1 <- data.frame(deg_table_nomo1[which(deg_table_nomo1$logFC >= 1),])
deg_table_DOWN_nomo1 <- data.frame(deg_table_nomo1[which(deg_table_nomo1$logFC <= 1),])
deg_table_UP_ociaml3 <- data.frame(deg_table_ociaml3[which(deg_table_ociaml3$logFC >= 1),])
deg_table_DOWN_ociaml3 <- data.frame(deg_table_ociaml3[which(deg_table_ociaml3$logFC <= 1),])
deg_table_UP_thp1 <- data.frame(deg_table_thp1[which(deg_table_thp1$logFC >= 1),])
deg_table_DOWN_thp1 <- data.frame(deg_table_thp1[which(deg_table_thp1$logFC <= 1),])
max.len.up = max(length(deg_table_UP_f36p$SYMBOL), length(deg_table_UP_hl60$SYMBOL),
length(deg_table_UP_kasumi1$SYMBOL), length(deg_table_UP_molm13$SYMBOL),
length(deg_table_UP_monomac6$SYMBOL), length(deg_table_UP_mv411$SYMBOL),
length(deg_table_UP_nb4$SYMBOL), length(deg_table_UP_nomo1$SYMBOL),
length(deg_table_UP_ociaml3$SYMBOL), length(deg_table_UP_thp1$SYMBOL))
f36p_UP_genes <- c(deg_table_UP_f36p$SYMBOL, rep(NA, max.len.up -
length(deg_table_UP_f36p$SYMBOL)))
hl60_UP_genes <- c(deg_table_UP_hl60$SYMBOL, rep(NA, max.len.up -
length(deg_table_UP_hl60$SYMBOL)))
kasumi1_UP_genes <- c(deg_table_UP_kasumi1$SYMBOL, rep(NA, max.len.up -
length(deg_table_UP_kasumi1$SYMBOL)))
molm13_UP_genes <- c(deg_table_UP_molm13$SYMBOL, rep(NA, max.len.up -
length(deg_table_UP_molm13$SYMBOL)))
monomac6_UP_genes <- c(deg_table_UP_monomac6$SYMBOL, rep(NA, max.len.up -
length(deg_table_UP_monomac6$SYMBOL)))
mv411_UP_genes <- c(deg_table_UP_mv411$SYMBOL, rep(NA, max.len.up -
length(deg_table_UP_mv411$SYMBOL)))
nb4_UP_genes <- c(deg_table_UP_nb4$SYMBOL, rep(NA, max.len.up - length(deg_table_UP_nb4$SYMBOL)))
nomo1_UP_genes <- c(deg_table_UP_nomo1$SYMBOL, rep(NA, max.len.up -
length(deg_table_UP_nomo1$SYMBOL)))
ociaml3_UP_genes <- c(deg_table_UP_ociaml3$SYMBOL, rep(NA, max.len.up -
length(deg_table_UP_ociaml3$SYMBOL)))
thp1_UP_genes <- c(deg_table_UP_thp1$SYMBOL, rep(NA, max.len.up -
length(deg_table_UP_thp1$SYMBOL)))
max.len.down = max(length(deg_table_DOWN_f36p$SYMBOL), length(deg_table_DOWN_hl60$SYMBOL),
length(deg_table_DOWN_kasumi1$SYMBOL), length(deg_table_DOWN_molm13$SYMBOL),
length(deg_table_DOWN_monomac6$SYMBOL), length(deg_table_DOWN_mv411$SYMBOL),
length(deg_table_DOWN_nb4$SYMBOL), length(deg_table_DOWN_nomo1$SYMBOL),
length(deg_table_DOWN_ociaml3$SYMBOL), length(deg_table_DOWN_thp1$SYMBOL))
f36p_DOWN_genes <- c(deg_table_DOWN_f36p$SYMBOL, rep(NA, max.len.down -
length(deg_table_DOWN_f36p$SYMBOL)))
hl60_DOWN_genes <- c(deg_table_DOWN_hl60$SYMBOL, rep(NA, max.len.down -
length(deg_table_DOWN_hl60$SYMBOL)))
kasumi1_DOWN_genes <- c(deg_table_DOWN_kasumi1$SYMBOL, rep(NA, max.len.down -
length(deg_table_DOWN_kasumi1$SYMBOL)))
molm13_DOWN_genes <- c(deg_table_DOWN_molm13$SYMBOL, rep(NA, max.len.down -
length(deg_table_DOWN_molm13$SYMBOL)))

116 Appendix
monomac6_DOWN_genes <- c(deg_table_DOWN_monomac6$SYMBOL, rep(NA, max.len.down -
length(deg_table_DOWN_monomac6$SYMBOL)))
mv411_DOWN_genes <- c(deg_table_DOWN_mv411$SYMBOL, rep(NA, max.len.down -
length(deg_table_DOWN_mv411$SYMBOL)))
nb4_DOWN_genes <- c(deg_table_DOWN_nb4$SYMBOL, rep(NA, max.len.down -
length(deg_table_DOWN_nb4$SYMBOL)))
nomo1_DOWN_genes <- c(deg_table_DOWN_nomo1$SYMBOL, rep(NA, max.len.down -
length(deg_table_DOWN_nomo1$SYMBOL)))
ociaml3_DOWN_genes <- c(deg_table_DOWN_ociaml3$SYMBOL, rep(NA, max.len.down -
length(deg_table_DOWN_ociaml3$SYMBOL)))
thp1_DOWN_genes <- c(deg_table_DOWN_thp1$SYMBOL, rep(NA, max.len.down -
length(deg_table_DOWN_thp1$SYMBOL)))
deg_table_UP_ALL <- data.frame(F36P = f36p_UP_genes, HL60 = hl60_UP_genes, KASUMI1 =
kasumi1_UP_genes, MOLM13 = molm13_UP_genes, MONOMAC6 = monomac6_UP_genes, MV411 =
mv411_UP_genes, NB4 = nb4_UP_genes, NOMO1 = nomo1_UP_genes, OCIAML3 = ociaml3_UP_genes, THP1 =
thp1_UP_genes)
deg_table_DOWN_ALL <- data.frame(F36P = f36p_DOWN_genes, HL60 = hl60_DOWN_genes, KASUMI1 =
kasumi1_DOWN_genes, MOLM13 = molm13_DOWN_genes, MONOMAC6 = monomac6_DOWN_genes,
MV411 = mv411_DOWN_genes, NB4 = nb4_DOWN_genes, NOMO1 = nomo1_DOWN_genes, OCIAML3 =
ociaml3_DOWN_genes, THP1 = thp1_DOWN_genes)
tab_UP <- table(unlist(deg_table_UP_ALL))
tab_DOWN <- table(unlist(deg_table_DOWN_ALL))
write.table(as.data.frame(tab_UP), "./edgeR_Results/AML_UP_DEG_ALL.txt", sep = "\t", row.names = F)
write.table(as.data.frame(tab_DOWN), "./edgeR_Results/AML_DOWN_DEG_ALL.txt", sep = "\t", row.names = F)
View(as.data.frame(tab[tab > 1]))
sessionInfo()
# Save R session
save.image("./edgeR_Results/AML_RNA-Seq_2017_edgeR.RData")

117 Appendix
Scientific publication
More P., Goedtel-Armbrust U, Shah V., Mathaes M., Kindler T., Andrade-Navarro M. A., and
Wojnowski L. “Drivers of topoisomerase II poisoning mimic and complement cytotoxicity in
AML cells.” (submitted)
Congress contributions
More P., Gödtel-Armbrust U., Wojnowski L. “Specific effectors of topoisomerase II poisons
contribute to cytotoxicity in AML cell lines.” The FEBS Congress 2018, 9th July 2018, Prague,
Czech Republic. (Poster presentation – outstanding poster in molecular oncology award)
More P., GödtelArmbrust U., Shah V., Kindler T., Andrade M., and Wojnowski L. “Smart
transcriptional effectors of etoposide contribute to cytotoxicity in AML cell lines.” UCT Science
Day, 6th September 2018, University Medical Center, Mainz, Germany. (Poster presentation)
More P. “Transcriptional effectors of etoposide contribute to cytotoxicity in AML”. TransMed
Christmas Colloquium, 12th December 2018, University Medical Center, Mainz, Germany. (Oral
presentation)
More P., GödtelArmbrust U., Shah V., Mathaes M, Kindler T., Andrade M., and Wojnowski L.
“Transcriptional effectors of etoposide contribute to cytotoxicity in AML cell lines”. 4th German
Pharm-Tox Summit: DGPT 2019, 26th February 2019, Stuttgart, Germany. (Oral presentation)
Copyright © 2022 FDOKUMEN