DfID Improving efficient woody biomass energy production ...
REGULAR ARTICLE
Relationships between leaf morphological traits, nutrientconcentrations and isotopic signatures for Mediterraneanwoody plant species and communities
María T. Domínguez & Cristina Aponte &
Ignacio M. Pérez-Ramos & Luis V. García &
Rafael Villar & Teodoro Marañón
Received: 15 September 2011 /Accepted: 11 March 2012 /Published online: 27 March 2012# Springer Science+Business Media B.V. 2012
AbstractBackground and aims Soil factors are driving forcesthat influence spatial distribution and functional traitsof plant species. We test whether two anchor mor-phological traits—leaf mass per area (LMA) and leafdry matter content (LDMC)—are significantly relat-ed to a broad range of leaf nutrient concentrations inMediterranean woody plant species. We also explore
the main environmental filters (light availability, soilmoisture and soil nutrients) that determine the pat-terns of these functional traits in a forest stand.Methods Four morphological and 19 chemical leaftraits (macronutrients and trace elements and δ13Cand δ15N signatures) were analysed in 17 woody plantspecies. Community-weighted leaf traits were calcu-lated for 57 plots within the forest. Links betweenLMA, LDMC and other leaf traits were analysed atthe species and the community level using standar-dised major axis (SMA) regressionsResults LMA and LDMC were significantly related tomany leaf nutrient concentrations, but only when us-ing abundance-weighted values at community level.Among-traits links were much weaker for the cross-species analysis. Nitrogen isotopic signatures wereuseful to understand different resource-use strategies.Community-weighted LMA and LDMC were nega-tively related to light availability, contrary to what wasexpected.Conclusion Community leaf traits have parallel shiftsalong the environmental factors that determine thecommunity assembly, even though they are weaklyrelated across individual taxa. Light availability isthe main environmental factor determining this con-vergence of the community leaf traits.
Keywords Community weighted means . Functionaltraits . Leaf dry matter content . Leaf mass perarea .Macronutrients . Specific leaf area . Isotopes
Plant Soil (2012) 357:407–424DOI 10.1007/s11104-012-1214-7
Responsible Editor: Hans Lambers.
Electronic supplementary material The online version of thisarticle (doi:10.1007/s11104-012-1214-7) containssupplementary material, which is available to authorized users.
M. T. Domínguez :C. Aponte : I. M. Pérez-Ramos :L. V. García : T. Marañón (*)Instituto de Recursos Naturales y Agrobiología de Sevilla,IRNAS, CSIC,PO Box 1052, 41080 Seville, Spaine-mail: [email protected]
R. VillarÁrea de Ecología, Edificio Celestino Mutis,Campus de Rabanales, Universidad de Córdoba,14071 Córdoba, Spain
Present Address:M. T. DomínguezCentre for Ecology and Hydrology,Environment Centre Wales,Deiniol Road,Bangor, Gwynedd LL57 2UW, UK

Introduction
The evolutionary radiation of vascular plants has pro-vided a wide variety of leaf shapes and structures for afew common functions of intercepting light, fixingcarbon and regulating water balance. Global patternsof leaf traits have been mostly related with climaticpatterns (Wright et al. 2004a, 2005) but recent studieshave remarked the importance of edaphic factors asdriving forces determining plant functional traits(Holdaway et al. 2011; Lambers et al. 2010).
Leaf traits are related among them by causal relation-ships that limit their possible combinations and imposetheir covariation with the result of trade-offs amongfunctionally distinct traits (Cornelissen et al. 1999;Meziane and Shipley 2001; Shipley et al. 2006).Among leaf traits, the leaf mass per area (LMA)—orits inversed value, specific leaf area (SLA)—has beenfrequently used as an indicator of differential functionalstrategies in plant species (Coley 1988; Cornelissen etal. 1999; Reich et al. 1991, 1998; Wright et al. 2004a).Two opposite functional strategies can be distinguishedfrom the range of trait variation that defines the leafeconomics spectrum (Diaz et al. 2004; Wright et al.2004). At one extreme, stand species with a conserva-tive resource-use strategy usually showing high valuesof LMA, high-density tissues, low leaf-N concentrationand long leaf-life span (Coley 1988; Reich et al. 1991,1998; Villar et al. 2006), that allow them to increasecompetitive abilities in dry and nutrient-poor environ-ments (Aerts 1995; Hobbie 1992). In contrast, specieswith a predominant resource-acquisition strategy haveopposite attributes commonly associated to rapid re-source capture and high relative growth rate (Diaz etal. 2004; Poorter and Garnier 1999; Ruíz-Robleto andVillar 2005;Wright andWestoby 2001), that allow themto be more dominant in moist and fertile areas (Grime etal. 1997; Reich et al. 1999).
Cross-species analyses at global-scale have demon-strated that LMA, N and P leaf concentrations, andphotosynthetic capacity are strongly inter-correlated(Poorter et al. 2009; Wright et al. 2004a). However,multivariate analyses of leaf composition have shownthat the N and P variation trend (so-called nucleic acid-protein set of elements) differs from the trend for otherelements such as Ca, K and Mg, which have predomi-nant structural and enzymatic functions (Aponte et al.2011; Garten 1978; Watanabe et al. 2007). The differ-ences among species in nutrient requirements, not only
of N and P, but also of Ca, K, Mg and micronutrientssuch as Mo, Fe and Cu, may favour their coexistence byseparation of their biogeochemical niches (sensuPeñuelas et al. 2008, 2011).
Although most studies have used LMA as the anchortrait (sensu Ackerly 2004), leaf dry matter content(LDMC, dry leaf mass per water-saturated fresh leafmass) has proved to be an equally or more importanttrait. LDMC is linked to the leaf protein concentrationand cytoplasmic volume, and therefore to plant metab-olism (Wilson et al. 1999). It can determine the above-ground primary productivity and the digestibility of theleaf (Pontes et al. 2007), the decomposability of the litter(Garnier et al. 2004), and sometimes it can be bettercorrelated with soil fertility than LMA (Hodgson et al.2011; Rusch et al. 2009). However, very few workshave analysed the relationships between LDMC and abroad range of leaf nutrient concentrations.
Isotopic signatures (expressed as N and C isotoperatios) also provide useful information to characterizedifferent strategies of resource acquisition in plants. Theleaf N isotopic signature integrates different factorsinvolved in N acquisition, such as the source and thesoil depth fromwhich N is taken up, the association withmycorrhizal and symbiotic microorganisms, and thewithin-plant processes of N transport and assimilation(Högberg 1997). The type of mycorrhizal interactionlargely explains the differences in δ15N among plantsat a global scale (Craine et al. 2009), as well as amongcoexisting species at the community scale (Hobbie et al.2000). Ericoid and ectomycorrhizal strategies, which areusually related to low leaf δ15N values (Craine et al.2009; Kranabetter and MacKenzie 2010), are linked toresource-conservation attributes, such as low plantgrowth rates, low foliar nutrient concentrations and poorlitter decomposability (Cornelissen et al. 2001; Meers etal. 2010). Negative δ15N values in leaves may be indic-ative of a high dependence on mycorrhizal interactionsfor N uptake, which is increased under low soil Navailability (Hobbie et al. 1999, 2000). The linkagesbetween leaf δ15N values and other leaf traits remainlargely untested. In contrast, the well-known relation-ship between δ13C and water use efficiency (Farquhar etal. 1989) has promoted the frequent use of this isotopicsignature to detect functional trait syndromes (e.g.,Escudero et al. 2008; Lamont et al. 2002).
Most studies on leaf traits have been carried out atthe species level (by comparing simple averages oftraits by species). To scale up from the species to the
408 Plant Soil (2012) 357:407–424

community level, recent studies have incorporated theuse of community-weighted-means (Díaz et al. 2007;Violle et al. 2007), where functional traits are weight-ed by the relative abundance of each of the dominantconstituting species. These community-aggregatedvalues are particularly helpful to study the responseof traits to environmental factors, and to explore thelinks between traits and ecosystem processes and serv-ices (Garnier et al. 2004). The environmental factorsdetermine how species replace each other, and thus,how different the weighted averages are across thestudied plots. A close link between traits at the com-munity level would suggest that the environmentalfilters that determine such community assembly pro-mote the convergence of certain individual traits inthat community. Since dominant species tend to haveleaf trait values better linked to their environmentsthan less abundant species, we expect to find strongerassociations among traits and a clearer response of traitsto environmental factors when using the abundance-weighted approach, rather than when using the averagetrait value for the species pool in the community(Ackerly et al. 2002; Cingolani et al. 2005, 2007).
In this study we explored the spectrum of leaf traits(mainly LMA and LDMC) and their relationships withnutrient concentrations and isotopic signatures in aMediterranean woodland, testing these relationshipsat both the species and the community level. Wepursued two particular objectives: first, we analysedthe relationships between LMA, LDMC and severalnutritional traits: leaf concentrations of macro- andmicronutrients, non-essential trace elements, and Cand N isotopes. Our hypothesis was that species witha marked resource-acquisition strategy (i.e., with lowvalues of LMA) will exhibit: i) higher nutrient leafconcentrations, especially for those nutrients with aprevalent photosynthetic function; ii) a lower depen-dence on mycorrhizal interactions for N-uptake (i.e.,higher leaf 15N values); and iii) a reduced water-useefficiency (i.e., lower 13C values). We tested whetherthe links among traits at the species level (whichwould reflect the evolutionary covariation of traits ina species pool) are similar to those links at the com-munity level (which would reflect the convergence oftraits promoted by the environmental filters).
Second, we studied the changes in communityweighted and unweighted means of LMA, LDMCand nutrient-related leaf traits along a broad and het-erogeneous range of environmental conditions in order
to identify the main abiotic factors structuring thosepatterns (light, soil water and soil fertility). The generalhypothesis here was that the dominance of the species inthe community is more strongly filtered by the abioticfactors than the presence/absence of individual taxa in aspecies pool. Thus the abundance-weighted traits areexpected to show higher relationships with the environ-mental factors than the unweighted (based on presence/absence) traits. In particular, the community-weightedLMA and LDMC values are expected to decrease withincreasing forest canopy density (lower light) as well aswith increasing nutrient and water availability in soil,due to a higher proportion of species with a predominantresource-acquisition strategy.
Material and methods
Study area, species selection and sampling design
The study area is located in the Aljibe Mountains, aprotected mixed oak forest area in southern Spain. Theclimate is of a sub-humidMediterranean type with mild,wet winters alternating with hot, dry summers and mostrainfall (95 %) occurring from October to May. Thebedrock is dominated by Oligo-Miocene sandstoneand produces acidic, nutrient-poor soils, which are fre-quently interspersed with layers of marl sediments,yielding soils richer in clay (Haploxererts, Soil SurveyStaff 2006). The vegetation is dominated by the ever-green cork oak (Q. suber L.) mixed with the winter-deciduous Algerian oak (Q. canariensis Willd.), whichis locally abundant in the valley bottoms (Urbieta et al.2008). The study was conducted in a forest stand (LaSauceda; 36° 31′ 54″N, 5° 34′ 29″ W) located at analtitude of 530–560 m on a NW facing slope. The meanannual temperature is 15.5 °C, and the mean annualrainfall is 1470 mm. Tree density in the stand is rela-tively low, with 219 stems ha−1 and a basal area of22 m2 ha−1 (see more details about the forest site inPérez-Ramos et al. 2008 and Quilchano et al. 2008).
To represent the dominant vegetation of the studiedmixed-oak forest, we selected seventeen woody plantspecies, including the dominant oak tree species (Q.suber and Q. canariensis) and the most abundantshrubs and vines in the understorey (Table 1). Theywere also selected to cover the widest variability ofleaf traits in the area. Nomenclature follows Valdés etal. (1987), with the exception of Teline linifolia
Plant Soil (2012) 357:407–424 409
(Talavera and Gibbs 1999). In late spring 2008, duringthe peak of vegetative growth, 32 plots (3×3 m) wereset up within the forest site covering a wide range ofenvironmental conditions. In each plot, one healthyadult of each of the most dominant woody plant spe-cies was collected for leaf trait measurements, makinga total of 85 individuals (five per species) distributedamong the 32 plots. For each selected individual, wecollected at least two branches with young, fully ex-panded leaves from those parts of the plant with thehighest light exposure. The branches were placed inplastic bags and transported in a chilled, dark contain-er to the laboratory, where the plants were stored indarkness at 15 °C with the stem bases submerged inwater for at least 12 h to fully rehydrate the leaves.
Each of these 32 plots was characterised by analysingsoil samples (0–25 cm depth) for physical and chemicalproperties. Soil texture was determined by the Bouyoucoshydrometer method; pH was measured in a 1:2.5 soil:water suspension; soil organic matter was determined by
combustion at 450 °C and total N was determined byKjeldahl digestion. Available Pwas estimated by the Braymethod; Ca, K and Mg were extracted with 1 M ammo-nium acetate and determined by atomic absorption spec-trophotometry. The availability of micronutrients (Cu, Fe,Mn and Zn) and S was determined using an EDTAsolution and analysed by ICP-OES (inductively coupledplasma optical emission spectrophotometry; ThermoJarrell Ash Corporation, Franklin, Massachusetts, USA).See details on methods for soil analyses in Sparks (1996)and a data summary in Table S1.
Leaf trait measurements
Morphological traits All leaf measurements were con-ducted following the criteria defined by Cornelissen etal. (2003). Five rehydrated and fully expanded youngleaves per individual were harvested and weighed toobtain the lamina and petiole fresh mass. Leaf thickness(average of three measurements per leaf) was measured
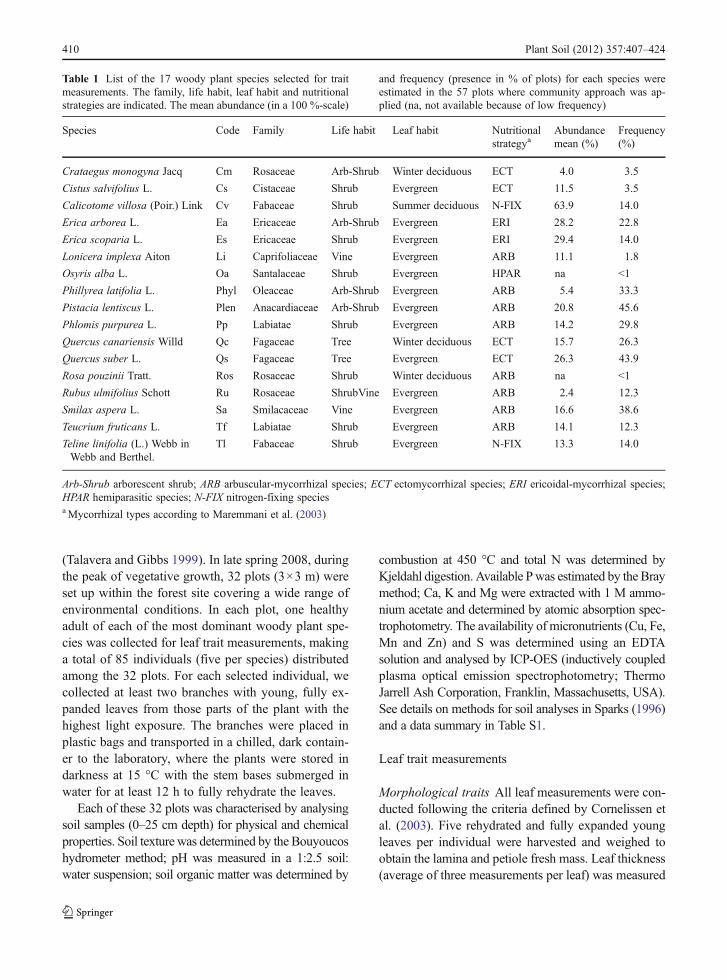
Table 1 List of the 17 woody plant species selected for traitmeasurements. The family, life habit, leaf habit and nutritionalstrategies are indicated. The mean abundance (in a 100 %-scale)
and frequency (presence in % of plots) for each species wereestimated in the 57 plots where community approach was ap-plied (na, not available because of low frequency)
Species Code Family Life habit Leaf habit Nutritionalstrategya
Abundancemean (%)
Frequency(%)
Crataegus monogyna Jacq Cm Rosaceae Arb-Shrub Winter deciduous ECT 4.0 3.5
Cistus salvifolius L. Cs Cistaceae Shrub Evergreen ECT 11.5 3.5
Calicotome villosa (Poir.) Link Cv Fabaceae Shrub Summer deciduous N-FIX 63.9 14.0
Erica arborea L. Ea Ericaceae Arb-Shrub Evergreen ERI 28.2 22.8
Erica scoparia L. Es Ericaceae Shrub Evergreen ERI 29.4 14.0
Lonicera implexa Aiton Li Caprifoliaceae Vine Evergreen ARB 11.1 1.8
Osyris alba L. Oa Santalaceae Shrub Evergreen HPAR na <1
Phillyrea latifolia L. Phyl Oleaceae Arb-Shrub Evergreen ARB 5.4 33.3
Pistacia lentiscus L. Plen Anacardiaceae Arb-Shrub Evergreen ARB 20.8 45.6
Phlomis purpurea L. Pp Labiatae Shrub Evergreen ARB 14.2 29.8
Quercus canariensis Willd Qc Fagaceae Tree Winter deciduous ECT 15.7 26.3
Quercus suber L. Qs Fagaceae Tree Evergreen ECT 26.3 43.9
Rosa pouzinii Tratt. Ros Rosaceae Shrub Winter deciduous ARB na <1
Rubus ulmifolius Schott Ru Rosaceae ShrubVine Evergreen ARB 2.4 12.3
Smilax aspera L. Sa Smilacaceae Vine Evergreen ARB 16.6 38.6
Teucrium fruticans L. Tf Labiatae Shrub Evergreen ARB 14.1 12.3
Teline linifolia (L.) Webb inWebb and Berthel.
Tl Fabaceae Shrub Evergreen N-FIX 13.3 14.0
Arb-Shrub arborescent shrub; ARB arbuscular-mycorrhizal species; ECT ectomycorrhizal species; ERI ericoidal-mycorrhizal species;HPAR hemiparasitic species; N-FIX nitrogen-fixing speciesaMycorrhizal types according to Maremmani et al. (2003)
410 Plant Soil (2012) 357:407–424
with a micrometer (Electronic Digital MicrometerComecta SA, Barcelona, Spain). For five of the 17selected species (C. villosa, E. arborea, E. scoparia,O. alba and T. linifolia), leaf thickness could not bemeasured because of their small leaf size. Fresh leaveswere scanned, and leaf area was determined by digitalanalysis of the images using specific software (Image-Pro Plus 4.5, Media Cybernetic Inc. USA). Finally, theleaves were oven-dried at 70 °C for 48 h and thenweighed to the nearest 0.0001 g.
The leaf mass per area (LMA, g m−2) was calculatedas the ratio between the dry mass of the lamina andits area. Likewise, the leaf dry matter content(LDMC, g g−1) was calculated as the ratio betweenthe dry and the fresh (saturated) weights of the lamina.
Chemical traits Additional leaves were collected fromeach individual (from the outer part of the crown) forchemical analysis. The laminas of the leaves wereseparated, oven-dried (at 70 °C for 48 h) and groundusing a stainless steel mill. The leaf carbon concentra-tion was determined in an elemental analyser (CHNSEurovector EA-3000). Nitrogen was analysed byKjeldahl digestion (Jones and Case, 1990). Theremaining macronutrients (Ca, K, Mg, P, and S),micronutrients (Cu, Co, Fe, Mn, Ni and Zn) and non-essential trace elements (Ba, Cd, Pb) were extracted bywet oxidation with concentrated HNO3 under pressurein a microwave digester. Macronutrients (except N) wereanalysed by ICP-OES.Micronutrients and trace elementswere analysed by inductively coupled plasma mass spec-troscopy (ICP-MS; Perkin Elmer, Sciex-Elan 5000,Cambridgeshire, UK) using the methods proposed byJones and Case (1990). Several plant reference materialswere analysed to assess the quality of the analysis: NCSDC 73350 (white poplar leaves, China National AnalysisCentre for Iron and Steel) and BCR-62 (olive tree leaves,European Community Bureau of Reference). Isotopicanalyses of C and N in the samples were performed usinga continuous flow elemental analyzer-isotopic ratio massspectrometer (EA Thermo 1112-IRMS Thermo Delta VAdvantage). The precision for both the δ13C and δ15Nanalyses was approximately 0.2 per mil.
Community-level leaf traits and environmentalheterogeneity
To study the variation in leaf functional traits at thecommunity level, we calculated community-weighted
means traits. For this purpose, we selected 57 plots(3×3 m) within the same forest site, which includedmost of the 32 plots where the plant species werecollected for leaf trait measurements (see above). Theenvironmental conditions of each of these 57 plots waspreviously characterised in a parallel study focused onseedling growth (Pérez-Ramos et al. 2010). Canopydensity was quantified by hemispherical photographyand image analysis (Hemiview canopy analysis soft-ware ver. 2.1) and represented by the total leaf areaindex (LAI) and the level of light intercepted by thecanopy (estimated as the global site factor, GSF).Photographs were taken at 0.5 m from the ground,using a horizontally-levelled digital camera and aimedat the zenith, using a fish-eye lens of 180º field ofview. Soil volumetric water content (12 cm depth) wasmeasured using a time-domain reflectometer (TDR,Campbell Scientific Inc., Logan, UT, USA) at everyseason during a year. Soil samples were taken for eachplot at a depth of 0–25 cm and were analysed for macro-nutrients and micronutrients (see methods above).
The site spanned a high environmental heterogene-ity, for example in light availability: LAI ranged from0.4 to 3 and GSF from 8 to 89 % (Table 2). Soilmoisture during the growing season was dependenton soil texture, and ranged from clay-rich waterloggedsoils to well-drained sandy soils with <25 % of soilmoisture. Soil phosphorus availability ranged from 0.2to 8.9 mg kg−1.
The relative abundance of the woody plant specieswas visually estimated, by agreement between two ex-perienced observers, as the percentage of plant cover ineach 3×3 m plot. Separate 5 %-increment cover esti-mates were given for each species in the shrub (up to 3–4 m height), liana and tree layers. The relative abun-dance for each species was then calculated by dividingits specific cover estimate by the (all-layers pooled) totalwoody cover. Although the cover of herbaceous speciesalso accounted for the total plant cover measure in eachplot (representing, on average, a 30 % all the total plantcover), in this work we focused only on woody plants,and thus we rescaled the woody plant cover to 100 %. Atotal of 21 woody species were found across the 57sampling sites, including the 17 species in our data set.Those four species not included in our data set can beconsidered as rare species, as they were, on average,only present in 4 out of the 57 plots.
Community-weighted-means (CWM) were calcu-lated for every leaf trait as ∑ Pi × Traiti where Pi is
Plant Soil (2012) 357:407–424 411
the relative abundance of the species “i” in the com-munity, and Traiti is the average trait value obtainedfor this species “i” (Violle et al. 2007). The CWMvalues integrate the information on community struc-ture (local abundances of species) as well as on thefunctional identity of the dominant species. We haveselected LMACWM and LDMCCWM as the key function-al variables which better explain the response of thecommunity to environmental factors (Garnier et al.2001).
Data analysis
A principal components analysis (PCA) of 20 leaftraits considered in this study (2 morphological, 16chemical, and 2 isotopic signatures) and 17 woodyspecies (mean values of 5 individuals for each) wasperformed to better understand the multivariate patternspresent in the data. Leaf thickness was excluded fromthe dataset for the multivariate analysis because meas-urements could not be obtained for some species withsmall-sized leaves. For comparison, a PCA analysis wasalso performed at the community level with the CWMvalues of 12 leaf traits (LMA, LDMC, isotopic signa-tures and macronutrient concentrations) for the 57 plots.
The bivariate relationships between species morpho-logical traits (LMA and LDMC) and the nutritional and
isotopic traits, previously averaged and log-transformed,were explored using standardised major axis slopes(SMAs, also known as reduced major axis slopes), astatistical tool highly recommended for allometricstudies (Warton et al. 2006). SMA slopes are fittedby minimising the sums of squares of errors in Xand Y dimensions simultaneously, and they show theproportional relationships between variables, i.e., howone variable scales against another. SMA regressionswere performed using SMATR software ver. 2.0 (Falsteret al. 2006). SMA fitting was also applied to explore therelationships between the same traits at the communitylevel, considering the CWM at each sampling unit. Theslope of the SMA regressions is of special interest, sinceit indicates the magnitude of the scaling between thevariables. We only emphasized in the results sectionthose relationships with an absolute value of the SMAslope higher than one.
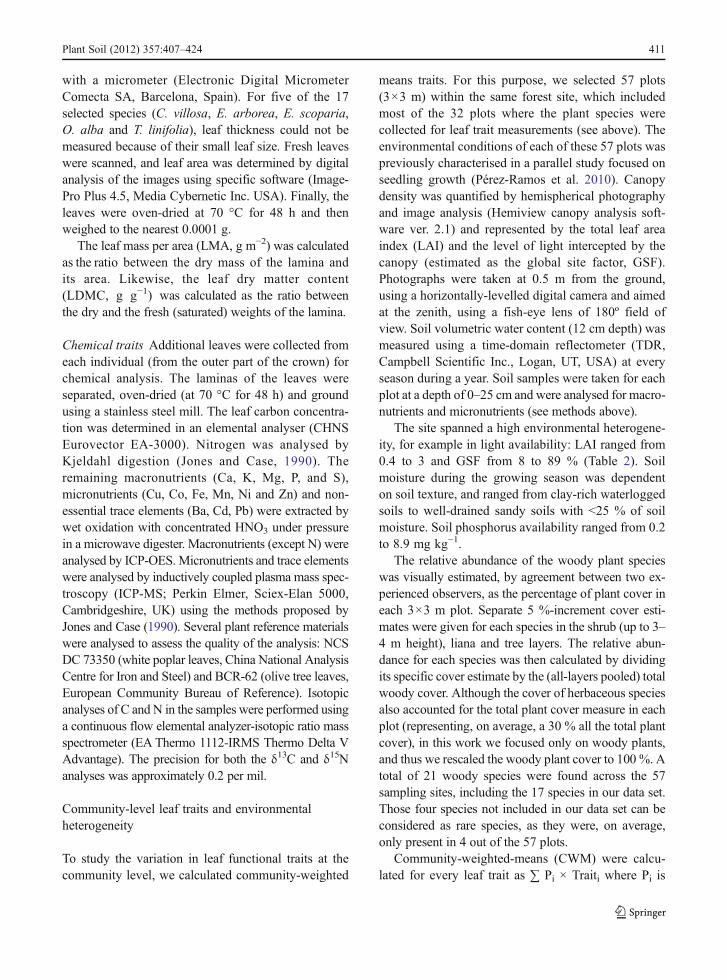
We analysed the variation in CWMs of leaf traits inresponse to key environmental factors (bivariate rela-tionships), by means of Pearson correlation analyses.Specifically, we used light availability (GSF), soilwater (annual average) and an integrated variable ofnutrient availability, represented by a PCA factor cov-ering soil organic matter, and the concentrations ofNH4
+, available P and available Mg (Table 2; scoresof factor 2 were inversely transformed for clarity).
Table 2 Environmental variables of the 57 forest plots where community trait analysis was applied, and results of the principalcomponent analysis (PCA). Data from Pérez-Ramos et al. (2010). GSF, global site factor
PCA factors
Environmental variable Mean ± SD Range Factor 1 Factor 2 Factor 3
Leaf area index (LAI) 1.70±0.70 [0.38–3.0] – – –
Light availability (GSF) 31.7±23.7 [8.0–88.9] −0.32 0.53 −0.68Soil volumetric water content (%)
Summer 9.3±2.8 [5.0–17.5] −0.71 −0.20 0.17
Spring 53.7±22.5 [25.2–>65] −0.89 0.14 −0.04Soil pH 6.2±0.6 [5.4–8.3] −0.77 −0.09 0.11
Soil organic matter (%) 10.5±3.7 [4.8–20.6] −0.32 −0.86 −0.06Soil total N (%) 0.33±0.12 [0.12–0.74] – – –
Soil available nutrients (mg kg−1)
NH4+ 30.7±29.1 [6.8–160.9] 0.32 −0.75 −0.30
P 1.9±1.8 [0.2–8.9] 0.45 −0.64 −0.21Ca 2903±1749 [477–7925] −0.86 −0.14 −0.09K 191±69 [89–419] −0.39 −0.29 0.11
Mg 261±100 [69–530] −0.26 −0.60 −0.33
412 Plant Soil (2012) 357:407–424

We controlled the increment of type I errors derivedfrom multiple testing at the 5 % level using the ‘falsediscovery rate’ (FDR) procedure (Hochberg andBenjamini 2000), as suggested by García (2003).The corrected significance level was 0.031.
Results
Leaf trait variability among species
Across the studied species, there was a strong variabilityin the leaf traits; for example leaf mass per area variedtwofold, from 60 gm−2 (Rubus ulmifolius) to 151 gm−2
(Teline linifolia) (Table 3). In general, micronutrientsand non-essential elements exhibited a greater inter-specific variability than macronutrients; while amongisotopic signatures, δ15N was more variable than δ13C(Tables S2, S3 and S4). The N isotopic composition wasassociated with the type of symbiotic/parasitic relation-ships of each species. Thus, N-fixing species (legumes)and the hemiparasitic species (O. alba) exhibited posi-tive values of δ15N, whereas the rest of species, which
had different mycorrhizal associations, showed negativeδ15N values (Figure S1; mycorrhizal types according toMaremmani et al. 2003).
In the multivariate analysis of leaf traits (by PCA), thefirst axis (explaining a 26.2 % of the variance) waspositively related to LMA, LDMC, C, the C:N ratio andδ13C, and negatively related to the leaf concentrations ofall macronutrients (with the exception of P) and micro-nutrients (Fig. 1). The second PCA axis wasmost stronglycorrelated with the N-related variables, including N:P andδ15N, as well as the leaf Mn and Ni concentrations.Winter deciduous species (such as C. monogyna) andlegume species (C. villosa and T. linifolia) were locatedtowards the nutrient-rich (negative) end of axis 1, incontrast to species with higher δ13C and LMA values(higher than 100 gm−2), such as Q. suber, P. lentiscusand P. latifolia, which were located in the positive end.Symbiotically nitrogen fixing (legume) species, in par-ticular C. villosa, were separated at the negative end ofaxis 2 (Fig. 1). For this PCA analysis, samples of O.alba (hemiparasitic shrub) were excluded because theirhigh concentration of P, Ca, Mg and S distorted theanalysis (as found in a preliminary PCA, not shown).
Table 3 Morphological leaf traits of the studied species (mean ± SD, n05)
Species LMA(g m−2)
LDMC(g g−1)
Leaf area(cm2)
Thickness(mm)
C. monogyna 73±26 0.35±0.1 4.14±1.75 0.23±0.03
C. salvifolius 140±37 0.35±0.05 1.81±0.67 0.47±0.07
C. villosa 72±12 0.24±0.01 1.12±1.04 na
E. arborea 97±22 0.40±0.04 0.03±0.01 na
E. scoparia 118±28 0.40±0.06 0.03±0.01 na
L. implexa 92±22 0.31±0.05 9.14±1.59 0.30±0.04
O. alba 115±31 0.30±0.03 0.75±0.32 na
P. latifolia 122±29 0.46±0.04 5.55±1.20 0.26±0.04
P. lentiscus 103±21 0.36±0.03 14.2±3.14 0.32±0.07
P. purpurea 125±28 0.38±0.04 14.3±8.9 0.66±0.08
Q. canariensis 116±20 0.46±0.02 20.7±10.5 0.32±0.05
Q. suber 144±24 0.45±0.04 7.62±2.60 0.35±0.04
R. pouzinii 68±5 0.39±0.01 23.3±4.2 0.18±0.01
R. ulmifolius 60±5 0.40±0.03 43.7±9.20 0.27±0.06
S. aspera 86±18 0.30±0.02 27.6±5.45 0.30±0.04
T. fruticans 79±21 0.35±0.05 3.97±1.24 0.33±0.01
T. linifolia 151±44 0.42±0.16 1.20±0.22 na
Community CV (%) 34 21 119 38
na for these species, leaf thickness could not be obtained
LMA leaf mass per area; LDMC leaf dry matter content; CV coefficient of variation (sd/mean) × 100
Plant Soil (2012) 357:407–424 413

At the community level, the first PCA axis wasdefined by a similar combination of leaf traits to thatdetected at the species level (Fig. 1), but with a muchstronger explanatory power (61 % versus 26 % of theexplained variance).
Links among leaf traits at the speciesand the community level
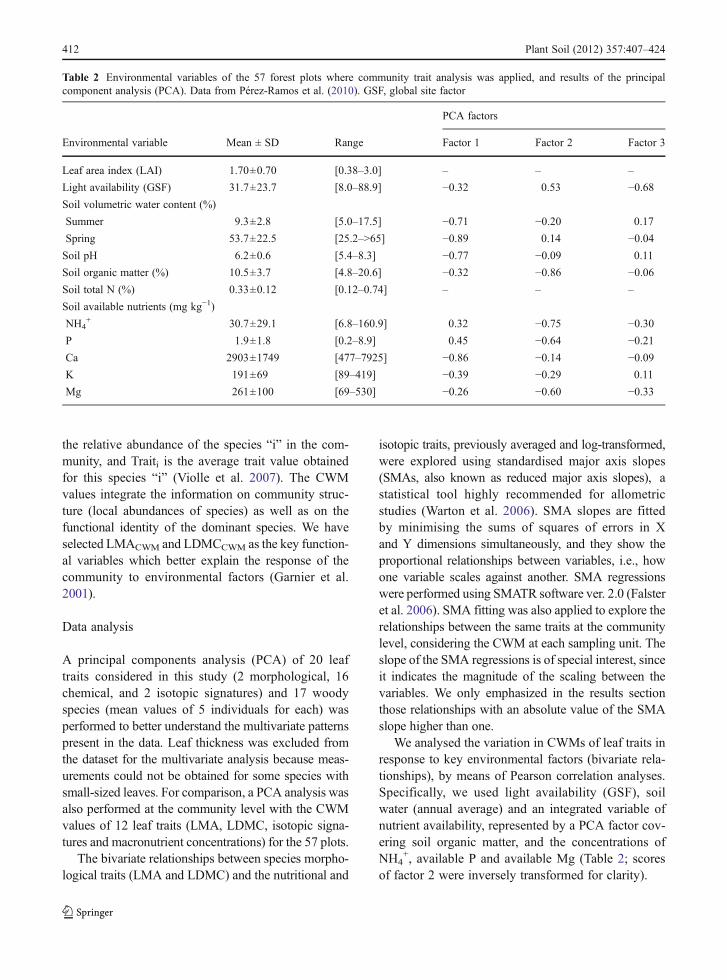
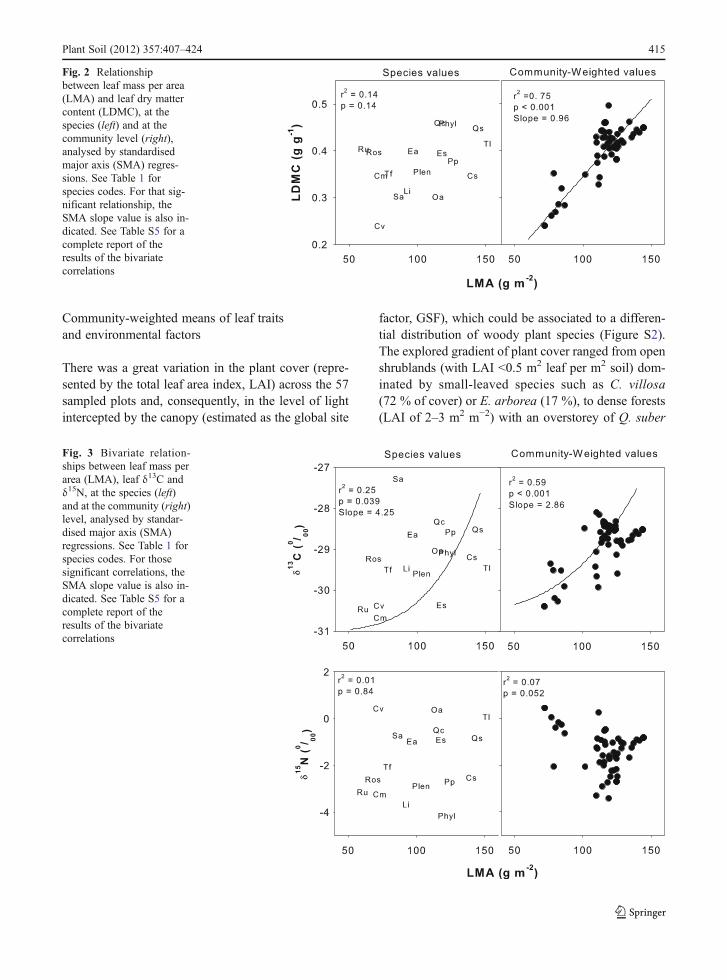
The relationships among leaf traits were not alwaysconsistent at the species and at the community level. Inmost cases, the relationships at the community werestronger than at the species level. For example, LMAand LDMC were positively and significantly relatedwhen community-weighted-means were considered,whereas no significant relationship was found in thecross-species analysis (Fig. 2). Interestingly, the rela-tionship between LMA and the isotopic signature of13C was positive and consistent at both levels, whereasfor 15N the relationship was non-significant at any level
(Fig. 3). The high values of the SMA slope for δ13C(above 4 at the species level) indicated that higher LMAspecies were related to an exponential increase in δ13Cand, thus, they were exponentially more efficient in theiruse of water than lower LMA species.
At the species level, LMA was not significantly re-lated with N, P or any other nutrient, with the exceptionof Mg (Fig. 4 and Table S5). However, at the commu-nity level, LMACWM was negatively related withN, Ca andMg concentrations with a SMA slope steeperthan −1, indicating a proportionally higher increase ofnutrient concentration towards the low LMA end of thetrait relationship (Fig. 4 and Table S5).
Bivariate relationships between LDMC and the nu-trient variables followed the same pattern as withLMA. In general, very few significant relationshipswere found when species values were considered (onlyfor Mg and Cu), while many of these relationships weresignificant when community-weighted values were used(Supplementary Material, Table S6).
Fig. 1 Ordination of leaftraits (upper left) andwoody plant species (upperright) in the space definedby the first and second axesof principal componentanalysis (PCA). See speciescodes in Table 1. Open andfilled circles correspond toevergreen and deciduousspecies, respectively. Thecomparative ordination ofcommunity-weighted leaftraits for 57 plots is showedin the lower panel (factor 2has been rotated for clarity).LMA, leaf mass per area;LDMC, leaf dry matter con-tent; δ13C, C13 abundance;δ15N, N15 abundance; C:N,carbon and nitrogen ratio; N:P, nitrogen and phosphorusratio; CWM, community-weighted mean
414 Plant Soil (2012) 357:407–424
Community-weighted means of leaf traitsand environmental factors
There was a great variation in the plant cover (repre-sented by the total leaf area index, LAI) across the 57sampled plots and, consequently, in the level of lightintercepted by the canopy (estimated as the global site
factor, GSF), which could be associated to a differen-tial distribution of woody plant species (Figure S2).The explored gradient of plant cover ranged from openshrublands (with LAI <0.5 m2 leaf per m2 soil) dom-inated by small-leaved species such as C. villosa(72 % of cover) or E. arborea (17 %), to dense forests(LAI of 2–3 m2 m−2) with an overstorey of Q. suber
Fig. 2 Relationshipbetween leaf mass per area(LMA) and leaf dry mattercontent (LDMC), at thespecies (left) and at thecommunity level (right),analysed by standardisedmajor axis (SMA) regres-sions. See Table 1 forspecies codes. For that sig-nificant relationship, theSMA slope value is also in-dicated. See Table S5 for acomplete report of theresults of the bivariatecorrelations
Fig. 3 Bivariate relation-ships between leaf mass perarea (LMA), leaf δ13C andδ15N, at the species (left)and at the community (right)level, analysed by standar-dised major axis (SMA)regressions. See Table 1 forspecies codes. For thosesignificant correlations, theSMA slope value is also in-dicated. See Table S5 for acomplete report of theresults of the bivariatecorrelations
Plant Soil (2012) 357:407–424 415

(14–23 %) and Q. canariensis (11–17 %) and a denseunderstorey of arborescent species such as P. lentis-cus (25–35 %), P. latifolia (8–16 %) and E. arborea(5–17 %).
The bivariate correlational analysis between theenvironmental factors and the studied leaf traitsshowed that light was the factor with the highestinfluence on the community-weighted-mean traits(Table 4). Unexpectedly, light availability was nega-tively related with both LMACWM and LDMCCWM
(Fig. 5), as well as with C:NCWM and δ13CCWM. Incontrast, light was positively correlated with both
NCWM and δ15NCWM. Soil moisture was only nega-tively related to CCWM and δ13CCWM, with no influ-ence on LMACWM or LDMCCWM. Soil fertility(represented by a PCA factor, which integrates soilorganic matter, and the availability of NH4
+, P andMg, Table 2), was weakly related to the morphologicaltraits (only a marginal positive relationship withLDMCCWM), but more closely linked to some chem-ical traits, such as NCWM, C:NCWM and δ15NCWM
(Table 4). In general, when the average trait valuesfor the species pool at each plot (without weighting bytheir relative abundance) were used, the links between
Fig. 4 Bivariate relation-ships between leaf mass perarea (LMA) and leaf nutrientconcentrations of N (top),Ca (centre) and Mg (bot-tom), at the species (left) andat the community (right)level, analysed by standar-dised major axis (SMA)regressions. See Table 1 forspecies codes. For signifi-cant correlations, the SMAslope value is also indicated.See Table S5 for a completereport of the results of thebivariate correlations
416 Plant Soil (2012) 357:407–424

LMA, LDMC and the environmental variables weresimilar (Fig 5), although the explanatory power of therelationships was higher for the CWM-values.
Discussion
Links among functional leaf traits at the speciesand community levels
Are LMA and LDMC related to plant nutrienteconomy?
Mediterranean ecosystems provide excellent siteswhere exploring the relationships among functionaltraits. The small-scale heterogeneity in the conditionsof irradiance and the usual concurrence of water andnutrient limitations in these systems may promote thecoexistence of different species with a wide range ofLMAvalues (Poorter et al. 2009). In the studied forest,LMAvalues ranged from 64 to 151 gm−2, which is thecommon range for Mediterranean woody plant spe-cies (Galmés et al. 2007; Hernández et al. 2010;Mediavilla et al. 2008; Paula and Pausas 2006;Villar and Merino 2001). Chemical traits were especial-ly variable, including the isotopic signatures; nitrogenisotopic signature differed among functional groups of
symbiotic interactions and, thus, could be used asa possible marker for mycorrhizal habit (Högberg1990).
All these chemical and morphological traits showeda strong multivariate covariation, especially at thecommunity level, which can be used to characterizedifferent plant functional groups. The main variationtrend was associated with the acquisition-conservationtrade-off (Diaz et al. 2004) and confirmed the role ofLMA and LDMC as indicators of differential func-tional strategies. Thus, communities with a predomi-nant conservative strategy exhibited high values ofLMA and LDMC, positively associated to C concen-tration, C:N ratio (sclerophyllous type) and high wateruse efficiency (high δ13C values). On the contrary, com-munities with a predominant resource-acquisition strat-egy showed a lower water-use efficiency (low δ13C) andlow LMA and LDMC (Poorter and Garnier 1999;Wright and Westoby 2001).
The bivariate analyses confirmed that the linksbetween the leaf morphological and the leaf nutritionaltraits are much weaker at the species than at thecommunity level. Thus, our first hypothesis was notsupported for the species pool (species mean values),but it was when considering the relative abundance ofthe dominant species constituting the community(community-weighted-means).
Table 4 Results of the bivariate correlations between community-weighted traits and environmental factors
LMACWM LDMCCWM CCWM NCWM C:NCWM δ13CCWM δ15NCWM
LAI 0.49*** 0.66*** 0.31 −0.55*** 0.47*** 0.45*** −0.36**GSF −0.63*** −0.78*** −0.32 0.66*** −0.56*** −0.53*** 0.37**
Soil pH −0.08 −0.08 −0.39** −0.03 −0.05 0.24 −0.22Soil organic matter 0.01 0.03 −0.27 −0.16 0.09 0.23 −0.39**Soil total N −0.01 0.03 −0.20 −0.16 0.09 0.21 −0.34**Soil NH4
+ 0.18 0.16 0.08 −0.20 0.19 0.14 −0.09Soil P 0.32 0.28 0.23 −0.23 0.25 0.09 0.02
Soil Ca 0.02 −0.05 −0.39** −0.13 0.05 0.32 −0.33Soil K 0.08 −0.05 −0.17 −0.16 0.15 0.19 −0.15Soil Mg 0.23 0.26 −0.18 −0.21 0.11 0.29 −0.14Soil Fertility Index (PCA Factor) 0.25 0.28* 0.07 0.37** 0.31* 0.39** 0.37**
Spring soil moisture −0.16 −0.20 −0.37** 0.01 −0.06 0.25 −0.12Summer soil moisture −0.04 −0.02 −0.37** −0.12 0.02 0.35** −0.22Annual mean soil moisture 0.06 0-11 0.47** 0.05 0.14 0.13 0.24
Bold characters indicate significant values after controlling for the false discovery rate (significance levels are * p<0.031; ** p<0.01;*** p<0.001)
LMA leaf mass per area; LDMC leaf dry matter content; GSF global site factor; LAI leaf area index
Plant Soil (2012) 357:407–424 417

At the species level, LMA or LDMCwere not relatedto almost any nutrient concentration, not even to thoseelements included in the nucleic acid-protein set (N, P,Cu, S, Fe, Garten 1978). These results contrast with theconsistently negative relationship between LMA andboth N and P concentrations that has been reported forglobal datasets (Liu et al. 2010; Ordoñez et al. 2009;Wright et al. 2004a, 2005), and thus, indicates thatglobal patterns may not hold at some local scales.
While trait relationships can be considered verygeneral, they are not necessarily universal (Wright etal. 2005). The specific environmental conditions ineach site may play a central role in the strength ofthe leaf morphology vs. nutrient relationships. Recentanalyses by Freschet et al. (2011) have shown that asmuch as a 50 % of the global variability in SLA andleaf N occurs within communities, which may becaused by large differences in the nature and strength
Fig. 5 Relationshipbetween main environmen-tal gradients (light, waterand soil fertility) and com-munity leaf mass per area(LMA), and leaf dry mattercontent (LDMC). Closedcircles and solid lines corre-spond to the community-weighted means (CWM,weighting by the relativeabundance of the species inthe community), while opentriangles and dashed linescorrespond to the unweight-ed trait values (average ofpresent species). Lightavailability was estimatedby global site factor (GSF),soil moisture was calculatedas the annual average, andsoil fertility was representedby a PCA factor integratingsoil organic matter and theavailability of NH4
+, P andMg
418 Plant Soil (2012) 357:407–424
of abiotic and biotic drivers of dominant species as-sembly at local scales. Within the worldwide LMAspectrum, Mediterranean species have low SLA (andtherefore high LMA), and comparatively high N con-centrations (Freschet et al. 2011), which is known toenhance water conservation during photosynthesis inspecies from low-rainfall sites (Wright and Westoby2002). In some P-limited ecosystems, as the studiedforest, leaf morphology and N concentrations are usu-ally unrelated, and LMA and net photosynthetic ca-pacity may be more closely linked to P (Niinemets andKull 2003; Liu et al. 2010; Chen et al. 2011). In thisstudy, however, we did not find significant links be-tween LMA and leaf phosphorous at the species or atthe community level.
If the strength of the links between LMA and leafnutrients depends on the relative availability of themost limiting element (Niinemets and Kull 2003), thenwe could conclude that Mg is the most limiting nutri-ent in the studied system, given the consistent negativerelationship between Mg and LMA at both levels ofanalysis. Among the studied species, leaf Mg rangedfrom 1.3 to 5.1 gkg−1, with a coefficient of variationhigher than 50 % (Table S2) probably reflecting largeamong-species differences in the requirements forthis essential element. The links between LMA andleaf Mg (which is a structural component of the chlor-ophylls and essential for photosynthesis) remainlargely untested both at the local and at the globalscales (but see Fyllas et al. 2009).
Potassium was neither related to LMA. In the leaf,this element has a less structural function than Nor Mg, as is mainly found as a dissolved ion,contributing to the leaf osmotic regulation and tothe activation of many photosynthetic enzymes.Despite in some local studies leaf K is significantlylinked to LMA (Niinemets and Kull 2003; Fyllas et al.2009), global data sets have shown that this element isvery weakly related to LMA, in comparison to N and P(Wright et al. 2005).
The range of growth forms and trait variation in thisstudy may also explain the discrepancies with theglobal patterns for the LMA vs. nutrient relationships.We focused here on woody plant species, which havea much greater proportion of biomass in non-productive tissues than herbaceous plants. The parti-tioning of nutrients among the different plant tissues atthe whole-plant level may mask the nutrient-LMArelationships for a set of woody plants, in comparison
to broader data sets including different growth forms.To detect broad trait relationships among species, therange of trait variability must be large, at least of oneorder of magnitude (Wright et al. 2004b). Based in thisdata set it can be concluded that, within the normalrange of LMAvalues for Mediterranean woody plants,and despite N and P values ranged 2.6 and 3.8-fold,respectively, the links between LMA and N or Pamong species are weak.
Interestingly, N and P were partly uncoupled atboth levels of analysis, located in opposite positionsin the PCA-axes, contrasting to the global trend ofpositive correlation between these two nutrients(Wright et al. 2004a). Again, local data set may notsupport the global general relationships between traits(Wright et al. 2005). This uncoupling may be drivenby the plant-microbial interactions, which are especiallyrelevant in these nutrient-poor soils. Phosphorous avail-ability is very low in comparison to N availability, asrevealed by the general high N:P ratios in the leaves(>20) of the studied plants. In these situations, the typeof mycorrhizal interaction may play a central rolein the community assembly. For example, Pekin etal. (2011) have shown that, in some Mediterraneanforest ecosystems, the distribution of root traits(including the type of symbiotic interactions) isdriven by the N to P availability ratio in the soil.Ectomycorrhizal, non-mycorrhizal and ericoid my-corrhizal species have a competitive advantageover arbuscular species at sites with low N fertilitywhere P is not limiting. According to our data, N-fixation, which promotes a high N leaf concentra-tion, does not seem to promote also a high P-uptake in the studied species. Actually, plants withhigher P leaf concentrations tended to have lowerδ15N, which characterized arbuscular and ectomy-corrhizal associations.
Despite that leaf 15N discriminated among mycor-rhizal groups, the hypothesis that plant species withlow LMA (and presumably a resource-acquisitionstrategy) have a low dependence on mycorrhizal inter-actions for N-uptake (i.e., higher leaf 15N values) wasnot supported by our data. In contrast, the hypothesisexpecting a positive relationship between LMA andδ13C was supported at both the species and the com-munity level, in accordance with the strong associationof LMA with plant water-use efficiency reported inprevious studies (Cunningham et al. 1999; de Bello etal. 2009).
Plant Soil (2012) 357:407–424 419
Are LMA and LDMC relationships consistentat the species and community levels?
The links between the morphological (LMA andLDMC) and the chemical traits were stronger at thecommunity level. By the community-weighted meananalysis the environmental filters are, somehow, takeninto account, since they determine how species replaceeach other, and thus, how different the weighted aver-ages are across the studied plots. This strong correla-tion among traits at the community level suggests that:i) those traits have parallel shifts along the environ-mental gradients that determine such community as-sembly, even though these traits are independent whenthe individual taxa are considered, and ii) the func-tional structure of the studied forest communities isdriven not only by species identity but also by theirrelative abundances within the community. Other stud-ies have also found differences in trait relationshipsdepending whether the species values or the commu-nity averages were used. In a Mediterranean chaparralof California, Ackerly et al. (2002) obtained strongerlinks between leaf size and specific leaf area, as wellas a stronger response of the leaf traits to insolation,when using weighted averages compared to the cross-species analyses. For a set of perennial species fromAustralia, Fonseca et al. (2000) also found that someleaf traits were not related across-species, but convergedalong gradients of rainfall and soil phosphorus. Potentiallimiting resources may act as the environmental filterspromoting the convergence of traits related to acquisi-tion/conservation of resources (Cornwell and Ackerly2010; Sonnier et al. 2010). In this study, the consistentstrong links between light availability (main environ-mental gradient) and the most important leaf traits(LMA, LDMC, N and C:N) support the convergenceof independently-related traits.
LMA and LDCM relationships with environmentalfilters
Which are the environmental factors that determinethe convergence of the leaf traits, and thus, the func-tional structure in the community?
Among the studied environmental factors, lightavailability at the understorey had the strongest rela-tionship with both morphological (LMACWM andLDMCCWM) and chemical traits (N, C:N, δ13C andδ15N community-weighted means). Interestingly, light
availability was negatively related with leaf LMACWM
and LDMCCWM (Table 4), contrary to our initial hy-pothesis. The results were similar when species aver-ages (without weighting by the relative abundance)were used, although with a lower explanatory power.The contrasting plant composition in the communityalong the light gradient determined this pattern. Onone side of the gradient, woody plant species withsclerophyll leaves (higher values of LMA, LDMCand C:N) and arbuscular and ericoid mycorrhizae(low foliar δ15N) tend to form denser forests and ashadier understorey, and to exclude juvenile light-demanders (Canham et al. 1994; Sack et al. 2003).On the other side, open microsites are dominated by alegume shrub (C. villosa) with the drought-avoidancestrategy (de Lillis and Fontanella 1992) of summer-deciduous leaf habit (lower LMA and LDMC) andsymbiotic N-fixation ability (higher δ15N and lowerC:N). This species was not present in the plots withlowest light availability within the forest (Figure S2).Woody legumes tend to have a reduced shade toler-ance, and are rarely found (excepting in tropical for-ests) in closed canopy systems (Vitousek et al. 2002).This successful combination of traits (summer leaffall, short leaf life-span, low LMA and high leaf Nconcentration) characterises the dominant plant spe-cies in some dry, highly exposed microsites underMediterranean climate (Westman 1981), and repre-sents the functional strategy of several opportunisticwoody Mediterranean species in canopy gaps follow-ing a perturbation (Ackerly 2004). Therefore, the ob-served reduction in LMA and LDMC with lightavailability is mainly driven by the presence anddominance of these deciduous legume shrub spe-cies in the gaps, and may not be applicable toother forest ecosystems. This pattern also suggeststhat, along this environmental gradient, light avail-ability filters both the presence and the dominanceof the species in a similar manner, that is, select-ing a reduced number of species with certain traitsin the most exposed sites. Since light availabilitywas the environmental factor most closely relatedto the dominance of the different functional traits,including the chemical traits, perturbations of can-opy conditions (and hence in light availability)may lead to changes in the LMA and LDMC of thedominant woody species, with important consequencesfor the biogeochemical cycles of C and N, and also ofMg, Ca, K and S.
420 Plant Soil (2012) 357:407–424

In spite of the widely recognised importance of soilwater as a main limiting resource for plants inMediterranean conditions, we did not find any signif-icant relationship between this soil factor and theLMACWM at the forest stand scale explored. Thus,the results did not support our hypothesis that thisfactor acts as the main environmental filter. This con-trasts with previous studies (of grassland communities)where community-weighted LMA clearly responded tosoil moisture or flooding gradients (Cingolani et al.2007; Jung et al. 2010). The lack of relationships be-tween soil moisture and leaf traits may be determined bythe concurrence of contrasting leaf strategies in thedriest end of the gradient, that is, that both summerdeciduous (low LMA) and sclerophyll evergreen (highLMA) species can coexist in the driest plots within theforest. Thus, soil moisture could promote the diver-gence, rather than the convergence of traits in the com-munity. On the other hand, Ackerly (2004) showed that,for a range of Mediterranean woody species, minimumseasonal leaf water potential (an indicator of waterstress) was related to wood density, vessel diameter,twig width, and leaf area:sapwood area ratios, but notto leaf life span (which is closely linked to LMA). Pekinet al. (2009) also found a high correlation between wateravailability and leaf area:sapwood area ratio inMediterranean forest ecosystems. For a complete under-standing of the response of this woody plant communityto soil moisture further investigations focused on rootand wood traits are needed.
Despite some recent studies have shown that soilfertility may be the environmental factor with thehighest influence on leaf traits at the global (Ordoñezet al. 2009) and at regional scales (Fyllas et al. 2009),in this forest ecosystem the soil fertility had no signif-icant influence on LMACWM of the woody species. Ithad some influence on LDMCCWM, although the ex-planatory power of this relationship was very low (r200.09), much lower than that of the relationship be-tween light and LDMC (r200.61). Nutrient limitationsare more likely to influence LMA through changes inthe leaf density (Poorter et al. 2009). Since LDMC andleaf density are highly correlated (Hodgson et al.2011) a subtle influence of soil fertility could be morelikely reflected on LDMC than on LMA variation. Inthis forest site, light and soil fertility gradients arelinked and opposed; thus open, disturbed sites are usu-ally nutrient-poor while P availability largely dependson the litter supplies from oak species in the shaded
understorey (García et al. 2006). In this situation, LMA,which is largely influenced by light conditions, maydiscriminate better among communities than LDMC(Hodgson et al. 2011). The links between soil fertilityand leaf traits found in this study, although weak, alsoreflected the contrasting plant composition along theenvironmental gradient. Soil fertility was positivelylinked to LDMC, C:N and δ13C, because those open,less fertile sites were dominated by Calicotome villosa,the summer-deciduous species with the lowest LDMCand the highest leaf N values in the community.
In conclusion, our study showed that LMA andLDMC were significantly related to many other chem-ical leaf traits (nutrient concentrations), but only whenusing abundance-weighted values (that is, at the com-munity level). Thus, most of the leaf traits have paral-lel shifts along the environmental factors thatdetermine the community assembly, even if they areindependent or weakly related across individual taxa.Light availability was the main environmental factordetermining this convergence of the community leaftraits, with no apparent influence of soil moisture onleaf traits (at the studied stand level) despite the im-portance of water in these drought-prone ecosystems.
Acknowledgements We thank the Consejería de MedioAmbiente (Andalusian Government) and Marco Antonio Tena,then Director of Los Alcornocales Natural Park, for the facilitiesand support to carry out our field work. We are grateful toEduardo Gutiérrez, Marga Santaella and Ramón Redondo forfield and/or lab assistance, to José Manuel Murillo, LourensPoorter and three anonymous reviewers for their comments onthe manuscript. This study was supported by a FPI-MEC grantto CA and a postdoctoral-MEC grant to MTD, by the SpanishMEC projects DINAMED (CGL2005-5830-C03-01 and −02)INTERBOS (CGL2008-4503-C03-01 and −02) and DIVER-BOS (CGL2011-30285-C02-01 and 02), and European FEDERfunds.
References
Ackerly DD (2004) Functional strategies of chaparral shrubs inrelation to seasonal water deficit and disturbance. EcolMonogr 74:25–44
Ackerly DD, Knight CA, Weiss SB, Barton K, Starmer KP(2002) Leaf size, specific leaf area and microhabitat distri-bution of chaparral woody plants: contrasting patterns inspecies level and community level analyses. Oecologia130:449–457
Aerts R (1995) The advantages of being evergreen. Trends EcolEvol 10:402–407
Plant Soil (2012) 357:407–424 421
Aponte C, García LV, Pérez-Ramos IM, Gutiérrez E, Marañón T(2011) Oak trees and soil interactions: a positive feedbackmodel. J Veg Sci 22:856–867
Canham CD, Finzi AC, Pacala SW, Burbank DH (1994) Causesand consequences of resource heterogeneity in forests:interspecific variation in light transmission by canopytrees. Can J For Res 24:337–349
Chen FS, Niklas K, Zeng DH (2011) Important foliar traitsdepend on species-grouping: analysis of a remnant temper-ate forest at the Keerqin Sandy Lands, China. Plant Soil340:337–345
Cingolani AM, Posse G, Collantes MB (2005) Plant functionaltraits, herbivory selectivity and response to sheep grazingin Patagonian steppe grasslands. J Appl Ecol 42:50–59
Cingolani AM, Cabildo M, Gurvich DE, Renison D, Díaz S(2007) Filtering processes in the assembly of plant com-munities: are species presence and abundance driven by thesame traits? J Veg Sci 18:911–920
Coley PD (1988) Effects of plant growth rate and leaf lifetimeon the amount and type of anti-herbivore defense. Oecologia74:531–536
Cornelissen JHC, Pérez-Harguindeguy N, Díaz S, Grime JP,Marzano B, Cabido M, Vendramini F, Cerabolini B(1999) Leaf structure and defence control litter decompo-sition rate across species and life forms in regional florason two continents. New Phytol 143:191–200
Cornelissen JHC, Aerts R, Cerabolini B, Werger M, van derHeijden M (2001) Carbon cycling traits of plant species arelinked with mycorrhizal strategy. Oecologia 129:611–619
Cornelissen JHC, Lavorel S, Garnier E, Diaz S, Buchmann N,Gurvich D, Reich P, ter Steege H, Morgan H, van derHeijden M, Pausas J, Poorter H (2003) A handbook ofprotocols for standardised and easy measurement of plantfunctional traits worldwide. Aust J Bot 51:335–380
Cornwell WK, Ackerly DD (2010) A link between plant traitsand abundance: evidence from coastal California woodyplants. J Ecol 98:814–821
Craine JM, Elmore AJ, Aidar MPM, Bustamante M, DawsonTE, Hobbie EA, Kahmen A, Mack MC, McLauchlan KK,Michelsen A, Nardoto GB, Pardo LH, Peñuelas J, ReichPB, Schuur EAG, Stock WD, Templer PH, Virginia RA,Welker JM, Wright IJ (2009) Global patterns of foliarnitrogen isotopes and their relationships with climate, my-corrhizal fungi, foliar nutrient concentrations, and nitrogenavailability. New Phytol 183:980–992
Cunningham SA, Summerhayes B, Westoby M (1999)Evolutionary divergences in leaf structure and chemistry,comparing rainfall and soil nutrient gradients. EcolMonogr 69:569–588
de Bello F, Buchmann N, Casals P, Leps J, Sebastià MT (2009)Relating plant species and functional diversity to commu-nity δ13C in NE Spain pastures. Agric Ecosyst Environ131:303–307
de Lillis M, Fontanella A (1992) Comparative phenology andgrowth in different species of the Mediterranean maquis ofcentral Italy. Vegetatio 99–100:83–96
Diaz S, Hodgson JG, Thompson K, Cabido M, CornelissenJHC, Jalili A, Montserrat-Martí G, Grime JP, ZarrinkamarF, Asri Y, Band SR, Basconcelo S, Castro-Díez P, Funes G,Hamzehee B, Khoshnevi M, Pérez-Harguindeguy N,Pérez-Rontomé MC, Shirvany FA, Vendramini F, Yazdani
S, Abbas-Azimi R, Bogaard A, Boustani S, Charles M,Dehghan M, de Torres-Espuny L, Falczuk V, Guerrero-Campo J, Hynd A, Jones G, Kowsary E, Kazemi-SaeedF, Maestro-Martínez M, Romo-Díez A, Shaw S, Siavash B,Villar-Salvador P, Zak MR (2004) The plant traits thatdrive ecosystems: evidence from three continents. J VegSci 15:295–304
Díaz S, Lavorel S, de Bello F, Quétier F, Grigulis K, Robson M(2007) Incorporating plant functional diversity effects inecosystem service assesments. Proc Natl Acad Sci USA104:20684–20689
Escudero A, Mediavilla S, Heilmeier H (2008) Leaf longevityand drought: avoidance of the costs and risks of early leafabscission as inferred from the leaf carbon isotopic com-position. Funct Plant Biol 35:705–713
Falster DS, Warton DI, Wright IJ (2006) User’s guide to SMATR:Standardised major axis tests and routines. Version 2.0,Copyright 2006. Website http://www.bio.mq.edu.au/ecology/SMATR
Farquhar GD, Ehleringer JR, Hubick KT (1989) Carbon isotopediscrimination and photosynthesis. Ann Rev Plant PhysiolPlant Mol Biol 40:503–537
Fonseca CR, Overton JM, Collins B, Westoby M (2000) Shiftsin trait-combinations along rainfall and phosphorus gra-dients. J Ecol 88:964–977
Freschet GT, Dias ATC, Ackerly DD, Aerts R, van BodegomPM, Cornwell WK, Dong M, Kurokawa H, Liu G,Onipchenko VG, Ordoñez JC, Peltzer DA, Richardson SJ,Shidakov II, Soudzilovskaia NA, Tao J, Cornelissen JHC(2011) Global to community scale differences in the preva-lence of convergent over divergent leaf trait distributions inplant assemblages. Global Ecol Biogeogr 20:755–765
Fyllas NM, Patiño S, Baker TR, Bielefeld Nardoto G, MartinelliLA, Quesada CA, Paiva R, Schwarz M, Horna V, MercadoLM, Santos A, Arroyo L, Jiménez EM, Luizão FJ, NeillDA, Silva N, Prieto A, Rudas A, Silviera M, Vieira ICG,Lopez-Gonzalez G, Malhi Y, Phillips OL, Lloyd J (2009)Basin-wide variations in foliar properties of Amazonian for-est: phylogeny, soils and climate. Biogeosciences 6:2677–2708
Galmés J, Flexas J, Savá R, Medrano H (2007) Water relationsand stomatal characteristics of Mediterranean plants withdifferent growth forms and leaf habits: responses to waterstress and recovery. Plant Soil 290:139–155
García LV (2003) Controlling the false discovery rate in eco-logical research. Trends Ecol Evol 18:553–554
García LV, Maltez-Mouro S, Pérez-Ramos IM, Freitas H,Marañón T (2006) Counteracting gradients of light and soilnutrients in the undestorey of Mediterranean oak forest. WebEcol 6:67–74
Garnier E, Laurent G, Bellmann A, Debain S, Berthelier P,Ducout B, Roumet C, Navas ML (2001) Consistency ofspecies ranking based on functional leaf traits. New Phytol152:69–83
Garnier E, Cortez J, Billes G, Navas ML, Roumet C, DebusscheM, Laurent G, Blanchard A, Aubry D, Bellmann A, NeillC, Toussaint JP (2004) Plant functional markers captureecosystem properties during secondary succession.Ecology 85:2630–2637
Garten CT (1978) Multivariate perspectives on the ecology ofplant mineral element composition. Am Nat 112:533–544
422 Plant Soil (2012) 357:407–424
Grime JP, Thompson K, Hunt R, Hodgson JG, Cornelissen JHC,Rorison IH, Hendry GAF, Ashenden TW, Askew AP, BandSR, Booth RE, Bossard CC, Campbell BD, Cooper JEL,Davison AW, Gupta PL, Hall W, Hand DW, Hannah MA,Hillier SH, Hodkinson DJ, Jalili A, Liu Z, Mackey JML,Matthews N, Mowforth MA, Neal AM, Reader RJ, ReilingK, Ross-Fraser W, Spencer RE, Sutton F, Tasker DE,Thorpe PC, Whitehouse (1997) Integrated screening vali-dates primary axes of specialisation in plants. Oikos79:259–281
Hernández E, Vilagrosa A, Pausas J, Bellot J (2010)Morphological traits and water use strategies in seedlingsof Mediterranean coexisting species. Plant Ecol 207:233–244
Hobbie SE (1992) Effects of plant species on nutrient cycling.Trends Ecol Evol 7:336–339
Hobbie EA, Macko SA, Shugart HH (1999) Interpretation ofnitrogen isotope signatures using the NIFTE model.Oecologia 120:405–415
Hobbie EA, Macko SA, Williams M (2000) Correlations be-tween foliar δ15N and nitrogen concentrations may indicateplant-mycorrhizal interactions. Oecologia 122:273–283
Hochberg Y, Benjamini Y (2000) On the adaptive control of thefalse discovery rate in multiple testing with independentstatistics. J Educ Behav Stat 25:60–83
Hodgson JG, Montserrat-Martí G, Charles M, Jones G, WilsonP, Shipley B, Sharafi M, Cerabolini BEL, Cornelissen JHC,Band SR, Bogard A, Castro-Díez P, Guerrero-Campo J,Palmer C, Pérez-Rontomé MC, Carter G, Hynd A, Romo-Díez A, de Torres EL, Royo Pla F (2011) Is leaf dry mattercontent a better predictor of soil fertility than specific leafarea? Ann Bot 108:1337–1345
Högberg P (1990) 15N natural abundance as a possible markerof the ectomycorrhizal habit of trees in mixed Africanwoodlands. New Phytol 115:483–486
Högberg P (1997) 15N natural abundance in soil-plant systems.New Phytol 137:179–203
Holdaway RJ, Richardson SJ, Dickie IA, Peltzer DA, CoomesDA (2011) Species- and community-level patterns in fineroot traits along a 120000-year soil chronosequence intemperate rain forest. J Ecol 99:954–963
Jones JB, Case VW (1990) Sampling, handling and analyzingplant tissues samples. In: Westerman R (ed) Soil testingand plant analysis. Soil Science Society of America,Madison, pp 389–427
Jung V, Violle C, Mondy C, Hoffmann L, Muller S (2010)Intraspecific variability and trait-based community assem-bly. J Ecol 98:1134–1140
Kranabetter J, MacKenzie W (2010) Contrast among mycorrhi-zal plant guilds in foliar nitrogen concentration and δ15Nalong productivity gradients of a boreal forest. Ecosystems13:108–117
Lambers H, Brundrett MC, Raven JA, Hopper SD (2010) Plantmineral nutrition in ancient landscapes: high plant speciesdiversity on infertile soils is linked to functional diversityfor nutritional strategies. Plant Soil 334:11–31
Lamont BB, Groom PK, Cowling RM (2002) High leaf massper area of related species assemblages may reflect lowrainfall and carbon isotope discrimination rather than lowphosphorus and nitrogen concentrations. Funct Ecol16:403–412
Liu G, Freschet GT, Pan X, Cornelissen JHC, Li Y, Dong M(2010) Coordinated variation in leaf and root traits acrossmultiple spatial scales in Chinese semi-arid and arid eco-systems. New Phytol 188:543–553
Maremmani A, Bedini S, Matoševic I, Tomei P, Giovannetti M(2003) Type of mycorrhizal associations in two coastalnature reserves of the Mediterranean basin. Mycorrhiza13:33–40
Mediavilla S, Garcia-Ciudad A, Garcia-Criado B, Escudero A(2008) Testing the correlations between leaf life span andleaf structural reinforcement in 13 species of EuropeanMediterranean woody plants. Funct Ecol 22:787–793
Meers TL, Bell TL, Enright NJ, Kasel S (2010) Do general-isations of global trade-offs in plant design apply to anAustralian sclerophyllous flora? Aust J Bot 58:257–270
Meziane D, Shipley B (2001) Direct and indirect relationshipsbetween specific leaf area, leaf nitrogen and leaf gas ex-change. Effects of irradiance and nutrient supply. Ann Bot88:915–927
Niinemets Ü, Kull K (2003) Leaf structure vs. nutrient relation-ships vary with soil conditions in temperate shrubs andtrees. Acta Oecol 24:209–219
Ordoñez JC, van Bodegom PM, Witte JPM, Wright IJ, ReichPB, Aerts R (2009) A global study of relationships betweenleaf traits, climate and soil measures of nutrient fertility.Glob Ecol Biogeogr 18:137–149
Paula S, Pausas JG (2006) Leaf traits and resprouting ability inthe Mediterranean basin. Funct Ecol 20:941–947
Pekin BK, Boer MM, Macfarlane C, Grierson PF (2009)Impacts of increased fire frequency and aridity on eucalyptforest structure, biomass and composition in southwestAustralia. For Ecol Man 258:2136–2142
Pekin BK, Wittkuhn RS, Boer MM, Macfarlane C, Grierson PF(2011) Plant functional traits along environmental gra-dients in seasonally dry and fire-prone ecosystem. J VegSci 22:1009–1020
Peñuelas J, Sardans J, Ogaya R, Estiarte M (2008) Nutrientstoichiometric relations and biogeochemical niche in coex-isting plant species: effect of simulated climate change. PolJ Ecol 56:613–622
Peñuelas J, Terradas J, Lloret F (2011) Solving the conundrumof plant species coexistence: water in space and time mat-ters most. New Phytol 189:5–8
Pérez-Ramos IM, Zavala MA, Marañón T, Díaz-Villa MD,Valladares F (2008) Dynamics of understorey herbaceousplant diversity following shrub clearing of cork oak forests:a five-year study. For Ecol Manag 255:3242–3253
Pérez-Ramos IM, Gómez-Aparicio L, Villar R, García LV,MarañónT (2010) Seedling growth and morphology of three oak spe-cies along field resource gradients and seed mass variation: aseedling age-dependent response. J Veg Sci 21:419–437
Pontes LDS, Soussana JF, Louault F, Andueza D, Carrère P(2007) Leaf traits affect the above-ground productivity andquality of pasture grasses. Funct Ecol 21:844–853
Poorter H, Garnier E (1999) Ecological significance of inherentvariation in relative growth rate and its components. In:Pugnaire FI, Valladares F (eds) Handbook of functionalplant ecology. Marcel Dekker, New York, pp 81–120
Poorter H, Niinemets Ü, Poorter L, Wright IJ, Villar R (2009)Causes and consequences of variation in leaf mass per area(LMA): a meta-analysis. New Phytol 182:565–588
Plant Soil (2012) 357:407–424 423
Quilchano C, Marañón T, Pérez-Ramos IM, Noejovich L,Valladares F, Zavala MA (2008) Patterns and ecologicalconsequences of abiotic heterogeneity in managed corkoak forests of Southern Spain. Ecol Res 23:127–139
Reich PB, Uhl C, Walters MB, Ellsworth DS (1991) Leaf life-span as a determinant of leaf structure and function among23 Amazonian tree species. Oecologia 86:16–24
Reich PB, Walters MB, Ellsworth DS, Vose JM, Volin JC,Gresham C, Bowman WD (1998) Relationships of leafdark respiration to leaf nitrogen, specific leaf area and leaflife-span: a test across biomes and functional groups.Oecologia 114:471–482
Reich PB, Ellsworth DS, Walters MB, Vose JM, Gresham C,Volin JC, Bowman WD (1999) Generality of leaf traitrelationships: a test across six biomes. Ecology 80:1955–1969
Ruíz-Robleto J, Villar R (2005) Relative growth rate and bio-mass allocation in ten woody species with different leaflongevity using phyllogenetic independent contrasts(PICs). Plant Biol 7:484–494
Rusch GM, Skarpe C, Halley DJ (2009) Plant traits link hy-pothesis about resource-use and response to herbivory.Basic Appl Ecol 10:466–474
Sack L, Grubb PJ, Marañón T (2003) The functional morphol-ogy of juvenile plants tolerant of strong summer drought inshaded forest understories in southern Spain. Plant Ecol168:139–163
Shipley B, Lechowicz MJ, Wright I, Reich PB (2006)Fundamental trade-offs generating the worldwide leaf eco-nomics spectrum. Ecology 87:535–541
Soil Survey Staff (2006) Keys to soil taxonomy, 10th ed.USDA,Natural Resources Conservation Service, Washington, DC
Sonnier G, Shipley B, Navas ML (2010) Quantifying relation-ships between traits and explicitly measured gradients ofstress and disturbance in early successional plant commu-nities. J Veg Sci 21:1014–1024
Sparks DL (1996) Methods of Soil Analysis. Part 3. ChemicalMethods. Soil Science Society of America and AmericanSociety of Agronomy, Madison, Wisconsin, USA
Talavera S, Gibbs PE (1999) Teline. In: Castroviejo S et al (eds)Flora Iberica, CSIC, Madrid, Spain, Vol 7, pp 141–147
Urbieta I, Zavala MA, Marañón T (2008) Human and non-human determinants of forest composition in southernSpain: evidence of shifts toward cork oak dominance due tomanagement over the past century. J Biogeogr 35:1688–1700
Valdés B, Talavera S, Fernández-Galiano E (1987) Flora vascularde Andalucía occidental, 3 Vols. Ketres, Barcelona
Villar R, Merino JA (2001) Comparison of leaf constructioncosts in woody species with differing leaf life-spans incontrasting ecosystems. New Phytol 151:213–226
Villar R, Ruiz-Robleto J, de Yong Y, Poorter H (2006)Differences in construction costs and chemical composi-tion between deciduous and evergreen woody species aresmall as compared to differences among families. PlantCell Environ 29:1629–1643
Violle C, Navas ML, Vile D, Kazakou E, Fortunel C, Hummel I,Garnier E (2007) Let the concept of trait be functional!Oikos 116:882–892
Vitousek PM, Cassman K, Cleveland C, Crews T, Field CB,Grimm NB, Howarth RW, Marino R, Martinelli L,Rastetter EB, Sprent JI (2002) Towards an ecological under-standing of biological nitrogen fixation. Biogeochemistry57:11–45
Warton DI, Wright IJ, Falster DS, Westoby M (2006) Bivariateline-fitting methods for allometry. Biol Rev 81:259–291
Watanabe T, Broadley MR, Jansen S, White PJ, Takada J,Satake K, Takamatsu T, Tuah SJ, Osaki M (2007)Evolutionary control of leaf element composition in plants.New Phytol 174:516–523
Westman WE (1981) Factors influencing the distribution ofspecies of California coastal sage scrub. Ecology 62:439–455
Wilson PJ, Thompson K, Hodgson JG (1999) Specific leaf areaand leaf dry matter content as alternative predictors of plantstrategies. New Phytol 143:155–162
Wright IJ, Westoby M (2001) Understanding seedling growthrelationships through specific leaf area and leaf nitrogenconcentration: generalisations across growth forms andgrowth irradiance. Oecologia 127:21–29
Wright IJ, Westoby M (2002) Leaves at low versus high rainfall:coordination of structure, lifespan and physiology. NewPhytol 155:403–416
Wright IJ, Groom PK, Lamont BB, Poot P, Prior LD, Reich PB,Schulze ED, Veneklaas EJ, Westoby M (2004a) Leaf traitrelationships in Australian plant species. Funct Plant Biol31:551–558
Wright IJ, Reich PB, Westoby M, Ackerly DD, Baruch Z,Bongers F, Cavender-Bares J, Chapin T, CornelissenJHC, Diemer M, Flexas J, Garnier E, Groom PK, GuliasJ, Hikosaka K, Lamont BB, Lee T, Lee W, Lusk C,Midgley JJ, Navas ML, Niinemets U, Oleksyn J, OsadaN, Poorter H, Poot P, Prior L, Pyankov VI, Roumet C,Thomas SC, Tjoelker MG, Veneklaas EJ, Villar R (2004b)The worldwide leaf economics spectrum. Nature 428:821–827
Wright IJ, Reich PB, Cornelissen JHC, Falster DS, Garnier E,Hikosaka K, Lamont BB, Lee W, Oleksyn J, Osada N,Poorter H, Villar R, Warton DI, Westoby M (2005)Assessing the generality of global leaf trait relationships.New Phytol 166:485–496
424 Plant Soil (2012) 357:407–424
Copyright © 2022 FDOKUMEN