Relationships between biodiversity and the stability of marine ecosystems: Comparisons at a European...
10
Relationships between biodiversity and the stability of marine ecosystems: Comparisons at a European scale using meta-analysis Mathieu Cusson a,b, ⁎, Tasman P. Crowe a,1 , Rita Araújo c , Francisco Arenas c , Rebbecca Aspden d , Fabio Bulleri b , Dominique Davoult e,f , Kirstie Dyson d , Simonetta Fraschetti g , Kristjan Herkül h , Cédric Hubas e,2 , Stuart Jenkins i,3 , Jonne Kotta h , Patrik Kraufvelin j,k , Aline Migné e,f , Markus Molis l , Olwyen Mulholland a , Laure M.-L.J. Noël f,4 , David M. Paterson d , James Saunders d , Paul J. Somerfield m , Isabel Sousa-Pinto c , Nicolas Spilmont n,5 , Antonio Terlizzi g , Lisandro Benedetti-Cecchi b,1 a School of Biological and Environmental Science, University College Dublin, Belfield, Dublin 4, Ireland b Dipartimento di Biologia, University of Pisa, Via Derna 1, I-56126 Pisa, Italy c Laboratory of Coastal Biodiversity, Centre of Marine and Environmental Research (CIIMAR), University of Porto, Rua dos Bragas 289, 4050-123 Porto, Portugal d Scottish Oceans Institute, University of St. Andrews, East Sands, Scotland KY16 8LB, United Kingdom e Sorbonne Universités, UPMC Univ Paris 6, UMR 7144, Station Biologique de Roscoff, Place Georges Teissier BP 74, 29682 Roscoff Cedex, France f CNRS, UMR 7144, Station Biologique de Roscoff, 29682 Roscoff Cedex, France g Laboratorio Zoologia e Biologia Marina, Dipartimento di Scienze e Tecnologie Biologiche ed Ambientali, Università di Lecce, CoNISMa, 73100 Lecce, Italy h Estonian Marine Institute, Department of Marine Biology, University of Tartu, Mäealuse 14, 12618 Tallinn, Estonia i The Marine Biological Association of the UK, The Laboratory, Citadel Hill, Plymouth PL1 2PB, United Kingdom j Environmental and Marine Biology, Department of Biosciences, Åbo Akademi University, Artillerigatan 6, 20520 Åbo, Finland k Novia University of Applied Sciences, Raseborgsvägen 9, FI-10600 Ekenäs, Finland l Section Functional Ecology, Biologische Anstalt Helgoland, Alfred-Wegener-Institute for Polar and Marine Research, Marine Station, Kurpromenade 201, 27498 Helgoland, Germany m Plymouth Marine Laboratory, Prospect Place, West Hoe, Plymouth PL1 3DH, United Kingdom n Université Lille Nord de France, Université Lille 1, CNRS UMR LOG 8187, Laboratoire Océanologie et Géosciences, 62930 Wimereux, France abstract article info Article history: Received 30 March 2014 Received in revised form 15 August 2014 Accepted 18 August 2014 Available online xxxx Keywords: Biodiversity Ecosystem Functioning Temporal Variability Diversity–Stability Relationships Community Variability Benthic Marine Coastal Habitats The relationship between biodiversity and stability of marine benthic assemblages was investigated through meta-analyses using existing data sets (n = 28) covering various spatial (m–km) and temporal (1973–2006; ranging from 5 to N 250 months) scales in different benthic habitats (emergent rock, rock pools and sedimentary habitats) over different European marine systems (North Atlantic and western Mediterranean). Stability was mea- sured by a lower variability in time, and variability was estimated as temporal variance of species richness, total abundance (density or % cover) and community structure (using Bray–Curtis dissimilarities on species composi- tion and abundance). Stability generally decreased with species richness. Temporal variability in species richness increased with the number of species at both quadrat (b 1m 2 ) and site (~100 m 2 ) scales, while no relationship was observed by multivariate analyses. Positive relationships were also observed at the scale of site between temporal variability in species richness and variability in community structure with evenness estimates. This implies that the relationship between species richness or evenness and species richness variability is slightly positive and de- pends on the scale of observation. Thus, species richness does not stabilize temporal fluctuations in species num- ber, rather species rich assemblages are those most likely to undergo the largest fluctuations in species numbers and abundance from time to time. Changes within community assemblages in terms of structure are, however, generally independent of biodiversity. Except for sedimentary and rock pool habitats, no relationship was ob- served between temporal variation of total abundances and diversity at either scale. Overall, our results emphasize that the relation between species richness and species-level measures of temporal variability depends on scale of measurements, type of habitats and the marine system (North Atlantic and Mediterranean) considered. © 2014 Elsevier B.V. All rights reserved. Journal of Sea Research xxx (2014) xxx–xxx ⁎ Corresponding author at: Département des sciences fondamentales, Université du Québec à Chicoutimi, 555 rue de l'Université, Chicoutimi, Québec G7H 2B1, Canada. Tel.: +1 418 545 5011#5065. E-mail address: [email protected] (M. Cusson). 1 Coordinators of BIOFUSE programme within MarBEF. 2 Present address: Muséum National d'Histoire Naturelle, UMR BOREA UPMC Univ Paris 6, CNRS 7208, IRD 207, UCBN, CP 53, 61 rue Buffon, 75231 Paris Cedex 5, France. 3 Present address: School of Ocean Sciences, Bangor University, Menai Bridge, Anglesey LL59 5AB, United Kingdom. 4 Present address: Centre d'Étude et de Valorisation des Algues (CEVA), Presqu'île de Pen-Lan — B.P. 3, 22610 Pleubian, France. 5 Present address: Environmental Futures Research Institute, Griffith University, Gold Coast Campus, QLD 4222, Australia. SEARES-01282; No of Pages 10 http://dx.doi.org/10.1016/j.seares.2014.08.004 1385-1101/© 2014 Elsevier B.V. All rights reserved. Contents lists available at ScienceDirect Journal of Sea Research journal homepage: www.elsevier.com/locate/seares Please cite this article as: Cusson, M., et al., Relationships between biodiversity and the stability of marine ecosystems: Comparisons at a European scale using meta-analysis, J. Sea Res. (2014), http://dx.doi.org/10.1016/j.seares.2014.08.004
-
Upload
triestearchitettura -
Category
Documents
-
view
4 -
download
0
Transcript of Relationships between biodiversity and the stability of marine ecosystems: Comparisons at a European...
Journal of Sea Research xxx (2014) xxx–xxx
SEARES-01282; No of Pages 10
Contents lists available at ScienceDirect
Journal of Sea Research
j ourna l homepage: www.e lsev ie r .com/ locate /seares
Relationships between biodiversity and the stability of marineecosystems: Comparisons at a European scale using meta-analysis
Mathieu Cusson a,b,⁎, Tasman P. Crowe a,1, Rita Araújo c, Francisco Arenas c, Rebbecca Aspden d, Fabio Bulleri b,Dominique Davoult e,f, Kirstie Dyson d, Simonetta Fraschetti g, Kristjan Herkül h, Cédric Hubas e,2,Stuart Jenkins i,3, Jonne Kotta h, Patrik Kraufvelin j,k, Aline Migné e,f, Markus Molis l, Olwyen Mulholland a,Laure M.-L.J. Noël f,4, David M. Paterson d, James Saunders d, Paul J. Somerfield m, Isabel Sousa-Pinto c,Nicolas Spilmont n,5, Antonio Terlizzi g, Lisandro Benedetti-Cecchi b,1
a School of Biological and Environmental Science, University College Dublin, Belfield, Dublin 4, Irelandb Dipartimento di Biologia, University of Pisa, Via Derna 1, I-56126 Pisa, Italyc Laboratory of Coastal Biodiversity, Centre of Marine and Environmental Research (CIIMAR), University of Porto, Rua dos Bragas 289, 4050-123 Porto, Portugald Scottish Oceans Institute, University of St. Andrews, East Sands, Scotland KY16 8LB, United Kingdome Sorbonne Universités, UPMC Univ Paris 6, UMR 7144, Station Biologique de Roscoff, Place Georges Teissier BP 74, 29682 Roscoff Cedex, Francef CNRS, UMR 7144, Station Biologique de Roscoff, 29682 Roscoff Cedex, Franceg Laboratorio Zoologia e Biologia Marina, Dipartimento di Scienze e Tecnologie Biologiche ed Ambientali, Università di Lecce, CoNISMa, 73100 Lecce, Italyh Estonian Marine Institute, Department of Marine Biology, University of Tartu, Mäealuse 14, 12618 Tallinn, Estoniai The Marine Biological Association of the UK, The Laboratory, Citadel Hill, Plymouth PL1 2PB, United Kingdomj Environmental and Marine Biology, Department of Biosciences, Åbo Akademi University, Artillerigatan 6, 20520 Åbo, Finlandk Novia University of Applied Sciences, Raseborgsvägen 9, FI-10600 Ekenäs, Finlandl Section Functional Ecology, Biologische Anstalt Helgoland, Alfred-Wegener-Institute for Polar and Marine Research, Marine Station, Kurpromenade 201, 27498 Helgoland, Germanym Plymouth Marine Laboratory, Prospect Place, West Hoe, Plymouth PL1 3DH, United Kingdomn Université Lille Nord de France, Université Lille 1, CNRS UMR LOG 8187, Laboratoire Océanologie et Géosciences, 62930 Wimereux, France
⁎ Corresponding author at: Département des sciences fo5011#5065.
E-mail address: [email protected] (M. Cusson)1 Coordinators of BIOFUSE programme within MarBEF.2 Present address: Muséum National d'Histoire Naturel3 Present address: School of Ocean Sciences, Bangor Un4 Present address: Centre d'Étude et de Valorisation de5 Present address: Environmental Futures Research Ins
http://dx.doi.org/10.1016/j.seares.2014.08.0041385-1101/© 2014 Elsevier B.V. All rights reserved.
Please cite this article as: Cusson,M., et al., Rescale using meta-analysis, J. Sea Res. (2014),
a b s t r a c t
a r t i c l e i n f oArticle history:Received 30 March 2014Received in revised form 15 August 2014Accepted 18 August 2014Available online xxxx
Keywords:Biodiversity Ecosystem FunctioningTemporal VariabilityDiversity–Stability RelationshipsCommunity VariabilityBenthic Marine Coastal Habitats
The relationship between biodiversity and stability of marine benthic assemblages was investigated throughmeta-analyses using existing data sets (n = 28) covering various spatial (m–km) and temporal (1973–2006;ranging from 5 to N250 months) scales in different benthic habitats (emergent rock, rock pools and sedimentaryhabitats) overdifferent Europeanmarine systems (North Atlantic andwesternMediterranean). Stabilitywasmea-sured by a lower variability in time, and variability was estimated as temporal variance of species richness, totalabundance (density or % cover) and community structure (using Bray–Curtis dissimilarities on species composi-tion and abundance). Stability generally decreased with species richness. Temporal variability in species richnessincreasedwith the numberof species at both quadrat (b1m2) and site (~100m2) scales,while no relationshipwasobserved bymultivariate analyses. Positive relationships were also observed at the scale of site between temporalvariability in species richness and variability in community structure with evenness estimates. This implies thatthe relationship between species richness or evenness and species richness variability is slightly positive and de-pends on the scale of observation. Thus, species richness does not stabilize temporal fluctuations in species num-ber, rather species rich assemblages are those most likely to undergo the largest fluctuations in species numbersand abundance from time to time. Changes within community assemblages in terms of structure are, however,generally independent of biodiversity. Except for sedimentary and rock pool habitats, no relationship was ob-served between temporal variation of total abundances and diversity at either scale. Overall, our results emphasizethat the relation between species richness and species-level measures of temporal variability depends on scale ofmeasurements, type of habitats and the marine system (North Atlantic and Mediterranean) considered.
© 2014 Elsevier B.V. All rights reserved.
ndamentales, Université duQuébec à Chicoutimi, 555 rue de l'Université, Chicoutimi, QuébecG7H 2B1, Canada. Tel.:+1418 545
.
le, UMR BOREA UPMC Univ Paris 6, CNRS 7208, IRD 207, UCBN, CP 53, 61 rue Buffon, 75231 Paris Cedex 5, France.iversity, Menai Bridge, Anglesey LL59 5AB, United Kingdom.s Algues (CEVA), Presqu'île de Pen-Lan— B.P. 3, 22610 Pleubian, France.titute, Griffith University, Gold Coast Campus, QLD 4222, Australia.
lationships between biodiversity and the stability ofmarine ecosystems: Comparisons at a Europeanhttp://dx.doi.org/10.1016/j.seares.2014.08.004
2 M. Cusson et al. / Journal of Sea Research xxx (2014) xxx–xxx
1. Introduction
For a long time, ecologists (e.g. Elton, 1958; MacArthur, 1955) havesuggested that more diverse communities are more stable anddiversity–stability relationships have been explored using varioustheoretical models (e.g. Loreau and de Mazancourt, 2013; May,1974; Raffaelli, 2004; Solan et al., 2004), laboratory and field studies(e.g. McGrady-Steed and Morin, 2000; Petchey et al., 2002; Tilmanand Downing, 1994). Interest in these relationships has resurged inrecent years due to concern about the potential consequences of chang-ing biodiversity for ecosystem functioning (e.g. Donohue et al., 2013;Stachowicz et al., 2007). Many of the theoretical and experimentalstudies have produced idiosyncratic results (Balvanera et al., 2006;Cottingham et al., 2001). Empirical support for relationships betweenbiodiversity and stability across different ecological systems and spatialscales is still limited and contrasting, partly because of the practicallimitations of empirical studies in encompassing long-term communitydynamics. Indeed, individual studies have shown that increasing diver-sity may reduce (Ives and Hughes, 2002; Li and Charnov, 2001; Loreauand de Mazancourt, 2013), increase (e.g. Isbell et al., 2009; McCann,2000; Tilman, 1996), or have little or no effect on the stability of somecommunity attributes (e.g. McGrady-Steed and Morin, 2000). Whileno widespread consensus has been reached in the literature on whichmechanisms are important in relating stability to biodiversity, a numberof factors are known to affect the relationship. Among others, theseinclude the scale of observation, historical effects of sites and species'life-histories, direct and indirect effects of disturbance (e.g. Bertocciet al., 2005; including speed and asynchrony of responses: Loreauand de Mazancourt, 2013), biodiversity and productivity (Kondoh,2001). Other factors that may prevent determining relationships arepitfalls in experimental design (e.g. Hector et al., 2007; Loreau et al.,2001), calculation method and bias in estimating temporal variability(Cottinghamet al., 2001;McArdle et al., 1990) and unappreciated statis-tical properties of these variables (Doak et al., 1998).
Studies on diversity and stability relationships have focussed largelyon community aggregated variables (i.e. total biomass, production) orpopulation abundances (see also Mykrä et al., 2011). Conversely, theanalysis of stability of diversity per se within assemblage has receivedless attention. Temporal stability (inversely proportional to variability)in richness is expected to decrease with increasing average in numberof taxa due to a pure statistic argument (positive scaling relationshipbetween mean and variance). On the other hand, temporal variabilityin richness and changes in species structure within assemblages are im-portant properties of communities. Disturbance regimes (Connell,1978; Hughes et al., 2007) and resource availability may contribute tomaintain high and relatively stable numbers of taxa at certain temporaland spatial scales. Several studies have shown that rich assemblagesare locally organized in complex networks with varying interactionstrengths and are prone to be generally more resistant to compositionalturnover than less complex systems (Frank and McNaughton, 1991;Levine andD'Antonio, 1999; Shurin et al., 2007). If assemblage complex-ity begets stability via increased networks of interactions that preventlocal extinctions, then rich (or more generally, diverse) assemblagesshould be compositionally more stable through time as comparedwith less diverse assemblages, despite the expected positive relation-ship between mean and variance. Also, intrinsic community propertiessuch as negative covariance in species occurrence could lead to lowertemporal variation at the more diverse sites offsetting the mean–variance scaling effect.
The role of evenness in diversity–stability relationships is not wellunderstood (Hillebrand et al., 2008) and its use can provide differentinformation not considered in the other diversity indices (Wilseyet al., 2005). Evenness within assemblages may enhance compositionalstability (Frank and McNaughton, 1991) and reduce the risk of localextinction and invasion provided that no strong dominant can preventfurther colonization. Polley et al. (2013) have shown that, in some
Please cite this article as: Cusson,M., et al., Relationships between biodiversscale using meta-analysis, J. Sea Res. (2014), http://dx.doi.org/10.1016/j.se
circumstances, evenness in plant abundances and functional traits con-tributes as much as species richness to reduce temporal variability inproductivity. Moreover, low dominance intensifies the stabilizing effectof richness on aggregated variables (e.g. total abundance): their vari-ability becomes less affected by the scaling coefficient, z, determiningthe strength of the relationship between the mean and the variance(Doak et al., 1998; Vogt et al., 2006).
Ecological mechanisms that govern diversity, resource availabilityand species interactions are scale-dependent, so the prevalence of onemechanism at a given scale does not exclude the potential influence ofother mechanisms at other scales (e.g. Raffaelli, 2006; Whittaker et al.,2001). This justifies the need to examine diversity–stability relation-ships at multiple scales. In this study, existing data sets were used toexamine diversity–stability relationships and test whether they weredifferent among habitats and between different European marine sys-tems. This approach tests the general hypothesis that diversity mea-sures (species richness and evenness) can be used as predictors oftemporal stability within assemblages. Temporal stability implieslower variability that was measured as temporal variance in total com-munity abundance, taxa number and community structure. Our specifichypotheses are that temporal variability in univariate and multivariatemeasures reflecting changes in species (or higher taxa) abundanceand compositionwithin assemblages is related to biodiversitymeasures(i) at the scale of small patches (quadrats or grabs; ~0.10m2); and (ii) atthe scale of shores (site; ~100 s of m2); and (iii) relationships betweentemporal variability and biodiversity at either scale vary according tothe type of habitats and regions (marine systems). We are aware thatthe above hypotheses testedwith observational data sets remain strictlycorrelative, not causal.
2. Methods
2.1. Data base description
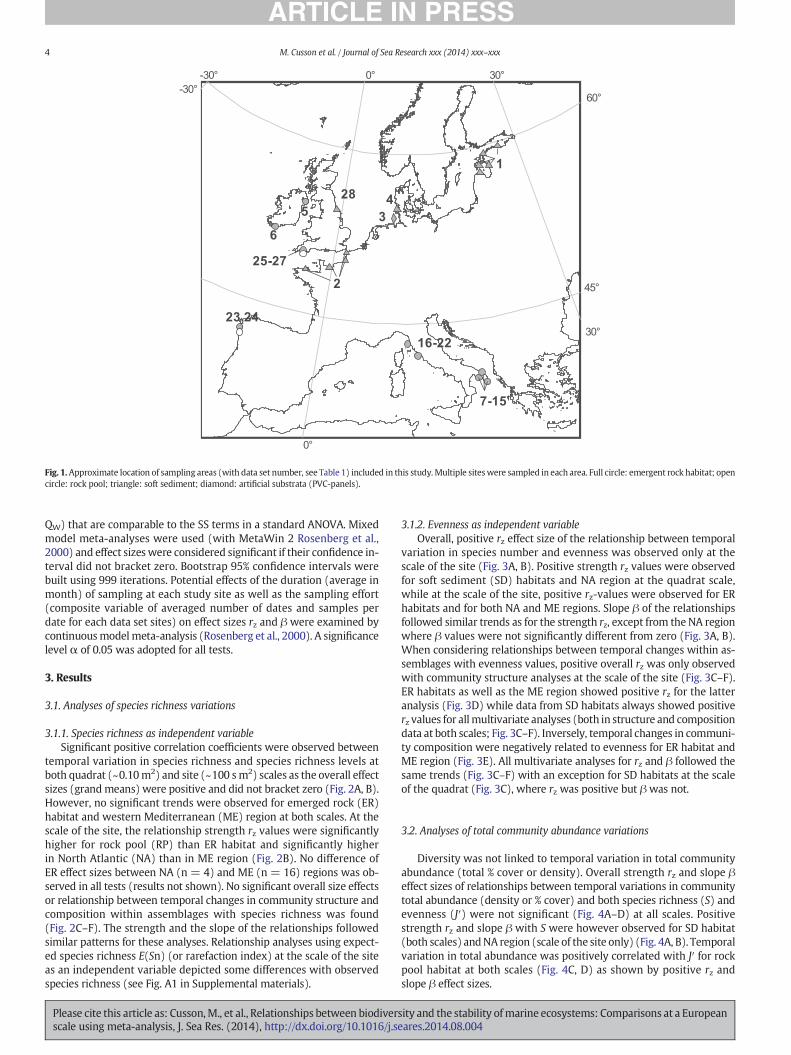
Existing data sets of macrobenthic communities (n= 28) have beencompiled (see list in Table 1). Each data set consists ofmulti-site tempo-ral series (6 minimum) of macrobenthic community abundances(densities or % cover) of algae and fauna and coveredmost European re-gions (Fig. 1). Data sets had median values of 12 sites per data set, 4sampling dates and 6 samples per date. The data sets cover diverse ma-rine benthic habitats (emergent rock: n = 20; rock pool: n = 3; sedi-ment: n = 4) with the addition of one data set using subsurfaceartificial panels (discarded for categorical habitat analyses).
2.2. Estimation of temporal variation
The temporal variability in species richness (number of species/taxawithin quadrats/grabs) and total abundance (as density or % cover,within quadrats/grabs) of macrobenthic algae and fauna were used assurrogate measures of the community stability (where low variabilitycorresponds to high stability). Due to differences in sampling designamong data sets, the temporal variability was estimated as follows:(i) For randomized spatial samples at each sampling date, temporal var-iability (σt
2) in targeted variableswas estimated using theMean Squares(MS) obtained froma one-wayANOVAwith time as independent factor,asσt
2≅ (MStime−MSresidual)/n, where n is the number of replicate quad-rats/grabs at each sampling date. (ii) In the case of unbalanced data, thevariance componentwas estimated by a restrictedmaximum likelihoodmethod (MIXED procedure in SAS, SAS, 1999). (iii) For fixed quadratsamples (i.e. repeated measures through time), temporal variabilitywas assessed as the variance (over time) of response variables from in-dividual quadrats.Multivariate temporal variability was estimated fromthe same linear model as for the univariate case using PermutationalMultivariate Analysis of Variance (PERMANOVA, Anderson, 2005). Forfixed quadrats the average Bray–Curtis dissimilarity for each replicatequadrat over time was used. For analyses of variation in community
ity and the stability ofmarine ecosystems: Comparisons at a Europeanares.2014.08.004
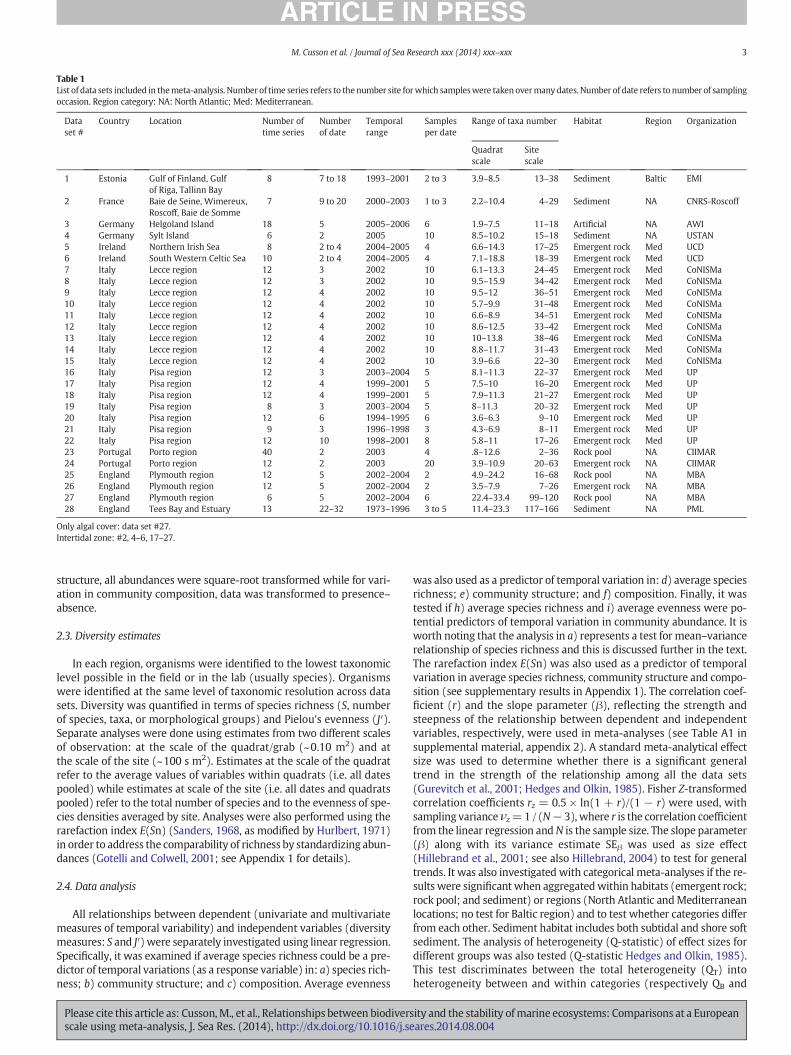
Table 1List of data sets included in themeta-analysis. Number of time series refers to thenumber site forwhich sampleswere takenovermany dates. Number of date refers to number of samplingoccasion. Region category: NA: North Atlantic; Med: Mediterranean.
Dataset #
Country Location Number oftime series
Numberof date
Temporalrange
Samplesper date
Range of taxa number Habitat Region Organization
Quadratscale
Sitescale
1 Estonia Gulf of Finland, Gulfof Riga, Tallinn Bay
8 7 to 18 1993–2001 2 to 3 3.9–8.5 13–38 Sediment Baltic EMI
2 France Baie de Seine, Wimereux,Roscoff, Baie de Somme
7 9 to 20 2000–2003 1 to 3 2.2–10.4 4–29 Sediment NA CNRS-Roscoff
3 Germany Helgoland Island 18 5 2005–2006 6 1.9–7.5 11–18 Artificial NA AWI4 Germany Sylt Island 6 2 2005 10 8.5–10.2 15–18 Sediment NA USTAN5 Ireland Northern Irish Sea 8 2 to 4 2004–2005 4 6.6–14.3 17–25 Emergent rock Med UCD6 Ireland South Western Celtic Sea 10 2 to 4 2004–2005 4 7.1–18.8 18–39 Emergent rock Med UCD7 Italy Lecce region 12 3 2002 10 6.1–13.3 24–45 Emergent rock Med CoNISMa8 Italy Lecce region 12 3 2002 10 9.5–15.9 34–42 Emergent rock Med CoNISMa9 Italy Lecce region 12 4 2002 10 9.5–12 36–51 Emergent rock Med CoNISMa10 Italy Lecce region 12 4 2002 10 5.7–9.9 31–48 Emergent rock Med CoNISMa11 Italy Lecce region 12 4 2002 10 6.6–8.9 34–51 Emergent rock Med CoNISMa12 Italy Lecce region 12 4 2002 10 8.6–12.5 33–42 Emergent rock Med CoNISMa13 Italy Lecce region 12 4 2002 10 10–13.8 38–46 Emergent rock Med CoNISMa14 Italy Lecce region 12 4 2002 10 8.8–11.7 31–43 Emergent rock Med CoNISMa15 Italy Lecce region 12 4 2002 10 3.9–6.6 22–30 Emergent rock Med CoNISMa16 Italy Pisa region 12 3 2003–2004 5 8.1–11.3 22–37 Emergent rock Med UP17 Italy Pisa region 12 4 1999–2001 5 7.5–10 16–20 Emergent rock Med UP18 Italy Pisa region 12 4 1999–2001 5 7.9–11.3 21–27 Emergent rock Med UP19 Italy Pisa region 8 3 2003–2004 5 8–11.3 20–32 Emergent rock Med UP20 Italy Pisa region 12 6 1994–1995 6 3.6–6.3 9–10 Emergent rock Med UP21 Italy Pisa region 9 3 1996–1998 3 4.3–6.9 8–11 Emergent rock Med UP22 Italy Pisa region 12 10 1998–2001 8 5.8–11 17–26 Emergent rock Med UP23 Portugal Porto region 40 2 2003 4 .8–12.6 2–36 Rock pool NA CIIMAR24 Portugal Porto region 12 2 2003 20 3.9–10.9 20–63 Emergent rock NA CIIMAR25 England Plymouth region 12 5 2002–2004 2 4.9–24.2 16–68 Rock pool NA MBA26 England Plymouth region 12 5 2002–2004 2 3.5–7.9 7–26 Emergent rock NA MBA27 England Plymouth region 6 5 2002–2004 6 22.4–33.4 99–120 Rock pool NA MBA28 England Tees Bay and Estuary 13 22–32 1973–1996 3 to 5 11.4–23.3 117–166 Sediment NA PML
Only algal cover: data set #27.Intertidal zone: #2, 4–6, 17–27.
3M. Cusson et al. / Journal of Sea Research xxx (2014) xxx–xxx
structure, all abundances were square-root transformed while for vari-ation in community composition, data was transformed to presence–absence.
2.3. Diversity estimates
In each region, organisms were identified to the lowest taxonomiclevel possible in the field or in the lab (usually species). Organismswere identified at the same level of taxonomic resolution across datasets. Diversity was quantified in terms of species richness (S, numberof species, taxa, or morphological groups) and Pielou's evenness (J′).Separate analyses were done using estimates from two different scalesof observation: at the scale of the quadrat/grab (~0.10 m2) and atthe scale of the site (~100 s m2). Estimates at the scale of the quadratrefer to the average values of variables within quadrats (i.e. all datespooled) while estimates at scale of the site (i.e. all dates and quadratspooled) refer to the total number of species and to the evenness of spe-cies densities averaged by site. Analyses were also performed using therarefaction index E(Sn) (Sanders, 1968, as modified by Hurlbert, 1971)in order to address the comparability of richness by standardizing abun-dances (Gotelli and Colwell, 2001; see Appendix 1 for details).
2.4. Data analysis
All relationships between dependent (univariate and multivariatemeasures of temporal variability) and independent variables (diversitymeasures: S and J′)were separately investigated using linear regression.Specifically, it was examined if average species richness could be a pre-dictor of temporal variations (as a response variable) in: a) species rich-ness; b) community structure; and c) composition. Average evenness
Please cite this article as: Cusson,M., et al., Relationships between biodiversscale using meta-analysis, J. Sea Res. (2014), http://dx.doi.org/10.1016/j.se
was also used as a predictor of temporal variation in: d) average speciesrichness; e) community structure; and f) composition. Finally, it wastested if h) average species richness and i) average evenness were po-tential predictors of temporal variation in community abundance. It isworth noting that the analysis in a) represents a test for mean–variancerelationship of species richness and this is discussed further in the text.The rarefaction index E(Sn) was also used as a predictor of temporalvariation in average species richness, community structure and compo-sition (see supplementary results in Appendix 1). The correlation coef-ficient (r) and the slope parameter (β), reflecting the strength andsteepness of the relationship between dependent and independentvariables, respectively, were used in meta-analyses (see Table A1 insupplemental material, appendix 2). A standard meta-analytical effectsize was used to determine whether there is a significant generaltrend in the strength of the relationship among all the data sets(Gurevitch et al., 2001; Hedges and Olkin, 1985). Fisher Z-transformedcorrelation coefficients rz = 0.5 × ln(1 + r)/(1 − r) were used, withsampling varianceνz=1 / (N− 3), where r is the correlation coefficientfrom the linear regression andN is the sample size. The slope parameter(β) along with its variance estimate SEβ was used as size effect(Hillebrand et al., 2001; see also Hillebrand, 2004) to test for generaltrends. It was also investigated with categorical meta-analyses if the re-sults were significant when aggregatedwithin habitats (emergent rock;rock pool; and sediment) or regions (North Atlantic andMediterraneanlocations; no test for Baltic region) and to test whether categories differfrom each other. Sediment habitat includes both subtidal and shore softsediment. The analysis of heterogeneity (Q-statistic) of effect sizes fordifferent groups was also tested (Q-statistic Hedges and Olkin, 1985).This test discriminates between the total heterogeneity (QT) intoheterogeneity between and within categories (respectively QB and
ity and the stability ofmarine ecosystems: Comparisons at a Europeanares.2014.08.004
-30° -30°
0°
0°
30°
30°
45°
60°
5
25-27
28
2
1
7-15
3
23,24
16-22
4
6
Fig. 1.Approximate location of sampling areas (with data set number, see Table 1) included in this study. Multiple siteswere sampled in each area. Full circle: emergent rock habitat; opencircle: rock pool; triangle: soft sediment; diamond: artificial substrata (PVC-panels).
4 M. Cusson et al. / Journal of Sea Research xxx (2014) xxx–xxx
QW) that are comparable to the SS terms in a standard ANOVA. Mixedmodel meta-analyses were used (with MetaWin 2 Rosenberg et al.,2000) and effect sizeswere considered significant if their confidence in-terval did not bracket zero. Bootstrap 95% confidence intervals werebuilt using 999 iterations. Potential effects of the duration (average inmonth) of sampling at each study site as well as the sampling effort(composite variable of averaged number of dates and samples perdate for each data set sites) on effect sizes rz and β were examined bycontinuousmodelmeta-analysis (Rosenberg et al., 2000). A significancelevel α of 0.05 was adopted for all tests.
3. Results
3.1. Analyses of species richness variations
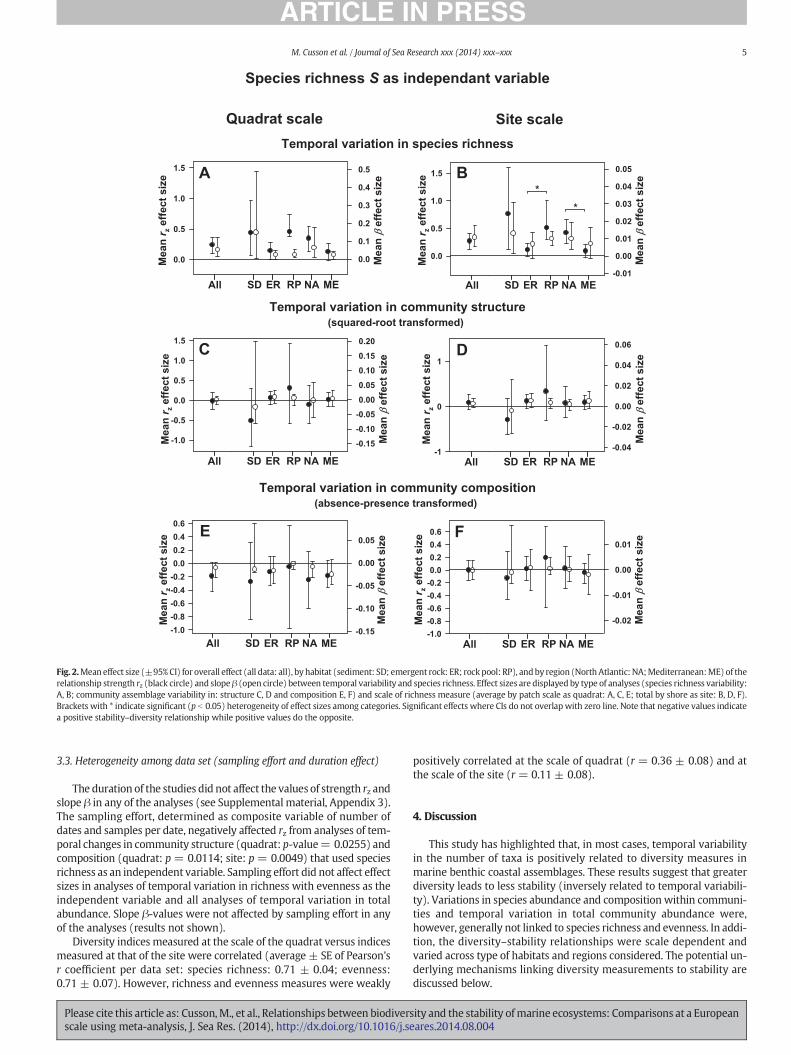
3.1.1. Species richness as independent variableSignificant positive correlation coefficients were observed between
temporal variation in species richness and species richness levels atboth quadrat (~0.10m2) and site (~100 sm2) scales as the overall effectsizes (grandmeans) were positive and did not bracket zero (Fig. 2A, B).However, no significant trends were observed for emerged rock (ER)habitat and western Mediterranean (ME) region at both scales. At thescale of the site, the relationship strength rz values were significantlyhigher for rock pool (RP) than ER habitat and significantly higherin North Atlantic (NA) than in ME region (Fig. 2B). No difference ofER effect sizes between NA (n = 4) and ME (n = 16) regions was ob-served in all tests (results not shown). No significant overall size effectsor relationship between temporal changes in community structure andcomposition within assemblages with species richness was found(Fig. 2C–F). The strength and the slope of the relationships followedsimilar patterns for these analyses. Relationship analyses using expect-ed species richness E(Sn) (or rarefaction index) at the scale of the siteas an independent variable depicted some differences with observedspecies richness (see Fig. A1 in Supplemental materials).
Please cite this article as: Cusson,M., et al., Relationships between biodiversscale using meta-analysis, J. Sea Res. (2014), http://dx.doi.org/10.1016/j.se
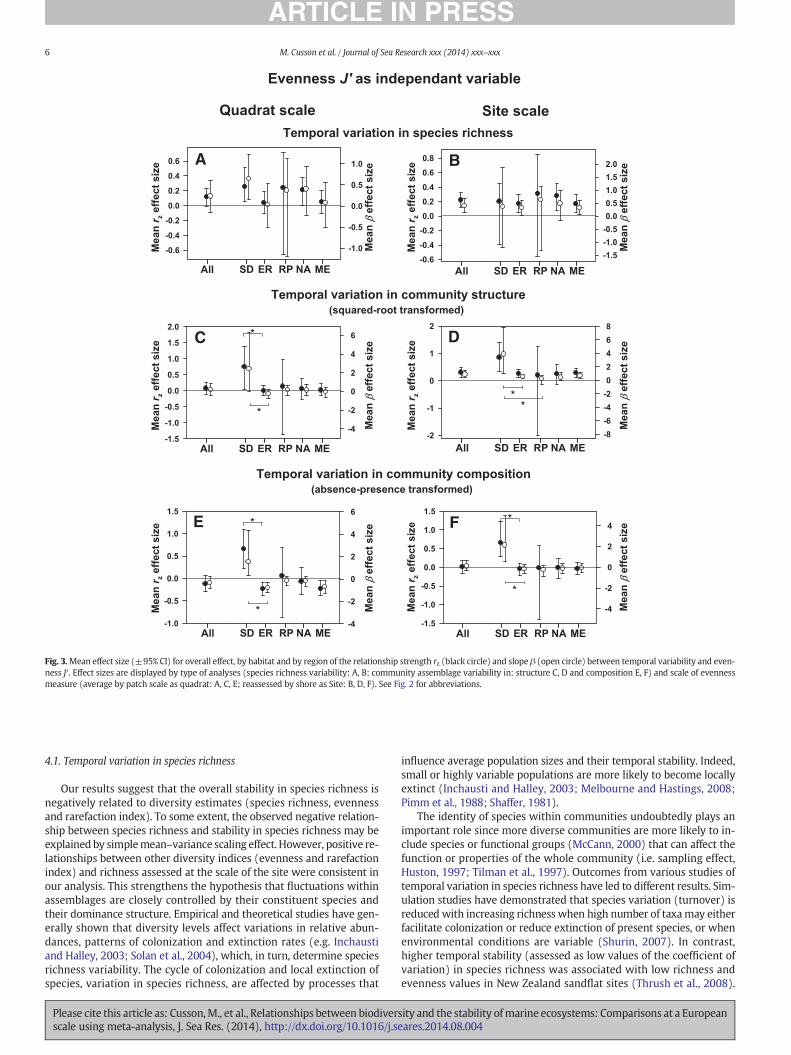
3.1.2. Evenness as independent variableOverall, positive rz effect size of the relationship between temporal
variation in species number and evenness was observed only at thescale of the site (Fig. 3A, B). Positive strength rz values were observedfor soft sediment (SD) habitats and NA region at the quadrat scale,while at the scale of the site, positive rz-values were observed for ERhabitats and for both NA and ME regions. Slope β of the relationshipsfollowed similar trends as for the strength rz, except from the NA regionwhere β values were not significantly different from zero (Fig. 3A, B).When considering relationships between temporal changes within as-semblages with evenness values, positive overall rz was only observedwith community structure analyses at the scale of the site (Fig. 3C–F).ER habitats as well as the ME region showed positive rz for the latteranalysis (Fig. 3D) while data from SD habitats always showed positiverz values for allmultivariate analyses (both in structure and compositiondata at both scales; Fig. 3C–F). Inversely, temporal changes in communi-ty composition were negatively related to evenness for ER habitat andME region (Fig. 3E). All multivariate analyses for rz and β followed thesame trends (Fig. 3C–F) with an exception for SD habitats at the scaleof the quadrat (Fig. 3C), where rz was positive but β was not.
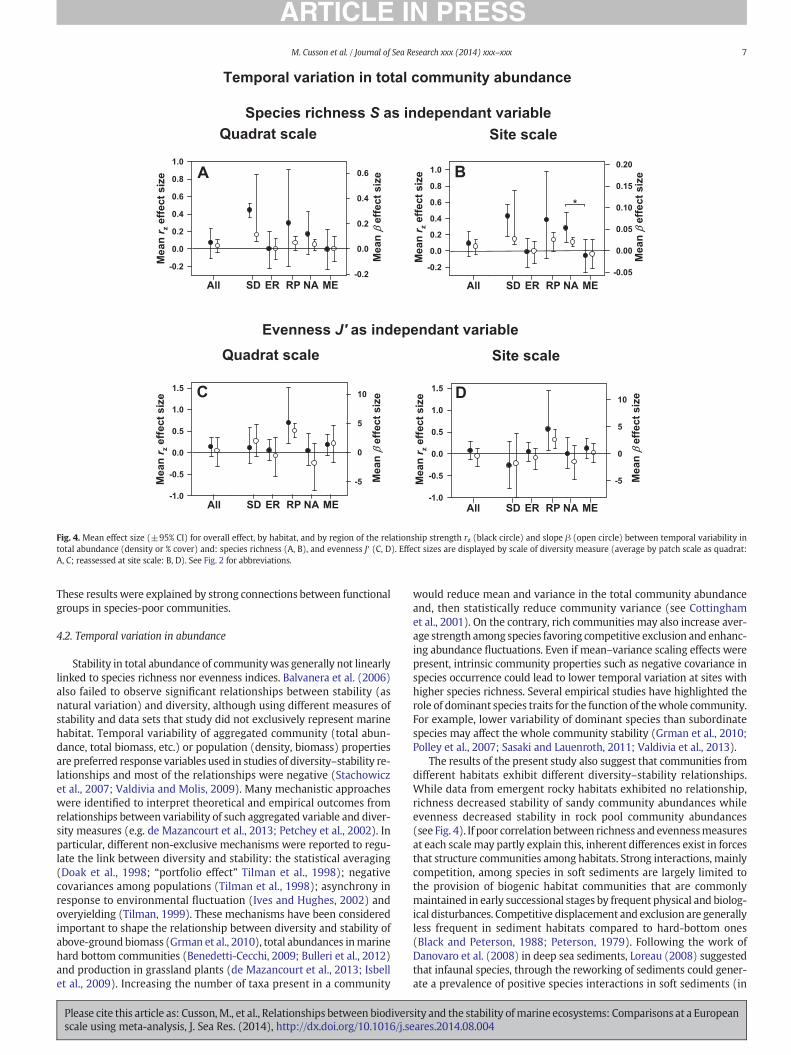
3.2. Analyses of total community abundance variations
Diversity was not linked to temporal variation in total communityabundance (total % cover or density). Overall strength rz and slope βeffect sizes of relationships between temporal variations in communitytotal abundance (density or % cover) and both species richness (S) andevenness (J′) were not significant (Fig. 4A–D) at all scales. Positivestrength rz and slope β with S were however observed for SD habitat(both scales) andNA region (scale of the site only) (Fig. 4A, B). Temporalvariation in total abundance was positively correlated with J′ for rockpool habitat at both scales (Fig. 4C, D) as shown by positive rz andslope β effect sizes.
ity and the stability ofmarine ecosystems: Comparisons at a Europeanares.2014.08.004
Quadrat scale Site scale
Temporal variation in community structure(squared-root transformed)
0.0
0.5
1.0
1.5
0.0
0.1
0.2
0.3
0.4
0.5
0.0
0.5
1.0
1.5
-0.01
0.00
0.01
0.02
0.03
0.04
0.05A
Mea
n r z
effe
ct s
ize B
Mea
n r z
effe
ct s
ize
-1.0
-0.5
0.0
0.5
1.0
1.5
-0.15
-0.10
-0.05
0.00
0.05
0.10
0.15
0.20
-1
0
1
-0.04
-0.02
0.00
0.02
0.04
0.06C DM
ean β
effe
ct s
ize
Mea
n β
effe
ct s
ize
Mea
n r z
effe
ct s
ize
Mea
n r z
effe
ct s
ize
Mea
n β
effe
ct s
ize
Mea
n β
effe
ct s
ize
Mea
n r z
effe
ct s
ize
Mea
n r z
effe
ct s
ize
Mea
n β
effe
ct s
ize
Mea
n β
effe
ct s
ize
-1.0-0.8-0.6-0.4-0.20.00.20.40.6
-0.15
-0.10
-0.05
0.00
0.05E
-1.0-0.8-0.6-0.4-0.20.00.20.40.6
-0.02
-0.01
0.00
0.01F
Species richness S as independant variable
All SD ER RP NA ME All SD ER RP NA ME
All SD ER RP NA ME All SD ER RP NA ME
All SD ER RP NA ME All SD ER RP NA ME
Temporal variation in species richness
**
Temporal variation in community composition(absence-presence transformed)
Fig. 2.Mean effect size (±95%CI) for overall effect (all data: all), by habitat (sediment: SD; emergent rock: ER; rockpool: RP), andby region (North Atlantic: NA;Mediterranean:ME) of therelationship strength rz (black circle) and slopeβ (open circle) between temporal variability and species richness. Effect sizes are displayed by type of analyses (species richness variability:A, B; community assemblage variability in: structure C, D and composition E, F) and scale of richness measure (average by patch scale as quadrat: A, C, E; total by shore as site: B, D, F).Brackets with * indicate significant (p b 0.05) heterogeneity of effect sizes among categories. Significant effects where CIs do not overlapwith zero line. Note that negative values indicatea positive stability–diversity relationship while positive values do the opposite.
5M. Cusson et al. / Journal of Sea Research xxx (2014) xxx–xxx
3.3. Heterogeneity among data set (sampling effort and duration effect)
The duration of the studies did not affect the values of strength rz andslope β in any of the analyses (see Supplemental material, Appendix 3).The sampling effort, determined as composite variable of number ofdates and samples per date, negatively affected rz from analyses of tem-poral changes in community structure (quadrat: p-value= 0.0255) andcomposition (quadrat: p= 0.0114; site: p= 0.0049) that used speciesrichness as an independent variable. Sampling effort did not affect effectsizes in analyses of temporal variation in richness with evenness as theindependent variable and all analyses of temporal variation in totalabundance. Slope β-values were not affected by sampling effort in anyof the analyses (results not shown).
Diversity indices measured at the scale of the quadrat versus indicesmeasured at that of the site were correlated (average ± SE of Pearson'sr coefficient per data set: species richness: 0.71 ± 0.04; evenness:0.71 ± 0.07). However, richness and evenness measures were weakly
Please cite this article as: Cusson,M., et al., Relationships between biodiversscale using meta-analysis, J. Sea Res. (2014), http://dx.doi.org/10.1016/j.se
positively correlated at the scale of quadrat (r = 0.36 ± 0.08) and atthe scale of the site (r = 0.11 ± 0.08).
4. Discussion
This study has highlighted that, in most cases, temporal variabilityin the number of taxa is positively related to diversity measures inmarine benthic coastal assemblages. These results suggest that greaterdiversity leads to less stability (inversely related to temporal variabili-ty). Variations in species abundance and composition within communi-ties and temporal variation in total community abundance were,however, generally not linked to species richness and evenness. In addi-tion, the diversity–stability relationships were scale dependent andvaried across type of habitats and regions considered. The potential un-derlying mechanisms linking diversity measurements to stability arediscussed below.
ity and the stability ofmarine ecosystems: Comparisons at a Europeanares.2014.08.004
Temporal variation in community structure(squared-root transformed)
Temporal variation in species richness
Temporal variation in community composition(absence-presence transformed)
-0.6
-0.4
-0.2
0.0
0.2
0.4
0.6
Quadrat scale Site scale
Evenness J' as independant variable
-1.0
-0.5
0.0
0.5
1.0M
ean r z
effe
ct s
ize
Mea
n β
effe
ct s
izeA
-1.5
-1.0
-0.5
0.0
0.5
1.0
1.5
2.0
-4
-2
0
2
4
6C
-2
-1
0
1
2
-8-6-4-202468
D
-1.0
-0.5
0.0
0.5
1.0
1.5
-4
-2
0
2
4
6E
-0.6
-0.4
-0.2
0.0
0.2
0.4
0.6
0.8
-1.5-1.0-0.50.00.51.01.52.0
Mea
n r z
effe
ct s
ize
Mea
n β
effe
ct s
ize
Mea
n r z
effe
ct s
ize
Mea
n β
effe
ct s
ize
Mea
n r z
effe
ct s
ize
Mea
n β
effe
ct s
ize
Mea
n r z
effe
ct s
ize
Mea
n β
effe
ct s
ize
Mea
n r z
effe
ct s
ize
Mea
n β
effe
ct s
ize
B
-1.5
-1.0
-0.5
0.0
0.5
1.0
1.5
-4
-2
0
2
4
*
F
*
*
*
*
*
*
*
All SD ER RP NA MEAll SD ER RP NA ME
All SD ER RP NA MEAll SD ER RP NA ME
All SD ER RP NA MEAll SD ER RP NA ME
Fig. 3.Mean effect size (±95% CI) for overall effect, by habitat and by region of the relationship strength rz (black circle) and slope β (open circle) between temporal variability and even-ness J′. Effect sizes are displayed by type of analyses (species richness variability: A, B; community assemblage variability in: structure C, D and composition E, F) and scale of evennessmeasure (average by patch scale as quadrat: A, C, E; reassessed by shore as Site: B, D, F). See Fig. 2 for abbreviations.
6 M. Cusson et al. / Journal of Sea Research xxx (2014) xxx–xxx
4.1. Temporal variation in species richness
Our results suggest that the overall stability in species richness isnegatively related to diversity estimates (species richness, evennessand rarefaction index). To some extent, the observed negative relation-ship between species richness and stability in species richness may beexplained by simplemean–variance scaling effect. However, positive re-lationships between other diversity indices (evenness and rarefactionindex) and richness assessed at the scale of the site were consistent inour analysis. This strengthens the hypothesis that fluctuations withinassemblages are closely controlled by their constituent species andtheir dominance structure. Empirical and theoretical studies have gen-erally shown that diversity levels affect variations in relative abun-dances, patterns of colonization and extinction rates (e.g. Inchaustiand Halley, 2003; Solan et al., 2004), which, in turn, determine speciesrichness variability. The cycle of colonization and local extinction ofspecies, variation in species richness, are affected by processes that
Please cite this article as: Cusson,M., et al., Relationships between biodiversscale using meta-analysis, J. Sea Res. (2014), http://dx.doi.org/10.1016/j.se
influence average population sizes and their temporal stability. Indeed,small or highly variable populations are more likely to become locallyextinct (Inchausti and Halley, 2003; Melbourne and Hastings, 2008;Pimm et al., 1988; Shaffer, 1981).
The identity of species within communities undoubtedly plays animportant role since more diverse communities are more likely to in-clude species or functional groups (McCann, 2000) that can affect thefunction or properties of the whole community (i.e. sampling effect,Huston, 1997; Tilman et al., 1997). Outcomes from various studies oftemporal variation in species richness have led to different results. Sim-ulation studies have demonstrated that species variation (turnover) isreduced with increasing richness when high number of taxamay eitherfacilitate colonization or reduce extinction of present species, or whenenvironmental conditions are variable (Shurin, 2007). In contrast,higher temporal stability (assessed as low values of the coefficient ofvariation) in species richness was associated with low richness andevenness values in New Zealand sandflat sites (Thrush et al., 2008).
ity and the stability ofmarine ecosystems: Comparisons at a Europeanares.2014.08.004
-0.2
0.0
0.2
0.4
0.6
0.8
1.0M
ean r z
effe
ct s
ize
Mea
n β
effe
ct s
ize
All SD ER RP NA ME-0.2
0.0
0.2
0.4
0.6
Temporal variation in total community abundance
Quadrat scale Site scaleSpecies richness S as independant variable
A
-0.2
0.0
0.2
0.4
0.6
0.8
1.0
All SD ER RP NA ME
Mea
n r z
effe
ct s
ize
Mea
n β
effe
ct s
ize
-0.05
0.00
0.05
0.10
0.15
0.20B
Evenness J' as independant variableQuadrat scale Site scale
-1.0
-0.5
0.0
0.5
1.0
1.5
-5
0
5
10
All SD ER RP NA ME
Mea
n r z
effe
ct s
ize
Mea
n β
effe
ct s
ize
-1.0
-0.5
0.0
0.5
1.0
1.5
-5
0
5
10
All SD ER RP NA ME
Mea
n r z
effe
ct s
ize
Mea
n β
effe
ct s
ize
*
C D
Fig. 4. Mean effect size (±95% CI) for overall effect, by habitat, and by region of the relationship strength rz (black circle) and slope β (open circle) between temporal variability intotal abundance (density or % cover) and: species richness (A, B), and evenness J′ (C, D). Effect sizes are displayed by scale of diversity measure (average by patch scale as quadrat:A, C; reassessed at site scale: B, D). See Fig. 2 for abbreviations.
7M. Cusson et al. / Journal of Sea Research xxx (2014) xxx–xxx
These results were explained by strong connections between functionalgroups in species-poor communities.
4.2. Temporal variation in abundance
Stability in total abundance of communitywas generally not linearlylinked to species richness nor evenness indices. Balvanera et al. (2006)also failed to observe significant relationships between stability (asnatural variation) and diversity, although using different measures ofstability and data sets that study did not exclusively represent marinehabitat. Temporal variability of aggregated community (total abun-dance, total biomass, etc.) or population (density, biomass) propertiesare preferred response variables used in studies of diversity–stability re-lationships and most of the relationships were negative (Stachowiczet al., 2007; Valdivia and Molis, 2009). Many mechanistic approacheswere identified to interpret theoretical and empirical outcomes fromrelationships between variability of such aggregated variable and diver-sity measures (e.g. de Mazancourt et al., 2013; Petchey et al., 2002). Inparticular, different non-exclusive mechanisms were reported to regu-late the link between diversity and stability: the statistical averaging(Doak et al., 1998; “portfolio effect” Tilman et al., 1998); negativecovariances among populations (Tilman et al., 1998); asynchrony inresponse to environmental fluctuation (Ives and Hughes, 2002) andoveryielding (Tilman, 1999). These mechanisms have been consideredimportant to shape the relationship between diversity and stability ofabove-ground biomass (Grman et al., 2010), total abundances inmarinehard bottom communities (Benedetti-Cecchi, 2009; Bulleri et al., 2012)and production in grassland plants (de Mazancourt et al., 2013; Isbellet al., 2009). Increasing the number of taxa present in a community
Please cite this article as: Cusson,M., et al., Relationships between biodiversscale using meta-analysis, J. Sea Res. (2014), http://dx.doi.org/10.1016/j.se
would reduce mean and variance in the total community abundanceand, then statistically reduce community variance (see Cottinghamet al., 2001). On the contrary, rich communities may also increase aver-age strength among species favoring competitive exclusion and enhanc-ing abundance fluctuations. Even if mean–variance scaling effects werepresent, intrinsic community properties such as negative covariance inspecies occurrence could lead to lower temporal variation at sites withhigher species richness. Several empirical studies have highlighted therole of dominant species traits for the function of thewhole community.For example, lower variability of dominant species than subordinatespecies may affect the whole community stability (Grman et al., 2010;Polley et al., 2007; Sasaki and Lauenroth, 2011; Valdivia et al., 2013).
The results of the present study also suggest that communities fromdifferent habitats exhibit different diversity–stability relationships.While data from emergent rocky habitats exhibited no relationship,richness decreased stability of sandy community abundances whileevenness decreased stability in rock pool community abundances(see Fig. 4). If poor correlation between richness and evennessmeasuresat each scale may partly explain this, inherent differences exist in forcesthat structure communities among habitats. Strong interactions, mainlycompetition, among species in soft sediments are largely limited tothe provision of biogenic habitat communities that are commonlymaintained in early successional stages by frequent physical and biolog-ical disturbances. Competitive displacement and exclusion are generallyless frequent in sediment habitats compared to hard-bottom ones(Black and Peterson, 1988; Peterson, 1979). Following the work ofDanovaro et al. (2008) in deep sea sediments, Loreau (2008) suggestedthat infaunal species, through the reworking of sediments could gener-ate a prevalence of positive species interactions in soft sediments (in
ity and the stability ofmarine ecosystems: Comparisons at a Europeanares.2014.08.004
8 M. Cusson et al. / Journal of Sea Research xxx (2014) xxx–xxx
contrast to hard-bottoms, cf Benedetti-Cecchi, 2009; Noël, 2007)leading to complementarity effects (Loreau, 2000). Positive covariance,which is observed when species fluctuate synchronously in response toenvironmental change, is widespread (Houlahan et al., 2007; Valoneand Barber, 2008) and contributes to increase variability in total abun-dance. However when present, the compensatory dynamics among in-tertidal species that contribute to stability has a lower effect in highlatitudewhere environmental forcingmay prevail on biological interac-tions (Bulleri et al., 2012). While rock pools are benign environmentscompared to emergent rock in terms of physical stress (i.e. desiccation,see Noël, 2007), they can be much more heavily grazed (e.g. Benedetti-Cecchi et al., 2005). This high grazing pressure observed in rock poolsmay change the nature of interactions between species from competi-tion to facilitation (Bertness and Callaway, 1994) and increase the num-ber of grazer resistant-species (Noël et al., 2009). If stabilizing effects ofspecies richness on community abundances were observed in rock poolmesocosms (Romanuk and Kolasa, 2002), the effect of evenness still re-mains unclear.
4.3. Temporal variation within communities
Usingmultivariate analyses, we found that stability (measured withBray–Curtis dissimilarities) of species abundance and compositionwithin communities are generally not correlated with diversity indices.Our results suggest that relationships between diversity and communi-ty stability may be governed by evenness rather than the number ofspecies (cf. Figs. 2 and 3). Moreover, contrasting results among habitatsexist, with sediment communities with high evenness being less stable,perhaps from prevalence of positive species interactions in this habitatpreviously discussed. Theoretical studies have revealed that relation-ships between community variability in composition and number oftaxa may increase, decrease or remain unchanged mainly due to thetype of calculation of variability used but also stochastic processes thatalter patterns of dominance and total abundance among species(Stevens et al., 2003). Among other results, Stevens et al. (2003) report-ed that simulated community variation in composition, given that totalabundance stays equal, would show positive correlation with evenness.Our empirical observations would give only little support to these pre-dictions (see Fig. 3E). At high dominance (or low evenness), it was ob-served that stability in species composition within a community maybe either enhanced on emergent rocky shores or become reduced onsediment shores (see Fig. 3E). Results from empirical studies have alsocontradictory outcomes showing that variousmeasures of grassland di-versity (including species richness and evenness) can enhance (Frankand McNaughton, 1991) or decrease stability (Rodriguez and Gomez,1994, while no effect was recorded for J′) measured by temporal vari-ance in compositional richness. Moreover, in contrast to our study,Mykrä et al. (2011) observed that stability within assemblage instreams is promoted by species richness, although this relationship dis-appeared when compositional stability was related to species richnessestimated with a rarefaction index that standardized abundance.
4.4. Scale of observation
Many rich benthic communities are actually composed by rare spe-cies (Ellingsen et al., 2007; Gray, 2000; Gray et al., 2005). Uncommonspecies are theoretically important to maintain ecosystem functions inthe context of the insurance hypothesis (Yachi and Loreau, 1999) andare important to ensure community persistence and resilience(Hillebrand et al., 2008). Spatial species distributions are highly hetero-geneous at various scales (e.g. Chapman et al., 2010; Kraufvelin et al.,2011). Indeed, variations in the number of taxa may be influenced bya combination of random spatial and temporal sampling errors thatcause species, particularly those that are either sparse or rare, to be in-cluded or not in a patch (de Juan and Hewitt, 2014; McArdle et al.,1990). The recent work of de Juan and Hewitt (2014) illustrated how
Please cite this article as: Cusson,M., et al., Relationships between biodiversscale using meta-analysis, J. Sea Res. (2014), http://dx.doi.org/10.1016/j.se
seasonality and inter-annual sampling schemes may affect variabilityin species composition and species accumulation profiles. In our study,care was taken to select data sets with sampling dates spread amongseasons or within years. There was no effect of the duration of the stud-ies on effect sizes measured, but seasonal variations within studies mayhave influenced our overall results. Patterns of diversity in small patcheshave been identified as potential contributors to ecological stability(Frank and McNaughton, 1991), but the consistency seen in our resultsat both quadrat and site scales indicates that mechanisms not related toheterogeneity among patches may dominate and create the observedpatterns. It has been generally accepted that regional species poolsmay regulate the species richness seen at smaller scales (e.g. Kottaand Witman, 2009; Ricklefs, 1987; Witman et al., 2004).
When data sets were analyzed separately, a large proportion of theobserved relationships between stability and biodiversity were weakor not significant. For example, in the analyses shown in Fig. 2A, only5 data sets out of 28 showed significant relationships and 6 show corre-lation coefficients over 0.5 (Table A1, appendix 2). The observed signif-icant results with combined data sets illustrate the importance of usingrobust meta-analytical tools to investigate such hypotheses. Nonethe-less, more data from soft sediments and rock pool habitats are neededto generate more conclusive results. The available data sets in thisstudy were to some extent over-represented in the Mediterranean re-gion and in the emergent rock habitat. Indeed, the Mediterranean re-gion was solely represented by studies on emergent rock. On theother hand, consistent results betweenMediterranean and North Atlan-tic results for emergent rockwere seen. Large scale comparison of diver-sity effects on ecosystem processes may be masked systematically bythe effects of variation in environmental variables on these processesand may lead to erroneous conclusions (Loreau, 1998, 2008).
5. Concluding remarks
This study provides one of the few comprehensive assessments oflarge spatial scale variation in the relationship between diversity andtemporal stability across different marine systems. Our results suggestthat diverse assemblages enhance variability in species richness with-out affecting variability in species abundance and composition withincommunity. The use of complementary diversity indices (e.g. richnessand evenness) over various time series warrants the generation ofrobust stability–diversity analyses. Despite the caveat resulting from in-complete and unevenly distributeddata, it has been highlighted that thescale of observation needs to be considered in diversity–stability studiesand outcomes may also depend on the habitats and the biogeographicsystems considered (e.g. North-Atlantic or western Mediterranean).Conversely, there are needs to extend the analyses shown here tomore sites (and time series) in order to generate better pictures acrosshabitats. Targeted long-term observations and experiments are un-doubtedly important to unravel effects of environmental variables, spe-cies interaction strength within assemblages and potential effect ofclimate changes on biodiversity and the functioning of ecosystems. Nev-ertheless, where sufficient data sets exist, a meta-analysis like the onepresented here can provide a cost-effective approach to clarifying andgenerating further hypotheses about diversity–stability relationships.
Acknowledgments
We are gratefully indebted to Carlo Heip for his outstandingachievements in the leadership of European research intomarine biodi-versity. We would like to acknowledge all participating institutions inBIOFUSE project and all participants that helped in field sampling, iden-tifying species aswell as by providing data and advice and comments onthe manuscript. The BIOFUSE project, led by TP Crowe and L Benedetti-Cecchi, has been carried out in the framework of theMarBEF Network ofExcellence ‘Marine Biodiversity and Ecosystem Functioning’which wasfunded by the Sustainable Development, Global Change and Ecosystems
ity and the stability ofmarine ecosystems: Comparisons at a Europeanares.2014.08.004
9M. Cusson et al. / Journal of Sea Research xxx (2014) xxx–xxx
Programme of the European Community's Sixth Framework Pro-gramme (contract # GOCE-CT-2003-505446), which was coordinatedby Carlo Heip. Additional funding was provided by partner institutions.During the writing, M Cusson was supported by the Natural Sciencesand Engineering Research Council of Canada (NSERC; Discovery Grants#371464-2009).
Appendix A. Supplementary data
Supplementary data to this article can be found online at http://dx.doi.org/10.1016/j.seares.2014.08.004.
References
Anderson, M.J., 2005. PERMANOVA: A FORTRAN Computer Program for PermutationalMultivariate Analysis of Variance. Department of Statistics, University of Auckland,New Zealand., Auckland.
Balvanera, P., Pfisterer, A.B., Buchmann, N., He, J.S., Nakashizuka, T., Raffaelli, D., Schmid, B.,2006. Quantifying the evidence for biodiversity effects on ecosystem functioning andservices. Ecol. Lett. 9, 1146–1156.
Benedetti-Cecchi, L., 2009. Mechanisms underpinning diversity–stability relationships inhard bottom assemblages. In: Wahl, M. (Ed.), Hard Bottom Communities: Patterns,Scales, Dynamics, Functions, Shifts. Springer Verlag, Berlin.
Benedetti-Cecchi, L., Vaselli, S., Maggi, E., Bertocci, I., 2005. Interactive effects of spatialvariance and mean intensity of grazing on algal cover in rock pools. Ecology 86,2212–2222.
Bertness, M.D., Callaway, R., 1994. Positive interactions in communities. Trends Ecol. Evol.9, 191–193.
Bertocci, I., Maggi, E., Vaselli, S., Benedetti-Cecchi, L., 2005. Contrasting effects of mean in-tensity and temporal variation of disturbance on a rocky seashore. Ecology 86,2061–2067.
Black, R., Peterson, C.H., 1988. Absence of preemption and interference competition forspace between large suspension-feeding bivalves and smaller infaunal macroinverte-brates. J. Exp. Mar. Biol. Ecol. 120, 183–198.
Bulleri, F., Benedetti-Cecchi, L., Cusson, M., Maggi, E., Arenas, F., Aspden, R., Bertocci, I.,Crowe, T.P., Davoult, D., Eriksson, B.K., Fraschetti, S., Gollety, C., Griffin, J.N., Jenkins,S.R., Kotta, J., Kraufvelin, P., Molis, M., Pinto, I.S., Terlizzi, A., Valdivia, N., Paterson,D.M., 2012. Temporal stability of European rocky shore assemblages: variation acrossa latitudinal gradient and the role of habitat-formers. Oikos 121, 1801–1809.
Chapman, M., Tolhurst, T., Murphy, R., Underwood, A., 2010. Complex and inconsistentpatterns of variation in benthos, micro-algae and sediment over multiple spatialscales. Mar. Ecol. Prog. Ser. 398, 33–47.
Connell, J.H., 1978. Diversity in tropical rain forest and coral reefs. Science 199,1302–1310.
Cottingham, K.L., Brown, B.L., Lennon, J.T., 2001. Biodiversity may regulate the temporalvariability of ecological systems. Ecol. Lett. 4, 72–85.
Danovaro, R., Gambi, C., Dell'Anno, A., Corinaidesi, C., Fraschetti, S., Vanreusel, A., Vincx, M.,Gooday, A.J., 2008. Exponential decline of deep-sea ecosystem functioning linked tobenthic biodiversity loss. Curr. Biol. 18, 1–8.
de Juan, S., Hewitt, J., 2014. Spatial and temporal variability in species richness in a tem-perate intertidal community. Ecography 37, 183–190.
deMazancourt, C., Isbell, F., Larocque, A., Berendse, F., De Luca, E., Grace, J.B., Haegeman, B.,WaynePolley, H., Roscher, C., Schmid, B., Tilman, D., van Ruijven, J.,Weigelt, A.,Wilsey,B.J., Loreau,M., 2013. Predicting ecosystemstability from community composition andbiodiversity. Ecol. Lett. 16, 617–625.
Doak, D.F., Bigger, D., Harding, E.K., Marvier, M.A., O'Malley, R.F., Thomson, D.H., 1998. Thestatistical inevitability of stability–diversity relationships in community ecology. Am.Nat. 151, 264–276.
Donohue, I., Petchey, O.L., Montoya, J.M., Jackson, A.L., McNally, L., Viana, M., Healy, K.,Lurgi, M., O'Connor, N.E., Emmerson, M.C., 2013. On the dimensionality of ecologicalstability. Ecol. Lett. 16, 421–429.
Ellingsen, K.E., Hewitt, J.E., Thrush, S.F., 2007. Rare species, habitat diversity and functionalredundancy in marine benthos. J. Sea Res. 58, 291–301.
Elton, C.S., 1958. The Ecology of Invasions by Animals and Plants. Wiley, London, U.K.Frank, D.A., McNaughton, S.J., 1991. Stability increases with diversity in plant communi-
ties: empirical evidence from the 1988 Yellowstone drought. Oikos 62, 360–362.Gotelli, N.J., Colwell, R.K., 2001. Quantifying biodiversity: procedures and pitfalls in the
measurement and comparison of species richness. Ecol. Lett. 4, 379–391.Gray, J.S., 2000. The measurement of marine species diversity, with an application to the
benthic fauna of the Norwegian continental shelf. J. Exp. Mar. Biol. Ecol. 250, 23–49.Gray, J.S., Bjorgesaeter, A., Ugland, K.I., 2005. The impact of rare species on natural assem-
blages. J. Anim. Ecol. 74, 1131–1139.Grman, E., Lau, J.A., Schoolmaster, D.R., Gross, K.L., 2010. Mechanisms contributing to sta-
bility in ecosystem function depend on the environmental context. Ecol. Lett. 13,1400–1410.
Gurevitch, J., Curtis, P.S., Jones, M.H., 2001. Meta-analysis in ecology. Adv. Ecol. Res. 32,199–247.
Hector, A., Joshi, J., Scherer-Lorenzen,M., Schmid, B., Spehn, E.M.,Wacker, L.,Weilenmann,M., Bazeley-White, E., Beiekuhnlein, C., Caldeira, M.C., Dimitrakopoulos, P.G., Finn, J.A.,Huss-Danell, K., Jumpponen, A., Leadley, P.W., Loreau,M.,Mulder, C.P.H., Neßhöver, C.,Palmborg, C., Read, D.J., Siamantziouras, A.S.D., Terry, A.C., Troumbis, A.Y., 2007.
Please cite this article as: Cusson,M., et al., Relationships between biodiversscale using meta-analysis, J. Sea Res. (2014), http://dx.doi.org/10.1016/j.se
Biodiversity and ecosystem functioning: reconciling the results of experimental andobservational studies. Funct. Ecol. 21, 998–1002.
Hedges, L.V., Olkin, I., 1985. Statistical Methods for Meta-Analysis. Academic Press,Orlando.
Hillebrand, H., 2004. On the generality of the latitudinal diversity gradient. Am. Nat. 163,192–211.
Hillebrand, H., Watermann, F., Karez, R., Berninger, U.G., 2001. Differences in species rich-ness patterns between unicellular and multicellular organisms. Oecologia 126,114–124.
Hillebrand, H., Bennett, D.M., Cadotte, M.W., 2008. Consequences of dominance: areview of evenness effects on local and regional ecosystem processes. Ecology89, 1510–1520.
Houlahan, J.E., Currie, D.J., Cottenie, K., Cumming, G.S., Ernest, S.K.M., Findlay, C.S.,Fuhlendorf, S.D., Gaedke, U., Legendre, P., Magnuson, J.J., McArdle, B.H., Muldavin, E.H.,Noble, D., Russell, R., Stevens, R.D., Willis, T.J., Woiwod, I.P., Wondzell, S.M., 2007.Compensatory dynamics are rare in natural ecological communities. Proc. Natl. Acad.Sci. U. S. A. 104, 3273–3277.
Hughes, A.R., Byrnes, J.E., Kirnbro, D.L., Stachowicz, J.J., 2007. Reciprocal relationships andpotential feedbacks between biodiversity and disturbance. Ecol. Lett. 10, 849–864.
Hurlbert, S.H., 1971. Nonconcept of species diversity — critique and alternative parame-ters. Ecology 52, 577–586.
Huston, M.A., 1997. Hidden treatments in ecological experiments: re-evaluating the eco-system function of biodiversity. Oecologia 110, 449–460.
Inchausti, P., Halley, J., 2003. On the relation between temporal variability and persistencetime in animal populations. J. Anim. Ecol. 72, 899–908.
Isbell, F.I., Polley, H.W., Wilsey, B.J., 2009. Biodiversity, productivity and the temporal sta-bility of productivity: patterns and processes. Ecol. Lett. 12, 443–451.
Ives, A.R., Hughes, J.B., 2002. General relationships between species diversity and stabilityin competitive systems. Am. Nat. 159, 388–395.
Kondoh, M., 2001. Unifying the relationships of species richness to productivity and dis-turbance. Proc. R. Soc. B 268, 269–271.
Kotta, J., Witman, J.D., 2009. Diversity patterns and their causes. Regional scale patterns.In: Wahl, M. (Ed.), Hard Bottom Communities: Patterns, Scales, Dynamics, Functions,Shifts. Springer Verlag, Berlin.
Kraufvelin, P., Perus, J., Bonsdorff, E., 2011. Scale-dependent distribution of soft-bottominfauna and possible structuring forces in low diversity systems. Mar. Ecol. Prog.Ser. 426, 13–28.
Levine, J.M., D'Antonio, C.M., 1999. Elton revisited: a review of evidence linking diversityand invasibility. Oikos 87, 15–26.
Li, B.-L., Charnov, E.L., 2001. Diversity–stability relationships revisited: scaling rules for bi-ological communities near equilibrium. Ecol. Model. 140, 247–254.
Loreau, M., 1998. Biodiversity and ecosystem functioning: a mechanistic model. Proc.Natl. Acad. Sci. U. S. A. 95, 5632–5636.
Loreau, M., 2000. Biodiversity and ecosystem functioning: recent theoretical advances.Oikos 91, 3–17.
Loreau, M., 2008. Biodiversity and ecosystem functioning: the mystery of the deep sea.Curr. Biol. 18, R126–R128.
Loreau, M., de Mazancourt, C., 2013. Biodiversity and ecosystem stability: a synthesis ofunderlying mechanisms. Ecol. Lett. 16, 106–115.
Loreau, M., Naeem, S., Inchausti, P., Bengtsson, J., Grime, J.P., Hector, A., Hooper, D.U.,Huston, M.A., Raffaelli, D., Schmid, B., Tilman, D., Wardle, D.A., 2001. Biodiversityand ecosystem functioning: current knowledge and future challenges. Science 294,804–808.
MacArthur, R., 1955. Fluctuations of animal populations and a measure of community sta-bility. Ecology 36, 533–536.
May, R.M., 1974. Stability and Complexity in Model Ecosystems. Princeton UniversityPress, Princeton, NJ, USA.
McArdle, B.H., Gaston, K.J., Lawton, J.H., 1990. Variation in the size of animal populations—patterns, problems and artifacts. J. Anim. Ecol. 59, 439–454.
McCann, K.S., 2000. The diversity–stability debate. Nature 405, 228–233.McGrady-Steed, J., Morin, P.J., 2000. Biodiversity, density compensation, and the dynam-
ics of populations and functional groups. Ecology 81, 361–373.Melbourne, B.A., Hastings, A., 2008. Extinction risk depends strongly on factors contribut-
ing to stochasticity. Nature 454, 100–103.Mykrä, H., Heino, J., Oksanen, J., Muotka, T., 2011. The stability–diversity relationship in
stream macroinvertebrates: influences of sampling effects and habitat complexity.Freshw. Biol. 56, 1122–1132.
Noël, L.M.-L.J., 2007. Species Interactions During Succession in Rockpools: Role ofHerbivores and Physical Factors. University of Plymouth, p. 210.
Noël, L.M.L.J., Hawkins, S.J., Jenkins, S.R., Thompson, R.C., 2009. Grazing dynamics in inter-tidal rockpools: connectivity of microhabitats. J. Exp. Mar. Biol. Ecol. 370, 9–17.
Petchey, O.L., Casey, T., Jiang, L., McPhearson, P.T., Price, J., 2002. Species richness, environ-mental fluctuations, and temporal change in total community biomass. Oikos 99,231–240.
Peterson, C.H., 1979. Predation, competitive exclusion, and diversity in the soft-sedimentbenthic communities of estuaries and lagoons. In: Livingston, R.J. (Ed.), EcologicalProcesses in Coastal and Marine Systems. Plenum Press, New York, pp. 223–264.
Pimm, S.L., Jones, H.L., Diamond, J., 1988. On the risk of extinction. Am. Nat. 132, 757–785.Polley, H.W., Wilsey, B.J., Derner, J.D., 2007. Dominant species constrain effects of species
diversity on temporal variability in biomass production of tallgrass prairie. Oikos 116,2044–2052.
Polley, H.W., Isbell, F.I., Wilsey, B.J., 2013. Plant functional traits improve diversity-basedpredictions of temporal stability of grassland productivity. Oikos 122, 1275–1282.
Raffaelli, D., 2004. How extinction patterns affect ecosystems. Science 306, 1141–1142.Raffaelli, D., 2006. Biodiversity and ecosystem functioning: issues of scale and trophic
complexity. Mar. Ecol. Prog. Ser. 311, 285–294.
ity and the stability ofmarine ecosystems: Comparisons at a Europeanares.2014.08.004
10 M. Cusson et al. / Journal of Sea Research xxx (2014) xxx–xxx
Ricklefs, R.E., 1987. Community diversity: relative roles of local and regional processes.Science 235, 167–171.
Rodriguez, M.A., Gomez, S.A., 1994. Stability may decrease with diversity in grasslandcommunities: empirical evidence from the 1986 Cantabrian Mountains (Spain)drought. Oikos 71, 177–180.
Romanuk, T.N., Kolasa, J., 2002. Environmental variability alters the relationship betweenrichness and variability of community abundances in aquatic rock pool microcosms.Ecoscience 9, 55–62.
Rosenberg, M.S., Adams, D.C., Gurevitch, J., 2000. MetaWin: Statistical Software for Meta-Analysis, Version 2.0 Ed. Sinauer Associates, Sunderland, Massachusetts.
Sanders, H.L., 1968. Marine benthic diversity — a comparative study. Am. Nat. 102,243–282.
SAS, 1999. The SAS System for Windows, Release 8.02 ed. SAS Institute Inc., Cary, NC.Sasaki, T., Lauenroth, W.K., 2011. Dominant species, rather than diversity, regulates tem-
poral stability of plant communities. Oecologia 166, 761–768.Shaffer, M.L., 1981. Minimum population sizes for species conservation. Bioscience 31,
131–134.Shurin, J.B., 2007. How is diversity related to species turnover through time? Oikos 116,
957–965.Shurin, J.B., Arnott, S.E., Hillebrand, H., Longmuir, A., Pinel-Alloul, B., Winder, M., Yan, N.D.,
2007. Diversity–stability relationship varies with latitude in zooplankton. Ecol. Lett.10, 127–134.
Solan, M., Cardinale, B.J., Downing, A.L., Engelhardt, K.A.M., Ruesink, J.L., Srivastava, D.S.,2004. Extinction and ecosystem function in the marine benthos. Science 306,1177–1180.
Stachowicz, J.J., Bruno, J.F., Duffy, E., 2007. Understanding the effects of marine biodiver-sity on communities and ecosystems. Annu. Rev. Ecol. Syst. 38, 739–766.
Stevens, M.H.H., Petchey, O.L., Smouse, P.E., 2003. Stochastic relations between speciesrichness and the variability of species composition. Oikos 103, 479–488.
Thrush, S.F., Coco, G., Hewitt, J.E., 2008. Complex positive connections between functionalgroups are revealed by neural network analysis of ecological time series. Am. Nat.171, 669–677.
Please cite this article as: Cusson,M., et al., Relationships between biodiversscale using meta-analysis, J. Sea Res. (2014), http://dx.doi.org/10.1016/j.se
Tilman, D., 1996. Biodiversity: population versus ecosystem stability. Ecology 77,350–363.
Tilman, D., 1999. The ecological consequences of changes in biodiversity: a search for gen-eral principles. Ecology 80, 1455–1474.
Tilman, D., Downing, J.A., 1994. Biodiversity and stability in grasslands. Nature 367,363–365.
Tilman, D., Lehman, C.L., Thomson, K.T., 1997. Plant diversity and ecosystem productivity:theoretical considerations. Proc. Natl. Acad. Sci. U. S. A. 94, 1857–1861.
Tilman, D., Lehman, C.L., Bristow, C.E., 1998. Diversity–stability relationships: statisticalinevitability or ecological consequence? Am. Nat. 151, 277–282.
Valdivia, N., Molis, M., 2009. Observational evidence of a negative biodiversity–stabilityrelationship in intertidal epibenthic communities. Aquat. Biol. 4, 263–271.
Valdivia, N., González, A.E., Manzur, T., Broitman, B.R., 2013. Mesoscale variation ofmechanisms contributing to stability in rocky shore communities. PLoS ONE 8,e54159.
Valone, T.J., Barber, N.A., 2008. An empirical evaluation of the insurance hypothesis indiversity–stability models. Ecology 89, 522–531.
Vogt, R.J., Romanuk, T.N., Kolasa, J., 2006. Species richness–variability relationships inmulti-trophic aquatic microcosms. Oikos 113, 55–66.
Whittaker, R.J., Willis, K.J., Field, R., 2001. Scale and species richness: towards a general,hierarchical theory of species diversity. J. Biogeogr. 28, 453–470.
Wilsey, B.J., Chalcraft, D.R., Bowles, C.M., Willig, M.R., 2005. Relationships among indicessuggest that richness is an incomplete surrogate for grassland biodiversity. Ecology86, 1178–1184.
Witman, J.D., Etter, R.J., Smith, F., 2004. The relationship between regional and local spe-cies diversity in marine benthic communities: a global perspective. Proc. Natl. Acad.Sci. U. S. A. 101, 15664–15669.
Yachi, S., Loreau, M., 1999. Biodiversity and ecosystem productivity in a fluctuating envi-ronment: the insurance hypothesis. Proc. Natl. Acad. Sci. U. S. A. 96, 1463–1468.
ity and the stability ofmarine ecosystems: Comparisons at a Europeanares.2014.08.004