Relating structure of fat crystal networks to mechanical properties
22
Relating structure of fat crystal networks to mechanical properties: a review Suresh S. Narine, Alejandro G. Marangoni* Department of Food Science, University of Guelph, Guelph, Ontario, Canada, N1G 2W1 Abstract This paper reviews the identification of the various levels of structure present in fat crystal networks, and the development of analytical techniques to quantify these levels. The relationship of the various levels of structure to macroscopic physical indicators of the mechanical strength of the network is discussed. The analysis of the microstructural level of the network via fractal geome- trical methods is discussed, as well as mechanical models relating the structure to mechanical properties. A method developed to quantify the fractality of fat crystal networks is also presented. The eect of processing conditions on microstructural indicators of the elastic modulus of the network is also discussed. This paper summarizes some 50 years of endeavor to relate the structure of fat crystal networks to their macroscopic rheological properties. # 1999 Candian Institute of Food Science and Technology. Published by Elsevier Science Ltd All rights reserved. Keywords: Microstructure; Fat crystal network; Fractal dimension; Polymorphism; Triglyceride; Processing conditions The macroscopic rheological properties of networks formed by lipids are of extreme importance in food products that contain significant amounts of fats. Such products include butter, margarine, chocolate, peanut butter, many spreads such as cream cheese, and ice cream. Many of the sensory attributes such as spread- ability, mouthfeel, snap of chocolate, texture, etc., are dependent on the mechanical strength of the underlying fat crystal network. In addition to this obvious indus- trial importance, fat crystal networks form a particular class of soft materials, which demonstrate a yield stress and viscoelastic properties, rendering these materials plastic. From a materials sciences point of view, these materials are also extremely important. Eorts to model the mechanical strength (Kamphuis & Jongschaap, 1985; Kamphuis, Jongschaap & Mijnlie, 1984; Nederveen, 1963; Papenhuijzen, 1971, 1972; Payne, 1964; Van den Tempel, 1961, 1979) of these networks have met with more failure than success over the past 50 years, mainly due to the lack of a comprehensive model to relate structural network characteristics and solid/ liquid ratios of lipid networks to their mechanical strength. This lack stemmed partly from the fact that many scientists in this area concentrated on the lipid composition and the polymorphism of the networks, in large part ignoring the in situ microstructure of the net- work. Lately, much work has been done in analysis of the microstructural level of the network, leading to encourag- ing results, which suggests that consideration of this level of structure is absolutely essential in assessing the mechanical strength of the fat network. Furthermore, the quantification of this level of structure has been achieved with the application of fractal mathematics to the geo- metry of the microstructure. Over a period of 7 years, this area of microstructural quantification using fractal geo- metry has seen an explosive burst of success suciently important to be reviewed in this special issue of Food Research International. In addition, microstructural analy- sis via fractal methods is also applicable to other food areas as well, for example in characterizing structures of whey protein gels (Hagiwara, Kumagai, Masunaga & Nakamura, 1997; Marangoni, Barbut, McGauley, Mar- cone & Narine, 1999; Stading, Langton & Hermansson, 1993; Vreeker, Hoekstra, den Boer & Agterof, 1992a). The importance of the microstructural level of structural organization becomes apparent when one examines the dierent levels of structure in a fat network in the context of how these levels of structure are responsible for the values of macroscopic physical measurements performed on the network. The levels of structure in a typical fat net- work are defined as the fat crystallizes from the melt. The growth of a fat crystal network can be visualized thus: 0963-9969/99/$20.00 # 1999 Candian Institute of Food Science and Technology. Published by Elsevier Science Ltd All rights reserved. PII: S0963-9969(99)00078-2 Food Research International 32 (1999) 227–248 www.elsevier.com/locate/foodres * Corresponding author. Tel.: +1-519-824-4120, ext. 4340; fax: +1-519-824-6631. E-mail address: [email protected] (A.G. Marangoni)
Transcript of Relating structure of fat crystal networks to mechanical properties
Relating structure of fat crystal networks to mechanical properties:a review
Suresh S. Narine, Alejandro G. Marangoni*
Department of Food Science, University of Guelph, Guelph, Ontario, Canada, N1G 2W1
Abstract
This paper reviews the identi®cation of the various levels of structure present in fat crystal networks, and the development of
analytical techniques to quantify these levels. The relationship of the various levels of structure to macroscopic physical indicatorsof the mechanical strength of the network is discussed. The analysis of the microstructural level of the network via fractal geome-trical methods is discussed, as well as mechanical models relating the structure to mechanical properties. A method developed to
quantify the fractality of fat crystal networks is also presented. The e�ect of processing conditions on microstructural indicators ofthe elastic modulus of the network is also discussed. This paper summarizes some 50 years of endeavor to relate the structure of fatcrystal networks to their macroscopic rheological properties. # 1999 Candian Institute of Food Science and Technology. Published
by Elsevier Science Ltd All rights reserved.
Keywords: Microstructure; Fat crystal network; Fractal dimension; Polymorphism; Triglyceride; Processing conditions
The macroscopic rheological properties of networksformed by lipids are of extreme importance in foodproducts that contain signi®cant amounts of fats. Suchproducts include butter, margarine, chocolate, peanutbutter, many spreads such as cream cheese, and icecream. Many of the sensory attributes such as spread-ability, mouthfeel, snap of chocolate, texture, etc., aredependent on the mechanical strength of the underlyingfat crystal network. In addition to this obvious indus-trial importance, fat crystal networks form a particularclass of soft materials, which demonstrate a yield stressand viscoelastic properties, rendering these materialsplastic. From a materials sciences point of view, thesematerials are also extremely important.E�orts to model the mechanical strength (Kamphuis &
Jongschaap, 1985; Kamphuis, Jongschaap & Mijnlie�,1984; Nederveen, 1963; Papenhuijzen, 1971, 1972; Payne,1964; Van den Tempel, 1961, 1979) of these networkshave met with more failure than success over the past 50years, mainly due to the lack of a comprehensive modelto relate structural network characteristics and solid/liquid ratios of lipid networks to their mechanicalstrength. This lack stemmed partly from the fact thatmany scientists in this area concentrated on the lipid
composition and the polymorphism of the networks, inlarge part ignoring the in situ microstructure of the net-work. Lately, much work has been done in analysis of themicrostructural level of the network, leading to encourag-ing results, which suggests that consideration of thislevel of structure is absolutely essential in assessing themechanical strength of the fat network. Furthermore, thequanti®cation of this level of structure has been achievedwith the application of fractal mathematics to the geo-metry of the microstructure. Over a period of 7 years, thisarea of microstructural quanti®cation using fractal geo-metry has seen an explosive burst of success su�cientlyimportant to be reviewed in this special issue of FoodResearch International. In addition, microstructural analy-sis via fractal methods is also applicable to other foodareas as well, for example in characterizing structures ofwhey protein gels (Hagiwara, Kumagai, Masunaga &Nakamura, 1997; Marangoni, Barbut, McGauley, Mar-cone & Narine, 1999; Stading, Langton & Hermansson,1993; Vreeker, Hoekstra, den Boer & Agterof, 1992a).The importance of the microstructural level of structural
organization becomes apparent when one examines thedi�erent levels of structure in a fat network in the contextof how these levels of structure are responsible for thevalues of macroscopic physical measurements performedon the network. The levels of structure in a typical fat net-work are de®ned as the fat crystallizes from the melt. Thegrowth of a fat crystal network can be visualized thus:
0963-9969/99/$20.00 # 1999 Candian Institute of Food Science and Technology. Published by Elsevier Science Ltd All rights reserved.
PI I : S0963-9969(99 )00078-2
Food Research International 32 (1999) 227±248
www.elsevier.com/locate/foodres
* Corresponding author. Tel.: +1-519-824-4120, ext. 4340; fax:
+1-519-824-6631.
E-mail address: [email protected] (A.G. Marangoni)
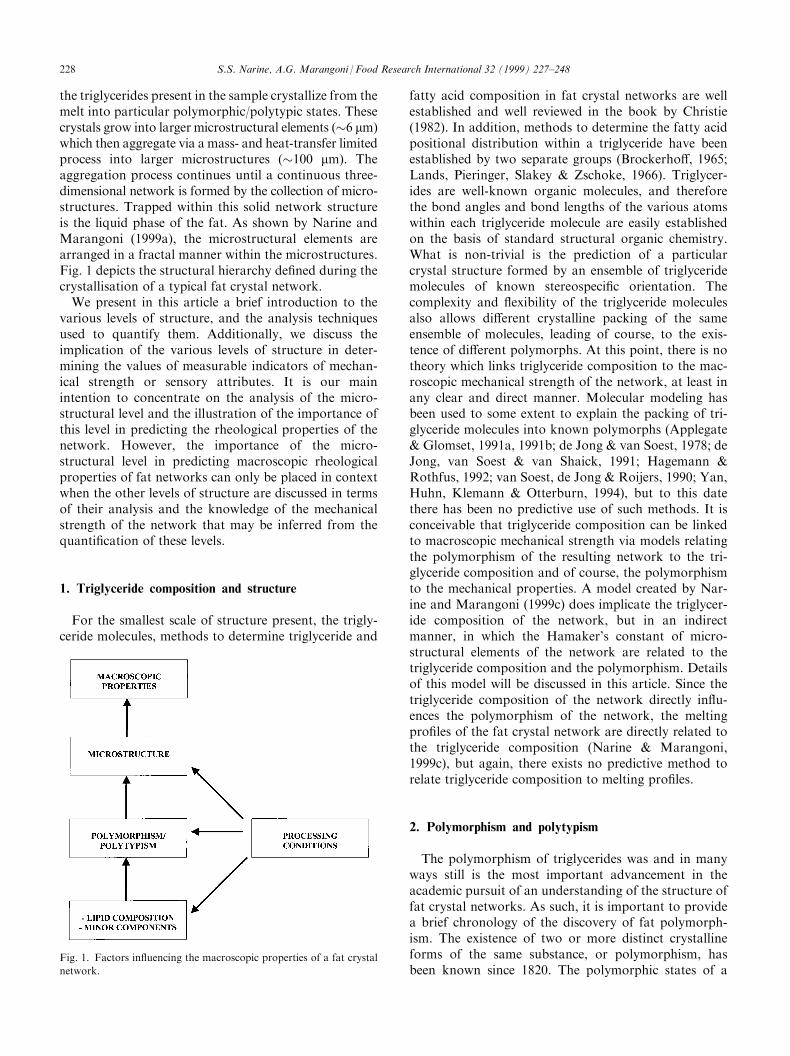
the triglycerides present in the sample crystallize from themelt into particular polymorphic/polytypic states. Thesecrystals grow into larger microstructural elements (�6 mm)which then aggregate via a mass- and heat-transfer limitedprocess into larger microstructures (�100 mm). Theaggregation process continues until a continuous three-dimensional network is formed by the collection of micro-structures. Trapped within this solid network structureis the liquid phase of the fat. As shown by Narine andMarangoni (1999a), the microstructural elements arearranged in a fractal manner within the microstructures.Fig. 1 depicts the structural hierarchy de®ned during thecrystallisation of a typical fat crystal network.We present in this article a brief introduction to the
various levels of structure, and the analysis techniquesused to quantify them. Additionally, we discuss theimplication of the various levels of structure in deter-mining the values of measurable indicators of mechan-ical strength or sensory attributes. It is our mainintention to concentrate on the analysis of the micro-structural level and the illustration of the importance ofthis level in predicting the rheological properties of thenetwork. However, the importance of the micro-structural level in predicting macroscopic rheologicalproperties of fat networks can only be placed in contextwhen the other levels of structure are discussed in termsof their analysis and the knowledge of the mechanicalstrength of the network that may be inferred from thequanti®cation of these levels.
1. Triglyceride composition and structure
For the smallest scale of structure present, the trigly-ceride molecules, methods to determine triglyceride and
fatty acid composition in fat crystal networks are wellestablished and well reviewed in the book by Christie(1982). In addition, methods to determine the fatty acidpositional distribution within a triglyceride have beenestablished by two separate groups (Brockerho�, 1965;Lands, Pieringer, Slakey & Zschoke, 1966). Triglycer-ides are well-known organic molecules, and thereforethe bond angles and bond lengths of the various atomswithin each triglyceride molecule are easily establishedon the basis of standard structural organic chemistry.What is non-trivial is the prediction of a particularcrystal structure formed by an ensemble of triglyceridemolecules of known stereospeci®c orientation. Thecomplexity and ¯exibility of the triglyceride moleculesalso allows di�erent crystalline packing of the sameensemble of molecules, leading of course, to the exis-tence of di�erent polymorphs. At this point, there is notheory which links triglyceride composition to the mac-roscopic mechanical strength of the network, at least inany clear and direct manner. Molecular modeling hasbeen used to some extent to explain the packing of tri-glyceride molecules into known polymorphs (Applegate& Glomset, 1991a, 1991b; de Jong & van Soest, 1978; deJong, van Soest & van Shaick, 1991; Hagemann &Rothfus, 1992; van Soest, de Jong & Roijers, 1990; Yan,Huhn, Klemann & Otterburn, 1994), but to this datethere has been no predictive use of such methods. It isconceivable that triglyceride composition can be linkedto macroscopic mechanical strength via models relatingthe polymorphism of the resulting network to the tri-glyceride composition and of course, the polymorphismto the mechanical properties. A model created by Nar-ine and Marangoni (1999c) does implicate the triglycer-ide composition of the network, but in an indirectmanner, in which the Hamaker's constant of micro-structural elements of the network are related to thetriglyceride composition and the polymorphism. Detailsof this model will be discussed in this article. Since thetriglyceride composition of the network directly in¯u-ences the polymorphism of the network, the meltingpro®les of the fat crystal network are directly related tothe triglyceride composition (Narine & Marangoni,1999c), but again, there exists no predictive method torelate triglyceride composition to melting pro®les.
2. Polymorphism and polytypism
The polymorphism of triglycerides was and in manyways still is the most important advancement in theacademic pursuit of an understanding of the structure offat crystal networks. As such, it is important to providea brief chronology of the discovery of fat polymorph-ism. The existence of two or more distinct crystallineforms of the same substance, or polymorphism, hasbeen known since 1820. The polymorphic states of a
Fig. 1. Factors in¯uencing the macroscopic properties of a fat crystal
network.
228 S.S. Narine, A.G. Marangoni / Food Research International 32 (1999) 227±248
particular substance have di�erent physical propertiesbut on melting yield identical liquids, since the poly-morphic states are merely due to di�erences in packingof the constituent molecules upon crystallisation. Thephysical and chemical properties of glycerides have beenstudied for more than a century. One of the indicatorsof di�erent polymorphic forms of triglycerides andacylglycerides in general has been a multiple meltingbehavior, noted as early as 1849. As summarized byChapman (1962) and by Hagemann (1989), numerousearly observations of variation in melting points of thesame glyceride compound was made, which in the mid-19th century was thought to be due to a form of iso-merism.Malkin and co-workers were the ®rst to utilize powder
X-ray di�raction to demonstrate conclusively that themelting behavior of glycerides were due to polymorphism(Clarkson & Malkin, 1934). This work resulted in theidenti®cation of four solid forms for tristearin. The lowestmelting form of tristearin was designated gamma, g, whichshowed a di�use X-ray Bragg spacing at 0.415 nmÐthisform was considered a non-crystalline vitreous solid andmelted at 54�C. The next polymorph in line in terms ofmelting point was designated alpha, a, and melted at65�C (Bragg spacing 0.415 nm), with the next poly-morph being designated beta prime, b0, melting at 70�C(Bragg spacings 0.38 and 0.42 nm). The ®nal form wasdesignated beta, b, and melted at 72�C with Bragg spa-cing 0.46 nm.Later work by other researchers (Filer, Sidhu, Dau-
bert & Longenecker, 1946; Lutton, 1945) brought intoquestion Malkin's work in terms of assignation of thedi�erent melting points with X-ray spacings. As will beexplained below, this controversy ended with the viewof Lutton and others being accepted over Malkin'sgroup, but it is important to note that Malkin's groupwas the ®rst to demonstrate conclusively that the exis-tence of multiple melting points for tristearin was due toa detectable, by X-ray di�raction, di�erence in crystal-line packing.Lutton and Malkin most energetically contested the
controversy over the assignation of the di�erent poly-morphic forms. Lutton denied the existence of the vitr-eous or g form, ascertaining that there were only threedistinct crystalline forms. Lutton claimed that the low-est melting point polymorph was the a form with aBragg spacing at 0.415 nm, which transformed into theb0 form (corresponding to Malkin's a form) whichtransformed to the highest-melting b form. In 1955,Chapman (1955) used infrared spectroscopy to con®rmthe claims of Lutton. The correlation of infrared and X-ray data led to the classi®cation of basic polymorphs,designated a, b0 and b according to the cross-sectionalpacking mode of the hydrocarbon chain, called ``subcellstructure.'' The a form has a hexagonal subcell packingand a Bragg spacing of 0.42 nm, the b0 form has
orthorhombic perpendicular subcell packing with Braggspacings of 0.42±0.43 and 0.37±0.40 nm, and the b formhas a triclinic parallel subcell with Bragg spacing of 0.46nm. The crystal structure has only been determined forthe stable b polymorph of three mono-acid triglycerides;tricaprin (Jensen & Mabis, 1966); trilaurin (Larsson,1964); and the triglyceride of 11-bromoundecanoic acid(Larsson, 1963) and one mixed acid triglyceride; 1,2-dipal-mitoyl-3-acetyl-sn-glycerol (Goto, Kodali, Small, Honda,Kozawa & Uchida, 1992). Depending on the acyl chaincomposition, other metastable polymorphs called the gand � forms and plural b0 and b forms have beenobserved in mixed acid triglycerides (Padley, 1996).Nomenclature of the di�erent polymorphic forms has
been covered by a number of authors (for example,Larsson, 1966; Lutton, 1950; Yano, 1998). However, themain structural factors used to characterize the di�erentpolymorphic forms are the subcell structure and thelayered structure. The subcell structure deals with thepacking mode of the hydrocarbon chains, whilst thelayered structure arises out of the repetitive sequence ofthe acyl chains which forms a unit lamella along thehydrocarbon chain axis. The subcell and layered struc-tures give rise to the short and long Bragg spacingsoften referred to in X-ray di�raction studies of fatpolymorphism. This information is the extent of ourknowledge of the crystalline structure of the systems:except for the mono-acid triglyceride b forms, ourknowledge is limited to the subcell and layered struc-turesÐno other information at the molecular level isavailable as to the packing of the triglyceride molecules.Therefore for the structures of the metastable poly-morphic forms such as the a and particularly the b0
forms, the molecular packing of the triglycerides stillremains to be determined. Furthermore, the structuresof saturated±unsaturated mixed acid triglycerides andthe structures of mixtures of di�erent triglycerides suchas is to be found in natural systems like cocoa butter arestill to be determined as well.Much work has been done on the investigation of
mixed-acid triglycerides (Arishima, Sagi, Mori & Sato,1991; Engstrom, 1992; Filer et al., 1946; Gibon, Durant& Deroanne, 1986b; Kodali, Atkinson, Redgrave &Small, 1987; Landman, Feuge & Lovegren, 1960; Lars-son, 1972; Lovegren, Gray & Feuge, 1971; Lutton &Jackson, 1950; Sato, Arishima, Wang, Ojima, Sagi &Mori, 1989). However, no fundamental set of rules forconstructing molecular structures has been determined;in fact beyond the subcell and layering lattice para-meters, little is known of the structure of mixed-acidtriglycerides. Due to the studies cited above, however,much is known of the thermodynamic behavior of thesesystems. Rossel (1967) reported molecular compoundformation (mixed-crystals) for some speci®c sets ofmixed acid triglycerides. The phase behavior, kineticbehavior and X-ray di�raction studies have been used
S.S. Narine, A.G. Marangoni / Food Research International 32 (1999) 227±248 229
to support mixed crystal formation of di�erent trigly-cerides as well as to investigate the resultant polymorph-ism of a mixture of triglycerides (deMan, 1963; Engstrom,1992; Knoester, Bruijne & Tempel, 1972; Lambelet &Raemy, 1983; Marangoni & Lencki, 1998; Minato, Ueno,Smith, Amemiya & Sato, 1997; Minato, Ueno, Yano, etal., 1997; Mulder, 1953; Oyano, Hachiya & Sato, 1992;Timms, 1980, 1984). However, the same problem existsas for the structure of mixed-acid triglycerides; beyondthe kinetic and phase behavior and the lattice para-meters of layering, there is no conclusive evidence of thefundamental molecular structures, and no acclaimedmethod for the construction of such structures.In addition to X-ray di�raction, a number of other tech-
niques are employed in the identi®cation of the di�erentpolymorphic forms; as mentioned before, vibrational spec-troscopy has been used (Amey & Chapman, 1984; Chap-man, 1960a, 1964; Freeman, 1968; O'Connor, DuPre &Feuge, 1955; Yano, 1998; Yano, Kaneko, Kobayashi,Kodali, Small, et al., 1997; Yano, Kaneko, Kobayashi &Sato, 1997b). Nuclear magnetic resonance (NMR) mea-surements have also been used to study the molecularmobility in polymorphs (Arishima, Sugimoto, Kiwata,Mori & Sato, 1996; Boceik, Ablett & Norton, 1985;Calaghan & Jolly, 1977; Chapman, 1960b; Eads, Blaurock,Bryant, Roy & Croasman, 1992; Gibon, Durant &Deroanne, 1986a; Hagemann & Rothfus, 1983; Norton,Lee-Tu�nel, Ablett & Bociek, 1985). Atomic forcemicroscopy has recently also been used to study thecrystal structure of triglycerides (Birker & Blonk,1993).The type of polymorph(s) present in the network
decidedly a�ects the macroscopic properties of the fatcrystal network. Certainly, the type of polymorph pre-sent will dictate the melting point of the network. Theshape and sizes of the crystals and crystal aggregatesfound in the network is a�ected by the polymorphicform of the crystals, but to varying extents in di�erentfats (Berger Jewel & Pollitt, 1979; Hoerr, 1960; Hoerr& Waugh, 1955; Kellens, Meeussen & Reynaers, 1992).The shape and sizes of crystals and aggregates of crys-tals (microstructural elements) do a�ect the macro-scopic elastic constant of the network. However, themeasurements needed to establish the di�erent poly-morphic types as explained above do not yield addi-tional information about the nature of the molecularstructure. Therefore, the understanding of the linkbetween polymorphism and morphology and size ofcrystals is still phenomenological in nature. Addition-ally, in a model created by Narine and Marangoni(1999c), the macroscopic elastic constant of the networkis dependent on the Hamaker's constant (a constantdepending on the polarizabilities of the triglyceridemolecules) of the microstructural elements within thenetwork, which in turn depends on the molecular packingin the crystals, but again, this is not yet a quanti®able
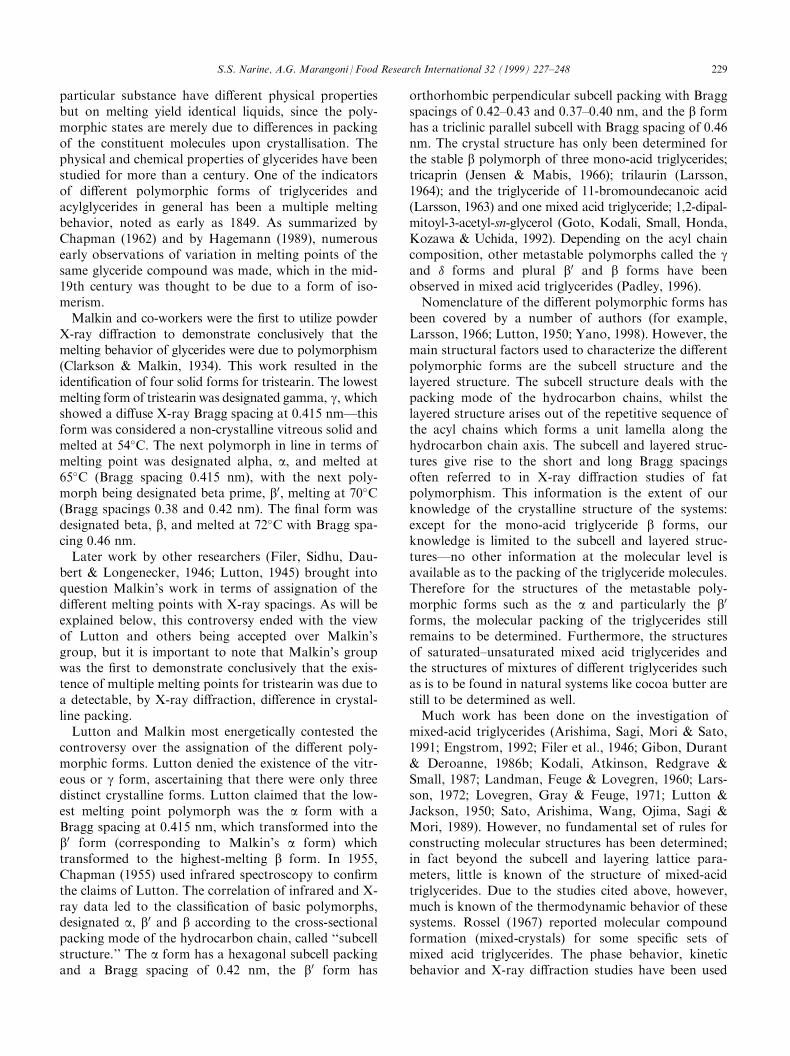
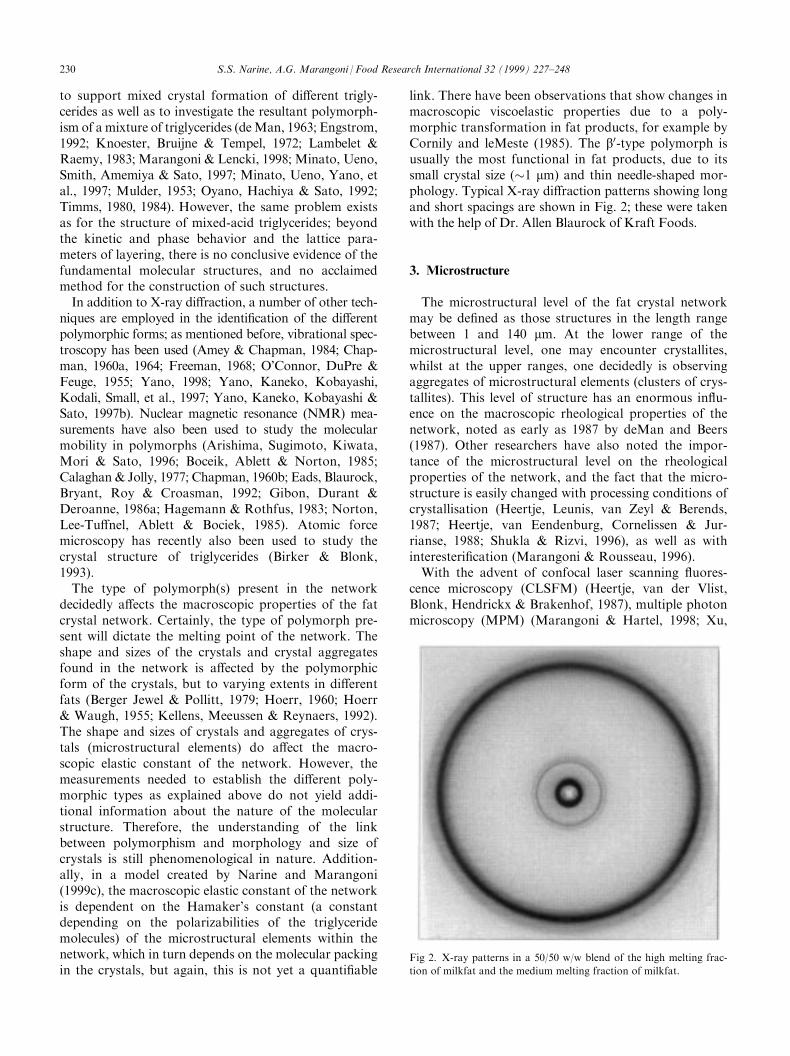
link. There have been observations that show changes inmacroscopic viscoelastic properties due to a poly-morphic transformation in fat products, for example byCornily and leMeste (1985). The b0-type polymorph isusually the most functional in fat products, due to itssmall crystal size (�1 mm) and thin needle-shaped mor-phology. Typical X-ray di�raction patterns showing longand short spacings are shown in Fig. 2; these were takenwith the help of Dr. Allen Blaurock of Kraft Foods.
3. Microstructure
The microstructural level of the fat crystal networkmay be de®ned as those structures in the length rangebetween 1 and 140 mm. At the lower range of themicrostructural level, one may encounter crystallites,whilst at the upper ranges, one decidedly is observingaggregates of microstructural elements (clusters of crys-tallites). This level of structure has an enormous in¯u-ence on the macroscopic rheological properties of thenetwork, noted as early as 1987 by deMan and Beers(1987). Other researchers have also noted the impor-tance of the microstructural level on the rheologicalproperties of the network, and the fact that the micro-structure is easily changed with processing conditions ofcrystallisation (Heertje, Leunis, van Zeyl & Berends,1987; Heertje, van Eendenburg, Cornelissen & Jur-rianse, 1988; Shukla & Rizvi, 1996), as well as withinteresteri®cation (Marangoni & Rousseau, 1996).With the advent of confocal laser scanning ¯uores-
cence microscopy (CLSFM) (Heertje, van der Vlist,Blonk, Hendrickx & Brakenhof, 1987), multiple photonmicroscopy (MPM) (Marangoni & Hartel, 1998; Xu,
Fig 2. X-ray patterns in a 50/50 w/w blend of the high melting frac-
tion of milkfat and the medium melting fraction of milkfat.
230 S.S. Narine, A.G. Marangoni / Food Research International 32 (1999) 227±248
Zipfel, Shear, Williams & Webb, 1996) and atomic forcemicroscopy (AFM) (Narine & Marangoni, 1999e), threenew tools have been added to the standard tools of lightmicroscopy (LM) (Flint, 1984, 1991; Inoe, 1987; Yiu,1985) and electron microscopy (EM) (Brooker, 1990;Buchheim, 1982; de Man, 1982; Heertje, Leunis, van Zeyl& Berends, 1987; Kalab, 1983; Sargeant, 1988) that wasmost widely used in the past to study the microstructure offats and foods in general. Heertje's work (1993; Heertje,Leunis, et al.; Heertje, van der Vlist, et al., 1987; Heertje, etal., 1988) on the visualization of the microstructure in fatsremains one of the most important contributions to the®eld. In his method, a cold solvent mixture (isobutanol±methanol) was used to remove the liquid oil from the solidfat in a sample mounted on a special holder. After removalof the liquid oil, the structure of the solid fat network couldbe visualized.The nomenclature introduced earlier for the di�erent
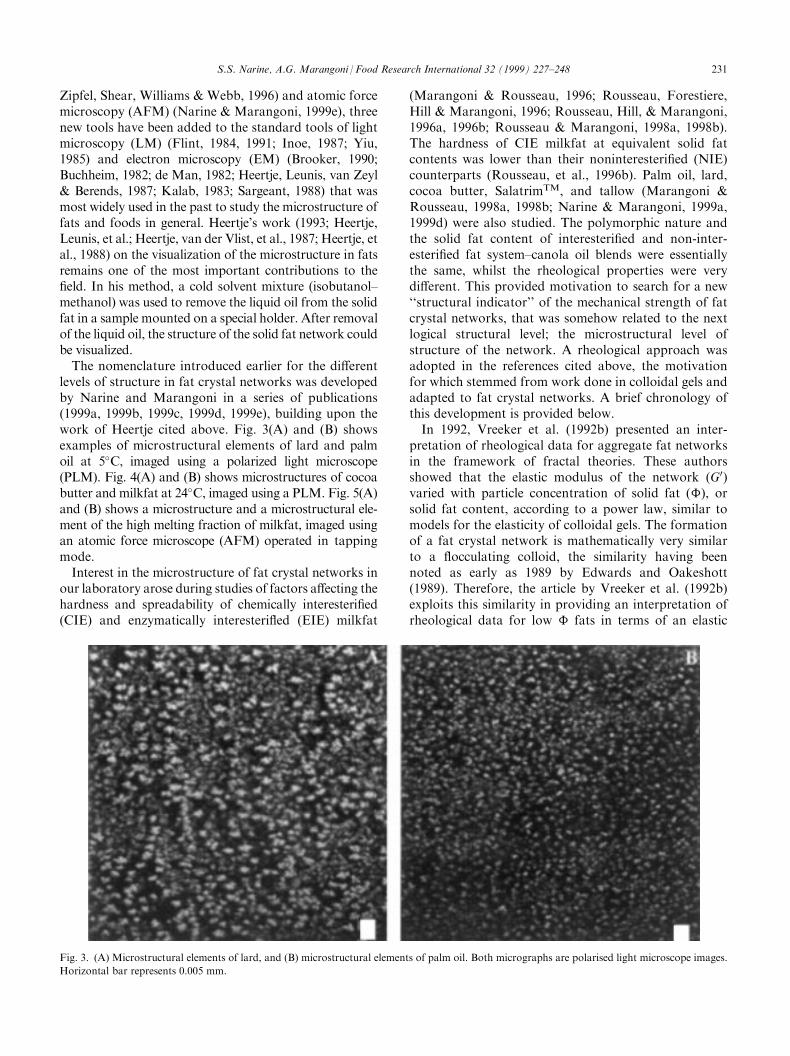
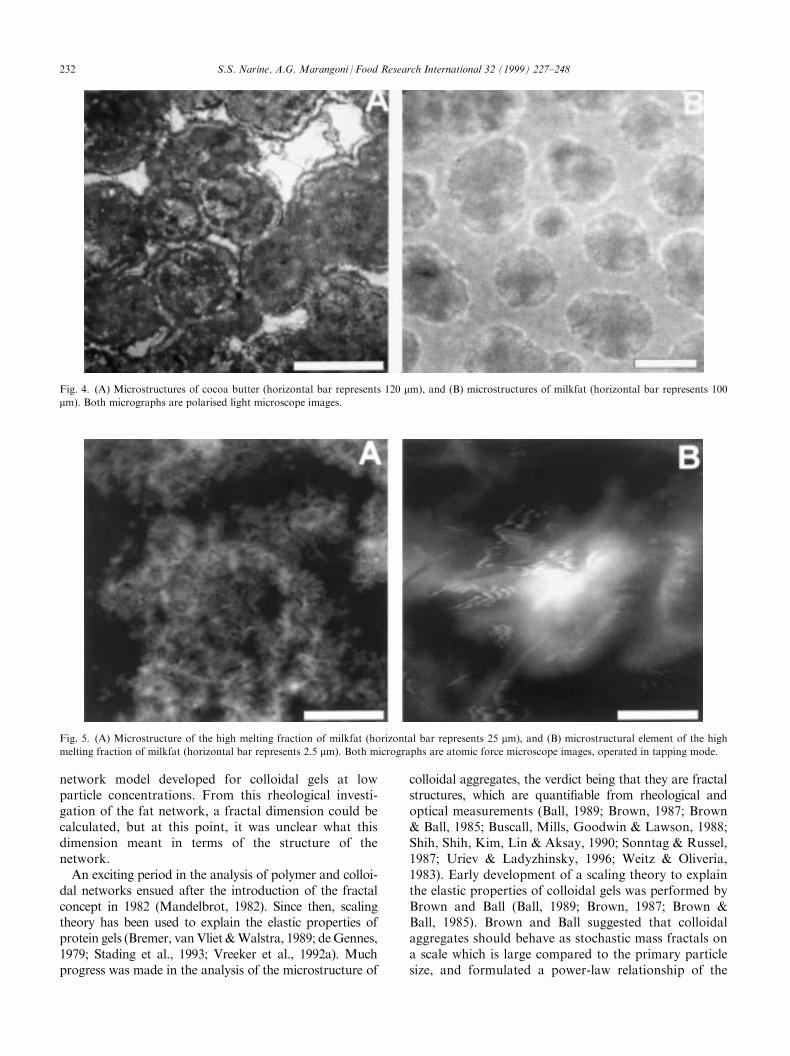
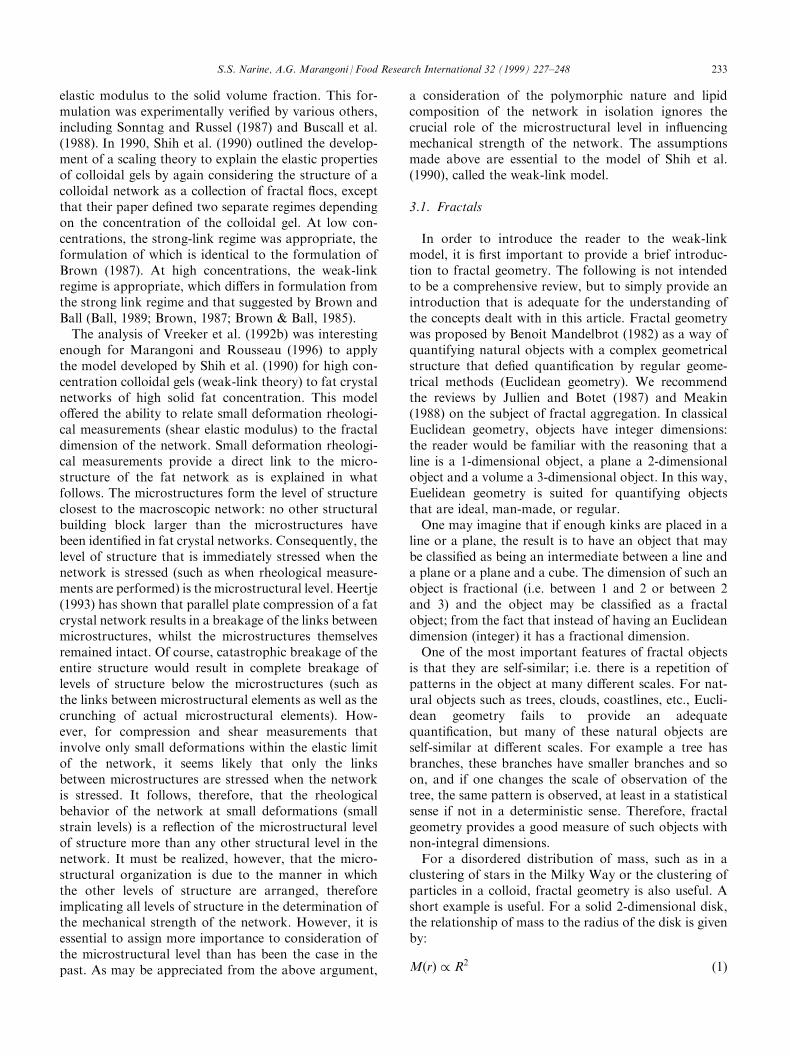
levels of structure in fat crystal networks was developedby Narine and Marangoni in a series of publications(1999a, 1999b, 1999c, 1999d, 1999e), building upon thework of Heertje cited above. Fig. 3(A) and (B) showsexamples of microstructural elements of lard and palmoil at 5�C, imaged using a polarized light microscope(PLM). Fig. 4(A) and (B) shows microstructures of cocoabutter and milkfat at 24�C, imaged using a PLM. Fig. 5(A)and (B) shows a microstructure and a microstructural ele-ment of the high melting fraction of milkfat, imaged usingan atomic force microscope (AFM) operated in tappingmode.Interest in the microstructure of fat crystal networks in
our laboratory arose during studies of factors a�ecting thehardness and spreadability of chemically interesteri®ed(CIE) and enzymatically interesteri¯ed (EIE) milkfat
(Marangoni & Rousseau, 1996; Rousseau, Forestiere,Hill & Marangoni, 1996; Rousseau, Hill, & Marangoni,1996a, 1996b; Rousseau & Marangoni, 1998a, 1998b).The hardness of CIE milkfat at equivalent solid fatcontents was lower than their noninteresteri®ed (NIE)counterparts (Rousseau, et al., 1996b). Palm oil, lard,cocoa butter, SalatrimTM, and tallow (Marangoni &Rousseau, 1998a, 1998b; Narine & Marangoni, 1999a,1999d) were also studied. The polymorphic nature andthe solid fat content of interesteri®ed and non-inter-esteri®ed fat system±canola oil blends were essentiallythe same, whilst the rheological properties were verydi�erent. This provided motivation to search for a new``structural indicator'' of the mechanical strength of fatcrystal networks, that was somehow related to the nextlogical structural level; the microstructural level ofstructure of the network. A rheological approach wasadopted in the references cited above, the motivationfor which stemmed from work done in colloidal gels andadapted to fat crystal networks. A brief chronology ofthis development is provided below.In 1992, Vreeker et al. (1992b) presented an inter-
pretation of rheological data for aggregate fat networksin the framework of fractal theories. These authorsshowed that the elastic modulus of the network (G0)varied with particle concentration of solid fat (�), orsolid fat content, according to a power law, similar tomodels for the elasticity of colloidal gels. The formationof a fat crystal network is mathematically very similarto a ¯occulating colloid, the similarity having beennoted as early as 1989 by Edwards and Oakeshott(1989). Therefore, the article by Vreeker et al. (1992b)exploits this similarity in providing an interpretation ofrheological data for low � fats in terms of an elastic
Fig. 3. (A) Microstructural elements of lard, and (B) microstructural elements of palm oil. Both micrographs are polarised light microscope images.
Horizontal bar represents 0.005 mm.
S.S. Narine, A.G. Marangoni / Food Research International 32 (1999) 227±248 231
network model developed for colloidal gels at lowparticle concentrations. From this rheological investi-gation of the fat network, a fractal dimension could becalculated, but at this point, it was unclear what thisdimension meant in terms of the structure of thenetwork.An exciting period in the analysis of polymer and colloi-
dal networks ensued after the introduction of the fractalconcept in 1982 (Mandelbrot, 1982). Since then, scalingtheory has been used to explain the elastic properties ofprotein gels (Bremer, vanVliet &Walstra, 1989; deGennes,1979; Stading et al., 1993; Vreeker et al., 1992a). Muchprogress was made in the analysis of the microstructure of
colloidal aggregates, the verdict being that they are fractalstructures, which are quanti®able from rheological andoptical measurements (Ball, 1989; Brown, 1987; Brown& Ball, 1985; Buscall, Mills, Goodwin & Lawson, 1988;Shih, Shih, Kim, Lin & Aksay, 1990; Sonntag & Russel,1987; Uriev & Ladyzhinsky, 1996; Weitz & Oliveria,1983). Early development of a scaling theory to explainthe elastic properties of colloidal gels was performed byBrown and Ball (Ball, 1989; Brown, 1987; Brown &Ball, 1985). Brown and Ball suggested that colloidalaggregates should behave as stochastic mass fractals ona scale which is large compared to the primary particlesize, and formulated a power-law relationship of the
Fig. 5. (A) Microstructure of the high melting fraction of milkfat (horizontal bar represents 25 mm), and (B) microstructural element of the high
melting fraction of milkfat (horizontal bar represents 2.5 mm). Both micrographs are atomic force microscope images, operated in tapping mode.
Fig. 4. (A) Microstructures of cocoa butter (horizontal bar represents 120 mm), and (B) microstructures of milkfat (horizontal bar represents 100
mm). Both micrographs are polarised light microscope images.
232 S.S. Narine, A.G. Marangoni / Food Research International 32 (1999) 227±248
elastic modulus to the solid volume fraction. This for-mulation was experimentally veri®ed by various others,including Sonntag and Russel (1987) and Buscall et al.(1988). In 1990, Shih et al. (1990) outlined the develop-ment of a scaling theory to explain the elastic propertiesof colloidal gels by again considering the structure of acolloidal network as a collection of fractal ¯ocs, exceptthat their paper de®ned two separate regimes dependingon the concentration of the colloidal gel. At low con-centrations, the strong-link regime was appropriate, theformulation of which is identical to the formulation ofBrown (1987). At high concentrations, the weak-linkregime is appropriate, which di�ers in formulation fromthe strong link regime and that suggested by Brown andBall (Ball, 1989; Brown, 1987; Brown & Ball, 1985).The analysis of Vreeker et al. (1992b) was interesting
enough for Marangoni and Rousseau (1996) to applythe model developed by Shih et al. (1990) for high con-centration colloidal gels (weak-link theory) to fat crystalnetworks of high solid fat concentration. This modelo�ered the ability to relate small deformation rheologi-cal measurements (shear elastic modulus) to the fractaldimension of the network. Small deformation rheologi-cal measurements provide a direct link to the micro-structure of the fat network as is explained in whatfollows. The microstructures form the level of structureclosest to the macroscopic network: no other structuralbuilding block larger than the microstructures havebeen identi®ed in fat crystal networks. Consequently, thelevel of structure that is immediately stressed when thenetwork is stressed (such as when rheological measure-ments are performed) is the microstructural level. Heertje(1993) has shown that parallel plate compression of a fatcrystal network results in a breakage of the links betweenmicrostructures, whilst the microstructures themselvesremained intact. Of course, catastrophic breakage of theentire structure would result in complete breakage oflevels of structure below the microstructures (such asthe links between microstructural elements as well as thecrunching of actual microstructural elements). How-ever, for compression and shear measurements thatinvolve only small deformations within the elastic limitof the network, it seems likely that only the linksbetween microstructures are stressed when the networkis stressed. It follows, therefore, that the rheologicalbehavior of the network at small deformations (smallstrain levels) is a re¯ection of the microstructural levelof structure more than any other structural level in thenetwork. It must be realized, however, that the micro-structural organization is due to the manner in whichthe other levels of structure are arranged, thereforeimplicating all levels of structure in the determination ofthe mechanical strength of the network. However, it isessential to assign more importance to consideration ofthe microstructural level than has been the case in thepast. As may be appreciated from the above argument,
a consideration of the polymorphic nature and lipidcomposition of the network in isolation ignores thecrucial role of the microstructural level in in¯uencingmechanical strength of the network. The assumptionsmade above are essential to the model of Shih et al.(1990), called the weak-link model.
3.1. Fractals
In order to introduce the reader to the weak-linkmodel, it is ®rst important to provide a brief introduc-tion to fractal geometry. The following is not intendedto be a comprehensive review, but to simply provide anintroduction that is adequate for the understanding ofthe concepts dealt with in this article. Fractal geometrywas proposed by Benoit Mandelbrot (1982) as a way ofquantifying natural objects with a complex geometricalstructure that de®ed quanti®cation by regular geome-trical methods (Euclidean geometry). We recommendthe reviews by Jullien and Botet (1987) and Meakin(1988) on the subject of fractal aggregation. In classicalEuclidean geometry, objects have integer dimensions:the reader would be familiar with the reasoning that aline is a 1-dimensional object, a plane a 2-dimensionalobject and a volume a 3-dimensional object. In this way,Euelidean geometry is suited for quantifying objectsthat are ideal, man-made, or regular.One may imagine that if enough kinks are placed in a
line or a plane, the result is to have an object that maybe classi®ed as being an intermediate between a line anda plane or a plane and a cube. The dimension of such anobject is fractional (i.e. between 1 and 2 or between 2and 3) and the object may be classi®ed as a fractalobject; from the fact that instead of having an Euclideandimension (integer) it has a fractional dimension.One of the most important features of fractal objects
is that they are self-similar; i.e. there is a repetition ofpatterns in the object at many di�erent scales. For nat-ural objects such as trees, clouds, coastlines, etc., Eucli-dean geometry fails to provide an adequatequanti®cation, but many of these natural objects areself-similar at di�erent scales. For example a tree hasbranches, these branches have smaller branches and soon, and if one changes the scale of observation of thetree, the same pattern is observed, at least in a statisticalsense if not in a deterministic sense. Therefore, fractalgeometry provides a good measure of such objects withnon-integral dimensions.For a disordered distribution of mass, such as in a
clustering of stars in the Milky Way or the clustering ofparticles in a colloid, fractal geometry is also useful. Ashort example is useful. For a solid 2-dimensional disk,the relationship of mass to the radius of the disk is givenby:
M�r� / R2 �1�
S.S. Narine, A.G. Marangoni / Food Research International 32 (1999) 227±248 233
so that in this case, the dimension is an integer and theobject is an Euclidean object. However, for a disordereddistribution of mass, if at di�erent scales of observationthe patterns are statistically self-similar, then the rela-tionship of radius to mass may be given by (Jullien &Botet, 1987; Uriev & Ladyzhinsky, 1996; Vreeker et al.,1992b):
M�r� / RD �2�
where D is a fractional or fractal dimension. Here, thesymbol � is taken to mean ``approximately proportionalto.'' It was shown experimentally by Vreeker et al.(1992b) and by Rousseau and Marangoni (Marangoni &Rousseau, 1996, 1998a, 1998b; Rousseau, et al., 1996;Rousseau, et al., 1996a, 1996b; Rousseau & Marangoni,1998a, 1998b; Rousseau, Marangoni & Je�rey, 1998)that the elastic properties of fat crystal networks at lowand high solid fat contents respectively, are dominatedby the fractal nature of the microstructure. For theshear elastic modulus G0,
G0 � �m �3�where � is the particle volume fraction of solid fat andm depends on the fractal dimension of the network.Following is a description of a theory submitted by
Shih et al. (1990) on the scaling behavior of the elasticproperties of colloidal gels under two regimes. Theseregimes are dependent upon the strength of the linksbetween the clusters (microstructures in the fat crystalnetwork) of a colloidal gel relative to the strength of theclusters themselves. Because of the similarities betweencolloidal gels and fat crystal networks, this theory hasbeen adapted for fat crystal networks.
3.2. Strong-link regime
For colloidal gels, at low particle concentrations thestrong-link regime is applicable. In this case, the indivi-dual clusters grow large, so that each acts like a weakspring. Therefore, the elastic constant of the system as afunction of particle concentration is dominated by theelastic constant of the ¯ocs. For the strong-link regime, thefollowing relationship is suggested by Shih et al. (1990):
G0 � ���d�x�=�dÿD�� �4�
where x is the backbone fractal dimension (chemicallength exponent) or tortuosity of the network: usually anumber which is less than the fractal dimension of thenetwork, but larger than unity in order to provide aconnected path. Shih et al. (1990) found that for thecolloidal gels they studied, x was a value between 1 and1.3. Narine and Marangoni (1999a) have devised anexperimental method to calculate x, and this will beoutlined later in this article.
3.3. Weak-link regime
The weak-link regime behavior is observed at highparticle concentrations. Here, the inter-microstructurallinks are weak compared to the intra-microstructurallinks and therefore the elastic constant of the system isdominated by the elastic constant of the links betweenthe microstructures. The macroscopic elastic constant Kof a system of size L can be written in terms of the inter-microstructural links:
K � L
�
� �dÿ2Kl � �ÿ�dÿ2� �5�
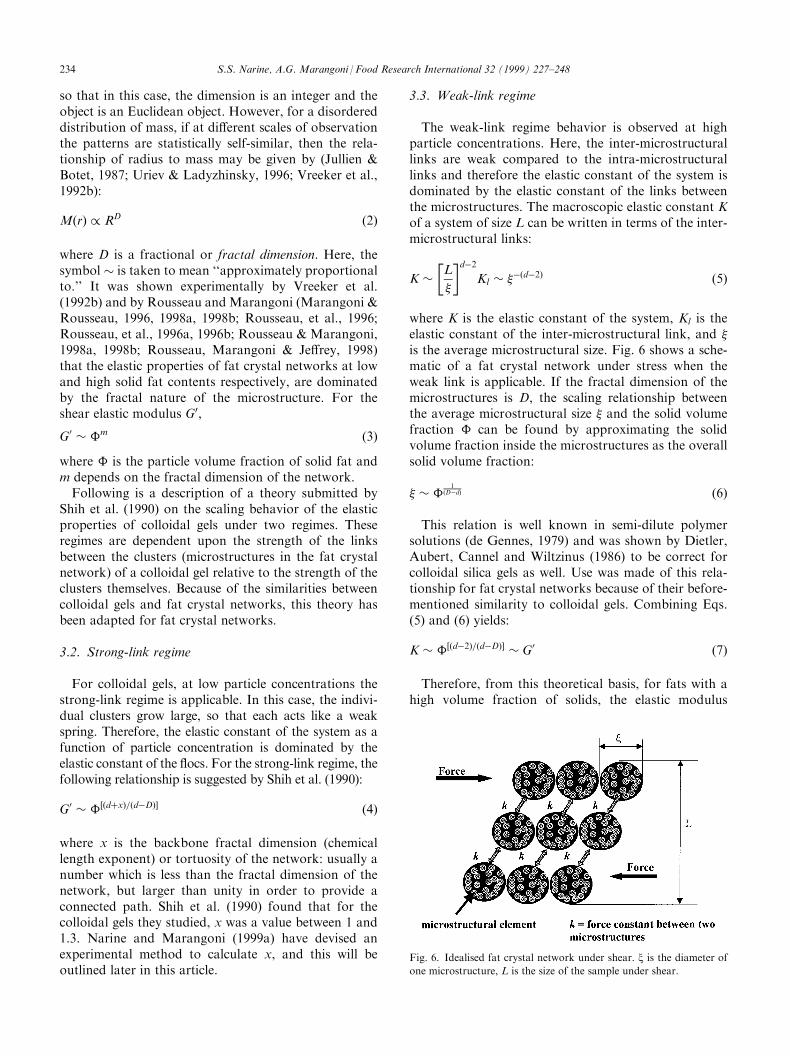
where K is the elastic constant of the system, Kl is theelastic constant of the inter-microstructural link, and �is the average microstructural size. Fig. 6 shows a sche-matic of a fat crystal network under stress when theweak link is applicable. If the fractal dimension of themicrostructures is D, the scaling relationship betweenthe average microstructural size � and the solid volumefraction � can be found by approximating the solidvolume fraction inside the microstructures as the overallsolid volume fraction:
� � �1
�Dÿd� �6�
This relation is well known in semi-dilute polymersolutions (de Gennes, 1979) and was shown by Dietler,Aubert, Cannel and Wiltzinus (1986) to be correct forcolloidal silica gels as well. Use was made of this rela-tionship for fat crystal networks because of their before-mentioned similarity to colloidal gels. Combining Eqs.(5) and (6) yields:
K � ���dÿ2�=�dÿD�� � G0 �7�
Therefore, from this theoretical basis, for fats with ahigh volume fraction of solids, the elastic modulus
Fig. 6. Idealised fat crystal network under shear. x is the diameter of
one microstructure, L is the size of the sample under shear.
234 S.S. Narine, A.G. Marangoni / Food Research International 32 (1999) 227±248
increases as a function of � in a power law manner,with slope f�dÿ 2�=�dÿD�g, or f1=�dÿD�g since thesamples examined are 3-dimensional. Depending on theregime, the value of m in Eq. (3) can be calculated fromEq. (4) or (7). Bremer et al. (1989) noted that Eq. (3) canbe written as:
G0 � �m �8�
where g is a constant independent of the volume frac-tion, but dependent on the size of the primary particlesand on the interactions between them. This seems tosuggest that the value of g will depend on the poly-morphic nature of the fat crystal network, which in turnwill depend on the particular lipid or triglyceride com-position of the sample and on the processing conditionsused to crystallize the sample from the melt. Sig-ni®cantly di�erent polymorphic states can be achievedfrom the same sample, depending on processing condi-tions, as is evidenced in the case of tripalmitin (Kellenset al., 1992). This therefore makes a strong case for thestudy of the in¯uence of polymorphism on g, which iscurrently underway in our laboratory.From Eq. (8), the macroscopic elastic constant of a
network of particles is a function of both the spatialdistribution of aggregating particles, characterised bythe fractal dimension, and the mechanical properties ofthe particles which make up the network. Informationon the elastic constant of the particles is contained inthe parameter g. Knowledge of the fractal dimension ofthe network may be used to infer the mechanism bywhich the network was formed (di�usion-limited, reac-tion-limited, cluster±cluster aggregation, etc.).
3.4. Rheology
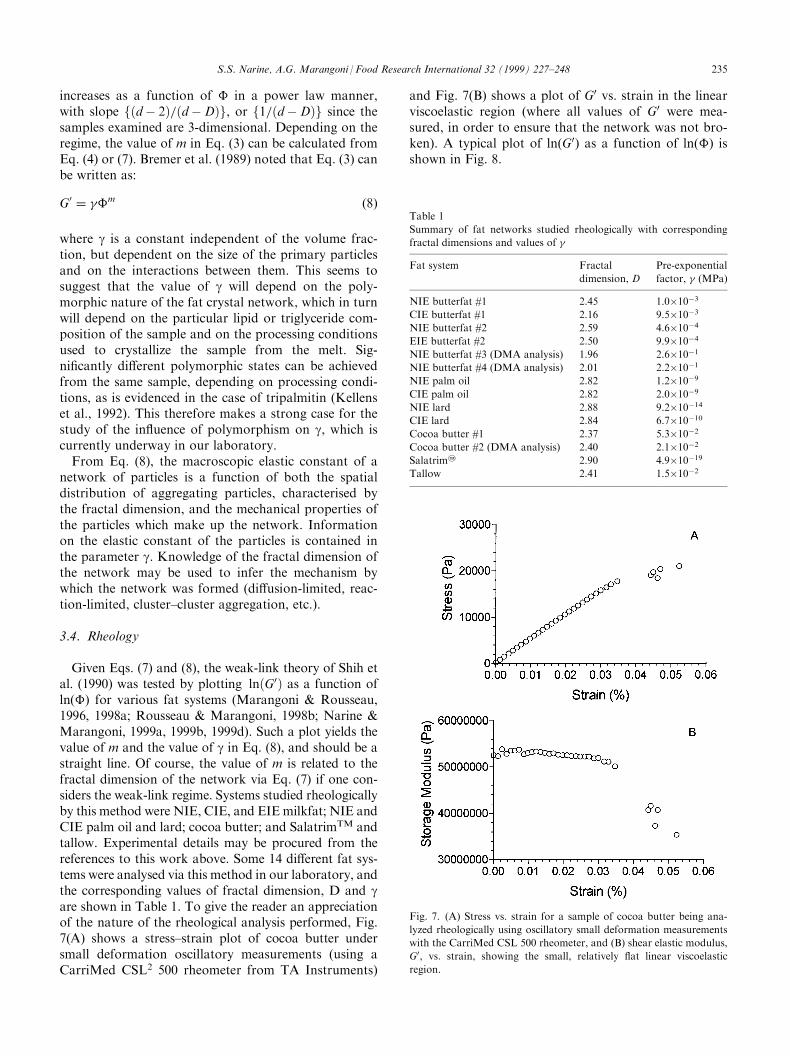
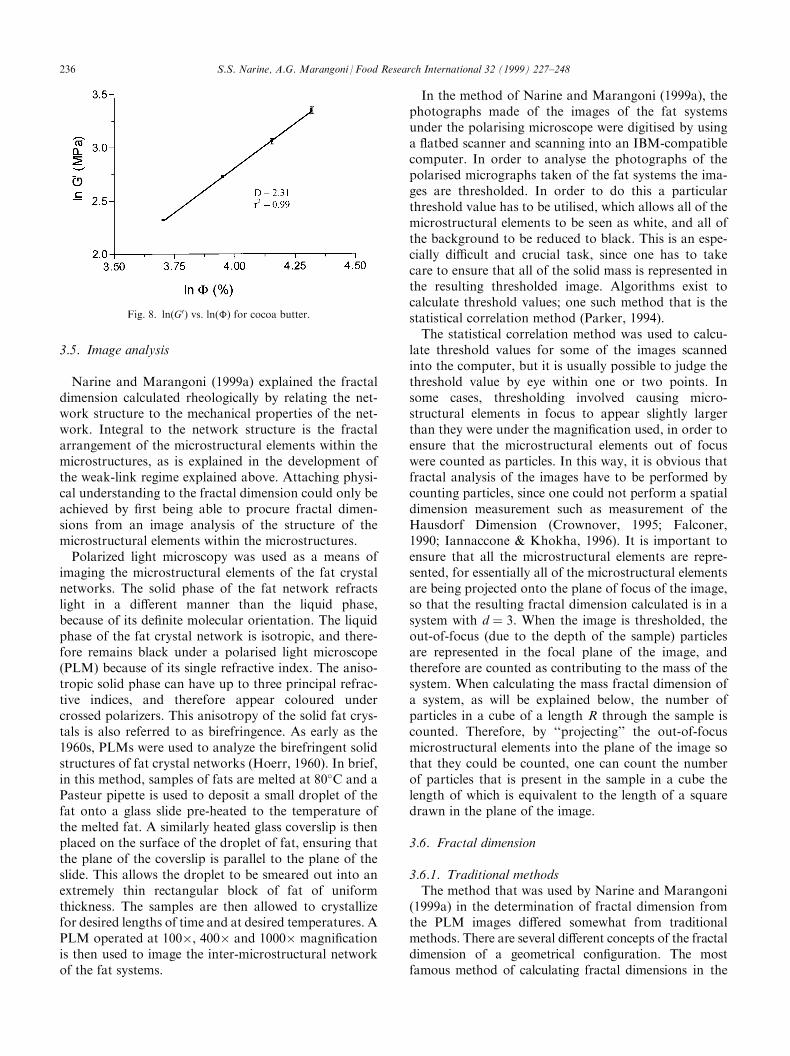
Given Eqs. (7) and (8), the weak-link theory of Shih etal. (1990) was tested by plotting ln�G0� as a function ofln(�) for various fat systems (Marangoni & Rousseau,1996, 1998a; Rousseau & Marangoni, 1998b; Narine &Marangoni, 1999a, 1999b, 1999d). Such a plot yields thevalue of m and the value of g in Eq. (8), and should be astraight line. Of course, the value of m is related to thefractal dimension of the network via Eq. (7) if one con-siders the weak-link regime. Systems studied rheologicallyby this method were NIE, CIE, and EIEmilkfat; NIE andCIE palm oil and lard; cocoa butter; and SalatrimTM andtallow. Experimental details may be procured from thereferences to this work above. Some 14 di�erent fat sys-tems were analysed via this method in our laboratory, andthe corresponding values of fractal dimension, D and gare shown in Table 1. To give the reader an appreciationof the nature of the rheological analysis performed, Fig.7(A) shows a stress±strain plot of cocoa butter undersmall deformation oscillatory measurements (using aCarriMed CSL2 500 rheometer from TA Instruments)
and Fig. 7(B) shows a plot of G0 vs. strain in the linearviscoelastic region (where all values of G0 were mea-sured, in order to ensure that the network was not bro-ken). A typical plot of ln(G0) as a function of ln(�) isshown in Fig. 8.
Table 1
Summary of fat networks studied rheologically with corresponding
fractal dimensions and values of
Fat system Fractal
dimension, D
Pre-exponential
factor, (MPa)
NIE butterfat #1 2.45 1.0�10ÿ3CIE butterfat #1 2.16 9.5�10ÿ3NIE butterfat #2 2.59 4.6�10ÿ4EIE butterfat #2 2.50 9.9�10ÿ4NIE butterfat #3 (DMA analysis) 1.96 2.6�10ÿ1NIE butterfat #4 (DMA analysis) 2.01 2.2�10ÿ1NIE palm oil 2.82 1.2�10ÿ9CIE palm oil 2.82 2.0�10ÿ9NIE lard 2.88 9.2�10ÿ14CIE lard 2.84 6.7�10ÿ10Cocoa butter #1 2.37 5.3�10ÿ2Cocoa butter #2 (DMA analysis) 2.40 2.1�10ÿ2Salatrim2 2.90 4.9�10ÿ19Tallow 2.41 1.5�10ÿ2
Fig. 7. (A) Stress vs. strain for a sample of cocoa butter being ana-
lyzed rheologically using oscillatory small deformation measurements
with the CarriMed CSL 500 rheometer, and (B) shear elastic modulus,
G0, vs. strain, showing the small, relatively ¯at linear viscoelastic
region.
S.S. Narine, A.G. Marangoni / Food Research International 32 (1999) 227±248 235
3.5. Image analysis
Narine and Marangoni (1999a) explained the fractaldimension calculated rheologically by relating the net-work structure to the mechanical properties of the net-work. Integral to the network structure is the fractalarrangement of the microstructural elements within themicrostructures, as is explained in the development ofthe weak-link regime explained above. Attaching physi-cal understanding to the fractal dimension could only beachieved by ®rst being able to procure fractal dimen-sions from an image analysis of the structure of themicrostructural elements within the microstructures.Polarized light microscopy was used as a means of
imaging the microstructural elements of the fat crystalnetworks. The solid phase of the fat network refractslight in a di�erent manner than the liquid phase,because of its de®nite molecular orientation. The liquidphase of the fat crystal network is isotropic, and there-fore remains black under a polarised light microscope(PLM) because of its single refractive index. The aniso-tropic solid phase can have up to three principal refrac-tive indices, and therefore appear coloured undercrossed polarizers. This anisotropy of the solid fat crys-tals is also referred to as birefringence. As early as the1960s, PLMs were used to analyze the birefringent solidstructures of fat crystal networks (Hoerr, 1960). In brief,in this method, samples of fats are melted at 80�C and aPasteur pipette is used to deposit a small droplet of thefat onto a glass slide pre-heated to the temperature ofthe melted fat. A similarly heated glass coverslip is thenplaced on the surface of the droplet of fat, ensuring thatthe plane of the coverslip is parallel to the plane of theslide. This allows the droplet to be smeared out into anextremely thin rectangular block of fat of uniformthickness. The samples are then allowed to crystallizefor desired lengths of time and at desired temperatures. APLM operated at 100�, 400� and 1000� magni®cationis then used to image the inter-microstructural networkof the fat systems.
In the method of Narine and Marangoni (1999a), thephotographs made of the images of the fat systemsunder the polarising microscope were digitised by usinga ¯atbed scanner and scanning into an IBM-compatiblecomputer. In order to analyse the photographs of thepolarised micrographs taken of the fat systems the ima-ges are thresholded. In order to do this a particularthreshold value has to be utilised, which allows all of themicrostructural elements to be seen as white, and all ofthe background to be reduced to black. This is an espe-cially di�cult and crucial task, since one has to takecare to ensure that all of the solid mass is represented inthe resulting thresholded image. Algorithms exist tocalculate threshold values; one such method that is thestatistical correlation method (Parker, 1994).The statistical correlation method was used to calcu-
late threshold values for some of the images scannedinto the computer, but it is usually possible to judge thethreshold value by eye within one or two points. Insome cases, thresholding involved causing micro-structural elements in focus to appear slightly largerthan they were under the magni®cation used, in order toensure that the microstructural elements out of focuswere counted as particles. In this way, it is obvious thatfractal analysis of the images have to be performed bycounting particles, since one could not perform a spatialdimension measurement such as measurement of theHausdorf Dimension (Crownover, 1995; Falconer,1990; Iannaccone & Khokha, 1996). It is important toensure that all the microstructural elements are repre-sented, for essentially all of the microstructural elementsare being projected onto the plane of focus of the image,so that the resulting fractal dimension calculated is in asystem with d � 3. When the image is thresholded, theout-of-focus (due to the depth of the sample) particlesare represented in the focal plane of the image, andtherefore are counted as contributing to the mass of thesystem. When calculating the mass fractal dimension ofa system, as will be explained below, the number ofparticles in a cube of a length R through the sample iscounted. Therefore, by ``projecting'' the out-of-focusmicrostructural elements into the plane of the image sothat they could be counted, one can count the numberof particles that is present in the sample in a cube thelength of which is equivalent to the length of a squaredrawn in the plane of the image.
3.6. Fractal dimension
3.6.1. Traditional methodsThe method that was used by Narine and Marangoni
(1999a) in the determination of fractal dimension fromthe PLM images di�ered somewhat from traditionalmethods. There are several di�erent concepts of the fractaldimension of a geometrical con®guration. The mostfamous method of calculating fractal dimensions in the
Fig. 8. ln(G0) vs. ln(�) for cocoa butter.
236 S.S. Narine, A.G. Marangoni / Food Research International 32 (1999) 227±248
natural sciences in the so-called box counting dimen-sion. Many excellent volumes have been written on thesubject, and for a description of the traditional meth-ods, we recommend the books by Falconer (1990),Crownover (1995) and Mandelbrot (1982).
3.6.2. Particle-counting method
The images of the fat networks that are acquired fromPLM are not suitable for analysis by the traditionalmethods of fractal dimension determination. The reasonis because such images are subsets of 2-dimensionalspace, but represents a subset of a 3-dimensional net-work. Furthermore, because of the need to utilisethresholding methods to ensure the representation of allthe microstructural elements within the 2-dimensionalimage, the size of the microstructural elements alreadyin focus are increased, whilst those out of focus appearssmaller than the magni®cation warrants. Therefore, thesize of the individual microstructural elements are notrepresentative of the size of the fractal, at whatevermagni®cation the picture is taken.If it is assumed that the constituent particles (micro-
structural elements) of a particular microstructure are ofthe same average diameter, then for calculation of themass fractal dimension, it is su�cient to just count theparticles, regardless if some appears larger when theimage is thresholded. Therefore, the number of particlespresent in a 3-dimensional portion of the sample iscounted by ®rst representing all of the particles presentin that portion of the sample in the plane of the image.Of course, those particles that did not appear in thepicture due to geometrical shadowing are missed, butthe number of these can be rendered negligible by mak-ing the thickness of the sample very small. Since thismethod is essentially restricted by the nature of therepresentation of the fractal (fat crystal network) tocounting microstructural elements, Eq. (2) is utilised. Thisequation stems from one of the principal characteristics ofa particle-aggregation fractal system, where the fractaldimension D relates the number of particles N to thelinear size of the fractal R and the linear size of oneparticle (microstructural element) �:
N � R
�
� �;N� 1 �9�
Here, the fractal object is a mass fractal (a micro-structure), and � refers to the radius of the particlesconstituting the fractal, whilst R corresponds to theradius of the entire fractal object. One can approximateR to be the length of a cube that just covers the entirefractal object if the fractal is in a d � 3 system, thelength of a square for a d � 2 system and length of aline for a d � 1 system. Assuming a statistically constantparticle size, or in this case, a statistically constantmicrostructural element size:
N � cRD �10�
Taking logarithms:
log10 N�R� � log10 c�D log10 R �11�
where c is a constant greater than 1, N(R) is the numberof particles in the fractal of length R, and R is the lengthof the line segment, length of a side of a square, orlength of a side of a cube which covers or envelopes thefractal. The lower limit of this relationship then becomesthe size of one microstructural element, i.e. R �a;N�R� � 1 is the lower limit. Therefore, proceeding inlike manner to the traditional form of box-counting, N(R)for various values of R� a is counted, and log10�N�R��plotted vs. log10�R�, the resulting slope of the line beingequal to D. Since N�R� determined this way is only anapproximation, more points in such a plot serves todecrease the error.
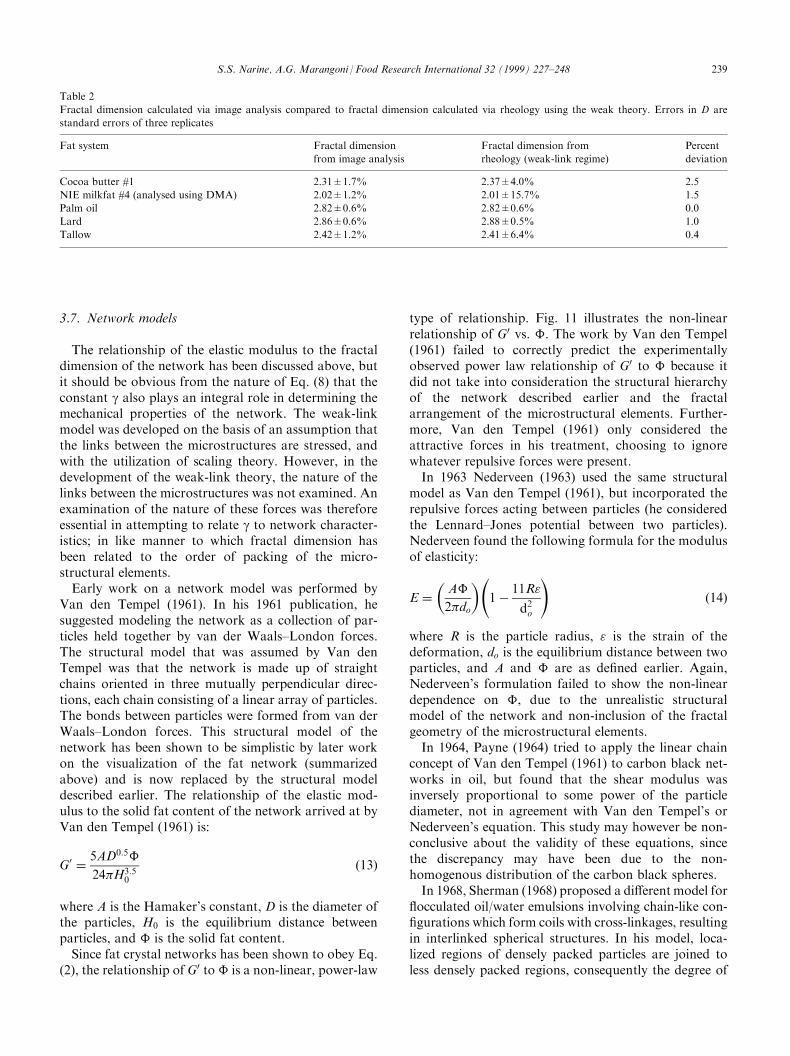
3.6.2.1. Fractal dimension, D. In order to calculate thevalue of D (with d � 3), the number of microstructuralelements N(R) projected onto a square area of side oflength R is counted, the square being drawn in the focalplane of the image. This count represents the number ofparticles present in a cube of length R through the frac-tal. Fig. 9(A) shows a schematic of the projection ofmicrostructural elements onto the area of side R. Valuesof log10�N�R�� are plotted against log10(R) for varyingvalues of R. The resulting slope of the line is taken asbeing equal to D. An example of a plot of log10�N�R��vs. log10(R) is shown in Fig. 10(A).
3.6.2.2. Fractal backbone dimension, x. The fractalbackbone dimension of the network may be thought ofas an indicator of the spatial distribution of the micro-structural elements in chains of these elements con-stituting a microstructure. It is understood that these``chains'' are arbitrary in terms of which microstructuralelements belong to which chains. These chains are ofcourse in a d � 2 space, and therefore a variation of Eq.(8) in a 2-dimensional system is applicable:
N � R
�
� �x
�12�
where R is the length of an area enveloping the fractalchain and x is the fractal backbone dimension, chemicallength exponent or tortuosity. The thresholded imagesof fat crystal networks represent all the particles in thed � 3 network projected onto the plane of the image.Therefore, a vertical straight line drawn on the thre-sholded image will intersect all of the particles thatbelong to a particular chain that lies in the plane per-pendicular to the plane of the image and which intersectsthe vertical line. Fig. 9(B) represents a cross-sectional
S.S. Narine, A.G. Marangoni / Food Research International 32 (1999) 227±248 237
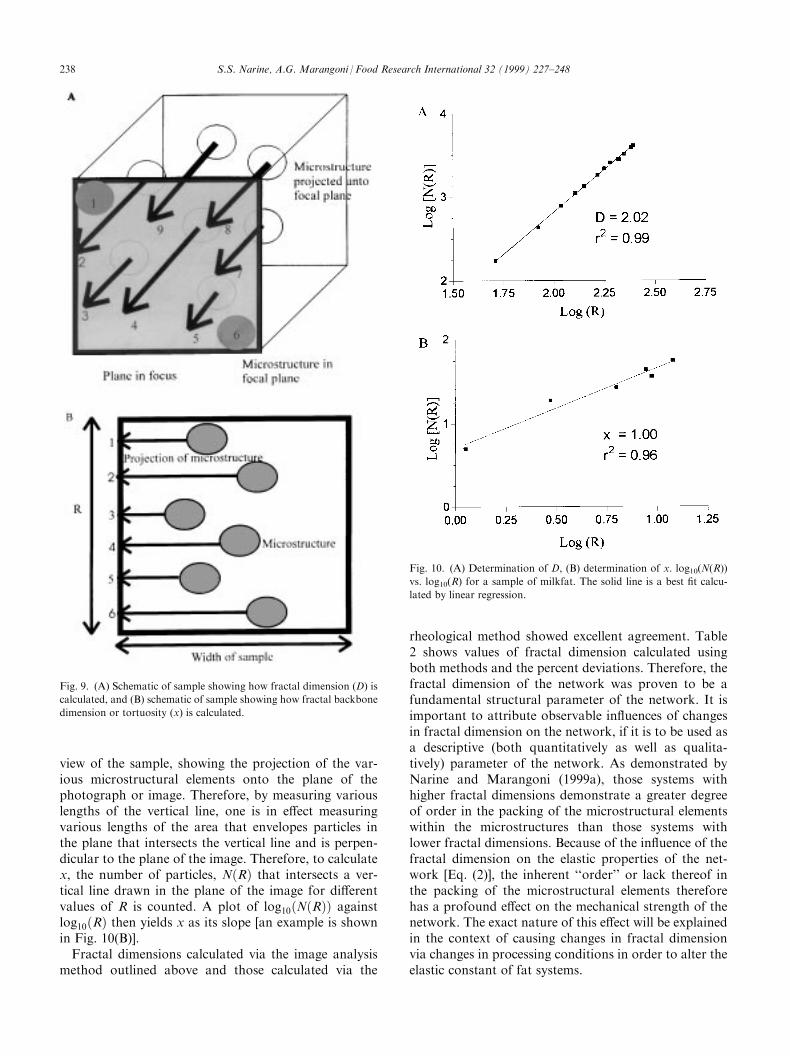
view of the sample, showing the projection of the var-ious microstructural elements onto the plane of thephotograph or image. Therefore, by measuring variouslengths of the vertical line, one is in e�ect measuringvarious lengths of the area that envelopes particles inthe plane that intersects the vertical line and is perpen-dicular to the plane of the image. Therefore, to calculatex, the number of particles, N�R� that intersects a ver-tical line drawn in the plane of the image for di�erentvalues of R is counted. A plot of log10�N�R�� againstlog10�R� then yields x as its slope [an example is shownin Fig. 10(B)].Fractal dimensions calculated via the image analysis
method outlined above and those calculated via the
rheological method showed excellent agreement. Table2 shows values of fractal dimension calculated usingboth methods and the percent deviations. Therefore, thefractal dimension of the network was proven to be afundamental structural parameter of the network. It isimportant to attribute observable in¯uences of changesin fractal dimension on the network, if it is to be used asa descriptive (both quantitatively as well as qualita-tively) parameter of the network. As demonstrated byNarine and Marangoni (1999a), those systems withhigher fractal dimensions demonstrate a greater degreeof order in the packing of the microstructural elementswithin the microstructures than those systems withlower fractal dimensions. Because of the in¯uence of thefractal dimension on the elastic properties of the net-work [Eq. (2)], the inherent ``order'' or lack thereof inthe packing of the microstructural elements thereforehas a profound e�ect on the mechanical strength of thenetwork. The exact nature of this e�ect will be explainedin the context of causing changes in fractal dimensionvia changes in processing conditions in order to alter theelastic constant of fat systems.
Fig. 9. (A) Schematic of sample showing how fractal dimension (D) is
calculated, and (B) schematic of sample showing how fractal backbone
dimension or tortuosity (x) is calculated.
Fig. 10. (A) Determination of D, (B) determination of x. log10(N(R))
vs. log10(R) for a sample of milkfat. The solid line is a best ®t calcu-
lated by linear regression.
238 S.S. Narine, A.G. Marangoni / Food Research International 32 (1999) 227±248
3.7. Network models
The relationship of the elastic modulus to the fractaldimension of the network has been discussed above, butit should be obvious from the nature of Eq. (8) that theconstant g also plays an integral role in determining themechanical properties of the network. The weak-linkmodel was developed on the basis of an assumption thatthe links between the microstructures are stressed, andwith the utilization of scaling theory. However, in thedevelopment of the weak-link theory, the nature of thelinks between the microstructures was not examined. Anexamination of the nature of these forces was thereforeessential in attempting to relate g to network character-istics; in like manner to which fractal dimension hasbeen related to the order of packing of the micro-structural elements.Early work on a network model was performed by
Van den Tempel (1961). In his 1961 publication, hesuggested modeling the network as a collection of par-ticles held together by van der Waals±London forces.The structural model that was assumed by Van denTempel was that the network is made up of straightchains oriented in three mutually perpendicular direc-tions, each chain consisting of a linear array of particles.The bonds between particles were formed from van derWaals±London forces. This structural model of thenetwork has been shown to be simplistic by later workon the visualization of the fat network (summarizedabove) and is now replaced by the structural modeldescribed earlier. The relationship of the elastic mod-ulus to the solid fat content of the network arrived at byVan den Tempel (1961) is:
G0 � 5AD0:5�
24�H3:50
�13�
where A is the Hamaker's constant, D is the diameter ofthe particles, H0 is the equilibrium distance betweenparticles, and � is the solid fat content.Since fat crystal networks has been shown to obey Eq.
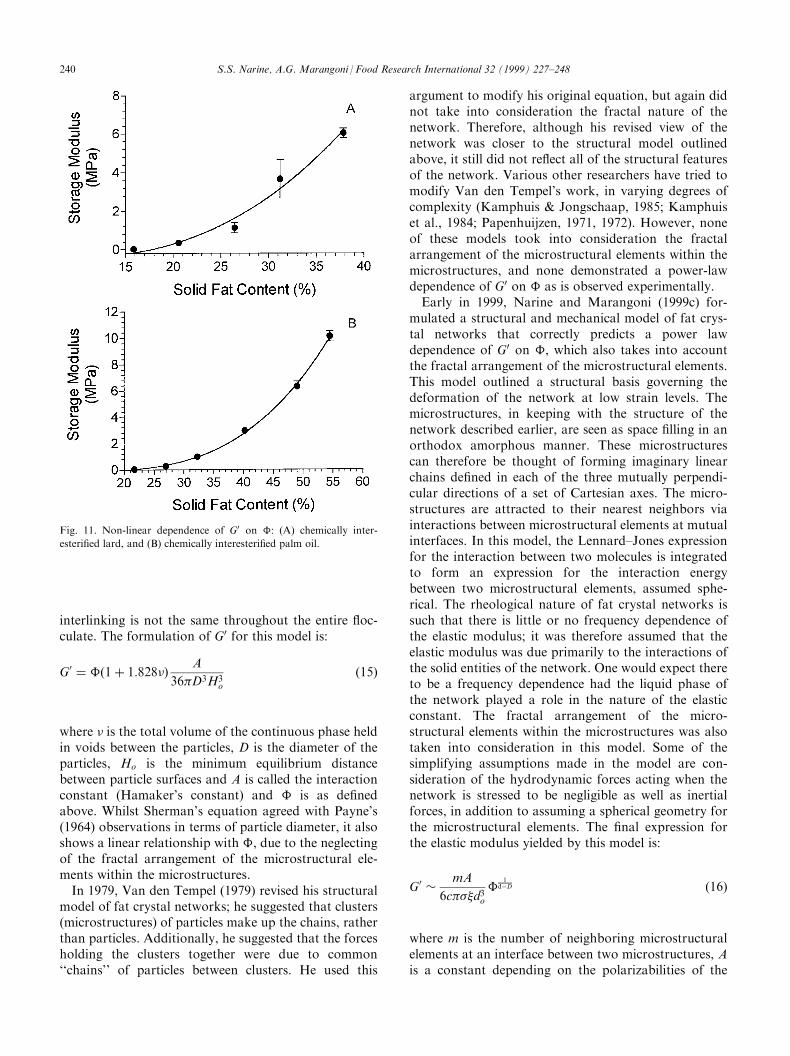
(2), the relationship of G0 to � is a non-linear, power-law
type of relationship. Fig. 11 illustrates the non-linearrelationship of G0 vs. �. The work by Van den Tempel(1961) failed to correctly predict the experimentallyobserved power law relationship of G0 to � because itdid not take into consideration the structural hierarchyof the network described earlier and the fractalarrangement of the microstructural elements. Further-more, Van den Tempel (1961) only considered theattractive forces in his treatment, choosing to ignorewhatever repulsive forces were present.In 1963 Nederveen (1963) used the same structural
model as Van den Tempel (1961), but incorporated therepulsive forces acting between particles (he consideredthe Lennard±Jones potential between two particles).Nederveen found the following formula for the modulusof elasticity:
E � A�
2�do
� �1ÿ 11R"
d2o
!�14�
where R is the particle radius, " is the strain of thedeformation, do is the equilibrium distance between twoparticles, and A and � are as de®ned earlier. Again,Nederveen's formulation failed to show the non-lineardependence on �, due to the unrealistic structuralmodel of the network and non-inclusion of the fractalgeometry of the microstructural elements.In 1964, Payne (1964) tried to apply the linear chain
concept of Van den Tempel (1961) to carbon black net-works in oil, but found that the shear modulus wasinversely proportional to some power of the particlediameter, not in agreement with Van den Tempel's orNederveen's equation. This study may however be non-conclusive about the validity of these equations, sincethe discrepancy may have been due to the non-homogenous distribution of the carbon black spheres.In 1968, Sherman (1968) proposed a di�erent model for
¯occulated oil/water emulsions involving chain-like con-®gurations which form coils with cross-linkages, resultingin interlinked spherical structures. In his model, loca-lized regions of densely packed particles are joined toless densely packed regions, consequently the degree of
Table 2
Fractal dimension calculated via image analysis compared to fractal dimension calculated via rheology using the weak theory. Errors in D are
standard errors of three replicates
Fat system Fractal dimension
from image analysis
Fractal dimension from
rheology (weak-link regime)
Percent
deviation
Cocoa butter #1 2.31�1.7% 2.37�4.0% 2.5
NIE milkfat #4 (analysed using DMA) 2.02�1.2% 2.01�15.7% 1.5
Palm oil 2.82�0.6% 2.82�0.6% 0.0
Lard 2.86�0.6% 2.88�0.5% 1.0
Tallow 2.42�1.2% 2.41�6.4% 0.4
S.S. Narine, A.G. Marangoni / Food Research International 32 (1999) 227±248 239
interlinking is not the same throughout the entire ¯oc-culate. The formulation of G0 for this model is:
G0 � ��1� 1:828�� A
36�D3H3o
�15�
where � is the total volume of the continuous phase heldin voids between the particles, D is the diameter of theparticles, Ho is the minimum equilibrium distancebetween particle surfaces and A is called the interactionconstant (Hamaker's constant) and � is as de®nedabove. Whilst Sherman's equation agreed with Payne's(1964) observations in terms of particle diameter, it alsoshows a linear relationship with �, due to the neglectingof the fractal arrangement of the microstructural ele-ments within the microstructures.In 1979, Van den Tempel (1979) revised his structural
model of fat crystal networks; he suggested that clusters(microstructures) of particles make up the chains, ratherthan particles. Additionally, he suggested that the forcesholding the clusters together were due to common``chains'' of particles between clusters. He used this
argument to modify his original equation, but again didnot take into consideration the fractal nature of thenetwork. Therefore, although his revised view of thenetwork was closer to the structural model outlinedabove, it still did not re¯ect all of the structural featuresof the network. Various other researchers have tried tomodify Van den Tempel's work, in varying degrees ofcomplexity (Kamphuis & Jongschaap, 1985; Kamphuiset al., 1984; Papenhuijzen, 1971, 1972). However, noneof these models took into consideration the fractalarrangement of the microstructural elements within themicrostructures, and none demonstrated a power-lawdependence of G0 on � as is observed experimentally.Early in 1999, Narine and Marangoni (1999c) for-
mulated a structural and mechanical model of fat crys-tal networks that correctly predicts a power lawdependence of G0 on �, which also takes into accountthe fractal arrangement of the microstructural elements.This model outlined a structural basis governing thedeformation of the network at low strain levels. Themicrostructures, in keeping with the structure of thenetwork described earlier, are seen as space ®lling in anorthodox amorphous manner. These microstructurescan therefore be thought of forming imaginary linearchains de®ned in each of the three mutually perpendi-cular directions of a set of Cartesian axes. The micro-structures are attracted to their nearest neighbors viainteractions between microstructural elements at mutualinterfaces. In this model, the Lennard±Jones expressionfor the interaction between two molecules is integratedto form an expression for the interaction energybetween two microstructural elements, assumed sphe-rical. The rheological nature of fat crystal networks issuch that there is little or no frequency dependence ofthe elastic modulus; it was therefore assumed that theelastic modulus was due primarily to the interactions ofthe solid entities of the network. One would expect thereto be a frequency dependence had the liquid phase ofthe network played a role in the nature of the elasticconstant. The fractal arrangement of the micro-structural elements within the microstructures was alsotaken into consideration in this model. Some of thesimplifying assumptions made in the model are con-sideration of the hydrodynamic forces acting when thenetwork is stressed to be negligible as well as inertialforces, in addition to assuming a spherical geometry forthe microstructural elements. The ®nal expression forthe elastic modulus yielded by this model is:
G0 � mA
6c���d3o�
1dÿD �16�
where m is the number of neighboring microstructuralelements at an interface between two microstructures, Ais a constant depending on the polarizabilities of the
Fig. 11. Non-linear dependence of G0 on �: (A) chemically inter-
esteri®ed lard, and (B) chemically interesteri®ed palm oil.
240 S.S. Narine, A.G. Marangoni / Food Research International 32 (1999) 227±248
atoms present (the Hamaker's constant), c is the con-stant of proportionality in Eq. (9), � is the diameter of amicrostructural element, � is the diameter of one micro-structure, and do is the average equilibrium distancebetween microstructural elements.Comparing Eq. (8) and Eq. (16):
� mA
6c���d3o�17�
The dependence of the hardness of fats on the solidfat content has been studied by a variety of researchers(Bailey, 1950; de Man, 1962; Haighton, 1976; Narine &Marangoni, 1999a, 1999b, 1999d; Nederveen, 1963;Vreeker et al., 1992b). In all cases hardness depended onthe solid fat content in a power law fashion. This issupported by Eq. (16). Particle size has been shown tobe an important parameter in the hardness of fat crystalnetworks (Bailey, 1950; Haighton, 1976; Nederveen,1963; Shama & Sherman, 1970; Sherman, 1968), whichis also re¯ected in Eq. (16). Additionally, Eq. (16) alsoshows an inverse relationship to the particle diameter(both microstructural diameter as well as micro-structural element diameter) seen by Payne (1964).The morphology of the microstructural elements also
a�ects the mechanical strength of the network (Cornily& leMeste, 1985; Hoerr, 1960; Hoerr & Waugh, 1955).Since the interactions between the microstructural ele-ments in this model were developed for sphericalmicrostructural elements, obviously morphologicalchanges of these elements would vary the form of Eq. (16).Additionally, changes in morphology would probablycause changes in the Hamaker's constant as well. Mor-phology and size of crystals are a�ected by the parti-cular polymorphism of the fat crystals formed(Chapman, 1962; Hoerr, 1960). The triglyceride com-position also in¯uences the size and rigidity of the crys-tals (Bailey, 1950). Therefore, it is important to establisha relationship between Hamaker's constant and trigly-ceride composition and polymorphism.Whilst Eq. (16) does not provide an absolute for-
mulation for g in Eq. (8), it does identify key networkparameters that are important in determining the shearelastic modulus of fat crystal networks. Furthermore, itagrees well with experimental observations and with Eq.(8), which has been shown to be valid for fat crystalnetworks (Narine & Marangoni, 1999a). The equationprovides impetus for the development of phenomen-ological investigations of relationships between trigly-ceride composition and polymorphism and values ofHamaker's constants and size of microstructural ele-ments. Insight on the changes in mechanical strength offat networks whose characteristics such as size ofmicrostructural elements, size of microstructures anddistances between microstructures have been alteredthrough processing conditions is also provided.
3.8. Processing conditions
It is important to note that Eqs. (16) and (8) are iden-tical in their forms; Eq. (8) was developed for colloidalgels originally, and from a consideration of the networkstructure of fat networks, Eq. (16) was developed. Fur-thermore, the general relationship demonstrated by Eq.(8) has been shown to be true for fat crystal networks.The rami®cations of these two equations are thereforeimportant, and provide a hitherto unavailable theore-tical framework to monitor elastic properties via chan-ges in structural characteristics. Furthermore, desiredchanges in elastic properties of particular fat crystalnetworks can now be e�ected by changing processingconditions so as to induce speci®c changes in networkstructure.For the parameters outlined in the parameter g shown
in Eq. (17), it is fairly obvious that increases in micro-structural element size, microstructure size and inter-microstructural distance will cause a decrease in theelastic constant. It is perhaps less direct, but certainlychanges in polymorphism and lipid composition willincur consequential changes in the Hamaker's constant,which will then a�ect the mechanical properties of thenetwork. For instance, it is generally known that themetastable b0 polymorph is preferred for plastic fats,whilst a transformation to the stable b polymorph isnotÐboth for the changes in elastic properties (andtherefore hardness) as well as for the higher meltingpoint. It remains a task to relate lipid composition andpolymorphic nature to changes in the Hamaker's con-stant; however, this is not a trivial task, as the molecularpacking of the various polymorphs are largelyunknown. It must be noted that increases in size of themicrostructures can also cause increases in the numberof microstructural elements at the interfaces betweenmicrostructures (or increases in the value of m), therebymaybe negating the e�ect of increases in size of themicrostructures. Certainly, this theory provides impetusfor the establishment of a knowledge database of the var-ious growth modes (in terms of structural characteristics)that can be e�ected via speci®c crystallisation conditionsfor the various important fat systems utilized in foods.Perhaps less obvious than the e�ects of factors a�ect-
ing g on elastic constant are the e�ects of the fractaldimension on the elastic constant. Narine and Mar-angoni (1999a) have investigated these e�ects, and whatfollows is a summary of their work as well. It is inter-esting to examine the theoretical variation of the elasticconstant (normalized with respect to g) with changes inthe fractal dimension. Fig. 12 shows the theoreticalprediction of the variation of the normalized shearelastic modulus (with respect to g) with fractal dimen-sion, depicted by the solid line. The points on the linerepresent actual rheological measurements made ondi�erent fat systems; the vertical error bars represent the
S.S. Narine, A.G. Marangoni / Food Research International 32 (1999) 227±248 241
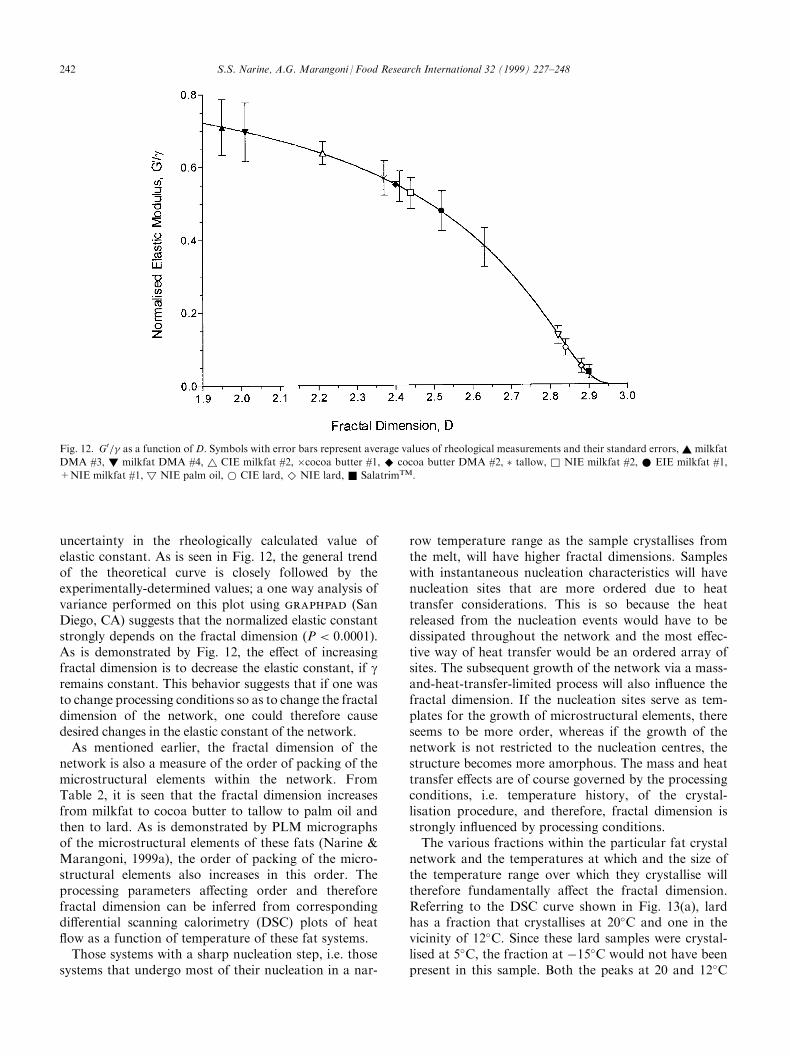
uncertainty in the rheologically calculated value ofelastic constant. As is seen in Fig. 12, the general trendof the theoretical curve is closely followed by theexperimentally-determined values; a one way analysis ofvariance performed on this plot using graphpad (SanDiego, CA) suggests that the normalized elastic constantstrongly depends on the fractal dimension (P < 0:0001).As is demonstrated by Fig. 12, the e�ect of increasingfractal dimension is to decrease the elastic constant, if gremains constant. This behavior suggests that if one wasto change processing conditions so as to change the fractaldimension of the network, one could therefore causedesired changes in the elastic constant of the network.As mentioned earlier, the fractal dimension of the
network is also a measure of the order of packing of themicrostructural elements within the network. FromTable 2, it is seen that the fractal dimension increasesfrom milkfat to cocoa butter to tallow to palm oil andthen to lard. As is demonstrated by PLM micrographsof the microstructural elements of these fats (Narine &Marangoni, 1999a), the order of packing of the micro-structural elements also increases in this order. Theprocessing parameters a�ecting order and thereforefractal dimension can be inferred from correspondingdi�erential scanning calorimetry (DSC) plots of heat¯ow as a function of temperature of these fat systems.Those systems with a sharp nucleation step, i.e. those
systems that undergo most of their nucleation in a nar-
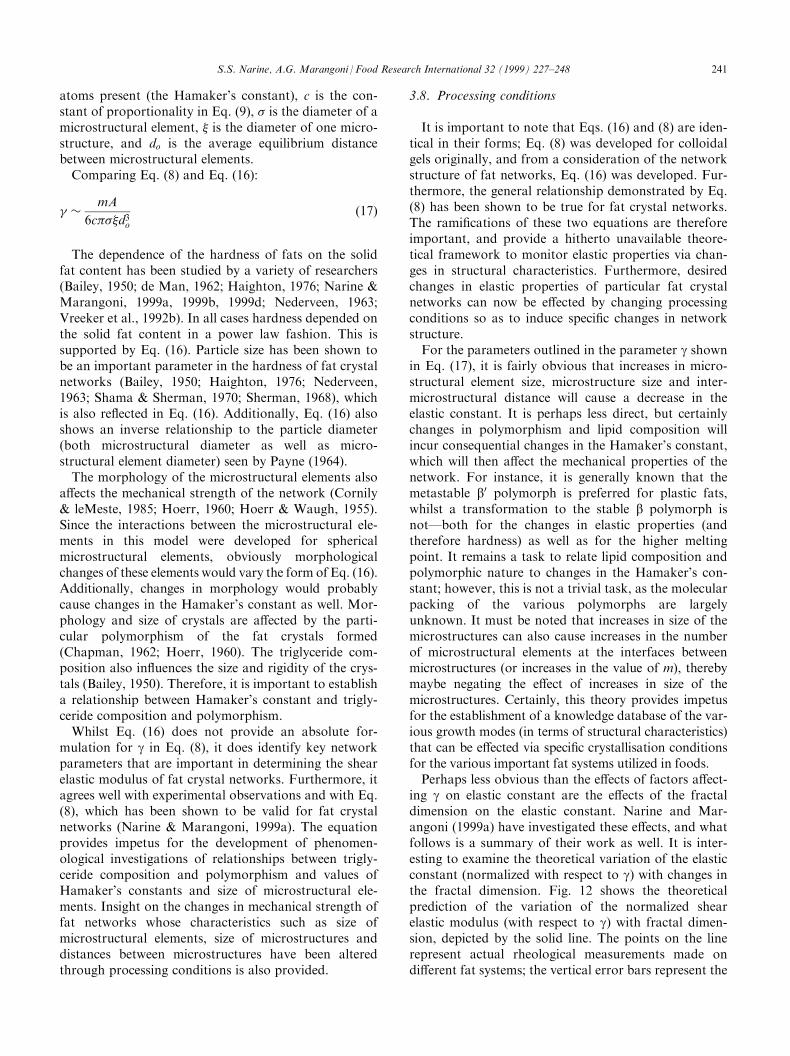
row temperature range as the sample crystallises fromthe melt, will have higher fractal dimensions. Sampleswith instantaneous nucleation characteristics will havenucleation sites that are more ordered due to heattransfer considerations. This is so because the heatreleased from the nucleation events would have to bedissipated throughout the network and the most e�ec-tive way of heat transfer would be an ordered array ofsites. The subsequent growth of the network via a mass-and-heat-transfer-limited process will also in¯uence thefractal dimension. If the nucleation sites serve as tem-plates for the growth of microstructural elements, thereseems to be more order, whereas if the growth of thenetwork is not restricted to the nucleation centres, thestructure becomes more amorphous. The mass and heattransfer e�ects are of course governed by the processingconditions, i.e. temperature history, of the crystal-lisation procedure, and therefore, fractal dimension isstrongly in¯uenced by processing conditions.The various fractions within the particular fat crystal
network and the temperatures at which and the size ofthe temperature range over which they crystallise willtherefore fundamentally a�ect the fractal dimension.Referring to the DSC curve shown in Fig. 13(a), lardhas a fraction that crystallises at 20�C and one in thevicinity of 12�C. Since these lard samples were crystal-lised at 5�C, the fraction at ÿ15�C would not have beenpresent in this sample. Both the peaks at 20 and 12�C
Fig. 12. G0= as a function of D. Symbols with error bars represent average values of rheological measurements and their standard errors,~ milkfat
DMA #3, ! milkfat DMA #4, ~ CIE milkfat #2, �cocoa butter #1, ^ cocoa butter DMA #2, � tallow, & NIE milkfat #2, * EIE milkfat #1,
+NIE milkfat #1, ! NIE palm oil, * CIE lard, ^ NIE lard, & SalatrimTM.
242 S.S. Narine, A.G. Marangoni / Food Research International 32 (1999) 227±248
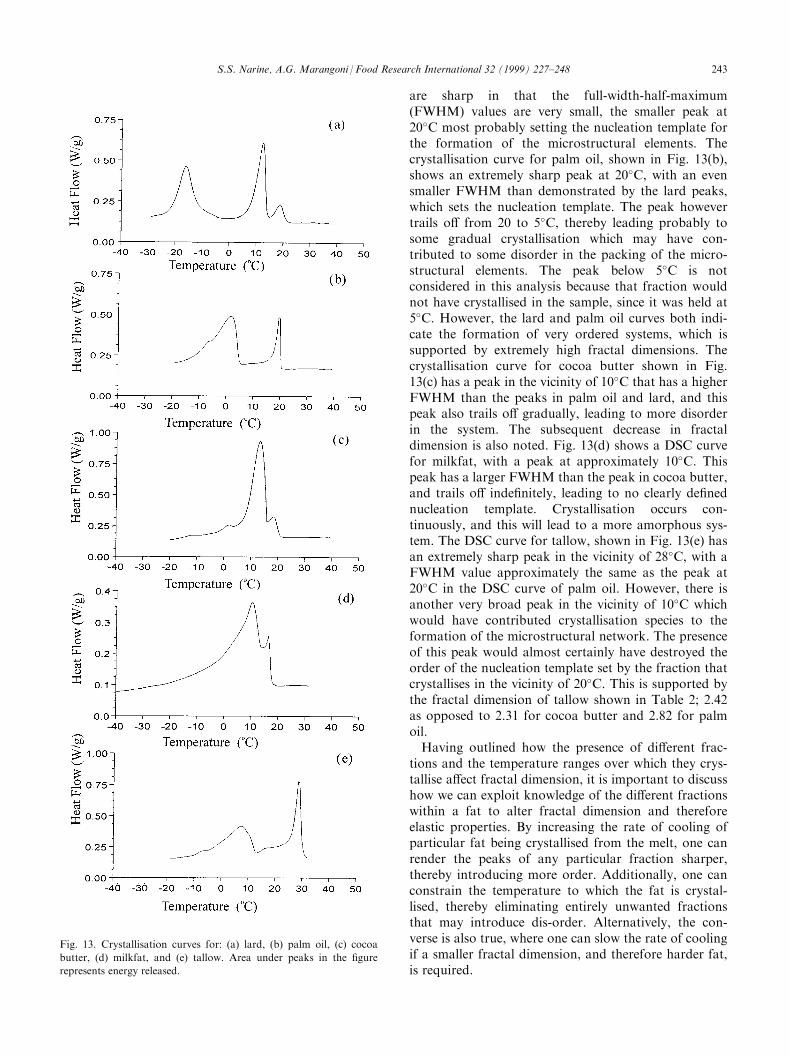
are sharp in that the full-width-half-maximum(FWHM) values are very small, the smaller peak at20�C most probably setting the nucleation template forthe formation of the microstructural elements. Thecrystallisation curve for palm oil, shown in Fig. 13(b),shows an extremely sharp peak at 20�C, with an evensmaller FWHM than demonstrated by the lard peaks,which sets the nucleation template. The peak howevertrails o� from 20 to 5�C, thereby leading probably tosome gradual crystallisation which may have con-tributed to some disorder in the packing of the micro-structural elements. The peak below 5�C is notconsidered in this analysis because that fraction wouldnot have crystallised in the sample, since it was held at5�C. However, the lard and palm oil curves both indi-cate the formation of very ordered systems, which issupported by extremely high fractal dimensions. Thecrystallisation curve for cocoa butter shown in Fig.13(c) has a peak in the vicinity of 10�C that has a higherFWHM than the peaks in palm oil and lard, and thispeak also trails o� gradually, leading to more disorderin the system. The subsequent decrease in fractaldimension is also noted. Fig. 13(d) shows a DSC curvefor milkfat, with a peak at approximately 10�C. Thispeak has a larger FWHM than the peak in cocoa butter,and trails o� inde®nitely, leading to no clearly de®nednucleation template. Crystallisation occurs con-tinuously, and this will lead to a more amorphous sys-tem. The DSC curve for tallow, shown in Fig. 13(e) hasan extremely sharp peak in the vicinity of 28�C, with aFWHM value approximately the same as the peak at20�C in the DSC curve of palm oil. However, there isanother very broad peak in the vicinity of 10�C whichwould have contributed crystallisation species to theformation of the microstructural network. The presenceof this peak would almost certainly have destroyed theorder of the nucleation template set by the fraction thatcrystallises in the vicinity of 20�C. This is supported bythe fractal dimension of tallow shown in Table 2; 2.42as opposed to 2.31 for cocoa butter and 2.82 for palmoil.Having outlined how the presence of di�erent frac-
tions and the temperature ranges over which they crys-tallise a�ect fractal dimension, it is important to discusshow we can exploit knowledge of the di�erent fractionswithin a fat to alter fractal dimension and thereforeelastic properties. By increasing the rate of cooling ofparticular fat being crystallised from the melt, one canrender the peaks of any particular fraction sharper,thereby introducing more order. Additionally, one canconstrain the temperature to which the fat is crystal-lised, thereby eliminating entirely unwanted fractionsthat may introduce dis-order. Alternatively, the con-verse is also true, where one can slow the rate of coolingif a smaller fractal dimension, and therefore harder fat,is required.
Fig. 13. Crystallisation curves for: (a) lard, (b) palm oil, (c) cocoa
butter, (d) milkfat, and (e) tallow. Area under peaks in the ®gure
represents energy released.
S.S. Narine, A.G. Marangoni / Food Research International 32 (1999) 227±248 243
Therefore, from a processing point of view, themicrostructural level of structure is extremely importantto the mechanical properties of the network. Addition-ally, characteristics of the key structural indicators ofelasticity outlined in the model by Narine and Marangonican be easily investigated via images of the network takenwith a PLM as described earlier. This provides the foodengineer with an easy method of determining the e�ectsof changes in processing conditions on the mechanicalproperties of fat systems being tailored for speci®capplications. Additionally this analysis provides valu-able quality control indicators to ensure the mechanicalproperties of fat networks being produced on a pro-duction line (for example butter and margarine pro-ducts) are consistent. Indicators of the value of g caneasily be determined from PLM micrographs, and Nar-ine and Marangoni are in the process of developingcommercial software to facilitate the computation offractal dimension from PLM micrographs of the fatsystems.
3.9. Relationship of hardness to shear elastic modulus
Hardness has been used synonymously with elasticmodulus rather loosely in this article. It is thereforeimportant to establish the relationship between elasticmodulus and hardness. It has been previously establishedthat the hardness of a fat, as determined by large scalerheological analyses such as cone penetrometry, isdirectly correlated to the hardness determined by sensoryanalysis (Haighton, 1959; Hayakawa & Man, 1982;Lefebvre, 1983; Rousseau & Marangoni, 1998c) (in conepenetrometry measurements strain levels are of the orderof 10%, hence the large-scale classi®cation). Further-more, measurements in our laboratory indicate thatthere exists a direct relationship between the elasticmodulus (storage shear modulus) of a fat and its hard-ness index, as determined by cone penetrometry mea-surements (measurement of shear storage modulus is asmall-scale rheological measurement with strain levels ofthe order of 0.5%) (Rousseau, et al., 1996b). Therefore,the elastic modulus of a fat crystal network is an indi-cator of the macroscopic consistency of that network.
3.10. Minor components
Whilst we have represented the structure of fat crystalnetworks as being composed of three hierarchical levelsof structure, we should also mention that the smallestlevel of structure is not limited to only triglycerides. Thepresence of mono- and diglycerides will also a�ect thestructure of the network, as well as other such minorcomponents as phospholipids and other polar and non-polar compounds present in minute amounts. The roleof these compounds in the structure of the network willprimarily be at the nucleation stage of crystallisation.
The e�ects of these ``minor components'' on nucleationand growth of the fat crystal network is a current sub-ject of intense interest, and active research is beingundertaken in this area by a number of groups, oursamong them. The e�ects of minor components oncrystallisation is a not an unknown phenomenon(Cebula & Smith, 1992; Gordon & Rahman, 1991;Loncin, 1958; Niiya, Maruyama, Imamura, Okada, &Matsumoto, 1973; Reddy & Prabhakar, 1987; Sambuc,Dirik, Reymond & Naudet, 1980; Siew & Ng, 1996; Vanden Tempel, 1968), but this area can now bene®t from newanalysis techniques that were not previously available,such as fractal analysis.
4. Conclusions
The elastic properties of fat crystal networks dependintegrally on the nature of the microstructure. Fractalanalysis combined with such structural factors as micro-structural element and microstructure characteristics canprovide quantitative information about the elastic prop-erties of the network, and therefore information aboutthe sensory hardness of the network. Additionally,changes of fractal dimension and network structuralcharacteristics due to changes in crystallisation proces-sing conditions of a fat system can be related to changesin the elastic property of the fat network formed. Poly-morphism and lipid composition of the network, whilstimportant, cannot yet provide an adequate prediction ofthe mechanical strength of the network. There is a needto develop methods to identify unambiguously themolecular packing in the crystals of various fats, basedon the lipid composition. The current methods of deter-mining fat polymorphism do not indicate molecularpacking in any de®nite manner. The analysis of themicrostructure of fat crystal networks via fractal geome-trical methods has proven to be important in predictingmacroscopic rheological properties of the network.
Acknowledgements
The authors would like to thank Rekha Narine forproof-reading the manuscript, Dr. Allen Blaurock forhelp with collection of the X-ray di�raction patternsshown, and Professor Peter Norton, Claire McCagueand Joy Munro of the University of Western Ontariofor help with collection of the atomic force microscopeimages shown. We are grateful to the Natural Sciencesand Engineering Research Council of Canada(NSERC), the Ontario Ministry of Agriculture, Foodand Rural A�airs (OMAFRA) and the Agriculture andAgrifood Canada Science Horizons Program for ®nan-cial support.
244 S.S. Narine, A.G. Marangoni / Food Research International 32 (1999) 227±248
References
Amey, R. L., & Chapman, D. (1984). Infrared spectroscopic studies of
model and natural biomembranes. In D. Chapman, Biomembrane
structure and function, topics in molecular and structural biology
(Vol. 4, pp. 199±256). Basel: Weinheim.
Applegate, K. R., & Glomset, J. A. (1991a). E�ect of acyl chain
unsaturation on the packing of model diacylglycerides in simulated
monolayers. Journal of Lipid Research, 32, 1645±1650.
Applegate, K. R., & Glomset, J. A. (1991b). E�ect of acyl chain
unsaturation on the packing of model diacylglycerols: a computer
modeling study. Journal of Lipid Research, 32, 1635±1644.
Arishima, T., Sagi, N., Mori, H., & Sato, K. (1991). Polymorphism of
POS. I. Occurence and polymorphic transformation. Journal of the
American Oil Chemists' Society, 66, 710±715.
Arishima, T., Sugimoto, K., Kiwata, R., Mori, H., & Sato, K. (1996).13C cross-polarization and magic-angle spinning nuclear magnetic
resonance of polymorphic forms of three triacy1glycerols. Journal of
the American Oil Chemists' Society, 73, 1231±1236.
Bailey, A. E. (1950). Melting and solidi®cation of fats. New York:
Interscience Publishers.
Ball, R. C. (1989). Fractal colloidal aggregates: consolidation and
elasticity. Physica D, 38, 13±15.
Berger, K. G., Jewel, G. G., & Pollitt, R. J. M. (1979). Study of lipid
systems. In J. G. Vaughan, Food microscopy. New York: Academic
Press.
Birker, P. J. W. L., & Blonk, J. C. G. (1993). Alkyl chain packing in a
b0 triacylglycerol measured by atomic force microscopy. Journal of
the American Oil Chemists' Society, 70, 319±321.
Boceik, S. M., Ablett, S., & Norton, I. T. (1985). 13C-NMR study of
the crystal polymorphism and internal mobilities of the triglycerides
tripalmitin and tristearin. Journal of the American Oil Chemists'
Society, 62, 1261±1266.
Bremer, L. G. B., van Wet, T., & Walstra, P. (1989). Theoretical and
experimental study of the fractal nature of the structure of casien
gels. J. Chem. Soc., Faraday Trans., 85, 3359±3372.
Brockerho�, H. (1965). A stereospeci®c analysis of triglycerides.
Journal of Lipid Research, 6, 10±15.
Brooker, B. E. (1990). Low temperature microscopy and X-ray analy-
sis of food systems. Trends in Food Science and Technology, 1, 100±
103.
Brown, W. D. (1987). Doctoral thesis, University of Cambridge.
Brown, W. D., & Ball, R. C. (1985). Computer simulation of chemi-
cally limited aggregation. J. Phys. A, 18, L517±L521.
Buchheim, W. (1982). Aspects of samples preparation for freeze-frac-
ture/freeze-etch studies of proteins and lipids in food systems. A
review. Food Microstructure, 1, 189±208.
Buscall, R., Mills, P. D. A., Goodwin, J. W., & Lawson, D. W. (1988).
Scaling behaviour of the rheology of aggregate networks formed
from colloidal particles. J. Chem. Soc., Faraday Trans., 84, 4249±
4260.
Calaghan, P. T., & Jolly, K. W. (1977). The use of 13C spin relaxation
to investigate molecular motion in liquid tristearin. J. Chem. Phys.
Lipids, 19, 56±73.
Cebula, D., & Smith, K. (1992). Di�erential scanning calorimetry of
confectionary fats; Part II Ð E�ects of blends and minor compo-
nents. Journal of the American Oil Chemists' Society, 69(10), 992±998.
Chapman, D. (1955). Infra-red spectra and the polymorphism of gly-
cerides. Nature, 176, 216±217.
Chapman, D. (1960a). Infrared spectroscopic characterization of gly-
cerides. Journal of the American Oil Chemists' Society, 37, 73±77.
Chapman, D. (1960b). Nuclear resonance spectra of the polymorphic
forms of glycerides. J Chem. Soc., 436±444.
Chapman, D. (1962). The polymorphism of glycerides. Chem. Rev., 62,
433±456.
Chapman, D. (1964). Infrared spectroscopy of lipids. Journal of the
American Oil Chemists' Society, 42, 353±371.
Christie, W. W. (1982). Lipid analysisÐisolation, separation, identi®-
cation and structural analysis of lipids (2nd ed.). Oxford: Pergamon
Press.
Clarkson, C. E. & Malkin, T. (1934). Alternation in long chain com-
pounds. Part II. An X-ray and thermal investigation of the trigly-
cerides. J. Chem. Soc., 666±671.
Cornily, G., & leMeste, M. (1985). Flow behavior of lard and its
fraction at 15 C. J. Texture Stud., 16, 383±402.
Crownover, R. M. (1995). Introduction to fractals and chaos. Boston:
Jones and Bartlett.
de Gennes, P. G. (1979). Scaling concepts in polymer physics. Ithaca,
NY: Cornell University Press.
de Jong, S., & van Soest, T. C. (1978). Crystal structures and the
melting points of saturated triglycerides in the b-2 phase. Acta
Crystallogr., B34, 1570±1583.
de Jong, S., van Soest, T. C., & van Shaick, M. A. (1991). Crystal
structures and melting points of unsaturated triacylglycerols in
the b phase. Journal of the American Oil Chemists' Society, 68, 371±
378.
de Man, J. M. (1962). Crystal structure and consistency of margarine.
In Proc. 1st Intern. Cong, Food Sci. Technol. (pp. 795±806). London.
de Man, J. M. (1963). Polymorphism in milkfat. Dairy Science
Abstracts, 25, 219±221.
de Man, J. M. (1982). Microscopy in the study of fats and emulsions.
Food Microstructure, 1, 209±222.
de Man, J. M., & Beers, A. M. (1987). Fat crystal networks: structure
and rheological properties. J. Text. Stud., 18, 303±318.
Dietler, G., Aubert, C., Cannel, D. S., & Wiltzinus, P. (1986). Gelation
of colloidal silica. Phys. Rev. Lett., 57, 3117±3120.
Eads, T. M., Blaurock, A. E., Bryant, R. G., Roy, D. L., & Croasman,
W. R. (1992). Molecular motion and transitions in solid tripalmitin
measured by deuterium nuclear magnetic resonance. Journal of the
American Oil Chemists' Society, 74, 1213±1220.
Edwards, S. E., & Oakeshott, R. B. S. (1989). The transmission of
stress in an aggregate. Physica D, 38, 88±92.
Engstrom, L. (1992). Triglyceride systems forming molecular com-
pounds. J. Fat Sci. Technol., 94, 173±181.
Falconer, K. (1990). Fractal geometry. Chichester, UK: Wiley.
Filer, L. J., Sidhu, S. S., Daubert, B. F., & Longenecker, J. E. (1946).
X-ray investigation of glycerides. III. Di�raction analyses of sym-
metrical monooleyldisaturated triglycerides. Journal of the American
Oil Chemists' Society, 68, 167±171.
Flint, O. (1984). Applications of light microscopy in food analysis.
Microscope, 32, 133±140.
Flint, O. (1991). Microscopy in the development of new food pro-
ducts. European Microsc. Anal., 10, 21±23.
Freeman, N. K. (1968). Applications of infrared absorption spectro-
scopy in the analysis of lipids. Journal of the American Oil Chemists'
Society, 45, 798±809.
Gibon, V., Durant, F., & Deroanne, C. (1986). Polymorphism and
intersolubility of some palmitic, stearic and oleic triglycerides: PPP,
PSP and POP. Journal of the American Oil Chemists' Society, 63,
1047±1055.
Gordon, M. H., & Rahman, E. A. (1991). E�ects of minor compo-
nents on the crystallisation of coconut oil. Journal of the American
Oil Chemists' Society, 68(8), 577±579.
Goto, M., Kodali, D. R., Small, D. M., Honda, K., Kozawa, K., &
Uchida, T. (1992). Single crystal structure of a mixed-chain tria-
cylglycerol: 1,2dipalmitoyl-2-acetyl-sn-glycerol. Proceedings of the
National Academy of Sciences of the United States of America, 89,
8083±8086.
Hagemann, J. A. (1989). Thermal behavior and polymorphism of acyl-
glycerides. New York: Marcel Dekker.
Hagemann, J. W., & Rothfus, J. A. (1983). Polymorphism and trans-
formation energetics of standard monoacid tryglycerides from dif-
ferential scanning calorimetry and theoretical modeling. Journal of
the American Oil Chemists' Society, 60, 1123±1131.
S.S. Narine, A.G. Marangoni / Food Research International 32 (1999) 227±248 245
Hagemann, J. W., & Rothfus, J. A. (1992). Computer modeling of
packing arrangements and transitions in saturated-cis-unsaturated
mixed triglycerides. Journal of the American Oil Chemists' Society,
69, 429±437.
Hagiwara, T., Kumagai, H., Masunaga, T., & Nakamura, K. (1997).
Analysis of aggregate structure in food protein gels with the concept
of fractal. Bioscience, Biotechnology, Biochemistry, 61, 1663±1667.
Haighton, A. J. (1959). Measurement of the hardness of margarines
and fats with the cone penetrometer. Journal of the American Oil
Chemists' Society, 36, 345±348.
Haighton, A. J. (1976). Blending, chilling and tempering of margarines
and shortenings. Journal of the American Oil Chemists' Society, 53,
397±399.
Hayakawa, M., & Man, J. M. d. (1982). Interpretation of cone penet-
rometer consistency measurements of fats. J. Texture Stud., 13, 201±
210.
Heertje, I. (1993). Microstructural studies in fat research. Food Struc-
ture, 12, 77±94.
Heertje, I., Leunis, M., van Zeyl, W. J. M., & Berends, E. (1987).
Product microscopy of fatty products. Food Microstructure, 6, 1±8.
Heertje, I., van der Vlist, P., Blonk, J. C. G., Hendrickx, H. A. C. M.,
& Brakenhof, G. J. (1987). Confocal laser scanning microscopy in
food research: some observations. Food Microstructure, 6, 115±120.
Heertje, I., van Eendenburg, J., Cornelissen, J. M., & Juriaanse, A. C.
(1988). The e�ect of processing on some microstructural character-
istics of fat spreads. Food Microstructure, 7, 189±193.
Hoerr, C. W. (1960). Morphology of fats, oils and shortenings. Journal
of the American Oil Chemists' Society, 37, 539±546.
Hoerr, C. W., & Waugh, D. F. (1955). Some physical characteristics of
rearranged lard. Journal of the American Oil Chemists' Society, 32,
37±41.
Iannaccone, P. M., & Khokha, M. K. (1996). In Fractal geometry in
biological systems. Boca Raton, FL: CRC Press.
Inoe, S. (1987). Video microscopy. New York: Plenum Press.
Jensen, L. H., & Mabis, A. J. (1966). Re®nement of the structure of b-tricaprin. Acta Crystallogr., 21, 770±781.
Jullien, R., & Botet, R. (1987). Aggregation and fractal aggregates.
Singapore: World Scienti®c Publishing.
Kalab, M. (1983). Electron microscopy of foods. In M. Peleg & E. B.
Bagley, Physical properties of foods (pp. 43±104). Westport, CT:
AVI Publishing.
Kamphuis, H., & Jongschaap, R. J. J. (1985). The rheological
behaviour of suspensions of fat particles in oil interpreted in terms
of a transient-network model. Colloid Polymer Science, 263, 1008±
1024.
Kamphuis, H., Jongschaap, R. J. J., & Mijnlie�, P. F. (1984). A tran-
sient-network model describing the rheological behaviour of con-
centrated dispersions. Rheol. Acta, 23, 329±344.
Kellens, M., Meeussen, W., & Reynaers, H. (1992). Study of the
polymorphism and crystallisation kinetics of tripalmitin: A microscopic
approach. Journal of the American Oil Chemists' Society, 69, 906±911.
Knoester, M., Bruijne, P. D., & Tempel, M. V. d. (1972). The solid±
liquid equilibrium of binary mixtures of triglycerides with palmitic
and stearic chains. Chemistry and Physics of Lipids, 9, 309±319.
Kodali, D. R., Atkinson, D., Redgrave, T. G., & Small, D. M. (1987).
Structure and polymorphism of 18-carbon fatty acyl triacylglycer-
ols: e�ect of unsaturation and substitution in the 2-position. Journal
of Lipid Research, 28, 403±413.
Lambelet, P., & Raemy, A. (1983). Iso-solid diagrams of fat blends
from thermal analysis. Journal of the American Oil Chemists'
Society, 60, 845±847.
Landman, W., Feuge, R. O., & Lovegren, N. V. (1960). Melting and
dilatometric behavior of 2-oleopalmitostearin and 2-oleodistearin.
Journal of the American Oil Chemists' Society, 37, 638±643.
Lands, W. E. M., Pieringer, R. A., Slakey, P. M., & Zschoke, A.
(1966). A micro-method for the stereospeci®c determination of tri-
glyceride structure. Journal of Lipids, 1, 444±448.
Larsson, K. (1963). The crystal structure of the b-form of triglycerides.
Proc. Chem. Soc., 87±88.
Larsson, K. (1964). The crystal structure of the b-form of trilaurin.
Ark. Kemi., 23, 1±15.
Larsson, K. (1966). Classi®cation of glyceride crystal forms. Acta
Chem. Scand., 20, 2255±2260.
Larsson, K. (1972). Molecular arrangement in glycerides. Fette Sei®en
Anstrichm., 74, 136±143.
Lefebvre, J. (1983). Finished product formulation. Journal of the
American Oil Chemists' Society, 60, 295±300.
Loncin, M. (1958). In¯uence des glycerides partiels sur la plasticite des
matieres grasses. Oleagineaux, 13(1), 33±37.
Lovegren, N. V., Gray, M. S., & Feuge, R. O. (1971). Properties of 2-
oleodipalmitin, 2-elaidodipalmitin and some of their mixtures.
Journal of the American Oil Chemists' Society, 48, 116±120.
Lutton, E. S. (1945). Journal of the American Oil Chemists' Society, 67,
524.
Lutton, E. S. (1950). Review of the polymorphism f saturated even
glycerides. Journal of the American Oil Chemists' Society, 27, 276±
281.
Lutton, E. S., & Jackson, F. L. (1950). The polymorphism of synthetic
and natural 2-oleyldipalmitin. Journal of the American Oil Chemists'
Society, 72, 3254±3257.
Mandelbrot, B. B. (1982). The fractal geometry of nature. New York:
Freeman.
Marangoni, A. G., Barbut, S., McGauley, S., Marcone, M., and
Narine, S. S. (1999). On the structure of particulate colloidal gels Ð
the case of salt-induced cold gelation of heat denatured whey
protein isolate. Submitted for publication.
Marangoni, A. G., & Hartel, R. W. (1998). Visualization and struc-
tural analysis of fat crystal networks. Food Technology, 52, 46±52.
Marangoni, A. G., & Lencki, R. W. (1998). Ternary phase behavior of
milk fat fractions. Journal of Agricultural and Food Chemistry, 46,
3879±3884.
Marangoni, A. G., & Rousseau, D. (1996). Is plastic fat rheology
governed by the fractal nature of the fat crystal network? Journal of
the American Oil Chemists' Society, 73, 991±993.
Marangoni, A. G., & Rousseau, D. (1998a). The in¯uence of chemical
interesteri®cation on physicochemical properties of complex fat
systems 1. Melting and crystallisation. Journal of the American Oil
Chemists' Society, 75, 1265±1271.
Marangoni, A. G., & Rousseau, D. (1998b). The in¯uence of chemical
interesteri®cation on the physicochemical properties of complex fat
systems. 3. Rheology and fractality of the crystal network. Journal
of the American Oil Chemists' Society, 75, 1633±1636.
Meakin, P. (1988). Fractal aggregates. Adv. Colloid and Interface Sci.,
28, 249±331.
Minato, A., Ueno, S., Smith, K., Amemiya, Y., & Sato, K. (1997).
Thermodynamic and kinetic study on phase behavior of binary
mixtures of POP and PPO forming molecular compound systems. J.
Phys. Chem. B., 101, 3498±3505.
Minato, A., Ueno, S., Yano, J., Smith, K., Seto, H., Amemiya, Y., &
Sato, K. (1997). Thermal and structural properties of sn-1,3-dipal-
mitoyl-2-oleoylglycerol and sn-1,3-dioleoyl-2-paimitoylglycerol bin-
ary mixtures examined with synchrotron radiation X-ray
di�raction. Journal of the American Oil Chemists' Society, 74, 1213±
1220.
Mulder, H. (1953). Melting and solidi®cation of milk fat. Neth. Milk
Dairy J., 7, 149±176.
Narine, S. S., & Marangoni, A. G. (1999a). Fractal nature of fat
crystal networks. Physical Review, E59, 1908±1920.
Narine, S. S., & Marangoni, A. G. (1999b). The di�erence between
cocoa butter and Salatrim lies in the microstructure of the fat crystal
network. Journal of the American Oil Chemists' Society, 76, 7±10.
Narine, S. S., and Marangoni, A. G. (1999c). Mechanical and struc-
tural model of fractal fat crystal networks at low deformations.
Submitted for publication.
246 S.S. Narine, A.G. Marangoni / Food Research International 32 (1999) 227±248
Narine, S. S., and Marangoni, A. G. (1999d). Microscopic and rheo-
logical studies of fat crystal networks. Journal of Crystal Growth,
198/199, 1315±1319.
Narine, S. S., and Marangoni, A. G. (1999e). Factors in¯uencing the
texture of plastic fats. Inform, 10(6), 566±570.
Nederveen, C. J. (1963). Dynamic mechanical behavior of suspensions
of fat particles in oil. Journal of Colloid and Interface Science, 18,
276±291.
Niiya, I., Maruyama, T., Imamura, M., Okada, M., & Matsumoto, T.
(1973). E�ect of emulsi®ers on the crystal growth of edible solid
fats. Part III. E�ect of saturated fatty acid monoglyceride. Japanese
Journal of Food Science and Technology, 20(5), 182±189.
Norton, I. T., Lee-Tu�nel, C. D., Ablett, S., & Bociek, S. M. (1985). A
calorimetric, NMR and X-ray di�raction study of the melting
behavior of tripalmitin and tristearin and their mixing behavior with
triolein. Journal of the American Oil Chemists' Society, 62, 1237±
1244.
O'Connor, R. T., DuPre, E. F., & Feuge, R. O. (1955). The infrared
spectra of mono-, di-, and triglycerides. Journal of the American Oil
Chemists' Society, 33, 88±93.
Oyano, T., Hachiya, I., & Sato, K. (1992). Phase behavior of mixed
systems of SOS and OSO. J. Phys. Chem., 96, 10514±10520.
Padley, F. (1996). Polymorphism of pure triacylglycerols and natural
fats (pp. 213±268). JAI Press.
Papenhuijzen, J. M. P. (1971). Superimposed steady and oscillatory
shear in dispersed systems. Rheol. Acta, 10, 493±502.
Papenhuijzen, J. M. P. (1972). The role of particle interactions in the
rheology of dispersed systems. Rheol. Acta, 11, 73±88.
Parker, J. R. (1994). Practical computer vision using C. New York:
Wiley.
Payne, A. R. (1964). The elasticity of carbon black networks. Journal
of Colloid Science, 19, 744±754.
Reddy, S. Y., & Prabhakar, J. V. (1987). E�ect of diglycerides on the
solidi®cation properties of Sal (Shorea robusta) fat. Fat. Sci. Tech-
nol. 89. Jahrgang. Nr., 10, 394±397.
Rossel, J. B. (1967). Phase diagrams of triglyceride systems. In R.
Paoletti, & D. Kretchevsky, Advances in lipid research (Vol. 5, pp.
353±408). New York: Academic Press.
Rousseau, D., Forestiere, K., Hill, A. R., & Marangoni, A. G. (1996).
Restructuring butterfat through blending and chemical inter-
esteri®cation. 1. Melting behavior and triacylglycerol modi®cations.
Journal of the American Oil Chemists' Society, 73, 963±972.
Rousseau, D., Hill, A. R., & Marangoni, A. G. (1996a). Restructuring
butterfat through blending and chemical interesteri®cation. 2.
Microstructure and polymorphism. Journal of the American Oil
Chemists' Society, 73, 973±981.
Rousseau, D., Hill, A. R., & Marangoni, A. G. (1996b). Restructuring
butterfat through blending and chemical interesteri®cation. 3.
Rheology. Journal of the AmericanOil Chemists' Society, 73, 983±989.
Rousseau, D., & Marangoni, A. G. (1998a). Tailoring the textural
attributes of butterfat/canola oil blends via Rhizopus arrhizus lipase-
catalyzed interesteri®cation. 1. Compositional modi®cations. Jour-
nal of Agricultural and Food Chemistry, 46, 2368±2374.
Rousseau, D., & Marangoni, A. G. (1998b). Tailoring the textural
attributes of butterfat/canola oil blends via Rhizopus arrhizus lipase-
catalyzed interesteri®cation. 2. Modi®cations of physical properties.
Journal of Agricultural and Food Chemistry, 46, 2375±2381.
Rousseau, D., & Marangoni, A. G. (1998c). The e�ects of inter-
esteri®cation on physical and sensory attributes of butterfat and
butterfat±canola oil spreads. Food Research International, 31, 381±
388.
Rousseau, D., Marangoni, A. G., & Je�rey, K. R. (1998). The in¯uence
of chemical interesteri®cation on the physicochemical properties of
complex fat systems. 2. Morphology and polymorphism. Journal of
the American Oil Chemists' Society, 75, 1833±1839.
Sambuc, E., Dirik, Z., Reymond, G., & Naudet, M. (1980). Etude de
la cristallisation des corps gras plastiques VI. In¯uence des glycer-
ides et des phosphatides en absence et en presence d'eau A. Cas des
monoglycerides stearopalmitiques. Rev. Franc. Des Corps Gras.,
27(11), 505±512.
Sargeant, J. A. (1988). The application of cold stage scanning electron
microscopy to food research. Food Microstructure, 7, 123±135.
Sato, K., Arishima, T., Wang, Z. H., Ojima, K., Sagi, N., & Mori, M.
(1989). Polymorphism of POP and SOS. 1. Occurence and poly-
morphic transformation. Journal of the American Oil Chemists'
Society, 66, 664±674.
Shama, F., & Sherman, P. (1970). The in¯uence of worksoftening on
the viscoelastic properties of butter and margarine. J. Texture Stud.,
1, 196±205.
Sherman, P. (1968). The in¯uence of particle size on the viscoelastic
properties of ¯occulated emulsions. In 5th Intern. Cong. on Rheology
(pp. 327±338). Kyoto, Japan.
Shih, W. H., Shih, W. Y., Kim, S. I., Lin, J., & Aksay, I. A. (1990).
Scaling behavior of the elastic properties of colloidal gels. Phys.
Rev. A, 42, 4772±4779.
Shukla, A., & Rizvi, S. S. H. (1996). Relationship among chemical
composition, microstructure and rheological properties of butter.
Milchwissenschaft, 51, 144±148.
Siew, W. L., & Ng, W. L. (1996). E�ect of diglycerides on the crystal-
lisation of palm oleins. Journal of the Science of Food and Agri-
culture, 71, 496±500.
Sonntag, R. C., & Russel, W. B. (1987). Elastic properties of ¯occu-
lated networks. Journal of Colloid and Interface Science, 116, 485±
489.
Stading, M., Langton, M., & Hermansson, A. M. (1993). Micro-
structure and rheological behaviour of particulate b-lactoglobulingels. Food Hydrocolloids, 7, 195±212.
Timms, R. E. (1980). The phase behavior and polymorphism of milk
fat, milk fat fractions and fully hardened milk fat. Australian Jour-
nal of Dairy Technology, 35, 47±52.
Timms, R. E. (1984). Phase behavior of fats and their mixtures. Prog.
Lipid Res., 23, 1±38.
Uriev, N. B., & Ladyzhinsky, I. Y. (1996). Fractal models in the
rheology of colloidal gels. Colloids and Surfaces A, 108, 1±11.
Van den Tempel, M. (1961). Mechanical properties of plastic-disperse
systems at very small deformations. Journal of Colloid and Interface
Science, 16, 284±296.
Van den Tempel, M. (1968). Surface-active lipids in foods. S.C.I.
Monograph, 32, 22±33.
Van den Tempel, M. (1979). Rheology of concentrated suspensions.
Journal of Colloid and Interface Science, 71, 18±20.
van Soest, T. C., de Jong, S., & Roijers, E. C. (1990). Crystal
structures and the melting points of saturated triacylglycerols in
the b-3 phase. Journal of the American Oil Chemists' Society, 67,
415±423.
Vreeker, R., Hoekstra, L. L., den Boer, D. C., & Agterof, W. G. M.
(1992a). Fractal aggregation of whey proteins. Food Hydrocolloids,
6, 423±435.
Vreeker, R., Hoekstra, L. L., den Boer, D. C., & Agterof, W. G. M.
(1992b). The fractal nature of fat crystal networks. Colloids and
Surfaces, 65, 185±189.
Weitz, D. A., & Oliveria, M. (1983). Phys. Rev. Lett., 52, 1433.
Xu, C., Zipfel, W., Shear, J. B., Williams, R. M., & Webb, W. W.
(1996). Multiphoton ¯uorescence excitation: new spectral windows
for biological nonlinear microscopy. Proceedings of the National
Academy of Sciences of the United States of America, 93, 10763±
10768.
Yan, Z. Y., Huhn, S. D., Klemann, L. P., & Otterburn, M. S. (1994).
Molecular modeling studies of triacylglycerols. Journal of Agri-
cultural and Food Chemistry, 42, 447±452.
Yano, J. (1998). Vibrational spectroscopic study on structures and poly-
morphic transformations of triacylglycerols. Osaka: Osaka University.
Yano, J., Kaneko, F., Kobayashi, M., Kodali, D. R., Small, D. M., &
Sata, K. (1997a). Structural analyses of triacylglycerol polymorphs
S.S. Narine, A.G. Marangoni / Food Research International 32 (1999) 227±248 247
with FT±IT techniques. 2. b01-form and 1,2-dipalmitoyl-3 -myristoyl-
sn-glycerol. The Journal of Physical Chemistry B, 101, 8120±8128.
Yano, J., Kaneko, F., Kobayashi, M., & Sata, K. (1997b). Structural
analyses of triacyiglycerol polymorphs with FT±IR techniques. 1.
Assignments of CH2 progression bands of saturated monoacid tria-
cylglycerols. The Journal of Physical Chemisty B, 101, 8112±8119.
Yiu, S. H. (1985). A ¯uorescence microscopic study of cheese. Food
Microstructure, 4, 99±106.
248 S.S. Narine, A.G. Marangoni / Food Research International 32 (1999) 227±248