Regional Evidence Generation and Policy & Institutional ...
339
1 R R e e g g i i o o n n a a l l E E v v i i d d e e n n c c e e G G e e n n e e r r a a t t i i o o n n a a n n d d P P o o l l i i c c y y & & I I n n s s t t i i t t u u t t i i o o n n a a l l M M a a p p p p i i n n g g o o n n F F o o o o d d & & B B i i o o e e n n e e r r g g y y A A n n I I n n t t e e g g r r a a t t i i o o n n Dr. Nerlita M. Manalili And Prof Moises A. Dorado S S o o u u t t h h e e r r n n A A d d v v i i s s o o r r y y G G r r o o u u p p
-
Upload
khangminh22 -
Category
Documents
-
view
2 -
download
0
Transcript of Regional Evidence Generation and Policy & Institutional ...

1
RReeggiioonnaall EEvviiddeennccee GGeenneerraattiioonn aanndd PPoolliiccyy && IInnssttiittuuttiioonnaall MMaappppiinngg
oonn FFoooodd && BBiiooeenneerrggyy
AAnn IInntteeggrraattiioonn
DDrr.. NNeerrlliittaa MM.. MMaannaalliillii
AAnndd PPrrooff MMooiisseess AA.. DDoorraaddoo
SSoouutthheerrnn AAddvviissoorryy GGrroouupp

i
TABLE OF CONTENTS
List of Tables ................................................................................................. iii List of Figures ................................................................................................ iv List of Acronyms ............................................................................................. v Executive Summary ....................................................................................... vi I. Introduction ........................................................................................ 1 A. Rationale ...................................................................................... 1 B. Objectives ..................................................................................... 3 C. Study Components and Implementing Strategies ………............ 4 II. The Global Energy and Biofuels Scenario .......................................... 5 A. World Energy Demand .................................................................. 5 B. World Demand for Biofuels ............................................................ 5 C. Regional Demands for Biofuels …………………………………….. 6 1. Biofuels in Africa ………………………………………………. 6 2. Biofuels in Asia ………………………………………………… 7 3. Biofuels in West Asia-North Africa (WANA) Region ……….. 8 4. Biofuels in Latin America and the Caribbean (LAC) ………. 9 III. Evidence Generation .......................................................................... 11 A. Evidences from Africa ………………………………………………….. 13 Senegal …………………………………………………………… 13 Mali ………………………………………………………………… 13 Tanzania ………………………………………………………….. 13 Kenya ……………………………………………………………… 14 Zambia ……………………………………………………………. 14 Mozambique ……………………………………………………… 14 B. Evidences from Asia …………………………………………………. 15 China ………………………………………………………………. 15 India ………………………………………………………………… 16 Philippines ………………………………………………………… 16 Thailand …………………………………………………………… 18 Vietnam …………………………………………………………… 19 C. Evidences from WANA ………………………………………………. 20

ii
Egypt ……………………………………………………………….. 20 Sudan ………………………………………………………………. 20 Turkey ………………………………………………………………. 21 Malta ………………………………………………………………… 21 Sultanate of Oman ………………………………………………… 21 Kingdom of Saudi Arabia …………………………………………. 22 United Arab Emerates ……………………………………………. 22 Jordan ………………………………………………………………. 22 D. Evidences from LAC ………………………………………………….. 23 IV. Institutional Mapping ............................................................................ 24 A. African Region …………………………………………………………. 24 B. Asian Region …………………………………………………………… 25 C. WANA Region …………………………………………………………. 27 D. LAC Region ……………………………………………………………. 28 V. Regional and Global Implications ......................................................... 29 A. African Region …………………………………………………………. 29 B. Asian Region …………………………………………………………… 29 C. WANA Region …………………………………………………………. 30 D. LAC Region ……………………………………………………………. 31 VI. Concluding Remarks ……………………………………………………… 32 VII. Areas for further research and development ………………………….. 33
References ....................................................................................................... 35 Appendices ........................................................................................................ 36 Attachments Study 1. Mapping Food and Bioenergy in Africa Study 2. Regional Evidence on the Impact of Biofuel Development on Welfare of Smallholder Farmers Study 3. Biofuel Production, Policy, Institutional Mapping and
their Impact on Food and Environment in WANA Region Study 4. Study on Regional Evidence Generation and Policy and Institutional Mapping on Food and Bioenergy:
Latin America and Caribbean-LAC

iii
LIST OF TABLES
Table 1. Members of the Study Team. ................................................................... 2 Table 2. ERA ARD Management Team. ............................................................... 3 Table 3. Total final energy supply including biomass energy in Africa. ……………………………………………....................... 6 Table 4. Forecast for bioethanol consumption in 18 countries within the LAC. ……………………………………………………………… 10 Table 5. Major findings from the Evidence Generation Activity (Activity 1) from each region. ……………………………………………. 12 Table 6. Latin America and the Caribbean. Prospective demand for area used for agriculture - 2010 – 2030 (in million ha) ………………….. 23 Table 7. Areas for Research and Development ..................................................... 33

iv
LIST OF FIGURES
Figure 1. World primary energy demand 1980-2030. ......................................... 5 Figure 2. Share of bioethanol production in 2005 ……………………………….. 7 Figure 3. Energy and food price indices. …………………………………………. 8 Figure 4. Policy and institutional map of food and bioenergy interphase for the African Region. ………………………………………. 25 Figure 5. Policy and institutional map of food and bioenergy interphase for the Asian Region. ………………………………………. 26 Figure 6. Policy and institutional map of food and bioenergy interphase for the WANA Region. ………………………………………. 27 Figure 7. Policy and institutional map of food and bioenergy interphase for the LAC Region. ………………………………………. 28

v
LIST OF ACRONYMS
AARINENA Association of Agricultural Research Institutions in the Near East and North Africa
APAARI Asia Pacific Association of Agricultural Research Institutions DFID Department For International Development ERA/ARD European Research Area / Agricultural Research for Development EU European Union FAO Food and Agriculture Organization of the United Nations FARA Forum for Agricultural Research in Africa FORAGRO Foro de las Américas para Investigación Agrícola y Desarrollo
Tecnológico / Forum for the Americas on Agricultural Research and Technical Development
LAC Latin America and the Caribbean SAG Southern Advisory Group WANA West Asia & North Africa

vi
EXECUTIVE SUMMARY
This study on Regional Evidence Generation and Policy and Institutional Mapping on Food and Bioenergy has seen that there is very minimal conversion of food to biofuel production areas. Current trend in the Regions is strict protection of the food the food areas set by national biofuels and related environmental policies. In general, biofuel programs have benefitted small farmers due to the alternative market option offered by biofuels from the traditional agricultural markets.
Other countries that have already experienced threats on conversion of food into biofuels have now adopted strategies of using non-food feedstocks and the development of marginal lands.
The speed of biofuel expansion, however, has also lead to the generation of greater preassures on land tenure arrangement that directly affect the small farmers. Poor households are threatened to either sell or be forced to relocate as the rush to meet increasing demand gathers momentum.
The degree of pressure on food to biofuel conversion varies even among countries within the regions. Some countries still have available arable lands while others have very limited areas for cultivation.
Dynamic partnership among the small farmers, the industry, and the government has been seen as crucial to the improvement of the livelihood and welfare of the small farmers, the development of the biofuels programs, and the prevention of food to biofuels conversion.
While small farmers are afforded better market opportunities and year round livelihood, still farmers remain to be on the receiving end of the biofuel industry development and are yet to be provided opportunities or venues to be active participants of the biofuel chain (i.e. evaluate options) and help shape the industry of which they are very much a part of.
There are indications, for the need to review country and regioanl policies’ responsiveness and appropriateness in consideration of both short term and long term gains (at the regional, national and industry stakeholders’ level) as well as of changing market scenario and global biofuel chain development. Policies on biofuel development both current and future should pass through a comprehensive multi agency evaluation that takes into account both short term and long term gains and implications. If and whenever in place, coordination of implementing bodies and participating sectors should be given utmost priority.
The regions are one in saying there is a lot of room for research and development to ensure sustainability of biofuel development within and across regions. Given that there are a number of initiatives and developments unique to each region, the possibility of cross regional learning or South to South collaboration is a timely opportunity.

Regional Evidence Generation and Policy and Institutional Mapping on Food and Bioenergy
1
SSoouutthheerrnn AAddvviissoorryy GGrroouupp
I. Introduction The ERA ARD Southern Advisory Group’s study on Regional Evidence Generation and Policy and Institutional Mapping on Food and Biofuel for the Africa, Asia and Latin American regions aims to better understand the current initiatives on food and bioenergy and their consequent effects on food availability and livelihood opportunities to smallholder farmers in developing regions. Generating evidences on the impact of converting food crop areas into bioenergy and mapping policies and institutional initiative in support of pro-poor bio energy programs of developing economies are the two major components of the study. Study results are viewed as crucial policy inputs to regional planning and are to be translated into popular documents for enhanced knowledge sharing.
ERA ARD brings together 14 European countries within the frame of the European Research Area Network (ERA Net) of the European Commission to promote collaboration in European agricultural research for the world’s poor. It likewise gives high priority to the participation of partners from the South in the decision-making process, thus the creation of the Southern Advisory Group (SAG) in 2006 comprised of representatives of regional fora, namely; AARINENA, APAARI, FARA and FORAGRO.
The five month scoping study was funded out of the United Kingdom’s contribution to ERA ARD, through its Department For International Development (DFID) and was conducted by the regional fora in their respective regions starting June 2009. It is a test case on how best to enhance SAG’s potential as a driving force in ensuring that European agricultural research for development works better for the South. The members of the Study Team are presented in Table 1. Detailed reports of each region are presented in the accompanying individual project reports by region (Studies 1-4).
A. Rationale
Bioenergy concerns are top of the global agenda, given the rising global demand for energy, expected fossil fuel shortages and the adverse effects of fossil energy consumption on our environment and climate. As an important energy alternative, bioenergy offers many opportunities, but poses a number of risks and trade-offs that include a) that it compromises the food supply of the poorest and the most food insecure (FAO 2006) and b) that the accompanying diversion of land from food to fuel commodities is increasing food prices and reducing food availability in some regions.
Governments of developed and developing economies alike are quick to respond to the energy challenge by formulating and putting in place bioenergy policies and programs. Developed economies, as main energy consumers, are into developing sourcing strategies while developing countries, particularly those from the South, are looking into possibilities of becoming major producers and exporters. Concerns, however, are mounting as to whether caution in terms of careful planning and assessments have been undertaken in the process, given the emerging food and energy conflict. While there may have been early indications of success in reconciling the seeming food and bioenergy conflict , as in the case of Brazil, still

Regional Evidence Generation and Policy and Institutional Mapping on Food and Bioenergy
2
SSoouutthheerrnn AAddvviissoorryy GGrroouupp
several questions are raised and needing answers, such as: How was it made possible? Is it sustainable? Can it be replicated?
Table 1. Members of the Study Team
Name Email address Involvement Position /Institution Study Sites Dr. Nerlita M. Manalili [email protected] Overall Project
leader Chair , Southern Advisory Group (SAG) of ERA ARD APAARI
1. Asia -East, South Southeast
2. WANA -West Asia & North Africa
3. Sub Saharan Africa 4. Latin America
&Caribbean 1. West Asia - North Africa a. Dr. Ibrahim Hamdam [email protected] Regional Coordinator Executive Secretary, AARINENA West Asia & North
Africa b. Prof M. Samir El-
Habbab [email protected]
Regional Study Leader
Professor, University of Jordan Egypt and Sudan
c. Dr. M. Majdalawi [email protected]
Study Team Member Coordinator- E consultation Jarrash University Amman Jordan
2. Asia Pacific a. Dr. Raj Paroda [email protected] Regional Coordinator Executive Secretary, APAARI Asia b. Dr. Rodrigo
Badayos [email protected]
Regional Study Leader
Director, Farming Systems Cluster University of the Philippines at Los Banos (UPLB)
East Asia: Guangxi, China Southeast Asia: Negros,Philippines; Khon Kaen Thailand & Ho Chi Minh, Vietnam South Asia:
India & Pakistan
c. Prof Moises Dorado
[email protected] Assistant Study leader & Study Team Member (East &SE Asia)
Associate Professor, College of Engineering and Agro industrial Technology, UPLB
d. Dr. Vijay Kumar Gour
[email protected] Study Team Member (South Asia)
Assoc. Professor, Plant Breeder & Genetics Department Jawaharlal Nehru Agricultural University, Jabalpur; M.P. India.
e. Dr. Nerlita M. Manalili
[email protected] Asia Team member Chair, SAG ERA ARD, APAARI
3. Latin America a. Dr. Jamil Macedo [email protected] Regional Coordinator Exec Secretary PROCITROPICOS
(Cooperative Program on R&D for the Tropics) FORAGRO
Latin America And Carribean (LAC)
b. Mr. Markus Ascher [email protected]
Regional Study Leader
Technical Advisor PROCITROPICOS
Argentina, Bolivia, Brazil, Colombia, Costa Rica, Ecuador,
Honduras, Mexico, Paraguay, Peru, Dominican Republic and Uruguay
c. Mr. Orlando Vega Charpentir
[email protected] Study Team Member Specialist in Agroenergy IICA, Costa Rica
d. Mr. Federico Ganduglia
Study Team Member Specialist in Agroenergy IICA, Argentina
e. Mr. Marco Ortega [email protected] Study Team Member Agroenergy Specialist IICA, Brazil
4. Africa A. Dr. Myra Wopereis-
Pura Regional Coordinator Director, Access to Knowledge &
Technologies, Forum for Agricultural Research in Africa
Sub Saharan Africa
B. Dr. Rocio A. Diaz-Chavez
Regional Study leader
Centre for Environmental Policy, ICEPT, Imperial College London
West, East and Southern Africa
C. Dr. Stephen Mutimba
Case Study Author Managing Director, Camco, Kenya Tanzania
D. Dr. Hookyung Kim Case Study Author Imperial College of London Ghana

Regional Evidence Generation and Policy and Institutional Mapping on Food and Bioenergy
3
SSoouutthheerrnn AAddvviissoorryy GGrroouupp
Table 2. ERA ARD Management Team ERA ARD
Name Email address Involvement Position /Institution Dr. Christian Hoste [email protected] ERA ARD Coordinator Deputy Director
European and International Relations Directorate CIRAD 42 rue Scheffer - 75116 PARIS, France
Dr. Guy Poulter [email protected]
ERA ARD Task Manager for the Southern Advisory Group (SAG)
Director Natural Resources Institute, University of Greenwich Central Avenue, Chatham Maritime, Kent ME4 4TB,UK
Dr. Alex Percy Smith [email protected] Program in Charge ERA ARD Bionergy Call
Coordinator for International Relations AARHUS University Forsøgsvej 1 DK-4200 Slagelse, Denmark
A well thought out program needs to mainstream bioenergy into development and poverty reduction strategies wherein the poor and rural population are considered. The concern, however, is that many developing economies have already embarked on large scale jathropha production and yet the negative impacts of this on local livelihoods and the environment remain to be assessed. Bioenergy production and policies need to be based on a broad cost/benefit analysis at multiple scales and for the entire production chain (Kavanagh, 2007). Likewise, for such a development initiative to succeed requires a coherent cross sectoral government intervention and policies that integrate the concerns of agriculture and food security, energy, environment and even trades.
This premise underscores the need for a) a broader understanding of the extent of the issues and concerns surrounding food to bioenergy conversion and b) the accompanying policy/institutional dimensions as input to the development of an appropriate and truly responsive food and bioenergy programs in developing economies. It is along this line that this study on Regional Evidence Generation and Policy and Institutional Mapping on Food and Biofuel for the Africa, Asia and Latin American Regions, was conducted. It will generate evidence on the impact of converting food crops into bioenergy and provide supporting documentation for the formulation of pro-poor policies.
B. Objectives
The study aims to undertake rapid assessments to provide an understanding of the current initiatives on food and bioenergy in Africa, Asia, West Asia-North Africa (WANA) and Latin America and the Caribbean (LAC) and their consequent effects on food availability and livelihood opportunities to smallholder farmers. Specifically the study aims to:
1. Generate regional evidence on the frequency of the conversion of cash food crops to biofuels;

Regional Evidence Generation and Policy and Institutional Mapping on Food and Bioenergy
4
SSoouutthheerrnn AAddvviissoorryy GGrroouupp
2. Determine perceived issues and concerns of this conversion by sector (regional, national, household);
3. Establish early indication of the impact (trends, patterns) to anticipate future scenarios; and
4. Undertake policy and institutional mapping as well as analysis to better understand the policy and institutional dimensions of the food and bioenergy inter-phase.
C. Study Components and Implementing Strategies The project is comprised of two parallel activities:
Activity 1: Evidence Generation Activity 2: Policy and Institutional Mapping
Evidence generation in Activity 1 will provide a general understanding, by region, of the magnitude of food to biofuel conversions, the ensuing and predominant concerns/ issues and give an early indication of their impact on food access and availability as well as livelihood sustainability of smallholder farmers. Activity 2 will enable a deeper understanding by documenting the policy and institutional background in which these conversions occurs.

Regional Evidence Generation and Policy and Institutional Mapping on Food and Bioenergy
5
SSoouutthheerrnn AAddvviissoorryy GGrroouupp
II. The Global Energy and Biofuels Scenario A. World Energy Demand
Report from the World Energy Outlook 2009 projects that the world primary energy demand will increase by 1.5% per year between 2007 and 2030 (Figure 1). In quantity, this is an increase from just over 12,000 million tons of oil equivalent (Mtoe) to 16,800 Mtoe or an overall increase of 40%. Figure 1. World primary energy demand 1980-2030. B. World Demand for Biofuels Considerable interests in biofuels started in the 1970s due to the oil crises in 1973 and in 1978-1979 (Clancy,2008). It was at this time that small number of countries started biofuel programs which, however, were discontinued in the late 1980s when cheap oil made a comeback. By the turn of the millennium, biofuel production has once again gained renewed interest. Global annual production of biodiesel and ethanol grew by 43% and 23%, respectively for the period 2001 to 2006 (Yan and Tin, 2009). In 2007, the growth of fuel ethanol production grew by 31%. The different forces that have rekindled the interest are of two categories namely: (1) The strong Northern agenda linked to fuel security, high oil prices and environmental concern and (2) The strong Southern (Asian region) agenda linked with the view that biofuel production can be a key to promoting rural development (Clancy,2008),. The South has a competitive advantage in the production of biofuels according to Clancey (2008). Biofuel yield per hectare is generally higher for tropical crops than temperate crops.
Regional Evidence Generation and Policy and Institutional Mapping on Food and Bioenergy
6
SSoouutthheerrnn AAddvviissoorryy GGrroouupp
Production cost is also lower. With these advantages, the increasing demand for alternative fuels in the Northern markets creates an opportunity for product diversification in tropical agriculture and an entry into new end-markets, thus providing stimulus to rural development. He added that the demand for biofuels has created new avenues for agricultural commodities beyond the traditional uses of food, feed and fiber which could help reduce volatility of commodity prices.
C. Regional Demands for Biofuels
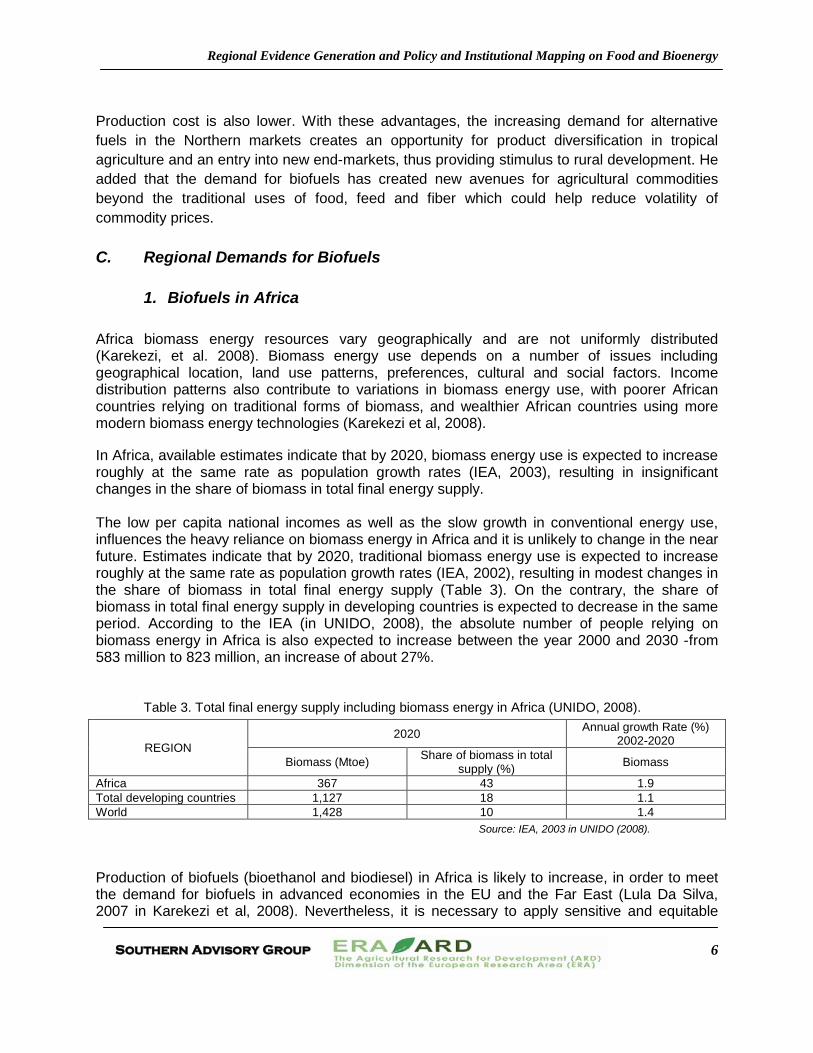
1. Biofuels in Africa Africa biomass energy resources vary geographically and are not uniformly distributed (Karekezi, et al. 2008). Biomass energy use depends on a number of issues including geographical location, land use patterns, preferences, cultural and social factors. Income distribution patterns also contribute to variations in biomass energy use, with poorer African countries relying on traditional forms of biomass, and wealthier African countries using more modern biomass energy technologies (Karekezi et al, 2008). In Africa, available estimates indicate that by 2020, biomass energy use is expected to increase roughly at the same rate as population growth rates (IEA, 2003), resulting in insignificant changes in the share of biomass in total final energy supply. The low per capita national incomes as well as the slow growth in conventional energy use, influences the heavy reliance on biomass energy in Africa and it is unlikely to change in the near future. Estimates indicate that by 2020, traditional biomass energy use is expected to increase roughly at the same rate as population growth rates (IEA, 2002), resulting in modest changes in the share of biomass in total final energy supply (Table 3). On the contrary, the share of biomass in total final energy supply in developing countries is expected to decrease in the same period. According to the IEA (in UNIDO, 2008), the absolute number of people relying on biomass energy in Africa is also expected to increase between the year 2000 and 2030 -from 583 million to 823 million, an increase of about 27%.
Table 3. Total final energy supply including biomass energy in Africa (UNIDO, 2008).
REGION 2020 Annual growth Rate (%)
2002-2020
Biomass (Mtoe) Share of biomass in total supply (%) Biomass
Africa 367 43 1.9 Total developing countries 1,127 18 1.1 World 1,428 10 1.4
Source: IEA, 2003 in UNIDO (2008). Production of biofuels (bioethanol and biodiesel) in Africa is likely to increase, in order to meet the demand for biofuels in advanced economies in the EU and the Far East (Lula Da Silva, 2007 in Karekezi et al, 2008). Nevertheless, it is necessary to apply sensitive and equitable

Regional Evidence Generation and Policy and Institutional Mapping on Food and Bioenergy
7
SSoouutthheerrnn AAddvviissoorryy GGrroouupp
management as large-scale modern biomass energy development can lead to further marginalization of the rural poor. However, the growth and development of modern technologies could provide better incomes particularly for smallholders. Mauritius provides a model case example of where a share of the benefits from large-scale co-generation plants that flow to low-income farmers have increased over time through direct policy interventions and an innovative revenue sharing mechanism (Deepchand, 2002; Karekezi et al, 2002 in Karekezi, 2008). Smeets et al. (2004) revealed that compared to all the world’s major regions, sub-Saharan Africa has the greatest bioenergy potential as a result of large areas of suitable cropland, large areas of unused pasture land and the low productivity of land under agriculture (Watson, 2008). There are six main crops for producing first generation biofuels in Southern Africa: sugarcane, sweet sorghum, cassava, jatropha, maize, soybean and sunflower.
2. Biofuels in Asia
There has been a dramatic increase in biofuels production in Asian countries in recent years. The major reasons for the increase are the pursuit for energy security, economic development (particularly, improvement of trade balances and expansion of the agriculture sector), and poverty alleviation (Yan and Tin, 2009). Most of the countries also have biofuel strategies that are focused around their main agricultural products and new business opportunities. The region now is in a complicated situation because of its increasing demand for fuel. Biofuel is an alternative source which the region has huge potential for tapping, Asia being a major agricultural producer. In fact in 2005, Asia has already contributed 15% of the world’s 37 Mtons production of bioethanol (Figure 2). And with fuel having a very attractive price index relative to food (Figure 3), the threat to of food to fuel conversion of farm areas can indeed be very real for the region.
Figure 2. Share of bioethanol production in 2005.

Regional Evidence Generation and Policy and Institutional Mapping on Food and Bioenergy
8
SSoouutthheerrnn AAddvviissoorryy GGrroouupp
Figure 3. Energy and food price indices.
3. Biofuels in West Asia-North Africa (WANA) Region WANA Region includes five sub-regions:
• Arabian Peninsula (Bahrain, Kuwait, Oman, Qatar, Saudi Arabia, UAE) • Maghreb (Algeria, Libya, Malta, Mauritania, Morocco, Tunisia) • Mashreq (Cyprus, Iraq, Jordan, Lebanon, Palestinian Authority, Syria) • Nile Valley & Red Sea (Djibouti, Egypt, Sudan, Somalia, Yemen) • Western Asia (Iran, Pakistan, Turkey)
Biofuel production in the region could be divided into three groups:
• Countries which do not have enough resources (mainly land and water) for biofuel production. These countries are Somalia, Yemen, Libya, Lebanon, Palestine, Tunisia, Djibouti, Cyprus, Kuwait, Bahrain, and Qatar.
• Countries which are producing, or planning to produce biofuel. These are: Egypt, Sudan, Turkey, Malta, Jordan , Oman, Kingdom of Saudi Arabia and the United Arab Emirates
• Countries which are not producing biofuel at present but they have the potential to produce it are: Algeria, Mauritania, Morocco, Iraq and Iran.

Regional Evidence Generation and Policy and Institutional Mapping on Food and Bioenergy
9
SSoouutthheerrnn AAddvviissoorryy GGrroouupp
Some of the countries produce fuel from edible oil as Turkey, and others use biomass, used edible oil and animal wastes for producing biofuel such as Malta. The third group of countries uses biomass from farm and processed residues such as Egypt (rice straw), Sudan (sugarcane residues), Oman (Date Palm biomass) and Pakistan (agricultural residues). The rest are trying to plant specialized plants such as Jatropha for biodiesel production such as Kingdom of Saudi Arabia (KSA) and Jordan.
4. Biofuels in Latin America and the Caribbean (LAC) South America in 2005 already has the largest contribution of 36% tied with North America in the bioethanol production of the world (Figure 2). In terms of bioethanol production, “Brazil is an emblematic case where the bioethanol experience should become a reference for developing countries and their increased opportunities in the world market. Its leadership in bioethanol and technologies associated with liquid fuels is undisputed. With over thirty years implementing a program with a strong government influence, its own technological developments and the ever-growing participation of biofuels in their transportation system make it a singular case among developing countries.”(CEPAL,2008). As a result, with over 90% of the grand total, Brazil currently produces and consumes most of the bioethanol produced in the LAC. Even with the increase in consumption in other countries also predicted for 2015 (particularly Colombia and Mexico), Brazil will still be responsible for over 80% of bioethanol consumption within the LAC region.
A significant increase in the use of sugarcane for bioethanol production is expected in Brazil, the world’s second largest bioethanol producer, stimulated by the anticipated growth of the flex-fuel vehicle fleet, a sizeable increase in the installation capabilities assumed by the current investor wave in the sugar and alcohol segment and the escalation of external demand. According to projections from the Brazilian Ministry of Agriculture, bioethanol production will go from 18,900 million liters in 2007 to over 31,800 million liters in 2013 (with over 7,000 million liters in exports), and should reach 41,600 million liters by 2018, with a domestic consumption of 30.3 thousand million liters (exports would be in the range of 11,300 million liters)(Ganduglia,2009).
The situation is slightly different for the projected consumption of biodiesel: while Brazil will be the largest biodiesel consumer in LAC by the year 2015, its consumption will represent less than a third of total consumption in the region. Countries such as Argentina, Bolivia, Chile, Colombia and Peru will also consume considerable amounts of biodiesel.
Brazil and Argentina will become firmly established among the main worldwide producers and exporters of biodiesel, especially soy-based. The still growing production and processing capacities of their emerging biofuel industries (downstream and upstream), which - including plants already in construction or in the process of being regulated as well as a number of approved blueprints - will soon facilitate the production of over 5,600 million liters, foretells a significant increase in the use of oleaginous plants and vegetable oils over the next few years.

Regional Evidence Generation and Policy and Institutional Mapping on Food and Bioenergy
10
SSoouutthheerrnn AAddvviissoorryy GGrroouupp
On top of that, the growing processing capabilities for bioethanol and biodiesel production in other Latin American and Caribbean countries will add to the ensuing demand for sugarcane, palm, soy bean and other raw materials (Ganduglia,2009).
Although Brazil has had an aggressive program to replace gasoline with ethanol (PROALCOOL) since 1974, and a program to replace diesel with biodiesel since 2005, in addition to generating bioelectricity from biomass, the share of biofuels in the regional energy mix is still marginal (1% of energy consumption in 2007). Brazil is the country that has had the greatest percentage of biofuels in terms of energy consumption thus far (3% in 2007). Table 4 shows the forecast for bioethanol consumption in 18 countries within the region.
Table 4. Forecast for bioethanol consumption in 18 countries within the LAC.
Source: (Ascher, 2009) Independent compilation based on 1). OLADE, except Argentina (Energy Secretariat) 2). An assumed annual cumulative growth rate of 3.5% was applied evenly to all countries. Notes: (i) Bolivia: The forecasted bioethanol consumption for Bolivia is based on the unlikely possibility of the regulation of the
corresponding legislation which is frozen due to a decision from the current government.
Final consumption –
2007
Gasoline consumption
in 20071) (in 1000 liters)1
Forecasted gasoline
consumption for 20102
(in 1000 liters)
Compulsory mixing with
bioethanol in 2010
Forecasted bioethanol
consumption for 2010
(in 1000 liters)
Forecasted gasoline
consumption for 20152
(in 1000 liters)
Compulsory mixing with
bioethanol in 2015
(in 1000 liters)
Forecasted bioethanol
consumption for 2015
(in 1000 liters))
Argentina 4,966,757 5,506,732 5% 275,337 6,540,270 5% 327,013 Bolivia (i) 550,800 610,682 10% 61,068 725,299 25% 181,325
Brazil (ii) 35,889,006 39,790,783 25% - 100% (flex- fuel vehicles) 28,000,000 47,258,968 25% - 100% (flex-
fuel vehicles) 45,000,000
Chile (iii) 2,762,861 3,063,233 2% 61,265 3,638,160 2% 72,763 Colombia (iv) 5,288,330 5,863,266 10% 586,327 6,963,720 20% 1,392,744 Costa Rica 801,560 888,704 8% 71,096 1,055,501 8% 84,440 Ecuador (v) 2,394,855 2,655,219 5% 132,761 3,153,567 5% 157,678 El Salvador (vi) 507,799 563,006 10% 56,301 668,675 10% 66,867 Guatemala (vii) 1,105,627 1,225,829 10% 122,583 1,455,900 10% 145,590
Honduras 505,223 560,149 To be determined - 665,282 To be
determined
Jamaica 638,574 707,999 10% 70,800 840,880 15% 126,132 Mexico (viii) 38,905,847 43,135,609 0% - 51,231,571 6% 3,073,894
Nicaragua 278,138 308,377 To be determined - 366,255 To be
determined
Panama 290,056 321,590 24% 77,182 381,948 24% 91,668 Paraguay (ix) 243,190 269,629 5% 13,481 320,234 5% 16,012 Peru 1,088,878 1,207,258 7.8% 94,166 1,433,844 7,8% 111,840 Dominican Republic 1,135,422 1,258,863 0% - 1,495,134 15% 224,270
Uruguay (x) 306,483 339,804 5% 16,990 403,580 5% 20,179
Total 97,659,409 108,276,732 29,507,526 128,598,792 51,092,416

Regional Evidence Generation and Policy and Institutional Mapping on Food and Bioenergy
11
SSoouutthheerrnn AAddvviissoorryy GGrroouupp
(ii) Brazil: MAPA’s bioethanol consumption forecast was used since it takes into account both the mix of anhydrous bioethanol with gasoline and the consumption of hydrated bioethanol by flex-fuel automobiles.
(iii) Chile: Mixing is not compulsory. (iv) Colombia: From 2012 on, compulsory mixing can be up to 85%. Reference is based on the UPME scenario of the
Colombian Ministry of Mining and Energy considering an E20 mix for the years 2009 to 2025. (v) Ecuador: Bioethanol consumption forecasted for 2010 was calculated based on the Biofuels Pilot Plan E5 in Guayaquil
(where gasoline consumption is officially estimated at 46,000 liters daily). Consumption forecasted for 2015 assumes that the Plan will be extended throughout the domestic territory.
(vi) El Salvador: Forecasted bioethanol consumption in El Salvador is based on the assumption that the proposed legislation will be passed.
(vii) Guatemala: Forecasted consumption for bioethanol is based on the assumption that the proposal from the Ministry of Mining and Energy will be implemented (Law for Incentives to the Development of Projects on Renewable Energies 2003, stagnant so far).
(viii) Mexico: Forecasted consumption for bioethanol for Mexico in 2015 is based on the assumption that the Bioenergy Starter Program will be extended throughout the country. The Program will start in Guadalajara in 2011 and will include Monterrey Metropolitan Areas and Valle de Mexico Metropolitan Areas.
(ix) Paraguay: The assumption was the usage of the maximum levels in the compulsory mix (E20-E24). (x) Uruguay: 5% optional in 2010, compulsory from 2015 on.
Some of the comparative advantages of the LAC countries with regard to the production of biofuels are their natural resources such as the availability of agricultural land, suitable climate, extensive cultivation season and sufficient water supply for high productivity. At the same time, the technology supply, manpower, administrative capabilities and investment capital, among other things, are important differential factors for competition. The size of the internal market and the access to fossil fuel sources or other competitive differentiating factors linked to the energy production potential from other renewable sources are also basic elements in the establishment of sustainable biofuel production. III. Evidence Generation Table 5 shows the major findings from the Evidence Generation Activity (Activity 1) from each region. Although there were a lot of issues that were observed during the conduct of the study, only three major issues are presented in this integration. These issues are (1) evidences of conversion from food to biofuel, (2) characteristics of policies/programs that have led or prevented the conversion, and (3) the impact of conversion on the small farmers. The other issues are presented in the accompanying individual project reports by region (Studies 1-4). Presented in Appendices 1a-1j are the summary of the in-country assessment of the state of biofuel development in the respective regions in terms of issues, policies, emerging patters and impacts/future implication. Discussions on these assessments are presented below.
On the issue on conversion of areas from food to biofuel, the findings from the four regions showed that there are very minimal conversions that are happening. For areas that experienced conversion, the size of area involved is too small to threaten the food security of the regions. The policies of the different regions directly or indirectly related to biofuel production provide protection to both food areas and the environment. These policies have helped in preventing the large-scale conversion of areas from food to biofuel in the regions. There are indications, though for the need to review policy responsiveness and appropriateness in consideration of both short term and long term gains (at the regional, national and industry stakeholders’ level) as well as of changing market scenario and global biofuel chain development. The impact on the small farmers on the food to biofuel conversion issue has so far been positive on all regions. The small farmers have been given new opportunities for income generation, and biofuel conversion have given them more diversification and flexibility in most cases resulting to higher income.

Table 5. Major findings from the Evidence Generation Activity (Activity 1) from each region.
Issues Region
Africa Asia West Asia-North Africa (WANA) Latin America & Caribbean (LAC)
Evidences of Conversion from Food crop areas to Biofuel
No problem of conversion there are still areas available for cultivation
• No evidence yet of food to fuel conversion of farmlands • vast land available, even when supplying other countries with food & biofuel
No evidence of conversion from food crops except in Turkey (from edible oils)
Little evidence of conversion
Key biofuel Sources
Sugarcane, jathropa and sweet sorghum
Sugarcane, cassava Plant residues and animal wastes; edible oils
Sugarcane(bioethanol); palm oil & Soybean (biodiesel)
Characteristics of Policies/ Programs
• regional declaration to develop biofuel given rising & volatile oil prices & need to stimulate growth & rural development
• initial focus on transport rather than electricity
• Enhanced competitiveness while minimizing the risks to small-scale producers
• Most countries have biofuel strategies that are focused around main agricultural crops).
• There is strict protection of food areas (regulatory policy )
• Few countries have comprehensive biofuel policies, and where present, are largely driven by agricultural considerations
• more of environmental protection
• Biofuel considered as Engine of development
• Most country governments have set goals for the local market & promoted legislations to develop biofuels without first consistently examining their potential impact
Impact on Small Farmers
More opportunities for income generation and diversification
Higher income & flexibility; Year round employment/ livelihood (compared with seasonal in case of sugar processing)
Creation of new markets
Sure income arising from promising market (if in well design packages)
Early indications of future scenario at given trends
• Biofuel can be grown on significant scales without indirect effects on food production (within certain production sustainability and policy considerations)
• Biofuel development represents a paradigm shift to agricultural development
• Prices more than national programs are seen to influence food to fuel conversion
• Boost and even revival of the sugarcane industry
• most land is used for grazing the Bedouins animals, if used for biofuel crops, will affect livestock sector
• Will put pressure on scarce resources (land & water)
Increase in energy crops may cause significant changes in the agrarian structure such as greater production and land ownership concentration and influx of new types of players & norms, creation of economies of scale and pressure on natural resources
Key regional Features
have highest ratio of arable land while scarce areas have non food agricultural activity and is not compromising Food Security
Supplies global food requirement (90% of rice & 70% of vegetables) Any regional threat to food production (from bioenergy will have global implications
80% of land is considered marginal
• Greater concentration of energy crops to fewer producers In countries where land holdings are large (Argentina, Uruguay, Brazil, Chile, etc)
• Biofuel crops opportunity is dependent on needed collaborations in countries where smaller land holdings predominates (Ecuador, Peru & Panama)

Regional Evidence Generation and Policy and Institutional Mapping on Food and Bioenergy
13
SSoouutthheerrnn AAddvviissoorryy GGrroouupp
A. Evidences from Africa There were six case studies from six countries conducted for the African Region from the countries of Senegal, Mali, Tanzania, Kenya, Zambia, and Mozambique.
There are many rural communities that are engaging in the cultivation of Jatropha in Senegal, but there is still little evidence of the mechanisms necessary to fully incorporate in, a more skilled manner, farmers in these activities. Despite the imports on food products (e.g. rice) there is also no evidence of a threat to food production regarding the biofuels activities in the country. The Biofuel Programme at present is focused on one single crop which is Jatropha, although one of the objectives is to look for crop diversification.
Senegal
The country is ongoing in an Agricultural reform focused on food products but also on other crops (e.g. groundnuts). These reforms may have a benefit in terms of agricultural production such as improving the yields. If adequate measures are taken there is no need to compromise food and biofuel production at the farm level, benefiting the farmers with additional income and if possible access to electricity. Mali Biofuels play an important role in the energy strategy and growth in Mali. Political support favours food security, economic development and environmental protection. However, the relative young government decentralisation process, lack of resources and low administration capacities hinder good natural resources management.
Sugarcane production is intended to satisfy sugar demand. Ethanol is not yet used as fuel but for the pharmaceutical and beverage industries. In terms of natural resources, particularly water availability, Mali presents large developments of irrigated land at the ON which can boost food and fuel production. Mali is one of the countries in West Africa with more experience on the use of biofuels for electricity generation at community level. International donors follow with particular attention these developments. The experience with Jatropha programs has shown that it can benefit small holder farmers without compromising food production at local level. These developments include commercial production of Jatropha (e.g. Mali Biocarburants) and not only community level initiatives (e.g. Mali Folk Center).
Although Mali has a number of initiatives for pro-poor energy production, Jatropha seed supply is still very limited. The challenge for Mali is also in the agriculture sector, specially for the efficient use of water, water access, costly extension services in need and low yields for all crops and not just energy crops.
Tanzania
Tanzania has received major attention from investors for large scale biofuel production forcing the government to accelerate the process of the creation of a Task Force in the absence of a

Regional Evidence Generation and Policy and Institutional Mapping on Food and Bioenergy
14
SSoouutthheerrnn AAddvviissoorryy GGrroouupp
biofuel policy. As in the previous case studies, the problem in the country lays in the issues regarding the willingness to grow bioenergy crops in the absence of investments. There are also issues on land tenure and the small average size of farms that will make difficult in certain areas to work with large scale initiatives. This could be related to the issue of either displacement of farmers or convincing the farmers of an alternative crop to work as out-growers. The stakeholder assessment demonstrated that there is need for cross-cutting activities at policy and planning level and with main actors such as farmers this in spite of the existence of a Task Force. The potential market for biofuels is big at all levels in Tanzania and with adequate enforcement of the policies and guidelines will be possible to produce bioenergy crops without jeopardizing food production. Kenya The case of Kenya is most relevant for it has been producing bioethanol for nearly 20 years. The production, however, has not been steady and has been mainly for export as drinks to neighboring countries. It has been reported that land will not be sufficient to produce the amount of ethanol needed for the transport sector in Kenya. Nevertheless, alternative crops have been considered that will not compete with food or that can produce both food and fuel (e.g. sweet sorghum, and castor oil). With its vast experience and policies already in place (e.g Task Force, Biofuels Programmes), it is possible that Kenya could produce biofuels in adequate areas that do not jeopardize food production, and would enhance rural development and better income to farmers. Positive impacts can be expected at local level with job creation in some areas where conflict with other resources (such as water) is not an issue. Zambia Zambia’s initial steps into biofuel production still seem to be controversial. This is one of the countries that provide an example of the need for energy alternatives as it is a landlock country. The country has had a food security crisis for a number of years despite that around 12% of the arable land is actually dedicated to agriculture. It seems that the dependency of the country on food imports is due to the lack of infrastructure and investment in the agricultural sector. The Energy Ministry considers that bioenergy could be an excellent opportunity to significantly enhance the production potential of feedstock for both food and biomass production. Zambia is an agricultural country with nearly 70% of the active population dedicated to this sector and has been looking at different crops for biofuel production such as sweet sorghum and cassava. The biofuels Association in Zambia is a strong organization and could play an important role in the promotion of biofuels and food production. The perspectives of different stakeholders continue to be an issue with opposite views. Mozambique Mozambique has been the recipient of numerous investors in the last years for bioenergy crops production. The National Government has followed a conscious path into the development of their policies and the mapping of the country to better identify the areas where this production is possible without generating negative impacts in local resources and food production. At farm level, the infrastructure and investment for agriculture is very limited or minimal to improve the

Regional Evidence Generation and Policy and Institutional Mapping on Food and Bioenergy
15
SSoouutthheerrnn AAddvviissoorryy GGrroouupp
yields. Mozambique is a net importer of food commodities, especially rice, wheat and, to a lesser extent, maize. At the same time the country relies on imports for all its domestic wheat requirements. Imports of rice account for about 75 per cent of total domestic consumption, and those of maize (mostly from South Africa) account for about 13 per cent of total domestic consumption. Nevertheless, there are reports about the land availability for food and bioenergy crop production. B. Evidences from Asia Five case studies were undertaken for the Asian Region, one case study each for the countries China, India, the Philippines, Thailand and Vietnam. China The case study in China involved the Qingle Village in Guangxi Zhuang Autonomous Region. The village supplies cassava to nearby industries that process cassava chips for modified starch and alcohol for beverages. Farmers are not in contract with any company. To capture the local supply of cassava, factory owner must provide incentives to cassava growers like offering competitive price and participating actively in technology promotion. Distance and buying price, remain as key determinants to the disposal of cassava chips by farmers. The volume of fresh cassava chips produced at Qingle village was only enough for 4 months out of 12 months requirements of most factories in the area. The companies would normally import dried cassava chips from Thailand, Indonesia, Laos and Cambodia to fill up its year round processing requirement (Sanchez and Junyang 2008). Farmers, in general, are not in any way party as to whatever becomes the end product of their crops. Farmers’ primary concern was to maximize income. Guangxi farmers of China operate based on the Family Production Responsibility System. The System gives individual households the agricultural production responsibility. Further, households have the option to lease additional land from their collectives and use the farmland however they see fit. Technically, however, the land is still owned by a collective, such as a village. Guangxi Zhuang Autonomous Region has been transformed from a traditional into a modern agricultural area. Shifting of planting food crops like rice and corn into planting industrial crops like sugarcane, cassava and other high value crops like fruits has dominated the area. The early inclusion of sugarcane growing in the region was triggered by trade liberation which raises the local price of sugar and gives sugarcane growers better income. Recent development shows that Guangxi farmers have been expanding and even converting sugarcane areas for cassava growing. This happened after the Chinese government encouraged use of non-grain crops like cassava for ethanol production. The government of China has been encouraging changes in farming system to help farmers in different situations become more productive and profitable in agribusiness.

Regional Evidence Generation and Policy and Institutional Mapping on Food and Bioenergy
16
SSoouutthheerrnn AAddvviissoorryy GGrroouupp
The initial move in China to convert surplus grains to biofuel had backfired raising the price of corn and threatened food security. Chinese government therefore prevented further expansion of grains utilization as feedstocks and advised local investors to consider instead non-food materials such sorghum, cassava, and sweet potato for ethanol (Liu and Cheng 2008). It was in 2005 when Chinese government regulated construction of additional ethanol plants relying on food grains for ethanol feedstocks. Instead, plants processing non-food crops were encouraged. India
Indian agriculture is characterized by pre-dominance of small and marginal farmers. India is home to 17% of the world population and has the world’s largest concentration of the poor. Some 70% of Indians depend on agriculture for the livelihood and about half of them are depend on rain-fed irrigation. There food and water security concerns exceed energy security concerns; and this fact of India matches many developing and underdeveloped economies of Asia-pacific region. One more fact as challenge is perpetuating since centuries, that incidence of poverty and land degradation is seen to co-exist in several agro-ecological zones in India and holds good for other countries too, need reprisal as per UN charter and MDG’s. However, the energy gains from renewable sources, through plantations on wasteland with rationality of using available water would improve the livelihood of rural poor combining science and sociology would give dividends on term.
Philippines Sugarcane farming is highly popular in the Province of Negros, Philippines. Large scale sugarcane plantations in the province before were generally administered by hacienderos under the hacienda system. The hacienda system that evolved in Negros was built on sharecropping and debt relations. Haciendero who runs the system took paternalistic care of “their” people from cradle to grave, serving as godparents, paying their medical bills, and occasionally bailing them out of jail (Henderson, 2000). In return, Haciendero demand and receive complete subservience based on sharecropping and the “company store” model.
During the implementation of the Comprehensive Agrarian Land Reform Program (CARP) in 1997, several tenants in sugarcane plantation were individually awarded land with sizes ranging between 3 to less than 1 hectare. However, even with the acquisition of their own land through land reform the living condition of sugarcane farmers did not improved. The land reform program implementation in the Philippines does not include financial assistance. Without financial complement, land reform beneficiaries were left to survive on their own. Farmer beneficiary must shoulder the cost of production and the cost of raising family. Land reform program in the country therefore did not really help alleviate the condition of sugarcane farmers. It even put farmers in more serious predicament, placing more farmers in extreme poverty situation. Informally, many of the land reform beneficiaries were forced to sell back their newly acquired farm and/or return to the folds of their former Hacienderos.
San Carlos, is the last city of the Northern part of Negros Island. It is located at the west coast of the Philippines. It used to be a bustling sugar capital, it being the seat of the 1st Sugar Milling

Regional Evidence Generation and Policy and Institutional Mapping on Food and Bioenergy
17
SSoouutthheerrnn AAddvviissoorryy GGrroouupp
Company in the country. Established in 1907, the San Carlos Milling Company Incorporated (SCMCI), which produces sugar with molasses as by-product, absorbed the sugarcane produce of most farming households within a 200 km radius. SCMI symbolizes income and livelihood to almost all of the farming households, as it provides a ready market, no matter how seasonal, to the produce of sugarcane farmers.
One could just imagine the impact of the company’s closure in 1998 to the sugarcane farming household, who after SCMCI’s closure has to bring their sugarcane to alternative markets 87 – 200 km away. The smallness of volume of canes marketed is a compounding problem, as most land holdings of the sugarcane farmers have been reduced to 7 hectares, given the land reform act passed in the country in the early 90’s.
An opportunity for an alternative market through an ethanol plant, brought about by the increasing demand for alternative fuel, aided by a government push to ethanol program, is a welcome development to the farming populace.
The growing ethanol market, the conducive investment climate (through government push for the ethanol industry) and the desire to revive the dying sugar industry, consequently giving livelihood security to sugarcane farmers, prompted the San Carlos Ethanol Plant to embark into ethanol production. Starting operation in 2009, the plant has an initial production of 1.6 M liters in just 9 months of operation. With the increasingly unmet demand for ethanol in the country, it will take about 10 ethanol plants of similar capacity to meet the estimated demand of 536 M (at 10% blend) liters in the country.
The ethanol plant with sugarcane as feedstock started operation in Jan 2009. Designed to operate on a year round basis, the plant has to initially deal with addressing the seasonality of the production system the farmers have been used to in the sugar milling which has only a 6-7 month operation calendar. The plain farmers, thus, have no source of income the rest of the year.
The opportunity for a continuous production is a welcome opportunity to the farmers. Not only is the problem of seasonality of activity addressed given the continuous supply requirement of the plant, but payment problem is now addressed. The farmers are now receiving payment within 2 days of the week ending of delivery date. More importantly, they are paid on a fresh cane basis unlike previously (in a milling operation) when they are paid on base sugar recovered.
The current pool of farmers in Negros only relies on income from sugarcane to buy food. Although rice is the staple food for most Negrenses, rice production in Negros Island continue to remain as minor crop. Conversion of sugarcane to food crops may not be easy and quite costly. So, food to fuel conversion in Negros, Philippines is therefore not an issue in the current biofuel program implementation in the Philippines.

Regional Evidence Generation and Policy and Institutional Mapping on Food and Bioenergy
18
SSoouutthheerrnn AAddvviissoorryy GGrroouupp
Thailand Thai farmers are proficient in mixed farming. It is a proven strategy adopted in many parts of Thailand to minimize risk of total crop failure and for food security. A typical mixed farm in Khon Kaen, for example, would generally consists of a combination of cassava and/or sugarcane, paddy rice, fish pond and patches of bamboo for commercial bamboo shoots production, mango, and eucalyptus tree plantation for wood chips. Farmers are given proper training about the mixed farming technology. Farmers are technically prepared and have the capacity to attain high productivity as they practice the use of new technologies, and are totally aware of the price and market potential of their products.
The King has been instrumental in the promotion of mixed or integrated farming system especially in poverty stricken areas of Thailand. Different mixed farming modules were product of long term research by concerned agencies of Thailand. Sugarcane and cassava production are recommended in Khon Kaen farms as cash crops, given the sturdiness of both crops to survive in areas with poor soil and extended drought period. Rice growing, may not be highly suitable in many agricultural areas in Thailand, but it remains as popular component of mixed farming. Ban Huai Kho, Nhong Vang Nangbao Sub-district, Phon District, Khon Kaen, Thailand is a community of 225 households consisting of 1,122 people (566 male and 556 female). Farmers aged between 15 to 49 years old (58.65 %) were mostly graduates of elementary grade. A typical farm household owns a house and lot, and owns the land it tills as well. The community is easily accessible where vehicles can easily move in and out of the area at all times along well paved roads. School, health center, and Buddhist temple are available.
The land areas within the community were generally undulating. Soil is predominantly sandy. Rice is a common crop produced by all households. Every household has a barn for rice storage. Farmers grow vegetable for family consumption.
The most dominant cash crops in the village were cassava and sugarcane. Prior to the implementation of ethanol program, cassava harvest goes to starch factory. Lately, cassava chips produced in the village were sold to ethanol factory. The reported average yield for cassava in the village was 12.5 tons/ha while yield for sugarcane was 62.5 tons/ha. Price for fresh cassava chips was comparable when sold to either the ethanol plant or to factories producing modified starch. All of the sugarcane produced in the village was sold to sugar factories in Nakhonratchasima Province and in Khon Kaen Province.
The apparent farm problems in the village were insufficient rainfall, soil erosion and low soil fertility. The village needed to be linked to an irrigation system like existing water reservoir and streams to supplement insufficient rainfall. Farmers solved soil fertility problem with the use of farmyard manure. Ordinarily farmers would cover planted areas with mulch to prevent soil erosion.

Regional Evidence Generation and Policy and Institutional Mapping on Food and Bioenergy
19
SSoouutthheerrnn AAddvviissoorryy GGrroouupp
Farmers in the village looked at the biofuel program launched by Thai government as new market opportunity for their products. Farmers learned about the Thai government biofuel program from news aired either on TV and/or radio. They learned that cassava, sugarcane, jatropha, and palm oil can be used as feedstock for biofuel. While cassava and sugarcane were popular among farmers in the community considering the proven good performance of both crops to the soil condition of most farms in the village, they were not as enthusiastic about planting jatropha. They understand that Jatropha can only be used to produce biodiesel. Farmers will have no alternative to sell harvested seeds in case problem arises in the processing of jatropha. Unlike cassava and sugarcane, they can sell cassava either for starch, sugarcane for sugar and that both can be processed into ethanol.
Thai government prevents any company from switching from ethanol to food. Further, no company is allowed to export ethanol. In return, the government provides the company with tax incentives. Vietnam Biofuels program implementation in Vietnam is in its early stage. Though Vietnam has been producing cassava chips for quite sometime now, those chips were mainly used for ethyl alcohol production sold for alcoholic beverage and for pharmaceutical industries. In order to accommodate biofuel production, Vietnamese government planned to expand production area of cassava and sugarcane to cover requirements for feedstock for ethanol, and encouraged jatropha seed production for biodiesel feedstock. The Vietnamese government intends to utilize idle and marginal areas for such expansion plan. Their strategy was to create favorable conditions for the development and promotion of investments on biofuels through tax incentives and low-interest loans. Research and development priorities in Vietnam were now focus on increasing crop productivity and development of advanced biofuel conversion technologies.
There was no reported food crop conversion to biofuel in Vietnam. Vietnam is currently exporting cassava for animal feed and/or modified starch and alcohol. Locally, Vietnam produces modified starch and alcohol from cassava for food to supply domestic demand.
The prevailing tenural system in Vietnam allows Vietnamese farmers to choose what crop to grow. Farmers were adequately trained to grow scientifically multiple types of crops. Biofuel development for many farmers in Vietnam provided added market opportunity for their product.
By mid-1980s, agriculture in Vietnam saw a significant transformation (Henin, 2002). With the framework set by the government for an economic and political reform program (Doi Moi or New Changes), markets were introduced into the national economy. This change in ideology, together with the recurring food shortages and building pressure from farming communities, led to a series of agrarian reforms that drastically changed the agriculture scene.

Regional Evidence Generation and Policy and Institutional Mapping on Food and Bioenergy
20
SSoouutthheerrnn AAddvviissoorryy GGrroouupp
Two decades of Doi Moi have given Vietnam one of the world’s most open economies. Bilateral trades with US alone has grown from almost nothing in 1994 to $10.6 billion in 2007 (Is Vietnam ...,2008). These changes have also led to the improvement in the lives of the peasant farmers. The relatively new biofuels program in Vietnam can be evaluated under such an atmosphere where the small farmers have more freedom to decide on what to do with their farm lands, and where the economy under Doi Moi is open to new investments from both local and international corporations.
A major concern that may arise due to the relative freedom of small farmers, which were experienced by two sugar refineries studied, is the steady supply of feedstocks. Although a national policy is already in-placed that will support the biofuels program, because of the freedom of the farmers to choose the crops they can grow and because of the suitability of the farm lands to sugarcane and cassava production, the biofuel companies may not be assured of the supply of feedstocks. The situation is definitely critical for the companies, but it is favorable for the small farmers because they can always choose to grow and sell their crops at the highest price. It is immaterial for the farmers whether they are growing the crops for food or fuel. In fact, because of the new market for their crops, wider opportunities are opened for them. C. Evidences from WANA Egypt In the beginning of the twenty first century new stage of using plant residues and specialized plants has started in Egypt. These new units of gas production from plant and plant residues were established and the planting of Jatropha took place in the Egyptian desert.
Planting Jatropha in Egypt was started five years ago by the Water and Environmental Research Institute. Although still at its experimental stage, it has been shown that Jatropha can grow well in the marginal areas and desert. The planting of this tree has succeeded in south of Egypt (Saeed Area) with the stage of growth, production and blooming being earlier than that in other countries. It produces the flowers after 18 months compared to three years in other countries. The planted area of Jatropha now in Egypt is about 500 hectares in three regions that include Asyoot, Sohaj and Al-Swies.
Planting of Jatrohpa in marginal areas has the advantage of being able to utilize non-agricultural areas thus preventing desertification of these areas. Treated wastewater could also be used to irrigate this crop without any side effect on the quality of products. The use of the treated water also offers solution to the environmental problem that could occur from the wastewater.
Sudan
Sudan is the largest country in the Arab World and considered as the best agricultural area. Sudan is a member of Bioenergy Global Partnership (BEGP), which was established to

Regional Evidence Generation and Policy and Institutional Mapping on Food and Bioenergy
21
SSoouutthheerrnn AAddvviissoorryy GGrroouupp
implement the commitments taken by the G8 in the 2005 Gleneagles Plan of Action to support biomass and biofuels.
At present, the Kenana Sugar Factory established in 2009 is the only factory that produces biofuel from sugarcane residues. Other projects are still in the experimental stage and these include biofuel from sweet sorghum under the Plant Research Center in Madani which was started in 2009 and biofuel from Jatropha under the Forest Research Center in Soba that was started in 2008. The Jatropha project has been extended to other areas; to the west of Sudan and to south of the Blue Nile. In General the plan is to plant Jatropha in the low rainfall areas. The Agricultural Institutes under the Ministry of Science and Culture mainly conduct researches of biofuel production.
Turkey
Certain projects are implemented to convert oil bearing seeds (such as sunflower, soya, canola) to biofuels. Turkey’s first bioethanol mixed petrol has been released to the market under the name “Bio-Benzin”. Turkey is also experimenting with safflower (aspir) production. This is especially important as safflower does not require major soil productivity or much irrigation and grows rather quickly without need for complex agricultural practices.
According to Karaosmanoğlu, the main deficiency in the Turkish biofuel sector does not lie in lack of proper investment but rather in lack of standardized planning, programming and implementation.
In 2005 the biodiesel production was estimated at 1,500,000 ton/yr, including the GAP (southeast) region’s potential for lucrative farming. Mehmer Çağlar has estimated that there are 1,900,000 hectares of unused and suitable land in different parts of Turkey with a total annual potential of 1,250,000 tons of biodiesel production.
A vast amount of fertile land is not used for agricultural or any other purpose. Many farmers in rural areas complain about the low gains from conventional crops. Under these conditions, Turkey’s emphasis on biofuel production can be a welcome alternative for the small farmers.
Malta
Malta is totally dependent upon imported fossil fuels for its energy needs, currently over 63% of the primary energy is used for power generation.
Malta is characterized by scarce arable land and limited amount of fresh water resources. Therefore, cultivation of crops for biofuel production is not a feasible or sustainable option. Currently, biodiesel produced are from either locally sourced recycled waste cooking oil or imported vegetable oil.
Sultanate of Oman
Plan from the private sector is on the way in producing and marketing of biofuel from date palm by 2010. The biofuel refinery, to be set up in Sohar, will have a capacity of 4.8 million tones
Regional Evidence Generation and Policy and Institutional Mapping on Food and Bioenergy
22
SSoouutthheerrnn AAddvviissoorryy GGrroouupp
within four years. In the first two years, capacity will be 900 thousand tones annually. The project is expected to create more jobs for Omanis, employing over 3,500 Omanis in the first five years. Kingdom of Saudi Arabia Planting of Jatropha curcas is fast catching up in the region. By 2010, several countries will be producing Jatropha biodiesel, including Egypt and Saudi Arabia. Saudi Arabia has already planted 50,000 dunums of Jatropha as a first stage to its targeted one million dunums (www.americanfuels.info/2008). D1 Oils Arabia will install refineries in Saudi Arabia and expand the D1 Oils brand throughout Saudi Arabia and into other Gulf area countries. The formation of D1 Oils Arabia is expected not only to provide Saudi based customers with innovative alternative renewable fuel solutions, but also help stem desertification and reclaim land by the planting of jatropha on marginalized land. As jatropha is a non-edible crop, D1 Oils is able to irrigate the plantations with wastewater that otherwise would have been difficult to dispose of.
United Arab Emerates (UAE) An UAE-based biodiesel plant will produce 3 million gallons annually of environmentally-friendlier diesel to power vehicles, drastically reducing greenhouse gas emission due to its less toxic content, by the end of 2009 (Gulf News, 2008). Biodiesel will come from a variety of organic sources such as vegetable oils, inedible oils and other biomass, and can be blended with petrodiesel by up to 20 per cent for use in vehicles without any alteration to the engine. EMIRATES BIODIESEL (EmBio) will be focusing largely on waste vegetable oil as feedstock; discarded oils which are derived from crops harvested for human consumption as the primary purpose. Once utilized, the waste oils are then channeled to company. Jordan
Jordan is located in arid and semi arid region, more than 80% of the total area is desert with average rainfall less than 200 mm. Jordan faces a real problem in availability of water. It is considered as one of the tenth poorest water country in the world. The average quantity of water per person is less than 160 cubic meters per year in 2007.
As a result of rising petroleum prices in the last years, the interest to find other alternatives is increased. Producing bio-gas from different source, residues and specialized crops, is considered as one of the alternatives of natural oil. The first station to produce bio-gas is established in 1998 and started its production for the first time in 2000.
Application of bio-fuel technology is new in Jordan, and thus, there are no specific regulations or laws directly related to its adoption. The only general laws that may be related are those pertaining to the protection of the environment. Since 2008, the Ministry of Energy and Mineral Wealth started to prepare the guidelines on exporting, importing, producing, storing and transporting of biodiesel.

Regional Evidence Generation and Policy and Institutional Mapping on Food and Bioenergy
23
SSoouutthheerrnn AAddvviissoorryy GGrroouupp
D. Evidences from LAC Data from Latin America and the Caribbean (Table 6) show that there are still great potential for expansion. Part of the available arable land could be used for energy crops if they come with a well-designed package of policies and programs. They could benefit millions of small-scale producers, who currently live below the poverty line, without compromising forested areas or the food security of the region.
The Latin America region can grouped into three based on each country’s unique position according to the availability of the potential area accessible for planting (Gazzoni, 2009):
a. Low availability: Chile, Dominican Republic, El Salvador, Haiti, Jamaica, Honduras, Trinidad and Tobago, Costa Rica, Belize, Guatemala and Panama. This group of countries has less than 1 million hectares of highly adequate soil.
b. Medium availability: Cuba, Nicaragua and French Guiana, with availability of up to 5 million hectares, which represents a comfortable situation for the domestic supply of biofuels, food and other agricultural products, and a small margin for agricultural exports.
c. High availability: Ecuador, Surinam, Guyana, Paraguay, Uruguay, Mexico, Peru, Venezuela, Colombia, Bolivia, Argentina and Brazil. These countries have between 6 and 343 million hectares available, making it feasible to expand the area for any type of crop, and to possibly provide other countries with food and biofuels.
According to the FAO, with regard to highly adequate soils, the total potential for agricultural expansion in Latin America and the Caribbean is 599.9 million hectares.
When compared to the prospective demand for annual crops (116.0 million ha), perennial crops (9.9 million ha), planted forests (7.7 million ha) and biofuels (9.5 million ha) for the 2010 – 2030 period, this availability establishes a positive demand for only 143.1 million hectares, according to estimates found in the Gazzoni-study(2009). The area under pasture is expected to decrease by some 65.0 million ha.
Considering the data presented in Table 6 and calculating the ratio between cultivable area demanded for the expansion of biofuels and total area still available for agricultural expansion, there are only 2,4 % of total area needed for biofuel expansion.
Table 6. Latin America and the Caribbean. Prospective demand for area used for agriculture - 2010 – 2030 (in million ha).
Year Biofuels Annual crops
Perennial crops
Pasture land Woods Total
Expansion area still available
2005 3.0 144.0 19.8 550.0 12.0 728.8 599.9 2010 5.0 175.0 20.0 557.0 13.3 770.3 558.4 2015 7.0 197.0 22.0 553.0 14.7 793.7 535.0 2020 11.8 215.0 24.4 539.0 16.2 806.4 522.3 2025 12.0 234.0 26.9 516.0 17.9 806.8 521.9 2030 12.5 260.0 29.7 485.0 19.7 806.9 521.8
Increase 2005 to 2030 9.5 116.0 9.9 -65.0 7.7 78.1
Source: Gazzoni, Decio Luiz. Biocombustibles y alimentos en América Latina y el Caribe. San José, C.R.: IICA, 2009.

Regional Evidence Generation and Policy and Institutional Mapping on Food and Bioenergy
24
SSoouutthheerrnn AAddvviissoorryy GGrroouupp
With regard to expanding the area planted with energy crops, a CEPAL study showed the magnitude of the expansion in relation to the current cultivated area. In a mixed scenario for E5, using sugarcane as a raw material, only Mexico would have to expand the current cultivated area 0.4 times, while Panama, Barbados, Jamaica and the Dominican Republic would require 0.2 times the current cultivated area. Argentina, Bolivia, Colombia, Costa Rica, Haiti and Trinidad and Tobago are in a better situation, since they would only have to increase their current cultivated area 0.1 times. Comparatively smaller expansions, representing only 0.06 and 0.01 times the current cultivated area, are needed for countries like Brazil, El Salvador, Guatemala, Honduras, Nicaragua and Cuba. In countries with severe limitations to expand cultivation area, like Chile, adoption of second and third generation biofuels is a more viable option. IV. Institutional Mapping The policy and institutional mapping conducted centered on the smallholder farmers. This is made to clearly establish and better understand how the policy and institutional dimensions of the food and bioenergy interphase truly affect the food availability and livelihood opportunities of the smallholder farmers. Public, private and to some extent civil society organizations (in the case of Africa and Asia) are actively involved in the ongoing biofuel development in each regions, in the range of feedstock production, processing and research and development, as the case may be. However, the lack of coordination between government institutions into biofuel development initiatives within countries and regions are cited. On the part of small farmers, while evidences have indicated better market opportunities and year round livelihood options resulting from biofuel industry development in most of the regions, still they remain to be on the receiving end of the biofuel industry development and are yet to be provided opportunities or venues to actively participate in decision process (i.e. evaluate options) and or help shape the industry of which they are very much a part of. Likewise the need to include other marginalized groups or sectors surfaced like women’s group. A. African Region In contrast to the development of bioenergy policies in other regions of the world, Africa does not have a comprehensive regional policy on biofuels to regulate the growing industry. This lack of a regional policy and strategy has led to underinvestment into biofuels research and development in Africa. The regional economic communities in Africa such as ECOWAS, SADC, AU/NEPD and EAC are playing and must play an important role in supporting the development of the biofuels industry in Africa. A number of international aid organizations are collaborating with different countries in Africa on the generation of the policies (GTZ in Mozambique, SIDA Sewdish Agency in Tanzania, CIRAD -Centre de Coopération Internationale en Recherche Agronomique pour le Dévelopment-in Burkina Faso).

Regional Evidence Generation and Policy and Institutional Mapping on Food and Bioenergy
25
SSoouutthheerrnn AAddvviissoorryy GGrroouupp
Figure 4. Policy and institutional map of food and bioenergy interphase for the African Region.
B. Asian Region The policy and institutional map of food and bioenergy interphase for Asia is shown in Figure 5. The farm of the smallholder farmer essentially provides the feedstock production for biofuels. There is no evident food to fuel conversion of farms in most countries of the region due to Biofuel Policies that restrict the production of non-food feedstock only on marginal areas or wastelands. Food production areas are further protected through the National Food Security Policy. In some areas showing evidences of food to biofuel conversion, food security is nevertheless assured with increased farm income and with designation of food production areas in other parts of the country.

Regional Evidence Generation and Policy and Institutional Mapping on Food and Bioenergy
26
SSoouutthheerrnn AAddvviissoorryy GGrroouupp
Figure 5. Policy and institutional map of food and bioenergy interphase for the Asian Region.
Governments also provide tax and other form of incentives both for the farmers and biofuels industry. Budgets are also allocated for the conduct of research and development that will support the implementation of biofuel programs. Research and development are conducted mostly through government-industry-university collaboration. Other relevant laws are in the form of Environmental Laws that regulates the management of wastes which is a major concern in the processing of biofuels.
Biofuel industry and smallholder farmers have strong relationship in the region. The industry provides both financial and technical supports to the farmers. Marketing assistance and input subsidy has also been provided to the farmers. Another type of support is in the form of delivery incentives wherein higher price is given if the feedstock is delivered to the processing plant.
Another institution that supports the farmers is the educational institutions. The support is in the form of research and development on production of feedstock and processing of biofuels which is being conducted in collaboration with government institutions and the industry.

Regional Evidence Generation and Policy and Institutional Mapping on Food and Bioenergy
27
SSoouutthheerrnn AAddvviissoorryy GGrroouupp
Some countries like India have their government engaged in the actual production of feedstock which provides additional revenue for the state. The government’s engagement in production also boosts the employment and revenues in rural areas.
Other groups that provide support and services to the smallholder farmers are the credit service providers and the farmer cooperatives.
C. WANA Region
Few countries in the Region have comprehensive biofuel policies, and where present, they are often driven largely by agricultural considerations. Policies are urgently required to capture a wide spectrum of activities involving energy, environment, land use, land-use change, forestry, agriculture, water resources, waste management, and transport; and address the economic, social and environmental implications of widespread production, use and trade in biofuels.
The Government encourages the researches in the field of bio-fuel production and supports them by different research centers. On the other hand, there are no specific regulations or polices related to biofuel production. (Figure 6)
International Organizations such as UNDP and GTZ: These organizations with cooperation of the government implement projects in the field of environmental protection include bio-fuel projects.
Figure 6. Policy and institutional map of food and bioenergy interphase for the WANA Region.

Regional Evidence Generation and Policy and Institutional Mapping on Food and Bioenergy
28
SSoouutthheerrnn AAddvviissoorryy GGrroouupp
D. LAC Region The situations in LAC countries present very marked differences regarding the production and use of biofuels. For some countries that have a long tradition with the production and use of bioethanol, technological developments at the different stages of the production chain, a mature automotive industry and a large domestic market would help them become large-scale exporters of that biofuel. In those countries, biofuel production could have a great impact on agricultural activities if it also leads to better management of land and water resources and improvement of existing varieties, as well as the incorporation of new varieties that are adapted to the ecological conditions.
For countries in the region with limited natural resources, some with marked poverty and/or malnutrition and inadequate fulfilment of basic energy requirements, the export option cannot be considered, as it would have adverse effects on different areas of sustainable development.
Figure 7. Policy and institutional map of food and bioenergy interphase for the LAC Region.
Regional Evidence Generation and Policy and Institutional Mapping on Food and Bioenergy
29
SSoouutthheerrnn AAddvviissoorryy GGrroouupp
Some governments as in Chile have several instruments at its disposal to foster the development of the biofuels sector. It provides resources to the relevant agents, who in turn benefit from the participation of the private sector. Resources and support are available for training courses; field trips; technical visits; visits to fairs; technology; the organization of seminars, training sessions and meetings; studies and applied research; technological consortiums, etc. With such tools, the formulation of a consistent and applicable legislative framework on biofuel has been accomplished. moving. Special emphasis is placed on regional and local solutions and the prevention of competition with food crop production. V. Regional and Global Implications The biofuel development potentials at the global and regional levels are enormous. However, they are not without accompanying challenges, oftentimes, unique to each region’s individual situations and needs. The only regional commonality is that, whatever their biofuel development thrusts and programs maybe, the implications on regional food security is always on top of their agenda. A. African Region The production and possibilities for investment on biofuels in Africa need to consider the differences and collection of factors at regional and local levels including geographical location, land use patterns, preferences, income distribution patterns, cultural and social aspects. With these assumptions it is possible to consider that in Africa, there is much scope for improving agricultural productivity. Biofuels can be grown on significant scales without direct effects on food production or natural habitats though some considerations on production, sustainability and policy should be taken into account. More specific implications on the region of food to energy conversion include:
• unlocking the latent potential of southern Africa thus increasing food production that can be brought about by biofuel investment in land, infrastructure, and human resources;
• extending productivity of unproductive dry areas through the cultivation of sweet sorghum and other biofuel crops;
• improving farm management practices to possibly increase yield by as much as three times the present level in order to free up more land for biofuel production; and
• negative impact of displacement of small farmers in some areas due to utilization of their land for biofuel production.
B. Asian Region Biofuel program implementation in the Asian Region will continue and biofuel production can even become a major industry in the future. While some Asian countries were ahead of others, there will definitely be some levelling in the near future. The fact that the current technology relies predominantly on feedstocks from agricultural products, the government should therefore

Regional Evidence Generation and Policy and Institutional Mapping on Food and Bioenergy
30
SSoouutthheerrnn AAddvviissoorryy GGrroouupp
intervene aggressively to protect the present and future food supply and see to it that farmers’ concerns were addressed. For most developing countries, food supply comes mostly from domestic output. It is the role of the government to create an environment favourable to the agriculture sector so as not to jeopardize the supply of at least the staple food for political stability. The volume of food supply should be the main occupation of the government. The future scenario regarding the supply of fossil fuel is not anymore very reassuring as before considering the high demand worldwide and the limited sources. Fortunately, there is biofuel which is renewable energy source, as an alternative to fossil fuel. The demand for biofuel is now being addressed through local supply and/or through importation. China, with its robust economy, would require high amount of biofuel from outside sources. With equally high demand from other developed countries, poor agricultural countries will be vulnerable to enticement by these countries to become future suppliers of biofuel with the possibility of sacrificing local food supply. It would be all up to the government if they will put export of biofuel feedstocks and/or biofuel over local food supply. Philippines had the chance to export biodiesel which were in excess of the blending requirement last year but it may not happen again as blending will be increased in the future. This was not happening yet in other countries. What is currently happening involved diversion in part of harvested agricultural products to produce new products like bioethanol from cassava, corn and cassava, and biodiesel from coconut, soybean and palm oil. Supply of agricultural products for food remains stable. This early farmers were observed to be better off in countries where biofuel program was implemented. Farmers get better and stable price for its commodity as market demands for agricultural products were all of a sudden become unlimited. With the whole year feedstock demand, farmers and other farm sectors can also have a potential year round source of income. Improvement in technology and infrastructure further enhance productivity at farm level. Government should not be remiss of its duty to protect its citizen on this issue of food or fuel, unless it wanted to create political instability. C. WANA Region In WANA region about 80% percent of the land is considered marginal land, and it is used for grazing the Bedouins animals. Using this land for producing biofuel crops will affect the livestock sub-sector in the region.
Marginal lands are particularly important to women. There is evidence, for instance, that in several Sub-Saharan African countries, women are often allocated low quality lands by their husbands. On marginal lands, women have traditionally grown crops for household consumption, rituals and medicinal uses. The conversion of these lands to plantations for biofuels production might therefore cause the partial or total displacement of women’s agricultural activities towards increasingly marginal lands, with negative repercussions for women’s ability to meet household obligations, including traditional food provision and food security. Furthermore, if land traditionally used by women switches to energy crop plantations, the roles men and women play in decision-making concerning household agricultural activities may be altered. In particular,

Regional Evidence Generation and Policy and Institutional Mapping on Food and Bioenergy
31
SSoouutthheerrnn AAddvviissoorryy GGrroouupp
women’s ability to participate in land-use decision-making may be reduced, as the amount of land they control will decline. As crops for biofuel become a major product of agricultural land, there will be pressure to increase the productivity of traditional food crops that will be allocated to reduced amounts of land. These may lead to higher food prices and increase land values that may negatively affect the poor. This possible negative impact can be partially mediated if the pressure on food systems will lead to increased emphasis on research of food production and better utilization of new technologies including biotechnology. In addition, biofuels production may negatively impact the livestock sector, which is key to the food security of rural households, through a reduction in the availability of land for grazing and an increase in the price of fodder (due to the growing use of agricultural commodities for biofuels production). The potential loss of both biodiversity and agro-biodiversity presents risks to food production as well, posing a serious threat to rural livelihoods and long-term food security. D. LAC Region In addition to providing the option of a new agricultural activity, the emergence and current configuration of the global agro-energy and biofuel production chain introduces the possibility of being at the center of a new paradigm, with numerous prospects and challenges. For countries in Latin America and the Caribbean, whether they are producers now, or will be in the future, the development of agro-energy and biofuels means economic, environmental, social and strategic opportunities.
Some of the most relevant results of the implementation of the agro-energy and biofuel production chains are: (a) less dependency on non-renewable energy sources and increased assurance of the continuity of the energy supply; (b) improved environmental conditions due to the reduction of polluting emissions; (c) generating direct and indirect, regional and rural investments and employment, thus creating new possibilities of entry for small and medium-size agricultural enterprises and family-run agricultural activities; (d) product diversification in the agricultural and livestock farming sector; (e) value added to the agro-industrial chain; and (f) an opportunity for the delayed development of regional economies, starting with energy crops in marginal areas (Ganduglia, 2008).
Although biofuel production is relatively low given the overall demand for energy, its potential to cause unexpected adverse effects on land, water and biodiversity is still a major concern. This underscores the importance and necessity of developing and refining instruments such as land-use or economic-ecological zoning, and implementing good agricultural practices (conservation agriculture), all of which are key elements for mitigating the negative externalities of biofuel production. Growing energy crops can cause significant changes in the agrarian structure, such as the increased concentration of production and ownership, and in the emergence of new players and standards. Significant changes in the economic structure could be another potential result,

Regional Evidence Generation and Policy and Institutional Mapping on Food and Bioenergy
32
SSoouutthheerrnn AAddvviissoorryy GGrroouupp
mainly due to the creation of economies of scale, with more pressure on natural resources, ecosystems and agriculture-related employment.
An increased demand for biofuels could also lead to higher prices for energy and non-energy crops and the reduction of products obtained from the production of biofuels. Livestock and forestry would also be affected. The impact on the livestock sector may be manifested through changes in the prices of animal feed. Such an effect could hamper the goal of some countries to strengthen the income of rural areas. VI. Concluding Remarks In general, biofuel development is seen by most countries as a quest for energy security, economic development (particularly, improvement of trade balances and expansion of the agriculture sector), and poverty alleviation (Yan and Tin, 2009). Most countries also have biofuel strategies that are focused around their main agricultural products and new business opportunities.
While evidence generation so far points to minimal indication of food crop to biofuel crop area conversion, the threat to food security out of biofuel development is still a glaring reality. There were issues and concerns raised by different sectors in the society particularly the impact of biofuel program on food supply, since the current technology on biofuel production still relies very much on the utilization of agricultural products for feedstock. Further, it was anticipated that feedstock production may encroach on food production areas. Both sceptics and strong advocates of countrywide mainstreaming of biofuel program were worried that farmers’ source of food and/or income may be affected. Other notable observations across regions include:
• Biofuel programs in most of the regions have given farmers better opportunity to maximize their potential income through the opening of alternative market option for their traditional agricultural markets.
• Policies on biofuel development both current and future should pass through a comprehensive multi agency evaluation that takes into account both short term and long term gains and implications.
• Food security does not only involve issues on land availability, crop selection and production. Other issues that must be considered are trends in national and international markets, speculation, and even activities of middlemen.
• Adequate investment for biofuel development should favor not just the National Economies but also the small producers.
• Strategy of shifting to non-food feedstock for biofuel has unwittingly helped the development of marginal areas which in turn benefited marginal farmers. The benefit to the marginal farmers was further increased through substantial financial and technical supports that were extended not only by governments but also by the industries.
• The biofuel option for the traditional agricultural crops has affected not only the profitability of the produce. It has also affected timing of operations in the farms which
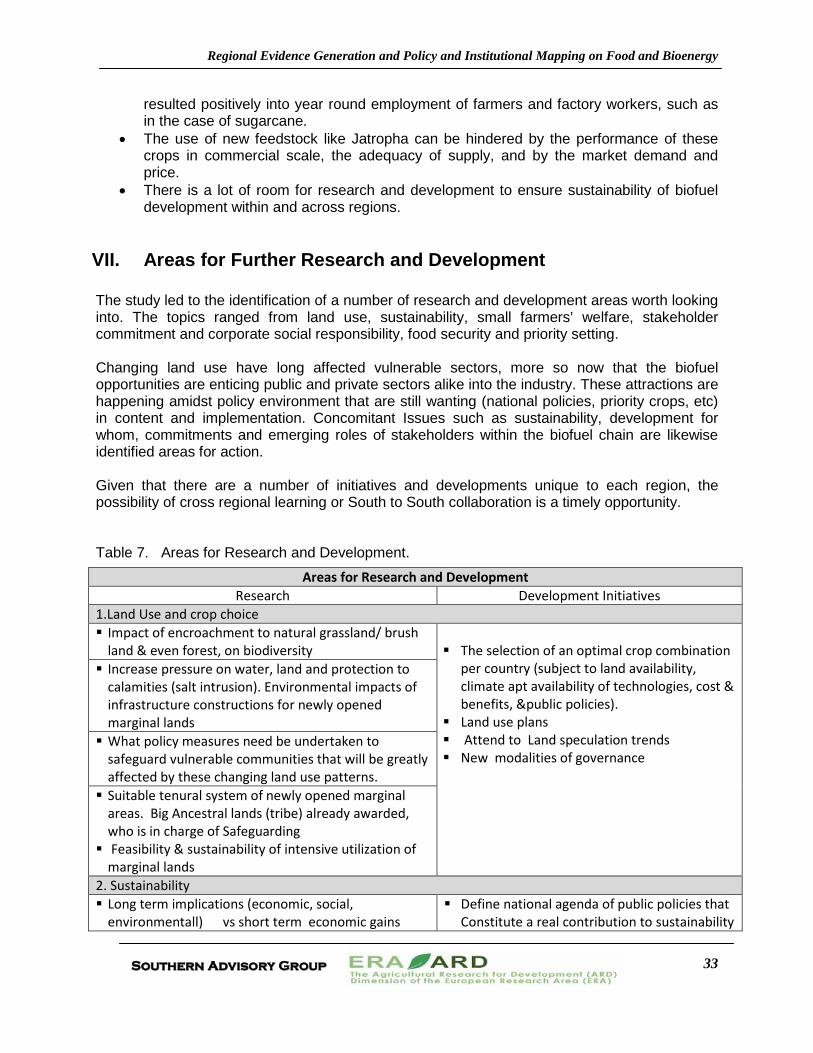
Regional Evidence Generation and Policy and Institutional Mapping on Food and Bioenergy
33
SSoouutthheerrnn AAddvviissoorryy GGrroouupp
resulted positively into year round employment of farmers and factory workers, such as in the case of sugarcane.
• The use of new feedstock like Jatropha can be hindered by the performance of these crops in commercial scale, the adequacy of supply, and by the market demand and price.
• There is a lot of room for research and development to ensure sustainability of biofuel development within and across regions.
VII. Areas for Further Research and Development
The study led to the identification of a number of research and development areas worth looking into. The topics ranged from land use, sustainability, small farmers’ welfare, stakeholder commitment and corporate social responsibility, food security and priority setting. Changing land use have long affected vulnerable sectors, more so now that the biofuel opportunities are enticing public and private sectors alike into the industry. These attractions are happening amidst policy environment that are still wanting (national policies, priority crops, etc) in content and implementation. Concomitant Issues such as sustainability, development for whom, commitments and emerging roles of stakeholders within the biofuel chain are likewise identified areas for action. Given that there are a number of initiatives and developments unique to each region, the possibility of cross regional learning or South to South collaboration is a timely opportunity. Table 7. Areas for Research and Development.
Areas for Research and Development Research Development Initiatives
1.Land Use and crop choice Impact of encroachment to natural grassland/ brush
land & even forest, on biodiversity
The selection of an optimal crop combination per country (subject to land availability, climate apt availability of technologies, cost & benefits, &public policies).
Land use plans Attend to Land speculation trends New modalities of governance
Increase pressure on water, land and protection to calamities (salt intrusion). Environmental impacts of infrastructure constructions for newly opened marginal lands What policy measures need be undertaken to
safeguard vulnerable communities that will be greatly affected by these changing land use patterns. Suitable tenural system of newly opened marginal
areas. Big Ancestral lands (tribe) already awarded, who is in charge of Safeguarding Feasibility & sustainability of intensive utilization of
marginal lands 2. Sustainability Long term implications (economic, social,
environmentall) vs short term economic gains Define national agenda of public policies that
Constitute a real contribution to sustainability

Regional Evidence Generation and Policy and Institutional Mapping on Food and Bioenergy
34
SSoouutthheerrnn AAddvviissoorryy GGrroouupp
(employment ,investment) o investigate the net balance of fossil energy,
(the substitution of petroleum products in domestic consumption, VS consumption of fossil energy throughout all stages of production chains of the biofuels. o in monocultures, assess impacts on social
conditions (labor market, ownership concentration concentration &social distribution of benefits from exploitation.
Prioritization /alignment of objectives (short term gains vs long term costs)
Awareness enhancement of farmers beyond economics (environmental and social consciousness not yet surfacing)
Capacity development need biofuel experts trained on technology transfer
Management capacity of biofuel business Farmers technically equipped on biofuel
technology
3.Farmers’ welfare Safeguarding farmers in terms of sustainability of
markets -research to determine the most appropriate alternative to produce biofuel
Development of Sustainable value chains Regional cooperation through technology transfer : the case of Thailand & the Philippine sugar-ethanol industry
4.Stakeholder commitment and Corporate Social Responsibility To what extent can biofuel industry sector
police their own ranks to ensure socially responsible moves to certify traceability of biofuel production scheme, whether from prime land versus marginal areas
What new roles are expected from various stakeholders
5.Food Security Food security at the national level but at the expense of food security at the household level. Is food security enough to govern food self
sufficiency mindset, if removed what will be the overall implication:
Farmers forced to plant rice for food self sufficiency but whether it leads to food security at household level.
Food security concerns are appeased by knowledge that they are food sufficient (enough stock for next season
6.Priority setting Priorities Look beyond country needs towards Regional
implications. The case of satisfying one country’s need through production in other countries of the region and even across regions . Development plans normally emanating from
developed countries, with food security sacrificed at country level
Independence of countries to decide for the overall welfare of its constituents, oftentimes influenced by donor countries in guise of employment, economic benefits
A closer look at the cooperation among countries on biofuel activities, particularly between
the developed and developing countries. Looking at greater implications (beyond country level) to find a mechanism to police countries’ decisions that are generally donor driven which can sacrifice national & regional long term interests.

Regional Evidence Generation and Policy and Institutional Mapping on Food and Bioenergy
35
SSoouutthheerrnn AAddvviissoorryy GGrroouupp
REFERENCES Clancy, J.S. 2008. Are biofuels pro-poor? Assessing the evidence. The European Journal of
Development Research. 20(3): 416-431. Energy Information Administration (EIA). 2009. International Energy Outlook 2009. http://www.eia.doe.
gov/oiaf/ieo/world.html Henin, Bernard. 2002. Agrarian change in Vietnam’s Northern Upland Region. Journal of Contemporary
Asia. 32(1): 3-28. IEA. Energy Statistics and Balances of Non-OECD Countries. 2003. Paris. International Energy Agency. Is Vietnam the next China? 2008. Crain’s Chicago Business. 31(30). Li, Yang-Rui and Yuan-an Wei. 2006. Sugar Industry in China: R & D and policy initiatives to meet sugar
UNEPand biofuel demand of future. Sugar Tech 8(4):203-216. Marsh S.P., MacAulay T.G. and Hung P.V. (eds) 2007. Agricultural development and land policy in
Vietnam: policy briefs. ACIAR Monograph No. 126, 72p. Marasigan, M.C. 2005. The Philippine Biofuels Program. Second Biomass-Asia workshop. 13-15
December 2005, Bankok Thailand Ministry of Agriculture and Rural Development (MARD). 2009. Ngo, C. and Natowitz, J.2009. Our Energy Future-- Resources, Alternatives, and the Environment. John
Wiley and Sons, New New York. Paritud, B. 2008. Status of Biofuel in GMS. Fifth Biomass-Asia Workshop december 4-6, 2008 Baiyun
International Convention Center, Guangzhou Sanchez, J. and J. Junyang. 2008. Peoples Republic of China, Bio-Fuels Annual 2008. GAIN Report
Number: CH8052. Soaring Food Prices: Facts, Perspectives, Impacts and Actions Required. 2008. High-level
Conference on World Food Security: The Challenges of Climate Change and Bioenergy. FAO. UNEP. 2007. Roundtable on sustainable Biofuels. Summary report. Second regional Stakeholder
Meeting. Michelin Bibendum Challenge – shanghai, China. November 13-14, 2007. UNIDO. 2008. International Conference on Renewable Energy in Africa. Making Renewable Energy
Markets Work for Africa. Policies, Industries and Finance for Scaling up. 16-18 April 2008. UNIDO. Dakar, Senegal.
World Energy Outlook 2009. 2009. OECD/IEA, France. Yan, J. and T. Lin. 2009. Biofuels in Asia. Applied Energy 86:S1-S10.

Regional Evidence Generation and Policy and Institutional Mapping on Food and Bioenergy
36
SSoouutthheerrnn AAddvviissoorryy GGrroouupp
APPENDIX 1
Summary of the in-country assesment of the state of biofuel development in the respective regions in terms of issues, policies, emerging patters and
impacts/future implication.
Appendix 1 a. Summary of the state of biofuel development in China (Asian Region) in terms of issues, policies, emerging patters and impacts/future implications.

Regional Evidence Generation and Policy and Institutional Mapping on Food and Bioenergy
37
SSoouutthheerrnn AAddvviissoorryy GGrroouupp
Appendix 1b. Summary of the state of biofuel development in Vietnam (Asian Region) in terms of issues, policies, emerging patters and impacts/future implications.

Regional Evidence Generation and Policy and Institutional Mapping on Food and Bioenergy
38
SSoouutthheerrnn AAddvviissoorryy GGrroouupp
Appendix 1c. Summary of the state of biofuel development in Thailand (Asian Region) in terms of issues, policies, emerging patters and impacts/future implications.

Regional Evidence Generation and Policy and Institutional Mapping on Food and Bioenergy
39
SSoouutthheerrnn AAddvviissoorryy GGrroouupp
Appendix 1d. Summary of the state of biofuel development in the Philippines (Asian Region) in terms of issues, policies, emerging patters and impacts/future implications.

Regional Evidence Generation and Policy and Institutional Mapping on Food and Bioenergy
40
SSoouutthheerrnn AAddvviissoorryy GGrroouupp
Appendix 1e. Summary of the state of biofuel development in Senegal (African Region) in terms of issues, policies, emerging patters and impacts/future implications.

Regional Evidence Generation and Policy and Institutional Mapping on Food and Bioenergy
41
SSoouutthheerrnn AAddvviissoorryy GGrroouupp
Appendix 1f. Summary of the state of biofuel development in Mali (African Region) in terms of issues, policies, emerging patters and impacts/future implications.

Regional Evidence Generation and Policy and Institutional Mapping on Food and Bioenergy
42
SSoouutthheerrnn AAddvviissoorryy GGrroouupp
Appendix 1g. Summary of the state of biofuel development in Tanzania (African Region) in terms of issues, policies, emerging patters and impacts/future implications.

Regional Evidence Generation and Policy and Institutional Mapping on Food and Bioenergy
43
SSoouutthheerrnn AAddvviissoorryy GGrroouupp
Appendix 1h. Summary of the state of biofuel development in Kenya (African Region) in terms of
issues, policies, emerging patters and impacts/future implications.

Regional Evidence Generation and Policy and Institutional Mapping on Food and Bioenergy
44
SSoouutthheerrnn AAddvviissoorryy GGrroouupp
Appendix 1i. Summary of the state of biofuel development in Zambia (African Region) in terms of
issues, policies, emerging patters and impacts/future implications.
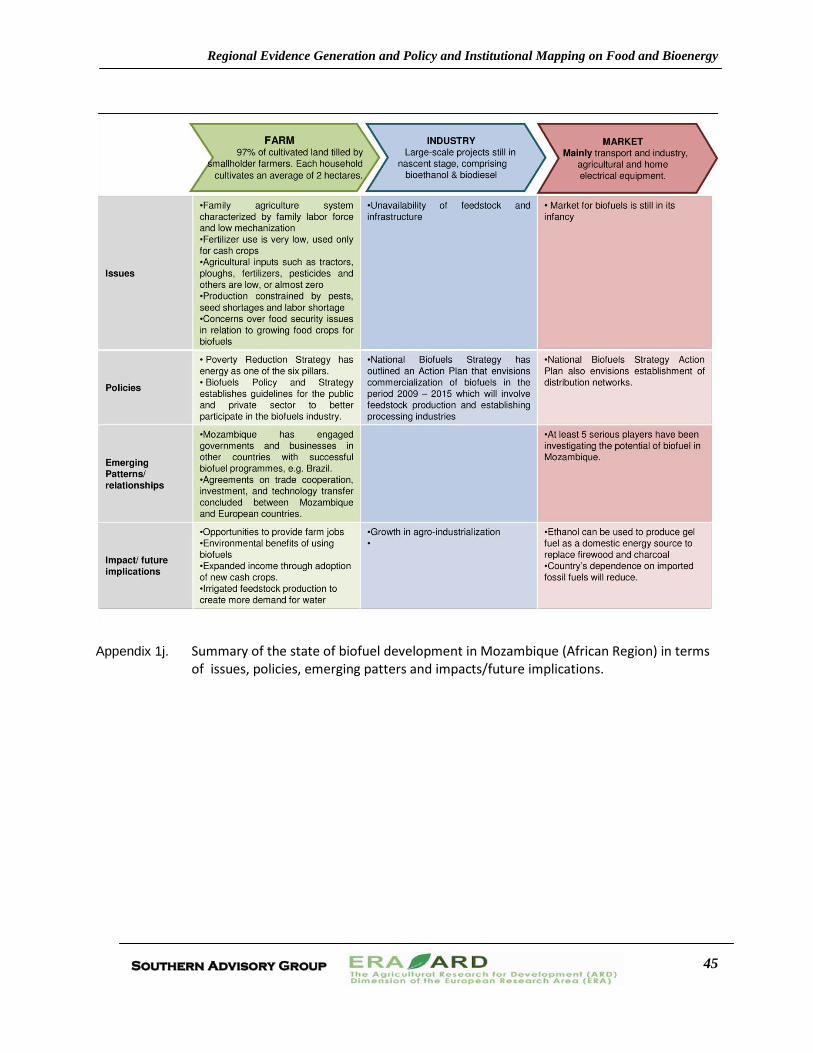
Regional Evidence Generation and Policy and Institutional Mapping on Food and Bioenergy
45
SSoouutthheerrnn AAddvviissoorryy GGrroouupp
Appendix 1j. Summary of the state of biofuel development in Mozambique (African Region) in terms
of issues, policies, emerging patters and impacts/future implications.

Attachments Study 1. Mapping Food and Bioenergy in Africa Study 2. Regional Evidence on the Impact of
biofuel Development on Welfare of Smallholder Farmers (Asia)
Study 3. Biofuel Production, Policy, Institutional Mapping and their Impact on Food and Environment in WANA Region
Study 4. Study on Regional Evidence Generation and Policy and Institutional Mapping on Food and Bioenergy: Latin America and Caribbean-LAC

ERA-ARD, SROs, FARA Africa
1
MAPPING FOOD AND BIOENERGY IN AFRICA
A report Prepared for FARA
February 2010

ERA-ARD, SROs, FARA Africa
2
A report produced on behalf of FARA Main contributors: Author and editor Dr Rocio A Diaz-Chavez – Imperial College CASE STUDIES Senegal Dr Massaër Nguer Mali Dr Sebastian Rodriguez-Sanchez Tanzania Stephen Mutimba, CAMCO Kenya CAMCO Mozambique CAMCO Zambia Dr Helen Watson Ghana Hookyung Kim, Imperial College Reviewer: Dr Jeremy Woods – Imperial College

ERA-ARD, SROs, FARA Africa
3
REPORT CONTENT 1. Introduction and presentation of the report. ....................................................................... 8
2. Africa bioenergy development. ........................................................................................ 11
3. Policy mechanisms to encourage the use of biofuels. ..................................................... 12
4. Land use ......................................................................................................................... 15
5. Existing and potential Biofuel Crops in Southern Africa .................................................. 16
6. SENEGAL CASE STUDY ............................................................................................... 23
6.1 Country’s characteristic: ............................................................................................ 23
6.2 Population size and characteristics ............................................................................ 24
6.3 Gross Domestic Product, Human development Index: ............................................... 24
6.4 Main food crops: ........................................................................................................ 24
6.5 Predominant land characteristics: .............................................................................. 26
6.6 Characteristics of livelihoods: .................................................................................... 26
6.7 Policies in place and link with the bioenergy sector. .................................................. 26
6.8 Biofuel industries/programmes development: ............................................................ 28
6.9 Crops used for Biofuel: .............................................................................................. 29
6.10 Implications for land tenure, water and employment: ............................................... 29
6.11 Mapping of policy and institutions ............................................................................ 30
6.12 Links in biofuels development in Senegal ................................................................ 31
6.13 Summary of biofuels activities implications in Senegal ............................................ 33
6.14 Conclusions ............................................................................................................. 33
7. MALI CASE STUDY ........................................................................................................ 35
7.1 Country’s characteristics. ........................................................................................... 35
7.2 Population Size and Characteristics .......................................................................... 35
7.3 Gross Domestic Product and Human Development Index ......................................... 36
7.4 Main food crops ......................................................................................................... 36
7.5 Predominant land characteristics ............................................................................... 37
7.6 Characteristics of livelihoods ..................................................................................... 37
7.7 Policies in place and link with the bioenergy sector ................................................... 38
7.8 Biofuels industry/programmes development ............................................................. 39
7.9 Crops used for biofuels .............................................................................................. 39
7.10 Implications of conversion of Biofuel raw material .................................................... 41
7.11 Mapping of the institutions: ...................................................................................... 43
7.12 Links in biofuels development in Mali ....................................................................... 51
7.13 Summary of biofuels activities implications in Mali ................................................... 53
7.14 Conclusion ............................................................................................................... 53
8. TANZANIA CASE STUDY ............................................................................................... 55
8.1 Country’s Characteristics ........................................................................................... 55
8.2 Population Size and Characteristics .......................................................................... 56
8.3 Gross Domestic Product, Human Development Index and Poverty Levels ................ 57
8.4 Main food crops ......................................................................................................... 58
8.5 Main Agricultural and Food Crops Imports/Exports .................................................... 58
8.6 Characteristics of Livelihoods in Farming Systems .................................................... 58
8.7 Policies in Place and Link with the Bioenergy Sector ................................................. 59
8.8 Biofuels Industry/Programmes Development ............................................................. 60
8.9 Crops Used for Biofuels: ............................................................................................ 61

ERA-ARD, SROs, FARA Africa
4
8.10 Implications of Conversion of Biofuels Raw Material ................................................ 62
8.11 Mapping of Policy and Institutions and Links with Bioenergy ................................... 62
8.12 Links in Biofuels Development in Tanzania .............................................................. 64
8.13 Summary of the biofuels activities in Tanzania ........................................................ 65
8.14 Conclusions ............................................................................................................. 65
9. KENYA CASE STUDY .................................................................................................... 67
9.1 Country’s characteristics ............................................................................................ 67
9.2 Population Size and Characteristics .......................................................................... 70
9.3 Gross Domestic Product, Human Development Index and Poverty Levels ................ 70
9.4 Main food crops ......................................................................................................... 71
9.5 Main Agricultural and Food Crops Imports/Exports .................................................... 71
9.6 Characteristics of Livelihoods in Farming Systems .................................................... 72
9.7 Policies in Place and Link with the Bioenergy Sector ................................................. 72
9.8 Biodiesel Programmes ............................................................................................... 75
9.9 Crops Used for Biofuels ............................................................................................. 76
9.10 Implications of Conversion of Biofuels Raw Material ................................................ 78
9.11Mapping of Policy and Institutions and Links with Bioenergy .................................... 79
9.12 Links in Biofuels Development in Tanzania .............................................................. 82
9.13 Summary of the biofuels activities implications in Kenya ......................................... 84
9.14 Conclusions ............................................................................................................. 84
10. ZAMBIA CASE STUDY ................................................................................................. 86
10.1. Country’s Characteristics ........................................................................................ 86
10.2. Population characteristics ....................................................................................... 89
10.3. Gross Domestic Product, Human Development Index and Poverty Levels ............. 89
10.4. Food security .......................................................................................................... 91
10.5. Main Crops: Production, Imports/Exports. ............................................................... 92
10.6 Characteristics of Livelihoods .................................................................................. 93
10.7 Policies Linked to Bioenergy Sector ......................................................................... 94
10.8 Biofuels Development Status ................................................................................... 94
10.9 Crops Used for Biofuels ........................................................................................... 95
10.10 Implications of Biofuels Production on Water and Employment.............................. 96
10.11 Stakeholder Roles and Views ................................................................................ 96
10.12 Links in biofuels development in Zambia ............................................................... 97
10.13 Summary of biofuels activities implications in Zambia ............................................ 98
10.14 Conclusions ........................................................................................................... 98
11. MOZAMBIQUE CASE STUDY ...................................................................................... 99
11.1Location .................................................................................................................... 99
11.2 Population Size and Characteristics ...................................................................... 100
11.3 Gross domestic product ......................................................................................... 100
10.4 Main food crops ..................................................................................................... 101
11.5 Main Agricultural food products imports and exports ............................................. 102
11.6 Characteristics of livelihoods ................................................................................. 102
11.7 Policies in place ..................................................................................................... 103
11.8 Biofuels industry programmes development .......................................................... 103
11.9 Crops used for biofuels .......................................................................................... 104
11.10 Expected end use of biofuels ............................................................................... 104
11.11 Mapping of policies and institutions ..................................................................... 104
11.12 Links in Biofuels Development in Mozambique .................................................... 105

ERA-ARD, SROs, FARA Africa
5
11.13 Summary Mozambique ........................................................................................ 106
11.14 Conclusions ......................................................................................................... 106
12. GENERAL CONCLUSIONS ........................................................................................ 108
13. GENERAL REFERENCES .......................................................................................... 110
13.1 References by Case study ..................................................................................... 111
14. ANNEXES ................................................................................................................... 117
Annex 1. ........................................................................................................................ 117
Annex 2. Case study Ghana .......................................................................................... 120

ERA-ARD, SROs, FARA Africa
6
LIST OF TABLES Page Table 1. Projected Final Biomass Consumption in Relation to Total Energy Use, 2000 and 2020 (UNIDO, 2008).
10
Table 2. Total Final Energy Supply Including Biomass Energy in Africa (UNIDO, 2008).
11
Table 3. Examples of African Countries policy, laws and programmes related to biofuels
14
Table 4. Land availability in Malawi, Mozambique and Zambia (Watson, 2008).
17
Table 5. Cassavaa production and use in 1993, and projected to 2020 (Scott et al. 2000) in Tonukari, 2008).
18
Case studies
Table 6.1 . Main crops in Senegal by hectare and tons 25 Table 6.2 Top 10 main agricultural and food crops imports 25 Table 6.3 Top 10 export of main agricultural and food crops 25 Table 7.1 Agricultural production in Mali (Thousands of Tons) 36 Table 8.1 Population trend in Tanzania 57 Table 8.2 Major agricultural crops in Tanzania. 58 Table 9.1 Viable Biofuel crops in Kenya 77 Table 9.2 Biofuel feedstocks prices in 2008 in Kenya 78 Table 10.1 Zambia’s Economic Indicators (adapted from DFAT, 2009) 90 Table 10.2 typical crops grown in Zambia’s three agro-ecological zones l 92 Table 10.3 2004 production status of potential biofuels feedstocks in Zambia
95
Table 11.1 Mozambique’s agriculture statistics 102

ERA-ARD, SROs, FARA Africa
7
LIST OF FIGURES Page Figure 1. Map of Africa and selected countries. 7 Figure 2. Diagram for Mapping of policies and institutions. 9 Figure 3. Land area, arable land area and forest area in different countries in Africa (Source: FAOSTAT, 2008).
10
Figure 4. Land covers unsuitable for bioenergy crops in Africa 15 Fig. 5. Areas that are unsuitable and /or unavailable for bioenergy crops in sub-Sahara’s arid and semi-arid regions
15
Figure 6. Arable land area evolution in selected African countries 1970-2005
16
Figure 7. Forest area evolution in selected African countries 1970-2005 16 Figure 8. Production, yield and area harvested of sorghum in the four case study countries of Botswana, Mozambique, South Africa and Zimbabwe (source: FAOSTAT, 2004).
19
Figure 9. Soybean area harvested for Southern African countries since 1970.
20
Figure 10. Sunflower area harvested for Southern African countries since 1970.
21
Figure 11: Map of Tanzania showing location relative to its neighbours 20
Case studies
Figure 6.1 Map of Senegal 23 Figure 7.1 Map of Mali 35 Figure 7.2 Evolution of selected agricultural products in Mali 36 Figure 8.1 Map of Tanzania 55 Figure 8.2 Tanzania’s GDP 57 Figure 9.1: Map of Kenya 67 Figure 9.2 Agro-Climatic Zones of Kenya 68 Figure 9.3: GDP Composition by Sector in Kenya 71 Figure 10.1: Map of Zambia 86 Figure 10.2: Relative importance of Zambia’s economic activities in 1996 87 Figure 10.3 Map showing Zambia’s three major agro-ecological zones 88 Figure 10.4: Production trends in food staples in Zambia 91 Figure 11.1: Map of Mozambique 99

ERA-ARD, SROs, FARA Africa
8
1. Introduction and presentation of the report.
According to the concept note from FARA this proposal will focus in Africa to fulfil the following objectives:
a. Generate regional evidence on the frequency of the conversion of cash food crops to biofuels.
b. Determine perceived issues and concerns of this conversion by sector (regional, national, household).
c. Establish early indication of the impact (trends, patterns) to anticipate future scenarios.
d. Undertake policy and institutional mapping as well as analysis to better understand the policy and institutional dimensions of the food and bioenergy interphase.
Report Approach: According to the development and interest of bioenergy production in Africa, this report will focus in a selection of countries in order to cover different regions from Africa.
• West Africa: Senegal and Mali • East Africa: Kenya and Tanzania • Southern Africa: Mozambique and Zambia
Figure 1 shows the map of Africa and in red lines the countries considered for the report. Ghana mapping of policies and institutions is included as a reference. The selected countries are those where more data is available and where relevant biofuel production is taking place. Other countries such as South Africa also have biofuel production but considering the GDPs of the continent those with more risk for impacts were selected.
Figure 1. Map of Africa and selected countries. Source: http://www.africamap.com/ According to ERA-ARD, the following are the expected outputs of the project:
1. Report on the impact of food to biofuel conversion inclusive of the; a. Detailed methodology, data summary and analysis b. Extent of cash food crops to biofuel conversion c. Issues and concerns of conversion phenomena

ERA-ARD, SROs, FARA Africa
9
d. Early indications of the impact of conversion on smallholder farmers food security and livelihood sustainability
For each country the following points will be included according to availability of data.)
1. Country’s characteristics: o location o geographical characteristics (including weather variables and fluctuations in
recent past) o environmental characteristics (Tendencies for desertification, flood and other
natural disaster) o population size
2. Population size and characteristics (gender) 3. Gross Domestic Product, Human Development Index and 4. Countries food sufficiency index including net importation / exportation of food items. 5. Main food crops (land, yields) 6. Predominant soil characteristics ( soil type, primary rock, production potentials and
resilient indicators) 7. Main agricultural and food crops imports/exports 8. Characteristics of livelihoods: average income for farmers; type of property in farms
(private, communal, tribal); 9. Policies in place: agriculture, energy, environment, land use, other. Link with the
bionergy sector 10. Biofuels industry/programmes development : main crops (potential crops), land used,
projects associated, technical conversions in practice 11. Crops used for biofuels:
o type and conversion technology (if known) o market (raw material) o end use (community energy generation) o Price payed to the farmer (in assets or cash) or if farmer is employed average
salary o Implications for land tenure, water and employment (these may be the most
relevant) 12. If conversion of raw material is taking place mark the implications for:
o Water use o employment
13. For the mapping of policy and institutions: o First hand players (e.g. if an investor wants to start a project which first
institution needs to approach) o National Ministries/Secretariats involved in the bioenergy
planning/applications o Directions involved in the bioenergy planning/applications o Regional and Local authorities involved in bioenergy plans, programmes,
projects o NGOS involved o Other stakeholders identified.
The report on institutions follows a top-bottom approach in order to map institutions involved (or not involved) in biofuel development. The focus considered was based on government (particularly ministries of energy and agriculture), private sector, NGOs, and CBOs. If available data for case studies is possible to gather, it will be integrated for the better understanding of the development of the industry and relative impacts on food production or security. The methodology for the mapping of policy and institutions firstly identifies the stakeholders for bioenergy crops and agriculture at national level. Then stakeholders at the productive

ERA-ARD, SROs, FARA Africa
10
level including NGOs, farmers, other civil organisations and the industry sector (including also farmers with different forms of participation (e.g. outgrowers). We considered a quadrate to include stakeholders from the local government, the national government, NGOs (including other civil organisations) and industry. These last two may include also farmers but at different levels of organisation. The links between these different bodies and stakeholders are expressed with the lines as direct, indirect or needed and the closer they are the closer the relationship is or should be.
Figure 2. Diagram for Mapping of policies and institutions.
Regional/Local authorities, regulations
National authorities, regulations
Stakeholders Industry level, Local producers, including NGOs, farmers hired
Stakeholders productive level small scale regulations, including NGOs, farmers, outgrowers
Key:
Direct links (--------)
Indirect links (-.-.-.-.)
Needed links (..........)

ERA-ARD, SROs, FARA Africa
11
2. Africa bioenergy development.
Africa biomass energy resources vary geographically and are not uniformly distributed (Karekezi, et al. 2008). Biomass energy use depends on a number of issues including geographical location, land use patterns, preferences, cultural and social factors. Income distribution patterns also contribute to variations in biomass energy use, with poorer African countries relying on traditional forms of biomass, and wealthier African countries using more modern biomass energy technologies (Karekezi et al, 2008). Figure 3 shows comparative areas in different countries in Africa in 2005, where forest area and arable land extension is compared to land area data.
Comparative areas in different countries in Africa
0200004000060000
80000100000120000140000
Moz
ambiq
ue
Tanza
nia
Zambia
Mala
wi
Kenya M
ali
Burkin
a Fas
o
Seneg
al
South
Afri
ca
Botsw
ana
1000 h
a Land area
Arable land 2005
Forest area 2005
Figure 3. Land area, arable land area and forest area in different countries in Africa (Source: FAOSTAT, 2008). In Africa, available estimates indicate that by 2020, biomass energy use is expected to increase roughly at the same rate as population growth rates (IEA, 2003), resulting in insignificant changes in the share of biomass in total final energy supply. In contrast, the share of biomass in total final energy supply in developing countries as a whole (Africa, Asia and Latin America) is expected to decrease in the same period particularly for Asia and Latin America which are expected to register a substantial reduction (Table 1). Table 1. Projected Final Biomass Consumption in Relation to Total Energy Use, 2000 and 2020 (UNIDO, 2008). Country/Region
2000 2020
Biomass Mtoe
Conventio-nal Energy Mtoe
Total Mtoe
Share of biomass (%)
Biomass Mtoe
Conventio-nal Energy Mtoe
Total Mtoe
Share of biomass (%)
China 214.48 943.4 1,157.9 18.50 224 1,524 1,748 13.00 Asia 343.20 467.74 810.94 42.30 394 1336 1730 22.80 Latin America
69.34 284.96 354.30 19.570 81 706 787 10.00
Africa 221.10 1,57.37 378.47 58.40 371 260 631 59.00 Total non OECD
859.65 2,417.86 3,277.51
26.23 1,097 5,494 6,591 17.00
OECD countries
126.17 3,551.32 3,677.49
3.40 96 3,872 3,968 2.00
World 985.2 5,969.18 6,955 14.20 1,193 9,365 10,558 11.00

ERA-ARD, SROs, FARA Africa
12
The low per capita national incomes as well as the slow growth in conventional energy use, influences the heavy reliance on biomass energy in Africa and it is unlikely change in the near future. Estimates indicate that by 2020, traditional biomass energy use is expected to increase roughly at the same rate as population growth rates (IEA, 2002), resulting in modest changes in the share of biomass in total final energy supply (Table 2). On the contrary, the share of biomass in total final energy supply in developing countries is expected to decrease in the same period. According to the IEA (in UNIDO, 2008), the absolute number of people relying on biomass energy in Africa is also expected to increase between the year 2000 and 2030 - from 583 million to 823 million, an increase of about 27% Table 2. Total Final Energy Supply Including Biomass Energy in Africa (UNIDO, 2008). 2020 Annual growth Rate (%)
2002-2020 Biomass (Mtoe) Share of biomass in
total supply (%) Biomass
Africa 367 43 1.9 Total developing countries
1,127 18 1.1
World 1,428 10 1.4 Source: IEA, 2003 in UNIDO (2008).
Production of biofuels (bioethanol and biodiesel) in Africa is likely to increase, in order to meet the demand for biofuels in advanced economies in the EU and the Far East (Lula Da Silva, 2007 in Karekezi et al, 2008). Nevertheless, it is necessary to apply sensitive and equitable management as large-scale modern biomass energy development can lead to further marginalisation of the rural poor. However, the growth and development of modern technologies could provide better incomes particularly for smallholders. Mauritius provides a model case example of where a share of the benefits from large-scale co-generation plants that flow to low-income farmers have increased over time through direct policy interventions and an innovative revenue sharing mechanism (Deepchand, 2002; Karekezi et al, 2002 in Karekezi, 2008).
3. Policy mechanisms to encourage the use of biofuels.
Policy and regulatory support is necessary for the successful implementation of improved and modern bioenergy projects. There are a number of international, national and regional initiatives in Africa regarding policies and plans. For instance, the 2007 Addis Abba Declaration that emanated from the First High Level meeting of African bioenergy stakeholders, committed the continent to sustainable bioenergy development. The Seminar was organised by The African Union Commission along with the United Nations Industrial Development Organisation (UNIDO) and the Brazilian government. The political declaration put out will, among other things, facilitate: a) the development of an enabling policy and regulatory frameworks for biofuels development in Africa b) the formulation of guiding principles on biofuels to enhance Africa’s competitiveness while minimizing the risks of biofuels development for small-scale producers c) the encouragement of the engagement of development partners to enable North- South and South-South cooperation in biofuels development (Jumbe and Msiska, 2007).

ERA-ARD, SROs, FARA Africa
13
The meeting also called for the engagement of public financing institutions to support biofuels projects and proposed the establishment of a forum to promote access to biofuels information and knowledge (IISD/UNIDO, 2007). Some examples of current legislation or programmes either directly related to biofuels production or related to issues regarding its production are presented in Table 3. Furthermore, some other initiatives are present in the continent, such as the South African Biofuel Association, the Biofuels Association of Zambia, the Programme for Basic Energy and Conservation (ProBEC) which is a Southern African Development Community (SADC) project, implemented by the German Development Co-operation (GTZ). In contrast to the development of bioenergy policies in other regions of the world, Africa does not have a comprehensive regional policy on biofuels to regulate the growing industry. This lack of a regional policy and strategy has led to underinvestment into biofuels research and development in Africa. The regional economic communities in Africa such as ECOWAS, SADC, AU/NEPD and EAC are playing and must play an important role in supporting the development of the biofuels industry in Africa. A number of international aid organisations are collaborating with different countries in Africa on the generation of the policies (GTZ in Mozambique, SIDA Sewdish Agency in Tanzania, CIRAD - Centre de Coopération Internationale en Recherche Agronomique pour le Dévelopment- in Burkina Faso) (see Annex 1).

ERA-ARD, SROs, FARA Africa
14
Table 3. Examples of African Countries policy, laws and programmes related to biofuels. Country Policy Documents Strategies on Biofuels Implementation Tanzania • Forest policy (1998)
• Energy policy of (2003) • Environmental policy of
(1997) • Land policy of (1997).
• Agriculture policy (1997). • National Biofuels Task
Force (2006) • The Land Act (199) and the
Village Act (1999)
• To ensure sustainable supply of forest products and services by maintaining sufficient forest area under effective management
• Promote efficient biomass conversion and end-use technologies; reduce rate of deforestation and land degradation
• Investment in Biomass development • Tanzania general underlying right to land, but clearly
recognizing and clarifying customary and other use rights to land.
• To promote sustainable food security, income generation, employment growth, and export
• To facilitate the ongoing and potential biofuels initiative; to conduct a Policy and regulatory Environmental scan; to develop guidelines for biofuels development.
• Land in Tanzania to be “ Public land” and are held by the
state for public purposes.
South Africa • White Paper on Energy Policy (1998)
• Draft Energy Efficiency
Strategy (Dept of Minerals and Energy)
• White Paper on Renewable Energy (2003)
• Draft Biofuel Strategy has
been released and approved by DME in Dec 2006
• Renewable Energy Subsidy Scheme (2006/07)
• Department of Agriculture • Central Energy Fund (CEF)
• To guarantee access to safe, reliable and affordable energy; to liberalise the energy sector and to introduce greater levels of competition in electricity markets.
• Target for energy efficiency improvement of 12% by 2014 • Target of 10.000 GWh of renewable energy contribution to
final energy consumption by 2013. The renewable energy is to be utilised for electricity generation (4% of projected electricity demand), heat and biofuel production.
• Addresses policy, regulations and incentives for biofuel industry. It proposes a 4.5 percent use of biofuels in liquid road transport fuels (gasoline and diesel) by 2013.
• Proposes a maximum capital subsidy of 16.7 SA¢/l provided
for bio-ethanol plants and 27.3 SA¢/l for biodiesel • Agriculture programmes to support small scale farmers and
emerging farmers for better targeted biofuel production. • Originally created for promoting synthetic fuel production can
be extended to the promotion of biofuel Burkina Faso • National Energy Sector
• Law N°005/97/ADP from
January 1997 on environmental issues
• National Strategy under
development • Energy and poverty
alleviation policies (2000)
• Not regulated • To observe the interdependence between environment and
socio-economic development; to ratify international agreements concerning environment conservation; to protect the future generations from environmental degradation.
• For the regulation of wood fuel trade • To develop the energy administration (organisation capacity
and policy formulation); to enhance efficient energy supply options (electricity, hydrocarbons, woodfuel, renewable energies); to provide socio- economic development and to alleviate poverty.
Mozambique • Urban Programme – Maputo, since 2006
• Rural Programme – Manica, since 2004 and Sofala, since 2007
• Biofuel Component – since mid 2007
National Biofuel Task Force of Mozambique
All programmes within PROBEC • To develop national sustainable criteria for biofuel production.
Zambia • National Energy Policy • No biofuels inclusion

ERA-ARD, SROs, FARA Africa
15
(NEP1994) • Reviewed in 2004 • Biofuels Act
• Government should ensure that it makes available land for
biofuels production in a transparent form • Allocation of land for growing of energy crops should not
compromise food security and priority is given to Zambians • There should be no sale of land. • Under development to stand alone
Source: COMPETE country reports on biofuels policy (2007) In terms of policies and regulations, one of the issues that deserves special attention is the land use tenure scheme in some African countries. The land is considered to be a national asset and can only be leased. Moreover, the right of occupancy can also be “revoked” if necessary (Tanzania). In the case of Zambia, there should not be sale of land involved in any development agreements entered into with the Minister.
4. Land use
Using GIS (Geographical Information System), the COMPETE project - Competence Platform on Energy Crop and Agroforestry Systems for Arid and Semi-arid Ecosystems - Africa (2007) researched, using various databases, the available land (arid and semiarid) for biofuels in Africa. As a precaution against detrimental impacts on biodiversity, all categories of protected areas, closed canopy forests and wetlands were designated as unavailable for bioenergy crop production and filtered out from the regions shown in the base map (Figure 4) (Watson, 2008). Watson concluded that the surfaces remaining as available and/or suitable for bioenergy crop production are: closed or sparse grassland, open grassland with sparse shrubs, open deciduous shrubland, deciduous shrubland with sparse trees, deciduous woodland, mosaic forest/cropland and mosaic forest/savanna (Figure 5). Grasslands and woodlands particularly in sub Sahara’s semi arid and arid regions generally have a very high biodiversity and play a very significant role in environmental services and rural livelihoods (Watson, 2008).
Figure 4. Land covers unsuitable for bioenergy crops in Africa
Fig. 5. Areas that are unsuitable and /or unavailable for bioenergy crops in sub-Sahara’s arid and semi-arid regions
Figures 6 and 7 show the variation in arable land area and forest area between 1970 and 2005 for a range of countries. The largest variation is observed in Tanzania, where the forest area has decreased by 6 184 000 ha in this period. South Africa has seen the most noticeable change in arable land, during the 1990s.

ERA-ARD, SROs, FARA Africa
16
Arable land
0
2000
4000
6000
8000
10000
12000
14000
16000
1970
1973
1976
1979
1982
1985
1988
1991
1994
1997
2000
2003
10
00 h
aMozambique
Tanzania
Zambia
Malawi
Kenya
Mali
Burkina Faso
Senegal
South Africa
Botswana
Forest Area
0
5000
10000
15000
20000
25000
30000
35000
40000
45000
1990
1991
1992
1993
1994
1995
1996
1997
1998
1999
2000
2001
2002
2003
2004
2005
1000 h
a
Mozambique
Tanzania
Zambia
Malawi
Kenya
Mali
Burkina Faso
Senegal
South Africa
Botswana
Figure 6. Arable land area evolution in selected African countries 1970-2005
Figure 7. Forest area evolution in selected African countries 1970-2005
Furthermore, the project presented case studies in South Africa, Botswana, Zambia, Tanzania, Kenya, Mali, Burkina Faso and Senegal. A second set of maps used the semi arid and arid regions of each of these countries in turn as a template on which available and suitable areas for bioenergy crop production, roads, railroads, rivers and populated places are sequentially shown and variously labelled (Watson, 2008). These maps also included data from ESRI (2006) on populated places. For instance, Mozambique has immense agricultural potential, with an estimated 36 million hectares of arable land, of which only 10 percent is presently in productive use (see figures 8 and 9). The wide diversity of soil types and the diverse climatic conditions in the country are suitable for a large variety of crops. Most of the agriculture practised in Mozambique is non-irrigated. However, Mozambique’s network of more than 60 rivers has allowed for the construction of irrigation schemes. Total potential irrigated area is estimated at 3.3 million hectares. At present the agricultural sector is still dominated by the family sub-sector which accounts for 90 percent of the cultivated areas and includes 2.5 million households. This sub-sector relies on rain-fed farming and has very basic techniques resulting in low yields. The remaining arable land is cultivated by large commercial farms that concentrate on cash and export crops (SADC, 2008). The specific habitat requirements of various bioenergy crops needs to be evaluated in order to identify the best potential candidates in different parts of each country. The current area used for main bioenergy crops (sugarcane, jatropha and sweet sorghum) is presented in the next section.
5. Existing and potential Biofuel Crops in Southern Africa
Smeets et al. (2004) revealed that compared to all the world’s major regions, sub-Saharan Africa has the greatest bioenergy potential as a result of large areas of suitable cropland, large areas of unused pasture land and the low productivity of land under agriculture (Watson, 2008). There are six main crops for producing first generation biofuels in Southern Africa: sugar cane, sweet sorghum, cassava, jatropha, maize, soybean and sunflower. Sugar Cane (Saccharum spp.) Most of the land suitable for sugar cane production in South Africa is already being used as such. Therefore the potential for expansion in that particular country is limited (Watson, 2007). Irrigated land in the Republic of South Africa (RSA) increased in late 1990s but now stringent legislation has been brought in to protect the scarce water resources. Therefore,

ERA-ARD, SROs, FARA Africa
17
unless drought tolerant varieties are introduced, this too will be a limiting factor in the country, making it an unlikely candidate for bioenergy in arid and semi-arid areas. However, in Southern Africa as a whole, Phillips (2002) estimated that a 50% increase in the region’s 2000 sugarcane production, would require expansion of 200 000 ha of land and create 100 000 jobs. Using GIS, it was discovered that large areas of land are available and suitable for sugar cane cultivation, especially in Mozambique, Malawi and Zambia. The analysis suggests that ‘land’ is unlikely to be a limiting factor in harnessing sugarcane’s bioenergy potential (Watson, 2007). Indeed, between the three mentioned countries, it was estimated that more than 3,700,000 ha were available for sugar cane expansion, as illustrated in Table 4. Table 4. Land availability in Malawi, Mozambique and Zambia (Watson, 2008). Malawi Mozambique Zambia
1000ha % 1000ha % 1000ha % Country area 9408 78409 74339 Potentially suitable for sugarcane 742 7.9 4906 6.3 3546 4.8 Protected areas filtered out 595 6.3 4602 5.9 2433 3.3 Slopes > 16% filtered out 580 6.2 4530 5.8 2427 3.3 Crops & wetlands filtered out 316 3.4 3773 4.8 1726 2.3 Existing sugarcane filtered out 314 3.3 3771 4.8 1726 2.3 Areas < 500 ha filtered out 256 2.7 3470 4.4 1485 2.0 Unsuitable soils & rainfall filtered out 206 2.2 2338 3.0 1178 1.6 As Johnson et al. (2006) note, the potential of these countries alone is greater than the current production of cane in SADC. Furthermore, they draw attention to the fact that the areas identified in these countries are better suited for cane-growing than much of the land that is under cane in South Africa and Mauritius. The IGBP/IHDP (1995) data suggests that substantial areas of Angola are suitable for sugarcane production. Now that the country is politically stable and cleared of landmines, a similar GIS analysis to that described above is currently being carried out under the Competence Platform on Energy Crop and Agroforestry Systems for Arid and Semi-arid Ecosystems – Africa (COMPETE, 2008). According to a recent scoping study from E4tech (2006) for the DTI (BERR), southern (SADC) Africa and the rest of Africa have similar amounts of land available for sugar cane expansion. This was based on the assumption, validated by local experts from industry, academia and NGO’s, that it could be feasible to expand sugar cane production from its current 0.7M ha to around 1.5M ha in the region within the next 10 to15 years (E4Tech, 2006). This would be enough to satisfy twice as much the current regional consumption of sugar and in addition produce up to 7.3 billion litres of bioethanol each year. This volume of bioethanol could replace around 30% of the gasoline required by the projected southern African gasoline vehicle fleet of 17 million cars by 2020. Alternatively, if blended into gasoline at a 10% rate, it could fuel between 50 and 60 million gasoline cars (E4tech, 2006). Cassava (Manihot esculenta) Cassava also called manioc, tapioca or yuca, is one of the most important food crops in the humid tropics, being particularly suited to conditions of low nutrient availability and able to survive drought (Tonukari, 2004). Compared to other crops, cassava excels under suboptimal conditions, offering the possibility of using marginal land to increase total agricultural production (Cock, 1982, in Tonukari, 2004). Cassava is also used to produce starch for industrial use and other products used in processed food. Sub-Saharan Africa is expected to experience the most rapid growth in food demand in root and tubers averaging 2.6 percent per year through 2020 (Scott et al. 2000 in Tonukari, 2004). This growth will

ERA-ARD, SROs, FARA Africa
18
account for nearly 122 million metric tons with most of the increase coming largely from cassava, 80 million metric tons (66% of the total). Table 5 shows the Cassavaa production and use in 1993, and projected to 2020 (Scott et al. (2000) in Tonukari, 2008). Table 5. Cassava production and use in 1993, and projected to 2020 (Scott et al. 2000) in Tonukari, 2008).
Ethanol can be produced from three main types of biomass raw materials: (a) sugar-bearing materials (such as sugarcane, molasses, and sweet sorghum); (b) starches (such as corn, cassava, and potatoes) and (c) celluloses (such as wood and agricultural residues) whose carbohydrate form is more complex (Thomas and Kwong, 2001). Some scenarios for major future expansion have on the cooking market, in which ethanol – made maize, sugar cane, sweet sorghum, cassava, and sweet potatoes – would be used to make gelfuel that would substitute for fuel-wood or charcoal (Utria, 2004, in Johnson and Matsika, 2006). For ethanol purposes it has to consider the higher cost to produce ethanol from starch than form sugar (Thomas and Kwong, 2001). Sorghum and Sweet Sorghum (Sorghum bicolor L. Moench) Sweet sorghum can be grown in a larger area of the Republic of South Africa and can achieve high yields. It is currently grown for food and for alcohol by small scale farmers and trials started in the Eastern Cape in 2007 to assess its bioenergy potential. Sorghum has shown low production in some countries in southern Africa, for instance, in Botswana (Figure 8.a). In contrast Mozambique showed an increasing yield and production without increasing the area harvested (Figure 8.b). The yield is also depicted by South Africa though its production and area harvested are being decreased, perhaps in response to market changes (Figure 8.d). In Zimbabwe the three aspects of production, yield and area harvested are resonating dynamically, reflecting a common overriding factor that is most likely to be climatic conditions (Eriksen et al, 2004). Sweet sorghum is more drought tolerant than sugar cane and can therefore be grown in a larger area whilst still achieving high yields. It is currently grown for food and for alcohol by small scale farmers and trials started in the Eastern Cape in 2007 to assess its bioenergy potential. Trials have also been undertaken in other southern African countries where it has been used as a supplement to sugar cane for ethanol production. It has been shown capable of complementing sugar cane ethanol by extending the production season.

ERA-ARD, SROs, FARA Africa
19
Furthermore, the non-sugar fractions of the crop can be used as feed for livestock and the seeds are already a common staple food, helping to address the issues of biofuels competition with food production. Thus, sweet sorghum is seen as a biofuels crop with high potential for the future in the semi arid tropics, including southern Africa.
Figure 8. Production, yield and area harvested of sorghum in the four case study countries of Botswana, Mozambique, South Africa and Zimbabwe (source: FAOSTAT, 2004). Jatropha (Jatropha curcas L.) By 2004, 400 million Jatropha curcas L. trees were planted on 45,000 ha in North West Province of the Republic of South Africa. The South African Government then called for a moratorium on further commercial planting until it was convinced that (a) the plant was not at risk of becoming an invasive alien, and (b) its toxicity does not pose an environmental and health risk. Commercial plantings were given the go-ahead in 2007. A list of companies which have invested in jatropha in Africa is given in Annex 2. This includes companies such as D1 Oils, who plan to double their current area under the crop and Emerald Oil International (Pty) Ltd, who commenced construction of a biodiesel plant in Durban with a 100,000 tons per year capacity. In addition to obtaining feedstock from South Africa, this company will source Jatropha curcas seeds in Zimbabwe, Zambia, Malawi and Madagascar. It has an agreement with the KwaZulu Natal Agricultural Extension to facilitate the establishment of an extensive network of Jatropha hedges (Moodley, 2007). Owen Sithole College of Agriculture has a trial project involving 100 trees (Henning, 2006). Maize (Zea mays spp) In 2006, Ethanol Africa (with Ecofields, Grain Alcohol Investments and Sterling Waterford as key shareholders) became South Africa’s first bioethanol producer using surplus maize. Due to increased and improved inputs and improved cultivars, most years, the country’s maize
Sorghum in Zimbabwe
0.00E+00
5.00E+04
1.00E+05
1.50E+05
2.00E+05
2.50E+05
3.00E+05
3.50E+05
1980
1982
1984
1986
1988
1990
1992
1994
1996
1998
2000
2002
Year
Pro
du
cti
on
(M
t) &
Are
a (
ha
)
0.00E+00
1.00E+03
2.00E+03
3.00E+03
4.00E+03
5.00E+03
6.00E+03
7.00E+03
8.00E+03
9.00E+03Y
ield
(H
g/h
a)
Area Harv Production Yield
Sorghum in South Africa
0.00E+00
1.00E+05
2.00E+05
3.00E+05
4.00E+05
5.00E+05
6.00E+05
7.00E+05
8.00E+05
1980
1982
1984
1986
1988
1990
1992
1994
1996
1998
2000
2002
Year
Pro
du
ctio
n (M
t) &
Are
a (h
a)
0.00E+00
5.00E+03
1.00E+04
1.50E+04
2.00E+04
2.50E+04
3.00E+04
3.50E+04
4.00E+04
Yie
ld (H
g/h
a)
Area Harv Production Yield
Sorghum in Mozambique
0.00E+00
1.00E+05
2.00E+05
3.00E+05
4.00E+05
5.00E+05
6.00E+05
1980
1982
1984
1986
1988
1990
1992
1994
1996
1998
2000
2002
Year
Pro
du
ctio
n (M
t) &
Are
a (h
a)
0.00E+00
2.00E+03
4.00E+03
6.00E+03
8.00E+03
1.00E+04
1.20E+04
Yie
ld (H
g/h
a)
Area Harv Production Yield
Sorghum Trends in Botswana
0.00E+00
5.00E+04
1.00E+05
1.50E+05
2.00E+05
2.50E+05
3.00E+05
3.50E+05
1980
1982
1984
1986
1988
1990
1992
1994
1996
1998
2000
2002
Year
Pro
du
cti
on
(M
t) &
Are
a (
ha
)
0.00E+00
5.00E+02
1.00E+03
1.50E+03
2.00E+03
2.50E+03
3.00E+03
3.50E+03
4.00E+03
4.50E+03
Yie
ld (
Hg
/ha
)
Area Harv Production Yield

ERA-ARD, SROs, FARA Africa
20
production exceeds domestic demand – a demand that includes the needs of Botswana, Lesotho, Namibia and Swaziland as part of an agreement of the long standing South African Customs Union. In December 2007, Parliament decreed that maize would no longer be used for this purpose as it was considered a staple food crop. Soybean (Glycine max or G. soja) Soybean has been cultivated in several countries in Africa though in some of them the data shows it has been recently incorporated into the agriculture systems. The only country which has shown an increment in area harvested, since the mid 1990s, has been South Africa. The production of soybeans in South Africa has increased from 770 tons/year in 1970 to 424000 tons/year in 2006. The second country in harvested area is Zambia which has also increased its production from 173 tons/year in 1973 to 12000 tons/year in 2006 (FAOSTAT, 2008).
Soybean area harvested
0
25000
50000
75000
100000
125000
150000
175000
200000
225000
250000
275000
1970
1973
1976
1979
1982
1985
1988
1991
1994
1997
2000
2003
2006
ha
Tanzania
Zambia
Kenya
Mali
Burkina Faso
Senegal
South Africa
Figure 9. Soybean area harvested for Southern African countries since 1970. Sunflower (Helianthus annuus) Sunflower is not reported for most of the countries reviewed in this report (see Figure 10). Nevertheless, South Africa is the country with the greatest area harvested for sunflower seed (FAOSTAT, 2008). It is not clear if the fluctuations respond to the market or to internal changes in the agriculture system experienced in South Africa, especially at the end of the Apartheid (Eriksen et al, 2004). In the FAO statistical system (2008) there is reference to some countries production of oilcrops but it is not clear which crops are included (e.g. Zambia and Tanzania).
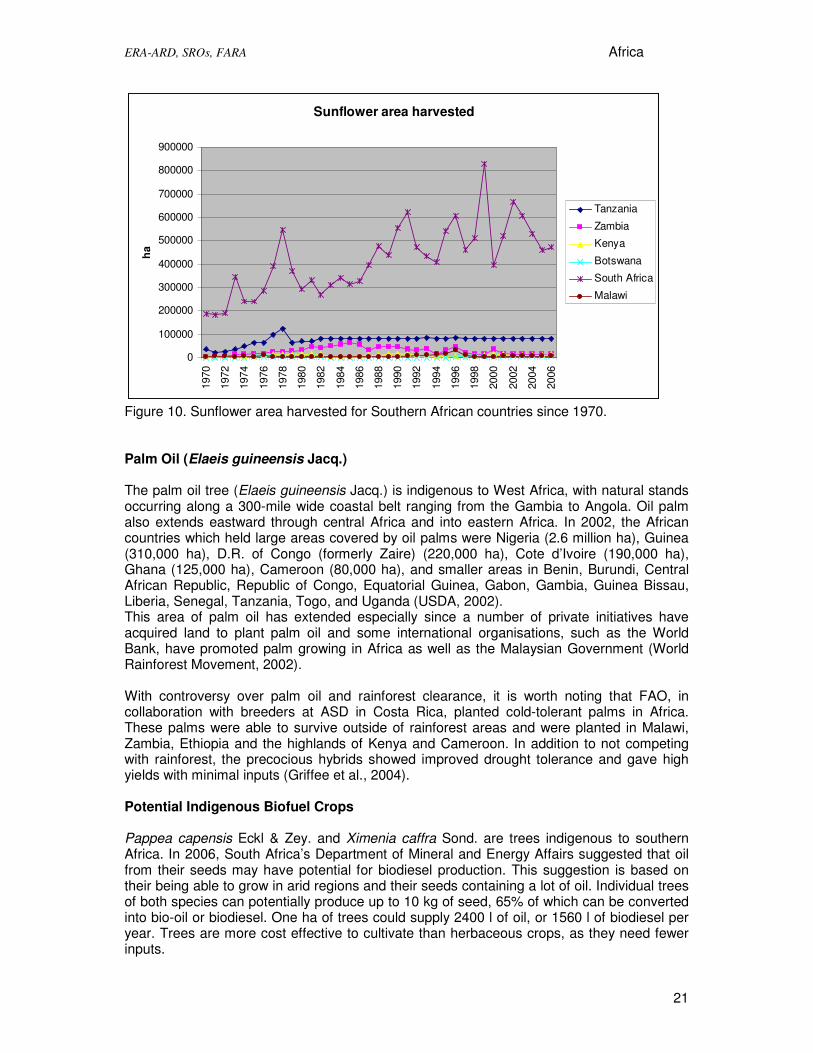
ERA-ARD, SROs, FARA Africa
21
Sunflower area harvested
0
100000
200000
300000
400000
500000
600000
700000
800000
900000
1970
1972
1974
1976
1978
1980
1982
1984
1986
1988
1990
1992
1994
1996
1998
2000
2002
2004
2006
ha
Tanzania
Zambia
Kenya
Botswana
South Africa
Malawi
Figure 10. Sunflower area harvested for Southern African countries since 1970. Palm Oil (Elaeis guineensis Jacq.) The palm oil tree (Elaeis guineensis Jacq.) is indigenous to West Africa, with natural stands occurring along a 300-mile wide coastal belt ranging from the Gambia to Angola. Oil palm also extends eastward through central Africa and into eastern Africa. In 2002, the African countries which held large areas covered by oil palms were Nigeria (2.6 million ha), Guinea (310,000 ha), D.R. of Congo (formerly Zaire) (220,000 ha), Cote d’Ivoire (190,000 ha), Ghana (125,000 ha), Cameroon (80,000 ha), and smaller areas in Benin, Burundi, Central African Republic, Republic of Congo, Equatorial Guinea, Gabon, Gambia, Guinea Bissau, Liberia, Senegal, Tanzania, Togo, and Uganda (USDA, 2002). This area of palm oil has extended especially since a number of private initiatives have acquired land to plant palm oil and some international organisations, such as the World Bank, have promoted palm growing in Africa as well as the Malaysian Government (World Rainforest Movement, 2002). With controversy over palm oil and rainforest clearance, it is worth noting that FAO, in collaboration with breeders at ASD in Costa Rica, planted cold-tolerant palms in Africa. These palms were able to survive outside of rainforest areas and were planted in Malawi, Zambia, Ethiopia and the highlands of Kenya and Cameroon. In addition to not competing with rainforest, the precocious hybrids showed improved drought tolerance and gave high yields with minimal inputs (Griffee et al., 2004). Potential Indigenous Biofuel Crops Pappea capensis Eckl & Zey. and Ximenia caffra Sond. are trees indigenous to southern Africa. In 2006, South Africa’s Department of Mineral and Energy Affairs suggested that oil from their seeds may have potential for biodiesel production. This suggestion is based on their being able to grow in arid regions and their seeds containing a lot of oil. Individual trees of both species can potentially produce up to 10 kg of seed, 65% of which can be converted into bio-oil or biodiesel. One ha of trees could supply 2400 l of oil, or 1560 l of biodiesel per year. Trees are more cost effective to cultivate than herbaceous crops, as they need fewer inputs.

ERA-ARD, SROs, FARA Africa
22
CASE STUDIES

ERA-ARD, SROs, FARA Africa
23
6. SENEGAL CASE STUDY
6.1 Country’s characteristic:
Location Senegalese territory is located between 12° 8 and 16 ° 41 north latitude and 11 ° 21 and 17 ° 32 west longitude. Senegal is the most western country in Africa and is bordering at south with Guinea and Guinea Bissau, at East with Mali, at North with Mauritania and at West with the North Atlantic Ocean. Geographical characteristics: - Area: Total surface: 196,190 km² with 192,000 km² of land and 4,190 km² of water.
Coastline is of 531 km. - Terrain: The country is generally flat with hills in Thies and foothills in the South oriental
part. - Climate: The country is characterized by a dry tropical climate. Temperatures are
moderate along the coast (16-30°C) and rise gradually as one moves away towards the continent (35-45°C). Highest temperatures are observed in May-June.
From north to south, four areas stand out: � An arid or semi-desert area with an annual precipitation not exceeding 350 mm; � A semi-arid continental dry area with isohyets between 350 and 700 mm; � A sub-humid zone, less hot and less dry than the previous ones, and characterized by
an annual rainfall ranging between 700 and 900 mm; � A wetland characterized by high rainfall of around 1000 to 1200 mm.
Figure 6.1 Map of Senegal showing location relative to its neighbouring countries The climate is divided into two seasons: A rainy season, from July to October and a dry season from November to June. In the oriental part of Senegal, rains start from end of May. Senegal is characterized by high rainfall variability from one year to another with the peak of the rainfall in August. Winds: The climate is influenced by three air masses:

ERA-ARD, SROs, FARA Africa
24
• The Alize, a sea breeze from Azores anticyclone, is a damp and cool wind but enable to give rainfall.
• The Harmattan, a wind especially hot and dry, coming from the continent. • The Monsoon is a very humid wind coming from the St.Helena anticyclone. It brings rains
from the South-West. • Hydrography: The country is crossed from east to west by three rivers: The Senegal (1700km), The Gambia (750km) and The Casamance (300km). The Senegal River is the main water resource of the country and feeds the groundwater and the lake Guiers.This one is the largest permanent freshwater reserve in the country.Significant groundwater resources are available for the implementation of a comprehensive water program. This water can be used in further potential hydraulic programs. The renewable water resources are estimated to 39.4 km3 (1987). Environmental characteristics: The key environmental challenges are illustrated by a fauna and a flora threatened by poaching, deforestation, overgrazing, soil erosion, desertification and overexploitation of fishing resources.
6.2 Population size and characteristics
• Population: 12,893,259 habitants in 2008 • Population density: 65 hab/km² • Urban population: 51% • Rural population: 49% • Women in 2008: 51% • Men in 2008: 49%
6.3 Gross Domestic Product, Human development Index:
• GDP (official exchange rate): 13 900 million USD (2008) • GDP per habitants : 1600 USD (2008) • Human development index : 0.499 (2005) • Growth rate : 3.3% (2008)
• GDP - Composition per sector (2008): o Agriculture : 16.1% o Industry : 19.3% o Services : 64.6% • Population below poverty line: 54% (2008)
6.4 Main food crops:
According to Matsumoto-Izadifar (2008), Senegal has seen some agricultural products, such as cereals and horticulture, growing. Production of rice, maize and manioc has increased in recent years to meet rising local demands in urban areas. The fruit and vegetables sub-sector presents the main hope of diversifying Senegal’s agricultural export structure. Grown mainly in the Niayes, the Senegal River Valley, Casamance and Dakar regions, fruits and vegetables for export have done well since the 1994 devaluation of the CFA franc. Senegal’s geographical and climatic situation enables out-of-season crops to be grown for the European market. The primary sector grew annually at an average 6.2 per cent between 2002 and 2005 (Matsumoto-Izadifar, 2008). Despite Senegal’s huge potential in horticultural

ERA-ARD, SROs, FARA Africa
25
exports, market opportunities at national, regional and international levels remain underexploited. Groundnuts earn less foreign revenue, with a 60 per cent drop in output over the past 20 years and do not make it any more a reliable market. According to the FAO (FAO statdata, 2009) millet and peanuts are the main crops produced in Senegal Table
Table 6.1 . Main crops in Senegal by hectare and tons
Source: (FAOstatdata, 2009). Several food crops are imported and exported to and from Senegal (FAOstat, 2009). The following tables show these products by ton and value in USD. Table 6.2 Top 10 main agricultural and food crops imports
Rank Commodities Quantity (tonnes) Value (1000$) 1 Rice Broken 1018729 350397 2 Wheat 395742 133974 3 Soybean oil 101776 93160 4 Milk Whole Dried 21444 79722 5 Malt Extract 17455 54255 6 Food Prep Nes 20204 53684 7 Sugar Refined 69387 41377 8 Palm oil 34885 30454
9 Tobacco, unmanufactured 3276 28481
10 Maize 97272 24421 Table 6.3 Top 10 export of main agricultural and food crops
Rank Commodities Quantity (tonnes) Value (1000$) 1 Groundnut oil 68675 67617 2 Food Prep Nes 11627 32189 3 Cotton lint 21415 28522 4 Rice Broken 73139 24729 5 Tobacco Products Nes 1337 16972
6 Tobacco, unmanufactured 1758 15984
7 Cigarettes 1783 13710 8 Tomatoes 8858 8639 9 Beans, green 6685 6512 10 Pastry 6581 6069
(Faostat,2009)
Product has tons
Peanuts 607,195 331,195
Millet 686,892 318,822
Maize 143,769 158,266
Sorghum 155,919 100,704
Rice 80,312 193,379
Tomato 6,594 178,600
Onions 5,100 142,000

ERA-ARD, SROs, FARA Africa
26
6.5 Predominant land characteristics:
Near 45 percent of Senegal is forested. Of this, near 18 percent is considered pristine primary forest, one of the higher rates in West Africa. While Senegal lost some 675,000 hectares of forest between 1990 and 2005, the country's deforestation rate has only increased by 5 percent since the 1990s. Deforestation is mostly the result of clearing for fuelwood, charcoal, and logging, though poaching, wildlife trafficking, and hydroelectric projects have further degraded forest areas. Government officials have blamed deforestation for increased soil erosion, flooding, and periodic drought which has had an adverse impact on regional agriculture (Mongabay, 2009).To slow the encroaching Sahara desert, Senegal announced in 2005 that it planned to promote a "Great Green Wall" of trees stretching for nearly 7,000 km (4,375 miles), from Dakar to Djibouti along the Sahel. Other African countries said they will participate in the massive reforestation project as well. Agriculture occupies 77 percent of the economically active population. However, only 12 percent of the land area is cultivated. Senegal is among the world's largest producers of peanuts (NADEV, 2009). Land access, encompassing access to natural resources such as soil and water, is governed through land tenure systems legally or customarily defined. Regulations of land tenure govern who can use what resources, either land, water, livestock or trees, and under what conditions (Platteau et al, 2005). In Senegal the land tenure system is largely a customary one in which a Chef de Terre, or Land Chief, acts as custodian of community land and distributes it among households as needed. This land is then inherited through family lineage from father to son. In recent decades, a shift to intensive agriculture and private tenure has reduced the powers of the lineage land chief. Yet the practice of collective management of family land is still largely observed (Platteau et al. 2000 in PLatteau et al 2005) In many sub-Saharan African countries, including Senegal and Burkina Faso, land tenure is determined by both statutory and customary laws.
6.6 Characteristics of livelihoods:
Despite of a good economic performance and sustained growth in recent years, the standard of living of the Senegalese remains very low. Inadequate agricultural production, low capacity of the economy to create sustainable jobs and inadequate resources allocated to social services contribute to poverty, which already affects nearly 54% of the population. - Gross national income (GNI): $ 540 per capita, - Life expectancy is just 56 years, - Literacy rate that does not exceed 40% of the adult population, - UNDP Human Development ranking in 2009: Senegal ranks 166th from 182 countries. Rural areas are characterized by poverty making 75% of the rural population poor. They are mainly farmers, women and young people who survive on subsistence crops and livestock on small plots that are often not sufficient to cover the needs of their families. Groundnut production accounts for around 40 per cent of cultivated land, taking up 2 million hectares, and provides employment for as many as 1 million people
6.7 Policies in place and link with the bioenergy sector.
Agricultural policy

ERA-ARD, SROs, FARA Africa
27
The agricultural policy in Senegal relies mainly on the “Agro-forestry-pastoral Guidance Law” (Loi d’Orientation Agro-sylvo-pastorale) which was initiated by the Government and adopted in National Assembly by May 25, 2004. This Guidance Law has defined the national agricultural and rural development policy for the next twenty years. Its specific objectives are: - Formal recognition of agro-forestry-pastoral professions and professional organizations, social protection and the definition of a legal status for farm exploitations as well as for land assets security and water control; - The diversification of production, the integration of streams, market regulation and the development of infrastructures and public services in rural areas; - The promotion of social equity in rural areas and protection against natural calamities and hazards related to agro-forestry-pastoral activities; - The development of agricultural information, education and training; capacity-building for rural organizations; - The development and sustainable financing of agricultural services. In order to implement this national policy, the Government has elaborated some development programs such as the Plan REVA (2006) and the GOANA (Great Agricultural Offensive for Food and Abundance, 2008). The Plan REVA or Return to Agriculture aims to establish populations including youth and women in their land in particular migrants and returnees. It aims also to increase significantly agricultural production including diversification crops. Plan REVA tries to meet the objectives of (i) the Accelerated Growth Strategy, (ii) the Millennium Development Goals and (iii) the fight against poverty (Strategy Document for Poverty Reduction). Within the framework of crop diversification, the Plan REVA has developed an important Biofuel production program at national level. Energy policy Access to energy services remains a problem despite the increase in the rate of electrification in particular that of rural electrification which increased from 6% in 2000 to 14.2% in 2006, while for urban areas, this rate is only 74.1%. Electricity is of thermal origin. SENELEC (production, supply and sale) has the monopole of electricity distribution in Senegal: SENELEC possesses a total settled power of 295, 6 MW for an annual consumption of 300000 T of oil. Some industrial entities such as CSS, SONACOS, ICS, SAR, Grands Moulins and SNTI, produce electricity for their own needs and resell the surplus to SENELEC. Strong energy dependence is a bottleneck for the economy. The oil bill of Senegal, which rose from 158 million USD in 2000 to 620 million USD in 2006, leads to a high output negatively affecting currency on the country's trade balance. Facing a rising crude price, subsidy equivalent to a power plant (234 million USD) has been paid to hold the price of electricity in 2005-2006. In order to find a solution to these problems, the Government has adopted a new energy orientation based on the development and use of renewable energies such as solar, wind, Biofuel and hydroelectricity. Environment policy The problems and constraints related to environmental management in Senegal derived from unsustainable practices: obsolete industries, average age of vehicles about 15 years old, unsustainable agricultural methods, forest degradation and difficulties in waste removal. This situation exacerbates substantially population’s poverty and vulnerability. To find a solution to these problems, Senegal has taken various initiatives including the development of a sustainable development strategy and a Sector Policy Letter for Environment (LPSE) for the reversal of trends in perspective of achieving the Millennium

ERA-ARD, SROs, FARA Africa
28
Development Goals. Senegal has signed the Kyoto Protocol and a legislative and regulatory framework for environmental protection has been adopted since 2005. Biomass consumption (40% for firewood and 16% for charcoal) represents a strong forest attack. Senegal has decided therefore to support any initiative aimed at diversifying energy sources, including renewable energies. It is in this sense that Senegal has adopted a new energy policy that aims to: • develop the institutional capacity and energy production • promote the driving force in productive activities• involve private operators, village
associations and local governments in infrastructure development and energy service • ensure the financing of energy sector development; • diversify energy sources and technologies; • promote energy efficiency and renewable energy implement a program investment for
access to energy services for economic and human development • improve and secure access of populations to domestic fuels in a perspective of
biomass transition; • increasing access to energy services in rural and sub-urban areas in order to facilitate
the functionality of basic infrastructures (schools, health facilities, storage facilities etc.) • improve access to oil.
6.8 Biofuel industries/programmes development:
Biofuel program Since 2006, Senegal has launched a National Program for Biofuel Production, with the aim of contributing to national energy self-sufficiency in the production of bio energy alternatives. This program provides, by 2012, to cover 321000ha of Jatropha plantation in the 321 Rural Communities that form the country, with a production goal of 1190.000.000 litres of refined oil from seeds. The objectives of the Senegal Biofuel program are:
• Crop Diversification • Reducing household and state oil invoice. • Energy Independence • Sufficiency in diesel from 2012 through satisfaction of national needs • Production of ethanol from crops like sugar cane. • Bioelectricity production from power plants that operate with Jatropha crude oil. • Jobs creation and agricultural jobs sufficiently paying. (about 100 000 direct jobs) • Accelerate the modernization of agriculture. • Creation of an attractive and appealing environment in rural areas. • Improvement of balance of trade and payments. • Improving the environment. • Reducing poverty and disparity between rural and urban world.
The programme will be implemented in three phases: - Phase 1: Production of raw material (Jatropha seeds) 2007 - 2012. - Phase 2: Processing Jatropha seeds into oil - Phase 3: Biofuel distribution In the first phase, the programme has already planted 5293 ha (2007-2008) and is expecting to plant 10 000ha in 2009 while producers demand is for 15,500 ha. Rural producers and organizations are now keener to the crop. Demands generally come from individuals, rural associations, industries (SOCOCIM), NGOs, and rural association, women and youth groups.
ERA-ARD, SROs, FARA Africa
29
Program organization: A National Technical Committee, headed by the Minister of Agriculture is responsible for implementing the seed production at national level. The technical committee has also technicians from the Ministry Department, peasant organizations, professional agricultural organizations, elected officials; deputy Governors for Development, youth and women village association’s representatives, partners in Development (NGOs), projects and programs. At departmental and local levels, supervisors are nominated by the farmers' organizations. Technical coordination is ensured by the Senegalese Institute for Agricultural Research (ISRA). A National Program Supervisor represented by the President of the National Rural Councillors Association in Senegal (ANCS) is responsible for the sensitization component towards rural authorities and rural producers.He should feedback their expressions of needs to the program’s National Coordination.
6.9 Crops used for Biofuel:
Types: Jatropha curcas for biodiesel and crude oil fuel; Sugarcane for ethanol production. Biofuel conversion technology from Jatropha seed has not started yet. However CSS (Senegalese Sugar Company) has inaugurated in 2008 a new bio ethanol plant. The distillery from molasses has an annual production capacity of 10 to 12 millions liters of ethanol, intended for the company consumption and Senegalese market supply (clean fuel, pharmaceutical alcohol and drinks). For its second phase (processing Jatropha seeds into oil), the National Biofuel Program has the intention to use oil presses or light expeller units for on-farm or community Biofuel production. Biodiesel production plants will be used at industrial level. Market: The Biofuel program is actually at plantation stage. However, actors involved in the production (rural producers, private actors and institutions) are already organizing themselves into a professional network in order to anticipate and prepare market dispositions as well as production and supply chain unionization. The founding general assembly of the Biofuel sector was held on September 2009.
6.10 Implications for land tenure, water and employment:
Land tenure: In its scope, Senegal is composed of 321 rural communities (rural administrative zones). The national Biofuel program has planned to cover 1000ha of Jatropha in each rural community. This very arithmetic orientation may create land tenure problem because, some of the rural communities do not have enough land to host 1000ha for this new additional crop, unless there is land expropriation or potential conversion from land-for-food crops to land-for- energy crops. Food security may also be affected when good oil price conditions can attract peasants to switch their traditional food crops to Jatropha cash crop. National Biofuel program’s approach should give consideration to this situation and reformulate its position about land tenure. Water: In order to mitigate water problems or conflicts with food crop irrigation, Senegal has opted for rain fed cultivation of Jatropha which is a plant with less water need. Though it is important to notice that, in areas with rainfall less than 700mm, young Jatropha plantations, for survival, need to be watered in the first two years. Water problems may then occur in most rural communities comprised within these isohyets. In these agro-pastoral areas, conflicts in water affectation can be expected if Jatropha is planted at large scale as planned in the Biofuel program. Employment: The National Biofuel Program has the aim to boost employment in rural areas.

ERA-ARD, SROs, FARA Africa
30
6.11 Mapping of policy and institutions
First hand player. APIX – Agence Nationale pour la Promotion des Investissements et des Grands Travaux (National agency for the promotion of investment and major works programs)
- Mission: • Improving the Senegalese business environment • Promoting Senegal, as an investment destination • Researching and identifying national and foreign investors • Follow-up of contacts and evaluation of investment projects Services: • Providing economic, business-related and technological information on a permanent basis • Welcoming and supporting investors throughout the investment chain • Supporting investors for the formalities of registration and for obtaining the various administrative authorizations • Directing towards financing structures/ Providing assistance in the search for partnership; • Solving of administrative problems. Besides this, APIX fulfils all the functions of a one-stop office by: • Issuing in 10 days the certification to the Investment Code and providing the exemption certificate for the customs formalities • Issuing in 21 days the certificate to the status of an off-shore export company • Carrying out within 48 hours formalities for administrative registration (NINEA - National Identification Number for companies and administrations, IPRES-pension fund-, Social Security fund, in the same place, and in the same form • Ensuring a follow-up of the approved investment projects National Ministries/Secretariats involved: The Government’s political will to develop Bioenergy is real and is illustrated by the creation of a ministry in charge of Biofuel. However, instability is denoted in the research of adequate ministerial supervision for hosting this Biofuel department. Since its beginning in 2007, Biofuel program has been hosted successively by the following ministries: - Ministry of Agriculture and Aquaculture and Biofuel (2007) - Ministry of Scientific Research and Biofuel (2008 – September 2009) - Ministry of Energy and Biofuel (October – December 2009) - Ministry of Biofuel and aquaculture (since December 2009) Though the Biofuel program will be run by the later ministry, other ministries still remain involved in the bioenergy planning and application: Agriculture, Energy, and Scientific Research.
• Directions and institutions involved ANCAR (National Agency for Rural and Agricultural Advisory). The Agency's main task is to establish an advisory service to producers and to meet their needs through contractual arrangements. The approach to agricultural and rural council is based on a true partnership with farmers and key stakeholders in rural development. ANCAR intervenes in all sectors (agriculture, forestry, and environment) and includes several functions (advisory support, transfer of appropriate technology, awareness, training, information, and intermediation) and activities (production, marketing, supply, credit, processing, crafts…). ANCAR has been officially assigned as a public partner in the implementation of the National Biofuel program

ERA-ARD, SROs, FARA Africa
31
ISRA (Senegalese Institute for Research in Agriculture). Its main task consists of designing and implementing of research programs on crop production, forestry, animal and fishery and rural economy. The coordination of the National Biofuel program is carried out by ISRA. Important research on Jatropha is being implemented particularly on selection, multiplication and agronomy. In the program, Jatropha seedling production and propagation is under ISRA’s prerogatives. National Technical Committee is created at the beginning of the Biofuel program by the ministry of Agriculture. The Committee is responsible for the implementation of the program, particularly seed production in rural areas. It is headed by a national coordinator (ISRA) and supervised by the President of the National Rural Councillors Association. Regional and Local authorities involved in bioenergy plans, programmes, projects: Chiefs of rural communities: These elected administrative authorities, in collaboration with their local community council, are the only one to have ability to identify, select and allocate land. One their mission is to facilitate in place, state programs implementation; that is why they are playing an important role in the National Biofuel program. Women groups and youth associations: With the enthusiasm created by the new bioenergy sector, most women and youth groups are organizing themselves in order to take full advantage in opportunities offered the Biofuel program. They are already implicated in the multiplication of Jatropha plants they sell to the program. Few women groups have already signed MOU with the Biofuel program for Jatropha plants production and supply. Farmer’s organisations: At departmental and local levels, supervisors are nominated by the farmers' organizations. NGOs involved • ENDA Energy aims to contribute to a better understanding of energy and development
issues in Africa from technical, economic, political and social standpoint. ENDA has also the objective to contribute at the definition of conditions for better access to energy services as a priority for the poorest people; and also to participate to the development and implementation of Multilateral Agreements on Environment by African countries: Conventions "Desertification", "Climate Change", "biodiversity", etc.
• CULTESA (Centre for Research in Biotechnology –Spain) is helping the Biofuel program to get adequate needed infrastructures in biotechnology for its multiplication activities of planting materials. A modern shade house of 5000m² is created for acclimatizing of Jatropha vitroplants, and a training plan in the use of biotechnology for Jatropha propagation, is adopted and is actually in execution for Senegalese technicians.
Other stakeholders identified. Some local industries are involved in Biofuel production but mainly for their own use. These are: • CSS (Senegalese Sugar Company) is producing Ethanol from Sugarcane • SOCOCIM (Local cement Company) aims, in very short term, to use Jatropha as
additional energy feedstock for its operation. Plantation of Jatropha has started since 2007.
• SODEFITEX (Local cotton Company) is experimenting cultivation of sunflower for Biofuel production. For the company, irrigated sunflower, as annual crop, can integrate local crop rotation and bring additional revenues to their partners (cotton producers) during dry season.
6.12 Links in biofuels development in Senegal

ERA-ARD, SROs, FARA Africa
32
Executive body Legislative body
Industries NGOs
Min Biof & Aqu
Min. Energyy
Chief rural comm.
APIX
Min Agricult
ISRA
WYG
F. org
ANCAR
NTC
CSS
SOCOCIM
ENDA
Cultesa
Legend:
Min Biof & Aqu : Ministry for Biofuel an Aquaculture Min. Energy : Ministry for Energy Min Agricult : Ministry of Agriculture Chief rural comm. : Chiefs of rural communities APIX : National agency for the promotion of investment and major works programs ISRA : Senegalese Institute for Research in Agriculture NTC : National Technical Committee WYG : Women and Youth groups F. org : Farmers organization ANCAR : National Agency for Rural and Agricultural Advisory Cultesa : Centre for Research in Biotechnology – Tenerife - Spain SOCOCIM : Local cement industry CSS : Senegalese Sugar Company SFTX : Cotton industry

ERA-ARD, SROs, FARA Africa
33
6.13 Summary of biofuels activities implications in Senegal
Issues - Enough marginal lands suitable for Jatropha
cultivation.
- Jatropha is locally adapted and well known as
fence crop.
- Raising demand from farmers to join the
national Biofuelprogram (NBP).
Biofuel conversion technology from
Jatropha seed has not started yet
- No market supply yet; untested
market
- Real market potential for local
consumption.
policies - Strong Government political will, illustrated by
a new ministry for Biofuel and by the NBP
implementation
- The NBP provides seeds and seedlings with
high yield varieties to partners. It offers also
technical support
- Many on-going agricultural research.
- NBP has opted for light expeller
units for on-farm biofuel
production and encourage the
development of biodiesel
production plants at industrial level
- Government through APIX
(Agency for the promotion of
Investments) provides needed
administrative, informative and
counseling supports to investors.
- In NBP conditions, biodiesel will
be sold to the State or to private
market organizations in a price
fixed by a State/partners
agreement.
-
Emergent patterns/rel
ationships
- Professionalization of the Biofuel sector: A
Biofuel chain network has been launched in
2009.
- Emergence of new private Jatropha nurseries
run by trained rural women groups and youth
groups.
- Land tenure based on protection of national
patrimony: land belongs to the state and is not
subject for sale or lease.
- Expansion of small scale expelling
units is expected in rural areas.
- Raising interest and demands
from local and foreign investors, on
investing to biofuel
- For biodiesel plants, two types of
feedstock from farmers is planned:
oil and seeds
Private actors and structures are
already organizing themselves into
a professional network in order to
anticipate and prepare future
market dispositions
Impact/
future
implications
- Valorization of poor lands in this desert
margin country.
- Soil fixation against land erosion.
- New income generation for rural population.
- Risk for food to Biofuelconversion because of
a lack of policy protecting food production
areas.
- Acquisition of new technical skills
for rural populations involved in on-
farm biofuelproduction.
- Boost employment and increase
income in rural areas.
- Protection of the national
economy: For any biodiesel
industry establishment, 51% of the
capital should belong to Senegalese
(according to the NBP conditions).
- New source of income for
Jatropha seed and oil rural
producers.
- Significant reduction of mineral oil
invoice at national level
FARM
Predominance
of small and
marginal farmers
INDUSTRY
Jatrophafor oil and
biodiesel
MARKET
DState and
organisms officially
recognized by State
Ethanol
6.14 Conclusions
Senegal’s interest in promoting a biofuels programme (NBP) responds to the ongoing activities mainly with Jatropha. The country does have restrictions on energy access and most of the fossil fuel needs to be imported. There are areas in Senegal where water availability does not represent a problem for agriculture while the extension of the Sahel continues to be a problem. Considering the development of biofuels as an activity in the agriculture sector, there is still need to link the objectives and on field activities of the Agriculture Ministry with the Energy Ministry. According to the research more rural communities are engaging in the cultivation of Jatropha but there is still little evidence of the mechanisms necessary to fully incorporate in a more skilled manner farmers in these activities. Despite the imports on food products (e.g. rice) there is also no evidence of a threat of food production regarding the biofuels activities in the country. Nevertheless, the future activities (considering the Biofuel Program) need to be cautious for large scale production. The Biofuel Programe is focused on one single crop

ERA-ARD, SROs, FARA Africa
34
(Jatropha) and despite that one of the objectives is to look for crop diversification, there might be the risk of putting all efforts into one single crop. The country is ongoing in an Agricultural reform focused on food products but also on other crops (e.g. groundnuts). These reforms may have a benefit in terms of agricultural production such as improving the yields. If adequate measures are taken there is no need to compromise food and biofuel production at the farm level, benefiting the farmers with additional income and if possible access to electricity.

ERA-ARD, SROs, FARA Africa
35
7. MALI CASE STUDY
7.1 Country’s characteristics.
Location Located in West Africa, Mali is lying between 10° and 25° N and 4° and 12° E. Neighbouring countries are Algeria, Niger, Burkina Faso, Ivory Coast, the Republic of Guinee, Mauritania and Senegal. Geographical characteristics Surface: 1,241,328 km2 out of which 65% is desertic or semi-desertic. Country divided in three decentralised layers of government: regions (8), cercles (49) and communes (703) plus the capital district of Bamako.
Figure 7.1 Map of Mali showing location relative to its neighbouring countries Environmental characteristics Food production in Mali has historically been highly variable due to fluctuating rainfall, which also influences river levels and hence irrigated as well as rainfed agriculture. This variability, combined with a low percentage of total production entering the market, makes market rices and quantities highly volatile. For example, during the 1980s and 1990s, millet and sorghum prices sometimes varied by a factor of 1:4 from year to year (Dembele and Staatz, 1999). Such instability makes food, and especially cereal, marketing risky, whether carried out by the public or private sector.
7.2 Population Size and Characteristics
Provisional data from the 4th General Census of the Population and Habitat (INSTAT, 2009), April 2009 showed a total population of 14,517,176 inhabitants. This represents an averaged

ERA-ARD, SROs, FARA Africa
36
annual population growth of 3.6% since 1998 when the population was 9,818,911 inhabitants. Women account for 50.4% of the population. The census also counted a total of 2,369,866 households and 11,453, settlements (villages, fractions, quartiers). Hence, in average 6.1 people live in one household and around 1,268 persons compose a mean Malian settlement. Population is not evenly distributed through the Malian territory. The most populated region is Sikaso (18%), followed by Koulikoro (16.7%) and Segou (16.1%). The less populated is Kidal (0.5%). The capital district of Bamako represents 10% of the total population (UNDAF, 2009).
7.3 Gross Domestic Product and Human Development Index
The human development index (HDI) for Mali is 0.371, which gives the country a rank of 178th out of 182 countries (UNDP, 2009). Touched by the financial and food crisis the Malian government has employed important fiscal resources to ensure that primary necessity articles remain accessible to the population. Economic growth has slowed down from 8% in 2008 to around 4.1% for 2009. Similarly inflation has changed from 1.4% in 2007 to 9.2% in 2008. The hike of fuel prices during 2008 was taken by the Malian state through substantial fuel subsidies to remain competitive in the subregion. Despite being a net fuel importer and land locked, fuel prices in Mali are lower than in neighbouring coastal countries. During 2008 the prices of cereals was increased by 33% (UNDAF, 2009).
7.4 Main food crops
The main crops in Mali are rice, cotton, millet, sorghum, karite (sheanuts), maize and vegetables. Table 7.2 Agricultural production in Mali (Thousands of Tons)
Year Groundnuts Millet Rice, paddy Sorghum Maize
2005 23,426 44,875 41,248 27,511 16339 2006 23,138 47,588 39,186 32,707 16396 2007 23,170 48,464 48,391 29,591 13160
Source: FAO Stats (2009)
-
10,000
20,000
30,000
40,000
50,000
60,000
2000 2001 2002 2003 2004 2005 2006 2007 2008
Year
Groundnuts, with shell Sorghum
Millet Rice, paddy
Maize Figure 7.2 Evolution of selected agricultural products in Mali
ERA-ARD, SROs, FARA Africa
37
Rice production is concentrated in the Office du Niger (ON) Zone with the rest of the production is done in rain feed fields and draught resistant rice varieties such “Nerica” (Nouveau Riz pour l’Afrique) in the southern regions of Mali (Kayes, Koulikoro et Sikasso) with a pluviometry above 900mm per year. Mali exports rice to Burkina Faso, Mauritania and Nigeria and has made some progress in recapturing the regional market from imported Asian rice1 (Coulibaly et al, 2009).
7.5 Predominant land characteristics
Mali depends on small family exploitation (68% of farmers cultivate less than 5ha) (Samake et al, 2009). Out of a total area of approximately 124 million of hectares, Mali has 5.5 million hectares of forest, 43.7 million of hectares of land suitable for the agriculture and livestock production and 74.8 million of hectares of desert. Mali has an estimated potential of 2.2 million hectares of land suitable for irrigation, out of which 960,000 hectares are attributed to the Office du Niger (ON). Mali’s agricultural sector is thwarted by numerous constraints relative notably to: a) its physical and institutional environment characterised by: (i) a deficit in rainfall, drought and irregular water levels; (ii) repeated locust outbreaks and invasion by floating plants ; (iii) insufficient water control and non-mastery of the technical conditions of production, attested by a low level of productivity and agricultural wages ; and b) issues relative to land security, factor costs and financing. Land composition and productivity vary from north to south following a rainfall gradient and according to soil quality and their topographical position. Land not occupied by crops is generally considered as having a sylvopastoral use. Pastures under these conditions cover about 49 million hectares. Their composition and productivity vary from north to south following a rainfall gradient and according to soil quality and their topographical position.
7.6 Characteristics of livelihoods
It is estimated that a fourth of the households in Mali are in a chronic situation of food insecurity with cereal consumption representing around 50% of household expenses (UNDAF, 2009). Economic poverty2 according to official figures in 2006 was 47.4% (Mise, 2009). The Malian land tenure is complex and characterised by the co-existence of customary and modern land tenure laws. Land tenure is governed by the “Code domanial et foncier” of 2002 (Ordonnance, 2002). This law in principle recognises customary law but grants ownership of land to the State, while individuals or groups of individuals only have the right of usufruct. Land can be accessed in three ways: renting, allocation or grant. Each of these methods has specific problems, mostly related to fulfilling commitments and complying with the agreed development period. Customary laws are oral, vague, variable, unpublished; and their co-existence with modern law is still conflictual. Customary tenure is based on kinship, gerontocracy, seniority, indigenousness and gender, to the disadvantage of women(Mali, Country Strategy Paper, 2005). Although women represent the majority of the agricultural work force less than 2% of women have registered property rights (Foncier, 2009). Land conflicts which occur on a
1 Currently, 60 %of the demand for rice in West Africa is supplied by imports, mainly from Asia
2 Share of the population that consume less than the equivalent of 157,920 FCFA (240 EUR) per year, per person.

ERA-ARD, SROs, FARA Africa
38
permanent basis, are exacerbated by demographic growth, high urbanisation rate, recurrent drought and poor land management practices.
7.7 Policies in place and link with the bioenergy sector
National level The Poverty Reduction Strategy of the GoM (IMF, 2008), highlights 3 main strategic orientations policies which the country intends to implement for 2007-2011 period. These orientations are: • Development of infrastructures and the productive sector; • Pursuance and consolidation of structural reforms; • Strengthening of the social sector (education, health, water access). These 3 orientations are detailed in 13 priority areas, being the 3 first: (1) Food security and rural development; (2) development of small and medium size enterprises; (3) protection and sustainable management of natural resources. Private sector New investments in Mali are governed by the Mali’s Investment Code (Code, 2005). This code encourages companies to settle investments in Mali, principally in the industry and agro forestry and pastoral business. Importation taxes on materials and machinery and other taxes such as the industrial and commercial benefits can be exonerated for periods depending on the size of the investment. The code also encourages settlement in regions with low industrialization, the consumption of local materials, the investment in research and development and training of qualified personnel. Agriculture and environment In 2006 Mali adopted the Agriculture Orientation Law (Loi, 2006) with the objectives of ensuring food security, promote sustainable agricultural production and enhance environment protection through more involvement of local municipalities (decentralization) and coherence with UOEMA regional legislation. Although this law is especially meant to minimize impacts of risk and calamities on agricultural development, no specific subsidies exist for environmental friendly enterprises. Further, there is little reliable information and weak functioning of different parts of the government to include environmental aspects into projects and programs evaluation and enforcement (Mise, ny). The Malian government has launched important initiatives to increase rice3 (in 2008) and maize (in 2009) output. However, despite a general increase of production, availability of such products and price reduction to consumers have been produced, mainly to weak supply chains and inefficient internal markets. A state secretary has been created to develop and increase the productivity of the ON and its institutional and management capacity. Water use, including irrigation and industrial use, is governed by the Code of Water (Loi, 2002). The GoM foresees the development of a total of 100,000 ha for 2012 of irrigated land, mostly at the ON (60,000 ha). Energy Mali has important energy needs as only 23% of Malian households have access to electricity (58% in urban areas and 11.23% in rural areas). In 2006 a National Strategy on Renewable Energy, promoted by Ministry of Energy and Water (MEE) in collaboration with the ministries of Agriculture, Finance, Commerce and Environment, was set up to obtain a
3 Official estimations are the production of 1.6 million tons of rice for 2008-2009 and 2 millions tons of rice for 2009-2010.

ERA-ARD, SROs, FARA Africa
39
10% reduction in fossil fuel imports by 2014, a 15% reduction by 2019, and a 20% reduction by 2024. This energy policy is defined by 5 major objectives: - to improve access to energy especially from renewable sources - to rationalise the use of existing energy sources - to make more efficient the use of existing natural resources to produce energy - to promote the sustainable use of biomass resources through the conservation and protection of forests - to strengthen government capacity and streamline administrative procedures within the energy sector
7.8 Biofuels industry/programmes development
Biofuels play a major role to achieve the objectives of the National Strategy on Renewable Energy. These objectives have been synthesised in the National Strategy on Biofuels that will be implemented in by the National Agency for the Development of Biofuels (ANADEB) legally established on 5th June 20094. ANADEB will develop and then oversee a legal framework to promote investments and development on biofuels. Biofuel production programmes in Mali are centred in two crops: 1) small scale production of Jatropha Curcas oil and biodiesel through groups of farmers and small private farms; 2) industrial ethanol production as by-product of sugar production, from irrigated sugar cane plantations on the Office du Niger (ON) zone. Other vegetable oils, such as cotton and peanut oil, have a high demanded (and margins) in an unsatisfied local alimentary oil market, which makes them unsuitable candidates for biofuel operations.
7.9 Crops used for biofuels
Jatropha Curcas Mali has been at the centre of Jatropha oil as biofuel development in West Africa. Jatropha was introduced in Mali with a role as live fence, territory demarcation and erosion protection (Yossi et al, 2006). Although it estimated that Mali has more than 20,000 km of Jatropha hedges (UNIDO, 2008) they are geographically dispersed and with little or no maintenance. Hedges yields are estimated between 1 and 2 kg per lineal meter. However, few seed collection is carried out due to the virtual inexistence of formal Jatropha seeds markets and limited awareness of its commercial value. Collected seeds are used locally for traditional soap manufacture, both task mostly carried out by women. The main zones with Jatropha concentration are the regions of Kayes, Koulikoro and Sikasso. Several private ventures and NGO projects have been initiated over the past 5 years to increase the intensity of Jatropha seed production and develop oil extraction to power agricultural machinery and small-scale electrification. One private venture has also started to produce biodiesel (fatty-acid methyl esthers) from Jatropha oil. These ventures and projects are active in specific regions, collaborating with formal farmers associations or informal village level organisations, such as the cotton production committees (developed by the CMDT) and women groups. However, in all the cases, intense work has to be carried out to offer extension services to farmers to improve their agroforestry techniques to produce Jatropha. Outside the ON zone large extensions of private land developed with Jatropha by 4 ANADEB was crated with the law N° 09-006/P-RM agreed by the General Assembly (Parliament) on 04 march 2009 and
promulgated by the President on 05 June 2009.

ERA-ARD, SROs, FARA Africa
40
a single individual or company are not well documented and very unlikely due to the Malian land tenure system. In the ON zone, various Jatropha ventures are in the process to start-up with land allocated but Jatropha planting and development of infrastructure has yet to materialise (see more in ANDEB’s registered projects). Sugar cane The development of sugar cane production in Mali has been important only since 1972 thanks to financial and technical cooperation with China in the ON zone. In 1996, the Malian state sold its majority stake of Sukala SA to a state-owned Chinese company. Sugar production in Mali is only 23% of that of its estimated 150,000 tons per year requirements. Sukala SA who owns and exploits around 5000 ha of sugar cane in two plantation sites for the primary production of sugar and ethanol for the alimentary and pharmaceutical industries. In recent years the GoM has worked to ensure foreign investments to boost the sugar production. At the end of 2009 two new large projects have been formalised to produce sugar and ethanol in the ON: N-Sukala (NS) and the Markala Sugar Project (PSM). It is necessary to note that the ethanol produced by Sukala SA and future ethanol production of the N-Sukala and the Markala Sugar Project is ethanol with a purity of 95-96% (hydric ethanol) used in the pharmaceutical and beverage industries. However, such ethanol quality is not suitable as fuel additive as is not totally miscible in gasoline. Further treatment of the ethanol has to be carried out to remove the water (normally referred as drying the ethanol) for its use as fuel additive for internal combustion engines. Other crops suitable for biofuels Cotton Cotton yields in Mali are approximately 1 ton per hectare, out of which 43% is fibre and the rest is cottonseed. From 1 ton of cottonseed a total of 100 liters of cotton oil can be extracted and the press cake is a very appreciated protein meal on animal feed husbandry (CIRAD, 2008). Tests on diesel engines running straight cotton oil have been carried out by the NGO GERES in the Koutiala cercle of Mali and by CIRAD in Burkina Faso. Cotton production in Mali is organised principally by the activities of CMDT and OHVN mobilising thousands of small producers (average cotton exploitation is smaller than 3 ha). Mali has seen a dramatic decline of cotton production in the past 3 years, which has been detrimental to the local oilseed extraction industry. The 2008/09 harvest of 201,000 tons of seed cotton and approximately 85,000 tons of fibre and 285,000 bales is the lowest production level in over 20 years (Hanson, 2009). This situation has been translated to deficits on the vegetable oil production for the alimentary market and protein meal for livestock industry. Similar shortages of cottonseed in neighbouring Burkina Faso and Cote d'Ivoire pose a grim picture to private oil extractors. As a result, alimentary grade palm oil imports are expected to rise dramatically and animal feed products could become dearer. The process of privatization of CMDT has significantly increased uncertainty in a sector that was already mired in high debts, structural problems and decrease in yields. A weak dollar in relation to the FCFA (the Franc CFA is pegged to the euro) and the global market situation has exacerbated the situation in Mali. Lower prices (between 160 and 200 FCFA /kg paid for the 2008/2009 harvest) and late payments are eroding the incentives for millions of smaller producers to continue producing cotton. The Malian government has installed initiatives to subsidize inputs5 although only a small amount of NPK fertilizer is currently available for distribution and its benefits have not been yet evaluated. The cotton industry is in the process of reorganisation through coordinated efforts of international donors and by the eventual division of the CMDT in 4 regional companies
5 Cost of NPK fertilizer is around 12 500 FCFA per 50 kg

ERA-ARD, SROs, FARA Africa
41
(Matsumoto-Isadifar, 2008). Technology transfer agreements have been signed between Institute of Rural Economy (IER) and the state-owned Brazilian company EMBRAPA (Empresa Brasileira de Pesquisa Agropecuária) to improve cotton agricultural techniques and the introduction of coloured cotton varieties. Groundnuts (Peanuts) Groundnuts are grown by a large majority of Malian farmers and as such, peanuts play an important role in the economy and diet in Mali. Groundnut hulls are used as fuel, and the burned ashes are used in local soap and lye production. Groundnut plants are important forage during the dry season. Groundnuts are grown throughout most parts of the country, although the major production regions are the west, southwest, and the centre of the country. About 6 % of Mali’s arable land is under groundnuts cultivation. There are many small groundnuts transformation units producing mainly paste. Modern paste transformation is done by SOSIMAPA (Chinese capital) with a capacity of 1000 tonnes. Industrial groundnut oil extraction is done by Huicoma (around 5000 tonnes in 2001) (Smake et al, 2009). This share is likely to increase as the company seeks to offset the fall of production and the cost increase of cost of cottonseed. Sorghum and millet Millet represents 40% (about 1.5 million hectares) and sorghum 21% (about 0.8 million hectares) of the total Mali’s cereal production in 2008 that is almost entirely rainfed. Millet and sorghum yields average only 0.66 and 0.89 tons per hectare, respectively (Toure et al, 2006). By comparison, rice yields average 1.7 tons per hectare, and maize about 1 ton per hectare. IER has been testing sweet sorghum varieties for the production of sugar and ethanol. However, these tests are only small scale. Sunflower Sunflower cultivation in Mali is not very well documented, but a USAID Mali report quotes an expected production of 50,000 tons in 2008. The cultivation of sunflower is restricted to the southern parts of Mali (Sikasso region) and for the alimentary oil production market.
7.10 Implications of conversion of Biofuel raw material
Land tenure A recent review of four small Jatropha producers projects and ventures (Mali Folkecentre’s Garalo project, Mali Biocarburant SA, the Jatropha Mali Initiative, and GERES) showed that the impacts of these programmes on land tenure and food security, are inexistent, albeit in the medium term (Palliere and Fauveaud, 2009). In all these initiatives, land ownership remains with small Jatropha farmers who normally produce less than 1 ha (many times on intercropped fashion). However, Jatropha adoption is slow due to the land delimiting character of Jatropha (internal land claims need to be solved before planting and limit the number of adopters) and extension services need to be offered, which translates into higher costs for these projects. Land tenure in the ON for biofuel production is through long term land concessions or holdings, which many times include the development of land for irrigation. Water use Mali Biocarburant SA has identified water access as one of the main barriers for Jatropha adoption, as it produces overlapping of agricultural calendars between Jatropha and cash crops. However, after cultivation, water use for Jatropha fields outside the ON is likely to negligible impact as few or no irrigation would be implemented. Farmers in the ON region have large family-based plots cultivating in a low-risk environment as part of a commercial strategy. They produce two crops a year, with rice only in the main

ERA-ARD, SROs, FARA Africa
42
season and a mix of rice and shallots or onions in the counter season. The main problem for family farmers in the ON is a high water loss and inadequate drainage. Channel irrigation maintenance in the ON is carried out by 3 layers of responsibility, with the State in charge of the principal channels, the ON of secondary channels and private farmers of tertiary channels that irrigate their fields. However, a recent evaluation of the maintenance objectives found that none of the parties respects their contractual commitments (31% by farmers, 45% by the ON and 70% by the State) (Office du Niger, 2007). Further conflicts with water allocation can exist when the water requirements by the new large projects at the ON start to become operational in the following 2 to 3 years, especially during the counter season. Employment Jatropha based projects produce direct employment through extension services and oil extraction. Mali Biocarburant SA, for example, has around 50 salaried personnel for its operations. Indirect employment, through seed production, collection and commercialization has great potential to generate real sources of income. Most of the players in the Jatropha sector in Mali agree that a price of 50 FCFA per kg (0.08 EUR/kg) of Jatropha seed is necessary to make competitive straight vegetable oil extraction and biodiesel production in relation to Diesel costs6. Comparative studies value the Jatropha production costs for small farmers between 18 and 42 FCFA, hence producing real benefits to farmers(Latapie, 2007). One of the key elements of the projects at the ON is that local farmers will be hired as seasonal workers. The Malian law guaranties a minimum professional salary close 28 460 FCFA (43.4 EUR) per month7. However, an informal labour market for non-skilled and seasonal workers is likely to pay less than this. Market The demand for Jatropha grains greatly surpasses the supply. As mentioned before, the Jatropha seed market is virtually inexistent outside the areas of the different project interventions, where most of the seeds are used to sustain planting campaigns and local soap production. Due to this weakness, it has been reported that informal buyers trade seeds up to 10 times more expensive the price the buy with local farmers (usually less than 50 FCFA per kg). In order to meet its fossil fuel reduction targets, the Ministry of Energy estimates that 75,000 ha of Jatropha need to be planted, which would displace 84 million liters of Diesel (Klarsfield at al, 2009). Mali Biocarburant, has started biodiesel production on its 2000 litres per day facility since the summer 2009, albeit supplemented with imported palm oil from Ivory Coast. The actual Sukala ethanol production is 2.3 million litres of ethanol pear year. However, none of this ethanol production is used as fuel. End use As mentioned before, most Jatropha projects are intended for local production of energy and local consumption of biodiesel. At least 3 factors promote this type of use: 1) the costly and logistically difficult exportation of goods from Mali (land-locked country), 2) projected internal growth and energy needs superior to fuel production, 3) Strong euro value which makes the exportation, if possible, unattractive outside the ECOWAS region. The actual ethanol production is consumed in Mali and Burkina Faso for the pharmaceutical and beverage industry. The biodiesel produced by Mali Biocarburant is mainly sold locally to private users and Grands Moulins du Mali (Flower mill). Mali Biocarburant also supplies straight Jatropha oil to a pilot programme of 10 Multifunctional Platforms (MFP) in collaboration with the National Multifunctional Platform Programme
6 For comparison the official cost of 1L of Diesel on January 2010 was 555 FCFA (8.84 EUR). In average, around 4kg of
Jatropha seed are needed to produce 1L of oil. 7 Information from the Agency for the Promotion of the Investments in Mali (API)

ERA-ARD, SROs, FARA Africa
43
7.11 Mapping of the institutions:
First hand players The first hand player for the production of biofuel in Mali is he new National Agency for the Development of Biofuels (ANADEB), once a new biofuel law is approved by Mali’s General Assembly (possibly late may 2010). ANADEB The ANADEB is attached to the Ministry of Energy and created with the following objectives: - To establish a centralized and harmonized framework for biofuel promotion; - To increase the number of professionals working in the biofuels field; - To enact production licensing requirements and technical quality standards for biofuels; - To create a dialogue between main public and private actors in the field; - To maintain trade between international partners in biofuels; ANADEB efforts for the time being are focused on the development of 2 principal feedstock sources: Jatropha and sugarcane. A draft of the legal framework for biofuel production is in consultation with other parts of the government and ANADEB. It is expected that the National Assembly pass it during the spring 2010. Some of the main characteristics of the draft pursued by ANADEB are: - Tax free importation for biofuel producing equipment (presses, reactors, etc). However, importation taxes at UEMOA level would apply. - Comply with the investment code (ministry of economy and finance). Tax breaks for up to 5 years will be encouraged inside the new introduced in the strategy of renewable energies allowed to private investors. - Promote the production of biomass for the co-generation of electricity - Establishment of quotas (to be defined) of biofuels produced in Mali for national consumption. - Quality control in line with European and American standards - The creation of a laboratory for testing of biofuels ANADEB is carrying out public awareness campaigns with the conversion of agricultural machinery to use straight Jatropha oil and collaboration with other parts of the government, NGOs and private sector. Office de Niger (ON) The Office du Niger zone (ON) is one of the oldest and largest gravity-fed irrigation areas in sub-Saharan Africa. The ON is a State owned establishment with industrial and commercial character that comprises the area between the river Niger and Bani, in the circles of Segu and Niono8, in the Segu region of Mali. This zone alone accounts for half of the Mali’s rice production9. Historically, the ON has been considered as a ‘state within the state’ in reference to specific economic, political and social organisations that exists there (al AOE, 2007) . A long story of reforms have transformed the ON from a closed state-run company to a more open to the private sector. Indeed, the ON has withdrawn itself from all crop harvesting and marketing functions but remains the critical actor for water access and
8 Latitudes (13°54’29’’N to 13°40’58’’N) and longitudes (6°4’13’’W – 5°50’7’’W)
9 The Segou region, which includes both the ON lands and the adjacent smaller Office Riz Segou (ORS), has a central role in
the production of rice supplying 87% of the total rice available for trade outside the region of production after local consumption needs are met.

ERA-ARD, SROs, FARA Africa
44
fertilizer supply, albeit there has been a formal transfer of such responsibility to farmer organisations. International cooperation, notably French and Dutch, have pledged for the continuation and improvement of household farming and the production intensification supported by technical improvements. Relations between the ON and many farmers and farmer organizations in its zone of intervention are generally poor. The ON is responsible for the allocation of irrigated parcels to users in the zone. However, final land ownership rests with the State and the ON functions as its agent. With a special derogation from this principle, farmers in the MCA Alatona project zone will be able to obtain actual land titles. Most ON land is held by family farms under 2 types of arrangements: 1) annually renewable farming leases that are not transmittable and 2) “farming permits” that are transmittable10. These types of land holdings can be, and are commonly revoked, by the ON if farmers fail to pay an annual water use fee meant to finance ON-contracted work to maintain irrigation infrastructure. Water use fee payment is usually above 95 percent because ON evicts farm families with revoked permits. Accusations of non-transparency for the attribution of new parcels are common as the demand for such attributions outstrip the supply ON can offer. Especially since 2002, other types of lease holdings exist to attract private investors who will construct new irrigation channels in return for long term (50 or 30 years) occupation rights granted as a reward for investment. One of the most high profile case under this scheme is the allocation of 100,000 hectares in the cercle of west Macina to Malibya Agriculture, a state owned company from Libya, for the production of rice, livestock farming and industry. Under this agreement a 40km supply channel with a capacity of 130 cubic meters per second will be developed. Multilateral UEMOA The West Africa Economic and Monetary Union (UEMOA) is a regional organization seeking the economic integration of the state members. The UEMOA members (Benin, Burkina Faso, Côte d’Ivoire, Mali, Niger, Senegal, Togo and Guinea-Bissau) share the same currency, the Franc CFA, whose exchange rate is tied to that of the euro and is guaranteed by the French Treasury. The UEMOA promotes greater competitiveness of the economic activities with the framework of open markets and juridical environment rationalized and homogenised. European Commission (EC) Under the programmes for environment and rural development, the EC supports the activities at the ON with the development and integration of information systems (Vision project). The UN system (UN) The United Nations (UN) system in Mali, through UNDP (United Nations Development Programme) and UNEP (United Nations Environment Programme), have introduced programmes to help the GoM to tackle environmental issues and their link to poverty. These activities have had a major role in the development of the national strategy for renewable energy and support programmes, such as the Multifunctional Platform Programme and AMADER, to enable sustainable energy access in rural communities. Bilateral United Sates of America (US) Through the United States Agency for International Development (USAID) in Mali and the Millennium Challenge Account (MCA) a 234.6 million USD irrigation project (Alatona
10
Farmers with a history of maintaining annual leases are generally able to transform these into farming permits

ERA-ARD, SROs, FARA Africa
45
irrigation project) has started at the ON (MCMali, 2009). This project consists on the redevelopment of 14,000 ha of agricultural land for increased productivity and production, through diversification of high-value crops such as sugar cane. The programme will upgrade 81km of roads (Niono-Goma Coura), support the ON water management, allocated new irrigated land to family farmers, women market gardeners, and farming companies in private ownership. Recipients will purchase the land by making annual payments over a 15-20 year period. The project will follow the process of parcel creation, land rights education, registration system upgrade, land parcel allocation and titling, and management of land revenues and will compensate families residing in the perimeter or with rights to land therein consistent with World Bank’s Operational Policy on Involuntary Resettlement by offering land in the irrigation perimeter or, if the land option is not chosen, other compensation alternatives. Social infrastructure, agricultural services and lending facilities are also part of the programme. The redevelopment of the first 5200 ha started in July 2009 and will be completed in 20 months by the French company Sogea Satom-Razel. Another component of the project is the rehabilitation of the main irrigation channels and regulators by the Chinese company Synohydro Corporation Limited, which would increase the water delivery from 180 to 300 cubic meters per second. China (CN) China has become a leading trading partner with Mali with the involvement on more than 80 projects, including sugar, textiles, pharmaceutics, the, cigars and matches, rice dehulling equipment and sponsor of important infrastructure projects such a 3rd bridge in Bamako and the construction of the University of Mali infrastructure. State owned Chinese companies are active as contractors for infrastructure projects, notably in hydraulic and road works. Denmark (DK) The kingdom of Denmark is a technical and financial sponsor of ANADEB. Historically, the Danish cooperation has been very active in the areas of renewable energy and environment with funding to the NGO sector such as Mali Folkecentre. France (FR) The French Development Agency (AFD) has supported various initiatives in the ON for many years and is one of its lead donor. It currently carries out the project PADON which supports the ON on water administration and land redevelopment and supports producers via the regional agricultural chambers. The proposed expansion of the main channel systems will complement a planned AFD project to strengthen certain sections in the area. Netherlands (NL) The international cooperation from kingdom of the Netherlands has historically been very active in the agricultural sector and worked closely with the ON for the last 30 years. The Dutch cooperation has committed 3.1 billion FCFA for the "Programme d’appui au contrat Plan Office du Niger 2008-2012” that tries to strengthen the capacity of the ON through feasibility studies for redevelopment of irrigated land and extension work. Government of Mali (GoM) Prime Minister Office Secretary of State in charge of the Integral Development of the Zone Office du Niger (SEDIZON) The SEDIZON, created in April 2009, has as mission to transform the ON into an economic, social and cultural development driver for Mali11. The direct attachment of SEDIZON to the Prime Minister Office and the large investments on sugar and food production materialized
11
Before the creation of the SEDIZON, the Ministry of Agriculture had the guardianship of the ON.

ERA-ARD, SROs, FARA Africa
46
during 2009 show the political will that the GoM has to attract important foreign investment in the agricultural business. Ministry of Energy and Water (MEE) National directorate of energy (DNE) The DNA is in charge to administrate policy related to energy supply. The main objectives of the NDE are: - To ensure that the greater number of the population has access to energy both in quantity and at low cost; - To develop the national potential of renewable energy; - To protect and preserve the existing wood fuel resources; - To liberalize the sector by mobilizing more initiatives of the decentralized communities and private funds; - To adapt institutions to the energy sector requirements through oriented capacities building, and the State strategic control. CENESOLER CENESOLER is the National Research Centre on Solar and Renewable Energies of Mali CENESOLER has a large experience in biofuels, especially with Jatropha, since the late 80’s when it hosted and collaborated with various Jatropha initiatives including GTZ’s Jatropha project and the former National Program for the Energetic Valorisation of Jatropha. The activities related to Jatropha are now under the supervision of ANADEB12. The CENESOLER is trying to become a regional centre for biofuels that could supply technical services with support of the UEOMA. AMADER Created in 2003, AMADER is the Malian Agency for the Development of Domestic Energy and Rural Electrification. It is a Public Administrative Establishment (EPA) set up as part of a World Bank/GEF/GoM project to support rural energy development. AMADER main activities are to promote private and non-profit sector ability to develop and operate viable electrification projects in rural and suburban areas through technical assistance and financial support (investment subsidies). AMADER also acts as de facto energy regulator in rural and suburban areas. Fuel costs in rural settings and the low level of constant payment subscribers are one of the recurrent problems for the profitability of many of the AMADER projects. EDM SA Electricité du Mali SA is the national electricity company in charge of production, transportation and distribution of electricity in the district of Bamako and the principal urban areas of Mali. Mali’s share of electricity production from thermal stations has increased from 23% in 2006 to around 45% in 2007 supported entirely by importation of fossil fuels (Diarra, 2009). The rest of the electricity production is produced through hydroelectric generation. Ministry of Mines (MM) The Ministry of Mines is in charge of managing policies for the exploitation of mineral resources in Mali, being the most notable gold, diamonds, phosphate and uranium. National Direction of Geology and Mines (DNGM) The National Direction of Geology and Mines is in charge of produce the policy documents related to research, development, exploitation and transformation of the mineral resources. The DNGM has a division for hydrocarbons and facilities for testing of minerals. Initial work with ANADEB is foreseen to help to draft national standards in terms of biofuel quality requirements.
12
The actual director of ANADEB is the former director of CENESOLER

ERA-ARD, SROs, FARA Africa
47
Ministry of the Industry, the Investments and Commerce (MIIC) API The Agency for the promotion of the investments (API) has been recently created to collaborate assist different investment in Mali. It also offers a ‘one-stop’ window to register companies under the Malian Law. Ministry of Economy and Finance (MEF) ONAP The National Office of Petrol Products (ONAP) is a EPA organization with moral and financial autonomy. ONAP seeks to ensure the availability of oil products in Mali, contribute to the definition of pricing policies and national stocks, fight against fraud in the oil subproducts sector and collect, organise and disseminate statistical and research information about the oil sector. Other attributes to ONAP are the definition of norms and control quality of oil based products in Mali. Ministry of promotion of Women, Child and Family (MPFEF) The MPFEF has under its guidance the Multifunctional Platform Program (PTFM) that has been a mayor player in the development of Jatropha oil as fuel in Mali. Multifunctional Platform Program (PTFM) The concept of a Multifunctional Platform was developed in Mali and is now a UNDP regional programme (Senegal, Ghana, Burkina Faso, Ghana, Mali). It consists of a small stationary diesel engine powering different productive modules (cereal thresher, cereal mill, water pump, battery charger, electricity generator). A PTFM is managed and owned by women groups that benefit from important time reductions of agro processing activities. The program has important impacts such as local employment, health improvement through better diet and increased school attendance of young girls. The PTFM programme traces its roots to the German Technical Cooperation (GTZ) in Mali during the late 80’s where pioneering work was carried out to use Jatropha oil as fuel for its engines. PTFM programme has installed around of 600 platforms in Mali and has the commitment to install another 300 in a 3-year period. Since October 2008 the PTFM program collaborates with MBSA for the set-up of 10 PTFM running on Jatropha oil through the intensification of Jatropha cultivation in those villages. The PTFM programme also works closely with AMADER to develop rural electrification programs where successful PTFMs are upgraded to small electricity suppliers. Ministry of Environment and Sanitation (MES) Agency for the basin of the Niger River (ABFN) The mission of ABFN is the protection, promotion and sustainable management of the Niger river and prevention of natural risks (flooding, erosion and draughts). Ministry of Agriculture (MA) Institute of Rural Economy (IER) Mali’s Institute of Rural Economy is a research organisation with technical expertise on agronomy, livestock, forestry, fisheries and systems of rural production and agricultural land development. The IER is active in the transfer of technologies and research staff training (including demonstration fields, seeds improvements) through 6 research centres, 8 stations and 12 sub-stations in the Malian Territory. The IER is carrying out tests with sweet sorghum for production of sugar and methanol. CMDT The Malian Company for the Development of Textiles (CMDT) was founded 1974 by the Malian state to administrate the national cotton production. CMDT is finalising a long privatisation process and remains the biggest supplier of inputs for cotton crops (such as NPK, seeds) and market price for cotton. The capital of the company belongs to the Malian

ERA-ARD, SROs, FARA Africa
48
state (60%) and to the French organization DAGRIS (Développement des Agro-Industries du Sud)13. The CMDT intervenes principally in the regions south of the Niger river (Cercle of Dioila in the Koulikoro region, circles of Baroueli, Bla and San in the Segu region and the entire Sikasso region) and the East of Mali (cercle of Kita). This zone comprises around 28% of the national population of Mali. The cotton cultivation is carried out during the rainy season of May to beginning of October. The CMDT is the principal player for ginning (separation of seed from fibre) the cotton. Cottonseeds are then sold to private oils extractors, such as Huicoma. Local transformation of cotton fibre into textile products is carried out by COMATEX and FITINA14. However, this accounts only about 1% of the fibre production. The CMDT works closely with the producers, through a large network or village agents and farmers organised cooperatives. Village agents and cooperatives participate in the acquisition of fertiliser and pesticides needed for the cotton production. They also set prices before the season, manage credit to farmers and organise the transport of the harvest. OHVN The Office of the High Valley of the Niger (OHVN) develops the cultivation of cotton and other agricultural products in the circles of Kati, Koulikoro and Kangaba. OHNV is the second producer and trader of cotton in Mali. However, OHVN is not involved in any transformation process, leaving it to the CMDT. Ministry of Secondary and Higher Education and Scientific Research (MESSRS) This ministry manages and orients higher education of the University of Mali. Within the University of Mali, two high education schools produce activities related to biofuels: IPR /IFRA and ENI. The National School of Engineers (ENI) ENI is active in the promotion and testing of vegetable oils as alternative fuels. It collaborates with ANADEB in the realisation of comparative tests of engines using Diesel and Jatropha oil. IPR/IFRA The Polytechnic Institute of Rural of Training and Applied Research15 (IPR/IFRA) focus its work on research and teaching of agronomy and animal husbandry. Located in Katibougou, region of Koulikoro, this centre is active in agronomic research on Jatropha curcas and local oil extraction. Non-governmental sector (NGO) The NGO sector involved in the production of biofuels is concentrated on Jatropha production. African Association for the Promotion of Biofuels (AAPB) The AAPB is an umbrella organization integrating biofuel producers. Although it’s main office is in Ouagadougou, Burkina Faso it has a representation office in Bamako, Mali. AEDR-Teriyabougou Teriyabogou16 is a sustainable tourism initiative and local development in the shores of the River Bani in the commune of Korodougou, cercle de Bla in the region of Segou. The project has planted 230ha in collaboration with neighbouring villages. Teriyabogou counts with a
13
Former Compagnie Française pour le Développement des Textiles (CFDT) 14
ITEMA (Industrie Textile du Mali) is another cotton fibre transformation company that is in the process to re-start activities. 15 http://www.ipr-ifra.org/ 16
Teriyabogou (Association Mali Aqua Viva) was started by the late priest Barnard Verspieren, who carried out some of Mali’s most important campaigns for providing drinking to rural populations.

ERA-ARD, SROs, FARA Africa
49
Jatropha oil extraction facility and intents to supplement its diesel consumption with Jatropha oil. GERES Groupe Energies Renouvelables, Environnement et Solidarités (GERES) is a French NGO working in Koutiala, region of Sikasso. GERES has planted around half a million Jatropha shrubs for research of production, transformation and consumption within a very delimited area of straight Jatropha oil. GERES works with a private rural electrification concessionaries to evaluate the economic viability of Jatropha oil produced locally. MFC Nyetaa, Mali-Folkecenter Nyetaa (MFC) is a Malian NGO founded in 1998 with roots linked to the Danish Folkecenter for Renewable Energy. MFC is very active in development of local use of straight Jatropha oil and has assisted in the transformation of multifunctional platforms on Jatropha oil and for the construction of oil presses in Mali. Its flagship project, Garalo Bagani Yelen, is a rural electrification venture of different partners such as ACCESS S.A.R.L. (a Malian rural energy service company), AMADER, FACT Foundation, the Stichting Het Groene Woudt and Stichting DOEN funds. Located in the village of Garalo, region of Sikaso, the Garalo Bagani Yelen project has planted 480 ha of intercropped Jatropha, installed a Jatropha pressing facility and 3 generators of 100kW serving around 230 clients (households, small business and government buildings). Plans are underway to replicate this model in other villages and expand the Jatropha plantation. Private Sector Sugar cane Sukala In 1996, the China Light Industrial Corporation for Foreign Economic and Technical Co-operation (CLETC) bought the majority stake (70%) of the state company Sukala SA (Forum on China, 2006) and has assure its independent management. Sukala SA produces ethanol in their installations of Dougabougou and Siribala, in the Segu region. Sugar production is around 35,000 tonnes per year, and between 8,000 and 10,000 tonnes of molasses per year (UNIDO, 2008). Around half these molasses are used to produce around 2.3 million litres of ethanol by distillation per year. The remainder of the molasses are important inputs for animal feed production. The ethanol produced is sold to the pharmaceutical, food and beverage industries in Mali and Burkina Faso. N-Sukala On 13th November 2009, Mali’s National Assembly (Parliament) approved the creation of a new company denominated N-Sukala (Nouveau complexe sucrier du Kala supérieur), where the Malian State is shareholder (40%) together CLETC (60%). The share of the Malian state is composed by the cession of 857ha for the construction of a sugar factory, the leasehold of 19,143 ha for sugar cane cultivation and capital contribution of 5.262 billion FCFA (8.022 million EUR) payable with a delay of 3 years after the legal registration of the company (Lam, 2009). The estimated capacity production of this project will be around 103 680 tonnes of sugar and 9.6 million litres of ethanol per year. The generation of 639 permanent and 10,000 seasonal jobs are expected with this project. PSM A third project is the Markala Sugar Project (PSM) is a public private partnership installed in the ON. It consists on the irrigation of 14,000 ha of sugar cane plantations and the construction of a factory producing 190,000 tons of sugar per year. The project is composed of the following partners:

ERA-ARD, SROs, FARA Africa
50
a) SoSuMar: the Markala Sugar Company (Société Sucrière de Markala), responsible for the industrial and private component of the Project, whose shareholders are: ILLOVO17 : 70% ; Schaffer : 4% ; Private Malians: 22% ; the GoM: 4% , and b) CaneCo: the Sugarcane Production Company (Société de production de canne à sucre), responsible for the agricultural aspect. The State of Mali is the majority shareholder of CaneCo with 90% of the shares (while SoSuMar holds the remaining 10%). CaneCo is the State-owned component of the project. A third entity, known as “CommCo” will be established to benefit the community. It will be responsible for developing 5,600 hectares for the exclusive benefit of the specific communities to which they will be allotted. These 5,600 hectares will all be allocated to the communities as compensation (1,465 ha) and for their development through the introduction of sugarcane cultivation (4,135 ha). This component will enable peasant farmers to become sugarcane farmers. The establishment of this entity will make a three-pronged partnership structure: GoM/SoSuMar /Community. SoSuMar will have installations to produce 460,000 tons of bagasse, which will be used for co-generation of 30MW electricity, including 3 MW that will be transferred to EDMs network. Around 60,000 tons of molasses will be produced for the creation of 15 millions of liters of ethanol. It is also estimated that the project will generate 95,886 tons of compost per year. The project has yet to raise significant money to finance the start-up of operations18. Cotton HUICOMA The Cotton Oil Factory of Mali (Huicoma) is the largest cotton oil factory in West Africa with a capacity of over 340,000 tonnes of seeds per year. Huicoma was founded in 1979 by the state owned CMDT that ensured its management until 1998 when a new autonomous management was appointed. In December 2002, the Malian group Tomota bought a majority share of the company (Tomota, 2009). The Malian state retains 12% of the company. Huicoma owns three production factories (Koulikoro, Kita and Koutiala) with an annual production capacity to produce of over 40,000 tonnes of refined cotton oil; 15,000 tonnes of soap and over 230,000 tonnes of meal cake. At full capacity, Huicoma employs 855 people in full time and 300 seasonal cookers. However, in the last 2 years Huicoma has struggle to continue normal operations due to elevated price and unavailability of cotton seed, forcing to substantial workforce reduction and technical stops of their factories (Privatisation, 2008). Jatropha Jatropha Mali Initiative (Eco-Carbone) The Jatropha Mali Initiative (JMI) is a private venture composed of three shareholders: Eco-Carbone (60%), Déguessi Vert, a Malian company, (21%) and Novartis (19%). The venture plans to plant 12,000 ha around the cercle of Kita (West of Mali) for the production of straight Jatropha oil. JMI has realised the plantation of 1200 ha of intercropped Jatropha and the installation of a pressing pilot pressing unit. Mali Biocarburant SA (MBSA) Mali Biocarburant SA (MBSA) is a biodiesel producer established in 2007 with the integration of private Malian and Dutch investors, including the Royal Tropical Institute (KIT), the Dutch Railway Company Pension Fund, Power Pack Plus, Interagro and a Jatropha farmer’s union, ULSPP. In February 2008 MBSA inaugurated a 2000 litres a day biodiesel refining unit in the city of Koulikoro. MBSA strategy is geared towards benefiting small producers of Jatropha Curcas through innovative agro-forestry practices and business approach. MBSA does not own Jatropha plantations but ensures its feedstock from farmers unions that benefit directly through the
17
http://www.illovo.co.za/ 18
The MSP is having a meeting 8-9 December in Bamako for a round of meetings with potential financing institutions.

ERA-ARD, SROs, FARA Africa
51
sale of Jatropha nuts they harvest. The additional income for small producers is estimated at 1250 FCFA/day (€1.90/day) compared to current alternative sources of income of maximum €1.15/day. MBSA is the first company in West Africa that has contracted its carbon reduction on the Voluntary Carbon Credit market to Trees for Travel who in turn has signed a contract with KIA Motors Netherlands. MBSA promotes a pro-poor carbon offset scheme and reinvested 75% of its 2007 carbon credit income in strengthening the capacities of its farmers. MBSA also valorises subproducts like the glycerine and Jatropha press cake, used in the cosmetic industry and as valuable fertilizer, respectively. MBSA currently gives direct jobs to over 50 people and partners with over 3000 farmers in three zones of Mali (Koulikoro, Kita and Ouelessembogou) and Burkina Faso (Leo region). Sud Agro-industrie (SAi) Sud Agro-Industrie is a Malian company working in the Sikasso region of Mali using Jatropha plantations. The company has as ambition to develop 50,000 ha of Jatropha. Bagani SA (BSA) Bagani SA is a trader of Jatropha seeds based in the region of Sikaso. Bagani SA counts with a network of traders that obtain their supply from existing Jatropha hedges and plans to enter into the development of Jatropha cultivation and oil production. Tomota Group (TG) The Tomota group, principal shareholder of HUICOMA, also intends to produce Jatropha at large scale in the Mecina cercle, inside of the ON. An amount of 100 000 Ha are projected for this development.
7.12 Links in biofuels development in Mali

ERA-ARD, SROs, FARA Africa
52
Acronyms MA Ministre de l'Agriculture IER Institute d’Economie Rurale MIIC Ministre de l'Industrie, des Investissements et du Commerce MEE Ministre de l'Energie et de l'Eau (MEE) DNE Direction National d’Energie CENESOLER Centre National des Energies Solaires et Renouvables AMADER Agence Malienne pour le Développement de l'Energie
Domestique et l'Electrification Rurale PJ Jatropha Project EDM Electricité du Mali SA ANADEB Agence National de Développement des Biocarburants MET Ministre de l'Equipement et des Transports MAT Ministere de la Administration Territoriale DNCT Direction National des Collectivités Territoriales MEF Ministre de l'Economie et des Finances ONAP Office National des Produits Pétroliers
MEA Ministre de l'Environnement et de l'Assainissement SEP-DIZON Secrétaire d’Etat auprès du Premier ministre, chargé du
Développement Intégré de la Zone Office du Niger
MPFEF Ministre de la Promotion de la Femme, de l'Enfant et de la Famille MESRC
Ministre des Enseignements Supérieur et de la Recherche Scientifique
MMEIA Ministre des Maliens de l'Extérieur et de l'Intégration Africaine' OdN Office du Niger IPR Institute Polytechnique Rurale de Formation et de Recherche
Applique International BAD African Development Bank UN United Nations UNDP UN Development Programme FAO UN Food and Agriculture Organization GEF EC European Comision, External Cooperation Programmes UEOMA West African Economic and Monetary Unio ECOWAS Economic Community Of West African States Bilateral FR France Agence Française de Développement (AFD) NL The Netherlands cooperation PRIVATE Sugar cane
PSM Project Sucrier Markala SUKALA Complexe Sucrier Du Kala Superieur SA Et Ethanol OdN Office du Niger PP Private Producers Cotton CMDT Compagnie Malienne du Développement des Textiles HC Huicoma SA Jatropha MBSA Mali Biocarburant SA GERES Groupe Energies Renouvelables Environnement et Solidarités BSA Bagani SA MFC Mali Folke Centre Nyeeta

ERA-ARD, SROs, FARA Africa
53
GRAT TY AEDR/Teriyabougou EC Jatropha Mali Initiative Eco-carbone
7.13 Summary of biofuels activities implications in Mali
7.14 Conclusion
Biofuels play an important role in the energy strategy and growth in Mali. Political support favours food security, economic development and environmental protection. However, the relative young government decentralisation process, lack of resources and low administration capacities hinder good natural resources management. Sugarcane production is intended to satisfy sugar demand. Ethanol is not yet used as fuel but for the pharmaceutical and beverage industries. In terms of natural resources, particularly water availability, Mali presents large developments of irrigated land at the ON which can boost food and fuel production.
FARMPredominance of small and
marginal farmers
INDUSTRYJatropha for oil and biodiesel
Sugarcane for ethanol
MARKETDirect sell of Jatropha oil,
Biodiesel and Ethanol
FARMPredominance of small and
marginal farmers
INDUSTRYJatropha for oil and biodiesel
Sugarcane for ethanol
MARKETDirect sell of Jatropha oil,
Biodiesel and Ethanol
Issues • Low land productivity and poor
water access challenges Jatropha
adoption
• Water management and
relations between small producers
and the ON
• Land tenure conflicts is
exacerbated with a young
decentralization process
• Inefficient agricultural markets
• Low availability of Jatropha and
other oilseeds
• Sugarcane production
dependant on irrigated land
development at ON
• Actual production is for hydrous
ethanol after sugar production
• Poor infrastructure and weak
supply chains increase
production costs
• Missing biofuel regulation
• High demand of fossil fuels
for energy production
• Lower fossil fuel prices in
landlocked Mali than in the
coastal neighboring countries
• Unsatisfied demand of
alimentary oil
Policies •Biofuel Policy highlights
sustainable production and food
security
• Development of irrigated land at
the ON
• Promotion of renewable in
country energy strategy
• Promotion of investment and
improved operations at the ON
assisted by international donors
• Export of biofuel after
national objectives are met
• Regional integration
• Biodiesel but not straight
oil mixing with diesel allowed
Emerging
Patterns/
relationships
• Long term leaseholds for
agribusiness at the ON
• R&D related to pro-poor
benefits, environment and
agronomic techniques
• Pro-poor strategies (outside
ON) and large industrial
developments (inside ON)
• Public Private Partnerships
• Regional approach
• Local energy projects
driving interests for Jatropha
• Sugar demand driving
ethanol production
Impact/
future
implications
• Increase in food output thanks to
development of irrigation
potential
• Increase of income and
diversification of rural economies
• Assured feedstock sources from
farms and village level
production
• Synergies with the alimentary
oil extraction industry
• Substitution of fossil fuel
importation
• Viability of rural energy
projects

ERA-ARD, SROs, FARA Africa
54
Nevertheless, water and environmental management are main concerns in the country due to the Sahel area. Mali is one of the countries in West Africa with more experience on the use of biofuels for electricity generation at community level. International donors follow with particular attention these developments. The experience with Jatropha programs has shown that it can benefit small holder farmers without compromising food production at local level. These developments include commercial production of Jatropha (e.g. Mali Biocarburants) and not only community level initiatives (e.g. Mali Folk Center). Although Mali has a number of initiatives for pro-poor energy production, Jatropha seed supply is still very limited. The challenge for Mali is also in the agriculture sector, specially for the efficient use of water, water access, costly extension services in need and low yields for all crops and not just energy crops.

ERA-ARD, SROs, FARA Africa
55
8. TANZANIA CASE STUDY
8.1 Country’s Characteristics
Location Tanzania is located in Eastern Africa between longitude 290 and 410 East, Latitude 10 and 120 South. It is situated in East Africa just south of the equator; mainland Tanzania lies between the area of the great lakes—Victoria, Tanganyika, and Malawi (Nyasa)—and the Indian Ocean. It contains a total area of 945,087 sq km (364,900 sq mi), including 59,050 sq km (22,799 sq mi) of inland water. It is bounded on the North by Uganda and Kenya, on the East by the Indian Ocean, on the South by Mozambique and Malawi, on the SW by Zambia, and on the West by Zaire, Burundi, and Rwanda, with a total boundary length of 4,826 km (2,999 mi), of which 1,424 km (885 mi) is coastline. The section of the United Republic known as Zanzibar comprises the islands of Zanzibar and Pemba and all islets within 19 km (12 mi) of their coasts, as well as uninhabited Latham Island, 58 km (36 mi) south of Zanzibar Island. Zanzibar Island lies 35 km (22 mi) off the coast, and Pemba Island is about 40 km (25 mi) to the NE. The former has an area of 1,657 sq km (640 sq mi), and the latter 984 sq km (380 sq mi). Tanzania's commercial capital city, Dar es Salaam, is located on the Indian Ocean coast while Dodoma is the political capital and seat of government. Dodoma is situated on the eastern edge of the southern highlands.
Figure 8.1 Map of Tanzania showing location relative to its neighbouring countries
Geographical Characteristics Tanzania is the biggest of the East Africa countries (i.e. Kenya, Uganda, Tanzania, Rwanda and Burundi). Tanzania contains three of Africa's best-known lakes - Victoria in the north, Tanganyika in the west, and Nyasa (Malawi) in the south. Mount Kilimanjaro in the north, 19,340 ft (5,895 m), is the highest point in Africa. The island of Zanzibar is separated from the mainland by a 22-mile channel.
The Great Rift Valley runs to the south of Tanzania splitting at Lake Nyasa; one branch runs down beyond Lake Nyasa to Mozambique; and another branch to north-west alongside Burundi, Rwanda, Tanzania and western part of Uganda. The valley is dotted with unique lakes which include Lakes Rukwa, Tanganyika, Nyasa, Kitangiri, Eyasi and Manyara. The

ERA-ARD, SROs, FARA Africa
56
uplands include Kipengere, Udzungwa, Matogoro, Livingstone, and the Fipa plateau forming the southern highlands. The Usambara, Pare, Meru, Kilimanjaro, the Ngorongoro Crater and the Oldonyo Lengai, all form the northern highlands. From these highlands and the central saucer plateau flow the drainage system to the Indian Ocean, Atlantic Ocean, Mediterranean Sea and the inland drainage system.
Climate Tanzania has a tropical type of climate. In the highlands, temperatures range between 100c and 200c.during cold and hot seasons respectively. The rest of the country has temperatures never falling lower than 200c. The hottest period spreads between November and February (250c - 310c) while the coldest period occurs between May and August (150c - 200c). Two rainfall regimes exist over Tanzania. One is unimodal (December - April) and the other is bimodal (October -December and March - May). The former is experienced in southern, south-west, central and western parts of the country, and the later is found to the north and northern coast. Administration Tanzania is divided into 26 administrative regions (21 on the mainland and 5 in Zanzibar) and 130 administrative districts (Zanzibar has 10 and Mainland has 120 administrative districts).
Environmental Characteristics Tanzania has extensive forest cover, most of which is savannah woodland and montane forest, with scattered patches of lowland forest. Much of this forest has high biodiversity and endemism—especially in the southern highlands region. However, these forests are increasingly threatened by fuelwood collection by the rapidly expanding population, as well as by commercial felling of timber and expanding agriculture. However, the country loses 91,000 hectares to illegal felling each year. In early 2006, the Tanzanian government reinforced the export ban logs and sandalwood in an effort to reduce deforestation. The country planted 100 million trees between 1999 and 2006. Although 40 percent of the country is preserved in parks, forests cover is reducing rapidly in some regions. Overall forest cover fell by 15 percent between 1990 and 2005, but deforestation rates have increased significantly since 2000. A recent survey (2009) among the ice fields on Mount Kilimanjaro found that the ice atop Africa's most famous mountain could be gone in twenty years or less. The study discovered that between 1912 and 2007, 85 percent of the ice that covered Mount Kilimanjaro vanished. When using 2000 as baseline the mountain has lost 26 percent of its ice. In Tanzania’s major towns and cities, solid and liquid wastes are left untreated. As a result, air and water are contaminated with pollutants, a major health hazard especially for those who live in low-income areas. In Dar es Salaam for example, few people are connected to a sewage system. The few sewage systems that exist disgorge their waste directly into the ocean, affecting marine habitats and species. Wildlife poaching is also a problem in rural Tanzania. Sometimes, this happens in retaliation to wildlife attacks which destroy crops, and hence livelihoods. Both poaching and human-wildlife conflicts add to the country’s environmental concerns. To make matters worse, Tanzania currently confronts issues of soil degradation, deforestation, and desertification.
8.2 Population Size and Characteristics
Tanzania’s population as per 2009 estimates is 41,048,532 with a growth rate of 3.0%. About 51% of the country’s population is women and 46% are under the age of 15. The birth rate is 34.2 per 1000 while the infant mortality rate is 84 per 1000; under five mortality Rate

ERA-ARD, SROs, FARA Africa
57
is 133.8. Total life expectancy is 54 years (but varies between males and females, i.e. 53 and 56, respectively) and the population density per sq kilometre is 46. According to Tanzania’s National Bureau of Statistics (2008), the country’s population trends over the years can be summarized as shown in the table below: Table 8.1 Population trend in Tanzania
Number of Inhabitants (’000) 1978
Census
1988 Census
2002 Census
2008 Projection
Tanzania Mainland 17,036 22,584 33,462 39,475
Tanzania Zanzibar 476 641 982 1,193
Tanzania 17,512 23,225 34,444 40,668
Population Density (pop./sq. km) 20 26 39 46
8.3 Gross Domestic Product, Human Development Index and Poverty Levels
The Per Capital GDP is estimated at US$ 424. The share of GDP by main sectors is as shown in the figure below.
Tanzania's Shares of GDP at 2008 Prices
services52%agriculture &
fishing27%
industry & construction
21%
Figure 8.2 Tanzania’s GDP
About 50% of the population is living below the poverty line. The United Nations Development Programme’s (UNDP) Human Development Index (HDI) listing, which arranges countries according to their overall level of human development, ranks Tanzania 151st out of a total of 174 nations. The HDI (0.530 for Tanzania) provides a composite measure of three dimensions of human development: living a long and healthy life (measured by life expectancy), being educated (measured by adult literacy and gross enrolment in education) and having a decent standard of living (measured by purchasing power parity, PPP, income). Tanzania’s economy is highly dependent on natural resources which include:
Minerals - gold, diamonds, tanzanite and various other gemstones, natural gas, iron ore, coal, spring water, phosphates, soda ash and salt.
Wildlife and Tourism - 12 National Parks, the Ngorongoro conservation Area, 13 Game reserves, 38 Game Controlled Areas: National Cultural Heritage Sites (about 120 sites).
Fisheries - three large lakes: Victoria, Tanganyika and Nyasa, the Indian Ocean coastline, rivers and wetlands. Potential yield of fish from natural waters is estimated to be 730,000 metric tons annually; present catch is 350,000 metric tons.

ERA-ARD, SROs, FARA Africa
58
Forestry and Beekeeping: Non-reserved forest-land (1,903.8 km2), forest/woodlands with national parks etc (200 km2), and Gazetted forest reserves (1,251.7 km2).
8.4 Main food crops
A recent Agriculture Census showed that the crop sector plays an important role in the Tanzania economy providing jobs, sustenance and income to 4,858,810 rural households growing crops (representing 99% of the total number of farming households in the rural areas and 95 percent of the total rural households). The total planted area with annual crops was 7,818,620 hectares and 1,234,999 hectares for permanent crops giving a total planted area of 9,053,619 hectares. There is a wide variety of crops grown in the country (over 95 types); however, small holder crop production is very much dominated by maize. Other important food crops are cassava, bananas, paddy, beans and groundnuts. Maize is grown extensively and in every region of the country. With the exception of seed, there is virtually no investment in crop production. Crop yields are very low because minor amounts of fertilizer are being applied and pesticide use is virtually absent especially on food crops. The average planted area of 1.61 hectares per household for annual crops is low to support an average size smallholder household and is insufficient to allow smallholders to move beyond subsistence existence. The best crop producing areas in Tanzania have less available land for cultivation.
8.5 Main Agricultural and Food Crops Imports/Exports
The main agricultural products including food and non-food crops are coffee, sisal, tea, cotton, pyrethrum, cashew nuts, tobacco, cloves, corn, wheat, cassava (tapioca), bananas, fruits, and vegetable. The table below shows the major agricultural crops marketed and their production trends over the last five years:
Table 8.2 Major agricultural crops in Tanzania.
Crop Production in ’000 Metric tons
2004 2005 2006 2007 2008
Sisal fibre 27 28 31 33 34
Coffee 39 34 46 55 44
Tobacco 44 57 51 51 55
Cashew nuts 80 90 88 91 98
Pyrethrum 1 3 2 2 1
Green tea leaves 1278 133 123 159 148
Seed cotton 140 378 131 131 201 The main agricultural exports include coffee, cotton, tea, sisal, cashew nuts, tobacco, cut flowers, seaweed, cloves and horticultural products.
8.6 Characteristics of Livelihoods in Farming Systems
The majority of crop-growing households in Tanzania are subsistence farmers. Capital investment in smallholder agriculture is virtually absent. Incomes are low, about 100 USD per household annually. The average land area per house hold is only 2 hectares. The percent of utilised land compared to available land is high and in some regions all available land is utilised. Although the last ten years has seen an increase in planted land area, the large increase in planted area has been offset by a reduction in productivity resulting in only a comparatively small increase in the quantity produced. Land ownership through formal titles/deeds is at a very low level with most of the land under customary rights.

ERA-ARD, SROs, FARA Africa
59
8.7 Policies in Place and Link with the Bioenergy Sector
The government of Tanzania has within her energy, agriculture, land environment and forest policies, statements of intentions to improve the supply and demand of bioenergy and ensure its sustainability. In 2006, the Government of Tanzania created the National Biofuels Task Force to promote development of the sector and develop legislation to stimulate use of biofuels. Furthermore, a statement on blending biofuels with mineral petrol has been slotted in the New Petroleum Supply Act. Agriculture Policy
For many years, Tanzania’s agricultural policies were based on government control of trade and production. However, the sector has now been substantially liberalized and market forces have been allowed to prevail. The government has withdrawn from direct involvement in production, processing and marketing and has retained only its role in setting policies. The overall agricultural policy of Tanzania recognizes the need to improve agricultural Technologies and practices to enhance productivity. Therefore labour-augmenting technology is a key to agricultural development. Tanzania’s main agricultural policy objectives are: • To ensure basic food security for the nation and increase nutritional standards. • To improve standards of living in rural areas through increased income from Agriculture
and livestock. • To increase foreign exchange earnings for the nation by increased production and
exportation of cash crops. • To produce and supply raw materials required by the local Industries both from crops
and livestock. • To develop and introduce new technologies to increase the productivity of labour and
land. • To promote integrated and sustainable use and management of natural resources. • To develop human resources within the sector in order to increase the productivity of
labour. • To provide support services to agricultural sector. • To promote specifically the access of women and youth to land, credit, education and
information. Energy Policy In Tanzania, bioenergy, and in particular traditional solid bioenergy i.e. woodfuels (charcoal firewood), agro residues remains the dominant energy source for cooking in most rural and urban households. These contribute more than 90% of the total energy consumed in Tanzania. The National Energy Policy of the United Republic of Tanzania was adopted in 2003 and replaced the previous energy policy from 1992. The main elements of the Energy Policy and strategy are to: • Develop domestic energy resources which are shown to be least cost options. • Promote economic energy pricing. • Improve energy reliability and security and enhance energy efficiency. Encourage
commercialization and private sector participation. • Reduce forest depletion. • Develop human resources. However, there is limited interface between energy policy and plans relating to national economic planning. Forest Policy

ERA-ARD, SROs, FARA Africa
60
The Forest policy (1998) Objective is to ensure sustainable supply of forest products and services by maintaining sufficient forest area under effective management. It also aims to enable participation of all stakeholders in forest management and conservation, through joint forest management agreements, with appropriate user rights and benefits. Sustainable bioenergy production can be achieved through sustainable forest management.
Land Policy The Land policy of (1997) recognized the confusion and uncertainty regarding land tenure and management authority over most land in Tanzania. The policy sought to dispel this confusion by reiterating government of Tanzania general underlying right to land, but clearly recognizing and clarifying customary and other use rights to land. This policy has major implications on large scale bioenergy production. In Tanzania land belongs to Government and a lease for specific period is given to person(s)/company/institution(s). Environmental Policy and Environment Management Act The Environmental policy of (1997) advocates for investment in Biomass development in Tanzania. It recognizes that this is vital for environmental protection and poverty reduction. The Environment Management Act (EMA) No. 20 of 2004, the part VI of the EMA deals with Impact Assessment (EIA) and other Assessments, and directs that EIA is mandatory for all development projects. Section 81 (2) states that “An environment Impact Assessment study shall be carried prior to the commencement of financing of a project or undertaking”. Other laws, relevant to bioenergy development include: The Water utilization (Control and Regulation ) Act (1974) s amended in 1981; The town and country planning Ordinance Cap 378 of 1956 (as amended in 1961); Wildlife Conservation Act No. 12 of 1974 (as amended in 1978 ); Protected places and areas Act (1969) and Local Government Act of 1982 (Urban and District Authorities).
8.8 Biofuels Industry/Programmes Development
Presently there are a few small-scale on going bioenergy projects aiming at improving the supply and use of solid and liquid bioenergy in Tanzania, including: Programme on Integrated Wood-fuel Services for Poverty Reduction in Tanzania This programme is being implemented by Tanzania Traditional Energy Development and Environment Organisation (TaTEDO0 with financial support from the EU and the HIVOs. It will be implemented over a period of four years from January 2006. The objective of this programme is to increase income of the rural and urban beneficiaries through reduced costs and increased efficiency of wood –fuel stoves, ovens and charcoal production kiln. The beneficiaries of this programme are households, social service centres, and small and medium enterprises.
Program for Biomass Energy Conservation (PROBEC) This is a SADC programme implemented by governments with some technical assistance from GTZ. It is being implemented in eight SADC member countries namely Lesotho, Malawi, Mozambique, Namibia, South Africa, Tanzania, Zambia and Zimbabwe. In Tanzania the programme implementation started in 2004 with the objective of improving access to improved wood fuels stoves for households, institutions and productive sectors. Liquid Bioenergy Initiatives There exist several initiatives from the national to the local levels with the objective of developing, policies, regulations and programme aiming at ensuring sustainable development of liquid bioenergy in Tanzania. The government through a Biofuels Task Force is working on the preparations of policies, regulations for creating enabling environment for stakeholders to participate in the development of biofuels. Several actors (e.g.

ERA-ARD, SROs, FARA Africa
61
multinationals, companies, NGOs, institutions and small holders farmers) are implementing projects aimed at increasing the supply of liquid biofuels in the country. More than ten companies already are at different stages of establishing farms for biofuels farming.
8.9 Crops Used for Biofuels:
Type and Conversion Technology Biofuel development in Tanzania is still at infancy stage. Current efforts are mostly focused on biodiesel from jatropha. The jatropha oil can be used either as Straight Vegetable Oil (SVO) or refined and blended with petro-diesel.
Potential Crops (Biofuel Feedstocks) Tanzania has ideal geographic and climatic conditions for growing a wide range of biofuel crops: sugar cane, sorghum, cassava, palm oil, jatropha, soy, cotton, pongamia, croton and others. Experts agree that Government policy should focus on non-staple food crops as a feedstock like Jatropha and pongamia in mitigating the direct impact of biofuel on food security.
Market for raw material Tanzania is a net fuel importer. Tanzania has therefore a high potential to become a significant biofuel producer. The many initiatives started will create market opportunities. Some investors have started biofuel production at least on the experimental stage. It is reported that there is currently a dramatic increase in demand for biofuels, attracting the interest of investors from within and outside of Tanzania. The trend shows that multinational investors/companies are increasing their investments into the cultivation of crops for biofuels production in the country. At the moment however, no commercial scale production or processing has been reported. Currently there is no market information available. Biofuel feedstocks are sold like other crops, and often without any deliberate intention to use them for biofuel.
End use There is potential to use biofuels at all levels (households, public facilities, transport and industry including power generation).
Implications for land tenure, water and employment Tanzania has over 88 million hectares of suitable agricultural land, of which less than 6% is currently utilized. Unlike many alternative countries, the vast majority of land in Tanzania that is available for cultivation is not virgin forest or environmentally sensitive. A recent study (FAO, 2007) estimated Tanzania to have more than 30 million hectares of land suitable for the cultivation of energy crops, whereby corresponding areas for sugarcane, cereals and root crops are 570,000 ha, 24 million ha and 14 million ha respectively. There are fears nevertheless that the sheer speed of biofuel expansion may generate new pressures on land tenure arrangements, leading to alienation. There are also fears that poor households may either sell or be forced to relocate as the rush to meet increasing demand gathers momentum. Competition for inputs (e.g. land, water, fertilizers) and other factors that might be diverted from food production might lead to a food crisis. However, opportunities exist for income generation and diversification by producing and selling biofuel feedstocks. Employment opportunities will be created through agro-industrializations. This will lead to improved standard of living and linkages with others sectors in the economy. Energy supply in rural areas will also stimulate rural development and reduce pollution caused by fire wood. Reduced time spent by women and children on

ERA-ARD, SROs, FARA Africa
62
basic survival activities (gathering firewood, fetching water, cooking, etc.). The development of biofuel as a source of energy, when grown on a large scale, could also represent a paradigm shift in agricultural development.
8.10 Implications of Conversion of Biofuels Raw Material
Conversion of raw materials is still at an infant state but a number of actors and developers are at various stages of developing/promoting biofuels. Examples include:
i. Sekab Biofuels (T) Ltd – to promote sugarcane based bioethanol ii. Prokon of Germany – [Jatropha] - Mpanda – Rukwa; iii. WILMA from USA [Croton spp.) [– Biharamulo, Kagera]; iv. Mitsubishi Corporation of Japan – Jatropha [Arusha and Dar es Salaam]; v. Farming for Energy Livelihood in Southern Africa (FELISA) [Oil palm - Kigoma]; vi. KAKUTE19 [jatropha] – Arusha; vii. Diligent – Dutch Firm [jatropha Oil]; viii. TaTEDO of Tanzania [jatropha]; ix. SunBiofuels (T) [jatropha - Kisarawe]
As such no significant impacts can be attributed to biofuels at the moment.
Implications for Water use Three of the largest 10 lakes in the world are found in Tanzania, and a large network of rivers, making most areas of Tanzania suitable for irrigated agriculture. Tanzania has significant potential for irrigated land and several areas apt for oil palm and jatropha have already been identified.
Implications for Employment As already stated, employment opportunities will be created through agro-industrializations. Some have already been created as a result of the aforementioned biofuel initiatives and are expected to increase as the sector grows.
8.11 Mapping of Policy and Institutions and Links with Bioenergy
The institutions involved in the development of biofuels in Tanzania include a variety of Government ministries and other government institutions including Tanzania Investment Centre (TIC), Attorney Generals chambers, (AGC), Tanzania Petroleum Development Corporation (TPDC) and Community Finance Limited (CFC). There are several Developmental organizations that are at the forefront of the development of biofuels, they include, TaTEDO, Sugar Producers Association, Envirocare and several other locally based NGOs and CBOs. Also there is increasing private sector participation from inside and outside the country. Some of such companies include Felisa, Kakute, Sun Energy LTD, Deligent, Wilma, Prokon, Bio-Alcohol Fuel foundation (BAFF), SEKAB.
First hand players There is currently no coordination of biofuels policy within Tanzania, although the Tanzanian Biofuels Task Force is in the process of drawing up policy guidelines. Investors are able to receive necessary investment, land and environmental approvals to start plantations without any concrete government policy. Foreign investment in Tanzanian biofuels is being
19
KAKUTE – Kampuni ya Kusambaza Teknolojia Tanzania

ERA-ARD, SROs, FARA Africa
63
encouraged as it has the potential to aid rural development and local livelihoods, improve energy security and reduce oil imports. All enterprises, whatever their legal forms, operating in Tanzania must register with the Business Registration and Licensing Agency (BRELA) of the Ministry of Industries and Trade. The first step is to obtain name clearance from BRELA. The investor will then register with the Tanzania Investment Centre (TIC) which assists foreign investors in setting up businesses in Tanzania. A Certificate of Incentives is then granted to those who have qualified. TIC performs a facilitative role for inward investment. In order to strengthen and expedite facilitation services, senior officers from Government Departments and other Government Agencies are permanently stationed and operating within TIC’s premises, representing the Lands Department, Tanzania Revenue Authority, Immigration Department, Labour Division, Directorate of Trade, and the Business Registration and Licensing Agency. TIC grants Certificates of Incentives to all bona fide investors. Extensive guarantees are provided to investors under TIC Certificate of Incentives. Such guarantees cover ownership of properties, dispensation of assets, repatriation of income and others.
Ministries/Secretariats Involved in the Bioenergy Planning/Applications The National Biofuels Taskforce is the key government body involved in promoting biofuels in Tanzania. It is made up of several ministries and government institutions including:
i. Ministry responsible for Planning, Economy and Empowerment, ii. Ministry of Energy and Minerals iii. Ministry responsible for Agriculture and Food Security iv. Ministry of Labor, Employment and Youth Development, v. Ministry of Finance, vi. Vice President’s Office –Division of Environment vii. Ministry of Water and Irrigation, viii. Ministry of Lands, Housing and Settlement Development, ix. Attorney General’s Chambers, x. Tanzania Investment Center, xi. Tanzania Petroleum Development Corporation, xii. Community Finance Limited, xiii. Tanzania Sugar Producers’ Association
NGOs Involved • The Tanzania Traditional Energy and Environment Development Organization
(TaTEDO)
TaTEDO is a local NGO based in Dar es Salaam, registered in 1990 and working in more than ten regions of Tanzania. TaTEDO is widely sensitizing rural and urban communities on the potential use of Jatropha. The main focus has been to provide information and extension services to smallholder farmers. • Jatropha Products Tanzania Limited (JPTL)
JPTL is a not-for-profit organization registered in 2005, based in Arusha but operating in five regions; Arusha, Tanga, Kilimanjaro, Manyara and Singida. It targets working with 2,000 households, and its main objective is to link research and development in areas of knowledge, skills, information and technology transfer to small scale farmers and enterprises interested in the Jatropha plant, seeds and products. Also, JPTL promotes the use of Jatropha oil in lanterns, stoves, and for soap making. • Envirocare
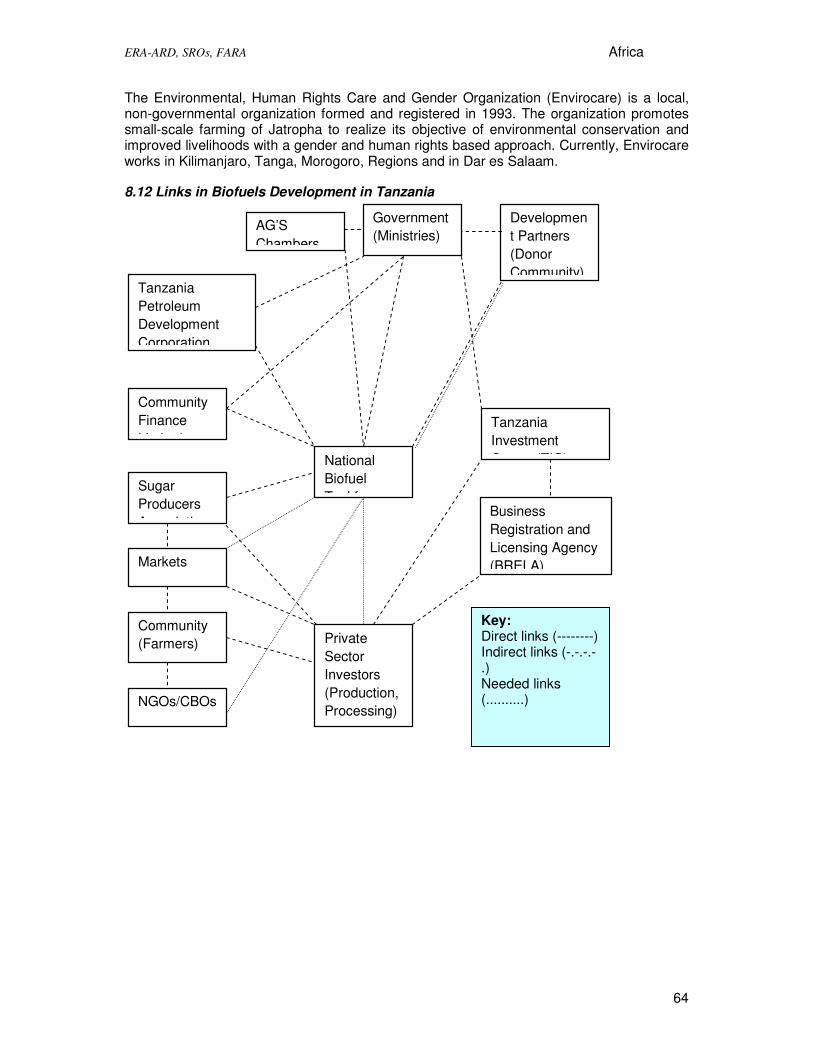
ERA-ARD, SROs, FARA Africa
64
The Environmental, Human Rights Care and Gender Organization (Envirocare) is a local, non-governmental organization formed and registered in 1993. The organization promotes small-scale farming of Jatropha to realize its objective of environmental conservation and improved livelihoods with a gender and human rights based approach. Currently, Envirocare works in Kilimanjaro, Tanga, Morogoro, Regions and in Dar es Salaam.
8.12 Links in Biofuels Development in Tanzania
Government (Ministries)
NGOs/CBOs
Community Finance Limited
Tanzania Investment Centre (TIC)
Business Registration and Licensing Agency (BRELA)
AG’S Chambers
Development Partners (Donor Community)
Sugar Producers Association
Community (Farmers) Private
Sector Investors (Production, Processing)
Tanzania Petroleum Development Corporation
National Biofuel Taskforce
Markets
Key: Direct links (--------) Indirect links (-.-.-.-.) Needed links (..........)

ERA-ARD, SROs, FARA Africa
65
8.13 Summary of the biofuels activities in Tanzania
The following figure presents the analysis and summary of the information gathered for the case study of Tanzania
8.14 Conclusions
Tanzania has received major attention from investors for large scale biofuel production forcing the government to accelerate the process of the creation of a Task Force in the absence of a biofuel policy. As in the previous case studies, the problem in the country lays
FARMTypically subsistence farming with low
capital investment. Land area per household ≈2ha. Ownership of formal
titles/deeds very low
INDUSTRYStill in nascent stages. Current
efforts mostly focused on biodiesel from jatropha.
MARKETPotential exists at all levels
(households, public facilities, transport and industry including
power generation).
•Initiatives started will create market opportunities•Tanzania is a net fuel importer hence high potential to become a significant biofuel producer. •Biofuel development could represent a paradigm shift in agricultural development.
•Growth in agro-industrialization•Private-sector-led development
•Improved standard of living and linkages with others sectors in the economy•Employment opportunities will be created through agro-industrializations•Opportunities for income generation and diversification by producing and selling biofuel feedstocks•Energy supply in rural areas will stimulate rural development and reduce pollution caused by fire wood•Reduced time spent by women and children on gathering firewood, fetching water, cooking, etc.•May generate new pressures on land tenure arrangements, leading to alienation•Poor households may either sell or be forced to relocate as the rush to meet increasing demand gathers momentum•Competition for inputs (e.g. land, water, fertilizers) that might be diverted from food production might precipitate a food crisis.
Impact/ future implications
•A statement on blending biofuels with mineral petrol has been slotted in the New Petroleum Supply Act.
•More than ten companies establishing farms for biofuels farming•Investors have started biofuel production at on the experimental stage
•Several actors (e.g. multinationals, NGOs, institutions and small holders farmers) are implementing biofuel projects. •Significant potential for irrigated land and several areas apt for oil palm and jatropha.
Emerging Patterns/ relationships
• Energy policy aims to promote economic energy pricing. •Develop domestic energy resources which are shown to be least cost options
•Limited interface between energy policy and plans relating to national economic planning. •Biofuels Task Force is working on the preparations of policies & regulations on biofuels.•Energy Policy encourages commercialization and private sector participation.
•Liberalization of agricultural sector •Focus on food security•Policy promotes cash crops and production of industrial raw material sustainably•Promote integrated and sustainable use of natural resources. •Land policy of 1997 clearly recognizes and clarifies customary and other use rights to land
Policies
• Market information lacking•Dramatic increase in demand for biofuels but no commercial supply
•Insufficient feedstock supply•Few processing facilities•No technical capacity •Economic feasibility still not assured•No commercial facilities established yet
• Low crop yields due to non-existent/low investment in crop production. •Average planted area of 1.61 hectares per household for annual crops is low to support an average size smallholder households•The best crop producing areas have less available land for cultivation.
Issues

ERA-ARD, SROs, FARA Africa
66
in the issues regarding the willingness to grow bioenergy crops in the absence of low or no existing investment that reflect in low yields. There is also a will in the industrial sector with major investors for this area. Nevertheless, issues regarding land tenure and the average size of farms for small holders will make difficult in certain areas to work with large scale initiatives. This could be related to the issue of either displacement of farmers or convincing the farmers of an alternative crop to work as out-growers. The stakeholder assessment demonstrated that there is need for cross-cutting activities at policy and planning level and with main actors such as farmers this in spite of the existence of a Task Force. The potential market for biofuels is big at all levels in Tanzania and with adequate enforcement of the policies and guidelines will be possible to produce bioenergy crops without jeopardising food production. At any rates, case by case of the initiatives need to be analysed.

ERA-ARD, SROs, FARA Africa
67
9. KENYA CASE STUDY
9.1 Country’s characteristics
Location Kenya is located on the eastern part of the African continent. It lies across the equator at latitude of 4° North to 4° South and Longitude 34° East to 41° East. The country is bordered by Sudan and Ethiopia in the north and Uganda to the west. Somalia lies to the east of the country while Indian Ocean borders the country in the south-eastern part. To the southwest of the country lies Tanzania while to the west lies Lake Victoria and Uganda. It contains a total area of 582,650sq km sq including 13,400 sq km of inland water and a 536km coastline.
Figure 9.1: Map of Kenya showing location relative to its neighbouring countries Geographical Characteristics Kenya’s geography is diverse and varied. The coast is a low-lying area and extremely fertile. It has a coral reef supported by a dry coastal plain that is covered by thorny bushes and savannah. The terrain of the country gradually changes from the low-lying coastal plains to the Kenyan highlands. The highest point of the country lies in Mount Kenya, which is 5,199 meters high. The Great Rift Valley is located in the central and western part of the country and basically dissects the Kenyan highlands into east and west. The highlands have a cool climate and are known for their fertile soil, forming one of the major agricultural regions of the country. However, about 80% of the land area is Arid and Semi Arid. A large number of swamps are in the Loraine Plain, situated in the north-eastern part of the country. There are also a number of lakes and rivers; most of the lakes are located in the Rift Valley. On the northern part of the country is Lake Turkana. On the western part of the country is Lake Victoria. Other major Rift Valley lakes include Lake Naivasha and Lake Nakuru. The rivers Tana and Athi flow in the south-eastern part of the country while Nzoia, Yala and Gori, flow across the country before draining into Lake Victoria. Ewaso Ng’iro River is found in the north-eastern part of the country.

ERA-ARD, SROs, FARA Africa
68
A large number of rainforests are found in the east of the country, including the Kakamega Forest and the Mau Forest. Kenya is divided into seven agro-ecological zones ranging from humid to very arid. Less than 20% of the land is suitable for cultivation, of which only 12% is classified as high potential (adequate rainfall) agricultural land and about 8% is medium potential land. The rest of the land is arid or semi-arid. Furthermore, only 60% of the high potential land is devoted for crop farming and intensive livestock production while the rest is used for food and cash crop production, leaving the rest for grazing and as protected. The agro-ecological zones (ACZ) are as shown in Figure 2 below: Figure 9.2 Agro-Climatic Zones of Kenya (Source: Kenya Soil Survey) Climate Kenya's climate is fairly warm throughout most of the country. Most of the country has a tropical climate. Exceptions to this are the coastal belt and the northern parts, which are generally arid and hot. It is hot and humid at the coast, temperate inland and very dry in the north and northeast parts of the country. The average annual rainfall at the coast is 1200mm and the average daily temperature ranges from 27°C to 31°C. Nairobi, the capital city, has an altitude 1,661 metres and has a temperature range of 25.20 -13.60°C. Eldoret is found in the Rift valley at an altitude of 3,085m, with a temperature range of 23.60 - 9.50°C. Lodwar, also in the Rift Valley but near the northern-most extremity is at an altitude of 506 m above seal level, with a temperature range of 34.80 - 23.70°C. There are 2 rainy seasons; the long rains occur from April to June and short rains from October to December. The rainfall is sometimes heavy and when it does come it often falls in the afternoons and evenings. The hottest period is from February to March and coldest in July to August. The majority of the country receives less than adequate rainfall needed to support crop cultivation. Over two-thirds of the country receives less than 500mm of rainfall per year and 79% has less then 700mm annually. Only 11% of the country receives more than 1000mm per year. The mean annual rainfall shows a wide spatial variation, ranging from about
ACZ CLASS RAINFALL (mm)
I Humid 1100 - 2700
II Sub-Humid 1000 - 1600
III Semi-Humid 800 - 1400
IV Semi Humid Semi Arid 600 - 1100
V Semi Arid 450 - 900
VI Arid 300 - 550
VII Very Arid 150 - 350

ERA-ARD, SROs, FARA Africa
69
200mm in the driest areas in northwestern and eastern parts of Kenya to the wetter areas with rainfall of 1200-2000 mm in areas bordering Lake Victoria and Central Highlands east of the Rift Valley. As a result, the Central Highlands, parts of Rift Valley, the Lake Victoria region and the coastal area boast the most intensive agriculture and greatest concentration of people. Pastoral farming dominates the remaining drier regions of Kenya. Administration Kenya is divided into 8 provinces; the provinces are subdivided into more than 71 districts which are then subdivided into more than 260 divisions. The divisions are subdivided into about 2500 locations which in turn are sub-divided into more than 6,600 sub-locations. Kenyan local authorities mostly do not follow common boundaries with divisions. They are classified as City, Municipality, Town or County councils. There are 210 constituencies which form the basis of parliamentary representation. Environmental Characteristics The environment is an increasingly important issue in Kenya as the poor directly rely on the water and land resources surrounding their communities. With only 8% of arable land and 75% of its workforce engaged in agriculture, Kenyan farmers face growing problems of soil erosion, deforestation, water pollution, and desertification. The recent drought (2008/9) left 3.5 million people without enough food to survive. In Northern Kenya, pastoralists have lost their herds to starvation and conflicts are mounting over scarce water resources. The most important current environmental issues include water pollution from urban and industrial wastes; degradation of water quality from increased use of pesticides and fertilizers; water hyacinth infestation in Lake Victoria; deforestation; soil erosion; desertification; and wildlife poaching for game meat and animal trophies. Kenya currently has approximately 1.24 million hectares of closed canopy indigenous forest. The majority of these forests are managed by the Kenya Forest Service, whilst the Kenya Wildlife Service (KWS) manages other forests in National Parks and Nature Reserves. Coastal forests play an important role in shoreline protection (particularly mangroves) whilst the five water towers (Cherangani Hills, Mount Elgon, Mount Kenya, Aberdares, and Mau Forest Complex) play an essential role in water management both nationally and internationally. The montane forests of Kenya’s five water towers are surrounded by some of the most densely populated areas of Kenya and are therefore under significant pressure for new settlements and the supply of timber and non timber products to those communities despite their designation as protected areas. Approximately 5% of the remaining forest area was lost between 1990 and 2005. The most threatened forests currently include Kakamega, the Mau Forest Complex and coastal forests. There are also currently approximately 165,000 hectares of plantation forestry in Kenya, which are generally poorly managed. One of the key identified drivers of deforestation and land degradation in Kenya is the demand for fuelwood which accounts for 70% of all energy consumed (90% in rural areas). About 80% of the total land area in Kenya is classified as arid and semi arid lands (ASAL) which comprises savannah and grassland ecosystems traditionally used as pastoral lands. Woodlands, bushlands and grasslands cover approximately 40 million hectares of land in Kenya and constitute significant carbon sinks. The ASALs are subject to recurring droughts and resource pressure resulting in high vulnerability to land degradation and desertification threatening livelihoods as well as resulting in high levels of greenhouse gas emissions. Approximately 30% of the land area in Kenya is affected by severe to very severe land degradation and an estimated 12 million people (one third of current population), depend directly on land that is being degraded. Besides forest lands 16% of the land cover in Kenya is classified as agricultural (arable) land.

ERA-ARD, SROs, FARA Africa
70
9.2 Population Size and Characteristics
Kenya’s population has grown by an average of one million people per year in the past 10 years. The data, based on the national census in August 2009, shows that the number of people in the country grew by 37.43%, from 28, 686, 607 at the 1999 census to 39, 423, 264 in 2009. The figures also show that the country has a population density of 67 people per square kilometer, with an annual population growth rate of approximately 2.7%. The infant mortality rate recorded in the survey was 52 deaths per 1,000 live births. The under-five-mortality rate decreased to 74 deaths per 1,000 live births in 2008-09 from 115 in 2003. The Age structure is as follows: 0-14 years - 42.3% of which males are 8,300,393 compared to 8,181,898 female; 15-64 years - 55.1%; 65 years and over: 2.6% . Seventy-five percent of Kenya’s population is under 30 years of age. Young people (15 - 30 years) number 10.8million or about 32% of the 2005 population projection. Of these, 57% are female and they form about 60% of the total active labor force in the country. The Birth rate by 2009 estimates is 36.64 births/1,000 of the population. The Death rate on the other hand is 9.72 deaths/1,000 of the population. The sex ratio at birth is 1.02 male(s)/female; under 15 years: 1.01 male(s)/female; 15-64 years: 1.01 male(s)/female; 65 years and over: 0.84 male(s)/female; total population: 1 male(s)/female. The total Infant mortality rate is 54.7 deaths/1,000 live births, for males 57.56 deaths/1,000 live births while the female mortality rate is 51.78 deaths/1,000 live births. The total life expectancy at birth is 57.86 years and is slightly lower for males at 57.49 years compared to the female mortality rate which is 58.24 years. The Total fertility rate on the other hand is 4.56 children born/woman.
9.3 Gross Domestic Product, Human Development Index and Poverty Levels
According to the Kenya Institute of Public Policy Research and Analysis (KIPPRA), Kenya’s poverty levels declined in 2006/07 but there are significant differences within and across provinces. Data available from the Kenya Integrated 2005 Household Budget Survey (KIHBS) show that national absolute poverty declined to about 46 per cent in 2005/06 from 55.5 per cent in 2000. Although the proportion of the population living in poverty has declined, the number of those living below the poverty line is estimated to have increased from 13.4 million in 1997 to about 16.6 million in 2006. Furthermore, although inequality situation in Kenya has improved over the last couple of years, it remains a policy concern. Analysis of household consumption expenditure distribution reveals that the poorest 10 per cent of rural households control only 1.63 per cent of the total expenditure, while the richest 10 per cent control 35.9 per cent of total household expenditure. There has been a remarkable improvement in the country’s economic performance in the last five years up to 2007. It is only in 2006 and 2007 that per capita income of Kenyans exceeded the levels registered in 1997. In June 2998, Kenya launched the Vision 2030, which is an economic development plan by the Kenyan government to develop several different economic zones in various parts of the country. The Vision 2030 targets a GDP growth of 10 per cent per annum, which implies that Kenya’s income per capita would double by 2018. The GDP (purchasing power parity) for 2008 was estimated to be 61.83 billion US Dollars, growing at a rate of 2.2% while the GDP per capita is 1, 600 US dollars. The GDP composition by sector is as follows:
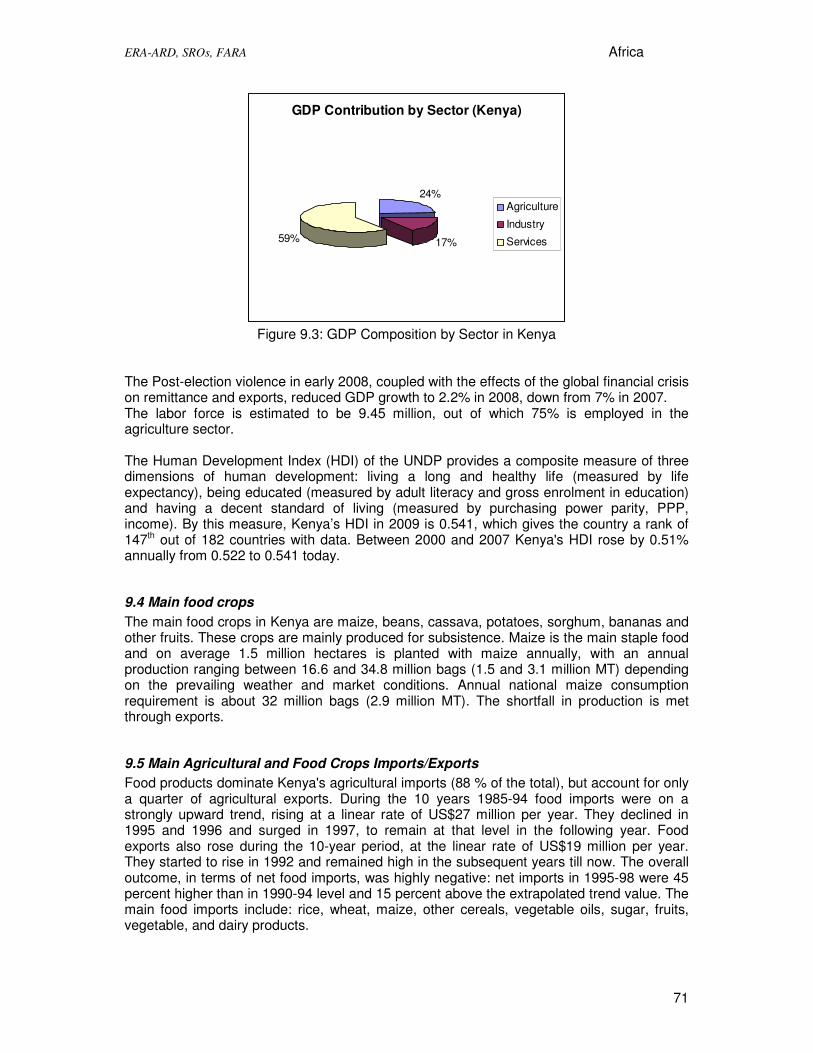
ERA-ARD, SROs, FARA Africa
71
GDP Contribution by Sector (Kenya)
24%
17%59%
Agriculture
Industry
Services
Figure 9.3: GDP Composition by Sector in Kenya
The Post-election violence in early 2008, coupled with the effects of the global financial crisis on remittance and exports, reduced GDP growth to 2.2% in 2008, down from 7% in 2007. The labor force is estimated to be 9.45 million, out of which 75% is employed in the agriculture sector. The Human Development Index (HDI) of the UNDP provides a composite measure of three dimensions of human development: living a long and healthy life (measured by life expectancy), being educated (measured by adult literacy and gross enrolment in education) and having a decent standard of living (measured by purchasing power parity, PPP, income). By this measure, Kenya’s HDI in 2009 is 0.541, which gives the country a rank of 147th out of 182 countries with data. Between 2000 and 2007 Kenya's HDI rose by 0.51% annually from 0.522 to 0.541 today.
9.4 Main food crops
The main food crops in Kenya are maize, beans, cassava, potatoes, sorghum, bananas and other fruits. These crops are mainly produced for subsistence. Maize is the main staple food and on average 1.5 million hectares is planted with maize annually, with an annual production ranging between 16.6 and 34.8 million bags (1.5 and 3.1 million MT) depending on the prevailing weather and market conditions. Annual national maize consumption requirement is about 32 million bags (2.9 million MT). The shortfall in production is met through exports.
9.5 Main Agricultural and Food Crops Imports/Exports
Food products dominate Kenya's agricultural imports (88 % of the total), but account for only a quarter of agricultural exports. During the 10 years 1985-94 food imports were on a strongly upward trend, rising at a linear rate of US$27 million per year. They declined in 1995 and 1996 and surged in 1997, to remain at that level in the following year. Food exports also rose during the 10-year period, at the linear rate of US$19 million per year. They started to rise in 1992 and remained high in the subsequent years till now. The overall outcome, in terms of net food imports, was highly negative: net imports in 1995-98 were 45 percent higher than in 1990-94 level and 15 percent above the extrapolated trend value. The main food imports include: rice, wheat, maize, other cereals, vegetable oils, sugar, fruits, vegetable, and dairy products.

ERA-ARD, SROs, FARA Africa
72
Major cash crops produced in Kenya include tea, horticultural produce, coffee, pyrethrum, cotton, cashew nuts, and coconuts among others. In addition to coffee, tea and horticultural produce, Kenya is the world's largest producer and exporter of pyrethrum. Most of these are produced in small holder farming systems. Sugarcane and wheat are mainly produced for the local market. Kenya also produces sisal, tobacco, and Bixa natto (a natural food coloring agent) for export. Kenya is Africa's leading tea producer, with black tea being Kenya's leading agricultural foreign exchange earner. Production in 1999 reached 220,000 tons. Tea exports were valued at $404.1 million in 2001, or nearly 18% of total exports. The tea industry is divided between small farms and large estates. Coffee is Kenya's third leading foreign exchange earner, after tourism and tea. In 2001, coffee earnings totaled $91.8 million. Production in 2001/02 amounted to 52,140 tons. Similar to the tea sector, coffee is produced on many small farms and a few large estates. All coffee is marketed through the parastatal Coffee Board of Kenya. Kenyan horticulture has become prominent in recent years, and is now the third leading agricultural export, following tea and coffee. Fresh produce accounted for about 30% of horticultural exports, and included green beans, onions, cabbages, snow peas, avocados, mangoes, and passion fruit. Flowers exported include roses, carnations, statice, astromeria, and lilies.
9.6 Characteristics of Livelihoods in Farming Systems
Land tenure in Kenya falls into four different entities namely government (public), County councils (local authorities), Individuals (private) and groups (communal). Different legal instruments govern different categories of land and owners thereof. To date, land ownership in over 40% of Kenya still remains informal. According to Kenya’s Ministry of Agriculture, the bulk (98%) of the farm holdings in Kenya are small (<10 ha) and lie mainly in the high potential areas. The medium and large scale farms account for about 2% of the holdings, but cover about 54% of the area farmed. Nationally, the average farm size is about 2.5 ha. On these small farms most of what they produce is to meet their family's needs. Some crops are grown for sale to raise money to buy consumer items. Typically a farmer grows several different crops together in the same field: a grain such as corn; a legume such as beans; and perhaps a few trees producing coffee, bananas, or mangoes. This allows the family to harvest a variety of foods for a balanced diet. Some farmers also keep a few animals such as cattle and goats, and many raise poultry.
9.7 Policies in Place and Link with the Bioenergy Sector
Kenya has a regulatory framework in the fields of biomass, biodiesel, bioethanol, charcoal, fuel wood, biogas and municipal waste. Energy Policy The Energy Policy is contained in Sessional paper no. 4 of 2004 and focuses on all forms of energy including bioenergy. Article 103, Part V, of the Energy Act 2006 addresses renewable energies, energy efficiency and conservation. Specifically, it mandates the Minster f or Energy to do the following duties that are directly relevant to biofuels development:
• Formulating a national strategy for coordinating research in renewable energy; • Providing an enabling framework for the efficient and sustainable production,
distribution and marketing of biomass, solar, wind, small hydro, municipal waste, geothermal and charcoal;

ERA-ARD, SROs, FARA Africa
73
• Promoting the use of fast maturing trees for energy including biofuels and the establishment of commercial woodlots including peri-urban plantations;
• Promoting the development of appropriate local capacity for the manufacture, installation, maintenance and operation of basic renewable technologies such as bio-digesters, solar systems and hydro turbines;
• Promoting international co-operation on programmes focusing on renewable energy sources;
• Harnessing opportunities offered under clean development mechanism and other mechanisms including, but not limited to, carbon credit trading to promote the development and exploitation of renewable energy sources;
• Promoting the utilization of renewable energy sources for either power generation or transportation;
• Promoting the production and use of gasohol and biodiesel. Bioenergy Policy The bioenergy policy objective is to ensure sufficient bioenergy supplies to meet demand on sustained basis while minimizing environmental impacts associated with usage. It has specific objectives which include to:
• Formulate national strategies; • Support and development of biofuels • Promote private sector participation; • Increase rate of adoption of efficient stoves • Use of fast growing trees for energy production
Fiscal Incentives There are also fiscal incentives which are intended to promote biofuels in Kenya through the following mechanisms:
• Provide tax incentives to producers of renewable energy technologies and related accessories to promote their widespread use
• A 10 year tax holiday for power plants using renewable energy including biomass • Allow duty free importation of renewable energy hardware to promote widespread
usage • Provide fiscal incentives to financial institutions to provide credit facilities to
consumers and entrepreneurs. Development of National Strategies There are also a number of initiatives under the biofuel policy, but three of specific relevance to biofuels are:
• Biodiesel strategy • Bioethanol strategy • National Task Force on Accelerated Development of Green Energy
National Biodiesel Strategy The National Biofuels Committee (NBC) was set up in 2006 to coordinate all biodiesel stakeholders. The committee first focused on developing biodiesel strategy for 2008-2012. The Stakeholders included Line Ministries (e.g. Energy, Agriculture), Research institutions, Academia, NGOs, and Private organizations. The NBC was later launched as the National Biodiesel Strategy. The crop of choice was Jatropha but the strategy also encourages research on other crops such as castor and croton. The purpose of the strategy is to:
• Fast track development of the biodiesel energy resource in Kenya; • Increase security of energy supply by reducing vulnerability resulting from
dependence on imported fossil fuels; • Achieve a blending ratio of B5 by 2012 and B10 by 2020;

ERA-ARD, SROs, FARA Africa
74
• Diversify rural energy sources by supplementing / substituting kerosene with biodiesel;
• To contribute to poverty alleviation through diversification of income sources; • Address global warming through substitution of petroleum fuels.
National Bioethanol Strategy Kenya also has a Bioethanol Strategy whose purpose is to:
• Fast track development of the bioethanol energy resource; • achieve blending ratio of E-10 (bioethanol with petrol) by December 31st 2010; • Increase security of energy supply by reducing reliance on imported fuels; • Diversify the sugar industry base and strengthen competitiveness of sugar
factories; • Minimize pollutant effects of woodfuel and kerosene by substituting these fuels
with bioethanol. National Task Force on Accelerated Development of Green Energy Kenya is fast-tracking its plan to boost renewable energy and recently launched the National Task Force on Accelerated Development of Green Energy. The initiative is being coordinated by the office of the Prime Minister. In adopting renewable energy, Kenya hopes to reap added gains of turning the country into a green economy. On top of benefiting from carbon finance, the renewable energy generation in Kenya will inject additional power to the national grid to assuage fears of the manufacturing sector and potential investors. By June 2012, according to the Office of the Prime Minister, the country will have boosted its energy capacity by up to 2,000MW through geothermal, wind, bio-fuel, and solid waste and coal-driven power plants. The Prime Minister chairs a taskforce that is to advise the government on the projects to be implemented. The taskforce’s chief task is establishing financing partnerships with the private investors. Members of the steering committee of the taskforce include the Prime Minister, the two Deputy Prime Ministers and the ministers for Energy, Industrialization, Environment and Agriculture. Others are the Prime Minister’s Permanent Secretary and the chairpersons of Kenya Private Sector Alliance and Association of Large Power Consumers. The experts group is chaired by Energy Permanent Secretary with his counterpart at Treasury and the Prime Minister’s economic adviser acting as alternative chairs. Agriculture Policy Agricultural policy in Kenya revolves around the main goals of increasing productivity and income growth, especially for smallholders; enhanced food security and equity, emphasis on irrigation to introduce stability in agricultural output, commercialisation and intensification of production especially among small scale farmers; appropriate and participatory policy formulation and environmental sustainability. The key areas of policy concern, therefore, include:
• Increasing agricultural productivity and incomes, especially for small-holder farmers; • Emphasis on irrigation to reduce over-reliance on rain-fed agriculture in the face of
limited high potential agricultural land; • Encouraging diversification into non-traditional agricultural commodities and value
addition to reduce vulnerability; • Enhancing the food security and a reduction in the number of those suffering from
hunger and hence the achievement of MDGs; • Encouraging private-sector-led development of the sector. Ensuring environmental
sustainability. Within the context of the policy therefore, biofuels production can be achieved not only as a way of enhancing farmer incomes but also ensuring environmental integrity.

ERA-ARD, SROs, FARA Africa
75
Forest Policy The Kenya Forest Policy of 2005 also advocates for environmental conservation and provision of sustainable biomass energy. This is also supportive of biofuels development in the country. Land Policy Kenya has not had a clearly defined or codified national land Policy since independence. However, in 2009 the Government embarked on formulation of a National Lands Policy whose goal is to guide the country through the sustainable and equitable use if land. The policy emphasizes the need to address environmental degradation and the need for security of tenure for all Kenyans, including all marginalized groups, communities and women. The policy designates all land in Kenya as either Public, private or Communal land. The policy was adopted by parliament on 3rd December 2009. Environmental Policy and Environment Management Act Kenya does not yet have an Environmental policy, although a Draft Environmental Policy is in the final stages before adoption. The Draft National Environmental Policy (NEP), 2008 treats climate change and disaster management as an emerging environmental issue and states that the government will adopt two approaches in combating climate change – mitigation and adaptation. The NEP suggests following measures that are of relevance to biofuels development:
• Identify and raise awareness of opportunities for adaptation measures through promotion of appropriate technology transfer and capacity building;
• Develop and implement under the Kyoto Protocol’s Clean Development Mechanism (CDM) programmes and projects that encourage significant levels of investment and technology transfer for sustainable development;
• Build and strengthen research capacity on climate change and related environmental issues.
Environmental Management and Coordination Act (EMCA) The legal framework for environmental concerns within Kenya is the Environmental Management and Coordination Act No. 8 (EMCA) of 1999. The act recognizes the need to promote renewable energy. Biofuels Industry/Programmes Development in Kenya Although the biofuel industry is not highly developed in Kenya, there currently exist many initiatives and programmes that are meant to promote the development of the sector. These initiatives involve the government, private sector, NGOs and research institutions. Bioethanol Programmes The pioneer industry in bioethanol production was the Agro-Chemical and Food Complex (ACFC) in Muhoroni which in the 1980s started production of ethanol form molasses for blending with petrol. This collapsed in 1993 due to lack of policy and unsustainable pricing. ACFC still produces ethanol albeit it is mostly exported fro manufacture of potable alcohol. Together with Spectre International, the two companies produce respectively, 60, 000 and 65, 000 litres daily. Mumias Sugar Company is set to start integrated ethanol production in 2013, with a capacity of 80, 000 litres daily.
9.8 Biodiesel Programmes
Although still in its nascent stage, a flurry of activities within government agencies, NGOs and the private sector indicate potential to develop the biodiesel sub-sector. The focus is currently on jatropha as a feedstock although castor, croton and coconut are also being considered.

ERA-ARD, SROs, FARA Africa
76
Examples of private sector, government agency and NGO involvement in biodiesel include: • Better Globe Forestry Limited which has planted 48 hectares of jatropha trial in
Kiambere in Eastern Kenya. • Green Fuels Kenya Limited also ahs trial jatropha plantation in Thika in Central
Kenya. • Energy Africa Limited has worked with over 200 farmers since 2006 and more
than 200, 000 jatropha trees have been planted. • Agri-Business Group is an agricultural consulting company based in Nakuru and
has been working with farmers that is working with farmers throughout Kenya. • Green Power East Africa Limited is currently producing biodiesel on a small scale
using a BioKing reactor with a capacity of about 1, 000 litres per day. • Kenya Industrial Research and Development Institute is experimenting with crude
home-made reactors using a variety of feedstock. • Kenya Forestry Research Institute has also been conducting research on various
trees and shrub species to evaluate their potential for biodiesel. • The Ministry of Energy established the National Biodiesel Committee with
representation from the petroleum industry, line ministries, NGOs and agricultural producers.
• ICRAF, the Aga Khan Foundation’s Coastal Rural Support Programme (CRSP), Vanilla Jatropha Development Foundation (VJDF), Norwegian Church Aid (NCA), Green Africa Foundation (GAF) and other NGOs are working with local farmers to promote jatropha for biodiesel in various parts of the country.
• Initiative for the Promotion of Biomass is lead by the Institute for Research in Sustainable Energy and Development (IRSEAD) with membership from the Monitoring and Evaluation Consulting Engineers, Ministry of Energy, Kenya Sugar Board, sugar factories and sugar farmers. It is supported by AFEPREN and the Heinrich Böll Foundation to increase the use of renewable energy in the region in the next 10-15 years.
• Initiative to Promote Renewable Energies for Poverty Alleviation lead by the Ministry of Energy and involves the participation of other ministries, NGOs, industries and bilateral donors.
• Jatropha Project in Kenya initiated by Biwako Bio-Laboratory Inc. and Hydronet Energy Company Limited and aims to grow up to 100, 000 hectares of jatropha.
9.9 Crops Used for Biofuels
Type and Conversion Technology Kenya has been producing ethanol for over twenty years in modest quantities and in the 1980s was blending it in a petrol distribution network as ‘gasohol’. Production was undertaken by Agro-Chemical and Food Complex in Muhoroni in the Western Region of Kenya. A new entrant to the ethanol production industry is Spectre International in Kisumu, also in the western region. Although Spectre International has invested in some state-of-the-art technologies, ethanol production is still low-efficiency and costly in Kenya. Ethanol in Kenya is currently being produced from sugar processing residue known as molasses in stand-alone facilities rather than as an integrated process with sugar manufacture (as is done in countries where power alcohol production is at advanced stages). Mumias Sugar Company is making plans to start an integrated ethanol production facility by 2013.The molasses is fermented and then distilled to produce concentrated (up to 98%) alcohol. Feedstock for ethanol includes starchy crops such as grains (maize, sorghum), tubers like cassava and sugarcane. The biodiesel industry in Kenya is not as well-developed and is still in its nascent stages, although a few small industries process and sell the biodiesel to operators in the matatu

ERA-ARD, SROs, FARA Africa
77
(public transport vehicles) industry. A process called trans-esterification is used, in which the vegetable oil is mixed with alcohol and a catalyst to produce biodiesel and glycerol. Straight vegetable oil (unprocessed biodiesel) is also used in lighting and cooking and running stationary engines such as power generators. Feedstocks for biodiesel include oil bearing seeds such as cottonseed, jatropha, coconut, croton, rapeseed and castor. Potential Crops (Biofuel Feedstocks) A 2008 study by ESDA (now Camco) commissioned by GTZ identified the most viable biofuel crops in Kenya and shows that the following yields are possible based on real-world scenarios as shown in the table below: Table 9.1 Viable Biofuel crops in Kenya New Farmlands Existing Farmlands
Yield (T/Ha)
Land Ha (’000)
Production (’000 tonnes)
Biofuel (’000 liters)
Land Ha (’000)
Production (’000 tonnes)
Biofuel (’000 liters)
Ethanol Cassava 9.6 2.08 19.97 3, 395 4.15 39.84 6, 773 Sorghum 35.0 5.09 206.50 8, 260 11.06 387.10 15, 484 Sugarcane 33.4 0.09 3.01 30 0.83 27.72 277 Biodiesel Castor 0.23 6.82 1.57 703 10.42 2.40 1, 075 Coconut 1.64 0.03 0.05 18 0.18 0.29 107 Cottonseed 0.6 1.42 0.85 124 1.76 1.06 154 Croton 2.50 0.65 1.63 548 2.56 6.40 2, 150 Jatropha 2.50 6.26 15.65 5, 258 9.41 25.53 8, 578 Rapeseed 2.00 0.16 0.32 125 0.82 1.64 643 Sunflower 0.92 3.48 3.20 1,325 5.78 5.32 2, 202 According to this study, sorghum-would provide the greatest opportunity to increase ethanol production without competing existing agricultural production. Other feedstock may not be viable in the short-term but in the long term would ensure sustainable production. Castor and rapeseed were identified as possible large sources of feedstock in the near term, with castor maximising more semi-arid areas and rapeseed being grown in conjunction – as rotational crop – with wheat, barley and other staples. The study also showed that if the production is optimized based on scientific literature and fro other arts of the world, it is possible to more than double these figures. Market for Raw Material An economic analysis shows that the feedstock costs in Kenya are 60% lower than in Brazil, but the cost of biofuel production is 75% higher in Kenya due to poor infrastructure and inefficiency in production. With the exception of ethanol, the market for biofuels is still in its infancy. Even for ethanol, with the collapse of the power alcohol programme in the early 1990s due to lack of policy and unsustainable pricing, the bulk of ethanol produced in the country is either exported or used as an intermediate feedstock for other industrial products. The prices of most potential feedstocks are therefore not based on their sale for biofuel manufacture, but for other more ‘conventional’ uses. The data in the table gives indicative figures on the cost of potential biofuel feedstocks as at 2008 (from both food and non-food crops) as shown in the table below. The prices are based on conversations with farmers, data from the Ministry of Agriculture, Kenya Agricultural Research Institute and FAOSTAT.

ERA-ARD, SROs, FARA Africa
78
Table 9.2 Biofuel feedstocks prices in 2008 in Kenya
Feedstock Price/ton of feedstock (USD at exchange rate of Ksh 70/USD)
Molasses (sugar processing waste) 28 - 35
Cassava 92.8 Sorghum 17 Sugarcane 35 Castor 285.7 Coconut 419 Cottonseed 285.7 Croton 214.3 Jatropha 214.3 Rapeseed 371.4 Sunflower 456.9
End use Currently, most of the ethanol produced in Kenya is exported to Uganda and the Democratic Republic of Congo (DRC) for beverage use. However, there is potential to use the ethanol as petrol blend, and fuel for lighting and cooking. A little biodiesel is currently produced and used to run cars and stationary engines in Kenya. Efforts have also been expended at the Kenyan coast by UNDP to promote the use of Straight Vegetable Oil for lighting and cooking as a substitute for kerosene, firewood and charcoal.
9.10 Implications of Conversion of Biofuels Raw Material
Ethanol production is a relatively mature technology in Kenya although the production capacity is low and currently is not used for fuel. Biodiesel, however, is still in its infancy and therefore few impacts can currently be attributing to it. However, with increasing investment in the biofuels industry, there are bound to major implications. Implications for Water use Although there are numerous environmental benefits of using biofuels, the processing of feedstock requires large amounts of water. Data shows that 1, 000 – 2, 000 litres of water is required to process one tonne of sugar to ethanol. Kenya is already classified as a water-stressed country with very little stored water per capita. When severe droughts occur, water storage areas are rapidly drawn down; and where boreholes and wells have been dug up, these dry up during droughts due to poor or low recharge. Additionally, huge investments need to be made in treatment plants to ensure compliance with established water quality standards. Information from Agro-Chemical and Food Complex Company, one of the largest ethanol manufacturers in Kenya shows that the spent wash from ethanol production has a malodorous smell and dark colour that often attracts complaints for the surrounding community. Implications for Employment Potential employment and incomes benefits are enormous for Kenya. A 2008 report showed that the jobs-to-investment ratio for biofuels is about 100 higher than for petroleum refineries. Employment opportunities will be created through agro-industrializations. Additionally, there are opportunities to provide farm jobs as well as expanded income through adoption of new cash crops.

ERA-ARD, SROs, FARA Africa
79
Data from Mumias Sugar Company, the biggest sugar producer in Kenya, shows that producing an additional 93 million litres of ethanol in Western Kenya (as is planned for 2013) would create 500 -1000 new jobs in the manufacturing and transport sector. In Mumias alone, up to 100 people including 20 professionals earning an average of Ksh 100, 000 (1, 430 USD) will be required. The other workers would earn 15, 000 – 35, 0000 kshs (214 – 500 USD). It is estimated that one wage farm job will be created for every 54.9 hectares planted with ethanol feedstock, and one casual farm job for every 30.4 hectares planted. For biodiesel, it is estimated that one non-farm job will be created for every 100, 000 – 180, 000 litres of biodiesel produced. Implications for land tenure Analysis shows that depending on the type of feedstock, there might or might not be enough land to produce enough feedstock to meet the required fossil fuel substitution/blending. Some feedstock can only grow on high potential arable land, while others can be grown in low potential land and therefore not compete with food crops for land. For example, growing more sugarcane will require one fifth of potentially suitable land that is not currently being used for food or cash crops. The analysis also shows that not enough land exists for producing the required amount of ethanol from molasses. However, ample, non-competitive but suitable land exists for cassava and sorghum. For biodiesel, ample land exists for croton, jatropha, sunflower and castor. Cottonseed, rapeseed and coconut are limited by land availability.
9.11Mapping of Policy and Institutions and Links with Bioenergy
First hand players The Ministry of Energy is in charge of all energy initiatives in the country and must be involved in all investments in the energy sector. In addition to dealing with the Ministry of Energy, there are certain standard procedures that every investor must comply with prior to commenting business in Kenya: i. Obtain an investment certificate form the Kenya Investment Authority. The certificates
entitle one to several licences (abut 71) that one must have before investing Kenya, including entry and employment permits under the Immigration Act. The KIA’s purpose if threefold – to aid investors in the bureaucratic requirements of starting a business, keep track of investments and protect local investors from detrimental investments.
ii. Acquiring land – biofuel investors can obtain feedstock from freehold land owned by the investor; leasehold ownership; a contract with a landowner where the investor has rights to the crop, or by purchasing feedstock form farmers or on the open market.
iii. The Environmental Management and Coordination Act requires an Environmental and Social Impact Assessment before the start of any development project.
iv. Equipment purchase and importation which requires the approval of the Kenya Bureau of Standards (KEBS) to ensure conformity with Kenya standards.
v. Since establishment of biofuel crops may require importation of plant material and /or seed, there is need for compliance with the Seed and Plant Varieties Act and the Protection Act. Under these acts, the Kenya Plant Health Inspectorate Service (KEPHIS) has the duty to carry out testing, certification, quarantine and grading of seed and plant material.
Ministries/Secretariats Involved in the Bioenergy Planning/Applications The Ministries involved include the Ministry of Energy, Ministry of Agriculture, Ministry of Trade and Industry, Ministry of Immigration, Ministry of Finance, Ministry of Environment and Mineral Resources, Ministry of Lands. Other agencies which although inked to parent

ERA-ARD, SROs, FARA Africa
80
ministries are autonomous bodies include National Environment Management Authority (NEMA), KEBS, KEPHIS, KIA and the various agencies under the lands Ministry. NGOs Involved NGO involvement in biofuels is limited to biodiesel. The following are some of the NGOs that are involved in biofuels initiatives in Kenya:
• Green Africa Foundation (GAF) works in partnership with the private sectors, individuals, self-hep groups and the government. GAF is working in partnership with Japanese investors who are planning to establish jatropha plantations and set up processing plants.
• The Vanilla Jatropha Development Foundation (VJDF) also works with government, private sector and farmers to increase jatropha production around the country. It has projects in Koibatek (in the mid-Rift Valley), Kisumu (in the Lake Victoria Basin) and Kibwezi (and ASAL area).
• The Norwegian Church Aid (NCA) is working in Mpeketoni with the Lamu Cotton Growers Association and ESDA (now Camco) to develop an integrated jatropha energy system that involves growing jatropha, extracting the straight vegetable oil and using it to generate electricity.
• Other non-governmental organisations include ICRAF, the UNDP small Grants Programme and the Aga Khan Foundation through the Coastal Rural Support Programme working with farmers at the Coast.
Other Stakeholders Identified Other stakeholders identified include: Kenya Biodiesel Association The association was formed to:
• Coordinate stake-holders including feedstock producers, processor, marketers, distributors etc.
• Establishment of buying centres • Price setting of feedstock • Assist small scale farmers to acquire technology and services • Provide an avenue for lobbying • Monitoring and evaluation.
Petroleum Institute of East Africa (PIEA) PIEA was launched in 199 and has corporate, individual and associate membership of players in the petroleum industry. Its mission is to provide a forum for expertise and excellence in the oil industry in the East African region with the aim of promoting professionalism and free enterprise in petroleum business supported by the highest business and operating standards, adherence to Environment, Health and Safety ideals. Kenya Private Sector Alliance (KEPSA) Kenya Private Sector Alliance (KEPSA) is the umbrella body of the private sector. It exists to pursue an enabling business environment, policies and laws for the large as well as the micro, small and medium size enterprises. Kenya Renewable Energy Association (KEREA) KEREA was formed in 2002 when members of the Renewable Energy Resources Technical Committee at the Kenya Bureau of Standards realized the need for an industry association comprising of businesses involved with renewable energy, consultants, educational institutional staff, government institutions and individuals. Objectives of KEREA include:
• To promote the interests of members of the renewable energy industry, Donor organizations, NGOs, General etc.

ERA-ARD, SROs, FARA Africa
81
• To create increased public awareness in renewable energy. • To assist the Government and industry on all issues related to renewable energy. • To promote better business practices and professionalism in the sector. • To apply for, acquire and hold charters, Acts of Parliament, privileges,
monopolies, licenses, concessions, and patents or other rights or powers from the Kenya Government or local authority or any other statutory body.
• To protect the consumer of Renewable Energy products by encouraging conformity with standards and safety of components and systems.
Parliamentary Network on Renewable Energy and Climate Change (PANERECC) PANERECC was established by Members of the Parliamentary Committee on Energy, Communications and Public Works in December 2006 to promote New and Renewable Energy (NRE) as a tool for combating climate change and ensuring development using sustainable pathways. It is open to all Members of Parliament with an interest in cleaner technologies, renewable energy, the environment and sustainable development. Associate membership is allowed for members of the public from private sector, civil society and multilateral organizations. The purpose of PANERECC is to ensure that parliamentarians are educated and better informed on the need for improved energy policy instruments and legal frameworks that address climate change mitigation as well as adaptation and that foster the accelerated development of renewable energy.
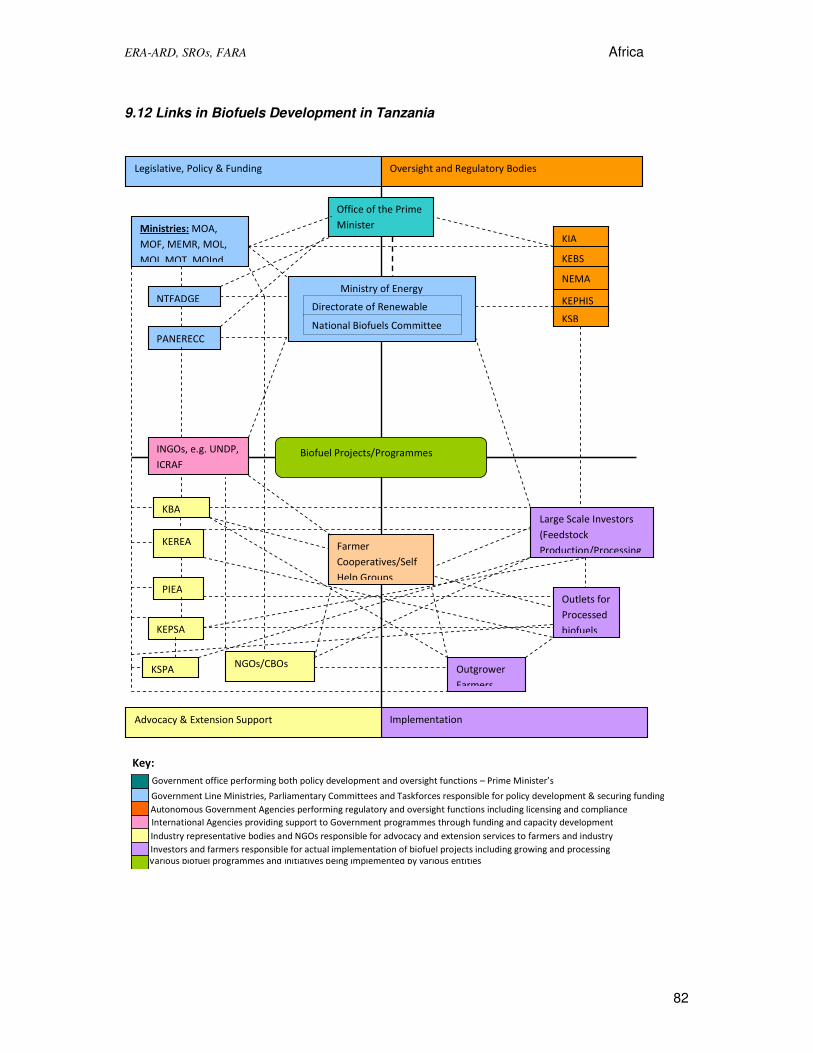
ERA-ARD, SROs, FARA Africa
82
9.12 Links in Biofuels Development in Tanzania
Key:
Legislative, Policy & Funding Oversight and Regulatory Bodies
Implementation Advocacy & Extension Support
NTFADGE
NGOs/CBOs Outgrower
Farmers
INGOs, e.g. UNDP,
ICRAF
Ministry of Energy
Directorate of Renewable
National Biofuels Committee
PANERECC
KEPSA
PIEA
KEREA
Large Scale Investors
(Feedstock
Production/Processing
Outlets for
Processed
biofuels
Farmer
Cooperatives/Self
Help Groups
Ministries: MOA,
MOF, MEMR, MOL,
MOI, MOT, MOInd,
KBA
KEPHIS
KEBS
NEMA
KIA
KSB
Office of the Prime
Minister
KSPA
Biofuel Projects/Programmes
Various biofuel programmes and initiatives being implemented by various entities
Investors and farmers responsible for actual implementation of biofuel projects including growing and processing
Industry representative bodies and NGOs responsible for advocacy and extension services to farmers and industry
International Agencies providing support to Government programmes through funding and capacity development
Autonomous Government Agencies performing regulatory and oversight functions including licensing and compliance
Government Line Ministries, Parliamentary Committees and Taskforces responsible for policy development & securing funding
Government office performing both policy development and oversight functions – Prime Minister’s

ERA-ARD, SROs, FARA Africa
83
Legend
CBO - Community Based Organization ICRAF – International Centre for Research in Agroforestry (World Agroforestry Centre) INGO - International Non-Governmental Organization KBA - Kenya Biodiesel Association KEBS – Kenya Bureau of Standards KEPHIS - Kenya Plant Health Inspectorate
Service KEPSA - Kenya Private Sector Alliance KEREA - Kenya Renewable Energy
Association KIA – Kenya Investment Authority KSB - Kenya Sugar Board KSPA - Kenya Sugar Producers Association
MEMR – Ministry of Environment & Mineral Resources MOA – Ministry of Finance MOI – Ministry of Immigration MOInd - Ministry of Industrialization MOL – Ministry of Lands MOT - Ministry of Trade NEMA -National Environment Management Authority NGO - Non – Governmental Organization NTFADGE – National Task Force for Accelerated Development of Green Energy PANERECC – Parliamentary Network on Renewable Energy & Climate Change PIEA – Petroleum Institute of East Africa UNDP - United Nations Development Programme

ERA-ARD, SROs, FARA Africa
84
9.13 Summary of the biofuels activities implications in Kenya
Issues
• Limited land.
• 98% of the farm holdings are small
(<10 ha) hence cannot support
sustainable feedstock production.
• Problems with sugar farming
• Maize, a potential ethanol
feedstock is the staple food and is
in short supply
• 60% of farming systems is
subsistence
• Food insecurity
• Insufficient feedstock supply
• Few processing facilities
• No technical capacity
• Economic feasibility still not assured
• Poor infrastructure and inefficiency
in production hampers growth
• Ethanol produced from sugar
molasses in stand-alone facilities
rather than as an integrated process
with sugar manufacture – more
costly
• Competition for ethanol for
beverage use.
• Unsustainable pricing
• Prices of potential feedstocks not
based on their sale for biofuel
manufacture, but for other more
‘conventional’ uses
• Market for biofuels is still in its
infancy
Policies
• Agriculture policy aims to increase
productivity and income growth
and enhanced food security and
equity
• Agriculture, Energy, Forest, Draft
Environment propose sustainable
biofuel feedstock production
• Establishment of Tax incentives – tax
holidays and fiscal incentives for
green energy investment
• Build and strengthen research
capacity
• Promote CDM and carbon trade
• Establishing financing partnerships
with the private investors
• Diversify the sugar industry base and
strengthen competitiveness of sugar
factories
• Achieve blending ratio of E-10
(bioethanol with petrol) by
December 31st 2010
• Promoting the utilization of
renewable energy sources for power
generation or transportation
Emerging Patterns/
relationships
• ICRAF, other NGOs and companies
working with farmers to promote
jatropha
• Focus on jatropha castor, croton
and coconut as biodiesel feedstock
• Kenya Forestry Research Institute
conducting research on various
species to evaluate biodiesel
potential.
• Initiative for the Promotion of
Biomass lead by the Institute for
Research in Sustainable Energy and
Development (IRSEAD)
• Biodiesel strategy
• Bioethanol strategy
• National Task Force on Accelerated
Development of Green Energy
• Active participation in R & D and
actual feedstock production
• National Biodiesel Committee with
membership of petroleum industry,
line ministries, NGOs and
agricultural producers.
Impact/ future
implications
• Opportunities to provide farm jobs
• Environmental benefits of using
biofuels
• Expanded income through
adoption of new cash crops.
• Irrigated feedstock production to
create more demand for water
• Growth in agro-industrialization
• Huge investments needed in
treatment plants to ensure
compliance with water quality
standards.
• Private-sector-led development
• Straight Vegetable Oil for lighting
and cooking to substitute kerosene,
firewood and charcoal.
• Integrated ethanol production to
increase efficiency and lower costs
• Diversify the sugar industry base and
strengthen competitiveness of sugar
factories
9.14 Conclusions
The case of Kenya is most relevant as has been producing bioethanol for nearly 20 years. The production has not been steady and tends to be exported for drinks to neighbour countries. It has been reported that land will not be sufficient to produce the amount of ethanol needed for the transport sector in Kenya. Nevertheless, alternative crops have been considered that do not compete with food or can produce both food and fuel (e.g. sweet sorghum, jatropha, castor oil). With the experience already in place and the different policy mechanisms (e.g Task Force, Biofuels Programmes) it is possible that Kenya could produce
FARM
About 20% of the land is suitable for cultivation,
predominantly for subsistence farming
INDUSTRY
In nascent stages but there currently exist many initiatives mainly ethanol and biodiesel
MARKET
Mainly transport industry and stationary applications. Some
domestic uses for SVO (cooking & lighting)

ERA-ARD, SROs, FARA Africa
85
biofuels in adequate areas that do not jeopardise food production in the country and do allow to rural development and a better income to the country. Positive impacts can be expected at local level with job creation in some areas where conflict with other resources (such as water) is not an issue.

ERA-ARD, SROs, FARA Africa
86
10. ZAMBIA CASE STUDY
10.1. Country’s Characteristics
Location Zambia occupies a near central location on the southern African sub-continent between 70 30’ and 180 45’ south latitude, and 220 00’ and 330 30’ east longitude. It is surrounded by the Democratic Republic of Congo in the north, Tanzania in the northeast, Malawi and Mozambique in the east, Zimbabwe, Botswana and Namibia in the south, and Angola in the west. It is divided into nine provinces. Lusaka is the capital and largest city (Figure 10.1).
Figure 10.1: Map of Zambia showing surrounding countries, provinces, population nodes, transport infrastructure, and main topographic features (UN, 2004). Geographical characteristics Zambia covers an area of 752 614 km2. Most of the western and central regions of the country are situated on the great plateau of central Africa. The plateau rises eastward from 915 to 1 520 m.a.m.s.l. and has an average altitude of 1 200 m.a.m.s.l. A faulted escarpment zone known as the Muchinga Mountains, traverses most of Northern Province. Its highest point is 2 170 m.a.m.s.l. North of the escarpment the topography is dominated by the Bangweulu swamps, Lake Bangweulu, Lake Mweru Wantipa, the eastern half of Lake Mweru, the southern extremity of Lake Tanganyika, and the Chambeshi River valley. East of the escarpment towards the border with Tanzania and Malawi, the land rises to over 1800 m.a.m.s.l. South of the escarpment the deep rift trough of the Luangwa River dominates the area. Most of the western part of the country is drained by the Zambezi River and its tributaries. The river forms most of Zambia’s southern boundary with Zimbabwe. Key features of the river include the Victoria Falls, the Kariba Dam and the deep rift trough of the Middle Zambezi Valley. Most of central Zambia is drained by the Kafue River and its tributaries (Aregheore, 2003, FAO, 2005). The Kafue is dammed above a gorge just south of Lusaka. The country has a further 1 700 medium to large concrete dams as well as about

ERA-ARD, SROs, FARA Africa
87
3000 small earth dams. The lakes, dams, and rivers comprise a water surface equivalent to 1,6 % of the country’s total area. Expansive wetlands, covering almost 5% of the country’s total area, are located on the alluvial plains of the main rivers. The Kafue Gorge Dam, Lake Kariba and Victoria Falls are equipped for hydroelectric power generation and generate more than 90% of the country’s electricity (Batidzirai et al., 1998). Zambia’s subtropical climate is characterized by three distinct seasons (1) The cool dry season from May to August when maximum temperatures range from 16°C to 21°C and frost occurs in the high altitude areas, (2) The hot dry season from September to November when maximum temperatures range from 27°C at high altitude, to 38°C in the river valleys. During both these dry seasons rainfall is minimal or absent, and relative humidity averages 40%. (3) The rainy season extends from late November to April with December, January and February being the wettest months. Although maximum temperatures during this season average 21°C, relative humidity is generally high. The distribution of moisture-laden winds driven into the country by the Inter-Tropical Convergence Zone is predominately influenced by changes in altitude and latitude. The country as a whole receives a mean annual rainfall (MAP) of 1 020mm. However, the MAP increases from 750mm in the southern region, to between 900 to 1 200mm in the central region, to 1 400mm in the northern region. In the latter, heavy rains may fall for 15 to 24 days per month during the rainy season (Chapman and Walmsley, 2003; FAO, 2005).
Figure 10.2: Relative importance of Zambia’s economic activities in 1996 (Europa Publications, 2010). Agriculture is Zambia’s second most important economic activity (Figure 10.2). About 70% of the country’s economically active population is employed in the agricultural sector as compared to 7 % in industry and 23% in services (ECZ, 2001). In 1997/98, crop failure due to flooding in the northern region and due to drought in the southern and western regions as well as considerable loss of livestock , saw the country’s growth rate plummet from + 7% in 1996/97 to -2%. Good weather and good crop harvests during 1998/99 and 1999/2000, saw the growth rate recover to almost + 4%. As Chapman and Walmsley (2003, pg. 6) note the country’s “economic performance is closely correlated to agriculture, which, in turn, is critically dependent on weather conditions”. This close correlation does not bode well for the future. According to GEF (2008), the later onset and earlier cessation of rains, the increased frequency and spatial extent of droughts and floods, and the occurrence of droughts during the rainy season, experienced since the late 1980s are due to climate change. These trends as well as an increase in temperature, are likely to become more prevalent. From 1988 onwards, the total area under cultivation and the total agricultural production declined. In addition to repeated droughts and floods, and loss of work oxen making farming unpredictable and risky, these decreases can be ascribed to the early 1990s removal of subsidies on agricultural inputs that forced most smallholder farmers to stop applying

ERA-ARD, SROs, FARA Africa
88
chemical fertilizers. There has been a significant switch from cultivating maize as the main food crop, to cultivating drought resistant food crops that require less fertilizer such as sorghum, cassava, millet, groundnuts and tubers (SIDA, 2004; Perret, 2006). Perret’s (2006) assertion that maize is no longer a suitable crop for Zambia’s bioclimatic and socioeconomic conditions, is substantiated by GEF’s (2008) predictions of average yield decreases of 66% for rainfed maize and 16% for irrigated maize, under the most probable climate change scenario applicable in the country in 2030. Environmental Characteristics Zambia has four major vegetation categories. Closed forests covering 6% of the country are restricted to the higher rainfall regions. Savanna woodlands cover 64% of the country and are predominately classed as Miombo woodland. The tree component of the woodlands range from sparsely scattered in the drier south to tall dense tickets in the moister north and northwest. Although Termitaria (anthill vegetation) is distributed throughout the country, it only covers about 3 % of its area. Grasslands cover 27% of the country and range from those found in the drier south to those associated with wetlands, to open grassy plains the high eastern escarpments. Deforestation is proceeding at the rate of about 200,000 ha per year. Coupled with overgrazing, it has contributed to severe soil degradation (ECZ, 2001, Aregheore, 2003). Approximately 30% of the land surface has been altered for agriculture, forestry and settlements (Chapman and Walmsley, 2003). On the basis of the combined influence of rainfall, temperature, altitude, topography and soils, on the length of the growing season and hence crop options, Zambia is divided into three major agro-ecological zones (Figure 10.3).
Figure 10.3 Map showing Zambia’s three major agro-ecological zones (ECZ, 2001). Zone 1 includes the major river valleys in the southwest, south, and southeastern parts of the country which experience very high summer temperatures and are prone to flooding. For the zone as a whole, MAP is 750 mm, the risk of drought is medium to high, the growing season is short (80 to 120 days), land degradation is widespread and the fertility of the soils is low. In addition, the soils are either characterized by an impermeable clay horizon which dependent on depth can make them difficult to plough and prone to cracking when dry, or a high sodium and base content which renders them highly erodible. Most of this zone has a poor agricultural potential

ERA-ARD, SROs, FARA Africa
89
Zone 2 covers most of the central full extent of the country. It has a MAP of 800 to 1 000 mm, a growing season of 100 to 140 days and a medium to low risk of drought. In the Western Province on both the plateau and Zambezi flood plain infertile, weakly developed, sandy soils predominate. The soils in the central and eastern parts of this zone generally have a better texture, structure and fertility status. The zone does have a severe water deficit during several periods of the cropping calendar. Although 87% of this zone has a good agricultural potential only half of it is accessible for this purpose. The balance has been set aside for national parks, game management areas and forests. Zone 3 covers the full extent of the northern part of the country and is the largest zone. MAP ranges from 1 000 to 1 400 mm, and drought risk is low. However, frosts are prevalent at high altitudes and floods at low altitudes, and the soils are generally highly leached and acidic. About half the zone has a good agricultural potential (ECZ, 2001; Aregheore, 2003; SIDA, 2004; FAO, 2005).
10.2. Population characteristics
Over the past three decades Zambia’s population has more than doubled from 5, 7 million people in 1980 (UN-HABITAT, 2005) to 12 million people in 2009 (DFAT, 2009). Population growth rates are however declining from the peak of 3,1 in the 1970s, to 2,7 in the 1980s, to 2,4 in the 1990s (UN-HABITAT, 2005), to 2,1 from 2000 to 2006 (CSO, 2007). In 2000, the average population density (inhabitants/ km²) in the agro-ecological zones 1, 2 and 3, were 3, 11 and less than one, respectively (SIDA, 2004). The population densities of Lusaka and Copperbelt provinces where people are concentrated in urban, industrial and mining centres and along the major transportation corridors are 65 and 53, respectively. In 2000, 44% of Zambia’s population lived in these concentrated areas. Although the population is comprised of an almost equal number of males and females (CSO, 2001), 65% of the rural population is female (SIDA, 2004). The 2000 census revealed that 20% of urban households were headed by women and that 45,5% of them were widowed. The average household size was five people. While 49% and 38% of them had access to safe water and garbage disposal respectively, only 15% and 16,7% had access to safe toilets and electricity, respectively. Wood for cooking and kerosene for lighting was used by 60,9% and 50% of the households, respectively (CSO 2001, UN-HABITAT, 2005). In 2002, 45,6, 53,7 and 2,3 % of Zambia’s population was less than 14 years of age, between 15 and 64, and over 65, respectively (UN-HABITAT, 2005) By 2004, 21,5% of Zambians were HIV positive or had AIDS – 60% of whom were women aged between 15 and 49 years, and over 100 thousand people had already died from the pandemic (UN-HABITAT, 2005). According to UNDP (2007) there were 845 546 children orphaned by AIDS in 2006, and this figure was projected to increase to 936 167 by 2010. HIV infection rates as well as life spans of people with AIDS, are however improving. CSO (2001) noted that life expectancy in Zambia rose from 47 years in 1990 to 50 years in 2000. During this decade it has remained about 50 years (UNDP, 2007).
10.3. Gross Domestic Product, Human Development Index and Poverty Levels
When Zambia gained independence in 1964, it was a middle-income country with copper responsible for approximately 80% of export earnings. During the 1970s and early 1980s its’ Human Development Index (HDI) grew slowly. Then, copper lost almost half its value on world markets resulting in a rapid reversal of the HDI to the extent that the 1995 value was

ERA-ARD, SROs, FARA Africa
90
less than the 1975 value (UNDP, 2007). In addition to increasing poverty, the country experienced increasing disparities between rich and poor (Chapman and Walmsley, 2003). Between 1989 and 2000, 56,5% of Zambia’s income was distributed amongst the country’s richest 20% of the population. By contrast only 3,3% was distributed amongst the poorest 20% of the population. Through until 1991 when the Movement for Multiparty Democracy Government (MMD) took office, Zambia’s economy was state-dominated and crippled by a lack of investment. The MMD abolished foreign exchange controls and subsidies on locally produced products and imports. It also embarked on a programme to privatize most government-owned copper mines thus freeing itself of enormous industry losses as the value of the metal continued to dip (Chapman and Walmsley, 2003). Although conditions were improving, in 2000 only 42% of Zambians were generating an income and most of them were doing so on an informal basis in the agricultural sector (UNDP, 2001). By 2004, 64% of Zambians were still living on less than the poverty threshold of US$ 1/day (UN-HABITAT, 2005). Comparing poverty in 1991 and 2004, Bigsten and Tengstam (2008) found that it decreased in rural areas from 88% to 78% but increased in urban areas from 49% to 53%. They attribute this to the greater diversity of income opportunities available to rural households. Since 2004, copper output has increased steadily due to a recovery of the value of the metal and increased foreign investment. In 2005, Zambia acquired US$ 6 billion in debt relief under the Highly Indebted Poor Country Initiative. In 2007, Zambia experienced a bumper harvest which boosted the GDP and agricultural exports. As is evident from Table 1, from 2004 to 2008 Zambia experienced strong growth with real GDP growth of about 6% per year, single-digit inflation, a relatively stable currency, decreasing interest rates, and increasing levels of trade. The weaker 2009 values given in Table 1 are IMF projections based on the world recession driven decline in commodity prices and the fact that elections were destined for 2009. Zambia’s HDI (0,481) in 2007 was finally better than in 1975 (0,448) when it was first estimated (UNDP, 2007, DFAT, 2009). Table 10.1 Zambia’s Economic Indicators (adapted from DFAT, 2009)
1995a 1999b 2004 2005 2006 2007 2008 2009
GDP (US$bn) current prices 5.4 7.3 10.9 11.4 14.7 12.3
GDP PPP*
12.4 13.4 14.7 16.1 17.4 18.5
GDP per capita (US$) 240 232 480 627 917 990 1, 248 1,027
GDP per capita PPP*(US$)
1,099 1,159 1,2422 1,399 1,482 1,544
Real GDP growth**
-3 2 5.4 5.3 6.2 6.3 5.8 4.5
Inflation **
46 21 18.0 18.3 9.0 10.7 12.4 14.0
* Purchasing power parity ** (% change yoy) a from Chapman and Walmsley (2003). b from UN-HABITAT (2005).
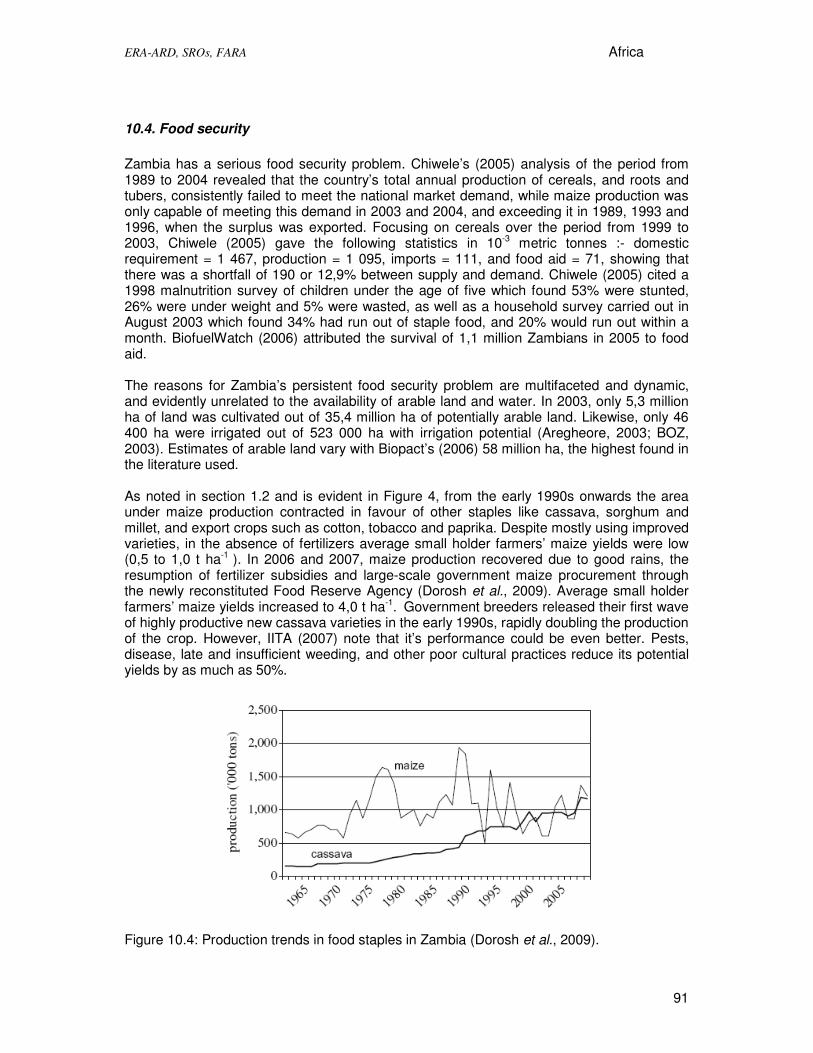
ERA-ARD, SROs, FARA Africa
91
10.4. Food security
Zambia has a serious food security problem. Chiwele’s (2005) analysis of the period from 1989 to 2004 revealed that the country’s total annual production of cereals, and roots and tubers, consistently failed to meet the national market demand, while maize production was only capable of meeting this demand in 2003 and 2004, and exceeding it in 1989, 1993 and 1996, when the surplus was exported. Focusing on cereals over the period from 1999 to 2003, Chiwele (2005) gave the following statistics in 10-3 metric tonnes :- domestic requirement = 1 467, production = 1 095, imports = 111, and food aid = 71, showing that there was a shortfall of 190 or 12,9% between supply and demand. Chiwele (2005) cited a 1998 malnutrition survey of children under the age of five which found 53% were stunted, 26% were under weight and 5% were wasted, as well as a household survey carried out in August 2003 which found 34% had run out of staple food, and 20% would run out within a month. BiofuelWatch (2006) attributed the survival of 1,1 million Zambians in 2005 to food aid. The reasons for Zambia’s persistent food security problem are multifaceted and dynamic, and evidently unrelated to the availability of arable land and water. In 2003, only 5,3 million ha of land was cultivated out of 35,4 million ha of potentially arable land. Likewise, only 46 400 ha were irrigated out of 523 000 ha with irrigation potential (Aregheore, 2003; BOZ, 2003). Estimates of arable land vary with Biopact’s (2006) 58 million ha, the highest found in the literature used. As noted in section 1.2 and is evident in Figure 4, from the early 1990s onwards the area under maize production contracted in favour of other staples like cassava, sorghum and millet, and export crops such as cotton, tobacco and paprika. Despite mostly using improved varieties, in the absence of fertilizers average small holder farmers’ maize yields were low (0,5 to 1,0 t ha-1 ). In 2006 and 2007, maize production recovered due to good rains, the resumption of fertilizer subsidies and large-scale government maize procurement through the newly reconstituted Food Reserve Agency (Dorosh et al., 2009). Average small holder farmers’ maize yields increased to 4,0 t ha-1. Government breeders released their first wave of highly productive new cassava varieties in the early 1990s, rapidly doubling the production of the crop. However, IITA (2007) note that it’s performance could be even better. Pests, disease, late and insufficient weeding, and other poor cultural practices reduce its potential yields by as much as 50%.
Figure 10.4: Production trends in food staples in Zambia (Dorosh et al., 2009).

ERA-ARD, SROs, FARA Africa
92
As a consequence of the release of several new cultivars of sweet potatoes, there has been a rapid increase in their production over the past decade (Dorosh et al., 2009). Improved varieties of sorghum and millet have been widely and increasingly adopted by all categories of farmers since their initial release in 1989. Although they perform better than maize under water stressed conditions and poor soils, they are more vulnerable to destruction by birds. Small holders generally grown them for home consumption and maize for cash income (even during droughts) because opportunities for them to market these crops are not as good as they are for maize (SIDA, 2004). Edible caterpillars of the Emperor moth (Saturniidae) picked from Miombo woodland play a significant role in ameliorating rural livelihoods. A substantial proportion of the harvest is dried and sold in urban centers. Crop residues and agro industrial by-products such as molasses, brewer’s grain, bone and fish meal, etc. play an important role in the nutrition of ruminant livestock (Aregheore, 2003, FAO, 2005).
10.5. Main Crops: Production, Imports/Exports.
In 2003, the agricultural sector’s contribution to the gross domestic product (GDP) was 21% while 2% of the export earnings originated from agriculture (SIDA, 2004). Small holder farms - most of which are female headed – produce most of Zambia’s food and a substantial proportion of its cash crops. The figures in brackets are SIDA’s (2004) estimates of the proportion of the country’s total production contributed by women - millet (95%), cotton (95%), sorghum (85%), groundnut (75%), maize (65%) and sunflower (55%). Table 10.2. shows the typical crops grown in Zambia’s three agro-ecological zones listed in decreasing order of potential and priority (adapted from Chalabesa et al., 1999).
Type of crops Zone 1 Zone 2 Zone 3
Staple crops 1. sorghum 1. maize 1. maize
2. maize 2. sorghum 2. cassava
3. Pearl millet 3. cassava 3. Finger millet
4. cassava 4. Pearl millet 4. sorghum
Food legumes 1. groundnut 1. groundnut 1. bean
2. cowpea 2. bean 2. groundnut
3. Bambara nut 3. Bambara nut 3. Bambara nut
4. cowpea 4. cowpea
5. Pigeon pea
6. Chick pea
Cash crops 1. cotton 1. soybean 1. soybean
2. soybean 2. wheat 2. wheat
3. sunflower 3. cotton 3. exotic vegetables
4. exotic vegetables 4. exotic vegetables. 4. rice
5. wheat 5. sunflower 5. sunflower
6. rice 6. rice 6. potato
7. castor 7. tobacco 7. spices
8. spices
9. flowers
Plantation crops 1. fruits 1. sugar cane 1. fruits

ERA-ARD, SROs, FARA Africa
93
2. sugar cane 2. fruits 2. pineapple
3. cashew 3. coffee
4. sugar cane
5. oil palm
6. tea Zambia’s main exports are copper and cobalt. However, since 1991 it has increasingly exported electricity, copper rods, gemstones and cement as well as the following agricultural produce: tobacco, sugar, beer, fruit juices, cold drinks, cotton, cotton yarn, cut flowers, specialty vegetables, spices, coffee, bone and fish meal, and live fish. Its main export partners are the UK, Switzerland, Tanzania, Zimbabwe, South Africa, The Netherlands, Germany and Australia. Since 1991, Zambia has been a net importer of goods. Its main imports are crude oil and fertilizer. Other significant imports include mining equipment, machines and their component parts, transport equipment and parts, motor vehicles and electricity. Dairy products and processed foods are routinely imported. As noted in section 4, dependent on domestic production maize, cereals etc are periodically imported. The main imports partners are the UK, UAE and South Africa. Goods are also imported from Saudi Arabia, Japan, and Malawi (DFAT, 2009).
10.6 Characteristics of Livelihoods
According to SIDA (2004) and FAO (2005) Zambia has four categories of farmers:-
(1) small holders: 75% of the farmers are subsistence producers of staple foods on farms ranging from 0,5 to 9 ha. Although they only market an occasional surplus, they account for 51% of the agricultural GDP.
(2) emergent farmers: 20% of the farmers produce food and cash crops on farms ranging from more than 9 to 20 ha,
(3) medium scale: about 4% of the farmers produce food and cash crops on farms ranging from more than 20 to 60 ha. Together with the emergent farmers, they produce 25% of the agricultural GDP.
(4) large scale: constituting less than 1% of the farmers and numbering less than 800 individuals or companies, these farmers grow cash crops on farms larger than 60 ha. Together with the medium scale farmers, they are commercial farmers characterized by high mechanization and have a well organized farmer network which facilitates the acquisition of inputs.
Prior to independence 6% of Zambia was Crown Land and 94% Reserves and Trust Land. In 1964, the Crown Land became State Land and it was nationalized requiring State consent for all dealings. This requirement hampered development of unused land. In 1991, the MMD reintroduced the economic value of undeveloped land and the right of private land ownership. The Reserves and Trust Land became Customary Lands where the community owns all the land on behalf of its members, and the consent of the Chief is required to settle in the area (UN-HABITAT, 2005). Most small holders have customary land use rights Most land in opened-up areas is occupied but unexploited agricultural land, which is generally distant from where minimal infrastructure is developed, still remains unoccupied (FAO, 2005). The Commissioner of Lands attached to the Ministry of Lands is responsible for granting State Land. However, the Ministry of Agriculture and Cooperatives is responsible for identifying, planning, demarcating, and recommending land for agriculture purposes, as well as monitoring land use change (UN-HABITAT, 2005).

ERA-ARD, SROs, FARA Africa
94
10.7 Policies Linked to Bioenergy Sector
According to Mr Oscar Kalumiana the current Director of the Department of Energy (DE) (Kalumiana, 2009), Zambia’s Government is committed to ensuring environmentally sustainable exploitation of biomass resources in order to (a) secure supplies and stabilize prices of transport fuels, (b) increase investment in the agricultural sector, and (c) contribute to socioeconomic development. While the DE’s specific policy goals in respect of biomass resources are (a) to improve the management of woodlands for sustainable firewood production, (b) to improve the efficiency of charcoal production, and (c) to promote alternatives to firewood, the Department recognizes that conditions in the country are favourable for the development of the bioenergy sector. The DE attributes the current dependency of the country on food imports to the lack of infrastructure and investment in the agricultural sector, and perceives bioenergy as an excellent opportunity to significantly enhance the production potential of feedstock for both food and biomass production. The DE is initially focusing on transport rather than electricity, and plans to introduce biodiesel to be used straight or blended with diesel, and ethanol to blend with petrol. Biofuels are defined as ‘fuel’ and regulated under the Energy Regulation Act of 2008. The Ministry of Energy and Water Development is developing a long-term strategy (2009 – 2030) which includes biofuels as a priority sub-sector, and which foresees close cooperation between the DE and the Environmental Council because Environmental and Social Impact Assessments (ESIA) will be required for bioenergy projects. The most recent policies or Acts of the following Ministries/Departments were scanned for reference to the use of biomass, crops or trees for bioenergy, biofuels, or electricity:- Agriculture, Food and Fisheries - Agriculture and Cooperatives; Environment, Natural Resources and Tourism; Forestry; Lands; Mines and Mineral Development; Transport; and Commerce, Trade and Industry. None was found.
10.8 Biofuels Development Status
Research Under the leadership of Professor Francis Yamba, the Centre for Energy, Environment and Engineering (CEEEZ) and the University of Zambia, assessed the performance of 9 varieties of sweet sorghum as a supplementary feedstock to ethanol production. The research was carried out in association with Dr Jeremy Woods of the Porter Institute and ICEPT, at Imperial College, London. Between 2004 and 2007, trails of these varieties were monitored on 8 small holder farms distributed across all three agro-ecological zones, at Kafue Sugar, and at the University research farm. Similar yields were obtained in Zone 1 and 2. Stem yields in Zone 3 were poor and this was attributed to the acidic soils and the lower number of sunshine hours. The highest sugar contents were obtained with Wray, Keller, GE2 and TS1, and lowest with Madhura. GE2, Praj-1 and GE3 should be grown by commercial farmers as they were the most responsive varieties to input applications. Yield differences between sub-optimal and optimal input applications, and across different environments were insignificant with Sima and Wray, suggesting they are best suited low-resource farmers (Woods, 2007). Takavarasha et al’s (2005) feasibility study for the production and use of biofuel in Zambia found that the area needed to be put under biofuel feedstocks in order to meet the domestic biofuel demand was equivalent to 4% of the area already under crops, 1,3% of the country’s potentially arable land, and 0,27% of the country’s total land surface. Von Maltitz and Brent (2009) estimated that Zambia needed to put 56 286 ha under biofuel feedstocks in order to meet their biofuel targets. This represents 4 % of the country’s arable land, 6 % of its available arable land and 0.8 % of its total land area.

ERA-ARD, SROs, FARA Africa
95
Walimwipi (2009) asserts that policies and business decisions required for biofuels implementation strategies are influenced by various and complex factors. The policymakers need to ensure that the environmental and socio-economic sustainability of the biofuel production, while those involved in the biofuels production chain want a meaningful return on their investments, as well as incentives to compete with gasoline and diesel fuels. Recognizing the need for an objective mechanism to guide the decision –making process, CEEEZ used an Integrated Decision Support Tool (DST) to assess the economic performance of different feedstocks for ethanol and biodiesel production. The DST was developed by UNIDO and technical support was provided by the German Biomass Research Institute. Sweet sorghum, sugarcane and maize were competitive at 50, 60 and 80 US$/ barrel, respectively. However, to produce 20 million litres of bioethanol per annum from maize requires 24 000 ha of land, as compared to 5 000 ha for sweet sorghum and for sugarcane. Apart from being the most competitive in production costs, Jatropha also requires less land than sunflowers, and substantially less than soya beans. Implementation Progress In November 2005, D1 Oils – a UK based company – established a partnership with the Zambian Government to plant 15 000 ha of Jatropha curcas in northern Zambia. The company provided farmers with tree seedlings, assisted in arranging finance for them to cover other planting costs, entered into a contract with them guaranteeing to buy their seeds, and continues to provide extension advice (Anon, 2005). In June 2006, D1 Oils was allocated 155 000 ha for planting (Anon, 2006). By June 2007, D1 Oils had established a managed plantation of 2411 ha, had contract farming taking place on 20 760 ha, was pleased with the performance of the trees and was on-track with its’ plans to expand (Le Roux, 2007). Unfortunately, the company has not responded yet to several requests for an update on its current status. Marli Investments – a Zambian company – initiated a Jatropha out-grower scheme near Kabwe and using cuttings, seeds and seedlings from trees already growing in the country, commenced planting in November 2004. As of November 2009, the company had distributed over 12 million seedlings and seeds to 25 000 out-growers at schemes covering 18 500 ha set up throughout the country. All seed yields to date have been used to extend the planted areas. As with D1 Oils, Marli Investments has entered into a contract with the out-growers guaranteeing to buy their seeds, and provides ongoing extension advice. Marli Investments planned to commence constructing a 600 000 tons per year biodiesel production plant in 2009 to be operational by 2011. Unfortunately, with the global recession it has been unable to attract the necessary funding to implement this plan (Desai, 2009).
10.9 Crops Used for Biofuels
Table 10.3: shows the 2004 production status of potential biofuels feedstocks in Zambia (Takavarasha et al, 2005).
Crop Area cultivated ha Yields mt Kg oil/ha L oil/ha
Sunflower 26 000 8 000 800 952
Soyabean 15 000 15 000 375 446
Maize 750 000 1 161 000
Sorghum 22 000 19 000
Sugarcane 17 000 1 800 000
Cassava 165 000 950 000

ERA-ARD, SROs, FARA Africa
96
Jatropha 1 590 1 892
Oil Palm 5 000 5 950
10.10 Implications of Biofuels Production on Water and Employment.
In areas where the MAP is greater than 800 mm rainfed sugar cane production is economically viable. The same applies to sweet sorghum where the MAP is greater than 600mm. However, irrigation substantially improves the yields of both crops (Watson et al., 2007). The survival rate of Jatropha seeds, seedlings and cuttings is substantially improved if they are watered for the first three years (Mudede, 2010). Given that Aregheore (2003) and BOZ (2003) estimated that less than 9% of the land with irrigation potential was irrigated (as noted in section 4), it would appear that Zambia can withstand a substantial production of biofuel feedstocks even under irrigated conditions, without detrimentally affecting national water availability. Biofuels production is likely to generate employment in both the informal and formal sectors. Von Maltitz and Brent (2009) estimated that Zambia would create 27 046 jobs in meeting its biofuel targets. However, they cautioned that “fuel production must provide jobs of sufficient quality to ensure that workers are able to achieve security through their remuneration from biofuel endeavours”.
10.11 Stakeholder Roles and Views
Against Biofuel Developments in Zambia:
(1) Scott (2009) representing Practical Action a UK based NGO, claims that investors are levying charges for extension services and scheme membership fees, and that growers have to pay to replace trees that die.
(2) ABN (2007) noting that the Zambian Commission for Catholic Justice and Peace concluded that for most farmers growing tobacco and cotton, the outgrower schemes have perpetuated or increased poverty, questions whether Jatropha outgrower schemes will not be any different.
(3) Biofuelwatch (2006) falsely claims that D1 Oils plans to have the Jatropha seeds grown in Zambia, processed into oil in South Africa for export to the European Union.
(4) Sibanda (2006) quotes Clement Chipokolo of the Participatory Ecological Land Use Management Association as saying "The increase in this type of plantation production will certainly affect the already unstable food production in Zambia where farming and food crises are common. Zambia will have to choose between feeding its population… or its ever growing number of cars and industries".
In Favour of Biofuel Developments in Zambia:
(1) Takavarasha et al. (2005) reported that Ministry of Agriculture was fully supportive of biofuels as an alternative market for crops, and believed that the seed industry and investment in irrigation would benefit from biofuels.
(2) Sibanda (2006) quotes Dr Judith Lungu – the Dean of the School of Agriculture at the University of Zambia as saying "I never saw cotton replace maize, so I think the farmers will continue to grow food alongside their Jatropha crops".
(3) The National Association for Peasant and Small-Scale Farmers of Zambia (2006) urged small-scale farmers to start growing biofuel crops in order to reduce rural poverty and cut energy costs.

ERA-ARD, SROs, FARA Africa
97
(4) The Biofuels Association of Zambia (2007) asserts that Jatropha cultivation creates a positive reciprocity between raw material/energy production and environment/food production. They refer to this reciprocity as the Jatropha System, and conceive of it as having four equal aspects: Renewable energy, Erosion control, Women promotion and Rural Income.
(5) Sinkala (2009): notes that Zambia’s mine dumps cover a total area of more than 10,000 Km2 and asserts that Jatropha should be used to rehabilitate them. Doing so would generate huge income. He goes on to suggest that deforestation in the country could be abated by engaging communities to make charcoal from Jatropha cake. He is adamant that biofuel crops have not and will not adversely effect food security in Zambia.
(6) Desai (2009) points out that small holder farmers who have become part of Marli Investments’ Jatropha outgrower schemes, have not used any of the land on which they grow their food crops. While the land that they have used for Jatropha may have previously been used for grazing or collecting fuelwood etc, because planting Jatropha does not involve total land clearance, these activities can continue to some degree thereafter. He also claims that many have already benefited from the additional income from the sale of their seeds.
(7) Von Maltitz and Brent (2009) concluded Zambia has the potential to meet all local liquid fuel needs as well as supporting an export market of fuels and food. The fact that there is both available land and the ability to intensify food production would seem to indicate that there would be limited competition between food and fuel, provided that fuel production does not displace current food production.
10.12 Links in biofuels development in Zambia
Producers
Customary
Lands
State
Lands
Environmental
Social Impact
Assessment
Industry
NGO’s
Govt Depts
1. Local Chief
2. Other community reps
3. Existing Community reps
4. Existing Outgrower Scheme
•Sugar Companies
•Marli Investments
•D1 Oils
•Individual Commercial farmers
•Commercial Farmer Associations
•Individual Outgrower Schemes
•Outgrower Scheme Associations
•Other National/Foreign Investors
•Transport
•Energy Regulation Board
•Zambia Electrical Supply Company
•Food Regulation Agency
•Forestry
•Mines and mineral development
•Commerce, Trade & Industry
•National Science & Technology Council
•Water Development Board
•Zambia Investment Centre
•Zambia Wildlife Authority
�Biofuels Assoc. of Zambia
� CEEEZ
�University of Zambia
�Copperbelt University
�Zambia Forestry College
�Environmental Conservation Assoc
of Zambia
•Wildlife & Environ. Conservation Society of
Zambia
•PLUM Association*
•NAPSSFZ**
•ZCCJP***
•Practical Action
•Biofuelwatch
•Petroleum refinery
•Sugar Companies
•Mining Companies
•Companies that import agricultural &
mining machinery & Parts
•Motor vehicle companies
•Ministry Agriculture, Food and Fisheries –
Agriculture & Cooperatives
•Ministry of Legal Affairs
•Ministry of Lands- Commissioner of Lands
•Ministry of Energy & Water Development
•Ministry Environment, Natural Resources &
Tourism - Environmental Council of Zambia
Women's
Groups
Mandatory connection between stake holders
Connection commonly made between
stakeholders dependent on how whether
proposed biofuels feedstocks production is
perceived as a threat to their interests or goals.
Connections Needed
Institutions listed in order of the frequency and
significance of their connections.
• Participatory Land Use Management
Association
** National association for Peasant and
Small Scale Farmers of Zambia
*** Zambian Commission for Catholic
Justice and Peace.
CEEEZ = Centre for Energy, Environment and
Engineering

ERA-ARD, SROs, FARA Africa
98
10.13 Summary of biofuels activities implications in Zambia
Issues
• Low crop yields due to non-existent/low investment in crop production.
• The best crop producing areas have less available land for cultivation.
• Insufficient feedstock supply • Few processing facilities • No technical capacity • Economic feasibility still not assured • No commercial facilities established
yet
• Market information lacking • Dramatic increase in demand for
biofuels but no commercial supply
Policies
• Liberalization of agricultural sector
• Focus on food security
• Policy promotes cash crops and production of industrial raw material sustainably
• Promote integrated and sustainable use of natural resources.
• Limited interface between energy policy and plans relating to national economic planning.
• Energy Policy encourages commercialization and private sector participation.
• Biofuels Association, and the Department of Energy (DE) has already taken the decision to initially focus on transport rather than electricity
• Plans to introduce biodiesel to be used straight or blended with diesel, and ethanol to blend with petrol
Emerging Patterns/ relationships
• Several actors (e.g. multinationals, NGOs, institutions and small holders farmers) are implementing biofuel projects.
• Significant potential for irrigated land and several areas apt for oil palm and jatropha.
• Investors have started biofuel production at on the experimental stage
• A statement on blending biofuels with mineral petrol has been slotted in the New Petroleum Supply Act.
Impact/ future implications
• Improved standard of living and linkages with others sectors in the economy
• Employment opportunities will be created through agro-industrializations
• Opportunities for income generation and diversification by producing and selling biofuel feedstocks
• Energy supply in rural areas will stimulate rural development and
• Growth in agro-industrialization • Private-sector-led development
• Initiatives started will create market opportunities
• Zambia is a net fuel importer hence high potential to become a significant biofuel producer.
• Biofuel development could represent a paradigm shift in agricultural development.
• The Ministry of Energy and Water Development is developing a long-term strategy (2009 – 2030) which
10.14 Conclusions
Zambia initial steps into biofuel production still seem to be controversial. This is one of the countries that provide an example of the need for energy alternatives as it is a landlock country. The country has had a food security crisis for a number of years despite that around12% of the arable land is actually dedicated to agriculture. It seems that the dependency of the country on food imports is due to the lack of infrastructure and investment in the agricultural sector. The Energy Ministry considers that bioenergy could be an excellent opportunity to significantly enhance the production potential of feedstock for both food and biomass production. Zambia is an agricultural country with nearly 70% of the active population dedicated to this sector and has been looking at different crops for biofuel production such as sweet sorghum and cassava. The biofuels Association in Zambia is a strong organization and could play an important role in the promotion of biofuels and food production. The perspectives of different stakeholders continues to be an issue with opposite views.
FARM
Typically subsistence farming with low capital investment. Land area
per household ≈2ha.
INDUSTRY
Still in nascent stages. Current efforts mostly focused on biodiesel
from jatropha.
MARKET
Potential exists at all levels (households, public facilities, transport
and industry including power generation).

ERA-ARD, SROs, FARA Africa
99
11. MOZAMBIQUE CASE STUDY
11.1Location
Mozambique is located on coordinates 18° 15’ S, 35° 00’ E in south-east Africa and borders the United Republic of Tanzania to the north, Malawi, Zambia, Zimbabwe, South Africa, Swaziland, and the Indian Ocean. It has a coastline of nearly 2,750km. The country is divided into eleven provinces (from south to north): Maputo, Maputo city, Gaza, Inhambane, Manica, Sofala, Zambézia, Tete, Nampula, Niassa, and Cabo Delgado. It has a total area of 801,590 sq km of which 784,090 sq km is land and 17,500 sq km is water.
Figure 11.1: Map of Mozambique showing surrounding countries, Geographical Characteristics Mozambique occupies the eastern fringe of the great southern African escarpment. The mountains of the interior fall to a broad plateau which descends to coastal hills and plain. Rivers generally run west to east. The coastal beaches are fringed by lagoons coral reefs and strings of islands. The extensive low plateau covers nearly half the land area. The Zambezi is the largest of 25 main rivers. Vegetation The plateau is savannah – dry and open bushveld and wide stretches of grassland. There are patches of forest in the western and northern highlands. Dense subtropical bush characterizes the coastal plain. Forest covers approximately 25% of the land area, having declined at 0.3% p.a. between in the period 1990 - 2005. Arable land comprises 5.6% and permanent cropland 0.3% of the total land area.

ERA-ARD, SROs, FARA Africa
100
Wildlife Mozambique has four national parks. Gorongosa, the biggest, extends to 3,770 sq km. There are also many forest and game reserves harboring zebra, water buffalo, giraffe, lions, elephants and rhinos, and many varieties of tropical water birds such as flamingos, cranes, storks and pelicans. Climate Climate ranges from tropical to subtropical. The inland is cooler than the coast and rainfall generally increases with altitude (which ranges from 0 meters above sea level to Monte Binga, the highest point, which 2,436 m high. Mean annual rainfall ranges from 800 mm to 1,000 mm along the coast; 1,200 mm in the central region of the country; and between 1,000 mm and 2,000 mm in the northern region. The hottest and wettest season is October to March. From April to September the coast has warm, mainly dry weather, tempered by se breezes. The country is vulnerable to cyclones. Administration Mozambique is divided into 10 provinces: Cabo Delgado, Gaza, Inhambane, Manica, Maputo, Nampula, Niassa, Sofala, Tete, Zambezia. Maputo is the administrative capital. Environmental Characteristics
The most significant environmental issues are desertification, pollution of surface and coastal waters, and persistent migration of people from the hinterland to urban and coastal areas caused mainly by a long civil war and recurrent drought in the hinterlands.
11.2 Population Size and Characteristics
The July 2009 population estimate for Mozambique is 21,669,278 people. The population density is estimated to be 28 people per sq km land area. The population estimates for Mozambique explicitly take into account the effects of excess mortality due to AIDS and are based on projections for 2009. Mozambique has very high HIV/AIDS prevalence rates. The adult prevalence rate is 12.5% by 2007 estimates with approximately 1.5 million people living with HIV/AIDS. In the same year, about 81,000 deaths from AIDS were reported.
Age structure (2009 estimates): 0-14 years - 44.3% (male 4,829,272/female 4,773,209); 15-64 years -52.8% (male 5,605,227/female 5,842,679); 65 years and over - 2.9% (male 257,119/female 361,772).
The population growth rate is 1.791% while the birth rate is 37.98 births per 1,000. The death rate by 2008 estimates is 20.29 deaths per 1,000.The urban population is estimated to be 37% of total population at 4.1% annual rate of urbanization. The Sex ratio at birth is 1.02 male(s)/female under 15 years; 1.01 male(s)/female 15-64 years; 0.96 male(s)/female 65 years and over: 0.71 male(s)/female total population: 0.97 male(s)/female .
The total Infant mortality rate is 105.8 deaths per 1,000 live births (108.57 deaths/1,000 live births for males and 103 deaths/1,000 live births for females). The total Life expectancy at birth is vey low, at 41.18 years (41.83 years for males and 40.53 years for females). The Total fertility rate is 5.18 children born per woman.
11.3 Gross domestic product
Although it has considerable mineral reserves, Mozambique is a highly indebted, poverty-stricken country. It is richly endowed with natural resources, including arable land, forest,

ERA-ARD, SROs, FARA Africa
101
grasslands, inland water resources from its network of rivers including the Zambezi, marine fisheries, minerals and hydroelectricity. As a result, the economy is diversified, and agriculture, transport, manufacturing, energy, fisheries, tourism and wage remittances all make important contributions to the economy. Following the rapid growth of the industrial sector in the past few years, the share of agriculture in national Gross Domestic Product (GDP) has been falling, down from over 27 percent in 1998 to below 21 percent in 2008. The sector, however, still employs about 81 percent of the total labour force and provides major export earnings from commodities such as prawns and fish, cotton, sugar, timber and cashew nuts. Other exports include aluminium and electricity. The poor status is largely due to Civil war, ineffective socialist economic policies, and severe droughts that plagued Mozambique's economy throughout the 1980s. The GDP is 9,735 million US dollars while the GDP per capita in 2009 is estimated to be $456 US dollars. Mozambique remains dependent upon foreign assistance for much of its annual budget, and the majority of the population remains below the poverty line (70%). Subsistence agriculture continues to employ the vast majority of the country's work force. A substantial trade imbalance exists. Between 1980 and 2007 Mozambique's Human Development Index (HDI) rose by 1.34% annually from 0.280 to 0.402 today. The HDI provides a composite measure of three dimensions of human development: living a long and healthy life (measured by life expectancy), being educated (measured by adult literacy and gross enrolment in education) and having a decent standard of living (measured by purchasing power parity, PPP, income). However, recent shifts in economic policy toward a market economy and a resolution of the civil war have laid the foundation for an economic recovery helping the economy to grow on average by 4.7% yearly between 1988 and 1998. In 2001, it stood at 9.2%.
10.4 Main food crops
The main food crops in Mozambique comprise cereals (maize, sorghum, millet and paddy rice) and cassava, supplemented by bananas and cashew nuts. According to FAO, the average yields of the main food crops are as follows:
o Maize: 0.4-1.3 tonnes/hectare o Cassava: 4-5 tonnes/hectare o Beans: 0.3-0.6 tonnes/hectare o Sorghum: 0.3-0.6 tonnes/hectare o Rice: 0.5-1.8 tonnes/hectare
About 4 million hectares of land equal to about 10% of arable land is under cultivation, out of which 97% is cultivated by smallholder farmers. About 3.2 million smallholder farmers are responsible for 95% of all agricultural production. Each household cultivates an average of 2 hectares. Approximately 91% of the land is tilled by small and medium scale farmers and is used for annual crops which include maize, cassava, rice, sorghum, millet, cowpeas and groundnuts. Maize, cassava and cowpeas were the most common food crops, cultivated by 79%, 73% and 50% of the farmers respectively. Of the maizeproduced in the country 99% is produced by the small-scale farmers in Zambézia, Nampula, Niassa, Manica, Tete Provinces including selected areas of Maputo and Gaza.

ERA-ARD, SROs, FARA Africa
102
11.5 Main Agricultural food products imports and exports
The main agricultural products include cotton, cashew nuts, sugarcane, tea, cassava, corn, coconuts, sisal, citrus and tropical fruits, potatoes, and sunflowers. Industrial crops include tobacco, cotton, cashew, coconuts, tea, paprika, soybeans, sesame, sunflower and citrus. Mozambique is a net importer of food commodities, especially rice, wheat and, to a lesser extent, maize20. Mozambique relies on imports for all its domestic wheat requirements. Imports of rice account for about 75 per cent of total domestic consumption, and those of maize (mostly from South Africa) account for about 13 per cent of total domestic consumption. Main agricultural exports include cotton, cashew nuts, sugarcane, tea, cassava (tapioca), corn, coconuts, sisal, citrus and tropical fruits, potatoes, sunflowers.
11.6 Characteristics of livelihoods
The majority, i.e. 80%, of the population is active in agriculture. Of these, about 90% work in the family farm sector. The family agriculture system is characterized by family labor force and low mechanization. Agricultural inputs such as tractors, ploughs, fertilizers, pesticides and others are low, or almost zero. The number of irrigated areas is mainly limited to bigger farms in lowland areas (rice) and mainly directed to vegetable production in small areas. In addition productivity per hectare is low. Hence, the potential for agricultural growth is significant. Fertilizer use is very low, used only for cash crops and is approximately 2kg of fertilizer per hectare of arable land. The table below shows some agricultural statistics.
Table 11.1 Mozambique’s agriculture statistics
Agricultural land - % of land area: 61.96 % of land area
Agricultural land - sq. km: 485,800 sq. km
Agricultural machinery - tractors: 5,750
Arable and permanent cropland: 4,135 thousand hectares
Arable land - % of land area: 5.55 % of land area
Arable land - hectares: 4,350,000 hectares
Cereal production: 131 thousand metric tons
Cereal yield - kg per hectare: 959.2 kg/ha
Food production index: 104 %
Labour share: 80.3% Land may not be sold; access is free of charge, but once occupied the land can be inherited to the occupant's direct descendants. Slash and burn techniques for preparing fields are still the main agricultural technique used. Main production constraints are pests, seed shortages and labour shortage, for both cash and food crops, since most of the cash crops serve as food crops.
20
International Institute for Sustainable Development, 2009. Agriculture: Future Scenarios for Southern Africa -Food Production in Mozambique and Rising Global Food Prices

ERA-ARD, SROs, FARA Africa
103
11.7 Policies in place
Energy Policies and Strategies
The energy Policy (1998) provides a clear statement on the need for providing energy to the household and productive sectors, building capacity and improving management in the sector, increasing exports and efficiency. The Energy Sector Strategy (2000) focuses on how to implement the policy, involving the private sector and the development of more competitive markets and the need for regulation. The strategy complements the Energy Policy, outlining and making explicit the intentions of the government in the development of plans of actions, programmes, projects, investments and other actions for the various energy sub sectors and for the guidance of operators in the sector, financial institutions and investors. However, the strategy is not fully developed and clear. The Poverty Reduction Strategy also has energy as one of the six pillars. There is also a policy for Rural Energy Development which aims to promote rural energy development by giving access to the poor to intermediate (Kerosene) and modern forms of energy (Electricity). Mozambique also has recently developed a Biofuels Policy and Strategy. The initiative was launched on 24 March 2009, and establishes guidelines for both the public and private sector to better participate in the biofuels industry. The purpose for adopting the measure is to reduce the country’s dependence on imported fossil fuels. Other factors include the need to ensure energy security, advantageous conditions for agriculture, and need to promote sustainable economic growth. Concerns over food security issues in relation to growing food crops for biofuels were highlighted in parliamentary discussions on the issue, and parliament agreed to produce biofuels without compromising food. The parliamentary session that voted to approve the document also agreed to create a National Biofuels Council which will be responsible for monitoring the implementation of policies targeting the sector. In an effort to promote the development of biofuel production, Mozambique has engaged governments and businesses in other countries, namely biofuels giant Brazil. Mozambique has already concluded agreements on trade cooperation, investment, and technology transfer for several years. More recently, Mozambican biofuels policies designed to stimulate the sector have led to the approval of three export-oriented projects in the south, north, and centre of the country. In order to stimulate domestic consumption, the government plans to establish a mandatory 15 percent blend of biofuel to petrol and diesel within five years.
Land Policy
A new law was passed in 1997 to ensure that Mozambicans are able to use land fairly and securely. Under the 1997 law, land in Mozambique is still owned by the state, and cannot be bought or sold. However, the law recognizes the rights of people or communities to use the land and sell assets on it. Long-term use rights can be obtained through occupation by communities, through occupation in good faith for at least 10 years or through a land allocation procedure, where the state can give user right title for various kinds of investment projects.
11.8 Biofuels industry programmes development
The development of large-scale renewable energy projects in Mozambique is still in its infancy. Mozambique’s huge untapped potential of renewable energy technologies is well-suited for both urban and rural energy development. The first ethanol plant in Mozambique, inaugurated in October 2007, received some US$510 million in support from the UK. The

ERA-ARD, SROs, FARA Africa
104
plant currently produces 120 million litres of ethanol per year. The National Biofuels Strategy has outlined an Action Plan that envisions commercialization of biofuels in the period 2009 – 2015 which will involve feedstock production, establishing processing industries and distribution networks. Data from the Investment Promotion Centre (CPI) and Ministry of Energy indicate that there are at least 5 serious players who had been investigating the potential of biofuel in Mozambique. The Ministry of Agriculture also reports that they are many enquiries from around companies interested in acquiring land to establish biofuel plantations. A number of companies are already involved in biofuels production or processing in Mozambique, including:
o Sun Biofuels o Green Fuels o Ginwala o Chemc o Geralco/Boror o Alif Quemica o Climate Change Corporation o Petromoc o Groupo Madal o Nhacoongo o Somoil o Olimax
11.9 Crops used for biofuels
Potential feedstocks include sugarcane, Sweet sorghum, cassava, maize (for ethanol), Jatropha curcas, coconut, sunflower, soy, groundnuts (for biodiesel). However based on sustainability of feedstock as well as evaluating their potential for income generation, cost of production, socioeconomic and environmental impacts the chosen crops for biofuel production in Mozambique are the following: sugarcane and sweet sorghum for ethanol, Jatropha curcas and coconut for biodiesel.
11.10 Expected end use of biofuels
Final use of biofuels in Mozambique will be for cars and industry, agricultural and home electrical equipment. Ethanol will be used as direct blend with fossil fuels. Ethanol can also be used to produce gel fuel as a domestic energy source to reduce over - dependence on Charcoal and wood. Biodiesel can be used in generators. Straight vegetable oil can be used in Stationary diesel equipments. For the use of cars, a blending of up to 20% biofuels can be implemented with out modifications to the engines.
11.11 Mapping of policies and institutions
Ministries/Secretariats Involved in the Bioenergy Planning/Applications
The major government institution overseeing the energy sector in Mozambique is the Ministry of Energy. Three directorates (Electricity Directorate, Fuels Directorate and Renewable Energy Directorate) within the ministry formulate policy, regulation and are responsible for energy planning and management.

ERA-ARD, SROs, FARA Africa
105
The Ministry of Energy (MoE) and the renewable energy and fuels directorate have the responsibility for formulating biofuel policy in Mozambique. Any investment in the sector would need to be cleared by the ministries. For instance a project to develop industrial capacity would and/or import / export oil need be reviewed by the Ministry of Trade and Industry. The Environment Ministry would need to be satisfied with the environmental impact of the project.
NGOs Involved
Technoserve: This is a US-funded Private Voluntary Organisation (PVO), and one of the few organisations active in developing extension services to small holders in the coconut sector. They are active in the coconut sector. GreenFuels are currently working with Technoserve, and the Ministry of Agriculture – small producers of biodiesel can obtain a license through a government approved Technoserve process.
Other Key Stakeholders Identified
Other key stakeholders include Petromoc, the largest fuel distributor and owner of storage facilities at Maputo Port and the Investment Promotion Centre (CPI) who aim to offer a ‘one-stop shop’ for investors.
11.12 Links in Biofuels Development in Mozambique
Ministry of Trade
& Industry
Technoserve
Finance
Ministry
Ministry of
Agriculture
Investment
Promotion
Centre (CPI)
Ministry of
Environment
Development
Partners
(Donor
Community)
Biofuel Project/Programme
Local
Community
(Farmers)
Private Sector
Investors
(Production,
Processing)
Ministry of
Planning
Petromoc
Key:
Direct links (--------)
Indirect links (-.-.-.-.)
Needed links (..........)
Ministry of Energy
Fuel Directorate
Renewable Energy Directorate
National Biofuel Commission
Parliament
NGOs/
CBOs
Govern
men
t A
gen
cies
Electricity Directorate

ERA-ARD, SROs, FARA Africa
106
11.13 Summary Mozambique
11.14 Conclusions
Mozambique has been the recipient of numerous investors in the last years for bioenergy crops production. The National Government has followed a conscious path into the development of their policies and the mapping of the country to better identify the areas where this production is possible without generating negative impacts in local resources and food production. At farmer level the infrastructure and investment for agriculture is very limited or nearly null affecting the yields. Mozambique is a net importer of food commodities, especially rice, wheat and, to a lesser extent, maize. At the same time the country relies on imports for all its domestic wheat requirements. Imports of rice account for about 75 per cent of total domestic consumption, and those of maize (mostly from South Africa) account for about 13 per cent of total domestic consumption. Nevertheless, there are reports about the land availability for food and bioenergy crop production.
FARM97% of cultivated land tilled by
smallholder farmers. Each household cultivates an average of 2 hectares.
INDUSTRYLarge-scale projects still in
nascent stage, comprising bioethanol & biodiesel
MARKETMainly transport and industry,
agricultural and home electrical equipment.
•Ethanol can be used to produce gel fuel as a domestic energy source to replace firewood and charcoal•Country’s dependence on imported fossil fuels will reduce.
•Growth in agro-industrialization•
•Opportunities to provide farm jobs•Environmental benefits of using biofuels•Expanded income through adoption of new cash crops. •Irrigated feedstock production to create more demand for water
Impact/ future implications
•At least 5 serious players have been investigating the potential of biofuel in Mozambique.
•Mozambique has engaged governments and businesses in other countries with successful biofuel programmes, e.g. Brazil.•Agreements on trade cooperation, investment, and technology transfer concluded between Mozambique and European countries.
Emerging Patterns/ relationships
•National Biofuels Strategy Action Plan also envisions establishment of distribution networks.
•National Biofuels Strategy has outlined an Action Plan that envisions commercialization of biofuels in the period 2009 – 2015 which will involve feedstock production and establishing processing industries
• Poverty Reduction Strategy has energy as one of the six pillars.• Biofuels Policy and Strategy establishes guidelines for the public and private sector to better participate in the biofuels industry.
Policies
• Market for biofuels is still in its infancy
•Unavailability of feedstock and infrastructure
•Family agriculture system characterized by family labor force and low mechanization•Fertilizer use is very low, used only for cash crops•Agricultural inputs such as tractors, ploughs, fertilizers, pesticides and others are low, or almost zero•Production constrained by pests, seed shortages and labor shortage•Concerns over food security issues in relation to growing food crops for biofuels
Issues

ERA-ARD, SROs, FARA Africa
107
Since most of the bioenergy initiatives have recently started it is difficult to assess how the local communities are engaging with the production.

ERA-ARD, SROs, FARA Africa
108
12. GENERAL CONCLUSIONS
The production and possibilities for investment on biofuels in Africa need to consider the differences and collection of factors at regional and local level including geographical location, land use patterns, preferences, income distribution patterns, cultural and social aspects. With these assumptions it is possible to consider that in Africa, there is much scope for improving agricultural productivity. Biofuels can be grown on significant scales without indirect effects on food production or natural habitats though some considerations on production, sustainability and policy should be taken into account as follows: • The stakeholder mapping in all the case studies showed the lack of interaction between
all of them (government, private, NGOs, farmers) despite that the bioenergy production activities show clear cross cuttings in different areas such as Agriculture, Energy, Industry, Transport, Social, Environment agencies and Ministries.
• The case studies reviewed in this document do not represent the total activities and situation of the rest of the countries in the continent but are some of the most relevant examples in different regions in the continent.
• On land currently under cultivation, in the less developed countries it can be possible to triple yields by using improved management practices, potentially freeing up more land for biofuel production.
• It is estimated that the area under sugar cane in the region could be doubled without reducing food production or destroying valuable habitats. Sweet sorghum shows promise for integration with sugar cane and extending production into drier areas.
• Jatropha is being planted in southern Africa with plans for expansion, but is relatively unproven and has yet to reach commercial-scale oil production. Oil palm is mostly grown in West Africa but cold-tolerant varieties have been successfully demonstrated in southern Africa.
• If biofuel production brings investment in land, infrastructure and human resources, it could help to unlock southern Africa’s latent potential and positively increase food production.
• Investors and Governments in the EU should look not just at local Policies but also at Regional Policies in Africa which create an umbrella for countries who do not have a dedicated policy on biofuels. Enacting a legal and regulatory framework that allows for the development of modern biomass is also necessary in African countries and EU countries can contribute to promote this and enforce regulations where available.
• In South Africa, expansion of agriculture may be limited, but in Mozambique, only 10% of arable land is currently under cultivation.
• It is necessary to look for subsidy policies, equitable power prices and consistent trade and taxation policies.
• Private investors should comply with international agreements, local policies and regulatory frameworks on trade, agriculture and sustainability issues.
• International agreements on land use and resources considerations (conservation areas, definition of idle land, suitable land for biofuels, water) will help to strength the sustainability considerations at local level.
• Secondary effects should be avoided strengthening the use of traditional environmental management methodologies (EIA, SEA, SIA) with local research groups and professional bodies.
Recommendations: • The involvement of stakeholders should be not only for the decision-making process
but also for the enforcement and monitoring of the bioenergy activities.

ERA-ARD, SROs, FARA Africa
109
• Food security involves many aspects that are not strictly related to land availability, crop selection and production. These other aspects such as trends in national and international markets, speculation, activities of middleman and others should also be considered as causes and not just the development of bioenergy industry.
• It cannot be denied that negative impacts have occurred in some areas (not whole countries), such as displacement, and these should not only be avoided but legally penalised.
• National Governments should also look at case by case for the decision making of investments not only for bioenergy crops but also for other agricultural and industrial developments, specially where these activities are increasing.
• Adequate investment for these activities should favour not just the National Economies but also the small producers.

ERA-ARD, SROs, FARA Africa
110
13. GENERAL REFERENCES
Compete. 2008. Competence Platform on Energy Crop and Agroforestry Systems for Arid
and Semi-arid Ecosystems – Africa. http://www.compete-bioafrica.net/index.html. Deepchand, K.2002. Promoting equity in large-scale renewable energy development: the
case of Mauritius. Energy Policy Volume 30, Issues 11-12, September Pages 1129-1142.
Eriksen, S, Watson, H and Woods, J. 2004. The Sustainable Use of Southern Africa’s Savanna Resources: Evaluating Resources and Options for Development. Southern African Savanna Network (SASN).
E4Tech. 2006. Brazil:UK:Africa Partnership on Bioethanol. Scoping study. Full report for DTI BERRA. http://www.berr.gov.uk/dius/science/int/page34980.html
FAOSTAT 2004. Agriculture Statistics. http://faostat.fao.org/default.aspx. FAOSTAT, 2008. Resources and production statistics for selected countries.
http://faostat.fao.org/default.aspx. Accessed April 2008. Griffee P. , Diemer P. and Chinchilla C. 2004. Smallholder Oil Palm Manual. FAO.
http://ecoport.org/ep?SearchType=earticleView&earticleId=180&page=-2 . Accessed April 2008.
GTZ 2005. Liquid Biofuels for Transportation in Tanzania: Potential and Implications for Sustainable Agriculture and Energy in the 21st Century. http://www.gtz.de/de/dokumente/en-biofuels-for-transportation-in-tanzania-2005.pdf Accessed April 2008.
Henning,R 2006. Jatropha curcas L in Africa: Assessment of the impact of the dissemination of the Jatropha System on the ecology of the rural and the social and the economic situation of the rural population in selected countries in Africa. Global Facilitation Unit for Underutilized Species. Rothkreuz 11, D-88138 Weissenberg, Gemany.
IEA. Energy Statistics and Balances of Non-OECD Countries. Paris. International Energy Agency. 2003.
IISD/UNIDO. First High-Level Biofuels Seminar in Africa. 2007. Addis Ababa, Ethiopia. 30 July-1 August.
Johnson, F and Matsika, E. Bio-energy trade and regional development: the case of bio-ethanol in southern Africa. Energy for Sustainable Development � Volume X No. 1 � March 2006.
Jumbe, Ch. and Msiska, F. 2007. Report on International and Regional Policies and Biofuels Sector Development in Sub-Saharan Africa. ANNEX 6-2: Report on Regional Policies and Strategies. Food Agriculture and Natural Resources Policy Analysis Network (FANRPAN). COMPETE. Germany,
Karekezi, S, Kithyoma, W. and Oruta, A. 2008. Scaling up Bio-energy in Africa. Afrepren. Background paper for the International Conference on Scaling-Up Renewables in Africa. UNIDO. Dakar April 2008.
Moodley, P., 2007: Assessment of Experiences and Status-Quoi of Jatropha curcus
cultivation in arid and semi arid regions of sub-Saharan Africa, Unpul. Bsc Hons. thesis, University of KwaZulu- Natal, Durban.
SADC, 2008. Mozambique country review. http://www.sadcreview.com/country_profiles/mozambique/moz_agriculture.htm. Accessed
April 2008.

ERA-ARD, SROs, FARA Africa
111
Smeets, E., Faaij, A.P.C., and Lewandowski, I., 2004. A Quickscan of Global Bio-energy
Potentials to 2050. Bottom-Up Scenario Analysis of Regional Biomass Production and
Export Potentials, Fair Biotrade Project, Utrecht University. Thomas, V, and Kwong, A. 2001. Ethanol as a lead replacement: phasing out leaded
gasoline in Africa. Energy Policy Volume 29, Issue 13, November 2001, Pages 1133-1143
Tonukari, N. 2004. Cassava and the future of starch. Electron. J. Biotechnol. [online]. abr. 2004, vol.7, no.1 [citado 25 Abril 2008], p.5-8. Disponible en la World Wide Web: <http://www.scielo.cl/scielo.php?script=sci_arttext&pid=S0717-34582004000100003&lng=es&nrm=iso>. ISSN 0717-3458. Accessed April 2008.
UNIDO. 2008. International Conference on Renewable Energy in Africa. Making Renewable Energy Markets Work for Africa. Policies, Industries and Finance for Scaling up. 16-18 April 2008. UNIDO. Dakar, Senegal
USDA. 2002. Production Estimates and Crop Assessment Division Foreign Agricultural Service. Favourable Palm Oil Production for Cote d’Ivoire. http://151.121.3.140/pecad2/highlights/2002/09/cote_divoire/index.htm. Accessed April 2008.
Watson, H. 2007. WP1:Current Land Use Patterns & Impacts. Kwazulu Natal University. Presentation at COMPETE meeting in Ougadougou, Burkina Faso.
Watson, H. 2008. WP1 First year report. COMPETE . Competence Platform on Energy Crop and Agroforestry Systems for Arid and Semi-arid Ecosystems – Africa. Kwazulu Natal University.
World Rainforest Movement 2001. The Bitter Fruit of Oil Palm: Dispossession and Deforestation.
13.1 References by Case study
SENEGAL FAOstat, 2009. Senegal Agricultural Statistics. http://faostat.fao.org/site/291/default.aspx.
Accessed: 12/12/09 INADEV, 2010. Senegal country characteristics. Institute for African Development.
http://www.inadev.org/. Accessed 14/01/2010. Mongabay, 2009. Senegal rainforest and land use characteristics.
http://rainforests.mongabay.com/. Accessed 10/01/2010. Platteau J, Abraham A, Gaspart F and Stevens L. 2005. Traditional marriage practices as
determinants of women's land rights: a review of research. FAO. http://www.fao.org/docrep/008/a0297e/a0297e05.htm. Accessed 15/01/2010
Matsumoto-Izadifar, Y. 2008. Senegal Making Better Use of Agribusiness Potential. www.oecd.org/dev/publications/businessfordevelopment. Accessed 02/02/2010
MALI al, A.O.e., A national institution for pro-poor growth: agribusiness versus household farming
in the office du niger, M.R.B. 2, Editor. 2007, DFID. IPPG Programme Office, IDPM, School of Environment & Development University of Manchester, Arthur Lewis Building, 2.023, Oxford Road Manchester M13 9PL.
CIRAD, 2009. L'Huile de Coton comme combustible, in Le Cirad en 2008..

ERA-ARD, SROs, FARA Africa
112
Code des Investissements. NB - Loi n°91-048/AN-RM du 26 février 1991. Modifiée par la Loi n°05-050 du 19 aout 2005. Coulibaly Y, M., Riz pluvial: le choix du nerica, in L'Essorn°16401 du - 2009-03-12 2009. Diarra, L., Tarifs d'électricité : un reajustement necessaire et modere, in l'Essor. 2009:
Bamako. Dembele, N.N. and J.M. Staatz, The Impact of Market reform on Agricultural Transformation
in Mali, in Workshop on Agricultural Transformation. MSU Agricultural Economics Staff Paper no. 99-29. 1999: Nairobi, Kenya.
Foncier : La part des femmes. l'Essor n°16588 du - 2009-12-10: Bamako. Forum on China-Africa Cooperation. 2006.Chinese Foreign Minister Li Zhaoxing and Malian
Prime Minister Maiga Attend the 10th Anniversary of the Founding of Sukala S.A., a China-Mali Joint Venture.
Hanson, R., Cotton and Products West Africa Cotton Annual 2009 2009, USDA Foreign Agricultural Service: Dakar.
IMF, IMF Country Report No. 08/121, in Mali: Poverty Reduction Strategy Paper 2008: Washington
INSTAT, Note de presentation des resultats provisoires du 4ème RGPH. 2009, Institut National de la Statistique. Ministere de l'Economie et des Finances: Bamako.
Klarsfield, L.O.d.Z., T., Aparna Raoi, Kelly Walters, Value Chain Analysis of Jatropha Oil. Evaluating the Use and Scale-Up of Jatropha Oil for the Multifunctional Platform Program in Mali 2009, Columbia University
LAM, A., Assamblee Nationale: Oui, a la participation de l'etat au capital de N-Sukala in L’Essor n°16569. 2009-11-13 Bamako.
Latapie, R., La culture du pourghere: une activite generatrice de revenus qui permet de faire face aux enjeux energetiques du Mali. Le cas du projet Garalo Bagani Yelen, in Faculté des sciences économiques. 2007, Université des Rennes I.
Loi N°02- 006/ du 31 Jan 2002. Portant Code de l'eau. Presidence de la Republique. Loi d'orientation agricole in LOI N° 06-40/AN-RM (2006) Asssemble Nationale Mali. Mali Country Strategy Paper 2005-2009, in African Developpment Bank. Country Operations
Department, West Region. 2005. Matsumoto-Izadifar, Y., Malt. Beyond Cotton, searching for "Green Gold", in 2008 Business
for Development. 2008, OECD. MCAMALI. 2009. Exectuive Sumary Millennium Challenge Compact with Mali. Available
from: http://www.mcamali.org/. Mise en Oeuvre des Objectifs du Millenaire pour le Developpment du Mali. En route vers
l'horizon 2015. Deuxieme Rapport., CT CLSP/ Systeme des Nations Unies Mali/ Mali. Office du Niger. 2007.Evaluation du Contrat plan 2005-2007, Etat-Office du Niger-
Exploitants Agricoles. Ordonnance N° 00-027/P-RM du 22 mars 2000 portant Code domanial et foncier, modifiée
et ratifiée par la loi N° 02-008 du 12 février 2002. , Mali, Editor. 2002. Palliere, G. and S. Fauveaud, Les enjeux des agrocarburants pour le monde paysan au
Mali. . 2009, Geres. Privatisation de la CMDT: une aubaine pour les huleries, in L'essor: n°16266 du 2008-08-20
2008: Bamako. Rapport pour la revue annuelle UNDAF. Bilan des annés 2008-2009. , S.d.N.U.a. Mali,
Editor. 2009.

ERA-ARD, SROs, FARA Africa
113
Samake, A., et al., Programme RuralStruc : les implications structurelles de la libéralisation
sur l’agriculture et le développement rural – première phase – Synthèse nationale - MALI W.B.C.-. IER/CIRAD, Editor. 2009.
Tomota Group - Huicoma. [cited 2009; Available from: http://www.pro2m.net/tomota/rubrique.php3?id_rubrique=14&posart=4&idphoto=0&id_article=0#sommaire_1.
Toure, A., et al., Program for Africa's Seed Systems (PASS). Country report Mali. . 2006, IER: Bamako.
UNDP, Human development Report -- Mali. 2009. UNIDO, Sustainable Bioenergy Development in UEMOA Member Countries. 2008, UNIDO. Yossi, H et al., Les haies vives au Sahel. 2006, World Agroforestry Centre (ICRAF):
Bamako. KENYA Akotsi E.F.N. Bioenergy: Strategies and Policy Implementation in Kenya. Paper Presented at
COMPETE Conference. Lusaka, Zambia. Alila, P.O. and R. Atieno: Agricultural Policy in Kenya: Issues and Processes. A Paper for
the Future Agricultures Consortium workshop. Institute of Development Studies, 20-22 March 2006.
COMPETE - Competence Platform on Energy Crop and Agroforestry Systems for Arid and Semi-arid Ecosystems – Africa, January 2008: National Policies and Strategies on
Bioenergy in Africa Case Study: Kenya
Department of Surveying. University of Nairobi. Nairobi, Kenya. Ekakoro, E., 2009: Personal Communication. Camco Advisory Services (K) Ltd. Nairobi,
Kenya. Government of Kenya, 2007: Kenya Vision 2030. Ministry of Planning and National
Development and the National Economic and Social Council (NESC), Office of the President. Nairobi.
Human Development Report 2009 - Country Fact Sheets – Kenya. http://hdrstats.undp.org/fr/countries/country_fact_sheets/cty_fs_KEN.html
Kabubo-Mariara and Karanja, 2006: The Economic Impact of Climate Change on Crop
Agriculture: a Ricardian Approach. CEEPA Discussion Paper no. 12, Centre for Environmental Economics and Policy in Africa (CEEPA), University of Pretoria.
Kameri-Mbote, P. Undated: Land Use, Land Tenure and Sustainability in Kenya: Towards Innovative Use of Wildlife in Kenya. International Environmental Law Research Centre.
Kenya Country Profile. http://earthtrends.wri.org KIPPRA, 2009: Kenya Economic Report 2009. Kenya Institute of Public policy Research and
Analysis. Nairobi, Kenya. Meijerink, G. & P. Roza, 2007): The role of agriculture in development. Markets, Chains and
Sustainable Development Strategy and Policy Paper, no. 5. Stichting DLO: Wageningen. Ministry of Agriculture & GTZ, 2008: A Road Map for Biofuels in Kenya: Opportunities and
Obstacles. Nairobi. Ministry of Lands, 2009: Draft National Land Policy. National Land Policy Secretariat.
Nairobi, Kenya.

ERA-ARD, SROs, FARA Africa
114
Mosiany, T., 2009: Biodiesel Production and Marketing in Kenya. Personal Communication. Project Manager, Green Power EA Ltd.
Mulaku, G.C. and G. Canny, Undated: Land Information Management in Kenya: An Integrated Approach
PANERECC, 2007: New and Renewable Energy in Kenya: Technologies, Potentials and Opportunities for Sustainable Development. Paper 2
Republic of Kenya, 1999: Environmental Management and Coordination Act (EMCA, 1999). Government Printer, Nairobi.
RoK, Republic of Kenya, 2005: Sessional Paper No. 9 of 2005 on Forest Policy. MENR. Government Printer, Nairobi.
UNEP, 2006: Africa Environment Outlook 2. United Nations Environment Programme, Nairobi
MOZAMBIQUE EATTA, East African Tea Trade Association: A Brief Analysis of the Energy Sector in
Mozambique. ESD, 2007: Mozambique Coconut Biodiesel Feasibility Study. Phase 1 Feasibility Report
presented to Greenergy, Energia Capital & Nhawelany Energia. FAO, 2005: FAO Global Information and Early Warning System on Food and Agriculture
World Food Programme. Special Report. FAO/WFP Crop and Food Supply Assessment Mission to Mozambique.
FAO, 2007: Promoting Integrated and Diversified Horticulture Production in Maputo Green
Zones towards a stable Food Security System. Human Development Report 2009 - Country Fact Sheets – Mozambique.
hdrstats.undp.org/../cty_fs_MOZ.html . International Institute for Sustainable Development, 2009: Agriculture: Future Scenarios for
Southern Africa - Food Production in Mozambique and Rising Global Food Price.
Mark Hankins, 2009: A Green Energy Plan for Mozambique. JA! Justiça Ambiental. Mozambique National Biofuels Strategy REEP, Renewable Energy and Energy Efficiency Partnership: Mozambique. Republic of Mozambique, Ministry of Energy, 2009: Renewable Energy Options in
Mozambique. A Presentation by Marcelina Mataveia, Head of Biomass Energy Department Mining and Energy for the Mozambique Energy Conference:. Maputo – Mozambique 19-20 of January, 2009.
World Bank, 2006: Mozambique Agricultural Development Strategy Stimulating Smallholder
Agricultural Growth. AFTS1 Agriculture, Environment, and Social Development Unit Country Department 2 Africa Region.
World Rivers Review, September 2009: Tapping Local Green Energy Could Light up
Mozambique.
ZAMBIA
Biles, P. 2006. Zambia: Fertile but hungry BBC.
http://news.bbc.co.uk/1/hi/world/africa/4678592.stm. Accessed April, 2008. Cheesman, O. 2004. Environmental Impacts of Sugar Production. CABI Publishing.

ERA-ARD, SROs, FARA Africa
115
http://books.google.co.uk/books?id=rchW4QutXqwC&pg=PA50&lpg=PA50&dq=irrigation+water+availability+potential+southern+africa&source=web&ots=vom5L0612E&sig=z6W4eJVIrGR546ed2Iuj7vNgk-c&hl=en#PPP1,M1. Accessed April 2008.
Chaudhry, N, Riaz, M and Ahmad, G. 2006. Comparison of some advanced lines of Sorghumbicolor L. Monech for green fodder/dry matter yields and morpho-economic parameters. J. Agric. Res., 2006, 44(3).
Cleemput, S, Muys, B, Kleinn, C, Janssens, M. n/y. Biomass estimation techniques for enclosures in a semi- arid area: a case study in Northern Ethiopia.
http://www.tropentag.de/2004/abstracts/full/3.pdf. Accessed April, 2008. Compete. 2008. Competence Platform on Energy Crop and Agroforestry Systems for Arid and Semi-arid Ecosystems – Africa. http://www.compete-
bioafrica.net/index.html. Eriksen, S, Watson, H and Woods, J. 2004. The Sustainable Use of Southern Africa’s
Savanna Resources: Evaluating Resources and Options for Development. Southern African Savanna Network (SASN).
E4Tech. 2006. Brazil:UK:Africa Partnership on Bioethanol. Scoping study. Full report for DTI BERRA. http://www.berr.gov.uk/dius/science/int/page34980.html
FAO. 2001. Conservation agriculture Case studies in Latin America and Africa. http://www.fao.org/docrep/003/Y1730E/y1730e00.HTM. Accessed April 2008.
FAOSTAT, 2008. Resources and production statistics for selected countires.
http://faostat.fao.org/default.aspx. Accessed April 2008. Griffee P. , Diemer P. and Chinchilla C. 2004. Smallholder Oil Palm Manual. FAO.
http://ecoport.org/ep?SearchType=earticleView&earticleId=180&page=-2 . Accessed April 2008.
Johnson, F and Matsika, E. Bio-energy trade and regional development: the case of bio-ethanol in southern Africa. Energy for Sustainable Development � Volume X No. 1 � March 2006.
Jumbe, Ch. and Msiska, F. 2007. Report on International and Regional Policies and Biofuels Sector Development in Sub-Saharan Africa. ANNEX 6-2: Report on Regional Policies and Strategies. Food Agriculture and Natural Resources Policy Analysis Network (FANRPAN). COMPETE. Germany,
Karekezi, S, Kithyoma, W. and Oruta, A. 2008. Scaling up Bio-energy in Africa. Afrepren. Background paper for the International Conference on Scaling-Up Renewables in Africa. UNIDO. Dakar April 2008.
Kinuthia, J. 1996. Global Warming and Climate Impacts in Southern Africa: How Might Things Change?. 2008. Internet Journal of African Studies. http://www.ccb.ucar.edu/ijas/ijasno2/kinuthia.html. Accessed April 2008.
REN21 Renewables 2007 Global Status Report, www.ren21.net SADC, 2008. Mozambique country review. http://www.sadcreview.com/country_profiles/mozambique/moz_agriculture.htm. Accessed
April 2008. Smeets, E., Faaij, A.P.C., and Lewandowski, I., 2004. A Quickscan of Global Bio-energy
Potentials to 2050. Bottom-Up Scenario Analysis of Regional Biomass Production and
Export Potentials, Fair Biotrade Project, Utrecht University. Thomas, V, and Kwong, A. 2001. Ethanol as a lead replacement: phasing out leaded
gasoline in Africa. Energy Policy Volume 29, Issue 13, November 2001, Pages 1133-1143

ERA-ARD, SROs, FARA Africa
116
Tonukari, N. 2004. Cassava and the future of starch. Electron. J. Biotechnol. [online]. abr. 2004, vol.7, no.1 [citado 25 Abril 2008], p.5-8. Disponible en la World Wide Web: <http://www.scielo.cl/scielo.php?script=sci_arttext&pid=S0717-34582004000100003&lng=es&nrm=iso>. ISSN 0717-3458. Accessed April 2008.
UEMOA, 2006. Document de Vision et de Stratégie Régionale de Valorisation Énergétique de la Biomasse pour un Développement Durable. Union Economique et Monetaire Ouest Africaine http://www.uemoa.int/PRBE/fiches/Vision%20et%20strategies.pdf. Accessed April 2008.
USDA. 2002. Production Estimates and Crop Assessment Division Foreign Agricultural Service. Favourable Palm Oil Production for Cote d’Ivoire. http://151.121.3.140/pecad2/highlights/2002/09/cote_divoire/index.htm. Accessed April 2008.
Watson, H. 2007. WP1:Current Land Use Patterns & Impacts. Kwazulu Natal University. Presentation at COMPETE meeting in Ougadougou, Burkina Faso.
Watson, H. 2008. WP1 First year report. COMPETE . Competence Platform on Energy Crop and Agroforestry Systems for Arid and Semi-arid Ecosystems – Africa. Kwazulu Natal University.
World Rainforest Movement 2001. The Bitter Fruit of Oil Palm: Dispossession and Deforestation.

ERA-ARD, SROs, FARA Africa
117
14. ANNEXES
Annex 1.
Regional Programmes related to biofuels .
Region Regional Policy
Document
Year Objectives
Strategies on
Renewable Energy
Strategies on
Biofuels
Implementation
Framework
ECOWAS(West Africa)
White Paper for a Regional Policy in West Africa
2006 Increase access to domestic cooking fuels for rural and peri urban populations of the region. Increase access to production energy services in villages, particularly motive power for productivity and improved community services. Increase access to electricity services
Actions: 1. Build capacities of public and private actors. 2. Help mobilise soft loans and funds from the private sector for projects to extend energy services to rural & peri urban areas. 3. Sharing promoting and disseminating sub-regional experiences relating to the supply of energy services. 4. Promotion of local production of energy goods and services.
Establish a regional Biofuels Centre of excellence to serve as a research hub for the region
Managing the energy and regional development information system • Helping Member States set up systems for assessing the impact of policies and programmes. • Holding regional workshops, training sessions and discussions on sustainable energy policies that will bring energy supplies to the poor. • Helping Member States to raise funds through project development and donor conferences. • Establish and manage an innovation fund to encourage innovation.
SADC SADC Protocol on Energy
It has six objectives amongst which are: To co-operate in the development and utilisation of energy in the Region in the following sub-sectors: coal, new and renewable energy sources, energy efficiency and conservation, and other cross-cutting themes of interest to member states. To co-operate in the research, development, adaptation, dissemination and transfer of low-cost energy technologies.
None besides mention of renewable energy in the major objectives.
None N/A
East African
East African Community
Oct 2006
No specific regional energy policy

ERA-ARD, SROs, FARA Africa
118
Community
Treaty objectives; energy priorities such as: the EAC partner states shall in particular promote within the Community all measures to supply affordable energy to their people taking cognizance of the protection of the environment as provided for by this Treaty
The African Union
Addis Ababa Declaration on Sustainable Biofuels Development in Africa
August 2007
Providing recommendations for the Biofuels development in Africa in view of the rising and volatile oil prices, and the need to stimulate growth and rural development, amongst others.
None The Declaration makes 12 recommendations for biofuels development which include: developing and enabling policy and regulatory frameworks for the biofuels development as a matter of priority taking into account the following aspects: link to overall sustainable development policies, promote equality including gender equality, ensure participation of all stakeholders, promote local consumption, and enhance energy security.
None
COMESA Region
e-COMESA newsletter
July 2007
Regional integration through trade and investments.
Africa has a comparative advantage in growing crops that can easily be transformed into biofuels and the technology used is relatively simple. Africa is to use this opportunity to lift its populations out of poverty.
If Africa is to take advantage of the increase in demand for biofuels: (i) it will need to signif. increase the land under sugar cane; assessment needed on land availability, both in terms of switching to sugar cane and new land. (ii) assess what investments will need to be made in sugar cane processing mills and work with the private sector to ensure these investments are realised.
AfDB to assist Africa in taking advantage of the Biofuels industry by establishing strong research capacities and working with Regional Organizations such as COMESA
Biomass Energy Conservation (PROBE
SADC countries, specially Lesotho, Malawi, Mozambique, Namibia, South
2004 Support social and environmentally sustainable production of biofuels in the
• To improve access to improved wood fuels stoves for households, institutions and productive sectors

ERA-ARD, SROs, FARA Africa
119
C) Africa, Tanzania, Zambia and Zimbabwe
SADC region.
• Sustainability criteria for biofuels
• Socio-economic aspects of biofuels
Build ProBEC, SADC Secretariat and other partner knowledge
Source: Modified from Jumbe and Msiska, 2007.

ERA-ARD, SROs, FARA Africa
120
Annex 2. Case study Ghana
The case of Ghana was included due to the biofuels activitethat the country has been experiencing in the last five years. It does not cover all the information as the other case studies and focuses only on the policy analysis and the stakeholder mapping. National Ministries/Secretariats involved in the bioenergy planning/applications
Ministry of Energy
Due to increasing foreign exchange deficit and the domestic demand for diesel consumption in transport sector, many African nations have recognised the potential positive contribution of biofuels for its domestic diesel supply as liquid fuel also for electricity supply. However it has recently realised that biofuels can be a highly sensitive subject in most of African countries where agriculture is its major industry. In particular, when it comes to land planning and rural livelihood, many governments understood that they should adopt a highly careful approach. Nonetheless, renewable energy is gaining more and more attention globally and it is widely seen that the biofuels can be one of the ways of diversifying energy supply, in particular, fuels sector, whose demand is consistently growing. It still faces several challenges such as financial issues and technical inefficiency, they can be solved with an appropriate stakeholder consultation and polished policy push up. Ministry of Energy is planning to offer a series of advantages to renewable energy project developers such as subsidies, loan and a removal of delivery barrier. Furthermore it is addressed by the Ministry of Energy that to create a domestic market and a mandatory target have to be prioritised for supporting the renewable energy projects. Energy Commission (EC)
The role of the Energy Commission is to assist the Ministry of Energy in developing legislation based on stakeholder consultation by providing below
1. Policy recommendations 2. Develop regulations 3. Develop standards in collaboration with GSB 4. Carry on a pilot farm 5. Compile and stall the database 6. Monitor operation
The Energy Commission has been actively involved in creating biofuels legislation from the publication of Strategic National Energy Plan to the most recently established final draft for renewable energy, that is currently under the EC’s revision and stakeholder consultation before it is passed onto the parliament. EC argues that the biofuels industry in Ghana is now on initial stage emerging quickly, therefore, it needs certain form of regulations in order to prevent abuse of monopoly, or domination of foreign capital. Energy Commission can provide those services and help the industry to grow in a more structured and organised way, and increase the potential, which make the EC to be most intimately interacting with biofuel project developers or investors. Ministry of Food and Agriculture (MoFA)
MoFA primarily aims to create an environment for sustainable growth and development in agriculture sector. Its major considerations are provision of food security, supply of raw

ERA-ARD, SROs, FARA Africa
121
materials for industry, creation of agricultural employment and an establishment of wealth based on agricultural activity. Therefore, biofuel projects which involves a large size of land and plantation, is certainly of MoFA’s interests. The current position of the Ministry for biofuels project has turned rather cautious, but still hopeful. The ministry has made several points clear. Specifically :
• Appropriate local community consultation and comprehensible land planning in order not to undermine, rural livelihood for traditional cash crop such as shea nut tree, cashu and dawadawa,
• a partial loss of productive land social incentives(travel cost due to the size of the farm),
• clear written agreement on social responsibility and improvement in rural employment, and
• sufficient information on and required training To summarise, the MoFA is keen on making progress with biofuels project, ensuring marginal land utilisation and an increase in women employment. The Ministry intends to involve more local people for these projects, also raise the ownership and awareness amongst them. That would be the way which benefit both the investors and the local people, and integrate them so that they can increase the labour efficiency and motivation. Council of Scientific and Industrial Research (CSIR)
The CSIR is a research institute under the Government. As biofuel projects have already grown quite fast, the CSIR would like to set off the scientific and technical research collaboration with other policy researchers in order to verify the suitability of biofuel production from Jatropha and other biofuel crops on Ghanaian soil, mostly for yield, high oil contents and water draught figure of the crops. Furthermore, the CSIR would like to propose the certification scheme for the biofuel that will enable the domestically produced biofuel to meet the foreign markets quality requirements. Currently there is no ongoing collaborations reported. The role of collaboration between the industry and the research institute for further R&D activities is likely to be significant for future development. Ghana Standard Boards (GSB)
GSB is a national statutory body responsible for the development promulgation of Ghana standards, as a member of the African Regional Organisation for Standardisation(ARSO), and the International Organisation for Standardisation. The current biofuels certification has primarily referred to ISO. The standards set for biodiesel specify the quality requirements and test methods for marketed and delivered biodiesel to be used either as automotive fuel for diesel engines at 100 per cent concentration, or biodiesel (B100) Grades S15 and S100 to be used as a blend component with middle distillate fuels. The company has to submit the sample of seeds and oil, get them tested, inspected. As the standards are only to verify the technical and scientific features, GSB conducts various lab experiments with the supplied oil. It also involves the visit to the plant and refinery facility. When the fuel passes all quality tests, certification is issued to the biofuel supplier to be able to be a legitimate supplier within the country. Furthermore, GSB is likely to be responsible for introducing Sustainability criteria if it happens. Ghana Investment Promotion Centre (GIPC)
The GIPA is responsible for investments in all sectors of the economy. Any foreign companies, wanting to initiate a business in Ghana, have to be registered at the GIPC. Once registration is completed, the GIPC provides a series of services such as tax incentives in a form of corporate tax rebates or tax exemptions if applicable. GIPC also assists foreign companies to ensure the transfer of dividends and bilateral investment treaties. Agro-processing from crops such as Cotton, Sorghum, Soya beans, Oil Palms, have already been identified as key investment opportunities. Even though biofuels itself has not been

ERA-ARD, SROs, FARA Africa
122
strongly promoted by GIPC, the interests from foreign investment are increasingly growing for the recent years. Environmental Protection Agency (EPA)
EPA is a public body for protecting and improving the environment in Ghana. It seeks to ensure environmentally sound and efficient use of both renewable and non-renewable resources in the process of national development. EPA is also responsible for implementing environmental policy and planning consistent with the country’s desire for effective, long-term maintenance of environmental quality. EPA has an authority at the competent regional level. As discussed earlier, EPA plays a very important role in developing biofuel projects, as any biofuel project developer with farms above 10 hectares is mandated to submit EIA in prior to the commencement of development to obtain certification from EPA. EMP (Envioronmental Management Plan), which can actually bring in the practical mitigation actions, should also be included in EIA. EPA also expects a periodic report by a project developer about any operations and activities concerning environmental sustainability and local livelihood. The whole procedure should be documentised for the further monitoring, and the project should be willingfully in compliance with the any legal requirements. The EPA believes that the EIA should not just remain as a requirement for a permit, but that it should go beyond paper works. EPA can be the most important agency for success of the project. Forest Commission (FC)
Timber is one of the major export products for many African countries. The FC is competent for managing and developing forest in Ghana, also utilising and regulating the forest resources. The FC recently has recently revealed a large potential for carbon credits opportunities in association with this reforestation programme. Currently, the FC only promotes forest trees such as cassia, senna simea; that is because these trees can be utilised by the local community for the cooking also timber sale, whilst they also can be exported to the international market at high price. Biofuels tress such as Jatropha, which is labelled as an agricultural tree, therefore, cannot be planted for reforestation programme and carbon credits in Ghana. However, recent research has been unveiling that Jatropha can grow up to 5 metre, also highly dry climate resistant. FC would be keen to conduct experiment and do more research to find out if Jatropha curcas L. can be as effective as other forest trees for carbon sinks. Land Commission (LC) The procedure of obtaining the land ownership in developing countries requires a more systematic approach as the buyer has to contend with both the traditional rules governed by the chief and the modern government institutions. It may vary depending on the regions. Generally speaking, however, chiefs have the legal authority to place commercial value, and to plan change in the terms and conditions of contract for the land. Once the deal is closed with the chief and the fee is paid, the land should be registered at the Land Commission. The buyers are given 99-year leases in conformity with the constitution of Ghana. Regional and Local authorities involved in bio-energy plans, programmes, projects
Local farmers (out-growers) Farmers and local communities appear to be very enthusiastic about the unprecedented increasing attention paid to them and the potential of new income source. Yet, at the same time, farmers and project developers claim that the promised benefits such as local

ERA-ARD, SROs, FARA Africa
123
employment, improving infrastructure and electricity generator installation have not been fully addressed yet. Several reasons have been identified here. For instance, the plantation management and generator installed tend to be a very slow process, as it is highly capital intensive. Quite often, local farmers are unable to deal with the investors or project managers directly, and there are always middle-men taking charge of the commission. Nonetheless, most of the local communities agreed that biofuel projects are highly welcome in rural area for encouraging the economic activities of rural area, even as a secondary income source. Farmers are keen to utilise marginal land for large scale plantation, as it provides them with stable employment and necessary farm equipments. At the same time they still have their small household scale farm for maize or peanuts, which is manageable in their spare time or at the weekend. It can be concluded that a systematic short/long term plan with a comprehensible sustainable land management. Also it is crucial to build up a cordial relationship with the community Women Group Women group in the local area can play a significant role with some educational and technical supports from NGOs or international organisations. As they have a strong bondage for years, the group is willing to collaborate and enjoy the benefits collectively. For instance seeds could be planted and harvested individually, and the milling machinery is used collectively. The oil is either used in the community for soap making, or sold at the market. The oil cake was utilised fertiliser and insecticides. The some portion of benefits could be used for communal purposes such as funeral and supporting school fee for a poor household. Chief of the community International organisations and NGOs involved
UNDP As the UN supports systematic bioenergy development and renewable energy promotion in developing countries, the UNDP has recently created Energy, Environment and Sustainable Rural Livelihood division, that is designed to be providing necessary assistance with the EC and the MoE of the national government. It aims to play an important role as a bridge between the government and the local community and the investors, facilitating the opinions of each stakeholders, and harmonise them, so that eventually to ensure that farmers work individually but also be engaged in the project communally, enjoy benefits collectively. GEF(Global Environmental Funds) GEF is sub organisation of UNDP. GEF, in its principles, is created to support a project conducted by NGOs, fallen under 4 themes; biodiversity, climate change, sustainable land management, organic products. GEF has a timeframe for each project and only provides initial investment such as funds, training, expertise to help the project settle in and the community to manage it by itself. After that, usually in the first 2 -3 years, GEF projects network can provide further technical assistance or intervened when necessary. The provided funds are not paid back, all given as a form of grants. In biofuel projects contexts, the GEF’s operations are mainly in association with NGOs’ rural sustainability project and the local women group for providing technical trainings with the farmers and scaling up the out growers scheme.

ERA-ARD, SROs, FARA Africa
124
Foreign government funded project Ohayo project funded by Japanese government (ongoing project in Ghana) Energy Foundation EU funded Jatropha project development (ongoing project in Ghana) KITE EU funded research on biofuel via phone interview (ongoing project in Ghana) Other stakeholders identified
Petroleum Industry (Domestic petroleum distributor) Whilst to establish the legal justice for biofuels projects and to construct a domestic oil infrastructure, such as refinery and bulk storage facilities are discussed as a national strategy, the supply and distribution of the crude oil products such as diesel, gasoline and aviation fuel are left for private petroleum industry’s realm for business. Despite a certain challenges such as a lack of infrastructure and a low awareness for bioenergy, the petroleum industry perceives that biofuels blending is strategically required to strengthen energy security. Therefore, the petroleum industry would be keen to engage in the development of the bioenergy projects and construction for biodiesel storage facility in Ghana, also to provide a financial back up to certain extent as a form of investment. Local vegetable oil milling plants Particular agricultural projects such as Palm oil involves development of local vegetable oil milling plants, as vegetable oil and the press cake are quite attractive market products in many developing countries. Due to a lack of technical advance and high costs for chemicals requirement, traditional mechanical expelling, which presents 27-30% oil extraction rate, is widely deployed in Africa, rather than solvent method. It is a small industry but can be fully utilised at local level, returning the profits straight back to the community.

ERA-ARD, SROs, FARA Africa
125
Mapping of stakeholders and institutions
Energy
Foundation
GSBMoE
MoFA
Domestic petroleum
products distributor
Local farmersLocal
milling
plants
FC
LC
CSIR
EPA
EC
GEF
Legislative body
IndustryNGOs
Executive body
Women
groupOut growers
GIPC
• MoE : Ministry of Energy • MoFA : Ministry of Food and Agriculture • GSB : Ghana Standards Board • EC : Energy Commission • FC : Forest Commission • LC : Land Commission • GIPC : Ghana Investment Promotion Centre • CSIR : Council for Scientific and Industrial Research • EPA : Environmental Protection Agency • UNDP : United National Development Programme • GEF : Global Environmental Funds

RReeggiioonnaall EEvviiddeennccee oonn tthhee IImmppaacctt ooff BBiiooffuueell DDeevveellooppmmeenntt oonn WWeellffaarree ooff
SSmmaallllhhoollddeerr FFaarrmmeerrss
TThhee CCaassee ooff SSeelleecctteedd AAssiiaann CCoouunnttrriieess
Rodrigo B. Badayos, Vijay K. Gour, Moises A. Dorado, and Nerlita M. Manalili
a study commissioned by
Asia-Pacific Association of Agricultural Research
Institutions (APAARI), Bangkok, Thailand
under the
Southern Advisory Group

i
TABLE OF CONTENTS
List of Tables ................................................................................................. iii List of Figures ................................................................................................ iv Study Team ................................................................................................... v Abstract ......................................................................................................... vi I. Introduction ........................................................................................ 1 A. The Global Energy Development Scenario ................................. 1 World Energy Demand .......................................................... 2 World Demand for Biofuels ................................................... 2 B. The Asian Regional Energy Scenario ................................... 2 Regional Energy Demand ..................................................... 2 Biofuels in Asia ..................................................................... 3 II. Evidence Generation ........................................................................ 4 A. China Situation ..................................................................... 4 The cassava growers in Guangxi Province ........................ 5 Will cassava production in Guangxi remain
robust for ethanol? ................................................... 6 The cassava based ethanol and starch industry
as market outlet. ...................................................... 8 Summary of the state of biofuel development in China .................................................................... 8
B. Vietnam Situation ................................................................ 9 The small farmers ............................................................... 10 The present agricultural scene ........................................... 10 Biofuels prospect ................................................................ 11
Summary of the state of biofuel development in Vietnam .................................................................... 12
C. Thailand Situation .............................................................. 13 The cassava and sugarcane community in Thailand ....... 15 Community Participation in Thai Biofuel Program ........... 15 The Industry Participation in Biofuel Program .................. 16
Summary of the state of biofuel development in Thailand .................................................................... 17

ii
D. Philippines Situation ......................................................... 17 A typical sugarcane farmer in Negros, Philippines ......... 20 The first sugarcane based ethanol plant in the country ... 21 Reviving a Dying Sugar Cane Industry
(The Firm’s Innovation) ...................................... 22 The Farmer’s response ................................................... 22
Summary of the state of biofuel development in the Philippines ................................................. 23 III. Policy and Institutional Mapping .................................................. 24 A. China ............................................................................... 24 B. Philippines ....................................................................... 25 C. India ................................................................................. 26 D. Thailand ........................................................................... 27 E. Vietnam ........................................................................... 28 IV. Implication to the Region ............................................................ 29 V. Concluding Remarks .................................................................. 30 Evidences of food-to-biofuel conversion ........................ 30 VI. Areas for further research and development initiatives
or follow up activities .................................................................. 31
References ............................................................................................ 32

iii
LIST OF TABLES
Table 1. Net inter-regional oil trade in the Reference Scenario. ........................... 3 Table 2. Cost of different feedstocks for bioethanol production in China. ........... 5 Table 3. Biofuel policy of China at the National and Local Level. ........................ 6 Table 4. Biofuel and related programs in Guangxi Province. ............................... 7 Table 5. Programs supporting the National Biofuel Policy of Vietnam. ................ 11 Table 6. Status of biofuel industry in Vietnam. ...................................................... 12 Table 7. Production and import of crude oil in the country. .................................. 13 Table 8. Annual land expansion/conversion (ha) in Thailand for biofuel. ............. 14 Table 9. Status of biofuel industry in the Thailand. ............................................... 14

iv
LIST OF FIGURES
Figure 1. World primary energy demand in the reference scenario. ................. 1 Figure 2. Incremental primary energy demand by fuel and region in
the Reference Scenario, 2007-2030. .................................................. 2
Figure 3. Share of bioethanol production, 2005 (total production 37Mt). .......... 4 Figure 4. Reuters-CRB Energy and FAO Food Price Indices. ........................... 4 Figure 5. Summary of the state of biofuel development in China
in terms of issues, policies, emerging patters and impacts/future implications. ................................................................ 9
Figure 6. Summary of the state of biofuel development in Vietnam in terms of issues, policies, emerging patters and impacts/future implications. ................................................................ 13
Figure 7. Summary of the state of biofuel development in Thailand in terms of issues, policies, emerging patters and impacts/future implications. ................................................................ 17
Figure 8. Summary of the state of biofuel development in the Philippines in terms of issues, policies, emerging patters and impacts/future implications. ................................................................ 23
Figure 9. Policy and institutional map of food and bioenergy
interphase for China. .......................................................................... 24
Figure 10. Policy and institutional map of food and bioenergy interphase for Philippines. .................................................................. 25
Figure 11. Policy and institutional map of food and bioenergy interphase for India. ........................................................................... 26
Figure 12. Policy and institutional map of food and bioenergy interphase for Thailand. ................................................................... 27
Figure 13. Policy and institutional map of food and bioenergy
interphase for Vietnam. ................................................................... 28

v
Study Team Name Designation Office Study Area
Dr. Raj Paroda Regional Coordinator
Executive Secretary, APAARI
East, South & Southeast Asia
Dr. Rodrigo Badayos Regional Study Leader
Director, Farming Systems Cluster, University of the Philippines at Los Banos
East Asia: (Guangxi, China) Southeast Asia: (Negros and Gen Santos, Philippines; Khon Kaen Thailand & Ho Chi Minh, Vietnam) South Asia: (India & Pakistan)
(East & Southeast Asia)
Prof Moises Dorado
Assistant Study leader & Study Team Member
Associate Professor, College of Engineering, University of the Philippines at Los Banos
Dr. Vijay Kumar Gour
Study Team Member
Associate Professor, Dept. of Plant Breeder & Genetics Jawaharlal Nehru Agricultural University, Jabalpur; M.P. India.
(South Asia)
Dr. Nerlie M. Manalili SAG Chair and Overall Study SAG Project Leader
Country Coordinators Dr. Tian Yinong Country Coordinator,
China Subtropical Crops Research Institute
Guangxi, China
Ms. Supranee Sritumboon
Country Coordinator, Thailand
PhD Student at UPLB
Khon Kaen University
Khon kaen Thailand
a) Dr. Nguyen Duy Duc b) Dr. Bui Van Nguyen
Country Coordinators, Vietnam
a) Director, Sub Institute of Agricultural Engineering and Post Harvest Technology (SIAEP)
b) Director, Min of Science & Technology (Most)
HCMC Vietnam

vi
Regional Evidence on the Impact of Biofuel Development on Welfare of Smallholder Farmers
The Case of Selected Asian Countries1
Rodrigo B. Badayos2, Vijay K. Gour3, Moises A. Dorado4, and Nerlita M. Manalili 5
Abstract
Evidences gathered from China, Philippines, Vietnam, Thailand and India showed that there is very minimal conversion of food to biofuel production areas. The current trend in fact, is strict protection of the food areas. Governments of the Asian Region, both developed and developing economies, have quickly responded to the energy challenge by formulating and putting in place bioenergy policies and programs that are not only focused on energy, but also protects the food areas.
China has an early record of food conversion to biofuel. However, the bad learning experience that caused price increase and shortage of grains, resulted into new government policies that now requires non-food feedstocks for biofuel, and the development of marginal lands that benefitted the marginal farmers. In the Philippines, the utilization of sugarcane for ethanol has given the sugarcane farmers better leverage on the scheduling of harvest, more market options and the possibility for a year round employment in the farm and in the factory. Vietnamese and Thai farmers that traditionally grow sugarcane and cassava, have now alternative market options. Biofuel program in both countries is giving farmers a better opportunity to maximize their potential income.
India remains non-committal to the proposed local blending of biofuel with gasoline. Sugarcane has been identified as potential feedstocks for ethanol, and Jatropha for biodiesel. Use of Jatropha for biodiesel is hindered by the following issues, namely: performance of commercial jatropha plantation, adequacy of supply, market demand and price.
_____________________________
1 Regional Paper presented as Asia component of the Southern Advisory Group (SAG) Study, on the occasion of the Bioenergy Event of the European Research Area- Agricultural Research for Development (ERA-ARD) in December 16th, 2009 at Brussels, Belgium. 2. SAG Study Leader for Asia and Director, Agricultural Systems Cluster of the College of Agriculture, University of the Philippines at Los Banos 3 SAG Study Team Member (South Asia) and Associate Professor, Department of Plant Breeder and Genetics, Jawaharlal Nehru Agriculture University, Jabalpur, M.P. India 4 SAG Study Team Member for Asia and Associate Professor of the College of Engineering and Agroindustrial Technology, University of the Philippines at Los Banos 5SAG Chair and Overall Study Coordinator; Regional Marketing Advisor of a number of regional value chain initiatives in Southeast Asia (i.e. those of AsiaDHRRA and UPWARD Program of the International Potato Center).

1
I. Introduction
Increasing interests on biofuel production are met with the usual contrasting views. On one hand are the negative social impacts that are anticipated due to the sudden and increasing demand of biofuel feedstocks from developed countries in line with food security, land rights, transparency and consultation, people’s livelihood, deforestation, indecent work conditions, lack of government stability and corruption. These negative impacts of biofuel production have been raised in the region during the Roundtable on Sustainable Biofuel held in Shanghai, China in November 2007 (UNEP,2007). Alongside these risks, however, are opportunities on biofuel programs in the areas of poverty alleviation, biodiversity offsets, adoption of consistent policies, implementation and better transparency, improve yields, preservation of biodiversity, value adding and market opportunities for rural areas as cited in the same forum.
Amidst these contrasting views, a lot of observers are more concerned on how the interests of the people in the small communities can be protected most especially the indigenous people who are oftentimes the ones caught at the middle of these controversies. It is alongside the same concern that the research project entitled “Regional Evidence Generation and Policy and Institutional Mapping on Food and Biofuel for the Africa, Asia and Latin American Region” was launched. The project aimed to provide specific insights on issues and concerns affecting farmers and their communities given varying biofuel initiatives in their respective regions. This rapid assessment type of study aimed to provide an understanding of the current initiatives on food and bioenergy in Africa, Asia and Latin America and their consequent effects on food availability and livelihood opportunities to small farmers with the end in view of identifying areas for action. This report covers the Asian part of the research project.
A. The Global Energy Development Scenario World Energy demand
Report from the World Energy Outlook 2009 projects that the world primary energy
demand will increase by 1.5% per year between 2007 and 2030 (Figure 1). In quantity, this Figure 1.
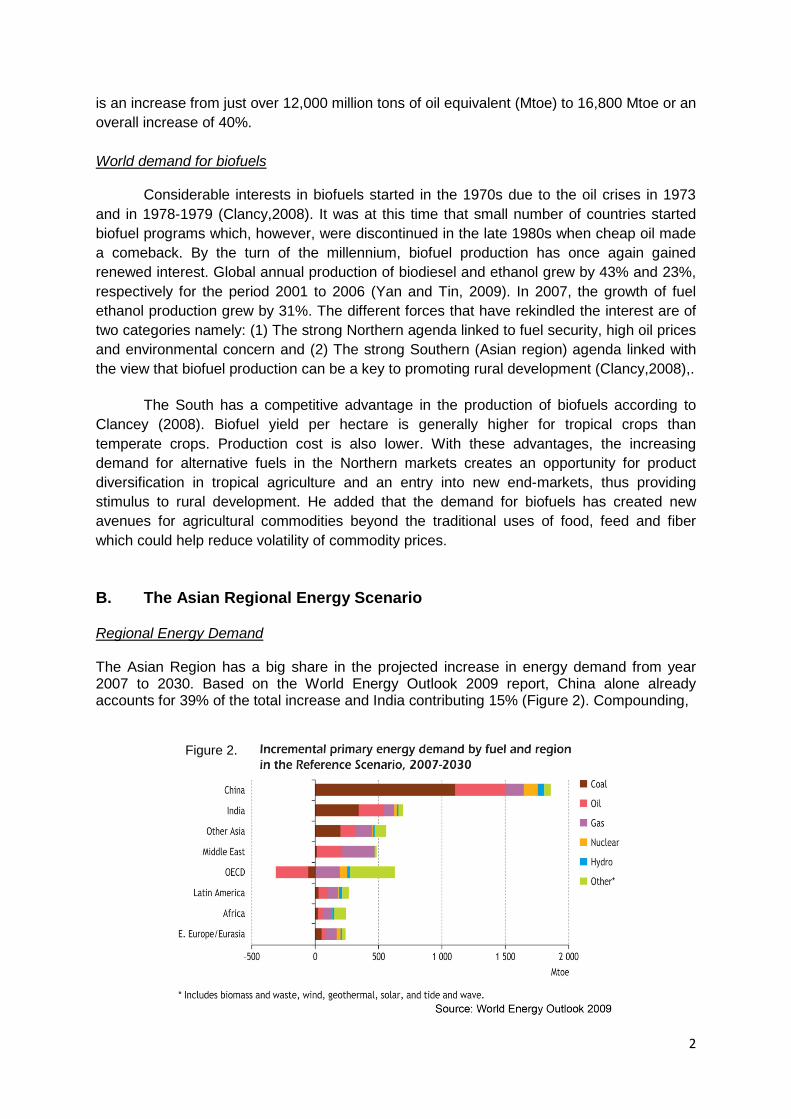
2
is an increase from just over 12,000 million tons of oil equivalent (Mtoe) to 16,800 Mtoe or an overall increase of 40%. World demand for biofuels
Considerable interests in biofuels started in the 1970s due to the oil crises in 1973 and in 1978-1979 (Clancy,2008). It was at this time that small number of countries started biofuel programs which, however, were discontinued in the late 1980s when cheap oil made a comeback. By the turn of the millennium, biofuel production has once again gained renewed interest. Global annual production of biodiesel and ethanol grew by 43% and 23%, respectively for the period 2001 to 2006 (Yan and Tin, 2009). In 2007, the growth of fuel ethanol production grew by 31%. The different forces that have rekindled the interest are of two categories namely: (1) The strong Northern agenda linked to fuel security, high oil prices and environmental concern and (2) The strong Southern (Asian region) agenda linked with the view that biofuel production can be a key to promoting rural development (Clancy,2008),.
The South has a competitive advantage in the production of biofuels according to Clancey (2008). Biofuel yield per hectare is generally higher for tropical crops than temperate crops. Production cost is also lower. With these advantages, the increasing demand for alternative fuels in the Northern markets creates an opportunity for product diversification in tropical agriculture and an entry into new end-markets, thus providing stimulus to rural development. He added that the demand for biofuels has created new avenues for agricultural commodities beyond the traditional uses of food, feed and fiber which could help reduce volatility of commodity prices.
B. The Asian Regional Energy Scenario Regional Energy Demand The Asian Region has a big share in the projected increase in energy demand from year 2007 to 2030. Based on the World Energy Outlook 2009 report, China alone already accounts for 39% of the total increase and India contributing 15% (Figure 2). Compounding, Figure 2.

3
the problem is the fact that China, India and most of Asia are importers of oil as shown in Table 1. Table 1. Biofuels in Asia
There has been a dramatic increase in biofuels production in Asian countries in recent years. The major reasons for the increase are the pursuit for energy security, economic development (particularly, improvement of trade balances and expansion of the agriculture sector), and poverty alleviation (Yan and Tin, 2009). Most of the countries also have biofuel strategies that are focused around their main agricultural products and new business opportunities.
The region now is in a complicated situation because of its increasing demand for fuel. Biofuel is an alternative source which the region has huge potential for tapping, Asia being a major agricultural producer. In fact in 2005, Asia has already contributed 15% of the world’s 37 Mtons production of bioethanol (Figure 3). And with fuel having a very attractive price index relative to food (Figure 4), the threat to of food to fuel conversion of farm areas can indeed be very real for the region.

4
Figure 3.
Figure 4.
II. Evidence Generation
A. China Situation
China has launched its bioethanol program in 2000 with the aim at increasing its transport fuel supply, mitigate the air pollution, develop rural economy and make full use of long stored grain (Song Yanqin 2007). The year 2000-2005 was a pilot period for China’s biofuel program. More than 80 percent of ethanol produced in China during this pilot phase were made from grains especially from corn. Since the start, biofuel producers in China enjoy favorable policies, including free income tax, VAT refund, and fiscal subsidy.

5
The initial move in China to convert surplus grains to biofuel had backfired raising the price of corn and threatened food security. Chinese government therefore prevented further expansion of grains utilization as feedstocks and advised local investors to consider instead non-food materials such sorghum, cassava, and sweet potato for ethanol (Liu and Cheng 2008). It was in 2005 when Chinese government regulated construction of additional ethanol plants relying on food grains for ethanol feedstocks. Instead, plants processing non-food crops were encouraged. Major feedstock being used in China including relative cost is shown below in Table 2.
Table 2. Cost of different feedstocks for bioethanol production in China. Feestock Unit Price Usage of feedstock (ton
of feedstock/ton of biofuel)
Feedstock cost (US$ per ton of biofuel)
Cassava fresh root 66.2 7 463.7 Cassava dried chips 183.8 2.8 514.6 Sugarcane 55.9 16 894.4 Mollases 132.4 5 662 Maize 225 3.2 720 Wheat 241 3.28 791.1 Potato 117.6 9 1058.4 Sweet potato 70.6 8.7 614.2
Source: Based on actual survey in 2008.
China aimed to produce by 2010 a total of 3 Mt/year of ethanol with 1 Mt/year coming
from grain, 1 Mt/year from cassava, 0.5 Mt/year from sweet sorghum, and another 0.5 Mt/year from sweet potato (Table 3). It also plan to produce 200,000 t/year of biodiesel. E10 is expected to be available to more provinces in China by 2010, this is in addition to the original 5 provinces (Helongjiang, Jilin, Liaoning, Henan, Anhui, and 27 cities: 9 in Hubei, 7 in Shandong, 6 in Hebei, and 5 in Jiangsu) (Milbrandt and Overend 2008). Biodiesel development in China remains at small scale due to limited supply of feedstocks.
The cassava growers in Guangxi Province
Guangxi farmers of China operate based on the Family Production Responsibility System. The System gives individual households the agricultural production responsibility. Further, households have the option to lease additonal land from their collectives and use the farmland however they see fit. Technically, however, the land is still owned by a collective, such as a village.
Researchers from the Cassava Research Institute have identified cassava as the most realistic ethanol feedstock that can be grown productively in the Guangxi Province. It was based on the high tolerance of cassava to poor soil physical and chemical properties including limited rainfall. Researchers from the center likewise believed that even under marginal condition, with appropriate production technology, cassava can give Guanzi farmers an edge and a new opportunity to increase farm productivity. Indeed, improved technology resulting into high productivity, has encouraged more farmers into cassava production. Guangxi now accounts for 70 percent of China's annual cassava output of about nine million tons (Sanchez and Junyang 2008). Further, it is already home to many

6
producers of the cassava-ethanol for liquor and modified starch. One company, the Guangxi COFCO Bio-energy Co. Ltd operating in Guangxi now produces 200,000 tons of ethanol per day from cassava. More bioethanol plants to use cassava for feedstock will be locating in Guangxi. They will operate at Beihai, Wuzhou, Baise, and Nanning with a capacity of 200,000; 300,000; 200,000; and 300,000 tons of ethanol, respectively.
Table 3. Biofuel policy of China at the National and Local Level.
Source: National Development and Reform Commission of China. Will cassava production in Guangxi remain robust for ethanol?
Qingle Village of Guangxi Province consisted of 1,000 households and with 4, 000 full time farmers. Farms were generally rainfed and averaged about 2.5 hectares. Major cash crops included cassava and sugarcane, with a combine area of 14,000 hectares (10,000 for cassava and 4,000 for sugarcane). There were also patches of rice paddies and fruit orchards that can be seen along with the main crops. Cassava plantations were commonly intercropped with peanut or watermelon. In general, each household keeps a number of heads of pig, chicken and other animals. The main source of income of farmers in the more rugged terrain of the village was the growing of eucalyptus trees for wood chips.
Farmers in the village were generally in their late 30’s, married, with 1 to 2 kids. Each household owns a house, use motorcycle for transport, and have acquired appliances like TV, radio including refrigerators. Total household incomes were mostly spent in crop
Name of Policy Year Implementing Office/Agency
Major features Goals/Objectives
National Level National Biofuel Policy
2006 Department of Environment
Biofuel to account for 2%, 3% and 5% in 2010, 2015, and 2025, respectively. By 2025, ethanol will replace 20% of the gasoline consumed and that biodiesel will replace 20% of the diesel consumed. Policy focuses primarily on the use of palm oil to make biodiesel and secondarily of Jatropha-derived oil.
By 2010: - Job creation of 3.5 million - increasing income for on- and off-farm workers up to the regional minimum payment -development of biofuel plantations on 5.25 million has of unused land - 100% energy self-sufficient villages and 12 special biofuel zones - reducing fossil fuel use for transport by up to 10%
2006 National Development and Reform Commision
Non-food. Non competition for land use for food crops
By 2010: Total capacity of bio-ethanol is 2,000,000 tons per year
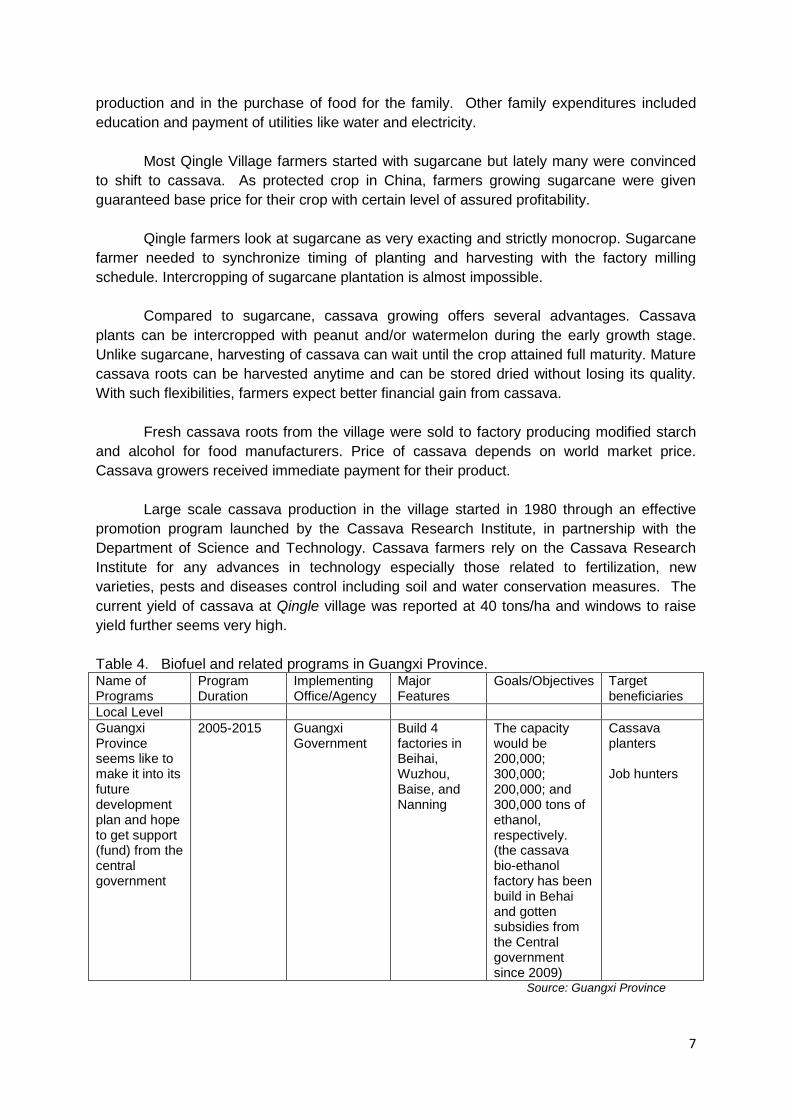
7
production and in the purchase of food for the family. Other family expenditures included education and payment of utilities like water and electricity.
Most Qingle Village farmers started with sugarcane but lately many were convinced to shift to cassava. As protected crop in China, farmers growing sugarcane were given guaranteed base price for their crop with certain level of assured profitability.
Qingle farmers look at sugarcane as very exacting and strictly monocrop. Sugarcane
farmer needed to synchronize timing of planting and harvesting with the factory milling schedule. Intercropping of sugarcane plantation is almost impossible.
Compared to sugarcane, cassava growing offers several advantages. Cassava plants can be intercropped with peanut and/or watermelon during the early growth stage. Unlike sugarcane, harvesting of cassava can wait until the crop attained full maturity. Mature cassava roots can be harvested anytime and can be stored dried without losing its quality. With such flexibilities, farmers expect better financial gain from cassava.
Fresh cassava roots from the village were sold to factory producing modified starch and alcohol for food manufacturers. Price of cassava depends on world market price. Cassava growers received immediate payment for their product.
Large scale cassava production in the village started in 1980 through an effective promotion program launched by the Cassava Research Institute, in partnership with the Department of Science and Technology. Cassava farmers rely on the Cassava Research Institute for any advances in technology especially those related to fertilization, new varieties, pests and diseases control including soil and water conservation measures. The current yield of cassava at Qingle village was reported at 40 tons/ha and windows to raise yield further seems very high.
Table 4. Biofuel and related programs in Guangxi Province. Name of Programs
Program Duration
Implementing Office/Agency
Major Features
Goals/Objectives Target beneficiaries
Local Level Guangxi Province seems like to make it into its future development plan and hope to get support (fund) from the central government
2005-2015 Guangxi Government
Build 4 factories in Beihai, Wuzhou, Baise, and Nanning
The capacity would be 200,000; 300,000; 200,000; and 300,000 tons of ethanol, respectively. (the cassava bio-ethanol factory has been build in Behai and gotten subsidies from the Central government since 2009)
Cassava planters Job hunters
Source: Guangxi Province

8
With several years of profitability, cassava farmers at Qingle Village can now afford
to buy hand tractor, essential equipment to a number of farm operations. Culture of cassava nowadays already included land terracing and mulching using plastic sheets to prevent soil erosion. Plastic sheets for mulching were also being replaced by cassava wood chips as more farmers can already afford to buy wood chipper. Cassava wood chips give added benefit by cycling back nutrients to soil as wood chips ultimately decompose.
The cassava based ethanol and starch industry as market outlet
Anning Starch Co. Ltd who buys cassava produced from Qingle village, process cassava chips for modified starch and alcohol for beverages. The company competes with other similar factories for cassava chips. Farmers were not in contract with anyone. To capture the local supply of cassava, factory owner must provide incentives to cassava growers like offering competitive price and participating actively in technology promotion. Distance and buying price, remain as key determinants to the disposal of cassava chips by farmers.
The volume of fresh cassava chips produced at Qingle village was only enough for 4 months out of 12 months requirements of Anning Starch Co. Ltd. The company would normally import dried cassava chips from Thailand, Indonesia, Laos and Cambodia to fill up its year round processing requirement (Sanchez and Junyang 2008).
Farmers, in general, are not in anyway party as to whatever becomes the end product of their crops. Farmers’ primary concern was to maximize income.
Guangxi Zhuang Autonomous Region has been transformed from a traditional into a
modern agricultural area. Shifting of planting food crops like rice and corn into planting industrial crops like sugarcane, cassava and other high value crops like fruits has dominated the area. The early inclusion of sugarcane growing in the region was triggered by trade liberation which raises the local price of sugar and gives sugarcane growers better income. Recent development shows that Guangxi farmers have been expanding and even converting sugarcane areas for cassava growing. This happened after the Chinese government encouraged use of non-grain crops like cassava for ethanol production. The government of China has been encouraging changes in farming system to help farmers in different situations become more productive and profitable in agribusiness.
Summary of the state of biofuel development in China
Figure 5 shows the summary of the result of the study in China showing the state of biofuel development in country in terms of issues, policies, emerging patters and impacts/future implications.

9
Figure 5. Summary of the state of biofuel development in China in terms of issues,
policies, emerging patters and impacts/future implications.
B. Vietnam Situation
Biofuels program implementation in Vietnam is in its early stage. Though Vietnam
has been producing cassava chips for quite sometime now, those chips were mainly used for ethyl alcohol production sold for alcoholic beverage and for pharmaceutical industries. In order to accommodate biofuel production, Vietnamese government planned to expand production area of cassava and sugarcane to cover requirements for feedstock for ethanol, and encouraged jatropha seed production for biodiesel feedstock. The Vietnamese government intends to utilize idle and marginal areas for such expansion plan. Their strategy was to create favorable conditions for the development and promotion of investments on biofuels through tax incentives and low-interest loans. Research and development priorities in Vietnam were now focus on increasing crop productivity and development of advanced biofuel conversion technologies.
Unlike China, there was no reported food crop conversion to biofuel in Vietnam. Vietnam is currently exporting cassava for animal feed and/or modified starch and alcohol. Locally, Vietnam produces modified starch and alcohol from cassava for food to supply domestic demand.
The prevailing tenural system in Vietnam allows Vietnamese farmers to choose what crop to grow. Farmers were adequately trained to grow scientifically multiple types of crops.

10
Biofuel development for many farmers in Vietnam provided added market opportunity for their product.
The small farmers
Mrs. Toî lives just a few meters away from the Bourbon Sugar Refinery in Tay Ninh province of Vietnam. She is one of the more than 3,000 farmers that supply sugarcane to the refinery. Her five (5) hectare farm is supposed to be part of the 40,000 hectare sugarcane farms that were expected to sustain the daily production of 16,000 tons refined sugar of Bourbon. There are times however, when she has no available sugarcane to supply the company because she has opted to grow cassava instead.
The case of Mrs. Toî is just like many of the other farmers that are supplying sugarcane to Bourbon. Even with existing contracts, the farmers shift from growing sugarcane to cassava because other factories are offering higher prices for cassava. Since most of the farms are suitable for both sugarcane and cassava, and because the farmers have the necessary skills of growing both crops, they can easily grow sugarcane in one season then cassava the following season, whichever is more profitable for them.
The case of Mr. Thaňh and his relationship with the Bien Hoa Sugar Refinery, on the
other hand is different. He owns a one and a half hectare land which is used to be mainly planted to sugarcane. In the past, he supplies cane to the nearby Bien Hoa Sugar Refinery. He and the other farmers supplying sugarcane to the refinery receive 12 mil/ha support from the refinery. Lately however, even with this support, he has now stopped supplying sugarcane mainly because of the lack of farm labor in the area.
A larger part of his farm is now planted to cassava which he can grow more profitably even with less available farm labor. His cassava produce is being bought by middlemen for flour processing. He has also put up a coffee shop where he is now using his small sugarcane produce as sweetened drink.
Other small farmers are making similar adjustments like Mr. Thaňh, since sugarcane is becoming less profitable. From pure sugarcane production, they are growing other crops like cassava.
The present agricultural scene
Before the mid-1980s, Mrs. Toî and Mr. Thaňh could not have simply changed their crops from sugarcane to cassava or vice-versa. The setup of agriculture then was collectivism. But by mid-1980s, agriculture in Vietnam saw a significant transformation (Henin, 2002). With the framework set by the government for an economic and political reform program (Doi Moi or New Changes), markets were introduced into the national economy. This change in ideology, together with the recurring food shortages and building pressure from farming communities, led to a series of agrarian reforms that drastically changed the agriculture scene.

11
Resolution 10 of the politburo entitled “Renovation in Agricultural Management” issued in April 1988 recognized the existence of the household sector and affirmed its equality to the state and collective sectors in rural areas (Henin, 2002). Under this directive, full-scale family farming was promoted through the “Contract 10” (khoan moi) or “household contract”, which gave peasants complete “use rights” on farm lands and the freedom to enter into crop production contracts with cooperatives.
Furthermore, two decades of Doi Moi have given Vietnam one of the world’s most open economies. Bilateral trades with US alone has grown from almost nothing in 1994 to $10.6 billion in 2007 (Is Vietnam ...,2008). These changes have also led to the improvement in the life of the peasant farmers. Biofuels prospect
The relatively new biofuels program in Vietnam can be evaluated under such an atmosphere where the small farmers have more freedom to decide on what to do with their farm lands, and where the economy under Doi Moi is open to new investments from both local and international corporations.
The National Biofuel Policy of 2007 aims for a 0.4%, 1%, and 5% biofuel mixture by year 2010, 2015 and 2025, respectively. The major feedstocks targeted for the program are cassava, sugarcane and jatropha. The other major programs that will support the policy are presented below. Table 5. Programs supporting the National Biofuel Policy of Vietnam.
Program Duration Major Features Goals/Objectives National Sugarcane Program
2007 – 2025 Increased production; processing for ethanol and electricity
• 220,000 ha • 5 million tons of
sugar by 2010 • 44 factories with total
of 83,000 ton/day National Cassava Program 2000 – 2010 Increased production;
Increased export and ethanol production
• 500,000 ha (2010) • Up to 8 million ton
(2010) • export up by 50%
National Jatropha Program 2008 – 2025 Cultivate area; develop technology
• 500,000 ha by 2025
Source: MARD,2009 The Biofuel Fuel Policy is well supported by the various national programs on
sugarcane, cassava and jatropha. The largest expected expansion of cultivated land is for jatropha which at present is only about 100 ha but is targeted to be expanded to 500,000 ha by 2025 using non-agricultural lands (MARD,2009). Less expansion is expected for sugarcane which is already at 180,000 ha. Cassava at present already exceeds the target and is now at 560,000 ha.
Because of the open economy of Vietnam, several corporations have already shown interests and have initially engaged in the development of the biofuel industry. These corporations are presented below.

12
Table 6. Status of biofuel industry in Vietnam.
Corporation Output Raw Material Petro Vietnam Biofuel Company (PVB) of Phu Tho
• 100,000 m3/year of E100 (Dec 2010 operation)
• 200,000 m3/year E100 (second phase)
• cassava (7000 dry ton/day) and sugarcane
• total 35,000 ha cultivated area
Biofuel Corporation Quang Nam (Green Field Co.)
• 100,000 m3/year (under construction)
• cassava and sugarcane
Biofuel Company of Binh Phuoc
• 50,000 m3/year of E100 (2010 ground breaking)
• jatropha and cassava
Vietnam Petro Oil (PVO) Dung Quat Bio-ethanol factory
• 100,000 m3/year of E100 (2010)
• sugarcane and jatropha
Biogas Co. of Ty Ninh • 10,000 m3/day of biogas • 3,000 m3 wastewater/day Source: MIT, 2009
With the participation of five companies with an aggregate production of at least
350,000 m3/year of biofuel in the next two to five years, the biofuels program of Vietnam can be expected to move in a positive direction in regards to the issue on the supply of biofuel that will sustain the economic activities.
A major concern that may arise, as seen from the experiences of the two sugar refineries earlier presented, which can also be experienced by the biofuel companies, is the steady supply of feedstocks. Although a national policy is already in-place that will support the biofuels program, because of the freedom of the farmers to choose the crops they can grow (ease of entry and exit) and because of the suitability of the farm lands to sugarcane and cassava production, the biofuel companies may not be assured of the supply of feedstocks. The situation is definitely critical for the companies, but it is favorable for the small farmers because they can always choose to grow and sell their crops at the highest price. It is immaterial for the farmers whether they are growing the crops for food or fuel. In fact, because of the new market for their crops, wider opportunities are opened for them.
The biofuel industry of Vietnam is just starting. There is no evidence yet on food to fuel conversion of farm lands. The situations that have been presented show that prices between food and biofuel products derived from sugarcane and cassava will have the more power in influencing food to fuel conversion rather than the national program on biofuels. Summary of the state of biofuel development in Vietnam
Figure 6 shows the summary of the result of the study in Vietnam showing the state of biofuel development in country in terms of issues, policies, emerging patters and impacts/future implications.

13
Figure 6. Summary of the state of biofuel development in Vietnam in terms of issues,
policies, emerging patters and impacts/future implications. C. Thailand Situation
The year 2003 marks the beginning of biofuel ventures in Thailand, when Thai government formally promoted biofuel as an alternative energy source in the country (Surki et.al. 2007). This move was in recognition by the Thai government on their need to reduce oil imports and in the process reduce carbon emissions. Their plan was to replace fossil fuel use on vehicles and encourage the use of biofuel as replacement. Thai government believed that the implementation of Biofuel program will also support rural development.
Table 7. Production and import of crude oil in the country.
Year Produce Import Total
Consumption (Ton)
1997 1,363,808.84 36,190,023.13 38,111,959.18 1998 1,460,993.20 33,755,249.66 35,844,887.07 1999 1,688,733.33 34,707,080.27 36,845,434.01 2000 2,877,143.54 31,880,242.18 37,226,474.15 2001 3,074,640.82 33,544,493.20 37,543,502.72 2002 3,409,397.96 31,377,882.99 39,249,120.41
Source : http://www.eppo.go.th/vrs/VRS55-10-energy.html (Retrieved August 10, 2009)

14
Thailand is seriously pushing its biofuel program and has earmarked areas for
expansion in order to achieve its blending goal.
Table 8. Annual land expansion/conversion (ha) in Thailand for biofuel.
Year Landuse Type Biofuels Crop Jatropha Cassava Sugarcane Palm Oil
2006 Agricultural/Cultivated Area Grassland* Forest*
- 74,296.32 965,332.96 472,627.84
2007 Agricultural/Cultivated Area Grassland Forest
- 75,971.68 1,010,287.20 511,620
2008 Agricultural/Cultivated Area Grassland Forest
- 76,877.44 1,054,439.04 550,783.68
Source: http://www2.oae.go.th/pdffile/commodity.pdf (Retrieved August 10, 2009) * data unavailable
Ethanol production in Thailand has already reached 192.8 million liters in 2007
(Paritud 2008). Thai government encourages construction of additional ethanol plants to raise production capacity of 440 million liters per year. Table 9. Status of biofuel industry in the Thailand (Latest Update: June 2009).
No Corporation Site Capacity Main Feedstock Commencing
(l/d) Date
1 PawnWiLai Inter Group Trading Ayuddhya 25,000 Molasses Oct-03
2 Thai Agro Energy Suphanburi 150,000 Molasses Jan-05
3 Thai Alcohol NakornPathom 200,000 Molasses Aug-04
4 Khon Kaen Alcohol Khon Kaen 150,000 Molasses Jan-06
5 Thai Nguan Ethanol Khon Kaen 130,000 Fresh Cassava Aug-05
6 Thai Sugar Ethanol Kanchanaburi 100,000 Molasses Apr-07
7 KI Ethanol Nakorn Ratchsima 100,000 Molasses Jun-07
8 Petro Green (Kanlaseen) Kanlaseen 200,000 Molasses Jan-08
9 Petro Green (Chaiyapoom) Chaiyapoom 200,000 Molasses Dec-06
10 EkrathPathana Nakorn Swan 200,000 Molasses Mar-08
11 ThaiRungRueng Energy Saraburi 120,000 Molasses Mar-08
12 Ratchburi Ethanol Ratchburi 150,000 Cassava Jan-09
13 ES Power Sakaew 150,000 Molasses Jan-09
14 Maesawd Clean Energy Tak 200,000 Sugarcane Juice May-09
15 SupThip Lopburi 200,000 Cassava May-09
Total Production Capacity 2,275,000 Source: http://www.dede.go.th/dede/fileadmin/upload/pictures_eng/pdffile/Existing_Ethanol_Plant.xls (Retrieved August 10, 2009)
15
The cassava and sugarcane community in Thailand
Thai farmers were proficient in mixed farming. It was a proven strategy adopted in many parts of Thailand to minimize risk of total crop failure and for food security. A typical mixed farm in Khon Kaen, for example, would generally consists of a combination of cassava and/or sugarcane, paddy rice, fish pond and patches of bamboo for commercial bamboo shoots production, mango, and eucalyptus tree plantation for wood chips. Farmers were given proper training about the mixed farming technology. Farmers were technically prepared and have the capacity to attain high productivity as they practice the use of new technologies, and were totally aware of the price and market potential of their products.
The King has been instrumental in the promotion of mixed or integrated farming
system especially in poverty stricken areas of Thailand. Different mixed farming modules were product of long term research by concern agencies of Thailand. Sugarcane and cassava production were recommended in Khon Kaen farms as cash crops, given the sturdiness of both crops to survive in areas with poor soil and extended drought period. Rice growing, may not be highly suitable in many agricultural areas in Thailand, but it remains as popular component of mixed farming. Community Participation in Thai Biofuel Program
Ban Huai Kho, Nhong Vang Nangbao Sub-district, Phon District, Khon Kaen,
Thailand is a community of 225 households consisting of 1,122 people (566 male and 556 female). Farmers aged between 15 to 49 years old (58.65 %) were mostly graduates of elementary grade. A typical farm household owns a house and lot, and owns the land it tills as well. The community is easily accessible where vehicles can easily move in and out of the area at all times along well paved roads. School, health center, and Buddhist temple were available.
The land areas within the community were generally undulating. Soil is predominantly
sandy. Rice is a common crop produced by all households. Every household has a barn for rice storage. Farmers grow vegetable for family consumption.
The most dominant cash crops in the village were cassava and sugarcane. Prior to
the implementation of ethanol program, cassava harvest goes to starch factory. Lately, cassava chips produced in the village were sold to ethanol factory. The reported average yield for cassava in the village was 12.5 tons/ha while yield for sugarcane was 62.5 tons/ha. Price for fresh cassava chips was comparable when sold to either the ethanol plant (Thai Nguan Ethanol) or to plants producing modified starch. All of the sugarcane produced in the village was sold to sugar factories in Nakhonratchasima Province and in Khon Kaen Province.
The apparent farm problems in the village were insufficient rainfall, soil erosion and
low soil fertility. The village needed to be linked to an irrigation system like existing water reservoir and streams to supplement insufficient rainfall. Farmers solved soil fertility

16
problem with the use of farmyard manure. Ordinarily farmers would cover planted areas with mulch to prevent soil erosion.
Farmers in the village looked at the biofuel program launched by Thai government as
new market opportunity for their products. Farmers learned about the Thai government biofuel program from news aired either on TV and/or radio. They learned that cassava, sugarcane, jatropha, and palm oil can be used as feedstock for biofuel. While cassava and sugarcane were popular among farmers in the community considering the proven good performance of both crops to the soil condition of most farms in the village, they were not as enthusiastic about planting jatropha. They understand that Jatropha can only be used to produce biodiesel. Farmers will have no alternative to sell harvested seeds in case problem arises in the processing of jatropha. Unlike cassava and sugarcane, they can sell cassava either for starch, sugarcane for sugar and that both can be processed into ethanol.
The Industry Participation in Biofuel Program
The Khon Kaen Alcohol Company Ltd has been established in 2006 primarily for alcohol production. The factory can use either molasses, syrup or cassava chips as raw material for ethanol. The ethanol plant is located adjacent to sugar mill owned by the same company. The plant has a capacity to produce 150,000 tons of alcohol per day, which is approximately equivalent to 5 million liters per year. Thai government prevents any company from switching from ethanol to food. Further, no company is allowed to export ethanol. In return, the government provides the company with tax incentives.
Khon Kaen Alcohol Company Limited, was apprehensive about the sustainability and adequacy of the supply of feedstocks. The company owner provided farmers with technical and financial assistance to encourage farmers to sell cane to them. In addition, the company supply farmers with biocompost and wastewater or slops to help reduce fertilizer cost. The slops were applied at the rate of 10 tons per rai (1 hectare = 6.25 Rai). Moreover, farmer gets reward for delivering clean (free of sand, little trashes) and unburned cane in the factory.
Khon Kaen farmers have already considered mixed cropping as their best option in
farming knowing the marginal condition of the land in their area. Their soils were generally sandy, saline and acid, with low organic matter and low water retention. Furthermore, the irregular rainfall and the undulating landscape in many areas imposed difficulty to the supply of sufficient water to crops (Mitsuchi, et al., Wada 2005)). Mixed cropping has help farmer minimize total crop failure which can likely happen if farmer would practice monocropping. Khon Kaen farm areas have been identified to be most suitable for sugarcane and cassava growing. Farmers in Khon Kaen have proven that indeed both crops can tolerate the limited rainfall as well marginal soils to attain decent yield level.
Khon Kaen farmers have been convinced that they already established the right
proportion between food crops and cash crops in their crop mixture. Only time will tell if farmers in the area will return to monocrop to take advantage of the high profitability obtain from either cassava or sugarcane. If ever, returning to monocropping system will not occur

17
overnight because of the bad experiences that farmers had with the intensive single cropping system.
Summary of the state of biofuel development in Thailand
Figure 7 shows the summary of the result of the study in Thailand showing the state of biofuel development in country in terms of issues, policies, emerging patters and impacts/future implications.
Figure 7. Summary of the state of biofuel development in Thailand in terms of issues, policies, emerging patters and impacts/future implications.
D. Philippines Situation
The Philippines embraced the development of biofuels with hopes to achieve future energy security, augment farmers’ income, and generate rural employment. The Philippine energy plan recognized the need to (a) ensure more sufficient, stable, secure, accessible and reasonably priced energy supply; (b) pursue cleaner and efficient energy utilization and cleaner energy technology applications; (c) cultivate strong partnership and collaboration with key partners and stakeholders; and (d) empower and balance the interest of the energy publics. Philippine government has issued the Biofuels Act of 2006 for immediate implementation. But the main challenge facing the Philippine biofuel program were the lack both of sufficient volume of feedstocks especially for ethanol and of ethanol designated processing facilities.

18
The Philippine Biofuel Act was put into law in 2006. The law provided the yearly progression of target mixture between biofuel and fossil fuel. The Philippine Biofuel Act likewise sets limits where biofuel feedstock may be grown. Other provisions of the law spell out responsible offices to implement the biofuel program of the country(Marasigan 2005).
Initial recommendations in the implementation of the Biofuel Law specify that the planting of feedstocks should be limited to marginal lands; encroachment on lands being used to plant food crops should be prevented; ban the planting of biofuels in arable and irrigated land; grow biofuel feedstocks in denuded mountain lands; and limit the production of bioethanol gasoline replacement to sugar-planting districts, i.e., utilizing excess production of sugar. The government expected local or foreign individual or organization to invest in the production of feedstocks and in the establishment of biofuel plants. Identified feedstocks for ethanol included molasses, sugarcane and cassava while coconut oil, Jatropha and palm oil was designated for biodiesel.
Primary feedstock for biodiesel production in the Philippines is coconut oil. The Philippines is one of the largest producers of coconut oil in the world - approximately 1,400 million liters per year. Nearly 20% (400 million liters) of this production is used for domestic consumption, and the balance of 80% is exported. Mindanao accounts for almost 60% of the economy's total coconut oil production (Embassy of the Republic of the Philippines 2007). Potential biodiesel feedstocks in the Philippines are jatropha and palm oil. The government has announced its plan to launch massive propagation and cultivation of jatropha seeds covering around 2 million hectares (ha) of unproductive and idle public and private lands nationwide. This effort will produce about 5,600 million liters of biofuel in the next 10 to 12 years (Bulatlat 2007). There are few pilot plantations growing oil palm.
In the Philippines, sugarcane is considered a primary source for ethanol production. The government sees it as the most reliable feedstock due to its well-established farming technologies and the highest yield per hectare compared to other feedstock (corn, cassava, and sweet sorghum). Sugarcane production in the Philippines is expected to increase to meet the requirements of the Biofuels Act. At present, the sugar industry can only supply 79% of the needs of the 5% ethanol blend, which is between 200 and 400 million litres per year. The Philippines, therefore, needs to expand its current 167,300 sugarcane farms covering a total area of 344,700 hectares to meet the ethanol demand. The Sugar Regulatory Administration (SRA) already identified 237,748 hectares of new sugar fields, mostly in Mindanao, that can be tapped to produce fuel ethanol (Bulatlat 2007). Additional ethanol feedstocks considered by the government are sweet sorghum and cassava.
The Philippines sets 5-point energy independence agenda:
• Accelerated development and utilization of indigenous energy resources (oil, gas, coal);
• Promotion and increased utilization of alternative fuels; • Aggressive promotion, development and utilization of renewable energy resources • Strategic alliance with other countries; and • Strengthened implementation of energy efficiency and conservation measures.
The Philippine Biofuels Act, implemented in January 2007, establishes the following
requirements for ethanol and biodiesel:
• Within two years from the affectivity of this Act, at least five percent (5%) bioethanol shall comprise the annual total volume of gasoline fuel actually sold and distributed

19
by each and every oil company in the member economy, subject to the requirement that all bioethanol blended gasoline shall contain a minimum of five percent (5%) bioethanol fuel by volume.
• Within four years from the effectivity of this Act, the National Biofuels Board (NBB) created under this Act is empowered to determine the feasibility and thereafter recommend to the Department of Energy (DOE) to mandate a minimum of ten percent (10%) blend of bioethanol by volume into all gasoline fuel distributed and sold by each and every oil company in the member economy. In the event of supply shortage of locally-produced bioethanol during the four-year period, oil companies shall be allowed to import bioethanol but only to the extent of the shortage as may be determined by the NBB.
• Within three months from the effectivity of this Act, a minimum of one percent (1%) biodiesel by volume shall be blended into all diesel engine fuels sold in the member economy; provided that the biodiesel blend conforms to the Philippine National Standards (PNS) for biodiesel. Within two years from the effectivity of this Act, the NBB created under this Act is empowered to determine the feasibility and thereafter recommend to DOE to mandate a minimum of two percent (2%) blend of biodiesel by volume which may be increased taking into account considerations including but not limited to domestic supply and availability of locally-sourced biodiesel component (Republic Act No. 9367).
Among the incentives designed to encourage the production and use of biofuels are an exemption of the ethanol/biodiesel portions of fuel blends and an exemption from value-added taxes for raw materials (coconut, sugarcane, jatropha, cassava, etc.). There are also favorable loan policies available from banks for biofuel investors and producers.
B1 is available through all service stations in the Philippines, and it has been successfully used by thousands of vehicles in the Philippines since 2002. E10 is currently offered by all Seaoil stations nationwide. It is expected that in 2008 more gas stations will be offering E10 (Biofuels Philippines 2007).
Chemrez Inc. has exported 500,000 liters of coconut-based biodiesel to Germany and to Asian markets including China, Chinese Taipei, South Korea, and Malaysia. If the mandated biodiesel blend increases to 2% in the next two years, as specified in the Biofuels Act, biodiesel companies in the Philippines may concentrate on supplying the domestic market and export only excess volumes.
The San Carlos Ethanol Plant was the first and only private organization in the Philippines to go into the business of processing sugarcane for ethanol. There were several foreign investors from countries like China, Korea and Japan, prospecting to produce biofuel in the Philippines, with the purpose of filling up their respective national demand. The Biofuel Act of 2006 does not rule out export of biofuel products.
The Philippines is currently producing biodiesel from coconut. Philippine government has also invested a sizeable amount of money for research on Jatropha for possible alternative feedstock for biodiesel. Several private individual have already invested in planting of Jatropha for small scale biodiesel plant processing. Palm oils produced in the Philippines were currently used mainly for vegetable oil. The Philippines required B1 mixture

20
this year and B2 mixture by next year. It was estimated that the volume of locally produced coconut oil can adequately satisfy the current required mixtures.
With biofuel program implementation in the Philippines, the program would be giving two of its major agricultural industries, sugarcane and coconut, new and reliable market opportunity.
Based on available records, the Philippine government has been entertaining local and foreign investors interested in biofuel to locate in the country. Currently, Philippines import most of its ethanol requirements since local ethanol supply is still limited. However, local biodiesel supply which comes from coconut was reported as adequate for B1 even for B2 (Marasigan 2005).
Agriculture in the country remains dominated by coconut, sugarcane and rice. Other crops included corn, banana, pineapple, abaca and cassava. Crops with potential for biofuel and with large enough area to accommodate local demand, export commitments and for biofuel were limited to sugarcane and coconut. Researchers were looking at other potential feedstock for biofuel like jatropha for biodiesel and agricultural wastes for ethanol (Pantua 2007).
A typical sugarcane farmer in Negros, Philippines
Sugarcane farming is highly popular in the Province of Negros, Philippines. Large scale sugarcane plantations in the province were generally administered by hacenderos under hacienda system. The hacienda system that evolved in Negros was built on sharecropping and debt relations. Hacendero who runs the system took paternalistic care of “their” people from cradle to grave, serving as godparents, paying their medical bills, and occasionally bailing them out of jail (Henderson 2000). In return, Hacendero demand and receive complete subservience based on sharecropping and the “company store” model.
While sugarcane farming may not be as lucrative as before, the landscape of Negros remains in sugarcane monoculture production still under the control of wealthy plantation owners known as hacienderos. Many landless laborers continue to work in the cane fields and are locked into the cycle of poverty, indebtedness and physically gruelling work.
During the implementation of the Comprehensive Agrarian Land Reform Program (CARP) in 1997, several tenants in sugarcane plantation were individually awarded land with sizes ranging between 3 to less than 1 hectare. However, even with the acquisition of their own land through land reform the living condition of sugarcane farmers remain bad. The land reform program implementation in the Philippines does not include financial assistance. Without financial complement, land reform beneficiaries were left to survive on their own. Farmer beneficiary must shoulder the cost of production and the cost of raising family. Land reform program in the country therefore did not really help alleviate the condition of sugarcane farmers. It even put farmers in more serious predicament, placing more farmers in extreme poverty situation. Informally, many of the land reform beneficiaries were forced to sell back their newly acquired farm and/or return to the folds of their former Hacenderos.

21
Recognizing the condition of land reform farmer beneficiaries, a lady entrepreneur, named Susan, has introduced a different type of arrangement with land reform beneficiaries. Being a landowner and sugarcane grower herself, Susan offered to provide the necessary capital to grow sugarcane and allow use of her farm equipments on condition that farmer will sell to her all of the harvested cane. Susan, the capitalist, would also advance some cash for family use to be deducted during harvest period. Such arrangement gives the farmer a chance to be freed from the landlord-tenant bond. Following her system, Susan can consolidate optimum land area and maximize the use of her farm facilities. Her system partly solved the financial concerns of land reform beneficiaries since earning from sugarcane remains seasonal. Poor sugarcane farmers must find offseason job to sustain daily family needs for the rest of the year.
The first sugarcane based ethanol plant in the country
San Carlos, is the last city of the Northern part of Negros Island. It is located at the west coast of the Philippines. It used to be a bustling sugar capital, it being the seat of the 1st and only Sugar Milling Company in the country and Negros, respectively. Established in 1907, the San Carlos Milling Company incorporated (SCMCI) which produces sugar with molasses as by product absorbed the sugar cane produce of most farming households within a 200 km radius. SCMI symbolizes income and livelihood to almost all of the farming households, as it provides a ready market, no matter how seasonal, to the produce of sugar cane farmers.
One could just imagine the impact of the company’s closure in 1998 to the sugarcane farming household, who after SCMCI’s closure has to bring their sugarcane to alternative markets 87 – 200 km away. The smallness of volume of canes marketed is a compounding problem, as most land holdings of the sugarcane farmers have been reduced to 7 hectares, given the land reform act passed in the country in the early 90’s.
The closure of SCMCI is attributable to a number of factors, among which is the losing proposition owing to fluctuations in the sugar market and the sorry state of facilities (including milling equipments), a problem confronting all sugar milling companies in the country. To modernize SMCI as a means to address the increasing livelihood woos of the San Carlos sugarcane farming community is out of the question as it will entail millions of peso in investment at a time when sugar market is not appealing. Thus, the opportunity for an alternative market through the ethanol plant, brought about an increasing demand for alternative fuel, aided by a government push to ethanol program, is a welcome development to the farming populace.
The growing ethanol market, the conducive investment climate (through government push for the ethanol industry) and the desire to revive the dying sugar industry and consequently give livelihood security to sugar farmers, prompted the San Carlos Ethanol Plant to embark into ethanol production. Starting operation in 2009, the plant has an initial production of 1.6 M liters in just 9 months of operation. With the increasingly unmet demand for ethanol in the country, it will take about 10 ethanol plants of similar capacity to meet the estimated demand of 536 M (at 10% blend) liters in the country.

22
Reviving a Dying Sugar Cane Industry (The Firm’s Innovation)
The ethanol plant with sugarcane as feedstock started operation in Jan 2009. Designed to operate on a year round basis, the plant has to initially deal with addressing the seasonality of the production systems the farmers have been used to when then catering to the sugar milling company which has a 6-7 month operation calendar.
Identifying farmer supplier. While there are a number of sugar cane farmers in San Carlos, the firm choose to work with organized farmers within 75 km radius for reasons of operational viability in terms of supervision and reach. The area is of 3 zones where a purchaser is assigned in each zone to consult with farmers in terms of production scheduling.
Reprogramming Planting Schedule. The first innovation is to reprogram planting operations, given that the harvesting/planting season has already commenced when the plant started operation. The firm has to adjust and have to deal with immature canes at the start of operation, sacrificing cane quality and recovery. For the firm, this is a necessary sacrifice so as to properly meet continuous production schedule.
Regulating Delivery Schedule. To ensure continuous supply of sugar cane while at the same time affording “a no waiting time” for sugarcane farmer suppliers , a program of regulating cane delivery was developed, aided by the deployment of purchasers who collaborate with farmer suppliers in terms of acceptable planting and harvesting schedule. A delivery ticket is given to farmers scheduled to supply the plant, which assures them that they are given priority at the same time discourages unscheduled delivery. The process of regulating delivery schedule was a success (acceptable to both firm and farmers) that an Ethanol firm in China is scheduled to visit to learn from the program. This likewise addresses pole-volting as inability to supply when already given ticket delivery would mean non inclusion in the scheduling program.
Provision of Slops as irrigation water and Compost . A 40Kg of compost/ ton of cane milled supplied free of charge to regular suppliers. While initial problems in application were experienced, slop application is administered to the 600 has around the plant only during land preparation
Incentive Provision. To meet appropriate requirement both in times of over and under supply situations, those who will mill early or late to help the firm meet schedule are given 200 pesos/ton of cane supplied as incentive. To the farmers, this is acceptable rather than incur additional cost and hassle of marketing their produce to the nearest plant 87 km away.
The Farmer’s response
The opportunity for a continuous production is a welcome opportunity to the farmers. Not only is the problem of seasonality of activity addressed given the continuous supply requirement of the plant, but payment problem is now addressed. The farmers are now receiving payment within 2 days of the week ending of delivery date. More importantly, they are paid on a fresh cane basis unlike previously (in a milling operation) when they are paid on base sugar recovered.

23
Farmers in Negros, Philippines have long been growing sugarcane as monocrop. During the Spanish occupation of the Philippines, the colonial government encouraged Filipinos to produce sugar by offering incentives e.g., easy credit, milling equipment and access to untitled lands. The landowners popularly known as hacenderos provided, in varying degrees, credit, animals, equipment, houses, medical fees, clothing and money for social obligations to labourers to ensure and control them to stay on the farms. Thus the paternalistic management styles in the sugar industry developed.
The current pool of farmers in Negros only relies on income from sugarcane to buy food. Although rice is the staple food for most Negrenses, rice production in Negros Island continue to remain as minor crop. Conversion of sugarcane to food crops may not be easy and quite costly. So, food to fuel conversion in Negros, Philippines is therefore not an issue in the current biofuel program implementation in the Philippines.
Summary of the state of biofuel development in the Philippines
Figure 8 shows the summary of the result of the study in the Philippines showing the state of biofuel development in country in terms of issues, policies, emerging patters and impacts/future implications.
Figure 8. Summary of the state of biofuel development in the Philippines in terms of issues, policies, emerging patters and impacts/future implications.

24
III. Policy and Institutional Mapping The policy and institutional mapping conducted centered on the smallholder farmers. This is made to clearly establish and better understand how the policy and institutional dimensions of the food and bioenergy interphase truly affect the food availability and livelihood opportunities of the smallholder farmers. A. China The policy and institutional map of food and bioenergy interphase for China is shown in Figure 9. The farm of the smallholder farmer essentially provides the feedstock production for biofuels. China has a Biofuels Program that mandates the production of biofuel feedstock for a province, cassava production as in the case of Guangxi. Although this feature of the program shows evidence of food to biofuel conversion of farm areas due to market demand aided by policy, food security is nevertheless assured with increased farm income and with designation of food production areas in other parts of the country.
Figure 9. Policy and institutional map of food and bioenergy interphase for China.
Biofuel industry and smallholder farmers have strong relationship in China. The industry provides both financial and technical supports to the farmers. Another form of support is given in terms of delivery incentives wherein higher price is given if the feedstock is delivered to the processing plant. At present, due to shortage of cassava feedstock, the industry is allowed to import both feedstock and processed biofuel. The biofuel program however aims to increase local production of feedstock that will reduce importation.

25
Another institution that supports the farmers is the educational institutions. The support is in the form of research and development on production of feedstock and processing of biofuels which is being conducted in collaboration with government institutions and the industry.
B. Philippines
For the Philippines, a Biofuels Act has been enacted which provides tax and other form of incentives both for the farmers and biofuels industry. The act also provides budget allocation for the conduct of research and development that will support the implementation of the Act. Research and development are conducted through government-industry-university collaboration. Other relevant laws are in the form of Environmental Laws that regulates the management of wastes which is a major concern in the processing of biofuels.
Figure 10. Policy and institutional map of food and bioenergy interphase for the Philippines.
As in the case of China, the biofuel industries in the Philippines also provide financial and technical supports to the farmers, including delivery incentives. The industry also contributes investment support to the biofuels program of the government. There are other groups that provide support and services to the smallholder farmers and these include the credit service providers and the farmer cooperatives.

26
C. India
There is no evident food to fuel conversion of farms in India due to the Biofuel Policy that restricts the production of non-food feedstock only in degraded areas or wastelands (Figure 3). Food production areas are further protected through the National Food Security Mission. Substantial funds are also provided of research and development.
Figure 11. Policy and institutional map of food and bioenergy interphase for India.
India has a state owned and/or corporation leasehold land tenure. The government is therefore engaged in the actual production of feedstock which provides additional revenue for the state. The government’s engagement in production also boosts the employment and revenues in rural areas.
In order to attract enough investment to be able to sustain the biofuel industry, India allows for a 100% equity in the industry but only for domestic consumption of biofuels. Export will only be allowed once the demand of the country is exceeded. Biofuel industry owners are also engaged in feedstock production which ensures the steady supply of feedstock for their own processing. The industry is also heavily involved in research and development of both production and processing.
Other important groups that support the biofuel program are the market outlets that are also actively involved in the production of feedstock in the farm. Although there are several sectors that are involved in the production of feedstock that include the government, the industry and the market outlets, due to the high demand and still insufficient amount of feed stock, there is still market for the produce of small farmers.
• Biofuel Policy (non-food feedstocks on degraded or wastelands); R&D
• National Food Security Mission protects food production areas
State owned and/or corporation leasehold land tenure system
Boost in employment and revenues in rural areas
Additional revenue for the state through engagement in actual production of feedstocks

27
D. Thailand
There is also no sign of food to fuel conversion in Thailand. The country has sufficient feedstock from molasses and cassava and will not require conversion of food to fuel to support the Biofuel Program of the government. Another policy of the government that encourages the use of waste materials like molasses, further increases the supply of feedstock, thus reducing the need for food to fuel conversion. The use of molasses for ethanol production has been decreed to be tax free. Together with the stiff wastewater policy for sugarmills which produces molasses as by-product of sugar processing, investing in biofuel processing from molasses has thus become attractive.
Figure 12. Policy and institutional map of food and bioenergy interphase for Thailand.
The government, together with the biofuel industry and other non-government entities, has provided the smallholder farmer the much needed training for new technologies needed in the biofuel production. Furthermore, marketing and financial assistance has been provided by these entities. Input subsidy has also been extended by the industry to the farmers.
Investment in biofuels venture is expected to increase since the domestic market can easily absorb the production. The smallholder farmers are expected to further benefit from these developments.

28
E. Vietnam
Biofuel program in Vietnam is still at an early stage. A government policy that has a great effect on the program is The Doi Moi (New Changes). Doi Moi provides complete “use rights” on farm lands and thus gives sufficient flexibility on the farmers on what to plant. And because of the highly suitable soil for both sugarcane and cassava, the farmers can easily shift from one crop to another, which can affect the supply of feedstock. At present, there is expansion in production area but no food to fuel conversion.
Figure 13. Policy and institutional map of food and bioenergy interphase for Vietnam.
There is no biofuel industry at the moment. However, experiences from a sugarmill factory has shown that the industry has no assured raw material because the farmers shift from planting sugarcane to cassava depending on the price difference between ethanol (food grade) and sugar. And although Doi Moi is open to new investments, since the biofuel industry is relatively new and untested, biofuel plants have not yet been constructed.
Doi Moi (New Changes) provide complete ‘’use rights” on farmlands
Small farmers can easily shift from sugarcane to cassava
Expansion in production area but no food to biofuel conversion

29
IV. Implication to the Region Biofuel program implementation in the Asian Region will continue and biofuel production can even become a major industry in the future. While some Asian countries were ahead of others, there will definitely be some levelling in the near future. The fact that the current technology relies predominantly on feedstocks from agricultural products, the government should therefore intervene aggressively to protect the present and future food supply and see to it that farmers’ concerns were addressed. For most developing countries, food supply comes mostly from domestic output. It is the role of the government to create an environment favourable to all sectors of the agriculture so as not to jeopardize the supply of at least the staple food for political stability. The volume of food supply should be the main occupation of the government. The future scenario regarding the supply of fossil fuel is not anymore very reassuring as before considering the high demand worldwide and the finiteness of the sources. Fortunately, there is biofuel which is renewable energy source, as an alternative to fossil fuel. Each country in the region has its own niche in agriculture determined by climate, area and available technology. Conflict was anticipated between food and fuel supply since the current first generation biofuel technology consists mostly of agricultural products (e.g. corn, cassava, sugarcane, wheat, soybean, coconut, etc.) use as feedstocks for biofuel. How to balance the food supply with fuel supply? The demand for biofuel is now being addressed through local supply and/or through importation. China, with its robust economy, would require high amount of biofuel from outside sources. With equally high demand from other developed countries, poor agricultural countries will be vulnerable to enticement by these countries to become future suppliers of biofuel with the possibility of sacrificing local food supply. It would be all up to the government if they will put export of biofuel feedstocks and/or biofuel over local food supply. Philippines had the chance to export biodiesel which were in excess of the blending requirement last year but it may not happen again as blending will be increased in the future. This was not happening yet in other countries. What is currently happening involved diversion in part of harvested agricultural products to produce new products like bioethanol from cassava, corn and cassava, and biodiesel from coconut, soybean and palm oil. Supply of agricultural products for food remains stable. This early farmers were observed to be better off in countries where biofuel program was implemented. Farmers get better and stable price for its commodity as market demands for agricultural products were all of a sudden become unlimited. With the whole year feedstock demand, farmers and other farm sectors can also have a potential year round source of income. Improvement in technology and infrastructure further enhance productivity at farm level. Government should not be remiss of its duty to protect its citizen on this issue of food or fuel, unless it wanted to create political instability.

30
V. Concluding Remarks
In general, biofuel development is seen by most countries as a quest for energy security, economic development (particularly, improvement of trade balances and expansion of the agriculture sector), and poverty alleviation (Yan and Tin, 2009). Most countries also have biofuel strategies that are focused around their main agricultural products and new business opportunities.
However, there were issues and concerns raised by different sectors in the society
particularly the impact of biofuel program on food supply since the current technology on biofuel production still relies very much on the utilization of agricultural products for feedstocks. Further, it was anticipated that feedstocks production may encroach on food production areas. Both sceptics and strong advocates of countrywide mainstreaming of biofuel program were worried that farmers’ source of food and/or income may be affected. Was there really as much anxiety among farmers in Asian countries who decided to mainstream biofuel program? Evidences of food-to-biofuel conversion China has an early record of food conversion to biofuel. Specifically, China experimented on using grain crops like corn and wheat to produce ethanol. The experiment resulted into price increase and shortage of grains supply for food. It was a bad learning experience which has been immediately addressed through policy intervention. Chinese government prevented building of new plants that will utilize grains for ethanol production. By shifting to non-food feedstocks, Chinese government unwittingly helped the development of marginal areas which in turn benefited marginal farmers. It was made possible by the substantial financial and technical support that marginal farmers get from the government whose object, obviously, was to maximize the domestic production of biofuel. The conversion of sugarcane from sugar to ethanol in the Philippines gives sugarcane farmers better leverage on the scheduling of harvest, more market options and the possibility for a year round employment for many sugarcane field and factory workers. Farmers that traditionally grow sugarcane and cassava in Vietnam and Thailand were also given alternative market option. Biofuel program in both countries is giving farmers a better opportunity to maximize their potential income.
India remains non-committal to the proposed local blending of biofuel with gasoline. However, India is hopeful that it can utilized sugarcane and sugar as potential feedstocks for ethanol and Jatropha for biodiesel. Utilizing sugarcane as feedstock will depend on the local demand of sugar for food. Jatropha use for biodiesel is hindered by the following issues, namely: performance of commercial jatropha plantation, adequacy of supply, market demand and price. Activities on jatropha remain under trial.

31
VII. Areas for further research and development initiatives or follow up activities.
Areas For Action Research Development Initiatives 1. Look beyond country needs towards
Regional implications. The case of satisfying one country’s need through production in other countries of the region and even across regions.
Development plans normally emanating from developed countries, with food security sacrificed at country level
Independence of countries to decide for the overall welfare of its constituents, oftentimes influenced by donor countries in guise of employment, economic benefits
1. A closer look at the cooperation among countries on biofuel activities, particularly between the developed and developing countries. Looking at the greater implication (beyond country level) to find a mechanism to police countries decisions that are generally donor driven where sacrificing national and regional long term interests.
2. Long term implications (sustainability (econ, envt’l, social) vs short term benefits of economic gains (employment , investment)
2. Awareness enhancement of the farmers beyond economics (environmental and social consciousness not yet surfacing)
3. Looking at the food vs biofuel issue using a value chain perspective framework
3. Regional cooperation through technology transfer the case of Thailand and the Philippine sugar-ethanol industry
4. Food security at the national level but at the expense of food security at the household level.
Debate of food security and food self sufficiency at household level. Is food security enough to govern food self sufficiency mindset, if removed what will be the overall implication Farmers forced to plant rice for food self sufficiency but whether it leads to food security at household level.
4. Food security are appeased by knowledge that they are food sufficient (enough stock for next season)
5. To what extent can industry sector police their own ranks to ensure socially responsible moves to certify traceability of biofuel production scheme, whether from prime land versus marginal areas (biofuel industry)
5. What new roles are expected from various stakeholders?

32
References: Clancy, J.S. 2008. Are biofuels pro-poor? Assessing the evidence. The European Journal of
Development Research. 20(3): 416-431. Energy Information Administration (EIA). 2009. International Energy Outlook 2009.
http://www.eia.doe. gov/oiaf/ieo/world.html Henin, Bernard. 2002. Agrarian change in Vietnam’s Northern Upland Region. Journal of
Contemporary Asia. 32(1): 3-28. Is Vietnam the next China? 2008. Crain’s Chicago Business. 31(30). Li, Yang-Rui and Yuan-an Wei. 2006. Sugar Industry in China: R & D and policy initiatives to
meet sugar UNEPand biofuel demand of future. Sugar Tech 8(4):203-216. Marsh S.P., MacAulay T.G. and Hung P.V. (eds) 2007. Agricultural development and land
policy in Vietnam: policy briefs. ACIAR Monograph No. 126, 72p. Marasigan, M.C. 2005. The Philippine Biofuels Program. Second Biomass-Asia workshop.
13-15 December 2005, Bankok Thailand Ministry of Agriculture and Rural Development (MARD). 2009. Ngo, C. and Natowitz, J.2009. Our Energy Future-- Resources, Alternatives, and the
Environment. John Wiley and Sons, New New York. Paritud, B. 2008. Status of Biofuel in GMS. Fifth Biomass-Asia Workshop december 4-6,
2008 Baiyun International Convention Center, Guangzhou Sanchez, J. and J. Junyang. 2008. Peoples Republic of China, Bio-Fuels Annual 2008.
GAIN Report Number: CH8052. Soaring Food Prices: Facts, Perspectives, Impacts and Actions Required. 2008. High-level
Conference on World Food Security: The Challenges of Climate Change and Bioenergy. FAO.
UNEP. 2007. Roundtable on sustainable Biofuels. Summary report. Second regional
Stakeholder Meeting. Michelin Bibendum Challenge – shanghai, China. November 13-14, 2007.
World Energy Outlook 2009. 2009. OECD/IEA, France. Yan, J. and T. Lin. 2009. Biofuels in Asia. Applied Energy 86:S1-S10.
Biofuel Production, Policy, Institutional Mapping and their Impact on Food and Environment in WANA Region
Prof. Mohammad Samir El-Habbab
and
Dr. Mohammad Majdalawi
Paper prepared on behalf of AARINENA

2
Table of Contents Page
List of Figure.................................................................................................................. 3 Abbreviations ................................................................................................................. 4 Executive Summary ....................................................................................................... 5 I- Introduction ................................................................................................................ 8
1.1Objectives of the Study..... .................................................................................... 8 1.2Expected Outputs and Outcomes….. .................................................................... 9 1.3.Methodology.... .................................................................................................... 9 1.3 Literature Review................................................................................................. 8
II. Evidence Generation and Impact of Food to biofuel Conversion ........................... 12 2.1Biofuel Supply and Demand Projections..... ....................................................... 12 2.2Biofuel Production in the Selected Countries..... ................................................ 16
2.2.1The Egyptian Experience in Producing Bio-fuel ......................................... 17 2.2.2 The Sudanese Experience in Producing Bio-fuel ....................................... 21 2.2.3The Experience of Turkey in Producing Bio-fuel........................................ 24 2.2.4The Experience of Malta in Producing Bio-fuel .......................................... 26 2.2.5The Experience of Pakistan in Producing Bio-fuel...................................... 28 2.2.6The Experience of the Sultanate of Oman in Producing Biofuel ................. 29 2.2.7The Experience of the Kingdom of Saudi Arabia in Producing Biofuel ..... 30 2.2.8The United Arab Emirates (UAE) in Producing Bio-fuel ........................... 31 2.2.9The Jordanian Experience in Producing Bio-fuel ........................................ 31
2.3The Impact of Biofuel Production on Agriculture..... ......................................... 32 5.1Positive Impacts...... ............................................................................................ 32 5.2Negative Impacts..... ........................................................................................... 34 2.4The Impact of Biofuel Production on Socio-Economic and Environment Aspects ............................................................................................... 35
2.4.1The Socio-Economic Effects of Converting Large-Scale Plantations to Produce Biofuel ................................................................................................... 36 2.4.2Socio-Economic Aspects of Using Marginal Land For Biofuel Production 36 2.4.3Impact of Using Marginal Land For Biofuel Production on Environment and Biodiversity .................................................................................................. 37 2.4.4The Impact of Biofuel Production on Employment ..................................... 38 2.4.5The Impact of Biofuel Production on Food Security ................................... 39 2.4.6The Impact of Biofuel Production on Health ............................................... 39 2.4.7The Impact of Biofuel Production on CO2 Emissions ................................ 39 2.4.8The Impact of Biofuel Production on Environment .................................... 40
2.5Caselets...... ......................................................................................................... 41 III. Policies and Institutional Mapping ........................................................................ 42 3.1Introduction..... ........................................................................................................ 42 3.2Institutions Concerned with Biofuel Production in WANA Region. ..................... 43
3.2.1Institutes, Centers and Organizations of BioFuel Production in Egypt ....... 43 3.2.2Institutes, Centers and Organizations of BioFuel Production in SudanError! Bookmark not defined.
3.3Policies Related to Biofuel Production in WANA Region.. ................................... 44 3.3.1Regulation and Polices of Biofuel in Egypt ................................................. 44 3.3.2Regulation and Polices of Biofuel in Sudan ................................................ 44
3.4Recommended Policies ........................................................................................... 44 References .................................................................................................................... 47

3
List of Figure Page
Figure 1 Biofuel Lifecycle and its Contribution to World Primary Energy Demand, 2006………………………………………………………………………………….15 Figure 2 Consumption of Biodiesel in Malta between 2003-2006………………….26

4
Abbreviations ARD Agricultural Research for Development AARINENA Association of Agricultural Research Institutions in the Near
East and North Africa BGP Bioenergy Global Partnership CPRs Common Property Resources ERA European Research Area EU European Union FAME Fatty Acid Methyl Ester FAO Food and Agricultural Organization for the United Nations GDP Gross Demestic Product GHGs Greenhouse Gases GWP Greenhouse Warming Potential EIA Energy Information Administration ISO International Sugar Organization IUCN International Union for Conservation of Nature, KSA Kingdom of Saudi Arabia MBT Mechanical Biological Treatment NETL National Energy Technology Laboratory SOM Soil Organic Matter WANA West Asia and North Africa UNEP United Nations Environment program UAE United Arab Emirates

5
Executive Summary Petroleum is the largest single source of energy consumed by the world’s population, exceeding coal, natural gas, nuclear, hydro and renewable sources. Global demand for petroleum is predicted to increase 40% by 2025. Concerns about oil supply and energy security have motivated many countries to consider alternatives to imported petroleum. Bioenergy concerns are top of the global agenda, given the rising global demand for energy, expected fossil fuel shortages and the adverse effects of fossil energy consumption on the environment and climate. As an important energy alternative, bioenergy offers many opportunities, but poses a number of risks and trade offs that include a) it compromises the food supply of the poorest and the most food insecure, and b) the accompanying diversion of land from food commodities to fuel increased food prices and reduced food availability in some regions. The global demand for liquid biofuels is more than tripled between 2000 and 2007. Future targets and investment plans suggest strong growth will continue in the near future. The major objectives of this study were: 1) To assess the status of liquid biofuel production and processing in West Asia and North Africa (WANA) Region ; 2) To identify multiple effects of biofuel production 3) To identify the opportunities and challenges stemming from emerging biofuel industry for smallholder producers in WANA Region Countries. Specifically the study will: 1) Generate regional evidence on the frequency of the conversion of cash food crops to biofuels. 2) Determine perceived issues and concerns of this conversion by sector (regional, national, household), and 3) Establish early indication of the impact (trends, patterns) to anticipate future scenarios, and 4) Undertake policy and institutional mapping as well as analysis to better understand the policy and institutional dimensions of the food and bioenergy interphase.
In this study, all the analysis will be devoted only to WANA Region, where biofuel production will be investigated, and the impact of converting food crop areas to bioenergy crop areas in these countries will be evaluated. Moreover, the study evaluated the potential for some countries in this region for producing biofuel from the first generation crops as well as the second generation crops. Evidence generated from the literature and the review team visit showed that the region does not produce biofuel from food crops except Turkey where they are converting some edible oils, such as canola and palm oil, to biodiesel. There are several countries in AARINENA sub-regions which produce biofuel. Some of them produce it from edible oil such as Turkey, while others use biomass and used edible oil and animal wastes for producing biofuel such as Malta. Third group of countries uses biomass from farm and processing residues such as Egypt (rice straw), Sudan (sugar cane residues, and Oman (Date Palm biomass). Other group is trying to plant specialized plants like Jatropha for biodiesel production such as Kingdom of Saudi Arabia (KSA), Egypt and Jordan. Although some of countries in AARINENA

6
sub-regions do not produce biofuel either because they do not have enough land and water recourses, such as Lebanon, Bahrain or do not want to produce it such as Iran. For the purpose of this study two countries; Egypt and Sudan were visited to get detailed information, while secondary information was collected for the rest of the countries in the region.
In the beginning of this century new stage of using waste has started in Egypt, in which new units of gas production from plant residues (mainly rice straw), were established and the planting of Jatropha took place in the Egyptian desert. In addition, a training center for recycling of agricultural residues and biogas technology was established. The main objectives of this center are: To implement recycling of waste for economic gain and environmental protection, produce biogas and organic fertilizer or any other technologies of waste management, act as an information center for farmers and improve the environmental awareness. Since the application of bio-fuel technology is new in Egypt there are no specific regulations or laws related to these issues. Only general law related to environment protection that is law number 94 part no. 5 which talks about the implementation of experimental projects to protect the natural resources and protect the environment from pollution.
The Sudanese government has unveiled the country’s first biofuel plant using sugarcane residues in 2009, joining other African countries like Egypt in the fight against global warming. Sudan is also collaborating with Egypt on the development of biofuels using non-edible crops. Reports said that the second project, worth US$150 million, will carry out research into the production of ethanol from rice straw. Such cellulosic ethanol fuel production using non-food plant sources, including agricultural waste such as the stalks and leaves of crops can also reduce the polluting practice of burning agricultural waste, the report said. The Government encourages the researches in the field of bio-fuel production and supports them by different research centers. It was noted that there is no specific regulations or polices related to biofuel production in the WANA region.
In Turkey, certain projects are implemented to convert oil bearing seeds (such as sunflower, soya, and canola) to biofuels. Turkey’s first bioethanol mixed petrol has been released to the market under the name of “Bio-Benzin”. Turkey is also experimenting with biofuel production from safflower. This is especially important as safflower does not require major soil fertility or much irrigation and grows rather quickly without need for complex agricultural practices.
In Malta, currently, biodiesel is produced from either locally sourced recycled waste cooking oil or imported vegetable oil. In this regard, privately owned companies in Malta have been very active in producing and promoting biodiesel for domestic consumption. The biomass content (i.e. the percentage element) in biodiesel in is the only source of indigenously produced biofuel, and in this regard privately owned companies in Malta have been very active in producing and promoting biodiesel for domestic consumption. The biomass content (i.e. the percentage element) in biodiesel in Malta is exempted from the payment of excise duty. This makes biodiesel currently cheaper than petroleum diesel retailed in filling stations and therefore a fiscal incentive provides one of the driving force for the biodiesel sales
The new site of the Pakistan Agricultural Research Council (PARC) announced the formal initiation of projects in Baluchistan province, for the planting of "three types of shrubs that have the potential to produce bulk quantities of biofuel. Three salt tolerant plants including Jatropha, Salicornia, and Castor oil plants were identified

7
which could grow in salt marshes, on sea beaches, and could survive even without water for five years.
Oman utilizes 10 million of the region's ubiquitous date palms as a feedstock for ethanol. Initially it was not clear which parts of the tree would be used, because that neither the fruit, nor the cellulosic biomass would be harvested.
The Positive and negative impacts in general were discussed briefly in Secton 7. Section 8 discusses the impact of biofuel production on socio-economic and poverty aspects, employment, food security, health, CO2 emission, and environment.
It was found that there is no well established biofuel energy policy in WANA region, except in Malta, but there are some environment policies implemented in most of the countries in the region. Accordingly, the last chapter provides few suggestions, in relation to policy arrangements for biofuel production in this region.

8
I- Introduction As oil prices continue to rise and with climate change mitigation became a high priority on the world agenda, targeted strategies for bioenergy production are gaining attention. Bioenergy will likely and inevitably play an important role in the future energy mix as we transition from a fossil fuel economy to an energy-efficient, renewable-based energy system. However, while governments are making commitments, parts of civil society are raising alarm bells. Rapid expansion of biofuels without adequate concern to risks and side-effects can indeed create serious problems. However, the current debate seems dominated by extreme viewpoints – from those seeing it as panacea for energy security to others seeing it as potentially causing a global famine and environmental mega-disaster. This document looks at some of the major concerns and opportunities of bioenergy, and develop recommendations for policy makers to harness this potential whilst minimizing the risk involved.
1.1 Objectives of the Study The objectives of this study are: To assess the status of liquid biofuel production and processing in The
Association of Agricultural Research Institutions in the Near East and North Africa (AARINENA) countries;
To identify multiple effects of biofuel production on food and environment in WANA region
To identify the opportunities and challenges stemming from emerging biofuel industry for smallholder producers in AARINENA countries;
Specifically the document will:
a. Provide regional evidence on the frequency, volume, and size of the conversion
of food crops to biofuels. b. Determine the concerns of this conversion at the household, national and regional
levels. c. Establish early indication of the impact (trends, patterns) and anticipate future
scenarios. d. Undertake policy and institutional mapping and analysis to better understand the
policy and institutional dimensions of the food and bioenergy interphase.
1.2 Expected Outputs and Outcomes The following are the expected outputs of the project: A. Better understanding and appreciation of food and energy issues and concerns by region. Evidence generated in terms of:
a. Extent of food to fuel conversion.
b. Early indications of the impact of conversion of food crops into biofuel on smallholder farmers food availability and livelihood sustainability

9
B. Technical/policy insights that can be offered to the relevant authorities for better policy formulation and implementation. C. Regional action plans to carry out projects/ formulate policy recommendations by regional fora on food and bioenergy. D. Results made available to the:
o The Agricultural Research for Development (ARD) Dimentin of the European Research Area (ERA) community and Bioenergy projects through the ERA ARD website
o Sub regional and regional networks who in turn are expected to disseminate the information to their constituents
The outcomes are summarized as follows: A better understanding and appreciation of food and energy issues and concerns by region. The evidence is generated in terms of:
c. Extent of food to fuel conversion.
d. Early indications of the impact of conversion of food crops into biofuel on smallholder farmers food security (availability) and livelihood sustainability
c. Regionally integrated documentation prepared on the same.
1.3 Methodology In this study, the focus only on AARINENA countries (WANA Region) where biofuel production was investigated, and the impact of converting food crop areas to crops that will be used for bioenergy in these countries was evaluated. Moreover, the study evaluated the potentially for some WANA countries for producing first and second generation generation of biofuel. . WANA Region includes five sub-regions: Arabian Peninsula (Bahrain, Kuwait, Oman, Qatar, Saudi Arabia, UAE) Maghreb (Algeria, Libya, Malta, Mauritania, Morocco, Tunisia) Mashreq (Cyprus, Iraq, Jordan, Lebanon, Palestinian Authority, Syria) Nile Valley & Red Sea (Djibouti, Egypt, Sudan, Somalia, Yemen) Western Asia (Iran, Pakistan, Turkey)
The Steps followed in Conducting the Study: For all the countries: Brief description of the agricultural resources, mainly land and water, in each
country of the WANA region. Literature review of the biofuel production in the covered countries. For the biofuel producing countries 1- Agricultural resources, i.e. land, water, labor resources were explored
10
2- Biofuel production practices were discussed in detail. This included the following points:
History of biofuel production in the country Sources of biofuel feedstock, including first and second generation processes Types of produced biofuel in the country Quantities of local production, exports and imports 3- Reviewthe bioenergy policies in the country 4- Evaluate the food & bioenergy policy institution mapping in each selected
country for either completed or ongoing programs if available, then suggest appropriate policy measures for producing biofuel in each selected country.
Two countries producing biofuel were visited (Egypt and Sudan) and detailed information was collected.
1.3 Literature Review A. Types of Biofuel Liquid biofuels are liquid fuels that can be produced from agricultural and forest products or the biodegradable portion of industrial and municipal waste. The two most common forms of liquid biofuels are bioethanol and biodiesel, which account for more than 90 percent of global liquid biofuel usage (mainly in the transport sector). Bioethanol is produced from agricultural products such as starchy and cereal crops (sugarcane, corn, beets, wheat and sorghum), while the main feedstock used in biodiesel production are oil crops and trees such as rapeseed, soybeans, sunflower, palm, jatropha or coconut. Recently, so-called “second-generation” liquid biofuels have started to be developed. Second-generation, lignocellulosic bioethanol is made from forestry products such as short rotation coppices and energy grasses, while new biodiesel technologies synthesize diesel fuels from wood and straw to a gasification stage1
Biofuels can range from solid, liquid and gaseous products, and their application is as varied as that of the petroleum products they replace. Biofuels can be used in almost all applications where petroleum products are used. Only in the aviation industry is their used still very limited and almost inexistent, however recent studies and experimental flights might in the future lead to a breakthrough and a wider use similar to that experienced in the road transport sector. The following is a list of the main biofuels available and a brief description of their use.2
a. Solid Biofuels Examples of solid biofuels are probably the most common to understand, as their use has been known for as long as man has discovered fire. The main examples are wood and charcoal which are used for everyday use in heating and cooking.
1 See Annex 1 for the sources of Biofuel 2 Malta Resources Authority. What are Biofuels. Malta, July 2008

11
b. Liquid Biofuels The two most common types of liquid biofuels are biodiesel and bioethanol which are respectively additive/substitutes for petroleum diesel and petrol. Biodiesel
Biodiesel is the everyday name given to Fatty Acid Methyl Ester (FAME), the most commonly used biofuel in Europe. It is produced from oils or fats and is a liquid similar in composition to petroleum diesel. Its production is quite straight forward and consists of mixing oils with sodium hydroxide and methanol by a process called transesterification. The resulting chemical process produces biodiesel (FAME) and glycerol. A vast range of raw materials, including soybean oil, palm oil, rape-seed oil, waste cooking oil and animal fats can be used as the base material for the production of biodiesel. In the United States, the favored raw material is soybean oil. This type of raw material alone accounts for about ninety percent of all biofuel stocks in the United States. In Europe, the favored raw material is rapeseed oil. Bioethanol
Ethanol fuel is basically an alcohol fuel produced by the use of enzymes and micro organisms through the process of fermentation of starches and sugar. It can be used as a fuel, mainly as a biofuel alternative to petrol, and is widely used in cars in Brazil, where sugar cane is used as the base material. Ethanol with less than 1% water called anhydrous ethanol can be blended with petrol in varying quantities. Currently, all sparkignited petrol engines can operate with mixtures of up to 5% bioethanol (E5), however certain engine manufacturers discourage and actually suggest higher blends of bioethanol to be used. c. Gaseous Biofuels Biogas is a renewable fuel, which is produced by the breaking down of organic matter by a process of microbiological activity. Basically this means that rotting municipal waste; food waste or sewage (both human and animal) is turned into gas by means of ‘anaerobic conversion’ in a digester. Biogas contains methane, which in itself is a fuel and can be recovered from industrial anaerobic digesters, mechanical biological treatment systems and engineered landfills. In engineered landfills, the collected landfill gas can be used to produce electricity and heat. Economics of Biofuels Production Energy outputs from ethanol produced using corn, switchgrass, and wood biomass are less than the respective fossil energy inputs. The same is true for producing biodiesel using soybeans and sunflower. However, the energy cost for producing soybean biodiesel is only slightly negative compared with ethanol production. Findings in terms of energy outputs compared with the energy inputs were:3
3 Pimentel, David and Tad W. Patzek. Ethanol Production Using Corn, Switchgrass, and Wood; Biodiesel Production Using Soybean and Sunflower. Natural Resources Research, Vol. 14, No. 1, March 2005 ( C_ 2005)

12
Ethanol production using corn grain requires 29% more fossil energy than the ethanol fuel produced.
Ethanol production using switchgrass requires 50% more fossil energy than the ethanol fuel produced.
Ethanol production using wood biomass requires 57% more fossil energy than the ethanol fuel produced.
Biodiesel production using soybean requires 27% more fossil energy than the biodiesel fuel produced (Note, the energy yield from soya oil per hectare is far lower than the ethanol yield from corn).
Biodiesel production using sunflower requires 118% more fossil energy than the biodiesel fuel production.
A feasibility study for growing Pongamia trees (Millettia pinnata) in a plantation in India on an area of 10,000 hectares of Millettia pinnata from seedlings by planting 200 trees per hectare on the 1st of January 2009, showed that there is loss (negative returns) in the first two years, then the returns increase continuously for the next thirteen years. Millettia seed oil revenue of $450 per ton, seed cake biomass revenue of $125 per ton, and pruning biomass revenue of $125 per ton. The Internal Rate of return (IRR) was 124% and the Net Present Value (NPV) was US$ 596.3 million.4
II. Evidence Generation and Impact of the Conversion of Food to Biofuel
2.1 Biofuel Supply and Demand Energy prices influence the food and agriculture sector in several ways. Classical macroeconomic effects affect all aspects of agriculture production, consumption and trade, and the costs of the energy-intensive inputs like fertilizer and fuel have more direct effects on agriculture production. Energy prices however, could also impact agriculture by creating new markets for those products which can be used as biomass feedstocks for the production of biofuels They could also raise the competitiveness of agricultural products like cotton or natural rubber, that compete with oil-based synthetics whose cost rises with the price of oil. Bioenergy concerns are at the global agenda given the rising global demand for energy, expected fossil fuel shortages and the adverse effects of fossil energy consumption on our environment and climate. As an important energy alternative, bioenergy offers many opportunities, but poses a number of risks and trade offs that include a) compromises the food supply of the poorest and the most food insecure, and b) the diversion of land from food to fuel commodities is increasing food prices and reducing food availability in some regions. The experts in the first FAO Technical Consultation on Bioenergy and Food Security agreed that the current expansion of bioenergy production in developing countries presented potential costs as well as benefits; it could compromise food security and result in environmental damage, but also offered significant opportunities for sustainable development and poverty reduction in rural communities by producing
4 Millettia Plantation. Millettia Pinnata Plantation Revenue Model. 2009.

13
bioenergy crops. The role of Government was seen as crucial in addressing food security and environmental concerns.5
Governments of developed and developing economies alike are quickly to respond to the energy challenge by formulating and putting in place bioenergy policies and programs. Developed economies, as main energy consumers, are into developing sourcing strategies while developing countries, particularly those from the South, are looking into possibilities of becoming major producers and exporters. Concerns, however, are mounting as to whether caution in terms of careful planning and assessments have been undertaken in the process, given the emerging food and energy conflict. While there may have been early indications of success in reconciling the seeming food and bioenergy conflict, as in the case of Brazil, still several questions are raised and needing answers, such as: How was it made possible? Is it sustainable? Can it be replicated? 6
Since the FAO's report in April 2006, tens of thousands of farmers have switched from food to fuel production to reduce US dependence on foreign oil. Spurred by generous subsidies, at least 8m hectares of maize, wheat, Soya and other crops which once provided animal feed and food have been taken out of production in the US. Similarly, large areas in Brazil, Argentina, Canada and Eastern Europe are diverting sugar cane, palm oil and soybean crops to biofuels. The result, exacerbated by energy price rises, speculation and shortages because of severe weather, has been big increases of all global food commodity prices. A well thought the programs for biofuel production need to mainstream bioenergy into development and poverty reduction strategies wherein the poor and rural population are considered. The concern, however, is that many developing economies have already embarked on large scale Jatropha production and yet the negative impacts of this on local livelihoods and the environment remain to be assessed. Bioenergy production and policies need to be based on a broad cost/benefit analysis at multiple scales and for the entire production chain. Likewise, for such a development initiative to succeed requires a coherent cross sectoral government intervention and policies that integrate the concerns of agriculture and food security, energy, environment and even trades. The global demand for liquid biofuels is more than tripled between 2000 and 2007. Future targets and investment plans suggest strong growth will continue in the near future. The demand for biofuels is already having an impact on the prices of the world's two leading agricultural biofuel feedstocks: maize and sugar. According to the FAO, an increased demand for biofuel production may keep prices above historic levels for the next 10 years and could affect food aid.
5 FAO. Summary Proceedings of the first FAO Technical Consultation on Bioenergy and Food Security. Rome, 16-18 April 2007 6 FAO. Ob. cit

14
Significant amount of literature has recently been published to explain the varying sources prices increase. The commonly cited reasons for the global food crises include rise in oil prices which have a direct impact on food prices especially through transportation costs; ever increasing demand for food as the world population grows (especially from India and China); altering food tastes of developing countries; environmental causes such as droughts, climate change and global warming, agricultural subsidies in developed countries and biofuels. Fuel from plant sources, on the other hand, would greatly reduce carbon-dioxide emissions and, for some countries, would also reduce reliance on foreign oil. Carbon accounting procedures have to be in place in order to determine net savings, if any, in the production of biofuel. For example, castor can be grown as a biodiesel feedstock, but it’s a plant that requires a good deal of irrigation to achieve optimal yields. Is this irrigation from groundwater? If so, is it mining the aquifer (i.e., removing more water than is recharged), and are the pumps running on fossil fuel? Is the harvesting mechanized, and if so, what fuel do the machines use? How much greenhouse gas was released to the atmosphere in the mining of the ore to produce the machines, and in their subsequent manufacture? How much fossil fuel may be burned in order to produce the fertilizers, pesticides, and herbicides required in the growing of the castor crop, and how much in the production and transport of the chemical catalysts needed to convert castor oil to biodiesel? Plans are underway to convert millions of hectares of arable land into biofuels and the justification for the promotion of large scale biofuels is that the country's demand and price for petroleum products are growing rapidly at a rate of more than 30 percent per year. While this is quite a positive move to the improvement of the country's economy, it is important to note that there are socio-economic and environmental prices that will be paid as a consequence. Biofuel production, despite all the negative affiliations attached to it, should be well evaluated and considered as an alternative to ever increasing oil dependency in all countries that have the potential and infrastructure suitable for biofuel development while maintaining the capability for agriculture based food sufficiency. Although increase in food prices had been blamed on diversion of crops to biofuel production more in depth analysis indicated that a significant increase actually came from increase in transportation costs due to higher oil prices. Because food prices decreased dramatically with oil prices while biofuel activities remained the same.

15
Figure 1 Biofuel Lifecycle and its Contribution to World Primary Energy Demand, 2006
Source: Nadine McCormick. Bioenergy Policies Worldwide- Questioning the underlying assumptions. IUCN. Feb. 2009
Global Biomass Consumption 1186 mt
Modern Biomass
462 mt
Traditional Biomass for Direct Heating and Cooking
724 mt
Biofuels (24.4 mt)
40 Gl Ethanol, 3 Gl biodiesel
On-Site Heat
243 mt
Electricity and direct Heat
80.7 mt
Losses 63.9mt
Buildings 194.4mt Industry
188.5mt

16
Three different visions of the future of global and US biofuels production were presented by researchers at Hart Energy.7
The global Picture shows the following:
Global ethanol demand will represent 12-14% of the global gasoline pool by 2015;
Demand for biodiesel and ethanol is expected to approximately double by 2015;
Biodiesel is in trouble. Demand is projected at 9.5 billion gallons in 2015, while potential supply will reach 24.8 billion gallons; Hart foresees a continued shakeout, cancellation of projects and low utilization rates in this sector.
Asia-Pacific ethanol production will grow tremendously in the coming years and will represent 20% of global production by 2015. Actual commercial growth in the production and use of [advanced biofuels] fuels between 2009 and 2015 is projected to remain behind expectations.”
2.2 Biofuel Production in the Selected Countries With respect to biofuel production, the region could be divided into three groups:
1- Countries which do not have enough resources (mainly land and water) for biofuel production. These countries are Somalia, Yemen, Libya, Lebanon, Palestine, Tunisia, Djibouti, Cyprus, Kuwait, Bahrain, and Qatar.
2- Countries which are producing, or planning to produce biofuel. These are: Egypt, Sudan, Turkey, Malta, Jordan , Oman, Kingdom of Saudi Arabia and the United Arab Emirates
3- Countries which are not producing biofuel at present but they have the potential to produce it are: Algeria, Mauritania, Morocco, Iraq and Iran.
Some of the countries in AARINENA sub-regions produce fuel from edible oil as Turkey, and others use biomass, used edible oil and animal wastes for producing biofuel such as Malta. The third group of countries uses biomass from farm and procesed residues such as Egypt (rice straw), Sudan (sugarcane residues), Oman (Date Palm biomass) and Pakistan (agricultural residues). The rest are trying to plant specialized plants such as Jatropha for biodiesel production such as Kingdom of Saudi Arabia(KSA) and Jordan. Two countries were visited to get detailed information; they are Egypt and Sudan, while secondary information was collected for the rest of the countries in the region.
7 Biofuel Digest. New projections point to massive biofuel supply/demand imbalances by 2015-2030; polyculture a way forward for sustainable production? October 2009.

17
2.2.1 The Egyptian Experience in Producing Bio-fuel A. Introduction The interest in producing biogas has started in Egypt in eighties of the last century by the Ministry of Agriculture through the Agricultural Research Center. In 1980 Training Center for Recycling of Agricultural Residues was established and considered as a training center for biogas technology. This center belongs to Soil, Water and Environmental Research Institute /Agricultural Research Center and it was located in Moshtohor village /Qualyobia Governorate.
In the beginning of the twenty first century new stage of using plant residues and specialized plants has started in Egypt, in this stage new units of gas production from plant residues were established and the planting of Jatropha took place in the Egyptian desert.
The data and information in this part have been collected as secondary data from the institutes working or supporting biofuel production. Primary information has been collected directly from farmers and producers and businessmen who are producing or have planed to produce bio-fuel. Moreover, meetings with technical and political persons were conducted. Visits to the units of gas production and training centers were made and meeting with key farmers to discuss with them the energy production and problems and suggestions for developing the process of energy production by using Rapid Rural Appraisal Methodology. For collecting data from these different parts three different questionnaires have been formulated. The analysis of all data and information led to a comprehensive view of bio-fuel use and the potential development which are discussed in the following parts.
B. Institutes, Centers and Organizations of bio-fuel production There are many institutions and organizations working or supporting the sector of biofuel production in Egypt. These are government institutes which support researches and applying the technology as pilot project, and non governmental organizations including the international organizations and the private sector which holding and establishing projects to gain economic benefits. The main institutes are the following:
o The Ministry of Agriculture/Agricultural Research Center. This center is conducting researches and studies and applying experiments on new technology in the field of bio-fuel. The division has the responsible of biofuel is attached to Soils, Water and Environmental Research Institute. The main implementation of this center in this field is the establishment of training Center for Recycling Agricultural Residues.
o National Center for Agricultural Research: This center is conducting researches and studies and application experiments with new technologies in the field of bio-fuel.
o The State Ministry for Environmental Affairs: This ministry supports the projects of environmental protection involving the use of bio-fuel. It gives the results of researches and any other information for the private sector. It has established two units to produce gas from plant residues and distributes this gas free for the habitants of the villages near the production factory.

18
o Industry Modernization Center: It has information about the private sector in issues related to industrial development.
o The Ministry of Oil and Energy: It implements projects and gives information in the field of energy to the private sector.
o International Organizations such as UNDP and GTZ: These organizations with cooperation of the government implement projects in the field of environmental protection including bio-fuel projects.
C. Projects and Activities Addressing Bio-fuel Production in Egypt The production of bio-fuel in Egypt can be divided into the following categories:
1. Production of Biogas by using the animals waste: in 1980 a training center of biogas production has been established. This center belongs to Soil, Water and Environmental Research Institute. The main objectives of this center are: To implement recycling of waste to gain an economic and environmental protection, produce biogas and organic fertilizer and develop other technologies for waste management, act as an information center for farmers to increase the environmental awareness. This center encourages the use of waste of animals for producing biofuel.
2. The training in this center is free of charge to encourage people to take this training. A modification and development in this center has been made by establishing a pilot project to be as demonstration project. This project encourages many trainees to establish a bio-fuel project in their farms. It is estimated that about 50% of the trainees has established a bio-fuel unit and has used the gas in their farms. From the date of starting activities of this center until now, about 3000 units have been established as bio-fuel units for individual farmers. It is estimated that 65% of these units are still working.
3. Production of gas by processing the residual of plants and crops and separating the gas in special tanks. The State Ministry for Environmental Affairs in Egypt has established two units to produce the gas from the rice residual with capacity of 500 tons of rice residues per year for each one. One in the eastern governorate and the other in Dakhaleia governorate. The gas which is produced by these units is distributed for the houses nearby the villages. Each unit cover about 56 houses and it could cover up to 300 houses in about 1.5 km2 around it. The gas is distributed free for these houses. The main aims of these units are to solve environmental problems arise from the traditional burning of the rice residues in different farms in Egypt and to use these residues to produce gas that can be used in the houses. In addition to solving the problem of insects of the rice residues. The Ministry of Environment with cooperation with Czech government established a project to produce bio-fuel from the residual of rice and exporting this product to European countries where they use it for house heating. The holding capacity of the factory is 50 thousands tons of rice residues. They have already made the economic and environment visibility study and started to produce the fuel in 2008 with the capacity of 10 thousand of rice residues.
4. Production of biodiesel from Jatropha: Planting Jatropha in Egypt started before five years, Water and Environmental Research Institute. It is still in the experimental stage but it proves that the potential to plant this tree is high in the marginal areas and desert. The planting of this tree has succeeded in south

19
of Egypt (Saeed Area) and the stage of growth and production and blooming is earlier than that in other countries. It produces the flowers after 18 months but in other countries it needs three years. The planted area of Jatropha now in Egypt is about 500 hectare in three regions: Asyoot, Sohaj and Al-Swies.
D. Future Plan of Bio-Fuel Production There are many plans to establish new projects in the field of bio-fuel nevertheless many feasibility studies have been done. The main planned projects could be summarized as follows:
1. Plant Jatropha: A Korean Company has signed a memorandum with the Ministry of Environment to plant about 147thousand hectares of Jatropha and establishes factories to produce biodiesel, the production of the factories will be exported to European countries. The first stage of this project is to plant about 113 hectare in Abu-Rawash in Cairo where the biggest wastewater treatment plant is. This stage is considered as an experimental stage. The estimated investment of this project is about US$ 250 Million.
2. Using the residues of rice to produce bio-diesel. The plan is to use about 200 thousand tons of rice residues. The estimated investment is about US$ 650 Million.
3. Using the residual of rice to produce bio-gas (Ethanol), the plan is to use about 120 thousand tons of residues of rice. The estimated investment is about US$150 Million.
4. In addition to the previous planed projects there are many plans from the private sector to produce bio-energy by planting Jatropha or using the residues of rice.
E. Government's Supports Egyptian government supports bio-fuel production for several reasons; the most important one is the conservation of the environment through using the residues of plants and the waste of animals. Nevertheless it is useful to plant the marginal and desert land with some kind of trees which could be planted under hard conditions and using water of low quality. The government supports have different means; it conducts the researches and implements experiments in different institutes, it conducts training courses in some regions to show people the importance of producing bioenergy and methods for implementing these techniques. These training courses are free of charge. Moreover, the government has established special units to produce bio-gas from the waste of animals in some villages and freely distribute this gas for people in these villages.
F. Problems Facing Producing Biofuel in Egypt and Suggestions To study the attitude of different stakeholders regarding the biofuel production in Egypt, a questionnaire was developed and addressed decision makers, biofuel producers and farmers. Based on the questionnaire results the following problems were cited:
o Transporting the treated wastewater from the treatment plant to the planting areas of Jatropha which usually located far from each other.
o Financial problems.

20
o In case of producing bio-fuel from some kind of crops like Jatropha, it could be unreliable resource for energy because of the fluctuation of the production depending on production conditions.
o Availability of inputs especially the seeds.
o Needs for experts and experience, furthermore it needs methods for transferring the technology.
Different suggestions have been obtained from different viewers, the most important suggestions are:
o Establish new units of bio-gas production in other villages and continue distributing the gas without any charge. This will encourage people to find out the advantages of biogas production and they will establish their own units.
o Planting other kind of crops than Jatropha such as Jojoba, which economically could be better than the Jatropha and it consumes less quantity of water.
o Make more cooperation between private sectors and the government.
o Plant Jatropha in non agricultural areas like the marginal land and desert areas.
G. Environmental Impact The different methods of bioenergy production in Egypt have been discussed; the different methods reflect different environmental impacts. At first producing bio-energy means safety and clean source of energy comparing with other resources. Also the dependence on other resources which have negative environmental impact, will be less. On the other side, producing bio-energy form plants residue and the waste of animals have positive impact on the environment. It has been estimated that the residue of different crops in Egypt is about 33.4 million tons per year (year 2005/2006) and the dry waste of 7.6 million tons. The farmers burn these residues and waste. It is estimated about 50% of these residues and wastes are burned. This behavior pollutes the air and distributes diseases. In addition to the loss of energy; the value of energy lost as a result of the low efficiency of burning methods is about 13 billion Egyptian pounds.
Planting Jatrohpa in marginal areas has an advantage which is using non-agricultural area and prevents desertification in these areas. The treated waste water could be used to irrigate this crop without any side effect on the quality of products. By using this water could be as a solution for the environmental problem that could occur from the wastewater.
H. Economic Impact and the Potential of development o The economic impact on the country level: if 50% of the residues of crops and
waste of animals, which are estimated to about 21.7 million tons per year, are used to produce biogas, then about 6.4 billion cubic meter of gas will be produced per year. This quantity is equivalent to 5.5 million ton of natural oil. Its value is about 8.8 billion Egyptian pounds per year. Add to this value about 2.85 billion Egyptian pounds as a value of fertilizers produced by the residues

21
fermenrtation. Then the total value is about 11.65 billion Egyptian pounds per year i.e. about US$400 million. 8
o The economic impact on producer: if each family establish a biogas unit –about 10 cubic meters- which needs about 90-100 kilograms of the animals waste per day taken from about 4-5 heads of animals, it will produce about 5 cubic meters of bio-gas per day or 1800 m3 per year. This quantity is equivalent to 720 kgs per year of natural gas or 360 Egyptian pounds per year. When adding the value 1137 Egyptian pounds per year as a value of fertilizer and then the total value is about 1500 Egyptian Pounds per year. The value of establishing this unit is about 6500 Egyptian pounds. It means the cost of this unit will be covered in about 4 years. At the same time the waste of animals are used and there is no need to burn it.
2.2.2 The Sudanese Experience in Producing Bio-fuel Introduction Sudan is the largest country in the Arab World and considered as the best agricultural area. Sudan is a member of Bioenergy Global Partnership (BEGP), which was established to implement the commitments taken by the G8 in the 2005 Gleneagles Plan of Action to support "biomass and biofuels deployment, particularly in developing countries where biomass use is prevalent".9
The Sudanese government has unveiled the country’s first biofuel plant using sugarcane residues of sugarcane in 2009, joining other African countries like Egypt in the fight against global warming. The plant located about 250 kilometres from the capital city, Khartoum, aims to produce 200 million liters of ethanol from sugar cane within the next two years. It was built by Brazilian group Dedini.
Talks between the officials in Egypt and Sudan comprised cooperation in the field of bio ethanol production from rice straw, with investments of $ 150 million, through establishing a joint company with Sudan MISRODAN for cultivating and producing ethanol.10
Sudan is also collaborating with Egypt on the development of biofuels using non-edible crops. Reports said the second project, worth US$150 million, will carry out research into the production of ethanol from rice straw. Such cellulosic ethanol fuel produced using non-food plant sources, including agricultural waste such as the stalks and leaves of crops can also reduce the polluting practice of burning agricultural waste.
11
8 Al-Shimee, samir. The economic and environment impact of bio-gas technology in Egypt. 9 Bioenergy Glabal Prtnership (BEGP). Hosted by FAO. Rome 10 Egyptian – Sudanese Cooperation in Biofuel Production. www.oilegypt.com 3/16/2008, Location: Africa 11 Weri Channel, Announcements made on the WATER AND ENERGY RELIEF website knowyourrights2008

22
Moreover, other experimental fields to produce biofuel from other crops like sweet sorghum or sorghum was implemented. Other experiments were implemented to produce biofuel from Jatropha and Moringa trees. Jatropha is already planted in Sudan but not for bio-fuel production. In early seventies of the last century Jatropha was planted as raw material to manufacturing soap.
Projects and Institutes of biofuel production One of the priorities of agricultural plan in Sudan is to increase sugar production. Experts recently outlined the country's plans to boost the sector's output ten-fold to an annual 10 million tones by 2015, up from some 850,000 tones at present. Sudan could eventually end up producing twice that - a staggering amount that would put Sudan in the top-five of world producers alongside Brazil, India and the EU. Obviously, when sugar plans are announced nowadays, biofuels are in the air. The majority of 13 projects included in a 10-year strategy to produce the 10 million tones are south of Khartoum between the White and Blue Niles. The largest of the projects, the Eljazeera project, was aiming to produce 2.9 million tones of sugar and 205 million litres of ethanol per year. Sudan, which produces 330,000 barrels per day of crude oil, is expected to legalize the blending of ethanol with petrol.12
In Sudan there is only one project to produce bio-fuel, Kenana Sugar Factory, and the project started in 2009. There are other projects but still in the experimental stage; one is a research project to identify the kind of sweet sorghum to produce bio-fuel. This project belongs to Plant Research Center in Madani and started in 2009. Another one is a project of producing bio-fuel from Jatropha which belongs to Forest Research Center in Soba and started in 2008. This project has been extended to other areas; to the west of Sudan and to south of the Blue Nile. In General the plan is to plant Jatropha in the low rainfall areas. Mainly the Agricultural Institutes which belong to the Ministry of Science and Culture conduct researches of bio-fuel production. Problems and Suggestions Depending on different questionnaires, one directed to the decision maker another to the producer; the following problems were cited:
o Financial problems and funding.
o Marketing problems because of the weakness of infrastructure or limiting exporting options.
o Needs for experts and experience, and needs for technology transfer.
Furthermore, different suggestions have been obtained from different viewers, the most important suggestions are:
o Improving the infrastructure.
o Funding and encouraging farmers to establish biofuel units.
o Implement training courses in the field of bio-fuel.
o Conducting researche to determine the best alternatives to produce bio-fuel.
12 Hassan Hashim Erwa, marketing manager for the Kenana Sugar Company speech in the International Sugar Organization (ISO) meeting in Mauritius. 2007

23
o Find markets for bio-fuel production.
The Production of Sugar in Sudan There are five sugar factories in Sudan, the largest one is Kenana Factory. The area planted by sugar cane that belongs to Kenana is 33600 hectares while the total area for the other four is the same size as for Kenana factory . One of these four factories is in Al-Jezera State another one is in Senar State and one in the Ghdaref State while the fourth is in the White Nile State. The Kenana Sugar Company was established in 1975 in The Blue Nile State. It contributes around 60% of the total sugar production in the country. Sugarcane is one of the established crops in Kenana. The total cane produced in 2006/07 season was 3.712 million tones from this area at an average yield of 112 tones per hectare with about 11 percent of sugar content by weight. Kenana Sugar Company generates additional sources of revenue by taking the advantage of producing ethanol from molasses in order to increase utilization of sugar production. Sugarcane processing produces about 240 thousand tons of molasses annually. Assuming 100 tons of cane as a base for processing, the ethanol production from secondary juice and from molasses of primary juice can be estimated to 2710 liters where as the ethanol produced from molasses of conventional process can be estimated to 1080 liters. Taking into account the projected cost of ethanol production from molasses in Kenana as US$ 0.18 per liter at U$ 40.0 per tone of molasses, sugarcane crop remains as one of the potential feedstock for ethanol production in Kenana. Kenana Sugar Company has the intension to produce 65 million liters of anhydrous alcohol per year. The company is studying to find an alternative option to fill the gap in feedstock required to meet the targeted ethanol production. Alternatives could be sugar beet, sorghum, sweet sorghum or corn. Research in Sugar Production in Sudan In Sudan, the scientific research on sugar beet dates back to 1930 in the Gezira scheme. Later in the early 1990s a number of sugar beet varieties were imported and grown in Khartoum region by the Arab Authority for Agricultural Investment and Development. The most recent research for adaptation of sugar beet to be cultivated as a complementary crop to sugarcane in tropical areas was started in 1999 at Kenana Research Department. Sugar beet grown for the first time in the most southerly location such as Kenana, was exceptionally excellent. Sugar beet root yields varying between 60 and 90 Ton/ha were obtained in the experimental as well as demonstration plots. Sugar content of the beet roots in Kenana ranged between 15 - 18%. The crop is best planted in early November. It takes 150 - 180 days from planting to harvest the roots. Likewise sugar beet offers a very high yield ranging between 6000-7000 liters of ethanol per hectare similar to that produced by sugarcane per unit area. The trials were initiated in response to the Kenana strategy for diversifying cropping and

24
revenues. Sugar beet as a short season crop with less inputs and requirements was thought to serve Kenana strategy for substantial reduction in cost of production.13
2.2.3 The Experience of Turkey in Producing Bio-fuel
Certain projects are implemented to convert oil bearing seeds (such as sunflower, soya, canola) to biofuels. Turkey’s first bioethanol mixed petrol has been released to the market under the name “Bio-Benzin”. Turkey is also experimenting with safflower (aspir) production. This is especially important as safflower does not require major soil productivity or much irrigation and grows rather quickly without need for complex agricultural practices. According to Karaosmanoğlu, the main deficiency in the Turkish biofuel sector does not lie in lack of proper investment but rather in lack of standardized planning, programming and implementation. 14
It should be noted that even before the legal instruments were in place, many companies started production on an illegal basis, exploiting the legal vacuum. This has caused mistrust among citizens whereby some have identified biofuel as “illegal petrol”. This misperception should be eliminated with efforts directed at educating and informing the population about the facts on biofuels along with efficient supervision of the energy market.
In 2005 the biodiesel production was estimated at 1,500,000 ton/yr, including the GAP (southeast) region’s potential for lucrative farming. Mehmer Çağlar has estimated that there are 1,900,000 hectares of unused and suitable land in different parts of Turkey with a total annual potential of 1,250,000 tons of biodiesel production. In November 2005 total biodiesel production in Gebze, Adana, İzmir, Bursa, Polatlı, Urfa, Tarsus, Kırıkkale, Ankara ... regions exceeded 50,000 tons with the number of producers reaching 87 facilities. Moreover, it is alleged that there are significant advantages for co-operatives to establish their own integrated biodiesel systems. Assuming a price of 0.55 YTL/Kg for canola seed and a 5 year pay-back period for an integrated biodiesel facility (oil production, biodiesel production, and purification of glycerine), the cost of biodiesel would be 1.27YTL/lt with additional by-product revenues of 0.08YTL/kg solids from oil production and 0.20YTL/lt revenues from purified glycerin. Canola and safflower oil will gain importance in biodiesel production since in Turkey their cultivation is much easier and the cost of production is lower than wheat and sunflower oil. They estimate that 2,000,000 hectare irrigated agricultural area in the GAP region would be suitable for cultivating safflower and soy along with cotton. A vast amount of fertile land is not used for any agricultural or other purpose. Many farmers in strained rural areas complain about the low gains from conventional crops.
13 Saeed, Ibrahim, Survey of Potential Feedstock Sources for Ethanol Production in Kenana sugar Company Limited. 14 Filiz Karaosmanoğlu Biyoyakıtlar, http://www.tarim.gov.tr/arayuz/10/icerik.asp?fl=duyurular/ayin_konugu/ayin_konugu

25
Under these conditions, Turkey’s emphasis on biofuel production can be a very wise decision.15
Their approximation is through triple rotation and use of 600,000 – 700,000 hectare land each year for oil seed production. About 2,000,000 ton seed can be obtained yielding 700,000 ton oil or biodiesel. In addition, canola plant helps extend honey production period by flowering early in the spring. Its pulp is also valuable due to its high protein content. Moreover Turkey has planted 130 thousand hectares of poplar trees, in several countries, poplar and willow resources are principally used for environmental purposes, including soil and water protection, providing valuable services rather than forest products. Biodiesel production in Turkey, until late 2005, was primarily based on imported oils, such as palm oil, soya oil, etc. The raw material cost of imported petroleum-based diesel that meets EU standards is 520$/ton. In Turkey, US$860/ton OTV tax (plus KDV of OTV) is added prior to the addition of about US$155/ton KDV tax and profits of distributing firms which is around 10%. Cost of biodiesel using imported inputs to produce crops is estimated as 720$/ton. Although this figure is $200/ton higher than petroleum based raw product cost. It is still considerably less than the fully taxed petroleum based diesel, so that if no OTV tax is paid on it, it is a very desirable commodity for fuel. Hence, notwithstanding the available land and agricultural capacity and the cost differences between fully taxed regular diesel and untaxed biodiesel, Turkish farmers do not benefit from this potentially lucrative business, with Turkish biodiesel consumers relying instead primarily on imports.16
Turkey still gives significant tax advantages to biodiesel produced from locally grown oil seeds, but eliminates all tax advantages of biodiesel made from imported oil. This will drastically reduce availability of untaxed biodiesel in the markets but its effectiveness to eliminate all biodiesel production from untaxed imported oil (imported with the “intention of food use”) remains to be seen, especially in the case of small fleet owners who may also own biodiesel production facilities. The same set of regulations also put various licensing requirements for facilities that produce biodiesel either for their own use or for sale.17
When corn competes head-to-head with canola in Turkey, as it does when irrigation is possible, then the more established crop of corn has both relatively higher profits, even in the best case for canola seed, and far less uncertainty, given current knowledge.
15 Başaran, Şerife. A Re-Look At Biofuels: "Crime Against Humanity" or Alternative Green Energy" May 2008 16Kleindorfer, Paul R. and Ülkü G. Öktem. Economic and Business Challenges for Biodiesel Production in Turkey. September 2007 17 Kleindorfer, Paul R. and Ülkü G. Öktem. Ob.cit

26
One of the main problems in Turkey is the perception that biodiesel will harm engines of cars. So, while truck owners in central Anatolia use biodiesel freely, people with latest model cars in cities think it is harmful. This is hampering biodiesel sales (even at 2% level). Since in Turkey there are several facilities that produce biodiesel using spent oil (and usually consume in their own fleets) due to perception issue most drivers shy away from even biodiesel produced from home grown virgin canola oil.
2.2.4 The Experience of Malta in Producing Bio-fuel Malta is totally dependent upon imported fossil fuels for its energy needs, currently over 63% of the primary energy is used for power generation. Malta is characterized by scarce arable land and the limited amount of fresh water resources; accordingly. Therefore, cultivation of crops for biofuel production is not a feasible or sustainable option. Currently, biodiesel produced from either locally sourced recycled waste cooking oil or imported vegetable oil is the only source of indigenously produced biofuel. In this regard privately owned companies in Malta have been very active in producing and promoting biodiesel for domestic consumption.18
The production and consumption level of biodiesel in Malta has been on the increase ever since its introduction in 2003 as can be testified in Figure 2. This figure shows that the transport sector has experienced a marked increase, which may mainly attributed to increased awareness about biofuels and increased consumer confidence. Moreover, biofuel is available in almost 40% of the filling stations.
In Malta, the biomass content (i.e. the percentage element) in biodiesel is exempted from the payment of excise duty for biofuel production. This makes biodiesel currently cheaper than petroleum diesel retailed in filling stations and therefore a fiscal incentive provides one of the driving forces for the biodiesel sales. Biofuel quota in Malta was considered to be 0.3%per year in 2005 as guidelines, but it will be compulsory in 2010 at 5.75%.
18 Malta Resource authority. Ob cit
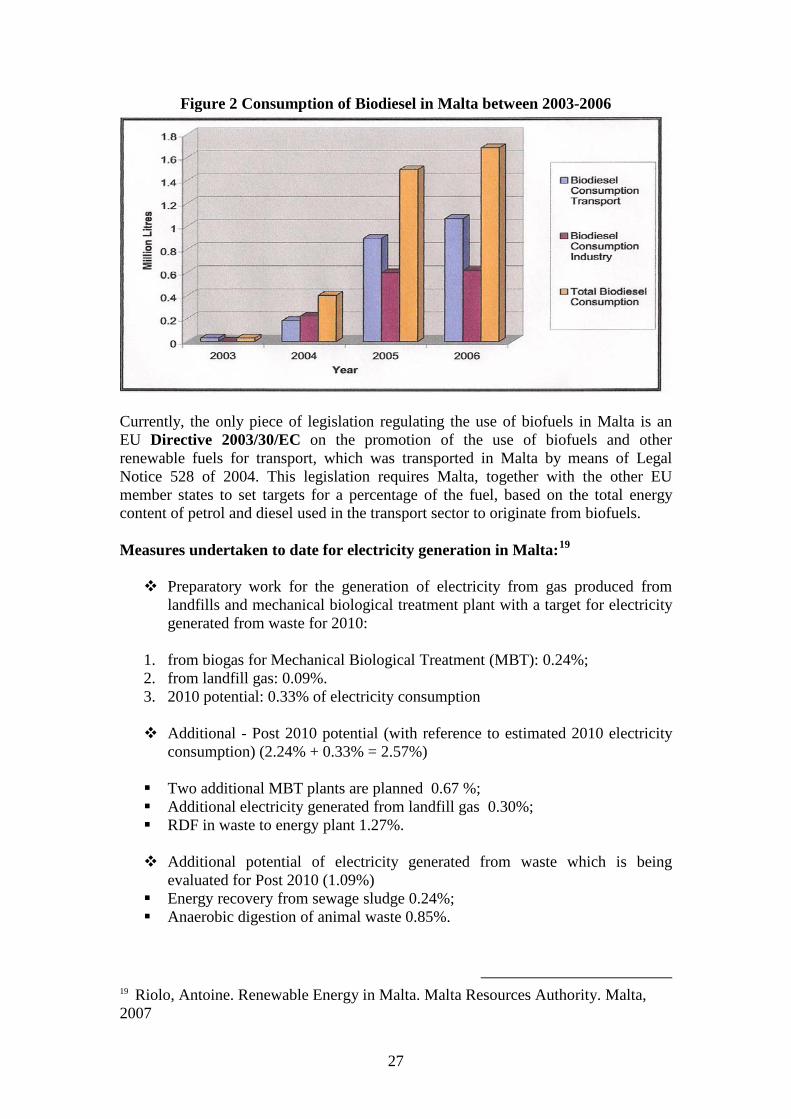
27
Figure 2 Consumption of Biodiesel in Malta between 2003-2006
Currently, the only piece of legislation regulating the use of biofuels in Malta is an EU Directive 2003/30/EC on the promotion of the use of biofuels and other renewable fuels for transport, which was transported in Malta by means of Legal Notice 528 of 2004. This legislation requires Malta, together with the other EU member states to set targets for a percentage of the fuel, based on the total energy content of petrol and diesel used in the transport sector to originate from biofuels. Measures undertaken to date for electricity generation in Malta:19
Preparatory work for the generation of electricity from gas produced from landfills and mechanical biological treatment plant with a target for electricity generated from waste for 2010:
1. from biogas for Mechanical Biological Treatment (MBT): 0.24%; 2. from landfill gas: 0.09%. 3. 2010 potential: 0.33% of electricity consumption Additional - Post 2010 potential (with reference to estimated 2010 electricity
consumption) (2.24% + 0.33% = 2.57%) Two additional MBT plants are planned 0.67 %; Additional electricity generated from landfill gas 0.30%; RDF in waste to energy plant 1.27%. Additional potential of electricity generated from waste which is being
evaluated for Post 2010 (1.09%) Energy recovery from sewage sludge 0.24%; Anaerobic digestion of animal waste 0.85%.
19 Riolo, Antoine. Renewable Energy in Malta. Malta Resources Authority. Malta, 2007

28
2.2.5 The Experience of Pakistan in Producing Biofuel Pakistan is highly dependent on imported fuels. However, sustainable production of biodiesel presents an opportunity to reduce reliance on imported oil, save foreign reserves, reduce poverty and unemployment. This will also stimulate rural development in areas with acute poverty and enhance access to renewable commercial energy. Pakistan's agriculture generates a lot of energy that is currently not used for the production of biofuels and bioenergy; most of it is burned in the open air, resulting in CO2 emissions, or left to waste. According to an FAO study, the country has a total agricultural residue base of around 84 million tons of biomass (field based and processing based), not taking into account residues from forestry. Taking a rough average of 15GJ of energy per air dry ton, the total amount of energy contained in this resource is around 1.26 Exajoules or 206 million barrels of oil equivalent energy. If all this biomass were to be collected and converted using current bioconversion technologies (with a total efficiency of around 20%), Pakistan could generate around 252 Petajoules of clean and renewable energy each year. Looking at the crop residues as a renewable and green energy source with a market value is set to increase the profitability of Pakistan's farming sector. The news site of the Pakistan Agricultural Research Council (PARC) announced the formal initiation of projects in Baluchistan province, for the planting of "three types of saplings that have the potential to produce bulk quantities of biofuel". According to PARC Chairman, Dr. Zafar Altaf, "We have identified three salt tolerant plants including Jatropha, Salicornia, and Castor oil plants which could grow in salt marshes, on sea beaches, and could survive even without water for five years ". The three feed-stocks produce seed-oils which can be processed into biodiesel. Dr. Altaf estimates oil production from the feedstocks as follows: 1100 liters per hectare for Jatropha, 1600 liters per hectare for Salicornia and 1800 liters per hectare for Castor. Cultivation of these bioenergy crops in coastal areas are seen to contribute to savings in oil imports.20
Based on the agricultural traditions in Pakistan, strong research capacity with ideal rainfall and availability of unused marginal lands as well as available unemployed workforce, it is ideal to cultivate this energy generating crop in the areas of interior Sindh, Sindh Balochistan and some parts of Punjab. Pakistan has large areas of poor quality land (more than 80 million acres); ideal for the cultivation of this energy crops, so growing Jatropha would not divert land away from growing vital food crops. And also have the ability for intercropping to generate extra money. With the projected estimates, by the end of 2014, Pakistan will have more than 0.3 million tons seeds. That will give us around 99000 tons of Biodiesel. Total savings
20 Pakistan Agricultural Research Council Initiates Bioenergy Crop Cultivation Projects. http://www.parc.gov.pk/enews.html
29
could be around worth US$50 million at the present expected rate of US$500 per ton (Rs.43 per liter). 21
Employment will be generated from plantation, seed collection, oil extraction, Bio- diesel manufacturing, and localized distribution. Employment generation from plantation and seed collection alone is estimated to be 40 man days/ha/ year. On the other hand, Pakistan produces around two million tons of molasses annually, out of which during the last year 1.45 million tons were exported at a nominal rate of $35 per ton, earning only $47 million. According to industry sources, more foreign exchange can be earned if the molasses is converted to more value-added products, like ethyl alcohol (ethanol). On an average ethanol recovery from one ton of molasses is estimated at 240 to 270 liters depending on the quality of molasses. If the entire two million tons of molasses are processed in distilleries, ethanol production will be over 500 million liters (0.4 million tones). Exporting the same at an average price of $360 per ton, the country can earn around $144 million.22
2.2.6 The Experience of the Sultanate of Oman in Producing Bio-fuel
A very ambitious biofuel project is presented by an entrepreneur from Oman. Mohammed bin Saif al-Harthy and his associates at the Oman Green Energy Company announced that they were going to utilize 10 million of the region's ubiquitous date palms as a feedstock for ethanol. Initially it was not clear which parts of the tree would be used, because al-Harty stressed that neither the fruit, nor the cellulosic biomass would be harvested.23
Mohammad Bin Saif Al Harthy and his family are successfully using ethanol produced from biomass for the last 18 months to run their cars in Sohar. The company uses the enzyme that it developed to extract the bio-mass from palm trees. From the project description we deduced that it might involve the traditional technique of tapping sucrose-rich sap from the palm tree (Phoenix Dactylifera), as is still done today to make date palm wine, sugar and syrup. The sugar contained in the palm juice can be processed into a range of products, from jaggery and crystalline sugar with remaining molasses, to sugar-candy, large sugar crystals and sugar syrup.
21 Usmani, Jafar N. Status of Jatropha Cultivation fo Biodiesel in Pakistan, 22 http://www.defence.pk/forums/economy-development/10237-bio-fuel-pakistan.html
23 Biopact's. Omani biofuel project involves tapping date palms - a closer look. J U N E 2 9 , 2 0 0 7

30
As an average the outturn of jaggery is 10-15% of the weight of the raw juice. Jaggery itself contains between 85-90% of total sugar (composed of different types), the rest being moisture, protein and fat. Taking a yield of 8 liters of sap per tree, a planting density of between 156 to 204 trees per hectare, and a harvesting period of 45 days per year (continuous tapping), between 56,160 and 73,440 liters of juice can be harvested per hectare per year. From this amount some 5616 to 7344 kilograms of jaggery can be obtained at low conversion efficiencies, which comes down to 4550 to 6240 kilograms of pure sugar (low estimate). As a rule of thumb, conventional yeast fermentation produces around 0.5 kg of ethanol from 1 kg of any the C6 sugars. In short, from one hectare of tapped date palms, some 2275 to 3120 kilos of ethanol can be obtained. The expected production by 2010 is summarized in the following:
• An Omani entrepreneur plans to start producing biofuel and marketing the same by 2010 through biofuel stations across the country.
• The biofuel refinery, to be set up in Sohar, will have a capacity of 4.8 million tones within four years. In the first two years the capacity will be 900 thousand tones annually.
• Ethanol, used as biofuel, is produced by fermentation of glucose, to be derived from date palm in Oman, by yeast.
• The biofuel project is expected to create more jobs for Omanis, employing over 3,500 Omanis in the first five years.
2.2.7 The Experience of the Kingdom of Saudi Arabia in Producing Biofuel Harvesting Jatropha curcas is catching on in the region, according the NEWS president. By 2010, several countries will be producing Jatropha biodiesel, including Egypt and Saudi Arabia. Saudi Arabia has already planted 50,000 dunums of Jatropha as a first stage to its targeted one million dunums.24
The oil giant BP and other firms are investing in jatropha in Thailand, the Philippines, Swaziland, Saudi Arabia and especially India.25
The UK-based D1 Oils is creating D1 Oils Arabia Limited with Jazeera For Modern Technology. D1 Oils Arabia will be a 50/50 joint venture and will manage the plantation of jatropha trees, which D1 Oils uses as feedstock to produce renewable biodiesel. Biodiesel can be made from other sources as well like soybeans, the predominant feedstock in the U.S.26
D1 Oils Arabia will also install refineries in Saudi Arabia and expand the D1 Oils brand throughout Saudi Arabia and into other Gulf area countries. The formation of
24 http://www.americanfuels.info/2008/01/kingdom-has-potential-to-develop.html. Friday, January 04, 2008 | 25 Patrick Barta. (2007). Jatropha Plant Gains Steam In Global Race for Biofuels. The Wall Street Journal August 24, 2007; Page A1 26 Renewable Energy World. Saudi Arabian Plantations to Produce Biodiesel. 2005

31
D1 Oils Arabia is expected not only to provide Saudi based customers with innovative alternative renewable fuel solutions, but also help stem desertification and reclaim land by the planting of jatropha on marginalized land. As jatropha is a non-edible crop, D1 Oils is able to irrigate the plantations with wastewater that otherwise would have been difficult to dispose of.
2.2.8 The United Arab Emirates (UAE) in Producing Bio-fuel An UAE-based biodiesel plant will produce 3 million gallons annually of environmentally-friendlier diesel to power vehicles, drastically reducing greenhouse gas emission due to its less toxic content, by the end of 2009.27
Biodiesel is made from a variety of organic sources such as vegetable oils, inedible oils and other biomass and can be blended with petrodiesel by up to 20 per cent for use in vehicles without any alteration to the engine. EMIRATES BIODIESEL (EmBio) will be focusing largely on waste vegetable oil as feedstock; discarded oils which are derived from crops harvested for human consumption as the primary purpose. Once utilized, the waste oils are then channeled to company.
2.2.9 The Jordanian Experience in Producing Bio-fuel
A. Introduction Jordan is located in arid and semi arid region, more than 80% of the total area is desert with average rainfall less than 200 mm. Jordan faces a real problem in availability of water. It is considered as one of the tenth poorest water country in the world. The average quantity of water per person is less than 160 cubic meters per year in 2007.
As a result of rising petroleum prices in the last years, the interest to find other alternatives is increased. Producing bio-gas from different source, residues and specialized crops, is considered as one of the alternatives of natural oil. The first station to produce bio-gas is established in 1998 and started its production for the first time in 2000.
B. Institutes, Centers and Organizations of bio-fuel production There are many institutes and organizations working or supporting bio-fuel production in Jordan. There are government institutes which support researches and applying the technology as pilot project, and non governmental organizations including the international organizations in addition to the universities and researches centers. The main institutes can be presented as follows:
o The Ministry of Agriculture/National center for Agricultural Research and Extension. This center is conducting researches and studies and applying experiments on new technology in the field of biofuel. Since 2008 this center started different experimental researches in biofuel production. In 2008 a project started as experimental research to plant Jatropha under different
27 Gulf News. UAE to host region's first biodiesel plant. December 10, 2008.

32
condition in Jordan. Another project started in 2009 aimed at planting different kind of plant that can be used to produce bio-fuel like Jatropha and Jojoba by using treated wastewater.
o University of Science and Technology\agricultural faculty: in this university a research project aims to plant Hohoba in the university is being implemented.
C. Regulation and polices of Bio-fuel Since the application of bio-fuel technology is new in Jordan there are no specific regulations or laws related to these issues and the only general law related to protect the environment. Since 2008 the ministry of Energy and Mineral Wealth started to prepare the guideline about the exporting, importing, producing, storing and transporting of biodiesel.
D. Projects and Activities of Biofuel Production A station to produce biogas has been established in 1998 in Al-Rosaifa by using the organic waste, this station aimed at generating electricity with capacity one Mega-Watt. The investment capital of this station is five thousand million dollar and started its production in 2000. The value of selling energy in 2000 was about 76 thousands Jordanian Dinar (JD)28
2.3 The Impact of Biofuel Production on Agriculture
while it was 340 thousand Jordanian Dinar in 2007.
In this section, the relationship between agriculture and biofuel in several parts of the world as reported in the literature will be discussed, mainly pointing at the positive impacts and negative impacts.
Biofuel economics depend heavily on following main factors:
• Availability of land and water at the right climate. • Technology development. • Government policies.
5.1 Positive Impacts Demand for agricultural feedstocks for liquid biofuels will be a significant
factor for agricultural markets and for world agriculture over the next decade and perhaps beyond. The demand for biofuel feedstocks may help reverse the long-term decline in real agricultural commodity prices, creating both opportunities and risks. All countries will face the impacts of liquid biofuel development – whether or not they participate directly in the sector – because all agricultural markets will be affected.
Harmonized approaches for assessing greenhouse gas balances and other environmental impacts of biofuel production are needed to achieve desirable outcomes. Criteria for sustainable production can contribute to improving the environmental footprint of biofuels, but they must focus on global public goods and be based on internationally agreed standards and must not put developing countries at a competitive disadvantage. The same agricultural commodities should not be treated differently according to whether they are
28 1 JD=US$1,41

33
destined for biofuel production or for traditional uses such as human consumption or feed.
Technological innovation can lower the costs of agricultural production and biofuel processing. Investment in research and development is critical for the future of biofuels as an economically and environmentally sustainable source of renewable energy. This applies both to the field of agronomy and to conversion technologies. Research and development on second-generation technologies, in particular, could significantly enhance the future role of biofuels.
In the longer run, growing demand for biofuels and the resulting rise in agricultural commodity prices can present an opportunity for promoting agricultural growth and rural development in developing countries. They strengthen the case for focusing on agriculture as an engine of growth for poverty alleviation. This requires strong government commitment to enhancing agricultural productivity, for which public investments are crucial. Support must focus particularly on enabling poor small producers to expand their production and gain access to markets. Moreover, Production of biofuel feedstocks may offer income-generating opportunities for farmers in developing countries. Experience shows that cash-crop production for markets does not necessarily come at the expense of food crops and that it may contribute to improving food security. For smallholder farmers there is promising future in biofuel crops. The challenge is how to integrate them in the value chain
Low-cost crop and forest residues, wood process wastes, and the organic fraction of municipal solid wastes, i.e. second-generationbiomasss, can all be used as ligno-cellulosic feedstocks. Where these materials are available, it should be possible to produce biofuels with virtually no additional land requirements or impacts on food and fiber crop production. However, in many regions these residue and waste feedstocks may have limited supplies, so the growing of vegetative grasses or short rotation forest crops will be necessary as supplements. Where potential energy crops can be grown on marginal and degraded land, these would not compete directly with growing food and fiber crops which require better quality arable land.
Some experts considered biofuel production could benefit the environment and increase food security if smallholders farmed biocrops and biomass as a source of energy for themselves and their local communities or contributed to commercial production for national or international markets. Some biocrops or other feedstock are best produced in landscape “mosaics“ where they are grown alongside food crops and other vegetation. Biofuel areas within these mosaics could provide other valuable benefits such as windbreaks, restoration of degraded areas, habitats for native biodiversity and a range of ecosystem services.
Biofuels production may result in macroeconomic benefits for developing countries, such as increased export revenues.

34
5.2 Negative Impacts Most of the following impacts needs further investigation. Biofuels will increase pressure on the food supplies in the country if first
generation products are used, or good resources are exploited and further erode food sovereignty
Rapidly growing demand for biofuel feedstock has contributed to higher food prices, which pose an immediate threat to the food security of poor net food buyers (in value terms) in both urban and rural areas.
Market opportunities cannot overcome existing social and institutional barriers to equitable growth – with exclusion factors such as gender, ethnicity and political powerlessness – and may even worsen them. Moreover, higher commodity prices alone are not in the longer term, expanded demand and increased prices for agricultural commodities may represent opportunities for agricultural and rural development.
The impact of biofuels on greenhouse gas emissions– one of the key motivations underlying support to the biofuel sector– differs according to feedstock, location, agricultural practice and conversion technology. In many cases, the net effect is unfavorable. On the other hand, effluent from biofuels processing industries once established if not properly treated could pollute the environment
The largest impact is determined by land-use change – for example through deforestation – as agricultural area is expanded to meet growing demand for biofuel feedstocks. Several other possible negative environmental effects – on land and water resources, as well as on biodiversity – occur largely because of changes in land use. Accelerated biofuel production, pushed by policy support, strongly enhances the risk of large-scale land-use change and the associated environmental threats.
Crops that were previously grown for food are grown for biofuel or replaced with biofuel crops, tens of thousands of acres of wetlands are slated to go under the plow in Africa to grow sugar cane, farmers in the US are growing corn on land previously set aside for conservation, deforestation in South America continues at an alarming rate, Indonesia is being replanted with palms, and on it goes on.
Forests, peat lands, mangroves and protected areas will be cut down, burned, and converted to farmland hence canceling any environmental benefit arising from biofuels
Birds and other wildlife, already huge victims of our gluttonous energy consumption, are losing more habitats.
Liquid biofuels are likely to replace only a small share of global energy supplies and cannot alone eliminate our dependence on fossil fuels. Land requirements for feedstock production would be too extensive to allow displacement of fossil fuels on a larger scale.
Production of liquid biofuels in many countries is not currently economically viable without subsidies, given existing agricultural production and biofuel processing technologies and recent relative prices of commodity feedstocks and crude oil. The most significant exception is sugar-cane-based ethanol production in Brazil. Competitiveness varies widely according to the specific biofuel, feedstock and production location, and economic viability can change

35
as countries face changing market prices for inputs and oil, as well as through technological advances in the industry itself. Policy interventions, especially in the form of subsidies and mandated blending of biofuels with fossil fuels, are driving the rush to liquid biofuels. However, many of the measures being implemented by both developed and developing countries have high economic, social and environmental costs. The interactions among agricultural, biofuel and trade policies often discriminate against developing country producers of biofuel feedstocks and compound impediments to the emergence of biofuel processing and exporting sectors in developing countries.
Many factors are responsible for the recent sharp increases in agricultural commodity prices; one of them is the growth in demand for liquid biofuels. Biofuels will continue to exert upward pressure on commodity prices, which will have implications for food security and poverty levels in developing countries. At the country level, higher commodity prices will have negative consequences for net food-importing developing countries. Especially for the low-income food-deficit countries, higher import prices can severely strain their food import bills.
Agricultural products transportation sector will be affected, since the products that are produced for biofuel are processed locally.
The use of perennial crops for the production of liquid biofuels presents some drawbacks as well. For instance, the long maturation phase that characterize perennial crops (up to four years for jatropha and up to eight years for pongamia), combined with the uncertainties associated with their cultivation and marketing, limit their adoption by smallholder farmers.
The large scale production of biofuels tends to be water intensive and may aggravate water scarcity related problems, unless alternative crops are used.
Development of biofuel feedstock production may present equity- and gender-related risks concerning issues such as labor conditions on plantations, access to land, constraints faced by smallholders and the disadvantaged position of women. Generally, these risks derive from existing institutional and political realities in the countries and call for attention irrespective of developments related to biofuels.
Massive subsidies to promote American corn production for ethanol have shifted soy production to Brazil where large areas of cerrado grasslands are being torn up for Soya bean farms. The expansion of soy in the region is contributing to deforestation in the Amazon. Some forests are directly cleared for soy farms. Farmers also purchase large expanses of cattle pasture for soy production, effectively pushing the ranchers further into the Amazonian frontier or onto lands unsuitable for soya production. While the corn connection to deforestation in the Amazon has been well-explored in recent months, the American biodiesel incentives that are promoting soy expansion in the Amazon are also fueling oil palm establishment in Indonesia, by boosting prices for all energy crops.
Extensive use of fertilizer and agrochemicals will also pollute water tables creating potable water problems. This needs to be considered when embarking on a biodiesel agriculture 2.4 The Impact of Biofuel Production on Socio-Economic and Environment Aspects

36
Most of the literature which dealt with quantitative evaluation of biofuel production was on the economic basis. In this section, the results of researches and reports related to the socio-economic analysis of producing biofuels, either with or against, will be discussed.
2.4.1 The Socio-Economic Effects of Converting Large-Scale Plantations to Produce Biofuel Biofuel feedstock production is characterized by important economies of scale, i.e. large-scale production. The large-scale production of liquid biofuels and the conversion of significant portions of land to energy crop plantations have begun only recently in developing countries. Thus, there is a lack of data (including sex-disaggregated data) on the socio-economic effects of such phenomena. However, based in part on evidence from other forms of commercial agricultural production, a few hypotheses can be made about the potential gender-differentiated risks associated with the establishment of large-scale plantations for biofuels production. Large-scale plantations for the production of liquid biofuels require an intensive use of resources and inputs to which smallholder farmers (particularly female farmers) traditionally have limited access. These resources include land and water, plus chemical fertilizers and pesticides to which women do not readily have access.
2.4.2 Socio-Economic Aspects of Using Marginal Land For Biofuel Production The growing global demand for liquid biofuels, combined with the high land requirement that characterizes the production of such fuels, might put pressure on the so-called “marginal” lands, providing an incentive to convert part of these lands, which may be perceived as less important and of less ‘used’, to biofuels production.29
These marginal lands (also called “wastelands”) are considered to provide little economic or ecological benefits. As shown in several studies, however, these lands, the majority of which are classified as common property resources (CPRs), represent an integral part of the livelihood of rural poor, to which they supply essential commodities such as food, fodder, fuel-wood, building materials, and so on. So-called marginal lands provide therefore key subsistence functions, particularly to the most vulnerable. In India, common property resources contribute between 12 percent and 25 percent of poor households’ incomes - the poorer the household, the higher the contribution. In WANA region about 80% percents of the land is considered marginal land, and it is used for grazing the Bedouins animals. Using this land for producing biofuel crops will affect the livestock sub-sector in the region.
29Rossi Andrea and Yianna Lambrou. Gender and Equity Issues in Liquid Biofuels Production -Minimizing the Risks to Maximize the Opportunities. FAO. Rome 2008

37
Marginal lands are particularly important to women. There is evidence, for instance, that in several Sub-Saharan African countries, women are often allocated low quality lands by their husbands. On marginal lands, women have traditionally grown crops for household consumption, rituals and medicinal uses. The conversion of these lands to plantations for biofuels production might therefore cause the partial or total displacement of women’s agricultural activities towards increasingly marginal lands, with negative repercussions for women’s ability to meet household obligations, including traditional food provision and food security. Furthermore, if land traditionally used by women switches to energy crop plantations, the roles men and women play in decision-making concerning household agricultural activities may be altered. In particular, women’s ability to participate in land-use decision-making may be reduced, as the amount of land they control will decline. As crops for biofuel become a major product of agricultural land, there will be pressure to increase the productivity of traditional food crops that will be allocated to reduced amounts of land. That may lead to higher food prices and increases land values that may negatively affect the poor. This possible negative impact can be partially mediated if the pressure on food systems will lead to increased emphasis on research of food production and better utilization of new technologies including biotechnology.
2.4.3 Impact of Using Marginal Land For Biofuel Production on Environment and Biodiversity Feedstock production is the most important factor in determining the sustainability of liquid biofuels production. The growing use of agricultural commodities for the production of such fuels and the establishment of large-scale energy crop plantations might exacerbate the pre-existing competition for land between forests, agricultural and urban uses, leading to deforestation (e.g. in Indonesia and Malaysia). In addition, energy crop plantations might expand into areas rich in biodiversity, such as riparian areas and peat lands. Moreover, large-scale biofuels production may replace low-productivity agricultural areas (which are characterized by a high biodiversity value) with biodiversity-poor monocultures. Each of these processes would cause a biodiversity loss, whose magnitude will depend on the type of crop grown, what it is replacing and the methods of cultivation and harvesting. 30
This potential loss of biodiversity might affect men and women differently. The establishment of large-scale plantations for the production of liquid biofuels on fallow fields and wildlands may threaten, in particular, the wild edible plant species that grow on these lands. This would have negative repercussions on poor rural households, who are largely dependent on natural resources and biodiversity for their food security and livelihoods, particularly in areas prone to food shortages. The loss of wild edible plant species would also threaten the knowledge and skills associated with the collection and the utilization of such species, particularly among women, who are often responsible for their collection, preparation and consumption and thus have a more highly specialized knowledge than men of wild plants used for food, fodder and medicine.
30 Rossi Andrea and Yianna Lambrou. Ob cit

38
The potential biodiversity loss associated with biofuels production might also lead to a “narrowing of future options”, through the loss of genetic information and genetic material (and of the associated knowledge) that could be introduced into domesticated crops and stock through breeding. Large-scale plantations for biofuels production may also be associated with increased soil and water pollution (from fertilizer and pesticide use), soil erosion and water run-off, with subsequent loss of biodiversity. The potential depletion (or degradation) of natural resources associated with biofuels production may place an additional burden on rural farmers’ work and health, in particular on female farmers. If biofuels production competes, either directly or indirectly, for water and firewood supplies, it could make such resources less readily available for household use. This would force women, who are traditionally responsible, in most developing countries, for collecting water and firewood, to travel longer distances, reducing the time available to them to participate in decision-making processes and income generating activities.
2.4.4 The Impact of Biofuel Production on Employment The growing global demand for liquid biofuels has been seen as a way to create new employment opportunities in rural areas through conducting contracts between then and the biofuel factories, thus leading to increase in income generation and rural development. However, with the increasing mechanization of agricultural production that is occurring in most developing countries (mainly on large-scale plantations), the number of agricultural jobs associated with the production of liquid biofuels is likely to decrease over time. In some southern African countries, however, there are also mixed systems in place, in which a machine cuts the cane that is then collected and gathered manually. Other important factors to be assessed are the working conditions and the health and safety risks associated with the agricultural jobs created by the expanding biofuel industry. It has been argued that a large share of these jobs would be of poor quality and conditions and targeted mainly to low-skilled seasonal agricultural workers (often migrants), who tend to be particularly vulnerable. Specific studies and data on the working conditions on dedicated energy crop plantations are still scarce. However, the cultivation of biofuel feedstocks such as sugarcane and palm oil has been linked, in several developing countries, to unfair conditions of employment, health and safety risks, child labor and forced labor. Biofuel production encourages the production in plantations, thus lot of displacement of farmers will occur, especially when producing in the degraded lands and thus will evacuate the pastoralists out of their land. On the other hand, biofuels have a domestic economic appeal partly because locally produced fuel creates jobs and keeps money within the country.

39
2.4.5 The Impact of Biofuel Production on Food Security The establishment of energy crop plantations and the impacts of the increasing demand for liquid biofuels on food prices might affect at least two key dimensions of food security – availability and access. Energy crop plantations, due to their high profitability, may be established on high-quality lands, leaving subsistence crops to the low-quality lands. In addition, biofuels production may negatively impact the livestock sector, which is key to the food security of rural households, through a reduction in the availability of land for grazing and an increase in the price of fodder (due to the growing use of agricultural commodities for biofuels production). The potential loss of both biodiversity and agro-biodiversity presents risks to food production as well, posing a serious threat to rural livelihoods and long-term food security. In particular, the potential deforestation associated with the establishment of large-scale plantations for biofuels production may negatively impact the peoples who depend on such forests for their livelihoods, increasing their food insecurity. The rising demand for liquid biofuels could also make the prices of agricultural commodities and food more unstable, exposing a significant number of households and individuals to the risk of food insecurity. Sudden increases in food prices would have negative repercussions in particular for poor households and vulnerable groups, particularly women and female-headed households, which tend to be particularly exposed to chronic and transitory food insecurity, due also to their limited access to income generating activities. Areas identified suitable for biofuels production are adjacent to rivers, or using non-renewable underground water which small scale farmers depend on. Large scale biofuels production will divert most of the water into their plantation, hence depriving small scale farmer's access to water. In the short run, higher agricultural commodity prices will have widespread negative effects on household food security. Particularly at risk are poor urban consumers and poor net food buyers in rural areas, who tend also to be the majority of the rural poor. There is a strong need for establishing appropriate safety nets to ensure access to food by the poor and vulnerable
2.4.6 The Impact of Biofuel Production on Health Ethanol is being promoted as a clean and renewable fuel that will reduce global warming and air pollution, but the results of study by Stanford University atmospheric scientist Mark Z. Jacobson showed that a high blend of ethanol poses an equal or greater risk to public health than gasoline, which already causes significant health damage.31
31 Butler, Rhett A. thanol may be greener but have higher health cost. mongabay.com April 18, 2007.

40
2.4.7 The Impact of Biofuel Production on CO2 Emissions The researchers say that producing one ton of palm oil on peat land generates 15 to 70 tons of CO2 over 25 years as a result of forest conversion, peat decomposition and emission from fires associated with land clearance.32
Fluxes of carbon in and out of the soil may have an impact on the emissions balance of biofuels. Under stable conditions the fluxes in and out are in balance, but changes to land cover may cause imbalance in the fluxes and consequently a change in the carbon content of the soil. If the influx of carbon exceeds the losses there will be an increase in Soil Organic Matter (SOM) content and vice versa. The content of organic matter in a given soil depends on the recent history of land cover, climatic factors and the physical properties of the soil. SOM is comprised of dead organic matter from plants, animals and microbes. The main processes that add organic matter to the soil are secretion of organic matter from roots of plants and the incorporation of dead plant matter into the soil. The main losses of organic matter are due to soil respiration, leaching and erosion. Typically the conversion of woodland or grassland to arable land will reduce the amount of SOM and the reverse processes will cause an increase.33
Releases of GHGs from the soil to the atmosphere influence the emissions balance of biofuels, as it must be added to the emissions caused by the production and use of these fuels. Two important greenhouse gases to consider in this context are carbon dioxide (CO2) from soil respiration and nitrous oxide (N2O) (IPCC, 2007). Nitrous oxide does not contain carbon and does not therefore directly affect the carbon balance, but its effect as a greenhouse gas is substantial with a greenhouse warming potential (GWP) of around 310 times that of carbon dioxide. Nitrous oxide is produced by soil microbes from available nitrogen in the soil and the resulting emissions tend to increase with the application of fertilizer. The level of nitrous oxide emissions is also influenced by factors such as soil type, crop type, fertilizer type, plant residue type, freezing and thawing, etc.
2.4.8 The Impact of Biofuel Production on Environment Although using the biofuels avoids many of the environmentally detrimental aspects of petroleum-based fossil fuels, biofuel production has its own environmental costs, largely related to fossil fuel use in converting crops to biofuels and crop cultivation itself, including ecological damages caused by nitrogen and phosphorus fertilizers, pesticides, and erosion. Sequestration A new generation of biofuels derived from lignocellulosic sources offers greatly reduced environmental impacts while potentially avoiding conflicts between food and
32 Page, Susan. Life cycle analysis of land use change in tropical peat lands. mongabay.com. December 17, 2007 33 Lyshede, B. M. Rapeseed Biodesil and Climate Change Mitigation in the European Union. Lund, 2008.

41
energy production. In particular, diverse mixtures of native prairie species offer biomass feedstocks that may yield greater net energy gains than monoculture energy crops when converted into biofuels, while also providing wildlife habitat and enriching degraded soils through carbon sequestration and nitrogen fixation. Ultimately, as demand for both food and energy rise in the coming decades, greater consideration will need to be given to how land can best be used for the greater benefit of society.
2.5 Caselets In this section, two case lets will be presented, the first from Egypt and the second from Jordan. A. Egypt's Caselet
Producing of Biogas by using the animals waste: in 1980 a training center of biogas production has been established, this center belongs to Soil, Water and Environmental Research Institute. The training in this center is free of charge to encourage people to take this training. A modification and development in this center has been made by establishing a pilot project to be as demonstration project. This project encourages many trainees to establish a bio-fuel project in their farms. It is estimated that about 50% of the trainees has established a bio-fuel unit and using this gas in their farms. From the date of starting activities of this center until now, about 3000 units have been established as bio-fuel units for individual farmers, it is estimated that 65% of these units are still working. The farmer uses the produced biofuel in his farm, but if whishes to sell it he can get EP 1.5/M3 , and sell the fermented manure by EP 120/ton.
Producing of Biogas by using rice straw: Rice straw is sold to the government processing plants by EP 85/ton. Each ton of rice straw produce one ton of biogas (433 M3), the cost of producing 1 CM of biogas costs about EP 3. Following is a simple calculation of processing one ton of rice straw to biogas:
1- Cost of rice straw: EP 85/ton
2- Rice straw processing to biogas: EP 400/ton
3- Total cost of the biogas produced from one ton of rice straw: 433*3= EP 1299
4- Net profit of the biogas produced from one ton of Rice straw:
1299- (400+85) = EP 814
B. Jordan's Caselet A station to produce biogas has been established in 1998 in Al-Rosaifa by using the organic waste, this station aimed at generating electricity with capacity one Mega-Watt. The investment capital of this station is five thousand dollar and started its production in 2000. The value of selling energy in 2000 was about 76 thousands Jordanian Dinar (JD)34
34 1 JD=US$1,41

42
III. Policies and Institutional Maping
while it was 340 thousand Jordanian Dinar in 2007.
3.1 Introduction Biofuels present both opportunities and risks. The outcome would depend on the specific context of the country and the policies adopted. The challenge is to reduce or manage the risks while sharing the opportunities more widely. The next generation of biofuels currently under development but not yet commercially available, using feedstocks such as wood, tall grasses, forestry and crop residues, could improve the fossil energy and greenhouse gas balance of biofuels. There seems to be a case for directing expenditures on biofuels more towards research and development, especially on second-generation technologies, which, if well designed and implemented, could hold more promise in terms of reductions in greenhouse gas emissions with less pressure on the natural resource base. Moreover, policymakers need to encourage farmers to grow biofuel crops under rainfed rather than irrigated conditions. Not only could such a policy boost agricultural returns in rainfed areas but, provided food crops aren’t displaced, the impact on food production would be minimal. More effective water policies and more efficient water institutions will be needed to put policies for better water use in place. Experience from a number of countries shows that active government involvement is important for developing biofuel programmes. Valuable lessons can be drawn from Germany, Brazil and the United States. Germany has become a leader in high-technology biofuel production, due to strong government commitment, viable policy and solid collaboration from the private sector. This positive environment has in turn unleashed innovation. The United States, too, has been active for some time. Congress and a number of States have provided robust support for biofuel development. So has Brazil, especially for bioethanol. Biofuels are near the top of development agenda in the country. But despite these lessons, African countries will still need to consider their own situations, since the experiences of others may not be easily replicable where conditions may differ. The Government's policy objectives for bioenergy development include: 1) Energy security to help stabilize the energy sector and facilitate economic
development through the diversification of energy sources to reduce dependence on imported fossil fuel products;
2) Attainment of food security and meet poverty reduction goals through income and employment generation,
3) Enhance rural development strategies via provision of rural energy services, employment generation, and establishment of agro-processing industries,
4) Diversification of agricultural production 5) Development of policies in forestry resource utilization and bio-energy
services provision to support Social and economic development while Protecting the natural resources and Environment
Few countries have comprehensive biofuel policies, and where present, they are often driven largely by agricultural considerations. Policies are urgently required to capture a wide spectrum of activities involving energy, environment, land use, land-use

43
change, forestry, agriculture, water resources, waste management, and transport; and address the economic, social and environmental implications of widespread production, use and trade in biofuels.
Successful policy development and implementation requires a robust legal, regulatory and institutional framework. Legislation would guide regulation, management and development of biofuels by creating an administrative framework and procedures for managing projects and programs. Informed and effective policymaking needs reliable data and information. Information is most useful when it has been painstakingly collected, processed and analyzed, and for biofuels, relevant information from the transportation, forestry, energy, agriculture, and environment sectors will be required. We still need to develop accurate ways to estimate and project biofuel demand in domestic and global markets. In the previous sections it was shown that no biofuel production policy was implemented in the AARINENA Sub-regions (WANA Region). Several countries have their own environment policies.
3.2 Institutions Concerned with Biofuel Production in WANA Region
3.2.1 Institutes, Centers and Organizations of BioFuel Production in Egypt There are many institutions and organizations working or supporting the sector of biofuel production in Egypt; there are government institutes which support researches and applying the technology as pilot project, and non governmental organizations including the international organizations and the private sector which hold and establishing projects to gain economic benefits. The main institutes are the following:
o The Ministry of Agriculture/Agricultural Research Center. This center is conducting researches and studies and applying experiments on new technology in the field of bio-fuel. The division has the responsibility of bio-fuel in Soils, Water and Environmental Research Institute. The main implementation of this center in this field is the establishment of training Center for Recycling Agricultural Residues.
o National Center for Agricultural Research: this center is conducting researches and studies and applying experiments with new technology in the field of bio-fuel.
o The state ministry for environmental Affairs: This ministry supports the projects of environmental protection involving the use of bio-fuel. It gives the results of researches and any other information for the private sector. It has established two units to produce gas from plant residues and distributes this gas free for the habitants of the villages near the production factory.
o Industry Modernization Center: It has information about the private sector in issues related to industrial development.
o The Ministry of Oil and Energy: It implements projects and gives information in the field of energy to the private sector.

44
o International Organizations such as UNDP and GTZ: These organizations with cooperation of the government implement projects in the field of environmental protection include bio-fuel projects.
3.3 Policies Related to Biofuel Production in WANA Region
3.3.1 Regulation and Polices of Bio-fuel in Egypt
Since the application of bio-fuel technology is new in Egypt there are no specific regulations or laws related to these issues. Only general law related to protect the environment that is law number 94 part no. 5 which talks about the implementation of experimental projects to protect the natural resources and protect the environment from pollution.
In these days there are restrictions in the regulations of planting Jatropha and in using the crops to produce bio-fuel. The government doesn’t allow planting Jatropha in the agricultural areas and also does't allow using fresh water for this plant, so the conditions to plant Jatropha are to plant it in the marginal or desert areas and to use treated waste water for irrigation. The government doesn’t allow using the food crops to produce bio-fuel, it allows producing biofuel only from the waste of animals or plant residues in addition to some kind of plants like Jatropha but under the conditions mentioned above.
3.3.2 Regulation and Polices of Bio-fuel in Sudan The Government encourages the researches in the field of bio-fuel production and supports them by different research centers. On the other hand, there is no specific regulations or polices related to biofuel production.
3.4 Recommended Policies To mitigate against the negative impacts of producing biofuel in the region and optimize the resource use we recommend a broad policy clauses as follows: 1- Biofuel production should be directed to the low-cost crop and forest residues,
wood process wastes, waste oil for biofuel production, and the organic fraction of municipal solid wastes can all be used as ligno-cellulosic feedstock. Where these materials are available, it should be possible to produce biofuels with virtually no additional land requirements or impacts on food and fiber crop production. However in many regions these residue and waste feedstock may have limited supplies, so the growing of vegetative grasses or short rotation forest crops will be necessary as supplements. Where potential energy crops can be grown on marginal and degraded land, these would not compete directly with growing food and fibre crops which require better quality arable land.35
35 International Energy Agency (IEA) From 1st- to 2nd-Generation Biofuel Technologies An overview of current industry and RD&D activities.

45
2- Harvesting, treating, transporting, storing, and delivering large volumes of biomass feedstock, at a desired quality, all-year-round, to a biofuel processing plant requires careful logisitical analysis prior to plant investment and construction. Supplies need to be contracted and guaranteed by the growers in advance for a prolonged period in order to reduce the project investment risks.
3- The governments have to offer substantial government grants, subsidies and tax exemptions when producing the second generation biomass, since the costs are higher than the production of biofuel from the first generation crops.
4- Success in the commercial development and deployment of second-generation biofuel technologies will require significant progress in a number of areas if the technological and cost barriers they currently face are to be overcome. Areas that need attention are:
• Improved understanding of feedstock, reduction in feedstock costs and development of energy crops
• Technology improvements for the biochemical route, in terms of feedstock pre-treatment, enzymes and efficiency improvement and cost reduction
• Technology improvements for the thermo-chemical route, in terms of feedstock pre-treatment, gasification and efficiency improvement and cost reductions, in addition to invest in co-products and ensure process integration
• An integrated package of policy measures will be needed to ensure commercialization, including continued support for R&D, specially to the2nd-generation biofuels, addressing the financial risks of developing demonstration plants; and providing for the deployment of 2nd-generation biofuels. This integrated policy approach, while not entirely removing financial risk for developers, will provide the certainty they need to invest with confidence in an emerging sector.
5- Environmental performance and certification schemes. Continued progress needs to be made in addressing and characterizing the environmental performance of biofuels. Approaches to standardization and assessment methods need to be agreed, as well as harmonizing potential sustainable biomass certification methods. These will need to cover the production of the biomass feedstock and potential impacts from land-use change.
6. In order to ensure that biofuels production contributes to reduce poverty and hunger, policies should be adopted, in developing countries, to strengthen the participation of smallholder farmers in biofuels production (particularly biofuel feedstock production), by increasing their access to land, capital and technology. This could be done, for instance, by promoting the establishment of cooperatives, to which men and women, as well as male- and female headed households, should have equal access. By organizing themselves in cooperatives, smallholder farmers might also take advantage of the economies of scale associated with biofuels production. In order to implement a pro-poor biofuel development strategy, developing countries should also adopt measures aimed to ensure that the establishment of dedicated energy crop plantations integrates, rather than replaces, existing local agri-food systems. A key objective of these policies should be to protect smallholder farmers’ traditional agricultural activities, skills and specialized knowledge, which are crucial to the food security and long-term resilience of

46
rural communities. One of the possible measures would be to promote the small-scale cultivation of multi-purpose, short-duration annual crops that can either be grown in rotation with food crops or simultaneously yield fuel along with food and/or fodder. This would have the advantage of providing additional seasonal income for smallholder farmers, without dismantling their existing livelihoods
8. Consider competing uses of marginal and idle land, such as biomass forage and as resources for the landless
9. Ensure flexibility in food and energy production technologies in order to minimize risk
10. Ensure any certification measures are pro-poor 11. Bioenergy feedstocks must be produced using better management practices
(BMPs) 12. Implementation of bioenergy policies must take into account food security and
must not threaten the realization of the right to food. 13. Social considerations and indigenous people’s rights must be considered as a
priority in bioenergy development. 14. Organization (FAO), UN Conference on Trade and Development (UNCTAD),
UN Environment Program help governments determine their strategy and engagement with bioenergy production, encourage sharing of experiences on small producers’ involvement. This would enable small producers to fully benefit from bioenergy production and help developing countries improve their capacity and competency to adapt existing technologies to local conditions and adjust to more sophisticated and likely, proprietary technologies.
15. Conduct further studies:
• The assessment of the working conditions and the health and safety risks associated with the agricultural jobs created by the expanding biofuel industry. On the other hand, The study should discuss the event of establishing plantations, thus lot of displacement of farmers will occur, especially when producing in the degraded lands and thus will evacuate the pastoralists out of their land.
• A comprehensive study should be taken to evaluate the effect changing food to biofuel on prices of stable food
• Conduct feasibility studies on converting crops and different biomass to biofuel

47
References Agricultural information center, Agricultural; and fishery statistic 2006. Qatar 2006 Al-Shimee, samir. The economic and environment impact of bio-gas technology in
Egypt. Başaran, Şerife. A Re-Look At Biofuels: "Crime Against Humanity" or Alternative
Green Energy" May 2008 Below, Fred. Tropical Maize for Biofuels. University of Illinois, Urbana-
Champaign. 2007 Bioenergy Glabal Prtnership (BEGP). Hosted by FAO. Rome Biofuel Digest. New projections point to massive biofuel supply/demand
imbalances by 2015-2030; polyculture a way forward for sustainable production? October 2009.
Biopact's. Omani biofuel project involves tapping date palms - a closer look. June 29, 2007 BIOPACT. The spirit of Rudolf Diesel: Peanuts and Socialism, Dec. 2008 Bipact. Syngenta introduces tropical sugar beet for food and biofuels, may yield
more than sugar cane. Tuesday, August 28, 2007 Brown, R.M Jr, and David Nobils Jr. New Source for Biofuels Discovered by
Researchers at The University of Texas at Austin. April 23, 2008 Butler, Rhett A. Ethanol may be greener but have higher health cost. mongabay.com
April 18, 2007. Center for Integrated Agricultural Systems. Switchgrass production for biomass
(Research Brief #51). 2001 D. Murat Özden, Hasan Dursun, A.Naci Sevinç. The Land Resources of Turkey And
Activities Of General Directorate Of Rural Services. Ankara / Turkey. Duncan, John. Costs of Biodiesel Production. Energy Efficiency and Conservation
Authority. New Zealand. 2003 EDWARDS, Robert, Szabolcs SZEKERES, Frederik NEUWAHL, and Vincent MAHIEU. Biofuels in the European Context: Facts and Uncertainties. JRC, the European Commission. 2008 Elbersen, H.W.,D.G. Christian, N. El Bassam, G. Sauerbeck, E. Alexopoulou, N.
Sharma, and I. Piscioneri. A Management Guide for Planting and Production of switchgrass as a biomass crop in Europe. Rome, 2004. Egyptian – Sudanese Cooperation in Biofuel Production.
www.oilegypt.com 3/16/2008, Location: Africa Energy Information Administration: International Energy Outlook 2005, 2005. http://www.eia.doe.gov FAO. Bioenergy production. ftp://ftp.fao.org/docrep/fao/010/i0139e/i0139e04.pdf FAO. The State of Food and Agriculture 2008. Rome 2009. FAO. Summary Proceedings of the first FAO Technical Consultation on Bioenergy
and Food Security. Rome, 16-18 April 2007 Filiz Karaosmanoğlu Biyoyakıtlar,
http://www.tarim.gov.tr/arayuz/10/icerik.asp?fl=duyurular/ayin_konugu/ayin_konugu
Gärtner & Reinhardt, 2003. Garland, Clark D. Growing and Harvesting Switchgrass for Ethanol Production in
Tennessee. UT Ag Research. Gulf News. UAE to host region's first biodiesel plant. December 10, 2008. Hassan Hashim Erwa, marketing manager for the Kenana Sugar Company speech in
the International Sugar Organization (ISO) meeting in Mauritius. 2007 ICRISAT. Pro-poor biofuel initiative,
http://www.icrisat.org/Media/2007/media5.htm International Energy Agency (IEA) From 1st- to 2nd-Generation Biofuel
Technologies An overview of current industry and RD&D activities.

48
IWMI International Water Management Institute. Water implications of biofuel crops: understanding tradeoffs and identifying options.2008
Jain Irrigation Systems Ltd. Cultivation of Jatropha. Kleindorfer, Paul R. and Ülkü G. Öktem. Economic and Business Challenges for
Biodiesel Production in Turkey. September 2007 Lyshede, B. M. Rapeseed Biodesil and Climate Change Mitigation in the European
Union. Lund, 2008. Malta Resources Authority. What are Biofuels. Malta, July 2008 Millettia Plantations. What makes Millettia pinnata (Pogmania) a superior, more
sustainable biofuel species? Australia. 2008. Millettia Plantation. Millettia Pinnata Plantation Revenue Model. 2009. Müller, Alexander . Bio-energy, food and water use interrelationships. International
Conference Linkages between Energy and Water Management for Agriculture in Nadine McCormick. Bioenergy Policies Worldwide- Questioning the underlying
assumptions. IUCN. Feb. 2009 National Energy Technology Laboratory: Peaking of World Oil Production: Impacts, Mitigation & Risk Management, 2005. http://www.netl.doe.gov/ Page, Susan. Life cycle analysis of land use change in tropical peat lands.
mongabay.com. December 17, 2007 Pakistan Agricultural Research Council Initiates Bioenergy Crop Cultivation
Projects. http://www.parc.gov.pk/enews.html 1 Pimentel, David and Tad W. Patzek. Ethanol Production Using Corn,
Switchgrass, and Wood; Biodiesel Production Using Soybean and Sunflower. Natural Resources Research, Vol. 14, No. 1, March 2005 ( C_ 2005)
Policy Exchange. “The Root of the Matter: Carbon Sequestration in Forests and Peatlands” 2008 Production -Minimizing the Risks to Maximize the Opportunities. FAO. Rome 2008
Rajvanshi, A. K. and N. Nimbkar. Sweet Corn R&D at the Nimbkar Agricultural Research Institute (NARI). Maharashta. India
Renewable Energy World. Saudi Arabian Plantations to Produce Biodiesel. 2005 Riolo, Antoine. Renewable Energy in Malta. Malta Resources Authority. Malta,
2007 Rossi Andrea and Yianna Lambrou. Gender and Equity Issues in Liquid Biofuels Saeed, Ibrahim, Survey of Potential Feedstock Sources for Ethanol Production in
Kenana sugar Company Limited. The Peninsula. ExxonMobil in biofuels foray. 2009. Tilman, David, Jason Hill, and Clarence Lehman, Carbon-Negative Biofuels from
Low-Input High-Diversity Grassland Biomass. Science Magazine, 8 December 2006: Vol. 314. no. 5805, pp. 1598 - 1600
UK Trade & Investment. Agriculture- Turkey. IATC Sector Note Edited by: Taylan Atakan Senior Trade and Investment Manager, British Embassy Ankara September 2008.
Usmani, Jafar N. Status of Jatropha Cultivation fo Biodiesel in Pakistan, Patrick Barta. (2007). Jatropha Plant Gains Steam In Global Race for Biofuels. The Wall Street Journal August 24, 2007; Page A1 Water Research Commission. Jatropha curcas: Measuring the Impact of Large-scale
Planting on Water Resources. South Africa. April 2008. Weri Channel, Announcements made on the WATER AND ENERGY RELIEF
website knowyourrights2008 Wikipedia, the free encyclopedia. 2006 World Soybean Research. Palm Oil Facts. Beijing, China August 11-15, 2009
World Soybean Research. Sunflower Facts. Beijing, China August 11-15, 2009

1
SAG’s Study on Regional Evidence Generation and Policy and Institutional Mapping on
Food and Bioenergy:
Latin America and Caribbean-LAC
Paper prepared on behalf of FORAGRO/PROCITROPICOS/IICA
– Version 1.0 –
LATIN AM
ERICA and CARIBBEAN - LAC
ww
w.era-ard.org


SAG’s
Study on Regional Evidence Generation and Policy and Institutional Mapping on
Food and Bioenergy: Latin America and Caribbean-LAC
– Version 1.0 –
Markus Ascher (Team Leader) Frederique Ganduglia
Orlando Vega Frederique Abreu
Jamil Macedo
Paper prepared on behalf of FORAGRO/PROCITROPICOS/IICA
Presented at the ERA-ARD/SAG Special Event on Bioenergy
Brussels, December 2009


Study on Regional Evidence Generation and Policy & Institutional Mapping on Food and Bioenergy
Region: Latin America and Caribbean - LAC
1
Table of Contents
1. Introduction: General outlook 05
2. Current situation of biofuels in Latin America and the Caribbean (LAC)
08
2.1. Energy mix in Latin America 08
2.2. Public support measures and policies for the production of biofuels 12
2.2.1. Political mapping 12
2.2.2. Overview of existing legislation 14
2.3. Consumption of biofuels and production of raw materials 25
2.3.1. Current and forecasted consumption of biofuels 25
2.3.2. Production of raw materials 29
3. The conflict between food production and biofuels 42 3.1. Food Security 42
3.2. Indicators for change in land use 43
3.2.1. Resource: “land” 45
3.2.2. Resource: “water” 48
3.2.3. Changes in land use 49
3.3. Effects on the agrarian structure at the system level 52
3.3.1. Increase in production 53
3.3.2. Size of energy crop plantations 59
3.3.3. Price evolution 60
3.3.4. Aggregate value 64
4. Elements for the formulation of public policies 66 4.1. Opportunities, technological challenges and impacts 66
4.2. Public policies 69

Study on Regional Evidence Generation and Policy & Institutional Mapping on Food and Bioenergy
Region: Latin America and Caribbean - LAC
2
List of tables
Table 2.1: Energy indicators for Latin America and the Caribbean - 2007 10 Table 2.2: Fuel consumption in Latin America and the Caribbean - 2007 11 Table 2.3: General Interest Statement - Purpose of the Law 15 Table 2.4: Law Enforcement Authorities 16 Table 2.5: Functions of Law Enforcement Authorities 17 Table 2.6: Mandatory blending targets suggested for biofuels in 18 LAC countries 19 Table 2.7: Tax incentives and public support 21 Table 2.8: Priority Sector / Approach for promoting the biofuel value chains 22 Table 2.9: Public and private investment in research, innovation and technology
transfer for the production of raw materials and biofuels (different technological routes)
23
Table 2.10: Gasoline consumption in Latin America and the Caribbean 25 Table 2.11: Diesel Consumption in Latin America and the Caribbean 26 Table 2.12: Forecast for bioethanol consumption in 18 countries within the region 27 Table 2.13: Forecast for biodiesel consumption in 18 countries within the region 28 Table 2.14: Raw materials used for bioethanol production in 10 South American
countries in 2007 30
Table 2.15: Raw materials for biodiesel production (from oleaginous seeds and fruit) for 10 South American countries in 2007
34
Table 2.16: Most important soy and African Palm-producing countries in the LAC 35 Table 2.17: Socio-economic analyses of the "Ricinus communis – Bean Consortium"
and results from the demonstration area at Inhamuns, State of Ceara 37
Table 2.18: Current data on the African Palm in Honduras 39 Table 2.19: Distribution of African Palm producers in Honduras by size of enterprise 40 Table 3.1: Preliminary assessment of soil, water, nutrient and climate requirements
for some crops that are considered agro-energy in Latin America and the Caribbean
44
Table 3.2: Land needed to produce biofuels, by region 45 Table 3.3: Latin America and the Caribbean. Prospective demand for area used for
agriculture - 2010 – 2030. 46
Table 3.4: Brazil and U.S.A. Water used to produce biofuels (2005) 49 Table 3.5: Expansion of land actually used for pasture and crops in some LAC
countries 50
Table 3.6: Conversion factor from biomass to biofuel and average crop yields according to crops with bioenergy potential
53
Table 3.7: Agro-ecological Zoning (ZAE) for Sugarcane in Brazil – summary table 56 Table 3.8: Global price variation for different products in five-year periods 54 Table 3.9: Earnings from selected studies among developing / tropical countries
biofuel production (thousands of $ per peta joule) 57
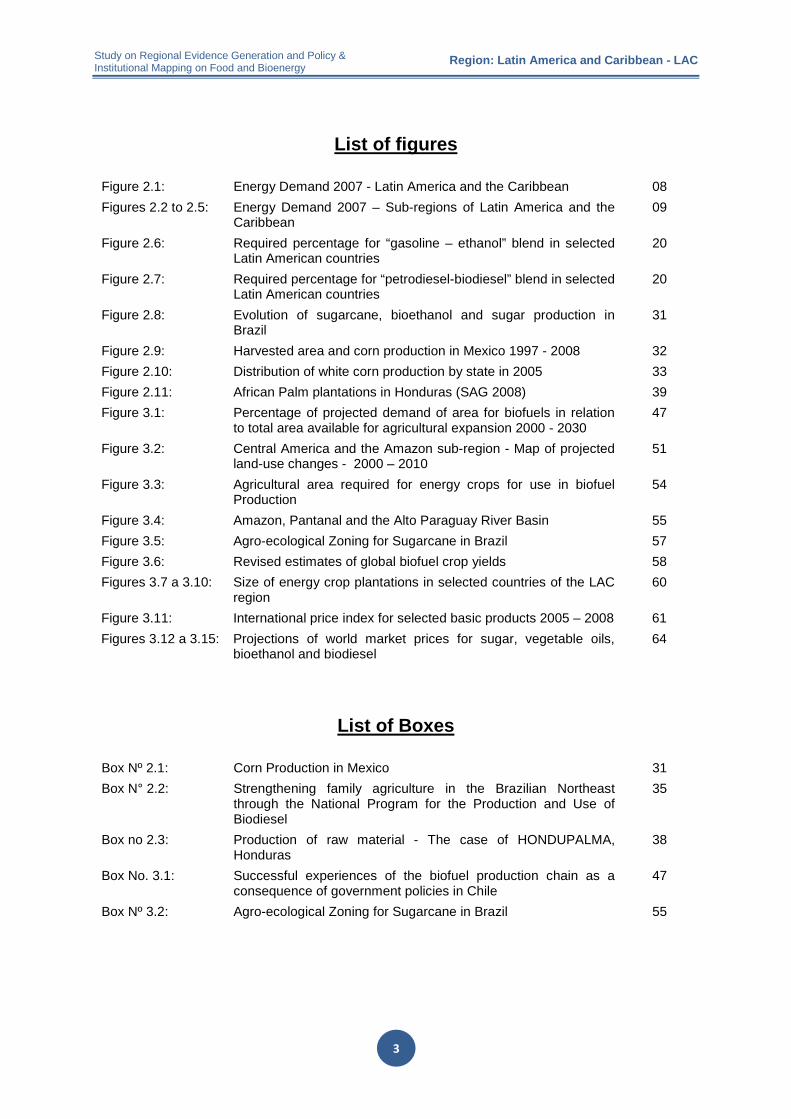
Study on Regional Evidence Generation and Policy & Institutional Mapping on Food and Bioenergy
Region: Latin America and Caribbean - LAC
3
List of figures
Figure 2.1: Energy Demand 2007 - Latin America and the Caribbean 08 Figures 2.2 to 2.5: Energy Demand 2007 – Sub-regions of Latin America and the
Caribbean 09
Figure 2.6: Required percentage for “gasoline – ethanol” blend in selected Latin American countries
20
Figure 2.7: Required percentage for “petrodiesel-biodiesel” blend in selected Latin American countries
20
Figure 2.8: Evolution of sugarcane, bioethanol and sugar production in Brazil
31
Figure 2.9: Harvested area and corn production in Mexico 1997 - 2008 32 Figure 2.10: Distribution of white corn production by state in 2005 33 Figure 2.11: African Palm plantations in Honduras (SAG 2008) 39 Figure 3.1: Percentage of projected demand of area for biofuels in relation
to total area available for agricultural expansion 2000 - 2030 47
Figure 3.2: Central America and the Amazon sub-region - Map of projected land-use changes - 2000 – 2010
51
Figure 3.3: Agricultural area required for energy crops for use in biofuel Production
54
Figure 3.4: Amazon, Pantanal and the Alto Paraguay River Basin 55 Figure 3.5: Agro-ecological Zoning for Sugarcane in Brazil 57 Figure 3.6: Revised estimates of global biofuel crop yields 58 Figures 3.7 a 3.10: Size of energy crop plantations in selected countries of the LAC
region 60
Figure 3.11: International price index for selected basic products 2005 – 2008 61 Figures 3.12 a 3.15: Projections of world market prices for sugar, vegetable oils,
bioethanol and biodiesel 64
List of Boxes
Box Nº 2.1: Corn Production in Mexico 31 Box N° 2.2: Strengthening family agriculture in the Brazilian Northeast
through the National Program for the Production and Use of Biodiesel
35
Box no 2.3: Production of raw material - The case of HONDUPALMA, Honduras
38
Box No. 3.1: Successful experiences of the biofuel production chain as a consequence of government policies in Chile
47
Box Nº 3.2: Agro-ecological Zoning for Sugarcane in Brazil 55

Study on Regional Evidence Generation and Policy & Institutional Mapping on Food and Bioenergy
Region: Latin America and Caribbean - LAC
4
List of Acronyms
BANADESA Banco Nacional de Desarrollo Agrícola (Honduras) BNDES Banco Nacional de Desenvolvimento Econômico e Social (Brasil) CDM Clean Development Mechanism CEDRSSA Centro de Estudios para el Desarrollo Rural Sustentable y la
Soberanía Alimentaria (México)
CEPAL see ECLAC CMM Centro Mario Molina (México) CNE Comisión Nacional de Energía (Chile) CNG Compressed Natural Gas
ECLAC UN Economic Commission for Latin America and the Caribbean EISA Energy Independence and Security Act (EE.UU.) EMBRAPA Empresa Brasileira de Pesquisa Agropecuária ERA/ARD European Research Area / Agricultural Research for Development ET Evapotranspiration EtOH Ethanol
FAO Food and Agriculture Organization of the United Nations FAPRI Food and Agricultural Policy Research Institute FOB Free On Board
FORAGRO Foro de las Américas para Investigación Agrícola y Desarrollo Tecnológico / Forum for the Americas on Agricultural Research and Technical Development
GHG Greenhouse Gases IICA Instituto Interamericano de Cooperación para la Agricultura Kbep Kilo barrels equivalent of petrol
LAC Latin America and the Caribbean LPG Liquified Petroleum Gas MAPA Ministério da Agricultura, Pecuária e Abastecimento (Brasil) MDA/SAG Ministério de Desenvolvimento Agrário / Secretaria de Agricultura
Familiar (Brasil) OLADE Organización Latinoamericana de Energía
PNPB Programa Nacional de Producción y Uso de Biodiesel (Brasil) PróAlcool Programa Nacional do Álcool (Brasil)/National Alcohol Program
(Brazil)
SAG Southern Advisory Group SAGARPA Secretaría de Agricultura, Ganadería, Desarrollo Rural, Pesca y
Alimentación (México) SENER Secretaría de Energía (México) SNV Servicio Holandés de Cooperación al Desarrollo UNICA União da Indústria de Cana-de-Açúcar (Brasil) UPME Unidad de Planeación Minero Energética Ministerio de Minas y
Energía (Colombia)
UWET Unified Wood Energy Terminology ZAE Agro-ecological Zoning for Sugarcane in Brazil (Zoneamiento
Agroecológico de la Caña de Azúcar)

Study on Regional Evidence Generation and Policy & Institutional Mapping on Food and Bioenergy
Region: Latin America and Caribbean - LAC
5
1. Introduction: General outlook
Indications for the twenty-first century point towards an increase in the global demand for food, fiber and energy. Tropical countries that are rich in land, water and solar energy will thus have a unique opportunity to play an essential role. At the same time, due to a new environmental awareness that focuses on the sustainability of production systems, there is a call to shift production patterns by adopting measures aimed at slowing down the depletion of natural resources and reducing greenhouse gases in order to diminish their effects on climate change.
Among the different measures possible to achieve this, the use of renewable energy instead of fossil fuels (oil and coal) shows great potential for the utilization of renewable energy, particularly what is produced from biomass. Raw materials used for the production of biofuels may be obtained by growing high energy density specimens, or through the exploitation of organic refuse and waste.
Most countries in Latin America and the Caribbean have been, or are currently, implementing policies or programs that provide incentives for producing biofuels. However, although they represent an important opportunity for agriculture in the region, biofuels can only be optimized if progress is made towards the achievement of the regulatory goals that will allow their insertion in the countries’ energy matrixes. The importance of clear regulatory goals stems mainly from the fact that, in their absence, a market cannot be created. Without a market, there are no investments and without investors the region may lose all comparative advantages it currently has over others with regard to biofuel production.
Another positive impact of renewable energy production is the redistribution of the income generated, since it requires a large raw material production base prior to processing and transportation. Employment and income supply are thus expanded, thereby helping to strengthen economic development in those countries.
According to the UWET (2001)1
Other classification criteria for biofuels take into account their physical state, origin, end use, or conversion process. This study will focus mainly on liquid biofuels generated from agricultural raw materials (agrofuels), or those whose end use is transportation (bioethanol and biodiesel).
biofuels may be classified in three groups: (a) wood fuels, which are directly or indirectly derived from trees and bushes that grow in or outside forests; (b) agrofuels, that derive mainly from biomass resulting from crops grown for fuel, and from agricultural, agro-industrial and animal byproducts; and (c) municipal byproducts from biomass waste generated by the urban population in cities and villages that can be either solid or liquid/gas.
There are currently mounting concerns about the actual sustainability of biofuel production. Discussions on this subject focus principally on maintaining the available land fit for cultivation for growing high energy density specimens, or for the organic waste and residue exploitation necessary for biofuels, in such a way so as not to compete with food production and security.
The production of biofuels may indeed have an adverse effect on agricultural markets. Much has been said about how the increase in the demand for biofuels could result in a greater concentration of production and land ownership. Although this is not out of the question, a good biofuel policy can serve to guide agricultural and social development in regions where agriculture is no longer a competitive activity.
1 Unified Wood Energy Terminology UWET”. FAO (2001a). Departamento de Montes de FAO. 2001. Disponible
en http://www.fao.org/docrep/008/j0926s/j0926s00.htm

Study on Regional Evidence Generation and Policy & Institutional Mapping on Food and Bioenergy
Region: Latin America and Caribbean - LAC
6
There are no clear-cut rules to be followed for biofuel policies, namely because each country must define its goals based on its own geographical, social and environmental realities. Nor is it necessary to reinvent the wheel, as a number of country profiles are readily available, including their experiences on the subject.
A great deal of information can also be found in the literature on the conflicts that biofuel production may cause with regard to food security, although analyses on the subject are often unilateral. From the point of view of land competition, any agricultural activity that does not directly target food generation is competing with food security. Likewise, other agricultural activities such as silviculture, or flower or tobacco growing, currently practiced for income diversification in rural areas, would be equally condemned, just like the production of biofuels.
A thorough study of land-use potential prior to creating regulatory goals, and the use of techniques such as crop rotation or no-till systems, would make the production of raw materials possible, both for biofuel or food, minimizing food security risks while increasing energy security.
According to the Food and Agriculture Organization of the United Nations (FAO)2
In light of such diversity, it was decided that this paper should analyze the 12 countries considered to be more representative of LAC in more depth, i.e. Argentina, Bolivia, Brazil, Colombia, Costa Rica, Ecuador, Honduras, Mexico, Paraguay, Peru, Dominican Republic and Uruguay, particularly over the last decade.
, the different countries in Latin America and the Caribbean (LAC) can be classified according to their availability of arable land for agricultural expansion. They are thus divided into three major groups: (a) little availability, i.e. less than 1 million ha, such as Chile, Dominican Republic, El Salvador, Haiti, Jamaica, Honduras, Trinidad and Tobago, Costa Rica, Belize, Guatemala and Panama; (b) average availability, between 1 and 5 million ha, such as Cuba, Nicaragua and French Guyana; and (c) great availability, between 6 and 340 million ha, such as Ecuador, Surinam, Guyana, Paraguay, Uruguay, Mexico, Peru, Venezuela, Colombia, Bolivia, Argentina and Brazil. For the last group, the expansion of any kind of agriculture, even for supplying other countries with food and biofuels, would not compete with food security.
Another important consideration regarding biofuels is that one must differentiate between ethanol and biodiesel policies. Sugarcane is used as a raw material for ethanol, particularly in Latin America and the Caribbean. A crop that has been in the region for many years, sugarcane has been highly successful in virtually all of the countries. On other hand, with regard to raw materials for biodiesel, very few countries other than Argentina, Brazil, Paraguay and Colombia are among the top producers of oleaginous crops.
Although Brazil is the world’s top sugarcane producer, the greatest agricultural productivity is in Colombia, with over 100 ton/ha, which can generate over 8,000 liters/ha of ethanol. In the case of biodiesel, agricultural productivity is quite a bit smaller, at less than 4,000 liters/ha even in the best conditions when using palm oil as a raw material, or 3,000 liters/ha when using jatropha. Such differences in agricultural productivity directly influence policy development, since biodiesel is usually more expensive than diesel, and ethanol is cheaper than gasoline. The general perception is that biodiesel policies have a social development characteristic that is far more important than that of energy security, while with ethanol there are more obvious energy and environmental objectives.
2 Bot, AJ; Nachtergaele, FO; Young, A. 2008. Land Resource Potential and Constraints at Regional and Country
Levels. Rome, IT, Land and Water Development Division, FAO. World Soil Resources Report 90.

Study on Regional Evidence Generation and Policy & Institutional Mapping on Food and Bioenergy
Region: Latin America and Caribbean - LAC
7
For purposes of this study, preference was given to those crop alternatives that can be used for human consumption as well as for biofuels, and that currently constitute the main raw materials, such as corn and sugarcane (bioethanol), and soy bean and African palm (biodiesel). These products occupy a distinguished position in the food pyramid (vegetable oils and sugar are placed higher in the pyramid). In fact, as in the case of soy beans, agrofuels are obtained from the byproducts of the agro-industrial process, thus making better use of crops while increasing economic viability. Biofuel production can positively impact agriculture by generating a secure income arising from a promising market, as long as it is done in a rational and planned manner.
Lastly, this document is part of the regional component for LAC under the responsibility of the Forum for the Americas on Agricultural Research and Technological Development (FORAGRO), of the “Global Study on Regional Evidence Generation and Policy and Institutional Mapping on Food and Bioenergy Production“, proposed by the Southern Advisory Group (SAG), of the European Research Area (ERA) / Agricultural Research for Development (ARD), whose objectives are to analyze the status of biofuel production and its possible implications for the production of food and food security on the different continents.

Study on Regional Evidence Generation and Policy & Institutional Mapping on Food and Bioenergy
Region: Latin America and Caribbean - LAC
8
2. Current situation of biofuels in Latin America and the Caribbean (LAC)
2.1. Energy mix in Latin America
Latin America has approximately 13% of the world’s viable oil reserves, which are concentrated in just three countries: Venezuela, Mexico and Brazil. Together they account for 94% of the reserves and 81% of the production in the region. Although they are among the group of 20 nations with the highest viable oil reserves, most countries in the region are facing a critical situation with regard to current and projected energy security, given their considerable dependence on oil imports and/or the low quantities of reserves over time.
Energy vulnerability is particularly important in Central America (except for Guatemala), the Caribbean (except for Trinidad and Tobago), Paraguay, Uruguay and Chile. Those nations normally import 100% of what they consume, as they do not have any reserves. Other countries, however, are either oil producers, although not enough to be self-sufficient (as is the case of Peru), or net exporters, but with declining production. Given their reserve horizon, the trend is for them to become net importers in the medium to long term (as is the case of Argentina).
Figure 2.1:
Energy Demand 2007 - Latin America and the Caribbean
Source:
Prepared by IICA based on energy statistics (OLADE, 2007, ECLAC, 2008) and official national sources.
On the demand side, energy use in the region is highly concentrated in fossil fuels (74% of total consumption), both in the aggregate amount and by sub-region. Central America is an exception, with a significant participation of biomass and hydropower. Brazil is an individual exception, with a 44% share of renewables in its energy mix (Figures 2.2 to 2.5). The country, which is considered to be a global reference in the use of renewable energy, traditionally obtains electricity from water sources. It has had an aggressive program to replace gasoline with ethanol (PROALCOOL) since 1974, and a program to replace diesel
Biomasa 13% Nuclear 1%
Geotermia y otras 2%
Biocombustible 1%
Petróleo y derivados 43%
Gas natural, 26%
Carbón mineral y coque 5%
Hidroenergía y electricidad 9%
(*)
Demanda de Energía 2007 - América Latina y el Caribe
Total: 5.347.855 kbep* Electricidad - Comercio Exterior

Study on Regional Evidence Generation and Policy & Institutional Mapping on Food and Bioenergy
Region: Latin America and Caribbean - LAC
9
with biodiesel since 2005, in addition to generating bioelectricity from biomass. As shown in Figure 2.1, the share of biofuels in the regional energy mix is still marginal (1% of energy consumption in 2007). Brazil is the country that has had the greatest percentage of biofuels in terms of energy consumption thus far (3% in 2007).
Figures 2.2 to 2.5:
Energy Demand 2007 – Sub-regions of Latin America and the Caribbean
Source:
Prepared by IICA based on energy statistics (OLADE, 2007, ECLAC, 2008) and official national sources
Table 2.1 presents a set of energy indicators, detailing the specific situation of each country in the region and classifying information according to their status as net importers or exporters of oil.
The Latin American transport sector is highly dependent on oil. In aggregate amounts this represents about 95% of the fuel consumption required to move its fleet, including land, water and air vehicles. As shown in Table 2.1, almost all of the countries in the region have a deficit of fossil fuels. With the exception of Venezuela and Trinidad and Tobago, all of them are net importers of diesel oil, even important oil-producing countries such as Mexico and Brazil. The only net exporters of gasoline in the region are Venezuela, Argentina, Trinidad and Tobago, Brazil, Colombia and Uruguay, while Bolivia is self-sufficient.
Biomasa, 6%Geotermia y
otras, 1%
Petróleo y derivados, 43%
Gas natural, 36%
Carbón mineral y coque, 3%
Hidroenergía y electricidad,
11%
Demanda de Energía 2007 - Región Andina
Total: 928,045 kbep * Electricidad - Comercio Exterior
Biomasa, 34%
Geotermia y otras, 8%
Petróleo y derivados, 48%
Carbón mineral y coque, 4%
Hidroenergía y electricidad,
6%
Demanda de Energía 2007 - Centro América
Total: 220,624 kbep * Electricidad - Comercio Exterior
Biomasa 10%,
Geotermia y otras 0%
Petróleo y derivados 51%
Gas natural 37%
Carbón mineral y coque 1%
Hidroenergía y electricidad 1%
Demanda de Energía 2007 - Caribe
Total: 350,201 kbep * Electricidad - Comercio Exterior
Biomasa, 9% Nuclear, 2%
Geotermia y otras, 1%
Biocombusti-bles, 0%
Petróleo y derivados, 38%
Gas natural , 39%
Carbón mineral y coque, 4%
Hidroenergía y electricidad, 7%
Demanda de Energía 2007 - Cono Sur
Total: 823,599 kbep * Electricidad - Comercio Exterior

Study on Regional Evidence Generation and Policy & Institutional Mapping on Food and Bioenergy
Region: Latin America and Caribbean - LAC
10
Table 2.1:
Energy indicators for Latin America and the Caribbean – 2007
Gasoline, naphtha and alcohol (ethyl or methyl), comprise 48% of the aggregate consumption of the transport sector in the region, while diesel oil accounts for 40%. The remaining 60% consists of kerosene and turbo, CNG and LPG.
It should be noted that the participation and importance of each of these fuels in the final demand from the transportation sector varies significantly from country to country, as can be seen in Table 2.2. Thus, in Venezuela, Mexico, Barbados and Grenada, gasoline represents 65% to 80% of this particular consumption, while Paraguay, Uruguay, Peru, Honduras and Argentina are characterized by a high incidence of diesel oil, between 56% and 79%. Argentina and Bolivia consume a fair amount of CNG. In absolute terms, Brazil is also a big CNG consumer, as is Colombia, although to a lesser extent.
Países importadores netos de petróleo y derivados
Reservas probadas de
petróleo
Alcance de las reservas de
petróleo
Alcance de las reservas de gas
natural
Consumo final energético
Participación de la biomasa en
el consumo final energético
Participación del petróleo
en el consumo final
energético
Participación del petróleo
importado en la oferta total de
petróleo
Importaciones netas de petróleo
Gbbl años años kbep % % % kbepBarbados 0,002 4,2 1,6 3.120 7 87 100% s/d Chile 0,03 30,1 20,7 220.221 17 50 103% 74.378 Costa Rica 0 0 0 34.487 15 48 96% 5.179 Cuba 0,05 2,8 38,4 100.099 8 82 65% 34.544 El Salvador 0 0 0 33.856 32 43 100% 6.230 Grenada 0 0 0 638 8 92 100% s/d Guyana 0 0 0 6.935 47 53 100% s/d Haití 0 0 0 19.476 72 26 100% s/d Honduras 0 0 0 34.150 41 51 100% s/d Jamaica 0 0 0 31.734 7 93 101% 7.491 Nicaragua 0 0 0 26.920 43 40 100% 5.779 Panamá 0 0 0 28.630 14 74 100% s/d Paraguay 0 0 0 39.524 38 24 96% s/d Perú 0,39 13,8 49,3 106.330 17 34 69% 30.160 República Dominicana 0 0 0 57.205 10 71 103% 12.963 Uruguay 0 0 0 23.409 14 58 94% 11.152
Países exportadores netos de petróleo y derivados
Reservas probadas de
petróleo
Alcance de las reservas de
petróleo
Alcance de las reservas de gas
natural
Consumo final energético
Participación de la biomasa en
el consumo final energético
Participación del petróleo
en el consumo final
energético
Participación del petróleo
exportado en la producción de
petróleo
Exportaciones netas de petróleo
Gbbl años años kbep % % % kbepArgentina 2,35 9,9 7,8 540.445 3 33 9% 20.761 Bolivia 0,39 22,4 45,5 36.659 14 40 29% 5.141 Brasil 20,38 31,9 33,7 1.713.531 25 38 24% 6.053 Colombia 1,36 7,0 15,0 219.716 10 43 43% 79.861 Ecuador 4,00 21,5 2,4 88.391 7 79 66% 124.081 Guatemala 0,48 85,1 0,0 62.582 48 40 86% 4.791 México 31,21 27,7 24,7 1.311.583 5 47 55% 653.218 Surinam 0,10 21,0 7.273 5 80 14% 693 Trinidad y Tobago 0,61 13,8 11,4 123.721 0 7 67% -9.085 Venezuela 99,38 89,0 152,1 476.950 0 41 68% 840.026
Reservas probadas de
petróleo
Alcance de las reservas de
petróleo
Alcance de las reservas de gas
natural
Consumo final energético
Participación de la biomasa en
el consumo final energético
Participación del petróleo
en el consumo final
energético
Participación del petróleo
exportado en la producción de
petróleo
Exportaciones netas de petróleo
Gbbl años años kbep % % % kbepTotal América Latina y Caribe 161 44 38 5.347.855 13 43 51% 1.538.029
Fuente: Elaborado por IICA en base a Informe de Estadísticas Energéticas: OLADE 2007 y CEPAL (2008)
Indicadores energéticos de América Latina y el Caribe - 2007

Study on Regional Evidence Generation and Policy & Institutional Mapping on Food and Bioenergy
Region: Latin America and Caribbean - LAC
11
Table 2.2: Fuel consumption in Latin America and the Caribbean - 2007
Although no aggregate statistics on the share of biofuels in the vehicle fuel mix are available for the region, there are some specific situations that are worth noting, together with historical experiences. In the case of Brazil, which has been using ethanol as a fuel since the mid-70s, and biodiesel since 2005, the use of biofuels reached 25.1% in vehicle fuel consumption (anhydrous ethanol: 7.6%; hydrated ethanol: 16.2%; and biodiesel: 1.34%) in 2008. In 2006, Paraguay, which uses alcohol fuel since 1999, recorded a 4.6% share in the automotive fuel mix for this biofuel. Current and expected required blends will be presented in the following chapter.
Table 2.2 also shows statistics for the agricultural sector’s diesel oil consumption, which is particularly significant in Brazil, Argentina, Mexico, and to a lesser extent, Colombia, Peru and Bolivia. Diesel oil is a major component in agricultural production costs. Together
Países importadores netos de petróleo y
derivados
Consumo de energía del sector transporte
Consumo de gasolinas /
alcohol para transporte
Participación de gasolinas /
alcohol en transporte
Consumo de diesel oil para
transporte
Participación de diesel oil
en transporte
Consumo de GNC o GNV
para transporte
Consumo de GLP para
transporte
Consumo de diesel oil para
agricultura, ganadería y
pesca
Balance de comercio
exterior en diesel oil
Balance de comercio
exterior en gasolinas /
alcohol
kbep kbep % kbep % kbep kbep kbep kbep kbepBarbados 960 740 77 220 23 4 -593 -740 Chile 59.103 17.155 29 25.873 44 162 27 -31.895 -173 Costa Rica 11.493 4.877 42 5.282 46 51 264 -5.734 -3.756 Cuba 3.541 454 13 1.569 44 18 3 1.086 -8.556 - El Salvador 7.245 3.057 42 3.630 50 -3.421 -2.314 Grenada 268 206 77 20 7 15 -272 -218 Guyana 1.117 700 63 324 29 580 -1.936 -759 Haití 3.035 1.689 56 1.163 38 -2.387 -1.689 Honduras 7.540 2.981 40 4.521 60 -5.016 -3.057 Jamaica 9.095 3.965 44 2.868 32 850 -4.042 -2.960 Nicaragua 3.950 1.587 40 2.167 55 41 -2.485 -1.069 Panamá 7.358 1.605 22 3.736 51 32 67 -5.686 -1.961 Paraguay 8.416 1.493 18 6.640 79 119 -6.641 -1.440 Perú 27.202 5.761 21 18.449 68 388 1.219 2.330 -6.085 7.379 República Dominicana 15.594 6.093 39 4.159 27 2.687 -7.372 -4.025 Uruguay 6.022 1.823 30 4.186 70 1.247 -2.069 949
Países exportadores netos de petróleo y
derivados
Consumo del sector transporte
Consumo de gasolinas /
alcohol para transporte
Participación de gasolinas /
alcohol en transporte
Consumo de diesel oil para
transporte
Participación de diesel oil
en transporte
Consumo de GNC o GNV
para transporte
Consumo de GLP para
transporte
Consumo de diesel oil para
agricultura, ganadería y
pesca
Balance de comercio
exterior en diesel oil
Balance de comercio
exterior en gasolinas /
alcohol
kbep kbep % kbep % kbep kbep kbep kbep kbepArgentina 86.849 14.302 16 48.694 56 17.091 21.685 -4.972 22.131 Bolivia 9.327 3.268 35 3.922 42 1.132 2.232 -2.761 77 Brasil 411.340 163.225 40 206.464 50 16.186 38.347 -20.088 7.697 Colombia 61.433 32.190 52 24.830 40 3.095 3.412 -2.123 2.733 Ecuador 33.947 14.172 42 17.176 51 269 -11.862 -5.834 Guatemala 15.429 6.694 43 8.512 55 19 -9.484 -7.225 México 371.599 240.302 65 98.827 27 112 7.598 17.384 -15.609 -75.299 Surinam 1.045 572 55 296 28 281 -1.040 -647 Trinidad y Tobago 5.826 3.192 55 2.019 35 10.211 7.578 Venezuela 111.852 89.786 80 20.812 19 54 48.264 38.548
Consumo del sector transporte
Consumo de gasolinas /
alcohol para transporte
Participación de gasolinas /
alcohol en transporte
Consumo de diesel oil para
transporte
Participación de diesel oil
en transporte
Consumo de GNC o GNV
para transporte
Consumo de GLP para
transporte
Consumo de diesel oil para
agricultura, ganadería y
pesca
Balance de comercio
exterior en diesel oil
Balance de comercio
exterior en gasolinas /
alcohol
kbep kbep % kbep % kbep kbep kbep kbep kbepTotal América Latina y Caribe 1.284.323 621.889 48 516.357 40 38.239 11.756 90.093 -103.654 -26.073
Fuente: Elaborado por IICA en base a Informe de Estadísticas Energéticas: OLADE 2007
Consumo de combustibles en América Latina - 2007

Study on Regional Evidence Generation and Policy & Institutional Mapping on Food and Bioenergy
Region: Latin America and Caribbean - LAC
12
with fertilizers, pesticides and transportation costs, it is an important mechanism for passing increases in oil prices onto the cost of food production. In this sense, the end of an era of cheap and abundant oil would mean more expensive food due to the impact on production costs, both in primary production and in the food and beverage industry. Rising energy prices also pose a threat to rural development by reducing access to energy services, a prerequisite for raising household incomes, and by absorbing increasing amounts of capital from rural areas.
2.2. Public support measures and policies for the production of biofuels
2.2.1. Political mapping
According to ECLAC (2008) there are three factors behind biofuel policies in the global agenda:3
a. Energy factors:
The increase in the global demand for oil is mainly the result of the growth in consumption for transportation, given the limited duration of viable global reserves and their maximum production capacity. Consequently, energy-related efforts to boost biofuel programs are mainly geared towards ensuring the security of supply, reducing dependence on imported oil and mitigating the impacts of international price volatility and uncertainty concerning price evolution.
Moreover, considering the volumes of fossil fuels consumed in countries with high and rising levels of energy consumption per capita (high level = "developed" countries: U.S.A., Europe, Japan, etc.; increasing level = emerging economies: China, India), and the dwindling availability of land for competitive crops, a potential market for an international biofuel trade is open, raising the hopes of some countries with favorable conditions (tropical climate, availability of land and water, etc.) to develop an export product (commodity). This is especially true for some larger countries in Latin America, although ECLAC (2008) concluded that exporting is only a sustainable option for a few countries4
b. Environmental factors:
.
Environmental factors are basically related to the need to reduce greenhouse gas emissions (GHGs), which would have a favorable impact on the environment, both globally and locally, especially in big cities. Thus, replacing fossil fuels with biofuels in the transportation sector is in line with commitments made under the Kyoto Protocol to the extent that it would contribute to reducing GHG emissions.
However, the net effect of biofuels on the environment is still being widely discussed, given the ensuing impacts throughout the entire chain of production, including their possible polluting effects on natural resources (soil, water), and the degree of responsibility for deforestation or the decline in biodiversity. Another issue, whose complexity has not been examined as thoroughly as it should be by the scientific world, and has therefore almost
3 CEPAL: Aporte de los biocombustibles a la sustentabilidad del desarrollo en América Latina y el Caribe:
Elementos para la formulación de políticas públicas. Santiago de Chile 2008. 4 CEPAL, 2009: Biocombustibles y Comercio Internacional: Una perspectiva Latinoamericana. See also Chapter
2.3.2 and footnote nº 12.

Study on Regional Evidence Generation and Policy & Institutional Mapping on Food and Bioenergy
Region: Latin America and Caribbean - LAC
13
been overlooked in policy design, is the GHG emissions resulting from land-use change and the ensuing debt in the balance (carbon debt).
c. Factors related to agricultural development:
Biofuels create new opportunities for agricultural development. Producers and exporters in tropical developing countries with the potential to produce biofuels from competitive crops, relative to oil prices, can take advantage of raw material price improvements to promote biofuels and thereby reduce imports and increase exports. However, risks related to land degradation, water use, land-use changes that could affect food supply, concentration of ownership and exclusion of small and medium-scale producers must be seriously considered, as well as the negative impact on biodiversity.
In addition to their positive impact on energy supply and the reduction of negative effects on the environment associated with fossil fuels, biofuels allow for a redistribution of the income generated in a given country whereas value chains of fossil fuels are highly concentrated. Agro-energy, on the other hand, needs an extensive production base of raw materials before the processing and transport stages. This implies extending the offer of employment and income and strengthening national economic development, especially in rural areas (IICA/Gazzoni 2009).5
In order for this redistribution to have a greater impact, policies and support measures for implementing projects geared towards the production and use of biofuels, an increase in capital investments, operational resources, management skills and production scales are needed. Moreover, the scenario for the implementation of support policies must be suitable in terms of legal security and contract enforcement, political and economic stability and an acceptable level of risk to the supply of foreign credit, foreign direct investment or even ownership interest.
The biofuel industry has been expanding since the 1970s. However, it is only now, out of necessity, and due to increased environmental concern, that a number of governments have begun to regulate their production, distribution and large-scale use. The leading ethanol-producing countries, such as Brazil, Colombia, Argentina and Mexico have a regulatory framework for the production, use and management of ethanol, and have established rates for the gasoline/ethanol blend. They also award incentives to producers. Some countries in Latin America and the Caribbean have yet to formulate a regulatory framework, while others already have bills that will be sent to Congress or are being reviewed by lawmakers.
Legislative proposals have been developed according to each country's specific interest in this alternative type of energy. Over 20 countries in Latin America and the Caribbean have laws or bioenergy-related decrees currently in force, most of which have been developed or updated in the last decade:
• Argentina, Bolivia, Brazil, Colombia, Costa Rica, Guatemala, Honduras, Paraguay, Panama, Peru, Dominican Republic, Ecuador, Mexico, Jamaica and Uruguay.
In the following countries they are up for revision/updating or preparation:
• Chile, Cuba, El Salvador, Guatemala, Honduras, Panama and Venezuela.
5 Gazzoni, Decio Luiz. Biocombustibles y alimentos en América Latina y el Caribe. San José, C.R.: IICA, 2009.

Study on Regional Evidence Generation and Policy & Institutional Mapping on Food and Bioenergy
Region: Latin America and Caribbean - LAC
14
2.2.2. Overview of existing legislation
The information presented below is mainly from the following agencies, in addition to
official national sources: OLADE, IICA, SNV, CEDRSSA and CMM 6
The summary that follows aims to provide an overview of the legal situation in Latin America and the Caribbean (LAC), given the regular structure of laws on biofuels. In order to show the measures and actions set out in each country to encourage the production and consumption of biofuels, and to present the main guidelines and regulations on the topic, a political map was organized according to the following themes:
.
a. Legal: Purpose of Law - Statement of National Interest - objectives of corresponding laws.
b. Institutional: Law enforcement authorities and their functions - advisory body and other officials involved.
c. Obligation: Blend of biofuels and fossil fuels - scope and targets (percentages currently valid and planned for bioethanol and biodiesel blends).
d. Incentives: Promoting the production and use of biofuels - national programs.
e. Research and technological innovation: Production of raw materials and developing technologies to produce biofuels.
The countries that have been taken into account are:
Argentina Bolivia Brazil Colombia Costa Rica Ecuador
Honduras Mexico Paraguay Peru Dominican Republic Uruguay
a. Legal: Purpose of Law - Statement of National Interest – Objectives of corresponding laws
Table 2.3 presents the main aims and objectives outlined in the corresponding laws. In some cases they are quite unequivocal, while in others they are tacit, numerous and rather extensive, as in the case of Brazil. In yet other countries they are more limited, as in the case of Paraguay.
The most common denominator between the laws in LAC is energy security: reducing reliance on fossil fuels and increasing energy self-sufficiency (see Table 2.3).
6 - Organización Latinoamericana de Energía: Legislación de Biocombustibles en América Latina y el Caribe:
http://www.olade.org/legislacionBio.html , 2009. - IICA, “Atlas de la agroenergía y los biocombustibles en las Américas: 1. Etanol”; San José, Costa Rica, 2007. - IICA, “Atlas de Biodiesel”, Edición Revisada octubre de 2009; San José, Costa Rica, 2007. - SNV (Servicio Holandés de Cooperación al Desarrollo): “Estudio Comparativo de La Legislación Latinoamericana sobre Biocombustibles”, Tegucigalpa Honduras – Julio 2008. - Centro de Estudios para el Desarrollo Rural Sustentable y la Soberanía Alimentaria – CEDRSSA: “Legislación sobre el Uso de Biocombustibles en América Latina y el Mundo”, México, 2007. - Centro Mario Molina: “Normatividad de biocombustibles en el mundo”, México, 2008.

Study on Regional Evidence Generation and Policy & Institutional Mapping on Food and Bioenergy
Region: Latin America and Caribbean - LAC
15
Some of the most frequently mentioned objectives of these instruments are: contributing to the country’s sustainable development, facilitating the implementation of projects under the Clean Development Mechanism - CDM (Argentina, Costa Rica, Ecuador, Mexico, Paraguay) and reducing environmental pollution (Colombia, Costa Rica, Honduras, Mexico, Peru) by encouraging the production and use of biofuels. Colombia, Peru and Honduras are also interested in creating jobs. Countries like Peru and Colombia have established a link to job generation in the development of the biofuel market through the promotion of farming and agribusiness activities, making that one of the objectives of the law. Another objective in Peru is to provide an alternative market to illicit crops, as part of the battle against drugs.
Laws in Argentina and Bolivia are not specific about their purposes, but judging from the spirit of the legal instruments, it would appear that these countries are aiming towards sustainable development and the reduction of dependence on fossil fuels.
Table 2.3: General Interest Statement - Purpose of the Law Countries
AR BO BR CO CR EC HN ME PA PE DR UR
Introduce biofuels into the national energy mix x x x x Contribute to sustainable development and facilitate implementation of CDM
x x x x x Energy security: Reduce reliance on fossil fuels and increase energy self-sufficiency
x x x x x x x x
Contribute to employment and income generation x x x x Mitigate negative environmental impacts of fossil fuel energy operations
x x x x x x x
Provide alternative markets for illicit crops x
Source: Adapted from SNV, 2008 and completed by authors based on official sources
b. Institutional: Law enforcement authorities and their functions - advisory body and other officials involved.
i. Law enforcement authorities
Due to the numerous goals and objectives associated with the production and use of biofuels and the horizontal nature of the value chain, different authorities have become responsible for enforcing biofuel-related laws. In almost every country, the authorities involved are linked to Mines and Energy; Natural Resources and Environment; Agriculture, Livestock and Fishing and/or Industry, Economy and Trade.
The following departments tend to be more involved in the principal phases of the production chain upstream (consisting exclusively of the agricultural stage) and downstream (covering the whole production chain after the agricultural stage):

Study on Regional Evidence Generation and Policy & Institutional Mapping on Food and Bioenergy
Region: Latin America and Caribbean - LAC
16
• Ministry of Agriculture, Livestock and Rural Development: Upstream section: promotion of sustainable production of biofuel supplies from agricultural and forestry activities, algae, biotechnological and enzymatic processes, technical assistance and research, innovation and technology transfer for the production of raw material.
• Ministry of Mines, Hydrocarbons and Energy: Downstream section: registration and control of biofuel production, blends and other issues, definition of technical specifications and standards, registration and monitoring of the biofuel trade.
The different ministries responsible for enforcing this specific legislation in the respective countries are: the Ministry of Environment and Natural Resources (Colombia, Ecuador, Honduras, Uruguay); Economy, Industry, Trade and Production (Argentina, Bolivia, Honduras, Paraguay); Planning and Finance (Argentina, Uruguay); and/or Science and Technology (Argentina, Paraguay).
Table 2.4: Law enforcement authorities
Authority Countries
AR BO BR CO CR EC HN ME PA PE DR UR
Agriculture, Livestock and Rural Development x x x x x x x x x x Mining, Hydrocarbons and Energy x x x x x x x Electricity and Renewable Energy x x x Environment and Natural Resources x x x x Economy, Industry, Trade and Production x x x x
Planning and Investment x x
Science and Technology x x
Others (Drug Control) x Agency, Commission or National Council x x x x x x x x x Source: Adapted from SNV, 2008 and completed by authors based on official sources
It is important to note that a number of responsibilities are normally involved in the development and conceptualization of bills. In Brazil, for example, over 10 federal ministries were involved in the manifold aspects of the process of designing and developing the National Program of Biodiesel Production and Use in 2004-2005.
ii. Advisory body or other officials involved
Because laws on biofuels address the different issues of public and private sectors and in order to provide consistency and comprehensiveness in the application of the law, in some countries, one of the first steps in the process is to form technical or advisory bodies whose purpose is to support the different authorities in law enforcement and implementation.

Study on Regional Evidence Generation and Policy & Institutional Mapping on Food and Bioenergy
Region: Latin America and Caribbean - LAC
17
In some countries, these are highly public and cross-sectoral (Argentina, Brazil, Colombia, Costa Rica, Mexico), while in others, while others count on the participation of private sector entities and the scientific community (Ecuador, Honduras, Peru).
National biofuels commissions (or agencies with similar names), are responsible for developing and establishing the general guidelines needed for the production, handling, processing and marketing of biofuels, among other functions. They are also in charge of proposing and recommending standards and complementary provisions for the law, and/or proposing an action plan to ministries with strategies for the short, medium and long-term implementation of the use of biofuels, as well as follow-up and control actions, determining who will be in charge and a time frame.
iii. Functions of the enforcement authorities
The relevant authorities are generally in charge of promoting and monitoring the production of biofuels and raw materials; establishing quality standards, requirements and the necessary conditions for the manufacturing plants; certifying investment-related and industrial activities; preparing regulations and technical standards; designing and implementing policies applicable to the sector; monitoring and supervising the production of raw materials; processing and production of biofuels and other environmental issues associated with biofuel production.
Table 2.5: Functions of law enforcement authorities
Main functions of the law enforcement authority
To promote and control the production of biofuels and raw materials: to promote the sustainable production of inputs for bioenergy from agricultural activities, forestry, algae, enzymatic and biotechnological processes and enhance their marketing, increasing competitiveness and profitability by means of scientific and technological development without jeopardizing food security and sovereignty;
Establish quality standards, requirements and necessary conditions for manufacturing plants;
Certify investment-related and industrial activities;
Prepare technical and security standards and regulations;
Design and implement policies applicable to the sector; define the scope of general incentives for the production and use of renewable energies such as tax incentives;
Monitor and supervise the production of raw materials, processing and production of biofuels and other environmental issues associated to biofuel production;
Seek to reduce air pollutant emissions and greenhouse gases (GHGs);
Coordinate actions among federal, state (if any), and municipal governments, as well as the private and social sectors.
Source: Adapted from SNV, 2008 and completed by authors based on official sources
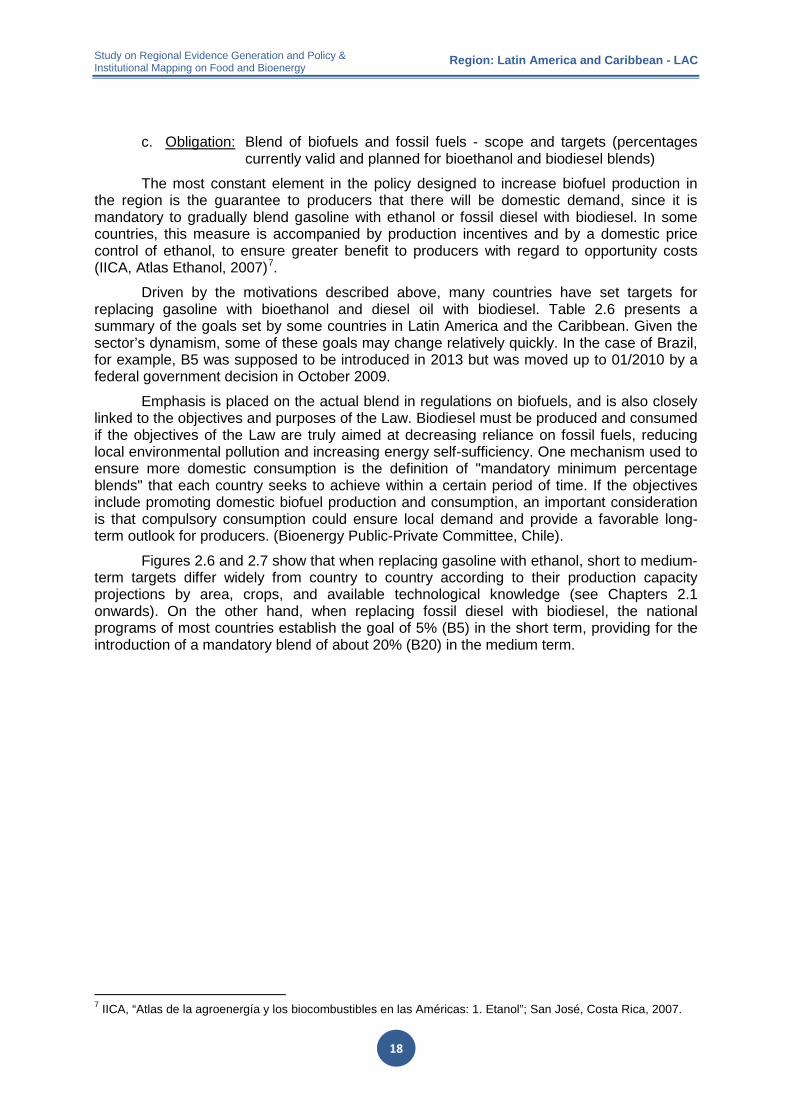
Study on Regional Evidence Generation and Policy & Institutional Mapping on Food and Bioenergy
Region: Latin America and Caribbean - LAC
18
c. Obligation: Blend of biofuels and fossil fuels - scope and targets (percentages currently valid and planned for bioethanol and biodiesel blends)
The most constant element in the policy designed to increase biofuel production in the region is the guarantee to producers that there will be domestic demand, since it is mandatory to gradually blend gasoline with ethanol or fossil diesel with biodiesel. In some countries, this measure is accompanied by production incentives and by a domestic price control of ethanol, to ensure greater benefit to producers with regard to opportunity costs (IICA, Atlas Ethanol, 2007)7
Driven by the motivations described above, many countries have set targets for replacing gasoline with bioethanol and diesel oil with biodiesel. Table 2.6 presents a summary of the goals set by some countries in Latin America and the Caribbean. Given the sector’s dynamism, some of these goals may change relatively quickly. In the case of Brazil, for example, B5 was supposed to be introduced in 2013 but was moved up to 01/2010 by a federal government decision in October 2009.
.
Emphasis is placed on the actual blend in regulations on biofuels, and is also closely linked to the objectives and purposes of the Law. Biodiesel must be produced and consumed if the objectives of the Law are truly aimed at decreasing reliance on fossil fuels, reducing local environmental pollution and increasing energy self-sufficiency. One mechanism used to ensure more domestic consumption is the definition of "mandatory minimum percentage blends" that each country seeks to achieve within a certain period of time. If the objectives include promoting domestic biofuel production and consumption, an important consideration is that compulsory consumption could ensure local demand and provide a favorable long-term outlook for producers. (Bioenergy Public-Private Committee, Chile).
Figures 2.6 and 2.7 show that when replacing gasoline with ethanol, short to medium-term targets differ widely from country to country according to their production capacity projections by area, crops, and available technological knowledge (see Chapters 2.1 onwards). On the other hand, when replacing fossil diesel with biodiesel, the national programs of most countries establish the goal of 5% (B5) in the short term, providing for the introduction of a mandatory blend of about 20% (B20) in the medium term.
7 IICA, “Atlas de la agroenergía y los biocombustibles en las Américas: 1. Etanol”; San José, Costa Rica, 2007.

Study on Regional Evidence Generation and Policy & Institutional Mapping on Food and Bioenergy
Region: Latin America and Caribbean - LAC
19
Table 2.6: Mandatory blending targets suggested for biofuels in 18 LAC countries
Country Bioethanol Biodiesel 1. Argentina 01/2010 5% on the final product 01/2010 5% on the final product
2. Bolivia
01/2007 2.5 % 2007-2015 Increase gradually according
to annual targets 01/2015 20.0%
3. Brazil A long time ago (Established consumption)
20.0% 10/2006 23.0% 07/2007 25.0%
01/2008 2% 01/2009 3% 07/2009 4% 01/2010 5%
01/2020 20%
4. Chile 5,7 %
5. Colombia
2005 10 % in metropolitan areas = 60% of national consumption
2007 10.0% 2012-2016 Increase gradually up to
15.0%
01/2008 5%
6. Costa Rica 01/2007 7.0% 01/2010 13.0%
01/2010 2.0% 01/2013 5.0%
until 2026 10.0%
7. Ecuador 10.0%
proposes 2.5 % Increase gradually according to annual
targets 01/2020 20.0%
8. El Salvador Central American Sustainable Energy Strategy sets a goal to replace 15% of fossil fuel consumption
9. Guatemala Currently 5.0% In discussion 10.0%
10. Honduras Up to 30 %
The Biofuel Technical Unit will establish blends according to prevailing conditions
11. Jamaica 05/2009 10.0%
12. Mexico No goals.
Tests performed between 2008 and 2010; nationwide distribution 2011-1014; Given the limited availability of biodiesel, only a few production centers could be used
13. Nicaragua Central American Sustainable Energy Strategy sets a goal to replace 15% of fossil fuel consumption
14. Panama 01/2009 10.0%
Central American Sustainable Energy Strategy sets a goal to replace 15% of fossil
fuel consumption
Central American Sustainable Energy Strategy sets a goal to replace 15% of fossil
fuel consumption
15. Paraguay Blend established since 1982 Currently mandatory 12.0% Currently authorized 18.0%
In discussion 20.0% to 25.0%
Currently 3.0% In discussion 5.0%
16. Peru 2006 – 2010 Increase gradually and
progressively by region according to annual targets
01/2010 7.8%
01/2009 2.0% 01/2011 5.0%
17. Dominican Republic 01/2015 15.0% 01/2015 2.0%
18. Uruguay Until 12/2015 5.0% (voluntary) 01/2015 5.0% (required)
Until 12/2008 2.0% (voluntary) 01/2009 2.0% (required)
02/2012 5.0% Source: based on 1) Latin American Energy Organization (www.olade.org), 2009; 2) IICA, Ethanol Atlas (2007), 3) IICA, Biodiesel Atlas (2009) and 4) official national documents

Study on Regional Evidence Generation and Policy & Institutional Mapping on Food and Bioenergy
Region: Latin America and Caribbean - LAC
20
Figure 2.6: Required percentage for “gasoline-ethanol” blend in selected Latin American countries
Source: Based on official national documents
Figure 2.7: Required percentage for the “petrodiesel-biodiesel” blend in selected Latin
American countries
Source: Based on official national documents
0
5
10
15
20
25
30
2007 2008 2009 2010 2011 2012 2013 2014 2015 2016
% o
blig
ator
ia
Argentina
Bolivia
Brasil
Colombia
Costa Rica
Peru
0
5
10
15
20
25
2007 2008 2009 2010 2011 2012 2013 2014 2015 2016
% o
blio
gato
ria
Argentina
Bolivia
Brasil
Colombia
Costa Rica
Peru

Study on Regional Evidence Generation and Policy & Institutional Mapping on Food and Bioenergy
Region: Latin America and Caribbean - LAC
21
d. Incentives: Promoting the production and use of biofuels – National incentive programs for the production and use of biofuels
The most significant incentive, implemented by almost all LAC countries that already have a biofuels policy, is tax exemption (Value Added Tax, Income Tax, Tax on Liquid Fuels and Natural Gas, etc.) for the various stages of the biofuel industry. Even though tax exemptions favor both, producers of raw materials (upstream section) and the industrial sector responsible for the production and marketing of biofuels (downstream section), most countries chose to establish much stronger and more consistent incentives for the downstream section (Table 2.7). The agricultural sector, as a supplier of raw material for biofuel producers, is expected to benefit from the steadfast and dynamic encouragement given to the industrial sector.
Table 2.7: Tax incentives and public support
Incentives Countries
AR BO BR CO CR EC HN ME PA PE DR UR
Incentives (tax and others) for the production of raw material (upstream section)
(x) x x x x x X
Technical assistance for the production of raw material X x x x x x x
Incentives (tax and others) for the industrial sector to implement investment projects (different technological routes), produce and trade biofuels (downstream section)
X x x x x x x x x X
Technical assistance for the production of biofuels (different technological routes)
X x x x x
Plan, strategy or national program for the development of the production and use of biofuels (see also Table 2.9)
X x x x x x x X
Direct statement in the laws or official government priority for food security and regular food supply to the domestic market before developing biofuels
x x x
(x) In Brazil, the law gives tax benefits to industrial producers who buy raw materials from smallholder producers (through special tax exemptions: those who incorporate raw material producers on a household scale pay lower taxes). Incentives therefore also indirectly benefit producers of raw material.
Source: Based on 1) IICA, Atlas Ethanol, 2007; 2) IICA, Atlas Biodiesel, 2009; 3) SNV, 2008 and 4) official sources.
Following the creation of an intersectoral technical advisory body (Table 2.4), many countries formulated a plan, a strategy or a program for the development of the production and use of biofuels (Table 2.7). The governments of these countries generally show a high degree of interest in developing biofuel production programs. Even countries that do not have a specific regulatory framework appear to be interested in promoting this type of program (IICA, Atlas Ethanol, 2007). The existence of a case-specific plan or program almost always coincides with a broader approach to the issue and the implementation of

Study on Regional Evidence Generation and Policy & Institutional Mapping on Food and Bioenergy
Region: Latin America and Caribbean - LAC
22
complementary measures such as technical assistance for the production of raw materials and/or biofuels, and public and private efforts in research and technological innovation (Tables 2.7 and 2.9).
It is becoming increasingly common for biofuel production programs to be an integral part of rural development strategies aimed at mitigating poverty and strengthening food security. These programs are thus viewed as activities that can significantly contribute to achieving the objectives and goals of social and economic programs in these regions. The private sector, particularly sugar producers and distilleries, are investing or planning to invest in an effort to expand their installations to meet the growing demand for ethanol. The industry sees this as a great opportunity to revitalize agricultural activity while expanding the distillery business at the same time (IICA, Ethanol Atlas, 2007).
In line with the aims and objectives formulated, the priority areas and approaches for promoting the value chain of biofuels are: (i) the industry involved with biofuel production and marketing, (ii) producers and (iii) the focus on the country’s available and established raw materials (Table 2.8).
Table 2.8: Priority Sector / Approach for promoting the value chain of biofuels
Approach Countries
AR BO BR CO CR EC HN ME PA PE DR UR
Household agriculture / small producers x x x Small and medium-sized businesses x x
Regional economies x x x x
Farmers x x x x x x x x x Industry (biofuel producers) and trade x x x x x x x x
Domestic raw material x x x x x x x x
Source: Adapted from SNV, 2008 and completed by IICA based on official sources
e. Research and technological innovation: The production of raw materials and the development of technologies for the production of biofuels
In general, every country in the region has set up agricultural research centers, which are responsible for conducting research on the different aspects of the production of raw materials for biofuel. The private sector also plays an important role in these centers. However, research and innovations for producing ethanol from sugarcane are limited to only a few countries, including Brazil, Mexico, Colombia and Argentina. Other countries, such as those in Central America like Belize and Panama, need technical assistance from nations that have made more progress in this area (IICA, Atlas of Ethanol, 2007).
Countries that have traditionally been dedicated to sugarcane production have focused their research on aspects such as increasing production and agricultural productivity, and in some cases, on the ethanol production process itself, in order to expand their ability to supply the domestic market and to participate in the international market as well.

Study on Regional Evidence Generation and Policy & Institutional Mapping on Food and Bioenergy
Region: Latin America and Caribbean - LAC
23
Table 2.9: Public and private investments in research, innovation and technology transfer for the production of raw materials and biofuels (different technological routes)
Investment Countries
AR BO BR CO CR EC HN ME PA PE DR UR
... in research, innovation and technology transfer for the production of raw material
Private x x x x x x x x
Public x x x x x x x x x x x … in research, innovation and technology transfer for 1. biofuel production
(different technological routes) and/or
2. its use (developing and adapting engines, electricity generation, etc.)
Private x x x x x
Public x x x x x x
Source: Based on 1) IICA, Atlas Ethanol, 2007; 2) IICA, Atlas Biodiesel, 2009; 3) SNV, 2008 and 4) official sources.
All of these countries are interested in expanding and diversifying their raw material production base and finding crops that can replace corn and sugarcane as sources of ethanol, and soy bean and oil palm as sources of biodiesel. Such is the case for beetroot, cassava, sweet sorghum, dairy products and panela, for example, for the production of ethanol, and algae, cotton, palm, sunflower, jatropha, castor bean, peanut, canola, among others, for the production of biodiesel. Agricultural research on raw materials for biofuel production has focused on the development of different plant varieties, including high yield sugarcane.
The most important medium-term technological development thus far is ethanol production from cellulose. The progress that will be made in the next five to 10 years is expected to facilitate industrial production, which would significantly expand the primary product base. In that case, other crops (plants with high potential for cellulose production), waste from agricultural production, wood itself, and even solid waste generated by cities could become the basis for ethanol production. Countries like Chile, with a long tradition as a forest product exporter (11.6% of total exports), will have an industrially viable opportunity in the ethanol market.
Countries that traditionally grow sugarcane are investigating, among other options, the possibilities of increasing agricultural yields and improve ethanol production in order to improve their supply capacity. The most recent example is that of Agro-ecological Zoning for Sugarcane in Brazil, launched in September 2009 (see Box 3.2, page 55). They are also seeking to promote affordable technologies for producers at the same time. Countries where sugarcane is not a feasible option are exploring the possibility of tapping into other resources such as drawing on their geographical location for exporting, or using other crops or residues generated by these crops.
In the upstream section, the main areas covered in research, development and technology transfer programs are:
(i) Breeding (plans to introduce different plant varieties and collections, germplasm conservation, procurement of local varieties, variety evaluation);

Study on Regional Evidence Generation and Policy & Institutional Mapping on Food and Bioenergy
Region: Latin America and Caribbean - LAC
24
(ii) Agronomy (spatial arrangement and variety, evaluation of cultivars on different sowing dates, precision agriculture, weed management, soil and fertilizers, pests, etc.);
(iii) Technologies for the sustainable production of cereals and oilseeds in agricultural systems; rotations and tillage methods; high productivity sustainable agricultural systems; diagnosis, nutrient replacement and fertilizer technology; adaptability and stability of grain and oilseed cultivars in different environments; integrated pest, weed and disease management; different quality management methods for cereals and oilseeds, etc.
In the downstream section, research covers such topics as:
(i) Designing, modeling, optimization of continuous and discontinuous (batch) chemical processes; reliable engineering with intelligent control and monitoring systems and processes for biodiesel and bioethanol; MSW biogas plant design, industrial and agricultural waste;
(ii) Plant design and engine test bench. Performance and gas emissions of alternative fuels in combustion engines;
(iii) Production of biodiesel with enzymes, heterogeneous catalysts and direct application of oil as a fuel oil; glycerol treatment. Biotechnology for the treatment of glycerol as a fuel;
(iv) Fuel quality control, according to international and national standards.

Study on Regional Evidence Generation and Policy & Institutional Mapping on Food and Bioenergy
Region: Latin America and Caribbean - LAC
25
2.3. Consumption of biofuels and production of raw materials
2.3.1. Current and forecasted consumption of biofuels
In 2008, the estimated gasoline market for Latin America and the Caribbean (LAC) was approximately 132 billion liters of gasoline and 101 billion liters of diesel (Tables 2.10 and 2.11). In terms of potential areas for expansion, countries with low land availability (Chile, Dominican Republic, El Salvador, Haiti, Jamaica, Honduras, Trinidad and Tobago, Costa Rica, Belize, Guatemala and Panama – see introduction) represent approximately 10% of regional diesel or gasoline consumption. Countries with higher consumption, such as Brazil, Mexico, Colombia and Venezuela, are also those with the greatest availability of land for agricultural expansion.8
Table 2.10: Gasoline consumption in Latin America and the Caribbean
Region / country Millions of liters
1990 2000 2003 2008*
Central America and the Caribbean 29,991 35,536 39,302 62,883
South America 35,377 45,658 43,579 69,725
Total 65,368 81,194 80,602 132,608 Argentina 5,451 4,392 3,144 3,616 Bolivia 465 553 663 762 Brazil 9,061 16,439 15,389 24,500 Chile 1,783 3,091 2,702 3,107 Colombia 5,671 5,486 4,788 5,506 Costa Rica 250 710 788 906 Cuba 1,325 492 533 613 Dominican Republic 693 1,599 1,296 1,490 Ecuador 1,603 1,852 228 3 El Salvador 215 440 501 576 Guatemala 405 976 1,023 1,176 Haiti 78 128 138 159 Honduras 171 396 414 476 Jamaica 306 638 672 773 Mexico 25,601 28,906 32,601 37,491 Netherlands Antilles 110 123 158 182 Nicaragua 113 192 215 247 Panama 273 506 523 601 Paraguay 158 206 215 247 Peru 1,381 1 ,187 1,021 1,174 Trinidad and Tobago 450 430 440 506 Uruguay 274 372 245 282 Venezuela 9,531 12,080 13,131 15,101 * Estimated Source: IICA, Gazzoni, 2009 en base al Instituto Mundial de Recursos 8 Gazzoni, Decio Luiz: “Biocombustibles y alimentos en América Latina y el Caribe”, IICA, San José Costa Rica,
2009.

Study on Regional Evidence Generation and Policy & Institutional Mapping on Food and Bioenergy
Region: Latin America and Caribbean - LAC
26
Table 2.11: Diesel consumption in Latin America and the Caribbean (LAC)
Region / country Millions of liters
1990 2000 2003 2008*
Central America and the Caribbean 11,443 14,990 16,552 26,485 South America 29,874 46,398 47,018 75,229
Total 41,317 61,387 63,571 101,714 Argentina 4,522 7,915 6,637 10,619 Bolivia 269 370 463 741 Brazil 17,939 26,280 27,325 43,720 Chile 1,477 3,051 3,207 5,131 Colombia 925 1,830 2,058 3,293 Costa Rica 345 465 610 976 Cuba 442 262 245 392 Dominican Republic 351 871 682 1,091 Ecuador 887 1,730 1,931 3,090 El Salvador 262 514 519 830 Guatemala 274 601 753 1,205 Haiti 84 140 163 261 Honduras 211 346 457 731 Jamaica 109 143 167 267 Mexico 8,726 10,465 11,372 18,195 Netherlands Antilles 221 315 369 590 Nicaragua 163 346 352 563 Panama 179 307 643 1,029 Paraguay 424 795 986 1,578 Peru 1,157 2,147 2,213 3,541 Trinidad and Tobago 77 213 221 354 Uruguay 275 559 522 835 Venezuela 1,998 1,722 1,676 2,682
* Estimated. Source: IICA, Gazzoni, 2009 en base al Instituto Mundial de Recursos.
Some of the comparative advantages of the LAC countries with regard to the production of biofuels are their natural resources such as the availability of agricultural land, suitable climate, extensive cultivation season and sufficient water supply for high productivity. At the same time, the technology supply, manpower, administrative capabilities and investment capital, among other things, are important differential factors for competition. The size of the internal market and the access to fossil fuel sources or other competitive differentiating factors linked to the energy production potential from other renewable sources are also basic elements in the establishment of sustainable biofuel production.
Consequently, most of the countries in the LAC have decided in favor of biofuels and have been fomenting their production and use in recent years (see Chapter 2.2). Based on the caloric value for the current consumption (2007) of fuel (Table 2.2), and considering the increase in consumption over the past few years (Tables 2.10 and 2.11) and the compulsory mixing proposed in the relevant laws, it is possible to predict biofuel consumption – bioethanol and biodiesel – in 18 LAC countries for the years 2010 and 2015 as presented in Tables 2.12 and 2.13.

Study on Regional Evidence Generation and Policy & Institutional Mapping on Food and Bioenergy
Region: Latin America and Caribbean - LAC
27
Table 2.12: Forecast for bioethanol consumption in 18 countries within the region
Final consumption –
2007
Gasoline consumption
in 20071) (in 1000 liters)1
Forecasted gasoline
consumption for 20102
(in 1000 liters)
Compulsory mixing with
bioethanol in 2010
Forecasted bioethanol
consumption for 2010
(in 1000 liters)
Forecasted gasoline
consumption for 20152
(in 1000 liters)
Compulsory mixing with
bioethanol in 2015
(in 1000 liters)
Forecasted bioethanol
consumption for 2015
(in 1000 liters))
Argentina 4,966,757 5,506,732 5% 275,337 6,540,270 5% 327,013 Bolivia (i) 550,800 610,682 10% 61,068 725,299 25% 181,325
Brazil (ii) 35,889,006 39,790,783 25% - 100% (flex- fuel vehicles) 28,000,000 47,258,968 25% - 100% (flex-
fuel vehicles) 45,000,000
Chile (iii) 2,762,861 3,063,233 2% 61,265 3,638,160 2% 72,763 Colombia (iv) 5,288,330 5,863,266 10% 586,327 6,963,720 20% 1,392,744 Costa Rica 801,560 888,704 8% 71,096 1,055,501 8% 84,440 Ecuador (v) 2,394,855 2,655,219 5% 132,761 3,153,567 5% 157,678 El Salvador (vi) 507,799 563,006 10% 56,301 668,675 10% 66,867 Guatemala (vii) 1,105,627 1,225,829 10% 122,583 1,455,900 10% 145,590
Honduras 505,223 560,149 To be determined - 665,282 To be
determined
Jamaica 638,574 707,999 10% 70,800 840,880 15% 126,132 Mexico (viii) 38,905,847 43,135,609 0% - 51,231,571 6% 3,073,894
Nicaragua 278,138 308,377 To be determined - 366,255 To be
determined
Panama 290,056 321,590 24% 77,182 381,948 24% 91,668 Paraguay (ix) 243,190 269,629 5% 13,481 320,234 5% 16,012 Peru 1,088,878 1,207,258 7.8% 94,166 1,433,844 7,8% 111,840 Dominican Republic 1,135,422 1,258,863 0% - 1,495,134 15% 224,270
Uruguay (x) 306,483 339,804 5% 16,990 403,580 5% 20,179
Total 97,659,409 108,276,732 29,507,526 128,598,792 51,092,416 Notes: (i) Bolivia: The forecasted bioethanol consumption for Bolivia is based on the unlikely possibility of the
regulation of the corresponding legislation which is frozen due to a decision from the current government. (ii) Brazil: MAPA’s bioethanol consumption forecast was used since it takes into account both the mix of
anhydrous bioethanol with gasoline and the consumption of hydrated bioethanol by flex-fuel automobiles. (iii) Chile: Mixing is not compulsory. (iv) Colombia: From 2012 on, compulsory mixing can be up to 85%. Reference is based on the UPME
scenario of the Colombian Ministry of Mining and Energy considering an E20 mix for the years 2009 to 2025.
(v) Ecuador: Bioethanol consumption forecasted for 2010 was calculated based on the Biofuels Pilot Plan E5 in Guayaquil (where gasoline consumption is officially estimated at 46,000 liters daily). Consumption forecasted for 2015 assumes that the Plan will be extended throughout the domestic territory.
(vi) El Salvador: Forecasted bioethanol consumption in El Salvador is based on the assumption that the proposed legislation will be passed.
(vii) Guatemala: Forecasted consumption for bioethanol is based on the assumption that the proposal from the Ministry of Mining and Energy will be implemented (Law for Incentives to the Development of Projects on Renewable Energies 2003, stagnant so far).
(viii) Mexico: Forecasted consumption for bioethanol for Mexico in 2015 is based on the assumption that the Bioenergy Starter Program will be extended throughout the country. The Program will start in Guadalajara in 2011 and will include Monterrey Metropolitan Areas and Valle de Mexico Metropolitan Areas.
(ix) Paraguay: The assumption was the usage of the maximum levels in the compulsory mix (E20-E24). (x) Uruguay: 5% optional in 2010, compulsory from 2015 on.
Source: Independent compilation based on 1). OLADE, except Argentina (Energy Secretariat) 2). An assumed annual cumulative growth rate of 3.5% was applied evenly to all countries.
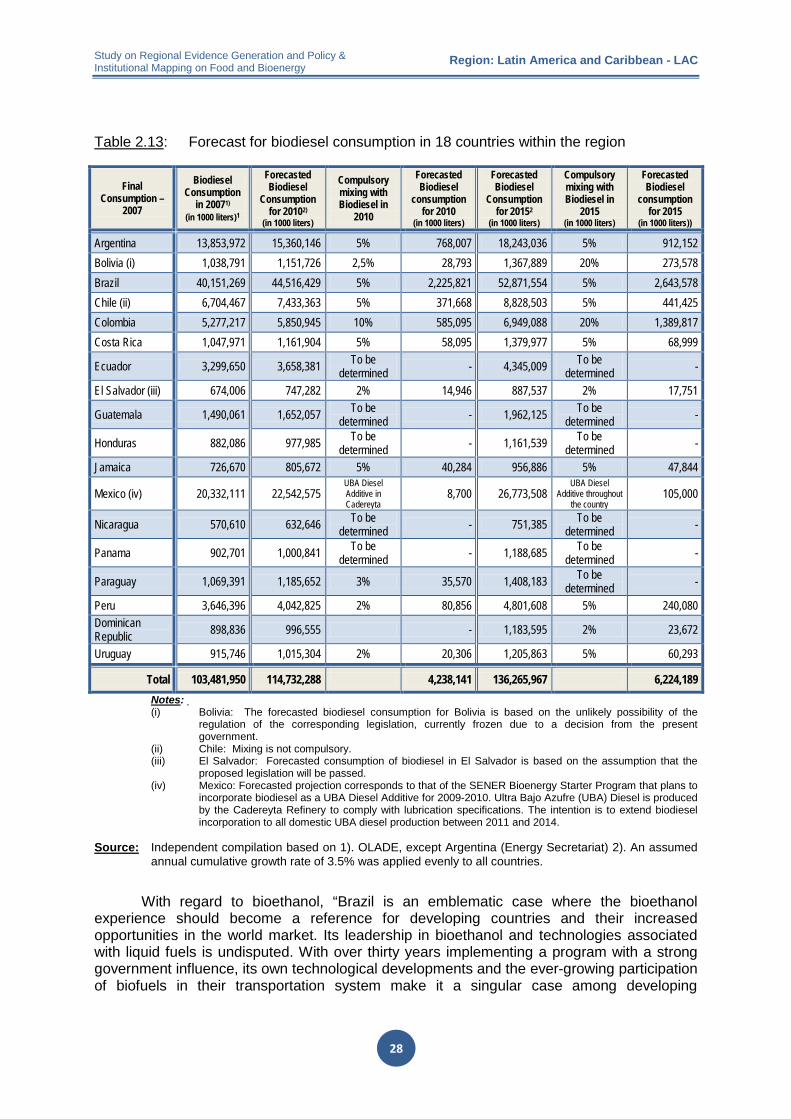
Study on Regional Evidence Generation and Policy & Institutional Mapping on Food and Bioenergy
Region: Latin America and Caribbean - LAC
28
Table 2.13: Forecast for biodiesel consumption in 18 countries within the region
Final Consumption –
2007
Biodiesel Consumption
in 20071) (in 1000 liters)1
Forecasted Biodiesel
Consumption for 20102)
(in 1000 liters)
Compulsory mixing with Biodiesel in
2010
Forecasted Biodiesel
consumption for 2010
(in 1000 liters)
Forecasted Biodiesel
Consumption for 20152
(in 1000 liters)
Compulsory mixing with Biodiesel in
2015 (in 1000 liters)
Forecasted Biodiesel
consumption for 2015
(in 1000 liters))
Argentina 13,853,972 15,360,146 5% 768,007 18,243,036 5% 912,152 Bolivia (i) 1,038,791 1,151,726 2,5% 28,793 1,367,889 20% 273,578 Brazil 40,151,269 44,516,429 5% 2,225,821 52,871,554 5% 2,643,578 Chile (ii) 6,704,467 7,433,363 5% 371,668 8,828,503 5% 441,425 Colombia 5,277,217 5,850,945 10% 585,095 6,949,088 20% 1,389,817 Costa Rica 1,047,971 1,161,904 5% 58,095 1,379,977 5% 68,999
Ecuador 3,299,650 3,658,381 To be determined - 4,345,009 To be
determined -
El Salvador (iii) 674,006 747,282 2% 14,946 887,537 2% 17,751
Guatemala 1,490,061 1,652,057 To be determined - 1,962,125 To be
determined -
Honduras 882,086 977,985 To be determined - 1,161,539 To be
determined -
Jamaica 726,670 805,672 5% 40,284 956,886 5% 47,844
Mexico (iv) 20,332,111 22,542,575 UBA Diesel Additive in Cadereyta
8,700 26,773,508 UBA Diesel
Additive throughout the country
105,000
Nicaragua 570,610 632,646 To be determined - 751,385 To be
determined -
Panama 902,701 1,000,841 To be determined - 1,188,685 To be
determined -
Paraguay 1,069,391 1,185,652 3% 35,570 1,408,183 To be determined -
Peru 3,646,396 4,042,825 2% 80,856 4,801,608 5% 240,080 Dominican Republic 898,836 996,555 - 1,183,595 2% 23,672
Uruguay 915,746 1,015,304 2% 20,306 1,205,863 5% 60,293
Total 103,481,950 114,732,288 4,238,141 136,265,967 6,224,189 Notes: (i) Bolivia: The forecasted biodiesel consumption for Bolivia is based on the unlikely possibility of the
regulation of the corresponding legislation, currently frozen due to a decision from the present government.
(ii) Chile: Mixing is not compulsory. (iii) El Salvador: Forecasted consumption of biodiesel in El Salvador is based on the assumption that the
proposed legislation will be passed. (iv) Mexico: Forecasted projection corresponds to that of the SENER Bioenergy Starter Program that plans to
incorporate biodiesel as a UBA Diesel Additive for 2009-2010. Ultra Bajo Azufre (UBA) Diesel is produced by the Cadereyta Refinery to comply with lubrication specifications. The intention is to extend biodiesel incorporation to all domestic UBA diesel production between 2011 and 2014.
Source: Independent compilation based on 1). OLADE, except Argentina (Energy Secretariat) 2). An assumed annual cumulative growth rate of 3.5% was applied evenly to all countries.
With regard to bioethanol, “Brazil is an emblematic case where the bioethanol experience should become a reference for developing countries and their increased opportunities in the world market. Its leadership in bioethanol and technologies associated with liquid fuels is undisputed. With over thirty years implementing a program with a strong government influence, its own technological developments and the ever-growing participation of biofuels in their transportation system make it a singular case among developing

Study on Regional Evidence Generation and Policy & Institutional Mapping on Food and Bioenergy
Region: Latin America and Caribbean - LAC
29
countries.”9
A significant increase in the use of sugarcane for bioethanol production is expected in Brazil, the world’s second largest bioethanol producer, stimulated by the anticipated growth of the flex-fuel vehicle fleet, a sizeable increase in the installation capabilities assumed by the current investor wave in the sugar and alcohol segment and the escalation of external demand. According to projections from the Brazilian Ministry of Agriculture, bioethanol production will go from 18,900 million liters in 2007 to over 31,800 million liters in 2013 (with over 7,000 million liters in exports), and should reach 41,600 million liters by 2018, with a domestic consumption of 30.3 thousand million liters (exports would be in the range of 11,300 million liters)
As a result, with over 90% of the grand total, Brazil currently produces and consumes most of the bioethanol produced in the LAC. Even with the increase in consumption in other countries also predicted for 2015 (particularly Colombia and Mexico), Brazil will still be responsible for over 80% of bioethanol consumption within the LAC region.
10
The situation is slightly different for the projected consumption of biodiesel: while Brazil will be the largest biodiesel consumer in LAC by the year 2015, its consumption will represent less than a third of total consumption in the region. Countries such as Argentina, Bolivia, Chile, Colombia and Peru will also consume considerable amounts of biodiesel, and
.
Brazil and Argentina will become firmly established among the main worldwide producers and exporters of biodiesel, especially soy-based. The still growing production and processing capacities of their emerging biofuel industries (downstream and upstream), which - including plants already in construction or in the process of being regulated as well as a number of approved blueprints - will soon facilitate the production of over 5,600 million liters, foretells a significant increase in the use of oleaginous plants and vegetable oils over the next few years. On top of that, the also growing processing capabilities for bioethanol and biodiesel production in other Latin American and Caribbean countries will add to the ensuing demand for sugarcane, palm, soy bean and other raw materials.11
2.3.2. Production of raw materials
Given the favorable situation in LAC regarding raw material production for biofuel, the region is expected to become a self-supplier, with biofuel-exporting potential in some cases (Brazil, Argentina).12
a. Raw materials for bioethanol production
Bioethanol can be obtained from three types of raw materials:
• Crops and products with a high sugar content such as sugarcane, beetroot, sweet sorghum and molasses.
9 CEPAL, 2008: Aporte de los biocombustibles a la sustentabilidad del desarrollo en América Latina y el Caribe:
Elementos para la formulación de políticas públicas. 10 Ganduglia, F y Equipo de Proyectos de Biocombustibles (EPB) – ARPEL. Inédito. Guía ARPEL – IICA sobre
Biocombustibles. Guía ARPEL REF No. 01-2009 – IICA REF No. 01-2009 11 Ganduglia, F y Equipo de Proyectos de Biocombustibles (EPB) – ARPEL loc.cit 12 CEPAL, 2009: Biocombustibles y Comercio Internacional: Una perspectiva Latinoamericana
“… There are few Latin American countries that currently have the potential to export biofuels… Being more specific, only Brazil and Argentina, which are currently the two greatest exporters of agricultural products in the region, display favorable conditions to the expansion of biofuel exports. In the other countries, biofuels have an important niche to fill, but it is within the domestic market.”

Study on Regional Evidence Generation and Policy & Institutional Mapping on Food and Bioenergy
Region: Latin America and Caribbean - LAC
30
• Starch crops with high starch content such as those found in cereals (corn, grain sorghum, wheat and barley), roots and tubers (manioc, potato, sweet potato, etc.) or inulins (Jerusalem artichoke or topinambur, agave, yam, etc.).
• Raw materials and crops with high cellulose content (lignocelluloses), where carbohydrates are found in a more complex form (wood, agricultural and forestry residue, lignocelluloses crops, herbaceous material, etc.).13
Ganduglia et al. estimate that the production of raw materials that are most relevant for bioethanol in 10 South American countries
14 amounted to almost 760 million tons in 2007 (Table 2.14). The crop with the greatest immediate availability in the region is sugarcane, which is grown in every country in South America except Chile, as well as throughout all of Central America and the Caribbean. Brazil, the world’s main sugarcane producer, leads significantly in the regional production of this raw material. Following sugarcane are corn, whose South American production is concentrated in Argentina and Brazil15, cassava, sorghum, sweet beetroot and yam (Table 2.14). The main South American producers of raw materials used in the production of bioethanol are Brazil, followed by Argentina and Colombia.16
Table 2.14: Raw materials used for bioethanol production in 10 South American countries in 2007
Raw Materials Total Production (in 1,000 tons)
Conversion to ethanol1) (l/t)
(b)
Potential of ethanol
production (in billion l)
(a) * (b)
Potential participation in
total ethanol production (%)
Sugarcane 635,530 81 51,5 55,3 %
Corn 80,016 410 32,8 35,2 %
Manioc 36,495 180 6,6 7,1 %
Sorghum 5,362 402 2,2 2,3 %
Yam 619 n/d n/d n/d
Sweet Beetroot 1,833 32 0,1 01 %
Source: Ganduglia, F. et al ARPEL/IICA (unpublished): Guía ARPEL – IICA sobre Biocombustibles (based on official statistics from each country and FAOSTAT) 1) Matt Johnston et al. 2009. Resetting global expectations from agricultural biofuels. Environmental. Research Letters. 4 (2009) 014004 (9pp): http://www.iop.org/EJ/article/1748-9326/4/1/014004/erl9_1_014004.pdf?request-id=f7eaac1d-97fb- 4eee-bf7d-5e47648f07ea
Around 5 million ha were used for growing sugarcane in Brazil in the 90s and in the early part of this century. From 2003 on, with the advent of flex-fuel engines, and their widespread acceptance by consumers, the increase of hydrated bioethanol consumption resumed in the domestic market, paving the way for new perspectives for the expansion of the sugarcane agro-industry in Brazil. Since that time, the Brazilian agro-industry has expanded significantly (Chart 2.8). According to UNICA17
13 Ganduglia, F y Equipo de Proyectos de Biocombustibles (EPB) – ARPEL. Loc.cit.
the area available for sugarcane harvesting increased to 5.83 million ha in 2007/08 and 6.75 million ha in 2008/09.
14 Argentina, Bolivia, Brazil, Chile, Columbia, Ecuador, Peru, Paraguay, Uruguay, Venezuela. 15 Another important corn producer is México (see Box No. 2.1) 16 Ganduglia, F y Equipo de Proyectos de Biocombustibles (EPB) – ARPEL. Loc.cit. 17 UNICA: “Avaliação da área de cana disponível para colheita na safra 2008/09”, available at
http://www.unica.com.br/dadosCotacao/estatistica
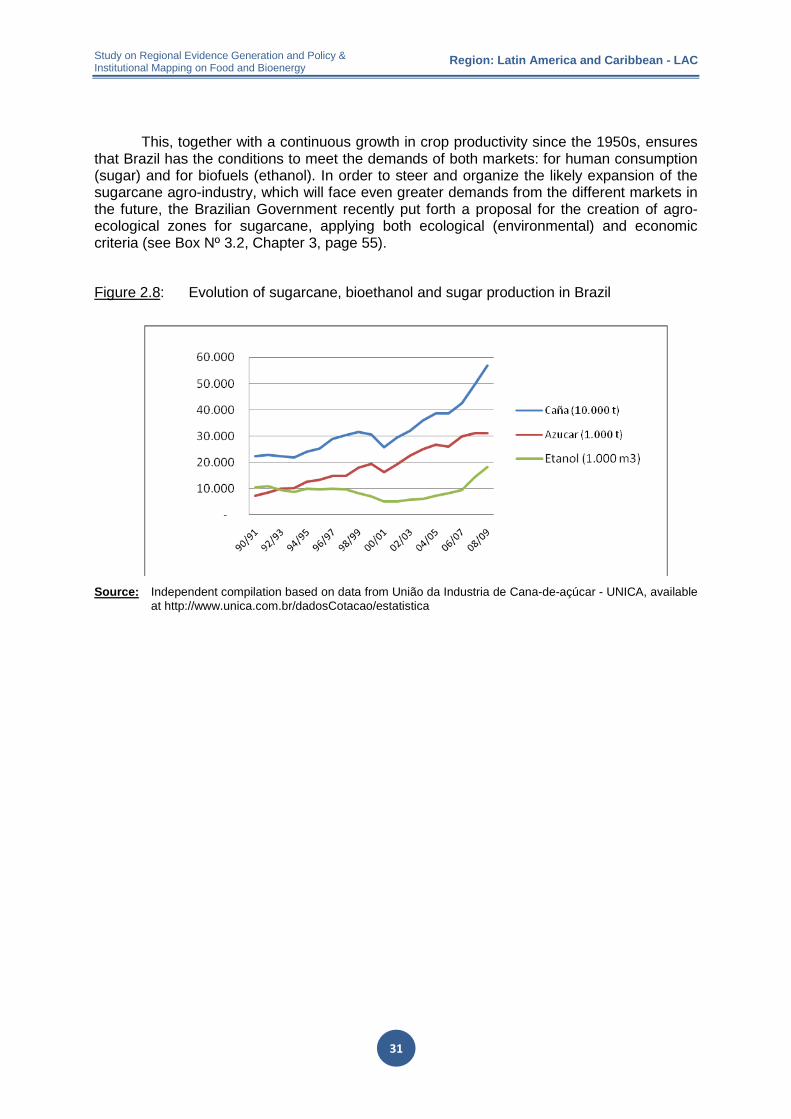
Study on Regional Evidence Generation and Policy & Institutional Mapping on Food and Bioenergy
Region: Latin America and Caribbean - LAC
31
This, together with a continuous growth in crop productivity since the 1950s, ensures that Brazil has the conditions to meet the demands of both markets: for human consumption (sugar) and for biofuels (ethanol). In order to steer and organize the likely expansion of the sugarcane agro-industry, which will face even greater demands from the different markets in the future, the Brazilian Government recently put forth a proposal for the creation of agro-ecological zones for sugarcane, applying both ecological (environmental) and economic criteria (see Box Nº 3.2, Chapter 3, page 55).
Figure 2.8: Evolution of sugarcane, bioethanol and sugar production in Brazil
Source: Independent compilation based on data from União da Industria de Cana-de-açúcar - UNICA, available at http://www.unica.com.br/dadosCotacao/estatistica

Study on Regional Evidence Generation and Policy & Institutional Mapping on Food and Bioenergy
Region: Latin America and Caribbean - LAC
32
Box Nº 2.1: Corn Production in Mexico
Corn is by far the most important agricultural crop in Mexico from the nutritional, industrial, political and social point of view. The country has two corn production cycles: spring-summer and autumn-winter, with very diverse agro-climatic conditions in terms of humidity, weather and irrigation. Mexico is a center of origin and diversity of corn, and recent studies reveal over 50 different types. In response to the importance of these crops, the Mexican government, through the Agricultural, Cattle Raising, Rural Development, Fishing and Food Secretariat (Secretaría de Agricultura, Ganadería, Desarrollo Rural, Pesca y Alimentación – SAGRAP) maintains several programs to foment the growing and conservation of the different varieties of Creole corn.
Corn production increased 6.1 million tons between 1994 and 2008, reaching a production level of 24.4 million tons (Graph 2.10) in 2008. The area cultivated over the past 25 years, which ranged between approximately 7.5 and 9.2 million ha has shown a significant trend towards a 1% decrease per year over the last decade (from 9.13 million ha in 1997 down to 7.9 million ha in 2008; Graph 2.10). The continued increase in total production is thus due to an increase in yield from 1.8 t/ha (in the 80s) to 2.3 t/ha (in the 90s) to 2.6 t/ha (2000-05) to 3.3 t/ha in 2008. Production for 2008 was in excess of 68 billion pesos (approximately US$ 5.3 billion), making Mexico the fourth largest corn producer in the world.
Figure 2.9: Harvested area and corn production in Mexico 1997 - 2008
Source: Independent compilation based on SAGARPA/SIAP (Servicio de Información Agroalimentaria y Pesquera), México, Available at: http://w4.siap.gob.mx/artus/eis/loadstage.asp
Corn contributes approximately 65% of total cereal production. A comparative analysis of corn with other cereals produced in Mexico (mainly wheat, sorghum, barley, rice and oats) with regard to the evolution of the volume of production, shows that corn increased an average of 2.0% per year between 1996 and 2006.
Domestically, corn crops occupy 38.5% of the total cultivated surface area. Approximately 2 million people grow corn as their main activity, a figure that represents 30% of the employed population in the primary sector of the country’s economy. Smallholder properties predominate for corn production. Out of the 1.9 million registered producers, 85.1% of them own land with less than 5 ha, and 56% have production units smaller than 2 ha. Consequently, corn growing in Mexico allows the coexistence of production systems: the first is known as a subsistence system, where small-scale land owners make up the majority (85%) and a good part of what is obtained from those lands is used for self-consumption, constituting an important part of the income of families living in the rural sector. The second, the commercial production system, is targeted to comply with demands imposed by the agro-industry responsible for the multiple products derived from corn such as: corn meal, tortilla, cornflower, starches, cereals and animal feed.

Study on Regional Evidence Generation and Policy & Institutional Mapping on Food and Bioenergy
Region: Latin America and Caribbean - LAC
33
Box Nº 2.1 (cont.): Corn Production in Mexico
The observable domestic consumption of corn in 2008 was 33.6 million tons, divided between white and yellow corn and other varieties. Domestic production provides the white corn for human consumption and imports are mostly yellow corn. By breaking down the main corn varieties, one can see that the country is self-sufficient in white corn, while 74% of the yellow corn supply comes from imported grain. In 2008, 93% of the imports referred to yellow corn being used mainly for cattle-raising and starch industries. From 2006 to 2008, corn imports were reduced by 1.5 million tons, dropping from 10.7 to 9.2 million tons.
Figure 2.10 Distribution of white corn production by state in 2005
Source: SAGARPA/SIAP “Situación actual y Perspectivas del Maíz en México 1996-2012” (pdf) México, sin año.
Bioenergy in Mexico is responsible for 8% of the primary energy consumption, which is why ethanol production in Mexico is still embryonic. Sugarcane chaff is the material used for bioenergy production, and it is used for electric and or thermal energy in the sugar industry. The first ethanol industrial plant has just become operational. Ethanol is produced from corn and sorghum. The ethanol produced as a result of the process is destined for the U.S. market.
Sources: 1.) Secretaría de Agricultura, Ganadería, Desarrollo Rural, Pesca y Alimentación – SAGRAP: “Producción de Maíz en México”, PowerPoint Presentation, Septiembre 2009, sent by Coordinación General de Comunicación Social ([email protected]) 2.) SAGARPA/SIAP “Descripcion del Maíz” (pdf), Mexico, without year. 3.) SAGARPA/SIAP -Servicio de Información Agroalimentaria y Pesquera; México, available at http://w4.siap.gob.mx/artus/eis/loadstage.asp 4) SAGARPA/SIAP “Situación actual y Perspectivas del Maíz en México 1996-2012” (pdf) México, without year.

Study on Regional Evidence Generation and Policy & Institutional Mapping on Food and Bioenergy
Region: Latin America and Caribbean - LAC
34
b. Raw materials for biodiesel production
Biodiesel is obtained from the transesterification of vegetable oils or animal fats. Vegetable oils can be obtained from a wide variety of oleaginous seeds and fruit, as well as other alternative raw materials such as seaweed. Recycled cooking oils are also used18
The crops that have the potential to increase the biodiesel supply in Latin America are the most widely grown oleaginous plants such as soy, African Palm, cotton, sunflower, peanut, etc., with soy in the forefront. In 2007, Ganduglia et al estimated the production of over 130 million tons of oleaginous seeds and fruit for the 10 countries in South America, resulting in around 17.3 million tons of vegetable oil (Table 2.15).
.
19
Table 2.15: Raw material for biodiesel production (from oleaginous seeds and fruit) for 10 South American countries in 2007
Oleaginous Total Production (in 1,000 tons)
Conversion to biodiesel1) (l/t)
(b)
Potential of biodiesel
Production (in billion l)
(a) * (b)
Potential participation in total biodiesel production (%)
Soy 112,473 183 20,6 83,9 %
African Palm 7,353 223 1,6 6,7 %
Cotton 4,749 103 0,5 2,0 %
Sunflower 4,043 418 1,7 6,9 %
Coconut 3,100 n/d n/d n/d
Peanut 908 n/d n/d n/d
Colza 195 392 0,1 0,3 %
Castor Oil 163 393 0,1 0,3 %
Sesame 115 n/d n/d n/d
Safflower 58 n/d n/d n/d
Flax 51 n/d n/d n/d
Tung 50 n/d n/d n/d
Source: Ganduglia, F. et al. ARPEL/IICA (Inédito): Guía ARPEL – IICA sobre Biocombustibles (en base a estadísticas oficiales de los países y FAOSTAT) 1/ Matt Johnston et al. 2009. Resetting global expectations from agricultural biofuels. Environmental. Research Letters. 4 (2009) 014004 (9pp). Available at: http://www.iop.org/EJ/article/1748-9326/4/1/014004/erl9_1_014004.pdf?request-id= f7eaac1d-97fb-4eee-bf7d-5e47648f07ea
Just as sugarcane is prevalent as a raw material in bioethanol production, soy appears to be the raw material of choice in the production of biodiesel. The production of this oleaginous plant was over 112 million tons in 2007, which is 87% of the total for oleaginous plants in the 10 countries. However, this output is mainly concentrated in the two large agro-exporting countries of the region, Brazil and Argentina. Soy is the most immediately available raw material, followed by the African Palm, cotton seeds and sunflower seeds (Table 2.15). The other important oleaginous crop is palm, which is mainly produced in Colombia and Ecuador in South America, and in Honduras, Costa Rica and Guatemala in Central America (Table 2.16). Palm is currently the crop with the greatest potential for vegetable oil production.
18 Ganduglia, F y Equipo de Proyectos de Biocombustibles (EPB) – ARPEL, loc. cit. 19 Argentina, Bolivia, Brazil, Chile, Columbia, Ecuador, Peru, Paraguay, Uruguay, Venezuela.

Study on Regional Evidence Generation and Policy & Institutional Mapping on Food and Bioenergy
Region: Latin America and Caribbean - LAC
35
Other crops such as castor oil or jatropha still have no tradition in the region. In Brazil, for example, the government supports the development of these crops as raw materials for the production of biodiesel since they are more consistent with small properties and semi-arid zones in the rural areas of Brazil, home to the country’s poorest populations. Nevertheless, harvest results are currently much lower than what was originally predicted.
Table 2.16: Most important soy and African Palm-producing countries in LAC (2007)
Source: adapted from: CEPAL, 2009: Biocombustibles y Comercio Internacional: Una perspectiva Latinoamericana”, en base de FAOSTAT.
Box No. 2.2: Strengthening family agriculture in the Brazilian Northeast through the National Program for the Production and Use of Biodiesel
The Brazilian Government created the National Program for the Production and Use of Biodiesel (Programa Nacional de Produção e Uso de Biodiesel - PNPB) as a self-sustaining energy program, taking into consideration the price, quality and security of the biodiesel supply. It offers development opportunities for Brazilian agriculture, especially for small-scale farmers in underprivileged and underdeveloped regions. The program’s objective includes the market introduction, production and rational use of biodiesel, considering aspects of ecological and economic feasibility and sustainability, fostering social inclusion and sustainable regional development in rural areas through the generation of income and employment for the farmer’s household.
How can family agriculture benefit from the improvement of biofuel production and the social inclusion of less favored rural sectors?
There are a number of crops from which oil can be extracted and transformed into biodiesel, and are specially suitable for family agriculture, such as Castor (Ricinus communis) and the Physic Nut (Jatropha curcas). They adapt to less demanding conditions and do not require large amounts of water or much agricultural care, allowing for cultivation with fewer investments. Another advantage of
Country Production (in tons)
Soy Argentina 40,467,100 Bolivia 1,619,000
Brazil 52,464,640 Paraguay 3,800,000 Uruguay 631,900
African Palm Brazil 590,000 Columbia 3,200,000 Costa Rica 790,000 Ecuador 2,000,000 Guatemala 605,000
Honduras 1,250,000 Mexico 309,582 Venezuela 307,403

Study on Regional Evidence Generation and Policy & Institutional Mapping on Food and Bioenergy
Region: Latin America and Caribbean - LAC
36
these crops is that they can be used in mixed intercropping production systems with other crops such as beans, which provide valuable nutrition and fix nitrogen to the soil, improving its fertility20
Castor is considered to be the main oleaginous crop in the Northeast for supply of raw material for the PNPB, as it has the following characteristics: i) it is adapted to the soil and climate conditions of the Northeast; ii) it has a high oil content (48%); iii) it has a short production cycle; iv) it can be cultivated in association with other (food) crops; v) it grows in degraded soils; vi) agro-ecological zoning for the crop has been done for over 725 departments in the Northeast and vii) farmers acquainted with the crop know the cultivation process (especially in the State of Bahia).
. The Brazilian Northeast is characterized by a semi-arid climate with irregular rainfall and frequent drought, rendering agricultural practices more difficult as a result of the frequent loss of production. The region is also characterized by a low human development index (HDI), socio-economic inequality, demographic pressure, rural poverty and a lack of opportunities and perspectives for family agriculture.
Consequently, the Brazilian Government is promoting the cultivation of castor. Of the approximately 900,000 km² of Brazil's semi-arid northeast region, more than 15,000,000 hectares meet the necessary climate, soil and elevation requirements (from 300 to 1500 above sea level) for its cultivation (SUDENE, 1989)21. Considering the limitations due to soil and climate, and the requirements of rain-fed agriculture, the Empresa Brasileira de Pesquisa Agropecuária [Brazilian Agricultural Research Corporation] (Embrapa) has developed stable and profitable production systems in combination with beans. Castor is being intercropped with different bean species (Vigna unguiculata L., Phaseolus vulgaris L.), which are the most important source of proteins for the rural population of the Northeast, or with peanuts (Arachis hypogeae L.), sorghum (Sorghum bicolor L.) or pearl millet (Pennisetum glaucum L. or Pennisetum americanum L. Leeke)22
Another advantage relates to the support of the state/government not only through technical assistance and rural development services, but also with the formalization of the biodiesel production chain, based on raw material from family agriculture. Through the so-called Social Biofuel Seal, the government has established tax benefits for biodiesel producers, assuring the commercialization of
production originating from family agriculture and consequently guaranteeing a reliable income for small-scale producers and the economic stability of the productive chain.
. Small-scale farmers implement the mixed cropping systems in small areas (2–6 ha), quite often on degraded soils. The cultivation of castor is considered an opportunity for small-scale producers in the region to diversify production, putting at their disposal a complementary cash crop, increasing revenues and decreasing agricultural risks (Table 2.17). Among other advantages, harvesting of castor occurs at a different season of the year than the associated crops, allowing a net income during the months that are deemed less profitable.
Obtaining the Social Biofuel Seal brings the following advantages to biodiesel production companies: i) tax benefits, including tax reduction; ii) better financing conditions via the BNDES; iii) participation in all biofuel auctions organized by the National Petrol Agency of ANP, which is the body that regulates the activities of the oil, natural gas and biofuel industry in Brazil; iv) benefitting from marketing campaigns organized and financed by the government. In order to obtain the Social Biofuel Seal and comply with counterpart obligations, biodiesel producers agree to:
- Acquire a certain percentage of raw material from family agriculture (50% in the Northeast, 10% in the Northern and the Midwest regions, and 30% in the Southwest and Southern regions).
- Sign and fulfill long-term supply contracts with family producers (or cooperatives) defining minimum prices, approved by the Federal Union of Rural Workers and recognized by the government. 20 Preguntas y respuestas más frecuentes sobre Biocombustibles. IICA. – San Jose, Costa Rica: IICA, 2007. 21 SUDENE. Programa Nacional de Incentivos à Cultura da Mamona - PROIMA. Recife, PE, Brasil, 1989. 22 Consórcio Mamona + Amendoim: Opção para a Agricultura Familiar. Circular Técnico No. 104, Embrapa Algodão, Campina Grande, Brazil 2006.

Study on Regional Evidence Generation and Policy & Institutional Mapping on Food and Bioenergy
Region: Latin America and Caribbean - LAC
37
- Provide proper technical assistance: certified seeds, rural technicians, good agricultural practices etc
Table 2.17: Socio-economic analyses of the "Ricinus communis – Bean Consortium"a) and results from the demonstration area at Inhamuns/Crateús, State of Cearab).
Note: 1) 1 R$ = aprox. 0.55 US$, December 2009. Sources: a) "Módulo de Produção de Matéria Prima na Agricultura Familiar - Resultado baseado na análise sócio-econômica
do consórcio mamona x feijão (COOPPE/UFRJ e Embrapa)", José Renato Cortez Bezerra, Embrapa Algodão; Taller "Produção de Biodiesel Através da Agricultura Familiar" Campinas, 09.03.2008. b) "Relatório de Implantação da Unidade Técnica Demonstrativa: Agricultor Antonio de Melo Neto, Município Parambu, Polo de produção Inhamuns/Crateús, estado de Ceara. Responsible Technician : Uires Amorim Loiola, 11.19. 2009. By the Agricultural Development Ministry (MDA), farm-household Secretary (SAF), Brazil.
In addition to complementing traditional food crops, other aspects of the economic feasibility of castor production in family agriculture include the establishment of production hubs, the possibility of organizing production in cooperatives and, eventually, the verticalization of production and added value by organizing oil extraction at the cooperative level. The joining together of several small-scale producers would suffice for the acquisition of a small facility for the production of biofuel to meet local power needs, or to find new business opportunities for the product23. With the obligation of establishing direct contracts between biofuel producers and raw material producers, the production chain has been shortened and the dependence of small-scale producers on intermediaries has been reduced24
The program’s political feasibility is defined by the participation of family agriculture, and positive environmental, economic, and social impacts are essential to justify the continuity of the public policy of supporting the inclusion of family agriculture in the biofuel chain. Once more, without the participation of family agriculture, the production of biofuel will remain in the hands of large-scale producers and in mono-cultivation. An unpublished evaluation of the program’s performance, however, indicates that the production of basic grains in the region, especially beans, has increased since the onset of the program due to the promotion of mixed cropping systems
.
25
23 Preguntas y respuestas más frecuentes sobre Biocombustibles. IICA. – San José, Costa Rica: IICA, 2007.
.
24 Verbal communication, December 2009. Ministério de Desenvolvimento Agrário (MDA), Secretaria de Agricultura Familiar (SAF), Brazil. 25 Comunicación Verbal communication, December 2009. Ministério de Desenvolvimento Agrário (MDA), Secretaria de Agricultura Familiar (SAF), Brazil.
Description Unit Potential Production a)
Actual average production in
the Northeasta)
Producer A. de Melo, Parambu, Crateus, Cearab)
Average productivity of ricinus communis (kg/ha) 1,500 1,000
1,600
Average productivity of beans (kg/ha) 400 300 480
Income from ricinus communis production (R$1)/ha) 1,125 400
1,920
Income from bean production (R$1)/ha) 600 750 638
Gross Income (R$1)/ha) 1,725 450 2,558
Production costs (R$1)/ha) 600 1,200 1,350
Net Income (R$1)/ha) 1,125 800 1,228

Study on Regional Evidence Generation and Policy & Institutional Mapping on Food and Bioenergy
Region: Latin America and Caribbean - LAC
38
Box no 2.3: Production of raw material - The case of HONDUPALMA26
Although the tropical climate of Honduras favors the production of a variety of commercial crops, the country continues to import the bulk of its agricultural products. However, the government has promoted the cultivation of the African Palm, established years ago along the country’s northern coast as an agricultural cash crop. The action is part of a strategy to reduce poverty and generate jobs and income, while at the same time helping to resolve the energy issue of the country through the production of biofuels for the national transportation sector.
, Honduras
The government strategy for the production of biofuels focused on expanding palm plantations in the hope that the crop and its products - vegetable oil and biodiesel - would reduce total dependency on imported fossil fuel. This would contribute to the government’s investments in initiatives to develop the national economy: creating new jobs and income-generating alternatives within a dynamic economic sector with growth potential; promoting agricultural development in rural areas often characterized by weak economic structures; reducing Greenhouse Gas emissions (GHG) and generating additional income under the Clean Development Mechanism (CDM) and the United Nations Framework Convention on Climate Change (UNFCCC).
In terms of environmental administration, the country has some of the largest tropical forests and biodiversity reserves of Central America. The development and expansion of agricultural production in Honduras for food and bioenergy thus requires the timely and thorough consideration of any negative impact - environmental or social - that might result from such expansion.
Current status of the African Palm in Honduras27
The first commercial plantations were established in the 1940s. From 1971 onwards, palm cultivation was strongly promoted as part of the agrarian reform process, which included the establishment of rural cooperatives in the departments of Colon and Yoro. Later on, these cooperatives formed larger organizations that are still functioning today, called COAPALMA (14 cooperatives) and HONDUPALMA (30 cooperatives and other grassroots organizations).
:
The African Palm cultivation area in Honduras has more than doubled, from approximately 40,000 hectares in the 1990s to 82,000 hectares in 2005. This increase was achieved as a result of record prices for palm oil, in addition to facilitated access to private financing and technical assistance for producers who are already involved in or getting started in the African Palm industry. In 2007, the total planted area was 96,000 hectares, and it is expected to reach 120,000 hectares by 2010. For the palm-producing region on the country’s northern coast, approximately 800 new producers have been registered in the departments of Atlántida, Cortés, Colón and Yoro, which offer the most favorable production conditions for that crop (Figure 2.12).
Table 2.18 provides the data for the palm sector for 2008 (SAG), while Table 2.19 shows the high number of small and medium-size producers, proving that palm-growing in Honduras is not strictly limited to large-scale agribusiness enterprises. Through the National Agriculture Development Bank (Banco Nacional de Desarrollo Agrícola - Banadesa), the government encourages small-scale producers to complement the cultivation of staple food crops with African Palm in order to diversify and compensate possible harvesting losses during the rainy season. Considering the crop’s profitability, financing for the cultivation of African palm has been made accessible to small and independent producers who are affiliated with the National Rural Workers Association of Honduras (Asociación Nacional de Campesinos de Honduras - ANACH).
With the main objective of the National Plan for the Production of African Palm being to increase the area of cultivation, training and technical assistance is offered to farmers so that they can improve overall farm management capabilities and increase productivity. Special assistance is given to new producers, while the approximately 6,000 current producers receive technical assistance and training in specific areas of production such as palm seed propagation and production, and genetic
26 Desarrollo de una Cadena de Valor de Biocombustibles en una Plantación de Palma Africana - El caso de Hondupalma. SNV, Tegucigalpa, 2009. 27 Honduran Government , Secretaria de Agricultura y ganadería - SAG http://www.sag.gob.hn/index.php?option=com_content&task=view&id=1628&Itemid=892

Study on Regional Evidence Generation and Policy & Institutional Mapping on Food and Bioenergy
Region: Latin America and Caribbean - LAC
39
improvement and control of plagues and diseases28. In addition, producers are included in a geo-referenced register currently being developed by the Ministry of Agriculture (Secretaria de Agricultura y ganadería – SAG).29
Figure 2.11: African Palm plantations in Honduras (SAG 2008)
Principal players participating in the African Palm value chain include small, medium or industrial-scale producers of raw material and their investors, refineries, local distributors and service providers and exporters.
Source: Ministry of Agriculture (Secretaría de Agricultura y Ganadería SAG), available at http://www.sag.gob.hn/ca/agroindustria/palma/Plantaciones_palma.pdf
Table 2.18: Current data on the African Palm in Honduras (SAG 2008)
Source: Ministry of Agriculture (Secretaria de Agricultura y ganadería - SAG), available at
http://www.sag.gob.hn/index.php?option=com_content&task=view&id=1628&Itemid=892
28 Implemented through governmental agencies such as Dirección de Ciencia y Tecnología Agropecuaria (DICTA), Servicio Nacional de Sanidad Agropecuaria (SENASA) or Programa Nacional Agroalimentario (PRONAGRO) 29 http://www.sag.gob.hn/index.php?Itemid=116&id=301&option=com_content&task=view
Cultivated Area 109,000 hectares
Production Area 86,000 hectares
Average age of plant 14 years
Fresh fruit yield 17.54 TM/hectare
Oil yield 21,00 %
Extractor plants 11
Industrial plants 4
Extraction capacity 497 TM/Hr. FF
Beneficiary 120,000 individuals, aprox.100,000 men, and 20,000 women

Study on Regional Evidence Generation and Policy & Institutional Mapping on Food and Bioenergy
Region: Latin America and Caribbean - LAC
40
Table 2.19: Distribution of African Palm producers in Honduras by size of enterprise
Source: Ministry of Agriculture (Secretaria de Agricultura y ganadería - SAG), available at http://www.sag.gob.hn/index.php?option=com_content&task=view&id=1628&Itemid=892
Hondupalma, a company that belongs to the social sector of the organized economy, consists of 30 cooperatives and public interest companies, with over 600 associate members and 125 independent producers. The company has an extractor plant for African Palm oil, which is supplied by approximately 6,000 hectares of planted palm crops, producing 89,282 tons of fresh fruit per year, with a processed yield of 15,200 tons of palm oil. The cooperative has a participative business model and is a leading agro-industrial entrepreneur in the region. Its most important products include vegetable oil, different types of unsaturated fats and biodiesel derived from low quality palm oil.30
Since 2007, Hondupalma, the Netherlands Development Organization (SNV) and the World Wide Fund for Nature (WWF) have been implementing a project to develop a sustainable biofuels value chain based on Hondupalma's African Palm plantations. The principal objective is to create more jobs and income-generating opportunities for 30 cooperatives and companies that include 600 small-scale African Palm oil producers so that they may participate in the emerging Honduran biofuel sector through the sustainable management of natural resources and the mitigation of climate change. The project design includes three principal areas of work: Experimentation, Adaptation and Implementation of Improved Agricultural Practices (Mejores Prácticas Agrícolas - MPA), Cleaner Production and the Clean Development Mechanism (CDM). The results of the project are reflected in improvements in production processes and technical design, administrative, technical and management capabilities, enhanced environmental sustainability, an overall increase of industrial competitiveness and the identification and exploration of new economic and environmental opportunities
31
Regarding the economical, ecological and social viability of producing biodiesel in Honduras, the Honduran Council of Private Enterprise (Consejo Hondureño de la Empresa Privada - COHEP
. The project demonstrates the economic viability of biofuel production with small-scale farmers in an environmentally sustainable way without compromising food production.
32
Biodiesel production should be economically feasible and competitive, without depending excessively on incentives and subsidies. Raw material production should be local, with low production costs. The production chain must be efficient and sustainable, from both the energy and the environmental point of view.
) concluded that:
30 Desarrollo de una Cadena de Valor de Biocombustibles en una Plantación de Palma Africana - El caso de Hondupalma. SNV, Tegucigalpa, 2009 31 Producción Más Limpia y el Mecanismo de Desarrollo Limpio en HONDUPALMA - Estudios de caso. SNV, Tegucigalpa, 2009 32 Biocombustibles, Ambiente y la Gestión Empresarial en Honduras. Nota Técnica. Centro de Investigaciones Económicas y sociales - CIES del Consejo Hondureño de la Empresa COHEP, Tegucigalpa, Abril 2008
Description Area (hectares) Producers Area (1,000 hectares)
Small less than 10 1,485 6.80
Average 10 – 100 773 31.39
Large 100 – 1,000 106 34.82
Extra large More than 1,000 7 36.09
TOTAL 2,371 109.10

Study on Regional Evidence Generation and Policy & Institutional Mapping on Food and Bioenergy
Region: Latin America and Caribbean - LAC
41
Honduras has identified and selected the areas most suitable for growing energy crops.
The production of biofuels must essentially rely on raw material obtained from the environmentally friendly cultivation of semi-perennial crops, such as African Palm, Jatropha/ Physic Nut (Jatropha curcas L.) or Castor (Ricinus communis L.)
In the case of the African Palm, the opportunity costs for the possible export of both raw and refined palm oil could reduce the feasibility of biodiesel production for national consumption in Honduras. However, the introduction of biodiesel in the country’s energy matrix might offer important social advantages, such as the creation of jobs and income, establishing the rural population firmly on the land as a result of the economic opportunities offered by the production of raw material and the possible use of idle, degraded and formerly unproductive land, the application of proper land-use planning, the organization of the agro-industrial territory and possibly avoided deforestation.

Study on Regional Evidence Generation and Policy & Institutional Mapping on Food and Bioenergy
Region: Latin America and Caribbean - LAC
42
3. The conflict between food production and biofuels
3.1. Food security
The conditions that ensure food security are:33
a) Physical availability of quality food in sufficient amounts either produced domestically or imported.
b) Universal access to food by means of available economic or other resources to purchase appropriate quantities of nutritional food.
c) Achievement of nutritional well-being in such a way so as to satisfy every physiological need, through adequate diet, availability of and access to drinking water, health care and medical assistance (importance of inputs in the diet).
d) Stability in terms of access to adequate food at all times, without risk of food scarcity as a consequence of a sudden political, economic or climate-related crisis or cyclical events (seasonal lack of food security).
These conditions cover the aspects of food availability and accessibility. Any possible conflict whose origin lies in the production of biofuels would be reflected in some of these conditions.
Aspects that could impact food availability and access are a function of the raw materials and the generation of technology used to produce biofuels, as described below:34
First generation biofuels are obtained from food crops (corn, sugarcane, beetroot, soy, palm, etc.) and through simple technologies used for fermentation (bioethanol) and transesterification (biodiesel).
1.5 generation biofuels include those produced using conventional technologies and alternative raw materials relative to those that are more readily available. They are less sensitive than the crops used for food. Among them are castor bean, jatropha, sweet sorghum or bicolor sorghum.
Second generation biofuel represents a change in conversion technology that allows for the replacement of sugar, starch and oil in the raw materials used by generation one biofuels with different forms of lignocellulosic biomass (agricultural and primary and secondary forestry residues, perennial grass, fast-growing trees, etc).
The FAO recognizes that the current debate on biofuels and food is mainly restricted
to first generation liquid biofuels that are made of grains – mostly corn – which are in direct competition with the production of food for human consumption and will be used mostly for the transportation sector.35, 36
At the High Level Expert Forum on How to Feed the World in 2050 held in Rome in October 2009, one of the many challenges presented for discussion was that bioenergy has created the largest new demand for agricultural products over the past few years. This is a
33 Brathwaite, Chelston W. D. 2009. La seguridad alimentaria en las Américas: la exigencia de un nuevo modelo
de desarrollo para el siglo XXI. Posición Institucional. In: COMUNIICA. Year 5 January - April 2009. P.10 34 Ganduglia, F y Equipo de Proyectos de Biocombustibles (EPB) – ARPEL. Inédito. Guía ARPEL – IICA sobre
Biocombustibles. Guía ARPEL REF Nº 01-2009 – IICA REF Nº 01-2009 35 FAO. 2008. Panorama del hambre en América Latina y el Caribe. Available at: http://www.rlc.fao.org/es/politicas/pdf/panorama.pdf 36 Liquid biofuels: bioethanol, biodiesel, vegetable oils and methyl esters from vegetable oils.

Study on Regional Evidence Generation and Policy & Institutional Mapping on Food and Bioenergy
Region: Latin America and Caribbean - LAC
43
unique opportunity to incorporate measures aimed at mitigating climate change and adjustments into agricultural practices.37, 38
To achieve this, bioenergy production must be promoted without endangering the food supply by including biofuels, specifically ethanol and biodiesel, in the energy mix of LAC countries. This would make it possible to evolve from oil-dependent agriculture to a more sustainable one.
39
3.2. Indicators for change in land use
Direct and indirect land-use changes have become critical factors for the greenhouse gas balance and have brought about some major environmental implications. Policies that limit land conversion, promote good agricultural practices, integrate food and energy production systems and focus on the landscape can help mitigate environmental risks.40
The next step towards obtaining preliminary indicators related to changes in land-use and biofuel management practices in LAC countries will be to assess the use of natural resources and their effect on the agricultural structure from a broader standpoint.
There are some larger categories for the primary biomass used to produce biofuels, with a vast spectrum of natural resource requirements (soil, water, climate and nutrients), which include energy crops and residues.
Energy crops can be classified, depending upon their category, as: 41
a. Sugar crops (sugarcane, beetroot, etc.)
b. Starch crops (cassava, potatoes, grains, etc.) c. Oilseed crops (rapeseed, soy, sunflower, etc.) d. Short-cycle forestry crops (willow, poplar and eucalyptus) e. Grasses (switchgrass, miscanthus, etc.)
Residues can be classified as:
a. Forestry, agricultural, animal feces (manure) b. Residues generated by cities – solid (organic waste, animal fat) and liquid (used
oil).
37 FAO, 2009. Office of the Secretary of the High-Level Expert Forum on How to Feed the World in 2050.
Challenges related to food and agriculture posed by climate changes and bioenergy (Desafíos en relación con la alimentación y la agricultura planteados por el cambio climático y la bioenergía). Rome, October 12 – 13, 2009. Available at: http://www.fao.org/fileadmin/templates/wsfs/docs/Issues_papers/Issues_papers_SP/cambio_clim%C3%A1tico_y_la_bioenerg%C3%ADa.pdf
38 Number 30 of the DECLARATION OF THE WORLD SUMMIT ON FOOD SECURITY. World Summit on Food Security. Rome, November 16–18, 2009. FAO WSFS 2009/2. Available at:
http://www.fao.org/fileadmin/templates/wsfs/Summit/Docs/Final_Declaration/K6050S_WSFS_OEWG_06.pdf 39 IICA, 2009. Agricultura de América Latina y el Caribe: bastión ante la crisis mundial y motor para el desarrollo
futuro / IICA – San José, C.R.: IICA, 2009. 28 p.; 15 cm. Available at: http://www.iica.int/Esp/conocimiento/actualidad/Documentos%20Seguridad%20Alimentaria/Agricultura%20en%20ALC.%20Basti%C3%B3n%20ante%20la%20crisis%20y%20motor%20del%20desarrollo%20futuro.%20Espa%C3%B1ol.pdf
40 FAO – CEPAL. Opportunities and risks arising from the use of bioenergy for food security in Latin America. Available at: http://www.rlc.fao.org/es/prioridades/bioenergia/pdf/bioenergiaen.pdf 41 Hoogwijk et al. (2005). “Potential of biomass energy out to 2100, for tour IPCC SRES land-use scenarios”.
Biomass and Bioenergy 29, p. 225-257. Available at: http://igitur-archive.library.uu.nl/chem/2007-0320-200454/Vries_05_%20Potential-of-biomass-energy-out-to-
2100,-for-four-IPCC-SRES-land-use-scenarios.pdf

Study on Regional Evidence Generation and Policy & Institutional Mapping on Food and Bioenergy
Region: Latin America and Caribbean - LAC
44
Given the scope of this study, we have provided below details of a preliminary assessment of natural resource requirements for sugar, starch, and oilseed crops, without expanding on other sources of raw material necessary to produce biofuels. The use of each of these natural resources is also explained.
Table 3.1: Preliminary assessment of soil, water, nutrient and climate requirements for some crops that are considered agro-energy in Latin America and the Caribbean
Crops used to produce ethanol
Crop Soil Water Nutrients Climate
Corn The soil must be well aired and drained. Uses water efficiently.
Requires a great deal of fertility and nutrients should be provided
continuously.
Temperate to tropical conditions.
Sugarcane Does not require a special type of soil, but it should
be preferably aired with at least 15% water content.
High and well distributed throughout the growth
season.
Great need for nitrogen and potassium, but during maturity the soil nitrogen content should be as low as possible to allow for a
good recovery of the sugar.
Tropical and subtropical climate.
Cassava Can adapt to infertile soils.
Can be grown in sandy Oxisols, Ultisols, Inceptisol
and Entisols.
Ideal precipitation between 1000 and 1800 mm/year.
A very high increase in accumulation of nutrients during the growth cycle
takes place between 2 and 4 months after the seeds
have been planted, especially N, K and Ca.
Humid tropical, even though it is highly resistant
to draught conditions, originating from prolonged
summers/dry seasons.
Sorghum Light to moderate soils,
well aired and drained and with relative tolerance to short periods of flooding.
Shows great flexibility regarding the depth and frequency of the water supply because of its resistance to draught.
Grass-like crop that requires very high supplies
of nitrogen.
Ideal temperatures for high-yield plant varieties of
more than 25º C.
Crops used to produce biodiesel
Soy Humid alluvial soils with a
good organic content, presence of water, good
structure, loose soil.
High Ideal soil pH - 6.0 to 6.5 Tropical, subtropical and temperate climates.
Oil palm Good drainage, pH
between 4.0 and 7.0; flat terrain, rich and deep.
Uniform rain distribution between1800 and 5000
mm a year. Low
Tropical and subtropical climate with temperatures ranging from 25 to 32º C.
Rapeseed Mild, deep loamy soil, medium texture, good
drainage. 600 mm of rain a years High
Sensitive to high temperatures, grows better
between 15º to 20º C.
Sunflower Can be grown under dry
conditions in many types of soil.
Ranges from 600 to 1000 mm, depending on the
climate and growth period. Moderate
Climate ranging from arid, dry, to temperate, under
dry conditions.
Jatropha Not very demanding, does not require tillage.
Can be grown under irrigated or dry conditions.
Adapted to low fertility land and alkaline soils, but the
use of fertilizers can improve production
Different environmental conditions, preferably mild
climates.
Source: 1/ Bioenergía sostenible: Un marco para la toma de decisiones, 2007. Traducción informal por la Oficina de la FAO en América Latina y el Caribe.: Available at http://www.oei.es/decada/biocombustible.pdf 2/ Cadavid, L. 2008. Fertilización del cultivo de la yuca (Manihot esculente Crantz). CLAYUCA – CIAT. Cali, Colombia. P.4 3/ CEPAL. 2007. Producción de biomasa para biocombustibles líquidos: el potencial de América Latina. Serie desarrollo productivo No 181. Unidad de Desarrollo Agrícola. División de Desarrollo Productivo y Empresarial. Santiago de Chile, November, 2007.

Study on Regional Evidence Generation and Policy & Institutional Mapping on Food and Bioenergy
Region: Latin America and Caribbean - LAC
45
3.2.1. Resource: “land”
The general view is that arable land is already completely occupied, or that there is very little space for expansion with new crops. Figures for Latin America and the Caribbean show that the exact opposite is true and that there is still great potential for expansion. Part of the available arable land could be used for energy crops if they come with a well-designed package of policies and programs. They could benefit millions of small-scale producers, who currently live below the poverty line, without compromising forested areas or the food security of the region.
According to the following table, there are different scenarios possible for Latin America regarding the land needed to produce biofuels to meet the needs of 2030, which would be added to planting sections that would not surpass 3.4% of the total planted area.
Table 3.2: Land needed to produce biofuels, by region
Region 2004 a/ 2030 reference
estimate b/ 2030 alternative policy estimate c/
2030 Second generation biofuelsd/
Million ha % agriculture Million ha %
agriculture Million
ha %
agriculture Million
ha %
agriculture
USA and Canada 8.4 1.9 12.0 5.4 20.4 9.2 22.6 10.2
European Union 2.6 1.2 12.6 11.6 15.7 14.5 17.1 15.7
Pacific OECD Ins ins 0.3 0.7 1.0 2.1 1.0 2.0
Transition economies Ins ins 0.1 0.1 0.2 0.1 0.2 0.1
Developing countries in Asia Ins ins 5.0 1.2 10.2 2.5 11.5 2.8
Latin America 2.7 0.9 3.5 2.4 4.3 2.9 5.0 3.4 Africa and the Middle East Ins ins 0.8 0.3 0.9 0.3 1.1 0.4
World 13.8 1.0 34.5 2.5 52.8 3.8 58.5 4.2
Notes: a. Land used to produce biofuels in 2004 and as a percentage of the total planted area. b. Situation in 2030 if current trends persist. c. Situation of countries that will adopt all the policies they are currently studying, regarding energy security and carbon emissions. d. Situation where part of the biomass for biofuels is obtained from land not suited for agriculture and residues, which decreases the need for using planted land. Ins = insignificant; ha = hectares.
Source: FAO. El cambio climático, los biocombustibles y la tierra. Available at: ftp://ftp.fao.org/docrep/fao/010/i0142s/i0142s05.pdf
However, if we separate the data for the Latin America region, each country’s unique position can be divided up into the three large groups listed below, according to the availability of the potential area accessible for planting (see table in Annex 1):42
I. Low availability: Chile, Dominican Republic, El Salvador, Haiti, Jamaica, Honduras, Trinidad and Tobago, Costa Rica, Belize, Guatemala and Panama. This group of countries has less than 1 million hectares of highly adequate soil.
42 Gazzoni, Decio Luiz. Biocombustibles y alimentos en América Latina y el Caribe. San José, C.R.: IICA, 2009.
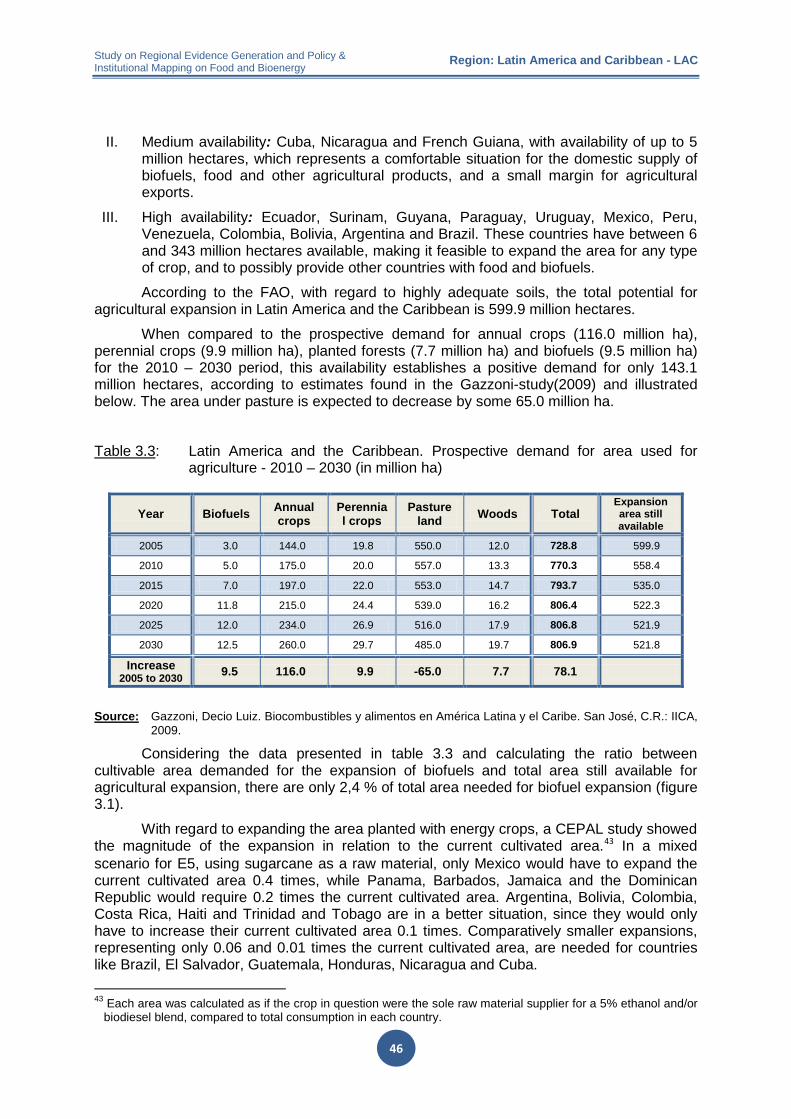
Study on Regional Evidence Generation and Policy & Institutional Mapping on Food and Bioenergy
Region: Latin America and Caribbean - LAC
46
II. Medium availability: Cuba, Nicaragua and French Guiana, with availability of up to 5 million hectares, which represents a comfortable situation for the domestic supply of biofuels, food and other agricultural products, and a small margin for agricultural exports.
III. High availability: Ecuador, Surinam, Guyana, Paraguay, Uruguay, Mexico, Peru, Venezuela, Colombia, Bolivia, Argentina and Brazil. These countries have between 6 and 343 million hectares available, making it feasible to expand the area for any type of crop, and to possibly provide other countries with food and biofuels.
According to the FAO, with regard to highly adequate soils, the total potential for agricultural expansion in Latin America and the Caribbean is 599.9 million hectares.
When compared to the prospective demand for annual crops (116.0 million ha), perennial crops (9.9 million ha), planted forests (7.7 million ha) and biofuels (9.5 million ha) for the 2010 – 2030 period, this availability establishes a positive demand for only 143.1 million hectares, according to estimates found in the Gazzoni-study(2009) and illustrated below. The area under pasture is expected to decrease by some 65.0 million ha.
Table 3.3: Latin America and the Caribbean. Prospective demand for area used for agriculture - 2010 – 2030 (in million ha)
Year Biofuels Annual crops
Perennial crops
Pasture land Woods Total
Expansion area still available
2005 3.0 144.0 19.8 550.0 12.0 728.8 599.9
2010 5.0 175.0 20.0 557.0 13.3 770.3 558.4
2015 7.0 197.0 22.0 553.0 14.7 793.7 535.0
2020 11.8 215.0 24.4 539.0 16.2 806.4 522.3
2025 12.0 234.0 26.9 516.0 17.9 806.8 521.9
2030 12.5 260.0 29.7 485.0 19.7 806.9 521.8
Increase 2005 to 2030 9.5 116.0 9.9 -65.0 7.7 78.1
Source: Gazzoni, Decio Luiz. Biocombustibles y alimentos en América Latina y el Caribe. San José, C.R.: IICA, 2009.
Considering the data presented in table 3.3 and calculating the ratio between cultivable area demanded for the expansion of biofuels and total area still available for agricultural expansion, there are only 2,4 % of total area needed for biofuel expansion (figure 3.1).
With regard to expanding the area planted with energy crops, a CEPAL study showed the magnitude of the expansion in relation to the current cultivated area.43
43 Each area was calculated as if the crop in question were the sole raw material supplier for a 5% ethanol and/or
biodiesel blend, compared to total consumption in each country.
In a mixed scenario for E5, using sugarcane as a raw material, only Mexico would have to expand the current cultivated area 0.4 times, while Panama, Barbados, Jamaica and the Dominican Republic would require 0.2 times the current cultivated area. Argentina, Bolivia, Colombia, Costa Rica, Haiti and Trinidad and Tobago are in a better situation, since they would only have to increase their current cultivated area 0.1 times. Comparatively smaller expansions, representing only 0.06 and 0.01 times the current cultivated area, are needed for countries like Brazil, El Salvador, Guatemala, Honduras, Nicaragua and Cuba.

Study on Regional Evidence Generation and Policy & Institutional Mapping on Food and Bioenergy
Region: Latin America and Caribbean - LAC
47
Figure 3.1: Percentage of projected demand of area for biofuels in relation to total area available for agricultural expansion 2000 - 2030
Source: Gazzoni, Decio Luiz. Biocombustibles y alimentos en América Latina y el Caribe. San José, C.R.: IICA, 2009.
On the other hand, in a B5 scenario, the same CEPAL study revealed that by using oil palm as a raw material, countries like Colombia, Ecuador, Costa Rica, Guatemala and Honduras would have to expand their current area planted with this crop 0.1 to 0.3 times. Using soy as the raw material, Argentina, Bolivia and Brazil would require an expansion of 0.1 and 0.24 times the area dedicated to this crop. Paraguay is an exception, since the current cultivated area would have to be expanded 0.07 times.
In countries with severe limitations to expand cultivation area and high energetic vulnerability research and development related to second and third generation biofuels and the needed raw materials becomes even more fundamental for the possible and intended changes in their energetic matrices towards renewable energies. This is the case for Chile, which due to its physical restrictions regarding the growing of first generation energy-plants has adopted an active strategy reespectivly. (Box 3.1).
Box No. 3.1: Successful experiences of the biofuel production chain as a consequence of government policies in Chile
The government in Chile has several instruments at its disposal to foster the development of the biofuels sector. It provides resources to the relevant agents, who in turn benefit from the participation of the private sector. Resources and support are available for training courses; field trips; technical visits; visits to fairs; technology; the organization of seminars, training sessions and meetings; studies and applied research; technological consortiums, etc.
With the help of such tools, the formulation of a consistent and applicable legislative framework and the creation of the Renewable Energy Centre (Centro de Energías Renovables CER), Chile's biofuel chain is moving ahead. Special emphasis is placed on regional and local solutions and the prevention of competition with food crop production. (See www.cne.cl and http://www.odepa.gob.cl/servlet/articulos.ServletMostrarDetalle?idcla=2&idcat=16&idn=2106).
0.50%
0.90%
1.31%
2.26% 2.30% 2.40%
0.00%
0.50%
1.00%
1.50%
2.00%
2.50%
3.00%
2005 2010 2015 2020 2025 2030
Pros
pect
ed a
rea
for b
iofu
els
/To
tal a
rea
for a
gric
ultu
ral x
pans
ion
(%)
Prospection 2005 - 2030

Study on Regional Evidence Generation and Policy & Institutional Mapping on Food and Bioenergy
Region: Latin America and Caribbean - LAC
48
Most liquid biofuel in Chile is currently produced from biodiesel from recycled vegetable oils for human consumption in the metropolitan region and in the south of the country. Research and development is focused on introduced (exotic) species (e.g. Jatropha curcas L.) as well as endemic species and their suitability for biofuel production.
Three research consortiums were recently selected, which had submitted their proposals for research and development on biofuels from algae, issued by the program "Innova Chile" of the Production Development Corporation (Corporación de Fomento de la Producción - Corfo) and the National Energy Commission (Comisión Nacional de Energía - CNE). The purpose of the tender was to enhance economic and productive development through the creation of sustainable research consortiums for the production of biofuel from micro- and macroalgae, and had a major impact due to the adoption, transfer and marketing of its results. These consortiums, which are integrated by universities, research centers and associated companies as a result of the application of promotional public policies, will conduct coordinated investigations on biofuel production.
With regard to bioethanol production, a pilot program was jointly developed by the Chilean and Brazilian governments to evaluate the technical and economic feasibility of ethanol distribution in the country. Research and global development programs are being implemented in different parts of the country, focusing on bioethanol production based on turnip (Brassica spp.) and on lignocelluloses residues.
In addition, there are two research consortiums that are focusing on the subject of producing ethanol from lignocelluloses, approved by Innova Corfo, and are receiving funds for the research, development and innovation of biofuel produced from lignocellulosic biomass, which facilitates the incorporation of second generation biofuel in the national energy matrix.
3.2.2. Resource: “water”
The potential impact on freshwater resources is at its greatest wherever agricultural production is dependent on irrigation, while it is negligible in cases where rain-fed production is practiced. Wherever irrigation is required for agriculture, the increased production of biofuel could result in the reduced water allocation for other crop commodities.44
Some production systems require a considerable amount of water, both for the production of basic materials and for their conversion into biofuel.
The most common crops used to produce ethanol and biodiesel, which are sugarcane (Saccharum officinarum) and oil palm (Elaeis guineensis), respectively, require a significant amount of water (between 1,500 and 2,500 mm/year), while corn (Zea mays), cassava (Manihot sculenta), soy (Glycine max), castor bean (Ricinus communis) and cotton (Gossypium sp.) are among the crops that are considered possible sources of biofuel that only require moderate amounts of water (between 500 and 1,000 mm/year).45
Around 7,130 km3 of water is evapotranspirated by crops annually worldwide, not counting biofuel crops, which account for an additional 100 km3 (or around 1%).
46
44 UN. 2009. The United Nations World Water Development Report 3: Water in a Changing World. World Water
Assessment Programme. Paris: UNESCO, and London: Earthscan.
45 FAO. 2008. Thirtieth Regional Conference for Latin America and the Caribbean. Opportunities and challenges of biofuel
production for food security and the environment in Latin America and the Caribbean. Brasilia, Braxil, April 14 to 18, 2008.
46 Charlotte de Fraiture, Mark Giordano and Yongsong Liao. 2007. Biofuels and implications for agricultural water use: blue impacts of green energy. International Water Management Institute. Colombo, Sri Lanka.
http://www.iwmi.cgiar.org/EWMA/files/papers/Biofuels-Charlotte.pdf

Study on Regional Evidence Generation and Policy & Institutional Mapping on Food and Bioenergy
Region: Latin America and Caribbean - LAC
49
In the U.S., where mainly rain-fed corn is used, only 3% of all irrigation withdrawals are for biofuel crop production, corresponding to 400 liters of irrigation water withdrawals per liter of ethanol. In Brazil, where the main biofuel crop – sugarcane – is mostly grown under rain-fed conditions, very little irrigation water is used for ethanol production. Under current production conditions, such as in Brazil and the U.S., roughly 2,500 liters of water are needed to produce 1 liter of liquid biofuel (see Table 3.4).
Table 3.4: Brazil and U.S.A. Water used to produce biofuels (2005)
Units Country
Brazil USA Feedstock Sugarcane Corn Bioethanol (EtOH) Million liters 15,098 12,907 Crop water ET km3 46.02 22.39 % of total ET used for biofuel % 10.7 4.0 Irrigation withdrawals for biofuels km3 1.31 5.44 % of total irrigation withdrawals for biofuels % 3.5 2.7
Crop water ET / Bioethanol liters ET / liter EtOH 3,048.1 1,734.7
Source: UN. 2009. The United Nations World Water Development Report 3: Water in a Changing World. World Water Assessment Programme. Paris: UNESCO, and London: Earthscan.
With regard to other crops that can be used to produce biofuels, cassava is an important source of starch from which ethanol can be produced in LAC countries, requiring 2,250 liters of water from evapotranspiration for each liter of ethanol under rainwater storage systems. Similarly, for canola and oil palm, consumption is reported to be between 2,360 and 3,330 liter of water from evapotranspiration for each liter of biodiesel, respectively, with both crops in a rain-fed regime. Soy is the only crop that surpasses those quantities, needing 10,000 liters for each liter of biodiesel under the same rainfall regime.47
3.2.3. Changes in land use
For this subtopic, a hypothesis needs to be formulated that can establish a relationship between biofuel production and the possible intrinsic risks of soil conversion, particularly in forested areas.
If we exclude from the scenario analysis the fact that we can use the wood produced in the existing forested areas, as well as wood residues and the wood recovered from these areas to produce energy, (these scenarios are not included in the scope of this paper), we could consider it a hypothetical scenario, as per the FAO Forestry and Energy Key issues paper:48
Possible scenario: Introduction of crops for the production of liquid biofuels in the forested areas of LAC countries.
47 UN. 2009. Op. Cit. 48 FAO. 2008. Forestry and Energy. Key issues. FAO Forestry Paper: 154. The Food and Agriculture Organization
of the United Nations. Rome, 2008. Available at: ftp://ftp.fao.org/docrep/fao/010/i0139s/i0139s00.pdf

Study on Regional Evidence Generation and Policy & Institutional Mapping on Food and Bioenergy
Region: Latin America and Caribbean - LAC
50
Hypothesis: This practice would cause deforestation and produce adverse effects on biodiversity and other forest-related goods and services. It would also result in an increase in greenhouse gas emissions.
The hypothesis formulated previously assumes that intensifying the requirements regarding the availability of land to produce first generation liquid biofuels will probably translate into increased pressure on forested and wetland areas throughout the world and in the LAC region unless the large expanses of degraded land found in many developing countries can be used for the possible expansion of energy crops.
For LAC countries, especially those in which the tropical forests are at risk of being converted into land to be used for other purposes, expansion of biofuel production must be accompanied by specific and enforceable land-use legislations.
In view of this scenario, it would be highly unlikely that the goals of climate change-related policies would be achieved, since the amount of carbon released during deforestation surpasses that which could be recaptured by bioenergy crops over many years.
There is very little evidence being generated to date that would help assess the magnitude of the changes that have occurred on lands originally occupied by forests, which have now been planted with bioenergy crops. However, there are estimates as to changes that have occurred when soils previously occupied by forests were used for pasture land and for planting other crops, as illustrated in the table below.
Table 3.5: Expansion of land actually used for pasture and crops in some LAC countries (in 1,000 ha)
Countries Expansion of pasture land
(in 1,000 ha) % of total
forested areas Crop
expansion (in 1,000 ha)
% of total forested areas
Costa Rica 82 82 18 18 Guatemala 321 60 216 40 Honduras 371 63 218 37
Nicaragua 537 77 163 23 Panama 376 73 143 27
Subtotal Central America 1,688 69 757 31
Bolivia 942 47 1,058 53 Brazil 13,974 61 9,119 39 Colombia 2,714 68 1,286 32
Ecuador 872 82 188 18 Guyana 355 89 45 11 Paraguay 778 63 452 37 Peru 1,519 54 1281 46 Venezuela 1,237 88 163 12
Subtotal South America 22,391 62 13,592 38
Source: Wassenaar, T., et al. Projecting land use changes in the Neotropics: The geography of pasture expansion into forest. Global Environmental Change 17 (2007) 86–104

Study on Regional Evidence Generation and Policy & Institutional Mapping on Food and Bioenergy
Region: Latin America and Caribbean - LAC
51
An analysis of the driving forces that could affect the forestry sector was presented in an FAO paper, The Latin American Forestry Sector Outlook Study. This paper presents the principal changes that could have medium and long-term implications for the forestry sector of the Amazon sub-region, among which the following macroeconomic aspect were highlighted: 49 and 50
Replacement of oil-based fuels with alternative fuels, such as bioethanol and biodiesel, will not only affect domestic trade, but also the social and environmental sectors. There will be a trend towards the greater development of ecological monocultures, and we will see adjustments in the area of engineering being made in the auto industry.
In view of this possible macroeconomic scenario, reviewing of estimates made in the previous chapter on the availability of the resource "land" is pertinent: For Latin America, we can envision different scenarios regarding the need for land to produce biofuels by 2030, in no case surpassing 3.4% of the total cultivated area.
Figure 3.2: Central America and the Amazon sub-region - Map of projected land-use
changes - 2000-2010
Source: Wassenaar, T., et al. Projecting land use changes in the Neotropics: The geography of pasture expansion into forest. Global Environmental Change 17 (2007) 86–104
49 FAO (2005). The Latin American Forestry Sector Outlook Study. A paper on the Amazon subregion. Working
paper written by Jefferson García for the FORESTRY DEPARTMENT. THE FOOD AND AGRICULTURE ORGANIZATION OF THE UNITED NATIONS. ESFAL/SR/1. Rome, 2005.
50 The paper covers the Amazon sub-region including the following countries: Bolivia, Brazil, Colombia, Ecuador, Peru and Venezuela.

Study on Regional Evidence Generation and Policy & Institutional Mapping on Food and Bioenergy
Region: Latin America and Caribbean - LAC
52
The above map shows the areas at risk of being used for agriculture in different parts of Central and South America for the period between 2000 and 2010. The study used a model that explicitly incorporates aspects such as location, adequacy and other factors that affect land-use-related economic values to identify areas at a higher risk of being transformed into pasture and agriculture land.51
Dark green represents thickly forested areas, while light green represents open or fragmented forests. Light blue corresponds to cropland expansion into the Amazon forest, while pink corresponds to diffuse agricultural expansion into the Amazon forest. Purple represents critical hotspots of pasture land expanding into the forest, and dark blue represents critical hotspots of cropland expanding into the forest.
3.3. Effects on the agrarian structure at system level
The productive structure is the result of governmental policy decisions regarding investments, and the players involved in the different production systems. These decisions are made based on opportunities that arise within their specific context, just as technological capabilities and the production quality structure are part of the institutional environment.52
It has thus been demonstrated that the adoption of biofuels as the engine behind development shall impact, among other things:
53
a. Land ownership structure.
b. Production systems and the crops to be promoted. c. Economies of scale. d. Value chains. e. Production and support service mechanisms.
Concurrently, a related ECLAC study reached the following conclusion:54
“The increase in energy crops may cause significant changes in the agrarian structure. The most important structural changes expected are greater production and land ownership concentration, and the influx of new types of players and norms. Significant changes may also occur in the economic structure, particularly due to the creation of economies of scale. Pressure on natural resources and ecosystems may also increase. Correspondingly, there would be an impact on agriculture-related jobs although it is hard to evaluate the actual figures involved”.
Given the numerous aspects that relate to the aforementioned agrarian structure, for the purpose of the following analysis, aspects such as the increase in production, the size of the cultivated area of agro-energetic crops, price evolution and aggregate value generation will be considered possible evidence of changes in the agrarian structure.
51 Wassenaar et. al., 2007. Op Cit. 52 CEPAL - IRDC. 2007. Progreso técnico y cambio estructural en América Latina. Documento de proyecto.
Comisión Económica para América Latina y el Caribe – International Research Development Centre, Canada. Available at: http://www.cepal.org/publicaciones/xml/9/32409/LCW136.pdf
53 Sepúlveda S., Sergio. 2007. Potencial de la agricultura y los territorios rurales para producir bioenergía. Serie Cuaderno Técnico de Desarrollo Rural No. 37. Instituto Interamericano de Cooperación para la Agricultura. San José, Costa Rica. Available at: http://www.iica.int/esp/regiones/sur/argentina/varios/ct_37.pdf
54 CEPAL (2007). Biocombustibles y su impacto potencial en la estructura agraria, precios y empleo en América Latina. Carlos Razo, Sofía Astete-Miller, Alberto Saucedo, Carlos Ludeña. (LC/L.2768-P) 2007. Available at: http://www.iadb.org/intal/intalcdi/PE/2007/00999.pdf

Study on Regional Evidence Generation and Policy & Institutional Mapping on Food and Bioenergy
Region: Latin America and Caribbean - LAC
53
3.3.1. Increase in production
Assuming that Latin America has both the land availability as well as the climatic conditions necessary for the production of energy crops, the increase in the production of biofuels is a transaction that is dependent on the production potential of the raw material source, the increase in the surface area sowed and the agricultural and industrial production yield.
a. Raw material source
Table 3.6 demonstrates that a total of 13 crops show the greatest potential for liquid biofuel production. Estimates for obtaining ethanol and biodiesel have been made based on these crops as well as on average yields for the different crops of the LAC. In almost every country in Latin America and the Caribbean, the potential main source for the production of bioethanol is sugarcane, since each one has surplus availability. For biodiesel, the most widely used crops in the region, based on planted area and oil yield, are currently palm oil and soy bean. However, countries such as Colombia and Brazil have recently been promoting jatropha as a potential alternative raw material.
Table 3.6: Conversion factor from biomass to biofuel and average crop yields according to crops with bioenergy potential
Crop Conversion to ethanol (l/ton) 1/
Average Yield LAC (t/ha) 2/
Corn 410 2.5 Sorghum 402 2.2 Yucca 180 9.9 Yam 125 42.2 3/ Potato 110 16.3 4/ Beets 103 32.4
Sugarcane 81 59.4
Crop Conversion to biodiesel (l/ton)
Average Yield LAC (t/ha) 2/
Sunflower Seed 418 1.3 Castor Oil 393 0.8 Colza 392 1.8
Palm Oil 223 15.9 Soy Bean 183 2.1 Cotton 103 0.8
Sources: 1/ Matt Johnston et al. 2009. Resetting global expectations from agricultural biofuels. Environmental.
Research Letters. 4 (2009) 014004 (9pp). Available at: http://www.iop.org/EJ/article/1748-9326/4/1/014004/erl9_1_014004.pdf?request-id=f7eaac1d-97fb-4eee-bf7d-5e47648f07ea 2/ CEPAL (2007) Producción de Biomasa para combustibles líquidos: el potencial de América Latina y el Caribe. C. Razo, et. Al.. Serie desarrollo productivo Nº 181 LC/L. 2803-P, 2007. http://www.cepal.org/ddpe/publicaciones/xml/9/33879/lcl2803e.pdf 3/ Média. Seleção e avaliação de dez cultivares de batata-doce para produção de etanol nas condições do Estado do Tocantins - Universidade Federal do Tocantins - UFT (1997-2007). Brasil. 4/ FAO. 2008. Año Internacional de la Papa 2008. FAO. Rome, 2008 Available at: http://www.fao.org/docrep/011/i0500s/i0500s00.htm

Study on Regional Evidence Generation and Policy & Institutional Mapping on Food and Bioenergy
Region: Latin America and Caribbean - LAC
54
In light of the ECLAC assessment of the LAC potential for biomass production, the following conclusion was reached:55
The selection of an optimal crop combination is specific to each country and is subject, among other things, to the availability of land with the appropriate climate for each species, the availability of technologies, production costs and public policies.
Residue may also be used in the production of biofuel. Nonetheless, new machinery is required to make harvesting easier, and for effecting changes in the post-harvest system and transportation.
Biomass obtained from silviculture may be used to generate energy such as heat, electricity and liquid fuels.
b. Increase of area
Based on the raw material sources for biodiesel production as shown in the previous table, it has been found that a total of 12.5 million hectares would be needed for biofuel production in the LAC for 2030, 9.5 million hectares of which would correspond to the incremental crop surface area aimed at energy production as shown in the following chart (figure 3.3). 56 and 57
Figure 3.3: Agricultural area required for energy crops for use in biofuel production, 2015 - 2030
Source: Gazzoni, Decio Luiz. Biocombustibles y alimentos en América Latina y el Caribe. San José, C.R.: IICA, 2009.
55 CEPAL (2007) Producción de Biomasa para combustibles líquidos: el potencial de América Latina y el Caribe.
Carlos Razo, Carlos Ludeña, Alberto Saucedo, Sofía Astete-Miller, Josefina Hepp y Alejandra Vildósola Serie desarrollo productivo Nº 181 LC/L. 2803-P), 2007. Available at: http://www.cepal.org/ddpe/publicaciones/xml/9/33879/lcl2803e.pdf
56 Gazzoni, D. (2009) óp. cit 57 The reference for ethanol production was sugarcane, which can be produced in almost every country in the
LAC. For biodiesel, a basket of annual or perennial oleaginous plants was considered.

Study on Regional Evidence Generation and Policy & Institutional Mapping on Food and Bioenergy
Region: Latin America and Caribbean - LAC
55
Box Nº 3.2: Agro-ecological Zoning for Sugarcane in Brazil
Faced with the probable expansion of the sugarcane agribusiness, Brazil's government issued a decree in September 2009, the Agro-ecological Zoning for Sugarcane (ZAE Cana). The decree creates zoning for sugarcane crops and is part of a set of initiatives meant to ensure the environmental, economic and social sustainability of Brazilian ethanol production from sugarcane.
The bill establishes rules for sugarcane expansion and criteria for granting loans for the sugar and alcohol production sector and is designed to ensure the sustainability of Brazilian control in the context of the increasing demand for biofuels, and the balanced and sustainable growth of its production. The policies outlined establish the agro-ecological zoning for sugarcane throughout the national territory, and were coordinated by the Ministry of Agriculture, Ministry of Livestock and Supply and the Ministry of the Environment.
The ZAE analyzed climatic and soil conditions, as well as environmental, economic and social aspects in order to guide the sustainable expansion of sugarcane production. The decree prohibits the expansion of sugarcane production in any native vegetation area in the Amazon, Pantanal and the Alto Paraguay River Basin (see Figure 3.3). The new rules also determine that sugarcane plantations can only be established in areas suitable for mechanized harvesting, which is defined as land with a slope of less than 12°. Those areas, plus the conservation units and indigenous reserves, where the legislation has already banned sugarcane plantations, cover 81.5% of the national territory. It is in these areas where sugarcane growing is prohibited by the government. About 7.8 million hectares of Brazilian territory (= 0.9%) are currently used for growing sugarcane (Table 3.7). Figure 3.4: Amazon, Pantanal and the Alto Paraguay River Basin
Another goal in addition to regulating the future expansion of sugarcane is to end the use of fires for deforestation in existing production areas, according to the transition scheduled to take place by 2017. As a first step, in sugarcane plantation areas where mechanized harvesting is possible, all harvest-related burning activities are baned within five years. That would help reduce costs related to greenhouse gas emissions that are the equivalent of 6 million tons of CO2 compared to 2008.

Study on Regional Evidence Generation and Policy & Institutional Mapping on Food and Bioenergy
Region: Latin America and Caribbean - LAC
56
Box Nº 3.1 (cont.)
With the publication of the ZAE, the Brazilian government is implementing an explicit FAO recommendation 58
“(i) Development and land use policies, starting with agro-ecological zoning that indicates the available land for energy crops, a system of incentives and penalties for the use of forests, water, etc.
:
Biofuel production should be oriented towards sustainable territorial development. Often, areas with potential for biofuel production are made up of communities of low social organization, with absence or shortage of basic infrastructure and social and technological difficulties in entering the global market. Overcoming these problems requires qualification, logistics, technology etc. Territorial development policies must start with a system based on a comprehensive view of the region concerned, with their potential expressed in productive vocations and their varied problems: economic, political, technological, legal, cultural and environmental.
On the other hand, agro-ecological zoning or natural resources inventory should take into account the potential impacts on land being used for the production of feedstock for biofuels, particularly virgin land and land of high conservation value, and its associated effects on habitat, biodiversity and water quality, air and soil”.
Agro-ecological zoning combines information from maps that includes soil, climate, environmental reserve areas, and geomorphological and topographical data. It also identifies the current land use, examines federal and state environmental legislation and analyzes agronomic sugarcane data, as well as ideal temperatures for growth, most suitable soil types, water requirements etc. Areas with the greatest potential for the establishment of sugarcane plantations and those where such crops (see Figures 3.3 and 3.4) are not allowed or recommended are thus defined and classified. The most important factor in the expansion process relates to the selection of areas that do not require full irrigation and thus save energy and water resources, and are also suitable for mechanization, while eliminating the cost of manual harvesting and the practice of setting fires for clearing the forest. According to the ZAE criteria, 92.5% of the national territory is not suitable for sugarcane.
Table 3.7: Agro-ecological Zoning (ZAE) for Sugarcane in Brazil – summary table
58 FAO: “Opportunities and Challenges of Biofuels production for food security and the Environment in Latin
America and the Caribbean” 30th FAO Regional Conference for Latin America and the Caribbean, Brasília, Brazil, 14 to April 18, 2008.
Territory or estimated area Millions of hectares
Percentage of the national territory
National territory (IBGE) 851.5 100.00%
Land suitable for agriculture 553.5
Land use in 2002 (estimated by PROBIO) 235.5 27.70% Areas with environmental restrictions (including biomes in the Amazon, Pantanal and the Paraguayan River Basin)
694.1 81.50%
Areas suitable for cultivation/expansion under various agricultural uses (livestock, farming and agriculture)
64.7 7.50 % Areas suitable for cultivation/expansion used with pasture
34.2 4.02% Area currently occupied by sugarcane crops (harvest of 2008/09)
7.8 0.90% Planned expansion by 2017 for the production of sugarcane (EPE)
6.7 0.80%
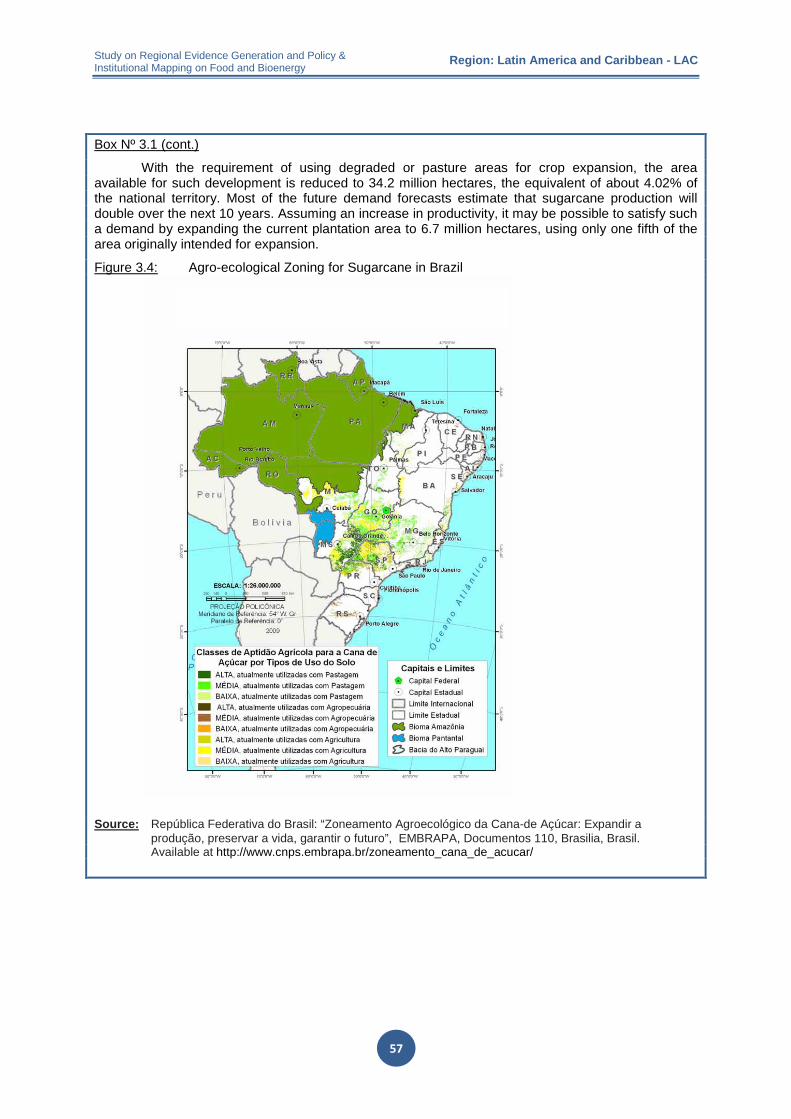
Study on Regional Evidence Generation and Policy & Institutional Mapping on Food and Bioenergy
Region: Latin America and Caribbean - LAC
57
Box Nº 3.1 (cont.)
With the requirement of using degraded or pasture areas for crop expansion, the area available for such development is reduced to 34.2 million hectares, the equivalent of about 4.02% of the national territory. Most of the future demand forecasts estimate that sugarcane production will double over the next 10 years. Assuming an increase in productivity, it may be possible to satisfy such a demand by expanding the current plantation area to 6.7 million hectares, using only one fifth of the area originally intended for expansion.
Figure 3.4: Agro-ecological Zoning for Sugarcane in Brazil
Source: República Federativa do Brasil: “Zoneamento Agroecológico da Cana-de Açúcar: Expandir a produção, preservar a vida, garantir o futuro”, EMBRAPA, Documentos 110, Brasilia, Brasil. Available at http://www.cnps.embrapa.br/zoneamento_cana_de_acucar/

Study on Regional Evidence Generation and Policy & Institutional Mapping on Food and Bioenergy
Region: Latin America and Caribbean - LAC
58
c. Crop yields
Crop yields are influenced by several factors, including mean climate and variability, soil conditions, inputs and management. They are also impacted by social, political and economic criteria.59
Inputs such as irrigation, fertilizers and pesticides, and management factors such as planting and harvest date, machinery use and efficiency of farming operations also contribute largely to the variability of global yields.
Figure 3.6: Revised estimates of global biofuel crop yields
Notes: (a) Global ethanol yields, (b) global biodiesel yields. (Box plots represent the variation of yields for common biofuel crops. Here we show average results for the entire globe (gray), developed countries (green) and developing countries (blue). The horizontal black bars represent median yields, and the boxes are bound vertically by 25th percentile yields on the bottom and 75th percentile yields on the top. The whiskers (in light gray) represent the absolute minimum and maximum yield values recorded in the M3 cropland datasets. The red and orange bars offer comparisons to two previous examples of biofuel feedstock yield estimates, reported by Worldwatch Institute [18] and Brown [16] respectively. Please note: the M3 results for sorghum are compared to Brown’s estimate for sweet sorghum, which is a different variety with higher sugar content than that normally grown and traded commercially.)
59 Source: Matt Johnston et al. 2009. Resetting global expectations from agricultural biofuels. Environmental Research Letter 4 (2009) 014004 (9pp). Available at: http://www.iop.org/EJ/article/1748-9326/4/1/014004/erl9_1_014004.pdf?request-id=f7eaac1d-97fb-4eee-bf7d-5e47648f07ea

Study on Regional Evidence Generation and Policy & Institutional Mapping on Food and Bioenergy
Region: Latin America and Caribbean - LAC
59
ECLAC summarized the regional state of crop yields as follows: 60
"Current average yields for each bioenergy crop for the different countries in Latin America and the Caribbean are quite heterogeneous.
The regional average yield surpasses or is within the scope of worldwide averages for yucca, sorghum, palm oil and soy bean. Conversely, others are below the global average.
In the case of crops used for bioethanol production, the average yield of sugarcane at the global level is between 40 and 80 ton/ha. The average for Latin America and the Caribbean is 59 ton/ha, and for most of the major producer countries in the region it is above this amount. The countries with the highest average yields are Peru (128 ton/ha), Guatemala (92 ton/ha) and Colombia (86 ton/ha), all three of which report higher figures than both global and regional averages."
3.3.2. Size of energy crop plantations
Information regarding the size of energy crop plantations was requested as follows from the same ECLAC source mentioned above: 61
"Current distribution of area used for energy crops, depending upon the plantation size, varies according to land ownership…. In countries with abundant land ownership (over 12 ha per agricultural worker working the land) larger plantations of crops predominate, as is the case of Argentina, Uruguay, Brazil, Chile and Nicaragua, among others. This results in a smaller number of producers (greater concentration), lower transaction costs and fewer logistical problems.
On the other hand, in countries with less land ownership (less than 12 ha of agricultural land per agricultural worker), smaller plantations clearly predominate, such as in Ecuador, Peru and Panama. In those countries, the opportunity for crops geared towards biofuels is dependent on the cooperation of several agents, keeping in mind that there will be a greater number of producers per crop, lower technological levels, less capacity building and higher transaction costs."
The following charts illustrate the magnitude of agro-energy crop plantations, based on information compiled by ECLAC on the national agrarian census for each of the countries examined:
60 CEPAL (2007). Biocombustibles y su impacto potencial en la estructura agraria, precios y empleo en América
Latina. Carlos Razo, Sofía Astete-Miller, Alberto Saucedo, Carlos Ludeña. (LC/L.2768-P) 2007. Available at: http://www.iadb.org/intal/intalcdi/PE/2007/00999.pdf
61 CEPAL (2007). Biocombustibles y su impacto potencial en la estructura agraria, precios y empleo en América Latina. Carlos Razo, Sofía Astete-Miller, Alberto Saucedo, Carlos Ludeña. (LC/L.2768-P) 2007. Available at: http://www.iadb.org/intal/intalcdi/PE/2007/00999.pdf

Study on Regional Evidence Generation and Policy & Institutional Mapping on Food and Bioenergy
Region: Latin America and Caribbean - LAC
60
Figures 3.7 to 3.10: Size of Energy Crop Plantations in Selected Countries of the LAC region
Source: CEPAL (2007). Biocombustibles y su impacto potencial en la estructura agraria, precios y empleo en América Latina. Carlos Razo, Sofía Astete-Miller, Alberto Saucedo, Carlos Ludeña. 2007. Available at: http://www.iadb.org/intal/intalcdi/PE/2007/00999.pdf
3.3.3. Price evolution
a. Recent developments 2005 - 2008
The latest FAO report on food and agriculture corresponding to the year 2008 stated that the prices of agricultural products had drastically increased over the past three years due to a combination of factors that are mutually reinforcing, among which the demand for biofuels could be included. The report also states that the historic links between agriculture and energy are growing stronger and that their characteristics are changing. Several factors contribute to this, although it is difficult to pinpoint exactly what the respective causes were. 62
An IICA study (2009) listed four factors that have influenced grain price acceleration for 2008:
63
I. The increase in the demand for biofuels.
II. The increase in demand in developing countries, particularly China and India.
62FAO (2008). EL ESTADO MUNDIAL DE LA AGRICULTURA Y LA ALIMENTACIÓN 2008.
BIOCOMBUSTIBLES: perspectivas, riesgos y oportunidades. Organización de las Naciones Unidas para la Agricultura y la Alimentación, Roma, 2008.
63 Paz, J. y Benavides, H. (2009). Evolución de los precios de productos agrícolas: Posible impacto en la agricultura de América Latina y el Caribe. En: COMUNIICA. Instituto Interamericano de Cooperación para la Agricultura. Año 4 Segunda etapa, Enero - Abril 2008.
0%
20%
40%
60%
80%
100%
Nicaragua Brasil Panamá Uruguay Perú Ecuador
3% 5%19% 9%
89% 80%
17% 20%
22%53%
7% 17%
80% 75%59%
38%
5% 3%
Varios países de ALC. Tamaño de la explotación para caña de azúcar(porcentaje de superficie de cultivo)
> 200
20 a 200
< 20
0%
20%
40%
60%
80%
100%
Brasil Ecuador Nicaragua
26,0%6,4%
47,0%69,6%
27,0% 23,9%
98,7%
Brasil, Ecuador y Nicaragua. Tamaño de la explotación para palma aceitera (porcentaje de superficie de cultivo)
> 200
20 a 200
< 20
0%
20%
40%
60%
80%
100%
Uruguay Brasil Chile Ecuador
7,0%
50,0%29,0%
91,6%
27,8%98,3%
64,0%
8,0%22,3%
Uruguay, Brasil, Chile y Ecuador. Tamaño de las explotaciones para soya (porcentaje de superficie de cultivo)
> 200
20 a 200
< 20
0%
20%
40%
60%
80%
100%
Chile Brasil Uruguay
21,1% 19,0%
62,2%
34,0%
3,9%
16,7%
48,0%
96,0%
Chile, Brasil y Uruguay. Tamaño de las explotaciones para girasol (porcentaje de superficie de cultivo)
> 200
20 a 200
< 20

Study on Regional Evidence Generation and Policy & Institutional Mapping on Food and Bioenergy
Region: Latin America and Caribbean - LAC
61
III. Worldwide low levels of grain stock. IV. The decrease in supply due to climatic conditions that have affected harvests
in the main supplier countries (Australia, United States, European Union, Canada and Ukraine).
In parallel, Joachim von Braun, General Director for the International Food Policy Research Institute (IFPRI), has listed a set of scenario-driven and structural aspects as causes for the imbalances and the volatility of the worldwide food equation that are as follows (in decreasing order of importance): 64
I. The growth of income and demand.
II. Biofuels. III. Low investments in technology and agricultural productivity. IV. Trade policies and low inventory. V. Production crises due to the emerging climate changes.
VI. Incidence of high costs on agricultural inputs and transportation. VII. Population growth.
With regard to biofuels, IFPRI has indicated that the main change in the establishment of worldwide food prices is the result of energy costs, which impact agricultural prices through inputs (for example, the price of fertilizers, biocides, irrigation, transportation) and strongly affect the prices of agricultural products through opportunity costs. Moreover, a flexible demand for energy creates price trends and levels for agricultural commodities and/or basic products as demonstrated in the following graph.
Figure 3.11: International price index for selected basic products 2005 – 2008
Source: Paz, J. y Benavides, H. (2009). Evolución de los precios de productos agrícolas: Posible impacto en la agricultura de América Latina y el Caribe. En: COMUNIICA. Instituto Interamericano de Cooperación para la Agricultura. Año 4 Segunda etapa, Enero - Abril 2008
64 Why Are They Rising, Who Is Affected, How Are They Affected, and What Should Be Done? Presented at a
U.S. Agency for International Development (USAID) conference on “Addressing the Challenges of a Changing World Food Situation: Preventing Crisis and Leveraging Opportunity” Washington, D.C. April 11, 2008.

Study on Regional Evidence Generation and Policy & Institutional Mapping on Food and Bioenergy
Region: Latin America and Caribbean - LAC
62
Over the past few years, other relationships between the energy and agricultural markets have evolved. Energy was traditionally thought of as an agricultural input, just like fertilizer and transportation cost entries. Now it is considered agricultural raw material for the production of biofuels.
According to an FAO Report for 200865
"Recent increases in oil prices have contributed to higher production costs for agricultural products, for example: USD prices for some fertilizers have risen over 160 percent the first few months of 2008 compared to the same period in 2007. In fact, the increase in energy costs has been very fast and perceptible, as indicated by the CRB-Reuters energy price index (Commodity Research Bureau), having grown threefold since 2003. Furthermore, with the rise in freight fees, which have doubled between February 2006 and 2007, the cost of transporting food to importing countries has also been affected.
:
The influence of energy prices on agricultural products is nothing new, since fertilizers and machinery have been used as inputs in product production processes for a long time."
The document Perspectivas de la agricultura y el desarrollo rural en las Américas 2009: una mirada hacia América Latina y el Caribe66
, has indicated that a new link for the period between 2005 – 2008 was recently created, derived from the increase in the demand for certain agricultural raw materials for producing biofuels. This has strengthened ties between energy and agricultural prices as shown in the following comparative table for price variations for five-year periods for different product groups:
Table 3.8: Global price variations for different products in five-year periods
Periods 1995-2000 2000-2005 2005-08
Commodities (totals) -1.6% 9.6% 16.2%
Non-fuel commodities -6.0% 5.3% 13.5% Fuels 4.9% 13.3% 18.5% Industrial Inputs -5.0% 5.5% 13.8% Metals -4.9% 10.2% 19.4%
Food and Beverage -6.9% 5.1% 13.3% Source: IICA with data from: World Economic Outlook Database (IMF) and International Commodities Prices (FAO)
The increase in the demand for raw materials for biofuels is not the only determining factor that has influenced agricultural prices during the study period. It has been noted that, in addition to other factors, the increase in the demand of emerging countries, speculative 65 FAO (2008). El estado mundial de la agricultura y la alimentación 2008. Biocombustibles: perspectivas, riesgos
y oportunidades. Organización de las Naciones Unidas para la Agricultura y la Alimentación, Rome, 2008. Available at: ftp://ftp.fao.org/docrep/fao/011/i0100s/i0100s.pdf
66 Perspectivas de la agricultura y del desarrollo rural en las Américas: una mirada hacia América Latina y el Caribe. 2009. This document was a consensus between the Economic Commission for Latin America and the Caribbean (ECLAC), the Food and Agriculture Organization for the United Nations (FAO) and the Inter-American Institute for Cooperation on Agriculture (IICA).

Study on Regional Evidence Generation and Policy & Institutional Mapping on Food and Bioenergy
Region: Latin America and Caribbean - LAC
63
demand for financial tools in the basic product markets, including agricultural products, and the occurrence of extreme climatic events have all had an impact on the food supply.67 and 68
Oil prices will play an essential role in the development of agricultural prices over the next decade. Barrel prices in excess of US$90-100 would cause agricultural prices to rise significantly, not only due to an increase in costs, but also to an upsurge in the demand for raw materials to produce biofuels at the expense of other food crops.
69 and 70
b. Price forecasts
The 2009 U.S. and World Agricultural Outlook published by the Food and Agricultural Policy Research Institute (FAPRI), has projected the prices of biofuels and feedstock: 71
"The world ethanol price increased 13.7% in 2008, to $0.465 per liter. It is projected to decrease by almost 16%, to $0.391 per liter in 2009 because of the dramatic drop in crude oil prices coupled with a significant reduction in U.S. ethanol imports. The ethanol price continues its downward trend until 2011, after which it begins to increase because of higher ethanol demand from the U.S. brought about by the Energy Independence and Security Act (EISA) 2007 biofuel mandates.
The world price of biodiesel (Central Europe FOB) decreases to $0.988 per liter in 2009, driven by a lower crude oil price and large supplies in the world market. The price then recovers as EU countries attempt to achieve their biofuel targets and because of rebounding crude oil prices. Expanded production in Argentina and Brazil also contributes to the temporary price decline and to a sharp increase in exports before the start of the countries’ B5 mandates. However, the world price increases to $1,469 per liter by 2018, driven by higher demand from the EU.
In the outlook for sugar, despite a production shortfall in 2008/09, the world price of sugar declines by 5%, aided by a 10% reduction in stocks. The price increases by 15% over the projection period, as more sugarcane is used for ethanol in Brazil, and sugar imports of the European Union, China, and India remain strong.
World prices of oilseeds and vegetable oil retreat from the historic highs of 2007/08 because of weaker demand. World trade of soy beans, soy meal, and soy oil grows by 33%, 31%, and 37%, respectively, over the next decade. Argentina, Brazil, Paraguay, and the U.S. account for 85% of the 296 mmt of world production in 2018/19. China continues to dominate world soy bean imports and expands its net trade to 56 mmt by 2018/19. Palm oil remains the cheapest and most widely traded edible oil."
67 International Sugar Organization. 2009. Sugarcane ethanol and food security. MECAS(09)07 Market Evaluation
Statistics Committee. April, 2009. London, U.K. 68 Mielke, Thomas. World Supply, Demand and Price Outlook for Oilseeds, Oils / Fats and Oilmeals Opportunities
& Challenges for Can. Canola. Annual Convention of the Canadian Canola Council in Toronto, March 10-12, 2009.
69 CEPAL – FAO – IICA. 2009. Ibíd. 70 von Braun, Joachim. (2008) El aumento en los precios de los alimentos ¿Qué hacer? IFPRI Perspectiva de
Políticas Alimentarias. Abril 2008. International Food Policy Research Institute (IFPRI) http://www.ifpri.org/sites/default/files/publications/bp001sp.pdf
71 Food and Agricultural Policy Research Institute. FAPRI 2009 U.S. AND WORLD AGRICULTURAL OUTLOOK. Iowa State University & University of Missouri-Columbia. Ames, Iowa. U.S.A. January 2009 http://www.fapri.iastate.edu/outlook/2009/text/OutlookPub2009.pdf.

Study on Regional Evidence Generation and Policy & Institutional Mapping on Food and Bioenergy
Region: Latin America and Caribbean - LAC
64
Figures 3.12 to 3.15: Projections of world market prices for sugar, vegetable oils, bioethanol and biodiesel
Source: Food and Agricultural Policy Research Institute (FAPRI)
3.3.4. Aggregate value
A desirable effect, if possible, would be to set up local industries to process biofuels from their byproducts or other raw materials in order to increase the aggregate value of primary production.
Raw material prices are a high percentage of the total production costs for biofuels and have a considerable effect on economic viability. In early 2005, raw material costs were responsible for 58% to 65% of total production costs for ethanol. In addition to raw material costs, other fully expressed costs include those for equipment required for production, agrochemicals, labor and energy used for production, maintenance and the net amount of the byproducts from the production process.72
Many of the economic aspects of the production and consumption of biodiesel are comparable to those of ethanol. Opportunity costs for the raw materials used in biodiesel production correspond to the higher prices of vegetable oils in the international market.
73
72 Masami Kojima, Donald Mitchell, and William Ward. 2007. Considering Trade Policies for Liquid Biofuels Renewable. Energy Sector Management Assistance Program (ESMAP). The World Bank. Energy Special Report 004/07. Disponible en:
http://siteresources.worldbank.org/INTOGMC/Resources/Considering_trade_policies_for_liquid_biofuels.pdf 73 One liter of vegetable oil produces approximately one liter of biodiesel.
287 279 287 292 298 305 310 315 323 329
500 483 480 484 488 492 491 487 485 484
0
100
200
300
400
500
600
09/10 10/11 11/12 12/13 13/14 14/15 15/16 16/17 17/18 18/19
Proyección de Precios Mundiales del Azúcar (US$/t)
Sugar FOB Caribbean Price Sugar New York Spot
1.029 1.097 1.140 1.172 1.205 1.236 1.263 1.292 1.316 1.340
659 706 743 772 800 826 852 879 905 931
0200400600800
1.0001.2001.4001.600
09/10 10/11 11/12 12/13 13/14 14/15 15/16 16/17 17/18 18/19
Proyección de Precios Mundiales de Aceites (US$/t)
Soybean Oil FOB Rotterdam Rapeseed Oil FOB Hamburg
Sunflower Oil FOB NW Europe Palm Oil CIF Rotterdam
0,391 0,359 0,340 0,354 0,361 0,382 0,399 0,404 0,428 0,446
0,443 0,462 0,479 0,505 0,525 0,555 0,578 0,575 0,544 0,528
0,000
0,100
0,200
0,300
0,400
0,500
0,600
0,700
09/10 10/11 11/12 12/13 13/14 14/15 15/16 16/17 17/18 18/19
Proyección de Precios Mundiales del Etanol (US$/litro)
Ethanol Anhydrous Ethanol Price, Brazil **
Ethanol Ethanol, FOB Omaha
0,9881,078
1,181 1,251 1,285 1,326 1,359 1,395 1,434 1,468
0,912 0,932 1,015 1,088 1,120 1,145 1,165 1,187 1,213 1,239
0,0000,2000,4000,6000,8001,0001,2001,4001,600
09/10 10/11 11/12 12/13 13/14 14/15 15/16 16/17 17/18 18/19
Proyección de Precios Mundiales del Biodiesel (US$/litro)
Biodiesel Central Europe FOB Price **
Biodiesel Biodiesel Plant

Study on Regional Evidence Generation and Policy & Institutional Mapping on Food and Bioenergy
Region: Latin America and Caribbean - LAC
65
In addition to raw material costs, plant costs need to reflect the return on capital expenditures for building the biodiesel plant, as well as operational costs, including the purchase of methanol. Earnings on sales of byproducts, such as glycerin, are deducted and a regular profit margin is added to reach the plant costs of biodiesel. This biodiesel balance point must be compared to that of diesel and oil, taking into account the economic penalties associated with fossil fuels and the environmental benefits resulting from the reduction of environmental emissions, regardless of whether or not current fuel prices take those aspects into account.
Most production costs thus far are related to the costs of raw materials, and the commercial viability of any biofuel is extremely dependent on raw material prices. Within the context of the market and predominant policies, the price that a farmer receives for a biofuel crop depends mainly on its potential energy, conversion and transportation costs and the value of the byproducts.
There is an estimated aggregate monetary value (profit) per energy unit for the intensive production systems under tropical conditions and in developing countries as shown in the table below. With regard to the first agricultural production system, which is called “farmers”, crop exploitation is carried out as intensive production in marginal soils, while in the intercropping system, biofuel production is derived from wood from intensive intercropping.
Table 3.9: Earnings from selected studies from developing/ tropical countries biofuel production (thousands of $ per peta joule) 1/
Bioenergy systems & Related activities
Intensive production farmers Farmers Mix
Intensive intercropping Intercropping Mix
Establishment 82.3 11.8% 54.9 9.3%
Weeding 205.8 29.6% 126.9 21.5%
Harvesting 257.2 36.9% 257.2 43.6%
Transport 68.6 9.9% 68.6 11.6%
Chipping 13.7 2.0% 13.7 2.3%
Administration 68.6 9.9% 68.6 11.6%
Total 696.2 100.0% 589.8 100.0% Note:1/ Joule (SI unit) J = kg m2 s-2; Petajoule (PJ) = 1015 J; 1 ton of oil equivalent (toe) = 0.00004184×10¹⁵ J Source: J. Domac et al. Socio-economic drivers in implementing bioenergy projects. Biomass and Bioenergy 28 98 (2005) 97–106
Aggregate amounts per energy unit produced as shown in the foregoing table confirm that the agricultural phase is responsible for about 78.3% and 74.4% of the total aggregate value, including establishment, weeding, and harvesting both for the farmers system and the crop association system, with intercropping, respectively.
Evidence from the table thus implicitly leads us to the conclusion that the agro-energy projects based on energy crops generate a significant aggregate value in the agricultural production systems.

Study on Regional Evidence Generation and Policy & Institutional Mapping on Food and Bioenergy
Region: Latin America and Caribbean - LAC
66
4. Elements for the formulation of public policies
4.1. Opportunities, technological challenges and impacts
In addition to providing the option of a new agricultural activity, the emergence and current configuration of the global agro-energy and biofuel production chain introduces the possibility of being at the center of a new paradigm, with numerous prospects and challenges. For countries in Latin America and the Caribbean, whether they are producers now, or will be in the future, the development of agro-energy and biofuels means economic, environmental, social and strategic opportunities.
Biofuel production systems are extremely complex, especially where there is a number of interrelated factors such as global and domestic markets, the possible impact on climate change, geopolitical issues and decisions pertaining to public policies that regulate this topic.
Moreover, the dynamism and uncertainty that usually accompany the emergence of a new activity also come with latent risks, conflicts and tensions, where a lot of attention is focused on the dilemma of “food vs. energy” as well as the potential negative effects on the environment and biodiversity that might be caused by the sector’s uncoordinated global expansion.
Some of the most relevant results of the implementation of the agro-energy and biofuel production chains are: (a) less dependency on non-renewable energy sources and increased assurance of the continuity of the energy supply; (b) improved environmental conditions due to the reduction of polluting emissions; (c) generating direct and indirect, regional and rural investments and employment, thus creating new possibilities of entry for small and medium-size agricultural enterprises and family-run agricultural activities; (d) product diversification in the agricultural and livestock farming sector; (e) value added to the agro-industrial chain; and (f) an opportunity for the delayed development of regional economies, starting with energy crops in marginal areas (Ganduglia, 2008).74
Although biofuel production is relatively low given the overall demand for energy, its potential to cause unexpected adverse effects on land, water and biodiversity is still a major concern. This underscores the importance and necessity of developing and refining instruments such as land-use or economic-ecological zoning, and implementing good agricultural practices (conservation agriculture), all of which are key elements for mitigating the negative externalities of biofuel production.
According to Gazzoni75
a. Production of raw materials, which should focus on products with high energy density, are easy to produce and transport and don’t conflict with the production of food or other agricultural products. From this perspective, cellulose and hemicellulose are the most suitable organic molecules for the production of affordable energy. Organic waste and algae offer excellent medium-term alternatives, the latter being heavily dependent on the development of mass production technology.
, the key to maintaining the competitiveness of sistems for biofuel production will be the introduction of new technologies in three main areas:
74 Ganduglia, F y Equipo de Proyectos de Biocombustibles (EPB) – ARPEL, loc. cit. 75 Gazzoni, Decio Luiz. Biocombustibles y alimentos en América Latina y el Caribe. San José, C.R.: IICA, 2009.

Study on Regional Evidence Generation and Policy & Institutional Mapping on Food and Bioenergy
Region: Latin America and Caribbean - LAC
67
b. Transformation processes that lead to more efficient and affordable biofuels, have less negative impact on the environment and are safer for inventory, transportation and use.
c. Engines and power converters for the progressive improvement of current diesel engines (otto cycle) until the introduction of fuel cells. The cells can be moved with low cost and high energy density organic molecules (such as alcohols) or molecular hydrogen (H2), which represents the apex of the energy density of a biofuel substance.
The management capacity for the "business" of biofuels also needs to be strengthened. The introduction of ethanol in Brazil's energy mix has proven to be a success for the production and marketing of biofuels. This could be the basis of a cooperative program to train entrepreneurs and policymakers in other LAC countries.
Other relevant information comes from the IV Latin American and Caribbean Seminar on Biofuels, held in Cali, Colombia in April 2009, an event institutionalized by the Latin American Energy Organization and implemented in coordination with the Food and Agriculture Organization of the United Nations (FAO), the Inter-American Institute for Cooperation on Agriculture (IICA) and the Ministry of Energy and Mines of Colombia, with technical support from the Ministry of Mines and Energy of Brazil76
a. The U.S. will increase strategic cooperation with other countries in the hemisphere, giving priority to energy security and climate change, expanding cooperation with other countries in clean energy and fossil fuels, and energy efficiency. It will also develop policies to increase investments in clean energy and reduce emissions.
.
b. Biofuels in Brazil are considered a component of energy security, since dependence on imported energy makes a country more vulnerable. Ethanol consumption is higher than that of gasoline in Brazil.
c. In Colombia, the use of ethanol and biodiesel is mandated by government policies in which private sector players play an active part. Ten percent of ethanol is mixed with gasoline and five percent of biodiesel is mixed with diesel fuel.
d. Using 10% ethanol-gasoline blends worldwide is possible using currently available technologies.
e. Specific public policies are necessary for the inclusion of biofuels in countries interested in this technology.
f. Definitions for the following are given: (i) first-generation biofuels: ethanol and biodiesel, currently produced with known and established technologies, processes and trading channels; (ii) second-generation biofuels: medium-term developing processes that use biomass, agricultural waste and microalgae; (iii) third-generation biofuels: long-term processes, including new energy and raw materials with genetic changes.
g. Commercial applications for the production of biofuels using second-generation technologies are already available.
h. Significant progress has been reported on the potential use of microalgae, including in commercial aviation.
76 OLADE/FAO/IICA/Ministerio de Energía y Minas de Colombia/Ministerio de Minas y Energía de Brasil: IV Seminario Latinoamericano y del Caribe de Biocombustibles: Informe Final. Available at http://www.olade.org.ec/biocombustibles/informe.html

Study on Regional Evidence Generation and Policy & Institutional Mapping on Food and Bioenergy
Region: Latin America and Caribbean - LAC
68
i. The assortment and processes of first-generation technologies need to be optimized: e.g. higher yield sugarcane (existing varieties in Colombia) and reduction of water use.
j. Emphasis should be placed on the introduction of the life cycle as an evaluation tool for processes and the sustainability of biofuel extraction.
k. Important experiences in the region have been presented on the use of alternative raw materials for fuel production: pine nut (Jatropha curcas), waste from tilapia processing and coffee byproducts, among others.
l. Progress has also been made in the use of biodiesel in the mass transit system in Bogota, which is beneficial to the environment.
According to ECLAC (2007)77
One of the limitations of biofuels is their high production cost compared to fossil fuels (gasoline and diesel). Factors such as international oil prices, the cost of biofuel processing and the price of alternative uses of crops all play a key role in determining profitability, opportunity costs and consequently the incentives for biofuel production. It is important to consider these aspects when designing public policies used to generate incentives for biofuel production.
, Latin America and the Caribbean have the potential to meet a substantial part of the global demand for ethanol and biodiesel. However, biofuel production could also mean the expansion of the production frontier, which is a serious challenge for the agricultural sector and possibly the environment of the countries in that region.
Growing energy crops can cause significant changes in the agrarian structure, such as the increased concentration of production and ownership, and in the emergence of new players and standards. Significant changes in the economic structure could be another potential result, mainly due to the creation of economies of scale, with more pressure on natural resources, ecosystems and agriculture-related employment.
An increased demand for biofuels could also lead to higher prices for energy and non-energy crops and the reduction of products obtained from the production of biofuels. Livestock and forestry would also be affected. The impact on the livestock sector may be manifested through changes in the prices of animal feed. Such an effect could hamper the goal of some countries to strengthen the income of rural areas.
It is important that countries design policies that promote and ensure the profitability of biofuels, that the benefits of biofuel production reach rural areas and that the countries promote and safeguard access to food for the most vulnerable sectors.
77 CEPAL, Biocombustibles y su impacto potencial en la estructura agraria, precios y empleo en América Latina, 2007

Study on Regional Evidence Generation and Policy & Institutional Mapping on Food and Bioenergy
Region: Latin America and Caribbean - LAC
69
4.2. Public policies
Public policies on biofuels should also take into account national goals related to productive specialization (agribusiness), the energy supply for the population and the protection of their natural heritage. Each country must therefore define its own agenda and leverage the demand of developed countries to open up new opportunities for sustainable rural development.
Many governments of countries in the region have established goals for the local market and promoted legislations designed to develop biofuels without first consistently examining their potential impact, not only on agriculture and the use of natural resources, but also at the social level, especially with regard to their effective contribution to combating poverty and its impact on food prices.
Therefore, according to ECLAC (2008)78
a. The investigation of the net balance of fossil energy, considering on the one hand the substitution of petroleum products in domestic consumption, particularly in the transport sector, compared to the consumption of fossil energy throughout all stages of the biofuel production chains. In the case that this balance is not significantly positive, there may be other negative impacts without any advantages in terms of fossil energy savings or the use of foreign currency for import-dependent countries.
, a task that lies ahead is the definition of its own public policy agenda that would truly contribute to sustainability, giving careful consideration to a set of topics before formulating these guidelines, such as:
b. In case the previous balance is not significantly positive, verify if the introduction of biofuels has a positive effect on greenhouse gas emissions, and if it makes a real and permanent contribution to achieving the goals of the Framework Convention on Climate Change.
c. When biofuel production is mainly based on monocultures, assess the impacts on social conditions that define the labor market, the concentration of ownership and the social distribution of benefits from exploitation. If only the monocultures prevail, the contribution of biofuel programs to employment, improvement of distributional asymmetries and rural development could be negative.
At any rate, the situations in LAC countries present very marked differences regarding the production and use of biofuels. For some countries that have a long tradition with the production and use of bioethanol, technological developments at the different stages of the production chain, a mature automotive industry and a large domestic market would help them become large-scale exporters of that biofuel. In those countries, biofuel production could have a great impact on agricultural activities if it also leads to better management of land and water resources and improvement of existing varieties, as well as the incorporation of new varieties that are adapted to the ecological conditions.
For countries in the region with limited natural resources, some with marked poverty and/or malnutrition and inadequate fulfillment of basic energy requirements, the export option cannot be considered, as it would have adverse effects on different areas of sustainable development.
78 CEPAL, 2008: Aporte de los Biocombustibles a la Sustentabilidad del Desarrollo en America Latina Y el Caribe – Elementos para la Formulacion de Politicas Publicas

Study on Regional Evidence Generation and Policy & Institutional Mapping on Food and Bioenergy
Region: Latin America and Caribbean - LAC
70
ECLAC insists that energy consumption should be moderated, especially in developed countries, so that saving energy becomes an alternative that is more compatible with sustainable development than biofuels. However, this appears to be an inconsequential and short-term solution to the most important energy and environment-related problems.
With regard to the sustainability of development, the most effective measure could be to meet the population’s basic energy requirements by fostering policies that promote rural development. This would help surmount problems of poverty and malnutrition, inequalities of distribution and the relocation of small-scale producers that may be caused by biofuel production.
ECLAC believes that public policies should take into consideration four groups of countries:
a. Those that depend on oil and/or byproducts that have problems with the balance of payments due to the high cost of energy bills, and minimal capacity to meet the basic energy needs of the poor;
b. Those that depend on oil and have an average capacity to meet basic energy needs;
c. Those that have a diversified range of energy resources and may further diversify their energy mix with the production of bioethanol and/or biodiesel, but are importing byproducts;
d. Those whose comparative advantage and technological learning curve enable them to have a presence in the global market.
ECLAC recommends that a multidimensional approach should be used when designing policies for biofuels, i.e. in addition to the political energy authority, the participation of policy-making authorities on agriculture, industry and transport, finance, natural resources and the environment, social and public health and regional entities should also be enlisted. Only with prior and well-founded agreements will it be possible to create a coherent biofuel policy. Once such a consensus is reached within the public authority, the reactions of stakeholders from civil society should be evaluated, and their contributions should be incorporated into the proposed policy. The rules of the game for investment should thus comply with a global rationale, and not an exclusively private one.