Regional differences in productivity growth in The Netherlands: an industry-level growth accounting
23
1 Regional Differences in Productivity Growth in The Netherlands: An Industry-level Growth Accounting Lourens Broersma † and Jouke van Dijk ‡ ABSTRACT It is well known that the productivity growth in Europe is slowing down, against an increasing growth rate in the US. The Netherlands is one of countries in Europe with the lowest growth rates of productivity. This paper presents the results of a growth accounting exercise applied to regional industry data of The Netherlands between 1995-2002. We find that low productivity growth in The Netherlands is particularly situated in the economic core regions of the west and south and is caused by slow growth of MFP. Compared to the more peripheral regions, MFP-growth is lower in all industries, except social and non-market services. Part of this slow MFP-growth can be explained by the high level of traffic congestion and relatively low labour effort in the core regions Groningen, March 2005 _____________________________________________ † University of Groningen, Faculty of Economics and Faculty of Spatial Sciences; Groningen Growth and Development Centre and Conference Board, New York. Mailing address: Lourens Broersma, University of Groningen, Department of Economics, P.O. Box 800, NL-9700 AV Groningen, The Netherlands; phone: +31 50 363 7053, e-mail: [email protected] . ‡ University of Groningen, Faculty of Spatial Sciences and Urban and Regional Studies Institute. Helpful comments and suggestions of participants of the ERSA Conference of August 25-29 2004 in Porto, participants of the RPB Spatial Conference of October 26 2004 in Rotterdam and of Robert Inklaar and Marcel Timmer are gratefully acknowledged. Special thanks go to Bertus Talsma for computational assistance.
-
Upload
independent -
Category
Documents
-
view
4 -
download
0
Transcript of Regional differences in productivity growth in The Netherlands: an industry-level growth accounting
1
Regional Differences in Productivity Growth in The Netherlands:
An Industry-level Growth Accounting
Lourens Broersma†
and
Jouke van Dijk‡
ABSTRACT
It is well known that the productivity growth in Europe is slowing down, against an increasing growth rate in the US. The Netherlands
is one of countries in Europe with the lowest growth rates of productivity. This paper presents the results of a growth accounting
exercise applied to regional industry data of The Netherlands between 1995-2002. We find that low productivity growth in The
Netherlands is particularly situated in the economic core regions of the west and south and is caused by slow growth of MFP. Compared to the more peripheral regions, MFP-growth is lower in all industries, except social and non-market services. Part of this slow MFP-growth can be explained by the high level of traffic congestion and relatively
low labour effort in the core regions
Groningen, March 2005 _____________________________________________ † University of Groningen, Faculty of Economics and Faculty of Spatial Sciences; Groningen Growth and Development Centre and Conference Board, New York. Mailing address: Lourens Broersma, University of Groningen, Department of Economics, P.O. Box 800, NL-9700 AV Groningen, The Netherlands; phone: +31 50 363 7053, e-mail: [email protected]. ‡ University of Groningen, Faculty of Spatial Sciences and Urban and Regional Studies Institute. Helpful comments and suggestions of participants of the ERSA Conference of August 25-29 2004 in Porto, participants of the RPB Spatial Conference of October 26 2004 in Rotterdam and of Robert Inklaar and Marcel Timmer are gratefully acknowledged. Special thanks go to Bertus Talsma for computational assistance.
2
1. Introduction The main point in the current European policy debate is to find instruments that stimulate the growth rate of labour productivity. The reason for this is a persistent slowdown in labour productivity growth in European countries and an increasing gap in growth rates between the USA and Europe starting in the second half of the 1990’s (see figure 1). Labour productivity in the US is nowadays at a much steeper growth path than in Europe. What is the reason for this increasing gap between Europe and the USA? This is an important question in order to assess the measures proposed in the Lisbon Agreement by the European Union (EU) to become the world’s most competitive and dynamic knowledge-based economy in 2010. With increasing globalisation and deregulation of international markets, productivity growth is the tool to enhance competitiveness. Therefore instruments are sought that will get the productivity growth rate in European countries back on track. One of the main explanatory factors for productivity growth is the production, use and diffusion of information technology (IT). 1 Timmer et al (2003), Inklaar et al. (2003) and Daveri (2004) show, however, that the main source for the European slowdown in productivity growth is not so much lagging IT use, but a deceleration of non-IT capital deepening (i.e. lagging increase of non-IT capital per hour worked) and, in contrast to the US, a lack of acceleration of MFP growth. MFP growth is the residual part of productivity growth that cannot be attributed to changes in labour quality and capital assets, usually subdivided in IT capital and non-IT capital. The deceleration of non-IT capital deepening of the nineties in Europe has coincided with a sharp rise in employment. Non-IT capital deepening, or the growth of non-IT capital per hour worked, is clearly related to the growth rates of the price of both inputs. Faster wage growth increases non-IT capital deepening because capital will substitute labour. An increase in the ‘price’ of non-IT-capital, on the other hand, makes capital more expensive and leads to deceleration of non-IT capital deepening. Inklaar et al. (2003), however, show that the impact of growth rates of wages and rental prices on non-IT capital deepening is much stronger for the US than Europe. The small effect of wage growth in European countries implies that wage moderation might be an important reason for the slowdown of non-IT capital deepening. Figure 1 shows that productivity growth in The Netherlands is at a persistently lower growth path than the European average. Since Dutch government policy has been directed at a sustained moderation of wages since the early 1980’s, a natural question to ask is whether this has led to an even slower rate of non-IT capital deepening than Europe or that other mechanisms have instead caused the Dutch slowdown of productivity growth. This issue will be addressed at a low spatial level: what is the reason for the Dutch slowdown, are there regions that have contributed more to the lagging productivity growth rate than others and which industries are responsible. This question will be answered using the growth accounting approach, which is also used to explain the widening of the productivity growth gap between Europe and the USA.2 At the provincial level of The Netherlands distinction can be made between growth rates of value added in constant prices, number of hours worked, the level of education of labour and IT and non-IT capital services for eight aggregate industries. This provides enough detail to determine the industry contribution by province to the lagging Dutch growth performance of the late 1990’s. This issue is useful from both an academic and a policy perspective.
1 In this paper the expression information technology (IT) is also used when reference is made to information and communication technology (ICT) in for example related studies. In the empirical part of this paper only IT equipment (computers, related equipment and software) can be distinguished. 2 See e.g. Jorgenson and Stiroh (2000), Oliner and Sichel (2000,2002), Inklaar et al. (2003) and McGuckin and van Ark (2004).
3
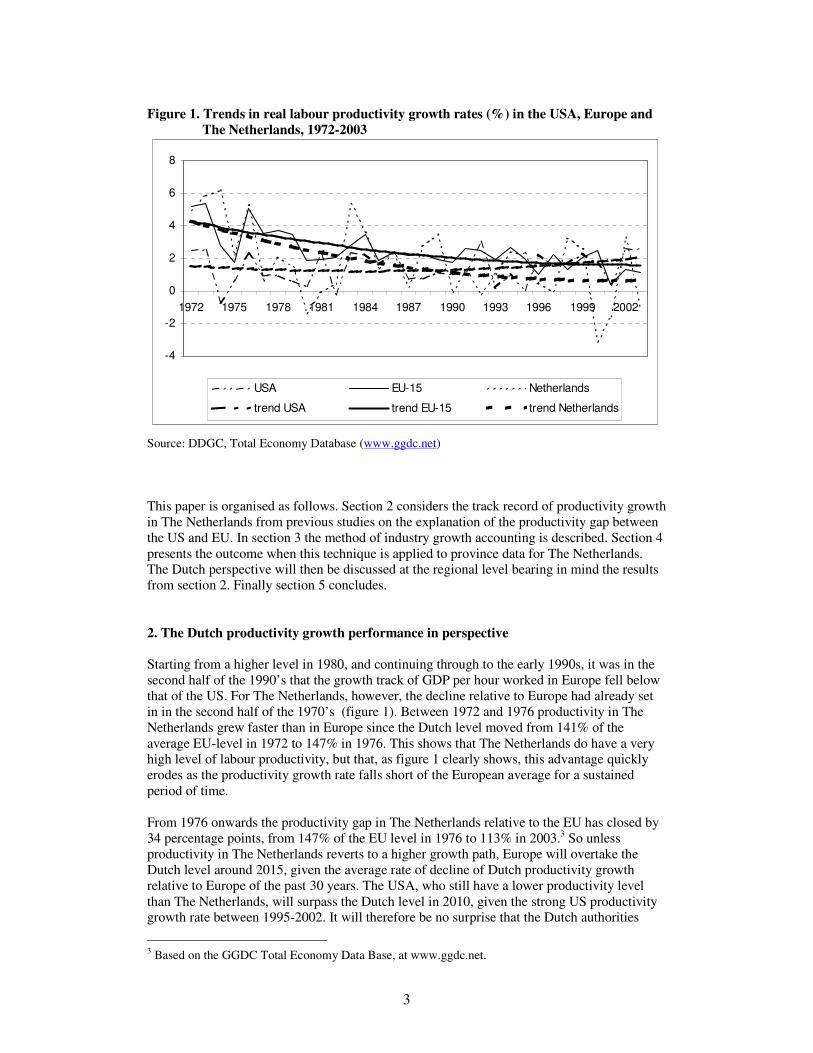
Figure 1. Trends in real labour productivity growth rates (%) in the USA, Europe and
The Netherlands, 1972-2003 Source: DDGC, Total Economy Database (www.ggdc.net) This paper is organised as follows. Section 2 considers the track record of productivity growth in The Netherlands from previous studies on the explanation of the productivity gap between the US and EU. In section 3 the method of industry growth accounting is described. Section 4 presents the outcome when this technique is applied to province data for The Netherlands. The Dutch perspective will then be discussed at the regional level bearing in mind the results from section 2. Finally section 5 concludes. 2. The Dutch productivity growth performance in perspective Starting from a higher level in 1980, and continuing through to the early 1990s, it was in the second half of the 1990’ s that the growth track of GDP per hour worked in Europe fell below that of the US. For The Netherlands, however, the decline relative to Europe had already set in in the second half of the 1970’ s (figure 1). Between 1972 and 1976 productivity in The Netherlands grew faster than in Europe since the Dutch level moved from 141% of the average EU-level in 1972 to 147% in 1976. This shows that The Netherlands do have a very high level of labour productivity, but that, as figure 1 clearly shows, this advantage quickly erodes as the productivity growth rate falls short of the European average for a sustained period of time. From 1976 onwards the productivity gap in The Netherlands relative to the EU has closed by 34 percentage points, from 147% of the EU level in 1976 to 113% in 2003.3 So unless productivity in The Netherlands reverts to a higher growth path, Europe will overtake the Dutch level around 2015, given the average rate of decline of Dutch productivity growth relative to Europe of the past 30 years. The USA, who still have a lower productivity level than The Netherlands, will surpass the Dutch level in 2010, given the strong US productivity growth rate between 1995-2002. It will therefore be no surprise that the Dutch authorities
3 Based on the GGDC Total Economy Data Base, at www.ggdc.net.
-4
-2
0
2
4
6
8
1972 1975 1978 1981 1984 1987 1990 1993 1996 1999 2002
USA EU-15 Netherlands
trend USA trend EU-15 trend Netherlands
4
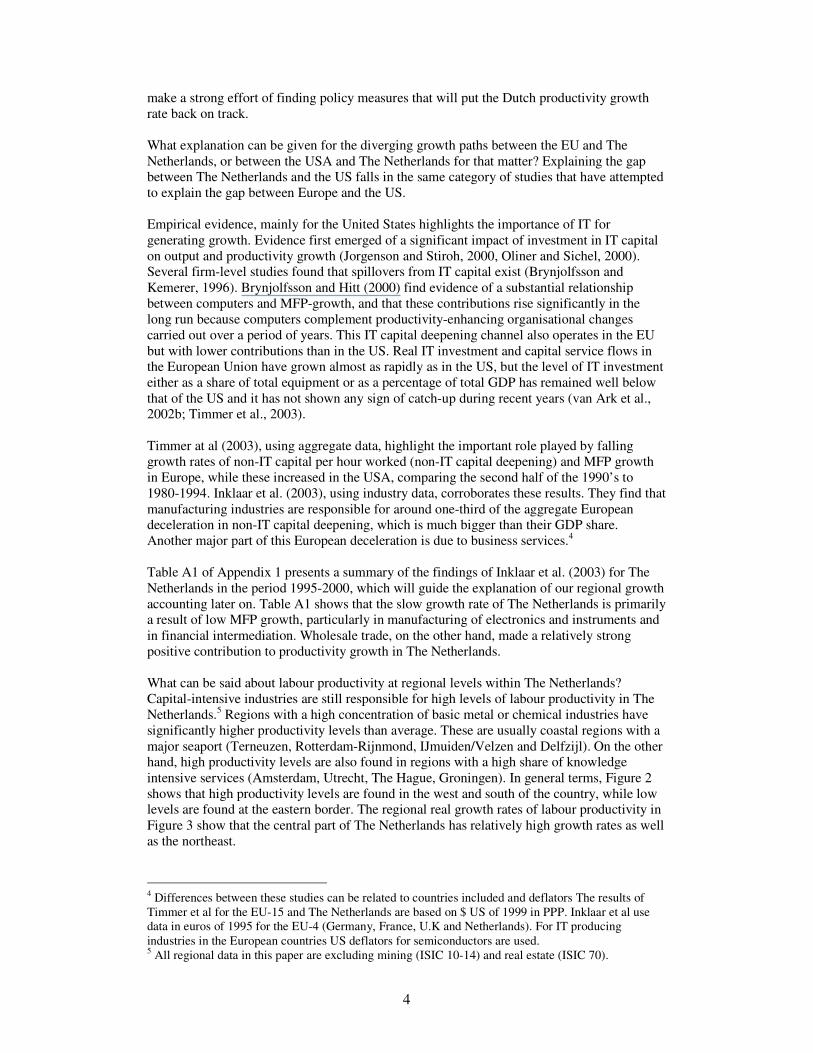
make a strong effort of finding policy measures that will put the Dutch productivity growth rate back on track. What explanation can be given for the diverging growth paths between the EU and The Netherlands, or between the USA and The Netherlands for that matter? Explaining the gap between The Netherlands and the US falls in the same category of studies that have attempted to explain the gap between Europe and the US. Empirical evidence, mainly for the United States highlights the importance of IT for generating growth. Evidence first emerged of a significant impact of investment in IT capital on output and productivity growth (Jorgenson and Stiroh, 2000, Oliner and Sichel, 2000). Several firm-level studies found that spillovers from IT capital exist (Brynjolfsson and Kemerer, 1996). Brynjolfsson and Hitt (2000) find evidence of a substantial relationship between computers and MFP-growth, and that these contributions rise significantly in the long run because computers complement productivity-enhancing organisational changes carried out over a period of years. This IT capital deepening channel also operates in the EU but with lower contributions than in the US. Real IT investment and capital service flows in the European Union have grown almost as rapidly as in the US, but the level of IT investment either as a share of total equipment or as a percentage of total GDP has remained well below that of the US and it has not shown any sign of catch-up during recent years (van Ark et al., 2002b; Timmer et al., 2003). Timmer at al (2003), using aggregate data, highlight the important role played by falling growth rates of non-IT capital per hour worked (non-IT capital deepening) and MFP growth in Europe, while these increased in the USA, comparing the second half of the 1990’ s to 1980-1994. Inklaar et al. (2003), using industry data, corroborates these results. They find that manufacturing industries are responsible for around one-third of the aggregate European deceleration in non-IT capital deepening, which is much bigger than their GDP share. Another major part of this European deceleration is due to business services.4 Table A1 of Appendix 1 presents a summary of the findings of Inklaar et al. (2003) for The Netherlands in the period 1995-2000, which will guide the explanation of our regional growth accounting later on. Table A1 shows that the slow growth rate of The Netherlands is primarily a result of low MFP growth, particularly in manufacturing of electronics and instruments and in financial intermediation. Wholesale trade, on the other hand, made a relatively strong positive contribution to productivity growth in The Netherlands. What can be said about labour productivity at regional levels within The Netherlands? Capital-intensive industries are still responsible for high levels of labour productivity in The Netherlands.5 Regions with a high concentration of basic metal or chemical industries have significantly higher productivity levels than average. These are usually coastal regions with a major seaport (Terneuzen, Rotterdam-Rijnmond, IJmuiden/Velzen and Delfzijl). On the other hand, high productivity levels are also found in regions with a high share of knowledge intensive services (Amsterdam, Utrecht, The Hague, Groningen). In general terms, Figure 2 shows that high productivity levels are found in the west and south of the country, while low levels are found at the eastern border. The regional real growth rates of labour productivity in Figure 3 show that the central part of The Netherlands has relatively high growth rates as well as the northeast.
4 Differences between these studies can be related to countries included and deflators The results of Timmer et al for the EU-15 and The Netherlands are based on $ US of 1999 in PPP. Inklaar et al use data in euros of 1995 for the EU-4 (Germany, France, U.K and Netherlands). For IT producing industries in the European countries US deflators for semiconductors are used. 5 All regional data in this paper are excluding mining (ISIC 10-14) and real estate (ISIC 70).
5
Figure 2. Labour productivity 2002 Figure 3. Real annual labour productivity (euro per hour) growth 1990-2002 (%)
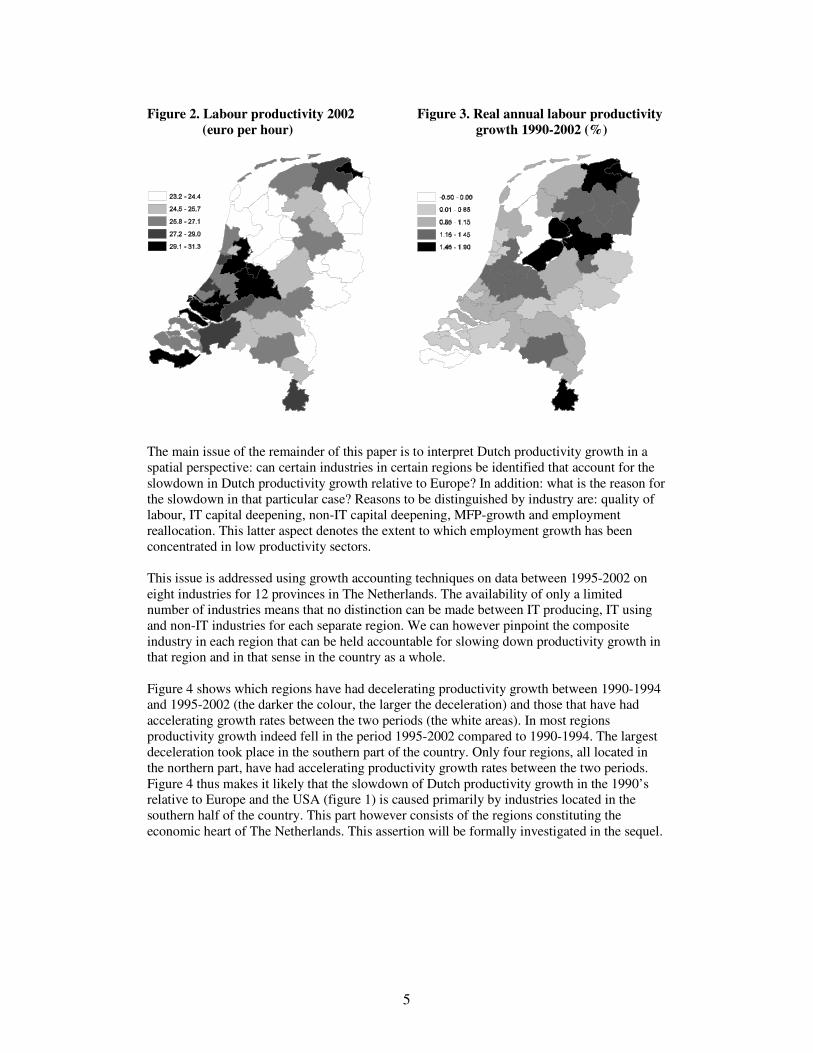
The main issue of the remainder of this paper is to interpret Dutch productivity growth in a spatial perspective: can certain industries in certain regions be identified that account for the slowdown in Dutch productivity growth relative to Europe? In addition: what is the reason for the slowdown in that particular case? Reasons to be distinguished by industry are: quality of labour, IT capital deepening, non-IT capital deepening, MFP-growth and employment reallocation. This latter aspect denotes the extent to which employment growth has been concentrated in low productivity sectors. This issue is addressed using growth accounting techniques on data between 1995-2002 on eight industries for 12 provinces in The Netherlands. The availability of only a limited number of industries means that no distinction can be made between IT producing, IT using and non-IT industries for each separate region. We can however pinpoint the composite industry in each region that can be held accountable for slowing down productivity growth in that region and in that sense in the country as a whole. Figure 4 shows which regions have had decelerating productivity growth between 1990-1994 and 1995-2002 (the darker the colour, the larger the deceleration) and those that have had accelerating growth rates between the two periods (the white areas). In most regions productivity growth indeed fell in the period 1995-2002 compared to 1990-1994. The largest deceleration took place in the southern part of the country. Only four regions, all located in the northern part, have had accelerating productivity growth rates between the two periods. Figure 4 thus makes it likely that the slowdown of Dutch productivity growth in the 1990’ s relative to Europe and the USA (figure 1) is caused primarily by industries located in the southern half of the country. This part however consists of the regions constituting the economic heart of The Netherlands. This assertion will be formally investigated in the sequel.
6
Figure 4. Acceleration/deceleration (+/-) in real annual labour productivity growth between 1995-2002 en 1990-1994
3. Growth accounting 3.1. Introduction The economic theory of productivity measurement goes back to Solow (1957). It has since developed due to major contributions of Jorgenson (1995), Griliches (1995) and Diewert (Diewert and Nakamura, 2005). They reformulated productivity measures in a production function setting and linked it to the analysis of economic growth. This production theoretical approach to productivity measurement is consistent with and integrates the neoclassical theory of the firm, index number theory and national accounts. It is called growth accounting. This growth accounting technique examines how much of the observed rate of change of an industry’ s output can be explained by the rate of change of the combined inputs. To construct an index of combined inputs, the rates of change of different inputs (labour, capital) have to be weighted appropriately. With these weights, index number theory comes in. From production theory, in addition to some simplifying assumptions, it can be shown that these weights are equal to the factor income shares, e.g. the share of labour compensation in total costs. These income shares approximate production elasticities, i.e. the effects of a 1% change in the individual inputs to output. As an alternative to growth accounting it is also possible to use the econometric approach to productivity measurement. This approach is based on observations of output and input volume, without postulating relationships between production elasticities and income shares beforehand. Instead these possible relations can be tested empirically. However, this comes at a price since it is difficult to make a link with economic theory, due to complex econometric issues, lack of robustness and the sample size of observations (OECD, 2001). However, the growth accounting and econometric approach are not competitors, but can instead supplement one another (Hulten, 2001). Econometric methods can be applied to further explain the productivity residual from growth accounting. This study applies the basic tools of the growth accounting approach to industry-level output and inputs in different regions. The residual MFP-growth rate that we find will subsequently be explained using econometric methods.
7
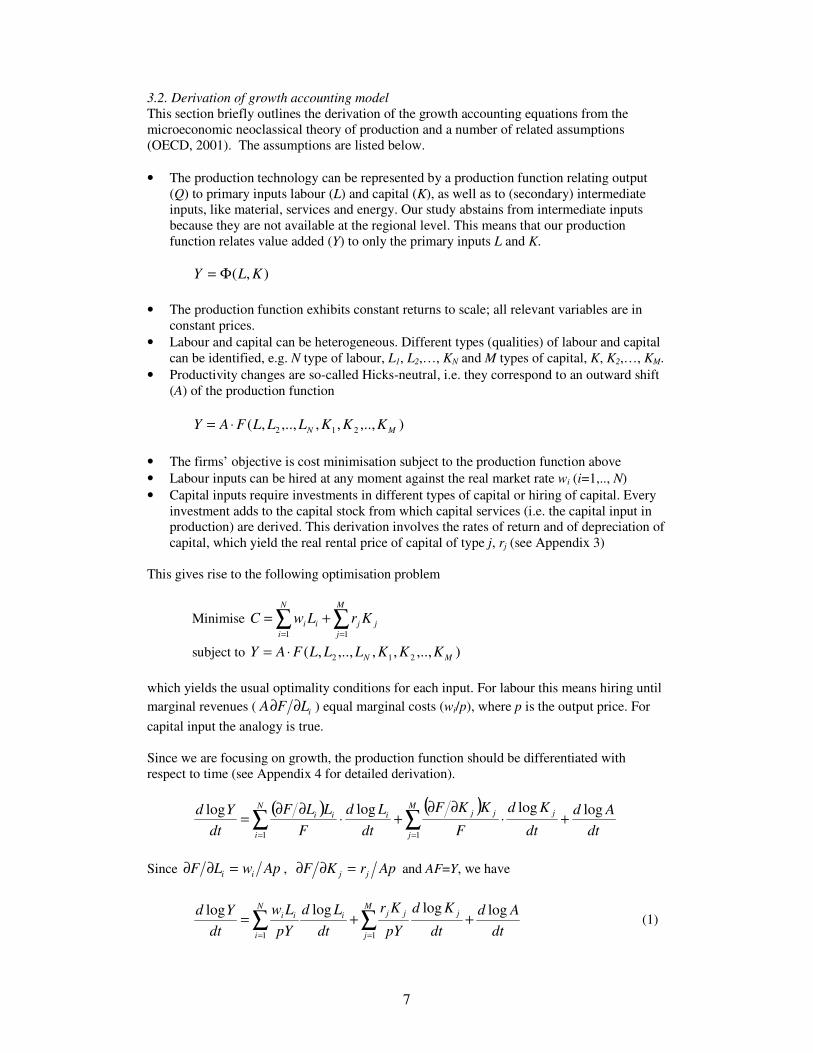
3.2. Derivation of growth accounting model This section briefly outlines the derivation of the growth accounting equations from the microeconomic neoclassical theory of production and a number of related assumptions (OECD, 2001). The assumptions are listed below. • The production technology can be represented by a production function relating output
(Q) to primary inputs labour (L) and capital (K), as well as to (secondary) intermediate inputs, like material, services and energy. Our study abstains from intermediate inputs because they are not available at the regional level. This means that our production function relates value added (Y) to only the primary inputs L and K.
),( KLY Φ=
• The production function exhibits constant returns to scale; all relevant variables are in
constant prices. • Labour and capital can be heterogeneous. Different types (qualities) of labour and capital
can be identified, e.g. N type of labour, L1, L2,…, KN and M types of capital, K, K2,…, KM. • Productivity changes are so-called Hicks-neutral, i.e. they correspond to an outward shift
(A) of the production function
),..,,,,..,,( 212 MN KKKLLLFAY ⋅= • The firms’ objective is cost minimisation subject to the production function above • Labour inputs can be hired at any moment against the real market rate wi (i=1,.., N) • Capital inputs require investments in different types of capital or hiring of capital. Every
investment adds to the capital stock from which capital services (i.e. the capital input in production) are derived. This derivation involves the rates of return and of depreciation of capital, which yield the real rental price of capital of type j, rj (see Appendix 3)
This gives rise to the following optimisation problem
Minimise ∑ ∑= =
+=N
i
M
jjjii KrLwC
1 1
subject to ),..,,,,..,,( 212 MN KKKLLLFAY ⋅= which yields the usual optimality conditions for each input. For labour this means hiring until marginal revenues ( iLFA ∂∂ ) equal marginal costs (wi/p), where p is the output price. For capital input the analogy is true. Since we are focusing on growth, the production function should be differentiated with respect to time (see Appendix 4 for detailed derivation).
( ) ( )
∑∑==
+⋅∂∂
+⋅∂∂=M
j
jjjiN
i
ii
dtAd
dt
Kd
F
KKF
dtLd
FLLF
dtYd
11
loglogloglog
Since ApwLF ii =∂∂ , AprKF jj =∂∂ and AF=Y, we have
dt
Addt
Kd
pY
Kr
dtLd
pYLw
dtYd M
j
jjjN
i
iii loglogloglog
11
++= ∑∑==
(1)
8
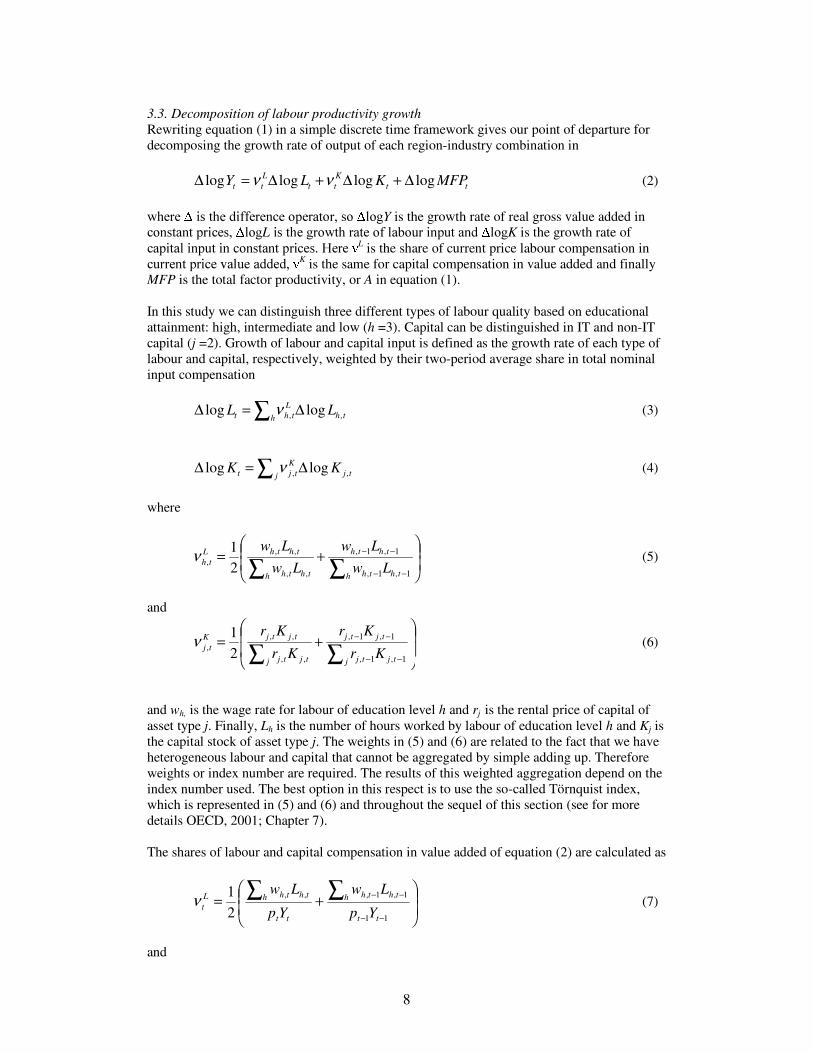
3.3. Decomposition of labour productivity growth Rewriting equation (1) in a simple discrete time framework gives our point of departure for decomposing the growth rate of output of each region-industry combination in
ttKtt
Ltt MFPKLY loglogloglog ∆+∆+∆=∆ νν (2)
ZKHUH� �LV�WKH�GLIIHUHQFH�RSHUDWRU��VR� ORJY is the growth rate of real gross value added in FRQVWDQW�SULFHV�� ORJL�LV�WKH�JURZWK�UDWH�RI�ODERXU�LQSXW�DQG� ORJK is the growth rate of FDSLWDO�LQSXW�LQ�FRQVWDQW�SULFHV��+HUH� L is the share of current price labour compensation in FXUUHQW�SULFH�YDOXH�DGGHG�� K is the same for capital compensation in value added and finally MFP is the total factor productivity, or A in equation (1). In this study we can distinguish three different types of labour quality based on educational attainment: high, intermediate and low (h =3). Capital can be distinguished in IT and non-IT capital (j =2). Growth of labour and capital input is defined as the growth rate of each type of labour and capital, respectively, weighted by their two-period average share in total nominal input compensation
∑ ∆=∆h th
Ltht LL ,, loglog ν (3)
∑ ∆=∆j tj
Ktjt KK ,, loglog ν (4)
where
+=
∑∑ −−
−−
h thth
thth
h thth
ththLth Lw
LwLw
Lw
1,1,
1,1,
,,
,,, 2
1ν (5)
and
+=
∑∑ −−
−−
j tjtj
tjtj
j tjtj
tjtjKtj Kr
Kr
Kr
Kr
1,1,
1,1,
,,
,,, 2
1ν (6)
and wh, is the wage rate for labour of education level h and rj is the rental price of capital of asset type j. Finally, Lh is the number of hours worked by labour of education level h and Kj is the capital stock of asset type j. The weights in (5) and (6) are related to the fact that we have heterogeneous labour and capital that cannot be aggregated by simple adding up. Therefore weights or index number are required. The results of this weighted aggregation depend on the index number used. The best option in this respect is to use the so-called Törnquist index, which is represented in (5) and (6) and throughout the sequel of this section (see for more details OECD, 2001; Chapter 7). The shares of labour and capital compensation in value added of equation (2) are calculated as
+=
−−
−−∑∑11
1,1,,,
21
tt
h thth
tt
h ththLt Yp
Lw
Yp
Lwν (7)
and
9
+=
−−
−−∑∑11
1,1,,,
21
tt
j tjtj
tt
j tjtjKt Yp
Kr
Yp
Krν (8)
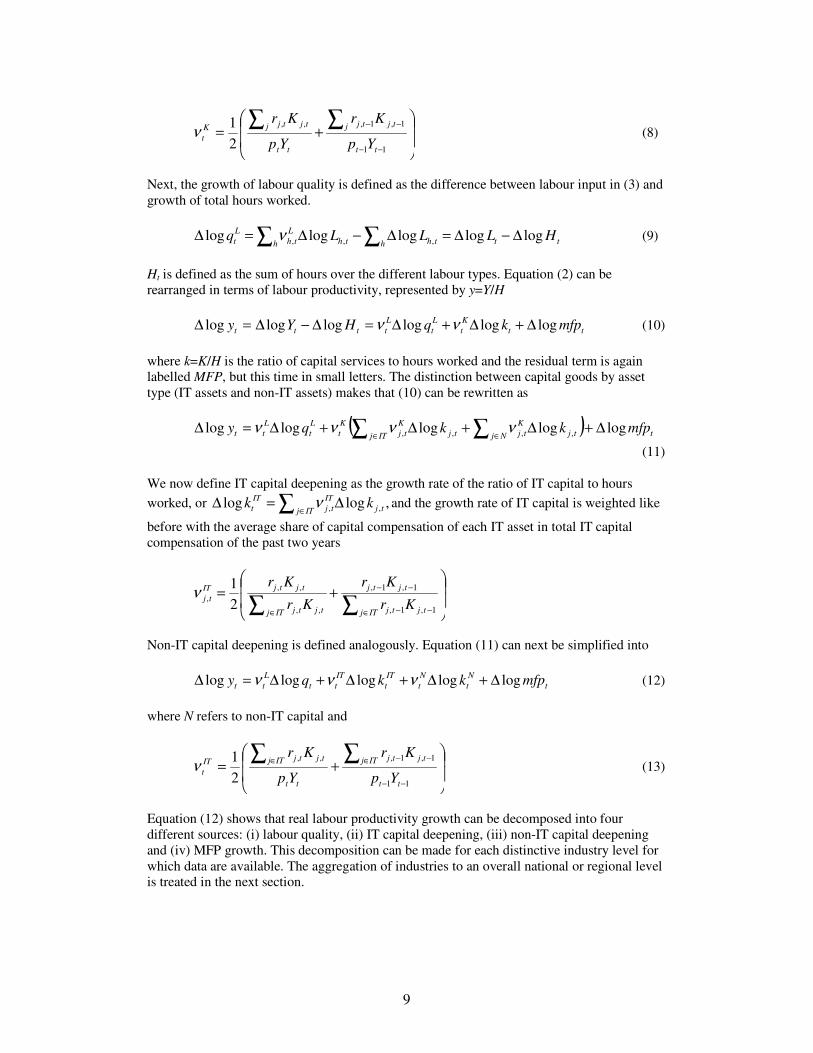
Next, the growth of labour quality is defined as the difference between labour input in (3) and growth of total hours worked.
∑∑ ∆−∆=∆−∆=∆h ttthh th
Lth
Lt HLLLq logloglogloglog ,,,ν (9)
Ht is defined as the sum of hours over the different labour types. Equation (2) can be rearranged in terms of labour productivity, represented by y=Y/H
ttKt
Lt
Ltttt mfpkqHYy loglogloglogloglog ∆+∆+∆=∆−∆=∆ νν (10)
where k=K/H is the ratio of capital services to hours worked and the residual term is again labelled MFP, but this time in small letters. The distinction between capital goods by asset type (IT assets and non-IT assets) makes that (10) can be rewritten as
( ) ttjNjK
tjtjITjK
tjKt
Lt
Ltt mfpkkqy logloglogloglog ,,,, ∆+∆+∆+∆=∆ ∑∑ ∈∈
νννν
(11) We now define IT capital deepening as the growth rate of the ratio of IT capital to hours worked, or ∑ ∈
∆=∆ITj tj
ITtj
ITt kk ,loglog ,,ν and the growth rate of IT capital is weighted like
before with the average share of capital compensation of each IT asset in total IT capital compensation of the past two years
+=
∑∑ ∈ −−
−−
∈ ITj tjtj
tjtj
ITj tjtj
tjtjITtj Kr
Kr
Kr
Kr
1,1,
1,1,
,,
,,, 2
1ν
Non-IT capital deepening is defined analogously. Equation (11) can next be simplified into
tNt
Nt
ITt
ITtt
Ltt mfpkkqy logloglogloglog ∆+∆+∆+∆=∆ ννν (12)
where N refers to non-IT capital and
+=
−−
∈ −−∈ ∑∑11
1,1,,,
21
tt
ITj tjtj
tt
ITj tjtjITt Yp
Kr
Yp
Krν (13)
Equation (12) shows that real labour productivity growth can be decomposed into four different sources: (i) labour quality, (ii) IT capital deepening, (iii) non-IT capital deepening and (iv) MFP growth. This decomposition can be made for each distinctive industry level for which data are available. The aggregation of industries to an overall national or regional level is treated in the next section.
10
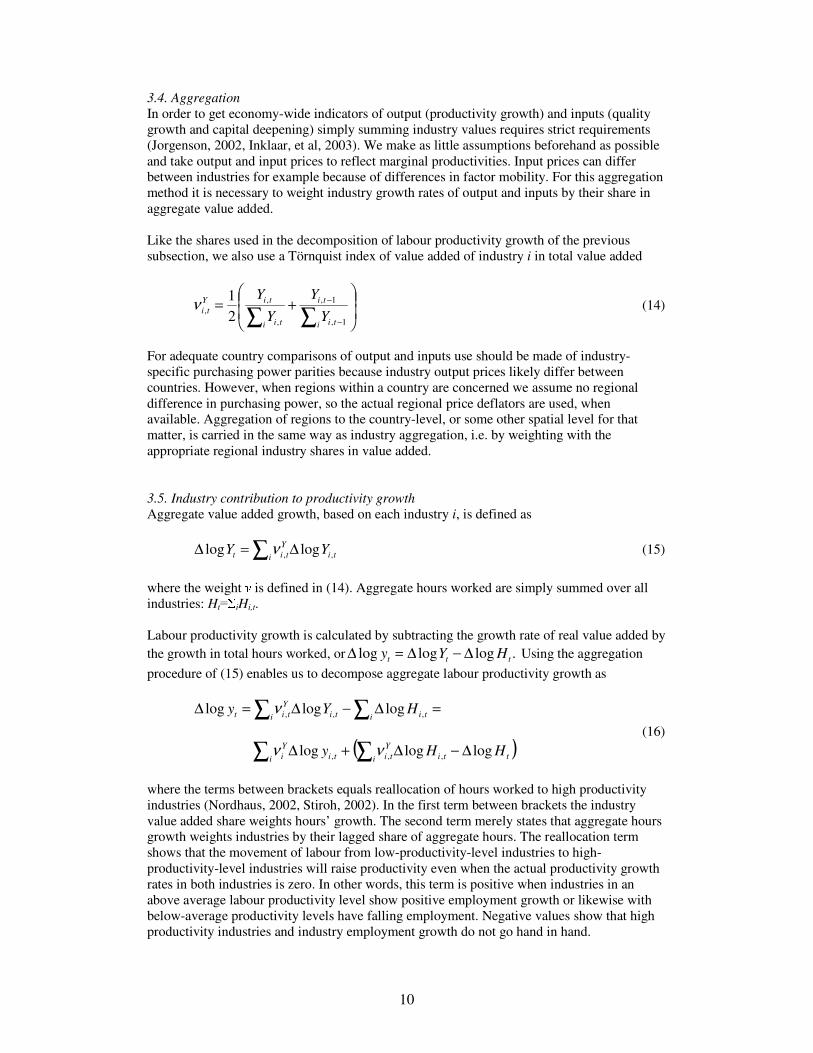
3.4. Aggregation In order to get economy-wide indicators of output (productivity growth) and inputs (quality growth and capital deepening) simply summing industry values requires strict requirements (Jorgenson, 2002, Inklaar, et al, 2003). We make as little assumptions beforehand as possible and take output and input prices to reflect marginal productivities. Input prices can differ between industries for example because of differences in factor mobility. For this aggregation method it is necessary to weight industry growth rates of output and inputs by their share in aggregate value added. Like the shares used in the decomposition of labour productivity growth of the previous subsection, we also use a Törnquist index of value added of industry i in total value added
+=
∑∑ −
−
i ti
ti
i ti
tiYti Y
YY
Y
1,
1,
,
,, 2
1ν (14)
For adequate country comparisons of output and inputs use should be made of industry-specific purchasing power parities because industry output prices likely differ between countries. However, when regions within a country are concerned we assume no regional difference in purchasing power, so the actual regional price deflators are used, when available. Aggregation of regions to the country-level, or some other spatial level for that matter, is carried in the same way as industry aggregation, i.e. by weighting with the appropriate regional industry shares in value added. 3.5. Industry contribution to productivity growth Aggregate value added growth, based on each industry i, is defined as tii
Ytit YY ,, loglog ∆=∆ ∑ ν (15)
where the weight is defined in (14). Aggregate hours worked are simply summed over all industries: Ht iHi,t. Labour productivity growth is calculated by subtracting the growth rate of real value added by the growth in total hours worked, or .logloglog ttt HYy ∆−∆=∆ Using the aggregation procedure of (15) enables us to decompose aggregate labour productivity growth as
∑ ∑ =∆−∆=∆i i titi
Ytit HYy ,,, logloglog ν
(16) ( )∑ ∑ ∆−∆+∆
i i ttiY
titiYi HHy logloglog ,,, νν
where the terms between brackets equals reallocation of hours worked to high productivity industries (Nordhaus, 2002, Stiroh, 2002). In the first term between brackets the industry value added share weights hours’ growth. The second term merely states that aggregate hours growth weights industries by their lagged share of aggregate hours. The reallocation term shows that the movement of labour from low-productivity-level industries to high-productivity-level industries will raise productivity even when the actual productivity growth rates in both industries is zero. In other words, this term is positive when industries in an above average labour productivity level show positive employment growth or likewise with below-average productivity levels have falling employment. Negative values show that high productivity industries and industry employment growth do not go hand in hand.
11
When combining IT or non-IT capital deepening by industry with their shares in value added, we get the contribution of IT or non-IT capital deepening in each industry to aggregate labour productivity growth. Omitting the time subscript t equations (12), (15) and (16) reflect the contribution of the inputs and MFP-growth for each industry to aggregate productivity growth
( )∑ +∆+∆+∆+∆=∆i i
Ni
Ni
ITi
ITi
Li
Li
Yi Rmfpkkqy logloglogloglog νννν (17)
where R is the reallocation of working hours defined in (16). Equation (17) also shows that aggregation over industries requires weighting with the industry share in value added. The contribution of IT capital deepening of industry i to aggregate productivity growth equals
( ).log ITi
ITi
Yi
ITi kLPCON ∆= νν (18)
The contribution of the other industry inputs to aggregate productivity growth is defined analogously. 3.6. Data issues This subsection briefly summarises the main data issues that arise when conducting this regional industry growth accounting for The Netherlands. More details are available in Appendix 3. Output In each region, output by industry is measured as value added. In all regions, mining (ISIC 10-14) and real estate (ISIC 70) are omitted from the analysis throughout this paper. As output deflator the regional GDP price index by industry is used, which is defined as the national GDP deflator adjusted to the regional sector composition. This regional price index is only available at a very high level of industry aggregation, which limits the industrial detail for each region. Labour Regional labour input by industry is measured as the total number of hour worked by both employees and self-employed. Regional hours worked by employees are simply the number of full-time equivalent (fte) jobs by industry per region times the annual working hours for full-time jobs by industry nation-wide. Regional self-employment by industry is taken into account by adjusting regional working hours of employees by the ratio of self-employed to employees by industry nation-wide. Capital Regional capital inputs by type of capital good (IT vs. non-IT) by industry are measured as capital service flows. This means that each type of capital good is based on its user cost. Capital services are defined as the flow of productive services from the cumulative capital stock, based on the combination of past investments and depreciation rates. The flow of services from any asset is generally assumed to be proportional to the capital stock. At a detailed industry level, particularly for IT-manufacturing industries, no adequate deflators are available for specific IT assets, like semiconductors, that take account of the rapid increase in their performance and quality. For that reason country comparisons are often made using harmonised US price deflators on semiconductors for all countries involved. However, our regional data do not allow for in-depth industry details by distinguishing specific IT producing or IT using industries. Therefore it is more appropriate to use national IT investment price deflators instead of US deflators for detailed investment goods. Similarly, for other non-IT investment goods the national deflator on total investment is used.

12
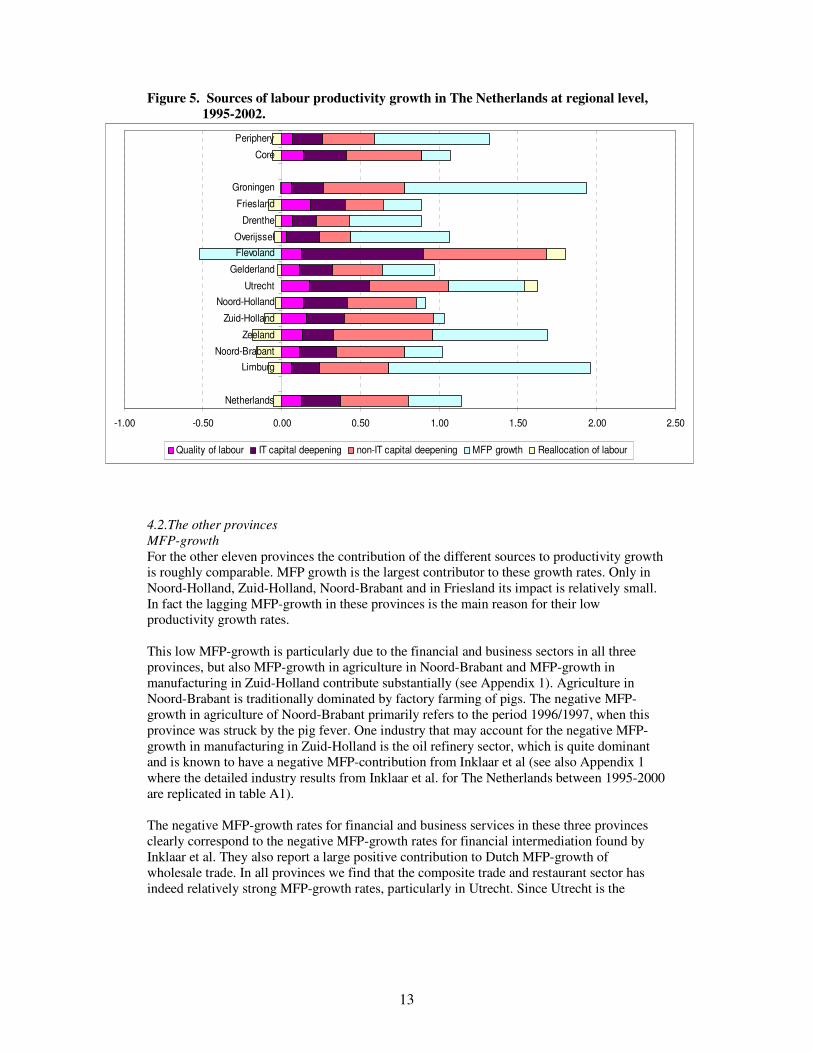
Labour quality Regional labour quality is based on the regional employed labour force by industry and education, where distinction is made in low, intermediate and high levels of education. For each region and industry the employment shares by educational level are used to obtain regional and industry hours worked by education. Labour compensation National information of hourly employee wages by industry and education multiplied by regional hours worked by industry and education yields regional labour compensation per hour worked. Sample period For most variables information for a substantial period of time is usually available, i.e. 1987-1995. This implies that differences in the first and second half of the 1990’ s can be distinguished. For data on investment in IT and non-IT capital by industry, however, the sample period is limited to 1995-2002. In other words, the sample period with which to conduct a regional growth accounting exercise for The Netherlands is 1995-2002, where the contribution to regional labour productivity can be determined of labour quality, IT capital deepening, non-IT capital deepening and MFP-growth. For more details on the definition and sources of the data we refer to Appendix 3. 4. Results Figure 5 presents an overview of the sources of aggregate productivity growth between 1995-2002 in The Netherlands and each of the twelve provinces under consideration. Table A2 in Appendix 1 presents an overview of all the sectoral and provincial results. The first phenomenon that catches the eye is the divergent pattern for the province of Flevoland. This is the sole region with a negative MFP growth rate, while the contribution of IT capital deepening to productivity growth is quite large. That is why we first need to elaborate on this province. 4.1.The special case of Flevoland Flevoland is the latest province of The Netherlands, established in 1986, and composed of newly conquered land from the IJsselmeer (see also Appendix 3, figure A1). This means that growth in this province has the character of catching-up to the Dutch average, both in growth of population, employment and output. It is further characterised by high levels of commuting, especially to the so-called Randstad area. In 2001 more than 60,000 workers, i.e. 41% of the working population in Flevoland, were commuting out to the Randstad, i.e. Noord-Holland, Zuid-Holland and Utrecht. On the other hand, the build-up from scratch of this province implied that use could be made of state of the art technology. At the same time a negative commuting balance implies a relatively low GDP. Both issues lead to the fact that Flevoland has the highest share of IT investment in GDP of all provinces (Appendix 2). It also explains why Flevoland has such a large contribution of IT capital deepening to productivity growth compared to other provinces, for which mainly the financial and business service sector is responsible (Appendix 1). However, this exact same industry is also largely responsible for the negative MFP-growth rate in Flevoland. Hence, the combination of advert patterns of (catch-up) growth, commuting and consequently a relatively low GDP levels in combination with high shares of IT investment may give rise to this adverse pattern of growth contributions in Flevoland.
13
Figure 5. Sources of labour productivity growth in The Netherlands at regional level, 1995-2002. 4.2.The other provinces MFP-growth For the other eleven provinces the contribution of the different sources to productivity growth is roughly comparable. MFP growth is the largest contributor to these growth rates. Only in Noord-Holland, Zuid-Holland, Noord-Brabant and in Friesland its impact is relatively small. In fact the lagging MFP-growth in these provinces is the main reason for their low productivity growth rates. This low MFP-growth is particularly due to the financial and business sectors in all three provinces, but also MFP-growth in agriculture in Noord-Brabant and MFP-growth in manufacturing in Zuid-Holland contribute substantially (see Appendix 1). Agriculture in Noord-Brabant is traditionally dominated by factory farming of pigs. The negative MFP-growth in agriculture of Noord-Brabant primarily refers to the period 1996/1997, when this province was struck by the pig fever. One industry that may account for the negative MFP-growth in manufacturing in Zuid-Holland is the oil refinery sector, which is quite dominant and is known to have a negative MFP-contribution from Inklaar et al (see also Appendix 1 where the detailed industry results from Inklaar et al. for The Netherlands between 1995-2000 are replicated in table A1). The negative MFP-growth rates for financial and business services in these three provinces clearly correspond to the negative MFP-growth rates for financial intermediation found by Inklaar et al. They also report a large positive contribution to Dutch MFP-growth of wholesale trade. In all provinces we find that the composite trade and restaurant sector has indeed relatively strong MFP-growth rates, particularly in Utrecht. Since Utrecht is the
-1.00 -0.50 0.00 0.50 1.00 1.50 2.00 2.50
Netherlands
LimburgNoord-Brabant
Zeeland
Zuid-Holland
Noord-HollandUtrecht
Gelderland
FlevolandOverijssel
Drenthe
Friesland
Groningen
Core
Periphery
Quality of labour IT capital deepening non-IT capital deepening MFP growth Reallocation of labour
14
province with the highest share of workers in wholesale trade, this corroborates Inklaar et al. as well.6 The highest positive contribution of MFP-growth to productivity growth is found in Groningen and Limburg. In Groningen this is mainly the result of the transport and communication sector and in Limburg of manufacturing. Transport and communication in Groningen is dominated by communication.7 Table A1 corroborates that national MFP-growth in communication is strong and positive. Therefore the large contribution of MFP-growth to labour productivity growth in Groningen can largely be attributed to communication. For MFP-growth in Limburg the same can be said of the chemical industry. IT capital deepening Figure 5 shows that the contribution of IT capital deepening (growth of IT capital per hour worked) has been positive in all regions. Apart from Flevoland, its contribution was particularly large in Utrecht and Noord-Holland, which was a result of financial and business services. In fact this sector made by far the highest contribution to IT capital deepening in all provinces, except for Drenthe (social/non-market services) and Zeeland (manufacturing and social/non-market services). Financial and business services are also the ones with a high contribution of IT capital deepening according to Inklaar et al. (table A1). Financial and business services are known to be intensive users of IT capital, which is an important explanation for their productivity performance (van Ark et al., 2002a; Appendix A). Another IT using industry that has a high contribution of IT capital deepening nation-wide is wholesale trade (Table A1). The contribution of composite trade and hotels is relatively high in provinces that also have a high share of wholesaling, as in Utrecht, Noord-Holland and Noord-Brabant. In these provinces it is therefore likely that IT capital deepening in wholesale trade has made a substantial contribution to productivity growth. Hence, IT capital deepening in IT using services industries has made important contributions to productivity growth in all provinces, but particularly in the central and southern ones. This corroborates the importance of IT use as carrier of productivity growth. Non-IT capital deepening Just like IT capital deepening, figure 5 also shows that non-IT capital deepening (growth of non-IT capital per hour) has generally made a positive contribution to productivity growth. The overall contribution of non-IT capital deepening is relatively low in the provinces of Friesland, Drenthe and Overijssel, despite the fact that the contribution of manufacturing to non-IT capital deepening in Drenthe and Overijssel is quite large compared to other regions. In Friesland the contribution of manufacturing is low in absolute terms for all industries. Another important sector in this respects are social and non-market services that generate a negative contribution of non-IT capital deepening to productivity growth. In most provinces the manufacturing sector is the major contributor. The highest contribution is found in Limburg, Zeeland and Groningen, who all have a high share of capital-intensive chemical industry. According to Inklaar et al. in the chemical industry non-IT capital deepening indeed makes a strong positive contribution to productivity growth (table A1). Only in Friesland and the three Randstad-provinces of Utrecht, Noord-Holland and Zuid-Holland the financial and business services sector has the largest contribution. Friesland has
6 Provincial employment data by industry of 2002 show that in Utrecht 35% of all employees in the composite trade and restaurant sector (ISIC 50-55) work in wholesale trade (ISIC 51) against 29% nation-wide (source: Statistics Netherlands, EWL) 7 Provincial employment data by industry of 2001 show that 47% of all employees in transport and communication (ISIC 60-64) in Groningen are in fact working in communications (ISIC 64) against 28% nation-wide (source: Statistics Netherlands, EWL, REJ)
15
an overrepresentation of financial services, while both financial and business services are dominant in the Randstad-provinces. Labour quality The overall contribution of labour quality to productivity growth is also positive in all provinces, but is relatively high in the Randstad-provinces of Utrecht, Noord-Holland a Zuid-Holland and relatively low in the peripheral provinces of Overijssel, Drenthe, Groningen and Limburg. In the economic core regions, all industries contribute positively to the effect of labour quality, particularly financial and business services. In fact the same is true for the peripheral regions, but to a lesser extent. Only in Overijssel financial and business services do not contribute to the effect labour quality, instead manufacturing is the dominant industry. Reallocation of hours work Equation (16) derives the reallocation of employment, which shows that the movement of labour from low-productivity-level industries to high-productivity-level industries will raise productivity even when the actual productivity growth rates in both industries is zero. In other words, this term is positive when industries in an above average labour productivity level show positive employment growth or likewise with below-average productivity levels have falling employment. Negative values show that high productivity industries and industry employment growth do not go hand in hand. Figure 5 shows that in almost all provinces this reallocation term is negative. This means that the expansion of employment in the second half of the 1990’ s in these provinces mainly took place in the less productive sectors, or that employment decline took place mainly in high productive sectors. Only in Utrecht and Flevoland the opposite occurred. Between 1995 and 2002 all provinces witnessed strong increases in employment. In many cases the effect of the employment rise in high productive jobs, like in financial institutions and knowledge intensive business services (KIS), was counteracted by an even larger rise in less productive industries, like health care, cleaning, security, the hotel business and temporary work agencies. The positive reallocation in Flevoland had to do with the catch-up growth mentioned earlier, because employment growth in every industry of this province was the highest of all. Utrecht, on the other hand, was the only province with a clear employment rise in high productive industries like communication, financial institutions and KIBS, whereas the rise in less productive industries, like health care, was very modest. 4.3. Peripheral versus core regions Figure 5 also shows the sources of labour productivity growth by a composition of provinces into an economic core and a peripheral region. The core region is identified as all provinces that roughly fall within a 100-kilometre radius of the (rectangle of) core cities of the Randstad formed by Utrecht, Amsterdam, Roterdam and The Hague. All provinces with a distance of more than 100 kilometres of these cities are labelled peripheral regions. Table 1 gives a division of provinces by core and peripheral regions. Table 1. Subdivision of provinces in core and peripheral regions
Core regions Peripheral regions Noord-Holland Groningen Zuid-Holland Friesland Zeeland Drenthe Noord-Brabant Overijssel Gelderland Limburg Flevoland
16
Figure 5 shows that labour productivity growth in the core regions has been lower than in the periphery. It also shows why this is the case. The core regions do have a slightly higher effect of labour quality and of IT and non-IT capital deepening, but by far a lower contribution of MFP-growth. This low rate of growth of MFP does correspond to what Inklaar et al (2003) report as the main source for the Dutch productivity slowdown in the second half of the 1990’ s. Table A2 of Appendix 1 shows that this low MFP-growth in the core region is a result of relatively low MFP-growth rates in agriculture, transport and communication and to a slightly lesser extent in manufacturing and financial and business services. Only MFP-growth in non-market services was larger in the core region than in the periphery. Notice that in both regions construction and the financial and business service sector had negative MFP-growth rates, which corresponds to Inklaar et al. (2003) (see also Table A1). Hence, the lagging MFP-growth rate is a phenomenon that occurred particularly in the core region, mainly Noord-Holland and Zuid-Holland and in Noord-Brabant. These three provinces account for 55% of the entire Dutch GDP, so they have a large weight in aggregate Dutch productivity growth. This also means that the slowdown in productivity growth for the period 1995-2002 can largely be attributed to these core regions, particularly due to lagging MFP-growth in agriculture, transport and communication and large negative MFP-growth in financial and business services. 4.4. Policy relevancy It may come as a surprise that particularly the core regions, which are the designated areas to which the Dutch government has assigned specific policy proposals to enhance productivity growth, are the main cause for the slowdown in Dutch productivity growth. The arguments to focus on these core regions are that they are high potential, high productivity areas with positive agglomeration effects.8 These policy plans fall within the framework of achieving a higher productivity growth rate than is currently the case (see introduction and Broersma and van Dijk, 2005). Based on the results of the current growth accounting exercise two types of measures can be thought of to get the productivity growth rate of The Netherlands back on track. One is to stimulate the lagging contribution of labour quality and IT capital deepening in the peripheral region. Labour quality growth in the peripheral regions has a low contribution in all sectors, apart from financial and business services. IT capital deepening in the periphery is lower is all sectors compared to the core region. The overall level of education of the labour force in the periphery is lower than in the core region (see Table A3 in Appendix 2). The same is true for the share of IT investments in value added (see Tables A4 and A5 in Appendix 2). Enhancing the use of IT equipment in all industries of the peripheral region may enlarge its contribution labour productivity growth. The other measure is to stimulate MFP-growth in the core region, because this seems to be the major factor that is responsible for the Dutch productivity slowdown in the latest years. The contribution of MFP-growth to labour productivity growth is negative in financial and business services and in construction. It is positive, but relatively low in agriculture, manufacturing and non-market services. The problem of trying to raise MFP-growth is the fact that it is composed of a myriad of different aspects, ranging from R&D and innovation to cultural differences and measurement errors.
8 See Dutch Ministry of Economic Affairs, “Pieken in de Delta” (in Dutch), the Traffic Ministry, “Nota Mobiliteit” (in Dutch) and the Ministry of Environmental Planning, “Nota Ruimte” (in Dutch).
17
R&D and innovation are known to be relatively high in the core regions (Broersma and Oosterhaven, 2004), so it is unlikely that they can explain their lagging MFP-growth. Another important difference between the core and periphery that has recently drawn attention is a negative agglomeration effect in the core regions with respect to productivity growth. Broersma and Oosterhaven (2004) found that doubling of job density, say, leads to a slowdown in labour productivity growth of about 0.5%. The main reason being congestion and lack of space. The core regions are known to have a substantially higher job density and also much higher traffic congestion than the periphery. The Dutch Traffic Ministry has recently estimated the direct effect of the latter on loss of output to be almost 1 billion euro. In the core regions, in which this congestion is concentrated, this implies about 6% less growth of GDP due to congestion. Given the growth rate of employment this means that productivity growth in the core regions could be 6% higher. This seems a minor influence of in fact less than 0.1 percentage point productivity growth, but this is an annual lag so it recurs every year, given the level of congestion. Second, the deteriorating effect of congestion on productivity in the future should not be thought of lightly. Next to the direct effect of loss of production, there are also indirect effects, like uncertainty about travel time that might divert companies away from settling in The Netherlands. These indirect effects might be more far reaching. Other aspects that may drive regional differences in MFP-growth are for instance work effort, local/provincial regulation, social-cultural aspects and the like. These are obviously broad measures that do affect business operations beyond the traditional production factors labour and capital by type. A major drawback is that they are not observed as such and can be only be approximated by proxy indicators. This measurement problem already pertains to the national level, so for region indicators it is even more acute. Nevertheless in the next section we will approximate these aspects by a number of different explanatory variables for regional MFP-growth. Unfortunately we cannot examine the effect of wage growth moderation on non-IT capital deepening. The main reason for this is the fact that regional wage rates in The Netherlands basically grow at the same rate each year, since there are no region-specific wage negotiations. Furthermore, our sample period is too short the examine whether the contribution of non-IT capital deepening has increased or decreased when the first and second half of the 1990’ s are compared. Nevertheless, based on Inklaar et al (2003) the effect of non-IT capital deepening on the deceleration of productivity growth in The Netherlands is far less important that MFP-growth. That means that the effect of wage growth moderation in The Netherlands did not have a large negative impact on the slowdown in productivity growth. Finally, another important aspect of this growth accounting exercise is the fact that in many regions the surge in employment of the second half of the 1990’ s took place mainly in low productivity sectors. This reallocation effect also contributed to the slowdown of productivity growth in The Netherlands in recent years. 4.5. Explaining regional MFP-growth MFP-growth is the part of productivity growth that cannot be attributed to changes in labour quality and capital assets, IT and non-IT capital. Economic theory predicts a number of variables to influence MFP-growth. Table 2 provides an overview of explanatory variables that are available at the regional level, the kind of theory the explanation stems from and the main reference on this topic. Appendix 3 shows how these indicators are constructed using regional statistical information of The Netherlands.
18
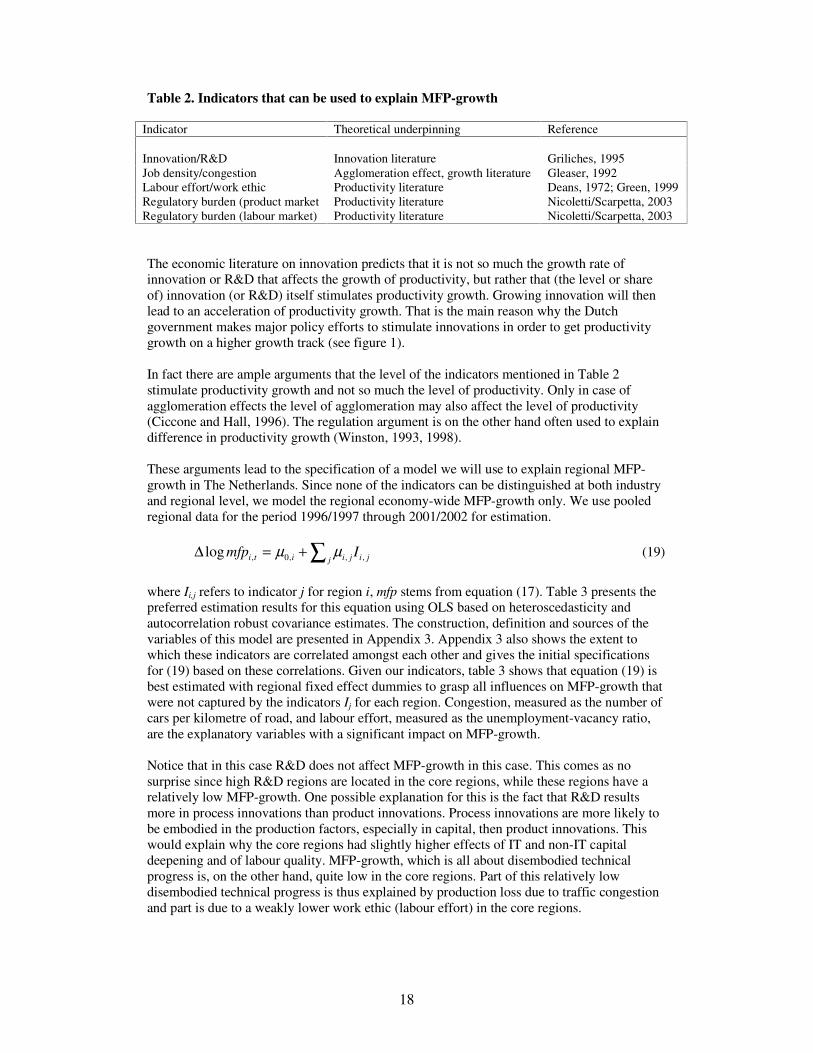
Table 2. Indicators that can be used to explain MFP-growth
Indicator Theoretical underpinning Reference Innovation/R&D Innovation literature Griliches, 1995 Job density/congestion Agglomeration effect, growth literature Gleaser, 1992 Labour effort/work ethic Productivity literature Deans, 1972; Green, 1999 Regulatory burden (product market Productivity literature Nicoletti/Scarpetta, 2003 Regulatory burden (labour market) Productivity literature Nicoletti/Scarpetta, 2003 The economic literature on innovation predicts that it is not so much the growth rate of innovation or R&D that affects the growth of productivity, but rather that (the level or share of) innovation (or R&D) itself stimulates productivity growth. Growing innovation will then lead to an acceleration of productivity growth. That is the main reason why the Dutch government makes major policy efforts to stimulate innovations in order to get productivity growth on a higher growth track (see figure 1). In fact there are ample arguments that the level of the indicators mentioned in Table 2 stimulate productivity growth and not so much the level of productivity. Only in case of agglomeration effects the level of agglomeration may also affect the level of productivity (Ciccone and Hall, 1996). The regulation argument is on the other hand often used to explain difference in productivity growth (Winston, 1993, 1998). These arguments lead to the specification of a model we will use to explain regional MFP-growth in The Netherlands. Since none of the indicators can be distinguished at both industry and regional level, we model the regional economy-wide MFP-growth only. We use pooled regional data for the period 1996/1997 through 2001/2002 for estimation. ∑+=∆
j jijiiti Imfp ,,,0,log µµ (19)
where Ii,j refers to indicator j for region i, mfp stems from equation (17). Table 3 presents the preferred estimation results for this equation using OLS based on heteroscedasticity and autocorrelation robust covariance estimates. The construction, definition and sources of the variables of this model are presented in Appendix 3. Appendix 3 also shows the extent to which these indicators are correlated amongst each other and gives the initial specifications for (19) based on these correlations. Given our indicators, table 3 shows that equation (19) is best estimated with regional fixed effect dummies to grasp all influences on MFP-growth that were not captured by the indicators Ij for each region. Congestion, measured as the number of cars per kilometre of road, and labour effort, measured as the unemployment-vacancy ratio, are the explanatory variables with a significant impact on MFP-growth. Notice that in this case R&D does not affect MFP-growth in this case. This comes as no surprise since high R&D regions are located in the core regions, while these regions have a relatively low MFP-growth. One possible explanation for this is the fact that R&D results more in process innovations than product innovations. Process innovations are more likely to be embodied in the production factors, especially in capital, then product innovations. This would explain why the core regions had slightly higher effects of IT and non-IT capital deepening and of labour quality. MFP-growth, which is all about disembodied technical progress is, on the other hand, quite low in the core regions. Part of this relatively low disembodied technical progress is thus explained by production loss due to traffic congestion and part is due to a weakly lower work ethic (labour effort) in the core regions.

19
Table 3. Estimation results of (19) with preferred explanatory indicators.
General model Simplified model All regions Core Periphery All regions Core Periphery Intercept 8.80
(3.20) 13.4
(3.59) 6.80
(1.21) 7.80
(5.88) 8.72
(6.61) 0.44
(0.97) Fixed effects Yes Yes Yes Yes Yes Yes R&D-share -0.27
(-0.52) -0.59
(-1.11) 0.08
(0.10)
Car density -0.15 (-4.75)
-0.20 (-6.04)
-0.13 (-1.27)
-0.14 (-6.08)
-0.15 (-7.49)
Labour effort 0.07 (1.36)
-0.13 (-1.32)
0.15 (1.970
0.09 (1.80)
0.22 (4.70)
Adjusted R2 0.39 0.37 0.44 0.40 0.37 0.47 Residual se 0.89 0.87 0.85 0.88 0.87 0.83 N 72 42 30 72 42 30
Note: t-values between brackets are based on the Newey-West covariances robust for heteroscedasticity and autocorrelation. 5. Concluding remarks Regional differences in labour productivity growth in The Netherlands are analysed in a regional growth accounting. Labour productivity growth appears to be higher in the peripheral regions of the North and South than in the economic core regions. The main reason for this lagging growth performance is the slow MFP-growth in these core regions. This lagging position is particularly caused by the financial and business sector. The contribution of labour quality, IT and non-IT capital deepening to productivity growth is, however, larger in the core regions that in the periphery, but cannot counteract the lower impact of MFP-growth. Although difficult to pinpoint, we found that the slow MFP-growth in the core regions is partly related to the high and rising traffic congestion and shortage of space and partly to lower work effort in these regions, compared to the periphery.
20
References Ark, Bart van, Robert Inklaar and Robert H. McGuckin, 2002a, “ ’ Changing Gear’ Productivity, ICT and Service Industries: Europe and the United States” , Working Paper No. 60, Groningen Growth and Development Centre, University of Groningen. Downloadable from http://www.ggdc.net/pub/gd60.pdf Ark, Bart van, Johanna Melka, Nanno Mulder, Marel P. Timmer and Gerard Ypma, 2002b, “ ICT Investments and Growth Accounts for the European Union 1980-2000” , GGDC Working Paper No. 56, Groningen Growth and Development Centre, University of Groningen. Broersma Lourens and Jouke van Dijk, 2003, “ Arbeidsproductiviteit in Fryslân: een analyse van het niveau en de groei van 1990-2000” , URSI-rapport No. 305, University of Groningen (in Dutch). Broersma, Lourens and Jan Oosterhaven, 2004, “ Regional Labour Productivity in The Netherlands. Diversification and Agglomeration Economies” , mimeographed, University of Groningen. Broersma, Lourens and Jouke van Dijk, 2005, “ Regional differences in labour productivity in the Netherlands” , forthcoming in Journal of Economic & Social Geography. Brynjolfsson Erik and Chris Kemerer, 1996, “ Network Externalities in Microcomputer Software: An Econometric Analysis of the Spreadsheet Market” , Management Science, 42 (12), 1627-2647. Brynjolfsson, Erik and Hitt, Lorin, 2000, “ Beyond Computation: Information Technology, Organizational Transformation and Business Performance” , Journal of Economic Perspectives, 14 (4), 23-48. Ciccone, Antonio and Robert E. Hall, 1996, “ Productivity and Density of Economic Activity” , American Economic Review, 86/1, 54-70. Daveri, Francesco, 2004, “ Why is there a Productivity Problem in the EU?” , CEPS Working Document No. 205, Centre for European Policy Studies, Brussels. Deans, R.C., 1972, “ Productivity and the New Work Ethic” , in W.B. Dickinson (ed), Editorial research reports on the American work ethic, Washington DCF: Congressional Quarterly. Diewert, Erwin W. and Alice O. Nakamura, 2005, “ A Survey of Empirical Methods of Productivity Measurement and Analysis” , in James J. Heckman and Edward E. Leamer (eds), Handbook of Econometrics, Volume 6 (forthcoming), Amsterdam: Elseviers Publishers Fraumeni, Barbara M., 1997, “ The Measurement of Depreciation in the US National Income and Product Accounts” , Survey of Current Business, 77 (7), 7-23. Glaeser, Edward L., Hedi D. Kallal, Jose A. Scheinkman and Andrei Shleifer, 1992, “ Growth in Cities” , Journal of Political Economy, 100 (6), 1126-1152. Green, Francis, 1999, “ It’ s Been A Hard Day’ s Night: The Concentration and Intensification of Work in Late 20th Century Britain” , Studies in Economics, No. 99/13, University of Kent at Canterbury.
21
Griliches, Zvi, 1995, “ R&D and Productivity: Econometric Results and Measurement Issues” , in: Paul Stoneman (ed), Handbook of the Economics of Innovation and Technological Change, Malden MA: Blackwell. Hulten, Charles R., 2001, “ Total Factor Productivity: A Short Biography” , in Charles R. Hulten, Edwin R. Dean and Michael J. Harper (eds), New Developments in Productivity Analysis, Chicago: University of Chicago Press. Inklaar, Robert, Mary O'Mahony and Marcel Timmer, “ ICT and Europe's Productivity Performance, Industry-level Growth Account Comparisons with the United States” , GGDC Working Paper No. 68, Groningen Growth and Development Centre, University of Groningen. Downloadable from http://www.ggdc.net/pub/gd68.pdf Jorgenson Dale W., 1995, Productivity Volume 1 and 2, Cambridge MA: MIT Press. Jorgenson Dale W. and Kevin J. Stiroh, 2000, “ Raising the Speed Limit: U.S. Economic Growth and the Information Age” , Brookings Paper on Economic Activity, 91 (1), 125-211. Jorgenson Dale W., Kevin J. Stiroh and Mun Ho, 2002, “ Information Technology, Education and the Sources of Economic Growth across US Industries” , downloadable from http://post.economics.harvard.edu/faculty/jorgenson/papers/jhscriw.pdf McGuckin, Robert H. & Bart van Ark, 2004, “ Performance 2004: Productivity, Employment and Income in the World’ s Economies” , The Conference Board, Report R-1328-03-RR, New York. Meinen, Gerhard, Piet Verbiest and Peter-Paul de Wolf, 1998, “ Perpetual Inventory Method: Service lives, Discard patterns and Depreciation methods” , Statistics Netherlands, Department of National Accounts. Nicoletti, Guiseppe and Stefano Scarpetta, 2003, “ Regulation, Productivity and Growth: OECD Evidence” , Economic Policy, 18 (36), 9-72. Nordhaus, William D., 2002, “ Productivity Growth and the New Economy” , Brookings Paper on Economic Activity, 2, 211-265. OECD, 2001, “ Measuring Productivity: Measurement of Aggregate and Industry-Level Productivity Growth” , OECD Manual, Paris: OECD, downloadable from www.oecd.org. Oliner Steven D. and Daniel E. Sichel, 2000, The Resurgence of Growth in the late 1990s: Is Information Technology the Story?” , Journal of Economic Perspectives, 14 (4), 3-22. Oliner Steven D. and Daniel E. Sichel, 2002, “ Information Technology and Productivity: Where Are We Now and Where Are We Going?” , downloadable from http://www.federalreserve.gov/feds/pubs/2002/200229200229pap.pfd Solow, Robert M., 1957, “ Technical Change and the Aggregate Production Function” , Review of Economics and Statistics, 39, 312-320. Stiroh, Kevin J. 2002, “ Information Technology and the US Productivity Revival: What Do the Industry Data Say?” , American Economic Review, 92 (5), 1559-1576. Timmer, Marcel, Gerard Ypma and Bart van Ark, 2003, “ IT in the European Union: Driving Productivity Divergence?” , GGDC Working Paper No. 67, Groningen Growth and

22
Development Centre, University of Groningen. Downloadable from http://www.ggdc.net/pub/gd67.pdf Winston, Clifford. 1993, “ Economic Deregulation: Days of Reckoning for Microeconomists” , Journal of Economic Literature, 31, 1263-1289. Winston, Clifford. 1998, “ US Industry Adjustment to Deregulation” , Journal of Economic Perspectives, 12 (3), 89-110.

23
Annexes All Annexes referred to in the text are omitted from this paper due to ERSA requirements concerning number of pages, but are available upon request from the authors.