Regen test paper open access 2016-12-12 - CORE
27
1 Evaluation of a Fuel-Efficient Urban Delivery Vehicle W.J.B. Midgley and D. Cebon Submitted to Proc. IMechE, Part D, Journal of Automotive Engineering, February, 2016 Accepted for publication, December, 2016 1 Abstract A novel, fuel-efficient, articulated urban delivery vehicle is developed and tested. The vehicle has a path-following steering system on the semitrailer which improves its manoeuvrability in narrow city streets. This enables the payload to be increased from 39.4m 3 of freight on a conventional rigid delivery vehicle to 84.2m 3 on this articulated counterpart: leading directly to up to 33% fuel saving per unit of freight task. The vehicle is also equipped with a hydraulic regenerative braking system which stores energy in hydraulic accumulators during braking events and releases this energy back to accelerate the vehicle in subsequent motion. The design of this system and the field testing programme are described. The experimental tests are used to determine hydraulic losses and to validate a mathematical model of the vehicle and regenerative braking system. Finally, the validated mathematical model is used to perform a parametric study for the vehicle operating on various standard driving cycles. It is found that operating the regenerative braking system with engine stop-start and optimized accumulator pre-charge pressures can reduce fuel consumption by 9 to 18% compared with the baseline vehicle, depending on the drive cycle. When combined with the performance improvements due to the trailer steering system and additional payload, this gives an overall reduction in fuel consumption of 35-42%. 2 Introduction The single most effective intervention for reducing the fuel consumption of a heavy goods vehicle is to increase its carrying capacity [1]. This reduces the number of vehicles needed for a given freight task. Provided the vehicle is fully loaded, it can lead to substantial fuel savings. For example, Odhams et al [1] showed that carrying freight on 44t articulated vehicles instead of 20t rigid trucks reduces the fuel consumption per tonne.km by approximately 30%. However, geometric constraints, imposed by narrow streets in UK and European cities can limit the use of full size tractor-semitrailer vehicles unless shortened trailers are used (reducing the benefit) or trailer steering is used to improve manoeuvrability. Consequently, significant effort has gone into developing computer-controlled, path-following trailer steering systems with accurate tracking fidelity [2]. Another way to significantly reduce the fuel usage of heavy goods vehicles (HGVs) in urban environments, is regenerative braking [1]. Previous work has shown that hydraulic regenerative braking systems are smaller and lighter than electrical hybrids for these vehicles [3]. Some commercial manufacturers such as Parker Hydraulics [4, 5] and Eaton Hydraulics [6-8] have built hydraulic hybrids for refuse and urban delivery applications. These technologies are installed on rigid vehicles and integrate directly into the drivetrain. Artemis Intelligent Power have a solution for urban buses. The manufacturer claims that it reduces fuel consumption by up to 25%, where the hybrid system is installed in parallel with the engine [9]. brought to you by CORE View metadata, citation and similar papers at core.ac.uk provided by Apollo
-
Upload
khangminh22 -
Category
Documents
-
view
0 -
download
0
Transcript of Regen test paper open access 2016-12-12 - CORE
1
Evaluation of a Fuel-Efficient Urban Delivery Vehicle
W.J.B. Midgley and D. Cebon
Submitted to Proc. IMechE, Part D, Journal of Automotive Engineering, February, 2016
Accepted for publication, December, 2016
1 Abstract
A novel, fuel-efficient, articulated urban delivery vehicle is developed and tested. The
vehicle has a path-following steering system on the semitrailer which improves its
manoeuvrability in narrow city streets. This enables the payload to be increased from 39.4m3
of freight on a conventional rigid delivery vehicle to 84.2m3 on this articulated counterpart:
leading directly to up to 33% fuel saving per unit of freight task.
The vehicle is also equipped with a hydraulic regenerative braking system which stores
energy in hydraulic accumulators during braking events and releases this energy back to
accelerate the vehicle in subsequent motion. The design of this system and the field testing
programme are described. The experimental tests are used to determine hydraulic losses and
to validate a mathematical model of the vehicle and regenerative braking system.
Finally, the validated mathematical model is used to perform a parametric study for the
vehicle operating on various standard driving cycles. It is found that operating the
regenerative braking system with engine stop-start and optimized accumulator pre-charge
pressures can reduce fuel consumption by 9 to 18% compared with the baseline vehicle,
depending on the drive cycle. When combined with the performance improvements due to
the trailer steering system and additional payload, this gives an overall reduction in fuel
consumption of 35-42%.
2 Introduction
The single most effective intervention for reducing the fuel consumption of a heavy goods
vehicle is to increase its carrying capacity [1]. This reduces the number of vehicles needed for
a given freight task. Provided the vehicle is fully loaded, it can lead to substantial fuel savings.
For example, Odhams et al [1] showed that carrying freight on 44t articulated vehicles instead
of 20t rigid trucks reduces the fuel consumption per tonne.km by approximately 30%.
However, geometric constraints, imposed by narrow streets in UK and European cities can
limit the use of full size tractor-semitrailer vehicles unless shortened trailers are used
(reducing the benefit) or trailer steering is used to improve manoeuvrability. Consequently,
significant effort has gone into developing computer-controlled, path-following trailer
steering systems with accurate tracking fidelity [2].
Another way to significantly reduce the fuel usage of heavy goods vehicles (HGVs) in
urban environments, is regenerative braking [1]. Previous work has shown that hydraulic
regenerative braking systems are smaller and lighter than electrical hybrids for these vehicles
[3]. Some commercial manufacturers such as Parker Hydraulics [4, 5] and Eaton Hydraulics
[6-8] have built hydraulic hybrids for refuse and urban delivery applications. These
technologies are installed on rigid vehicles and integrate directly into the drivetrain. Artemis
Intelligent Power have a solution for urban buses. The manufacturer claims that it reduces
fuel consumption by up to 25%, where the hybrid system is installed in parallel with the
engine [9].
brought to you by COREView metadata, citation and similar papers at core.ac.uk
provided by Apollo
2
Previous work has shown that a parallel hydraulic regenerative braking system can reduce
the fuel consumption of an urban HGV by 21% on idealised stop-start cycles and up to 17%
on legislative drive cycles [10]. A further advantage of such a system is that the regenerative
braking system can be used to ‘launch’ the vehicle from rest, enabling the engine to be
switched off during idle periods and switched back on during the early part of the acceleration
phase. This paper builds on the previous work to specify such a hydraulic regenerative
braking system [10, 11], and to design and build a prototype for a semtrailer with integrated
steering axles. It uses the results of tests on this vehicle to inform changes to the vehicle model
developed in [10-12]. This validated model is then used to determine the benefits of the system
‘as-built’ over a range of drive cycles, as well as the benefits of a realistic ‘commercial system’.
It is assumed that the provision of trailer steering enables use of a tractor-semtrailer
configuration instead of a rigid vehicle for this freight task. The trailer steering system is
described elsewhere [2], and is not investigated here.
3 System Modelling and Specification
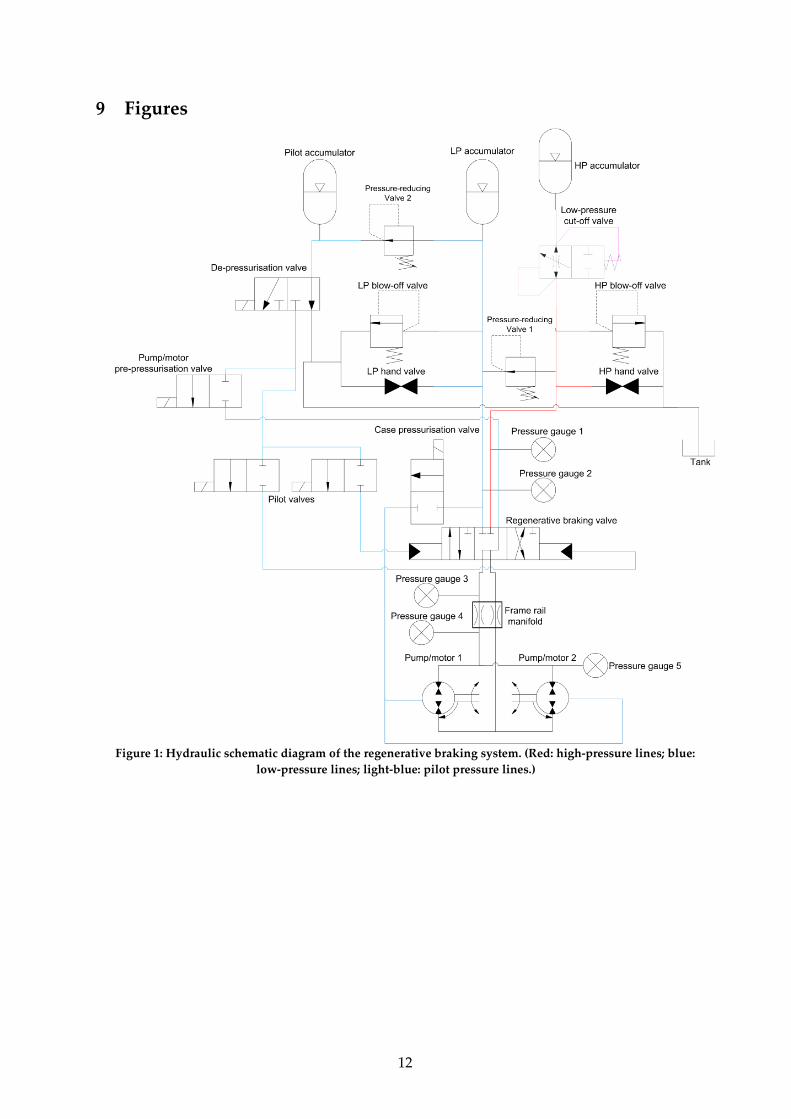
The details of the system model are given in [10] and summarised here. A pair of hydraulic
accumulators (one at high pressure (HP) and one at low pressure (LP)) are connected via a
valve block to in-wheel fixed-displacement pump-motors (PMs), as shown in the high-level
outline of the hydraulic circuit in Figure 1. (The full schematic is available in [13]). When the
vehicle is accelerating, the fluid from the HP accumulator is passed through the PMs to the
LP accumulator providing a positive (accelerating) torque. When decelerating, the opposite
happens: a braking torque is applied by the PMs, and fluid is forced from the LP to the HP
accumulator.
For an articulated vehicle such as that modelled in this and previous papers, the
regenerative braking system is intended for the trailer axles, with one PM per wheel. The fuel
saving could possibly be increased if a hybrid tractor unit is used as well, e.g. [14]. If only the
trailers are used for regenerative braking, there is insufficient tyre friction force available to
recover all of the energy available [11].
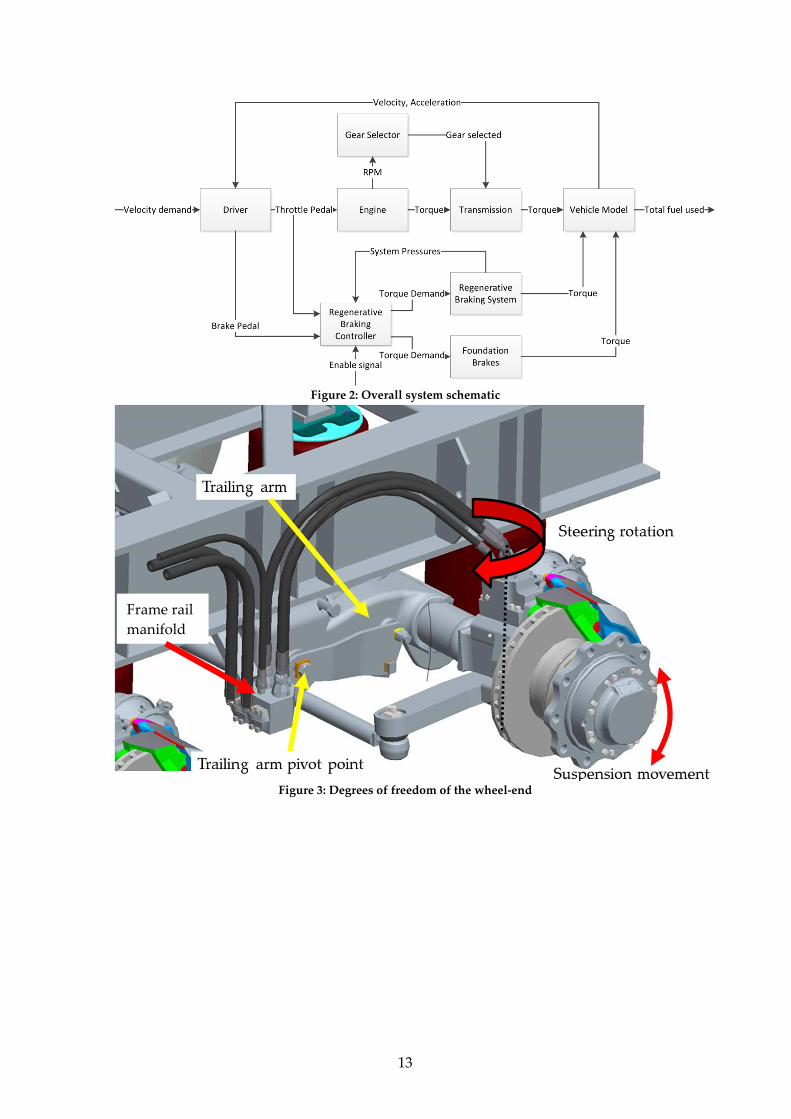
An overview of the computer model of the hybrid vehicle system, developed in [11, 12] is
given in Figure 2. A driver model is used to generate a throttle demand, which is then passed
to the engine and the regenerative braking controller. The regenerative braking controller
makes decisions on whether to use the regenerative braking system based on the current state
of the accumulators and the demanded torque, using a so-called ‘greedy’ strategy, where
energy is used and captured at the earliest opportunity. Previous studies give more detail on
the vehicle model and its validation [1, 3, 10-12], and the reasoning behind the choice of a
greedy controller over a more sophisticated one [15].
4 Hardware System
The final specification from [10] was used as a starting point for the construction of the
hydraulic regenerative braking system. Relevant values for the system properties are given in
Table 1. Design constraints limited the selection of components and so the specification was
changed between the original design in [10] and that of the final built system. The final
specifications are also given in Table 1, and the reasons for any differences are discussed
below. An existing experimental ‘B-link’ trailer with actively-steered axles [16] was adapted
to incorporate the braking hardware.
3
4.1 Mechanical
In order to ensure that the vehicle can navigate urban areas, the trailer requires steering
such as that introduced by Jujnovich et al. [2, 16, 17]. Given this constraint, in-wheel PMs were
chosen, to remove the need for any drivetrain to be added to the trailer. Fixed displacement
PMs were used because they are small, light, robust and fit easily into the wheel ends, enabling
the axles to steer.
However, this choice placed further constraints on the design of the system due to the
required articulation between the wheels and the trailer frame. The two main degrees of
freedom are shown in Figure 3: rotation between the wheel and the axle to allow steering of
the wheels through roughly ±25°; and rotation of the axle about the trailing arm pivot point,
which is produced by movement in the vertical direction to accommodate suspension travel.
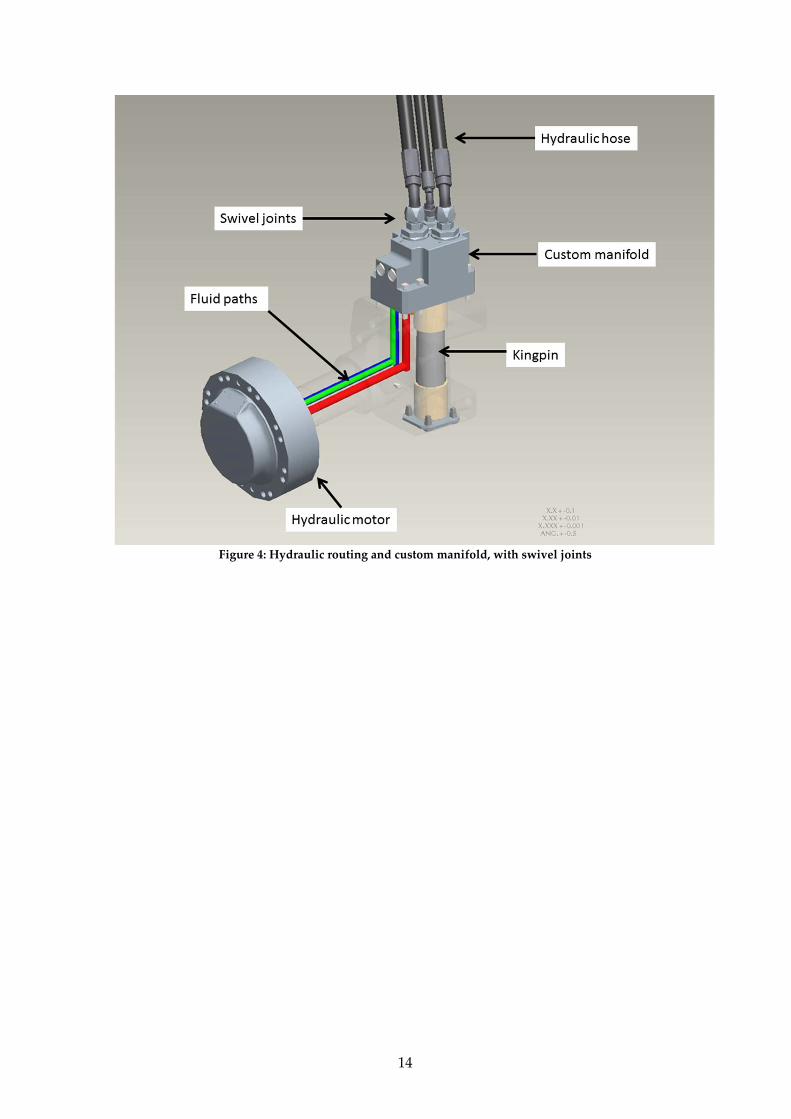
These constraints create challenges in routing the fluid to the PMs, which were mounted
on the wheel ends. Consequently, flexible hose was used in conjunction with swivel joints to
transport the fluid from the trailer frame to a custom-designed manifold located above the
steering kingpin (see Figures 3 and 4). Figure 4 also shows the custom-designed steering
knuckle-stub-axle unit, which includes fluid paths and a drain line for the PMs. In order to
attach the PMs to the wheels, new wheel hubs had to be designed and manufactured, and the
existing brake rotors modified.
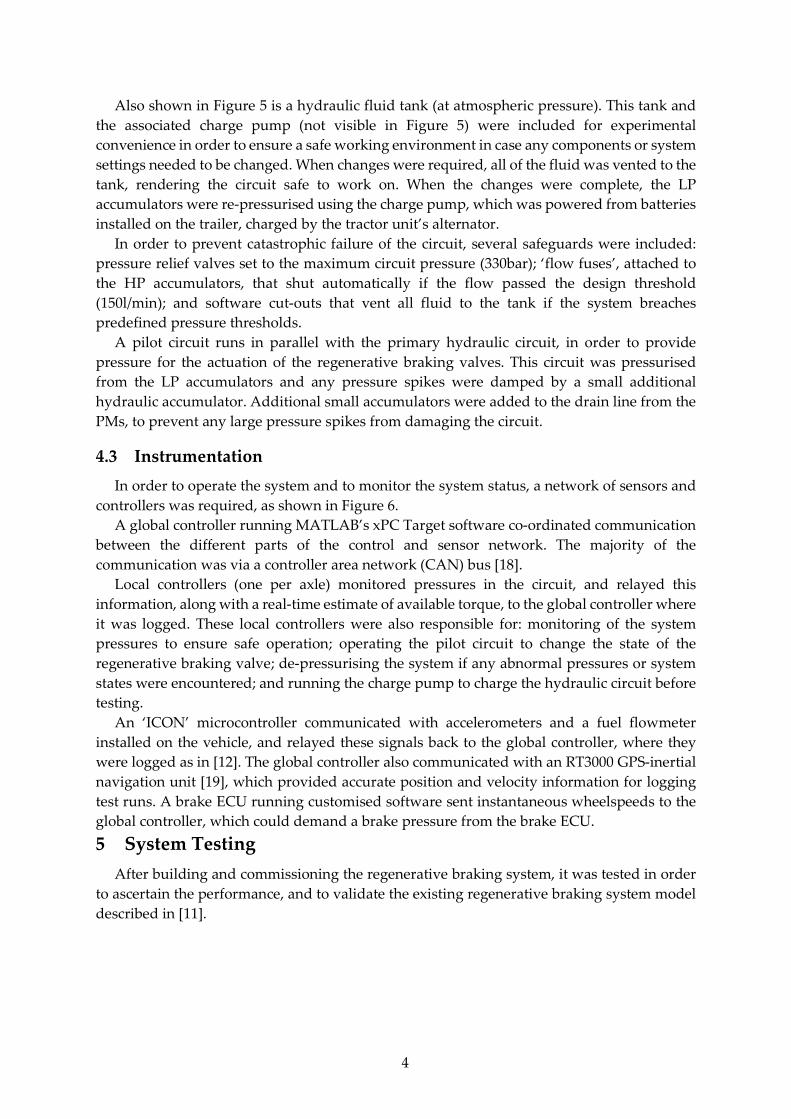
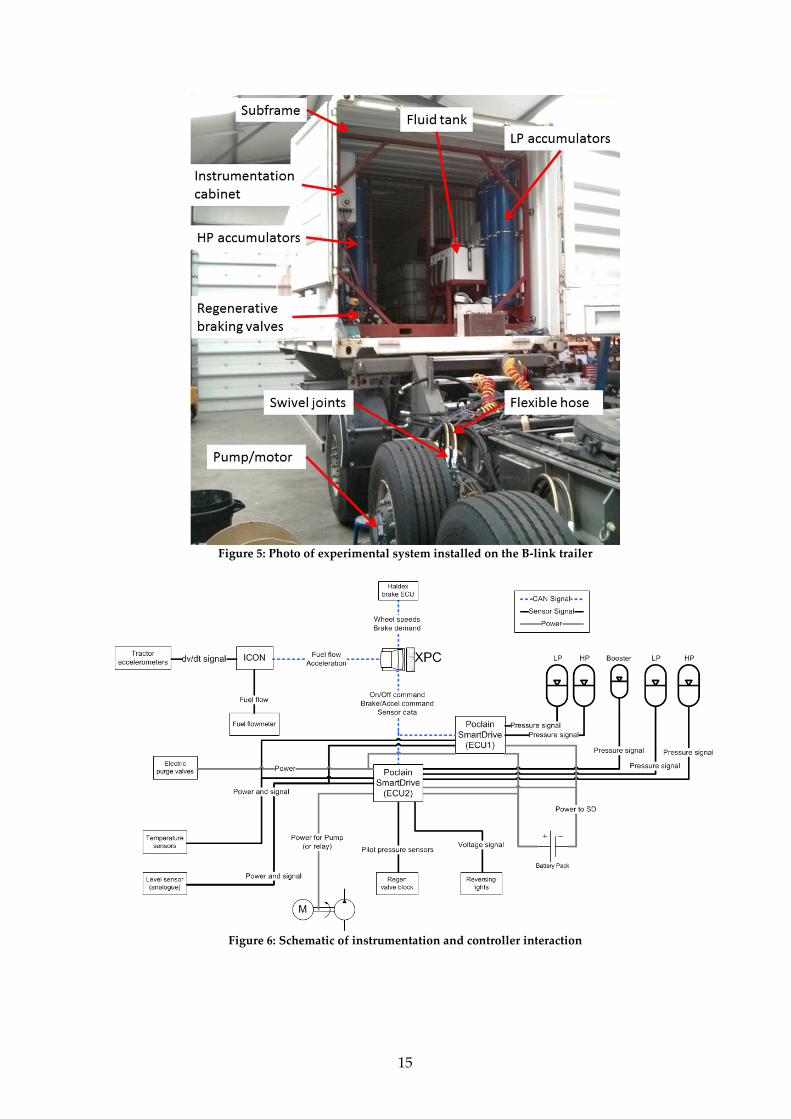
The accumulators and associated valves and instrumentation were installed in a frame
located in the rear of the trailer, to allow easy access during testing. A photograph of the
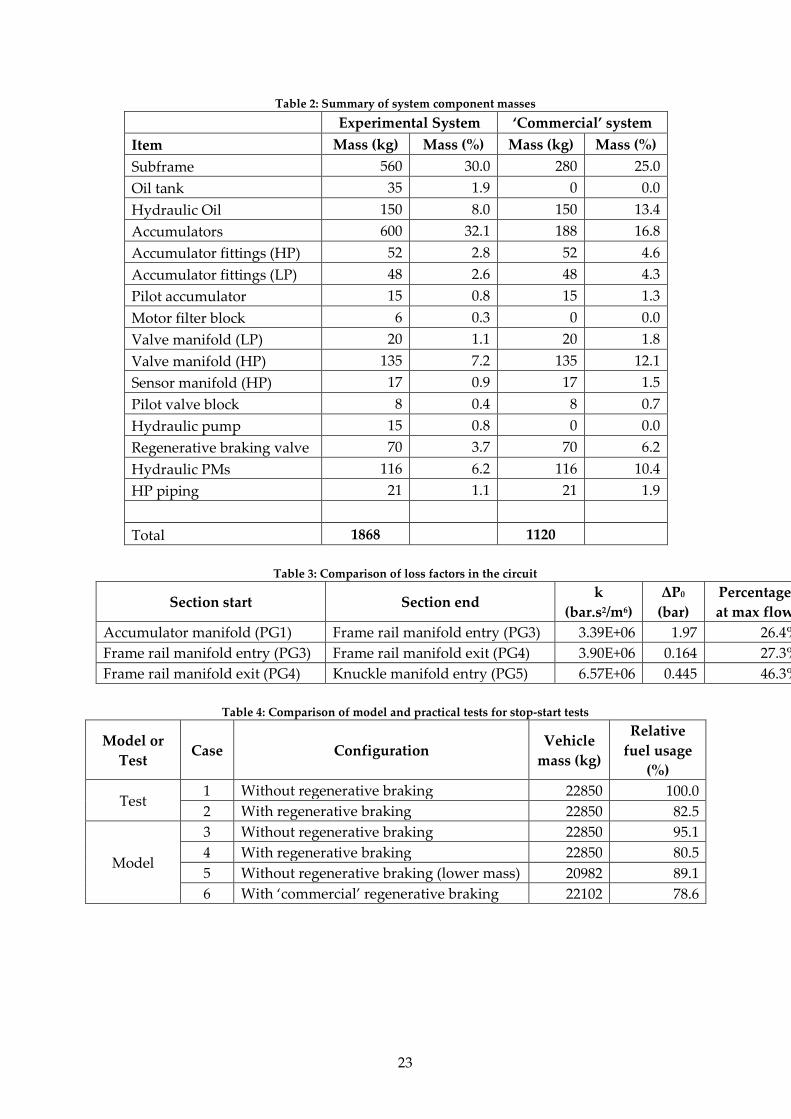
finished system is given in Figure 5. The masses for the components added to the vehicle are
given in Table 2. It is envisaged that this equipment would be installed under the trailer in a
commercial system, so as not to impact on the volumetric capacity of the trailer. It would
therefore not require the heavy frame which was built for experimental convenience.
4.2 Hydraulics
The original specification given in [10] assumed carbon-fibre accumulators from a
particular supplier. However, when this regenerative braking system was built, carbon-fibre
accumulators were temporarily unavailable. Instead, steel accumulators from a different
supplier were used. A simplified schematic of the system for one axle is given in Figure 1.
Two high-pressure accumulators and three low-pressure accumulators were used so as to
minimise the effects of heat dissipation from the compressed gas (though these are
represented as single accumulators in Figure 1 for simplicity). After consultation with the
manufacturers of the in-wheel PMs, the precharge of the LP accumulators was changed from
12.5bar to 27bar, in order to prevent the PMs from cavitating. In addition, the precharge of the
HP accumulators was limited to 97bar, due to operational constraints.
The high- and low-pressure accumulators were linked to the wheels through custom-made
manifolds, which were then linked to custom-made, low-loss, three-position hydraulic valves
(the ‘Regenerative braking valve’ in Figure 1). The valves were linked to manifolds near the
trailing arm (see Figure 3) by large-bore hydraulic hose. These ‘Frame rail manifolds’ are
shown schematically in Figure 3, and are represented as a fluid restriction in Figure 1, due to
the pressure drop encountered when fluid passes through them. From these manifolds, swivel
joints and smaller-bore ultra-flexible hydraulic hose were used to deliver the fluid to the
manifold which sits atop the steering knuckle. This manifold was then connected to the stub-
axle as mentioned above, to allow the fluid to pass through to the PMs. The PMs were the
same specification as given in [10].
4
Also shown in Figure 5 is a hydraulic fluid tank (at atmospheric pressure). This tank and
the associated charge pump (not visible in Figure 5) were included for experimental
convenience in order to ensure a safe working environment in case any components or system
settings needed to be changed. When changes were required, all of the fluid was vented to the
tank, rendering the circuit safe to work on. When the changes were complete, the LP
accumulators were re-pressurised using the charge pump, which was powered from batteries
installed on the trailer, charged by the tractor unit’s alternator.
In order to prevent catastrophic failure of the circuit, several safeguards were included:
pressure relief valves set to the maximum circuit pressure (330bar); ‘flow fuses’, attached to
the HP accumulators, that shut automatically if the flow passed the design threshold
(150l/min); and software cut-outs that vent all fluid to the tank if the system breaches
predefined pressure thresholds.
A pilot circuit runs in parallel with the primary hydraulic circuit, in order to provide
pressure for the actuation of the regenerative braking valves. This circuit was pressurised
from the LP accumulators and any pressure spikes were damped by a small additional
hydraulic accumulator. Additional small accumulators were added to the drain line from the
PMs, to prevent any large pressure spikes from damaging the circuit.
4.3 Instrumentation
In order to operate the system and to monitor the system status, a network of sensors and
controllers was required, as shown in Figure 6.
A global controller running MATLAB’s xPC Target software co-ordinated communication
between the different parts of the control and sensor network. The majority of the
communication was via a controller area network (CAN) bus [18].
Local controllers (one per axle) monitored pressures in the circuit, and relayed this
information, along with a real-time estimate of available torque, to the global controller where
it was logged. These local controllers were also responsible for: monitoring of the system
pressures to ensure safe operation; operating the pilot circuit to change the state of the
regenerative braking valve; de-pressurising the system if any abnormal pressures or system
states were encountered; and running the charge pump to charge the hydraulic circuit before
testing.
An ‘ICON’ microcontroller communicated with accelerometers and a fuel flowmeter
installed on the vehicle, and relayed these signals back to the global controller, where they
were logged as in [12]. The global controller also communicated with an RT3000 GPS-inertial
navigation unit [19], which provided accurate position and velocity information for logging
test runs. A brake ECU running customised software sent instantaneous wheelspeeds to the
global controller, which could demand a brake pressure from the brake ECU.
5 System Testing
After building and commissioning the regenerative braking system, it was tested in order
to ascertain the performance, and to validate the existing regenerative braking system model
described in [11].
5
5.1 Test Location
The tests were undertaken on the runway at Bourn Airfield, near Cambridge, UK. The tests
were always run on the same part of the airfield, and run in both the south-east and north-
west directions, to account for any variability in terrain and wind conditions.
5.2 Test Cycles
Given the limited area available for testing, only simple straight-line stop-start tests were
possible. Two main types of test were undertaken: one set for characterising the flow-induced
losses in the hydraulic system; and one for validation of the system model.
5.2.1 Stop-start to Characterise Losses
A significant parameter in the regenerative braking system model is the magnitude of the
hydraulic losses in the system. Previous modelling studies on this system assumed loss
coefficients based on experience and reference values for lengths of hydraulic hose and hose
fittings. Given the novel and intricate layout of the fluid paths in this system (see Figure 4 for
an example), it was important to characterise these losses to enhance the accuracy of the model.
The overall pressure losses (��) from end-to-end along a fluid path were modelled using:
(1)
Where k is the loss coefficient, Q is the instantaneous flowrate and ∆�� is the ‘crack pressure’
required to produce flow in the system.
For these tests, the wheel speed (�) measured by the ABS controller was used to determine
the instantaneous flowrate in the system:
mQ d ω= (2)
where �� is the known fixed displacement of the in-wheel PM. Additional pressure
transducers were added to the circuit in order to measure the end-to-end pressure drop and
are labelled as Pressure gauges (PG) 1-5 in Figure 1. Several stop-start tests were conducted,
ensuring adequate coverage of the operational flowrates of the system in both acceleration
and deceleration mode. For these tests, the difference in pressure between the two pressure
gauges was calculated at each timestep over the cycle.
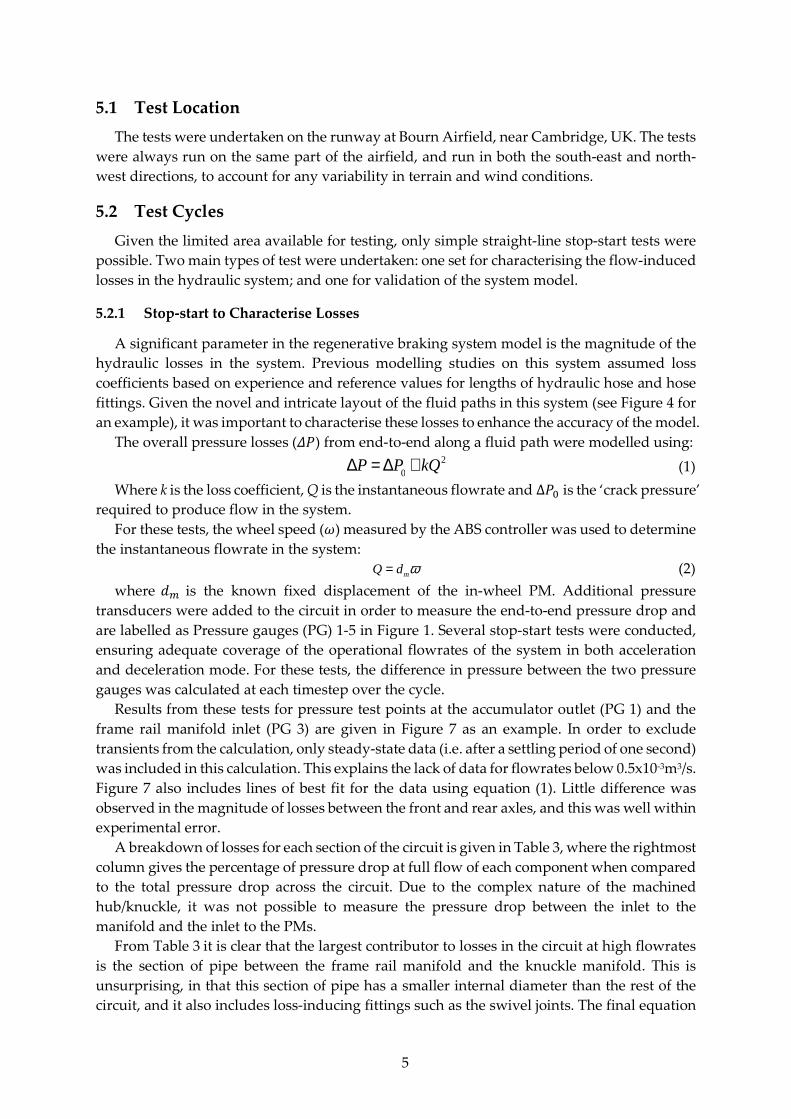
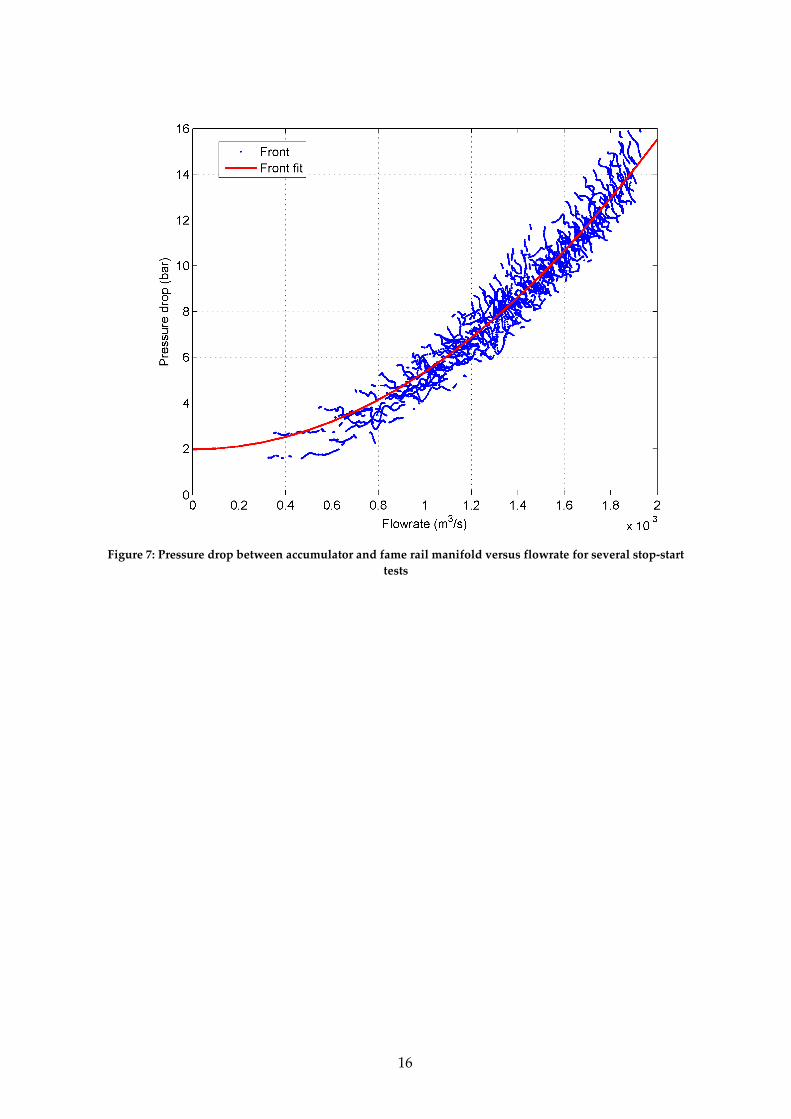
Results from these tests for pressure test points at the accumulator outlet (PG 1) and the
frame rail manifold inlet (PG 3) are given in Figure 7 as an example. In order to exclude
transients from the calculation, only steady-state data (i.e. after a settling period of one second)
was included in this calculation. This explains the lack of data for flowrates below 0.5x10⁻³m3/s.
Figure 7 also includes lines of best fit for the data using equation (1). Little difference was
observed in the magnitude of losses between the front and rear axles, and this was well within
experimental error.
A breakdown of losses for each section of the circuit is given in Table 3, where the rightmost
column gives the percentage of pressure drop at full flow of each component when compared
to the total pressure drop across the circuit. Due to the complex nature of the machined
hub/knuckle, it was not possible to measure the pressure drop between the inlet to the
manifold and the inlet to the PMs.
From Table 3 it is clear that the largest contributor to losses in the circuit at high flowrates
is the section of pipe between the frame rail manifold and the knuckle manifold. This is
unsurprising, in that this section of pipe has a smaller internal diameter than the rest of the
circuit, and it also includes loss-inducing fittings such as the swivel joints. The final equation
∆P = ∆P0
+ kQ2

6
used in the model to characterise the overall pressure loss for both the front and rear axles
was:
6 213.9 10 2.6P Q∆ = × + (3)
where �� is in bar and Q is the flowrate in m3/s.
5.2.2 Stop-start cycle
In order to prove the effectiveness of the system, and provide test results against which the
model could be validated, a series of stop-start tests were undertaken. The cycle used in [3]
was a stop-start from 13.4m/s (30mph) at -/+0.15g (1.47m/s), intended to emulate a typical
stop-start cycle in an urban environment. However, the PMs used on the vehicle have a
maximum operational speed of 11.1m/s (40km/h), above which they must be disengaged
hydraulically. In addition, during testing it was found that the maximum safe deceleration
was 0.9m/s2, above which experimental equipment in the truck cab became unstable. A further
constraint on the test cycle was the limited runway length available for testing.
Taking these restrictions into consideration, the test cycle used in these stop-start tests was:
1. Accelerate to 11.1m/s (40km/h)
2. Start the logging equipment
3. Decelerate to a standstill over 12 seconds under the action of the regenerative braking
system and the foundation friction brakes
4. Remain stationary for 5 seconds
5. Accelerate to 11.1m/s (40km/h) over 17 seconds using a combination of the
regenerative braking system and the truck engine using 2nd and 4th gears
As fully-automated acceleration and deceleration control of the system was not possible,
the regenerative braking was operated manually: when the deceleration section of the test was
started the system was switched into braking mode until it reached maximum pressure.
During the acceleration section the system was switched into acceleration mode until the
minimum pressure was reached in the HP accumulators. The driver acted as the velocity
controller, to try and match the vehicle’s deceleration profile to the desired one. A minimal
number of gear changes were used because these were found to be a source of large variation
between tests. The tests were run in both directions on the runway, in order to account for any
variations in surface profile or elevation.
6 Testing Results
This section focuses on one particular set of test runs, in order to show the differences
between the tests with and without regenerative braking.
6.1 Stop-Start Cycles
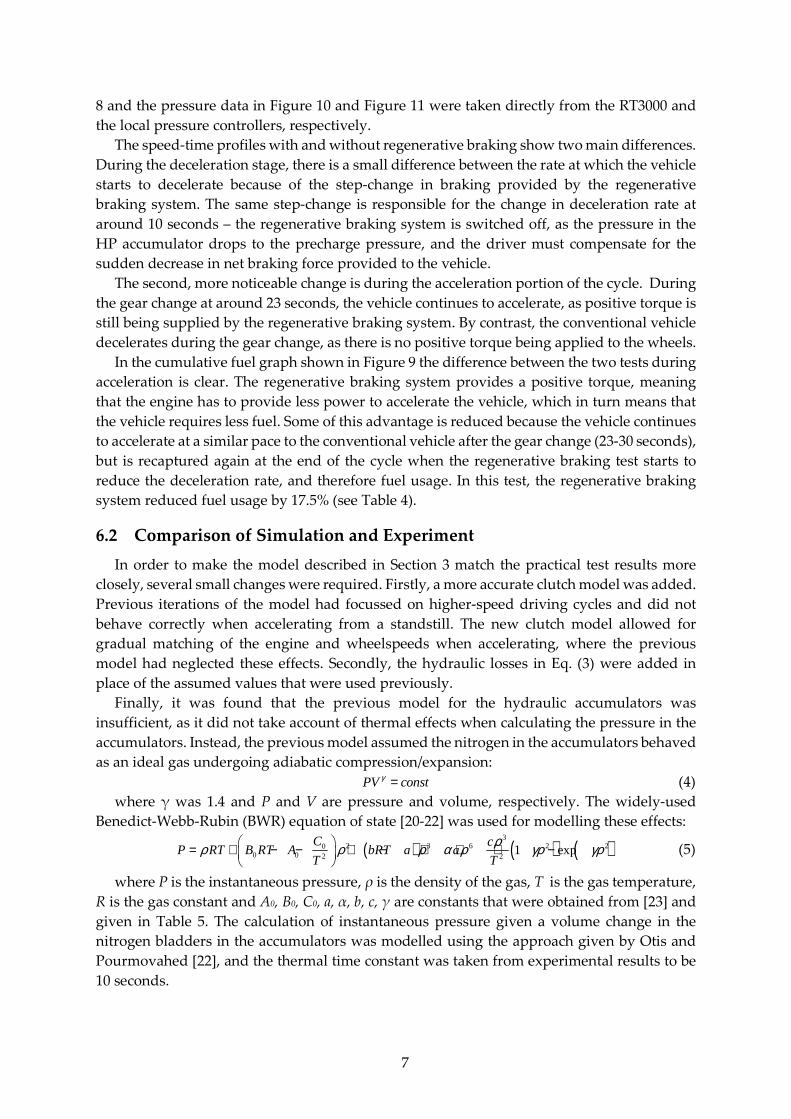
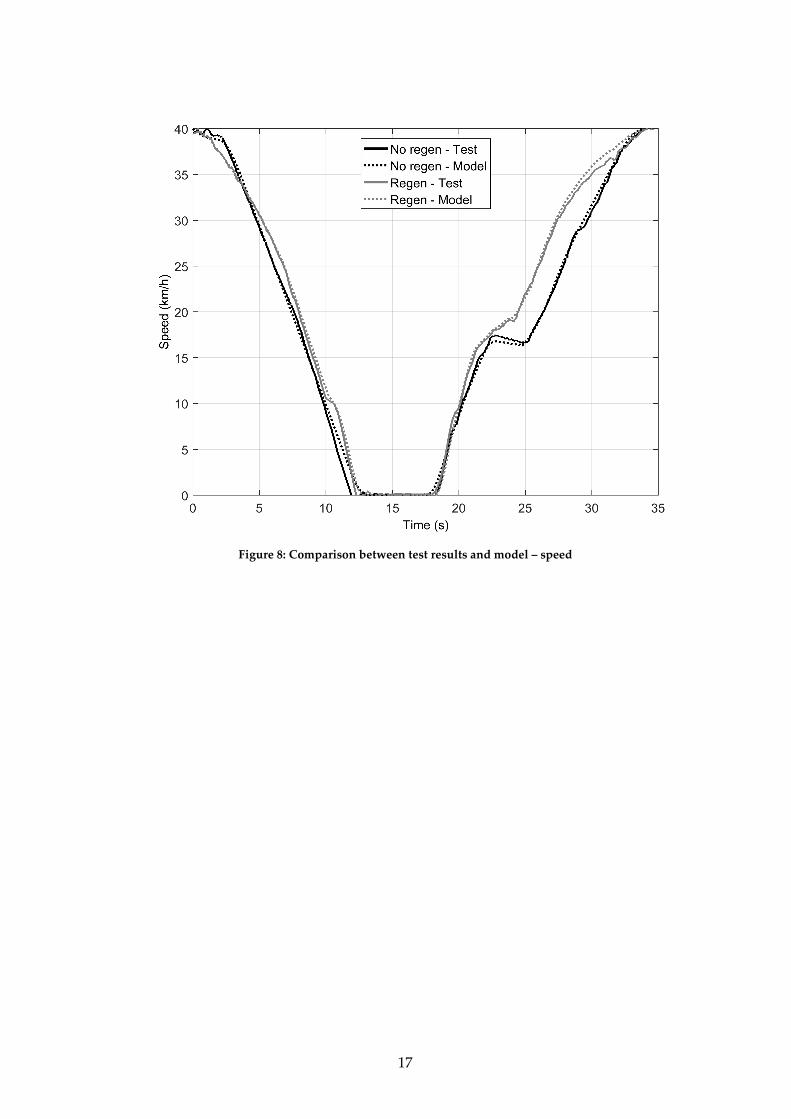
The speed-time trace of a stop-start cycle showing the results from comparable test runs
(i.e. in the same direction and in similar conditions) with and without regenerative braking is
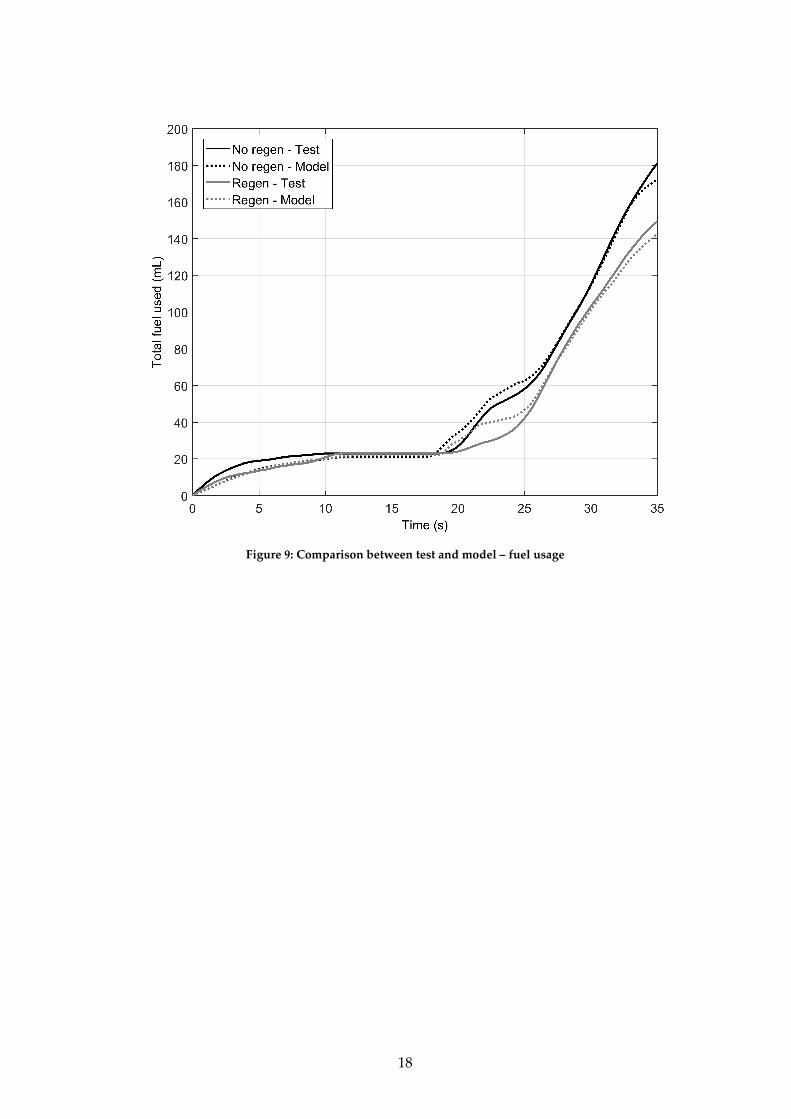
shown in Figure 8, and the accompanying cumulative fuel used is shown in Figure 9.
The fuel usage data presented in Figure 9 has been taken from the fuel flowmeter as shown
in Figure 2. This device produces pulses for each set volume of fluid that is injected into the
engine. These pulses are then window averaged in order to obtain a flowrate versus time plot
as shown in Figure 9. More details on this process are given in [12]. The speed data in Figure
7
8 and the pressure data in Figure 10 and Figure 11 were taken directly from the RT3000 and
the local pressure controllers, respectively.
The speed-time profiles with and without regenerative braking show two main differences.
During the deceleration stage, there is a small difference between the rate at which the vehicle
starts to decelerate because of the step-change in braking provided by the regenerative
braking system. The same step-change is responsible for the change in deceleration rate at
around 10 seconds – the regenerative braking system is switched off, as the pressure in the
HP accumulator drops to the precharge pressure, and the driver must compensate for the
sudden decrease in net braking force provided to the vehicle.
The second, more noticeable change is during the acceleration portion of the cycle. During
the gear change at around 23 seconds, the vehicle continues to accelerate, as positive torque is
still being supplied by the regenerative braking system. By contrast, the conventional vehicle
decelerates during the gear change, as there is no positive torque being applied to the wheels.
In the cumulative fuel graph shown in Figure 9 the difference between the two tests during
acceleration is clear. The regenerative braking system provides a positive torque, meaning
that the engine has to provide less power to accelerate the vehicle, which in turn means that
the vehicle requires less fuel. Some of this advantage is reduced because the vehicle continues
to accelerate at a similar pace to the conventional vehicle after the gear change (23-30 seconds),
but is recaptured again at the end of the cycle when the regenerative braking test starts to
reduce the deceleration rate, and therefore fuel usage. In this test, the regenerative braking
system reduced fuel usage by 17.5% (see Table 4).
6.2 Comparison of Simulation and Experiment
In order to make the model described in Section 3 match the practical test results more
closely, several small changes were required. Firstly, a more accurate clutch model was added.
Previous iterations of the model had focussed on higher-speed driving cycles and did not
behave correctly when accelerating from a standstill. The new clutch model allowed for
gradual matching of the engine and wheelspeeds when accelerating, where the previous
model had neglected these effects. Secondly, the hydraulic losses in Eq. (3) were added in
place of the assumed values that were used previously.
Finally, it was found that the previous model for the hydraulic accumulators was
insufficient, as it did not take account of thermal effects when calculating the pressure in the
accumulators. Instead, the previous model assumed the nitrogen in the accumulators behaved
as an ideal gas undergoing adiabatic compression/expansion:
PV constγ = (4)
where γ was 1.4 and P and V are pressure and volume, respectively. The widely-used
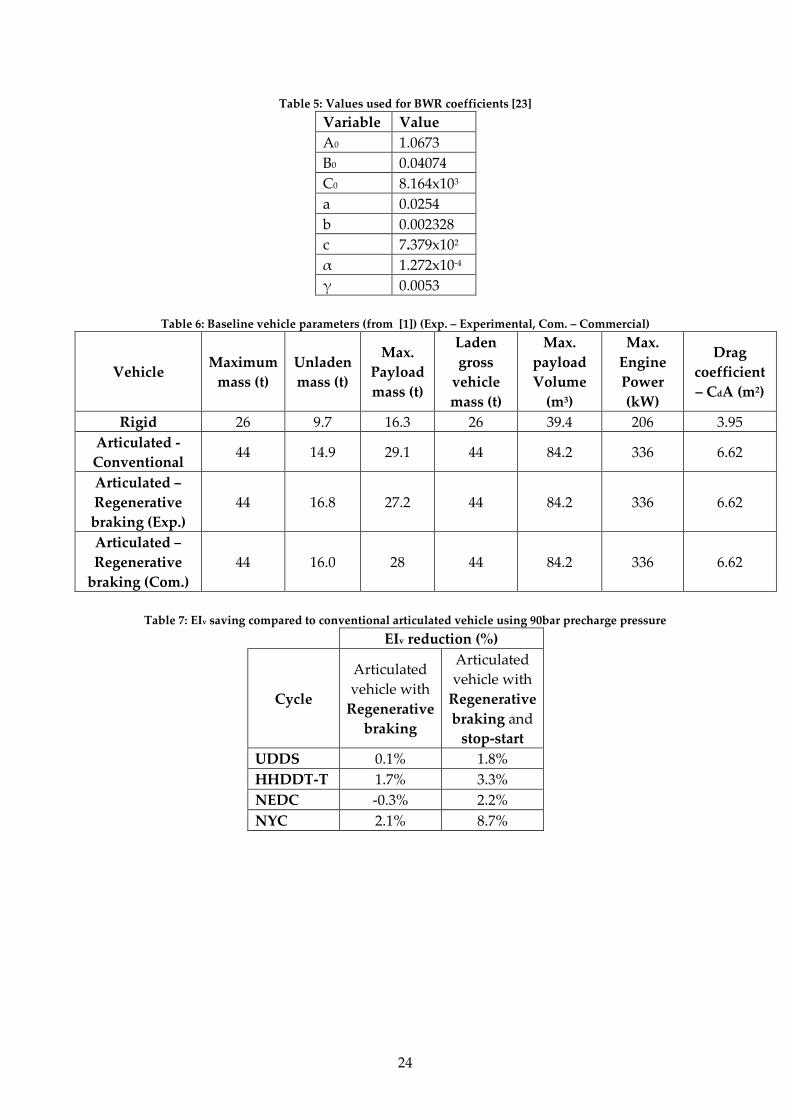
Benedict-Webb-Rubin (BWR) equation of state [20-22] was used for modelling these effects:
( ) ( ) ( )3
2 3 6 2 200 0 2 2
1 expC c
P RT B RT A bRT a aT T
ρρ ρ ρ α ρ γρ γρ = + − − + − + + + −
(5)
where P is the instantaneous pressure, ρ is the density of the gas, T is the gas temperature,
R is the gas constant and A0, B0, C0, a, α, b, c, γ are constants that were obtained from [23] and
given in Table 5. The calculation of instantaneous pressure given a volume change in the
nitrogen bladders in the accumulators was modelled using the approach given by Otis and
Pourmovahed [22], and the thermal time constant was taken from experimental results to be
10 seconds.
8
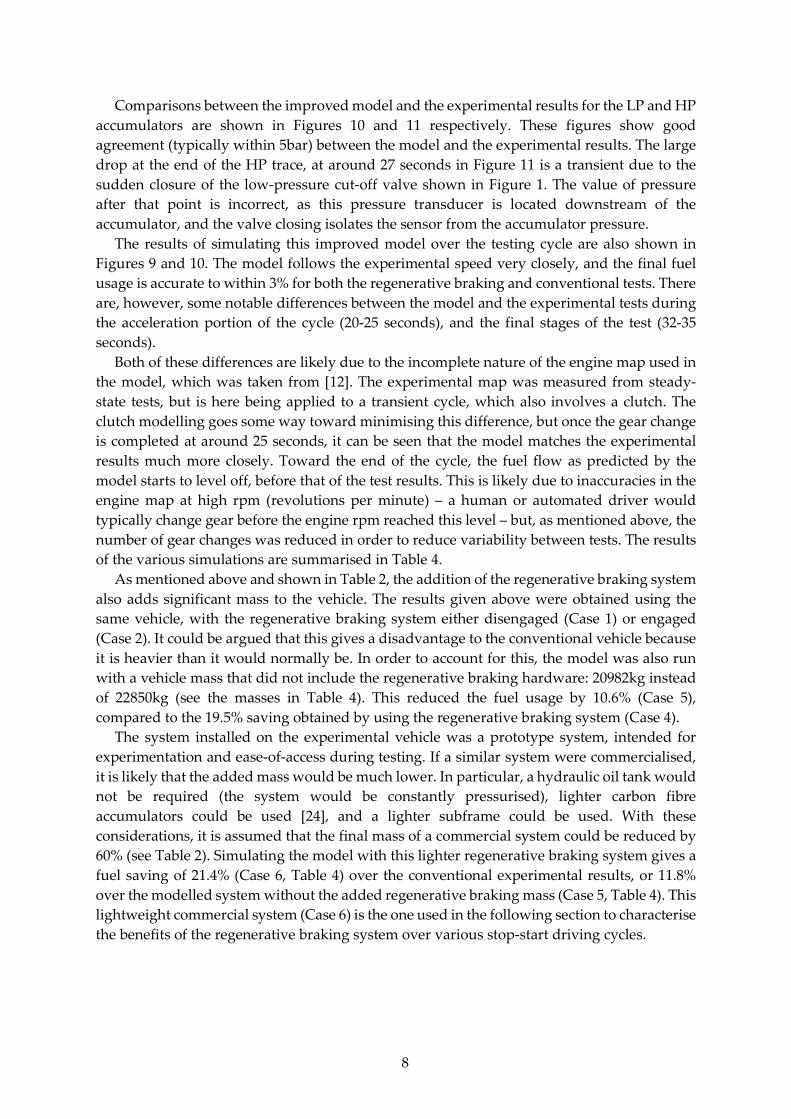
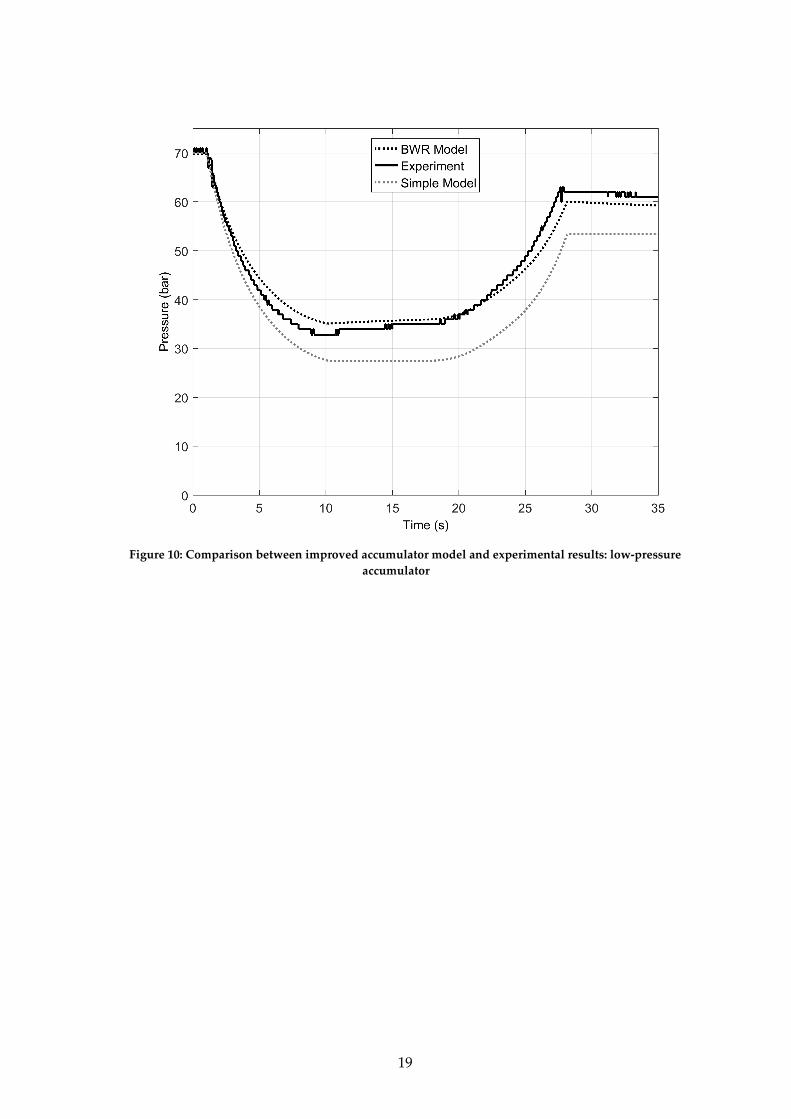
Comparisons between the improved model and the experimental results for the LP and HP
accumulators are shown in Figures 10 and 11 respectively. These figures show good
agreement (typically within 5bar) between the model and the experimental results. The large
drop at the end of the HP trace, at around 27 seconds in Figure 11 is a transient due to the
sudden closure of the low-pressure cut-off valve shown in Figure 1. The value of pressure
after that point is incorrect, as this pressure transducer is located downstream of the
accumulator, and the valve closing isolates the sensor from the accumulator pressure.
The results of simulating this improved model over the testing cycle are also shown in
Figures 9 and 10. The model follows the experimental speed very closely, and the final fuel
usage is accurate to within 3% for both the regenerative braking and conventional tests. There
are, however, some notable differences between the model and the experimental tests during
the acceleration portion of the cycle (20-25 seconds), and the final stages of the test (32-35
seconds).
Both of these differences are likely due to the incomplete nature of the engine map used in
the model, which was taken from [12]. The experimental map was measured from steady-
state tests, but is here being applied to a transient cycle, which also involves a clutch. The
clutch modelling goes some way toward minimising this difference, but once the gear change
is completed at around 25 seconds, it can be seen that the model matches the experimental
results much more closely. Toward the end of the cycle, the fuel flow as predicted by the
model starts to level off, before that of the test results. This is likely due to inaccuracies in the
engine map at high rpm (revolutions per minute) – a human or automated driver would
typically change gear before the engine rpm reached this level – but, as mentioned above, the
number of gear changes was reduced in order to reduce variability between tests. The results
of the various simulations are summarised in Table 4.
As mentioned above and shown in Table 2, the addition of the regenerative braking system
also adds significant mass to the vehicle. The results given above were obtained using the
same vehicle, with the regenerative braking system either disengaged (Case 1) or engaged
(Case 2). It could be argued that this gives a disadvantage to the conventional vehicle because
it is heavier than it would normally be. In order to account for this, the model was also run
with a vehicle mass that did not include the regenerative braking hardware: 20982kg instead
of 22850kg (see the masses in Table 4). This reduced the fuel usage by 10.6% (Case 5),
compared to the 19.5% saving obtained by using the regenerative braking system (Case 4).
The system installed on the experimental vehicle was a prototype system, intended for
experimentation and ease-of-access during testing. If a similar system were commercialised,
it is likely that the added mass would be much lower. In particular, a hydraulic oil tank would
not be required (the system would be constantly pressurised), lighter carbon fibre
accumulators could be used [24], and a lighter subframe could be used. With these
considerations, it is assumed that the final mass of a commercial system could be reduced by
60% (see Table 2). Simulating the model with this lighter regenerative braking system gives a
fuel saving of 21.4% (Case 6, Table 4) over the conventional experimental results, or 11.8%
over the modelled system without the added regenerative braking mass (Case 5, Table 4). This
lightweight commercial system (Case 6) is the one used in the following section to characterise
the benefits of the regenerative braking system over various stop-start driving cycles.
9
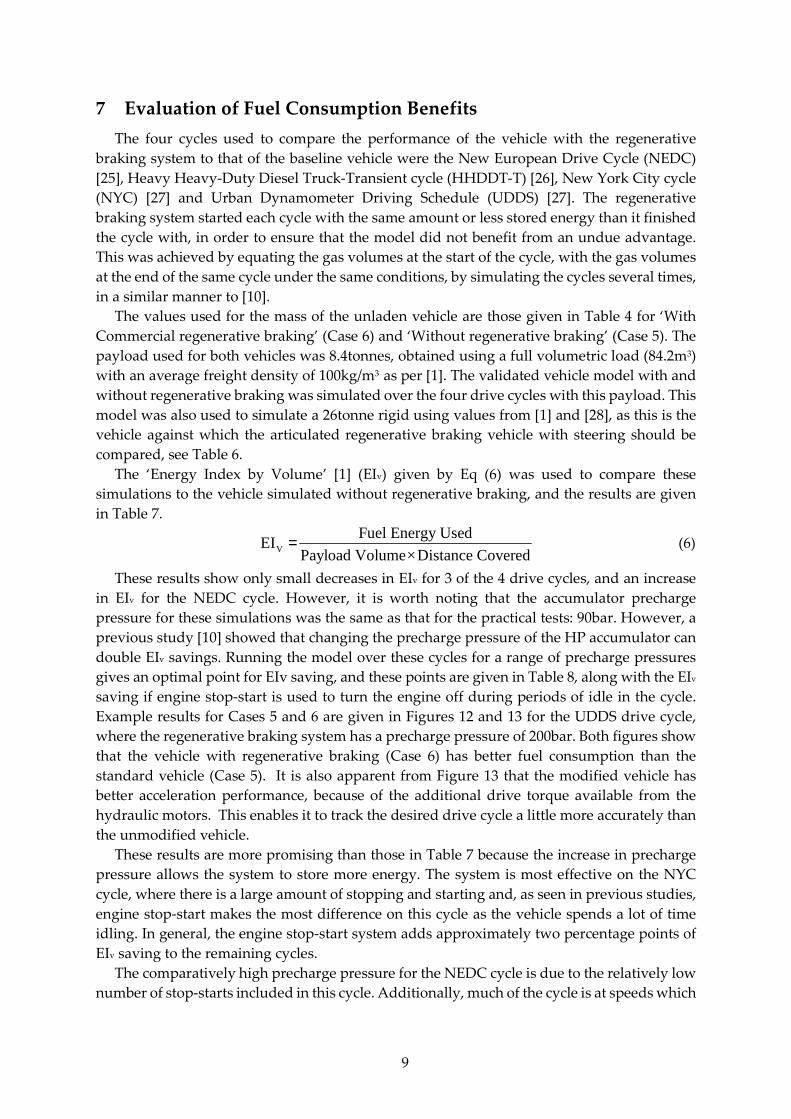
7 Evaluation of Fuel Consumption Benefits
The four cycles used to compare the performance of the vehicle with the regenerative
braking system to that of the baseline vehicle were the New European Drive Cycle (NEDC)
[25], Heavy Heavy-Duty Diesel Truck-Transient cycle (HHDDT-T) [26], New York City cycle
(NYC) [27] and Urban Dynamometer Driving Schedule (UDDS) [27]. The regenerative
braking system started each cycle with the same amount or less stored energy than it finished
the cycle with, in order to ensure that the model did not benefit from an undue advantage.
This was achieved by equating the gas volumes at the start of the cycle, with the gas volumes
at the end of the same cycle under the same conditions, by simulating the cycles several times,
in a similar manner to [10].
The values used for the mass of the unladen vehicle are those given in Table 4 for ‘With
Commercial regenerative braking’ (Case 6) and ‘Without regenerative braking’ (Case 5). The
payload used for both vehicles was 8.4tonnes, obtained using a full volumetric load (84.2m3)
with an average freight density of 100kg/m3 as per [1]. The validated vehicle model with and
without regenerative braking was simulated over the four drive cycles with this payload. This
model was also used to simulate a 26tonne rigid using values from [1] and [28], as this is the
vehicle against which the articulated regenerative braking vehicle with steering should be
compared, see Table 6.
The ‘Energy Index by Volume’ [1] (EIv) given by Eq (6) was used to compare these
simulations to the vehicle simulated without regenerative braking, and the results are given
in Table 7.
V
Fuel Energy UsedEI
Payload Volume×Distance Covered= (6)
These results show only small decreases in EIv for 3 of the 4 drive cycles, and an increase
in EIv for the NEDC cycle. However, it is worth noting that the accumulator precharge
pressure for these simulations was the same as that for the practical tests: 90bar. However, a
previous study [10] showed that changing the precharge pressure of the HP accumulator can
double EIv savings. Running the model over these cycles for a range of precharge pressures
gives an optimal point for EIv saving, and these points are given in Table 8, along with the EIv
saving if engine stop-start is used to turn the engine off during periods of idle in the cycle.
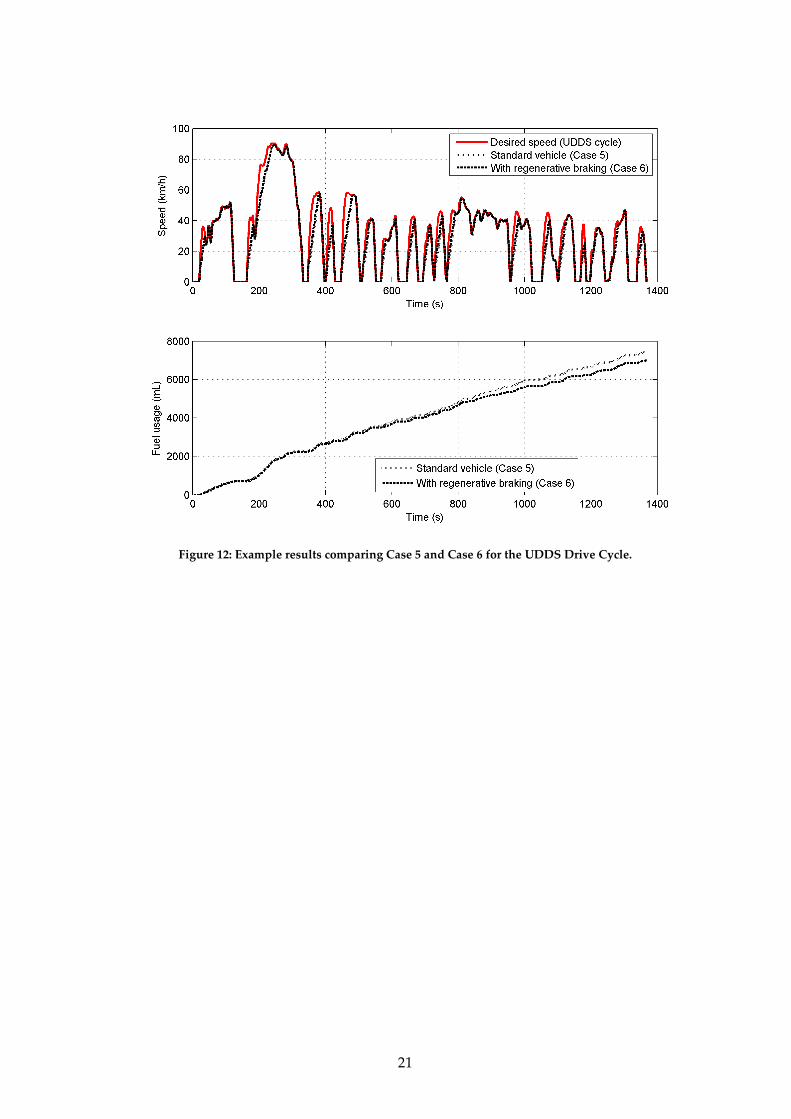
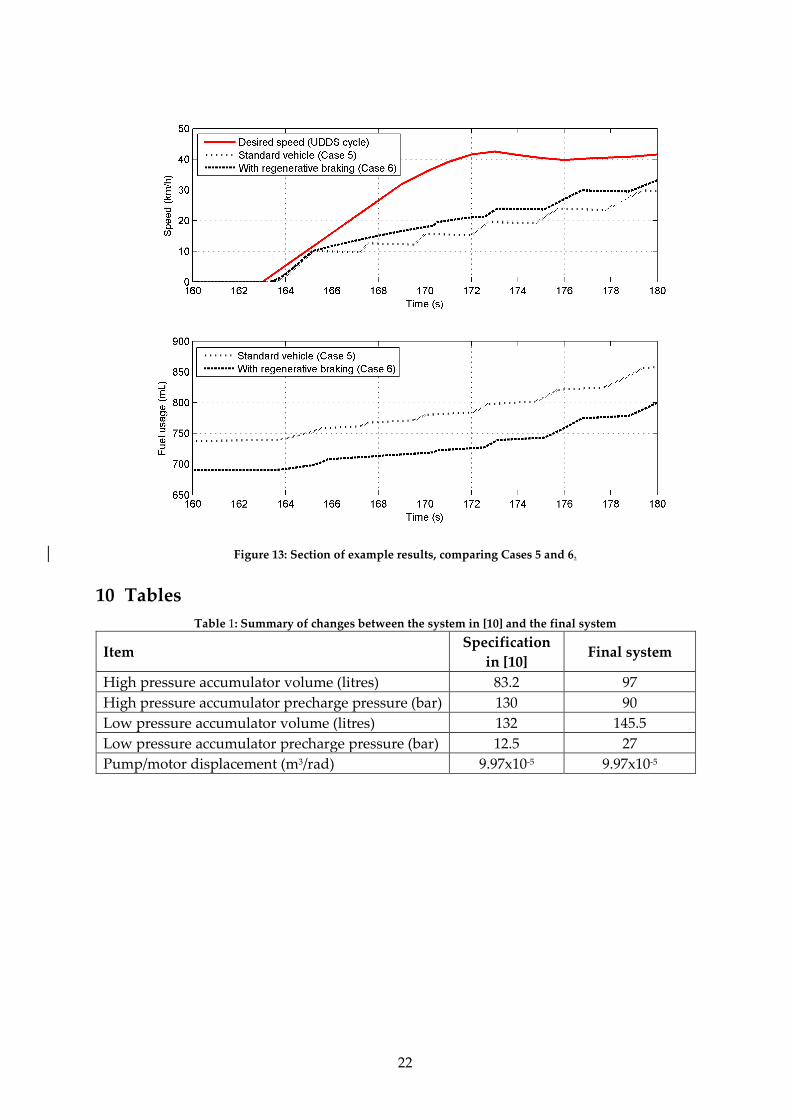
Example results for Cases 5 and 6 are given in Figures 12 and 13 for the UDDS drive cycle,
where the regenerative braking system has a precharge pressure of 200bar. Both figures show
that the vehicle with regenerative braking (Case 6) has better fuel consumption than the
standard vehicle (Case 5). It is also apparent from Figure 13 that the modified vehicle has
better acceleration performance, because of the additional drive torque available from the
hydraulic motors. This enables it to track the desired drive cycle a little more accurately than
the unmodified vehicle.
These results are more promising than those in Table 7 because the increase in precharge
pressure allows the system to store more energy. The system is most effective on the NYC
cycle, where there is a large amount of stopping and starting and, as seen in previous studies,
engine stop-start makes the most difference on this cycle as the vehicle spends a lot of time
idling. In general, the engine stop-start system adds approximately two percentage points of
EIv saving to the remaining cycles.
The comparatively high precharge pressure for the NEDC cycle is due to the relatively low
number of stop-starts included in this cycle. Additionally, much of the cycle is at speeds which

10
are too high to be considered urban, and are outside of the operating range of the regenerative
braking system.
In general the savings due to the regenerative braking system are lower than expected from
the previous studies, and this can be attributed to three main causes, the first being the very
high pressure drops in the system. Due to the constraints on transporting fluid to the wheel-
ends, the hydraulic circuit involves many changes of direction and changes in pipe diameter.
These serve to increase the pressure drop in the system, which is most apparent at high speeds
(see Figure 7), where the most energy can be harvested from the vehicle during deceleration.
The second cause that contributes to the reduction in effectiveness of the regenerative
braking system is the system mass. In previous studies, the mass of the system was assumed
to be significantly less than that of the finished system, and therefore contributed less toward
increased fuel usage.
The third important factor is the updated accumulator model. In previous simulation
studies, the accumulator model was simplistic, as the parameters of the final system were not
known. Incorporating the time-dependent BWR model, which takes account of heat transfer
within the accumulator decreases the efficiency of the system, as energy ‘leaks’ from the
accumulators as heat over the course of the cycles. These three factors combine to reduce the
energy savings from this regenerative braking system.
Each of these three factors could be mitigated in order to increase the efficiency of the
system. A commercial system using carbon fibre accumulators and lightweight components
built into the trailer axles could significantly reduce the added weight Similarly, the
mechanical and hydraulic systems could be integrated better in a ‘clean-slate’ design, rather
than retrofitting the hydraulic hardware as in this project, and would therefore incorporate
fewer sharp changes of direction and hose diameter. Thirdly, it has been shown that adding
foam in the gas bladder of a hydraulic accumulator can markedly improve their heat transfer
characteristics, reducing the energy lost to heat during operation [29, 30]. With these
mitigation strategies, a much more promising increase in fuel efficiency would be possible.
8 Conclusions
1) The hydraulic regenerative braking system has been successfully built, installed and
tested on a semitrailer.
2) Fuel use was reduced by 17.5% during simple stop-start tests.
3) Fuel use was reduced by 8.6% over the simple stop-start cycles when the added mass
from the regenerative braking system was taken into account.
4) The previous vehicle model was updated to incorporate hydraulic loss coefficients and
to include more sophisticated accumulator modelling, and agreed with the testing
results to within 5%.
5) The experimental regenerative braking system is heavier than previously expected,
but several opportunities exist for reducing mass, including the use of carbon fibre
accumulators instead of the current steel accumulators.
6) The three factors of increased vehicle mass, large hydraulic loss factors and heat
transfer within the hydraulic accumulator lead to a system which is less effective than
expected from previous studies.
7) The regenerative braking system would provide an EIv reduction of 7.5%, 6.6%, 4.1%
and 12.2% over the UDDS, HDDDT-T, NEDC and NYC drive cycles.
11
8) The regenerative braking system with engine stop-start would provide an EIv
reduction of 9.2%, 8.2%, 6.5%, and 18.1% over the UDDS, HDDDT-T, NEDC and NYC
cycles.
9) Changing from a 20t rigid to a 13.6m articulated vehicle with regenerative braking
system and stop-start was shown to reduce energy consumption by a total of 35% for
the UDDS drive cycle. This consists of 25.8% due to the capacity increase and a further
9.2% from regenerative braking and stop-start. For the NYC cycle the capacity increase
gives a 23.9% benefit, and the regenerative braking and stop-start give a further 18.1%,
giving a total reduction in fuel consumption of 42%.
12
9 Figures
Figure 1: Hydraulic schematic diagram of the regenerative braking system. (Red: high-pressure lines; blue:
low-pressure lines; light-blue: pilot pressure lines.)
13
Figure 2: Overall system schematic
Figure 3: Degrees of freedom of the wheel-end
Frame rail
manifold
14
Figure 4: Hydraulic routing and custom manifold, with swivel joints
15
Figure 5: Photo of experimental system installed on the B-link trailer
Figure 6: Schematic of instrumentation and controller interaction
16
Figure 7: Pressure drop between accumulator and fame rail manifold versus flowrate for several stop-start
tests
17
Figure 8: Comparison between test results and model – speed
18
Figure 9: Comparison between test and model – fuel usage
19
Figure 10: Comparison between improved accumulator model and experimental results: low-pressure
accumulator

20
Figure 11: Comparison between improved accumulator model and experimental results: high-pressure
accumulator.
21
Figure 12: Example results comparing Case 5 and Case 6 for the UDDS Drive Cycle.
22
Figure 13: Section of example results, comparing Cases 5 and 6.
10 Tables
Table 1: Summary of changes between the system in [10] and the final system
Item Specification
in [10] Final system
High pressure accumulator volume (litres) 83.2 97
High pressure accumulator precharge pressure (bar) 130 90
Low pressure accumulator volume (litres) 132 145.5
Low pressure accumulator precharge pressure (bar) 12.5 27
Pump/motor displacement (m3/rad) 9.97x10⁻⁵ 9.97x10⁻⁵
23
Table 2: Summary of system component masses
Experimental System ‘Commercial’ system
Item Mass (kg) Mass (%) Mass (kg) Mass (%)
Subframe 560 30.0 280 25.0
Oil tank 35 1.9 0 0.0
Hydraulic Oil 150 8.0 150 13.4
Accumulators 600 32.1 188 16.8
Accumulator fittings (HP) 52 2.8 52 4.6
Accumulator fittings (LP) 48 2.6 48 4.3
Pilot accumulator 15 0.8 15 1.3
Motor filter block 6 0.3 0 0.0
Valve manifold (LP) 20 1.1 20 1.8
Valve manifold (HP) 135 7.2 135 12.1
Sensor manifold (HP) 17 0.9 17 1.5
Pilot valve block 8 0.4 8 0.7
Hydraulic pump 15 0.8 0 0.0
Regenerative braking valve 70 3.7 70 6.2
Hydraulic PMs 116 6.2 116 10.4
HP piping 21 1.1 21 1.9
Total 1868 1120
Table 3: Comparison of loss factors in the circuit
Section start Section end k
(bar.s2/m6)
ΔP0
(bar)
Percentage
at max flow
Accumulator manifold (PG1) Frame rail manifold entry (PG3) 3.39E+06 1.97 26.4%
Frame rail manifold entry (PG3) Frame rail manifold exit (PG4) 3.90E+06 0.164 27.3%
Frame rail manifold exit (PG4) Knuckle manifold entry (PG5) 6.57E+06 0.445 46.3%
Table 4: Comparison of model and practical tests for stop-start tests
Model or
Test Case Configuration
Vehicle
mass (kg)
Relative
fuel usage
(%)
Test 1 Without regenerative braking 22850 100.0
2 With regenerative braking 22850 82.5
Model
3 Without regenerative braking 22850 95.1
4 With regenerative braking 22850 80.5
5 Without regenerative braking (lower mass) 20982 89.1
6 With ‘commercial’ regenerative braking 22102 78.6
24
Table 5: Values used for BWR coefficients [23]
Variable Value
A0 1.0673
B0 0.04074
C0 8.164x10³
a 0.0254
b 0.002328
c 7.379x10²
α 1.272x10⁻⁴
γ 0.0053
Table 6: Baseline vehicle parameters (from [1]) (Exp. – Experimental, Com. – Commercial)
Vehicle Maximum
mass (t)
Unladen
mass (t)
Max.
Payload
mass (t)
Laden
gross
vehicle
mass (t)
Max.
payload
Volume
(m3)
Max.
Engine
Power
(kW)
Drag
coefficient
– CdA (m2)
Rigid 26 9.7 16.3 26 39.4 206 3.95
Articulated -
Conventional 44 14.9 29.1 44 84.2 336 6.62
Articulated –
Regenerative
braking (Exp.)
44 16.8 27.2 44 84.2 336 6.62
Articulated –
Regenerative
braking (Com.)
44 16.0 28 44 84.2 336 6.62
Table 7: EIv saving compared to conventional articulated vehicle using 90bar precharge pressure
EIv reduction (%)
Cycle
Articulated
vehicle with
Regenerative
braking
Articulated
vehicle with
Regenerative
braking and
stop-start
UDDS 0.1% 1.8%
HHDDT-T 1.7% 3.3%
NEDC -0.3% 2.2%
NYC 2.1% 8.7%

25
Table 8: Simulated fuel savings using higher precharge pressure
EIv reduction (%) compared to
conventional artic. EIv reduction (%) compared to rigid
Precharge
pressure
(bar) Regenerative
braking
Regenerative
braking and
stop-start
Regenerative
braking
Regenerative
braking and
stop-start
UDDS 7.5% 9.2% 34% 35% 200
HDDDT-T 6.6% 8.2% 37% 38% 170
NEDC 4.1% 6.5% 34% 36% 240
NYC 12.2% 18.1% 38% 42% 220
11 Acknowledgements
The authors would like to thank Poclain Hydraulics for their support, as well as Team MRO
for their help with this research. Additionally, none of this research would have been possible
without the generous technical support of the Cambridge Vehicle Dynamics Consortium
whose members at the time of writing were: Camcon, Denby Transport, Firestone Industrial
Products, Goodyear Tires, Haldex Brake Products, SDC Trailers, SIMPACK, MIRA, Poclain
Hydraulics, Tinsley Bridge, Tridec BV and Volvo Trucks. This research would not have been
undertaken without the financial support of the Centre for Sustainable Road Freight
www.csrf.ac.uk.
12 Funding
This work was supported by the Cambridge Vehicle Dynamics Consortium, the Centre for
Sustainable Road Freight and the Engineering and Physical Sciences Research Council (grant
number EP/K00915X/).
13 References
[1] A. M. C. Odhams, R. L. Roebuck, Y. J. Lee, S. W. Hunt, and D. Cebon, "Factors
Influencing the Energy Consumption of Road Freight Transport," Proc IMechE Part C,
J Mech Eng Sci, vol. 224, pp. 1995-2010, 2010.
[2] B. A. Jujnovich and D. Cebon, "Path-Following Steering Control for Articulated
Vehicles," ASME Journal of Dynamic Systems, Measurement, and Control, vol. 135, pp.
031006-031006, 2013.
[3] W. J. Midgley and D. Cebon, "Comparison of regenerative braking technologies for
heavy goods vehicles in urban environments," Proceedings of the Institution of
Mechanical Engineers, Part D: Journal of Automobile Engineering, vol. 226, pp. 957-970,
July 1, 2012 2012.
[4] A. M. Klemp. The Business of Big Hybrids. Diesel Progress. 12-16. Available:
http://www.parker.com/literature/Hydraulics%20Group%20US/Big_Hybrids_Diesel
_Progress_Feb10.pdf
[5] "Parker RunWise Advanced Series Hybrid Drive," ed: System Brochure - Parker
Hydraulics, 2011.

26
[6] D. J. Cole, A. C. Collop, T. E. C. Potter, and D. Cebon, "Spatial repeatability of
measured dynamic tyre forces," J. Auto. Eng, IMech E, vol. 210, pp. 185-197, 1996.
[7] M. EauClaire. (2008, March 2008) Joining Forces. OEM Off-Highway. 40-47.
[8] G. Ehrenman, "Look, Ma, No Transmission," Mechanical Engineering, vol. 127, pp. 24-
26, 2005.
[9] W. Flugge, Viscoelasticity: Blaisdell Publishing Company, 1967.
[10] W. J. B. Midgley, H. Cathcart, and D. Cebon, "Modelling of hydraulic regenerative
braking systems for heavy vehicles," Proceedings of the Institution of Mechanical Engineers,
Part D: Journal of Automobile Engineering, vol. 227, pp. 1072-1084, July 1, 2013 2013.
[11] W. J. B. Midgley and D. Cebon, "Design and Specification of Hydraulic Hybrid System
for HGVs," presented at the HVTT 2014, San Luis, Argentina, 2014.
[12] S. W. Hunt, A. M. C. Odhams, R. L. Roebuck, and D. Cebon, "Parameter measurement
for heavy-vehicle fuel consumption modelling," Proceedings of the Institution of
Mechanical Engineers, Part D: Journal of Automobile Engineering, vol. 225, pp. 567-589,
May 1, 2011 2010.
[13] W. J. B. Midgley, "Regenerative Braking of Urban Delivery Heavy Goods Vehicles,"
PhD, Department of Engineering, University of Cambridge, 2012.
[14] "Volvo FE Hybrid," ed: Volvo Truck Corporation, 2011.
[15] W. J. B. Midgley and D. Cebon, "Control of a Hydraulic Regenerative Braking System
for Heavy Goods Vehicles," Sub. J Auto Eng, 2014.
[16] A. M. C. Odhams, R. L. Roebuck, B. A. Jujnovich, and D. Cebon, "Active steering of a
tractor--semi-trailer," Proceedings of the Institution of Mechanical Engineers, Part D:
Journal of Automobile Engineering, vol. 225, pp. 847-869, July 1, 2011.
[17] B. Jujnovich, R. Roebuck, A. Odhams, and D. Cebon, "Implementation of active rear
steering of a tractor -- semi-trailer," presented at the Heavy Vehicle Transport
Technology 10, Paris, 2008.
[18] "11898-1:2003 Road vehicles -- Controller area network (CAN)," ed: International
Standards Organisation, 2003.
[19] "RT3000 Inertial and GPS Navigation System," ed. Oxford Technical Solutions. Last
accessed 27/09/2015: http://www.oxts.com/Downloads/Products/RT3000/RT3000-
Single-Antenna.pdf, 2012.
[20] M. Benedict, G. B. Webb, and L. C. Rubin, "An Empirical Equation for Thermodynamic
Properties of Light Hydrocarbons and Their Mixtures I. Methane, Ethane, Propane and
n‐Butane," The Journal of Chemical Physics, vol. 8, pp. 334-345, 1940.
[21] H. B. Hansen and P. W. Rasmussen, "Modeling Hydraulic Accumulators for use in
Wind Turbines," presented at the The 13th Scandinavian International Conference on
Fluid Power, Linköping, Sweden, 2013.
[22] D. R. Otis and A. Pourmovahed, "An Algorithm for Computing Nonflow Gas
Processes in Gas Springs and Hydropneumatic Accumulators," Journal of Dynamic
Systems, Measurement, and Control, vol. 107, pp. 93-96, 1985.
[23] H. W. Cooper and J. C. Goldfrank, "B-W-R Constants and New Correlations,"
Hydrocarbon Processing, vol. 46, pp. 141-146, 1967.
[24] "Bottom Repairable Lightweight High Pressure Compostie Accumulator," ed.
Steelhead Composites. Last accessed 17/10/2015:
http://steelheadcomposites.com/shc/wp-content/uploads/2015/05/SHC-BR6000.pdf,
2014.

27
[25] A. C. Collop, D. Cebon, and M. S. A. Hardy, "A visco-elastic approach to rutting in
flexible pavements," ASCE Journal of Transportation Engineering, vol. 121, pp. 82-93,
1995.
[26] R. Radlinski, "Development of a truck-tractor pneumatic simulator and optimization
of trailer air brake plumbing," Vehicle Research and Test Center, National Highway
Traffic Safety Administration, U.S. Dept. of Transport., Memorandum Report CAR-5,
April, 1981 1981.
[27] T. M. Post, P. S. Fancher, and J. E. Bernard, "Torque characteristics of commercial
vehicle brakes," SAE 750210, 1975.
[28] "FE 26 Tonne 6x4 B Ride Rigid - data sheet," ed: Volvo Trucks, last accessed: 2014-04-
04, available at
http://www.volvotrucks.com/sitecollectiondocuments/vtc/uk/trucks/fe/fe64bride.pdf,
2008.
[29] Z. Filipi and Y. J. Kim, "Hydraulic Hybrid Propulsion for Heavy Vehicles: Combining
the Simulation and Engine-In-the-Loop Techniques to Maximize the Fuel Economy
and Emission Benefits," Oil Gas Sci. Technol., vol. 65, pp. 155-178, 2010.
[30] A. Pourmovahed, N. H. Beachley, and F. J. Fronczak, "Modeling of a Hydraulic Energy
Regeneration System: Part II---Experimental Program," Journal of Dynamic Systems,
Measurement, and Control, vol. 114, pp. 160-165, 1992.
For access to the raw data used in the production of this paper, please see:
http://www.repository.cam.ac.uk/handle/1810/248831