Reforms in Forest Management in West Bengal
36
Munich Personal RePEc Archive Reforms in Forest Management in West Bengal: A Game of Strategic Profile Das, Nimai and Sarker, Debnarayan Centre for Economic Studies, Presidency College, Kolkata-73 2006 Online at https://mpra.ub.uni-muenchen.de/14889/ MPRA Paper No. 14889, posted 29 Apr 2009 07:13 UTC
-
Upload
khangminh22 -
Category
Documents
-
view
0 -
download
0
Transcript of Reforms in Forest Management in West Bengal
Munich Personal RePEc Archive
Reforms in Forest Management in West
Bengal: A Game of Strategic Profile
Das, Nimai and Sarker, Debnarayan
Centre for Economic Studies, Presidency College, Kolkata-73
2006
Online at https://mpra.ub.uni-muenchen.de/14889/
MPRA Paper No. 14889, posted 29 Apr 2009 07:13 UTC
Published in Edited Book Second Generation Reforms (2008), pp. 79-101, Allied Publishers, New Delhi
Authors: N. Das and D. Sarker 1
Reforms in Forest Management in West Bengal:
A Game of Strategic Profile
Nimai Das and Debnarayan Sarker Centre for Economic Studies, Presidency College, Kolkata (INDIA)
ABSTRACT: This paper attempts to find out the economic outcome of joint forest management
(JFM) programme for forest fringe community and government based on a field survey of Bankura
district in West Bengal. This empirical study suggests that the economic outcome of the JFM
programme has been beneficial for both government and forest community and this is due to the
strict dominant cooperative strategy of community, not government. Economically, government was
the worst sufferer for her earlier restrictive forest policy. The higher economic outcome of the
government is due to the cooperation of community whom government neglected earlier. Our study
under the model of common property resource (CPR) game also suggests that in spite of equal effort
level for each type of player, cooperative equilibrium is also stable with the highest level of stock.
This study also suggests that force or law can not effectively control the illegal collection of timber
forest products for the poor agricultural households, which mainly depend on forest resources for
livelihood security and that live below poverty line, until and unless a considerable increase in the
income from legal forest products and forest wage income meet their livelihood security.
KEYWORDS: Bengal forest resource, reforms in forest management, economic outcome of joint
forest management, common property resource game, model of legal-illegal income
substitutability.
This paper attempts to find out the economic outcome of joint forest management (JFM)
programme for forest fringe community and government based on a field survey of Bankura district
in West Bengal.
Forests contribute significantly to the economic, social and environmental well being of a
country. Their role is more pronounced in a developing country like India that has a predominantly
The authors would like to thank Mr. K. C. Gayen, Principal Chief Conservator of Forest and Divisional Forest Officers
(Bankura North, Bankura South and Panchet Soil Conservation), Directorate of Forest, Govt. of West Bengal, for
providing data of this paper. Special thanks to Mr. Nihar Ranjan Chakroborty, DFO (Statistic) and Mr. Gopal Ch. De,
Assistant Statistician, Directorate of Forest, Govt. of West Bengal, for helpful comments.

Published in Edited Book Second Generation Reforms (2008), pp. 79-101, Allied Publishers, New Delhi
Authors: N. Das and D. Sarker 2
agriculture-based rural economy. Forest in India constitutes just over one-fifth of the land area of the
country. Forest meets nearly 40 per cent of the energy needs of the country (more than 80 per cent in
the rural sector), the bulk of it as direct subsidy to the poor. They also provide about 25 per cent of the
fodder needs of our vast cattle population. Forest products are crucial to the rural and tribal economy.
Many of the products, including non-timber forest products (NTFPs), provide sustenance to the rural
people who collect a large part of their day-to-day necessities, including food and medicines, from the
forests (Sarma and Rai, 2000: 207). The dependence of tribal on forests for sustenance and income
generation is also significant, ranging from 15 to 84 per cent, depending on the community and region.
The overall estimate is that 33 per cent of the tribal earn their livelihood from forests and forest
products. The World Bank Report (2006) indicates that forests offer vast potential for poverty
reduction and rural economy growth in India while also supporting critical national conservation goals
(World Bank, 2006: xiii). The Report also revels that half of India’s 89 million tribal people, the most
disadvantaged section of society, live in forest fringe areas and forests have the potential to improve the
livelihoods of forest dwelling people, particularly tribal people who are the most disadvantaged group
in Indian society (ibid: 2). Increasing interest in rural poverty alleviation has thus resulted in a new
focus in the forest dependent poor (Fisher, 2004; Pattanayak et al., 2004; Angelsen and Winder, 2003;
Kumar, 2002; Kumar et al., 2000; Arnold, 2001; World Bank, 2001; Wunder, 2001; Cavendish, 1999;
Scherr et al., 2002; Somanathan, 1991).
Issues relating to households’ income accounts in rural areas of southern Malawi in Africa
are presented by Fisher (2004) in two sources – forest and non-forest (farm, self-employment, non-
forest wage work, sales assets and transfers)1. There is rich empirical evidence to support the claim
that forest is an important source of income for the poor forest fringe households through the
extraction of wood (timber and firewood) and non-timber forest products (NTFPs) or non-wood
forest products (NWFPs) by preserving the forest resource sustainable with the help of cooperative
management (Somanathan, 1991; Pattanayak et al., 2004; Guha, 1989; Jodha, 1986, 1992; Kumar et
al., 2000; World Bank, 2001). In an attempt to measure the effect of JFM on various social groups –
landless, marginal farmer, small farmer, medium farmer and large farmer – Kumar(2002) observes
that the poorer sections of village community are disproportionally dependent on non-wood forest
products both for subsistence and extra income due to low opportunity cost of labour (p.770). Access
to forest for fuelwood is substantially important to local people and makes substantial contribution
to households’ welfare (Pattanayak et al., 2004: 176). The demand for fuelwood collection for poor
households is inelastic with respect to their travel cost (or the shadow price of fuelwood) indicating

Published in Edited Book Second Generation Reforms (2008), pp. 79-101, Allied Publishers, New Delhi
Authors: N. Das and D. Sarker 3
that fuelwood is essential for these households, whereas improved economic conditions that increase
household wealth and raise opportunity cost reduce household dependence on fuel wood from
forest(ibid:175). Asset-poor in Malawi in southern Africa are observed more reliant on both low
return forest activities (LRFA) – e.g. fuel wood and non-timber forest products – and high return
forest activities (HRFA) – e.g. timber – compared with the better off and access to forest income in
rural Malawi help the poor not only to prevent by supplementing income, but also to improve their
living standard over time (Fisher, 2004: 147-151). Without any legal punishment by law traditional
cooperative management system based on self-enforcing social norms and customs – each person
knows that if they cheat, the other will as well, and to their supply of forest products in years to
come will be jeopardized – were enough to restrain people from overlooping and looping trees from
forest and the prevailing conditions ensures that the forest dependent households did not suffer from
a scarcity of forest resource on which they were so dependent (Somanathan, 1991:PE 38-9).
This paper attempts to find out the economic outcome of joint forest management (JFM)
programme for forest fringe communities and government who jointly manage the forest protection
activities, based on a field survey of Bankura district in West Bengal. The present paper is important
in that it tries to examine as to whether the institutional arrangements of community management
under JFM have been economically beneficial for its member households belonging to agricultural
households under three categories – landless, marginal farmer and small farmer – which depends on
forest for their subsistence and income, compared with strict regulatory policy system of government
before JFM, and contribute to extract forest resources sustainably. This paper is organized as
follows. Section II presents the historical perspective of the study. A short review of relevant
common pool resource (CPR) game is contained in section III. Section IV deals with survey design
and methodology of the empirical exercise. Section V covers the findings of the study. Conclusions
and policy implications appear in section VI.
II. Historical Perspective
Evidence of earliest forest management by the state is found in Kautilya’s Arthashastra (BC
321) which refers to ‘forests’ being managed as ‘state reserves for revenue’ and for ‘public use’
(Sarmah and Rai, 2000: 209). But, indeed, no rulers in India did execute these policies in the
management of forest resources of our economy before 1988. Rather, the forest policy of India
before the year 1988 was oriented with commercial need either of the government or of the rulers of
India without safeguarding the traditional rights and concessions of the forest fringe communities on

Published in Edited Book Second Generation Reforms (2008), pp. 79-101, Allied Publishers, New Delhi
Authors: N. Das and D. Sarker 4
forestland. There was no systematic management of forest in the country before 1865. Some of the
recorded forest conservation measures were initiated by Emperor Ashoka, as is testified by the
decrees inscribed in rock and pillar edicts (ibid: 209). This concern continued till the beginning of
the 6th century. Systematic management of forest in country began in 1864 with the appointment of
Dietrich Brandis, a trained German forester, as the Inspector General of Forests. The government
decided to treat forests as state property by enacting the Indian Forest Act, 1865 (Act VII of 1865).
Although, the first Act of forestry in India was enacted in 1865, the major laws governing forestry
have formulated by the Indian Forest Act of 1878, Indian Forest Act of 1927 and the Forest
Conservation Act of 1980 (World Bank, 2006: xvi). The Forest Conservation Act of 1878 and that
of 1927 emphasized commercial timber production. The Forest Conservation Act of 1980 and the
1988 National Forest Policy shifted the pendulum strongly towards forest conservation and joint
forest management (ibid: 16-18). The revision of the National Forest Policy in 1988 marks a major
departure from the earlier policies which emphasis on production of commercial wood and disregard
for local need (Poffenberger, 1995; Sarmah and Rai, 2000: 213), because Government of India, then,
could understand that until and unless the benefit of forest fringe communities is secured, neither
forest resources nor forest management can be sustainable. So, in order to execute sustainable forest
management system, the active participation of local forest communities in forest management for
conservation and development plans of forest resources and the participatory forest management on
usufruct sharing basis for safeguarding their traditional rights subject to the carrying capacity of
forest was first introduced and implemented by the National Forest Policy of 1988.
However, far-reaching developments in the demographic, economic, social and
environmental fields have resulted in the revision of the National Forest Policy in 1988. The national
policy of 1988 constitutes a significant departure from earlier policies of forest management
practice, for its emphasizes on: 1) obtaining the active participation of local people in forest
conservation and development programmes of local forest lands; and 2) the benefit sharing
arrangements, which is intended to provide village communities living near the forests a stake in the
protection and development on the degraded forests.
JFM programmes in India currently span over 27 states, represent 85000 village
communities, and cover more than 17.3 million hectors of forestland. The programme encompasses
an estimated 8.3 million families, half of which are SC and ST (Bahuguna, 2004, cited in World
Bank, 2006:1). Most JFM committees use the surrounding forests mainly as a safety net or for
regular or seasonal subsistence production of firewood, fodder and minor forest products.
Published in Edited Book Second Generation Reforms (2008), pp. 79-101, Allied Publishers, New Delhi
Authors: N. Das and D. Sarker 5
The JFM in West Bengal has its origin in the success achieved in rejuvenating a patch of 17
hectares of degraded forests under a pilot project implemented during 1972 near Arabari in
Midnapore district. About 618 families living in 11 villages lying in the fringe voluntarily protected
these forests when in return they were assured provision of fuelwood and fodder from the
regenerated forest and employment in forestry activities. In 1987 these villagers were also declared
as beneficiaries for these rejuvenated forests and granted 25 per cent share from the revenue earned
from final harvest. This project made both government and community benefited (SFR, 2000:47). It
seems to be relevant to mention that the key precursor to JFM in India, from a management
perspective, was a local level initiative, dating from the early 1970s, in the Arabari in West Bengal
(Jeffery and Sundar, 1999:28).
In West Bengal, the JFM movement gathered momentum when in 1989 a programme of
resuscitation and reestablishment of moribund sal and other hardwood forests in the districts of
Midnapore, Bankura, Purulia, Burdwan and Birbhum in south West Bengal was initiated by the
government with the active participation and involvement of the local people. West Bengal
government’s resolution in 1989 was issued by declaring the principles of sharing of duties,
responsibilities as well as the usufructs from the forests to the participant local people living in the
fringe of the forests. The procedures for establishment of the institution called forest protection
committee (FPC), comprising of these participants as members, were also defined. The foundation
of an innovative forest protection system and the participatory forest management was thus laid for
the forests of south West Bengal which covers approximately 38 per cent of the total forest area of
the State. West Bengal State Forest Report (2000) clearly mentions:
“As a result of participatory and joint forest management activities in south West Bengal the
vast tract of scattered, over-exploited and degraded forests containing mainly the sal were
resuscitated and restored to productivity with great improvement in quality and density” (SFR,
2000: 47).
Government report (State Forest Report, 2000) reveals that the overexploitation of trees for
timber was so severe that thousand and thousand hectares of forest lands in the south West Bengal
except Sundarban were almost treated as bare plain land, when the JFM was established; but such
lands are almost secured after JFM programme. Secondly, government revenue from the degraded
forest was almost nil when the JFM was established, but it has significantly increased after JFM.
However, with regard to the historical perspective of the Government of India in general and
Government of West Bengal in particular are concerned, we usually observe two forest policies of

Published in Edited Book Second Generation Reforms (2008), pp. 79-101, Allied Publishers, New Delhi
Authors: N. Das and D. Sarker 6
the government – strictly regulatory policy (SRP) and cooperative policy (CP). The SRP was usually
used before 1988 when the JFM was established and CP has been executing as soon as the JFM
came into being. Hence the strategy-set of government is {SRP, CP}.
On the contrary, against the custodian forest management system (SRP action of
government), the local forest fringe communities in different parts of India have mobilized
repeatedly from long past to protect their traditional right on forest (Poffenberger, 1995). In keeping
with this, Santal, Bhumij and Mahato tribal with some low cast Hindus in south West Bengal
mobilized repeatedly against Mughal and British rulers to protect their traditional rights on
forestland from long past. Chur Rebellion (from 1767 to 1805), Naik Revolt (1806-16), Hul
Rebellion (1855) are the glaring examples of the history in south West Bengal where forest fringe
communities organized resistance against rulers of India to protect their own right in forestland.
During Chur Rebellion, the tribal communities of this area mobilized resistance through a series of
armed revolts against the British empowered a new class of zaminders who took attempts to clear
forest land and convert it into agricultural land to increase their revenue. Tribal guerrillas were so
effective that even as late as 1800, after nearly forty years of British occupation, a collector reported
that two thirds of Midnapore consisted of jungle, the greater part of which was inaccessible’(Sarker
and Das, 2004: 172). Yet, gradually the Company succeeded in strengthening its control, despite
subsequent revolts by forest people, such as the Naik Revolt (1806-16). The pressure on the forest
grew further by the 1860s as the growing railway system demanded immense quantities of sal logs to
provide sleepers for rail bed. Commercial demand for timber accelerated forest cutting, and raised
the value of forestlands. Timber merchants rushed in, even before the rail lines opened and began
leasing or purchasing large tracts from the Midnapore Zamindary Company and other zamindars. In
early 1855, six to seven thousand Santal tribal from, Birbhum, Bankura, Chotonagpur and Hazribagh
began meeting for organizing resistance in response to their growing marginalization. On July 16,
1855 some ten thousand tribal, under the messianic leadership of four Santal brothers stood their
ground firmly and fought with bows and a kind of battle-axe in a battle near Pirpaiti (Dutta, 1940:
26). The revolt collapsed eventually after half their members were reportedly killed. Despite their
defeat, the Hul Rebellion (as it is known among the Santal) profoundly influenced the ideological
development of many Santal communities (Duyker, 1987: 35), and lives on in the songs and oral
traditions of the tribal people of this area.
JFM can, thus, be seen to emerge as the major policy change and attempt to create a new
relationship between the government and the community in terms of cooperative framework. Thus,
Published in Edited Book Second Generation Reforms (2008), pp. 79-101, Allied Publishers, New Delhi
Authors: N. Das and D. Sarker 7
from the standpoint of the forest fringe community is concerned, one may usually find two actions of
the community on its forestland – fighting policy (FP), which was mainly executed when
government’s SRP was in operation. They usually executed this policy to meet up their livelihood
security. The cooperative policy (CP) of forest fringe communities has been gaining ground on as
soon as the JFM programme came into being. So the community’s strategy-set is {FP, CP}.
III. Review of the Relevant CPR Game
The daily livelihood of vast masses of the rural poor in many countries depends on the
success with which common pool resources (CPRs) – such as forest and water resources – are
managed and on the environmental consequences of their management. “CPR (common pool
resource) management is a collective action dilemma: a situation in which mutual cooperation is
collectively rational for the group as a whole, but individual cooperation is not necessarily
individually rational for each member”(Dayton-Johnson and Bardhan, 2002:577). There is now a
vast literature which examines the problem of extracting commonly owned renewable resources by
game-theoretic framework (Clark, 1980; Dasgupta and Heal, 1979; Ostrom et al., 1990; Gardner et
al., 1990; Ostrom et al., 1992; Chichilnisky, 1994; Sethi and Somanathan, 1996; Dayton-Johnson
and Bardhan, 2002). Game theory provides a useful tool for many problems in environmental
economics. The theory is concerned with the strategic action of different agents/players where these
actions are in some way interlinked. It is said that the absence of private property rights in common
property resources is characterized by a negative externality whenever the resource is scare; this
leads to inefficiently high levels of extraction, possibly high enough to exceed the maximum
sustainable yield, and threaten thereby the long run viability of the resource. But there is
considerable literature of common pool resource game which suggests that cooperative management
of common property resources guided by social norms and customs have been successful over long
period of time (Fudenberg and Maskin, 1986; Williamsen, 1985; Ostrom, 1990; Ostrom et al., 1990;
Hecheter, 1987; Acherson, 1993; Sethi and Somanathan, 1996). In a study of CPR institution,
Cordell and McKean (1992) identity the established codes of conduct which are far more binding on
individual conscience than any governmental regulations. These codes of conduct serve to ensure
both sustainable aggregate harvests and an equitable distribution of access to the resource. Acheson
(1993) is another example of sustainable management of common resources based on customs and
social norms. In fact, self-organized CPR institutions have been devised without reference to
centralized authorities and sustained over long period of time (Hechter, 1987; Willamson, 1985).
Published in Edited Book Second Generation Reforms (2008), pp. 79-101, Allied Publishers, New Delhi
Authors: N. Das and D. Sarker 8
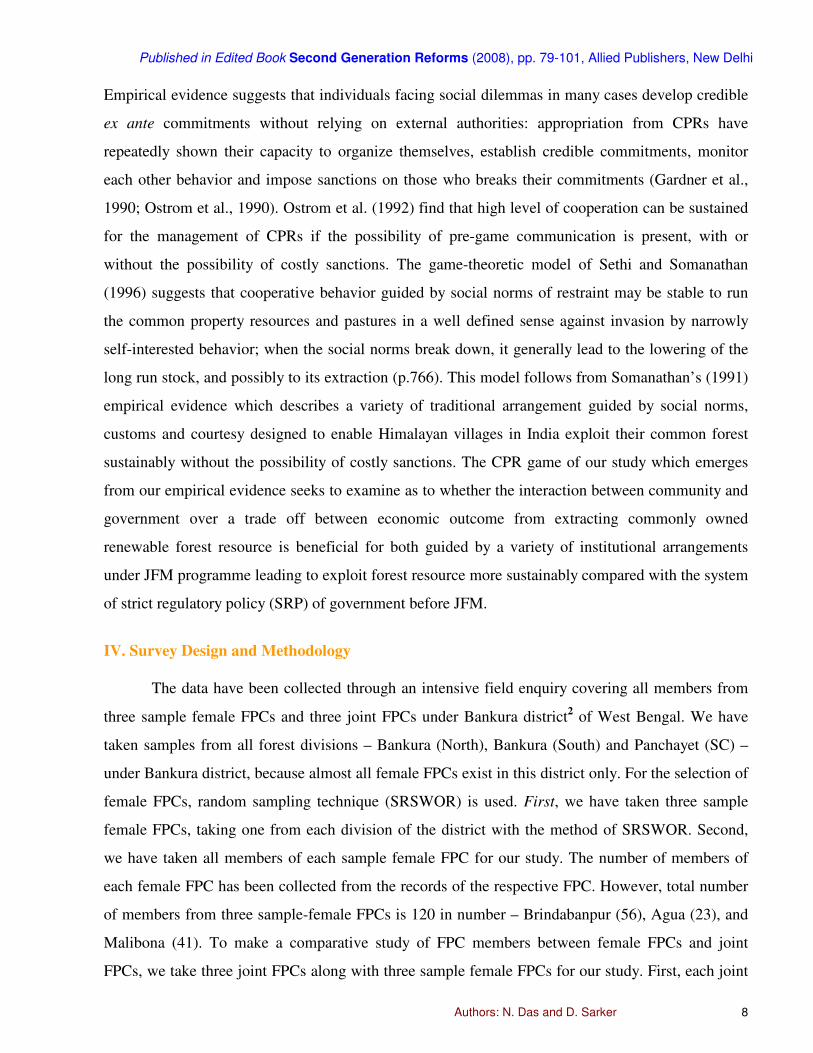
Empirical evidence suggests that individuals facing social dilemmas in many cases develop credible
ex ante commitments without relying on external authorities: appropriation from CPRs have
repeatedly shown their capacity to organize themselves, establish credible commitments, monitor
each other behavior and impose sanctions on those who breaks their commitments (Gardner et al.,
1990; Ostrom et al., 1990). Ostrom et al. (1992) find that high level of cooperation can be sustained
for the management of CPRs if the possibility of pre-game communication is present, with or
without the possibility of costly sanctions. The game-theoretic model of Sethi and Somanathan
(1996) suggests that cooperative behavior guided by social norms of restraint may be stable to run
the common property resources and pastures in a well defined sense against invasion by narrowly
self-interested behavior; when the social norms break down, it generally lead to the lowering of the
long run stock, and possibly to its extraction (p.766). This model follows from Somanathan’s (1991)
empirical evidence which describes a variety of traditional arrangement guided by social norms,
customs and courtesy designed to enable Himalayan villages in India exploit their common forest
sustainably without the possibility of costly sanctions. The CPR game of our study which emerges
from our empirical evidence seeks to examine as to whether the interaction between community and
government over a trade off between economic outcome from extracting commonly owned
renewable forest resource is beneficial for both guided by a variety of institutional arrangements
under JFM programme leading to exploit forest resource more sustainably compared with the system
of strict regulatory policy (SRP) of government before JFM.
IV. Survey Design and Methodology
The data have been collected through an intensive field enquiry covering all members from
three sample female FPCs and three joint FPCs under Bankura district2 of West Bengal. We have
taken samples from all forest divisions – Bankura (North), Bankura (South) and Panchayet (SC) –
under Bankura district, because almost all female FPCs exist in this district only. For the selection of
female FPCs, random sampling technique (SRSWOR) is used. First, we have taken three sample
female FPCs, taking one from each division of the district with the method of SRSWOR. Second,
we have taken all members of each sample female FPC for our study. The number of members of
each female FPC has been collected from the records of the respective FPC. However, total number
of members from three sample-female FPCs is 120 in number – Brindabanpur (56), Agua (23), and
Malibona (41). To make a comparative study of FPC members between female FPCs and joint
FPCs, we take three joint FPCs along with three sample female FPCs for our study. First, each joint
Published in Edited Book Second Generation Reforms (2008), pp. 79-101, Allied Publishers, New Delhi
Authors: N. Das and D. Sarker 9
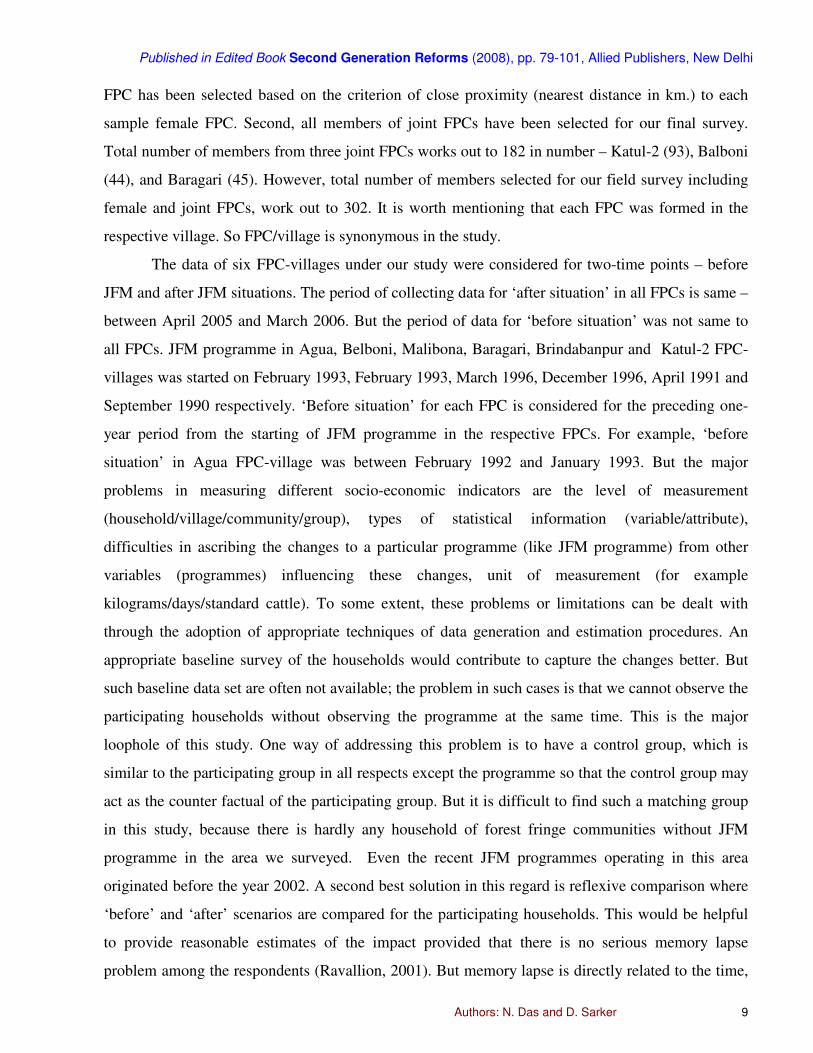
FPC has been selected based on the criterion of close proximity (nearest distance in km.) to each
sample female FPC. Second, all members of joint FPCs have been selected for our final survey.
Total number of members from three joint FPCs works out to 182 in number – Katul-2 (93), Balboni
(44), and Baragari (45). However, total number of members selected for our field survey including
female and joint FPCs, work out to 302. It is worth mentioning that each FPC was formed in the
respective village. So FPC/village is synonymous in the study.
The data of six FPC-villages under our study were considered for two-time points – before
JFM and after JFM situations. The period of collecting data for ‘after situation’ in all FPCs is same –
between April 2005 and March 2006. But the period of data for ‘before situation’ was not same to
all FPCs. JFM programme in Agua, Belboni, Malibona, Baragari, Brindabanpur and Katul-2 FPC-
villages was started on February 1993, February 1993, March 1996, December 1996, April 1991 and
September 1990 respectively. ‘Before situation’ for each FPC is considered for the preceding one-
year period from the starting of JFM programme in the respective FPCs. For example, ‘before
situation’ in Agua FPC-village was between February 1992 and January 1993. But the major
problems in measuring different socio-economic indicators are the level of measurement
(household/village/community/group), types of statistical information (variable/attribute),
difficulties in ascribing the changes to a particular programme (like JFM programme) from other
variables (programmes) influencing these changes, unit of measurement (for example
kilograms/days/standard cattle). To some extent, these problems or limitations can be dealt with
through the adoption of appropriate techniques of data generation and estimation procedures. An
appropriate baseline survey of the households would contribute to capture the changes better. But
such baseline data set are often not available; the problem in such cases is that we cannot observe the
participating households without observing the programme at the same time. This is the major
loophole of this study. One way of addressing this problem is to have a control group, which is
similar to the participating group in all respects except the programme so that the control group may
act as the counter factual of the participating group. But it is difficult to find such a matching group
in this study, because there is hardly any household of forest fringe communities without JFM
programme in the area we surveyed. Even the recent JFM programmes operating in this area
originated before the year 2002. A second best solution in this regard is reflexive comparison where
‘before’ and ‘after’ scenarios are compared for the participating households. This would be helpful
to provide reasonable estimates of the impact provided that there is no serious memory lapse
problem among the respondents (Ravallion, 2001). But memory lapse is directly related to the time,
Published in Edited Book Second Generation Reforms (2008), pp. 79-101, Allied Publishers, New Delhi
Authors: N. Das and D. Sarker 10
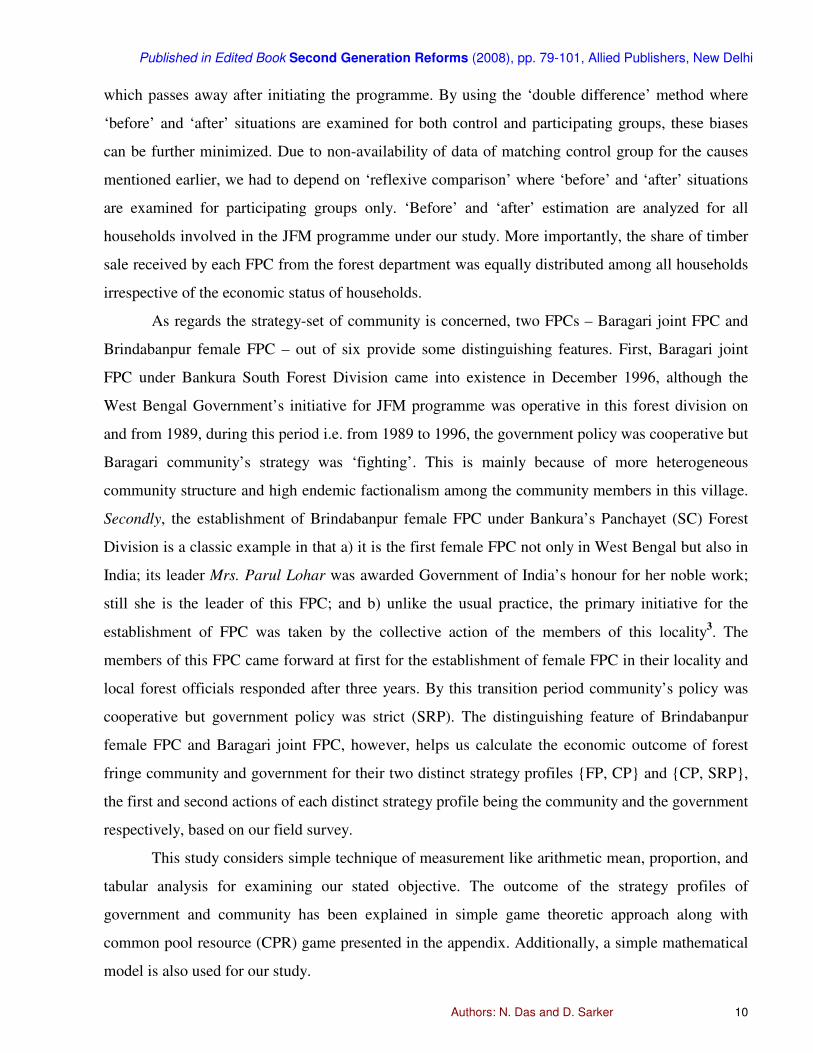
which passes away after initiating the programme. By using the ‘double difference’ method where
‘before’ and ‘after’ situations are examined for both control and participating groups, these biases
can be further minimized. Due to non-availability of data of matching control group for the causes
mentioned earlier, we had to depend on ‘reflexive comparison’ where ‘before’ and ‘after’ situations
are examined for participating groups only. ‘Before’ and ‘after’ estimation are analyzed for all
households involved in the JFM programme under our study. More importantly, the share of timber
sale received by each FPC from the forest department was equally distributed among all households
irrespective of the economic status of households.
As regards the strategy-set of community is concerned, two FPCs – Baragari joint FPC and
Brindabanpur female FPC – out of six provide some distinguishing features. First, Baragari joint
FPC under Bankura South Forest Division came into existence in December 1996, although the
West Bengal Government’s initiative for JFM programme was operative in this forest division on
and from 1989, during this period i.e. from 1989 to 1996, the government policy was cooperative but
Baragari community’s strategy was ‘fighting’. This is mainly because of more heterogeneous
community structure and high endemic factionalism among the community members in this village.
Secondly, the establishment of Brindabanpur female FPC under Bankura’s Panchayet (SC) Forest
Division is a classic example in that a) it is the first female FPC not only in West Bengal but also in
India; its leader Mrs. Parul Lohar was awarded Government of India’s honour for her noble work;
still she is the leader of this FPC; and b) unlike the usual practice, the primary initiative for the
establishment of FPC was taken by the collective action of the members of this locality3. The
members of this FPC came forward at first for the establishment of female FPC in their locality and
local forest officials responded after three years. By this transition period community’s policy was
cooperative but government policy was strict (SRP). The distinguishing feature of Brindabanpur
female FPC and Baragari joint FPC, however, helps us calculate the economic outcome of forest
fringe community and government for their two distinct strategy profiles {FP, CP} and {CP, SRP},
the first and second actions of each distinct strategy profile being the community and the government
respectively, based on our field survey.
This study considers simple technique of measurement like arithmetic mean, proportion, and
tabular analysis for examining our stated objective. The outcome of the strategy profiles of
government and community has been explained in simple game theoretic approach along with
common pool resource (CPR) game presented in the appendix. Additionally, a simple mathematical
model is also used for our study.

Published in Edited Book Second Generation Reforms (2008), pp. 79-101, Allied Publishers, New Delhi
Authors: N. Das and D. Sarker 11
V. Findings
At the very outset, we examine some basic characteristics of our sample FPCs (Table 1).
First, all members of FPCs – both female and joint – in five FPCs out of six are either SC or ST
(column 11). In Baragari joint FPC, about 90 per cent of members do not belong to SC/ST. Second,
about 43 per cent of households (129 out of 302 cases) are landless, about 45 per cent of households
are marginal and the rest, about 12 per cent are small (columns 7, 8 and 9 respectively). In our
sample there is no household, which belongs to medium or big category4. Third, over 77 per cent of
households in each village live below poverty line5 (column 5), the incidence of poverty being the
lowest in Baragari (77.78 percentage). Fourth, except Baragari and Katul-2, majority of members in
each village are illiterate (column 12). This study, however, indicates the abject economic and social
conditions of the tribal people who are among the most disadvantaged group in rural Indian society.
Table 2 presents annual net real income (in Rs.) of sample households from forest source,
non- forest source and from all sources along with the change of income between two time points.
The real income (in Rs.) is determined after deflating the money income by cost of living index
(general) of agricultural labourer. As mention earlier, we consider the year 2005-06 as the base year.
In doing so we use the technique of splicing (which consists in combining two or more overlapping
series of index number to obtain a single continuous series) 6
. Table 2 shows the following important
results: 1) annual net real income (in Rs.) for all categories of households under our sample except
small land holding households in Baragai joint FPC have considerably increased (ranging between
12.84 and 41.56 percentage points) after JFM (column 11); 2) the increase of the annual net real
income of households from all sources is only due to the net increase in income from forest source
after JFM (column 9); 3) the annual net income from non-forest source of sample households in all
FPCs has decreased to a large extent (column 10); 4) the dependence on forest income for all
categories of households has considerably increased after JFM(column 3). Before JFM programme
the annual net real income from forest source out of annual net income from all sources from sample
households ranges between 61.56 percentage point and 78.51 percentage points (column 6). It
implies that forest was major source of income for all categories before JFM; 5) after JFM, annual
net income of forest fringe communities has made a substantial increase. After JFM programme, the
contribution of annual net real income from forest source out of annual net real income from all
sources from sample households works out between 65.84 and 89.62 percentage points except
Baragari FPC (column 3); and 6) the incidence of the dependence on forest income is much lower
Published in Edited Book Second Generation Reforms (2008), pp. 79-101, Allied Publishers, New Delhi
Authors: N. Das and D. Sarker 12
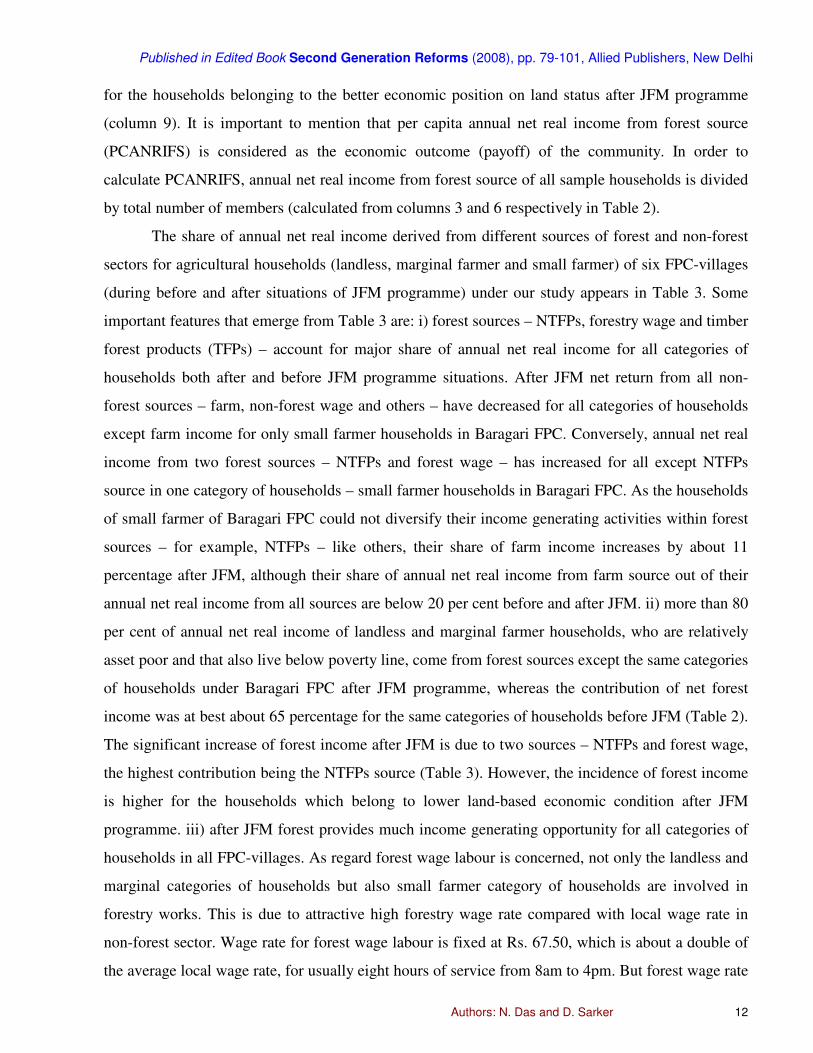
for the households belonging to the better economic position on land status after JFM programme
(column 9). It is important to mention that per capita annual net real income from forest source
(PCANRIFS) is considered as the economic outcome (payoff) of the community. In order to
calculate PCANRIFS, annual net real income from forest source of all sample households is divided
by total number of members (calculated from columns 3 and 6 respectively in Table 2).
The share of annual net real income derived from different sources of forest and non-forest
sectors for agricultural households (landless, marginal farmer and small farmer) of six FPC-villages
(during before and after situations of JFM programme) under our study appears in Table 3. Some
important features that emerge from Table 3 are: i) forest sources – NTFPs, forestry wage and timber
forest products (TFPs) – account for major share of annual net real income for all categories of
households both after and before JFM programme situations. After JFM net return from all non-
forest sources – farm, non-forest wage and others – have decreased for all categories of households
except farm income for only small farmer households in Baragari FPC. Conversely, annual net real
income from two forest sources – NTFPs and forest wage – has increased for all except NTFPs
source in one category of households – small farmer households in Baragari FPC. As the households
of small farmer of Baragari FPC could not diversify their income generating activities within forest
sources – for example, NTFPs – like others, their share of farm income increases by about 11
percentage after JFM, although their share of annual net real income from farm source out of their
annual net real income from all sources are below 20 per cent before and after JFM. ii) more than 80
per cent of annual net real income of landless and marginal farmer households, who are relatively
asset poor and that also live below poverty line, come from forest sources except the same categories
of households under Baragari FPC after JFM programme, whereas the contribution of net forest
income was at best about 65 percentage for the same categories of households before JFM (Table 2).
The significant increase of forest income after JFM is due to two sources – NTFPs and forest wage,
the highest contribution being the NTFPs source (Table 3). However, the incidence of forest income
is higher for the households which belong to lower land-based economic condition after JFM
programme. iii) after JFM forest provides much income generating opportunity for all categories of
households in all FPC-villages. As regard forest wage labour is concerned, not only the landless and
marginal categories of households but also small farmer category of households are involved in
forestry works. This is due to attractive high forestry wage rate compared with local wage rate in
non-forest sector. Wage rate for forest wage labour is fixed at Rs. 67.50, which is about a double of
the average local wage rate, for usually eight hours of service from 8am to 4pm. But forest wage rate

Published in Edited Book Second Generation Reforms (2008), pp. 79-101, Allied Publishers, New Delhi
Authors: N. Das and D. Sarker 13
and the number of working days as wage labour under forest department by the poor forest fringe
communities are more or less fixed. Usually, one person from each poor household with a family
size of five or less gets the opportunity of forest work from 35-40 days per year. If the size of
member of a poor household is grater than five, usually, two persons get the opportunity; iii) out of
annual net real income from all sources, NTFPs’ share has increased in all FPCs for all categories of
households, except small category of households in Baragari FPC. But most importantly, compared
with before JFM period the change of annual net income of NTFPs after JFM, particularly, for
landless and marginal categories of households, who are relatively asset poor than small categories
of households and that live below poverty line, marks a major increases, ranging between 42.38
percentage point and 440.73 percentage point, in all FPC-villages excepts landless and marginal
categories of households in Baragari village. Conversely annual net real income from timber forest
products (TFPs) generating from illegal source7 for landless and marginal categories of households
in Baragari FPC-village has increased during after JFM period as compared with before JFM period,
whereas net annual real income from TFPs yielding from illegal source for the same categories of
households in other FPC-villages has considerably decreased during the same period, ranging
between 44.27 percentage point and 72.71 percentage point. Moreover, net annual real income from
TFPs has considerably decreased for small category of households in all FPC-villages.
The break-up of annual net real income from legal and illegal forest sources for below
poverty line households before and after JFM situations appears in Table 4. It reveals that the illegal
income from TFPs after JFM has substantially increased (30.59 percentage point) to poor categories
of households which live below poverty line in Baragari joint FPC (column 9). The change of illegal
income from TFPs after JFM for the same categories of households to other FPC-villages is highly
negative (ranging between 20.77 and 74.47 percentage points). This is mainly because the change of
income from legal forest products of the poor categories of households of Baragari FPC after JFM is
much lower than that of same categories of households in other FPCs. In all FPCs, except Baragari,
the change of income from legal sources of forest is highly positive ranging between 42.91
percentage point to 117.17 percentage point; in Baragari this change is negative (12.92 percentage
point). It clearly indicates that force or law can not effectively control the illegal collection of TFPs
of the poor categories of households, which live below poverty line, until and unless a considerable
income from legal forest source meets up their bare minimum level of subsistence.
However, while considering per capita annual net real income from forest source
(PCANRIFS) as the payoff of the community together with the break-up of share of income from

Published in Edited Book Second Generation Reforms (2008), pp. 79-101, Allied Publishers, New Delhi
Authors: N. Das and D. Sarker 14
different sources, we also calculate the government’s economic outcome by considering annual net
real income from forestland per FPC (ANRIFFPFPC) as the economic outcome (payoff) of the
government. As mentioned earlier, the payoff of the Government of West Bengal (GoWB) from the
degraded forest, particularly from south West Bengal is concerned, was almost nil for her SRP. A
little payoff that GoWB would usually receive from this forestland was the auction sale of those
trees that were removed by rain and/or by storm. As no specific government revenue had been
reported from the FPC we surveyed before JFM was established and, on the contrary, government
does not give an account of her little revenue for the particular division as a whole, we consider the
critical ANRIFFPFPC for government as Re.1 for her SRP.
With a list of pure strategies available to each player, we now have the game of two-player
(so that the industry is a duopoly) with two strategy sets G ={SRP, CP} and C ={FP, CP} along with
its four distinct strategy profiles {SRP, FP}, {SRP, CP}. {CP, FP}, and {CP, CP} in the following
simple form. It is assumed that both players choose annual net real income in per capita/per FPC
terms rather than annual net money income. First, we use normal form of representation in analyzing
static game (simultaneous move) of complete information8. In figure 1, payoff in the left hand side
indicates the payoff of community and right hand side, the government’s payoff.
Obviously for community, FP is strictly dominated by CP, because 2570>2359 and
3723>2613. It seems to be important to mention that for government, the strategy SRP is said to be
weakly dominated by CP9. But when a strictly dominated strategy equilibrium exists we can
confidently predict that this will be the outcome of the game (Bierman and Fernandez, 1998: 34). So
as a rational player, community will not play FP. Thus government knows that community is
rational; then government will eliminate FP from community’s strategy-space. SRP is now strictly
dominated by CP for government. Thus community knows that government is rational, and then
community will eliminate SRP from government’s strategy-space leaving the strategy profile (CP,
CP) as the outcome of the game. This process is called iterated elimination of strictly dominated
strategies. Unlike Prisoner’s Dilemmas case, this outcome is Pareto optimum because it is not
dominated by any other outcome of the game. The outcome (CP, CP) will hold good as producing
cooperative is a dominant strategy for community. So the strategy profile (CP, CP) is the unique
Nash equilibrium.
The outcome (CP, CP) will also result if community or government moves first. In the
dynamic game of complete and perfect information, we may extend the extensive form of
representation of a two-player, two-stage game in figure 2. Here the players move in sequence, all
Published in Edited Book Second Generation Reforms (2008), pp. 79-101, Allied Publishers, New Delhi
Authors: N. Das and D. Sarker 15
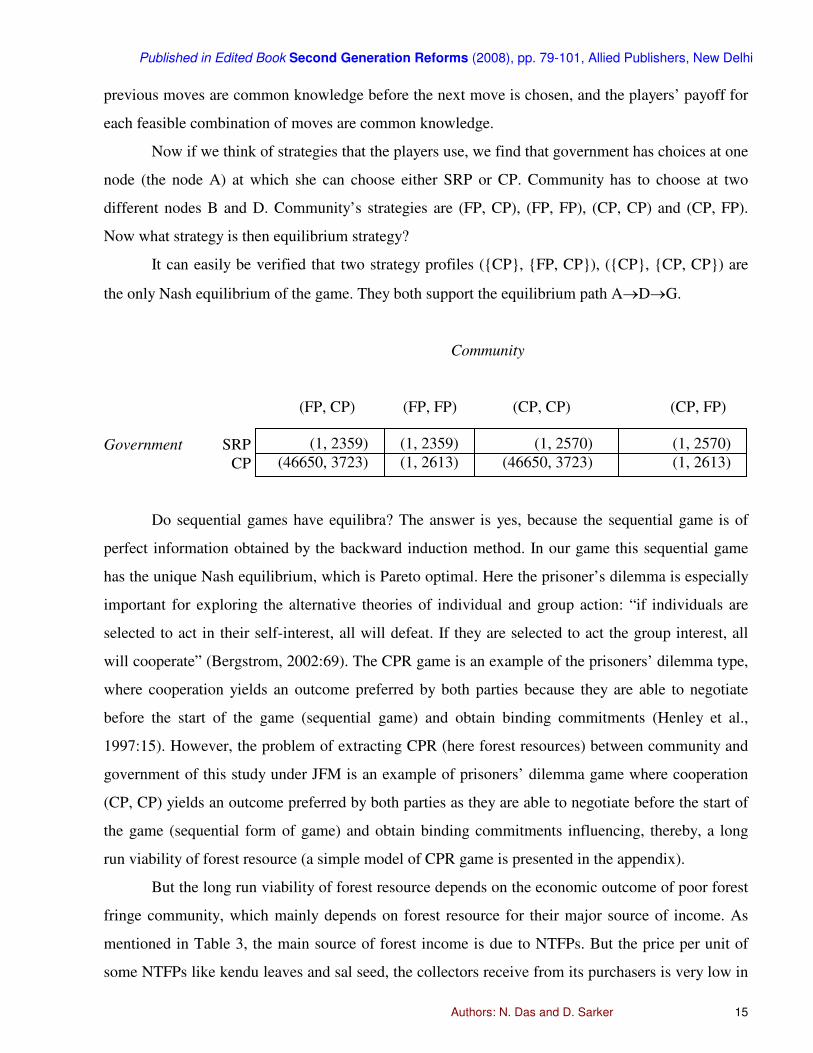
previous moves are common knowledge before the next move is chosen, and the players’ payoff for
each feasible combination of moves are common knowledge.
Now if we think of strategies that the players use, we find that government has choices at one
node (the node A) at which she can choose either SRP or CP. Community has to choose at two
different nodes B and D. Community’s strategies are (FP, CP), (FP, FP), (CP, CP) and (CP, FP).
Now what strategy is then equilibrium strategy?
It can easily be verified that two strategy profiles ({CP}, {FP, CP}), ({CP}, {CP, CP}) are
the only Nash equilibrium of the game. They both support the equilibrium path A→D→G.
Community
(FP, CP) (FP, FP) (CP, CP) (CP, FP)
Government SRP
CP
Do sequential games have equilibra? The answer is yes, because the sequential game is of
perfect information obtained by the backward induction method. In our game this sequential game
has the unique Nash equilibrium, which is Pareto optimal. Here the prisoner’s dilemma is especially
important for exploring the alternative theories of individual and group action: “if individuals are
selected to act in their self-interest, all will defeat. If they are selected to act the group interest, all
will cooperate” (Bergstrom, 2002:69). The CPR game is an example of the prisoners’ dilemma type,
where cooperation yields an outcome preferred by both parties because they are able to negotiate
before the start of the game (sequential game) and obtain binding commitments (Henley et al.,
1997:15). However, the problem of extracting CPR (here forest resources) between community and
government of this study under JFM is an example of prisoners’ dilemma game where cooperation
(CP, CP) yields an outcome preferred by both parties as they are able to negotiate before the start of
the game (sequential form of game) and obtain binding commitments influencing, thereby, a long
run viability of forest resource (a simple model of CPR game is presented in the appendix).
But the long run viability of forest resource depends on the economic outcome of poor forest
fringe community, which mainly depends on forest resource for their major source of income. As
mentioned in Table 3, the main source of forest income is due to NTFPs. But the price per unit of
some NTFPs like kendu leaves and sal seed, the collectors receive from its purchasers is very low in
(1, 2359) (1, 2359) (1, 2570) (1, 2570)
(46650, 3723) (1, 2613) (46650, 3723) (1, 2613)

Published in Edited Book Second Generation Reforms (2008), pp. 79-101, Allied Publishers, New Delhi
Authors: N. Das and D. Sarker 16
relation to the market price. What is more significant is that whatever amount of more valuable
NTFPs per unit (in Rs.) the collectors desire to sell in the market they have only to sell it legally to
the agents of LAMS (Large Adibasi Multipurpose Society), which usually pay to their collectors
considerably lower price per unit for the amount the latter sell to the former. Table 5 shows that net
profit per K.G. of kendu leaves for the agents of LAMPS is about hundred percent of the collector’s
price. Similarly, net profit per K.G. of sal seeds is more than hundred percent of the collector’s price.
This situation is more or less similar with Jharkhand state, very close to West Bengal state. In
Jharkhand, Jharkhand State Forest Development Corporation (JSFDC), licensed traders operating on
behalf of the state, controls kendu leaves marketing in the state, where villagers are little more than
collectors operating as pure price takers in a monopsony, with no bargaining position and no
incentives to improve quality above minimum standards (World Bank, 2006: 46).
However, the success of JFM programme with respect to economic outcome for forest fringe
community and government of this study highlights some particular issues of the poor households of
community, which live below poverty line: 1) more than 80 percent of net annual real income of
poor forest fringe communities yield from forest source – legal or/and illegal source(s); 2) when
NTFPs and wage income from forest are inadequate to meet the bare subsistence level of income of
the poor forest communities, who live below poverty line, they are involved in yielding illegal
income by removing timber forest products from the forest land to meet up their minimum
livelihood security; 3) wage rate for forest wage labour is fixed at Rs. 67.50, which is about a double
of the average local wage rate, for usually eight hours of service from 8am to 4pm; 4) forest wage
rate and the number of working days as wage labour under forest department by the poor forest
fringe communities during present situation of JFM programme are more or less fixed; 5) the price
per unit of some NTFPs the collectors (forest communities) receive from the agent of LAMPS is
considerably lower than market price; and 6) the incidence of the dependence on forest income is
considerably higher for the households which belong to lower economic condition after JFM
programme.
Hence the issue is: what are the means to overcome the problem of the poor categories of
households, which live below poverty line, when legal forest income (income from legal forest
products like NTFPs, fuel wood, timber share from government and wage income from forest) is
inadequate to meet up their bare minimum level of subsistence? There seems to be three ways to
tackle the situation – one is to increase the production of quick growing NTFPs, fuel wood etc. in
order that the poor households may increase the legal collection of those products; but its proper

Published in Edited Book Second Generation Reforms (2008), pp. 79-101, Allied Publishers, New Delhi
Authors: N. Das and D. Sarker 17
execution is hardly short term in nature. The second is to increase the existing government wage rate
and the increase of the number of working days as wage labour under the department of forest. But
the existing government wage rate (Rs. 67.50/- for usually eight hours’ of work a day) is high
enough as compared with the local wage rate (local wage rate ranges between Rs. 30 to 40 for
usually eight hours’ of work a day). Similarly the increase of labour days also depends on new
aforestation programme, which seem to be hardly possible within a short period. The third is to
increase the per unit price of Forest Products (FPs) the collectors have to sell to the agents of LAMS.
This measure seems to be useful for the short period. The following simple mathematical model is
an attempt to analyse this issue in the short run.
We assume Ui = Ui(Z1i, Z2i) ….. (1)
where Z1 = Commodity (like TFPs) that yields illegal income, YI (measured in time unit) from forest
resource; Z2 = Commodity (like NTFPs, wage-labour on forest related service) that yields legal
income, YL (measured in monetary unit) from forest resource; and i = Individual i of poor categories
of households which live below poverty line.
Thus we can write Z1i ≡ YIi
and Z2i ≡ YLi
then Ui = f(YI, YL) ….. (2)
YI is risky and punishable offence for the members of a household if legal authority takes
action against the criminal. But its implications seem to be insignificant for the individuals of very
poor category of households because YI including YL, which would yield illegal income for all i
before JFM programme, was the major source of livelihood security for the same categories of
households before JFM programme; moreover after JFM programme YI is one of the major sources
of the income for poor individuals in one FPC (Baragari), where legal source of income from forest
products is very low in relation to the individuals of very poor category of households in other
villages ( Table 3). So it is assumed that f(YI, YL) is continuous and has first and second order partial
derivatives; it is regular strictly quasi-concave function. The rate of substitution of YL for YI is
– 2
1
f
f
dY
dY
I
L =
But YI = TF – [ LL WW +′ ] ….. (3)
where TF = Total units of available time for forest work by an individual; ′
LW = Total units of
available time for the collection of legal forest products like NTFPs and LW = Total time of legal

Published in Edited Book Second Generation Reforms (2008), pp. 79-101, Allied Publishers, New Delhi
Authors: N. Das and D. Sarker 18
wage work (fixed) under forest department. It is assumed that total available time is 24 hours, and
the individual will never work more than 12 hours per day [∝−t
Lim (′
LW + LW ) = 12].
Then the budget constraint is
YL = p′
LW + r LW ….. (4)
where p = price of legal NTFPs; and r = forest wage rate, which is fixed at r .
Thus U = f(TF – [ LL WW +′ ], p′
LW + r LW ) ….. (5)
To maximize utility we set the derivative of (5) with respect to ′
LW equal zero
′
LdW
dU= – f1 + f2p = 0
and therefore – 2
1
f
f
dY
dY
I
L = = p …..(6)
This second order condition is satisfied provided that it is negative.
2
2
LWd
Ud
′= f11 – 2f12 p′+ f22p
2 < 0
Equation (6) is a relation in terms of legal forest work (′
LW ) and price of legal forest
commodities (p) and is based on the behavior of individual, who live below poverty line. Equation
(6) is, therefore, the supply curve for legal forest work and states how much individual i will legally
work at various prices of NTFPs. Since the supply curve of legal forest work is equivalent to
demand for legal income, (6) indirectly provides the individual’s demand curve for legal income. We
also assume that YI is a normal good. Then hours in legal forest work will increase with the increase
of price of NTFPs. The higher price for legal forest products like NTFPs will induce the individual i
to reduce his illegal work time of forest related work (like collection of TFPs) and so reduces YI
(Figure 3) so long as individual i’s economic condition does not improve. So, the positive
relationship between ′
LW and p and the consequent reduction of YI will continue till the point (P3).
When the price makes individual i so well off that he is induced to cut down legal working time WL
(i.e. increase the YI time) and earn a higher income. But this condition implies a better economic
condition (or upward mobility) of very poor categories of individuals. Practically, when the
individual will be well off, he will also have more opportunities to increase his income other than
forest source. Out study also clearly suggests that more well off individuals are less dependent on

Published in Edited Book Second Generation Reforms (2008), pp. 79-101, Allied Publishers, New Delhi
Authors: N. Das and D. Sarker 19
income from forest resources (Table 2). So P4 provides an indication that individual i is less
dependent on income from forest resource (a better economic condition or a upward mobility of
individual i).
VI. Conclusions and Policy Implications
This empirical study suggests that the economic outcome of the JFM programme has been
beneficial for both community belonging to marginal landholding, small landholding and landless
agricultural households and government and this is due to the strict dominant cooperative strategy of
community. But the earlier forest policy of the government was oriented with the commercial need
of the government disregarding the traditional right and benefit of the forest fringe communities.
Economically government was the worst sufferer for her SRP, because law or force could not
effectively control the illegal collection of forest products of the poor forest fringe communities
which mainly depend on income from forest resource and that live below poverty line, until and
unless a bare minimum level of subsistence level of these communities was met up. The success of
JFM programme has proved that active involvement of forest fringe communities in protection,
regeneration and development planning of forest resource not only provides a significant increase in
income of the community but also begets a major increase in income of the government who failed
to receive such income while she executed SRP. The higher economic outcome of the government is
due to the cooperation of community whom government neglected earlier. Similarly, the coordinated
action by the community, which belong to marginal landholding, small landholding and landless
agricultural households, also help them generate a substantial increase of forest income after JFM as
compared with before JFM mainly from two sources – NTFPs and forest wage, the highest
contribution being the NTFPs’ source. But the incidence of forest income is higher for the
households which belong to lower land-based economic condition and that live below poverty line
after JFM. However, the CPR game of our study, which follows from our empirical evidence,
suggests that the interaction between community and government over a trade off between economic
outcome from extracting commonly owned renewable forest resource has been beneficial for both
guided by cooperation (CP, CP) preferred by both parties within a variety of institutional
arrangement under JFM programme leading, thereby, to exploit the forest more sustainably
compared with the system of strict regulatory policy (SRP) of government before JFM. Although
forest resource of south West Bengal including our study area was resuscitated and restored to
productivity with great improved in quality and density after JFM compared with before JFM, as
Published in Edited Book Second Generation Reforms (2008), pp. 79-101, Allied Publishers, New Delhi
Authors: N. Das and D. Sarker 20
mentioned in SFR (2000:47), the institutional arrangement of JFM could not retain the poor
households which are mainly dependent on forest resource for their livelihood security and that live
below poverty line, from illegal collection of timber products until and unless a considerable income
from legal forest sources – NTFPs, forestry wage and government’ timber share – meets their
livelihood security. This study also suggests that the prices per unit of NTFPs the collectors have to
sell to the agents of LAMPS are considerably lower than their market prices.
In this perspective, however, there seems to be three ways to tackle these problems within the
existing JFM programme – one is to increase the production of quick growing NTFPs, fuelwood etc.
in order that the very poor households may increase the legal collection of those products; but this
depends on the participatory forest management programmes and its proper execution which is
hardly short term in nature. Secondly, the existing government wage rate on forest work is
considerably higher (about a double) than that of the average local wage rate. The increase of labour
days by the forest department depends on new afforestation programme, which also seems to be
hardly possible within a short period. The third is to increase the price per unit of NTFPs the
collectors have to sell to the agents of LAMS. So, in order to have the higher economic outcome
and the higher outreach of the JFM programme, government should restrict the power of the
LAMPS so that the collectors of NTFPs may sell their products at a higher price in the market and
increase their income. But the increase of the collectors’ price of NTFPs may not increase
considerable income of the households below poverty line for the long period. Together with it,
more pro-poor programmes under both government and non-government initiatives that complement
the benefit of JFM programme need to be introduced.
Appendix :
We start with a static model of the CPR as an n-person game (Dasgupta and Heal, 1979;
Chichilnisky, 1994; Ostrom et al., 1992) which has been used by Sethi and Somanathan (1996). We
exclude the assumption of costly sanction on the violation of illegal collection of forest products or
of institutional arrangement under JFM. As mentioned in the text, institutional arrangement of JFM
could not restrain the poor households, which are mainly dependent on forest resource for their
livelihood security and that live below poverty line, from illegal collection of forest products
(timber) until and unless a considerable income from legal forest sources meets up their minimum
livelihood security. Force or law can not effectively control the illegal collection of TFPs of the

Published in Edited Book Second Generation Reforms (2008), pp. 79-101, Allied Publishers, New Delhi
Authors: N. Das and D. Sarker 21
landless and marginal categories of households. Hence the possibility of costly sanction against the
violation of extracting illegal forest products under JFM programme of this study is ruled out. We
also assume a fixed number of n individuals who have complete rights of access and removal to the
forest resource, a renewable natural resource, from a ‘common pool’ under institutional
arrangements of JFM. Let the labour or effort expanded per unit of time by agent (FPC member
household) i on resource extraction be li and the aggregate lobour expanded, L. The sum of
individual labour flows:
∑=
=n
i
ilL1
First, we assume the case where the total stock of resource K=Ko, an exogenously given
constant. Then the aggregate harvesting per unit of time is a function of aggregate flow L and
exogenously given constant Ko i.e.
h(L, Ko) = f(L) …………….(1)
We assume fL>0, fLL<0 i.e. the total harvest per unit of time is an increasing function of effort
and the value of the function is increasing at a deceasing rate. We also assume A(L)= f(L)/L is
decreasing. Each extra effort (labour) of an individual FPC member reduces the harvest available for
other FPC member and therefore the average harvest. In other words f(L)/L diminishes as li
increases. Let us assume that the cost of labour per unit of time is w, which is constant and
exogenously given. This is true because empirical evidence of this study reveals that the wage rate
for forest wage labour per day is fixed at Rs.67.50 (discussed in the text). If we normalize the price
of resource to unity, the efficient level of effort (we ignore changes in the stock) at which the
marginal product of labour equals the wage
( ) wLf =′ …………….(2)
The share of total harvest obtained by ith FPC member is directly proportional to the share of
FPC member i’s effort to total effort, so that FPC member i’s net benefit from resource extraction,
denoted by Πi , is
Πi (l1, l2,….., ln) = ( ) i
i wlLfL
l−
Therefore the aggregate payoff p (l1, l2, ....., ln) satisfies
( ) ( )∑=
−==n
i
in wLLflllp1
21 ,....., π
Published in Edited Book Second Generation Reforms (2008), pp. 79-101, Allied Publishers, New Delhi
Authors: N. Das and D. Sarker 22
Let cL ˆ be the level of aggregate effort which maximizes p. this is the efficient level of effort
(given the stock) at which the marginal product of labour equals the wage ( ) wLf c =′ˆ .
This is shown in Figure a. cL ˆ is unique due to concavity of the function.
Let us now examine what the outcome will be under the usual assumption of rational, self-
interested behaviour by each FPC member. Each FPC member will compare his/her return
( )LLfLA /)()( = with the cost of effort, w . Concavity of the function means that A(L) is decreasing
(mentioned earlier). The FPC member intending harvesting an additional unit will compare
f(L+1)/(L+1) with w and will go on harvesting if f(L+1)/(L+1)> w . However, from individual point
of view labour will be added to the stock harvesting until wcLC
=�� / (Figure a). This may be
interpreted as free entry, zero profit condition with
A(L) w= ……………(3)
Payoff of ith FPC member is now
Πi (li, L) ( )wLAli −= )(
While the aggregate payoff is
P ( )wLAL −= )(
Thus if the resource is characterized by open access, so that the number of user can expand
without limit, then it is clear that labour will be put in until the average product equals the wage and
rents(profits) are driven to zero as shown at C
L � in Figure a. This is clearly inefficient, because
adding harvesting has a negative externality effect on the forest resource. However, disregarding the
negative externality, each individual will put in more labour them is efficient so long as there is
positively rent (profit) from the extraction (or harvesting). The CRP game has a unique Nash
equilibrium, which is symmetric with Li cL= for all FPC members. It is inefficient and involves
overexploitationCC
LL <ˆ . There are positive rents in equilibrium: CCC
LnLL �<= so
that wLAC
>)( . This is the classic problem of the common users: each individual would be better off
if all would restrain their use, but it is never in the interest of any individual to do so (Dasgupta and
Heal, 1979; Hardin, 1968; Weitzman, 1974; Sethi and Somanathan, 1996).

Published in Edited Book Second Generation Reforms (2008), pp. 79-101, Allied Publishers, New Delhi
Authors: N. Das and D. Sarker 23
Har
ves
t →
O
CL ˆ C
L Aggregate extraction effort →
Figure a
In the case of resource dynamics, the case of renewable forest resources is different from the
assumption of exogenously given forest resource by virtue of the fact that it is naturally generated
within a time period relevant to human exploitation. Renewable resources are often assumed to
follow a ‘natural growth law’ which is assumed to be simply a function of the size of resource stock.
The relationship is not monotonic, but inverse U-shape (the logistic growth function). The growth
rate at first rises with the size of stock, and then falls i.e., the slope of the curve is positive and
decreasing. It is due to the fact that the natural environment has a ‘carrying capacity’ for the
resource; a maximum population that it can sustain. There is zero growth rate for this size of stock.
We assume equal effort level by each type of player – government and community – under
cooperative management of forest in the dynamic analysis. This is, mainly, because the CPR game
of our study considers two types of players – community and government – in community forestry
where forest department and community jointly manage the forest protection activities within a joint
cooperative institutional framework without any costly sanctions. Hence we assume equal effort
level for both – community and government. Then there is the unique Nash equilibrium for all FPC
members at which maximum sustainable yield is equated to the corresponding resource stock. This
stage is called the socially optimum average effort level corresponding to the resource stock (Sethi
and Somanathan, 1996, 777-8). This is shown at KM in Figure b. If we indigenize K, the aggregate
harvest per unit of time is a function
H(L, K) ……………………(4)
CL �
MR
AR
TR
AC = MC = w

Published in Edited Book Second Generation Reforms (2008), pp. 79-101, Allied Publishers, New Delhi
Authors: N. Das and D. Sarker 24
Rat
e o
f ch
ang
e o
f
reso
urc
e st
ock
→
As renewable resources are often assumed to follow natural growth law, HK>0, HKK<0.
LM(K)
KF KM KL O
Resource stock →
Figure b
In addition to its dependence on the harvest, the evolution of the resource stock will depend
on its own natural rate of replenishment, which we represent by the differentiable function R(K).
There is finite carrying capacity of the resource stock (KL in Figure b) so that R(K)<0 for K>KL, and
R(KL) = 0. Let KF>0 be the minimum viable stock, so that R(K) > 0 for KF<K<KL, and R(K) < 0 for
0<K<KF. The minimum viable stock is the level below which the resource can not recover by natural
reproduction even in the absence of harvesting. Finally, let R be a unique maximum at some KM.
This is the standard specification used to characterize the dynamic of renewable resources. The
growth rate of the resource stock, taking account of harvesting, is then given by
),()( KLHKIK −=� ……………(5)
The extraction per unit of effort is assumed constant proportion of the stock. Letting LM(K)
denote the (statistically) socially optimum average effort level and LN(K) denotes the Nash
equilibrium effort level corresponding to resource stock K, it is clear that LM(K)=LN(K)=0. The
stable cooperative equilibrium point of the system is the type of behaviour and levels of resource
stock that we may expect to see in the long run. This is satisfied at the aggregate effort levels L and
resource stock K for which 0=K� . For any KF<K<KL, I(K)>0, so by putting in enough effort the
harvest can be raised high enough that it equals the rate of replenishment, thus causing K� to equals
zero (KM in Figure b). The average product now depends both on aggregate extraction effort and the
resource stock
Published in Edited Book Second Generation Reforms (2008), pp. 79-101, Allied Publishers, New Delhi
Authors: N. Das and D. Sarker 25
L
KLHKLA
),(),( =
As we assume equal effort level for each type of player – government and community –
under cooperative management of forest, the payoff of each type of player will be
( )wKLAKlii −= ),()(π
Therefore, the aggregate payoff is
( )wKLAKLn
i
i −=∑=
),()(1
π
In this perspective it is relevant to mention that the game theoretic framework of Sethi and
Somanathan (1996) shows that whenever there is a stable non-cooperative equilibrium (one in which
individuals do not restrain their use with different effort level) with a positive renewable stock, then
there is a cooperative equilibrium with a higher stock and that cooperative norms of behaviour is
stable. The CPR model of our study also suggests that in spite of equal effort level for each type of
player, cooperative equilibrium is also stable with the highest level of stock.
Let us consider a two stage game: the first stage discussed in the CPR game and the second
one is the game in which individuals have the option of imposing sanctions on other agent in
response to their observed extraction level. Sanctioning behaviour is costly not only for the
punished, but also for the punisher (Sethi and Somanathan, 1996:771). But such a sanctioning
behaviour is unimportant in our empirical study. Hence at KM, there is unique sub-game perfect
equilibrium in which all agents choose LN effort level and no agent sanctions any other. Hirshleifer
and Rasmusen (1989) show that cooperation can be sustained in sub-game perfect equilibrium in a
finitely repeated prisoners’ dilemma with rationing. Ostrom et al.(1992) show that even in clearing
specified finite horizon games designed to extract commons, high level cooperation can be sustained
if the possibility of pre-game communication is present, with or without the possibility of costly
sanctions. It seems to be relevant to mention that despite without the possibility of costly sanctions
against the violators (poor forest fringe communities) of extracting illegal forest products, forest
resources in south West Bengal including our study area was resuscitated and restored to
productivity with great improvement in quality and density as a result of participatory and JFM
activities compared with before JFM situation (SFR, 2000:47).

Published in Edited Book Second Generation Reforms (2008), pp. 79-101, Allied Publishers, New Delhi
Authors: N. Das and D. Sarker 26
Notes
1) Farm income implies earnings from sales of field crops including fruit crops. Self-employment includes
non-forest based business like resale of agricultural commodities, tailor, money lending, sales of fish,
grocery sales, public transport operation, radio and bike repair, tinsmith, and stone breaking. Wage work
includes non-forest off-farm employment like contract agricultural labour, forestry officer, teacher,
mechanic, watchman, and village headperson. Sales assets consider sales of livestock and poultry,
property rental, and sales of personal and household items. Transfers include remittance from household
residents, gifts from relatives, and loans.
2) We take all samples for our study from Bankura district only since almost all female FPCs in West Bengal
are operating in Bankura district, being extended to all three forest divisions – Bankura (north), Bankura
(south), and Panchet S C – of the district. As this paper has been prepared based on PhD research work
entitled ‘Women’s Dependence on Forest and Participation in Forestry: A Case Study of Joint Forest
Management Programme in West Bengal’, we consider all samples from Bankura district in south West
Bengal where the vast tract of forest land containing mainly the sal were overexploited and degraded
before JFM situation. After JFM the forest land under our study have been resuscitated and restored to
productivity with great improvement in quality and density.
3) It is worth mentioning that forest officials usually take the primary initiative (during 1988-89) for the
establishment of both joint FPC and female FPCs in this area. They first speak to the local forest
communities, local panchayet bodies about the utility of the establishment of FPC under JFM programme.
Later, local forest communities and local panchayet respond to it.
4) In the irrigated area households possessing cultivable land between 0.01 and 2.49 acres are treated as
marginal farmer households, between 2.50 and 4.99 acres, as small farmer households, while in the
unirrigated area, this is twice the area of their irrigated lands.
5) Poverty line income in rural West Bengal on the basis of PCME (per capita monthly expenditure) by NSS
of 55th round (1999-00) is Rs. 350.17. Based on the CPIAL (Consumer Price Index of Agricultural Labour
[General]) per capita monthly expenditure for the year 2005-06, the poverty line income for the year
2005-06 is calculated as Rs. 393 approximately.
6) Indian Labour Journal (1991, Vol. 32, No. 4: p. 662) provides the Consumer Price Index Number of
Agriculture Labour (General) for rural West Bengal on and from 1990-91 to 1995-96, the base year being
1960-61. Similarly, Indian Labour Journal (2005, Vol. 46, No. 12: p. 1225) provides the same for rural
West Bengal on and from 1995-96 to 2005-06 with 1986-87 as base year. We then shift the base year of
1960-61 to 1986-87 for all the years from 1990-91 to 2005-06. Again we shift the base year from 1986-87
to 2005-06 and calculate the CPIAL from 1990-91 to 2005-06.

Published in Edited Book Second Generation Reforms (2008), pp. 79-101, Allied Publishers, New Delhi
Authors: N. Das and D. Sarker 27
7) Never did the respondents say that their source of income was illegal; rather, while examining the answer
from the respondents regarding their break-up of their source of income, the distinction between legal and
illegal source was clearly demarcated.
8) It might be a game of complete information because each player’s payoff function (the function that
determines the player’s payoff from the combination of action chosen by the players) is common
knowledge among all the players (Gibbons, 1992: 2).
9) SRP is no longer strictly dominated by CP, because both strategies provide same payoff (Re 1) to the
government if community adopts a FP strategy, but strictly higher payoff to government if community
adopts CP.
References
Acheson, J. M. (1993), Capturing the Commons: Legal and Illegal Strategies, in: T. L. Anderson and R. T.
Simmons, eds., The political economy of customs and culture: Informal solutions to the commons
problem, Rowman and Littlefield, Lanham.
Angelsen, A. and S. Wunder (2003), Exploring the forest-poverty link: key concepts, issues and research
implications, CIFOR Occasional Paper No. 40, Center for International Forestry Research, Bogor,
Indonesia.
Arnold, M. (2001), Forestry Poverty and Aid, Occasional Paper No. 33(E), Center for International Forestry
Research, Bogor, Indonesia.
Bahuguna, V. K. (2004), Root to Canopy: An Overview, in: V. K. Bahuguna, K. Mitra, D. Capitrano, and S.
Sargal, eds., In Root to Canopy: Regenerating Forests through Community-State Partnerships,
Winrock International and Commonwealth Forestry Association, Delhi.
Bergstrom, T. (2002), Evolution of Social Behaviour: Individual and Group Selection, Journal of Economic
Perspectives, Vol. 16, No. 2, 67-88.
Bierman, H. S. and L. Fernandez (1998), Game Theory with Economic Applications, Pearson Education:
Delhi.
Cavendish, W. (1999), Poverty, Inequality and Environmental Resources: Quantitative Analysis of Rural
Households, Working Paper Series No. 99-9, Center for the Study of African Economics, Oxford.
Chichilnisky, G. (1994), North South Trade and the Global Environment, American Economic Review, Vol.
84, No. 4, 851-74.
Clark, C. W. (1980), Restricted Access to Common-Property Fishery Resources: A Game-theoretic Analysis,
in: Pan-Tai Liu, ed., Dynamic Optimization and Mathematical Economics, Plenum, New Work.
Cordell, J. and M.A. McKean (1992), Sea Tenure in Bahia, Brazil, in: D.W. Bromley, ed., Making the
commons work, ICS Press, San Francisco.
Published in Edited Book Second Generation Reforms (2008), pp. 79-101, Allied Publishers, New Delhi
Authors: N. Das and D. Sarker 28
Dasgupta, P. and G. Heal (1979), Economic theory and exhaustible resources, Cambridge University Press,
Cambridge.
Dayton-Johnson, J. and P. Bardhan (2002), Inequality and Conservation on the Local Commons: A
Theoretical Exercise, The Economic Journal, Vol. 112, 577-602.
Dutta K.K. (1940), The Santal Insurrection of 1955-1857, University of Calcutta: Calcutta.
Duyker, E. (1987), Tribal Guerrillas: The Santals of West Bengal and the Naxalite Movement, Oxford
University Press: Delhi.
Fisher, M. (2004), Household welfare and forest dependence in Southern Malawi, Environment and
Development Economics, Vol. 9, 135-154.
Fudenberg, D. and E. Maskin (1986), The Folk Theorem in Repeated Games with Discounting or with
Incomplete Information, Econometrica, Vol. 54, No. 3, 533-54.
Gardner, R., E. Ostrom and J. Walker (1990), The Nature of Common-Pool Resource Problems, Rationality
and Society, Vol. 2, 335-58.
Gibbons, R. (1992), Game Theory for Applied Economists, Princeton University Press: New Jersey.
Guha, R. (1989), The Unquiet Woods, Oxford University Press, Delhi.
Hardin, G. (1968), The Tragedy of the Commons, Science, Vol. 162, 1243-48.
Hanley, N., J.F.Shogren and B.White (1997): Environmental Economics - in Theory and Practice,
Macmillan: New Delhi.
Hechter, M. (1987), Principles of Group Solidarity, Berkeley University California Press, California.
Hirshleifer, D. and E. Rasmusen (1989), Cooperation in a Repeated Prisoners’ Dilemma with Ostracism,
Journal of Economic Behavior and Organization, Vol. 12, No. 1, 87-106.
Jeffery, R. and N. Sundar, eds., (1999), A New Moral Economy for India’s Forests? Discourses of
Community Participation, Sage Publications: New Delhi.
Jodha, N.S. (1992), Common Property Resources and Rural Poor in Dry Regions of India, Economic and
Political Weekly, Vol. 21, 1169-1181.
Jodha, N.S. (1986), Common Property Resources: A Missing Dimension of Development Strategies,
Discussion Paper No. 169, The World Bank, Washington DC.
Kholin, G. and M. Ostwald (2001), Impact of Plantations on Forest Use and Forest Status in Orissa, India,
Ambio, Vol. 30, No. 1.
Kumar, S. (2002), Does “Participation” in Common Pool Resource Management Help the poor? A Social
Cost Benefit Analysis of Joint Forest Management in Jharkhand, India, World Development, Vol. 30,
No. 5, 763-782.
Kumar, S., N. Saxena, Y. Alagh and K. Mitra (2000), India: Alleviating Poverty through Forest
Development – Evaluation Country Case Study, The World Bank, Washington DC.
Ostrom, E. (1990), Governing the commons: The evolution of institutions for collective action, Cambridge
University Press, Cambridge.

Published in Edited Book Second Generation Reforms (2008), pp. 79-101, Allied Publishers, New Delhi
Authors: N. Das and D. Sarker 29
Ostrom, E., R. Gardner and J. Walker (1990), Rules and Games: Institutions and Common-Pool Resources,
University of Michigan Press, Ana Arbor.
Ostrom, E., J. Walker and R. Gardner (1992), Covenants With and Without a Sword: Self-Governance Is
Possible, American Political Science Review, Vol. 86, No. 2, 404-17.
Pattanayak, S.K., E.O. Sills and R.A. Kramer (2004), Seeing the forest for the fuel, Environment and
Development Economics, Vol. 9, 155-179.
Poffenberger, M. (1995), The Resurgence of Community Forest Management in the Jungle Mahals of West
Bengal, in: D. Arnold and R. C. Guha, eds., Nature, Culture and Imperialism: Essays on the
Environmental History of South Asia, 336-69, Oxford University Press: Delhi.
Ravillion, M. (2001), The Mystery of the Vanishing Benefits: An Introduction to Impact Evaluation, The
World Bank Economic Review, Vol. 15, No. 1.
Sarker, D. N. and N. Das (2004), Historical Relevance of Joint Forest Management Programme and the Key
Element of Its Sustainability: Evidence from Western Midnapore Division of West Bengal,
International Journal of Environment and Development, Vol. 1, No. 2, 169-91.
Sarmah, D. and S. N. Rai (2001), Forest Resource Management in India: Role of the State and its
Effectiveness, in: S.N. Chary and V. Vyasulu, eds., Environment and Management, 206-20,
Macmillan: New Delhi.
Scherr, S.J., A. White and D. Kaimowitz (2002), Making Markets Work for Forest Communities, Forest
Trends Policy Brief, Washington DC.
Sethi, R. and E. Somanathan, (1996), The Evolution of Social Norms in Common Property Resource Use,
The American Economic Review, Vol. 86, No. 4, 766-88.
SFR (2000), State Forest Report, Office of the Principal Chief Conservator of Forest, Directorate of Forest,
Government of West Bengal, Kolkata.
Somanathan, E. (1991), Deforestation, Property Rights and Incentives in Central Himalaya, Economic and
Political Weekly, January 26, PE37-46.
Weitzman, M.L. (1974), Free Access vs. Private Ownership as Alternative Systems for Managing Common
Property, Journal of Economic Theory, Vol. 8, No. 2, 225-34.
Williamsen, O.E. (1985), The Economic Institutions of Capitalism: Firms, Market, Relational Contracting,
Free Press, New York.
World Bank (2001), A Revised Forest Strategy for the World Bank Group (Draft), The World Bank,
Washington DC.
World Bank (2006), India: Unlocking Opportunities for Forest-Dependent People, The World Bank,
Agriculture and Rural Development Sector Unit, South Asia Region, Oxford University Press: New
Delhi.
Wunder, S. (2001), Poverty Alleviation and Tropical Forests – What Scope for Synergies?, World
Development, Vol. 29, 1817- 1833.

Published in Edited Book Second Generation Reforms (2008), pp. 79-101, Allied Publishers, New Delhi
Authors: N. Das and D. Sarker 30
Table 1: Some Basic Characteristics of the Sample FPC/Village Households
Status of agricultural land
holding**
Sex of FPC
member Division FPC/Village
No.
of
HH
Average
size
of
HH
% of HH
live below
poverty line*
Size of forest
land (ha.)
protected
under JFMP Land less Marginal Small Female {Male}
% of HH
belongs to
SC [ST]
category
% of
illiterate
FPC
member
1 2 3 4 5 6 7 8 9 10 11 12
Agua 23 4.52 100 13.75 19 4 0 23{0} 100 [0] 95.24 Bankura
North Belboni 44 4.95 100 70 41 3 0 2{42} 100 [0] 86.36
Malibona 41 4.97 95.12 70 4 35 2 41{0} 9.75[90.25] 51.22 Bankura
South Baragari 45 5.44 77.78 70 3 32 10 2{43} 2.22 [8.89] 33.33
Brindabanpur 56 4.80 80.36 56 29 16 11 56{0} 100 [0] 77.50 Panchayet
S C Katul-2 93 5.08 84.95 180 33 46 14 3{90} 100 [0] 42.63
* Poverty line in year 2005-06 is per capita expenditure of Rs. 393 /-
** Holding of agricultural land from 0.01 to 2.50 acres are treated as marginal, from 2.51 to 5.00 acres as small. For unirrigated land these would be doubled.
Table 2: Annual Net Real Income (in Rs.) from All Sources of Sample Households*
Present Before % change
FPC/ Village
Category
of
house-
holds
Net return from
forest
sources
Net return from
non-forest
sources
Net return
from all
sources
Net return from
forest
sources
Net return from
non-forest
sources
Net return
from all
sources
Net return
from
forest
sources
Net return
from non-
forest
source
Net
return
from all
sources
1 2 3 4 5 6 7 8 9 10 11 12 13 14 15 16 17
Landless 327825.8
(86.14) 0.29
52747.4
(13.86) 1.48
380573.2
(100.00) 1.08
173018.4
(64.36) 0.36
95810.6
(35.64) 3.42
268829.0
(100.00) 2.11 89.47 - 44.95 41.56
Agua
Marginal 65496.0
(85.06) 0.38
11503.8
(14.94) 1.59
76999.80
(100.00) 1.19
42175.6
(67.87) 0.48
19964.2
(32.13) 3.96
62139.8
(100.00) 2.49
55.29
- 42.38 38.04
CV CV CV CV CV CV

Published in Edited Book Second Generation Reforms (2008), pp. 79-101, Allied Publishers, New Delhi
Authors: N. Das and D. Sarker 31
*The real income is determined after deflating the money income by cost of living index (general) of agricultural labour. We consider 2005-06 as the base year.
CV = coefficient of variation.
Landless 766193.2
(87.66) 0.24
107857.9
(12.34) 1.16
874051.1
(100.00) 1.01
430512.0
(63.92) 0.33
243004.9
(36.08) 3.09
673516.9
(100.00) 1.90 77.97 - 55.61 29.77
Belboni
Marginal 53202.7
(85.84) 0.30
8776.2
(14.16) 1.31
61978.9
(100.00) 1.12
31508.2
(64.89) 0.44
17048.2
(35.11) 3.48
48556.4
(100.00) 2.21 68.85 - 48.52 27.64
Landless 76308.4
(89.62) 0.32
8838.2
(10.38) 1.86
85146.6
(100.00) 1.30
44898.8
(65.12) 0.38
24049.1
(34.88) 3.57
68947.9
(100.00) 2.20 69.96 - 63.25 23.49
Marginal 681299.2
(88.18) 0.41
91324.0
(11.82) 1.92
772623.2
(100.00) 1.39
425916.3
(64.88) 0.51
230551.6
(35.12) 3.95
656467.9
(100.00) 2.53 59.96 - 60.39 17.69 Malibona
Small 37745.8
(86.20) 0.83
6042.8
(13.80) 2.21
43788.60
(100.00) 1.96
26510.9
(78.51) 1.25
7256.4
(21.49) 4.12
33767.3
(100.00) 3.36 42.38 - 16.72 29.68
Landless 51154.2
(72.16) 0.39
19735.8
(27.84) 1.66
70890.00
(100.00) 1.27
38831.5
(64.11) 0.62
21738.6
(35.89) 3.75
60570.1
(100.00) 2.54 31.73 - 9.21 17.04
Marginal 574257.2
(70.75) 0.58
237413.8
(29.25) 2.12
811671.0
(100.00) 1.69
460344.3
(64.00) 0.99
258943.6
(36.00) 3.92
719287.9
(100.00) 3.02 24.74 - 8.31 12.84 Baragari
Small 133182.4
(56.06) 0.98
104388.8
(43.94) 2.57
237571.2
(100.00) 2.31
140987.2
(61.56) 1.67
88036.8
(38.44) 4.26
229024.0
(100.00) 3.85 - 5.53 - 18.60 3.73
Landless 574140.6
(81.24) 0.35
132581.0
(18.76) 1.75
706721.6
(100.00) 1.25
360161.6
(62.10) 0.41
219808.8
(37.90) 3.41
579970.4
(100.00) 2.17 59.41 - 39.68 21.85
Marginal 298869.9
(80.91) 0.44
70515.7
(19.09) 1.99
369385.6
(100.00) 1.48
214342.2
(66.40) 0.83
108461.4
(33.60) 3.68
322803.6
(100.00) 2.71 43.42 - 34.98 14.43 Brindabanpur
Small 166586.3
(79.83) 0.76
42090.1
(20.17) 2.57
208676.4
(100.00) 2.09
116871.0
(70.58) 1.08
48718.5
(29.42) 3.89
165589.5
(100.00) 3.09 42.54 - 13.60 26.02
Landless 651273.6
(83.12) 0.36
132260.6
(16.88) 1.82
783534.2
(100.00) 1.31
374660.7
(63.23) 0.59
217875.5
(36.77) 3.50
592536.2
(100.00) 2.40 73.83 - 39.29 32.23
Marginal 846732.2
(82.55) 0.51
178988.2
(17.45) 2.04
1025720.4
(100.00) 1.56
519358.3
(65.25) 0.92
276542.3
(34.75) 3.82
795900.6
(100.00) 2.88 63.03 - 35.28 28.87 Katul-2
Small 295158.8
(80.72) 0.85
70498.8
(19.28) 2.55
365657.6
(100.00) 2.18
211210.5
(72.20) 1.14
81344.8
(27.80) 4.01
292553.3
(100.00) 3.20 39.75 - 13.33 24.99

Published in Edited Book Second Generation Reforms (2008), pp. 79-101, Allied Publishers, New Delhi
Authors: N. Das and D. Sarker 32
Table 3: Annual Net Real Income Share (in percentage) by Sources of Sample Households
Net return from forest sources Net return from non-forest sources % change
TFPsa Net return from forest sources Net return from non-forest sources
FPC/Village Category
of
households NTFPs
Forestry
wage Total Illegal Farmb
Non-forest
wagec
Othersd NTFPs Forestry wage TFPs Farm Non-forest wage Others
1 2 3 4 5 6 7 8 9 10 11 12 13 14 15
Landless 58.68
(19.67)
14.52
(8.24)
11.86
(36.45)
11.67
(36.45)
0.00
(0.00)
8.59
(25.35)
5.27
(10.29) 198.32 76.21
- 64.50
[- 67.98] - - 66.11 - 48.79
Agua
Marginal 58.92
(22.73)
13.97
(8.27)
11.17
(36.87)
10.86
(36.87)
5.08
(5.99)
4.31
(14.21)
5.55
(11.93) 159.21 68.92
-66.99
[- 70.57] - 15.19 - 69.67 - 53.48
Landless 53.56
(15.75)
15.35
(7.50)
17.32
(40.67)
17.18
(40.67)
0.00
(0.00)
8.83
(26.64)
3.51
(9.44) 240.19 104.67
- 53.91
[- 57.76] - - 66.85 - 62.82
Belboni
Marginal 54.54
(14.45)
13.34
(8.18)
16.96
(42.26)
16.34
(42.26)
4.72
(5.17)
4.55
(18.78)
4.89
(11.16) 277.47 63.08
- 57.51
[- 61.33] - 8.70 - 75.77 - 56.18
Landless 53.61
(19.46)
16.34
(10.36)
18.46
(35.30)
18.58
(35.30)
0.00
(0.00)
6.80
(23.62)
3.58
(11.26) 175.47 57.72
- 44.27
[- 47.37] - - 71.21 - 68.21
Marginal 55.93
(19.61)
14.17
(10.41)
17.68
(34.86)
17.03
(34.86)
4.58
(4.90)
2.40
(16.45)
4.84
(13.77) 185.19 36.12
- 48.12
[- 51.15] - 6.53 - 85.41 - 64.85 Malibona
Small 59.79
(38.14)
11.62
(7.75)
14.79
(32.62)
13.73
(32.62)
7.35
(7.62)
0.00
(0.00)
6.45
(13.87) 56.76 49.94
- 54.66
[- 57.92] - 3.54 - - 53.50
Landless 17.55
(14.46)
8.61
(6.64)
45.99
(43.01)
44.85
(43.01)
0.00
(0.00)
18.44
(22.45)
9.40
(13.44) 21.39 29.67
6.94
[4.28] - - 17.86 - 30.06
Marginal 18.36
(17.07)
8.51
(5.87)
43.17
(41.06)
42.81
(41.06)
3.88
(4.05)
15.50
(18.20)
9.87
(13.75) 7.57 44.97
6.86
[4.26] - 4.20 - 14.84 - 28.22 Baragari
Small 19.45
(20.44)
4.77
(3.15)
31.84
(37.97)
30.70
(37.97)
19.48
(17.55)
0.00
(0.00)
24.46
(20.89) - 4.84 51.43
- 16.14
[- 19.15] 11.00 - - 17.09
Landless 57.77
(34.85)
17.61
(8.16)
4.09
(19.09)
3.51
(19.09)
0.00
(0.00)
10.30
(22.15)
8.46
(15.75) 65.76 115.81
- 69.30
[- 81.61] - - 53.50 - 46.29
Marginal 58.89
(41.36)
17.24
(8.08)
3.41
(16.96)
2.30
(16.96)
6.32
(7.56)
4.07
(9.86)
8.70
(16.18) 42.38 113.37
- 71.80
[- 86.44] - 16.4 -58.72 - 46.23 Brindabanpur
Small 64.62
(48.39)
12.05
(6.40)
3.16
(15.79)
0.14
(15.79)
10.94
(12.05)
0.00
(0.00)
9.23
(17.37) 33.54 88.28
- 79.99
[- 99.11] - 9.21 - - 46.86

Published in Edited Book Second Generation Reforms (2008), pp. 79-101, Allied Publishers, New Delhi
Authors: N. Das and D. Sarker 33
Landless 52.77
(9.76)
16.47
(7.42)
12.45
(46.05)
12.75
(46.05)
0.00
(0.00)
9.60
(23.88)
7.28
(12.89) 440.73 121.97
- 69.87
[- 72.31] - - 59.80 - 43.52
Marginal 54.67
(14.01)
15.80
(6.98)
11.78
(44.26)
10.88
(44.26)
6.57
(6.90)
3.25
(12.84)
7.63
(15.01) 290.23 126.36
- 72.71
[- 75.42] - 4.78 - 74.69 - 49.17 Katul-2
Small 59.90
(26.24)
11.48
(5.33)
9.34
(40.63)
8.32
(40.63)
11.06
(11.51)
0.00
(0.00)
8.22
(16.29) 128.28 115.38
- 77.01
[- 79.53] - 3.91 - - 49.54
Notes: 1. Figures within ( ) and [ ] represent the value during before situation of JFM programme and percentage change of illegal timber forest products respectively;
2. a) TFPs(timber forest products) include net return from two sources – share from government’ timber sale and sale of illegally collected timber; b) net return from sale of farm
crops including households crops; c) non-forest wage includes farm and/or non-farm labour wage other than forest wage employment; and d) others’ non-forest source
includes net return from self-employment(business activities like market middle man, tailor, and radio and bike repair) and net return from sale of livestock, personal and
household items etc.
Table 4: Annual Net Real Income (Rs.) from Forest for BPL Categories of Households
Present net return of forest from Before net return of forest from % change
FPC/ Village Legal
sources
Illegal
sources
All sources Legal
sources
Illegal
sources All sources
Legal
sources
Illegal
sources All sources
1 2 3 4 5 6 7 8 9 10
Agua 281848
(71.66)
45360
(11.53)
393322
[85.96]
136594
(63.47)
78600
(36.52)
215194
[65.00] 106.34 - 42.29 82.78
Belboni 549153
(67.02)
140280
(17.12)
819396
[87.54]
273620
(59.22)
188400
(40.78)
462020
[63.98] 100.70 - 25.54 77.35
Malibona 516157
(68.13)
130200
(17.19)
757608
[88.32]
306487
(65.10)
164278
(34.90)
470765
[64.90] 68.41 - 20.77 60.93
Baragari 255426
(40.84)
268800
(42.98)
625411
[70.86]
293343
(58.76)
205833
(41.23)
499176
[64.00] - 12.92 30.59 25.28
Brindabanpur 670515
(76.80)
26880
(3.08)
873010
[81.13]
469198
(81.67)
105306
(18.33)
574504
[63.64] 42.91 - 74.47 51.96
Katul-2 1067680
(71.27)
174720
(11.66)
1498006
[82.80]
491638
(54.99)
402381
(45.01)
894019
[64.39] 117.17 - 56.58 67.56
Total 556796
(67.13)
131040
(15.83)
827792
[82.51]
328480
(63.26)
190808
(36.74)
519288
[64.25] 69.51 - 31.32 59.41
* Figures within ( ) represent percentages out of total forest income; Figures within [ ] represent percentages of forest income out of total income.
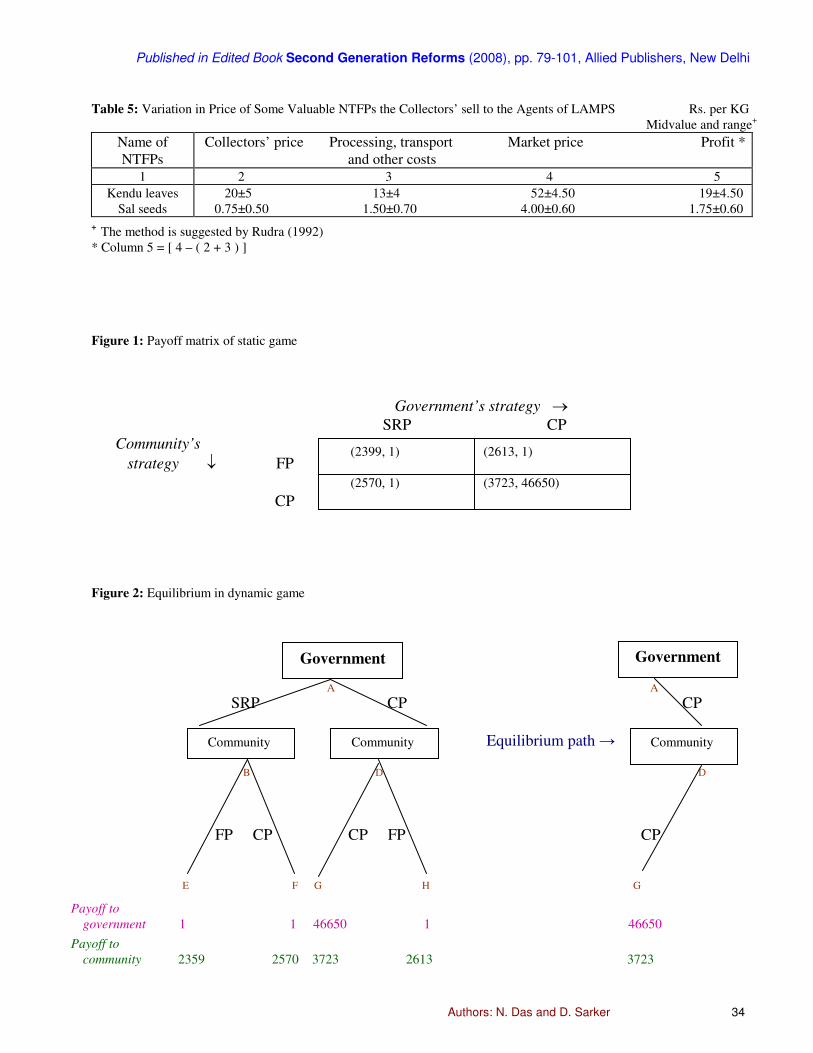
Published in Edited Book Second Generation Reforms (2008), pp. 79-101, Allied Publishers, New Delhi
Authors: N. Das and D. Sarker 34
Table 5: Variation in Price of Some Valuable NTFPs the Collectors’ sell to the Agents of LAMPS Rs. per KG
Midvalue and range+
Name of
NTFPs
Collectors’ price Processing, transport Market price Profit *
and other costs
1 2 3 4 5
Kendu leaves
Sal seeds
20±5 13±4 52±4.50 19±4.50
0.75±0.50 1.50±0.70 4.00±0.60 1.75±0.60
+ The method is suggested by Rudra (1992)
* Column 5 = [ 4 – ( 2 + 3 ) ]
Figure 1: Payoff matrix of static game
Government’s strategy →
SRP CP
Community’s
strategy ↓ FP
CP
Figure 2: Equilibrium in dynamic game
A A
SRP CP CP
Equilibrium path →
B
D
D
FP CP CP FP CP
E F G H G
Payoff to
government 1 1 46650 1 46650
Payoff to
community 2359 2570 3723 2613 3723
(2399, 1) (2613, 1)
(2570, 1) (3723, 46650)
Community
Government
Community Community
Government

Published in Edited Book Second Generation Reforms (2008), pp. 79-101, Allied Publishers, New Delhi
Authors: N. Das and D. Sarker 35
Figure 3: Legal-illegal income substitutability
YL
s4
s3
s2
s1
0 Z YI
Debnarayan Sarker is Professor of Economics at the Centre for Economic Studies, Department of
Economics, Presidency College, Kolkata, India.
Nimai Das is Senior Research Fellow of Economics at the Centre for Economic Studies,
Department of Economics, Presidency College, Kolkata, India.
Address: Centre for Economic Studies, Department of Economics, Presidency College, 86/1 College
Street, Kolkata - 700073, India.
[Email: [email protected] , [email protected]]
P4
P23
P1
P3
IC1
IC2
IC3
IC4