
Reference class forecasting of innovation diffusion with Bass models
13
1 Reference class forecasting of diffusion with Bass models and a basic diffusion number Dr. J.R. Reagan Senior Professional Faculty Johns Hopkins Carey School of Business Luke Otterblad Statistician Abstract: This paper looks at past and presently ongoing examples of innovation to model the timeline of diffusion by building a historical database. We also borrow a basic idea from epidemiology, the basic reproductive number, which we label as the basic diffusion number. We show how to measure the basic diffusion number in a community and test the following hypothesis: When the basic diffusion number is greater than 1 the prediction is that an innovation will spread through the community via the mathematical properties of the Bass model. When the basic diffusion number is below 1 it’s predicted not to spread through a community. We test the prediction against an open-source time series forecasting library in the R programming language. Keywords: diffusion of innovation; community detection; basic reproduction number; new product forecasting; reference class forecasting. Diffusion and Adoption of Innovations Everett Rogers defines diffusion as the process by which an innovation is communicated through certain channels over time among the members of a social system. He regards diffusion as a special type of communication concerned with the creating and sharing of information about new ideas. Broadly speaking, there are two sets of factors that influence how quickly innovations are dif- fused and adopted. The first set relates to attributes (perceived to be) intrinsic to the innovation itself and the second relates to attributes of the social context within which the innovation is disseminated. (Rogers, 2003) Rogers found that the following five attributes of innovations, as perceived by users, ex- plained over half the variance in innovations’ rates of adoption: relative advantage, compatibility, complexity, trialability and observability (Rogers, 2003, Ch.6). In diffusion research, adopters of innovations are often categorized on the basis of their inno- vativeness, i.e. the relative speed at which they adopt innovations compared to the mean (see Figure 5). The standard five adopter categories that are generally used are 1) innovators, 2) early adopters, 3) early majority, 4) late majority and 5) laggards (Rogers, 2003, Ch.7). Rogers argues that each catego- ry has distinct attributes that explain the relative speed at which its members adopt new innovations. He contends, for example, that early adopters have generally a higher socio-economic status than later adopters. He also argues that early adopters are generally: more intelligent, less averse to change, more able to cope with risk and that they are more interconnected in the interpersonal networks of
Transcript of Reference class forecasting of innovation diffusion with Bass models

1
Reference class forecasting of diffusion with Bass models and a basic diffusion number
Dr. J.R. Reagan
Senior Professional Faculty
Johns Hopkins Carey School of Business
Luke Otterblad Statistician
Abstract: This paper looks at past and presently ongoing examples of innovation to model the timeline of diffusion by building a historical database. We also borrow a basic idea from epidemiology, the basic reproductive number, which we label as the basic diffusion number. We show how to measure the basic diffusion number in a community and test the following hypothesis: When the basic diffusion number is greater than 1 the prediction is that an innovation will spread through the community via the mathematical properties of the Bass model. When the basic diffusion number is below 1 it’s predicted not to spread through a community. We test the prediction against an open-source time series forecasting library in the R programming language.
Keywords: diffusion of innovation; community detection; basic reproduction number; new product forecasting; reference class forecasting.
Diffusion and Adoption of Innovations
Everett Rogers defines diffusion as the process by which an innovation is communicated through certain channels over time among the members of a social system. He regards diffusion as a special type of communication concerned with the creating and sharing of information about new ideas. Broadly speaking, there are two sets of factors that influence how quickly innovations are dif-fused and adopted. The first set relates to attributes (perceived to be) intrinsic to the innovation itself and the second relates to attributes of the social context within which the innovation is disseminated. (Rogers, 2003)
Rogers found that the following five attributes of innovations, as perceived by users, ex-plained over half the variance in innovations’ rates of adoption: relative advantage, compatibility, complexity, trialability and observability (Rogers, 2003, Ch.6).
In diffusion research, adopters of innovations are often categorized on the basis of their inno-vativeness, i.e. the relative speed at which they adopt innovations compared to the mean (see Figure 5). The standard five adopter categories that are generally used are 1) innovators, 2) early adopters, 3) early majority, 4) late majority and 5) laggards (Rogers, 2003, Ch.7). Rogers argues that each catego-ry has distinct attributes that explain the relative speed at which its members adopt new innovations. He contends, for example, that early adopters have generally a higher socio-economic status than later adopters. He also argues that early adopters are generally: more intelligent, less averse to change, more able to cope with risk and that they are more interconnected in the interpersonal networks of

2
their system (Rogers, 2003, Ch.7). Laggards, on the other hand, he argues, are traditional in their out-look and often near isolates in the social networks of their system. They are suspicious about innova-tions and their precarious economic situation forces them to be very cautious about adopting anything new (Rogers, 2003, Ch.7).
Source: Rogers, 2003
Michael Raynor points out that in the case of disruptive innovations patterns of diffusion cannot be explained on the basis of a categorization of adopters based on innovativeness (Raynor, 2003, Ch.5, pp.5-6). He makes the point that a disruptive innovation penetrates a market not merely as a function of less innovative customers finally “getting it”. Rather, disruptive innovations grow because they have improved in ways that allow them to appeal to the needs of more demanding cus-tomers. As its performance profile improves, it surpasses incumbent solutions and triggers adoption by segments of the market that have more stringent requirements. According to Disruptive Innova-tion Theory, then, the later adopters are not less innovative but more demanding (Raynor, 2003, Ch.5, pp.6-7).
Additionally in “The diffusion of interactive communication innovations and the critical mass: The adoption of telecommunications services by German Banks” (Mahler and Rogers, 1999), the researchers studied the adoption of 10 telecommunications innovations by German Banks. Mahler and Rogers found that main reason German banks had not adopted technological innovations like e-mail, video conferencing or an online database service was “low diffusion”. In other words, their fellow banks hadn’t adopted them yet, so they didn’t. Their study showed that more banks adopted these innovations later on (skewed right and more peaked), rather than in the fashion of a normal distribution based on “innovativeness”, as was seen in previous innovation adoption studies.
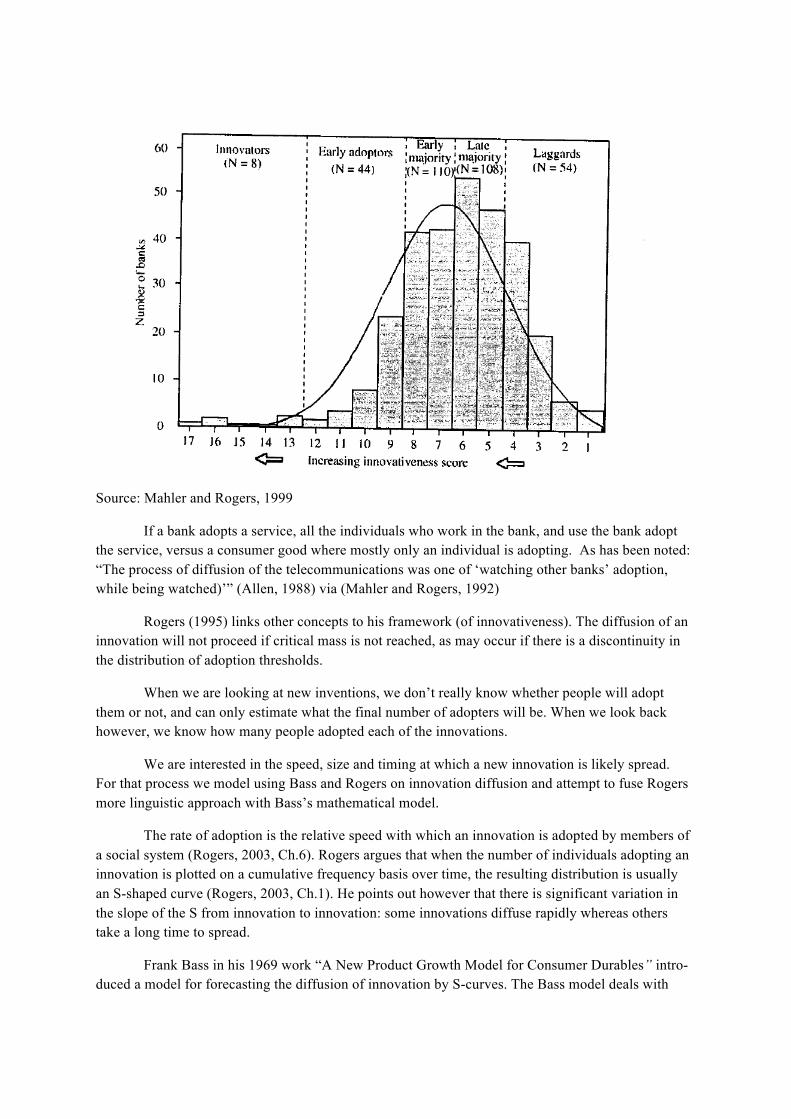
Source: Mahler and Rogers, 1999
If a bank adopts a service, all the individuals who work in the bank, and use the bank adopt the service, versus a consumer good where mostly only an individual is adopting. As has been noted: “The process of diffusion of the telecommunications was one of ‘watching other banks’ adoption, while being watched)’” (Allen, 1988) via (Mahler and Rogers, 1992)
Rogers (1995) links other concepts to his framework (of innovativeness). The diffusion of an innovation will not proceed if critical mass is not reached, as may occur if there is a discontinuity in the distribution of adoption thresholds.
When we are looking at new inventions, we don’t really know whether people will adopt them or not, and can only estimate what the final number of adopters will be. When we look back however, we know how many people adopted each of the innovations.
We are interested in the speed, size and timing at which a new innovation is likely spread. For that process we model using Bass and Rogers on innovation diffusion and attempt to fuse Rogers more linguistic approach with Bass’s mathematical model.
The rate of adoption is the relative speed with which an innovation is adopted by members of a social system (Rogers, 2003, Ch.6). Rogers argues that when the number of individuals adopting an innovation is plotted on a cumulative frequency basis over time, the resulting distribution is usually an S-shaped curve (Rogers, 2003, Ch.1). He points out however that there is significant variation in the slope of the S from innovation to innovation: some innovations diffuse rapidly whereas others take a long time to spread.
Frank Bass in his 1969 work “A New Product Growth Model for Consumer Durables” intro-duced a model for forecasting the diffusion of innovation by S-curves. The Bass model deals with

4
variability’s in S-curves, as mentioned in by Rogers, by adjusting its parameters of the coefficient of imitation, the coefficient of innovation, and the population size. The Bass model works with very limited data. Given that you know two points of the time of adoption of an innovation and cumulative total adopters, you can estimate the coefficient of innovation and the coefficient of imitation.
One method of forecasting is to forecast by reference class. For this task we build a database reference innovations based on (Jiang, Bass, and Bass, 2006). This gives us references for coefficients of innovation and imitation. In the case of the historical database they are labeled as p (innovation) and q (imitation).
To choose between the historical cases we implement a nearest neighbor model with 5 rat-ings, scaled from 1 to 5. Users can simply describe a new products similarity to other products. When we describe a new innovation, all we need do is rate the similarity with other diffusions on a scale of 1 to 5 to get a p and q estimate. The recommendation system then returns the top 3 most likely refer-ences for p and q. It is up to the user of to decide whether to just take the top choice (default) or to average p and q between all or some of the returned results. The system is not based on assessing the content of an innovation (this is left to the forecaster). So, anyone rating new items and can use Rog-ers’ factors or they can use another system that they trust as a guide.
Factors we considered (when considering innovation similarity) are the speed of adoption, Rogers factors (Relative advantage, Compatability, Complexity, Trialability, Observability), the type of innovation decision, the promotion of the innovation, and dependent diffusions. For example it is impossible for subscription data plans to diffuse without smartphones diffusing before them (or at the same time). We propose that, in the examination of internet adoption we can use the diffusion of sat-ellite dishes as a comparable p and q (while they will have vastly different final population sizes).
Final Code:
https://github.com/lotterblad/bullwhip_effect/blob/master/supplier_buyer_graph/rate_of_adoption/diffusion_query_branch.py
After this is done the p and q of the model are returned. The next step is to estimate whether an innovation will diffuse, as well as estimate population size.
The Critical Mass
Estimates of final population size before a diffusion of an innovation can get population size very wrong. One example occurred in the mid-1980s. AT&T engaged McKinsey for advice on a po-tential entry into the cell phone market after investing in initial research and development work. The consulting firm conducted in-depth market research and concluded the cell phone market was not a profitable option for AT&T to enter, as the worldwide market potential would be only around 900,000. AT&T’s mainstream market still preferred the land- line phone because of its reliability, cost, and coverage, and the consultants recommended AT&T pull out of the cell phone market (Econ-

omist, 1999) via (Govindarajan and Kopalle, 2006). We know (after the fact) that the total population of users for wireless was 6 billion while the total population of landline users was 1.3 billion. Consid-ering the final cell phone market size (as of 2012) this estimate of population size was extremely wrong. Where did the analysis err?
While cell phones had a low number of adopters, we argue they achieved saturation within communities. Cell phones started in big cities like Chicago then moved to Los Angeles, New York and so on. Although the initial market size was small (900,000) the cell phone achieved critical mass within communities: cities. Our point here is merely an argument which we will back up with data via another example. How do we propose to measure whether a new innovation has or will achieve criti-cal mass?
To measure this we need to ask: What are communities? Universities and cities are communi-ties. Banks and other types of businesses are communities. Companies, workplaces, churches, and social classes (Upper, lower, middle, working) also are communities. They could be called the net-works of diffusion. Some of this type of data (on percentage adoption of a new innovation within communities) will be available while some will not. Thus, we design the modeling process to be able to operate with a minimum of information, while hoping for as much information as possible. To do this we use a dataset of the diffusion of the internet through countries.
But, before we get to dissecting this set, we need a method of estimating when the critical mass will occur. Researcher Maksim Tsvetovat has explored this particular topic of diffusion under the idea of triadic closure. Triadic closure is defined as a situation in a community when “a friend of a friend is my friend”. He has proposed:
“If the transition from linear propagation to exponential (viral) growth indeed depends on tri-adic closure (i.e., “friend of a friend is my friend”) then the critical mass of connections can be esti-mated by measuring the probability that a randomly created link from A to B will form one or more open triads with other nodes. This is proportional to the number of nodes already connected (we dou-ble the number of nodes because each tie involves 2 nodes):
Probability of an Open Triad:
Number of Ties/ (2*Number of nodes)
Thus, probability of an open triad reaches 50% when a quarter of the nodes are connected—and every new connection causes the triadic closure rules to create even more connections, further increasing the probability of a cascade. In our experiments, we have found that the transition from linear growth (where connections are added one by one) to going viral happens somewhere around 7% density—i.e., if 7% of people in the intended audience adopt a meme, retweet a video, join a site, etc., the rest will follow shortly in a viral wave.” (Social Network Analysis for Startups, 2012)
The following section is a test is the predictive ability of triadic closure, on a well-known event: the diffusion of the internet through countries around the world.
Community Adoption Test

6
-the dataset: percentage of internet users in each country, year by year obtained via (Interna-tional Telecommunications Union, 2012)
-historical similarity: When rating the diffusion of the internet through the sample countries, the most similar imitation and innovation was determined to be Satellite TV. This was because at the time of satellite TV, many people already had cable or terrestrial TV, except those who lived out of range of those services. In this case this puts p at .05 and q at .33. Remember that this historical simi-larity doesn’t say that the population sizes will be the same, rather that they will be adopted by com-munities at a similar rate.
Define: The basic diffusion number. The number is similar to the basic reproductive number in epidemiology, whereby a disease is predicted to spread if the number is over 1. It is an observed and measured phenomenon (rather than one of mathematical proof).
-One of the maximum known basic reproductive numbers from epidemiology is measles which comes out at around 12-18
We propose that instead of “somewhere around 7% density” that we use 6.67% (1 over 15) as the basic diffusion number = 1. While we suspect the variable 5.5% to 8.3% may be a more correct range, in some of the equations used below we need to use a single number (for example in using the number in division).
Our hypothesis then is that:
• The spread in a community is based on the Bass model given achievement of a 6.67% adop-tion rate.
• This is where the Basic diffusion number = 1
The International Telecommunications Union dataset describes the country, the year, and the percent of people in a country that have adopted the internet from 2000 to 2011. The first step in-volves splitting the dataset into just the counties that can be tested.
1) Countries that don’t have a 6.67% diffusion point (due to being far past that point) are nor included in the analysis. Many western countries are not used in the test because of this.
2) The data is split into the sequence of years over 6.67% adoptions and the sequence of years under 6.67%
To benchmark and compare our projection we use a well-developed forecasting library: the forecast package in the R programming language based on the research of Rob J. Hyndman. The time series before 6.67% is used to forecast the available years after 6.67% with appropriate confidence intervals. The forecast library uses the Akaiake Information Criterion to choose between the best model, based on previous information.
In the general case, the AIC is

AIC = 2k - 2ln(L)
Where k is the number of parameters in the statistical model, and L is the maximized value of the likelihood function for the estimated model.
It uses this parameter to select between the best future forecast from all of its possible types of forecast distributions (Holt-Winters, Additive, Mean, etc) , with the best fit projection being select-ed with the best fit, 95% confidence, and 80% confidence intervals.
Next, the test data is then mapped onto the same plot
Examples
Case: Bass Accurate
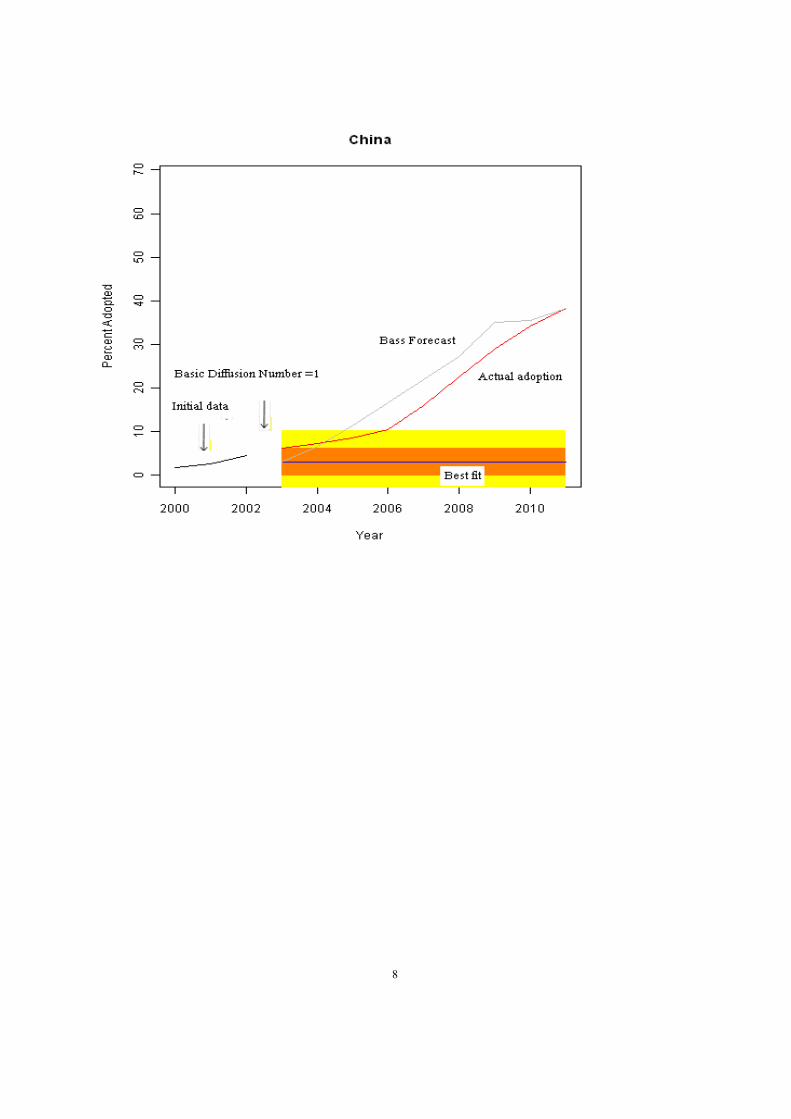
8
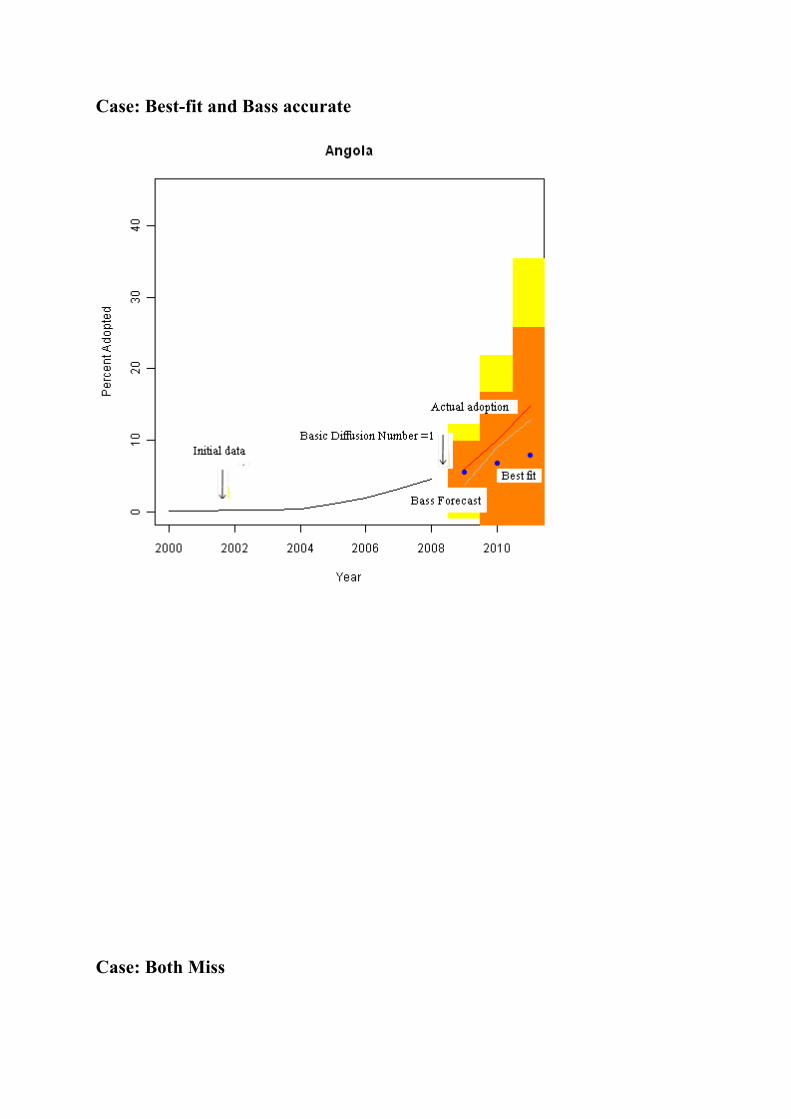
Case: Best-fit and Bass accurate
Case: Both Miss
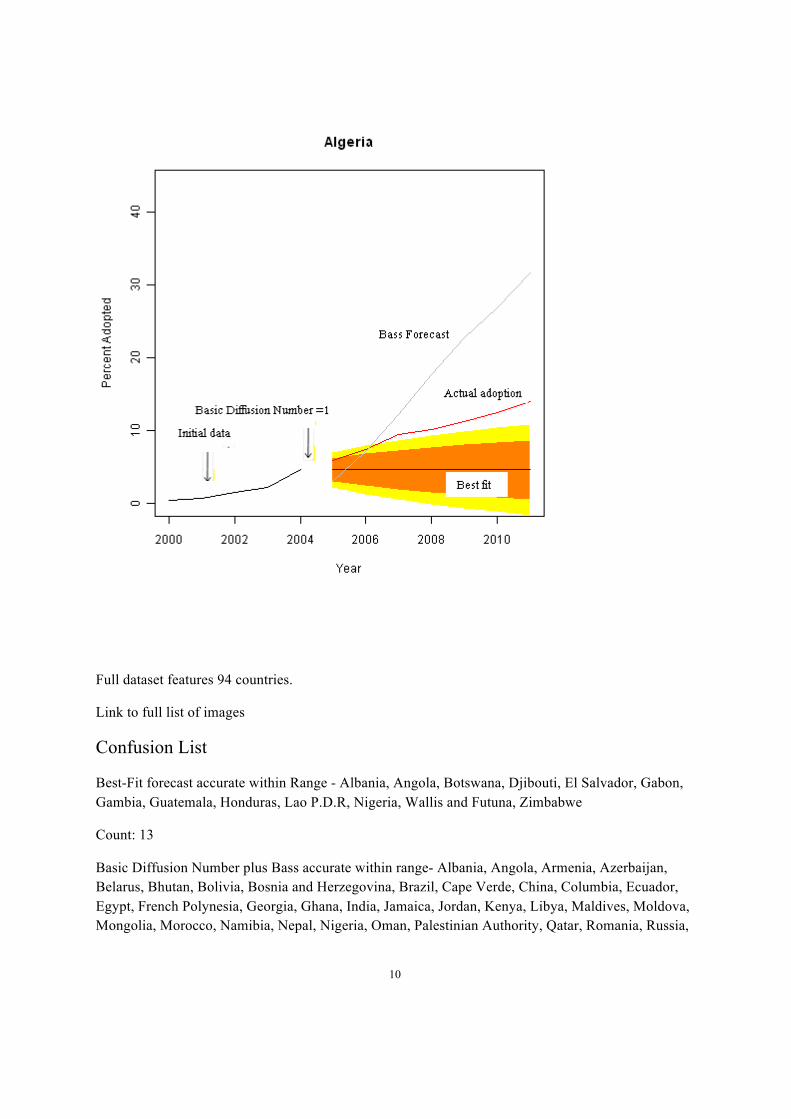
10
Full dataset features 94 countries.
Link to full list of images
Confusion List
Best-Fit forecast accurate within Range - Albania, Angola, Botswana, Djibouti, El Salvador, Gabon, Gambia, Guatemala, Honduras, Lao P.D.R, Nigeria, Wallis and Futuna, Zimbabwe
Count: 13
Basic Diffusion Number plus Bass accurate within range- Albania, Angola, Armenia, Azerbaijan, Belarus, Bhutan, Bolivia, Bosnia and Herzegovina, Brazil, Cape Verde, China, Columbia, Ecuador, Egypt, French Polynesia, Georgia, Ghana, India, Jamaica, Jordan, Kenya, Libya, Maldives, Moldova, Mongolia, Morocco, Namibia, Nepal, Nigeria, Oman, Palestinian Authority, Qatar, Romania, Russia,

Rwanda, S Tome Princepe, Saudi Arabia, Sri Lanka, St. Kitss and Nevis, St. Vincent and the Gena-dines, Suriname, Syria, Swaziland, Syria, Tajikistan, TFYR Macedonia, Thailand, Tonga, Tunisia, Turkey, Tuvalu, Uganda, Ukraine, Uzbekistan, Venezuela, Vietnam, Yemen, Zambia, Zimbabwe, Swaziland
Count: 66
Neither Best fit forecast or Basic Diffusion number is correct – Algeria, Cuba, Dominican Republic, Fiji, Granada, Guyana, Indonesia, Iran, Jamaica, Kazahkstan, Kiribati, Kyrgizstan, Nicaragua, Paki-stan, Paraguay, Philippines, Rwanda, Senegal, South Africa, Tanzania, Thailand, Tajikistan, Uganda, Wallis and Futuna, Yemen. Zimbabwe
Count:14
Not enough data to test either forecast -Belize, Equatorial Guinea, Eritrea, Grenada, Madagascar, Micronesia, Monaco, Samoa, St.Kitss and Nevis, Sudan, Vanuatu,
Count: 9
Total Countries Tested: 94.
Note: Some Countries are in two categories as they are both forecasted correctly from the initial data and experience exponential growth at basic diffusion number =1.
-Bass Model
-test predicted versus actual population size of Bass versus
We propose that measuring the critical mass can greatly increase forecast accuracy. The sud-den jump in the dataset often is not “predictable” from the direct prior observations in a time series. We propose it is forecast able, if a community perspective is taken into account. It isn’t certain, but it is in this preliminary test far more accurate than “just the numbers”. In addition: instead of trying to predict what a whole population will do, it’s far less error prone to break the problem down into communities (as small of communities as you can get data for preferably). The summation to an en-tire population can then be done on the bases of summing up the diffusion projections of communi-ties.
Thinking further on: If an innovation reaches 6.67% adoption in 6.67% of communities we should expect extreme growth results. For example: if a startup achieves 6.67% adoption in 6.67% of cities and does so in 6.67% of countries, we are probably looking at a phenomenon of similar size to cell phone usage. If however it only achieves this rate in cities but not countries, there is probably a large difference to be expected in final population size (such as the difference with landlines and cell phones).
Another factor to watch for, which we first studied in “When to Bet on Green Bananas” (Ot-terblad and Reagan, 2012) focuses on the learning effect which indicates that for some tasks every doubling of volume of the same task achieves a 20% drop in time (and often cost).

12
Thus, from this we focus on the path of an innovation as a point of risk. If an innovation achieves critical mass in large enough community, it can diffuse to the next similar communities by passing the time (and likely cost) savings on to consumers (that is if adoption demand of the next community is based on lower cost).
-Full Model Pipeline:
Historical Similarity of innovation and imitation -> community analysis, population, and adoption statistics -> forecasted adoption at a given year
- Final Full Model
-Output the Total Predicted Population by 2011 by bass versus that of best fit.
Bass Model Projection (Based on pre 2009 data)
1,411,395,465 of 5,064,405,546 (27%) in 2011
Actual
1,285,122,029 of 5,064,405,546 (25%) in 2011
-https://github.com/lotterblad/bullwhip_effect/blob/master/community_test/population_size.py
-This is large improvement versus 900,000 and 6 billion (cellphone example).
Summary
One of benefits of modeling is that it describes a type of data that we need to find while tak-ing in information. The model then tests hypothesis of how to turn unstructured information into in-sight. Summing up we looked at:
-Rogers on why people adopt
-Bass Model
-Developed Historical Similarity of imitation and innovation
-Conducted community analysis using the Basic Diffusion Number for forecasting tipping points
-Final Model that estimates a population of adopters, in a community, at a given time.
-Summing up the two papers, (diffusion, networks), the bullwhip effect (our study indicates) can be seen as a result of relying on just the recent numbers, while being blind to the effects commu-nities on cascades of adoption. Even the best forecasting algorithms can’t spot something that is a social phenomenon.

Future questions
-historical database should include failures. New innovations may be most similar to something that never spread. This has never been well documented.
References
Christensen, Clayton. M. and Raynor, M.E (2003). The Innovator’s Solution: Creating and Sustain-ing Successful Growth. Boston, MA: Harvard Business School Press.
Raynor, Michael (2011). The Innovator's Manifesto: Deliberate Disruption for Transformational Growth, Crown Business, New York.
Bass, F. M. (1969). A new product growth model for consumer durables. Management Science, 15(5), 215−227.
Rogers, E. M. (2005), Diffusion of Innovations, 5th Edition, Kindle Edition
Jiang, Zhengrui, Bass, Frank M and Bass, Portia (2006). Virtual Bass Model and the left-hand data-truncation bias in diffusion of innovation studies. International Journal of Research in Marketing 23. 93–106
Govindarajan, Vijay and Kopalle, Praveen K. Disruptiveness of Innovations: Measurement and an Assessment of Reliability and Validity. Strategic Management Journal. Vol. 27, No. 2 (Feb., 2006), pp. 189-199. Published by: John Wiley & Sons Stable URL: http://www.jstor.org/stable/20142325 .Accessed: 30/05/2012 14:41
Tsvetovat, Maksim and Kouznetsov, Alexander (2011).. Social Network Analysis for Startups. O’Reilly Media Inc. Sebastapool, CA.
Mahler, Alwin and Everett M. Rogers (1999). The diffusion of interactive communication innovations and the critical mass: The adoption of telecommunications services by German banks. Telecommuni-cations Policy 23. 719-740.
International Telecommunications Union. http://www.itu.int/ITU-D/ict/statistics/. Accessed January 2013
Hyndman, R.J. and Athanasopoulos, G. (2012). Forecasting: principles and practice. http://otexts.com/fpp/. Accessed on January 2013.
History and Epidemiology of Global Smallpox Eradication "Smallpox: Disease, Prevention, and In-tervention".http://www.bt.cdc.gov/agent/smallpox/training/overview/pdf/eradicationhistory.pdf. Ac-cessed January 2013. The CDC and the World Health Organization. Slide 16-17.
Akaike H. A new look at the statistical model identification. IEEE Trans. Automat. Contr. AC-19:716-23, 1974
http://cran.r-project.org/web/packages/forecast/index.html