Reductions in Child Obesity Among Disadvantaged School Children With Community Involvement: The...
9
S36 VOLUME 18 SUPPLEMENT 1 | FEBRUARY 2010 | www.obesityjournal.org ARTICLES nature publishing group CHILDHOOD OBESITY 1 Michael & Susan Dell Center for Advancement of Healthy Living, University of Texas School of Public Health, Austin Regional Campus, Austin, Texas, USA. Correspondence: D.M. Hoelscher ([email protected]) INTRODUCTION Childhood obesity is a significant public health issue in the United States and worldwide (1). Although recent data have shown that the increasing rates of child obesity have slowed (2,3), current prevalence rates are still considerably higher than the Healthy People 2010 goals (4). Because of the association between childhood obesity and comorbidities (5), as well as the tracking of excess weight during childhood into adulthood (6), prevention of childhood obesity has become a primary goal of many governmental, state, and private organizations. e dominant paradigm for youth health promotion inter- ventions is to treat the local school as a key center of the larger community. is is particularly true for elementary school children where the local school is centrally located to where most children and families live. In addition to the school’s edu- cational mission, the local school is also a hub for community activities: festivals, adult education, town hall meetings, voter registration, and polling. Schools have been identified as an ideal location for obesity prevention (7–9) because nearly all young children attend school, parents are accustomed to regu- larly visiting the school site, and most schools serve children foods and have gymnasiums, playing fields, and playgrounds. In contrast, programs outside the school cannot ensure the same high levels of child and family reach, programmatic intensity, and economies of scale. Although school-based interventions alone have had mixed success in the prevention of obesity, recent studies indicate that school programs when implemented with complemen- tary community programs can significantly prevent the onset of child obesity (3,10,11). e Shape Up Somerville study tar- geted weight gain prevention in US public elementary school children in grades 1–3 through mobilizing a range of com- munity organizations and individuals in various aspects of the intervention, including the study design and intervention plan. e intervention focused on changes in the home and school as well as broader community, and included activities such as walk to school campaigns, cooking lessons aſter school, and promoting portion size control in local restaurants (10). Reductions in Child Obesity Among Disadvantaged School Children With Community Involvement: The Travis County CATCH Trial Deanna M. Hoelscher 1 , Andrew E. Springer 1 , Nalini Ranjit 1 , Cheryl L. Perry 1 , Alexandra E. Evans 1 , Melissa Stigler 1 and Steven H. Kelder 1 The objective of this study was to compare the impact of two intervention approaches on the prevalence of child overweight and obesity: (i) Coordinated Approach To Child Health BasicPlus (CATCH BP), in which schools were provided evidence-based coordinated school health program training, materials, and facilitator support visits, and (ii) CATCH BP and Community (BPC), in which BP schools received additional promotion of community partnerships with the aim of integrating community members and organizations into schools, local decision making and action, and best practices workshops. Schools (n = 97) in four central Texas districts were recruited to participate in the 4-year project. Of the low-income schools (n = 58), 15 schools were selected to receive the BPC intervention and matched with 15 schools in the BP condition. A serial cross-sectional design was used, in which 4th grade student BMI, physical activity, and diet were assessed in the 30 schools in spring 2007 and 2008. Measurements in spring 2007 included 1,107 students, with 53% female; 61% Hispanic, and 14% African American; and mean age of 9.9 years. Adjusted prevalence of overweight/obesity (≥85th percentile) was 42.0 and 47.4% in spring 2007 for the BP and BPC students, respectively. From spring 2007 to spring 2008, the percent of students classified as overweight/obese decreased by 1.3 percentage points (P = 0.33) in BP schools, compared to a decrease of 8.3 percentage points (P < 0.005) in students from BPC schools; the difference between conditions was significant (P = 0.05). CATCH BPC students also reported more positive trends in related behaviors. Implementation of a community-enhanced school program can be effective in reducing the prevalence of child overweight in low-income student populations.
Transcript of Reductions in Child Obesity Among Disadvantaged School Children With Community Involvement: The...

S36 VOLUME 18 SUPPLEMENT 1 | FEBRUARY 2010 | www.obesityjournal.org
Articles nature publishing group
childhood obesity
1Michael & Susan Dell Center for Advancement of Healthy Living, University of Texas School of Public Health, Austin Regional Campus, Austin, Texas, USA. Correspondence: D.M. Hoelscher ([email protected])
INTRODUCTIONChildhood obesity is a significant public health issue in the United States and worldwide (1). Although recent data have shown that the increasing rates of child obesity have slowed (2,3), current prevalence rates are still considerably higher than the Healthy People 2010 goals (4). Because of the association between childhood obesity and comorbidities (5), as well as the tracking of excess weight during childhood into adulthood (6), prevention of childhood obesity has become a primary goal of many governmental, state, and private organizations.
The dominant paradigm for youth health promotion inter-ventions is to treat the local school as a key center of the larger community. This is particularly true for elementary school children where the local school is centrally located to where most children and families live. In addition to the school’s edu-cational mission, the local school is also a hub for community activities: festivals, adult education, town hall meetings, voter registration, and polling. Schools have been identified as an ideal location for obesity prevention (7–9) because nearly all
young children attend school, parents are accustomed to regu-larly visiting the school site, and most schools serve children foods and have gymnasiums, playing fields, and playgrounds. In contrast, programs outside the school cannot ensure the same high levels of child and family reach, programmatic intensity, and economies of scale.
Although school-based interventions alone have had mixed success in the prevention of obesity, recent studies indicate that school programs when implemented with complemen-tary community programs can significantly prevent the onset of child obesity (3,10,11). The Shape Up Somerville study tar-geted weight gain prevention in US public elementary school children in grades 1–3 through mobilizing a range of com-munity organizations and individuals in various aspects of the intervention, including the study design and intervention plan. The intervention focused on changes in the home and school as well as broader community, and included activities such as walk to school campaigns, cooking lessons after school, and promoting portion size control in local restaurants (10).
Reductions in Child Obesity Among Disadvantaged School Children With Community Involvement: The Travis County CATCH TrialDeanna M. Hoelscher1, Andrew E. Springer1, Nalini Ranjit1, Cheryl L. Perry1, Alexandra E. Evans1, Melissa Stigler1 and Steven H. Kelder1
The objective of this study was to compare the impact of two intervention approaches on the prevalence of child overweight and obesity: (i) Coordinated Approach To Child Health BasicPlus (CATCH BP), in which schools were provided evidence-based coordinated school health program training, materials, and facilitator support visits, and (ii) CATCH BP and Community (BPC), in which BP schools received additional promotion of community partnerships with the aim of integrating community members and organizations into schools, local decision making and action, and best practices workshops. Schools (n = 97) in four central Texas districts were recruited to participate in the 4-year project. Of the low-income schools (n = 58), 15 schools were selected to receive the BPC intervention and matched with 15 schools in the BP condition. A serial cross-sectional design was used, in which 4th grade student BMI, physical activity, and diet were assessed in the 30 schools in spring 2007 and 2008. Measurements in spring 2007 included 1,107 students, with 53% female; 61% Hispanic, and 14% African American; and mean age of 9.9 years. Adjusted prevalence of overweight/obesity (≥85th percentile) was 42.0 and 47.4% in spring 2007 for the BP and BPC students, respectively. From spring 2007 to spring 2008, the percent of students classified as overweight/obese decreased by 1.3 percentage points (P = 0.33) in BP schools, compared to a decrease of 8.3 percentage points (P < 0.005) in students from BPC schools; the difference between conditions was significant (P = 0.05). CATCH BPC students also reported more positive trends in related behaviors. Implementation of a community-enhanced school program can be effective in reducing the prevalence of child overweight in low-income student populations.

obeSity | VOLUME 18 SUPPLEMENT 1 | FEBRUARY 2010 S37
Articles
The Be Active Eat Well study focused on community capac-ity building and action planning to promote healthy weight in children and adolescents in Australia (11,12). Intervention strategies for Be Active Eat Well included changes in school nutrition policies, dissemination of parent obesity prevention–related tip sheets, community gardens, after school program-ming, and community-wide social marketing, among other strategies. In El Paso, Texas, a regional decrease of 7% in the prevalence of obesity among 4th grade children was observed over a 2.5-year period following an initiative spearheaded by the Paso del Norte Health Foundation which included wide-spread implementation of the Coordinated Approach To Child Health (CATCH) elementary school health program, a televi-sion/radio ad campaign, a community-based nutrition educa-tion program, and a walking promotion program (3). Shared aspects of these interventions include support of local school health promotion plus considerable local development, tailored community approaches, and intensive community involve-ment. Although these approaches, if replicated, offer consid-erable promise, because of their idiosyncratic and rigorously tailored community involvement, generalization and replica-tion may prove difficult. An important unanswered question pertains to identifying the minimal threshold of intervention dose required to achieve reductions in child obesity incidence. A model in which a less intensive array of community activities is implemented in tandem with a school-based obesity preven-tion program potentially offers greater generalizability and reach than these efforts to date.
The primary objective of this article is to compare two inter-vention approaches to prevent child overweight or obesity, and related outcomes: (i) CATCH BasicPlus (CATCH BP), in which schools were provided with an evidence-based health promotion program training, materials, and support visits, and (ii) CATCH BP and Community involvement (CATCH BPC), in which schools were provided the same inputs as the CATCH BP schools as well as additional support for building school and community partnerships and local decision making and capacity building related to physical activity (PA) and healthy eating promotion. We hypothesized that students who were in CATCH BPC schools would have a decreased prevalence of overweight/obesity compared with students in the CATCH BP schools.
METHODS AND PROCEDURESProject descriptionThe Travis County CATCH Project is a 4-year, school- and community-based child obesity prevention project in 97 schools in four school dis-tricts in Travis County. The overall goal of the Travis County CATCH Project is to decrease the prevalence of child obesity by 2010. A sec-ondary goal is to determine whether adding a community involvement component to a coordinated school health program can positively affect outcomes. This article presents interim results from program implemen-tation (spring 2007 to spring 2008).
CATCH is a behaviorally based coordinated school health program that has been found to significantly impact healthy eating and PA behav-iors (13,14). The CATCH program targets multiple aspects of the school environment, including the classroom, nutrition services and the caf-eteria environment, physical education (PE) activities, family and home
environment, and, via school health promotion messages and events, the broader school community. The goal of the original CATCH study was to reduce cardiovascular disease risk factors in children in grades 3–5. Although the original CATCH trial did show significant changes in risk factors for obesity, such as decreased dietary fat intake and increased self-reported vigorous PA, the main CATCH trial did not show a signifi-cant reduction in child overweight or obesity, probably due to the fact(s) that: (i) reduction of overweight/obesity was not a major outcome of the trial and (ii) the overall study population did not have a high rate of obesity, because CATCH was conducted in 1991–1994, during the period when the secular increases in child obesity were first noted. In recent years, research on the translation of CATCH to low-income elemen-tary schools in El Paso demonstrated a significant reduction (−11% for girls; −8% for boys) in the increase of overweight or obesity in high-risk children attending CATCH schools (15).
Study designWe compared the impact of the facilitator supported CATCH BP (n = 15 schools) condition (defined below) to the CATCH BPC condition (n = 15 schools) using serial springtime cross-sectional samples of 4th grade students from the first 2 years of a 3-year intervention (Table 1).
Table 1 CATCH Travis County program intervention activities by school type, Travis County CATCH Study, 2007–2008
BasicPlus (15 schools)
BasicPlus + Community (15 schools)
Coordinated school health CATCH training
X X
Booster training sessions X X
CATCH program materialsa X X
CATCH Committee Meetings X X
Family Fun Night activities/events X X
CATCH Awards Program (recognition and funds for CATCH)
X X
CATCH component coordination kit
X X
Teacher-led activity breaks X X
School social marketing efforts X X
Supplemental health promotion resourcesb
X X
CATCH facilitator support visits (1 visit/4–6 weeks)
X X
Additional CATCH facilitator visits (2–3 visits/4–6 weeks)
X
CATCH Community “Best Practices” workshops (3/year)
X
Community member required on CATCH Committee
X
CDC School Health Index used as planning tool
X
School program and community health promotion activity guidec
X
CATCH, Coordinated Approach To Child Health.aCATCH materials include: CATCH PE activity box and teacher guide; CATCH “Go for Health” classroom curriculum; “Eat Smart” food service curriculum; and CATCH coordination kit. bPhysical activity equipment (balls, cones, scarves, etc.), CATCH Family Fun Night promotional funds, and CATCH classroom posters. cThis activity guide (CATCH Café menu) was a list of evidence-based practices for school and school plus community.

S38 VOLUME 18 SUPPLEMENT 1 | FEBRUARY 2010 | www.obesityjournal.org
Articles
In the Travis County CATCH demonstration study, all 97 elementary schools received some level of CATCH intervention. Higher income schools received training and CATCH basic materials (≤60% of students economically disadvantaged, n = 38). The remaining schools (n = 59) were classified as low income (≥60% of school composition of economi-cally disadvantaged students). Of these 59 low-income schools, 15 were selected to receive CATCH BPC (training, CATCH basic materials, addi-tional CATCH equipment, monthly site facilitator visits, and community involvement; see Table 1). The CATCH BPC schools were selected to participate based on input from school district leaders regarding percep-tions of the school principal, PE teacher, and school faculty support for participation in the more intensive community involvement condition. In selecting the BPC schools, we followed tenets of community-based participatory research that emphasize the importance of involving com-munity partners in the research process (16). The remaining 44 low-income schools received CATCH BP (training, CATCH basic materials, additional CATCH equipment, and monthly facilitator support visits).
For evaluation, the 15 CATCH BPC schools were matched to 15 similar low-income CATCH BP schools by ethnicity and percent economic dis-advantaged; baseline demographics for the 30 schools which comprised the two measured comparison conditions are shown in Table 2. Although five schools were measured from the higher income schools, we excluded them from the analyses for this article because our research questions and grant mandate focused on lower income students and the evaluation design did not sufficiently power for comparisons between high- and low-income schools.
Study population and sampling strategyAll 4th grade students in the 30 CATCH BP/BPC measurement schools were invited to participate in a self-administered survey along with measurement of height and weight. In addition, one class each of 3rd, 4th, and 5th grade students was randomly selected for direct obser-vations of student PA during PE class. University and school district human subject approval was obtained, as well as parental consent (active or passive, depending on the school district) and child assent prior to each measurement.
Intervention descriptionCATCH BP intervention. The Travis County CATCH team updated the original CATCH curriculum to reflect the 2005 US Dietary Guide-lines (17), as well as targeting sedentary activity (e.g., television viewing), which has been linked to obesity prevention (7). Specific behavioral objec-tives were included: (i) to increase moderate-to- vigorous PA in students, in school PE and activity breaks as well as at home; (ii) to decrease sedentary activity, specifically television viewing; (iii) to increase fruit and vegetable consumption; (iv) to decrease sugar- sweetened beverage consumption; (v) to increase consumption of CATCH GO foods; and (vi) to encourage healthy meal patterns, such as breakfast consumption.
The Travis County CATCH program incorporated elements of social ecological models (18,19) and Social Cognitive Theory (20) for a broader and more community-focused approach to child obesity prevention using the Centers for Disease Control and Prevention (CDC) coordi-nated school health program model. The four core CATCH components have been described elsewhere (21), and include: K-5 classroom cur-ricula, a PE program, a child nutrition services component, and family involvement. To increase school involvement, each school was required to appoint a CATCH Committee and CATCH Champion (Table 1) to guide site-level implementation decisions. Additional program components were developed to enhance program fidelity and future sustainability, including: (i) CATCH training sessions for team members from each school; (ii) booster PE training sessions; (iii) a CATCH coordination kit providing “how-to” implementation instructions; (iv) awards ($2–5,000) for exemplary CATCH implementation; (v) teacher-led activity breaks, which consisted of structured time during the week for PA and health education, with activities adapted from the CATCH Kids Club (22); and (vi) social marketing strategies, which included morning messages, CATCH signage, and messages on school menus. Program components
were developed by working in a community participatory manner with district leaders and teachers.
CATCH BPC intervention. The BPC condition was developed to form school and larger community partnerships so that local school initia-tives were further developed and supported by external community organizations and to extend school programs to the surrounding com-munity. A first step of this initiative was the addition of a community partner to the school-based CATCH Committee to form a “CATCH Community Action” team. CATCH Community Action teams (n = 15 school teams) were asked to: (i) conduct a self-assessment using the CDC School Health Index to identify priority areas of action (n = 15 schools); (ii) attend three “Best Practices” workshops per year with all CATCH BPC schools (n = 15 attended ≥2 workshops; n = 13 attended all workshops); and (iii) select an activity each semester from a “CATCH Community Café” menu of evidence-based strategies for promoting PA and healthy eating in the school setting (n = 15 implemented ≥1 activities) (Table 1). Examples of specific activities from the CATCH
Table 2 Baseline demographic characteristics of 4th grade students by type of intervention, Travis County CATCH Study, 2007–2008
BasicPlus (BP) (n = 15
schools)
BasicPlus + Community
(BPC) (n = 15 schools)
Total sample (n = 30
schools)
No. of students (Spring 2007)
554 553 1,107a
Age in years (mean, s.d.)
10.0 (0.71) 9.85 (0.38) 9.92 (0.51)
Gender (n, %)
Female 299 (54) 284 (51) 583 (53)
Male 255 (46) 268 (49) 523 (47)
Ethnicity (n, %)
African American 85 (15) 76 (14) 161 (14)
Hispanic 339 (61) 382 (69) 721 (66)
White/other 130 (23) 95 (17) 225 (20)
Percent economically disadvantaged (mean, s.d.)
90.0 (6.7) 88.6 (8.12) 89.2 (7.3)
Percent of students passing standardized math test (mean, s.d.)
71.7 (11.4) 74.7 (10.2) 73.2 (10.7)
Percent of students passing standardized reading test (mean, s.d.)
81.2 (6.7) 80.7 (7.0) 81.0 (6.7)
Students attending largest school district (n, %)b
458 (83) 421 (76)c 879 (79)
Mean (s.d.) BMI 20.62 (4.8) 20.85 (5.1) 20.74 (5.0)
No. of students (Spring 2008)
699 471 1,170
CATCH, Coordinated Approach To Child Health.aInformation on gender was missing for one person. bAs one of the school districts (n = 4) was much larger than the other three, districts were divided into largest school district vs. smaller ones for comparison purposes. cIndicates that BP schools are significantly different from BPC schools (test based on ANOVA).

obeSity | VOLUME 18 SUPPLEMENT 1 | FEBRUARY 2010 S39
Articles
“menu” implemented by schools included: providing opportunities for students to have a taste of healthful foods (n = 7 schools); implementa-tion of school gardening programs (n = 6 schools); implementation of PA breaks during class time (n = 5 schools); and implementation of after-school PA programs (n = 7 schools). Additional project staff visits were provided to facilitate these activities, with CATCH facilita-tors providing 172 visits to BPC schools compared to 129 visits to BP schools during the 2007–2008 school year. The role of CATCH facilita-tors during school visits included: organizing and attending CATCH committee meetings, presenting to school faculty on CATCH, provid-ing in-service trainings to classroom teachers, and checking in with key school leaders regarding implementation of CATCH components.
MeasuresFourth grade students were surveyed each spring using a modified PA and nutrition questionnaire from the School Physical Activity and Nutri-tion (SPAN) study (3,23), and heights and weights were obtained. In addition, school-level observations and teacher surveys provided process measures.
Student outcome measures. Information regarding gender, age, lan-guage spoken at home, and race/ethnicity was collected on the CATCH SPAN Questionnaire described below (23). Height and weight mea-surement were conducted following standard protocols, using trained and certified research staff. Weight measurements were collected using a Tanita BWB-800S scale; a Perspectives Enterprise stadiometer was used to measure height. BMI was calculated using the standard for-mula, and BMI percentiles were calculated using the CDC 2000 growth charts (24,25).
PA and dietary intake patterns: A cross-sectional sample of 4th grade student participants from the 30 schools filled out a SPAN question-naire during the spring semesters of 2007 and 2008. The SPAN is a self-administered, 62-item questionnaire that assesses PA, food con-sumption, and dietary and PA knowledge, self-efficacy, and outcome expectations (26–28). Items assessing PA and nutrition have acceptable to good level of reproducibility, with Kappa statistics ranging from 0.51 to 0.82 (26). Food consumption items were found to have an acceptable level of correlation with a 24-h dietary recall (r = 0.25–0.67) (27).
From the SPAN dietary intake items, two indexes were calculated: (i) a “Healthy Food Index,” which summed responses to questions about the prior day’s consumption of baked or grilled fish or chicken, milk, whole wheat bread/rolls, hot or cold cereal, starch vegetables, other vegetables, salad, beans, other vegetables, fruit, and fruit juice and (ii) an “Unhealthy Food Index,” which summed responses to fatty meats, fried meat with a crust, french fries/chips, white bread, fruit punch, sodas, frozen des-serts, sweet rolls/cake, chocolate candy, and other candy. These scales had acceptable internal consistency, with Cronbach’s α of 0.73 and 0.76 for 4th grade students for the Healthy Food Index and the Unhealthy Food Index, respectively. From other pilot work, percent concordance between servings consumed and times consumed, a closely related meas-ure, ranged from 75 to 91% for items on the Healthy Food Index, and 85 to 99% for items on the Unhealthy Food Index.
Process measuresModerate-to-vigorous PA during PE class: Student engagement in mod-erate-to-vigorous PA during PE class was assessed using the System for Observing Fitness Instruction Time (SOFIT) method. SOFIT uses direct observation based on momentary time sampling to obtain a simultane-ous measure of students’ PA levels and lesson contexts in PE classes. Development and validation of the SOFIT has been described elsewhere (29). Three assessments per school were conducted using certified data collectors with one class each of 3rd, 4th, and 5th grade students.
School implementation of CATCH: Measures to assess the implemen-tation of the CATCH program included a structured interview with the CATCH Champion and a self-administered questionnaire with 4th grade classroom teachers conducted in spring 2007 and spring 2008.
These instruments were developed based on previous instruments used to measure the dissemination of the CATCH program (30). Process variables included: (i) mean number of CATCH Committee meetings held, (ii) perceptions of CATCH Committee activity, (iii) perceived principal CATCH support, (iv) CATCH Committee composition, (v) implementation of CATCH Family Fun Night, and (vi) mean number of CATCH and health lessons taught.
Process measures were also obtained from the CATCH SPAN student questionnaire and included: (i) students’ report of CATCH lessons taught, (ii) students’ correct identification of “Go” foods, (iii) student identification of CATCH characters, (iv) student report of access to fruit at lunch time; (v) student classification of school lunch as “usually healthy,” and (vi) student report of teachers leading a PA break.
Data collection methodsOutcome and process measures were collected during spring 2007 and spring 2008 using trained and certified data collectors and quality control measures. An initial data collection was attempted during fall 2006; however, these data were not used as baseline data for several reasons: (i) implementation of the entire coordinated school health program did not occur fully in all four districts until fall 2007 because of delays in teacher training and lack of incorporation of the program into annual teacher lesson plans; (ii) student weight differs by season (31), so measurements conducted at the same time of year are more com-parable; (iii) data collection for spring 2007 measures began 1 month after collection of fall 2006 measures due to difficulties into getting into classrooms during the fall; and (iv) fall 2006 and spring 2007 measures were collected on the same children, so the data were not independent and consistent with the overall study design.
Data analysisThe primary outcome targeted by the intervention was reduction in prevalence of overweight and obesity (BMI ≥85th percentile and ≥95th percentile using CDC growth charts, respectively) (24,25). Implausible/extreme ranges for height and weight were determined using criteria for the Youth Risk Behavior Survey (YRBS), and/or values that fell outside of 4 standard deviations from the mean for that grade. In total, two cases were excluded based on these criteria.
We also hypothesized that reductions in BMI would be the results of increases in PA and healthy eating behaviors as well as reductions in unhealthy eating and sedentary activities. Because the intervention components were designed to increase healthy behaviors, we employed one-tailed tests of significance to evaluate changes in outcomes, with the threshold level of significance (α) set at P = 0.05.
The selection of schools rather than individual students to interven-tion conditions potentially induces correlation between subjects within schools, thus violating the usual independence assumption of regression. To account for this, we employed random-intercept regression mod-els with school as a random effect. Potential student-level confounders in the models included age, sex, and race/ethnicity (white, black, and Hispanic); school-level confounders included whether or not the school belonged to the major study school district (n = 81.4% of Travis County CATCH schools) compared to the three smaller school districts, and the proportion of kids that were economically disadvantaged at each school. The effect of the type of intervention on changes in outcomes was mod-eled using an interaction of intervention type × time of data collection, where time of data collection was a discrete-valued variable with values for spring 2007 and spring 2008, respectively. Prevalence estimates were obtained at the mean population level of all covariates.
Distributions of key variables across the two types of interventions, as well as in all schools, were examined using ANOVA for continuous variables and χ2-tests for categorical variables. Changes in the prevalence of child overweight and obesity, as well as BMI, across the period of the intervention were examined using stratified analyses. Separate strata for males, females, and each of the three major racial/ethnic groups were examined. Dietary and PA outcomes, obtained from the student

S40 VOLUME 18 SUPPLEMENT 1 | FEBRUARY 2010 | www.obesityjournal.org
Articles
questionnaire, were evaluated using similar models. Process measures were examined by comparing the mean process level across the two time periods, for each of the two types of intervention. Mean process level for student-level outcomes were estimated by regression models adjusting for confounders and school-level random effect. Unadjusted means and standard error estimates are presented for process measures elicited from teachers (n = 280) and champions (n = 104) because of limited number of variables available for regression adjustment.
RESULTSStudy sampleNo differences between CATCH BP and CATCH BPC schools were found for mean age, gender distribution, racial/ethnic com-position, percent of economically disadvantaged students, aca-demic achievement indicators, BMI, and percent overweight/obese for spring 2007 (Table 2). Approximately 1,100 stu-dents participated in each measurement period (Table 3), with Hispanic/Latino children representing 61% of the total sample.
Overweight and obesityThe percentage of students classified as either overweight or obese (≥85th percentile for gender and age based on CDC growth charts) decreased by 1.3 points (3.1%) (P = 0.33) in students from CATCH BP schools compared to a decrease of 8.3 points
(8.2%) (P < 0.005) in students from CATCH BPC schools. Thus, students in the CATCH BPC showed a significant decrease over time in overweight and obesity. Significant decreases in the prevalence of overweight and obesity were found in the BPC schools among boys (percentage point decreases of −7.8, P < 0.05), girls (−9.0%, P < 0.05); and Hispanics (−7.5%, P < 0.05). The differences between conditions were significant (P = 0.05) for all students, and marginal (P = 0.09) for girls.
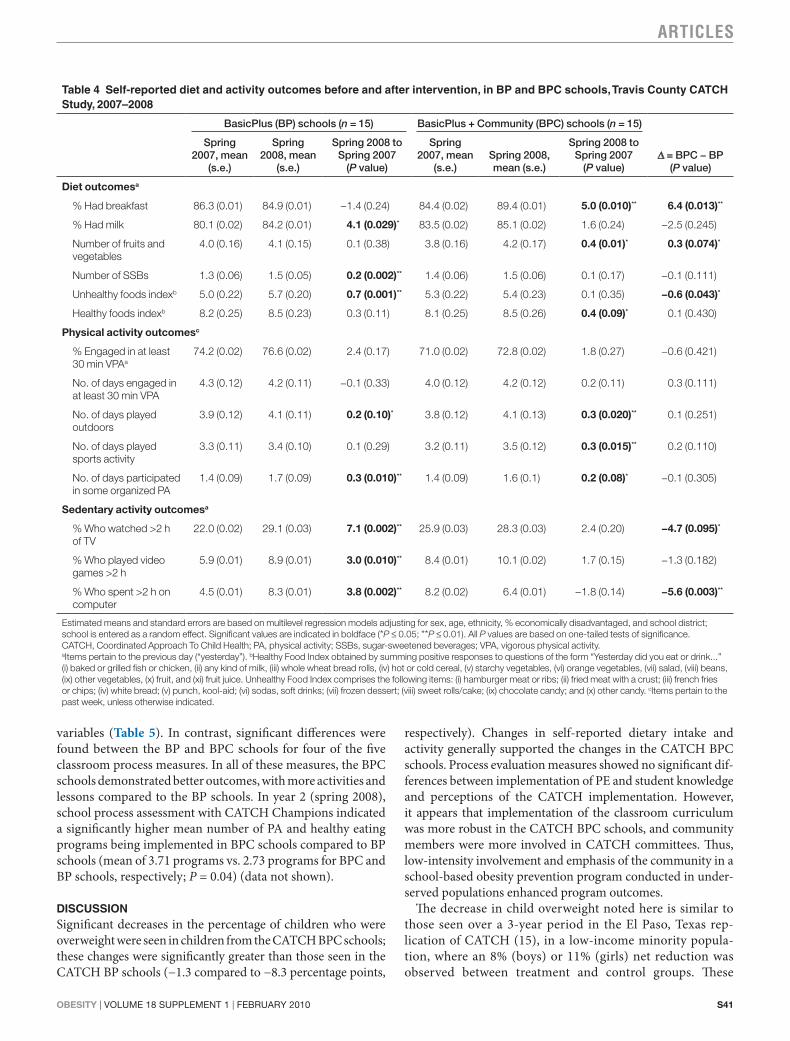
Dietary intake and activity behaviorsIn general, more positive results were found among dietary and activity behaviors for the students in the CATCH BPC schools (Table 4). Significant differences between students in the BP and BPC schools were seen for percentage reporting breakfast con-sumption, the Unhealthy Food Index, and the percentage of stu-dents who spent >2 h on the computer/day. These differences all suggest a more positive impact of the CATCH BPC intervention.
Process measuresIn general, no significant differences were found in the mean values across both years for the two conditions for any of the PE observation variables or student knowledge and perception
Table 3 Prevalence of overweight and obesity before and after intervention, in BP and BPC schools, Travis County CATCH Study, 2007–2008
BasicPlus (BP) schools (n = 15) BasicPlus + Community (BPC) schools (n = 15)
Spring 2007, mean (s.e.)
Spring 2008, mean (s.e.)
Spring 2008 to Spring 2007
(P value)Spring 2007, mean (s.e.)
Spring 2008, mean (s.e.)
Spring 2008 to Spring 2007
(P value)Δ = BPC − BP
(P value)
Percent ≥85th percentile
Total sample 42 (0.02) 40.7 (0.02) −1.3 (0.33) 47.4 (0.02) 39.1 (0.02) −8.3 (0.005)** −7.0 (0.051)*
Gender
Boys 45.3 (0.04) 43.4 (0.03) −1.9 (0.33) 51.0 (0.03) 43.2 (0.03) −7.8 (0.047)* −5.9 (0.18)
Girls 39.3 (0.03) 38 (0.03) −1.3 (0.37) 44.0 (0.03) 35.0 (0.03) −9.0 (0.020)** −7.7 (0.09)*
Ethnicity
White 30.7 (0.08) 28.6 (0.08) −2.1 (0.42) 31.7 (0.08) 17.1 (0.08) −14.6 (0.12) −12.5 (0.20)
African American
41.5 (0.05) 39.8 (0.05) −1.7 (0.40) 47.7 (0.06) 50.8 (0.07) 3.1 (0.38) 4.8 (0.35)
Hispanic 51.6 (0.03) 50.1 (0.03) −1.5 (0.34) 50.8 (0.03) 43.3 (0.03) −7.5 (0.026)** −6.0 (0.14)
Percent ≥95th percentile
Total sample 23.9 (0.02) 22 (0.02) −1.9 (0.21) 27.5 (0.02) 23.9 (0.02) −3.6 (0.09) −1.7 (0.33)
Gender
Boys 29 (0.03) 25.4 (0.03) −3.6 (0.16) 32.7 (0.03) 30.1 (0.03) −2.6 (0.27) 1.0 (0.41)
Girls 19.7 (0.03) 19.3 (0.02) −0.4 (0.44) 23.2 (0.03) 18.4 (0.03) −4.8 (0.09)* −4.4 (0.18)
Ethnicity
White 8.5 (0.04) 10.1 (0.04) 1.6 (0.39) 13.6 (0.06) 11.5 (0.07) −2.1 (0.41) −3.7 (0.36)
African American
22.5 (0.05) 24.8 (0.04) 2.3 (0.36) 32.0 (0.06) 37.2 (0.07) 5.2 (0.29) 2.9 (0.42)
Hispanic 31.7 (0.03) 29.4 (0.02) −2.3 (0.25) 28.9 (0.02) 27.5 (0.02) −1.4 (0.34) 0.9 (0.44)
Estimated means and standard errors are based on multilevel regression models adjusting for sex, age, ethnicity, % economically disadvantaged, and school district (largest vs. three smaller); school is entered as a random effect. Significant values are indicated in boldface (*P ≤ 0.05; **P ≤ 0.01). All P values are based on one-tailed tests of significance. Mean BMI, and prevalence of overweight and obesity were not significant between BP and BPC at spring 2007. CATCH, Coordinated Approach To Child Health.
obeSity | VOLUME 18 SUPPLEMENT 1 | FEBRUARY 2010 S41
Articles
variables (Table 5). In contrast, significant differences were found between the BP and BPC schools for four of the five classroom process measures. In all of these measures, the BPC schools demonstrated better outcomes, with more activities and lessons compared to the BP schools. In year 2 (spring 2008), school process assessment with CATCH Champions indicated a significantly higher mean number of PA and healthy eating programs being implemented in BPC schools compared to BP schools (mean of 3.71 programs vs. 2.73 programs for BPC and BP schools, respectively; P = 0.04) (data not shown).
DISCUSSIONSignificant decreases in the percentage of children who were overweight were seen in children from the CATCH BPC schools; these changes were significantly greater than those seen in the CATCH BP schools (−1.3 compared to −8.3 percentage points,
respectively). Changes in self-reported dietary intake and activity generally supported the changes in the CATCH BPC schools. Process evaluation measures showed no significant dif-ferences between implementation of PE and student knowledge and perceptions of the CATCH implementation. However, it appears that implementation of the classroom curriculum was more robust in the CATCH BPC schools, and community members were more involved in CATCH committees. Thus, low-intensity involvement and emphasis of the community in a school-based obesity prevention program conducted in under-served populations enhanced program outcomes.
The decrease in child overweight noted here is similar to those seen over a 3-year period in the El Paso, Texas rep-lication of CATCH (15), in a low-income minority popula-tion, where an 8% (boys) or 11% (girls) net reduction was observed between treatment and control groups. These
Table 4 Self-reported diet and activity outcomes before and after intervention, in BP and BPC schools, Travis County CATCH Study, 2007–2008
BasicPlus (BP) schools (n = 15) BasicPlus + Community (BPC) schools (n = 15)
Spring 2007, mean
(s.e.)
Spring 2008, mean
(s.e.)
Spring 2008 to Spring 2007
(P value)
Spring 2007, mean
(s.e.)Spring 2008, mean (s.e.)
Spring 2008 to Spring 2007
(P value)Δ = BPC − BP
(P value)
Diet outcomesa
% Had breakfast 86.3 (0.01) 84.9 (0.01) −1.4 (0.24) 84.4 (0.02) 89.4 (0.01) 5.0 (0.010)** 6.4 (0.013)**
% Had milk 80.1 (0.02) 84.2 (0.01) 4.1 (0.029)* 83.5 (0.02) 85.1 (0.02) 1.6 (0.24) −2.5 (0.245)
Number of fruits and vegetables
4.0 (0.16) 4.1 (0.15) 0.1 (0.38) 3.8 (0.16) 4.2 (0.17) 0.4 (0.01)* 0.3 (0.074)*
Number of SSBs 1.3 (0.06) 1.5 (0.05) 0.2 (0.002)** 1.4 (0.06) 1.5 (0.06) 0.1 (0.17) −0.1 (0.111)
Unhealthy foods indexb 5.0 (0.22) 5.7 (0.20) 0.7 (0.001)** 5.3 (0.22) 5.4 (0.23) 0.1 (0.35) −0.6 (0.043)*
Healthy foods indexb 8.2 (0.25) 8.5 (0.23) 0.3 (0.11) 8.1 (0.25) 8.5 (0.26) 0.4 (0.09)* 0.1 (0.430)
Physical activity outcomesc
% Engaged in at least 30 min VPAa
74.2 (0.02) 76.6 (0.02) 2.4 (0.17) 71.0 (0.02) 72.8 (0.02) 1.8 (0.27) −0.6 (0.421)
No. of days engaged in at least 30 min VPA
4.3 (0.12) 4.2 (0.11) −0.1 (0.33) 4.0 (0.12) 4.2 (0.12) 0.2 (0.11) 0.3 (0.111)
No. of days played outdoors
3.9 (0.12) 4.1 (0.11) 0.2 (0.10)* 3.8 (0.12) 4.1 (0.13) 0.3 (0.020)** 0.1 (0.251)
No. of days played sports activity
3.3 (0.11) 3.4 (0.10) 0.1 (0.29) 3.2 (0.11) 3.5 (0.12) 0.3 (0.015)** 0.2 (0.110)
No. of days participated in some organized PA
1.4 (0.09) 1.7 (0.09) 0.3 (0.010)** 1.4 (0.09) 1.6 (0.1) 0.2 (0.08)* −0.1 (0.305)
Sedentary activity outcomesa
% Who watched >2 h of TV
22.0 (0.02) 29.1 (0.03) 7.1 (0.002)** 25.9 (0.03) 28.3 (0.03) 2.4 (0.20) −4.7 (0.095)*
% Who played video games >2 h
5.9 (0.01) 8.9 (0.01) 3.0 (0.010)** 8.4 (0.01) 10.1 (0.02) 1.7 (0.15) −1.3 (0.182)
% Who spent >2 h on computer
4.5 (0.01) 8.3 (0.01) 3.8 (0.002)** 8.2 (0.02) 6.4 (0.01) −1.8 (0.14) −5.6 (0.003)**
Estimated means and standard errors are based on multilevel regression models adjusting for sex, age, ethnicity, % economically disadvantaged, and school district; school is entered as a random effect. Significant values are indicated in boldface (*P ≤ 0.05; **P ≤ 0.01). All P values are based on one-tailed tests of significance.CATCH, Coordinated Approach To Child Health; PA, physical activity; SSBs, sugar-sweetened beverages; VPA, vigorous physical activity.aItems pertain to the previous day (“yesterday”). bHealthy Food Index obtained by summing positive responses to questions of the form “Yesterday did you eat or drink...” (i) baked or grilled fish or chicken, (ii) any kind of milk, (iii) whole wheat bread rolls, (iv) hot or cold cereal, (v) starchy vegetables, (vi) orange vegetables, (vii) salad, (viii) beans, (ix) other vegetables, (x) fruit, and (xi) fruit juice. Unhealthy Food Index comprises the following items: (i) hamburger meat or ribs; (ii) fried meat with a crust; (iii) french fries or chips; (iv) white bread; (v) punch, kool-aid; (vi) sodas, soft drinks; (vii) frozen dessert; (viii) sweet rolls/cake; (ix) chocolate candy; and (x) other candy. cItems pertain to the past week, unless otherwise indicated.

S42 VOLUME 18 SUPPLEMENT 1 | FEBRUARY 2010 | www.obesityjournal.org
Articles
Table 5 Process-related outcomes of CATCH implementation, Travis County CATCH Study, 2007–2008
BasicPlus schools (BP) (n = 15)
BasicPlus + Community (BPC) schools (n = 15)
Spring 2007
Spring 2008
Mean (s.e.) level across 2007–2008
Spring 2007
Spring 2008
Mean (s.e.) level across 2007–2008
Mean BPC − mean BP (P value)
Direct observation of Pe class (SoFit)
Mean % of class time spent in VPA 10.3 17 14.2 (2.30) 10.7 13.4 12.5 (1.30) −1.7 (0.26)
Mean % of class time spent in MVPA 43.1 47.2 46.6 (4.01) 42.1 47.6 46.2 (2.27) −0.4 (0.47)
Mean % time spent in management lesson contexta
33.1 18.4 21.0 (2.75) 29.6 23.2 20.8 (1.55) −0.2 (0.47)
Mean % time spent in active lesson contextb
53 63.1 59.3 (3.85) 55.3 60 59.0 (2.18) −0.3 (0.47)
CAtCH classroom activitiesc
CATCH parent and extracurricular activities (mean, s.e.)d
1.6 2.4 1.9 (0.17) 1.9 2.3 2.1 (0.16) 0.2 (0.24)
CATCH coordinated healthy eating–related activities (mean, s.e.)e
0.9 0.9 0.9 (0.17) 1 1.6 1.3 (0.16) 0.4 (0.049)*
CATCH coordinated physical activity–related activities (mean, s.e.)f
0.8 5.5 2.9 (0.49) 0.9 6.9 4.0 (0.46) 1.1 (0.046)*
Number of CATCH lessons taught (mean, s.e.)
0.7 0.8 0.8 (0.22) 1.1 2 1.6 (0.21) 0.8 (0.005)**
Number of health lessons taught (mean, s.e.)
1.2 1.8 1.5 (0.30) 1.7 3.5 2.7 (0.28) 1.2 (0.002)**
CAtCH school-level coordination and leadershipg
% Reporting administrative person on CATCH Committee
73.3 66.7 70.0 (0.08) 93.3 78.6 86.2 (0.06) 16.2 (0.07)*
% Reporting parent representative on CATCH Committee
60 66.7 63.3 (0.09) 80 64.3 72.4 (0.08) 9.1 (0.23)
% Reporting community representative on CATCH Committee
6.7 6.7 6.7 (0.05) 53.3 42.9 48.3 (0.09) 41.6 (0.001)**
Number of CATCH meetings over past semester
0.7 0.7 0.7 (0.08) 0.9 0.8 0.9 (0.08) 0.2 (0.07)*
% Rating principal as supportive 80 92.9 86.2 (0.06) 100 85.7 93.1 (0.05) 6.9 (0.20)
% Rating committee rated as active 83.3 100 92.6 (0.05) 100 92.9 96.6 (0.03) 4.0 (0.26)
Student knowledge and perceptionsh
% Reporting CATCH lessons in schoolroom
51.1 46.5 48.6 (0.03) 51.2 51.8 51.5 (0.03) 2.9 (0.17)
% That correctly identified “Go” food 53.9 67.2 61.3 (0.06) 40.6 67.4 52.6 (0.06) −8.7 (0.29)
% That correctly identified CATCH character
44 43.8 43.9 (0.03) 36.2 50.6 42.5 (0.04) −1.4 (0.29)
% Reporting that fruit usually served at lunch
61.6 61.7 61.6 (0.03) 63.8 67.3 65.4 (0.03) 3.8 (0.19)
% Describing lunch as usually healthy 58 59.5 58.8 (0.02) 53.7 60.6 56.7 (0.03) −2.1 (0.37)
Days/week that PA break is teacher led (mean, s.e.)
1.8 1.9 1.9 (0.10) 1.6 2 1.8 (0.10) −0.1 (0.16)
For student knowledge and perceptions, regression models were adjust for sex, age, ethnicity, % economically disadvantaged, and school district, as well as school random effect; for SOFIT outcomes, we adjusted for grade and school district, as well as school-level random effect. Unadjusted means are presented for CATCH activities. Significant values are indicated in boldface (*P ≤ 0.05; **P ≤ 0.01). All P values are based on one-tailed tests of significance.CATCH, Coordinated Approach To Child Health; MVPA, moderate-to-vigorous physical activity; PA, physical activity; PE, physical education; SOFIT, System for Observing Fitness Instruction Time; VPA, vigorous physical activity.aManagement context includes time students spend in activities related to classroom management, such as explanation of class agenda or rules. bActive lesson context refers to the time children spend in activities related to fitness, skills, drills, and games. cData collected from self-administered questionnaires with 4th grade teachers. Data represent teacher reports over past semester. dActivities include: inviting parents to help with healthy snack preparation, teacher participation in Family Fun Night/health-related family event; teacher participation in health day–themed events (based on seven items). eActivities include: cafeteria “field trip,” taste-testing parties, participation of food service staff in teaching students about nutrition or food preparation (based on 10 items). fActivities include: teacher participation in PE class with students, creation of posters and banners related to physical activity, coordination of school-wide or grade-level walking contests, etc. (based on six items). gData collected from structured interviews with CATCH Champion, a designated school staff member. Data represent CATCH Champion report over past semester. hData collected from self-administered questionnaires with 4th grade students (n = 1,107, Spring 2007; n =1,170, Spring 2008).

obeSity | VOLUME 18 SUPPLEMENT 1 | FEBRUARY 2010 S43
Articles
obesity prevention effects were also observed among 4th grade students in the El Paso region in a separate surveillance study of obesity in Texas (3). Unlike the original CATCH trial (12), the Coleman et al., replication study (15) and the El Paso surveillance study (3) both included a population that was at increased risk of child obesity and CATCH was implemented concomitantly with several related community-based programs (32–34) that supported CATCH health mes-sages. Although the El Paso replication study is similar to the Travis County study, one significant difference is that in El Paso, the community intervention components were funded and operationalized separately, where in the current Travis County study, the goal was to integrate community involve-ment through the school in a coordinated manner in the BPC condition.
Travis County CATCH results are also similar to those reported by Economos et al. (10) and Sanigorski et al. (12). The Shape Up Somerville study (10) used a community par-ticipatory approach that involved schools, as well as diverse community organizations and events that led to a decreases in BMI z-scores. The Be Active Eat Well (BAEW) interven-tion (11,12) also involved schools with significant com-munity and social marketing components, with intent to increase community capacity, and reported lower increases in body weight.
Although Shape Up Somerville and BAEW included a small proportion of lower socioeconomic participants, the El Paso and Travis County CATCH projects were conducted by design in low-income, minority schools, where children are at greater risk: a population with 80% classified as economi-cally disadvantaged in the 30 evaluation schools. Although children from lower socioeconomic status populations have been found to have higher rates of obesity (35), few research studies have been conducted in these populations. Although this study found encouraging differences with the communi-ty-focused intervention condition, outreach efforts were not without specific challenges, including the need for consistent follow-up from study facilitators and concomitant outreach to community groups. Recent strategies such as engaging other groups concerned with child health and well-being, but not necessarily diet and activity; convening a community advisory committee; and targeting parent support specialists/promoto-ras have been added to the community-level intervention to enhance community capacity and outreach efforts.
Implementation of the community component enhanced implementation of the CATCH curriculum. Of all of the CATCH components, the classroom curriculum is least likely to be implemented due to testing requirements and other pri-orities in classrooms (30). It may be that the emphasis on the community aspects of CATCH or the more frequent facilitator visits raised teacher awareness and accountability for teaching the curriculum.
Strengths and limitationsThe main strengths of the study include the use of a diverse study population, direct assessments of height and weight,
adequate sample size, evaluation at interim time points, and use of validated and pretested measures specific to CATCH. The Travis County CATCH Program is unique because of the emphasis on lower income populations and a community participatory focus that involved relatively large numbers of students and schools.
Limitations include the use a serial cross-sectional design vs. cohort, self-reported behavioral measures, the lack of a no- intervention control group, and potential bias in selec-tion of the BPC schools. Although the dietary intake, activity, and process measures were self-reported, all of the measures were adopted from previous work by the study investigators (26–28,30) and have demonstrated face validity, and have been evaluated for reproducibility.
Because this was a community participatory study, school district representatives assisted in the selection of the CATCH BPC schools. Schools that were selected for the BPC intervention condition could potentially have been more receptive to the intervention, which could have affected the outcomes; however, both groups (BP and BPC) shared simi-lar demographics (Table 2), academic achievement indica-tors, baseline BMI, and key school-level measures (Table 5). School-level variables that influence implementation of an intervention, such as principal support, can be fluid and dependent upon many factors, including staff turnover, aca-demic performance of the schools, and community involve-ment. Our process measures indicated that school support for the program was strong in both conditions: BP and BPC schools both reported high levels of principal support and active CATCH committees at the beginning of the study (Table 5). Although BPC schools initially reported slightly higher levels of support, these numbers tended to attenuate as the intervention progressed, so that there were no signifi-cant differences in the means over time (Table 5). Although this selection bias could conceivably affect the rigor of the study, it also increases the generalizability of the findings. Because of the community participatory nature of the study, we elected to include the community partners in various study decisions (16), as well as to compare alternative lev-els of intervention intensity rather than use a no-treatment comparison group.
ConclusionsResults from this study indicate the need for community-level emphasis and involvement in school-based interven-tions that target underserved populations, and supports previous child obesity prevention work with CATCH (3,15). Future work should emphasize strategies to build com-munity capacity and to increase and maintain community involvement with school programs in a manner that can be easily replicable and disseminated. This study further under-scores the importance of community involvement in child obesity prevention in low-income settings, to address and counteract disparities in environmental and social factors that contribute to higher rates of obesity in these popula-tions. The positive results to date for this study suggest that

S44 VOLUME 18 SUPPLEMENT 1 | FEBRUARY 2010 | www.obesityjournal.org
Articles
such efforts can have an important impact on child obesity in these settings.
ACKNOWLEDGMENTSThis study was funded by the Michael & Susan Dell Foundation. We acknowledge the school districts, school district leaders, school faculty and staff, and children who participated in the study. We also acknowledge Joanne Delk and Martin Evans for their assistance in data collection and editing; Tiffni Menendez and Elizabeth Camp for their editorial assistance; Roy Allen for database management; and Joey Walker, Peter Cribb, Karen Burnell, Jim DeLine, and Isabel Clark for their assistance in program implementation.
DISCLOSURED.M.H. and S.H.K. receive funding from Flaghouse, Inc. and the Michael & Susan Dell Foundation for development, dissemination and evaluation of CATCH. The University of Texas School of Public Health receives royalties based on sale of CATCH curriculum, of which 100% goes back into further research and development. The funding organizations listed above were not involved in the data management, analysis, or interpretation of the data, or in the preparation, review, or approval of the manuscript. The study was funded by the Michael & Susan Dell Foundation. C.L.P. receives funding as a co-investigator from the Michael & Susan Dell Foundation for development, dissemination and evaluation of CATCH. The University of Minnesota receives royalties from Flaghouse, Inc. based on sale of CATCH curriculum materials, of which a portion is paid as royalties to the investigators. The funding organizations listed above were not involved in the data management, analysis, or interpretation of the data, or in the preparation, review, or approval of the manuscript. The study was funded by the Michael & Susan Dell Foundation. The remaining authors declared no conflict of interest.
© 2010 The Obesity Society
REFERENCES1. Institute of Medicine. Preventing Childhood Obesity: Health in Balance.
National Academy of Sciences: Washington, DC, 1994.2. Ogden CL, Carroll MD, Flegal KM. High body mass index for age
among US children and adolescents, 2003-2006. JAMA 2008;299: 2401–2405.
3. Hoelscher DM, Kelder SH, Perez A et al. Changes in the regional prevalence of child obesity in 4th, 8th, and 11th grade students in Texas from 2000–2002 to 2004–2005. Obesity (Silver Spring) 2009; e-pub ahead of print 1 October 2009.
4. US Department of Health and Human Services. Healthy People 2010, 2nd edn. US Government Printing Office: Washington, DC, 2005.
5. Must A, Anderson SE. Effects of obesity on morbidity in children and adolescents. Nutr Clin Care 2003;6:4–12.
6. Whitaker RC, Wright JA, Pepe MS, Seidel KD, Dietz WH. Predicting obesity in young adulthood from childhood and parental obesity. N Engl J Med 1997;337:869–873.
7. American Dietetic Association. Position of the American Dietetic Association: individual-, family-, school-, and community-based interventions for pediatric overweight. J Am Diet Assoc 2006;106:925–945.
8. Wechsler H, McKenna ML, Lee SM, Dietz WH. The role of schools in preventing childhood obesity. National Association of State Boards of Education, 4–12 December 2004 <http://www.cdc.gov/healthyyouth/physicalactivity/pdf/roleofschools-obesity.pdf>.
9. Kropski JA, Keckley PH, Jensen GL. School-based obesity prevention programs: an evidence-based review. Obesity (Silver Spring) 2008;16:1009–1018.
10. Economos CD, Hyatt RR, Goldberg JP et al. A community intervention reduces BMI z-score in children: Shape Up Somerville first year results. Obesity (Silver Spring) 2007;15:1325–1336.
11. Swinburn B. Obesity prevention in children and adolescents. Child Adolesc Psychiatr Clin N Am 2009;18:209–223.
12. Sanigorski AM, Bell AC, Kremer PJ, Cuttler R, Swinburn BA. Reducing unhealthy weight gain in children through community capacity-building:
results of a quasi-experimental intervention program, Be Active Eat Well. Int J Obes (Lond) 2008;32:1060–1067.
13. Luepker RV, Perry CL, McKinlay SM et al. Outcomes of a field trial to improve children’s dietary patterns and physical activity. The Child and Adolescent Trial for Cardiovascular Health. CATCH collaborative group. JAMA 1996;275:768–776.
14. Nader PR, Stone EJ, Lytle LA et al. Three-year maintenance of improved diet and physical activity: the CATCH cohort. Child and Adolescent Trial for Cardiovascular Health. Arch Pediatr Adolesc Med 1999;153:695–704.
15. Coleman KJ, Tiller CL, Sanchez J et al. Prevention of the epidemic increase in child risk of overweight in low-income schools: the El Paso coordinated approach to child health. Arch Pediatr Adolesc Med 2005;159:217–224.
16. Minkler M, Wallerstein N. Community Based Participatory Research for Health. Jossey-Bass: San Francisco, CA, 2003.
17. US Department of Agriculture, US Department of Health and Human Services. Dietary Guidelines for Americans <http://www.healthierus.gov/dietaryguidelines/> (2005).
18. McLeroy KR, Bibeau D, Steckler A, Glanz K. An ecological perspective on health promotion programs. Health Educ Q 1988;15:351–377.
19. Sallis JF, Cervero RB, Ascher W et al. An ecological approach to creating active living communities. Annu Rev Public Health 2006;27:297–322.
20. Bandura A. Social Foundations of Thought and Action: Social Cognitive Theory. Prentice Hall: Englewood Cliffs, NJ, 1986.
21. Perry CL, Stone EJ, Parcel GS et al. School-based cardiovascular health promotion: the child and adolescent trial for cardiovascular health (CATCH). J Sch Health 1990;60:406–413.
22. Kelder S, Hoelscher DM, Barroso CS et al. The CATCH Kids Club: a pilot after-school study for improving elementary students’ nutrition and physical activity. Public Health Nutr 2005;8:133–140.
23. Hoelscher DM, Day RS, Lee ES et al. Measuring the prevalence of overweight in Texas schoolchildren. Am J Public Health 2004;94: 1002–1008.
24. Centers for Disease Control and Prevention, Division of Nutrition and Physical Activity, National Center for Chronic Disease Prevention and Health Promotion. Healthy weight—it’s not a diet, it’s a lifestyle!<http://www.cdc.gov/healthyweight/assessing/bmi/> (2009).
25. Barlow SE; Expert Committee. Expert committee recommendations regarding the prevention, assessment, and treatment of child and adolescent overweight and obesity: summary report. Pediatrics 2007;120(Suppl 4):S164–S192.
26. Penkilo M, George GC, Hoelscher DM. Reproducibility of the School-Based Nutrition Monitoring Questionnaire among fourth-grade students in Texas. J Nutr Educ Behav 2008;40:20–27.
27. Thiagarajah K, Fly AD, Hoelscher DM et al. Validating the food behavior questions from the elementary school SPAN questionnaire. J Nutr Educ Behav 2008;40:305–310.
28. Hoelscher DM, Day RS, Kelder SH, Ward JL. Reproducibility and validity of the secondary level School-Based Nutrition Monitoring student questionnaire. J Am Diet Assoc 2003;103:186–194.
29. McKenzie TL, Sallis JF, Nader PR. SOFIT: system for observing fitness instruction time. J Teach Phys Educ 1991;11:195–205.
30. Hoelscher DM, Feldman HA, Johnson CC et al. School-based health education programs can be maintained over time: results from the CATCH Institutionalization study. Prev Med 2004;38:594–606.
31. von Hippel PT, Powell B, Downey DB, Rowland NJ. The effect of school on overweight in childhood: gain in body mass index during the school year and during summer vacation. Am J Public Health 2007;97:696–702.
32. Smith WE, Day RS, Brown LB. Heritage retention and bean intake correlates to dietary fiber intakes in Hispanic mothers—Qué Sabrosa Vida. J Am Diet Assoc 2005;105:404–411; discussion 411.
33. Heath EM, Coleman KJ. Evaluation of the institutionalization of the coordinated approach to child health (CATCH) in a U.S./Mexico border community. Health Educ Behav 2002;29:444–460.
34. Rutt C, Coleman KJ. The impact of the built environment on walking as a leisure-time activity along the U.S./Mexico border. J Phys Act Health 2005;3:257–271.
35. Strauss RS, Pollack HA. Epidemic increase in childhood overweight, 1986-1998. JAMA 2001;286:2845–2848.