Recommendations to Improve Public Safety, Animal Welfare
406
Memorandum CITY OF DALLAS DATE August 26, 2016 TO Honorable Mayor and Members of the City Council SUBJECT Loose dogs in Dallas: Strategic Recommendations to Improve Public Safety and Animal Welfare in Dallas On August 30, 2016, the Dallas City Council will be briefed on the Strategic Recommendations to Improve Public Safety and Animal Welfare in Dallas by The Boston Consulting Group. The briefing materials are attached for your review. Please contact me if you have any questions or need additional information. Joey Zapata Assistant City Manager Attachments c: A.C. Gonzalez, City Manager Christopher D. Bowers, Interim City Attorney Craig D. Kinton, City Auditor Rosa A. Rios, City Secretary Daniel F. Solis, Administrative Judge Ryan S. Evans, First Assistant City Manager Jill A. Jordan, P.E., Assistant City Manager Eric D. Campbell, Assistant City Manager Mark McDaniel, Assistant City Manager Jeanne Chipperfield, Chief Financial Officer Sana Syed, Public Information Officer Elsa Cantu, Assistant to the City Manager – Mayor & Council
-
Upload
khangminh22 -
Category
Documents
-
view
2 -
download
0
Transcript of Recommendations to Improve Public Safety, Animal Welfare
Memorandum
CITY OF DALLAS
DATE August 26, 2016
TO Honorable Mayor and Members of the City Council
SUBJECT Loose dogs in Dallas: Strategic Recommendations to Improve Public Safety and Animal Welfare in Dallas On August 30, 2016, the Dallas City Council will be briefed on the Strategic Recommendations to Improve Public Safety and Animal Welfare in Dallas by The Boston Consulting Group. The briefing materials are attached for your review.
Please contact me if you have any questions or need additional information.
Joey Zapata Assistant City Manager
Attachments
c: A.C. Gonzalez, City Manager Christopher D. Bowers, Interim City Attorney Craig D. Kinton, City Auditor Rosa A. Rios, City Secretary Daniel F. Solis, Administrative Judge Ryan S. Evans, First Assistant City Manager
Jill A. Jordan, P.E., Assistant City Manager Eric D. Campbell, Assistant City Manager Mark McDaniel, Assistant City Manager Jeanne Chipperfield, Chief Financial Officer Sana Syed, Public Information Officer Elsa Cantu, Assistant to the City Manager – Mayor & Council

Loose dogs in Dallas:
Strategic Recommendations to Improve
Public Safety and Animal Welfare Presentation of findings to City Council
August 30, 2016
20160826_1130_Council_Deck.pptx 1
Co
pyrig
ht
© 2
01
6 b
y T
he
Bo
sto
n C
onsultin
g G
roup
, In
c.
All
rig
hts
re
se
rve
d.
Agenda
Context
Key Findings
Recommendations
Next steps
20160826_1130_Council_Deck.pptx 2
Co
pyrig
ht
© 2
01
6 b
y T
he
Bo
sto
n C
onsultin
g G
roup
, In
c.
All
rig
hts
re
se
rve
d.
Context
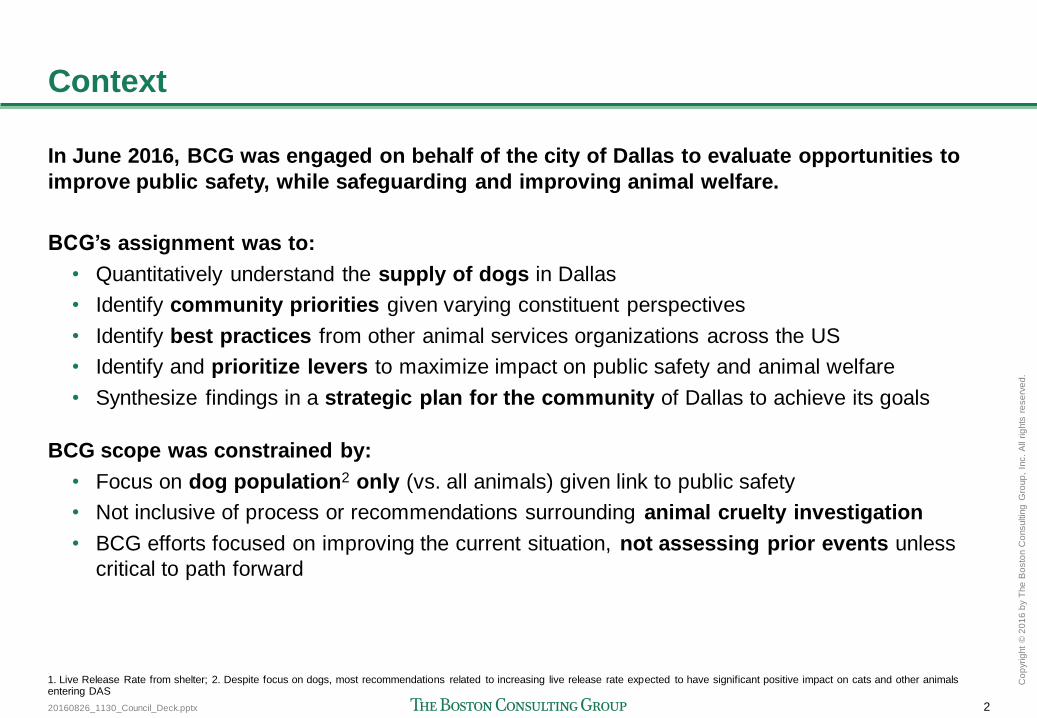
In June 2016, BCG was engaged on behalf of the city of Dallas to evaluate opportunities to
improve public safety, while safeguarding and improving animal welfare.
BCG’s assignment was to:
• Quantitatively understand the supply of dogs in Dallas
• Identify community priorities given varying constituent perspectives
• Identify best practices from other animal services organizations across the US
• Identify and prioritize levers to maximize impact on public safety and animal welfare
• Synthesize findings in a strategic plan for the community of Dallas to achieve its goals
BCG scope was constrained by:
• Focus on dog population2 only (vs. all animals) given link to public safety
• Not inclusive of process or recommendations surrounding animal cruelty investigation
• BCG efforts focused on improving the current situation, not assessing prior events unless
critical to path forward
1. Live Release Rate from shelter; 2. Despite focus on dogs, most recommendations related to increasing live release rate expected to have significant positive impact on cats and other animals entering DAS
20160826_1130_Council_Deck.pptx 3
Co
pyrig
ht
© 2
01
6 b
y T
he
Bo
sto
n C
onsultin
g G
roup
, In
c.
All
rig
hts
re
se
rve
d.
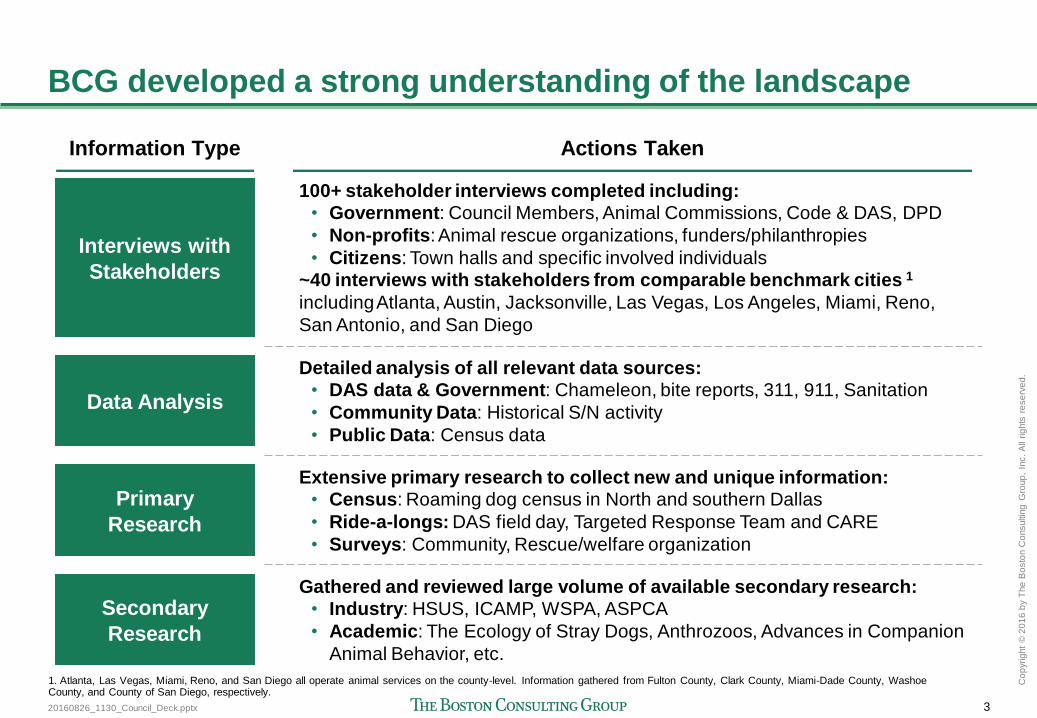
BCG developed a strong understanding of the landscape
Interviews with
Stakeholders
100+ stakeholder interviews completed including:
• Government: Council Members, Animal Commissions, Code & DAS, DPD
• Non-profits: Animal rescue organizations, funders/philanthropies
• Citizens: Town halls and specific involved individuals
~40 interviews with stakeholders from comparable benchmark cities 1
including Atlanta, Austin, Jacksonville, Las Vegas, Los Angeles, Miami, Reno,
San Antonio, and San Diego
Secondary
Research
Primary
Research
Extensive primary research to collect new and unique information:
• Census: Roaming dog census in North and southern Dallas
• Ride-a-longs: DAS field day, Targeted Response Team and CARE
• Surveys: Community, Rescue/welfare organization
Data Analysis
Detailed analysis of all relevant data sources:
• DAS data & Government: Chameleon, bite reports, 311, 911, Sanitation
• Community Data: Historical S/N activity
• Public Data: Census data
Gathered and reviewed large volume of available secondary research:
• Industry: HSUS, ICAMP, WSPA, ASPCA
• Academic: The Ecology of Stray Dogs, Anthrozoos, Advances in Companion
Animal Behavior, etc.
Actions Taken Information Type
1. Atlanta, Las Vegas, Miami, Reno, and San Diego all operate animal services on the county-level. Information gathered from Fulton County, Clark County, Miami-Dade County, Washoe County, and County of San Diego, respectively.
20160826_1130_Council_Deck.pptx 4
Co
pyrig
ht
© 2
01
6 b
y T
he
Bo
sto
n C
onsultin
g G
roup
, In
c.
All
rig
hts
re
se
rve
d.
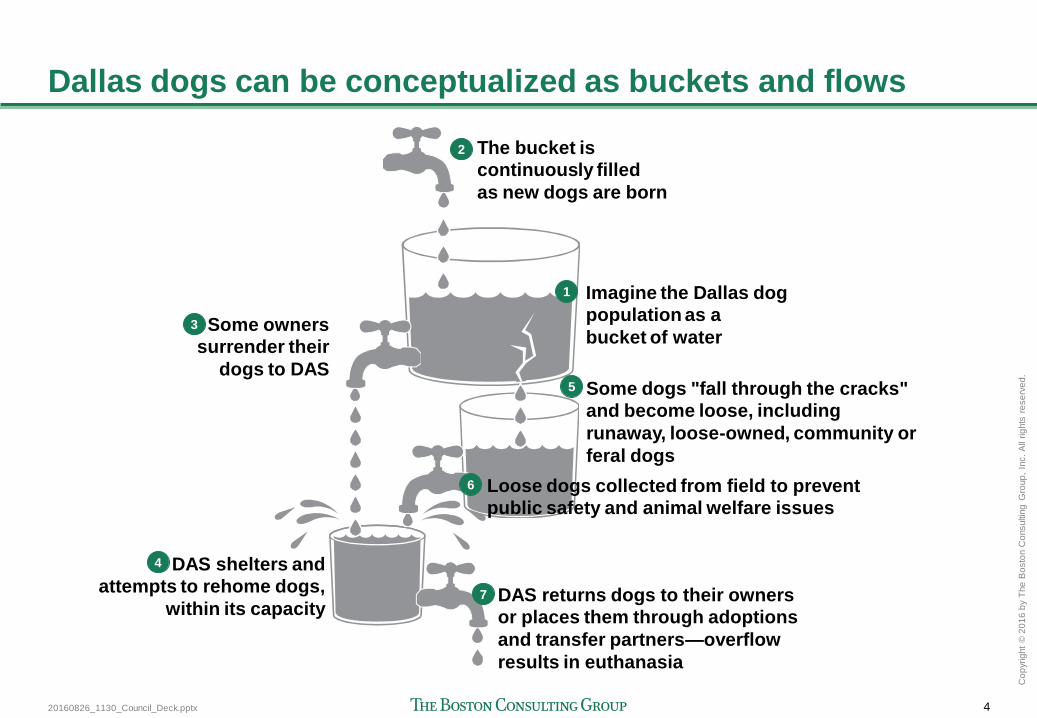
Loose dogs
in Dallas
Imagine the Dallas dog
population as a
bucket of water
The bucket is
continuously filled
as new dogs are born
Some owners
surrender their
dogs to DAS
DAS shelters and
attempts to rehome dogs,
within its capacity
Some dogs "fall through the cracks"
and become loose, including
runaway, loose-owned, community or
feral dogs
Loose dogs collected from field to prevent
public safety and animal welfare issues
DAS returns dogs to their owners
or places them through adoptions
and transfer partners—overflow
results in euthanasia
1
2
3
4
5
6
7
Dallas dogs can be conceptualized as buckets and flows
20160826_1130_Council_Deck.pptx 5
Co
pyrig
ht
© 2
01
6 b
y T
he
Bo
sto
n C
onsultin
g G
roup
, In
c.
All
rig
hts
re
se
rve
d.
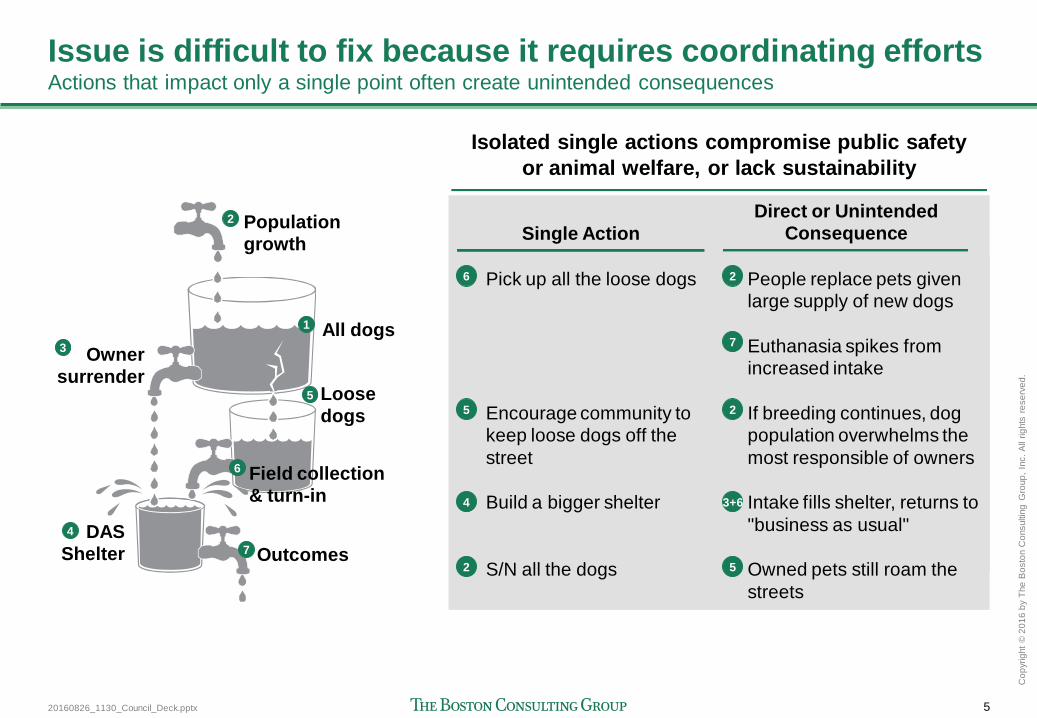
Issue is difficult to fix because it requires coordinating efforts Actions that impact only a single point often create unintended consequences
Loose dogs
in Dallas
All dogs
Population
growth
Owner
surrender
DAS
Shelter
Loose
dogs
Field collection
& turn-in
Outcomes
1
2
3
4
5
6
7
6
Single Action
Direct or Unintended
Consequence
Pick up all the loose dogs
Encourage community to
keep loose dogs off the
street
Build a bigger shelter
S/N all the dogs
People replace pets given
large supply of new dogs
Euthanasia spikes from
increased intake
If breeding continues, dog
population overwhelms the
most responsible of owners
Intake fills shelter, returns to
"business as usual"
Owned pets still roam the
streets
2
7
5 2
4 3+6
2 5
Isolated single actions compromise public safety
or animal welfare, or lack sustainability
20160826_1130_Council_Deck.pptx 6
Co
pyrig
ht
© 2
01
6 b
y T
he
Bo
sto
n C
onsultin
g G
roup
, In
c.
All
rig
hts
re
se
rve
d.
Agenda
Context
Key Findings
Recommendations
Next steps
20160826_1130_Council_Deck.pptx 7
Co
pyrig
ht
© 2
01
6 b
y T
he
Bo
sto
n C
onsultin
g G
roup
, In
c.
All
rig
hts
re
se
rve
d.
Executive Findings
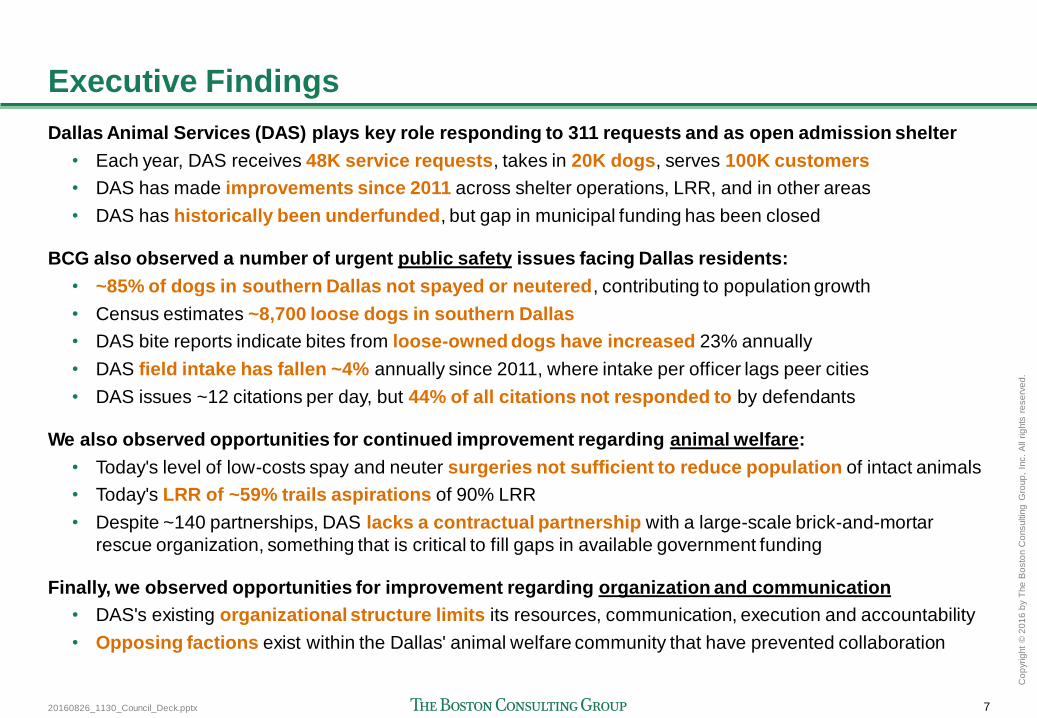
Dallas Animal Services (DAS) plays key role responding to 311 requests and as open admission shelter
• Each year, DAS receives 48K service requests, takes in 20K dogs, serves 100K customers
• DAS has made improvements since 2011 across shelter operations, LRR, and in other areas
• DAS has historically been underfunded, but gap in municipal funding has been closed
BCG also observed a number of urgent public safety issues facing Dallas residents:
• ~85% of dogs in southern Dallas not spayed or neutered, contributing to population growth
• Census estimates ~8,700 loose dogs in southern Dallas
• DAS bite reports indicate bites from loose-owned dogs have increased 23% annually
• DAS field intake has fallen ~4% annually since 2011, where intake per officer lags peer cities
• DAS issues ~12 citations per day, but 44% of all citations not responded to by defendants
We also observed opportunities for continued improvement regarding animal welfare:
• Today's level of low-costs spay and neuter surgeries not sufficient to reduce population of intact animals
• Today's LRR of ~59% trails aspirations of 90% LRR
• Despite ~140 partnerships, DAS lacks a contractual partnership with a large-scale brick-and-mortar
rescue organization, something that is critical to fill gaps in available government funding
Finally, we observed opportunities for improvement regarding organization and communication
• DAS's existing organizational structure limits its resources, communication, execution and accountability
• Opposing factions exist within the Dallas' animal welfare community that have prevented collaboration
20160826_1130_Council_Deck.pptx 8
Co
pyrig
ht
© 2
01
6 b
y T
he
Bo
sto
n C
onsultin
g G
roup
, In
c.
All
rig
hts
re
se
rve
d.
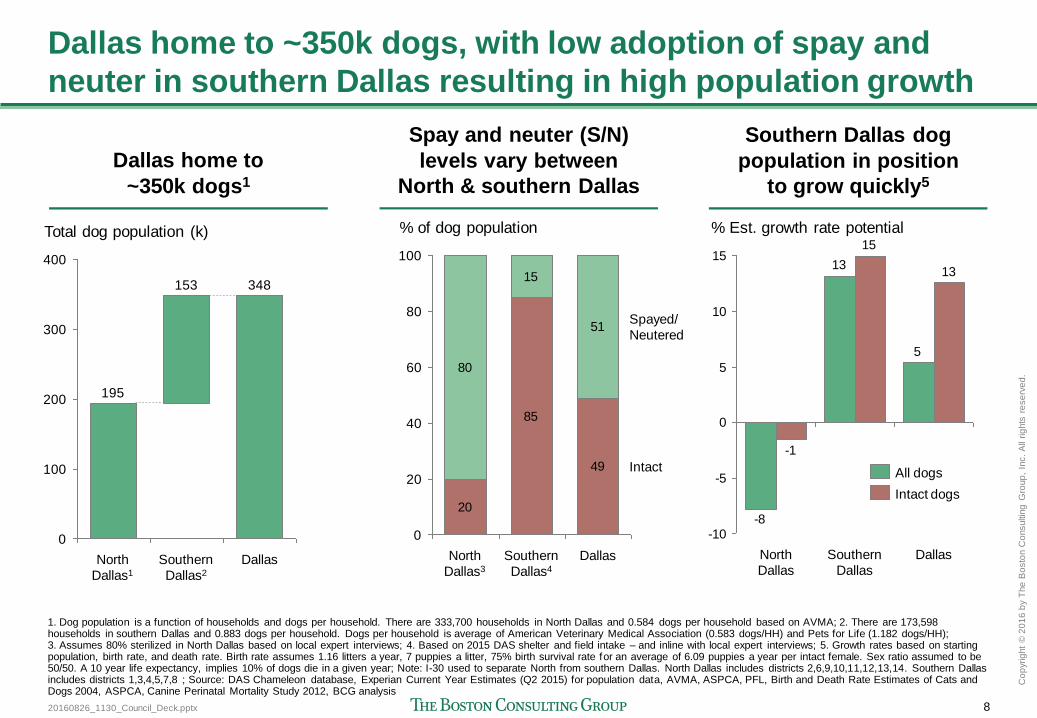
Dallas home to ~350k dogs, with low adoption of spay and
neuter in southern Dallas resulting in high population growth
Dallas home to
~350k dogs1
Spay and neuter (S/N)
levels vary between
North & southern Dallas
Southern Dallas dog
population in position
to grow quickly5
300
400
200
100
0
195
153
Southern
Dallas2
348
Total dog population (k)
Dallas North
Dallas1
5
13
-8
13
15
-1
-10
-5
0
5
10
15
Southern
Dallas
North
Dallas
Dallas
% Est. growth rate potential
All dogs
Intact dogs 20
85
49
80
15
51
0
80
60
40
20
100
Spayed/
Neutered
Southern
Dallas4
Dallas North
Dallas3
Intact
% of dog population
1. Dog population is a function of households and dogs per household. There are 333,700 households in North Dallas and 0.584 dogs per household based on AVMA; 2. There are 173,598 households in southern Dallas and 0.883 dogs per household. Dogs per household is average of American Veterinary Medical Association (0.583 dogs/HH) and Pets for Life (1.182 dogs/HH); 3. Assumes 80% sterilized in North Dallas based on local expert interviews; 4. Based on 2015 DAS shelter and field intake – and inline with local expert interviews; 5. Growth rates based on starting population, birth rate, and death rate. Birth rate assumes 1.16 litters a year, 7 puppies a litter, 75% birth survival rate for an average of 6.09 puppies a year per intact female. Sex ratio assumed to be 50/50. A 10 year life expectancy, implies 10% of dogs die in a given year; Note: I-30 used to separate North from southern Dallas. North Dallas includes districts 2,6,9,10,11,12,13,14. Southern Dallas includes districts 1,3,4,5,7,8 ; Source: DAS Chameleon database, Experian Current Year Estimates (Q2 2015) for population data, AVMA, ASPCA, PFL, Birth and Death Rate Estimates of Cats and Dogs 2004, ASPCA, Canine Perinatal Mortality Study 2012, BCG analysis
20160826_1130_Council_Deck.pptx 9
Co
pyrig
ht
© 2
01
6 b
y T
he
Bo
sto
n C
onsultin
g G
roup
, In
c.
All
rig
hts
re
se
rve
d.
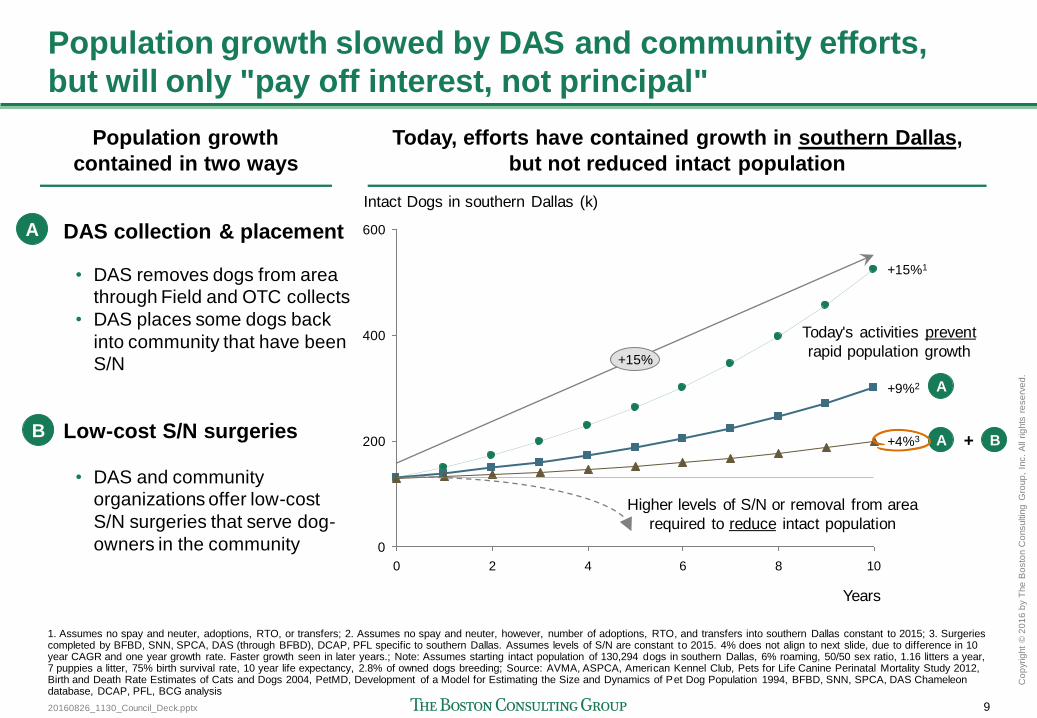
Population growth slowed by DAS and community efforts,
but will only "pay off interest, not principal"
1. Assumes no spay and neuter, adoptions, RTO, or transfers; 2. Assumes no spay and neuter, however, number of adoptions, RTO, and transfers into southern Dallas constant to 2015; 3. Surgeries completed by BFBD, SNN, SPCA, DAS (through BFBD), DCAP, PFL specific to southern Dallas. Assumes levels of S/N are constant to 2015. 4% does not align to next slide, due to difference in 10 year CAGR and one year growth rate. Faster growth seen in later years.; Note: Assumes starting intact population of 130,294 dogs in southern Dallas, 6% roaming, 50/50 sex ratio, 1.16 litters a year, 7 puppies a litter, 75% birth survival rate, 10 year life expectancy, 2.8% of owned dogs breeding; Source: AVMA, ASPCA, American Kennel Club, Pets for Life Canine Perinatal Mortality Study 2012, Birth and Death Rate Estimates of Cats and Dogs 2004, PetMD, Development of a Model for Estimating the Size and Dynamics of Pet Dog Population 1994, BFBD, SNN, SPCA, DAS Chameleon database, DCAP, PFL, BCG analysis
0 2 4 6 8 10
600
400
200
0
+15%
+4%3
+9%2
+15%1
Intact Dogs in southern Dallas (k)
Years
Today, efforts have contained growth in southern Dallas,
but not reduced intact population
Population growth
contained in two ways
A
B
DAS collection & placement
Low-cost S/N surgeries
• DAS removes dogs from area
through Field and OTC collects
• DAS places some dogs back
into community that have been
S/N
• DAS and community
organizations offer low-cost
S/N surgeries that serve dog-
owners in the community
A
A B +
Higher levels of S/N or removal from area
required to reduce intact population
Today's activities prevent
rapid population growth
20160826_1130_Council_Deck.pptx 10
Co
pyrig
ht
© 2
01
6 b
y T
he
Bo
sto
n C
onsultin
g G
roup
, In
c.
All
rig
hts
re
se
rve
d.
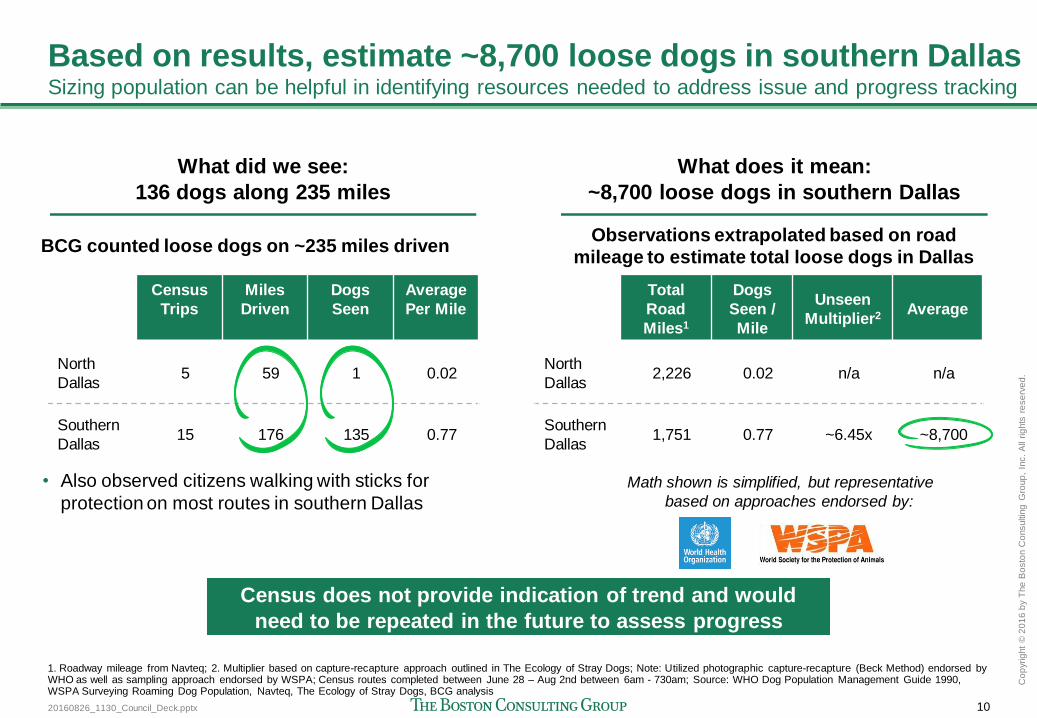
Based on results, estimate ~8,700 loose dogs in southern Dallas Sizing population can be helpful in identifying resources needed to address issue and progress tracking
1. Roadway mileage from Navteq; 2. Multiplier based on capture-recapture approach outlined in The Ecology of Stray Dogs; Note: Utilized photographic capture-recapture (Beck Method) endorsed by WHO as well as sampling approach endorsed by WSPA; Census routes completed between June 28 – Aug 2nd between 6am - 730am; Source: WHO Dog Population Management Guide 1990, WSPA Surveying Roaming Dog Population, Navteq, The Ecology of Stray Dogs, BCG analysis
What did we see:
136 dogs along 235 miles
BCG counted loose dogs on ~235 miles driven
• Also observed citizens walking with sticks for
protection on most routes in southern Dallas
What does it mean:
~8,700 loose dogs in southern Dallas
Census
Trips
Miles
Driven
Dogs
Seen
Average
Per Mile
North
Dallas 5 59 1 0.02
Southern
Dallas 15 176 135 0.77
Observations extrapolated based on road
mileage to estimate total loose dogs in Dallas
Math shown is simplified, but representative
based on approaches endorsed by:
Total
Road
Miles1
Dogs
Seen /
Mile
Unseen
Multiplier2 Average
North
Dallas 2,226 0.02 n/a n/a
Southern
Dallas 1,751 0.77 ~6.45x ~8,700
Census does not provide indication of trend and would
need to be repeated in the future to assess progress

20160826_1130_Council_Deck.pptx 11
Co
pyrig
ht
© 2
01
6 b
y T
he
Bo
sto
n C
onsultin
g G
roup
, In
c.
All
rig
hts
re
se
rve
d.
Reported dog bites in Dallas up 15% annually from 2013-15
with bites from loose-owned dogs growing at 23%
1. DAS dog bite reports from 2013-2016 (n=4,290); BCG performed manual data entry of key fields; 2. Compounded annual growth rate; 3. Stray defined as a dog without an owner; 4. Compared the total dog bites for January to March of 2015 and 2016 to find ~1.1x growth in 2016. Applied ~1.1x to the total number of bites in 2015 (1,524) to estimate 2016 total dog bites. ; Note: For the fields that were left blank in the bite reports, assumed those reports were distributed in line with completed records. Whether dog was stray or owned had 213 incompletes (~4.9%). Of owned dogs, 1,384 (42.9%) had the "at large," or loose, field incomplete; Note: Dog bites are thought to be underreported in the US. In the future, better tracking of bites may result in an apparent increase as previously unreported bites begin to be reported; Source: DAS bite reports 2013 - Q1 2016, BCG analysis
0
500
1,000
1,500
2,000
est. 20164
39%
37%
2013
40%
2014
No. dog bites1
21%
21%
2015
23% 41%
Loose
owned
Stray3
37%
40%
+15%
Restrained
owned
14%
1,647
42%
1,524
1,251 1,148
44%
In Dallas, dog bites, especially those
from loose-owned, dogs are growing
DAS completes a "bite report" for
every reported dog bite
per CDC guidelines
Annual
Increase
(CAGR2 )
2013-2015
10%
10%
23%
Annual Increase
(CAGR2 )
2013-2015
20160826_1130_Council_Deck.pptx 12
Co
pyrig
ht
© 2
01
6 b
y T
he
Bo
sto
n C
onsultin
g G
roup
, In
c.
All
rig
hts
re
se
rve
d.
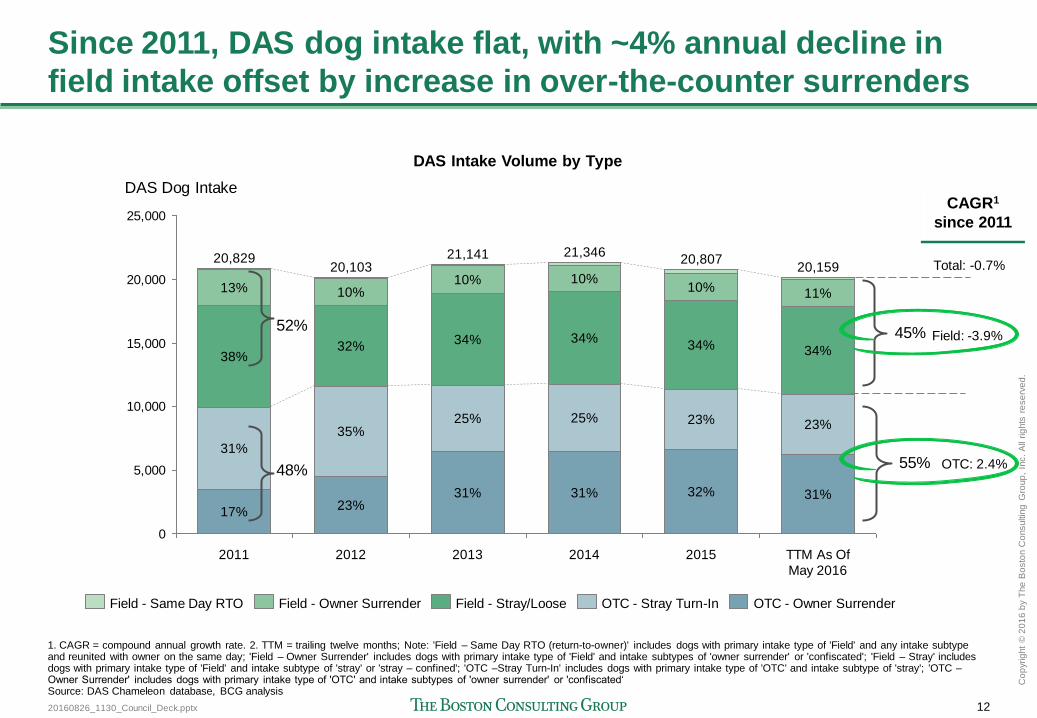
Since 2011, DAS dog intake flat, with ~4% annual decline in
field intake offset by increase in over-the-counter surrenders
0
5,000
10,000
15,000
20,000
25,000
35%
32%
10%
2011
20,829
17%
31%
38%
13%
DAS Dog Intake
TTM As Of
May 2016
20,159
31%
23%
34%
11%
2015
20,807
32%
23%
34%
10%
2014
21,346
31%
25%
34%
10%
2013
21,141
31%
25%
34%
10%
2012
20,103
23%
OTC - Owner Surrender OTC - Stray Turn-In Field - Stray/Loose Field - Owner Surrender Field - Same Day RTO
45%
55%
52%
48%
Field: -3.9%
OTC: 2.4%
Total: -0.7%
1. CAGR = compound annual growth rate. 2. TTM = trailing twelve months; Note: 'Field – Same Day RTO (return-to-owner)' includes dogs with primary intake type of 'Field' and any intake subtype and reunited with owner on the same day; 'Field – Owner Surrender' includes dogs with primary intake type of 'Field' and intake subtypes of 'owner surrender' or 'confiscated'; 'Field – Stray' includes dogs with primary intake type of 'Field' and intake subtype of 'stray' or 'stray – confined'; 'OTC –Stray Turn-In' includes dogs with primary intake type of 'OTC' and intake subtype of 'stray'; 'OTC – Owner Surrender' includes dogs with primary intake type of 'OTC' and intake subtypes of 'owner surrender' or 'confiscated‘ Source: DAS Chameleon database, BCG analysis
CAGR1
since 2011
DAS Intake Volume by Type
20160826_1130_Council_Deck.pptx 13
Co
pyrig
ht
© 2
01
6 b
y T
he
Bo
sto
n C
onsultin
g G
roup
, In
c.
All
rig
hts
re
se
rve
d.
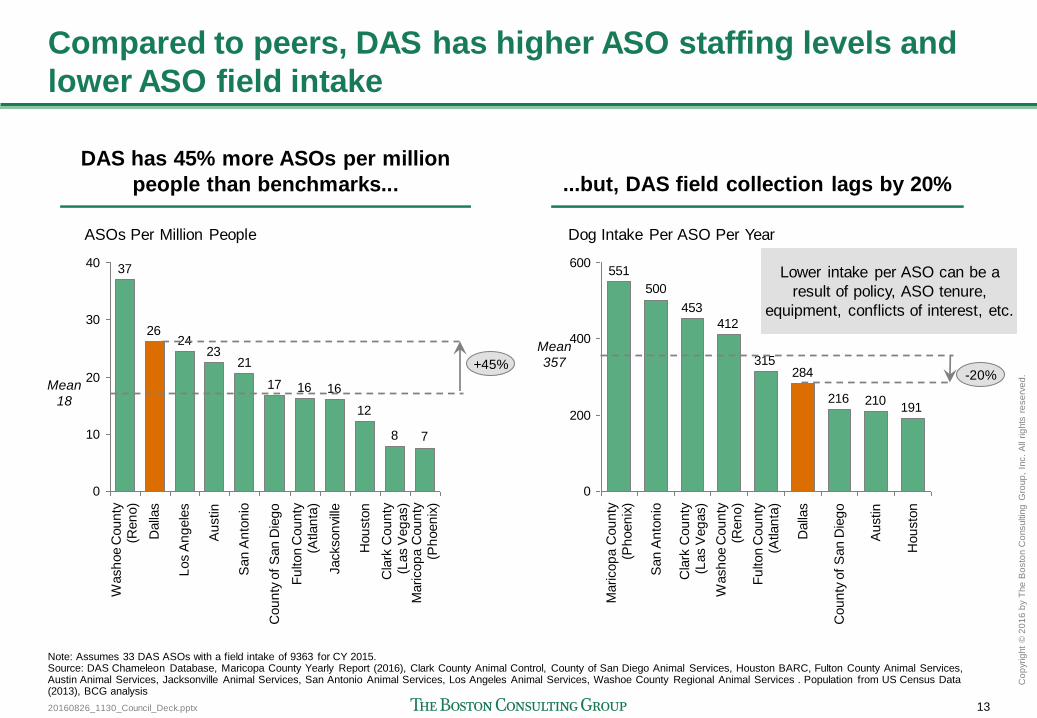
Compared to peers, DAS has higher ASO staffing levels and
lower ASO field intake
Note: Assumes 33 DAS ASOs with a field intake of 9363 for CY 2015. Source: DAS Chameleon Database, Maricopa County Yearly Report (2016), Clark County Animal Control, County of San Diego Animal Services, Houston BARC, Fulton County Animal Services, Austin Animal Services, Jacksonville Animal Services, San Antonio Animal Services, Los Angeles Animal Services, Washoe County Regional Animal Services . Population from US Census Data (2013), BCG analysis
DAS has 45% more ASOs per million
people than benchmarks...
78
12
161617
2123
2426
37
0
10
20
30
40
Wash
oe C
ou
nty
(Ren
o)
Fu
lton
Cou
nty
(Atlan
ta)
Jackson
ville
Hou
sto
n
Cla
rk C
ou
nty
(Las V
eg
as)
Maricop
a C
ou
nty
(Ph
oen
ix)
ASOs Per Million People
Dalla
s
Los A
ng
ele
s
Au
stin
San
An
ton
io
Cou
nty
of
San
Die
go
Mean
18
+45%
191210216
284315
412
453
500
551
0
200
400
600
Dalla
s
San
An
ton
io
Fu
lton
Cou
nty
(Atlan
ta)
Cla
rk C
ou
nty
(Las V
eg
as)
Maricop
a C
ou
nty
(Ph
oen
ix)
Wash
oe C
ou
nty
(Ren
o)
Cou
nty
of
San
Die
go
Au
stin
Hou
sto
n
Dog Intake Per ASO Per Year
...but, DAS field collection lags by 20%
Mean
357 -20%
Lower intake per ASO can be a
result of policy, ASO tenure,
equipment, conflicts of interest, etc.
20160826_1130_Council_Deck.pptx 14
Co
pyrig
ht
© 2
01
6 b
y T
he
Bo
sto
n C
onsultin
g G
roup
, In
c.
All
rig
hts
re
se
rve
d.
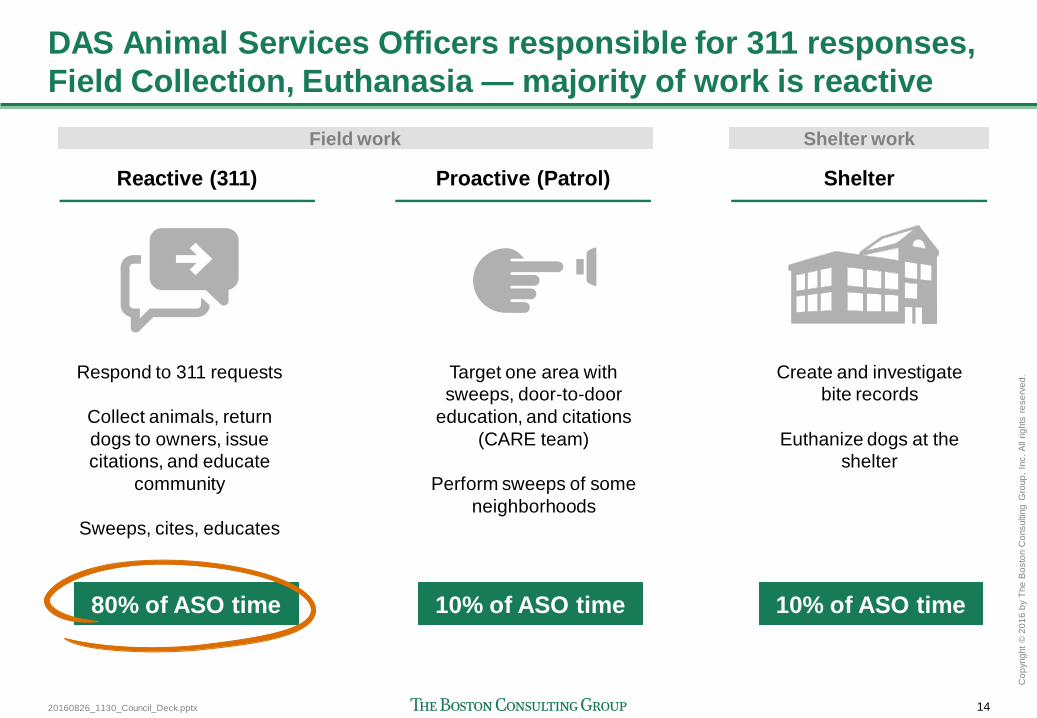
DAS Animal Services Officers responsible for 311 responses,
Field Collection, Euthanasia — majority of work is reactive
Respond to 311 requests
Collect animals, return
dogs to owners, issue
citations, and educate
community
Sweeps, cites, educates
Reactive (311) Proactive (Patrol)
Target one area with
sweeps, door-to-door
education, and citations
(CARE team)
Perform sweeps of some
neighborhoods
Shelter
Create and investigate
bite records
Euthanize dogs at the
shelter
80% of ASO time
Field work Shelter work
10% of ASO time 10% of ASO time
20160826_1130_Council_Deck.pptx 15
Co
pyrig
ht
© 2
01
6 b
y T
he
Bo
sto
n C
onsultin
g G
roup
, In
c.
All
rig
hts
re
se
rve
d.
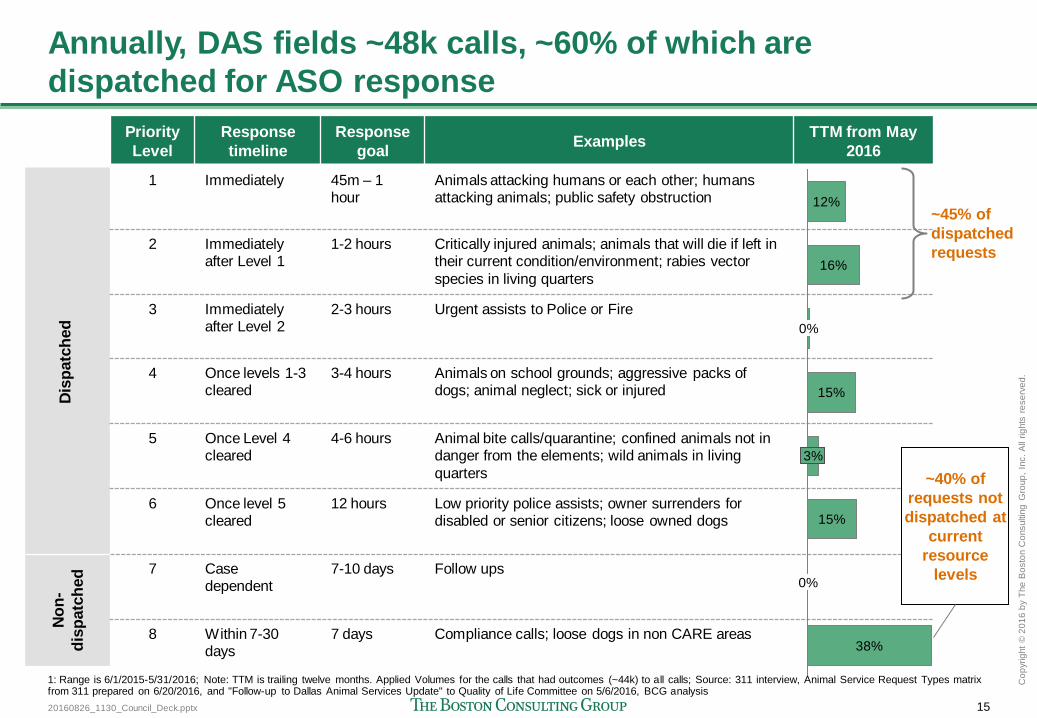
Annually, DAS fields ~48k calls, ~60% of which are
dispatched for ASO response
Priority
Level
Response
timeline
Response
goal Examples
TTM from May
2016
1 Immediately 45m – 1 hour
Animals attacking humans or each other; humans attacking animals; public safety obstruction
2 Immediately after Level 1
1-2 hours Critically injured animals; animals that will die if left in their current condition/environment; rabies vector
species in living quarters
3 Immediately after Level 2
2-3 hours Urgent assists to Police or Fire
4 Once levels 1-3 cleared
3-4 hours Animals on school grounds; aggressive packs of dogs; animal neglect; sick or injured
5 Once Level 4 cleared
4-6 hours Animal bite calls/quarantine; confined animals not in danger from the elements; wild animals in living
quarters
6 Once level 5 cleared
12 hours Low priority police assists; owner surrenders for disabled or senior citizens; loose owned dogs
7 Case dependent
7-10 days Follow ups
8 Within 7-30 days
7 days Compliance calls; loose dogs in non CARE areas
Dis
patc
hed
N
on
-
dis
patc
hed
38%
0%
0%
16%
12%
15%
15%
3%
1: Range is 6/1/2015-5/31/2016; Note: TTM is trailing twelve months. Applied Volumes for the calls that had outcomes (~44k) to all calls; Source: 311 interview, Animal Service Request Types matrix from 311 prepared on 6/20/2016, and "Follow-up to Dallas Animal Services Update" to Quality of Life Committee on 5/6/2016, BCG analysis
~45% of
dispatched
requests
~40% of
requests not
dispatched at
current
resource
levels
20160826_1130_Council_Deck.pptx 16
Co
pyrig
ht
© 2
01
6 b
y T
he
Bo
sto
n C
onsultin
g G
roup
, In
c.
All
rig
hts
re
se
rve
d.
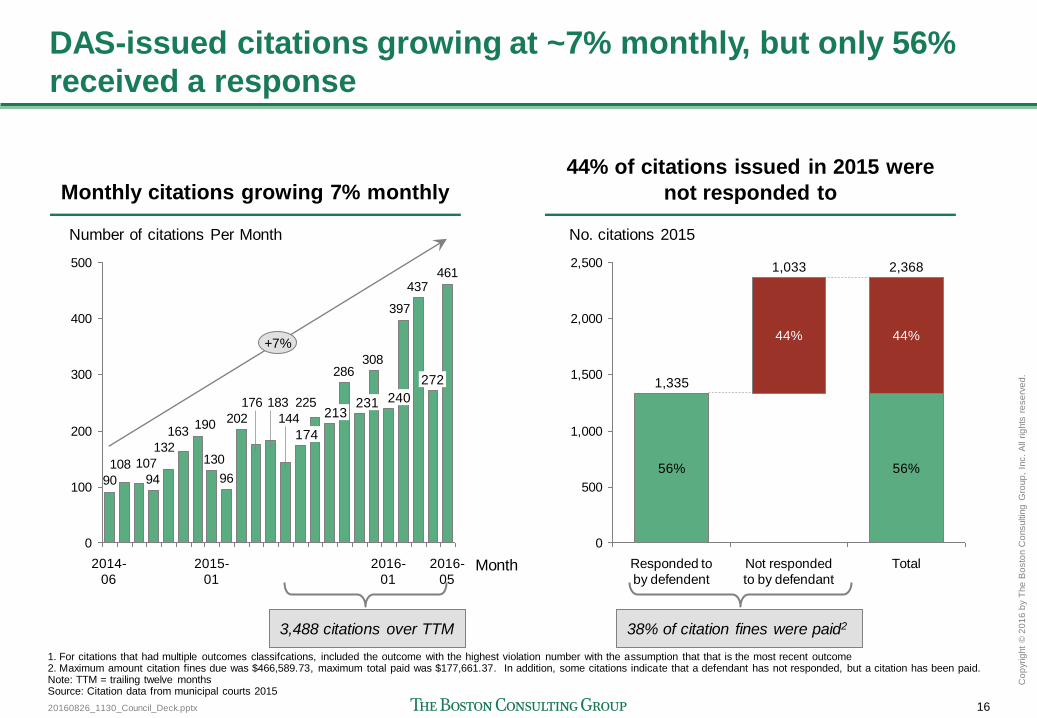
DAS-issued citations growing at ~7% monthly, but only 56%
received a response
461437
397
308286
225
144
183176
202
96
130
190163
132
94
107108
90
0
100
200
300
400
500
Number of citations Per Month
Month
+7%
2016-
05
272
2016-
01
240 231 213
174
2015-
01
2014-
06
1. For citations that had multiple outcomes classifcations, included the outcome with the highest violation number with the assumption that that is the most recent outcome 2. Maximum amount citation fines due was $466,589.73, maximum total paid was $177,661.37. In addition, some citations indicate that a defendant has not responded, but a citation has been paid. Note: TTM = trailing twelve months Source: Citation data from municipal courts 2015
Monthly citations growing 7% monthly
44% of citations issued in 2015 were
not responded to
3,488 citations over TTM
0
500
1,000
1,500
2,000
2,500
1,335
56%
Not responded
to by defendant
Responded to
by defendent
1,033
44%
56%
2,368
44%
No. citations 2015
Total
38% of citation fines were paid2
20160826_1130_Council_Deck.pptx 17
Co
pyrig
ht
© 2
01
6 b
y T
he
Bo
sto
n C
onsultin
g G
roup
, In
c.
All
rig
hts
re
se
rve
d.
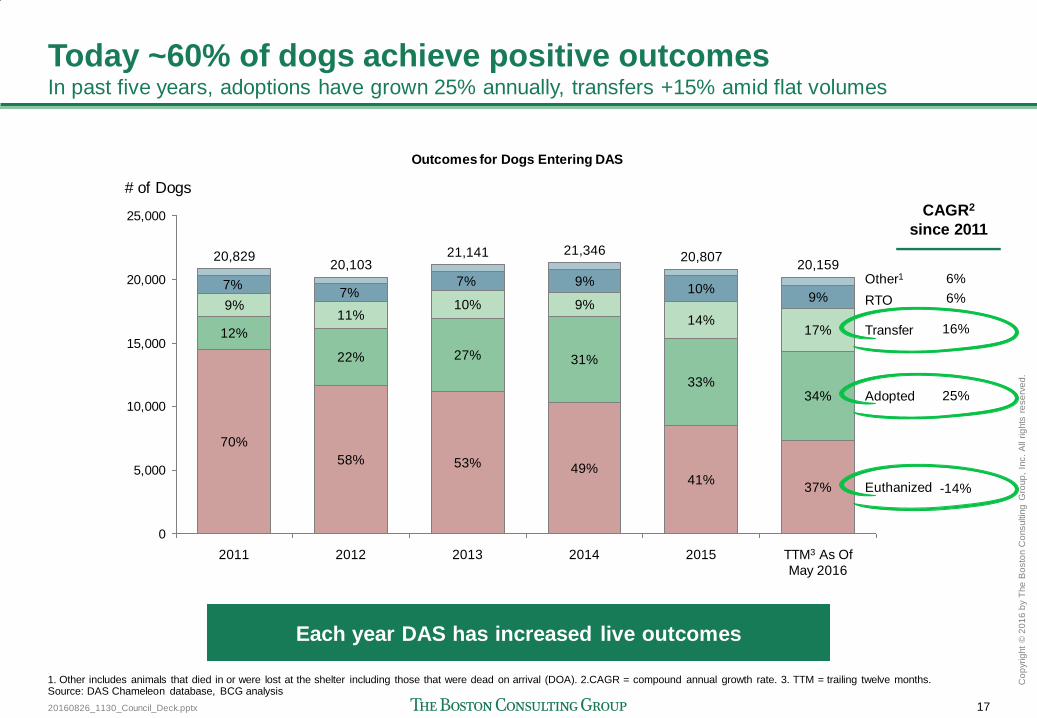
Today ~60% of dogs achieve positive outcomes In past five years, adoptions have grown 25% annually, transfers +15% amid flat volumes
0
5,000
10,000
15,000
20,000
25,000
2015
20,807
41%
33%
14%
10%
2014
21,346
49%
31%
9%
9%
2013
21,141
53%
27%
10%
7%
2012
20,103
58%
22%
11%
7%
2011
20,829
70%
12%
9%
TTM3 As Of
May 2016
# of Dogs
20,159
37%
34%
17%
7% 9%
Euthanized
Adopted
Transfer
RTO
Other1
1. Other includes animals that died in or were lost at the shelter including those that were dead on arrival (DOA). 2.CAGR = compound annual growth rate. 3. TTM = trailing twelve months. Source: DAS Chameleon database, BCG analysis
6%
6%
16%
25%
-14%
CAGR2
since 2011
Each year DAS has increased live outcomes
Outcomes for Dogs Entering DAS
20160826_1130_Council_Deck.pptx 18
Co
pyrig
ht
© 2
01
6 b
y T
he
Bo
sto
n C
onsultin
g G
roup
, In
c.
All
rig
hts
re
se
rve
d.
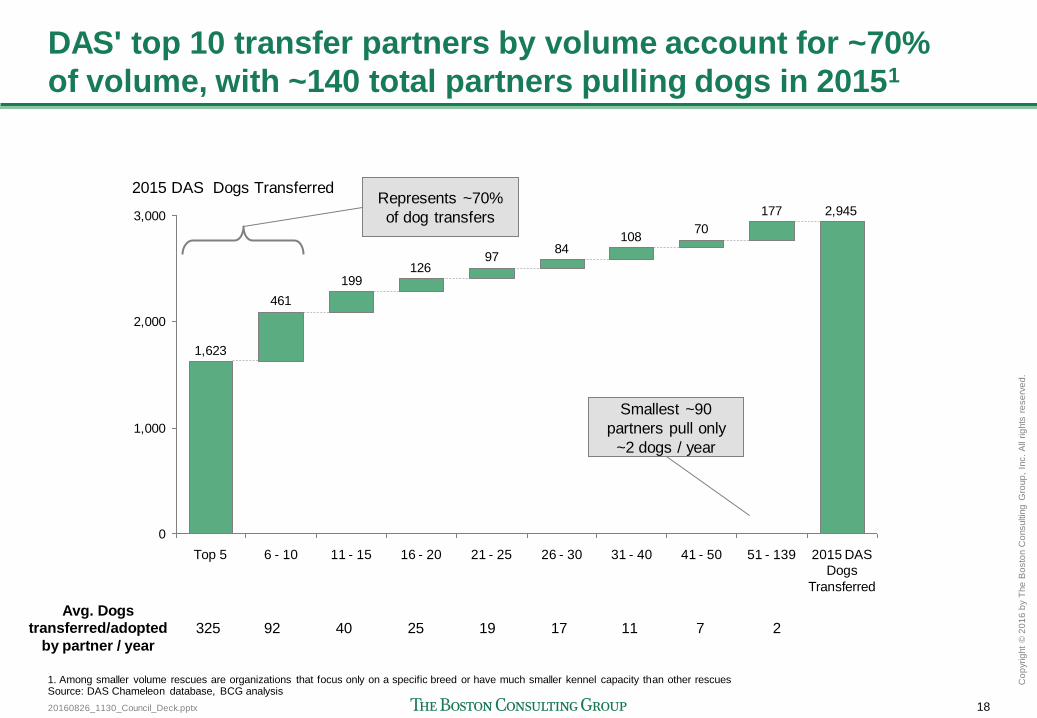
DAS' top 10 transfer partners by volume account for ~70%
of volume, with ~140 total partners pulling dogs in 20151
1. Among smaller volume rescues are organizations that focus only on a specific breed or have much smaller kennel capacity than other rescues Source: DAS Chameleon database, BCG analysis
2,945177
70108
8497
126199
461
1,623
0
1,000
2,000
3,000
11 - 15 6 - 10 Top 5
2015 DAS Dogs Transferred
2015 DAS
Dogs
Transferred
31 - 40 26 - 30 16 - 20 21 - 25 41 - 50 51 - 139
Avg. Dogs transferred/adopted
by partner / year
325 92 40 25 19 17 11 7 2
Represents ~70%
of dog transfers
Smallest ~90
partners pull only
~2 dogs / year
20160826_1130_Council_Deck.pptx 19
Co
pyrig
ht
© 2
01
6 b
y T
he
Bo
sto
n C
onsultin
g G
roup
, In
c.
All
rig
hts
re
se
rve
d.
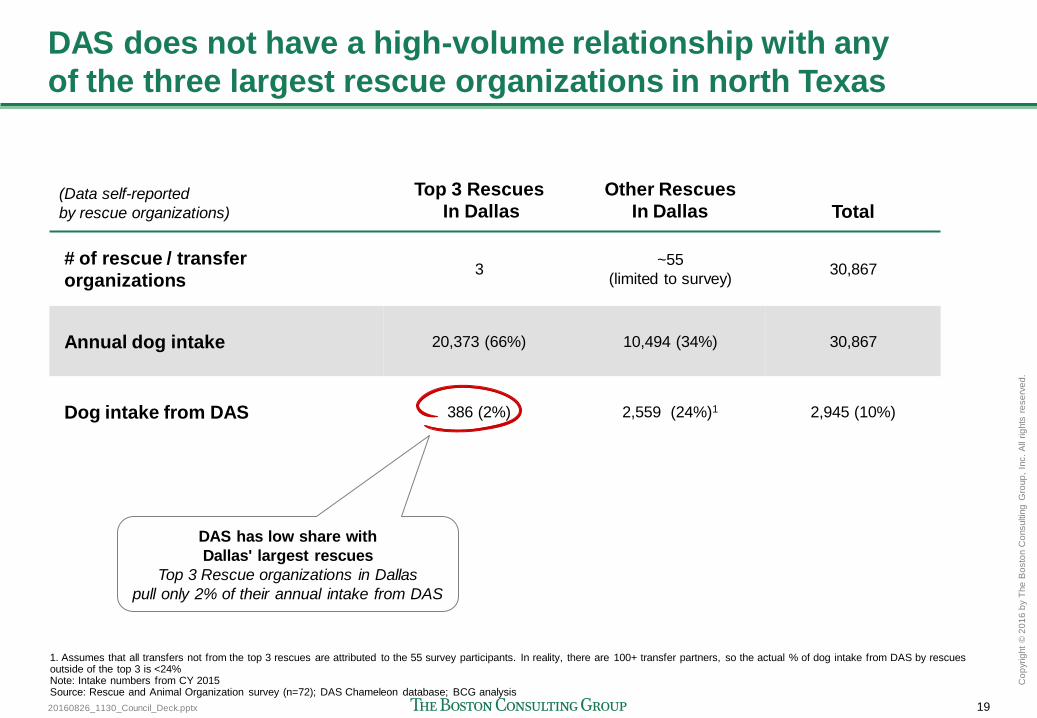
DAS does not have a high-volume relationship with any
of the three largest rescue organizations in north Texas
(Data self-reported
by rescue organizations)
Top 3 Rescues
In Dallas
Other Rescues
In Dallas Total
# of rescue / transfer
organizations 3
~55
(limited to survey) 30,867
Annual dog intake 20,373 (66%) 10,494 (34%) 30,867
Dog intake from DAS 386 (2%) 2,559 (24%)1 2,945 (10%)
1. Assumes that all transfers not from the top 3 rescues are attributed to the 55 survey participants. In reality, there are 100+ transfer partners, so the actual % of dog intake from DAS by rescues outside of the top 3 is <24% Note: Intake numbers from CY 2015 Source: Rescue and Animal Organization survey (n=72); DAS Chameleon database; BCG analysis
DAS has low share with
Dallas' largest rescues
Top 3 Rescue organizations in Dallas
pull only 2% of their annual intake from DAS
20160826_1130_Council_Deck.pptx 20
Co
pyrig
ht
© 2
01
6 b
y T
he
Bo
sto
n C
onsultin
g G
roup
, In
c.
All
rig
hts
re
se
rve
d.
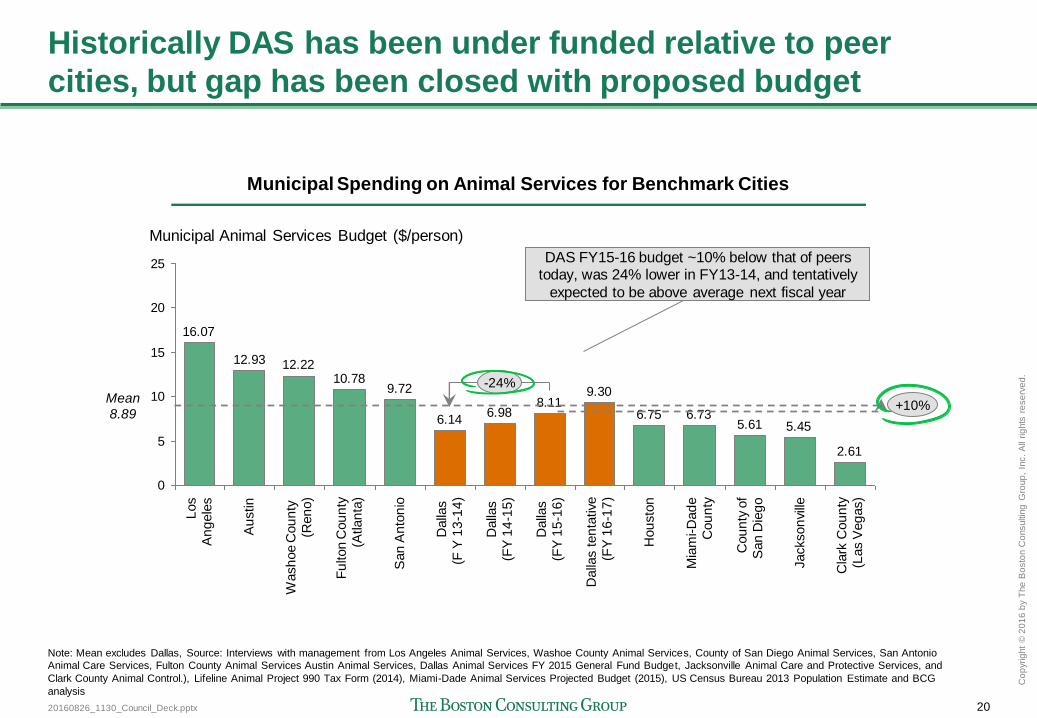
Historically DAS has been under funded relative to peer
cities, but gap has been closed with proposed budget
2.61
5.455.616.736.75
9.308.11
6.986.14
9.7210.78
12.2212.93
16.07
0
5
10
15
20
25
Municipal Animal Services Budget ($/person) A
ustin
Wash
oe C
ou
nty
(Ren
o)
Fu
lton
Cou
nty
(Atlan
ta)
San
An
ton
io
Dalla
s
(F Y
13
-14
)
Dalla
s
(FY
14
-15
)
Dalla
s
(FY
15
-16
)
Dalla
s t
en
tative
(FY
16
-17
)
Hou
sto
n
Mia
mi-D
ad
e
Cou
nty
Cou
nty
of
San
Die
go
Jackson
ville
Cla
rk C
ou
nty
(Las V
eg
as)
-24%
Los
An
gele
s
Note: Mean excludes Dallas, Source: Interviews with management from Los Angeles Animal Services, Washoe County Animal Services, County of San Diego Animal Services, San Antonio
Animal Care Services, Fulton County Animal Services Austin Animal Services, Dallas Animal Services FY 2015 General Fund Budget, Jacksonville Animal Care and Protective Services, and
Clark County Animal Control.), Lifeline Animal Project 990 Tax Form (2014), Miami-Dade Animal Services Projected Budget (2015), US Census Bureau 2013 Population Estimate and BCG
analysis
Mean
8.89 +10%
Municipal Spending on Animal Services for Benchmark Cities
DAS FY15-16 budget ~10% below that of peers today, was 24% lower in FY13-14, and tentatively
expected to be above average next fiscal year
20160826_1130_Council_Deck.pptx 21
Co
pyrig
ht
© 2
01
6 b
y T
he
Bo
sto
n C
onsultin
g G
roup
, In
c.
All
rig
hts
re
se
rve
d.
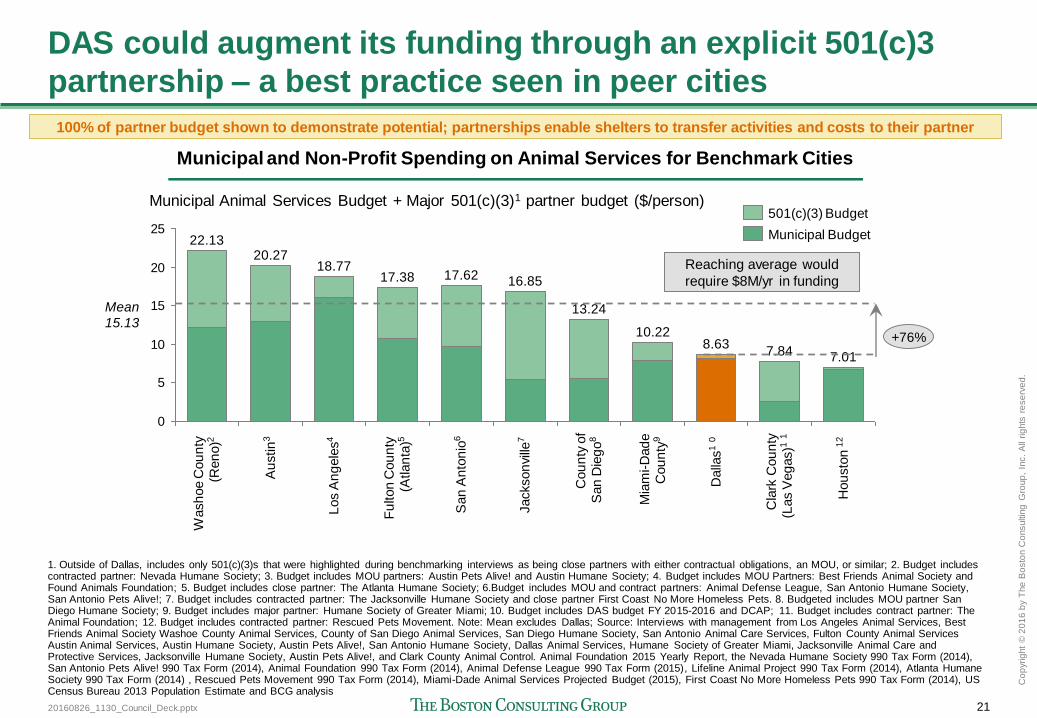
DAS could augment its funding through an explicit 501(c)3
partnership – a best practice seen in peer cities
0
5
10
15
20
25
Municipal Animal Services Budget + Major 501(c)(3)1 partner budget ($/person)
Hou
sto
n 1
2
7.01
Cla
rk C
ou
nty
(Las V
eg
as)1
1
7.84
Dalla
s1 0
8.63
Mia
mi-D
ad
e
Cou
nty
9
10.22
Cou
nty
of
San
Die
go
8
13.24
Jackson
ville
7
16.85
San
An
ton
io6
17.62
Fu
lton
Cou
nty
(Atlan
ta)5
17.38
Los A
ng
ele
s4
18.77 A
ustin
3
20.27
Wash
oe C
ou
nty
(Ren
o)2
22.13 Municipal Budget
501(c)(3) Budget
Mean
15.13 +76%
Reaching average would
require $8M/yr in funding
Municipal and Non-Profit Spending on Animal Services for Benchmark Cities
1. Outside of Dallas, includes only 501(c)(3)s that were highlighted during benchmarking interviews as being close partners with either contractual obligations, an MOU, or similar; 2. Budget includes contracted partner: Nevada Humane Society; 3. Budget includes MOU partners: Austin Pets Alive! and Austin Humane Society; 4. Budget includes MOU Partners: Best Friends Animal Society and Found Animals Foundation; 5. Budget includes close partner: The Atlanta Humane Society; 6.Budget includes MOU and contract partners: Animal Defense League, San Antonio Humane Society, San Antonio Pets Alive!; 7. Budget includes contracted partner: The Jacksonville Humane Society and close partner First Coast No More Homeless Pets. 8. Budgeted includes MOU partner San Diego Humane Society; 9. Budget includes major partner: Humane Society of Greater Miami; 10. Budget includes DAS budget FY 2015-2016 and DCAP; 11. Budget includes contract partner: The Animal Foundation; 12. Budget includes contracted partner: Rescued Pets Movement. Note: Mean excludes Dallas; Source: Interviews with management from Los Angeles Animal Services, Best Friends Animal Society Washoe County Animal Services, County of San Diego Animal Services, San Diego Humane Society, San Antonio Animal Care Services, Fulton County Animal Services Austin Animal Services, Austin Humane Society, Austin Pets Alive!, San Antonio Humane Society, Dallas Animal Services, Humane Society of Greater Miami, Jacksonville Animal Care and Protective Services, Jacksonville Humane Society, Austin Pets Alive!, and Clark County Animal Control. Animal Foundation 2015 Yearly Report, the Nevada Humane Society 990 Tax Form (2014), San Antonio Pets Alive! 990 Tax Form (2014), Animal Foundation 990 Tax Form (2014), Animal Defense League 990 Tax Form (2015), Lifeline Animal Project 990 Tax Form (2014), Atlanta Humane Society 990 Tax Form (2014) , Rescued Pets Movement 990 Tax Form (2014), Miami-Dade Animal Services Projected Budget (2015), First Coast No More Homeless Pets 990 Tax Form (2014), US Census Bureau 2013 Population Estimate and BCG analysis
100% of partner budget shown to demonstrate potential; partnerships enable shelters to transfer activities and costs to their partner
20160826_1130_Council_Deck.pptx 22
Co
pyrig
ht
© 2
01
6 b
y T
he
Bo
sto
n C
onsultin
g G
roup
, In
c.
All
rig
hts
re
se
rve
d.
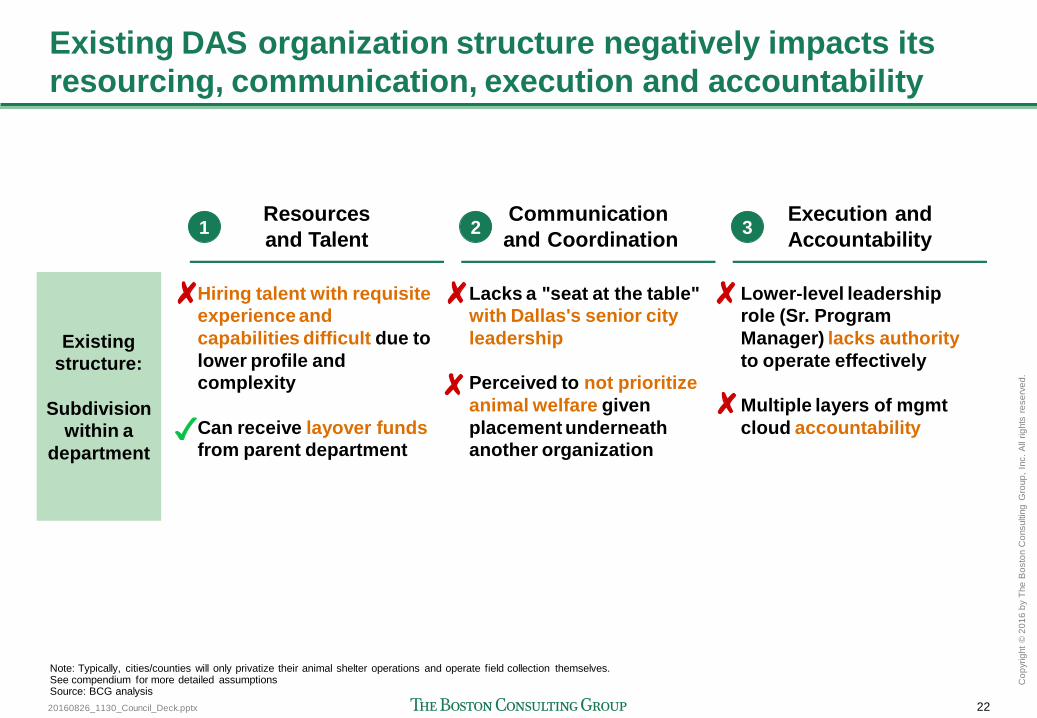
Existing DAS organization structure negatively impacts its
resourcing, communication, execution and accountability
Hiring talent with requisite
experience and
capabilities difficult due to
lower profile and
complexity
Can receive layover funds
from parent department
Lacks a "seat at the table"
with Dallas's senior city
leadership
Perceived to not prioritize
animal welfare given
placement underneath
another organization
Lower-level leadership
role (Sr. Program
Manager) lacks authority
to operate effectively
Multiple layers of mgmt
cloud accountability
Existing
structure:
Subdivision
within a
department
Resources
and Talent
Communication
and Coordination
Execution and
Accountability 1 2 3
Note: Typically, cities/counties will only privatize their animal shelter operations and operate field collection themselves. See compendium for more detailed assumptions Source: BCG analysis
20160826_1130_Council_Deck.pptx 23
Co
pyrig
ht
© 2
01
6 b
y T
he
Bo
sto
n C
onsultin
g G
roup
, In
c.
All
rig
hts
re
se
rve
d.
Agenda
Context
Key Findings
Recommendations
Next steps
20160826_1130_Council_Deck.pptx 24
Co
pyrig
ht
© 2
01
6 b
y T
he
Bo
sto
n C
onsultin
g G
roup
, In
c.
All
rig
hts
re
se
rve
d.
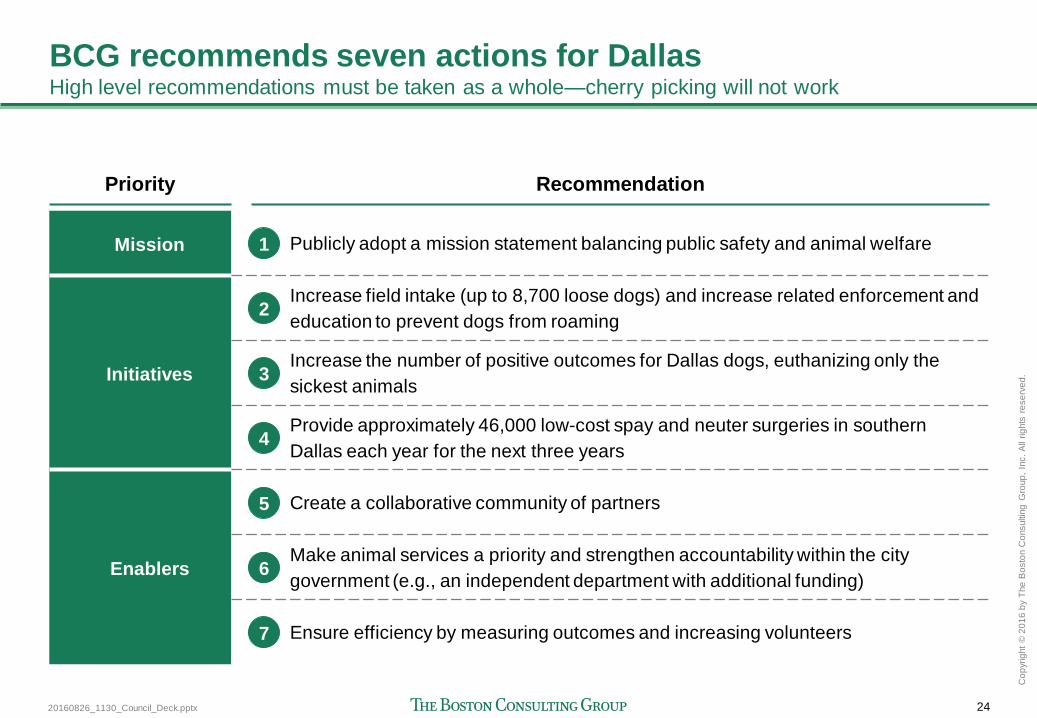
BCG recommends seven actions for Dallas High level recommendations must be taken as a whole—cherry picking will not work
Priority Recommendation
Mission Publicly adopt a mission statement balancing public safety and animal welfare
Initiatives
Increase field intake (up to 8,700 loose dogs) and increase related enforcement and
education to prevent dogs from roaming
Increase the number of positive outcomes for Dallas dogs, euthanizing only the
sickest animals
Provide approximately 46,000 low-cost spay and neuter surgeries in southern
Dallas each year for the next three years
Enablers
Create a collaborative community of partners
Make animal services a priority and strengthen accountability within the city
government (e.g., an independent department with additional funding)
Ensure efficiency by measuring outcomes and increasing volunteers
1
2
3
4
5
6
7
20160826_1130_Council_Deck.pptx 25
Co
pyrig
ht
© 2
01
6 b
y T
he
Bo
sto
n C
onsultin
g G
roup
, In
c.
All
rig
hts
re
se
rve
d.
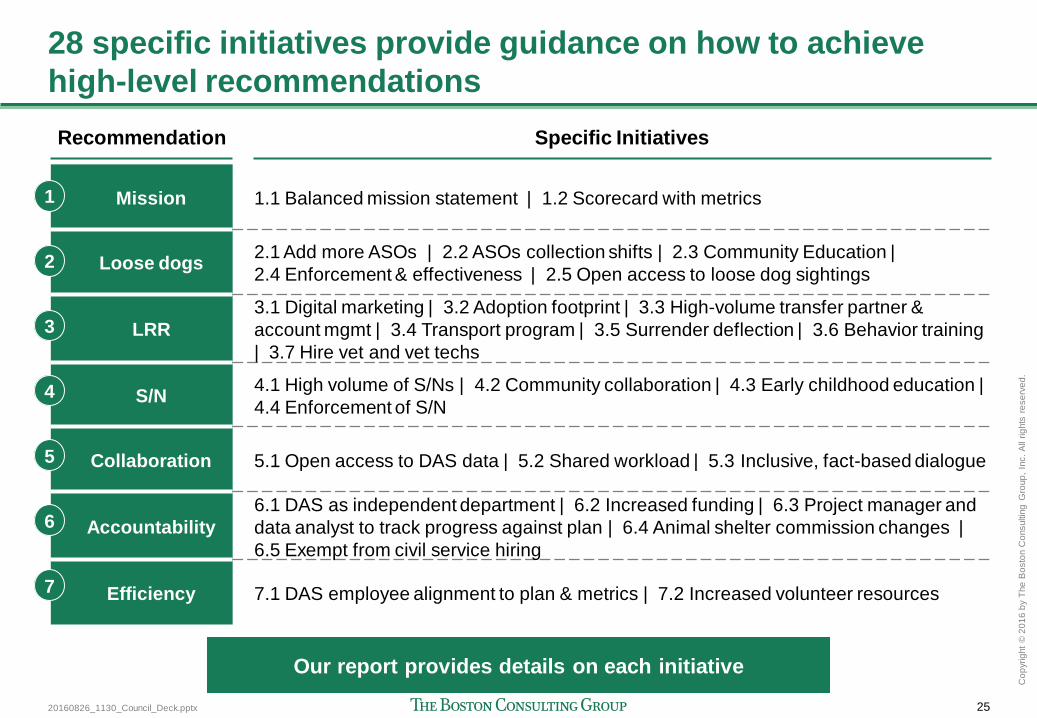
28 specific initiatives provide guidance on how to achieve
high-level recommendations
Recommendation Specific Initiatives
Mission 1.1 Balanced mission statement | 1.2 Scorecard with metrics
Loose dogs 2.1 Add more ASOs | 2.2 ASOs collection shifts | 2.3 Community Education |
2.4 Enforcement & effectiveness | 2.5 Open access to loose dog sightings
LRR
3.1 Digital marketing | 3.2 Adoption footprint | 3.3 High-volume transfer partner &
account mgmt | 3.4 Transport program | 3.5 Surrender deflection | 3.6 Behavior training
| 3.7 Hire vet and vet techs
S/N 4.1 High volume of S/Ns | 4.2 Community collaboration | 4.3 Early childhood education |
4.4 Enforcement of S/N
Collaboration 5.1 Open access to DAS data | 5.2 Shared workload | 5.3 Inclusive, fact-based dialogue
Accountability
6.1 DAS as independent department | 6.2 Increased funding | 6.3 Project manager and
data analyst to track progress against plan | 6.4 Animal shelter commission changes |
6.5 Exempt from civil service hiring
Efficiency 7.1 DAS employee alignment to plan & metrics | 7.2 Increased volunteer resources
1
2
3
4
5
6
7
Our report provides details on each initiative
20160826_1130_Council_Deck.pptx 26
Co
pyrig
ht
© 2
01
6 b
y T
he
Bo
sto
n C
onsultin
g G
roup
, In
c.
All
rig
hts
re
se
rve
d.
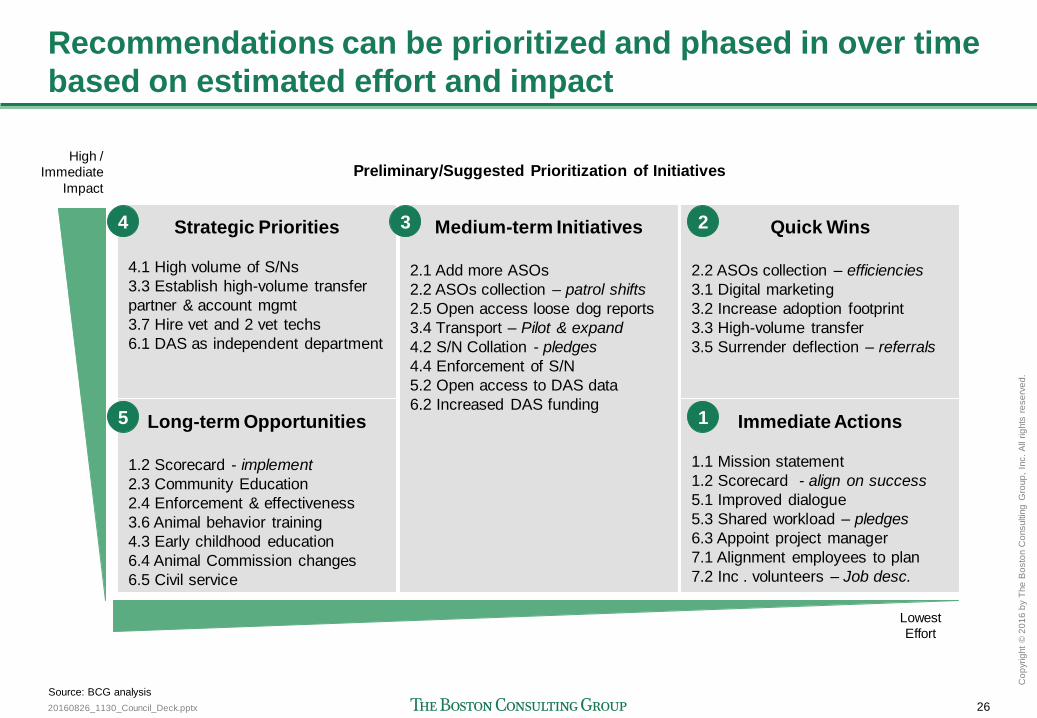
Recommendations can be prioritized and phased in over time
based on estimated effort and impact
Strategic Priorities
4.1 High volume of S/Ns
3.3 Establish high-volume transfer
partner & account mgmt
3.7 Hire vet and 2 vet techs
6.1 DAS as independent department
Medium-term Initiatives
2.1 Add more ASOs
2.2 ASOs collection – patrol shifts
2.5 Open access loose dog reports
3.4 Transport – Pilot & expand
4.2 S/N Collation - pledges
4.4 Enforcement of S/N
5.2 Open access to DAS data
6.2 Increased DAS funding Long-term Opportunities
1.2 Scorecard - implement
2.3 Community Education
2.4 Enforcement & effectiveness
3.6 Animal behavior training
4.3 Early childhood education
6.4 Animal Commission changes
6.5 Civil service
High /
Immediate
Impact
Lowest
Effort
Quick Wins
2.2 ASOs collection – efficiencies
3.1 Digital marketing
3.2 Increase adoption footprint
3.3 High-volume transfer
3.5 Surrender deflection – referrals
Immediate Actions
1.1 Mission statement
1.2 Scorecard - align on success
5.1 Improved dialogue
5.3 Shared workload – pledges
6.3 Appoint project manager
7.1 Alignment employees to plan
7.2 Inc . volunteers – Job desc.
Preliminary/Suggested Prioritization of Initiatives
Source: BCG analysis
1
2 3 4
5
20160826_1130_Council_Deck.pptx 27
Co
pyrig
ht
© 2
01
6 b
y T
he
Bo
sto
n C
onsultin
g G
roup
, In
c.
All
rig
hts
re
se
rve
d.
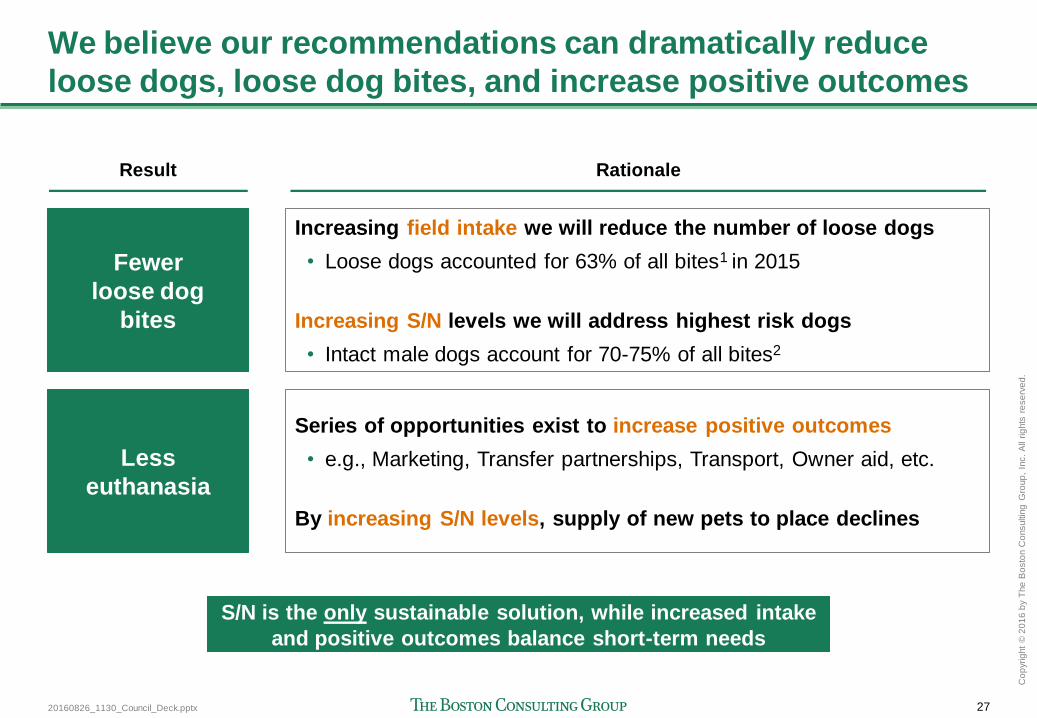
We believe our recommendations can dramatically reduce
loose dogs, loose dog bites, and increase positive outcomes
Fewer
loose dog
bites
Increasing field intake we will reduce the number of loose dogs
• Loose dogs accounted for 63% of all bites1 in 2015
Increasing S/N levels we will address highest risk dogs
• Intact male dogs account for 70-75% of all bites2
Less
euthanasia
Series of opportunities exist to increase positive outcomes
• e.g., Marketing, Transfer partnerships, Transport, Owner aid, etc.
By increasing S/N levels, supply of new pets to place declines
S/N is the only sustainable solution, while increased intake
and positive outcomes balance short-term needs
Result Rationale
20160826_1130_Council_Deck.pptx 28
Co
pyrig
ht
© 2
01
6 b
y T
he
Bo
sto
n C
onsultin
g G
roup
, In
c.
All
rig
hts
re
se
rve
d.
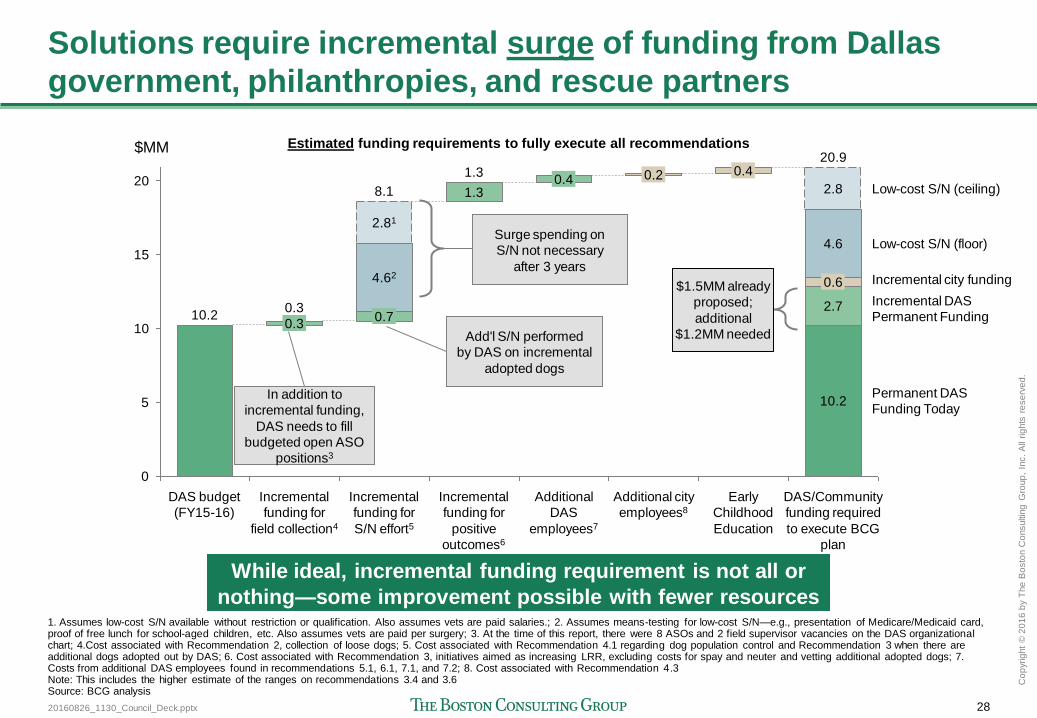
Solutions require incremental surge of funding from Dallas
government, philanthropies, and rescue partners
15
0
5
10
20
Permanent DAS
Funding Today
$MM 20.9
DAS/Community
funding required
to execute BCG
plan
Low-cost S/N (floor)
Additional city
employees8
Additional
DAS
employees7
10.2
0.4
4.6
Incremental
funding for
positive
outcomes6
1.3
1.3
Incremental
funding for
S/N effort5
8.1
0.7
4.62
2.81
Incremental
funding for
field collection4
Low-cost S/N (ceiling)
0.3
DAS budget
(FY15-16)
10.2
Early
Childhood
Education
0.2
0.6
0.4
2.7
2.8
Incremental DAS
Permanent Funding
Incremental city funding
0.3
1. Assumes low-cost S/N available without restriction or qualification. Also assumes vets are paid salaries.; 2. Assumes means-testing for low-cost S/N—e.g., presentation of Medicare/Medicaid card, proof of free lunch for school-aged children, etc. Also assumes vets are paid per surgery; 3. At the time of this report, there were 8 ASOs and 2 field supervisor vacancies on the DAS organizational chart; 4.Cost associated with Recommendation 2, collection of loose dogs; 5. Cost associated with Recommendation 4.1 regarding dog population control and Recommendation 3 when there are additional dogs adopted out by DAS; 6. Cost associated with Recommendation 3, initiatives aimed as increasing LRR, excluding costs for spay and neuter and vetting additional adopted dogs; 7. Costs from additional DAS employees found in recommendations 5.1, 6.1, 7.1, and 7.2; 8. Cost associated with Recommendation 4.3 Note: This includes the higher estimate of the ranges on recommendations 3.4 and 3.6 Source: BCG analysis
Estimated funding requirements to fully execute all recommendations
$1.5MM already
proposed;
additional
$1.2MM needed
In addition to
incremental funding,
DAS needs to fill
budgeted open ASO
positions3
Add'l S/N performed
by DAS on incremental
adopted dogs
Surge spending on
S/N not necessary
after 3 years
While ideal, incremental funding requirement is not all or
nothing—some improvement possible with fewer resources
20160826_1130_Council_Deck.pptx 29
Co
pyrig
ht
© 2
01
6 b
y T
he
Bo
sto
n C
onsultin
g G
roup
, In
c.
All
rig
hts
re
se
rve
d.
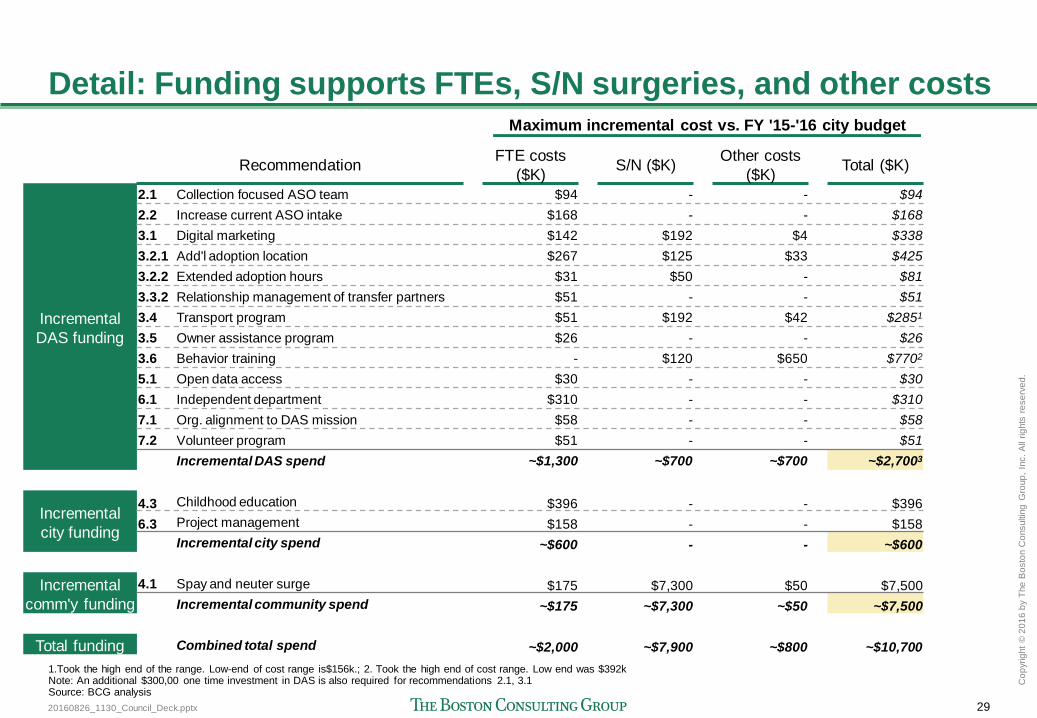
Detail: Funding supports FTEs, S/N surgeries, and other costs
Recommendation FTE costs
($K) S/N ($K)
Other costs
($K) Total ($K)
Incremental
DAS funding
2.1 Collection focused ASO team $94 - - $94
2.2 Increase current ASO intake $168 - - $168
3.1 Digital marketing $142 $192 $4 $338
3.2.1 Add'l adoption location $267 $125 $33 $425
3.2.2 Extended adoption hours $31 $50 - $81
3.3.2 Relationship management of transfer partners $51 - - $51
3.4 Transport program $51 $192 $42 $2851
3.5 Owner assistance program $26 - - $26
3.6 Behavior training - $120 $650 $7702
5.1 Open data access $30 - - $30
6.1 Independent department $310 - - $310
7.1 Org. alignment to DAS mission $58 - - $58
7.2 Volunteer program $51 - - $51
Incremental DAS spend ~$1,300 ~$700 ~$700 ~$2,7003
Incremental
city funding
4.3 Childhood education $396 - - $396
6.3 Project management $158 - - $158
Incremental city spend ~$600 - - ~$600
Incremental
comm'y funding
4.1 Spay and neuter surge $175 $7,300 $50 $7,500
Incremental community spend ~$175 ~$7,300 ~$50 ~$7,500
Total funding Combined total spend ~$2,000 ~$7,900 ~$800 ~$10,700
1.Took the high end of the range. Low-end of cost range is$156k.; 2. Took the high end of cost range. Low end was $392k Note: An additional $300,00 one time investment in DAS is also required for recommendations 2.1, 3.1 Source: BCG analysis
Maximum incremental cost vs. FY '15-'16 city budget
20160826_1130_Council_Deck.pptx 30
Co
pyrig
ht
© 2
01
6 b
y T
he
Bo
sto
n C
onsultin
g G
roup
, In
c.
All
rig
hts
re
se
rve
d.
Agenda
Context
Key Findings
Recommendations
Next steps
20160826_1130_Council_Deck.pptx 31
Co
pyrig
ht
© 2
01
6 b
y T
he
Bo
sto
n C
onsultin
g G
roup
, In
c.
All
rig
hts
re
se
rve
d.
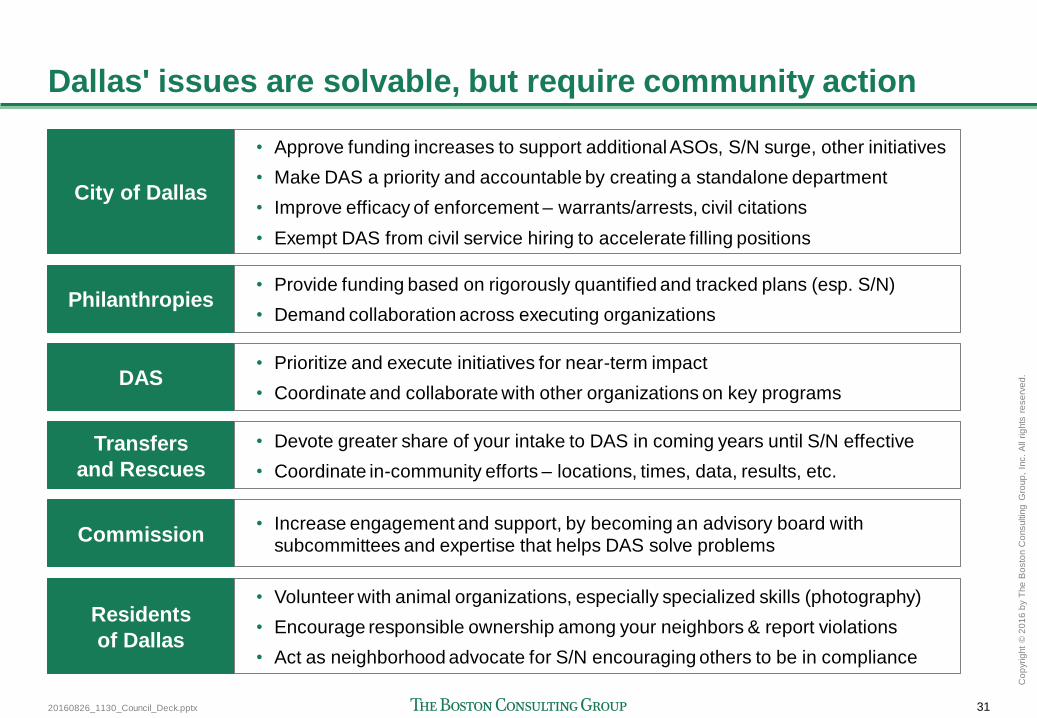
Dallas' issues are solvable, but require community action
City of Dallas
• Approve funding increases to support additional ASOs, S/N surge, other initiatives
• Make DAS a priority and accountable by creating a standalone department
• Improve efficacy of enforcement – warrants/arrests, civil citations
• Exempt DAS from civil service hiring to accelerate filling positions
DAS • Prioritize and execute initiatives for near-term impact
• Coordinate and collaborate with other organizations on key programs
Transfers
and Rescues
• Devote greater share of your intake to DAS in coming years until S/N effective
• Coordinate in-community efforts – locations, times, data, results, etc.
Commission • Increase engagement and support, by becoming an advisory board with
subcommittees and expertise that helps DAS solve problems
Philanthropies • Provide funding based on rigorously quantified and tracked plans (esp. S/N)
• Demand collaboration across executing organizations
Residents
of Dallas
• Volunteer with animal organizations, especially specialized skills (photography)
• Encourage responsible ownership among your neighbors & report violations
• Act as neighborhood advocate for S/N encouraging others to be in compliance
20160826_1130_Council_Deck.pptx 32
Co
pyrig
ht
© 2
01
6 b
y T
he
Bo
sto
n C
onsultin
g G
roup
, In
c.
All
rig
hts
re
se
rve
d.
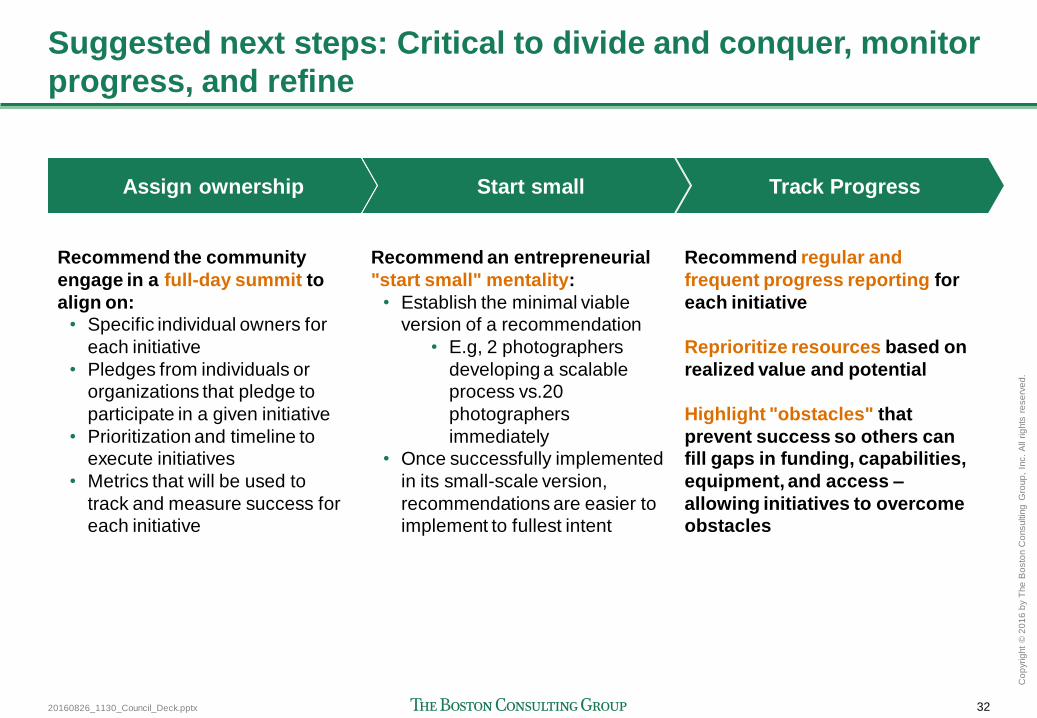
Suggested next steps: Critical to divide and conquer, monitor
progress, and refine
Assign ownership Start small Track Progress
Recommend the community
engage in a full-day summit to
align on:
• Specific individual owners for
each initiative
• Pledges from individuals or
organizations that pledge to
participate in a given initiative
• Prioritization and timeline to
execute initiatives
• Metrics that will be used to
track and measure success for
each initiative
Recommend an entrepreneurial
"start small" mentality:
• Establish the minimal viable
version of a recommendation
• E.g, 2 photographers
developing a scalable
process vs.20
photographers
immediately
• Once successfully implemented
in its small-scale version,
recommendations are easier to
implement to fullest intent
Recommend regular and
frequent progress reporting for
each initiative
Reprioritize resources based on
realized value and potential
Highlight "obstacles" that
prevent success so others can
fill gaps in funding, capabilities,
equipment, and access –
allowing initiatives to overcome
obstacles
20160826_1130_Council_Deck.pptx 33
Co
pyrig
ht
© 2
01
6 b
y T
he
Bo
sto
n C
onsultin
g G
roup
, In
c.
All
rig
hts
re
se
rve
d.
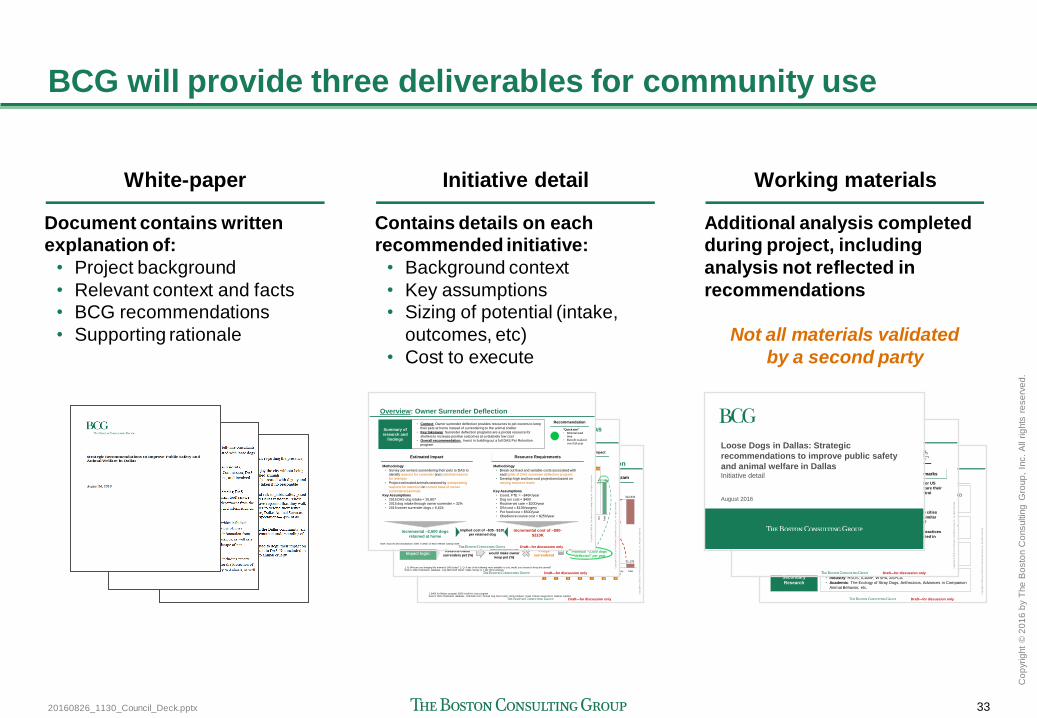
BCG will provide three deliverables for community use
White-paper
Document contains written
explanation of:
• Project background
• Relevant context and facts
• BCG recommendations
• Supporting rationale
Initiative detail
Contains details on each
recommended initiative:
• Background context
• Key assumptions
• Sizing of potential (intake,
outcomes, etc)
• Cost to execute
Working materials
Additional analysis completed
during project, including
analysis not reflected in
recommendations
Not all materials validated
by a second party
Draft—for discussion only
Copyr
ight ©
2016 b
y T
he B
osto
n C
onsulti
ng G
roup, In
c.
All
rights
reserv
ed.
Resource requirements: Deflection program costs ~$90-
$310K, dependent upon "Robust" or "Lean" implementation
Key assumptions... Estimated yearly costs of Owner Deflection program
1. $400 for Robust program, $200 credit for Lean programSource: DAS Chameleon database, PetFinder.Com "Annual Dog Care Costs", BCG Analysis, Texas Tribune Government Salaries Explorer
312,834004,1406,5778,280134,373
136,265
23,200
0
100,000
200,000
300,000
400,000
Cost ($)
Costs incurred on a per "deflected" dog basis
Fixed
program
costs
Program coordinator½ FTE @
$46K/yr
DAS Owner Deflection:
Dog Run/ Fence $4001
Routine Vet Care $200
S/N Surgery $139
Pet Food Expense $500/yr
Behavior Courses $250/yr
Temporary Foster -
Remove Citations -
91,13300000068,13323,000
0
200,000
400,000
600,000
800,000
Cost ($)
TotalTemporary
Foster
Remove
Citations
Behavior
Courses
S/N
Surgery
Pet FoodRoutine
Vet Care
Dog Run/
Fence
Program
Coord
Costs incurred on a per "deflected" dog basis
Fixed
program
costs
"Robust"
Program
"Lean"
Program
Incremental cost of
~$90K - $310K per year
i ii iv iii v vii vi
vi
ii
i
iv
v
vii
iii
Draft—for discussion only
Copyr
ight ©
2016 b
y T
he B
osto
n C
onsulti
ng G
roup, In
c.
All
rights
reserv
ed.
Projected Retention Impact
Estimated impact: Owner Surrender Deflection program has
potential to deflect ~2,600 dogs per year
Key assumptions
Surveyed reason for
surrender at DAS1
1. Q: Why are you bringing this animal to DAS today? 2. Q: If any of the following were available to you, would you choose to keep this animal?Source: DAS Chameleon database, July 2016 DAS Owner Intake Survey (n = 44), BCG Analysis
225
779
1416
2023
25
3030
39
0%
10%
20%
30%
40%
Anim
al aggre
ssio
n
Anim
al in
tera
ctio
n
Anim
al obedie
nce
Cost of
eve
ry d
ay c
are
Yard
/Housin
g
Lifesty
le
Movi
ng
Num
ber
of
anim
als
Euth
anasia
Anim
al S
erv
ice O
ffic
ers
Oth
er
% of respondents indicating surrender reason
Pers
onal health
Cost of
medic
al care
Lack o
f tim
e
Surveyed reason for
retention at DAS2
1333
5
10
1414
47
0%
20%
40%
60%
Pet fo
od P
roducts
Dog r
un/f
encin
g
Vet C
are
Tem
pora
ry H
om
e
Oth
er
Do n
ot
want
anim
al
S/N
Obedie
nce c
ours
es
Tic
kets
/ cita
tions R
em
oval
% of respondents indicating retention reason2015 DAS Dog
Intake20,807
2015 % Dog Intake
through Owner32%
2015 Owner Dog
Intake6,624
DAS Owner Deflection:
Dog Run/ Fence
Routine Vet Care
S/N Surgery
Pet Food Expense
Behavior Courses
Temporary Foster
Remove Citations
vi ii i iv v vii iii
2,59347189199
199341
672
946
0
1,000
2,000
3,000
4,000
Tota
l
Tic
kets
/ cita
tions R
em
oval
S/N
Projected dogs retained
Pet fo
od P
roducts
Dog r
un/f
encin
g
Obedie
nce c
ours
es
Vet C
are
Tem
pora
ry H
om
e
vi ii i iv v vii iii
Potential ~2,600 dogs
"deflected" per year
Reasons owner
surrenders pet (%)
Interventions that
would make owner
keep pet (%)
# dogs
surrenderedImpact logic:
I II III
I II III
vi
ii
i
iv
v
vii
iii
Draft—for discussion only
Copyr
ight ©
2016 b
y T
he B
osto
n C
onsulti
ng G
roup, In
c.
All
rights
reserv
ed.
Overview: Owner Surrender Deflection
Summary of
research and
findings
• Context: Owner surrender deflection provides resources to pet owners to keep
their pets at home instead of surrendering to the animal shelter
• Key takeaway: Surrender deflection programs are a pivotal resource for
shelters to increase positive outcomes at a relatively low cost
• Overall recommendation: Invest in building out a full DAS Pet Retention
program
Estimated Impact
Methodology
• Survey pet owners surrendering their pets to DAS to
identify reasons for surrender and potential reasons
for retention
• Project estimated animals retained by extrapolating
reasons for retention on current base of owner
surrendered animals
Key Assumptions
• 2015 DAS dog intake = 20,807
• 2015 dog intake through owner surrender = 32%
• 2015 owner surrender dogs = 6,624
Resource Requirements
Methodology
• Break out fixed and variable costs associated with
each pillar of DAS surrender deflection program
• Develop high and low cost projections based on
varying resource levels
Key Assumptions
• Coord. FTE = ~$46K/year
• Dog run cost = $400
• Routine vet care = $200/year
• S/N cost = $139/surgery
• Pet food cost = $500/year
• Obedience course cost = $250/year
Recommendation
Incremental ~2,600 dogs
retained at home
Incremental cost of ~$90-
$310K
"Quick win"
• Minimal lead
time
• Benefit realized
over full year
Note: Sources and assumptions listed in detail on each relevant backup slide
Implied cost of ~$35 - $120
per retained dog
Draft—for discussion only
Copyr
ight ©
2016 b
y T
he B
osto
n C
onsulti
ng G
roup, I
nc.
All
rights
reserv
ed.
Interviews with
Stakeholders
100+ stakeholder interviews completed including:
• Government: Council Members, Animal Commissions, Code & DAS, DPD
• Non-profits: Animal rescue organizations, funders/philanthropies
• Citizens: Town halls and specific involved individuals
~40 interviews with stakeholders from comparable benchmark cities
Secondary
Research
Primary Research
Extensive primary research to collect new and unique information:
• Census: Roaming dog census in North and South Dallas
• Ride-a-longs: DAS field day, Targeted Response Team and CARE
• Surveys: Community, Rescue/welfare organization
Data Analysis
Detailed analysis of all relevant data sources:
• DAS data & Government: Chameleon, bite reports, 311, 911, Sanitation
• Community Data: Historical S/N activity
• Public Data: Census data
Gathered and reviewed large volume of available secondary research:
• Industry: HSUS, ICAMP, WSPA, ASPCA
• Academic: The Ecology of Stray Dogs, Anthrozoos, Advances in Companion
Animal Behavior, etc.
How BCG developed its recommendation
What we didActivity
Draft—for discussion only
Copyr
ight ©
2016 b
y T
he B
osto
n C
onsulti
ng G
roup, I
nc.
All
rights
reserv
ed.
BCG framework for understanding the situation
Supply
of Dogs
How many dogs are in
Dallas?
• Registered, Loose?
Do dogs pose a public
safety risk?
What services are
available to prevent
population growth
Benchmarks
How do other US
cities structure their
Animal control
agencies?
How have
comparable cities
overcome similar
dog issues?
What best practices
can be applied in
Dallas?
DAS
Operations
How effectively does
DAS collect dogs?
How efficiently and
quickly does DAS
operate its shelter?
How effectively does
DAS rehome dogs?
Enforcement &
Responsiveness
How effectively does
Dallas institute and
enforce animal
ordinances?
How effectively does
DAS respond to
animal related
requests /
complaints?
Loose Dogs in Dallas: Strategic
recommendations to improve public safety
and animal welfare in Dallas Initiative detail
August 2016
20160826_1130_Council_Deck.pptx 34
Co
pyrig
ht
© 2
01
6 b
y T
he
Bo
sto
n C
onsultin
g G
roup
, In
c.
All
rig
hts
re
se
rve
d. Q A &

Appendix
20160826_1130_Council_Deck.pptx 36
Co
pyrig
ht
© 2
01
6 b
y T
he
Bo
sto
n C
onsultin
g G
roup
, In
c.
All
rig
hts
re
se
rve
d.
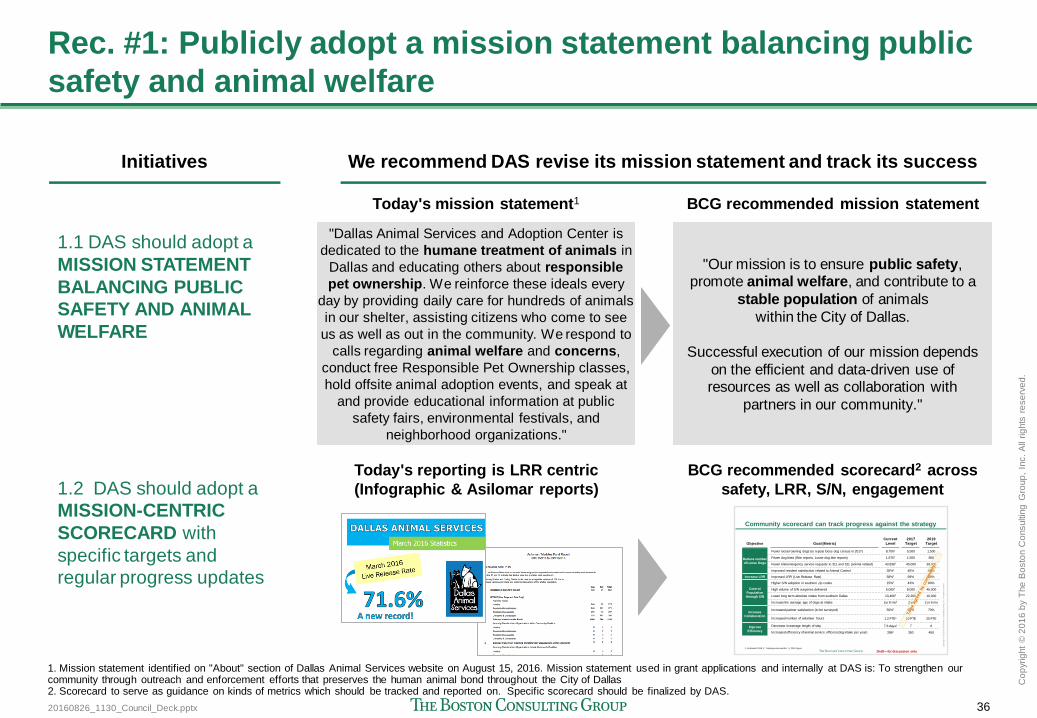
Rec. #1: Publicly adopt a mission statement balancing public
safety and animal welfare
Initiatives We recommend DAS revise its mission statement and track its success
1.1 DAS should adopt a
MISSION STATEMENT
BALANCING PUBLIC
SAFETY AND ANIMAL
WELFARE
1.2 DAS should adopt a
MISSION-CENTRIC
SCORECARD with
specific targets and
regular progress updates
"Our mission is to ensure public safety, promote animal welfare, and contribute to a
stable population of animals
within the City of Dallas.
Successful execution of our mission depends
on the efficient and data-driven use of resources as well as collaboration with
partners in our community."
"Dallas Animal Services and Adoption Center is
dedicated to the humane treatment of animals in
Dallas and educating others about responsible
pet ownership. We reinforce these ideals every
day by providing daily care for hundreds of animals
in our shelter, assisting citizens who come to see
us as well as out in the community. We respond to
calls regarding animal welfare and concerns,
conduct free Responsible Pet Ownership classes,
hold offsite animal adoption events, and speak at
and provide educational information at public
safety fairs, environmental festivals, and
neighborhood organizations."
Today's mission statement1 BCG recommended mission statement
Today's reporting is LRR centric
(Infographic & Asilomar reports)
BCG recommended scorecard2 across
safety, LRR, S/N, engagement
Draft—for discussion only
Co
pyrig
ht ©
20
16
by T
he B
osto
n C
on
sultin
g G
roup, In
c. A
ll rig
hts
re
serv
ed.
Community scorecard can track progress against the strategy
1. Estimated 2016 2. Trailing tw elve months 3. 2015 figure
Objective Goal (Metric)
Current
Level
2017
Target
2019
Target
Reduce number
of Loose Dogs
Fewer loose/roaming dogs (to repeat loose dog census in 2017) 8,7001 5,500 1,500
Fewer dog bites (Bite reports, Loose dog bite reports) 1,6761 1,500 800
Fewer bite/emergency service requests to 311 and 911 (animal related) 43,8362 40,000 30,000
Improved resident satisfaction related to Animal Control 30%1 45% 60%
Increase LRR Improved LRR (Live Release Rate) 58%1 69% 86%
Control
Population
through S/N
Higher S/N adoption in southern zip codes 15%1 43% 80%
High volume of S/N surgeries delivered 5,0001 8,000 46,000
Lower long term absolute intake from southern Dallas 13,4663 22,266 10,000
Increase the average age of dogs at intake 1yr 8 mo2 2 yr 2 yr 6 mo
Increase
Collaboration
Increased partner satisfaction (to be surveyed) 50%1 60% 70%
Increased number of volunteer hours 1.2 FTE1 10 FTE 25 FTE
Improve Efficiency
Decrease in average length of stay 7.6 days2 7 6
Increased efficiency of animal service officers (dog intake per year) 2862 350 450
1. Mission statement identified on "About" section of Dallas Animal Services website on August 15, 2016. Mission statement used in grant applications and internally at DAS is: To strengthen our community through outreach and enforcement efforts that preserves the human animal bond throughout the City of Dallas 2. Scorecard to serve as guidance on kinds of metrics which should be tracked and reported on. Specific scorecard should be finalized by DAS.
20160826_1130_Council_Deck.pptx 37
Co
pyrig
ht
© 2
01
6 b
y T
he
Bo
sto
n C
onsultin
g G
roup
, In
c.
All
rig
hts
re
se
rve
d.
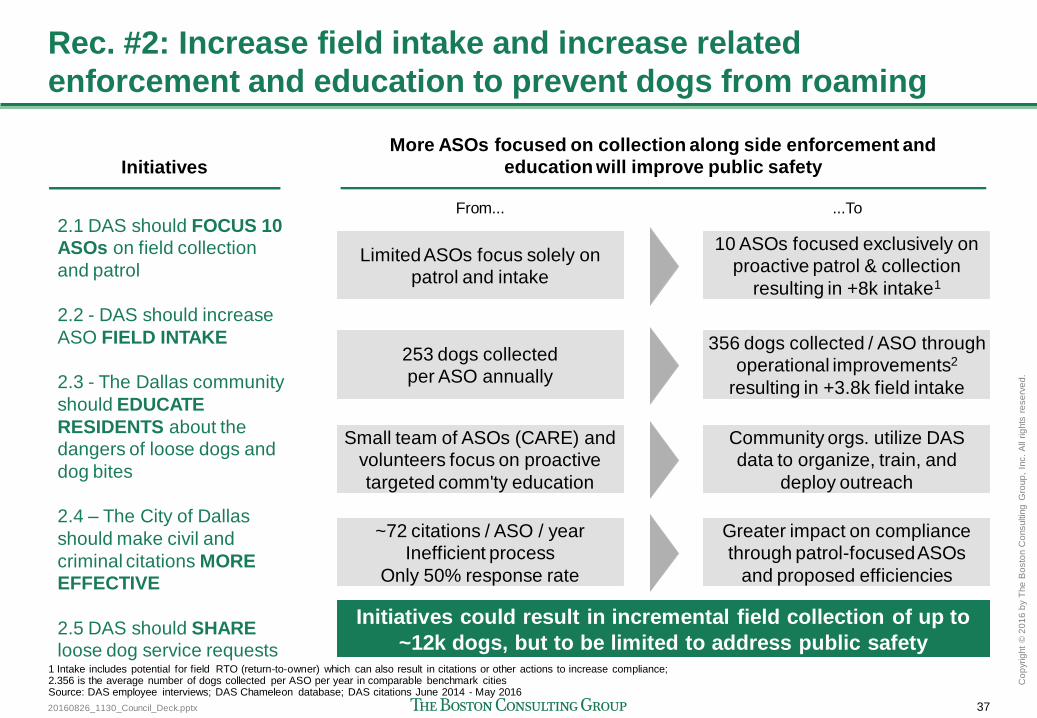
Rec. #2: Increase field intake and increase related
enforcement and education to prevent dogs from roaming
Initiatives
More ASOs focused on collection along side enforcement and
education will improve public safety
2.1 DAS should FOCUS 10
ASOs on field collection
and patrol
2.2 - DAS should increase
ASO FIELD INTAKE
2.3 - The Dallas community
should EDUCATE
RESIDENTS about the
dangers of loose dogs and
dog bites
2.4 – The City of Dallas
should make civil and
criminal citations MORE
EFFECTIVE
2.5 DAS should SHARE
loose dog service requests
356 dogs collected / ASO through
operational improvements2
resulting in +3.8k field intake
253 dogs collected
per ASO annually
From... ...To
10 ASOs focused exclusively on
proactive patrol & collection
resulting in +8k intake1
Limited ASOs focus solely on
patrol and intake
Community orgs. utilize DAS
data to organize, train, and
deploy outreach
Small team of ASOs (CARE) and
volunteers focus on proactive
targeted comm'ty education
Greater impact on compliance
through patrol-focused ASOs
and proposed efficiencies
~72 citations / ASO / year
Inefficient process
Only 50% response rate
Initiatives could result in incremental field collection of up to
~12k dogs, but to be limited to address public safety 1 Intake includes potential for field RTO (return-to-owner) which can also result in citations or other actions to increase compliance; 2.356 is the average number of dogs collected per ASO per year in comparable benchmark cities Source: DAS employee interviews; DAS Chameleon database; DAS citations June 2014 - May 2016
20160826_1130_Council_Deck.pptx 38
Co
pyrig
ht
© 2
01
6 b
y T
he
Bo
sto
n C
onsultin
g G
roup
, In
c.
All
rig
hts
re
se
rve
d.
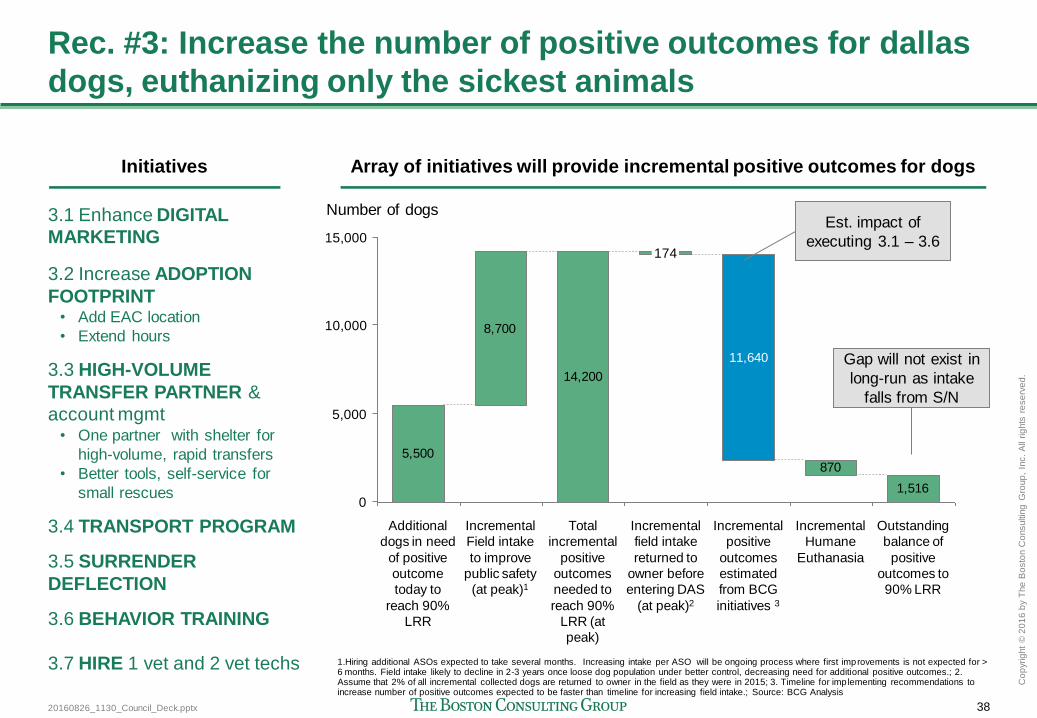
Rec. #3: Increase the number of positive outcomes for dallas
dogs, euthanizing only the sickest animals
Initiatives Array of initiatives will provide incremental positive outcomes for dogs
3.1 Enhance DIGITAL
MARKETING
3.2 Increase ADOPTION
FOOTPRINT • Add EAC location
• Extend hours
3.3 HIGH-VOLUME
TRANSFER PARTNER &
account mgmt • One partner with shelter for
high-volume, rapid transfers
• Better tools, self-service for
small rescues
3.4 TRANSPORT PROGRAM
3.5 SURRENDER
DEFLECTION
3.6 BEHAVIOR TRAINING
3.7 HIRE 1 vet and 2 vet techs
5,500
8,700
14,200
870
1,516
11,640
15,000
10,000
5,000
0
Incremental
field intake
returned to
owner before
entering DAS
(at peak)2
174
Outstanding
balance of
positive
outcomes to
90% LRR
Incremental
Humane
Euthanasia
Incremental
positive
outcomes
estimated
from BCG
initiatives 3
Total
incremental
positive
outcomes
needed to
reach 90%
LRR (at
peak)
Incremental
Field intake
to improve
public safety
(at peak)1
Additional
dogs in need
of positive
outcome
today to
reach 90%
LRR
Number of dogs Est. impact of
executing 3.1 – 3.6
Gap will not exist in
long-run as intake
falls from S/N
1.Hiring additional ASOs expected to take several months. Increasing intake per ASO will be ongoing process where first improvements is not expected for > 6 months. Field intake likely to decline in 2-3 years once loose dog population under better control, decreasing need for additional positive outcomes.; 2. Assume that 2% of all incremental collected dogs are returned to owner in the field as they were in 2015; 3. Timeline for implementing recommendations to increase number of positive outcomes expected to be faster than timeline for increasing field intake.; Source: BCG Analysis
20160826_1130_Council_Deck.pptx 39
Co
pyrig
ht
© 2
01
6 b
y T
he
Bo
sto
n C
onsultin
g G
roup
, In
c.
All
rig
hts
re
se
rve
d.
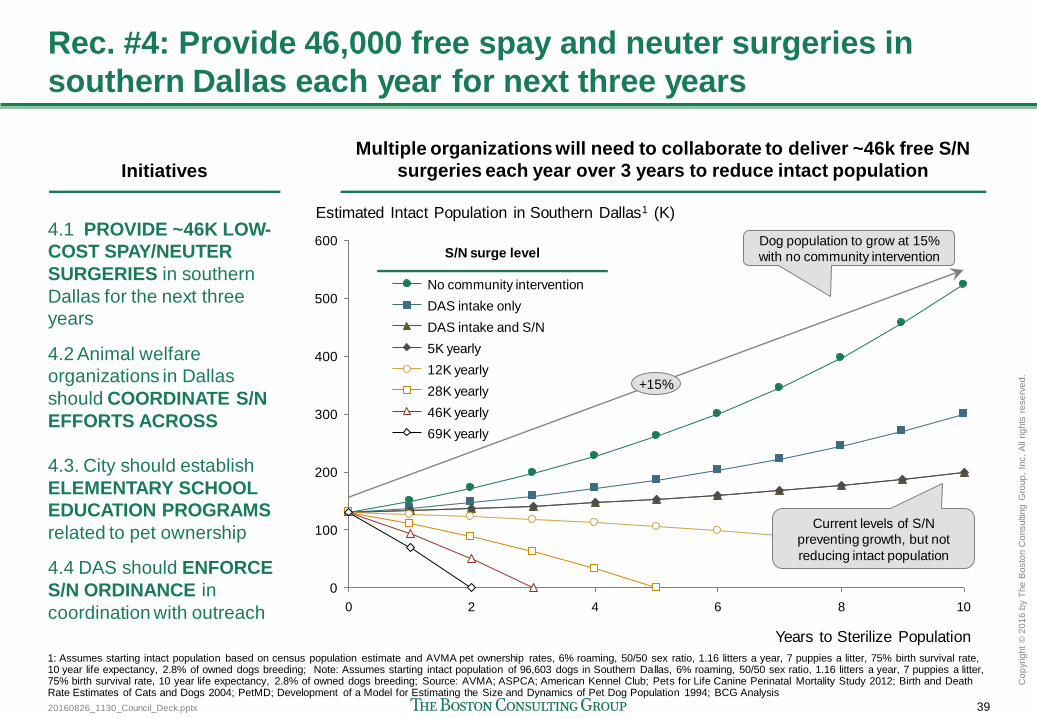
Rec. #4: Provide 46,000 free spay and neuter surgeries in
southern Dallas each year for next three years
Initiatives
Multiple organizations will need to collaborate to deliver ~46k free S/N
surgeries each year over 3 years to reduce intact population
4.1 PROVIDE ~46K LOW-
COST SPAY/NEUTER
SURGERIES in southern
Dallas for the next three
years
4.2 Animal welfare
organizations in Dallas
should COORDINATE S/N
EFFORTS ACROSS
4.3. City should establish
ELEMENTARY SCHOOL
EDUCATION PROGRAMS
related to pet ownership
4.4 DAS should ENFORCE
S/N ORDINANCE in
coordination with outreach
0 2 4 6 8 10
600
400
200
0
300
100
500
Years to Sterilize Population
+15%
Estimated Intact Population in Southern Dallas1 (K)
Current levels of S/N
preventing growth, but not
reducing intact population
12K yearly
5K yearly
DAS intake and S/N
DAS intake only
No community intervention
46K yearly
28K yearly
69K yearly
Dog population to grow at 15%
with no community intervention S/N surge level
1: Assumes starting intact population based on census population estimate and AVMA pet ownership rates, 6% roaming, 50/50 sex ratio, 1.16 litters a year, 7 puppies a litter, 75% birth survival rate, 10 year life expectancy, 2.8% of owned dogs breeding; Note: Assumes starting intact population of 96,603 dogs in Southern Dallas, 6% roaming, 50/50 sex ratio, 1.16 litters a year, 7 puppies a litter, 75% birth survival rate, 10 year life expectancy, 2.8% of owned dogs breeding; Source: AVMA; ASPCA; American Kennel Club; Pets for Life Canine Perinatal Mortality Study 2012; Birth and Death Rate Estimates of Cats and Dogs 2004; PetMD; Development of a Model for Estimating the Size and Dynamics of Pet Dog Population 1994; BCG Analysis
20160826_1130_Council_Deck.pptx 40
Co
pyrig
ht
© 2
01
6 b
y T
he
Bo
sto
n C
onsultin
g G
roup
, In
c.
All
rig
hts
re
se
rve
d.
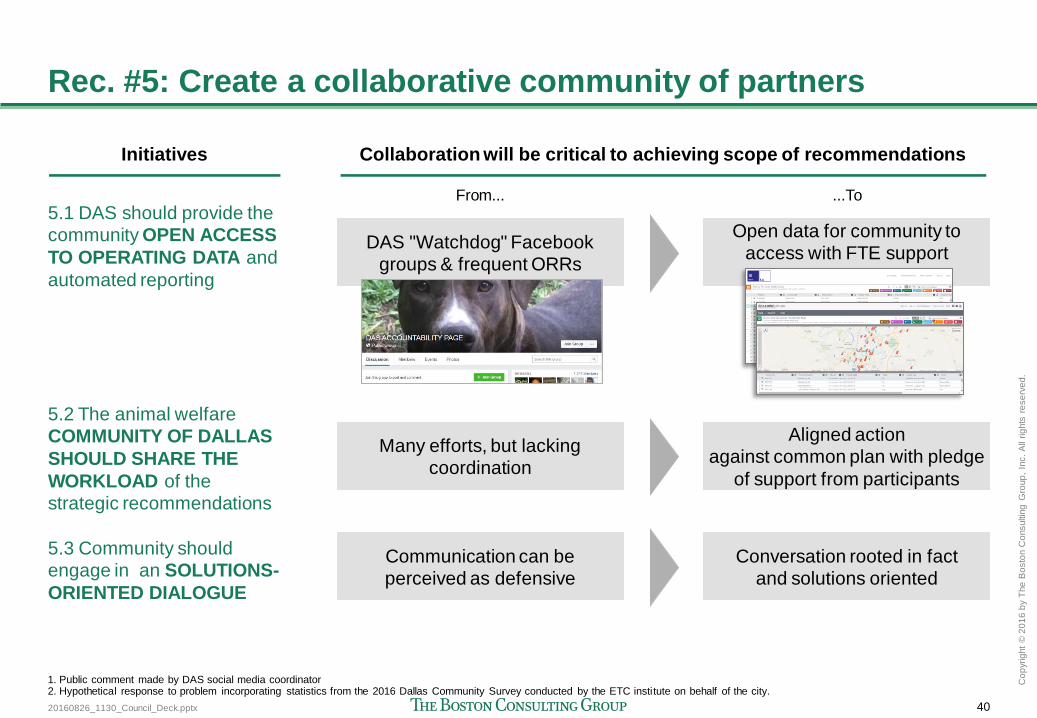
Rec. #5: Create a collaborative community of partners
Initiatives Collaboration will be critical to achieving scope of recommendations
5.1 DAS should provide the
community OPEN ACCESS
TO OPERATING DATA and
automated reporting
5.2 The animal welfare
COMMUNITY OF DALLAS
SHOULD SHARE THE
WORKLOAD of the
strategic recommendations
5.3 Community should
engage in an SOLUTIONS-
ORIENTED DIALOGUE
From... ...To
Conversation rooted in fact
and solutions oriented
Communication can be
perceived as defensive
Aligned action
against common plan with pledge
of support from participants
Many efforts, but lacking
coordination
Open data for community to
access with FTE support
DAS "Watchdog" Facebook
groups & frequent ORRs
1. Public comment made by DAS social media coordinator 2. Hypothetical response to problem incorporating statistics from the 2016 Dallas Community Survey conducted by the ETC institute on behalf of the city.
20160826_1130_Council_Deck.pptx 41
Co
pyrig
ht
© 2
01
6 b
y T
he
Bo
sto
n C
onsultin
g G
roup
, In
c.
All
rig
hts
re
se
rve
d.
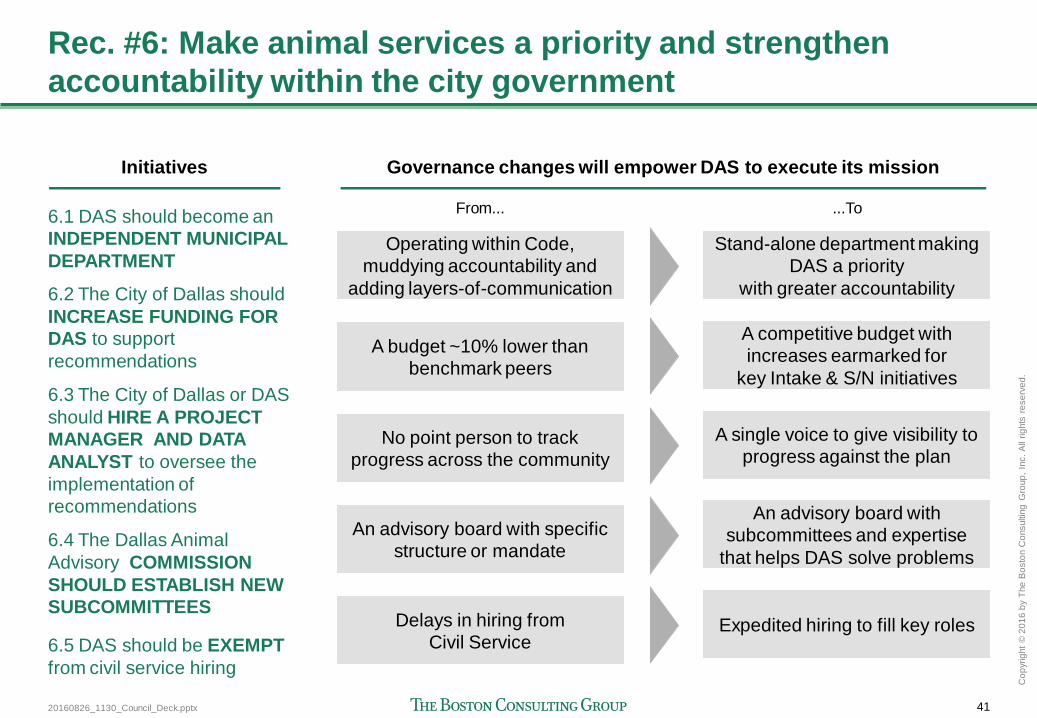
Rec. #6: Make animal services a priority and strengthen
accountability within the city government
Initiatives Governance changes will empower DAS to execute its mission
6.1 DAS should become an
INDEPENDENT MUNICIPAL
DEPARTMENT
6.2 The City of Dallas should
INCREASE FUNDING FOR
DAS to support
recommendations
6.3 The City of Dallas or DAS
should HIRE A PROJECT
MANAGER AND DATA
ANALYST to oversee the
implementation of
recommendations
6.4 The Dallas Animal
Advisory COMMISSION
SHOULD ESTABLISH NEW
SUBCOMMITTEES
6.5 DAS should be EXEMPT
from civil service hiring
From... ...To
Stand-alone department making
DAS a priority
with greater accountability
Operating within Code,
muddying accountability and
adding layers-of-communication
A competitive budget with
increases earmarked for
key Intake & S/N initiatives
A budget ~10% lower than
benchmark peers
A single voice to give visibility to
progress against the plan No point person to track
progress across the community
Expedited hiring to fill key roles Delays in hiring from
Civil Service
An advisory board with
subcommittees and expertise
that helps DAS solve problems
An advisory board with specific
structure or mandate

20160826_1130_Council_Deck.pptx 42
Co
pyrig
ht
© 2
01
6 b
y T
he
Bo
sto
n C
onsultin
g G
roup
, In
c.
All
rig
hts
re
se
rve
d.
Rec. #7: Ensure efficiency by measuring outcomes and
increasing volunteers
Initiatives Managing to metrics focused deployment of limited resources
7.1 DAS should ALIGN
ORG STRUCTURE and
employee performance
against its mission
7.2 DAS should
INCREASE SCALE OF
VOLUNTEER
PROGRAM with a
greater variety of roles
From... ...To
Individual ownership
of each initiative Large set of recommendations
Target of 10-20 FTEs of volunteer
time across varied roles
Today ~1.2 FTEs of volunteer
time at DAS (since recent start)
Example
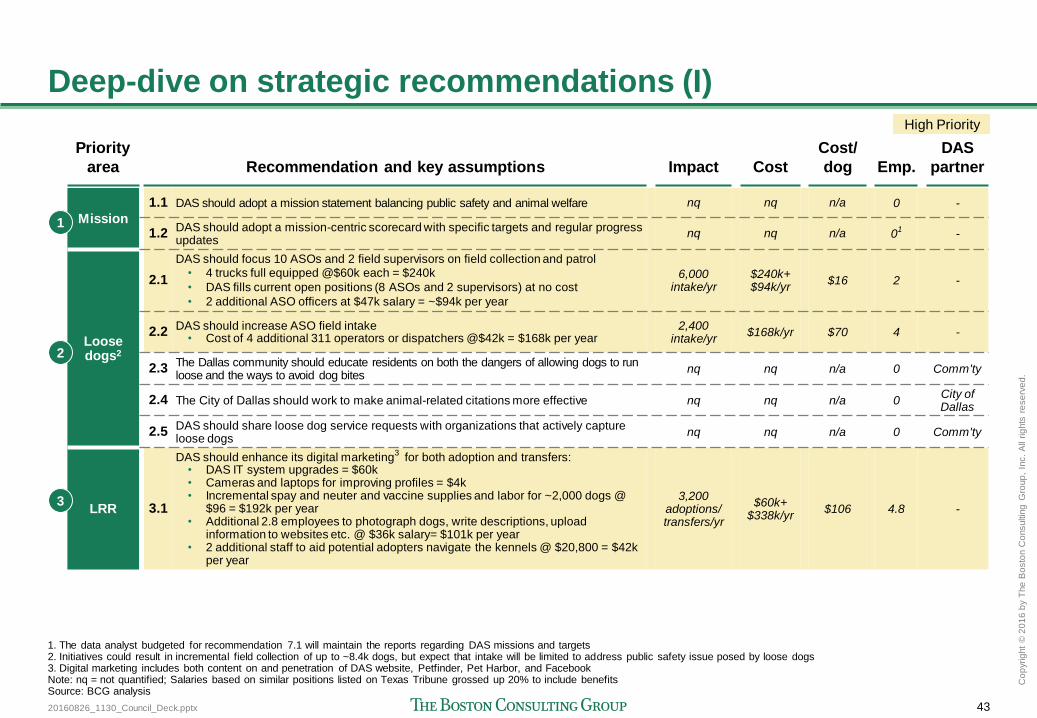
20160826_1130_Council_Deck.pptx 43
Co
pyrig
ht
© 2
01
6 b
y T
he
Bo
sto
n C
onsultin
g G
roup
, In
c.
All
rig
hts
re
se
rve
d.
Deep-dive on strategic recommendations (I)
Priority
area Recommendation and key assumptions Impact Cost
Cost/
dog Emp.
DAS
partner
Mission
1.1 DAS should adopt a mission statement balancing public safety and animal welfare nq nq n/a 0 -
1.2 DAS should adopt a mission-centric scorecard with specific targets and regular progress updates
nq nq n/a 01 -
Loose dogs2
2.1
DAS should focus 10 ASOs and 2 field supervisors on field collection and patrol • 4 trucks full equipped @$60k each = $240k
• DAS fills current open positions (8 ASOs and 2 supervisors) at no cost
• 2 additional ASO officers at $47k salary = ~$94k per year
6,000 intake/yr
$240k+ $94k/yr
$16 2 -
2.2 DAS should increase ASO field intake • Cost of 4 additional 311 operators or dispatchers @$42k = $168k per year
2,400 intake/yr
$168k/yr $70 4 -
2.3 The Dallas community should educate residents on both the dangers of allowing dogs to run loose and the ways to avoid dog bites
nq nq n/a 0 Comm'ty
2.4 The City of Dallas should work to make animal-related citations more effective nq nq n/a 0 City of Dallas
2.5 DAS should share loose dog service requests with organizations that actively capture loose dogs
nq nq n/a 0 Comm'ty
LRR 3.1
DAS should enhance its digital marketing3 for both adoption and transfers:
• DAS IT system upgrades = $60k • Cameras and laptops for improving profiles = $4k • Incremental spay and neuter and vaccine supplies and labor for ~2,000 dogs @
$96 = $192k per year • Additional 2.8 employees to photograph dogs, write descriptions, upload
information to websites etc. @ $36k salary= $101k per year • 2 additional staff to aid potential adopters navigate the kennels @ $20,800 = $42k
per year
3,200 adoptions/ transfers/yr
$60k+ $338k/yr
$106 4.8 -
1
2
3
1. The data analyst budgeted for recommendation 7.1 will maintain the reports regarding DAS missions and targets 2. Initiatives could result in incremental field collection of up to ~8.4k dogs, but expect that intake will be limited to address public safety issue posed by loose dogs 3. Digital marketing includes both content on and penetration of DAS website, Petfinder, Pet Harbor, and Facebook Note: nq = not quantified; Salaries based on similar positions listed on Texas Tribune grossed up 20% to include benefits Source: BCG analysis
High Priority
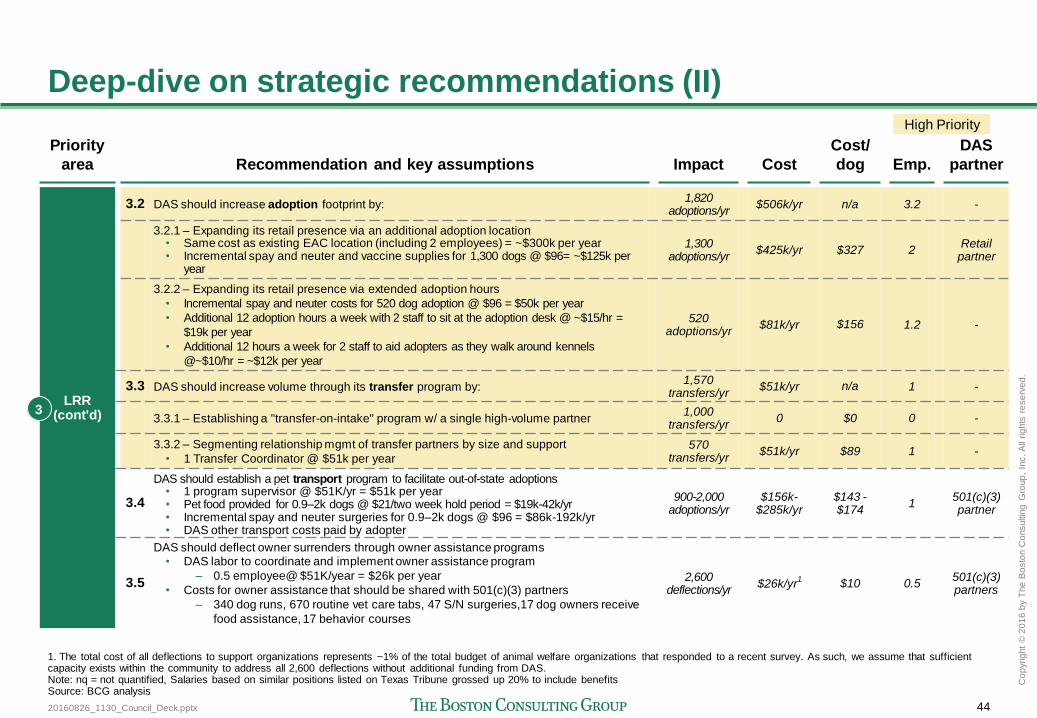
20160826_1130_Council_Deck.pptx 44
Co
pyrig
ht
© 2
01
6 b
y T
he
Bo
sto
n C
onsultin
g G
roup
, In
c.
All
rig
hts
re
se
rve
d.
Deep-dive on strategic recommendations (II)
Priority
area Recommendation and key assumptions Impact Cost
Cost/
dog Emp.
DAS
partner
LRR (cont'd)
3.2 DAS should increase adoption footprint by: 1,820
adoptions/yr $506k/yr n/a 3.2 -
3.2.1 – Expanding its retail presence via an additional adoption location • Same cost as existing EAC location (including 2 employees) = ~$300k per year • Incremental spay and neuter and vaccine supplies for 1,300 dogs @ $96= ~$125k per
year
1,300 adoptions/yr
$425k/yr $327 2 Retail
partner
3.2.2 – Expanding its retail presence via extended adoption hours
• Incremental spay and neuter costs for 520 dog adoption @ $96 = $50k per year
• Additional 12 adoption hours a week with 2 staff to sit at the adoption desk @ ~$15/hr =
$19k per year
• Additional 12 hours a week for 2 staff to aid adopters as they walk around kennels
@~$10/hr = ~$12k per year
520 adoptions/yr
$81k/yr $156 1.2 -
3.3 DAS should increase volume through its transfer program by: 1,570
transfers/yr $51k/yr n/a 1 -
3.3.1 – Establishing a "transfer-on-intake" program w/ a single high-volume partner 1,000
transfers/yr 0 $0 0 -
3.3.2 – Segmenting relationship mgmt of transfer partners by size and support
• 1 Transfer Coordinator @ $51k per year 570
transfers/yr $51k/yr $89 1 -
3.4
DAS should establish a pet transport program to facilitate out-of-state adoptions • 1 program supervisor @ $51K/yr = $51k per year • Pet food provided for 0.9–2k dogs @ $21/two week hold period = $19k-42k/yr • Incremental spay and neuter surgeries for 0.9–2k dogs @ $96 = $86k-192k/yr • DAS other transport costs paid by adopter
900-2,000 adoptions/yr
$156k-$285k/yr
$143 -$174
1 501(c)(3) partner
3.5
DAS should deflect owner surrenders through owner assistance programs • DAS labor to coordinate and implement owner assistance program
– 0.5 employee@ $51K/year = $26k per year
• Costs for owner assistance that should be shared with 501(c)(3) partners
– 340 dog runs, 670 routine vet care tabs, 47 S/N surgeries,17 dog owners receive
food assistance, 17 behavior courses
2,600 deflections/yr
$26k/yr1 $10 0.5
501(c)(3) partners
3
High Priority
1. The total cost of all deflections to support organizations represents ~1% of the total budget of animal welfare organizations that responded to a recent survey. As such, we assume that sufficient capacity exists within the community to address all 2,600 deflections without additional funding from DAS. Note: nq = not quantified, Salaries based on similar positions listed on Texas Tribune grossed up 20% to include benefits Source: BCG analysis
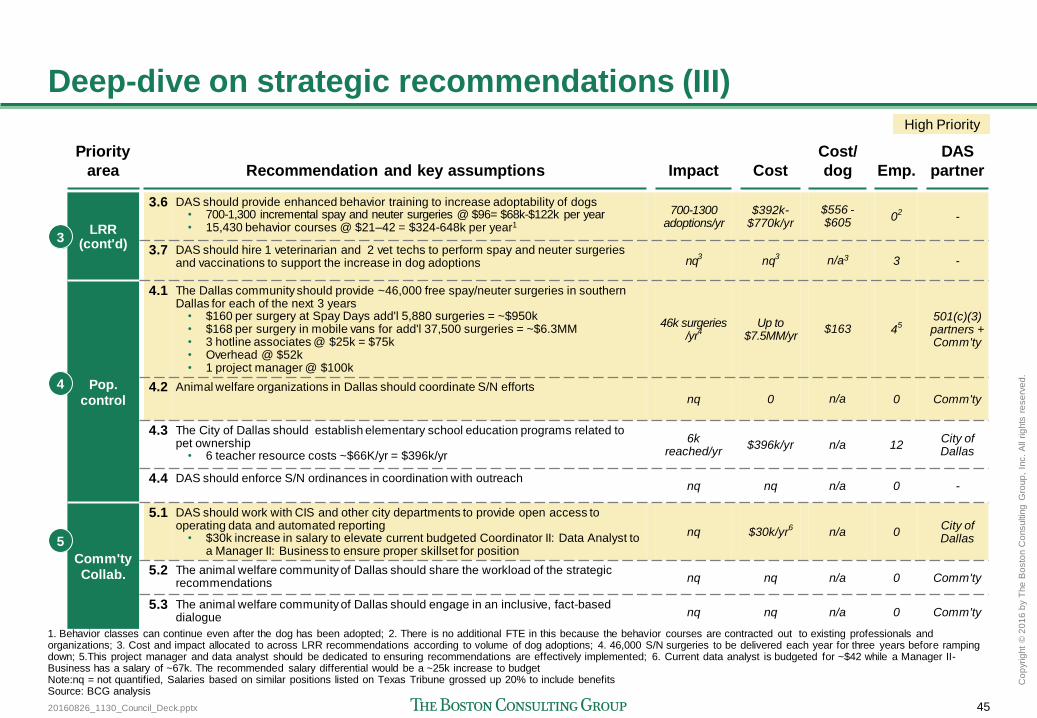
20160826_1130_Council_Deck.pptx 45
Co
pyrig
ht
© 2
01
6 b
y T
he
Bo
sto
n C
onsultin
g G
roup
, In
c.
All
rig
hts
re
se
rve
d.
Deep-dive on strategic recommendations (III) High Priority
Priority
area Recommendation and key assumptions Impact Cost
Cost/
dog Emp.
DAS
partner
LRR (cont'd)
3.6 DAS should provide enhanced behavior training to increase adoptability of dogs • 700-1,300 incremental spay and neuter surgeries @ $96= $68k-$122k per year • 15,430 behavior courses @ $21–42 = $324-648k per year1
700-1300 adoptions/yr
$392k-$770k/yr
$556 - $605
02 -
3.7 DAS should hire 1 veterinarian and 2 vet techs to perform spay and neuter surgeries and vaccinations to support the increase in dog adoptions nq
3 nq
3 n/a3 3 -
Pop.
control
4.1 The Dallas community should provide ~46,000 free spay/neuter surgeries in southern Dallas for each of the next 3 years
• $160 per surgery at Spay Days add'l 5,880 surgeries = ~$950k • $168 per surgery in mobile vans for add'l 37,500 surgeries = ~$6.3MM • 3 hotline associates @ $25k = $75k • Overhead @ $52k • 1 project manager @ $100k
46k surgeries /yr
4
Up to $7.5MM/yr
$163 45
501(c)(3) partners + Comm'ty
4.2 Animal welfare organizations in Dallas should coordinate S/N efforts nq 0 n/a 0
Comm'ty
4.3 The City of Dallas should establish elementary school education programs related to pet ownership
• 6 teacher resource costs ~$66K/yr = $396k/yr
6k reached/yr
$396k/yr n/a 12 City of Dallas
4.4 DAS should enforce S/N ordinances in coordination with outreach nq nq n/a 0 -
Comm'ty
Collab.
5.1 DAS should work with CIS and other city departments to provide open access to operating data and automated reporting
• $30k increase in salary to elevate current budgeted Coordinator II: Data Analyst to a Manager II: Business to ensure proper skillset for position
nq $30k/yr6 n/a 0
City of Dallas
5.2 The animal welfare community of Dallas should share the workload of the strategic recommendations nq nq n/a 0 Comm'ty
5.3 The animal welfare community of Dallas should engage in an inclusive, fact-based dialogue nq nq n/a 0 Comm'ty
3
4
5
1. Behavior classes can continue even after the dog has been adopted; 2. There is no additional FTE in this because the behavior courses are contracted out to existing professionals and organizations; 3. Cost and impact allocated to across LRR recommendations according to volume of dog adoptions; 4. 46,000 S/N surgeries to be delivered each year for three years before ramping down; 5.This project manager and data analyst should be dedicated to ensuring recommendations are effectively implemented; 6. Current data analyst is budgeted for ~$42 while a Manager II- Business has a salary of ~67k. The recommended salary differential would be a ~25k increase to budget Note:nq = not quantified, Salaries based on similar positions listed on Texas Tribune grossed up 20% to include benefits Source: BCG analysis
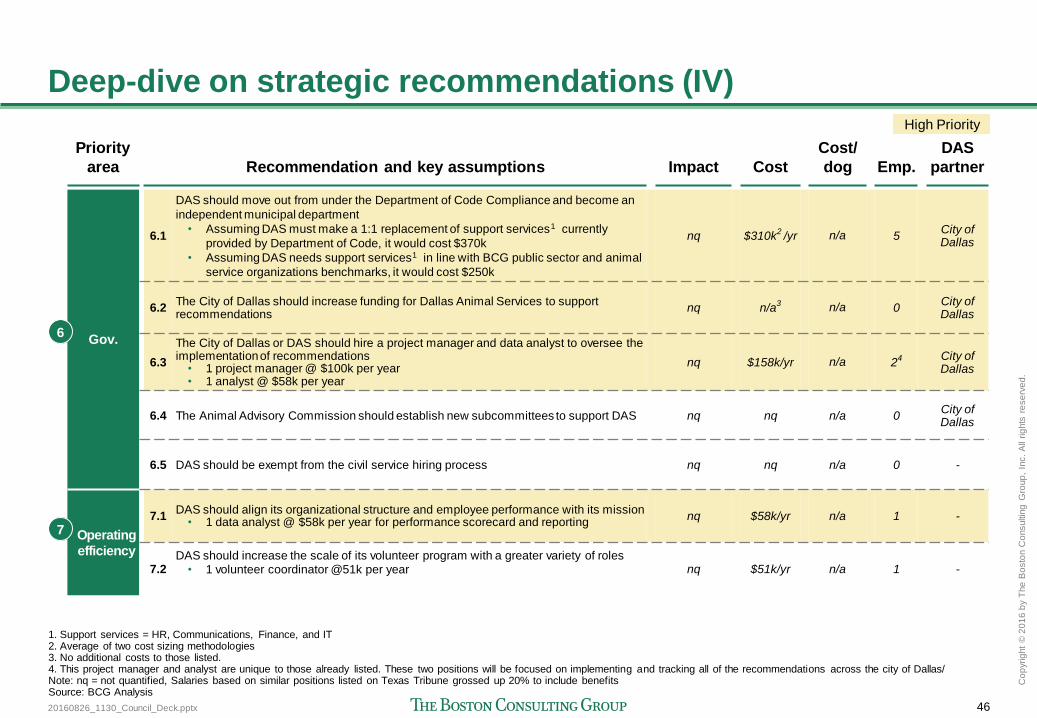
20160826_1130_Council_Deck.pptx 46
Co
pyrig
ht
© 2
01
6 b
y T
he
Bo
sto
n C
onsultin
g G
roup
, In
c.
All
rig
hts
re
se
rve
d.
Deep-dive on strategic recommendations (IV) High Priority
Priority
area Recommendation and key assumptions Impact Cost
Cost/
dog Emp.
DAS
partner
Gov.
6.1
DAS should move out from under the Department of Code Compliance and become an
independent municipal department
• Assuming DAS must make a 1:1 replacement of support services1 currently
provided by Department of Code, it would cost $370k
• Assuming DAS needs support services1 in line with BCG public sector and animal
service organizations benchmarks, it would cost $250k
nq $310k2 /yr
n/a 5 City of Dallas
6.2 The City of Dallas should increase funding for Dallas Animal Services to support recommendations
nq n/a3 n/a 0
City of Dallas
6.3
The City of Dallas or DAS should hire a project manager and data analyst to oversee the implementation of recommendations
• 1 project manager @ $100k per year • 1 analyst @ $58k per year
nq $158k/yr n/a 2
4 City of Dallas
6.4 The Animal Advisory Commission should establish new subcommittees to support DAS nq nq n/a 0 City of Dallas
6.5 DAS should be exempt from the civil service hiring process nq nq n/a 0 -
Operating
efficiency
7.1 DAS should align its organizational structure and employee performance with its mission
• 1 data analyst @ $58k per year for performance scorecard and reporting nq $58k/yr n/a 1 -
7.2 DAS should increase the scale of its volunteer program with a greater variety of roles
• 1 volunteer coordinator @51k per year
nq $51k/yr n/a 1 -
6
7
1. Support services = HR, Communications, Finance, and IT 2. Average of two cost sizing methodologies 3. No additional costs to those listed. 4. This project manager and analyst are unique to those already listed. These two positions will be focused on implementing and tracking all of the recommendations across the city of Dallas/ Note: nq = not quantified, Salaries based on similar positions listed on Texas Tribune grossed up 20% to include benefits Source: BCG Analysis
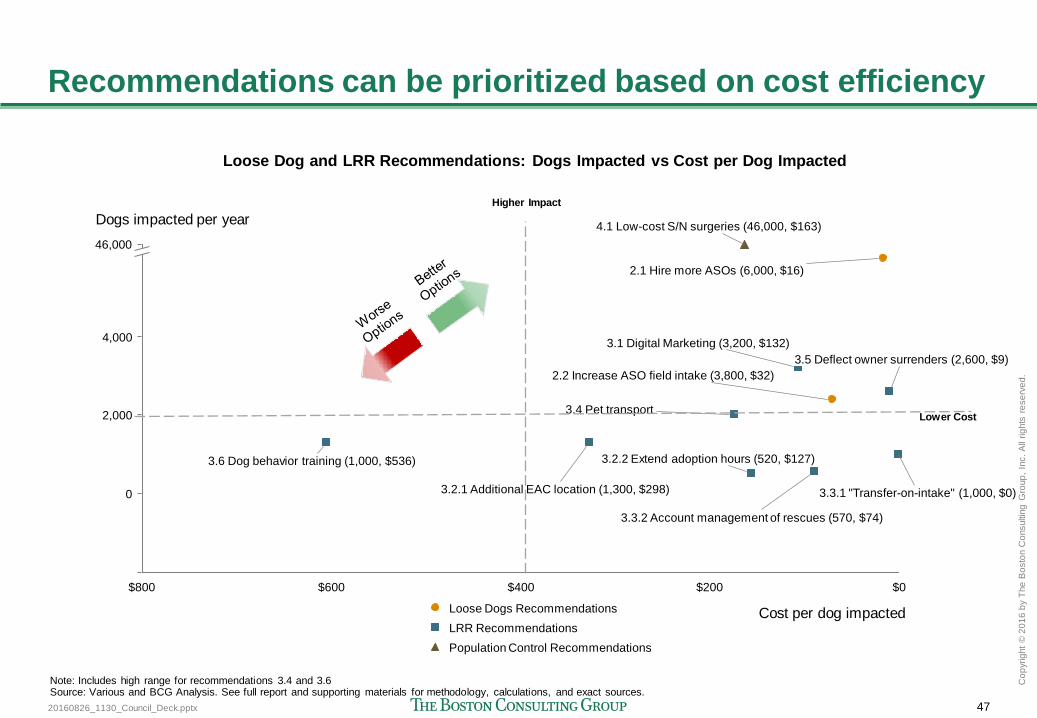
20160826_1130_Council_Deck.pptx 47
Co
pyrig
ht
© 2
01
6 b
y T
he
Bo
sto
n C
onsultin
g G
roup
, In
c.
All
rig
hts
re
se
rve
d.
Recommendations can be prioritized based on cost efficiency
46,000
4,000
2,000
0
$0 $200 $400 $600 $800
Dogs impacted per year
Cost per dog impacted
4.1 Low-cost S/N surgeries (46,000, $163)
2.1 Hire more ASOs (6,000, $16)
3.2.1 Additional EAC location (1,300, $298)
3.2.2 Extend adoption hours (520, $127)
3.1 Digital Marketing (3,200, $132)
3.4 Pet transport
3.3.1 "Transfer-on-intake" (1,000, $0)
3.3.2 Account management of rescues (570, $74)
3.5 Deflect owner surrenders (2,600, $9)
3.6 Dog behavior training (1,000, $536)
2.2 Increase ASO field intake (3,800, $32)
Population Control Recommendations
LRR Recommendations
Loose Dogs Recommendations
Higher Impact
Lower Cost
Note: Includes high range for recommendations 3.4 and 3.6 Source: Various and BCG Analysis. See full report and supporting materials for methodology, calculations, and exact sources.
Loose Dog and LRR Recommendations: Dogs Impacted vs Cost per Dog Impacted
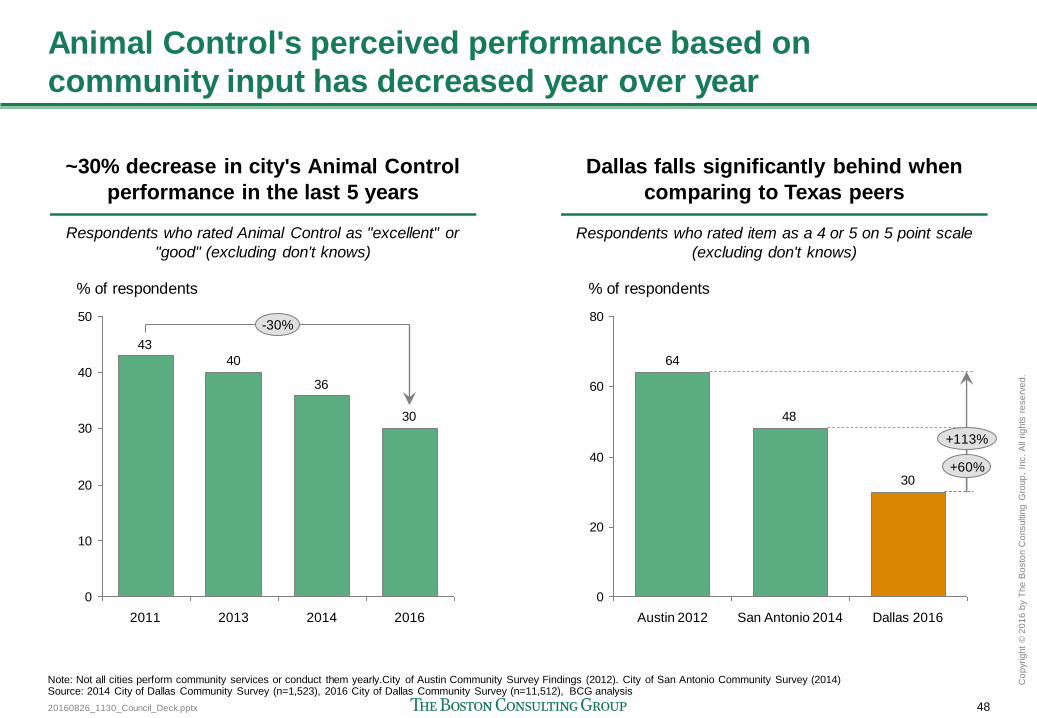
20160826_1130_Council_Deck.pptx 48
Co
pyrig
ht
© 2
01
6 b
y T
he
Bo
sto
n C
onsultin
g G
roup
, In
c.
All
rig
hts
re
se
rve
d.
Animal Control's perceived performance based on
community input has decreased year over year
~30% decrease in city's Animal Control
performance in the last 5 years
Dallas falls significantly behind when
comparing to Texas peers
Respondents who rated item as a 4 or 5 on 5 point scale
(excluding don't knows)
30
36
40
43
0
10
20
30
40
50-30%
2016 2014 2013 2011
% of respondents
Respondents who rated Animal Control as "excellent" or
"good" (excluding don't knows)
Note: Not all cities perform community services or conduct them yearly.City of Austin Community Survey Findings (2012). City of San Antonio Community Survey (2014) Source: 2014 City of Dallas Community Survey (n=1,523), 2016 City of Dallas Community Survey (n=11,512), BCG analysis
30
48
64
0
20
40
60
80
San Antonio 2014 Dallas 2016 Austin 2012
% of respondents
+113%
+60%
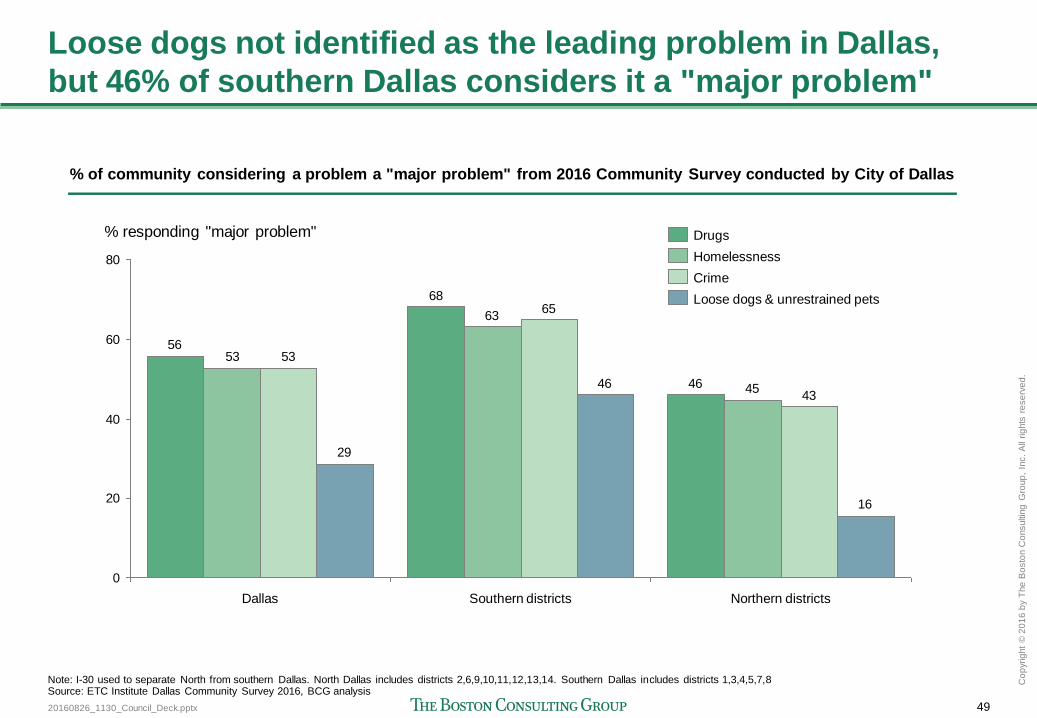
20160826_1130_Council_Deck.pptx 49
Co
pyrig
ht
© 2
01
6 b
y T
he
Bo
sto
n C
onsultin
g G
roup
, In
c.
All
rig
hts
re
se
rve
d.
Loose dogs not identified as the leading problem in Dallas,
but 46% of southern Dallas considers it a "major problem"
46
68
56
45
63
53
43
65
53
16
46
29
0
20
40
60
80
% responding "major problem"
Northern districts Southern districts Dallas
Crime
Drugs
Loose dogs & unrestrained pets
Homelessness
Note: I-30 used to separate North from southern Dallas. North Dallas includes districts 2,6,9,10,11,12,13,14. Southern Dallas includes districts 1,3,4,5,7,8 Source: ETC Institute Dallas Community Survey 2016, BCG analysis
% of community considering a problem a "major problem" from 2016 Community Survey conducted by City of Dallas
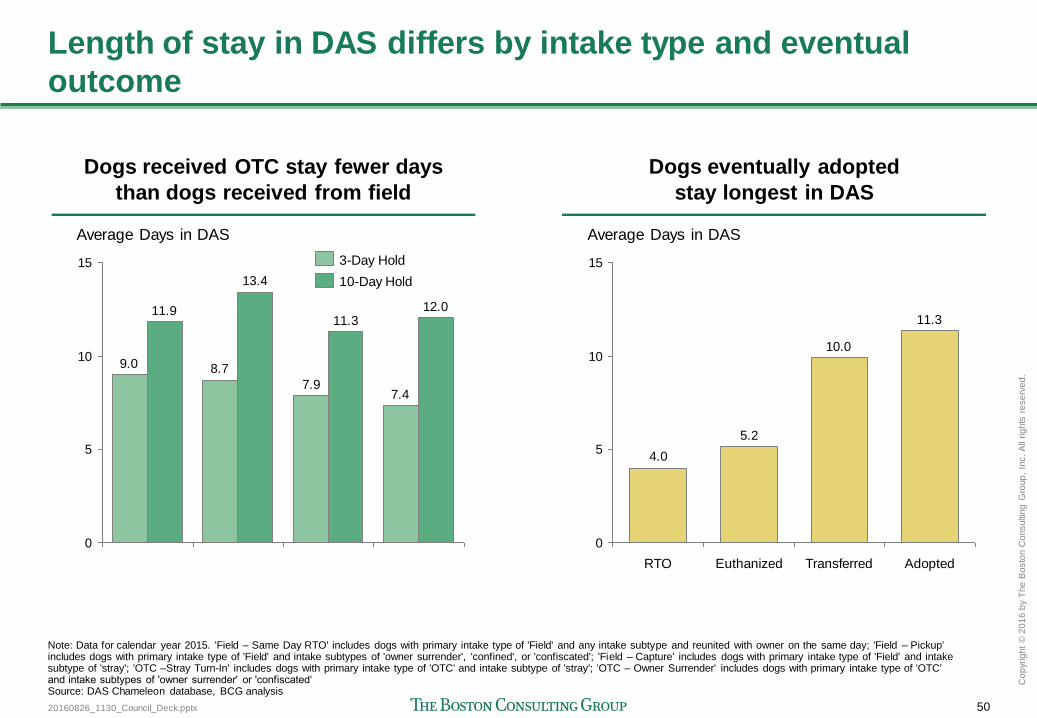
20160826_1130_Council_Deck.pptx 50
Co
pyrig
ht
© 2
01
6 b
y T
he
Bo
sto
n C
onsultin
g G
roup
, In
c.
All
rig
hts
re
se
rve
d.
Length of stay in DAS differs by intake type and eventual
outcome
7.47.9
8.79.0
12.011.3
13.4
11.9
0
5
10
15
Average Days in DAS
3-Day Hold
10-Day Hold
11.3
10.0
5.2
4.0
0
5
10
15
RTO Transferred
Average Days in DAS
Euthanized Adopted
Dogs received OTC stay fewer days
than dogs received from field
Dogs eventually adopted
stay longest in DAS
Note: Data for calendar year 2015. 'Field – Same Day RTO' includes dogs with primary intake type of 'Field' and any intake subtype and reunited with owner on the same day; 'Field – Pickup' includes dogs with primary intake type of 'Field' and intake subtypes of 'owner surrender', 'confined', or 'confiscated'; 'Field – Capture' includes dogs with primary intake type of 'Field' and intake subtype of 'stray'; 'OTC –Stray Turn-In' includes dogs with primary intake type of 'OTC' and intake subtype of 'stray'; 'OTC – Owner Surrender' includes dogs with primary intake type of 'OTC' and intake subtypes of 'owner surrender' or 'confiscated‘ Source: DAS Chameleon database, BCG analysis
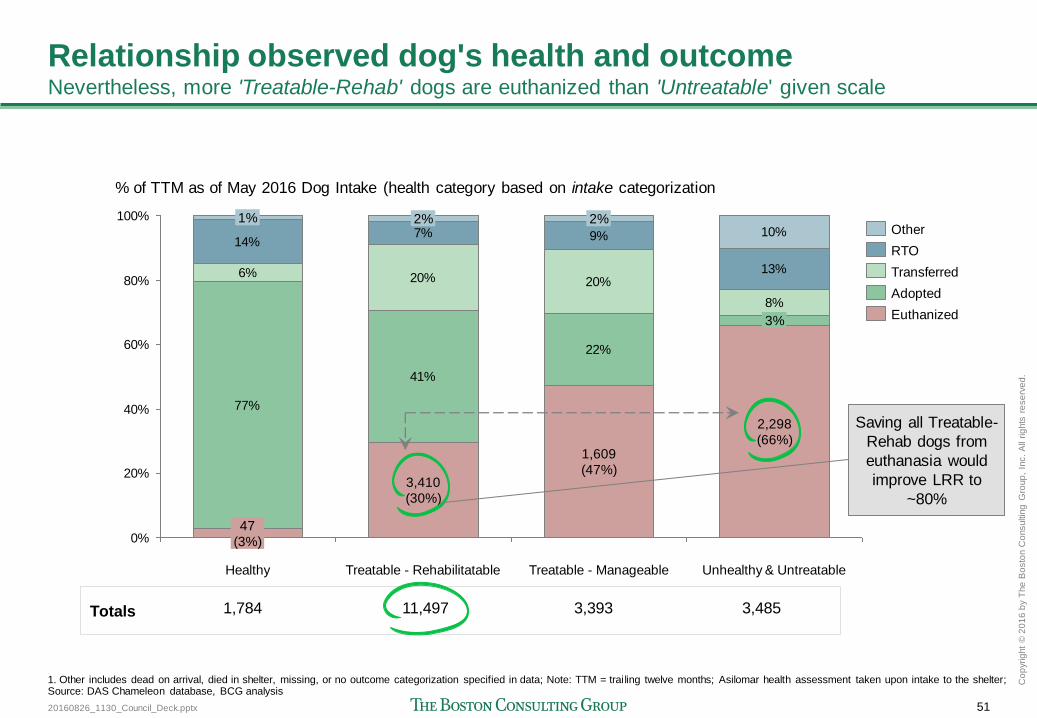
20160826_1130_Council_Deck.pptx 51
Co
pyrig
ht
© 2
01
6 b
y T
he
Bo
sto
n C
onsultin
g G
roup
, In
c.
All
rig
hts
re
se
rve
d.
Relationship observed dog's health and outcome Nevertheless, more 'Treatable-Rehab' dogs are euthanized than 'Untreatable' given scale
77%
41%
22%
6% 20% 20%
8%
14%7% 9%
13%
10%
0%
20%
40%
60%
80%
100% 2%
Healthy
1%
47
(3%)
3%
Unhealthy & Untreatable
2,298
(66%)
Treatable - Manageable
1,609
(47%)
Treatable - Rehabilitatable
3,410
(30%)
2%
% of TTM as of May 2016 Dog Intake (health category based on intake categorization
1. Other includes dead on arrival, died in shelter, missing, or no outcome categorization specified in data; Note: TTM = trailing twelve months; Asilomar health assessment taken upon intake to the shelter; Source: DAS Chameleon database, BCG analysis
Transferred
Other
Adopted
Euthanized
RTO
1,784 11,497 3,393 3,485 Totals
Saving all Treatable-
Rehab dogs from
euthanasia would
improve LRR to
~80%
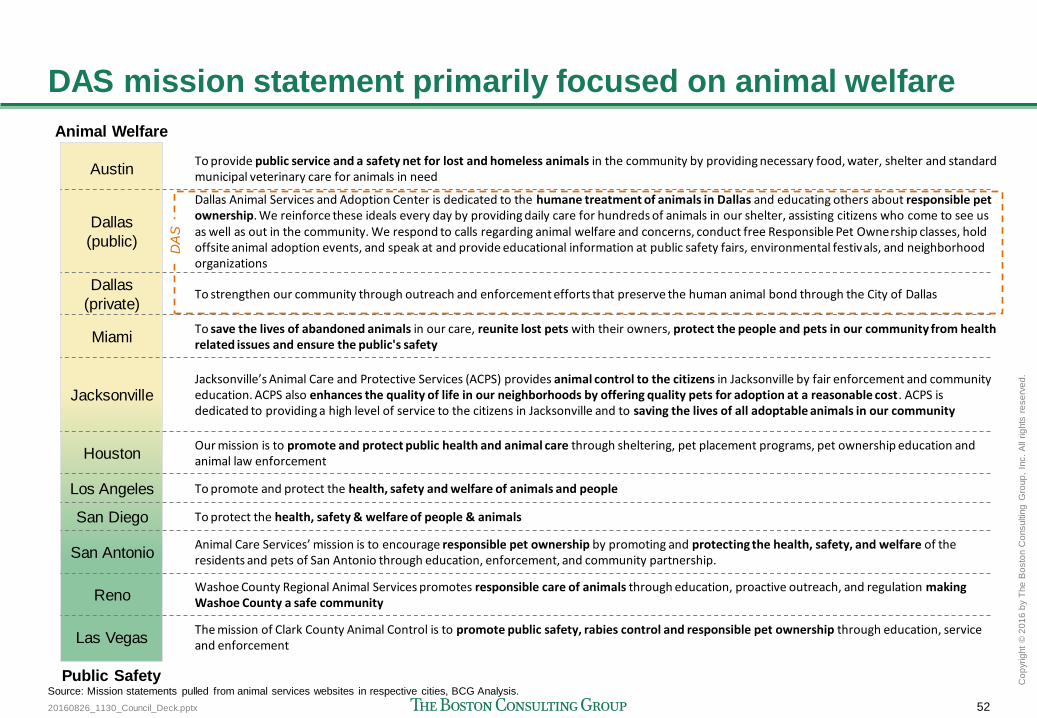
20160826_1130_Council_Deck.pptx 52
Co
pyrig
ht
© 2
01
6 b
y T
he
Bo
sto
n C
onsultin
g G
roup
, In
c.
All
rig
hts
re
se
rve
d.
Animal Welfare
Dallas Animal Services and Adoption Center is dedicated to the humane treatment of animals in Dallas and educating others about responsible pet ownership. We reinforce these ideals every day by providing daily care for hundreds of animals in our shelter, assisting citizens who come to see us as well as out in the community. We respond to calls regarding animal welfare and concerns, conduct free Responsible Pet Ownership classes, hold offsite animal adoption events, and speak at and provide educational information at public safety fairs, environmental festivals, and neighborhood organizations
DAS mission statement primarily focused on animal welfare
Public Safety Source: Mission statements pulled from animal services websites in respective cities, BCG Analysis.
To promote and protect the health, safety and welfare of animals and people
To protect the health, safety & welfare of people & animals
Washoe County Regional Animal Services promotes responsible care of animals through education, proactive outreach, and regulation making Washoe County a safe community
Our mission is to promote and protect public health and animal care through sheltering, pet placement programs, pet ownership education and animal law enforcement
To save the lives of abandoned animals in our care, reunite lost pets with their owners, protect the people and pets in our community from health related issues and ensure the public's safety
Jacksonville’s Animal Care and Protective Services (ACPS) provides animal control to the citizens in Jacksonville by fair enforcement and community education. ACPS also enhances the quality of life in our neighborhoods by offering quality pets for adoption at a reasonable cost. ACPS is dedicated to providing a high level of service to the citizens in Jacksonville and to saving the lives of all adoptable animals in our community
To provide public service and a safety net for lost and homeless animals in the community by providing necessary food, water, shelter and standard municipal veterinary care for animals in need
The mission of Clark County Animal Control is to promote public safety, rabies control and responsible pet ownership through education, service and enforcement
Animal Care Services’ mission is to encourage responsible pet ownership by promoting and protecting the health, safety, and welfare of the residents and pets of San Antonio through education, enforcement, and community partnership.
Austin
Miami
Jacksonville
Houston
Los Angeles
San Diego
San Antonio
Reno
Las Vegas
Dallas
(public)
Dallas
(private) To strengthen our community through outreach and enforcement efforts that preserve the human animal bond through the City of Dallas
DA
S
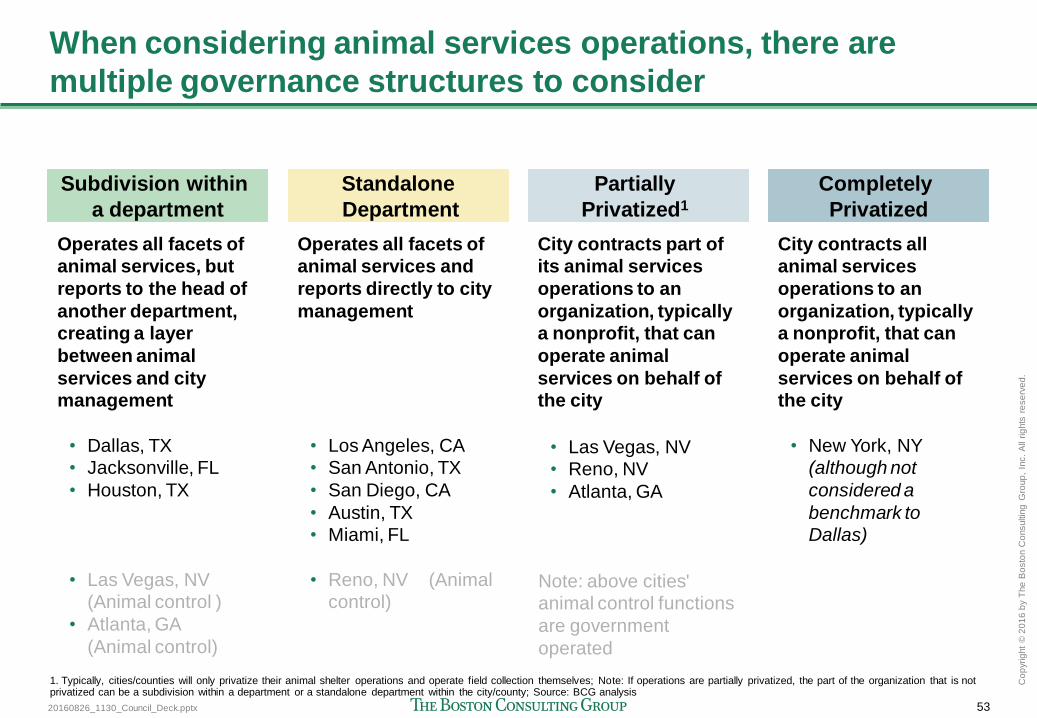
20160826_1130_Council_Deck.pptx 53
Co
pyrig
ht
© 2
01
6 b
y T
he
Bo
sto
n C
onsultin
g G
roup
, In
c.
All
rig
hts
re
se
rve
d.
When considering animal services operations, there are
multiple governance structures to consider
• Dallas, TX
• Jacksonville, FL
• Houston, TX
• Las Vegas, NV
(Animal control )
• Atlanta, GA
(Animal control)
• Los Angeles, CA
• San Antonio, TX
• San Diego, CA
• Austin, TX
• Miami, FL
• Reno, NV (Animal
control)
Operates all facets of
animal services, but
reports to the head of
another department,
creating a layer
between animal
services and city
management
Subdivision within
a department
Operates all facets of
animal services and
reports directly to city
management
Standalone
Department
City contracts part of
its animal services
operations to an
organization, typically
a nonprofit, that can
operate animal
services on behalf of
the city
Partially
Privatized1
City contracts all
animal services
operations to an
organization, typically
a nonprofit, that can
operate animal
services on behalf of
the city
Completely
Privatized
• Las Vegas, NV
• Reno, NV
• Atlanta, GA
Note: above cities'
animal control functions
are government
operated
• New York, NY
(although not
considered a
benchmark to
Dallas)
1. Typically, cities/counties will only privatize their animal shelter operations and operate field collection themselves; Note: If operations are partially privatized, the part of the organization that is not privatized can be a subdivision within a department or a standalone department within the city/county; Source: BCG analysis
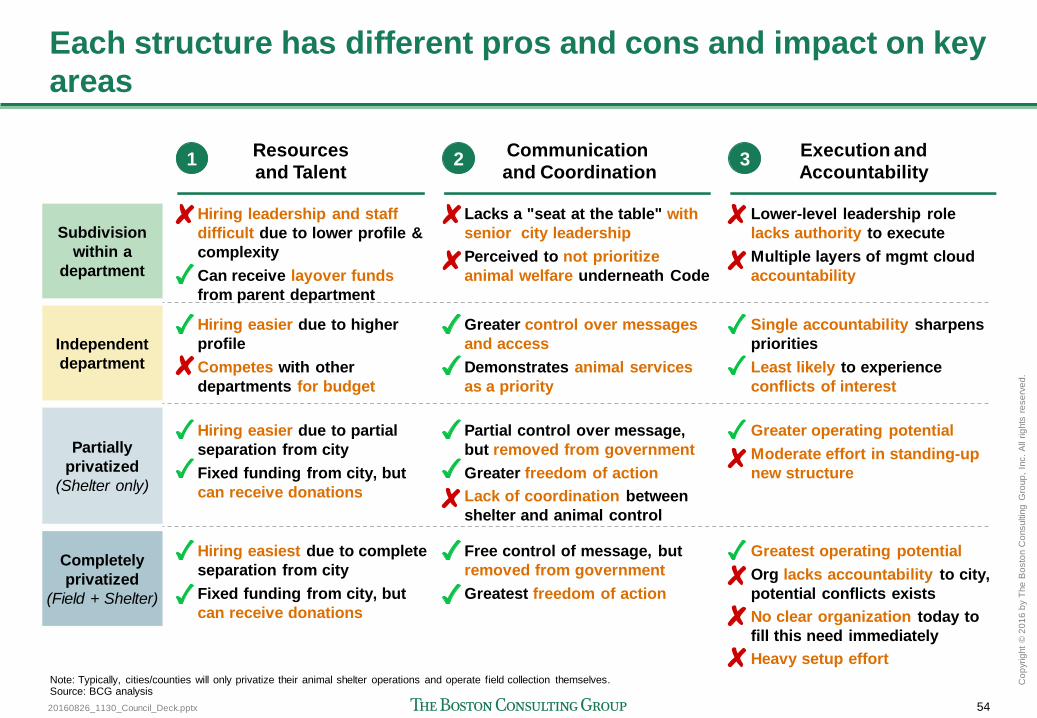
20160826_1130_Council_Deck.pptx 54
Co
pyrig
ht
© 2
01
6 b
y T
he
Bo
sto
n C
onsultin
g G
roup
, In
c.
All
rig
hts
re
se
rve
d.
Each structure has different pros and cons and impact on key
areas
Subdivision
within a
department
Resources
and Talent
Execution and
Accountability 1 3
Note: Typically, cities/counties will only privatize their animal shelter operations and operate field collection themselves. Source: BCG analysis
Independent
department
Hiring easier due to higher
profile
Competes with other
departments for budget
Single accountability sharpens
priorities
Least likely to experience
conflicts of interest
Hiring leadership and staff
difficult due to lower profile &
complexity
Can receive layover funds
from parent department
Lower-level leadership role
lacks authority to execute
Multiple layers of mgmt cloud
accountability
Completely
privatized
(Field + Shelter)
Hiring easiest due to complete
separation from city
Fixed funding from city, but
can receive donations
Greatest operating potential
Org lacks accountability to city,
potential conflicts exists
No clear organization today to
fill this need immediately
Heavy setup effort
Partially
privatized
(Shelter only)
Hiring easier due to partial
separation from city
Fixed funding from city, but
can receive donations
Greater operating potential
Moderate effort in standing-up
new structure
Communication
and Coordination 2
Greater control over messages
and access
Demonstrates animal services
as a priority
Lacks a "seat at the table" with
senior city leadership
Perceived to not prioritize
animal welfare underneath Code
Free control of message, but
removed from government
Greatest freedom of action
Partial control over message,
but removed from government
Greater freedom of action
Lack of coordination between
shelter and animal control
20160826_1130_Council_Deck.pptx 55
Co
pyrig
ht
© 2
01
6 b
y T
he
Bo
sto
n C
onsultin
g G
roup
, In
c.
All
rig
hts
re
se
rve
d.
The services and materials provided by The Boston Consulting Group (BCG) are subject to BCG's Standard Terms
(a copy of which is available upon request) or such other agreement as may have been previously executed by BCG. BCG does not
provide legal, accounting, or tax advice. The Client is responsible for obtaining independent advice concerning these matters. This
advice may affect the guidance given by BCG. Further, BCG has made no undertaking to update these materials after the date
hereof, notwithstanding that such information may become outdated or inaccurate.
The materials contained in this presentation are designed for the sole use by the board of directors or senior management of the
Client and solely for the limited purposes described in the presentation. The materials shall not be copied or given to any person or
entity other than the Client ("Third Party") without the prior written consent of BCG. These materials serve only as the focus for
discussion; they are incomplete without the accompanying oral commentary and may not be relied on as a stand-alone document.
Further, Third Parties may not, and it is unreasonable for any Third Party to, rely on these materials for any purpose whatsoever. To
the fullest extent permitted by law (and except to the extent otherwise agreed in a signed writing by BCG), BCG shall have no liability
whatsoever to any Third Party, and any Third Party hereby waives any rights and claims it may have at any time against BCG with
regard to the services, this presentation, or other materials, including the accuracy or completeness thereof. Receipt and review of
this document shall be deemed agreement with and consideration for the foregoing.
BCG does not provide fairness opinions or valuations of market transactions, and these materials should not be relied on or construed
as such. Further, the financial evaluations, projected market and financial information, and conclusions contained in these materials
are based upon standard valuation methodologies, are not definitive forecasts, and are not guaranteed by BCG. BCG has used public
and/or confidential data and assumptions provided to BCG by the Client. BCG has not independently verified the data and
assumptions used in these analyses. Changes in the underlying data or operating assumptions will clearly impact the analyses and
conclusions.
Disclaimer

Thank you
bcg.com | bcgperspectives.com

Loose dogs in Dallas: Strategic Recommendations to Improve Public Safety and Animal Welfare
August 26, 2016
BCG Strategic Recommendations to Improve Public Safety and Animal Welfare in Dallas 2016
2
August 26, 2016
We are pleased to enclose The Boston Consulting Group's (BCG's) strategic recommendations for the city of Dallas, Dallas Animal Services (DAS), and the broader Dallas community. It has been a pleasure working closely with the Dallas community over the past three months, including members of Dallas Animal Services, City Council, the Dallas Animal Shelter Commission, individuals from local animal welfare organizations, and citizens.
During the course of this study, we have validated the seriousness of the loose dog problem in Dallas as it negatively affects the public safety of citizens and the well-being of dogs. Although this problem has plagued the city for many years, we believe that these strategic recommendations, if executed by a cohesive Dallas community, can make a material difference
In the pages that follow, we provide more detail on our approach, diagnostic findings, recommendations, and proposed path forward.
We are grateful for the opportunity to work with both Dallas Animal Services and the larger Dallas community and look forward to seeing quality of life and animal welfare improve across the city of Dallas.
Sincerely,
Dylan Bolden Senior Partner & Managing Director Head of BCG Dallas Office The Boston Consulting Group
BCG Strategic Recommendations to Improve Public Safety and Animal Welfare in Dallas 2016
3
Table of Contents
Table of Contents .................................................................................................................. 3
Executive summary ............................................................................................................... 5
Basis for BCG recommendations ...................................................................................... 10
Context .................................................................................................................................. 11
Dog population in Dallas ................................................................................................................ 12
Loose dogs in Dallas ......................................................................................................................... 14
Dog-related public safety ................................................................................................................ 17
Dallas animal services shelter operations ..................................................................................... 19
Dallas animal services field operations ......................................................................................... 25
Dallas animal services resources .................................................................................................... 31
Dallas animal welfare organizations ............................................................................................. 33
Recommendations .............................................................................................................. 35
Recommendation 1 – Publicly adopt a mission statement balancing public safety and animal welfare ............................................................................................................................................. 39
1.1 DAS should adopt a mission statement balancing public safety and animal welfare .................. 40
1.2 DAS should adopt a mission-centric scorecard with specific targets and regular progress updates ............................................................................................................................................................ 41
Recommendation 2 – Increase field intake (up to 8,700 loose dogs) and increase related enforcement and education to prevent dogs from roaming ........................................................ 43
2.1 DAS should hire additional ASOs and focus 10 ASOs and 2 field supervisors on field collection and patrol ........................................................................................................................................... 43
2.2 DAS should increase ASO field intake .............................................................................................. 45
2.3 The Dallas community should educate residents on both the dangers of allowing dogs to run loose and the ways to avoid dog bites .............................................................................................. 47
2.4 The City of Dallas should make animal-related citations more effective ...................................... 48
2.5. DAS should share loose dog service requests with organizations that actively capture loose dogs ............................................................................................................................................................ 49
Recommendation 3 – Increase the number of positive outcomes for Dallas dogs, euthanizing only the sickest animals .................................................................................................................. 50
3.1 DAS should enhance its digital marketing for both adoptions and transfers ................................ 51
3.2 DAS should increase adoption footprint ......................................................................................... 52
3.2.1 Expanding its retail presence via an additional adoption location........................................ 53
3.2.2 Expanding its retail presence via extended adoption hours .................................................. 53
3.3 DAS should increase volume through its transfer program ............................................................ 55
3.3.1 Establishing a "transfer-on-intake" program with a single high-volume partner ................... 55
3.3.2 Segmenting transfers by size and support ............................................................................... 56
3.4 DAS should establish a pet transport program to facilitate out-of-state adoptions ...................... 57
BCG Strategic Recommendations to Improve Public Safety and Animal Welfare in Dallas 2016
4
3.5 DAS should deflect owner surrenders through owner assistance programs ................................... 58
3.6 DAS should provide enhanced behavior training to increase adoptability of dogs ...................... 59
3.7 DAS should hire one veterinarian and two vet techs to perform spay and neuter surgeries and vaccinations to support the increase in dog adoptions ................................................................... 59
Recommendation 4 – Provide 46,000 low-cost spay and neuter surgeries in southern Dallas each year for next three years ........................................................................................................ 61
4.1 The Dallas community should provide 46,000 low-cost spay and neuter surgeries in southern Dallas for each of the next three years............................................................................................. 61
4.2 Animal welfare organizations in Dallas should coordinate spay and neuter efforts .................... 63
4.3 The City of Dallas should establish elementary school education programs related to pet ownership .......................................................................................................................................... 65
4.4 DAS should enforce spay and neuter ordinances in coordination with outreach ......................... 66
Recommendation 5 – Create a collaborative community of partners ........................................ 67
5.1 DAS should work with CIS and other city departments to provide open access to operating data and automated reporting .................................................................................................................. 67
5.2 The animal welfare community of Dallas should share the workload of the strategic recommendations .............................................................................................................................. 68
5.3 The animal welfare community of Dallas should engage in an inclusive, fact-based dialogue ... 69
Recommendation 6 – Make animal services a priority and strengthen accountability within the city government ........................................................................................................................ 71
6.1 DAS should move out from under the Department of Code Compliance and become an independent municipal department ................................................................................................ 71
6.2 The city of Dallas should increase funding for Dallas Animal Services to support recommendations .............................................................................................................................. 75
6.3 The City of Dallas or DAS should hire a project manager and data analyst to oversee the implementation of recommendations .............................................................................................. 75
6.4 The Animal Advisory Commission should establish new subcommittees to support DAS .......... 76
6.5 DAS should be exempt from the civil service hiring process .......................................................... 79
Recommendation 7 – Ensure efficiency by measuring outcomes and increasing volunteers ... 80
7.1 DAS should align its organizational structure and employee performance with its mission ....... 80
7.2 DAS should increase the scale of its volunteer program with a greater variety of roles .............. 82
Next steps .............................................................................................................................. 85
Conclusion ............................................................................................................................ 87
Glossary of terms ................................................................................................................. 89
BCG team .............................................................................................................................. 91
Endnotes ............................................................................................................................... 91
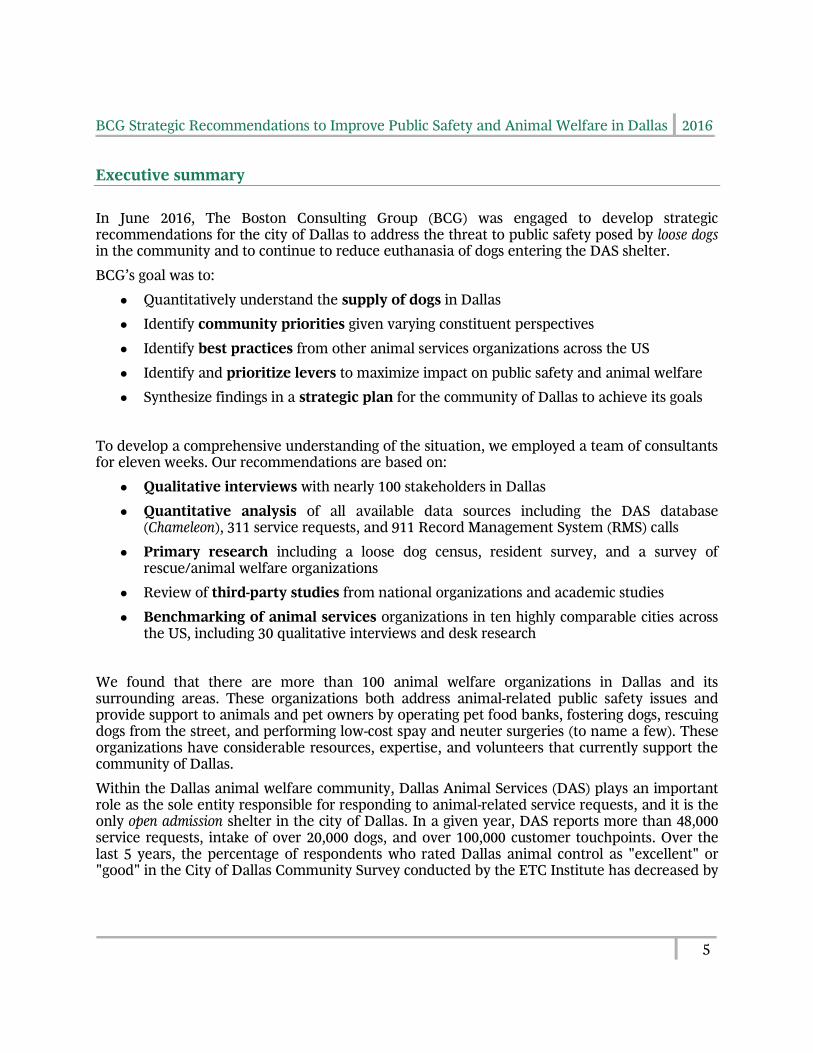
BCG Strategic Recommendations to Improve Public Safety and Animal Welfare in Dallas 2016
5
Executive summary
In June 2016, The Boston Consulting Group (BCG) was engaged to develop strategic recommendations for the city of Dallas to address the threat to public safety posed by loose dogs in the community and to continue to reduce euthanasia of dogs entering the DAS shelter.
BCG’s goal was to:
● Quantitatively understand the supply of dogs in Dallas
● Identify community priorities given varying constituent perspectives
● Identify best practices from other animal services organizations across the US
● Identify and prioritize levers to maximize impact on public safety and animal welfare
● Synthesize findings in a strategic plan for the community of Dallas to achieve its goals
To develop a comprehensive understanding of the situation, we employed a team of consultants for eleven weeks. Our recommendations are based on:
● Qualitative interviews with nearly 100 stakeholders in Dallas
● Quantitative analysis of all available data sources including the DAS database (Chameleon), 311 service requests, and 911 Record Management System (RMS) calls
● Primary research including a loose dog census, resident survey, and a survey of rescue/animal welfare organizations
● Review of third-party studies from national organizations and academic studies
● Benchmarking of animal services organizations in ten highly comparable cities across the US, including 30 qualitative interviews and desk research
We found that there are more than 100 animal welfare organizations in Dallas and its surrounding areas. These organizations both address animal-related public safety issues and provide support to animals and pet owners by operating pet food banks, fostering dogs, rescuing dogs from the street, and performing low-cost spay and neuter surgeries (to name a few). These organizations have considerable resources, expertise, and volunteers that currently support the community of Dallas.
Within the Dallas animal welfare community, Dallas Animal Services (DAS) plays an important role as the sole entity responsible for responding to animal-related service requests, and it is the only open admission shelter in the city of Dallas. In a given year, DAS reports more than 48,000 service requests, intake of over 20,000 dogs, and over 100,000 customer touchpoints. Over the last 5 years, the percentage of respondents who rated Dallas animal control as "excellent" or "good" in the City of Dallas Community Survey conducted by the ETC Institute has decreased by
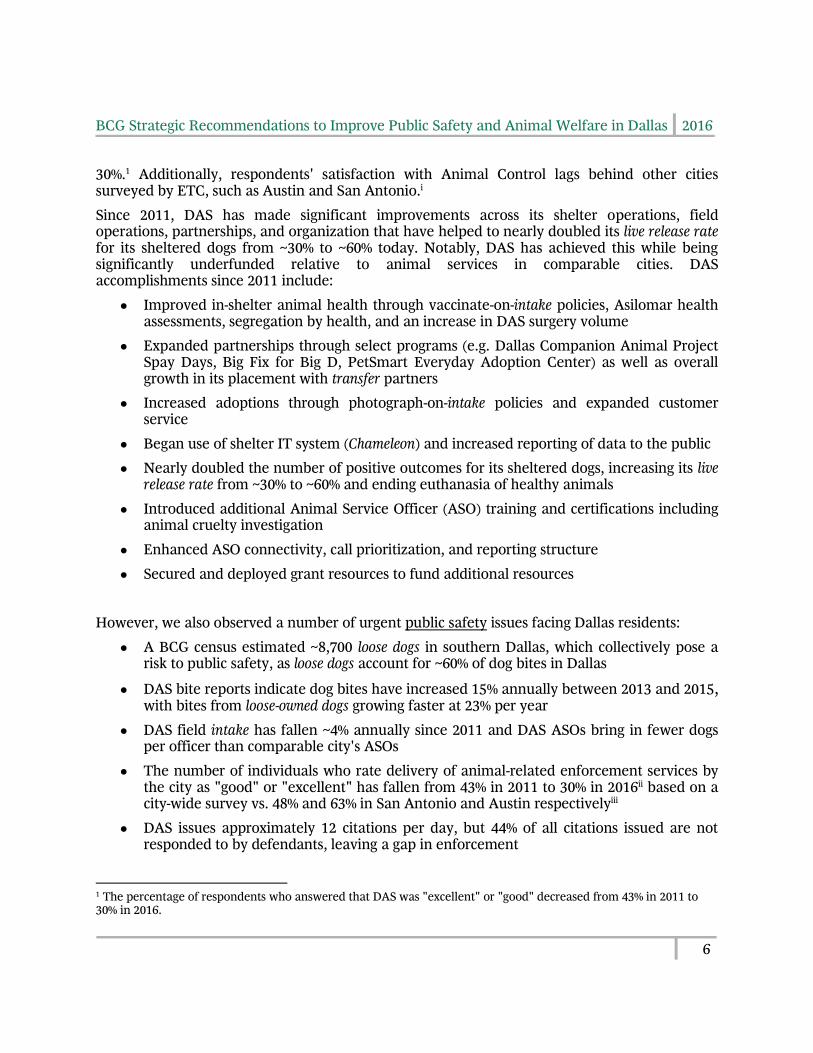
BCG Strategic Recommendations to Improve Public Safety and Animal Welfare in Dallas 2016
6
30%.1 Additionally, respondents' satisfaction with Animal Control lags behind other cities surveyed by ETC, such as Austin and San Antonio.i
Since 2011, DAS has made significant improvements across its shelter operations, field operations, partnerships, and organization that have helped to nearly doubled its live release rate for its sheltered dogs from ~30% to ~60% today. Notably, DAS has achieved this while being significantly underfunded relative to animal services in comparable cities. DAS accomplishments since 2011 include:
● Improved in-shelter animal health through vaccinate-on-intake policies, Asilomar health assessments, segregation by health, and an increase in DAS surgery volume
● Expanded partnerships through select programs (e.g. Dallas Companion Animal Project Spay Days, Big Fix for Big D, PetSmart Everyday Adoption Center) as well as overall growth in its placement with transfer partners
● Increased adoptions through photograph-on-intake policies and expanded customer service
● Began use of shelter IT system (Chameleon) and increased reporting of data to the public
● Nearly doubled the number of positive outcomes for its sheltered dogs, increasing its live release rate from ~30% to ~60% and ending euthanasia of healthy animals
● Introduced additional Animal Service Officer (ASO) training and certifications including animal cruelty investigation
● Enhanced ASO connectivity, call prioritization, and reporting structure
● Secured and deployed grant resources to fund additional resources
However, we also observed a number of urgent public safety issues facing Dallas residents:
● A BCG census estimated ~8,700 loose dogs in southern Dallas, which collectively pose a risk to public safety, as loose dogs account for ~60% of dog bites in Dallas
● DAS bite reports indicate dog bites have increased 15% annually between 2013 and 2015, with bites from loose-owned dogs growing faster at 23% per year
● DAS field intake has fallen ~4% annually since 2011 and DAS ASOs bring in fewer dogs per officer than comparable city's ASOs
● The number of individuals who rate delivery of animal-related enforcement services by the city as "good" or "excellent" has fallen from 43% in 2011 to 30% in 2016ii based on a city-wide survey vs. 48% and 63% in San Antonio and Austin respectivelyiii
● DAS issues approximately 12 citations per day, but 44% of all citations issued are not responded to by defendants, leaving a gap in enforcement
1 The percentage of respondents who answered that DAS was "excellent" or "good" decreased from 43% in 2011 to 30% in 2016.
BCG Strategic Recommendations to Improve Public Safety and Animal Welfare in Dallas 2016
7
We also observed opportunities for improvement regarding animal welfare:
● We estimate that ~85% of dogs in southern Dallas have not been spayed or neutered, which contributes to a high population of dogs and places a burden on the community to find homes for these animals (e.g., southern Dallas’ dog population is estimated to produce approximately ~32,500 new puppies annually)
● Despite the community's effort to perform ~6,000 spay and neuter surgeries annually, the high percentage of intact dogs suggests too few surgeries occur to control the population
● In 2015, the live release rate for the ~20,000 dogs entering DAS was 59%; DAS euthanized a total of 8,535 dogs, of which 4,033 were assessed as treatable-rehabilitatable and 1,756 were categorized as treatable-manageable, indicating room for continued improvement
● DAS lacks a formal and contractual partnership with a large-scale brick and mortar rescue organization, something that is typical (and reported to be critical) among comparable cities to fill gaps in available government funding
● Finally, the various animal welfare organizations operating in Dallas, taken as a whole, have limited central coordination or collaboration resulting in an overlap of mission and effort
Finally we observed opportunities for improvement regarding organization and communication:
DAS's existing organizational structure as a subsidiary of the Department of Code Compliance limits its visibility to city leadership, muddles accountability, and lessens its perceived status as a city priority
● A large portion of stakeholders highlighted the existence of opposing factions in Dallas' animal welfare community and a history of public attacks across these groups that have prevented collaboration across the community
● Limited access to data, whether due to systems limitations, policy decisions or a failure to communicate effectively, has impeded trust and collaboration across the community
To help address these issues, we recommend seven strategic priorities designed to improve public safety, improve animal outcomes, increase spay and neuter efforts, and facilitate organizational change.
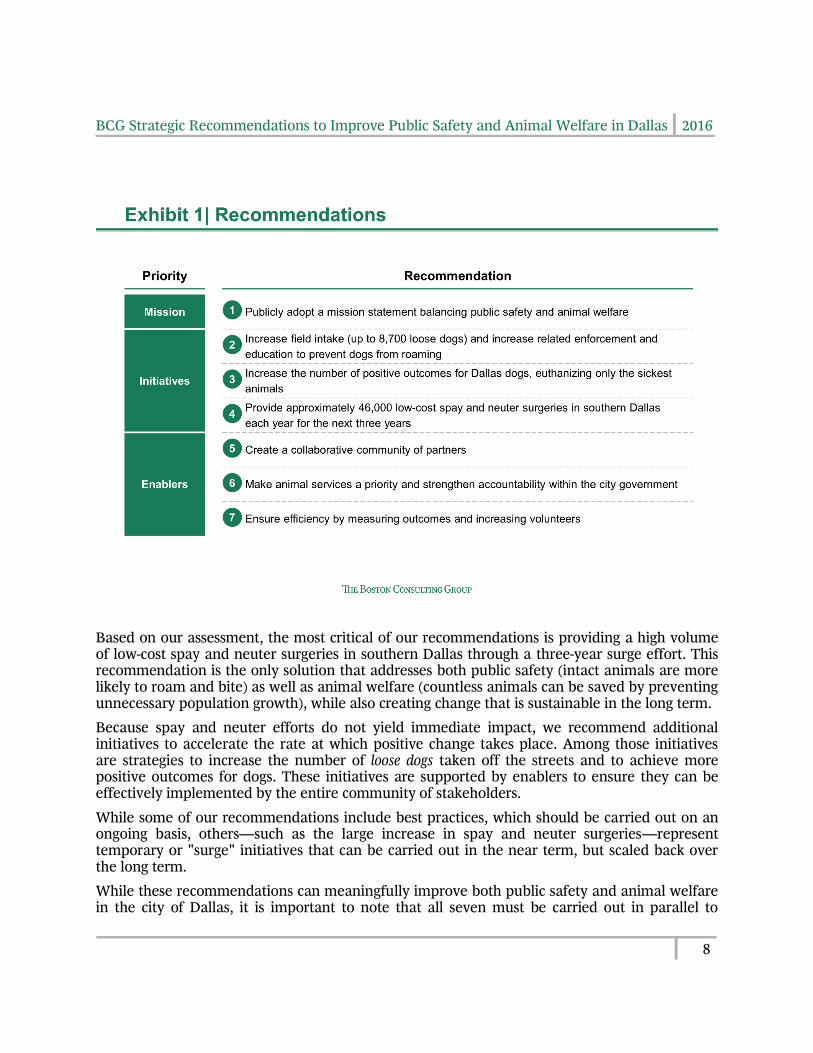
BCG Strategic Recommendations to Improve Public Safety and Animal Welfare in Dallas 2016
8
Based on our assessment, the most critical of our recommendations is providing a high volume of low-cost spay and neuter surgeries in southern Dallas through a three-year surge effort. This recommendation is the only solution that addresses both public safety (intact animals are more likely to roam and bite) as well as animal welfare (countless animals can be saved by preventing unnecessary population growth), while also creating change that is sustainable in the long term.
Because spay and neuter efforts do not yield immediate impact, we recommend additional initiatives to accelerate the rate at which positive change takes place. Among those initiatives are strategies to increase the number of loose dogs taken off the streets and to achieve more positive outcomes for dogs. These initiatives are supported by enablers to ensure they can be effectively implemented by the entire community of stakeholders.
While some of our recommendations include best practices, which should be carried out on an ongoing basis, others—such as the large increase in spay and neuter surgeries—represent temporary or "surge" initiatives that can be carried out in the near term, but scaled back over the long term.
While these recommendations can meaningfully improve both public safety and animal welfare in the city of Dallas, it is important to note that all seven must be carried out in parallel to
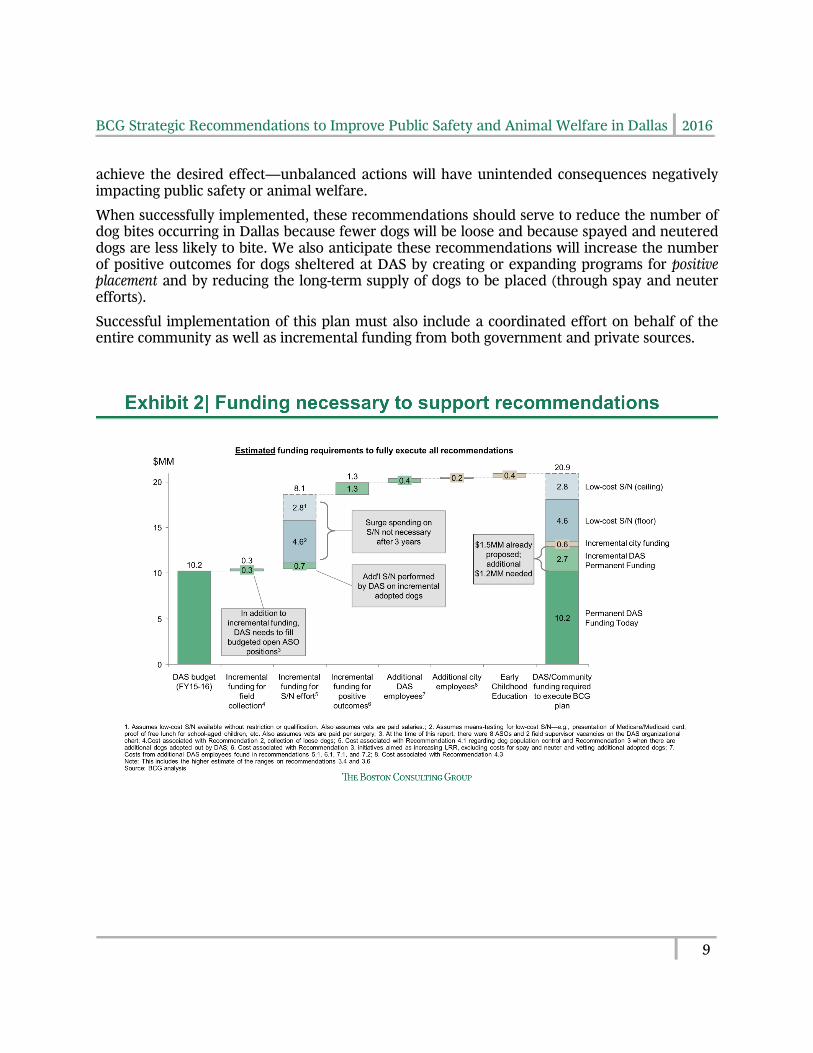
BCG Strategic Recommendations to Improve Public Safety and Animal Welfare in Dallas 2016
9
achieve the desired effect—unbalanced actions will have unintended consequences negatively impacting public safety or animal welfare.
When successfully implemented, these recommendations should serve to reduce the number of dog bites occurring in Dallas because fewer dogs will be loose and because spayed and neutered dogs are less likely to bite. We also anticipate these recommendations will increase the number of positive outcomes for dogs sheltered at DAS by creating or expanding programs for positive placement and by reducing the long-term supply of dogs to be placed (through spay and neuter efforts).
Successful implementation of this plan must also include a coordinated effort on behalf of the entire community as well as incremental funding from both government and private sources.

BCG Strategic Recommendations to Improve Public Safety and Animal Welfare in Dallas 2016
10
In the pages that follow, we provide more detail on our approach, diagnostic findings, recommendations, and proposed path forward.
Basis for BCG recommendations
Between June 20 and August 19, 2016, BCG dedicated a team of consultants to analyze the public safety and animal welfare issues associated with loose dogs in Dallas.
To develop an understanding of animal services and public safety in Dallas, BCG completed local stakeholder interviews, analyzed relevant data sets, conducted its own census and surveys, studied efforts from comparable benchmark cities, and reviewed governmental and academic research.
Throughout the course of this project, BCG was aided considerably by the city of Dallas and Dallas Animal Services, who provided unfettered access to personnel and data.
In addition, nearly 100 private citizens in Dallas and 40 animal control and animal welfare professionals from across the country contributed their experiences and perspectives over the course of this project. Out of respect for their privacy we have not explicitly included their names in this report, but we owe them a debt of gratitude for their assistance.
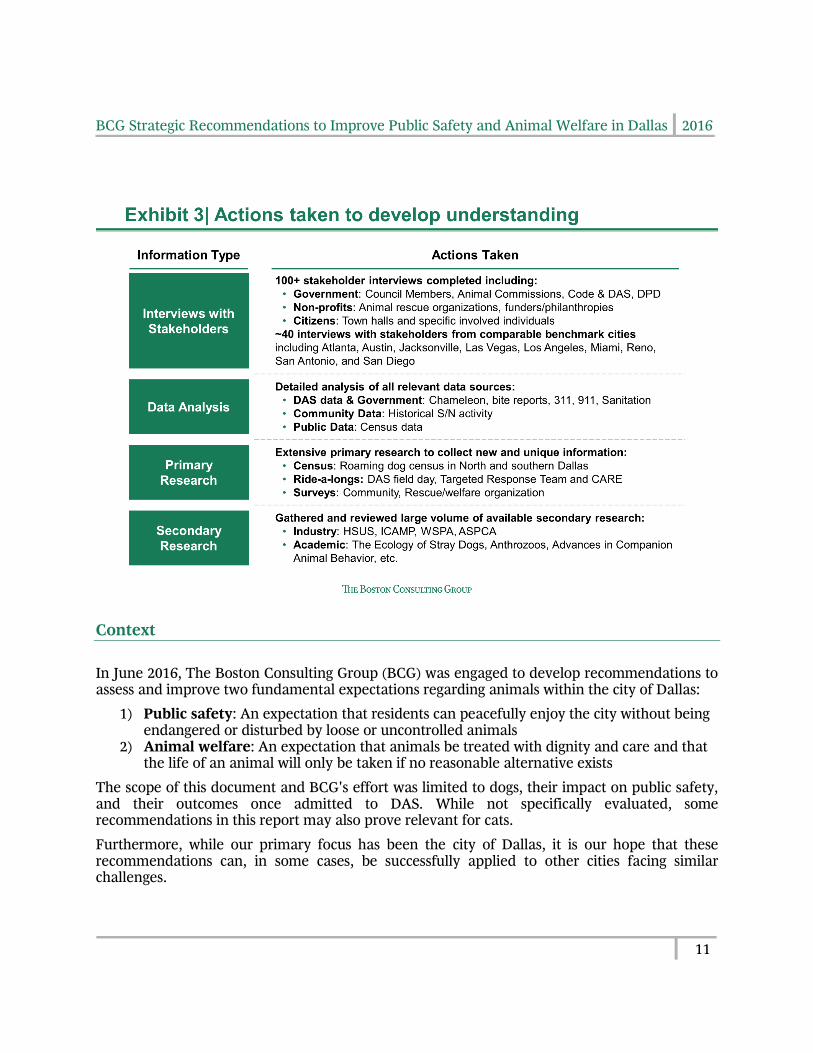
BCG Strategic Recommendations to Improve Public Safety and Animal Welfare in Dallas 2016
11
Context
In June 2016, The Boston Consulting Group (BCG) was engaged to develop recommendations to assess and improve two fundamental expectations regarding animals within the city of Dallas:
1) Public safety: An expectation that residents can peacefully enjoy the city without being endangered or disturbed by loose or uncontrolled animals
2) Animal welfare: An expectation that animals be treated with dignity and care and that the life of an animal will only be taken if no reasonable alternative exists
The scope of this document and BCG's effort was limited to dogs, their impact on public safety, and their outcomes once admitted to DAS. While not specifically evaluated, some recommendations in this report may also prove relevant for cats.
Furthermore, while our primary focus has been the city of Dallas, it is our hope that these recommendations can, in some cases, be successfully applied to other cities facing similar challenges.
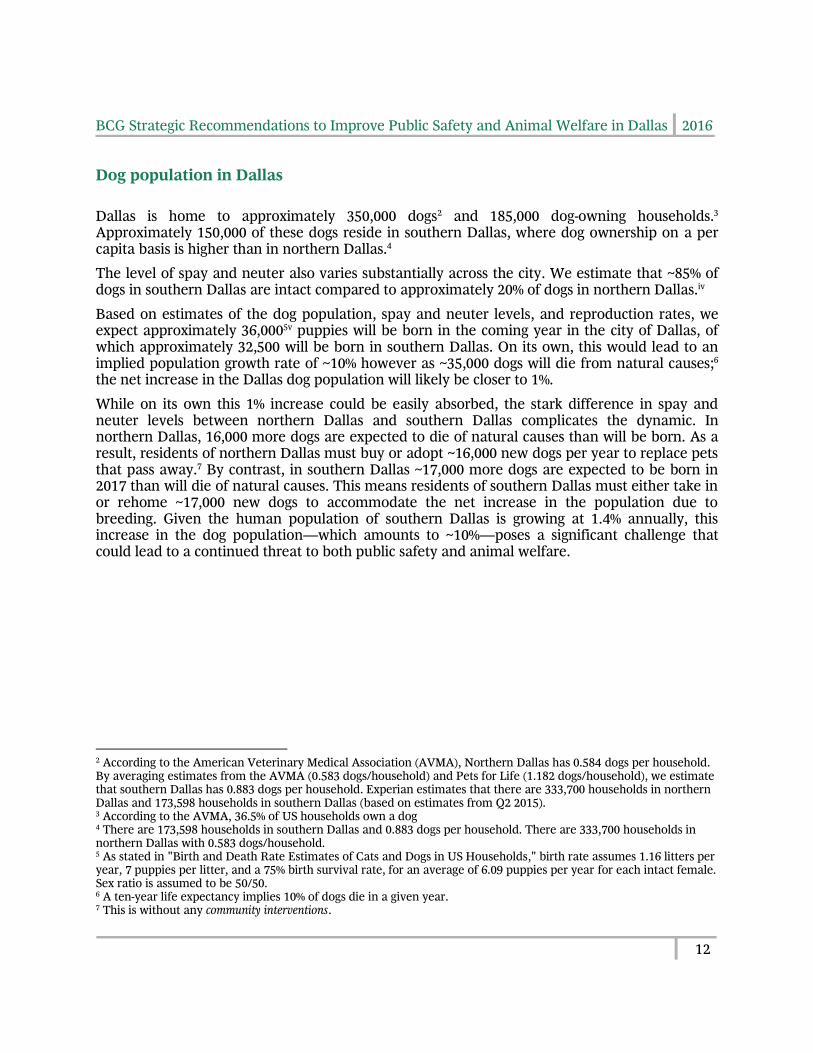
BCG Strategic Recommendations to Improve Public Safety and Animal Welfare in Dallas 2016
12
Dog population in Dallas
Dallas is home to approximately 350,000 dogs2 and 185,000 dog-owning households.3 Approximately 150,000 of these dogs reside in southern Dallas, where dog ownership on a per capita basis is higher than in northern Dallas.4
The level of spay and neuter also varies substantially across the city. We estimate that ~85% of dogs in southern Dallas are intact compared to approximately 20% of dogs in northern Dallas.iv
Based on estimates of the dog population, spay and neuter levels, and reproduction rates, we expect approximately 36,0005v puppies will be born in the coming year in the city of Dallas, of which approximately 32,500 will be born in southern Dallas. On its own, this would lead to an implied population growth rate of ~10% however as ~35,000 dogs will die from natural causes;6 the net increase in the Dallas dog population will likely be closer to 1%.
While on its own this 1% increase could be easily absorbed, the stark difference in spay and neuter levels between northern Dallas and southern Dallas complicates the dynamic. In northern Dallas, 16,000 more dogs are expected to die of natural causes than will be born. As a result, residents of northern Dallas must buy or adopt ~16,000 new dogs per year to replace pets that pass away.7 By contrast, in southern Dallas ~17,000 more dogs are expected to be born in 2017 than will die of natural causes. This means residents of southern Dallas must either take in or rehome ~17,000 new dogs to accommodate the net increase in the population due to breeding. Given the human population of southern Dallas is growing at 1.4% annually, this increase in the dog population—which amounts to ~10%—poses a significant challenge that could lead to a continued threat to both public safety and animal welfare.
2 According to the American Veterinary Medical Association (AVMA), Northern Dallas has 0.584 dogs per household. By averaging estimates from the AVMA (0.583 dogs/household) and Pets for Life (1.182 dogs/household), we estimate that southern Dallas has 0.883 dogs per household. Experian estimates that there are 333,700 households in northern Dallas and 173,598 households in southern Dallas (based on estimates from Q2 2015). 3 According to the AVMA, 36.5% of US households own a dog 4 There are 173,598 households in southern Dallas and 0.883 dogs per household. There are 333,700 households in northern Dallas with 0.583 dogs/household. 5 As stated in "Birth and Death Rate Estimates of Cats and Dogs in US Households," birth rate assumes 1.16 litters per year, 7 puppies per litter, and a 75% birth survival rate, for an average of 6.09 puppies per year for each intact female. Sex ratio is assumed to be 50/50. 6 A ten-year life expectancy implies 10% of dogs die in a given year. 7 This is without any community interventions.
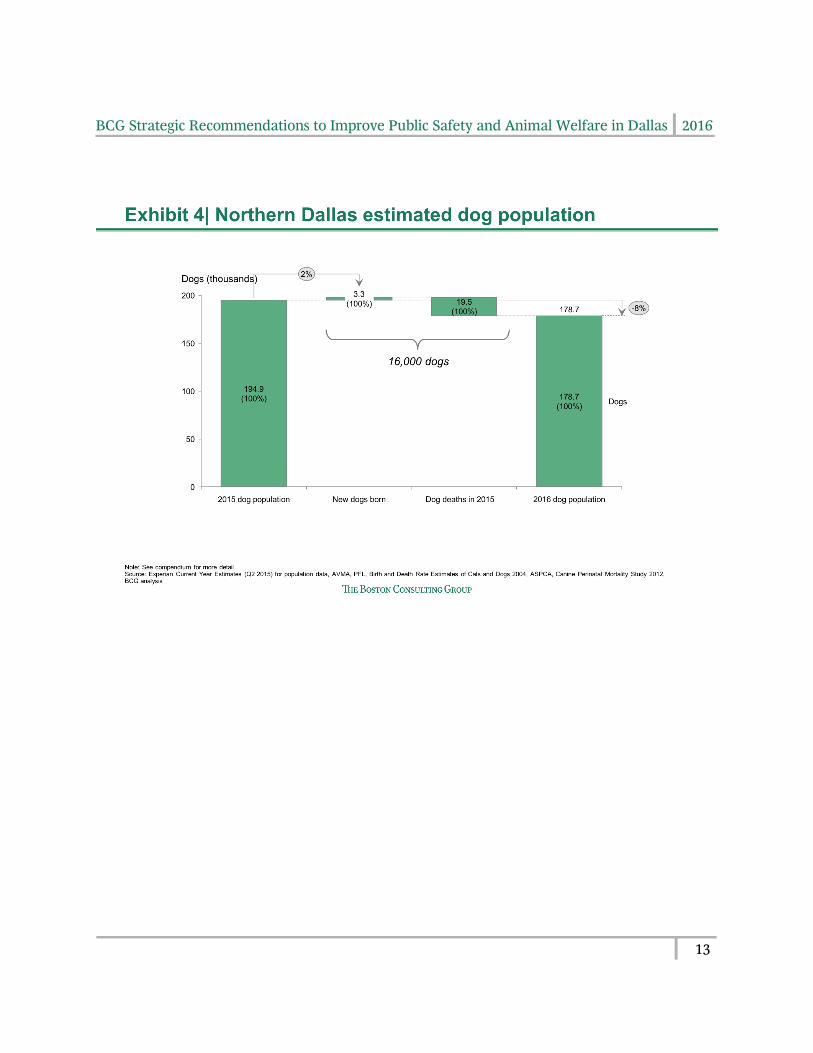
BCG Strategic Recommendations to Improve Public Safety and Animal Welfare in Dallas 2016
13
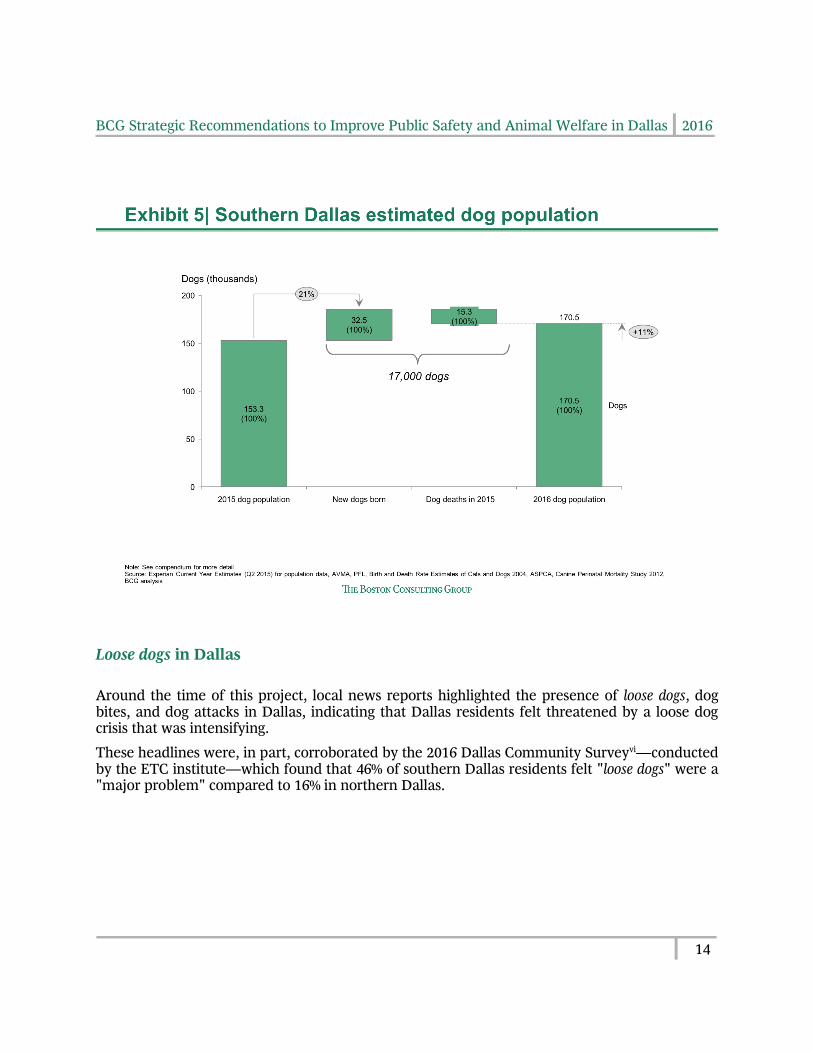
BCG Strategic Recommendations to Improve Public Safety and Animal Welfare in Dallas 2016
14
Loose dogs in Dallas
Around the time of this project, local news reports highlighted the presence of loose dogs, dog bites, and dog attacks in Dallas, indicating that Dallas residents felt threatened by a loose dog crisis that was intensifying.
These headlines were, in part, corroborated by the 2016 Dallas Community Surveyvi—conducted by the ETC institute—which found that 46% of southern Dallas residents felt "loose dogs" were a "major problem" compared to 16% in northern Dallas.
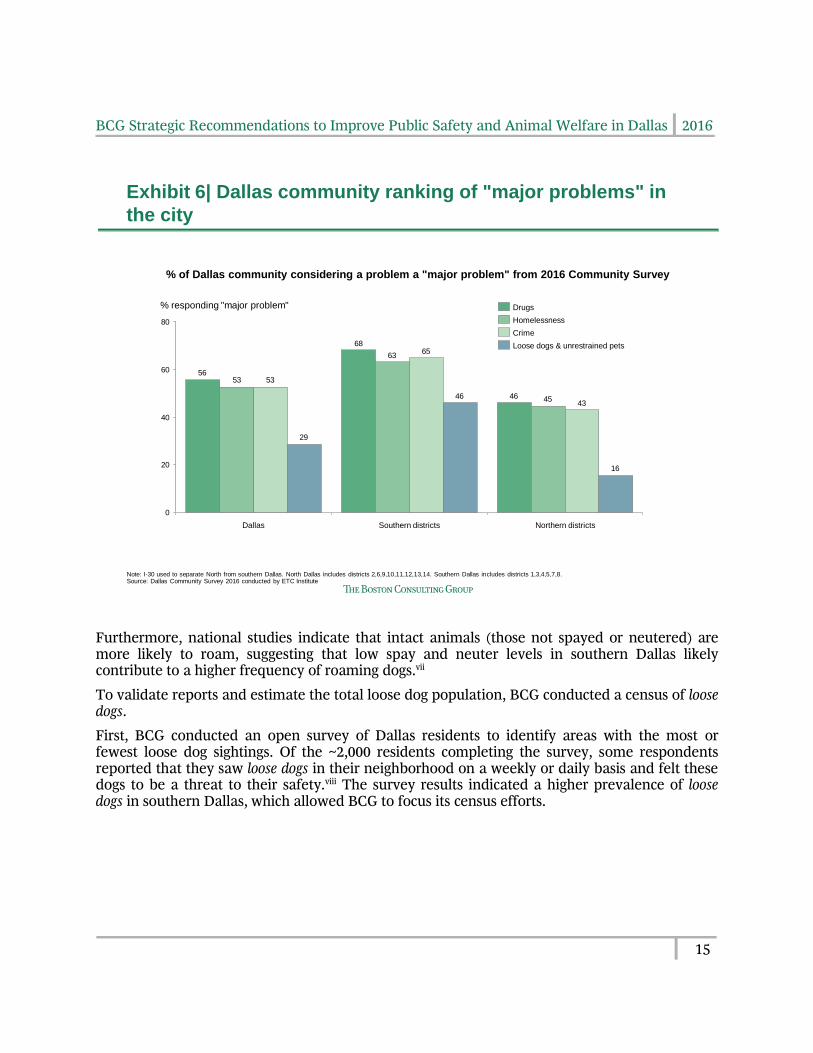
BCG Strategic Recommendations to Improve Public Safety and Animal Welfare in Dallas 2016
15
Furthermore, national studies indicate that intact animals (those not spayed or neutered) are more likely to roam, suggesting that low spay and neuter levels in southern Dallas likely contribute to a higher frequency of roaming dogs.vii
To validate reports and estimate the total loose dog population, BCG conducted a census of loose dogs.
First, BCG conducted an open survey of Dallas residents to identify areas with the most or fewest loose dog sightings. Of the ~2,000 residents completing the survey, some respondents reported that they saw loose dogs in their neighborhood on a weekly or daily basis and felt these dogs to be a threat to their safety.viii The survey results indicated a higher prevalence of loose dogs in southern Dallas, which allowed BCG to focus its census efforts.
Exhibit 6| Dallas community ranking of "major problems" in
the city
46
68
56
45
63
53
43
65
53
16
46
29
0
20
40
60
80
% responding "major problem"
Northern districtsSouthern districtsDallas
Crime
Drugs
Loose dogs & unrestrained pets
Homelessness
% of Dallas community considering a problem a "major problem" from 2016 Community Survey
Note: I-30 used to separate North from southern Dallas. North Dallas includes districts 2,6,9,10,11,12,13,14. Southern Dallas includes districts 1,3,4,5,7,8. Source: Dallas Community Survey 2016 conducted by ETC Institute
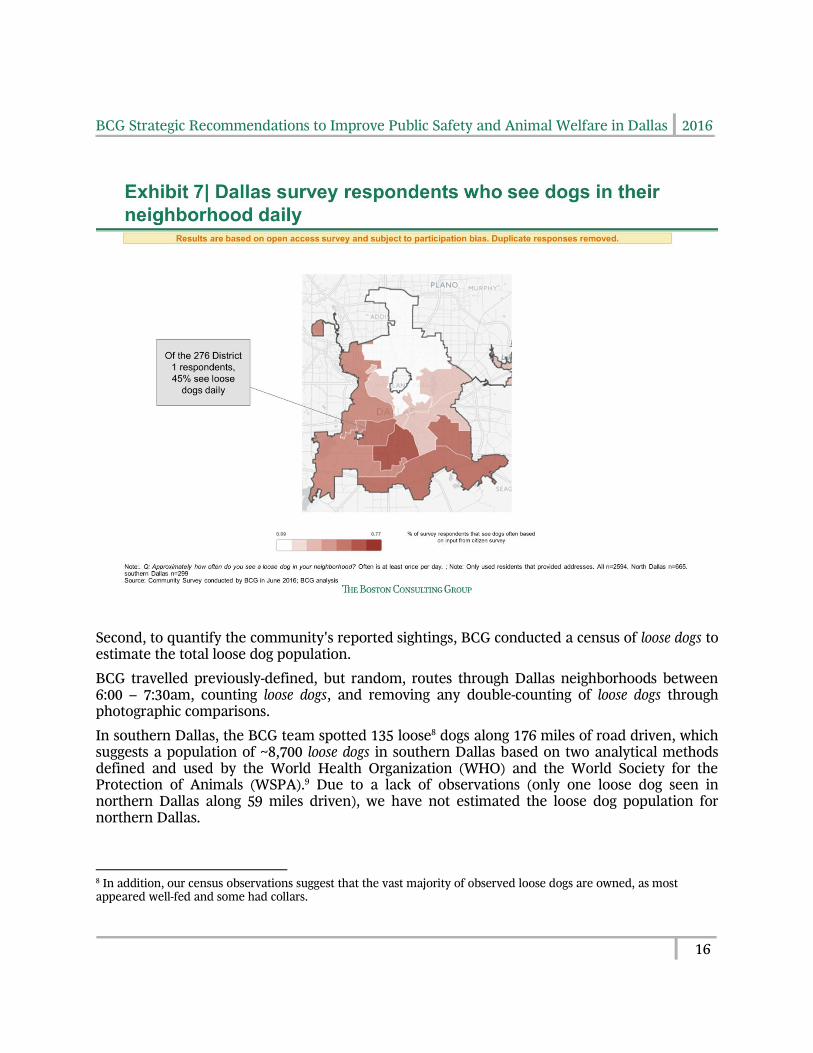
BCG Strategic Recommendations to Improve Public Safety and Animal Welfare in Dallas 2016
16
Second, to quantify the community's reported sightings, BCG conducted a census of loose dogs to estimate the total loose dog population.
BCG travelled previously-defined, but random, routes through Dallas neighborhoods between 6:00 – 7:30am, counting loose dogs, and removing any double-counting of loose dogs through photographic comparisons.
In southern Dallas, the BCG team spotted 135 loose8 dogs along 176 miles of road driven, which suggests a population of ~8,700 loose dogs in southern Dallas based on two analytical methods defined and used by the World Health Organization (WHO) and the World Society for the Protection of Animals (WSPA).9 Due to a lack of observations (only one loose dog seen in northern Dallas along 59 miles driven), we have not estimated the loose dog population for northern Dallas.
8 In addition, our census observations suggest that the vast majority of observed loose dogs are owned, as most appeared well-fed and some had collars.
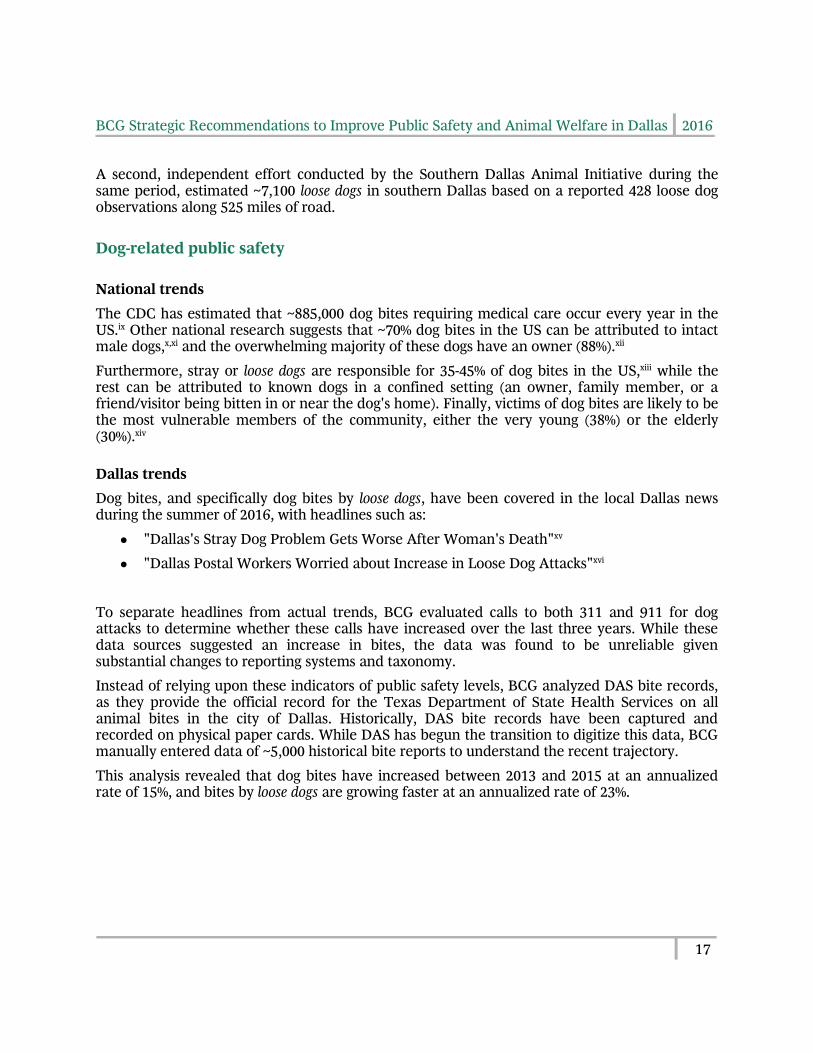
BCG Strategic Recommendations to Improve Public Safety and Animal Welfare in Dallas 2016
17
A second, independent effort conducted by the Southern Dallas Animal Initiative during the same period, estimated ~7,100 loose dogs in southern Dallas based on a reported 428 loose dog observations along 525 miles of road.
Dog-related public safety
National trends
The CDC has estimated that ~885,000 dog bites requiring medical care occur every year in the US.ix Other national research suggests that ~70% dog bites in the US can be attributed to intact male dogs,x,xi and the overwhelming majority of these dogs have an owner (88%).xii
Furthermore, stray or loose dogs are responsible for 35-45% of dog bites in the US,xiii while the rest can be attributed to known dogs in a confined setting (an owner, family member, or a friend/visitor being bitten in or near the dog's home). Finally, victims of dog bites are likely to be the most vulnerable members of the community, either the very young (38%) or the elderly (30%).xiv
Dallas trends
Dog bites, and specifically dog bites by loose dogs, have been covered in the local Dallas news during the summer of 2016, with headlines such as:
● "Dallas's Stray Dog Problem Gets Worse After Woman's Death"xv
● "Dallas Postal Workers Worried about Increase in Loose Dog Attacks"xvi
To separate headlines from actual trends, BCG evaluated calls to both 311 and 911 for dog attacks to determine whether these calls have increased over the last three years. While these data sources suggested an increase in bites, the data was found to be unreliable given substantial changes to reporting systems and taxonomy.
Instead of relying upon these indicators of public safety levels, BCG analyzed DAS bite records, as they provide the official record for the Texas Department of State Health Services on all animal bites in the city of Dallas. Historically, DAS bite records have been captured and recorded on physical paper cards. While DAS has begun the transition to digitize this data, BCG manually entered data of ~5,000 historical bite reports to understand the recent trajectory.
This analysis revealed that dog bites have increased between 2013 and 2015 at an annualized rate of 15%, and bites by loose dogs are growing faster at an annualized rate of 23%.
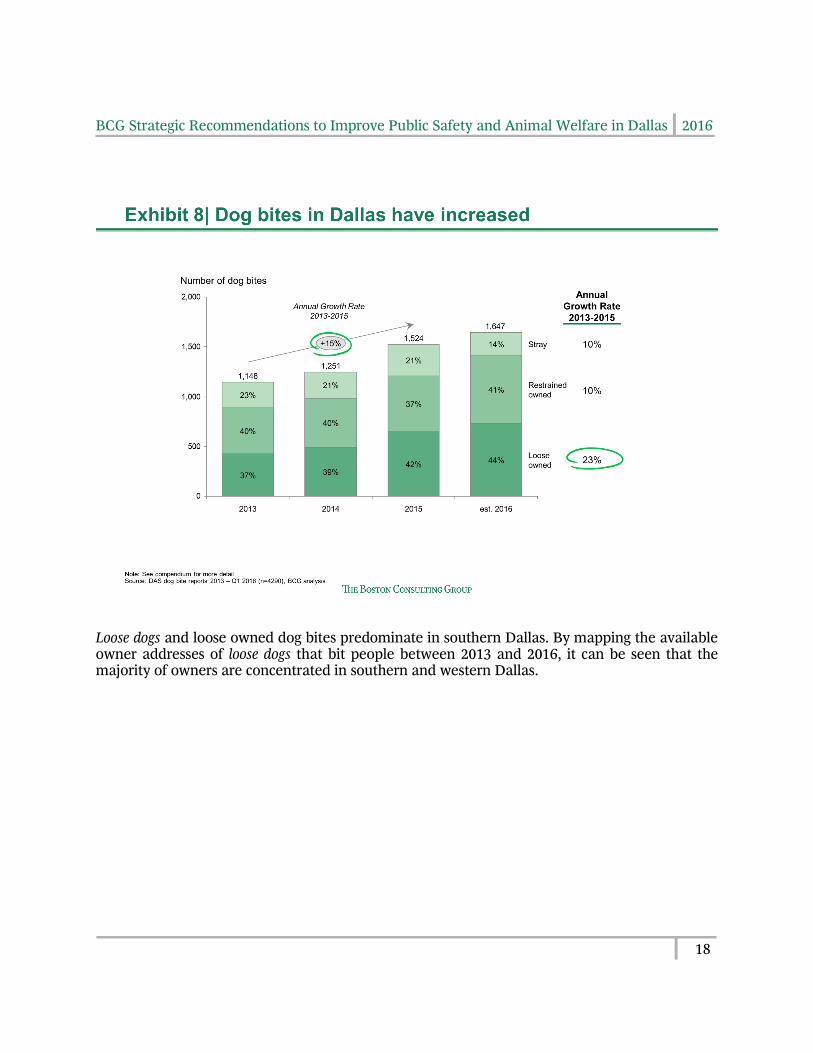
BCG Strategic Recommendations to Improve Public Safety and Animal Welfare in Dallas 2016
18
Loose dogs and loose owned dog bites predominate in southern Dallas. By mapping the available owner addresses of loose dogs that bit people between 2013 and 2016, it can be seen that the majority of owners are concentrated in southern and western Dallas.
BCG Strategic Recommendations to Improve Public Safety and Animal Welfare in Dallas 2016
19
In conversations with southern Dallas residents, many claimed to carry protection against loose dogs when walking in their neighborhoods (including bats, knives, guns, and pepper spray), and such behavior was observed by BCG consultants during the dog census.
Dallas animal services shelter operations
DAS collects dogs daily through its field operations and, because it is an open admission shelter, must also accept all dogs that residents of Dallas bring to its shelter. DAS is responsible for collecting animals across the city of Dallas ("the field") through its Animal Service Officers (ASOs). In addition to field intake, ASOs respond to animal-related complaints from 311, investigate possible rabies bites, enforce animal related ordinances, investigate animal cruelty, handle court-related activities, assist in disaster response, and administer euthanasia.

BCG Strategic Recommendations to Improve Public Safety and Animal Welfare in Dallas 2016
20
From 2011-2015, DAS had an annual intake of approximately 20,000 dogs, which equates to an average of approximately 55 dogs per day. This number fluctuates seasonally, peaking significantly in the summer, with some days approaching an intake of 150 dogs.
In 2015, 55% of intake came over the counter, or OTC (that is, dogs brought directly into DAS), and 45% came from the field (that is, dogs collected by DAS animal service officers). Specifically, intake was split among OTC – Owner Surrenders (~6,600, 32%), OTC – Stray Turn-In (~4,700, 23%), Field – Stray (~7,000, 34%), Field – Owner Surrender (~2,100, 10%), and Field – Same Day RTO (~400, 2%). Overall, dog intake has remained relatively flat since 2011.
The DAS shelter has approximately 500 kennels10 to house dogs. Of these kennels, ~120 are for adoption, ~200 are for general use, and ~180 are for restricted specific use (e.g., for dogs that are contagious, injured, quarantined, in protective custody, isolated, new moms, and puppies). During 2015, average kennel utilization across all dog kennels was ~70%, with kennel utilization for both general and adoption kennels at ~90%, and restricted dog kennel utilization at ~45%.
10 Dallas Animal Services’ Westmoreland location has approximately 650 kennels for all animals.
BCG Strategic Recommendations to Improve Public Safety and Animal Welfare in Dallas 2016
21
Usage above 90% can effectively be viewed as 100% utilization, as the average daily intake exceeds the average number of available kennels.
Dogs entering the DAS shelter for any reason, other than owner surrender, must be held by DAS for a mandatory three-day11 or ten-day12 legal hold. In 2015, 38% of dogs were not subject to a legal hold, 47% were subject to a three-day hold, and 15% were subject to a ten-day hold. On average, dogs stayed at DAS ~9.4 days total or ~5.5 days beyond the legal hold period. For dogs with a three-day hold, the average stay beyond the legal hold was 5.3 days. For dogs with a ten-day hold, the average stay beyond the legal hold was 2.2 days. 13
At DAS, animal health is assessed upon intake using Asilomar Accords which were adopted in 2011. The Asilomar Accords are used nationwide by numerous animal shelters and rescues, though adjusted for a given community to reflect its unique circumstances. Today, 9% of dogs arriving at DAS are identified as "Healthy," 57% as "Treatable-Rehabilitatable," 17% as "Treatable-Manageable," and 17% as "Unhealthy and Untreatable."
11 Any animal that enters the shelter without a microchip or collar is subject to a three-day legal hold, not including the day of intake. 12 Any animal that enters the shelter with a microchip or collar is subject to a ten-day hold, not including the day of intake. 13 This excludes dogs that are euthanized or returned to owner on the day of intake.
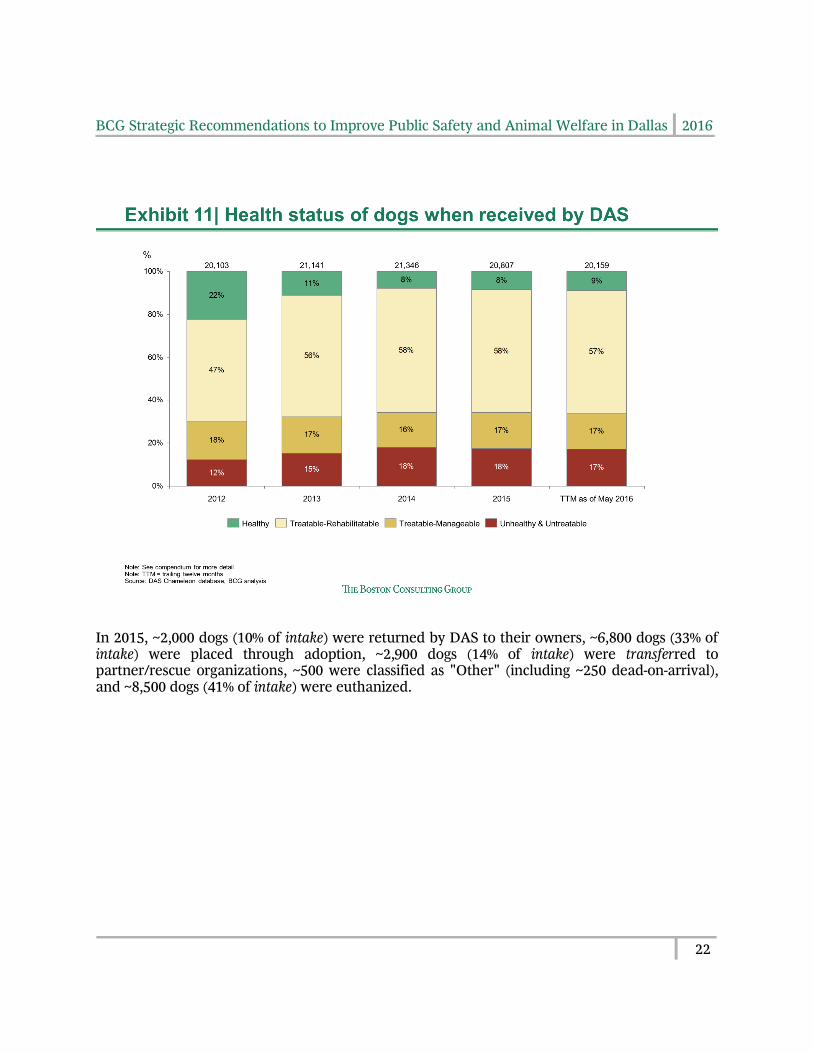
BCG Strategic Recommendations to Improve Public Safety and Animal Welfare in Dallas 2016
22
In 2015, ~2,000 dogs (10% of intake) were returned by DAS to their owners, ~6,800 dogs (33% of intake) were placed through adoption, ~2,900 dogs (14% of intake) were transferred to partner/rescue organizations, ~500 were classified as "Other" (including ~250 dead-on-arrival), and ~8,500 dogs (41% of intake) were euthanized.
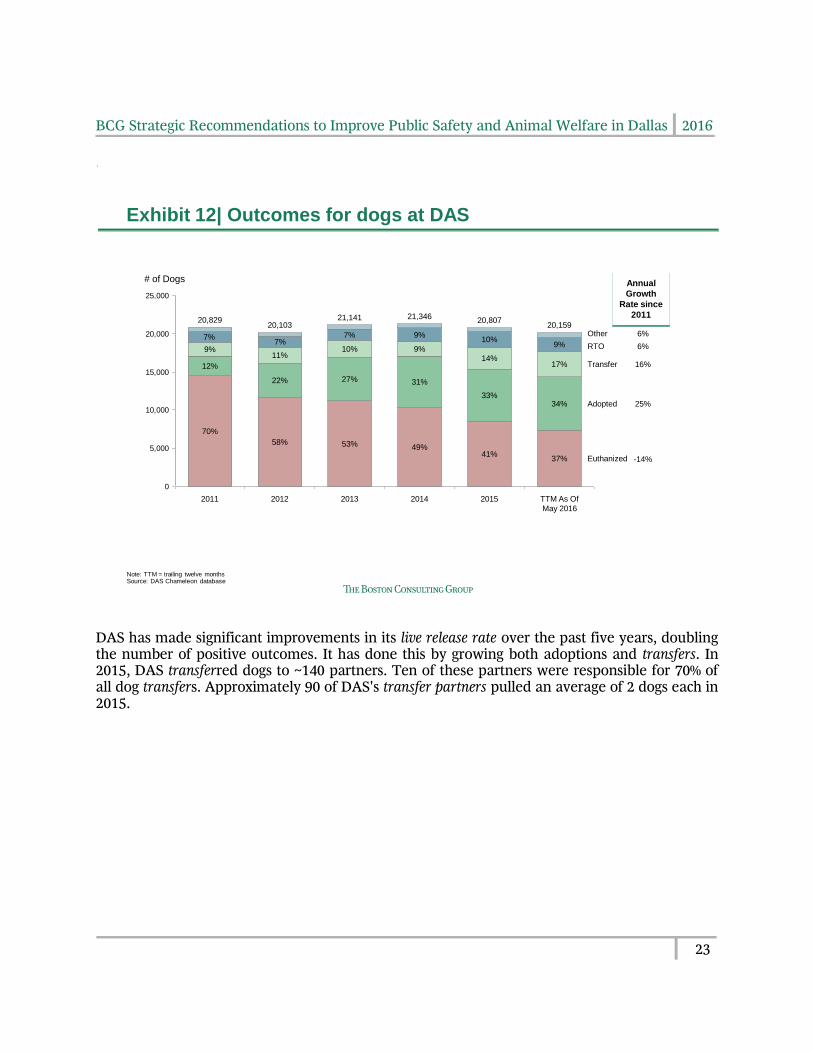
BCG Strategic Recommendations to Improve Public Safety and Animal Welfare in Dallas 2016
23
DAS has made significant improvements in its live release rate over the past five years, doubling the number of positive outcomes. It has done this by growing both adoptions and transfers. In 2015, DAS transferred dogs to ~140 partners. Ten of these partners were responsible for 70% of all dog transfers. Approximately 90 of DAS's transfer partners pulled an average of 2 dogs each in 2015.
Exhibit 12| Outcomes for dogs at DAS
0
5,000
10,000
15,000
20,000
25,000
2015
20,807
41%
33%
14%
10%
2014
21,346
49%
31%
9%
9%
2013
21,141
53%
27%
10%
7%
2012
20,103
58%
22%
11%
7%
2011
20,829
70%
12%
9%
TTM As Of
May 2016
# of Dogs
20,159
37%
34%
17%
7%9%
Euthanized
Adopted
Transfer
RTO
Other 6%
6%
16%
25%
-14%
Note: TTM = trailing twelve monthsSource: DAS Chameleon database
Annual
Growth
Rate since
2011
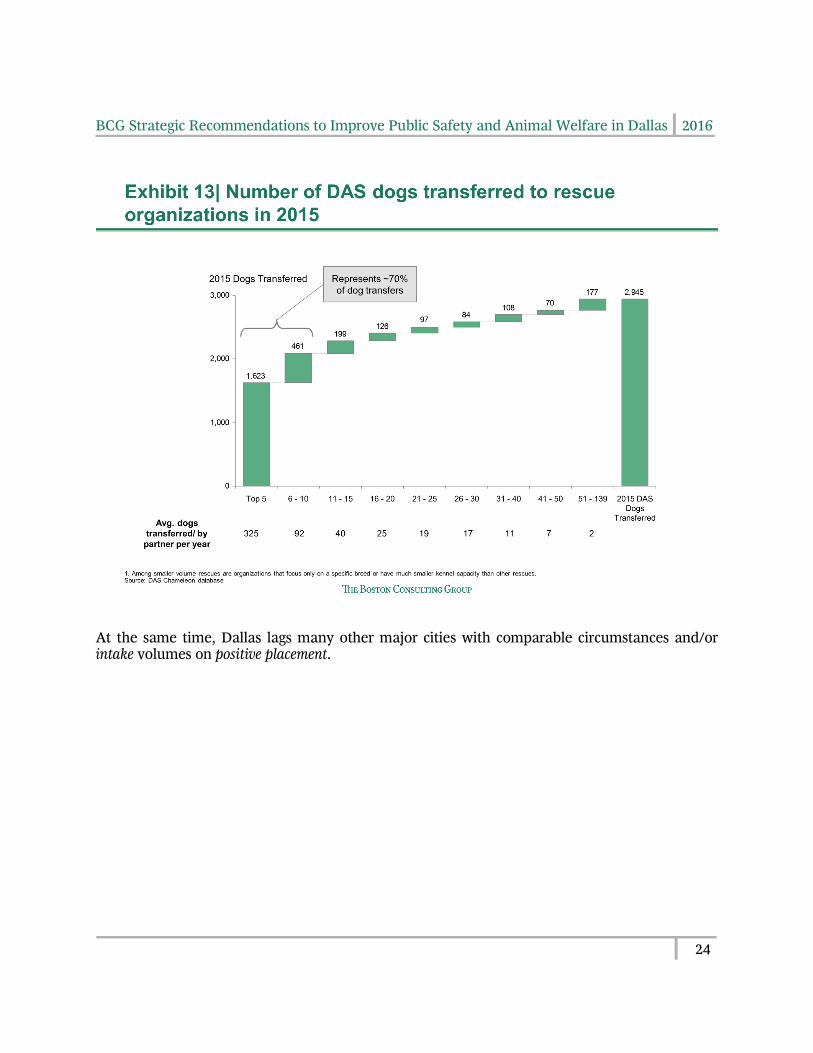
BCG Strategic Recommendations to Improve Public Safety and Animal Welfare in Dallas 2016
24
At the same time, Dallas lags many other major cities with comparable circumstances and/or intake volumes on positive placement.
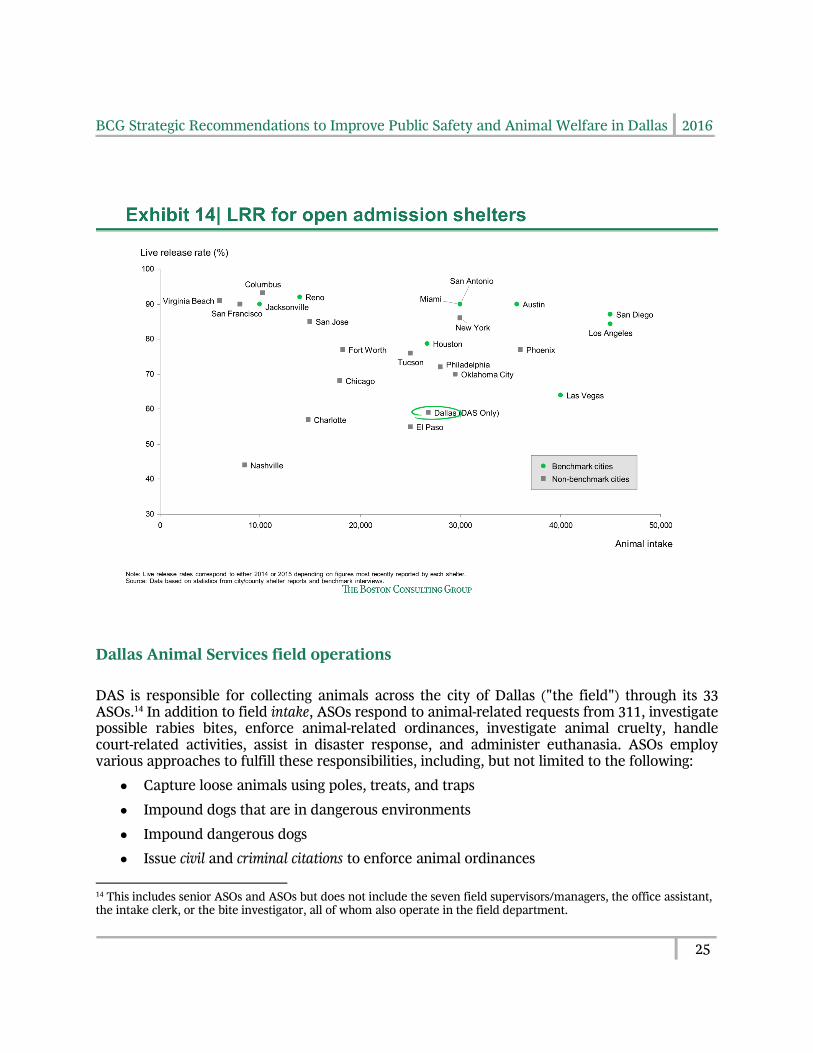
BCG Strategic Recommendations to Improve Public Safety and Animal Welfare in Dallas 2016
25
Dallas Animal Services field operations
DAS is responsible for collecting animals across the city of Dallas ("the field") through its 33 ASOs.14 In addition to field intake, ASOs respond to animal-related requests from 311, investigate possible rabies bites, enforce animal-related ordinances, investigate animal cruelty, handle court-related activities, assist in disaster response, and administer euthanasia. ASOs employ various approaches to fulfill these responsibilities, including, but not limited to the following:
● Capture loose animals using poles, treats, and traps
● Impound dogs that are in dangerous environments
● Impound dangerous dogs
● Issue civil and criminal citations to enforce animal ordinances
14 This includes senior ASOs and ASOs but does not include the seven field supervisors/managers, the office assistant, the intake clerk, or the bite investigator, all of whom also operate in the field department.
BCG Strategic Recommendations to Improve Public Safety and Animal Welfare in Dallas 2016
26
● Issue violations to warn and educate citizens on proper ordinances
● Educate citizens on pet ownership and city ordinances
● Investigate animal cruelty cases
● Manage rabies quarantine and reporting process
● Conduct bite investigations
● Assist police and fire department
● Support disaster response efforts
Our interviews indicate that DAS’ 33 ASOs spend a large portion of their time on manual, administrative processes: mapping and driving between locations in Dallas (35%), processing intake at the shelter (11%), and updating the Chameleon database on their activities (6%).xvii
Each officer serves four 10-hour shifts each week. There are three types of shifts for ASOs:xviii
1) Reactive: Approximately 80% of shifts are spent responding to 311 calls. ASOs drive to the addresses provided in 311 service requests in prioritized order. The result of these requests is typically dog capture, citations, and/or education.
2) Proactive: Approximately 10% of shifts are proactive education, targeted outreach, and proactive dog collection. This occurs primarily through Targeted response team sweeps and the CARE team efforts.
3) Shelter: Approximately 10% of shifts are spent in the shelter with ASOs recording bite data and administering euthanasia.
The following sections include additional detail on 311 requests, the CARE team, citations, and dog collection.
311 requests
From June 2015 to May 2016, DAS received over 48,000 requests from 311. Of all the 311 requests, ~30,000 were dispatched and responded to by ASOs.xix,xx When an ASO responds to a request, he or she drives to the specified address and searches for the complaint. Sometimes, the source of a complaint cannot be located because there is no animal or person at the address and no follow-up information has been provided. If the source of the complaint can be located, the ASO will typically capture a dog, issue a citation, and/or educate the person on city animal ordinances.
ASOs work 10-hour shifts, starting as early as 7:00 am and ending as late as 11:00 pm. On average, ~80 requests are dispatched to ASOs each day, and ~45% of these are priority 1 or 2 requests regarding a human or animal in imminent danger. Given that there are 12 ASOs responding on any given day, ASOs respond to an average of 7 requests each shift.
Of the ~48,000 total requests received over the 12 months ending May 2016, ~19,000 (38%) were not dispatched to ASOs because they were categorized as the lowest priority. These non-
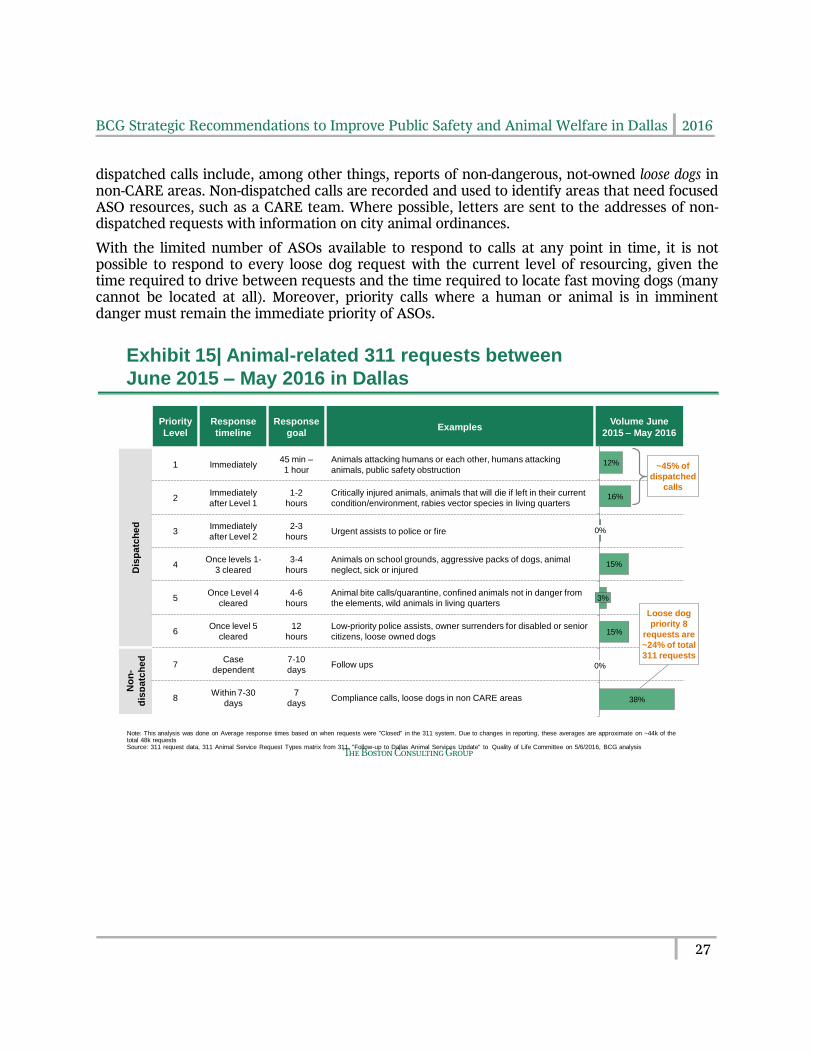
BCG Strategic Recommendations to Improve Public Safety and Animal Welfare in Dallas 2016
27
dispatched calls include, among other things, reports of non-dangerous, not-owned loose dogs in non-CARE areas. Non-dispatched calls are recorded and used to identify areas that need focused ASO resources, such as a CARE team. Where possible, letters are sent to the addresses of non-dispatched requests with information on city animal ordinances.
With the limited number of ASOs available to respond to calls at any point in time, it is not possible to respond to every loose dog request with the current level of resourcing, given the time required to drive between requests and the time required to locate fast moving dogs (many cannot be located at all). Moreover, priority calls where a human or animal is in imminent danger must remain the immediate priority of ASOs.
Priority
Level
Response
timeline
Response
goalExamples
Volume June
2015 – May 2016
Dis
pa
tch
ed
1 Immediately45 min –
1 hour
Animals attacking humans or each other, humans attacking
animals, public safety obstruction
2Immediately
after Level 1
1-2
hours
Critically injured animals, animals that will die if left in their current
condition/environment, rabies vector species in living quarters
3Immediately
after Level 2
2-3
hoursUrgent assists to police or fire
4Once levels 1-
3 cleared
3-4
hours
Animals on school grounds, aggressive packs of dogs, animal
neglect, sick or injured
5Once Level 4
cleared
4-6
hours
Animal bite calls/quarantine, confined animals not in danger from
the elements, wild animals in living quarters
6Once level 5
cleared
12
hours
Low-priority police assists, owner surrenders for disabled or senior
citizens, loose owned dogs
No
n-
dis
pa
tch
ed
7Case
dependent
7-10
daysFollow ups
8Within 7-30
days
7
daysCompliance calls, loose dogs in non CARE areas 38%
0%
15%
3%
15%
0%
16%
12%
Exhibit 15| Animal-related 311 requests between
June 2015 – May 2016 in Dallas
Note: This analysis was done on Average response times based on when requests were "Closed" in the 311 system. Due to changes in reporting, these averages are approximate on ~44k of the total 48k requestsSource: 311 request data, 311 Animal Service Request Types matrix from 311, "Follow-up to Dallas Animal Services Update" to Quality of Life Committee on 5/6/2016, BCG analysis
~45% of
dispatched
calls
Loose dog
priority 8
requests are
~24% of total
311 requests
BCG Strategic Recommendations to Improve Public Safety and Animal Welfare in Dallas 2016
28
CARE teamxxi
The CARE team (Community Animal Resource Effort) consists of 4 ASOs and 3 coordinators/managers that are responsible for the majority of DAS's proactive education. This team works four days a week conducting door-to-door outreach in one census tract over the course of one month. A census tract is an area roughly equivalent to a neighborhood with a population of 2,500-8,000 people. Census tracts are prioritized for the CARE team based on historical 311 animal-related service requests.
During the first half of a given shift, the CARE team sweeps the area for loose dogs and returns them to owners, where possible. (BCG was unable to determine the number of dogs that are collected during these sweeps.) For the second half of the shift, this team visits every household in the neighborhood to educate citizens on animal-related city ordinances and available low-cost animal resources (e.g., spay and neuter). Sometimes, the CARE team must visit a house multiple times before someone is home, especially given that many residents work during the time of the shifts. Two weeks after the initial visit, the CARE team returns to households with pets to determine if they are in compliance with animal-related ordinances. If they are not, ASOs issue citations.xxii,xxiii
From April through July 19 of 2016, according to internal DAS records, the CARE team made contact with an average of 105 houses per dayxxiv . Prior to April 2016, derivations of the CARE team, such as the Targeted Area Initiative, were executed. As of mid August 2016, the CARE team began to use volunteers in its efforts.xxv Although the volunteer role in this program has not been scaled yet, DAS plans to do so.
Citations
During the 24 months between June 2014 and May 2016, the number of citations issued by ASOs increased each month at a rate of 7%. In January through May of 2016, ASOs issued 1,807 citations, averaging approximately 12 citations per day in total, or 11 citations per month per ASO.xxvi Approximately 2% of all citations issued during this time were civil citations, and the rest were criminal citations.
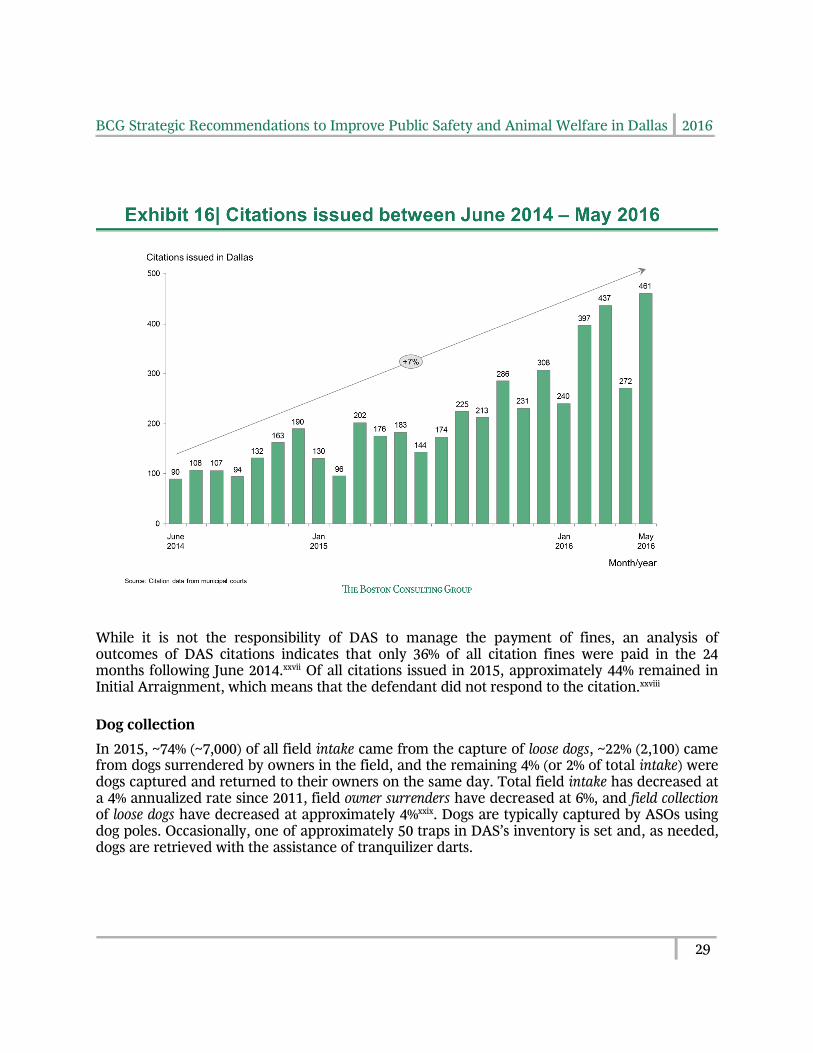
BCG Strategic Recommendations to Improve Public Safety and Animal Welfare in Dallas 2016
29
While it is not the responsibility of DAS to manage the payment of fines, an analysis of outcomes of DAS citations indicates that only 36% of all citation fines were paid in the 24 months following June 2014.xxvii Of all citations issued in 2015, approximately 44% remained in Initial Arraignment, which means that the defendant did not respond to the citation.xxviii
Dog collection
In 2015, ~74% (~7,000) of all field intake came from the capture of loose dogs, ~22% (2,100) came from dogs surrendered by owners in the field, and the remaining 4% (or 2% of total intake) were dogs captured and returned to their owners on the same day. Total field intake has decreased at a 4% annualized rate since 2011, field owner surrenders have decreased at 6%, and field collection of loose dogs have decreased at approximately 4%xxix. Dogs are typically captured by ASOs using dog poles. Occasionally, one of approximately 50 traps in DAS’s inventory is set and, as needed, dogs are retrieved with the assistance of tranquilizer darts.

BCG Strategic Recommendations to Improve Public Safety and Animal Welfare in Dallas 2016
30
ASO staffing levels
DAS has 33 active ASOs. 15 When compared to organizations in peer cities, DAS has 45% more ASOs per million people, but each ASO collects approximately 20% fewer dogs than ASOs in peer cities do. Other measures of ASO productivity could include citations issued, education administered, and call volume addressed.
15 DAS has self-reported an actual ASO base of 33. The FY16 budget has 37 ASOs. On the June 27, 2016 organization chart, there are 37 filled positions and 8 vacant ASO positions. For the purposes of this report, we assume that DAS has 33 active ASOs on staff.
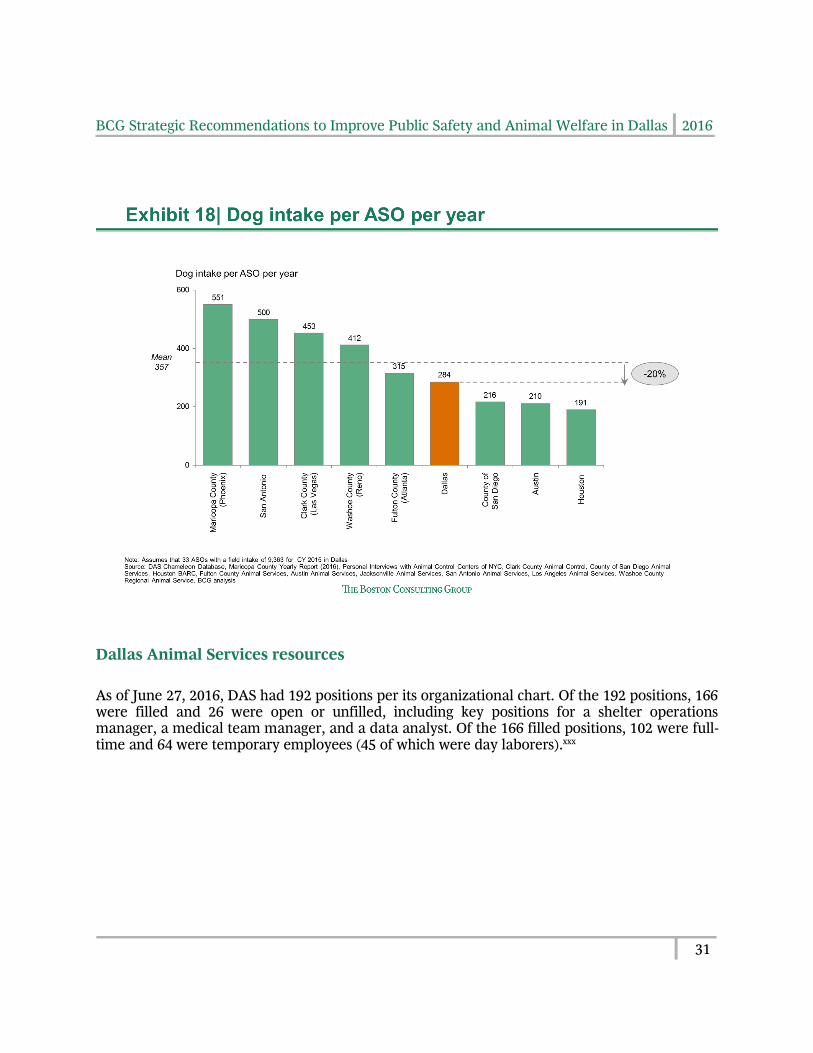
BCG Strategic Recommendations to Improve Public Safety and Animal Welfare in Dallas 2016
31
Dallas Animal Services resources
As of June 27, 2016, DAS had 192 positions per its organizational chart. Of the 192 positions, 166 were filled and 26 were open or unfilled, including key positions for a shelter operations manager, a medical team manager, and a data analyst. Of the 166 filled positions, 102 were full-time and 64 were temporary employees (45 of which were day laborers).xxx
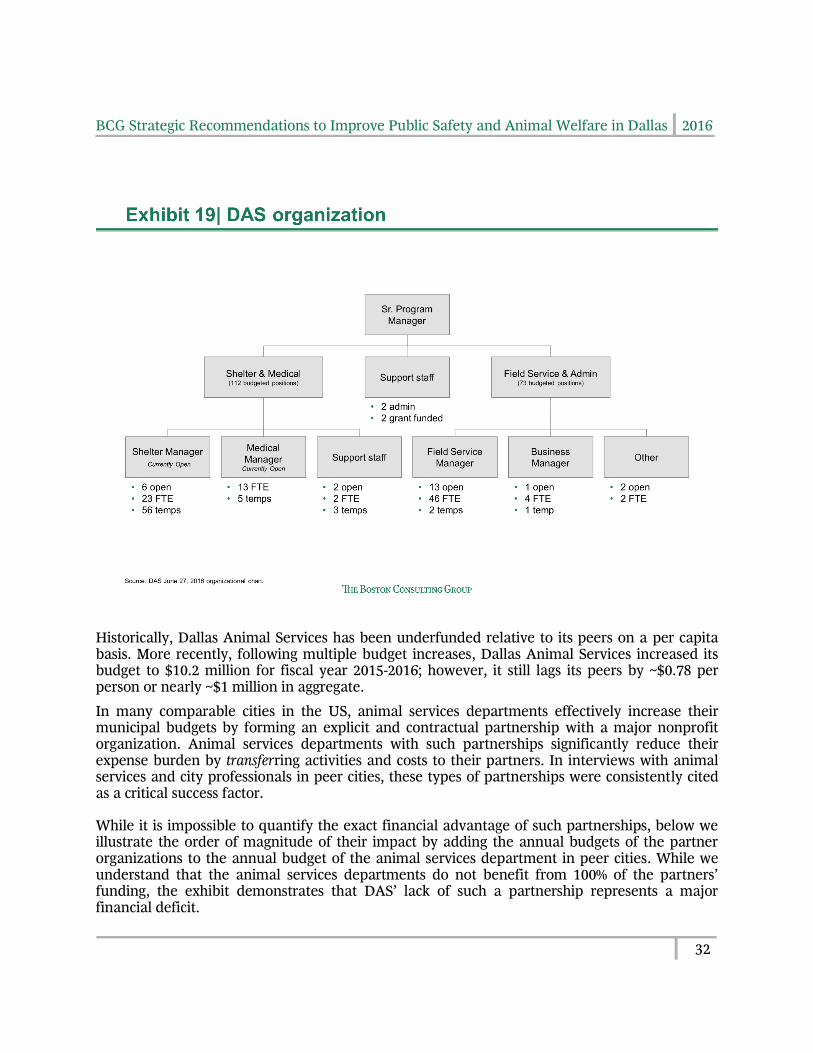
BCG Strategic Recommendations to Improve Public Safety and Animal Welfare in Dallas 2016
32
Historically, Dallas Animal Services has been underfunded relative to its peers on a per capita basis. More recently, following multiple budget increases, Dallas Animal Services increased its budget to $10.2 million for fiscal year 2015-2016; however, it still lags its peers by ~$0.78 per person or nearly ~$1 million in aggregate.
In many comparable cities in the US, animal services departments effectively increase their municipal budgets by forming an explicit and contractual partnership with a major nonprofit organization. Animal services departments with such partnerships significantly reduce their expense burden by transferring activities and costs to their partners. In interviews with animal services and city professionals in peer cities, these types of partnerships were consistently cited as a critical success factor.
While it is impossible to quantify the exact financial advantage of such partnerships, below we illustrate the order of magnitude of their impact by adding the annual budgets of the partner organizations to the annual budget of the animal services department in peer cities. While we understand that the animal services departments do not benefit from 100% of the partners’ funding, the exhibit demonstrates that DAS’ lack of such a partnership represents a major financial deficit.
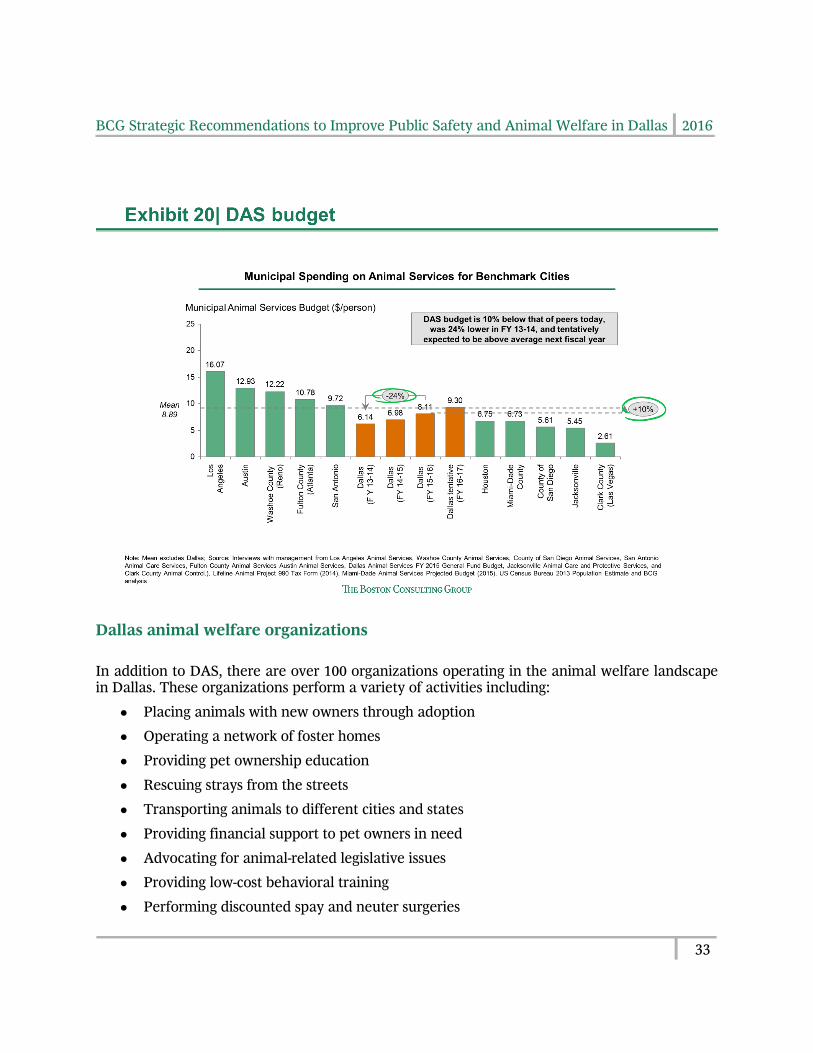
BCG Strategic Recommendations to Improve Public Safety and Animal Welfare in Dallas 2016
33
Dallas animal welfare organizations
In addition to DAS, there are over 100 organizations operating in the animal welfare landscape in Dallas. These organizations perform a variety of activities including:
● Placing animals with new owners through adoption
● Operating a network of foster homes
● Providing pet ownership education
● Rescuing strays from the streets
● Transporting animals to different cities and states
● Providing financial support to pet owners in need
● Advocating for animal-related legislative issues
● Providing low-cost behavioral training
● Performing discounted spay and neuter surgeries
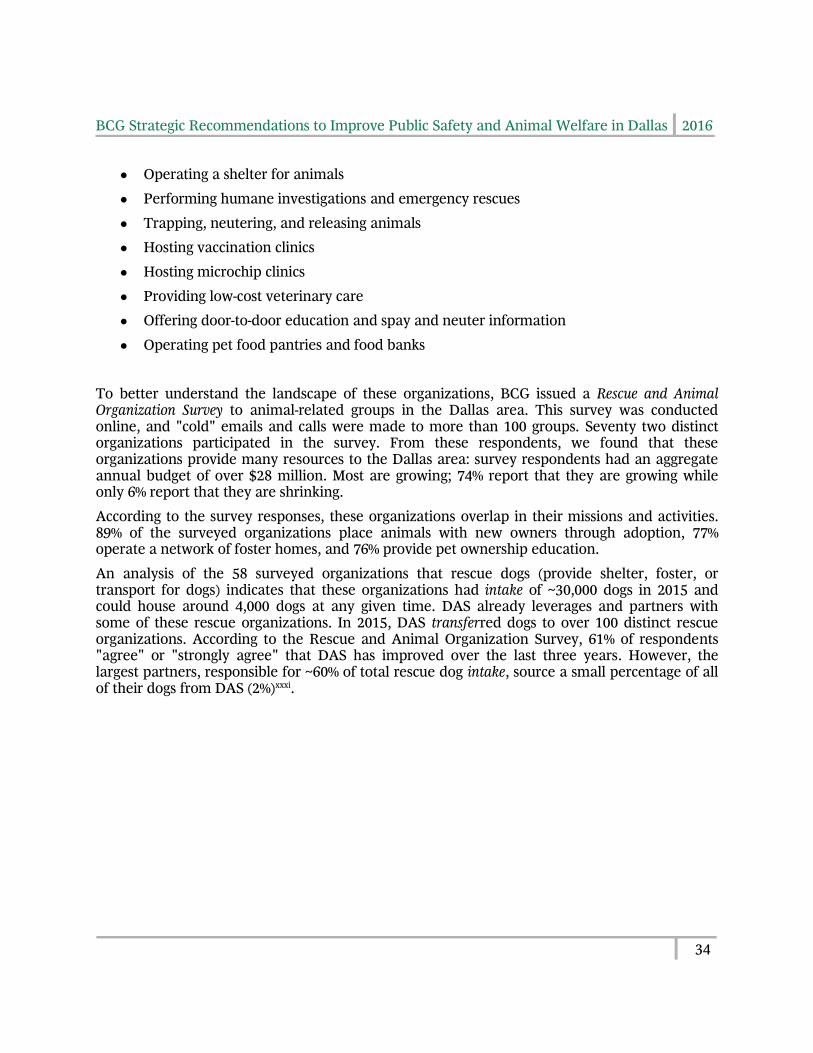
BCG Strategic Recommendations to Improve Public Safety and Animal Welfare in Dallas 2016
34
● Operating a shelter for animals
● Performing humane investigations and emergency rescues
● Trapping, neutering, and releasing animals
● Hosting vaccination clinics
● Hosting microchip clinics
● Providing low-cost veterinary care
● Offering door-to-door education and spay and neuter information
● Operating pet food pantries and food banks
To better understand the landscape of these organizations, BCG issued a Rescue and Animal Organization Survey to animal-related groups in the Dallas area. This survey was conducted online, and "cold" emails and calls were made to more than 100 groups. Seventy two distinct organizations participated in the survey. From these respondents, we found that these organizations provide many resources to the Dallas area: survey respondents had an aggregate annual budget of over $28 million. Most are growing; 74% report that they are growing while only 6% report that they are shrinking.
According to the survey responses, these organizations overlap in their missions and activities. 89% of the surveyed organizations place animals with new owners through adoption, 77% operate a network of foster homes, and 76% provide pet ownership education.
An analysis of the 58 surveyed organizations that rescue dogs (provide shelter, foster, or transport for dogs) indicates that these organizations had intake of ~30,000 dogs in 2015 and could house around 4,000 dogs at any given time. DAS already leverages and partners with some of these rescue organizations. In 2015, DAS transferred dogs to over 100 distinct rescue organizations. According to the Rescue and Animal Organization Survey, 61% of respondents "agree" or "strongly agree" that DAS has improved over the last three years. However, the largest partners, responsible for ~60% of total rescue dog intake, source a small percentage of all of their dogs from DAS (2%)xxxi.
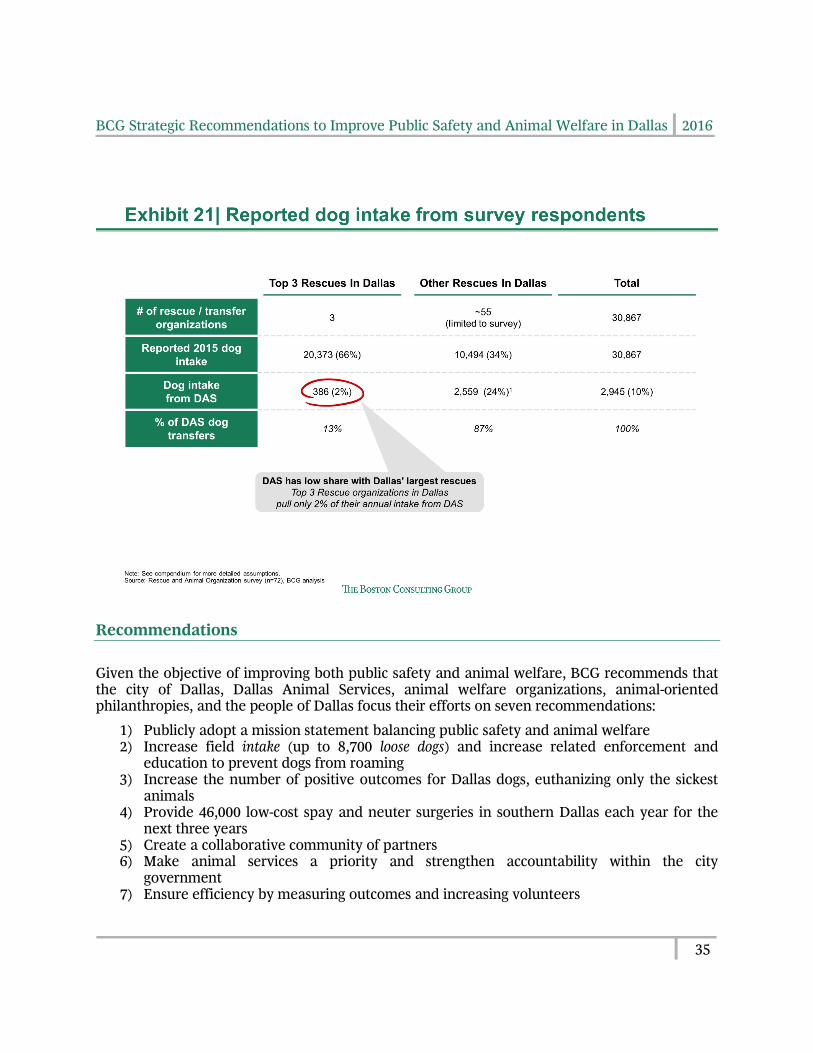
BCG Strategic Recommendations to Improve Public Safety and Animal Welfare in Dallas 2016
35
Recommendations
Given the objective of improving both public safety and animal welfare, BCG recommends that the city of Dallas, Dallas Animal Services, animal welfare organizations, animal-oriented philanthropies, and the people of Dallas focus their efforts on seven recommendations:
1) Publicly adopt a mission statement balancing public safety and animal welfare 2) Increase field intake (up to 8,700 loose dogs) and increase related enforcement and
education to prevent dogs from roaming 3) Increase the number of positive outcomes for Dallas dogs, euthanizing only the sickest
animals 4) Provide 46,000 low-cost spay and neuter surgeries in southern Dallas each year for the
next three years 5) Create a collaborative community of partners 6) Make animal services a priority and strengthen accountability within the city
government 7) Ensure efficiency by measuring outcomes and increasing volunteers
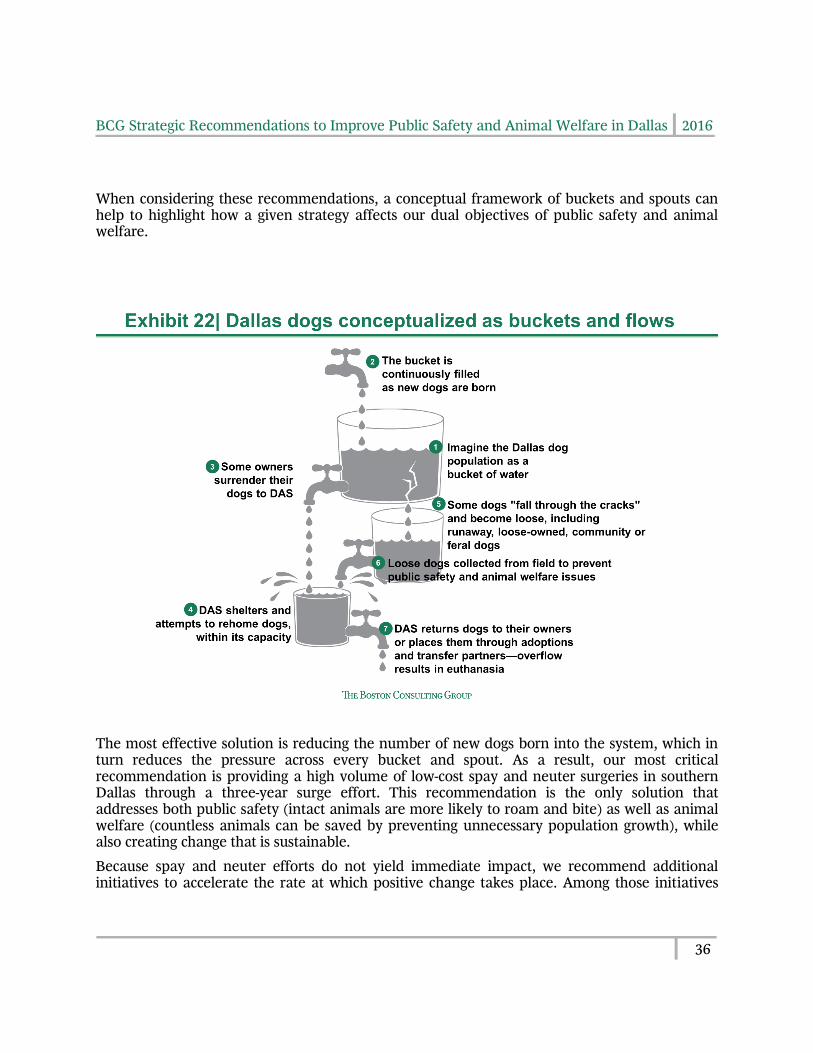
BCG Strategic Recommendations to Improve Public Safety and Animal Welfare in Dallas 2016
36
When considering these recommendations, a conceptual framework of buckets and spouts can help to highlight how a given strategy affects our dual objectives of public safety and animal welfare.
The most effective solution is reducing the number of new dogs born into the system, which in turn reduces the pressure across every bucket and spout. As a result, our most critical recommendation is providing a high volume of low-cost spay and neuter surgeries in southern Dallas through a three-year surge effort. This recommendation is the only solution that addresses both public safety (intact animals are more likely to roam and bite) as well as animal welfare (countless animals can be saved by preventing unnecessary population growth), while also creating change that is sustainable.
Because spay and neuter efforts do not yield immediate impact, we recommend additional initiatives to accelerate the rate at which positive change takes place. Among those initiatives
BCG Strategic Recommendations to Improve Public Safety and Animal Welfare in Dallas 2016
37
are strategies to reduce the number of loose dogs on the streets and to create more positive outcomes for dogs.
While these recommendations can meaningfully improve both public safety and animal welfare in the city of Dallas, it is important to note that all seven must be carried out in parallel to achieve the desired effect—unbalanced actions may have unintended consequences that negatively impact public safety or animal welfare. For example, focusing exclusively on picking up loose dogs would likely result in higher levels of euthanasia in the short term and have little benefit to public safety in the long term as new dogs are born.
While some of our recommendations include best practices, which should be carried out on an ongoing basis, others—such as the large increase in spay and neuter surgeries—represent temporary or "surge" initiatives that can be carried out in the near term, but scaled back over the long term.
When successfully implemented, these recommendations should serve to reduce the number of dog bites occurring in Dallas as a result of fewer dogs being loose and the fact that spayed and neutered dogs are less likely to bite. We also anticipate these recommendations will increase the number of positive outcomes for dogs sheltered at DAS by creating or expanding programs for
Exhibit 23| A coordinated effort required
Loose
dogs
in Dallas
All dogs
Population
growth
Owner
surrender
DAS
Shelter
Loose
dogs
Field collection
& turn-in
Outcomes
1
2
3
4
5
6
7
6
Single Action
Direct or Unintended
Consequence
Pick up all the loose dogs
Encourage community to
keep loose dogs off the
street
Build a bigger shelter
S/N all the dogs
People replace pets given
large supply of new dogs
Euthanasia spikes from
increased intake
If breeding continues, dog
population overwhelms the
most responsible of owners
Intake fills shelter, returns to
"business as usual"
Owned pets still roam the
streets
2
7
5 2
4 3+6
2 5
Isolated single actions compromise public safety
or animal welfare, or lack sustainability
BCG Strategic Recommendations to Improve Public Safety and Animal Welfare in Dallas 2016
38
positive placement and by reducing the long-term supply of dogs to be placed through spay and neuter efforts.
Supporting these solution-oriented initiatives are recommended enablers to ensure these efforts are effectively implemented by the entire community of stakeholders.
Successful implementation of this plan requires a coordinated effort by the entire community as well as incremental funding from both government and private sources.
In the pages that follow, we provide a rationale for each recommendation, suggested ownership, supporting evidence, and estimated costs to implement.
BCG Strategic Recommendations to Improve Public Safety and Animal Welfare in Dallas 2016
39
Recommendation 1 – Publicly adopt a mission statement balancing public safety and animal welfare
Today, DAS's mission, as stated on their website, is largely focused on animal welfare.
Dallas Animal Services and Adoption Center is dedicated to the humane treatment of animals in Dallas and educating others about responsible pet ownership. We reinforce these ideals every day by providing daily care for hundreds of animals in our shelter, assisting citizens who come to see us as well as out in the community. We respond to calls regarding animal welfare and concerns, conduct free Responsible Pet Ownership classes, hold offsite animal adoption events, and speak at and provide educational information at public safety fairs, environmental festivals, and neighborhood organizations.
DAS also has a secondary mission statement that has not been publicly shared, which is also largely focused on animal welfare.
To strengthen our community through outreach and enforcement efforts that preserve the human animal bond through the city of Dallas
When comparing mission statements of comparable cities one can observe a range of statements that emphasize animal welfare, public safety, or a blend of the two, where DAS's mission statement(s) have a heavier focus on animal welfare than many other comparable organizations.
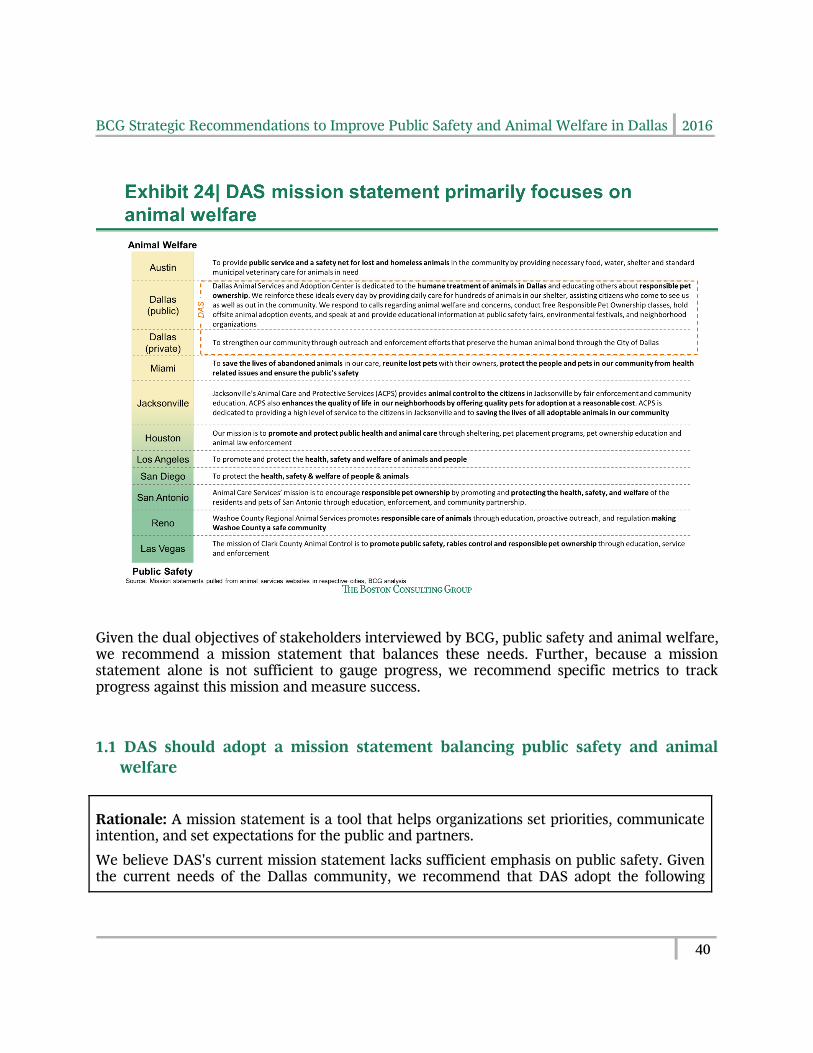
BCG Strategic Recommendations to Improve Public Safety and Animal Welfare in Dallas 2016
40
Given the dual objectives of stakeholders interviewed by BCG, public safety and animal welfare, we recommend a mission statement that balances these needs. Further, because a mission statement alone is not sufficient to gauge progress, we recommend specific metrics to track progress against this mission and measure success.
1.1 DAS should adopt a mission statement balancing public safety and animal
welfare
Rationale: A mission statement is a tool that helps organizations set priorities, communicate intention, and set expectations for the public and partners.
We believe DAS's current mission statement lacks sufficient emphasis on public safety. Given the current needs of the Dallas community, we recommend that DAS adopt the following
BCG Strategic Recommendations to Improve Public Safety and Animal Welfare in Dallas 2016
41
mission statement (or similar):
● Our mission is to ensure public safety, promote animal welfare, and contribute to a stable population of animals within the city of Dallas. Successful execution of our mission depends on the efficient and data-driven use of resources as well as collaboration with community partners.
1.2 DAS should adopt a mission-centric scorecard with specific targets and regular
progress updates
Rationale: While a focused mission statement is useful to align stakeholder expectations and priorities, it is not sufficient to measure success. To succeed in its mission, we recommend DAS adopt the following mission-centric scorecard and targets (or a similar set of metrics).
A balanced scorecard should include metrics that measure public safety, positive outcomes, population control, partnership success, and operating efficiency.
A data analyst will be necessary to create and update the mission-centric scorecard. The cost for this employee is included in recommendation 7.1.
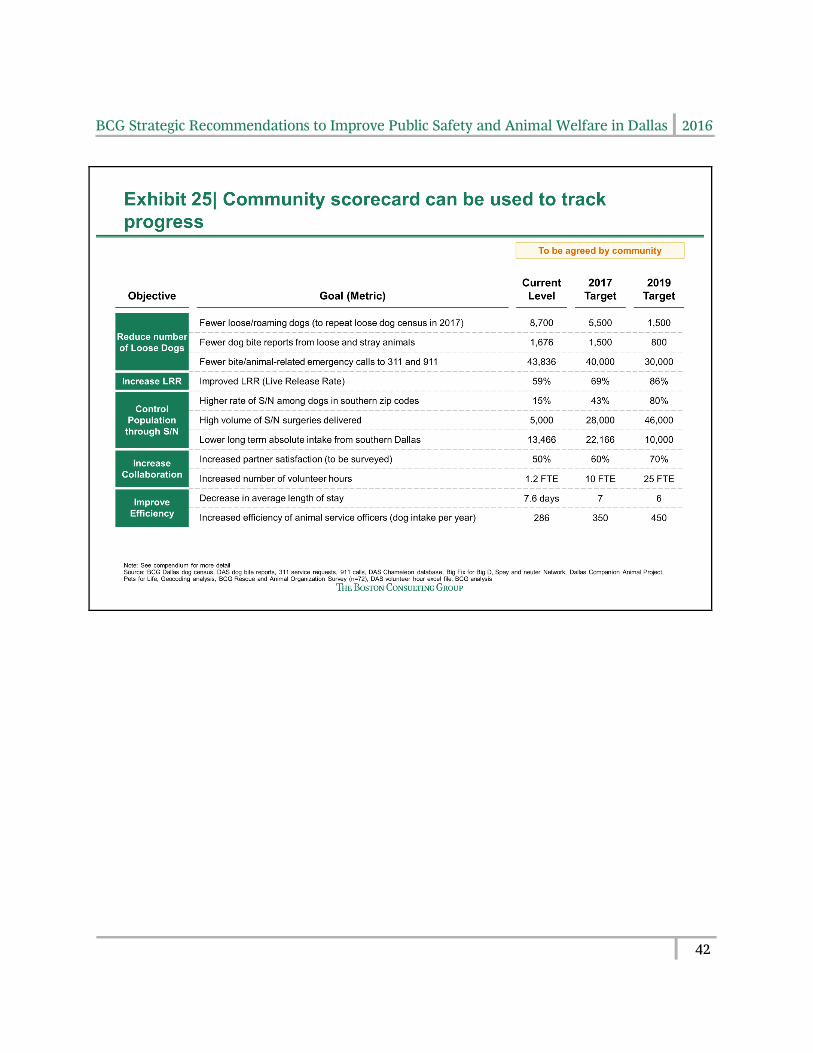
BCG Strategic Recommendations to Improve Public Safety and Animal Welfare in Dallas 2016
42
BCG Strategic Recommendations to Improve Public Safety and Animal Welfare in Dallas 2016
43
Recommendation 2 – Increase field intake (up to 8,700 loose dogs) and increase related enforcement and education to prevent dogs from roaming
BCG's second recommendation focuses on reducing the number of loose dogs on the streets of Dallas, with the goal of improving public safety and quality of life. Dallas residents have the right to peacefully enjoy the city without being endangered or disturbed by loose or uncontrolled animals.
Increasing field intake, in isolation, would likely result in higher levels of euthanasia at Dallas Animal Services, due to the relationship between shelter utilization and euthanasia. However, when implemented in parallel with recommendation 3 (opportunities to increase positive outcomes for dogs), the increased intake should not result in higher levels of euthanasia. We believe increased intake is necessary to balance both public safety and animal welfare.
It should also be noted that any success in picking up loose dogs would be short-lived unless accompanied by long-term improvements in spay and neuter levels (to bring future population growth under control) as outlined in recommendation 4. In short, if Dallas does not control population growth, there will always be more dogs to collect. Hence, recommendations 2, 3, and 4 must exist in harmony to balance public safety and animal welfare, and achieve sustainable results.
2.1 DAS should hire additional ASOs and focus 10 ASOs and 2 field supervisors on
field collection and patrol
Rationale: Today, the majority of DAS ASOs are call-focused in that ~80% of their collective time is spent responding to priority 311 calls. These calls are necessary from an animal services and population health perspective; however, 311 calls are a largely unproductive means of collecting dogs. DAS typically has 12 to 14 ASOs16 working field shifts each day, excluding shifts in the shelter, with daily field intake of 25 dogs per day.
Based on expert interviews, a dedicated ASO unit that would proactively patrol a given area would be a more effective means of increased field intake of loose dogs.
We recommend DAS dedicate two teams of five ASOs to such a unit, which would be responsible for collecting loose dogs using the most effective methods appropriate, educating the community about ordinances, and referring those in need to available assistance.
For example, on a given day this unit might:
● Catch a loose dog using a standard ASO pole
● Trap or chemically capture a loose dog
● Issue citations for loose, unregistered, unvaccinated, or intact dogs
16 On any given day, DAS deploys two shifts of five ASOs responding to 311 requests, two ASOs from the CARE team, and two additional ASOs working in the field.
BCG Strategic Recommendations to Improve Public Safety and Animal Welfare in Dallas 2016
44
● Educate an owner about ordinances regarding loose, unregistered, unvaccinated, or intact dogs and refer them to resources to bring their animal into compliance
● Return a loose dog caught to its owner in the field with the appropriate citation and/or scheduled appointment to bring that animal into compliance
● Introduce themselves to actively involved neighbors who could become a direct source of information about loose animals and built trust in the community
Today, DAS executes Targeted response team sweeps weekly (typically on Wednesdays) in which it targets specific areas of the city with a team that patrols, collects, and issues citations over a few hours. It will be helpful to leverage this pre-existing practice for this recommendation, but increase the scale of that effort to full-time coverage. The first priority of this team should be to locate and collect loose dogs while door-to-door education efforts are secondary.
With the recommended dog field collection teams, DAS has the opportunity to collect an additional ~6,000 dogs each year. This estimated impact relies on several key assumptions. First, the dedicated force of ASOs would work in two teams of five, given that the team-based capture model is most effective for loose dog collection.xxxii Second, each ASO team can collect approximately 15 dogs per team per day (three per ASO).xxxiii Third, each intake-dedicated ASO team would run sweeps four days per week, focusing, for example, on early morning (3:00 am – 9:00 am) and early evening (6:00 pm – 9:00 pm), when dogs are most active and when ASOs could engage with residents leaving for or coming home from work.xxxiv As seasonal shifts occur, it may be necessary to alter the sweep times to adapt to dog behavior.
The incremental cost incurred would be ~$240,000 for four additional fully-equipped trucks, at a cost of $60,000 each (one-time cost), and ~$94,000 in recurring labor costs each year for two additional ASOs.17 It also requires that DAS fill current open positions (as of the writing of this report, the DAS organizational chart showed that there were 8 open ASO positions and 2 open supervisor positions) and reallocate additional ASOs to this dedicated collection effort.
To speed the hiring process, it is recommended that DAS forgo the civil service hiring process (as noted in recommendation 6.5).
In the event that DAS is unable to hire additional ASOs for an extended period of time, it is recommended that DAS partner with local organizations that are active in loose dog capture (as noted in recommendation 2.5).
17 This was determined by finding the median salary of a comparable position on the Texas Tribune Salary Explorer, and then applying an extra 20% to that salary to account for benefits.
BCG Strategic Recommendations to Improve Public Safety and Animal Welfare in Dallas 2016
45
2.2 DAS should increase ASO field intake
Rationale: On average, one DAS ASO brings in ~284 dogs a year,18 which is approximately 73 fewer than comparable animal control units. Cities with high intake per ASO include Phoenix (Maricopa County) and San Antonio, where annual dog intake per ASO is 551 and 500, respectively.
DAS could make several changes to increase ASO intake. By implementing the following tactics, it is believed that ASOs can increase their intake level to 357 dogs per ASO per year, which is the average field intake for ASOs from comparable cities.
1) Improve 311 processes. 311 dispatch and operators are a pain point for ASOs. Calls are sometimes miscategorized as high priority or lack sufficient information for ASOs to respond. Approximately 30% of all priority 1 requests cannot be responded to because by the time an ASO arrives at the address there is no person, no animal, or no follow up contact information.xxxv As one DAS ASO commented, “Sometimes, I get to a Priority 1 call for Attack in Progress, and when I get there, there is no human, no dog, and no contact information for the recorded address. That call was probably a loose dog and not an attack. It shouldn’t have even been dispatched.” If the 311 operator and dispatcher could more effectively capture data, categorize requests, and dispatch requests, ASOs’ responses to calls could be more efficient. This can be achieved by revising the 311 scripts, increasing coordination between 311 and DAS, and/or bringing the 311 operator and dispatcher in house. Approximately half of benchmark cities have their own animal control call centers and the other half utilize the city's or county's general call center.xxxvi The 311 operator/dispatcher needs to develop expertise in animal-related calls and continuously improve the 311 animal-related script in order to more accurately classify requests and capture the information necessary for effective ASO response. We recommend DAS bring a four-person 311 request team in house to improve the 311 process.
2) Optimize 311 response mapping. Approximately 6% of ASO time is spent mapping out routesxxxvii on physical maps or on personal phones. (Historically, ASOs have been provided flip phones by DAS). 29% of time is spent driving between calls. By automating mapping, either on smartphones or through the mapping application in Chameleon, ASOs can minimize their time spent prioritizing calls, mapping routes, and driving, and instead focus more time on dog capture or community engagement. DAS has reported that it is in the process of sourcing smartphones, and we support these efforts.
3) Eliminate manual record keeping. Today, ASOs spend time recording 311 requests
18 This assumes 33 DAS ASOs collected 9,363 dogs in 2015.
BCG Strategic Recommendations to Improve Public Safety and Animal Welfare in Dallas 2016
46
and bite reports on paperxxxviii even though ASOs also enter their activities and outcomes in the Chameleon database. By streamlining data entry and relying on Chameleon as the definitive source of data, ASOs can eliminate time spent on manual recordings. Completely digitized records will also eliminate complexity in reporting and retrieving data. DAS has reported that it is in the process of digitizing more information, and we support these efforts and encourage that they be accelerated. The success of this outcome relies, in part, on the efficacy of DAS's technology systems.
4) Upgrade field connectivity to Chameleon. Chameleon software is used to dispatch officers and store all of their activity data. Often the computers in their trucks become dislodged from the docking station or disconnected from the Internet.xxxix One ASO reported “[We need] improved access to our primary operating system [Chameleon] while in the van. Most of the docking posts [in the vans] provide terrible connection to the system, causing numerous delays.”xl By improving field connectivity, DAS can eliminate ASO time spent waiting to upload notes or to determine their next 311 response.
5) Improve fleet and equipment management. Evidence suggests the fleet of DAS trucks has not been efficiently maintained, leaving trucks and equipment in disrepair. One DAS supervisor reported that the majority of trucks were overdue for maintenance and oil checks. As a result, on days when shifts overlap, there may not be enough trucks available for ASOs to drive. As one ASO noted, “Often vans are not working, poles are not working, and I have not been able to get new ones for quite some time.”xli If maintenance were done consistently on the trucks and equipment throughout the year, ASOs could increase the number of loose dogs captured.
6) Encourage ASOs with recognition and metrics. ASOs report feeling isolated from the rest of DAS staff. During staff meetings, field operations are reportedly excluded and ASO achievements in capturing dogs or issuing citations are not recognized. In order to better motivate and include ASOs in the operations, DAS should introduce metrics and recognition around dog capture and citations.
7) Require consistent schedules from ASOs. According to the DAS employee interviews, ASOs are able to miss work for extended periods of time without any consequences. One ASO pointed out that there are some officers “who refuse to work or come to work.” While we cannot verify this assertion, a larger share of ASOs vs. other DAS positions reported that poor individual performance is tolerated. DAS should ensure that ASOs maintain consistent schedules, especially during times when calls are most active.
Management at DAS has already initiated several changes to improve ASOs’ field intake. For example, more equipment, such as blowguns, has been ordered. New trucks with LED lights for night shifts have been budgeted and the efficacy of night shifts has been evaluated. Truck
BCG Strategic Recommendations to Improve Public Safety and Animal Welfare in Dallas 2016
47
inspections have been scheduled. In addition, DAS field supervisors have recently adjusted the ASO schedule to be two ten-hour shifts, ensuring that there are overlapping shifts during the times when there is the highest volume of 311 requests (Tuesday-Thursday from 1-5pm).
To be more in line with other cities, DAS should aim to increase field intake to 357 dogs per ASO per year, or an additional ~2,400 annual field intake, given the current number of ASOs (33) and current annual field intake. The estimated cost would be ~$168,000, which would cover salaries ($42,000)19 for two 311 dispatchers and two 311 operators. If DAS chooses to improve the 311 request process without bringing operators and dispatchers in house, it should use the $168,000 to support other efforts that would increase ASO efficiency.
2.3 The Dallas community should educate residents on both the dangers of
allowing dogs to run loose and the ways to avoid dog bites
Rationale: Today, community education efforts in Dallas are facilitated by the DAS CARE team and other volunteer organizations.
Currently, the CARE team that works 4 shifts a week, with the help of volunteers, the team visits 105 houses a day.20 This model is not a scalable solution to address the 173,598 households in southern Dallas. In fact, at the current rate it would require ~17 years for the DAS CARE team to reach each southern Dallas household twice.21 In order to reach each southern Dallas household twice within two years, the community needs ~8.5 times more manpower than the current CARE team today.
To reach the population in a timely manner, it is imperative that community organizations and volunteers take responsibility for community education efforts.
In the future, education efforts should emphasize the negative impact that loose dogs have on
the community (to encourage residents to restrain or confine their dogs). The community
should also be educated on ways to avoid dog bites (including proper handling of pets and
appropriate responses to loose dogs).
The goals of the education program should be to reduce the number of loose dogs on streets and increase community awareness of how to interact with dogs in a safe manner. There will not be any costs associated with this effort based on the assumption that the community will execute these responsibilities.
19 This was determined by finding the median salary of a comparable position on the Texas Tribune Salary Explorer, and then applying an extra 20% to that salary to account for benefits. 20 CARE team data from April – July 2016. 21 Pets for Life in southern Dallas suggests two touches per household.
BCG Strategic Recommendations to Improve Public Safety and Animal Welfare in Dallas 2016
48
2.4 The city of Dallas should make animal-related citations more effective
Rationale: If used effectively, citations encourage compliance with local animal ordinances. As one manager of animal services in a benchmark city claimed, “There is never a silver bullet, but our ‘animal-citation’ program is the best thing we have done.”xlii In order to ensure that citations are effective, they need to be easily issued and appropriately followed through.
Today, there are two types of animal citations: criminal and civil. Criminal citations can result in jail or warrants, while civil can result in a collection agency and bad credit.
Today, it is difficult to issue citations in Dallas, whether criminal or civil, for several reasons.
First, ASOs spend the majority of their time responding to 311 requests, and therefore have limited opportunity to patrol areas and proactively issue citations. 311 calls infrequently result in a citation because by the time an ASO arrives at the specified address, there are no people or dogs to be found—and an ASO must witness a violation in order to issue a citation.xliii If a citizen reports a dog confined in a car, for example, an ASO cannot issue a citation unless he or she witnesses the confined dog.
Second, appearing in court to defend criminal citations is time consuming (98% of all citations issued are criminal citations). On average, each officer spends one entire day each month in court, during which he or she could be responding to 311 calls or proactively patrolling a given neighborhood.xliv
Third, issuing civil citations takes a large amount of time. In 2012, DAS helped to initiate the change to allow ASOs to write civil citations, in part because civil citations do not require an ASO to attend court hearings. In order to issue a civil citation, an ASO must have a concrete court date to write on the citation, which can only be generated by the docket. Because the docket is shared by the entire Department of Code Compliance and can only be accessed by one person at a time, it can take more than an hour to receive a court date and complete a civil citation. As one DAS supervisor commented, “A few weeks ago, I was on the phone with an officer for two hours while I tried to enter the docket.”
Aside from the inefficiencies in giving citations, there are also issues with follow through. When citations are issued, they are rarely paid. Only 38% of all fines were paid in 2015. Most defendants simply do not respond to citations; 44% of all citations issued in 2015 were stuck in “initial arraignment,”xlv meaning the defendant did not respond to the citation.
While BCG did not have the necessary information to assess the number of repeat offenders, we support the execution of warrants against defendants with the highest number of outstanding citations.
To improve the process of issuing citations, the city of Dallas can take action in three areas.
● Increase the amount of time that officers patrol neighborhoods to issue citations more proactively
● Transition from issuing criminal citations to civil citations to minimize ASO time spent in court. In 2016, DAS ASOs started to implement civil citations more regularly
BCG Strategic Recommendations to Improve Public Safety and Animal Welfare in Dallas 2016
49
although still as a small percentage of total issued citations.
Invest in IT to create one docket for animal services, thereby minimizing the time needed to issue a citation (as of the writing of this report, DAS reported that they had initiated this change)
We also recommend the city of Dallas consider changing the citation court process to increase compliance with city animal ordinances and increase responsiveness to citations. Potential suggestions include:
● Including fines in a resident’s water bill
● Creating a dedicated animal court (as in San Antonio)
● Actively issuing warrants when fines go unpaid
We have not estimated a cost for these potential changes, but the primary cost drivers would be system enhancements to revise the docket and additional time spent by marshals and court personnel.
2.5. DAS should share loose dog service requests with organizations that actively
capture loose dogs
Rationale: DAS receives ~48,000 311 requests yearly, ~12,000 (24%) of which are loose dog calls that are not dispatched to ASOs.xlvi
At the same time, multiple private street rescue teams exist in Dallas, which based on BCG's Rescue and Animal Organization survey, rescued a reported ~6,000 dogs directly from the street in 2015.
We recommend that DAS share information about non-dispatched loose dog calls in real-time with street rescue organizations to augment DAS's field staff. This communication could be automated with a description of the dog, its location, and when it was last seen.
It should be noted that a clear memorandum of understanding would likely be necessary with these organizations and that all captured animals should be brought to DAS for the stray hold period.
Given volume of ~30 non-dispatched calls per day, this communication could be managed by DAS employees (e.g., field dispatch) until an automated solution is put in place. Accordingly, this initiative will incur no additional costs in the immediate future. We have not sized this opportunity which would be impacted by partner participation, speed of responding to loose dog sightings, and success rate of catching dogs. Implementing this recommendation would require a change in DAS’s technological capabilities and its current approach on active disclosure of data to the public, which we address in recommendation 5.1 below.
BCG Strategic Recommendations to Improve Public Safety and Animal Welfare in Dallas 2016
50
Recommendation 3 – Increase the number of positive outcomes for Dallas dogs, euthanizing only the sickest animals
DAS collects dogs daily through its field operations and, because it is an open admission shelter, must also accept every dog that residents of Dallas bring to its shelter. If all dog kennels are in use, DAS is forced to euthanize dogs in order to make space for new dogs that enter the shelter each day.22
By speeding up dog adoptions and transfers (e.g., reducing the average length of stay), DAS can free up kennel space and reduce its euthanasia rates.
The following initiatives will place thousands of dogs into positive outcomes and continue to increase DAS's live release rate for dogs which has already grown from ~30% in 2011 to ~60% in 2015.
These initiatives play a critical role in offsetting any temporary spike in field intake (recommendation 2) until a successful spay and neuter program (recommendation 4) results in lower intake.
22 The same is true of cats and other animals. It should be noted, however, that dog and cat kennels are not typically interchangeable.

BCG Strategic Recommendations to Improve Public Safety and Animal Welfare in Dallas 2016
51
3.1 DAS should enhance its digital marketing for both adoptions and transfers
Rationale: Digital marketing is an important tool that can be used by shelters to increase adoptions and transfers. Marketing materials showcase dogs available for adoption and highlight their unique characteristics. As one director of a successful city shelter commented, "All principles of retail marketing apply to adoptions."
Effective marketing, especially online pet profiles (photographs and descriptions of dogs), can significantly impact outcomes. One study found that high-quality online profiles can increase speed to adoption by ~40% compared to animals that have low-quality pictures or descriptions.xlvii Another study found that high-quality photos alone can lead to a ~63% decrease in the median days to adoption for a shelter dog.xlviii
DAS currently underutilizes digital marketing in two ways.
● DAS’s online content is not at its maximum scale or potential. Many pet profiles have poor photos (or missing photos) and do not include unique descriptions for each dog.
BCG Strategic Recommendations to Improve Public Safety and Animal Welfare in Dallas 2016
52
● DAS does not fully take advantage of external websites that can expose rescue organizations and adopters to its dogs, including Petfinder, Pet Harbor, and Facebook. Currently, not all dogs are searchable on Petfinder and only ~10%xlix of dogs are posted to the Dallas Dogs In Need of Transfer Facebook page, a page maintained by a DAS volunteer. In addition, DAS’s website does not feature pet profiles.
We recommend DAS feature high-quality photographs and unique descriptions in its pet profiles and make better use of complementary websites.
By improving its pet profiles (especially by taking good photographs and posting them on more websites), DAS has the potential to increase positive outcomes by ~3,200 assuming that improved profiles increase positive outcomes by 20%l and dogs posted to Facebook have an LRR 28% higher than those that aren't.
To achieve this aggregate ~3,200 positive outcomes, a ~$60,000 initial investment is necessary for an IT system upgrade. Anecdotally, the internet and computers at DAS are prohibitively slow. An additional ~$338,000 in recurring costs will also be required to cover:
● Additional spay and neuter surgeries and vaccinations (all adopted dogs receive spay and neuter surgery and vaccinations) at $96 per adopted dog (~$192,000)23
● The ~2.8 employees needed to create pet profiles by taking good photographs, writing good descriptions, and posting them to the necessary websites (~$101,000)24
● The two staff that will give additional customer service to adopters as they visit the kennels (~$42,000)25
● The equipment needed to improve dog profiles, such as cameras and laptops (~$4,000)
3.2 DAS should increase adoption footprint
DAS should tailor its adoption program to meet consumer needs and preferences. Accordingly, DAS should ensure that its locations and hours of operation provide sufficient adoption opportunities within the community.
There are several opportunities for DAS to enhance its retail effectiveness.
23 The $96 includes $28 for veterinary labor and $68 for consumables, such as supplies. The cost to DAS for a spay/neuter surgery will differ from the cost needed to provide a low-cost spay/neuter surgery to the community. 24 This was determined by finding the median salary of a comparable position on the Texas Tribune Salary Explorer, and then applying an extra 20% to that salary to account for benefits. 25 This was determined by finding the median salary of a comparable position on the Texas Tribune Salary Explorer, and then applying an extra 20% to that salary to account for benefits.
BCG Strategic Recommendations to Improve Public Safety and Animal Welfare in Dallas 2016
53
3.2.1 Expanding its retail presence via an additional adoption location
Rationale: Today, in partnership with PetSmart Charities, DAS manages an “Everyday Adoption Center” (EAC), a retail store located in a North Dallas PetSmart. This facility has 18 kennels available for dog adoption (compared with 118 kennels at the main DAS facility in Westmoreland).li Though it is just 15% of the size, the EAC is responsible for 25%lii of all DAS adoptions.
There are many reasons why the EAC is successful. The EAC facility was purposefully designed for retail adoption by a leading national retailer, and it features spacious open kennels, multiple viewing areas, and a socialization room for potential adopters to connect with dogs. The EAC site is also located in northern Dallasliii—an area that needs to "import" dogs due to higher levels of spay and neuter surgeries and lower in-community birth rates.
Expanding DAS’s retail presence by opening another adoption location, in partnership with PetSmart or another organization, could significantly boost DAS’s adoption rate.
Because a new adoption location may not be as effective as the current EAC facility (which facilitates 1,736 dog adoptions per year),liv we conservatively estimated 75% of current volume. Even at 75% of current performance, a new adoption location could result in a projected ~1,300 dog adoptions per year.
Assuming the existing partnership through DAS and PetSmart Charities could be replicated either with a PetSmart or another retail partner, the cost of operating an additional adoption facility would average ~$425,000 per year. This cost includes labor necessary for operation, as well as $9626,lv cost to prepare each of the 1,300 dogs for adoption (e.g., spay and neuter surgery and vaccines). The construction costs of the additional facility would be incurred by a retail partner, as is in line with the cost structure of the current EAC site.
3.2.2 Expanding its retail presence via extended adoption hours
Rationale: DAS currently operates its Westmoreland Adoption Center for 50 hours each week, Monday through Saturday, 11:00am - 6:30pm, and Sunday 12:00pm - 5:00pm. In 2015, DAS facilitated 6,406 animal adoptions with these hours of operation.lvi,27
Through analysis of the adoption hours and adoption volume of other animal services agencies across the US, we found that approximately four animals are adopted for each additional hour that an adoption center is open.28
26 The $96 includes $28 for veterinary labor and $68 for consumables, such as supplies. 27 Excluding adoptions from the EAC facility. 28 This analysis included a regression of adoption hours on animals adopted from other animal service agencies.
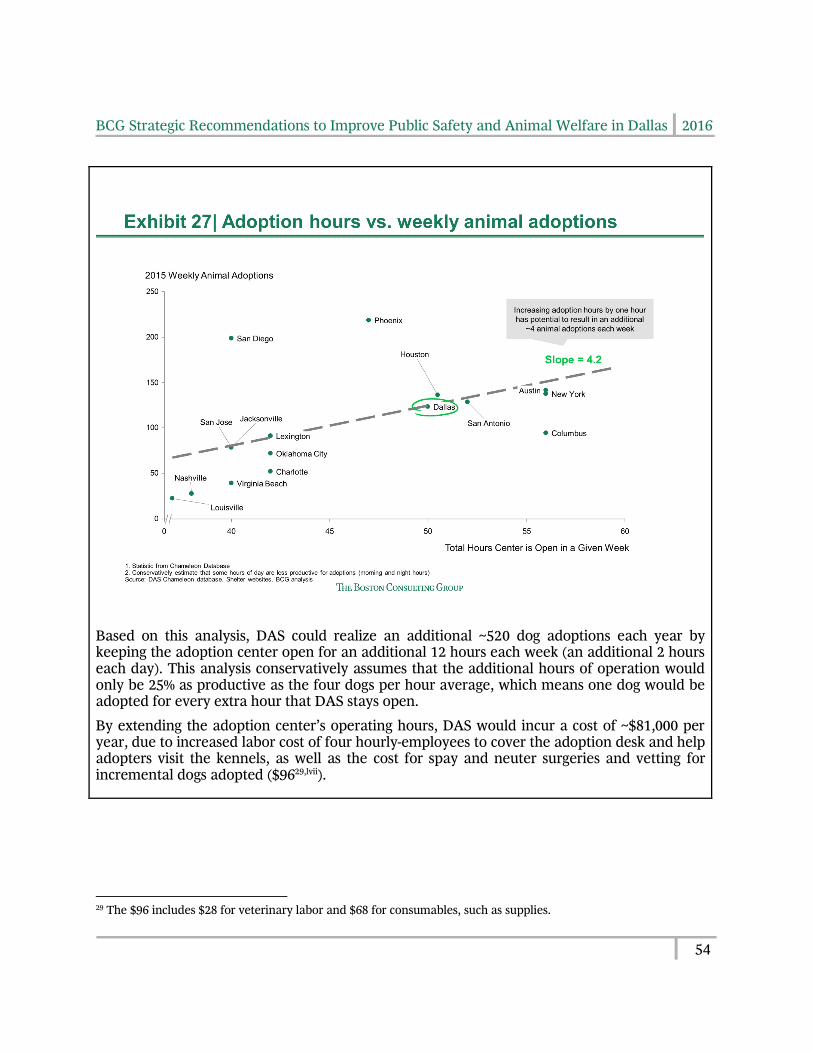
BCG Strategic Recommendations to Improve Public Safety and Animal Welfare in Dallas 2016
54
Based on this analysis, DAS could realize an additional ~520 dog adoptions each year by keeping the adoption center open for an additional 12 hours each week (an additional 2 hours each day). This analysis conservatively assumes that the additional hours of operation would only be 25% as productive as the four dogs per hour average, which means one dog would be adopted for every extra hour that DAS stays open.
By extending the adoption center’s operating hours, DAS would incur a cost of ~$81,000 per year, due to increased labor cost of four hourly-employees to cover the adoption desk and help adopters visit the kennels, as well as the cost for spay and neuter surgeries and vetting for incremental dogs adopted ($9629,lvii).
29 The $96 includes $28 for veterinary labor and $68 for consumables, such as supplies.
BCG Strategic Recommendations to Improve Public Safety and Animal Welfare in Dallas 2016
55
3.3 DAS should increase volume through its transfer program
Rescue organizations are vital partners for a city shelter to maintain a high LRR. In many cities, shelters depend on rescue organizations, or transfer partners, to place a considerable amount of dogs into new homes. As one director of animal services advised, “befriend rescue groups. You have to make them your partners.” DAS can better leverage the resources and capacity of rescue partners to transfer more dogs and increase LRR rates.
Both DAS transfer records from Chameleon and BCG's Rescue and Animal Organization Survey confirm the rescue organization landscape is concentrated in Dallas. For example, 10 partners were responsible for 70% of all DAS transfers in 2015 while 100+ were responsible for the remaining 30%. In the greater Dallas-Fort Worth area, three large rescue organizations are responsible for the majority of dog intake, but these same organizations only pull 2% of their dogs from DAS. Refer to Exhibits 13 and 21 for more detail.
The following initiatives identify opportunities to enhance transfer partnerships and better leverage the capacity that they have to offer, especially the capacity of the larger partners
3.3.1 Establishing a "transfer-on-intake" program with a single high-volume partner
Rationale: In benchmark interviews with other cities, a key success factor needed to increase LRR was a high-volume rescue partner. As one animal services agency director commented, “We would never have the same [LRR] rate that we do if it weren’t for our rescue partners.”
In addition, many municipal shelters have found that immediately transferring animals on intake to a partner helps to ensure that adoptable animals remain healthy, while also freeing up capacity. One large transfer said, “We would prefer to have the animals before they ever have to enter a municipal shelter.”
Such immediate transfers have a drastic impact on average length of stay, reducing it to zero days for the affected population of dogs.
Therefore, the potential exists for DAS to develop its own "transfer-on-intake" program with a high-volume partner. This partner would commit to pulling a minimum number of dogs annually (e.g., 1,000 – 3,000). In return, the partner would typically be allowed to tag and immediately pull any dog it chooses, before the dog technically enters the DAS shelter. The legal hold would still apply to these dogs, as 10% of all DAS dogs are eventually returned to their owner (40% of all microchipped loose dogs are returned and 6% of unchipped loose dogs are returned). The partner's shelters would coordinate with DAS to track legal holds and circulate the location of dogs in the event that an owner is looking for his or her dog. Each dog can still be photographed on intake and uploaded into the Chameleon database, making it easier for owners to locate lost pets. Finally, such rapid transfers would typically qualify as an intake and transfer, benefiting any LRR reporting by DAS.
By developing a "transfer-on-intake" program with a high-volume partner, DAS could transfer
BCG Strategic Recommendations to Improve Public Safety and Animal Welfare in Dallas 2016
56
an additional ~1,000 dogs per year before the dogs enter the DAS shelter, while still contributing positively to DAS's LRR. This estimate is based on existing partnerships across comparable cities.
This program could be established at no additional cost to DAS. There would be minimal work added to the transfer's current responsibilities (e.g., communicating with large transfers). The cost of transportation to the partner's shelter is typically incurred by the transfer.
3.3.2 Segmenting transfers by size and support
Rationale: While rescue organizations have an altruistic mission, the number of animals they take from a given shelter and the number of animals they subsequently place in homes can be increased through proper management of these partnerships. Relationships between the rescue organizations (also referred to as transfers) and DAS are managed by DAS's transfer.
Today, 90% of the transfer's day is spent answering questions from transfers about dogs, or tagging and pulling dogs on behalf of partners.lviii As a result, there is little time to proactively cultivate relationships with partners.
According to respondents from the Rescue and Animal Organization Survey, DAS has already established solid relationships with transfers. 67% of survey respondents agreed that DAS is "helpful and supportive of their work," and multiple respondents pointed to the transfer as someone who is "amazing" and "good to work with."
However, there is still room for improvement. Although 50% of rescue partners "strongly agree" or "agree" that they are satisfied with DAS, 26% "strongly disagree" or "disagree." Improved relationships between DAS and its transfers has a tangible benefit in that the most satisfied partners pull a larger percentage of dogs from DAS (versus other city shelters).lix If DAS can better support its transfers and increase satisfaction, it can increase the number of dogs transferred.
To increase satisfaction, DAS should first hire an additional transfer who is responsible for proactive relationship management. This coordinator should focus at least half of his or her time on developing relationships and addressing the needs of the ~15 largest partners as they have the potential to pull the majority of DAS transfers. The relationships with larger partners will require the transfer to tailor DAS services to each partner’s individual needs (e.g., expediting their pulling process, answering questions on dogs immediately).
The additional transfer should spend the remaining time developing relationships with the 100+ small partners and addressing common needs. Rather than tailor services to each partner, DAS can improve these relationships overall by streamlining processes and holding monthly meetings where all partners can be heard.
One change in particular that can streamline communication with smaller transfers is
BCG Strategic Recommendations to Improve Public Safety and Animal Welfare in Dallas 2016
57
automating tagging. Today, a transfer can tag, or claim, a dog by directly emailing the DAS transfer. The coordinator checks whether the dog is still at the shelter, alerts the adoption desk, and ensures that the dog is entered in Chameleon. The process of tagging and pulling dogs takes up ~50% of the transfer's time today. It’s time consuming and also more likely for human error. Mistakes and inefficiencies in the tagging process can undermine relations with transfers and with the public. If an email is missed, or a tag is entered incorrectly, a dog may be euthanized before the mistake is discovered.
DAS can automate the tag by enabling transfers to tag immediately and online through the Chameleon database. This would eliminate error, eliminate transfer time spent on manual tasks, and increase satisfaction of transfers. 44% of all respondents from the Rescue and Animal Organization Survey said they would be more likely to transfer dogs from DAS if the process for tagging/reserving dogs was improved.
If DAS can better support its transfers, it will increase partner satisfaction and increase the number of dogs transferred from DAS by an estimated 570 each year. An additional transfer will be necessary to build these relationships and will require approximately $51,000lx in annual salary. There is not an incremental spay and neuter cost associated with transfers.
3.4 DAS should establish a pet transport program to facilitate out-of-state
adoptions
Rationale: Pet transport, the process of transporting pets from one city to another, connects adopters in areas with a dearth of animals (many northern cities) with shelters in areas with excess animals (many southern cities like Dallas). Roughly 12,000-14,000 dogs and cats are transported by major pet transport companies each year,lxi primarily through ground transportation (e.g., trucks, cars, vans).
Today, DAS does not operate a systematic out-of-state transport program; however, their peers do participate in pet transport programs. The Houston BARC foundation, for example, partners with a Houston nonprofit to transport pets each week from Houston to Colorado. BARC’s initial agreement was to transport at least 50 animals to Colorado each week (~2,500 annually).lxii Miami Animal Services also operates an out-of-state pet transport program, transporting nearly 20 animals out-of-state every week (~1,000 annually).
Establishing an out-of-state dog transport program would require DAS to hire one additional program supervisor focused on transport coordination. It would also require DAS to either establish, or partner with, a foster home network in the Dallas area. The foster network is a necessary program requirement because interstate pet transport regulations dictate that dogs must to have a two-week stay out of the shelter prior to transport.
By developing a structured transport program, DAS can achieve an additional ~900-2,000 adoptions each year. The impact of the transport program depends upon the scale of the foster network. An established network of ~100 foster homes, each fostering one dog at a time

BCG Strategic Recommendations to Improve Public Safety and Animal Welfare in Dallas 2016
58
with two-week turnover throughout the year (20 “turns” each year) would support up to ~2,000 transported dogs. However, a less robust network of 60 fosters, each fostering two dogs at a time and participating in 15 “turns” throughout the year, would support a more conservative ~900 transported dogs.
A structured transport program would cost approximately $156,000 - $285,000 each year. This includes the cost of hiring an additional transport coordinator (approximately $51,000 salary),30 two weeks of dog food during foster care (~$21 for total cost of ~$19,000 - $42,000),31 and incremental medical costs associated with spay and neuter surgeries and vetting for adopted dogs (~$96 each for a total of ~$86,000 - $192,000).32,lxiii As is common in other cities, volunteers can be used to help the transport coordinator manage program logistics.
3.5 DAS should deflect owner surrenders through owner assistance programs
Rationale: Deflection programs, such as the ASPCA’s “Project Safety Net,” encourage owners to keep their dogs instead of surrendering them to the shelter. This keeps dogs from ever entering the shelter, freeing kennel capacity. Given that DAS has a limited number of dog kennels, there is a direct correlation between kennel capacity and euthanasia rates.
In a survey of owners surrendering their pets to DAS, the most common reasons for surrendering an animal were: not having a yard suitable for a dog (24%), lack of time to care for a dog (24%), and not having enough money to care for a dog (21%).lxiv A deflection program can provide support to Dallas dog owners, enabling them to keep their animals, reduce the strain on the shelter intake system, and increase the overall rate of positive dog outcomes.
Survey responses also revealed that approximately 37% of all surrendered dogs could be deflected if owner aid were available.lxv Specifically, 12% of owners would keep their dog if provided with resources for a temporary home for their pet, 9% would keep their dog if provided resources to cover routine veterinary care costs, 7% would keep their dog if provided with pet behavior training, and 5% would keep their dog if provided with support for a dog run or fence.
Based on the statements of Dallas residents responding to the survey, a program to support owners has the potential to keep up to ~2,600 dogs from entering the shelter each year (based on 2015 volume). The cost of instituting a surrender deflection program is expected to be ~$26,000lxvi per year which includes the salary for an additional 0.5 DAS employee to coordinate the program and connect owners with community resources.
It is assumed that assistance with resources, such as dog runs, pet food, or veterinary care, can
30This was determined by finding the median salary of a comparable position on the Texas Tribune Salary Explorer and then applying an extra 20% to that salary to account for benefits 31 By comparison, caring for a dog at DAS costs ~$15/day and takes up kennel space, which can contribute to euthanasia when space for new animals is unavailable. 32 The $96 includes $28 for veterinary labor and $68 for consumables, such as supplies.

BCG Strategic Recommendations to Improve Public Safety and Animal Welfare in Dallas 2016
59
be provided by existing animal welfare organizations already providing these services to the community. For example, an owner intending to surrender a dog due to the price of dog food could be directed to the North Texas Pet Food Pantry, which offers dog food to those in need.
3.6 DAS should provide enhanced behavior training to increase adoptability of
dogs
Rationale: Studies show dogs that receive behavior training are 1.4 times more likely to be adopted than dogs that do not.33,lxvii DAS does not currently have a dog behavior program.
There is an opportunity for DAS to institute behavior training courses for a subset of its dog population in order to increase adoption volume. Based on interviews with other shelters and senior DAS management, we recommend that DAS consider both treatable-rehabilitatable (TR) and treatable-manageable (TM) dogs as candidates for these programs. Based on 2015 numbers, this would amount to approximately 15,400 dogs eligible for behavior training.
Providing behavior training to 15,400 dogs would result in 700-1,300 additional dogs adopted each year. According to Chameleon records, behavior was cited as the reason for euthanasia in 50% of euthanized TR and TM dogs.34 We also assume that training courses would make these dogs 1.4 times more likely to be adopted. Dogs will start training immediately in the shelter. Once they are adopted out, they will be given vouchers to continue their training.
Providing behavior training to this group of ~15,400 TR and TM dogs would incur a cost of ~$392,000 - $770,000 each year. The cost of providing behavior training classes to all TR and TM dogs at DAS would range from ~$21 - $42 per dog. The cost for spay and neuter surgeries and vetting for 700-1300 additional dogs would be ~$96 per dog. 35, lxviii Behavior training would comprise ~75% of the total cost to implement.
3.7 DAS should hire one veterinarian and two vet techs to perform spay and
neuter surgeries and vaccinations to support the increase in dog adoptions
Rationale: DAS is legally required to spay and neuter and vaccinate all of its dogs adopted by the public, and recommendation 3 will lead to a substantial increase in adoptions (up to ~7,100). To keep up with demand, DAS will need to hire an additional veterinarian and two
33 As stated in "The Effects of Training and Environmental Alterations on Adoption Success of Shelter Dogs," there is a 77% adoption rate for trained dogs vs. 56% adoption rate for untrained dogs. 35 The $96 includes $28 for veterinary labor and $68 for consumables, such as supplies.
BCG Strategic Recommendations to Improve Public Safety and Animal Welfare in Dallas 2016
60
veterinary technicians to perform these surgeries each year.
Assuming this team can perform at maximum ~8,000 surgeries each year, the total cost would be $200,000, with the veterinarian receiving a salary of $100,000 and each veterinary technician receiving a salary of $50,000.lxix
These labor costs ($28 per surgery36), along with consumable costs ($68 per surgery), have been allocated to the individual initiatives to cover all incremental spay and neuter surgeries and vetting required in recommendation 3 ($96 per surgery).
36 Recommendation 3 will result in an additional ~7,100 dog adoptions. We allocated a $200,000 salary to cover these 7,100 surgeries, which amounts to approximately $28 per surgery.
BCG Strategic Recommendations to Improve Public Safety and Animal Welfare in Dallas 2016
61
Recommendation 4 – Provide 46,000 low-cost spay and neuter surgeries in southern Dallas each year for next three years
Population control is critical to achieve a long-term, sustainable solution for the city of Dallas, where today approximately 36,000 puppies are born annually. In cities that have achieved high spay and neuter levels, shelter intake tends to fall over time, reducing shelter utilization and increasing the LRR. Population control also serves to protect public safety, given that intact male dogs account for 70 - 75% of bites.lxx lxxi
4.1 The Dallas community should provide 46,000 low-cost spay and neuter
surgeries in southern Dallas for each of the next three years
Rationale: Today, only ~15% of dogs in southern Dallas are believed to be spayed or neutered.lxxii With such low spay and neuter levels, and dogs’ ability to reproduce quickly, the southern Dallas dog population could, in theory, double to ~300,000 dogs over the next 10 years if no other intervention occurred.
Some of the largest consumer barriers to spay and neuter surgeries are pricelxxiii and access. Today, ~40% of southern Dallas residents live in poverty,37 and the average ~$150 cost of spaying or neutering a pet would likely strain a family's finances. Similarly, ~74% of pets in southern Dallas have never gone to a veterinarian for a check-up or treatment.lxxiv
To overcome low spay and neuter levels, a series of non-profits in Dallas have delivered ~6,000 low-cost spay and neuter surgeries annually within southern Dallas over the past few years. These organizations include DAS, the Spay Neuter Network, the Dallas Companion Animal Project, Pets for Life, the SPCA, and were funded, in part, by the Big Fix for Big D. Separately, DAS has delivered an incremental ~3,500 free spay and neuter surgeries annually through the adopted dogs it has placed into southern Dallas.lxxv
Because "access" or "convenience" is a typical barrier to having one's pet spayed or neutered, these organizations have used both brick-and-mortar locations (where transport is provided) as well as mobile units.
Based on BCG projections, the historical volume of low-cost spay and neuter surgeries deployed has slowed the population growth of intact dogs in Dallas, but the dog population is still rising each year. To control the dog population in southern Dallas, it will require a surge effort of 46,000 low-cost spay and neuter surgeries each year for the next three years (equivalent to 35 surgeries per thousand residents).
37 We used asset poverty as a proxy for the poverty line, which is when families cannot support their households at poverty level for three months if they lose their income.
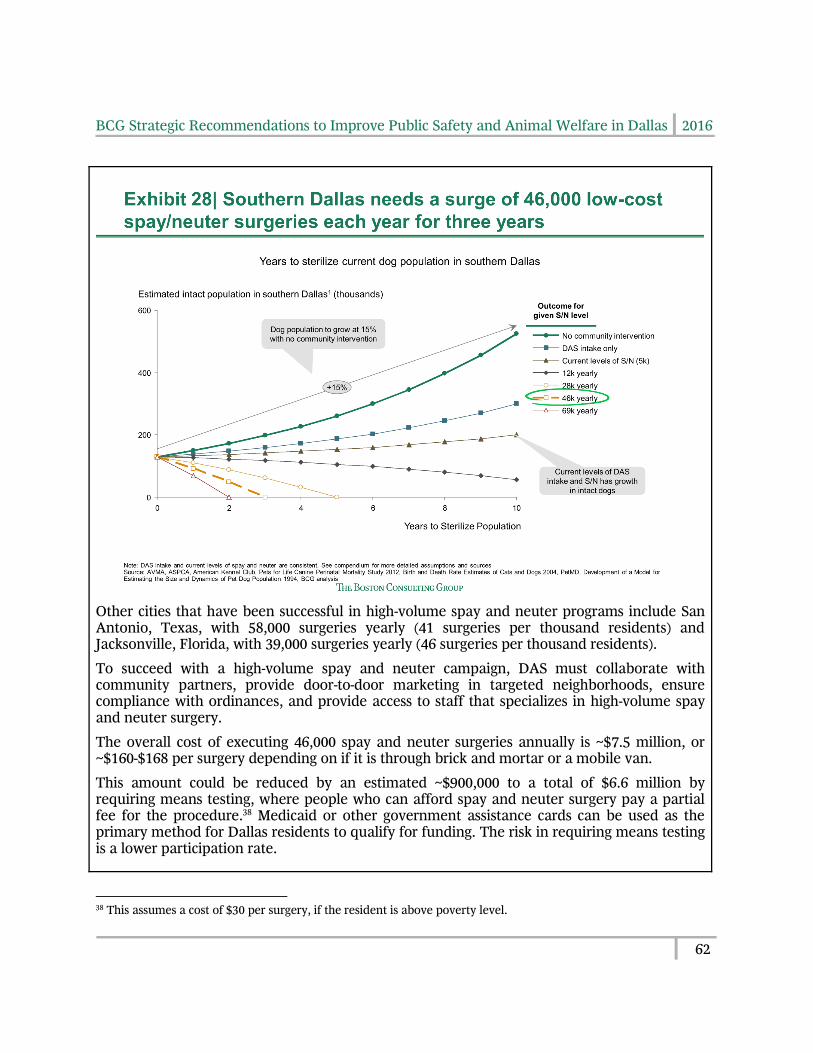
BCG Strategic Recommendations to Improve Public Safety and Animal Welfare in Dallas 2016
62
Other cities that have been successful in high-volume spay and neuter programs include San Antonio, Texas, with 58,000 surgeries yearly (41 surgeries per thousand residents) and Jacksonville, Florida, with 39,000 surgeries yearly (46 surgeries per thousand residents).
To succeed with a high-volume spay and neuter campaign, DAS must collaborate with community partners, provide door-to-door marketing in targeted neighborhoods, ensure compliance with ordinances, and provide access to staff that specializes in high-volume spay and neuter surgery.
The overall cost of executing 46,000 spay and neuter surgeries annually is ~$7.5 million, or ~$160-$168 per surgery depending on if it is through brick and mortar or a mobile van.
This amount could be reduced by an estimated ~$900,000 to a total of $6.6 million by requiring means testing, where people who can afford spay and neuter surgery pay a partial fee for the procedure.38 Medicaid or other government assistance cards can be used as the primary method for Dallas residents to qualify for funding. The risk in requiring means testing is a lower participation rate.
38 This assumes a cost of $30 per surgery, if the resident is above poverty level.
BCG Strategic Recommendations to Improve Public Safety and Animal Welfare in Dallas 2016
63
The cost of the program could also be reduced by an additional estimated $2 million to a total of ~$4.6 million by using salaried veterinarians vs. a pay-per-surgery fee structure on top of means testing, if available in the area. A pay-per-surgery approach can be expedient, given the limited supply of high-quality and high-speed surgeons available to provide such programs.
4.2 Animal welfare organizations in Dallas should coordinate spay and neuter
efforts
Rationale: Today, no single organization in Dallas is capable of delivering 46,000 spay and neuter surgeries annually. To successfully deliver these surgeries, organizations across the community will need to divide the workload by agreeing to individual targets, coordinating delivery across the city as part of an integrated plan, and sharing data to track progress and prioritize efforts.
To begin this process, interested organizations should hold a summit to determine the gaps between what exists today and what is needed to deliver 46,000 surgeries. Armed with this information, these organizations should form a coalition with a common brand, mission, and a well-defined operating agreement or memorandum of understanding, including a detailed account of individual commitments to deliver a specific number of spay and neuter surgeries.
Next, this coalition should agree on an initial set of zip codes39 to target, defining clear goals, end points and a schedule or timelines to achieve these. Having this set of goals, end points, and a well-defined timeline will give funders the confidence they need to provide any missing resources.
As a starting point, BCG recommends delivering the following number of surgeries in these southern Dallas zip codes.
39 In place of zip codes, the coalition could also focus on census tracts or any other means of subdividing Dallas into discrete plots of land.
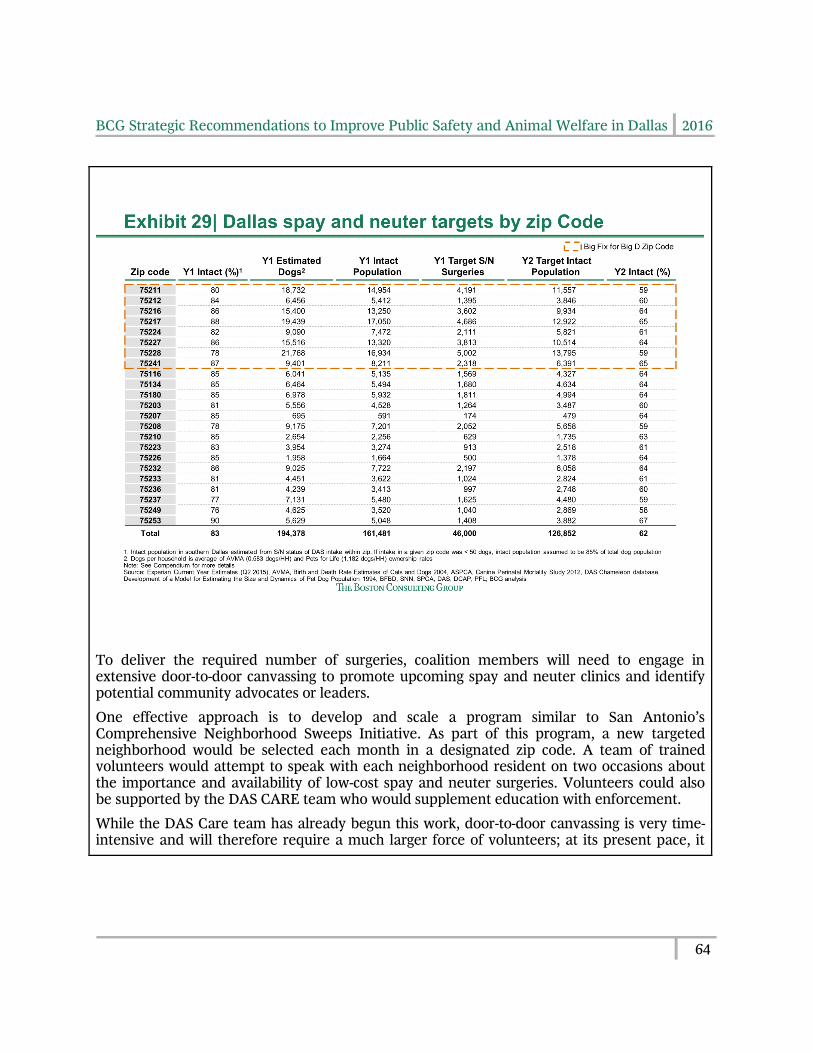
BCG Strategic Recommendations to Improve Public Safety and Animal Welfare in Dallas 2016
64
To deliver the required number of surgeries, coalition members will need to engage in extensive door-to-door canvassing to promote upcoming spay and neuter clinics and identify potential community advocates or leaders.
One effective approach is to develop and scale a program similar to San Antonio’s Comprehensive Neighborhood Sweeps Initiative. As part of this program, a new targeted neighborhood would be selected each month in a designated zip code. A team of trained volunteers would attempt to speak with each neighborhood resident on two occasions about the importance and availability of low-cost spay and neuter surgeries. Volunteers could also be supported by the DAS CARE team who would supplement education with enforcement.
While the DAS Care team has already begun this work, door-to-door canvassing is very time-intensive and will therefore require a much larger force of volunteers; at its present pace, it
BCG Strategic Recommendations to Improve Public Safety and Animal Welfare in Dallas 2016
65
will take ~17 years for the four-person CARE team to effectively reach each household twice in southern Dallas.40
During canvassing, detailed data should be collected on a household basis to prioritize follow-up visits. This might include the address, dog ownership, spay or neuter status, historical litters, loose dog sightings, etc. Today, multiple organizations that perform door-to-door outreach already collect this information; however, collection should be standardized and shared across organizations to improve the efficiency of follow-up outreach.
Target neighborhoods within the designated zip code should be canvassed until the coalition achieves its objectives (e.g., by delivering surgeries or increasing spay and neuter levels). Once these objectives have been achieved, the coalition should select a new zip code and begin the effort again.
During this process, zip codes should be constantly reprioritized based on any and all available data, and community advocates should be engaged to ensure that any continuing needs for spay and neuter surgeries in these neighborhoods are met.
4.3 The city of Dallas should establish elementary school education programs
related to pet ownership
Rationale: Changing fundamental cultural habits can take an entire generation or more, as has been seen with recycling and seatbelt use.
Today, Dallas has no education programs to teach children about responsible pet ownership, which makes it unlikely that tomorrow's pet owners will behave differently in the future.
Conversely, other US cities have been successful in implementing school-based animal education programs targeted at young children. Santa Fe, New Mexico, for example, is home to one of the nation's leading animal education programs. Animal Protection of New Mexico (APNM) and Santa Fe Public Schools jointly developed a program called "The Animal Connection" in order to deliver animal education in schools. Started in 2011, this program delivers expert instruction in animal care and instills positive behaviors around pet ownership to elementary school children.lxxvi The instruction is delivered by dedicated teachers, with assistance from APNM ASOs and shelter animals, and it engages students through both interactive exercises and fact-based discussions.
Dallas has the opportunity to develop its own animal education program focused on children enrolled in Pre-K through 8th grade. Rather than developing its own curriculum, the Dallas Independent School District (DISD) could leverage existing curriculum from New Mexico. In addition to providing education to students and preparing the next generation of responsible
40 There are 173,598 households in southern Dallas and Pets for Life suggests two touches per household are required before a resident agrees to spay or neuter an intact animal. This assumes the CARE team visits approximately 105 houses per month (which was the average for CARE teams between April – July 2016).
BCG Strategic Recommendations to Improve Public Safety and Animal Welfare in Dallas 2016
66
pet owners, this curriculum could also be used as an opportunity to deliver material to students on low-cost spay and neuter programs that they or their parents could immediately benefit from.
DISD has 152 primary schools41 with ~118,000 students.lxxvii By hiring six full-time teachers to deliver this program, DISD could reach ~6,000 students each year ensuring each student is able to receive each lesson at least once.
Assuming a fully-loaded salary of $66,000 for each of the six teachers, the total cost for this program would be $396,00042 per year.43 This recommendation is a long-term option that will require lead time in order to fund, implement, and see results.
4.4 DAS should enforce spay and neuter ordinances in coordination with outreach
Rationale: ASOs can promote spay and neuter outreach to residents that are not in compliance, while enforcing spay and neuter ordinances. Today, ASOs do issue citations regarding spay and neutering, and at the same time, disseminate flyers regarding available low-cost spay and neuter options.
From June 2014 – May 2016, 406 spay and neuter citations were issued and 199 received no response (49%). That equates to one spay and neuter citation being acknowledged every three days. ASOs should more actively enforce spay and neuter ordinances, but also balance their messages by offering support (as is current practice). If a dog owner is not in compliance, ASOs can educate the owner on the mandatory requirement for and the benefits of sterilization, provide the owner with low-cost spay and neuter options, and offer the opportunity for the owner to become compliant within a certain timeframe before issuing a citation.
This approach has been successful in San Antonio’s Comprehensive Neighborhood Sweeps Initiative. The first week of outreach focuses on education. ASOs give warnings to ordinance violators and provide information on how to become compliant. In the second week, free vaccination clinics are provided. In the third week, citations are issued to violators.
41 Pre K – 8th grade. 42 This was determined by finding the median salary of a comparable position on the Texas Tribune Salary Explorer, and then applying an extra 20% to that salary to account for benefits. 43 As a point of clarification, this cost would be incremental to the DISD budget and would not be paid for out of the DAS budget.
BCG Strategic Recommendations to Improve Public Safety and Animal Welfare in Dallas 2016
67
Recommendation 5 – Create a collaborative community of partners
We believe that Dallas' loose dog and animal welfare challenges cannot be overcome without collaboration across the community.
Today, many organizations operate independently. There is no common plan or a common data set against which Dallas can measure community results. Our interviews highlighted a dissonance and negative dialogue amongst some animal welfare organizations that prohibit groups from collaborating.
We believe that if the city of Dallas is going to address its animal-related challenges, it must unite animal organizations and advocates in a collaborative community that includes increased data sharing, coordination of resources, and a greater level of trust and courtesy across organizations.
Data is critical to measuring impact and progress, evaluating the effectiveness of a given approach, and re-prioritizing future efforts. It can also provide transparency across organizations that create a greater sense of trust, understanding, and proof of value. Coordination of resources will be critical as no single organization in Dallas will be adequate to meet the breadth or scale of these responsibilities independently. And finally, trust will be critical to stay committed to the mission and strengthen organizational relationships.
5.1 DAS should work with CIS and other city departments to provide open access
to operating data and automated reporting
Rationale: Data transparency is beneficial to citizens, private organizations, and governments.lxxviii Open data creates trust and collaboration between governments and citizens, promotes greater innovation by providing the data sets necessary for innovation, provides access to critical information, and offers transparency and visibility to the public. Open data policies can provide these same benefits to DAS and its animal welfare community.
Today, DAS does not publish its Chameleon database online, beyond a set of monthly reports. As a result, citizens must file Open Record Requests (ORRs) in order to access more detailed DAS data. DAS responds to approximately 160 ORRs per year, some of which are specific to Chameleon.44 This requires time and effort from DAS in order to organize and respond to the ORRs, and these requests also prove frustrating to citizens who want ready access to DAS data.lxxix In addition to ORRs, residents often reach out to DAS to confirm the status of a specific animal, which requires manual effort on behalf of DAS employees.
By partnering with Communication Information Services (CIS) and other relevant city departments, DAS can open its data to the public by leveraging the existing Dallas Open Data Portal. Precedence for this model exists in other Texas cities. Austin, for example, makes its data available to the public, offering full datasets, standardized tables, and interactive maps.
44 This is the projected volume for ORRs in 2016.
BCG Strategic Recommendations to Improve Public Safety and Animal Welfare in Dallas 2016
68
By providing open access to its data, DAS would enable residents to directly access the information they need from the online database.
We believe open DAS data is an important tool to engage and promote greater transparency across the entire community.
The DAS database analyst can lead open data implementation. This position is open and funded, though it has not yet been filled. The database analyst would be responsible for making the Chameleon data available online, managing the connection between Chameleon and CIS, and assisting individuals in working with DAS data.
Because DAS will need a data analyst with experience in SQL and database management, the current budgeted Coordinator II: Data Analyst position at ~$42,000 is not likely to attract the right level of talent. This position should be elevated to a Manager II: Business position at ~$67,00045 in order to secure the right skill set (requiring a ~$25,000 increase in salary which translates to a $30,000 increase in budget, considering benefits).
5.2 The animal welfare community of Dallas should share the workload of the
strategic recommendations
Rationale: By coordinating efforts, the community can work together to tackle the strategic recommendations and reach its goals more quickly (especially for spay and neuter initiatives).
There are over 150 animal-related organizations in and around Dallas. These organizations range from low-cost spay and neuter clinics to foster organizations that temporarily house animals until they can be adopted, among many other functions. While each of these organizations does valuable work, there is significant overlap and a lack of coordination. Resources are not strategically orchestrated, where better coordination could increase efficacy.
In the words of one animal control department manager in a benchmark city, "The shelter didn't create the problem. It was created to fix the problem, but it can't do it alone." The director of a large animal nonprofit agreed: "Collective impact is the key to success." Indeed, collective efforts are often rewarded with temporary funds and grant money. For instance, funding for “Big Fix for Big D” was contingent on the commitment and participation of community partners. Best Friends Animal Society has also given grants to rescue organizations that collaborate with partners.lxxx
To leverage the resources and expertise of existing organizations, Dallas animal welfare organizations should identify common goals and clearly define responsibilities, pledging to a piece of a larger plan. By recognizing specialized strengths and experience, Dallas can increase
45 This was determined by finding the median salary of a comparable position on the Texas Tribune Salary Explorer, and then applying an extra 20% to that salary to account for benefits.
BCG Strategic Recommendations to Improve Public Safety and Animal Welfare in Dallas 2016
69
fundraising success for the overall animal welfare community.
To increase collaboration, we recommend hosting a preliminary workshop that allows organizations to make specific commitments that would be tracked by an overall project manager budgeted for in recommendation 6.3.
5.3 The animal welfare community of Dallas should engage in an inclusive, fact-
based dialogue
Rationale: As BCG completed nearly 100 interviews of relevant stakeholders in Dallas, a large portion of interviewees highlighted the existence of opposing factions in Dallas' animal welfare community and a history of public attacks across these groups and towards specific individuals or organizations.
Because we believe that our plan will not be successful without community support and collaboration, we recommend that the community attempt to engage in fact-based and solutions-oriented dialogue. Historically, examples of unproductive discourse can be attributed to many members of the community, including individuals, DAS employees/temps, members of non-profit organizations, and members of the Animal Shelter Commission.
While a cessation of negative opinion and discourse cannot be guaranteed across the public at large, we request the public at large to be solutions-minded and recommend DAS leverage standardized responses and hold its own employees to a higher standard for online conduct.
To demonstrate our perspective, we have identified common situations that have historically produced dialogue that we do not believe to be solution-oriented and serves to erode the relationship between DAS and the community.
Representative context Alternative (recommended) response
When DAS was accused of being "evil" for euthanizing a dog
"At DAS our goal is to not euthanize any animal that could be placed. We haven't achieved that goal yet, but we are making progress every day through expanded adoptions and transfers. Just like you, we don't like seeing any animals euthanized. To find out how you can help go to [link]"
Regarding DAS euthanizing animals
"When our facilities at DAS are full and we do not have transfers available to take the animals, we have the very difficult responsibility of deciding which animals are euthanized. We do this through a standard and defined process which you can view here [link]. In the future we hope that no animals

BCG Strategic Recommendations to Improve Public Safety and Animal Welfare in Dallas 2016
70
will be euthanized through expanded adoptions and transfers."
Regarding a private individual reporting to have saved many animals
"At DAS we know we can't save every animal. Your actions are helping the animals in our city. Thank you."
Regarding anti-DAS conversations
"Your opinion is important to DAS. We'd like to understand what policies and or procedures we could improve to better serve the community in the future"
Regarding loose dogs in Dallas "DAS has an obligation to the residents of Dallas. We take your safety seriously and are doing [A, B, C] to address these concerns."
The community, which includes animal welfare advocates, the public, and DAS, can build trust by fostering a fact-based, solutions-oriented dialogue.
DAS should proactively address mistakes or concerns from residents head-on, explain its policies directly (and often), and communicate its achievements (such as its increased adoption rate) as well as its strategic goals. Animal welfare organizations and advocates should reciprocate.
In addition, DAS should refine its social media policy to be similar to that of the Dallas Police Department to ensure that all employees are projecting a similar message, even when speaking under their personal accounts.
The DPD Section 214.04 reads, "Employees are free to express themselves as private citizens on social media sites to the degree that their speech and/or language does not impair working relationships of the Department, impede the performance of their duties, impair discipline and harmony among coworkers, or negatively affect the
public perception of the Department."lxxxi
There should be no additional cost to creating an open, fact-based dialogue, as the effort can be led by the social media coordinator or, if DAS becomes an independent municipal department (recommendation 6.1), by an additional communications/public information officer.
BCG Strategic Recommendations to Improve Public Safety and Animal Welfare in Dallas 2016
71
Recommendation 6 – Make animal services a priority and strengthen accountability within the city government
The structure of an organization first, defines the environment in which its people and processes are organized and second, defines the individuals that participate in the decision-making process.
With respect to Dallas Animal Services, its organizational structure as a subsidiary of the Department of Code Compliance impacts its visibility (e.g., reduced access to Council), muddles accountability (e.g., more layers of management), and lessens its perceived status (e.g., of lower priority than Code).
Organizational design also encompasses advisory boards, a similar function to today's Animal Shelter Commission. In a typical private or nonprofit landscape, such organizations play an important role in providing both advice and oversight or accountability to the larger organization.
To increase the efficacy of Dallas Animal Services, we recommend several changes to its current organizational structure.
6.1 DAS should move out from under the Department of Code Compliance and
become an independent municipal department
Rationale: Today, DAS is a municipal organization underneath the Department of Code Compliance which itself reports into the Assistant City Manager responsible for Dallas's "quality of life" portfolio of departments.46
Through the course of BCG's stakeholder interviews, individuals pointed out that DAS’s organizational placement within the Department of Code Compliance impacts three areas:
● Resources and Talent
● Communication and Coordination
● Execution and Accountability
46 This includes the Department of Code Compliance, Dallas Public Libraries, the Office of Cultural Affairs, and Sanitation.
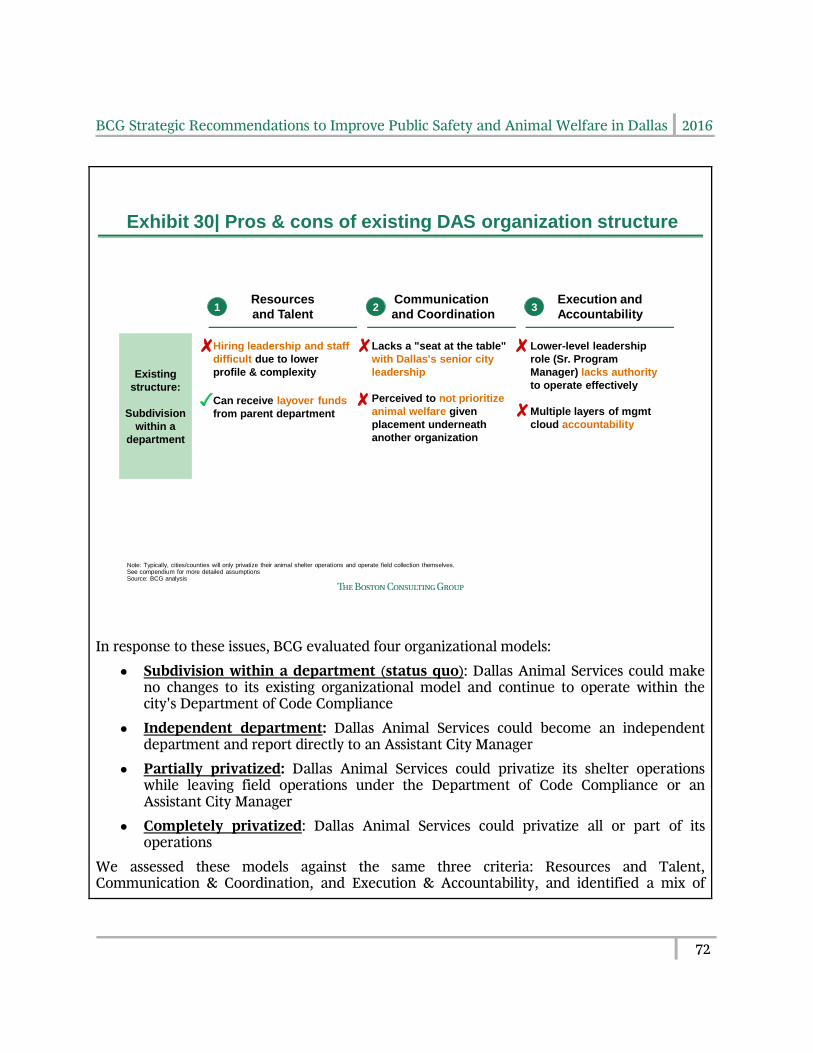
BCG Strategic Recommendations to Improve Public Safety and Animal Welfare in Dallas 2016
72
In response to these issues, BCG evaluated four organizational models:
● Subdivision within a department (status quo): Dallas Animal Services could make no changes to its existing organizational model and continue to operate within the city's Department of Code Compliance
● Independent department: Dallas Animal Services could become an independent department and report directly to an Assistant City Manager
● Partially privatized: Dallas Animal Services could privatize its shelter operations while leaving field operations under the Department of Code Compliance or an Assistant City Manager
● Completely privatized: Dallas Animal Services could privatize all or part of its operations
We assessed these models against the same three criteria: Resources and Talent, Communication & Coordination, and Execution & Accountability, and identified a mix of
Exhibit 30| Pros & cons of existing DAS organization structure
Hiring leadership and staff
difficult due to lower
profile & complexity
Can receive layover funds
from parent department
Lacks a "seat at the table"
with Dallas's senior city
leadership
Perceived to not prioritize
animal welfare given
placement underneath
another organization
Lower-level leadership
role (Sr. Program
Manager) lacks authority
to operate effectively
Multiple layers of mgmt
cloud accountability
Existing
structure:
Subdivision
within a
department
Resources
and Talent
Communication
and Coordination
Execution and
Accountability1 2 3
Note: Typically, cities/counties will only privatize their animal shelter operations and operate field collection themselves.See compendium for more detailed assumptionsSource: BCG analysis
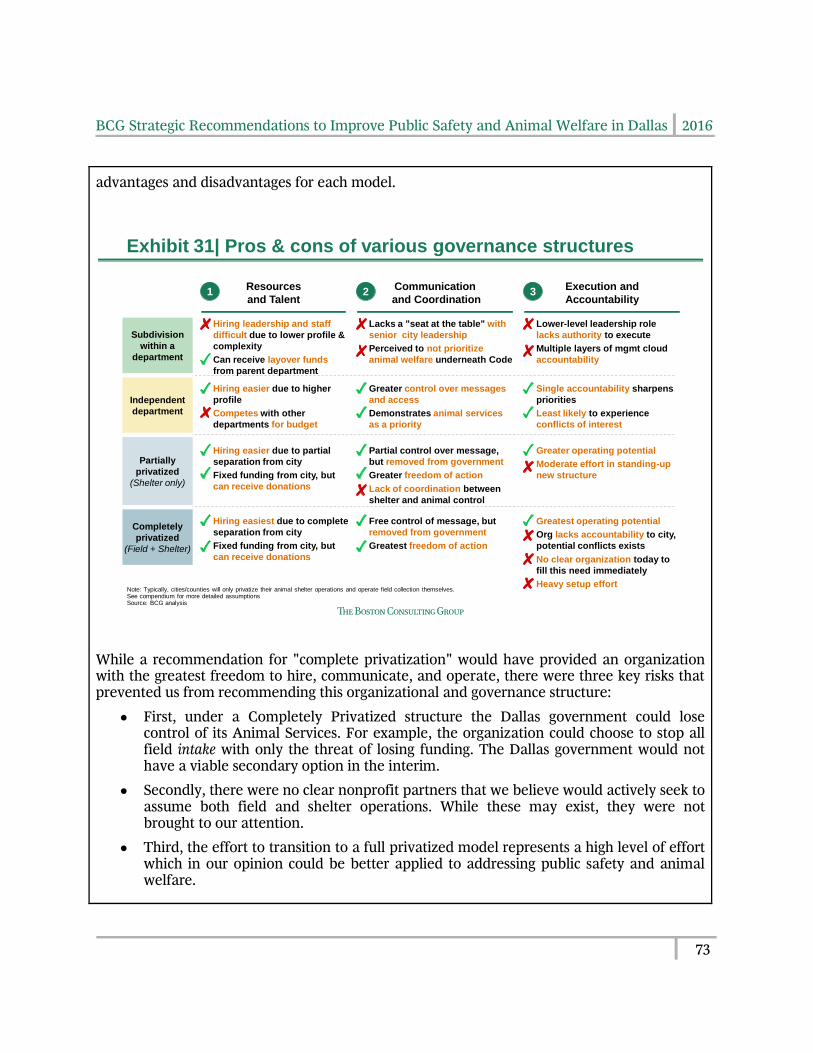
BCG Strategic Recommendations to Improve Public Safety and Animal Welfare in Dallas 2016
73
advantages and disadvantages for each model.
While a recommendation for "complete privatization" would have provided an organization with the greatest freedom to hire, communicate, and operate, there were three key risks that prevented us from recommending this organizational and governance structure:
● First, under a Completely Privatized structure the Dallas government could lose control of its Animal Services. For example, the organization could choose to stop all field intake with only the threat of losing funding. The Dallas government would not have a viable secondary option in the interim.
● Secondly, there were no clear nonprofit partners that we believe would actively seek to assume both field and shelter operations. While these may exist, they were not brought to our attention.
● Third, the effort to transition to a full privatized model represents a high level of effort which in our opinion could be better applied to addressing public safety and animal welfare.
Exhibit 31| Pros & cons of various governance structures
Subdivision
within a
department
Resources
and Talent
Execution and
Accountability1 3
Note: Typically, cities/counties will only privatize their animal shelter operations and operate field collection themselves.See compendium for more detailed assumptionsSource: BCG analysis
Independent
department
Hiring easier due to higher
profile
Competes with other
departments for budget
Single accountability sharpens
priorities
Least likely to experience
conflicts of interest
Hiring leadership and staff
difficult due to lower profile &
complexity
Can receive layover funds
from parent department
Lower-level leadership role
lacks authority to execute
Multiple layers of mgmt cloud
accountability
Completely
privatized
(Field + Shelter)
Hiring easiest due to complete
separation from city
Fixed funding from city, but
can receive donations
Greatest operating potential
Org lacks accountability to city,
potential conflicts exists
No clear organization today to
fill this need immediately
Heavy setup effort
Partially
privatized
(Shelter only)
Hiring easier due to partial
separation from city
Fixed funding from city, but
can receive donations
Greater operating potential
Moderate effort in standing-up
new structure
Communication
and Coordination2
Greater control over messages
and access
Demonstrates animal services
as a priority
Lacks a "seat at the table" with
senior city leadership
Perceived to not prioritize
animal welfare underneath Code
Free control of message, but
removed from government
Greatest freedom of action
Partial control over message,
but removed from government
Greater freedom of action
Lack of coordination between
shelter and animal control
BCG Strategic Recommendations to Improve Public Safety and Animal Welfare in Dallas 2016
74
Partial privatization would create a model in which the city focuses almost exclusively on public safety and the partnering non-profit would assume all responsibility for intake of collected animals and animal welfare. Such a model exists in two comparable cities/counties: Nevada Humane Society for Washoe County (Reno) and The Animal Foundation of Clark County (Las Vegas). This model:
● Allows the city to focus all of its resources entirely on public safety (field operations)
● Provides the non-profit organization greater access to fundraising, hiring, and ease of operations.
Ultimately we felt that the effort in implementing partial privatization was not necessary given alternatives available:
● A similar impact on live release rate could be achieved through establishing a contractual relationship with a high-volume transfer, as opposed to ceding the existing shelter operations to that organization.
● The effort to transition to a full privatized model represents a moderate level of effort, which, in our opinion, could be better applied to addressing public safety and animal welfare.
When speaking with leaders in the animal welfare community across the country, many believed animal services needs to be an independent department. One interviewee noted, "Animal services needs to be a priority…[you] cannot put it inside another department and say it's a priority"
There are many benefits to becoming an independent department. Hiring is easier due to the organization’s higher profile within the city. Communication and coordination with stakeholders is more effective thanks to greater control over messaging. And delivery of services is improved due to a single point of accountability, which sharpens management priorities and limits conflicts of interest.
Therefore, it is our recommendation that DAS become an independent department that delivers both field and shelter-related services.
As an independent department, DAS will likely need to add additional personnel in finance, human resources, communications, and IT. The cost for these new positions was estimated at $310,000 based on current transfer costs incurred by DAS, general public sector benchmarks, and comparison to other animal services departments.
Whether the newly independent DAS department should continue to exist within the "quality of life" portfolio or become part of the "public safety" portfolio, which includes DPD, was not evaluated.
BCG Strategic Recommendations to Improve Public Safety and Animal Welfare in Dallas 2016
75
6.2 The city of Dallas should increase funding for Dallas Animal Services to
support recommendations
Rationale: Historically, Dallas Animal Services has been underfunded relative to its peers on a per capita basis. More recently, and following multiple budget increases, Dallas Animal Services' budget still lags its peers for fiscal year 2015-2016, but only by ~$0.78 per person or nearly ~$1 million in aggregate.
In many comparable cities in the US, animal services departments effectively augment their municipal budgets by forming explicit and contractual partnerships with a major nonprofit organization. Animal Services departments that achieve this significantly increase their potential funding, where Dallas lags peers with such arrangements by nearly $8 million annually on a per person adjusted basis.
In total, BCG recommendations will require long-term incremental funding to DAS of ~$2.7 million, a three-year surge of funding for spay and neuter totaling ~$7.5 million per year, and additional city spending of ~$0.4 million and ~$0.2 million for animal-related early childhood education and a two-person project management team, respectively. (Refer to Exhibit 2 for details on necessary funding.) While the project management team is an urgent, short-term recommendation, the childhood education recommendation is a long term option that will require lead time in order to fund, implement, and see results.
We recommend that the city of Dallas approve DAS budget increases in the incoming fiscal year by~$1.2 million (in excess of the current proposed $1.5 million budget increase) to a total of $12.9 million.
By doing so, the city will both enable DAS to execute this sweeping set of recommendations and also demonstrate its commitment to the community of private funders that will also be necessary to succeed in this mission.
At the same time, we encourage the city government to insist on clear metrics for success (recommendation 1.2) that will demonstrate the value of an investment.
6.3 The city of Dallas or DAS should hire a project manager and data analyst to
oversee the implementation of recommendations
Rationale: Due to the large scope of these recommendations, a project manager should oversee projects, track success, and identify potential opportunities to reprioritize as necessary. Project managers effectively manage time, budget, and overall scope. They should also build a project plan, guide implementation of recommendations, and track progress.
In addition to the project manager, the data analyst will be responsible for tracking progress

BCG Strategic Recommendations to Improve Public Safety and Animal Welfare in Dallas 2016
76
and generating automatic or weekly reports to ensure initiatives are successfully on track.
The project manager will escalate potential issues, ensure alignment, and eliminate any barriers to implementation. The yearly cost for a project manager is ~$100,000, and the yearly cost for a data analyst is $58,000.47
6.4 The Animal Advisory Commission should establish new subcommittees to
support DAS
Rationale: Most for-profit and non-profit organizations have boards that actively support and contribute to the success of the overall organization. In the nonprofit world, these boards are made up of civic-minded, highly engaged individuals who work on behalf of their organization to identify and solve complex issues. To engage in effective problem solving, most boards have subcommittees that focus on specific topic areas.lxxxii
When speaking with animal officials in benchmark interviews,48 the split between municipalities that did and did not have an animal advisory board was roughly 50/50. In municipalities that did have an animal advisory board, interviewees often struggled to work with their boards in a way that created value. As one animal services official said, "The productivity of the board varies dramatically with its members. I can't always count on the board to help."
Currently, Dallas City Code, Section 2-157 mandates that the city of Dallas must have an Animal Advisory Commission to support DAS. This commission has 15 members, each appointed by members of the city council. By law, the commission must include one licensed veterinarian, one city or county official, one member who operates an animal shelter, and one member from an animal welfare organization. Unlike most nonprofit boards, the current animal advisory commission has no specific subcommittees or mandate around which to organize. The city council should appoint members that have the skills and experience to create positive change for the Dallas community.
To better serve the community, as well as DAS, we recommend that the Dallas Animal Advisory Commission be restructured to create relevant subcommittees, reform membership rules, and strengthen its contributions to DAS and the community.
Animal Advisory Commission Subcommittees and Membership
We recommend the formation of five subcommittees responsible for public safety, shelter
47 This was determined by finding the median salary of a comparable position on the Texas Tribune Salary Explorer, and then applying an extra 20% to that salary to account for benefits. 48 Benchmark cities include Atlanta, Austin, Houston, Jacksonville, Las Vegas, Los Angeles, Miami, Reno, San Antonio, and San Diego.
BCG Strategic Recommendations to Improve Public Safety and Animal Welfare in Dallas 2016
77
management, animal cruelty, public relations, and external relations. Each subcommittee would consist of three members. This member limitlxxxiii represents standard practice and is meant to ensure productivity and foster innovative ideas and suggestions based on each member's specific background. To support DAS, members will be responsible for assisting or advising in the development of policies and procedures relating to their subcommittee's focus area.
The Public Safety subcommittee would provide advice on issues relating to the population of loose dogs, the number of dog bites, and the efficacy of field intake programs.
The Shelter Management subcommittee would provide advice on issues affecting data collection and reporting, euthanization decision processes, adoptions, transfers, and the foster program.
The Animal Cruelty subcommittee would advise DAS on the animal cruelty investigation process, including education strategies, and enforcement procedures.
The Public Relations committee would offer guidance on the effectiveness of DAS' communication with the public, including standard policies and procedures related to social media, marketing materials, strategies for major events and day-to-day operations, and crisis and emergency management.
The External Relations subcommittee would advise DAS on its relationships with philanthropic organizations, major adoption partners, and other allied organizations (such as the proposed spay and neuter coalition).
To ensure the commission has the required skills to appropriately staff each subcommittee, we further recommend that the commission include at least one member each with a background in law enforcement or public safety, technology or data science, law or legislation, communications and business development, or corporate strategy.
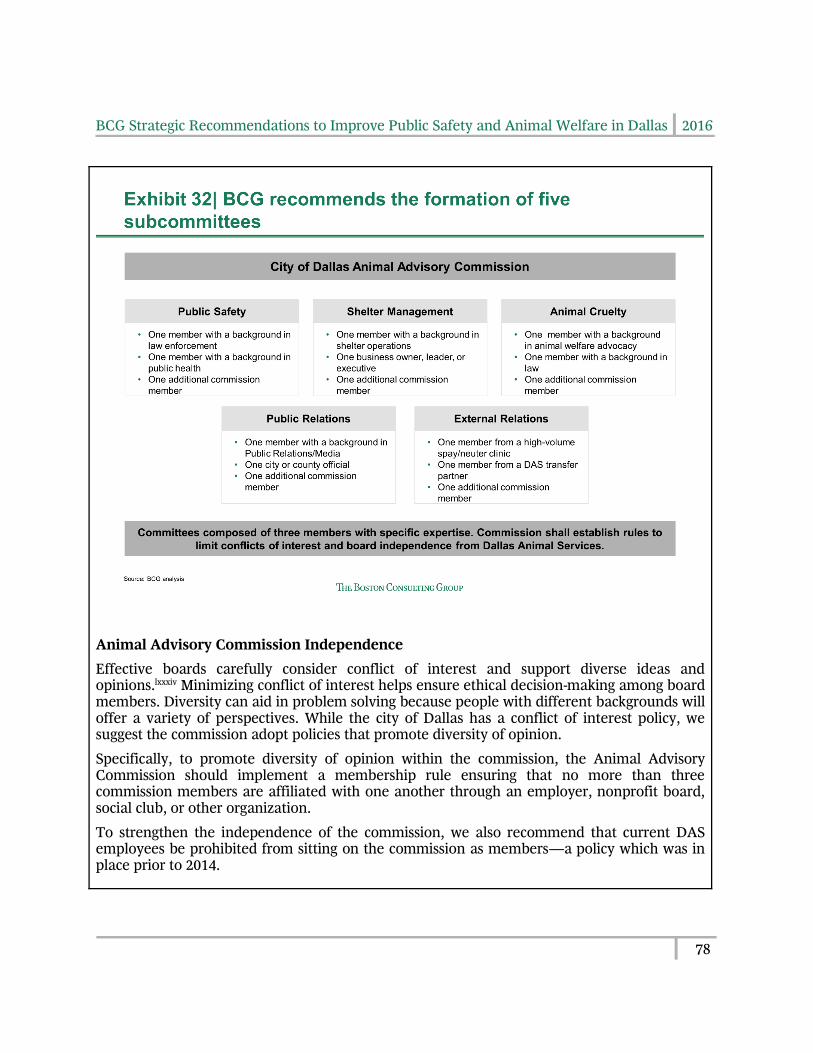
BCG Strategic Recommendations to Improve Public Safety and Animal Welfare in Dallas 2016
78
Animal Advisory Commission Independence
Effective boards carefully consider conflict of interest and support diverse ideas and opinions.lxxxiv Minimizing conflict of interest helps ensure ethical decision-making among board members. Diversity can aid in problem solving because people with different backgrounds will offer a variety of perspectives. While the city of Dallas has a conflict of interest policy, we suggest the commission adopt policies that promote diversity of opinion.
Specifically, to promote diversity of opinion within the commission, the Animal Advisory Commission should implement a membership rule ensuring that no more than three commission members are affiliated with one another through an employer, nonprofit board, social club, or other organization.
To strengthen the independence of the commission, we also recommend that current DAS employees be prohibited from sitting on the commission as members—a policy which was in place prior to 2014.
BCG Strategic Recommendations to Improve Public Safety and Animal Welfare in Dallas 2016
79
6.5 DAS should be exempt from the civil service hiring process
Rationale: Today, DAS hires employees through the civil service process. Anecdotally, it can take up to nine months to fill a position, and good candidates often find employment elsewhere. This difficulty contributes to the challenges DAS has filling all open positions (14% of its positions unfilled).
While the civil service provides worker protections and prevents political appointments, the hiring process at DAS needs to be improved if the recommendations on this report are to be put in place.
If DAS were to receive a civil service exemption for hiring (e.g., job postings, resume screening, and interviewing) it would streamline the hiring process, allow the organization to attract top talent, decrease the time to fill open positions, and allow DAS to hire candidates with specialized training. This exemption would not erode protections for new or existing employees as it would impact only the process of filling an open position.
If DAS becomes an independent department (recommendation 6.1), this could be implemented without incremental cost as additional human resources personnel are already budgeted for. If DAS is not an independent department, an additional employee may be needed to manage the hiring process.

BCG Strategic Recommendations to Improve Public Safety and Animal Welfare in Dallas 2016
80
Recommendation 7 – Ensure efficiency by measuring outcomes and increasing volunteers
Over time, any organization should strive to do more with the same level of resources – or the same amount of output with fewer resources. Improving in this manner typically results from delegation and performance tracking, where work is divided up across an organization and individuals or teams are measured and managed according to specific performance metrics. Alternatively, organizations can become more efficient by tapping into cheaper pools of resources, e.g., volunteers.
In this set of initiatives, we recommend that DAS delegate initiatives across its organizational structure, where the balance of non-DAS led initiatives would be assumed by other organizations (as specified in recommendation 5.2).
Additionally, we recommend DAS expand its existing volunteer program, both in the number of volunteer hours and volunteer tasks, to increase the efficiency of shelter operations and free up resources for other tasks.
7.1 DAS should align its organizational structure and employee performance with
its mission
Rationale: In our opinion, it is not feasible for a single individual within DAS to effectively oversee and manage implementation of all of BCG’s recommended actions. Accordingly, each recommendation should be assigned a specific owner to oversee its implementation and long-term success. Certain DAS roles are a natural fit for some of the recommendations, while others initiatives require coordinated efforts across DAS, the city of Dallas, and animal welfare organizations.
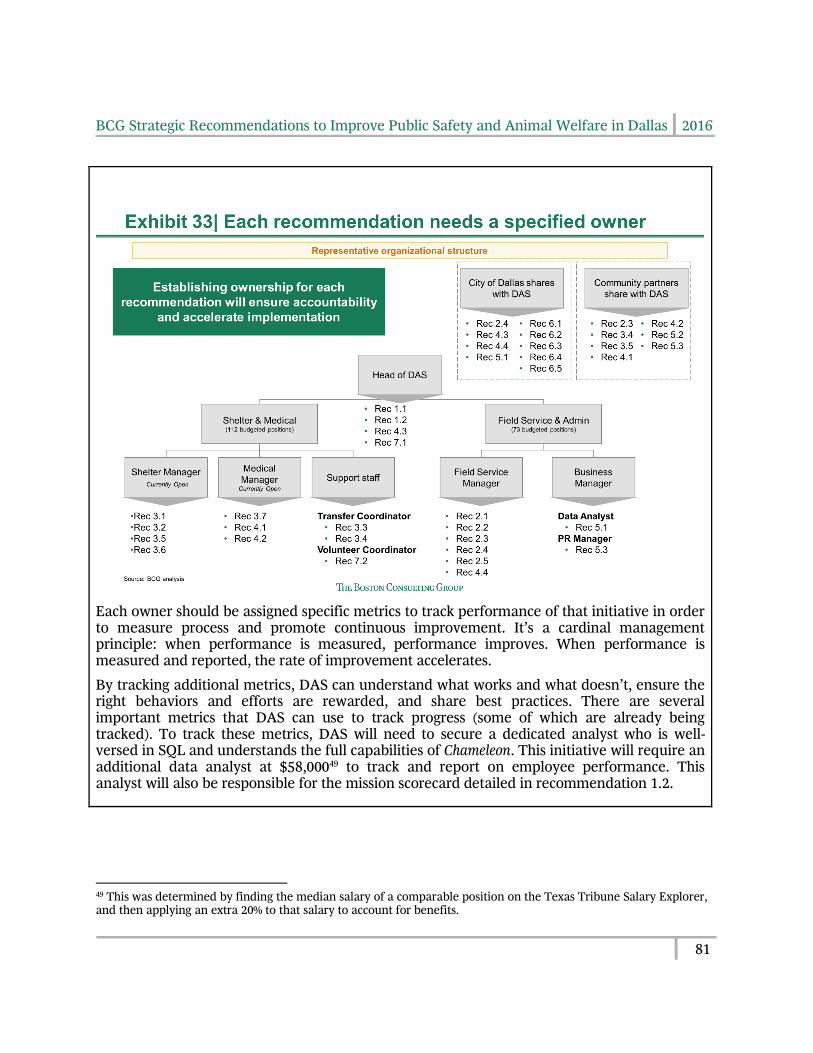
BCG Strategic Recommendations to Improve Public Safety and Animal Welfare in Dallas 2016
81
Each owner should be assigned specific metrics to track performance of that initiative in order to measure process and promote continuous improvement. It’s a cardinal management principle: when performance is measured, performance improves. When performance is measured and reported, the rate of improvement accelerates.
By tracking additional metrics, DAS can understand what works and what doesn’t, ensure the right behaviors and efforts are rewarded, and share best practices. There are several important metrics that DAS can use to track progress (some of which are already being tracked). To track these metrics, DAS will need to secure a dedicated analyst who is well-versed in SQL and understands the full capabilities of Chameleon. This initiative will require an additional data analyst at $58,00049 to track and report on employee performance. This analyst will also be responsible for the mission scorecard detailed in recommendation 1.2.
49 This was determined by finding the median salary of a comparable position on the Texas Tribune Salary Explorer, and then applying an extra 20% to that salary to account for benefits.
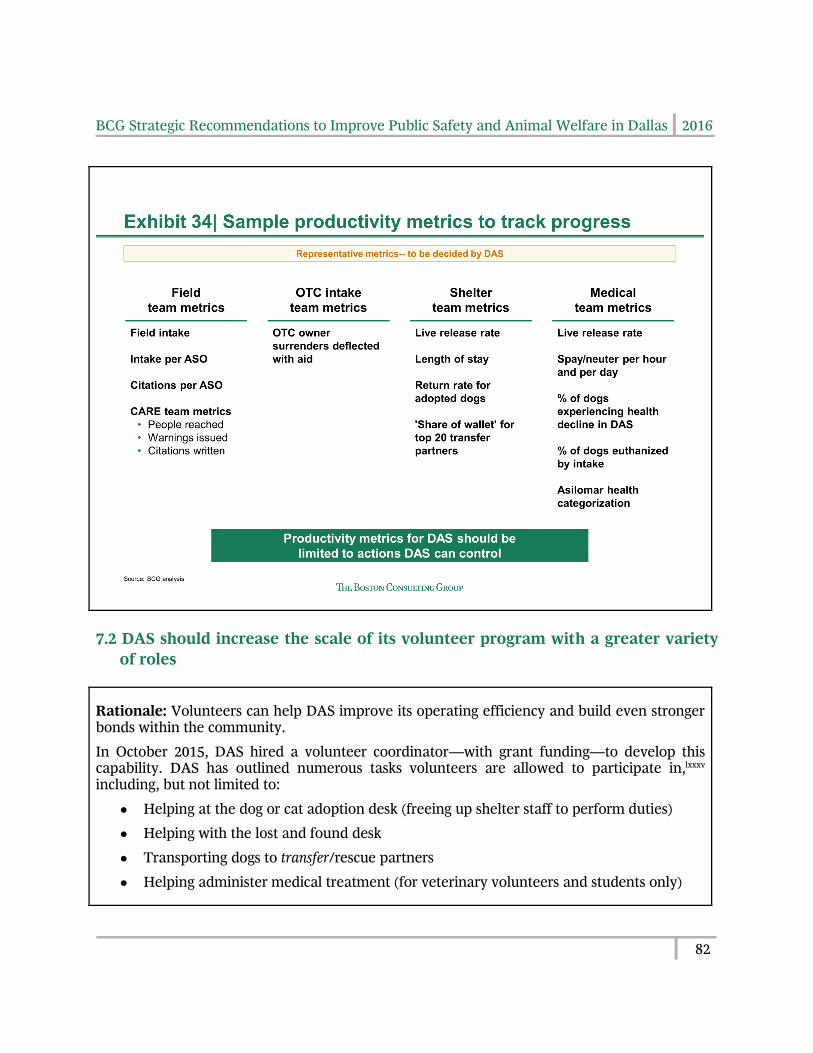
BCG Strategic Recommendations to Improve Public Safety and Animal Welfare in Dallas 2016
82
7.2 DAS should increase the scale of its volunteer program with a greater variety
of roles
Rationale: Volunteers can help DAS improve its operating efficiency and build even stronger bonds within the community.
In October 2015, DAS hired a volunteer coordinator—with grant funding—to develop this capability. DAS has outlined numerous tasks volunteers are allowed to participate in,lxxxv including, but not limited to:
● Helping at the dog or cat adoption desk (freeing up shelter staff to perform duties)
● Helping with the lost and found desk
● Transporting dogs to transfer/rescue partners
● Helping administer medical treatment (for veterinary volunteers and students only)
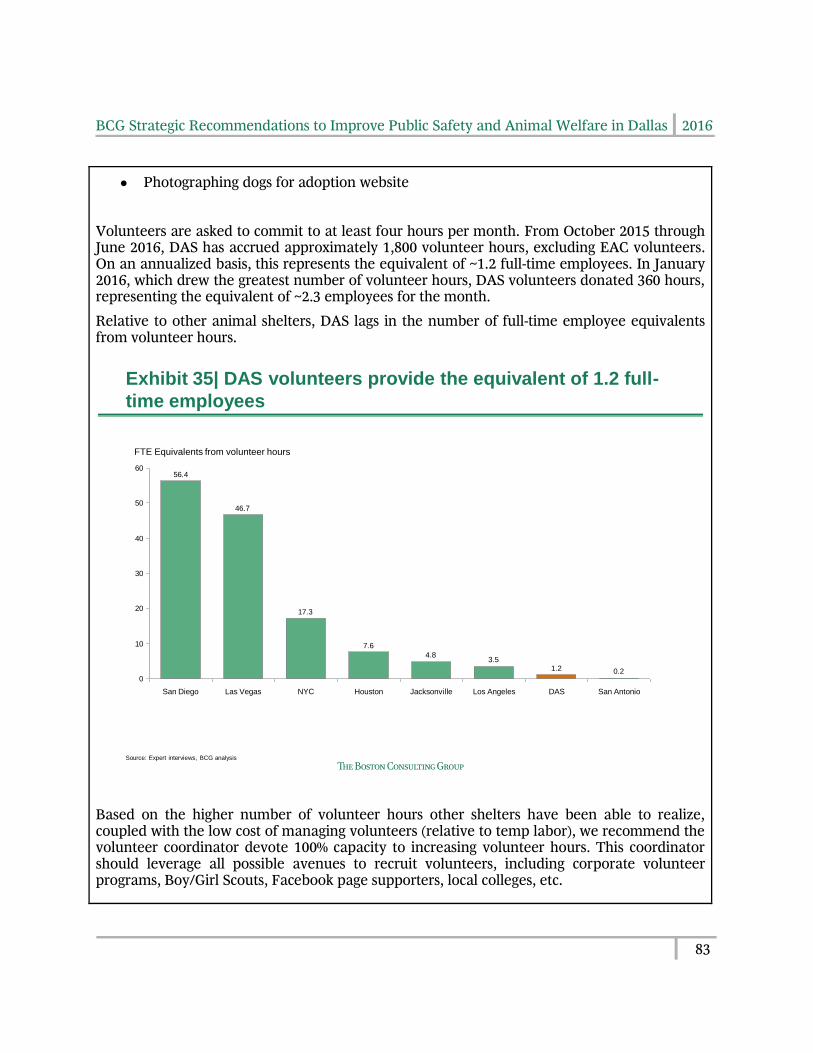
BCG Strategic Recommendations to Improve Public Safety and Animal Welfare in Dallas 2016
83
● Photographing dogs for adoption website
Volunteers are asked to commit to at least four hours per month. From October 2015 through June 2016, DAS has accrued approximately 1,800 volunteer hours, excluding EAC volunteers. On an annualized basis, this represents the equivalent of ~1.2 full-time employees. In January 2016, which drew the greatest number of volunteer hours, DAS volunteers donated 360 hours, representing the equivalent of ~2.3 employees for the month.
Relative to other animal shelters, DAS lags in the number of full-time employee equivalents from volunteer hours.
Based on the higher number of volunteer hours other shelters have been able to realize, coupled with the low cost of managing volunteers (relative to temp labor), we recommend the volunteer coordinator devote 100% capacity to increasing volunteer hours. This coordinator should leverage all possible avenues to recruit volunteers, including corporate volunteer programs, Boy/Girl Scouts, Facebook page supporters, local colleges, etc.
Exhibit 35| DAS volunteers provide the equivalent of 1.2 full-
time employees
0.21.23.5
4.8
7.6
17.3
46.7
56.4
0
10
20
30
40
50
60
Las Vegas San AntonioDASHoustonNYC
FTE Equivalents from volunteer hours
Jacksonville Los AngelesSan Diego
Source: Expert interviews, BCG analysis
BCG Strategic Recommendations to Improve Public Safety and Animal Welfare in Dallas 2016
84
DAS could increase the number of volunteers by publicizing the numerous volunteer roles it has already created as well as adding some new ones such as:
● Fostering animals who remain in stray hold but are good candidates for adoption
● Creating reports and analyzing Chameleon data
While the volunteer program currently does assist the shelter in other ways, the program is not as robust as it is in other peer cities. By building on current momentum, DAS can create a volunteer program that materially impacts its operation and builds a strong base of supporters among the community. Following the expiration of the grant, the cost of this initiative will be $51,00050 per year for a full-time volunteer coordinator.
50 This was determined by finding the median salary of a comparable position on the Texas Tribune Salary Explorer, and then applying an extra 20% to that salary to account for benefits.
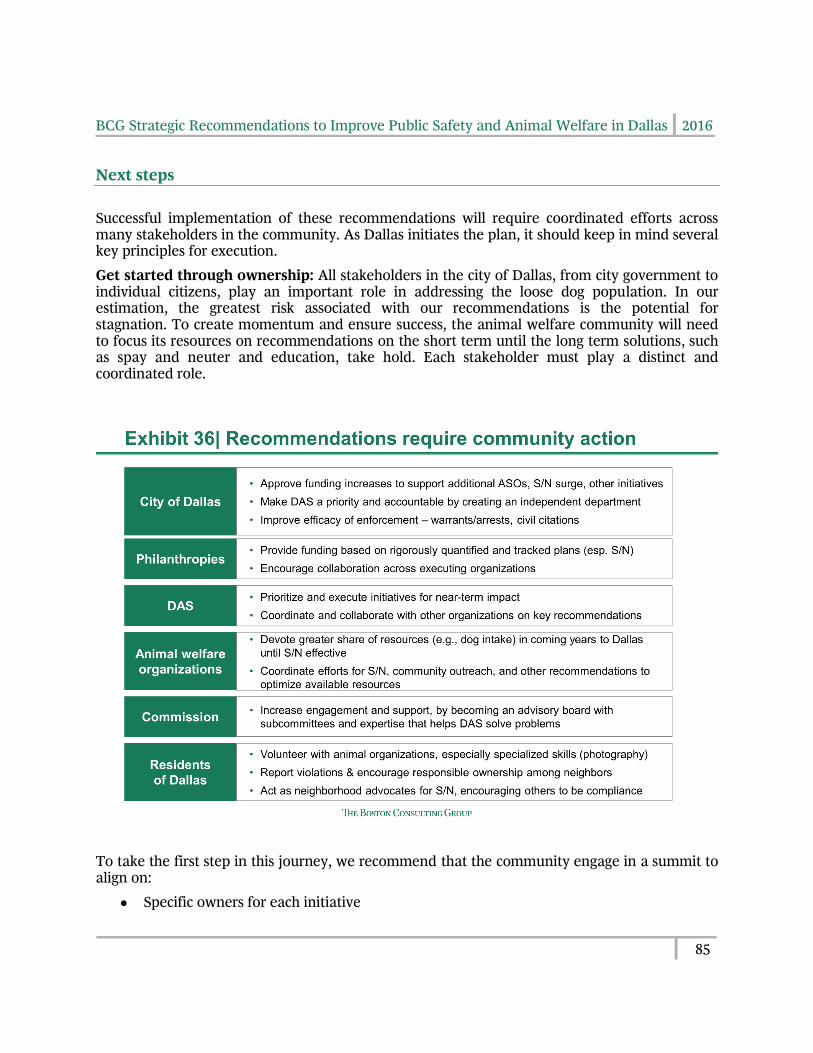
BCG Strategic Recommendations to Improve Public Safety and Animal Welfare in Dallas 2016
85
Next steps
Successful implementation of these recommendations will require coordinated efforts across many stakeholders in the community. As Dallas initiates the plan, it should keep in mind several key principles for execution.
Get started through ownership: All stakeholders in the city of Dallas, from city government to individual citizens, play an important role in addressing the loose dog population. In our estimation, the greatest risk associated with our recommendations is the potential for stagnation. To create momentum and ensure success, the animal welfare community will need to focus its resources on recommendations on the short term until the long term solutions, such as spay and neuter and education, take hold. Each stakeholder must play a distinct and coordinated role.
To take the first step in this journey, we recommend that the community engage in a summit to align on:
● Specific owners for each initiative
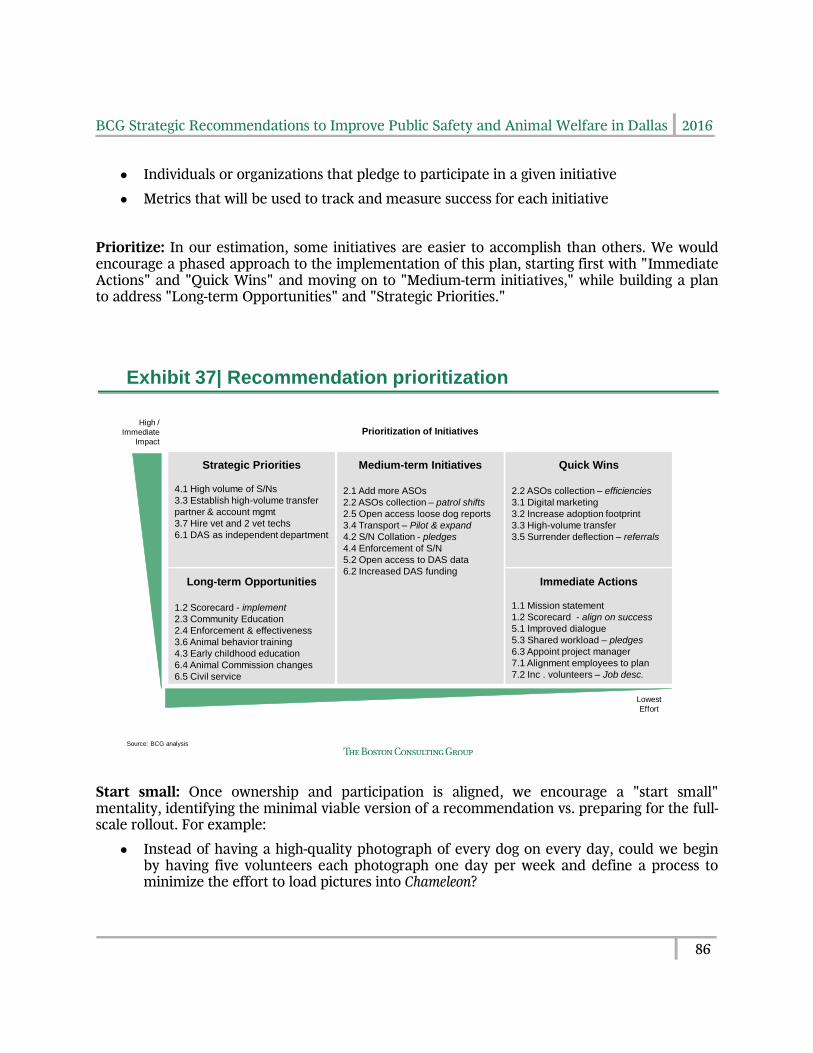
BCG Strategic Recommendations to Improve Public Safety and Animal Welfare in Dallas 2016
86
● Individuals or organizations that pledge to participate in a given initiative
● Metrics that will be used to track and measure success for each initiative
Prioritize: In our estimation, some initiatives are easier to accomplish than others. We would encourage a phased approach to the implementation of this plan, starting first with "Immediate Actions" and "Quick Wins" and moving on to "Medium-term initiatives," while building a plan to address "Long-term Opportunities" and "Strategic Priorities."
Start small: Once ownership and participation is aligned, we encourage a "start small" mentality, identifying the minimal viable version of a recommendation vs. preparing for the full-scale rollout. For example:
● Instead of having a high-quality photograph of every dog on every day, could we begin by having five volunteers each photograph one day per week and define a process to minimize the effort to load pictures into Chameleon?
Exhibit 37| Recommendation prioritization
Strategic Priorities
4.1 High volume of S/Ns
3.3 Establish high-volume transfer
partner & account mgmt
3.7 Hire vet and 2 vet techs
6.1 DAS as independent department
Medium-term Initiatives
2.1 Add more ASOs
2.2 ASOs collection – patrol shifts
2.5 Open access loose dog reports
3.4 Transport – Pilot & expand
4.2 S/N Collation - pledges
4.4 Enforcement of S/N
5.2 Open access to DAS data
6.2 Increased DAS fundingLong-term Opportunities
1.2 Scorecard - implement
2.3 Community Education
2.4 Enforcement & effectiveness
3.6 Animal behavior training
4.3 Early childhood education
6.4 Animal Commission changes
6.5 Civil service
High /
Immediate
Impact
Lowest
Effort
Quick Wins
2.2 ASOs collection – efficiencies
3.1 Digital marketing
3.2 Increase adoption footprint
3.3 High-volume transfer
3.5 Surrender deflection – referrals
Immediate Actions
1.1 Mission statement
1.2 Scorecard - align on success
5.1 Improved dialogue
5.3 Shared workload – pledges
6.3 Appoint project manager
7.1 Alignment employees to plan
7.2 Inc . volunteers – Job desc.
Prioritization of Initiatives
Source: BCG analysis
BCG Strategic Recommendations to Improve Public Safety and Animal Welfare in Dallas 2016
87
● Instead of having a robust foster network of 100 homes to support a full-scale transport program, could we establish two fosters to understand the transport process and network with adopters in northern cities?
● Instead of a team of five ASOs, could we assign two ASOs to an early morning shift and empower them to use the right tools to increase intake?
Once successfully implemented in its small-scale version, a recommendation is easier to implement to its fullest intent. In addition, the small-scale version can be started quickly, ensuring momentum for the entire plan.
Separately, we recommend that DAS identify the specific actions or recommendations that can be executed independently—without outside coordination or increased funding (e.g., improve dog photographs on Petfinder, build up the volunteer program, establish a program to deflect owner surrenders, and extend adoption hours).
Track progress: As certain initiatives are implemented, the potential value may be higher or lower than expected. By frequently tracking and reporting progress, resources can be properly allocated to the highest performing opportunities.
Highlight obstacles: As the community works through these initiatives, there will certainly be challenges. We encourage individuals and organizations to quickly highlight "obstacles" that prevent them from success within their own organizations or across organizations. This transparency can help others fill gaps in funding, capabilities, equipment, and access – allowing initiatives to overcome obstacles.
To succeed, the Dallas community must have a bias for action. We believe ownership, prioritization, starting small, tracking progress, and highlighting obstacles will contribute to the successful implementation of these recommendations.
Conclusion
The city of Dallas is facing both a challenge and an opportunity. The challenge of improving quality of life for Dallas residents by addressing loose or uncontrolled dogs, and the opportunity to rescue animals and treat them with dignity and care. We believe that any solutions pursued by the city should strike a balance to address both needs: public safety and animal welfare.
In total, BCG's seven recommendations strike this balance, enabling city leaders to remove greater numbers of loose dogs from the streets and control the dog population over the long term, while simultaneously improving outcomes for Dallas dogs.
While some of these recommendations can be implemented by Dallas Animal Services, the majority will require a coordinated effort by a broad group of stakeholders, including city leadership, the animal welfare community, and Dallas residents. These actions must be implemented in an orchestrated manner to achieve optimal results and avoid unintended consequences. Stakeholders will need to meet regularly, communicate openly, and measure progress over time.

BCG Strategic Recommendations to Improve Public Safety and Animal Welfare in Dallas 2016
88
With a clear strategy, and a sustained focus on balancing public safety and animal welfare, we are confident that the recommendations outlined in this report will improve quality of life for Dallas residents and dogs.
BCG Strategic Recommendations to Improve Public Safety and Animal Welfare in Dallas 2016
89
Glossary of terms
Chameleon: A software and technology system/database for animal control agencies, humane societies, SPCAs, and other animal sheltering organizations to manage data
Civil citations: A class of citations that does not require the defendant (or the issuing ASO) to be present in court to be found guilty of the citation. These citations cannot result in a sentence but can be followed up by a collection agency.
Community interventions: Refers to return to owners, adoptions, transfers, and spay and neuter surgeries
Criminal citations: A class of citations that requires the defendant and issuing ASO to be present in court to defend or contest the citation. These citations can result in sentences, warrants, and jail time.
Docket: A digital portal that supervisors can access in order to assign a court date for a civil citation
Field capture: When an animal service officer captures a loose animal in the field that is not confined
Field collection: When an ASO collects an animal in the field, including capture of loose dogs, collection of confined animals, and owner surrenders
Field return to owner: Refers to the process when an animal service officer brings an animal back to its owner
Intake: Used to describe the amount of animals entering the municipal shelter or 501(c)(3)
Live release rate (LRR): The percent of dogs entering a shelter that are not euthanized
Loose dogs: Any dog not under direct control or not prevented from roaming51
Open admission shelter: Often referred to as “open intake” shelter, these shelters never turn away an animal regardless of health, age, breed, or temperament
51 Hassan Aidaros, “Monitoring and Control of Dog Populations,” World Organisation for Animal Health.
BCG Strategic Recommendations to Improve Public Safety and Animal Welfare in Dallas 2016
90
Owner surrender: When an individual makes the decision to give up a pet due to financial hardship, moving, behavior issues, etc.
Petfinder: A national online portal where adoptable dogs, including DAS dogs, can be browsed by the public. The DAS inventory of adoptable dogs is automatically updated daily via Chameleon.
Pet Harbor: A national online website where all dogs from city shelters can be browsed by those who lost dogs and/or those who want to adopt. This website is operated by Chameleon so DAS's dog inventory is updated automatically every hour.
Positive placement: A term referring to all pets who are adopted, rescued, transferred to another shelter, or returned to owners after being lost
Pulling a dog: When a transfer physically picks up a dog from a shelter, claiming ownership of said dog
Return to owner (RTO): Animals that are successfully returned to their owners after being lost
Stray dogs: Dogs without owners
Stray turn in: Refers to a citizen bringing an animal that does not belong to them to the municipal shelter or 501(c)(3) organization
Tagging a dog: When a transfer puts a hold on a dog to be picked-up within 24 hours
Targeted response team sweeps: When one team of ASOs sweeps a census track or targeted area that has a lot of 311 requests mapped to it. These often occur on Wednesdays when all ASOs work.
Transfer: A dog that is taken from DAS and fostered or housed in a shelter until it can be adopted by a new owner
Transfer partner: A rescue groups that takes dogs from DAS and other municipal shelters to house in another shelter or with a foster until the dogs are adopted by a new owner
Transfer coordinator: The one FTE at DAS who has the responsibility for communicating with and pulling dogs for rescue partners
BCG Strategic Recommendations to Improve Public Safety and Animal Welfare in Dallas 2016
91
BCG team
Endnotes
i 2011 City of Dallas Community Survey and 2016 City of Dallas Community Survey, both conducted by the ETC Institute on behalf of the City of Dallas. ii 2011 City of Dallas Community Survey and 2016 City of Dallas Community Survey, both conducted by the ETC Institute on behalf of the City of Dallas. iii 2014 City of San Antonio Community Survey and 2014 City of Austin Community Survey, both conducted by the ETC institute. iv Based on observed spay and neuter levels of the 2015 DAS shelter, field intake, local expert interviews, and secondary in-community data sets. v New JC Jr, Kelch WJ, Hutchison JM, Salman MD, King M, Scarlett JM, Kass PH, "Birth and Death Rate Estimates of Cats and Dogs in US Households and Related Factors," The Journal of Applied Animal Welfare Science 2004;7(4):229-41. vi 2016 City of Dallas Community Survey, conducted by the ETC Institute on behalf of the City of Dallas. vii Alan M. Beck, The Ecology of Stray Dogs: A Study of Free-Ranging Urban Animals, Purdue University Press, 2002. viii BCG Dallas Community Survey, conducted in June 2015. ix Gilchrist J, Sacks JJ, White D, Kresnow MJ, "Dog Bites: Still a Problem?" Injury Prevention 2008 Oct;14(5):296-301, http://www.ncbi.nlm.nih.gov/pubmed/18836045.
BCG Strategic Recommendations to Improve Public Safety and Animal Welfare in Dallas 2016
92
x Wright JC, "Canine Aggression Toward People: Bite Scenarios and Prevention," Veterinary Clinics of North America: Small Animal Practice 1991;21(2):299-314, http://www.jurispro.com/uploadArticles/Wright-Canine%20Aggression.pdf. xi Gershman KA, Sacks JJ, Wright JC, "Which Dogs Bite? A Case-Control Study of Risk Factors," Pediatrics, 1994;93(6):913-917, http://www.ncbi.nlm.nih.gov/pubmed/8190576. xii John C. Wright, "Reported Dog Bites: Are Owned and Stray dogs Different?” Anthrozoös, 1990;4(2):113-119, http://www.tandfonline.com/doi/abs/10.2752/089279391787057260. xiii Patrick GR, O'Rourke KM, "Dog and Cat Bites: Epidemiologic Analyses Suggest Different Prevention Strategies," Public Health Reports, 1998; May-Jun;113(3):252-7, http://www.ncbi.nlm.nih.gov/pubmed/9633872. xiv Lockwood, Randall, "The Ethology and Epidemiology of Canine Aggression," in The Domestic Dog: Its Evolution, Behaviour, and Interactions with People, edited by James Serpell, Cambridge University Press, 1995, http://www.dogsbite.org/pdf/ethology-epidemiology-of-canine-aggression-randall-lockwood.pdf. xv NPR, May 28, 2016, Interview with Courtney Collins, Weekend Edition Saturday. xvi Fox4 News, May 25, 2016. xvii DAS employee interviews. xviii ASO ride-alongs (6/21/2016, 6/22/2016, 7/6/2016); interviews with field supervisors (7/25/2016, 7/26/2016). xix 311 call volume from June 2015 - May 2016; DAS 311 Request Priority Matrix. xx DAS 311 Request Priority Matrix. xxi Interviews with DAS supervisors and ASO CARE team ride-alongs. xxii Interviews with DAS supervisors. xxiii ASO CARE team ride-alongs. xxiv This assumes the team worked four days a week for four weeks each month. xxv CARE team data from April – July 2016. xxvi Dallas municipal court data from June 2014 - May 2016. xxvii Dallas municipal court data from June 2014-May 2016 (n=5,059). xxviii Dallas municipal court data from June 2014-May 2016 (n=5,059). xxix These growth rates are all determined from DAS Chameleon data and include data from 2011 to May 2016. xxx DAS organization chart as of Jun4 27, 2016. xxxi DAS Chameleon database and Rescue and Animal Organization Survey conducted by BCG in July 2016 xxxii Interview with DAS Field Services employees. xxxiii Interview with DAS Field Services employees. xxxiv Alan M. Beck, The Ecology of Stray Dogs: A Study of Free-Ranging Urban Animals, Purdue University Press, 2002. xxxv 311 service request data. xxxvi Benchmark interviews. See appendix for detailed information on each city benchmark. xxxvii DAS employee interviews. xxxviii DAS employee interviews. xxxix ASO ride-alongs. xlDAS employee interviews. xli DAS employee interviews. xlii Interview with general manager of animal services in a comparable city. xliii ASO ride-alongs. xliv Interview with DAS ASO supervisor. xlv Dallas municipal court data between June 2014 and May 2016. xlvi 311 service request data.
BCG Strategic Recommendations to Improve Public Safety and Animal Welfare in Dallas 2016
93
xlvii Workman MK, Hoffman CL, "An Evaluation of the Role the Internet Site Petfinder Plays in Cat Adoptions," The Journal of Applied Animal Welfare Science, 2015;18(4):388-97, http://www.ncbi.nlm.nih.gov/pubmed/26114500. xlviii Lampe, R and Witte TH, "Speed of Dog Adoption: Impact of Online Photo Traits," Journal of Applied Animal Welfare Science, 2015;18(4):343-354, http://www.tandfonline.com/doi/abs/10.1080/10888705.2014.982796. xlix Interview with volunteer who maintains the Facebook page, Dallas Dogs In Need of Transfer. l This is an approximation based on expert interviews with other animal shelters. li DAS Chameleon Database. lii DAS Chameleon Database. liii This is based on forecasted population growth in northern Dallas. liv DAS Chameleon Database. lv Expert interviews with low-cost spay and neuter providers, lvi DAS Chameleon Database, lvii Expert interviews with low-cost spay and neuter providers. lviii Interview with DAS transfer coordinator, May 22, 2016. lix Rescue and Animal Organization Survey conducted by BCG in July 2016 (n=72). lx This was determined by finding the median salary of a comparable position on the Texas Tribune Salary Explorer, and then applying an extra 20% to that salary to account for benefits. lxi Expert interview with owner of a pet transportation company. lxii BARC Foundation website. lxiii Expert interviews with low-cost spay and neuter providers. lxiv DAS Owner Surrender Survey (n=84), Q: “Why are you surrendering your pet to DAS today?” lxv DAS Owner Surrender Survey (n=84), Q: “If any of the following were available to you, would you choose to keep this animal? lxvi This was determined by finding the median salary of a comparable position on the Texas Tribune Salary Explorer, and then applying an extra 20% to that salary to account for benefits. lxvii Luescher, AU and Medlock, RT, "The Effects of Training and Environmental Alterations on Adoption Success of Shelter Dogs," February 2009;117(1-2):63-68, http://www.appliedanimalbehaviour.com/article/S0168-1591(08)00308-0/abstract. lxviii Expert interviews with low-cost spay and neuter providers. lxix Interviews with DAS supervisors, August 17, 2016. lxx Wright JC, "Canine Aggression Toward People: Bite Scenarios and Prevention," Veterinary Clinics of North America: Small Animal Practice 1991;21(2):299-314, http://www.jurispro.com/uploadArticles/Wright-Canine%20Aggression.pdf. lxxi Gershman KA, Sacks JJ, Wright JC, "Which Dogs Bite? A Case-Control Study of Risk Factors," Pediatrics, 1994;93(6):913-917, http://www.ncbi.nlm.nih.gov/pubmed/8190576. lxxii This figure is based on DAS intake, observations, and expert interviews with animal welfare groups active in community. lxxiii PetSmart Charities 2011 survey. lxxiv Data from Pets for Life work in southern Dallas. lxxv DAS Chameleon database. lxxvi "The Animal Connection: APNM's Humane Education Program," Making Tracks, 2016:1-4. lxxvii Dallas Independent School District 2015-2016 statistics. lxxviii OECD, "Open Data,” http://www.oecd.org/gov/digital-government/open-government-data.htm. lxxix Dallas Animal Advisory Commission recording, Jan 21, 2016. lxxx Interview with rescue organization. lxxxi Dallas Police Department General Order, Section 214.
BCG Strategic Recommendations to Improve Public Safety and Animal Welfare in Dallas 2016
94
lxxxii “How Nonprofit Boards can Effectively Utilize Committees,” Social Venture Partners Boulder County white paper, November 2011, http://socialventurepartners.s3-us-west-2.amazonaws.com/www.socialventurepartners.org/sites/60/2013/08/SVP-White-Paper-Utilize-Committees-Effectively-2011.pdf. lxxxiii McNamara, C, Field Guide to Developing, Operating and Restoring Your Nonprofit Board, Authenticity Consulting, 2008. lxxxiv Masaoka, J, "Nonprofit Conflict of Interest: A 3-Dimensional View," Blue Avocado: A Magazine of American Nonprofits, July, 2010, http://www.blueavocado.org/content/nonprofit-conflict-interest-3-dimensional-view. lxxxv DAS volunteer manual and interviews with DAS supervisors.

Loose Dogs in Dallas: Strategic
recommendations to improve public safety
and animal welfare in Dallas Initiative detail
August 2016
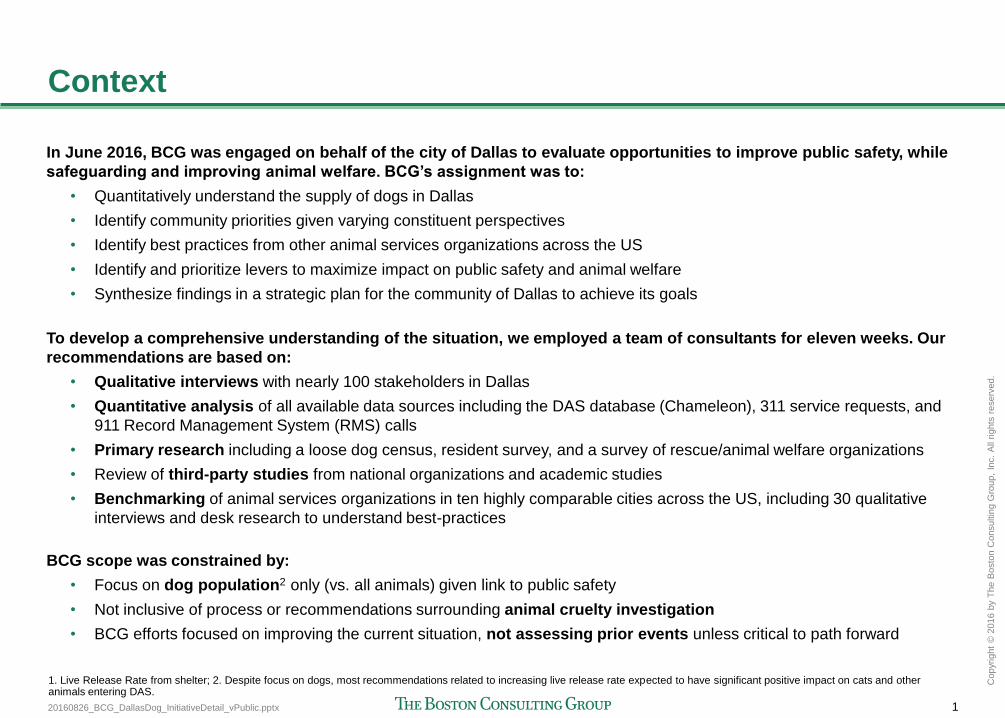
20160826_BCG_DallasDog_InitiativeDetail_vPublic.pptx 1
Copyr
ight
© 2
016 b
y T
he B
osto
n C
onsultin
g G
roup,
Inc.
All
rights
reserv
ed.
Context
In June 2016, BCG was engaged on behalf of the city of Dallas to evaluate opportunities to improve public safety, while
safeguarding and improving animal welfare. BCG’s assignment was to:
• Quantitatively understand the supply of dogs in Dallas
• Identify community priorities given varying constituent perspectives
• Identify best practices from other animal services organizations across the US
• Identify and prioritize levers to maximize impact on public safety and animal welfare
• Synthesize findings in a strategic plan for the community of Dallas to achieve its goals
To develop a comprehensive understanding of the situation, we employed a team of consultants for eleven weeks. Our
recommendations are based on:
• Qualitative interviews with nearly 100 stakeholders in Dallas
• Quantitative analysis of all available data sources including the DAS database (Chameleon), 311 service requests, and
911 Record Management System (RMS) calls
• Primary research including a loose dog census, resident survey, and a survey of rescue/animal welfare organizations
• Review of third-party studies from national organizations and academic studies
• Benchmarking of animal services organizations in ten highly comparable cities across the US, including 30 qualitative
interviews and desk research to understand best-practices
BCG scope was constrained by:
• Focus on dog population2 only (vs. all animals) given link to public safety
• Not inclusive of process or recommendations surrounding animal cruelty investigation
• BCG efforts focused on improving the current situation, not assessing prior events unless critical to path forward
1. Live Release Rate from shelter; 2. Despite focus on dogs, most recommendations related to increasing live release rate expected to have significant positive impact on cats and other animals entering DAS.
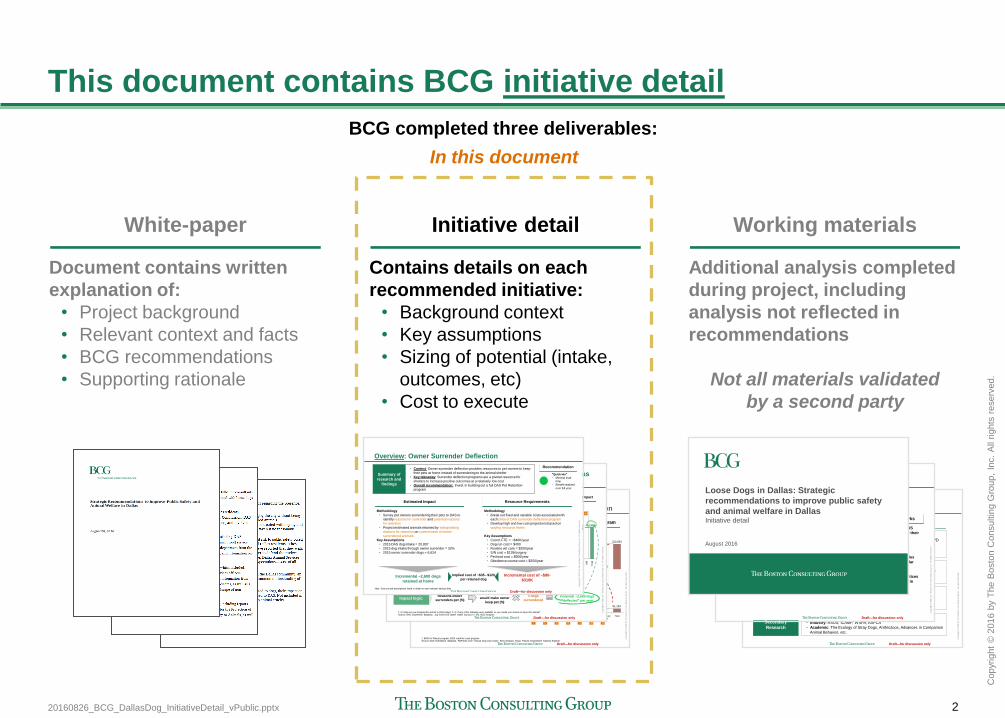
20160826_BCG_DallasDog_InitiativeDetail_vPublic.pptx 2
Copyr
ight
© 2
016 b
y T
he B
osto
n C
onsultin
g G
roup,
Inc.
All
rights
reserv
ed.
This document contains BCG initiative detail
BCG completed three deliverables:
White-paper
Document contains written
explanation of:
• Project background
• Relevant context and facts
• BCG recommendations
• Supporting rationale
Initiative detail
Contains details on each
recommended initiative:
• Background context
• Key assumptions
• Sizing of potential (intake,
outcomes, etc)
• Cost to execute
Working materials
Additional analysis completed
during project, including
analysis not reflected in
recommendations
Not all materials validated
by a second party
Draft—for discussion only
Copyright ©
2016 b
y T
he B
osto
n C
onsultin
g G
roup, In
c.
All
rights
reserv
ed.
Resource requirements: Deflection program costs ~$90-
$310K, dependent upon "Robust" or "Lean" implementation
Key assumptions... Estimated yearly costs of Owner Deflection program
1. $400 for Robust program, $200 credit for Lean programSource: DAS Chameleon database, PetFinder.Com "Annual Dog Care Costs", BCG Analysis, Texas Tribune Government Salaries Explorer
312,834004,1406,5778,280134,373
136,265
23,200
0
100,000
200,000
300,000
400,000
Cost ($)
Costs incurred on a per "deflected" dog basis
Fixed
program
costs
Program coordinator½ FTE @
$46K/yr
DAS Owner Deflection:
Dog Run/ Fence $4001
Routine Vet Care $200
S/N Surgery $139
Pet Food Expense $500/yr
Behavior Courses $250/yr
Temporary Foster -
Remove Citations -
91,13300000068,13323,000
0
200,000
400,000
600,000
800,000
Cost ($)
TotalTemporary
Foster
Remove
Citations
Behavior
Courses
S/N
Surgery
Pet FoodRoutine
Vet Care
Dog Run/
Fence
Program
Coord
Costs incurred on a per "deflected" dog basis
Fixed
program
costs
"Robust"
Program
"Lean"
Program
Incremental cost of
~$90K - $310K per year
i ii iv iii v vii vi
vi
ii
i
iv
v
vii
iii
Draft—for discussion only
Copyright ©
2016 b
y T
he B
osto
n C
onsultin
g G
roup, In
c.
All
rights
reserv
ed.
Projected Retention Impact
Estimated impact: Owner Surrender Deflection program has
potential to deflect ~2,600 dogs per year
Key assumptions
Surveyed reason for
surrender at DAS1
1. Q: Why are you bringing this animal to DAS today? 2. Q: If any of the following were available to you, would you choose to keep this animal?Source: DAS Chameleon database, July 2016 DAS Owner Intake Survey (n = 44), BCG Analysis
225
779
1416
2023
25
3030
39
0%
10%
20%
30%
40%
Anim
al aggre
ssio
n
Anim
al in
tera
ction
Anim
al obedie
nce
Cost of
eve
ry d
ay c
are
Yard
/Housin
g
Lifesty
le
Movi
ng
Num
ber
of
anim
als
Euth
anasia
Anim
al S
erv
ice O
ffic
ers
Oth
er
% of respondents indicating surrender reason
Pers
onal health
Cost of
medic
al care
Lack o
f tim
e
Surveyed reason for
retention at DAS2
1333
5
10
1414
47
0%
20%
40%
60%
Pet fo
od P
roducts
Dog r
un/f
encin
g
Vet C
are
Tem
pora
ry H
om
e
Oth
er
Do n
ot
want
anim
al
S/N
Obedie
nce c
ours
es
Tic
kets
/ citations R
em
oval
% of respondents indicating retention reason2015 DAS Dog
Intake20,807
2015 % Dog Intake
through Owner32%
2015 Owner Dog
Intake6,624
DAS Owner Deflection:
Dog Run/ Fence
Routine Vet Care
S/N Surgery
Pet Food Expense
Behavior Courses
Temporary Foster
Remove Citations
vi ii i iv v vii iii
2,59347189199
199341
672
946
0
1,000
2,000
3,000
4,000
Tota
l
Tic
kets
/ citations R
em
oval
S/N
Projected dogs retained
Pet fo
od P
roducts
Dog r
un/f
encin
g
Obedie
nce c
ours
es
Vet C
are
Tem
pora
ry H
om
e
vi ii i iv v vii iii
Potential ~2,600 dogs
"deflected" per year
Reasons owner
surrenders pet (%)
Interventions that
would make owner
keep pet (%)
# dogs
surrenderedImpact logic:
I II III
I II III
vi
ii
i
iv
v
vii
iii
Draft—for discussion only
Copyright ©
2016 b
y T
he B
osto
n C
onsultin
g G
roup, In
c.
All
rights
reserv
ed.
Overview: Owner Surrender Deflection
Summary of
research and
findings
• Context: Owner surrender deflection provides resources to pet owners to keep
their pets at home instead of surrendering to the animal shelter
• Key takeaway: Surrender deflection programs are a pivotal resource for
shelters to increase positive outcomes at a relatively low cost
• Overall recommendation: Invest in building out a full DAS Pet Retention
program
Estimated Impact
Methodology
• Survey pet owners surrendering their pets to DAS to
identify reasons for surrender and potential reasons
for retention
• Project estimated animals retained by extrapolating
reasons for retention on current base of owner
surrendered animals
Key Assumptions
• 2015 DAS dog intake = 20,807
• 2015 dog intake through owner surrender = 32%
• 2015 owner surrender dogs = 6,624
Resource Requirements
Methodology
• Break out fixed and variable costs associated with
each pillar of DAS surrender deflection program
• Develop high and low cost projections based on
varying resource levels
Key Assumptions
• Coord. FTE = ~$46K/year
• Dog run cost = $400
• Routine vet care = $200/year
• S/N cost = $139/surgery
• Pet food cost = $500/year
• Obedience course cost = $250/year
Recommendation
Incremental ~2,600 dogs
retained at home
Incremental cost of ~$90-
$310K
"Quick win"
• Minimal lead
time
• Benefit realized
over full year
Note: Sources and assumptions listed in detail on each relevant backup slide
Implied cost of ~$35 - $120
per retained dog
In this document
Draft—for discussion only
Copyright ©
2016 b
y T
he B
osto
n C
onsultin
g G
roup, In
c.
All
rights
reserv
ed.
Interviews with
Stakeholders
100+ stakeholder interviews completed including:
• Government: Council Members, Animal Commissions, Code & DAS, DPD
• Non-profits: Animal rescue organizations, funders/philanthropies
• Citizens: Town halls and specific involved individuals
~40 interviews with stakeholders from comparable benchmark cities
Secondary
Research
Primary Research
Extensive primary research to collect new and unique information:
• Census: Roaming dog census in North and South Dallas
• Ride-a-longs: DAS field day, Targeted Response Team and CARE
• Surveys: Community, Rescue/welfare organization
Data Analysis
Detailed analysis of all relevant data sources:
• DAS data & Government: Chameleon, bite reports, 311, 911, Sanitation
• Community Data: Historical S/N activity
• Public Data: Census data
Gathered and reviewed large volume of available secondary research:
• Industry: HSUS, ICAMP, WSPA, ASPCA
• Academic: The Ecology of Stray Dogs, Anthrozoos, Advances in Companion
Animal Behavior, etc.
How BCG developed its recommendation
What we didActivity
Draft—for discussion only
Copyright ©
2016 b
y T
he B
osto
n C
onsultin
g G
roup, In
c.
All
rights
reserv
ed.
BCG framework for understanding the situation
Supply
of Dogs
How many dogs are in
Dallas?
• Registered, Loose?
Do dogs pose a public
safety risk?
What services are
available to prevent
population growth
Benchmarks
How do other US
cities structure their
Animal control
agencies?
How have
comparable cities
overcome similar
dog issues?
What best practices
can be applied in
Dallas?
DAS
Operations
How effectively does
DAS collect dogs?
How efficiently and
quickly does DAS
operate its shelter?
How effectively does
DAS rehome dogs?
Enforcement &
Responsiveness
How effectively does
Dallas institute and
enforce animal
ordinances?
How effectively does
DAS respond to
animal related
requests /
complaints?
Loose Dogs in Dallas: Strategic
recommendations to improve public safety
and animal welfare in Dallas Initiative detail
August 2016
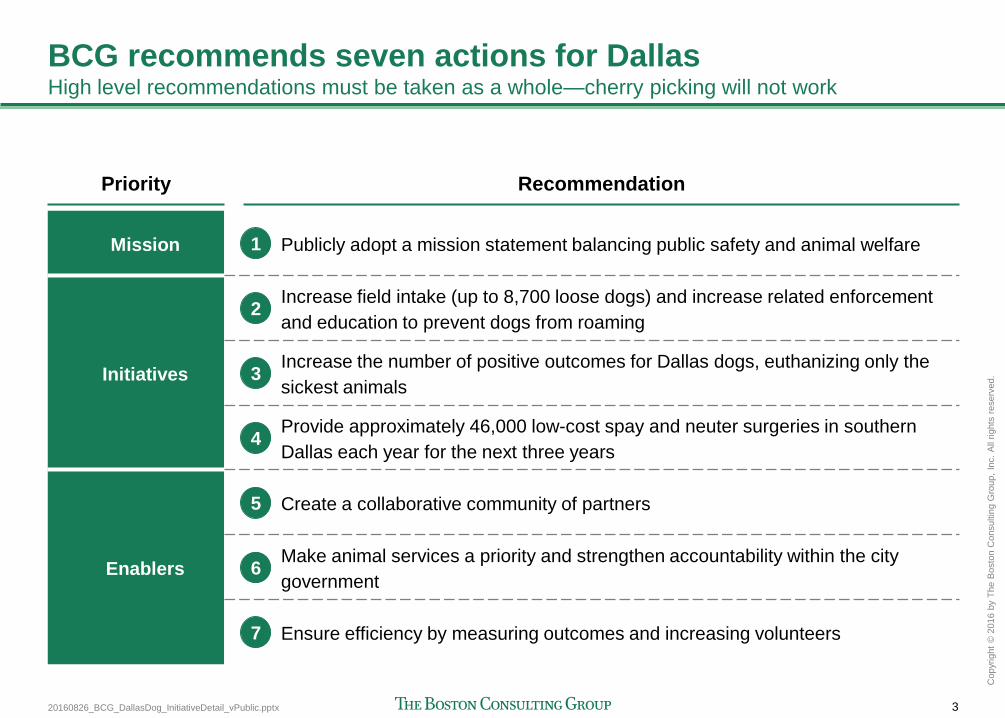
20160826_BCG_DallasDog_InitiativeDetail_vPublic.pptx 3
Copyr
ight
© 2
016 b
y T
he B
osto
n C
onsultin
g G
roup,
Inc.
All
rights
reserv
ed.
BCG recommends seven actions for Dallas High level recommendations must be taken as a whole—cherry picking will not work
Priority Recommendation
Mission Publicly adopt a mission statement balancing public safety and animal welfare
Initiatives
Increase field intake (up to 8,700 loose dogs) and increase related enforcement
and education to prevent dogs from roaming
Increase the number of positive outcomes for Dallas dogs, euthanizing only the
sickest animals
Provide approximately 46,000 low-cost spay and neuter surgeries in southern
Dallas each year for the next three years
Enablers
Create a collaborative community of partners
Make animal services a priority and strengthen accountability within the city
government
Ensure efficiency by measuring outcomes and increasing volunteers
1
2
3
4
5
6
7
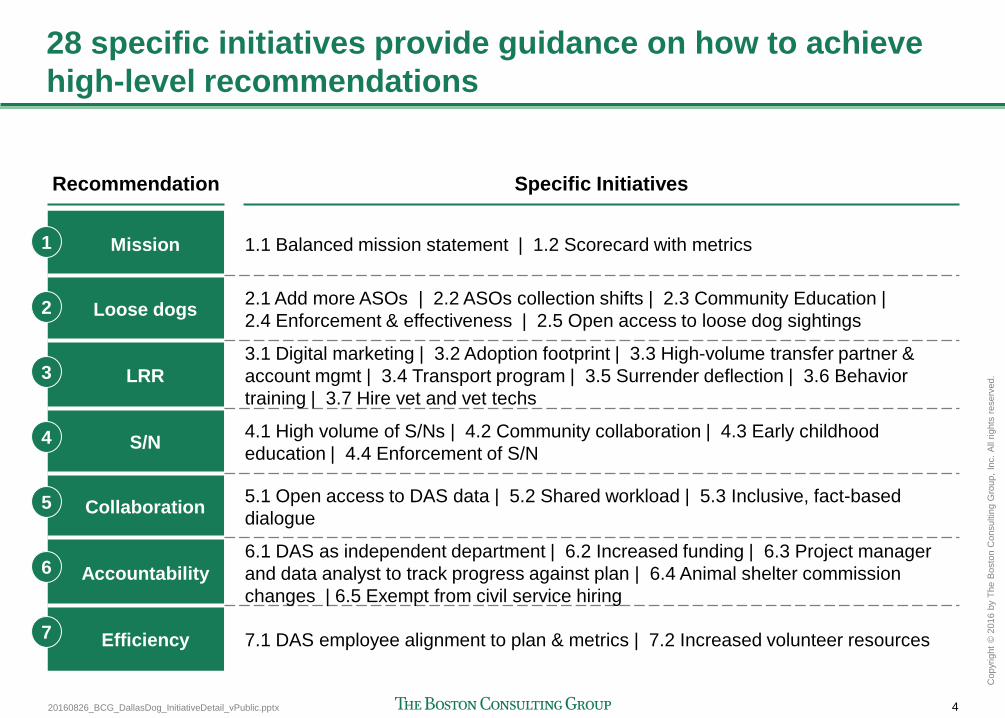
20160826_BCG_DallasDog_InitiativeDetail_vPublic.pptx 4
Copyr
ight
© 2
016 b
y T
he B
osto
n C
onsultin
g G
roup,
Inc.
All
rights
reserv
ed.
28 specific initiatives provide guidance on how to achieve
high-level recommendations
Recommendation Specific Initiatives
Mission 1.1 Balanced mission statement | 1.2 Scorecard with metrics
Loose dogs 2.1 Add more ASOs | 2.2 ASOs collection shifts | 2.3 Community Education |
2.4 Enforcement & effectiveness | 2.5 Open access to loose dog sightings
LRR
3.1 Digital marketing | 3.2 Adoption footprint | 3.3 High-volume transfer partner &
account mgmt | 3.4 Transport program | 3.5 Surrender deflection | 3.6 Behavior
training | 3.7 Hire vet and vet techs
S/N 4.1 High volume of S/Ns | 4.2 Community collaboration | 4.3 Early childhood
education | 4.4 Enforcement of S/N
Collaboration 5.1 Open access to DAS data | 5.2 Shared workload | 5.3 Inclusive, fact-based
dialogue
Accountability
6.1 DAS as independent department | 6.2 Increased funding | 6.3 Project manager
and data analyst to track progress against plan | 6.4 Animal shelter commission
changes | 6.5 Exempt from civil service hiring
Efficiency 7.1 DAS employee alignment to plan & metrics | 7.2 Increased volunteer resources
1
2
3
4
5
6
7
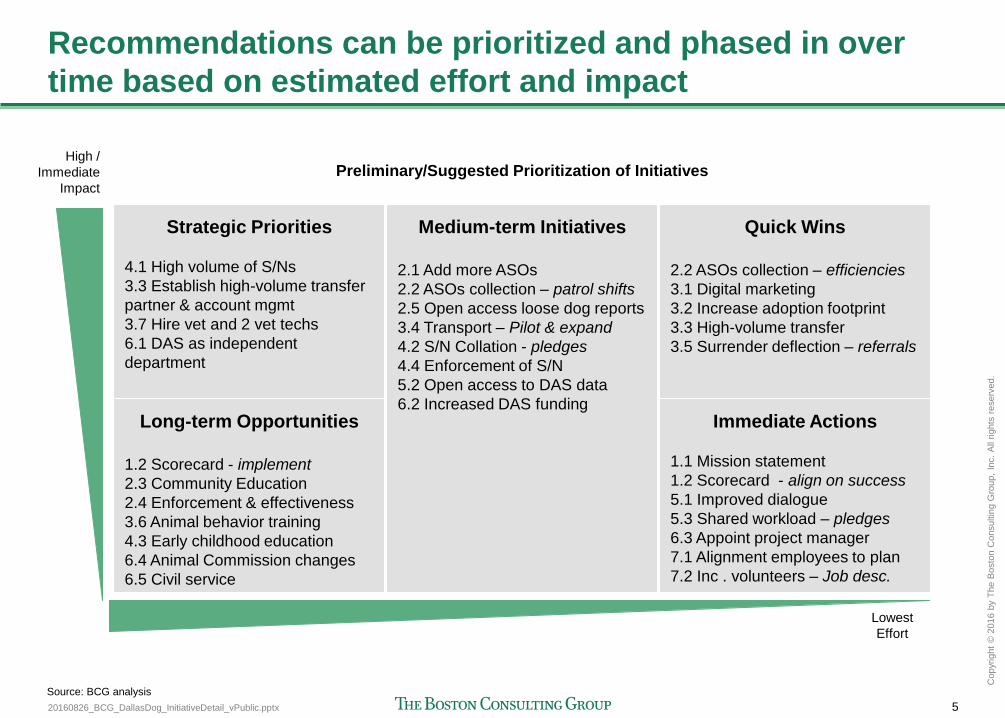
20160826_BCG_DallasDog_InitiativeDetail_vPublic.pptx 5
Copyr
ight
© 2
016 b
y T
he B
osto
n C
onsultin
g G
roup,
Inc.
All
rights
reserv
ed.
Recommendations can be prioritized and phased in over
time based on estimated effort and impact
Strategic Priorities
4.1 High volume of S/Ns
3.3 Establish high-volume transfer
partner & account mgmt
3.7 Hire vet and 2 vet techs
6.1 DAS as independent
department
Medium-term Initiatives
2.1 Add more ASOs
2.2 ASOs collection – patrol shifts
2.5 Open access loose dog reports
3.4 Transport – Pilot & expand
4.2 S/N Collation - pledges
4.4 Enforcement of S/N
5.2 Open access to DAS data
6.2 Increased DAS funding Long-term Opportunities
1.2 Scorecard - implement
2.3 Community Education
2.4 Enforcement & effectiveness
3.6 Animal behavior training
4.3 Early childhood education
6.4 Animal Commission changes
6.5 Civil service
High /
Immediate
Impact
Lowest
Effort
Quick Wins
2.2 ASOs collection – efficiencies
3.1 Digital marketing
3.2 Increase adoption footprint
3.3 High-volume transfer
3.5 Surrender deflection – referrals
Immediate Actions
1.1 Mission statement
1.2 Scorecard - align on success
5.1 Improved dialogue
5.3 Shared workload – pledges
6.3 Appoint project manager
7.1 Alignment employees to plan
7.2 Inc . volunteers – Job desc.
Preliminary/Suggested Prioritization of Initiatives
Source: BCG analysis
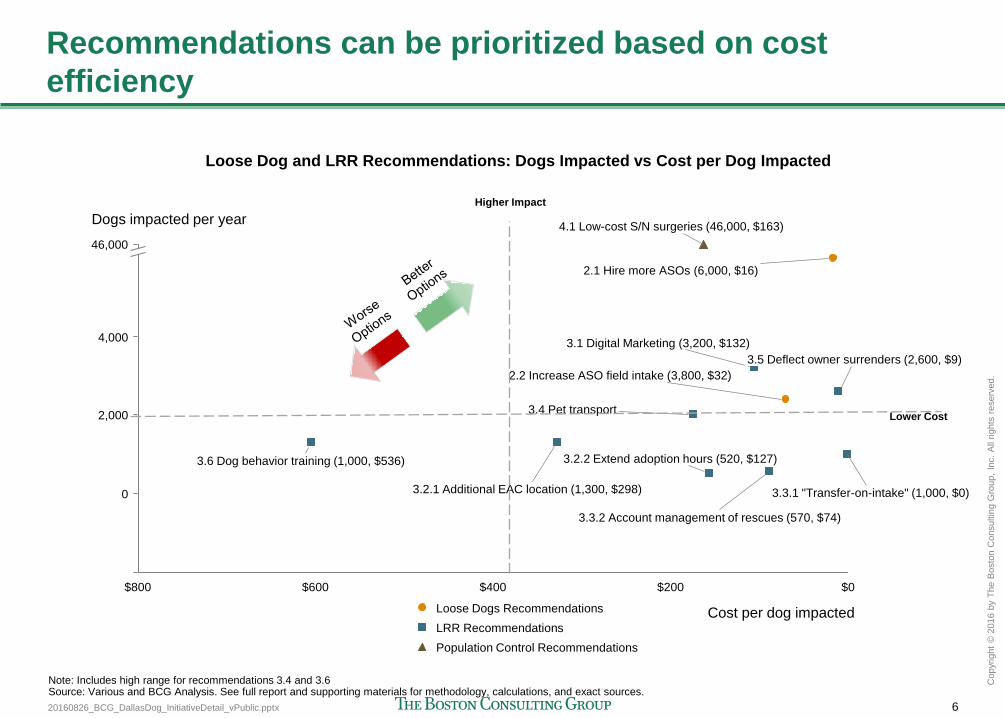
20160826_BCG_DallasDog_InitiativeDetail_vPublic.pptx 6
Copyr
ight
© 2
016 b
y T
he B
osto
n C
onsultin
g G
roup,
Inc.
All
rights
reserv
ed.
Recommendations can be prioritized based on cost
efficiency
$200 $400 $600 $800
46,000
4,000
2,000
0
$0
Dogs impacted per year
Cost per dog impacted
4.1 Low-cost S/N surgeries (46,000, $163)
3.2.1 Additional EAC location (1,300, $298)
3.6 Dog behavior training (1,000, $536) 3.2.2 Extend adoption hours (520, $127)
2.1 Hire more ASOs (6,000, $16)
3.3.1 "Transfer-on-intake" (1,000, $0)
3.3.2 Account management of rescues (570, $74)
3.4 Pet transport
2.2 Increase ASO field intake (3,800, $32)
3.1 Digital Marketing (3,200, $132)
3.5 Deflect owner surrenders (2,600, $9)
Population Control Recommendations
LRR Recommendations
Loose Dogs Recommendations
Higher Impact
Lower Cost
Note: Includes high range for recommendations 3.4 and 3.6 Source: Various and BCG Analysis. See full report and supporting materials for methodology, calculations, and exact sources.
Loose Dog and LRR Recommendations: Dogs Impacted vs Cost per Dog Impacted
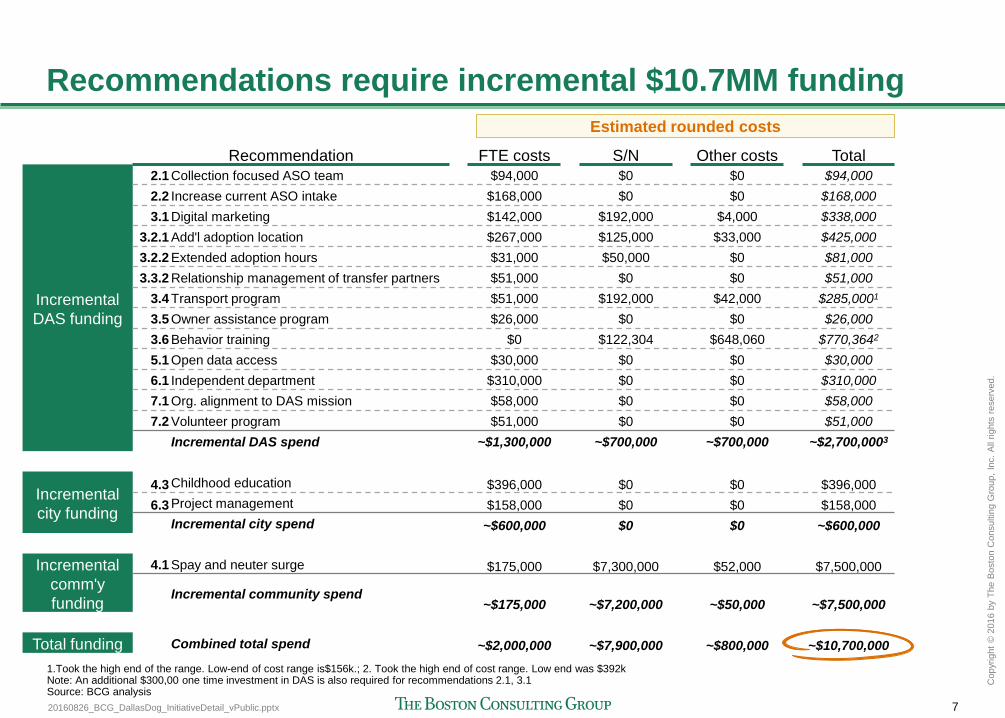
20160826_BCG_DallasDog_InitiativeDetail_vPublic.pptx 7
Copyr
ight
© 2
016 b
y T
he B
osto
n C
onsultin
g G
roup,
Inc.
All
rights
reserv
ed.
Recommendations require incremental $10.7MM funding
Recommendation FTE costs S/N Other costs Total
Incremental
DAS funding
2.1 Collection focused ASO team $94,000 $0 $0 $94,000
2.2 Increase current ASO intake $168,000 $0 $0 $168,000
3.1 Digital marketing $142,000 $192,000 $4,000 $338,000
3.2.1 Add'l adoption location $267,000 $125,000 $33,000 $425,000
3.2.2 Extended adoption hours $31,000 $50,000 $0 $81,000
3.3.2 Relationship management of transfer partners $51,000 $0 $0 $51,000
3.4 Transport program $51,000 $192,000 $42,000 $285,0001
3.5 Owner assistance program $26,000 $0 $0 $26,000
3.6 Behavior training $0 $122,304 $648,060 $770,3642
5.1 Open data access $30,000 $0 $0 $30,000
6.1 Independent department $310,000 $0 $0 $310,000
7.1 Org. alignment to DAS mission $58,000 $0 $0 $58,000
7.2 Volunteer program $51,000 $0 $0 $51,000
Incremental DAS spend ~$1,300,000 ~$700,000 ~$700,000 ~$2,700,0003
Incremental
city funding
4.3 Childhood education $396,000 $0 $0 $396,000
6.3 Project management $158,000 $0 $0 $158,000
Incremental city spend ~$600,000 $0 $0 ~$600,000
Incremental
comm'y
funding
4.1 Spay and neuter surge $175,000 $7,300,000 $52,000 $7,500,000
Incremental community spend ~$175,000 ~$7,200,000 ~$50,000 ~$7,500,000
Total funding Combined total spend ~$2,000,000 ~$7,900,000 ~$800,000 ~$10,700,000
1.Took the high end of the range. Low-end of cost range is$156k.; 2. Took the high end of cost range. Low end was $392k Note: An additional $300,00 one time investment in DAS is also required for recommendations 2.1, 3.1 Source: BCG analysis
Estimated rounded costs
20160826_BCG_DallasDog_InitiativeDetail_vPublic.pptx 8
Copyr
ight
© 2
016 b
y T
he B
osto
n C
onsultin
g G
roup,
Inc.
All
rights
reserv
ed.
Agenda
Recommendation 1: Publicly adopt a mission statement balancing public
safety and animal welfare
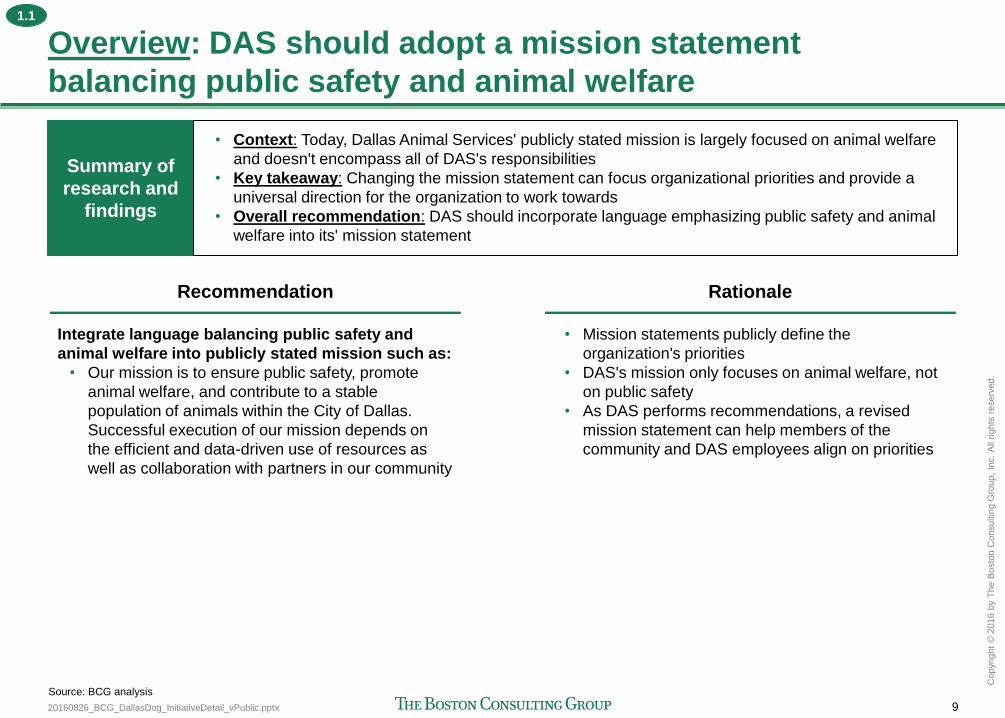
20160826_BCG_DallasDog_InitiativeDetail_vPublic.pptx 9
Copyr
ight
© 2
016 b
y T
he B
osto
n C
onsultin
g G
roup,
Inc.
All
rights
reserv
ed.
Overview: DAS should adopt a mission statement
balancing public safety and animal welfare
Summary of
research and
findings
• Context: Today, Dallas Animal Services' publicly stated mission is largely focused on animal welfare
and doesn't encompass all of DAS's responsibilities
• Key takeaway: Changing the mission statement can focus organizational priorities and provide a
universal direction for the organization to work towards
• Overall recommendation: DAS should incorporate language emphasizing public safety and animal
welfare into its' mission statement
Recommendation
Integrate language balancing public safety and
animal welfare into publicly stated mission such as:
• Our mission is to ensure public safety, promote
animal welfare, and contribute to a stable
population of animals within the City of Dallas.
Successful execution of our mission depends on
the efficient and data-driven use of resources as
well as collaboration with partners in our community
Rationale
• Mission statements publicly define the
organization's priorities
• DAS's mission only focuses on animal welfare, not
on public safety
• As DAS performs recommendations, a revised
mission statement can help members of the
community and DAS employees align on priorities
Source: BCG analysis
1.1
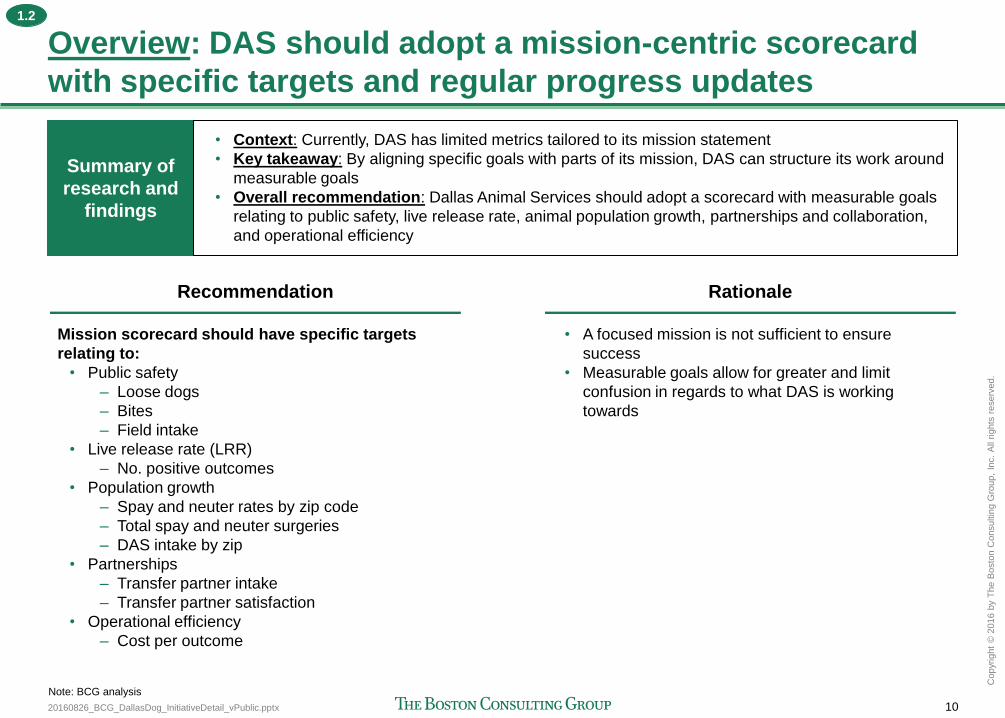
20160826_BCG_DallasDog_InitiativeDetail_vPublic.pptx 10
Copyr
ight
© 2
016 b
y T
he B
osto
n C
onsultin
g G
roup,
Inc.
All
rights
reserv
ed.
Overview: DAS should adopt a mission-centric scorecard
with specific targets and regular progress updates
Summary of
research and
findings
• Context: Currently, DAS has limited metrics tailored to its mission statement
• Key takeaway: By aligning specific goals with parts of its mission, DAS can structure its work around
measurable goals
• Overall recommendation: Dallas Animal Services should adopt a scorecard with measurable goals
relating to public safety, live release rate, animal population growth, partnerships and collaboration,
and operational efficiency
Recommendation
Mission scorecard should have specific targets
relating to:
• Public safety
– Loose dogs
– Bites
– Field intake
• Live release rate (LRR)
– No. positive outcomes
• Population growth
– Spay and neuter rates by zip code
– Total spay and neuter surgeries
– DAS intake by zip
• Partnerships
– Transfer partner intake
– Transfer partner satisfaction
• Operational efficiency
– Cost per outcome
Rationale
• A focused mission is not sufficient to ensure
success
• Measurable goals allow for greater and limit
confusion in regards to what DAS is working
towards
Note: BCG analysis
1.2
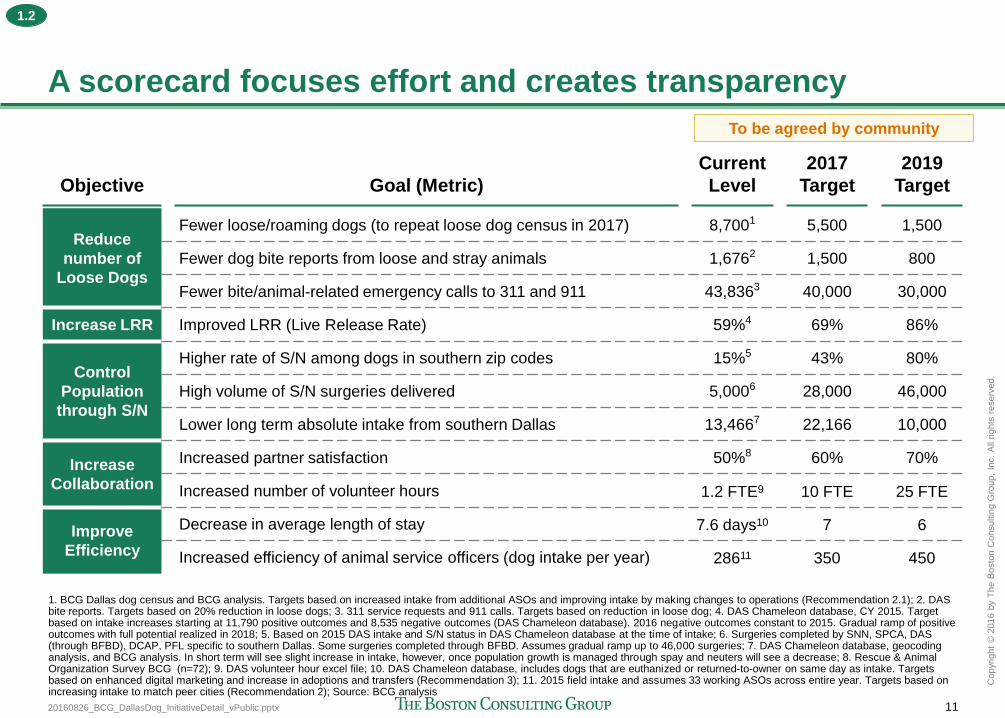
20160826_BCG_DallasDog_InitiativeDetail_vPublic.pptx 11
Copyr
ight
© 2
016 b
y T
he B
osto
n C
onsultin
g G
roup,
Inc.
All
rights
reserv
ed.
A scorecard focuses effort and creates transparency
Objective Goal (Metric)
Current
Level
2017
Target
2019
Target
Reduce
number of
Loose Dogs
Fewer loose/roaming dogs (to repeat loose dog census in 2017) 8,7001 5,500 1,500
Fewer dog bite reports from loose and stray animals 1,6762 1,500 800
Fewer bite/animal-related emergency calls to 311 and 911 43,8363 40,000 30,000
Increase LRR Improved LRR (Live Release Rate) 59%4 69% 86%
Control
Population
through S/N
Higher rate of S/N among dogs in southern zip codes 15%5 43% 80%
High volume of S/N surgeries delivered 5,0006 28,000 46,000
Lower long term absolute intake from southern Dallas 13,4667 22,166 10,000
Increase
Collaboration
Increased partner satisfaction 50%8 60% 70%
Increased number of volunteer hours 1.2 FTE9 10 FTE 25 FTE
Improve
Efficiency
Decrease in average length of stay 7.6 days10 7 6
Increased efficiency of animal service officers (dog intake per year) 28611 350 450
To be agreed by community
1. BCG Dallas dog census and BCG analysis. Targets based on increased intake from additional ASOs and improving intake by making changes to operations (Recommendation 2.1); 2. DAS bite reports. Targets based on 20% reduction in loose dogs; 3. 311 service requests and 911 calls. Targets based on reduction in loose dog; 4. DAS Chameleon database, CY 2015. Target based on intake increases starting at 11,790 positive outcomes and 8,535 negative outcomes (DAS Chameleon database). 2016 negative outcomes constant to 2015. Gradual ramp of positive outcomes with full potential realized in 2018; 5. Based on 2015 DAS intake and S/N status in DAS Chameleon database at the time of intake; 6. Surgeries completed by SNN, SPCA, DAS (through BFBD), DCAP, PFL specific to southern Dallas. Some surgeries completed through BFBD. Assumes gradual ramp up to 46,000 surgeries; 7. DAS Chameleon database, geocoding analysis, and BCG analysis. In short term will see slight increase in intake, however, once population growth is managed through spay and neuters will see a decrease; 8. Rescue & Animal Organization Survey BCG (n=72); 9. DAS volunteer hour excel file; 10. DAS Chameleon database, includes dogs that are euthanized or returned-to-owner on same day as intake. Targets based on enhanced digital marketing and increase in adoptions and transfers (Recommendation 3); 11. 2015 field intake and assumes 33 working ASOs across entire year. Targets based on increasing intake to match peer cities (Recommendation 2); Source: BCG analysis
1.2
20160826_BCG_DallasDog_InitiativeDetail_vPublic.pptx 12
Copyr
ight
© 2
016 b
y T
he B
osto
n C
onsultin
g G
roup,
Inc.
All
rights
reserv
ed.
Agenda
Recommendation 2: Increase field intake (up to 8,700 loose dogs) and
increase related enforcement and education to prevent dogs from roaming
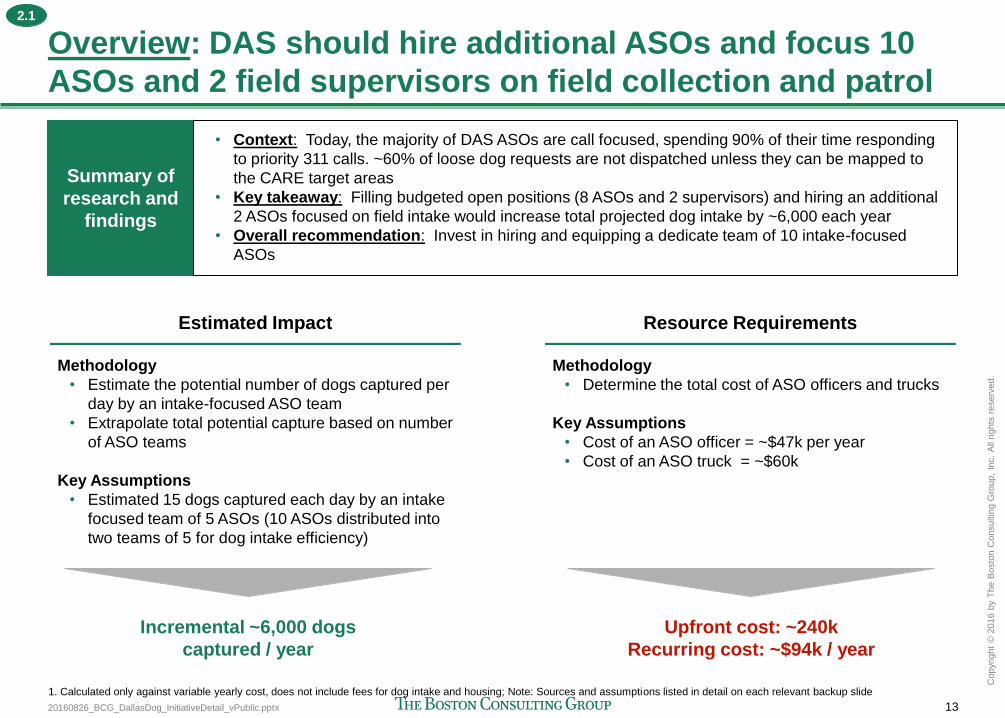
20160826_BCG_DallasDog_InitiativeDetail_vPublic.pptx 13
Copyr
ight
© 2
016 b
y T
he B
osto
n C
onsultin
g G
roup,
Inc.
All
rights
reserv
ed.
Overview: DAS should hire additional ASOs and focus 10
ASOs and 2 field supervisors on field collection and patrol
Estimated Impact
Methodology
• Estimate the potential number of dogs captured per
day by an intake-focused ASO team
• Extrapolate total potential capture based on number
of ASO teams
Key Assumptions
• Estimated 15 dogs captured each day by an intake
focused team of 5 ASOs (10 ASOs distributed into
two teams of 5 for dog intake efficiency)
Resource Requirements
Methodology
• Determine the total cost of ASO officers and trucks
Key Assumptions
• Cost of an ASO officer = ~$47k per year
• Cost of an ASO truck = ~$60k
Incremental ~6,000 dogs
captured / year
Upfront cost: ~240k
Recurring cost: ~$94k / year
1. Calculated only against variable yearly cost, does not include fees for dog intake and housing; Note: Sources and assumptions listed in detail on each relevant backup slide
Summary of
research and
findings
• Context: Today, the majority of DAS ASOs are call focused, spending 90% of their time responding
to priority 311 calls. ~60% of loose dog requests are not dispatched unless they can be mapped to
the CARE target areas
• Key takeaway: Filling budgeted open positions (8 ASOs and 2 supervisors) and hiring an additional
2 ASOs focused on field intake would increase total projected dog intake by ~6,000 each year
• Overall recommendation: Invest in hiring and equipping a dedicate team of 10 intake-focused
ASOs
2.1
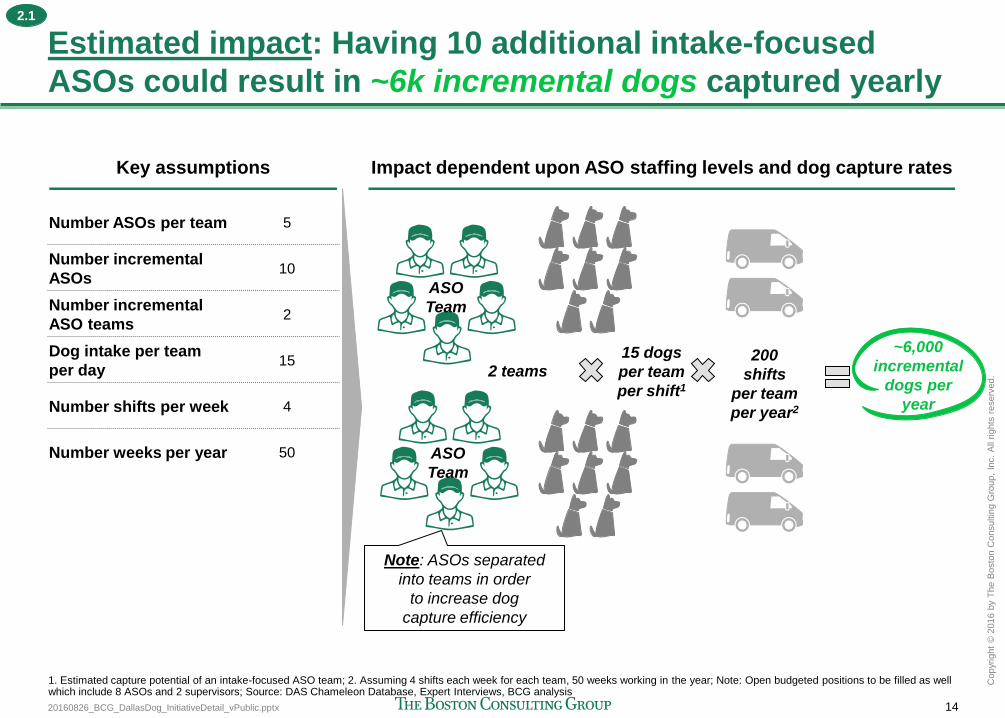
20160826_BCG_DallasDog_InitiativeDetail_vPublic.pptx 14
Copyr
ight
© 2
016 b
y T
he B
osto
n C
onsultin
g G
roup,
Inc.
All
rights
reserv
ed.
Estimated impact: Having 10 additional intake-focused
ASOs could result in ~6k incremental dogs captured yearly
1. Estimated capture potential of an intake-focused ASO team; 2. Assuming 4 shifts each week for each team, 50 weeks working in the year; Note: Open budgeted positions to be filled as well which include 8 ASOs and 2 supervisors; Source: DAS Chameleon Database, Expert Interviews, BCG analysis
Impact dependent upon ASO staffing levels and dog capture rates Key assumptions
Number ASOs per team 5
Number incremental
ASOs 10
Number incremental
ASO teams 2
Dog intake per team
per day 15
Number shifts per week 4
Number weeks per year 50
ASO
Team
ASO
Team
2 teams 15 dogs
per team
per shift1
~6,000
incremental
dogs per
year
Note: ASOs separated
into teams in order
to increase dog
capture efficiency
200
shifts
per team
per year2
2.1

20160826_BCG_DallasDog_InitiativeDetail_vPublic.pptx 15
Copyr
ight
© 2
016 b
y T
he B
osto
n C
onsultin
g G
roup,
Inc.
All
rights
reserv
ed.
240,000
94,000
334,000
0
100,000
200,000
300,000
400,000
Cost ($)
Truck Cost (Fixed) ASO Cost (Variable) Total Year 1
(Fixed + Variable)
Resource requirements: Having 10 additional intake-
focused ASOs would incur ~$94k yearly cost
Incremental
number ASOs 2
Cost per ASO per year $47,0001
Cost per ASO truck $60,000
Number of trucks
per team 22
Key assumptions Resource requirements dependent upon ASO and truck cost
Incremental cost of ~$94k
per year
2 teams x 2 trucks per
team x ~$60k/truck
2 incremental non-budgeted
ASOs x ~$47k/year
1. Determined by finding the median salary of a comparable position on the Texas Tribune Salary Explorer, and then applying an extra 20% to that salary to account for benefits; 2. Only 1 truck needed per team at a time, 1 truck kept for backup and ad-hoc sweeps; Source: DAS Chameleon Database, Texas Tribune, BCG analysis
2.1
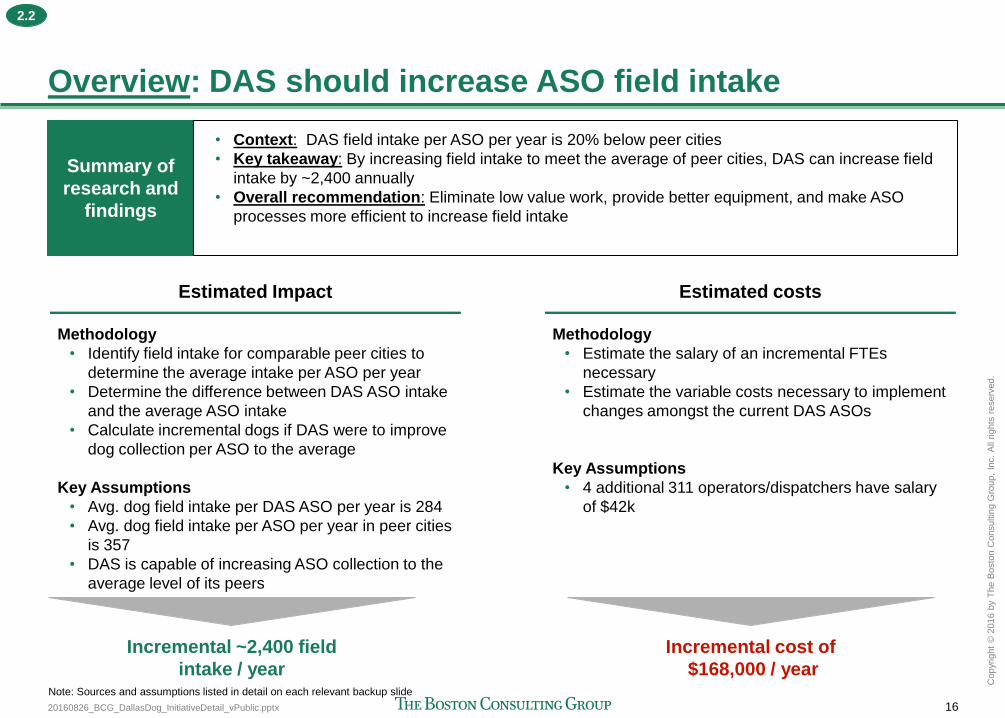
20160826_BCG_DallasDog_InitiativeDetail_vPublic.pptx 16
Copyr
ight
© 2
016 b
y T
he B
osto
n C
onsultin
g G
roup,
Inc.
All
rights
reserv
ed.
Overview: DAS should increase ASO field intake
Estimated Impact
Methodology
• Identify field intake for comparable peer cities to
determine the average intake per ASO per year
• Determine the difference between DAS ASO intake
and the average ASO intake
• Calculate incremental dogs if DAS were to improve
dog collection per ASO to the average
Key Assumptions
• Avg. dog field intake per DAS ASO per year is 284
• Avg. dog field intake per ASO per year in peer cities
is 357
• DAS is capable of increasing ASO collection to the
average level of its peers
Estimated costs
Methodology
• Estimate the salary of an incremental FTEs
necessary
• Estimate the variable costs necessary to implement
changes amongst the current DAS ASOs
Key Assumptions
• 4 additional 311 operators/dispatchers have salary
of $42k
Incremental ~2,400 field
intake / year
Incremental cost of
$168,000 / year Note: Sources and assumptions listed in detail on each relevant backup slide
Summary of
research and
findings
• Context: DAS field intake per ASO per year is 20% below peer cities
• Key takeaway: By increasing field intake to meet the average of peer cities, DAS can increase field
intake by ~2,400 annually
• Overall recommendation: Eliminate low value work, provide better equipment, and make ASO
processes more efficient to increase field intake
2.2
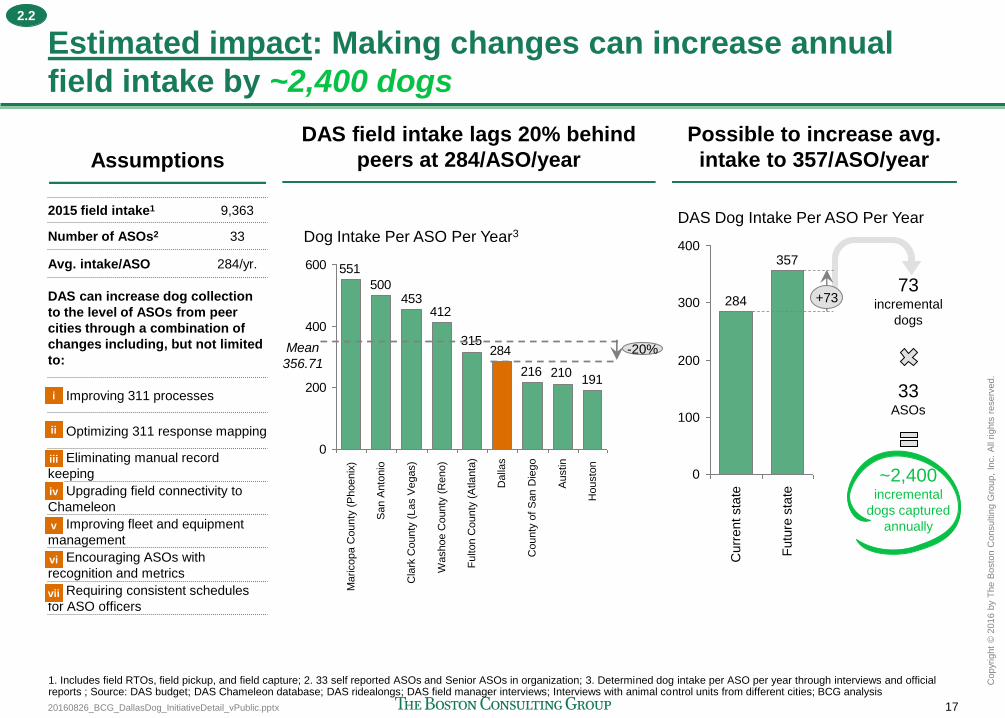
20160826_BCG_DallasDog_InitiativeDetail_vPublic.pptx 17
Copyr
ight
© 2
016 b
y T
he B
osto
n C
onsultin
g G
roup,
Inc.
All
rights
reserv
ed.
Estimated impact: Making changes can increase annual
field intake by ~2,400 dogs
1. Includes field RTOs, field pickup, and field capture; 2. 33 self reported ASOs and Senior ASOs in organization; 3. Determined dog intake per ASO per year through interviews and official reports ; Source: DAS budget; DAS Chameleon database; DAS ridealongs; DAS field manager interviews; Interviews with animal control units from different cities; BCG analysis
Assumptions
2015 field intake1 9,363
Number of ASOs2 33
Avg. intake/ASO 284/yr.
DAS can increase dog collection
to the level of ASOs from peer
cities through a combination of
changes including, but not limited
to:
Improving 311 processes
Optimizing 311 response mapping
Eliminating manual record
keeping
Upgrading field connectivity to
Chameleon
Improving fleet and equipment
management
Encouraging ASOs with
recognition and metrics
Requiring consistent schedules
for ASO officers
vi
ii
i
iv
v
vii
iii
DAS field intake lags 20% behind
peers at 284/ASO/year
Possible to increase avg.
intake to 357/ASO/year
400
300
200
100
0
DAS Dog Intake Per ASO Per Year
357
+73
Futu
re s
tate
Curr
ent sta
te
284 73
incremental
dogs
33 ASOs
~2,400 incremental
dogs captured
annually
191210216
284315
412453
500
551
0
200
400
600
Dog Intake Per ASO Per Year3
Housto
n
Austin
County
of
San D
iego
Dalla
s
Fu
lton C
ounty
(A
tla
nta
)
Washoe C
ounty
(R
eno)
Cla
rk C
ounty
(Las V
egas)
San A
nto
nio
Maricopa C
ounty
(P
hoenix
)
Mean
356.71 -20%
2.2
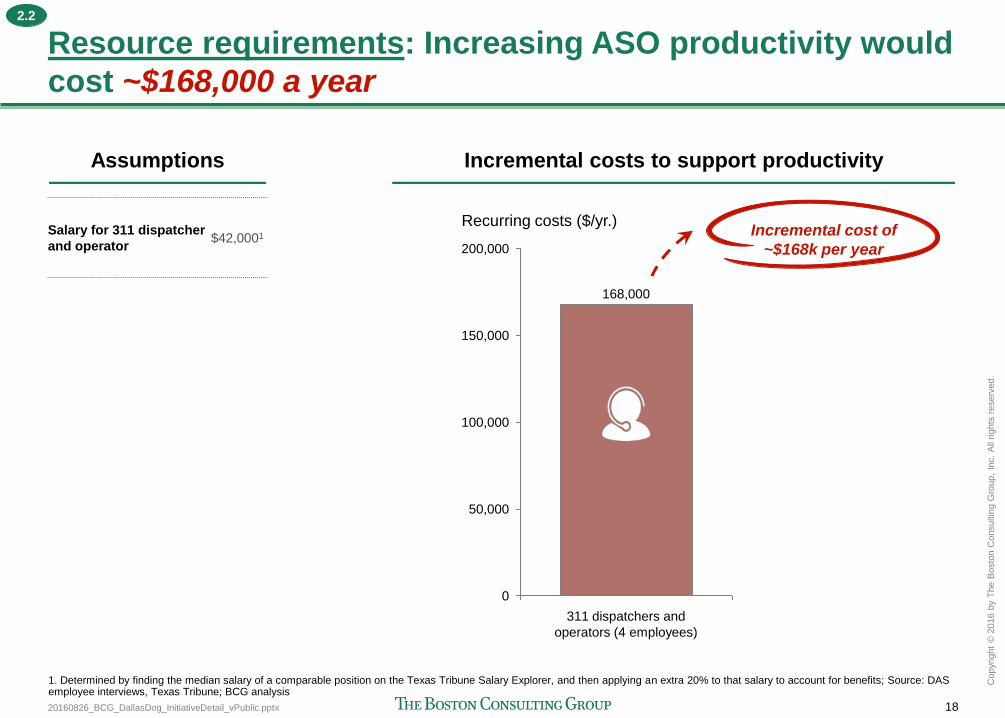
20160826_BCG_DallasDog_InitiativeDetail_vPublic.pptx 18
Copyr
ight
© 2
016 b
y T
he B
osto
n C
onsultin
g G
roup,
Inc.
All
rights
reserv
ed.
Resource requirements: Increasing ASO productivity would
cost ~$168,000 a year
Salary for 311 dispatcher
and operator $42,0001
100,000
0
50,000
150,000
200,000
Recurring costs ($/yr.)
311 dispatchers and
operators (4 employees)
168,000
1. Determined by finding the median salary of a comparable position on the Texas Tribune Salary Explorer, and then applying an extra 20% to that salary to account for benefits; Source: DAS employee interviews, Texas Tribune; BCG analysis
Incremental cost of
~$168k per year
Assumptions Incremental costs to support productivity
2.2

20160826_BCG_DallasDog_InitiativeDetail_vPublic.pptx 19
Copyr
ight
© 2
016 b
y T
he B
osto
n C
onsultin
g G
roup,
Inc.
All
rights
reserv
ed.
Compared to peers, DAS has higher ASO staffing levels and
lower ASO field intake
DAS has 45% more ASOs per million
people than benchmarks...
78
12
161617
2123
2426
37
0
10
20
30
40
ASOs Per Million People
Washoe C
ounty
(Reno)
Cla
rk C
ounty
(Las V
egas)
Housto
n
Jacksonvill
e
Fulton C
ounty
(Atlanta
)
County
of S
an D
iego
San A
nto
nio
Austin
Los A
ngele
s
Dalla
s
Maricopa C
ounty
(Phoenix
)
Mean
18.14
+45%
191210216
284315
412
453
500
551
0
200
400
600
San A
nto
nio
Maricopa C
ounty
(Phoenix
)
Dog Intake Per ASO Per Year
Cla
rk C
ounty
(Las V
egas)
Washoe C
ounty
(Reno)
Fulton C
ounty
(Atlanta
)
Housto
n
Dalla
s
County
of S
an D
iego
Austin
...but, DAS field collection lags by 20%
Mean
356.71 -20%
Note: Assumes that 33 DAS ASOs with a field intake of 9,363 for CY 2015; Source: DAS Chameleon Database; Maricopa County Yearly Report (2016); Clark County Animal Control, County of San Diego Animal Services, Houston BARC, Fulton County Animal Services, Austin Animal Services, Jacksonville Animal Services, San Antonio Animal Services, Los Angeles Animal Services, Washoe County Regional Animal Services . Population from US Census Data (2013); BCG analysis
2.2

20160826_BCG_DallasDog_InitiativeDetail_vPublic.pptx 20
Copyr
ight
© 2
016 b
y T
he B
osto
n C
onsultin
g G
roup,
Inc.
All
rights
reserv
ed.
Overview: Dallas community should educate residents
about the dangers of loose dogs and ways to avoid bites
Recommendation / Rationale
Incorporate dangers of loose dogs and ways to
avoid dog bites when encountering a dog in
existing education efforts
• DAS CARE team and volunteer organizations to
continue community education efforts
– Build on education efforts currently in place for
spay/neuter
• Education materials to be created regarding:
– Potential hazards of loose dogs on community
– Dangers of loose dogs
Presence of loose owned dogs is, in part, a function
of human behavior
Goal is to:
• Increase community awareness
• Reduce loose-owned dogs on streets
Rationale – Current solution not scalable
1. Pets for Life in southern Dallas suggests two touches per household; Source: Experian Current Year Estimates (Q2 2015) for population data; CARE team data from April – July 2016; PFL; WHO-WSPA dog population management 1990; BCG analysis
Factor Value
Southern Dallas households 173,598
CARE team HH/day 105
Days worked/week 4
Weeks/month 4
CARE team HH/month 1,674
Months to reach all HHs once 104
Years to reach all HHs once 8.6
Years to reach all HHs twice1 17.3
Note: In order to reach each southern Dallas household
twice within two years, community needs ~8.5 times
more manpower of the current CARE team today
Summary of
research and
findings
• Context: CARE team and volunteer organizations conduct community outreach that includes
educational and outreach component, but today lacks scale to reach all of southern Dallas quickly
• Key takeaway: By educating people on dangers of loose dogs, Dallas can reduce loose-owned dogs
• Overall recommendation: Dangers of loose dogs and how to avoid dog bites should be incorporated
in current outreach efforts in order to educate the community
2.3
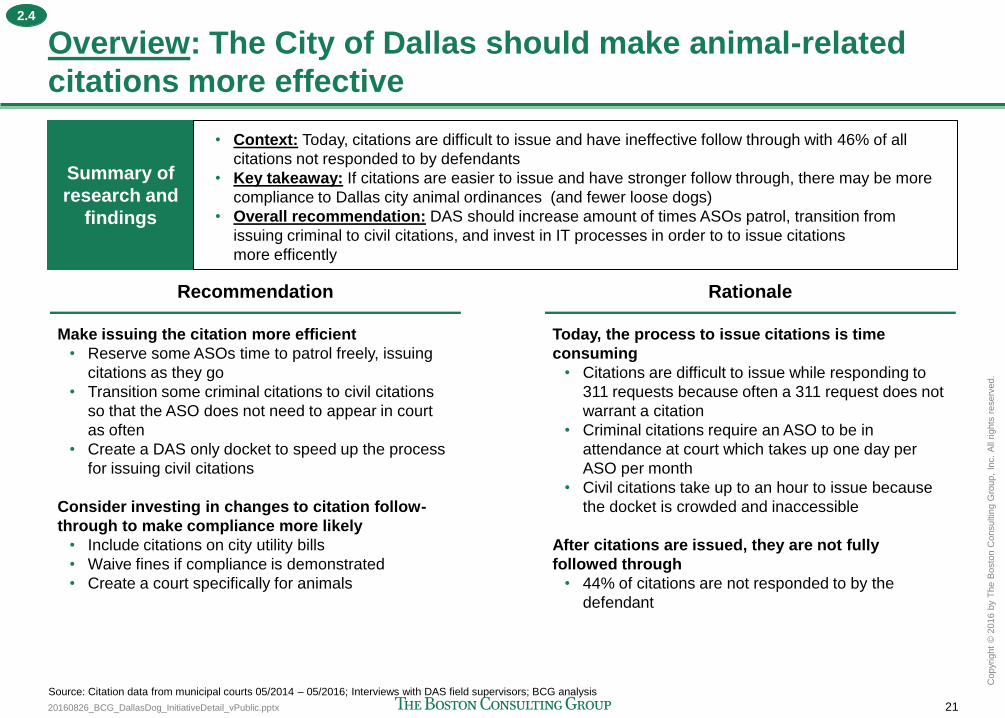
20160826_BCG_DallasDog_InitiativeDetail_vPublic.pptx 21
Copyr
ight
© 2
016 b
y T
he B
osto
n C
onsultin
g G
roup,
Inc.
All
rights
reserv
ed.
Overview: The City of Dallas should make animal-related
citations more effective
Recommendation
Make issuing the citation more efficient
• Reserve some ASOs time to patrol freely, issuing
citations as they go
• Transition some criminal citations to civil citations
so that the ASO does not need to appear in court
as often
• Create a DAS only docket to speed up the process
for issuing civil citations
Consider investing in changes to citation follow-
through to make compliance more likely
• Include citations on city utility bills
• Waive fines if compliance is demonstrated
• Create a court specifically for animals
Rationale
Today, the process to issue citations is time
consuming
• Citations are difficult to issue while responding to
311 requests because often a 311 request does not
warrant a citation
• Criminal citations require an ASO to be in
attendance at court which takes up one day per
ASO per month
• Civil citations take up to an hour to issue because
the docket is crowded and inaccessible
After citations are issued, they are not fully
followed through
• 44% of citations are not responded to by the
defendant
Source: Citation data from municipal courts 05/2014 – 05/2016; Interviews with DAS field supervisors; BCG analysis
Summary of
research and
findings
• Context: Today, citations are difficult to issue and have ineffective follow through with 46% of all
citations not responded to by defendants
• Key takeaway: If citations are easier to issue and have stronger follow through, there may be more
compliance to Dallas city animal ordinances (and fewer loose dogs)
• Overall recommendation: DAS should increase amount of times ASOs patrol, transition from
issuing criminal to civil citations, and invest in IT processes in order to to issue citations
more efficently
2.4
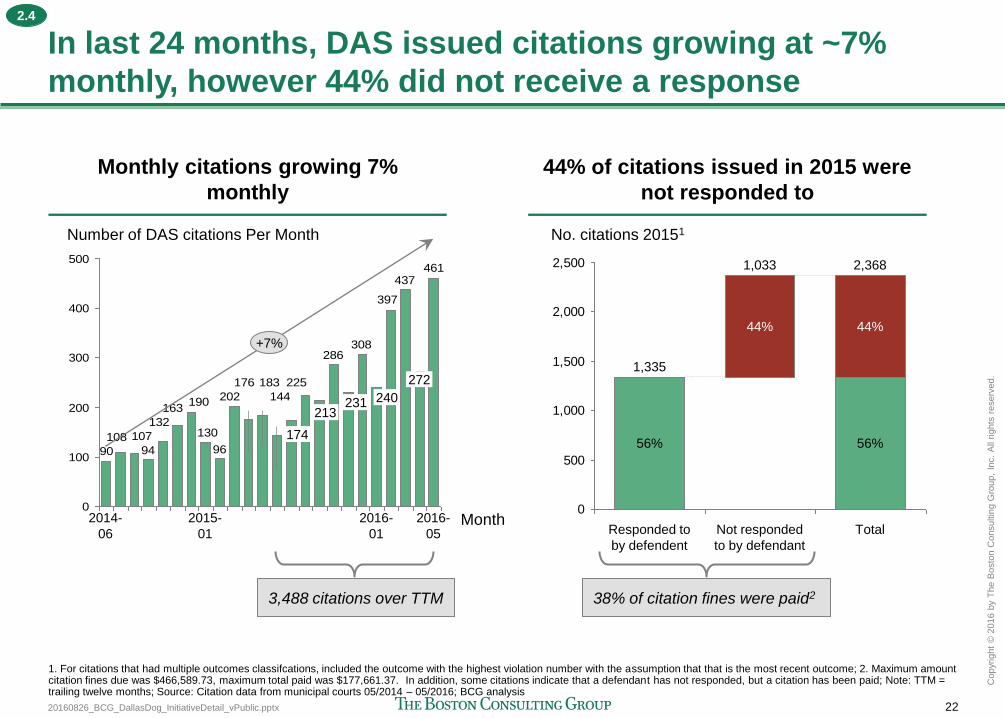
20160826_BCG_DallasDog_InitiativeDetail_vPublic.pptx 22
Copyr
ight
© 2
016 b
y T
he B
osto
n C
onsultin
g G
roup,
Inc.
All
rights
reserv
ed.
In last 24 months, DAS issued citations growing at ~7%
monthly, however 44% did not receive a response
461437
397
308286
225
144
183176
202
96
130
190163
132
94
107108
90
0
100
200
300
400
500
Number of DAS citations Per Month
Month
+7%
2016-
05
272
2016-
01
240 231 213
174
2015-
01
2014-
06
Monthly citations growing 7%
monthly
44% of citations issued in 2015 were
not responded to
3,488 citations over TTM
0
500
1,000
1,500
2,000
2,500
1,335
56%
Not responded
to by defendant
Responded to
by defendent
1,033
44%
56%
2,368
44%
No. citations 20151
Total
38% of citation fines were paid2
1. For citations that had multiple outcomes classifcations, included the outcome with the highest violation number with the assumption that that is the most recent outcome; 2. Maximum amount citation fines due was $466,589.73, maximum total paid was $177,661.37. In addition, some citations indicate that a defendant has not responded, but a citation has been paid; Note: TTM = trailing twelve months; Source: Citation data from municipal courts 05/2014 – 05/2016; BCG analysis
2.4
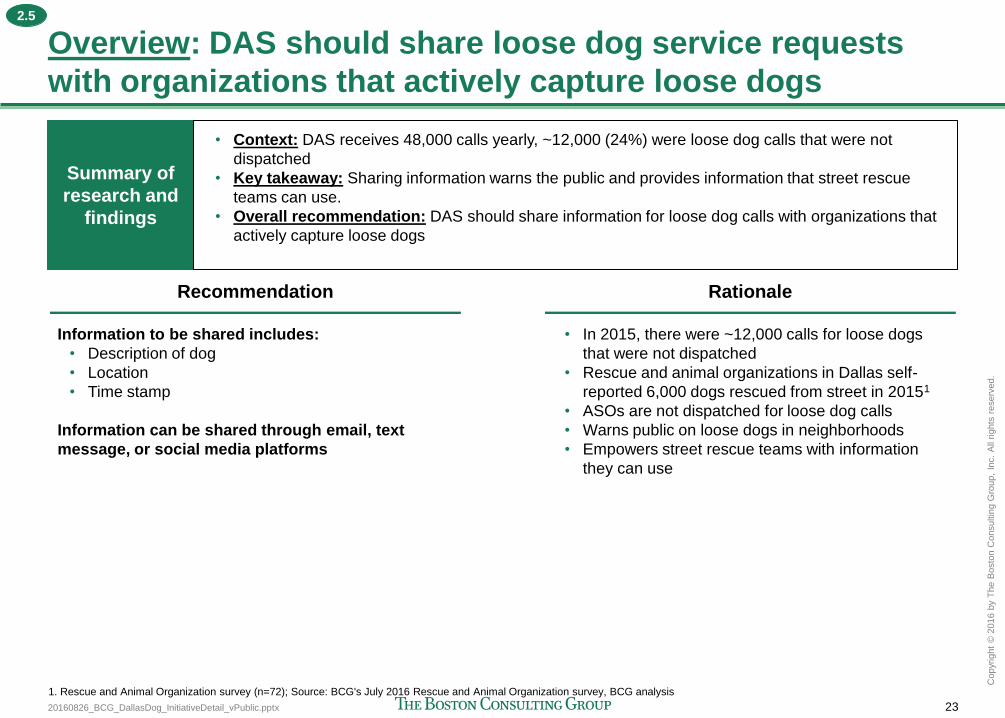
20160826_BCG_DallasDog_InitiativeDetail_vPublic.pptx 23
Copyr
ight
© 2
016 b
y T
he B
osto
n C
onsultin
g G
roup,
Inc.
All
rights
reserv
ed.
Overview: DAS should share loose dog service requests
with organizations that actively capture loose dogs
Recommendation
Information to be shared includes:
• Description of dog
• Location
• Time stamp
Information can be shared through email, text
message, or social media platforms
Rationale
• In 2015, there were ~12,000 calls for loose dogs
that were not dispatched
• Rescue and animal organizations in Dallas self-
reported 6,000 dogs rescued from street in 20151
• ASOs are not dispatched for loose dog calls
• Warns public on loose dogs in neighborhoods
• Empowers street rescue teams with information
they can use
1. Rescue and Animal Organization survey (n=72); Source: BCG's July 2016 Rescue and Animal Organization survey, BCG analysis
Summary of
research and
findings
• Context: DAS receives 48,000 calls yearly, ~12,000 (24%) were loose dog calls that were not
dispatched
• Key takeaway: Sharing information warns the public and provides information that street rescue
teams can use.
• Overall recommendation: DAS should share information for loose dog calls with organizations that
actively capture loose dogs
2.5
20160826_BCG_DallasDog_InitiativeDetail_vPublic.pptx 24
Copyr
ight
© 2
016 b
y T
he B
osto
n C
onsultin
g G
roup,
Inc.
All
rights
reserv
ed.
Agenda
Recommendation 3: Increase the number of positive outcomes for Dallas
dogs, euthanizing only the sickest animals
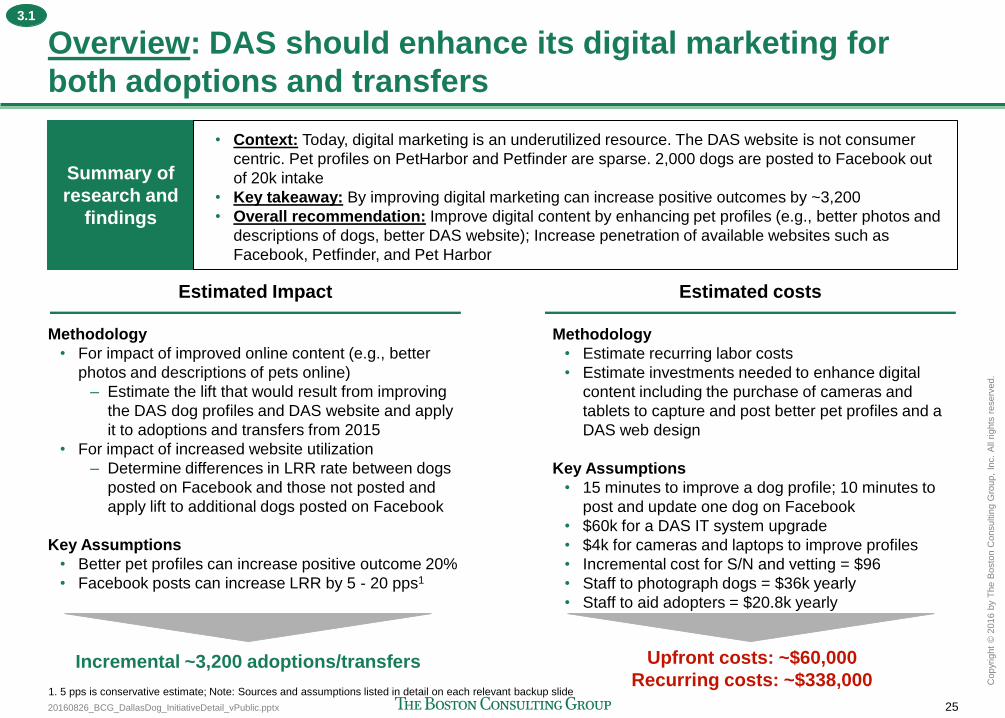
20160826_BCG_DallasDog_InitiativeDetail_vPublic.pptx 25
Copyr
ight
© 2
016 b
y T
he B
osto
n C
onsultin
g G
roup,
Inc.
All
rights
reserv
ed.
Overview: DAS should enhance its digital marketing for
both adoptions and transfers
Estimated Impact
Methodology
• For impact of improved online content (e.g., better
photos and descriptions of pets online)
– Estimate the lift that would result from improving
the DAS dog profiles and DAS website and apply
it to adoptions and transfers from 2015
• For impact of increased website utilization
– Determine differences in LRR rate between dogs
posted on Facebook and those not posted and
apply lift to additional dogs posted on Facebook
Key Assumptions
• Better pet profiles can increase positive outcome 20%
• Facebook posts can increase LRR by 5 - 20 pps1
Estimated costs
Methodology
• Estimate recurring labor costs
• Estimate investments needed to enhance digital
content including the purchase of cameras and
tablets to capture and post better pet profiles and a
DAS web design
Key Assumptions
• 15 minutes to improve a dog profile; 10 minutes to
post and update one dog on Facebook
• $60k for a DAS IT system upgrade
• $4k for cameras and laptops to improve profiles
• Incremental cost for S/N and vetting = $96
• Staff to photograph dogs = $36k yearly
• Staff to aid adopters = $20.8k yearly
Incremental ~3,200 adoptions/transfers Upfront costs: ~$60,000
Recurring costs: ~$338,000 1. 5 pps is conservative estimate; Note: Sources and assumptions listed in detail on each relevant backup slide
Summary of
research and
findings
• Context: Today, digital marketing is an underutilized resource. The DAS website is not consumer
centric. Pet profiles on PetHarbor and Petfinder are sparse. 2,000 dogs are posted to Facebook out
of 20k intake
• Key takeaway: By improving digital marketing can increase positive outcomes by ~3,200
• Overall recommendation: Improve digital content by enhancing pet profiles (e.g., better photos and
descriptions of dogs, better DAS website); Increase penetration of available websites such as
Facebook, Petfinder, and Pet Harbor
3.1
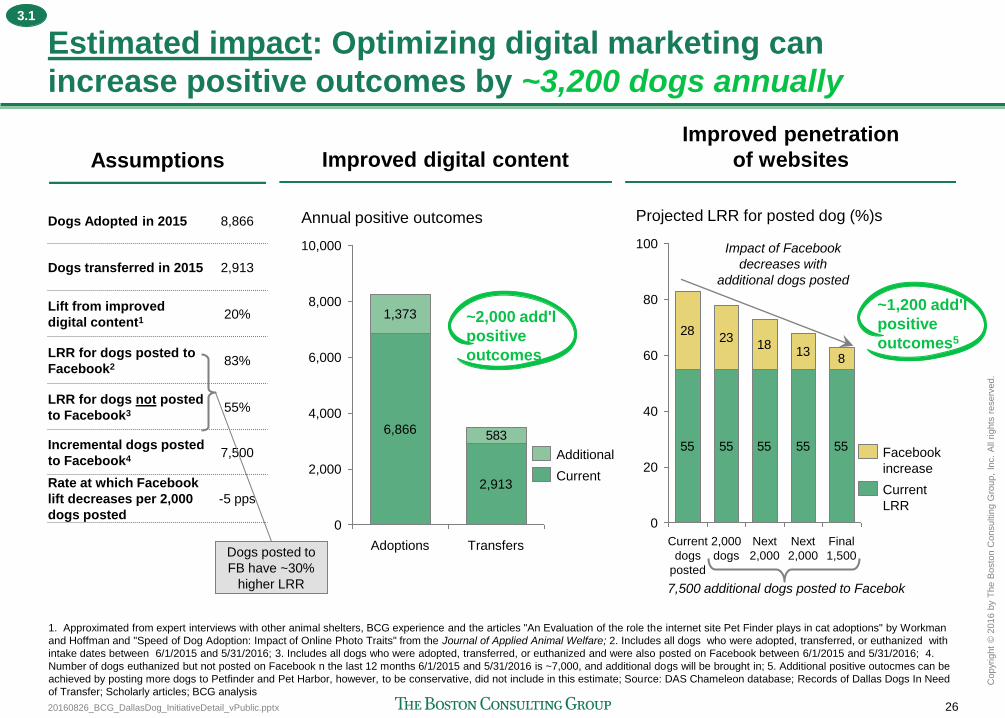
20160826_BCG_DallasDog_InitiativeDetail_vPublic.pptx 26
Copyr
ight
© 2
016 b
y T
he B
osto
n C
onsultin
g G
roup,
Inc.
All
rights
reserv
ed.
Estimated impact: Optimizing digital marketing can
increase positive outcomes by ~3,200 dogs annually
Dogs Adopted in 2015 8,866
Dogs transferred in 2015 2,913
Lift from improved
digital content1 20%
LRR for dogs posted to
Facebook2 83%
LRR for dogs not posted
to Facebook3 55%
Incremental dogs posted
to Facebook4 7,500
Rate at which Facebook
lift decreases per 2,000
dogs posted
-5 pps
55 55 55 55 55
2823
1813
8
80
20
40
0
100
60
Projected LRR for posted dog (%)s
Final
1,500
Next
2,000
Next
2,000
2,000
dogs
Current
dogs
posted
Current
LRR
increase
1. Approximated from expert interviews with other animal shelters, BCG experience and the articles "An Evaluation of the role the internet site Pet Finder plays in cat adoptions" by Workman
and Hoffman and "Speed of Dog Adoption: Impact of Online Photo Traits" from the Journal of Applied Animal Welfare; 2. Includes all dogs who were adopted, transferred, or euthanized with
intake dates between 6/1/2015 and 5/31/2016; 3. Includes all dogs who were adopted, transferred, or euthanized and were also posted on Facebook between 6/1/2015 and 5/31/2016; 4.
Number of dogs euthanized but not posted on Facebook n the last 12 months 6/1/2015 and 5/31/2016 is ~7,000, and additional dogs will be brought in; 5. Additional positive outocmes can be
achieved by posting more dogs to Petfinder and Pet Harbor, however, to be conservative, did not include in this estimate; Source: DAS Chameleon database; Records of Dallas Dogs In Need
of Transfer; Scholarly articles; BCG analysis
~1,200 add'l
positive
outcomes5
7,500 additional dogs posted to Facebok
Impact of Facebook
decreases with
additional dogs posted
583
0
4,000
10,000
2,000
8,000
6,000
Adoptions
6,866
Transfers
1,373
Annual positive outcomes
2,913 Current
Additional
~2,000 add'l
positive
outcomes
Dogs posted to
FB have ~30%
higher LRR
Assumptions Improved digital content
Improved penetration
of websites
3.1
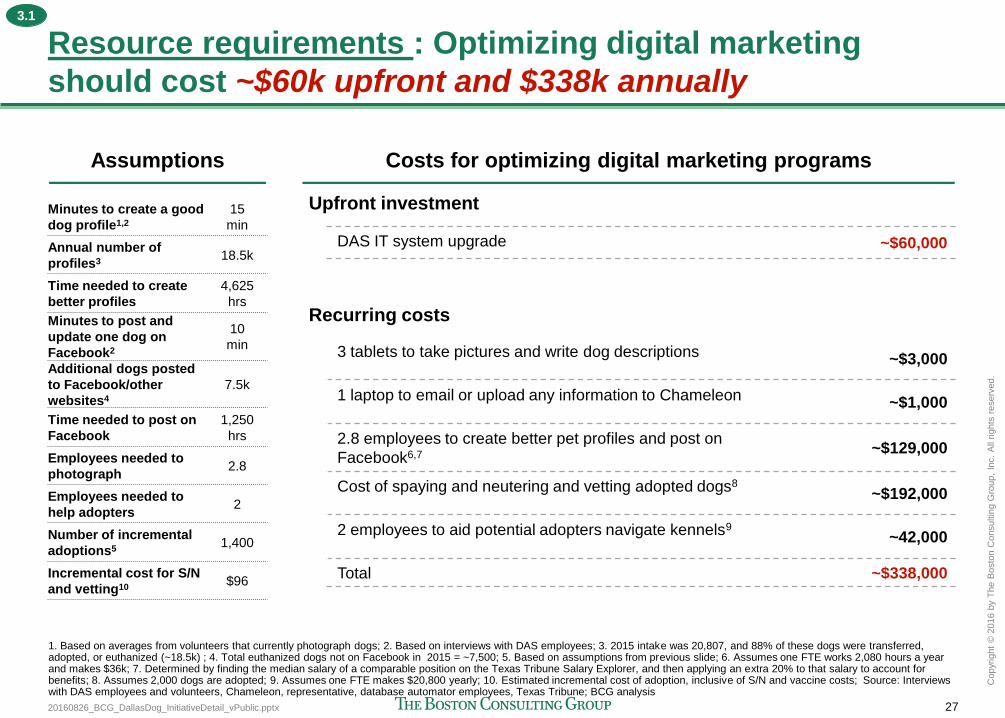
20160826_BCG_DallasDog_InitiativeDetail_vPublic.pptx 27
Copyr
ight
© 2
016 b
y T
he B
osto
n C
onsultin
g G
roup,
Inc.
All
rights
reserv
ed.
Resource requirements : Optimizing digital marketing
should cost ~$60k upfront and $338k annually
1. Based on averages from volunteers that currently photograph dogs; 2. Based on interviews with DAS employees; 3. 2015 intake was 20,807, and 88% of these dogs were transferred, adopted, or euthanized (~18.5k) ; 4. Total euthanized dogs not on Facebook in 2015 = ~7,500; 5. Based on assumptions from previous slide; 6. Assumes one FTE works 2,080 hours a year and makes $36k; 7. Determined by finding the median salary of a comparable position on the Texas Tribune Salary Explorer, and then applying an extra 20% to that salary to account for benefits; 8. Assumes 2,000 dogs are adopted; 9. Assumes one FTE makes $20,800 yearly; 10. Estimated incremental cost of adoption, inclusive of S/N and vaccine costs; Source: Interviews with DAS employees and volunteers, Chameleon, representative, database automator employees, Texas Tribune; BCG analysis
Minutes to create a good
dog profile1,2
15
min
Annual number of
profiles3 18.5k
Time needed to create
better profiles
4,625
hrs
Minutes to post and
update one dog on
Facebook2
10
min
Additional dogs posted
to Facebook/other
websites4
7.5k
Time needed to post on
1,250
hrs
Employees needed to
photograph 2.8
Employees needed to
help adopters 2
Number of incremental
adoptions5 1,400
Incremental cost for S/N
and vetting10 $96
Upfront investment
Recurring costs
DAS IT system upgrade ~$60,000
3 tablets to take pictures and write dog descriptions ~$3,000
1 laptop to email or upload any information to Chameleon ~$1,000
2.8 employees to create better pet profiles and post on
Facebook6,7 ~$129,000
Cost of spaying and neutering and vetting adopted dogs8 ~$192,000
2 employees to aid potential adopters navigate kennels9 ~42,000
Total ~$338,000
Assumptions Costs for optimizing digital marketing programs
3.1
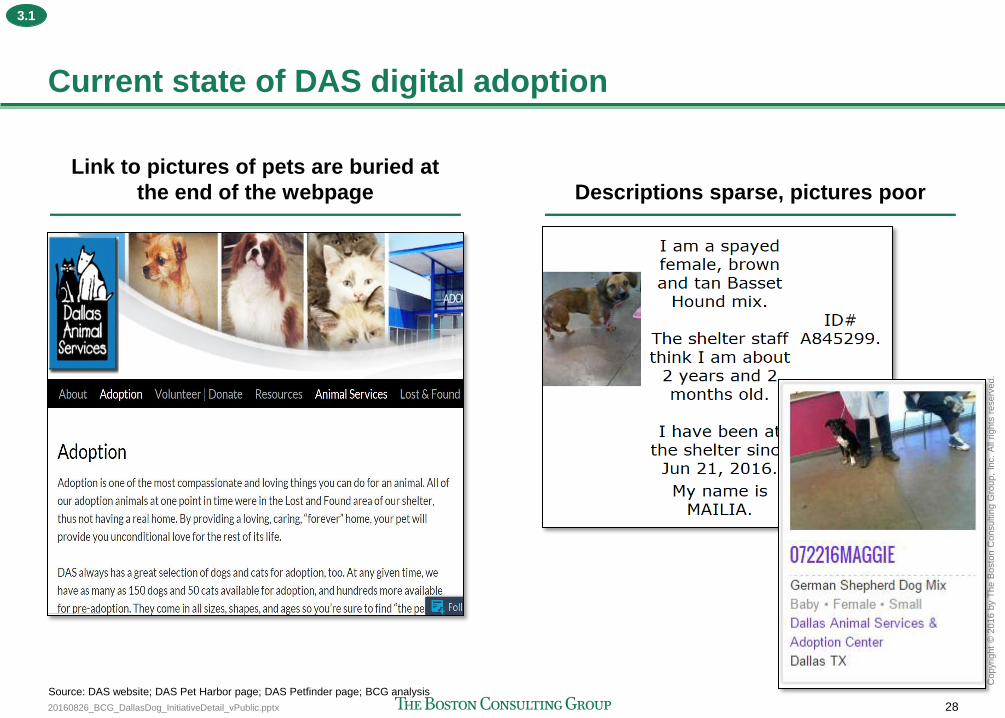
20160826_BCG_DallasDog_InitiativeDetail_vPublic.pptx 28
Copyr
ight
© 2
016 b
y T
he B
osto
n C
onsultin
g G
roup,
Inc.
All
rights
reserv
ed.
Current state of DAS digital adoption
Link to pictures of pets are buried at
the end of the webpage Descriptions sparse, pictures poor
Source: DAS website; DAS Pet Harbor page; DAS Petfinder page; BCG analysis
3.1
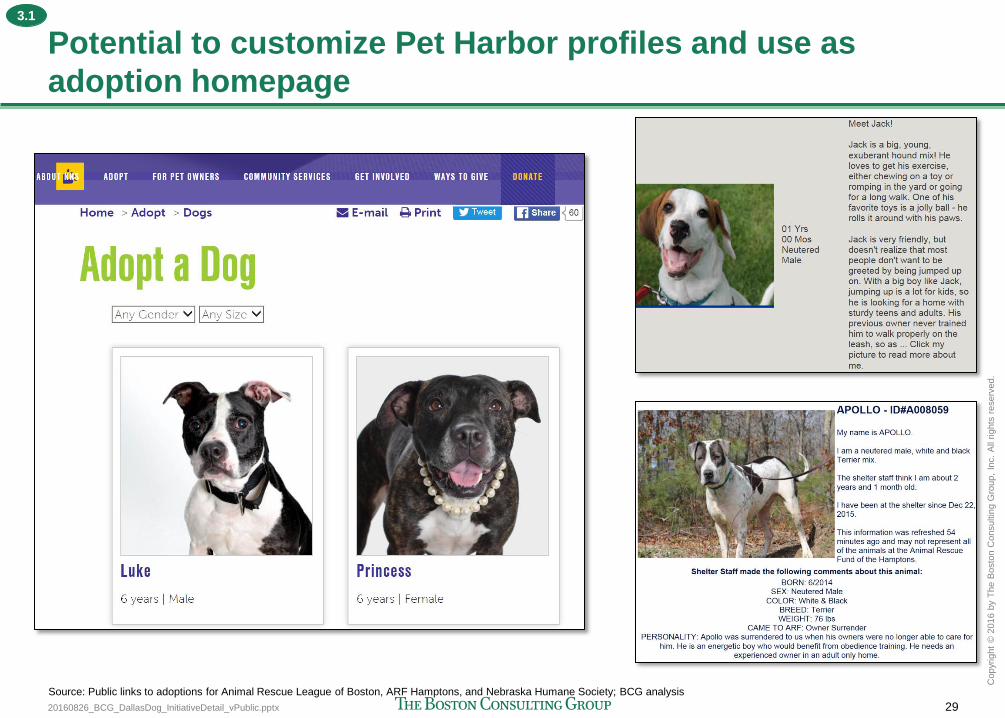
20160826_BCG_DallasDog_InitiativeDetail_vPublic.pptx 29
Copyr
ight
© 2
016 b
y T
he B
osto
n C
onsultin
g G
roup,
Inc.
All
rights
reserv
ed.
Potential to customize Pet Harbor profiles and use as
adoption homepage
Source: Public links to adoptions for Animal Rescue League of Boston, ARF Hamptons, and Nebraska Humane Society; BCG analysis
3.1
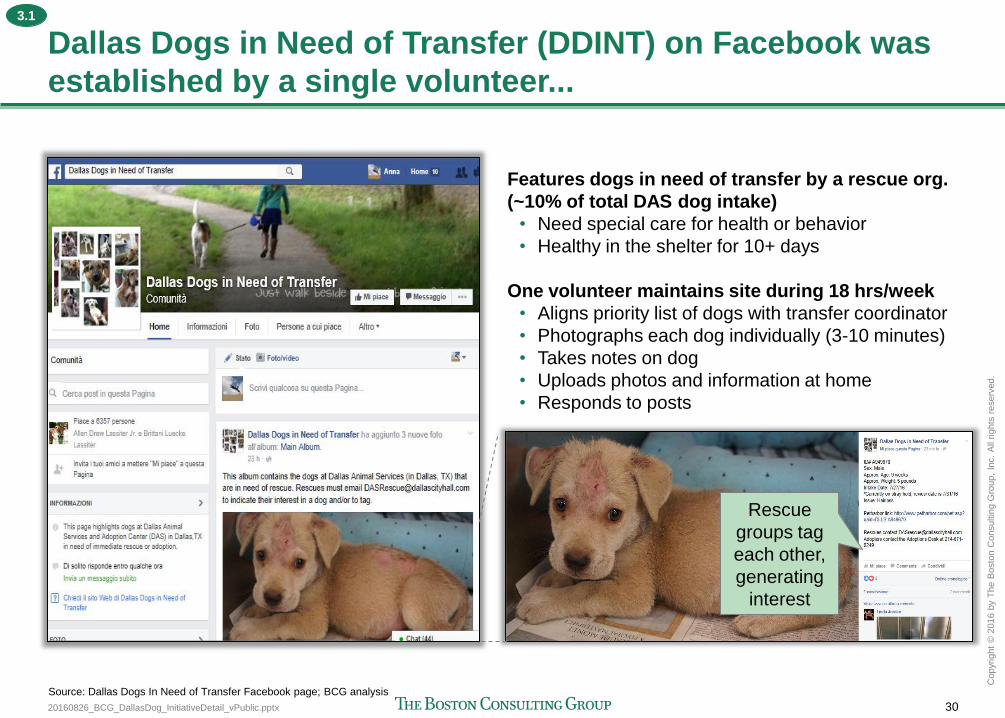
20160826_BCG_DallasDog_InitiativeDetail_vPublic.pptx 30
Copyr
ight
© 2
016 b
y T
he B
osto
n C
onsultin
g G
roup,
Inc.
All
rights
reserv
ed.
Dallas Dogs in Need of Transfer (DDINT) on Facebook was
established by a single volunteer...
Features dogs in need of transfer by a rescue org.
(~10% of total DAS dog intake)
• Need special care for health or behavior
• Healthy in the shelter for 10+ days
One volunteer maintains site during 18 hrs/week
• Aligns priority list of dogs with transfer coordinator
• Photographs each dog individually (3-10 minutes)
• Takes notes on dog
• Uploads photos and information at home
• Responds to posts
Rescue
groups tag
each other,
generating
interest
Source: Dallas Dogs In Need of Transfer Facebook page; BCG analysis
3.1
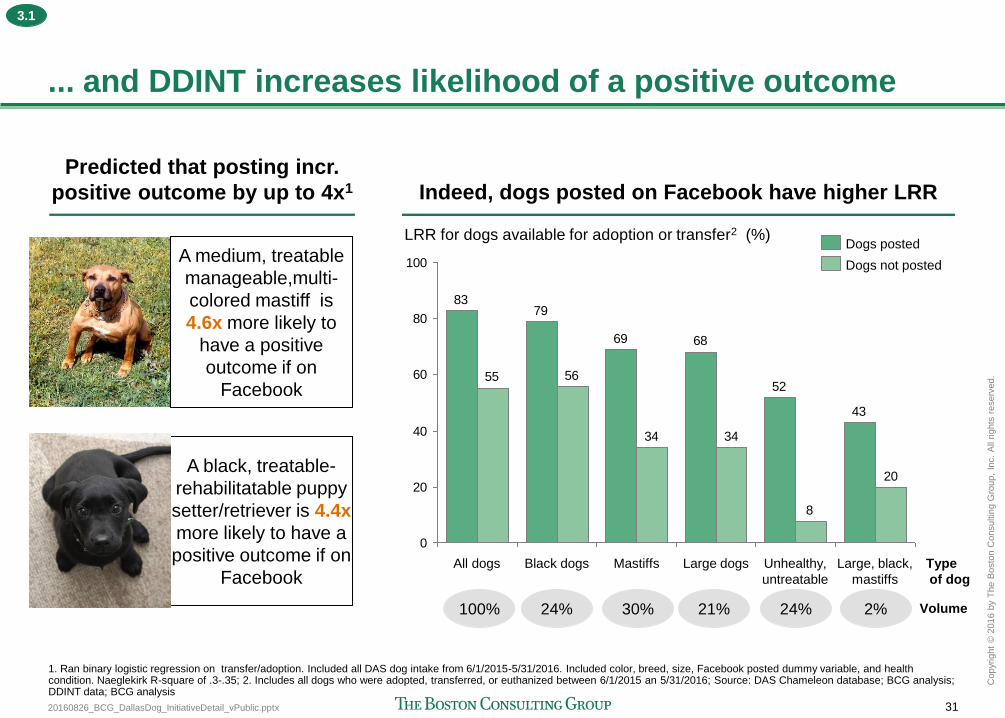
20160826_BCG_DallasDog_InitiativeDetail_vPublic.pptx 31
Copyr
ight
© 2
016 b
y T
he B
osto
n C
onsultin
g G
roup,
Inc.
All
rights
reserv
ed.
... and DDINT increases likelihood of a positive outcome
43
52
6869
7983
20
8
3434
5655
0
20
40
60
80
100
Unhealthy,
untreatable
dogs
Large dogs Mastiffs Black dogs All dogs
LRR for dogs available for adoption or transfer2 (%)
Type
of dog
Large, black,
mastiffs
Dogs not posted
Dogs posted
Predicted that posting incr.
positive outcome by up to 4x1 Indeed, dogs posted on Facebook have higher LRR
1. Ran binary logistic regression on transfer/adoption. Included all DAS dog intake from 6/1/2015-5/31/2016. Included color, breed, size, Facebook posted dummy variable, and health condition. Naeglekirk R-square of .3-.35; 2. Includes all dogs who were adopted, transferred, or euthanized between 6/1/2015 an 5/31/2016; Source: DAS Chameleon database; BCG analysis; DDINT data; BCG analysis
100% 24% 30% 21% 24% 2% Volume
A black, treatable-
rehabilitatable puppy
setter/retriever is 4.4x
more likely to have a
positive outcome if on
A medium, treatable
manageable,multi-
colored mastiff is
4.6x more likely to
have a positive
outcome if on
3.1
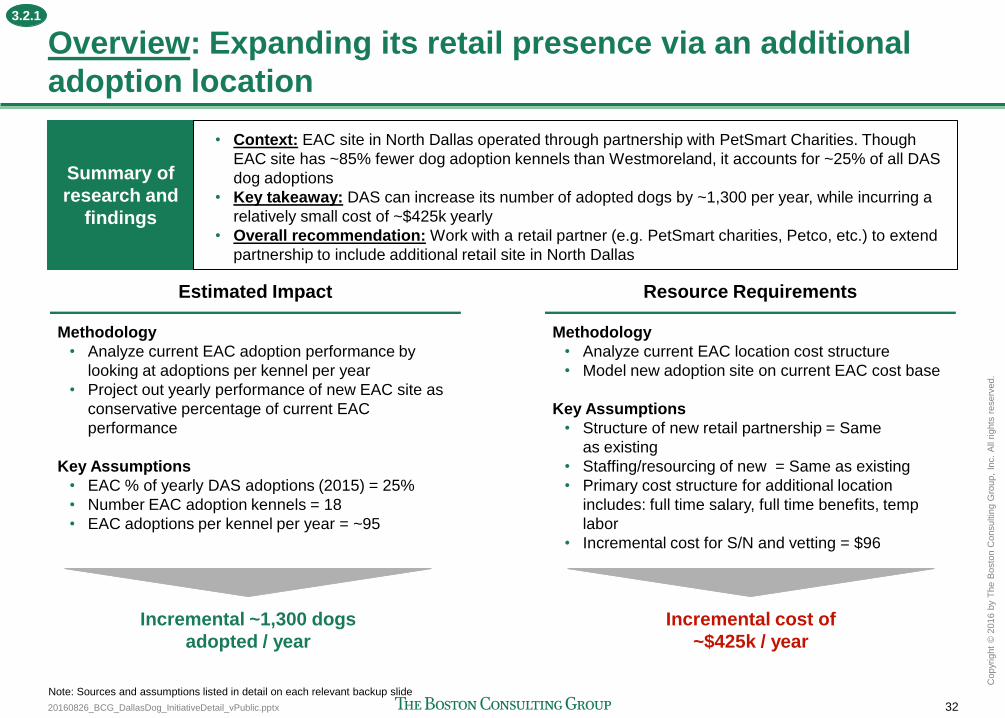
20160826_BCG_DallasDog_InitiativeDetail_vPublic.pptx 32
Copyr
ight
© 2
016 b
y T
he B
osto
n C
onsultin
g G
roup,
Inc.
All
rights
reserv
ed.
Overview: Expanding its retail presence via an additional
adoption location
Methodology
• Analyze current EAC adoption performance by
looking at adoptions per kennel per year
• Project out yearly performance of new EAC site as
conservative percentage of current EAC
performance
Key Assumptions
• EAC % of yearly DAS adoptions (2015) = 25%
• Number EAC adoption kennels = 18
• EAC adoptions per kennel per year = ~95
Methodology
• Analyze current EAC location cost structure
• Model new adoption site on current EAC cost base
Key Assumptions
• Structure of new retail partnership = Same
as existing
• Staffing/resourcing of new = Same as existing
• Primary cost structure for additional location
includes: full time salary, full time benefits, temp
labor
• Incremental cost for S/N and vetting = $96
Incremental ~1,300 dogs
adopted / year
Incremental cost of
~$425k / year
Note: Sources and assumptions listed in detail on each relevant backup slide
Estimated Impact Resource Requirements
Summary of
research and
findings
• Context: EAC site in North Dallas operated through partnership with PetSmart Charities. Though
EAC site has ~85% fewer dog adoption kennels than Westmoreland, it accounts for ~25% of all DAS
dog adoptions
• Key takeaway: DAS can increase its number of adopted dogs by ~1,300 per year, while incurring a
relatively small cost of ~$425k yearly
• Overall recommendation: Work with a retail partner (e.g. PetSmart charities, Petco, etc.) to extend
partnership to include additional retail site in North Dallas
3.2.1
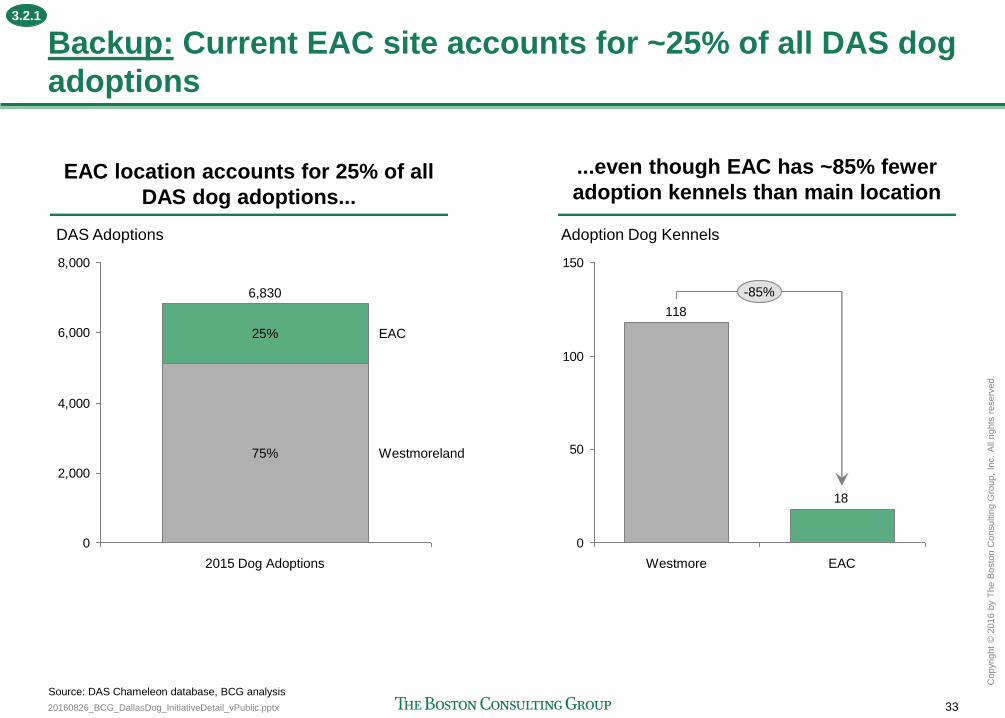
20160826_BCG_DallasDog_InitiativeDetail_vPublic.pptx 33
Copyr
ight
© 2
016 b
y T
he B
osto
n C
onsultin
g G
roup,
Inc.
All
rights
reserv
ed.
Backup: Current EAC site accounts for ~25% of all DAS dog
adoptions
0
2,000
4,000
6,000
8,000
Westmoreland
EAC
2015 Dog Adoptions
6,830
75%
25%
DAS Adoptions
18
118
0
50
100
150
-85%
Adoption Dog Kennels
EAC Westmore
...even though EAC has ~85% fewer
adoption kennels than main location
Source: DAS Chameleon database, BCG analysis
EAC location accounts for 25% of all
DAS dog adoptions...
3.2.1
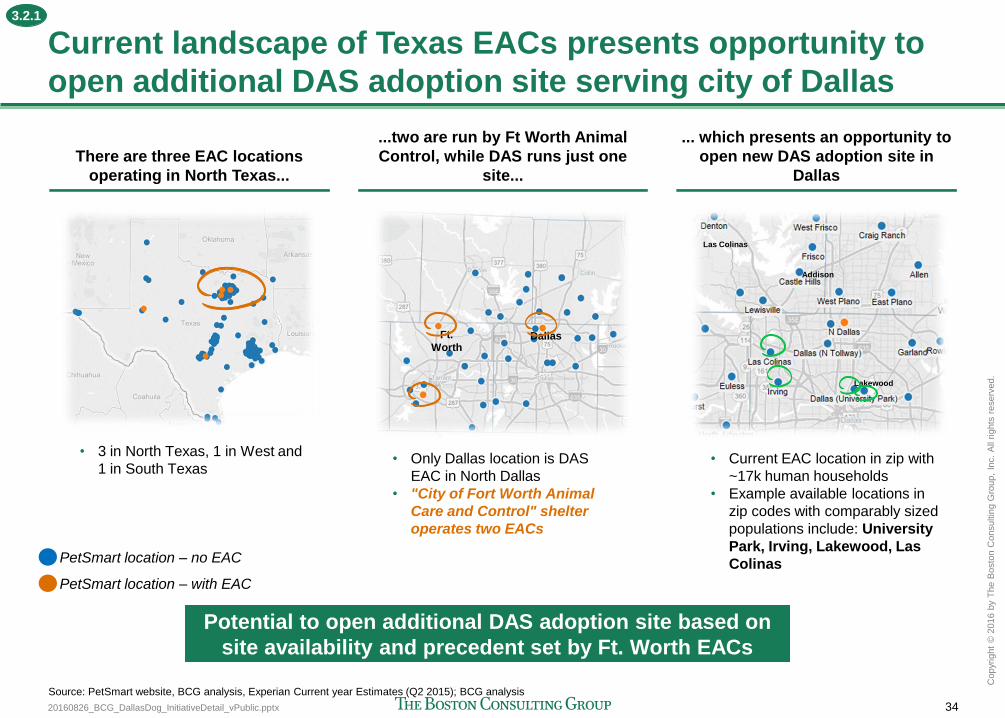
20160826_BCG_DallasDog_InitiativeDetail_vPublic.pptx 34
Copyr
ight
© 2
016 b
y T
he B
osto
n C
onsultin
g G
roup,
Inc.
All
rights
reserv
ed.
Current landscape of Texas EACs presents opportunity to
open additional DAS adoption site serving city of Dallas
Potential to open additional DAS adoption site based on
site availability and precedent set by Ft. Worth EACs
PetSmart location – no EAC
PetSmart location – with EAC
There are three EAC locations
operating in North Texas...
• 3 in North Texas, 1 in West and
1 in South Texas
...two are run by Ft Worth Animal
Control, while DAS runs just one
site...
• Only Dallas location is DAS
EAC in North Dallas
• "City of Fort Worth Animal
Care and Control" shelter
operates two EACs
Dallas Ft.
Worth
... which presents an opportunity to
open new DAS adoption site in
Dallas
• Current EAC location in zip with
~17k human households
• Example available locations in
zip codes with comparably sized
populations include: University
Park, Irving, Lakewood, Las
Colinas
Las Colinas
Lakewood
Addison
Source: PetSmart website, BCG analysis, Experian Current year Estimates (Q2 2015); BCG analysis
3.2.1
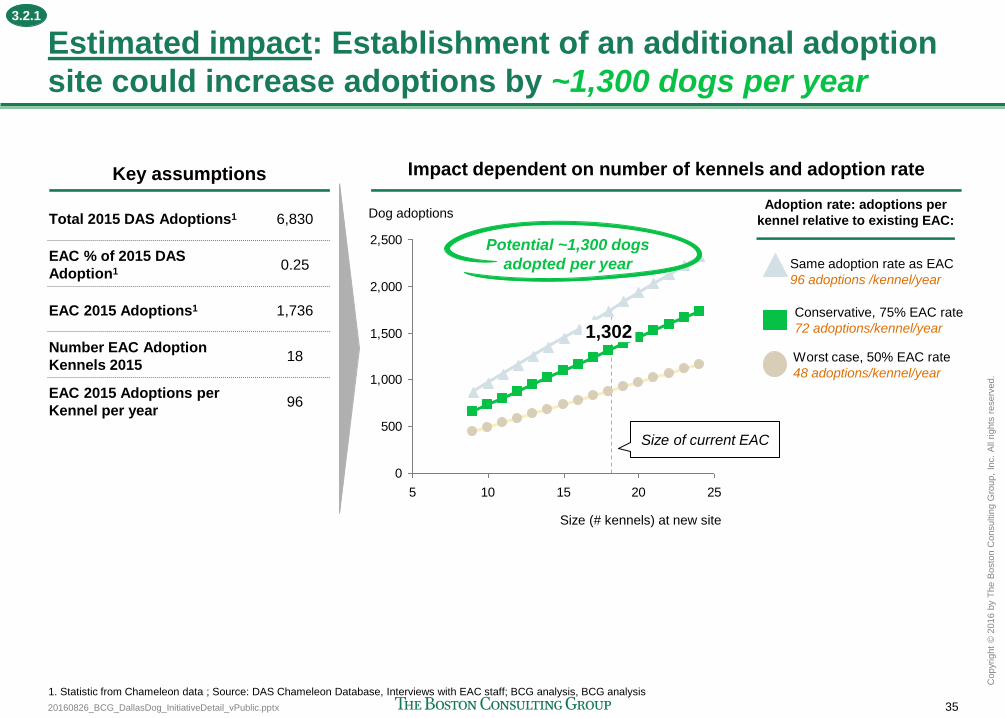
20160826_BCG_DallasDog_InitiativeDetail_vPublic.pptx 35
Copyr
ight
© 2
016 b
y T
he B
osto
n C
onsultin
g G
roup,
Inc.
All
rights
reserv
ed.
Estimated impact: Establishment of an additional adoption
site could increase adoptions by ~1,300 dogs per year
Total 2015 DAS Adoptions1 6,830
EAC % of 2015 DAS
Adoption1 0.25
EAC 2015 Adoptions1 1,736
Number EAC Adoption
Kennels 2015 18
EAC 2015 Adoptions per
Kennel per year 96
Impact dependent on number of kennels and adoption rate
0
500
1,000
1,500
2,000
2,500
5 10 15 20 25
1,302
Dog adoptions
Size (# kennels) at new site
Adoption rate: adoptions per
kennel relative to existing EAC:
Same adoption rate as EAC
96 adoptions /kennel/year
Conservative, 75% EAC rate
72 adoptions/kennel/year
Worst case, 50% EAC rate
48 adoptions/kennel/year
Potential ~1,300 dogs
adopted per year
Size of current EAC
1. Statistic from Chameleon data ; Source: DAS Chameleon Database, Interviews with EAC staff; BCG analysis, BCG analysis
Key assumptions
3.2.1
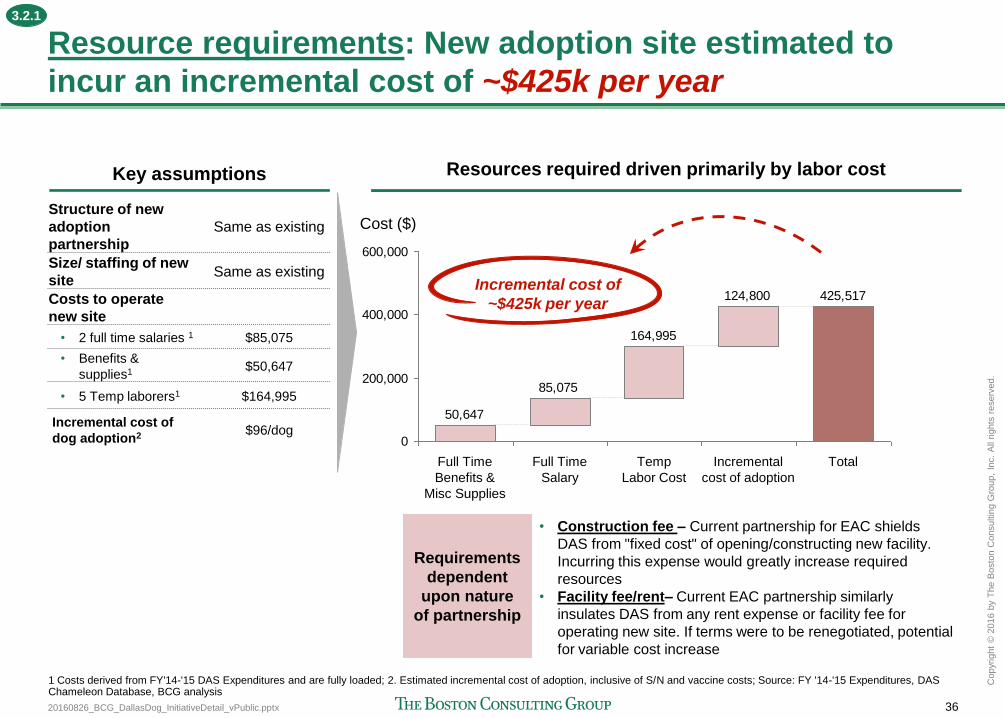
20160826_BCG_DallasDog_InitiativeDetail_vPublic.pptx 36
Copyr
ight
© 2
016 b
y T
he B
osto
n C
onsultin
g G
roup,
Inc.
All
rights
reserv
ed.
Resource requirements: New adoption site estimated to
incur an incremental cost of ~$425k per year
Structure of new
adoption
partnership
Same as existing
Size/ staffing of new
site Same as existing
Costs to operate
new site
• 2 full time salaries 1 $85,075
• Benefits &
supplies1 $50,647
• 5 Temp laborers1 $164,995
Incremental cost of
dog adoption2 $96/dog
425,517124,800
164,995
85,075
50,647
0
200,000
400,000
600,000
Temp
Labor Cost
Full Time
Salary
Full Time
Benefits &
Misc Supplies
Incremental
cost of adoption
Cost ($)
Total
Requirements
dependent
upon nature
of partnership
• Construction fee – Current partnership for EAC shields
DAS from "fixed cost" of opening/constructing new facility.
Incurring this expense would greatly increase required
resources
• Facility fee/rent– Current EAC partnership similarly
insulates DAS from any rent expense or facility fee for
operating new site. If terms were to be renegotiated, potential
for variable cost increase
Incremental cost of
~$425k per year
1 Costs derived from FY'14-'15 DAS Expenditures and are fully loaded; 2. Estimated incremental cost of adoption, inclusive of S/N and vaccine costs; Source: FY '14-'15 Expenditures, DAS Chameleon Database, BCG analysis
Key assumptions Resources required driven primarily by labor cost
3.2.1
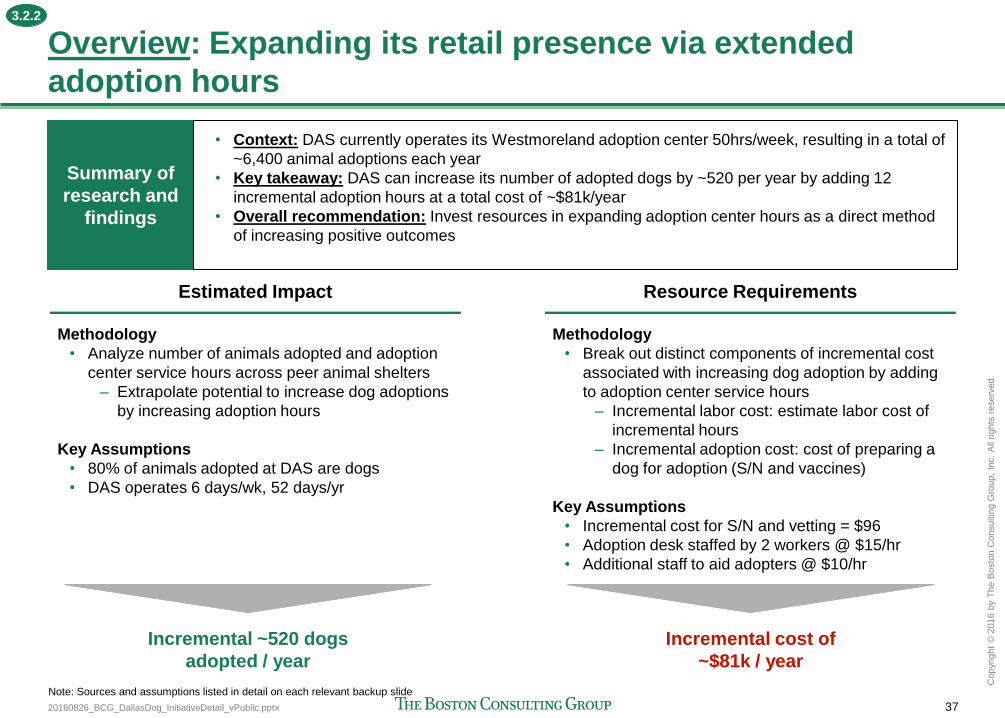
20160826_BCG_DallasDog_InitiativeDetail_vPublic.pptx 37
Copyr
ight
© 2
016 b
y T
he B
osto
n C
onsultin
g G
roup,
Inc.
All
rights
reserv
ed.
Overview: Expanding its retail presence via extended
adoption hours
Methodology
• Analyze number of animals adopted and adoption
center service hours across peer animal shelters
– Extrapolate potential to increase dog adoptions
by increasing adoption hours
Key Assumptions
• 80% of animals adopted at DAS are dogs
• DAS operates 6 days/wk, 52 days/yr
Methodology
• Break out distinct components of incremental cost
associated with increasing dog adoption by adding
to adoption center service hours
– Incremental labor cost: estimate labor cost of
incremental hours
– Incremental adoption cost: cost of preparing a
dog for adoption (S/N and vaccines)
Key Assumptions
• Incremental cost for S/N and vetting = $96
• Adoption desk staffed by 2 workers @ $15/hr
• Additional staff to aid adopters @ $10/hr
Incremental ~520 dogs
adopted / year
Incremental cost of
~$81k / year
Note: Sources and assumptions listed in detail on each relevant backup slide
Estimated Impact Resource Requirements
Summary of
research and
findings
• Context: DAS currently operates its Westmoreland adoption center 50hrs/week, resulting in a total of
~6,400 animal adoptions each year
• Key takeaway: DAS can increase its number of adopted dogs by ~520 per year by adding 12
incremental adoption hours at a total cost of ~$81k/year
• Overall recommendation: Invest resources in expanding adoption center hours as a direct method
of increasing positive outcomes
3.2.2
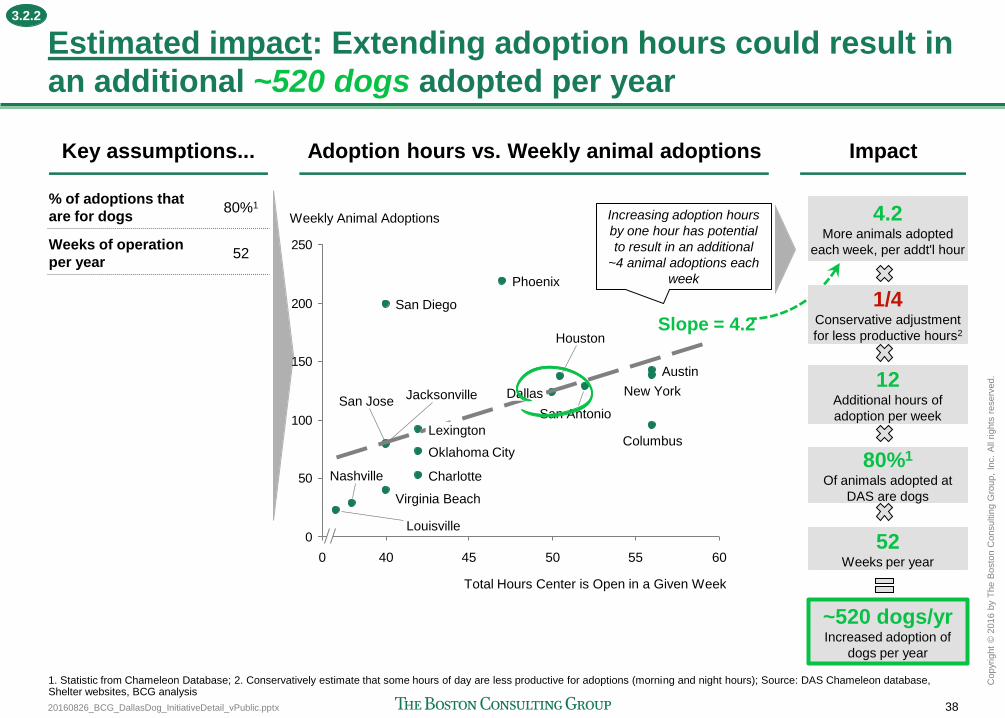
20160826_BCG_DallasDog_InitiativeDetail_vPublic.pptx 38
Copyr
ight
© 2
016 b
y T
he B
osto
n C
onsultin
g G
roup,
Inc.
All
rights
reserv
ed.
Estimated impact: Extending adoption hours could result in
an additional ~520 dogs adopted per year
0
50
100
150
200
250
50 60 55 45 40 0
Total Hours Center is Open in a Given Week
Weekly Animal Adoptions
Oklahoma City
Louisville
Columbus
San Jose
Virginia Beach
Charlotte
Houston
Nashville
Lexington
Phoenix
Jacksonville
Austin
New York
San Diego
San Antonio
Dallas
Adoption hours vs. Weekly animal adoptions
Slope = 4.2
1. Statistic from Chameleon Database; 2. Conservatively estimate that some hours of day are less productive for adoptions (morning and night hours); Source: DAS Chameleon database, Shelter websites, BCG analysis
Increasing adoption hours
by one hour has potential
to result in an additional
~4 animal adoptions each
week
Impact
4.2 More animals adopted
each week, per addt'l hour
80%1 Of animals adopted at
DAS are dogs
52 Weeks per year
~520 dogs/yr Increased adoption of
dogs per year
12 Additional hours of
adoption per week
1/4 Conservative adjustment
for less productive hours2
% of adoptions that
are for dogs 80%1
Weeks of operation
per year 52
Key assumptions...
3.2.2
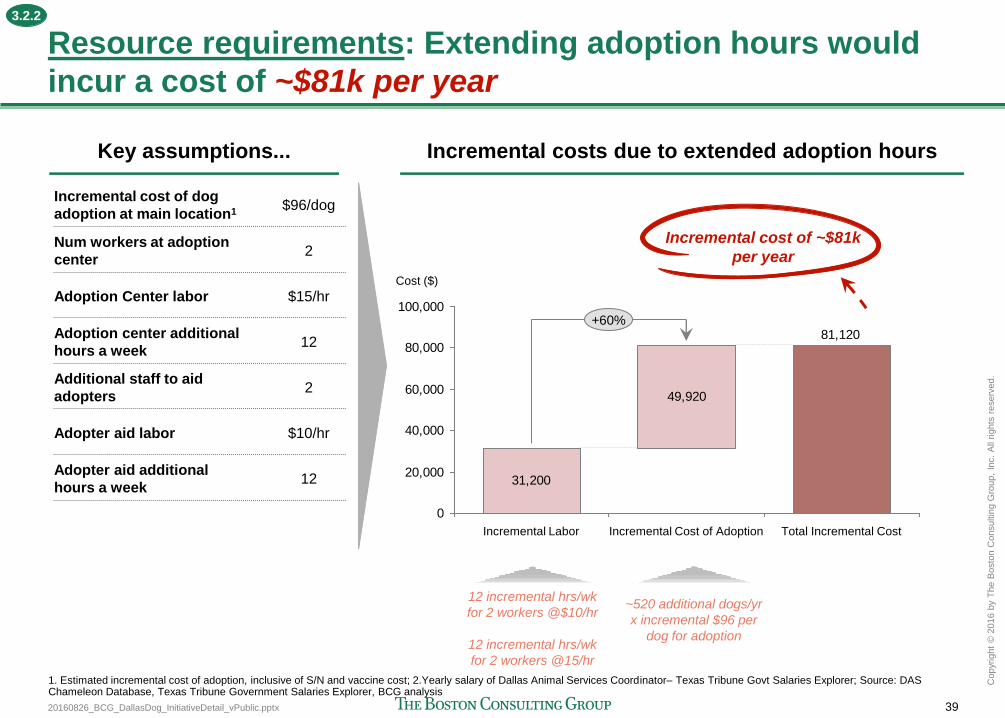
20160826_BCG_DallasDog_InitiativeDetail_vPublic.pptx 39
Copyr
ight
© 2
016 b
y T
he B
osto
n C
onsultin
g G
roup,
Inc.
All
rights
reserv
ed.
Resource requirements: Extending adoption hours would
incur a cost of ~$81k per year
31,200
49,920
81,120
0
20,000
40,000
60,000
80,000
100,000
Cost ($)
Total Incremental Cost Incremental Cost of Adoption Incremental Labor
+60%
12 incremental hrs/wk
for 2 workers @$10/hr
12 incremental hrs/wk
for 2 workers @15/hr
~520 additional dogs/yr
x incremental $96 per
dog for adoption
Incremental cost of dog
adoption at main location1 $96/dog
Num workers at adoption
center 2
Adoption Center labor $15/hr
Adoption center additional
hours a week 12
Additional staff to aid
adopters 2
Adopter aid labor $10/hr
Adopter aid additional
hours a week 12
Incremental cost of ~$81k
per year
1. Estimated incremental cost of adoption, inclusive of S/N and vaccine cost; 2.Yearly salary of Dallas Animal Services Coordinator– Texas Tribune Govt Salaries Explorer; Source: DAS Chameleon Database, Texas Tribune Government Salaries Explorer, BCG analysis
Incremental costs due to extended adoption hours Key assumptions...
3.2.2
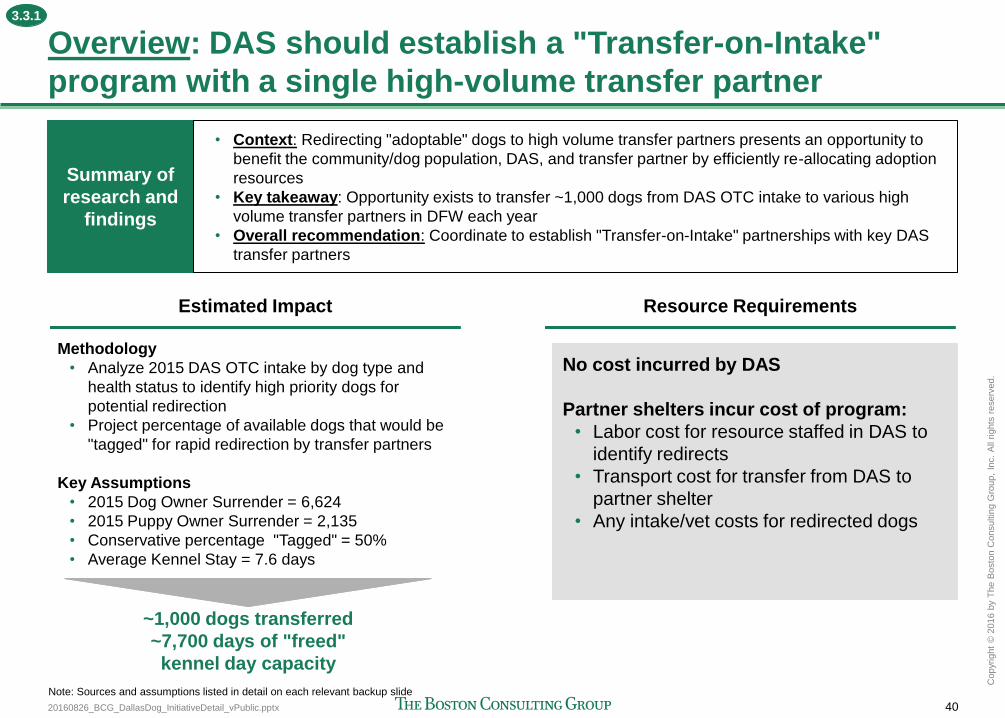
20160826_BCG_DallasDog_InitiativeDetail_vPublic.pptx 40
Copyr
ight
© 2
016 b
y T
he B
osto
n C
onsultin
g G
roup,
Inc.
All
rights
reserv
ed.
Overview: DAS should establish a "Transfer-on-Intake"
program with a single high-volume transfer partner
Estimated Impact
Methodology
• Analyze 2015 DAS OTC intake by dog type and
health status to identify high priority dogs for
potential redirection
• Project percentage of available dogs that would be
"tagged" for rapid redirection by transfer partners
Key Assumptions
• 2015 Dog Owner Surrender = 6,624
• 2015 Puppy Owner Surrender = 2,135
• Conservative percentage "Tagged" = 50%
• Average Kennel Stay = 7.6 days
Resource Requirements
~1,000 dogs transferred
~7,700 days of "freed"
kennel day capacity
Note: Sources and assumptions listed in detail on each relevant backup slide
No cost incurred by DAS
Partner shelters incur cost of program:
• Labor cost for resource staffed in DAS to
identify redirects
• Transport cost for transfer from DAS to
partner shelter
• Any intake/vet costs for redirected dogs
Summary of
research and
findings
• Context: Redirecting "adoptable" dogs to high volume transfer partners presents an opportunity to
benefit the community/dog population, DAS, and transfer partner by efficiently re-allocating adoption
resources
• Key takeaway: Opportunity exists to transfer ~1,000 dogs from DAS OTC intake to various high
volume transfer partners in DFW each year
• Overall recommendation: Coordinate to establish "Transfer-on-Intake" partnerships with key DAS
transfer partners
3.3.1
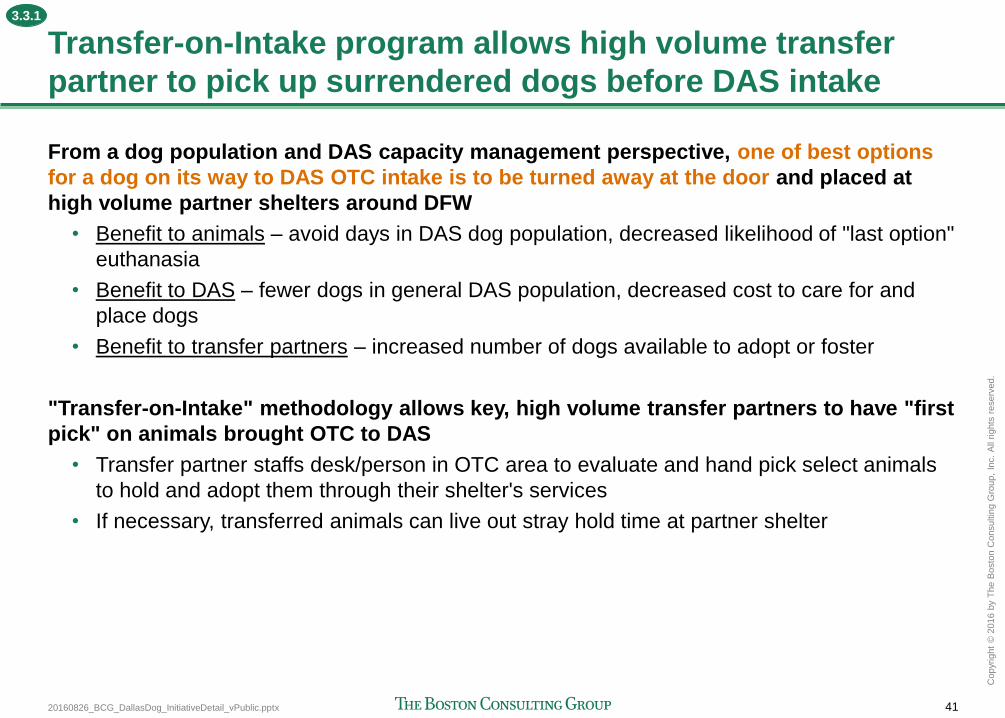
20160826_BCG_DallasDog_InitiativeDetail_vPublic.pptx 41
Copyr
ight
© 2
016 b
y T
he B
osto
n C
onsultin
g G
roup,
Inc.
All
rights
reserv
ed.
Transfer-on-Intake program allows high volume transfer
partner to pick up surrendered dogs before DAS intake
From a dog population and DAS capacity management perspective, one of best options
for a dog on its way to DAS OTC intake is to be turned away at the door and placed at
high volume partner shelters around DFW
• Benefit to animals – avoid days in DAS dog population, decreased likelihood of "last option"
euthanasia
• Benefit to DAS – fewer dogs in general DAS population, decreased cost to care for and
place dogs
• Benefit to transfer partners – increased number of dogs available to adopt or foster
"Transfer-on-Intake" methodology allows key, high volume transfer partners to have "first
pick" on animals brought OTC to DAS
• Transfer partner staffs desk/person in OTC area to evaluate and hand pick select animals
to hold and adopt them through their shelter's services
• If necessary, transferred animals can live out stray hold time at partner shelter
3.3.1
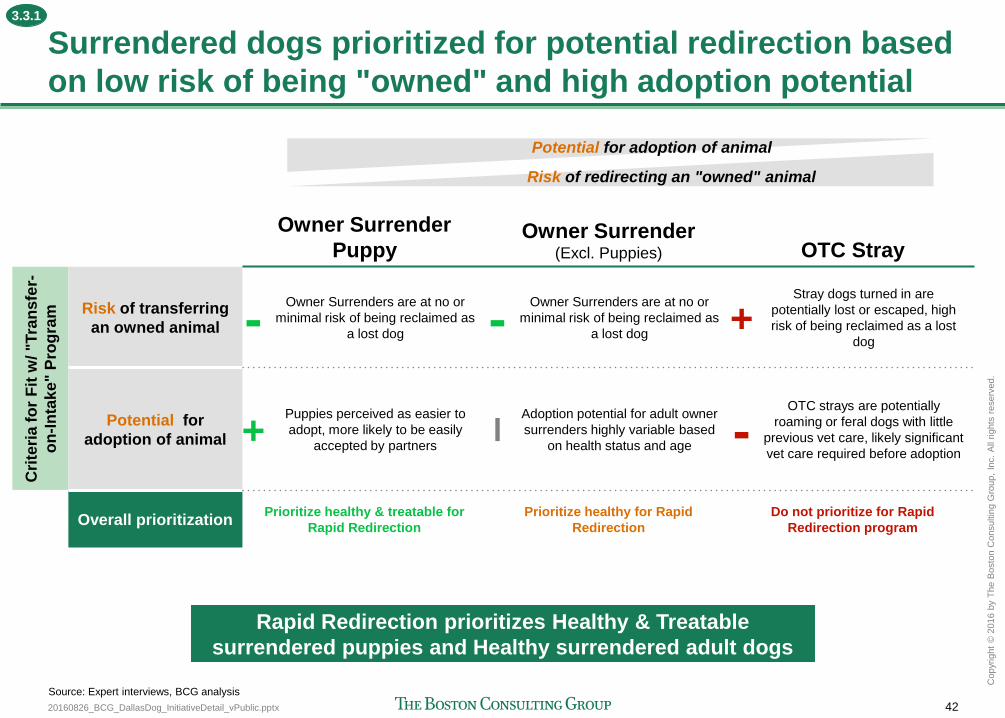
20160826_BCG_DallasDog_InitiativeDetail_vPublic.pptx 42
Copyr
ight
© 2
016 b
y T
he B
osto
n C
onsultin
g G
roup,
Inc.
All
rights
reserv
ed.
Surrendered dogs prioritized for potential redirection based
on low risk of being "owned" and high adoption potential
Owner Surrender
Puppy Owner Surrender
(Excl. Puppies) OTC Stray
Cri
teri
a f
or
Fit
w/ "T
ran
sfe
r-
on
-In
tak
e" P
rog
ram
Risk of transferring
an owned animal - Owner Surrenders are at no or
minimal risk of being reclaimed as
a lost dog - Owner Surrenders are at no or
minimal risk of being reclaimed as
a lost dog + Stray dogs turned in are
potentially lost or escaped, high
risk of being reclaimed as a lost
dog
Potential for
adoption of animal + Puppies perceived as easier to
adopt, more likely to be easily
accepted by partners l
Adoption potential for adult owner
surrenders highly variable based
on health status and age - OTC strays are potentially
roaming or feral dogs with little
previous vet care, likely significant
vet care required before adoption
Overall prioritization Prioritize healthy & treatable for
Rapid Redirection
Prioritize healthy for Rapid
Redirection
Do not prioritize for Rapid
Redirection program
Risk of redirecting an "owned" animal
Potential for adoption of animal
Rapid Redirection prioritizes Healthy & Treatable
surrendered puppies and Healthy surrendered adult dogs
Source: Expert interviews, BCG analysis
3.3.1
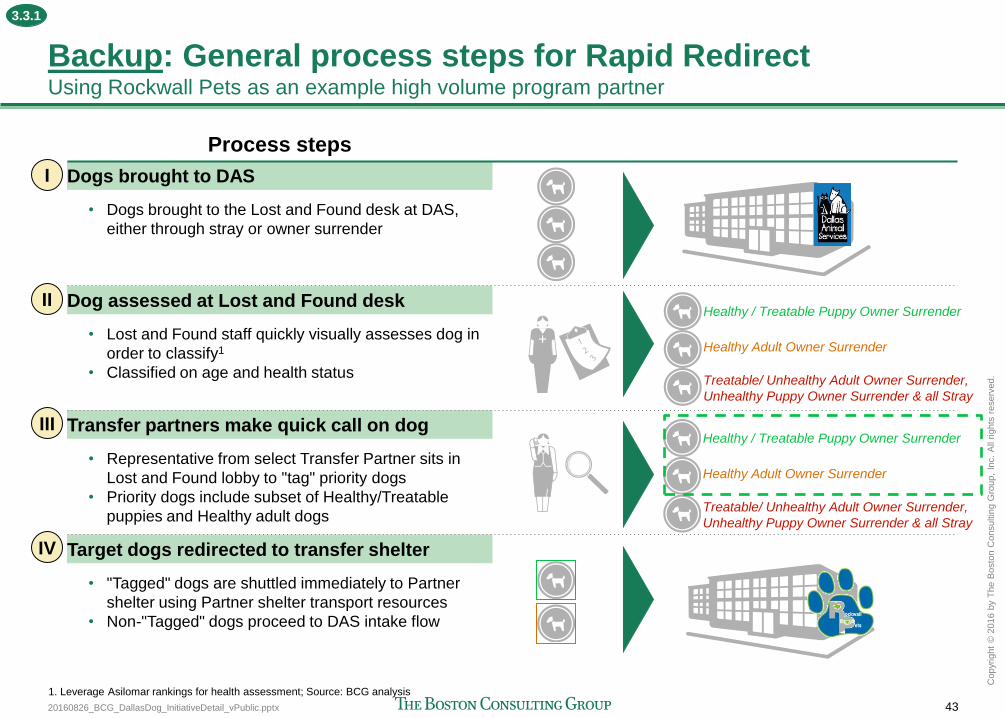
20160826_BCG_DallasDog_InitiativeDetail_vPublic.pptx 43
Copyr
ight
© 2
016 b
y T
he B
osto
n C
onsultin
g G
roup,
Inc.
All
rights
reserv
ed.
Process steps
Dogs brought to DAS
• Dogs brought to the Lost and Found desk at DAS,
either through stray or owner surrender
Dog assessed at Lost and Found desk
• Lost and Found staff quickly visually assesses dog in
order to classify1
• Classified on age and health status
Transfer partners make quick call on dog
• Representative from select Transfer Partner sits in
Lost and Found lobby to "tag" priority dogs
• Priority dogs include subset of Healthy/Treatable
puppies and Healthy adult dogs
Target dogs redirected to transfer shelter
• "Tagged" dogs are shuttled immediately to Partner
shelter using Partner shelter transport resources
• Non-"Tagged" dogs proceed to DAS intake flow
Backup: General process steps for Rapid Redirect Using Rockwall Pets as an example high volume program partner
Healthy / Treatable Puppy Owner Surrender
Healthy Adult Owner Surrender
Treatable/ Unhealthy Adult Owner Surrender,
Unhealthy Puppy Owner Surrender & all Stray
I
II
III
IV
Healthy Adult Owner Surrender
Treatable/ Unhealthy Adult Owner Surrender,
Unhealthy Puppy Owner Surrender & all Stray
Healthy / Treatable Puppy Owner Surrender
1. Leverage Asilomar rankings for health assessment; Source: BCG analysis
3.3.1
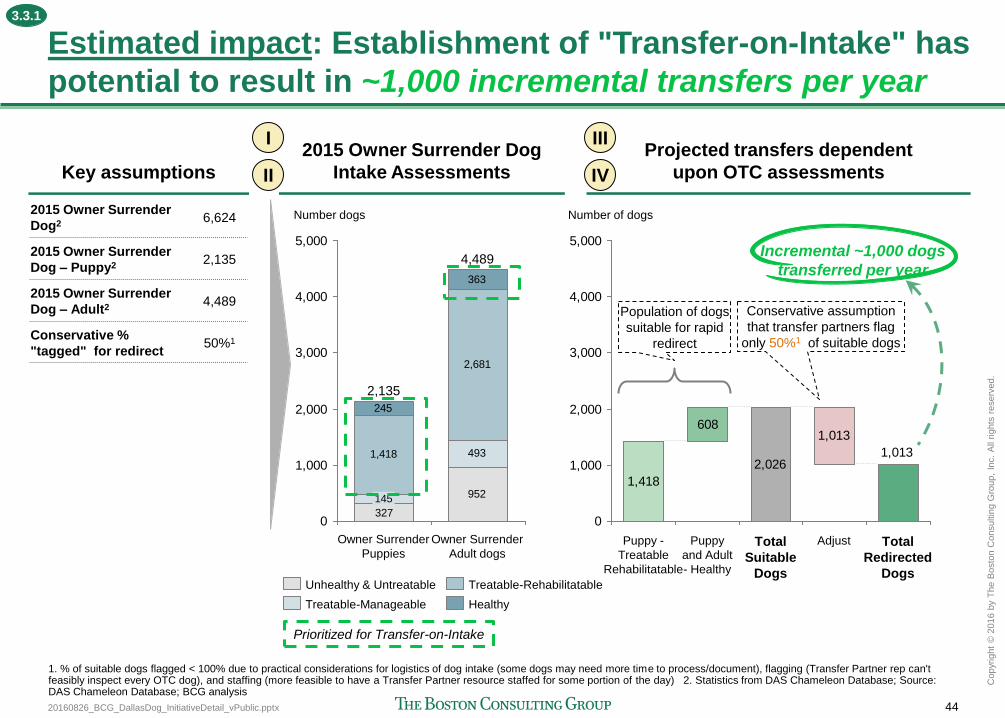
20160826_BCG_DallasDog_InitiativeDetail_vPublic.pptx 44
Copyr
ight
© 2
016 b
y T
he B
osto
n C
onsultin
g G
roup,
Inc.
All
rights
reserv
ed.
2015 Owner Surrender Dog
Intake Assessments
Estimated impact: Establishment of "Transfer-on-Intake" has
potential to result in ~1,000 incremental transfers per year
2015 Owner Surrender
Dog2 6,624
2015 Owner Surrender
Dog – Puppy2 2,135
2015 Owner Surrender
Dog – Adult2 4,489
Conservative %
"tagged" for redirect 50%1
Key assumptions
952
1,418
2,681
245
363
327
493
0
1,000
2,000
3,000
4,000
5,000
Owner Surrender
Adult dogs
4,489
Owner Surrender
Puppies
2,135
Number dogs
145
Projected transfers dependent
upon OTC assessments
Unhealthy & Untreatable
Healthy
Treatable-Rehabilitatable
Treatable-Manageable
1,418
608
2,026
1,013
1,013
0
1,000
2,000
3,000
4,000
5,000
Puppy -
Treatable
Rehabilitatable
Number of dogs
Total
Redirected
Dogs
Adjust Puppy
and Adult
- Healthy
Total
Suitable
Dogs
Population of dogs
suitable for rapid
redirect
Conservative assumption
that transfer partners flag
only 50%1 of suitable dogs
Incremental ~1,000 dogs
transferred per year
Prioritized for Transfer-on-Intake
I
II
III
IV
1. % of suitable dogs flagged < 100% due to practical considerations for logistics of dog intake (some dogs may need more time to process/document), flagging (Transfer Partner rep can't feasibly inspect every OTC dog), and staffing (more feasible to have a Transfer Partner resource staffed for some portion of the day) 2. Statistics from DAS Chameleon Database; Source: DAS Chameleon Database; BCG analysis
3.3.1
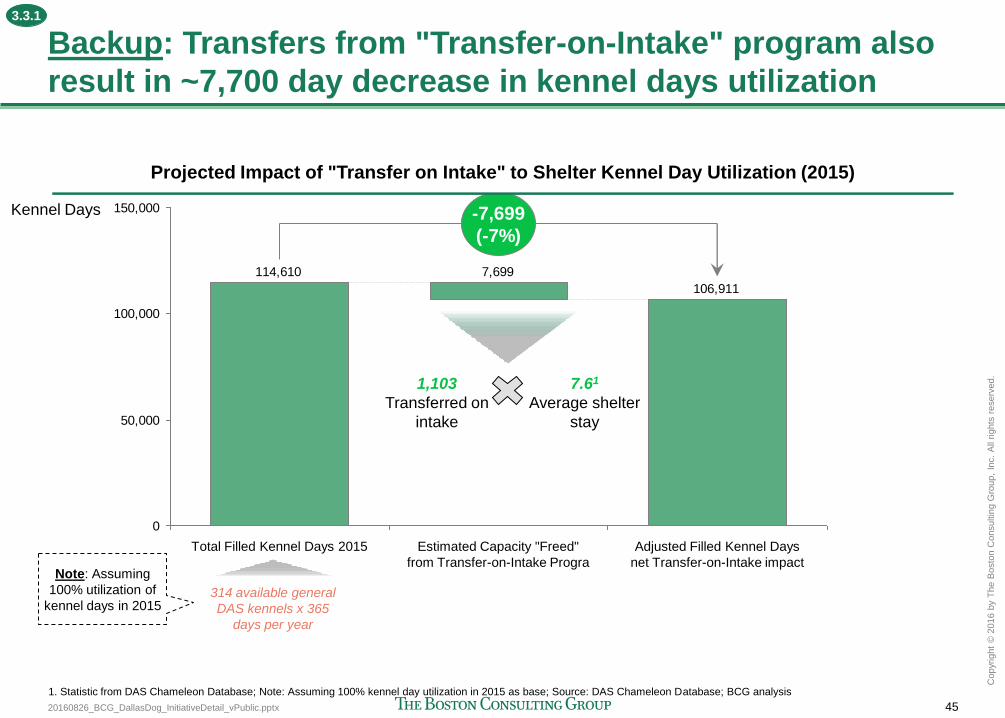
20160826_BCG_DallasDog_InitiativeDetail_vPublic.pptx 45
Copyr
ight
© 2
016 b
y T
he B
osto
n C
onsultin
g G
roup,
Inc.
All
rights
reserv
ed.
Backup: Transfers from "Transfer-on-Intake" program also
result in ~7,700 day decrease in kennel days utilization
106,911
7,699114,610
0
50,000
100,000
150,000
Estimated Capacity "Freed"
from Transfer-on-Intake Progra
Total Filled Kennel Days 2015
-7,699
(-7%)
Adjusted Filled Kennel Days
net Transfer-on-Intake impact
Kennel Days
1,103
Transferred on
intake
7.61
Average shelter
stay
314 available general
DAS kennels x 365
days per year
Note: Assuming
100% utilization of
kennel days in 2015
1. Statistic from DAS Chameleon Database; Note: Assuming 100% kennel day utilization in 2015 as base; Source: DAS Chameleon Database; BCG analysis
Projected Impact of "Transfer on Intake" to Shelter Kennel Day Utilization (2015)
3.3.1
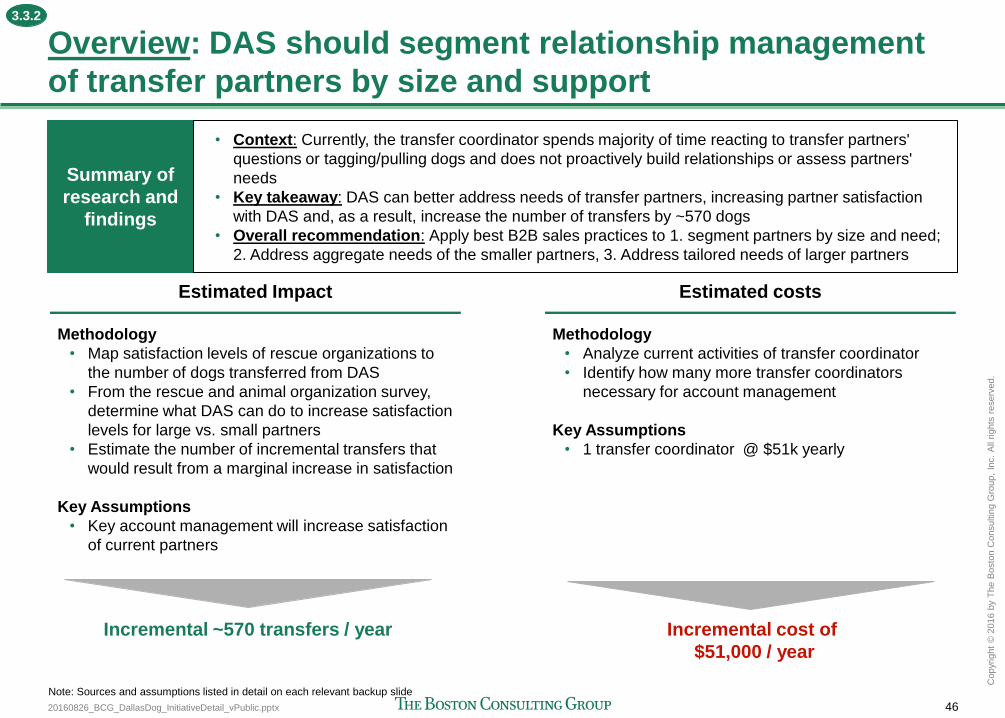
20160826_BCG_DallasDog_InitiativeDetail_vPublic.pptx 46
Copyr
ight
© 2
016 b
y T
he B
osto
n C
onsultin
g G
roup,
Inc.
All
rights
reserv
ed.
Overview: DAS should segment relationship management
of transfer partners by size and support
Estimated Impact
Methodology
• Map satisfaction levels of rescue organizations to
the number of dogs transferred from DAS
• From the rescue and animal organization survey,
determine what DAS can do to increase satisfaction
levels for large vs. small partners
• Estimate the number of incremental transfers that
would result from a marginal increase in satisfaction
Key Assumptions
• Key account management will increase satisfaction
of current partners
Estimated costs
Methodology
• Analyze current activities of transfer coordinator
• Identify how many more transfer coordinators
necessary for account management
Key Assumptions
• 1 transfer coordinator @ $51k yearly
Incremental ~570 transfers / year Incremental cost of
$51,000 / year
Note: Sources and assumptions listed in detail on each relevant backup slide
Summary of
research and
findings
• Context: Currently, the transfer coordinator spends majority of time reacting to transfer partners'
questions or tagging/pulling dogs and does not proactively build relationships or assess partners'
needs
• Key takeaway: DAS can better address needs of transfer partners, increasing partner satisfaction
with DAS and, as a result, increase the number of transfers by ~570 dogs
• Overall recommendation: Apply best B2B sales practices to 1. segment partners by size and need;
2. Address aggregate needs of the smaller partners, 3. Address tailored needs of larger partners
3.3.2
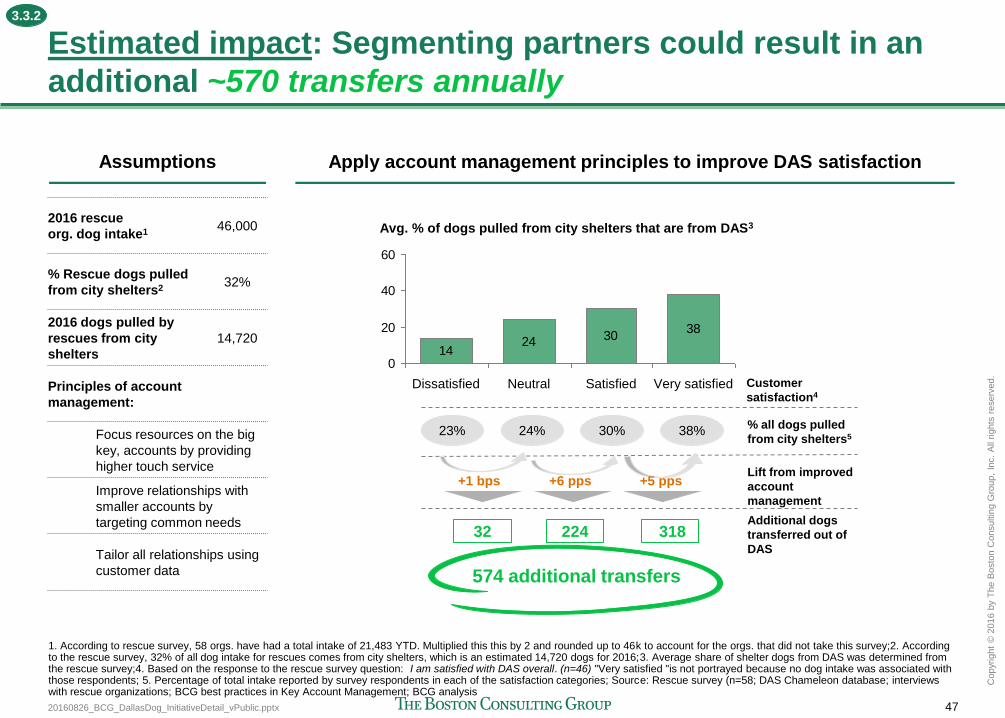
20160826_BCG_DallasDog_InitiativeDetail_vPublic.pptx 47
Copyr
ight
© 2
016 b
y T
he B
osto
n C
onsultin
g G
roup,
Inc.
All
rights
reserv
ed.
Estimated impact: Segmenting partners could result in an
additional ~570 transfers annually
1. According to rescue survey, 58 orgs. have had a total intake of 21,483 YTD. Multiplied this this by 2 and rounded up to 46k to account for the orgs. that did not take this survey;2. According to the rescue survey, 32% of all dog intake for rescues comes from city shelters, which is an estimated 14,720 dogs for 2016;3. Average share of shelter dogs from DAS was determined from the rescue survey;4. Based on the response to the rescue survey question: I am satisfied with DAS overall. (n=46) "Very satisfied "is not portrayed because no dog intake was associated with those respondents; 5. Percentage of total intake reported by survey respondents in each of the satisfaction categories; Source: Rescue survey (n=58; DAS Chameleon database; interviews with rescue organizations; BCG best practices in Key Account Management; BCG analysis
Assumptions Apply account management principles to improve DAS satisfaction
24 3038
140
20
40
60
Avg. % of dogs pulled from city shelters that are from DAS3
Very satisfied Customer
satisfaction4 Satisfied Neutral Dissatisfied
% all dogs pulled
from city shelters5
Lift from improved
account
management
Additional dogs
transferred out of
DAS
+1 bps +6 pps +5 pps
23% 24% 30% 38%
32 224 318
2016 rescue
org. dog intake1 46,000
% Rescue dogs pulled
from city shelters2 32%
2016 dogs pulled by
rescues from city
shelters
14,720
Principles of account
management:
Focus resources on the big
key, accounts by providing
higher touch service
Improve relationships with
smaller accounts by
targeting common needs
Tailor all relationships using
customer data 574 additional transfers
3.3.2
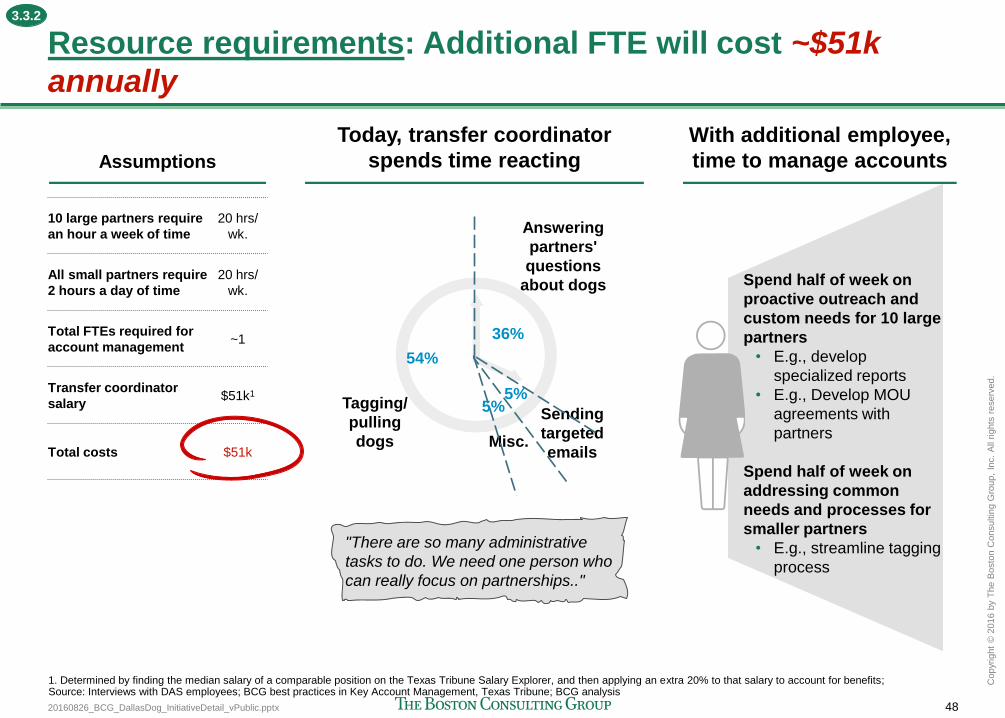
20160826_BCG_DallasDog_InitiativeDetail_vPublic.pptx 48
Copyr
ight
© 2
016 b
y T
he B
osto
n C
onsultin
g G
roup,
Inc.
All
rights
reserv
ed.
Resource requirements: Additional FTE will cost ~$51k
annually
1. Determined by finding the median salary of a comparable position on the Texas Tribune Salary Explorer, and then applying an extra 20% to that salary to account for benefits; Source: Interviews with DAS employees; BCG best practices in Key Account Management, Texas Tribune; BCG analysis
Today, transfer coordinator
spends time reacting
With additional employee,
time to manage accounts
Misc.
Sending
targeted
emails
Answering
partners'
questions
about dogs
Tagging/
pulling
dogs
54%
36%
5% 5%
"There are so many administrative
tasks to do. We need one person who
can really focus on partnerships.."
10 large partners require
an hour a week of time
20 hrs/
wk.
All small partners require
2 hours a day of time
20 hrs/
wk.
Total FTEs required for
account management ~1
Transfer coordinator
salary $51k1
Total costs $51k
Spend half of week on
proactive outreach and
custom needs for 10 large
partners
• E.g., develop
specialized reports
• E.g., Develop MOU
agreements with
partners
Spend half of week on
addressing common
needs and processes for
smaller partners
• E.g., streamline tagging
process
Assumptions
3.3.2
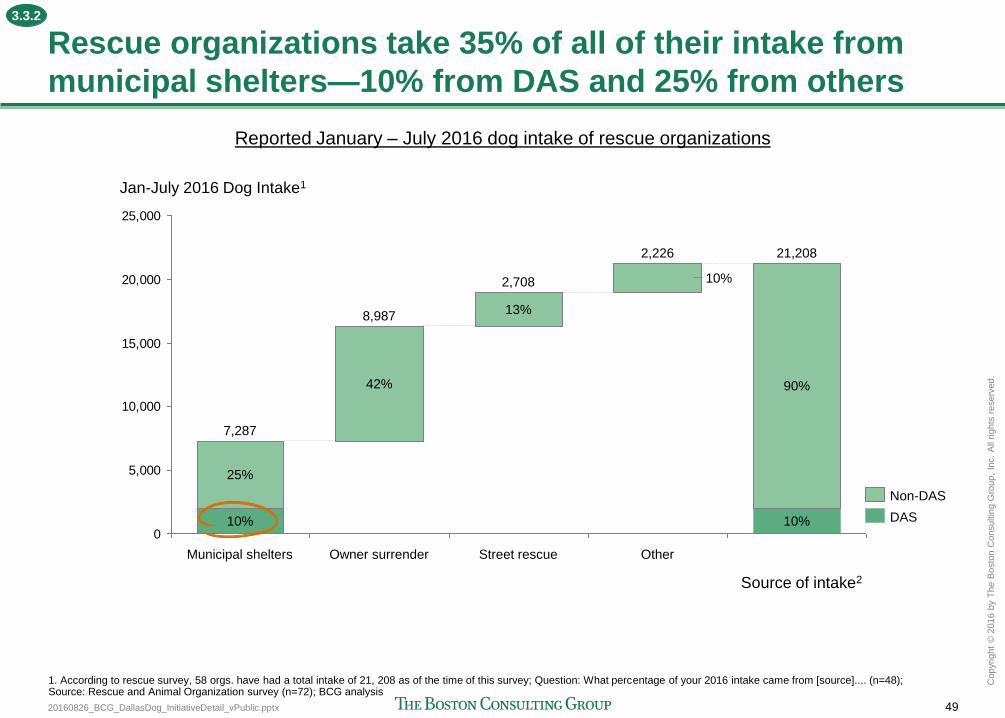
20160826_BCG_DallasDog_InitiativeDetail_vPublic.pptx 49
Copyr
ight
© 2
016 b
y T
he B
osto
n C
onsultin
g G
roup,
Inc.
All
rights
reserv
ed.
Rescue organizations take 35% of all of their intake from
municipal shelters—10% from DAS and 25% from others
0
5,000
10,000
15,000
20,000
25,000
Jan-July 2016 Dog Intake1
21,208
Source of intake2
10%
90%
2,226
10%
Other Street rescue
2,708
8,987
Owner surrender
13%
42%
Municipal shelters
7,287
10%
25%
DAS
Non-DAS
1. According to rescue survey, 58 orgs. have had a total intake of 21, 208 as of the time of this survey; Question: What percentage of your 2016 intake came from [source].... (n=48); Source: Rescue and Animal Organization survey (n=72); BCG analysis
Reported January – July 2016 dog intake of rescue organizations
3.3.2
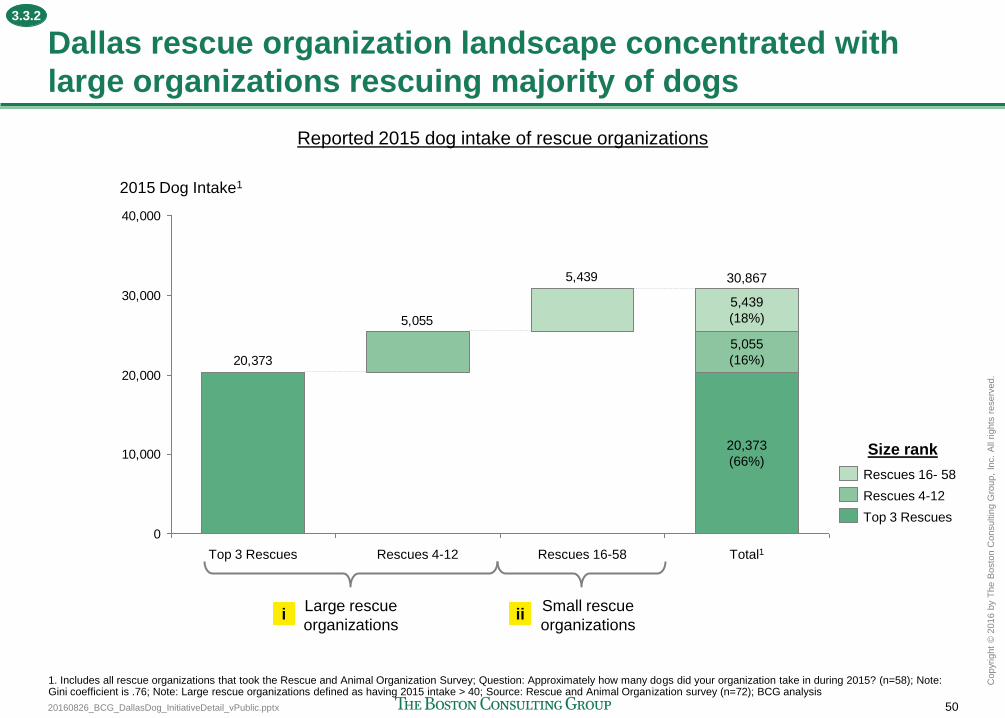
20160826_BCG_DallasDog_InitiativeDetail_vPublic.pptx 50
Copyr
ight
© 2
016 b
y T
he B
osto
n C
onsultin
g G
roup,
Inc.
All
rights
reserv
ed.
5,439
5,055
20,373
0
10,000
20,000
30,000
40,000
Total1
2015 Dog Intake1
Top 3 Rescues Rescues 4-12
5,439
(18%)
Rescues 16-58
5,055
(16%)
30,867
20,373
(66%)
Top 3 Rescues
Rescues 16- 58
Rescues 4-12
Dallas rescue organization landscape concentrated with
large organizations rescuing majority of dogs
1. Includes all rescue organizations that took the Rescue and Animal Organization Survey; Question: Approximately how many dogs did your organization take in during 2015? (n=58); Note: Gini coefficient is .76; Note: Large rescue organizations defined as having 2015 intake > 40; Source: Rescue and Animal Organization survey (n=72); BCG analysis
Large rescue
organizations
Small rescue
organizations
Size rank
i ii
Reported 2015 dog intake of rescue organizations
3.3.2
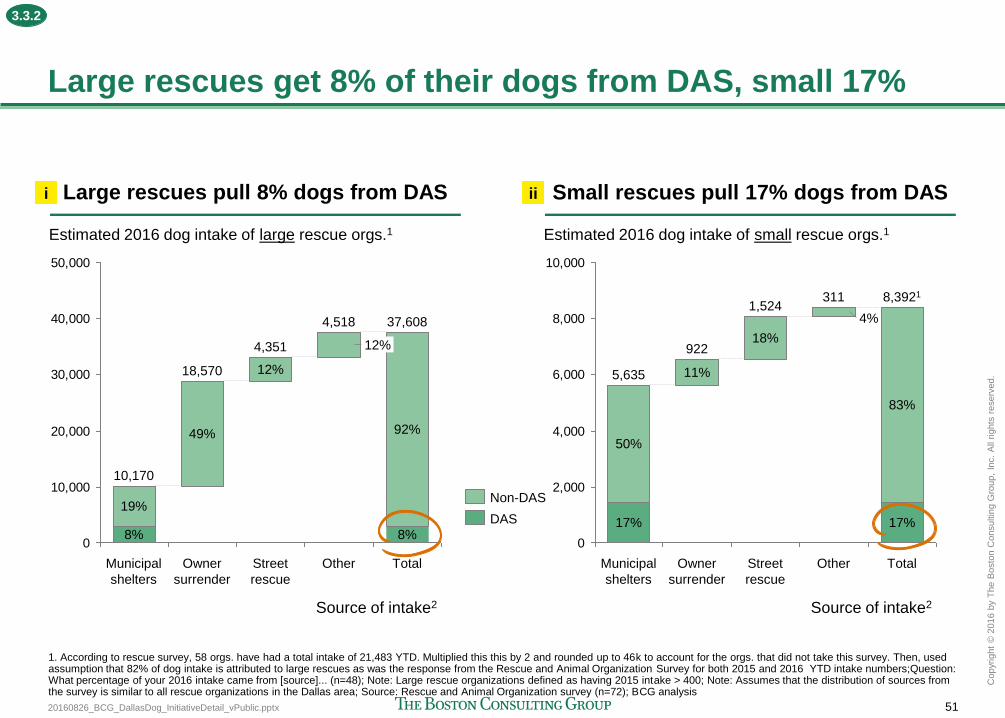
20160826_BCG_DallasDog_InitiativeDetail_vPublic.pptx 51
Copyr
ight
© 2
016 b
y T
he B
osto
n C
onsultin
g G
roup,
Inc.
All
rights
reserv
ed.
Large rescues get 8% of their dogs from DAS, small 17%
Large rescues pull 8% dogs from DAS Small rescues pull 17% dogs from DAS
0
10,000
20,000
30,000
40,000
50,000
19%
Estimated 2016 dog intake of large rescue orgs.1
Source of intake2
Other
4,518
12%
Street
rescue
4,351
12%
Owner
surrender
18,570
49%
Municipal
shelters
10,170
37,608
92%
8%
Total
8% 0
2,000
4,000
6,000
8,000
10,000
Estimated 2016 dog intake of small rescue orgs.1
Source of intake2
Total
8,3921
17%
83%
Other
311
4%
Street
rescue
1,524
18%
Owner
surrender
922
11%
Municipal
shelters
5,635
17%
50%
DAS
Non-DAS
1. According to rescue survey, 58 orgs. have had a total intake of 21,483 YTD. Multiplied this this by 2 and rounded up to 46k to account for the orgs. that did not take this survey. Then, used assumption that 82% of dog intake is attributed to large rescues as was the response from the Rescue and Animal Organization Survey for both 2015 and 2016 YTD intake numbers;Question: What percentage of your 2016 intake came from [source]... (n=48); Note: Large rescue organizations defined as having 2015 intake > 400; Note: Assumes that the distribution of sources from the survey is similar to all rescue organizations in the Dallas area; Source: Rescue and Animal Organization survey (n=72); BCG analysis
i ii
3.3.2
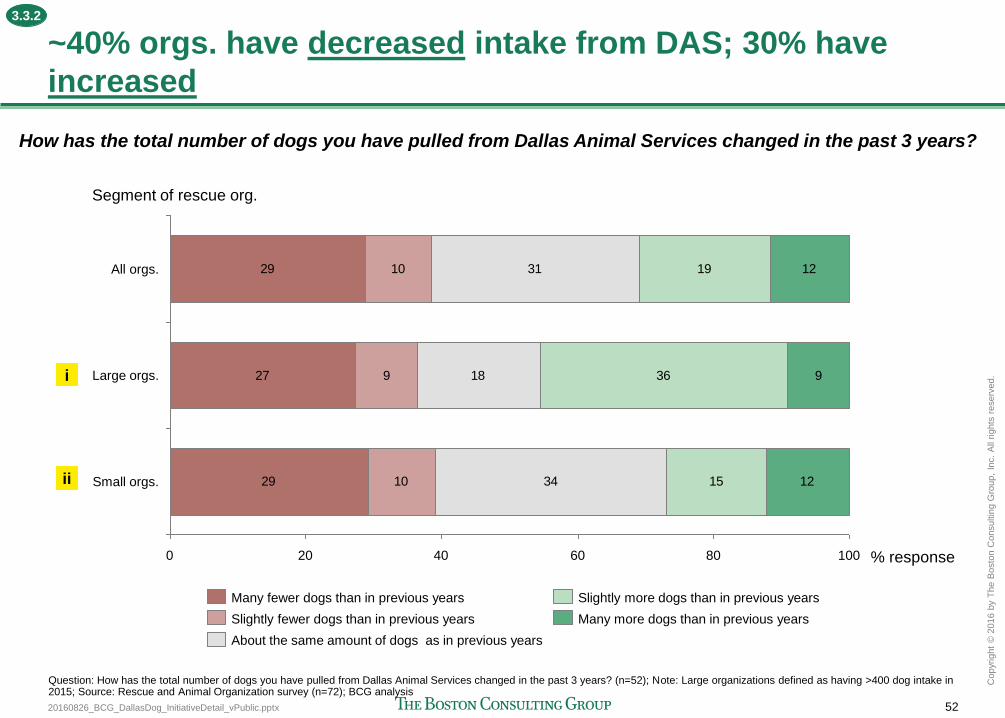
20160826_BCG_DallasDog_InitiativeDetail_vPublic.pptx 52
Copyr
ight
© 2
016 b
y T
he B
osto
n C
onsultin
g G
roup,
Inc.
All
rights
reserv
ed.
~40% orgs. have decreased intake from DAS; 30% have
increased
29
27
29
10
9
10
31
18
34
19
36
15
12
9
12
0 40 60 20 80 100
Small orgs.
Large orgs.
% response
All orgs.
Segment of rescue org.
Many fewer dogs than in previous years Slightly more dogs than in previous years
About the same amount of dogs as in previous years
Many more dogs than in previous years Slightly fewer dogs than in previous years
How has the total number of dogs you have pulled from Dallas Animal Services changed in the past 3 years?
i
ii
Question: How has the total number of dogs you have pulled from Dallas Animal Services changed in the past 3 years? (n=52); Note: Large organizations defined as having >400 dog intake in 2015; Source: Rescue and Animal Organization survey (n=72); BCG analysis
3.3.2
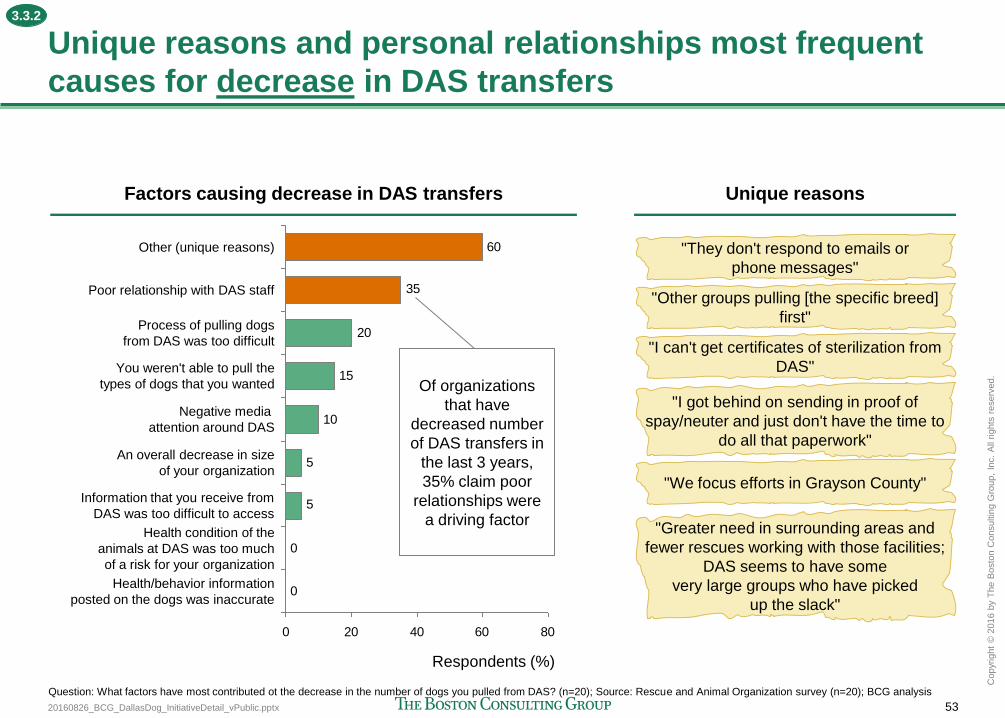
20160826_BCG_DallasDog_InitiativeDetail_vPublic.pptx 53
Copyr
ight
© 2
016 b
y T
he B
osto
n C
onsultin
g G
roup,
Inc.
All
rights
reserv
ed.
Unique reasons and personal relationships most frequent
causes for decrease in DAS transfers
Factors causing decrease in DAS transfers
0
0
5
5
10
15
20
35
60
0 20 40 60 80
Respondents (%)
Health/behavior information
posted on the dogs was inaccurate
Health condition of the
animals at DAS was too much
of a risk for your organization
Information that you receive from
DAS was too difficult to access
An overall decrease in size
of your organization
Negative media
attention around DAS
You weren't able to pull the
types of dogs that you wanted
Process of pulling dogs
from DAS was too difficult
Poor relationship with DAS staff
Other (unique reasons)
Unique reasons
"They don't respond to emails or
phone messages"
"Other groups pulling [the specific breed]
first"
"I can't get certificates of sterilization from
DAS"
"I got behind on sending in proof of
spay/neuter and just don't have the time to
do all that paperwork"
Question: What factors have most contributed ot the decrease in the number of dogs you pulled from DAS? (n=20); Source: Rescue and Animal Organization survey (n=20); BCG analysis
Of organizations
that have
decreased number
of DAS transfers in
the last 3 years,
35% claim poor
relationships were
a driving factor
"We focus efforts in Grayson County"
"Greater need in surrounding areas and
fewer rescues working with those facilities;
DAS seems to have some
very large groups who have picked
up the slack"
3.3.2
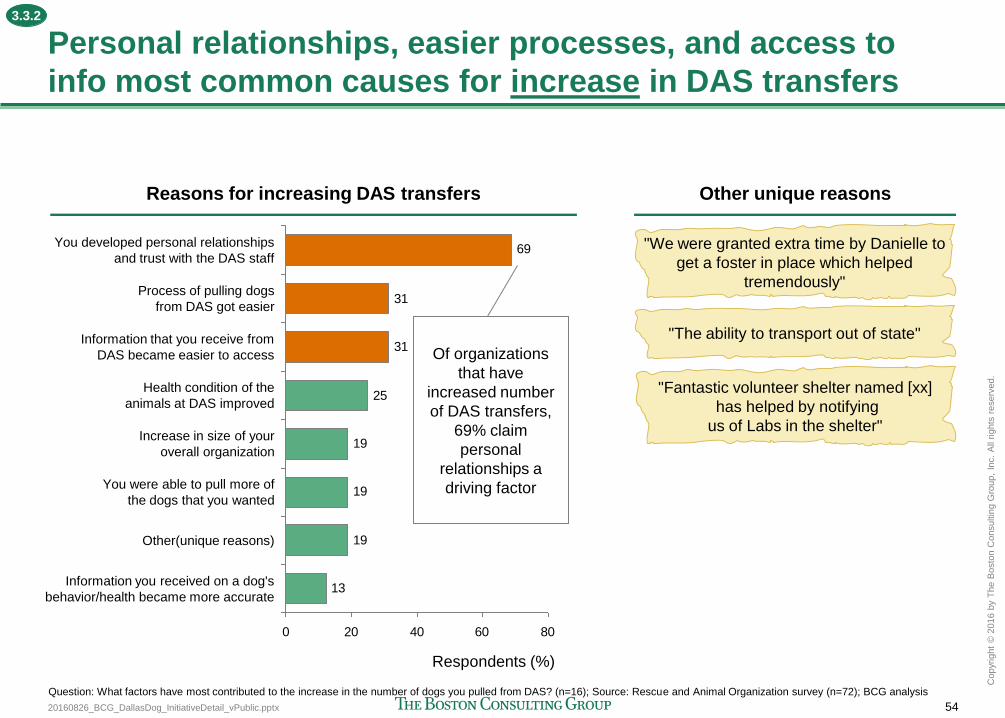
20160826_BCG_DallasDog_InitiativeDetail_vPublic.pptx 54
Copyr
ight
© 2
016 b
y T
he B
osto
n C
onsultin
g G
roup,
Inc.
All
rights
reserv
ed.
Personal relationships, easier processes, and access to
info most common causes for increase in DAS transfers
Reasons for increasing DAS transfers
13
19
19
19
25
31
31
69
0 20 40 60 80
Process of pulling dogs
from DAS got easier
Increase in size of your
overall organization
Respondents (%)
Information that you receive from
DAS became easier to access
Other(unique reasons)
You were able to pull more of
the dogs that you wanted
Information you received on a dog's
behavior/health became more accurate
You developed personal relationships
and trust with the DAS staff
Health condition of the
animals at DAS improved
Question: What factors have most contributed to the increase in the number of dogs you pulled from DAS? (n=16); Source: Rescue and Animal Organization survey (n=72); BCG analysis
Other unique reasons
"Fantastic volunteer shelter named [xx]
has helped by notifying
us of Labs in the shelter"
"The ability to transport out of state"
"We were granted extra time by Danielle to
get a foster in place which helped
tremendously"
Of organizations
that have
increased number
of DAS transfers,
69% claim
personal
relationships a
driving factor
3.3.2
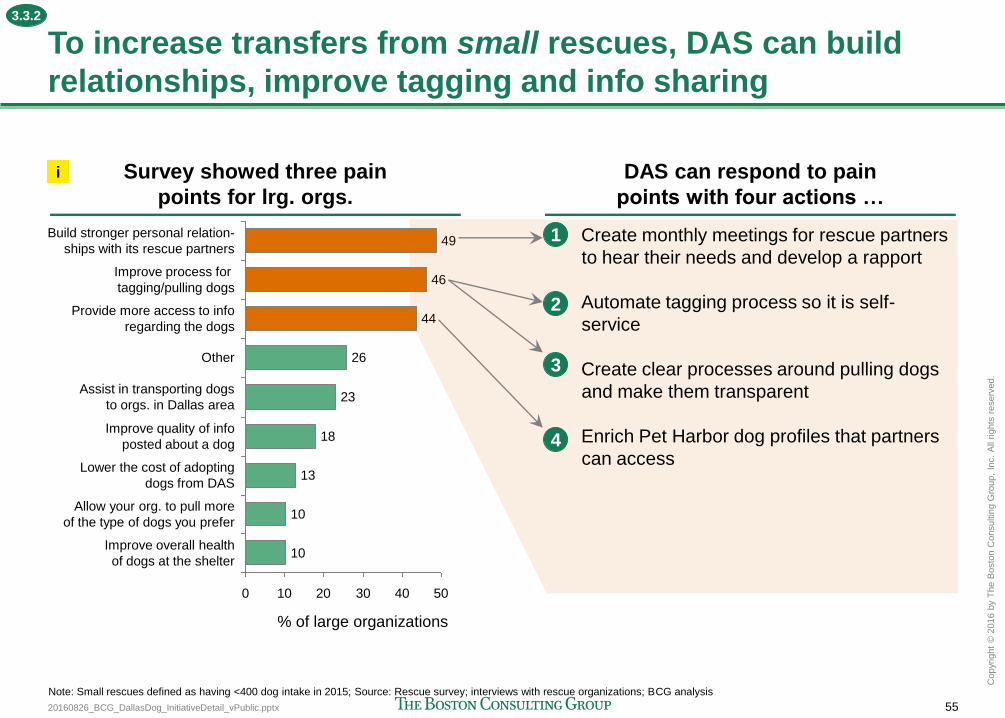
20160826_BCG_DallasDog_InitiativeDetail_vPublic.pptx 55
Copyr
ight
© 2
016 b
y T
he B
osto
n C
onsultin
g G
roup,
Inc.
All
rights
reserv
ed.
To increase transfers from small rescues, DAS can build
relationships, improve tagging and info sharing
Survey showed three pain
points for lrg. orgs.
DAS can respond to pain
points with four actions …
Create monthly meetings for rescue partners
to hear their needs and develop a rapport
Automate tagging process so it is self-
service
Create clear processes around pulling dogs
and make them transparent
Enrich Pet Harbor dog profiles that partners
can access
50 40 30 20 10 0
% of large organizations
23
Other 26
Provide more access to info
regarding the dogs 44
Improve process for
tagging/pulling dogs 46
Build stronger personal relation-
ships with its rescue partners 49
Improve overall health
of dogs at the shelter 10
Allow your org. to pull more
of the type of dogs you prefer 10
Lower the cost of adopting
dogs from DAS 13
Improve quality of info
posted about a dog 18
Assist in transporting dogs
to orgs. in Dallas area
1
2
3
4
Note: Small rescues defined as having <400 dog intake in 2015; Source: Rescue survey; interviews with rescue organizations; BCG analysis
i
3.3.2

20160826_BCG_DallasDog_InitiativeDetail_vPublic.pptx 56
Copyr
ight
© 2
016 b
y T
he B
osto
n C
onsultin
g G
roup,
Inc.
All
rights
reserv
ed.
To increase transfers from large rescues, DAS can address
specific needs and improve tagging and info
60 40 20 0
% of large organizations
Allow your org. to pull more of
the type of dogs you prefer 9
45
Other: specific needs 55
Provide more access to info
regarding the dogs 18
Build stronger relationships
with rescue partners 27
Assist in transporting dogs
to orgs. in Dallas area 27
Lower the cost of adopting
dogs from DAS 27
Improve overall health
of dogs at the shelter 27
Improve quality of info
posted about a dog 36
Improve process for
tagging/pulling dogs
Survey showed three pain
points for lrg. orgs.
DAS can respond to pain points
with five actions …
Provide higher touch relationships to better
understand their needs
Tailor transfer coordinator relationship to the
diverse specific needs of each large partner
Create MOUs with expedited processes for
larger partners to pull dogs
Automate tagging process so it is self-
service
Enrich Pet Harbor dog profiles that partners
can access
Note: Large rescues defined as having >400 dog intake in 2015; Source: Rescue survey; interviews with rescue organizations; BCG analysis
1
2
3
4
5
ii
3.3.2
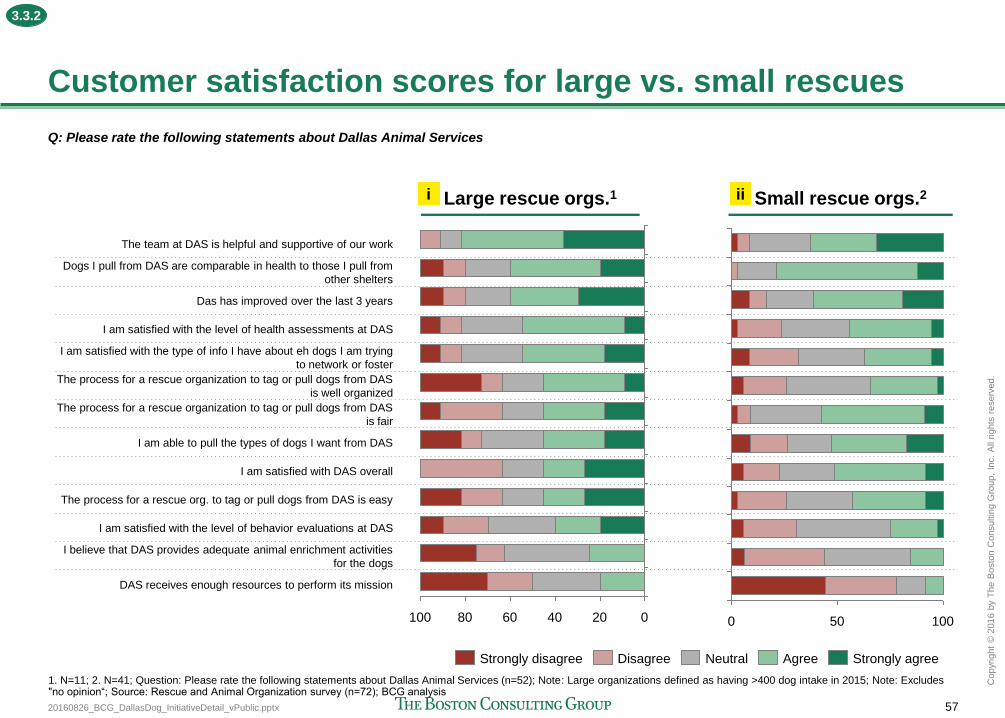
20160826_BCG_DallasDog_InitiativeDetail_vPublic.pptx 57
Copyr
ight
© 2
016 b
y T
he B
osto
n C
onsultin
g G
roup,
Inc.
All
rights
reserv
ed.
The team at DAS is helpful and supportive of our work
Dogs I pull from DAS are comparable in health to those I pull from
other shelters
Das has improved over the last 3 years
I am satisfied with the level of health assessments at DAS
I am satisfied with the type of info I have about eh dogs I am trying
to network or foster
The process for a rescue organization to tag or pull dogs from DAS
is well organized
The process for a rescue organization to tag or pull dogs from DAS
is fair
I am able to pull the types of dogs I want from DAS
I am satisfied with DAS overall
The process for a rescue org. to tag or pull dogs from DAS is easy
I am satisfied with the level of behavior evaluations at DAS
I believe that DAS provides adequate animal enrichment activities
for the dogs
DAS receives enough resources to perform its mission
Small rescue orgs.2
100 80 60 40 20 0 100 50 0
Strongly agree Agree Neutral Disagree Strongly disagree
Customer satisfaction scores for large vs. small rescues
Large rescue orgs.1
1. N=11; 2. N=41; Question: Please rate the following statements about Dallas Animal Services (n=52); Note: Large organizations defined as having >400 dog intake in 2015; Note: Excludes "no opinion“; Source: Rescue and Animal Organization survey (n=72); BCG analysis
Q: Please rate the following statements about Dallas Animal Services
i ii
3.3.2
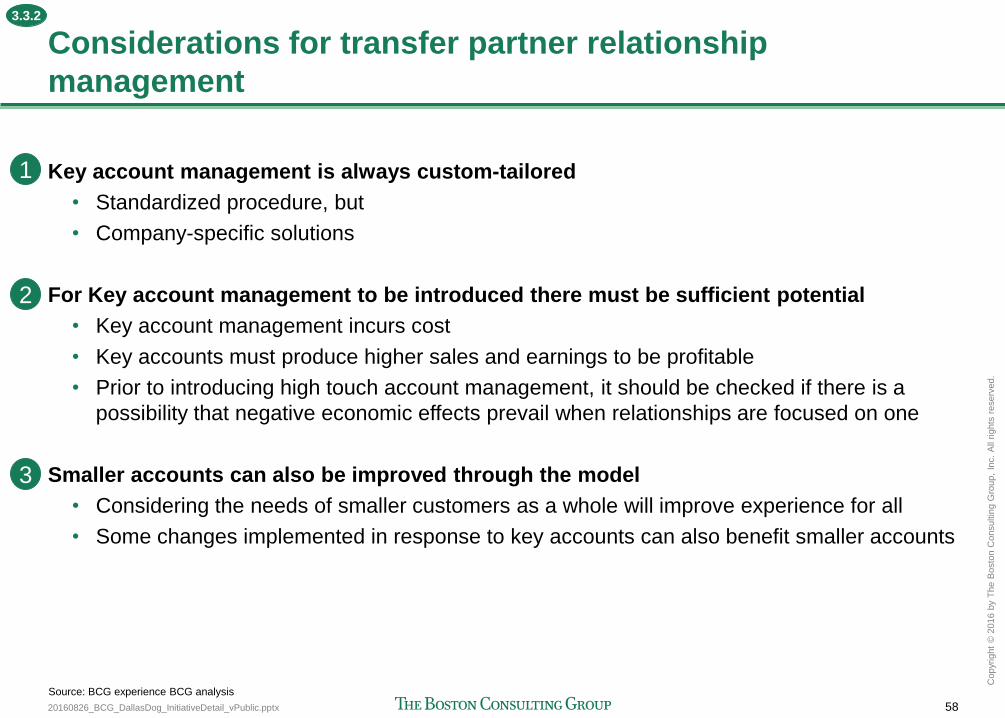
20160826_BCG_DallasDog_InitiativeDetail_vPublic.pptx 58
Copyr
ight
© 2
016 b
y T
he B
osto
n C
onsultin
g G
roup,
Inc.
All
rights
reserv
ed.
Considerations for transfer partner relationship
management
Key account management is always custom-tailored
• Standardized procedure, but
• Company-specific solutions
For Key account management to be introduced there must be sufficient potential
• Key account management incurs cost
• Key accounts must produce higher sales and earnings to be profitable
• Prior to introducing high touch account management, it should be checked if there is a
possibility that negative economic effects prevail when relationships are focused on one
Smaller accounts can also be improved through the model
• Considering the needs of smaller customers as a whole will improve experience for all
• Some changes implemented in response to key accounts can also benefit smaller accounts
2
3
1
Source: BCG experience BCG analysis
3.3.2
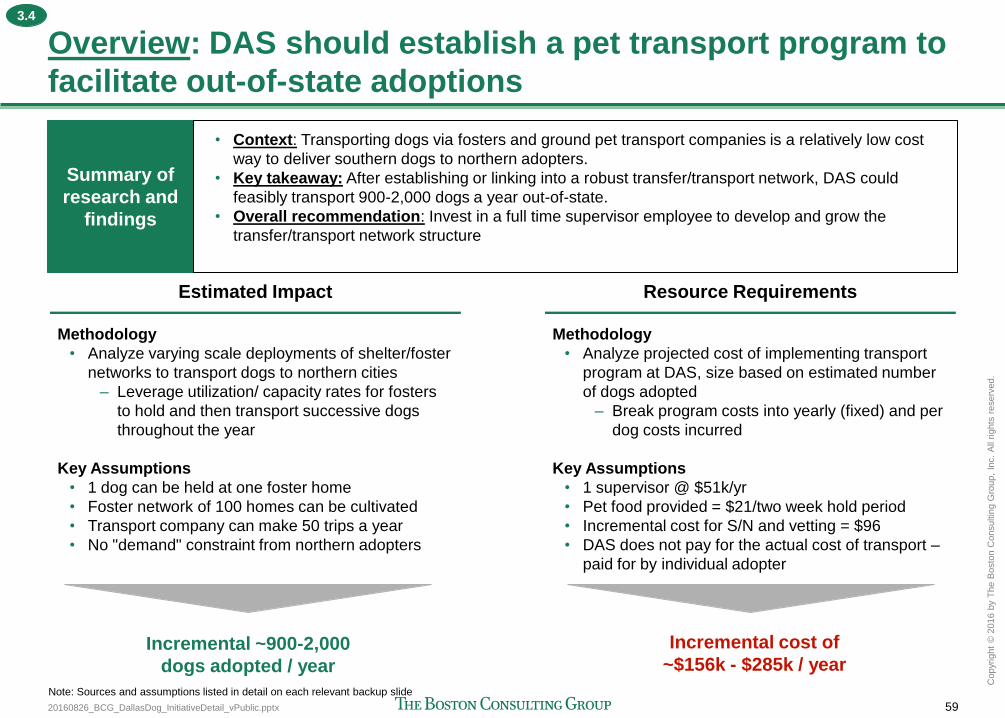
20160826_BCG_DallasDog_InitiativeDetail_vPublic.pptx 59
Copyr
ight
© 2
016 b
y T
he B
osto
n C
onsultin
g G
roup,
Inc.
All
rights
reserv
ed.
Overview: DAS should establish a pet transport program to
facilitate out-of-state adoptions
Estimated Impact
Methodology
• Analyze varying scale deployments of shelter/foster
networks to transport dogs to northern cities
– Leverage utilization/ capacity rates for fosters
to hold and then transport successive dogs
throughout the year
Key Assumptions
• 1 dog can be held at one foster home
• Foster network of 100 homes can be cultivated
• Transport company can make 50 trips a year
• No "demand" constraint from northern adopters
Resource Requirements
Methodology
• Analyze projected cost of implementing transport
program at DAS, size based on estimated number
of dogs adopted
– Break program costs into yearly (fixed) and per
dog costs incurred
Key Assumptions
• 1 supervisor @ $51k/yr
• Pet food provided = $21/two week hold period
• Incremental cost for S/N and vetting = $96
• DAS does not pay for the actual cost of transport –
paid for by individual adopter
Incremental ~900-2,000
dogs adopted / year
Incremental cost of
~$156k - $285k / year
Note: Sources and assumptions listed in detail on each relevant backup slide
Summary of
research and
findings
• Context: Transporting dogs via fosters and ground pet transport companies is a relatively low cost
way to deliver southern dogs to northern adopters.
• Key takeaway: After establishing or linking into a robust transfer/transport network, DAS could
feasibly transport 900-2,000 dogs a year out-of-state.
• Overall recommendation: Invest in a full time supervisor employee to develop and grow the
transfer/transport network structure
3.4
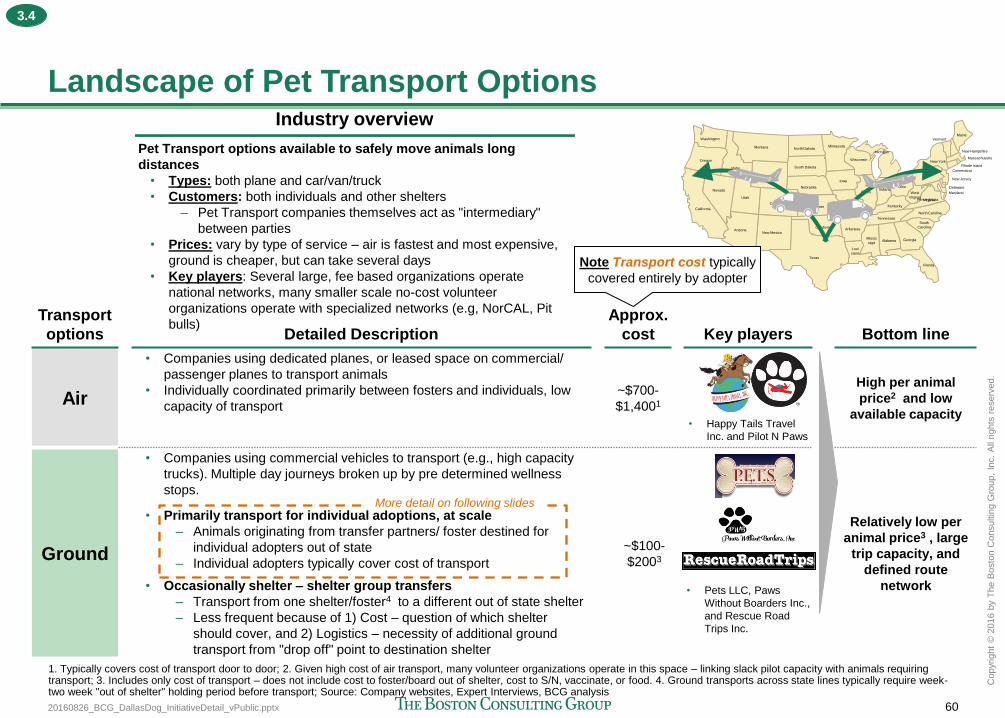
20160826_BCG_DallasDog_InitiativeDetail_vPublic.pptx 60
Copyr
ight
© 2
016 b
y T
he B
osto
n C
onsultin
g G
roup,
Inc.
All
rights
reserv
ed.
Industry overview
Transport
options Detailed Description
Approx.
cost Key players Bottom line
Air
• Companies using dedicated planes, or leased space on commercial/
passenger planes to transport animals
• Individually coordinated primarily between fosters and individuals, low
capacity of transport
~$700-
$1,4001
• Happy Tails Travel
Inc. and Pilot N Paws
High per animal
price2 and low
available capacity
Ground
• Companies using commercial vehicles to transport (e.g., high capacity
trucks). Multiple day journeys broken up by pre determined wellness
stops.
• Primarily transport for individual adoptions, at scale
– Animals originating from transfer partners/ foster destined for
individual adopters out of state
– Individual adopters typically cover cost of transport
• Occasionally shelter – shelter group transfers
– Transport from one shelter/foster4 to a different out of state shelter
– Less frequent because of 1) Cost – question of which shelter
should cover, and 2) Logistics – necessity of additional ground
transport from "drop off" point to destination shelter
~$100-
$2003
• Pets LLC, Paws
Without Boarders Inc.,
and Rescue Road
Trips Inc.
Relatively low per
animal price3 , large
trip capacity, and
defined route
network
Landscape of Pet Transport Options
Pet Transport options available to safely move animals long
distances
• Types: both plane and car/van/truck
• Customers: both individuals and other shelters
– Pet Transport companies themselves act as "intermediary"
between parties
• Prices: vary by type of service – air is fastest and most expensive,
ground is cheaper, but can take several days
• Key players: Several large, fee based organizations operate
national networks, many smaller scale no-cost volunteer
organizations operate with specialized networks (e.g, NorCAL, Pit
bulls)
1. Typically covers cost of transport door to door; 2. Given high cost of air transport, many volunteer organizations operate in this space – linking slack pilot capacity with animals requiring transport; 3. Includes only cost of transport – does not include cost to foster/board out of shelter, cost to S/N, vaccinate, or food. 4. Ground transports across state lines typically require week-two week "out of shelter" holding period before transport; Source: Company websites, Expert Interviews, BCG analysis
North Dakota
South Dakota
Nebraska
Kansas
Oklahoma
Washington
Oregon
California
Montana
Idaho
Nevada
Utah
Arizona New Mexico
Colorado
Wyoming
Texas
Loui
siana
Arkansas
Missouri
Iowa
Minnesota
Wisconsin
Illinois
Missis
sippi Alabama Georgia
Florida
South
Carolina
North Carolina
Tennessee
Kentucky
Virginia
West
Virginia
Ohio Indiana
Pennsylvania
Maryland
New Jersey
New York
Maine Vermont
New Hampshire
Massachusetts
Rhode Island
Connecticut
Michigan
Delaware
More detail on following slides
Note Transport cost typically
covered entirely by adopter
3.4
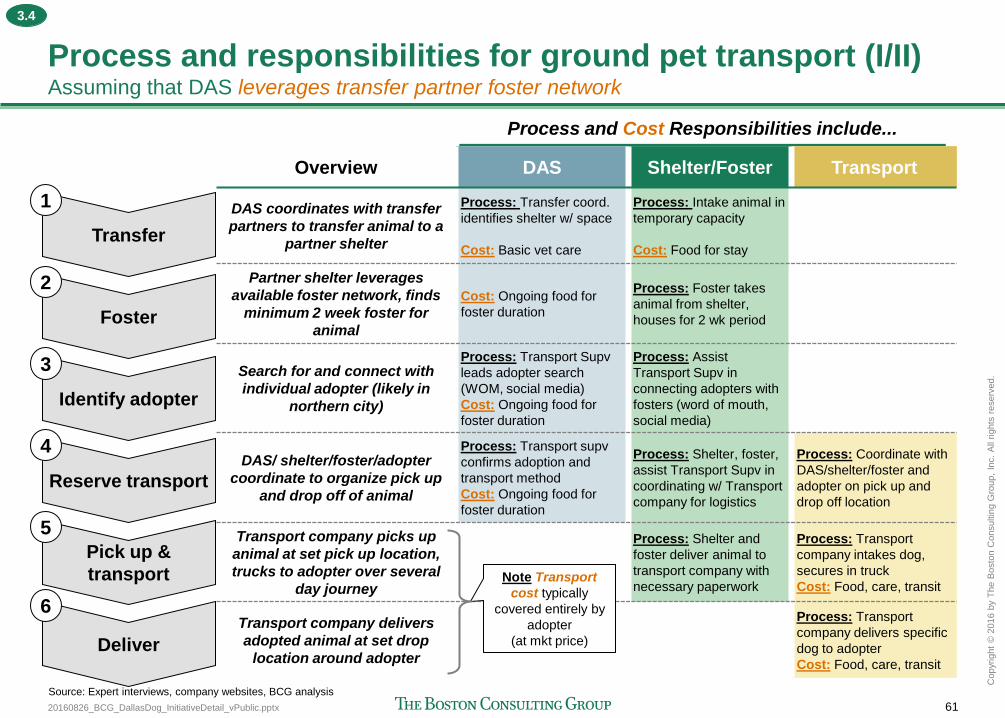
20160826_BCG_DallasDog_InitiativeDetail_vPublic.pptx 61
Copyr
ight
© 2
016 b
y T
he B
osto
n C
onsultin
g G
roup,
Inc.
All
rights
reserv
ed.
Overview DAS Shelter/Foster Transport
DAS coordinates with transfer
partners to transfer animal to a
partner shelter
Process: Transfer coord.
identifies shelter w/ space
Cost: Basic vet care
Process: Intake animal in
temporary capacity
Cost: Food for stay
Partner shelter leverages
available foster network, finds
minimum 2 week foster for
animal
Cost: Ongoing food for
foster duration
Process: Foster takes
animal from shelter,
houses for 2 wk period
Search for and connect with
individual adopter (likely in
northern city)
Process: Transport Supv
leads adopter search
(WOM, social media)
Cost: Ongoing food for
foster duration
Process: Assist
Transport Supv in
connecting adopters with
fosters (word of mouth,
social media)
DAS/ shelter/foster/adopter
coordinate to organize pick up
and drop off of animal
Process: Transport supv
confirms adoption and
transport method
Cost: Ongoing food for
foster duration
Process: Shelter, foster,
assist Transport Supv in
coordinating w/ Transport
company for logistics
Process: Coordinate with
DAS/shelter/foster and
adopter on pick up and
drop off location
Transport company picks up
animal at set pick up location,
trucks to adopter over several
day journey
Process: Shelter and
foster deliver animal to
transport company with
necessary paperwork
Process: Transport
company intakes dog,
secures in truck
Cost: Food, care, transit
Transport company delivers
adopted animal at set drop
location around adopter
Process: Transport
company delivers specific
dog to adopter
Cost: Food, care, transit
Process and Cost Responsibilities include...
Note Transport
cost typically
covered entirely by
adopter
(at mkt price)
Transfer
Foster
Identify adopter
Reserve transport
Pick up &
transport
Deliver
1
2
3
4
5
6
Process and responsibilities for ground pet transport (I/II) Assuming that DAS leverages transfer partner foster network
Source: Expert interviews, company websites, BCG analysis
3.4
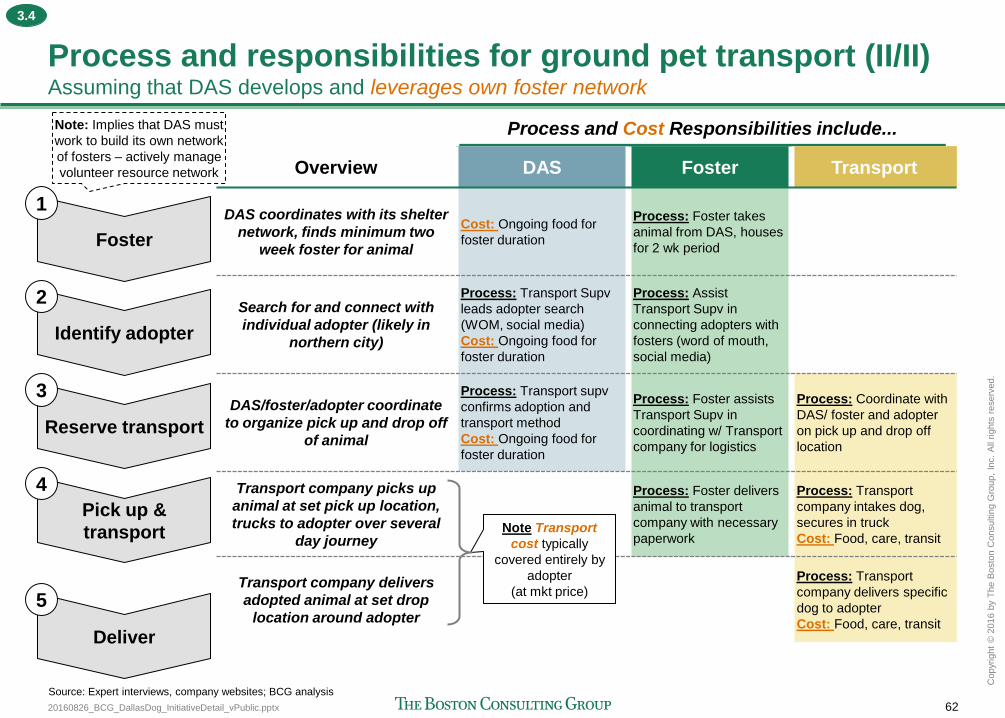
20160826_BCG_DallasDog_InitiativeDetail_vPublic.pptx 62
Copyr
ight
© 2
016 b
y T
he B
osto
n C
onsultin
g G
roup,
Inc.
All
rights
reserv
ed.
Process and responsibilities for ground pet transport (II/II) Assuming that DAS develops and leverages own foster network
Overview DAS Foster Transport
DAS coordinates with its shelter
network, finds minimum two
week foster for animal
Cost: Ongoing food for
foster duration
Process: Foster takes
animal from DAS, houses
for 2 wk period
Search for and connect with
individual adopter (likely in
northern city)
Process: Transport Supv
leads adopter search
(WOM, social media)
Cost: Ongoing food for
foster duration
Process: Assist
Transport Supv in
connecting adopters with
fosters (word of mouth,
social media)
DAS/foster/adopter coordinate
to organize pick up and drop off
of animal
Process: Transport supv
confirms adoption and
transport method
Cost: Ongoing food for
foster duration
Process: Foster assists
Transport Supv in
coordinating w/ Transport
company for logistics
Process: Coordinate with
DAS/ foster and adopter
on pick up and drop off
location
Transport company picks up
animal at set pick up location,
trucks to adopter over several
day journey
Process: Foster delivers
animal to transport
company with necessary
paperwork
Process: Transport
company intakes dog,
secures in truck
Cost: Food, care, transit
Transport company delivers
adopted animal at set drop
location around adopter
Process: Transport
company delivers specific
dog to adopter
Cost: Food, care, transit
Note Transport
cost typically
covered entirely by
adopter
(at mkt price)
Foster
1
Identify adopter
2
Reserve transport
3
Pick up &
transport
4
Deliver
5
Note: Implies that DAS must
work to build its own network
of fosters – actively manage
volunteer resource network
Source: Expert interviews, company websites; BCG analysis
Process and Cost Responsibilities include...
3.4
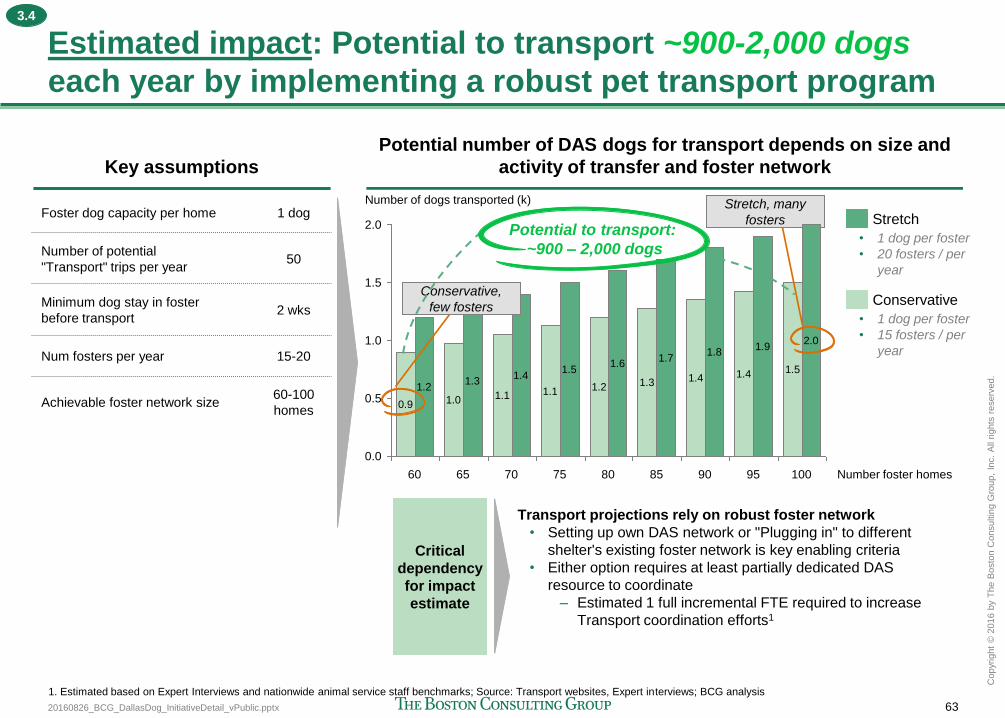
20160826_BCG_DallasDog_InitiativeDetail_vPublic.pptx 63
Copyr
ight
© 2
016 b
y T
he B
osto
n C
onsultin
g G
roup,
Inc.
All
rights
reserv
ed.
Estimated impact: Potential to transport ~900-2,000 dogs
each year by implementing a robust pet transport program
Transport projections rely on robust foster network
• Setting up own DAS network or "Plugging in" to different
shelter's existing foster network is key enabling criteria
• Either option requires at least partially dedicated DAS
resource to coordinate
– Estimated 1 full incremental FTE required to increase
Transport coordination efforts1
Stretch
• 1 dog per foster
• 20 fosters / per
year
Conservative
• 1 dog per foster
• 15 fosters / per
year
Foster dog capacity per home 1 dog
Number of potential
"Transport" trips per year 50
Minimum dog stay in foster
before transport 2 wks
Num fosters per year 15-20
Achievable foster network size 60-100
homes
Stretch, many
fosters 2.0
1.5
0.0
1.0
0.5
Number of dogs transported (k)
1.8
1.4
85
1.7
1.3
80
1.2
0.9
1.4
1.1
65
1.3
1.0
2.0
95
1.9
1.4
90
1.6
1.2
75
1.5
1.1
70 100 Number foster homes
1.5
60
Key assumptions
Potential to transport:
~900 – 2,000 dogs
Conservative,
few fosters
Critical
dependency
for impact
estimate
1. Estimated based on Expert Interviews and nationwide animal service staff benchmarks; Source: Transport websites, Expert interviews; BCG analysis
Potential number of DAS dogs for transport depends on size and
activity of transfer and foster network
3.4

20160826_BCG_DallasDog_InitiativeDetail_vPublic.pptx 64
Copyr
ight
© 2
016 b
y T
he B
osto
n C
onsultin
g G
roup,
Inc.
All
rights
reserv
ed.
0
100
200
300
238
191
75
227
183
70
285
Number of foster homes
215 174
65
203 165
60
262
209
85
250
200
80
191 156
95
273
218
90 100
227
Cost to transport ($k)
Resource requirements: Implementing a robust pet
Transport program would cost ~$156k-$285k each year
Transport costs (excluding transport company fee) driven by
supervisor salary and vet / dog food costs
1. Estimated incremental cost of adoption, inclusive of S/N and vaccine cost; 2. Assumed to cover two weeks of pet food expenses; 3. Determined by finding the median salary of a comparable position on the Texas Tribune Salary Explorer, and then applying an extra 20% to that salary to account for benefits; 4. Rates for PETS LLC, Rescue Road Trips, Alpha Dog Transport; Source: Company websites, Petfinder.com, Texas Tribune Government Salaries Explorer; BCG analysis
High cost
• 1 dog per foster
• 20 fosters / per
year
Low cost
• 1 dog per foster
• 15 fosters / per
year
Foster dog capacity per home 1 dogs
Number of potential "Transport"
trucks per year 50
Minimum dog stay in foster
before transport 2 wks
Num fosters per year 15-20
Achievable foster network size 60-100
homes
Staffing requirement 1 supv.
employee
Cost to transport (Excluding transport fee)
• Incremental cost of dog
adoption $961
• Pet food expense (per dog) $212
• 1 Supv employee (yearly) $51k3
Approx. annual cost:
~$156k - $285k
Stretch, many
fosters
Conservative,
few fosters
Individual adopters typically cover transport provider's full price
• Depending on transportation company chosen, rates vary from
$100-$2004
• Other fees (cost of preparatory S/N and vaccines and food during
foster) incurred by DAS/other shelter/non-profit org
• Note: If considering shelter – shelter transport, full burden of all
costs (transport, vet, boarding, etc.) negotiated separately
Critical
dependency
for resource
estimates
Key assumptions
3.4
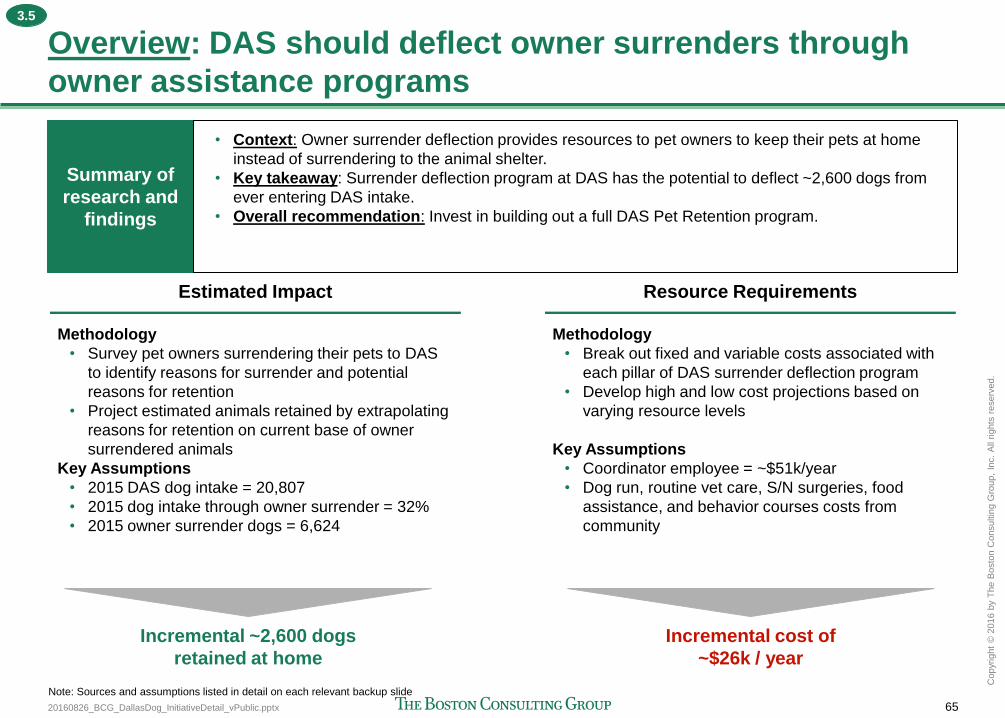
20160826_BCG_DallasDog_InitiativeDetail_vPublic.pptx 65
Copyr
ight
© 2
016 b
y T
he B
osto
n C
onsultin
g G
roup,
Inc.
All
rights
reserv
ed.
Overview: DAS should deflect owner surrenders through
owner assistance programs
Estimated Impact
Methodology
• Survey pet owners surrendering their pets to DAS
to identify reasons for surrender and potential
reasons for retention
• Project estimated animals retained by extrapolating
reasons for retention on current base of owner
surrendered animals
Key Assumptions
• 2015 DAS dog intake = 20,807
• 2015 dog intake through owner surrender = 32%
• 2015 owner surrender dogs = 6,624
Resource Requirements
Methodology
• Break out fixed and variable costs associated with
each pillar of DAS surrender deflection program
• Develop high and low cost projections based on
varying resource levels
Key Assumptions
• Coordinator employee = ~$51k/year
• Dog run, routine vet care, S/N surgeries, food
assistance, and behavior courses costs from
community
Incremental ~2,600 dogs
retained at home
Incremental cost of
~$26k / year
Note: Sources and assumptions listed in detail on each relevant backup slide
Summary of
research and
findings
• Context: Owner surrender deflection provides resources to pet owners to keep their pets at home
instead of surrendering to the animal shelter.
• Key takeaway: Surrender deflection program at DAS has the potential to deflect ~2,600 dogs from
ever entering DAS intake.
• Overall recommendation: Invest in building out a full DAS Pet Retention program.
3.5
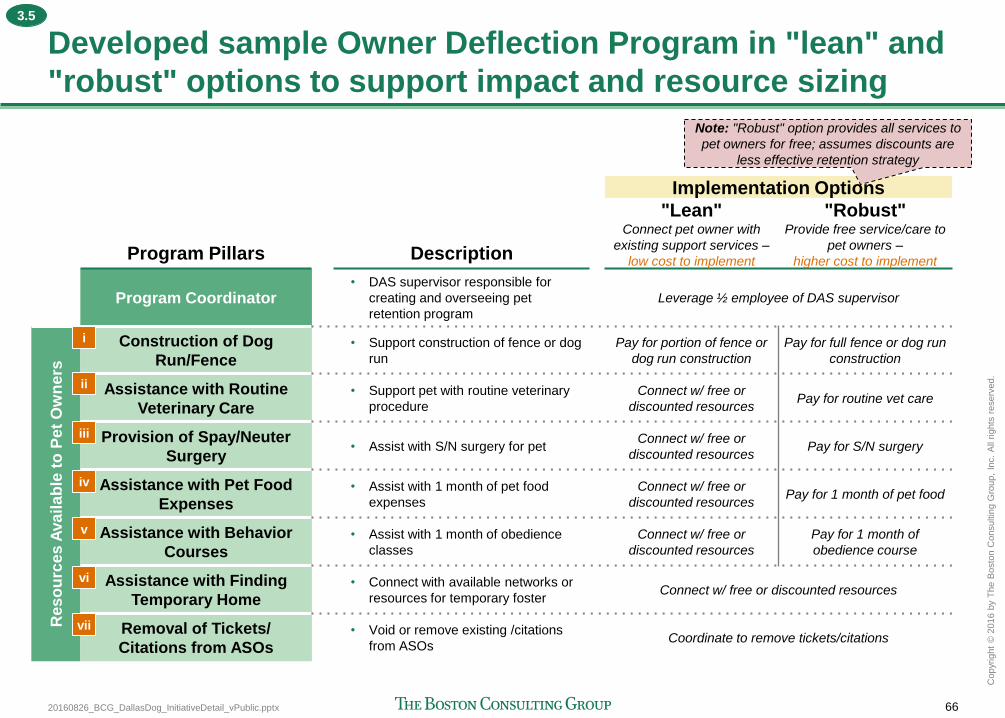
20160826_BCG_DallasDog_InitiativeDetail_vPublic.pptx 66
Copyr
ight
© 2
016 b
y T
he B
osto
n C
onsultin
g G
roup,
Inc.
All
rights
reserv
ed.
Developed sample Owner Deflection Program in "lean" and
"robust" options to support impact and resource sizing
Implementation Options
Program Pillars Description
"Lean" Connect pet owner with
existing support services –
low cost to implement
"Robust" Provide free service/care to
pet owners –
higher cost to implement
Program Coordinator • DAS supervisor responsible for
creating and overseeing pet
retention program
Leverage ½ employee of DAS supervisor
Res
ou
rce
s A
va
ila
ble
to
Pe
t O
wn
ers
Construction of Dog
Run/Fence • Support construction of fence or dog
run
Pay for portion of fence or
dog run construction
Pay for full fence or dog run
construction
Assistance with Routine
Veterinary Care • Support pet with routine veterinary
procedure
Connect w/ free or
discounted resources Pay for routine vet care
Provision of Spay/Neuter
Surgery • Assist with S/N surgery for pet
Connect w/ free or
discounted resources Pay for S/N surgery
Assistance with Pet Food
Expenses • Assist with 1 month of pet food
expenses
Connect w/ free or
discounted resources Pay for 1 month of pet food
Assistance with Behavior
Courses • Assist with 1 month of obedience
classes
Connect w/ free or
discounted resources
Pay for 1 month of
obedience course
Assistance with Finding
Temporary Home • Connect with available networks or
resources for temporary foster Connect w/ free or discounted resources
Removal of Tickets/
Citations from ASOs • Void or remove existing /citations
from ASOs Coordinate to remove tickets/citations
i
ii
iii
iv
v
vi
vii
Note: "Robust" option provides all services to
pet owners for free; assumes discounts are
less effective retention strategy
3.5
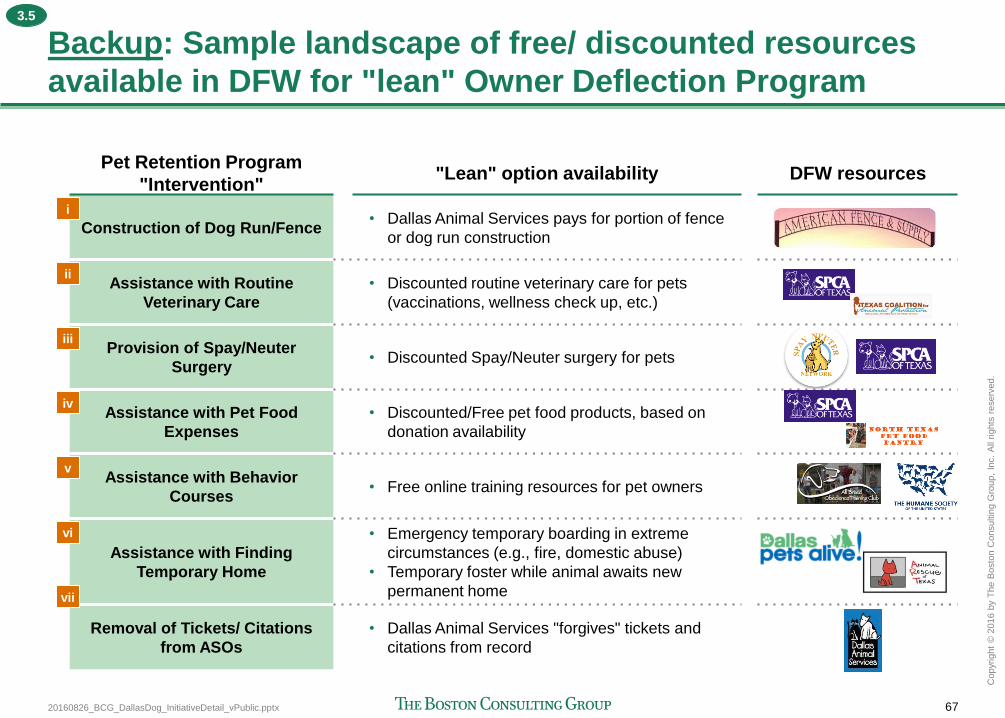
20160826_BCG_DallasDog_InitiativeDetail_vPublic.pptx 67
Copyr
ight
© 2
016 b
y T
he B
osto
n C
onsultin
g G
roup,
Inc.
All
rights
reserv
ed.
Backup: Sample landscape of free/ discounted resources
available in DFW for "lean" Owner Deflection Program
Pet Retention Program
"Intervention" "Lean" option availability DFW resources
Construction of Dog Run/Fence • Dallas Animal Services pays for portion of fence
or dog run construction
Assistance with Routine
Veterinary Care
• Discounted routine veterinary care for pets
(vaccinations, wellness check up, etc.)
Provision of Spay/Neuter
Surgery • Discounted Spay/Neuter surgery for pets
Assistance with Pet Food
Expenses
• Discounted/Free pet food products, based on
donation availability
Assistance with Behavior
Courses • Free online training resources for pet owners
Assistance with Finding
Temporary Home
• Emergency temporary boarding in extreme
circumstances (e.g., fire, domestic abuse)
• Temporary foster while animal awaits new
permanent home
Removal of Tickets/ Citations
from ASOs
• Dallas Animal Services "forgives" tickets and
citations from record
i
ii
iii
iv
v
vi
vii
3.5
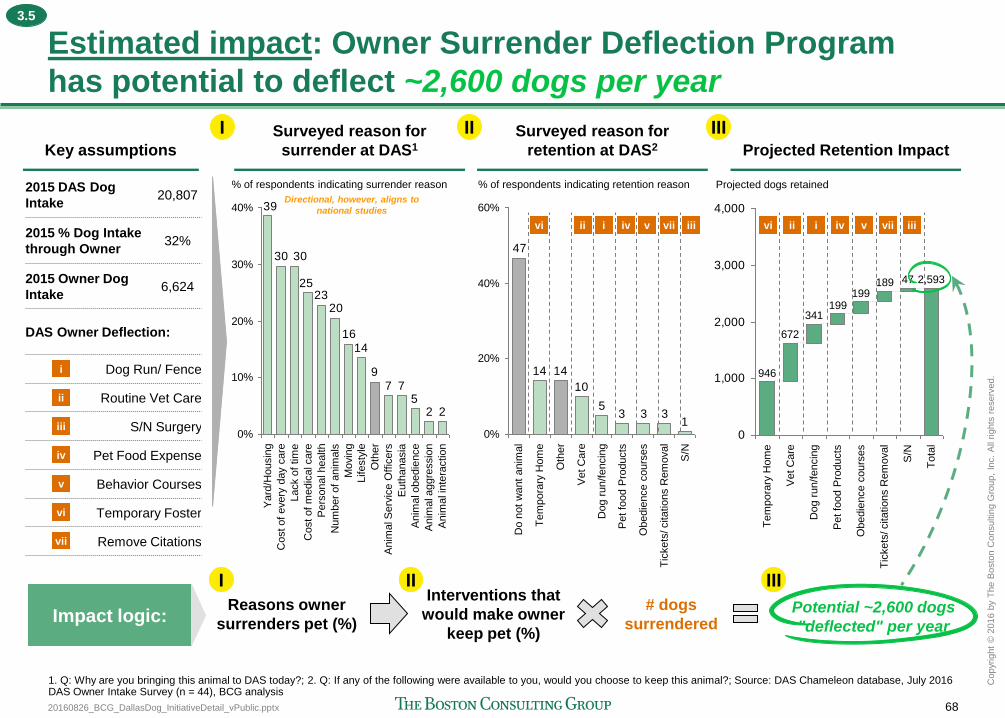
20160826_BCG_DallasDog_InitiativeDetail_vPublic.pptx 68
Copyr
ight
© 2
016 b
y T
he B
osto
n C
onsultin
g G
roup,
Inc.
All
rights
reserv
ed.
Projected Retention Impact
Estimated impact: Owner Surrender Deflection Program
has potential to deflect ~2,600 dogs per year
Key assumptions
Surveyed reason for
surrender at DAS1
1. Q: Why are you bringing this animal to DAS today?; 2. Q: If any of the following were available to you, would you choose to keep this animal?; Source: DAS Chameleon database, July 2016 DAS Owner Intake Survey (n = 44), BCG analysis
225
779
1416
2023
25
3030
39
0%
10%
20%
30%
40%
Anim
al a
ggre
ssio
n
Anim
al i
nte
ractio
n
Anim
al o
bedie
nce
Cost of
every
day c
are
Yard
/Housin
g
Lifesty
le
Movin
g
Num
ber
of
anim
als
Euth
anasia
Anim
al S
erv
ice O
ffic
ers
Oth
er
% of respondents indicating surrender reason
Pers
onal health
Cost of
medic
al care
Lack o
f tim
e
Surveyed reason for
retention at DAS2
1333
5
10
1414
47
0%
20%
40%
60%
Pet fo
od P
roducts
Dog r
un/f
encin
g
Vet C
are
Te
mpora
ry H
om
e
Oth
er
Do n
ot
want
anim
al
S/N
Obedie
nce c
ours
es
Tic
kets
/ citatio
ns R
em
oval
% of respondents indicating retention reason 2015 DAS Dog
Intake 20,807
2015 % Dog Intake
through Owner 32%
2015 Owner Dog
Intake 6,624
DAS Owner Deflection:
Dog Run/ Fence
Routine Vet Care
S/N Surgery
Pet Food Expense
Behavior Courses
Temporary Foster
Remove Citations
vi ii i iv v vii iii
2,59347189199
199341
672
946
0
1,000
2,000
3,000
4,000
To
tal
Tic
kets
/ citatio
ns R
em
oval
S/N
Projected dogs retained
Pet fo
od P
roducts
Dog r
un/f
encin
g
Obedie
nce c
ours
es
Vet C
are
Te
mpora
ry H
om
e
vi ii i iv v vii iii
Potential ~2,600 dogs
"deflected" per year
Reasons owner
surrenders pet (%)
Interventions that
would make owner
keep pet (%)
# dogs
surrendered Impact logic:
I II III
I II III
vi
ii
i
iv
v
vii
iii
Directional, however, aligns to
national studies
3.5

20160826_BCG_DallasDog_InitiativeDetail_vPublic.pptx 69
Copyr
ight
© 2
016 b
y T
he B
osto
n C
onsultin
g G
roup,
Inc.
All
rights
reserv
ed.
Resource requirements: Deflection program costs ~$26k a
year
Estimated yearly costs of Owner Deflection Program
Program coordinator ½ FTE @
$51k/yr1
DAS Owner Deflection:
Dog Run/ Fence -
Routine Vet Care -
S/N Surgery -
Pet Food Expense -
Behavior Courses -
Temporary Foster -
Remove Citations -
vi
ii
i
iv
v
vii
iii
25,000
20,000
15,000
10,000
5,000
0
30,000
Cost ($)
Incremental Labor Costs
25,500
Incremental cost of ~$26k
per year
1. Determined by finding the median salary of a comparable position on the Texas Tribune Salary Explorer, and then applying an extra 20% to that salary to account for benefits; Source: DAS Chameleon database, PetFinder.Com "Annual Dog Care Costs", Texas Tribune Government Salaries Explorer, BCG analysis
Key assumptions
3.5
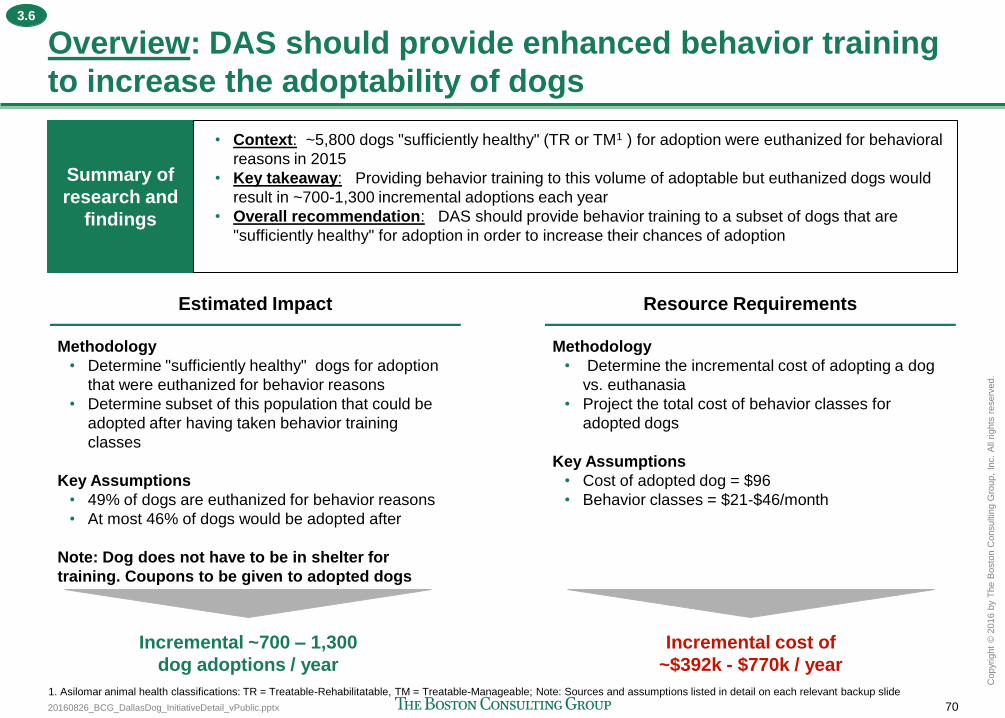
20160826_BCG_DallasDog_InitiativeDetail_vPublic.pptx 70
Copyr
ight
© 2
016 b
y T
he B
osto
n C
onsultin
g G
roup,
Inc.
All
rights
reserv
ed.
Overview: DAS should provide enhanced behavior training
to increase the adoptability of dogs
Estimated Impact
Methodology
• Determine "sufficiently healthy" dogs for adoption
that were euthanized for behavior reasons
• Determine subset of this population that could be
adopted after having taken behavior training
classes
Key Assumptions
• 49% of dogs are euthanized for behavior reasons
• At most 46% of dogs would be adopted after
Note: Dog does not have to be in shelter for
training. Coupons to be given to adopted dogs
Resource Requirements
Methodology
• Determine the incremental cost of adopting a dog
vs. euthanasia
• Project the total cost of behavior classes for
adopted dogs
Key Assumptions
• Cost of adopted dog = $96
• Behavior classes = $21-$46/month
Incremental ~700 – 1,300
dog adoptions / year
Incremental cost of
~$392k - $770k / year
1. Asilomar animal health classifications: TR = Treatable-Rehabilitatable, TM = Treatable-Manageable; Note: Sources and assumptions listed in detail on each relevant backup slide
Summary of
research and
findings
• Context: ~5,800 dogs "sufficiently healthy" (TR or TM1 ) for adoption were euthanized for behavioral
reasons in 2015
• Key takeaway: Providing behavior training to this volume of adoptable but euthanized dogs would
result in ~700-1,300 incremental adoptions each year
• Overall recommendation: DAS should provide behavior training to a subset of dogs that are
"sufficiently healthy" for adoption in order to increase their chances of adoption
3.6
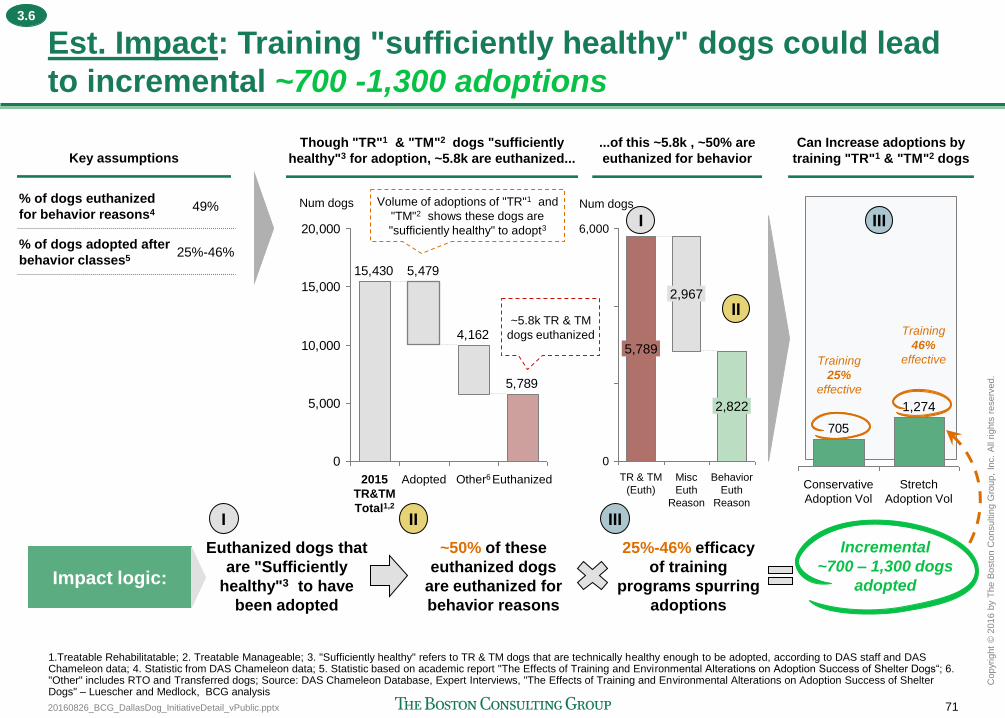
20160826_BCG_DallasDog_InitiativeDetail_vPublic.pptx 71
Copyr
ight
© 2
016 b
y T
he B
osto
n C
onsultin
g G
roup,
Inc.
All
rights
reserv
ed.
Est. Impact: Training "sufficiently healthy" dogs could lead
to incremental ~700 -1,300 adoptions
% of dogs euthanized
for behavior reasons4 49%
% of dogs adopted after
behavior classes5 25%-46%
Key assumptions
Though "TR"1 & "TM"2 dogs "sufficiently
healthy"3 for adoption, ~5.8k are euthanized...
6,000
0
Behavior
Euth
Reason
2,822
Misc
Euth
Reason
2,967
TR & TM
(Euth)
5,789
Num dogs
Incremental
~700 – 1,300 dogs
adopted
Euthanized dogs that
are "Sufficiently
healthy"3 to have
been adopted
~50% of these
euthanized dogs
are euthanized for
behavior reasons
25%-46% efficacy
of training
programs spurring
adoptions
Impact logic:
Training
25%
effective
Training
46%
effective
705
Stretch
Adoption Vol
1,274
Conservative
Adoption Vol
Can Increase adoptions by
training "TR"1 & "TM"2 dogs
I
II
III
I II III
5,789
4,162
5,47915,430
0
5,000
10,000
15,000
20,000
Num dogs
Euthanized Other6 Adopted 2015
TR&TM
Total1,2
Volume of adoptions of "TR"1 and
"TM"2 shows these dogs are
"sufficiently healthy" to adopt3
~5.8k TR & TM
dogs euthanized
...of this ~5.8k , ~50% are
euthanized for behavior
1.Treatable Rehabilitatable; 2. Treatable Manageable; 3. "Sufficiently healthy" refers to TR & TM dogs that are technically healthy enough to be adopted, according to DAS staff and DAS Chameleon data; 4. Statistic from DAS Chameleon data; 5. Statistic based on academic report "The Effects of Training and Environmental Alterations on Adoption Success of Shelter Dogs“; 6. "Other" includes RTO and Transferred dogs; Source: DAS Chameleon Database, Expert Interviews, "The Effects of Training and Environmental Alterations on Adoption Success of Shelter Dogs" – Luescher and Medlock, BCG analysis
3.6
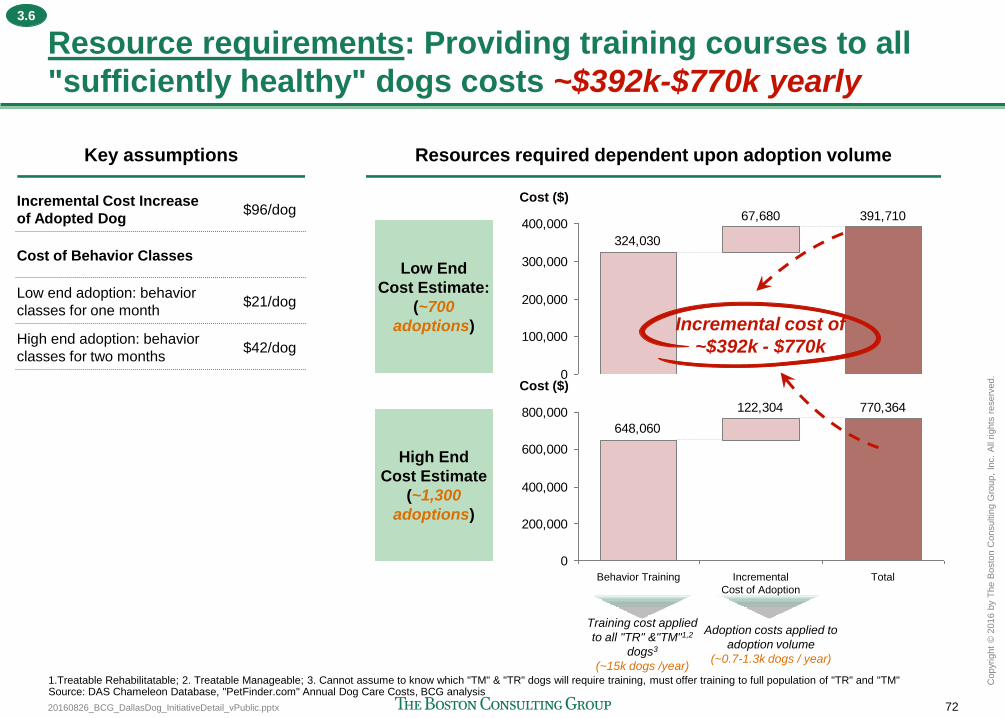
20160826_BCG_DallasDog_InitiativeDetail_vPublic.pptx 72
Copyr
ight
© 2
016 b
y T
he B
osto
n C
onsultin
g G
roup,
Inc.
All
rights
reserv
ed.
Resource requirements: Providing training courses to all
"sufficiently healthy" dogs costs ~$392k-$770k yearly
Resources required dependent upon adoption volume
Incremental Cost Increase
of Adopted Dog $96/dog
Cost of Behavior Classes
Low end adoption: behavior
classes for one month $21/dog
High end adoption: behavior
classes for two months $42/dog
391,71067,680
324,030
0
100,000
200,000
300,000
400,000
Cost ($)
770,364122,304
648,060
0
200,000
400,000
600,000
800,000
Total
Cost ($)
Incremental
Cost of Adoption
Behavior Training
Low End
Cost Estimate:
(~700
adoptions)
High End
Cost Estimate
(~1,300
adoptions)
Incremental cost of
~$392k - $770k
Training cost applied
to all "TR" &"TM"1,2
dogs3
(~15k dogs /year)
Adoption costs applied to
adoption volume
(~0.7-1.3k dogs / year)
1.Treatable Rehabilitatable; 2. Treatable Manageable; 3. Cannot assume to know which "TM" & "TR" dogs will require training, must offer training to full population of "TR" and "TM" Source: DAS Chameleon Database, "PetFinder.com" Annual Dog Care Costs, BCG analysis
Key assumptions
3.6
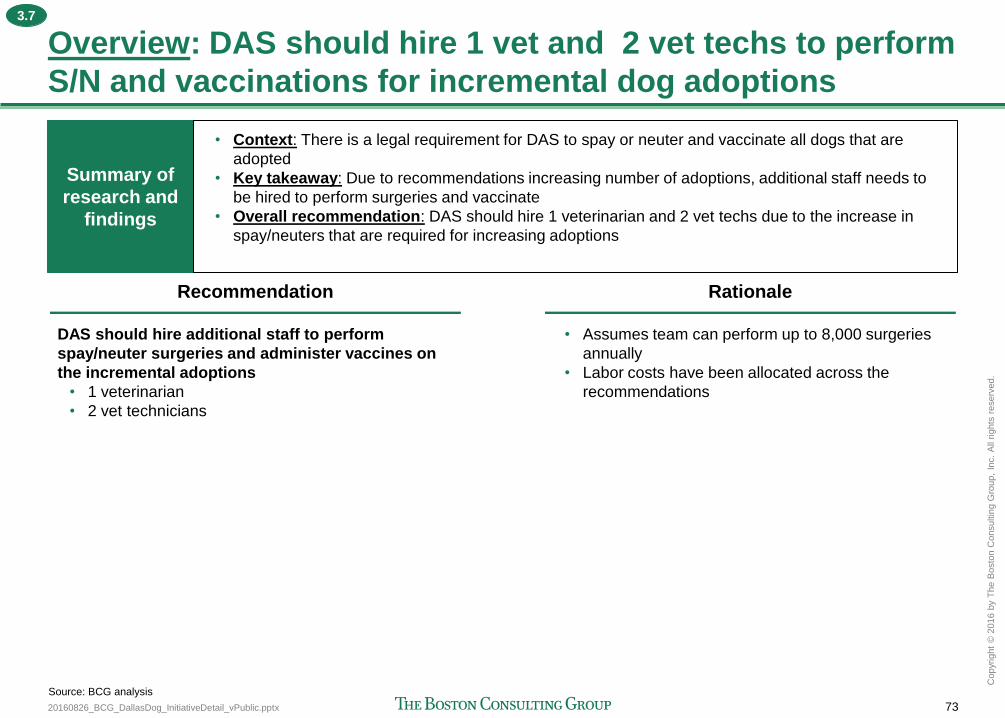
20160826_BCG_DallasDog_InitiativeDetail_vPublic.pptx 73
Copyr
ight
© 2
016 b
y T
he B
osto
n C
onsultin
g G
roup,
Inc.
All
rights
reserv
ed.
Overview: DAS should hire 1 vet and 2 vet techs to perform
S/N and vaccinations for incremental dog adoptions
Recommendation
DAS should hire additional staff to perform
spay/neuter surgeries and administer vaccines on
the incremental adoptions
• 1 veterinarian
• 2 vet technicians
Rationale
• Assumes team can perform up to 8,000 surgeries
annually
• Labor costs have been allocated across the
recommendations
Source: BCG analysis
Summary of
research and
findings
• Context: There is a legal requirement for DAS to spay or neuter and vaccinate all dogs that are
adopted
• Key takeaway: Due to recommendations increasing number of adoptions, additional staff needs to
be hired to perform surgeries and vaccinate
• Overall recommendation: DAS should hire 1 veterinarian and 2 vet techs due to the increase in
spay/neuters that are required for increasing adoptions
3.7

20160826_BCG_DallasDog_InitiativeDetail_vPublic.pptx 74
Copyr
ight
© 2
016 b
y T
he B
osto
n C
onsultin
g G
roup,
Inc.
All
rights
reserv
ed.
Agenda
Recommendation 4: Provide 46,000 free spay and neuter surgeries in
southern Dallas each year for next three years
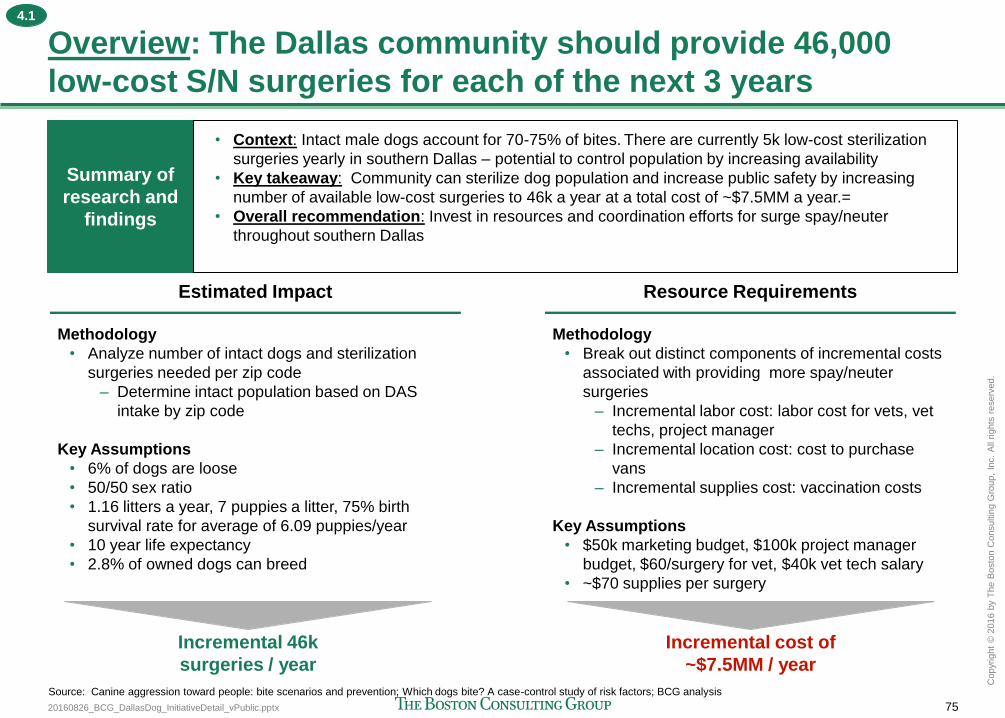
20160826_BCG_DallasDog_InitiativeDetail_vPublic.pptx 75
Copyr
ight
© 2
016 b
y T
he B
osto
n C
onsultin
g G
roup,
Inc.
All
rights
reserv
ed.
Overview: The Dallas community should provide 46,000
low-cost S/N surgeries for each of the next 3 years
Estimated Impact
Methodology
• Analyze number of intact dogs and sterilization
surgeries needed per zip code
– Determine intact population based on DAS
intake by zip code
Key Assumptions
• 6% of dogs are loose
• 50/50 sex ratio
• 1.16 litters a year, 7 puppies a litter, 75% birth
survival rate for average of 6.09 puppies/year
• 10 year life expectancy
• 2.8% of owned dogs can breed
Resource Requirements
Methodology
• Break out distinct components of incremental costs
associated with providing more spay/neuter
surgeries
– Incremental labor cost: labor cost for vets, vet
techs, project manager
– Incremental location cost: cost to purchase
vans
– Incremental supplies cost: vaccination costs
Key Assumptions
• $50k marketing budget, $100k project manager
budget, $60/surgery for vet, $40k vet tech salary
• ~$70 supplies per surgery
Incremental 46k
surgeries / year
Incremental cost of
~$7.5MM / year
Source: Canine aggression toward people: bite scenarios and prevention; Which dogs bite? A case-control study of risk factors; BCG analysis
Summary of
research and
findings
• Context: Intact male dogs account for 70-75% of bites. There are currently 5k low-cost sterilization
surgeries yearly in southern Dallas – potential to control population by increasing availability
• Key takeaway: Community can sterilize dog population and increase public safety by increasing
number of available low-cost surgeries to 46k a year at a total cost of ~$7.5MM a year.=
• Overall recommendation: Invest in resources and coordination efforts for surge spay/neuter
throughout southern Dallas
4.1
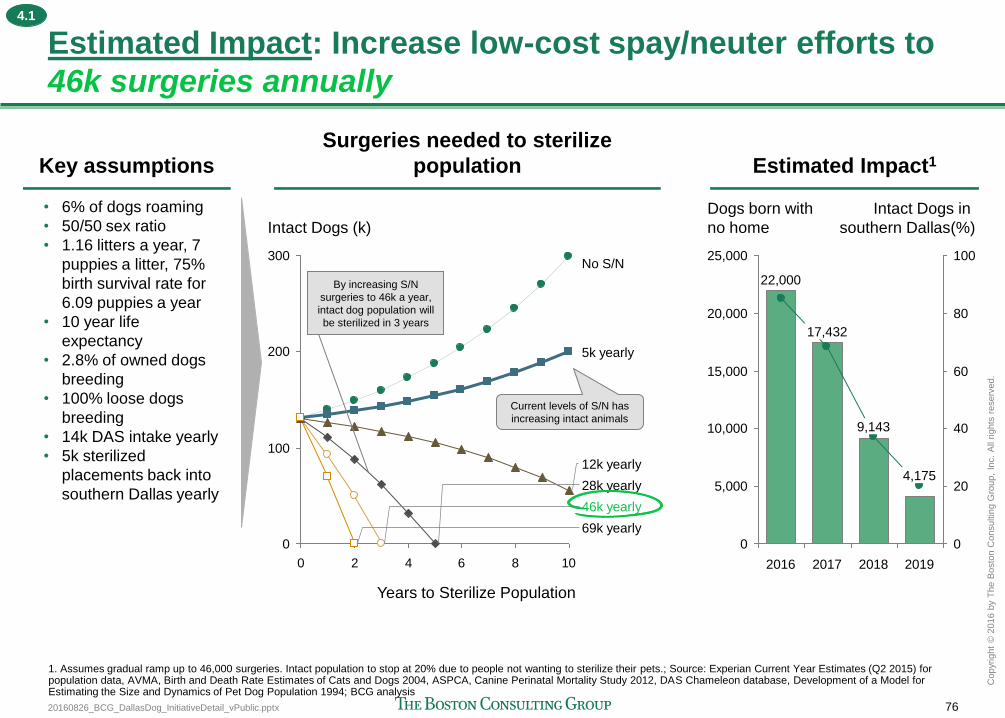
20160826_BCG_DallasDog_InitiativeDetail_vPublic.pptx 76
Copyr
ight
© 2
016 b
y T
he B
osto
n C
onsultin
g G
roup,
Inc.
All
rights
reserv
ed. 15,000
10,000
0
5,000
100
80
60
40
20
0
25,000
20,000
4,175
2019
17,432
2018 2017 2016
9,143
22,000
Intact Dogs in
southern Dallas(%)
Dogs born with
no home
0 2 4 6 8 10
300
200
100
0
Intact Dogs (k)
Years to Sterilize Population
69k yearly
46k yearly
28k yearly
12k yearly
5k yearly
No S/N
Estimated Impact: Increase low-cost spay/neuter efforts to
46k surgeries annually
Key assumptions
• 6% of dogs roaming
• 50/50 sex ratio
• 1.16 litters a year, 7
puppies a litter, 75%
birth survival rate for
6.09 puppies a year
• 10 year life
expectancy
• 2.8% of owned dogs
breeding
• 100% loose dogs
breeding
• 14k DAS intake yearly
• 5k sterilized
placements back into
southern Dallas yearly
Surgeries needed to sterilize
population Estimated Impact1
By increasing S/N
surgeries to 46k a year,
intact dog population will
be sterilized in 3 years
Current levels of S/N has
increasing intact animals
1. Assumes gradual ramp up to 46,000 surgeries. Intact population to stop at 20% due to people not wanting to sterilize their pets.; Source: Experian Current Year Estimates (Q2 2015) for population data, AVMA, Birth and Death Rate Estimates of Cats and Dogs 2004, ASPCA, Canine Perinatal Mortality Study 2012, DAS Chameleon database, Development of a Model for Estimating the Size and Dynamics of Pet Dog Population 1994; BCG analysis
4.1
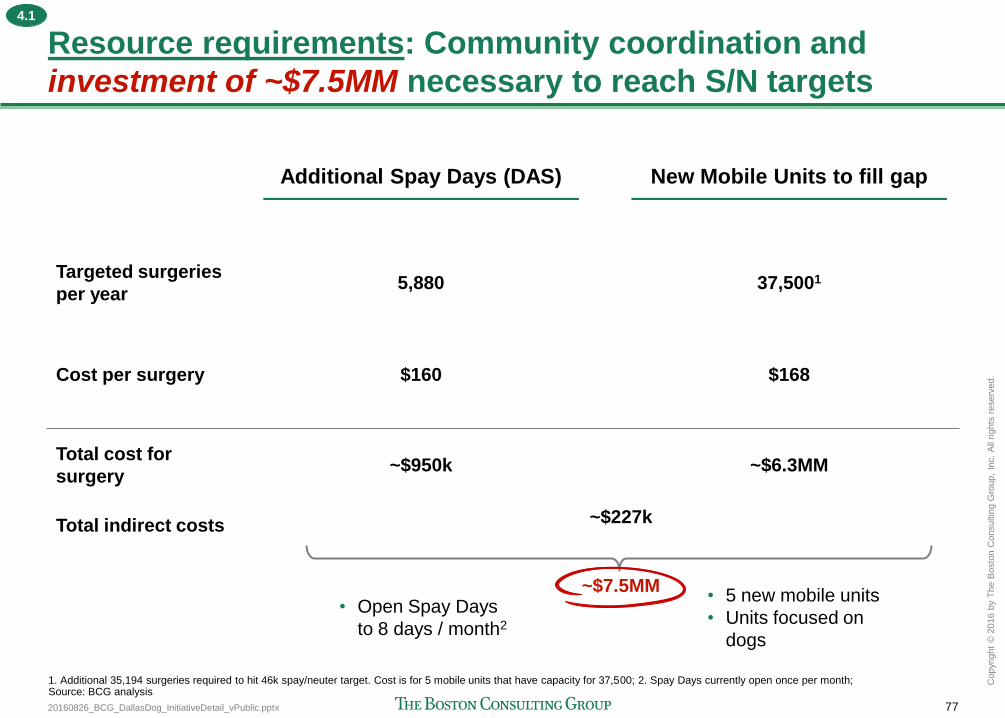
20160826_BCG_DallasDog_InitiativeDetail_vPublic.pptx 77
Copyr
ight
© 2
016 b
y T
he B
osto
n C
onsultin
g G
roup,
Inc.
All
rights
reserv
ed.
Resource requirements: Community coordination and
investment of ~$7.5MM necessary to reach S/N targets
Additional Spay Days (DAS)
$160
New Mobile Units to fill gap
$168
~$950k ~$6.3MM
5,880 37,5001
• Open Spay Days
to 8 days / month2
• 5 new mobile units
• Units focused on
dogs
Cost per surgery
Total cost for
surgery
Targeted surgeries
per year
~$7.5MM
Total indirect costs ~$227k
1. Additional 35,194 surgeries required to hit 46k spay/neuter target. Cost is for 5 mobile units that have capacity for 37,500; 2. Spay Days currently open once per month; Source: BCG analysis
4.1
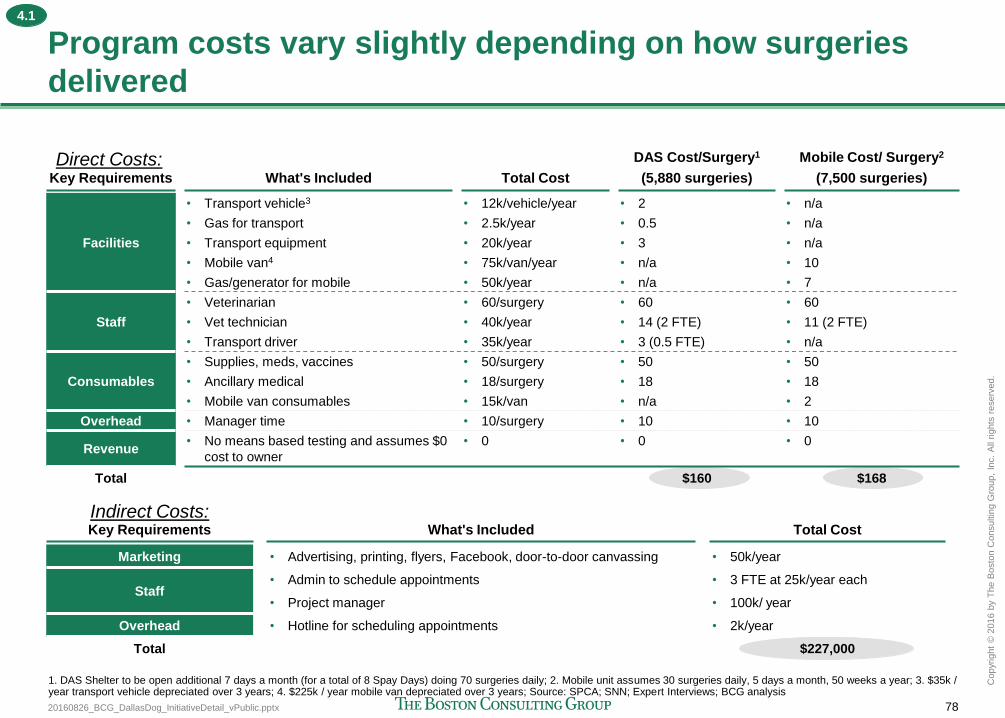
20160826_BCG_DallasDog_InitiativeDetail_vPublic.pptx 78
Copyr
ight
© 2
016 b
y T
he B
osto
n C
onsultin
g G
roup,
Inc.
All
rights
reserv
ed.
Key Requirements What's Included Total Cost
DAS Cost/Surgery1
(5,880 surgeries)
Mobile Cost/ Surgery2
(7,500 surgeries)
Facilities
• Transport vehicle3 • 12k/vehicle/year • 2 • n/a
• Gas for transport • 2.5k/year • 0.5 • n/a
• Transport equipment • 20k/year • 3 • n/a
• Mobile van4 • 75k/van/year • n/a • 10
• Gas/generator for mobile • 50k/year • n/a • 7
Staff
• Veterinarian • 60/surgery • 60 • 60
• Vet technician • 40k/year • 14 (2 FTE) • 11 (2 FTE)
• Transport driver • 35k/year • 3 (0.5 FTE) • n/a
Consumables
• Supplies, meds, vaccines • 50/surgery • 50 • 50
• Ancillary medical • 18/surgery • 18 • 18
• Mobile van consumables • 15k/van • n/a • 2
Overhead • Manager time • 10/surgery • 10 • 10
Revenue • No means based testing and assumes $0
cost to owner
• 0 • 0 • 0
Total $160 $168
Key Requirements What's Included Total Cost
Marketing • Advertising, printing, flyers, Facebook, door-to-door canvassing • 50k/year
Staff • Admin to schedule appointments • 3 FTE at 25k/year each
• Project manager • 100k/ year
Overhead • Hotline for scheduling appointments • 2k/year
Total $227,000
Program costs vary slightly depending on how surgeries
delivered
Direct Costs:
Indirect Costs:
1. DAS Shelter to be open additional 7 days a month (for a total of 8 Spay Days) doing 70 surgeries daily; 2. Mobile unit assumes 30 surgeries daily, 5 days a month, 50 weeks a year; 3. $35k / year transport vehicle depreciated over 3 years; 4. $225k / year mobile van depreciated over 3 years; Source: SPCA; SNN; Expert Interviews; BCG analysis
4.1
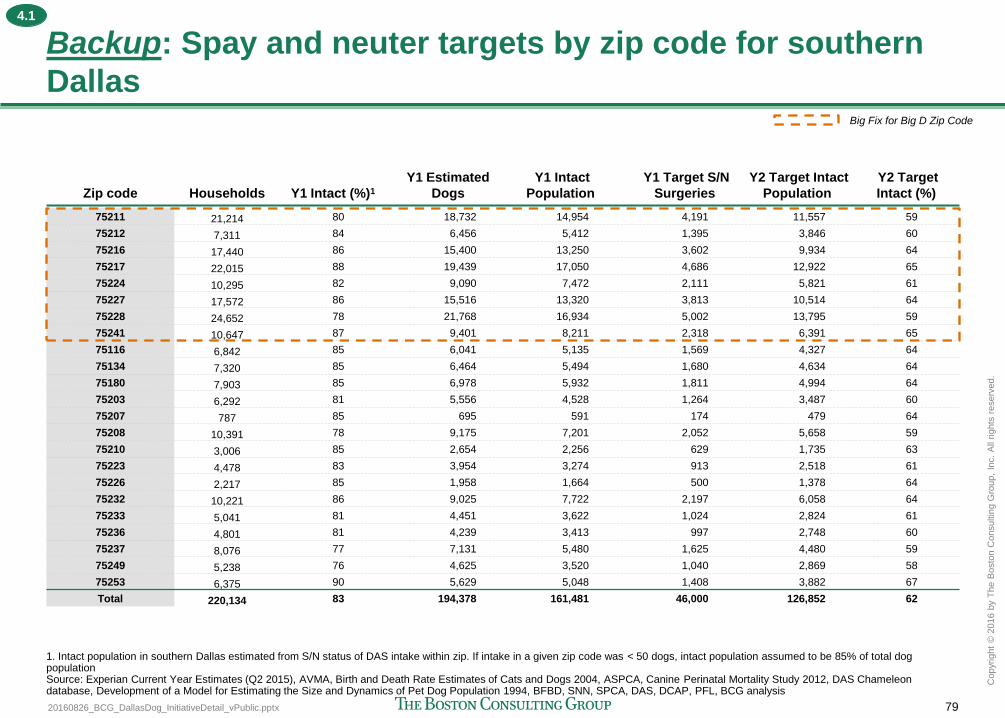
20160826_BCG_DallasDog_InitiativeDetail_vPublic.pptx 79
Copyr
ight
© 2
016 b
y T
he B
osto
n C
onsultin
g G
roup,
Inc.
All
rights
reserv
ed.
Zip code Households Y1 Intact (%)1
Y1 Estimated
Dogs
Y1 Intact
Population
Y1 Target S/N
Surgeries
Y2 Target Intact
Population
Y2 Target
Intact (%)
75211 21,214 80 18,732 14,954 4,191 11,557 59
75212 7,311 84 6,456 5,412 1,395 3,846 60
75216 17,440 86 15,400 13,250 3,602 9,934 64
75217 22,015 88 19,439 17,050 4,686 12,922 65
75224 10,295 82 9,090 7,472 2,111 5,821 61
75227 17,572 86 15,516 13,320 3,813 10,514 64
75228 24,652 78 21,768 16,934 5,002 13,795 59
75241 10,647 87 9,401 8,211 2,318 6,391 65
75116 6,842 85 6,041 5,135 1,569 4,327 64
75134 7,320 85 6,464 5,494 1,680 4,634 64
75180 7,903 85 6,978 5,932 1,811 4,994 64
75203 6,292 81 5,556 4,528 1,264 3,487 60
75207 787 85 695 591 174 479 64
75208 10,391 78 9,175 7,201 2,052 5,658 59
75210 3,006 85 2,654 2,256 629 1,735 63
75223 4,478 83 3,954 3,274 913 2,518 61
75226 2,217 85 1,958 1,664 500 1,378 64
75232 10,221 86 9,025 7,722 2,197 6,058 64
75233 5,041 81 4,451 3,622 1,024 2,824 61
75236 4,801 81 4,239 3,413 997 2,748 60
75237 8,076 77 7,131 5,480 1,625 4,480 59
75249 5,238 76 4,625 3,520 1,040 2,869 58
75253 6,375 90 5,629 5,048 1,408 3,882 67
Total 220,134 83 194,378 161,481 46,000 126,852 62
Backup: Spay and neuter targets by zip code for southern
Dallas
1. Intact population in southern Dallas estimated from S/N status of DAS intake within zip. If intake in a given zip code was < 50 dogs, intact population assumed to be 85% of total dog population Source: Experian Current Year Estimates (Q2 2015), AVMA, Birth and Death Rate Estimates of Cats and Dogs 2004, ASPCA, Canine Perinatal Mortality Study 2012, DAS Chameleon database, Development of a Model for Estimating the Size and Dynamics of Pet Dog Population 1994, BFBD, SNN, SPCA, DAS, DCAP, PFL, BCG analysis
Big Fix for Big D Zip Code
4.1
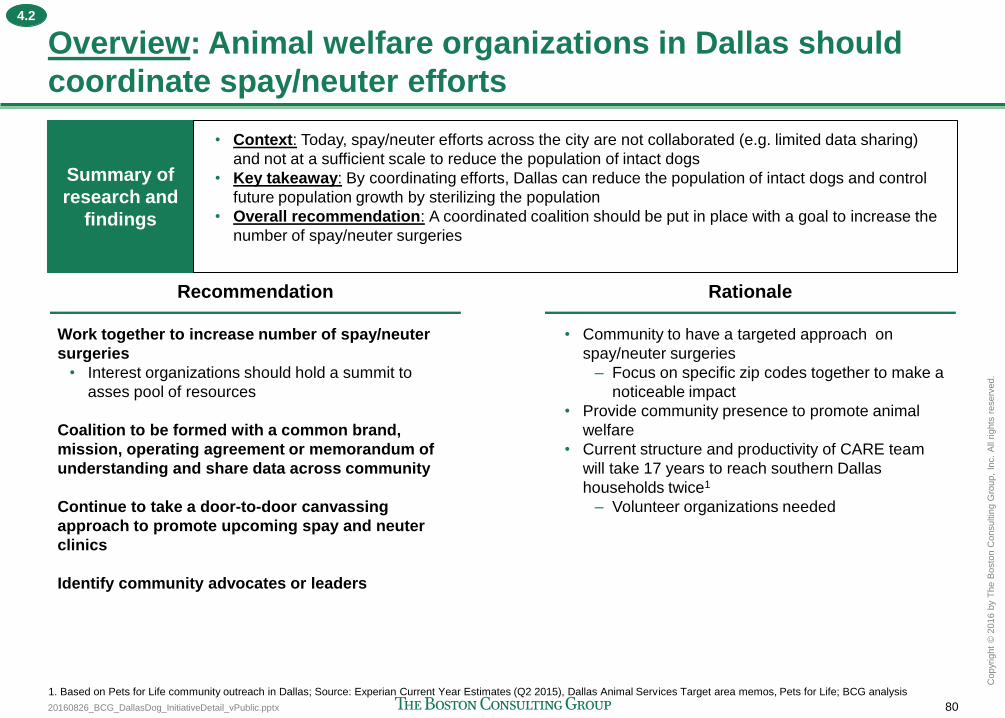
20160826_BCG_DallasDog_InitiativeDetail_vPublic.pptx 80
Copyr
ight
© 2
016 b
y T
he B
osto
n C
onsultin
g G
roup,
Inc.
All
rights
reserv
ed.
Overview: Animal welfare organizations in Dallas should
coordinate spay/neuter efforts
Recommendation
Work together to increase number of spay/neuter
surgeries
• Interest organizations should hold a summit to
asses pool of resources
Coalition to be formed with a common brand,
mission, operating agreement or memorandum of
understanding and share data across community
Continue to take a door-to-door canvassing
approach to promote upcoming spay and neuter
clinics
Identify community advocates or leaders
Rationale
• Community to have a targeted approach on
spay/neuter surgeries
– Focus on specific zip codes together to make a
noticeable impact
• Provide community presence to promote animal
welfare
• Current structure and productivity of CARE team
will take 17 years to reach southern Dallas
households twice1
– Volunteer organizations needed
1. Based on Pets for Life community outreach in Dallas; Source: Experian Current Year Estimates (Q2 2015), Dallas Animal Services Target area memos, Pets for Life; BCG analysis
Summary of
research and
findings
• Context: Today, spay/neuter efforts across the city are not collaborated (e.g. limited data sharing)
and not at a sufficient scale to reduce the population of intact dogs
• Key takeaway: By coordinating efforts, Dallas can reduce the population of intact dogs and control
future population growth by sterilizing the population
• Overall recommendation: A coordinated coalition should be put in place with a goal to increase the
number of spay/neuter surgeries
4.2
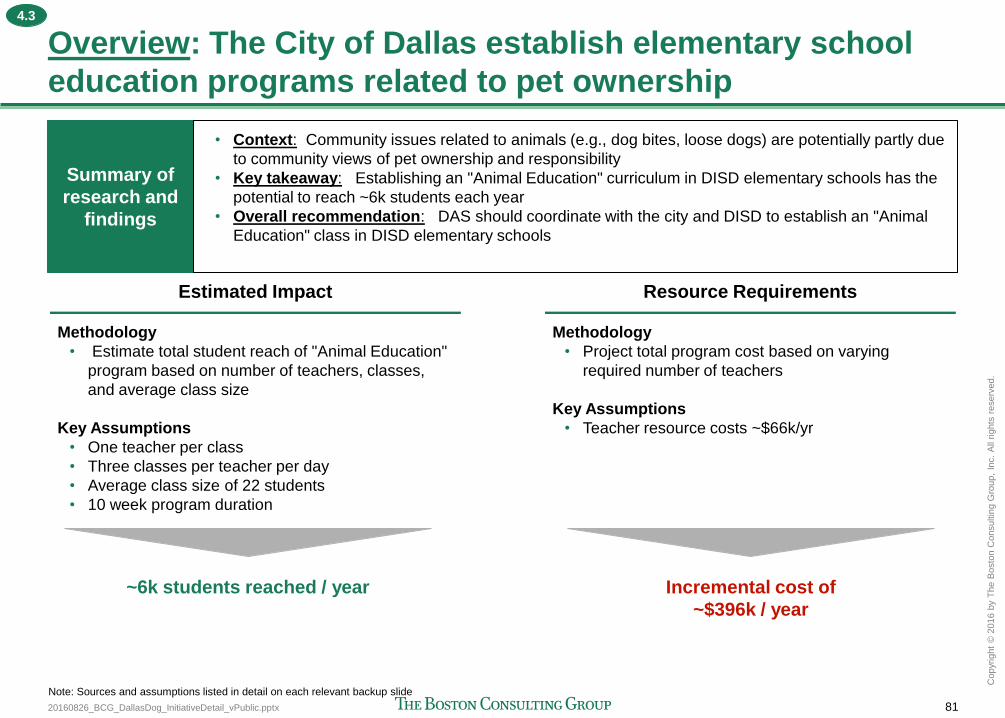
20160826_BCG_DallasDog_InitiativeDetail_vPublic.pptx 81
Copyr
ight
© 2
016 b
y T
he B
osto
n C
onsultin
g G
roup,
Inc.
All
rights
reserv
ed.
Estimated Impact Resource Requirements
Overview: The City of Dallas establish elementary school
education programs related to pet ownership
Methodology
• Estimate total student reach of "Animal Education"
program based on number of teachers, classes,
and average class size
Key Assumptions
• One teacher per class
• Three classes per teacher per day
• Average class size of 22 students
• 10 week program duration
Methodology
• Project total program cost based on varying
required number of teachers
Key Assumptions
• Teacher resource costs ~$66k/yr
~6k students reached / year Incremental cost of
~$396k / year
Note: Sources and assumptions listed in detail on each relevant backup slide
Summary of
research and
findings
• Context: Community issues related to animals (e.g., dog bites, loose dogs) are potentially partly due
to community views of pet ownership and responsibility
• Key takeaway: Establishing an "Animal Education" curriculum in DISD elementary schools has the
potential to reach ~6k students each year
• Overall recommendation: DAS should coordinate with the city and DISD to establish an "Animal
Education" class in DISD elementary schools
4.3
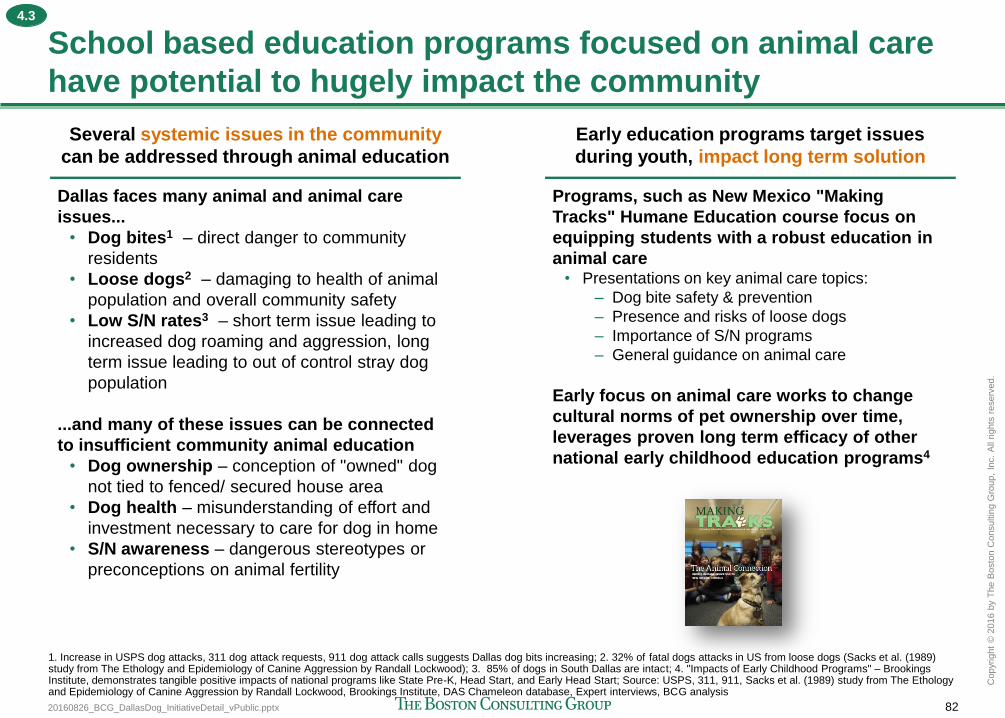
20160826_BCG_DallasDog_InitiativeDetail_vPublic.pptx 82
Copyr
ight
© 2
016 b
y T
he B
osto
n C
onsultin
g G
roup,
Inc.
All
rights
reserv
ed.
School based education programs focused on animal care
have potential to hugely impact the community
Several systemic issues in the community
can be addressed through animal education
Dallas faces many animal and animal care
issues...
• Dog bites1 – direct danger to community
residents
• Loose dogs2 – damaging to health of animal
population and overall community safety
• Low S/N rates3 – short term issue leading to
increased dog roaming and aggression, long
term issue leading to out of control stray dog
population
...and many of these issues can be connected
to insufficient community animal education
• Dog ownership – conception of "owned" dog
not tied to fenced/ secured house area
• Dog health – misunderstanding of effort and
investment necessary to care for dog in home
• S/N awareness – dangerous stereotypes or
preconceptions on animal fertility
Early education programs target issues
during youth, impact long term solution
Programs, such as New Mexico "Making
Tracks" Humane Education course focus on
equipping students with a robust education in
animal care • Presentations on key animal care topics:
– Dog bite safety & prevention
– Presence and risks of loose dogs
– Importance of S/N programs
– General guidance on animal care
Early focus on animal care works to change
cultural norms of pet ownership over time,
leverages proven long term efficacy of other
national early childhood education programs4
1. Increase in USPS dog attacks, 311 dog attack requests, 911 dog attack calls suggests Dallas dog bits increasing; 2. 32% of fatal dogs attacks in US from loose dogs (Sacks et al. (1989) study from The Ethology and Epidemiology of Canine Aggression by Randall Lockwood); 3. 85% of dogs in South Dallas are intact; 4. "Impacts of Early Childhood Programs" – Brookings Institute, demonstrates tangible positive impacts of national programs like State Pre-K, Head Start, and Early Head Start; Source: USPS, 311, 911, Sacks et al. (1989) study from The Ethology and Epidemiology of Canine Aggression by Randall Lockwood, Brookings Institute, DAS Chameleon database, Expert interviews, BCG analysis
4.3
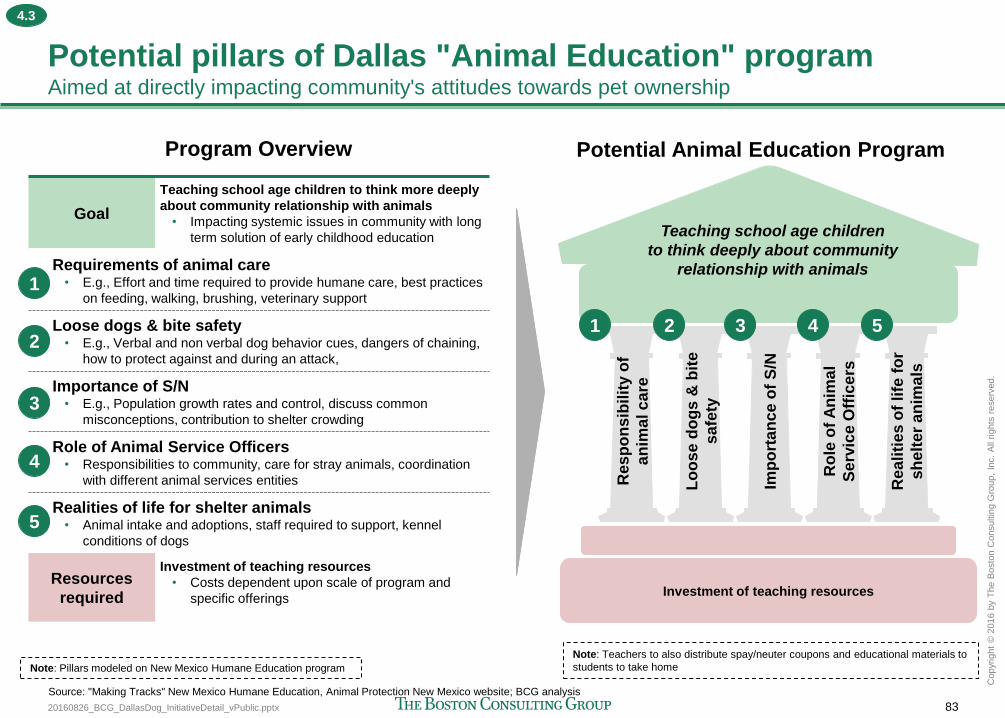
20160826_BCG_DallasDog_InitiativeDetail_vPublic.pptx 83
Copyr
ight
© 2
016 b
y T
he B
osto
n C
onsultin
g G
roup,
Inc.
All
rights
reserv
ed.
Potential pillars of Dallas "Animal Education" program Aimed at directly impacting community's attitudes towards pet ownership
Program Overview
Goal
Teaching school age children to think more deeply
about community relationship with animals
• Impacting systemic issues in community with long
term solution of early childhood education
Requirements of animal care • E.g., Effort and time required to provide humane care, best practices
on feeding, walking, brushing, veterinary support
Loose dogs & bite safety • E.g., Verbal and non verbal dog behavior cues, dangers of chaining,
how to protect against and during an attack,
Importance of S/N • E.g., Population growth rates and control, discuss common
misconceptions, contribution to shelter crowding
Role of Animal Service Officers • Responsibilities to community, care for stray animals, coordination
with different animal services entities
Realities of life for shelter animals • Animal intake and adoptions, staff required to support, kennel
conditions of dogs
Resources
required
Investment of teaching resources
• Costs dependent upon scale of program and
specific offerings
1
2
3
4
5
Investment of teaching resources
Res
po
nsib
ilit
y o
f
an
ima
l c
are
Lo
ose
do
gs &
bit
e
sa
fety
Imp
ort
an
ce
of
S/N
Ro
le o
f A
nim
al
Se
rvic
e O
ffic
ers
Rea
liti
es
of
life
fo
r
sh
elt
er
an
ima
ls
Potential Animal Education Program
Teaching school age children
to think deeply about community
relationship with animals
1 2 3 4 5
Note: Pillars modeled on New Mexico Humane Education program
Source: "Making Tracks" New Mexico Humane Education, Animal Protection New Mexico website; BCG analysis
Note: Teachers to also distribute spay/neuter coupons and educational materials to
students to take home
4.3
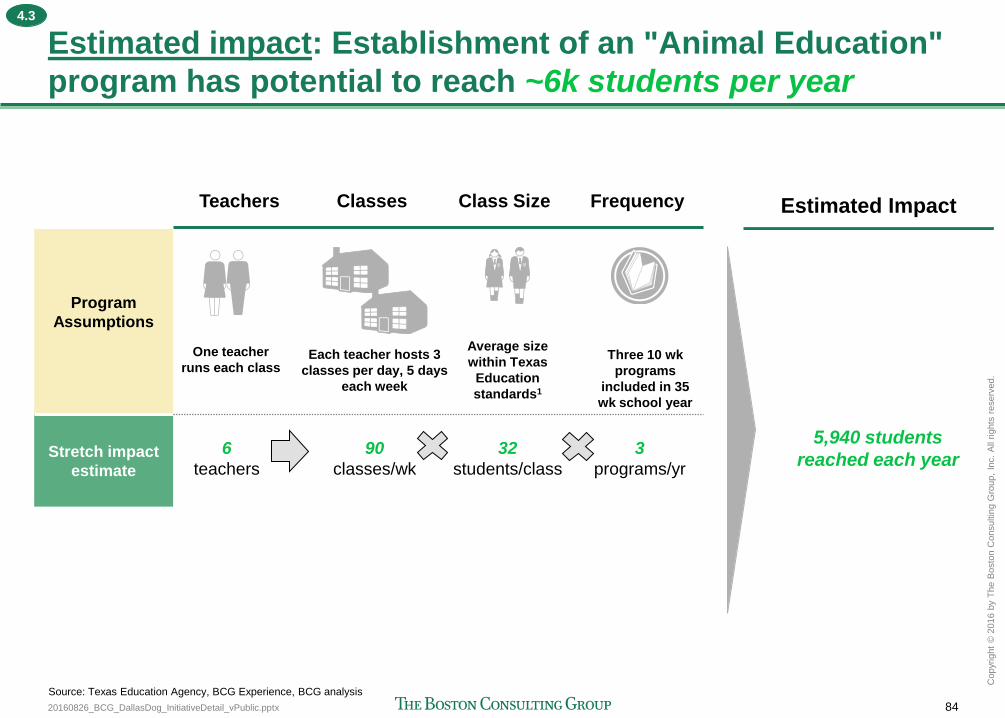
20160826_BCG_DallasDog_InitiativeDetail_vPublic.pptx 84
Copyr
ight
© 2
016 b
y T
he B
osto
n C
onsultin
g G
roup,
Inc.
All
rights
reserv
ed.
Estimated impact: Establishment of an "Animal Education"
program has potential to reach ~6k students per year
Teachers Classes Class Size Frequency
Program
Assumptions
Stretch impact
estimate
6
teachers
90
classes/wk
32
students/class
3
programs/yr
Estimated Impact
5,940 students
reached each year
One teacher
runs each class Each teacher hosts 3
classes per day, 5 days
each week
Average size
within Texas
Education
standards1
Three 10 wk
programs
included in 35
wk school year
Source: Texas Education Agency, BCG Experience, BCG analysis
4.3
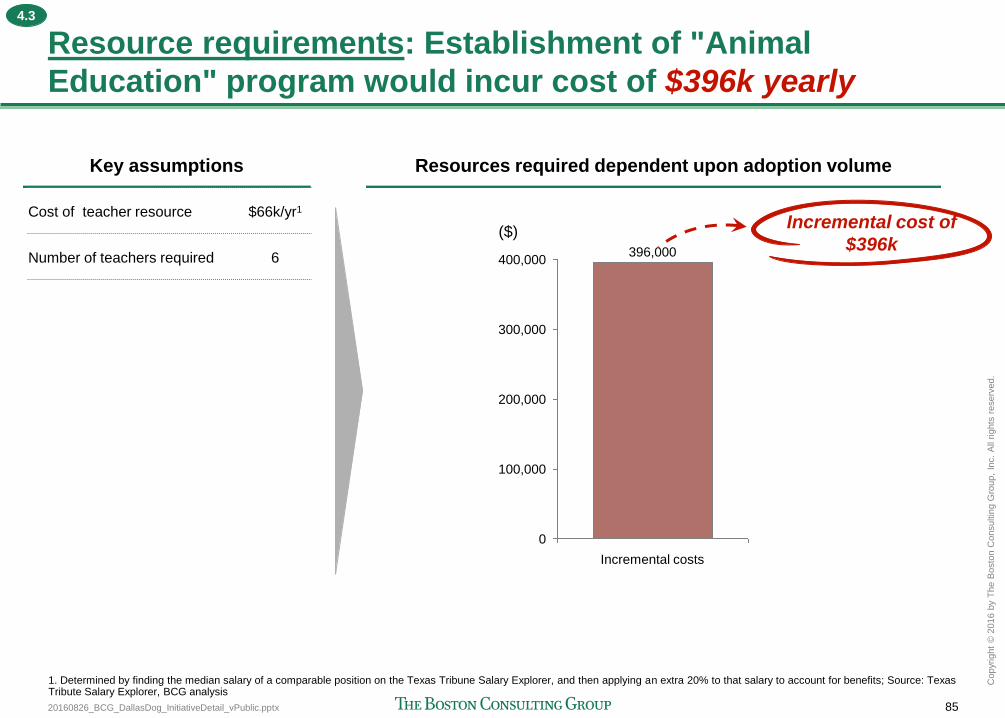
20160826_BCG_DallasDog_InitiativeDetail_vPublic.pptx 85
Copyr
ight
© 2
016 b
y T
he B
osto
n C
onsultin
g G
roup,
Inc.
All
rights
reserv
ed.
400,000
200,000
0
100,000
300,000
($)
Incremental costs
396,000
Resource requirements: Establishment of "Animal
Education" program would incur cost of $396k yearly
Key assumptions Resources required dependent upon adoption volume
Cost of teacher resource $66k/yr1
Number of teachers required 6
Incremental cost of
$396k
1. Determined by finding the median salary of a comparable position on the Texas Tribune Salary Explorer, and then applying an extra 20% to that salary to account for benefits; Source: Texas Tribute Salary Explorer, BCG analysis
4.3
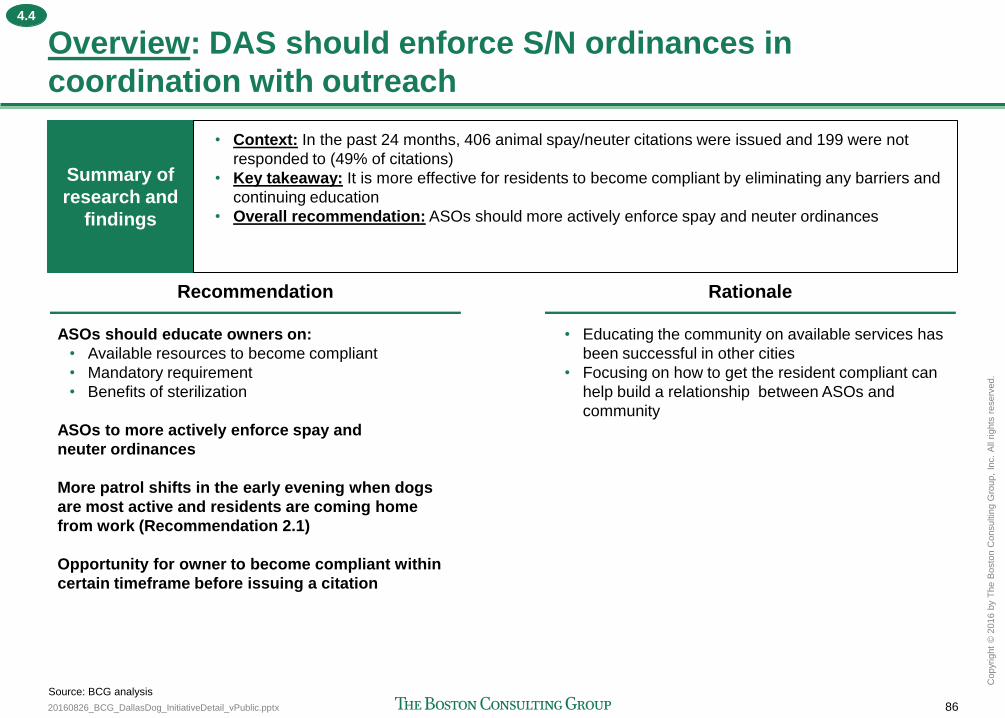
20160826_BCG_DallasDog_InitiativeDetail_vPublic.pptx 86
Copyr
ight
© 2
016 b
y T
he B
osto
n C
onsultin
g G
roup,
Inc.
All
rights
reserv
ed.
Overview: DAS should enforce S/N ordinances in
coordination with outreach
ASOs should educate owners on:
• Available resources to become compliant
• Mandatory requirement
• Benefits of sterilization
ASOs to more actively enforce spay and
neuter ordinances
More patrol shifts in the early evening when dogs
are most active and residents are coming home
from work (Recommendation 2.1)
Opportunity for owner to become compliant within
certain timeframe before issuing a citation
• Educating the community on available services has
been successful in other cities
• Focusing on how to get the resident compliant can
help build a relationship between ASOs and
community
Source: BCG analysis
Recommendation Rationale
Summary of
research and
findings
• Context: In the past 24 months, 406 animal spay/neuter citations were issued and 199 were not
responded to (49% of citations)
• Key takeaway: It is more effective for residents to become compliant by eliminating any barriers and
continuing education
• Overall recommendation: ASOs should more actively enforce spay and neuter ordinances
4.4
20160826_BCG_DallasDog_InitiativeDetail_vPublic.pptx 87
Copyr
ight
© 2
016 b
y T
he B
osto
n C
onsultin
g G
roup,
Inc.
All
rights
reserv
ed.
Agenda
Recommendation 5: Create a collaborative community of partners
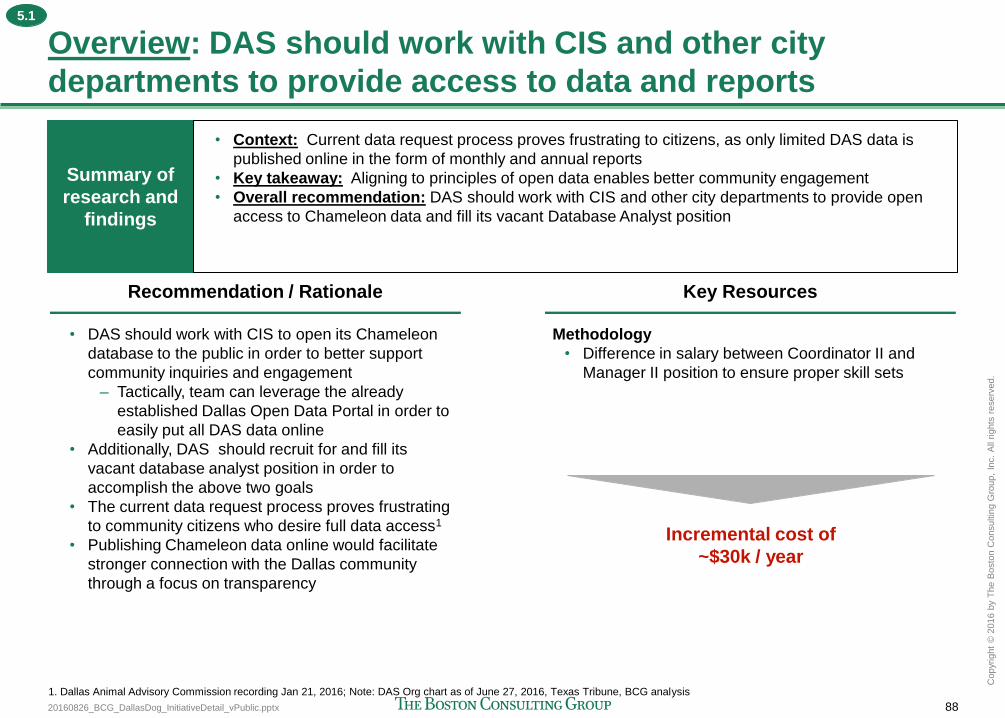
20160826_BCG_DallasDog_InitiativeDetail_vPublic.pptx 88
Copyr
ight
© 2
016 b
y T
he B
osto
n C
onsultin
g G
roup,
Inc.
All
rights
reserv
ed.
Overview: DAS should work with CIS and other city
departments to provide access to data and reports
Recommendation / Rationale
• DAS should work with CIS to open its Chameleon
database to the public in order to better support
community inquiries and engagement
– Tactically, team can leverage the already
established Dallas Open Data Portal in order to
easily put all DAS data online
• Additionally, DAS should recruit for and fill its
vacant database analyst position in order to
accomplish the above two goals
• The current data request process proves frustrating
to community citizens who desire full data access1
• Publishing Chameleon data online would facilitate
stronger connection with the Dallas community
through a focus on transparency
Key Resources
Methodology
• Difference in salary between Coordinator II and
Manager II position to ensure proper skill sets
Incremental cost of
~$30k / year
1. Dallas Animal Advisory Commission recording Jan 21, 2016; Note: DAS Org chart as of June 27, 2016, Texas Tribune, BCG analysis
Summary of
research and
findings
• Context: Current data request process proves frustrating to citizens, as only limited DAS data is
published online in the form of monthly and annual reports
• Key takeaway: Aligning to principles of open data enables better community engagement
• Overall recommendation: DAS should work with CIS and other city departments to provide open
access to Chameleon data and fill its vacant Database Analyst position
5.1

20160826_BCG_DallasDog_InitiativeDetail_vPublic.pptx 89
Copyr
ight
© 2
016 b
y T
he B
osto
n C
onsultin
g G
roup,
Inc.
All
rights
reserv
ed.
Overview: The animal welfare community should share the
workload of the strategic recommendations
Recommendation
• Form a coalition between Dallas animal welfare
organizations
• Create a community plan for addressing the loose
dog problem
– Identify measurable community goals
– Determine specific roles and commitments for
organizations to play
• Coordinate efforts to implement plan
– E.g., several rescue organizations put into play
an owner surrender deflection program at DAS
and apply for a joint grant from Best Buddies
• Track progress towards community goals and
troubleshoot when implementation is off track
Rationale
• Animal welfare organizations have a lot to offer
Dallas
– Annual funding of $28MM+ a year to impact at
least 128k animals1
• Dallas will need to rely on the resources of many of
these organizations in order to address the loose
dog population
• Currently, there is no organizing body or collective
to coordinate and leverage the scale of Dallas
animal welfare organizations
• In order to focus and gain buy in from these
organizations, a coalition is necessary
• Animal welfare organizations can benefit from
coordination to scale fundraising and volunteer
efforts which all have identified as a catalyst for
growth1
1: Rescue and Animal Organization Survey (n=72); Source: Expert interviews, BCG analysis
Summary of
research and
findings
• Context: There are 150+ animal related organizations throughout Dallas, however, there is little
collaboration between organizations to leverage or focus resources
• Key takeaway: Animal welfare community can better channel and coordinate their work and benefit
from specialization, experience, and increased fundraising success
• Overall recommendation: Dallas community to create a plan and coalition to determine common
goals and specific roles for each
5.2
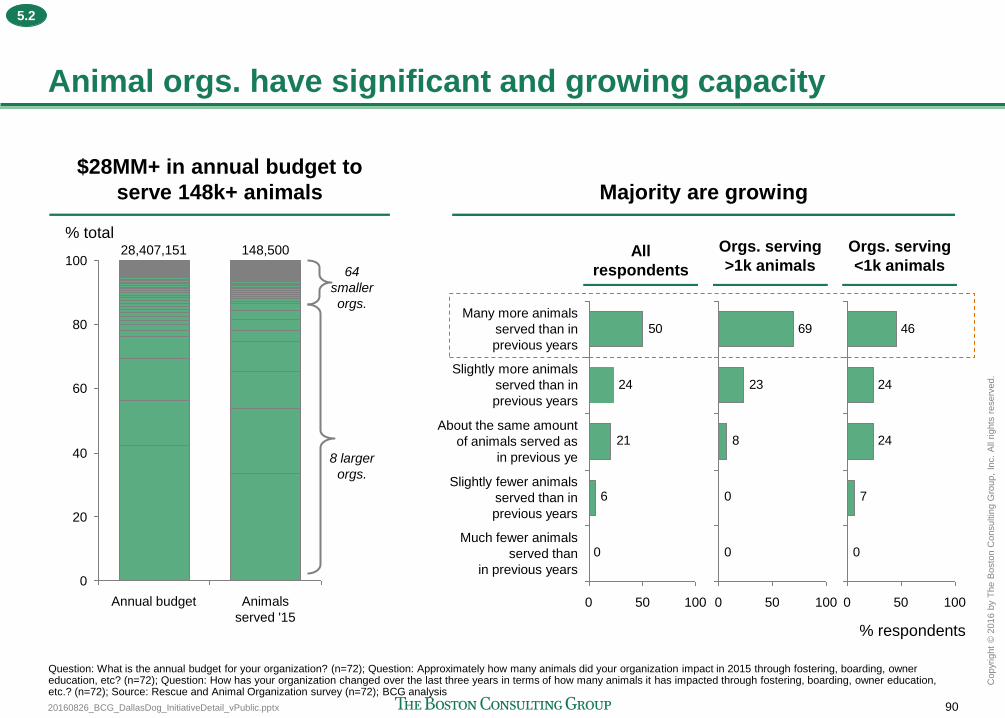
20160826_BCG_DallasDog_InitiativeDetail_vPublic.pptx 90
Copyr
ight
© 2
016 b
y T
he B
osto
n C
onsultin
g G
roup,
Inc.
All
rights
reserv
ed.
All
respondents
Orgs. serving
>1k animals
Orgs. serving
<1k animals
Animal orgs. have significant and growing capacity
100
80
60
40
20
0
% total
Animals
served '15
148,500
Annual budget
28,407,151
$28MM+ in annual budget to
serve 148k+ animals Majority are growing
0
6
21
24
50
50 100 0
Much fewer animals
served than
in previous years
Slightly fewer animals
served than in
previous years
About the same amount
of animals served as
in previous ye
Slightly more animals
served than in
previous years
Many more animals
served than in
previous years
0
0
8
23
69
100 50 0
0
7
24
24
46
100 50 0
% respondents
Question: What is the annual budget for your organization? (n=72); Question: Approximately how many animals did your organization impact in 2015 through fostering, boarding, owner education, etc? (n=72); Question: How has your organization changed over the last three years in terms of how many animals it has impacted through fostering, boarding, owner education, etc.? (n=72); Source: Rescue and Animal Organization survey (n=72); BCG analysis
8 larger
orgs.
64
smaller
orgs.
5.2
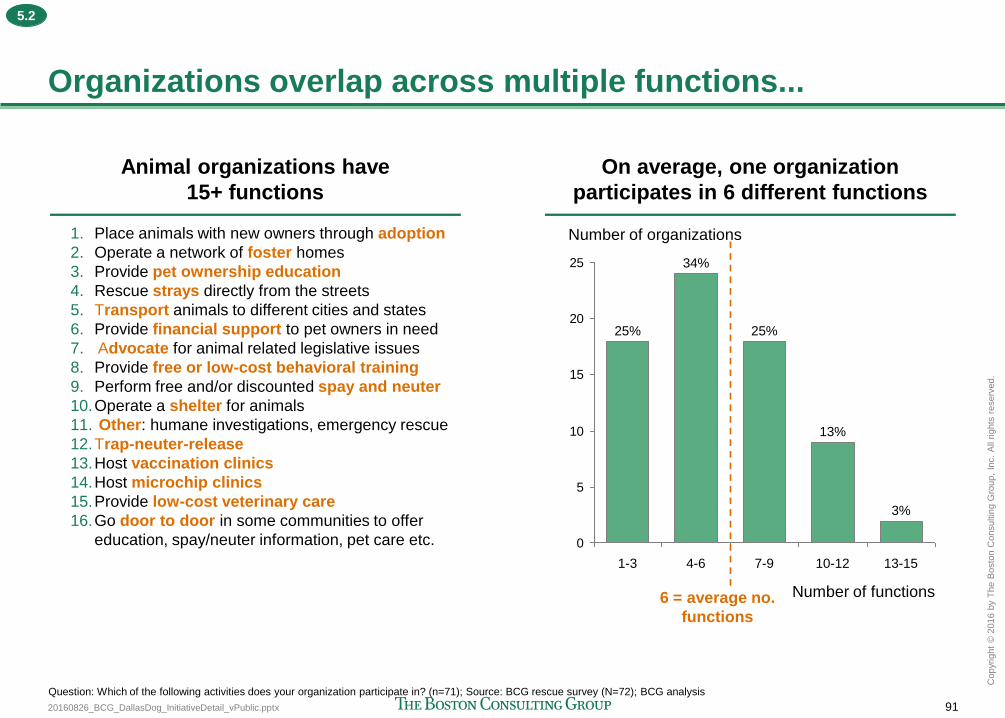
20160826_BCG_DallasDog_InitiativeDetail_vPublic.pptx 91
Copyr
ight
© 2
016 b
y T
he B
osto
n C
onsultin
g G
roup,
Inc.
All
rights
reserv
ed.
1. Place animals with new owners through adoption
2. Operate a network of foster homes
3. Provide pet ownership education
4. Rescue strays directly from the streets
5. Transport animals to different cities and states
6. Provide financial support to pet owners in need
7. Advocate for animal related legislative issues
8. Provide free or low-cost behavioral training
9. Perform free and/or discounted spay and neuter
10.Operate a shelter for animals
11. Other: humane investigations, emergency rescue
12.Trap-neuter-release
13.Host vaccination clinics
14.Host microchip clinics
15.Provide low-cost veterinary care
16.Go door to door in some communities to offer
education, spay/neuter information, pet care etc.
Organizations overlap across multiple functions...
On average, one organization
participates in 6 different functions
0
5
10
15
20
25
Number of functions
13-15 10-12 1-3
13%
34%
3%
25%
7-9 4-6
25%
Number of organizations
6 = average no.
functions
Animal organizations have
15+ functions
Question: Which of the following activities does your organization participate in? (n=71); Source: BCG rescue survey (N=72); BCG analysis
5.2
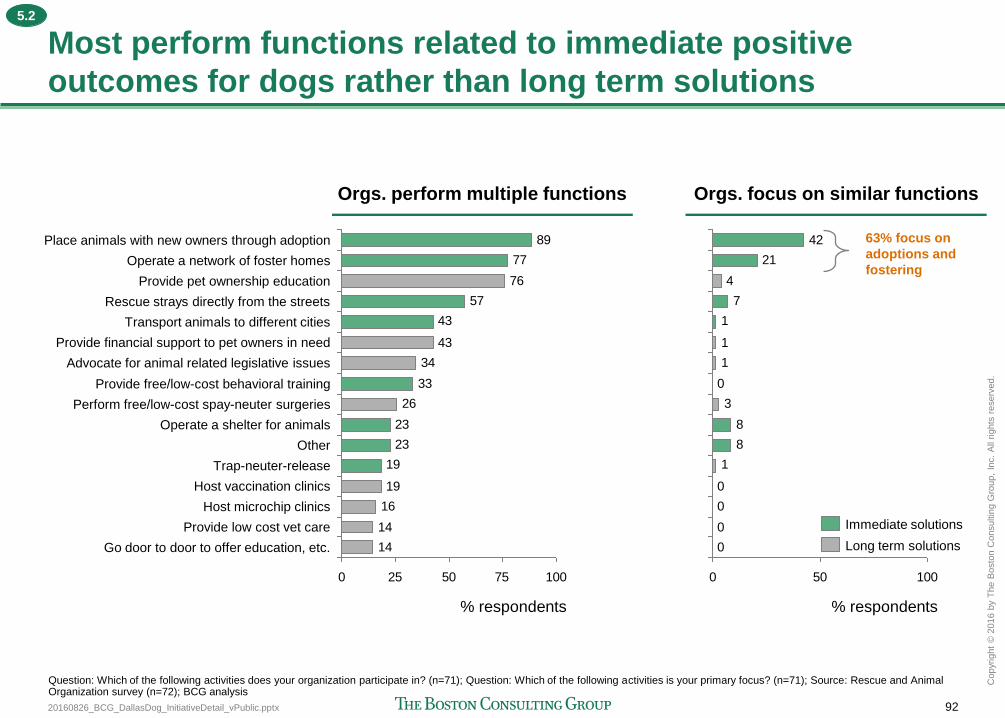
20160826_BCG_DallasDog_InitiativeDetail_vPublic.pptx 92
Copyr
ight
© 2
016 b
y T
he B
osto
n C
onsultin
g G
roup,
Inc.
All
rights
reserv
ed.
Most perform functions related to immediate positive
outcomes for dogs rather than long term solutions
14
14
16
19
19
23
23
26
33
34
43
43
57
76
77
89
0 25 50 75 100
% respondents
Operate a network of foster homes
Place animals with new owners through adoption
Provide pet ownership education
Rescue strays directly from the streets
Transport animals to different cities
Provide free/low-cost behavioral training
Provide financial support to pet owners in need
Advocate for animal related legislative issues
Go door to door to offer education, etc.
Provide low cost vet care
Host microchip clinics
Host vaccination clinics
Trap-neuter-release
Other
Operate a shelter for animals
Perform free/low-cost spay-neuter surgeries
Question: Which of the following activities does your organization participate in? (n=71); Question: Which of the following activities is your primary focus? (n=71); Source: Rescue and Animal Organization survey (n=72); BCG analysis
0
0
0
0
1
8
8
3
0
1
1
1
7
4
21
42
0 50 100
% respondents
Orgs. perform multiple functions Orgs. focus on similar functions
63% focus on
adoptions and
fostering
Long term solutions
Immediate solutions
5.2
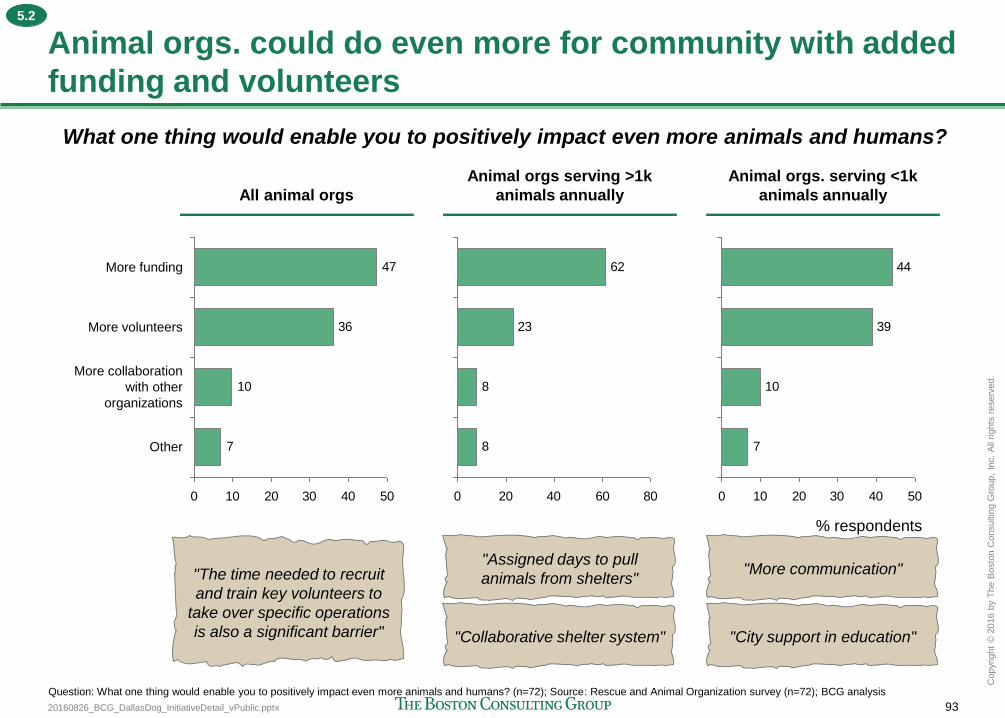
20160826_BCG_DallasDog_InitiativeDetail_vPublic.pptx 93
Copyr
ight
© 2
016 b
y T
he B
osto
n C
onsultin
g G
roup,
Inc.
All
rights
reserv
ed.
Animal orgs. could do even more for community with added
funding and volunteers
7
10
36
47
0 10 20 30 40 50
More volunteers
More funding
Other
More collaboration
with other
organizations
8
8
23
62
0 20 40 60 80
7
10
39
44
0 10 20 30 40 50
% respondents
All animal orgs
Animal orgs serving >1k
animals annually
Animal orgs. serving <1k
animals annually
"Assigned days to pull
animals from shelters"
"Collaborative shelter system"
"More communication"
"City support in education"
Question: What one thing would enable you to positively impact even more animals and humans? (n=72); Source: Rescue and Animal Organization survey (n=72); BCG analysis
"The time needed to recruit
and train key volunteers to
take over specific operations
is also a significant barrier"
What one thing would enable you to positively impact even more animals and humans?
5.2
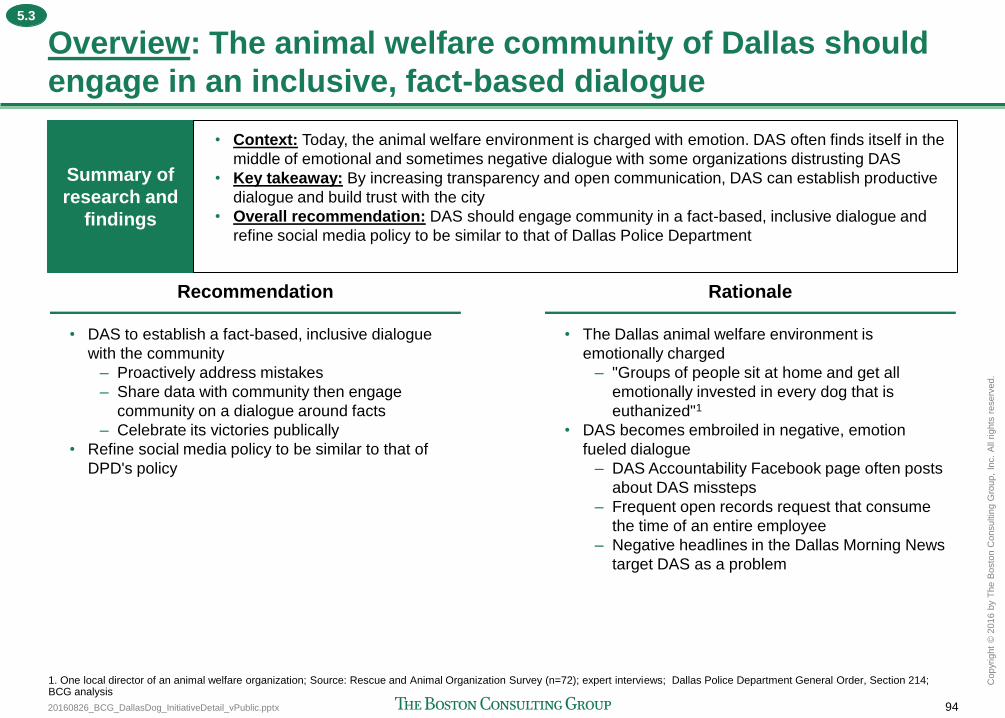
20160826_BCG_DallasDog_InitiativeDetail_vPublic.pptx 94
Copyr
ight
© 2
016 b
y T
he B
osto
n C
onsultin
g G
roup,
Inc.
All
rights
reserv
ed.
Overview: The animal welfare community of Dallas should
engage in an inclusive, fact-based dialogue
Recommendation
• DAS to establish a fact-based, inclusive dialogue
with the community
– Proactively address mistakes
– Share data with community then engage
community on a dialogue around facts
– Celebrate its victories publically
• Refine social media policy to be similar to that of
DPD's policy
Rationale
• The Dallas animal welfare environment is
emotionally charged
– "Groups of people sit at home and get all
emotionally invested in every dog that is
euthanized"1
• DAS becomes embroiled in negative, emotion
fueled dialogue
– DAS Accountability Facebook page often posts
about DAS missteps
– Frequent open records request that consume
the time of an entire employee
– Negative headlines in the Dallas Morning News
target DAS as a problem
1. One local director of an animal welfare organization; Source: Rescue and Animal Organization Survey (n=72); expert interviews; Dallas Police Department General Order, Section 214; BCG analysis
Summary of
research and
findings
• Context: Today, the animal welfare environment is charged with emotion. DAS often finds itself in the
middle of emotional and sometimes negative dialogue with some organizations distrusting DAS
• Key takeaway: By increasing transparency and open communication, DAS can establish productive
dialogue and build trust with the city
• Overall recommendation: DAS should engage community in a fact-based, inclusive dialogue and
refine social media policy to be similar to that of Dallas Police Department
5.3
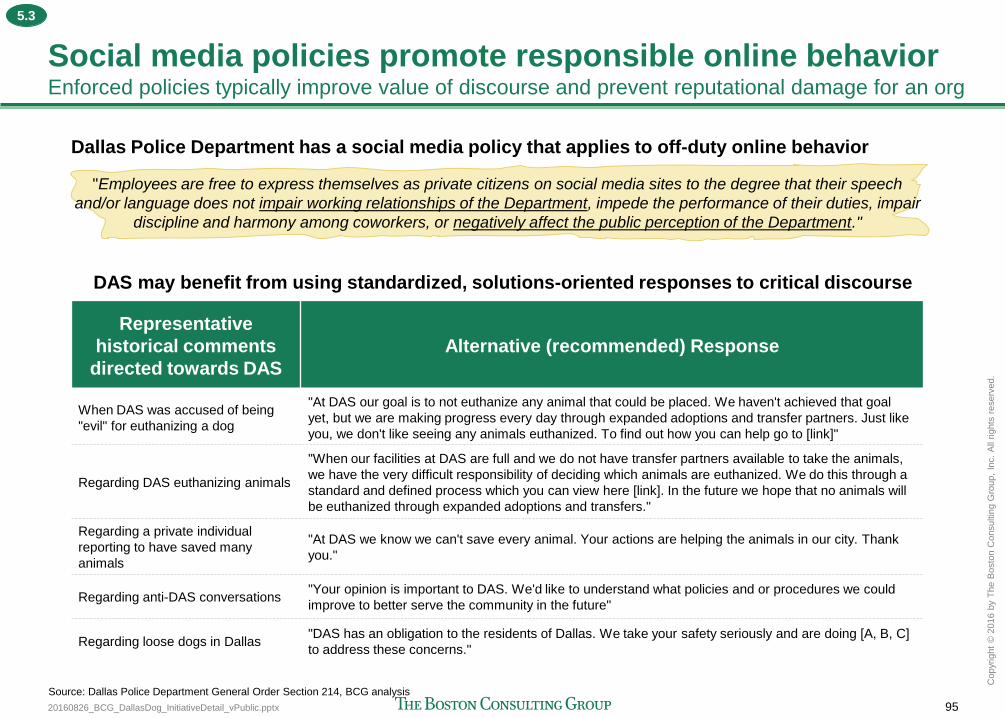
20160826_BCG_DallasDog_InitiativeDetail_vPublic.pptx 95
Copyr
ight
© 2
016 b
y T
he B
osto
n C
onsultin
g G
roup,
Inc.
All
rights
reserv
ed.
Social media policies promote responsible online behavior Enforced policies typically improve value of discourse and prevent reputational damage for an org
Representative
historical comments
directed towards DAS
Alternative (recommended) Response
When DAS was accused of being
"evil" for euthanizing a dog
"At DAS our goal is to not euthanize any animal that could be placed. We haven't achieved that goal
yet, but we are making progress every day through expanded adoptions and transfer partners. Just like
you, we don't like seeing any animals euthanized. To find out how you can help go to [link]"
Regarding DAS euthanizing animals
"When our facilities at DAS are full and we do not have transfer partners available to take the animals,
we have the very difficult responsibility of deciding which animals are euthanized. We do this through a
standard and defined process which you can view here [link]. In the future we hope that no animals will
be euthanized through expanded adoptions and transfers."
Regarding a private individual
reporting to have saved many
animals
"At DAS we know we can't save every animal. Your actions are helping the animals in our city. Thank
you."
Regarding anti-DAS conversations "Your opinion is important to DAS. We'd like to understand what policies and or procedures we could
improve to better serve the community in the future"
Regarding loose dogs in Dallas "DAS has an obligation to the residents of Dallas. We take your safety seriously and are doing [A, B, C]
to address these concerns."
Source: Dallas Police Department General Order Section 214, BCG analysis
Dallas Police Department has a social media policy that applies to off-duty online behavior
"Employees are free to express themselves as private citizens on social media sites to the degree that their speech
and/or language does not impair working relationships of the Department, impede the performance of their duties, impair
discipline and harmony among coworkers, or negatively affect the public perception of the Department."
DAS may benefit from using standardized, solutions-oriented responses to critical discourse
5.3
20160826_BCG_DallasDog_InitiativeDetail_vPublic.pptx 96
Copyr
ight
© 2
016 b
y T
he B
osto
n C
onsultin
g G
roup,
Inc.
All
rights
reserv
ed.
Agenda
Recommendation 6: Make animal services a priority and strengthen
accountability within the city government
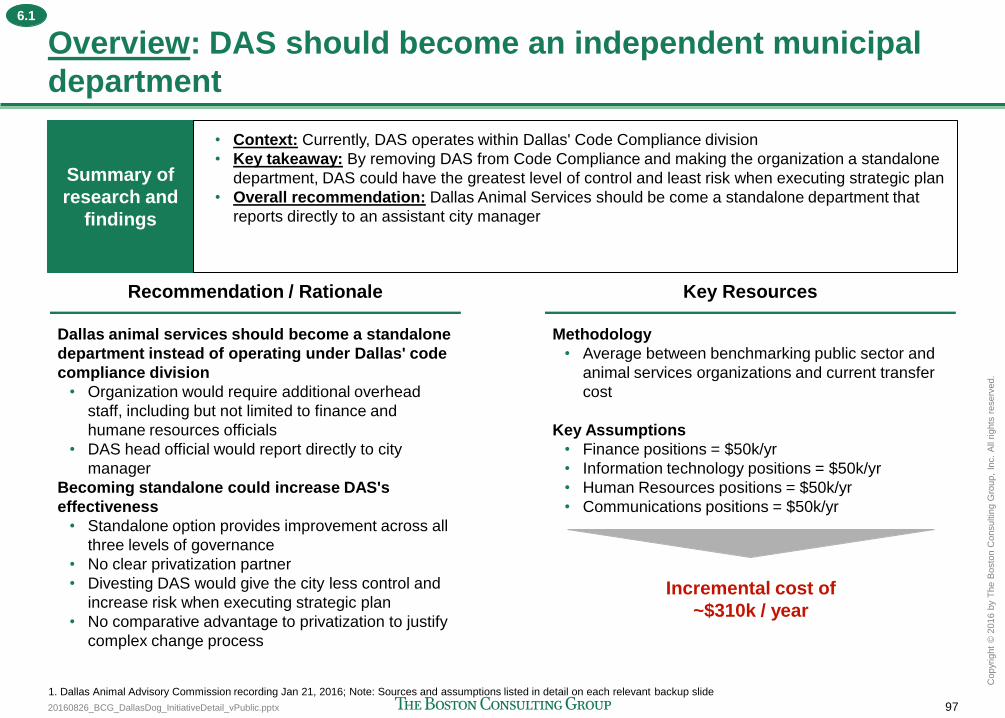
20160826_BCG_DallasDog_InitiativeDetail_vPublic.pptx 97
Copyr
ight
© 2
016 b
y T
he B
osto
n C
onsultin
g G
roup,
Inc.
All
rights
reserv
ed.
Overview: DAS should become an independent municipal
department
Recommendation / Rationale
Dallas animal services should become a standalone
department instead of operating under Dallas' code
compliance division
• Organization would require additional overhead
staff, including but not limited to finance and
humane resources officials
• DAS head official would report directly to city
manager
Becoming standalone could increase DAS's
effectiveness
• Standalone option provides improvement across all
three levels of governance
• No clear privatization partner
• Divesting DAS would give the city less control and
increase risk when executing strategic plan
• No comparative advantage to privatization to justify
complex change process
Key Resources
1. Dallas Animal Advisory Commission recording Jan 21, 2016; Note: Sources and assumptions listed in detail on each relevant backup slide
Methodology
• Average between benchmarking public sector and
animal services organizations and current transfer
cost
Key Assumptions
• Finance positions = $50k/yr
• Information technology positions = $50k/yr
• Human Resources positions = $50k/yr
• Communications positions = $50k/yr
Incremental cost of
~$310k / year
Summary of
research and
findings
• Context: Currently, DAS operates within Dallas' Code Compliance division
• Key takeaway: By removing DAS from Code Compliance and making the organization a standalone
department, DAS could have the greatest level of control and least risk when executing strategic plan
• Overall recommendation: Dallas Animal Services should be come a standalone department that
reports directly to an assistant city manager
6.1
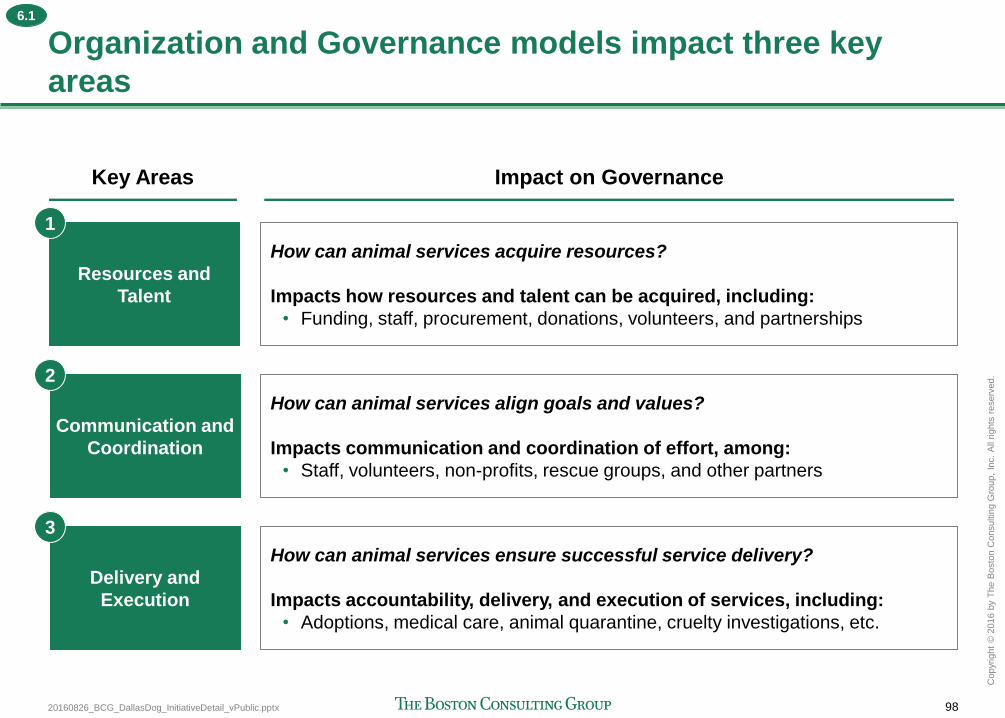
20160826_BCG_DallasDog_InitiativeDetail_vPublic.pptx 98
Copyr
ight
© 2
016 b
y T
he B
osto
n C
onsultin
g G
roup,
Inc.
All
rights
reserv
ed.
Organization and Governance models impact three key
areas
Communication and
Coordination
How can animal services align goals and values?
Impacts communication and coordination of effort, among:
• Staff, volunteers, non-profits, rescue groups, and other partners
Delivery and
Execution
How can animal services ensure successful service delivery?
Impacts accountability, delivery, and execution of services, including:
• Adoptions, medical care, animal quarantine, cruelty investigations, etc.
Key Areas Impact on Governance
Resources and
Talent
How can animal services acquire resources?
Impacts how resources and talent can be acquired, including:
• Funding, staff, procurement, donations, volunteers, and partnerships
1
2
3
6.1
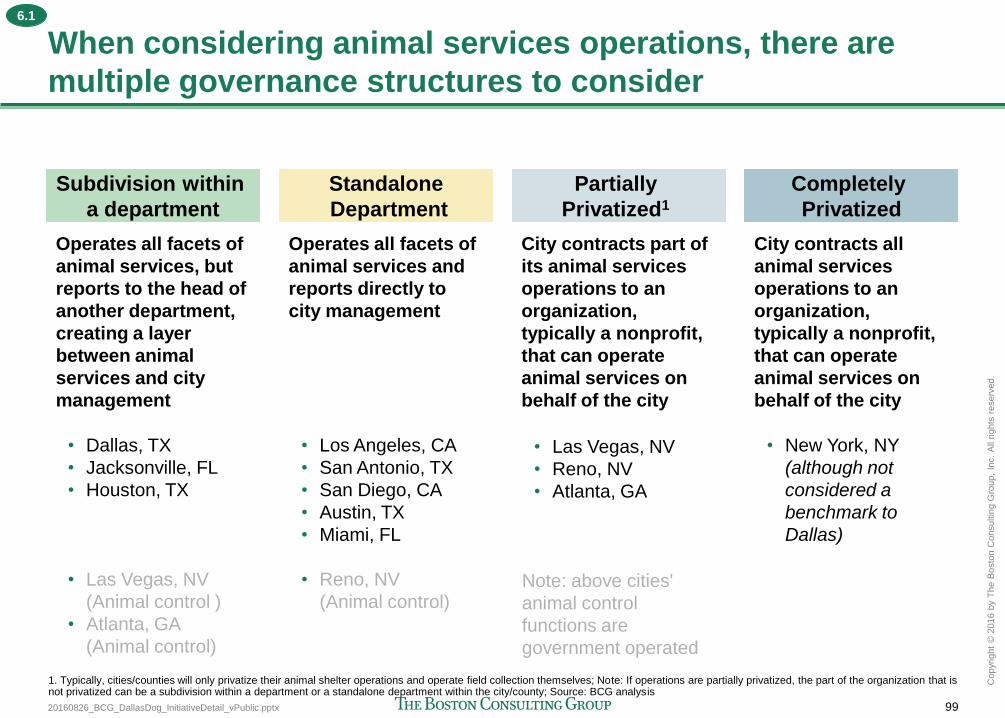
20160826_BCG_DallasDog_InitiativeDetail_vPublic.pptx 99
Copyr
ight
© 2
016 b
y T
he B
osto
n C
onsultin
g G
roup,
Inc.
All
rights
reserv
ed.
When considering animal services operations, there are
multiple governance structures to consider
• Dallas, TX
• Jacksonville, FL
• Houston, TX
• Las Vegas, NV
(Animal control )
• Atlanta, GA
(Animal control)
• Los Angeles, CA
• San Antonio, TX
• San Diego, CA
• Austin, TX
• Miami, FL
• Reno, NV
(Animal control)
Operates all facets of
animal services, but
reports to the head of
another department,
creating a layer
between animal
services and city
management
Subdivision within
a department
Operates all facets of
animal services and
reports directly to
city management
Standalone
Department
City contracts part of
its animal services
operations to an
organization,
typically a nonprofit,
that can operate
animal services on
behalf of the city
Partially
Privatized1
City contracts all
animal services
operations to an
organization,
typically a nonprofit,
that can operate
animal services on
behalf of the city
Completely
Privatized
• Las Vegas, NV
• Reno, NV
• Atlanta, GA
Note: above cities'
animal control
functions are
government operated
• New York, NY
(although not
considered a
benchmark to
Dallas)
1. Typically, cities/counties will only privatize their animal shelter operations and operate field collection themselves; Note: If operations are partially privatized, the part of the organization that is not privatized can be a subdivision within a department or a standalone department within the city/county; Source: BCG analysis
6.1
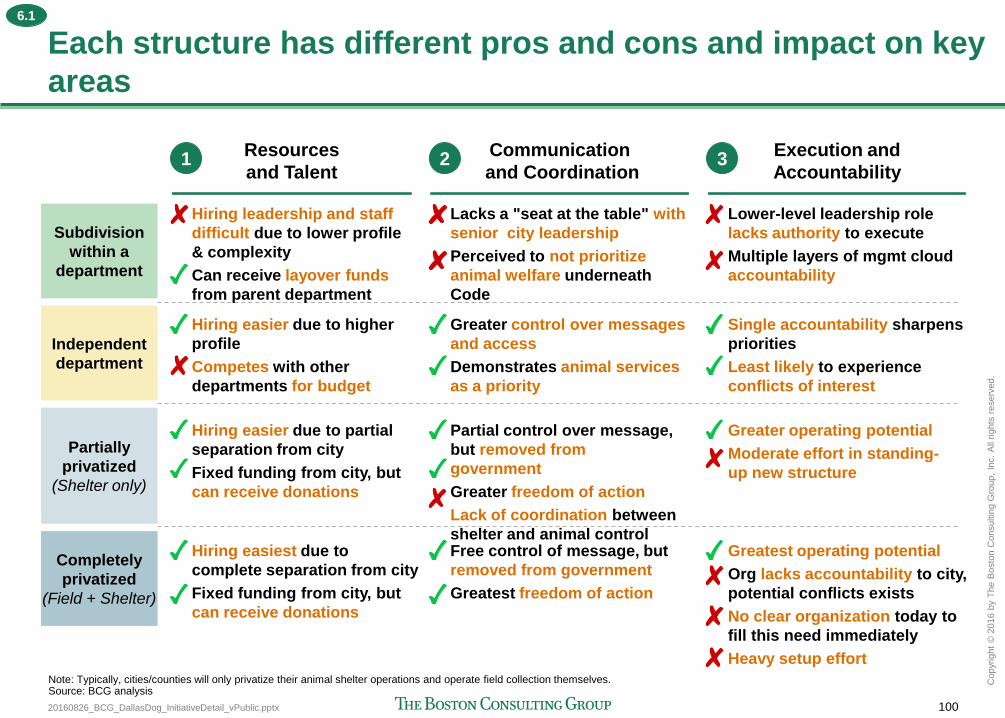
20160826_BCG_DallasDog_InitiativeDetail_vPublic.pptx 100
Copyr
ight
© 2
016 b
y T
he B
osto
n C
onsultin
g G
roup,
Inc.
All
rights
reserv
ed.
Each structure has different pros and cons and impact on key
areas
Subdivision
within a
department
Resources
and Talent
Execution and
Accountability 1 3
Note: Typically, cities/counties will only privatize their animal shelter operations and operate field collection themselves. Source: BCG analysis
Independent
department
Hiring easier due to higher
profile
Competes with other
departments for budget
Single accountability sharpens
priorities
Least likely to experience
conflicts of interest
Hiring leadership and staff
difficult due to lower profile
& complexity
Can receive layover funds
from parent department
Lower-level leadership role
lacks authority to execute
Multiple layers of mgmt cloud
accountability
Completely
privatized
(Field + Shelter)
Hiring easiest due to
complete separation from city
Fixed funding from city, but
can receive donations
Greatest operating potential
Org lacks accountability to city,
potential conflicts exists
No clear organization today to
fill this need immediately
Heavy setup effort
Partially
privatized
(Shelter only)
Hiring easier due to partial
separation from city
Fixed funding from city, but
can receive donations
Greater operating potential
Moderate effort in standing-
up new structure
Communication
and Coordination 2
Greater control over messages
and access
Demonstrates animal services
as a priority
Lacks a "seat at the table" with
senior city leadership
Perceived to not prioritize
animal welfare underneath
Code
Free control of message, but
removed from government
Greatest freedom of action
Partial control over message,
but removed from
government
Greater freedom of action
Lack of coordination between
shelter and animal control
6.1
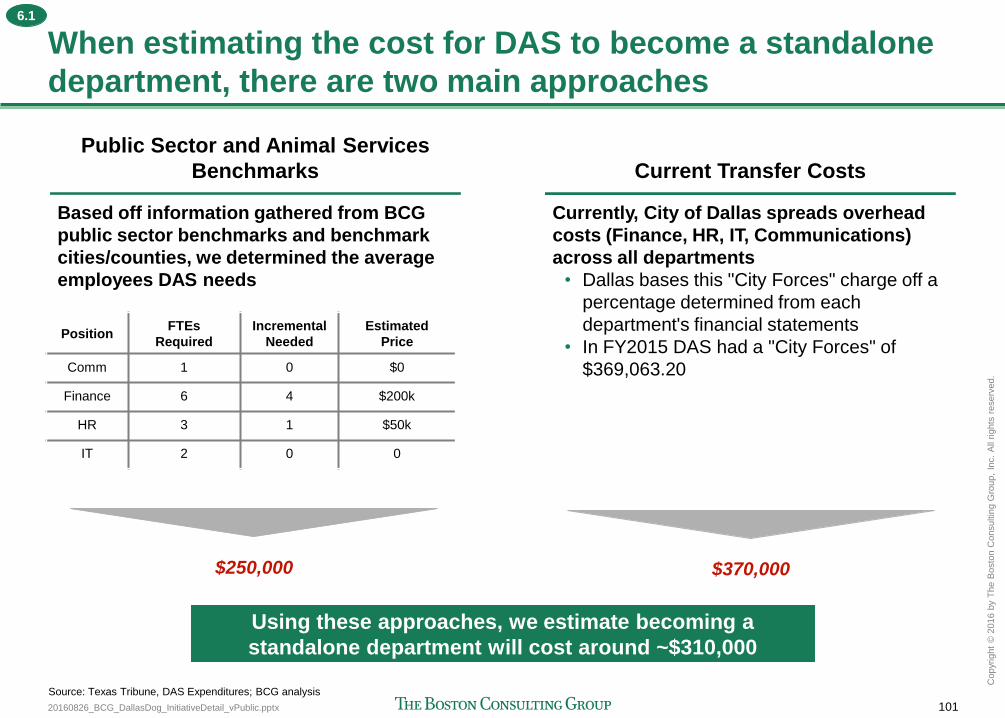
20160826_BCG_DallasDog_InitiativeDetail_vPublic.pptx 101
Copyr
ight
© 2
016 b
y T
he B
osto
n C
onsultin
g G
roup,
Inc.
All
rights
reserv
ed.
When estimating the cost for DAS to become a standalone
department, there are two main approaches
Current Transfer Costs
Currently, City of Dallas spreads overhead
costs (Finance, HR, IT, Communications)
across all departments
• Dallas bases this "City Forces" charge off a
percentage determined from each
department's financial statements
• In FY2015 DAS had a "City Forces" of
$369,063.20
Public Sector and Animal Services
Benchmarks
Based off information gathered from BCG
public sector benchmarks and benchmark
cities/counties, we determined the average
employees DAS needs
Using these approaches, we estimate becoming a
standalone department will cost around ~$310,000
Position FTEs
Required
Incremental
Needed
Estimated
Price
Comm 1 0 $0
Finance 6 4 $200k
HR 3 1 $50k
IT 2 0 0
$250,000 $370,000
Source: Texas Tribune, DAS Expenditures; BCG analysis
6.1
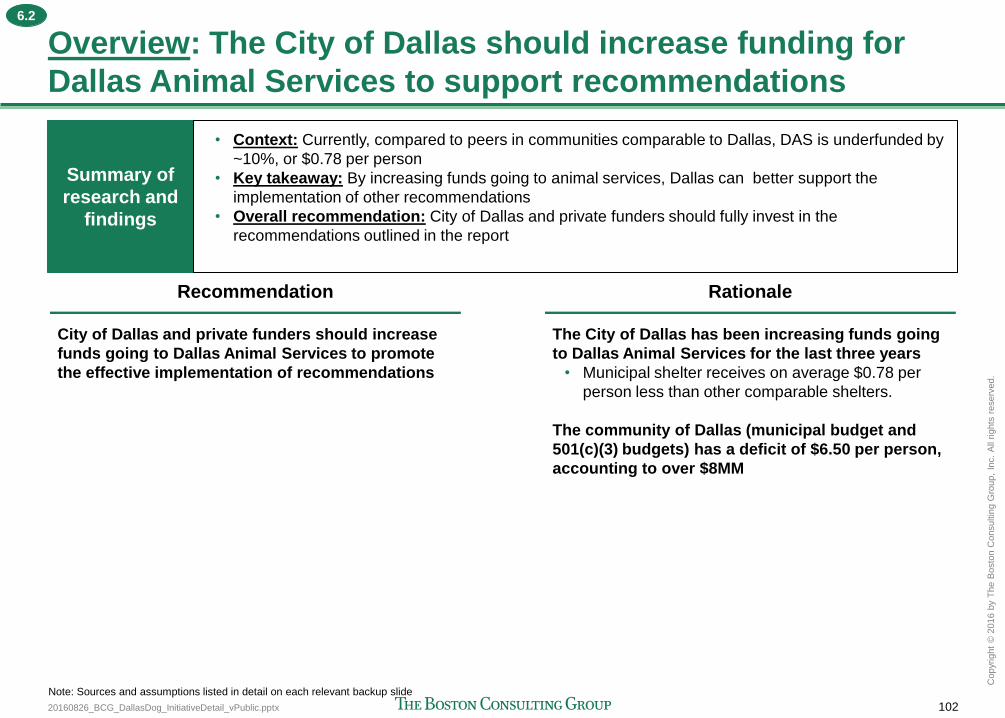
20160826_BCG_DallasDog_InitiativeDetail_vPublic.pptx 102
Copyr
ight
© 2
016 b
y T
he B
osto
n C
onsultin
g G
roup,
Inc.
All
rights
reserv
ed.
Overview: The City of Dallas should increase funding for
Dallas Animal Services to support recommendations
Recommendation
City of Dallas and private funders should increase
funds going to Dallas Animal Services to promote
the effective implementation of recommendations
Rationale
The City of Dallas has been increasing funds going
to Dallas Animal Services for the last three years
• Municipal shelter receives on average $0.78 per
person less than other comparable shelters.
The community of Dallas (municipal budget and
501(c)(3) budgets) has a deficit of $6.50 per person,
accounting to over $8MM
Note: Sources and assumptions listed in detail on each relevant backup slide
Summary of
research and
findings
• Context: Currently, compared to peers in communities comparable to Dallas, DAS is underfunded by
~10%, or $0.78 per person
• Key takeaway: By increasing funds going to animal services, Dallas can better support the
implementation of other recommendations
• Overall recommendation: City of Dallas and private funders should fully invest in the
recommendations outlined in the report
6.2
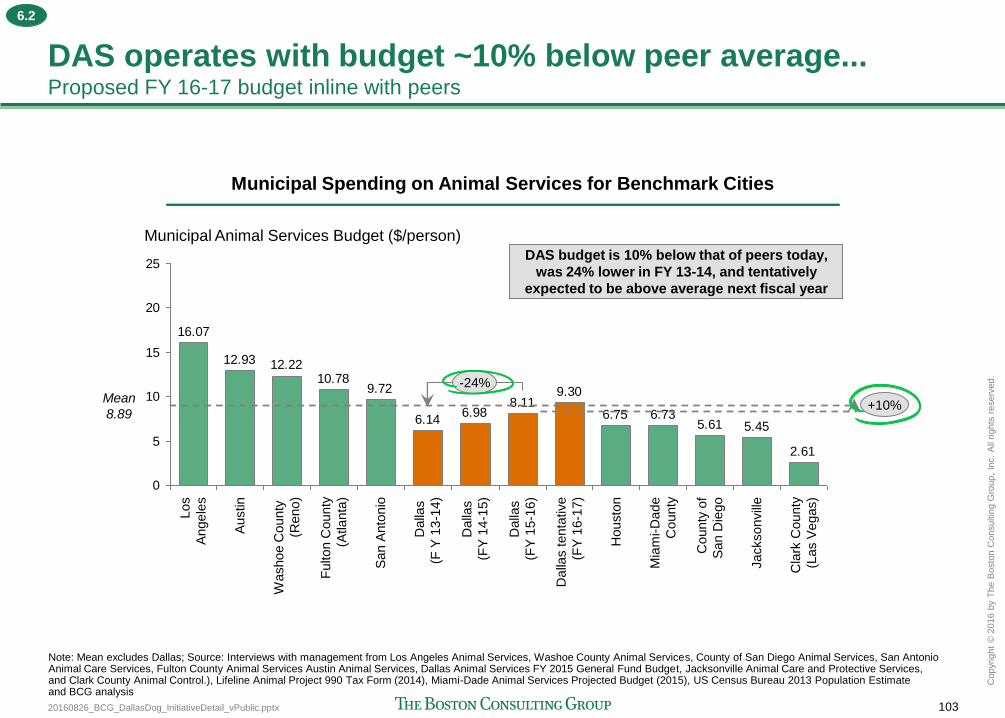
20160826_BCG_DallasDog_InitiativeDetail_vPublic.pptx 103
Copyr
ight
© 2
016 b
y T
he B
osto
n C
onsultin
g G
roup,
Inc.
All
rights
reserv
ed.
DAS operates with budget ~10% below peer average... Proposed FY 16-17 budget inline with peers
2.61
5.455.616.736.75
9.308.11
6.986.14
9.7210.78
12.2212.93
16.07
0
5
10
15
20
25
Municipal Animal Services Budget ($/person)
-24%
Cla
rk C
ounty
(Las V
egas)
Jacksonvill
e
County
of
San D
iego
Mia
mi-D
ade
County
Housto
n
Dalla
s tenta
tive
(FY
16-1
7)
Dalla
s
(FY
15
-16)
Dalla
s
(FY
14
-15)
Dalla
s
(F Y
13
-14)
San A
nto
nio
Fulton C
ounty
(Atlanta
)
Washoe C
ounty
(Reno)
Austin
Los
Angele
s
Mean
8.89 +10%
Municipal Spending on Animal Services for Benchmark Cities
DAS budget is 10% below that of peers today,
was 24% lower in FY 13-14, and tentatively
expected to be above average next fiscal year
Note: Mean excludes Dallas; Source: Interviews with management from Los Angeles Animal Services, Washoe County Animal Services, County of San Diego Animal Services, San Antonio Animal Care Services, Fulton County Animal Services Austin Animal Services, Dallas Animal Services FY 2015 General Fund Budget, Jacksonville Animal Care and Protective Services, and Clark County Animal Control.), Lifeline Animal Project 990 Tax Form (2014), Miami-Dade Animal Services Projected Budget (2015), US Census Bureau 2013 Population Estimate and BCG analysis
6.2
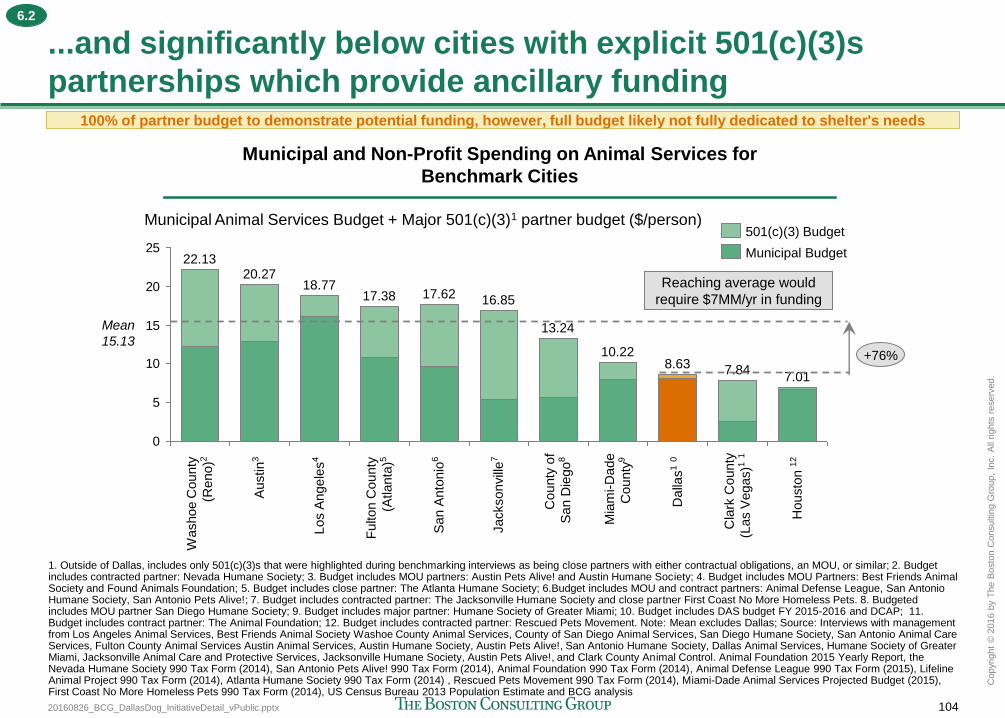
20160826_BCG_DallasDog_InitiativeDetail_vPublic.pptx 104
Copyr
ight
© 2
016 b
y T
he B
osto
n C
onsultin
g G
roup,
Inc.
All
rights
reserv
ed.
...and significantly below cities with explicit 501(c)(3)s
partnerships which provide ancillary funding
0
5
10
15
20
25
Municipal Animal Services Budget + Major 501(c)(3)1 partner budget ($/person)
Housto
n 1
2
7.01
Cla
rk C
ounty
(Las V
egas)1
1
7.84
Dalla
s1 0
8.63
Mia
mi-D
ade
County
9
10.22
County
of
San D
iego
8
13.24
Jacksonvill
e7
16.85
San A
nto
nio
6
17.62
Fulton C
ounty
(Atlanta
)5
17.38
Los A
ngele
s4
18.77
Austin
3
20.27
Washoe C
ounty
(Reno)2
22.13 Municipal Budget
501(c)(3) Budget
Mean
15.13 +76%
Reaching average would
require $7MM/yr in funding
Municipal and Non-Profit Spending on Animal Services for
Benchmark Cities
1. Outside of Dallas, includes only 501(c)(3)s that were highlighted during benchmarking interviews as being close partners with either contractual obligations, an MOU, or similar; 2. Budget includes contracted partner: Nevada Humane Society; 3. Budget includes MOU partners: Austin Pets Alive! and Austin Humane Society; 4. Budget includes MOU Partners: Best Friends Animal Society and Found Animals Foundation; 5. Budget includes close partner: The Atlanta Humane Society; 6.Budget includes MOU and contract partners: Animal Defense League, San Antonio Humane Society, San Antonio Pets Alive!; 7. Budget includes contracted partner: The Jacksonville Humane Society and close partner First Coast No More Homeless Pets. 8. Budgeted includes MOU partner San Diego Humane Society; 9. Budget includes major partner: Humane Society of Greater Miami; 10. Budget includes DAS budget FY 2015-2016 and DCAP; 11. Budget includes contract partner: The Animal Foundation; 12. Budget includes contracted partner: Rescued Pets Movement. Note: Mean excludes Dallas; Source: Interviews with management from Los Angeles Animal Services, Best Friends Animal Society Washoe County Animal Services, County of San Diego Animal Services, San Diego Humane Society, San Antonio Animal Care Services, Fulton County Animal Services Austin Animal Services, Austin Humane Society, Austin Pets Alive!, San Antonio Humane Society, Dallas Animal Services, Humane Society of Greater Miami, Jacksonville Animal Care and Protective Services, Jacksonville Humane Society, Austin Pets Alive!, and Clark County Animal Control. Animal Foundation 2015 Yearly Report, the Nevada Humane Society 990 Tax Form (2014), San Antonio Pets Alive! 990 Tax Form (2014), Animal Foundation 990 Tax Form (2014), Animal Defense League 990 Tax Form (2015), Lifeline Animal Project 990 Tax Form (2014), Atlanta Humane Society 990 Tax Form (2014) , Rescued Pets Movement 990 Tax Form (2014), Miami-Dade Animal Services Projected Budget (2015), First Coast No More Homeless Pets 990 Tax Form (2014), US Census Bureau 2013 Population Estimate and BCG analysis
100% of partner budget to demonstrate potential funding, however, full budget likely not fully dedicated to shelter's needs
6.2
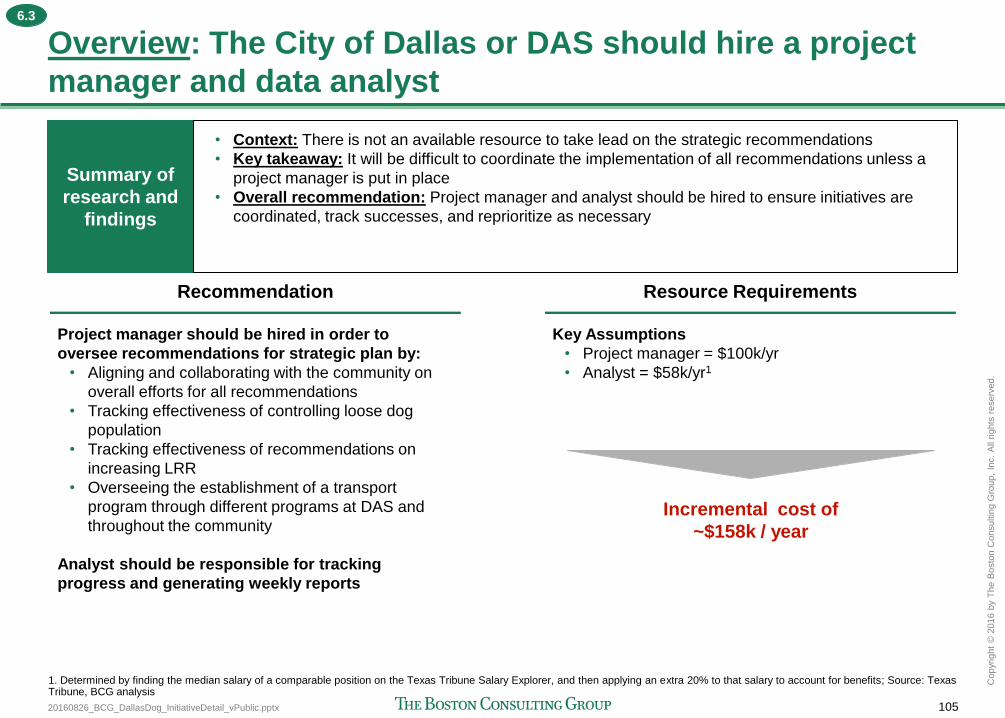
20160826_BCG_DallasDog_InitiativeDetail_vPublic.pptx 105
Copyr
ight
© 2
016 b
y T
he B
osto
n C
onsultin
g G
roup,
Inc.
All
rights
reserv
ed.
Overview: The City of Dallas or DAS should hire a project
manager and data analyst
Recommendation
Project manager should be hired in order to
oversee recommendations for strategic plan by:
• Aligning and collaborating with the community on
overall efforts for all recommendations
• Tracking effectiveness of controlling loose dog
population
• Tracking effectiveness of recommendations on
increasing LRR
• Overseeing the establishment of a transport
program through different programs at DAS and
throughout the community
Analyst should be responsible for tracking
progress and generating weekly reports
Resource Requirements
1. Determined by finding the median salary of a comparable position on the Texas Tribune Salary Explorer, and then applying an extra 20% to that salary to account for benefits; Source: Texas Tribune, BCG analysis
Key Assumptions
• Project manager = $100k/yr
• Analyst = $58k/yr1
Incremental cost of
~$158k / year
Summary of
research and
findings
• Context: There is not an available resource to take lead on the strategic recommendations
• Key takeaway: It will be difficult to coordinate the implementation of all recommendations unless a
project manager is put in place
• Overall recommendation: Project manager and analyst should be hired to ensure initiatives are
coordinated, track successes, and reprioritize as necessary
6.3
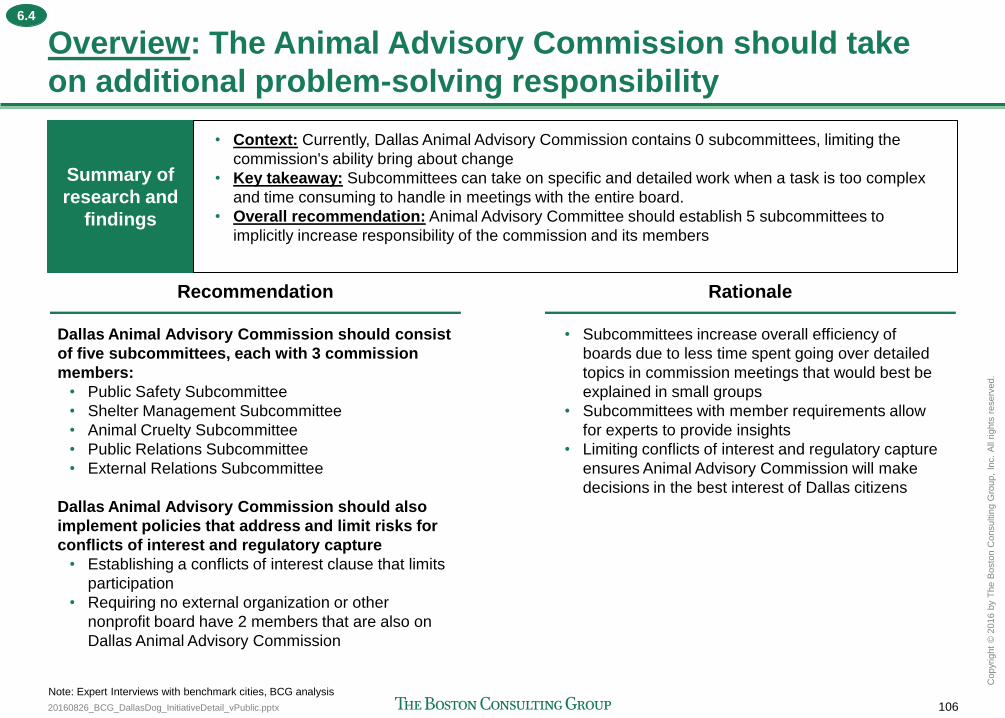
20160826_BCG_DallasDog_InitiativeDetail_vPublic.pptx 106
Copyr
ight
© 2
016 b
y T
he B
osto
n C
onsultin
g G
roup,
Inc.
All
rights
reserv
ed.
Overview: The Animal Advisory Commission should take
on additional problem-solving responsibility
Recommendation
Dallas Animal Advisory Commission should consist
of five subcommittees, each with 3 commission
members:
• Public Safety Subcommittee
• Shelter Management Subcommittee
• Animal Cruelty Subcommittee
• Public Relations Subcommittee
• External Relations Subcommittee
Dallas Animal Advisory Commission should also
implement policies that address and limit risks for
conflicts of interest and regulatory capture
• Establishing a conflicts of interest clause that limits
participation
• Requiring no external organization or other
nonprofit board have 2 members that are also on
Dallas Animal Advisory Commission
Rationale
• Subcommittees increase overall efficiency of
boards due to less time spent going over detailed
topics in commission meetings that would best be
explained in small groups
• Subcommittees with member requirements allow
for experts to provide insights
• Limiting conflicts of interest and regulatory capture
ensures Animal Advisory Commission will make
decisions in the best interest of Dallas citizens
Note: Expert Interviews with benchmark cities, BCG analysis
Summary of
research and
findings
• Context: Currently, Dallas Animal Advisory Commission contains 0 subcommittees, limiting the
commission's ability bring about change
• Key takeaway: Subcommittees can take on specific and detailed work when a task is too complex
and time consuming to handle in meetings with the entire board.
• Overall recommendation: Animal Advisory Committee should establish 5 subcommittees to
implicitly increase responsibility of the commission and its members
6.4
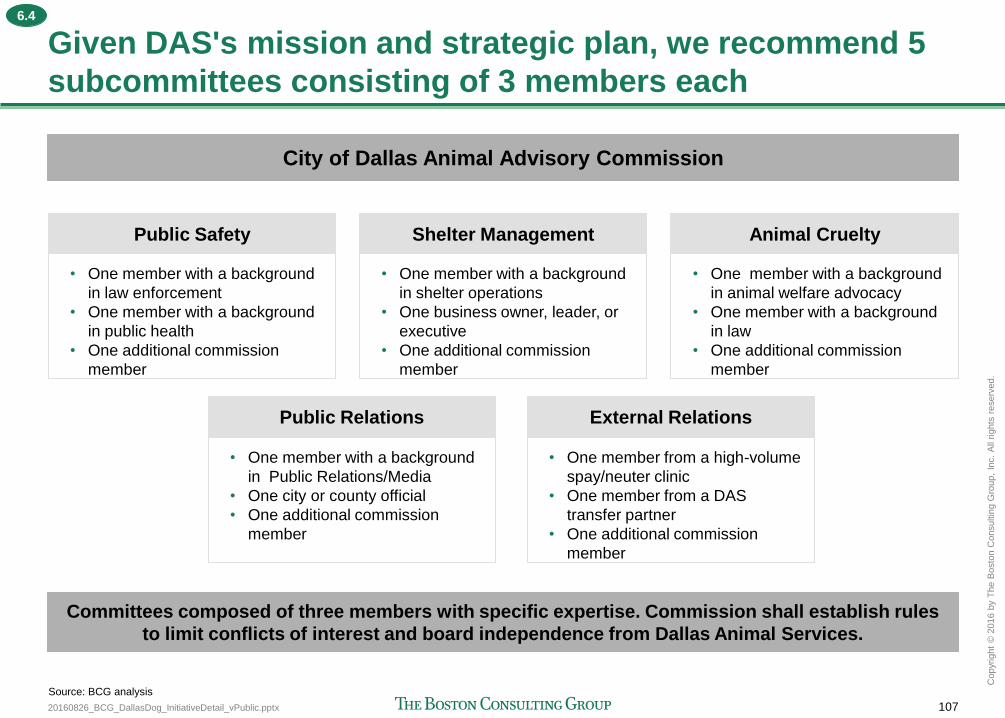
20160826_BCG_DallasDog_InitiativeDetail_vPublic.pptx 107
Copyr
ight
© 2
016 b
y T
he B
osto
n C
onsultin
g G
roup,
Inc.
All
rights
reserv
ed.
Given DAS's mission and strategic plan, we recommend 5
subcommittees consisting of 3 members each
Public Safety
• One member with a background
in law enforcement
• One member with a background
in public health
• One additional commission
member
Shelter Management
• One member with a background
in shelter operations
• One business owner, leader, or
executive
• One additional commission
member
Animal Cruelty
• One member with a background
in animal welfare advocacy
• One member with a background
in law
• One additional commission
member
Public Relations
• One member with a background
in Public Relations/Media
• One city or county official
• One additional commission
member
External Relations
• One member from a high-volume
spay/neuter clinic
• One member from a DAS
transfer partner
• One additional commission
member
City of Dallas Animal Advisory Commission
Committees composed of three members with specific expertise. Commission shall establish rules
to limit conflicts of interest and board independence from Dallas Animal Services.
Source: BCG analysis
6.4
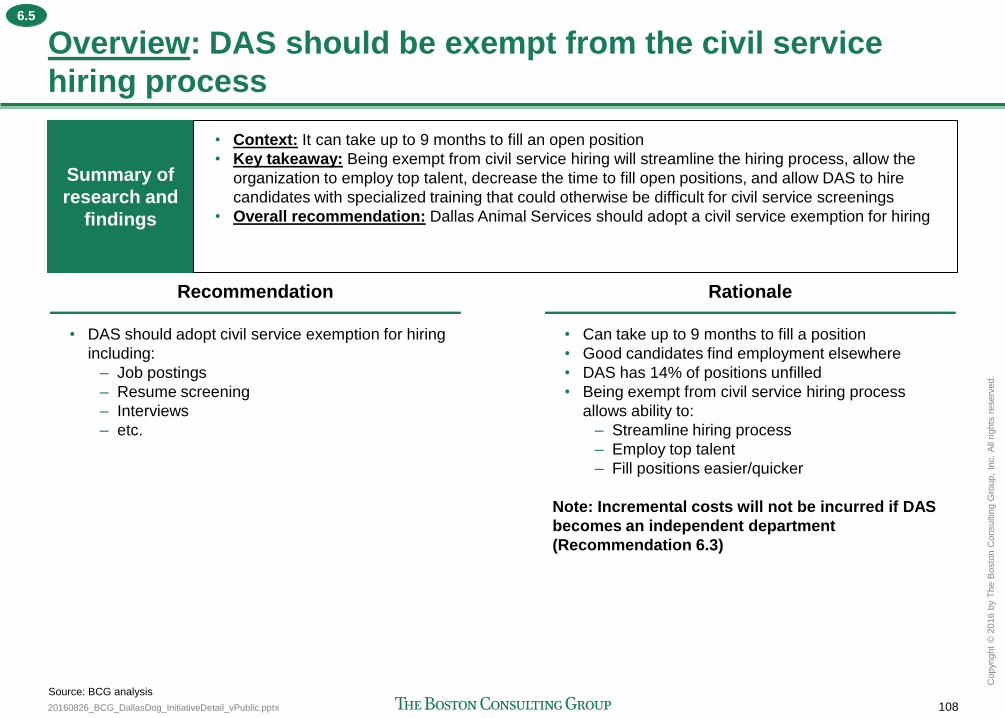
20160826_BCG_DallasDog_InitiativeDetail_vPublic.pptx 108
Copyr
ight
© 2
016 b
y T
he B
osto
n C
onsultin
g G
roup,
Inc.
All
rights
reserv
ed.
Overview: DAS should be exempt from the civil service
hiring process
Recommendation
• DAS should adopt civil service exemption for hiring
including:
– Job postings
– Resume screening
– Interviews
– etc.
Rationale
• Can take up to 9 months to fill a position
• Good candidates find employment elsewhere
• DAS has 14% of positions unfilled
• Being exempt from civil service hiring process
allows ability to:
– Streamline hiring process
– Employ top talent
– Fill positions easier/quicker
Note: Incremental costs will not be incurred if DAS
becomes an independent department
(Recommendation 6.3)
Source: BCG analysis
Summary of
research and
findings
• Context: It can take up to 9 months to fill an open position
• Key takeaway: Being exempt from civil service hiring will streamline the hiring process, allow the
organization to employ top talent, decrease the time to fill open positions, and allow DAS to hire
candidates with specialized training that could otherwise be difficult for civil service screenings
• Overall recommendation: Dallas Animal Services should adopt a civil service exemption for hiring
6.5
20160826_BCG_DallasDog_InitiativeDetail_vPublic.pptx 109
Copyr
ight
© 2
016 b
y T
he B
osto
n C
onsultin
g G
roup,
Inc.
All
rights
reserv
ed.
Agenda
Recommendation 7: Ensure efficiency by measuring outcomes and
increasing volunteers
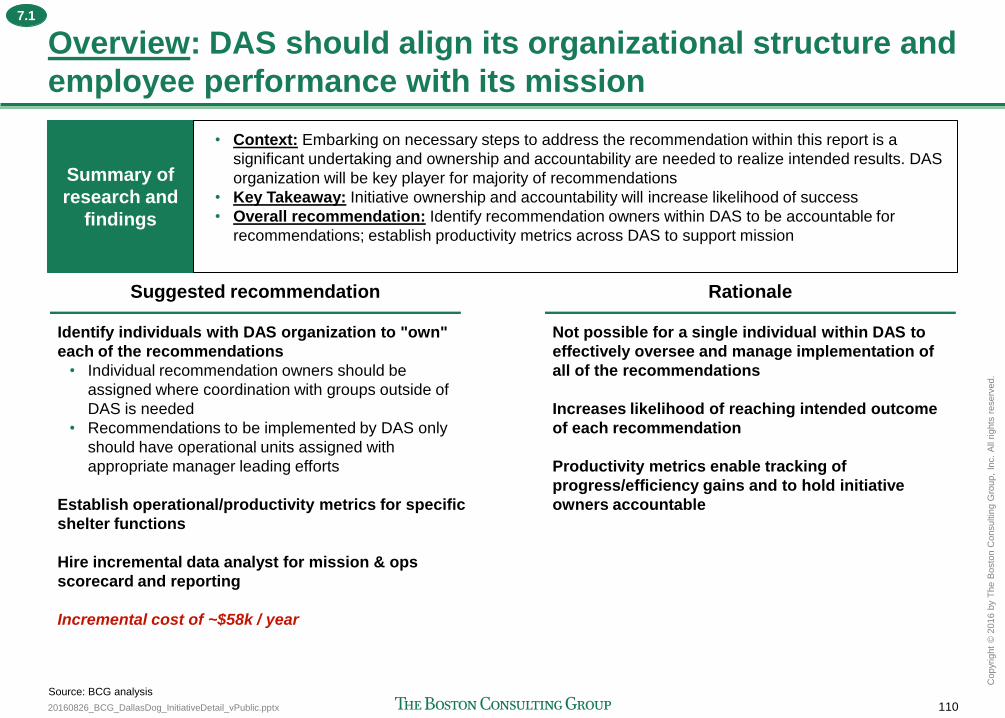
20160826_BCG_DallasDog_InitiativeDetail_vPublic.pptx 110
Copyr
ight
© 2
016 b
y T
he B
osto
n C
onsultin
g G
roup,
Inc.
All
rights
reserv
ed.
Overview: DAS should align its organizational structure and
employee performance with its mission
Suggested recommendation Rationale
Identify individuals with DAS organization to "own"
each of the recommendations
• Individual recommendation owners should be
assigned where coordination with groups outside of
DAS is needed
• Recommendations to be implemented by DAS only
should have operational units assigned with
appropriate manager leading efforts
Establish operational/productivity metrics for specific
shelter functions
Hire incremental data analyst for mission & ops
scorecard and reporting
Incremental cost of ~$58k / year
Not possible for a single individual within DAS to
effectively oversee and manage implementation of
all of the recommendations
Increases likelihood of reaching intended outcome
of each recommendation
Productivity metrics enable tracking of
progress/efficiency gains and to hold initiative
owners accountable
Source: BCG analysis
Summary of
research and
findings
• Context: Embarking on necessary steps to address the recommendation within this report is a
significant undertaking and ownership and accountability are needed to realize intended results. DAS
organization will be key player for majority of recommendations
• Key Takeaway: Initiative ownership and accountability will increase likelihood of success
• Overall recommendation: Identify recommendation owners within DAS to be accountable for
recommendations; establish productivity metrics across DAS to support mission
7.1
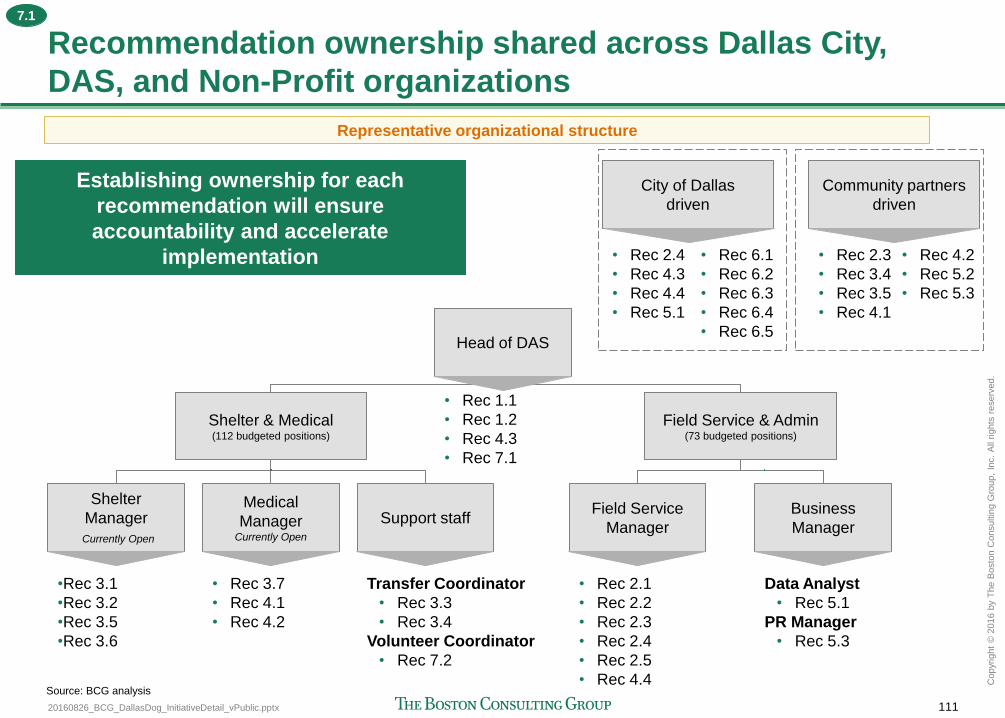
20160826_BCG_DallasDog_InitiativeDetail_vPublic.pptx 111
Copyr
ight
© 2
016 b
y T
he B
osto
n C
onsultin
g G
roup,
Inc.
All
rights
reserv
ed.
Recommendation ownership shared across Dallas City,
DAS, and Non-Profit organizations
Head of DAS
Shelter & Medical (112 budgeted positions)
Field Service & Admin (73 budgeted positions)
Shelter
Manager
Currently Open
Medical
Manager Currently Open
Support staff Field Service
Manager
Business
Manager
•Rec 3.1
•Rec 3.2
•Rec 3.5
•Rec 3.6
• Rec 3.7
• Rec 4.1
• Rec 4.2
Transfer Coordinator
• Rec 3.3
• Rec 3.4
Volunteer Coordinator
• Rec 7.2
• Rec 2.1
• Rec 2.2
• Rec 2.3
• Rec 2.4
• Rec 2.5
• Rec 4.4
Data Analyst
• Rec 5.1
PR Manager
• Rec 5.3
• Rec 1.1
• Rec 1.2
• Rec 4.3
• Rec 7.1
City of Dallas
driven
Establishing ownership for each
recommendation will ensure
accountability and accelerate
implementation
Source: BCG analysis
Representative organizational structure
Community partners
driven
• Rec 2.4
• Rec 4.3
• Rec 4.4
• Rec 5.1
• Rec 2.3
• Rec 3.4
• Rec 3.5
• Rec 4.1
• Rec 6.1
• Rec 6.2
• Rec 6.3
• Rec 6.4
• Rec 6.5
• Rec 4.2
• Rec 5.2
• Rec 5.3
7.1
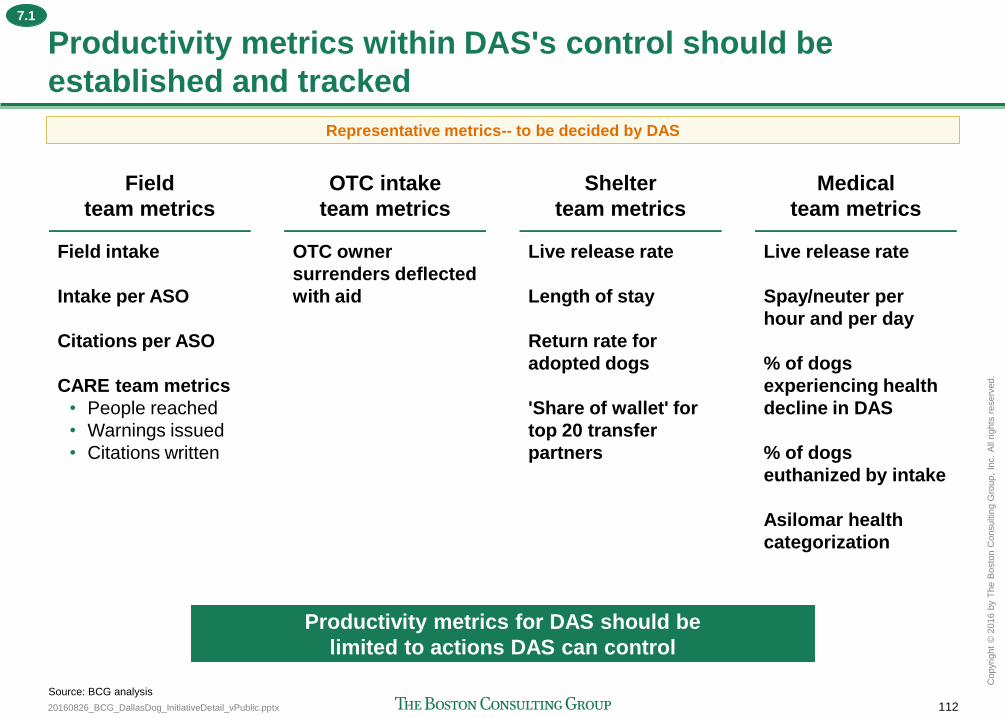
20160826_BCG_DallasDog_InitiativeDetail_vPublic.pptx 112
Copyr
ight
© 2
016 b
y T
he B
osto
n C
onsultin
g G
roup,
Inc.
All
rights
reserv
ed.
Productivity metrics within DAS's control should be
established and tracked
Field
team metrics
Field intake
Intake per ASO
Citations per ASO
CARE team metrics
• People reached
• Warnings issued
• Citations written
OTC intake
team metrics
OTC owner
surrenders deflected
with aid
Shelter
team metrics
Live release rate
Length of stay
Return rate for
adopted dogs
'Share of wallet' for
top 20 transfer
partners
Medical
team metrics
Live release rate
Spay/neuter per
hour and per day
% of dogs
experiencing health
decline in DAS
% of dogs
euthanized by intake
Asilomar health
categorization
Productivity metrics for DAS should be
limited to actions DAS can control
Source: BCG analysis
Representative metrics-- to be decided by DAS
7.1
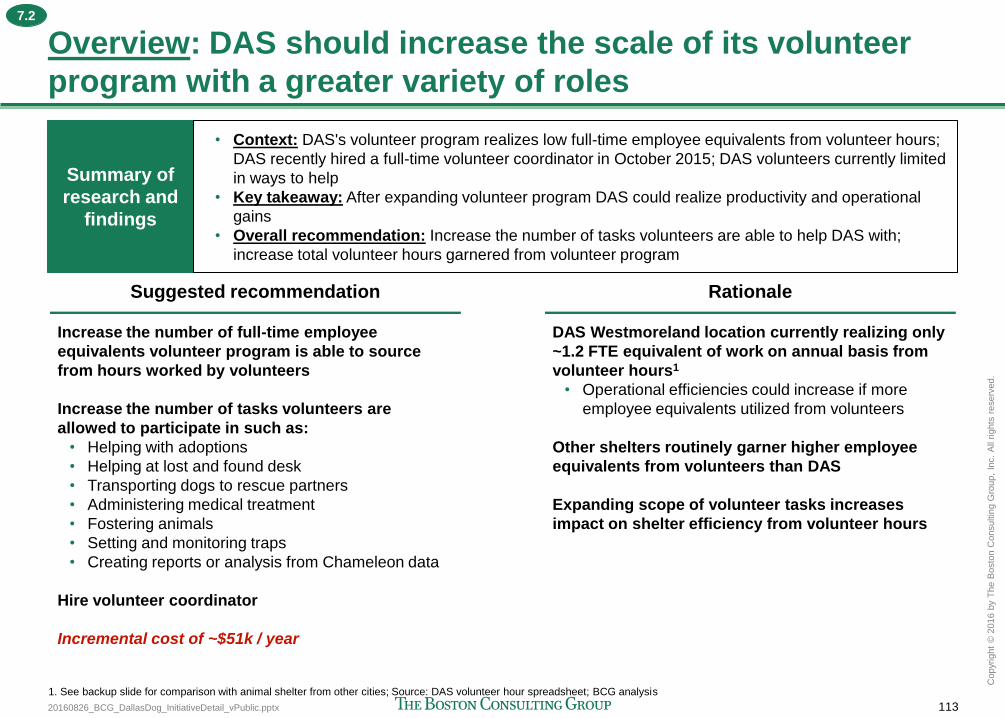
20160826_BCG_DallasDog_InitiativeDetail_vPublic.pptx 113
Copyr
ight
© 2
016 b
y T
he B
osto
n C
onsultin
g G
roup,
Inc.
All
rights
reserv
ed.
Overview: DAS should increase the scale of its volunteer
program with a greater variety of roles
Suggested recommendation Rationale
Increase the number of full-time employee
equivalents volunteer program is able to source
from hours worked by volunteers
Increase the number of tasks volunteers are
allowed to participate in such as:
• Helping with adoptions
• Helping at lost and found desk
• Transporting dogs to rescue partners
• Administering medical treatment
• Fostering animals
• Setting and monitoring traps
• Creating reports or analysis from Chameleon data
Hire volunteer coordinator
Incremental cost of ~$51k / year
DAS Westmoreland location currently realizing only
~1.2 FTE equivalent of work on annual basis from
volunteer hours1
• Operational efficiencies could increase if more
employee equivalents utilized from volunteers
Other shelters routinely garner higher employee
equivalents from volunteers than DAS
Expanding scope of volunteer tasks increases
impact on shelter efficiency from volunteer hours
1. See backup slide for comparison with animal shelter from other cities; Source: DAS volunteer hour spreadsheet; BCG analysis
Summary of
research and
findings
• Context: DAS's volunteer program realizes low full-time employee equivalents from volunteer hours;
DAS recently hired a full-time volunteer coordinator in October 2015; DAS volunteers currently limited
in ways to help
• Key takeaway: After expanding volunteer program DAS could realize productivity and operational
gains
• Overall recommendation: Increase the number of tasks volunteers are able to help DAS with;
increase total volunteer hours garnered from volunteer program
7.2
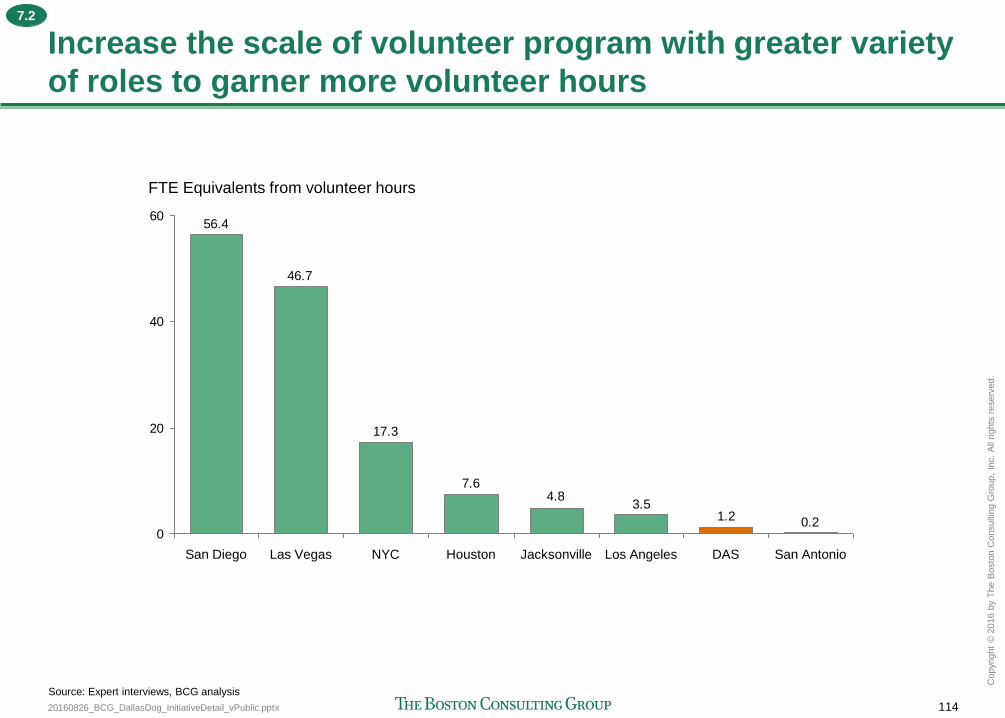
20160826_BCG_DallasDog_InitiativeDetail_vPublic.pptx 114
Copyr
ight
© 2
016 b
y T
he B
osto
n C
onsultin
g G
roup,
Inc.
All
rights
reserv
ed.
Increase the scale of volunteer program with greater variety
of roles to garner more volunteer hours
0.21.23.5
4.87.6
17.3
46.7
56.4
0
20
40
60
Las Vegas San Antonio DAS Houston NYC
FTE Equivalents from volunteer hours
Jacksonville Los Angeles San Diego
Source: Expert interviews, BCG analysis
7.2

Thank you
bcg.com | bcgperspectives.com
Loose Dogs in Dallas: Strategic
recommendations to improve public safety
and animal welfare in Dallas BCG working materials
August 2016
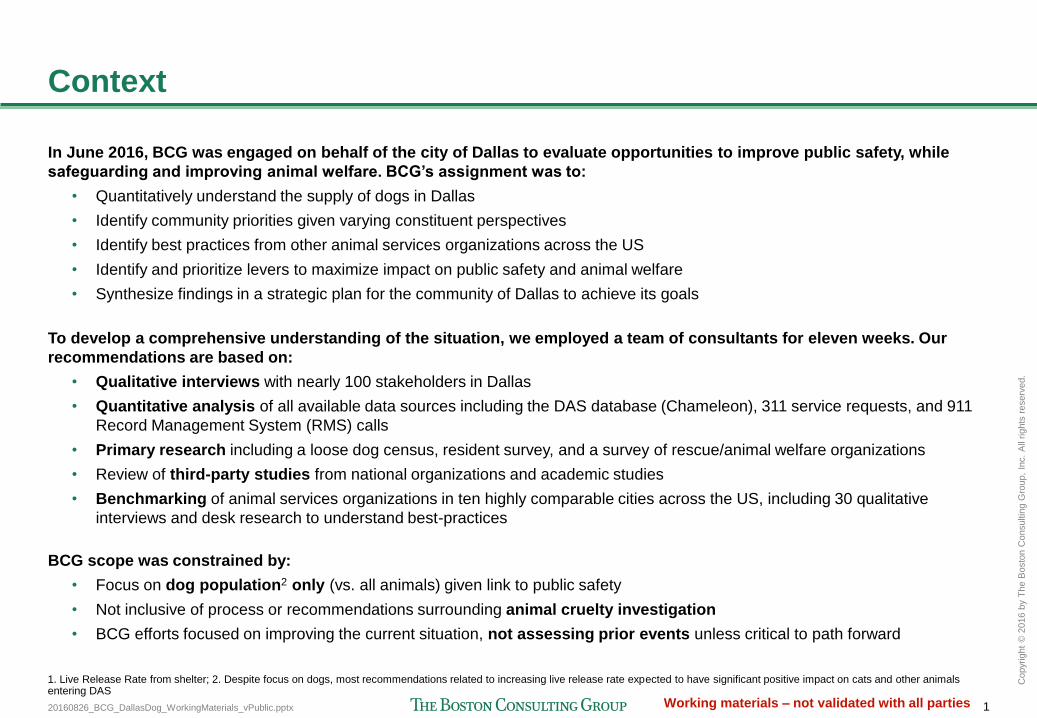
20160826_BCG_DallasDog_WorkingMaterials_vPublic.pptx 1
Copyr
ight
© 2
016 b
y T
he B
osto
n C
onsultin
g G
roup,
Inc.
All
rights
reserv
ed.
Working materials – not validated with all parties
Context
In June 2016, BCG was engaged on behalf of the city of Dallas to evaluate opportunities to improve public safety, while
safeguarding and improving animal welfare. BCG’s assignment was to:
• Quantitatively understand the supply of dogs in Dallas
• Identify community priorities given varying constituent perspectives
• Identify best practices from other animal services organizations across the US
• Identify and prioritize levers to maximize impact on public safety and animal welfare
• Synthesize findings in a strategic plan for the community of Dallas to achieve its goals
To develop a comprehensive understanding of the situation, we employed a team of consultants for eleven weeks. Our
recommendations are based on:
• Qualitative interviews with nearly 100 stakeholders in Dallas
• Quantitative analysis of all available data sources including the DAS database (Chameleon), 311 service requests, and 911
Record Management System (RMS) calls
• Primary research including a loose dog census, resident survey, and a survey of rescue/animal welfare organizations
• Review of third-party studies from national organizations and academic studies
• Benchmarking of animal services organizations in ten highly comparable cities across the US, including 30 qualitative
interviews and desk research to understand best-practices
BCG scope was constrained by:
• Focus on dog population2 only (vs. all animals) given link to public safety
• Not inclusive of process or recommendations surrounding animal cruelty investigation
• BCG efforts focused on improving the current situation, not assessing prior events unless critical to path forward
1. Live Release Rate from shelter; 2. Despite focus on dogs, most recommendations related to increasing live release rate expected to have significant positive impact on cats and other animals entering DAS

20160826_BCG_DallasDog_WorkingMaterials_vPublic.pptx 2
Copyr
ight
© 2
016 b
y T
he B
osto
n C
onsultin
g G
roup,
Inc.
All
rights
reserv
ed.
Working materials – not validated with all parties
This document contains BCG working materials
BCG completed three deliverables:
White-paper
Document contains written
explanation of:
• Project background
• Relevant context and facts
• BCG recommendations
• Supporting rationale
Initiative detail
Contains details on each
recommended initiative:
• Background context
• Key assumptions
• Sizing of potential (intake,
outcomes, etc)
• Cost to execute
Working materials
Additional analysis completed
during project, including
analysis not reflected in
recommendations
Not all materials validated
by a second party
Draft—for discussion onlyC
opyr
ight ©
2016 b
y T
he B
osto
n C
onsulti
ng G
roup, In
c.
All
rights
reserv
ed.
Resource requirements: Deflection program costs ~$90-
$310K, dependent upon "Robust" or "Lean" implementation
Key assumptions... Estimated yearly costs of Owner Deflection program
1. $400 for Robust program, $200 credit for Lean programSource: DAS Chameleon database, PetFinder.Com "Annual Dog Care Costs", BCG Analysis, Texas Tribune Government Salaries Explorer
312,834004,1406,5778,280134,373
136,265
23,200
0
100,000
200,000
300,000
400,000
Cost ($)
Costs incurred on a per "deflected" dog basis
Fixed
program
costs
Program coordinator½ FTE @
$46K/yr
DAS Owner Deflection:
Dog Run/ Fence $4001
Routine Vet Care $200
S/N Surgery $139
Pet Food Expense $500/yr
Behavior Courses $250/yr
Temporary Foster -
Remove Citations -
91,13300000068,13323,000
0
200,000
400,000
600,000
800,000
Cost ($)
TotalTemporary
Foster
Remove
Citations
Behavior
Courses
S/N
Surgery
Pet FoodRoutine
Vet Care
Dog Run/
Fence
Program
Coord
Costs incurred on a per "deflected" dog basis
Fixed
program
costs
"Robust"
Program
"Lean"
Program
Incremental cost of
~$90K - $310K per year
i ii iv iii v vii vi
vi
ii
i
iv
v
vii
iii
Draft—for discussion onlyC
opyr
ight ©
2016 b
y T
he B
osto
n C
onsulti
ng G
roup, In
c.
All
rights
reserv
ed.
Projected Retention Impact
Estimated impact: Owner Surrender Deflection program has
potential to deflect ~2,600 dogs per year
Key assumptions
Surveyed reason for
surrender at DAS1
1. Q: Why are you bringing this animal to DAS today? 2. Q: If any of the following were available to you, would you choose to keep this animal?Source: DAS Chameleon database, July 2016 DAS Owner Intake Survey (n = 44), BCG Analysis
225
779
1416
2023
25
3030
39
0%
10%
20%
30%
40%
Anim
al aggre
ssio
n
Anim
al in
tera
ctio
n
Anim
al obedie
nce
Cost of
eve
ry d
ay c
are
Yard
/Housin
g
Lifesty
le
Movi
ng
Num
ber
of
anim
als
Euth
anasia
Anim
al S
erv
ice O
ffic
ers
Oth
er
% of respondents indicating surrender reason
Pers
onal health
Cost of
medic
al care
Lack o
f tim
e
Surveyed reason for
retention at DAS2
1333
5
10
1414
47
0%
20%
40%
60%
Pet fo
od P
roducts
Dog r
un/f
encin
g
Vet C
are
Tem
pora
ry H
om
e
Oth
er
Do n
ot
want
anim
al
S/N
Obedie
nce c
ours
es
Tic
kets
/ cita
tions R
em
oval
% of respondents indicating retention reason2015 DAS Dog
Intake20,807
2015 % Dog Intake
through Owner32%
2015 Owner Dog
Intake6,624
DAS Owner Deflection:
Dog Run/ Fence
Routine Vet Care
S/N Surgery
Pet Food Expense
Behavior Courses
Temporary Foster
Remove Citations
vi ii i iv v vii iii
2,59347189199
199341
672
946
0
1,000
2,000
3,000
4,000
Tota
l
Tic
kets
/ cita
tions R
em
oval
S/N
Projected dogs retained
Pet fo
od P
roducts
Dog r
un/f
encin
g
Obedie
nce c
ours
es
Vet C
are
Tem
pora
ry H
om
e
vi ii i iv v vii iii
Potential ~2,600 dogs
"deflected" per year
Reasons owner
surrenders pet (%)
Interventions that
would make owner
keep pet (%)
# dogs
surrenderedImpact logic:
I II III
I II III
vi
ii
i
iv
v
vii
iii
Draft—for discussion only
Copyr
ight ©
2016 b
y T
he B
osto
n C
onsulti
ng G
roup, In
c.
All
rights
reserv
ed.
Overview: Owner Surrender Deflection
Summary of
research and
findings
• Context: Owner surrender deflection provides resources to pet owners to keep
their pets at home instead of surrendering to the animal shelter
• Key takeaway: Surrender deflection programs are a pivotal resource for
shelters to increase positive outcomes at a relatively low cost
• Overall recommendation: Invest in building out a full DAS Pet Retention
program
Estimated Impact
Methodology
• Survey pet owners surrendering their pets to DAS to
identify reasons for surrender and potential reasons
for retention
• Project estimated animals retained by extrapolating
reasons for retention on current base of owner
surrendered animals
Key Assumptions
• 2015 DAS dog intake = 20,807
• 2015 dog intake through owner surrender = 32%
• 2015 owner surrender dogs = 6,624
Resource Requirements
Methodology
• Break out fixed and variable costs associated with
each pillar of DAS surrender deflection program
• Develop high and low cost projections based on
varying resource levels
Key Assumptions
• Coord. FTE = ~$46K/year
• Dog run cost = $400
• Routine vet care = $200/year
• S/N cost = $139/surgery
• Pet food cost = $500/year
• Obedience course cost = $250/year
Recommendation
Incremental ~2,600 dogs
retained at home
Incremental cost of ~$90-
$310K
"Quick win"
• Minimal lead
time
• Benefit realized
over full year
Note: Sources and assumptions listed in detail on each relevant backup slide
Implied cost of ~$35 - $120
per retained dog
In this document
Draft—for discussion only
Copyr
ight ©
2016 b
y T
he B
osto
n C
onsulti
ng G
roup, I
nc.
All
rights
reserv
ed.
Interviews with
Stakeholders
100+ stakeholder interviews completed including:
• Government: Council Members, Animal Commissions, Code & DAS, DPD
• Non-profits: Animal rescue organizations, funders/philanthropies
• Citizens: Town halls and specific involved individuals
~40 interviews with stakeholders from comparable benchmark cities
Secondary
Research
Primary Research
Extensive primary research to collect new and unique information:
• Census: Roaming dog census in North and South Dallas
• Ride-a-longs: DAS field day, Targeted Response Team and CARE
• Surveys: Community, Rescue/welfare organization
Data Analysis
Detailed analysis of all relevant data sources:
• DAS data & Government: Chameleon, bite reports, 311, 911, Sanitation
• Community Data: Historical S/N activity
• Public Data: Census data
Gathered and reviewed large volume of available secondary research:
• Industry: HSUS, ICAMP, WSPA, ASPCA
• Academic: The Ecology of Stray Dogs, Anthrozoos, Advances in Companion
Animal Behavior, etc.
How BCG developed its recommendation
What we didActivity
Draft—for discussion only
Copyr
ight ©
2016 b
y T
he B
osto
n C
onsulti
ng G
roup, I
nc.
All
rights
reserv
ed.
BCG framework for understanding the situation
Supply
of Dogs
How many dogs are in
Dallas?
• Registered, Loose?
Do dogs pose a public
safety risk?
What services are
available to prevent
population growth
Benchmarks
How do other US
cities structure their
Animal control
agencies?
How have
comparable cities
overcome similar
dog issues?
What best practices
can be applied in
Dallas?
DAS
Operations
How effectively does
DAS collect dogs?
How efficiently and
quickly does DAS
operate its shelter?
How effectively does
DAS rehome dogs?
Enforcement &
Responsiveness
How effectively does
Dallas institute and
enforce animal
ordinances?
How effectively does
DAS respond to
animal related
requests /
complaints?
Loose Dogs in Dallas: Strategic
recommendations to improve public safety
and animal welfare in Dallas Initiative detail
August 2016
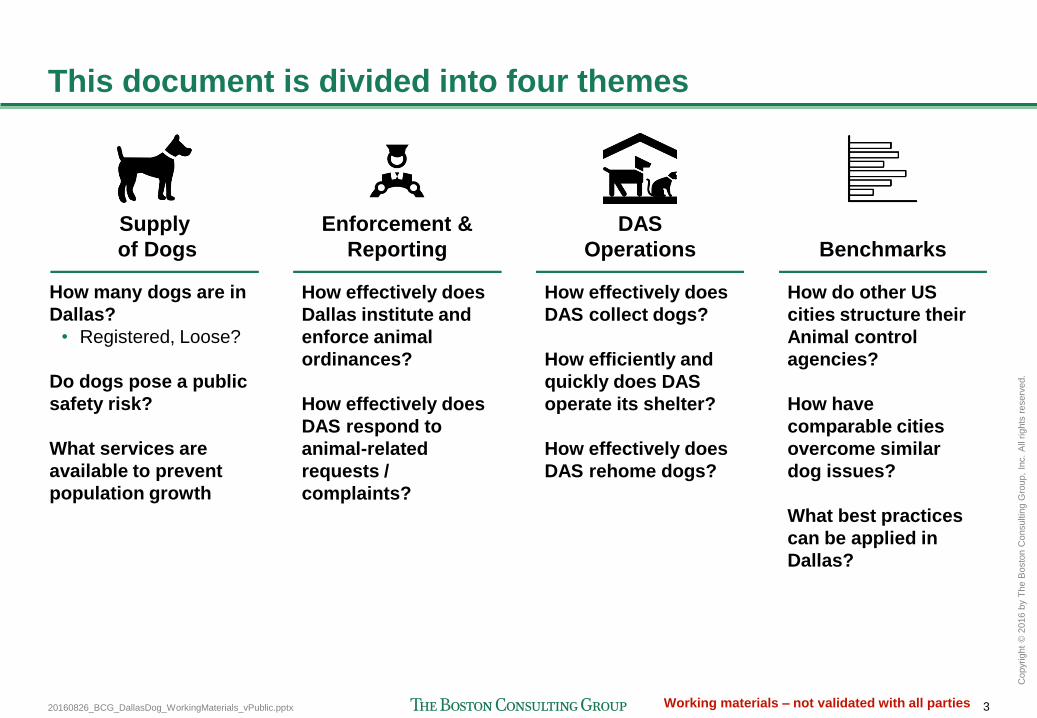
20160826_BCG_DallasDog_WorkingMaterials_vPublic.pptx 3
Copyr
ight
© 2
016 b
y T
he B
osto
n C
onsultin
g G
roup,
Inc.
All
rights
reserv
ed.
Working materials – not validated with all parties
This document is divided into four themes
Supply
of Dogs
How many dogs are in
Dallas?
• Registered, Loose?
Do dogs pose a public
safety risk?
What services are
available to prevent
population growth
Benchmarks
How do other US
cities structure their
Animal control
agencies?
How have
comparable cities
overcome similar
dog issues?
What best practices
can be applied in
Dallas?
DAS
Operations
How effectively does
DAS collect dogs?
How efficiently and
quickly does DAS
operate its shelter?
How effectively does
DAS rehome dogs?
Enforcement &
Reporting
How effectively does
Dallas institute and
enforce animal
ordinances?
How effectively does
DAS respond to
animal-related
requests /
complaints?
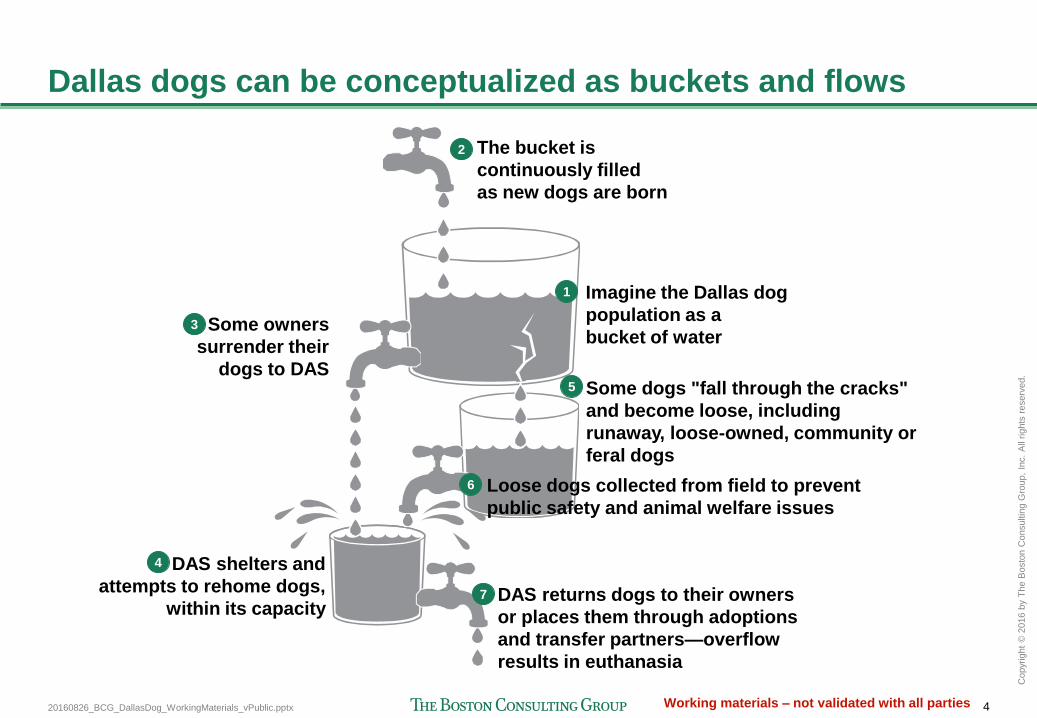
20160826_BCG_DallasDog_WorkingMaterials_vPublic.pptx 4
Copyr
ight
© 2
016 b
y T
he B
osto
n C
onsultin
g G
roup,
Inc.
All
rights
reserv
ed.
Working materials – not validated with all parties
Loose dogs
in Dallas
Imagine the Dallas dog
population as a
bucket of water
The bucket is
continuously filled
as new dogs are born
Some owners
surrender their
dogs to DAS
DAS shelters and
attempts to rehome dogs,
within its capacity
Some dogs "fall through the cracks"
and become loose, including
runaway, loose-owned, community or
feral dogs
Loose dogs collected from field to prevent
public safety and animal welfare issues
DAS returns dogs to their owners
or places them through adoptions
and transfer partners—overflow
results in euthanasia
1
2
3
4
5
6
7
Dallas dogs can be conceptualized as buckets and flows
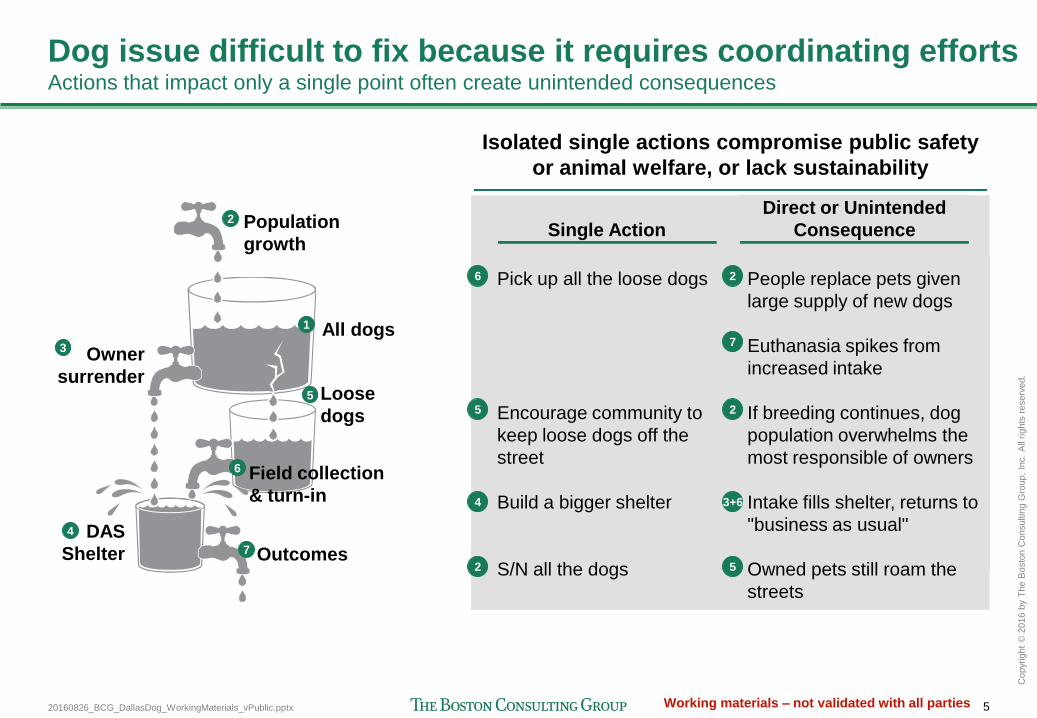
20160826_BCG_DallasDog_WorkingMaterials_vPublic.pptx 5
Copyr
ight
© 2
016 b
y T
he B
osto
n C
onsultin
g G
roup,
Inc.
All
rights
reserv
ed.
Working materials – not validated with all parties
Dog issue difficult to fix because it requires coordinating efforts Actions that impact only a single point often create unintended consequences
Loose
dogs
in Dallas
All dogs
Population
growth
Owner
surrender
DAS
Shelter
Loose
dogs
Field collection
& turn-in
Outcomes
1
2
3
4
5
6
7
6
Single Action
Direct or Unintended
Consequence
Pick up all the loose dogs
Encourage community to
keep loose dogs off the
street
Build a bigger shelter
S/N all the dogs
People replace pets given
large supply of new dogs
Euthanasia spikes from
increased intake
If breeding continues, dog
population overwhelms the
most responsible of owners
Intake fills shelter, returns to
"business as usual"
Owned pets still roam the
streets
2
7
5 2
4 3+6
2 5
Isolated single actions compromise public safety
or animal welfare, or lack sustainability
20160826_BCG_DallasDog_WorkingMaterials_vPublic.pptx 6
Copyr
ight
© 2
016 b
y T
he B
osto
n C
onsultin
g G
roup,
Inc.
All
rights
reserv
ed.
Working materials – not validated with all parties
Supply of Dogs 1
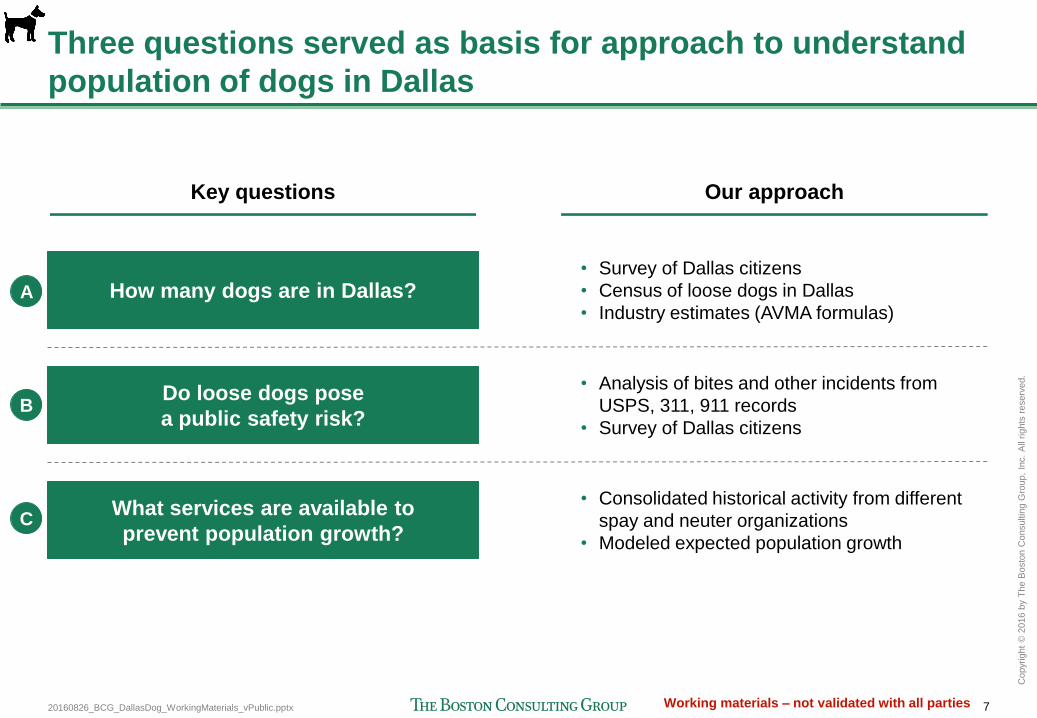
20160826_BCG_DallasDog_WorkingMaterials_vPublic.pptx 7
Copyr
ight
© 2
016 b
y T
he B
osto
n C
onsultin
g G
roup,
Inc.
All
rights
reserv
ed.
Working materials – not validated with all parties
Three questions served as basis for approach to understand
population of dogs in Dallas
Key questions Our approach
How many dogs are in Dallas?
Do loose dogs pose
a public safety risk?
What services are available to
prevent population growth?
• Survey of Dallas citizens
• Census of loose dogs in Dallas
• Industry estimates (AVMA formulas)
• Analysis of bites and other incidents from
USPS, 311, 911 records
• Survey of Dallas citizens
• Consolidated historical activity from different
spay and neuter organizations
• Modeled expected population growth
A
B
C
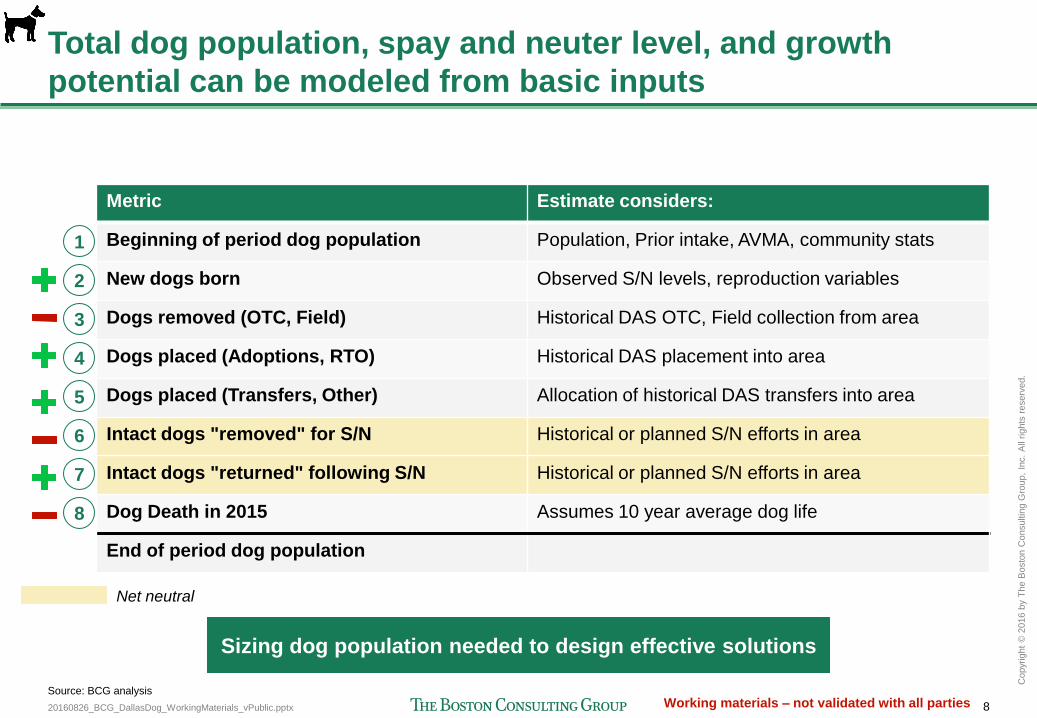
20160826_BCG_DallasDog_WorkingMaterials_vPublic.pptx 8
Copyr
ight
© 2
016 b
y T
he B
osto
n C
onsultin
g G
roup,
Inc.
All
rights
reserv
ed.
Working materials – not validated with all parties
Total dog population, spay and neuter level, and growth
potential can be modeled from basic inputs
Metric Estimate considers:
Beginning of period dog population Population, Prior intake, AVMA, community stats
New dogs born Observed S/N levels, reproduction variables
Dogs removed (OTC, Field) Historical DAS OTC, Field collection from area
Dogs placed (Adoptions, RTO) Historical DAS placement into area
Dogs placed (Transfers, Other) Allocation of historical DAS transfers into area
Intact dogs "removed" for S/N Historical or planned S/N efforts in area
Intact dogs "returned" following S/N Historical or planned S/N efforts in area
Dog Death in 2015 Assumes 10 year average dog life
End of period dog population
Net neutral
1
2
3
4
5
6
7
Sizing dog population needed to design effective solutions
8
Source: BCG analysis
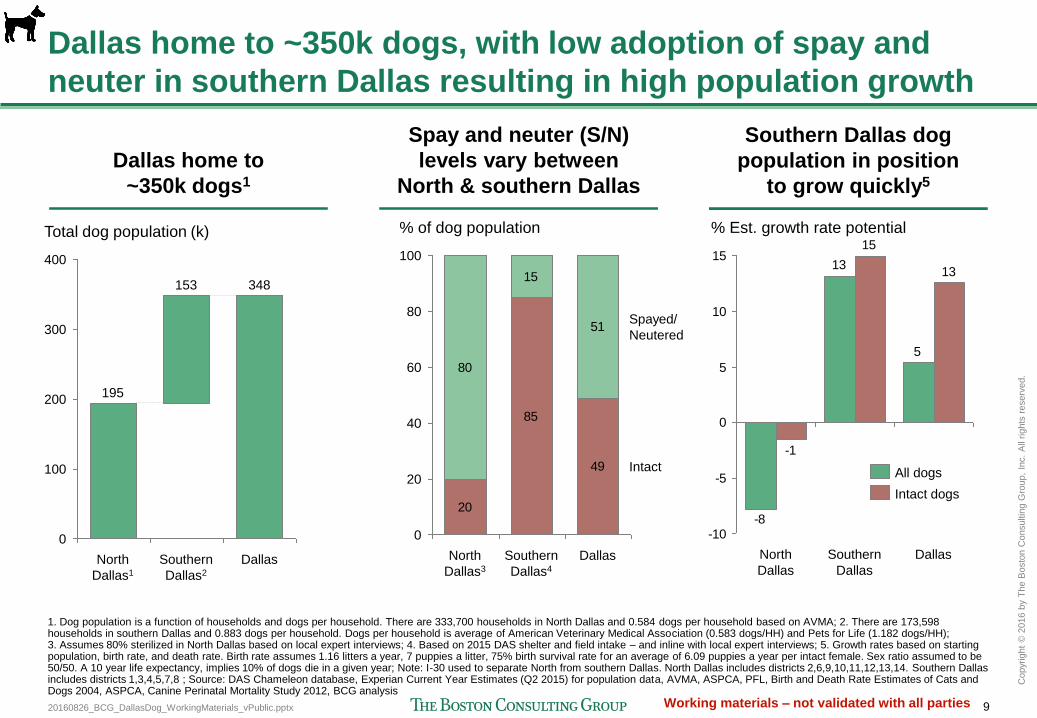
20160826_BCG_DallasDog_WorkingMaterials_vPublic.pptx 9
Copyr
ight
© 2
016 b
y T
he B
osto
n C
onsultin
g G
roup,
Inc.
All
rights
reserv
ed.
Working materials – not validated with all parties
Dallas home to ~350k dogs, with low adoption of spay and
neuter in southern Dallas resulting in high population growth
Dallas home to
~350k dogs1
Spay and neuter (S/N)
levels vary between
North & southern Dallas
Southern Dallas dog
population in position
to grow quickly5
300
400
200
100
0
195
153
Southern
Dallas2
348
Total dog population (k)
Dallas North
Dallas1
5
13
-8
13
15
-1
-10
-5
0
5
10
15
Southern
Dallas
North
Dallas
Dallas
% Est. growth rate potential
All dogs
Intact dogs 20
85
49
80
15
51
0
80
60
40
20
100
Spayed/
Neutered
Southern
Dallas4
Dallas North
Dallas3
Intact
% of dog population
1. Dog population is a function of households and dogs per household. There are 333,700 households in North Dallas and 0.584 dogs per household based on AVMA; 2. There are 173,598 households in southern Dallas and 0.883 dogs per household. Dogs per household is average of American Veterinary Medical Association (0.583 dogs/HH) and Pets for Life (1.182 dogs/HH); 3. Assumes 80% sterilized in North Dallas based on local expert interviews; 4. Based on 2015 DAS shelter and field intake – and inline with local expert interviews; 5. Growth rates based on starting population, birth rate, and death rate. Birth rate assumes 1.16 litters a year, 7 puppies a litter, 75% birth survival rate for an average of 6.09 puppies a year per intact female. Sex ratio assumed to be 50/50. A 10 year life expectancy, implies 10% of dogs die in a given year; Note: I-30 used to separate North from southern Dallas. North Dallas includes districts 2,6,9,10,11,12,13,14. Southern Dallas includes districts 1,3,4,5,7,8 ; Source: DAS Chameleon database, Experian Current Year Estimates (Q2 2015) for population data, AVMA, ASPCA, PFL, Birth and Death Rate Estimates of Cats and Dogs 2004, ASPCA, Canine Perinatal Mortality Study 2012, BCG analysis
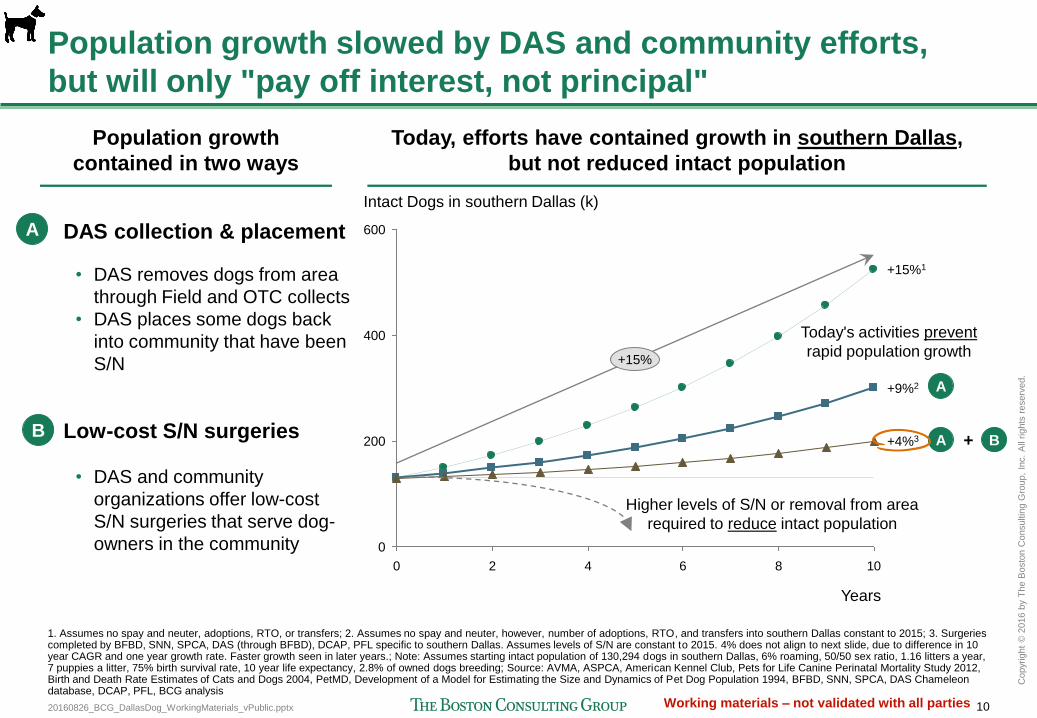
20160826_BCG_DallasDog_WorkingMaterials_vPublic.pptx 10
Copyr
ight
© 2
016 b
y T
he B
osto
n C
onsultin
g G
roup,
Inc.
All
rights
reserv
ed.
Working materials – not validated with all parties
Population growth slowed by DAS and community efforts,
but will only "pay off interest, not principal"
1. Assumes no spay and neuter, adoptions, RTO, or transfers; 2. Assumes no spay and neuter, however, number of adoptions, RTO, and transfers into southern Dallas constant to 2015; 3. Surgeries completed by BFBD, SNN, SPCA, DAS (through BFBD), DCAP, PFL specific to southern Dallas. Assumes levels of S/N are constant to 2015. 4% does not align to next slide, due to difference in 10 year CAGR and one year growth rate. Faster growth seen in later years.; Note: Assumes starting intact population of 130,294 dogs in southern Dallas, 6% roaming, 50/50 sex ratio, 1.16 litters a year, 7 puppies a litter, 75% birth survival rate, 10 year life expectancy, 2.8% of owned dogs breeding; Source: AVMA, ASPCA, American Kennel Club, Pets for Life Canine Perinatal Mortality Study 2012, Birth and Death Rate Estimates of Cats and Dogs 2004, PetMD, Development of a Model for Estimating the Size and Dynamics of Pet Dog Population 1994, BFBD, SNN, SPCA, DAS Chameleon database, DCAP, PFL, BCG analysis
0 2 4 6 8 10
600
400
200
0
+15%
+4%3
+9%2
+15%1
Intact Dogs in southern Dallas (k)
Years
Today, efforts have contained growth in southern Dallas,
but not reduced intact population
Population growth
contained in two ways
A
B
DAS collection & placement
Low-cost S/N surgeries
• DAS removes dogs from area
through Field and OTC collects
• DAS places some dogs back
into community that have been
S/N
• DAS and community
organizations offer low-cost
S/N surgeries that serve dog-
owners in the community
A
A B +
Higher levels of S/N or removal from area
required to reduce intact population
Today's activities prevent
rapid population growth
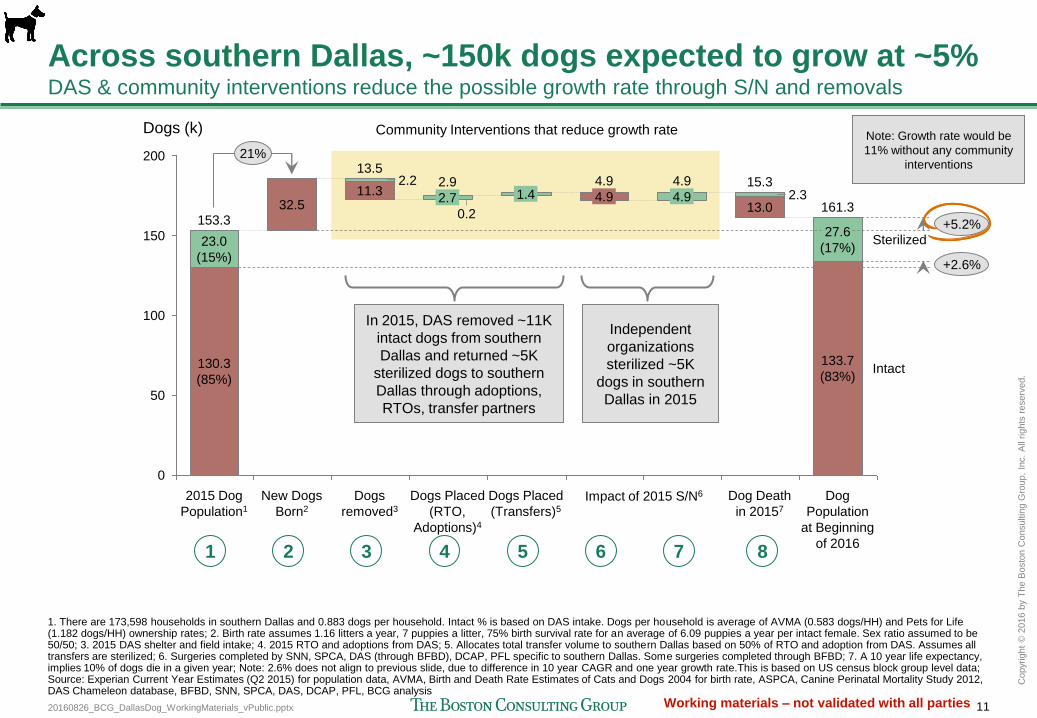
20160826_BCG_DallasDog_WorkingMaterials_vPublic.pptx 11
Copyr
ight
© 2
016 b
y T
he B
osto
n C
onsultin
g G
roup,
Inc.
All
rights
reserv
ed.
Working materials – not validated with all parties
50
150
0
200
100
2015 Dog
Population1
32.5 153.3
130.3
(85%)
23.0
(15%)
New Dogs
Born2
Dogs
removed3
2.7 11.3
2.2
4.9
Dogs Placed
(RTO,
Adoptions)4
4.9 4.9
4.9 2.3
Dog Death
in 20157
133.7
(83%)
15.3
27.6
(17%)
13.0
Dog
Population
at Beginning
of 2016
+2.6%
21%
0.2
Dogs Placed
(Transfers)5
13.5
Sterilized
161.3
+5.2%
1.4
Intact
2.9
Dogs (k) Community Interventions that reduce growth rate
Across southern Dallas, ~150k dogs expected to grow at ~5% DAS & community interventions reduce the possible growth rate through S/N and removals
1. There are 173,598 households in southern Dallas and 0.883 dogs per household. Intact % is based on DAS intake. Dogs per household is average of AVMA (0.583 dogs/HH) and Pets for Life (1.182 dogs/HH) ownership rates; 2. Birth rate assumes 1.16 litters a year, 7 puppies a litter, 75% birth survival rate for an average of 6.09 puppies a year per intact female. Sex ratio assumed to be 50/50; 3. 2015 DAS shelter and field intake; 4. 2015 RTO and adoptions from DAS; 5. Allocates total transfer volume to southern Dallas based on 50% of RTO and adoption from DAS. Assumes all transfers are sterilized; 6. Surgeries completed by SNN, SPCA, DAS (through BFBD), DCAP, PFL specific to southern Dallas. Some surgeries completed through BFBD; 7. A 10 year life expectancy, implies 10% of dogs die in a given year; Note: 2.6% does not align to previous slide, due to difference in 10 year CAGR and one year growth rate.This is based on US census block group level data; Source: Experian Current Year Estimates (Q2 2015) for population data, AVMA, Birth and Death Rate Estimates of Cats and Dogs 2004 for birth rate, ASPCA, Canine Perinatal Mortality Study 2012, DAS Chameleon database, BFBD, SNN, SPCA, DAS, DCAP, PFL, BCG analysis
In 2015, DAS removed ~11K
intact dogs from southern
Dallas and returned ~5K
sterilized dogs to southern
Dallas through adoptions,
RTOs, transfer partners
Independent
organizations
sterilized ~5K
dogs in southern
Dallas in 2015
Note: Growth rate would be
11% without any community
interventions
1 2 3 4 5 6 7 8
Impact of 2015 S/N6

20160826_BCG_DallasDog_WorkingMaterials_vPublic.pptx 12
Copyr
ight
© 2
016 b
y T
he B
osto
n C
onsultin
g G
roup,
Inc.
All
rights
reserv
ed.
Working materials – not validated with all parties
100
150
0
50
Dogs Placed
(Transfers)5
1.2
Dogs Placed
(RTO,
Adoptions)4
2.3
0.2
21%
Dogs
removed3
11.0
9.3 1.7
New Dogs
Born2
24.1
2015 Dog
Population1
115.8
96.6
(83%)
19.2
(17%)
Dogs (k)
120.7
+4.3%
+0.7%
Intact
Sterilized
Dog
Population
at Beginning
of 2016
97.3
(81%)
23.4
(19%)
Dog Death
in 20157
2.1
11.6
9.7 1.9
4.6
4.6
4.6
4.6
In areas targeted for Big Fix low-cost S/N campaigns, growth
slightly slower, but intact population still growing at 1%
Impact of 2015 S/N6
1. There are 131,146 households and 0.883 dogs per household. Intact % is based on DAS intake. Dogs per household is average of AVMA (0.583 dogs/HH) and Pets for Life (1.182 dogs/HH) ownership rates; 2. Birth rate assumes 1.16 litters a year, 7 puppies a litter, 75% birth survival rate for an average of 6.09 puppies a year per intact female. Sex ratio assumed to be 50/50; 3. 2015 DAS shelter and field intake; 4. 2015 RTO and adoptions from DAS; 5. Allocates total transfer volume to BFBD zips based on 50% of RTO and adoption from DAS. Assumes all transfers are sterilized 6. Surgeries completed by SNN, SPCA, DAS (through BFBD), DCAP, PFL specific to BFBD zip codes. Some surgeries completed through BFBD; 7. A 10 year life expectancy, implies 10% of dogs die in a given year; Note: This is based on zip code level data; Source: Experian Current Year Estimates (Q2 2015) for population data, AVMA, Birth and Death Rate Estimates of Cats and Dogs 2004 for birth rate, ASPCA, Canine Perinatal Mortality Study 2012, DAS Chameleon database, BFBD, SNN, SPCA, DAS, DCAP, PFL, BCG analysis
In 2015, DAS removed ~10K
intact dogs from BFBD zips
and returned ~3K sterilized
dogs to BFBD zips through
adoptions, RTOs, transfer
partners
Independent
organizations
sterilized ~5K
dogs in BFBD
zips in 2015
Community Interventions that reduce growth rate
1 2 3 4 5 6 7 8
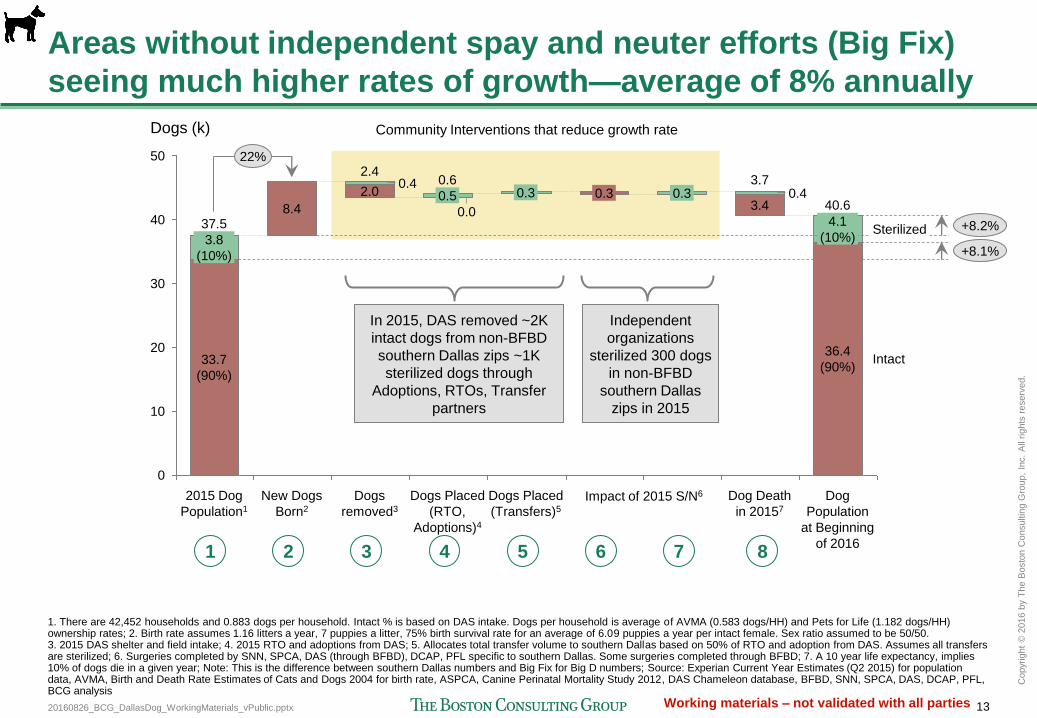
20160826_BCG_DallasDog_WorkingMaterials_vPublic.pptx 13
Copyr
ight
© 2
016 b
y T
he B
osto
n C
onsultin
g G
roup,
Inc.
All
rights
reserv
ed.
Working materials – not validated with all parties
50
40
10
30
20
0
Dogs Placed
(Transfers)5
3.7
+8.1%
Intact
Sterilized
Dog
Population
at Beginning
of 2016
36.4
(90%)
Dogs (k)
4.1
(10%)
Dog Death
in 20157
3.4 0.4 0.3 0.3
22%
40.6
+8.2%
0.3
Dogs Placed
(RTO,
Adoptions)4
0.6
0.0
0.5
Dogs
removed3
2.4
2.0 0.4
New Dogs
Born2
8.4
2015 Dog
Population1
37.5
33.7
(90%)
3.8
(10%)
Areas without independent spay and neuter efforts (Big Fix)
seeing much higher rates of growth—average of 8% annually
1. There are 42,452 households and 0.883 dogs per household. Intact % is based on DAS intake. Dogs per household is average of AVMA (0.583 dogs/HH) and Pets for Life (1.182 dogs/HH) ownership rates; 2. Birth rate assumes 1.16 litters a year, 7 puppies a litter, 75% birth survival rate for an average of 6.09 puppies a year per intact female. Sex ratio assumed to be 50/50. 3. 2015 DAS shelter and field intake; 4. 2015 RTO and adoptions from DAS; 5. Allocates total transfer volume to southern Dallas based on 50% of RTO and adoption from DAS. Assumes all transfers are sterilized; 6. Surgeries completed by SNN, SPCA, DAS (through BFBD), DCAP, PFL specific to southern Dallas. Some surgeries completed through BFBD; 7. A 10 year life expectancy, implies 10% of dogs die in a given year; Note: This is the difference between southern Dallas numbers and Big Fix for Big D numbers; Source: Experian Current Year Estimates (Q2 2015) for population data, AVMA, Birth and Death Rate Estimates of Cats and Dogs 2004 for birth rate, ASPCA, Canine Perinatal Mortality Study 2012, DAS Chameleon database, BFBD, SNN, SPCA, DAS, DCAP, PFL, BCG analysis
1 2 3 4 5 6 7 8
Community Interventions that reduce growth rate
Impact of 2015 S/N6
In 2015, DAS removed ~2K
intact dogs from non-BFBD
southern Dallas zips ~1K
sterilized dogs through
Adoptions, RTOs, Transfer
partners
Independent
organizations
sterilized 300 dogs
in non-BFBD
southern Dallas
zips in 2015
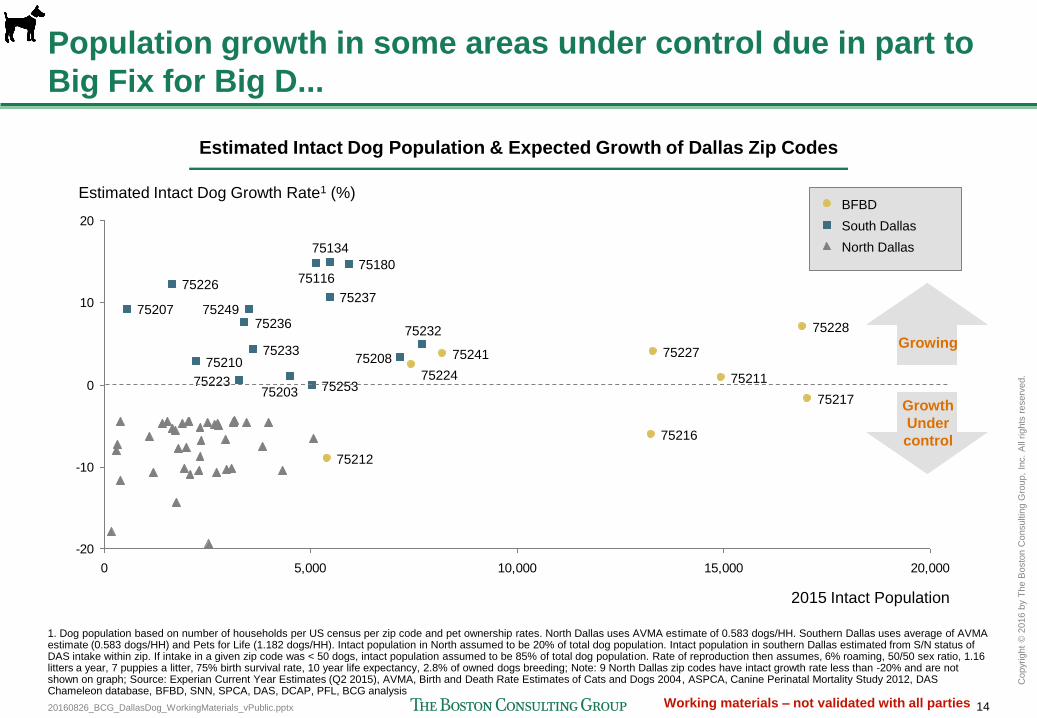
20160826_BCG_DallasDog_WorkingMaterials_vPublic.pptx 14
Copyr
ight
© 2
016 b
y T
he B
osto
n C
onsultin
g G
roup,
Inc.
All
rights
reserv
ed.
Working materials – not validated with all parties
-20
-10
0
10
20
0 5,000 10,000 15,000 20,000
Estimated Intact Dog Growth Rate1 (%)
2015 Intact Population
75253
75249 75237
75236
75233
75232
75226
75223
75210 75208
75207
75203
75180
75134
75116
75241
75228
75227
75224
75217
75216
75212
75211
North Dallas
South Dallas
BFBD
Population growth in some areas under control due in part to
Big Fix for Big D...
1. Dog population based on number of households per US census per zip code and pet ownership rates. North Dallas uses AVMA estimate of 0.583 dogs/HH. Southern Dallas uses average of AVMA estimate (0.583 dogs/HH) and Pets for Life (1.182 dogs/HH). Intact population in North assumed to be 20% of total dog population. Intact population in southern Dallas estimated from S/N status of DAS intake within zip. If intake in a given zip code was < 50 dogs, intact population assumed to be 85% of total dog population. Rate of reproduction then assumes, 6% roaming, 50/50 sex ratio, 1.16 litters a year, 7 puppies a litter, 75% birth survival rate, 10 year life expectancy, 2.8% of owned dogs breeding; Note: 9 North Dallas zip codes have intact growth rate less than -20% and are not shown on graph; Source: Experian Current Year Estimates (Q2 2015), AVMA, Birth and Death Rate Estimates of Cats and Dogs 2004, ASPCA, Canine Perinatal Mortality Study 2012, DAS Chameleon database, BFBD, SNN, SPCA, DAS, DCAP, PFL, BCG analysis
Growing
Growth
Under
control
Estimated Intact Dog Population & Expected Growth of Dallas Zip Codes
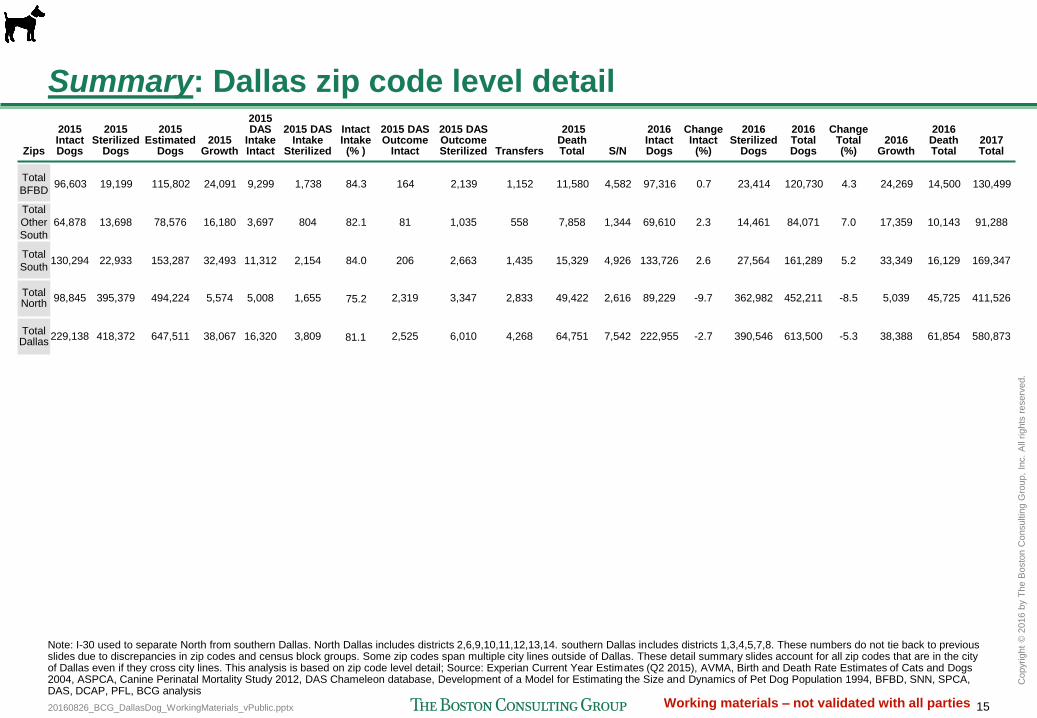
20160826_BCG_DallasDog_WorkingMaterials_vPublic.pptx 15
Copyr
ight
© 2
016 b
y T
he B
osto
n C
onsultin
g G
roup,
Inc.
All
rights
reserv
ed.
Working materials – not validated with all parties
Summary: Dallas zip code level detail
Note: I-30 used to separate North from southern Dallas. North Dallas includes districts 2,6,9,10,11,12,13,14. southern Dallas includes districts 1,3,4,5,7,8. These numbers do not tie back to previous slides due to discrepancies in zip codes and census block groups. Some zip codes span multiple city lines outside of Dallas. These detail summary slides account for all zip codes that are in the city of Dallas even if they cross city lines. This analysis is based on zip code level detail; Source: Experian Current Year Estimates (Q2 2015), AVMA, Birth and Death Rate Estimates of Cats and Dogs 2004, ASPCA, Canine Perinatal Mortality Study 2012, DAS Chameleon database, Development of a Model for Estimating the Size and Dynamics of Pet Dog Population 1994, BFBD, SNN, SPCA, DAS, DCAP, PFL, BCG analysis
Zips
2015 Intact Dogs
2015 Sterilized
Dogs
2015 Estimated
Dogs 2015
Growth
2015 DAS
Intake Intact
2015 DAS Intake
Sterilized
Intact Intake (% )
2015 DAS Outcome
Intact
2015 DAS Outcome Sterilized Transfers
2015 Death Total S/N
2016 Intact Dogs
Change Intact
(%)
2016 Sterilized
Dogs
2016 Total Dogs
Change Total (%)
2016 Growth
2016 Death Total
2017 Total
Total
BFBD 96,603 19,199 115,802 24,091 9,299 1,738 84.3 164 2,139 1,152 11,580 4,582 97,316 0.7 23,414 120,730 4.3 24,269 14,500 130,499
Total
Other
South
64,878 13,698 78,576 16,180 3,697 804 82.1 81 1,035 558 7,858 1,344 69,610 2.3 14,461 84,071 7.0 17,359 10,143 91,288
Total
South 130,294 22,933 153,287 32,493 11,312 2,154 84.0 206 2,663 1,435 15,329 4,926 133,726 2.6 27,564 161,289 5.2 33,349 16,129 169,347
Total North
98,845 395,379 494,224 5,574 5,008 1,655 75.2 2,319 3,347 2,833 49,422 2,616 89,229 -9.7 362,982 452,211 -8.5 5,039 45,725 411,526
Total Dallas
229,138 418,372 647,511 38,067 16,320 3,809 81.1 2,525 6,010 4,268 64,751 7,542 222,955 -2.7 390,546 613,500 -5.3 38,388 61,854 580,873
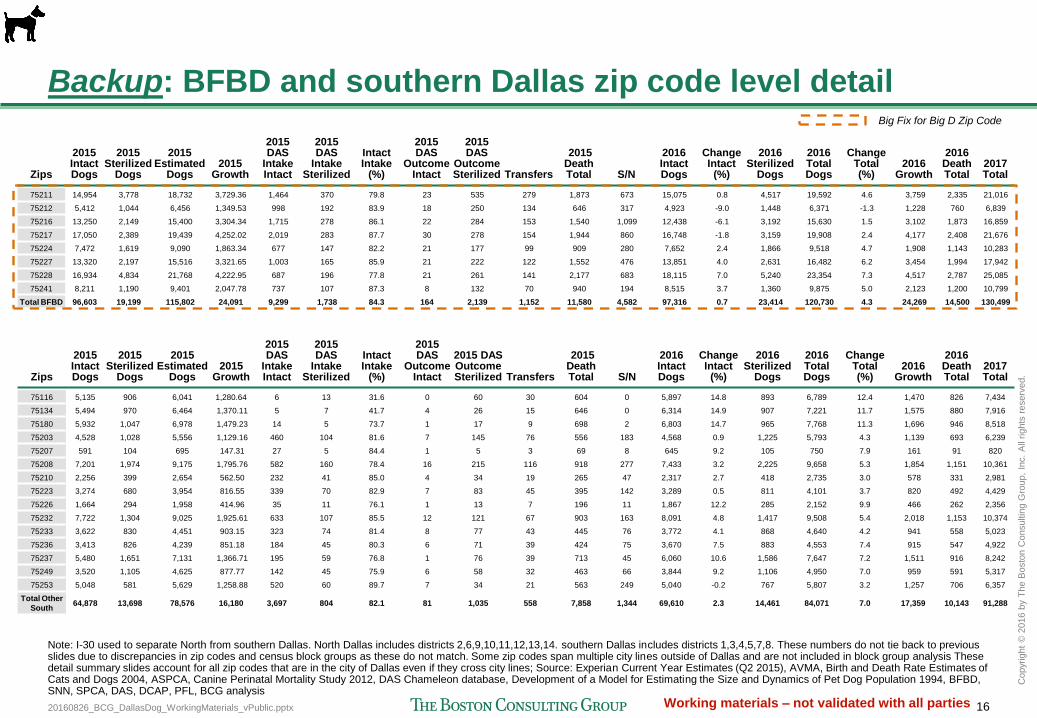
20160826_BCG_DallasDog_WorkingMaterials_vPublic.pptx 16
Copyr
ight
© 2
016 b
y T
he B
osto
n C
onsultin
g G
roup,
Inc.
All
rights
reserv
ed.
Working materials – not validated with all parties
Zips
2015 Intact Dogs
2015 Sterilized
Dogs
2015 Estimated
Dogs 2015
Growth
2015 DAS
Intake Intact
2015 DAS
Intake Sterilized
Intact Intake
(%)
2015 DAS
Outcome Intact
2015 DAS
Outcome Sterilized Transfers
2015 Death Total S/N
2016 Intact Dogs
Change Intact
(%)
2016 Sterilized
Dogs
2016 Total Dogs
Change Total (%)
2016 Growth
2016 Death Total
2017 Total
75211 14,954 3,778 18,732 3,729.36 1,464 370 79.8 23 535 279 1,873 673 15,075 0.8 4,517 19,592 4.6 3,759 2,335 21,016
75212 5,412 1,044 6,456 1,349.53 998 192 83.9 18 250 134 646 317 4,923 -9.0 1,448 6,371 -1.3 1,228 760 6,839
75216 13,250 2,149 15,400 3,304.34 1,715 278 86.1 22 284 153 1,540 1,099 12,438 -6.1 3,192 15,630 1.5 3,102 1,873 16,859
75217 17,050 2,389 19,439 4,252.02 2,019 283 87.7 30 278 154 1,944 860 16,748 -1.8 3,159 19,908 2.4 4,177 2,408 21,676
75224 7,472 1,619 9,090 1,863.34 677 147 82.2 21 177 99 909 280 7,652 2.4 1,866 9,518 4.7 1,908 1,143 10,283
75227 13,320 2,197 15,516 3,321.65 1,003 165 85.9 21 222 122 1,552 476 13,851 4.0 2,631 16,482 6.2 3,454 1,994 17,942
75228 16,934 4,834 21,768 4,222.95 687 196 77.8 21 261 141 2,177 683 18,115 7.0 5,240 23,354 7.3 4,517 2,787 25,085
75241 8,211 1,190 9,401 2,047.78 737 107 87.3 8 132 70 940 194 8,515 3.7 1,360 9,875 5.0 2,123 1,200 10,799
Total BFBD 96,603 19,199 115,802 24,091 9,299 1,738 84.3 164 2,139 1,152 11,580 4,582 97,316 0.7 23,414 120,730 4.3 24,269 14,500 130,499
Backup: BFBD and southern Dallas zip code level detail
Zips
2015 Intact Dogs
2015 Sterilized
Dogs
2015 Estimated
Dogs 2015
Growth
2015 DAS
Intake Intact
2015 DAS
Intake Sterilized
Intact Intake
(%)
2015 DAS
Outcome Intact
2015 DAS Outcome Sterilized Transfers
2015 Death Total S/N
2016 Intact Dogs
Change Intact
(%)
2016 Sterilized
Dogs
2016 Total Dogs
Change Total (%)
2016 Growth
2016 Death Total
2017 Total
75116 5,135 906 6,041 1,280.64 6 13 31.6 0 60 30 604 0 5,897 14.8 893 6,789 12.4 1,470 826 7,434
75134 5,494 970 6,464 1,370.11 5 7 41.7 4 26 15 646 0 6,314 14.9 907 7,221 11.7 1,575 880 7,916
75180 5,932 1,047 6,978 1,479.23 14 5 73.7 1 17 9 698 2 6,803 14.7 965 7,768 11.3 1,696 946 8,518
75203 4,528 1,028 5,556 1,129.16 460 104 81.6 7 145 76 556 183 4,568 0.9 1,225 5,793 4.3 1,139 693 6,239
75207 591 104 695 147.31 27 5 84.4 1 5 3 69 8 645 9.2 105 750 7.9 161 91 820
75208 7,201 1,974 9,175 1,795.76 582 160 78.4 16 215 116 918 277 7,433 3.2 2,225 9,658 5.3 1,854 1,151 10,361
75210 2,256 399 2,654 562.50 232 41 85.0 4 34 19 265 47 2,317 2.7 418 2,735 3.0 578 331 2,981
75223 3,274 680 3,954 816.55 339 70 82.9 7 83 45 395 142 3,289 0.5 811 4,101 3.7 820 492 4,429
75226 1,664 294 1,958 414.96 35 11 76.1 1 13 7 196 11 1,867 12.2 285 2,152 9.9 466 262 2,356
75232 7,722 1,304 9,025 1,925.61 633 107 85.5 12 121 67 903 163 8,091 4.8 1,417 9,508 5.4 2,018 1,153 10,374
75233 3,622 830 4,451 903.15 323 74 81.4 8 77 43 445 76 3,772 4.1 868 4,640 4.2 941 558 5,023
75236 3,413 826 4,239 851.18 184 45 80.3 6 71 39 424 75 3,670 7.5 883 4,553 7.4 915 547 4,922
75237 5,480 1,651 7,131 1,366.71 195 59 76.8 1 76 39 713 45 6,060 10.6 1,586 7,647 7.2 1,511 916 8,242
75249 3,520 1,105 4,625 877.77 142 45 75.9 6 58 32 463 66 3,844 9.2 1,106 4,950 7.0 959 591 5,317
75253 5,048 581 5,629 1,258.88 520 60 89.7 7 34 21 563 249 5,040 -0.2 767 5,807 3.2 1,257 706 6,357
Total Other
South 64,878 13,698 78,576 16,180 3,697 804 82.1 81 1,035 558 7,858 1,344 69,610 2.3 14,461 84,071 7.0 17,359 10,143 91,288
Note: I-30 used to separate North from southern Dallas. North Dallas includes districts 2,6,9,10,11,12,13,14. southern Dallas includes districts 1,3,4,5,7,8. These numbers do not tie back to previous slides due to discrepancies in zip codes and census block groups as these do not match. Some zip codes span multiple city lines outside of Dallas and are not included in block group analysis These detail summary slides account for all zip codes that are in the city of Dallas even if they cross city lines; Source: Experian Current Year Estimates (Q2 2015), AVMA, Birth and Death Rate Estimates of Cats and Dogs 2004, ASPCA, Canine Perinatal Mortality Study 2012, DAS Chameleon database, Development of a Model for Estimating the Size and Dynamics of Pet Dog Population 1994, BFBD, SNN, SPCA, DAS, DCAP, PFL, BCG analysis
Big Fix for Big D Zip Code
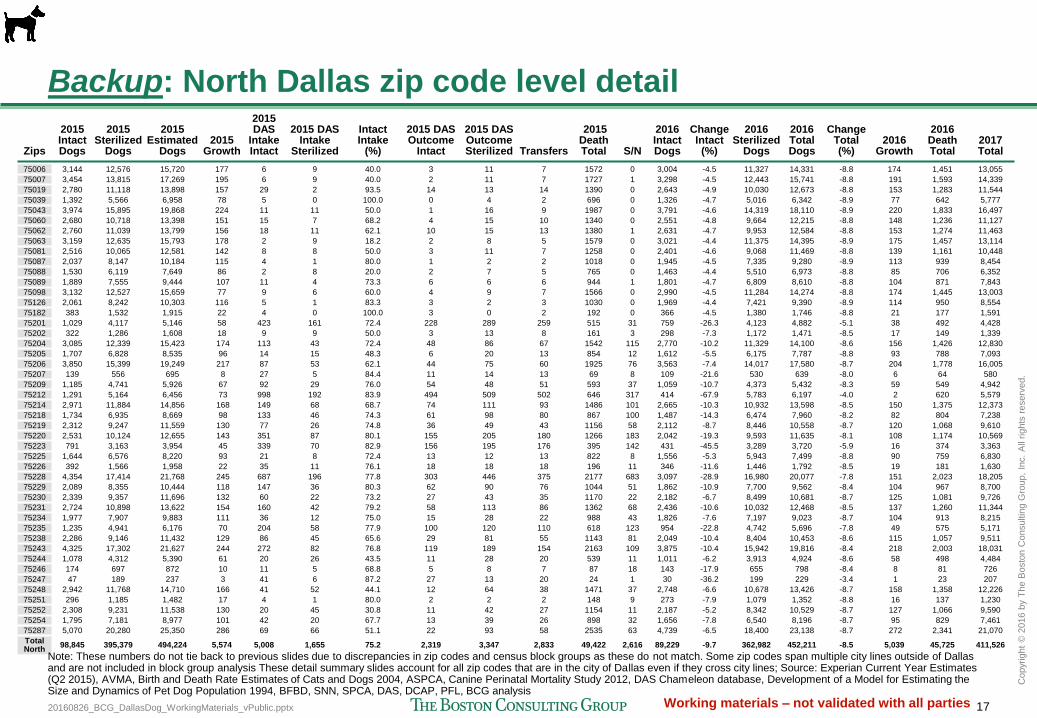
20160826_BCG_DallasDog_WorkingMaterials_vPublic.pptx 17
Copyr
ight
© 2
016 b
y T
he B
osto
n C
onsultin
g G
roup,
Inc.
All
rights
reserv
ed.
Working materials – not validated with all parties
Zips
2015 Intact Dogs
2015 Sterilized
Dogs
2015 Estimated
Dogs 2015
Growth
2015 DAS
Intake Intact
2015 DAS Intake
Sterilized
Intact Intake
(%)
2015 DAS Outcome
Intact
2015 DAS Outcome Sterilized Transfers
2015 Death Total S/N
2016 Intact Dogs
Change Intact (%)
2016 Sterilized
Dogs
2016 Total Dogs
Change Total (%)
2016 Growth
2016 Death Total
2017 Total
75006 3,144 12,576 15,720 177 6 9 40.0 3 11 7 1572 0 3,004 -4.5 11,327 14,331 -8.8 174 1,451 13,055
75007 3,454 13,815 17,269 195 6 9 40.0 2 11 7 1727 1 3,298 -4.5 12,443 15,741 -8.8 191 1,593 14,339
75019 2,780 11,118 13,898 157 29 2 93.5 14 13 14 1390 0 2,643 -4.9 10,030 12,673 -8.8 153 1,283 11,544
75039 1,392 5,566 6,958 78 5 0 100.0 0 4 2 696 0 1,326 -4.7 5,016 6,342 -8.9 77 642 5,777
75043 3,974 15,895 19,868 224 11 11 50.0 1 16 9 1987 0 3,791 -4.6 14,319 18,110 -8.9 220 1,833 16,497
75060 2,680 10,718 13,398 151 15 7 68.2 4 15 10 1340 0 2,551 -4.8 9,664 12,215 -8.8 148 1,236 11,127
75062 2,760 11,039 13,799 156 18 11 62.1 10 15 13 1380 1 2,631 -4.7 9,953 12,584 -8.8 153 1,274 11,463
75063 3,159 12,635 15,793 178 2 9 18.2 2 8 5 1579 0 3,021 -4.4 11,375 14,395 -8.9 175 1,457 13,114
75081 2,516 10,065 12,581 142 8 8 50.0 3 11 7 1258 0 2,401 -4.6 9,068 11,469 -8.8 139 1,161 10,448
75087 2,037 8,147 10,184 115 4 1 80.0 1 2 2 1018 0 1,945 -4.5 7,335 9,280 -8.9 113 939 8,454
75088 1,530 6,119 7,649 86 2 8 20.0 2 7 5 765 0 1,463 -4.4 5,510 6,973 -8.8 85 706 6,352
75089 1,889 7,555 9,444 107 11 4 73.3 6 6 6 944 1 1,801 -4.7 6,809 8,610 -8.8 104 871 7,843
75098 3,132 12,527 15,659 77 9 6 60.0 4 9 7 1566 0 2,990 -4.5 11,284 14,274 -8.8 174 1,445 13,003
75126 2,061 8,242 10,303 116 5 1 83.3 3 2 3 1030 0 1,969 -4.4 7,421 9,390 -8.9 114 950 8,554
75182 383 1,532 1,915 22 4 0 100.0 3 0 2 192 0 366 -4.5 1,380 1,746 -8.8 21 177 1,591
75201 1,029 4,117 5,146 58 423 161 72.4 228 289 259 515 31 759 -26.3 4,123 4,882 -5.1 38 492 4,428
75202 322 1,286 1,608 18 9 9 50.0 3 13 8 161 3 298 -7.3 1,172 1,471 -8.5 17 149 1,339
75204 3,085 12,339 15,423 174 113 43 72.4 48 86 67 1542 115 2,770 -10.2 11,329 14,100 -8.6 156 1,426 12,830
75205 1,707 6,828 8,535 96 14 15 48.3 6 20 13 854 12 1,612 -5.5 6,175 7,787 -8.8 93 788 7,093
75206 3,850 15,399 19,249 217 87 53 62.1 44 75 60 1925 76 3,563 -7.4 14,017 17,580 -8.7 204 1,778 16,005
75207 139 556 695 8 27 5 84.4 11 14 13 69 8 109 -21.6 530 639 -8.0 6 64 580
75209 1,185 4,741 5,926 67 92 29 76.0 54 48 51 593 37 1,059 -10.7 4,373 5,432 -8.3 59 549 4,942
75212 1,291 5,164 6,456 73 998 192 83.9 494 509 502 646 317 414 -67.9 5,783 6,197 -4.0 2 620 5,579
75214 2,971 11,884 14,856 168 149 68 68.7 74 111 93 1486 101 2,665 -10.3 10,932 13,598 -8.5 150 1,375 12,373
75218 1,734 6,935 8,669 98 133 46 74.3 61 98 80 867 100 1,487 -14.3 6,474 7,960 -8.2 82 804 7,238
75219 2,312 9,247 11,559 130 77 26 74.8 36 49 43 1156 58 2,112 -8.7 8,446 10,558 -8.7 120 1,068 9,610
75220 2,531 10,124 12,655 143 351 87 80.1 155 205 180 1266 183 2,042 -19.3 9,593 11,635 -8.1 108 1,174 10,569
75223 791 3,163 3,954 45 339 70 82.9 156 195 176 395 142 431 -45.5 3,289 3,720 -5.9 16 374 3,363
75225 1,644 6,576 8,220 93 21 8 72.4 13 12 13 822 8 1,556 -5.3 5,943 7,499 -8.8 90 759 6,830
75226 392 1,566 1,958 22 35 11 76.1 18 18 18 196 11 346 -11.6 1,446 1,792 -8.5 19 181 1,630
75228 4,354 17,414 21,768 245 687 196 77.8 303 446 375 2177 683 3,097 -28.9 16,980 20,077 -7.8 151 2,023 18,205
75229 2,089 8,355 10,444 118 147 36 80.3 62 90 76 1044 51 1,862 -10.9 7,700 9,562 -8.4 104 967 8,700
75230 2,339 9,357 11,696 132 60 22 73.2 27 43 35 1170 22 2,182 -6.7 8,499 10,681 -8.7 125 1,081 9,726
75231 2,724 10,898 13,622 154 160 42 79.2 58 113 86 1362 68 2,436 -10.6 10,032 12,468 -8.5 137 1,260 11,344
75234 1,977 7,907 9,883 111 36 12 75.0 15 28 22 988 43 1,826 -7.6 7,197 9,023 -8.7 104 913 8,215
75235 1,235 4,941 6,176 70 204 58 77.9 100 120 110 618 123 954 -22.8 4,742 5,696 -7.8 49 575 5,171
75238 2,286 9,146 11,432 129 86 45 65.6 29 81 55 1143 81 2,049 -10.4 8,404 10,453 -8.6 115 1,057 9,511
75243 4,325 17,302 21,627 244 272 82 76.8 119 189 154 2163 109 3,875 -10.4 15,942 19,816 -8.4 218 2,003 18,031
75244 1,078 4,312 5,390 61 20 26 43.5 11 28 20 539 11 1,011 -6.2 3,913 4,924 -8.6 58 498 4,484
75246 174 697 872 10 11 5 68.8 5 8 7 87 18 143 -17.9 655 798 -8.4 8 81 726
75247 47 189 237 3 41 6 87.2 27 13 20 24 1 30 -36.2 199 229 -3.4 1 23 207
75248 2,942 11,768 14,710 166 41 52 44.1 12 64 38 1471 37 2,748 -6.6 10,678 13,426 -8.7 158 1,358 12,226
75251 296 1,185 1,482 17 4 1 80.0 2 2 2 148 9 273 -7.9 1,079 1,352 -8.8 16 137 1,230
75252 2,308 9,231 11,538 130 20 45 30.8 11 42 27 1154 11 2,187 -5.2 8,342 10,529 -8.7 127 1,066 9,590
75254 1,795 7,181 8,977 101 42 20 67.7 13 39 26 898 32 1,656 -7.8 6,540 8,196 -8.7 95 829 7,461
75287 5,070 20,280 25,350 286 69 66 51.1 22 93 58 2535 63 4,739 -6.5 18,400 23,138 -8.7 272 2,341 21,070
Total North
98,845 395,379 494,224 5,574 5,008 1,655 75.2 2,319 3,347 2,833 49,422 2,616 89,229 -9.7 362,982 452,211 -8.5 5,039 45,725 411,526
Backup: North Dallas zip code level detail
Note: These numbers do not tie back to previous slides due to discrepancies in zip codes and census block groups as these do not match. Some zip codes span multiple city lines outside of Dallas and are not included in block group analysis These detail summary slides account for all zip codes that are in the city of Dallas even if they cross city lines; Source: Experian Current Year Estimates (Q2 2015), AVMA, Birth and Death Rate Estimates of Cats and Dogs 2004, ASPCA, Canine Perinatal Mortality Study 2012, DAS Chameleon database, Development of a Model for Estimating the Size and Dynamics of Pet Dog Population 1994, BFBD, SNN, SPCA, DAS, DCAP, PFL, BCG analysis
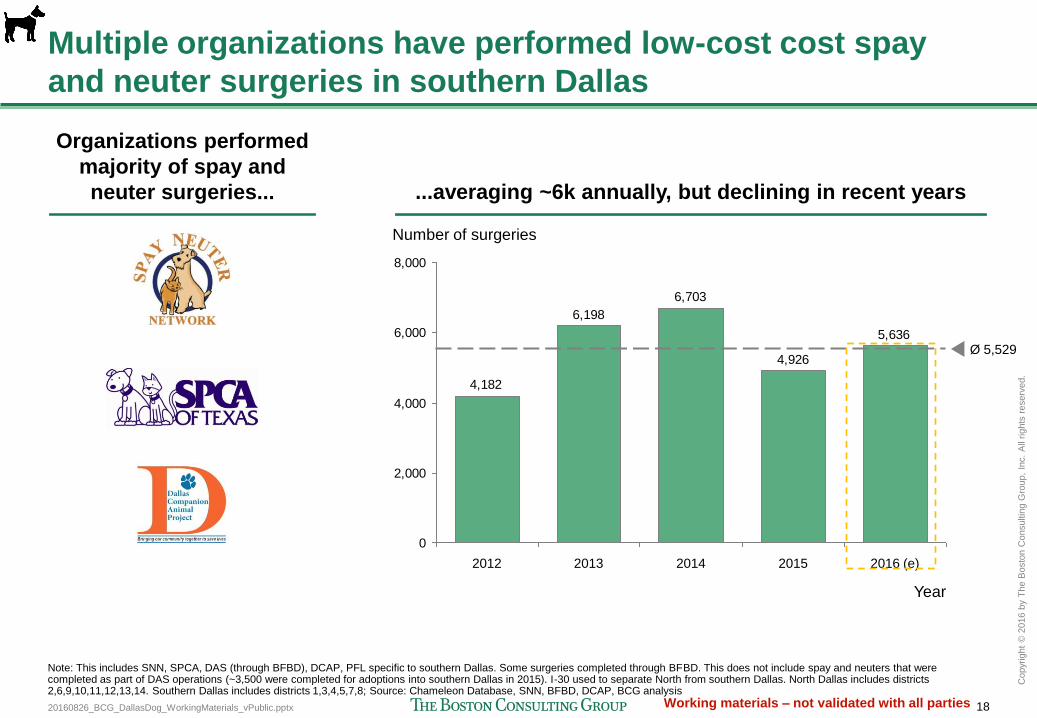
20160826_BCG_DallasDog_WorkingMaterials_vPublic.pptx 18
Copyr
ight
© 2
016 b
y T
he B
osto
n C
onsultin
g G
roup,
Inc.
All
rights
reserv
ed.
Working materials – not validated with all parties
Note: This includes SNN, SPCA, DAS (through BFBD), DCAP, PFL specific to southern Dallas. Some surgeries completed through BFBD. This does not include spay and neuters that were completed as part of DAS operations (~3,500 were completed for adoptions into southern Dallas in 2015). I-30 used to separate North from southern Dallas. North Dallas includes districts 2,6,9,10,11,12,13,14. Southern Dallas includes districts 1,3,4,5,7,8; Source: Chameleon Database, SNN, BFBD, DCAP, BCG analysis
5,636
4,926
6,703
6,198
4,182
0
2,000
4,000
6,000
8,000
Year
Ø 5,529
2016 (e) 2015 2012 2014 2013
Number of surgeries
Multiple organizations have performed low-cost cost spay
and neuter surgeries in southern Dallas
Organizations performed
majority of spay and
neuter surgeries... ...averaging ~6k annually, but declining in recent years
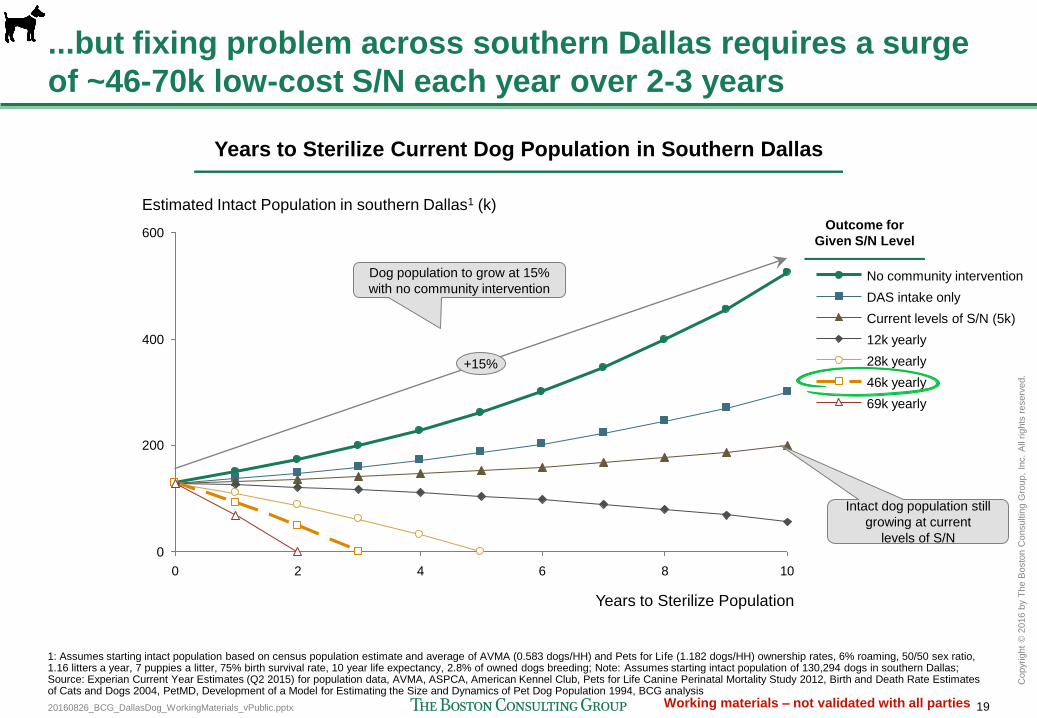
20160826_BCG_DallasDog_WorkingMaterials_vPublic.pptx 19
Copyr
ight
© 2
016 b
y T
he B
osto
n C
onsultin
g G
roup,
Inc.
All
rights
reserv
ed.
Working materials – not validated with all parties
...but fixing problem across southern Dallas requires a surge
of ~46-70k low-cost S/N each year over 2-3 years
1: Assumes starting intact population based on census population estimate and average of AVMA (0.583 dogs/HH) and Pets for Life (1.182 dogs/HH) ownership rates, 6% roaming, 50/50 sex ratio, 1.16 litters a year, 7 puppies a litter, 75% birth survival rate, 10 year life expectancy, 2.8% of owned dogs breeding; Note: Assumes starting intact population of 130,294 dogs in southern Dallas; Source: Experian Current Year Estimates (Q2 2015) for population data, AVMA, ASPCA, American Kennel Club, Pets for Life Canine Perinatal Mortality Study 2012, Birth and Death Rate Estimates of Cats and Dogs 2004, PetMD, Development of a Model for Estimating the Size and Dynamics of Pet Dog Population 1994, BCG analysis
0 2 4 6 8 10
600
400
200
0
Estimated Intact Population in southern Dallas1 (k)
Years to Sterilize Population
+15%
Intact dog population still
growing at current
levels of S/N
Years to Sterilize Current Dog Population in Southern Dallas
46k yearly
69k yearly
28k yearly
12k yearly
Current levels of S/N (5k)
DAS intake only
No community intervention Dog population to grow at 15%
with no community intervention
Outcome for
Given S/N Level
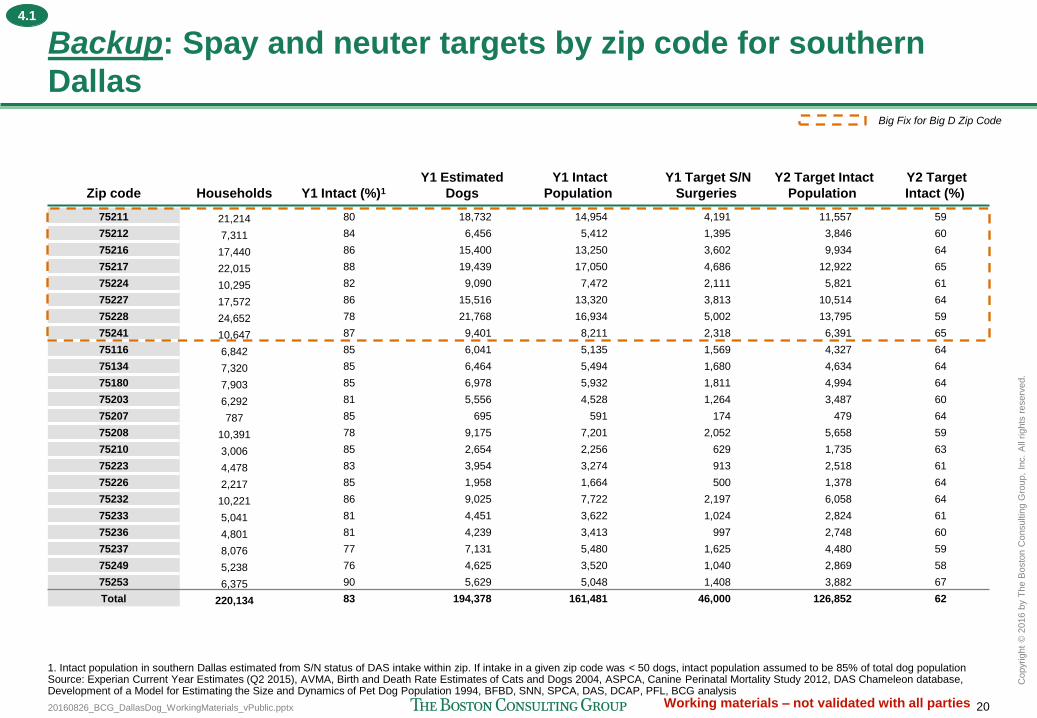
20160826_BCG_DallasDog_WorkingMaterials_vPublic.pptx 20
Copyr
ight
© 2
016 b
y T
he B
osto
n C
onsultin
g G
roup,
Inc.
All
rights
reserv
ed.
Working materials – not validated with all parties
Zip code Households Y1 Intact (%)1
Y1 Estimated
Dogs
Y1 Intact
Population
Y1 Target S/N
Surgeries
Y2 Target Intact
Population
Y2 Target
Intact (%)
75211 21,214 80 18,732 14,954 4,191 11,557 59
75212 7,311 84 6,456 5,412 1,395 3,846 60
75216 17,440 86 15,400 13,250 3,602 9,934 64
75217 22,015 88 19,439 17,050 4,686 12,922 65
75224 10,295 82 9,090 7,472 2,111 5,821 61
75227 17,572 86 15,516 13,320 3,813 10,514 64
75228 24,652 78 21,768 16,934 5,002 13,795 59
75241 10,647 87 9,401 8,211 2,318 6,391 65
75116 6,842 85 6,041 5,135 1,569 4,327 64
75134 7,320 85 6,464 5,494 1,680 4,634 64
75180 7,903 85 6,978 5,932 1,811 4,994 64
75203 6,292 81 5,556 4,528 1,264 3,487 60
75207 787 85 695 591 174 479 64
75208 10,391 78 9,175 7,201 2,052 5,658 59
75210 3,006 85 2,654 2,256 629 1,735 63
75223 4,478 83 3,954 3,274 913 2,518 61
75226 2,217 85 1,958 1,664 500 1,378 64
75232 10,221 86 9,025 7,722 2,197 6,058 64
75233 5,041 81 4,451 3,622 1,024 2,824 61
75236 4,801 81 4,239 3,413 997 2,748 60
75237 8,076 77 7,131 5,480 1,625 4,480 59
75249 5,238 76 4,625 3,520 1,040 2,869 58
75253 6,375 90 5,629 5,048 1,408 3,882 67
Total 220,134 83 194,378 161,481 46,000 126,852 62
Backup: Spay and neuter targets by zip code for southern
Dallas
1. Intact population in southern Dallas estimated from S/N status of DAS intake within zip. If intake in a given zip code was < 50 dogs, intact population assumed to be 85% of total dog population Source: Experian Current Year Estimates (Q2 2015), AVMA, Birth and Death Rate Estimates of Cats and Dogs 2004, ASPCA, Canine Perinatal Mortality Study 2012, DAS Chameleon database, Development of a Model for Estimating the Size and Dynamics of Pet Dog Population 1994, BFBD, SNN, SPCA, DAS, DCAP, PFL, BCG analysis
Big Fix for Big D Zip Code
4.1
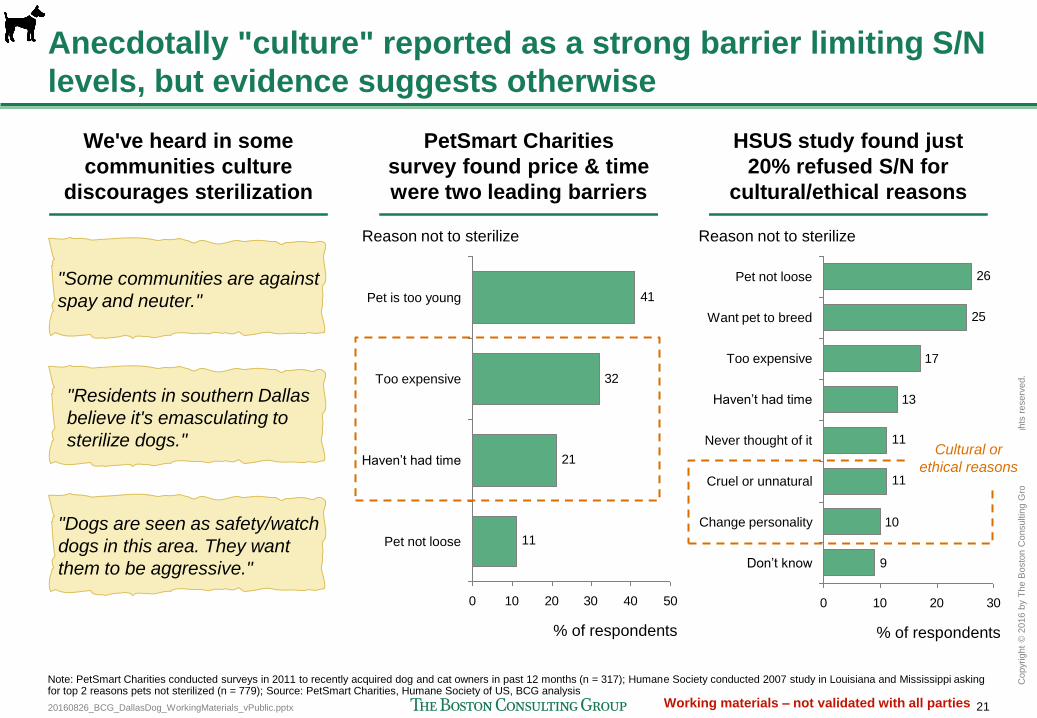
20160826_BCG_DallasDog_WorkingMaterials_vPublic.pptx 21
Copyr
ight
© 2
016 b
y T
he B
osto
n C
onsultin
g G
roup,
Inc.
All
rights
reserv
ed.
Working materials – not validated with all parties
Anecdotally "culture" reported as a strong barrier limiting S/N
levels, but evidence suggests otherwise
We've heard in some
communities culture
discourages sterilization
PetSmart Charities
survey found price & time
were two leading barriers
HSUS study found just
20% refused S/N for
cultural/ethical reasons
"Some communities are against
spay and neuter."
"Residents in southern Dallas
believe it's emasculating to
sterilize dogs."
"Dogs are seen as safety/watch
dogs in this area. They want
them to be aggressive."
11
21
32
41
0 10 20 30 40 50
% of respondents
Pet not loose
Reason not to sterilize
Haven’t had time
Too expensive
Pet is too young
9
10
11
11
13
17
25
26
0 10 20 30
Too expensive
Haven’t had time
Never thought of it
Cruel or unnatural
Change personality
Don’t know
Reason not to sterilize
Pet not loose
Want pet to breed
% of respondents
Cultural or
ethical reasons
Note: PetSmart Charities conducted surveys in 2011 to recently acquired dog and cat owners in past 12 months (n = 317); Humane Society conducted 2007 study in Louisiana and Mississippi asking for top 2 reasons pets not sterilized (n = 779); Source: PetSmart Charities, Humane Society of US, BCG analysis
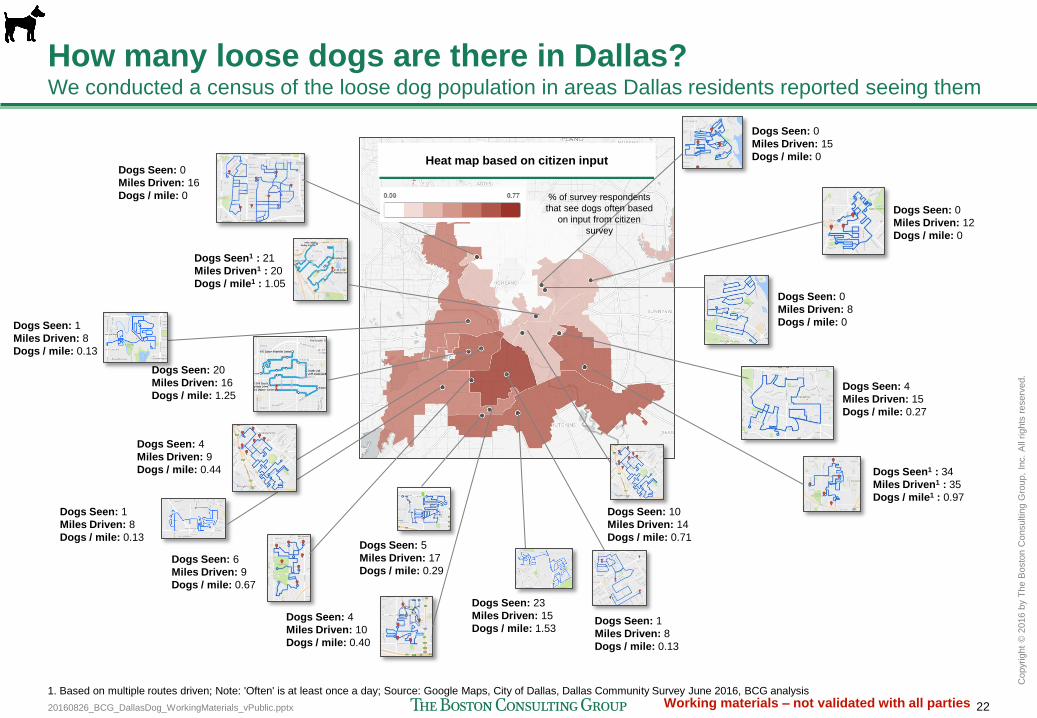
20160826_BCG_DallasDog_WorkingMaterials_vPublic.pptx 22
Copyr
ight
© 2
016 b
y T
he B
osto
n C
onsultin
g G
roup,
Inc.
All
rights
reserv
ed.
Working materials – not validated with all parties 1. Based on multiple routes driven; Note: 'Often' is at least once a day; Source: Google Maps, City of Dallas, Dallas Community Survey June 2016, BCG analysis
How many loose dogs are there in Dallas? We conducted a census of the loose dog population in areas Dallas residents reported seeing them
Dogs Seen: 0
Miles Driven: 15
Dogs / mile: 0
Dogs Seen: 0
Miles Driven: 16
Dogs / mile: 0
Dogs Seen1 : 21
Miles Driven1 : 20
Dogs / mile1 : 1.05
Dogs Seen: 0
Miles Driven: 12
Dogs / mile: 0
Dogs Seen: 0
Miles Driven: 8
Dogs / mile: 0
Dogs Seen: 1
Miles Driven: 8
Dogs / mile: 0.13
Dogs Seen: 4
Miles Driven: 15
Dogs / mile: 0.27
Dogs Seen1 : 34
Miles Driven1 : 35
Dogs / mile1 : 0.97
Dogs Seen: 10
Miles Driven: 14
Dogs / mile: 0.71
Dogs Seen: 23
Miles Driven: 15
Dogs / mile: 1.53
Dogs Seen: 4
Miles Driven: 9
Dogs / mile: 0.44
Dogs Seen: 20
Miles Driven: 16
Dogs / mile: 1.25
Dogs Seen: 6
Miles Driven: 9
Dogs / mile: 0.67
Dogs Seen: 5
Miles Driven: 17
Dogs / mile: 0.29
Dogs Seen: 4
Miles Driven: 10
Dogs / mile: 0.40
Dogs Seen: 1
Miles Driven: 8
Dogs / mile: 0.13
Dogs Seen: 1
Miles Driven: 8
Dogs / mile: 0.13
Heat map based on citizen input
% of survey respondents
that see dogs often based
on input from citizen
survey
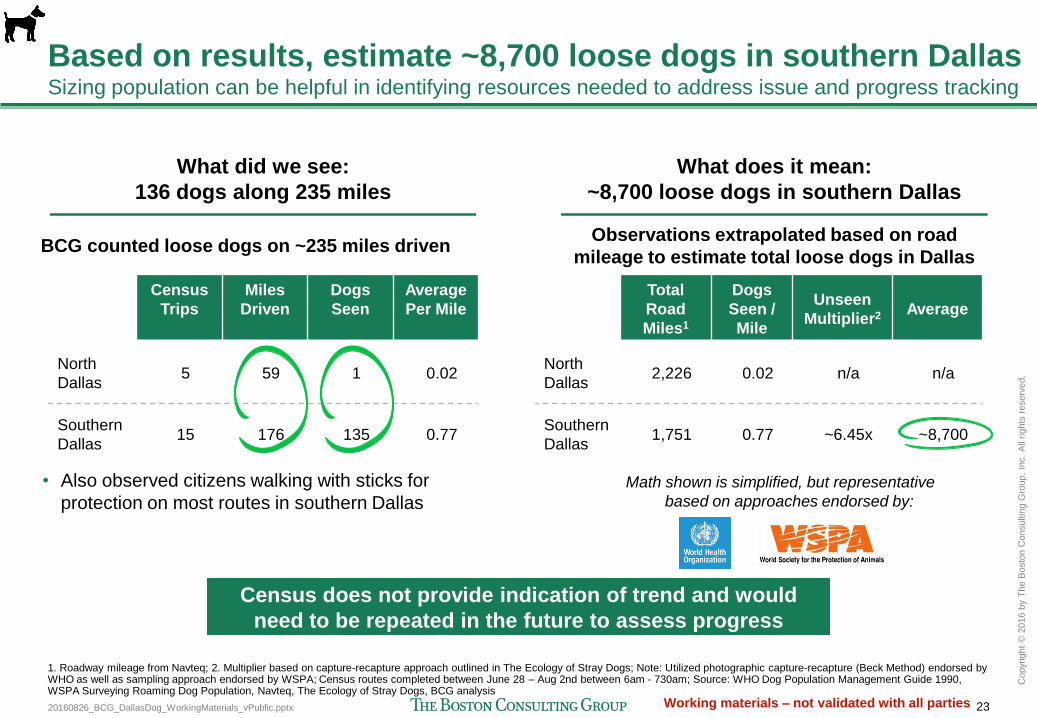
20160826_BCG_DallasDog_WorkingMaterials_vPublic.pptx 23
Copyr
ight
© 2
016 b
y T
he B
osto
n C
onsultin
g G
roup,
Inc.
All
rights
reserv
ed.
Working materials – not validated with all parties
Based on results, estimate ~8,700 loose dogs in southern Dallas Sizing population can be helpful in identifying resources needed to address issue and progress tracking
1. Roadway mileage from Navteq; 2. Multiplier based on capture-recapture approach outlined in The Ecology of Stray Dogs; Note: Utilized photographic capture-recapture (Beck Method) endorsed by WHO as well as sampling approach endorsed by WSPA; Census routes completed between June 28 – Aug 2nd between 6am - 730am; Source: WHO Dog Population Management Guide 1990, WSPA Surveying Roaming Dog Population, Navteq, The Ecology of Stray Dogs, BCG analysis
What did we see:
136 dogs along 235 miles
BCG counted loose dogs on ~235 miles driven
• Also observed citizens walking with sticks for
protection on most routes in southern Dallas
What does it mean:
~8,700 loose dogs in southern Dallas
Census
Trips
Miles
Driven
Dogs
Seen
Average
Per Mile
North
Dallas 5 59 1 0.02
Southern
Dallas 15 176 135 0.77
Observations extrapolated based on road
mileage to estimate total loose dogs in Dallas
Math shown is simplified, but representative
based on approaches endorsed by:
Total
Road
Miles1
Dogs
Seen /
Mile
Unseen
Multiplier2 Average
North
Dallas 2,226 0.02 n/a n/a
Southern
Dallas 1,751 0.77 ~6.45x ~8,700
Census does not provide indication of trend and would
need to be repeated in the future to assess progress

20160826_BCG_DallasDog_WorkingMaterials_vPublic.pptx 24
Copyr
ight
© 2
016 b
y T
he B
osto
n C
onsultin
g G
roup,
Inc.
All
rights
reserv
ed.
Working materials – not validated with all parties
Detail: Loose dogs spotted during census were of various
sizes and breeds—most appeared healthy and owned
Source: BCG Dog Census June 2016, BCG analysis
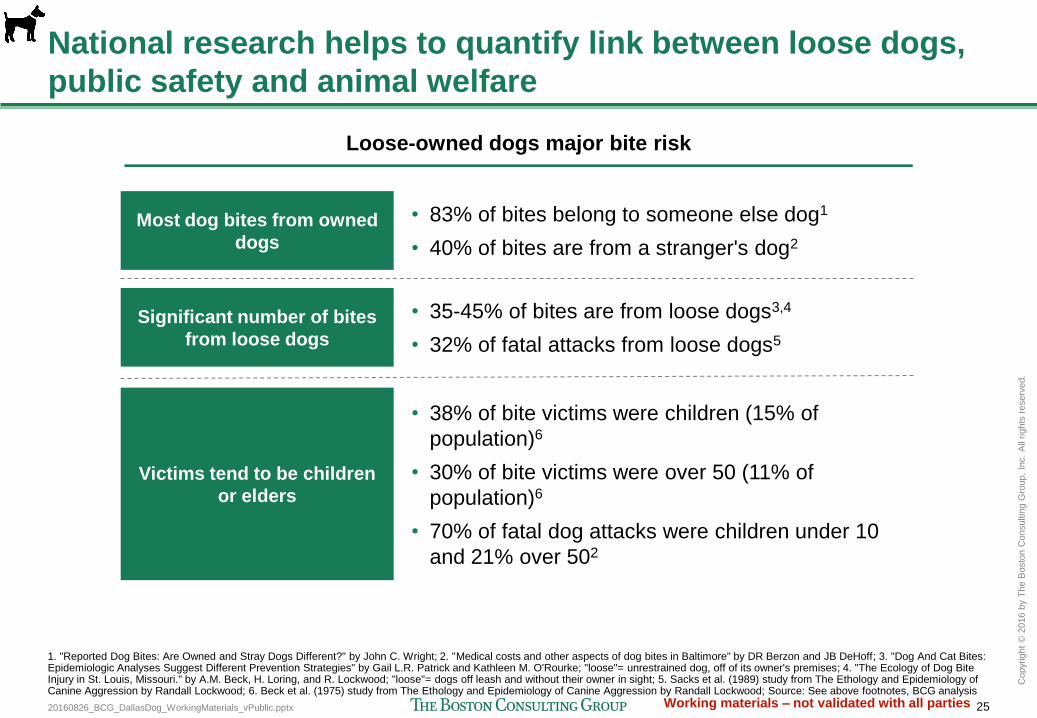
20160826_BCG_DallasDog_WorkingMaterials_vPublic.pptx 25
Copyr
ight
© 2
016 b
y T
he B
osto
n C
onsultin
g G
roup,
Inc.
All
rights
reserv
ed.
Working materials – not validated with all parties
National research helps to quantify link between loose dogs,
public safety and animal welfare
Loose-owned dogs major bite risk
• 83% of bites belong to someone else dog1
• 40% of bites are from a stranger's dog2
1. "Reported Dog Bites: Are Owned and Stray Dogs Different?" by John C. Wright; 2. "Medical costs and other aspects of dog bites in Baltimore" by DR Berzon and JB DeHoff; 3. "Dog And Cat Bites: Epidemiologic Analyses Suggest Different Prevention Strategies" by Gail L.R. Patrick and Kathleen M. O'Rourke; "loose"= unrestrained dog, off of its owner's premises; 4. "The Ecology of Dog Bite Injury in St. Louis, Missouri." by A.M. Beck, H. Loring, and R. Lockwood; "loose"= dogs off leash and without their owner in sight; 5. Sacks et al. (1989) study from The Ethology and Epidemiology of Canine Aggression by Randall Lockwood; 6. Beck et al. (1975) study from The Ethology and Epidemiology of Canine Aggression by Randall Lockwood; Source: See above footnotes, BCG analysis
• 35-45% of bites are from loose dogs3,4
• 32% of fatal attacks from loose dogs5
Most dog bites from owned
dogs
Significant number of bites
from loose dogs
Victims tend to be children
or elders
• 38% of bite victims were children (15% of
population)6
• 30% of bite victims were over 50 (11% of
population)6
• 70% of fatal dog attacks were children under 10
and 21% over 502
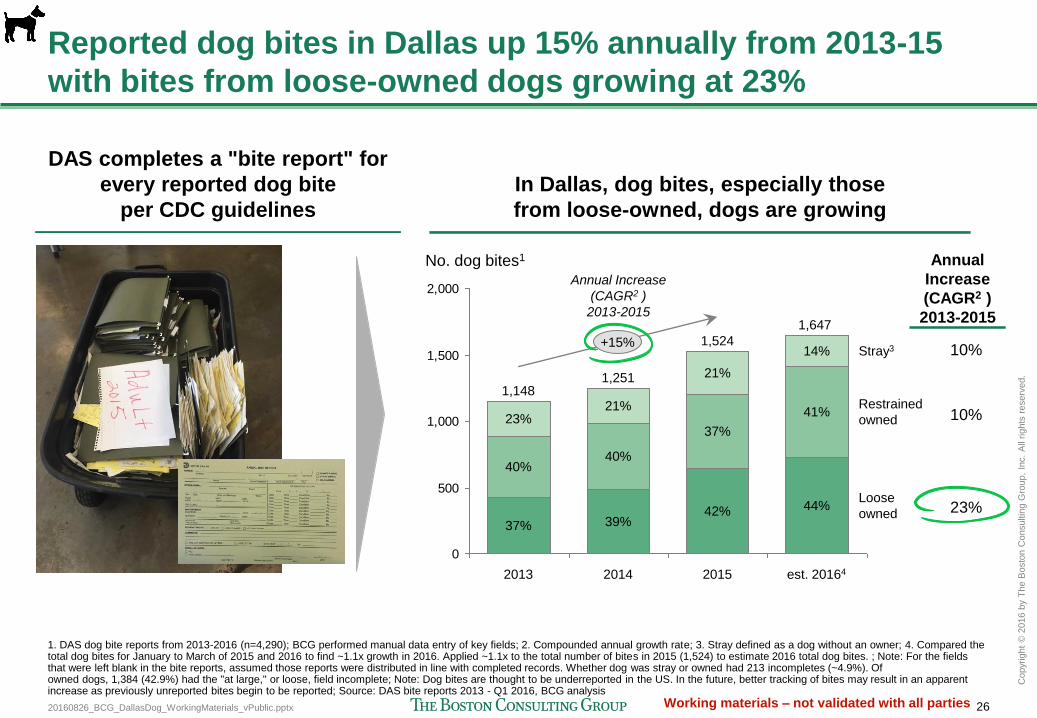
20160826_BCG_DallasDog_WorkingMaterials_vPublic.pptx 26
Copyr
ight
© 2
016 b
y T
he B
osto
n C
onsultin
g G
roup,
Inc.
All
rights
reserv
ed.
Working materials – not validated with all parties
Reported dog bites in Dallas up 15% annually from 2013-15
with bites from loose-owned dogs growing at 23%
1. DAS dog bite reports from 2013-2016 (n=4,290); BCG performed manual data entry of key fields; 2. Compounded annual growth rate; 3. Stray defined as a dog without an owner; 4. Compared the total dog bites for January to March of 2015 and 2016 to find ~1.1x growth in 2016. Applied ~1.1x to the total number of bites in 2015 (1,524) to estimate 2016 total dog bites. ; Note: For the fields that were left blank in the bite reports, assumed those reports were distributed in line with completed records. Whether dog was stray or owned had 213 incompletes (~4.9%). Of owned dogs, 1,384 (42.9%) had the "at large," or loose, field incomplete; Note: Dog bites are thought to be underreported in the US. In the future, better tracking of bites may result in an apparent increase as previously unreported bites begin to be reported; Source: DAS bite reports 2013 - Q1 2016, BCG analysis
0
500
1,000
1,500
2,000
est. 20164
39%
37%
2013
40%
2014
No. dog bites1
21%
21%
2015
23% 41%
Loose
owned
Stray3
37%
40%
+15%
Restrained
owned
14%
1,647
42%
1,524
1,251 1,148
44%
In Dallas, dog bites, especially those
from loose-owned, dogs are growing
DAS completes a "bite report" for
every reported dog bite
per CDC guidelines
Annual
Increase
(CAGR2 )
2013-2015
10%
10%
23%
Annual Increase
(CAGR2 )
2013-2015
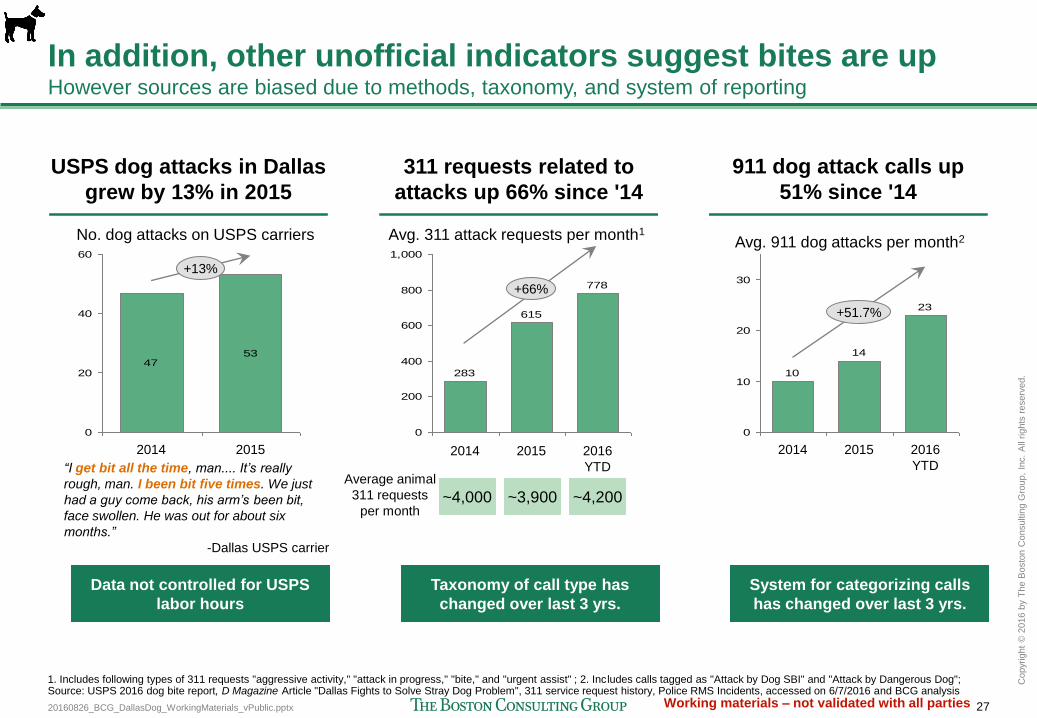
20160826_BCG_DallasDog_WorkingMaterials_vPublic.pptx 27
Copyr
ight
© 2
016 b
y T
he B
osto
n C
onsultin
g G
roup,
Inc.
All
rights
reserv
ed.
Working materials – not validated with all parties
In addition, other unofficial indicators suggest bites are up However sources are biased due to methods, taxonomy, and system of reporting
USPS dog attacks in Dallas
grew by 13% in 2015
311 requests related to
attacks up 66% since '14
911 dog attack calls up
51% since '14
4753
0
20
40
60
2014 2015
+13%
No. dog attacks on USPS carriers
1. Includes following types of 311 requests "aggressive activity," "attack in progress," "bite," and "urgent assist" ; 2. Includes calls tagged as "Attack by Dog SBI" and "Attack by Dangerous Dog"; Source: USPS 2016 dog bite report, D Magazine Article "Dallas Fights to Solve Stray Dog Problem", 311 service request history, Police RMS Incidents, accessed on 6/7/2016 and BCG analysis
“I get bit all the time, man.... It’s really
rough, man. I been bit five times. We just
had a guy come back, his arm’s been bit,
face swollen. He was out for about six
months.”
-Dallas USPS carrier
23
14
10
0
10
20
30
2014
+51.7%
2015 2016
YTD
Avg. 911 dog attacks per month2
778
615
283
0
200
400
600
800
1,000
2014
+66%
Avg. 311 attack requests per month1
2016
YTD
2015
Average animal
311 requests
per month ~4,200 ~3,900 ~4,000
Data not controlled for USPS
labor hours
Taxonomy of call type has
changed over last 3 yrs.
System for categorizing calls
has changed over last 3 yrs.
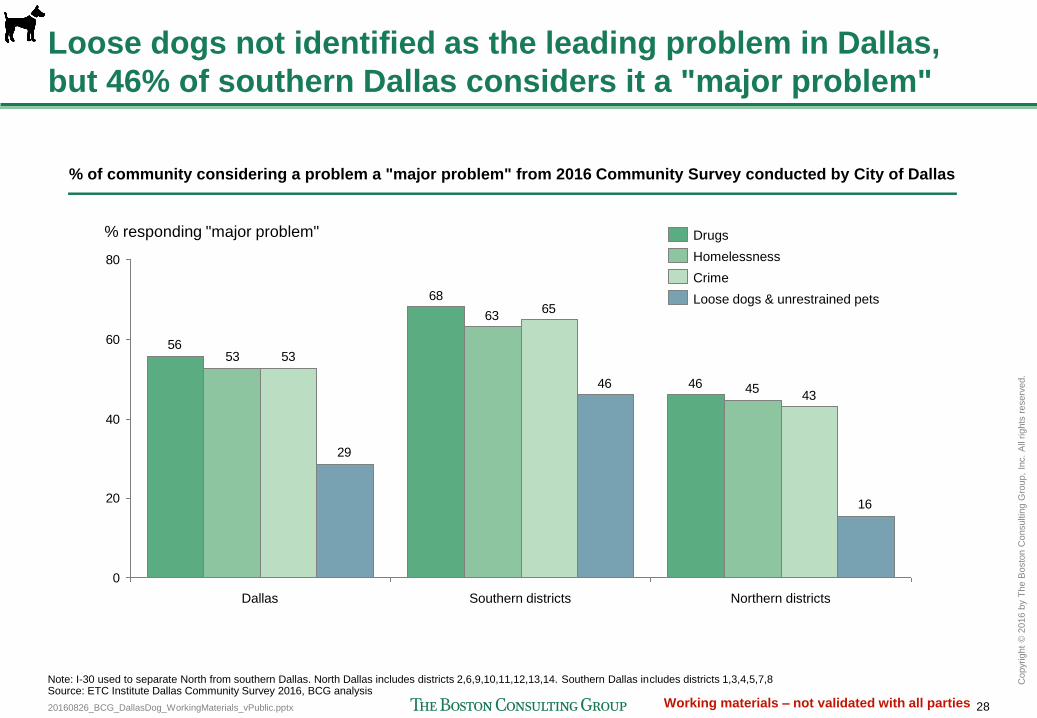
20160826_BCG_DallasDog_WorkingMaterials_vPublic.pptx 28
Copyr
ight
© 2
016 b
y T
he B
osto
n C
onsultin
g G
roup,
Inc.
All
rights
reserv
ed.
Working materials – not validated with all parties
Loose dogs not identified as the leading problem in Dallas,
but 46% of southern Dallas considers it a "major problem"
46
68
56
45
63
53
43
65
53
16
46
29
0
20
40
60
80
% responding "major problem"
Northern districts Southern districts Dallas
Crime
Drugs
Loose dogs & unrestrained pets
Homelessness
Note: I-30 used to separate North from southern Dallas. North Dallas includes districts 2,6,9,10,11,12,13,14. Southern Dallas includes districts 1,3,4,5,7,8 Source: ETC Institute Dallas Community Survey 2016, BCG analysis
% of community considering a problem a "major problem" from 2016 Community Survey conducted by City of Dallas
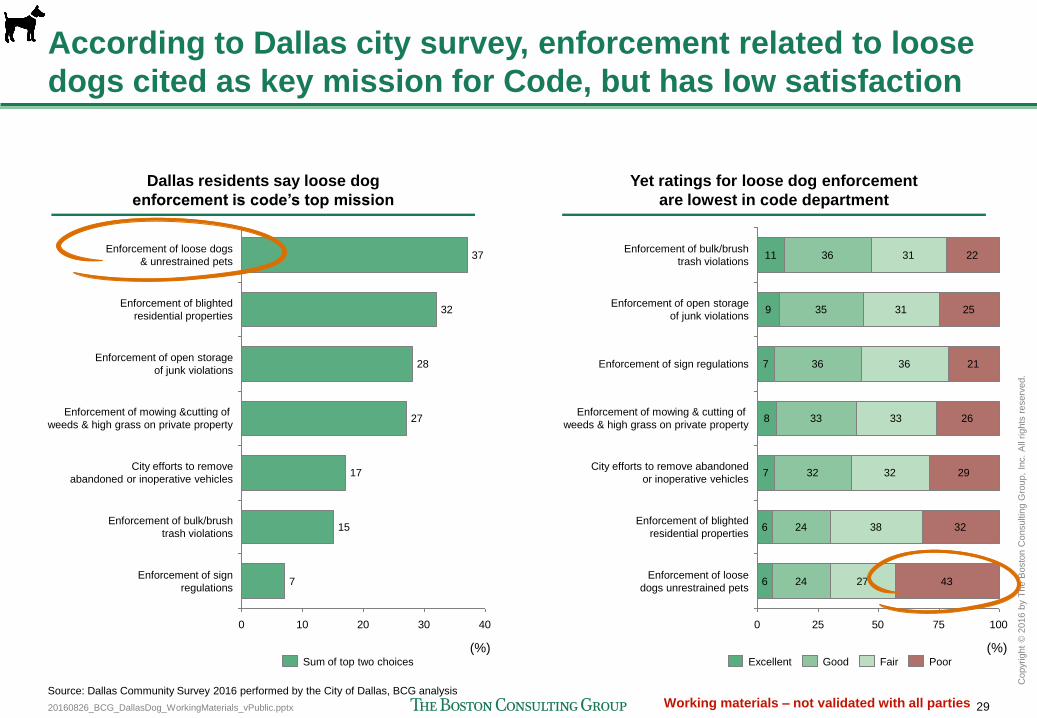
20160826_BCG_DallasDog_WorkingMaterials_vPublic.pptx 29
Copyr
ight
© 2
016 b
y T
he B
osto
n C
onsultin
g G
roup,
Inc.
All
rights
reserv
ed.
Working materials – not validated with all parties
According to Dallas city survey, enforcement related to loose
dogs cited as key mission for Code, but has low satisfaction
Dallas residents say loose dog
enforcement is code’s top mission
Yet ratings for loose dog enforcement
are lowest in code department
0 10 20 30 40
(%)
Enforcement of sign
regulations 7
Enforcement of bulk/brush
trash violations 15
City efforts to remove
abandoned or inoperative vehicles 17
Enforcement of mowing &cutting of
weeds & high grass on private property 27
Enforcement of open storage
of junk violations 28
Enforcement of blighted
residential properties 32
Enforcement of loose dogs
& unrestrained pets 37
0 25 50 75 100
33 33 26
Enforcement of sign regulations 7 36 36 21
Enforcement of open storage
of junk violations 9 35 31
(%)
Enforcement of loose
dogs unrestrained pets 6 24
25
Enforcement of bulk/brush
trash violations 11 36 31 22
8
27 43
Enforcement of blighted
residential properties 6 24 38 32
City efforts to remove abandoned
or inoperative vehicles 7 32 32 29
Enforcement of mowing & cutting of
weeds & high grass on private property
Sum of top two choices Poor Excellent Fair Good
Source: Dallas Community Survey 2016 performed by the City of Dallas, BCG analysis

20160826_BCG_DallasDog_WorkingMaterials_vPublic.pptx 30
Copyr
ight
© 2
016 b
y T
he B
osto
n C
onsultin
g G
roup,
Inc.
All
rights
reserv
ed.
Working materials – not validated with all parties
Enforcement & Reporting 2
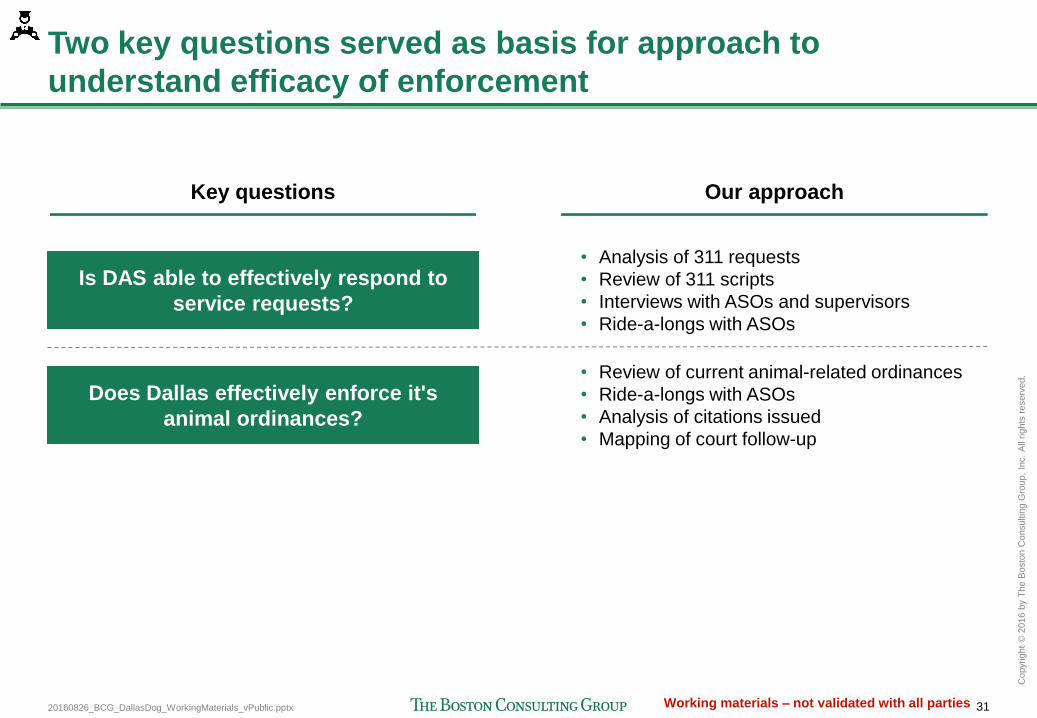
20160826_BCG_DallasDog_WorkingMaterials_vPublic.pptx 31
Copyr
ight
© 2
016 b
y T
he B
osto
n C
onsultin
g G
roup,
Inc.
All
rights
reserv
ed.
Working materials – not validated with all parties
Two key questions served as basis for approach to
understand efficacy of enforcement
Key questions Our approach
Does Dallas effectively enforce it's
animal ordinances?
Is DAS able to effectively respond to
service requests?
• Review of current animal-related ordinances
• Ride-a-longs with ASOs
• Analysis of citations issued
• Mapping of court follow-up
• Analysis of 311 requests
• Review of 311 scripts
• Interviews with ASOs and supervisors
• Ride-a-longs with ASOs

20160826_BCG_DallasDog_WorkingMaterials_vPublic.pptx 32
Copyr
ight
© 2
016 b
y T
he B
osto
n C
onsultin
g G
roup,
Inc.
All
rights
reserv
ed.
Working materials – not validated with all parties
Section 7 of the City of Dallas, Texas Code of Ordinances
covers all rules related to animals
Sec.
Article Title Key Points
7. 1 General • Defines of adopters, animal, animal services, etc.
7.2 Animal Services; City Animal Shelters • Establishes policies regarding DAS rights to impound, redeem,
adopt, and euthanize animals
7.3 Care and Treatment of Animals • States animals need to be properly restrained
• States animals need to live in sanitary conditions
7.4 Specific Requirements for Dogs and Cats
• Requires dogs and cats to be vaccinated and registered
• Limits number of dogs and cats in a single dwelling
• Requires dogs and cats to be sterilized
7.5 Dangerous Dogs
• Defines dangerous dog as one that makes an unprovoked attack
• Permits director to investigate dog upon written request
• Allow director to impound dangerous dog if it makes an attack
7.6 Prohibited and Regulated Animals • Requires regulated animals to have a valid permit
7.7 Miscellaneous
• States a person cannot interfere with animal services
• States a person cannot sell an animal found on public property
• Prohibits animals from being awarded as prizes
7.8 Violations, Penalties, and Enforcement • States violations and penalties for Section 7
• Routes all monetary penalties to the Dallas Animal Welfare Fund
Source: Dallas City Code, BCG analysis
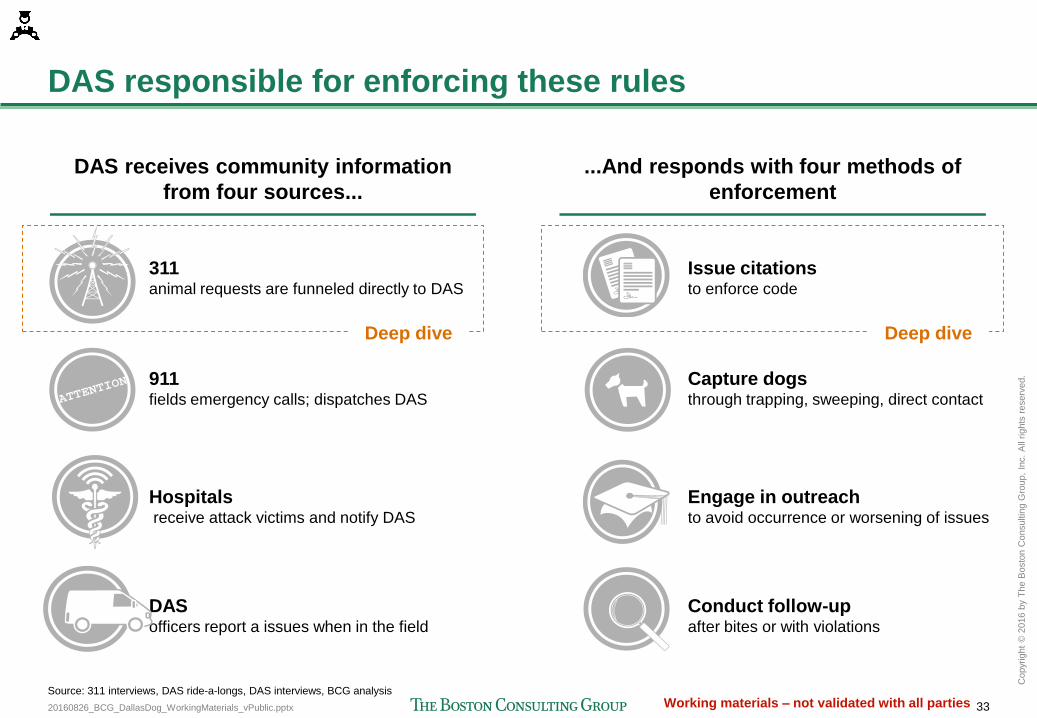
20160826_BCG_DallasDog_WorkingMaterials_vPublic.pptx 33
Copyr
ight
© 2
016 b
y T
he B
osto
n C
onsultin
g G
roup,
Inc.
All
rights
reserv
ed.
Working materials – not validated with all parties
DAS responsible for enforcing these rules
911 fields emergency calls; dispatches DAS
Hospitals receive attack victims and notify DAS
311
animal requests are funneled directly to DAS
DAS
officers report a issues when in the field
Issue citations to enforce code
Capture dogs through trapping, sweeping, direct contact
Conduct follow-up after bites or with violations
Engage in outreach to avoid occurrence or worsening of issues
DAS receives community information
from four sources...
...And responds with four methods of
enforcement
Deep dive Deep dive
Source: 311 interviews, DAS ride-a-longs, DAS interviews, BCG analysis

20160826_BCG_DallasDog_WorkingMaterials_vPublic.pptx 34
Copyr
ight
© 2
016 b
y T
he B
osto
n C
onsultin
g G
roup,
Inc.
All
rights
reserv
ed.
Working materials – not validated with all parties
311 animal requests made through three channels, but only
urgent requests received via phone are dispatched to ASOs
All
animal-
related
requests
311 dispatcher ASO officer
• Respond to request in person
and in order of priorities
• Might issue a citation, capture an
animal, or perform outreach
+ Urgent requests
dispatched
Non-urgent requests
sent directly to DAS
Computer
(some non-urgent requests)
DAS • Track data to identify areas for
sweeps and targeted initiatives
• Send letters to addresses of
requests that outline animal
ordinances and animal-related
resources
Mobile app
(some non-urgent requests)
Call 311 agent
(all requests)
1
2
3
Source: 311 interviews, DAS ride-a-longs, DAS interviews, BCG analysis
311
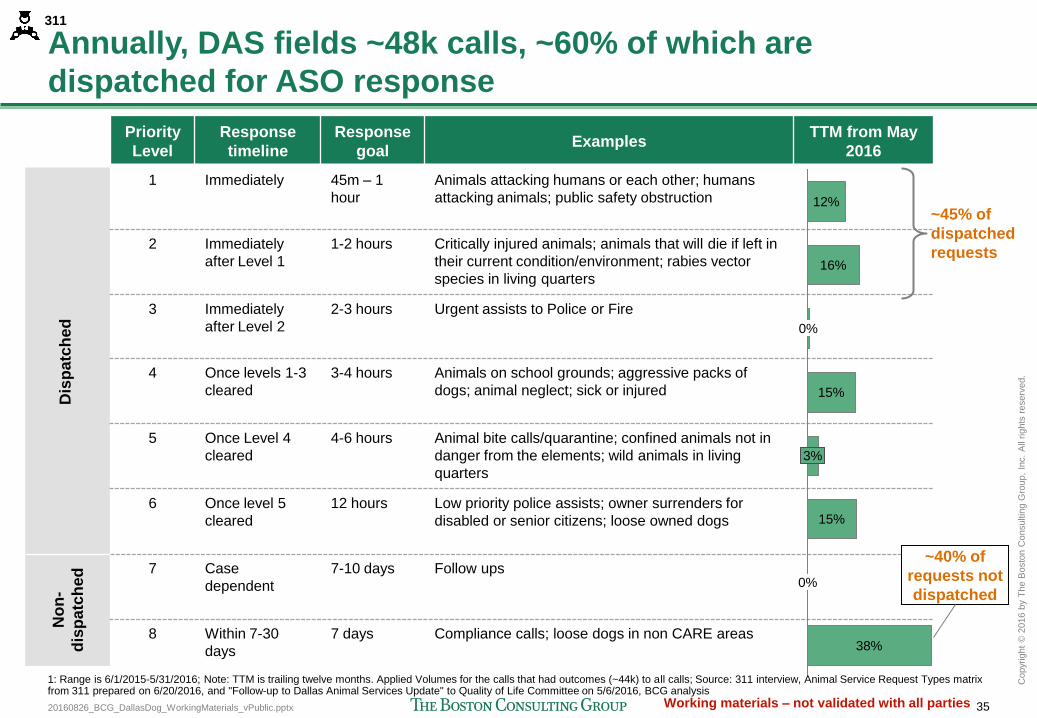
20160826_BCG_DallasDog_WorkingMaterials_vPublic.pptx 35
Copyr
ight
© 2
016 b
y T
he B
osto
n C
onsultin
g G
roup,
Inc.
All
rights
reserv
ed.
Working materials – not validated with all parties
Annually, DAS fields ~48k calls, ~60% of which are
dispatched for ASO response
Priority
Level
Response
timeline
Response
goal Examples
TTM from May
2016
1 Immediately 45m – 1
hour
Animals attacking humans or each other; humans
attacking animals; public safety obstruction
2 Immediately
after Level 1
1-2 hours Critically injured animals; animals that will die if left in
their current condition/environment; rabies vector
species in living quarters
3 Immediately
after Level 2
2-3 hours Urgent assists to Police or Fire
4 Once levels 1-3
cleared
3-4 hours Animals on school grounds; aggressive packs of
dogs; animal neglect; sick or injured
5 Once Level 4
cleared
4-6 hours Animal bite calls/quarantine; confined animals not in
danger from the elements; wild animals in living
quarters
6 Once level 5
cleared
12 hours Low priority police assists; owner surrenders for
disabled or senior citizens; loose owned dogs
7 Case
dependent
7-10 days Follow ups
8 Within 7-30
days
7 days Compliance calls; loose dogs in non CARE areas
Dis
patc
hed
N
on
-
dis
patc
hed
38%
0%
0%
16%
12%
15%
15%
3%
1: Range is 6/1/2015-5/31/2016; Note: TTM is trailing twelve months. Applied Volumes for the calls that had outcomes (~44k) to all calls; Source: 311 interview, Animal Service Request Types matrix from 311 prepared on 6/20/2016, and "Follow-up to Dallas Animal Services Update" to Quality of Life Committee on 5/6/2016, BCG analysis
~45% of
dispatched
requests
311
~40% of
requests not
dispatched
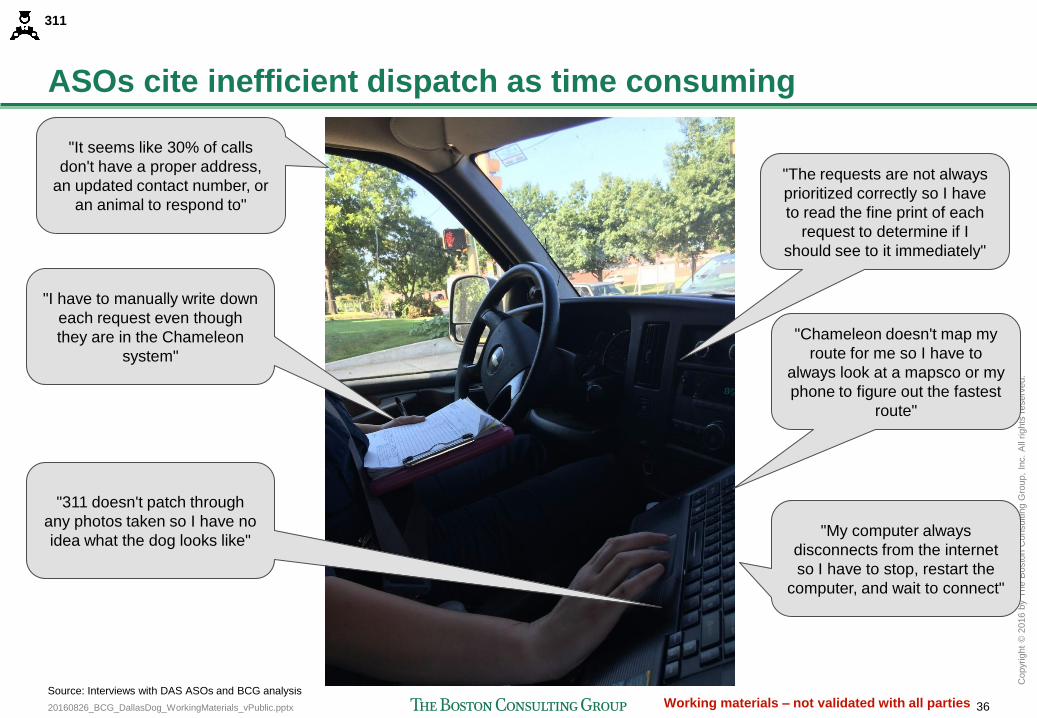
20160826_BCG_DallasDog_WorkingMaterials_vPublic.pptx 36
Copyr
ight
© 2
016 b
y T
he B
osto
n C
onsultin
g G
roup,
Inc.
All
rights
reserv
ed.
Working materials – not validated with all parties
ASOs cite inefficient dispatch as time consuming
"The requests are not always
prioritized correctly so I have
to read the fine print of each
request to determine if I
should see to it immediately"
"Chameleon doesn't map my
route for me so I have to
always look at a mapsco or my
phone to figure out the fastest
route"
"My computer always
disconnects from the internet
so I have to stop, restart the
computer, and wait to connect"
Source: Interviews with DAS ASOs and BCG analysis
"It seems like 30% of calls
don't have a proper address,
an updated contact number, or
an animal to respond to"
"I have to manually write down
each request even though
they are in the Chameleon
system"
"311 doesn't patch through
any photos taken so I have no
idea what the dog looks like"
311
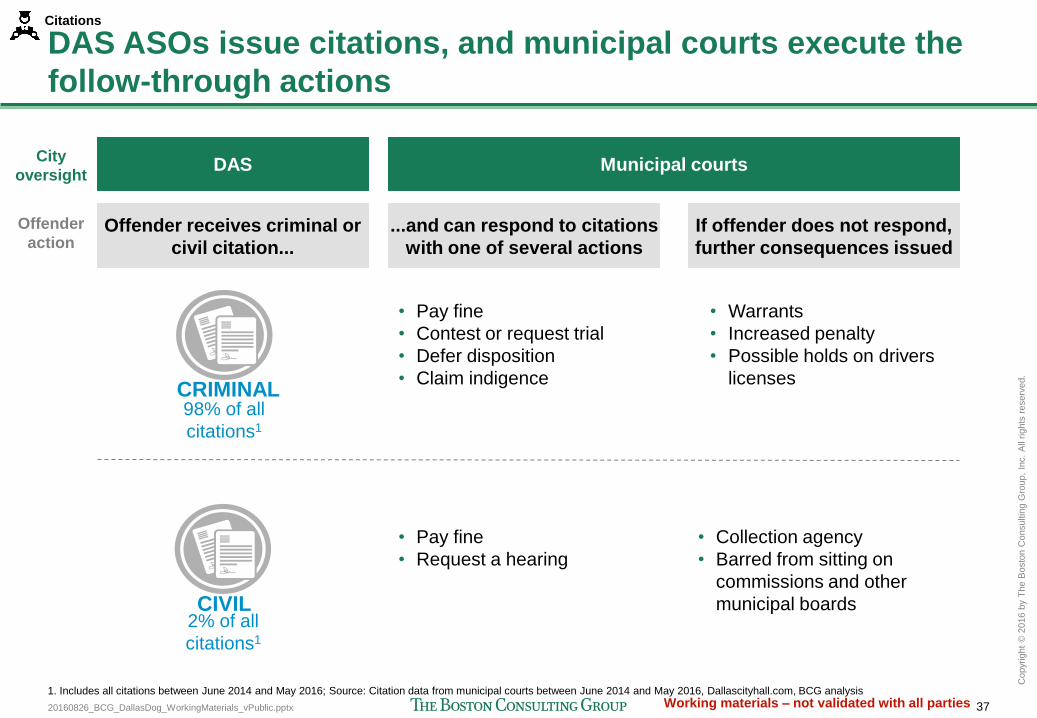
20160826_BCG_DallasDog_WorkingMaterials_vPublic.pptx 37
Copyr
ight
© 2
016 b
y T
he B
osto
n C
onsultin
g G
roup,
Inc.
All
rights
reserv
ed.
Working materials – not validated with all parties
DAS ASOs issue citations, and municipal courts execute the
follow-through actions
• Pay fine
• Contest or request trial
• Defer disposition
• Claim indigence
• Pay fine
• Request a hearing
• Warrants
• Increased penalty
• Possible holds on drivers
licenses
• Collection agency
• Barred from sitting on
commissions and other
municipal boards
Offender receives criminal or
civil citation...
...and can respond to citations
with one of several actions
If offender does not respond,
further consequences issued
DAS Municipal courts City
oversight
Offender
action
1. Includes all citations between June 2014 and May 2016; Source: Citation data from municipal courts between June 2014 and May 2016, Dallascityhall.com, BCG analysis
CRIMINAL
CIVIL 2% of all
citations1
98% of all
citations1
Citations
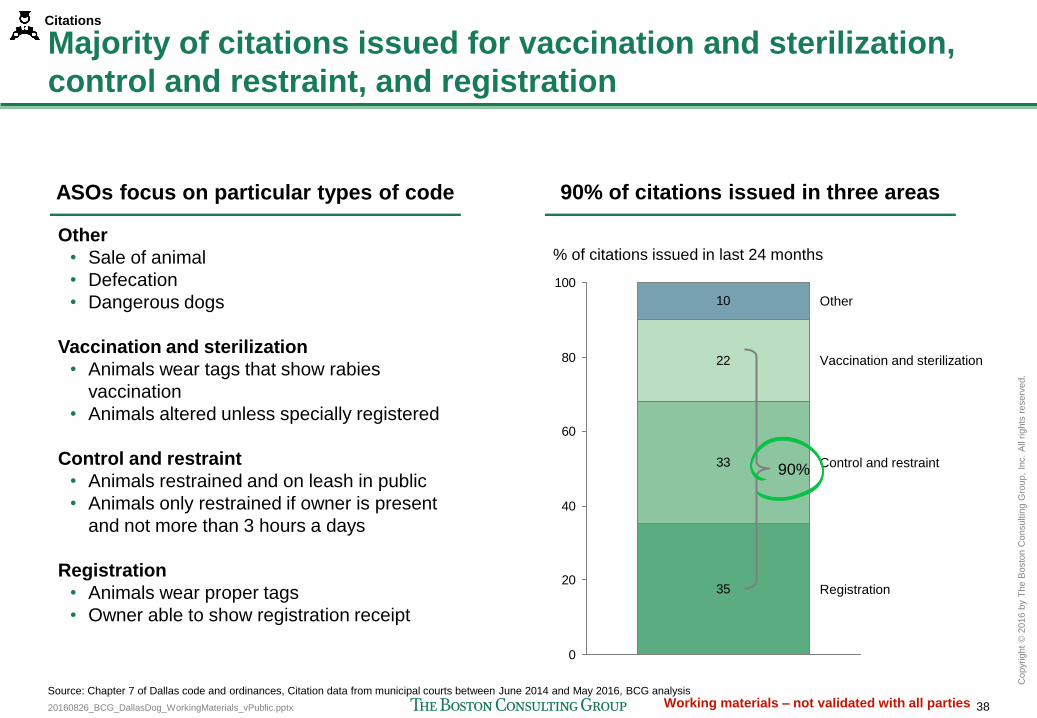
20160826_BCG_DallasDog_WorkingMaterials_vPublic.pptx 38
Copyr
ight
© 2
016 b
y T
he B
osto
n C
onsultin
g G
roup,
Inc.
All
rights
reserv
ed.
Working materials – not validated with all parties
Majority of citations issued for vaccination and sterilization,
control and restraint, and registration
35
33
22
10
0
20
40
60
80
100
% of citations issued in last 24 months
Registration
Vaccination and sterilization
Control and restraint
Other
Source: Chapter 7 of Dallas code and ordinances, Citation data from municipal courts between June 2014 and May 2016, BCG analysis
90% of citations issued in three areas ASOs focus on particular types of code
Other
• Sale of animal
• Defecation
• Dangerous dogs
Vaccination and sterilization
• Animals wear tags that show rabies
vaccination
• Animals altered unless specially registered
Control and restraint
• Animals restrained and on leash in public
• Animals only restrained if owner is present
and not more than 3 hours a days
Registration
• Animals wear proper tags
• Owner able to show registration receipt
90%
Citations
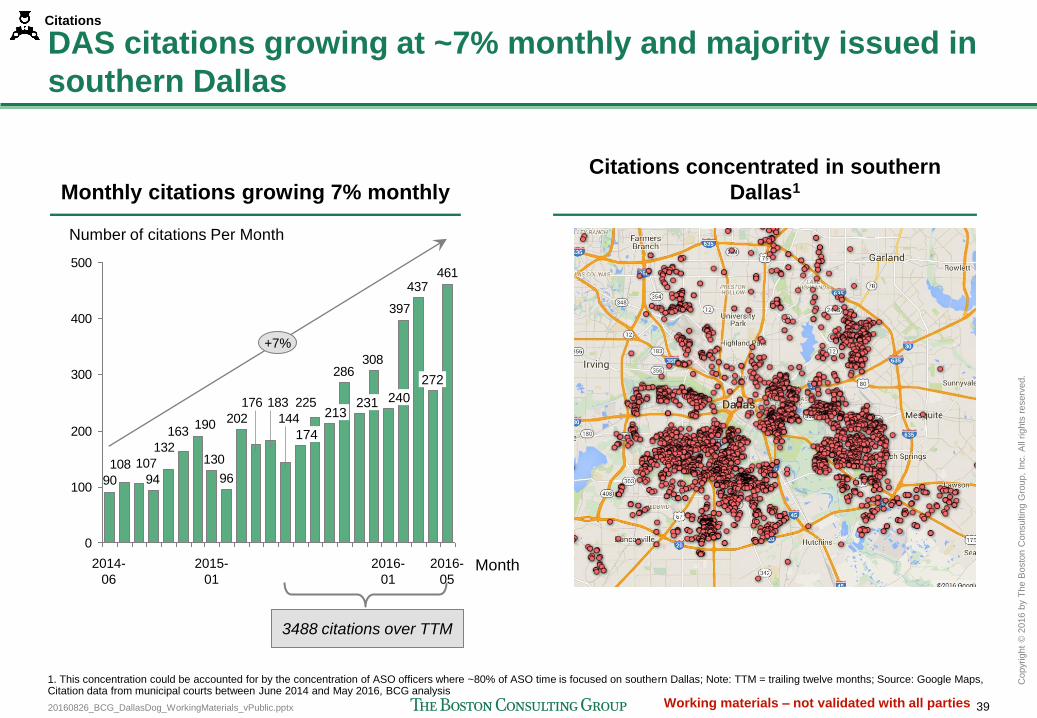
20160826_BCG_DallasDog_WorkingMaterials_vPublic.pptx 39
Copyr
ight
© 2
016 b
y T
he B
osto
n C
onsultin
g G
roup,
Inc.
All
rights
reserv
ed.
Working materials – not validated with all parties
DAS citations growing at ~7% monthly and majority issued in
southern Dallas
461437
397
308286
225
144
183176
202
96
130
190163
132
94
107108
90
0
100
200
300
400
500
Number of citations Per Month
Month
+7%
2016-
05
272
2016-
01
240 231 213
174
2015-
01
2014-
06
1. This concentration could be accounted for by the concentration of ASO officers where ~80% of ASO time is focused on southern Dallas; Note: TTM = trailing twelve months; Source: Google Maps, Citation data from municipal courts between June 2014 and May 2016, BCG analysis
Monthly citations growing 7% monthly
3488 citations over TTM
Citations
Citations concentrated in southern
Dallas1
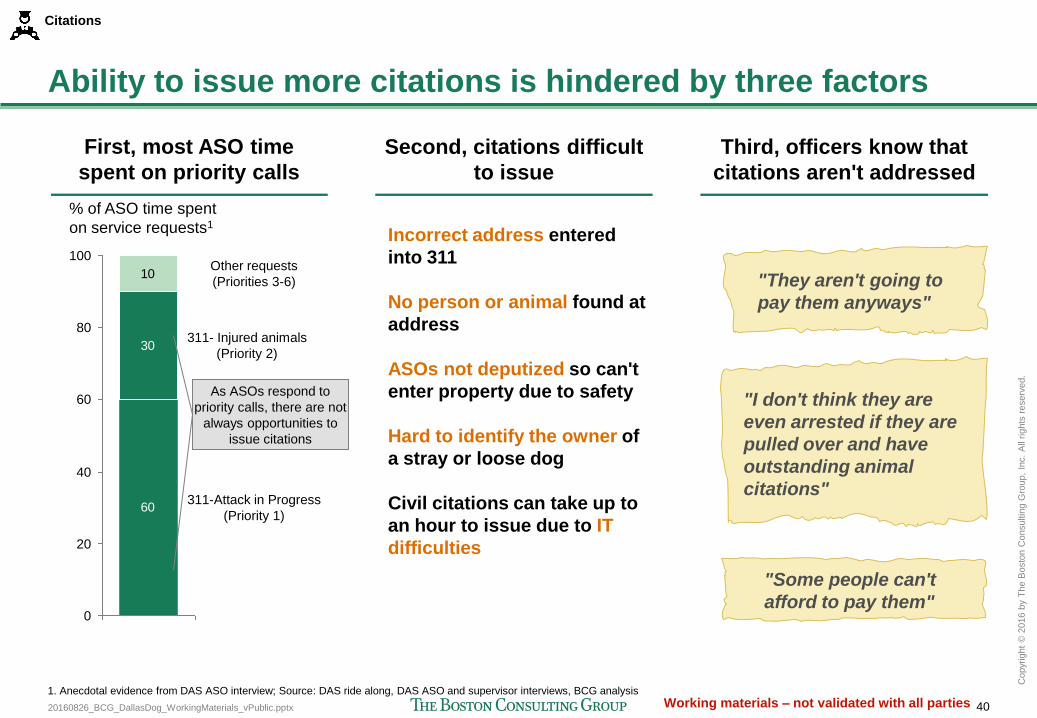
20160826_BCG_DallasDog_WorkingMaterials_vPublic.pptx 40
Copyr
ight
© 2
016 b
y T
he B
osto
n C
onsultin
g G
roup,
Inc.
All
rights
reserv
ed.
Working materials – not validated with all parties
Ability to issue more citations is hindered by three factors
60
30
10
80
0
60
40
20
100
% of ASO time spent
on service requests1
311-Attack in Progress
(Priority 1)
311- Injured animals
(Priority 2)
Other requests
(Priorities 3-6)
First, most ASO time
spent on priority calls
Second, citations difficult
to issue
Third, officers know that
citations aren't addressed
Incorrect address entered
into 311
No person or animal found at
address
ASOs not deputized so can't
enter property due to safety
Hard to identify the owner of
a stray or loose dog
Civil citations can take up to
an hour to issue due to IT
difficulties
"They aren't going to
pay them anyways"
"I don't think they are
even arrested if they are
pulled over and have
outstanding animal
citations"
"Some people can't
afford to pay them"
1. Anecdotal evidence from DAS ASO interview; Source: DAS ride along, DAS ASO and supervisor interviews, BCG analysis
Citations
As ASOs respond to
priority calls, there are not
always opportunities to
issue citations
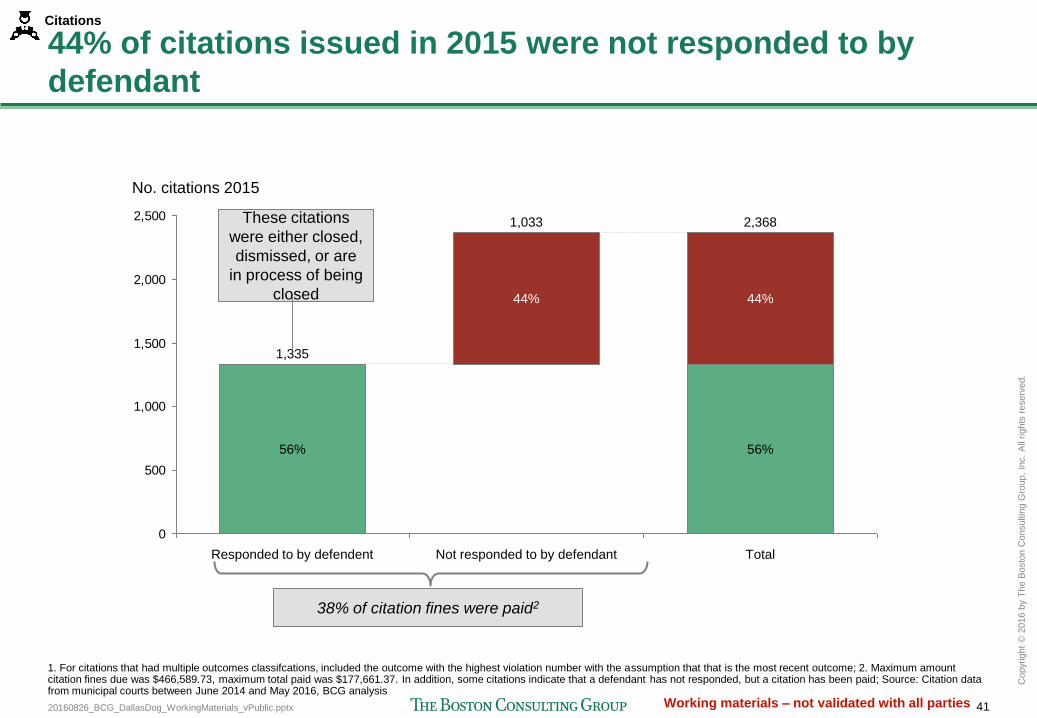
20160826_BCG_DallasDog_WorkingMaterials_vPublic.pptx 41
Copyr
ight
© 2
016 b
y T
he B
osto
n C
onsultin
g G
roup,
Inc.
All
rights
reserv
ed.
Working materials – not validated with all parties
44% of citations issued in 2015 were not responded to by
defendant
1. For citations that had multiple outcomes classifcations, included the outcome with the highest violation number with the assumption that that is the most recent outcome; 2. Maximum amount citation fines due was $466,589.73, maximum total paid was $177,661.37. In addition, some citations indicate that a defendant has not responded, but a citation has been paid; Source: Citation data from municipal courts between June 2014 and May 2016, BCG analysis
0
500
1,000
1,500
2,000
2,500
1,335
56%
Not responded to by defendant Responded to by defendent
1,033
44%
56%
2,368
44%
No. citations 2015
Total
38% of citation fines were paid2
Citations
These citations
were either closed,
dismissed, or are
in process of being
closed

20160826_BCG_DallasDog_WorkingMaterials_vPublic.pptx 42
Copyr
ight
© 2
016 b
y T
he B
osto
n C
onsultin
g G
roup,
Inc.
All
rights
reserv
ed.
Working materials – not validated with all parties
DAS Operations 3
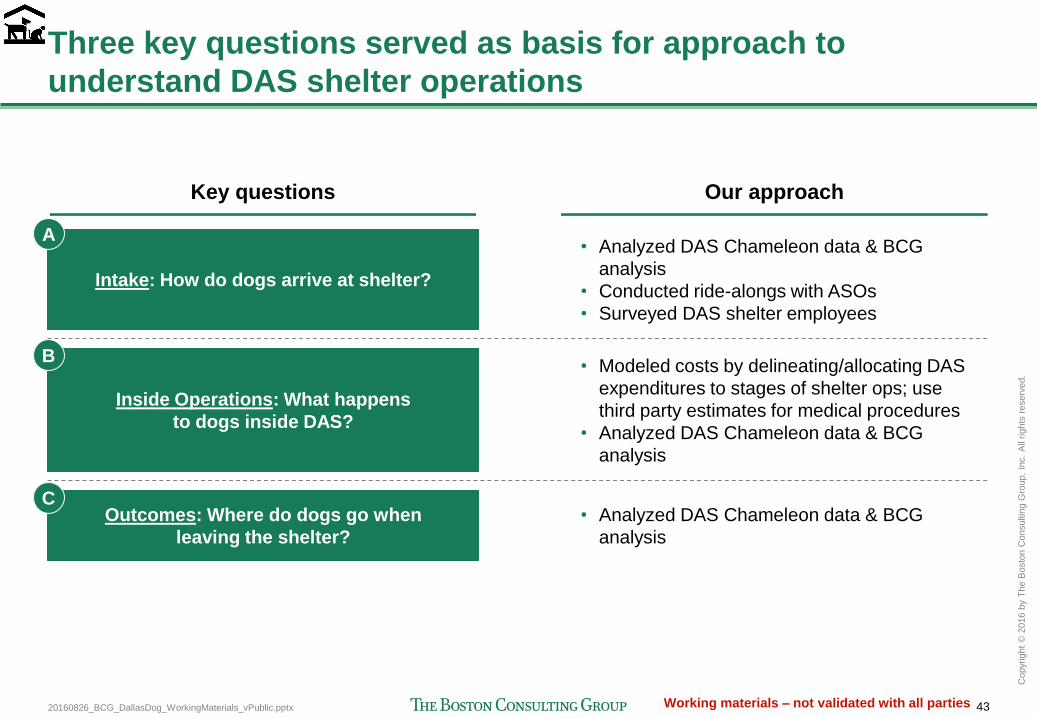
20160826_BCG_DallasDog_WorkingMaterials_vPublic.pptx 43
Copyr
ight
© 2
016 b
y T
he B
osto
n C
onsultin
g G
roup,
Inc.
All
rights
reserv
ed.
Working materials – not validated with all parties
Three key questions served as basis for approach to
understand DAS shelter operations
Key questions Our approach
Intake: How do dogs arrive at shelter?
• Analyzed DAS Chameleon data & BCG
analysis
• Conducted ride-alongs with ASOs
• Surveyed DAS shelter employees
Inside Operations: What happens
to dogs inside DAS?
• Modeled costs by delineating/allocating DAS
expenditures to stages of shelter ops; use
third party estimates for medical procedures
• Analyzed DAS Chameleon data & BCG
analysis
Outcomes: Where do dogs go when
leaving the shelter?
• Analyzed DAS Chameleon data & BCG
analysis
A
B
C
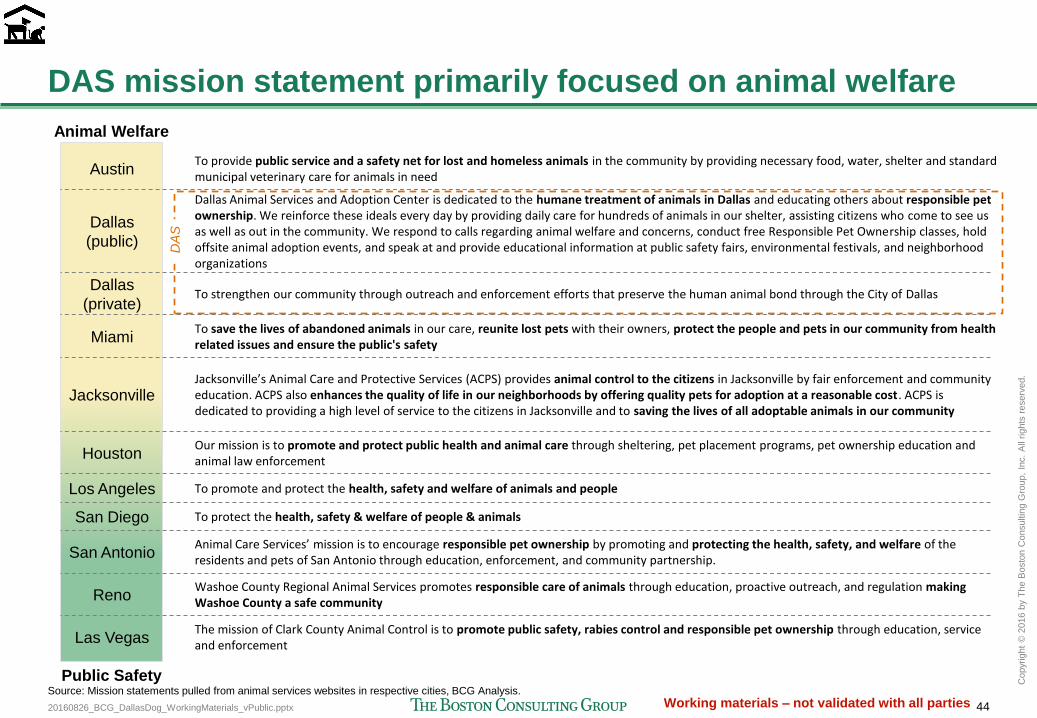
20160826_BCG_DallasDog_WorkingMaterials_vPublic.pptx 44
Copyr
ight
© 2
016 b
y T
he B
osto
n C
onsultin
g G
roup,
Inc.
All
rights
reserv
ed.
Working materials – not validated with all parties
Animal Welfare
Dallas Animal Services and Adoption Center is dedicated to the humane treatment of animals in Dallas and educating others about responsible pet ownership. We reinforce these ideals every day by providing daily care for hundreds of animals in our shelter, assisting citizens who come to see us as well as out in the community. We respond to calls regarding animal welfare and concerns, conduct free Responsible Pet Ownership classes, hold offsite animal adoption events, and speak at and provide educational information at public safety fairs, environmental festivals, and neighborhood organizations
DAS mission statement primarily focused on animal welfare
Public Safety Source: Mission statements pulled from animal services websites in respective cities, BCG Analysis.
To promote and protect the health, safety and welfare of animals and people
To protect the health, safety & welfare of people & animals
Washoe County Regional Animal Services promotes responsible care of animals through education, proactive outreach, and regulation making Washoe County a safe community
Our mission is to promote and protect public health and animal care through sheltering, pet placement programs, pet ownership education and animal law enforcement
To save the lives of abandoned animals in our care, reunite lost pets with their owners, protect the people and pets in our community from health related issues and ensure the public's safety
Jacksonville’s Animal Care and Protective Services (ACPS) provides animal control to the citizens in Jacksonville by fair enforcement and community education. ACPS also enhances the quality of life in our neighborhoods by offering quality pets for adoption at a reasonable cost. ACPS is dedicated to providing a high level of service to the citizens in Jacksonville and to saving the lives of all adoptable animals in our community
To provide public service and a safety net for lost and homeless animals in the community by providing necessary food, water, shelter and standard municipal veterinary care for animals in need
The mission of Clark County Animal Control is to promote public safety, rabies control and responsible pet ownership through education, service and enforcement
Animal Care Services’ mission is to encourage responsible pet ownership by promoting and protecting the health, safety, and welfare of the residents and pets of San Antonio through education, enforcement, and community partnership.
Austin
Miami
Jacksonville
Houston
Los Angeles
San Diego
San Antonio
Reno
Las Vegas
Dallas
(public)
Dallas
(private) To strengthen our community through outreach and enforcement efforts that preserve the human animal bond through the City of Dallas
DA
S
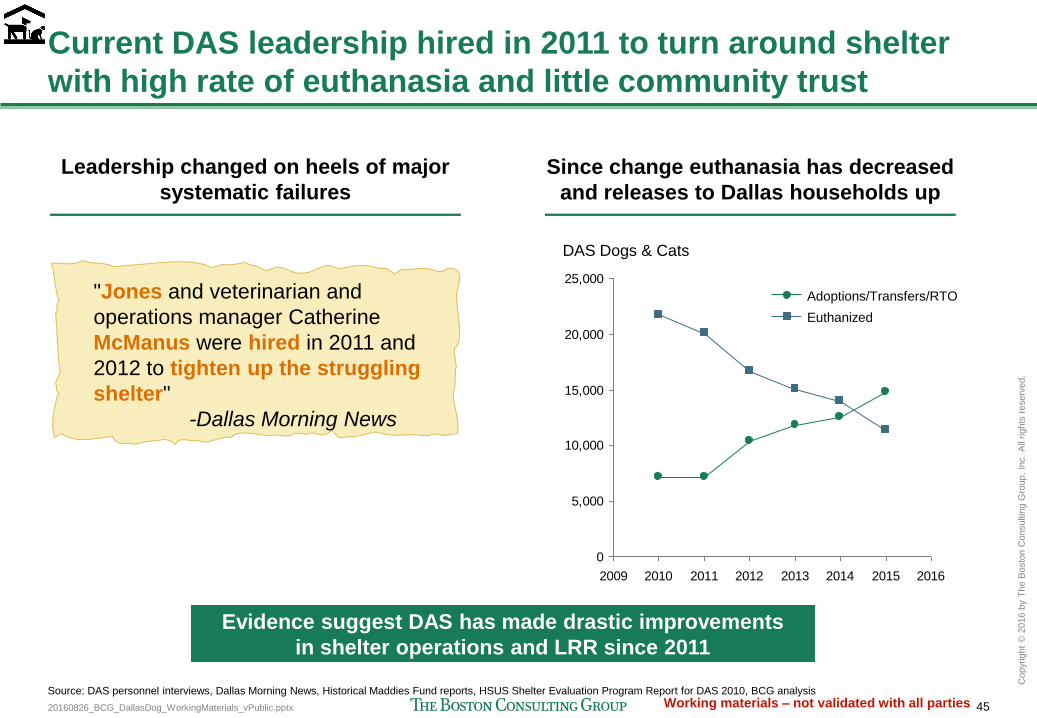
20160826_BCG_DallasDog_WorkingMaterials_vPublic.pptx 45
Copyr
ight
© 2
016 b
y T
he B
osto
n C
onsultin
g G
roup,
Inc.
All
rights
reserv
ed.
Working materials – not validated with all parties
Current DAS leadership hired in 2011 to turn around shelter
with high rate of euthanasia and little community trust
Leadership changed on heels of major
systematic failures
Since change euthanasia has decreased
and releases to Dallas households up
"Jones and veterinarian and
operations manager Catherine
McManus were hired in 2011 and
2012 to tighten up the struggling
shelter"
-Dallas Morning News
Source: DAS personnel interviews, Dallas Morning News, Historical Maddies Fund reports, HSUS Shelter Evaluation Program Report for DAS 2010, BCG analysis
0
5,000
10,000
15,000
20,000
25,000
2009 2010 2011 2012 2013 2014 2015 2016
DAS Dogs & Cats
Euthanized
Adoptions/Transfers/RTO
Evidence suggest DAS has made drastic improvements
in shelter operations and LRR since 2011
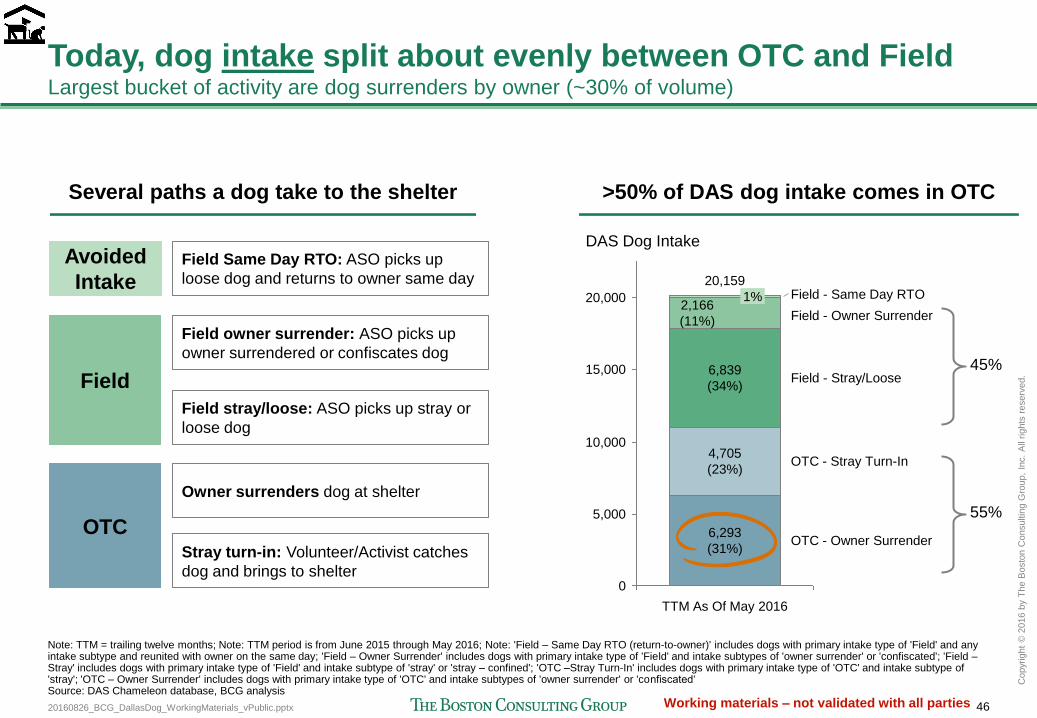
20160826_BCG_DallasDog_WorkingMaterials_vPublic.pptx 46
Copyr
ight
© 2
016 b
y T
he B
osto
n C
onsultin
g G
roup,
Inc.
All
rights
reserv
ed.
Working materials – not validated with all parties
Today, dog intake split about evenly between OTC and Field Largest bucket of activity are dog surrenders by owner (~30% of volume)
>50% of DAS dog intake comes in OTC
Field
OTC
Field stray/loose: ASO picks up stray or
loose dog
Owner surrenders dog at shelter
Field owner surrender: ASO picks up
owner surrendered or confiscates dog
Stray turn-in: Volunteer/Activist catches
dog and brings to shelter
Field Same Day RTO: ASO picks up
loose dog and returns to owner same day 20,000
15,000
10,000
5,000
0
DAS Dog Intake
OTC - Owner Surrender
OTC - Stray Turn-In
Field - Stray/Loose
Field - Owner Surrender
Field - Same Day RTO
TTM As Of May 2016
20,159
6,293
(31%)
4,705
(23%)
6,839
(34%)
2,166
(11%)
1%
Note: TTM = trailing twelve months; Note: TTM period is from June 2015 through May 2016; Note: 'Field – Same Day RTO (return-to-owner)' includes dogs with primary intake type of 'Field' and any intake subtype and reunited with owner on the same day; 'Field – Owner Surrender' includes dogs with primary intake type of 'Field' and intake subtypes of 'owner surrender' or 'confiscated'; 'Field – Stray' includes dogs with primary intake type of 'Field' and intake subtype of 'stray' or 'stray – confined'; 'OTC –Stray Turn-In' includes dogs with primary intake type of 'OTC' and intake subtype of 'stray'; 'OTC – Owner Surrender' includes dogs with primary intake type of 'OTC' and intake subtypes of 'owner surrender' or 'confiscated‘ Source: DAS Chameleon database, BCG analysis
55%
45%
Avoided
Intake
Several paths a dog take to the shelter
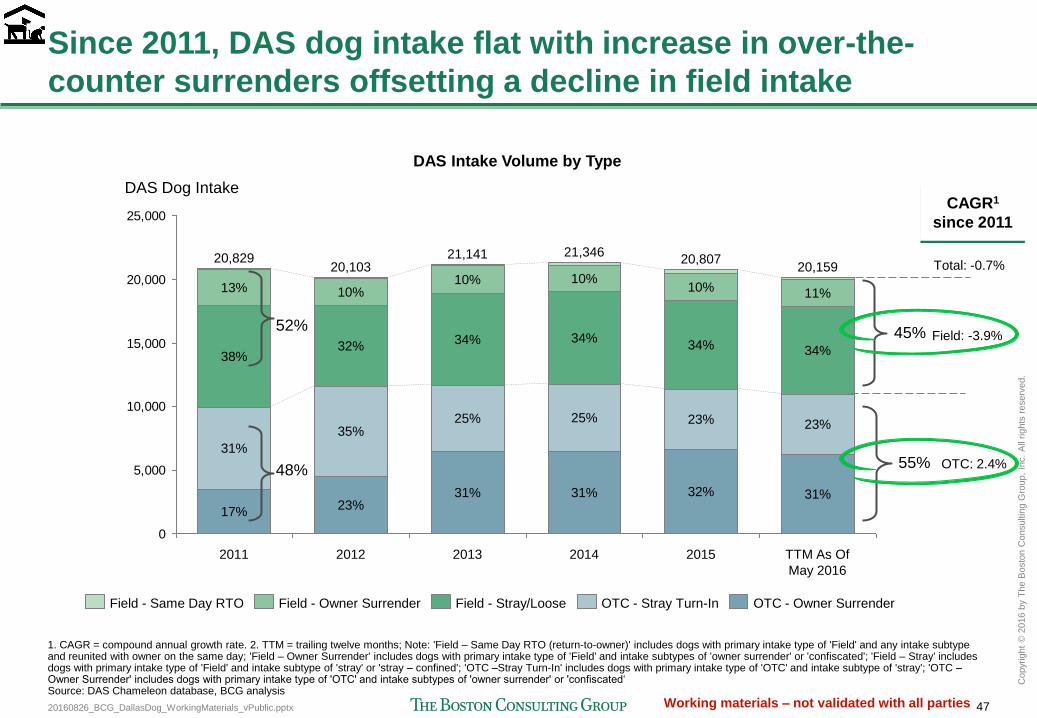
20160826_BCG_DallasDog_WorkingMaterials_vPublic.pptx 47
Copyr
ight
© 2
016 b
y T
he B
osto
n C
onsultin
g G
roup,
Inc.
All
rights
reserv
ed.
Working materials – not validated with all parties
Since 2011, DAS dog intake flat with increase in over-the-
counter surrenders offsetting a decline in field intake
0
5,000
10,000
15,000
20,000
25,000
35%
32%
10%
2011
20,829
17%
31%
38%
13%
DAS Dog Intake
TTM As Of
May 2016
20,159
31%
23%
34%
11%
2015
20,807
32%
23%
34%
10%
2014
21,346
31%
25%
34%
10%
2013
21,141
31%
25%
34%
10%
2012
20,103
23%
OTC - Owner Surrender OTC - Stray Turn-In Field - Stray/Loose Field - Owner Surrender Field - Same Day RTO
45%
55%
52%
48%
Field: -3.9%
OTC: 2.4%
Total: -0.7%
1. CAGR = compound annual growth rate. 2. TTM = trailing twelve months; Note: 'Field – Same Day RTO (return-to-owner)' includes dogs with primary intake type of 'Field' and any intake subtype and reunited with owner on the same day; 'Field – Owner Surrender' includes dogs with primary intake type of 'Field' and intake subtypes of 'owner surrender' or 'confiscated'; 'Field – Stray' includes dogs with primary intake type of 'Field' and intake subtype of 'stray' or 'stray – confined'; 'OTC –Stray Turn-In' includes dogs with primary intake type of 'OTC' and intake subtype of 'stray'; 'OTC – Owner Surrender' includes dogs with primary intake type of 'OTC' and intake subtypes of 'owner surrender' or 'confiscated‘ Source: DAS Chameleon database, BCG analysis
CAGR1
since 2011
DAS Intake Volume by Type
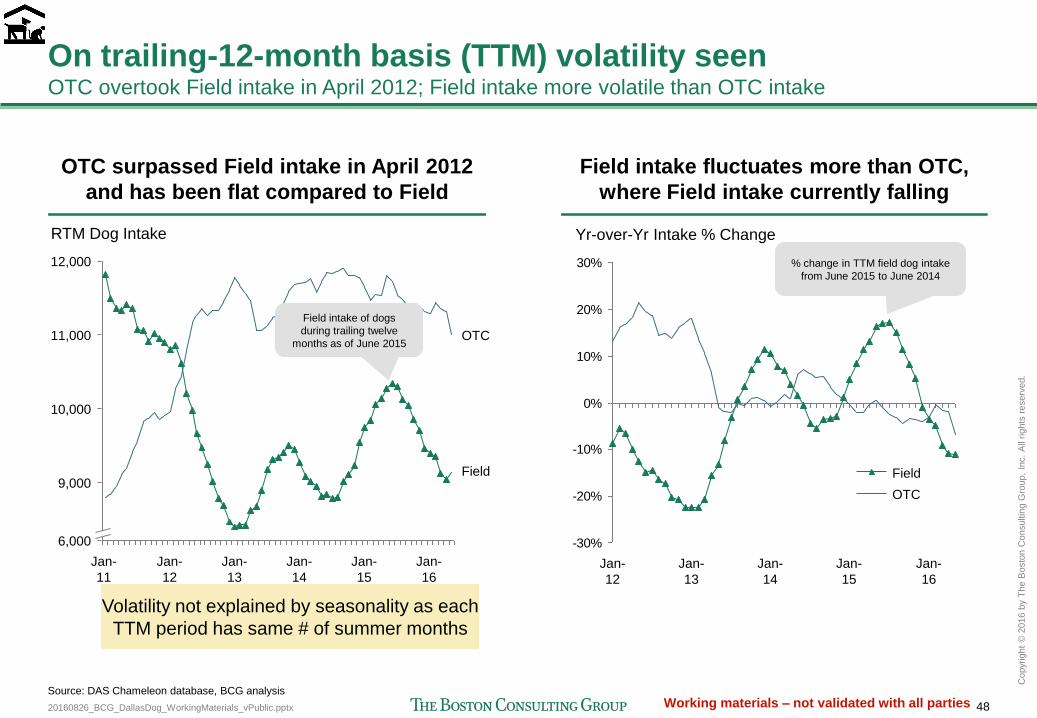
20160826_BCG_DallasDog_WorkingMaterials_vPublic.pptx 48
Copyr
ight
© 2
016 b
y T
he B
osto
n C
onsultin
g G
roup,
Inc.
All
rights
reserv
ed.
Working materials – not validated with all parties
On trailing-12-month basis (TTM) volatility seen OTC overtook Field intake in April 2012; Field intake more volatile than OTC intake
12,000
11,000
10,000
9,000
6,000
RTM Dog Intake
OTC
Field
Jan-
16
Jan-
15
Jan-
14
Jan-
13
Jan-
12
Jan-
11
-30%
-20%
-10%
0%
10%
20%
30%
Yr-over-Yr Intake % Change
Jan-
14
Jan-
13
Jan-
12
Jan-
16
Jan-
15
OTC
Field
OTC surpassed Field intake in April 2012
and has been flat compared to Field
Field intake fluctuates more than OTC,
where Field intake currently falling
Source: DAS Chameleon database, BCG analysis
Volatility not explained by seasonality as each
TTM period has same # of summer months
Field intake of dogs
during trailing twelve
months as of June 2015
% change in TTM field dog intake
from June 2015 to June 2014

20160826_BCG_DallasDog_WorkingMaterials_vPublic.pptx 49
Copyr
ight
© 2
016 b
y T
he B
osto
n C
onsultin
g G
roup,
Inc.
All
rights
reserv
ed.
Working materials – not validated with all parties
DAS Animal Services Officers responsible for 311 responses,
Field Collection, Euthanasia — majority of work is reactive
Respond to 311 requests
Collect animals, return
dogs to owners, issue
citations, and educate
community
Sweeps, cites, educates
Reactive (311) Proactive (Patrol)
Target one area with
sweeps, door-to-door
education, and citations
(CARE team)
Perform sweeps of some
neighborhoods
Shelter
Create and investigate
bite records
Euthanize dogs at the
shelter
~80% of ASO time
Field work Shelter work
~10% of ASO time ~10% of ASO time
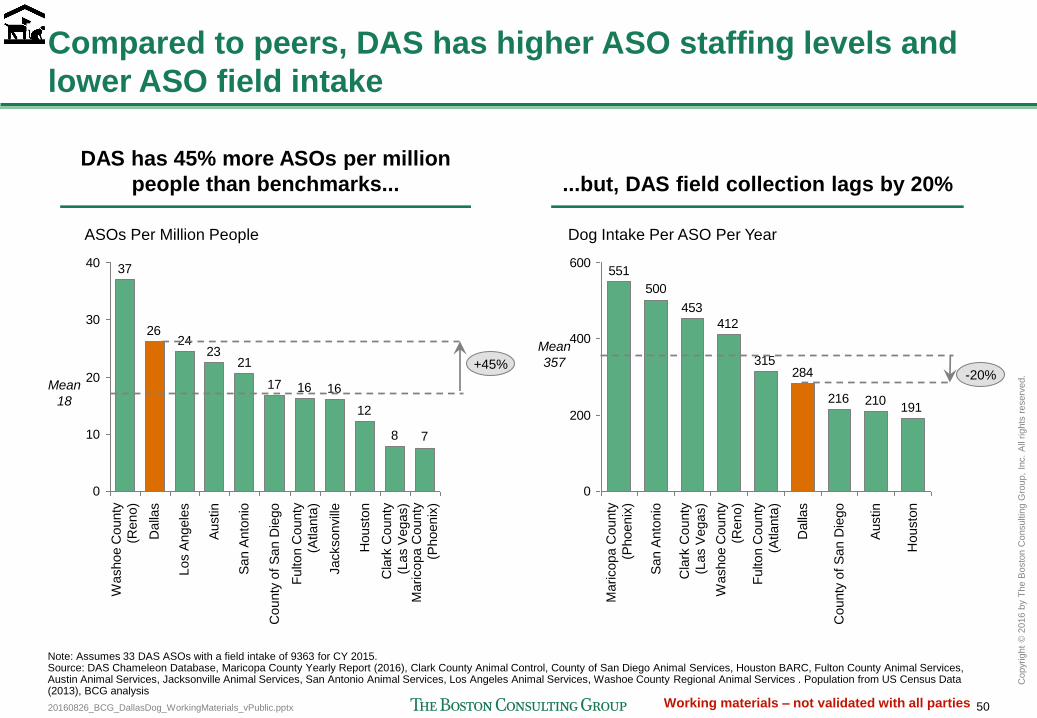
20160826_BCG_DallasDog_WorkingMaterials_vPublic.pptx 50
Copyr
ight
© 2
016 b
y T
he B
osto
n C
onsultin
g G
roup,
Inc.
All
rights
reserv
ed.
Working materials – not validated with all parties
Compared to peers, DAS has higher ASO staffing levels and
lower ASO field intake
Note: Assumes 33 DAS ASOs with a field intake of 9363 for CY 2015. Source: DAS Chameleon Database, Maricopa County Yearly Report (2016), Clark County Animal Control, County of San Diego Animal Services, Houston BARC, Fulton County Animal Services, Austin Animal Services, Jacksonville Animal Services, San Antonio Animal Services, Los Angeles Animal Services, Washoe County Regional Animal Services . Population from US Census Data (2013), BCG analysis
DAS has 45% more ASOs per million
people than benchmarks...
78
12
161617
2123
2426
37
0
10
20
30
40
Washoe C
ounty
(Reno)
Fulton C
ounty
(Atlanta
)
Jacksonvill
e
Housto
n
Cla
rk C
ounty
(Las V
egas)
Maricopa C
ounty
(Phoenix
)
ASOs Per Million People
Dalla
s
Los A
ngele
s
Austin
San A
nto
nio
County
of S
an D
iego
Mean
18
+45%
191210216
284315
412
453
500
551
0
200
400
600
Dalla
s
San A
nto
nio
Fulton C
ounty
(Atlanta
)
Cla
rk C
ounty
(Las V
egas)
Maricopa C
ounty
(Phoenix
)
Washoe C
ounty
(Reno)
County
of S
an D
iego
Austin
Housto
n
Dog Intake Per ASO Per Year
...but, DAS field collection lags by 20%
Mean
357 -20%

20160826_BCG_DallasDog_WorkingMaterials_vPublic.pptx 51
Copyr
ight
© 2
016 b
y T
he B
osto
n C
onsultin
g G
roup,
Inc.
All
rights
reserv
ed.
Working materials – not validated with all parties
Majority of DAS dog intake from southern Dallas 75% of field intake from southern Dallas; 57% of OTC intake from southern Dallas
70 71 71 70 72 73 75
29 28 27 28 26 25 24
100
80
60
40
20
0
% of Field intake
Southern Dallas
North Dallas
Not Dallas
TTM as
of May
2016
2
2015
2
2014
2
2013
2
2012
2
2011
2
2010
1
Note: Used only intakes that were coded with addresses (88% of intakes). I-30 used to separate North from southern Dallas. North Dallas includes districts 2,6,9,10,11,12,13,14. Southern Dallas includes districts 1,3,4,5,7,8; Source: DAS Chameleon database, BCG analysis
Field: 75% of Field intake from southern
Dallas and has been trending up
OTC: 57% of OTC intake from southern
Dallas
40 4454 52
4656 57
34
37
37 4047
36 35
2719
9 8 8 7 7100
80
60
40
20
0
% of OTC intake
2010 2011
South
ern
Dalla
s
North
Dalla
s
Not D
alla
s
TTM as
of May
2016
2015 2014 2013 2012
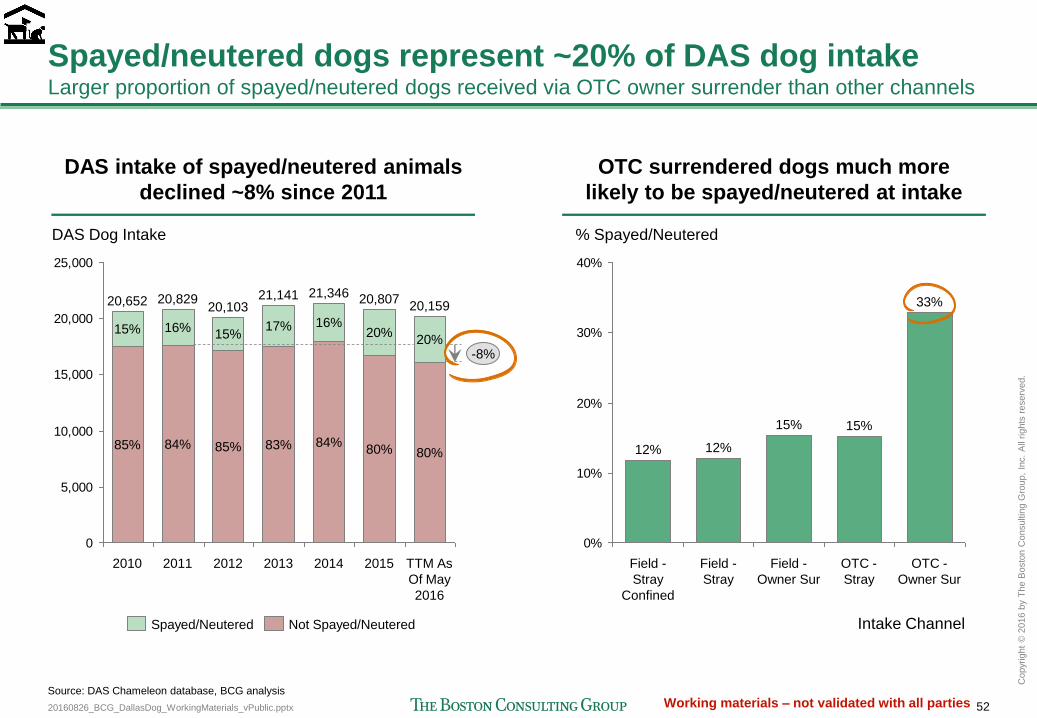
20160826_BCG_DallasDog_WorkingMaterials_vPublic.pptx 52
Copyr
ight
© 2
016 b
y T
he B
osto
n C
onsultin
g G
roup,
Inc.
All
rights
reserv
ed.
Working materials – not validated with all parties
Spayed/neutered dogs represent ~20% of DAS dog intake Larger proportion of spayed/neutered dogs received via OTC owner surrender than other channels
DAS intake of spayed/neutered animals
declined ~8% since 2011
OTC surrendered dogs much more
likely to be spayed/neutered at intake
0
5,000
10,000
15,000
20,000
25,000
2012
20,103
17%
85%
15%
2011
20,829
16%
84%
2010
20,652
85%
15% 16%
21,141
2013
83%
-8%
TTM As
Of May
2016
80%
20%
2015
20,807
80%
20%
2014
21,346
84%
DAS Dog Intake
20,159
Spayed/Neutered Not Spayed/Neutered
Source: DAS Chameleon database, BCG analysis
0%
10%
20%
30%
40%
12%
% Spayed/Neutered
15% 15%
Intake Channel
12%
33%
OTC -
Stray
Field -
Stray
OTC -
Owner Sur
Field -
Owner Sur
Field -
Stray
Confined
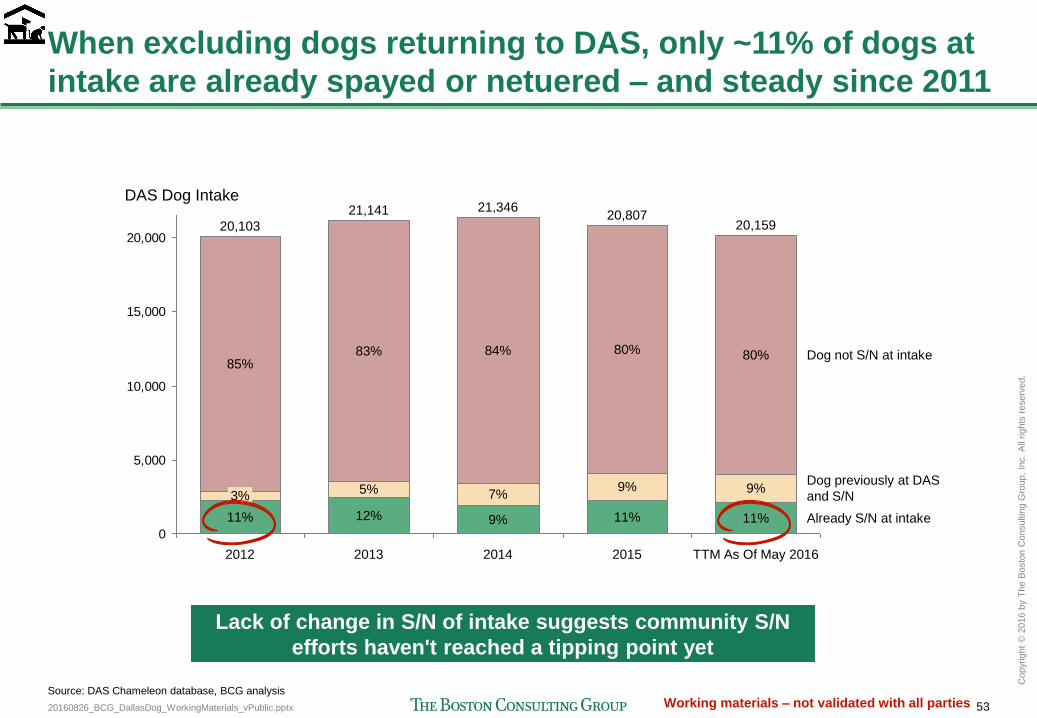
20160826_BCG_DallasDog_WorkingMaterials_vPublic.pptx 53
Copyr
ight
© 2
016 b
y T
he B
osto
n C
onsultin
g G
roup,
Inc.
All
rights
reserv
ed.
Working materials – not validated with all parties
When excluding dogs returning to DAS, only ~11% of dogs at
intake are already spayed or netuered – and steady since 2011
0
5,000
10,000
15,000
20,000
Already S/N at intake
Dog previously at DAS
and S/N
Dog not S/N at intake
DAS Dog Intake
20,159
TTM As Of May 2016
11%
9%
80%
2015
20,807
11%
9%
80%
2014
21,346
9%
7%
84%
2013
21,141
12%
5%
83%
2012
20,103
11%
3%
85%
Source: DAS Chameleon database, BCG analysis
Lack of change in S/N of intake suggests community S/N
efforts haven't reached a tipping point yet
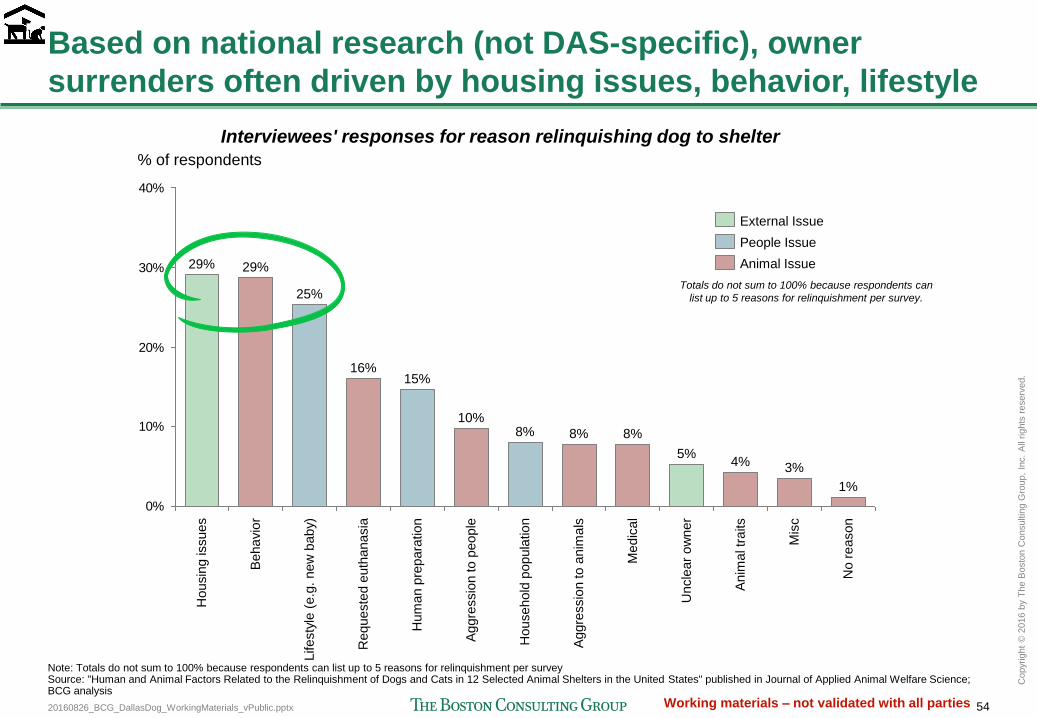
20160826_BCG_DallasDog_WorkingMaterials_vPublic.pptx 54
Copyr
ight
© 2
016 b
y T
he B
osto
n C
onsultin
g G
roup,
Inc.
All
rights
reserv
ed.
Working materials – not validated with all parties
Based on national research (not DAS-specific), owner
surrenders often driven by housing issues, behavior, lifestyle
Note: Totals do not sum to 100% because respondents can list up to 5 reasons for relinquishment per survey Source: "Human and Animal Factors Related to the Relinquishment of Dogs and Cats in 12 Selected Animal Shelters in the United States" published in Journal of Applied Animal Welfare Science; BCG analysis
0%
10%
20%
30%
40%
8%
Aggre
ssio
n to a
nim
als
8%
Household
popula
tion
8%
Aggre
ssio
n to p
eople
10% H
um
an p
repara
tion
15%
Requeste
d e
uth
anasia
16%
Lifesty
le (
e.g
. new
baby)
25%
Behavio
r 29%
Housin
g issues
29%
% of respondents
No r
eason
1%
Mis
c
3%
Anim
al tr
aits
4%
Uncle
ar
ow
ner
5%
Medic
al
Animal Issue
External Issue
People Issue
Interviewees' responses for reason relinquishing dog to shelter
Totals do not sum to 100% because respondents can
list up to 5 reasons for relinquishment per survey.
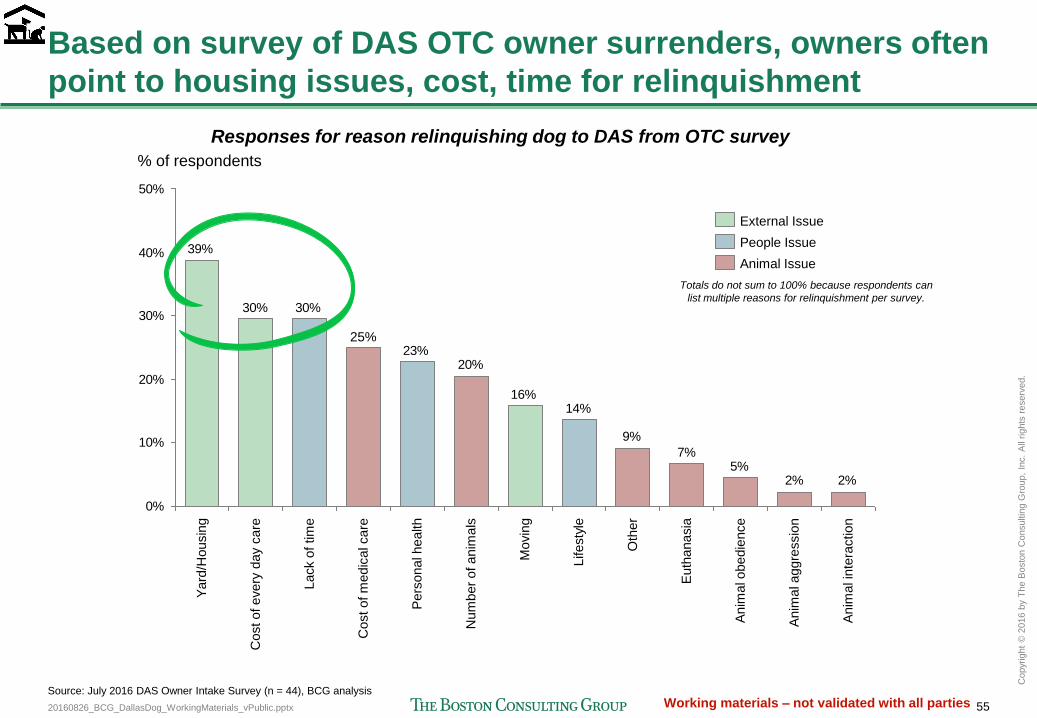
20160826_BCG_DallasDog_WorkingMaterials_vPublic.pptx 55
Copyr
ight
© 2
016 b
y T
he B
osto
n C
onsultin
g G
roup,
Inc.
All
rights
reserv
ed.
Working materials – not validated with all parties
Based on survey of DAS OTC owner surrenders, owners often
point to housing issues, cost, time for relinquishment
2%2%5%
7%
9%
14%16%
20%23%
30%30%
39%
0%
10%
20%
30%
40%
50%
Anim
al in
tera
ction
% of respondents
Anim
al aggre
ssio
n
Anim
al obedie
nce
Euth
anasia
Oth
er
Lifesty
le
Movin
g
25%
Lack o
f tim
e
Cost of every
day c
are
Yard
/Housin
g
Num
ber
of anim
als
Pers
onal health
Cost of m
edic
al care
Source: July 2016 DAS Owner Intake Survey (n = 44), BCG analysis
Animal Issue
People Issue
External Issue
Responses for reason relinquishing dog to DAS from OTC survey
Totals do not sum to 100% because respondents can
list multiple reasons for relinquishment per survey.
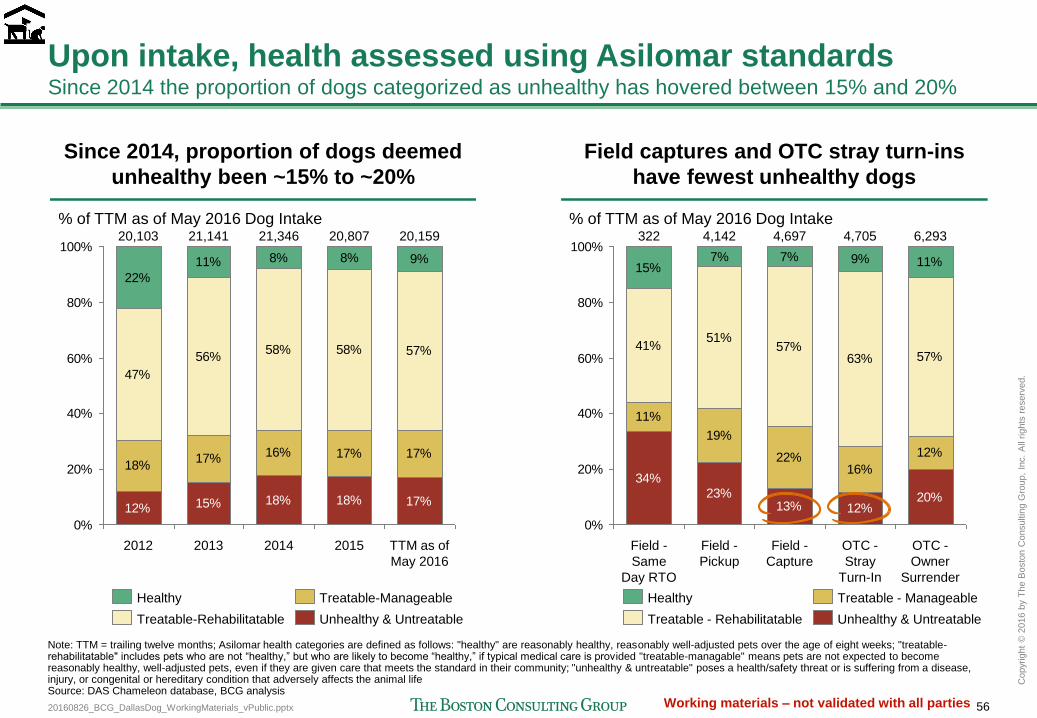
20160826_BCG_DallasDog_WorkingMaterials_vPublic.pptx 56
Copyr
ight
© 2
016 b
y T
he B
osto
n C
onsultin
g G
roup,
Inc.
All
rights
reserv
ed.
Working materials – not validated with all parties
Upon intake, health assessed using Asilomar standards Since 2014 the proportion of dogs categorized as unhealthy has hovered between 15% and 20%
12% 15% 18% 18% 17%
18%17% 16% 17% 17%
47%
56%58% 58% 57%
22%
11% 8% 8% 9%
0%
20%
40%
60%
80%
100%
% of TTM as of May 2016 Dog Intake 20,807
2014
21,346
2013
21,141
TTM as of
May 2016
20,159
2015 2012
20,103
34%23%
13% 12%20%
11%
19%
22%16%
12%
41%51%
57%63% 57%
15%7% 7% 9% 11%
0%
20%
40%
60%
80%
100%
% of TTM as of May 2016 Dog Intake
OTC -
Owner
Surrender
6,293
Field -
Pickup
4,142
Field -
Same
Day RTO
322
OTC -
Stray
Turn-In
4,705
Field -
Capture
4,697
Healthy
Unhealthy & Untreatable
Treatable-Manageable
Treatable-Rehabilitatable Unhealthy & Untreatable
Treatable - Manageable
Treatable - Rehabilitatable
Healthy
Since 2014, proportion of dogs deemed
unhealthy been ~15% to ~20%
Field captures and OTC stray turn-ins
have fewest unhealthy dogs
Note: TTM = trailing twelve months; Asilomar health categories are defined as follows: "healthy" are reasonably healthy, reasonably well-adjusted pets over the age of eight weeks; "treatable-rehabilitatable" includes pets who are not “healthy,” but who are likely to become “healthy,” if typical medical care is provided "treatable-managable" means pets are not expected to become reasonably healthy, well-adjusted pets, even if they are given care that meets the standard in their community; "unhealthy & untreatable" poses a health/safety threat or is suffering from a disease, injury, or congenital or hereditary condition that adversely affects the animal life Source: DAS Chameleon database, BCG analysis
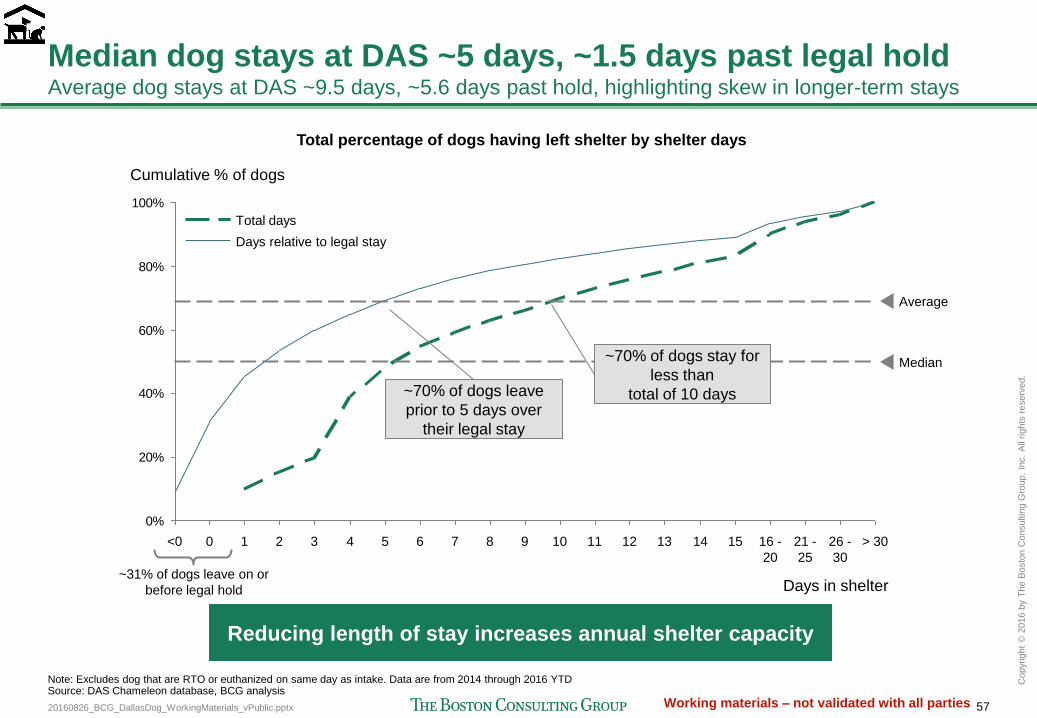
20160826_BCG_DallasDog_WorkingMaterials_vPublic.pptx 57
Copyr
ight
© 2
016 b
y T
he B
osto
n C
onsultin
g G
roup,
Inc.
All
rights
reserv
ed.
Working materials – not validated with all parties
Median dog stays at DAS ~5 days, ~1.5 days past legal hold Average dog stays at DAS ~9.5 days, ~5.6 days past hold, highlighting skew in longer-term stays
0%
20%
40%
60%
80%
100%
> 30 26 -
30
21 -
25
16 -
20
15 14 13 12 11 10 9 8 7 6 5 4 3 2 1 0 <0
Average
Median
Cumulative % of dogs
Days in shelter
Days relative to legal stay
Total days
Total percentage of dogs having left shelter by shelter days
~31% of dogs leave on or
before legal hold
~70% of dogs stay for
less than
total of 10 days
Reducing length of stay increases annual shelter capacity
~70% of dogs leave
prior to 5 days over
their legal stay
Note: Excludes dog that are RTO or euthanized on same day as intake. Data are from 2014 through 2016 YTD Source: DAS Chameleon database, BCG analysis
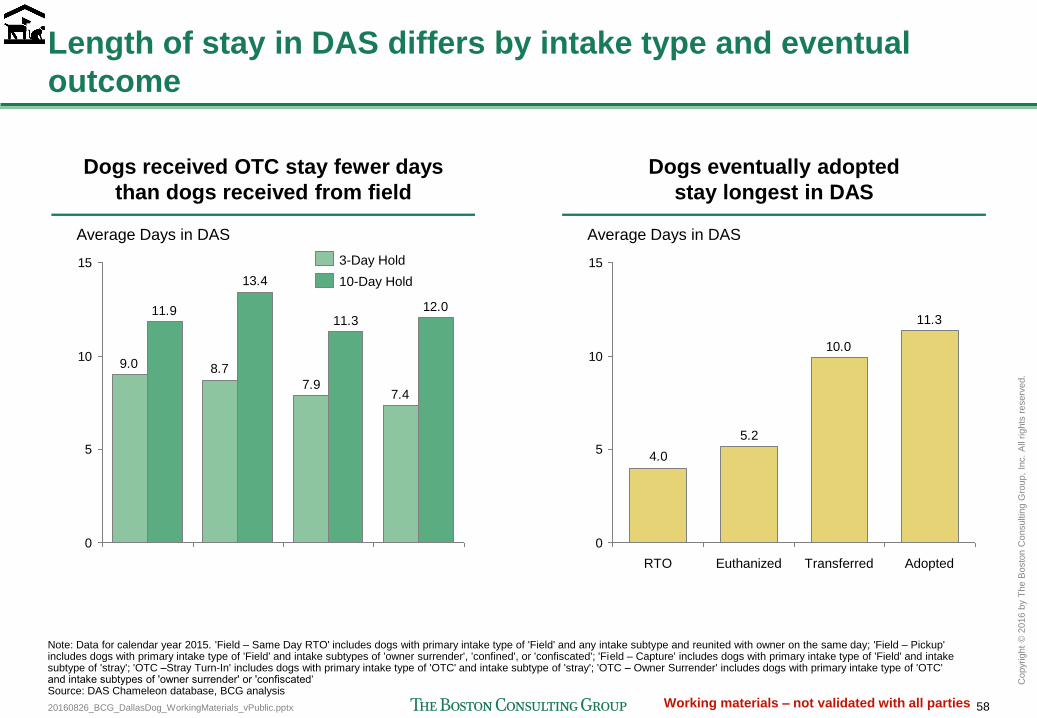
20160826_BCG_DallasDog_WorkingMaterials_vPublic.pptx 58
Copyr
ight
© 2
016 b
y T
he B
osto
n C
onsultin
g G
roup,
Inc.
All
rights
reserv
ed.
Working materials – not validated with all parties
Length of stay in DAS differs by intake type and eventual
outcome
7.47.9
8.79.0
12.011.3
13.4
11.9
0
5
10
15
Average Days in DAS
3-Day Hold
10-Day Hold
11.3
10.0
5.2
4.0
0
5
10
15
RTO Transferred
Average Days in DAS
Euthanized Adopted
Dogs received OTC stay fewer days
than dogs received from field
Dogs eventually adopted
stay longest in DAS
Note: Data for calendar year 2015. 'Field – Same Day RTO' includes dogs with primary intake type of 'Field' and any intake subtype and reunited with owner on the same day; 'Field – Pickup' includes dogs with primary intake type of 'Field' and intake subtypes of 'owner surrender', 'confined', or 'confiscated'; 'Field – Capture' includes dogs with primary intake type of 'Field' and intake subtype of 'stray'; 'OTC –Stray Turn-In' includes dogs with primary intake type of 'OTC' and intake subtype of 'stray'; 'OTC – Owner Surrender' includes dogs with primary intake type of 'OTC' and intake subtypes of 'owner surrender' or 'confiscated‘ Source: DAS Chameleon database, BCG analysis
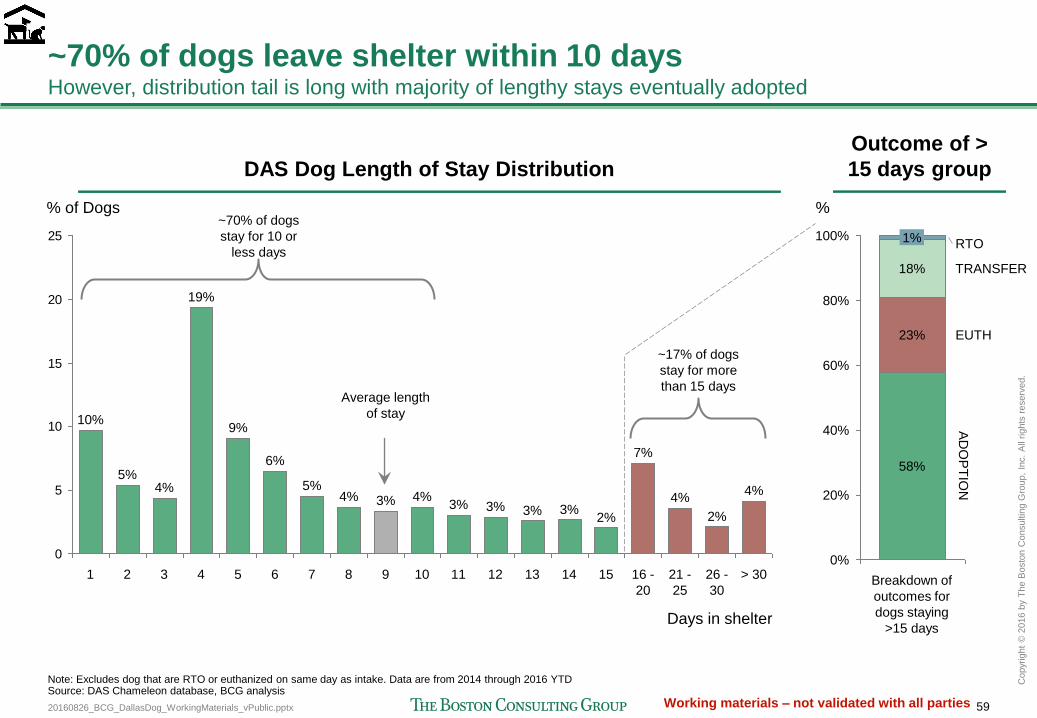
20160826_BCG_DallasDog_WorkingMaterials_vPublic.pptx 59
Copyr
ight
© 2
016 b
y T
he B
osto
n C
onsultin
g G
roup,
Inc.
All
rights
reserv
ed.
Working materials – not validated with all parties
0
5
10
15
20
25
4%
5
9%
8
3%
9
4%
10
3%
11
3%
12
3%
13
3%
% of Dogs
6
19%
5%
3 4
Days in shelter
> 30
4%
26 -
30
2%
21 -
25
4%
16 -
20
7%
15
2%
14
4%
2 7
5%
1
10%
6%
Average length
of stay
~17% of dogs
stay for more
than 15 days
DAS Dog Length of Stay Distribution
Outcome of >
15 days group
60%
80%
0%
40%
20%
100% RTO
AD
OP
TIO
N
Breakdown of
outcomes for
dogs staying
>15 days
%
58%
TRANSFER
EUTH
18%
23%
1%
~70% of dogs
stay for 10 or
less days
~70% of dogs leave shelter within 10 days However, distribution tail is long with majority of lengthy stays eventually adopted
Note: Excludes dog that are RTO or euthanized on same day as intake. Data are from 2014 through 2016 YTD Source: DAS Chameleon database, BCG analysis
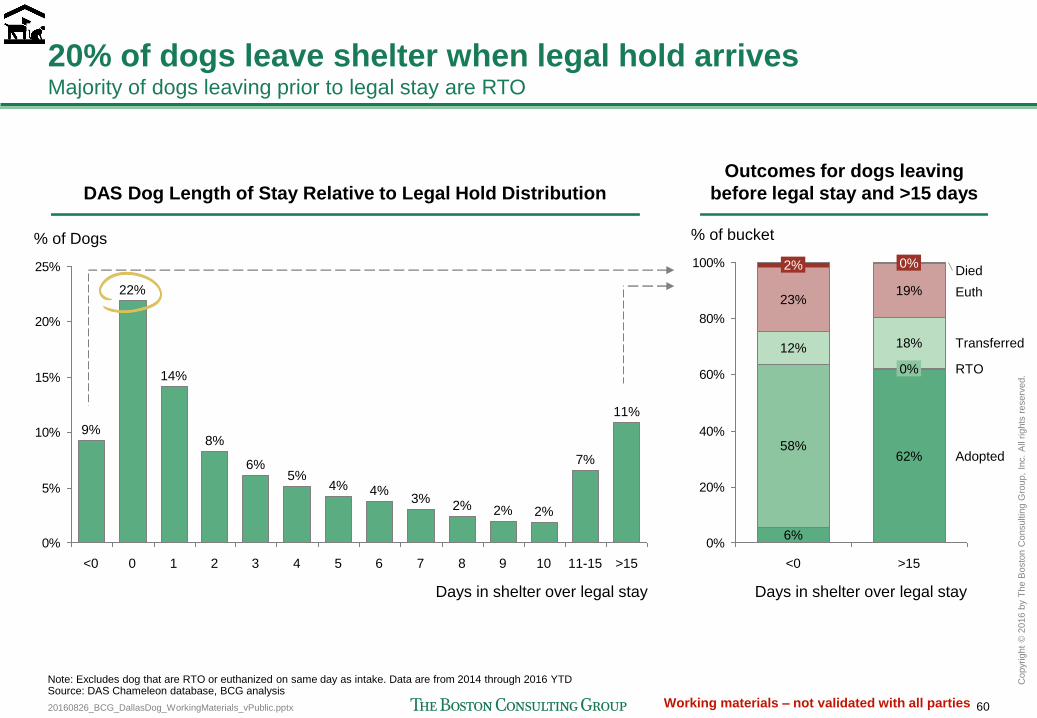
20160826_BCG_DallasDog_WorkingMaterials_vPublic.pptx 60
Copyr
ight
© 2
016 b
y T
he B
osto
n C
onsultin
g G
roup,
Inc.
All
rights
reserv
ed.
Working materials – not validated with all parties
20% of dogs leave shelter when legal hold arrives Majority of dogs leaving prior to legal stay are RTO
0%
5%
10%
15%
20%
25%
3
9%
0
% of Dogs
5%
5 7 6
4% 4% 3%
4
6%
14%
1 2
8%
Days in shelter over legal stay
>15
11%
11-15
7%
10
2%
9
2%
8
2%
22%
<0
Note: Excludes dog that are RTO or euthanized on same day as intake. Data are from 2014 through 2016 YTD Source: DAS Chameleon database, BCG analysis
0%
20%
40%
60%
80%
100% 0%
19%
0%
58%
18%
6%
12%
62%
2%
23%
% of bucket
>15 <0
Transferred
RTO
Adopted
Days in shelter over legal stay
Died
Euth
DAS Dog Length of Stay Relative to Legal Hold Distribution
Outcomes for dogs leaving
before legal stay and >15 days
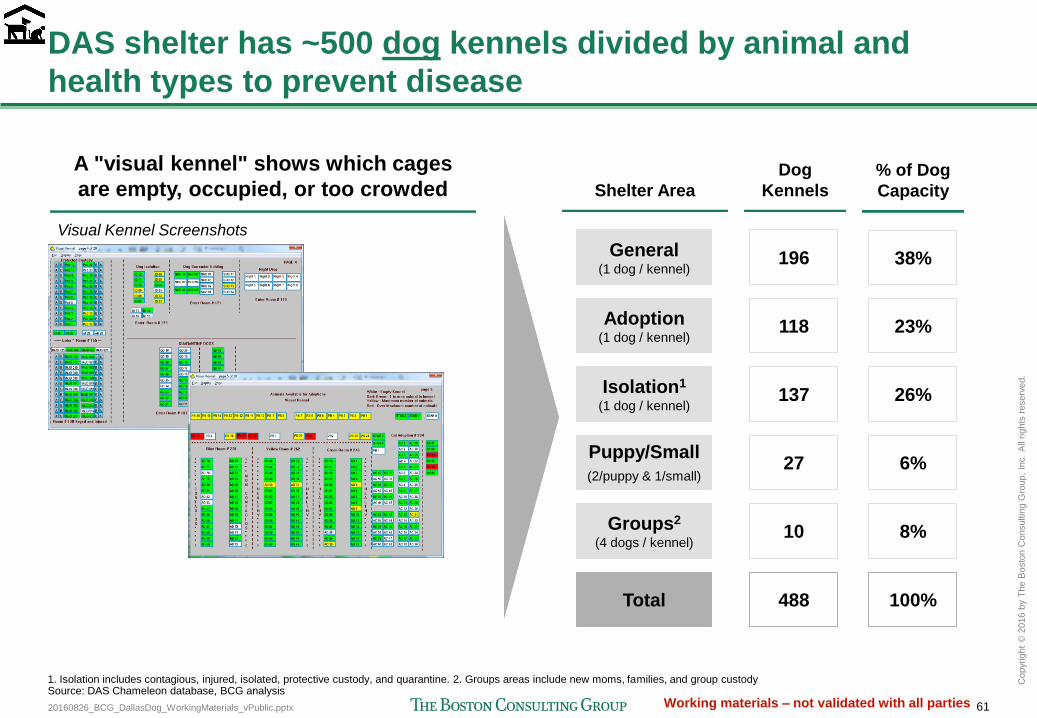
20160826_BCG_DallasDog_WorkingMaterials_vPublic.pptx 61
Copyr
ight
© 2
016 b
y T
he B
osto
n C
onsultin
g G
roup,
Inc.
All
rights
reserv
ed.
Working materials – not validated with all parties
DAS shelter has ~500 dog kennels divided by animal and
health types to prevent disease
A "visual kennel" shows which cages
are empty, occupied, or too crowded
Visual Kennel Screenshots
General (1 dog / kennel)
Adoption (1 dog / kennel)
Isolation1
(1 dog / kennel)
Puppy/Small
(2/puppy & 1/small)
Groups2
(4 dogs / kennel)
Shelter Area
Dog
Kennels
196
118
137
27
10
38%
23%
26%
6%
8%
% of Dog
Capacity
1. Isolation includes contagious, injured, isolated, protective custody, and quarantine. 2. Groups areas include new moms, families, and group custody Source: DAS Chameleon database, BCG analysis
Total 488 100%
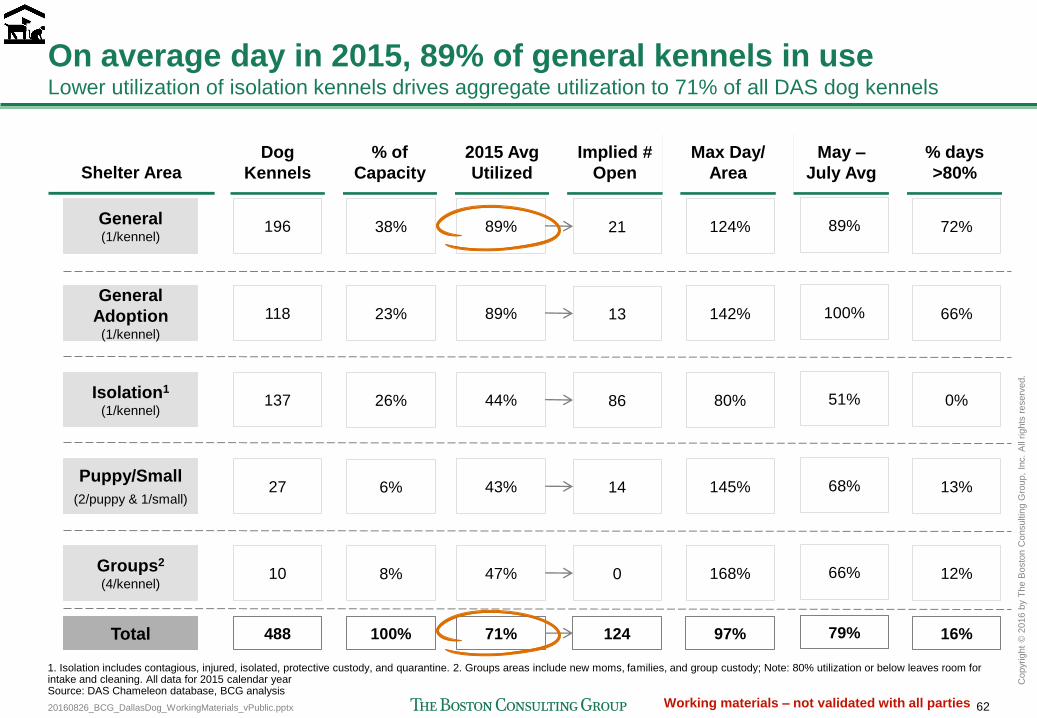
20160826_BCG_DallasDog_WorkingMaterials_vPublic.pptx 62
Copyr
ight
© 2
016 b
y T
he B
osto
n C
onsultin
g G
roup,
Inc.
All
rights
reserv
ed.
Working materials – not validated with all parties
On average day in 2015, 89% of general kennels in use Lower utilization of isolation kennels drives aggregate utilization to 71% of all DAS dog kennels
General (1/kennel)
General
Adoption (1/kennel)
Isolation1
(1/kennel)
Puppy/Small
(2/puppy & 1/small)
Groups2
(4/kennel)
Shelter Area
Dog
Kennels
2015 Avg
Utilized
Max Day/
Area
% days
>80%
196
118
137
27
10
89%
89%
44%
43%
47%
145%
168%
0%
13%
12%
1. Isolation includes contagious, injured, isolated, protective custody, and quarantine. 2. Groups areas include new moms, families, and group custody; Note: 80% utilization or below leaves room for intake and cleaning. All data for 2015 calendar year Source: DAS Chameleon database, BCG analysis
38%
23%
26%
6%
8%
% of
Capacity
124%
142%
80%
72%
66%
Implied #
Open
14
0
21
13
86
Total 488 100% 71% 124 97% 16%
May –
July Avg
51%
68%
66%
89%
100%
79%
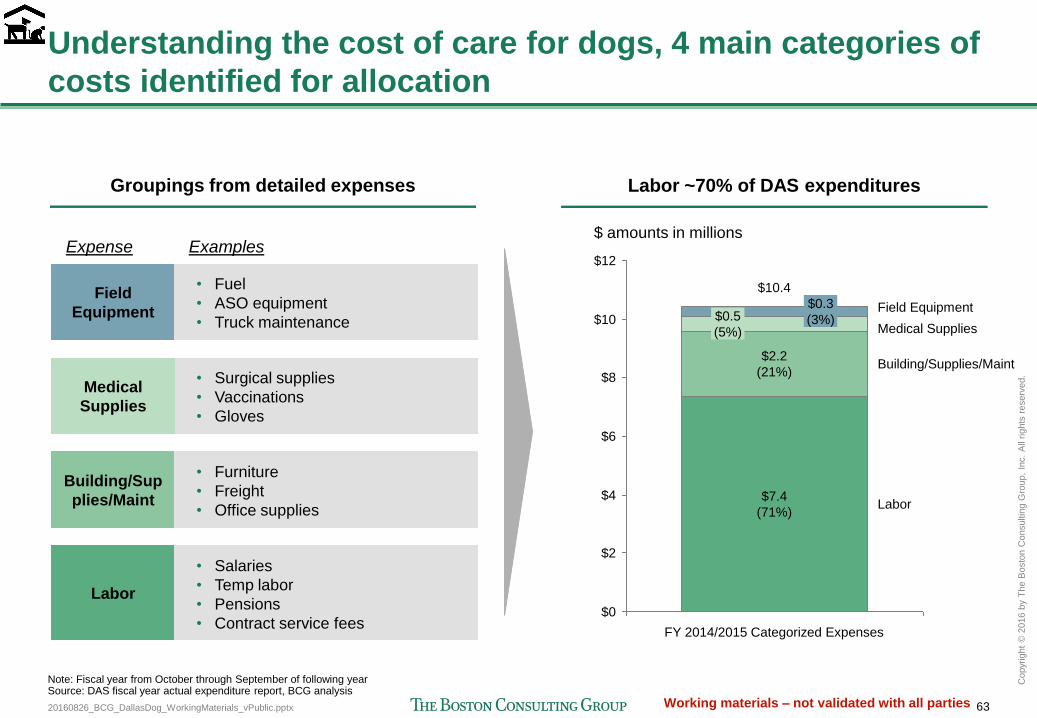
20160826_BCG_DallasDog_WorkingMaterials_vPublic.pptx 63
Copyr
ight
© 2
016 b
y T
he B
osto
n C
onsultin
g G
roup,
Inc.
All
rights
reserv
ed.
Working materials – not validated with all parties
Understanding the cost of care for dogs, 4 main categories of
costs identified for allocation
$0
$12
$10
$4
$6
$8
$2
FY 2014/2015 Categorized Expenses
$ amounts in millions
Field Equipment
Medical Supplies
Building/Supplies/Maint
$0.3
(3%)
$7.4
(71%)
$0.5
(5%)
$2.2
(21%)
$10.4
Labor
• Surgical supplies
• Vaccinations
• Gloves
Building/Sup
plies/Maint
• Furniture
• Freight
• Office supplies
Labor
• Salaries
• Temp labor
• Pensions
• Contract service fees
Field
Equipment
• Fuel
• ASO equipment
• Truck maintenance
Medical
Supplies
Expense Examples
Groupings from detailed expenses Labor ~70% of DAS expenditures
Note: Fiscal year from October through September of following year Source: DAS fiscal year actual expenditure report, BCG analysis
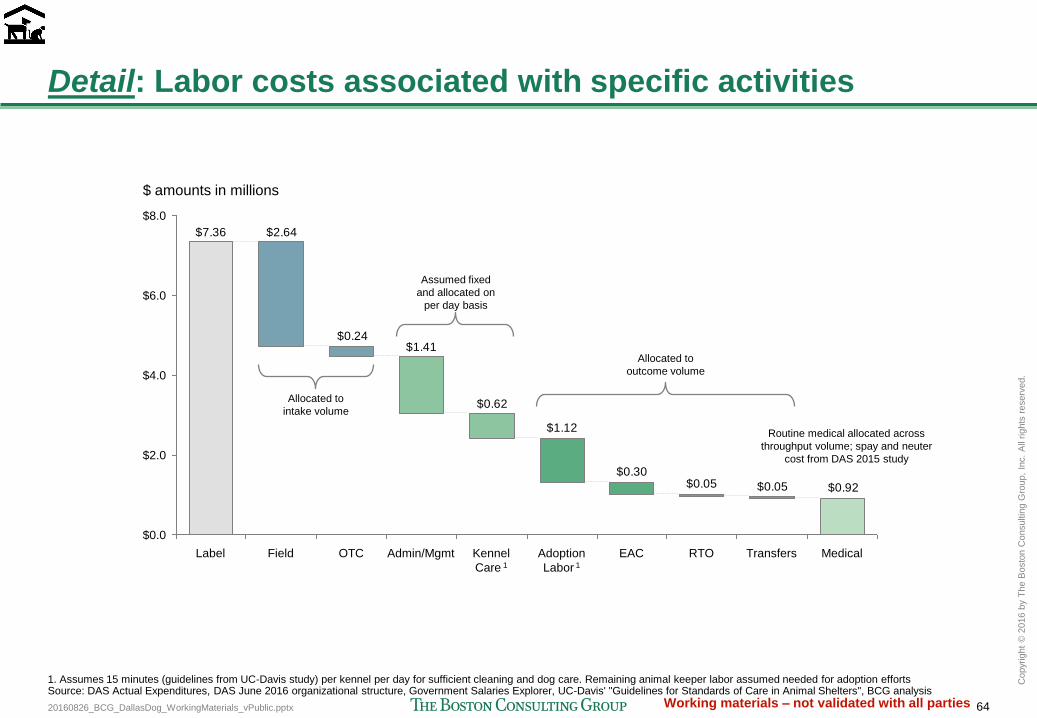
20160826_BCG_DallasDog_WorkingMaterials_vPublic.pptx 64
Copyr
ight
© 2
016 b
y T
he B
osto
n C
onsultin
g G
roup,
Inc.
All
rights
reserv
ed.
Working materials – not validated with all parties
Detail: Labor costs associated with specific activities
$0.92$0.05$0.05$0.30
$1.12
$0.62
$1.41$0.24
$2.64$7.36
$4.0
$6.0
$0.0
$2.0
$8.0
$ amounts in millions
Transfers Admin/Mgmt EAC RTO Adoption
Labor 1
Kennel
Care 1
Medical Field OTC Label
Allocated to
intake volume
Assumed fixed
and allocated on
per day basis
Allocated to
outcome volume
Routine medical allocated across
throughput volume; spay and neuter
cost from DAS 2015 study
1. Assumes 15 minutes (guidelines from UC-Davis study) per kennel per day for sufficient cleaning and dog care. Remaining animal keeper labor assumed needed for adoption efforts Source: DAS Actual Expenditures, DAS June 2016 organizational structure, Government Salaries Explorer, UC-Davis' "Guidelines for Standards of Care in Animal Shelters", BCG analysis
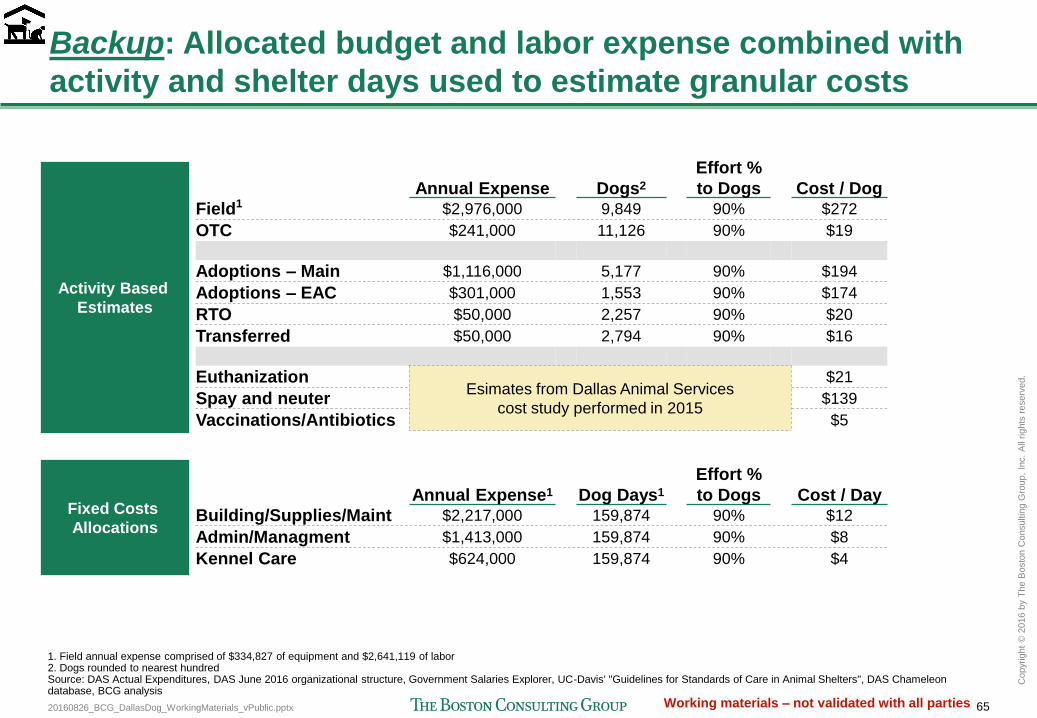
20160826_BCG_DallasDog_WorkingMaterials_vPublic.pptx 65
Copyr
ight
© 2
016 b
y T
he B
osto
n C
onsultin
g G
roup,
Inc.
All
rights
reserv
ed.
Working materials – not validated with all parties
Backup: Allocated budget and labor expense combined with
activity and shelter days used to estimate granular costs
Activity Based
Estimates
Annual Expense1 Dog Days1
Effort %
to Dogs Cost / Day
Building/Supplies/Maint $2,217,000 159,874 90% $12
Admin/Managment $1,413,000 159,874 90% $8
Kennel Care $624,000 159,874 90% $4
Fixed Costs
Allocations
Annual Expense Dogs2
Effort %
to Dogs Cost / Dog
Field1 $2,976,000 9,849 90% $272
OTC $241,000 11,126 90% $19
Adoptions – Main $1,116,000 5,177 90% $194
Adoptions – EAC $301,000 1,553 90% $174
RTO $50,000 2,257 90% $20
Transferred $50,000 2,794 90% $16
Euthanization Esimates from Dallas Animal Services
cost study performed in 2015
$21
Spay and neuter $139
Vaccinations/Antibiotics $5
1. Field annual expense comprised of $334,827 of equipment and $2,641,119 of labor 2. Dogs rounded to nearest hundred Source: DAS Actual Expenditures, DAS June 2016 organizational structure, Government Salaries Explorer, UC-Davis' "Guidelines for Standards of Care in Animal Shelters", DAS Chameleon database, BCG analysis
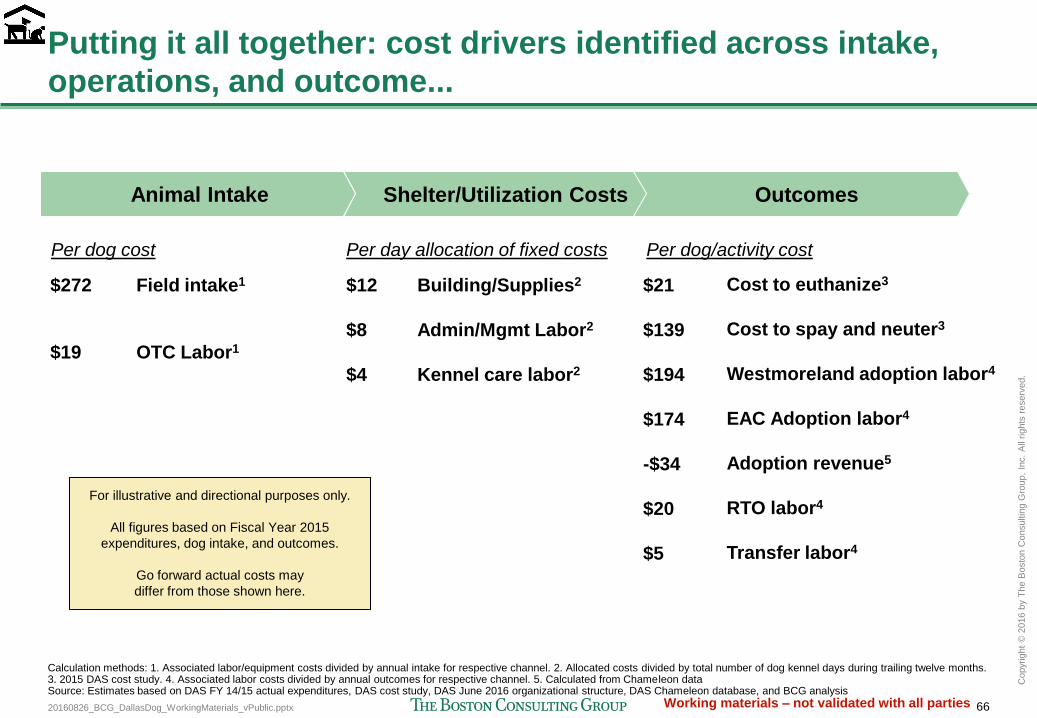
20160826_BCG_DallasDog_WorkingMaterials_vPublic.pptx 66
Copyr
ight
© 2
016 b
y T
he B
osto
n C
onsultin
g G
roup,
Inc.
All
rights
reserv
ed.
Working materials – not validated with all parties
Putting it all together: cost drivers identified across intake,
operations, and outcome...
Shelter/Utilization Costs Animal Intake Outcomes
Field intake1
OTC Labor1
$272
$19
Building/Supplies2
Admin/Mgmt Labor2
Kennel care labor2
$12
$8
$4
Cost to euthanize3
Cost to spay and neuter3
Westmoreland adoption labor4
EAC Adoption labor4
Adoption revenue5
RTO labor4
Transfer labor4
$21
$139
$194
$174
-$34
$20
$5
Per dog cost Per dog/activity cost Per day allocation of fixed costs
Calculation methods: 1. Associated labor/equipment costs divided by annual intake for respective channel. 2. Allocated costs divided by total number of dog kennel days during trailing twelve months. 3. 2015 DAS cost study. 4. Associated labor costs divided by annual outcomes for respective channel. 5. Calculated from Chameleon data Source: Estimates based on DAS FY 14/15 actual expenditures, DAS cost study, DAS June 2016 organizational structure, DAS Chameleon database, and BCG analysis
For illustrative and directional purposes only.
All figures based on Fiscal Year 2015
expenditures, dog intake, and outcomes.
Go forward actual costs may
differ from those shown here.
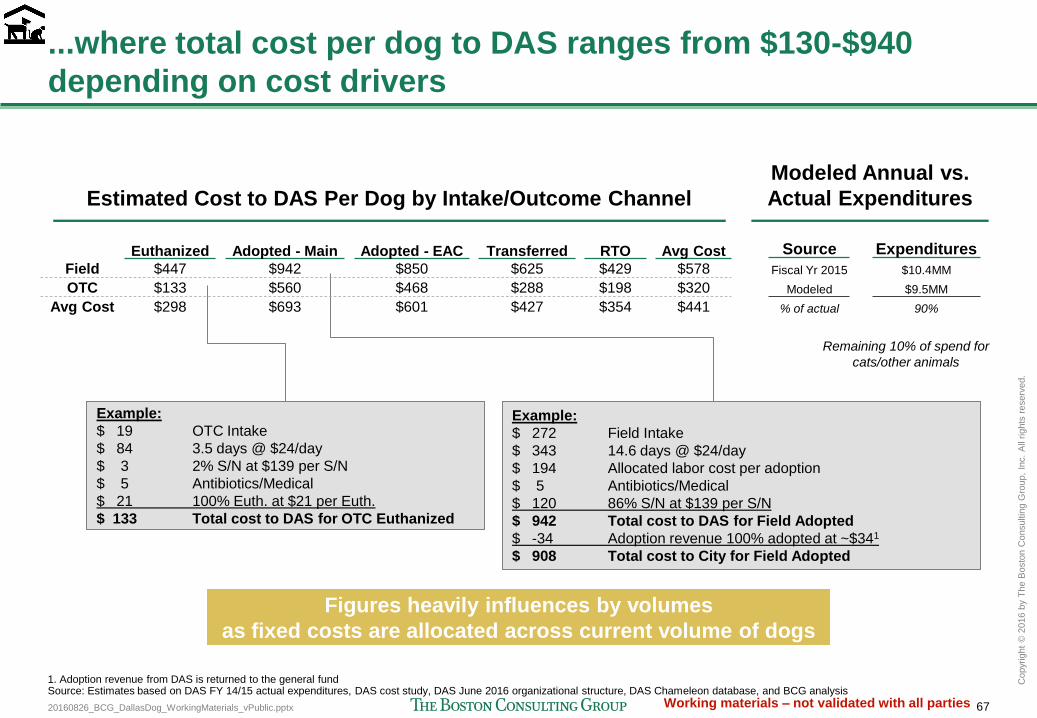
20160826_BCG_DallasDog_WorkingMaterials_vPublic.pptx 67
Copyr
ight
© 2
016 b
y T
he B
osto
n C
onsultin
g G
roup,
Inc.
All
rights
reserv
ed.
Working materials – not validated with all parties
...where total cost per dog to DAS ranges from $130-$940
depending on cost drivers
Estimated Cost to DAS Per Dog by Intake/Outcome Channel
Modeled Annual vs.
Actual Expenditures
Remaining 10% of spend for
cats/other animals
Example:
$ 19 OTC Intake
$ 84 3.5 days @ $24/day
$ 3 2% S/N at $139 per S/N
$ 5 Antibiotics/Medical
$ 21 100% Euth. at $21 per Euth.
$ 133 Total cost to DAS for OTC Euthanized
Example:
$ 272 Field Intake
$ 343 14.6 days @ $24/day
$ 194 Allocated labor cost per adoption
$ 5 Antibiotics/Medical
$ 120 86% S/N at $139 per S/N
$ 942 Total cost to DAS for Field Adopted
$ -34 Adoption revenue 100% adopted at ~$341
$ 908 Total cost to City for Field Adopted
1. Adoption revenue from DAS is returned to the general fund Source: Estimates based on DAS FY 14/15 actual expenditures, DAS cost study, DAS June 2016 organizational structure, DAS Chameleon database, and BCG analysis
Source Expenditures
Fiscal Yr 2015 $10.4MM
Modeled $9.5MM
% of actual 90%
Euthanized Adopted - Main Adopted - EAC Transferred RTO Avg Cost
Field $447 $942 $850 $625 $429 $578
OTC $133 $560 $468 $288 $198 $320
Avg Cost $298 $693 $601 $427 $354 $441
Figures heavily influences by volumes
as fixed costs are allocated across current volume of dogs
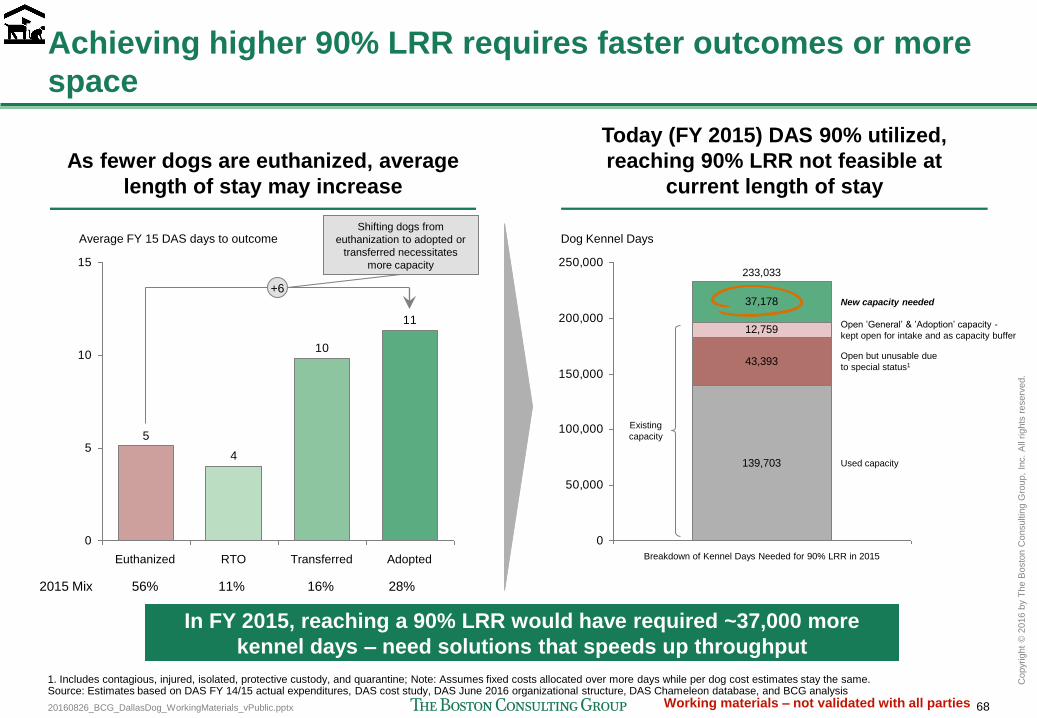
20160826_BCG_DallasDog_WorkingMaterials_vPublic.pptx 68
Copyr
ight
© 2
016 b
y T
he B
osto
n C
onsultin
g G
roup,
Inc.
All
rights
reserv
ed.
Working materials – not validated with all parties
Achieving higher 90% LRR requires faster outcomes or more
space
11
10
4
5
0
5
10
15
Average FY 15 DAS days to outcome
Euthanized RTO Transferred Adopted
+6
56% 11% 16% 28% 2015 Mix
Shifting dogs from
euthanization to adopted or
transferred necessitates
more capacity
139,703
43,393
12,759
37,178
0
50,000
100,000
150,000
200,000
250,000
Used capacity
Open but unusable due
to special status1
Open ’General’ & ’Adoption’ capacity -
kept open for intake and as capacity buffer
New capacity needed
Dog Kennel Days
Breakdown of Kennel Days Needed for 90% LRR in 2015
233,033
As fewer dogs are euthanized, average
length of stay may increase
Today (FY 2015) DAS 90% utilized,
reaching 90% LRR not feasible at
current length of stay
In FY 2015, reaching a 90% LRR would have required ~37,000 more
kennel days – need solutions that speeds up throughput
1. Includes contagious, injured, isolated, protective custody, and quarantine; Note: Assumes fixed costs allocated over more days while per dog cost estimates stay the same. Source: Estimates based on DAS FY 14/15 actual expenditures, DAS cost study, DAS June 2016 organizational structure, DAS Chameleon database, and BCG analysis
Existing
capacity
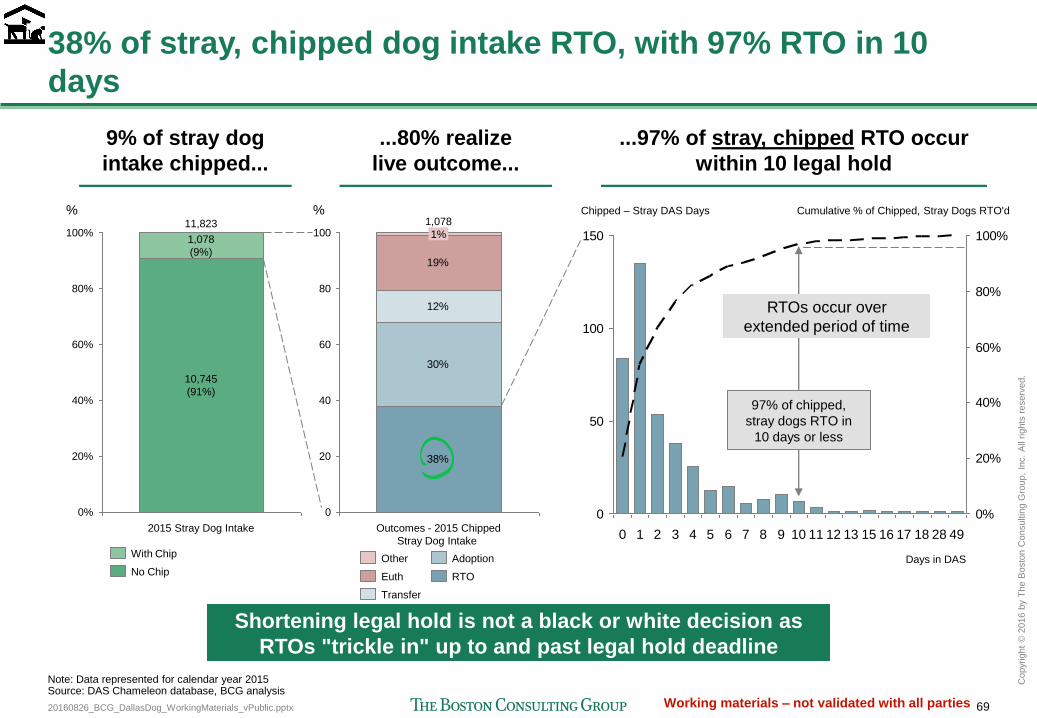
20160826_BCG_DallasDog_WorkingMaterials_vPublic.pptx 69
Copyr
ight
© 2
016 b
y T
he B
osto
n C
onsultin
g G
roup,
Inc.
All
rights
reserv
ed.
Working materials – not validated with all parties
38% of stray, chipped dog intake RTO, with 97% RTO in 10
days
0%
60%
20%
40%
80%
100%
%
2015 Stray Dog Intake
11,823
10,745
(91%)
1,078
(9%)
38%
30%
12%
19%
100
80
60
40
20
0
%
1%
Outcomes - 2015 Chipped
Stray Dog Intake
1,078
With Chip
No Chip
0
50
100
150
0%
20%
40%
60%
80%
100%
3 28 49 18
Days in DAS
Chipped – Stray DAS Days
0 1 2
Cumulative % of Chipped, Stray Dogs RTO'd
5 4 6 7 8 9 10 11 12 13 15 16 17
Euth
Other
Transfer
RTO
Adoption
97% of chipped,
stray dogs RTO in
10 days or less
9% of stray dog
intake chipped...
...80% realize
live outcome...
...97% of stray, chipped RTO occur
within 10 legal hold
Note: Data represented for calendar year 2015 Source: DAS Chameleon database, BCG analysis
Shortening legal hold is not a black or white decision as
RTOs "trickle in" up to and past legal hold deadline
RTOs occur over
extended period of time
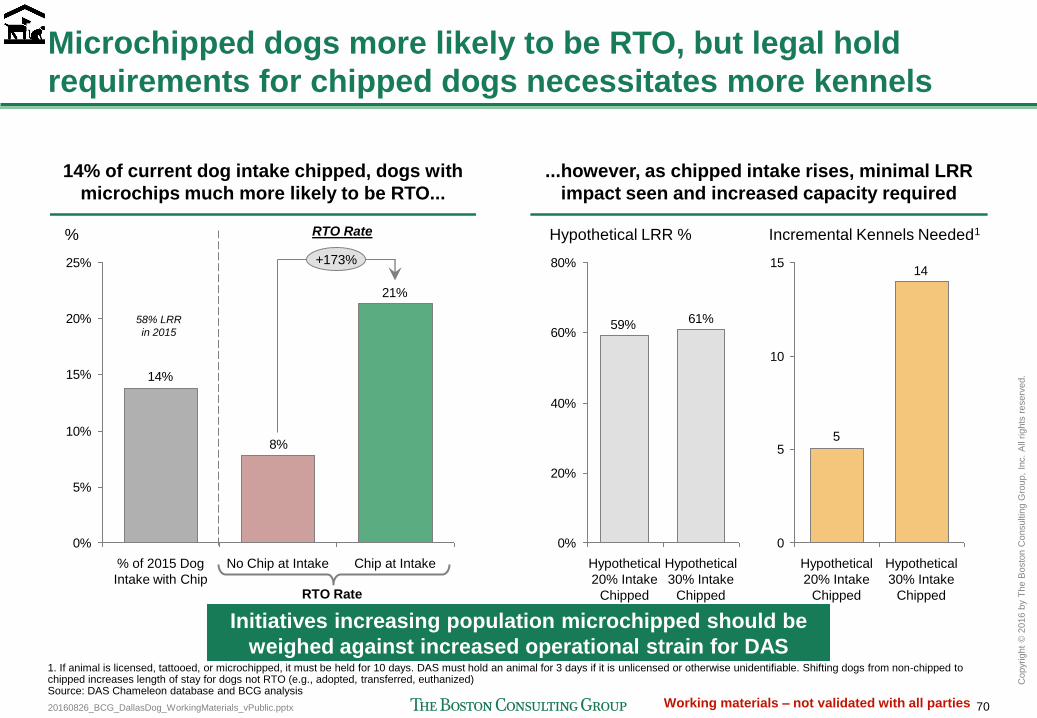
20160826_BCG_DallasDog_WorkingMaterials_vPublic.pptx 70
Copyr
ight
© 2
016 b
y T
he B
osto
n C
onsultin
g G
roup,
Inc.
All
rights
reserv
ed.
Working materials – not validated with all parties
Microchipped dogs more likely to be RTO, but legal hold
requirements for chipped dogs necessitates more kennels
14% of current dog intake chipped, dogs with
microchips much more likely to be RTO...
...however, as chipped intake rises, minimal LRR
impact seen and increased capacity required
21%
8%
14%
0%
5%
10%
15%
20%
25%
%
% of 2015 Dog
Intake with Chip
Chip at Intake No Chip at Intake
+173%
RTO Rate
61%59%
0%
20%
40%
60%
80%
Hypothetical
30% Intake
Chipped
Hypothetical
20% Intake
Chipped
Hypothetical LRR %
14
5
0
5
10
15
Incremental Kennels Needed1
Hypothetical
20% Intake
Chipped
Hypothetical
30% Intake
Chipped
1. If animal is licensed, tattooed, or microchipped, it must be held for 10 days. DAS must hold an animal for 3 days if it is unlicensed or otherwise unidentifiable. Shifting dogs from non-chipped to chipped increases length of stay for dogs not RTO (e.g., adopted, transferred, euthanized) Source: DAS Chameleon database and BCG analysis
58% LRR
in 2015
Initiatives increasing population microchipped should be
weighed against increased operational strain for DAS
RTO Rate
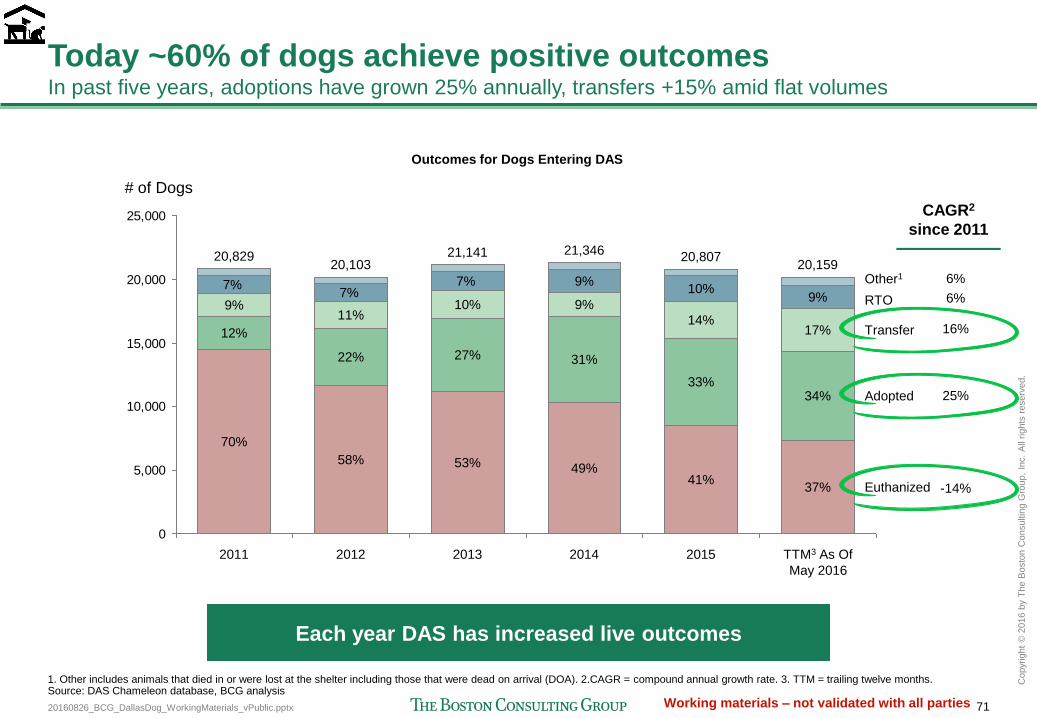
20160826_BCG_DallasDog_WorkingMaterials_vPublic.pptx 71
Copyr
ight
© 2
016 b
y T
he B
osto
n C
onsultin
g G
roup,
Inc.
All
rights
reserv
ed.
Working materials – not validated with all parties
Today ~60% of dogs achieve positive outcomes In past five years, adoptions have grown 25% annually, transfers +15% amid flat volumes
0
5,000
10,000
15,000
20,000
25,000
2015
20,807
41%
33%
14%
10%
2014
21,346
49%
31%
9%
9%
2013
21,141
53%
27%
10%
7%
2012
20,103
58%
22%
11%
7%
2011
20,829
70%
12%
9%
TTM3 As Of
May 2016
# of Dogs
20,159
37%
34%
17%
7% 9%
Euthanized
Adopted
Transfer
RTO
Other1
1. Other includes animals that died in or were lost at the shelter including those that were dead on arrival (DOA). 2.CAGR = compound annual growth rate. 3. TTM = trailing twelve months. Source: DAS Chameleon database, BCG analysis
6%
6%
16%
25%
-14%
CAGR2
since 2011
Each year DAS has increased live outcomes
Outcomes for Dogs Entering DAS
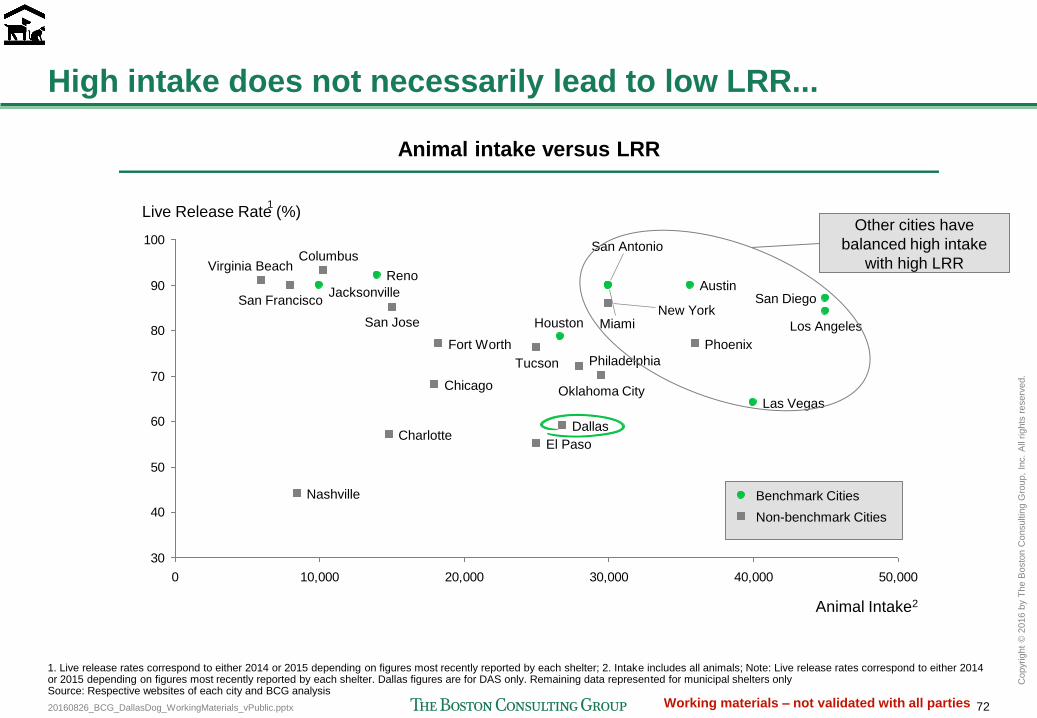
20160826_BCG_DallasDog_WorkingMaterials_vPublic.pptx 72
Copyr
ight
© 2
016 b
y T
he B
osto
n C
onsultin
g G
roup,
Inc.
All
rights
reserv
ed.
Working materials – not validated with all parties
High intake does not necessarily lead to low LRR...
30
40
50
60
70
80
90
100
0 10,000 20,000 30,000 40,000 50,000
El Paso
Phoenix
Jacksonville Austin
New York San Diego
Los Angeles
Las Vegas
San Antonio
Philadelphia
San Francisco
Chicago
Miami Houston
Reno
Nashville
Charlotte
Fort Worth
Tucson
Virginia Beach
San Jose
Columbus
Oklahoma City
Dallas
Live Release Rate (%)
Animal Intake2
1. Live release rates correspond to either 2014 or 2015 depending on figures most recently reported by each shelter; 2. Intake includes all animals; Note: Live release rates correspond to either 2014 or 2015 depending on figures most recently reported by each shelter. Dallas figures are for DAS only. Remaining data represented for municipal shelters only Source: Respective websites of each city and BCG analysis
Benchmark Cities
Non-benchmark Cities
Other cities have
balanced high intake
with high LRR
Animal intake versus LRR
1
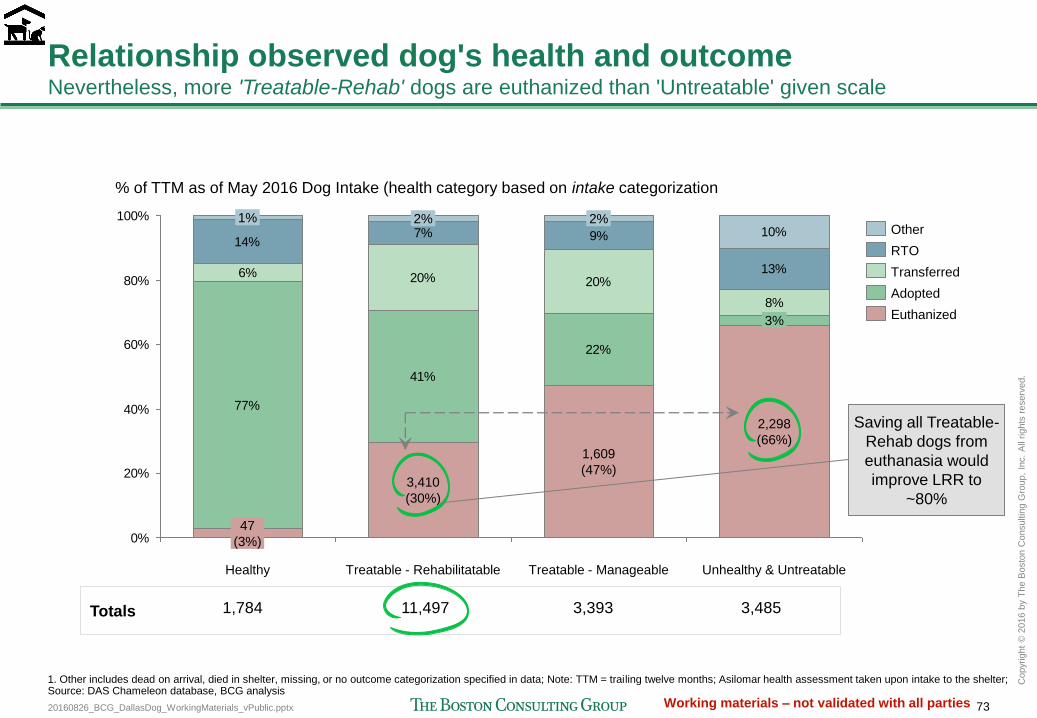
20160826_BCG_DallasDog_WorkingMaterials_vPublic.pptx 73
Copyr
ight
© 2
016 b
y T
he B
osto
n C
onsultin
g G
roup,
Inc.
All
rights
reserv
ed.
Working materials – not validated with all parties
Relationship observed dog's health and outcome Nevertheless, more 'Treatable-Rehab' dogs are euthanized than 'Untreatable' given scale
77%
41%
22%
6% 20% 20%
8%
14%7% 9%
13%
10%
0%
20%
40%
60%
80%
100% 2%
Healthy
1%
47
(3%)
3%
Unhealthy & Untreatable
2,298
(66%)
Treatable - Manageable
1,609
(47%)
Treatable - Rehabilitatable
3,410
(30%)
2%
% of TTM as of May 2016 Dog Intake (health category based on intake categorization
1. Other includes dead on arrival, died in shelter, missing, or no outcome categorization specified in data; Note: TTM = trailing twelve months; Asilomar health assessment taken upon intake to the shelter; Source: DAS Chameleon database, BCG analysis
Transferred
Other
Adopted
Euthanized
RTO
1,784 11,497 3,393 3,485 Totals
Saving all Treatable-
Rehab dogs from
euthanasia would
improve LRR to
~80%
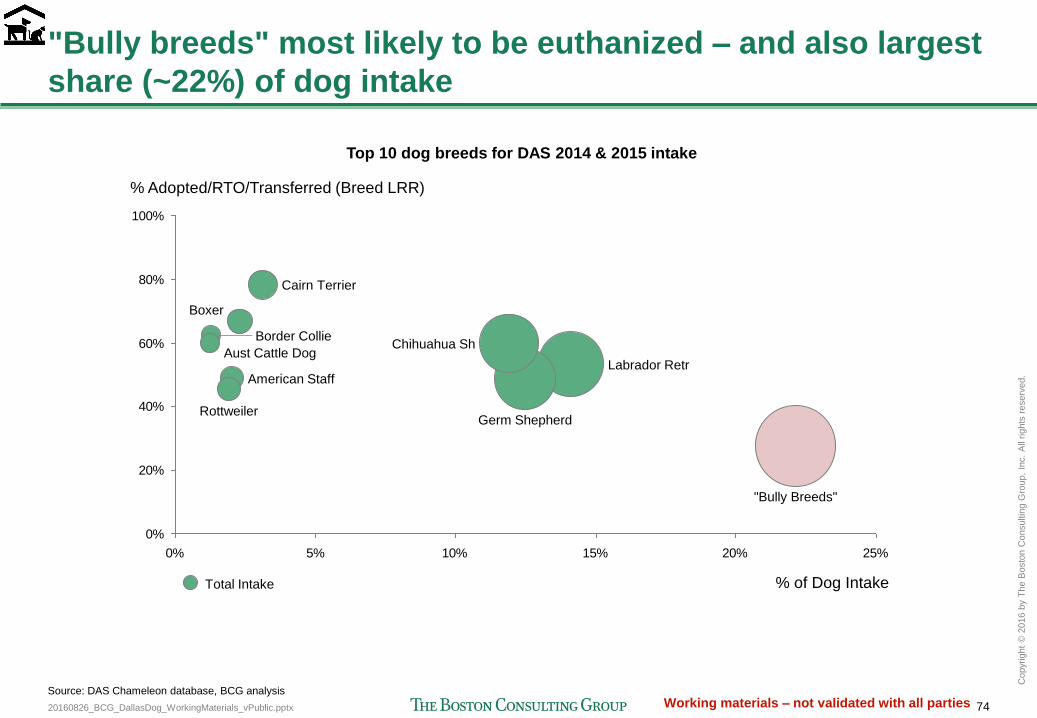
20160826_BCG_DallasDog_WorkingMaterials_vPublic.pptx 74
Copyr
ight
© 2
016 b
y T
he B
osto
n C
onsultin
g G
roup,
Inc.
All
rights
reserv
ed.
Working materials – not validated with all parties
"Bully breeds" most likely to be euthanized – and also largest
share (~22%) of dog intake
0%
20%
40%
60%
80%
100%
0% 5% 10% 15% 20% 25%
% Adopted/RTO/Transferred (Breed LRR)
% of Dog Intake
"Bully Breeds"
Rottweiler
American Staff Labrador Retr
Germ Shepherd
Chihuahua Sh
Cairn Terrier
Boxer
Border Collie
Aust Cattle Dog
Total Intake
Top 10 dog breeds for DAS 2014 & 2015 intake
Source: DAS Chameleon database, BCG analysis
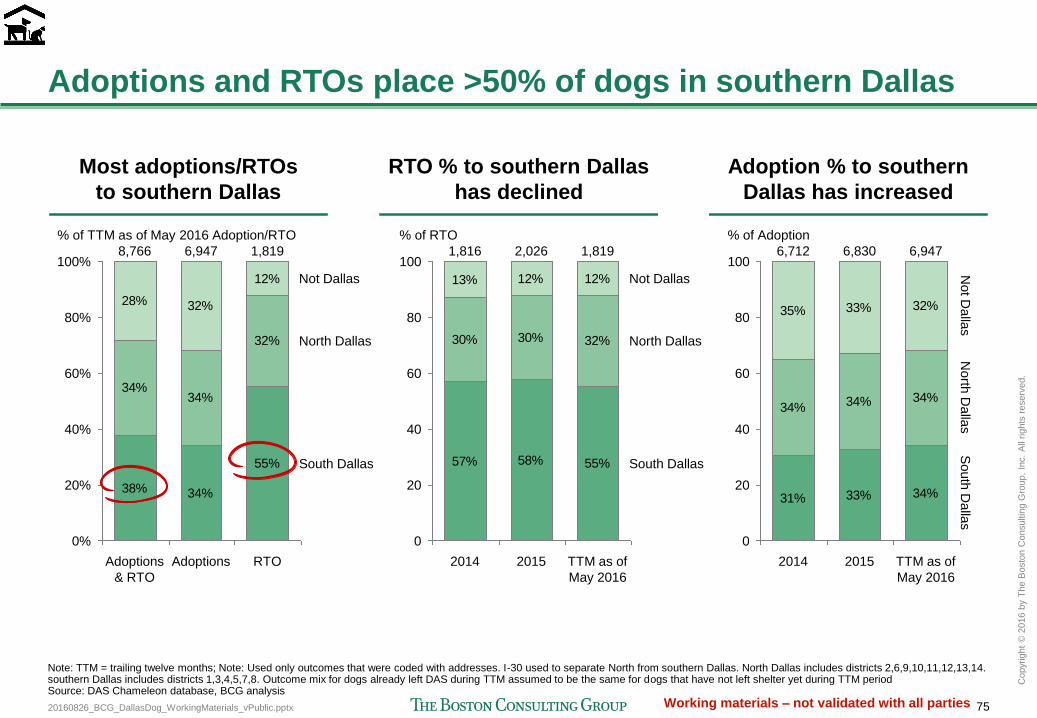
20160826_BCG_DallasDog_WorkingMaterials_vPublic.pptx 75
Copyr
ight
© 2
016 b
y T
he B
osto
n C
onsultin
g G
roup,
Inc.
All
rights
reserv
ed.
Working materials – not validated with all parties
Adoptions and RTOs place >50% of dogs in southern Dallas
Most adoptions/RTOs
to southern Dallas
RTO % to southern Dallas
has declined
Adoption % to southern
Dallas has increased
38%
55%
34%34%
32%
28% 32%
12%
34%
100%
80%
60%
40%
20%
0%
6,947
% of TTM as of May 2016 Adoption/RTO
South Dallas
North Dallas
Not Dallas
RTO Adoptions Adoptions
& RTO
8,766 1,819
Note: TTM = trailing twelve months; Note: Used only outcomes that were coded with addresses. I-30 used to separate North from southern Dallas. North Dallas includes districts 2,6,9,10,11,12,13,14. southern Dallas includes districts 1,3,4,5,7,8. Outcome mix for dogs already left DAS during TTM assumed to be the same for dogs that have not left shelter yet during TTM period Source: DAS Chameleon database, BCG analysis
57% 58% 55%
30% 30% 32%
13% 12% 12%
20
0
100
80
60
40
% of RTO
South Dallas
North Dallas
Not Dallas
TTM as of
May 2016
2015 2014
2,026 1,816 1,819
31% 33% 34%
34% 34% 34%
35% 33% 32%
100
80
20
60
40
0
2015 2014
% of Adoption
South
Dalla
s
North
Dalla
s
Not D
alla
s
TTM as of
May 2016
6,830 6,712 6,947
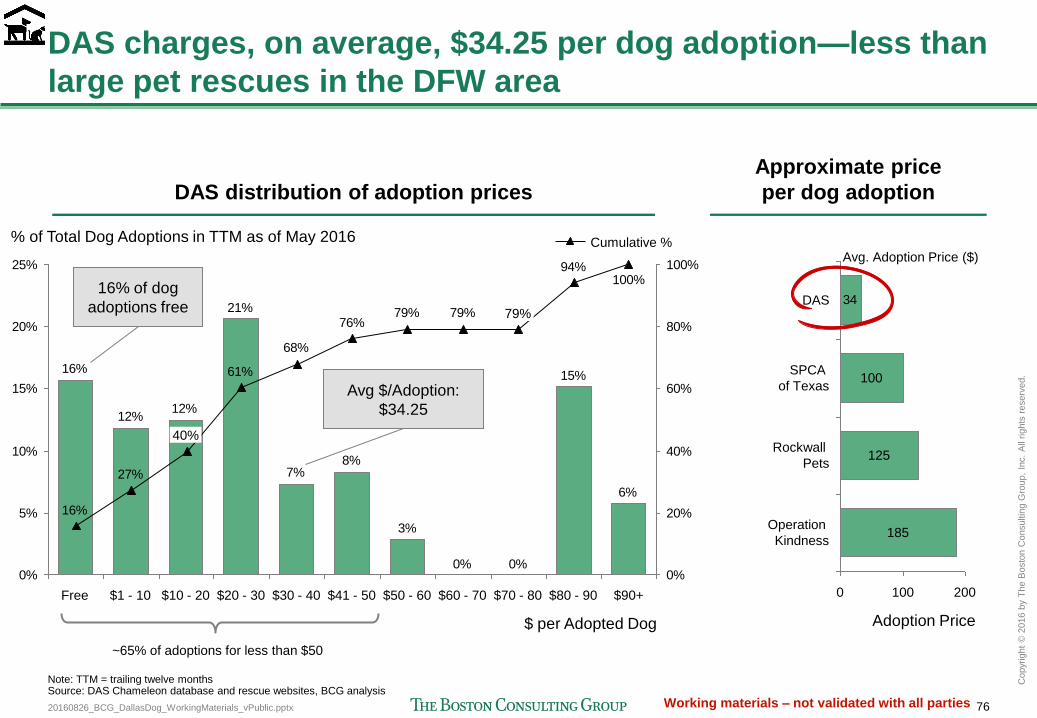
20160826_BCG_DallasDog_WorkingMaterials_vPublic.pptx 76
Copyr
ight
© 2
016 b
y T
he B
osto
n C
onsultin
g G
roup,
Inc.
All
rights
reserv
ed.
Working materials – not validated with all parties
DAS charges, on average, $34.25 per dog adoption—less than
large pet rescues in the DFW area
DAS distribution of adoption prices
Approximate price
per dog adoption
6%
15%
0%0%
3%
8%7%
21%
12%12%
16%
100%94%
79%79%76%
68%
61%
27%
16%
0%
5%
10%
15%
20%
25%
0%
20%
40%
60%
80%
100%
% of Total Dog Adoptions in TTM as of May 2016
$ per Adopted Dog
$90+ $80 - 90 $70 - 80
79%
$60 - 70 $50 - 60 $41 - 50 $30 - 40 $20 - 30 $10 - 20
40%
$1 - 10 Free
Avg $/Adoption:
$34.25
Note: TTM = trailing twelve months Source: DAS Chameleon database and rescue websites, BCG analysis
16% of dog
adoptions free
Cumulative %
~65% of adoptions for less than $50
34
200 100 0
Adoption Price
Avg. Adoption Price ($)
Operation
Kindness 185
Rockwall
Pets 125
SPCA
of Texas 100
DAS
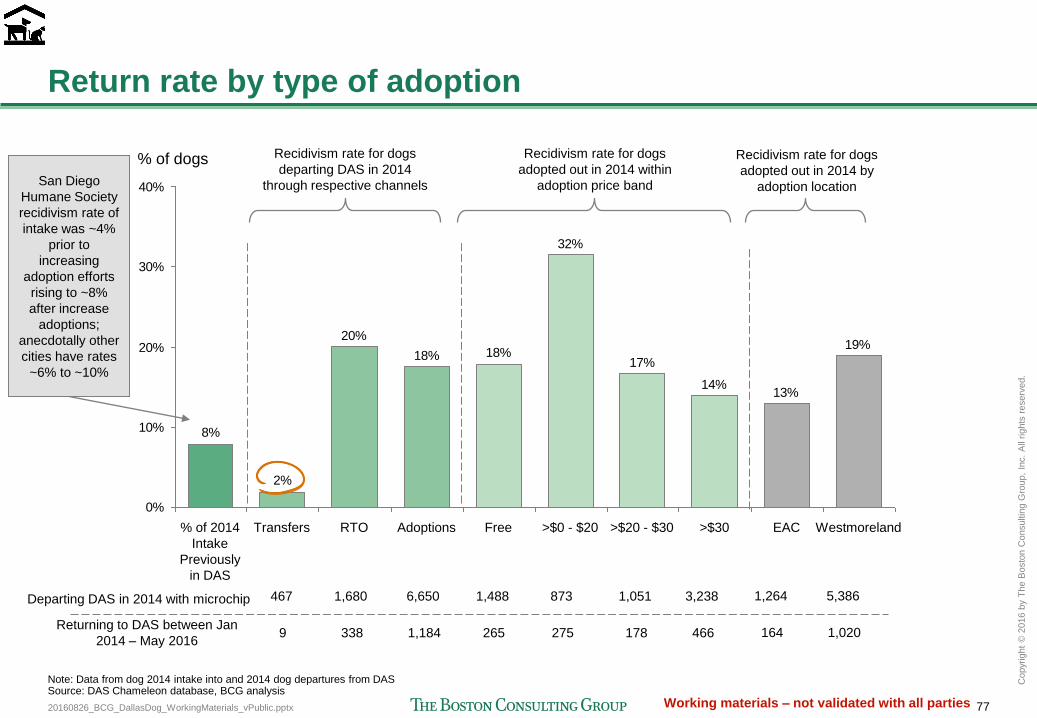
20160826_BCG_DallasDog_WorkingMaterials_vPublic.pptx 77
Copyr
ight
© 2
016 b
y T
he B
osto
n C
onsultin
g G
roup,
Inc.
All
rights
reserv
ed.
Working materials – not validated with all parties
19%
13%14%
17%
32%
18%18%
20%
2%
8%
0%
10%
20%
30%
40%
Westmoreland EAC >$30 >$20 - $30 >$0 - $20 Free Adoptions RTO Transfers % of 2014
Intake
Previously
in DAS
% of dogs
Note: Data from dog 2014 intake into and 2014 dog departures from DAS Source: DAS Chameleon database, BCG analysis
Recidivism rate for dogs
departing DAS in 2014
through respective channels
Recidivism rate for dogs
adopted out in 2014 within
adoption price band San Diego
Humane Society
recidivism rate of
intake was ~4%
prior to
increasing
adoption efforts
rising to ~8%
after increase
adoptions;
anecdotally other
cities have rates
~6% to ~10%
Recidivism rate for dogs
adopted out in 2014 by
adoption location
467
9
Departing DAS in 2014 with microchip
Returning to DAS between Jan
2014 – May 2016
1,680
338
6,650
1,184
1,488
265
873
275
1,051
178
3,238
466
1,264
164
5,386
1,020
Return rate by type of adoption
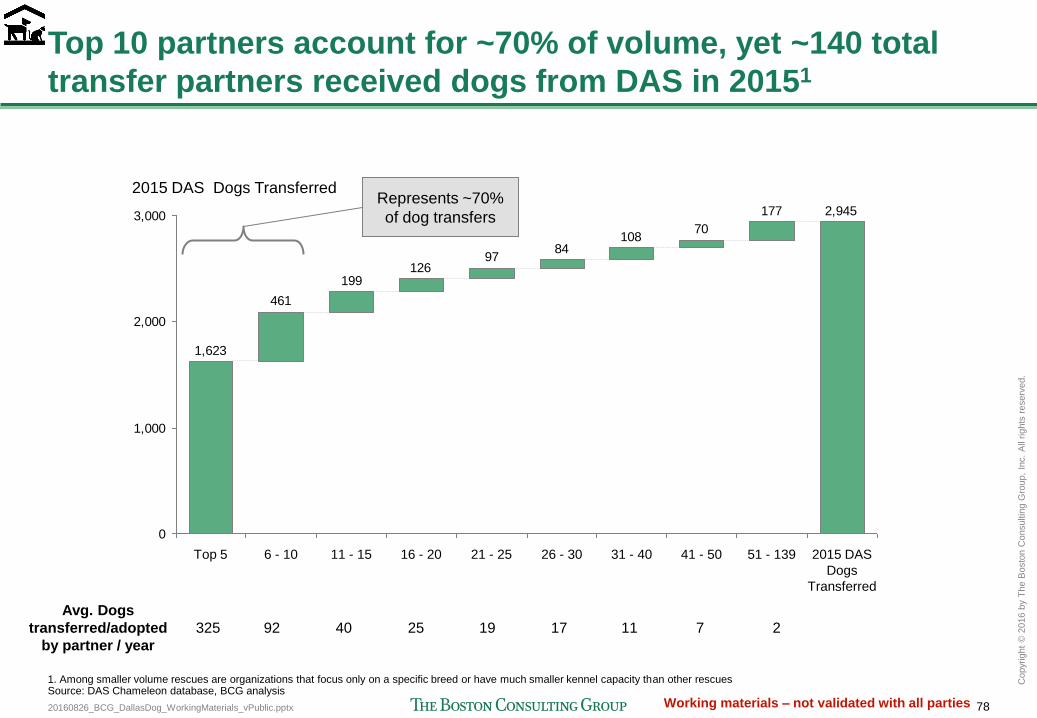
20160826_BCG_DallasDog_WorkingMaterials_vPublic.pptx 78
Copyr
ight
© 2
016 b
y T
he B
osto
n C
onsultin
g G
roup,
Inc.
All
rights
reserv
ed.
Working materials – not validated with all parties
Top 10 partners account for ~70% of volume, yet ~140 total
transfer partners received dogs from DAS in 20151
1. Among smaller volume rescues are organizations that focus only on a specific breed or have much smaller kennel capacity than other rescues Source: DAS Chameleon database, BCG analysis
2,945177
70108
8497
126199
461
1,623
0
1,000
2,000
3,000
11 - 15 6 - 10 Top 5
2015 DAS Dogs Transferred
2015 DAS
Dogs
Transferred
31 - 40 26 - 30 16 - 20 21 - 25 41 - 50 51 - 139
Avg. Dogs
transferred/adopted
by partner / year
325 92 40 25 19 17 11 7 2
Represents ~70%
of dog transfers
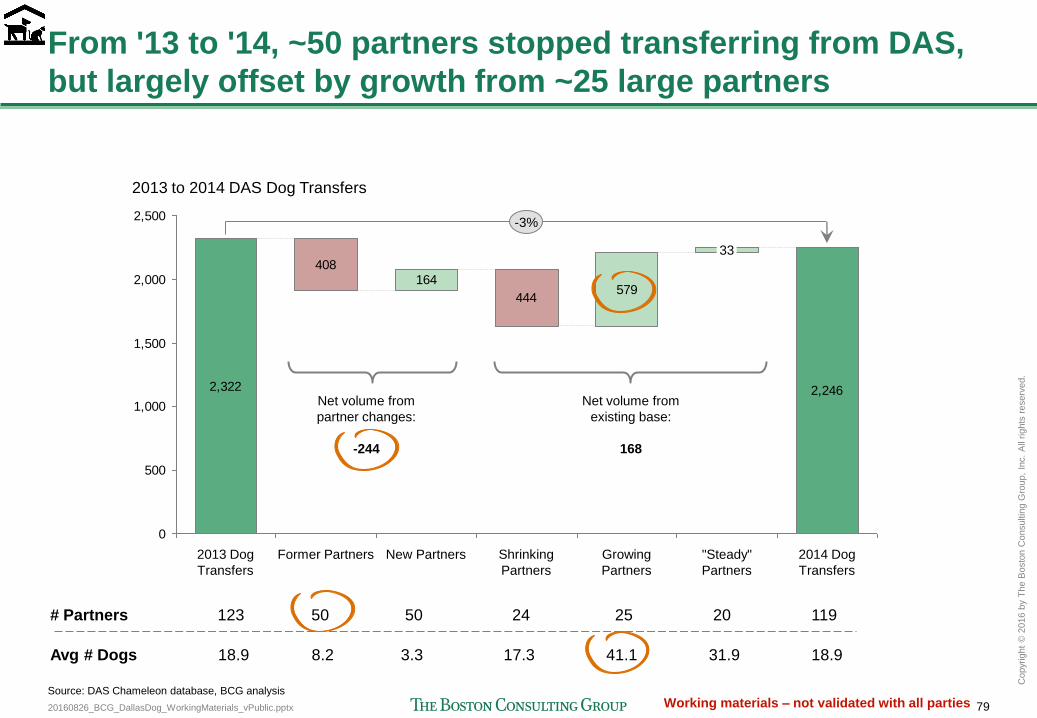
20160826_BCG_DallasDog_WorkingMaterials_vPublic.pptx 79
Copyr
ight
© 2
016 b
y T
he B
osto
n C
onsultin
g G
roup,
Inc.
All
rights
reserv
ed.
Working materials – not validated with all parties
From '13 to '14, ~50 partners stopped transferring from DAS,
but largely offset by growth from ~25 large partners
2,322
408164
444579
2,246
0
500
1,000
1,500
2,000
2,500
2014 Dog
Transfers
33
2013 to 2014 DAS Dog Transfers
"Steady"
Partners
Growing
Partners
Shrinking
Partners
New Partners Former Partners 2013 Dog
Transfers
-3%
Net volume from
partner changes:
-244
Net volume from
existing base:
168
# Partners 123 50 50 24 25 20 119
Avg # Dogs 18.9 8.2 3.3 17.3 41.1 31.9 18.9
Source: DAS Chameleon database, BCG analysis
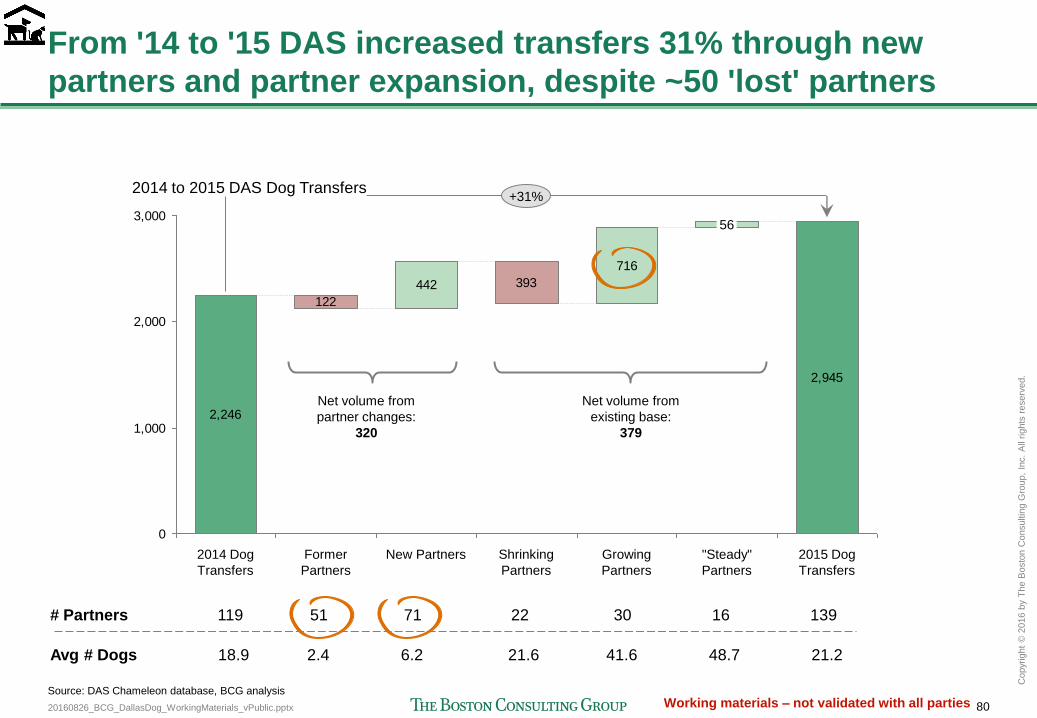
20160826_BCG_DallasDog_WorkingMaterials_vPublic.pptx 80
Copyr
ight
© 2
016 b
y T
he B
osto
n C
onsultin
g G
roup,
Inc.
All
rights
reserv
ed.
Working materials – not validated with all parties
From '14 to '15 DAS increased transfers 31% through new
partners and partner expansion, despite ~50 'lost' partners
2,246
122
393
716
2,945
442
0
1,000
2,000
3,000
2014 to 2015 DAS Dog Transfers +31%
2015 Dog
Transfers
"Steady"
Partners
56
Growing
Partners
Shrinking
Partners
New Partners Former
Partners
2014 Dog
Transfers
Net volume from
partner changes:
320
Net volume from
existing base:
379
# Partners 119 51 71 22 30 16 139
Avg # Dogs 18.9 2.4 6.2 21.6 41.6 48.7 21.2
Source: DAS Chameleon database, BCG analysis
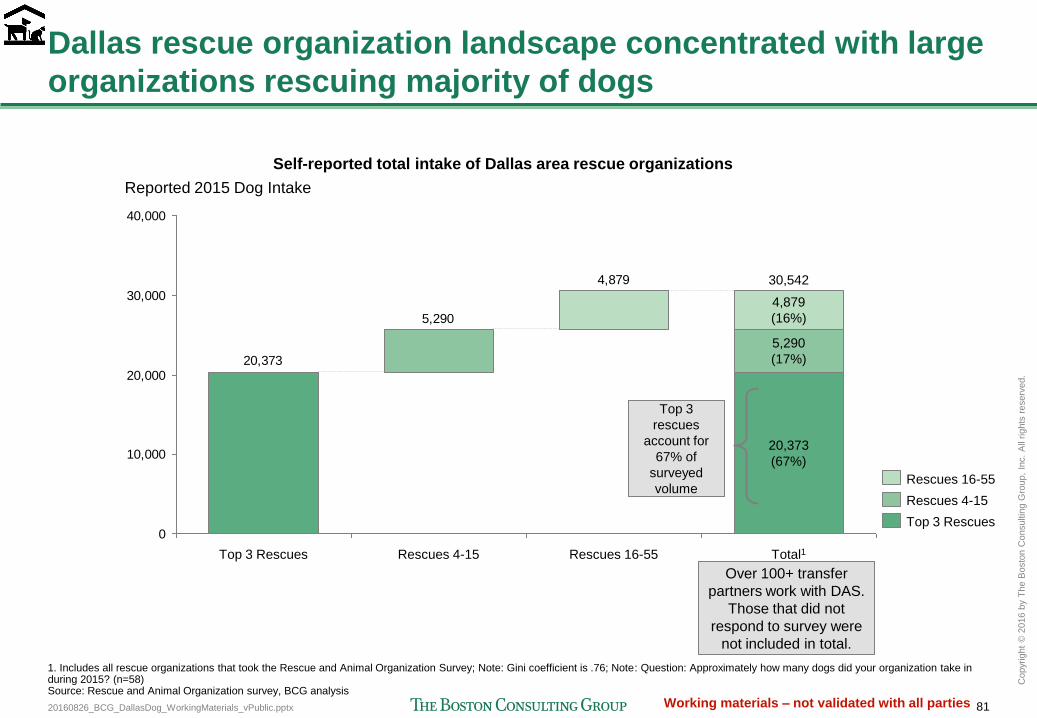
20160826_BCG_DallasDog_WorkingMaterials_vPublic.pptx 81
Copyr
ight
© 2
016 b
y T
he B
osto
n C
onsultin
g G
roup,
Inc.
All
rights
reserv
ed.
Working materials – not validated with all parties
4,879
5,290
20,373
0
10,000
20,000
30,000
40,000
Total1
Reported 2015 Dog Intake
Top 3 Rescues Rescues 4-15
4,879
(16%)
Rescues 16-55
5,290
(17%)
30,542
20,373
(67%)
Top 3 Rescues
Rescues 16-55
Rescues 4-15
Dallas rescue organization landscape concentrated with large
organizations rescuing majority of dogs
1. Includes all rescue organizations that took the Rescue and Animal Organization Survey; Note: Gini coefficient is .76; Note: Question: Approximately how many dogs did your organization take in during 2015? (n=58) Source: Rescue and Animal Organization survey, BCG analysis
Top 3
rescues
account for
67% of
surveyed
volume
Over 100+ transfer
partners work with DAS.
Those that did not
respond to survey were
not included in total.
Self-reported total intake of Dallas area rescue organizations
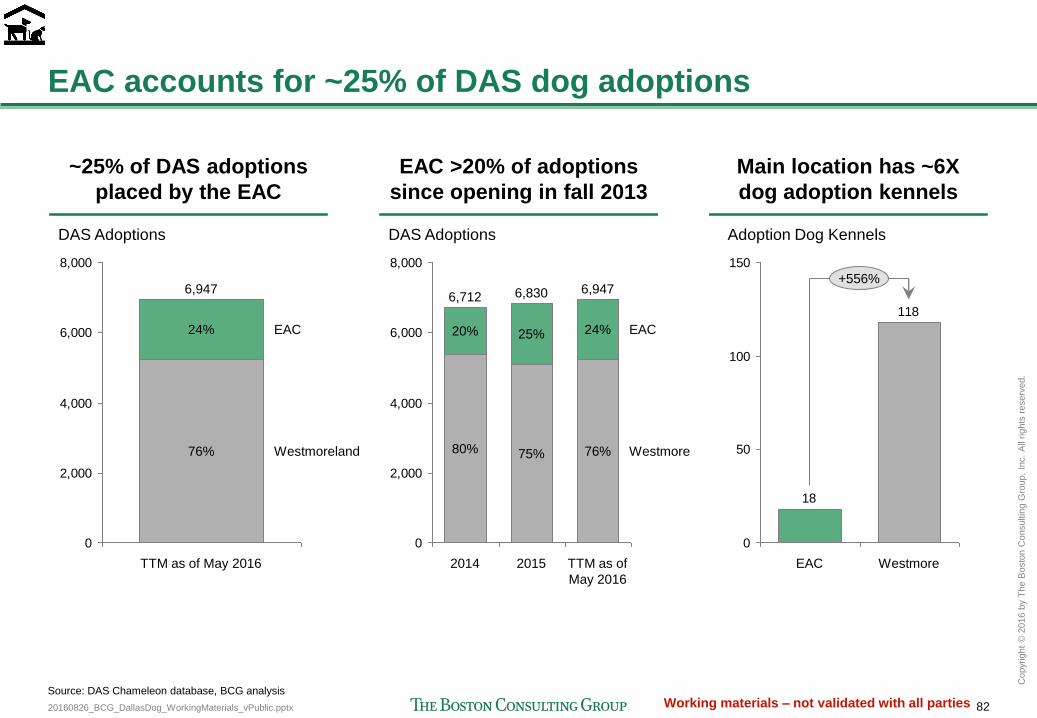
20160826_BCG_DallasDog_WorkingMaterials_vPublic.pptx 82
Copyr
ight
© 2
016 b
y T
he B
osto
n C
onsultin
g G
roup,
Inc.
All
rights
reserv
ed.
Working materials – not validated with all parties
EAC accounts for ~25% of DAS dog adoptions
0
2,000
4,000
6,000
8,000
DAS Adoptions
Westmoreland
EAC
TTM as of May 2016
6,947
76%
24%
~25% of DAS adoptions
placed by the EAC
EAC >20% of adoptions
since opening in fall 2013
0
2,000
4,000
6,000
8,000
DAS Adoptions
Westmore
EAC
TTM as of
May 2016
6,947
76%
24%
2015
6,830
75%
25%
2014
6,712
80%
20%
118
18
0
50
100
150
Adoption Dog Kennels
Westmore EAC
+556%
Main location has ~6X
dog adoption kennels
Source: DAS Chameleon database, BCG analysis

20160826_BCG_DallasDog_WorkingMaterials_vPublic.pptx 83
Copyr
ight
© 2
016 b
y T
he B
osto
n C
onsultin
g G
roup,
Inc.
All
rights
reserv
ed.
Working materials – not validated with all parties
Dogs adopted through EAC have similar length of stay as
other dogs, but are adopted quickly once at EAC
10.9510.973.00
4.49
3.48
0
5
10
15
Avg days in DAS system prior to adoption during TTM as of May 2016
Avg Days at
Westmoreland from
legal hold & prior to
transfer to EAC
Avg days in
Westmoreland and
not sent to EAC
Avg days for dogs sent
to EAC & adopted
Avg days at EAC
prior to adoption
Avg Days at
Westmoreland
prior to legal hold
Dogs spend ~70%
less time at EAC
than those at
Westmoreland
Could moving dogs to EAC sooner reduce length of stay
and thereby increase shelter capacity?
Source: DAS Chameleon database, BCG analysis
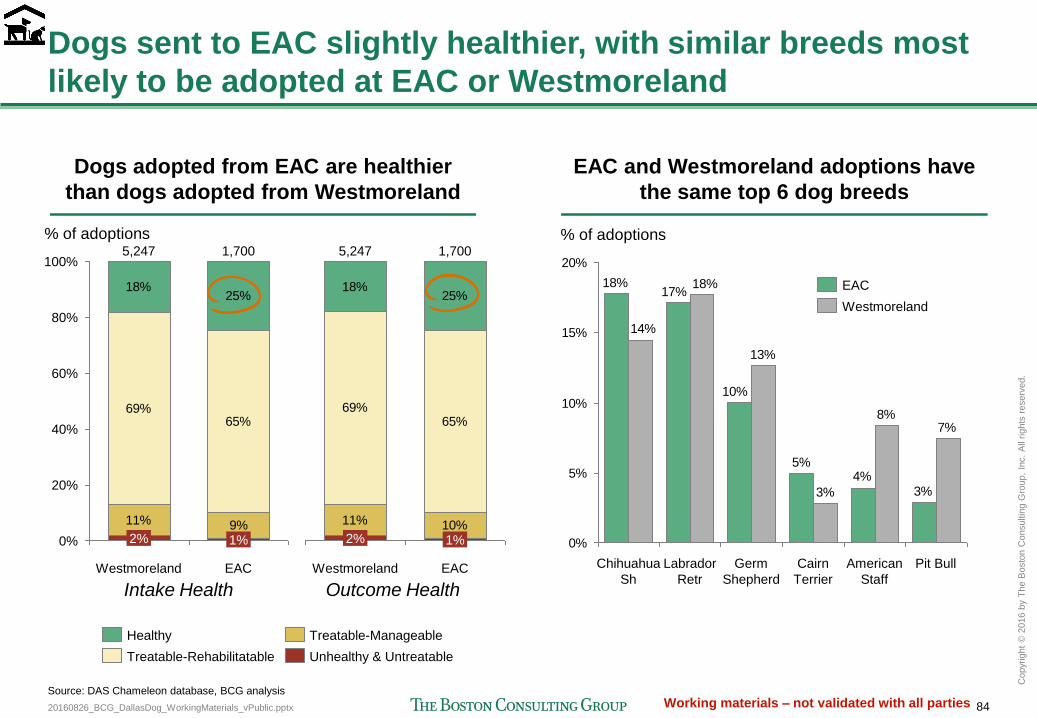
20160826_BCG_DallasDog_WorkingMaterials_vPublic.pptx 84
Copyr
ight
© 2
016 b
y T
he B
osto
n C
onsultin
g G
roup,
Inc.
All
rights
reserv
ed.
Working materials – not validated with all parties
Dogs sent to EAC slightly healthier, with similar breeds most
likely to be adopted at EAC or Westmoreland
11% 9%
69%65%
18%25%
0%
100%
60%
20%
40%
80%
5,247
Westmoreland
% of adoptions
2%
EAC
1,700
1%
Treatable-Rehabilitatable
Treatable-Manageable
Unhealthy & Untreatable
Healthy
Dogs adopted from EAC are healthier
than dogs adopted from Westmoreland
EAC and Westmoreland adoptions have
the same top 6 dog breeds
3%4%
5%
10%
17%18%
7%8%
3%
13%
18%
14%
0%
5%
10%
15%
20%
Chihuahua
Sh
American
Staff
Germ
Shepherd
Cairn
Terrier
Pit Bull Labrador
Retr
% of adoptions
EAC
Westmoreland
11% 10%
69%65%
18%25%
5,247
2%
1,700
1%
EAC Westmoreland
Intake Health Outcome Health
Source: DAS Chameleon database, BCG analysis
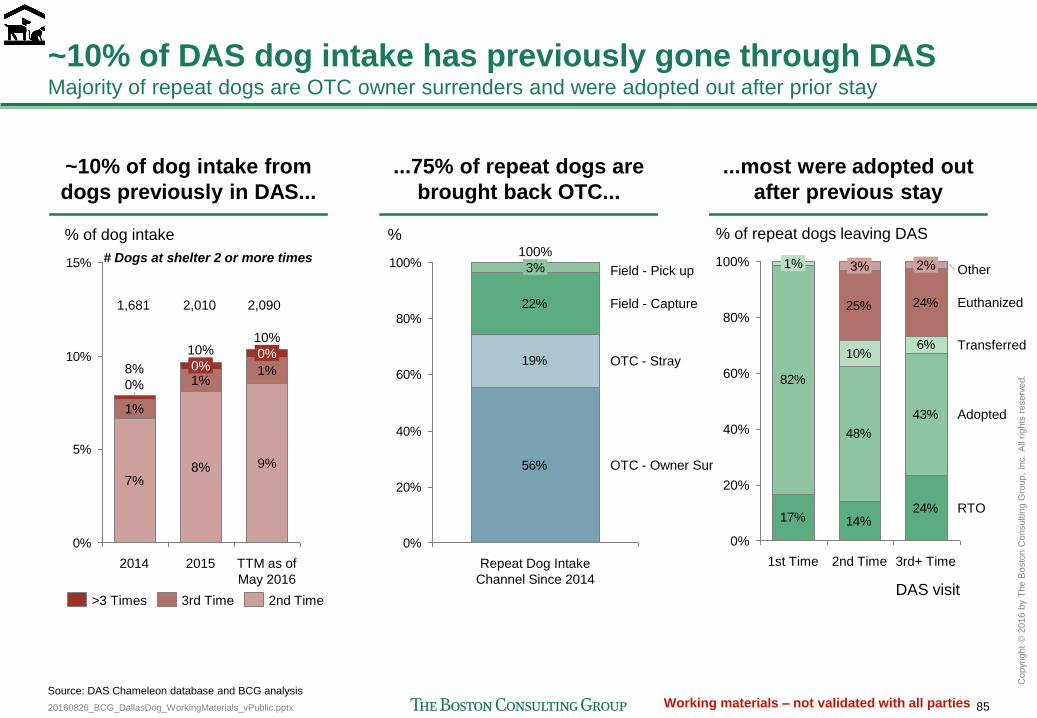
20160826_BCG_DallasDog_WorkingMaterials_vPublic.pptx 85
Copyr
ight
© 2
016 b
y T
he B
osto
n C
onsultin
g G
roup,
Inc.
All
rights
reserv
ed.
Working materials – not validated with all parties
~10% of DAS dog intake has previously gone through DAS Majority of repeat dogs are OTC owner surrenders and were adopted out after prior stay
~10% of dog intake from
dogs previously in DAS...
...75% of repeat dogs are
brought back OTC...
0%
5%
10%
15%
% of dog intake
9%
TTM as of
May 2016
10%
1%
10%
2015
0%
1%
8%
0%
1%
7%
8%
2014
0%
>3 Times 3rd Time 2nd Time
56%
19%
22%
0%
20%
40%
60%
80%
100% 3%
Repeat Dog Intake
Channel Since 2014
100%
OTC - Owner Sur
OTC - Stray
Field - Capture
Field - Pick up
%
Source: DAS Chameleon database and BCG analysis
1,681 2,010 2,090
# Dogs at shelter 2 or more times
...most were adopted out
after previous stay
17% 14%24%
82%
48%
43%
10%6%
25% 24%
100%
80%
60%
0%
20%
40%
% of repeat dogs leaving DAS
DAS visit
RTO
Adopted
Euthanized
Transferred
Other
3rd+ Time 2nd Time
2% 3%
1st Time
1%
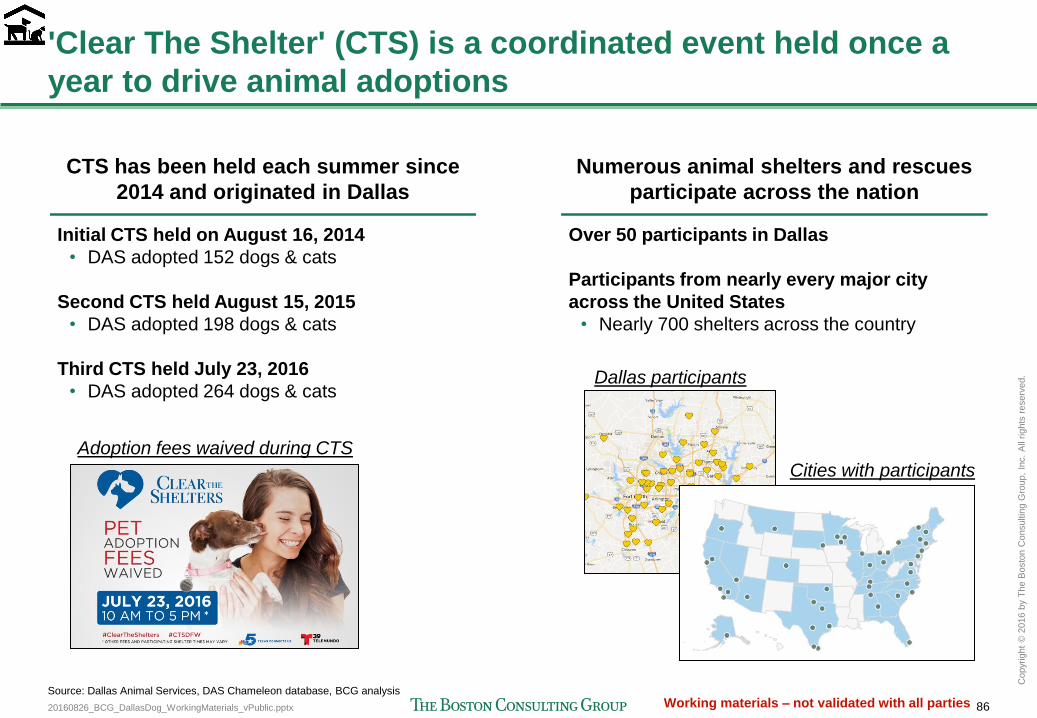
20160826_BCG_DallasDog_WorkingMaterials_vPublic.pptx 86
Copyr
ight
© 2
016 b
y T
he B
osto
n C
onsultin
g G
roup,
Inc.
All
rights
reserv
ed.
Working materials – not validated with all parties
Over 50 participants in Dallas
Participants from nearly every major city
across the United States
• Nearly 700 shelters across the country
'Clear The Shelter' (CTS) is a coordinated event held once a
year to drive animal adoptions
CTS has been held each summer since
2014 and originated in Dallas
Initial CTS held on August 16, 2014
• DAS adopted 152 dogs & cats
Second CTS held August 15, 2015
• DAS adopted 198 dogs & cats
Third CTS held July 23, 2016
• DAS adopted 264 dogs & cats
Numerous animal shelters and rescues
participate across the nation
Dallas participants
Cities with participants
Adoption fees waived during CTS
Source: Dallas Animal Services, DAS Chameleon database, BCG analysis
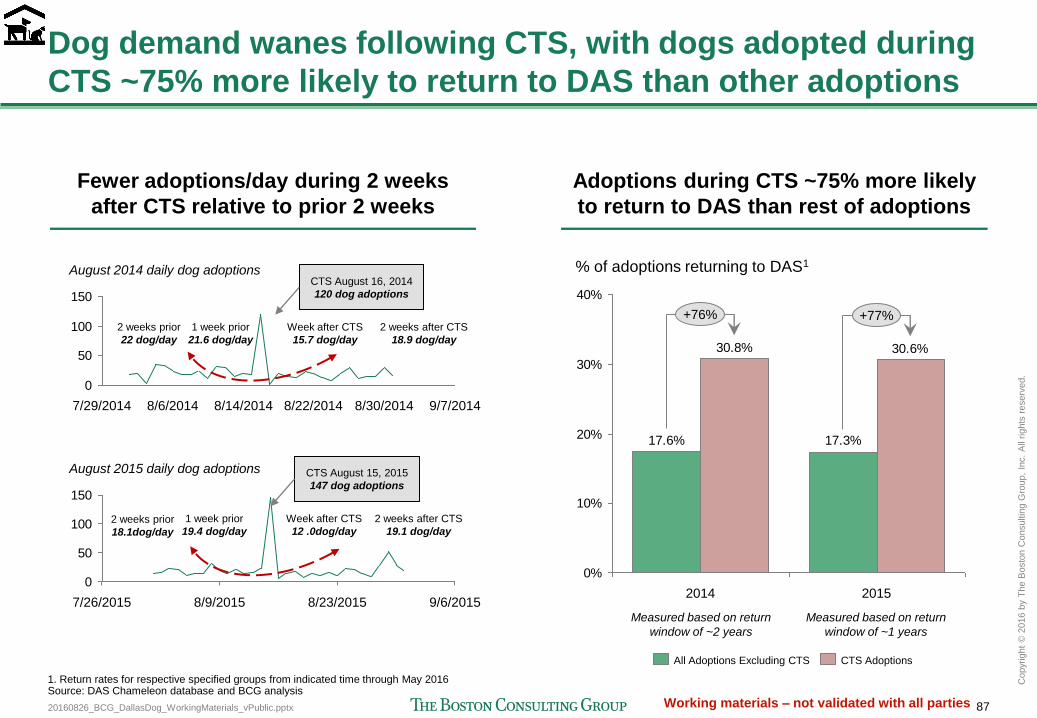
20160826_BCG_DallasDog_WorkingMaterials_vPublic.pptx 87
Copyr
ight
© 2
016 b
y T
he B
osto
n C
onsultin
g G
roup,
Inc.
All
rights
reserv
ed.
Working materials – not validated with all parties
Dog demand wanes following CTS, with dogs adopted during
CTS ~75% more likely to return to DAS than other adoptions
0
50
100
150
7/29/2014 8/22/2014 8/14/2014 8/6/2014 8/30/2014 9/7/2014
August 2014 daily dog adoptions
Fewer adoptions/day during 2 weeks
after CTS relative to prior 2 weeks
Adoptions during CTS ~75% more likely
to return to DAS than rest of adoptions
CTS August 16, 2014
120 dog adoptions
Week after CTS
15.7 dog/day
0
50
100
150
7/26/2015 8/9/2015 8/23/2015 9/6/2015
August 2015 daily dog adoptions
1 week prior
19.4 dog/day
CTS August 15, 2015
147 dog adoptions
Week after CTS
12 .0dog/day
17.3%17.6%
30.6%30.8%
0%
10%
20%
30%
40%
% of adoptions returning to DAS1
+77% +76%
2015 2014
CTS Adoptions All Adoptions Excluding CTS
1. Return rates for respective specified groups from indicated time through May 2016 Source: DAS Chameleon database and BCG analysis
2 weeks after CTS
19.1 dog/day
2 weeks after CTS
18.9 dog/day
2 weeks prior
18.1dog/day
1 week prior
21.6 dog/day
2 weeks prior
22 dog/day
Measured based on return
window of ~2 years
Measured based on return
window of ~1 years
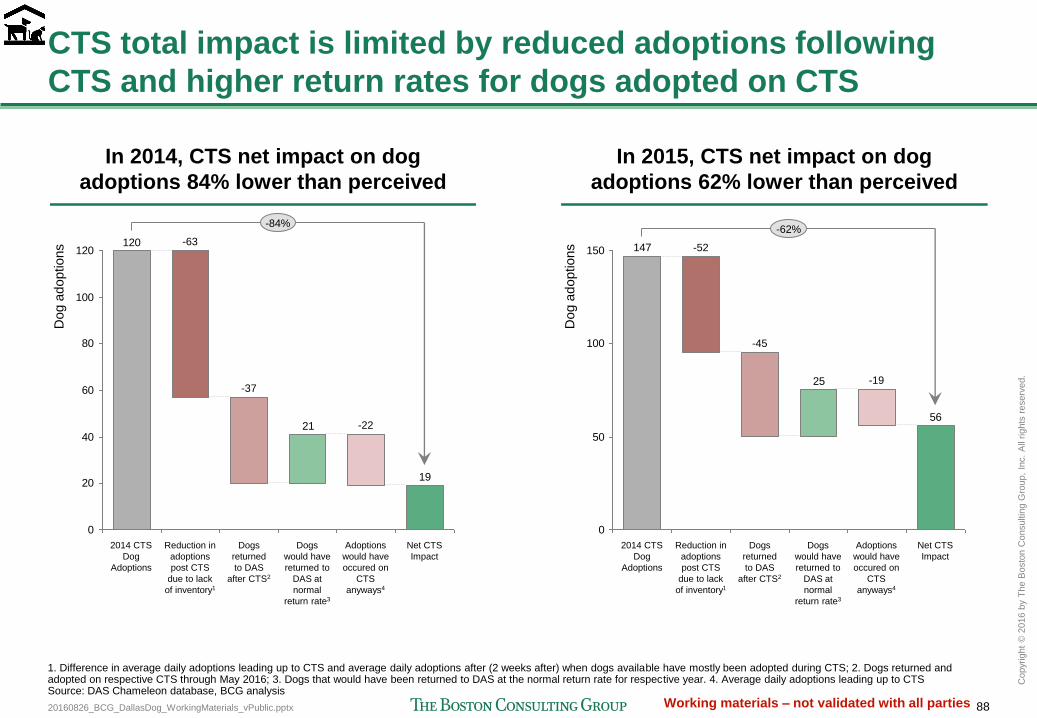
20160826_BCG_DallasDog_WorkingMaterials_vPublic.pptx 88
Copyr
ight
© 2
016 b
y T
he B
osto
n C
onsultin
g G
roup,
Inc.
All
rights
reserv
ed.
Working materials – not validated with all parties
CTS total impact is limited by reduced adoptions following
CTS and higher return rates for dogs adopted on CTS
19
21
120
0
20
40
60
80
100
120
Dog a
doptions
Net CTS
Impact
-84%
Adoptions
would have
occured on
CTS
anyways4
-22
Dogs
would have
returned to
DAS at
normal
return rate3
Dogs
returned
to DAS
after CTS2
-37
Reduction in
adoptions
post CTS
due to lack
of inventory1
-63
2014 CTS
Dog
Adoptions
56
25
147
0
50
100
150
Dog a
doptions
Net CTS
Impact
-62%
Adoptions
would have
occured on
CTS
anyways4
-19
Dogs
would have
returned to
DAS at
normal
return rate3
Dogs
returned
to DAS
after CTS2
-45
Reduction in
adoptions
post CTS
due to lack
of inventory1
-52
2014 CTS
Dog
Adoptions
In 2014, CTS net impact on dog
adoptions 84% lower than perceived
In 2015, CTS net impact on dog
adoptions 62% lower than perceived
1. Difference in average daily adoptions leading up to CTS and average daily adoptions after (2 weeks after) when dogs available have mostly been adopted during CTS; 2. Dogs returned and adopted on respective CTS through May 2016; 3. Dogs that would have been returned to DAS at the normal return rate for respective year. 4. Average daily adoptions leading up to CTS Source: DAS Chameleon database, BCG analysis
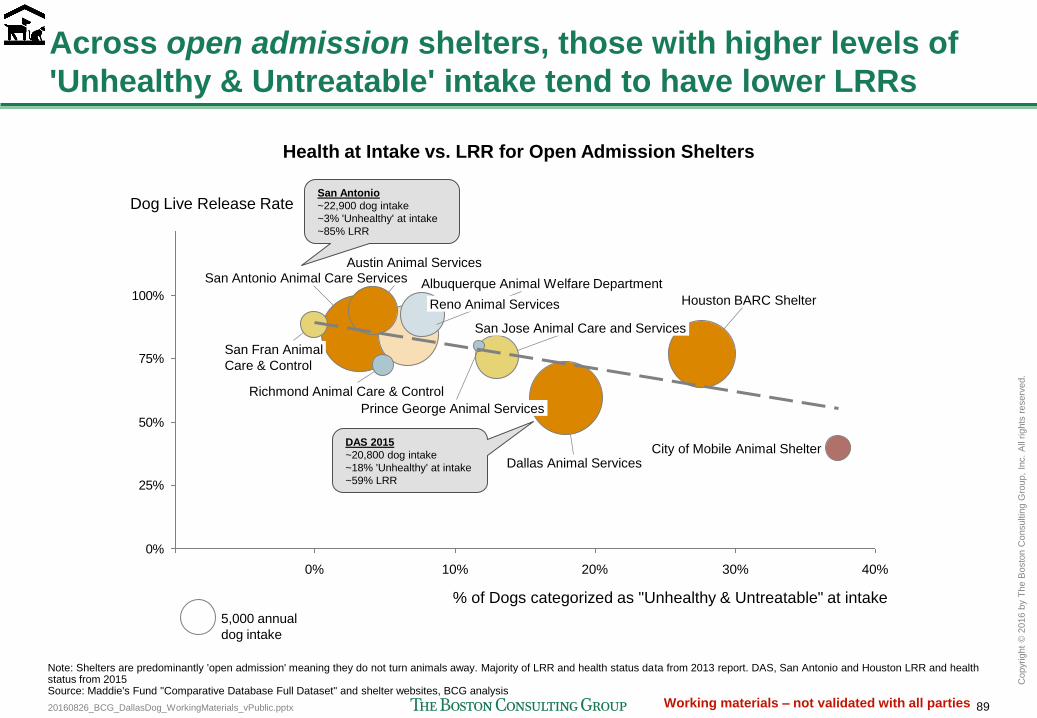
20160826_BCG_DallasDog_WorkingMaterials_vPublic.pptx 89
Copyr
ight
© 2
016 b
y T
he B
osto
n C
onsultin
g G
roup,
Inc.
All
rights
reserv
ed.
Working materials – not validated with all parties
Across open admission shelters, those with higher levels of
'Unhealthy & Untreatable' intake tend to have lower LRRs
0%
25%
50%
75%
100%
125%
40% 30% 20% 10% 0%
Houston BARC Shelter Reno Animal Services
San Antonio Animal Care Services Albuquerque Animal Welfare Department
San Jose Animal Care and Services
San Fran Animal
Care & Control
City of Mobile Animal Shelter
Richmond Animal Care & Control
Prince George Animal Services
Austin Animal Services
Dallas Animal Services
Dog Live Release Rate
% of Dogs categorized as "Unhealthy & Untreatable" at intake
5,000 annual
dog intake
DAS 2015
~20,800 dog intake
~18% 'Unhealthy' at intake
~59% LRR
Note: Shelters are predominantly 'open admission' meaning they do not turn animals away. Majority of LRR and health status data from 2013 report. DAS, San Antonio and Houston LRR and health status from 2015 Source: Maddie's Fund "Comparative Database Full Dataset" and shelter websites, BCG analysis
San Antonio
~22,900 dog intake
~3% 'Unhealthy' at intake
~85% LRR
Health at Intake vs. LRR for Open Admission Shelters
20160826_BCG_DallasDog_WorkingMaterials_vPublic.pptx 90
Copyr
ight
© 2
016 b
y T
he B
osto
n C
onsultin
g G
roup,
Inc.
All
rights
reserv
ed.
Working materials – not validated with all parties
Benchmarks 4
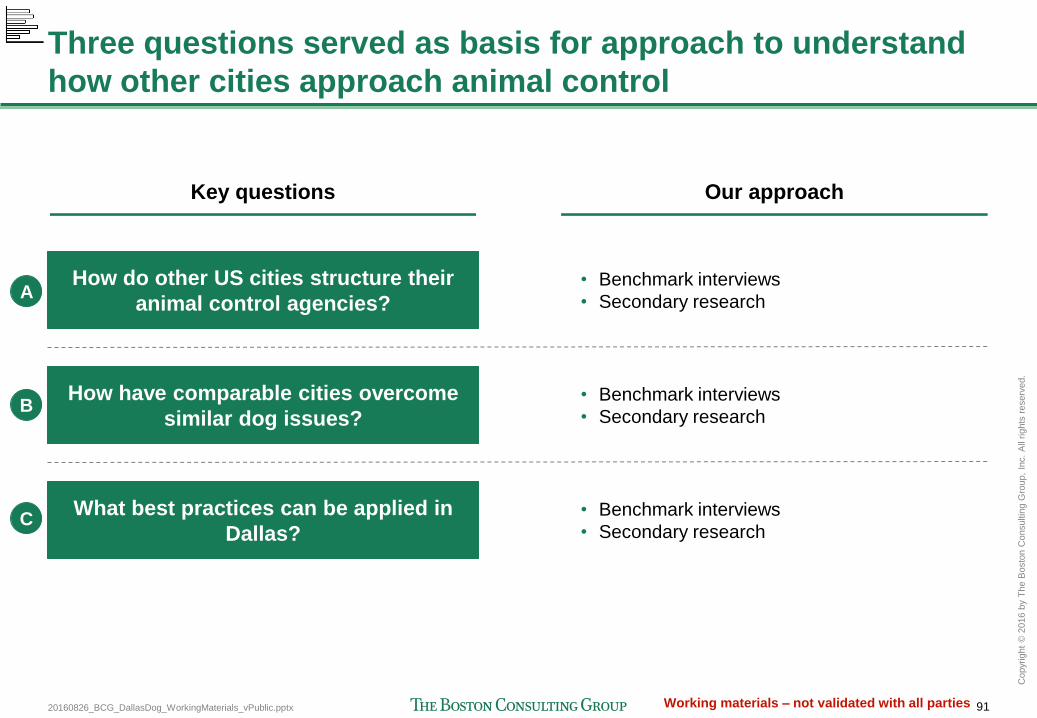
20160826_BCG_DallasDog_WorkingMaterials_vPublic.pptx 91
Copyr
ight
© 2
016 b
y T
he B
osto
n C
onsultin
g G
roup,
Inc.
All
rights
reserv
ed.
Working materials – not validated with all parties
Three questions served as basis for approach to understand
how other cities approach animal control
Key questions Our approach
How do other US cities structure their
animal control agencies?
How have comparable cities overcome
similar dog issues?
What best practices can be applied in
Dallas?
• Benchmark interviews
• Secondary research
• Benchmark interviews
• Secondary research
• Benchmark interviews
• Secondary research
A
B
C

20160826_BCG_DallasDog_WorkingMaterials_vPublic.pptx 92
Copyr
ight
© 2
016 b
y T
he B
osto
n C
onsultin
g G
roup,
Inc.
All
rights
reserv
ed.
Working materials – not validated with all parties
DAS operates with budget ~10% below peer average...
2.61
5.455.616.736.75
9.308.11
6.986.14
9.7210.78
12.2212.93
16.07
0
5
10
15
20
25
Municipal Animal Services Budget ($/person) A
ustin
Washoe C
ounty
(Reno)
Fulton C
ounty
(Atlanta
)
San A
nto
nio
Dalla
s
(F Y
13
-14)
Dalla
s
(FY
14
-15)
Dalla
s
(FY
15
-16)
Dalla
s tenta
tive
(FY
16-1
7)
Housto
n
Mia
mi-D
ade
County
County
of
San D
iego
Jacksonvill
e
Cla
rk C
ounty
(Las V
egas)
-24%
Los
Angele
s
Note: Mean excludes Dallas, Source: Interviews with management from Los Angeles Animal Services, Washoe County Animal Services, County of San Diego Animal Services, San Antonio
Animal Care Services, Fulton County Animal Services Austin Animal Services, Dallas Animal Services FY 2015 General Fund Budget, Jacksonville Animal Care and Protective Services, and
Clark County Animal Control.), Lifeline Animal Project 990 Tax Form (2014), Miami-Dade Animal Services Projected Budget (2015), US Census Bureau 2013 Population Estimate and BCG
analysis
Mean
8.89 +10%
Municipal Spending on Animal Services for Benchmark Cities
DAS FY15-16 budget ~10% below that of peers
today, was 24% lower in FY13-14, and tentatively
expected to be above average next fiscal year
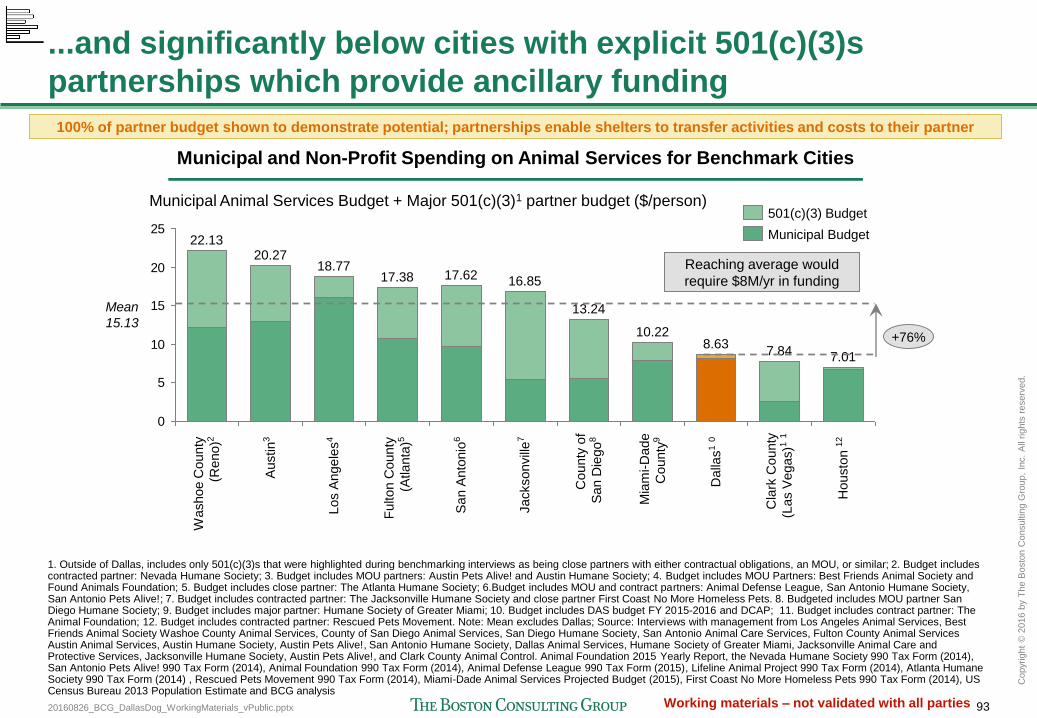
20160826_BCG_DallasDog_WorkingMaterials_vPublic.pptx 93
Copyr
ight
© 2
016 b
y T
he B
osto
n C
onsultin
g G
roup,
Inc.
All
rights
reserv
ed.
Working materials – not validated with all parties
...and significantly below cities with explicit 501(c)(3)s
partnerships which provide ancillary funding
0
5
10
15
20
25
Municipal Animal Services Budget + Major 501(c)(3)1 partner budget ($/person)
Housto
n 1
2
7.01
Cla
rk C
ounty
(Las V
egas)1
1
7.84
Dalla
s1 0
8.63
Mia
mi-
Dade
County
9
10.22
County
of
San D
iego
8
13.24
Jacksonvill
e7
16.85
San A
nto
nio
6
17.62
Fulton C
ounty
(Atlanta
)5
17.38
Los A
ngele
s4
18.77 A
ustin
3
20.27
Washoe C
ounty
(Reno)2
22.13 Municipal Budget
501(c)(3) Budget
Mean
15.13 +76%
Reaching average would
require $8M/yr in funding
Municipal and Non-Profit Spending on Animal Services for Benchmark Cities
1. Outside of Dallas, includes only 501(c)(3)s that were highlighted during benchmarking interviews as being close partners with either contractual obligations, an MOU, or similar; 2. Budget includes contracted partner: Nevada Humane Society; 3. Budget includes MOU partners: Austin Pets Alive! and Austin Humane Society; 4. Budget includes MOU Partners: Best Friends Animal Society and Found Animals Foundation; 5. Budget includes close partner: The Atlanta Humane Society; 6.Budget includes MOU and contract partners: Animal Defense League, San Antonio Humane Society, San Antonio Pets Alive!; 7. Budget includes contracted partner: The Jacksonville Humane Society and close partner First Coast No More Homeless Pets. 8. Budgeted includes MOU partner San Diego Humane Society; 9. Budget includes major partner: Humane Society of Greater Miami; 10. Budget includes DAS budget FY 2015-2016 and DCAP; 11. Budget includes contract partner: The Animal Foundation; 12. Budget includes contracted partner: Rescued Pets Movement. Note: Mean excludes Dallas; Source: Interviews with management from Los Angeles Animal Services, Best Friends Animal Society Washoe County Animal Services, County of San Diego Animal Services, San Diego Humane Society, San Antonio Animal Care Services, Fulton County Animal Services Austin Animal Services, Austin Humane Society, Austin Pets Alive!, San Antonio Humane Society, Dallas Animal Services, Humane Society of Greater Miami, Jacksonville Animal Care and Protective Services, Jacksonville Humane Society, Austin Pets Alive!, and Clark County Animal Control. Animal Foundation 2015 Yearly Report, the Nevada Humane Society 990 Tax Form (2014), San Antonio Pets Alive! 990 Tax Form (2014), Animal Foundation 990 Tax Form (2014), Animal Defense League 990 Tax Form (2015), Lifeline Animal Project 990 Tax Form (2014), Atlanta Humane Society 990 Tax Form (2014) , Rescued Pets Movement 990 Tax Form (2014), Miami-Dade Animal Services Projected Budget (2015), First Coast No More Homeless Pets 990 Tax Form (2014), US Census Bureau 2013 Population Estimate and BCG analysis
100% of partner budget shown to demonstrate potential; partnerships enable shelters to transfer activities and costs to their partner
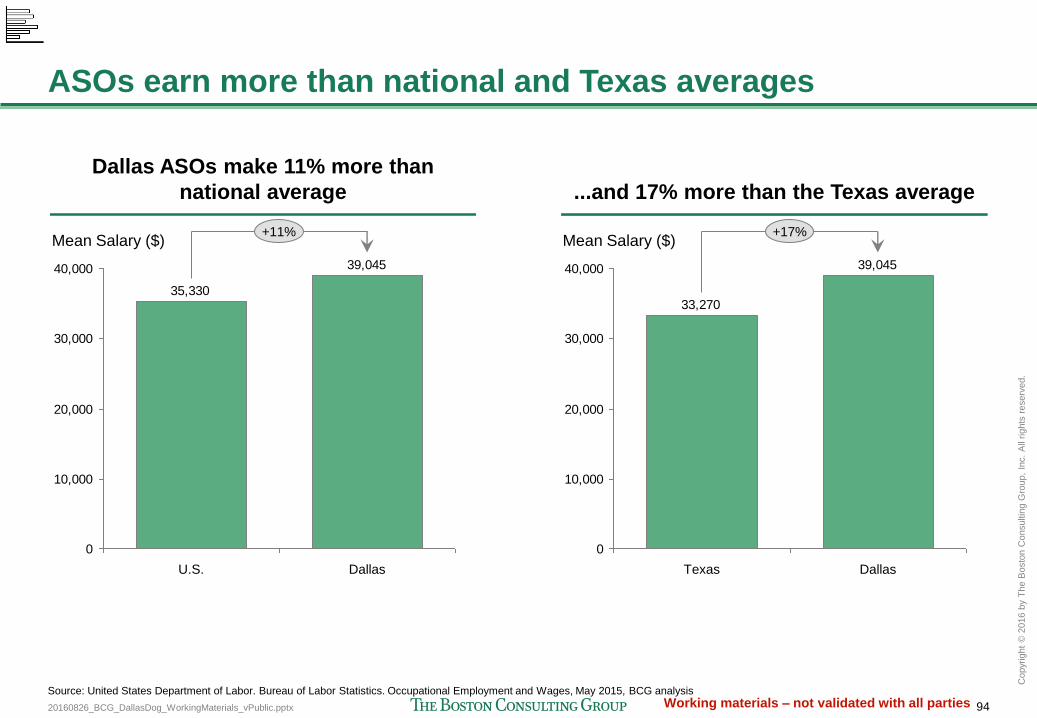
20160826_BCG_DallasDog_WorkingMaterials_vPublic.pptx 94
Copyr
ight
© 2
016 b
y T
he B
osto
n C
onsultin
g G
roup,
Inc.
All
rights
reserv
ed.
Working materials – not validated with all parties
ASOs earn more than national and Texas averages
39,045
33,270
0
10,000
20,000
30,000
40,000
Mean Salary ($) +17%
Dallas Texas
...and 17% more than the Texas average
Dallas ASOs make 11% more than
national average
39,045
35,330
0
10,000
20,000
30,000
40,000
Mean Salary ($) +11%
Dallas U.S.
Source: United States Department of Labor. Bureau of Labor Statistics. Occupational Employment and Wages, May 2015, BCG analysis
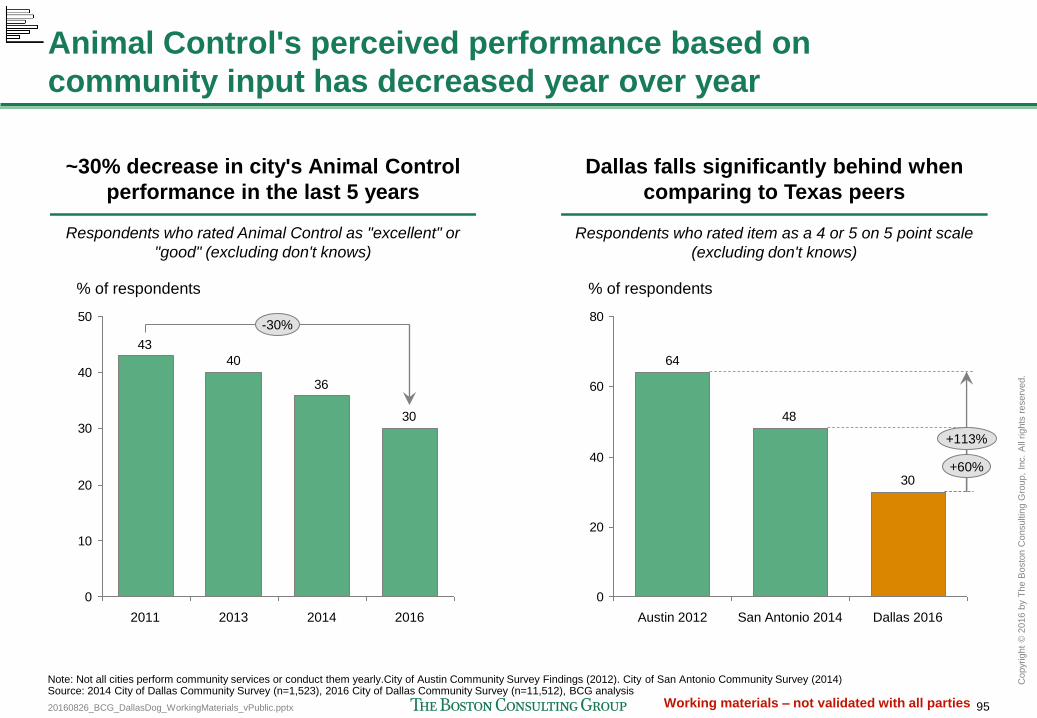
20160826_BCG_DallasDog_WorkingMaterials_vPublic.pptx 95
Copyr
ight
© 2
016 b
y T
he B
osto
n C
onsultin
g G
roup,
Inc.
All
rights
reserv
ed.
Working materials – not validated with all parties
Animal Control's perceived performance based on
community input has decreased year over year
~30% decrease in city's Animal Control
performance in the last 5 years
Dallas falls significantly behind when
comparing to Texas peers
Respondents who rated item as a 4 or 5 on 5 point scale
(excluding don't knows)
30
36
40
43
0
10
20
30
40
50-30%
2016 2014 2013 2011
% of respondents
Respondents who rated Animal Control as "excellent" or
"good" (excluding don't knows)
Note: Not all cities perform community services or conduct them yearly.City of Austin Community Survey Findings (2012). City of San Antonio Community Survey (2014) Source: 2014 City of Dallas Community Survey (n=1,523), 2016 City of Dallas Community Survey (n=11,512), BCG analysis
30
48
64
0
20
40
60
80
San Antonio 2014 Dallas 2016 Austin 2012
% of respondents
+113%
+60%
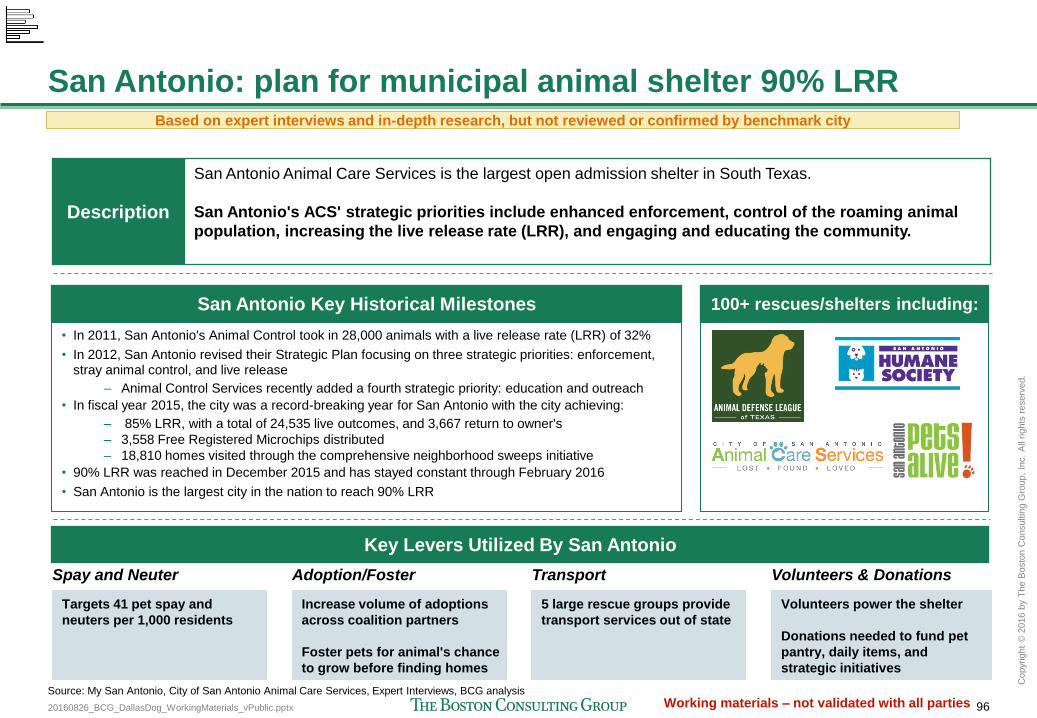
20160826_BCG_DallasDog_WorkingMaterials_vPublic.pptx 96
Copyr
ight
© 2
016 b
y T
he B
osto
n C
onsultin
g G
roup,
Inc.
All
rights
reserv
ed.
Working materials – not validated with all parties
San Antonio: plan for municipal animal shelter 90% LRR
San Antonio Animal Care Services is the largest open admission shelter in South Texas.
San Antonio's ACS' strategic priorities include enhanced enforcement, control of the roaming animal
population, increasing the live release rate (LRR), and engaging and educating the community. Description
• In 2011, San Antonio's Animal Control took in 28,000 animals with a live release rate (LRR) of 32%
• In 2012, San Antonio revised their Strategic Plan focusing on three strategic priorities: enforcement, stray animal control, and live release
– Animal Control Services recently added a fourth strategic priority: education and outreach
• In fiscal year 2015, the city was a record-breaking year for San Antonio with the city achieving:
– 85% LRR, with a total of 24,535 live outcomes, and 3,667 return to owner's
– 3,558 Free Registered Microchips distributed
– 18,810 homes visited through the comprehensive neighborhood sweeps initiative
• 90% LRR was reached in December 2015 and has stayed constant through February 2016
• San Antonio is the largest city in the nation to reach 90% LRR
San Antonio Key Historical Milestones
Targets 41 pet spay and
neuters per 1,000 residents
Increase volume of adoptions
across coalition partners
Foster pets for animal's chance
to grow before finding homes
5 large rescue groups provide
transport services out of state
Volunteers power the shelter
Donations needed to fund pet
pantry, daily items, and
strategic initiatives
100+ rescues/shelters including:
Spay and Neuter Adoption/Foster Transport Volunteers & Donations
Key Levers Utilized By San Antonio
Source: My San Antonio, City of San Antonio Animal Care Services, Expert Interviews, BCG analysis
Based on expert interviews and in-depth research, but not reviewed or confirmed by benchmark city
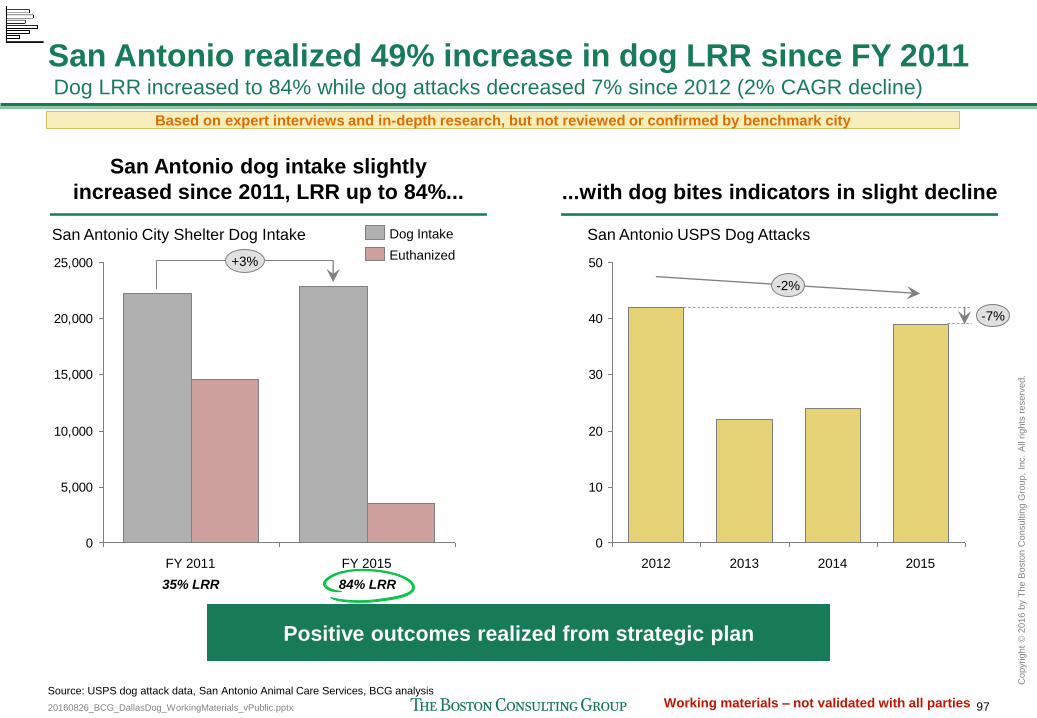
20160826_BCG_DallasDog_WorkingMaterials_vPublic.pptx 97
Copyr
ight
© 2
016 b
y T
he B
osto
n C
onsultin
g G
roup,
Inc.
All
rights
reserv
ed.
Working materials – not validated with all parties
San Antonio realized 49% increase in dog LRR since FY 2011 Dog LRR increased to 84% while dog attacks decreased 7% since 2012 (2% CAGR decline)
San Antonio dog intake slightly
increased since 2011, LRR up to 84%... ...with dog bites indicators in slight decline
0
5,000
10,000
15,000
20,000
25,000
San Antonio City Shelter Dog Intake
FY 2011
+3%
FY 2015
Dog Intake
Euthanized
0
10
20
30
40
50
2012 2013 2014 2015
-2%
-7%
San Antonio USPS Dog Attacks
35% LRR 84% LRR
Positive outcomes realized from strategic plan
Source: USPS dog attack data, San Antonio Animal Care Services, BCG analysis
Based on expert interviews and in-depth research, but not reviewed or confirmed by benchmark city
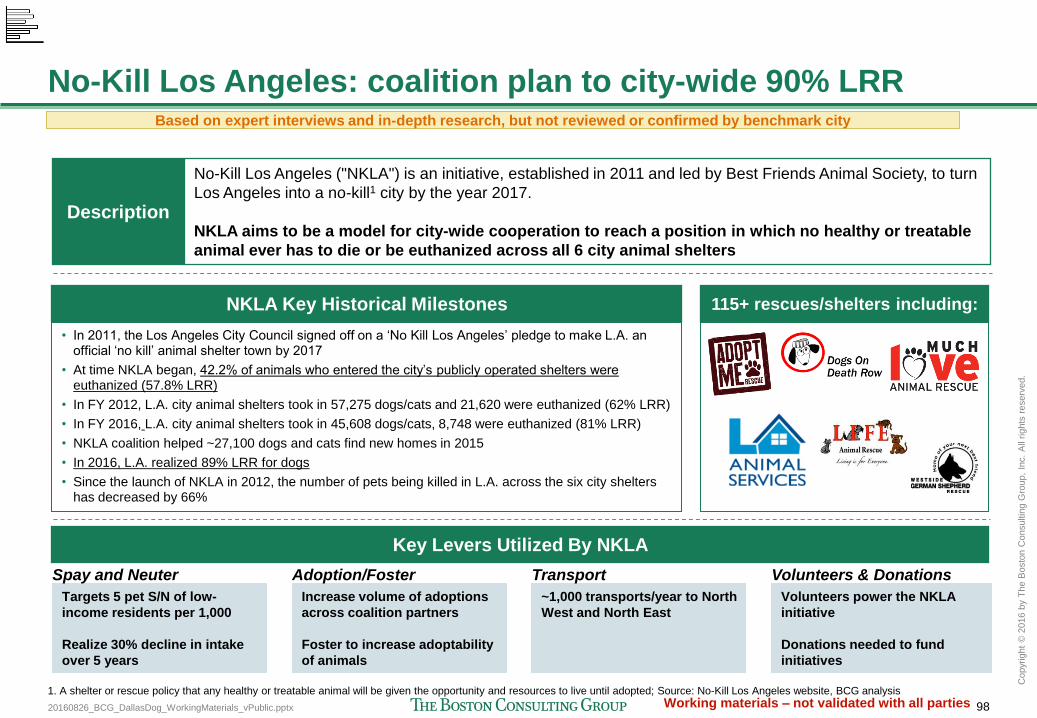
20160826_BCG_DallasDog_WorkingMaterials_vPublic.pptx 98
Copyr
ight
© 2
016 b
y T
he B
osto
n C
onsultin
g G
roup,
Inc.
All
rights
reserv
ed.
Working materials – not validated with all parties
No-Kill Los Angeles: coalition plan to city-wide 90% LRR
No-Kill Los Angeles ("NKLA") is an initiative, established in 2011 and led by Best Friends Animal Society, to turn
Los Angeles into a no-kill1 city by the year 2017.
NKLA aims to be a model for city-wide cooperation to reach a position in which no healthy or treatable
animal ever has to die or be euthanized across all 6 city animal shelters
Description
• In 2011, the Los Angeles City Council signed off on a ‘No Kill Los Angeles’ pledge to make L.A. an official ‘no kill’ animal shelter town by 2017
• At time NKLA began, 42.2% of animals who entered the city’s publicly operated shelters were euthanized (57.8% LRR)
• In FY 2012, L.A. city animal shelters took in 57,275 dogs/cats and 21,620 were euthanized (62% LRR)
• In FY 2016, L.A. city animal shelters took in 45,608 dogs/cats, 8,748 were euthanized (81% LRR)
• NKLA coalition helped ~27,100 dogs and cats find new homes in 2015
• In 2016, L.A. realized 89% LRR for dogs
• Since the launch of NKLA in 2012, the number of pets being killed in L.A. across the six city shelters has decreased by 66%
NKLA Key Historical Milestones
Targets 5 pet S/N of low-
income residents per 1,000
Realize 30% decline in intake
over 5 years
Increase volume of adoptions
across coalition partners
Foster to increase adoptability
of animals
~1,000 transports/year to North
West and North East
Volunteers power the NKLA
initiative
Donations needed to fund
initiatives
115+ rescues/shelters including:
Spay and Neuter Adoption/Foster Transport Volunteers & Donations
1. A shelter or rescue policy that any healthy or treatable animal will be given the opportunity and resources to live until adopted; Source: No-Kill Los Angeles website, BCG analysis
Key Levers Utilized By NKLA
Based on expert interviews and in-depth research, but not reviewed or confirmed by benchmark city
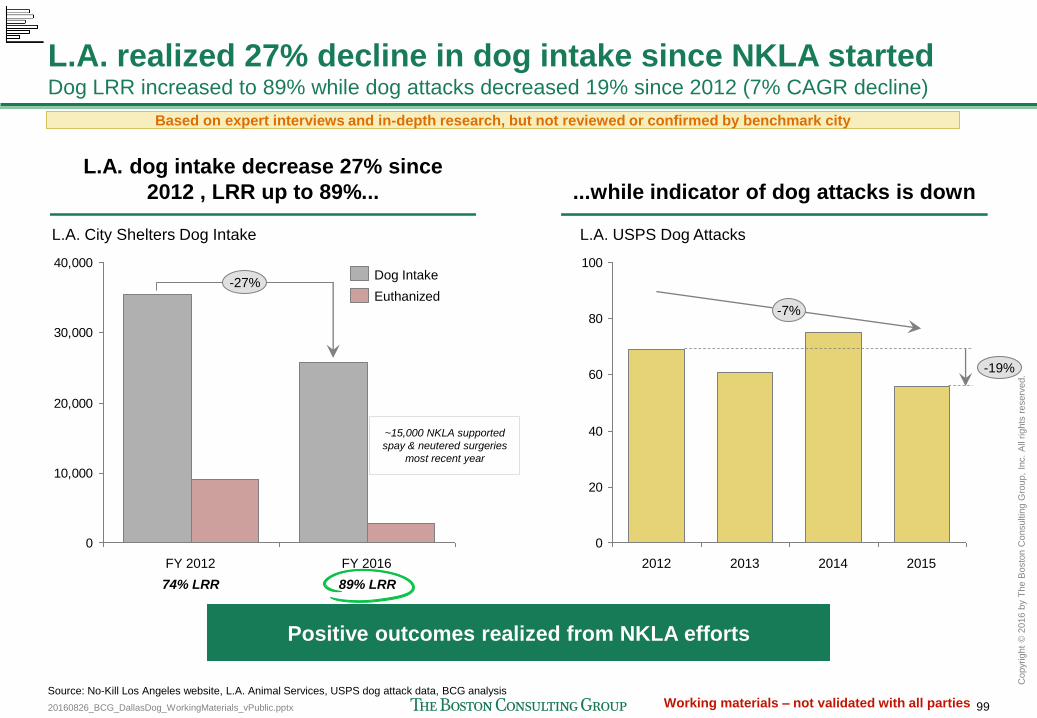
20160826_BCG_DallasDog_WorkingMaterials_vPublic.pptx 99
Copyr
ight
© 2
016 b
y T
he B
osto
n C
onsultin
g G
roup,
Inc.
All
rights
reserv
ed.
Working materials – not validated with all parties
L.A. realized 27% decline in dog intake since NKLA started Dog LRR increased to 89% while dog attacks decreased 19% since 2012 (7% CAGR decline)
L.A. dog intake decrease 27% since
2012 , LRR up to 89%... ...while indicator of dog attacks is down
0
10,000
20,000
30,000
40,000
FY 2012 FY 2016
-27%
L.A. City Shelters Dog Intake
Dog Intake
Euthanized
0
20
40
60
80
100
-19%
2012 2014 2013
-7%
2015
L.A. USPS Dog Attacks
74% LRR 89% LRR
Positive outcomes realized from NKLA efforts
~15,000 NKLA supported
spay & neutered surgeries
most recent year
Source: No-Kill Los Angeles website, L.A. Animal Services, USPS dog attack data, BCG analysis
Based on expert interviews and in-depth research, but not reviewed or confirmed by benchmark city
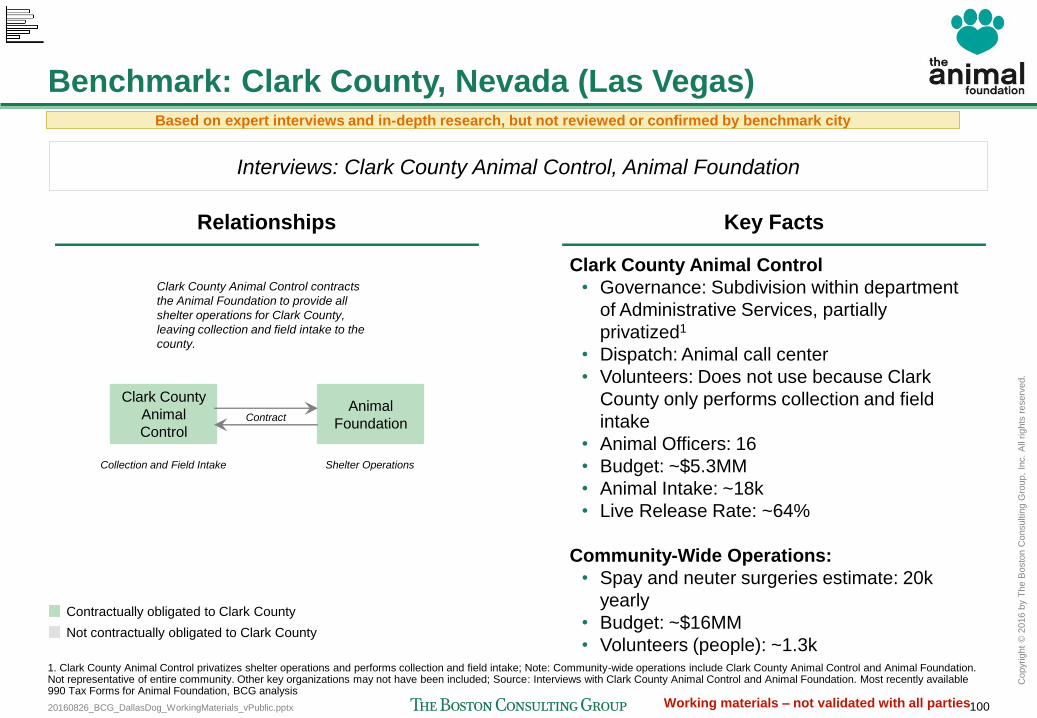
20160826_BCG_DallasDog_WorkingMaterials_vPublic.pptx 100
Copyr
ight
© 2
016 b
y T
he B
osto
n C
onsultin
g G
roup,
Inc.
All
rights
reserv
ed.
Working materials – not validated with all parties
Benchmark: Clark County, Nevada (Las Vegas)
Relationships Key Facts
Clark County Animal Control
• Governance: Subdivision within department
of Administrative Services, partially
privatized1
• Dispatch: Animal call center
• Volunteers: Does not use because Clark
County only performs collection and field
intake
• Animal Officers: 16
• Budget: ~$5.3MM
• Animal Intake: ~18k
• Live Release Rate: ~64%
Community-Wide Operations:
• Spay and neuter surgeries estimate: 20k
yearly
• Budget: ~$16MM
• Volunteers (people): ~1.3k 1. Clark County Animal Control privatizes shelter operations and performs collection and field intake; Note: Community-wide operations include Clark County Animal Control and Animal Foundation. Not representative of entire community. Other key organizations may not have been included; Source: Interviews with Clark County Animal Control and Animal Foundation. Most recently available 990 Tax Forms for Animal Foundation, BCG analysis
Interviews: Clark County Animal Control, Animal Foundation
Clark County Animal Control contracts
the Animal Foundation to provide all
shelter operations for Clark County,
leaving collection and field intake to the
county.
Clark County
Animal
Control
Animal
Foundation Contract
Collection and Field Intake Shelter Operations
Contractually obligated to Clark County
Not contractually obligated to Clark County
Based on expert interviews and in-depth research, but not reviewed or confirmed by benchmark city
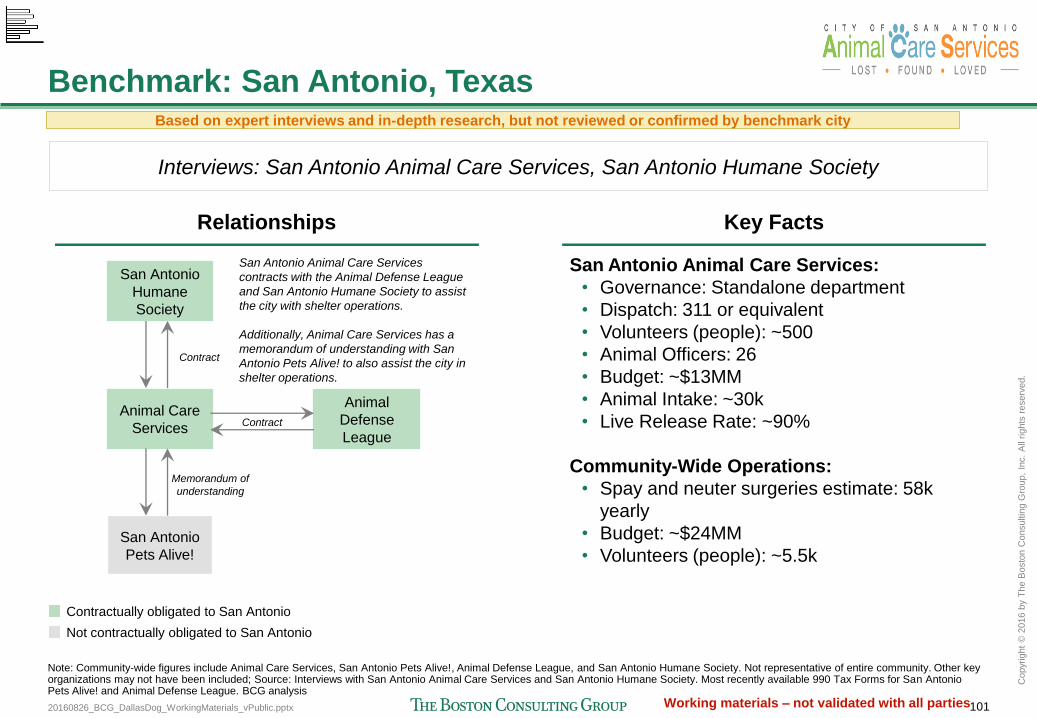
20160826_BCG_DallasDog_WorkingMaterials_vPublic.pptx 101
Copyr
ight
© 2
016 b
y T
he B
osto
n C
onsultin
g G
roup,
Inc.
All
rights
reserv
ed.
Working materials – not validated with all parties
Benchmark: San Antonio, Texas
Note: Community-wide figures include Animal Care Services, San Antonio Pets Alive!, Animal Defense League, and San Antonio Humane Society. Not representative of entire community. Other key organizations may not have been included; Source: Interviews with San Antonio Animal Care Services and San Antonio Humane Society. Most recently available 990 Tax Forms for San Antonio Pets Alive! and Animal Defense League. BCG analysis
San Antonio Animal Care Services:
• Governance: Standalone department
• Dispatch: 311 or equivalent
• Volunteers (people): ~500
• Animal Officers: 26
• Budget: ~$13MM
• Animal Intake: ~30k
• Live Release Rate: ~90%
Community-Wide Operations:
• Spay and neuter surgeries estimate: 58k
yearly
• Budget: ~$24MM
• Volunteers (people): ~5.5k
Animal Care
Services
Animal
Defense
League
San Antonio
Pets Alive!
Contract
Memorandum of
understanding
Contract
San Antonio
Humane
Society
San Antonio Animal Care Services
contracts with the Animal Defense League
and San Antonio Humane Society to assist
the city with shelter operations.
Additionally, Animal Care Services has a
memorandum of understanding with San
Antonio Pets Alive! to also assist the city in
shelter operations.
Based on expert interviews and in-depth research, but not reviewed or confirmed by benchmark city
Relationships Key Facts
Interviews: San Antonio Animal Care Services, San Antonio Humane Society
Contractually obligated to San Antonio
Not contractually obligated to San Antonio
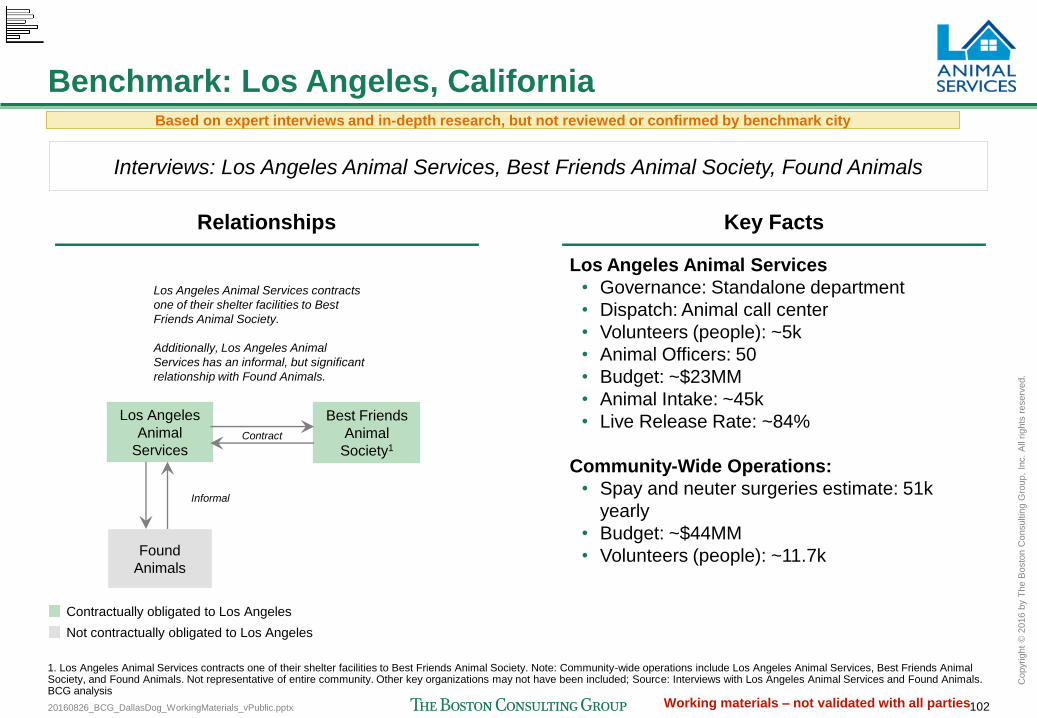
20160826_BCG_DallasDog_WorkingMaterials_vPublic.pptx 102
Copyr
ight
© 2
016 b
y T
he B
osto
n C
onsultin
g G
roup,
Inc.
All
rights
reserv
ed.
Working materials – not validated with all parties
Benchmark: Los Angeles, California
1. Los Angeles Animal Services contracts one of their shelter facilities to Best Friends Animal Society. Note: Community-wide operations include Los Angeles Animal Services, Best Friends Animal Society, and Found Animals. Not representative of entire community. Other key organizations may not have been included; Source: Interviews with Los Angeles Animal Services and Found Animals. BCG analysis
Los Angeles Animal Services
• Governance: Standalone department
• Dispatch: Animal call center
• Volunteers (people): ~5k
• Animal Officers: 50
• Budget: ~$23MM
• Animal Intake: ~45k
• Live Release Rate: ~84%
Community-Wide Operations:
• Spay and neuter surgeries estimate: 51k
yearly
• Budget: ~$44MM
• Volunteers (people): ~11.7k
Los Angeles
Animal
Services
Best Friends
Animal
Society1
Found
Animals
Contract
Informal
Los Angeles Animal Services contracts
one of their shelter facilities to Best
Friends Animal Society.
Additionally, Los Angeles Animal
Services has an informal, but significant
relationship with Found Animals.
Contractually obligated to Los Angeles
Not contractually obligated to Los Angeles
Based on expert interviews and in-depth research, but not reviewed or confirmed by benchmark city
Relationships Key Facts
Interviews: Los Angeles Animal Services, Best Friends Animal Society, Found Animals
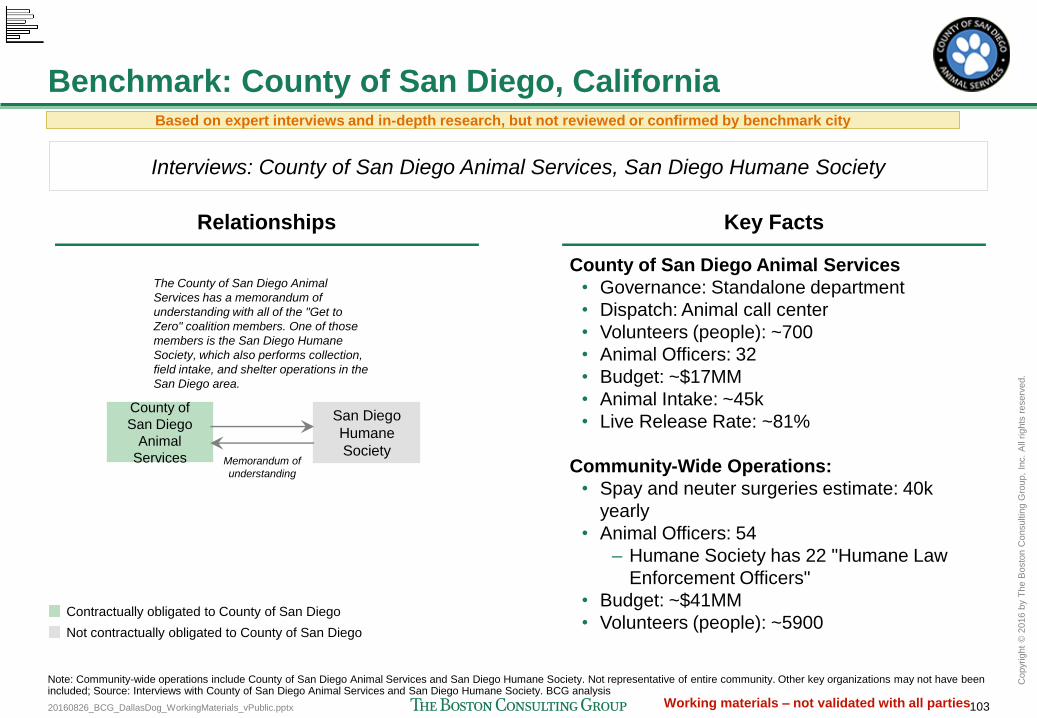
20160826_BCG_DallasDog_WorkingMaterials_vPublic.pptx 103
Copyr
ight
© 2
016 b
y T
he B
osto
n C
onsultin
g G
roup,
Inc.
All
rights
reserv
ed.
Working materials – not validated with all parties
Benchmark: County of San Diego, California
Note: Community-wide operations include County of San Diego Animal Services and San Diego Humane Society. Not representative of entire community. Other key organizations may not have been included; Source: Interviews with County of San Diego Animal Services and San Diego Humane Society. BCG analysis
County of San Diego Animal Services
• Governance: Standalone department
• Dispatch: Animal call center
• Volunteers (people): ~700
• Animal Officers: 32
• Budget: ~$17MM
• Animal Intake: ~45k
• Live Release Rate: ~81%
Community-Wide Operations:
• Spay and neuter surgeries estimate: 40k
yearly
• Animal Officers: 54
– Humane Society has 22 "Humane Law
Enforcement Officers"
• Budget: ~$41MM
• Volunteers (people): ~5900
County of
San Diego
Animal
Services
San Diego
Humane
Society Memorandum of
understanding
The County of San Diego Animal
Services has a memorandum of
understanding with all of the "Get to
Zero" coalition members. One of those
members is the San Diego Humane
Society, which also performs collection,
field intake, and shelter operations in the
San Diego area.
Based on expert interviews and in-depth research, but not reviewed or confirmed by benchmark city
Relationships Key Facts
Interviews: County of San Diego Animal Services, San Diego Humane Society
Contractually obligated to County of San Diego
Not contractually obligated to County of San Diego
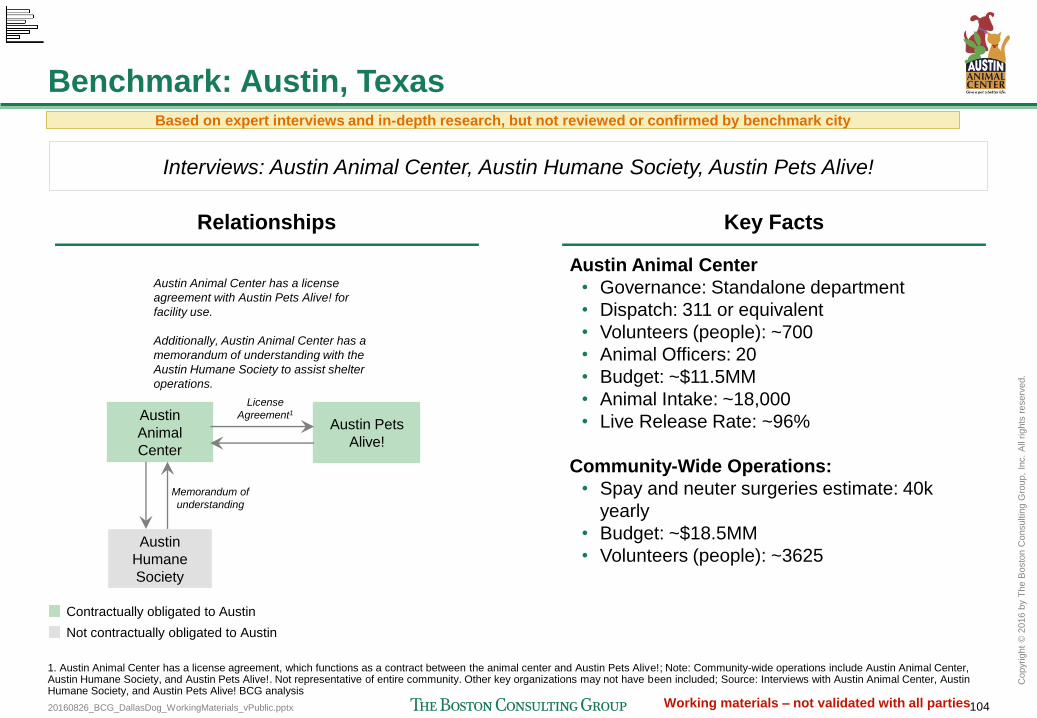
20160826_BCG_DallasDog_WorkingMaterials_vPublic.pptx 104
Copyr
ight
© 2
016 b
y T
he B
osto
n C
onsultin
g G
roup,
Inc.
All
rights
reserv
ed.
Working materials – not validated with all parties
Benchmark: Austin, Texas
1. Austin Animal Center has a license agreement, which functions as a contract between the animal center and Austin Pets Alive!; Note: Community-wide operations include Austin Animal Center, Austin Humane Society, and Austin Pets Alive!. Not representative of entire community. Other key organizations may not have been included; Source: Interviews with Austin Animal Center, Austin Humane Society, and Austin Pets Alive! BCG analysis
Austin Animal Center
• Governance: Standalone department
• Dispatch: 311 or equivalent
• Volunteers (people): ~700
• Animal Officers: 20
• Budget: ~$11.5MM
• Animal Intake: ~18,000
• Live Release Rate: ~96%
Community-Wide Operations:
• Spay and neuter surgeries estimate: 40k
yearly
• Budget: ~$18.5MM
• Volunteers (people): ~3625
Austin
Animal
Center
Austin Pets
Alive!
Austin
Humane
Society
Memorandum of
understanding
License
Agreement1
Austin Animal Center has a license
agreement with Austin Pets Alive! for
facility use.
Additionally, Austin Animal Center has a
memorandum of understanding with the
Austin Humane Society to assist shelter
operations.
Contractually obligated to Austin
Not contractually obligated to Austin
Based on expert interviews and in-depth research, but not reviewed or confirmed by benchmark city
Relationships Key Facts
Interviews: Austin Animal Center, Austin Humane Society, Austin Pets Alive!
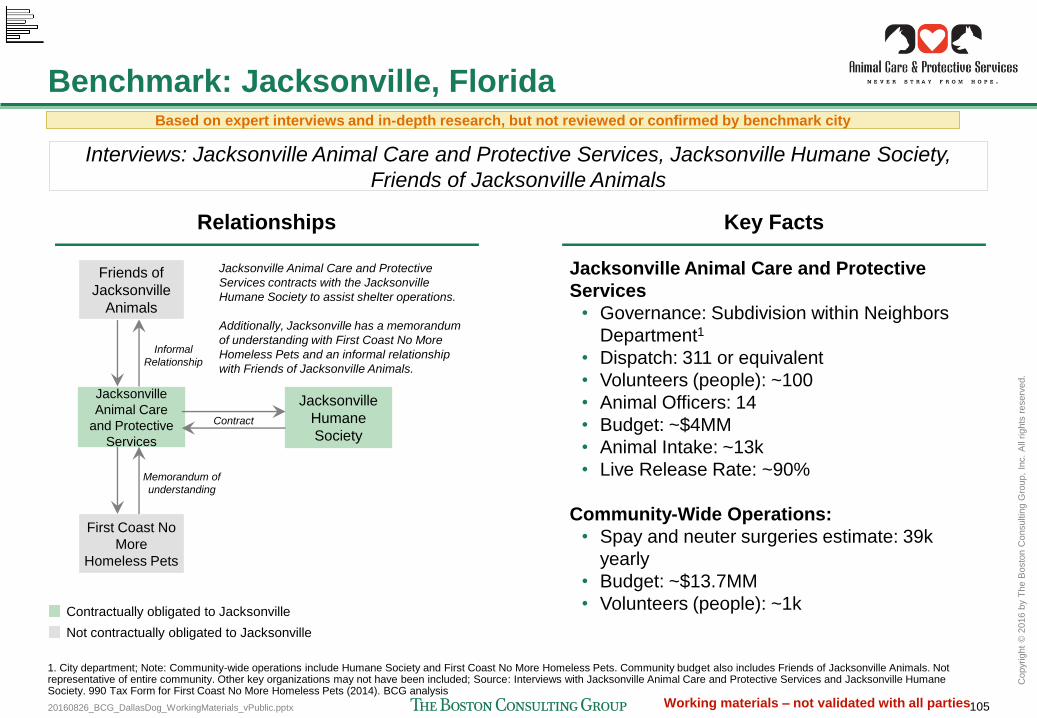
20160826_BCG_DallasDog_WorkingMaterials_vPublic.pptx 105
Copyr
ight
© 2
016 b
y T
he B
osto
n C
onsultin
g G
roup,
Inc.
All
rights
reserv
ed.
Working materials – not validated with all parties
Benchmark: Jacksonville, Florida
1. City department; Note: Community-wide operations include Humane Society and First Coast No More Homeless Pets. Community budget also includes Friends of Jacksonville Animals. Not representative of entire community. Other key organizations may not have been included; Source: Interviews with Jacksonville Animal Care and Protective Services and Jacksonville Humane Society. 990 Tax Form for First Coast No More Homeless Pets (2014). BCG analysis
Jacksonville Animal Care and Protective
Services
• Governance: Subdivision within Neighbors
Department1
• Dispatch: 311 or equivalent
• Volunteers (people): ~100
• Animal Officers: 14
• Budget: ~$4MM
• Animal Intake: ~13k
• Live Release Rate: ~90%
Community-Wide Operations:
• Spay and neuter surgeries estimate: 39k
yearly
• Budget: ~$13.7MM
• Volunteers (people): ~1k
Jacksonville
Animal Care
and Protective
Services
Jacksonville
Humane
Society
First Coast No
More
Homeless Pets
Contract
Memorandum of
understanding
Informal
Relationship
Friends of
Jacksonville
Animals
Jacksonville Animal Care and Protective
Services contracts with the Jacksonville
Humane Society to assist shelter operations.
Additionally, Jacksonville has a memorandum
of understanding with First Coast No More
Homeless Pets and an informal relationship
with Friends of Jacksonville Animals.
Contractually obligated to Jacksonville
Not contractually obligated to Jacksonville
Based on expert interviews and in-depth research, but not reviewed or confirmed by benchmark city
Relationships Key Facts
Interviews: Jacksonville Animal Care and Protective Services, Jacksonville Humane Society,
Friends of Jacksonville Animals
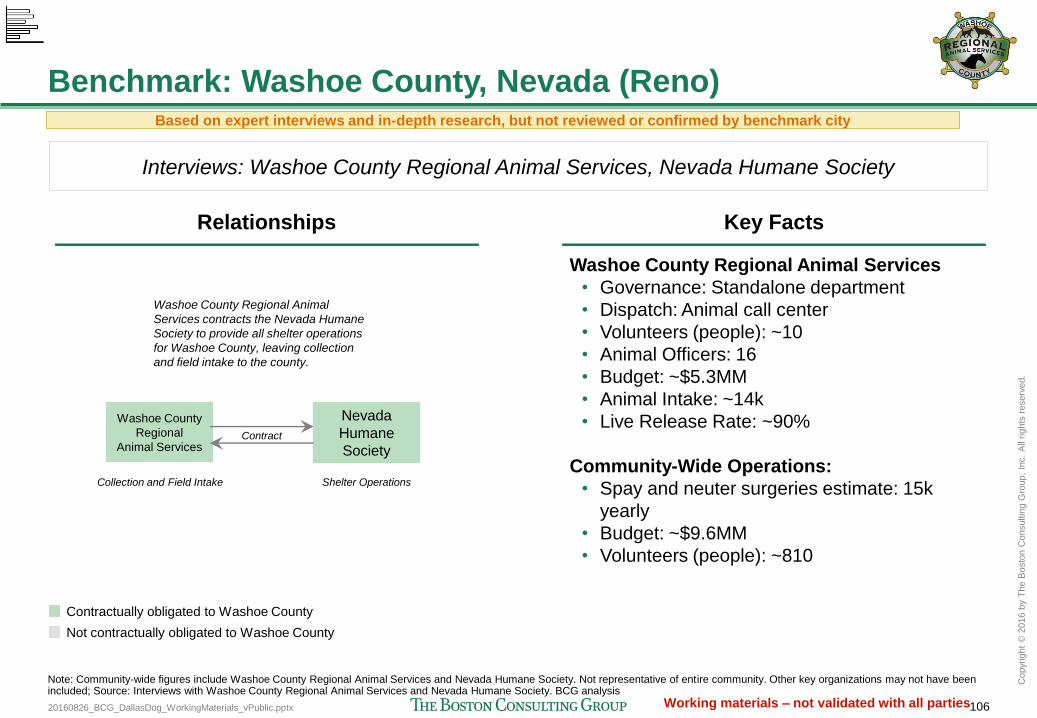
20160826_BCG_DallasDog_WorkingMaterials_vPublic.pptx 106
Copyr
ight
© 2
016 b
y T
he B
osto
n C
onsultin
g G
roup,
Inc.
All
rights
reserv
ed.
Working materials – not validated with all parties
Benchmark: Washoe County, Nevada (Reno)
Note: Community-wide figures include Washoe County Regional Animal Services and Nevada Humane Society. Not representative of entire community. Other key organizations may not have been included; Source: Interviews with Washoe County Regional Animal Services and Nevada Humane Society. BCG analysis
Washoe County Regional Animal Services
• Governance: Standalone department
• Dispatch: Animal call center
• Volunteers (people): ~10
• Animal Officers: 16
• Budget: ~$5.3MM
• Animal Intake: ~14k
• Live Release Rate: ~90%
Community-Wide Operations:
• Spay and neuter surgeries estimate: 15k
yearly
• Budget: ~$9.6MM
• Volunteers (people): ~810
Washoe County Regional Animal
Services contracts the Nevada Humane
Society to provide all shelter operations
for Washoe County, leaving collection
and field intake to the county.
Washoe County
Regional
Animal Services
Nevada
Humane
Society Contract
Collection and Field Intake Shelter Operations
Contractually obligated to Washoe County
Not contractually obligated to Washoe County
Based on expert interviews and in-depth research, but not reviewed or confirmed by benchmark city
Relationships Key Facts
Interviews: Washoe County Regional Animal Services, Nevada Humane Society
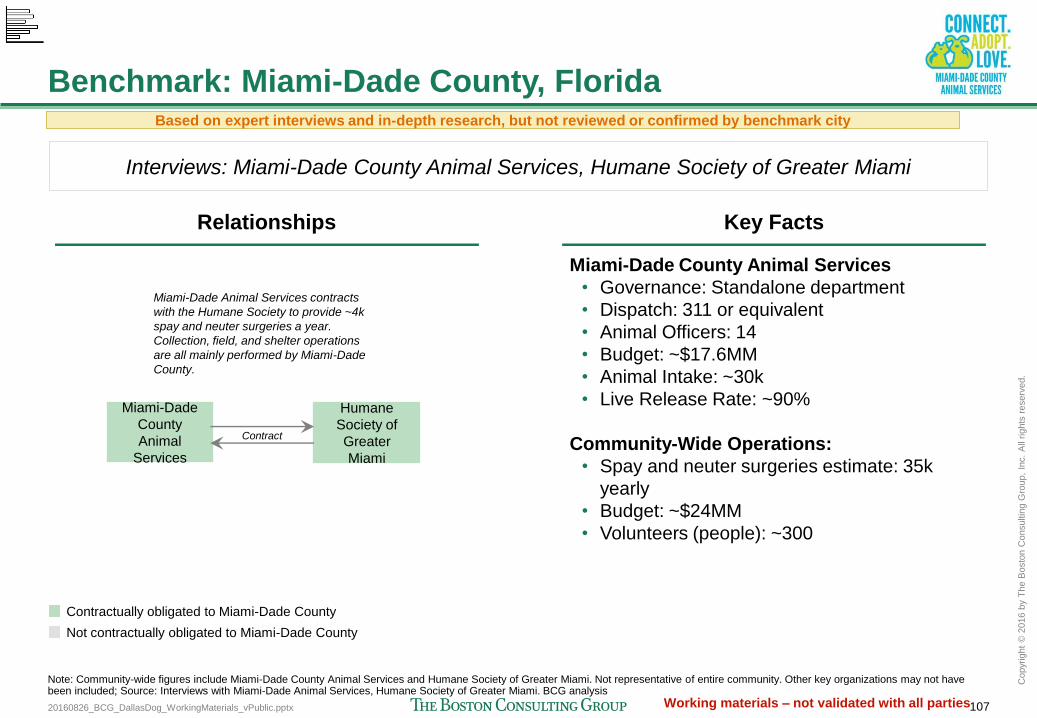
20160826_BCG_DallasDog_WorkingMaterials_vPublic.pptx 107
Copyr
ight
© 2
016 b
y T
he B
osto
n C
onsultin
g G
roup,
Inc.
All
rights
reserv
ed.
Working materials – not validated with all parties
Benchmark: Miami-Dade County, Florida
Note: Community-wide figures include Miami-Dade County Animal Services and Humane Society of Greater Miami. Not representative of entire community. Other key organizations may not have been included; Source: Interviews with Miami-Dade Animal Services, Humane Society of Greater Miami. BCG analysis
Miami-Dade County Animal Services
• Governance: Standalone department
• Dispatch: 311 or equivalent
• Animal Officers: 14
• Budget: ~$17.6MM
• Animal Intake: ~30k
• Live Release Rate: ~90%
Community-Wide Operations:
• Spay and neuter surgeries estimate: 35k
yearly
• Budget: ~$24MM
• Volunteers (people): ~300
Miami-Dade
County
Animal
Services
Humane
Society of
Greater
Miami
Contract
Miami-Dade Animal Services contracts
with the Humane Society to provide ~4k
spay and neuter surgeries a year.
Collection, field, and shelter operations
are all mainly performed by Miami-Dade
County.
Contractually obligated to Miami-Dade County
Not contractually obligated to Miami-Dade County
Based on expert interviews and in-depth research, but not reviewed or confirmed by benchmark city
Relationships Key Facts
Interviews: Miami-Dade County Animal Services, Humane Society of Greater Miami
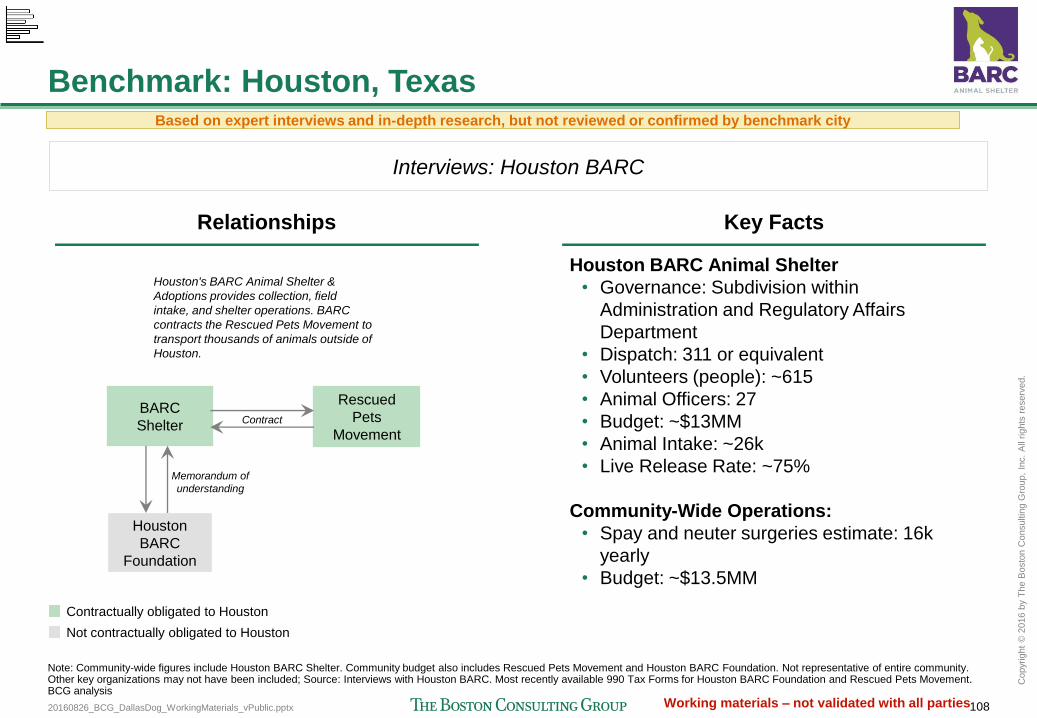
20160826_BCG_DallasDog_WorkingMaterials_vPublic.pptx 108
Copyr
ight
© 2
016 b
y T
he B
osto
n C
onsultin
g G
roup,
Inc.
All
rights
reserv
ed.
Working materials – not validated with all parties
Benchmark: Houston, Texas
Note: Community-wide figures include Houston BARC Shelter. Community budget also includes Rescued Pets Movement and Houston BARC Foundation. Not representative of entire community. Other key organizations may not have been included; Source: Interviews with Houston BARC. Most recently available 990 Tax Forms for Houston BARC Foundation and Rescued Pets Movement. BCG analysis
Houston BARC Animal Shelter
• Governance: Subdivision within
Administration and Regulatory Affairs
Department
• Dispatch: 311 or equivalent
• Volunteers (people): ~615
• Animal Officers: 27
• Budget: ~$13MM
• Animal Intake: ~26k
• Live Release Rate: ~75%
Community-Wide Operations:
• Spay and neuter surgeries estimate: 16k
yearly
• Budget: ~$13.5MM
BARC
Shelter
Rescued
Pets
Movement
Houston
BARC
Foundation
Contract
Memorandum of
understanding
Houston's BARC Animal Shelter &
Adoptions provides collection, field
intake, and shelter operations. BARC
contracts the Rescued Pets Movement to
transport thousands of animals outside of
Houston.
Contractually obligated to Houston
Not contractually obligated to Houston
Based on expert interviews and in-depth research, but not reviewed or confirmed by benchmark city
Relationships Key Facts
Interviews: Houston BARC

20160826_BCG_DallasDog_WorkingMaterials_vPublic.pptx 109
Copyr
ight
© 2
016 b
y T
he B
osto
n C
onsultin
g G
roup,
Inc.
All
rights
reserv
ed.
Working materials – not validated with all parties
Benchmark: Fulton County, Georgia (Atlanta)
Note: Community-wide figures include Fulton County Animal Services., Lifeline Animal Project, and Humane Society of Atlanta. Not representative of entire community. Other key organizations may not have been included; Source: Interview with Fulton County Animal Services. Most recently available 990 Tax forms for Lifeline Animal Project and Humane Society of Atlanta. BCG analysis
Fulton County Animal Services
• Governance: Subdivision within Health
Department
• Dispatch: Animal call center
• Animal Officers: 16
• Budget: ~$3MM
• Animal Intake: ~15k
• Live Release Rate: ~85%
Community-Wide Operations:
• Spay and neuter Surgeries Estimate: 10k
yearly
• Budget: ~$17MM
Fulton County
Animal
Services
Lifeline
Animal
Project
Atlanta
Humane
Society
Contract
Informal, but integral
partner
Contractually obligated to Fulton County
Not contractually obligated to Fulton County
Fulton County Animal Services contracts shelter
operations for the county to Lifeline Animal Project.
The county still performs field collection and intake.
Additionally, in interviews, Atlanta Humane Society
was described as an integral partner that has no
formalized contract with the county.
Based on expert interviews and in-depth research, but not reviewed or confirmed by benchmark city
Relationships Key Facts
Interviews: Fulton County Animal Services
Appendix: Rescue and Animal Welfare Organization Survey
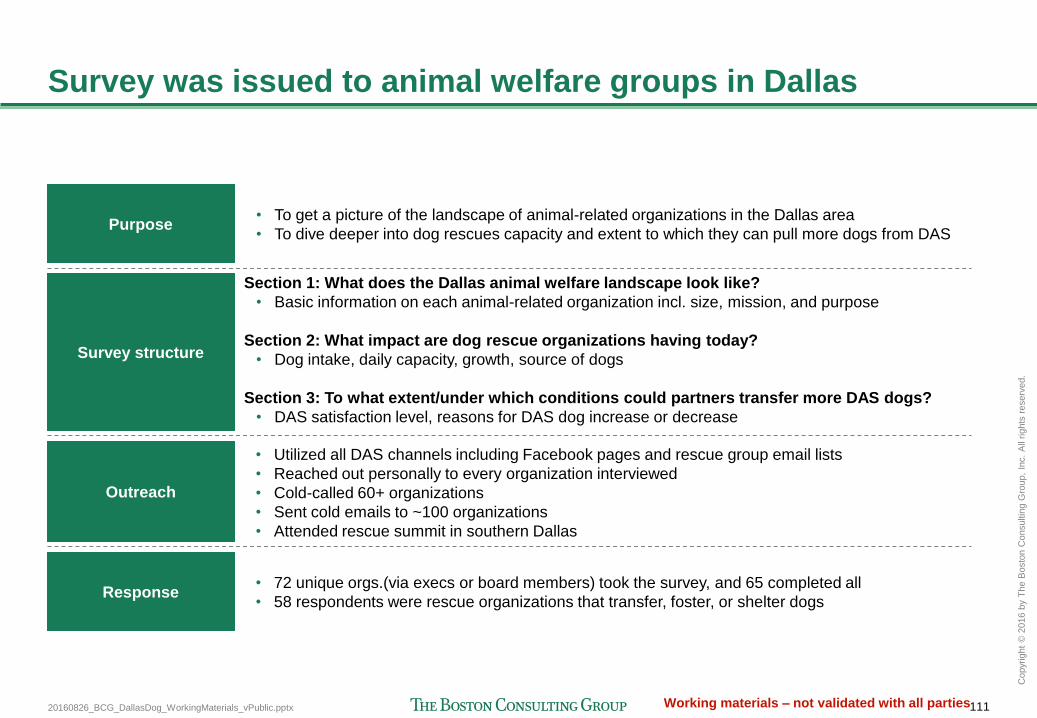
20160826_BCG_DallasDog_WorkingMaterials_vPublic.pptx 111
Copyr
ight
© 2
016 b
y T
he B
osto
n C
onsultin
g G
roup,
Inc.
All
rights
reserv
ed.
Working materials – not validated with all parties
Survey was issued to animal welfare groups in Dallas
Purpose
Survey structure
Response
Outreach
• To get a picture of the landscape of animal-related organizations in the Dallas area
• To dive deeper into dog rescues capacity and extent to which they can pull more dogs from DAS
Section 1: What does the Dallas animal welfare landscape look like?
• Basic information on each animal-related organization incl. size, mission, and purpose
Section 2: What impact are dog rescue organizations having today?
• Dog intake, daily capacity, growth, source of dogs
Section 3: To what extent/under which conditions could partners transfer more DAS dogs?
• DAS satisfaction level, reasons for DAS dog increase or decrease
• 72 unique orgs.(via execs or board members) took the survey, and 65 completed all
• 58 respondents were rescue organizations that transfer, foster, or shelter dogs
• Utilized all DAS channels including Facebook pages and rescue group email lists
• Reached out personally to every organization interviewed
• Cold-called 60+ organizations
• Sent cold emails to ~100 organizations
• Attended rescue summit in southern Dallas
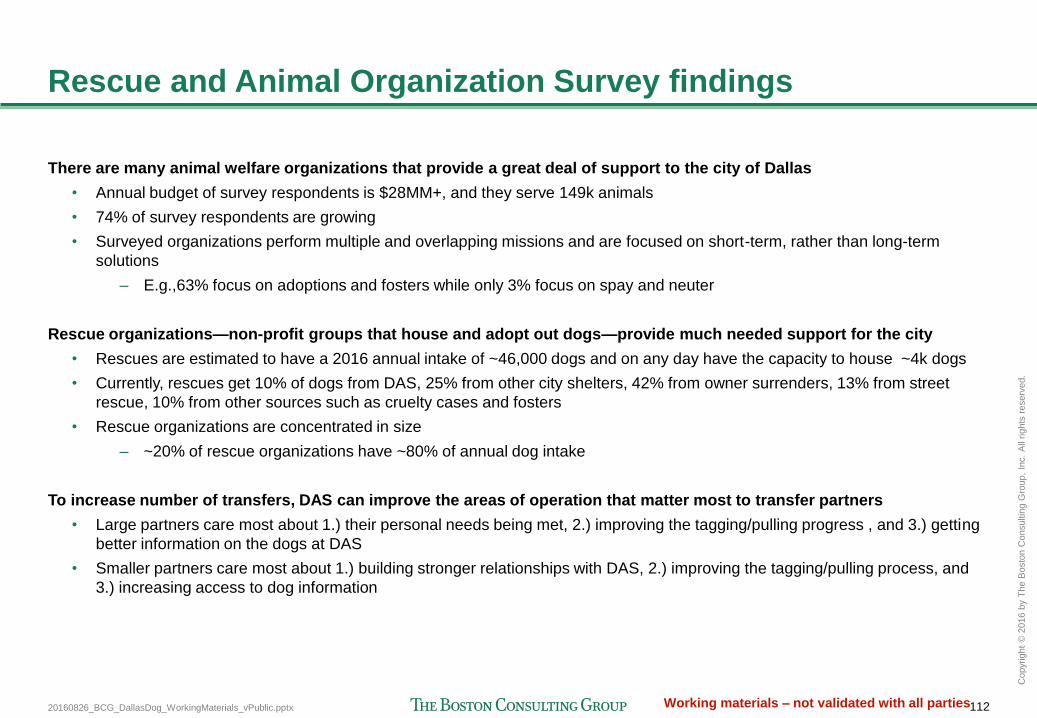
20160826_BCG_DallasDog_WorkingMaterials_vPublic.pptx 112
Copyr
ight
© 2
016 b
y T
he B
osto
n C
onsultin
g G
roup,
Inc.
All
rights
reserv
ed.
Working materials – not validated with all parties
Rescue and Animal Organization Survey findings
There are many animal welfare organizations that provide a great deal of support to the city of Dallas
• Annual budget of survey respondents is $28MM+, and they serve 149k animals
• 74% of survey respondents are growing
• Surveyed organizations perform multiple and overlapping missions and are focused on short-term, rather than long-term
solutions
– E.g.,63% focus on adoptions and fosters while only 3% focus on spay and neuter
Rescue organizations—non-profit groups that house and adopt out dogs—provide much needed support for the city
• Rescues are estimated to have a 2016 annual intake of ~46,000 dogs and on any day have the capacity to house ~4k dogs
• Currently, rescues get 10% of dogs from DAS, 25% from other city shelters, 42% from owner surrenders, 13% from street
rescue, 10% from other sources such as cruelty cases and fosters
• Rescue organizations are concentrated in size
– ~20% of rescue organizations have ~80% of annual dog intake
To increase number of transfers, DAS can improve the areas of operation that matter most to transfer partners
• Large partners care most about 1.) their personal needs being met, 2.) improving the tagging/pulling progress , and 3.) getting
better information on the dogs at DAS
• Smaller partners care most about 1.) building stronger relationships with DAS, 2.) improving the tagging/pulling process, and
3.) increasing access to dog information
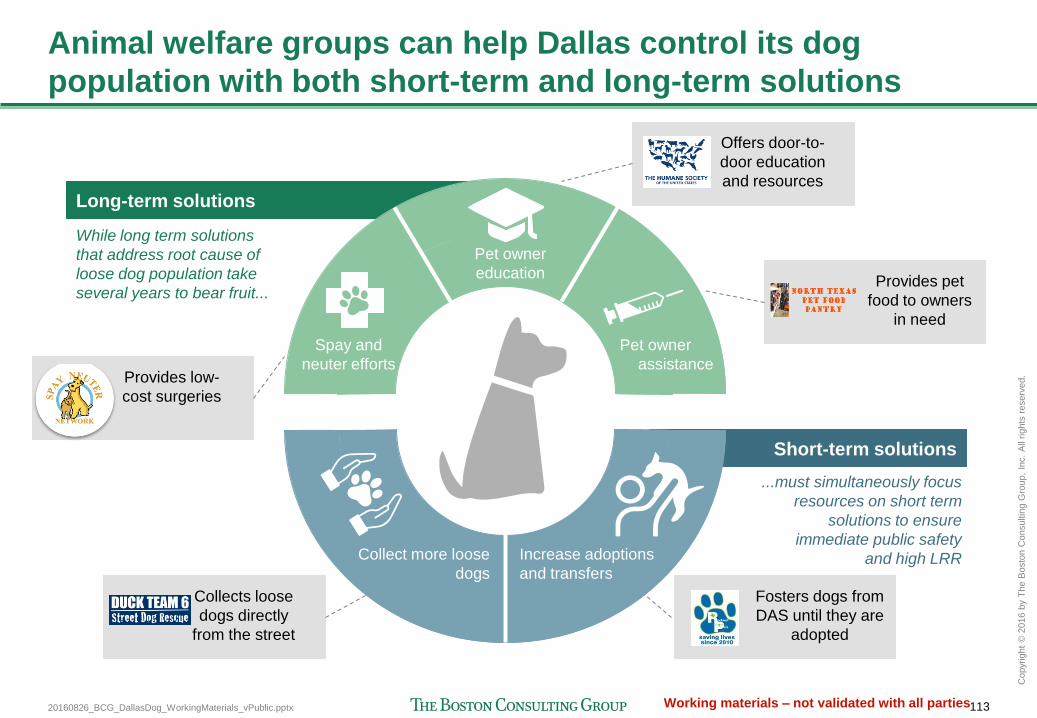
20160826_BCG_DallasDog_WorkingMaterials_vPublic.pptx 113
Copyr
ight
© 2
016 b
y T
he B
osto
n C
onsultin
g G
roup,
Inc.
All
rights
reserv
ed.
Working materials – not validated with all parties
Long-term solutions
Short-term solutions
Animal welfare groups can help Dallas control its dog
population with both short-term and long-term solutions
...must simultaneously focus
resources on short term
solutions to ensure
immediate public safety
and high LRR
While long term solutions
that address root cause of
loose dog population take
several years to bear fruit...
Pet owner
assistance
Pet owner
education
Spay and
neuter efforts
Increase adoptions
and transfers
Collect more loose
dogs
Provides low-
cost surgeries
Collects loose
dogs directly
from the street
Offers door-to-
door education
and resources
Provides pet
food to owners
in need
Fosters dogs from
DAS until they are
adopted

20160826_BCG_DallasDog_WorkingMaterials_vPublic.pptx 114
Copyr
ight
© 2
016 b
y T
he B
osto
n C
onsultin
g G
roup,
Inc.
All
rights
reserv
ed.
Working materials – not validated with all parties
All
respondents
Orgs. serving
>1k animals
Orgs. serving
<1k animals
Animal orgs. have significant and growing capacity
100
80
60
40
20
0
% total
Animals served '15
148,500
Annual budget
28,407,151
$28MM+ in annual budget to
serve 148k+ animals Majority are growing
0
6
21
24
50
50 100 0
Much fewer animals
served than
in previous years
Slightly fewer animals
served than in
previous years
About the same amount
of animals served as
in previous ye
Slightly more animals
served than in
previous years
Many more animals
served than in
previous years
0
0
8
23
69
100 50 0
0
7
24
24
46
100 50 0
% respondents
Question: What is the annual budget for your organization? (n=72); Question: Approximately how many animals did your organization impact in 2015 through fostering, boarding, owner education, etc? (n=72); Question: How has your organization changed over the last three years in terms of how many animals it has impacted through fostering, boarding, owner education, etc.? (n=72); Source: Rescue and Animal Organization survey (n=72), BCG analysis
8 larger
orgs.
64
smaller
orgs.
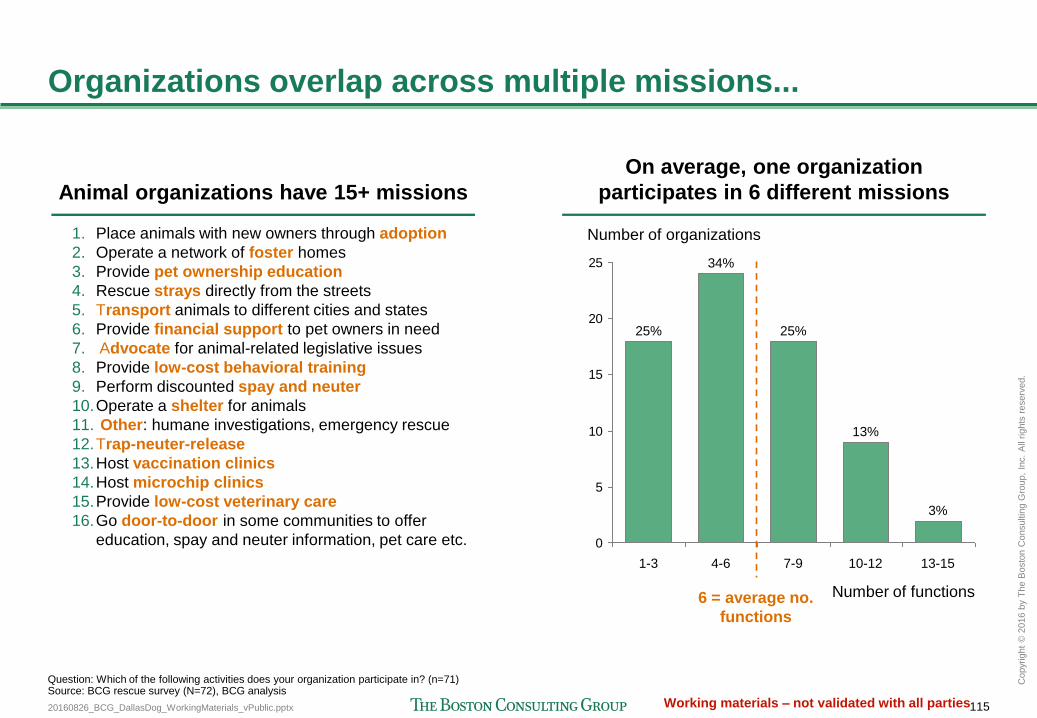
20160826_BCG_DallasDog_WorkingMaterials_vPublic.pptx 115
Copyr
ight
© 2
016 b
y T
he B
osto
n C
onsultin
g G
roup,
Inc.
All
rights
reserv
ed.
Working materials – not validated with all parties
1. Place animals with new owners through adoption
2. Operate a network of foster homes
3. Provide pet ownership education
4. Rescue strays directly from the streets
5. Transport animals to different cities and states
6. Provide financial support to pet owners in need
7. Advocate for animal-related legislative issues
8. Provide low-cost behavioral training
9. Perform discounted spay and neuter
10.Operate a shelter for animals
11. Other: humane investigations, emergency rescue
12.Trap-neuter-release
13.Host vaccination clinics
14.Host microchip clinics
15.Provide low-cost veterinary care
16.Go door-to-door in some communities to offer
education, spay and neuter information, pet care etc.
Organizations overlap across multiple missions...
On average, one organization
participates in 6 different missions
0
5
10
15
20
25
Number of functions
13-15 10-12 1-3
13%
34%
3%
25%
7-9 4-6
25%
Number of organizations
6 = average no.
functions
Animal organizations have 15+ missions
Question: Which of the following activities does your organization participate in? (n=71) Source: BCG rescue survey (N=72), BCG analysis
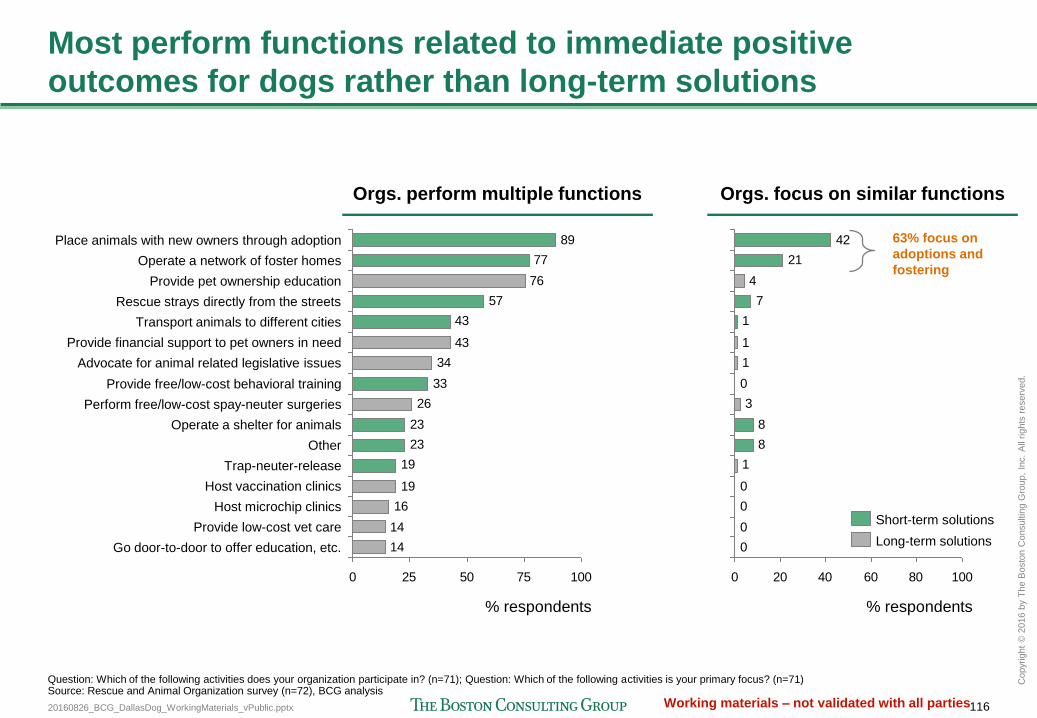
20160826_BCG_DallasDog_WorkingMaterials_vPublic.pptx 116
Copyr
ight
© 2
016 b
y T
he B
osto
n C
onsultin
g G
roup,
Inc.
All
rights
reserv
ed.
Working materials – not validated with all parties
Most perform functions related to immediate positive
outcomes for dogs rather than long-term solutions
14
14
16
19
19
23
23
26
33
34
43
43
57
76
77
89
0 25 50 75 100
% respondents
Operate a network of foster homes
Place animals with new owners through adoption
Provide pet ownership education
Rescue strays directly from the streets
Transport animals to different cities
Provide free/low-cost behavioral training
Provide financial support to pet owners in need
Advocate for animal related legislative issues
Go door-to-door to offer education, etc.
Provide low-cost vet care
Host microchip clinics
Host vaccination clinics
Trap-neuter-release
Other
Operate a shelter for animals
Perform free/low-cost spay-neuter surgeries
Question: Which of the following activities does your organization participate in? (n=71); Question: Which of the following activities is your primary focus? (n=71) Source: Rescue and Animal Organization survey (n=72), BCG analysis
0
0
0
0
1
8
8
3
0
1
1
1
7
4
21
42
0 20 40 60 80 100
% respondents
Orgs. perform multiple functions Orgs. focus on similar functions
63% focus on
adoptions and
fostering
Long-term solutions
Short-term solutions
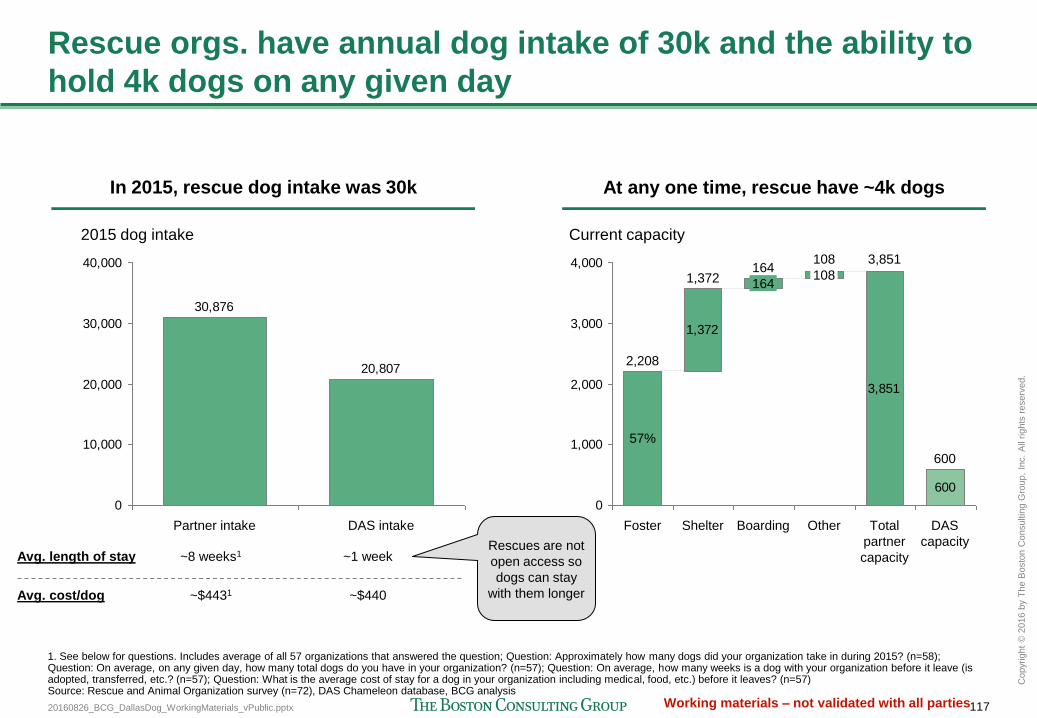
20160826_BCG_DallasDog_WorkingMaterials_vPublic.pptx 117
Copyr
ight
© 2
016 b
y T
he B
osto
n C
onsultin
g G
roup,
Inc.
All
rights
reserv
ed.
Working materials – not validated with all parties
Rescue orgs. have annual dog intake of 30k and the ability to
hold 4k dogs on any given day
20,807
30,876
0
10,000
20,000
30,000
40,000
2015 dog intake
DAS intake Partner intake
In 2015, rescue dog intake was 30k At any one time, rescue have ~4k dogs
1,372
3,851
600
0
1,000
2,000
3,000
4,000108
164
Current capacity
600
DAS
capacity
Total
partner
capacity
3,851
Other
108
Boarding
164
Shelter
1,372
Foster
2,208
57%
1. See below for questions. Includes average of all 57 organizations that answered the question; Question: Approximately how many dogs did your organization take in during 2015? (n=58); Question: On average, on any given day, how many total dogs do you have in your organization? (n=57); Question: On average, how many weeks is a dog with your organization before it leave (is adopted, transferred, etc.? (n=57); Question: What is the average cost of stay for a dog in your organization including medical, food, etc.) before it leaves? (n=57) Source: Rescue and Animal Organization survey (n=72), DAS Chameleon database, BCG analysis
Avg. length of stay ~8 weeks1 ~1 week
Avg. cost/dog ~$4431 ~$440
Rescues are not
open access so
dogs can stay
with them longer
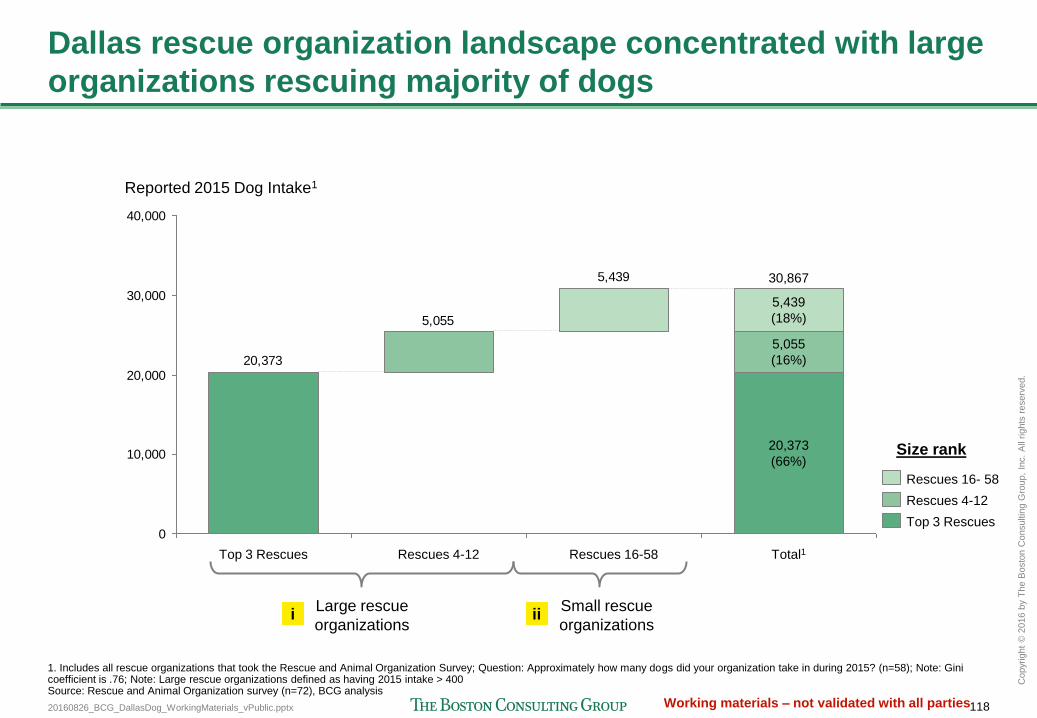
20160826_BCG_DallasDog_WorkingMaterials_vPublic.pptx 118
Copyr
ight
© 2
016 b
y T
he B
osto
n C
onsultin
g G
roup,
Inc.
All
rights
reserv
ed.
Working materials – not validated with all parties
5,439
5,055
20,373
0
10,000
20,000
30,000
40,000
Total1 Rescues 16-58
5,055
(16%)
5,439
(18%)
Rescues 4-12 Top 3 Rescues
20,373
(66%)
30,867
Reported 2015 Dog Intake1
Rescues 4-12
Top 3 Rescues
Rescues 16- 58
Dallas rescue organization landscape concentrated with large
organizations rescuing majority of dogs
1. Includes all rescue organizations that took the Rescue and Animal Organization Survey; Question: Approximately how many dogs did your organization take in during 2015? (n=58); Note: Gini coefficient is .76; Note: Large rescue organizations defined as having 2015 intake > 400 Source: Rescue and Animal Organization survey (n=72), BCG analysis
Large rescue
organizations
Small rescue
organizations
Size rank
i ii
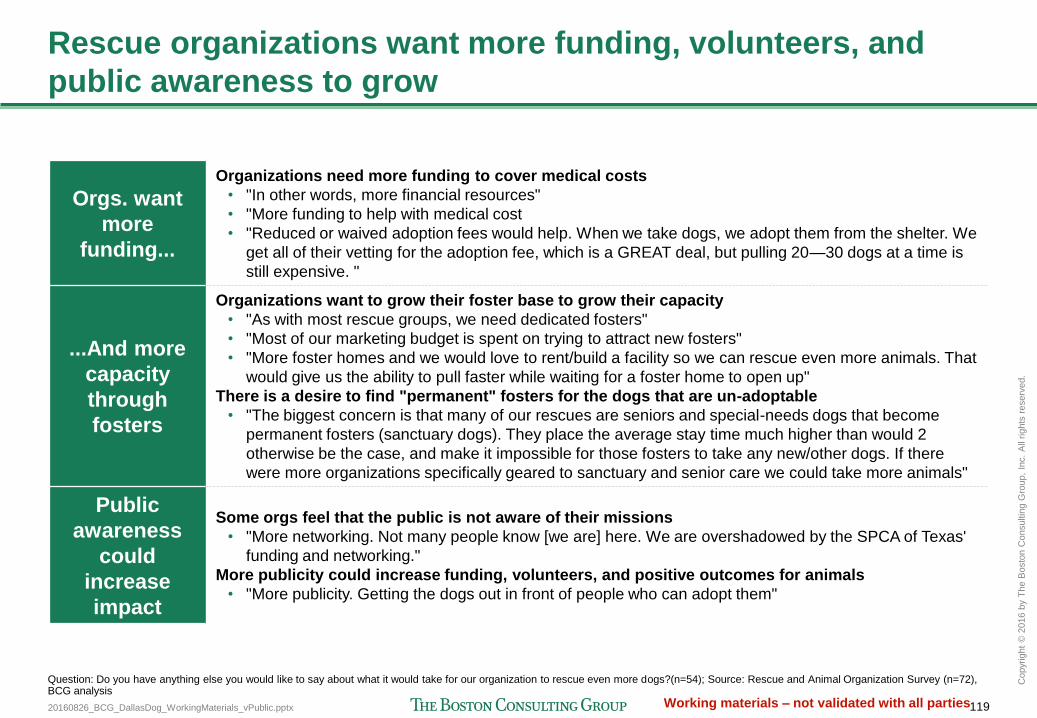
20160826_BCG_DallasDog_WorkingMaterials_vPublic.pptx 119
Copyr
ight
© 2
016 b
y T
he B
osto
n C
onsultin
g G
roup,
Inc.
All
rights
reserv
ed.
Working materials – not validated with all parties
Rescue organizations want more funding, volunteers, and
public awareness to grow
Orgs. want
more
funding...
Organizations need more funding to cover medical costs
• "In other words, more financial resources"
• "More funding to help with medical cost
• "Reduced or waived adoption fees would help. When we take dogs, we adopt them from the shelter. We
get all of their vetting for the adoption fee, which is a GREAT deal, but pulling 20—30 dogs at a time is
still expensive. "
...And more
capacity
through
fosters
Organizations want to grow their foster base to grow their capacity
• "As with most rescue groups, we need dedicated fosters"
• "Most of our marketing budget is spent on trying to attract new fosters"
• "More foster homes and we would love to rent/build a facility so we can rescue even more animals. That
would give us the ability to pull faster while waiting for a foster home to open up"
There is a desire to find "permanent" fosters for the dogs that are un-adoptable
• "The biggest concern is that many of our rescues are seniors and special-needs dogs that become
permanent fosters (sanctuary dogs). They place the average stay time much higher than would 2
otherwise be the case, and make it impossible for those fosters to take any new/other dogs. If there
were more organizations specifically geared to sanctuary and senior care we could take more animals"
Public
awareness
could
increase
impact
Some orgs feel that the public is not aware of their missions
• "More networking. Not many people know [we are] here. We are overshadowed by the SPCA of Texas'
funding and networking."
More publicity could increase funding, volunteers, and positive outcomes for animals
• "More publicity. Getting the dogs out in front of people who can adopt them"
Question: Do you have anything else you would like to say about what it would take for our organization to rescue even more dogs?(n=54); Source: Rescue and Animal Organization Survey (n=72), BCG analysis
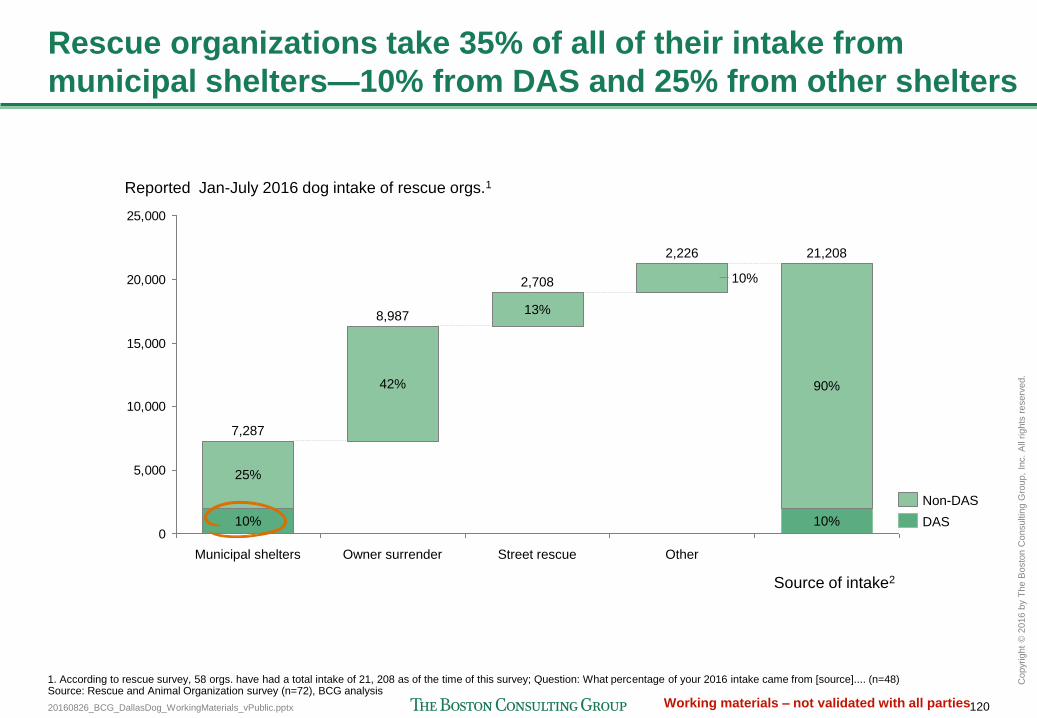
20160826_BCG_DallasDog_WorkingMaterials_vPublic.pptx 120
Copyr
ight
© 2
016 b
y T
he B
osto
n C
onsultin
g G
roup,
Inc.
All
rights
reserv
ed.
Working materials – not validated with all parties
Rescue organizations take 35% of all of their intake from
municipal shelters—10% from DAS and 25% from other shelters
0
5,000
10,000
15,000
20,000
25,000
Reported Jan-July 2016 dog intake of rescue orgs.1
21,208
Source of intake2
10%
90%
2,226
10%
Other Street rescue
2,708
8,987
Owner surrender
13%
42%
Municipal shelters
7,287
10%
25%
DAS
Non-DAS
1. According to rescue survey, 58 orgs. have had a total intake of 21, 208 as of the time of this survey; Question: What percentage of your 2016 intake came from [source].... (n=48) Source: Rescue and Animal Organization survey (n=72), BCG analysis

20160826_BCG_DallasDog_WorkingMaterials_vPublic.pptx 121
Copyr
ight
© 2
016 b
y T
he B
osto
n C
onsultin
g G
roup,
Inc.
All
rights
reserv
ed.
Working materials – not validated with all parties
Large rescues get 8% of their dogs from DAS, small 17%
Large rescues pull 8% dogs from DAS Small rescues pull 17% dogs from DAS
0
5,000
10,000
15,000
Source of intake2
Reported Jan. - Jul. 2016 dog intake of large rescue orgs.1
17,339
8%
92%
Other
2,083
Total
12%
Street
rescue
2,006
12%
Owner
surrender
8,562
49%
Municipal
shelters
4,689
8%
19%
0
1,000
2,000
3,000
4,000
Reported Jan. - Jul. 2016 dog intake of small rescue orgs.1
Other
143
4%
Street
rescue
702
18%
Owner
surrender
425
11%
Municipal
shelters
2,598
17%
50%
3,869
Total
Source of intake2
17%
83%
Non-DAS
DAS
1. According to rescue survey, 58 orgs. have had a total intake of 21,208 YTD; Note: Large rescue organizations defined as having 2015 intake > 400; Question: What percentage of your 2016 intake came from [source].... (n=48) Source: Rescue and Animal Organization survey (n=72), BCG analysis
i ii
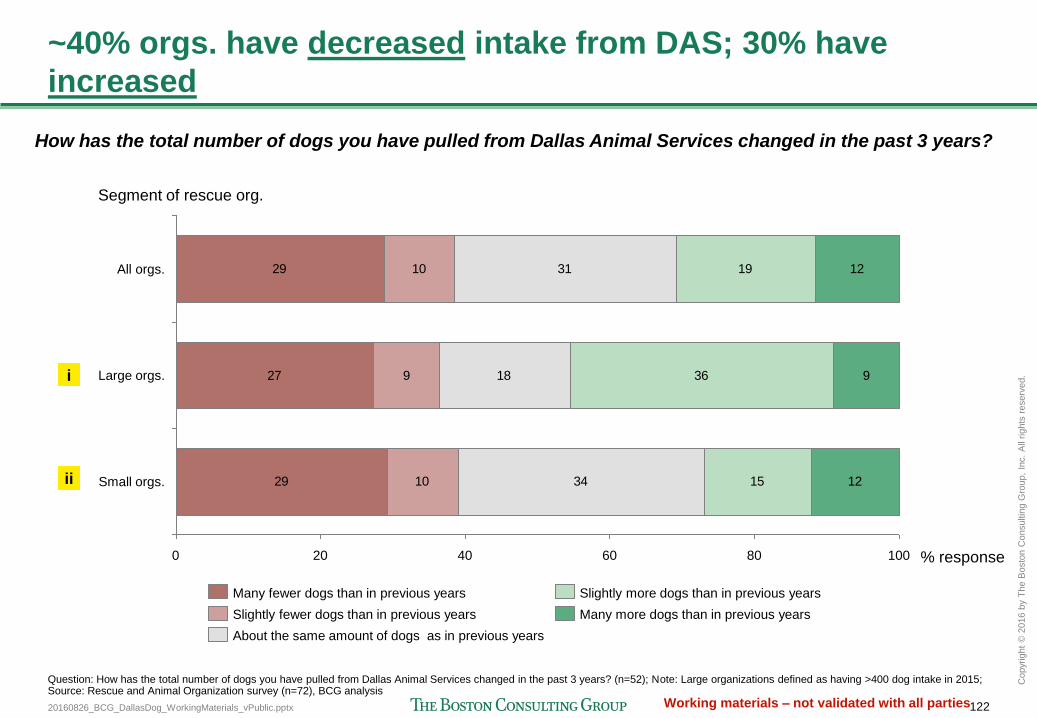
20160826_BCG_DallasDog_WorkingMaterials_vPublic.pptx 122
Copyr
ight
© 2
016 b
y T
he B
osto
n C
onsultin
g G
roup,
Inc.
All
rights
reserv
ed.
Working materials – not validated with all parties
~40% orgs. have decreased intake from DAS; 30% have
increased
29
27
29
10
9
10
31
18
34
19
36
15
12
9
12
0 40 60 20 80 100
Small orgs.
Large orgs.
% response
All orgs.
Segment of rescue org.
Many fewer dogs than in previous years Slightly more dogs than in previous years
About the same amount of dogs as in previous years
Many more dogs than in previous years Slightly fewer dogs than in previous years
Question: How has the total number of dogs you have pulled from Dallas Animal Services changed in the past 3 years? (n=52); Note: Large organizations defined as having >400 dog intake in 2015; Source: Rescue and Animal Organization survey (n=72), BCG analysis
How has the total number of dogs you have pulled from Dallas Animal Services changed in the past 3 years?
i
ii
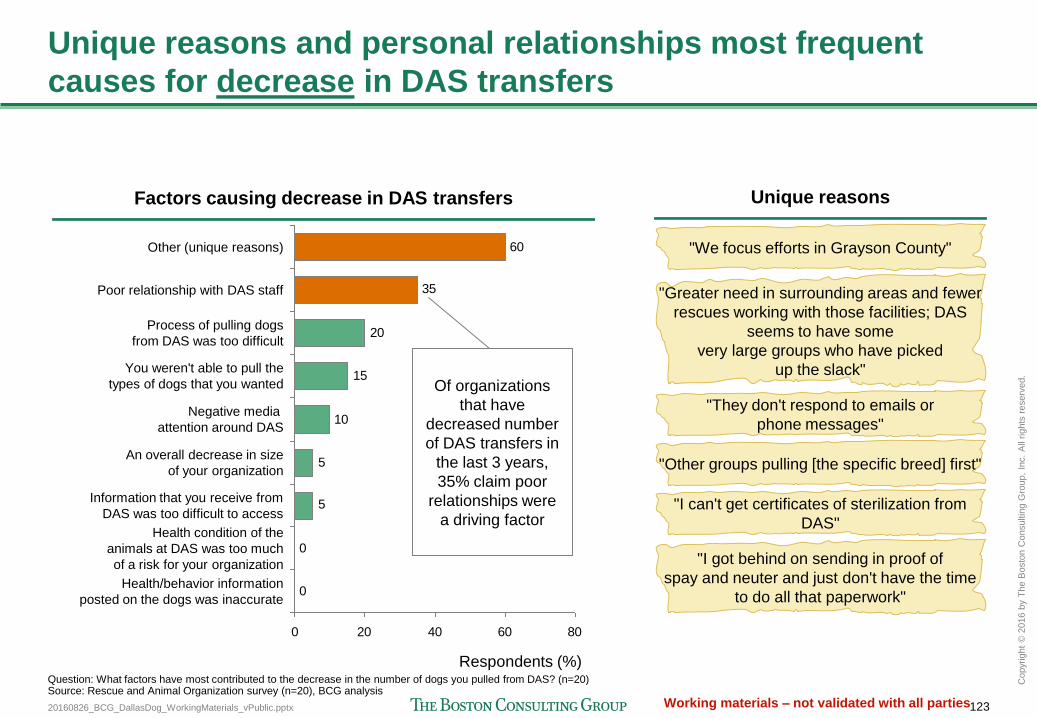
20160826_BCG_DallasDog_WorkingMaterials_vPublic.pptx 123
Copyr
ight
© 2
016 b
y T
he B
osto
n C
onsultin
g G
roup,
Inc.
All
rights
reserv
ed.
Working materials – not validated with all parties
Unique reasons and personal relationships most frequent
causes for decrease in DAS transfers
Factors causing decrease in DAS transfers
0
0
5
5
10
15
20
35
60
0 20 40 60 80
Respondents (%)
Health/behavior information
posted on the dogs was inaccurate
Health condition of the
animals at DAS was too much
of a risk for your organization
Information that you receive from
DAS was too difficult to access
An overall decrease in size
of your organization
Negative media
attention around DAS
You weren't able to pull the
types of dogs that you wanted
Process of pulling dogs
from DAS was too difficult
Poor relationship with DAS staff
Other (unique reasons)
Unique reasons
"We focus efforts in Grayson County"
"Greater need in surrounding areas and fewer
rescues working with those facilities; DAS
seems to have some
very large groups who have picked
up the slack"
"They don't respond to emails or
phone messages"
"Other groups pulling [the specific breed] first"
"I can't get certificates of sterilization from
DAS"
"I got behind on sending in proof of
spay and neuter and just don't have the time
to do all that paperwork"
Question: What factors have most contributed to the decrease in the number of dogs you pulled from DAS? (n=20) Source: Rescue and Animal Organization survey (n=20), BCG analysis
Of organizations
that have
decreased number
of DAS transfers in
the last 3 years,
35% claim poor
relationships were
a driving factor
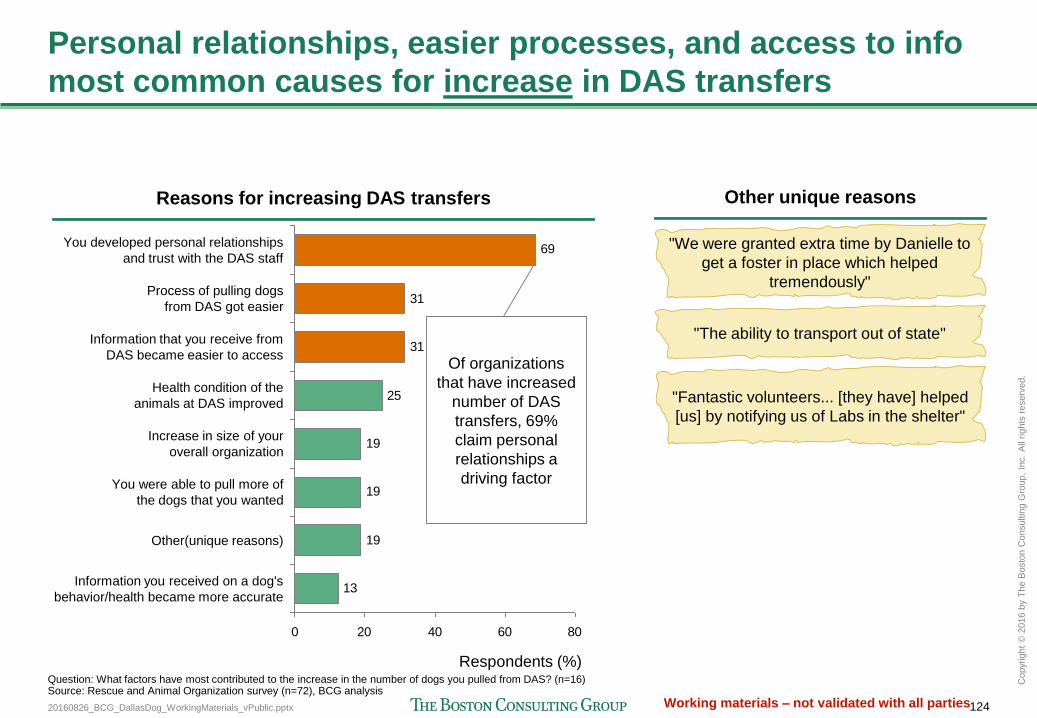
20160826_BCG_DallasDog_WorkingMaterials_vPublic.pptx 124
Copyr
ight
© 2
016 b
y T
he B
osto
n C
onsultin
g G
roup,
Inc.
All
rights
reserv
ed.
Working materials – not validated with all parties
Personal relationships, easier processes, and access to info
most common causes for increase in DAS transfers
Reasons for increasing DAS transfers
13
19
19
19
25
31
31
69
0 20 40 60 80
Process of pulling dogs
from DAS got easier
Increase in size of your
overall organization
Respondents (%)
Information that you receive from
DAS became easier to access
Other(unique reasons)
You were able to pull more of
the dogs that you wanted
Information you received on a dog's
behavior/health became more accurate
You developed personal relationships
and trust with the DAS staff
Health condition of the
animals at DAS improved
Question: What factors have most contributed to the increase in the number of dogs you pulled from DAS? (n=16) Source: Rescue and Animal Organization survey (n=72), BCG analysis
Other unique reasons
"Fantastic volunteers... [they have] helped
[us] by notifying us of Labs in the shelter"
"The ability to transport out of state"
"We were granted extra time by Danielle to
get a foster in place which helped
tremendously"
Of organizations
that have increased
number of DAS
transfers, 69%
claim personal
relationships a
driving factor
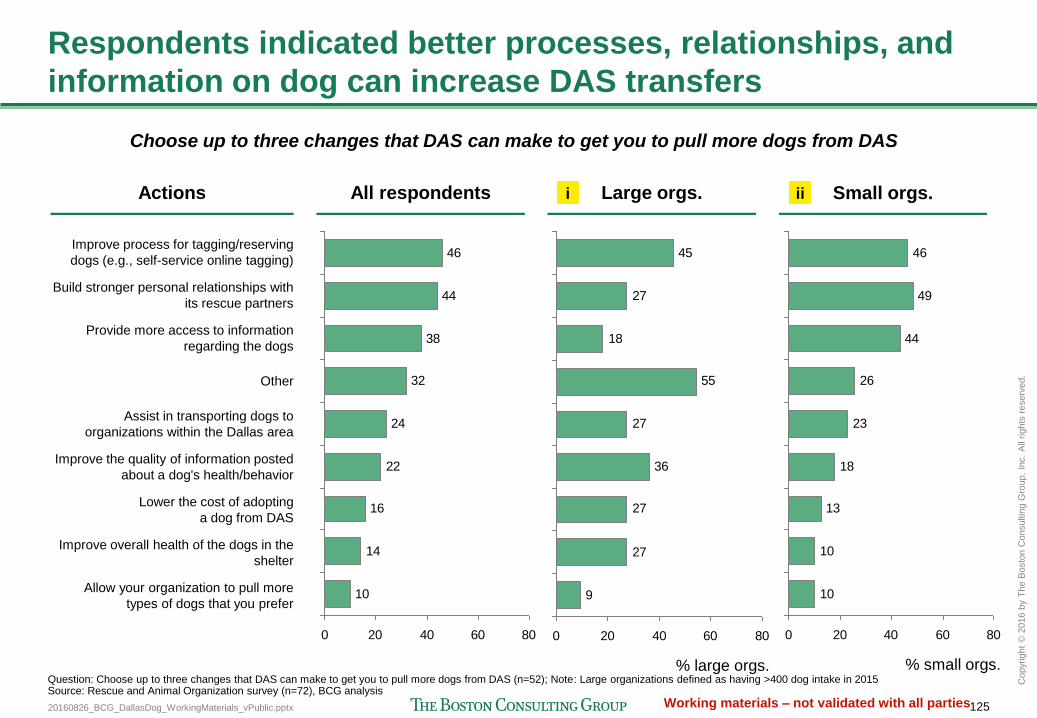
20160826_BCG_DallasDog_WorkingMaterials_vPublic.pptx 125
Copyr
ight
© 2
016 b
y T
he B
osto
n C
onsultin
g G
roup,
Inc.
All
rights
reserv
ed.
Working materials – not validated with all parties
Respondents indicated better processes, relationships, and
information on dog can increase DAS transfers
Actions All respondents Large orgs. Small orgs.
10
14
16
22
24
32
38
44
46
0 20 40 60 80
9
27
27
36
27
55
18
27
45
0 20 40 60 80
% large orgs.
10
10
13
18
23
26
44
49
46
0 20 40 60 80
% small orgs.
Improve process for tagging/reserving
dogs (e.g., self-service online tagging)
Build stronger personal relationships with
its rescue partners
Provide more access to information
regarding the dogs
Other
Assist in transporting dogs to
organizations within the Dallas area
Improve the quality of information posted
about a dog's health/behavior
Lower the cost of adopting
a dog from DAS
Improve overall health of the dogs in the
shelter
Allow your organization to pull more
types of dogs that you prefer
Question: Choose up to three changes that DAS can make to get you to pull more dogs from DAS (n=52); Note: Large organizations defined as having >400 dog intake in 2015 Source: Rescue and Animal Organization survey (n=72), BCG analysis
Choose up to three changes that DAS can make to get you to pull more dogs from DAS
i ii
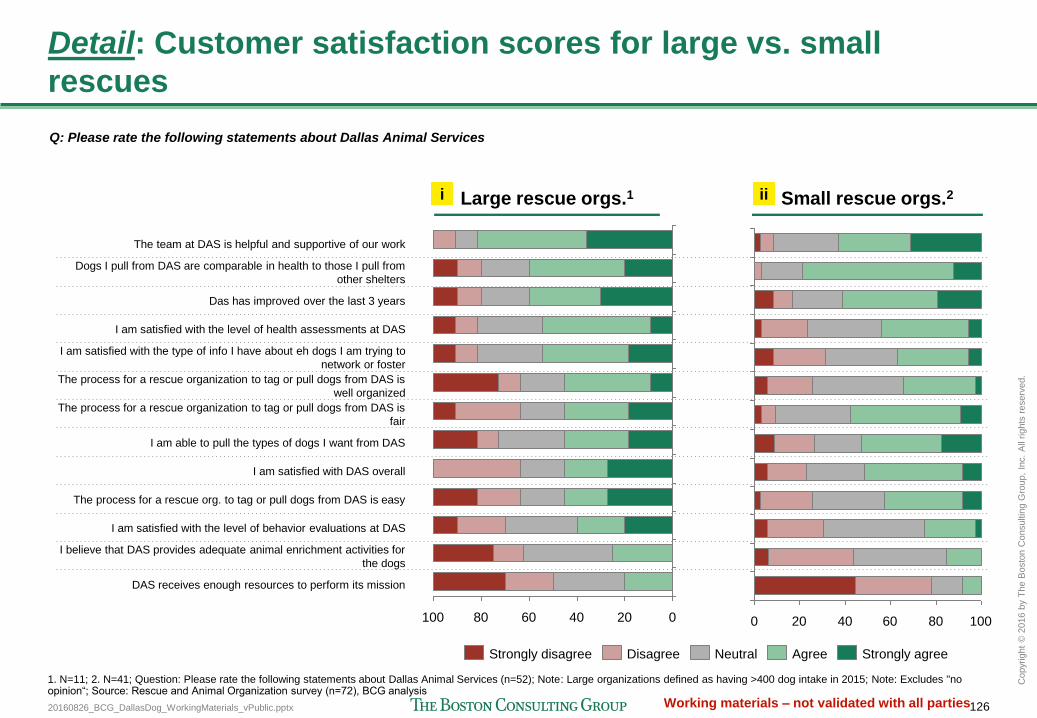
20160826_BCG_DallasDog_WorkingMaterials_vPublic.pptx 126
Copyr
ight
© 2
016 b
y T
he B
osto
n C
onsultin
g G
roup,
Inc.
All
rights
reserv
ed.
Working materials – not validated with all parties
Small rescue orgs.2
100 80 60 40 20 0 100 0 20 40 60 80
Strongly agree Agree Neutral Disagree Strongly disagree
Detail: Customer satisfaction scores for large vs. small
rescues
Large rescue orgs.1
1. N=11; 2. N=41; Question: Please rate the following statements about Dallas Animal Services (n=52); Note: Large organizations defined as having >400 dog intake in 2015; Note: Excludes "no opinion“; Source: Rescue and Animal Organization survey (n=72), BCG analysis
Q: Please rate the following statements about Dallas Animal Services
The team at DAS is helpful and supportive of our work
Dogs I pull from DAS are comparable in health to those I pull from
other shelters
Das has improved over the last 3 years
I am satisfied with the level of health assessments at DAS
I am satisfied with the type of info I have about eh dogs I am trying to
network or foster
The process for a rescue organization to tag or pull dogs from DAS is
well organized
The process for a rescue organization to tag or pull dogs from DAS is
fair
I am able to pull the types of dogs I want from DAS
I am satisfied with DAS overall
The process for a rescue org. to tag or pull dogs from DAS is easy
I am satisfied with the level of behavior evaluations at DAS
I believe that DAS provides adequate animal enrichment activities for
the dogs
DAS receives enough resources to perform its mission
i ii
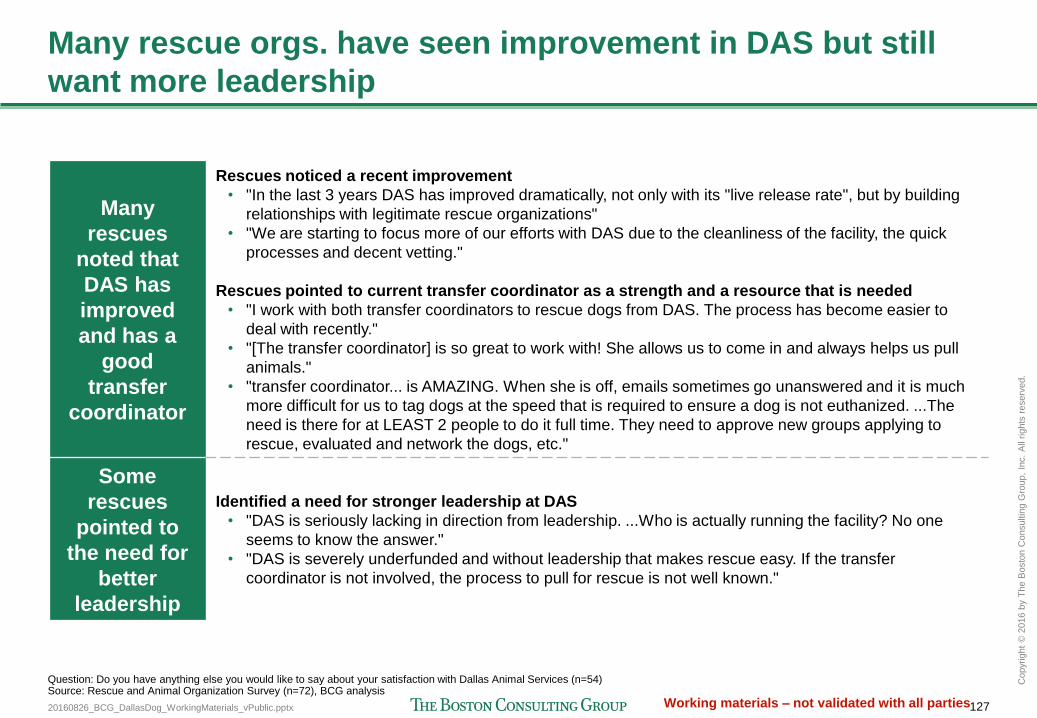
20160826_BCG_DallasDog_WorkingMaterials_vPublic.pptx 127
Copyr
ight
© 2
016 b
y T
he B
osto
n C
onsultin
g G
roup,
Inc.
All
rights
reserv
ed.
Working materials – not validated with all parties
Many rescue orgs. have seen improvement in DAS but still
want more leadership
Many
rescues
noted that
DAS has
improved
and has a
good
transfer
coordinator
Rescues noticed a recent improvement
• "In the last 3 years DAS has improved dramatically, not only with its "live release rate", but by building
relationships with legitimate rescue organizations"
• "We are starting to focus more of our efforts with DAS due to the cleanliness of the facility, the quick
processes and decent vetting."
Rescues pointed to current transfer coordinator as a strength and a resource that is needed
• "I work with both transfer coordinators to rescue dogs from DAS. The process has become easier to
deal with recently."
• "[The transfer coordinator] is so great to work with! She allows us to come in and always helps us pull
animals."
• "transfer coordinator... is AMAZING. When she is off, emails sometimes go unanswered and it is much
more difficult for us to tag dogs at the speed that is required to ensure a dog is not euthanized. ...The
need is there for at LEAST 2 people to do it full time. They need to approve new groups applying to
rescue, evaluated and network the dogs, etc."
Some
rescues
pointed to
the need for
better
leadership
Identified a need for stronger leadership at DAS
• "DAS is seriously lacking in direction from leadership. ...Who is actually running the facility? No one
seems to know the answer."
• "DAS is severely underfunded and without leadership that makes rescue easy. If the transfer
coordinator is not involved, the process to pull for rescue is not well known."
Question: Do you have anything else you would like to say about your satisfaction with Dallas Animal Services (n=54) Source: Rescue and Animal Organization Survey (n=72), BCG analysis
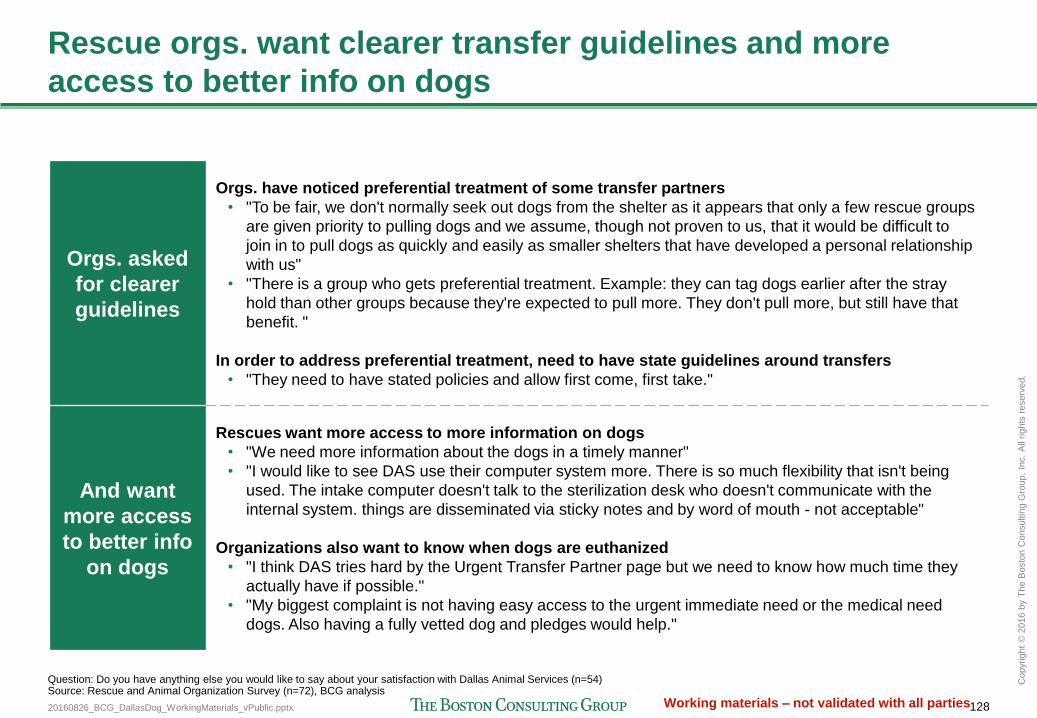
20160826_BCG_DallasDog_WorkingMaterials_vPublic.pptx 128
Copyr
ight
© 2
016 b
y T
he B
osto
n C
onsultin
g G
roup,
Inc.
All
rights
reserv
ed.
Working materials – not validated with all parties
Rescue orgs. want clearer transfer guidelines and more
access to better info on dogs
Orgs. asked
for clearer
guidelines
Orgs. have noticed preferential treatment of some transfer partners
• "To be fair, we don't normally seek out dogs from the shelter as it appears that only a few rescue groups
are given priority to pulling dogs and we assume, though not proven to us, that it would be difficult to
join in to pull dogs as quickly and easily as smaller shelters that have developed a personal relationship
with us"
• "There is a group who gets preferential treatment. Example: they can tag dogs earlier after the stray
hold than other groups because they're expected to pull more. They don't pull more, but still have that
benefit. "
In order to address preferential treatment, need to have state guidelines around transfers
• "They need to have stated policies and allow first come, first take."
And want
more access
to better info
on dogs
Rescues want more access to more information on dogs
• "We need more information about the dogs in a timely manner"
• "I would like to see DAS use their computer system more. There is so much flexibility that isn't being
used. The intake computer doesn't talk to the sterilization desk who doesn't communicate with the
internal system. things are disseminated via sticky notes and by word of mouth - not acceptable"
Organizations also want to know when dogs are euthanized
• "I think DAS tries hard by the Urgent Transfer Partner page but we need to know how much time they
actually have if possible."
• "My biggest complaint is not having easy access to the urgent immediate need or the medical need
dogs. Also having a fully vetted dog and pledges would help."
Question: Do you have anything else you would like to say about your satisfaction with Dallas Animal Services (n=54) Source: Rescue and Animal Organization Survey (n=72), BCG analysis
20160826_BCG_DallasDog_WorkingMaterials_vPublic.pptx 129
Copyr
ight
© 2
016 b
y T
he B
osto
n C
onsultin
g G
roup,
Inc.
All
rights
reserv
ed.
Working materials – not validated with all parties
Appendix: Dallas Community Survey
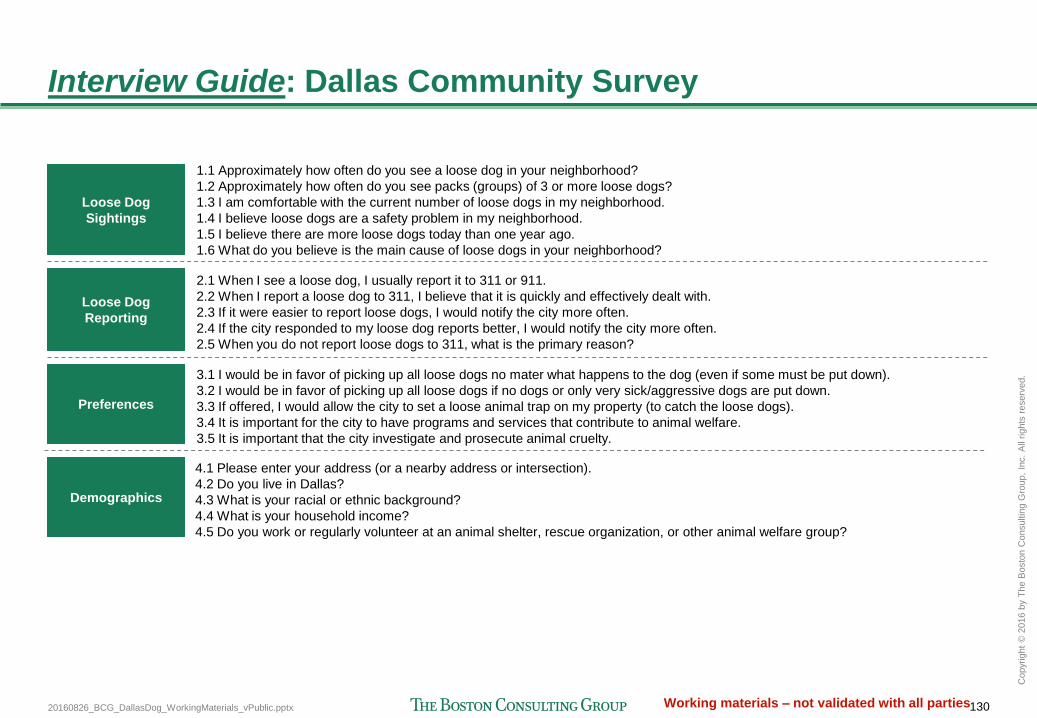
20160826_BCG_DallasDog_WorkingMaterials_vPublic.pptx 130
Copyr
ight
© 2
016 b
y T
he B
osto
n C
onsultin
g G
roup,
Inc.
All
rights
reserv
ed.
Working materials – not validated with all parties
Interview Guide: Dallas Community Survey
Loose Dog
Sightings
1.1 Approximately how often do you see a loose dog in your neighborhood?
1.2 Approximately how often do you see packs (groups) of 3 or more loose dogs?
1.3 I am comfortable with the current number of loose dogs in my neighborhood.
1.4 I believe loose dogs are a safety problem in my neighborhood.
1.5 I believe there are more loose dogs today than one year ago.
1.6 What do you believe is the main cause of loose dogs in your neighborhood?
Loose Dog
Reporting
2.1 When I see a loose dog, I usually report it to 311 or 911.
2.2 When I report a loose dog to 311, I believe that it is quickly and effectively dealt with.
2.3 If it were easier to report loose dogs, I would notify the city more often.
2.4 If the city responded to my loose dog reports better, I would notify the city more often.
2.5 When you do not report loose dogs to 311, what is the primary reason?
Demographics
4.1 Please enter your address (or a nearby address or intersection).
4.2 Do you live in Dallas?
4.3 What is your racial or ethnic background?
4.4 What is your household income?
4.5 Do you work or regularly volunteer at an animal shelter, rescue organization, or other animal welfare group?
Preferences
3.1 I would be in favor of picking up all loose dogs no mater what happens to the dog (even if some must be put down).
3.2 I would be in favor of picking up all loose dogs if no dogs or only very sick/aggressive dogs are put down.
3.3 If offered, I would allow the city to set a loose animal trap on my property (to catch the loose dogs).
3.4 It is important for the city to have programs and services that contribute to animal welfare.
3.5 It is important that the city investigate and prosecute animal cruelty.
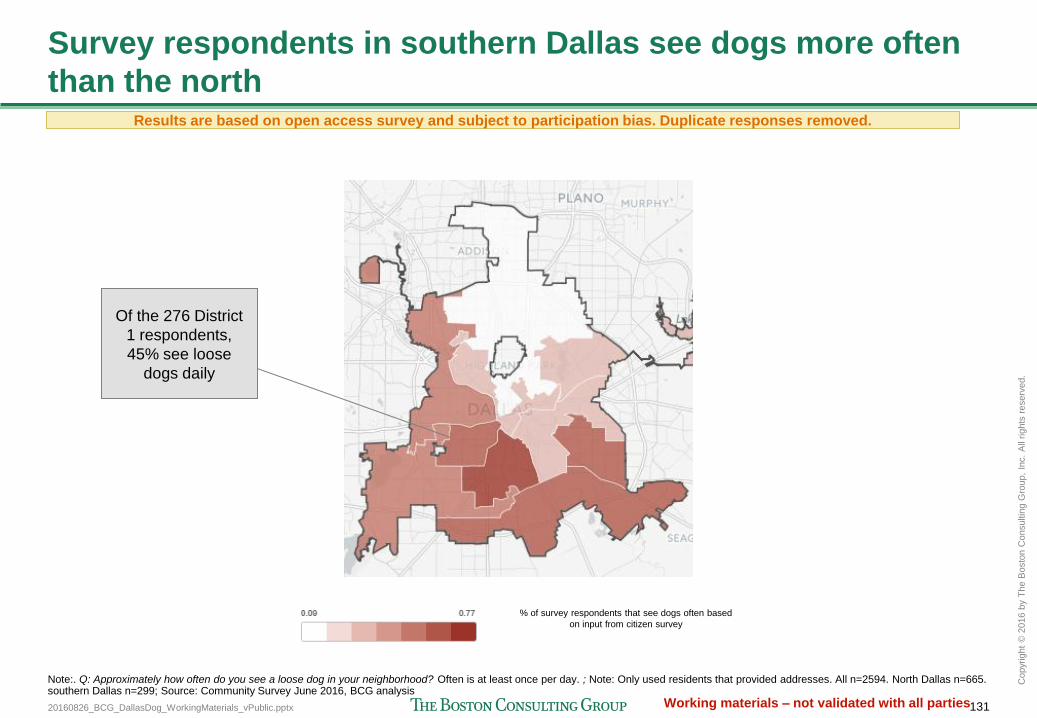
20160826_BCG_DallasDog_WorkingMaterials_vPublic.pptx 131
Copyr
ight
© 2
016 b
y T
he B
osto
n C
onsultin
g G
roup,
Inc.
All
rights
reserv
ed.
Working materials – not validated with all parties
Survey respondents in southern Dallas see dogs more often
than the north
Note:. Q: Approximately how often do you see a loose dog in your neighborhood? Often is at least once per day. ; Note: Only used residents that provided addresses. All n=2594. North Dallas n=665. southern Dallas n=299; Source: Community Survey June 2016, BCG analysis
% of survey respondents that see dogs often based
on input from citizen survey
Results are based on open access survey and subject to participation bias. Duplicate responses removed.
Of the 276 District
1 respondents,
45% see loose
dogs daily

20160826_BCG_DallasDog_WorkingMaterials_vPublic.pptx 132
Copyr
ight
© 2
016 b
y T
he B
osto
n C
onsultin
g G
roup,
Inc.
All
rights
reserv
ed.
Working materials – not validated with all parties
Beliefs regarding dogs: Public views animal welfare and a
priority for city
27
14
64
81
40 60 80 100 0 20
% respondents
N/A
Strongly Agree
Agree
Neutral
Disagree
Strongly Disagree
Q: It is important for
the city to have
programs and
services that
contribute to animal
welfare.
Q: It is important that
the city investigate
and prosecute
animal cruelty.
24
12
68
82
100 20 40 60 80 0
% respondents
29
19
60
72
80 100 60 20 40 0
% respondents
Note: I-30 used to separate North from southern Dallas. North Dallas includes districts 2,6,9,10,11,12,13,14. Southern Dallas includes districts 1,3,4,5,7,8. Only used residents that provided addresses. All n=2673. North Dallas n=1222. Southern Dallas n=637; Source: Community Survey June 2016, BCG analysis
Results are based on open access survey and subject to participation bias. Duplicate responses removed.
City of Dallas North Dallas Southern Dallas
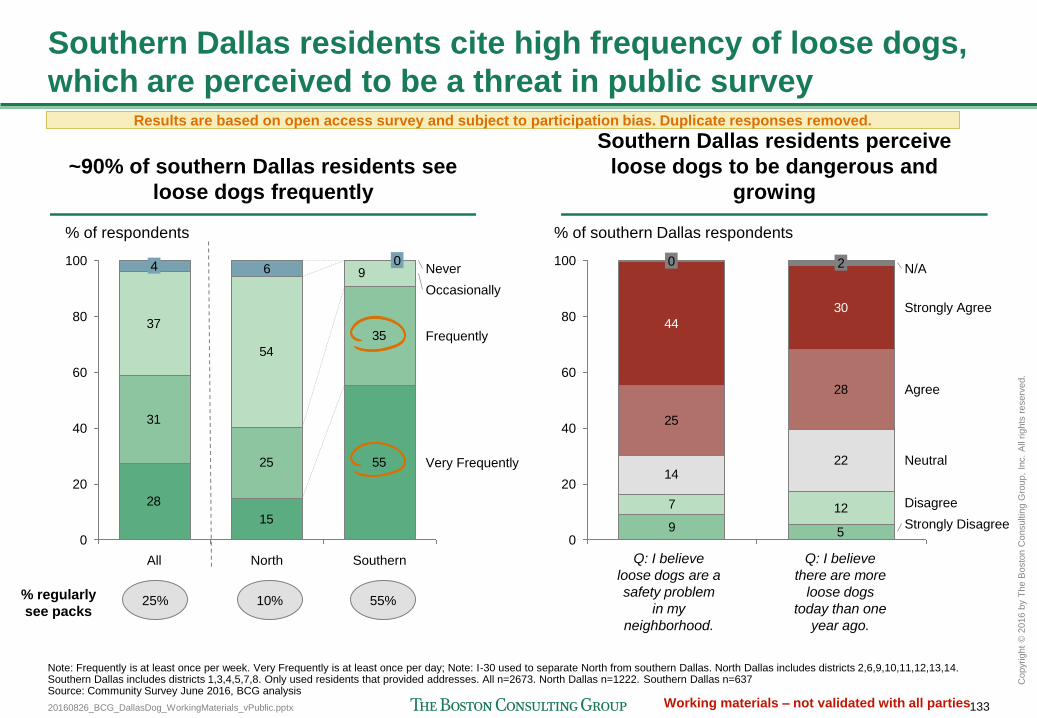
20160826_BCG_DallasDog_WorkingMaterials_vPublic.pptx 133
Copyr
ight
© 2
016 b
y T
he B
osto
n C
onsultin
g G
roup,
Inc.
All
rights
reserv
ed.
Working materials – not validated with all parties
Southern Dallas residents cite high frequency of loose dogs,
which are perceived to be a threat in public survey
28
15
55
31
25
3537
54
96100
80
60
40
20
0
0
North All
4
% of respondents
Very Frequently
Frequently
Occasionally
Never
Southern
% regularly
see packs 25% 55% 10%
~90% of southern Dallas residents see
loose dogs frequently
Southern Dallas residents perceive
loose dogs to be dangerous and
growing
9
7 12
1422
25
28
44
30
5
100
80
60
40
20
0
% of southern Dallas respondents
Strongly Disagree
Disagree
Neutral
Agree
Strongly Agree
N/A 2 0
Q: I believe
loose dogs are a
safety problem
in my
neighborhood.
Q: I believe
there are more
loose dogs
today than one
year ago.
Note: Frequently is at least once per week. Very Frequently is at least once per day; Note: I-30 used to separate North from southern Dallas. North Dallas includes districts 2,6,9,10,11,12,13,14. Southern Dallas includes districts 1,3,4,5,7,8. Only used residents that provided addresses. All n=2673. North Dallas n=1222. Southern Dallas n=637 Source: Community Survey June 2016, BCG analysis
Results are based on open access survey and subject to participation bias. Duplicate responses removed.

20160826_BCG_DallasDog_WorkingMaterials_vPublic.pptx 134
Copyr
ight
© 2
016 b
y T
he B
osto
n C
onsultin
g G
roup,
Inc.
All
rights
reserv
ed.
Working materials – not validated with all parties
Loose dog sightings: Southern Dallas residents perceive
loose dogs to be dangerous
19
17
13
28
21
20
25
1715
22
100 80 60 40 20 0
% respondents
3
1
N/A
Strongly Agree
Agree
Neutral
Disagree
Strongly Disagree
Q: I believe loose
dogs are a safety
problem in my
neighborhood.
Q: I believe there
are more loose dogs
today than one year
ago.
28
23
12
27
15
1518
30
12
13
4
100 80 60 40 20 0
% respondents
2 7
12
14
22
25
285
9
30
44
100 80 60 40 20 0
% respondents
2
0
Note: I-30 used to separate North from southern Dallas. North Dallas includes districts 2,6,9,10,11,12,13,14. Southern Dallas includes districts 1,3,4,5,7,8. Only used residents that provided addresses. All n=2673. North Dallas n=1222. Southern Dallas n=637; Source: Community Survey June 2016, BCG analysis
Results are based on open access survey and subject to participation bias. Duplicate responses removed.
City of Dallas North Dallas Southern Dallas
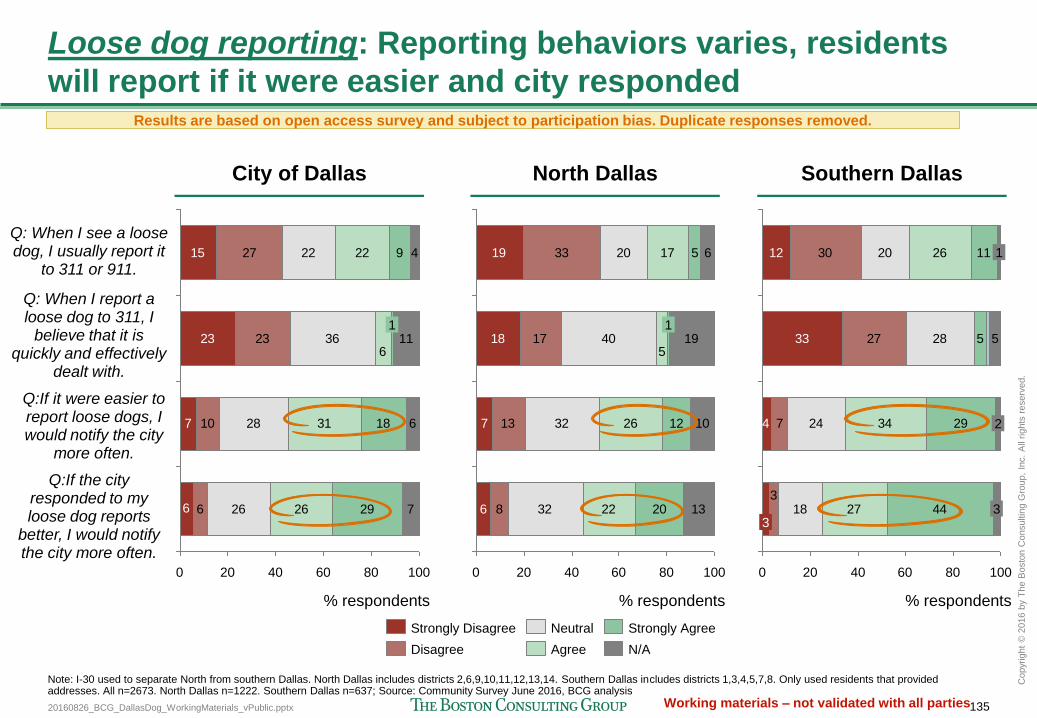
20160826_BCG_DallasDog_WorkingMaterials_vPublic.pptx 135
Copyr
ight
© 2
016 b
y T
he B
osto
n C
onsultin
g G
roup,
Inc.
All
rights
reserv
ed.
Working materials – not validated with all parties
Loose dog reporting: Reporting behaviors varies, residents
will report if it were easier and city responded
15
23
7
27
23
10
6
22
36
28
26
22
31
26
9
18
29
4
11
6
76
6
100 80 60 40 20 0
% respondents
1
N/A
Strongly Agree
Agree
Neutral
Disagree
Strongly Disagree
Q: When I see a loose dog, I usually report it
to 311 or 911.
Q: When I report a loose dog to 311, I
believe that it is quickly and effectively
dealt with.
Q:If it were easier to report loose dogs, I would notify the city
more often.
19
18
7
6
33
17
13
8
20
40
32
32
17
26
22
5
12
20
6
19
10
13
5
100 80 60 40 20 0
% respondents
1
12
33
30
27
7
20
28
24
18
26
5
34
27
11
29
44
4
3
5
100 80 60 40 20 0
% respondents
3 3
2
1
Q:If the city responded to my loose dog reports
better, I would notify the city more often.
Note: I-30 used to separate North from southern Dallas. North Dallas includes districts 2,6,9,10,11,12,13,14. Southern Dallas includes districts 1,3,4,5,7,8. Only used residents that provided addresses. All n=2673. North Dallas n=1222. Southern Dallas n=637; Source: Community Survey June 2016, BCG analysis
Results are based on open access survey and subject to participation bias. Duplicate responses removed.
City of Dallas North Dallas Southern Dallas
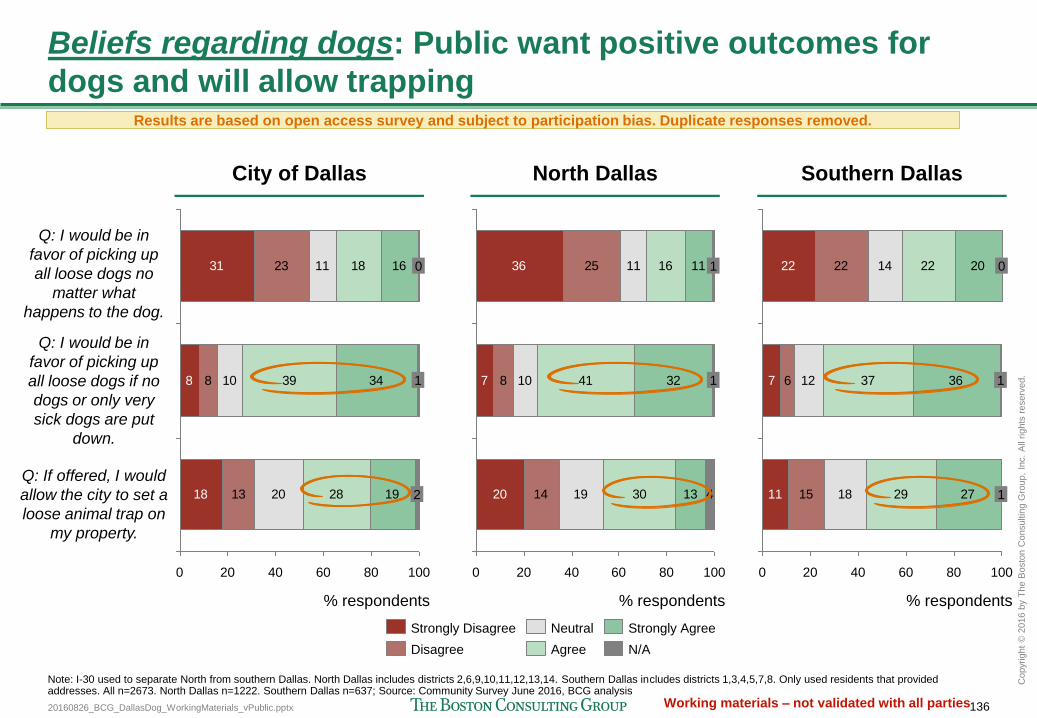
20160826_BCG_DallasDog_WorkingMaterials_vPublic.pptx 136
Copyr
ight
© 2
016 b
y T
he B
osto
n C
onsultin
g G
roup,
Inc.
All
rights
reserv
ed.
Working materials – not validated with all parties
Beliefs regarding dogs: Public want positive outcomes for
dogs and will allow trapping
31
8
18
23
8
13
11
10
20
18
39
28
16
34
19
100 80 60 40 20 0
% respondents
2
1
0
N/A
Strongly Agree
Agree
Neutral
Disagree
Strongly Disagree
Q: I would be in
favor of picking up
all loose dogs no
matter what
happens to the dog.
Q: I would be in
favor of picking up
all loose dogs if no
dogs or only very
sick dogs are put
down.
Q: If offered, I would
allow the city to set a
loose animal trap on
my property.
36
7
20
25
8
14
11
10
19
16
41
30
11
32
13 4
100 80 60 40 20 0
% respondents
1
1 22
7
11
22
6
15
14
12
18
22
37
29
20
36
27
100 80 60 40 20 0
% respondents
1
1
0
Note: I-30 used to separate North from southern Dallas. North Dallas includes districts 2,6,9,10,11,12,13,14. Southern Dallas includes districts 1,3,4,5,7,8. Only used residents that provided addresses. All n=2673. North Dallas n=1222. Southern Dallas n=637; Source: Community Survey June 2016, BCG analysis
Results are based on open access survey and subject to participation bias. Duplicate responses removed.
City of Dallas North Dallas Southern Dallas

Thank you
bcg.com | bcgperspectives.com