Palynology of the Lower Eocene deposits of northwest Jutland, Denmark
Upload
independentCategory
view
2download
0
Earth and Planetary Science Letters 373 (2013) 160–168
Contents lists available at SciVerse ScienceDirect
Earth and Planetary Science Letters
0012-82http://d
n CorrDepartmTexel, th
E-m1 Pr
of Califo
journal homepage: www.elsevier.com/locate/epsl
Recognition of Early Eocene global carbon isotope excursions usinglipids of marine Thaumarchaeota
Petra L. Schoon a,1, Claus Heilmann-Clausen b, Bo Pagh Schultz c, Appy Sluijs d,Jaap S. Sinninghe Damsté a,d, Stefan Schouten a,d,n
a NIOZ Royal Netherlands Institute for Sea Research, Department of Marine Organic Biogeochemistry, P.O. Box 59, 1790 AB Den Burg, Texel, the Netherlandsb Aarhus University, Department of Geoscience, Høegh-Guldbergs Gade 2, 8000 Aarhus C, Denmarkc Fur Museum, Nederby 28, 7884 Fur, Denmarkd Department of Earth Sciences, Faculty of Geosciences, Utrecht University, 43584 CD Utrecht, The Netherlands
a r t i c l e i n f o
Article history:Received 15 October 2012Received in revised form24 April 2013Accepted 25 April 2013
Editor: G. Hendersonmassive dissolution of deep sea carbonate. However, the magnitude of these CIEs vary with the type of
Available online 27 May 2013
Keywords:PETMcarbon isotope excursionGDGTs
1X/$ - see front matter & 2013 Elsevier B.V. Ax.doi.org/10.1016/j.epsl.2013.04.037
esponding author at: NIOZ Royal Netherlandent of Marine Organic Biogeochemistry, P.Oe Netherlands. Tel.: +31 22236 9565; fax: +31ail address: [email protected] (S. Schouesent address: Department of Earth Sciences—rnia Riverside, 900 University Ave., Riverside
a b s t r a c t
The Paleocene–Eocene Thermal Maximum (PETM; ∼56 Ma) and Eocene Thermal Maximum 2 (ETM2;∼53 Ma) are geological short (o200,000 years) episodes of extreme global warming and environmentalchange. Both the PETM and ETM2 are associated with the injection of 13C-depleted carbon into theocean–atmosphere system as revealed through a globally recognized carbon isotope excursion (CIE) and
fossil matter, i.e. multiple carbonate phases, bulk organic matter, and terrestrial and marine biomarkerlipids, making it difficult to constrain the actual CIE in atmospheric and oceanic carbon pools. Here weanalyzed the stable carbon isotopic composition (δ13C) of glycerol dibiphytanyl glycerol tetraether lipids(GDGTs) derived from marine Thaumarchaeota in sediments deposited during the PETM in the North SeaBasin and ETM2 in the Arctic Ocean. The δ13C values of these lipids are potentially directly recordingvariations in δ13C dissolved inorganic carbon (DIC) and can thus provide a record of marine δ13C DICacross both these Eocene carbon cycle perturbations. Reconstructed pre-CIE δ13CDIC values are slightlylower (0.5–1‰) than modern day values, possibly because Thaumarchaeotal lipids are not only derivedfrom surface waters but also from 13C-depleted subsurface waters. Their values decrease by ∼3.6 (70.3)‰ and ∼2.5 (70.7)‰ during the PETM and ETM2, respectively. The CIE in crenarchaeol for ETM2 ishigher than that in marine calcite from other locations, possibly because of the admixture of deep water13C-depleted CO2 generated by the euxinic conditions that developed occasionally during ETM2.However, the reconstructed PETM CIE lies close to the CIE inferred from marine calcite, suggesting thatthe δ13C record of crenarchaeol may document changes in marine DIC during the PETM in the North SeaBasin. The δ13C of thaumarchaeotal lipids may thus be a novel tool to reconstruct the δ13C of DIC insediments that are devoid of carbonates, but relatively rich in organic matter, such as shallow marinecoastal settings.
& 2013 Elsevier B.V. All rights reserved.
1. Introduction
The Paleocene–Eocene Thermal Maximum (PETM) is character-ized by a rapid large decrease in stable carbon isotope ratios (δ13C)in marine and terrestrial carbonates and organic matter andmassive dissolution of seafloor carbonates, providing evidencefor the massive and rapid injection of 13C-depleted carbon in theoceans and atmosphere (Dickens et al., 1997; Zachos et al., 2005;
ll rights reserved.
s Institute for Sea Research,. Box 59, 1790 AB Den Burg,22231 9674.
ten).Biogeochemistry, University
, CA 92521, USA.
McInerney and Wing, 2011). Several mechanisms have beenproposed to explain the global negative carbon isotope excursion(CIE), amongst others the release of thermogenic methane due tocontact metamorphism (Svensen et al., 2004), rapid burning ofterrestrial organic matter (Kurtz et al., 2003), the release of carbonstored in permafrost soils at high latitudes triggered by orbitalforcing (DeConto et al., 2012), and the dissociation of methanehydrates (Dickens et al., 1995). Several of these hypotheses providemechanisms that not only explain the CIE of the PETM, but alsooffer an explanation for the several smaller CIEs that haveoccurred after the PETM, such as the Eocene Thermal Maximum2 (ETM2) and H2 event (Cramer et al., 2003; Lourens et al., 2005;Nicolo et al., 2007; Sluijs et al., 2009; Stap et al., 2010; Westerholdet al., 2009; Slotnick et al., 2012). However, authentication of thesources of the 13C-depleted carbon strongly depends on the
P.L. Schoon et al. / Earth and Planetary Science Letters 373 (2013) 160–168 161
magnitude of the actual CIE recorded in the PETM sediments(e.g., Pagani et al., 2006; Dickens, 2011). Unfortunately, thereported magnitude of the CIEs vary widely between differentmarine and terrestrial carbon records, such as carbonateshells, bulk organic matter and specific terrestrial and marinebiomarkers (see Table 1 in McInerney and Wing, 2011). Thesevariations in shape and magnitude of individual carbon isotoperecords are often caused through changes in: (1) the relativeabundance of mixed components with different δ13C valueswithin a measured substrate, (2) change in isotope fractionationthrough physiological change, and (3) the isotope compositionof the carbon source, or combinations of these (Sluijs andDickens, 2012 and references cited therein). Although themagnitude of the biases generated by these factors is relativelywell known, assessing the magnitude of these biases for anyindividual δ13C record remains a challenge (Sluijs and Dickens,2012).
In this study, we investigate the potential use of the stablecarbon isotopic composition (δ13C) of the biomarker lipid cre-narchaeol, which exclusively occurs in ammonia-oxidizing Thau-marchaeota (Pitcher et al., 2011 and references cited therein), toreconstruct the variations in δ13C of marine dissolved inorganiccarbon (DIC), the largest carbon reservoir in the global exogeniccarbon pool, during the Eocene hyperthermals. Several studiesusing 13C-labeling experiments and cultivation studies showedthat Thaumarchaeota have a chemoautotrophic lifestyle (Junget al., 2011; Park et al., 2010; Wuchter et al., 2003), usingammonium as electron donor, which is oxidized to nitrite(Hallam et al., 2006; Könneke et al., 2005; Wuchter et al., 2006).Based on the relatively 13C-enriched isotopic composition ofcrenarchaeol, and the isoprenoidal ether-bound lipids (biphy-tanes) derived thereof, compared to algal biomarkers, it wassuggested that Thaumarchaeota take up bicarbonate as a carbonsource (Hoefs et al., 1997; Pearson et al., 2001a; Kuypers et al.,
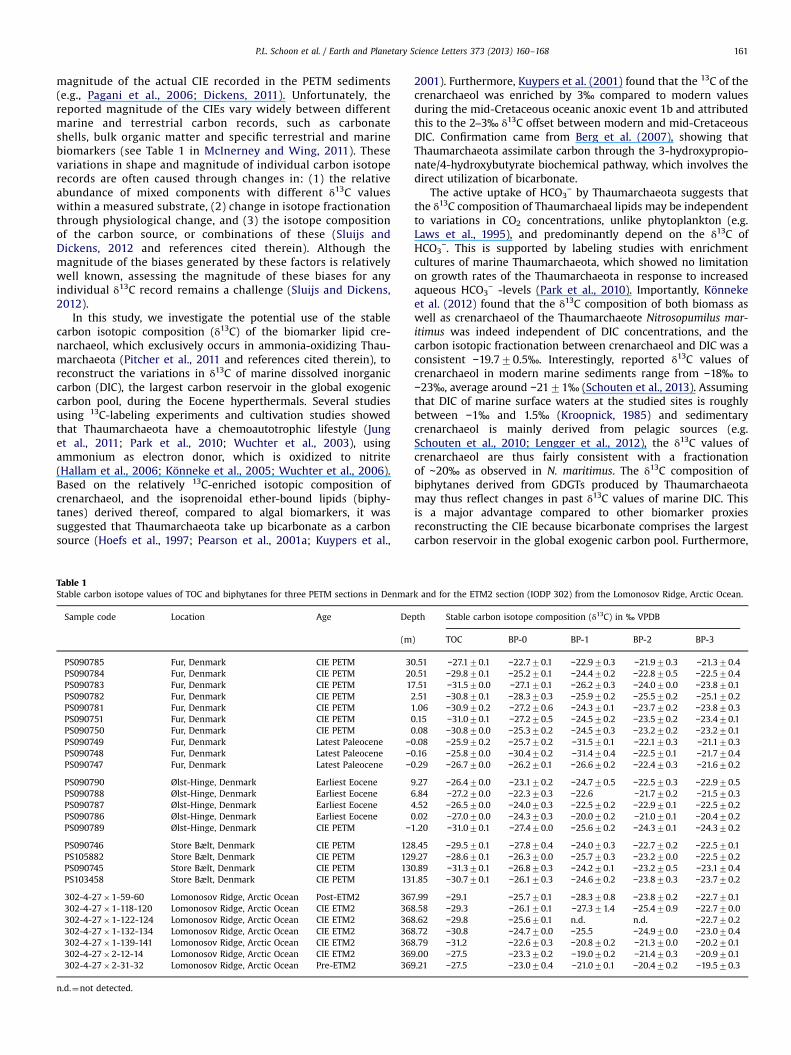
Table 1Stable carbon isotope values of TOC and biphytanes for three PETM sections in Denmar
Sample code Location Age De
(m
PS090785 Fur, Denmark CIE PETM 30PS090784 Fur, Denmark CIE PETM 20PS090783 Fur, Denmark CIE PETM 17PS090782 Fur, Denmark CIE PETM 2PS090781 Fur, Denmark CIE PETM 1PS090751 Fur, Denmark CIE PETM 0PS090750 Fur, Denmark CIE PETM 0PS090749 Fur, Denmark Latest Paleocene −0PS090748 Fur, Denmark Latest Paleocene −0PS090747 Fur, Denmark Latest Paleocene −0
PS090790 Ølst-Hinge, Denmark Earliest Eocene 9PS090788 Ølst-Hinge, Denmark Earliest Eocene 6PS090787 Ølst-Hinge, Denmark Earliest Eocene 4PS090786 Ølst-Hinge, Denmark Earliest Eocene 0PS090789 Ølst-Hinge, Denmark CIE PETM −1
PS090746 Store Bælt, Denmark CIE PETM 128PS105882 Store Bælt, Denmark CIE PETM 129PS090745 Store Bælt, Denmark CIE PETM 130PS103458 Store Bælt, Denmark CIE PETM 131
302-4-27�1-59-60 Lomonosov Ridge, Arctic Ocean Post-ETM2 367302-4-27�1-118-120 Lomonosov Ridge, Arctic Ocean CIE ETM2 368302-4-27�1-122-124 Lomonosov Ridge, Arctic Ocean CIE ETM2 368302-4-27�1-132-134 Lomonosov Ridge, Arctic Ocean CIE ETM2 368302-4-27�1-139-141 Lomonosov Ridge, Arctic Ocean CIE ETM2 368302-4-27�2-12-14 Lomonosov Ridge, Arctic Ocean CIE ETM2 369302-4-27�2-31-32 Lomonosov Ridge, Arctic Ocean Pre-ETM2 369
n.d.¼not detected.
2001). Furthermore, Kuypers et al. (2001) found that the 13C of thecrenarchaeol was enriched by 3‰ compared to modern valuesduring the mid-Cretaceous oceanic anoxic event 1b and attributedthis to the 2–3‰ δ13C offset between modern and mid-CretaceousDIC. Confirmation came from Berg et al. (2007), showing thatThaumarchaeota assimilate carbon through the 3-hydroxypropio-nate/4-hydroxybutyrate biochemical pathway, which involves thedirect utilization of bicarbonate.
The active uptake of HCO3− by Thaumarchaeota suggests that
the δ13C composition of Thaumarchaeal lipids may be independentto variations in CO2 concentrations, unlike phytoplankton (e.g.Laws et al., 1995), and predominantly depend on the δ13C ofHCO3
−. This is supported by labeling studies with enrichmentcultures of marine Thaumarchaeota, which showed no limitationon growth rates of the Thaumarchaeota in response to increasedaqueous HCO3
− -levels (Park et al., 2010). Importantly, Könnekeet al. (2012) found that the δ13C composition of both biomass aswell as crenarchaeol of the Thaumarchaeote Nitrosopumilus mar-itimus was indeed independent of DIC concentrations, and thecarbon isotopic fractionation between crenarchaeol and DIC was aconsistent −19.770.5‰. Interestingly, reported δ13C values ofcrenarchaeol in modern marine sediments range from −18‰ to−23‰, average around −2171‰ (Schouten et al., 2013). Assumingthat DIC of marine surface waters at the studied sites is roughlybetween −1‰ and 1.5‰ (Kroopnick, 1985) and sedimentarycrenarchaeol is mainly derived from pelagic sources (e.g.Schouten et al., 2010; Lengger et al., 2012), the δ13C values ofcrenarchaeol are thus fairly consistent with a fractionationof ∼20‰ as observed in N. maritimus. The δ13C composition ofbiphytanes derived from GDGTs produced by Thaumarchaeotamay thus reflect changes in past δ13C values of marine DIC. Thisis a major advantage compared to other biomarker proxiesreconstructing the CIE because bicarbonate comprises the largestcarbon reservoir in the global exogenic carbon pool. Furthermore,
k and for the ETM2 section (IODP 302) from the Lomonosov Ridge, Arctic Ocean.
pth Stable carbon isotope composition (δ13C) in ‰ VPDB
) TOC BP-0 BP-1 BP-2 BP-3
.51 −27.170.1 −22.770.1 −22.970.3 −21.970.3 −21.370.4
.51 −29.870.1 −25.270.1 −24.470.2 −22.870.5 −22.570.4
.51 −31.570.0 −27.170.1 −26.270.3 −24.070.0 −23.870.1
.51 −30.870.1 −28.370.3 −25.970.2 −25.570.2 −25.170.2
.06 −30.970.2 −27.270.6 −24.370.1 −23.770.2 −23.870.3
.15 −31.070.1 −27.270.5 −24.570.2 −23.570.2 −23.470.1
.08 −30.870.0 −25.370.2 −24.570.3 −23.270.2 −23.270.1
.08 −25.970.2 −25.770.2 −31.570.1 −22.170.3 −21.170.3
.16 −25.870.0 −30.470.2 −31.470.4 −22.570.1 −21.770.4
.29 −26.770.0 −26.270.1 −26.670.2 −22.470.3 −21.670.2
.27 −26.470.0 −23.170.2 −24.770.5 −22.570.3 −22.970.5
.84 −27.270.0 −22.370.3 −22.6 −21.770.2 −21.570.3
.52 −26.570.0 −24.070.3 −22.570.2 −22.970.1 −22.570.2
.02 −27.070.0 −24.370.3 −20.070.2 −21.070.1 −20.470.2
.20 −31.070.1 −27.470.0 −25.670.2 −24.370.1 −24.370.2
.45 −29.570.1 −27.870.4 −24.070.3 −22.770.2 −22.570.1
.27 −28.670.1 −26.370.0 −25.770.3 −23.270.0 −22.570.2
.89 −31.370.1 −26.870.3 −24.270.1 −23.270.5 −23.170.4
.85 −30.770.1 −26.170.3 −24.670.2 −23.870.3 −23.770.2
.99 −29.1 −25.770.1 −28.370.8 −23.870.2 −22.770.1
.58 −29.3 −26.170.1 −27.371.4 −25.470.9 −22.770.0
.62 −29.8 −25.670.1 n.d. n.d. −22.770.2
.72 −30.8 −24.770.0 −25.5 −24.970.0 −23.070.4
.79 −31.2 −22.670.3 −20.870.2 −21.370.0 −20.270.1
.00 −27.5 −23.370.2 −19.070.2 −21.470.3 −20.970.1
.21 −27.5 −23.070.4 −21.070.1 −20.470.2 −19.570.3

P.L. Schoon et al. / Earth and Planetary Science Letters 373 (2013) 160–168162
since crenarchaeol is a unique biomarker lipid for marine Thau-marchaeota, the CIE in crenarchaeol should not be affected bymixing of different components with different δ13C values as withe.g. TOC.
To test this hypothesis, we analyzed the δ13C compositions ofthe biphytane moieties derived of archaeal GDGTs, obtained afterether-bond cleavage with HI/LiAlH4, from sediment records span-ning the PETM and ETM2 in the North Sea Basin and Arctic Ocean,respectively. We compare the δ13C values of the biphytanes witheach other, in order to constrain sources of GDGTs and utilize theδ13C value of the biphytane specifically derived from crenarchaeolto reconstruct δ13CDIC across the Eocene hyperthermals.
2. Materials and methods
2.1. Samples and sampling sites
In this study, we used sediment samples that were previouslyused for other palynological and (organic) geochemical studies ofthe North Sea Basin PETM (Nielsen et al., 1986; Schmitz et al.,2004; Schoon, 2013) and Arctic Ocean ETM2 (Schoon et al., 2011;Sluijs et al., 2009) (Table 1). Sediments that cover the Paleocene–Eocene transition are derived from three sites located in Denmark(Fig. 1). At time of deposition, Denmark was situated in the easternpart of the semi-enclosed, epicontinental, North Sea Basin. Two ofthe study sites are outcrops, of which one is located in the westernLimfjorden area on the island Fur and the other is the Ølst-Hingeclay pit located in central Jutland. The third study site is anoffshore section located in the sea strait Store Bælt cored in 1983(Borehole no. 83101 carried out by the Danish GeotechnicalInstitute) in between the Danish islands Sjælland and Fyn(Nielsen et al., 1986). The PETM has been recognized at these siteson the basis of a negative 6–8‰ CIE in total organic carbon (TOC)and on the concomitant abundance peaks of dinocysts that belongto the organic-walled dinoflagellate cyst genus Apectodinium,including the species Apectodinium augustum, which is diagnosticof the PETM (Heilmann-Clausen and Schmitz, 2000; Schmitz et al.,
Fig. 1. Palaeogeographical map of the Late Paleocene and early Eocene showing thestudy locations of the PETM (Denmark) and ETM2 (Lomonosov Ridge).Adapted from Sluijs et al. (2009).
2004). The continuous section at Store Bælt records the entire CIEof the PETM. The Fur section, however, is interrupted by aglacially-disturbed interval of 10–20 m and possibly the maximumof the CIE of the PETM is missing (Schoon, 2013). The part of theØlst-Hinge section studied here is a record of the earliest Eoceneand includes the recovery phase of the CIE of the PETM.
Samples from ETM2 are derived from the Integrated OceanDrilling Project (IODP) Hole 302‐4 A, which was retrieved in 2004(Backman et al., 2006). The site is located on the Lomonosov Ridgeat ∼851N palaeolatitude in the Central Arctic Ocean (O'Regan et al.,2008) (Fig. 1). This marine sedimentary sequence contains theETM2 interval between 368.9 and 368.2 m composite depth (mcd)based on the 3.5‰ CIE in TOC and the presence of the dinocystspecies Cerodinium wardenese and Hystrichosphaeridium tubiferum(Sluijs et al., 2009). During the early Eocene this location waswarm and strongly influenced by freshwater input and highnutrient concentrations (Sluijs et al., 2009).
2.2. δ13C analyses of GDGT-derived biphytanes
All sediment samples were extracted by means of a DionexAccelerated Solvent Extractor (ASE) using a 9:1 (v:v) mixture ofdichloromethane (DCM) and methanol (MeOH), at high pressure(7.6�106 Pa) and temperature (100 1C). An aliquot of the totalextract was separated into an apolar and a polar fraction using asmall column with activated alumina (Al2O3) using n-hexane/DCM(9:1, v/v) and MeOH/DCM (1:1, v/v) as eluents, respectively. TheGDGTs, present in the polar fraction, were analyzed by highpressure liquid chromatography-mass spectrometry (HPLC-MS)as previously described by Sluijs et al. (2009) for Arctic OceanETM2, and Schoon (2013) for the North Sea Basin PETM, todetermine their relative abundances.
To be able to analyze the stable carbon isotopic composition ofthese lipids, the polar fractions were refluxed with 56 wt% HI (inH2O) for 1 h, which cleaves the ether bonds of GDGTs and releasestheir isoprenoid carbon skeletons (Schouten et al., 1998). Thebiphytanes were analyzed by gas chromatography (GC), gaschromatography/mass spectrometry (GC/MS) and isotope ratiomonitoring-GC/MS as described in Schoon et al. (2011). All carbonisotopic values were determined at least in duplicate and areaveraged to obtain a mean and a standard deviation (s), which arereported in the δ13C notation relative to the VPDB standard.
3. Results
3.1. Variation in GDGT distribution
HPLC–MS analysis of the North Sea Basin PETM sedimentsshowed that crenarchaeol is the most dominant GDGT throughoutthe entire Fur section (Figs. 2A and 3). Before and after the CIE,crenarchaeol is only slightly higher in relative abundance thanGDGT-0, but during the entire PETM interval the abundance ofcrenarchaeol increases up to 75% of total GDGTs (Fig. 3).The relative abundance of GDGTs in sediments deposited in theArctic Basin do not show substantial variations across ETM2, withcrenarchaeol being generally more abundant than GDGT-0 (Fig. 4).In both the PETM and ETM2 sediments, GDGT-1, -2, and -3 are onlyminor components (combined ranging from 0% to 20% of allGDGTs) (Figs. 3 and 4). TEX86 temperatures derived from theseGDGTs at the North Sea Basin PETM sections vary from ca. 17–24 1Cprior to the CIE to up to 30 1C during the CIE (Schoon, 2013). Forthe Arctic ETM2 section, TEX′86 temperatures were 21–23 1C priorto the CIE and rose to up to 26–27 1C during the CIE (Sluijs et al.,2009). Values of the BIT index, a proxy for the input of soil-derivedGDGTs (Hopmans et al., 2004), are generallyo0.1 prior to, and

Fig. 2. (A) HPLC–MS base peak chromatogram from a sediment extract and (B) partial GC–MS chromatogram of hydrocarbons released from HI/LiAlH4 treatment of asediment extract from the CIE of the PETM (130.89 m at Store Bælt; Table 1), (C) Structures of the GDGTs and associated biphytanes.
Fig. 3. Fractional abundance of GDGTs (percentage of total isoprenoid GDGTs) and δ13C records of the TOC, and the acyclic (BP-0), monocyclic (BP-1), bicyclic (BP-2) andtricyclic (BP-3) biphytanes of the section at Fur, Denmark across the PETM. The dashed line indicates the onset of the CIE, whereas the grey area indicates the entire PETMinterval. Abbreviations: LP¼Late Paleocene, GS–ØC¼Glauconitic Silt–Østerrende Clay, SC¼Stolleklint Clay.
P.L. Schoon et al. / Earth and Planetary Science Letters 373 (2013) 160–168 163
during, the CIE in the Arctic Basin sediments (Sluijs et al., 2009) aswell as during the CIE in the North Sea basin PETM sediments(Schoon, 2013), signifying low soil input (Schouten et al., 2013 andreferences cited therein). Only prior to the PETM, North Sea Basinsediments have elevated BIT values ranging from 0.3 to 0.7(Schoon, 2013).
Upon chemical degradation of the GDGTs with HI/LiAlH4, fourbiphytanes, i.e., an acyclic (BP-0), a monocyclic (BP-1), a bicyclic(BP-2) and a tricyclic (BP-3) biphytane (e.g. Fig. 2A and B), weregenerated. The latter structure contains, besides two cyclopentane
moieties, also a cyclohexane moiety and has been shown toexclusively derive from crenarchaeol (Schouten et al., 2000;Sinninghe Damsté et al., 2002). Theoretically, the abundance ofthe released biphytanes depends on the relative concentration ofthe GDGTs and on the type of GDGT. For instance, both GDGT-0and GDGT-1 contribute to the total pool of BP-0. However, GDGT-1is only a minor contributor to the total pool of GDGTs and containsonly one BP-0 moiety. This is in contrast to GDGT-0, which is adominant GDGT in all samples and contains two BP-0 moieties(Fig. 2C). Therefore, GDGT-0 contributes substantially more to the

Fig. 4. Fractional abundance of GDGTs (percentage of total isoprenoid GDGTs) and δ13C records of the TOC, and the acyclic (BP-0), monocyclic (BP-1), bicyclic (BP-2) andtricyclic (BP-3) biphytanes from sediments deposited during ETM2 in the Arctic Basin. The dashed line indicates the onset of the CIE, whereas the grey area indicates theentire ETM2 interval.
Fig. 5. Predicted (from measured GDGT distributions) and measured average fractional abundances of the four biphytanes released from the GDGTs present in the sedimentsrepresenting intervals of the pre-CIE, CIE, post-CIE PETM and in the interval representing the entire ETM2.
P.L. Schoon et al. / Earth and Planetary Science Letters 373 (2013) 160–168164
total BP-0 pool than GDGT-1. Thus, if we assume that GDGT-4 doesnot contribute to the total pool of GDGTs in the PETM and ETM2sediments and that GDGT-2 consists of two BP-1 moieties, it ispossible to predict the distribution of the biphytanes from thedistribution of the GDGTs. The relative amount of the biphytanescan then be calculated using the following formulas:
f BP-0 ¼ f GDGT−0 þ 1=2� f GDGT−1 ð1Þ
f BP-1 ¼ 1=2� f GDGT−1 þ f GDGT−2 þ 1=2� f GDGT−3 ð2Þ
f BP-2 ¼ 1=2� f cren þ 1=2� f GDGT−3 ð3Þ
f BP-3 ¼ 1=2� f cren ð4Þin which f stands for the fraction of the component. This calculateddistribution fits generally well with the actual biphytane distribu-tion observed after HI-LiAlH4 degradation (Fig. 2A, B and Fig. 5).At the onset of the CIE of the PETM, the ratio of BP-2 and BP-3 withrespect to BP-0 increased substantially, in agreement withthe dominance of crenarchaeol in these sediments (Fig. 5). Afterthe PETM, the biphytane abundance equals those from prior to thePETM (Fig. 5). We further observe no substantial variation inbiphytane distribution in the sediments from the Arctic Basinfrom before, during or after ETM2 (Fig. 5). That is, BP-0 is the mostabundant, followed by BP-2 and BP-3. In all samples BP-1 is lowestin abundance (Fig. 5).
3.2. Stable carbon isotopic compositions of acyclic and cyclicbiphytanes
Despite the fact that GDGTs were detected in all sediments byHPLC–MS, it was not always possible to obtain δ13C values of thebiphytanes. For example, in most Late Paleocene sediments, withTOC contents o1%, biphytanes were below detection limit or onlypresent in trace amounts. This corresponds well with the fact thatabsolute GDGT concentrations in these sediments are low(o0.1 μg g−1; Schoon et al., 2012). Therefore, we could only obtainrelatively complete (i.e. covering the CIE) biphytane δ13C recordsfor the PETM of the Fur section and ETM2 of the Arctic Basin,whereas for the other two Danish PETM sections we only obtainedCIE and post-CIE δ13C values.
3.2.1. PETM—North SeaIn general, BP-3 is most enriched in 13C, with δ13C values
varying from −20‰ to −25‰, whereas BP-0 is generally the most13C-depleted from −22‰ down to values of −31‰ (Table 1).Intermediate δ13C values are recorded for the other biphytanes.At the Fur section, BP-2 and BP-3 have δ13C values of around −22‰and −21‰, respectively, prior to the CIE of the PETM (Fig. 3). Bothbiphytanes show an initial shift of 1.5–2.0‰ coincident with theonset of the CIE in OC (Fig. 3) and peak δ13C values are reached justbefore the glacially-disturbed interval with a maximum negative
P.L. Schoon et al. / Earth and Planetary Science Letters 373 (2013) 160–168 165
shift of 3.2‰ in BP-2 and 3.6‰ in BP-3, respectively. Subsequently,the δ13C values of these biphytanes increase, towards valuesslightly more negative than pre-excursion values. We observe adifferent δ13C pattern for BP-0 and BP-1. Prior to the CIE in OC bothbiphytanes show a distinct negative shift to depleted values of∼−31‰ after which they return to initial δ13C values of around−25‰ at and just after the onset of the CIE. Subsequently, bothBP-0 and BP-1 δ13C values show a gradual negative shift towardspeak values of around −28‰ and −26‰, respectively. The δ13Cbiphytane values of the CIE and post-CIE sections at Store Bælt andØlst-Hinge, compare well with those in the equivalent sections atFur (Table 1).
3.2.2. ETM2—Arctic oceanBiphytane values range from −19‰ to −28‰ for the Arctic Basin
sediments (Table 1). As for the PETM in the North Sea, BP-3 is themost enriched in 13C, whereas BP-0 is in general the most13C-depleted. Prior to the CIE of ETM2, BP-2 and BP-3 have similarδ13C values of around −21‰ and −20‰, respectively. All biphy-tanes shift towards more negative δ13C values during the CIE,though these shifts occur slightly after the CIE in OC, i.e. at368.79 mcd versus 368.72 mcd, respectively (Fig. 4). The negativeshift recorded in BP-3 is ∼2.5‰ (Fig. 4), whereas the negative shiftin BP-2 is larger, ∼4.2‰. For BP-0 a similar shift is observed at ∼3‰but much larger shift is found for BP-1, ∼6‰ (Fig. 4 and Table 1).
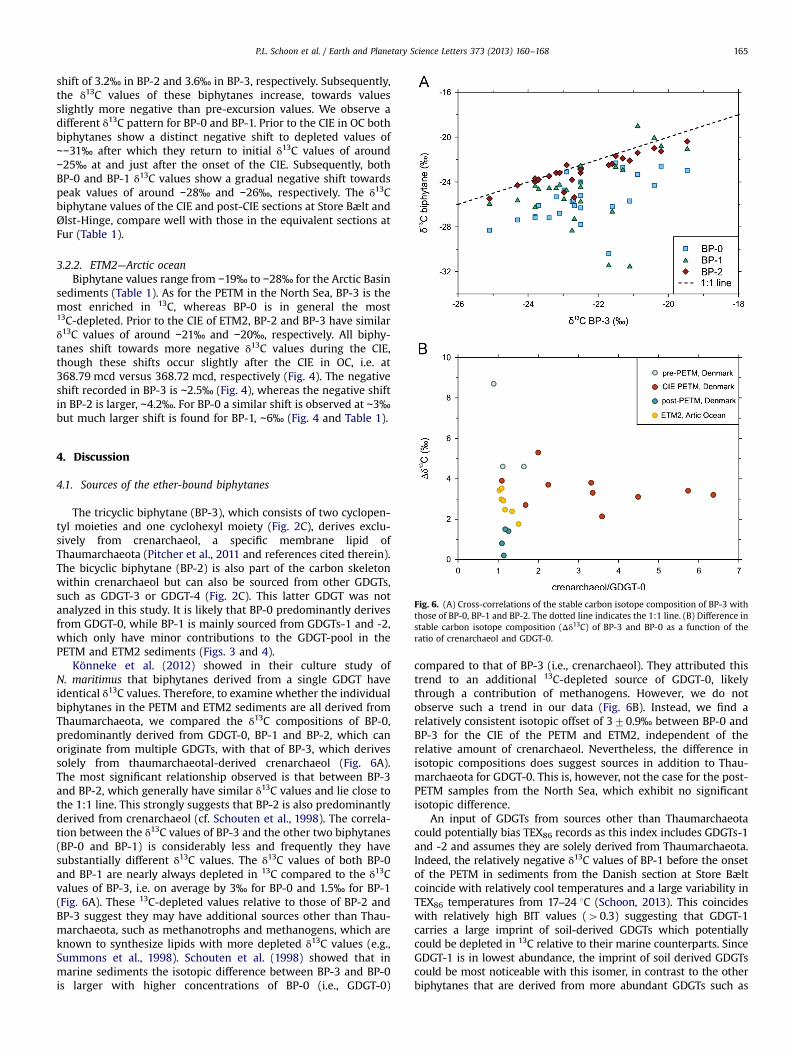
Fig. 6. (A) Cross-correlations of the stable carbon isotope composition of BP-3 withthose of BP-0, BP-1 and BP-2. The dotted line indicates the 1:1 line. (B) Difference instable carbon isotope composition (Δδ13C) of BP-3 and BP-0 as a function of theratio of crenarchaeol and GDGT-0.
4. Discussion
4.1. Sources of the ether-bound biphytanes
The tricyclic biphytane (BP-3), which consists of two cyclopen-tyl moieties and one cyclohexyl moiety (Fig. 2C), derives exclu-sively from crenarchaeol, a specific membrane lipid ofThaumarchaeota (Pitcher et al., 2011 and references cited therein).The bicyclic biphytane (BP-2) is also part of the carbon skeletonwithin crenarchaeol but can also be sourced from other GDGTs,such as GDGT-3 or GDGT-4 (Fig. 2C). This latter GDGT was notanalyzed in this study. It is likely that BP-0 predominantly derivesfrom GDGT-0, while BP-1 is mainly sourced from GDGTs-1 and -2,which only have minor contributions to the GDGT-pool in thePETM and ETM2 sediments (Figs. 3 and 4).
Könneke et al. (2012) showed in their culture study ofN. maritimus that biphytanes derived from a single GDGT haveidentical δ13C values. Therefore, to examine whether the individualbiphytanes in the PETM and ETM2 sediments are all derived fromThaumarchaeota, we compared the δ13C compositions of BP-0,predominantly derived from GDGT-0, BP-1 and BP-2, which canoriginate from multiple GDGTs, with that of BP-3, which derivessolely from thaumarchaeotal-derived crenarchaeol (Fig. 6A).The most significant relationship observed is that between BP-3and BP-2, which generally have similar δ13C values and lie close tothe 1:1 line. This strongly suggests that BP-2 is also predominantlyderived from crenarchaeol (cf. Schouten et al., 1998). The correla-tion between the δ13C values of BP-3 and the other two biphytanes(BP-0 and BP-1) is considerably less and frequently they havesubstantially different δ13C values. The δ13C values of both BP-0and BP-1 are nearly always depleted in 13C compared to the δ13Cvalues of BP-3, i.e. on average by 3‰ for BP-0 and 1.5‰ for BP-1(Fig. 6A). These 13C-depleted values relative to those of BP-2 andBP-3 suggest they may have additional sources other than Thau-marchaeota, such as methanotrophs and methanogens, which areknown to synthesize lipids with more depleted δ13C values (e.g.,Summons et al., 1998). Schouten et al. (1998) showed that inmarine sediments the isotopic difference between BP-3 and BP-0is larger with higher concentrations of BP-0 (i.e., GDGT-0)
compared to that of BP-3 (i.e., crenarchaeol). They attributed thistrend to an additional 13C-depleted source of GDGT-0, likelythrough a contribution of methanogens. However, we do notobserve such a trend in our data (Fig. 6B). Instead, we find arelatively consistent isotopic offset of 370.9‰ between BP-0 andBP-3 for the CIE of the PETM and ETM2, independent of therelative amount of crenarchaeol. Nevertheless, the difference inisotopic compositions does suggest sources in addition to Thau-marchaeota for GDGT-0. This is, however, not the case for the post-PETM samples from the North Sea, which exhibit no significantisotopic difference.
An input of GDGTs from sources other than Thaumarchaeotacould potentially bias TEX86 records as this index includes GDGTs-1and -2 and assumes they are solely derived from Thaumarchaeota.Indeed, the relatively negative δ13C values of BP-1 before the onsetof the PETM in sediments from the Danish section at Store Bæltcoincide with relatively cool temperatures and a large variability inTEX86 temperatures from 17–24 1C (Schoon, 2013). This coincideswith relatively high BIT values (40.3) suggesting that GDGT-1carries a large imprint of soil-derived GDGTs which potentiallycould be depleted in 13C relative to their marine counterparts. SinceGDGT-1 is in lowest abundance, the imprint of soil derived GDGTscould be most noticeable with this isomer, in contrast to the otherbiphytanes that are derived from more abundant GDGTs such as

P.L. Schoon et al. / Earth and Planetary Science Letters 373 (2013) 160–168166
GDGT-0 and crenarchaeol. The input of soil derived GDGTs couldthus potentially have biased the sedimentary GDGT distribution, inparticular GDGT-1 and -2, and lead to lower and variable TEX86
values. However, Schoon (2013) also found that independentlyreconstructed continental air temperatures using the distributionof branched GDGTs, derived from soil bacteria, show similar trendsas the TEX86 record, suggesting that input of non-Thaumarchaeotalsourced GDGTs may have not affected TEX86 records to a largedegree.
In any case, the similar isotopic composition, and changestherein, between BP-3 and BP-2 (Fig. 6B) supports the idea thatboth biphytanes derive from crenarchaeol and therefore their δ13Cvalues reflect that of crenarchaeol.
4.2. Magnitude and timing of the CIE in Thaumarchaeota
The magnitude of the carbon isotope excursion for BP-2 andBP-3 at the Danish PETM section at Fur, where we have a completeisotope record, is 3.670.3‰ (Fig. 3). This is considerably less thanmeasured in OC (5–6‰) and n-alkanes (6–7‰) at this location(Schoon et al., 2012), but is similar to the ∼3‰ CIE measured inmarine calcite elsewhere (McInerney and Wing, 2011; Dickens,2011) and isotope records of marine organic matter (Sluijs andDickens, 2012). Possibly, peak values are masked by the glacially-disturbed interval at Fur (Schoon et al., 2012) and, therefore, theCIE in crenarchaeol may be underestimated. However, the δ13Cvalues of BP-3 at the CIE sections of Store Bælt and Ølst-Hinge arenearly identical to that of Fur (Table 1), suggesting that theminimum values in the crenarchaeol record at Fur correspond tothe minimum values in the exogenic carbon pool, and thus the CIEin crenarchaeol is unlikely to be higher than 3.6‰.
The magnitude of the CIE recorded in BP-3 at ETM2 is∼2.570.7‰. This is slightly lower than that measured for TOC(3.1‰; Table 1), but similar when the OC record is corrected forterrestrial organic matter contributions (2.5‰; Sluijs and Dickens,2012). It is smaller than excursions found for marine biomarkers,which ranged from 3.2‰ to 4.5‰ (Schoon et al., 2011), but largerthan the 1.4‰ excursion of benthic foraminifera as measured atWalvis Ridge (Stap et al., 2010). The larger magnitude of the CIE inthe marine algal biomarkers may be due to enhanced CO2
concentrations leading to increased isotopic fractionations (e.g.Schoon et al., 2011; Sluijs and Dickens, 2012). The differencebetween the CIE in crenarchaeol versus that in marine calcitepotentially reflect mixing effects, local variations in the magnitudeof the different CIEs in the DIC (specifically bicarbonate) of thesemi-restricted Arctic Basin and South Atlantic Ocean, or it mayreflect an impact of environmental factors on the isotopic fractio-nation of marine Thaumarchaeota.
Intriguingly, the timing of the CIE of crenarchaeol apparentlydiffers to that recorded in OC and marine biomarkers for ETM2.Where the marine biomarker and marine organic matter CIEs alltrack the negative shift in δ13CTOC at 368.90 mcd marking the onsetof ETM2 (Sluijs et al., 2009; Schoon et al., 2011; Sluijs and Dickens,2012), the δ13C negative shift in BP-3 occurs later, i.e. between368.79 and 368.72 mcd (Fig. 4). It is unclear why the sediment at368.79 mcd does not show a more negative δ13C compared to pre-CIE values. Although it is a single point in the record (attempts toobtain isotope data for other depth intervals were not successful),the other marine biomarkers in the same sediment intervalalready show a negative shift of ∼1–2‰ (Schoon et al., 2012).One possibility to explain the apparent delayed onset of the CIE ofcrenarchaeol, as well as the relatively large CIE compared to deepmarine calcite, is that euxinic conditions developed in the deeperpart of the photic zone during ETM2, as evidenced by the presenceof derivatives of the biomarker isorenieratene derived fromanoxygenic phototrophic green sulfur bacteria (Sluijs et al.,
2009). In the contemporary euxinic Black Sea, Thaumarchaeotareside at the deeper and colder chemocline (Coolen et al., 2007),where δ13CDIC values are always substantially more negative thanat the surface (e.g.,∼−4.5‰ for the Black Sea chemocline; Freemanand Wakeham, 1991) due to the production of depleted CO2 bymineralization of descending particles rich in 13C-depleted organicmatter (Fry et al., 1991; Freeman and Wakeham, 1991). It istherefore possible that the δ13C of crenarchaeol may be morenegative due to the migration of the Thaumarchaeota to deeperwaters. Indeed, the δ13C negative shift of the biphytanes at ETM2coincides with peak concentrations of derivatives of the specificbiomarker isorenieratene and with a sharp cooling of tempera-tures inferred from TEX′86 (Sluijs et al., 2009). Furthermore, BP-1shows an even larger depletion in 13C at this time by up to 6‰,suggesting that it is derived from deeper-dwelling archaea(Table 1). This may imply that the Thaumarchaeota responded tothe arising euxinic conditions at this location by migrating downtowards the chemocline, thereby yielding lower TEX86 tempera-tures (cf. Menzel et al., 2006) and depleted 13C-values.At 368.79 mcd, where a CIE of crenarchaeol is not yet exhibited,no isorenieratane was detected (Schoon et al., 2012) and thuseuxinic conditions, which likely already developed in the bottomwaters, did not reach the photic zone at this depth interval.Possibly, the Thaumarchaeota migrated initially upwards duringthe first stages of the CIE such that the CIE was partly offset by themore enriched δ13CDIC in the surface waters compared to deeperwaters. This is supported by the recorded increase in temperaturesas derived from TEX′86.
The apparent correlation between development of photic zoneeuxinia and increasing 13C-depletion in crenarchaeol during ETM2,does not seem to apply for the eastern North Sea Basin during thePETM. Schoon (2013) also found isorenieratene derivatives in thesediments at the Fur section, suggesting that photic zone euxiniaexisted throughout the CIE. However, the TEX86 temperaturerecords from all three Danish sites do not show any cooling eventsduring the CIE of the PETM but rather a warming trend, asobserved globally in PETM sections (Schoon et al., 2012).This suggests that the niche of the Thaumarchaeota remainedrelatively constant there and possibly at shallower depths than inthe Arctic Basin, with no apparent migration to deeper waters.
It remains also possible that the 2.5‰ CIE as recorded for ETM2in the Arctic is simply larger than the CIE of the global exogeniccarbon pool. Similar to the PETM, the CIE of crenarchaeol at ETM2in the Arctic Basin is smaller than that recorded in other biomar-kers such as sulfur-bound phytane and C25 HBI, which showedCIEs of 3.2‰ and 4.5‰, respectively (Schoon et al., 2011). Schoonet al. (2011) attributed the large magnitude of the CIE in these algalbiomarkers to enhanced CO2 concentrations. In contrast, the δ13Ccompositions of Thaumarchaeal lipids are independent to varia-tions in DIC concentration, at least in culture experiments, andmay predominantly depend on δ13C of DIC only (Könneke et al.,2012). Therefore, it may well be that the δ13CDIC in the Arctic basindecreased relative to the global exogenic carbon pool, as pre-viously hypothesized (Sluijs and Dickens, 2012) based on arecorded regional increase in fresh-water input (Sluijs et al. 2009).
The δ13C values of BP-3 do not only allow to reconstructvariations in δ13CDIC but possibly also absolute δ13CDIC values ofthe upper part of the water column, assuming the constantfractionation between biphytanes and DIC of ca. 20‰ observedin cultures (Könneke et al., 2012) and present-day marine settings(Schouten et al., 2013). Pre-PETM δ13CDIC estimates range between−1‰ and −2‰, more negative than contemporary δ13CDIC valuesobserved in North Sea surface waters (∼1‰; Mook and Tan, 1991).Pre-ETM2 δ13CDIC estimates are ∼0‰, also lower than thoseobserved in present-day Greenland Sea (∼ 1.5‰; Kroopnick et al.,1985) and the estimated surface water δ13CDIC value of ∼1‰ in the

P.L. Schoon et al. / Earth and Planetary Science Letters 373 (2013) 160–168 167
Nansen Basin in the Arctic Ocean inferred from planktonic for-aminifera (Bauch et al., 2000). This is in contrast with planktonicand benthic foraminifera records, which suggests that late Paleo-cene δ13CDIC is likely to have been slightly more enriched in 13Ccompared to present day (Hayes et al., 1999; Zachos et al., 2001).One explanation could be that while at present both the North Seaand the Arctic Ocean are relatively open systems with inflow ofwell oxygenated waters, in the Early Palaeogene they were likelysemi-enclosed basins with restricted inflow from the Atlantic orTethys Ocean (Moran et al., 2006; Brinkhuis et al., 2006; Steinet al., 2006; Kender et al., 2012). This is comparable to estuarinecirculation conditions of the Black Sea, where, due to intenserecycling of CO2, surface water δ13CDIC values in the Black Sea arein general lower than those of open waters (e.g., Fry et al., 1991).Thus, local δ13CDIC values in the North Sea and Arctic Basins mayhave been more negative, due to restricted circulation, comparedto the open ocean.
Alternatively, and perhaps more likely, the δ13C of crenarchaeolis not reflecting the δ13CDIC of surfaces waters but that of the upperpart of the water column where there is a gradient in δ13CDIC, i.e.an increasing depletion in 13C with depth. Several studies haveshown that GDGTs in surface sediments may not only derive fromsurface waters but also from deeper water layers (e.g. Pearsonet al., 2001a; Huguet et al., 2007; Shah et al., 2008; Lopes dosSantos et al., 2010). In fact, TEX86 values in surface marinesediments have been shown to correlate well with the average0–200 m water temperatures (Kim et al., 2012). Thus, the δ13Cvalue of crenarchaeol may well be a depth-integrated signal of theupper part of the water column rather than merely of surfacewaters. Furthermore, as discussed above, development of a strongchemocline may also alter the depth habitat of Thaumarchaeota,and thus the isotopic signal carried by crenarchaeol. These factorsmay explain some potential differences in magnitude and timingof the CIE in the δ13C value of crenarchaeol versus that of thecalcite of planktonic foraminifera.
Nevertheless, our results suggest that the δ13C values ofThaumarchaeotal biphytanes have the potential to record varia-tions in δ13CDIC and can give insight in the magnitude of the carbonisotope excursions of the exogenic carbon pool during hyperther-mals. The similar CIE of crenarchaeol compared to that of marinecalcite during the PETM suggests that the marine DIC pool shiftedwith a maximum of 3.6‰, which is consistent with that found bySluijs and Dickens (2012) in marine organic matter from theLomonosov Ridge after correcting the TOC record for terrestrialcontributions. However, CIEs in δ13CDIC were unlikely uniformacross semi-enclosed basins, coastal seas and open oceans becauseof regional deviations from the global exogenic carbon pool (e.g.,Sluijs and Dickens, 2012). Therefore, to precisely constrain themagnitude of the CIEs in global ocean DIC based on δ13C values ofcrenarchaeol, data from other PETM sites are required. Further-more, potential factors influencing the magnitude of isotopicfractionation by Thaumarchaeota, such as temperature, growthrate and mixotrophy, should also be tested using culture experi-ments, although the relative consistent δ13C values of crenarchaeolin modern settings (Hoefs et al., 1997; Schouten et al., 2013 andreferences cited therein) suggest these factors may be of relativeminor importance.
5. Conclusions
We examined the potential use of stable carbon isotopes ofThaumarchaeotal GDGTs as a proxy for δ13CDIC in order toreconstruct the CIE of marine dissolved inorganic carbon duringEocene hyperthermals. The similar δ13C composition of the tricyc-lic and bicyclic biphytanes in PETM and ETM2 sediments suggest
they are both derived from the Thaumarchaeotal biomarkercrenarchaeol, while other GDGTs have a more 13C-depleted sig-nature, suggesting additional sources. The reported, relativelyconstant carbon isotopic fractionation (∼20‰) between the biphy-tanes and DIC, allowed us to reconstruct δ13CDIC records across twoEocene hyperthermals. We record δ13CDIC shifts of ∼3.6‰ (from0.5–1‰ to ∼4.6‰) and ∼2.5‰ (from ∼0.5‰ to ∼3‰) in the δ13C ofcrenarchaeol for PETM and ETM2, respectively, which are similarand slightly higher, respectively, than that of marine calcite. Thissuggests that the negative carbon isotope shifts recorded increnarchaeol may record changes in marine DIC at these sitesduring these Eocene hyperthermals.
Acknowledgments
We thank the editor Dr. E. Henderson, Dr. R. Pancost and ananonymous reviewer for their constructive comments whichimproved the manuscript. We thank C. Heeren, M. Kienhuis,J. Ossebaar, A. Mets and M. Baas for their laboratory and technicalsupport. The Darwin Center for Biogeosciences partially fundedthis project. Financial support also came from a Vici grant from theNetherlands Organisation for Scientific Research to SS. AS thanksthe European Research Council under the European Community'sSeventh Framework Program for ERC Starting Grant no. 259627.
References
Backman, J., Moran, K., McInroy, D.B., Mayer, L.A., and Expedition-302-Scientists,2006. Proceedings of the Integrated Ocean Drilling Program 302, IntegratedOcean Drilling Program Management International, Inc., Edinburgh.
Bauch, D., Carstens, J., Wefer, G., Thiede, J., 2000. The imprint of anthropogenic CO2
in the Arctic Ocean: evidence from planktic δ13C data from watercolumn andsediment surface. Deep-Sea Res. II 47, 1791–1808.
Berg, I.A., Kockelkorn, D., Buckel, W., Fuchs, G., 2007. A 3-hydroxypropionate/4-hydroxybutyrate autotrophic carbon dioxide assimilation pathway in archaea.Science 318, 1782–1786.
Brinkhuis, H., Schouten, S., Collinson, M.E., Sluijs, A., Sinninghe Damsté, J.S.,Dickens, G.R., Huber, M., Cronin, T.M., Onodera, J., Takahashi, K., Bujak, J.P.,Stein, R., Van Der Burgh, J., Eldrett, J.S., Harding, I.C., Lotter, A.F., Sangiorgi, F.,Van Konijnenburg-Van Cittert, H., De Leeuw, J.W., Matthiessen, J., Backman, J.,Moran, K., The Expedition 302 Scientists, 2006. Episodic fresh surface waters inthe Eocene Arctic Ocean. Nature 441, 606–609.
Cramer, B.S., Wright, J.D., Kent, D.V., Aubry, M.-P., 2003. Orbital climate forcing ofδ13C excursions in the late Paleocene–early Eocene (chrons C24n–C25n).Paleoceanography 18, 1097.
Coolen, M.J.L., Abbas, B., van Bleijswijk, J., Hopmans, E.C., Kuypers, M.M.M.,Wakeham, S.G., Sinninghe Damsté, J.S., 2007. Putative ammonia-oxidizingCrenarchaeota in suboxic waters of the Black Sea: a basin-wide ecologicalstudy using 16S ribosomal and functional genes and membrane lipids. Environ.Microbiol. 9, 1001–1016.
DeConto, R.M., Galeotti, S., Pagani, M., Tracy, D., Schaefer, K., Zhang, T., Pollard, D.,Beerling, D.J., 2012. Past extreme warming events linked to massive carbonrelease from thawing permafrost. Nature 484, 87–92.
Dickens, G.R., O'Neil, J.R., Rea, D.K., Owen, R.M., 1995. Dissociation of oceanicmethane hydrate as a cause of the carbon isotope excursion at the end of thePaleocene. Paleoceanography 10, 965–971.
Dickens, G.R., Castillo, M.M., Walker, J.C.G., 1997. A blast of gas in the latestPaleocene: simulating first-order effects of massive dissociation of oceanicmethane hydrate. Geology 25, 259–262.
Dickens, G.R, 2011. Down the Rabbit Hole: toward appropriate discussion ofmethane release from gas hydrate systems during the Paleocene–Eocenethermal maximum and other past hyperthermal events. Clim. Past 7, 831–846.
Freeman, K.H., Wakeham, S.G., 1991. Variations in the distributions and isotopiccompositions of alkenones in Black Sea particles and sediments. Org. Geochem.19, 277–285.
Fry, B., Jannasch, H.W., Molyneaux, S.J., Wirsen, C.O., Muramoto, J.A., King, S., 1991.Stable isotope studies of the carbon, nitrogen and sulfur cycles in the Black Seaand the Cariaco Trench. Deep-Sea Res. 38 (Suppl. 2), S1003–S1019.
Hallam, S.J., Mincer, T.J., Schleper, C., Preston, C.M., Roberts, K., Richardson, P.M.,DeLong, E.F., 2006. Pathways of carbon assimilation and ammonia oxidationsuggested by environmental genomic analyses of marine Crenarchaeota. PLoSBiol. 4, 520–536.
Hayes, J.M., Strauss, H., Kaufman, A.J., 1999. The abundance of 13C in marine organicmatter and isotopic fractionation in the global biogeochemical cycle of carbonduring the past 800 Ma. Chem. Geol. 161, 103–125.

P.L. Schoon et al. / Earth and Planetary Science Letters 373 (2013) 160–168168
Heilmann-Clausen, C., Schmitz, B., 2000. The late Paleocene thermal maximum δ13Cexcursion in Denmark? Geol. Forens. Forhand. 122, 70.
Hopmans, E.C., Weijers, J.W.H., Schefuß, E., Herfort, L., Sinninghe Damsté, J.S.,Schouten, S., 2004. A novel proxy for terrestrial organic matter in sedimentsbased on branched and isoprenoid tetraether lipids. Earth Planet Sci. Lett. 224,107–116.
Hoefs, M.E.L., Schouten, S., King, L.L., Wakeham, S.G., De Leeuw, J.W., SinningheDamsté, J.S., 1997. Ether lipids of planktonic archaea in the marine watercolumn. Appl. Environ. Microbiol. 63, 3090–3095.
Huguet, C., Schimmelmann, A., Thunell, R., Lourens, L.J., Sinninghe Damsté, J.S.,Schouten, S., 2007. A study of the TEX86 paleothermometer in the water columnand sediments of the Santa Barbara Basin, California. Paleoceanographyhttp://dxdoi.org/10.1029/2006PA001310.
Jung, M-Y., Park, S-J., Min, D., Kim, J-S., Rijpstra, W.I.C., Sinninghe Damsté, J.S., Kim,G-J., Madsen, E.L., Rhee, S-K., 2011. Enrichment and characterization of anautotrophic ammonia-oxidizing archaeon of mesophilic crenarchaeal group I.1afrom an agricultural soil. Appl. Environ. Microbiol. 77, 8635–8647.
Kender, S., Stephenson, M.H., Riding, J.B., Leng, M.J., Knox, R, O'B., W., Peck, V.L.,Kendrick, C.P., Ellis, M.A., Vane, C.H., Jamieson, R., 2012. Marine and terrestrialenvironmental changes in NW Europe preceding carbon release at thePaleocene–Eocene transition. Earth. Planet. Sci. Lett. 353–354, 108–120.
Kim, J.H., Romero, O.E., Lohmann, L., Donner, B., Laepple, T., Haam, E., SinningheDamsté, J.S., 2012. Pronounced subsurface cooling of North Atlantic waters offNorthwest Africa during Dansgaard–Oeschger interstadials. Earth Planet. Sci.Lett. 339–340, 95–102.
Könneke, M., Lipp, J.S., Hinrichs, K-U., 2012. Carbon isotope fractionation by themairne ammonia-oxidizing archaeon Nitrosopumilis maritimus. Org. Geochem.48, 21–24.
Könneke, M., de la Torre, J.R., Walker, C.B, Waterbury, J.B., Stahl, D.A., 2005. Isolationof an autotrophic ammonia-oxidizing marine archaeon. Nature 437, 543–546.
Kroopnick, P.M., 1985. The distribution of 13C of ∑CO2 in the world oceans. Deep-Sea Res. 32, 54–84.
Kurtz, A.C., Kump, L.R., Arthur, M.A., Zachos, J.C., Paytan, A., 2003. Early Cenozoicdecoupling of the global carbon and sulfur cycles. Paleoceanography 18, 14–1-14-13.
Kuypers, M.M.M., Blokker, P., Erbacher, J., Kinkel, H., Pancost, R.D., Schouten, S.,Sinninghe Damsté, J.S., 2001. Massive expansion of marine archaea during amid-Cretaceous oceanic anoxic event. Science 293, 92–94.
Laws, E.A., Popp, B.N., Bidigare, R., Kennicutt, M.C., Macko, S.A., 1995. Dependenceof phytoplankton carbon isotopic composition on growth rate and [CO2]aq.:theoretical considerations and experimental results. Geochim. Cosmochim.Acta 59, 1131–1138.
Lengger, S.K., Hopmans, E.C., Reichart, G.-J., Sinninghe Damsté, J.S., Schouten, S.,2012. Intact polar and core glycerol dibiphytanyl glycerol tetraether lipids in theArabian Sea Water Oxygen Minimum Zone: II. Selective preservation anddegradation in sediments and consequences for the TEX86. Geochim. Cosmo-chim. Acta, 98; 244–258.
Lopes dos Santos, R., Prange, M., Castañeda, I.S., Schefuß, E., Mulitza, S., Schulz, M.,Niedermeyer, E.M., Sinninghe Damsté, J.S., Schouten, S., 2010. Glacial–inter-glacial variability in Atlantic meridional overturning circulation and thermo-cline adjustments in the tropical North Atlantic. Earth Planet. Sci. Lett. 300,407–414.
Lourens, L.J., Sluijs, A., Kroon, D., Zachos, J.C., Thomas, E., Röhl, U., Bowles, J., Raffi, I.,2005. Astronomical pacing of late Paleocene to early Eocene global warmingevents. Nature 435, 1083–1087.
McInerney, F.A., Wing, S.L., 2011. The Paleocene–Eocene Thermal Maximum—aperturbation of carbon cycle, climate, and biosphere with implications for thefuture. Annu. Rev. Earth Planet. Sci. 39, 489–516.
Menzel, D., Hopmans, E.C., Schouten, S., Sinninghe Damsté, J.S., 2006. Membranetetraether lipids of planktonic Crenarchaeota in Pliocene sapropels of theeastern Mediterranean Sea. Palaeogeo. Palaeoclimatol. Palaeoecol. 239, 1–15.
Mook, W.G., Tan, F.C., 1991. Stable carbon isotopes in rivers and estuaries. In:Degens, E.T., et al. (Eds.), Biogeochemistry of Major World Rivers, 42. SCOPE,pp. 245–264.
Moran, K., Backman, J., Brinkhuis, H., Clemens, S.C., Cronin, T., Dickens, G.R., Eynaud, F.,Gattacceca, J., Jakobsson, M., Jordan, R.W., Kaminski, M., King, J., Koc, N., Krylov, A.,Martinez, N., Matthiessen, J., McInroy, D., Moore, T.C., Onodera, J., O'Regan, M.,Palike, H., Rea, B., Rio, D., Sakamoto, T., Smith, D.C., Stein, R., St John, K., Suto, I.,Suzuki, N., Takahashi, K., Watanabe, M., Yamamoto, M., Farrell, J., Frank, M., Kubik,P., Jokat, W., Kristoffersen, Y., 2006. The Cenozoic palaeoenvironment of the ArcticOcean. Nature 441, 601–605.
Nicolo, M., Dickens, G.R., Hollis, C.J., Zachos, J.C., 2007. Multiple early Eocenehyperthermals: their sedimentary expression on the New Zealand continentalmargin and in the deep sea. Geology 35, 699–702.
Nielsen, O.B., Baumann, J., Zhang, D., Heilmann-Clausen, C., Larsen, G, 1986. Tertiarydeposits in store bælt. In: Møller, J.T. (Ed.), Twenty five Years of Geology inAarhus. Geoskrifter No. 24, Department of Geoscience, Aarhus University,pp. 235–253.
O'Regan, M., Moran, K., Backman, J., Jakobsson, M., Sangiorgi, F., Brinkhuis, H.,Pockalny, R., Skelton, A., Stickley, C., Koc, N., Brumsack, H.J., Willard, D., 2008.Mid-Cenozoic tectonic and paleoenvironmental setting of the central ArcticOcean. Paleoceanography 23, http://dx.doi.org/10.1029/2007PA001559, PA1S20.
Pagani, M., Caldeira, K., Archer, D., Zachos., J.C., 2006. An ancient carbon mystery.Science 314, 1556–1557.
Park, B.-J., Park, S.-J., Yoon, D.-N., Schouten, S., Sinninghe Damsté, J.S., Rhee, S.-K.,2010. Cultivation of autotrophic ammonia-oxidizing archaea from marinesediments in coculture with sulfur-oxidizing bacteria. Appl. Environ. Microbiol.76, 7575–7587.
Pearson, A., McNichol, A.P., Benitez-Nelson, B.C., Hayes, J.M., Eglinton, T.I., 2001a.Origins of lipid biomarkers in Santa Monica Basin surface sediment: a casestudy using compound-specific δ14C analysis. Geochim. Cosmochim. Acta 65,3123–3127.
Pitcher, A., Hopmans, E.C., Mosier, A.C., Park, S.-J., Rhee, S.-K., Francis, C.A.,Schouten, S., Sinninghe Damsté, J.S., 2011. Core and intact polar glyceroldibiphytanyl glycerol tetraether lipids of ammonia-oxidizing Archaea enrichedfrom marine and estuarine sediments. Appl. Environ. Microbiol. 77, 3468–3477.
Schmitz, B., Peucker-Ehrenbrink, B., Heilmann-Clausen, C., Åberg, G., Asaro, F., Lee,C.-T.A., 2004. Basaltic explosive volcanism, but no comet impact, at thePaleocene-Eocene boundary: high-resolution chemical and isotopic recordsfrom Egypt, Spain and Denmark. Earth Planet. Sci. Lett. 225, 1–17.
Schoon, P.L., Sluijs, A., Sinninghe Damsté, J.S., Schouten, S., 2011. Stable carbonisotope patterns of marine biomarker lipids in the Arctic Ocean during EoceneThermal Maximum 2. Paleoceanography 26, PA3215, http://dx.doi.org/10.1029/2010PA002028.
Schoon, P.L., 2013 Impact of CO2 and pH on the Distribution and Stable CarbonIsotopic Composition of Microbial Biomarker Lipids (Ph.D. thesis), University ofUtrecht, pp. 185. Available from: ⟨http://igitur-archive.library.uu.nl/dissertations/2013-0410-200505/UUindex.html⟩.
Schouten, S., Hoefs, M.J.L., Koopmans, M.P., Bosch, H.-J., Sinninghe Damsté, J.S.,1998. Structural characterization, occurrence and fate of archaeal ether-boundacyclic and cyclic biphytanes and corresponding diols in sediments. Org.Geochem. 29, 1305–1319.
Schouten, S., Hopmans, E.C., Pancost, R.D., Sinninghe Damsté, J.S., 2000. Wide-spread occurrence of structurally diverse tetraether membrane lipids: evidencefor the ubiquitous presence of low-temperature relatives of hyperthermophiles.Proc. Natl. Acad. Sci. USA 97, 14421–14426.
Schouten, S., Middelburg, J.J., Hopmans, E.C., Sinninghe Damsté, J.S., 2010. Fossiliza-tion and degradation of intact polar lipids in deep subsurface sediments: atheoretical approach. Geochim. Cosmochim. Acta 74, 3806–3814.
Schouten, S., Hopmans, E.C., Sinninghe Damsté, J.S., 2013. The organic geochemistryof glycerol dialkyl glycerol tetraether lipids: a review. Org. Geochem. 54, 19–61.
Shah, S.R., Mollenhauer, G., Ohkouchi, N., Eglinton, T.I., Pearson, A., 2008. Origins ofarchaeal tetraether lipids in sediments: insights from radiocarbon analysis.Geochim. Cosmochim. Acta 72, 4577–4594.
Sinninghe Damsté, J.S., Schouten, S., Hopmans, E.C., van Duin, A.C.T., Geenevasen, J.A.J., 2002. Crenarchaeol: the characteristic core glycerol dibiphytanyl glyceroltetraether membrane lipid of cosmopolitan pelagic crenarchaeota. J. Lipid Res.43, 1641–1651.
Slotnick, B.S., Dickens, G.R., Nicolo, M.J., Hollis, C.J., Crampton, J.S., Zachos, J.C., Sluijs,A., 2012. Large-amplitude variations in carbon cycling and terrestrial weath-ering during the latest Paleocene and earliest Eocene: the record at MeadStream, New Zealand. J. Geol. 120, 487–505.
Sluijs, A., Schouten, S., Donders, T.H., Schoon, P.L., Röhl, U., Reichart, G.J., Sangiorgi,F., Kim, J.-H., Sinninghe Damsté, J.S., Brinkhuis, H., 2009. Warm and wetconditions in the Arctic region during Eocene Thermal Maximum 2. Nat.Geosci. 2, 777–780.
Sluijs, A., Dickens, G.R., 2012. Assessing offsets between the δ13C of sedimentarycomponents and the global exogenic carbon pool across Early Paleogene carboncycle perturbations. Global Biogeochem. Cycles 26, GB4005.
Stap, L., Lourens, L.J., Thomas, E., Sluijs, A., Bohaty, S., Zachos, J.C., 2010. High-resolution deep-sea carbon and oxygen isotope records of Eocene ThermalMaximum 2 and H2. Geology 38, 607–610.
Stein, R., Boucsein, B., Meyer, H., 2006. Anoxia and high primary production in thePaleogene central Arctic Ocean: first detailed records from Lomonosov Ridge.Geophys. Res. Lett. 33, L18606.
Summons, R.E., Franzmann, P.D., Nichols, P.D., 1998. Carbon isotopic fractionationassociated with methylotrophic methanogenesis. Org. Geochem. 28, 465–475.
Svensen, H., Planke, S., Malthe-Sørenssen, A., Jamtveit, B., Myklebust, R., RasmussenEidem, T., Rey, S., 2004. Release of methane from a volcanic basin as amechanism for initial Eocene global warming. Nature 429, 542–545.
Westerhold, T., Röhl, U., McCarren, H.K., Zachos, J.C., 2009. Latest on the absoluteage of the Paleocene–Eocene Thermal Maximum (PETM): new insights fromexact stratigraphic position of key ash layers +19 and-17. Earth Planet. Sci. Lett.287, 412–419.
Wuchter, C., Schouten, S., Boschker, H.T.S., Sinninghe Damsté, J.S., 2003. Bicarbo-nate uptake by marine Crenarchaeota. FEMS Microbiol. Lett. 219, 203–207.
Wuchter, C., Abbas, B., Coolen, M.J.L., Herfort, L., Timmers, P., Strous, M., VanBleijswijk, J., Teira, E., Herndl, G.J., Middelburg, J.J., Schouten, S., SinningheDamsté, J.S., 2006. Archaeal nitrification in the ocean. Proc. Natl. Acad. Sci. USA103, 12317–12322.
Zachos, J., Pagani, M., Sloan, L., Thomas, E., Billups, K., 2001. Trends, rhythms, andaberrations in global climate 65 Ma to present. Science 292, 686–693.
Zachos, J.C., Röhl, U., Schellenberg, S.A., Sluijs, A., Hodell, D.A., Kelly, D.C., Thomas, E.,Nicolo, M., Raffi, I., Lourens, L.J., McCarren, H., Kroon, D., 2005. Rapid acidifica-tion of the ocean during the Paleocene–Eocene thermal maximum. Science 308,1611–1615.
Copyright © 2022 FDOKUMEN