reclaiming - Equinet Africa
244
RECLAIMING THE RESOURCES FOR HEALTH A REGIONAL ANALYSIS OF EQUITY IN HEALTH IN EAST AND SOUTHERN AFRICA Regional Network for Equity in Health in East and Southern Africa E Q U I N E T
-
Upload
khangminh22 -
Category
Documents
-
view
2 -
download
0
Transcript of reclaiming - Equinet Africa
RECLAIMINGTHERESOURCES FOR
HEALTHA REGIONAL ANALYSIS OF EQUITY IN HEALTH
IN EAST AND SOUTHERN AFRICA
RegionalNetwork
for Equity inHealth in Eastand Southern
Africa
EQUINET

RECLAIMINGTHERESOURCES FOR
HEALTHA REGIONAL ANALYSIS OF EQUITY IN HEALTH
IN EAST AND SOUTHERN AFRICA
RegionalNetwork for
Equity in Healthin East and
Southern Africa
EQUINET
Fountain PublishersKampala – Uganda
www.fountainpublishers.co.ug
Copyright © EQUINET 2007Regional Network for Equity in Health in east and southern Africa (EQUINET)
c/o Training and Research Support Centre (TARSC), Box CY2720, Causeway, Harare, Zimbabwe
All rights reserved. Redistribution of the material presented in this work is encouraged by thepublisher, provided that the original text is not altered, that the original source is properly and fullyacknowledged and that the objective of the redistribution is not commercial gain.Please contact the publisher if you wish to reproduce, redistribute or transmit, in any form or by anymeans, this work or any portion thereof. Photographs and graphics are covered by copyright held bythe sources listed below each and permission must be sought from the copyright holder for use.Individual contributors cannot be held accountable for the report as a whole nor for the informationand views it presents. EQUINET does not warrant that the information contained in this publicationis complete and correct and shall not be held liable for any damages incurred as a result of its use.
ISBN (Zimbabwe): 978-1-77922-066-0; ISBN(South Africa): 978-1-77009-409-3; ISBN (Uganda): 978-9970-02-754-5Edit, design and layout: Margo BedingfieldIllustrations: courtesy Mashet Ndhlovu, TARSC and IfakaraPhotography by: Brian Goddard, K Hofnie, Indymedia, Mwajuma Masaiganah, Itai Rusike, TAC and TARSCCover and section cover photographs by B Goddard, Indymedia, TAC, DfID, B Partridge and K HofniePrinted by: Précigraph Ltd MauritiusPublished by: EQUINET in association with Weaver Press, Zimbabwe (www.weaverpresszimbabwe.com), FountainPublishers, Uganda (www.fountainpublishers.co.ug) and Jacana, South Africa (www.jacana.co.za)For all queries on this publication or for orders please email [email protected]
Acknowledgements
The report was produced under the overall direction of the EQUINET Steering Committee. It draws on thework of is the EQUINET Steering Committee and the many organisations and individuals working for healthequity in east and southern Africa. The principal author was Rene Loewenson. Contribution across all sectionswas made by Lexi Bambas Nolen and Rebecca Pointer. The other main contributors to sections were: Section 1:Godfrey Woelk; Section 2: Percy Makombe, Riaz Tayob, Patrick Bond, Mickey Chopra, Mark Tomlinson, GeorgeDor; Section 3: Lucy Gilson, Ireen Makwiza, Sally Theobald, Leslie London, Greg Ruiters, NomafrenchMbombo, Gabriel Mwaluko; Section 4: Vimbayi Mutyambizi, Di McIntyre, Lucy Gilson; Section 5: AntoinetteNtuli, Scholastika Iipinge, Moses Kachima; Section 6: Itai Rusike, Aillet Mukono, TJ Ngulube, Martha Kwataine,Selemani Mbuyita, Hon Blessing Chebundo, Hon Austin Mtukula, Mwajuma Masaiganah, Fortunate Machingura.
Many individuals and organisations were consulted during the preparation of the report directly or through inputat meetings. Not all are named and we thank all. Valuable input and advice was received from Helen Lugina,Firoze Manji, Barbara Kaim, Charles Mayombana, Ahmed Makemba, Kathe Hofnie Hoebes, Richard Jordi, ClaraMbwili-Muleya, Annie Holmes, Zvikie Mlambo, members of the secretariat of the East, Central and SouthernAfrican Health Community, members of the SADC directorate on Human Resources and Social Development,colleagues at the World Health Organisation at headquarters and AFRO, researchers in the network onparticipatory methods for people centred health systems in east and southern Africa, members of the HealthCivil Society Network in East and Southern Africa, members of the Association of Parliamentary Committees inEast and Southern Africa, members of the Community Working Group on Health, colleagues involved in theCommission on the Social Determinants of Health and from government, academic and civil society membersinvolved in EQUINET work.
We gratefully acknowledge the peer review of the report by Chris Mwikisa, Eli Nangawi, Armando de Negri,Christina Zarowsky and the SIDA (Sweden) headquarters health team co-ordinated by Ulrike Hertel. Wegratefully acknowledge the financial and institutional support of SIDA Sweden, IDRC Canada and of theinstitutions in the EQUINET steering committee.
ContentsIntroduction ………………………………………………………………………………viiExecutive summary …………………………………………………………………………ixAcronyms……………………………………………………………………………………xiSection 1 Progress in health equity in east and southern Africa ………………………1
Opportunities for health in east and southern Africa …………………………5Health status in east and southern Africa ……………………………………13Access to health care in east and southern Africa ……………………………21Equity through reclaiming the resources for health …………………………28References……………………………………………………………………33
Section 2 Reclaiming the economic resources for health ……………………………35The dispossession of African wealth at the cost of African health …………37Reclaiming resources for health………………………………………………50Food sovereignty as a means to improve nutrition……………………………53Protecting health in trade agreements ………………………………………62References……………………………………………………………………69
Section 3 Building universal, comprehensive people-centred health systems…………71What kind of health system reclaims the resources for health? ………………73Organising health systems around primary health care ………………………74Lessons learned from the roll out of antiretroviral therapy …………………81Threats to equity-oriented health systems ……………………………………87Reasserting public interest in health systems …………………………………94References …………………………………………………………………102
Section 4 Fair financing of health systems……………………………………………105Adequate resources for a national health system ……………………………107Fair financing of health systems ……………………………………………114Mobilising resources for health through progressive revenue ………………116Reducing out-of-pocket funding, including user fees ………………………120Predictable external financing ………………………………………………128Equitable allocation of resources for health ………………………………131Mobilising support for fair financing ………………………………………137References …………………………………………………………………138
Section 5 Valuing and reclaiming investments in health workers ……………………141Valuing health workers ……………………………………………………143Adequate health workers with relevant training ……………………………144An outflow of health workers ………………………………………………151Valuing and retaining health workers ………………………………………157Reclaiming resources from health worker migration ………………………163References …………………………………………………………………169
Section 6 Organising people centred health systems ………………………………171Empowering communities for health ………………………………………173Supporting empowerment in health systems ………………………………177Mechanisms for people centred health systems ……………………………183Social action for public interests ……………………………………………190References …………………………………………………………………198
Section 7 Taking action to reclaim the resources for health…………………………201Commitments and actions to advance equity in health ……………………203Progress and targets in reclaiming the resources for health …………………212A focus for action …………………………………………………………216References …………………………………………………………………220
Index………………………………………………………………………………………222
LIST OFTABLES
Table 1.1 Economic indicators in east and southern Africa, 2000 and 2005 .........................................................................5Table 1.2 Human development index trends in east and southern Africa, 1975–2003 ........................................................6Table 1.3 Indicators of human development, gender development and poverty in east and southern Africa .................9Table 1.4 Poverty and inequality in east and southern Africa ................................................................................................11Table 1.5 Overview of demographic indicators in east and southern African countries ...................................................13Table 1.6 Infant and child mortality in east and southern African countries ......................................................................14Table 1.7 Inequalities in nutrition and mortality across income groups ...............................................................................16Table 1.8 HIV and AIDS data in east and southern African countries, 2005 .....................................................................20Table 1.9 Trends in health inequalities in selected east and southern African countries, 1990-2002 ...............................25Table 1.10 Provision of antiretrovirals in east and southern African countries .....................................................................27
Table 2.1: Commodity price declines, 1980–2001 ......................................................................................................................39Table 2.2 Revenue implications of an economic partnership agreement between the European Union and
east and southern Africa .............................................................................................................................................42Table 2.3 Foreign direct investment inflows and outflows, Africa ........................................................................................43Table 2.4 Bilateral trade between Africa and China .................................................................................................................44Table 2.5 Africa’s debt and repayments: 1980 to 2002 .............................................................................................................47Table 2.6 Nutrition levels and inequalities across income groups in east and southern Africa .........................................53Table 2.7 Health issues and relevant World Trade Organisation agreements ......................................................................62Table 2.8 World Trade Organisation status of countries in east and southern Africa in 1995 .........................................64Table 2.9 Use of TRIPS flexibilities in east and southern Africa in 1995.............................................................................64
Table 3.1 Poor/rich differences in benefits of health spending at different levels .............................................................75Table 3.2 Ratification of human rights treaties in the region as of 2005 ..............................................................................98
Table 4.1: Health financing in east and southern Africa .........................................................................................................107Table 4.2 Per capita demands of Millennium Development Goals for health in selected countries, 2002 ...................110Table 4.3 Health as a share (percentage) of government expenditure, east and southern Africa, 2003 ........................112Table 4.4 Debt, debt service and health spending in east and southern African countries .............................................113Table 4.5 Sources of health financing in east and southern Africa, 2004 ..........................................................................115Table 4.6 Per capita spending on health financing in east and southern African, 1998 and 2004 .................................116Table 4.7 Poverty, inequality and out-of-pocket spending on health in east and southern Africa, 2003/04 .................123Table 4.8 Comparison of geographical equity in expenditure: South Africa, Kenya and Mozambique, 1997/98.......132
Table 5.1 Health workers per 100,000 population, 2004........................................................................................................144Table 5.2 Health worker adequacy and health outcomes, 2004 ............................................................................................146Table 5.3 Health worker adequacy and antiretroviral treatment outcomes, 2004/05 ......................................................147Table 5.4 Distribution of health workers: % births attended by skilled health personnel by income quintile in
selected east and southern African countries, 2003..............................................................................................150Table 5.5 Distribution of the health workforce, 2004 (excluding Tanzania: 2002) ...........................................................150Table 5.6 Factors influencing migration from east and southern Africa.............................................................................154Table 5.7 Financial incentives for health workers in east and southern African countries ..............................................158Table 5.8 Non-financial incentives for health workers in east and southern African countries ......................................160
Table 6.1 Tuberculosis control in east and southern African countries, 2003 ...................................................................178Table 6.2 Forms of decentralisation in selected east and southern African countries......................................................183Table 6.3 Health systems strategies to facilitate and enable social empowerment.............................................................186
LIST OF FIGURES
Figure 1.1 The countries in the east and southern African region ............................................................................................4Figure 1.2 Per capita gross domestic product in east and southern Africa, 2005 ...................................................................6Figure 1.3 Human development index trends in east and southern Africa, 1975-2004 ........................................................7Figure 1.4 Gross domestic product rank minus human development index rank for east and southern Africa, 2004 ....8Figure 1.5 Population living below US$1 and US$2 per day (1993 purchasing power parity in US$), 1990–2003 ..........10
Figure 1.6 Gini coefficients in east and southern Africa ..........................................................................................................11Figure 1.7 Regional shares of world wealth.................................................................................................................................12Figure 1.8 Inequalities in under-five mortality by wealth, maternal education and rural/urban divides, east and
southern African countries, 1998–2004 ....................................................................................................................16Figure 1.9 Adult literacy and female literacy in east and southern Africa, 2004 ....................................................................17Figure 1.10 School enrolment in east and southern Africa, 2002–2003....................................................................................18Figure 1.11 Adult prevalence of HIV infection: east and southern African countries, 2005 ...............................................18Figure 1.12 Regional comparison of number of people living with HIV or AIDS, 2005 ....................................................19Figure 1.13 Rural and urban access to sanitation, east and southern African countries, 2002 .............................................22Figure 1.14 Rural and urban access to safe water, 2002 ..............................................................................................................22Figure 1.15 Measles immunisation, children 12–23 months in east and southern Africa, 1997–2004 ................................23Figure 1.16 Contraceptive prevalence rate in east and southern African countries, women 15–49 years ..........................23Figure 1.17 Access to basic facilities according to income in South Africa, 2000 ...................................................................24Figure 1.18 Births attended by skilled personnel for east and southern African countries, 1998–2004 .............................24Figure 1.19 Chain of disadvantage from morbidity to treatment outcomes ...........................................................................26
Figure 2.1a Global cartogram with country sizes proportional to their gross domestic product.........................................38Figure 2.1b Global cartogram with country sizes proportional to their child mortality ........................................................38Figure 2.2a Global cartogram with country sizes proportional to energy consumption .......................................................46Figure 2.2b Global cartogram with country sizes proportional to population living with HIV and AIDS ........................46Figure 2.3 Public expenditure on health by debt service levels, east and southern Africa ..................................................47Figure 2.4 Third world aid trends, 1965–2004: official development assistance as a percentage of gross national
income ............................................................................................................................................................................49Figure 2.5 Trends in child malnutrition in developing countries 1990–2000 .........................................................................54Figure 2.6 National trends in underweight prevalence in selected east and southern Africa countries ............................55
Figure 3.1 Measles cases and deaths, South Africa, 1980-2003 ................................................................................................77Figure 3.2 Share government spending on health by GDP/capita (PPP), east and southern Africa, 2003 ......................78Figure 3.3 Correlation between the Gini coefficient and % public expenditure of health budget among countries in
SADC..............................................................................................................................................................................79Figure 3.4 Share of public spending on health as a percentage of gross domestic product (2003) and maternal
mortality rate in east and southern Africa (1985–2003)..........................................................................................80Figure 3.5 Share public spending on health as a percentage of gross domestic product (2003) and under 5
mortality rate (2004) in east and southern Africa countries ...................................................................................80Figure 3.6 Share of people in need of antiretroviral therapy receiving it in east and southern Africa, 2005 ...................82Figure 3.7 External resources share of health financing, east and southern Africa, 1999-2003 .........................................92
Figure 4.1 Government expenditure as a % of total expenditure on health, east and southern Africa, 1998-2003......108Figure 4.2 Per capita expenditure on health US$, east and southern African countries, 2003 ..........................................109Figure 4.3 Health as a percentage share of government expenditure, east and southern Africa 1998–2005 .................113Figure 4.4 Comparison of out-of-pocket, government and external funding levels in African countries ......................121Figure 4.5 Health service utilisation in Uganda before and after abolition of user fees, Kisoro district .......................125Figure 4.6 Externally funded expenditure on health as a percentage of total health expenditure for selected east
and southern African countries, 1998-2004............................................................................................................128Figure 4.7 Equitable access to public facilities: Seeing all pieces of the puzzle...................................................................131Figure 4.8 Comparison of hospital and primary care expenditure as a share of total health expenditure in selected
countries in east and southern African, 1997/98...................................................................................................135
Figure 5.1 Number of doctors, nurses per 100,000 population in east and southern African countries, 2004..............145Figure 5.2 Pattern of movement and migration of health personnel ...................................................................................151Figure 5.3 African-trained nurses registered per year in the United Kingdom, 1998–2003 ..............................................152Figure 5.4 International and United Kingdom sources of new nurse registration, 1989-2003.........................................152Figure 5.5 Ratio of nurse wages (purchasing power parity US$), destination to source country .....................................153Figure 5.6 Data from sending and receiving countries of health worker migration ...........................................................164
Figure 6.1 Adult literacy and adult female literacy in east and southern African countries, 2004 ...................................176

vii
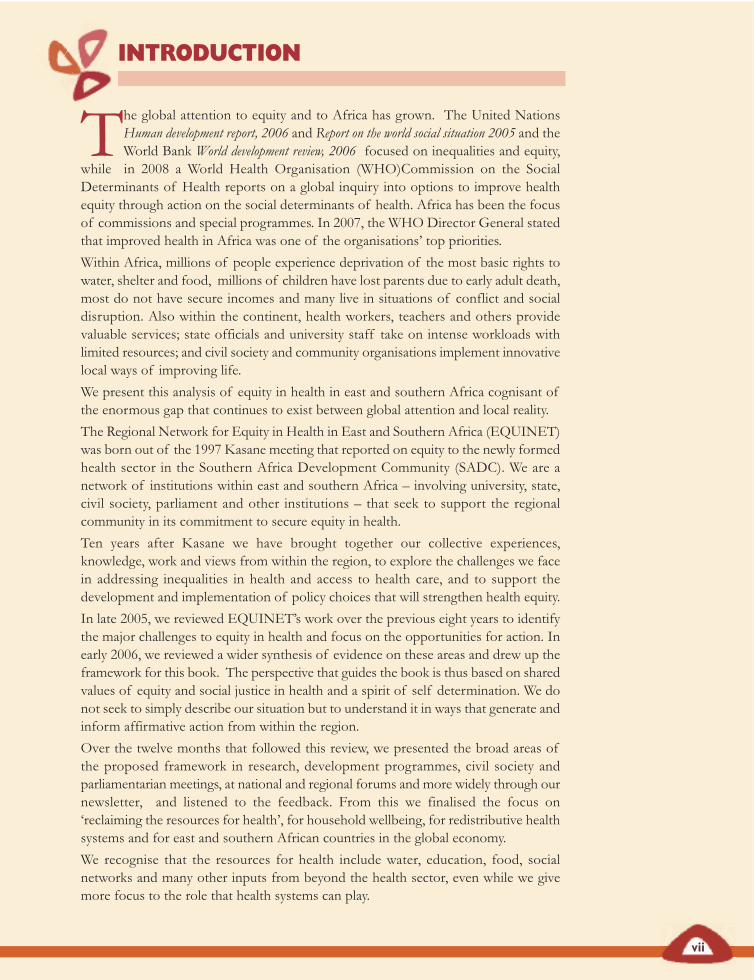
The global attention to equity and to Africa has grown. The United NationsHuman development report, 2006 and Report on the world social situation 2005 and theWorld Bank World development review, 2006 focused on inequalities and equity,
while in 2008 a World Health Organisation (WHO)Commission on the SocialDeterminants of Health reports on a global inquiry into options to improve healthequity through action on the social determinants of health. Africa has been the focusof commissions and special programmes. In 2007, the WHO Director General statedthat improved health in Africa was one of the organisations’ top priorities.
Within Africa, millions of people experience deprivation of the most basic rights towater, shelter and food, millions of children have lost parents due to early adult death,most do not have secure incomes and many live in situations of conflict and socialdisruption. Also within the continent, health workers, teachers and others providevaluable services; state officials and university staff take on intense workloads withlimited resources; and civil society and community organisations implement innovativelocal ways of improving life.
We present this analysis of equity in health in east and southern Africa cognisant ofthe enormous gap that continues to exist between global attention and local reality.
The Regional Network for Equity in Health in East and Southern Africa (EQUINET)was born out of the 1997 Kasane meeting that reported on equity to the newly formedhealth sector in the Southern Africa Development Community (SADC). We are anetwork of institutions within east and southern Africa – involving university, state,civil society, parliament and other institutions – that seek to support the regionalcommunity in its commitment to secure equity in health.
Ten years after Kasane we have brought together our collective experiences,knowledge, work and views from within the region, to explore the challenges we facein addressing inequalities in health and access to health care, and to support thedevelopment and implementation of policy choices that will strengthen health equity.
In late 2005, we reviewed EQUINET’s work over the previous eight years to identifythe major challenges to equity in health and focus on the opportunities for action. Inearly 2006, we reviewed a wider synthesis of evidence on these areas and drew up theframework for this book. The perspective that guides the book is thus based on sharedvalues of equity and social justice in health and a spirit of self determination. We donot seek to simply describe our situation but to understand it in ways that generate andinform affirmative action from within the region.
Over the twelve months that followed this review, we presented the broad areas ofthe proposed framework in research, development programmes, civil society andparliamentarian meetings, at national and regional forums and more widely through ournewsletter, and listened to the feedback. From this we finalised the focus on‘reclaiming the resources for health’, for household wellbeing, for redistributive healthsystems and for east and southern African countries in the global economy.
We recognise that the resources for health include water, education, food, socialnetworks and many other inputs from beyond the health sector, even while we givemore focus to the role that health systems can play.
INTRODUCTION
viii
The book presents a synthesis of the evidence gathered from a range of sources.These include published literature on and from the region, reviews of current evidence,where available, and data drawn primarily from government, inter-governmental,particularly African Union and United Nations sources. We draw attention to the widerhealth reviews and policy documents on health in the region, keeping our focus on theissues specifically relevant to equity. We have also drawn on the less commonlydocumented and disseminated experience within the region, found in grey literature,interviews and testimonials, and gathered through participatory processes.
We acknowledge the limits to the evidence presented in the book, as well as its diversity.Dense tables and figures may be difficult to absorb but they feed the analysis. Casestudies, quotes and images from different sources are an important source of evidenceon the vision, views, experience and practices that stimulate and shape action. Despitelimits and complexities, we contend that it is possible to learn from existing experiencein order to act.
On some issues there is clear evidence of the kind conventionally accepted by publichealth practitioners as ‘rigorous’. On others, action can be based on a combination ofvalues and an assessment of how available evidence can be made useful in differentcontexts, understanding that action is imperative in the face of inequity.
The book is written for many audiences. For the diverse community involved in healthequity within east and southern Africa, we hope it will provide a source of evidenceand analysis to support and advance their work. We intend to ‘repackage’ the materialinto briefs, leaflets, presentations and other tools that will support its use, including atcommunity level. We present it to those making decisions on policies and programmeswithin and beyond the health sector within our region, to inform, strengthen and, insome cases, to challenge the policies and programmes that impact on equity in health.The analysis shows that local and national realities are deeply influenced by the policiesand actions of international global institutions and we address ourselves also to thislevel of international partners, particularly given the global commitments to equityraised at the beginning of this introduction.
It is our understanding that a book of this nature is a point in a process, within arapidly changing world. It has drawn on many inputs, acknowledged in later pages.The book is also presented to encourage debate and dialogue, to draw out furtherexperience and to stimulate research to gather new knowledge. We invite feedback,peer review and debate. As the book was being finalised, new policy commitments andstrategies were being voiced by the African Union health ministers, new work wasemerging on rights to health from civil society, new commitments were being made atthe World Health Assembly and others will emerge that post-date the evidence wepresent.
Yet the determinants of unfair and avoidable inequalities in health that are presentedappear to be persistent. They point to broad policy choices and specific options thatfairly respond to these inequalities and more importantly to strategies to strengthen theautonomy and capability of disadvantaged communities to influence these choices.We are excited to be part of this process.
EQUINET steering committee
August 2007
ix
We have the knowledge, ability and experience to overcome persistentinequalities in health in east and southern Africa. This analysis provides aninspiring and empowering message, exploring several aspects of health andhealth systems and providing many examples of good practice in the region.
The evidence in this analysis points to three ways in which reclaiming theresources for health can improve health equity. These are:
• for poor people to claim a fairer share of national resources to im-prove their health;
• for a more just return for east and southern African countries fromthe global economy to increase the resources for health; and
• for a larger share of global and national resources to be investedin redistributive health systems to overcome the impoverishing ef-fects of ill health.
Although the health picture for east and southern Africa is currently quite bleak,with high mortality rates, low life expectancy and high burdens of under-nutrition, HIV and AIDS, tuberculosis (TB) and malaria, the message thatemerges from this book is one of hope and recognition of our strengths andpossibilities for action.
The region has the economic and social potential to address its major healthneeds, yet improved growth has occurred with falling human development andincreasing poverty. In many east and southern African countries, wideningnational inequalities in wealth block poor households from the benefits ofgrowth, while substantial resources flow outwards from Africa, leaving most ofits people in poverty and depleting the resources for health. The analysis addsevidence to the growing call for a fairer form of globalisation and a more justreturn to Africa from the global economy. The book maps the trade, investmentand production policies and measures that have strong public health impact andoffers options to address outflows and promote access to food, health care andmedicines. National measures that redistribute these resources for widereconomic and social gain provide clear pathways for equitable use of fundsreleased from debt cancellation, improved terms of trade, increased externalfunding and other global measures.
While many of these actions lie outside the health sector, the analysis arguesthat health systems can make a difference by providing leadership, shaping widersocial norms and values, demonstrating health impacts and promoting workacross sectors.
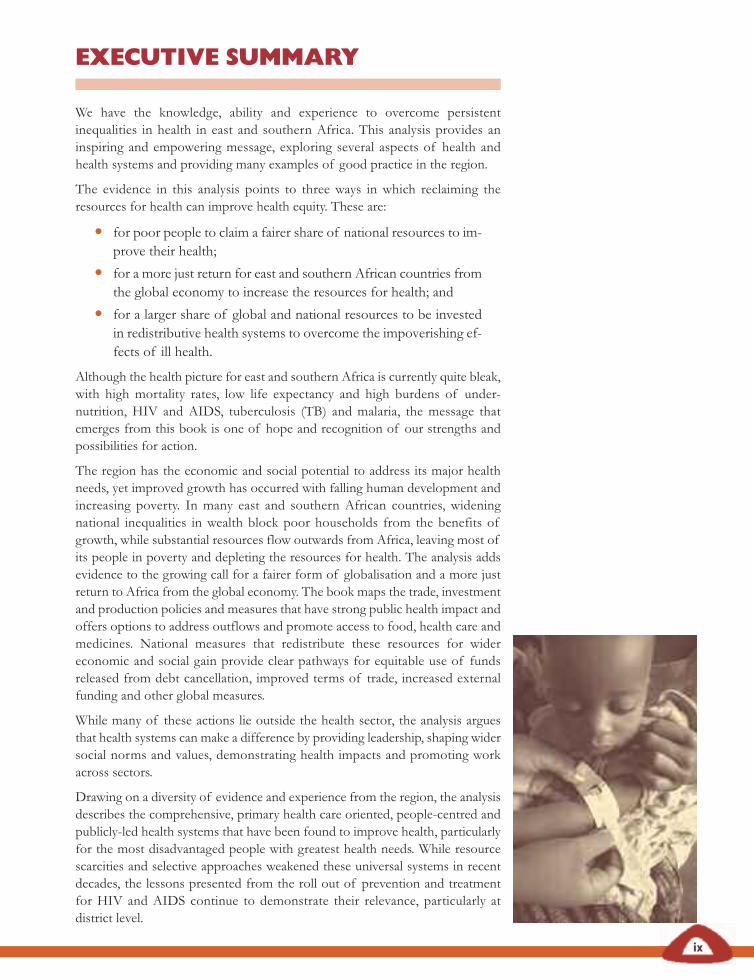
Drawing on a diversity of evidence and experience from the region, the analysisdescribes the comprehensive, primary health care oriented, people-centred andpublicly-led health systems that have been found to improve health, particularlyfor the most disadvantaged people with greatest health needs. While resourcescarcities and selective approaches weakened these universal systems in recentdecades, the lessons presented from the roll out of prevention and treatmentfor HIV and AIDS continue to demonstrate their relevance, particularly atdistrict level.
EXECUTIVE SUMMARY
That those with highest health needs are being persistently disadvantaged in accessto health care is thus of concern. The analysis explores the reasons for this – withinthe way health systems are funded and organised – and identifies the barriers thatpeople encounter in using health services.
Addressing these problems demands a strengthened public sector in health.Current average spending on health systems in the region is below the minimumfor a functional health system, or even for the most basic interventions for majorpublic health burdens. Therefore one priority is for governments to meet the(largely unmet) commitment made in Abuja to 15 per cent of governmentspending on health, excluding external financing. We argue, however, for ‘AbujaPLUS’ – for international delivery on debt cancellation and for a significantlygreater share of this government spending to be allocated to district health systems.
The analysis presents progressive options for mobilising these additional domesticresources for health systems without burdening poor households, and forincreasing spending on district and primary health care systems. One focus area forincreased spending is health workers. Without health workers there is no healthsystem. In the face of massive shortfalls and significant outflows of health workers,the analysis explores what incentives countries in the region are using to train andretain health workers and to ensure they are effective and motivated. Recognisingthat many health workers prefer not to migrate, the report examines how bilateralagreements and compensatory investments can support these incentives to valueand retain the health workforce.
These approaches are not without challenges, whether from local elites, competingapproaches or global trade pressures. Yet health is a universal human right andinternational and regional conventions call for core rights and obligations to protectpeople’s health. One basis for optimism is the significant social pressure for the goalof equity in health and the social resources, networks and capabilities available toachieve it. The analysis points to the many ways health systems can empowerpeople, stimulate social action and create powerful constituencies to advance publicinterests in health. Tapping these potentials calls for a robust, systematic form ofparticipatory democracy and a more collectively organised and informed society.
These measures are within our means to achieve in the region but demandconcerted action.
To champion these values, policies and measures, to monitor progress and enhanceaccountability, the analysis proposes a set of targets and indicators that signalprogress in key dimensions of health equity, and towards meeting regional andglobal commitments. EQUINET, as a network of institutions in the region, iscommitted to implementing and supporting the building of knowledge, skills andlearning to meet these goals.
The analysis is a resource for the institutions and alliances working in and beyondthe region towards goals of improved health and social justice. The evidencepresented is diverse, some from the region and not commonly diseminated. Despitelimits to the evidence and complexity in the context, we contend that it is possibleto act, drawing on shared values and an assessment of how available evidence canbe made useful in different contexts, recognising that action is imperative in theface of inequity
x
xi
AIDS acquired immune deficiency syndromeART antiretroviral therapyARV antiretroviralAU African UnionCAADP Comprehensive Africa Agriculture
Development ProgrammeCEDAW Convention on the Elimination of All Forms
of Discrimination against WomenCHP Centre for Health PolicyCMH Commission on Macroeconomics and HealthCMR child mortality rateCWGH Community Working Group on HealthDAC Development Assistance CommitteeDHS demographic health surveysDOT directly observed treatmentDRC Democratic Republic of CongoDSS demographic surveillance systemECA Economic Commission for AfricaECSA East, Central, and Southern African Health
CommunityEPA Economic Partnership AgreementEQUINET Regional Network for Equity in Health in
east and southern AfricaESA east and southern AfricaEU European UnionFAO Food and Agriculture OrganisationFDI foreign direct investmentFTA free trade agreementGATS General Agreement on Trade in ServicesGBS general budget supportGDP gross domestic productGP general practitionerGST general sales taxHAI Health Action InternationalHDI Human Development IndexHIPC Heavily Indebted Poor CountriesHIV human immunodeficiency virusHPI Human Poverty IndexHRH Human Resources for HealthIFAD International Fund for Agricultural
DevelopmentIHRDC Ifakara Health Research and Development
CentreIMF International Monetary FundIMR infant mortality rateLDC least developed country
MDGs Millenium Development GoalsMMR maternal mortality rateMoH Ministry of HealthMoHCW Ministry of Health and Child WelfareNEPAD New Economic Partnership for African
DevelopmentNHA national health accountsODA overseas development aidODI Overseas Development InstituteOECD Organisation for Economic Co-operation
and DevelopmentOPM Oxford Policy ManagementPATAM Pan African Treatment Access MovementPPP purchasing power parityPRSP poverty reduction strategy paperSACU Southern African Customs UnionSADC Southern African Development CommunitySAMWU South African Municipal Workers UnionSASF Southern Africa Social ForumSATUCC Southern African Trade Union Co-ordinating
CouncilSEATINI Southern and Eastern African Trade Infor-
mation and Negotiations InstituteSC steering committeeSTI sexually transmitted infectionSURF Sub-Regional Resource Facility for West and
Central AfricaSWAp sector wide approachTAC Treatment Action CampaignTARSC Training and Research Suppport CentreTB tuberculosisTRIPS Trade Related Intellectual Property RightsUN United NationsUNDP United Nations Development ProgrammeUN SCN United Nations Standing Committee on
NutritionUSAID United States Agency for International
DevelopmentVAT value added taxWCSDG World Commission on the Social Dimension
of GlobalisationWFP World Food ProgrammeWHA World Health AssemblyWHO World Health OrganisationWONCA World Organisation of Family DoctorsWTO World Trade Organisation
ACRONYMS


Progress inHEALTHEQUITYIN EAST AND SOUTHERN AFRICA
SECTION
1
KEY ISSUES
SECTION
1
Countries in east and southern Africa have the economic andsocial potential to address their major health needs. Their grossdomestic products are, however, a poor reflection of their
abundant natural wealth. Across the region, improved growth hasoccurred with falling human development and many countries haverecorded increased poverty and widening national inequality in wealth.Globally, inequalities in wealth are also widening.
East and southern African countries have experienced persistentinequalities in health, both between the different countries in the regionand within the countries themselves. Despite health services expandingin the past decades, inequalities in access to health care and other healthinputs persist. Inevitably these gaps in access are widest in groups withthe greatest health needs.
For decades, countries in the region have expressed theircommitment to overcoming unfair differences in access to healthand to allocating more resources to those with greater health needs.To do this in the current context, however, we need to reclaim theresources for health: Poor households need to access a fairer shareof national resources. We need to invest a great deal more in the healthservices used by these communities and African countries need to havegreater latitude in the global economy to effectively use their resourcesto improve the health of their citizens.
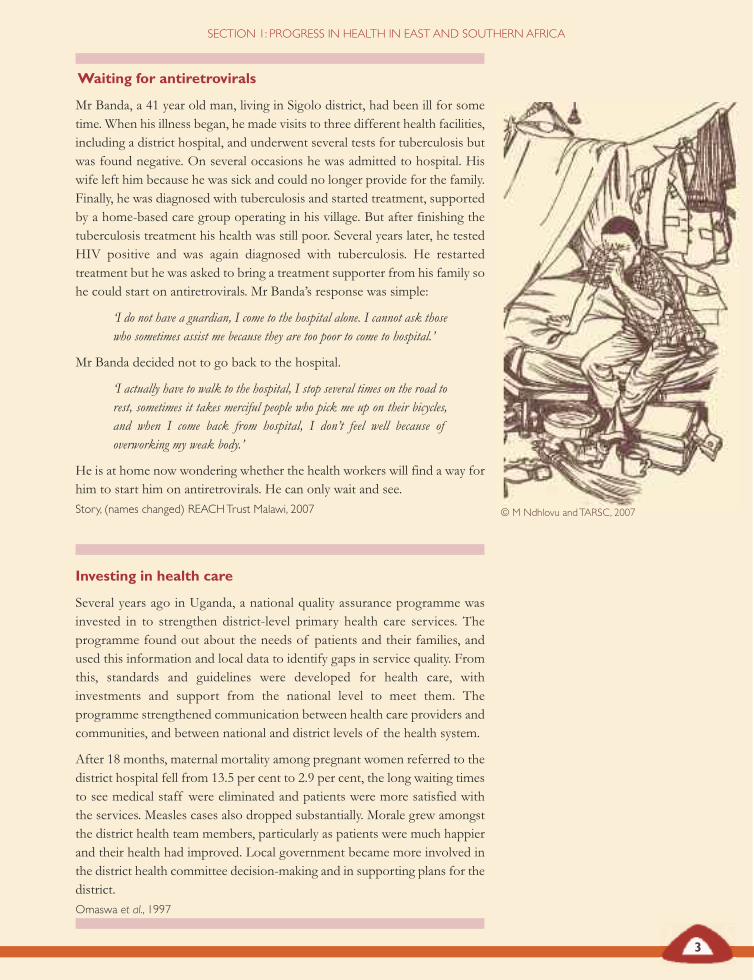
Waiting for antiretrovirals
Mr Banda, a 41 year old man, living in Sigolo district, had been ill for sometime. When his illness began, he made visits to three different health facilities,including a district hospital, and underwent several tests for tuberculosis butwas found negative. On several occasions he was admitted to hospital. Hiswife left him because he was sick and could no longer provide for the family.Finally, he was diagnosed with tuberculosis and started treatment, supportedby a home-based care group operating in his village. But after finishing thetuberculosis treatment his health was still poor. Several years later, he testedHIV positive and was again diagnosed with tuberculosis. He restartedtreatment but he was asked to bring a treatment supporter from his family sohe could start on antiretrovirals. Mr Banda’s response was simple:
‘I do not have a guardian, I come to the hospital alone. I cannot ask thosewho sometimes assist me because they are too poor to come to hospital.’
Mr Banda decided not to go back to the hospital.
‘I actually have to walk to the hospital, I stop several times on the road torest, sometimes it takes merciful people who pick me up on their bicycles,and when I come back from hospital, I don’t feel well because ofoverworking my weak body.’
He is at home now wondering whether the health workers will find a way forhim to start him on antiretrovirals. He can only wait and see.Story, (names changed) REACHTrust Malawi, 2007
Investing in health care
Several years ago in Uganda, a national quality assurance programme wasinvested in to strengthen district-level primary health care services. Theprogramme found out about the needs of patients and their families, andused this information and local data to identify gaps in service quality. Fromthis, standards and guidelines were developed for health care, withinvestments and support from the national level to meet them. Theprogramme strengthened communication between health care providers andcommunities, and between national and district levels of the health system.
After 18 months, maternal mortality among pregnant women referred to thedistrict hospital fell from 13.5 per cent to 2.9 per cent, the long waiting timesto see medical staff were eliminated and patients were more satisfied withthe services. Measles cases also dropped substantially. Morale grew amongstthe district health team members, particularly as patients were much happierand their health had improved. Local government became more involved inthe district health committee decision-making and in supporting plans for thedistrict.Omaswa et al., 1997
3
SECTION 1: PROGRESS IN HEALTH IN EAST AND SOUTHERN AFRICA
© M Ndhlovu andTARSC, 2007
4
RECLAIMINGTHE RESOURCES FOR HEALTH:ADVANCING HEALTH EQUITY IN EAST AND SOUTHERN AFRICA
Equity in health impliesaddressing differences in healthstatus that are unnecessary,avoidable and unfair. Equitymotivated interventions seek toallocate resources preferentially tothose with the lowest healthstatus. This means understandingand influencing the redistributionof social and economic resourcesfor equity oriented interventions,and understanding and informingthe power and ability people (andsocial groups) have to makechoices over health inputs and touse these choices towards betterhealth.EQUINET steering committee, 1998
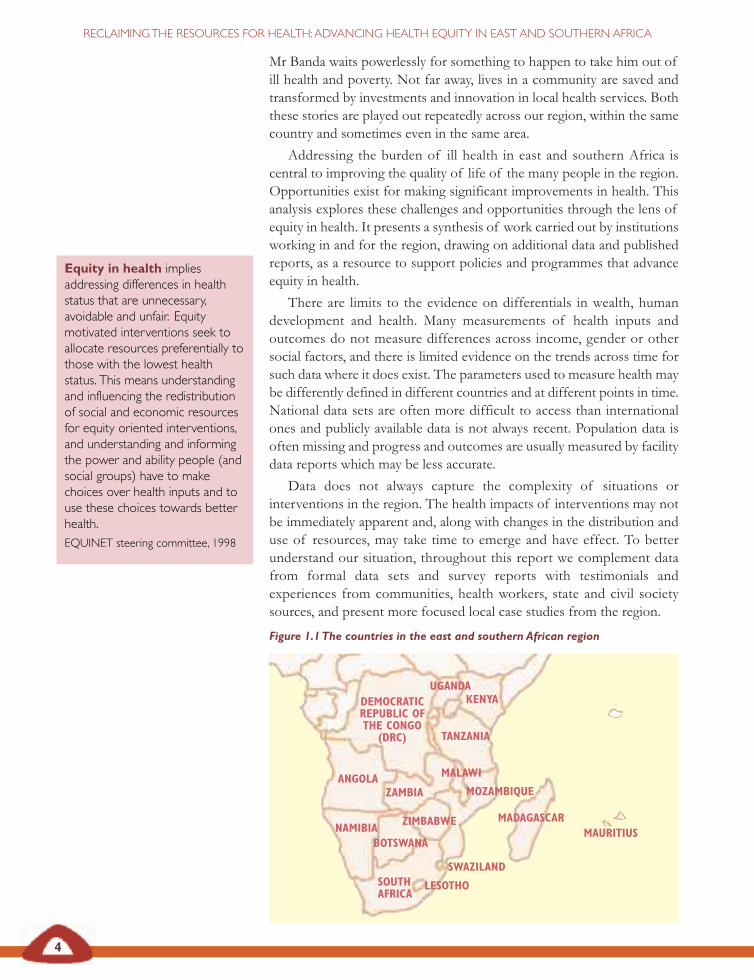
Figure 1.1The countries in the east and southern African region
Mr Banda waits powerlessly for something to happen to take him out ofill health and poverty. Not far away, lives in a community are saved andtransformed by investments and innovation in local health services. Boththese stories are played out repeatedly across our region, within the samecountry and sometimes even in the same area.
Addressing the burden of ill health in east and southern Africa iscentral to improving the quality of life of the many people in the region.Opportunities exist for making significant improvements in health. Thisanalysis explores these challenges and opportunities through the lens ofequity in health. It presents a synthesis of work carried out by institutionsworking in and for the region, drawing on additional data and publishedreports, as a resource to support policies and programmes that advanceequity in health.
There are limits to the evidence on differentials in wealth, humandevelopment and health. Many measurements of health inputs andoutcomes do not measure differences across income, gender or othersocial factors, and there is limited evidence on the trends across time forsuch data where it does exist. The parameters used to measure health maybe differently defined in different countries and at different points in time.National data sets are often more difficult to access than internationalones and publicly available data is not always recent. Population data isoften missing and progress and outcomes are usually measured by facilitydata reports which may be less accurate.
Data does not always capture the complexity of situations orinterventions in the region. The health impacts of interventions may notbe immediately apparent and, along with changes in the distribution anduse of resources, may take time to emerge and have effect. To betterunderstand our situation, throughout this report we complement datafrom formal data sets and survey reports with testimonials andexperiences from communities, health workers, state and civil societysources, and present more focused local case studies from the region.
ANGOLAZAMBIA
MALAWI
NAMIBIA
LESOTHO
SWAZILAND
MADAGASCAR
MOZAMBIQUE
ZIMBABWE
TANZANIA
KENYAUGANDA
MAURITIUS
DEMOCRATICREPUBLIC OFTHE CONGO
(DRC)
BOTSWANA
SOUTHAFRICA
5
SECTION 1: PROGRESS IN HEALTH IN EAST AND SOUTHERN AFRICA
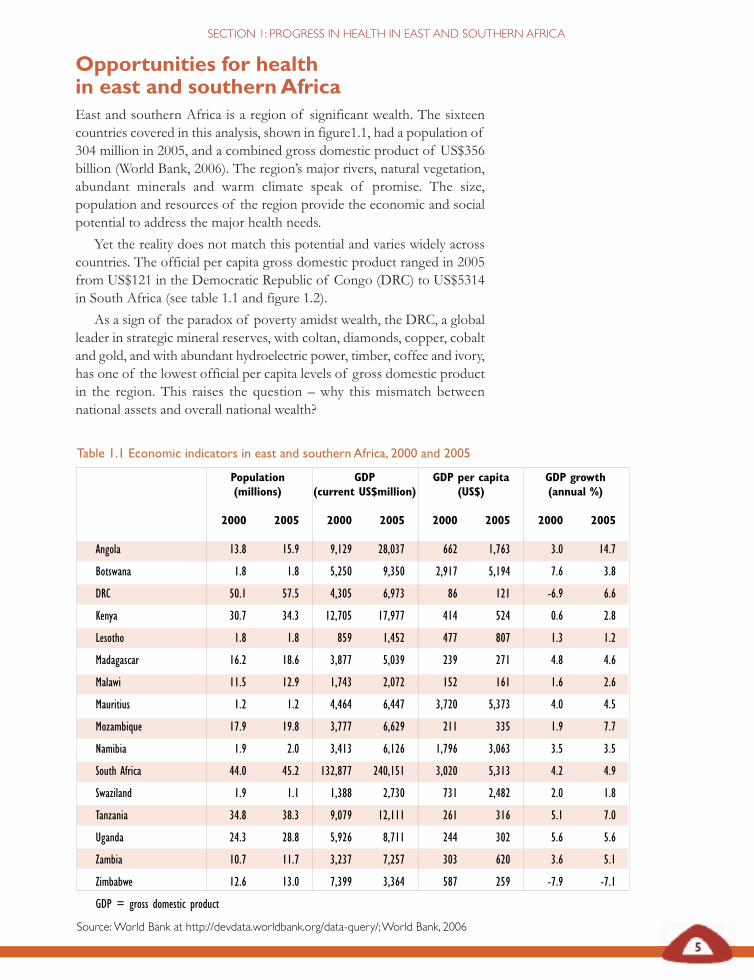
Table 1.1 Economic indicators in east and southern Africa, 2000 and 2005
Population GDP GDP per capita GDP growth(millions) (current US$million) (US$) (annual %)
2000 2005 2000 2005 2000 2005 2000 2005
Angola 13.8 15.9 9,129 28,037 662 1,763 3.0 14.7
Botswana 1.8 1.8 5,250 9,350 2,917 5,194 7.6 3.8
DRC 50.1 57.5 4,305 6,973 86 121 -6.9 6.6
Kenya 30.7 34.3 12,705 17,977 414 524 0.6 2.8
Lesotho 1.8 1.8 859 1,452 477 807 1.3 1.2
Madagascar 16.2 18.6 3,877 5,039 239 271 4.8 4.6
Malawi 11.5 12.9 1,743 2,072 152 161 1.6 2.6
Mauritius 1.2 1.2 4,464 6,447 3,720 5,373 4.0 4.5
Mozambique 17.9 19.8 3,777 6,629 211 335 1.9 7.7
Namibia 1.9 2.0 3,413 6,126 1,796 3,063 3.5 3.5
South Africa 44.0 45.2 132,877 240,151 3,020 5,313 4.2 4.9
Swaziland 1.9 1.1 1,388 2,730 731 2,482 2.0 1.8
Tanzania 34.8 38.3 9,079 12,111 261 316 5.1 7.0
Uganda 24.3 28.8 5,926 8,711 244 302 5.6 5.6
Zambia 10.7 11.7 3,237 7,257 303 620 3.6 5.1
Zimbabwe 12.6 13.0 7,399 3,364 587 259 -7.9 -7.1
GDP = gross domestic product
Source:World Bank at http://devdata.worldbank.org/data-query/;World Bank, 2006
Opportunities for healthin east and southernAfricaEast and southern Africa is a region of significant wealth. The sixteencountries covered in this analysis, shown in figure1.1, had a population of304 million in 2005, and a combined gross domestic product of US$356billion (World Bank, 2006). The region’s major rivers, natural vegetation,abundant minerals and warm climate speak of promise. The size,population and resources of the region provide the economic and socialpotential to address the major health needs.
Yet the reality does not match this potential and varies widely acrosscountries. The official per capita gross domestic product ranged in 2005from US$121 in the Democratic Republic of Congo (DRC) to US$5314in South Africa (see table 1.1 and figure 1.2).
As a sign of the paradox of poverty amidst wealth, the DRC, a globalleader in strategic mineral reserves, with coltan, diamonds, copper, cobaltand gold, and with abundant hydroelectric power, timber, coffee and ivory,has one of the lowest official per capita levels of gross domestic productin the region. This raises the question – why this mismatch betweennational assets and overall national wealth?
6
RECLAIMINGTHE RESOURCES FOR HEALTH:ADVANCING HEALTH EQUITY IN EAST AND SOUTHERN AFRICA
Table 1.2 Human development index trends in east and southern Africa, 1975–2003
HDI* rank2004 1975 1980 1985 1990 1995 2000 2004
65 Mauritius .. 0.659 0.690 0.724 0.747 0.776 0.800
120 South Africa 0.655 0.674 0.702 0.735 0.742 0.696 0.653
125 Namibia .. .. .. .. 0.693 0.649 0.627
131 Botswana 0.503 0.577 0.638 0.681 0.659 0.596 0.570
144 Uganda .. .. 0.412 0.409 0.412 0.474 0.508
145 Zimbabwe 0.546 0.574 0.640 0.637 0.589 0.527 0.491
146 Madagascar 0.400 0.437 0.436 0.446 0.458 .. 0.509
147 Swaziland 0.530 0.562 0.584 0.624 0.603 0.534 0.500
149 Lesotho 0.461 0.510 0.534 0.571 0.573 0.520 0.494
154 Kenya 0.461 0.509 0.530 0.546 0.524 0.499 0.491
160 Angola .. .. .. .. .. .. 0.439
164 Tanzania .. .. .. 0.435 0.422 0.416 0.430
165 Malawi 0.320 0.351 0.362 0.371 0.412 0.402 0.400
166 Zambia 0.468 0.475 0.484 0.462 0.424 0.409 0.407
167 DRC 0.414 0.423 0.431 0.422 0.393 .. 0.391
168 Mozambique .. 0.299 0.287 0.311 0.328 0.360 0.390
* HDI values were calculated using a consistent methodology and data series. Range is 0 (lowest) to 1 (highest).
Source: UNDP, 2005
Per capita GDP US$
0–499
500–999
1000–2999
3000–4999
5000+
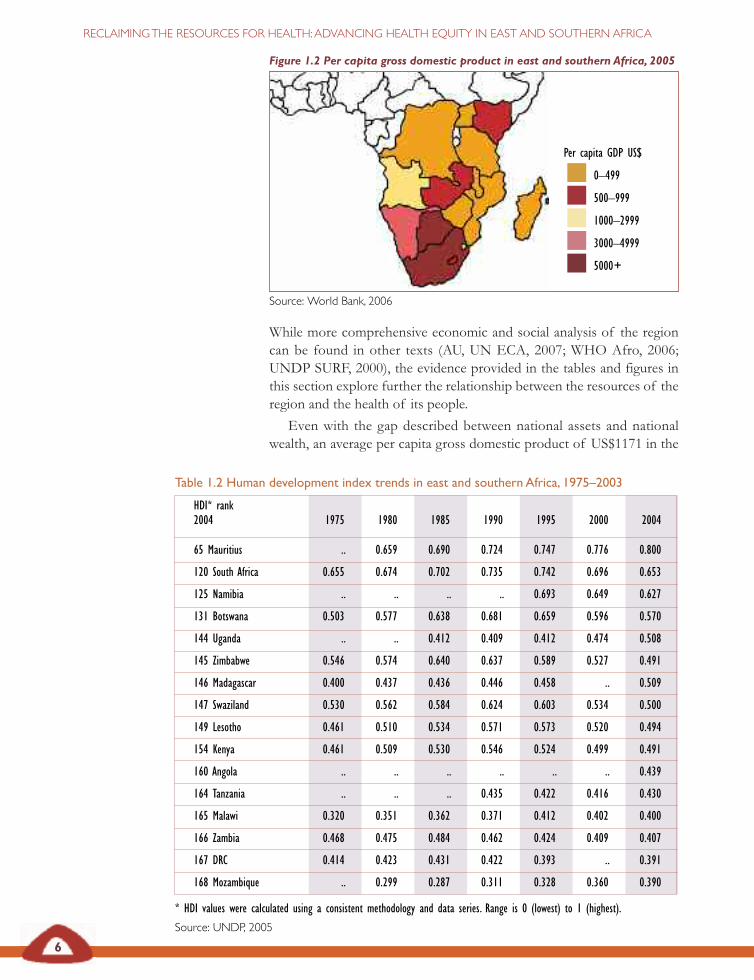
While more comprehensive economic and social analysis of the regioncan be found in other texts (AU, UN ECA, 2007; WHO Afro, 2006;UNDP SURF, 2000), the evidence provided in the tables and figures inthis section explore further the relationship between the resources of theregion and the health of its people.
Even with the gap described between national assets and nationalwealth, an average per capita gross domestic product of US$1171 in the
Figure 1.2 Per capita gross domestic product in east and southern Africa, 2005
Source: World Bank, 2006
7
SECTION 1: PROGRESS IN HEALTH IN EAST AND SOUTHERN AFRICA
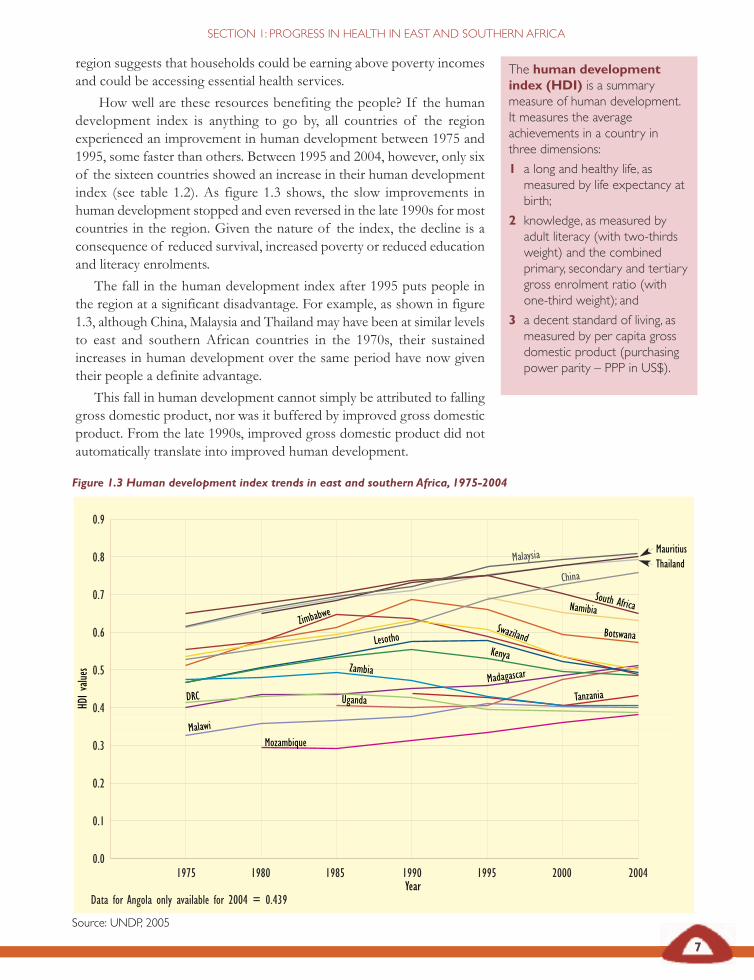
The human developmentindex (HDI) is a summarymeasure of human development.It measures the averageachievements in a country inthree dimensions:
1 a long and healthy life, asmeasured by life expectancy atbirth;
2 knowledge, as measured byadult literacy (with two-thirdsweight) and the combinedprimary, secondary and tertiarygross enrolment ratio (withone-third weight); and
3 a decent standard of living, asmeasured by per capita grossdomestic product (purchasingpower parity – PPP in US$).
1975 1980 1985 1990 1995 2000 2004
0.9
0.8
0.7
0.6
0.5
0.4
0.3
0.2
0.1
0.0
MauritiusThailandMalaysia
China
South AfricaNamibia
Botswana
Uganda
Zimbabwe
Madagascar
Swaziland
Zambia
Kenya
Tanzania
Malawi
Lesotho
DRC
Mozambique
HDIvalu
es
Year
Figure 1.3 Human development index trends in east and southern Africa, 1975-2004
Data for Angola only available for 2004 = 0.439
Source: UNDP, 2005
region suggests that households could be earning above poverty incomesand could be accessing essential health services.
How well are these resources benefiting the people? If the humandevelopment index is anything to go by, all countries of the regionexperienced an improvement in human development between 1975 and1995, some faster than others. Between 1995 and 2004, however, only sixof the sixteen countries showed an increase in their human developmentindex (see table 1.2). As figure 1.3 shows, the slow improvements inhuman development stopped and even reversed in the late 1990s for mostcountries in the region. Given the nature of the index, the decline is aconsequence of reduced survival, increased poverty or reduced educationand literacy enrolments.
The fall in the human development index after 1995 puts people inthe region at a significant disadvantage. For example, as shown in figure1.3, although China, Malaysia and Thailand may have been at similar levelsto east and southern African countries in the 1970s, their sustainedincreases in human development over the same period have now giventheir people a definite advantage.
This fall in human development cannot simply be attributed to fallinggross domestic product, nor was it buffered by improved gross domesticproduct. From the late 1990s, improved gross domestic product did notautomatically translate into improved human development.
8
RECLAIMINGTHE RESOURCES FOR HEALTH:ADVANCING HEALTH EQUITY IN EAST AND SOUTHERN AFRICA
Mauritius
SouthAfrica
Swaziland
Namibia
Botsw
ana
Lesotho
Zimbabwe
Kenya
DRC
Madagasca
r
Zamb
ia
Tanzania
Uganda
Malaw
i
Angola
Mozamb
ique
Norway
Niger
40
20
0
-20
-40
-60
-80
GDPrank
minusHD
Irank
*Comparison is given with the countries rated highest (Norway) and lowest (Niger) on human development index.
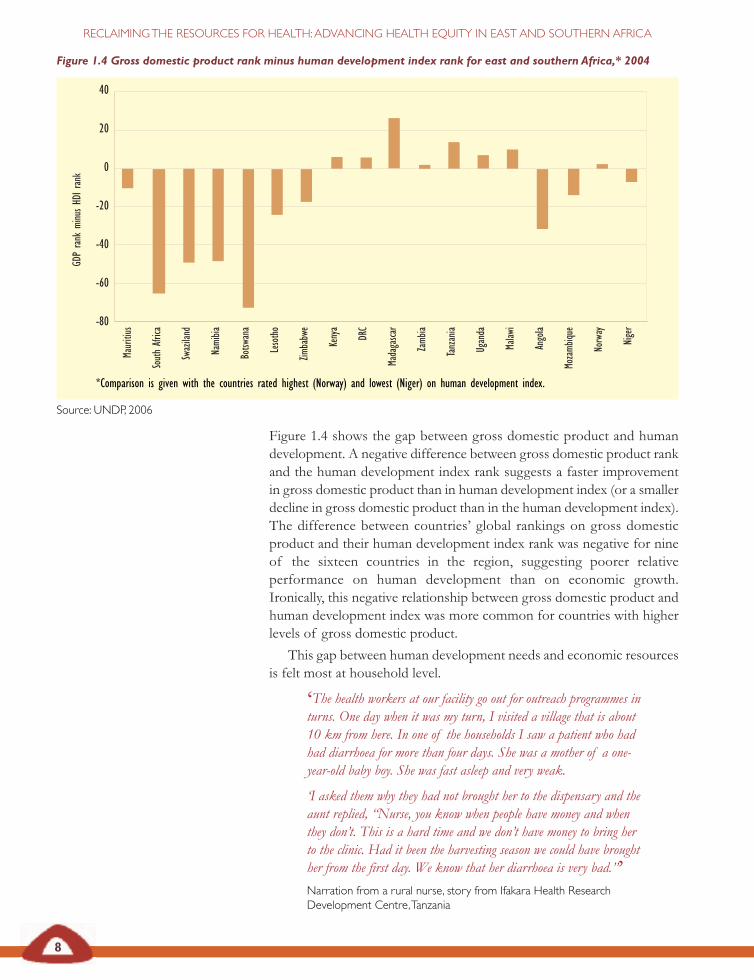
Figure 1.4 Gross domestic product rank minus human development index rank for east and southern Africa,* 2004
Source: UNDP, 2006
Figure 1.4 shows the gap between gross domestic product and humandevelopment. A negative difference between gross domestic product rankand the human development index rank suggests a faster improvementin gross domestic product than in human development index (or a smallerdecline in gross domestic product than in the human development index).The difference between countries’ global rankings on gross domesticproduct and their human development index rank was negative for nineof the sixteen countries in the region, suggesting poorer relativeperformance on human development than on economic growth.Ironically, this negative relationship between gross domestic product andhuman development index was more common for countries with higherlevels of gross domestic product.
This gap between human development needs and economic resourcesis felt most at household level.
‘The health workers at our facility go out for outreach programmes inturns. One day when it was my turn, I visited a village that is about10 km from here. In one of the households I saw a patient who hadhad diarrhoea for more than four days. She was a mother of a one-year-old baby boy. She was fast asleep and very weak.
‘I asked them why they had not brought her to the dispensary and theaunt replied, “Nurse, you know when people have money and whenthey don’t. This is a hard time and we don’t have money to bring herto the clinic. Had it been the harvesting season we could have broughther from the first day. We know that her diarrhoea is very bad.”’Narration from a rural nurse, story from Ifakara Health ResearchDevelopment Centre,Tanzania
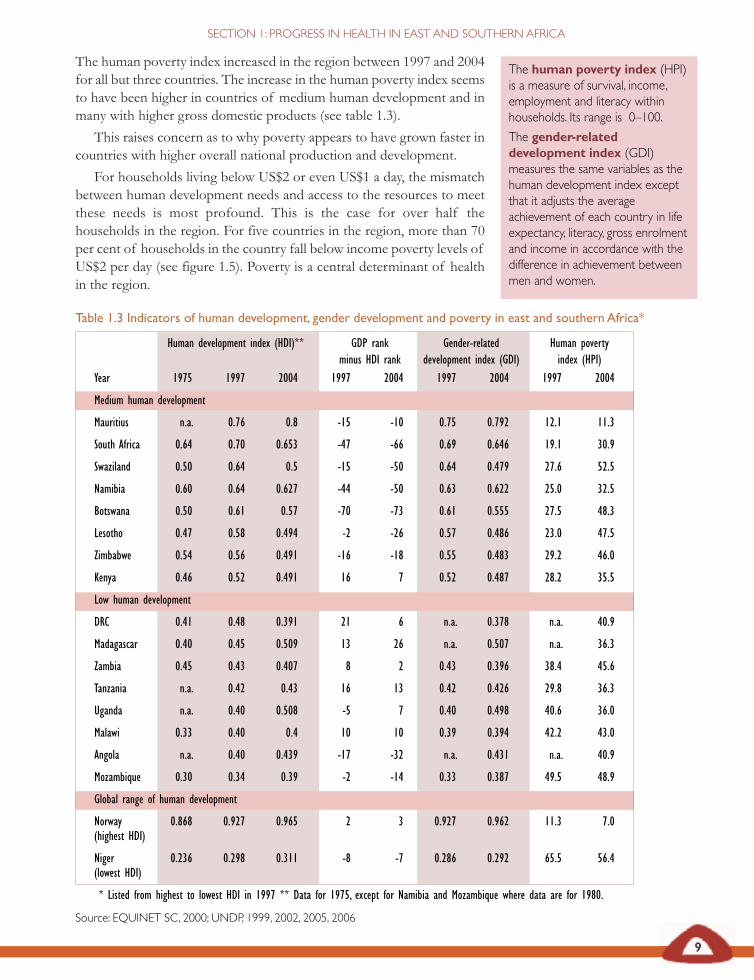
Table 1.3 Indicators of human development, gender development and poverty in east and southern Africa*
Human development index (HDI)** GDP rank Gender-related Human povertyminus HDI rank development index (GDI) index (HPI)
Year 1975 1997 2004 1997 2004 1997 2004 1997 2004
Medium human development
Mauritius n.a. 0.76 0.8 -15 -10 0.75 0.792 12.1 11.3
South Africa 0.64 0.70 0.653 -47 -66 0.69 0.646 19.1 30.9
Swaziland 0.50 0.64 0.5 -15 -50 0.64 0.479 27.6 52.5
Namibia 0.60 0.64 0.627 -44 -50 0.63 0.622 25.0 32.5
Botswana 0.50 0.61 0.57 -70 -73 0.61 0.555 27.5 48.3
Lesotho 0.47 0.58 0.494 -2 -26 0.57 0.486 23.0 47.5
Zimbabwe 0.54 0.56 0.491 -16 -18 0.55 0.483 29.2 46.0
Kenya 0.46 0.52 0.491 16 7 0.52 0.487 28.2 35.5
Low human development
DRC 0.41 0.48 0.391 21 6 n.a. 0.378 n.a. 40.9
Madagascar 0.40 0.45 0.509 13 26 n.a. 0.507 n.a. 36.3
Zambia 0.45 0.43 0.407 8 2 0.43 0.396 38.4 45.6
Tanzania n.a. 0.42 0.43 16 13 0.42 0.426 29.8 36.3
Uganda n.a. 0.40 0.508 -5 7 0.40 0.498 40.6 36.0
Malawi 0.33 0.40 0.4 10 10 0.39 0.394 42.2 43.0
Angola n.a. 0.40 0.439 -17 -32 n.a. 0.431 n.a. 40.9
Mozambique 0.30 0.34 0.39 -2 -14 0.33 0.387 49.5 48.9
Global range of human development
Norway 0.868 0.927 0.965 2 3 0.927 0.962 11.3 7.0(highest HDI)
Niger 0.236 0.298 0.311 -8 -7 0.286 0.292 65.5 56.4(lowest HDI)
* Listed from highest to lowest HDI in 1997 ** Data for 1975, except for Namibia and Mozambique where data are for 1980.
Source: EQUINET SC, 2000; UNDP, 1999, 2002, 2005, 2006
9
SECTION 1: PROGRESS IN HEALTH IN EAST AND SOUTHERN AFRICA
The human poverty index (HPI)is a measure of survival, income,employment and literacy withinhouseholds. Its range is 0–100.
The gender-relateddevelopment index (GDI)measures the same variables as thehuman development index exceptthat it adjusts the averageachievement of each country in lifeexpectancy, literacy, gross enrolmentand income in accordance with thedifference in achievement betweenmen and women.
The human poverty index increased in the region between 1997 and 2004for all but three countries. The increase in the human poverty index seemsto have been higher in countries of medium human development and inmany with higher gross domestic products (see table 1.3).
This raises concern as to why poverty appears to have grown faster incountries with higher overall national production and development.
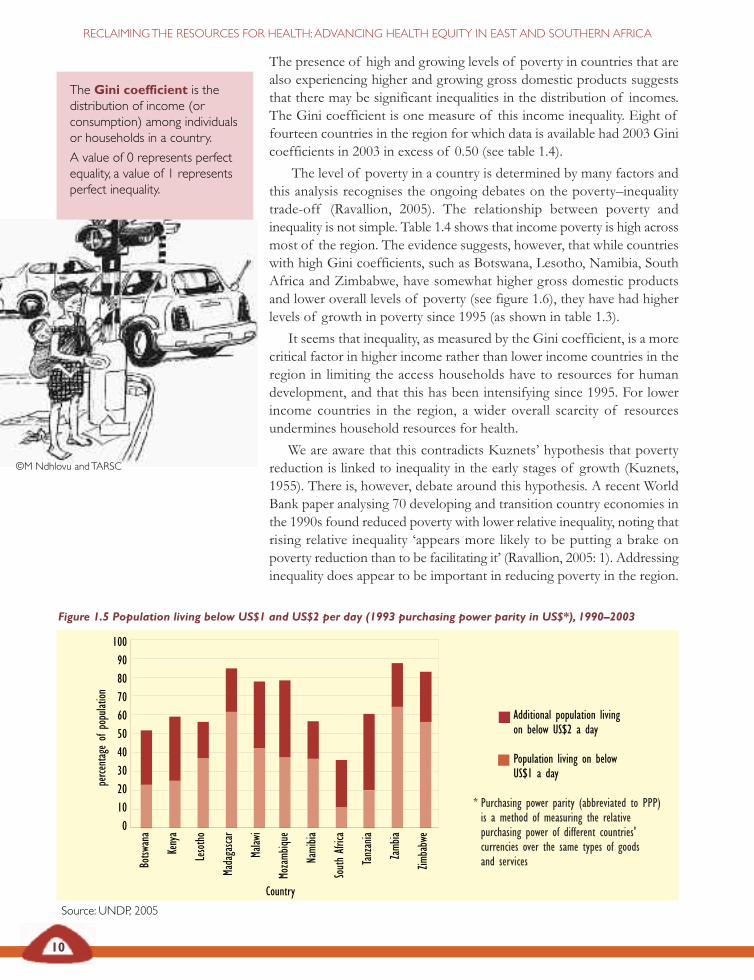
For households living below US$2 or even US$1 a day, the mismatchbetween human development needs and access to the resources to meetthese needs is most profound. This is the case for over half thehouseholds in the region. For five countries in the region, more than 70per cent of households in the country fall below income poverty levels ofUS$2 per day (see figure 1.5). Poverty is a central determinant of healthin the region.
10
RECLAIMINGTHE RESOURCES FOR HEALTH:ADVANCING HEALTH EQUITY IN EAST AND SOUTHERN AFRICA
Additional population livingon below US$2 a day
Population living on belowUS$1 a day
Source: UNDP, 2005
1009080706050403020100
Botsw
ana
Kenya
Lesotho
Madagasca
r
Malaw
i
Mozamb
ique
Namibia
SouthAfrica
Tanzania
Zamb
ia
Zimbabwe
perce
ntageof
population
Country
Figure 1.5 Population living below US$1 and US$2 per day (1993 purchasing power parity in US$*), 1990–2003
The presence of high and growing levels of poverty in countries that arealso experiencing higher and growing gross domestic products suggeststhat there may be significant inequalities in the distribution of incomes.The Gini coefficient is one measure of this income inequality. Eight offourteen countries in the region for which data is available had 2003 Ginicoefficients in 2003 in excess of 0.50 (see table 1.4).
The level of poverty in a country is determined by many factors andthis analysis recognises the ongoing debates on the poverty–inequalitytrade-off (Ravallion, 2005). The relationship between poverty andinequality is not simple. Table 1.4 shows that income poverty is high acrossmost of the region. The evidence suggests, however, that while countrieswith high Gini coefficients, such as Botswana, Lesotho, Namibia, SouthAfrica and Zimbabwe, have somewhat higher gross domestic productsand lower overall levels of poverty (see figure 1.6), they have had higherlevels of growth in poverty since 1995 (as shown in table 1.3).
It seems that inequality, as measured by the Gini coefficient, is a morecritical factor in higher income rather than lower income countries in theregion in limiting the access households have to resources for humandevelopment, and that this has been intensifying since 1995. For lowerincome countries in the region, a wider overall scarcity of resourcesundermines household resources for health.
We are aware that this contradicts Kuznets’ hypothesis that povertyreduction is linked to inequality in the early stages of growth (Kuznets,1955). There is, however, debate around this hypothesis. A recent WorldBank paper analysing 70 developing and transition country economies inthe 1990s found reduced poverty with lower relative inequality, noting thatrising relative inequality ‘appears more likely to be putting a brake onpoverty reduction than to be facilitating it’ (Ravallion, 2005: 1). Addressinginequality does appear to be important in reducing poverty in the region.
©M Ndhlovu andTARSC
* Purchasing power parity (abbreviated to PPP)is a method of measuring the relativepurchasing power of different countries'currencies over the same types of goodsand services
The Gini coefficient is thedistribution of income (orconsumption) among individualsor households in a country.
A value of 0 represents perfectequality, a value of 1 representsperfect inequality.
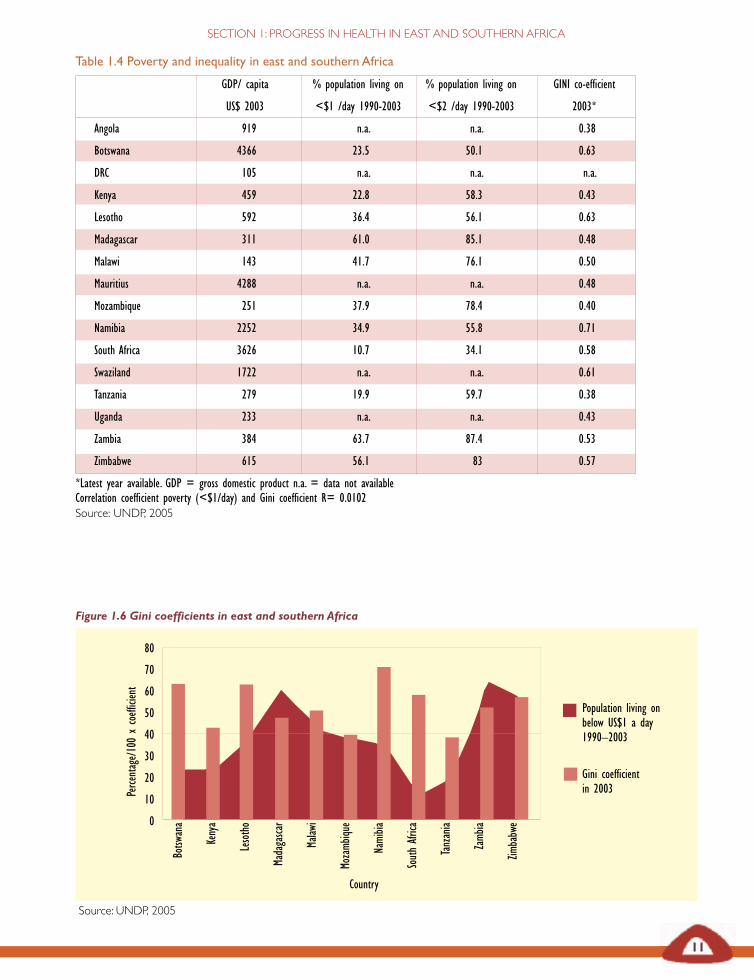
Table 1.4 Poverty and inequality in east and southern Africa
GDP/ capita % population living on % population living on GINI co-efficient
US$ 2003 <$1 /day 1990-2003 <$2 /day 1990-2003 2003*
Angola 919 n.a. n.a. 0.38
Botswana 4366 23.5 50.1 0.63
DRC 105 n.a. n.a. n.a.
Kenya 459 22.8 58.3 0.43
Lesotho 592 36.4 56.1 0.63
Madagascar 311 61.0 85.1 0.48
Malawi 143 41.7 76.1 0.50
Mauritius 4288 n.a. n.a. 0.48
Mozambique 251 37.9 78.4 0.40
Namibia 2252 34.9 55.8 0.71
South Africa 3626 10.7 34.1 0.58
Swaziland 1722 n.a. n.a. 0.61
Tanzania 279 19.9 59.7 0.38
Uganda 233 n.a. n.a. 0.43
Zambia 384 63.7 87.4 0.53
Zimbabwe 615 56.1 83 0.57
*Latest year available. GDP = gross domestic product n.a. = data not availableCorrelation coefficient poverty (<$1/day) and Gini coefficient R= 0.0102Source: UNDP, 2005
11
SECTION 1: PROGRESS IN HEALTH IN EAST AND SOUTHERN AFRICA
Country
Source: UNDP, 2005
80
70
60
50
40
30
20
10
0
Botsw
ana
Kenya
Lesotho
Madagasca
r
Malaw
i
Mozamb
ique
Namibia
SouthAfrica
Tanzania
Zamb
ia
Zimbabwe
Population living onbelow US$1 a day1990–2003
Gini coefficientin 2003Pe
rcentage/100xcoefficient
Figure 1.6 Gini coefficients in east and southern Africa
12
RECLAIMINGTHE RESOURCES FOR HEALTH:ADVANCING HEALTH EQUITY IN EAST AND SOUTHERN AFRICA
In all east and southern Africancountries the possibilities for human
development are weak in manyhouseholds. In all these countries
there are warning signs that growth isoccurring with increasing poverty and
that increased poverty is oneimportant determinant of poor
outcomes in human development.For many of these countries, reducinginequality appears to be important
for growth to translate intomeaningful levels of poverty
reduction.
A recent analysis of inequality in seven African countries found thatinequality in assets between households was wider in rural than in urbanareas, although rural inequality was decreasing and urban inequalityincreasing. The share of wages to profits was found to be one keydeterminant of income inequality. Studies in Uganda, South Africa,Namibia, Mozambique and Ethiopia all found that current rates of growthwould not produce a sufficient rate of reduction in poverty to meet theUnited Nations’ Millennium Development Goals unless there was also areduction in income or asset inequality (Okojie and Shimeles, 2006).
In all east and southern African countries the possibilities for humandevelopment are weak in many households. In all these countries thereare warning signs that growth is occurring with increasing poverty andthat increased poverty is one important determinant of poor outcomes inhuman development. For many of these countries, reducing inequalityappears to be important for growth to translate into meaningful levels ofpoverty reduction.
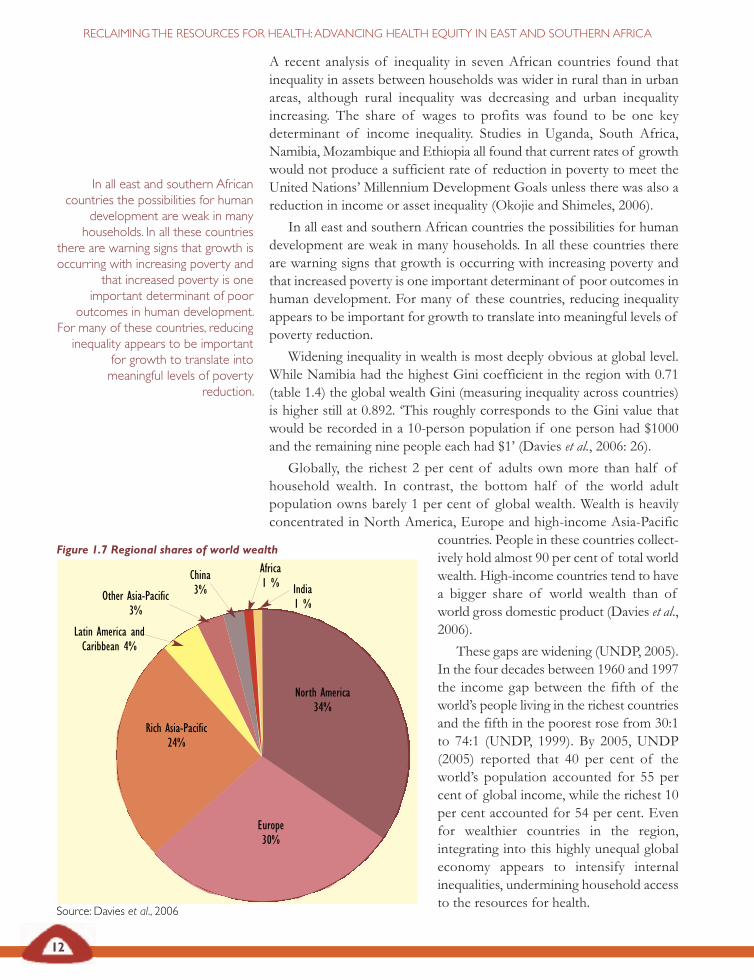
Widening inequality in wealth is most deeply obvious at global level.While Namibia had the highest Gini coefficient in the region with 0.71(table 1.4) the global wealth Gini (measuring inequality across countries)is higher still at 0.892. ‘This roughly corresponds to the Gini value thatwould be recorded in a 10-person population if one person had $1000and the remaining nine people each had $1’ (Davies et al., 2006: 26).
Globally, the richest 2 per cent of adults own more than half ofhousehold wealth. In contrast, the bottom half of the world adultpopulation owns barely 1 per cent of global wealth. Wealth is heavilyconcentrated in North America, Europe and high-income Asia-Pacific
countries. People in these countries collect-ively hold almost 90 per cent of total worldwealth. High-income countries tend to havea bigger share of world wealth than ofworld gross domestic product (Davies et al.,2006).
These gaps are widening (UNDP, 2005).In the four decades between 1960 and 1997the income gap between the fifth of theworld’s people living in the richest countriesand the fifth in the poorest rose from 30:1to 74:1 (UNDP, 1999). By 2005, UNDP(2005) reported that 40 per cent of theworld’s population accounted for 55 percent of global income, while the richest 10per cent accounted for 54 per cent. Evenfor wealthier countries in the region,integrating into this highly unequal globaleconomy appears to intensify internalinequalities, undermining household accessto the resources for health.
Europe30%
Rich Asia-Pacific24%
Latin America andCaribbean 4%
India1 %
North America34%
Other Asia-Pacific3%
China3%
Africa1 %
Figure 1.7 Regional shares of world wealth
Source: Davies et al., 2006

Table 1.5 Overview of demographic indicators in east and southern African countries*
Life expectancy Adult literacy HDI % < fives Under five IMR MMRat birth underweight CMR/1,000 /1,000 /100,000
Year 1997 2004 1997 2004 2004 1995- 2004 2004 1990-2003 2004
Medium human development
Mauritius 71.4 72.4 83.0 84.4 0.80 15 15 14 22
South Africa 54.7 47.0 84.0 82.4 0.65 12 67 54 150
Swaziland 60.2 31.3 77.5 79.6 0.50 10 156 108 230
Namibia 52.4 47.2 79.8 85.0 0.63 24 63 47 270
Botswana 47.4 34.9 74.4 81.2 0.57 13 116 84 330
Lesotho 56.0 35.2 82.3 82.2 0.49 18 82 61 n.a
Zimbabwe 44.1 36.6 90.9 n.a. 0.49 13 129 79 700
Kenya 52.0 47.5 79.3 73.6 0.49 20 120 79 410
Low human development
DRC 50.8 43.5 77.0 67.2 0.39 31 205 129 1300
Madagascar 57.5 55.6 47.0 70.7 0.51 33 123 76 470
Zambia 40.1 37.7 75.1 68.0 0.41 28 182 102 730
Tanzania 47.9 45.9 71.6 69.4 0.43 29 126 78 580
Uganda 39.6 46.4 64.0 66.8 0.51 23 138 80 510
Malawi 39.3 39.8 57.7 64.1 0.40 22 175 110 1100
Angola 46.5 41.0 45.0 67.4 0.44 31 260 154 n.a
Mozambique 45.2 41.6 40.5 n.a. 0.39 24 152 104 410
*Listed from highest to lowest HDI in 1997.
HDI = human development index CMR = under five year old child mortality rate n.a. = data not availableIMR = infant mlortalityr rate MMR = maternal mortality rate
Sources: EQUINET SC, 2000; UNDP, 1999; 2002; 2006; WHO, 2006
13
SECTION 1: PROGRESS IN HEALTH IN EAST AND SOUTHERN AFRICA
Health status in east and southernAfrica
Health status indicators reflect the wider economic and humandevelopment outcomes, and contribute to them.
Certainly, human development in the region has been stronglyinfluenced by a fall in life expectancy over the late 1990s and 2000s, drivenprimarily by HIV and AIDS (see table 1.5). The fall in life expectancy dueto AIDS is a contributor, with poverty, to the post-1995 declines in thehuman development index.
There are significant differences in health within and across countriesof the region. For example, life expectancy at birth in 2003 ranged from32.5 years in Swaziland to 72.2 years in Mauritius, a range of 40 years inthe same geographical region. A child born in Mozambique has a
©M Ndhlovu andTARSC
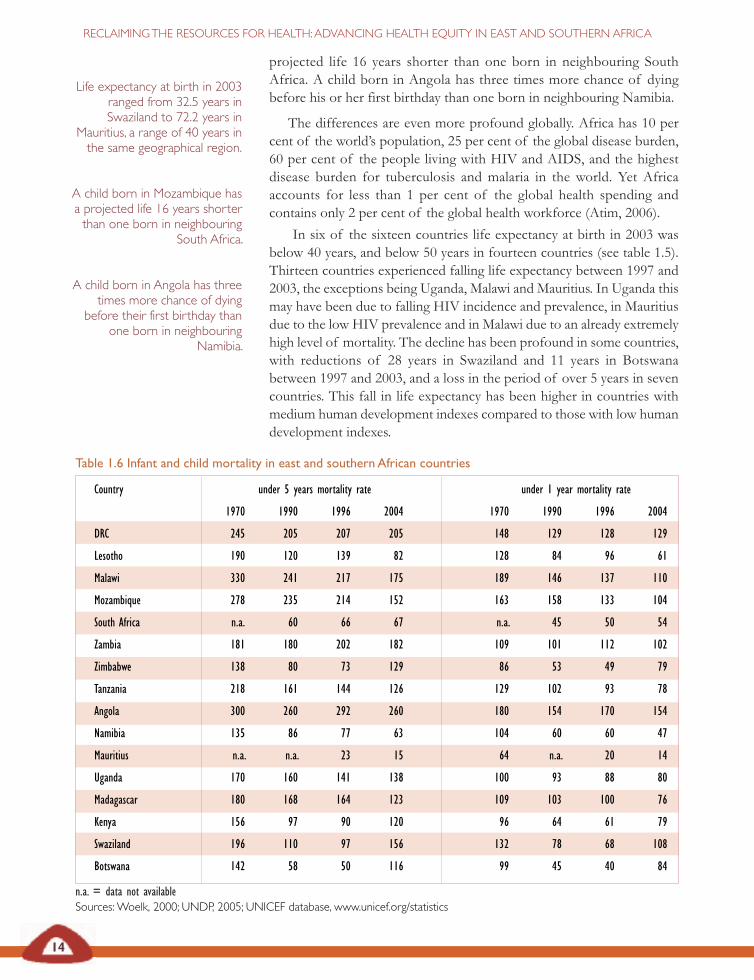
Table 1.6 Infant and child mortality in east and southern African countries
Country under 5 years mortality rate under 1 year mortality rate
1970 1990 1996 2004 1970 1990 1996 2004
DRC 245 205 207 205 148 129 128 129
Lesotho 190 120 139 82 128 84 96 61
Malawi 330 241 217 175 189 146 137 110
Mozambique 278 235 214 152 163 158 133 104
South Africa n.a. 60 66 67 n.a. 45 50 54
Zambia 181 180 202 182 109 101 112 102
Zimbabwe 138 80 73 129 86 53 49 79
Tanzania 218 161 144 126 129 102 93 78
Angola 300 260 292 260 180 154 170 154
Namibia 135 86 77 63 104 60 60 47
Mauritius n.a. n.a. 23 15 64 n.a. 20 14
Uganda 170 160 141 138 100 93 88 80
Madagascar 180 168 164 123 109 103 100 76
Kenya 156 97 90 120 96 64 61 79
Swaziland 196 110 97 156 132 78 68 108
Botswana 142 58 50 116 99 45 40 84
n.a. = data not availableSources:Woelk, 2000; UNDP, 2005; UNICEF database, www.unicef.org/statistics
14
RECLAIMINGTHE RESOURCES FOR HEALTH:ADVANCING HEALTH EQUITY IN EAST AND SOUTHERN AFRICA
projected life 16 years shorter than one born in neighbouring SouthAfrica. A child born in Angola has three times more chance of dyingbefore his or her first birthday than one born in neighbouring Namibia.
The differences are even more profound globally. Africa has 10 percent of the world’s population, 25 per cent of the global disease burden,60 per cent of the people living with HIV and AIDS, and the highestdisease burden for tuberculosis and malaria in the world. Yet Africaaccounts for less than 1 per cent of the global health spending andcontains only 2 per cent of the global health workforce (Atim, 2006).
In six of the sixteen countries life expectancy at birth in 2003 wasbelow 40 years, and below 50 years in fourteen countries (see table 1.5).Thirteen countries experienced falling life expectancy between 1997 and2003, the exceptions being Uganda, Malawi and Mauritius. In Uganda thismay have been due to falling HIV incidence and prevalence, in Mauritiusdue to the low HIV prevalence and in Malawi due to an already extremelyhigh level of mortality. The decline has been profound in some countries,with reductions of 28 years in Swaziland and 11 years in Botswanabetween 1997 and 2003, and a loss in the period of over 5 years in sevencountries. This fall in life expectancy has been higher in countries withmedium human development indexes compared to those with low humandevelopment indexes.
Life expectancy at birth in 2003ranged from 32.5 years inSwaziland to 72.2 years in
Mauritius, a range of 40 years inthe same geographical region.
A child born in Mozambique hasa projected life 16 years shorterthan one born in neighbouring
South Africa.
A child born in Angola has threetimes more chance of dying
before their first birthday thanone born in neighbouring
Namibia.
SECTION 1: PROGRESS IN HEALTH IN EAST AND SOUTHERN AFRICA
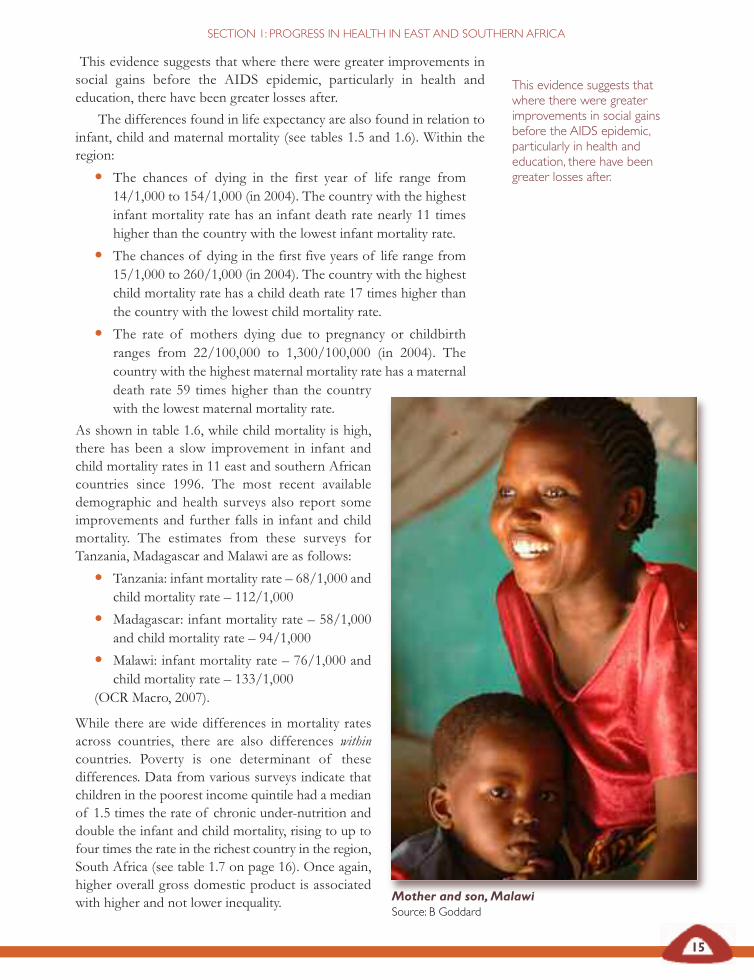
This evidence suggests thatwhere there were greaterimprovements in social gainsbefore the AIDS epidemic,particularly in health andeducation, there have beengreater losses after.
This evidence suggests that where there were greater improvements insocial gains before the AIDS epidemic, particularly in health andeducation, there have been greater losses after.
The differences found in life expectancy are also found in relation toinfant, child and maternal mortality (see tables 1.5 and 1.6). Within theregion:
• The chances of dying in the first year of life range from14/1,000 to 154/1,000 (in 2004). The country with the highestinfant mortality rate has an infant death rate nearly 11 timeshigher than the country with the lowest infant mortality rate.
• The chances of dying in the first five years of life range from15/1,000 to 260/1,000 (in 2004). The country with the highestchild mortality rate has a child death rate 17 times higher thanthe country with the lowest child mortality rate.
• The rate of mothers dying due to pregnancy or childbirthranges from 22/100,000 to 1,300/100,000 (in 2004). Thecountry with the highest maternal mortality rate has a maternaldeath rate 59 times higher than the countrywith the lowest maternal mortality rate.
As shown in table 1.6, while child mortality is high,there has been a slow improvement in infant andchild mortality rates in 11 east and southern Africancountries since 1996. The most recent availabledemographic and health surveys also report someimprovements and further falls in infant and childmortality. The estimates from these surveys forTanzania, Madagascar and Malawi are as follows:
• Tanzania: infant mortality rate – 68/1,000 andchild mortality rate – 112/1,000
• Madagascar: infant mortality rate – 58/1,000and child mortality rate – 94/1,000
• Malawi: infant mortality rate – 76/1,000 andchild mortality rate – 133/1,000
(OCR Macro, 2007).
While there are wide differences in mortality ratesacross countries, there are also differences withincountries. Poverty is one determinant of thesedifferences. Data from various surveys indicate thatchildren in the poorest income quintile had a medianof 1.5 times the rate of chronic under-nutrition anddouble the infant and child mortality, rising to up tofour times the rate in the richest country in the region,South Africa (see table 1.7 on page 16). Once again,higher overall gross domestic product is associatedwith higher and not lower inequality. Mother and son,Malawi
Source: B Goddard
15
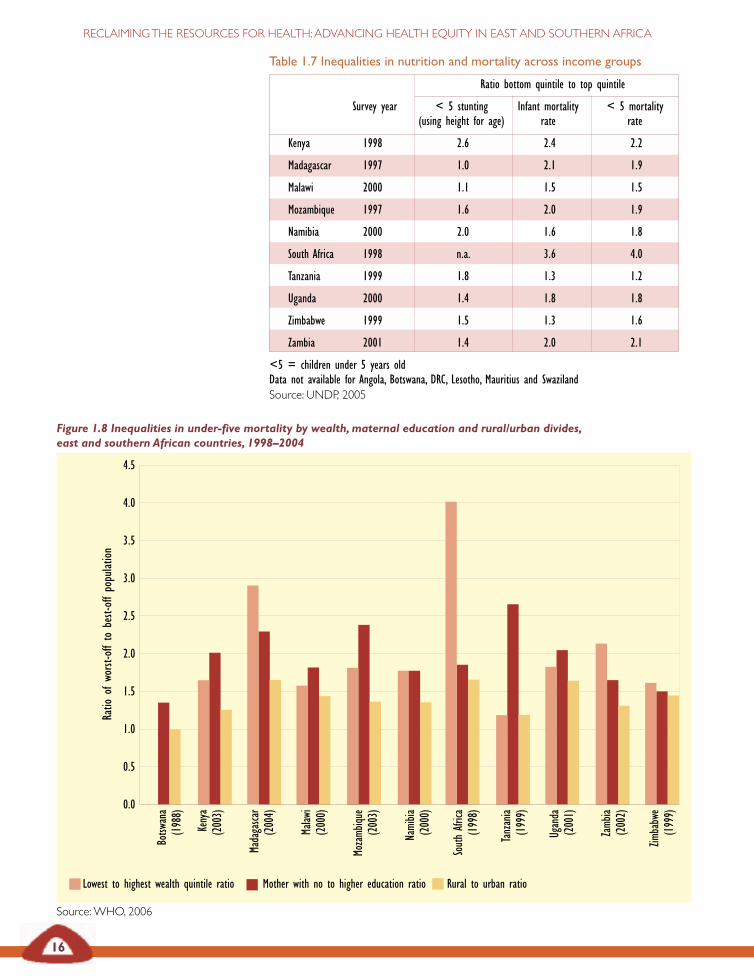
Table 1.7 Inequalities in nutrition and mortality across income groups
Ratio bottom quintile to top quintile
Survey year < 5 stunting Infant mortality < 5 mortality(using height for age) rate rate
Kenya 1998 2.6 2.4 2.2
Madagascar 1997 1.0 2.1 1.9
Malawi 2000 1.1 1.5 1.5
Mozambique 1997 1.6 2.0 1.9
Namibia 2000 2.0 1.6 1.8
South Africa 1998 n.a. 3.6 4.0
Tanzania 1999 1.8 1.3 1.2
Uganda 2000 1.4 1.8 1.8
Zimbabwe 1999 1.5 1.3 1.6
Zambia 2001 1.4 2.0 2.1
<5 = children under 5 years oldData not available for Angola, Botswana, DRC, Lesotho, Mauritius and SwazilandSource: UNDP, 2005
Lowest to highest wealth quintile ratio Mother with no to higher education ratio Rural to urban ratio
16
RECLAIMINGTHE RESOURCES FOR HEALTH:ADVANCING HEALTH EQUITY IN EAST AND SOUTHERN AFRICA
Figure 1.8 Inequalities in under-five mortality by wealth,maternal education and rural/urban divides,east and southern African countries, 1998–2004
Source:WHO, 2006
Ratio
ofworst-offto
best-offpopulation
0.0
0.5
1.0
1.5
2.0
2.5
3.0
3.5
4.0
4.5
Botsw
ana
(1988)
Kenya
(2003)
Madagasca
r(2004)
Malaw
i(2000)
Mozamb
ique
(2003)
Namibia
(2000)
SouthAfrica
(1998)
Tanzania
(1999)
Uganda
(2001)
Zamb
ia(2002)
Zimbabwe
(1999)
Angola
Botsw
ana
DRC
Kenya
Lesotho
Madagasca
r
Malaw
i
Mauritius
Namibia
SouthAfrica
Swaziland
Tanzania
Uganda
Zamb
ia
All adults Female adults
17
SECTION 1: PROGRESS IN HEALTH IN EAST AND SOUTHERN AFRICA
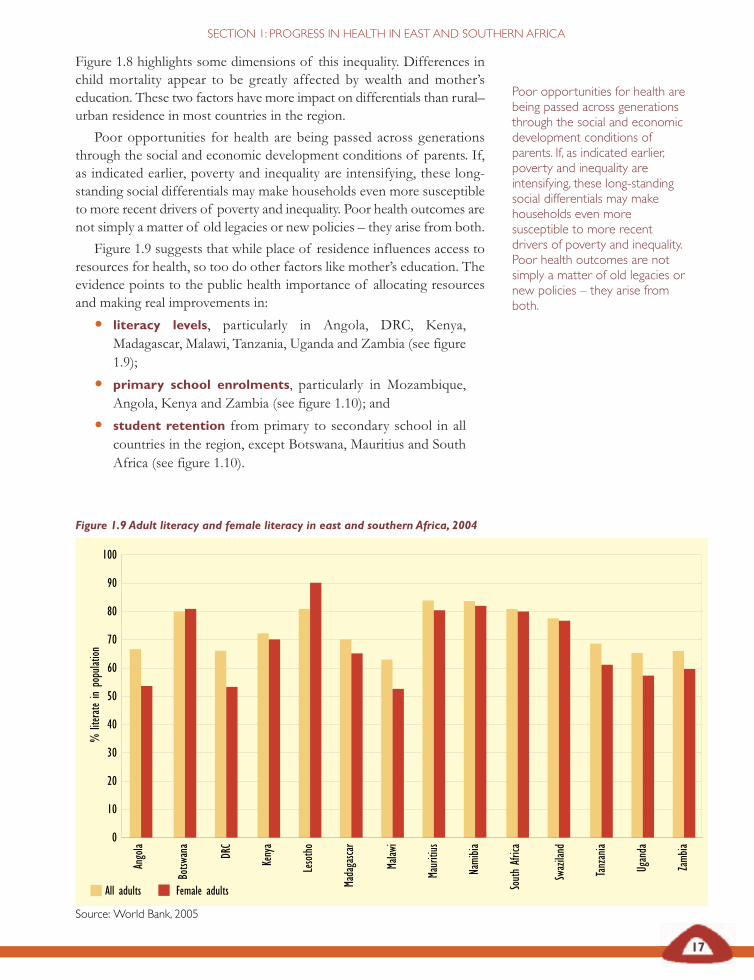
Figure 1.8 highlights some dimensions of this inequality. Differences inchild mortality appear to be greatly affected by wealth and mother’seducation. These two factors have more impact on differentials than rural–urban residence in most countries in the region.
Poor opportunities for health are being passed across generationsthrough the social and economic development conditions of parents. If,as indicated earlier, poverty and inequality are intensifying, these long-standing social differentials may make households even more susceptibleto more recent drivers of poverty and inequality. Poor health outcomes arenot simply a matter of old legacies or new policies – they arise from both.
Figure 1.9 suggests that while place of residence influences access toresources for health, so too do other factors like mother’s education. Theevidence points to the public health importance of allocating resourcesand making real improvements in:
• literacy levels, particularly in Angola, DRC, Kenya,Madagascar, Malawi, Tanzania, Uganda and Zambia (see figure1.9);
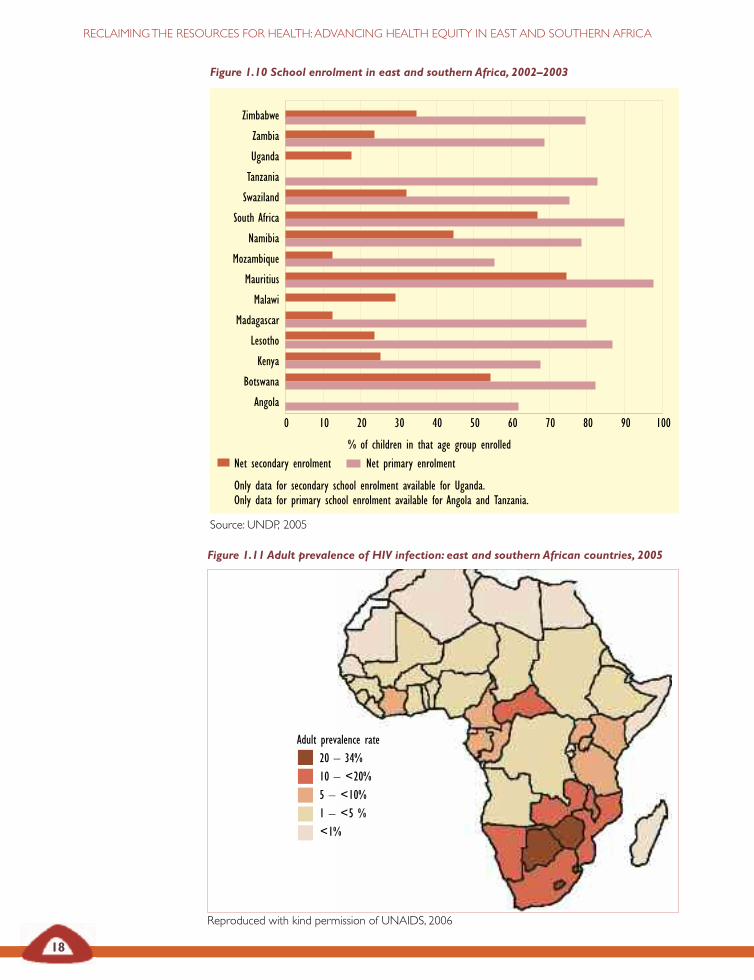
• primary school enrolments, particularly in Mozambique,Angola, Kenya and Zambia (see figure 1.10); and
• student retention from primary to secondary school in allcountries in the region, except Botswana, Mauritius and SouthAfrica (see figure 1.10).
Poor opportunities for health arebeing passed across generationsthrough the social and economicdevelopment conditions ofparents. If, as indicated earlier,poverty and inequality areintensifying, these long-standingsocial differentials may makehouseholds even moresusceptible to more recentdrivers of poverty and inequality.Poor health outcomes are notsimply a matter of old legacies ornew policies – they arise fromboth.
Figure 1.9 Adult literacy and female literacy in east and southern Africa, 2004
Source: World Bank, 2005
0
10
20
30
40
50
60
70
80
90
100
%literatein
population
18
RECLAIMINGTHE RESOURCES FOR HEALTH:ADVANCING HEALTH EQUITY IN EAST AND SOUTHERN AFRICA
Figure 1.10 School enrolment in east and southern Africa, 2002–2003
Source: UNDP, 2005
Figure 1.11 Adult prevalence of HIV infection: east and southern African countries, 2005
Reproduced with kind permission of UNAIDS, 2006
Zimbabwe
Zambia
Uganda
Tanzania
Swaziland
South Africa
Namibia
Mozambique
Mauritius
Malawi
Madagascar
Lesotho
Kenya
Botswana
Angola
% of children in that age group enrolled
0 10 20 30 40 50 60 70 80 90 100
Net secondary enrolment Net primary enrolment
Only data for secondary school enrolment available for Uganda.Only data for primary school enrolment available for Angola and Tanzania.
Adult prevalence rate20 – 34%10 – <20%5 – <10%1 – <5 %<1%
19
SECTION 1: PROGRESS IN HEALTH IN EAST AND SOUTHERN AFRICA
An analysis of inequality in access to public services in African countriesfound that while overall access had improved in the past two decades, therelative disadvantage in access in rural areas persisted (Okojie andShimeles, 2006).
Analyses from within the region have attributed increases in mortalityin the past decade to: food insecurity; poor access to safe water, sanitation,energy, transport and shelter; high prevalence levels of HIV and AIDS,tuberculosis, malaria and other communicable and non-communicablediseases; and illness and mortality related to reproductive roles (SADC,2003; WHO Afro, 2006). These reports provide comprehensive reviewsof the overall health status in the region (WHO Afro, 2006). They indicatethat AIDS has had the greatest impact on mortality across almost all ofthe countries of the region.
‘The HIV and AIDS pandemic is reversing the developmentalgains made in the past decades and is posing the greatest threat tosustainable development of the region..’SADC Heads of State, 2003
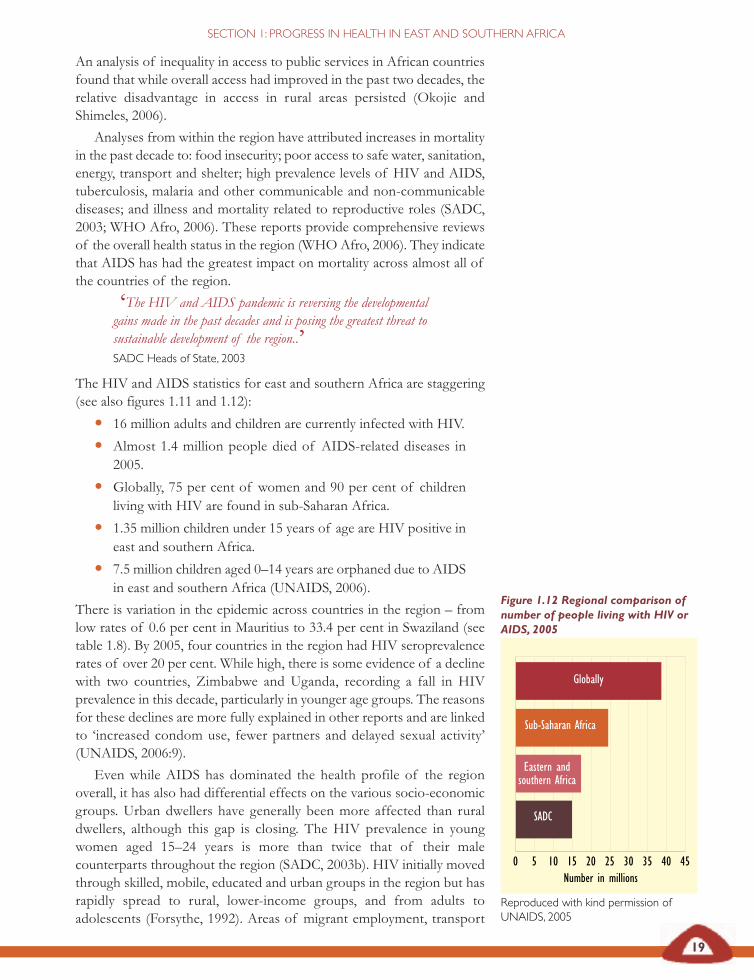
The HIV and AIDS statistics for east and southern Africa are staggering(see also figures 1.11 and 1.12):
• 16 million adults and children are currently infected with HIV.
• Almost 1.4 million people died of AIDS-related diseases in2005.
• Globally, 75 per cent of women and 90 per cent of childrenliving with HIV are found in sub-Saharan Africa.
• 1.35 million children under 15 years of age are HIV positive ineast and southern Africa.
• 7.5 million children aged 0–14 years are orphaned due to AIDSin east and southern Africa (UNAIDS, 2006).
There is variation in the epidemic across countries in the region – fromlow rates of 0.6 per cent in Mauritius to 33.4 per cent in Swaziland (seetable 1.8). By 2005, four countries in the region had HIV seroprevalencerates of over 20 per cent. While high, there is some evidence of a declinewith two countries, Zimbabwe and Uganda, recording a fall in HIVprevalence in this decade, particularly in younger age groups. The reasonsfor these declines are more fully explained in other reports and are linkedto ‘increased condom use, fewer partners and delayed sexual activity’(UNAIDS, 2006:9).
Even while AIDS has dominated the health profile of the regionoverall, it has also had differential effects on the various socio-economicgroups. Urban dwellers have generally been more affected than ruraldwellers, although this gap is closing. The HIV prevalence in youngwomen aged 15–24 years is more than twice that of their malecounterparts throughout the region (SADC, 2003b). HIV initially movedthrough skilled, mobile, educated and urban groups in the region but hasrapidly spread to rural, lower-income groups, and from adults toadolescents (Forsythe, 1992). Areas of migrant employment, transport
Figure 1.12 Regional comparison ofnumber of people living with HIV orAIDS, 2005
Reproduced with kind permission ofUNAIDS, 2005
Number in millions0 5 10 15 20 25 30 35 40 45
Globally
Sub-Saharan Africa
Eastern andsouthern Africa
SADC
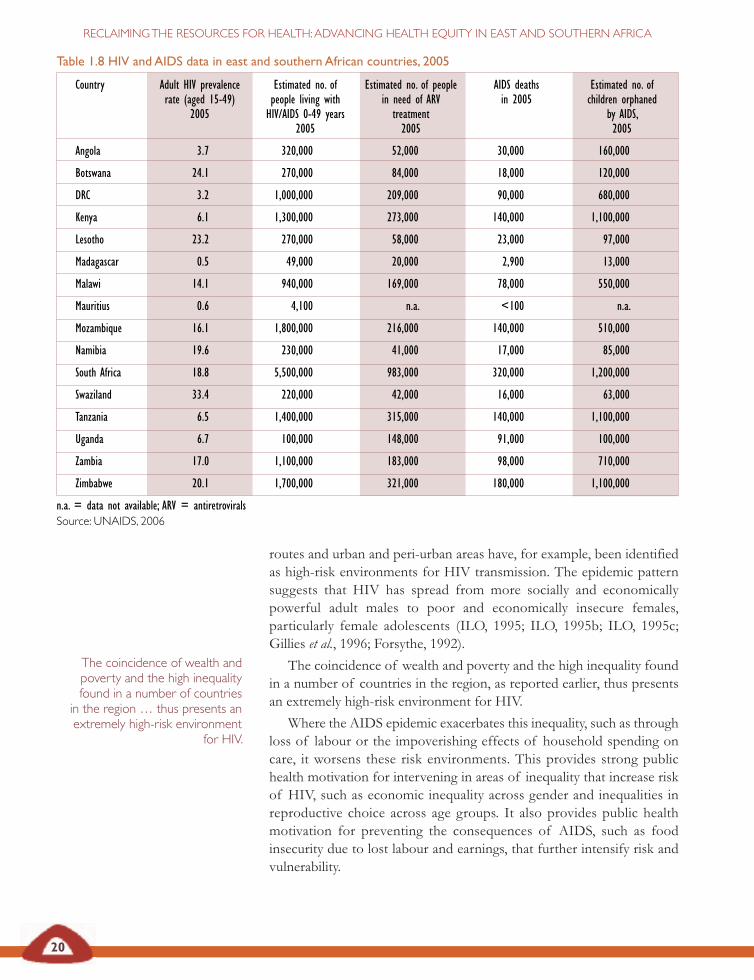
Country Adult HIV prevalence Estimated no. of Estimated no. of people AIDS deaths Estimated no. ofrate (aged 15-49) people living with in need of ARV in 2005 children orphaned
2005 HIV/AIDS 0-49 years treatment by AIDS,2005 2005 2005
Angola 3.7 320,000 52,000 30,000 160,000
Botswana 24.1 270,000 84,000 18,000 120,000
DRC 3.2 1,000,000 209,000 90,000 680,000
Kenya 6.1 1,300,000 273,000 140,000 1,100,000
Lesotho 23.2 270,000 58,000 23,000 97,000
Madagascar 0.5 49,000 20,000 2,900 13,000
Malawi 14.1 940,000 169,000 78,000 550,000
Mauritius 0.6 4,100 n.a. <100 n.a.
Mozambique 16.1 1,800,000 216,000 140,000 510,000
Namibia 19.6 230,000 41,000 17,000 85,000
South Africa 18.8 5,500,000 983,000 320,000 1,200,000
Swaziland 33.4 220,000 42,000 16,000 63,000
Tanzania 6.5 1,400,000 315,000 140,000 1,100,000
Uganda 6.7 100,000 148,000 91,000 100,000
Zambia 17.0 1,100,000 183,000 98,000 710,000
Zimbabwe 20.1 1,700,000 321,000 180,000 1,100,000
n.a. = data not available; ARV = antiretrovirals
Table 1.8 HIV and AIDS data in east and southern African countries, 2005
20
RECLAIMINGTHE RESOURCES FOR HEALTH:ADVANCING HEALTH EQUITY IN EAST AND SOUTHERN AFRICA
routes and urban and peri-urban areas have, for example, been identifiedas high-risk environments for HIV transmission. The epidemic patternsuggests that HIV has spread from more socially and economicallypowerful adult males to poor and economically insecure females,particularly female adolescents (ILO, 1995; ILO, 1995b; ILO, 1995c;Gillies et al., 1996; Forsythe, 1992).
The coincidence of wealth and poverty and the high inequality foundin a number of countries in the region, as reported earlier, thus presentsan extremely high-risk environment for HIV.
Where the AIDS epidemic exacerbates this inequality, such as throughloss of labour or the impoverishing effects of household spending oncare, it worsens these risk environments. This provides strong publichealth motivation for intervening in areas of inequality that increase riskof HIV, such as economic inequality across gender and inequalities inreproductive choice across age groups. It also provides public healthmotivation for preventing the consequences of AIDS, such as foodinsecurity due to lost labour and earnings, that further intensify risk andvulnerability.
The coincidence of wealth andpoverty and the high inequalityfound in a number of countriesin the region … thus presents anextremely high-risk environment
for HIV.
Source: UNAIDS, 2006
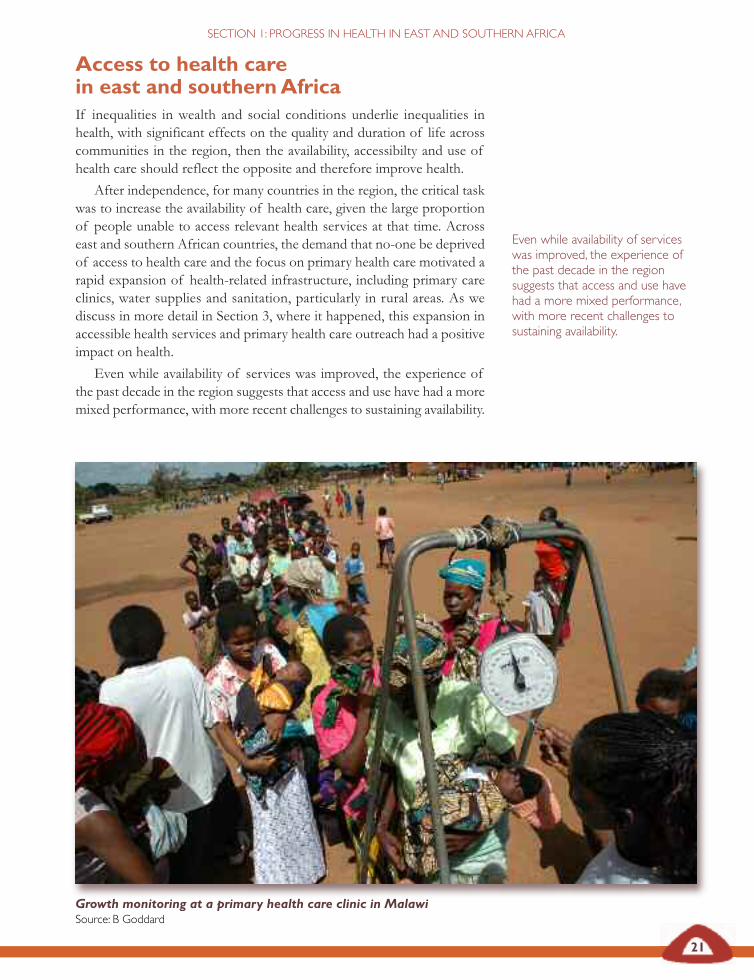
21
SECTION 1: PROGRESS IN HEALTH IN EAST AND SOUTHERN AFRICA
Access to health carein east and southernAfricaIf inequalities in wealth and social conditions underlie inequalities inhealth, with significant effects on the quality and duration of life acrosscommunities in the region, then the availability, accessibilty and use ofhealth care should reflect the opposite and therefore improve health.
After independence, for many countries in the region, the critical taskwas to increase the availability of health care, given the large proportionof people unable to access relevant health services at that time. Acrosseast and southern African countries, the demand that no-one be deprivedof access to health care and the focus on primary health care motivated arapid expansion of health-related infrastructure, including primary careclinics, water supplies and sanitation, particularly in rural areas. As wediscuss in more detail in Section 3, where it happened, this expansion inaccessible health services and primary health care outreach had a positiveimpact on health.
Even while availability of services was improved, the experience ofthe past decade in the region suggests that access and use have had a moremixed performance, with more recent challenges to sustaining availability.
Even while availability of serviceswas improved, the experience ofthe past decade in the regionsuggests that access and use havehad a more mixed performance,with more recent challenges tosustaining availability.
Growth monitoring at a primary health care clinic in MalawiSource: B Goddard
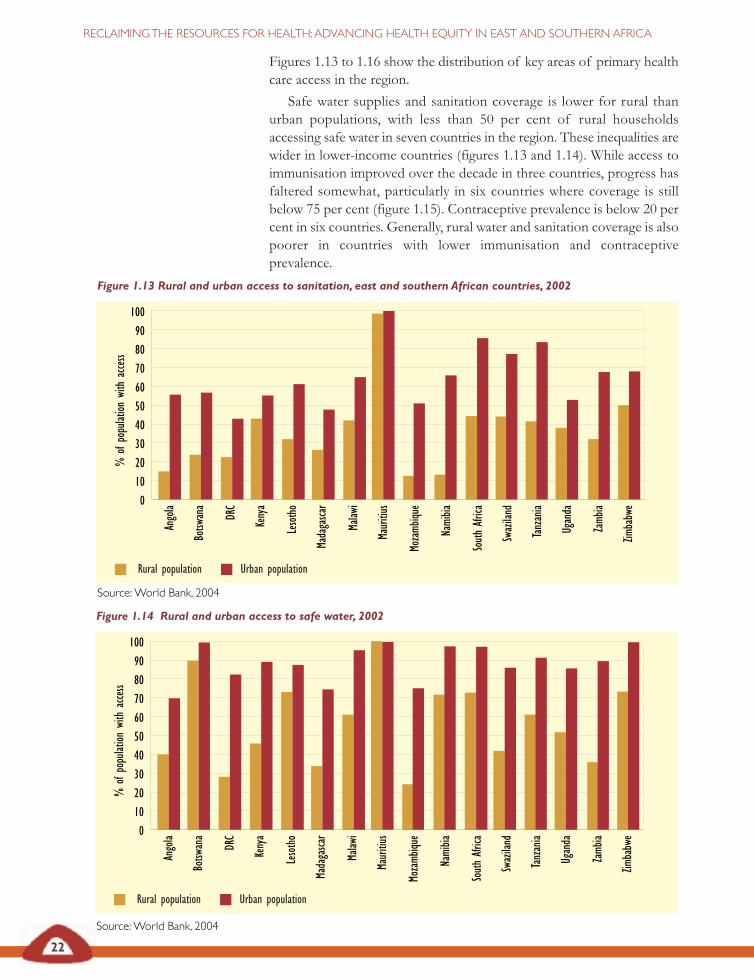
Figure 1.13 Rural and urban access to sanitation, east and southern African countries, 2002
Source:World Bank, 2004
Rural population Urban population
22
RECLAIMINGTHE RESOURCES FOR HEALTH:ADVANCING HEALTH EQUITY IN EAST AND SOUTHERN AFRICA
Figures 1.13 to 1.16 show the distribution of key areas of primary healthcare access in the region.
Safe water supplies and sanitation coverage is lower for rural thanurban populations, with less than 50 per cent of rural householdsaccessing safe water in seven countries in the region. These inequalities arewider in lower-income countries (figures 1.13 and 1.14). While access toimmunisation improved over the decade in three countries, progress hasfaltered somewhat, particularly in six countries where coverage is stillbelow 75 per cent (figure 1.15). Contraceptive prevalence is below 20 percent in six countries. Generally, rural water and sanitation coverage is alsopoorer in countries with lower immunisation and contraceptiveprevalence.
Angola
Botsw
ana
DRC
Kenya
Lesotho
Madagasca
r
Malaw
i
Mauritius
Mozamb
ique
Namibia
SouthAfrica
Swaziland
Tanzania
Uganda
Zamb
ia
Zimbabwe
100
90
80
70
60
50
40
30
20
10
0
%of
population
with
access
Figure 1.14 Rural and urban access to safe water, 2002
Source:World Bank, 2004
Rural population Urban population
Angola
Botsw
ana
DRC
Kenya
Lesotho
Madagasca
r
Malaw
i
Mauritius
Mozamb
ique
Namibia
SouthAfrica
Swaziland
Tanzania
Uganda
Zamb
ia
Zimbabwe
100
90
80
70
60
50
40
30
20
10
0
%of
population
with
access
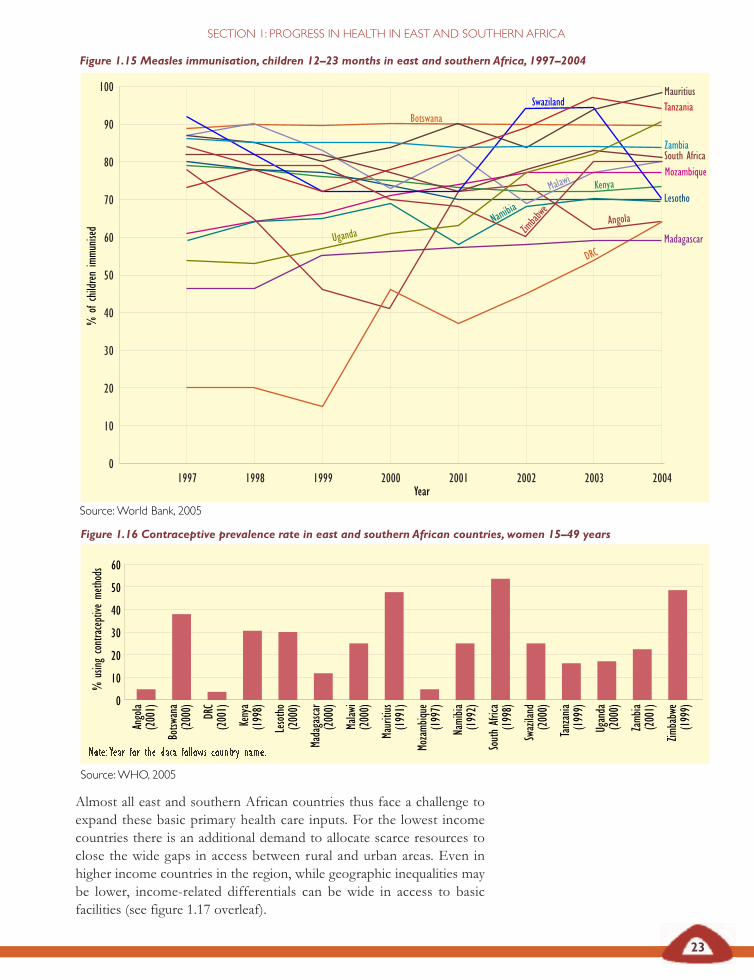
Figure 1.16 Contraceptive prevalence rate in east and southern African countries, women 15–49 years
Note: Year for the data follows country name.
Source:WHO, 2005
Figure 1.15 Measles immunisation, children 12–23 months in east and southern Africa, 1997–2004
Source:World Bank, 2005
23
SECTION 1: PROGRESS IN HEALTH IN EAST AND SOUTHERN AFRICA
Almost all east and southern African countries thus face a challenge toexpand these basic primary health care inputs. For the lowest incomecountries there is an additional demand to allocate scarce resources toclose the wide gaps in access between rural and urban areas. Even inhigher income countries in the region, while geographic inequalities maybe lower, income-related differentials can be wide in access to basicfacilities (see figure 1.17 overleaf).
Angola
(2001)
Botsw
ana
(2000) DRC
(2001)
Kenya
(1998)
Lesotho
(2000)
Madagasca
r(2000)
Malaw
i(2000)
Mauritius
(1991)
Mozamb
ique
(1997)
Namibia
(1992)
SouthAfrica
(1998)
Swaziland
(2000)
Tanzania
(1999)
Uganda
(2000)
Zamb
ia(2001)
Zimbabwe
(1999)0
10
20
30
40
50
60
1997 1998 1999 2000 2001 2002 2003 2004
90
100
80
70
60
50
40
30
20
10
0
South Africa
Namibia
Botswana
Uganda
Zimbabwe
Madagascar
Swaziland
Zambia
Kenya
Angola
MauritiusTanzania
Lesotho
DRC
Mozambique
%of
childrenimmu
nised
Year
Malawi
%using
contraceptive
methods
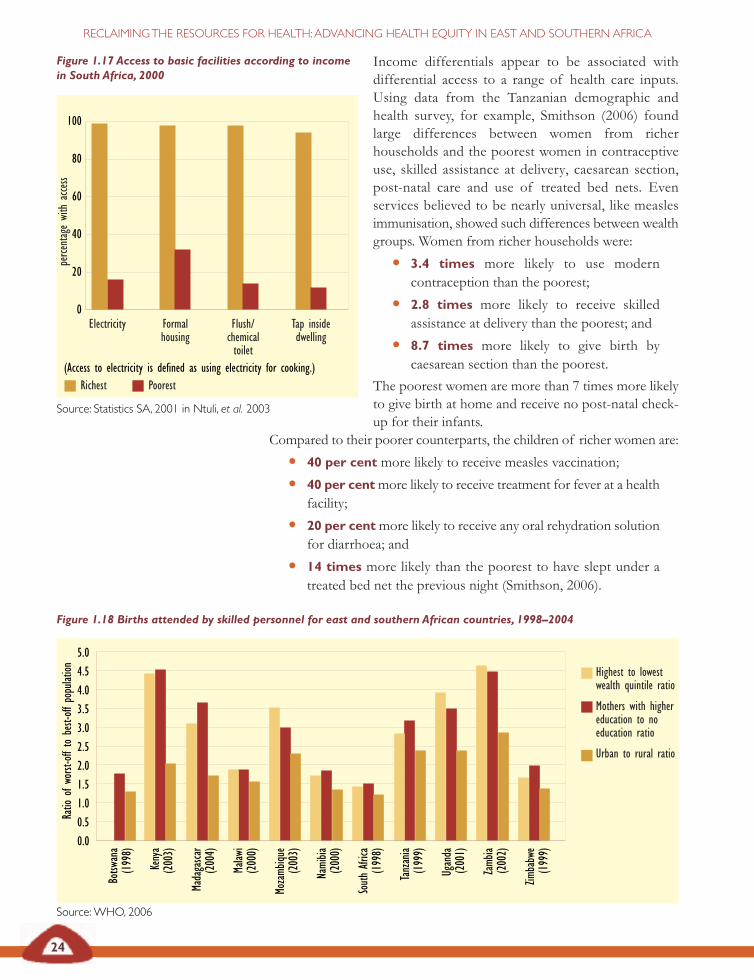
Figure 1.17 Access to basic facilities according to incomein South Africa, 2000
(Access to electricity is defined as using electricity for cooking.)
Source: Statistics SA, 2001 in Ntuli, et al. 2003
24
RECLAIMINGTHE RESOURCES FOR HEALTH:ADVANCING HEALTH EQUITY IN EAST AND SOUTHERN AFRICA
Income differentials appear to be associated withdifferential access to a range of health care inputs.Using data from the Tanzanian demographic andhealth survey, for example, Smithson (2006) foundlarge differences between women from richerhouseholds and the poorest women in contraceptiveuse, skilled assistance at delivery, caesarean section,post-natal care and use of treated bed nets. Evenservices believed to be nearly universal, like measlesimmunisation, showed such differences between wealthgroups. Women from richer households were:
• 3.4 times more likely to use moderncontraception than the poorest;
• 2.8 times more likely to receive skilledassistance at delivery than the poorest; and
• 8.7 times more likely to give birth bycaesarean section than the poorest.
The poorest women are more than 7 times more likelyto give birth at home and receive no post-natal check-up for their infants.
Figure 1.18 Births attended by skilled personnel for east and southern African countries, 1998–2004
Source:WHO, 2006
100
0.0
0.5
1.0
1.5
2.0
2.5
3.0
3.5
4.0
4.5
5.0
80
60
40
20
0Electricity Formal
housingFlush/chemicaltoilet
Tap insidedwelling
Richest Poorest
perce
ntagewith
access
Compared to their poorer counterparts, the children of richer women are:
• 40 per cent more likely to receive measles vaccination;
• 40 per centmore likely to receive treatment for fever at a healthfacility;
• 20 per centmore likely to receive any oral rehydration solutionfor diarrhoea; and
• 14 times more likely than the poorest to have slept under atreated bed net the previous night (Smithson, 2006).
Botsw
ana
(1998)
Kenya
(2003)
Madagasca
r(2004)
Malaw
i(2000)
Mozamb
ique
(2003)
Namibia
(2000)
SouthAfrica
(1998)
Tanzania
(1999)
Uganda
(2001)
Zamb
ia(2002)
Zimbabwe
(1999)
Ratio
ofworst-offto
best-off
population Highest to lowest
wealth quintile ratio
Mothers with highereducation to noeducation ratio
Urban to rural ratio
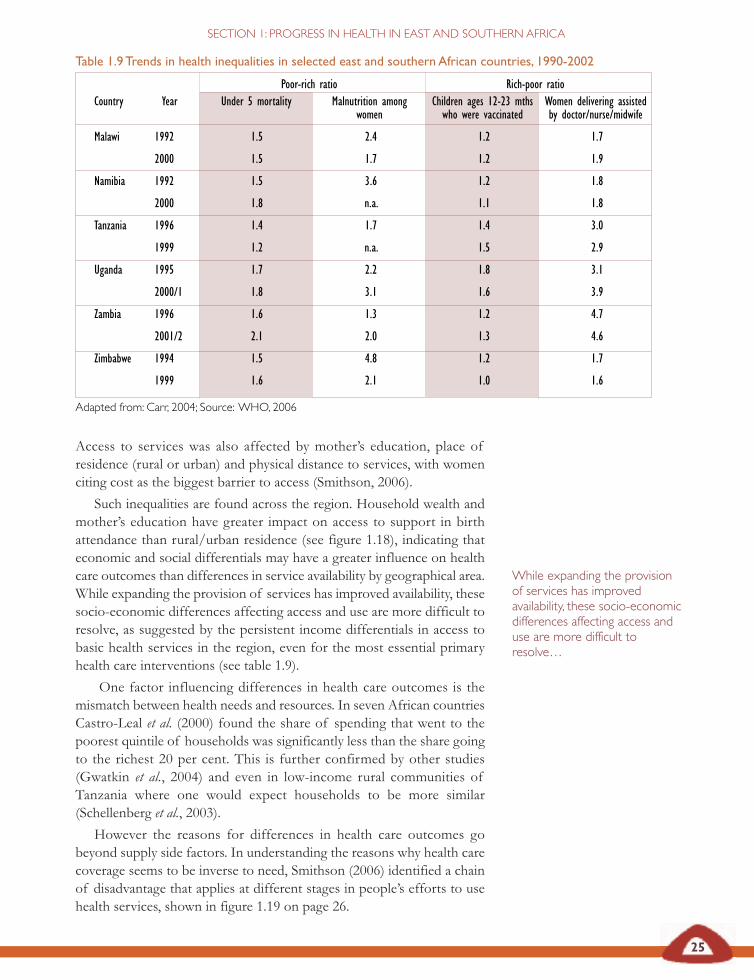
25
SECTION 1: PROGRESS IN HEALTH IN EAST AND SOUTHERN AFRICA
Access to services was also affected by mother’s education, place ofresidence (rural or urban) and physical distance to services, with womenciting cost as the biggest barrier to access (Smithson, 2006).
Such inequalities are found across the region. Household wealth andmother’s education have greater impact on access to support in birthattendance than rural/urban residence (see figure 1.18), indicating thateconomic and social differentials may have a greater influence on healthcare outcomes than differences in service availability by geographical area.While expanding the provision of services has improved availability, thesesocio-economic differences affecting access and use are more difficult toresolve, as suggested by the persistent income differentials in access tobasic health services in the region, even for the most essential primaryhealth care interventions (see table 1.9).
One factor influencing differences in health care outcomes is themismatch between health needs and resources. In seven African countriesCastro-Leal et al. (2000) found the share of spending that went to thepoorest quintile of households was significantly less than the share goingto the richest 20 per cent. This is further confirmed by other studies(Gwatkin et al., 2004) and even in low-income rural communities ofTanzania where one would expect households to be more similar(Schellenberg et al., 2003).
However the reasons for differences in health care outcomes gobeyond supply side factors. In understanding the reasons why health carecoverage seems to be inverse to need, Smithson (2006) identified a chainof disadvantage that applies at different stages in people’s efforts to usehealth services, shown in figure 1.19 on page 26.
While expanding the provisionof services has improvedavailability, these socio-economicdifferences affecting access anduse are more difficult toresolve…
Table 1.9Trends in health inequalities in selected east and southern African countries, 1990-2002
Poor-rich ratio Rich-poor ratioCountry Year Under 5 mortality Malnutrition among Children ages 12-23 mths Women delivering assisted
women who were vaccinated by doctor/nurse/midwife
Malawi 1992 1.5 2.4 1.2 1.7
2000 1.5 1.7 1.2 1.9
Namibia 1992 1.5 3.6 1.2 1.8
2000 1.8 n.a. 1.1 1.8
Tanzania 1996 1.4 1.7 1.4 3.0
1999 1.2 n.a. 1.5 2.9
Uganda 1995 1.7 2.2 1.8 3.1
2000/1 1.8 3.1 1.6 3.9
Zambia 1996 1.6 1.3 1.2 4.7
2001/2 2.1 2.0 1.3 4.6
Zimbabwe 1994 1.5 4.8 1.2 1.7
1999 1.6 2.1 1.0 1.6
Adapted from: Carr, 2004; Source: WHO, 2006
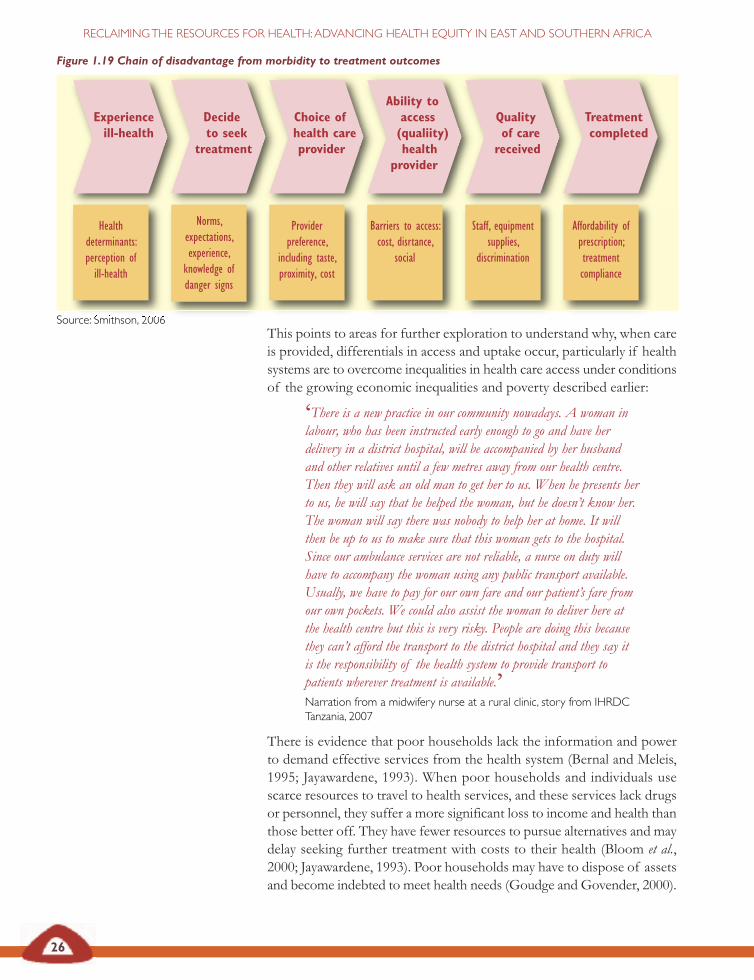
26
RECLAIMINGTHE RESOURCES FOR HEALTH:ADVANCING HEALTH EQUITY IN EAST AND SOUTHERN AFRICA
This points to areas for further exploration to understand why, when careis provided, differentials in access and uptake occur, particularly if healthsystems are to overcome inequalities in health care access under conditionsof the growing economic inequalities and poverty described earlier:
‘There is a new practice in our community nowadays. A woman inlabour, who has been instructed early enough to go and have herdelivery in a district hospital, will be accompanied by her husbandand other relatives until a few metres away from our health centre.Then they will ask an old man to get her to us. When he presents herto us, he will say that he helped the woman, but he doesn’t know her.The woman will say there was nobody to help her at home. It willthen be up to us to make sure that this woman gets to the hospital.Since our ambulance services are not reliable, a nurse on duty willhave to accompany the woman using any public transport available.Usually, we have to pay for our own fare and our patient’s fare fromour own pockets. We could also assist the woman to deliver here atthe health centre but this is very risky. People are doing this becausethey can’t afford the transport to the district hospital and they say itis the responsibility of the health system to provide transport topatients wherever treatment is available.’Narration from a midwifery nurse at a rural clinic, story from IHRDCTanzania, 2007
There is evidence that poor households lack the information and powerto demand effective services from the health system (Bernal and Meleis,1995; Jayawardene, 1993). When poor households and individuals usescarce resources to travel to health services, and these services lack drugsor personnel, they suffer a more significant loss to income and health thanthose better off. They have fewer resources to pursue alternatives and maydelay seeking further treatment with costs to their health (Bloom et al.,2000; Jayawardene, 1993). Poor households may have to dispose of assetsand become indebted to meet health needs (Goudge and Govender, 2000).
Figure 1.19 Chain of disadvantage from morbidity to treatment outcomes
Source: Smithson, 2006
Experienceill-health
Decideto seek
treatment
Choice ofhealth careprovider
Ability toaccess(qualiity)health
provider
Qualityof carereceived
Treatmentcompleted
Healthdeterminants:perception ofill-health
Norms,expectations,experience,knowledge ofdanger signs
Providerpreference,
including taste,proximity, cost
Barriers to access:cost, disrtance,
social
Staff, equipmentsupplies,
discrimination
Affordability ofprescription;treatmentcompliance
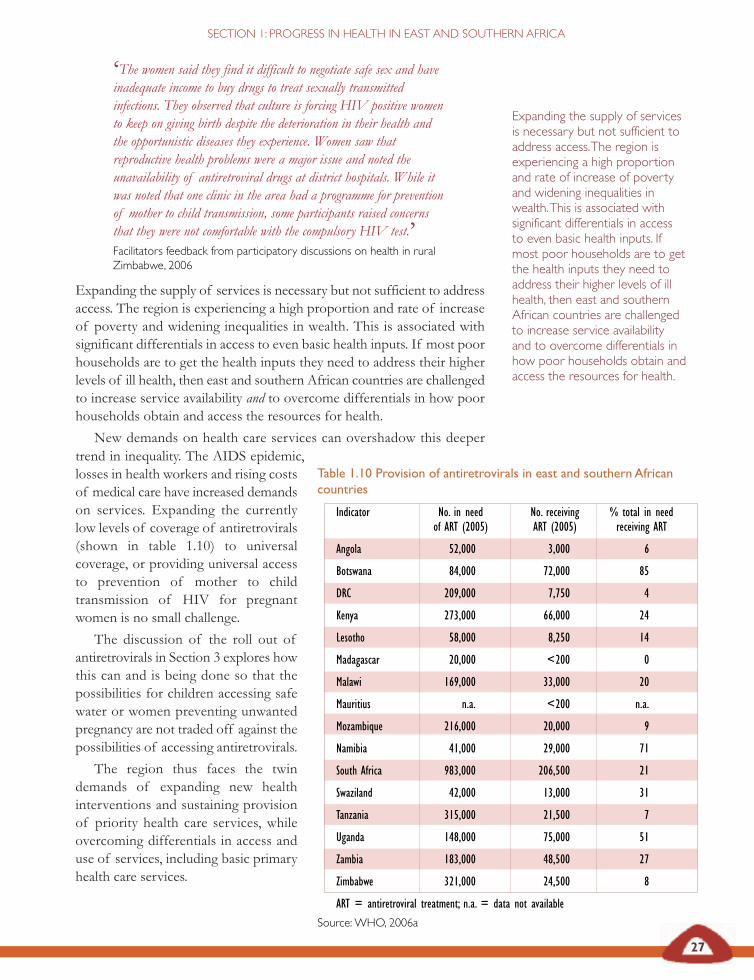
27
SECTION 1: PROGRESS IN HEALTH IN EAST AND SOUTHERN AFRICA
‘The women said they find it difficult to negotiate safe sex and haveinadequate income to buy drugs to treat sexually transmittedinfections. They observed that culture is forcing HIV positive womento keep on giving birth despite the deterioration in their health andthe opportunistic diseases they experience. Women saw thatreproductive health problems were a major issue and noted theunavailability of antiretroviral drugs at district hospitals. While itwas noted that one clinic in the area had a programme for preventionof mother to child transmission, some participants raised concernsthat they were not comfortable with the compulsory HIV test.’Facilitators feedback from participatory discussions on health in ruralZimbabwe, 2006
Expanding the supply of services is necessary but not sufficient to addressaccess. The region is experiencing a high proportion and rate of increaseof poverty and widening inequalities in wealth. This is associated withsignificant differentials in access to even basic health inputs. If most poorhouseholds are to get the health inputs they need to address their higherlevels of ill health, then east and southern African countries are challengedto increase service availability and to overcome differentials in how poorhouseholds obtain and access the resources for health.
New demands on health care services can overshadow this deeper
Expanding the supply of servicesis necessary but not sufficient toaddress access.The region isexperiencing a high proportionand rate of increase of povertyand widening inequalities inwealth.This is associated withsignificant differentials in accessto even basic health inputs. Ifmost poor households are to getthe health inputs they need toaddress their higher levels of illhealth, then east and southernAfrican countries are challengedto increase service availabilityand to overcome differentials inhow poor households obtain andaccess the resources for health.
trend in inequality. The AIDS epidemic,losses in health workers and rising costsof medical care have increased demandson services. Expanding the currentlylow levels of coverage of antiretrovirals(shown in table 1.10) to universalcoverage, or providing universal accessto prevention of mother to childtransmission of HIV for pregnantwomen is no small challenge.
The discussion of the roll out ofantiretrovirals in Section 3 explores howthis can and is being done so that thepossibilities for children accessing safewater or women preventing unwantedpregnancy are not traded off against thepossibilities of accessing antiretrovirals.
The region thus faces the twindemands of expanding new healthinterventions and sustaining provisionof priority health care services, whileovercoming differentials in access anduse of services, including basic primaryhealth care services.
Table 1.10 Provision of antiretrovirals in east and southern Africancountries
Indicator No. in need No. receiving % total in needof ART (2005) ART (2005) receiving ART
Angola 52,000 3,000 6
Botswana 84,000 72,000 85
DRC 209,000 7,750 4
Kenya 273,000 66,000 24
Lesotho 58,000 8,250 14
Madagascar 20,000 <200 0
Malawi 169,000 33,000 20
Mauritius n.a. <200 n.a.
Mozambique 216,000 20,000 9
Namibia 41,000 29,000 71
South Africa 983,000 206,500 21
Swaziland 42,000 13,000 31
Tanzania 315,000 21,500 7
Uganda 148,000 75,000 51
Zambia 183,000 48,500 27
Zimbabwe 321,000 24,500 8
ART = antiretroviral treatment; n.a. = data not available
Source:WHO, 2006a
28
RECLAIMINGTHE RESOURCES FOR HEALTH:ADVANCING HEALTH EQUITY IN EAST AND SOUTHERN AFRICA
Equity through reclaiming the resourcesfor health
‘Inequity is increasing between and within countries, widening thehealth gap and sub-Saharan Africa carries the greatest burden ofdisease and underdevelopment.
The summit should agree on steps to reduce inequity in society, tonarrow the gap between rich and poor, and within and betweencountries and, to this end, to focus measures on those mostvulnerable.’Johannesburg Declaration on Health and Sustainable Development, SADCMinisters of Health, Summit on Sustainable Development, 19-22 January 2002
Drawing on evidence from east and southern Africa, this section identifiesthat gross domestic product is often a poor reflection of the natural assetsand wealth of those countries. There is wide variability in aggregate grossdomestic product across the region and, while there has been economicgrowth, this has often not translated into human developmentimprovements. The evidence presented suggests that the benefits ofgrowth are not reaching households, particularly where there is a rise inhousehold poverty and widening inequality in access to wealth. That thisis happening at a higher rate in the countries with higher overall grossdomestic product reflects possible problems in the paths to growth. Theevidence suggests that relative inequality in incomes and wealth may beacting as a brake to poverty reduction, even where growth occurs. Theburden of AIDS mortality on human development adds furtherimperative to addressing this.
The Millennium Development Goals set by the United Nations seekto free men, women, and children from the dehumanising conditions ofextreme poverty. The targets for these goals are used as a framework tomeasure development progress. The eight goals are to:
1 eradicate extreme poverty and hunger;
2 achieve universal primary education;
3 promote gender equality and empower women;
4 reduce child mortality;
5 improve maternal health;
6 combat HIV and AIDS, malaria and other diseases;
7 ensure environmental sustainability; and
8 develop a global partnership for development.
This analysis does not repeat the well-documented performance of eastand southern African countries against the goals, found, for example, atthe following website:
http://web.worldbank.org/WBSITE/EXTERNAL/COUNTRIES/AFRICAEXT/0,,contentMDK:20234497~menuPK:485868~pagePK:146736~piPK:226340~theSitePK:258644,00.html (World Bank, 2000).
29
SECTION 1: PROGRESS IN HEALTH IN EAST AND SOUTHERN AFRICA
The evidence in this section suggests, however, that the limited returnsfrom growth to households challenges delivery on these commitments todevelopment. This echoes similar warnings made in other global reviews(UNDP, 2005).
Poverty and inequality in wealth are associated with inequalities inhealth, while improvements in health can contribute to reducing poverty.In addition to the significant reversals in life expectancy at birth thatresulted from the AIDS epidemic, households with lower levels ofincome, poor education or living in under resourced rural communitiesexperience both higher levels of ill health and have less access to theinputs for health.
The effect of economic policy choices on these health outcomes issignificant and potentially long term. Zimbabwe’s experience describedon page 30 shows that economic policies can differently affect groupsacross the wealth spectrum, fragmenting their relationship with healthservices and setting the basis for their subsequent health experience.
While health systems can make a difference to health outcomes., arecent analysis of inequality in Africa highlights the role of publicexpenditure, particularly on primary health care services, in redistributingresources and addressing inequalities in assets and income (Okojie andShimeles, 2006). So the expansion of health services in east and southernAfrica in the past decades is likely to have played an important role inreducing both poverty and inequality. Health services now appear to facenew challenges, however, with the following demands to:
• develop new interventions due to AIDS and other chronicdiseases;
• maintain service provisioning, sometimes in the face of risingcosts (discussed further in the next section); and
• address the continuing gaps in access to and use of theseservices among those groups with greatest health needs.
There is a long-standing commitment in this region to close up these gaps.Challenges to unfair and avoidable inequalities in health were an inherentpart of most liberation movement policies, incorporated into foundinghealth policies and programmes of independent governments in theregion. When the Southern African Development Community (SADC)health sector was formed in the late 1990s, it included a focus onaddressing these unfair inequalities in health, building on a report tabledby the Ministry of Health (Botswana) from the regional meeting held inKasane, Botswana. Commitments to equity have since been expressed bySADC and by the health ministers in east, central and southern Africa.
The current health conditions in the region described in this sectionindicate that this commitment to equity remains relevant. According tothe definition of equity given at the beginning of the section, equity-oriented policies seek to overcome avoidable and unfair differences inhealth, such as those along dimensions of wealth, gender, place oreducation, that have been outlined in this section.
Poverty and inequality in wealthare associated with inequalities inhealth, while improvements inhealth can contribute to reducingpoverty.
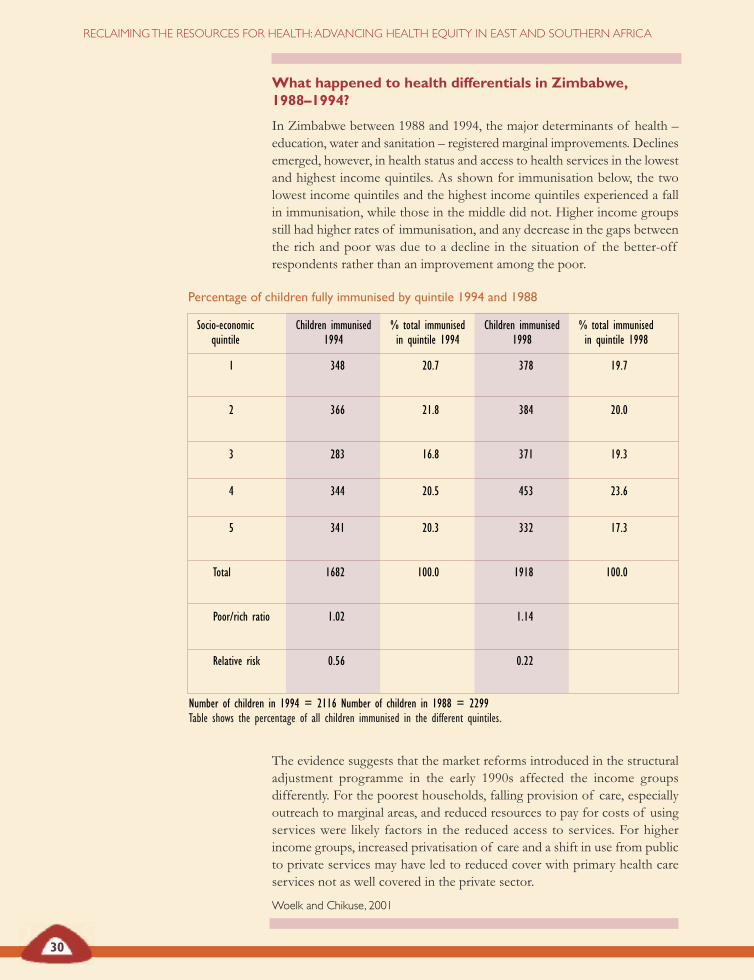
Percentage of children fully immunised by quintile 1994 and 1988
Socio-economic Children immunised % total immunised Children immunised % total immunisedquintile 1994 in quintile 1994 1998 in quintile 1998
1 348 20.7 378 19.7
2 366 21.8 384 20.0
3 283 16.8 371 19.3
4 344 20.5 453 23.6
5 341 20.3 332 17.3
Total 1682 100.0 1918 100.0
Poor/rich ratio 1.02 1.14
Relative risk 0.56 0.22
What happened to health differentials in Zimbabwe,1988–1994?
In Zimbabwe between 1988 and 1994, the major determinants of health –education, water and sanitation – registered marginal improvements. Declinesemerged, however, in health status and access to health services in the lowestand highest income quintiles. As shown for immunisation below, the twolowest income quintiles and the highest income quintiles experienced a fallin immunisation, while those in the middle did not. Higher income groupsstill had higher rates of immunisation, and any decrease in the gaps betweenthe rich and poor was due to a decline in the situation of the better-offrespondents rather than an improvement among the poor.
The evidence suggests that the market reforms introduced in the structuraladjustment programme in the early 1990s affected the income groupsdifferently. For the poorest households, falling provision of care, especiallyoutreach to marginal areas, and reduced resources to pay for costs of usingservices were likely factors in the reduced access to services. For higherincome groups, increased privatisation of care and a shift in use from publicto private services may have led to reduced cover with primary health careservices not as well covered in the private sector.
Woelk and Chikuse, 2001
RECLAIMINGTHE RESOURCES FOR HEALTH:ADVANCING HEALTH EQUITY IN EAST AND SOUTHERN AFRICA
Number of children in 1994 = 2116 Number of children in 1988 = 2299Table shows the percentage of all children immunised in the different quintiles.
30
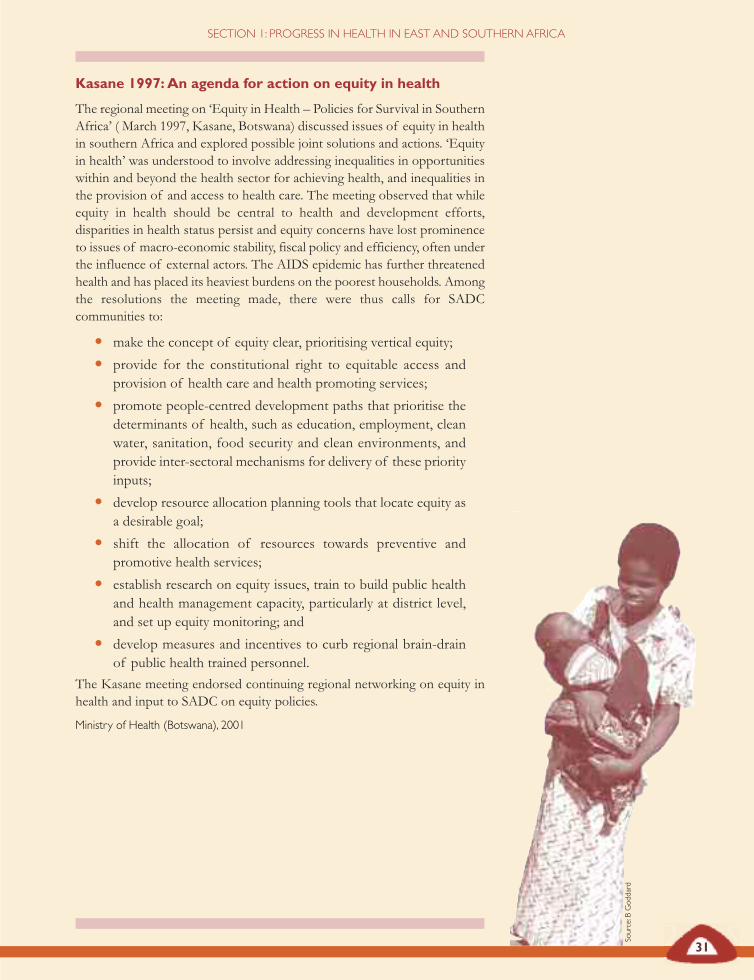
SECTION 1: PROGRESS IN HEALTH IN EAST AND SOUTHERN AFRICA
Kasane 1997:An agenda for action on equity in health
The regional meeting on ‘Equity in Health – Policies for Survival in SouthernAfrica’ ( March 1997, Kasane, Botswana) discussed issues of equity in healthin southern Africa and explored possible joint solutions and actions. ‘Equityin health’ was understood to involve addressing inequalities in opportunitieswithin and beyond the health sector for achieving health, and inequalities inthe provision of and access to health care. The meeting observed that whileequity in health should be central to health and development efforts,disparities in health status persist and equity concerns have lost prominenceto issues of macro-economic stability, fiscal policy and efficiency, often underthe influence of external actors. The AIDS epidemic has further threatenedhealth and has placed its heaviest burdens on the poorest households. Amongthe resolutions the meeting made, there were thus calls for SADCcommunities to:
• make the concept of equity clear, prioritising vertical equity;
• provide for the constitutional right to equitable access andprovision of health care and health promoting services;
• promote people-centred development paths that prioritise thedeterminants of health, such as education, employment, cleanwater, sanitation, food security and clean environments, andprovide inter-sectoral mechanisms for delivery of these priorityinputs;
• develop resource allocation planning tools that locate equity asa desirable goal;
• shift the allocation of resources towards preventive andpromotive health services;
• establish research on equity issues, train to build public healthand health management capacity, particularly at district level,and set up equity monitoring; and
• develop measures and incentives to curb regional brain-drainof public health trained personnel.
The Kasane meeting endorsed continuing regional networking on equity inhealth and input to SADC on equity policies.
Ministry of Health (Botswana), 2001
31
Source:BGoddard
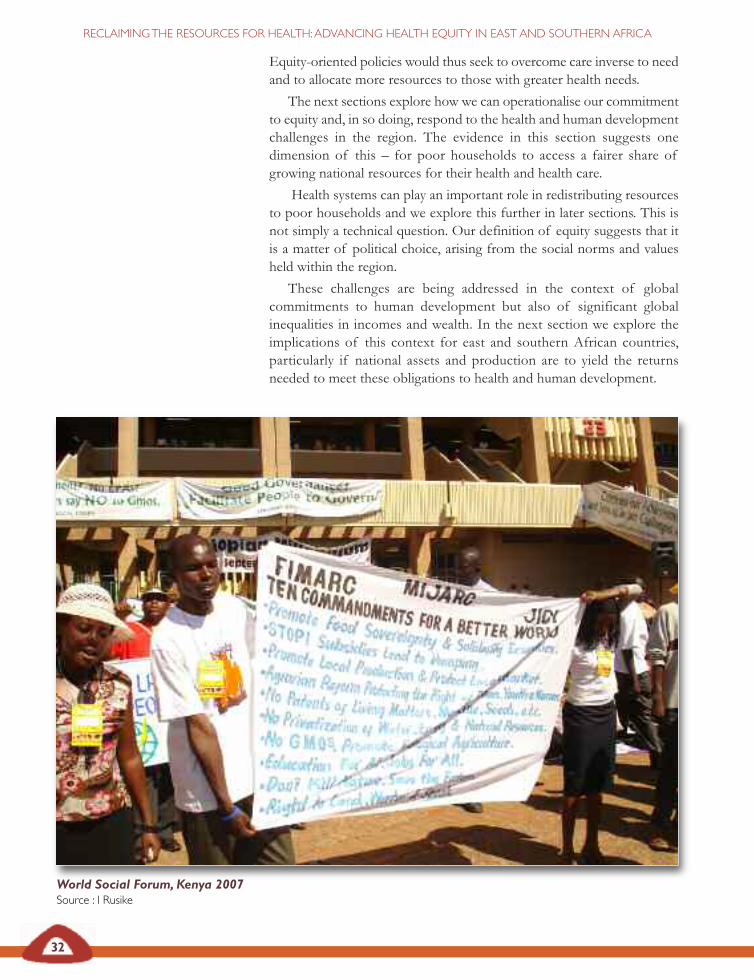
32
RECLAIMINGTHE RESOURCES FOR HEALTH:ADVANCING HEALTH EQUITY IN EAST AND SOUTHERN AFRICA
Equity-oriented policies would thus seek to overcome care inverse to needand to allocate more resources to those with greater health needs.
The next sections explore how we can operationalise our commitmentto equity and, in so doing, respond to the health and human developmentchallenges in the region. The evidence in this section suggests onedimension of this – for poor households to access a fairer share ofgrowing national resources for their health and health care.
Health systems can play an important role in redistributing resourcesto poor households and we explore this further in later sections. This isnot simply a technical question. Our definition of equity suggests that itis a matter of political choice, arising from the social norms and valuesheld within the region.
These challenges are being addressed in the context of globalcommitments to human development but also of significant globalinequalities in incomes and wealth. In the next section we explore theimplications of this context for east and southern African countries,particularly if national assets and production are to yield the returnsneeded to meet these obligations to health and human development.
World Social Forum, Kenya 2007Source : I Rusike

33
SECTION 1: PROGRESS IN HEALTH IN EAST AND SOUTHERN AFRICA
REFERENCESAtim C (2006) Financial factors affecting slow progress in reachingagreed targets on HIV/AIDS, TB and malaria in Africa, DFIDHealth Resource Centre, prepared for the AU, Addis Ababa,downloaded 7 March 2007 at www.africa-union.org
African Union (AU), United Nations Economic Commissionfor Africa (UNECA) (2007) Accelerating Africa’s developmentthrough diversification, AU/UNECA, Ethiopia.
Bernal P and Meleis A (1995) ‘Self care actions ofColombian Por Dia domestic workers: On prevention andcare’, Women and Health 22 (4): 77-95.
Bloom G, Lucas H, Edun A, Lenneiye M and Milimo J (2000)Working paper 103: Health and poverty in sub-Saharan Africa,Institute of Development Studies, Brighton.
Carr D (2004) ‘Improving the health of the world’s poorestpeople’, Health Bulletin 1, Population Reference Bureau,Washington DC, accessed 6 Dec 2006 at http://www.prb.org/pdf/Improvingthe HealthWorld_Eng.pdf
Castro-Leal F, Dayton J, Demery L, Mehra K (2000) ‘Publicspending on health care in Africa: Do the poor benefit?’,Bulletin of the World Health Organisation 78(1).
Davies JB, Sandstrom S, Shorrocks A, Wolff EN (2006) ‘Theworld distribution of household wealth,’ UN Univ., WorldInstitute for Development Economics research paper, WIDER,Helsinki, Finland.
EQUINET Steering Committee (1998) ‘Equity in healthsouthern Africa: Overview and issues from an annotatedbibliography’, EQUINET policy paper 2, EQUINET, Harare.– (2000) ‘Turning values into practice: Equity in health insouthern Africa’, EQUINET policy paper 7, EQUINET,Harare.
Forsythe S (1992) ‘The economic impact of HIV and AIDSin Malawi’, Report for the National AIDS Control Programme(confidential mimeo), Government of Malawi, Lilongwe.
Gillies P, Tolley K and Wolstenholme J (1996) ‘Is AIDS adisease of poverty?’, AIDS Care (8)3: 351-364.
Goudge J and Govender V (2000) ‘A review of experienceconcerning household ability to cope with the resourcedemands of ill health and health care utlisation’, EQUINETpolicy paper 3, EQUINET, Harare.
Gwatkin DR, Bhuiya A, Victora CG (2004) ‘Making healthsystems more equitable’, The Lancet 364: 1273-1280.
International Labour Organisation (ILO) (1995) ‘The impactof HIV/AIDS on the productive labour force in Africa’,EAMAT working paper 1, ILO, Addis Ababa.– (1995b) ‘The Impact of HIV/AIDS on the productivelabour force in Zambia,’ EAMAT working paper 5, ILO, AddisAbaba.– (1995c) ‘The Impact of HIV/AIDS on the productivelabour force in Tanzania’, EAMAT working paper 3, ILO,Addis Ababa.
Jayawardene R (1993) ‘Illness perception: Social cost andcoping strategies of malaria cases’, Social Science and Medicine37 (9):1169-1176.
Kuznets S (1955) ‘Toward a theory of economic growth’, inLekachman R, National policy for economic welfare at home andabroad, Doubleday, Garden City, New York.
Ministry of Health (Botswana) (2001) ‘Equity in health:Kasane report’, memo, feedback to the SADC health sector,Govt of Botswana, Gabarone.
OCR Macro (2007) ‘MEASURE DHS STAT compiler’,accessed 8 June 2007 at www.measuremenths.com
Okojie C, Shimeles A (2006) Inequality in sub-Saharan Africa: Asynthesis of recent research on the levels, trends, effects and determinantsof inequality in its different dimensions, The Inter-RegionalInequality Facility, ODI, UK.
Omaswa F, Burnham G, Baingana G, Mwebesa H andMorrow R (1997) ‘Introducing quality management intoprimary health care services in Uganda’, Bulletin of the WorldHealth Organisation 75(2): 155-161.
Ravallion M (2005) ‘A poverty–inequality trade off?’, WorldBank policy research paper 3579, April 2005, accessed 4 June2007 at http://econ.worldbank.org/external/default/main?Img PagePK=64202990&entity ID=000012009_20050505134719&menuPK=64168175&pagePK=64210502&theSitePK=477894&piPK=64210520
Schellenberg JA, Victora CG, Mushi A, de Savigny D,Schellenberg D, Mshinda H and Bryce J (2003) ‘Inequitiesamong the very poor: Health care for children in ruralsouthern Tanzania’, The Lancet online 4 February 2003, athttp://image.thelancet/com/extras/02Art2280web.pdf
Smithson P (2006) Fairs fair: Health inequalities and equity inTanzania, Womens Dignity Project, Ifakara Health ResearchDevelopment Centre, Dar es Salaam.
Southern African Development Community (SADC) (4 July2003) Maseru declaration on HIV/AIDS, Maseru, Lesotho,SADC, Gabarone.– (2003b) SADC HIV/AIDS framework and strategic programmeof action 2003–2007, SADC, Gabarone.
Statistics South Africa (2001) ‘Census in brief 2001’, Pretoria,2003 cited in Ntuli A, Ijumba P, McCoy D, Padarath A andBerthiaume L (2003) ‘HIV/AIDS and health sector responsesin South Africa: Treatment access and equity: Balancing theact’, EQUINET discussion paper 7, EQUINET and OXFAMGB, Harare.
UNAIDS (2005) Regional comparison in people living with HIV andAIDS, 2005, UNAIDS, Geneva.– (2006) Report on the global AIDS epidemic, May 2006,UNAIDS, Geneva accessed 2 June 2007at http://www.unaids.org/en/HIV_data/2006GlobalReport/default.asp
United Nations Development Programme (UNDP) (1999)Human development report 1999, OUP: New York, accessed 2June 2007 at http://hdr.undp.org/reports /view_reports.cfm?type=–(2002) Human development report 2002, OUP, New York,accessed at http://hdr.undp.org/reports/ view_reports.cfm?type=1 June 2 2007
34
RECLAIMINGTHE RESOURCES FOR HEALTH:ADVANCING HEALTH EQUITY IN EAST AND SOUTHERN AFRICA
–(2005) Human development report 2005– International co-operationat a crossroads:Aid, trade and security in an unequal world, OUP ,New York, accessed 1 June 2 2007 at http://hdr.undp.org/reports/view_reports.cfm?type=– (2006) Human development report 2006, OUP, New York,accessed 2 June 2007 at http://hdr.undp.org/hdr2006/
UNDP Sub-regional Resource Facility (SURF) for SouthernAfrica (2000) United Nations southern Africa regional humandevelopment report 2000, UNDP, Pretoria.
United Nations Children’s Fund (UNICEF)(2007) Monitoringand statistics web databases accessed 2 June 2007 atwww.unicef.org/statistics
Woelk G (2000) ‘Analysing inequities in health status and inhealth care using demographic and health survey data:Zimbabwe’, paper presented at the EQUINET conference,Midrand South Africa, September 2000, EQUINET, Harare.
Woelk G and Chikuse P (2001) ‘Using demographic andhealth survey data to describe intra-country inequalities inhealth status: Zimbabwe’, EQUINET policy paper 9,EQUINET, Harare.
World Bank (2000) Millenium Development Goal indicators: Africa,World Bank, New York available at http://web.worldbank.org/WBSITE/EXTERNAL/COUNTRIES/AFRICAEXT/0,,contentMDK:20234497~menuPK:485868~pagePK:146736~piPK:226340~theSitePK:258644,00.html
– (2004) World development indicators database 2004, World Bank,Washington, accessed 2 June 2007 at http://devdata.worldbank.org/wdi2004/index2.htm– (2005) World development indicators database 2005, World Bank,Washington, accessed 2 June 2007 at http://devdata.worldbank.org/wdi2005/index2.htm– (2006) World development indicators database 2006, World Bank,Washington, accessed 2 June 2007 at http://devdata.worldbank.org/wdi2006/contents/Section4.htm
World Health Organisation (WHO) (2005) WHO global healthatlas, WHO, Geneva, accessed March 2006 athttp://globalatlas.who.int.– (2006) Core health indicators database 2006, WHO, Geneva,accessed Nov 2006 at: http://www.who.int/whosis /en/– (2006a) Progress on global access to antiretroviral therapy: A reporton ‘3 by 5’ and beyond, WHO, Geneva, available at: http://www.who.int/hiv/mediacentre/news57/en/index.htl
WHO Afro (2006) The African regional health report 2006,WHO-Afro Region, Brazzaville, accessed 2 June 2007 athttp://www.afro.who.int/regionaldirector/african_regional_health_report2006.pdf
WHO, Dept of Health (SA) and SADC (2002) ‘Johannesburgdeclaration on health and sustainable development: Meetingof senior officials and ministers of health’, World Summit onSustainable Development, Johannesburg, 19–22 January, WHO,Geneva, available at: http://www.who.int/mediacentre/events/HSD_Plaq_02.8_def1.pdf
ReclaimingTHE ECONOMIC RESOURCES FOR
HEALTH
SECTION
2
KEY ISSUES
SECTION
2
IsAfrica a ‘poor continent’? We don’t believe so – but Africa’ssubstantial resources tend to flow outwards. This resource drain,and the inequality in wealth described in Section 1, leaves most of
Africa’s people in poverty and depletes the resources for health. It takesplace in many different ways – through debt; falling terms of trade;capital and financial market outflows; reduced foreign direct investmentand domestic savings; as well as through the outflow of human andnatural resources. Private finance in Africa has shifted from recordingnet inflows in the 1970s to gradual outflows during the 1980s andfinally to substantial outflows after the 1990s.
These outflows deplete the national and household resources forhealth. To reclaim these resources, policies and measures outside thehealth sector must become matters for public health concern.
For example, the rising levels of under-nutrition in parts of theregion have drawn attention to food and agriculture policies. Tradeliberalisation, unfair trade barriers and monopoly control over foodproduction have not only weakened household and smallholderproduction, they have also undermined the basis for improved nutrition.An alternative route lies in promoting food sovereignty – increasinginvestments in smallholder farmers, especially women, and enhancingtheir control over land, seed and other production inputs.
Trade agreements are increasingly influencing health and healthcare, particularly in relation to people’s access to medicines and thefinancing and provision of health care. Dialogue across trade and healthministries enables us to audit the impact these agreements may have onhealth, to fully use the flexibilities they provide and to negotiate thepolicy space and government authority needed to protect public health.
Health systems can make a difference to these wider influences onhealth and provide leadership – shaping wider social norms and values,motivating public health awareness and working across sectors in acommon approach. What kind of health system plays that role? We takethis up in the next section.
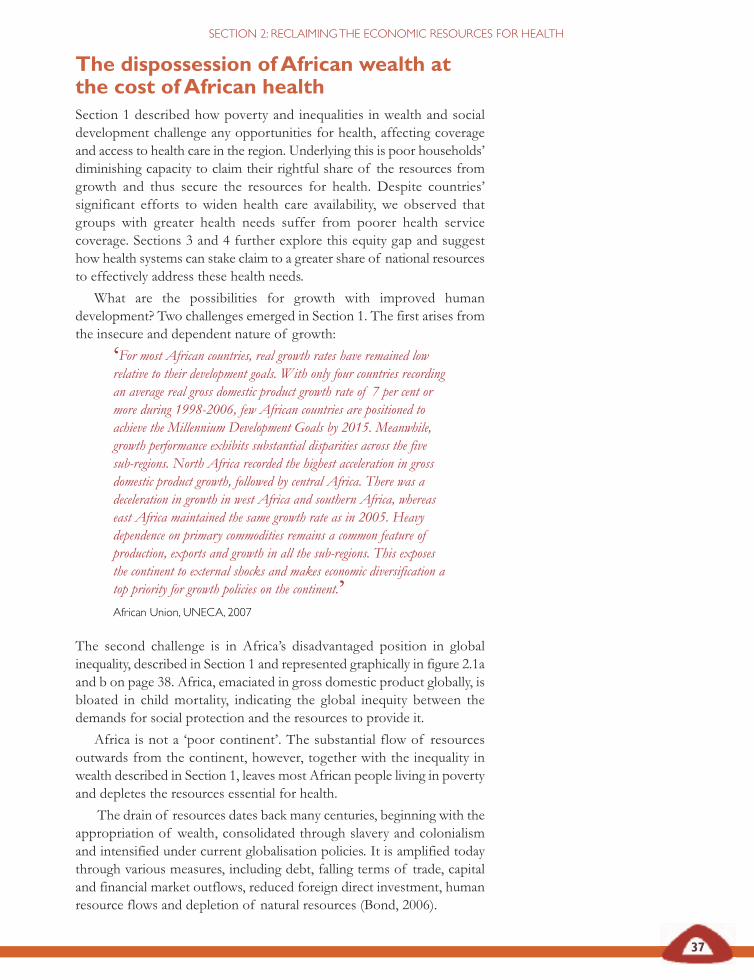
37
SECTION 2: RECLAIMINGTHE ECONOMIC RESOURCES FOR HEALTH
The dispossession ofAfrican wealth atthe cost ofAfrican healthSection 1 described how poverty and inequalities in wealth and socialdevelopment challenge any opportunities for health, affecting coverageand access to health care in the region. Underlying this is poor households’diminishing capacity to claim their rightful share of the resources fromgrowth and thus secure the resources for health. Despite countries’significant efforts to widen health care availability, we observed thatgroups with greater health needs suffer from poorer health servicecoverage. Sections 3 and 4 further explore this equity gap and suggesthow health systems can stake claim to a greater share of national resourcesto effectively address these health needs.
What are the possibilities for growth with improved humandevelopment? Two challenges emerged in Section 1. The first arises fromthe insecure and dependent nature of growth:
‘For most African countries, real growth rates have remained lowrelative to their development goals. With only four countries recordingan average real gross domestic product growth rate of 7 per cent ormore during 1998-2006, few African countries are positioned toachieve the Millennium Development Goals by 2015. Meanwhile,growth performance exhibits substantial disparities across the fivesub-regions. North Africa recorded the highest acceleration in grossdomestic product growth, followed by central Africa. There was adeceleration in growth in west Africa and southern Africa, whereaseast Africa maintained the same growth rate as in 2005. Heavydependence on primary commodities remains a common feature ofproduction, exports and growth in all the sub-regions. This exposesthe continent to external shocks and makes economic diversification atop priority for growth policies on the continent.’African Union, UNECA, 2007
The second challenge is in Africa’s disadvantaged position in globalinequality, described in Section 1 and represented graphically in figure 2.1aand b on page 38. Africa, emaciated in gross domestic product globally, isbloated in child mortality, indicating the global inequity between thedemands for social protection and the resources to provide it.
Africa is not a ‘poor continent’. The substantial flow of resourcesoutwards from the continent, however, together with the inequality inwealth described in Section 1, leaves most African people living in povertyand depletes the resources essential for health.
The drain of resources dates back many centuries, beginning with theappropriation of wealth, consolidated through slavery and colonialismand intensified under current globalisation policies. It is amplified todaythrough various measures, including debt, falling terms of trade, capitaland financial market outflows, reduced foreign direct investment, humanresource flows and depletion of natural resources (Bond, 2006).
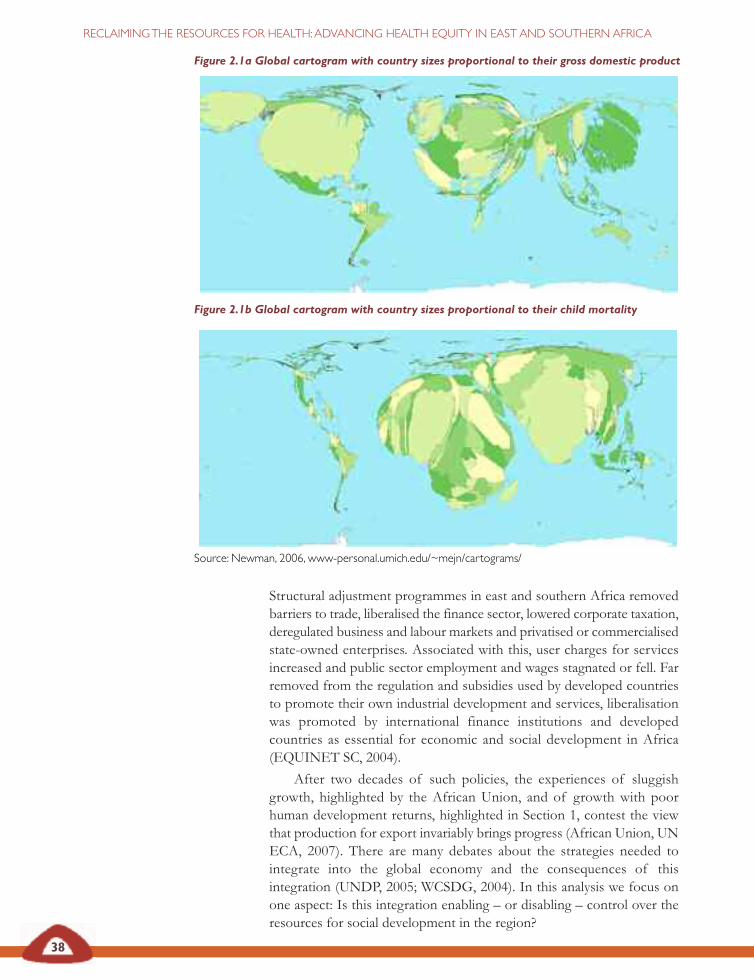
38
RECLAIMINGTHE RESOURCES FOR HEALTH:ADVANCING HEALTH EQUITY IN EAST AND SOUTHERN AFRICA
Structural adjustment programmes in east and southern Africa removedbarriers to trade, liberalised the finance sector, lowered corporate taxation,deregulated business and labour markets and privatised or commercialisedstate-owned enterprises. Associated with this, user charges for servicesincreased and public sector employment and wages stagnated or fell. Farremoved from the regulation and subsidies used by developed countriesto promote their own industrial development and services, liberalisationwas promoted by international finance institutions and developedcountries as essential for economic and social development in Africa(EQUINET SC, 2004).
After two decades of such policies, the experiences of sluggishgrowth, highlighted by the African Union, and of growth with poorhuman development returns, highlighted in Section 1, contest the viewthat production for export invariably brings progress (African Union, UNECA, 2007). There are many debates about the strategies needed tointegrate into the global economy and the consequences of thisintegration (UNDP, 2005; WCSDG, 2004). In this analysis we focus onone aspect: Is this integration enabling – or disabling – control over theresources for social development in the region?
Figure 2.1a Global cartogram with country sizes proportional to their gross domestic product
Figure 2.1b Global cartogram with country sizes proportional to their child mortality
Source: Newman, 2006, www-personal.umich.edu/~mejn/cartograms/
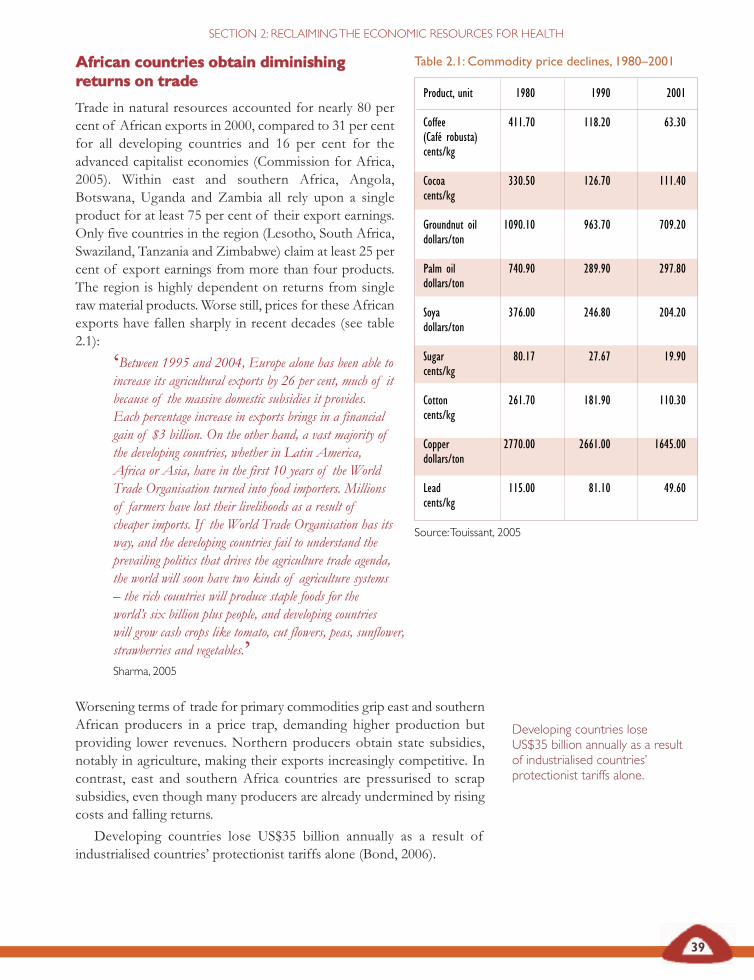
AAffrriiccaann ccoouunnttrriieess oobbttaaiinn ddiimmiinniisshhiinnggrreettuurrnnss oonn ttrraaddee
Trade in natural resources accounted for nearly 80 percent of African exports in 2000, compared to 31 per centfor all developing countries and 16 per cent for theadvanced capitalist economies (Commission for Africa,2005). Within east and southern Africa, Angola,Botswana, Uganda and Zambia all rely upon a singleproduct for at least 75 per cent of their export earnings.Only five countries in the region (Lesotho, South Africa,Swaziland, Tanzania and Zimbabwe) claim at least 25 percent of export earnings from more than four products.The region is highly dependent on returns from singleraw material products. Worse still, prices for these Africanexports have fallen sharply in recent decades (see table2.1):
‘Between 1995 and 2004, Europe alone has been able toincrease its agricultural exports by 26 per cent, much of itbecause of the massive domestic subsidies it provides.Each percentage increase in exports brings in a financialgain of $3 billion. On the other hand, a vast majority ofthe developing countries, whether in Latin America,Africa or Asia, have in the first 10 years of the WorldTrade Organisation turned into food importers. Millionsof farmers have lost their livelihoods as a result ofcheaper imports. If the World Trade Organisation has itsway, and the developing countries fail to understand theprevailing politics that drives the agriculture trade agenda,the world will soon have two kinds of agriculture systems– the rich countries will produce staple foods for theworld’s six billion plus people, and developing countrieswill grow cash crops like tomato, cut flowers, peas, sunflower,strawberries and vegetables.’ Sharma, 2005
Worsening terms of trade for primary commodities grip east and southernAfrican producers in a price trap, demanding higher production butproviding lower revenues. Northern producers obtain state subsidies,notably in agriculture, making their exports increasingly competitive. Incontrast, east and southern Africa countries are pressurised to scrapsubsidies, even though many producers are already undermined by risingcosts and falling returns.
Developing countries lose US$35 billion annually as a result ofindustrialised countries’ protectionist tariffs alone (Bond, 2006).
39
SECTION 2: RECLAIMING THE ECONOMIC RESOURCES FOR HEALTH
Developing countries loseUS$35 billion annually as a resultof industrialised countries’protectionist tariffs alone.
Table 2.1: Commodity price declines, 1980–2001
Product, unit 1980 1990 2001
Coffee 411.70 118.20 63.30(Café robusta) cents/kg
Cocoa 330.50 126.70 111.40cents/kg
Groundnut oil 1090.10 963.70 709.20dollars/ton
Palm oil 740.90 289.90 297.80dollars/ton
Soya 376.00 246.80 204.20dollars/ton
Sugar 80.17 27.67 19.90cents/kg
Cotton 261.70 181.90 110.30cents/kg
Copper 2770.00 2661.00 1645.00dollars/ton
Lead 115.00 81.10 49.60 cents/kg
Source: Touissant, 2005
40
RECLAIMING THE RESOURCES FOR HEALTH: ADVANCING HEALTH EQUITY IN EAST AND SOUTHERN AFRICA
Effects of northern agricultural subsidies in east andsouthern Africa
Kenya had more than doubled its processed milk production between 1980and 1990 but imports of milk powder soared after 1990, increasing from 48tonnes to 2,500 tonnes by 1998. At the same time, domestic production ofprocessed milk plummeted by almost 70 per cent. Kenya’s ability to diversifyinto processing was undermined and small producers bore the brunt of thedecline in demand for local fresh milk.
European Union beef is sold in southern Africa for 30 pence a kilogramalthough it costs one pound per kilogram to produce it. This has completelychanged the economics of the Namibian meat canning industry which hasshifted from local beef to the imported subsidised beef.
South Africa dismantled its subsidy scheme for fruit and vegetables as part ofits re-entry into the international market. However the European Unionretained its subsidies and placed tariffs of between 11 and 23 per cent onSouth African canned fruit and vegetables. This has led to many small fruitand vegetable farmers in South Africa being forced to sell or to consolidatewith larger farming concerns.
Chopra, 2004
Domination of the food supply chain by transnationalcorporations
• Six transnational corporations account for 85 per cent of world trade ingrain.
• Eight transnational corporations account for 60 per cent of globalcoffee sales (Madeley, 2003).
• Cargill, a transnational corporation, controls 80 per cent of graindistribution throughout the world (Kneen, 1996).
• Ten agrochemical companies control 81 per cent of the US$29 billionglobal agrochemical market.
• Four transnational corporations own nearly 45 per cent of patents forstaples such as rice and maize (ActionAid, 2003).
• In South Africa, Monsanto controls 100 per cent of the national marketfor genetically modified seed, 60 per cent of the hybrid maize marketand 90 per cent of the wheat market.
• Three large retailers are now responsible for over 70 per cent of totalfood sales in east and southern Africa
Madeley, 2003
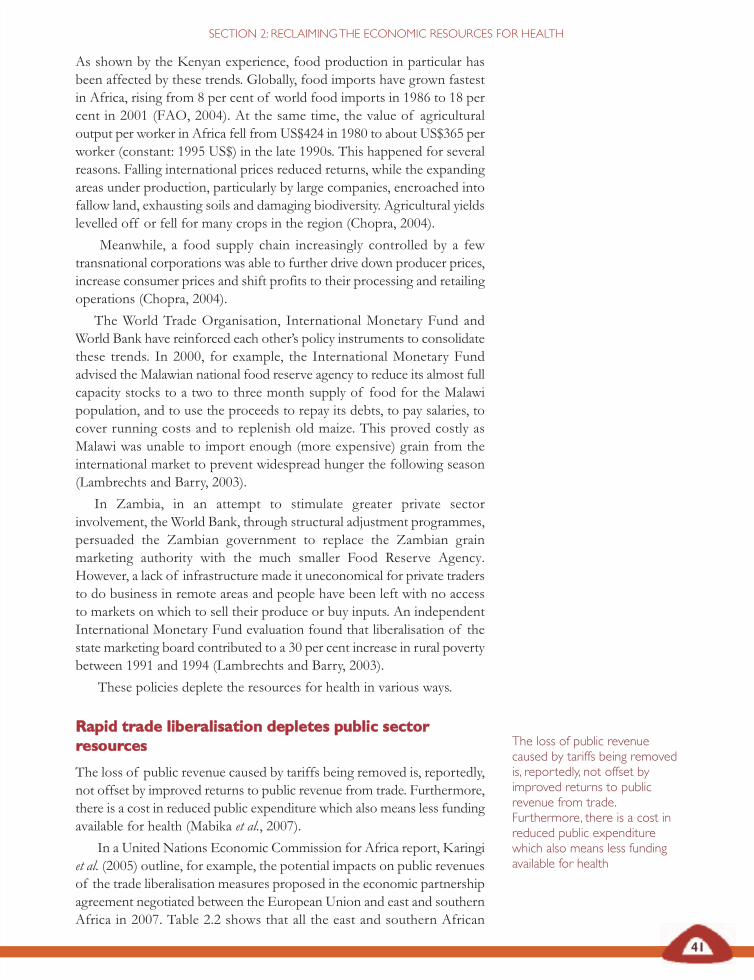
41
SECTION 2: RECLAIMING THE ECONOMIC RESOURCES FOR HEALTH
As shown by the Kenyan experience, food production in particular hasbeen affected by these trends. Globally, food imports have grown fastestin Africa, rising from 8 per cent of world food imports in 1986 to 18 percent in 2001 (FAO, 2004). At the same time, the value of agriculturaloutput per worker in Africa fell from US$424 in 1980 to about US$365 perworker (constant: 1995 US$) in the late 1990s. This happened for severalreasons. Falling international prices reduced returns, while the expandingareas under production, particularly by large companies, encroached intofallow land, exhausting soils and damaging biodiversity. Agricultural yieldslevelled off or fell for many crops in the region (Chopra, 2004).
Meanwhile, a food supply chain increasingly controlled by a fewtransnational corporations was able to further drive down producer prices,increase consumer prices and shift profits to their processing and retailingoperations (Chopra, 2004).
The World Trade Organisation, International Monetary Fund andWorld Bank have reinforced each other’s policy instruments to consolidatethese trends. In 2000, for example, the International Monetary Fundadvised the Malawian national food reserve agency to reduce its almost fullcapacity stocks to a two to three month supply of food for the Malawipopulation, and to use the proceeds to repay its debts, to pay salaries, tocover running costs and to replenish old maize. This proved costly asMalawi was unable to import enough (more expensive) grain from theinternational market to prevent widespread hunger the following season(Lambrechts and Barry, 2003).
In Zambia, in an attempt to stimulate greater private sectorinvolvement, the World Bank, through structural adjustment programmes,persuaded the Zambian government to replace the Zambian grainmarketing authority with the much smaller Food Reserve Agency.However, a lack of infrastructure made it uneconomical for private tradersto do business in remote areas and people have been left with no accessto markets on which to sell their produce or buy inputs. An independentInternational Monetary Fund evaluation found that liberalisation of thestate marketing board contributed to a 30 per cent increase in rural povertybetween 1991 and 1994 (Lambrechts and Barry, 2003).
These policies deplete the resources for health in various ways.
RRaappiidd ttrraaddee lliibbeerraalliissaattiioonn ddeepplleetteess ppuubblliicc sseeccttoorrrreessoouurrcceess
The loss of public revenue caused by tariffs being removed is, reportedly,not offset by improved returns to public revenue from trade. Furthermore,there is a cost in reduced public expenditure which also means less fundingavailable for health (Mabika et al., 2007).
In a United Nations Economic Commission for Africa report, Karingiet al. (2005) outline, for example, the potential impacts on public revenuesof the trade liberalisation measures proposed in the economic partnershipagreement negotiated between the European Union and east and southernAfrica in 2007. Table 2.2 shows that all the east and southern African
The loss of public revenuecaused by tariffs being removedis, reportedly, not offset byimproved returns to publicrevenue from trade.Furthermore, there is a cost inreduced public expenditurewhich also means less fundingavailable for health
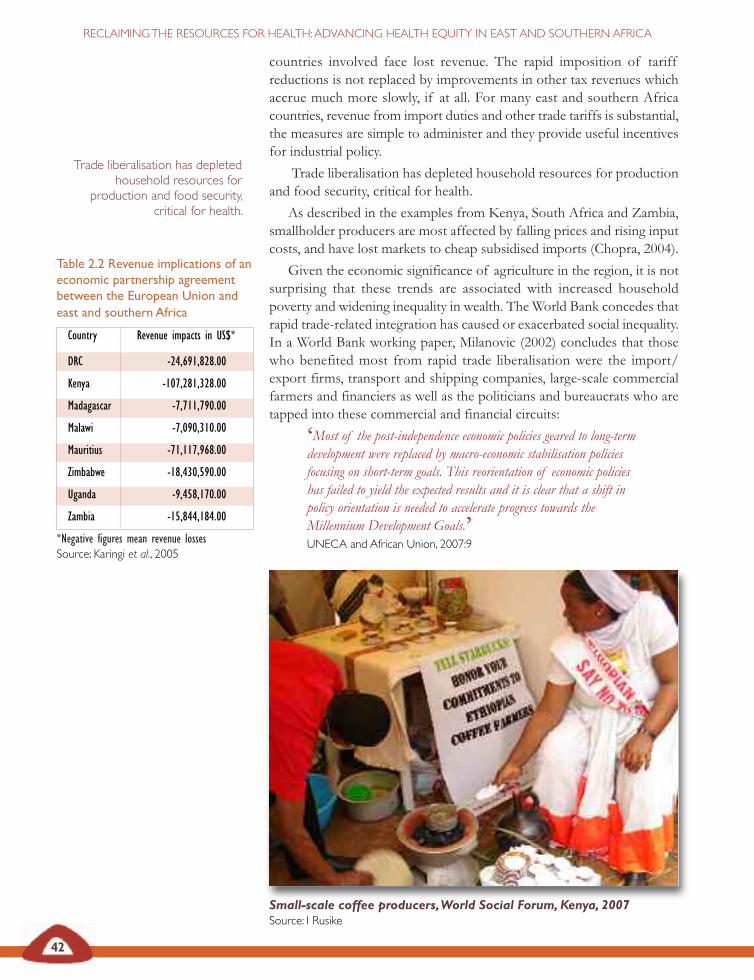
Table 2.2 Revenue implications of aneconomic partnership agreementbetween the European Union andeast and southern Africa
Country Revenue impacts in US$*
DRC -24,691,828.00
Kenya -107,281,328.00
Madagascar -7,711,790.00
Malawi -7,090,310.00
Mauritius -71,117,968.00
Zimbabwe -18,430,590.00
Uganda -9,458,170.00
Zambia -15,844,184.00
*Negative figures mean revenue lossesSource: Karingi et al., 2005
42
RECLAIMING THE RESOURCES FOR HEALTH: ADVANCING HEALTH EQUITY IN EAST AND SOUTHERN AFRICA
countries involved face lost revenue. The rapid imposition of tariffreductions is not replaced by improvements in other tax revenues whichaccrue much more slowly, if at all. For many east and southern Africacountries, revenue from import duties and other trade tariffs is substantial,the measures are simple to administer and they provide useful incentivesfor industrial policy.
Trade liberalisation has depleted household resources for productionand food security, critical for health.
As described in the examples from Kenya, South Africa and Zambia,smallholder producers are most affected by falling prices and rising inputcosts, and have lost markets to cheap subsidised imports (Chopra, 2004).
Given the economic significance of agriculture in the region, it is notsurprising that these trends are associated with increased householdpoverty and widening inequality in wealth. The World Bank concedes thatrapid trade-related integration has caused or exacerbated social inequality.In a World Bank working paper, Milanovic (2002) concludes that thosewho benefited most from rapid trade liberalisation were the import/export firms, transport and shipping companies, large-scale commercialfarmers and financiers as well as the politicians and bureaucrats who aretapped into these commercial and financial circuits:
‘Most of the post-independence economic policies geared to long-termdevelopment were replaced by macro-economic stabilisation policiesfocusing on short-term goals. This reorientation of economic policieshas failed to yield the expected results and it is clear that a shift inpolicy orientation is needed to accelerate progress towards theMillennium Development Goals.’ UNECA and African Union, 2007:9
Trade liberalisation has depletedhousehold resources for
production and food security,critical for health.
Small-scale coffee producers, World Social Forum, Kenya, 2007Source: I Rusike
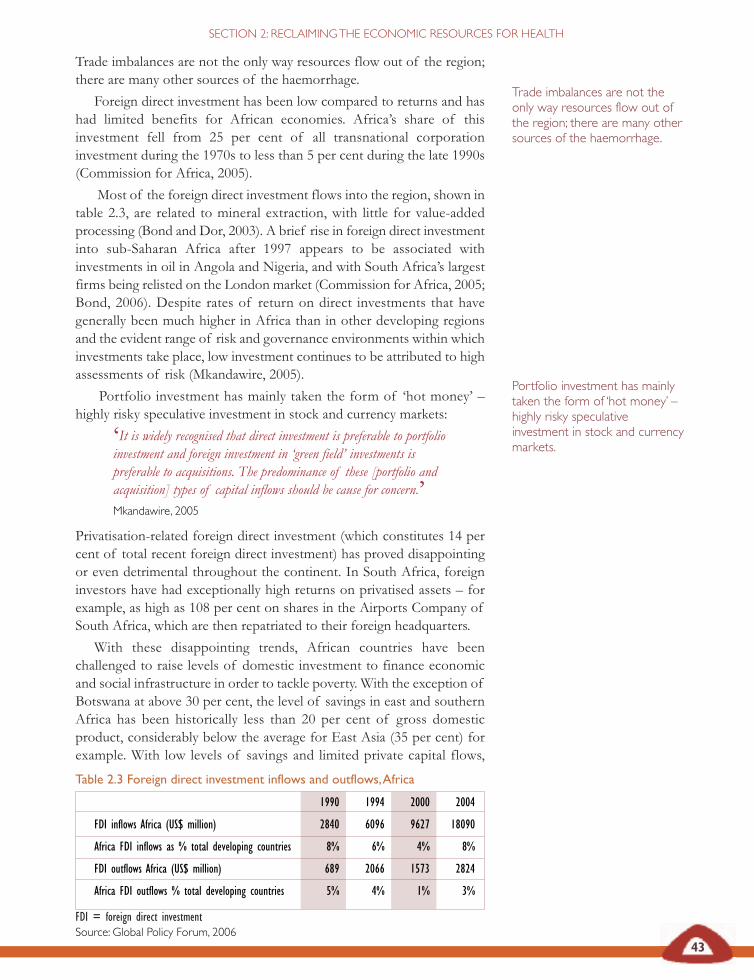
Table 2.3 Foreign direct investment inflows and outflows, Africa
1990 1994 2000 2004
FDI inflows Africa (US$ million) 2840 6096 9627 18090
Africa FDI inflows as % total developing countries 8% 6% 4% 8%
FDI outflows Africa (US$ million) 689 2066 1573 2824
Africa FDI outflows % total developing countries 5% 4% 1% 3%
FDI = foreign direct investmentSource: Global Policy Forum, 2006
43
SECTION 2: RECLAIMING THE ECONOMIC RESOURCES FOR HEALTH
Trade imbalances are not the only way resources flow out of the region;there are many other sources of the haemorrhage.
Foreign direct investment has been low compared to returns and hashad limited benefits for African economies. Africa’s share of thisinvestment fell from 25 per cent of all transnational corporationinvestment during the 1970s to less than 5 per cent during the late 1990s(Commission for Africa, 2005).
Most of the foreign direct investment flows into the region, shown intable 2.3, are related to mineral extraction, with little for value-addedprocessing (Bond and Dor, 2003). A brief rise in foreign direct investmentinto sub-Saharan Africa after 1997 appears to be associated withinvestments in oil in Angola and Nigeria, and with South Africa’s largestfirms being relisted on the London market (Commission for Africa, 2005;Bond, 2006). Despite rates of return on direct investments that havegenerally been much higher in Africa than in other developing regionsand the evident range of risk and governance environments within whichinvestments take place, low investment continues to be attributed to highassessments of risk (Mkandawire, 2005).
Portfolio investment has mainly taken the form of ‘hot money’ –highly risky speculative investment in stock and currency markets:
‘It is widely recognised that direct investment is preferable to portfolioinvestment and foreign investment in ‘green field’ investments ispreferable to acquisitions. The predominance of these [portfolio andacquisition] types of capital inflows should be cause for concern.’ Mkandawire, 2005
Privatisation-related foreign direct investment (which constitutes 14 percent of total recent foreign direct investment) has proved disappointingor even detrimental throughout the continent. In South Africa, foreigninvestors have had exceptionally high returns on privatised assets – forexample, as high as 108 per cent on shares in the Airports Company ofSouth Africa, which are then repatriated to their foreign headquarters.
With these disappointing trends, African countries have beenchallenged to raise levels of domestic investment to finance economicand social infrastructure in order to tackle poverty. With the exception ofBotswana at above 30 per cent, the level of savings in east and southernAfrica has been historically less than 20 per cent of gross domesticproduct, considerably below the average for East Asia (35 per cent) forexample. With low levels of savings and limited private capital flows,
Trade imbalances are not theonly way resources flow out ofthe region; there are many othersources of the haemorrhage.
Portfolio investment has mainlytaken the form of ‘hot money’ –highly risky speculativeinvestment in stock and currencymarkets.
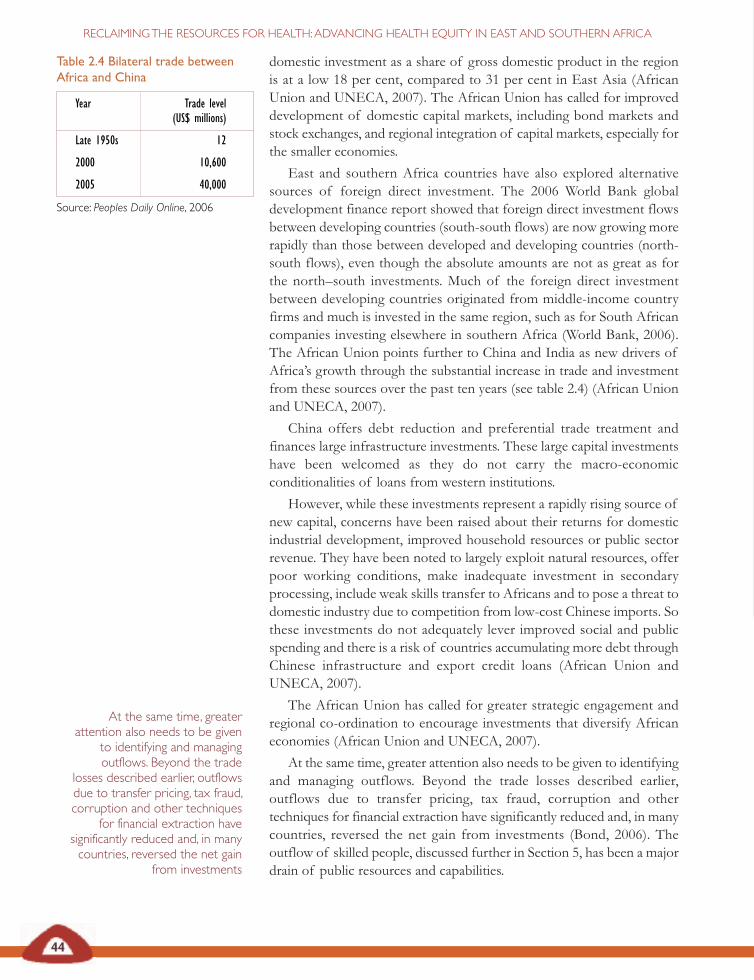
44
RECLAIMING THE RESOURCES FOR HEALTH: ADVANCING HEALTH EQUITY IN EAST AND SOUTHERN AFRICA
domestic investment as a share of gross domestic product in the regionis at a low 18 per cent, compared to 31 per cent in East Asia (AfricanUnion and UNECA, 2007). The African Union has called for improveddevelopment of domestic capital markets, including bond markets andstock exchanges, and regional integration of capital markets, especially forthe smaller economies.
East and southern Africa countries have also explored alternativesources of foreign direct investment. The 2006 World Bank globaldevelopment finance report showed that foreign direct investment flowsbetween developing countries (south-south flows) are now growing morerapidly than those between developed and developing countries (north-south flows), even though the absolute amounts are not as great as forthe north–south investments. Much of the foreign direct investment between developing countries originated from middle-income countryfirms and much is invested in the same region, such as for South Africancompanies investing elsewhere in southern Africa (World Bank, 2006).The African Union points further to China and India as new drivers ofAfrica’s growth through the substantial increase in trade and investmentfrom these sources over the past ten years (see table 2.4) (African Unionand UNECA, 2007).
China offers debt reduction and preferential trade treatment andfinances large infrastructure investments. These large capital investmentshave been welcomed as they do not carry the macro-economicconditionalities of loans from western institutions.
However, while these investments represent a rapidly rising source ofnew capital, concerns have been raised about their returns for domesticindustrial development, improved household resources or public sectorrevenue. They have been noted to largely exploit natural resources, offerpoor working conditions, make inadequate investment in secondaryprocessing, include weak skills transfer to Africans and to pose a threat todomestic industry due to competition from low-cost Chinese imports. Sothese investments do not adequately lever improved social and publicspending and there is a risk of countries accumulating more debt throughChinese infrastructure and export credit loans (African Union andUNECA, 2007).
The African Union has called for greater strategic engagement andregional co-ordination to encourage investments that diversify Africaneconomies (African Union and UNECA, 2007).
At the same time, greater attention also needs to be given to identifyingand managing outflows. Beyond the trade losses described earlier,outflows due to transfer pricing, tax fraud, corruption and othertechniques for financial extraction have significantly reduced and, in manycountries, reversed the net gain from investments (Bond, 2006). Theoutflow of skilled people, discussed further in Section 5, has been a majordrain of public resources and capabilities.
Table 2.4 Bilateral trade betweenAfrica and China
Year Trade level (US$ millions)
Late 1950s 12
2000 10,600
2005 40,000
Source: Peoples Daily Online, 2006
At the same time, greaterattention also needs to be given
to identifying and managingoutflows. Beyond the trade
losses described earlier, outflowsdue to transfer pricing, tax fraud,corruption and other techniques
for financial extraction havesignificantly reduced and, in manycountries, reversed the net gain
from investments
45
SECTION 2: RECLAIMING THE ECONOMIC RESOURCES FOR HEALTH
Flows of private African finance shifted from a net inflow during the1970s, to gradual outflows during the 1980s and substantial outflowsduring the 1990s.
Official outflows out of Africa from residents have, on average,exceeded US$10 billion a year between 1998 and 2004. The total overseasaccounts of African citizens in northern banks and tax havens wasestimated at $80 billion in 2003, while African countries owed $30 billionto those same banks (Bond, 2006). These outflows have been linked toeconomic policies (exchange rate valuation), high-risk ratings,indebtedness, political instability and corruption (Sundberg and Gelb,2006; ECA, African Ministers of Finance, 1999; Collier et al., 1999).
China’s investments in Zambia
China pledged in 2007 to pour US$800 million into Zambia over thefollowing three years and to write off US$11 million worth of debt. Itpromised to build schools and provide agricultural training and loans for road-construction equipment. A US$200 million copper smelter is the centrepieceof an economic and trade co-operation zone in the Copperbelt province, thefirst of five such zones to be established in Africa with Chinese investmentand the co-operation of host governments. The Zambian zone is expected tocreate 50,000 new jobs by 2010. Zambia offers in return: tax holidays, a low0.6 per cent mineral royalty tax – the global norm is 3 per cent – and no dutyimposed on imports of equipment and machinery.
However, the benefit of Chinese investment in Zambia is under debate.Muweme Muweme, social conditions research project officer at the JesuitCentre for Theological Reflections, has called for China to rather ‘build thecapacity of the local people so that they can contribute to their own economicgrowth’. Emily Sikazwe, executive director of Women for Change, decriedZambia becoming: ‘a provider of cheap raw resources and a market for poor-quality goods’:
‘We expect China to make their investment in our country more meaningfulby observing human rights, especially the right to livelihood and dignity.’
Criticism has been made of the conditions Zambian workers experienceworking at these investments, including the salaries and safety conditions. In2005, 49 miners were killed in an accident at the Chinese-owned Chambishimine in the Copperbelt and in 2006 five miners were shot dead by policeduring violent protests over working conditions at the same mine.
IRIN News, 5 February 2007
Flows of private African financeshifted from a net inflow duringthe 1970s, to gradual outflowsduring the 1980s and substantialoutflows during the 1990s.
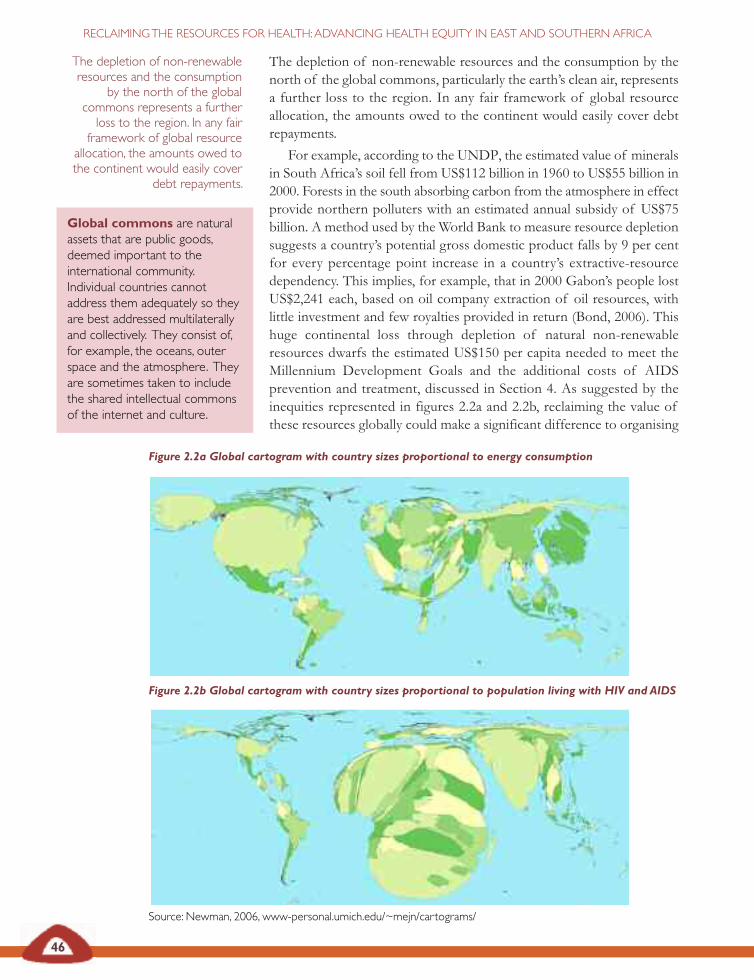
46
RECLAIMING THE RESOURCES FOR HEALTH: ADVANCING HEALTH EQUITY IN EAST AND SOUTHERN AFRICA
The depletion of non-renewable resources and the consumption by thenorth of the global commons, particularly the earth’s clean air, representsa further loss to the region. In any fair framework of global resourceallocation, the amounts owed to the continent would easily cover debtrepayments.
For example, according to the UNDP, the estimated value of mineralsin South Africa’s soil fell from US$112 billion in 1960 to US$55 billion in2000. Forests in the south absorbing carbon from the atmosphere in effectprovide northern polluters with an estimated annual subsidy of US$75billion. A method used by the World Bank to measure resource depletionsuggests a country’s potential gross domestic product falls by 9 per centfor every percentage point increase in a country’s extractive-resourcedependency. This implies, for example, that in 2000 Gabon’s people lostUS$2,241 each, based on oil company extraction of oil resources, withlittle investment and few royalties provided in return (Bond, 2006). Thishuge continental loss through depletion of natural non-renewableresources dwarfs the estimated US$150 per capita needed to meet theMillennium Development Goals and the additional costs of AIDSprevention and treatment, discussed in Section 4. As suggested by theinequities represented in figures 2.2a and 2.2b, reclaiming the value ofthese resources globally could make a significant difference to organising
Global commons are naturalassets that are public goods,deemed important to theinternational community.Individual countries cannotaddress them adequately so theyare best addressed multilaterallyand collectively. They consist of,for example, the oceans, outerspace and the atmosphere. Theyare sometimes taken to includethe shared intellectual commonsof the internet and culture.
The depletion of non-renewableresources and the consumption
by the north of the globalcommons represents a furtherloss to the region. In any fairframework of global resource
allocation, the amounts owed tothe continent would easily cover
debt repayments.
Figure 2.2a Global cartogram with country sizes proportional to energy consumption
Figure 2.2b Global cartogram with country sizes proportional to population living with HIV and AIDS
Source: Newman, 2006, www-personal.umich.edu/~mejn/cartograms/
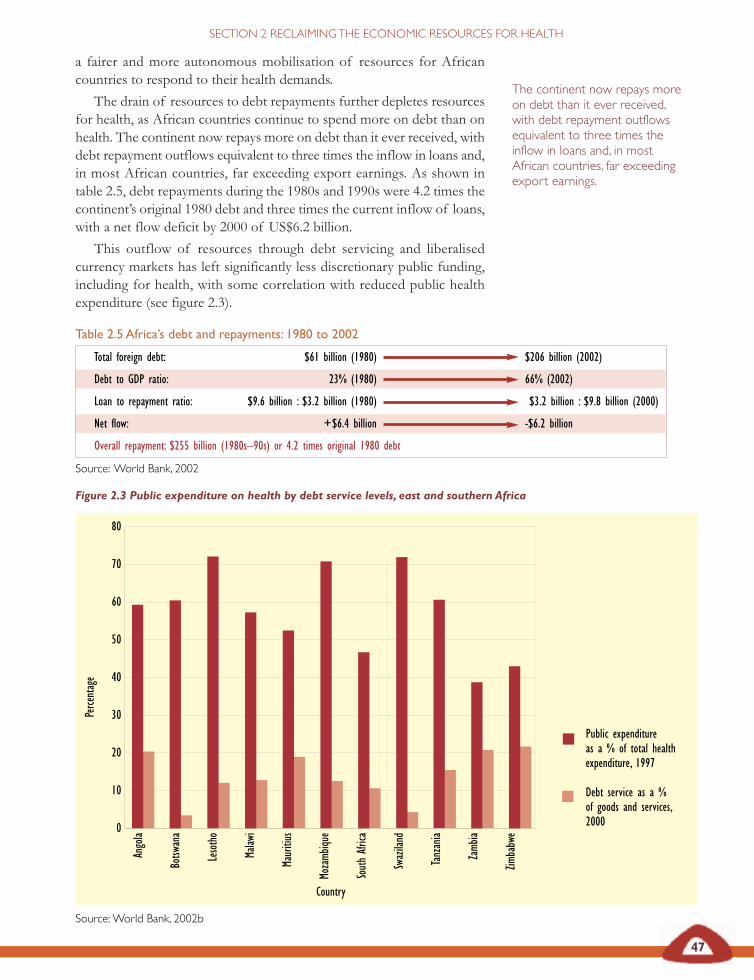
Table 2.5 Africa’s debt and repayments: 1980 to 2002
Total foreign debt: $61 billion (1980) $206 billion (2002)
Debt to GDP ratio: 23% (1980) 66% (2002)
Loan to repayment ratio: $9.6 billion : $3.2 billion (1980) $3.2 billion : $9.8 billion (2000)
Net flow: +$6.4 billion -$6.2 billion
Overall repayment: $255 billion (1980s–90s) or 4.2 times original 1980 debt
Source: World Bank, 2002
47
SECTION 2 RECLAIMING THE ECONOMIC RESOURCES FOR HEALTH
a fairer and more autonomous mobilisation of resources for Africancountries to respond to their health demands.
The drain of resources to debt repayments further depletes resourcesfor health, as African countries continue to spend more on debt than onhealth. The continent now repays more on debt than it ever received, withdebt repayment outflows equivalent to three times the inflow in loans and,in most African countries, far exceeding export earnings. As shown intable 2.5, debt repayments during the 1980s and 1990s were 4.2 times thecontinent’s original 1980 debt and three times the current inflow of loans,with a net flow deficit by 2000 of US$6.2 billion.
This outflow of resources through debt servicing and liberalisedcurrency markets has left significantly less discretionary public funding,including for health, with some correlation with reduced public healthexpenditure (see figure 2.3).
The continent now repays moreon debt than it ever received,with debt repayment outflowsequivalent to three times theinflow in loans and, in mostAfrican countries, far exceedingexport earnings.
Figure 2.3 Public expenditure on health by debt service levels, east and southern Africa
Source: World Bank, 2002b
Public expenditure as a % of total health expenditure, 1997
Debt service as a % of goods and services,2000
80
70
60
50
40
30
20
10
0
Angola
Botsw
ana
Lesotho
Malaw
i
Mauritius
Mozamb
ique
South Africa
Swaziland
Tanzania
Zamb
ia
Zimbabwe
Perce
ntage
Country
48
RECLAIMING THE RESOURCES FOR HEALTH: ADVANCING HEALTH EQUITY IN EAST AND SOUTHERN AFRICA
Both globally and in the region, there has been significant pressure fordebt cancellation:
‘We, southern and northern people’s movements and organisations…recognise that the accelerating processes of globalisation have onlyextended and exacerbated the debt crisis, one of the worst scourgesafflicting humanity. … Debt is used as a tool of control overexploited and impoverished countries. Debt domination must beended immediately. The injustice and poverty caused by debt must beended and reparations made for its consequences. The plunder ofnatural resources and the exploitation of peoples carried out in orderto guarantee debt servicing must be ended. The use of debt to imposepolicies such as neo-liberalism on the countries of the south must beended. ….This cancellation must not be linked to externally imposedconditions.
Cancel all illegitimate and odious debt now. Don’t owe, won’t pay!’ Declaration of Havana South-North Consultation on Resistance and Alternatives to Debt Domination Havana, Cuba, 28–30 September 2005, Jubilee South, 2005
Pressure from states and civil society globally has triggered a series ofdebt relief measures, first under the Heavily-Indebted Poor Countriesinitiative (HIPC), covering 32 sub-Saharan Africa countries, then, afterthe 2005 Gleneagles G8 Summit, through the proposal to cancel 100 percent of outstanding debts of eligible countries to the InternationalMonetary Fund, the International Development Association (the lendingsection of the World Bank) and the African Development Fund (G8Finance ministers, 2005).
Experience from the first round of the Heavily-Indebted PoorCountries initiative suggests that while there has been increased socialspending in support of poverty reduction, this has mainly benefited theeducation sector, with much smaller increases in expenditure in the healthsector. Nevertheless, debt cancellation holds promise, as does therequirement that public revenue released through debt relief be spent onsocial services. There are still concerns, however, about the long periodover which this will take effect (40 years) levering quite small annualreductions in debt burdens in the face of significant immediate deficits inhealth and the health system (Abugre, 2005):
‘The hope that Africa’s external debt will be significantly reducedunder the Highly Indebted Poor Countries initiative and thateconomic reforms will stimulate private capital inflows has been veryslow to materialise. Although Africa’s debt stock declinedconsiderably relative to gross domestic product, total debt serviceobligations remained unchanged in 2006 due to rising interest rates.The debt burden seriously constrains spending on public investmentand ultimately retards growth and employment generation.’ African Union and UNECA, 2007
Debt cancellation holds promise,as does the requirement that
public revenue released throughdebt relief be spent on social
services.
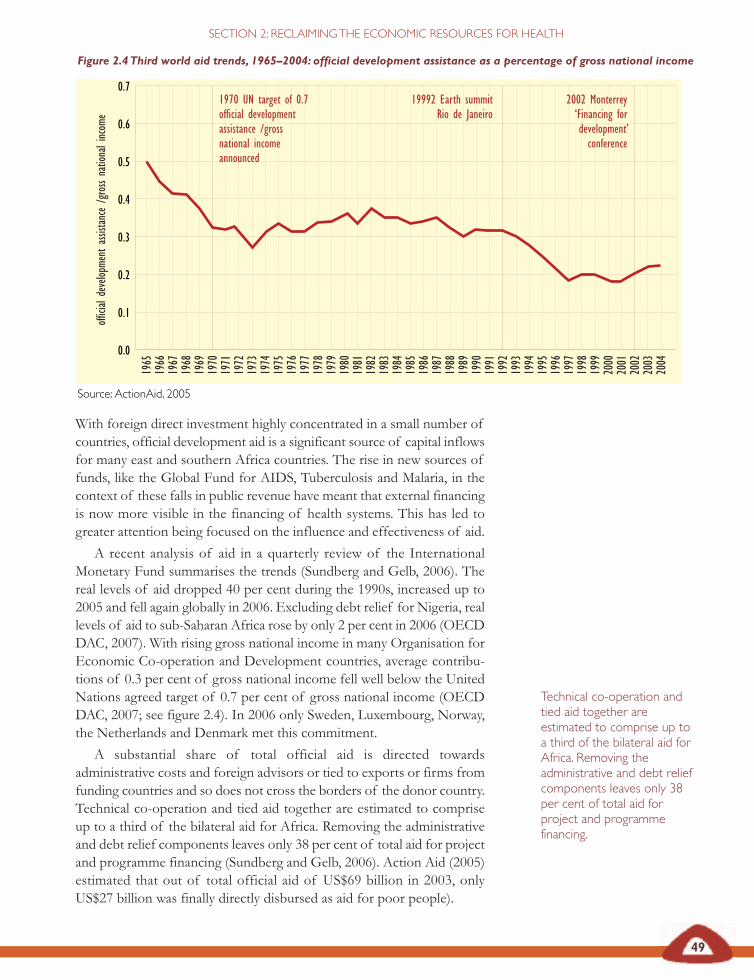
49
SECTION 2: RECLAIMING THE ECONOMIC RESOURCES FOR HEALTH
With foreign direct investment highly concentrated in a small number ofcountries, official development aid is a significant source of capital inflowsfor many east and southern Africa countries. The rise in new sources offunds, like the Global Fund for AIDS, Tuberculosis and Malaria, in thecontext of these falls in public revenue have meant that external financingis now more visible in the financing of health systems. This has led togreater attention being focused on the influence and effectiveness of aid.
A recent analysis of aid in a quarterly review of the InternationalMonetary Fund summarises the trends (Sundberg and Gelb, 2006). Thereal levels of aid dropped 40 per cent during the 1990s, increased up to2005 and fell again globally in 2006. Excluding debt relief for Nigeria, reallevels of aid to sub-Saharan Africa rose by only 2 per cent in 2006 (OECDDAC, 2007). With rising gross national income in many Organisation forEconomic Co-operation and Development countries, average contribu -tions of 0.3 per cent of gross national income fell well below the UnitedNations agreed target of 0.7 per cent of gross national income (OECDDAC, 2007; see figure 2.4). In 2006 only Sweden, Luxembourg, Norway,the Netherlands and Denmark met this commitment.
A substantial share of total official aid is directed towardsadministrative costs and foreign advisors or tied to exports or firms fromfunding countries and so does not cross the borders of the donor country.Technical co-operation and tied aid together are estimated to compriseup to a third of the bilateral aid for Africa. Removing the administrativeand debt relief components leaves only 38 per cent of total aid for projectand programme financing (Sundberg and Gelb, 2006). Action Aid (2005)estimated that out of total official aid of US$69 billion in 2003, onlyUS$27 billion was finally directly disbursed as aid for poor people).
0.0
0.1
0.2
0.3
0.4
0.5
0.6
0.7
1965
1966
1967
1968
1969
1970
1971
1972
1973
1974
1975
1976
1977
1978
1979
1980
1981
1982
1983
1984
1985
1986
1987
1988
1989
1990
1991
1992
1993
1994
1995
1996
1997
1998
1999
2000
2001
2002
2003
2004
1970 UN target of 0.7official developmentassistance /grossnational incomeannounced
19992 Earth summitRio de Janeiro
2002 Monterrey‘Financing fordevelopment’conference
official develop
ment assistance /gross national incom
e
Figure 2.4 Third world aid trends, 1965–2004: official development assistance as a percentage of gross national income
Source: ActionAid, 2005
Technical co-operation andtied aid together areestimated to comprise up toa third of the bilateral aid forAfrica. Removing theadministrative and debt reliefcomponents leaves only 38per cent of total aid forproject and programmefinancing.
50
RECLAIMING THE RESOURCES FOR HEALTH: ADVANCING HEALTH EQUITY IN EAST AND SOUTHERN AFRICA
Levels of per capita aid have not in the past correlated well with indicatorsof social need, like lower human development index ratings (UNDP,2005). Aid has been criticised for being more linked to geopolitical aimsthan development objectives, while conflict, corruption and instability inAfrica are reported to have eroded the gains from prior external funding(Sundberg and Gelb, 2006; ECA Ministers of Finance, 1999). Recentassessment suggests that these trends are changing, with improvedresponsiveness to policy and poverty levels, greater focus on countryownership and mutual accountability, and with strengthened publicresource management and financial monitoring (Sundberg and Gelb,2006).
As increasingly recognised, however, including in global platforms, realaid inflows do not match the outflows from the continent described in thissection and aid cannot substitute for measures to provide fair returns inglobal trade and investment (UNDP, 2005).
An effective response to the outflows must thus be a part of anysustainable strategy to reclaim the resources for health.
Reclaiming resources for health Reform proposals for over two decades have suggested that Africanpoverty can be reversed through ‘a stronger climate for investment andmarket access’, with higher levels of integration into the global economythrough increasing export-led growth and increasingly liberalised trade.The evidence on the economic outcomes of these strategies, drawing onlived experience from the region, raises serious questions about thisstrategy and particularly about its ability to deliver on policy goals ofenhanced domestic investment and savings, diversified industry and wideraccess to land and capital for production (African Union, UN ECAS2007). One example of the basis for these concerns is described oppositeand relates to Zambia’s structural adjustment programme.
East and southern Africa countries face significant challenges tonegotiate and secure fairer returns from the global economy. Equally,options are being raised for strategic management, control and use ofdomestic resources.
Various policy options have been raised to create negative incentivesfor outflows. They include the following measures:
• improving disclosure of financial flows;
• systematically defaulting on third world debt repayments;
• enforcing domestic reinvestment of pension, insurance andother institutional funds using well-tested strategies, such asprescribed assets;
• regulating financial transfers from offshore tax havens on anational scale, to control capital flight, as part of re-establishingexchange controls;
• refusing offers of tied or phantom aid;
As increasingly recognised,… real aid inflows do not matchthe outflows from the continentdescribed in this section and aidcannot substitute for measuresto provide fair returns in global
trade and investment. Aneffective response to the
outflows must thus be a part ofany sustainable strategy to
reclaim the resources for health.
51
SECTION 2: RECLAIMING THE ECONOMIC RESOURCES FOR HEALTH
New study attributes Zambian economic fall in 1990s toWorld Bank and International Monetary Fund intervention
A World Development Movement report claims that reforms forced onZambia by the World Bank and the International Monetary Fund ‘directlyresulted in making tens of thousands unemployed, destroyed key industries,caused extensive social unrest and increasing poverty’. The report, ‘Zambia:condemned to debt’, charts the link between ‘sweeping trade liberalisation,deregulation, dismantling of the public sector and massive privatisation’ anda drop of 36 places in Zambia’s United Nations human development ranking between 1990 and 2001.
Reduced import tariffs on textile products and used clothes resulted in large-scale import of cheap second-hand clothing, and a closure of 132 textilemanufacturing firms over the decade, with a loss of 30,000 jobs. ‘We used tosupply retailers with three and a half thousand tonnes of clothing annually,we’re down to less than 500 tonnes now,’ Ramesh Patel from a textilecompany is quoted as saying. The firm that employed 250 people eight yearsago now employs 25.
The World Bank itself acknowledged in 2000 that removal of subsidies onmaize and fertilisers had led to ‘stagnation and regression instead of helpingZambia’s agricultural sector’. The ‘one-size-fits all’ privatisation programmehas meant that ‘many companies have collapsed, jobs have been lost andwelfare programmes have not been continued by private companies’.Zambian president, Levy Mwanawasa, stated in 2003 that the InternationalMonetary Fund privatisation programme had ‘been of no significant benefitto the country. Privatisation of crucial state enterprises has led to poverty,asset stripping and job losses’. The failed policies led to widespreaddissatisfaction, with government caught between social protest and pressurefrom the International Monetary Fund and the World Bank. The WorldDevelopment Movement asserts:
‘It is not acceptable that these institutions have effective control over policy-making in countries like Zambia. Policies need to be developed which aregenuinely homegrown alternatives that put the Zambian people, especiallythe poor, first.’
Suri, 2004
• for trade relations, pursuing strategies and applying tradeincentives that develop and protect infant industries;
• carefully calculating the costs of foreign direct investment (notsimply the benefits), including natural resource depletion,transfer pricing and profit/dividend outflows;
• refusing investment where such calculations are not favourable;
• imposing taxes on currency transfers (Tobin taxes); and
• making ecological reparations.
Bond, 2006
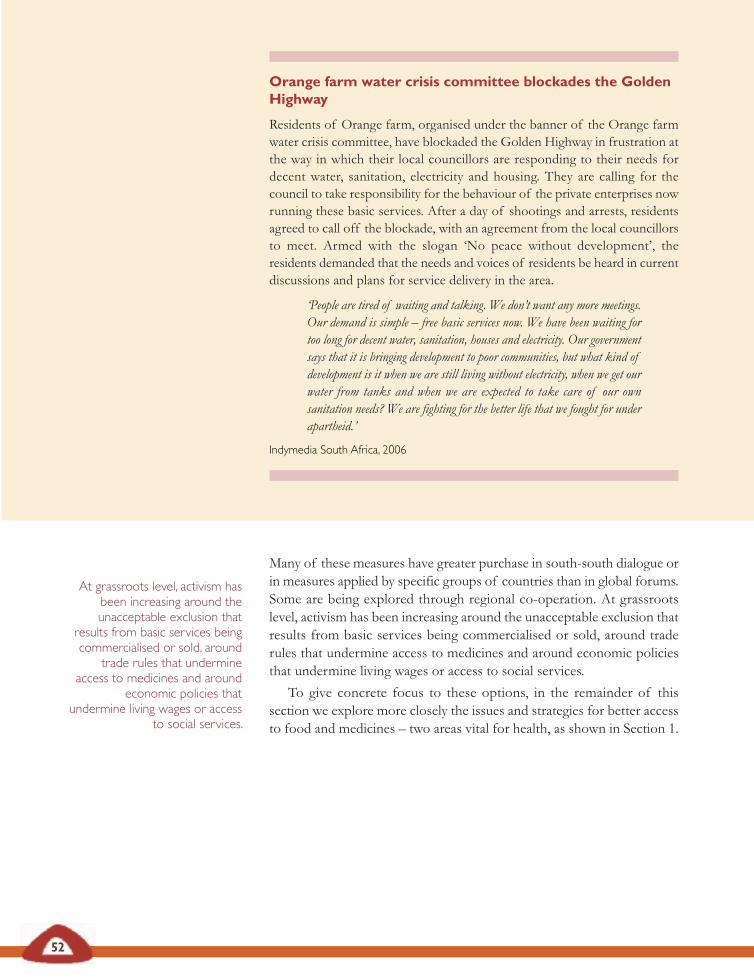
52
RECLAIMING THE RESOURCES FOR HEALTH: ADVANCING HEALTH EQUITY IN EAST AND SOUTHERN AFRICA
Many of these measures have greater purchase in south-south dialogue orin measures applied by specific groups of countries than in global forums.Some are being explored through regional co-operation. At grassrootslevel, activism has been increasing around the unacceptable exclusion thatresults from basic services being commercialised or sold, around traderules that undermine access to medicines and around economic policiesthat undermine living wages or access to social services.
To give concrete focus to these options, in the remainder of thissection we explore more closely the issues and strategies for better accessto food and medicines – two areas vital for health, as shown in Section 1.
Orange farm water crisis committee blockades the GoldenHighway
Residents of Orange farm, organised under the banner of the Orange farmwater crisis committee, have blockaded the Golden Highway in frustration atthe way in which their local councillors are responding to their needs fordecent water, sanitation, electricity and housing. They are calling for thecouncil to take responsibility for the behaviour of the private enterprises nowrunning these basic services. After a day of shootings and arrests, residentsagreed to call off the blockade, with an agreement from the local councillorsto meet. Armed with the slogan ‘No peace without development’, theresidents demanded that the needs and voices of residents be heard in currentdiscussions and plans for service delivery in the area.
‘People are tired of waiting and talking. We don’t want any more meetings.Our demand is simple – free basic services now. We have been waiting fortoo long for decent water, sanitation, houses and electricity. Our governmentsays that it is bringing development to poor communities, but what kind ofdevelopment is it when we are still living without electricity, when we get ourwater from tanks and when we are expected to take care of our ownsanitation needs? We are fighting for the better life that we fought for underapartheid.’
Indymedia South Africa, 2006
At grassroots level, activism hasbeen increasing around theunacceptable exclusion that
results from basic services beingcommercialised or sold, around
trade rules that undermineaccess to medicines and around
economic policies thatundermine living wages or access
to social services.
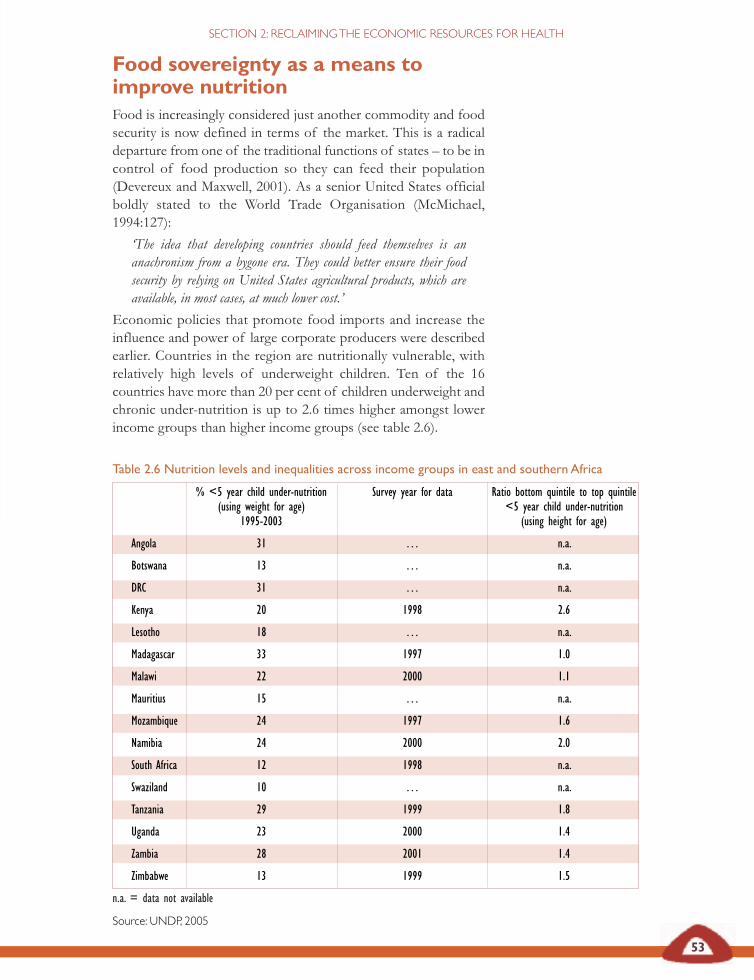
Table 2.6 Nutrition levels and inequalities across income groups in east and southern Africa
% <5 year child under-nutrition Survey year for data Ratio bottom quintile to top quintile (using weight for age) <5 year child under-nutrition
1995-2003 (using height for age)
Angola 31 … n.a.
Botswana 13 … n.a.
DRC 31 … n.a.
Kenya 20 1998 2.6
Lesotho 18 … n.a.
Madagascar 33 1997 1.0
Malawi 22 2000 1.1
Mauritius 15 … n.a.
Mozambique 24 1997 1.6
Namibia 24 2000 2.0
South Africa 12 1998 n.a.
Swaziland 10 … n.a.
Tanzania 29 1999 1.8
Uganda 23 2000 1.4
Zambia 28 2001 1.4
Zimbabwe 13 1999 1.5
n.a. = data not available
Source: UNDP, 2005
53
SECTION 2: RECLAIMING THE ECONOMIC RESOURCES FOR HEALTH
Food sovereignty as a means toimprove nutrition Food is increasingly considered just another commodity and foodsecurity is now defined in terms of the market. This is a radicaldeparture from one of the traditional functions of states – to be incontrol of food production so they can feed their population(Devereux and Maxwell, 2001). As a senior United States officialboldly stated to the World Trade Organisation (McMichael,1994:127):
‘The idea that developing countries should feed themselves is ananachronism from a bygone era. They could better ensure their foodsecurity by relying on United States agricultural products, which areavailable, in most cases, at much lower cost.’
Economic policies that promote food imports and increase theinfluence and power of large corporate producers were describedearlier. Countries in the region are nutritionally vulnerable, withrelatively high levels of underweight children. Ten of the 16countries have more than 20 per cent of children underweight andchronic under-nutrition is up to 2.6 times higher amongst lowerincome groups than higher income groups (see table 2.6).
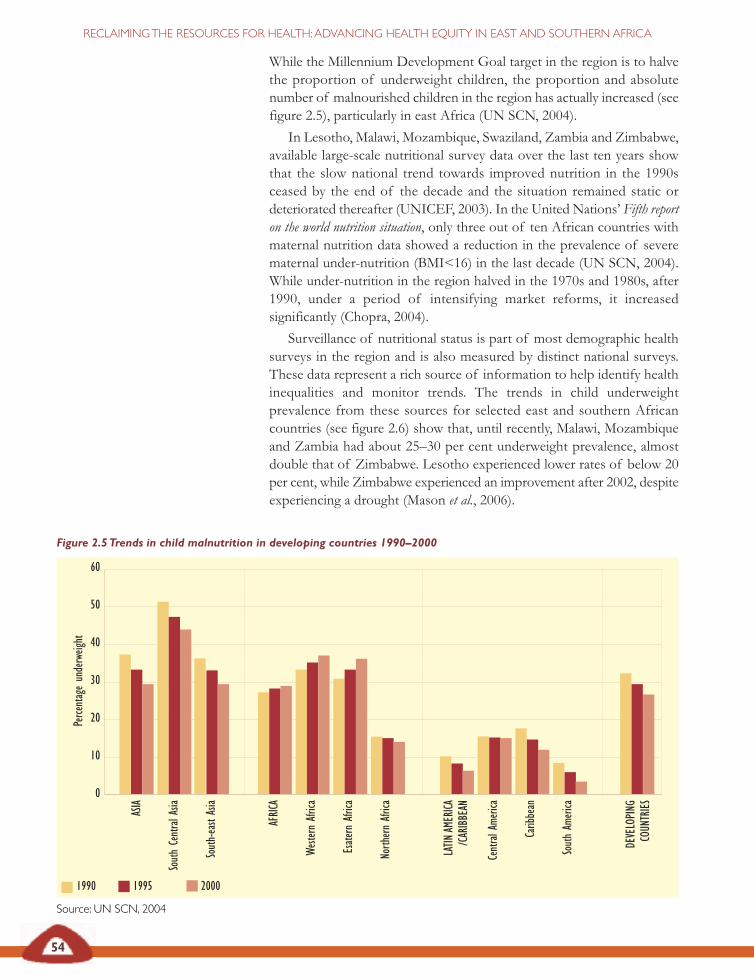
54
RECLAIMING THE RESOURCES FOR HEALTH: ADVANCING HEALTH EQUITY IN EAST AND SOUTHERN AFRICA
While the Millennium Development Goal target in the region is to halvethe proportion of underweight children, the proportion and absolutenumber of malnourished children in the region has actually increased (seefigure 2.5), particularly in east Africa (UN SCN, 2004).
In Lesotho, Malawi, Mozambique, Swaziland, Zambia and Zimbabwe,available large-scale nutritional survey data over the last ten years showthat the slow national trend towards improved nutrition in the 1990sceased by the end of the decade and the situation remained static ordeteriorated thereafter (UNICEF, 2003). In the United Nations’ Fifth reporton the world nutrition situation, only three out of ten African countries withmaternal nutrition data showed a reduction in the prevalence of severematernal under-nutrition (BMI<16) in the last decade (UN SCN, 2004).While under-nutrition in the region halved in the 1970s and 1980s, after1990, under a period of intensifying market reforms, it increasedsignificantly (Chopra, 2004).
Surveillance of nutritional status is part of most demographic healthsurveys in the region and is also measured by distinct national surveys.These data represent a rich source of information to help identify healthinequalities and monitor trends. The trends in child underweightprevalence from these sources for selected east and southern Africancountries (see figure 2.6) show that, until recently, Malawi, Mozambiqueand Zambia had about 25–30 per cent underweight prevalence, almostdouble that of Zimbabwe. Lesotho experienced lower rates of below 20per cent, while Zimbabwe experienced an improvement after 2002, despiteexperiencing a drought (Mason et al., 2006).
Figure 2.5 Trends in child malnutrition in developing countries 1990–2000
Source: UN SCN, 2004
ASIA
South Central Asia
South-east Asia
AFRICA
Western Africa
Esatern Africa
North
ern Africa
LATIN
AMERICA
/CARIBBEAN
Central Ame
rica
Caribbean
South Am
erica
DEVELOPING
COUNTRIES
1990 1995 2000
0
10
20
30
40
50
60
Perce
ntage underweight
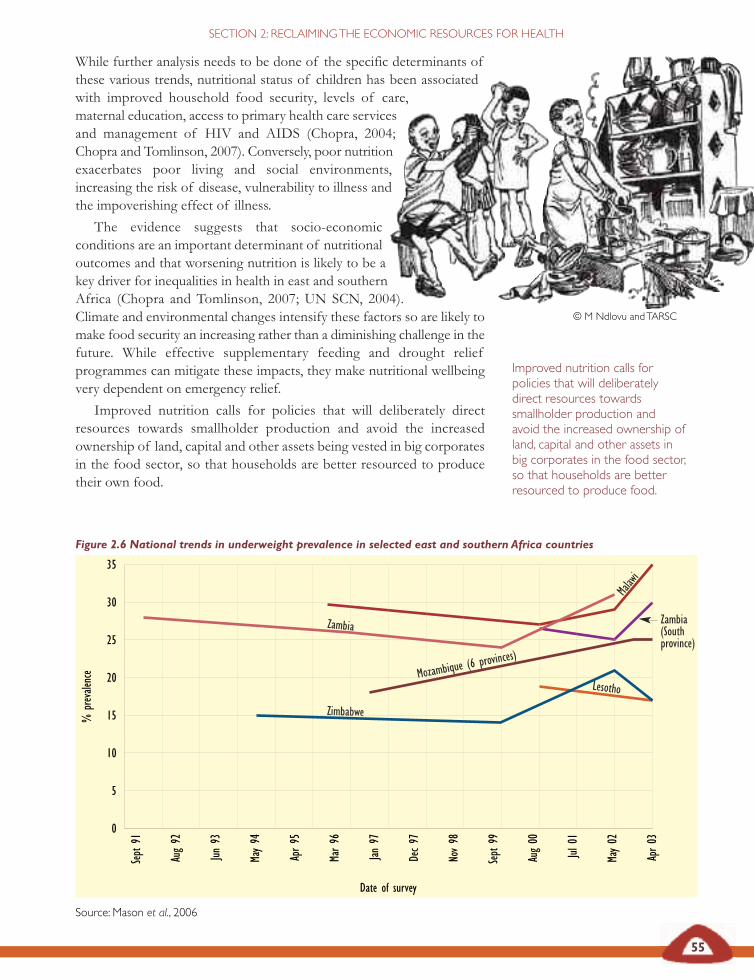
55
SECTION 2: RECLAIMING THE ECONOMIC RESOURCES FOR HEALTH
While further analysis needs to be done of the specific determinants ofthese various trends, nutritional status of children has been associatedwith improved household food security, levels of care,maternal education, access to primary health care servicesand management of HIV and AIDS (Chopra, 2004;Chopra and Tomlinson, 2007). Conversely, poor nutritionexacerbates poor living and social environments,increasing the risk of disease, vulnerability to illness andthe impoverishing effect of illness.
The evidence suggests that socio-economicconditions are an important determinant of nutritionaloutcomes and that worsening nutrition is likely to be akey driver for inequalities in health in east and southernAfrica (Chopra and Tomlinson, 2007; UN SCN, 2004).Climate and environmental changes intensify these factors so are likely tomake food security an increasing rather than a diminishing challenge in thefuture. While effective supplementary feeding and drought reliefprogrammes can mitigate these impacts, they make nutritional wellbeingvery dependent on emergency relief.
Improved nutrition calls for policies that will deliberately directresources towards smallholder production and avoid the increasedownership of land, capital and other assets being vested in big corporatesin the food sector, so that households are better resourced to producetheir own food.
Figure 2.6 National trends in underweight prevalence in selected east and southern Africa countries
Source: Mason et al., 2006
© M Ndlovu and TARSC
Improved nutrition calls forpolicies that will deliberatelydirect resources towardssmallholder production andavoid the increased ownership ofland, capital and other assets inbig corporates in the food sector,so that households are betterresourced to produce food.
Malawi
Zambia
Mozambique (6 provi
nces)
Lesotho
Zimbabwe
Zambia (South province)
0
5
10
15
20
25
30
35
Sept 91
Aug 92
Jun 93
May 94
Apr 95
Mar 96
Jan 97
Dec 97
Nov 98
Sept 99
Aug 00
Jul 0
1
May 02
Apr 03
% prevalen
ce
Date of survey
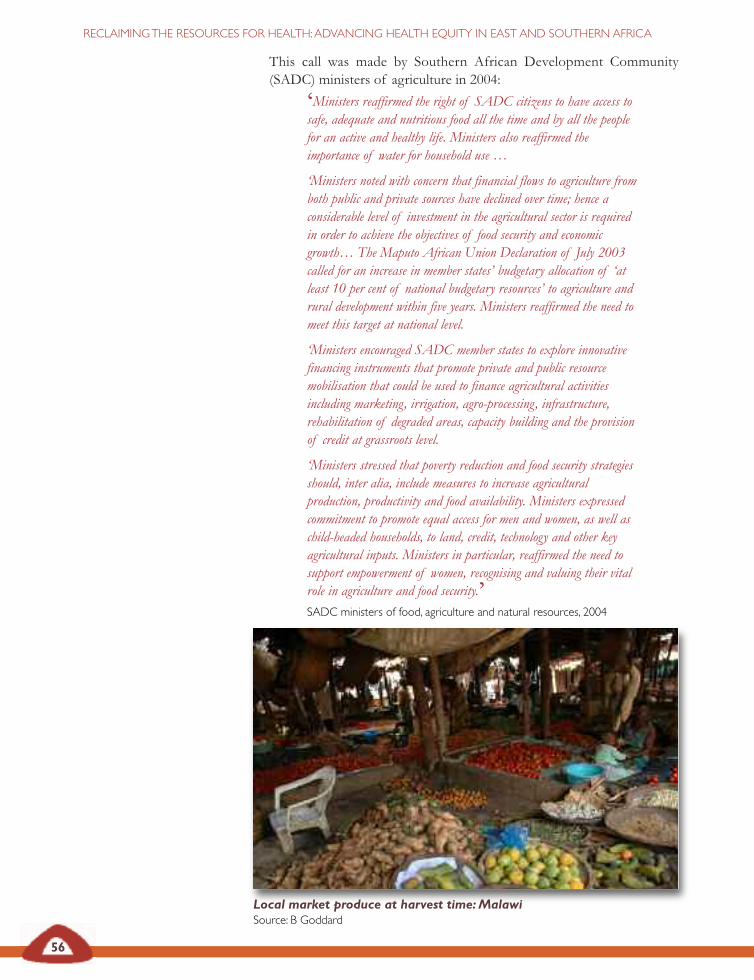
56
RECLAIMING THE RESOURCES FOR HEALTH: ADVANCING HEALTH EQUITY IN EAST AND SOUTHERN AFRICA
This call was made by Southern African Development Community(SADC) ministers of agriculture in 2004:
‘Ministers reaffirmed the right of SADC citizens to have access tosafe, adequate and nutritious food all the time and by all the peoplefor an active and healthy life. Ministers also reaffirmed theimportance of water for household use …
‘Ministers noted with concern that financial flows to agriculture fromboth public and private sources have declined over time; hence aconsiderable level of investment in the agricultural sector is requiredin order to achieve the objectives of food security and economicgrowth… The Maputo African Union Declaration of July 2003called for an increase in member states’ budgetary allocation of ‘atleast 10 per cent of national budgetary resources’ to agriculture andrural development within five years. Ministers reaffirmed the need tomeet this target at national level.
‘Ministers encouraged SADC member states to explore innovativefinancing instruments that promote private and public resourcemobilisation that could be used to finance agricultural activitiesincluding marketing, irrigation, agro-processing, infrastructure,rehabilitation of degraded areas, capacity building and the provisionof credit at grassroots level.
‘Ministers stressed that poverty reduction and food security strategiesshould, inter alia, include measures to increase agriculturalproduction, productivity and food availability. Ministers expressedcommitment to promote equal access for men and women, as well aschild-headed households, to land, credit, technology and other keyagricultural inputs. Ministers in particular, reaffirmed the need tosupport empowerment of women, recognising and valuing their vitalrole in agriculture and food security.’ SADC ministers of food, agriculture and natural resources, 2004
Local market produce at harvest time: MalawiSource: B Goddard
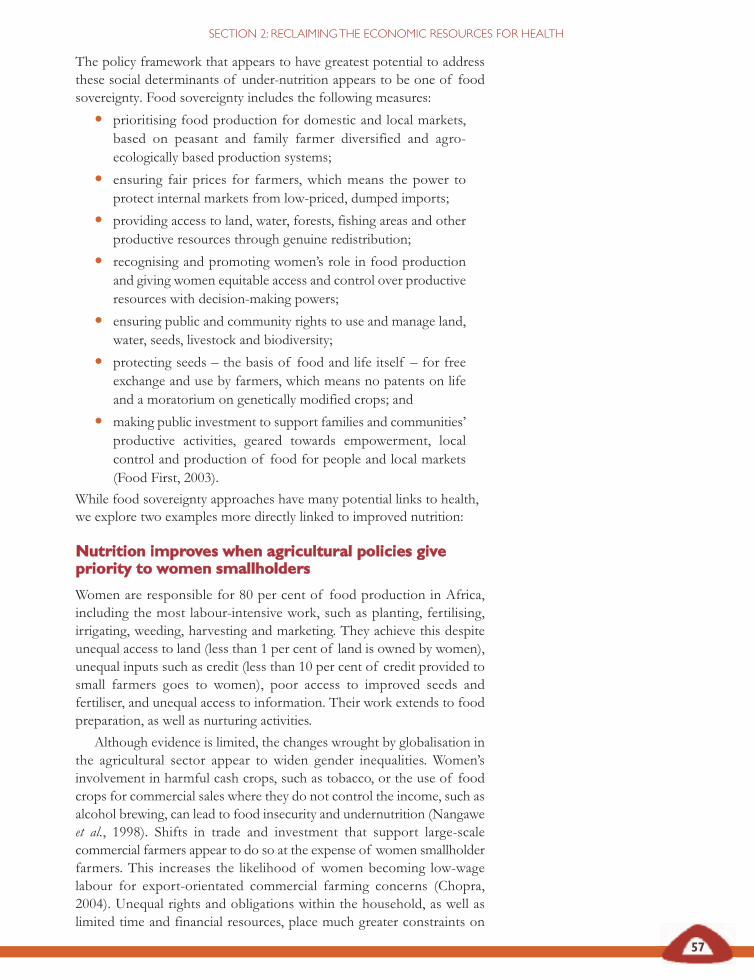
57
SECTION 2: RECLAIMING THE ECONOMIC RESOURCES FOR HEALTH
The policy framework that appears to have greatest potential to addressthese social determinants of under-nutrition appears to be one of foodsovereignty. Food sovereignty includes the following measures:
• prioritising food production for domestic and local markets,based on peasant and family farmer diversified and agro-ecologically based production systems;
• ensuring fair prices for farmers, which means the power toprotect internal markets from low-priced, dumped imports;
• providing access to land, water, forests, fishing areas and otherproductive resources through genuine redistribution;
• recognising and promoting women’s role in food productionand giving women equitable access and control over productiveresources with decision-making powers;
• ensuring public and community rights to use and manage land,water, seeds, livestock and biodiversity;
• protecting seeds – the basis of food and life itself – for freeexchange and use by farmers, which means no patents on lifeand a moratorium on genetically modified crops; and
• making public investment to support families and communities’productive activities, geared towards empowerment, localcontrol and production of food for people and local markets(Food First, 2003).
While food sovereignty approaches have many potential links to health,we explore two examples more directly linked to improved nutrition:
NNuuttrriittiioonn iimmpprroovveess wwhheenn aaggrriiccuullttuurraall ppoolliicciieess ggiivveepprriioorriittyy ttoo wwoommeenn ssmmaallllhhoollddeerrss
Women are responsible for 80 per cent of food production in Africa,including the most labour-intensive work, such as planting, fertilising,irrigating, weeding, harvesting and marketing. They achieve this despiteunequal access to land (less than 1 per cent of land is owned by women),unequal inputs such as credit (less than 10 per cent of credit provided tosmall farmers goes to women), poor access to improved seeds andfertiliser, and unequal access to information. Their work extends to foodpreparation, as well as nurturing activities.
Although evidence is limited, the changes wrought by globalisation inthe agricultural sector appear to widen gender inequalities. Women’sinvolvement in harmful cash crops, such as tobacco, or the use of foodcrops for commercial sales where they do not control the income, such asalcohol brewing, can lead to food insecurity and undernutrition (Nangaweet al., 1998). Shifts in trade and investment that support large-scalecommercial farmers appear to do so at the expense of women smallholderfarmers. This increases the likelihood of women becoming low-wagelabour for export-orientated commercial farming concerns (Chopra,2004). Unequal rights and obligations within the household, as well aslimited time and financial resources, place much greater constraints on
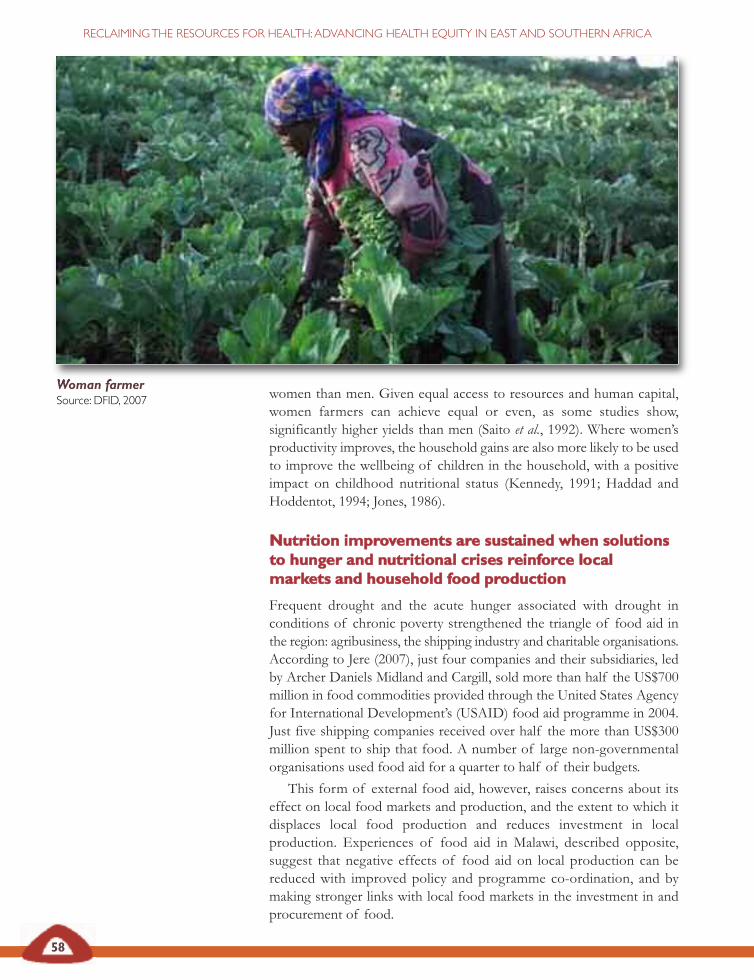
58
RECLAIMING THE RESOURCES FOR HEALTH: ADVANCING HEALTH EQUITY IN EAST AND SOUTHERN AFRICA
women than men. Given equal access to resources and human capital,women farmers can achieve equal or even, as some studies show,significantly higher yields than men (Saito et al., 1992). Where women’sproductivity improves, the household gains are also more likely to be usedto improve the wellbeing of children in the household, with a positiveimpact on childhood nutritional status (Kennedy, 1991; Haddad andHoddentot, 1994; Jones, 1986).
NNuuttrriittiioonn iimmpprroovveemmeennttss aarree ssuussttaaiinneedd wwhheenn ssoolluuttiioonnssttoo hhuunnggeerr aanndd nnuuttrriittiioonnaall ccrriisseess rreeiinnffoorrccee llooccaallmmaarrkkeettss aanndd hhoouusseehhoolldd ffoooodd pprroodduuccttiioonn
Frequent drought and the acute hunger associated with drought inconditions of chronic poverty strengthened the triangle of food aid inthe region: agribusiness, the shipping industry and charitable organisations.According to Jere (2007), just four companies and their subsidiaries, ledby Archer Daniels Midland and Cargill, sold more than half the US$700million in food commodities provided through the United States Agencyfor International Development’s (USAID) food aid programme in 2004.Just five shipping companies received over half the more than US$300million spent to ship that food. A number of large non-governmentalorganisations used food aid for a quarter to half of their budgets.
This form of external food aid, however, raises concerns about itseffect on local food markets and production, and the extent to which itdisplaces local food production and reduces investment in localproduction. Experiences of food aid in Malawi, described opposite,suggest that negative effects of food aid on local production can bereduced with improved policy and programme co-ordination, and bymaking stronger links with local food markets in the investment in andprocurement of food.
Woman farmer Source: DFID, 2007
59
Food aid in Malawi Persistent food deficits in Malawi in the past five years can be attributed toreduced maize production due to poor rains, lack of inputs and infertile soils.The deficits were bridged through a mixture of food aid, commercial importsand informal cross-border trade:
• Programme food aid was provided to the government as conditionalloans or grants mainly to provide balance of payment and budgetarysupport for subsidised food in local markets and to build up strategicfood reserves.
• Project food aid was provided as grants in support of specificdevelopment objectives and beneficiary groups through non-governmental organisations.
• Relief food aid, provided as a grant, was distributed to targetedbeneficiaries to address critical food needs.
Malawi has no explicit policy framework for food aid despite its growing sizeand importance, although policies on economic growth and development,food security, safety nets and disasters have relevance.
Evidence from food aid programmes this decade indicate that imported foodaid has had a negative effect on local production. For example, World FoodProgramme assessments found that free humanitarian food aid suppliesreduced demand for commercial maize, resulting in unintended excesscommercial maize stocks, dampening consumer and producer prices, andputting pressure on the government budget as they were financed throughdomestic borrowing. Response to such evidence in 2005/06 led to better co-ordination between donor, government, United Nations andnon-governmental organisation responses, with increased stakeholderparticipation and an increase in the local procurement of food aid products.
Jere, 2007
SECTION 2 RECLAIMING THE ECONOMIC RESOURCES FOR HEALTH
Decisions on the design of such schemes to source food locally to fulfilaid requirements are not made in the health sector but health systems canlever approaches and partnerships with agriculture, education, socialprotection and other sectors to support food sovereignty. For example, anintegrated approach involving home-based caregivers, orphan committees,agricultural extension agents and health workers can ensure that food,school fee relief, home gardens and health care go directly to families thatmost need them (IFAD, 2001).
How well are these options currently being implemented? While schoolfeeding programmes have spread regionally, an analysis of suchprogrammes in Malawi and South Africa indicates that despite their health,education and poverty reduction goals, the programmes are not adequatelylinked to wider nutritional or agrarian policies and are often localised,vertically provided and inconsistent (Tomlinson, 2007). Generally, localfarmers have not been supported with the resources and opportunities to
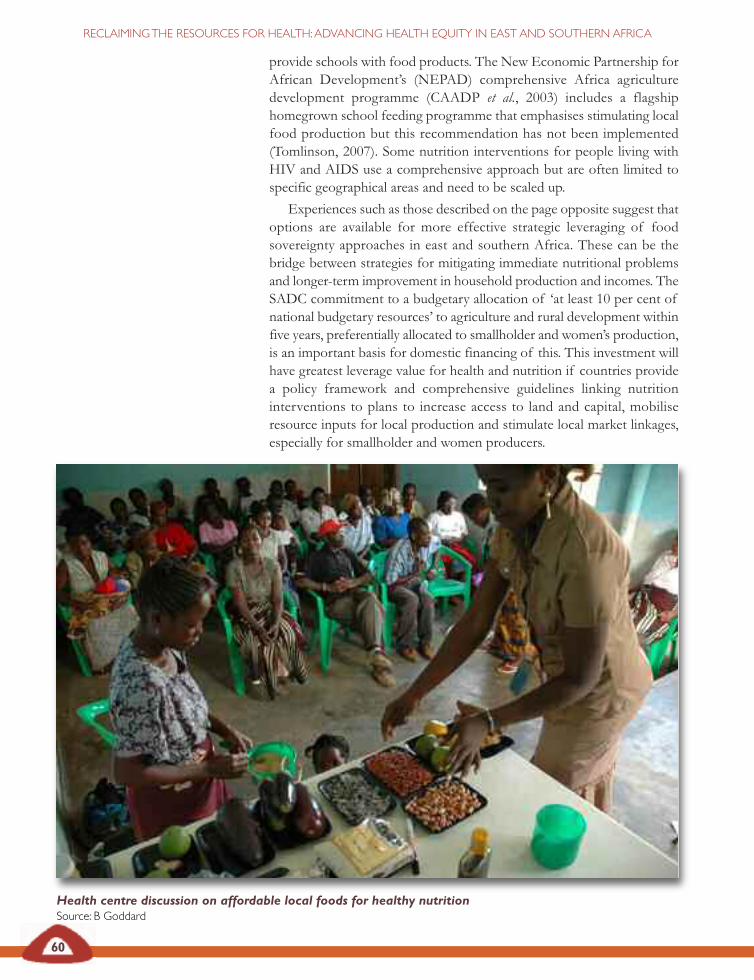
60
RECLAIMING THE RESOURCES FOR HEALTH: ADVANCING HEALTH EQUITY IN EAST AND SOUTHERN AFRICA
Health centre discussion on affordable local foods for healthy nutrition Source: B Goddard
provide schools with food products. The New Economic Partnership forAfrican Development’s (NEPAD) comprehensive Africa agriculturedevelopment programme (CAADP et al., 2003) includes a flagshiphomegrown school feeding programme that emphasises stimulating localfood production but this recommendation has not been implemented(Tomlinson, 2007). Some nutrition interventions for people living withHIV and AIDS use a comprehensive approach but are often limited tospecific geographical areas and need to be scaled up.
Experiences such as those described on the page opposite suggest thatoptions are available for more effective strategic leveraging of foodsovereignty approaches in east and southern Africa. These can be thebridge between strategies for mitigating immediate nutritional problemsand longer-term improvement in household production and incomes. TheSADC commitment to a budgetary allocation of ‘at least 10 per cent ofnational budgetary resources’ to agriculture and rural development withinfive years, preferentially allocated to smallholder and women’s production,is an important basis for domestic financing of this. This investment willhave greatest leverage value for health and nutrition if countries providea policy framework and comprehensive guidelines linking nutritioninterventions to plans to increase access to land and capital, mobiliseresource inputs for local production and stimulate local market linkages,especially for smallholder and women producers.
61
SECTION 2: RECLAIMING THE ECONOMIC RESOURCES FOR HEALTH
Experiences of nutritional support for people living withHIV and AIDS in east and southern Africa
Several Ugandan ministries have initiated an AIDS control programme tostrengthen AIDS education, promote nutrition standards for people livingwith HIV and AIDS and their families, and to reduce poverty by establishingenergy and time saving agro-enterprises making people better equipped tocope with the epidemic. Support from international agencies is organised tocomplement this, including agricultural and market support to small-scalefarmers from the World Food Programme and micro-credit support fromthe Belgian Survival Fund.
A number of Kenyan non-governmental organisation programmes promotehousehold access to savings and credit, while both state and non-governmental organisation programmes offer various dimensions of supportto household food production, access and nutritional sufficiency. The foodfor work project contributes to public infrastructures, including village roads,small-scale irrigation and planting vegetation on restored physical structuresin order to minimise soil and water erosion. The Nyanza healthy water project aims to improve the quality of household drinking water. The Siaya-Busiahousehold livelihood security project supports safe water and sanitationinterventions and inputs to improve farm productivity of staple foods. Thelivestock marketing enterprise project assists pastoralists from north easternKenya in accessing and benefiting from livestock markets.
In Zimbabwe, comprehensive guidelines provide a framework for linksbetween food security activities and interventions on HIV and AIDS, such asthe connection made by the World Food Programme between nutritionalsupport to pregnant and lactating women and prevention of mother-to-childtransmission services.
The Mozambique government has plans to distribute multi-micronutrientsupplements to all people living with HIV and AIDS using a clinic andcommunity-based approach, and to provide a corn-soy blend foodsupplement and agreed food basket to various target groups, includingpatients on antiretrovirals and those HIV positive patients with chronicillnesses. The Food and Agriculture Organisation supported junior farmerfield and life schools for children and young people to share agriculturalknowledge, business skills and life skills with orphans and vulnerable childrenbetween 12 and 18 years of age.
Atekyereza and Panagides, 2007
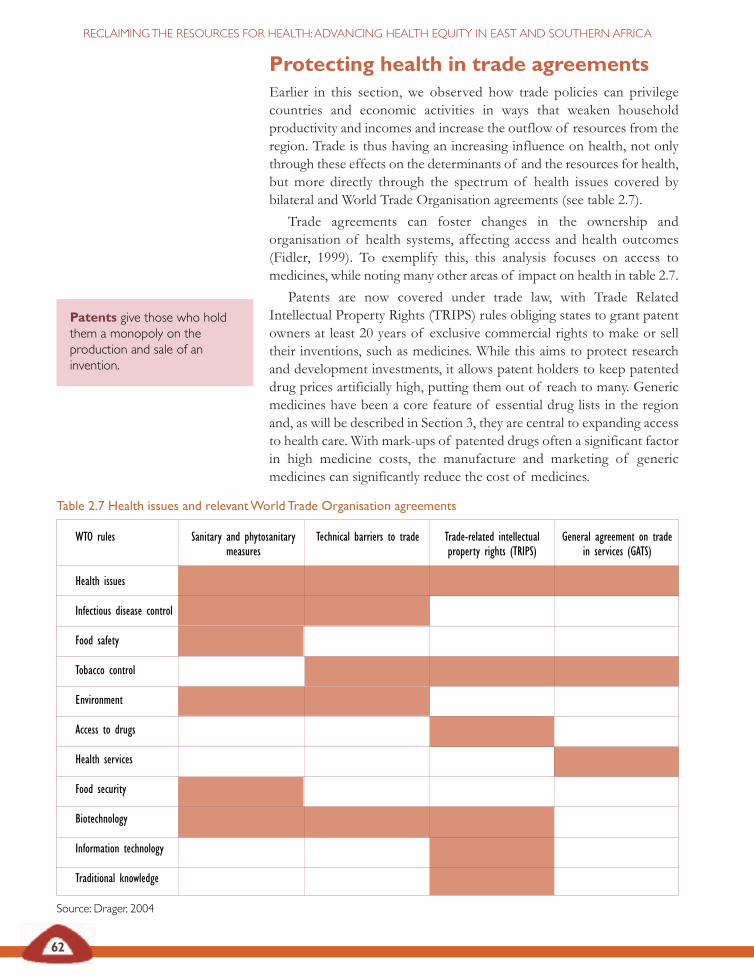
Table 2.7 Health issues and relevant World Trade Organisation agreements
WTO rules Sanitary and phytosanitary Technical barriers to trade Trade-related intellectual General agreement on trade measures property rights (TRIPS) in services (GATS)
Health issues
Infectious disease control
Food safety
Tobacco control
Environment
Access to drugs
Health services
Food security
Biotechnology
Information technology
Traditional knowledge
Source: Drager, 2004
62
RECLAIMING THE RESOURCES FOR HEALTH: ADVANCING HEALTH EQUITY IN EAST AND SOUTHERN AFRICA
Protecting health in trade agreements Earlier in this section, we observed how trade policies can privilegecountries and economic activities in ways that weaken householdproductivity and incomes and increase the outflow of resources from theregion. Trade is thus having an increasing influence on health, not onlythrough these effects on the determinants of and the resources for health,but more directly through the spectrum of health issues covered bybilateral and World Trade Organisation agreements (see table 2.7).
Trade agreements can foster changes in the ownership andorganisation of health systems, affecting access and health outcomes(Fidler, 1999). To exemplify this, this analysis focuses on access tomedicines, while noting many other areas of impact on health in table 2.7.
Patents are now covered under trade law, with Trade RelatedIntellectual Property Rights (TRIPS) rules obliging states to grant patentowners at least 20 years of exclusive commercial rights to make or selltheir inventions, such as medicines. While this aims to protect researchand development investments, it allows patent holders to keep patenteddrug prices artificially high, putting them out of reach to many. Genericmedicines have been a core feature of essential drug lists in the regionand, as will be described in Section 3, they are central to expanding accessto health care. With mark-ups of patented drugs often a significant factorin high medicine costs, the manufacture and marketing of genericmedicines can significantly reduce the cost of medicines.
Patents give those who holdthem a monopoly on theproduction and sale of aninvention.
63
SECTION 2: RECLAIMING THE ECONOMIC RESOURCES FOR HEALTH
Procurement of higher cost imported drugs drains resources from healthsystems and for many years has been a barrier to access to treatment.Public health principles were asserted over trade rules at the 2001 DohaWorld Trade Organisation ministerial meeting in the face of massivepublic health needs, clear experience of the value of generic drugs,significant treatment activism and south-south governmental pressures.The 2001 Doha Declaration (article 4) provided that the TRIPS agreement‘can and should be interpreted and implemented in a manner supportiveof World Trade Organisation members’ right to protect public health and,in particular, of access to medicines for all’.
This important recognition of the demand for trade to protect andpromote health gave authority to use flexibilities in the TRIPS agreementin the interest of public health by:
• giving transition periods for laws to be TRIPS-compliant;
• providing in law for compulsory licensing or the right to granta licence, without permission from the licence holder, onvarious grounds including public health;
• providing in law for parallel importation or the right to importproducts patented in one country from a country where theprice is lower;
• providing for exceptions from patentability and limits on dataprotection; and
• providing for early working, know as the Bolar provision,allowing generic producers to conduct tests and obtain healthauthority approvals before a patent expires, making cheapergeneric drugs available more quickly at that time.
For example, after the Zimbabwe government declared a nationalemergency on HIV and AIDS in 2002 (as provided for in Zimbabwe law)it issued compulsory licences to three local companies to either import orproduce four antiretroviral varieties at about a third of the cost ofpatented products, leading to price reductions in the antiretroviral, Zerit,from US$400 in 2001 to US$30 in 2002 (Musungu and Oh, 2006).Similarly, Mozambique granted a compulsory licence to a local company,Pharco Mozambique Ltd, for the local manufacture of the triplecompound of generic antiretroviral drugs.
East and southern African countries need to amend their laws to usethese flexibilities. All countries in the region are World Trade Organisationmembers and most have least developed country status (see table 2.8 onpage 64). This gives them until 2016 to be TRIPS compliant. Some eastand southern Africa countries have, however, still not enacted theseflexibilities, won at Doha (see table 2.9 on page 64).
The legal provisions are not complex, as exemplified by thecomprehensive TRIPS-compliant national laws already developed in someeast and southern Africa countries.
Compulsory licences areissued by countries to importdrugs without permission of thelicence holder for those drugs.
Parallel importation is whengovernments import, withoutpermission of the patent holder,a product manufactured under apatent held in one country butsold at lower prices in anothercountry.
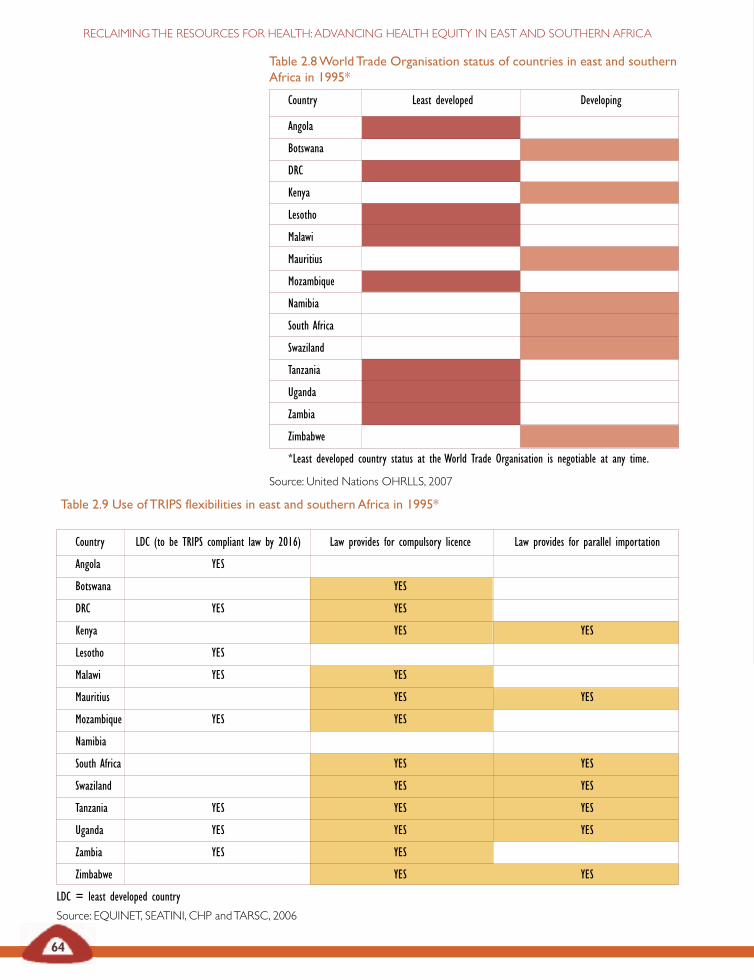
Table 2.8 World Trade Organisation status of countries in east and southernAfrica in 1995*
Country Least developed Developing
Angola
Botswana
DRC
Kenya
Lesotho
Malawi
Mauritius
Mozambique
Namibia
South Africa
Swaziland
Tanzania
Uganda
Zambia
Zimbabwe
*Least developed country status at the World Trade Organisation is negotiable at any time.
Source: United Nations OHRLLS, 2007
Table 2.9 Use of TRIPS flexibilities in east and southern Africa in 1995*
Country LDC (to be TRIPS compliant law by 2016) Law provides for compulsory licence Law provides for parallel importation
Angola YES
Botswana YES
DRC YES YES
Kenya YES YES
Lesotho YES
Malawi YES YES
Mauritius YES YES
Mozambique YES YES
Namibia
South Africa YES YES
Swaziland YES YES
Tanzania YES YES YES
Uganda YES YES YES
Zambia YES YES
Zimbabwe YES YES
LDC = least developed country
Source: EQUINET, SEATINI, CHP and TARSC, 2006
64
RECLAIMING THE RESOURCES FOR HEALTH: ADVANCING HEALTH EQUITY IN EAST AND SOUTHERN AFRICA
65
SECTION 2: RECLAIMING THE ECONOMIC RESOURCES FOR HEALTH
Legislating TRIPS flexibility to protect access to genericmedicines in Kenya
Kenyan law permits parallel importation of patented medicines previouslysold abroad and of generic medicine produced pursuant to a compulsorylicence as provided for in TRIPS, article 6. Kenya applies ‘internationalexhaustion’ which implies that the exclusive right of a patent holder to importa product is exhausted and ends when that product is launched on the market.
Kenya Industrial property Act 2001 Section 58(2)
The rights under the patent shall not extend to acts in respect of articleswhich have been put on the market in Kenya or in any other country orimported into Kenya.
Kenya Industrial Property Act 2001 Section 80 (1) a and b
(1a) Upon exercising the powers conferred upon him under subsection(1), the Minister may, notwithstanding any of the measures set out inthis section, authorise by written order the importation, manufactureor supply, or authorise the utilisation of any molecule or substancewhatsoever by any individual, corporation or society as named ordescribed by any individual, corporation or society as named ordescribed in the order without notice to the patent holder or anyother notifiable party, and such order shall remain in force untilrevoked by the minister in writing, after giving six months’ priornotice of his intention of such revocation to the party named ordescribed in the order.
(1b) An order made under the subsection (1a) shall not require thepayment of compensation to the owner of the patent or licenceholder or any other party so interested by the Minister in writing,giving six months prior notice of intention of such revocation to theparty named or described in the order.
Musungu and Oh, 2006
Countries that do not yet have provisions in their laws for compulsorylicensing and parallel importation are thus encouraged to:
• include these provisions in their law; • provide deferred implementation and enforcement ofpharmaceutical patents until 2016;
• specify as many of the possible grounds for issuing compulsorylicences to avoid ambiguity or uncertainty;
• provide in competition law for issuing a compulsory licence onthe basis of unfair competition in line with article 31(k) ofTRIPS;
66
RECLAIMING THE RESOURCES FOR HEALTH: ADVANCING HEALTH EQUITY IN EAST AND SOUTHERN AFRICA
• include explicit provisions for the waiver of negotiations withthe patent holder in cases of compulsory licensing forgovernment use or for national emergencies;
• provide explicit provisions for the waiver of remuneration paidto the patent holder in importing countries;
• provide for time limitations for negotiation for voluntarylicences in circumstances where compulsory licences are notapplied, after which time the requirement shall be deemedsatisfied and a compulsory licence granted;
• provide for international exhaustion of intellectual propertyrights;
• provide swift procedures and clear guidance in law for royaltyrates so granting compulsory licences is not held up in legalappeals and royalty squabbles; and
• ensure other health and pharmaceutical laws are amended ifthey affect the application of these flexibilities (EQUINET,SEATINI, CHP, TARSC, 2006).
Experience shows that efforts to enact and use these laws encounter manyobstacles in the wider global environment. Five years after Doha, 75 percent of antiretrovirals in developing countries are still under monopoly,with no generics available in some countries (Act-Up, 2006). East andsouthern African countries implementing TRIPS flexibilities lackinformation about options for accessing cheaper generic medicines andabout the status of patents in countries importing and exporting particularmedicines. Rich countries have in the past exerted diplomatic, trade andpolitical pressure, through trade-related technical assistance and bilateraltrade agreements, to interpret TRIPS flexibilities narrowly and detercountries from using them. This occurred in the United States–SouthernAfrican Customs Union (SACU) free trade agreement negotiations.Signing agreements with TRIPS-plus rules may undermine the regulatoryflexibility needed to ensure access to affordable medicines.
This has, for example, emerged as an issue in the EconomicPartnership Agreement being negotiated in 2007 between the EuropeanUnion and east and southern Africa. The proposed economic partnershipagreement includes intellectual property rights. In the past the EuropeanUnion has used free trade agreements to push for standards that gobeyond those outlined by the World Trade Organisation TRIPSagreement, such as in the free trade agreement of 1999 between theEuropean Union and South Africa. Hence while some commitment hasbeen expressed towards respecting TRIPS flexibilities, east and southernAfrican countries justifiably seek to ensure that trade partners such as theEuropean Union explicitly commit to not push for TRIPS-plus measures,to give east and southern Africa countries the policy space to freely useTRIPS flexibilities, to provide for political and technical support to use thesafeguards under TRIPS to ensure access to affordable medicines andfinally to encourage development of east and southern African countries’pharmaceutical industries (Mabika et al., 2007).
…east and southern Africancountries justifiably seek to
ensure that trade partners suchas the European Union explicitlycommit to not push for TRIPS-plus measures, to give east andsouthern Africa countries the
policy space to freely use TRIPSflexibilities, to provide for politicaland technical support to use the
safeguards under TRIPS toensure access to affordablemedicines and finally to
encourage development of eastand southern Africa countries’
pharmaceutical industries.
67
SECTION 2: RECLAIMING THE ECONOMIC RESOURCES FOR HEALTH
Draft text prepared by east and southern Africa countries for negotiationthus includes important safeguards for essential medicines:
• ensuring availability of legal, institutional and human resourcescapacities and policy frameworks for the protection ofintellectual property rights whilst respecting and safeguardingthe public policies of east and southern African countries;
• ensuring the implementation of the flexibilities as is providedfor under the TRIPS agreement;
• providing for enhanced incentives for the development andresearch into new technologies, especially in pharmaceuticalproducts, including the production of generic medicine;
• providing support to east and southern Africa countries toenable them to benefit from the relevant provisions of theTRIPS agreement and the in-built flexibilities, especially withregard to public health, including access to pharmaceuticalproducts at a reasonable price; and
• providing support from European Union to east and southernAfrican countries to enact appropriate laws, formulate policiesand develop infrastructure for local production ofpharmaceutical products, transfer of technology and theattraction of investment in their pharmaceutical sectors (citedin Mabika et al., 2007).
The challenges east and southern African countries face to protect accessto medicines highlights what happens when the struggle for health isdirected at challenging global trends that undermine the resources forhealth. However, the challenges extend beyond the region. India, thelargest producer of generic drugs in the world, was required in January2005 to grant patent protection to new drugs and to drugs invented since1995. Subsequent World Trade Organisation provisions, known as the‘August 30th decision’, provide that countries that have no capacity tomanufacture generics themselves (as is the case in many east and southernAfrican countries) are permitted to import from another country (suchas India) if that country issues a compulsory licence and if both partiesinform the World Trade Organisation of the nature and duration of thelicence and the product quantities involved. This puts the burden on eastand southern African countries to carry out the legal and institutionalreforms to issue compulsory licences and adds new rules to thesetransactions. The new challenge is for countries in the region to exertpressure internationally for simplified procedures for such exports, andto explore other sources of cheaper generic drugs that are not covered bypatents, such as from Brazil and Thailand (EQUINET, SEATINI, CHPand TARSC, 2006).
This calls for high levels of exchange of information, resources andexpertise across and beyond the region. In Sections 3 and 6 we discussfurther how state, parliament and civil society alliances can take up andhave taken up these challenges. We also point to the strategic role of
The new challenge is forcountries in the region to exertpressure internationally forsimplified procedures for suchexports, and explore othersources of cheaper generic drugsthat are not covered by patents,such as from Brazil and Thailand
68
RECLAIMING THE RESOURCES FOR HEALTH: ADVANCING HEALTH EQUITY IN EAST AND SOUTHERN AFRICA
regional alliances and of rights to health in giving countries leverage innegotiating and implementing policies that seek to guarantee health.Working as a region, east and southern African countries can, for example,collectively issue compulsory licences for common public health problems.This was done in Latin America where ten countries combined efforts toget agreements from generic manufacturers and originators. Regionalframeworks to collectively issue compulsory licences for the same drugmay build a sufficient market to encourage producers to invest in genericversions of these drugs. They provide a means to address the urgent needto protect indigenous medicines from foreign patenting, while promotingtheir development. Regional co-operation offers opportunities for bulkprocurement of drugs to reduce costs, buffer against stock-outs andstimulate generic production. It is an essential basis for building thecomparative advantage, skills and markets to engage south-south co-operation to promote local production of essential drugs.
East and southern African countries are engaging in a global economythat has produced significant disadvantages in resource outflows, sluggishgrowth, speculative investment and household poverty. This sectionhighlights the challenges involved and the opportunities that exist for theregion to gain greater control over the outflow of resources, implementdomestically-driven strategies and secure greater returns from the globaleconomy. It highlights why this is important for public health, focusing onthe food inputs for health and the medicines essential for health care.There is a resonance between the wider economic strategies needed andeffective public health strategies in both these examples. In both cases,there are policies and measures that can strengthen national and householdcontrol over the resources for health, with gains for household andnational production.
What role do health professionals and health workers play in advancingsuch win-win strategies?
As we showed in relation to nutrition and access to medicines, healthsystems can make a difference in these areas, and to health equity, byproviding leadership, shaping wider social norms and values, providingthe public health motivation for action by other sectors and supportingwork across sectors in a shared approach. As we demonstrate, both inrelation to nutrition and access to medicines, the health sector in the regioncan play a role in providing the public health basis for levering, supportingand implementing the policies and actions that reclaim the resources forhealth in the global economy, and in effectively directing these resourcesnationally to the household level.
How do health systems best do this and what kind of health systemplays that role? We take this up in the next section.
Health systems are all theactivities whose primarypurpose is to promote, restore,or maintain health WHO, 2000
Regional co-operation offersopportunities for bulk
procurement of drugs to reducecosts, buffer against stock-outs
and stimulate generic production.It is an essential basis for buildingthe comparative advantage, skillsand markets to engage south-south co-operation to promote
local production of drugs.
69
SECTION 2: RECLAIMING THE ECONOMIC RESOURCES FOR HEALTH
Abugre C (2005) ‘G8: Hot air and little substance,’ PambazukaNews 215, Fahamu, Oxford.
ActionAid (2003) Going against the grain, ActionAid, accessed24 August 2004 at www.actionaid.co.uk.– (2005) Real aid: An agenda for making aid work, Action Aid,London.
Act-Up (2006) ‘Five years later the WTO deal on access tomedicines is a failure: G8 leaders must step up,’ mimeo, Paris.
African Union (AU), United Nations Economic Commissionfor Africa (UNECA) (2007) Accelerating Africa’s developmentthrough diversification, Ethiopia.
Atekyereza P and Panagides D (2007) ‘HIV/AIDS and foodand nutrition security policy and programming in eastern andsouthern Africa’, EQUINET discussion paper 45, EQUINET/Medical Research Council (MRC), South Africa.
Bond P and Dor G (2003) ‘Neoliberalism and povertyreduction strategies in Africa,’ EQUINET discussion paper 3,EQUINET, Johannesburg.
Bond P (2006) ‘The dispossession of African wealth: Perversesubsidies and reverse resource flows,’ EQUINET discussionpaper 30, EQUINET, Centre for Economic Justice, Harare.
Comprehen sive Africa Agriculture Development Programme,New Economic Partnership for Development, World FoodProgramme and Millennium Hunger Task Force (2003) Home-grown school feeding programme, NEPAD, Abuja.
Chopra M (2004) ‘Food security, rural development andhealth equity in southern Africa,’ EQUINET discussion paper22, EQUINET, Harare.
Chopra M and Tomlinson M (2007) ‘Food sovereignty andnutrition in east and southern Africa: A synthesis of casestudy evidence,’ EQUINET discussion paper 47, EQUINET/MRC, South Africa.
Collier P, Hoeffler A, Pattilo C (1999) ‘Flight capital as aportfolio choice’, World Bank research working paper 2066,accessed 7 June 2007 at http://ssrn.com/abstract=569197
Commission for Africa (2005) Our common future, London.
Devereux S and Maxwell S (eds) (2001) Food security in Africa,Intermediate Technology Development Group, London.
DfID (2007) Photograph of woman farmer, Research 4Development, March 2007, accessed 7 June 2007 athttp://www.research4 development.info
Drager N (2004) ‘Public health implications of multilateraltrade agreements’, Lausanne, June 2004, WHO, Geneva.
Economic Commission for Africa, African finance ministers(1999) ECA briefing on the 33rd session of the commis sion/24thmeeting of the Conference of Ministers/ 7th Conference of AfricanMinisters of Finance, Addis Ababa, Ethiopia 6-8 May 1999,accessed 7 June 2007 at http://www. uneca.org/eca_resources/major_eca_websites/joint/p76.htm
EQUINET steering committee (2004) ‘Reclaiming the state:Advancing people’s health, challenging injustice’, EQUINETpolicy paper 15, EQUINET, Harare.
EQUINET, SEATINI, CHP and TARSC (2006) Promotinghealth in trade agreements: A training kit for east and southern Africa,EQUINET/ SEATINI, Harare.
European Union-South Africa (1999) ‘Agreement on trade,development and co-operation between the EC and itsmember states, of the one part, and the Republic of SouthAfrica, of the other part,’ Official Journal L311 of 4 December1999: 0003-0297 available at http://www.bilaterals.org/article.php3?id_article=419
EU–Syria Association Agreement (2004) ‘Proposal for acouncil decision on the conclusion of a Euro-Mediterraneanassociation agreement between the European community andits member states of the one part, and the Syrian ArabRepublic, of the other part’, COM 17 December (2004) 808final EU, Brussels accessed 28 February 2007 at http://www.bilaterals.org/article.php3?id_article=2549
FAO (2004) FAOSTAT, FAO, Rome.
Food First (2003) Food sovereignty, Food First, Oakland,California, accessed at www.foodfirst.org/progs/global/food/finaldeclaration.html.
Fidler DP (November 1999) ‘International law and globalpublic health’, Law Review, University of Kansas, Kansas.
G8 finance ministers (2005) ‘G8 finance ministers agree toproposal for debt relief ’ accessed 2 June 2007at http://usinfo.state.gov/ei/Archive/2005/Sep/27-620259.html
Global Policy Forum (2006) Foreign direct investment inflows andoutflows in developing regions, 1990–2004, Global Policy Forum,New York, accessed March 2007 at www.globalpolicy.org/socecon/ffd/fdi/tables/developingregions.htm
Government of Kenya (2001) Industrial Property Act 2001,Nairobi.
Haddad L and Hoddentot J (1994) ‘Women’s income andboy–girl nutrition outcomes in the Côte d’Ivoire’, WorldDevelopment 22 (4): 543–553.
Indymedia South Africa (3 October 2006) ‘No peace withoutdevelopment!’ Independent media centre, available at http://southafrica.indymedia. org/news/2006/ 10/11343.php
Integrated Regional Network (IRIN) (5 February 2007)‘Zambia: Cold reception for China’s president,’ IRIN News,UN-OCHA, New York.
International Fund for Agricultural Development (IFAD)(2001) Strategy paper on HIV and AIDS for East and SouthernAfrica, IFAD, Rome.
Jere P (2007)‘The impact of food aid on food markets andfood security in Malawi’, EQUINET discussion paper 45,EQUINET /MRC, South Africa.
Jones C (1986) ‘Intrahousehold bargaining in response to theintroduction of new crops: A case study from northCameroon’ in Moock J (ed) Understanding Africa’s ruralhouseholds and farming systems, Westview Press, USA.
Jubilee South (2005) Declaration of Havana south-northconsultation on resistance and alternatives to debt domination, Havana,Cuba, 28–30 Sept, Jubilee South, Quezon City, available athttp:// www.jubileesouth. org/news/EEuppyEpFFowVacRTa.shtml
REFERENCES
70
RECLAIMING THE RESOURCES FOR HEALTH: ADVANCING HEALTH EQUITY IN EAST AND SOUTHERN AFRICA
Karingi S, Lang S, Oulmane N, Perez N, Sadni Jallab M,Hammouda HB (2005) Economic and welfare impacts of the EU–Africa Economic Partnership Agreements, UN ECA, ATPC Workin Progress 10, Addis Ababa.
Kennedy E (1991) ‘Income sources of the rural poor insouthwestern Kenya’, in von Braun J and Pandya-Lorch L(eds) ‘Income sources of malnourished people in rural areas:microlevel information and policy implications’,Workingpapers on commercialization of agriculture and nutrition 5,International Food Policy Research Institute, Washington DC.
Kneen B (1996) Invisible giant, Pluto Press, London.
Lambrechts K and Barry G (2003) ‘Why is southern Africahungry? The roots of southern Africa’s food crisis,’ ChristianAid policy briefing, Christian Aid, London, at www.christianaid.org.
Mabika A, Makombe P, Chizarura L, Loewenson R (2007)‘Health implications of proposed Economic PartnershipAgreement between east and southern African countries andthe European Union,’ EQUINET discussion paper 41,EQUINET/SEATINI, Harare.
Madeley J (2003) Food for all: The need for a new agriculture, ZedBooks, London
Mason J, Gillenwater K, Pugh R, Kenefik E, Collins G,Whitaker M and Volk D (2006) ‘Analysis of nutritionalsurveys across the ESARO region,’ Practical Analysis ofNutritional Data (PANDA), Tulane University, New Orleans.
McMichael P (ed) (1994) The global restructuring of agro-foodsystems, Cornell University Press, Ithaca.
Milanovic B (2002) ‘Can we discern the effect ofglobalisation on income distribution? Evidence fromhousehold budget surveys’, Policy research working paper 2876,World Bank, Washington.
Mkandawire T (2005) ‘Maladjusted African economies andglobalisation’, Africa Development 30: 1-2.
Musungu SF and Oh C (2006) The use of flexibilities in TRIPSby developing countries: Can they promote access to medicines? SouthCentre, Geneva.
Nangawe E, Simwanza E, Mubanga F (1998) Determinants ofaction against malnutrition in < 5 children, Kasama district, northernZambia, ZPC Publications, Lusaka.
Newman MEJ (2006) Images of the social and economic world,Dept of Physics and Centre for the Study of ComplexSystems, Univ. of Michigan, Michigan, available at www-personal.umich.edu/~mejn/cartograms/
Organisation for Economic Co-operation and DevelopmentDevelopment Co-operation Directorate (OECD DCD-DAC)(2007) ‘Development aid from OECD countries fell 5.1% in2006’ accessed June 2007 at http://www.oecd.org/document/17/0,3343,en_2649_34447_38341265_1_1_1_1,00.htm
Peoples Daily Online (25 April 2006) ‘Africa and AboriginalTuesdays: China and Africa seek a win-win’, downloaded 9March 2007 from http://www.blackelectorate.com/print_article.asp?ID=1630
Saito KA and Mekonnen H (1992) Raising the productivity ofwomen farmers in sub-Saharan Africa, World Bank, New York.
SADC ministers of food, agriculture and natural resources(2004) Communique, 14 February 2004, Dar es Salaam,Tanzania, SADC, Gabarone.
Sharma D (27 Nov 2005) ‘Farm subsidies: The report card’,ZNet commentary, ZNet, Massachusets.
Sundberg M, Gelb A (Dec 2006) ‘Making aid work in financeand development’, IMF quarterly, Vol 43, No 4 accessed June2007 at http:// www.imf.org/external/pubs/ft/fandd/2006/12/sundberg.htm
Suri S (24 May 2004) ‘If the IMF could do this to Zambia…’Inter Press Service News Agency, Rome, downloaded 1March 2007 from http://ipsnews.net/africa/interna.asp?idnews=23882
Tomlinson M (2007) ‘School feeding in ESA: Improving foodsovereignty or photo opportunity?’ EQUINET discussion paper46, EQUINET/MRC, Cape Town.
Toussaint E (2005) Your money or your life, Haymarket Press,Chicago.
UNDP (2005) Human development report 2005, OUP, NewYork, accessed 2 June 2007 at http://hdr.undp.org/reports/view_reports.cfm?type=1
UNICEF (2003) Southern African humanitarian crisis: Review ofnutrition information, ESARO, Nairobi.
United Nations Standing Committee on Nutrition (2004)‘Nutrition for improved development outcomes’, The 5threport on the world nutrition situation: Nutrition for improveddevelopment outcomes, UN SCN, Geneva.
UN Office for the high representative for the least developedcountries, landlocked developing countries and small islanddeveloping states (2007) List of least developed countries, UNOHRLLS, New York, available athttp://www.un.org/special-rep/ohrlls/ldc/list.htm
World Bank (2002) Global finance tables, Washington. – (2002b)World health report, at http://devdata.worldbank.org/data-query/ – (2006) ‘Changing the face of development finance?’ GlobalDevelopment Finance 2006, World Bank, New York, available athttp://web.worldbank.org/WEBSITE/EXTERNAL/NEWS /0contentMDK:20935894 ~pagePK:64257043 ~piPK:437376~theSitePK:4607,00.htm
World Commission on the Social Dimension ofGlobalisation (2004) A fair globalisation: Creating opportunities forall, ILO, Geneva.
WHO (2000)World health report: Health systems improvingperformance, World Health Organisation, Geneva.
WTO (Nov 2001) ‘The Doha declaration,’ The 4th ministerialmeeting of WTO, Doha, Quatar, Geneva.
BuildingUNIVERSAL, COMPREHENSIVE, PEOPLE-CENTRED
HEALTHSYSTEMS
SECTION
3
The economic and social inequality in east and southern Africacalls for health systems to play a role in redistributingresources to those with greatest health needs.
Countries in the region have done this through public sector ledhealth systems. Increased public investment in health andcomprehensive primary health care approaches have led to improvedhealth outcomes, especially for those with greatest health needs.While such approaches spread in Africa in the 1980s, declininginvestment in primary health care and rising financing of vertical,disease-based programmes has occurred more recently, often inresponse to national resource constraints.
Economic liberalisation has been associated with commercialisationand privatisation of health services, particularly through user chargesand the expansion of formal and informal for-profit services. Thesehave had negative effects on equity and access to health care in theregion, making state intervention essential to manage the marketforces within health systems.
The scale of the AIDS epidemic and the limitations of verticalprogrammes in the context of weak health systems make the lessonslearned from the roll out of prevention and treatment for HIV andAIDS strategically significant. The most enabling conditions forsustained, equitable antiretroviral therapy roll out appear to occurwhere treatment is free at point of delivery through adequately-staffed district health systems, with a range of services for adult andchild illness and support for community outreach. These lessonssignal the continued relevance of primary health care, even in the faceof new challenges such as AIDS.
Rebuilding universal, comprehensive people-centred systems calls forpublic leadership to manage pressures to commercialise health careand use resources provided for immediate tasks, such as treatmentroll out, to reinforce the longer term development of health systems.This political leadership needs backing from social action, frompublic–public partnerships and from rights to health written intonational constitutions and laws and protected by internationalconventions.
KEY ISSUES
SECTION
3
73
SECTION 3: BUILDING UNIVERSAL, COMPREHENSIVE, PEOPLE-CENTRED HEALTH SYSTEMS
What kind of health system reclaims theresources for health?Section 2 highlighted the strategic role that health systems can play inredistributing the resources for health. Health systems, while oftenreduced to just health care programmes, actually incorporate all thoseactions whose primary purpose is to promote, restore or maintain health.They can provide a means to improve people’s lives – protecting themfrom the vulnerability of sickness, generating a sense of human securityand building common purpose and trust within society. Health systemscan widen the inclusiveness of and benefits from socio-economicdevelopment (Gilson et al., 2007). They are social institutions that assertand protect social values and norms. They also reflect social inequalities(Mackintosh, 2001).
This may seem paradoxical – but health systems are sites of struggle.Some interests and policies that reform health systems also help them tocope with, rather than challenge, policies that widen inequality in wealth.But there are also activities and institutions within health systems that havecontested inequality and the policies that drive it, to better protect publichealth. In our region, we have experienced both these scenarios.
At different times in the past two decades, health systems in the regionhave challenged and been challenged by policies that widen inequalitiesin health. Yet they have made significant improvements when they usespecific strategies to direct resources to those with greatest health needs:
• Promoting a comprehensive, a primary health care orientedapproach and providing the public leadership to involve othersectors in healthThere is extensive evidence that health systems in the region markedlyimprove health when they provide prevention, treatment and carewithin effective and comprehensive district-level systems, organisedaround primary health care (WHOAfro, 2006; Baez and Barron, 2006;De Savigny et al., 2004). More recent evidence shows this is equallyimportant in dealing with chronic illness. Most commonly this isorganised through public sector led services, co-ordinated withinterventions provided by non-profit organisations (WHOAfro, 2006;Baez and Barron, 2006).
• Redistributing resources within the systemThis is implemented through redistributing budgets towards prevention,improving rural infrastructure, strengthening primary health careapproaches and providing improved quality health services free at pointof use (Loewenson et al., 1991; Haddad and Fourier, 1995; Kida andMackintosh, 2005). Health outcomes have improved when healthsystems deploy and orient health personnel towards major healthproblems, using staff time effectively and balancing tasks with resourcesat primary care level (Haddad and Fourier, 1995). Such redistributionensures that private sector provision complements public provisioninstead of competing for public funding (Makwiza et al., 2006).
At different times in the past twodecades, health systems in theregion have challenged and beenchallenged by policies that wideninequalities in health.
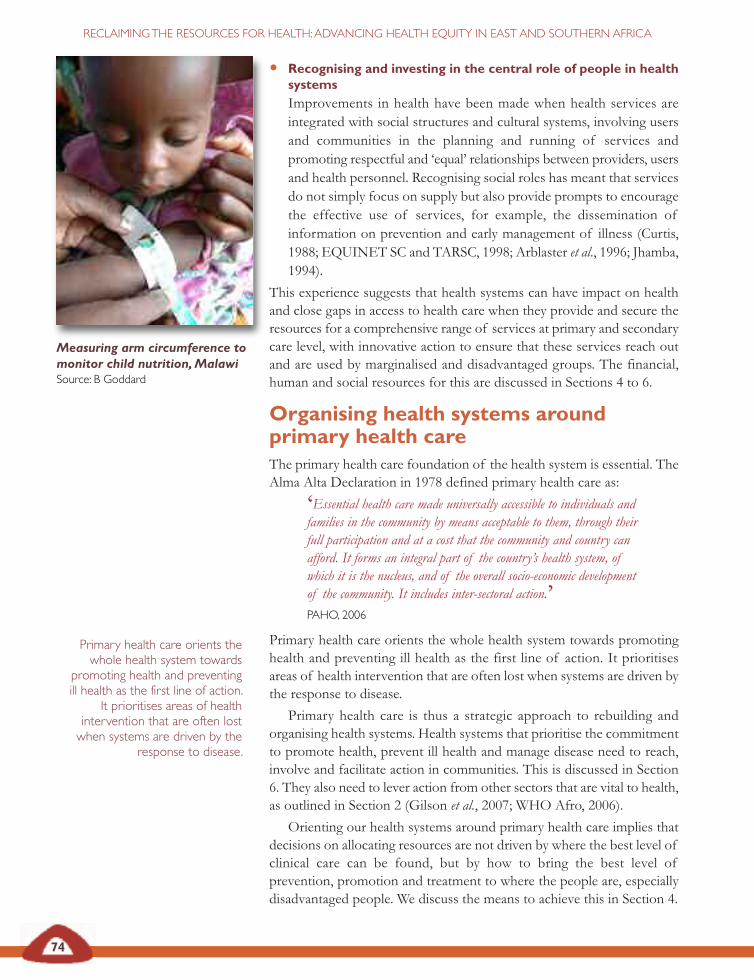
74
RECLAIMINGTHE RESOURCES FOR HEALTH:ADVANCING HEALTH EQUITY IN EAST AND SOUTHERN AFRICA
• Recognising and investing in the central role of people in healthsystemsImprovements in health have been made when health services areintegrated with social structures and cultural systems, involving usersand communities in the planning and running of services andpromoting respectful and ‘equal’ relationships between providers, usersand health personnel. Recognising social roles has meant that servicesdo not simply focus on supply but also provide prompts to encouragethe effective use of services, for example, the dissemination ofinformation on prevention and early management of illness (Curtis,1988; EQUINET SC and TARSC, 1998; Arblaster et al., 1996; Jhamba,1994).
This experience suggests that health systems can have impact on healthand close gaps in access to health care when they provide and secure theresources for a comprehensive range of services at primary and secondarycare level, with innovative action to ensure that these services reach outand are used by marginalised and disadvantaged groups. The financial,human and social resources for this are discussed in Sections 4 to 6.
Organising health systems aroundprimary health careThe primary health care foundation of the health system is essential. TheAlma Alta Declaration in 1978 defined primary health care as:
‘Essential health care made universally accessible to individuals andfamilies in the community by means acceptable to them, through theirfull participation and at a cost that the community and country canafford. It forms an integral part of the country’s health system, ofwhich it is the nucleus, and of the overall socio-economic developmentof the community. It includes inter-sectoral action.’PAHO, 2006
Primary health care orients the whole health system towards promotinghealth and preventing ill health as the first line of action. It prioritisesareas of health intervention that are often lost when systems are driven bythe response to disease.
Primary health care is thus a strategic approach to rebuilding andorganising health systems. Health systems that prioritise the commitmentto promote health, prevent ill health and manage disease need to reach,involve and facilitate action in communities. This is discussed in Section6. They also need to lever action from other sectors that are vital to health,as outlined in Section 2 (Gilson et al., 2007; WHO Afro, 2006).
Orienting our health systems around primary health care implies thatdecisions on allocating resources are not driven by where the best level ofclinical care can be found, but by how to bring the best level ofprevention, promotion and treatment to where the people are, especiallydisadvantaged people. We discuss the means to achieve this in Section 4.
Measuring arm circumference tomonitor child nutrition,MalawiSource: B Goddard
Primary health care orients thewhole health system towards
promoting health and preventingill health as the first line of action.
It prioritises areas of healthintervention that are often lostwhen systems are driven by the
response to disease.
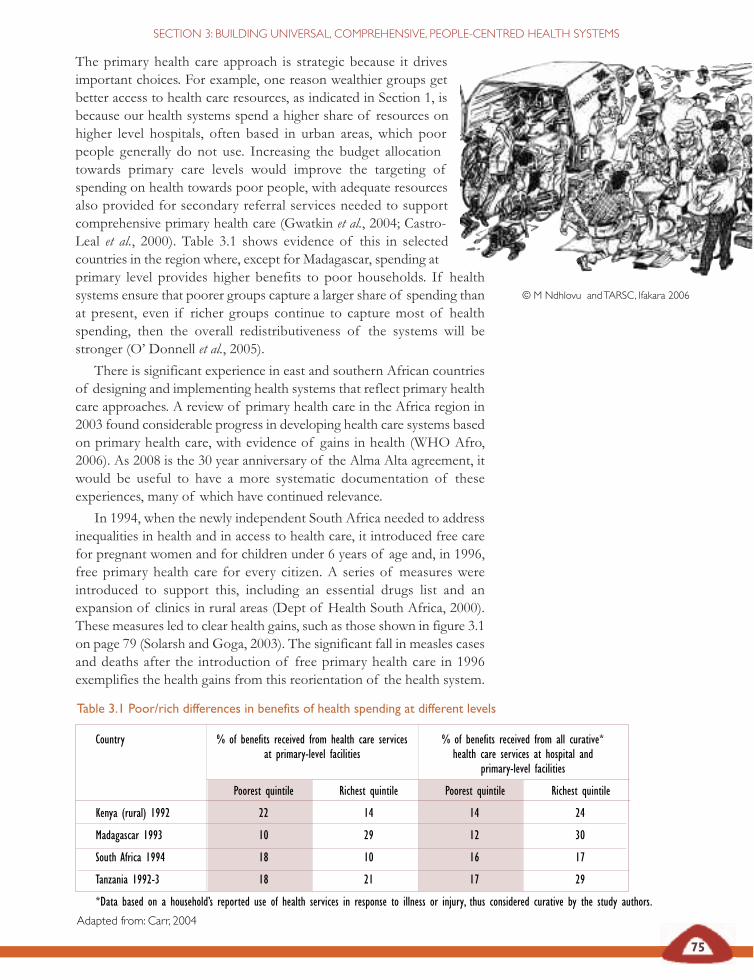
The primary health care approach is strategic because it drivesimportant choices. For example, one reason wealthier groups getbetter access to health care resources, as indicated in Section 1, isbecause our health systems spend a higher share of resources onhigher level hospitals, often based in urban areas, which poorpeople generally do not use. Increasing the budget allocationtowards primary care levels would improve the targeting ofspending on health towards poor people, with adequate resourcesalso provided for secondary referral services needed to supportcomprehensive primary health care (Gwatkin et al., 2004; Castro-Leal et al., 2000). Table 3.1 shows evidence of this in selectedcountries in the region where, except for Madagascar, spending atprimary level provides higher benefits to poor households. If healthsystems ensure that poorer groups capture a larger share of spending thanat present, even if richer groups continue to capture most of healthspending, then the overall redistributiveness of the systems will bestronger (O’ Donnell et al., 2005).
There is significant experience in east and southern African countriesof designing and implementing health systems that reflect primary healthcare approaches. A review of primary health care in the Africa region in2003 found considerable progress in developing health care systems basedon primary health care, with evidence of gains in health (WHO Afro,2006). As 2008 is the 30 year anniversary of the Alma Alta agreement, itwould be useful to have a more systematic documentation of theseexperiences, many of which have continued relevance.
In 1994, when the newly independent South Africa needed to addressinequalities in health and in access to health care, it introduced free carefor pregnant women and for children under 6 years of age and, in 1996,free primary health care for every citizen. A series of measures wereintroduced to support this, including an essential drugs list and anexpansion of clinics in rural areas (Dept of Health South Africa, 2000).These measures led to clear health gains, such as those shown in figure 3.1on page 79 (Solarsh and Goga, 2003). The significant fall in measles casesand deaths after the introduction of free primary health care in 1996exemplifies the health gains from this reorientation of the health system.
Table 3.1 Poor/rich differences in benefits of health spending at different levels
Country % of benefits received from health care services % of benefits received from all curative*at primary-level facilities health care services at hospital and
primary-level facilities
Poorest quintile Richest quintile Poorest quintile Richest quintile
Kenya (rural) 1992 22 14 14 24
Madagascar 1993 10 29 12 30
South Africa 1994 18 10 16 17
Tanzania 1992-3 18 21 17 29
*Data based on a household’s reported use of health services in response to illness or injury, thus considered curative by the study authors.
Adapted from: Carr, 2004
75
SECTION 3: BUILDING UNIVERSAL, COMPREHENSIVE, PEOPLE-CENTRED HEALTH SYSTEMS
© M Ndhlovu andTARSC, Ifakara 2006
76
RECLAIMINGTHE RESOURCES FOR HEALTH:ADVANCING HEALTH EQUITY IN EAST AND SOUTHERN AFRICA
Although a decline in primary health care was noted by ministers of healthat the WHO Africa regional committee meeting in 2006 (WHO Afro,2006), positive experiences continue to emerge across the region. Primaryhealth care oriented systems at national level have improved healthpractices such as breastfeeding, mother and child health and nutrition andintegrated management of childhood illness, and have led to outcomessuch as improved maternal mortality rates and patient satisfaction (WHO,2003; Guyon et al., 2006; Omaswa et al., 1997). Despite positiveexperiences in the 1980s, and less well documented but continued positiveexperiences in recent years, a review of primary health care in Africasuggests that liberalisation policies have generally undermined countries’
Community-based tuberculosis care in Namibia
The steep rise in the tuberculosis caseload due to the HIV epidemicoverwhelmed the capacity of many government health services to providequality tuberculosis care in Namibia. The country has one of the world’sheaviest per capita burdens of tuberculosis at 748 cases per 100,000 people.Although case detection is high (88 per cent) only 63 per cent of new smear-positive patients were completing treatment. This called for new approachesthrough local health centres and communities, drawing on the decentralisationof tuberculosis control services into the primary health care system. In 1999,Omaheke region had the country’s worst treatment outcomes, with successrates of less than 30 per cent. The region has a highly mobile San populationin a vast and sparsely populated farming area, making patient follow-up amajor challenge.
Initially hospital staff introduced direct observation of treatment on thewards. When these measures proved insufficient to improve results,tuberculosis inpatients were counselled about tuberculosis and its treatmentand were given the option of treatment under the supervision of their nearestclinic or of a community treatment supporter. Community volunteers weretrained on treatment observation. Each local clinic had a focal person whowas trained to supervise the community treatment supporters. Clinic healthcommittees were formed and became the link between the community,including local San chiefs and the Ministry of Health and Social Services. Theprogramme provides transport and drivers to be used for primary health careoutreach activities, including following up defaulters. Treatment supporterswere also trained to refer any chronic coughers to clinics for investigation,further increasing case detection rates. The introduction of a ‘Best managedclinic health committee of the year’ competition based on tuberculosis controlcriteria generated great interest and enthusiasm.
The results were remarkable. Hospital wards were decongested. Of an initial1,200 defaulters in the region’s tuberculosis register at the outset, only twowere not located, but the rest were put back on treatment, which theycompleted. Treatment success increased from less than 30 per cent in 1999to 89 per cent in 2003 and the stigma associated with tuberculosis decreased.
AU, 2006
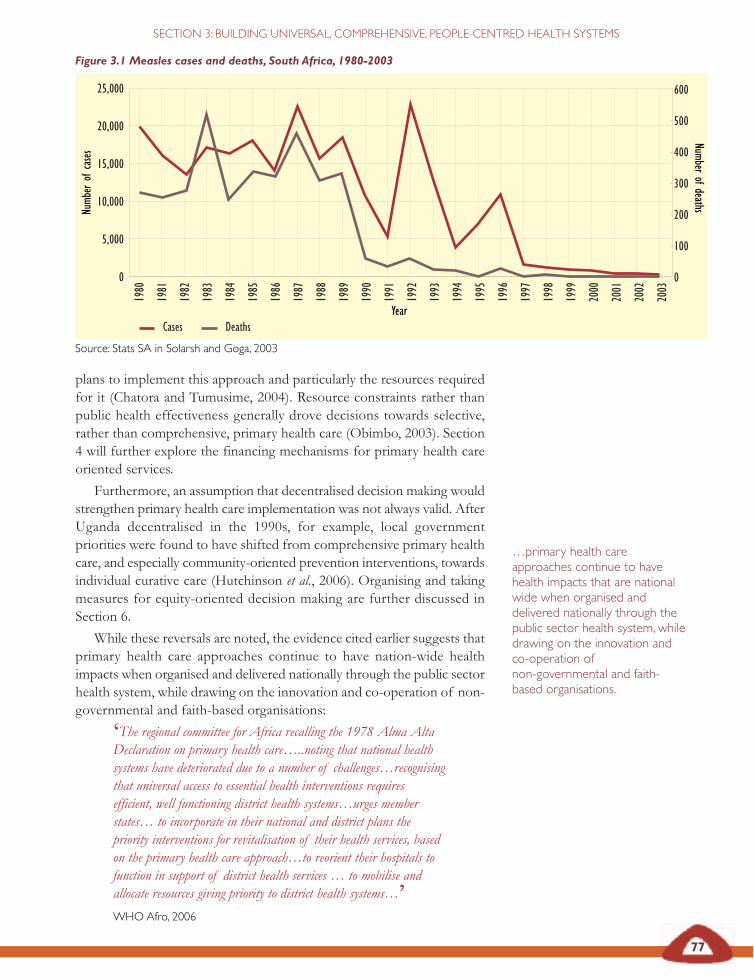
Figure 3.1 Measles cases and deaths, South Africa, 1980-2003
Source: Stats SA in Solarsh and Goga, 2003
77
SECTION 3: BUILDING UNIVERSAL, COMPREHENSIVE, PEOPLE-CENTRED HEALTH SYSTEMS
1980
1981
1982
1983
1984
1985
1986
1987
1988
1989
1990
1991
1992
1993
1994
1995
1996
1997
1998
1999
2000
2001
2002
2003
25,000
20,000
15,000
10,000
5,000
0
Numb
erof
case
s
Year
0
100
200
300
400
500
600
Numberofdeaths
Cases Deaths
plans to implement this approach and particularly the resources requiredfor it (Chatora and Tumusime, 2004). Resource constraints rather thanpublic health effectiveness generally drove decisions towards selective,rather than comprehensive, primary health care (Obimbo, 2003). Section4 will further explore the financing mechanisms for primary health careoriented services.
Furthermore, an assumption that decentralised decision making wouldstrengthen primary health care implementation was not always valid. AfterUganda decentralised in the 1990s, for example, local governmentpriorities were found to have shifted from comprehensive primary healthcare, and especially community-oriented prevention interventions, towardsindividual curative care (Hutchinson et al., 2006). Organising and takingmeasures for equity-oriented decision making are further discussed inSection 6.
While these reversals are noted, the evidence cited earlier suggests thatprimary health care approaches continue to have nation-wide healthimpacts when organised and delivered nationally through the public sectorhealth system, while drawing on the innovation and co-operation of non-governmental and faith-based organisations:
‘The regional committee for Africa recalling the 1978 Alma AltaDeclaration on primary health care…..noting that national healthsystems have deteriorated due to a number of challenges…recognisingthat universal access to essential health interventions requiresefficient, well functioning district health systems…urges memberstates… to incorporate in their national and district plans thepriority interventions for revitalisation of their health services, basedon the primary health care approach…to reorient their hospitals tofunction in support of district health services … to mobilise andallocate resources giving priority to district health systems…’WHOAfro, 2006
…primary health careapproaches continue to havehealth impacts that are nationalwide when organised anddelivered nationally through thepublic sector health system, whiledrawing on the innovation andco-operation ofnon-governmental and faith-based organisations.
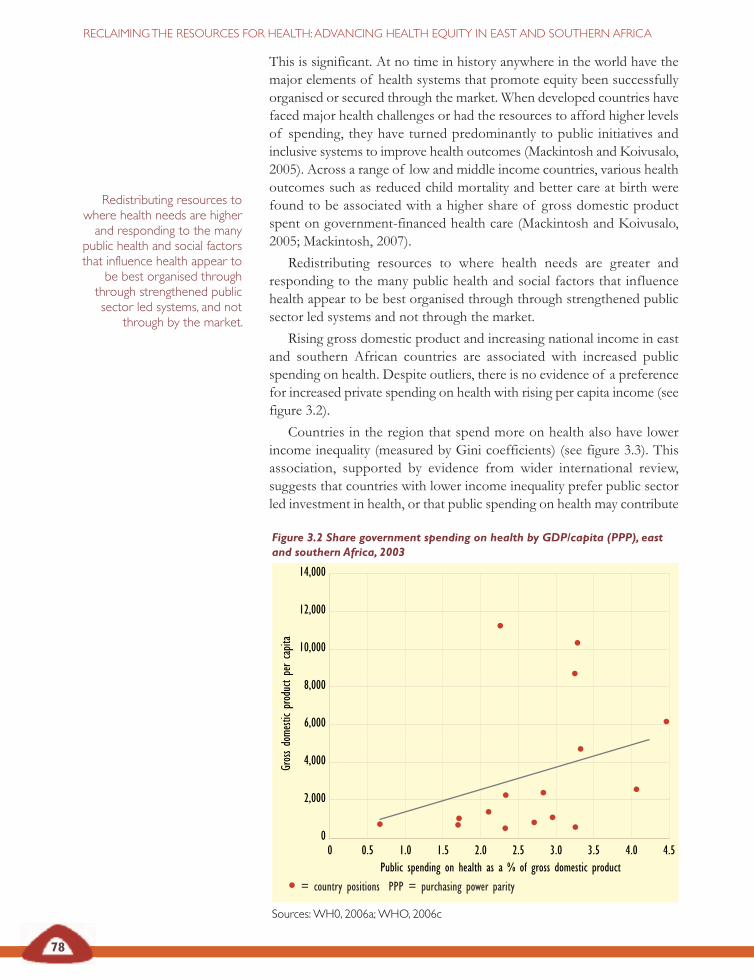
Figure 3.2 Share government spending on health by GDP/capita (PPP), eastand southern Africa, 2003
PPP = purchasing power parity
Sources:WH0, 2006a;WHO, 2006c
14,000
12,000
10,000
8,000
6,000
4,000
2,000
00 0.5 1.0 1.5 2.0 2.5 3.0 3.5 4.0 4.5
Public spending on health as a % of gross domestic product
Gros
sdo
mesti
cpr
oduc
tpe
rca
pita
78
RECLAIMINGTHE RESOURCES FOR HEALTH:ADVANCING HEALTH EQUITY IN EAST AND SOUTHERN AFRICA
This is significant. At no time in history anywhere in the world have themajor elements of health systems that promote equity been successfullyorganised or secured through the market. When developed countries havefaced major health challenges or had the resources to afford higher levelsof spending, they have turned predominantly to public initiatives andinclusive systems to improve health outcomes (Mackintosh and Koivusalo,2005). Across a range of low and middle income countries, various healthoutcomes such as reduced child mortality and better care at birth werefound to be associated with a higher share of gross domestic productspent on government-financed health care (Mackintosh and Koivusalo,2005; Mackintosh, 2007).
Redistributing resources to where health needs are greater andresponding to the many public health and social factors that influencehealth appear to be best organised through through strengthened publicsector led systems and not through the market.
Rising gross domestic product and increasing national income in eastand southern African countries are associated with increased publicspending on health. Despite outliers, there is no evidence of a preferencefor increased private spending on health with rising per capita income (seefigure 3.2).
Countries in the region that spend more on health also have lowerincome inequality (measured by Gini coefficients) (see figure 3.3). Thisassociation, supported by evidence from wider international review,suggests that countries with lower income inequality prefer public sectorled investment in health, or that public spending on health may contribute
Redistributing resources towhere health needs are higherand responding to the many
public health and social factorsthat influence health appear to
be best organised throughthrough strengthened publicsector led systems, and not
through by the market.
= country positions PPP = purchasing power parity
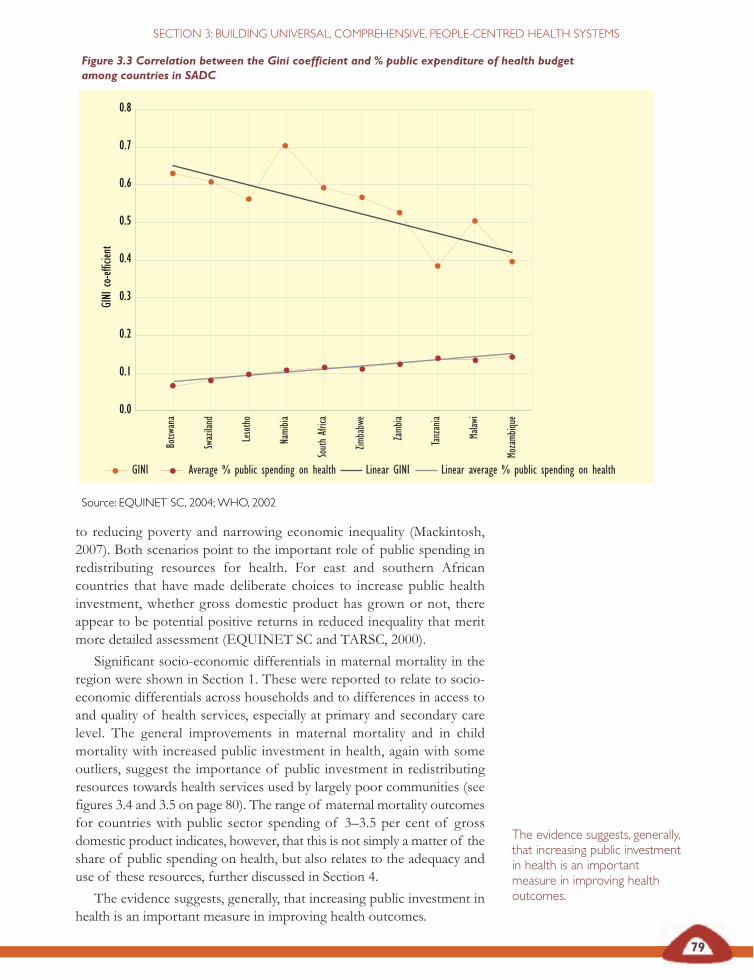
79
SECTION 3: BUILDING UNIVERSAL, COMPREHENSIVE, PEOPLE-CENTRED HEALTH SYSTEMS
Figure 3.3 Correlation between the Gini coefficient and % public expenditure of health budgetamong countries in SADC
Source: EQUINET SC, 2004;WHO, 2002
0.7
0.8
0.6
0.5
0.4
0.3
0.2
0.1
0.0
GINI
co-ef
ficien
t
Botsw
ana
Swaz
iland
Leso
tho
Nami
bia
Sout
hAfr
ica
Zimba
bwe
Zamb
ia
Tanz
ania
Malaw
i
Moza
mbiqu
e
GINI Average % public spending on health Linear GINI Linear average % public spending on health
to reducing poverty and narrowing economic inequality (Mackintosh,2007). Both scenarios point to the important role of public spending inredistributing resources for health. For east and southern Africancountries that have made deliberate choices to increase public healthinvestment, whether gross domestic product has grown or not, thereappear to be potential positive returns in reduced inequality that meritmore detailed assessment (EQUINET SC and TARSC, 2000).
Significant socio-economic differentials in maternal mortality in theregion were shown in Section 1. These were reported to relate to socio-economic differentials across households and to differences in access toand quality of health services, especially at primary and secondary carelevel. The general improvements in maternal mortality and in childmortality with increased public investment in health, again with someoutliers, suggest the importance of public investment in redistributingresources towards health services used by largely poor communities (seefigures 3.4 and 3.5 on page 80). The range of maternal mortality outcomesfor countries with public sector spending of 3–3.5 per cent of grossdomestic product indicates, however, that this is not simply a matter of theshare of public spending on health, but also relates to the adequacy anduse of these resources, further discussed in Section 4.
The evidence suggests, generally, that increasing public investment inhealth is an important measure in improving health outcomes.
The evidence suggests, generally,that increasing public investmentin health is an importantmeasure in improving healthoutcomes.

80
RECLAIMINGTHE RESOURCES FOR HEALTH:ADVANCING HEALTH EQUITY IN EAST AND SOUTHERN AFRICA
Figure 3.5 Share public spending on health as a percentage of gross domestic product(2003) and under 5 mortality rate (2004) in east and southern Africa countries
Sources:WHO, 2006a;World Bank, 2006
Figure 3.4 Share of public spending on health as a percentage of gross domesticproduct (2003) and maternal mortality rate in east and southern Africa (1985–2003)
Sources:WHO, 2006a; UNDP, 2005
1200
1000
800
600
400
200
00 0.5 1.0 1.5 2.0 2.5 3.0 3.5 4.0 4.5 5.0
Public spending on health as a % of gross domestic product, 2003
Mater
nalm
orta
lity
rate
,198
5–20
03(m
ost
rece
ntye
arav
ailab
le)
300
250
200
150
100
50
00 0.5 1.0 1.5 2.0 2.5 3.0 3.5 4.0 4.5 5.0
Public spending on health as a % of gross domestic product, 2003
Unde
r5
morta
lity
rate
,200
4
In east and southern Africa, public spending on health is directed largelythrough publicly provided or private non-profit services (discussed furtherin Section 4). Improved public spending on health thus appears tostrengthen the strategic role of public leadership in health systems. It maydo this in two ways. Firstly by direct delivery of public health services,including the training of health personnel, and secondly by giving thepublic sector the leverage and resources to effectively co-ordinate othersectors and providers to work towards national health goals.
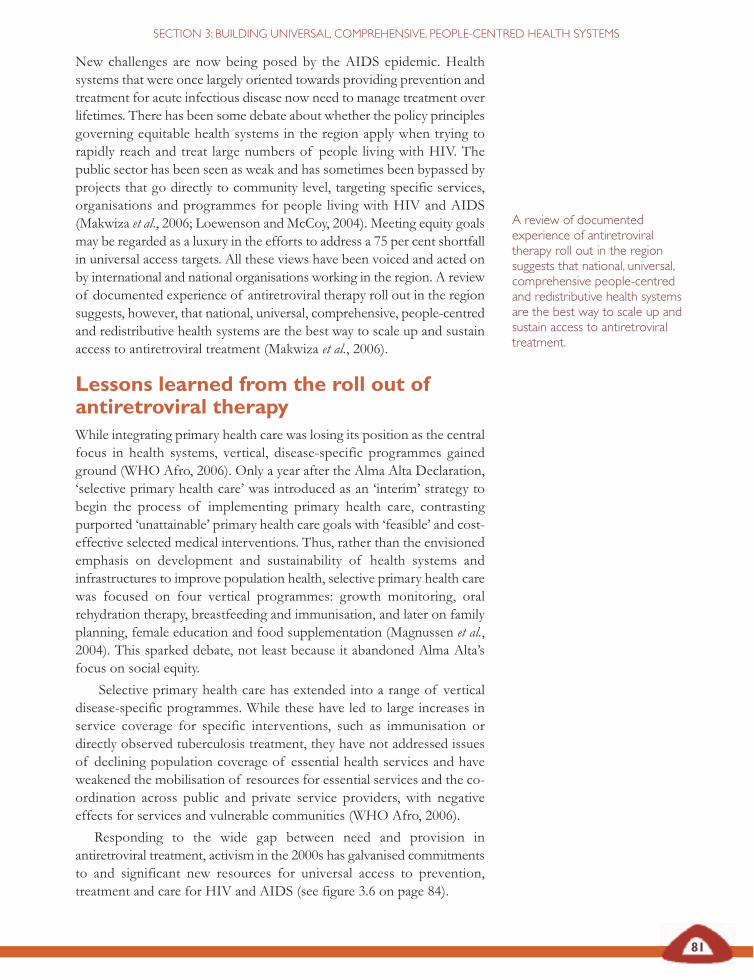
81
SECTION 3: BUILDING UNIVERSAL, COMPREHENSIVE, PEOPLE-CENTRED HEALTH SYSTEMS
New challenges are now being posed by the AIDS epidemic. Healthsystems that were once largely oriented towards providing prevention andtreatment for acute infectious disease now need to manage treatment overlifetimes. There has been some debate about whether the policy principlesgoverning equitable health systems in the region apply when trying torapidly reach and treat large numbers of people living with HIV. Thepublic sector has been seen as weak and has sometimes been bypassed byprojects that go directly to community level, targeting specific services,organisations and programmes for people living with HIV and AIDS(Makwiza et al., 2006; Loewenson and McCoy, 2004). Meeting equity goalsmay be regarded as a luxury in the efforts to address a 75 per cent shortfallin universal access targets. All these views have been voiced and acted onby international and national organisations working in the region. A reviewof documented experience of antiretroviral therapy roll out in the regionsuggests, however, that national, universal, comprehensive, people-centredand redistributive health systems are the best way to scale up and sustainaccess to antiretroviral treatment (Makwiza et al., 2006).
Lessons learned from the roll out ofantiretroviral therapyWhile integrating primary health care was losing its position as the centralfocus in health systems, vertical, disease-specific programmes gainedground (WHO Afro, 2006). Only a year after the Alma Alta Declaration,‘selective primary health care’ was introduced as an ‘interim’ strategy tobegin the process of implementing primary health care, contrastingpurported ‘unattainable’ primary health care goals with ‘feasible’ and cost-effective selected medical interventions. Thus, rather than the envisionedemphasis on development and sustainability of health systems andinfrastructures to improve population health, selective primary health carewas focused on four vertical programmes: growth monitoring, oralrehydration therapy, breastfeeding and immunisation, and later on familyplanning, female education and food supplementation (Magnussen et al.,2004). This sparked debate, not least because it abandoned Alma Alta’sfocus on social equity.
Selective primary health care has extended into a range of verticaldisease-specific programmes. While these have led to large increases inservice coverage for specific interventions, such as immunisation ordirectly observed tuberculosis treatment, they have not addressed issuesof declining population coverage of essential health services and haveweakened the mobilisation of resources for essential services and the co-ordination across public and private service providers, with negativeeffects for services and vulnerable communities (WHO Afro, 2006).
Responding to the wide gap between need and provision inantiretroviral treatment, activism in the 2000s has galvanised commitmentsto and significant new resources for universal access to prevention,treatment and care for HIV and AIDS (see figure 3.6 on page 84).
A review of documentedexperience of antiretroviraltherapy roll out in the regionsuggests that national, universal,comprehensive people-centredand redistributive health systemsare the best way to scale up andsustain access to antiretroviraltreatment.
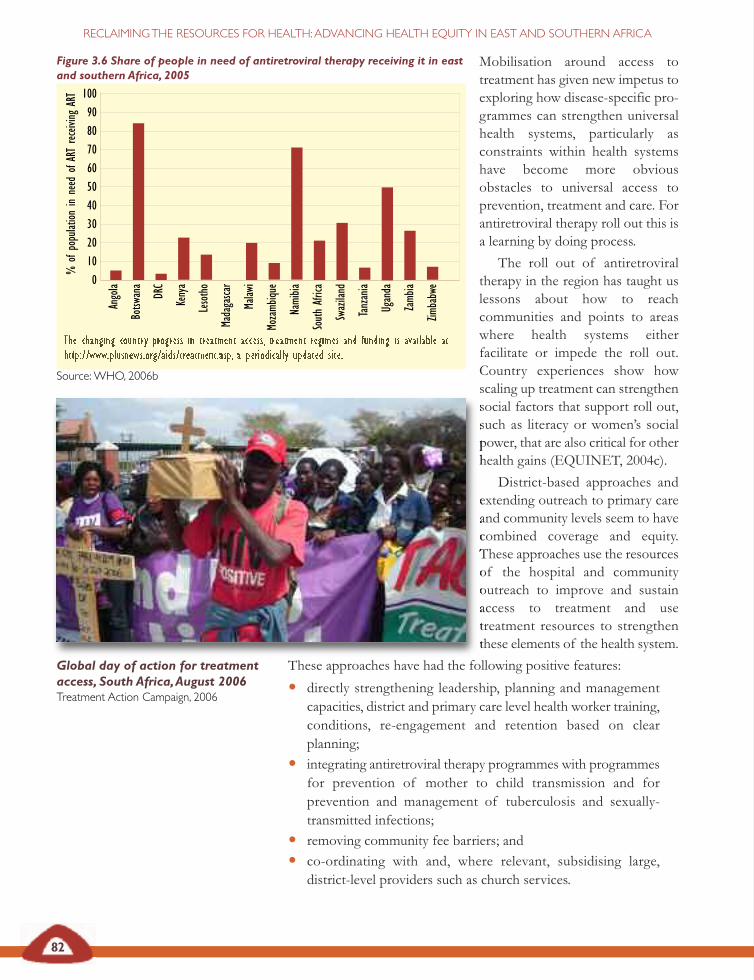
82
RECLAIMINGTHE RESOURCES FOR HEALTH:ADVANCING HEALTH EQUITY IN EAST AND SOUTHERN AFRICA
Mobilisation around access totreatment has given new impetus toexploring how disease-specific pro-grammes can strengthen universalhealth systems, particularly asconstraints within health systemshave become more obviousobstacles to universal access toprevention, treatment and care. Forantiretroviral therapy roll out this isa learning by doing process.
The roll out of antiretroviraltherapy in the region has taught uslessons about how to reachcommunities and points to areaswhere health systems eitherfacilitate or impede the roll out.Country experiences show howscaling up treatment can strengthensocial factors that support roll out,such as literacy or women’s socialpower, that are also critical for otherhealth gains (EQUINET, 2004c).
District-based approaches andextending outreach to primary careand community levels seem to havecombined coverage and equity.These approaches use the resourcesof the hospital and communityoutreach to improve and sustainaccess to treatment and usetreatment resources to strengthenthese elements of the health system.
These approaches have had the following positive features:
• directly strengthening leadership, planning and managementcapacities, district and primary care level health worker training,conditions, re-engagement and retention based on clearplanning;
• integrating antiretroviral therapy programmes with programmesfor prevention of mother to child transmission and forprevention and management of tuberculosis and sexually-transmitted infections;
• removing community fee barriers; and
• co-ordinating with and, where relevant, subsidising large,district-level providers such as church services.
Figure 3.6 Share of people in need of antiretroviral therapy receiving it in eastand southern Africa, 2005
The changing country progress in treatment access, treatment regimes and funding is available athttp://www.plusnews.org/aids/treatment.asp, a periodically updated site.
Source:WHO, 2006b
Ango
la
Botsw
ana
DRC
Keny
a
Leso
tho
Mada
gasca
r
Malaw
i
Moza
mbiqu
e
Nami
bia
Sout
hAfr
ica
Swaz
iland
Tanz
ania
Ugan
da
Zamb
ia
Zimba
bwe0
102030405060708090
100
%of
popu
lation
inne
edof
ART
rece
iving
ART
Global day of action for treatmentaccess, South Africa,August 2006Treatment Action Campaign, 2006
83
SECTION 3: BUILDING UNIVERSAL, COMPREHENSIVE, PEOPLE-CENTRED HEALTH SYSTEMS
Scaling up antiretroviral therapy in Malawi
Scaling up antiretroviral therapy in Malawi started in 2004 and the treatmenthas since been provided free in all public and Christian Health Association ofMalawi facilities. In 2004 it was estimated that only 5.1 per cent of people inneed of antiretrovirals were actually receiving them and most districts did nothave access to the therapy. Antiretroviral therapy was introduced into analready overstretched health system with high vacancy rates among clinicalofficers, nurses and pharmacists. Statistically, over half the 29 districts hadfewer than 1.5 nurses per facility and five districts had fewer than one.
Recognising this situation, government and key players made the effort tointegrate antiretroviral therapy services into the broad health system and builtco-operation between the public and private sectors. The goal was set that bythe end of 2005, all districts should have at least one health centre providingantiretrovirals and measures implemented to strengthen the services at thislevel to manage this, while also building synergies with existing services.Antiretroviral therapy services were also integrated with tuberculosisprogrammes.
Additional staff needs and resources were estimated and integrated intofunding proposals and plans. A six-year human resources emergency reliefplan costing US$273 million was developed and the HIV and AIDS crisis wasused to focus attention and show the need for the improvements in this plan.Investments were made in training capacity, in retention and re-engagementincentives and programmes, and in management capacities within the Ministryof Health. Health workers themselves were considered a priority group forreceiving antiretrovirals.
In Malawi, antiretroviral therapy is provided to health facilities if they areassessed as ‘ready’ to provide treatment. The health team has to have hadformal training and done a successful clinical attachment in an antiretroviraltherapy clinic and a qualified nurse has to draw up a report assessing the siteas satisfactory.
Evidence from monitoring indicates that by the end of 2005 more womenthan men accessed antiretroviral therapy in every region and children hadrelatively less access to the therapy than adults. Gender equity was difficult toassess in the absence of gender and age sensitive prevalence rates in thecountry. In rural communities and among children, access was still limitedand antiretroviral therapy services were less integrated with related services,such as prevention of mother to child transmission and treatment of sexually-transmitted infections. Limited human resources further limited the expansionof antiretroviral therapy services.
Makwiza et al., 2005; Schouten, 2006
84
RECLAIMINGTHE RESOURCES FOR HEALTH:ADVANCING HEALTH EQUITY IN EAST AND SOUTHERN AFRICA
Integration within wider primary care and district services is importanton both public health and organisational grounds. It is estimated, forexample, that about 80 per cent of tuberculosis patients are co-infectedwith HIV and eligible for antiretrovirals. Joint tuberculosis and HIVactivities have been adopted in many sub-Saharan African countries and,as tuberculosis programmes are mainly decentralised, they have thepotential to support decentralisation of antiretroviral services (Makwizaet al., 2006; Chakanyuka, 2005). Women’s high access to antenatal careservices in the region provides an important entry point for prevention ofmother to child transmission programmes, if effectively integrated. Thelow coverage of prevention of mother to child transmission (only 11 percent of eligible pregnant women) suggests that these synergies are not yeteffectively tapped (WHO et al., 2007).
The lessons learned from antiretroviral therapy roll out more generallyinform the actions needed to ensure that health systems reach out to allmarginalised groups. In a context of universal district health systems,experience across the region suggests that access for groups with highhealth needs and low income or social power has been improved by:
• selecting points of entry in district or catchment areas basedon, for example, their poverty levels or particular public healthor gender equity concerns;
• locating antiretroviral therapy (or other needed interventions) athealth service points used by low income groups;
• operating on a first come, first served basis but putting in placeexplicit measures to overcome barriers to access, such as incomeand travel support or female empowerment (this can includespecific measures for tracing and follow-up of people ontreatment, as done with tuberculosis, to enhance compliance);
• providing antiretroviral therapy (or other needed interventions)free at the point of delivery in the public health system;
• prioritising treatment access for service providers, such as healthworkers and teachers, who significantly contribute to widerepidemic control and poverty reduction; and
• involving communities in setting criteria for patient selectionand monitoring to prevent the development of patronage orcorrupt practices (Makwiza et al., 2006; Loewenson and McCoy,2004).
Nevertheless, problems persist. In 2007, there was still an urban bias inservice provision in many countries, low paediatric access to antiretroviraltreatment, social and cost barriers, as well as unmet transport and otherneeds (Makwiza et al., 2006):
‘So the problem that is there is that we men are selfish, selfish in theway that we are only buying medicines for ourselves and denying ourpartners to buy the medicine as well. Maybe if it were halved butK2500, how much money do we get?’Community member Malawi, communication, REACHTrust, 2004
Women’s high access toantenatal care services in theregion provides an importantentry point for prevention ofmother to child transmission
programmes, if effectivelyintegrated.The low coverage ofprevention of mother to child
transmission (only 11 per cent ofeligible pregnant women)
suggests that these synergies areyet to be effectively tapped
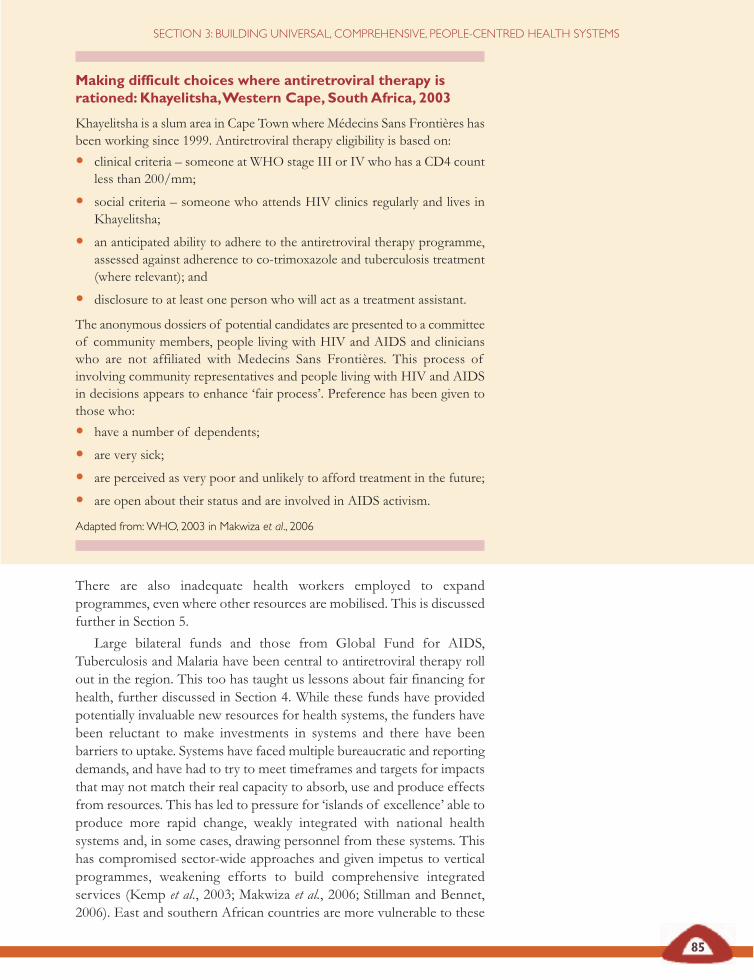
85
SECTION 3: BUILDING UNIVERSAL, COMPREHENSIVE, PEOPLE-CENTRED HEALTH SYSTEMS
Making difficult choices where antiretroviral therapy isrationed: Khayelitsha,Western Cape, SouthAfrica, 2003
Khayelitsha is a slum area in Cape Town where Médecins Sans Frontières hasbeen working since 1999. Antiretroviral therapy eligibility is based on:
• clinical criteria – someone at WHO stage III or IV who has a CD4 countless than 200/mm;
• social criteria – someone who attends HIV clinics regularly and lives inKhayelitsha;
• an anticipated ability to adhere to the antiretroviral therapy programme,assessed against adherence to co-trimoxazole and tuberculosis treatment(where relevant); and
• disclosure to at least one person who will act as a treatment assistant.
The anonymous dossiers of potential candidates are presented to a committeeof community members, people living with HIV and AIDS and clinicianswho are not affiliated with Medecins Sans Frontières. This process ofinvolving community representatives and people living with HIV and AIDSin decisions appears to enhance ‘fair process’. Preference has been given tothose who:
• have a number of dependents;
• are very sick;
• are perceived as very poor and unlikely to afford treatment in the future;
• are open about their status and are involved in AIDS activism.
Adapted from:WHO, 2003 in Makwiza et al., 2006
There are also inadequate health workers employed to expandprogrammes, even where other resources are mobilised. This is discussedfurther in Section 5.
Large bilateral funds and those from Global Fund for AIDS,Tuberculosis and Malaria have been central to antiretroviral therapy rollout in the region. This too has taught us lessons about fair financing forhealth, further discussed in Section 4. While these funds have providedpotentially invaluable new resources for health systems, the funders havebeen reluctant to make investments in systems and there have beenbarriers to uptake. Systems have faced multiple bureaucratic and reportingdemands, and have had to try to meet timeframes and targets for impactsthat may not match their real capacity to absorb, use and produce effectsfrom resources. This has led to pressure for ‘islands of excellence’ able toproduce more rapid change, weakly integrated with national healthsystems and, in some cases, drawing personnel from these systems. Thishas compromised sector-wide approaches and given impetus to verticalprogrammes, weakening efforts to build comprehensive integratedservices (Kemp et al., 2003; Makwiza et al., 2006; Stillman and Bennet,2006). East and southern African countries are more vulnerable to these
86
RECLAIMINGTHE RESOURCES FOR HEALTH:ADVANCING HEALTH EQUITY IN EAST AND SOUTHERN AFRICA
pressures when domestic planning and resource mobilisation are weaker.There are, however, some examples of national resource mobilisation forAIDS, such as Zimbabwe’s AIDS levy of 3 per cent levy on taxableincome to government and the Zambian levy on financial transactions.
Antiretroviral therapy roll out has made clearer the constraints touniversal access and equity in existing health systems, such as: the urbanand tertiary care biases in resource flows; the inadequacy of trained andsupported health workers at primary care and district level; the weakintegration with existing services (unless actively organised); and thefragmentation and segmentation of donors and providers, especiallyprivate providers. If these weaknesses can be dealt with, health systemswill benefit from an increased capacity to reach all marginalised groups.
The lessons learned from antiretroviral therapy roll out are relevantfor improving health systems, while strong health systems are essentialfor antiretroviral therapy roll out. Strategic information is vital to informand exchange this learning and to inform planning. The SADC businessplan on AIDS calls for monitoring of the equity and health system impactsof antiretroviral therapy roll out. Indicators of equity and health systemsstrengthening in antiretroviral therapy roll out have been developed andare being piloted within national monitoring systems (EQUINET, 2004b;EQUINET et al., 2004). It would be desirable to have regular publicreporting at regional level on progress on these key national and regionalgoals, as implemented at global level (WHO et al., 2007).
The experience of antiretroviral therapy roll out in east and southernAfrica suggests the continued relevance of comprehensive, primary healthcare oriented district health systems. The features sustaining equitable rollout appear to include:
• free services at point of delivery;
• provision of community outreach;
• links with other sectors for support like food and transportinputs;
• comprehensive and integrated prevention and care servicesclose to communities; and
• social and community action to demand service outreach,participate in decisions on new developments and facilitateuptake and effective use of services.
Rather than reducing the commitment to public sector led, national healthsystems, AIDS and the challenges of universal access to treatment furtherreinforce the demand for delivery on this commitment.
The experience of antiretroviraltherapy roll out in east andsouthern Africa suggests the
continued relevance ofcomprehensive, primary health
care oriented district healthsystems.
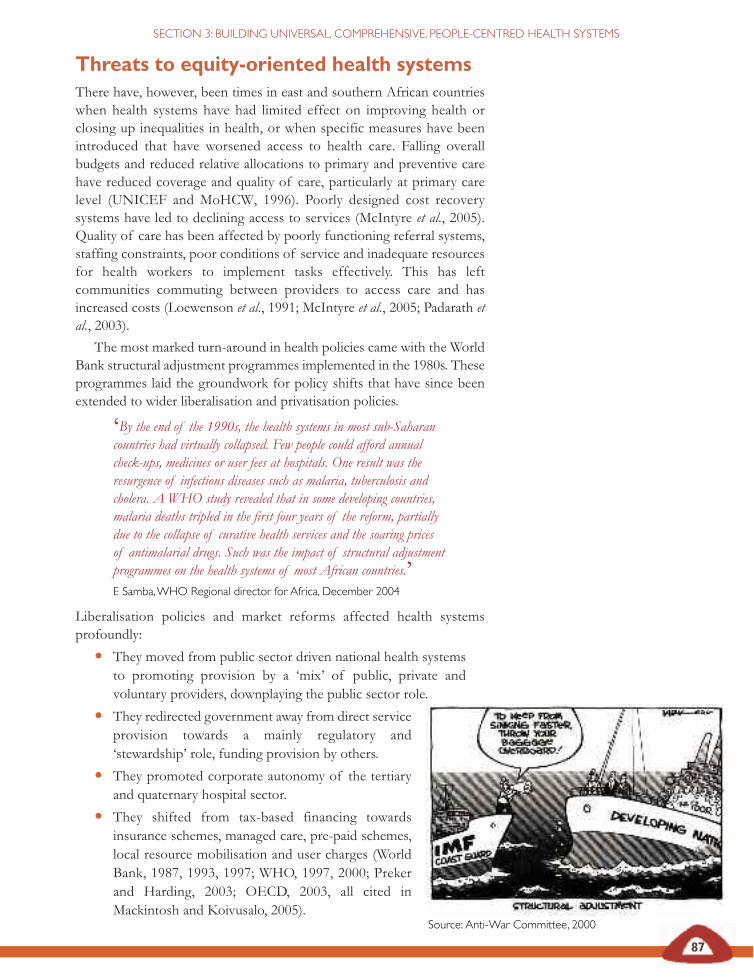
87
SECTION 3: BUILDING UNIVERSAL, COMPREHENSIVE, PEOPLE-CENTRED HEALTH SYSTEMS
Threats to equity-oriented health systemsThere have, however, been times in east and southern African countrieswhen health systems have had limited effect on improving health orclosing up inequalities in health, or when specific measures have beenintroduced that have worsened access to health care. Falling overallbudgets and reduced relative allocations to primary and preventive carehave reduced coverage and quality of care, particularly at primary carelevel (UNICEF and MoHCW, 1996). Poorly designed cost recoverysystems have led to declining access to services (McIntyre et al., 2005).Quality of care has been affected by poorly functioning referral systems,staffing constraints, poor conditions of service and inadequate resourcesfor health workers to implement tasks effectively. This has leftcommunities commuting between providers to access care and hasincreased costs (Loewenson et al., 1991; McIntyre et al., 2005; Padarath etal., 2003).
The most marked turn-around in health policies came with the WorldBank structural adjustment programmes implemented in the 1980s. Theseprogrammes laid the groundwork for policy shifts that have since beenextended to wider liberalisation and privatisation policies.
‘By the end of the 1990s, the health systems in most sub-Saharancountries had virtually collapsed. Few people could afford annualcheck-ups, medicines or user fees at hospitals. One result was theresurgence of infectious diseases such as malaria, tuberculosis andcholera. A WHO study revealed that in some developing countries,malaria deaths tripled in the first four years of the reform, partiallydue to the collapse of curative health services and the soaring pricesof antimalarial drugs. Such was the impact of structural adjustmentprogrammes on the health systems of most African countries.’E Samba,WHO Regional director for Africa, December 2004
Liberalisation policies and market reforms affected health systemsprofoundly:
• They moved from public sector driven national health systemsto promoting provision by a ‘mix’ of public, private andvoluntary providers, downplaying the public sector role.
• They redirected government away from direct serviceprovision towards a mainly regulatory and‘stewardship’ role, funding provision by others.
• They promoted corporate autonomy of the tertiaryand quaternary hospital sector.
• They shifted from tax-based financing towardsinsurance schemes, managed care, pre-paid schemes,local resource mobilisation and user charges (WorldBank, 1987, 1993, 1997; WHO, 1997, 2000; Prekerand Harding, 2003; OECD, 2003, all cited inMackintosh and Koivusalo, 2005).
Source: Anti-War Committee, 2000
88
RECLAIMINGTHE RESOURCES FOR HEALTH:ADVANCING HEALTH EQUITY IN EAST AND SOUTHERN AFRICA
Kenya’s experience of structural adjustment in health
Kenya’s health care crisis has been 20 years in the making. Its dimensions arespelled out in the 2004 Poverty reduction strategy paper, a government documentwritten in consultation with the International Monetary Fund and the WorldBank and approved by both bodies’ boards. Life expectancy declined from 57in 1986 to 47 in 2000; infant mortality increased from 62 per thousand in1993 to 78 per thousand in 2003; and under-five mortality rose from 96 perthousand births to 114 per thousand births in the same period. Thepercentage of children with stunted growth increased from 29 per cent in1993 to 31 per cent in 2003 and the percentage of Kenya’s children who arefully-vaccinated dropped from 79 per cent in 1993 to 52 per cent in 2003.
Why this deterioration? As in most African countries, Kenya’s health caresystem was hit hard by International Monetary Fund and World Bankstructural adjustment policies introduced in the 1980s. As usual with suchprogrammes, the emphasis was on cutting budgets. As a result, local healthclinics and dispensaries had fewer supplies and medicines, and user feesbecame more common. Standards of care fell in the public hospitals and thelargest public facility, Kenyatta National Hospital in Nairobi, began to askpatients’ families to provide outside food and medical supplies. Professionalstaff took on jobs – some part-time, others full-time – at private health carefacilities or migrated to Europe or North America in search of better pay.
Between 1991 and 2003, the Kenyan government reduced its workforce by 30per cent – hard-hitting cuts. A World Bank group document from November2003, written to justify waiving a loan condition calling for a workforcereduction, noted:
‘This condition required retrenching 32,000 personnel from the civil serviceover a period of two years. In practice, 23,448 civil servants wereretrenched in 2000/01 before the programme was interrupted by lawsuits.[…] A specific commitment in the updated [agreement] is to reduce the sizeof the civil service by 5,000 per year through natural attrition.’
Ironically the very same document supports Kenya’s Assistant MinisterKibunguchy’s assessment of the sector’s current needs: ‘the health sectorcurrently experiences a staff shortage of about 10,000 health workers’.
These effects were cited recently by Member of Parliament, Alfred Nderitu,as the primary motivation for his motion of censure against the InternationalMonetary Fund and World Bank in the Kenyan parliament. He insisted thatany future loans from these institutions get parliamentary approval.
Ambrose, 2006

89
SECTION 3: BUILDING UNIVERSAL, COMPREHENSIVE, PEOPLE-CENTRED HEALTH SYSTEMS
Proponents of commercialisation and privatisation of health systems haveargued that these measures will improve equity and efficiency of services,enhance sustainable health care financing and improve accountability toclients as consumers (Turshen, 1999). Arguments for privatisation havealso been made in the face of declining public funding in health, as ameans to draw increasing private sector resources into health. Substantivereviews of health service privatisation in Africa (Turshen, 1999) andcommercialisation of health services globally (Mackintosh and Koivusalo,2005) explore these assumptions in the face of empirical evidence on usercharges, self financing insurance, investment in private services and use ofmarket incentives to motivate staff and allocate resources. Both reviewsquestion the claims of the proponents, pointing to market failures andnegative consequences for access to quality health services, particularly inpoor communities.
Privatisation and commercialisation of services has had negativeeffects on equity and access.
A review of evidence on user fees and price increases in health servicesfound that they had led to falling use of services, especially in poorhouseholds, resulting in increased child mortality and disease burden(Gilson, 1997). These outcomes are not limited to health services only,but apply in relation to other essential services for health. Inequalities inaccess to safe water and sanitation in east and southern Africa weredescribed in Section 1, despite the importance of these inputs for health.Research on privatisation and commercialisation of water services insouthern Africa found that privatised water services have led to increaseduser fees and falling use (McDonald and Ruiters, 2005). The case study inDar es Salaam on page 90 exemplifies this. While user charges may appearcost effective, if falling use of services increases the rate of disease anddemand for curative care, the returns can be negative.
Poorly maintained water services, South AfricaSource: Municipal Services Project, 2005
Privatisation andcommercialisation of services hashad negative effects on equityand access.
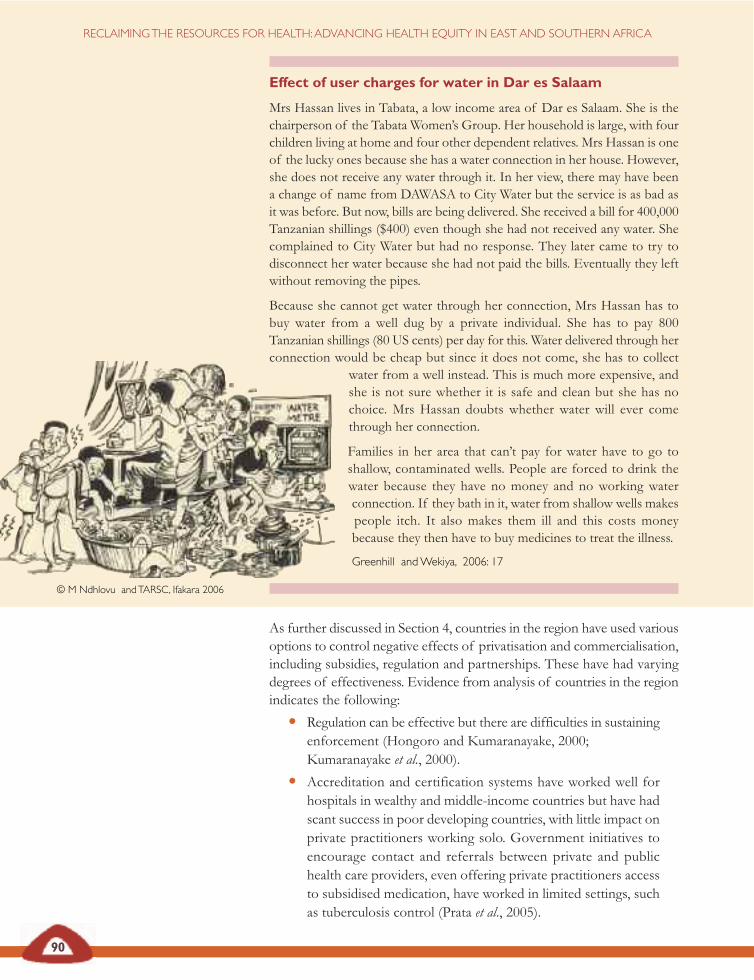
90
RECLAIMINGTHE RESOURCES FOR HEALTH:ADVANCING HEALTH EQUITY IN EAST AND SOUTHERN AFRICA
As further discussed in Section 4, countries in the region have used variousoptions to control negative effects of privatisation and commercialisation,including subsidies, regulation and partnerships. These have had varyingdegrees of effectiveness. Evidence from analysis of countries in the regionindicates the following:
• Regulation can be effective but there are difficulties in sustainingenforcement (Hongoro and Kumaranayake, 2000;Kumaranayake et al., 2000).
• Accreditation and certification systems have worked well forhospitals in wealthy and middle-income countries but have hadscant success in poor developing countries, with little impact onprivate practitioners working solo. Government initiatives toencourage contact and referrals between private and publichealth care providers, even offering private practitioners accessto subsidised medication, have worked in limited settings, suchas tuberculosis control (Prata et al., 2005).
Effect of user charges for water in Dar es Salaam
Mrs Hassan lives in Tabata, a low income area of Dar es Salaam. She is thechairperson of the Tabata Women’s Group. Her household is large, with fourchildren living at home and four other dependent relatives. Mrs Hassan is oneof the lucky ones because she has a water connection in her house. However,she does not receive any water through it. In her view, there may have beena change of name from DAWASA to City Water but the service is as bad asit was before. But now, bills are being delivered. She received a bill for 400,000Tanzanian shillings ($400) even though she had not received any water. Shecomplained to City Water but had no response. They later came to try todisconnect her water because she had not paid the bills. Eventually they leftwithout removing the pipes.
Because she cannot get water through her connection, Mrs Hassan has tobuy water from a well dug by a private individual. She has to pay 800Tanzanian shillings (80 US cents) per day for this. Water delivered through herconnection would be cheap but since it does not come, she has to collect
water from a well instead. This is much more expensive, andshe is not sure whether it is safe and clean but she has nochoice. Mrs Hassan doubts whether water will ever comethrough her connection.
Families in her area that can’t pay for water have to go toshallow, contaminated wells. People are forced to drink thewater because they have no money and no working waterconnection. If they bath in it, water from shallow wells makespeople itch. It also makes them ill and this costs moneybecause they then have to buy medicines to treat the illness.
Greenhill andWekiya, 2006: 17
© M Ndhlovu andTARSC, Ifakara 2006
91
SECTION 3: BUILDING UNIVERSAL, COMPREHENSIVE, PEOPLE-CENTRED HEALTH SYSTEMS
Risk pooling refers togrouping people with differenthealth risks so that the costs ofmeeting individual risks areshared across many people. Thelarger the risk pool the morerisks are shared.
Cross-subsidisation refers tothe use of resources paid bylower risk groups to supportcosts of higher risk groupswithin a risk pool, for example,between healthy, younger andmore wealthy groups and sick,elderly and poorer groups.
• Contracted HIV testing and counselling services in Zimbabwesupported by community health workers led to increasedmonthly visits and improved generic drug access (Prata et al.,2005).
• Voucher systems increased affordability of specific health caretreatments but are prohibitively expensive to manage throughlarge numbers of service-delivery points (Mushi et al., 2003).
• While postgraduate education for private providers led toimproved quality of clinical care, the benefits declined over timein the absence of systems for continued regular engagementwith public and private systems (Prata et al., 2005).
Commercialisation of health services has thus created problems forcoverage and access to vital services, while a fall in public sector fundingat the same time has depleted public services. Privatisation andcommercialisation have led to multiple, smaller providers, fragmentedsystems, weakened risk pooling and cross-subsidisation in health servicefinancing and weakened public sector ability to meet health obligations(EQUINET, SEATINI, CHP, TARSC, 2006; Muroyi et al., 2003). Theimplications of this for rebuilding universal coverage are discussed in thenext section.
Cuts in the size of the civil service, declining morale and reduced realwages have exacerbated salary differentials between private and publicsectors. This led to attrition of skilled health professionals from the publicto the private for-profit health sectors, later turning into a flow of healthworkers to higher income countries. With falling resources in public sectorhealth systems in the 1990s, the World Bank promoted ‘essential packagesof care’ to target the main causes of the burden of disease and combinevarious vertical interventions for those judged to be cost-effective (WorldBank, 1993). While intended as ‘pro-poor’, this approach underestimatedneeds and the investment required to extend services to vulnerable groupsand populations in remote areas (Bond and Dor, 2003). The combinationof interventions did not adequately reflect the comprehensive district andprimary health care systems needed to adequately provide health for suchgroups and did not adequately invest in the system-wide processesnecessary for the interventions to work. The relatively low estimated costof the packages was used to justify further cuts in public health spending.
Countries and communities struggling to deal with the consequencesof these policies also need to see how they are realigning values and policyprinciples. Equitable health systems are framed on values of equity andsolidarity, goals of human development and justice and on public healthprinciples. While proposals for reduced public sector roles, privatisationand commercialisation did not make their values explicit and werepresented as purely technical in content, they were driven by explicitmarket values. In March 2002, the World Bank’s Sourcebook on community-driven development in the Africa region made the World Bank’s position clearon essential services such as water:
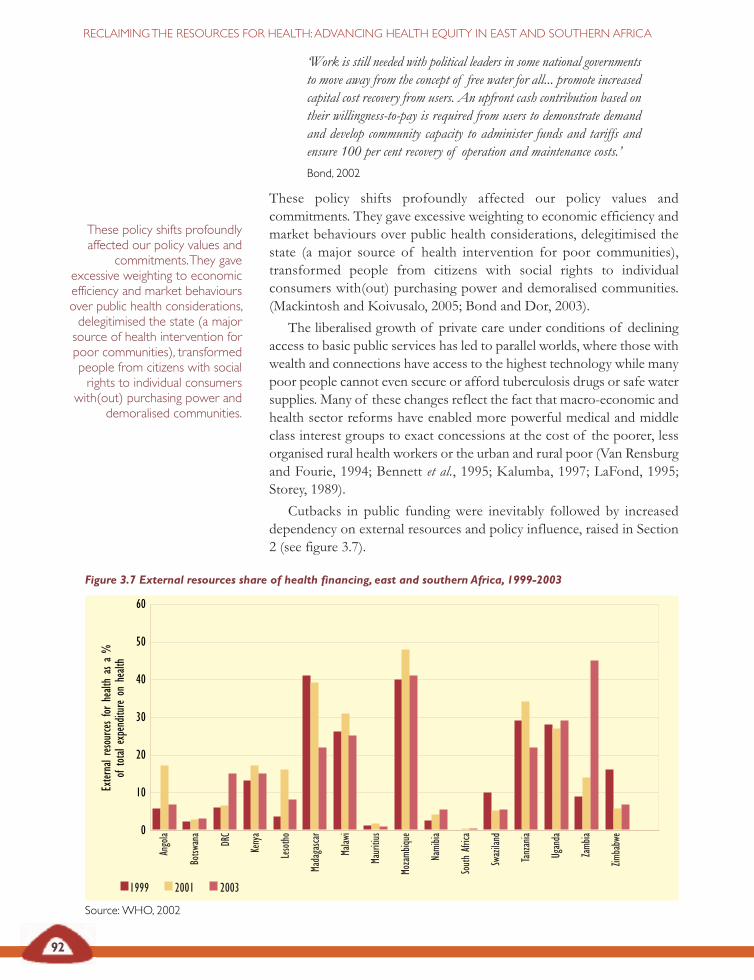
Figure 3.7 External resources share of health financing, east and southern Africa, 1999-2003
Source:WHO, 2002
92
RECLAIMINGTHE RESOURCES FOR HEALTH:ADVANCING HEALTH EQUITY IN EAST AND SOUTHERN AFRICA
Exter
nalr
esou
rces
forhe
alth
asa
%of
tota
lexp
endit
ure
onhe
alth
0
10
20
30
40
50
60
Ango
la
Botsw
ana
DRC
Keny
a
Leso
tho
Mada
gasca
r
Malaw
i
Maur
itius
Moza
mbiqu
e
Nami
bia
Sout
hAfr
ica
Swaz
iland
Tanz
ania
Ugan
da
Zamb
ia
Zimba
bwe
1999 2001 2003
‘Work is still needed with political leaders in some national governmentsto move away from the concept of free water for all... promote increasedcapital cost recovery from users. An upfront cash contribution based ontheir willingness-to-pay is required from users to demonstrate demandand develop community capacity to administer funds and tariffs andensure 100 per cent recovery of operation and maintenance costs.’Bond, 2002
These policy shifts profoundly affected our policy values andcommitments. They gave excessive weighting to economic efficiency andmarket behaviours over public health considerations, delegitimised thestate (a major source of health intervention for poor communities),transformed people from citizens with social rights to individualconsumers with(out) purchasing power and demoralised communities.(Mackintosh and Koivusalo, 2005; Bond and Dor, 2003).
The liberalised growth of private care under conditions of decliningaccess to basic public services has led to parallel worlds, where those withwealth and connections have access to the highest technology while manypoor people cannot even secure or afford tuberculosis drugs or safe watersupplies. Many of these changes reflect the fact that macro-economic andhealth sector reforms have enabled more powerful medical and middleclass interest groups to exact concessions at the cost of the poorer, lessorganised rural health workers or the urban and rural poor (Van Rensburgand Fourie, 1994; Bennett et al., 1995; Kalumba, 1997; LaFond, 1995;Storey, 1989).
Cutbacks in public funding were inevitably followed by increaseddependency on external resources and policy influence, raised in Section2 (see figure 3.7).
These policy shifts profoundlyaffected our policy values and
commitments.They gaveexcessive weighting to economicefficiency and market behavioursover public health considerations,delegitimised the state (a majorsource of health intervention forpoor communities), transformedpeople from citizens with socialrights to individual consumers
with(out) purchasing power anddemoralised communities.
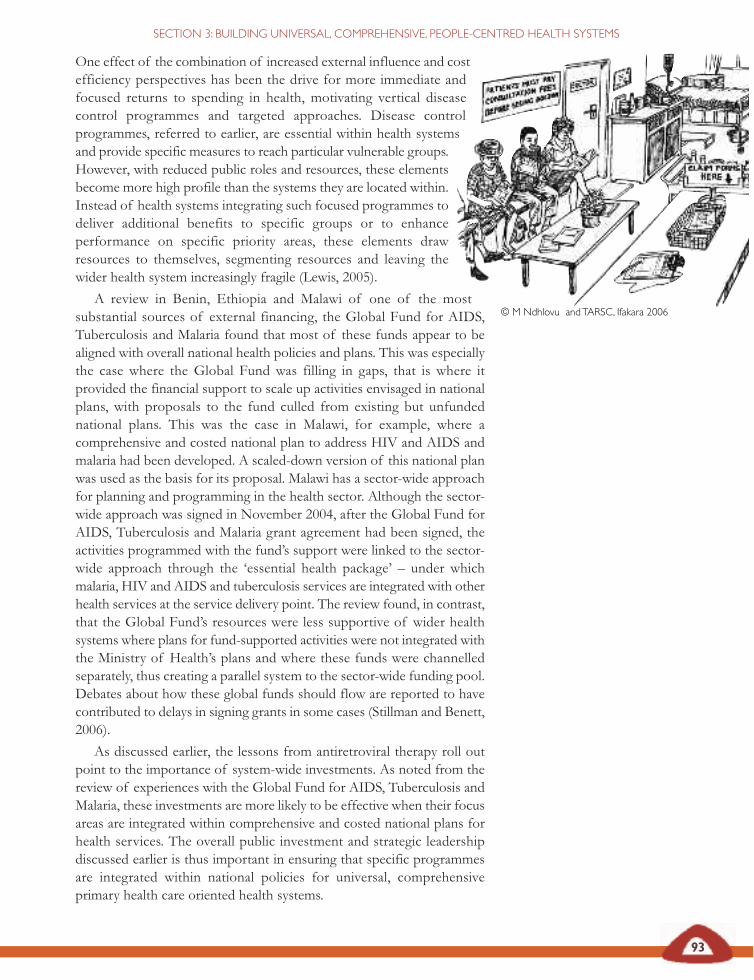
93
SECTION 3: BUILDING UNIVERSAL, COMPREHENSIVE, PEOPLE-CENTRED HEALTH SYSTEMS
One effect of the combination of increased external influence and costefficiency perspectives has been the drive for more immediate andfocused returns to spending in health, motivating vertical diseasecontrol programmes and targeted approaches. Disease controlprogrammes, referred to earlier, are essential within health systemsand provide specific measures to reach particular vulnerable groups.However, with reduced public roles and resources, these elementsbecome more high profile than the systems they are located within.Instead of health systems integrating such focused programmes todeliver additional benefits to specific groups or to enhanceperformance on specific priority areas, these elements drawresources to themselves, segmenting resources and leaving thewider health system increasingly fragile (Lewis, 2005).
A review in Benin, Ethiopia and Malawi of one of the mostsubstantial sources of external financing, the Global Fund for AIDS,Tuberculosis and Malaria found that most of these funds appear to bealigned with overall national health policies and plans. This was especiallythe case where the Global Fund was filling in gaps, that is where itprovided the financial support to scale up activities envisaged in nationalplans, with proposals to the fund culled from existing but unfundednational plans. This was the case in Malawi, for example, where acomprehensive and costed national plan to address HIV and AIDS andmalaria had been developed. A scaled-down version of this national planwas used as the basis for its proposal. Malawi has a sector-wide approachfor planning and programming in the health sector. Although the sector-wide approach was signed in November 2004, after the Global Fund forAIDS, Tuberculosis and Malaria grant agreement had been signed, theactivities programmed with the fund’s support were linked to the sector-wide approach through the ‘essential health package’ – under whichmalaria, HIV and AIDS and tuberculosis services are integrated with otherhealth services at the service delivery point. The review found, in contrast,that the Global Fund’s resources were less supportive of wider healthsystems where plans for fund-supported activities were not integrated withthe Ministry of Health’s plans and where these funds were channelledseparately, thus creating a parallel system to the sector-wide funding pool.Debates about how these global funds should flow are reported to havecontributed to delays in signing grants in some cases (Stillman and Benett,2006).
As discussed earlier, the lessons from antiretroviral therapy roll outpoint to the importance of system-wide investments. As noted from thereview of experiences with the Global Fund for AIDS, Tuberculosis andMalaria, these investments are more likely to be effective when their focusareas are integrated within comprehensive and costed national plans forhealth services. The overall public investment and strategic leadershipdiscussed earlier is thus important in ensuring that specific programmesare integrated within national policies for universal, comprehensiveprimary health care oriented health systems.
© M Ndhlovu andTARSC, Ifakara 2006
94
RECLAIMINGTHE RESOURCES FOR HEALTH:ADVANCING HEALTH EQUITY IN EAST AND SOUTHERN AFRICA
Reasserting public interest in healthsystemsThis section presents and gives evidence around two scenarios: publicly-driven national health systems organised around principles of publichealth, equity and solidarity or commercialised, segmented health systems,organised around market and cost-efficiency principles. The evidencepoints to the former being preferred politically and socially and havingbetter health outcomes in the region, particularly when accompanied bymeasures to redistribute resources to primary health care oriented servicesthat reach into communities and address areas of greatest health need.These lessons have been reinforced by experiences of antiretroviraltherapy roll out.
The experience of the last two decades draws attention to theimportance of not only what policy choices are made but how thesechoices are made. When economic policies are profoundly affected byglobal pressures for austerity and liberalisation, how does the healthsystem hold its ground on a different set of principles and values, maintainits space and even influence these policies? How do we reassert publicinterest in health?
In Section 4 we explore how the financing of health systems enablesor disables the assertion of public interest in health. Section 5 examineshow we can value and involve health workers. The common term, ‘humanresources for health’ signals that health workers have becomecommodified and need to be repositioned as actors – people who shapethe functioning of health systems. In Section 6 we explore the ways inwhich popular involvement, control and support within health systemscan be strengthened to develop the social power to advance equity andpromote public interests.
Public interests are asserted through the public partnerships developedto strengthen and sustain health systems. For example, countries havepursued partnerships with the not-for-profit private sector or with publicauthorities in health, rather than with for-profit providers. The Tsumebmarket project in Namibia, described opposite, is one such example. Suchpublic–public partnerships offer opportunities for capacity transfersacross public agencies and for stronger community support andaccountability for services (Hall et al., 2005). Partnerships betweendifferent public sector health agencies within countries (universities, localauthorities, central government) blend different skills and capacities formutual benefit. Those between public sector health agencies and localcommunities can make the planning and delivery of health services betterinformed by the needs of local communities.
Development partnerships between public sector health agencies inhigh-income countries and public health care agencies in low-incomecountries provide opportunities for two-way learning, while those betweenpublic sector agencies at international level, such as local authoritiesworking in partnerships to promote healthy cities, provide room forsharing information and experience, for training and capacity-building.
The experience of the last twodecades draws attention to the
importance not only of whatpolicy choices are made, but of
how those choices are made.When economic policies areprofoundly affected by global
pressures for austerity andliberalisation, how does the
health system hold its ground ona different set of principles andvalues, maintain its space andeven influence these policies?How do we reassert public
interest in health?
Public interests are assertedthrough the public partnerships
developed to strengthen andsustain health systems.
95
SECTION 3: BUILDING UNIVERSAL, COMPREHENSIVE, PEOPLE-CENTRED HEALTH SYSTEMS
Tsumeb market development project,Namibia
Tsumeb municipality in Namibia and Chesterfield Borough council in theUnited Kingdom have had an official twinning relationship since 1993. Theaim of the partnership was to develop Tsumeb’s informal local market intoa well-managed market with good amenities. This would contribute toimproved standards in food safety and public health.
At the beginning of the market development project, the informal market (atNomtsoub) was the largest income generator for poor people in the town,providing a living for 234 families. The market was a focal point for the localcommunity and it provided a source of affordable food and other services.However, hygiene standards were poor and the market lacked basic amenities.The capacity-building project involved three groups of players: the marketcommunity; Tsumeb municipality and Chesterfield Borough council. Theexchange group (two environmental health officers) from Chesterfield, themarket committee and a field worker from the Urban Trust of Namibiaformed the Okapana Action Force and set up the ‘Let’s build a sink’ project.Negotiations took place between the Urban Trust of Namibia, Tsumebmunicipality and the market committee on the increased role of thecommittee and the creation of a community-based organisation, TulongeniPamwe, which would take over the roles of the market committee. Theproject has led to a number of public health improvements: sanitation hasimproved; food hygiene training continues; legal power connections are nowavailable and sharing power connections is banned; and meat is inspectedevery morning. Traders take pride in the cleanliness of the market andwelcome public health advice, the municipality understands the needs of thetraders and communication has improved.
One of the most significant factors in the success of this initiative was thechange in culture in the town that enabled the municipality to allow the markettraders to take action and to respect their views about how to develop themarket. This led to the market committee developing a sense of ownershipof the market. This has ensured the sustainability of the public healthimprovements.
Didcock, 2002; Hall, et al., 2005
Developing trust and respect are essential to such partnerships (Dowlinget al., 2004; Hall et al., 2005). Where there are sharp inequalities in income,cooperative inter-municipal arrangements may facilitate more equalredistribution of resources and promote economic development betterthan privatisation (Hall et al., 2005).
Asserting public interest demands that states regulate and limitcommercial interests that are harmful to health. Countries in the regionhave taken positions on the activities of private business when this isharmful to public health, even if this confronts economic activities. Thisis evident in relation to tobacco control, control of breastmilk substitutes(discussed in Section 6), control of hazardous chemicals, regulating pricing
Asserting public interestdemands that states regulate andlimit commercial interests thatare harmful to health.
96
RECLAIMINGTHE RESOURCES FOR HEALTH:ADVANCING HEALTH EQUITY IN EAST AND SOUTHERN AFRICA
SouthAfrica squeezes big tobacco
Rapidly increasing tobacco consumption in many parts of Africa has led toan epidemic of tobacco-related disease and death. It is projected that this willovertake AIDS in Africa in terms of cumulative deaths by the year 2010. InSouth Africa, prior to 1994, a third of all South Africans smoked, excise taxeswere low and there were few tobacco control measures. In 2005, there were25,000 deaths from tobacco-related disease.
From 1991, civil society action on tobacco grew. A tobacco action group, acoalition of various anti-tobacco lobbies, raised public awareness aboutsmoking hazards and drove tobacco control to the forefront of the politicalagenda. From the early 1990s action by government ensued. A TobaccoProducts Control Act controlled smoking in enclosed public areas, ensuredhealth warnings on tobacco products and prohibited sales to children under16. The Act was further strengthened over the decade with restrictions onsmoking in government buildings and in some private businesses, whilegovernment also moved to increase cigarette taxes.
These actions attracted a response from the industry, with claims of joblosses, loss of tax revenue and loss of foreign exchange earnings. Research bythe South African Medical Research Council and the University of CapeTown contradicted the industry claims and the measures were furtherstrengthened. Between 1994 and 1999 tobacco consumption went down 21per cent. Although overall smoking rates declined, targeted advertising onradio (still exempt from the ban on advertising) was associated with risingsmoking rates among coloured and black people. In response, radio airtimewas used to broadcast health messages and shift public opinion in favour oftobacco control. By 1998, a poll showed that 90 per cent of non-smokersand 70 per cent of smokers supported a stronger ban on smoking in publicplaces. This strong public backing gave the health minister the political roomto propose one of the world’s strongest tobacco control laws.
Industry reacted, arguing that tourism and small businesses could not affordthe changes required by the law and that advertising was not aimed atinfluencing non-smokers to take up the habit but at competing over marketshare. Some groups, scared by the supposed economic threat, testified againstthe Bill. The contestation led to over two years passing between the TobaccoProducts Control Bill being passed by South African parliament in December1998 and its eventual approval into law in 2000.
Stronger legislation in South Africa could simply cause the industry toredouble its efforts in other countries in the region. The WHO FrameworkConvention on Tobacco Control, adopted in 2003 with over 40 countriesratifying it through their domestic processes by 2004, came into force in early2005, making the principles of the South African law a legally binding publichealth treaty at global level. For countries in the east and southern Africaregion, this means putting the WHO convention clauses into domestic law,closing any legal loopholes, such as definitions of ‘public place’ and ‘tobaccoproduct’, and using systems of enforcement, strict penalties and socialmonitoring to ensure that the control of tobacco is implemented.Independent Online, 2006; Schwarz, 1999; White, 2001
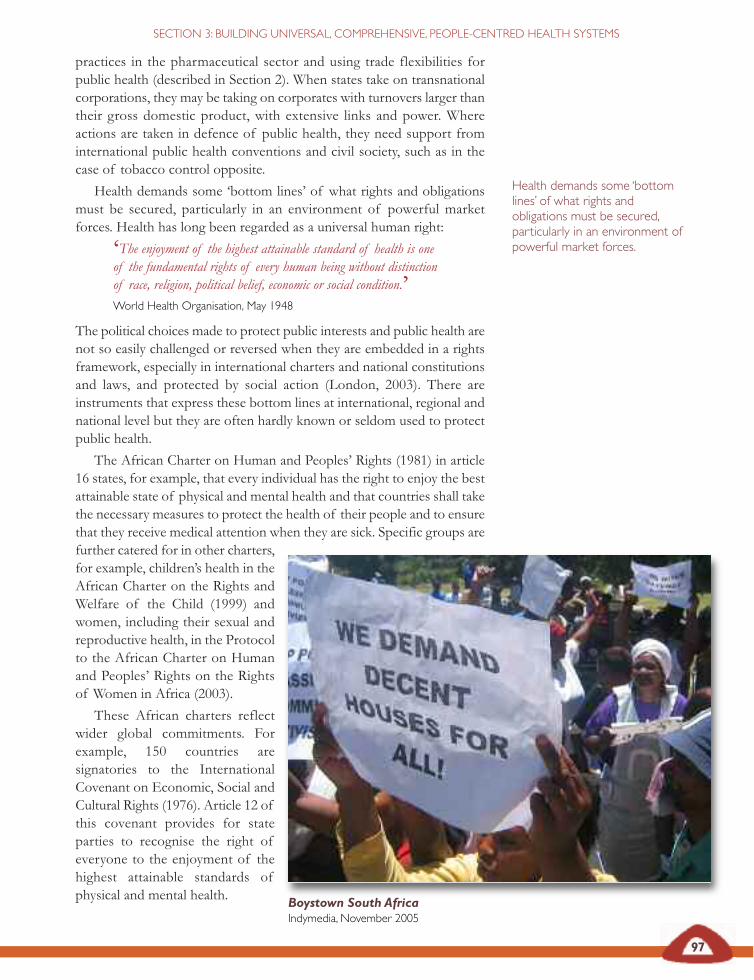
97
SECTION 3: BUILDING UNIVERSAL, COMPREHENSIVE, PEOPLE-CENTRED HEALTH SYSTEMS
practices in the pharmaceutical sector and using trade flexibilities forpublic health (described in Section 2). When states take on transnationalcorporations, they may be taking on corporates with turnovers larger thantheir gross domestic product, with extensive links and power. Whereactions are taken in defence of public health, they need support frominternational public health conventions and civil society, such as in thecase of tobacco control opposite.
Health demands some ‘bottom lines’ of what rights and obligationsmust be secured, particularly in an environment of powerful marketforces. Health has long been regarded as a universal human right:
‘The enjoyment of the highest attainable standard of health is oneof the fundamental rights of every human being without distinctionof race, religion, political belief, economic or social condition.’World Health Organisation, May 1948
The political choices made to protect public interests and public health arenot so easily challenged or reversed when they are embedded in a rightsframework, especially in international charters and national constitutionsand laws, and protected by social action (London, 2003). There areinstruments that express these bottom lines at international, regional andnational level but they are often hardly known or seldom used to protectpublic health.
The African Charter on Human and Peoples’ Rights (1981) in article16 states, for example, that every individual has the right to enjoy the bestattainable state of physical and mental health and that countries shall takethe necessary measures to protect the health of their people and to ensurethat they receive medical attention when they are sick. Specific groups arefurther catered for in other charters,for example, children’s health in theAfrican Charter on the Rights andWelfare of the Child (1999) andwomen, including their sexual andreproductive health, in the Protocolto the African Charter on Humanand Peoples’ Rights on the Rightsof Women in Africa (2003).
These African charters reflectwider global commitments. Forexample, 150 countries aresignatories to the InternationalCovenant on Economic, Social andCultural Rights (1976). Article 12 ofthis covenant provides for stateparties to recognise the right ofeveryone to the enjoyment of thehighest attainable standards ofphysical and mental health.
Health demands some ‘bottomlines’ of what rights andobligations must be secured,particularly in an environment ofpowerful market forces.
Boystown South AfricaIndymedia, November 2005
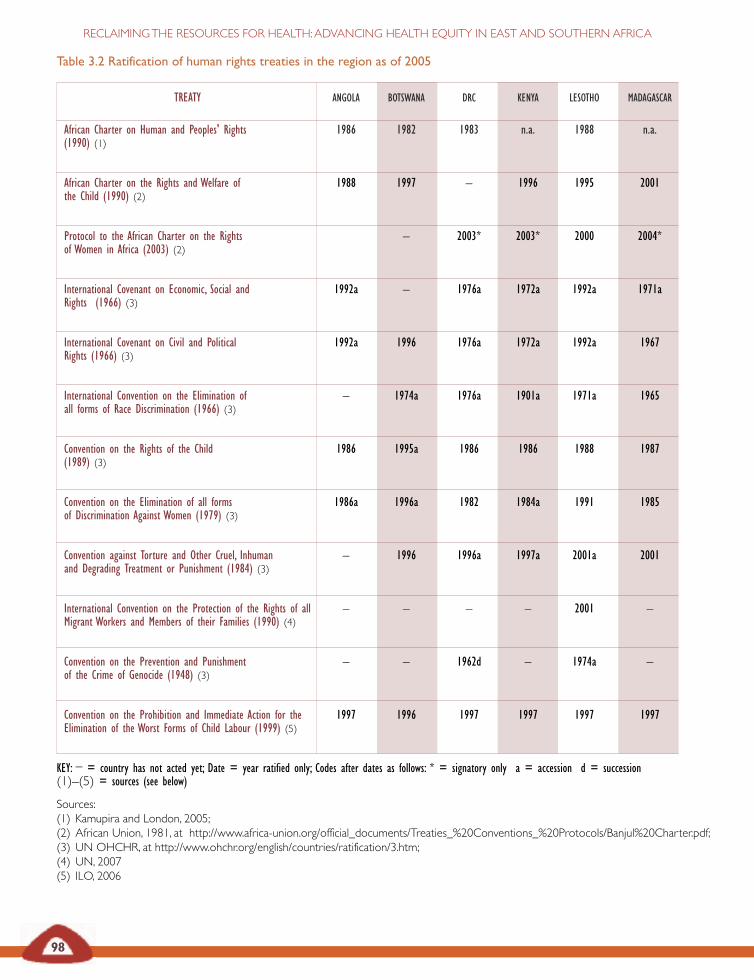
98
RECLAIMINGTHE RESOURCES FOR HEALTH:ADVANCING HEALTH EQUITY IN EAST AND SOUTHERN AFRICA
Table 3.2 Ratification of human rights treaties in the region as of 2005
TREATY ANGOLA BOTSWANA DRC KENYA LESOTHO MADAGASCAR
African Charter on Human and Peoples' Rights 1986 1982 1983 n.a. 1988 n.a.(1990) (1)
African Charter on the Rights and Welfare of 1988 1997 – 1996 1995 2001the Child (1990) (2)
Protocol to the African Charter on the Rights – 2003* 2003* 2000 2004*of Women in Africa (2003) (2)
International Covenant on Economic, Social and 1992a – 1976a 1972a 1992a 1971aRights (1966) (3)
International Covenant on Civil and Political 1992a 1996 1976a 1972a 1992a 1967Rights (1966) (3)
International Convention on the Elimination of – 1974a 1976a 1901a 1971a 1965all forms of Race Discrimination (1966) (3)
Convention on the Rights of the Child 1986 1995a 1986 1986 1988 1987(1989) (3)
Convention on the Elimination of all forms 1986a 1996a 1982 1984a 1991 1985of Discrimination Against Women (1979) (3)
Convention against Torture and Other Cruel, Inhuman – 1996 1996a 1997a 2001a 2001and Degrading Treatment or Punishment (1984) (3)
International Convention on the Protection of the Rights of all – – – – 2001 –Migrant Workers and Members of their Families (1990) (4)
Convention on the Prevention and Punishment – – 1962d – 1974a –of the Crime of Genocide (1948) (3)
Convention on the Prohibition and Immediate Action for the 1997 1996 1997 1997 1997 1997Elimination of the Worst Forms of Child Labour (1999) (5)
KEY: – = country has not acted yet; Date = year ratified only; Codes after dates as follows: * = signatory only a = accession d = succession(1)–(5) = sources (see below)
Sources:(1) Kamupira and London, 2005;(2) African Union, 1981, at http://www.africa-union.org/official_documents/Treaties_%20Conventions_%20Protocols/Banjul%20Charter.pdf;(3) UN OHCHR, at http://www.ohchr.org/english/countries/ratification/3.htm;(4) UN, 2007(5) ILO, 2006
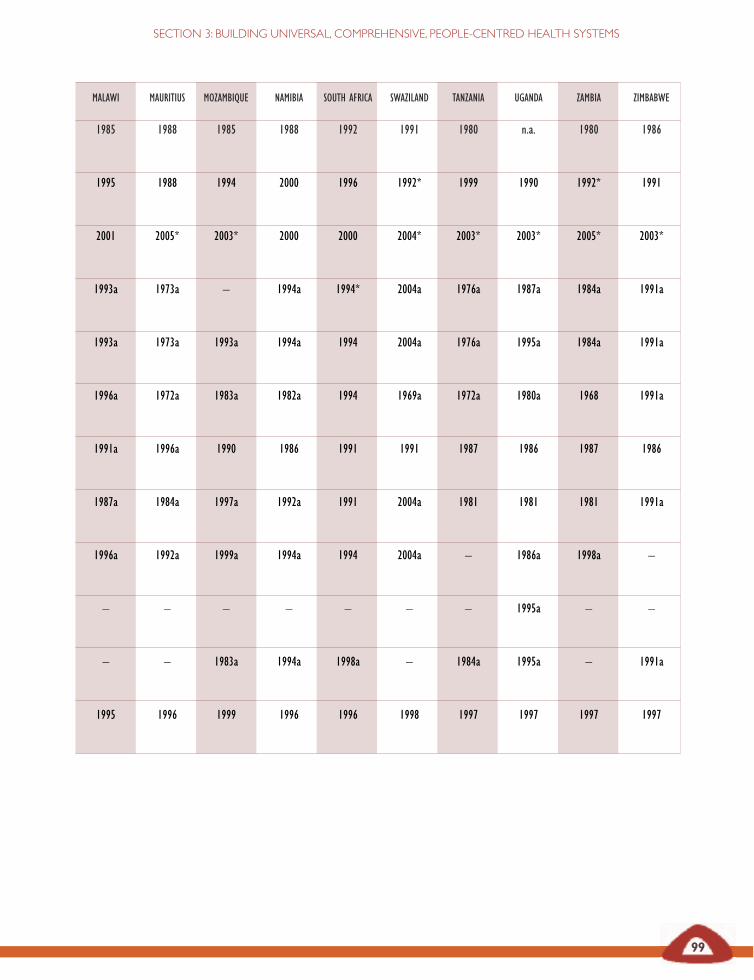
MALAWI MAURITIUS MOZAMBIQUE NAMIBIA SOUTH AFRICA SWAZILAND TANZANIA UGANDA ZAMBIA ZIMBABWE
1985 1988 1985 1988 1992 1991 1980 n.a. 1980 1986
1995 1988 1994 2000 1996 1992* 1999 1990 1992* 1991
2001 2005* 2003* 2000 2000 2004* 2003* 2003* 2005* 2003*
1993a 1973a – 1994a 1994* 2004a 1976a 1987a 1984a 1991a
1993a 1973a 1993a 1994a 1994 2004a 1976a 1995a 1984a 1991a
1996a 1972a 1983a 1982a 1994 1969a 1972a 1980a 1968 1991a
1991a 1996a 1990 1986 1991 1991 1987 1986 1987 1986
1987a 1984a 1997a 1992a 1991 2004a 1981 1981 1981 1991a
1996a 1992a 1999a 1994a 1994 2004a – 1986a 1998a –
– – – – – – – 1995a – –M
– – 1983a 1994a 1998a – 1984a 1995a – 1991a
1995 1996 1999 1996 1996 1998 1997 1997 1997 1997
99
SECTION 3: BUILDING UNIVERSAL, COMPREHENSIVE, PEOPLE-CENTRED HEALTH SYSTEMS
100
RECLAIMINGTHE RESOURCES FOR HEALTH:ADVANCING HEALTH EQUITY IN EAST AND SOUTHERN AFRICA
This is stated as extending beyond medical care and treatment, andincludes access to underlying determinants of health, such as safe andpotable water, adequate sanitation, an adequate supply of safe food,housing, healthy occupational and environmental conditions and health-related education and information, including on sexual and reproductivehealth. In relation to health care it calls for: health facilities, goods andservices to be accessible to all, especially the vulnerable or marginalisedamong the population; health facilities to be within safe physical reach forall sections of the population; facilities to be affordable for all withpayment based on the principle of equity; and for access to informationon health issues.
The Committee on the International Covenant on Economic, Socialand Cultural Rights, tasked with monitoring the implementation of thetreaty obligations, noted that states parties have a core obligation to ensurethe satisfaction of minimum essential levels of each of the rightsenunciated in the covenant, including essential primary health care. Readin conjunction with more contemporary instruments, they concluded in2000 that the Alma Alta Declaration provides compelling guidance on thecore obligations arising from article 12. Accordingly, the committeesuggested that these core obligations include at least the followingobligations to:
• ensure the right of access to health facilities, goods and serviceson a non-discriminatory basis, especially for vulnerable ormarginalised groups;
SouthAfrican constitutional provisions on health
South Africans have the right to:
• bodily and psychological integrity;
• make decisions concerning reproduction;
• secure and control over one’s body and not to be subjected tomedical or scientific experiments without consent[Section 12(2)];
• an environment that is not harmful to their health or wellbeing[Section 24];
• access to health care services, including reproductive health care[Section 27(1a)];
• access to sufficient food and water [Section 27 (1b)];
• guaranteed emergency medical treatment [Section 27(3)].
South African children have the right to:
• basic nutrition, shelter, basic health care services and socialservices [Section 28 (1c)].
The state must take reasonable legislative and other measures, within itsavailable resources, to realise these rights.
Government of South Africa,1996
101
SECTION 3: BUILDING UNIVERSAL, COMPREHENSIVE, PEOPLE-CENTRED HEALTH SYSTEMS
• ensure access to the minimum essential food which isnutritionally adequate and safe, to ensure freedom from hungerfor everyone;
• ensure access to basic shelter, housing and sanitation, and anadequate supply of safe and potable water;
• provide essential drugs, as from time to time defined under theWHO action programme on essential drugs;
• ensure equitable distribution of all health facilities, goods andservices; and
• adopt and implement a national public health strategy and planof action, on the basis of epidemiological evidence, addressingthe health concerns of the whole population. The strategy andplan of action shall be devised, and periodically reviewed, onthe basis of a participatory and transparent process (London,2003).
As shown in table 3.2 on pages 100 and 101, most countries in the regionhave ratified these treaties. Some have embedded rights to health andhealth care in their constitutions, as a point of reference for officialpolicies and to establish the protection of public health as a condition forcurtailing individual rights and commercial interests.
Constitutional provisions vary across the region and generally cover:
• the prohibition of conduct injurious to health (for example,limiting alcohol exposure);
• provision for specific programmes and services (for example,medical services and emergency care);
• provisions for the production of health resources (for example,drugs);
• provisions for social financing of health;
• regulation of the quality of care; and
• regulation of the rights and relationships between healthprofessionals and community or state (EQUINET SC andTARSC, 1998).
Embedding the provisions of article 12 of the International Covenant onEconomic, Social and Cultural Rights in east and southern African countrylaws and constitutions would appear to be fundamental to protecting theright to health. Where constitutional rights place an obligation to protectthe health and health care of the population, and specifically of vulnerablegroups like children, they strengthen the hand of states and communitiesto assert public interest.
We also need the mechanisms to deliver on those values andentitlements and the social action to implement and defend them. Wediscuss these in the following sections.
Embedding the provisions ofarticle 12 of the InternationalCovenant on Economic, Socialand Cultural Rights in east andsouthern African country lawsand constitutions would appearto be fundamental to protectingthe right to health … theystrengthen the hand of statesand communities to assert publicinterest.
102
RECLAIMINGTHE RESOURCES FOR HEALTH:ADVANCING HEALTH EQUITY IN EAST AND SOUTHERN AFRICA
African Union (1999) African Charter on the Rights and Welfare ofthe Child, AU, Addis Ababa.– (2003) Protocol to the African Charter on Human and Peoples’Rights on the Rights of Women in Africa, AU, Addis Ababa.– (1981) African (Banjul) Charter on Human and Peoples’ Rights(adopted 27 June 1981), OAU Doc. CAB/LEG/67/3 rev. 5,21 I.L.M. 58 (1982), accessed June 2007 at www.africa-union.org/official_documents/Treaties_%20Conventions_%20Protocols/Banjul%20Charter.pd– (2006) ‘Community-based TB care in Namibia’, SpecialSummit of African Union on HIV/AIDS, Tuberculosis andMalaria, 2-4 May 2006, Abuja, Nigeria, AU, Addis Ababa,available at www.africa-union.org/root/au/ conferences/past/2006/may/summit/doc/en/ SP_PRC_ATM6I_Best%20Practices.pdf.
Ambrose S (June 2006) ‘Preserving disorder: IMF policies andKenya’s health care crisis’, Pambazuka News, Fahamu, Oxford.
Anti-war Committee (2000) ‘Structural adjustment anti-warcommittee, USA’, accessed Dec 2006 at http://www.antiwarcommittee.org/images/clipart/ economics/SAP.jpg
Arblaster L, Lambert M, Entwistle V, Forster M, Fullerton D,Sheldon T and Watt I (1996) ‘A systematic review of theeffectiveness of health service interventions aimed atreducing inequalities in health’, Journal of Health ServicesResearch and Policy 1(2):93-103.
Baez C and Barron P (2006) ‘Community voice and role indistrict health systems in east and southern Africa: A literaturereview’, EQUINET discussion paper 39, EQUINET, Harare.
Bennett S, Russell S and Mills A (1995) ‘Institutional andeconomic perspectives on government capacity to assumenew roles in the health sector: A review of experience’, HealthEconomics and Financing Programme working paper, London Schoolof Hygiene and Tropical Medicine, London.
Bond P (2002) Unsustainable South Africa: Environment,development and social protest, Merlin Press, London.
Bond P and Dor G (2003) ‘Neoliberalism and povertyreduction strategies in Africa’, EQUINET discussion paper 3,EQUINET, Johannesburg.
Carr D (2004) ‘Improving the health of the world’s poorestpeople’, Health Bulletin 1, Population Reference Bureau,Washington DC, accessed 6 Dec 2006 at http://www.prb.org/pdf/ImprovingtheHealth World_Eng.pdf
Castro-Leal F, Dayton J, Demery L, Mehra K (2000) ‘Publicspending on health care in Africa: Do the poor benefit?’,Bulletin of the World Health Organisation 78(1): 66-74.
Chakanyuka C (2005) ‘Update of the antiretroviral therapyprogramme in Zimbabwe’, unpublished report, Zimbabwe.
Chatora R and Tumusime J (2004) ‘Primary health care: Areview of its implementation in sub-Saharan Africa’, PrimaryHealth Care Research and Development 5: 296-306.
Curtis C (1988) ‘Botswana: Reaching out to a scatteredpopulation’, People 15(2): 1-3.
Dept of Health, South Africa (2000) Primary health care progressreport 2000, South African Govt, Pretoria, available athttp://www.doh.gov.za/docs/ reports/2000/dhis 2000.pdf.
De Savigny D, Kasale H, Mbuya C and Reid G (2004) Fixinghealth systems, IDRC, Ottawa.
Didcock S (2002) Tsumeb market development project, Namibia1999–2002, sponsored by Chesterfield Borough Council andthe Commonwealth Local Government Forum, London.
Dowling B, Powell M and Glendinning C (2004)‘Conceptualised successful partnerships’, Health and Social Carein the Community 12(4):309–317.
EQUINET steering committee and TARSC (1998) ‘Equity inhealth southern Africa: Overview and issues from anannotated bibliography’, EQUINET policy paper 2,EQUINET, Harare.– (2000) ‘Turning values into practice: Equity in health insouthern Africa,’ EQUINET policy paper 7, EQUINET,Harare.– (2004) ‘Reclaiming the state: Advancing people’s health,challenging injustice’, EQUINET policy paper 15, EQUIINET,Harare.
EQUINET (2004b) ‘Expanding treatment access andstrengthening HIV/AIDS programmes in ways thatstrengthen the broader health systems agenda: Issues for theGlobal Fund to fight HIV/AIDS, Tuberculosis and Malaria’,mimeo, EQUINET and IDRC Research Matters, Harare.– (2004c) ‘Principles, issues and options for strengtheninghealth systems for treatment access and equitable responsesto HIV and AIDS in southern Africa’, EQUINET discussionpaper 15, EQUINET, Harare.
EQUINET, SEATINI, CHP, TARSC (2006) Promoting healthin trade agreements: A training kit for east and southern Africa,EQUINET/ SEATINI, Harare.
EQUINET, Equi TB and TARSC (2004) ‘Strengtheninghealth systems for treatment access and equitable responsesto HIV and AIDS in southern Africa’, Meeting report, 16-17 Feb2004, EQUINET, Harare.
Gilson L (1997) ‘In defence and pursuit of equity’, mimeo,London School of Hygiene and Tropical Medicine, London.
Gilson L, Doherty J, Loewenson R, Francis V (2007) Finalreport of the Knowledge Network on Health Systems,WHOCommission on the Social Determinants of Health, Geneva.
Global Fund to Fight AIDS, Tuberculosis and Malaria (2006)‘Disbursement details report’, Geneva, accessed 3 Dec 2006at: http://www. theglobalfund.org/en/funds_raised/commitments/
Greenhill R and Wekiya I (2006) Turning off the taps: Donorconditionality and water privatisation in Dar es Salaam, Tanzania,Action Aid International, UK.
Guyon A, Quinn V, and Hainsworth M (2006) ‘Using theessential nutrition actions approach to improve the nutritionalpractices of women and children at Scale in Antananarivo andFianarantsoa provinces of Madagascar: Results and trends2000 to 2005’, Ministry of Health, Govt of Madagascar,Linkages, Antananarivo, at http://www. linkagesproject.org/publications/Madagascar_Final_Report_2006.pdf
Gwatkin DR, Bhuiya A, Victora CG (2004) ‘Making healthsystems more equitable’, The Lancet 364: 1273-1280.
REFERENCES
103
SECTION 3: BUILDING UNIVERSAL, COMPREHENSIVE, PEOPLE-CENTRED HEALTH SYSTEMS
Haddad S and Fourier P (1995) ‘Quality, cost and utilisationof health services in developing countries: A longitudinalstudy’, Zaire Social Science and Medicine 40(6): 743-53.
Hall D, Lethbridge J and Lobina E (2005) ‘Public-publicpartnerships in health and essential services’, EQUINETdiscussion paper 23, EQUINET and MSP, Harare.
Hongoro C, Kumaranayake L (2000) ‘Do they work?Regulating for-profit providers in Zimbabwe’, Health Policy andPlanning 15:368-77.
Hutchinson P, Akin J and Ssengooba F (2006) ‘The impactsof decentralisation on health care seeking behaviours inUganda’, International Journal of Health Planning and Management21(3):239-70.
Independent Online (21 September 2006) ‘Second tobaccoBill is on the way’, at http://www.int.iol. co.za/general/news/newsprint.php?art_id=qw1158872581125B231&sf=
Indymedia South Africa (18 November 2005) Photograph:Boystown housing protest, Indymedia Cape Town, accessedDec 2006 at www.sa.indymedia.org
International Labour Organisation (2006) Convention No. C182was ratified by 163 countries, ILO International LabourStandards Department, Geneva.
Jhamba T (1994) ‘Mortality determinants in Zimbabwe: Policyimplications,’ mimeo, UZ Sociology Dept, Harare.
Kalumba K (1997) ‘Towards an equity-oriented policy ofdecentralisation in health systems under conditions ofturbulence: The case of Zambia’, EQUINET discussion paper 6,EQUINET, Harare.
Kamupira M and London L (2005) ‘Human rightscommitments relevant to health made by states in southernAfrica: Implications for health equity’, EQUINET discussionpaper 25, EQUINET, South Africa.
Kemp J, Aitken JM, LeGrand S, Mwale BI (2003) ‘Equity inhealth sector responses to HIV/AIDS in Malawi’, EQUINETdiscussion paper 6, EQUINET and OXFAM GB, Harare.
Kida T and Mackintosh M (2005) ‘Public expenditureallocation and incidence under health care marketliberalisation: A Tanzanian case study,’ in Mackintosh andKoivusalo (eds) Commercialisation of health care: Global and localdynamics and policy responses, Palgrave Macmillan, Basingstoke.
Kumaranayake L, Mujinja P, Hongoro C and Mpembeni R(2000) ‘How do countries regulate the health sector?Evidence from Tanzania and Zimbabwe’, Health Policy andPlanning 15: 357-67.
LaFond AK (1995) ‘Improving the quality of investing inhealth: Lessons on sustainability’, Health Policy and Planning 10(Supplement): 63-76.
Lewis M (2005) ‘Addressing the challenge of HIV/AIDS:Macroeconomic, fiscal and institutional issues’,Working paper58, Centre for Global Development, Washington DC.
Loewenson R, Sanders D and Davies R (1991) ‘Challenges toequity in health and health care: A Zimbabwean case study’,Social Science and Medicine 32(10): 1079-1088.
Loewenson R and McCoy D (2004) ‘Access to antiretroviraltherapy treatment in Africa: New resources and sustainablehealth systems are needed’, British Medical Journal 328: 241–2.
London L (2003) ‘Can human rights serve as a tool forequity?’, EQUINET policy paper 14, EQUINET, Harare.
Mackintosh M (2001) ‘Do health care systems contribute toinequalities?’, in Leon D and Walt GT (eds) Poverty, inequalityand health: An international perspective, Oxford MedicalPublications, Oxford.– (2007) ‘Planning and market regulation: Strengths,weaknesses and interactions in the provision of lessinequitable and better quality health care’, paper prepared forthe WHO CSDH Health Systems Knowledge Network,WHO CSDH, Geneva.
Mackintosh M and Koivusalo M (2005) Commercialisation ofhealth care: Global and local dynamics and policy responses, PalgraveMacmillan, Basingstoke.
Magnussen L, Ehiri J and Jolly P (2004) ‘Comprehensiveversus selective primary health care: Lessons for global healthpolicy’, Health Affairs 23(3): 167-176, at http://content.healthaffairs.org/cgi/content/full/23/3/167
Makwiza I, Nyirenda L, Bongololo G, Loewenson R,Theobald S (2005) ‘Monitoring equity and health systems inthe provision of antiretroviral therapy: Malawi countryreport’, EQUINET discussion paper 24, EQUINET, Harare.
Makwiza I, Nyirenda L, Goma F, Hassan F, Chingombe I,Bongololo G, Theobald S (2006) ‘Equity and health systemsin antiretroviral therapy roll out: An analysis from literaturereview of experiences from east and southern Africa, Malawi’,EQUINET discussion paper 38, EQUINET, Harare.
McIntyre D, Gilson L, Mutyambizi V (2005) ‘Promotingequitable health care financing in the African context: Currentchallenges and future prospects’, EQUINET discussion paper27, EQUINET, Harare.
McDonald DA and Ruiters G (2005) The age of commodity:Water privatisation in southern Africa, Earthscan, London.
Municipal Services Project (MSP) (2005) ‘Poorly maintainedwater services, South Africa’, photograph, Cape Town.
Muroyi R, Tayob R and Loewenson R (2003) ‘Trade protocolsand health: Issues for health equity in southern Africa’,EQUINET discussion paper 6, EQUINET, Harare.
Mushi AK, Schellenberg JR, Mponda H, Lengeler C (2003)‘Targeted subsidy for malaria control with treated nets using adiscount voucher system in Tanzania’, Health Policy Planning18:163-171.
Obimbo EM (2003) ‘Primary health care: Selective orcomprehensive, which way to go?’ East African Medical Journal80(1):7-10.
O’Donnell O, Van Doorslaer E, Rannan-Eliya R,Somanathan A, Adhikari SR, Harbianto D, Garg CC,Hanvoravongchai P, Huq MN, Karan A, Leung GM, Ng CW,Pande BR, Tin K, Tisayaticom K, Trisnantoro L, Zhang Y,Zhao Y (2005) ‘Who benefits from public spending on healthcare in Asia?’, EQUITAP project working paper 3, Erasmus Univ.and IPS, Rotterdam and Colombo, at www.equitap.org/publications/ wps/EquitapWP3.pd.
Omaswa F, Burnham G, Baingana G, Mwebesa H andMorrow R (1997) ‘Introducing quality management intoprimary health care services in Uganda’, Bulletin of the WorldHealth Organisation 75(2): 155-161, WHO, Geneva.
104
RECLAIMINGTHE RESOURCES FOR HEALTH:ADVANCING HEALTH EQUITY IN EAST AND SOUTHERN AFRICA
Pan American Health Organisation (2006) ‘Renewing primaryhealth care in the Americas’, a PAHO position paper of the PanAmerican Health Organisation.
Padarath A, Chamberlain C, McCoy D, Ntuli A, Rowson Mand Loewenson R (2003) ‘Health personnel in southernAfrica: Confronting maldistribution and brain drain’,EQUINET discussion paper 3, EQUINET, Harare.
PlusNews (2007) Country profiles/ Treatment map, IRIN, NewYork, at http://www.plusnews.org/aids/treatment. asp
Prata N, Montagu D and Jefferys E (2005) ‘Private sector,human resources and health franchising in Africa’, Bulletin ofthe World Health Organisation 83: 4, WHO, Geneva.
SADC (1999) SADC Health Protocol, Gabarone, accessed 6Aug 2006 at http://www.sadc.int/english/documents/legal/protocols/health.php#article3
Samba EM (Dec 2004) ‘African health care systems: whatwent wrong?’, Editorial, WHO, Geneva, at http://www.afro.who.int/regionaldirector/ emeriti/samba/reports/afrhealthsys200412en.doc
Schouten E (2006) ‘ The Malawi government’s emergencyhuman resources programme’, Joint Consultation on AIDS andHuman Resources for Health, Geneva, May 2006, WHO, IOM andILO, Geneva.
Schwarz T (1999) ‘Tobacco economics: South Africa, a casestudy’, Bulletin von Medicus Mundi Schweiz 72, at http://www.medicusmundi.ch/mms/services/bulletin/bulletin199901/kap02/09southafrica.html
Solarsh G and Goga A (2003) ‘Child health,’ in Ijumba P,Day C and Ntuli A (eds) South African Health Review 2003/4,Health Systems Trust, Durban.
South African Government (1996) Constitution of the Republicof South Africa, accessed 2 June 2007 at http://www.info.gov.za/ documents/constitution/index.htm
Stillman K and Bennet S (2006) System-wide effects of the globalfund: Preliminary findings from three country case studies, ABTAssociates, Maryland.
Storey P (1989) ‘Health care in South Africa: The rights andresponsibilities of the community’, Medicine and Law 7(6): 649-655.
Treatment Action Campaign (24 Aug 2006) photograph,South Africa, at http://www.tac.org.za
Turshen M (1999) Privatising health services in Africa, RutgersUniversity Press, New Jersey.
UN Commission on Economic, Social and Cultural Rights(1966) International Covenant on Economic, Social and CulturalRights, UNHCHR, Geneva, at http://www.unhchr.ch/html/menu3/b/a_cescr.htm
UNDP (2005) Human development report 2005, UNDP, NewYork, accessed 2 Dec 2006 at http://hdr.undp.org/
UNICEF and Zimbabwe Ministry of Health and ChildWelfare (1996) ‘District health service costs, resourceadequacy and efficiency: a comparison of three districts’,mimeo, Harare.
United Nations (2007) United Nations treaty collection, NewYork, at http://untreaty.un.org
United Nations Office of the High Commission on HumanRights (2007) ‘Reservations and ratifications: InternationalCovenant on Economic, Social and Cultural Rights, NewYork 16 Dec 1966’, UN, New York, at http://www.ohchr.org/english/countries/ ratification/3.htm
Van Rensburg HC and Fourie A (1994) ‘Inequalities in SouthAfrican health care’, South African Medical Journal 84(2):95-103.
White A (2001) ‘The great South African smoke-out’,Multinational Monitor 22:1-2, at http://multinationalmonitor.org/mm2001/01jan-feb/corp8.html
World Bank (1993)World Bank development report 1993: Investingin health, OUP, New York.– (2002) Sourcebook on community-driven development in the Africaregion, World Bank, New York.– (2006)World development indicators database, World Bank, NewYork, accessed 3 Dec 2006 at http://devdata.worldbank.org/wdi2006/contents/Section4.htm
World Health Organisation (1948) Constitution of the WorldHealth Organisation accessed 2 June 2007 at http://www.who.int/gb/bd/PDF/BDenglish/Constitution.pdf– (1981) ‘International code of marketing of breast-milksubstitutes’, WHO, Geneva, accessed 6 Dec 2006 athttp://www.who. int /nutrition/publications/ infantfeeding/en/index.html– (2002)World health report 2002, WHO, Geneva, accessed 1Dec 2006 at http://www.who.int/whr/2002/en/ whr2002_annex5.pdf– (2003) Community-based strategies for breastfeeding promotion andsupport in developing countries, WHO, Geneva, at http://www.who.int/child-adolescent health/New_Publications/NUTRITION/ISBN_92_4_ 159121_8.pdf– (2006a)World health report 2006:Working together for health,WHO, Geneva, accessed 6 Dec 2006 at: http://www.who.int/whr/2006/annex/en– (2006b) Progress on global access to antiretroviral therapy: A reporton ‘3 by 5’ and beyond,WHO, Geneva, accessed 25 Nov 2006at: http://www.who.int/hiv/mediacentre /news57/en/index.html– (2006c) Core indicators database, WHO, Geneva.
WHO Afro (2006) ‘Revitalising health services using theprimary health care approach in the African region’, WHORegional Committee for Africa, Aug/ Sept 2006, Brazzaville.
WHO, UNAIDS and UNICEF (2007) Towards universal access,WHO, Geneva.
FAIRFINANCING OF
HEALTHsystems
SECTION
4
Health systems and households are better able to reclaimresources for health when countries have adequate healthfinancing, mobilised though progressive means, organised
within a framework of universal coverage and allocated on the basis ofneed.
Based on estimates detailed in this section, the real costs of financing ahealth system are at least US$60 per person per year, with the mostbasic interventions for major public health burdens costing US$34 percapita. There are additional demands from AIDS and the MillenniumDevelopment Goals, costing up to US$150 per capita. Yet nearly halfthe countries in the region have not attained these levels overall andtwelve countries fall below these levels in the public sector, the majorsource of health care for the low income majority.
Addressing this gap calls for governments to increase their ownfinancing to health to at least the 15 per cent commitment made inAbuja, excluding external financing. However, we argue for ‘Abuja plus’– for cancelling debts, releasing the resources going to debt servicingand allocating these funds to health, with dialogue between internationalagencies and governments to address the remaining shortfall.
No one who needs health services should be denied access due toinability to pay and the costs of health care should not threatenanyone’s livelihood. High levels of out-of-pocket financing for healthshould thus be replaced by increased progressive tax revenues andmeasures to bring various forms of health insurance into a frameworkof universal coverage. Those with greater ability to pay shouldcontribute a higher proportion of their income than those with lowerincomes.
Government allocations are a critical way of offsetting disparities, ifthese disparities are explicitly taken into account when allocating publicfunds across areas and levels of the health system. Resource allocationformulae should include equity measures, with increased allocations todistrict and primary health care systems, and use of tax and regulatorymeasures to improve efficiency and equity in the private health sector.
KEY ISSUES
SECTION
4
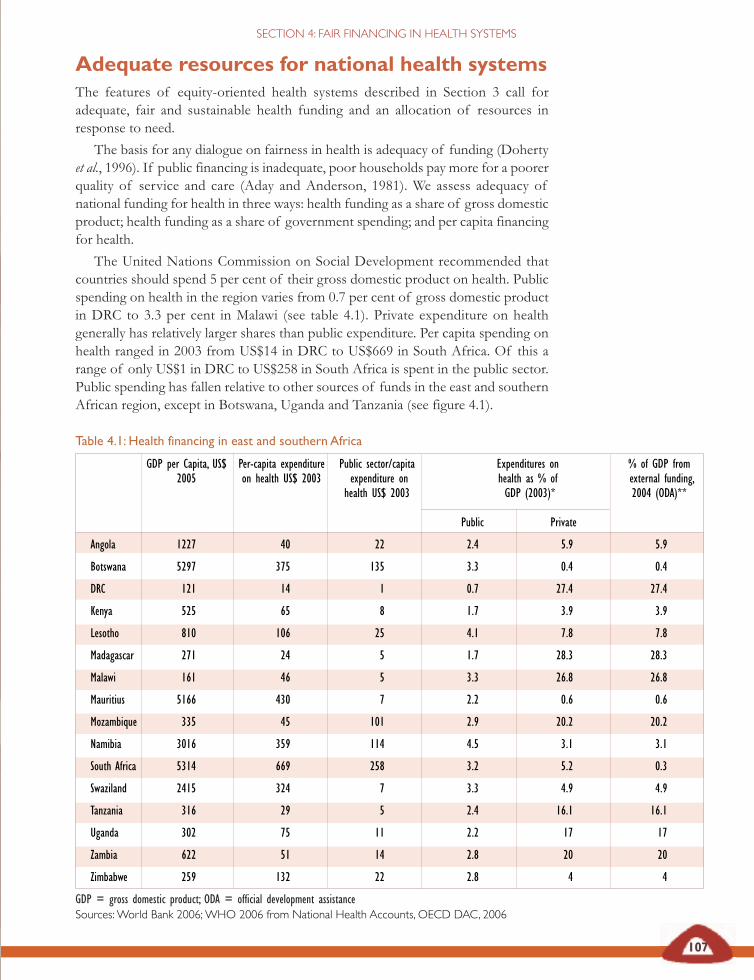
Table 4.1: Health financing in east and southern Africa
GDP per Capita, US$ Per-capita expenditure Public sector/capita Expenditures on % of GDP from2005 on health US$ 2003 expenditure on health as % of external funding,
health US$ 2003 GDP (2003)* 2004 (ODA)**
Public Private
Angola 1227 40 22 2.4 5.9 5.9
Botswana 5297 375 135 3.3 0.4 0.4
DRC 121 14 1 0.7 27.4 27.4
Kenya 525 65 8 1.7 3.9 3.9
Lesotho 810 106 25 4.1 7.8 7.8
Madagascar 271 24 5 1.7 28.3 28.3
Malawi 161 46 5 3.3 26.8 26.8
Mauritius 5166 430 7 2.2 0.6 0.6
Mozambique 335 45 101 2.9 20.2 20.2
Namibia 3016 359 114 4.5 3.1 3.1
South Africa 5314 669 258 3.2 5.2 0.3
Swaziland 2415 324 7 3.3 4.9 4.9
Tanzania 316 29 5 2.4 16.1 16.1
Uganda 302 75 11 2.2 17 17
Zambia 622 51 14 2.8 20 20
Zimbabwe 259 132 22 2.8 4 4
GDP = gross domestic product; ODA = official development assistanceSources:World Bank 2006;WHO 2006 from National Health Accounts, OECD DAC, 2006
107
SECTION 4: FAIR FINANCING IN HEALTH SYSTEMS
Adequate resources for national health systemsThe features of equity-oriented health systems described in Section 3 call foradequate, fair and sustainable health funding and an allocation of resources inresponse to need.
The basis for any dialogue on fairness in health is adequacy of funding (Dohertyet al., 1996). If public financing is inadequate, poor households pay more for a poorerquality of service and care (Aday and Anderson, 1981). We assess adequacy ofnational funding for health in three ways: health funding as a share of gross domesticproduct; health funding as a share of government spending; and per capita financingfor health.
The United Nations Commission on Social Development recommended thatcountries should spend 5 per cent of their gross domestic product on health. Publicspending on health in the region varies from 0.7 per cent of gross domestic productin DRC to 3.3 per cent in Malawi (see table 4.1). Private expenditure on healthgenerally has relatively larger shares than public expenditure. Per capita spending onhealth ranged in 2003 from US$14 in DRC to US$669 in South Africa. Of this arange of only US$1 in DRC to US$258 in South Africa is spent in the public sector.Public spending has fallen relative to other sources of funds in the east and southernAfrican region, except in Botswana, Uganda and Tanzania (see figure 4.1).

Figure 4.1 Government expenditure as a % of total expenditure on health, east and southern Africa, 1998-2003
Source:WHO, 2006
Ango
la
Botsw
ana
DRC
Keny
a
Leso
tho
Mada
gasca
r
Malaw
i
Maur
itius
Moza
mbiqu
e
Nami
bia
Sout
hAfr
ica
Swaz
iland
Tanz
ania
Ugan
da
Zamb
ia
Zimba
bwe
108
RECLAIMINGTHE RESOURCES FOR HEALTH:ADVANCING HEALTH EQUITY IN EAST AND SOUTHERN AFRICA
In principle, government spending on health should be counter-cyclical toeconomic trends. Increased growth has certainly been associated withreduced public spending on health. However, this reduced spending hasaccompanied widening economic inequality and poverty, depleting theresources for rising health needs. As described in Section 2, an export-ledand often speculative growth path has produced little gain for healthsectors. The health sector does not earn from exports, faces the high costsof imported drugs and technology and tends to allocate a large share ofbudgets to wages.
Using the average per capita gross domestic product for the region ofUS$1,171, a 5 per cent share of gross domestic product represents anaverage of US$59 and 2.5 per cent represents an average of US$29 spenton health. Is this enough? What does a health system cost?
It is impossible to cost a health system precisely and internationalestimates tend to ignore national perceptions of how comprehensive orintegrated the system should be. These estimates take little account of thesocial norms involved or the social consensus on what constitutes fair andactionable proposals. Many estimates are based on a package of servicesor discreet interventions rather than a functional health system whichpresents additional complications:
‘Applying unit costs [for achieving the health-related MillenniumDevelopment Goals] to the treatment population could lead to bothan over- and an under- estimate of the costs of reaching the healthgoals. It could be an over-estimate because the diseases are inter-related: tuberculosis spreads much more rapidly in the presence ofAIDS; AIDS has an impact on infant and maternal mortality;and malaria kills a large number of young children. At the sametime, it could be an under-estimate because of the many ‘weak linksin the chain’ going from public health spending to health outcomes.’Devarajan et al., 2002: 7
Using the average per capitaGDP for the region of US$1171,
a 5 per cent share of GDPrepresents an average of US$59,and 2.5 per cent represents anaverage of US$29 spent on
health. Is this adequate financingfor health?What does a health
system cost?
0
10
20
30
40
50
60
70
80
90
100
1998 2001 2003
Perce
ntag
e
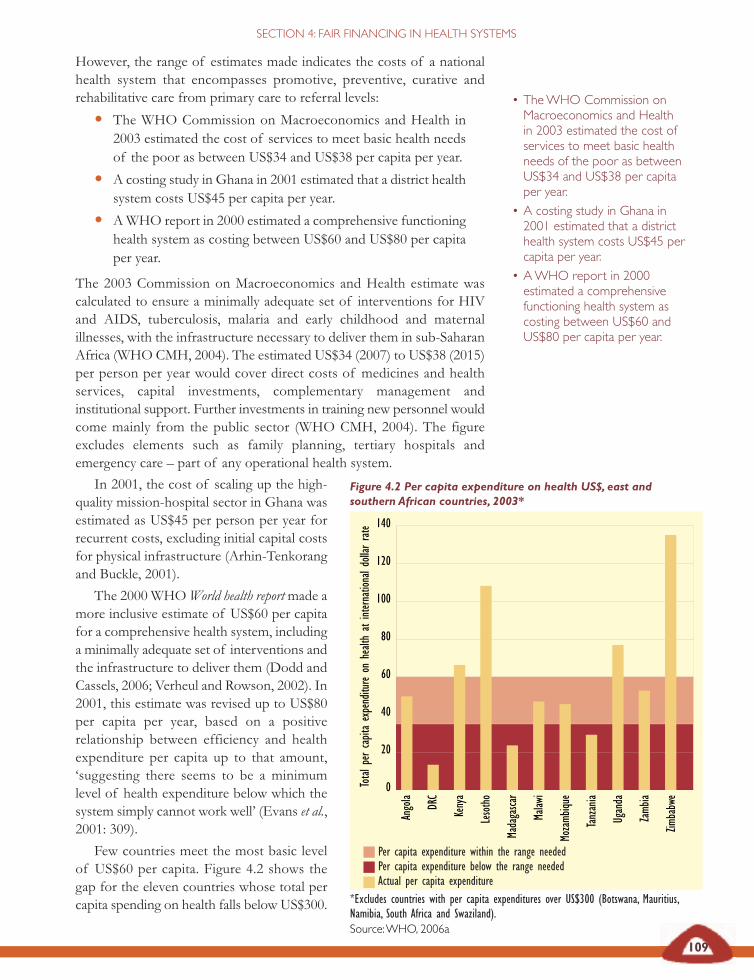
Figure 4.2 Per capita expenditure on health US$, east andsouthern African countries, 2003*
*Excludes countries with per capita expenditures over US$300 (Botswana, Mauritius,Namibia, South Africa and Swaziland).Source:WHO, 2006a
Ango
la
DRC
Keny
a
Leso
tho
Mada
gasca
r
Malaw
i
Moza
mbiqu
e
Tanz
ania
Ugan
da
Zamb
ia
Zimba
bwe
0
20
40
60
80
100
120
140
Tota
lper
capit
aex
pend
iture
onhe
alth
atint
erna
tiona
ldoll
arra
te
Per capita expenditure within the range neededPer capita expenditure below the range neededActual per capita expenditure
SECTION 4: FAIR FINANCING IN HEALTH SYSTEMS
However, the range of estimates made indicates the costs of a nationalhealth system that encompasses promotive, preventive, curative andrehabilitative care from primary care to referral levels:
• The WHO Commission on Macroeconomics and Health in2003 estimated the cost of services to meet basic health needsof the poor as between US$34 and US$38 per capita per year.
• A costing study in Ghana in 2001 estimated that a district healthsystem costs US$45 per capita per year.
• AWHO report in 2000 estimated a comprehensive functioninghealth system as costing between US$60 and US$80 per capitaper year.
The 2003 Commission on Macroeconomics and Health estimate wascalculated to ensure a minimally adequate set of interventions for HIVand AIDS, tuberculosis, malaria and early childhood and maternalillnesses, with the infrastructure necessary to deliver them in sub-SaharanAfrica (WHO CMH, 2004). The estimated US$34 (2007) to US$38 (2015)per person per year would cover direct costs of medicines and healthservices, capital investments, complementary management andinstitutional support. Further investments in training new personnel wouldcome mainly from the public sector (WHO CMH, 2004). The figureexcludes elements such as family planning, tertiary hospitals andemergency care – part of any operational health system.
109
In 2001, the cost of scaling up the high-quality mission-hospital sector in Ghana wasestimated as US$45 per person per year forrecurrent costs, excluding initial capital costsfor physical infrastructure (Arhin-Tenkorangand Buckle, 2001).
The 2000 WHOWorld health reportmade amore inclusive estimate of US$60 per capitafor a comprehensive health system, includinga minimally adequate set of interventions andthe infrastructure to deliver them (Dodd andCassels, 2006; Verheul and Rowson, 2002). In2001, this estimate was revised up to US$80per capita per year, based on a positiverelationship between efficiency and healthexpenditure per capita up to that amount,‘suggesting there seems to be a minimumlevel of health expenditure below which thesystem simply cannot work well’ (Evans et al.,2001: 309).
Few countries meet the most basic levelof US$60 per capita. Figure 4.2 shows thegap for the eleven countries whose total percapita spending on health falls below US$300.
• TheWHO Commission onMacroeconomics and Healthin 2003 estimated the cost ofservices to meet basic healthneeds of the poor as betweenUS$34 and US$38 per capitaper year.
• A costing study in Ghana in2001 estimated that a districthealth system costs US$45 percapita per year.
• AWHO report in 2000estimated a comprehensivefunctioning health system ascosting between US$60 andUS$80 per capita per year.
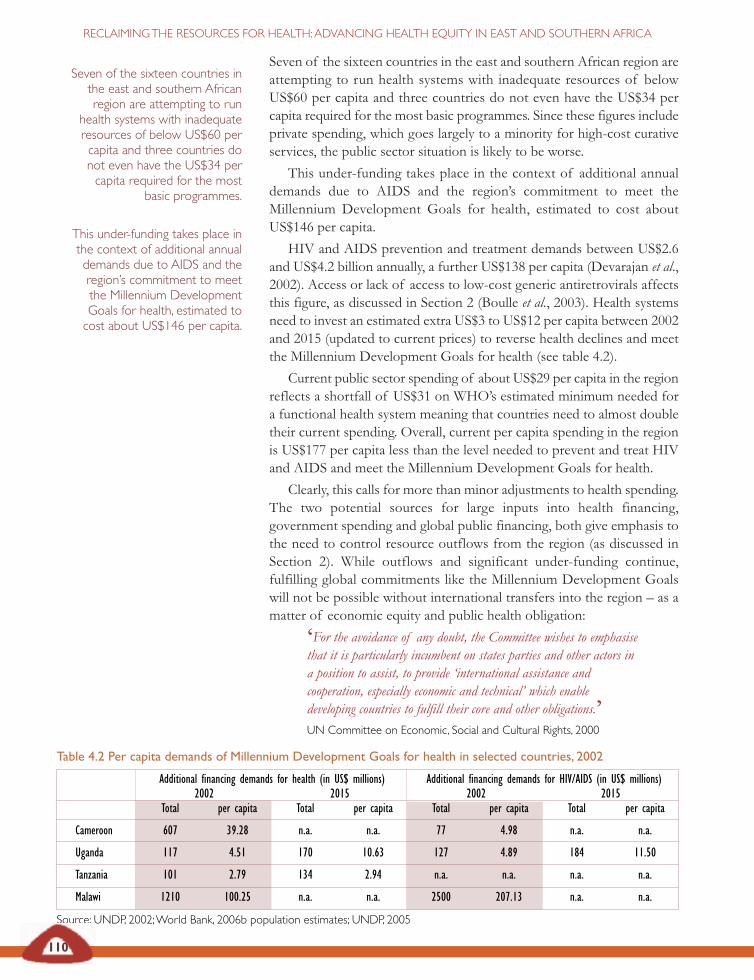
Table 4.2 Per capita demands of Millennium Development Goals for health in selected countries, 2002
Additional financing demands for health (in US$ millions) Additional financing demands for HIV/AIDS (in US$ millions)2002 2015 2002 2015
Total per capita Total per capita Total per capita Total per capita
Cameroon 607 39.28 n.a. n.a. 77 4.98 n.a. n.a.
Uganda 117 4.51 170 10.63 127 4.89 184 11.50
Tanzania 101 2.79 134 2.94 n.a. n.a. n.a. n.a.
Malawi 1210 100.25 n.a. n.a. 2500 207.13 n.a. n.a.
Source: UNDP, 2002;World Bank, 2006b population estimates; UNDP, 2005
110
RECLAIMINGTHE RESOURCES FOR HEALTH:ADVANCING HEALTH EQUITY IN EAST AND SOUTHERN AFRICA
Seven of the sixteen countries in the east and southern African region areattempting to run health systems with inadequate resources of belowUS$60 per capita and three countries do not even have the US$34 percapita required for the most basic programmes. Since these figures includeprivate spending, which goes largely to a minority for high-cost curativeservices, the public sector situation is likely to be worse.
This under-funding takes place in the context of additional annualdemands due to AIDS and the region’s commitment to meet theMillennium Development Goals for health, estimated to cost aboutUS$146 per capita.
HIV and AIDS prevention and treatment demands between US$2.6and US$4.2 billion annually, a further US$138 per capita (Devarajan et al.,2002). Access or lack of access to low-cost generic antiretrovirals affectsthis figure, as discussed in Section 2 (Boulle et al., 2003). Health systemsneed to invest an estimated extra US$3 to US$12 per capita between 2002and 2015 (updated to current prices) to reverse health declines and meetthe Millennium Development Goals for health (see table 4.2).
Current public sector spending of about US$29 per capita in the regionreflects a shortfall of US$31 on WHO’s estimated minimum needed fora functional health system meaning that countries need to almost doubletheir current spending. Overall, current per capita spending in the regionis US$177 per capita less than the level needed to prevent and treat HIVand AIDS and meet the Millennium Development Goals for health.
Clearly, this calls for more than minor adjustments to health spending.The two potential sources for large inputs into health financing,government spending and global public financing, both give emphasis tothe need to control resource outflows from the region (as discussed inSection 2). While outflows and significant under-funding continue,fulfilling global commitments like the Millennium Development Goalswill not be possible without international transfers into the region – as amatter of economic equity and public health obligation:
‘For the avoidance of any doubt, the Committee wishes to emphasisethat it is particularly incumbent on states parties and other actors ina position to assist, to provide ‘international assistance andcooperation, especially economic and technical’ which enabledeveloping countries to fulfill their core and other obligations.’UN Committee on Economic, Social and Cultural Rights, 2000
Seven of the sixteen countries inthe east and southern Africanregion are attempting to run
health systems with inadequateresources of below US$60 percapita and three countries donot even have the US$34 percapita required for the most
basic programmes.
This under-funding takes place inthe context of additional annualdemands due to AIDS and theregion’s commitment to meetthe Millennium DevelopmentGoals for health, estimated tocost about US$146 per capita.
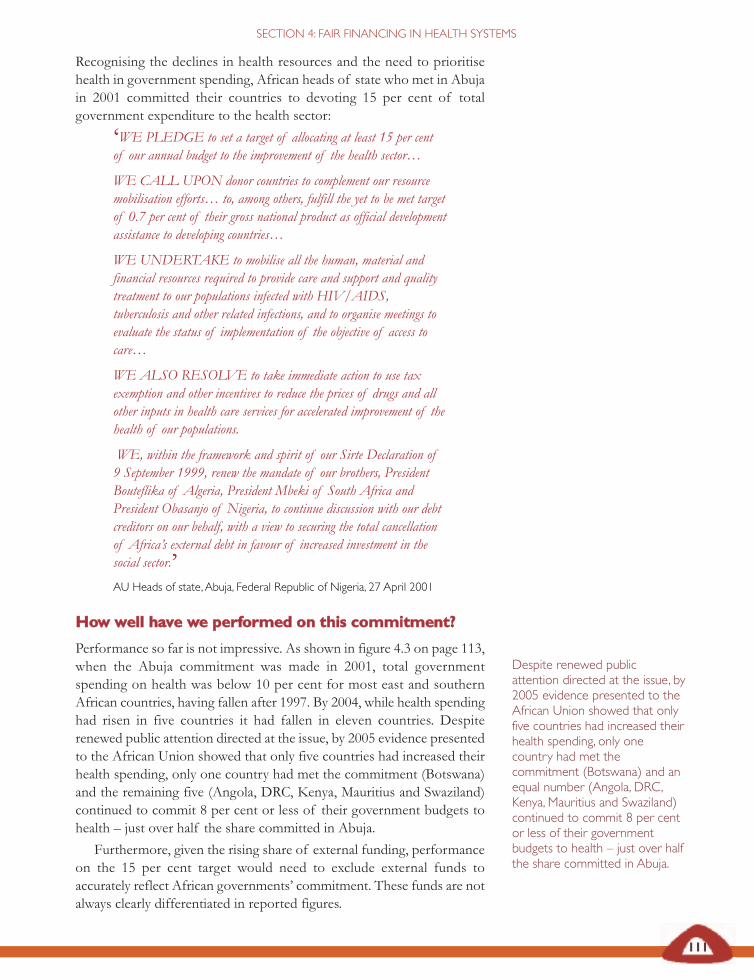
111
SECTION 4: FAIR FINANCING IN HEALTH SYSTEMS
Recognising the declines in health resources and the need to prioritisehealth in government spending, African heads of state who met in Abujain 2001 committed their countries to devoting 15 per cent of totalgovernment expenditure to the health sector:
‘WE PLEDGE to set a target of allocating at least 15 per centof our annual budget to the improvement of the health sector…
WE CALL UPON donor countries to complement our resourcemobilisation efforts… to, among others, fulfill the yet to be met targetof 0.7 per cent of their gross national product as official developmentassistance to developing countries…
WE UNDERTAKE to mobilise all the human, material andfinancial resources required to provide care and support and qualitytreatment to our populations infected with HIV/AIDS,tuberculosis and other related infections, and to organise meetings toevaluate the status of implementation of the objective of access tocare…
WE ALSO RESOLVE to take immediate action to use taxexemption and other incentives to reduce the prices of drugs and allother inputs in health care services for accelerated improvement of thehealth of our populations.
WE, within the framework and spirit of our Sirte Declaration of9 September 1999, renew the mandate of our brothers, PresidentBouteflika of Algeria, President Mbeki of South Africa andPresident Obasanjo of Nigeria, to continue discussion with our debtcreditors on our behalf, with a view to securing the total cancellationof Africa’s external debt in favour of increased investment in thesocial sector.’AU Heads of state,Abuja, Federal Republic of Nigeria, 27 April 2001
HHooww wweellll hhaavvee wwee ppeerrffoorrmmeedd oonn tthhiiss ccoommmmiittmmeenntt??
Performance so far is not impressive. As shown in figure 4.3 on page 113,when the Abuja commitment was made in 2001, total governmentspending on health was below 10 per cent for most east and southernAfrican countries, having fallen after 1997. By 2004, while health spendinghad risen in five countries it had fallen in eleven countries. Despiterenewed public attention directed at the issue, by 2005 evidence presentedto the African Union showed that only five countries had increased theirhealth spending, only one country had met the commitment (Botswana)and the remaining five (Angola, DRC, Kenya, Mauritius and Swaziland)continued to commit 8 per cent or less of their government budgets tohealth – just over half the share committed in Abuja.
Furthermore, given the rising share of external funding, performanceon the 15 per cent target would need to exclude external funds toaccurately reflect African governments’ commitment. These funds are notalways clearly differentiated in reported figures.
Despite renewed publicattention directed at the issue, by2005 evidence presented to theAfrican Union showed that onlyfive countries had increased theirhealth spending, only onecountry had met thecommitment (Botswana) and anequal number (Angola, DRC,Kenya, Mauritius and Swaziland)continued to commit 8 per centor less of their governmentbudgets to health – just over halfthe share committed in Abuja.
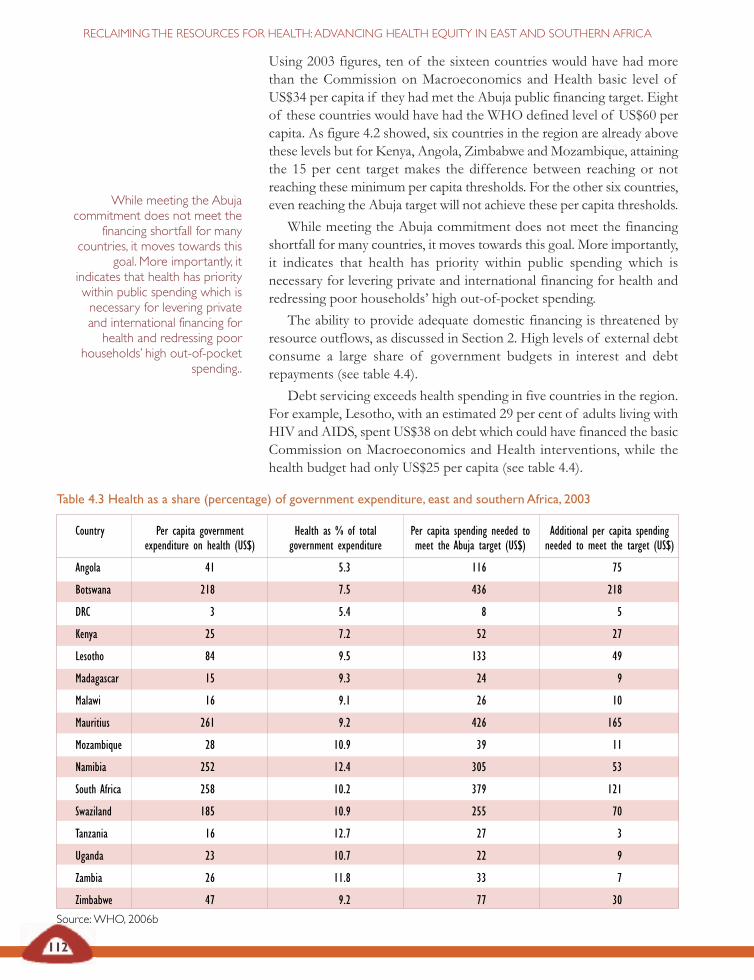
Table 4.3 Health as a share (percentage) of government expenditure, east and southern Africa, 2003
Country Per capita government Health as % of total Per capita spending needed to Additional per capita spending expenditure on health (US$) government expenditure meet the Abuja target (US$) needed to meet the target (US$)
Angola 41 5.3 116 75
Botswana 218 7.5 436 218
DRC 3 5.4 8 5
Kenya 25 7.2 52 27
Lesotho 84 9.5 133 49
Madagascar 15 9.3 24 9
Malawi 16 9.1 26 10
Mauritius 261 9.2 426 165
Mozambique 28 10.9 39 11
Namibia 252 12.4 305 53
South Africa 258 10.2 379 121
Swaziland 185 10.9 255 70
Tanzania 16 12.7 27 3
Uganda 23 10.7 22 9
Zambia 26 11.8 33 7
Zimbabwe 47 9.2 77 30
Source: WHO, 2006b
112
RECLAIMING THE RESOURCES FOR HEALTH: ADVANCING HEALTH EQUITY IN EAST AND SOUTHERN AFRICA
Using 2003 figures, ten of the sixteen countries would have had morethan the Commission on Macroeconomics and Health basic level ofUS$34 per capita if they had met the Abuja public financing target. Eightof these countries would have had the WHO defined level of US$60 percapita. As figure 4.2 showed, six countries in the region are already abovethese levels but for Kenya, Angola, Zimbabwe and Mozambique, attainingthe 15 per cent target makes the difference between reaching or notreaching these minimum per capita thresholds. For the other six countries,even reaching the Abuja target will not achieve these per capita thresholds.
While meeting the Abuja commitment does not meet the financingshortfall for many countries, it moves towards this goal. More importantly,it indicates that health has priority within public spending which isnecessary for levering private and international financing for health andredressing poor households’ high out-of-pocket spending.
The ability to provide adequate domestic financing is threatened byresource outflows, as discussed in Section 2. High levels of external debtconsume a large share of government budgets in interest and debtrepayments (see table 4.4).
Debt servicing exceeds health spending in five countries in the region.For example, Lesotho, with an estimated 29 per cent of adults living withHIV and AIDS, spent US$38 on debt which could have financed the basicCommission on Macroeconomics and Health interventions, while thehealth budget had only US$25 per capita (see table 4.4).
While meeting the Abujacommitment does not meet the
financing shortfall for manycountries, it moves towards this
goal. More importantly, itindicates that health has prioritywithin public spending which isnecessary for levering privateand international financing forhealth and redressing poor
households’ high out-of-pocketspending..
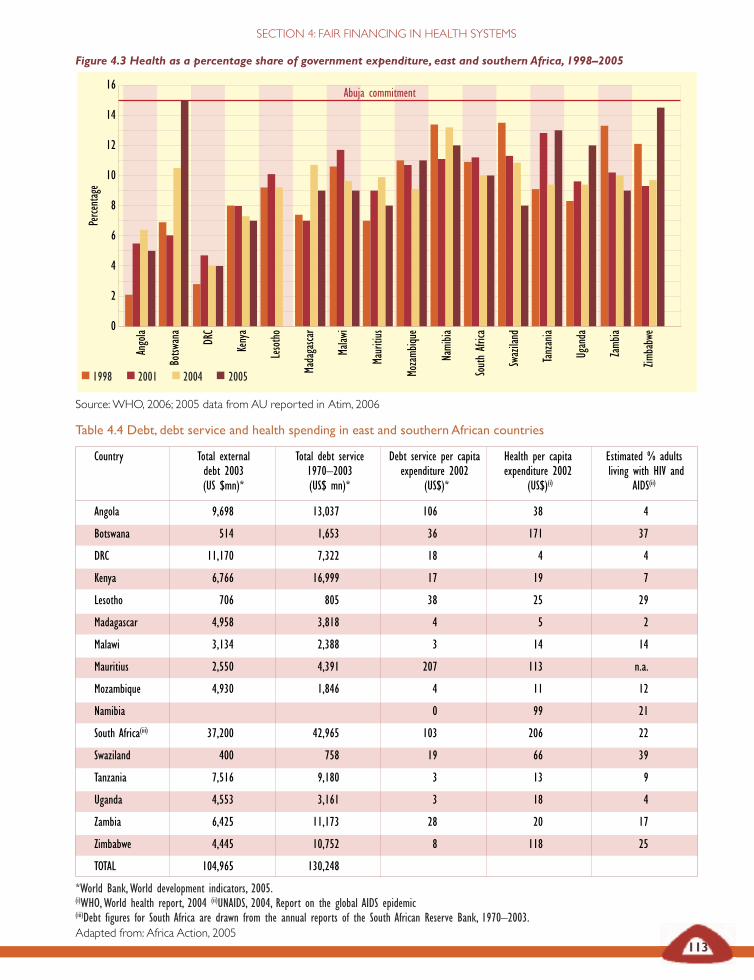
Figure 4.3 Health as a percentage share of government expenditure, east and southern Africa, 1998–2005
Source: WHO, 2006; 2005 data from AU reported in Atim, 2006
Ango
la
Botsw
ana
DRC
Keny
a
Leso
tho
Mada
gasca
r
Malaw
i
Maur
itius
Moza
mbiqu
e
Nami
bia
Sout
h Afr
ica
Swaz
iland
Tanz
ania
Ugan
da
Zamb
ia
Zimba
bwe
16
14
12
10
8
6
4
2
0
113
SECTION 4: FAIR FINANCING IN HEALTH SYSTEMS
Table 4.4 Debt, debt service and health spending in east and southern African countries
Country Total external Total debt service Debt service per capita Health per capita Estimated % adultsdebt 2003 1970–2003 expenditure 2002 expenditure 2002 living with HIV and (US $mn)* (US$ mn)* (US$)* (US$)(i) AIDS(ii)
Angola 9,698 13,037 106 38 4
Botswana 514 1,653 36 171 37
DRC 11,170 7,322 18 4 4
Kenya 6,766 16,999 17 19 7
Lesotho 706 805 38 25 29
Madagascar 4,958 3,818 4 5 2
Malawi 3,134 2,388 3 14 14
Mauritius 2,550 4,391 207 113 n.a.
Mozambique 4,930 1,846 4 11 12
Namibia 0 99 21
South Africa(iii) 37,200 42,965 103 206 22
Swaziland 400 758 19 66 39
Tanzania 7,516 9,180 3 13 9
Uganda 4,553 3,161 3 18 4
Zambia 6,425 11,173 28 20 17
Zimbabwe 4,445 10,752 8 118 25
TOTAL 104,965 130,248
*World Bank, World development indicators, 2005. (i)WHO, World health report, 2004 (ii)UNAIDS, 2004, Report on the global AIDS epidemic(iii)Debt figures for South Africa are drawn from the annual reports of the South African Reserve Bank, 1970–2003. Adapted from: Africa Action, 2005
Perce
ntag
e
1998 2001 2004 2005
Abuja commitment
114
RECLAIMING THE RESOURCES FOR HEALTH: ADVANCING HEALTH EQUITY IN EAST AND SOUTHERN AFRICA
Over the past three decades, east and southern African countries havepaid on average US$14 per capita annually in debt servicing. Even in the1990s, under the Heavily Indebted Poor Countries and debt reliefprogrammes, when payments fell, debt servicing dwarfed governmentspending on health, and grant aid and tax revenue also fell, despite theclear returns to health of debt cancellation, exemplified in the Ugandacase study above (UNDP, 2002).
Health financing thus calls for ‘Abuja plus’ – 15 per cent governmentspending on health accompanied by international support and debtcancellation.
Fair financing of health systemsIt is not simply the adequacy of health funding that is important but alsoits fairness. If health systems are to be national (nationally determinedand managed), comprehensive (adequately financed across all priorityhealth needs), universal (covering and accessible to all) and people-centred(ensuring inclusion and not raising barriers to health care), then resourcemobilisation needs to:
• be obtained fairly (generally from those who are wealthier);
• avoid further impoverishing poor people through increasedhealth service charges; and
• allocate resources towards areas of highest health need andgreatest health impact.
Health financing thus calls for’Abuja plus’: 15 per cent
government spending on healthaccompanied by internationalsupport and debt cancellation.
Debt relief in Uganda
In 2000 Uganda accessed debt relief under an enhanced Heavily IndebtedPoor Countries debt relief initiative, with total debt relief initiatives savingapproximately $90 million annually on Uganda’s repayments of foreign debts.The Uganda government met with 45 civil society organisations in aconsultative meeting with World Bank officials. The Uganda Debt Network,formed in 1996 to campaign for debt relief under the Jubilee 2000 campaign,led the civil society input.
The Uganda Debt Network’s priority was to ensure that savings from debtrelief were spent on poverty eradication – especially on education and health.The government set up a poverty action fund, ring-fencing a set of costedexpenditures for ‘directly poverty reducing’ areas. The costs of theseinvestments were compared with spending in the 2000/01 budget and theGovernment of Uganda re-prioritised expenditures in line with the findings.Hence the primary health care budget increased by 50 per cent and the waterand sanitation budget increased by more than 40 per cent, in both cases usingdebt relief funds through the poverty action fund.
In this case, research and information, a political commitment to povertyreduction and civil society involvement ensured that debt relief savings weretargeted towards meeting key poverty reduction goals.
Freer, 2002
If health systems are to benational, comprehensive,
universal and people centredthen resource mobilisation needs
to: be obtained fairly ; avoidfurther impoverishing poor
people through increased healthservice charges; and allocateresources towards areas of
highest health need and greatesthealth impact.
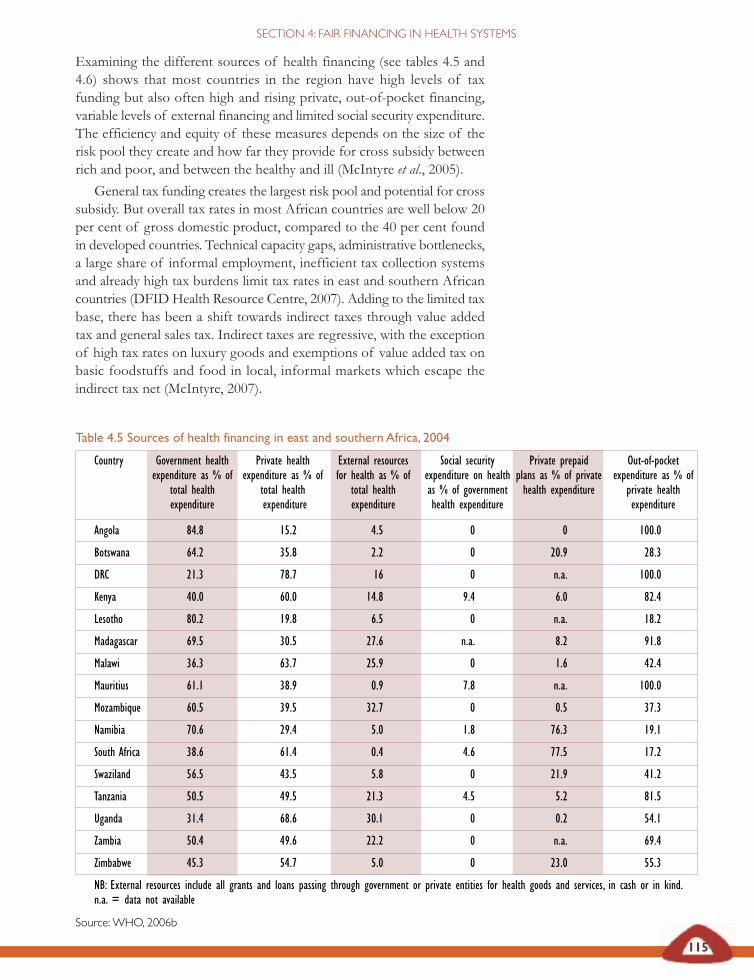
115
SECTION 4: FAIR FINANCING IN HEALTH SYSTEMS
Table 4.5 Sources of health financing in east and southern Africa, 2004
Country Government health Private health External resources Social security Private prepaid Out-of-pocket expenditure as % of expenditure as % of for health as % of expenditure on health plans as % of private expenditure as % of
total health total health total health as % of government health expenditure private health expenditure expenditure expenditure health expenditure expenditure
Angola 84.8 15.2 4.5 0 0 100.0
Botswana 64.2 35.8 2.2 0 20.9 28.3
DRC 21.3 78.7 16 0 n.a. 100.0
Kenya 40.0 60.0 14.8 9.4 6.0 82.4
Lesotho 80.2 19.8 6.5 0 n.a. 18.2
Madagascar 69.5 30.5 27.6 n.a. 8.2 91.8
Malawi 36.3 63.7 25.9 0 1.6 42.4
Mauritius 61.1 38.9 0.9 7.8 n.a. 100.0
Mozambique 60.5 39.5 32.7 0 0.5 37.3
Namibia 70.6 29.4 5.0 1.8 76.3 19.1
South Africa 38.6 61.4 0.4 4.6 77.5 17.2
Swaziland 56.5 43.5 5.8 0 21.9 41.2
Tanzania 50.5 49.5 21.3 4.5 5.2 81.5
Uganda 31.4 68.6 30.1 0 0.2 54.1
Zambia 50.4 49.6 22.2 0 n.a. 69.4
Zimbabwe 45.3 54.7 5.0 0 23.0 55.3
NB: External resources include all grants and loans passing through government or private entities for health goods and services, in cash or in kind.n.a. = data not available
Source: WHO, 2006b
Examining the different sources of health financing (see tables 4.5 and4.6) shows that most countries in the region have high levels of taxfunding but also often high and rising private, out-of-pocket financing,variable levels of external financing and limited social security expenditure.The efficiency and equity of these measures depends on the size of therisk pool they create and how far they provide for cross subsidy betweenrich and poor, and between the healthy and ill (McIntyre et al., 2005).
General tax funding creates the largest risk pool and potential for crosssubsidy. But overall tax rates in most African countries are well below 20per cent of gross domestic product, compared to the 40 per cent foundin developed countries. Technical capacity gaps, administrative bottlenecks,a large share of informal employment, inefficient tax collection systemsand already high tax burdens limit tax rates in east and southern Africancountries (DFID Health Resource Centre, 2007). Adding to the limited taxbase, there has been a shift towards indirect taxes through value addedtax and general sales tax. Indirect taxes are regressive, with the exceptionof high tax rates on luxury goods and exemptions of value added tax onbasic foodstuffs and food in local, informal markets which escape theindirect tax net (McIntyre, 2007).

Table 4.6 Per capita spending on health financing in east and southern African, 1998 and 2004
Per capita US$ spending on health 1998 Per capita US$ spending on health 2004
Public Donor Private Overall Public Donor Private Overallsources sources sources sources sources sources
Angola 15 1 26 41 44 2 8 52
Botswana 122 6 108 230 316 11 176 492
DRC 1 1 13 14 3 2 11 14
Kenya 31 9 37 68 25 9 38 63
Lesotho 77 4 19 96 90 7 22 112
Madagascar 11 7 8 19 19 7 8 27
Malawi 15 13 27 42 18 13 31 49
Mauritius 176 4 105 281 299 4 190 489
Mozambique 16 9 12 28 29 16 19 48
Namibia 227 8 87 314 273 19 113 386
South Africa 252 1 350 602 275 3 439 714
Swaziland 186 62 143 329 176 18 135 311
Tanzania 7 6 12 19 15 6 14 29
Uganda 13 14 31 44 26 25 58 84
Zambia 32 12 19 51 27 12 26 53
Zimbabwe 152 48 120 272 68 8 82 150
Sources: National Health Accounts Network, ESA NHA, 2001; WHO, 2006
116
RECLAIMING THE RESOURCES FOR HEALTH: ADVANCING HEALTH EQUITY IN EAST AND SOUTHERN AFRICA
In the past two decades, as described in Section 2, wider liberalisation wasaccompanied by support for a mix of public, private and voluntaryproviders, local resource gathering, user charges, as well as a shift towardsliberalised private insurance arrangements and away from more equitabletax-based financing mechanisms (Mackintosh and Koivusalo, 2005).
The increase in private (usually out-of-pocket) financing in most eastand southern African countries raises concerns about fairness of financingand of the size of risk pools and opportunities available for crosssubsidies. This section explores the opportunities for improvedprogressive tax funding and enhancing the equity and efficiency of otherfinancing sources.
Mobilising resources for health throughprogressive revenue In progressive tax systems personal income tax is complemented by areasonably substantial company income tax component, with value-addedtax contributing a low proportion of general tax revenue.
East and southern African countries can consider a range of wealthtaxes, including taxes on financial transaction flows, luxury airline traveland currency exchanges (McIntyre et al., 2005). Zimbabwe has, forexample, introduced a 3 per cent levy on top of the existing personal andcompany income tax rates to fund AIDS interventions.
In progressive tax systemspersonal income tax is
complemented by a reasonablysubstantial company income taxcomponent, with value-added
tax contributing a lowproportion of general tax
revenue.
117
SECTION 4: FAIR FINANCING IN HEALTH SYSTEMS
Countries can limit the percentage of profits that foreign corporationsare allowed to relocate – such companies have tended to relocate profitsleading to minimal tax revenue and benefit for African governments fromthese foreign investments (Bond, 2006).
Internationally, new income streams have been proposed, including anairline ticket levy, a stamp duty on currency transactions, an internationalfinancing facility for immunisation and a global lottery. The tax oncurrency transactions or ‘Tobin tax’ has been implemented in France andBelgium. The revenue potential of these types of taxes is significant. Theworldwide application of the stamp duty on currency transactions alonewould generate about US$35 billion (Hillman, 2006).
While many of these options for tax revenue are still under-explored,new attention has turned to health insurance. Private insurance of anymagnitude is largely restricted to southern Africa (Botswana, Madagascar,South Africa, Swaziland, Zimbabwe) and Kenya, mainly through privatevoluntary coverage of formal sector employees. Community healthinsurance (pre-payment) schemes have expanded in the region, and wediscuss this later. They remain, however, a small component of overallhealth care financing (see table 4.5). The experience of private voluntaryhealth insurance has not been positive, with limited coverage,fragmentation of risk pools and rapid, uncontrolled cost spiralsthreatening sustainability (McIntyre et al., 2005). Nevertheless, theirexpansion calls for measures to regulate these schemes and to provideincentives for them to integrate, increase their risk pool, cover low incomepopulations and contribute to public health services.
Several countries in the region are considering mandatory social healthinsurance, compulsory by law for all or some citizens. Tanzania, SouthAfrica, Kenya and Zimbabwe are exploring or introducing social healthinsurance schemes. While South Africa and Tanzania have vowed toextend insurance to a larger section of the population, no country in theregion has declared an intention to move towards universal coverage, anexplicit goal in Ghana, for example.
The Zimbabwe parliamentary committee on health’s consultations onthe proposed mandatory national health insurance suggested that suchschemes are likely to be contested where employment levels are falling,where tax levels are already high and where medical aid societies arerelatively well established. High inflation further complicates the costingof the benefits package (Rusike, 2007). Where health insurance coversselected groups, there have been criticisms of a resulting two-tier healthsystem, creating a divide between those who are insured (with access to arange of high quality health services) and those who are uninsured (oftenconsigned to under-resourced public sector services). Tax funding isrequired to cover the costs of care for groups who are hard to reachthrough insurance, such as those in the informal sector or the self-employed. If civil servants are amongst the first group to be covered,limited government funds can be diverted for these payments from taxfunding for public health services (Kutzin, 1998).
The experience of privatevoluntary health insurance hasnot been positive, with limitedcoverage, fragmentation of riskpools and rapid, uncontrolledcost spirals threateningsustainability
118
RECLAIMING THE RESOURCES FOR HEALTH: ADVANCING HEALTH EQUITY IN EAST AND SOUTHERN AFRICA
Levering contributions from private financing for publichealth care in South Africa
The way health care is currently financed in South Africa contributes to theinequity between public and private health sectors. Most health care funds inSouth Africa (62 per cent) flow via private sector financing intermediaries,the largest share of these being medical aid schemes. Public sector providersreceive about a third (39 per cent) of all health care expenditure while privatesector providers receive 61 per cent. This is inequitable when one considersthe number of people treated by the public sector.
Recognising the inequities between the public and private sectors, the SouthAfrican government initiated a process to develop a health sector charter.This charter is an agreement between the public, private and non-governmental organisation sector to transform the health sector in SouthAfrica.
The charter has four pillars:
1 Access to health services
2 Equity in health care
3 Quality of health services
4 Empowerment – broad-based black economic empowerment.
The charter is almost complete and has drawn all stakeholders together toaddress these issues. An innovative strategy in the charter is theimplementation of the public health enhancement fund which sees the privatesector contributing a percentage of their funds to strengthen the public healthsector.
Chetty, 2007
Mandatory health insurance in Kenya
Kenya is explicitly pursuing the introduction of mandatory insurance throughnational health insurance. This will provide a mechanism to move away fromuser fees, given their adverse consequences, and to reduce other out-of-pocketpayments made to private providers. The insured will have access to a rangeof providers accredited on the basis of adequacy and quality of care and theirwillingness to accept insurance scheme reimbursement rates. Accreditationwill include public and private not-for-profit facilities, like those run bymissions. Private for-profit facilities may be accredited if they are willing tocharge the reasonable insurance company rates. This approach will limit out-of-pocket payments to services outside of the benefit package. The schemeis paying careful attention to improving drug procurement, distribution andstock control during implementation to ensure that out-of-pocket paymentsare reduced effectively.
McIntyre et al., 2005
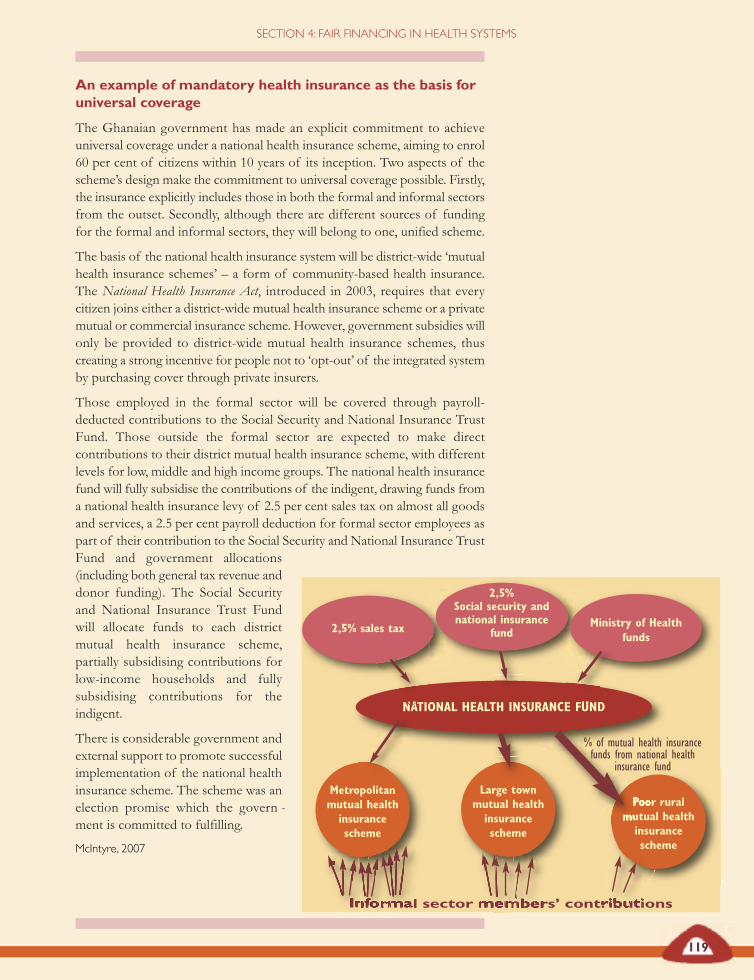
An example of mandatory health insurance as the basis foruniversal coverage
The Ghanaian government has made an explicit commitment to achieveuniversal coverage under a national health insurance scheme, aiming to enrol60 per cent of citizens within 10 years of its inception. Two aspects of thescheme’s design make the commitment to universal coverage possible. Firstly,the insurance explicitly includes those in both the formal and informal sectorsfrom the outset. Secondly, although there are different sources of fundingfor the formal and informal sectors, they will belong to one, unified scheme.
The basis of the national health insurance system will be district-wide ‘mutualhealth insurance schemes’ – a form of community-based health insurance.The National Health Insurance Act, introduced in 2003, requires that everycitizen joins either a district-wide mutual health insurance scheme or a privatemutual or commercial insurance scheme. However, government subsidies willonly be provided to district-wide mutual health insurance schemes, thuscreating a strong incentive for people not to ‘opt-out’ of the integrated systemby purchasing cover through private insurers.
Those employed in the formal sector will be covered through payroll-deducted contributions to the Social Security and National Insurance TrustFund. Those outside the formal sector are expected to make directcontributions to their district mutual health insurance scheme, with differentlevels for low, middle and high income groups. The national health insurancefund will fully subsidise the contributions of the indigent, drawing funds froma national health insurance levy of 2.5 per cent sales tax on almost all goodsand services, a 2.5 per cent payroll deduction for formal sector employees aspart of their contribution to the Social Security and National Insurance TrustFund and government allocations(including both general tax revenue anddonor funding). The Social Securityand National Insurance Trust Fundwill allocate funds to each districtmutual health insurance scheme,partially subsidising contributions forlow-income households and fullysubsidising contributions for theindigent.
There is considerable government andexternal support to promote successfulimplementation of the national healthinsurance scheme. The scheme was anelection promise which the govern -ment is committed to fulfilling.
McIntyre, 2007
119
SECTION 4: FAIR FINANCING IN HEALTH SYSTEMS
2,5% sales tax
2,5%Social security andnational insurance
fundMinistry of Health
funds
NATIONAL HEALTH INSURANCE FUND
Metropolitanmutual health
insurancescheme
Large townmutual health
insurancescheme
Poor ruralmutual health
insurancescheme
Informal sector members’ contributions
% of mutual health insurancefunds from national health
insurance fund
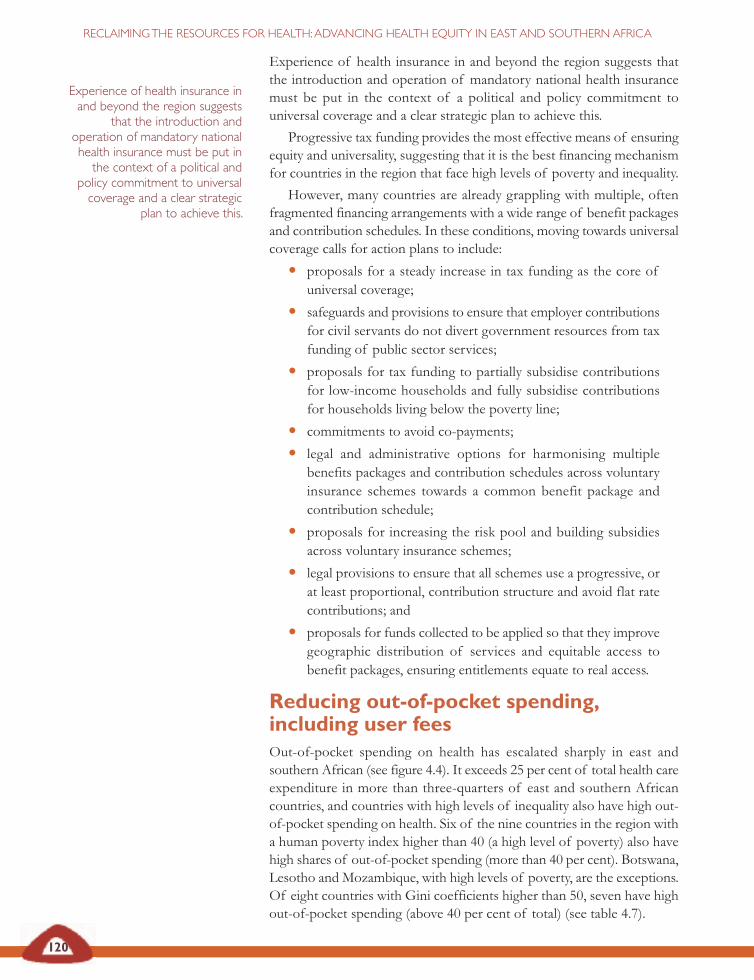
120
RECLAIMING THE RESOURCES FOR HEALTH: ADVANCING HEALTH EQUITY IN EAST AND SOUTHERN AFRICA
Experience of health insurance in and beyond the region suggests thatthe introduction and operation of mandatory national health insurancemust be put in the context of a political and policy commitment touniversal coverage and a clear strategic plan to achieve this.
Progressive tax funding provides the most effective means of ensuringequity and universality, suggesting that it is the best financing mechanismfor countries in the region that face high levels of poverty and inequality.
However, many countries are already grappling with multiple, oftenfragmented financing arrangements with a wide range of benefit packagesand contribution schedules. In these conditions, moving towards universalcoverage calls for action plans to include:
• proposals for a steady increase in tax funding as the core ofuniversal coverage;
• safeguards and provisions to ensure that employer contributionsfor civil servants do not divert government resources from taxfunding of public sector services;
• proposals for tax funding to partially subsidise contributionsfor low-income households and fully subsidise contributionsfor households living below the poverty line;
• commitments to avoid co-payments;
• legal and administrative options for harmonising multiplebenefits packages and contribution schedules across voluntaryinsurance schemes towards a common benefit package andcontribution schedule;
• proposals for increasing the risk pool and building subsidiesacross voluntary insurance schemes;
• legal provisions to ensure that all schemes use a progressive, orat least proportional, contribution structure and avoid flat ratecontributions; and
• proposals for funds collected to be applied so that they improvegeographic distribution of services and equitable access tobenefit packages, ensuring entitlements equate to real access.
Reducing out-of-pocket spending,including user feesOut-of-pocket spending on health has escalated sharply in east andsouthern African (see figure 4.4). It exceeds 25 per cent of total health careexpenditure in more than three-quarters of east and southern Africancountries, and countries with high levels of inequality also have high out-of-pocket spending on health. Six of the nine countries in the region witha human poverty index higher than 40 (a high level of poverty) also havehigh shares of out-of-pocket spending (more than 40 per cent). Botswana,Lesotho and Mozambique, with high levels of poverty, are the exceptions.Of eight countries with Gini coefficients higher than 50, seven have highout-of-pocket spending (above 40 per cent of total) (see table 4.7).
Experience of health insurance inand beyond the region suggests
that the introduction andoperation of mandatory nationalhealth insurance must be put inthe context of a political and
policy commitment to universalcoverage and a clear strategic
plan to achieve this.
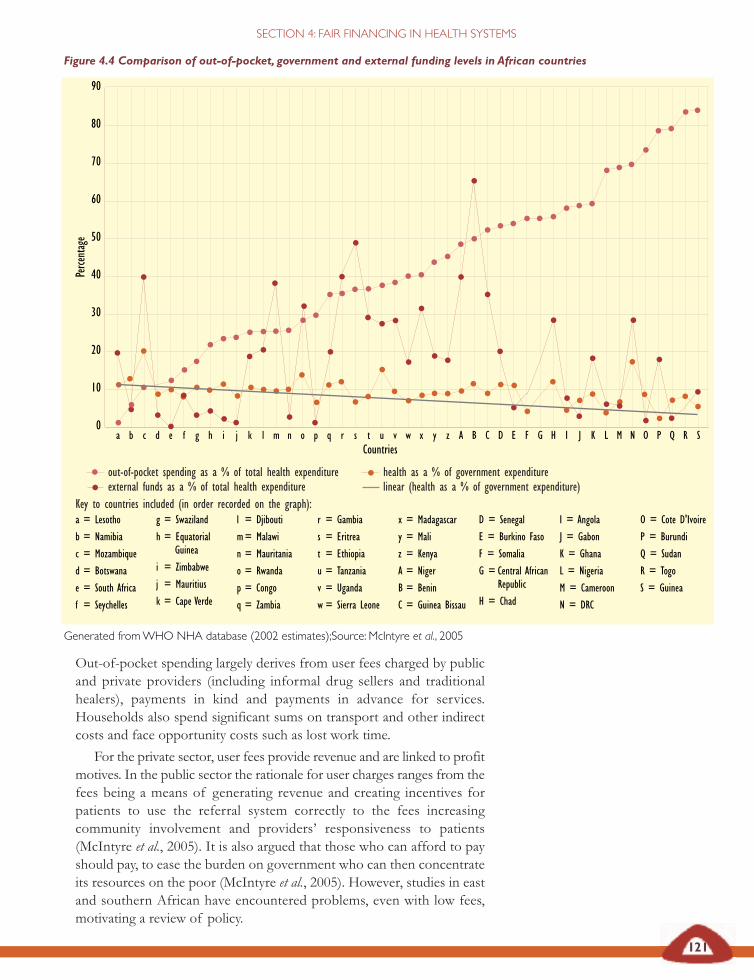
vCountries
Figure 4.4 Comparison of out-of-pocket, government and external funding levels in African countries
Generated from WHO NHA database (2002 estimates);Source: McIntyre et al., 2005
121
SECTION 4: FAIR FINANCING IN HEALTH SYSTEMS
0
10
20
30
40
50
60
70
80
90Pe
rcent
age
out-of-pocket spending as a % of total health expenditure health as a % of government expenditureexternal funds as a % of total health expenditure linear (health as a % of government expenditure)
Out-of-pocket spending largely derives from user fees charged by publicand private providers (including informal drug sellers and traditionalhealers), payments in kind and payments in advance for services.Households also spend significant sums on transport and other indirectcosts and face opportunity costs such as lost work time.
For the private sector, user fees provide revenue and are linked to profitmotives. In the public sector the rationale for user charges ranges from thefees being a means of generating revenue and creating incentives forpatients to use the referral system correctly to the fees increasingcommunity involvement and providers’ responsiveness to patients(McIntyre et al., 2005). It is also argued that those who can afford to payshould pay, to ease the burden on government who can then concentrateits resources on the poor (McIntyre et al., 2005). However, studies in eastand southern African have encountered problems, even with low fees,motivating a review of policy.
a = Lesotho
b = Namibia
c = Mozambique
d = Botswana
e = South Africa
f = Seychelles
g = Swaziland
h = Equatorial Guinea
i = Zimbabwe
j = Mauritius
k = Cape Verde
l = Djibouti
m= Malawi
n = Mauritania
o = Rwanda
p = Congo
q = Zambia
r = Gambia
s = Eritrea
t = Ethiopia
u = Tanzania
v = Uganda
w = Sierra Leone
x = Madagascar
y = Mali
z = Kenya
A = Niger
B = Benin
C = Guinea Bissau
D = Senegal
E = Burkino Faso
F = Somalia
G = Central AfricanRepublic
H = Chad
I = Angola
J = Gabon
K = Ghana
L = Nigeria
M = Cameroon
N = DRC
O = Cote D'Ivoire
P = Burundi
Q = Sudan
R = Togo
S = Guinea
Key to countries included (in order recorded on the graph):
a b c d e f g h i j k l m n o p q r s t u w x y z A B C D E F G H I J K L M N O P Q R S
122
RECLAIMING THE RESOURCES FOR HEALTH: ADVANCING HEALTH EQUITY IN EAST AND SOUTHERN AFRICA
Out-of-pocket spending in Tanzania
In one rural district of Tanzania, health workers found a growing trend ofsevere malaria between 1998 and 2002. Community members reported thatpoverty and the use of traditional medicines meant that people delayed goingto health services:
‘Leave alone the issue of fees, some households find it difficult to raise even1000 shillings in a month and end up opting for paracetamol from kiosksor just use mitishamba (local herbs).’
Health workers and some community leaders found that during long rainyseasons (March-May and October-December), malaria in under fives peakedsince villagers were busy preparing their rice and maize shambas (farms), withlittle time to take care of their children. This period was reported to be thetime when households have little cash because they have not yet harvested andwhat they have is spent either on fertilisers and other farm inputs or on foodlike maize flour. From October each year, most households tend to startsaving for the December Christian and Islamic holidays, new-year celebrationsand school fees for their children. This leaves little or no money for healthcare, including for the costs of transport to health services for those livingvery far away.
Mubyazi and Hutton, 2003
Out-of-pocket spending on tuberculosis in Malawi
A recent analysis of the costs of obtaining a tuberculosis diagnosis in urbanLilongwe also highlighted the high cost of accessing public health care forthe poor (Mann et al., 2002). Patients on average spent 972 Malawi kwacha(US$13) and lost up to 22 days work while accessing a tuberculosis diagnosis.For non-poor patients, the total costs equated to 124 per cent of total monthlyincome or 174 per cent after food expenditure. For the poor, this cost rose to248 per cent of monthly income or 584 per cent after food.
The study reportedly found that men spent more than women for theirdiagnosis and women took longer to access care than men. As patients wereseeking care, 12.7 per cent of all activities were done by children – and mostlyby female children (11.5 per cent). For poor women, female children werefound to replace activities for 65 days – possibly days lost from school.Various studies report the coping strategies households use to pay fortuberculosis care, including: missing meals, taking on high interest local loans,selling assets (water buckets and cooking utensils), stopping the purchase ofclean water or not paying school fees.
Mann et al., 2002; Govt of Malawi Ministry of Health and Population, 2002
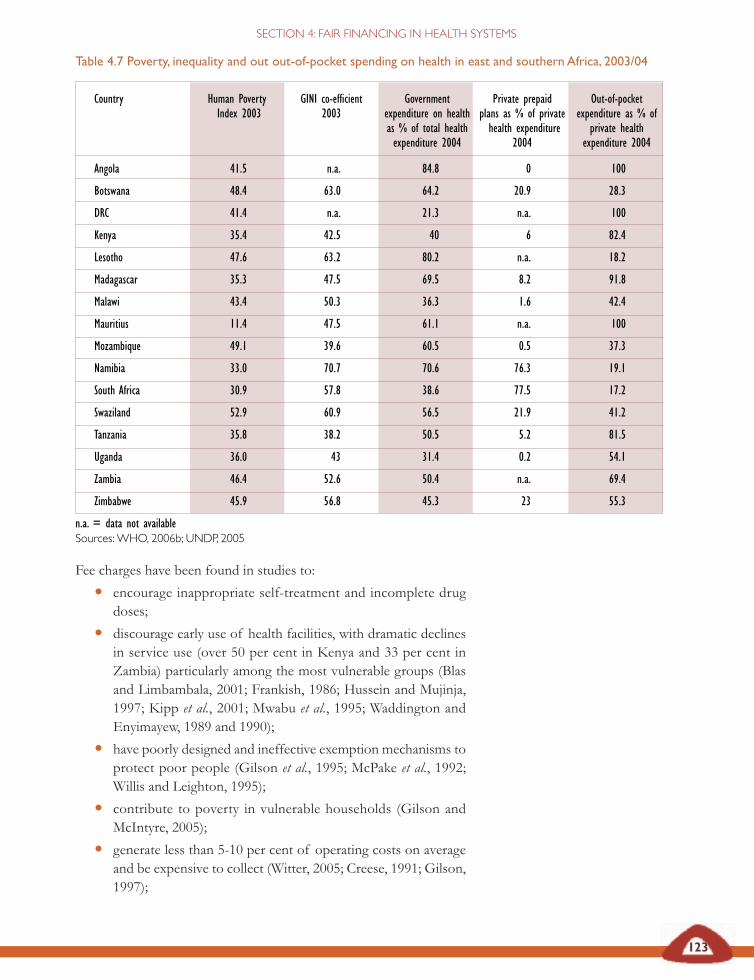
123
SECTION 4: FAIR FINANCING IN HEALTH SYSTEMS
Fee charges have been found in studies to:
• encourage inappropriate self-treatment and incomplete drugdoses;
• discourage early use of health facilities, with dramatic declinesin service use (over 50 per cent in Kenya and 33 per cent inZambia) particularly among the most vulnerable groups (Blasand Limbambala, 2001; Frankish, 1986; Hussein and Mujinja,1997; Kipp et al., 2001; Mwabu et al., 1995; Waddington andEnyimayew, 1989 and 1990);
• have poorly designed and ineffective exemption mechanisms toprotect poor people (Gilson et al., 1995; McPake et al., 1992;Willis and Leighton, 1995);
• contribute to poverty in vulnerable households (Gilson andMcIntyre, 2005);
• generate less than 5-10 per cent of operating costs on averageand be expensive to collect (Witter, 2005; Creese, 1991; Gilson,1997);
Table 4.7 Poverty, inequality and out out-of-pocket spending on health in east and southern Africa, 2003/04
Country Human Poverty GINI co-efficient Government Private prepaid Out-of-pocket Index 2003 2003 expenditure on health plans as % of private expenditure as % of
as % of total health health expenditure private healthexpenditure 2004 2004 expenditure 2004
Angola 41.5 n.a. 84.8 0 100
Botswana 48.4 63.0 64.2 20.9 28.3
DRC 41.4 n.a. 21.3 n.a. 100
Kenya 35.4 42.5 40 6 82.4
Lesotho 47.6 63.2 80.2 n.a. 18.2
Madagascar 35.3 47.5 69.5 8.2 91.8
Malawi 43.4 50.3 36.3 1.6 42.4
Mauritius 11.4 47.5 61.1 n.a. 100
Mozambique 49.1 39.6 60.5 0.5 37.3
Namibia 33.0 70.7 70.6 76.3 19.1
South Africa 30.9 57.8 38.6 77.5 17.2
Swaziland 52.9 60.9 56.5 21.9 41.2
Tanzania 35.8 38.2 50.5 5.2 81.5
Uganda 36.0 43 31.4 0.2 54.1
Zambia 46.4 52.6 50.4 n.a. 69.4
Zimbabwe 45.9 56.8 45.3 23 55.3
n.a. = data not availableSources: WHO, 2006b; UNDP, 2005
124
RECLAIMING THE RESOURCES FOR HEALTH: ADVANCING HEALTH EQUITY IN EAST AND SOUTHERN AFRICA
• compel use of poverty-inducing coping mechanisms, likeborrowing, cutting essential expenses and selling productiveassets (Verheul and Rowson, 2002); and
• have weak or temporary impacts on the referral system withoutcorresponding changes in the quality of care (McCoy andGilson,1997; Lennock, 1994; Hongoro and Chandiwana,1994;Zigora et al., 1996; Wang’ombe, 1997).
‘When my elder sister was sick, first of all she paid for her ownmedical care with the money she earned from where she worked inDar es Salaam. Her condition didn’t improve. She was then broughthere from Dar es Salaam. Our family later decided that our brothershould go to Dar es Salaam and sell all her belongings so that wecould get money to take her to Ndanda hospital. The money broughtwas used up but my sister didn’t recover. My father put his coconutplantation in pawn and we took her to a traditional healer but shestill didn’t recover. Finally, we just took her home and waited for herdays to finish as there was nothing left to sell to help her. In the endshe died and my father lost his plantation as he couldn’t afford toreclaim it within the agreed time.’Focus group discussion in Lindi, Tanzania, Save the Children, 2005
A review of user fees in Africa found that they contributed little to publicservice revenue and offered arguable relief for ministries of finance tryingto improve health budgets (Yates, 2006). In contrast, abolishing user feeshas resulted in significant increases in the use of services, especially bythe poor. In Uganda, for example, service use rose from 41 per cent in1999 to 84 per cent in 2002 (Uganda Debt Network, 2004; Hutton, 2004)(see figure 4.5). This positive impact has also been found in relation toother user charges – free net retreatment policies in Malawi, for example,boosted community participation and improved coverage of insecticidetreated bednets (Govt of Malawi MoHP, 2005).
South Africa, Zambia and Uganda, among other countries, haveremoved user fees for some or all public health services and there ispressure for other countries to adopt a similar policy. Existing experiencedemonstrates that fee removal needs to be undertaken carefully, given thesubstantial and sustained increases in use which could lead to drugshortages, staff difficulties and lower quality of care. Health workerconsultation is important. On the one hand, fees have been used bycommunities to supplement resources at district level and helpcompensate health workers (as further discussed in Section 5, healthworkers value this contribution). On the other hand, health workers areput in a difficult position when patients cannot afford services becauseof charges. Simply removing user fees without improving basic servicescan leave health workers unable to offer the services people need.
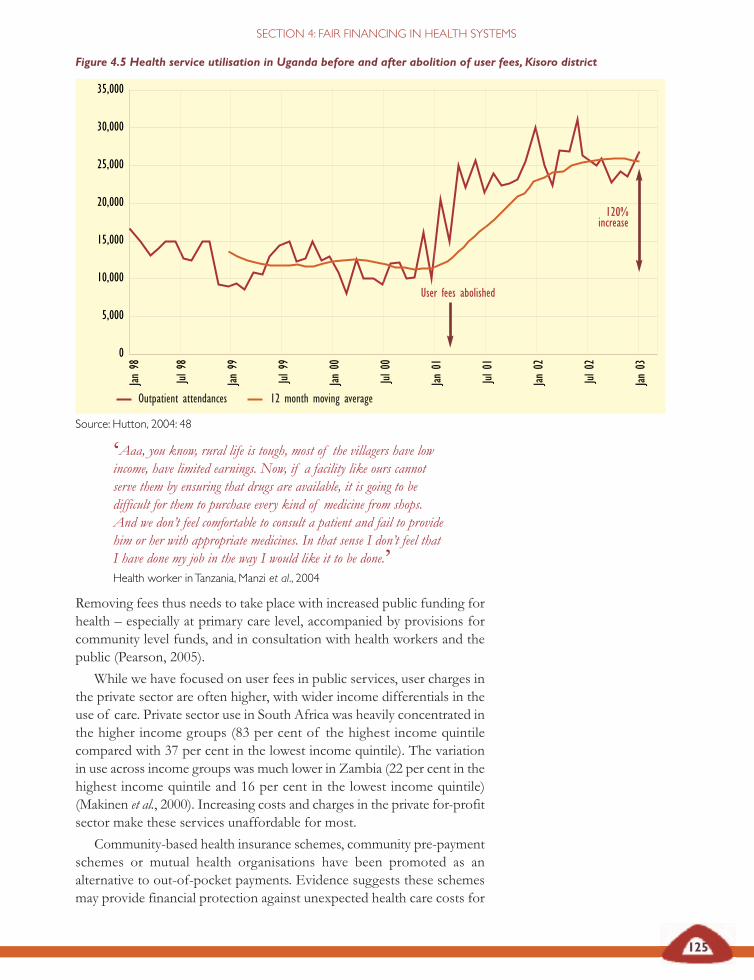
Figure 4.5 Health service utilisation in Uganda before and after abolition of user fees, Kisoro district
Source: Hutton, 2004: 48
125
SECTION 4: FAIR FINANCING IN HEALTH SYSTEMS
Eastern andsouthern Africa
‘Aaa, you know, rural life is tough, most of the villagers have lowincome, have limited earnings. Now, if a facility like ours cannotserve them by ensuring that drugs are available, it is going to bedifficult for them to purchase every kind of medicine from shops.And we don’t feel comfortable to consult a patient and fail to providehim or her with appropriate medicines. In that sense I don’t feel thatI have done my job in the way I would like it to be done.’Health worker in Tanzania, Manzi et al., 2004
Removing fees thus needs to take place with increased public funding forhealth – especially at primary care level, accompanied by provisions forcommunity level funds, and in consultation with health workers and thepublic (Pearson, 2005).
While we have focused on user fees in public services, user charges inthe private sector are often higher, with wider income differentials in theuse of care. Private sector use in South Africa was heavily concentrated inthe higher income groups (83 per cent of the highest income quintilecompared with 37 per cent in the lowest income quintile). The variationin use across income groups was much lower in Zambia (22 per cent in thehighest income quintile and 16 per cent in the lowest income quintile)(Makinen et al., 2000). Increasing costs and charges in the private for-profitsector make these services unaffordable for most.
Community-based health insurance schemes, community pre-paymentschemes or mutual health organisations have been promoted as analternative to out-of-pocket payments. Evidence suggests these schemesmay provide financial protection against unexpected health care costs for
30,000
35,000
25,000
20,000
15,000
10,000
5,000
0
Jan 9
8
Jul 9
8
Jan 9
9
Jul 9
9
Jan 0
0
Jul 0
0
Jan 0
1
Jul 0
1
Jan 0
2
Jul 0
2
Jan 0
3
User fees abolished
120%increase
Outpatient attendances 12 month moving average
126
RECLAIMING THE RESOURCES FOR HEALTH: ADVANCING HEALTH EQUITY IN EAST AND SOUTHERN AFRICA
their members and improve access to services (Schneider and Diop, 2004).However, their coverage is relatively low, they do not incorporate the mostvulnerable households, giving them small risk pools and limited cross-subsidies, and they generate limited revenue (Chee et al., 2002).Furthermore, the poorest and most vulnerable groups seem to beexcluded from these schemes due to cost barriers (Ekman, 2004; Jakaband Krishnan, 2004).
Claims that these schemes are the new ‘one size fits all solution’ to the
Removal of user fees in Uganda
Uganda introduced user fees on a universal basis in 1993. Although revenuegeneration was relatively low (generally less than 5 per cent of expenditure),it was an important source of funds for supplementing health worker salaries,maintaining facilities and purchasing additional drugs. However, there was adramatic decline in the use of health care services and there were growingconcerns about the impact on the poor.
User fees at public sector facilities were abolished in March 2001, with theexception of private wards. Various studies showed that health services useincreased immediately and dramatically. Two years after the abolition of fees,sustained increases in use of 77 per cent were recorded. Evidence from theUgandan national household surveys (1999/2000 and 2002/03) and from the healthmanagement information system highlighted how poor people had benefitedfrom the removal of fees. While the incidence of reported illness did notchange significantly, ill people were more likely to seek professional care andlose fewer days from work. Cost was a less frequent cause cited for notseeking care (down from 50 per cent to 30 per cent). These gains were mostmarked in the poorest quintile.
However, the evidence also indicates that gains in use and in health carecoverage could not have been achieved without an increase in the resourcesavailable for public sector health services. Of particular importance was thepro-active provision of a US$5.5 million buffer fund by the Ministry ofHealth to offset the potential impact on availability of drugs arising from theloss of fee revenue and increases in use. External funders set up a sector-wide approach support to the Ministry of Health which doubled the budgetbetween 1999/2000 and 2002/03. The Ministry of Health directed theadditional resources preferentially to primary health care services and districtbudgets increased seven-fold after 1999. There was some loss in staff moralerelated to a loss of fee revenue used to supplement staff salaries and anincrease in workload of about 47 per cent. Health workers and health facilitymanagement committees also indicated that maintenance of health facilitiesand cleanliness had declined. While the sustained improvements in access forpoor people were triggered by removing user fees, sustaining the effect wasa product of increased and well directed funding (above and beyond the lossof fee revenue). The experience also highlights the negative effects on healthworkers’ pay and workloads that need to be taken into account.
Pearson, 2005 ; McIntyre, 2007
127
SECTION 4: FAIR FINANCING IN HEALTH SYSTEMS
The Tanzania community health fund
In the Tanzania community health fund, government and external funds areused to provide ‘matching grants’ according to the amount of revenuegenerated by each scheme. This is intended as an incentive for the scheme toregister as many members and generate as much revenue from schemecontributions as possible. It does mean, however, that areas with less povertywhich are likely to generate the largest revenue from contributions, generallysecure the largest share of subsidies from government and external funds,raising equity concerns.
Previous evaluations of community health fund schemes in Tanzania haveidentified four main causes of low enrolment in the schemes: inability to paymembership contributions, low quality of health care provided by communityhealth fund facilities, lack of trust in community health fund managers andcommunity members not understanding the rationale of the risk covered bythe schemes. A study in 2004 found that these barriers were related to theperformance of district managers. District managers made little effort toaddress the problem of ability to pay, ignored exemption guidelines from thecentral government and demands for exemption from the communities, andresponded ineffectively to requests to improve health care from thecommunities. They made little effort to educate communities about thebenefits and rationale of risk-sharing and prepayment concepts. Thisresistance in the district managers was found to stem from the top-downexecution of the community health fund in the districts.
The equity concerns and study findings indicate that the design ofprepayment schemes needs to be more effectively addressed. In particular,an equitable injection of public funds is needed to protect access to care inlow income areas and policy makers should consult district governments andcommunities to better understand implementation constraints, includingthose affecting improvements in the quality of health care
McIntyre et al., 2005; Kamuzora and Gilson, 2006
health care financing gap in the region should thus be treated with caution.As raised earlier in relation to social health insurance, considering the endgoal of universal coverage, we need to consider how to integrate theseschemes into the overall health system and specify measures to ensureconsistency in their contribution levels and benefit packages (Bennett et al.,1998). However, even with the options to widen pre-payment, integrateprice discrimination and exempt poor and vulnerable groups from fees,the gains to health equity are greatest when fee charges are removed.
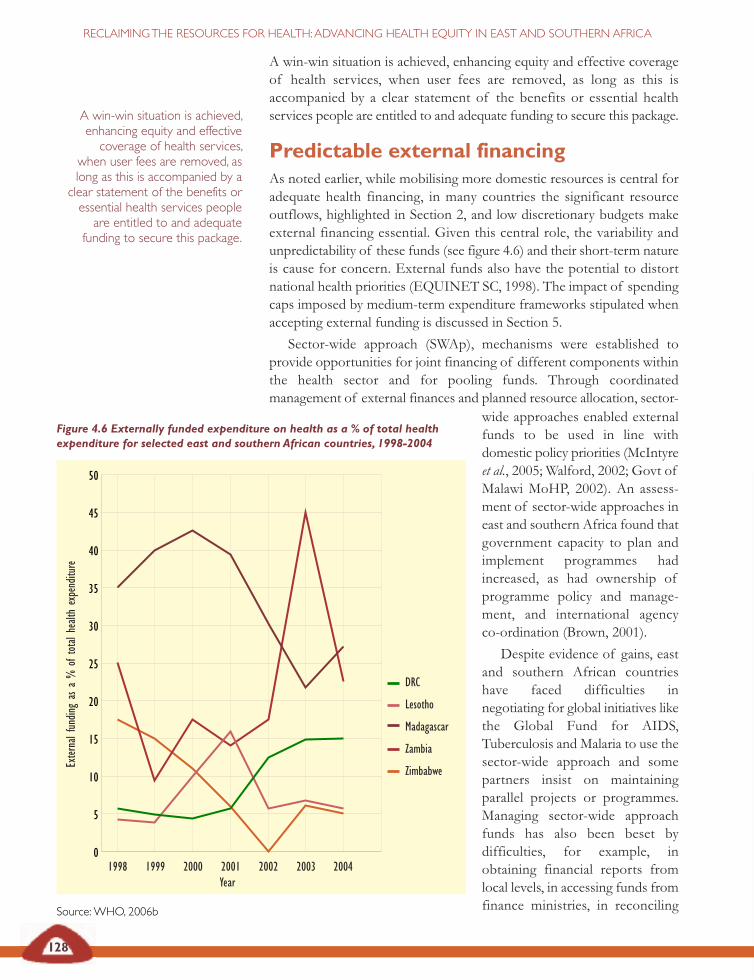
128
RECLAIMING THE RESOURCES FOR HEALTH: ADVANCING HEALTH EQUITY IN EAST AND SOUTHERN AFRICA
A win-win situation is achieved, enhancing equity and effective coverageof health services, when user fees are removed, as long as this isaccompanied by a clear statement of the benefits or essential healthservices people are entitled to and adequate funding to secure this package.
Predictable external financing As noted earlier, while mobilising more domestic resources is central foradequate health financing, in many countries the significant resourceoutflows, highlighted in Section 2, and low discretionary budgets makeexternal financing essential. Given this central role, the variability andunpredictability of these funds (see figure 4.6) and their short-term natureis cause for concern. External funds also have the potential to distortnational health priorities (EQUINET SC, 1998). The impact of spendingcaps imposed by medium-term expenditure frameworks stipulated whenaccepting external funding is discussed in Section 5.
Sector-wide approach (SWAp), mechanisms were established toprovide opportunities for joint financing of different components withinthe health sector and for pooling funds. Through coordinatedmanagement of external finances and planned resource allocation, sector-
Figure 4.6 Externally funded expenditure on health as a % of total healthexpenditure for selected east and southern African countries, 1998-2004
Source: WHO, 2006b
A win-win situation is achieved,enhancing equity and effectivecoverage of health services,
when user fees are removed, aslong as this is accompanied by aclear statement of the benefits oressential health services peopleare entitled to and adequate
funding to secure this package.
50
45
40
35
30
25
20
15
10
5
0
DRC
Lesotho
Madagascar
Zambia
Zimbabwe
1998 1999 2000 2001 2002 2003 2004
Exter
nal f
undin
g as
a %
of t
otal
healt
h ex
pend
iture
wide approaches enabled externalfunds to be used in line withdomestic policy priorities (McIntyreet al., 2005; Walford, 2002; Govt ofMalawi MoHP, 2002). An assess-ment of sector-wide approaches ineast and southern Africa found thatgovernment capacity to plan andimplement programmes hadincreased, as had ownership ofprogramme policy and manage-ment, and international agencyco-ordination (Brown, 2001).
Despite evidence of gains, eastand southern African countrieshave faced difficulties innegotiating for global initiatives likethe Global Fund for AIDS,Tuberculosis and Malaria to use thesector-wide approach and somepartners insist on maintainingparallel projects or programmes.Managing sector-wide approachfunds has also been beset bydifficulties, for example, inobtaining financial reports fromlocal levels, in accessing funds fromfinance ministries, in reconciling
Year
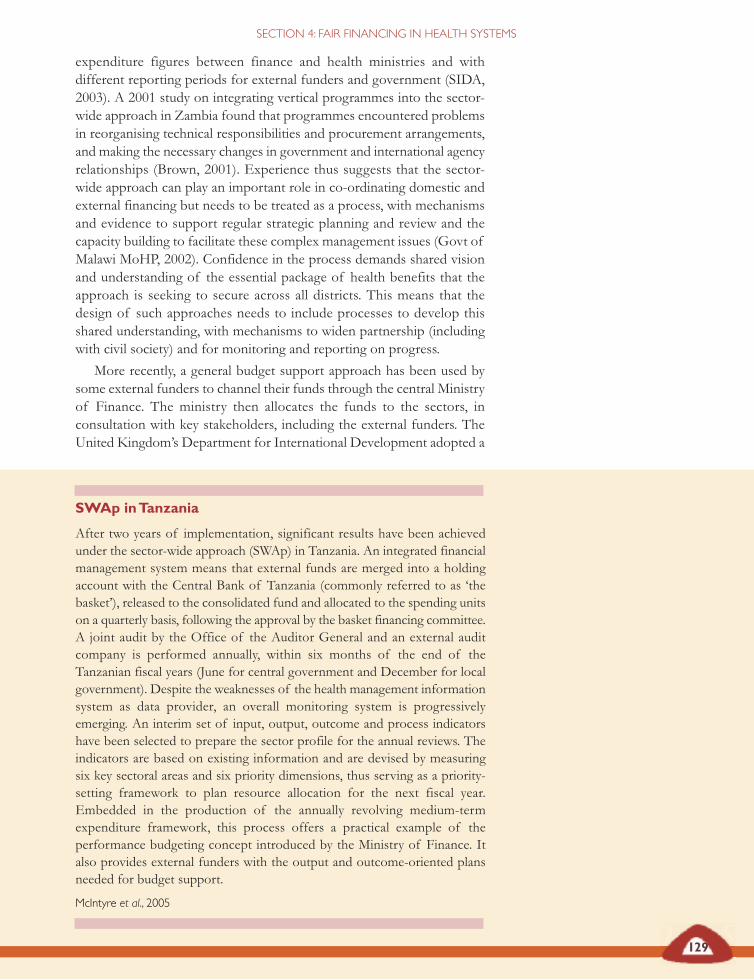
129
SECTION 4: FAIR FINANCING IN HEALTH SYSTEMS
expenditure figures between finance and health ministries and withdifferent reporting periods for external funders and government (SIDA,2003). A 2001 study on integrating vertical programmes into the sector-wide approach in Zambia found that programmes encountered problemsin reorganising technical responsibilities and procurement arrangements,and making the necessary changes in government and international agencyrelationships (Brown, 2001). Experience thus suggests that the sector-wide approach can play an important role in co-ordinating domestic andexternal financing but needs to be treated as a process, with mechanismsand evidence to support regular strategic planning and review and thecapacity building to facilitate these complex management issues (Govt ofMalawi MoHP, 2002). Confidence in the process demands shared visionand understanding of the essential package of health benefits that theapproach is seeking to secure across all districts. This means that thedesign of such approaches needs to include processes to develop thisshared understanding, with mechanisms to widen partnership (includingwith civil society) and for monitoring and reporting on progress.
More recently, a general budget support approach has been used bysome external funders to channel their funds through the central Ministryof Finance. The ministry then allocates the funds to the sectors, inconsultation with key stakeholders, including the external funders. TheUnited Kingdom’s Department for International Development adopted a
SWAp in Tanzania
After two years of implementation, significant results have been achievedunder the sector-wide approach (SWAp) in Tanzania. An integrated financialmanagement system means that external funds are merged into a holdingaccount with the Central Bank of Tanzania (commonly referred to as ‘thebasket’), released to the consolidated fund and allocated to the spending unitson a quarterly basis, following the approval by the basket financing committee.A joint audit by the Office of the Auditor General and an external auditcompany is performed annually, within six months of the end of theTanzanian fiscal years (June for central government and December for localgovernment). Despite the weaknesses of the health management informationsystem as data provider, an overall monitoring system is progressivelyemerging. An interim set of input, output, outcome and process indicatorshave been selected to prepare the sector profile for the annual reviews. Theindicators are based on existing information and are devised by measuringsix key sectoral areas and six priority dimensions, thus serving as a priority-setting framework to plan resource allocation for the next fiscal year.Embedded in the production of the annually revolving medium-termexpenditure framework, this process offers a practical example of theperformance budgeting concept introduced by the Ministry of Finance. Italso provides external funders with the output and outcome-oriented plansneeded for budget support.
McIntyre et al., 2005
130
RECLAIMING THE RESOURCES FOR HEALTH: ADVANCING HEALTH EQUITY IN EAST AND SOUTHERN AFRICA
general budget support approach (2004 cited in McIntyre et al., 2005)known as the ‘poverty reduction budget support approach’, identifying itas ‘the aid instrument most likely to support a relationship betweenexternal funders and developing country partners which will help to buildthe accountability and capability of the state.’
The factors motivating external funders to shift to general budgetsupport include:
• increased ownership and an alignment of external funds withthe national budget process and national priorities;
• improved policy dialogue between governments and externalfunders on key expenditure priorities, measures and ways toimplement the funding programmes;
• increased harmonisation of external funder activities, with clearbench marks, reporting requirements and conditionalities;
• increased predictability of external funding over the mediumterm, allowing for comprehensive planning of service deliveryactivities;
• decreased transaction costs in the medium term as internalagencies begin to use government’s own accounting andreporting systems for monitoring;
• improved efficiency in public expenditure management,expanded and more effective service delivery and more robustdelivery institutions; and
• potential for increased democratic accountability as thebudgeting and planning system becomes more transparent(McIntyre et al., 2005).
When external funders gain policy leverage over treasuries and financeministries through general budget support, ministries of health face newchallenges to their policy authority and power (EQUINET SC, 2004).Ministries of health are obliged to argue the case for health resourceswithin ministry of finance budget processes and are not always fullyprepared for this task. The challenge is more easily met when countrieshave aligned wider priorities to pro-poor service delivery and wherespecific targets for heath care financing and delivery are set, publiclyknown and monitored (McIntyre et al., 2005). There is still limitedfeedback on the impact of the general budget support approach in eastand southern African countries. Uganda, one of the first countries toinstitute this approach, found that while there was increased governmentcontrol over external funds and improved budget allocations in line withgovernment priorities, administrative costs remained high and externalfunding was still unpredictable (OPM and ODI, 2003).
Generally, experience from the region calls for predictable externalfunding, linked to sectoral financing and national health policy priorities,and managed through domestic government-led decision making,involving wider stakeholders.
Figure 4.7 Equitable access to public facilities: Seeing all pieces of the puzzle
Source: McIntyre et al., 2005
131
While direct investments in communities can support demand and use ofservices to promote equity, external funding needs to flow through andprovide incentives for equity-oriented allocations within the overall systemof health financing.
Equitable allocation of resources for healthA greater share of available resources needs to reach those with greatesthealth need, if households are to benefit from improved levels of healthfinancing. This is affected to some extent by choices made on how tomobilise the resources. Figure 4.7 below, for example, compares thepossible situation in a rural and urban area (McIntyre et al., 2005).
The bars represent the level of funding from alternative sources on aper capita basis. The bottom block in each bar indicates that governmenthas allocated its resources on an equal per capita basis. The next barindicates that more user fee revenue is generated in the urban district thanthe rural one, due to greater ability to pay among urban dwellers workingin the formal or informal sectors. The same applies to community-basedhealth insurance contributions. Assuming that government matches suchcontributions on a ‘dollar for dollar’ basis, this again preferentially benefitsthe urban district. The block second from the top of the right-hand bar(and top of the left-hand bar) represents external programme funds, suchas the Global Fund for AIDS, Tuberculosis and Malaria, discussed inSection 3, which may still be concentrated in urban area hospitals. Finally,the top block of the right-hand bar represents revenue that public sectorfacilities, particularly hospitals, may generate in the form of mandatoryhealth insurance reimbursements when their members use these facilities,again more likely to be concentrated in urban areas (McIntyre et al., 2005).
The diagram shows how significant inequities in the allocation ofhealth care resources may arise, even when government allocates its tax
Generally, experience from theregion calls for predictableexternal funding, linked tosectoral financing and nationalhealth policy priorities, andmanaged through domesticgovernment-led decision making,involving wider stakeholders.
Mandatory insurance reimbursements
Global Fund for antiretrovirals
Matching government grant
Community-based health insurance contributions
Out-of-pocket user fee revenue
Tax and donor funds pooled
SECTION 4 FAIR FINANCING IN HEALTH SYSTEMS
URBAN AREARURAL AREA
resources on an equal per capitabasis. It emphasises the import-ance of taking a comprehensiveview of health financing in termsof equity within each mechanismand across the overall healthfinancing system. Governmentallocations are a critical way ofoffsetting disparities arising fromother health care financingmechanisms, so these disparitiesneed to be taken into accountwhen allocating govern ment andpooled external funds acrossgeographical areas (McIntyre etal., 2005).
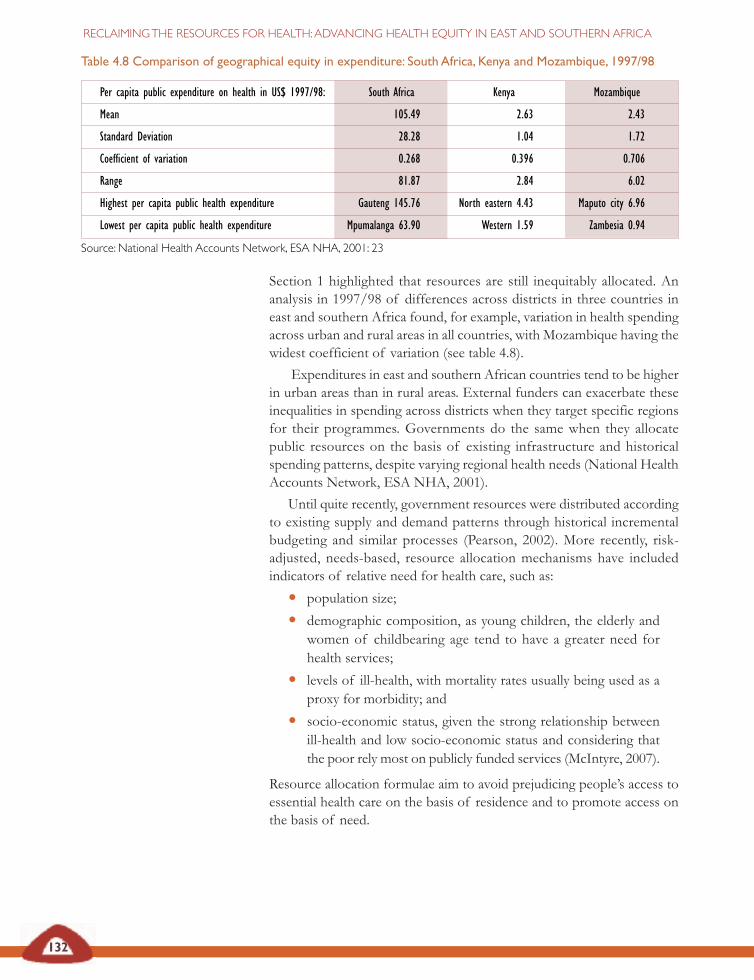
132
RECLAIMING THE RESOURCES FOR HEALTH: ADVANCING HEALTH EQUITY IN EAST AND SOUTHERN AFRICA
Section 1 highlighted that resources are still inequitably allocated. Ananalysis in 1997/98 of differences across districts in three countries ineast and southern Africa found, for example, variation in health spendingacross urban and rural areas in all countries, with Mozambique having thewidest coefficient of variation (see table 4.8).
Expenditures in east and southern African countries tend to be higherin urban areas than in rural areas. External funders can exacerbate theseinequalities in spending across districts when they target specific regionsfor their programmes. Governments do the same when they allocatepublic resources on the basis of existing infrastructure and historicalspending patterns, despite varying regional health needs (National HealthAccounts Network, ESA NHA, 2001).
Until quite recently, government resources were distributed accordingto existing supply and demand patterns through historical incrementalbudgeting and similar processes (Pearson, 2002). More recently, risk-adjusted, needs-based, resource allocation mechanisms have includedindicators of relative need for health care, such as:
• population size;
• demographic composition, as young children, the elderly andwomen of childbearing age tend to have a greater need forhealth services;
• levels of ill-health, with mortality rates usually being used as aproxy for morbidity; and
• socio-economic status, given the strong relationship betweenill-health and low socio-economic status and considering thatthe poor rely most on publicly funded services (McIntyre, 2007).
Resource allocation formulae aim to avoid prejudicing people’s access toessential health care on the basis of residence and to promote access onthe basis of need.
Table 4.8 Comparison of geographical equity in expenditure: South Africa, Kenya and Mozambique, 1997/98
Per capita public expenditure on health in US$ 1997/98: South Africa Kenya Mozambique
Mean 105.49 2.63 2.43
Standard Deviation 28.28 1.04 1.72
Coefficient of variation 0.268 0.396 0.706
Range 81.87 2.84 6.02
Highest per capita public health expenditure Gauteng 145.76 North eastern 4.43 Maputo city 6.96
Lowest per capita public health expenditure Mpumalanga 63.90 Western 1.59 Zambesia 0.94
Source: National Health Accounts Network, ESA NHA, 2001: 23
133
SECTION 4: FAIR FINANCING IN HEALTH SYSTEMS
Examples of resource allocation formulae in east andsouthern Africa
Tanzania
The Tanzanian formula for the allocation of basket funds to districts includespopulation size, under-five mortality as a proxy for disease burden andpoverty level, and adjusts for the differential cost of providing health servicesin rural and low-density areas. A basket financing committee approved theuse of a revised resource allocation formula from January 2004, using thefollowing variables:
• population size (with a 70 per cent weighting);
• under-five mortality rate as a proxy for burden of disease (10 per centweighting);
• mileage covered for service supervision and distribution of supplies (10per cent weighting); and
• poverty levels (10 per cent weighting).
Uganda
The primary health care budget is allocated between districts using aformula based on population size, the inverse of the human developmentindex, the inverse of per capita external funding and non-governmentalorganisation spending and supplements for districts with difficult securitysituations and those with no district hospital. In this formula, the humandevelopment index component includes both measures of socio-economicstatus and ill-health, while taking account of external and non-governmental organisation funding which ensures that the full resourceenvelope for each district is considered when determining the allocationof government funds.
Namibia
Making decisions about allocating resources has been based on historicalbudgeting processes and substantial differences in health and socio-economicstatus are evident between geographic areas, despite the improvements inhealth status in the 1990s. There are particularly vulnerable groups, such as theSan, and other groups with specific health needs. Resources need to beallocated more in line with these needs and with greater transparencysurrounding the process of resource allocation and spending levels indifferent geographic areas. Research in Namibia has indicated that allocationtends to be inverse to need. This research suggested that, in the short term,allocations should aim to equalise expenditure per capita and promote theprinciple of vertical equity, moving away from incrementalist budgetingtowards needs-based allocation. This has to be gradual as, in the short run,most of the resources are fixed and a rapid reduction of resources in someareas may adversely affect performance. The requisite capacity also needs tobe built up to absorb the injection of more resources.
134
RECLAIMING THE RESOURCES FOR HEALTH: ADVANCING HEALTH EQUITY IN EAST AND SOUTHERN AFRICA
It is not only across geographical areas that more equitable allocation isneeded. A comparison of public sector expenditure on hospitals andprimary care in selected east and southern African countries, includingsome central African countries, found skewed spending towards hospitalsin five of the seven countries, particularly in South Africa, Rwanda andKenya (see figure 4.8).
As these countries have relatively high levels of private, insurance andout-of-pocket spending on health, the large private sector may be thefactor leading to increased public spending on hospitals. Yet, as shown inSection 3, health systems in the region have greatest impact on diseaseburdens and protection of poor households at the district and primaryhealth care level. Although not in the region, Ethiopia provides usefulexperience. Its highest expenditure is at outpatient level and, while thecountry had the lowest per capita expenditure on health among all thecountries in this study, its health indicators were better than in manycountries in the region. This suggests that despite lower levels of spending,investing more resources at this care level yields better outcomes (ESANHA, 2001).
The Global Health Watch 2005 presented targets for allocation withinhealth systems to address national priorities and Millennium DevelopmentGoal targets:
• Allocations to district health services (up to and including levelone hospital services) should be at least 50 per cent of totalpublic health expenditure, of which half (25 per cent of total)should be on primary level health care.
• Allocations to district health services should be at least 40 percent of total public and private health expenditure.
• Allocations of total expenditure on district health services inthe highest spending district compared to the lowest spendingdistrict should have a ratio of no more than one to five (GlobalHealth Watch, 2005: 85).
Zambia
Initially, a simple per capita formula was used in Zambia because of thescarcity of accurate data on other needs-based indicators. However,weightings for remoteness and disease patterns have recently beenincluded in the formula. A resource allocation formula for determining thedistribution of recurrent budgets was introduced a few years ago. Thisformula was based on the population size in each district, with adjustmentsfor rural tenure and other relevant indicators. Work on revising theformula was initiated in 1998. There is a desire to include a wider rangeof indicators of need, including the distribution of the burden of ill-health between districts.MoHSS, Namibia and WHO, 2005; Semali and Minja, 2005; McIntyre, 2007
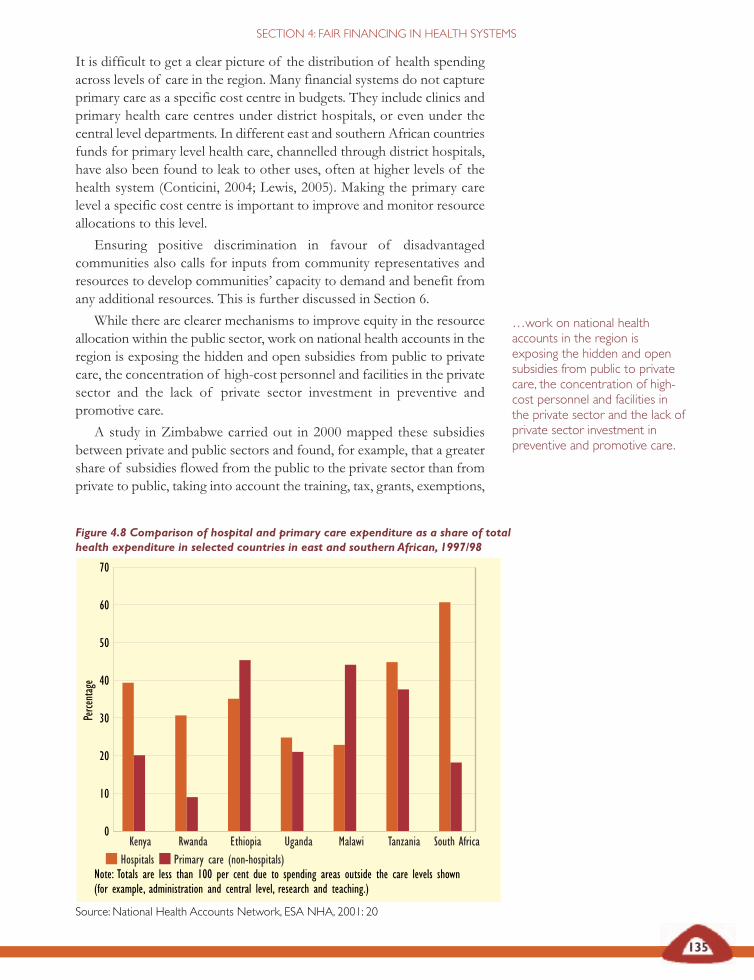
135
SECTION 4: FAIR FINANCING IN HEALTH SYSTEMS
Figure 4.8 Comparison of hospital and primary care expenditure as a share of totalhealth expenditure in selected countries in east and southern African, 1997/98
Hospitals Primary care (non-hospitals)Note: Totals are less than 100 per cent due to spending areas outside the care levels shown (for example, administration and central level, research and teaching.)
Source: National Health Accounts Network, ESA NHA, 2001: 20
It is difficult to get a clear picture of the distribution of health spendingacross levels of care in the region. Many financial systems do not captureprimary care as a specific cost centre in budgets. They include clinics andprimary health care centres under district hospitals, or even under thecentral level departments. In different east and southern African countriesfunds for primary level health care, channelled through district hospitals,have also been found to leak to other uses, often at higher levels of thehealth system (Conticini, 2004; Lewis, 2005). Making the primary carelevel a specific cost centre is important to improve and monitor resourceallocations to this level.
Ensuring positive discrimination in favour of disadvantagedcommunities also calls for inputs from community representatives andresources to develop communities’ capacity to demand and benefit fromany additional resources. This is further discussed in Section 6.
While there are clearer mechanisms to improve equity in the resourceallocation within the public sector, work on national health accounts in theregion is exposing the hidden and open subsidies from public to privatecare, the concentration of high-cost personnel and facilities in the privatesector and the lack of private sector investment in preventive andpromotive care.
A study in Zimbabwe carried out in 2000 mapped these subsidiesbetween private and public sectors and found, for example, that a greatershare of subsidies flowed from the public to the private sector than fromprivate to public, taking into account the training, tax, grants, exemptions,
0
10
20
30
40
50
60
70
Kenya Rwanda Ethiopia Uganda Malawi Tanzania South Africa
Perce
ntag
e
…work on national healthaccounts in the region isexposing the hidden and opensubsidies from public to privatecare, the concentration of high-cost personnel and facilities inthe private sector and the lack ofprivate sector investment inpreventive and promotive care.

136
RECLAIMING THE RESOURCES FOR HEALTH: ADVANCING HEALTH EQUITY IN EAST AND SOUTHERN AFRICA
and use of public and private facilities and personnel (Mudyarabikwa,2000). Only subsidies directly provided to private not-for-profit providers(churches and non-governmental organisations), consumers and to thepublic sector were judged to have a high impact on equity and to benefitcommunities.
For the private sector, government has a mix of measures from taxincentives to regulatory tools to deter rising costs to consumers andpromote national health policy goals and equity. Some of these have beenhighlighted in Section 3 and earlier in this section. For example, discussionon tax reforms in South Africa have pointed to opportunities for taxmeasures to promote efficiency, coverage and equity. These include:
• making sure that tax benefits only extend to an efficientlycovered basic benefit package;
• achieving a better balance in the resources available to medicalscheme members and those dependent on tax-funded healthservices, relative to the population served by each;
• limiting tax-free medical scheme contributions to cover only theprescribed minimum benefit package, with an additionalallowance for routine primary health care;
• avoiding tax benefits for additional medical expenses outsidethis basic coverage; and
• making subsidy payments from tax revenue towards thecontributions of those below the tax threshold who elect tobecome medical scheme members (McIntyre et al., 2005b).
These measures aim to ensure that available resources target those withgreatest health needs. In the discussion on resource mobilisation, weargued that those with greater ability to pay should contribute a higherproportion of their income than those with lower incomes. In relation toallocation, we propose that countries in the region need to institute explicitmeasures to positively discriminate in favour of disadvantagedcommunities.
This section suggests policy tools that governments can use for riskadjusted, needs-based resource allocation that promotes equity andefficiency between private and public sectors. Governments can useregulations and tax measures, for example, to ensure that resources areallocated to district and primary health care systems that have the greatestimpact on population health.
In resource mobilisation, weargued that those with greater
ability to pay should contribute ahigher proportion of their
income than those with lowerincomes. In relation to allocation,we propose that countries in theregion need to institute explicit
measures to positivelydiscriminate in favour of
disadvantaged communities.
137
SECTION 4: FAIR FINANCING IN HEALTH SYSTEMS
Mobilising support for fair financing The economic policy trends outlined in Sections 1 and 2 have had animpact on health financing in the region, as described in this section. Ifeast and southern African countries are to provide the kind of healthsystem suggested in Section 3 for households with greatest needs, theyneed a basic set of principles to shape and adjudicate trends and optionsin reclaiming the resources for health, whether from central or localbudget processes, external funding relationships or new forms ofdomestic resource mobilisation.
Fundamental to these principles is financial protection – no one inneed of health services should be denied access due to inability to payand households’ livelihoods should not be threatened by costs of care.There are further principles:
• Progressive health care financing implies that contributionsare distributed according to ability-to-pay and those better ableto pay should contribute a higher proportion of their income.
• Cross-subsidies from the healthy to the ill and from thewealthy to the poor should be promoted in the overall healthsystem. Fragmentation between and within individual financingmechanisms should be reduced and mechanisms put in placeto allow cross-subsidies across all financing mechanisms.
• The package of benefits people are entitled to should beclear, so they are aware of and can claim these entitlements,and so that parliaments can monitor them. The essential healthpackage outlined in Section 3 is one such example.
• Individuals should not be prejudiced in accessing essentialhealth care due to their place of residence, income or otherfactors. Government allocations are critical in offsettingdisparities arising from other factors; and it should take thesedisparities into account when allocating resources across areasand levels of the health system.
Protecting these principles under current economic and social conditionscalls for political leadership, health worker support, public understandingand social action. The importance of strategic information was raised inSection 3. Government management and information systems need totrack and report on expenditures in relation to national goals and targets(we discuss this further in Section 7). Recognising this, there have alsobeen civil society initiatives to monitor resources and engage withparliaments on budgets, as discussed in Section 6. Measures to improveequity in health financing can challenge the interests of articulate andpowerful private for-profit businesses and high-income consumers. Thissection has examined how these interests can be managed withinprocesses that effectively engage different actors, provide clear policyleadership and involve health workers and communities – issues furtherexplored in the next three sections.
…no one in need of healthservices should be denied accessdue to inability to pay andhouseholds’ livelihoods shouldnot be threatened by costs ofcare.
138
RECLAIMING THE RESOURCES FOR HEALTH: ADVANCING HEALTH EQUITY IN EAST AND SOUTHERN AFRICA
Aday LU and Andersen RM (1981) ‘Equity of access to med-ical care: A conceptual and empirical overview’, Medical Care19 (12 supp.): 4–27.
Africa Action (2005) Africa Action statement on 100 per cent debtcancellation for Africa, Washington DC, at www.africaaction.orgnewsroom/docs/AfricaActionDebt Statement2005Final. pdf
African Union Heads of State (2001) ‘Abuja declaration onHIV/AIDS, tuberculosis and other infectious diseases andplan of action’, African summit on HIV/AIDS tuberculosis andother infectious diseases, 24–27 April OAU, Addis Ababa, athttp://www.un.or/ga/aids/pdf/abuja_declaration.pdf
Arhin-Tenkorang D and Buckle G (2001) ‘Cost of scaling upprovision of primary and secondary health care services inGhana’, unpublished paper.
Atim C (2006) ‘Financial factors affecting slow progress inreaching agreed targets on HIV/AIDS, tuberculosis andmalaria in Africa’, DFID Health Resource Centre, preparedfor AU, Addis Ababa, downloaded on 7 March 2007 from:www.africa-union.org
Bennett S, Creese A and Monasch R (1998) ‘Health insuranceschemes for people outside formal sector employment’,Analysis, research and assessment paper 16, Division of Analysis,Research and Assessment, WHO, Geneva.
Blas E and Limbambala M (2001) ‘User payment,decentralisation and health service utilisation in Zambia’,Health Policy and Planning 16.
Bond P (2006) ‘The dispossession of African wealth:Perverse subsidies and reverse resource flows’, EQUINETdiscussion paper 30, EQUINET, Centre for Economic Justice,Harare.
Boulle A, Kenyon C, Abdullah F (2003) ‘A review ofantiretroviral costing models in South Africa’, Economics ofAIDS and access to HIV/AIDS care in developing countries: Issuesand challenges, Agence Nationale de Recherches sur le SIDA,Stockholm, at http://www.iaen.org/papers/anrs.php
Brown A (2001) ‘Integrating vertical programmes into sector-wide approaches: Experiences and lessons’, The pros, cons andconsequences of shifting from programme-based aid to sector-wideapproaches in the health sector, HLSP Institute, London.
Chee G, Smith K and Kapinga A (2002) Assessment of thecommunity health fund in Hanang district, Tanzania, Partnershipsfor Health Reform, Bethesda, MD.
Chetty KS (2007) ‘Equity promoting health care policies inSouth Africa’, WHO CSDH Health Systems KnowledgeNetwork, WHO, Witwatersrand Univ., Centre for HealthPolicy, Johannesburg.
Creese A (1991) ‘User charges for health care: A review ofrecent experience’, Health Policy and Planning 6: 309-319.
Conticini A (2004) Macroeconomics and health in Malawi: Whatway forward?, WHO, Geneva.
Devarajan S, Miller MJ, Swanson EV (2002) ‘Goals fordevelopment: History, prospects, and costs’, Policy Researchworking paper 2819:7, World Bank, New York.
DfID Health Resource Centre and AU (2007) Financial factorsaffecting slow progress in reaching agreed targets on HIV/AIDS, TBand malaria in Africa, AU, Addis Ababa, downloaded 7 March2007 at HYPERLINK http://www.africa-union.org
Doherty J, McIntyre D, Bloom G (1996) ‘Value for money inSouth African health care: Findings of a review of healthexpenditure and finance’, Central African Journal of Medicine42(1):21-24.
Dodd R and Cassels A (2006) ‘Health, development and theMillenium Development Goals’, Annals of Tropical Medicineand Parasitology 100 (5 and 6): 379-87.
Ekman B (2004) ‘Community-based health insurance in low-income countries: A systematic review of the evidence’,Health Policy and Planning 19: 249-270.
EQUINET steering committee (1998) ‘Bibliography andoverview: Equity in health in the SADC region’, EQUINETpolicy paper 2, EQUNET, Harare.– (2004) ‘Reclaiming the state: Advancing people’s health,challenging injustice’, EQUINET policy paper 15, EQUINET,Harare.
East and Southern Africa National Health Accounts Network(ESA NHA)(2001) National health accounts in eastern and southernAfrica: A comparative analysis, ESA NHA, Cape Town.
Evans D, Tandon A, Murray C and Lauer J (2001)‘Comparative efficiency of national health systems: Crossnational econometric analysis’, British Medical Journal 323:307-310.
Frankish J (1986) ‘Day hospital fees and accessibility ofessential health services’, South African Medical Journal 70.
Freer M (2002) ‘Debt relief in action: Uganda,’ Tearfundadvocacy case study, Tearfund/tilz, Teddington, downloaded 2March 2007 at http://tilz.tearfund.org/ webdocs/Tilz/Topics/Advocacy%20case%20study%20-%20Debt%20relief%20Uganda.pdf
Gilson L, Russell S and Buse K (1995) ‘The political economyof user fees with targeting: Developing equitable healthfinancing policy’, Journal of International Development 7: 369-401.
Gilson L (1997) ‘The lessons of user fee experience inAfrica’, Health Policy and Planning 12(4): 273-285.
Gilson L and McIntyre D (2005) ‘Removing user fees forprimary care in Africa: The need for careful action’, BritishMedical Journal 331: 762-765.
Global Health Watch (2005) Global health watch, 2005, GlobalHealth Watch, Cape Town.
Govt of Malawi, Ministry of Health and Population (MoHP)(2002) ‘SWAps: Today, tomorrow, together’, Final report of theSWAp design mission, Govt of Malawi, Lilongwe.– (2005) Annual report of the work of the Malawi health sector forthe year July 2004-June 2005, Ministry of Health, Lilongwe.
REFERENCES
139
SECTION 4: FAIR FINANCING IN HEALTH SYSTEMS
Hillman D (2006) ‘Speech to the leading group’s meeting oninnovative financing mechanisms: Fighting hunger andpoverty through pilot projects’, Brasilia, 6 July 2006, StampOut Poverty, London, downloaded at http://www.tobintax.org.uk/?lid=10376
Hongoro C and Chandiwana S (1994) ‘Effects of user fees onhealth care in Zimbabwe’, mimeo, Blair Laboratory andZimbabwe Ministry of Health and Child Welfare, Harare.
Hutton G (2004) Charting the path to the World Bank’s ‘Noblanket policy on user fees’, DfID Health Systems ResourceCentre, London, accessed Dec 2006 at http://www. dfidhealthrc.org/publications/health_sector_financing/04Hut01.pdf.
Hussein A and Mujinja P (1997) ‘Impact of user charges ongovernment health facilities in Tanzania’, East African MedicalJournal 74: 751-757.
Jakab M and Krishnan C (2004) ‘Review of the strengths andweaknesses of community financing’, in Preker A and CarrinG (eds) Health financing for poor people: Resource mobilisation andrisk sharing, World Bank, Washington DC.
Kamuzora P and Gilson L (2006) ‘Factors influencingimplementation of the community health fund in Tanzania’,Health Policy and Planning 22: 95–102.
Kipp W, Kamugisha J, Jacobs P, Burnham G and Rubaale T(2001) ‘User fees, health staff incentives and serviceutilisation in Kabarole district, Uganda’, Bulletin of the WorldHealth Organisation 79: 1032-1037, WHO, Geneva.
Kutzin J (1998) ‘Health insurance for the formal sector inAfrica: “Yes, but…”’, in Beattie A, Doherty J, Gilson L,Lambo E and Shaw P (eds) Sustainable health care financing insouthern Africa, World Bank, Washington DC.
Lennock J (1994) Paying for health: Poverty and structuraladjustment in Zimbabwe, Oxfam, Oxford.
Lewis M (2005) ‘Addressing the challenge of HIV/AIDS:Macroeconomic, fiscal and institutional issues’, Working paper58, Centre for Global Development, Washington DC.
Mackintosh M and Koivusalo M (2005) Commercialisation ofhealth care: Global and local dynamics and policy responses, PalgraveMacmillan, Basingstoke.
Makinen M, Waters H, Rauch M, Almagambetova N, BitranR, Gilson L, McIntyre D, Pannarunothai S, Prieto A, Ubilla Gand Ram S (2000) ‘Inequalities in health care use andexpenditures: Empirical data from eight developing countriesand countries in transition’, Bulletin of the World HealthOrganisation 78: 55-65.
Mann G, Squire SB, Nhlema B, Luhanga T, Salaniponi FML,Kemp J (2002) ‘Expanding DOTS? Time for cost-effectivediagnostic strategies for the poorest in Malawi’, Late breakersession, 33rd World Conference on Lung Health of the InternationalUnion Against Tuberculosis and Lung Disease, Montreal Canada 6-10 October 2002, International Union Against TB and LungDisease, Montreal.
Manzi F, Kida F, Mbuyita S, Palmer N and Gilson L (2004)Exploring the influence of workplace trust over health workerperformance; Preliminary national overview report: Tanzania, Health
Economics and Financing Programme, London School ofHygiene and Tropical Medicine, London, atwww.lshtm.ac.uk/ hpu/hefp, www.wits.ac.za/chp
McCoy D and Gilson L (1997) ‘Improving and monitoringthe equity of health care provision: A discussion of theselection of indicators’, mimeo, South Africa.
McIntyre D, Muirhead D, Gilson L, Govender D, Mbatsha S,Goudge S, Wadee H and Ntutela P (2001) ‘Geographicpatterns of deprivation and health inequities in South Africa:Informing public resource allocation strategies’, EQUINETpolicy paper 10, EQUINET, Harare.
McIntyre D, Gilson L and Mutyambizi V (2005) ‘Promotingequitable health care financing in the African context:Current challenges and future prospects’, EQUINETdiscussion paper 27, EQUINET, Harare.
McIntyre D, McLeod H, Thiede M (2005b) ‘Comments onthe National Treasury discussion document on the proposedtax reforms relating to medical scheme contributions andmedical expenses’, mimeo (21 Sept), Health Economics Unitand Department of Public Health and Family Medicine,University of Cape Town, Cape Town.
McIntyre D (2007) Learning from experience, health care financingin low and middle income countries, Global Forum for HealthResearch, Geneva (in press).
McPake B, Hanson K and Mills A (1992) ‘Implementing theBamako Initiative in Africa: A review and five case studies’,Public Health and Policy Publication 8, Department of PublicHealth and Policy, London School of Hygiene and TropicalMedicine, London.
Ministry of Health and Social Services, Namibia and WHO(2005) ‘Equity in health care in Namibia: Towards a needs-based allocation formula’, EQUINET discussion paper 26,MoHSS (Namibia), WHO, EQUINET, Harare.
Mudyarabikwa O (2000) ‘An examination of public sectorsubsidies to the private health sector: A Zimbabwe casestudy’, EQUINET policy paper 8, EQUINET, Harare.
Mubyazi G and Hutton G (2003) ‘Understandingmechanisms for integrating community priorities in healthplanning, resource allocation and service delivery: Results ofa literature review’, EQUINET discussion paper 13, EQUINET,Harare.
Mwabu G, Mwanzia J and Liambila W (1995) ‘User charges ingovernment health facilities in Kenya: Effect on attendanceand revenue’, Health Policy and Planning 10: 164-170.
National Treasury (2005) ‘Discussion document on theproposed tax reforms relating to medical schemecontributions and medical expenses’, Govt of South Africa,Pretoria.
OECD DAC (2006) Aid statistics accessed Nov 2006 at:http://www.oecd.org/ department/0,2688,en_2649_34447_1_1_1_1_1,00.html
OPM/ODI (2003) General budget support evaluability study,DfID, Evaluation report EV643 Vol 1, London.
140
RECLAIMING THE RESOURCES FOR HEALTH: ADVANCING HEALTH EQUITY IN EAST AND SOUTHERN AFRICA
Pearson M (2005) ‘Abolishing user fees in Africa? Itdepends…’, Technical approach paper, HLSP Institute, London,downloaded 2 March 2007 at www.hlspinstitute.org/files/project /83490/abolishing_user_fees.pdf
Rusike I (2007) ‘CWGH memo on the parliamentaryconsultations for the National Health insurance scheme inZimbabwe, Harare’, CWGH, Harare.
Save the Children UK (2005) ‘The cost of coping withillness’, East and Central Africa briefing, SCF, London.
Schneider P and Diop F (2004) ‘Community-based healthinsurance in Rwanda’, in Preker A and Carrin G (eds) Healthfinancing for poor people: Resource mobilisation and risk sharing,World Bank, Washington DC.
Semali I and Minja G (2005) ‘Deprivation and the equitableallocation of health care resources to decentralised districts inTanzania’, EQUINET discussion paper 33, EQUINET, Harare.
South African Reserve Bank (1970-2003) Annual reports of theSouth African Reserve Bank, Govt of South Africa, Pretoria.
Swedish International Development Cooperation Agency(SIDA) (2003) Mapping of sector-wide approaches in health,Institute for Health Sector Development, London, athttp://www.hlspinstitute.org/files/project/15377/IHSDmapping.pdf
Uganda Debt Network (UDN) (2004) The poverty reductionstrategy papers and resource allocation to the health sector in Uganda,UDN, Kampala.
UNAIDS (2004) Report on the global AIDS epidemic, UNAIDS,Geneva.
UN Committee on Economic, Social and Cultural Rights(2000) The right to the highest attainable standard of health: CESCRgeneral comment 14, OUNCHR, Geneva, at http://www.unhchr.ch/tbs/doc.nsf/ (symbol)/E.C.12.2000.4.En?OpenDocument
UNDP (2002) ‘Financing the development goals: An analysisof Tanzania, Cameroon, Malawi, Uganda and Philippines’,UNDP summary report, UNDP, New York, at http://www.undp.org/ffd/MDGfinal.pdf.– (2005) Human development report 2005, OUP, New York, athttp://hdr.undp.org/reports/view_reports. cfm?type=1 June2 2007
Verheul E and Rowson M (2002) ‘Where is health?’ TropicalMedicine and International Health 7(5): 391-394.
Waddington C and Enyimayew K (1989) ‘A price to pay: Theimpact of user charges in Ashanti-Akim district, Ghana’,International Journal of Health Planning and Management 4: 17-47.– (1990) ‘A price to pay, part 2: The impact of user charges inthe Volta Region of Ghana’, International Journal of HealthPlanning and Management 5: 287-312.
Walford V (2002) Health in poverty reduction strategy papers: Anintroduction and early experience, DFID Health Systems ResourceCentre, London.
Wang’ombe J (1997) ‘Health sector reform policies on costrecovery, the sub-Saharan Africa experience in the 1990s’,unpublished paper.
Willis C and Leighton C (1995) ‘Protecting the poor: The roleof means testing’, Health Policy and Planning 10: 241-256.
Witter S (2005) An unnecessary evil? User fees for health care in low-income countries: User fee removal must be accompanied by long-termdonor support, Save the Children, Connecticut, at http://www.savethechildren.org.uk/scuk_cache/scuk/cache/cmsattach/3027_An%20Unnecessary%20Evil.pdf
World Bank (2002, 2005)World development indicators database2002 and 2005, World Bank, Washington, accessed 2 June2007 at http://devdata.worldbank.org/wdi2005/index2.htm – (2006) World development indicators database, World Bank,Washington, accessed 2 June 2007 at http://devdata.worldbank.org/wdi2006/ contents/Section4.htm – (2006b) The costs of attaining the Millennium Development Goals,World Bank, Washington DC, available at http://www.worldbank.org/html/extdr/mdgassessment. pdf#search=%22costing%20of%20the%20MDGs%22)
WHO (2000)World health report 2000: Health systems: Improvingperformance, WHO, Geneva, available at http://www.who.int/whr/2000/en/– (2004) World health report 2004: Changing history,WHO,Geneva, available at http://www.who.int/whr/2004/en/– (2006) Core health indicators database 2006, WHO, Geneva,accessed November 2006 at: http://www.who.int/whosis/en/– (2006b) International migration of health personnel: A challenge forhealth systems in developing countries, report by the secretariat tothe 59th World Health Assembly, WHO, Geneva.
WHO Commission on Macroeconomics and Health (2004)Investing in health: A summary of the findings of the WHOCommission on Macroeconomics and Health, WHO, Genevaaccessed June 2007 at http://www.who.int/macrohealth/infocentre/advocacy/ en/investinginhealth02052003.pdf
WHO Regional Office for Africa and Eastern Mediterranean(2004) Mid-term progress report on Abuja declaration for malariacontrol, WHO, Geneva, downloaded 10 March 2007 fromwww.afro.who. int/malaria/publications/AbujaProgressReport2004.pdf
Yates R (June 2006) International experiences in removing user feesfor health services: Implications for Mozambique, DfID HealthResource Centre, London.
Zigora T, Chihanga S, Makahamadze R, Hongoro C, Ropi T(1996) ‘An evaluation of the abolition of user fees at ruralhealth centres and rural hospitals,' unpublished paper, BlairResearch Laboratory, Ministry of Health, Zimbabwe, Harare.
ValuingAND RECLAIMING INVESTMENTS IN
HEALTHWORKERS
SECTION
5
Without health workers there can be no health system.East and southern African countries are suffering froman unprecedented shortage of health workers.
Significant numbers have migrated to other countries. Withincountries, many have found employment in urban hospitals and theprivate sector, leading to rural shortfalls. Delivering equitable healthsystems calls for immediate and forward-looking measures to trainand retain health workers and ensure they can work effectively,especially within district and primary health care systems.
The first, immediate steps are often financial, to address real wagedeclines and improve real earnings. These new salary scales are bestbacked by a mix of incentives that address health workers’concerns, including opportunities for professional development,meaningful career paths and training loans as well as improvedworking, living and social conditions. Health workers needincentives that address their social needs, such as transport,housing, children’s education, electricity, community support andaccess to health care, including antiretrovirals. These measures havealready been shown to improve the retention of health workers andimprove their performance. They need to be financed andsupported by strategic management, information and monitoringsystems, together with mechanisms for co-operation across sectorsand for constant dialogue with health workers.
This resource demand is confronted by the loss to the public sectorof the investments made in training through out-migration to highincome countries. The resource flows are significant and have a realimpact on state obligations to health and health care. They thusneed to be managed through enforceable and transparentinternational agreements, with provisions for compensatoryinvestments for east and southern African countries to produce,value and retain their health workers.
KEY ISSUES
SECTION
5
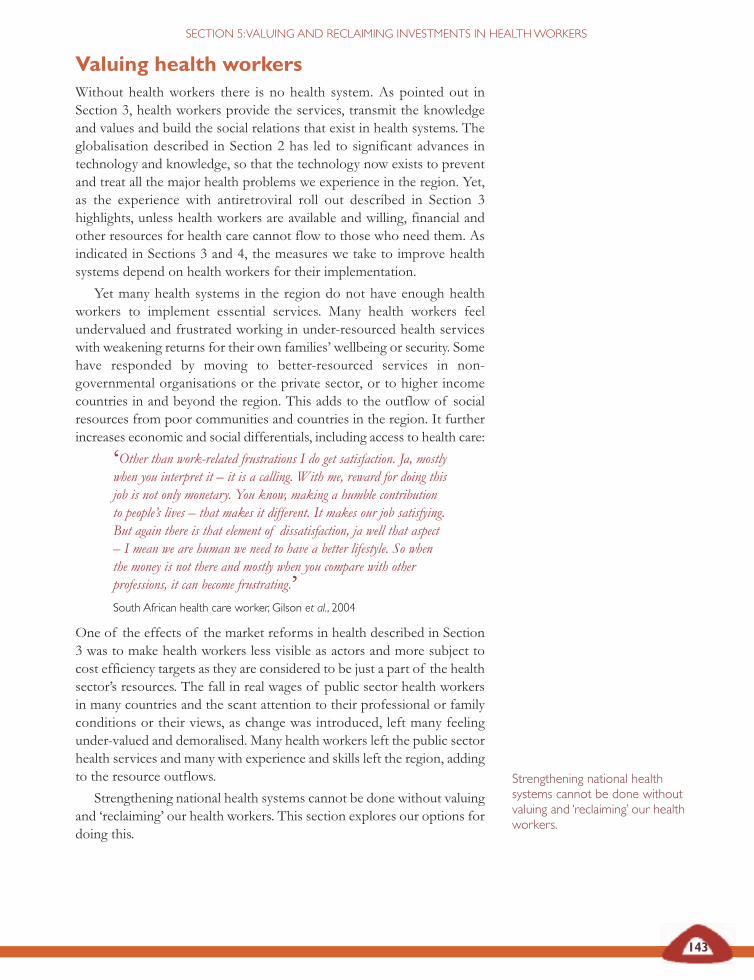
143
SECTION 5:VALUING AND RECLAIMING INVESTMENTS IN HEALTHWORKERS
Valuing health workersWithout health workers there is no health system. As pointed out inSection 3, health workers provide the services, transmit the knowledgeand values and build the social relations that exist in health systems. Theglobalisation described in Section 2 has led to significant advances intechnology and knowledge, so that the technology now exists to preventand treat all the major health problems we experience in the region. Yet,as the experience with antiretroviral roll out described in Section 3highlights, unless health workers are available and willing, financial andother resources for health care cannot flow to those who need them. Asindicated in Sections 3 and 4, the measures we take to improve healthsystems depend on health workers for their implementation.
Yet many health systems in the region do not have enough healthworkers to implement essential services. Many health workers feelundervalued and frustrated working in under-resourced health serviceswith weakening returns for their own families’ wellbeing or security. Somehave responded by moving to better-resourced services in non-governmental organisations or the private sector, or to higher incomecountries in and beyond the region. This adds to the outflow of socialresources from poor communities and countries in the region. It furtherincreases economic and social differentials, including access to health care:
‘Other than work-related frustrations I do get satisfaction. Ja, mostlywhen you interpret it – it is a calling. With me, reward for doing thisjob is not only monetary. You know, making a humble contributionto people’s lives – that makes it different. It makes our job satisfying.But again there is that element of dissatisfaction, ja well that aspect– I mean we are human we need to have a better lifestyle. So whenthe money is not there and mostly when you compare with otherprofessions, it can become frustrating.’South African health care worker, Gilson et al., 2004
One of the effects of the market reforms in health described in Section3 was to make health workers less visible as actors and more subject tocost efficiency targets as they are considered to be just a part of the healthsector’s resources. The fall in real wages of public sector health workersin many countries and the scant attention to their professional or familyconditions or their views, as change was introduced, left many feelingunder-valued and demoralised. Many health workers left the public sectorhealth services and many with experience and skills left the region, addingto the resource outflows.
Strengthening national health systems cannot be done without valuingand ‘reclaiming’ our health workers. This section explores our options fordoing this.
Strengthening national healthsystems cannot be done withoutvaluing and ‘reclaiming’ our healthworkers.
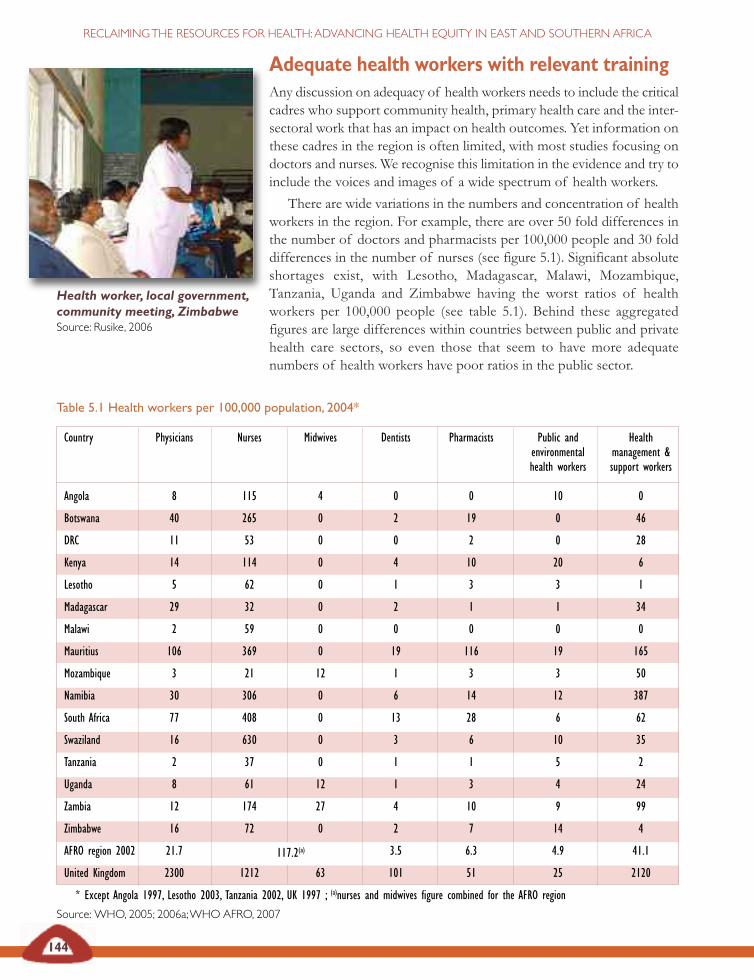
Table 5.1 Health workers per 100,000 population, 2004*
Country Physicians Nurses Midwives Dentists Pharmacists Public and Healthenvironmental management &health workers support workers
Angola 8 115 4 0 0 10 0
Botswana 40 265 0 2 19 0 46
DRC 11 53 0 0 2 0 28
Kenya 14 114 0 4 10 20 6
Lesotho 5 62 0 1 3 3 1
Madagascar 29 32 0 2 1 1 34
Malawi 2 59 0 0 0 0 0
Mauritius 106 369 0 19 116 19 165
Mozambique 3 21 12 1 3 3 50
Namibia 30 306 0 6 14 12 387
South Africa 77 408 0 13 28 6 62
Swaziland 16 630 0 3 6 10 35
Tanzania 2 37 0 1 1 5 2
Uganda 8 61 12 1 3 4 24
Zambia 12 174 27 4 10 9 99
Zimbabwe 16 72 0 2 7 14 4
AFRO region 2002 21.7 117.2(a) 3.5 6.3 4.9 41.1
United Kingdom 2300 1212 63 101 51 25 2120
* Except Angola 1997, Lesotho 2003, Tanzania 2002, UK 1997 ; (a)nurses and midwives figure combined for the AFRO region
Source: WHO, 2005; 2006a;WHO AFRO, 2007
144
RECLAIMINGTHE RESOURCES FOR HEALTH:ADVANCING HEALTH EQUITY IN EAST AND SOUTHERN AFRICA
Adequate health workers with relevant trainingAny discussion on adequacy of health workers needs to include the criticalcadres who support community health, primary health care and the inter-sectoral work that has an impact on health outcomes. Yet information onthese cadres in the region is often limited, with most studies focusing ondoctors and nurses. We recognise this limitation in the evidence and try toinclude the voices and images of a wide spectrum of health workers.
There are wide variations in the numbers and concentration of healthworkers in the region. For example, there are over 50 fold differences inthe number of doctors and pharmacists per 100,000 people and 30 folddifferences in the number of nurses (see figure 5.1). Significant absoluteshortages exist, with Lesotho, Madagascar, Malawi, Mozambique,Tanzania, Uganda and Zimbabwe having the worst ratios of healthworkers per 100,000 people (see table 5.1). Behind these aggregatedfigures are large differences within countries between public and privatehealth care sectors, so even those that seem to have more adequatenumbers of health workers have poor ratios in the public sector.
Health worker, local government,community meeting, ZimbabweSource: Rusike, 2006
117.2(a)
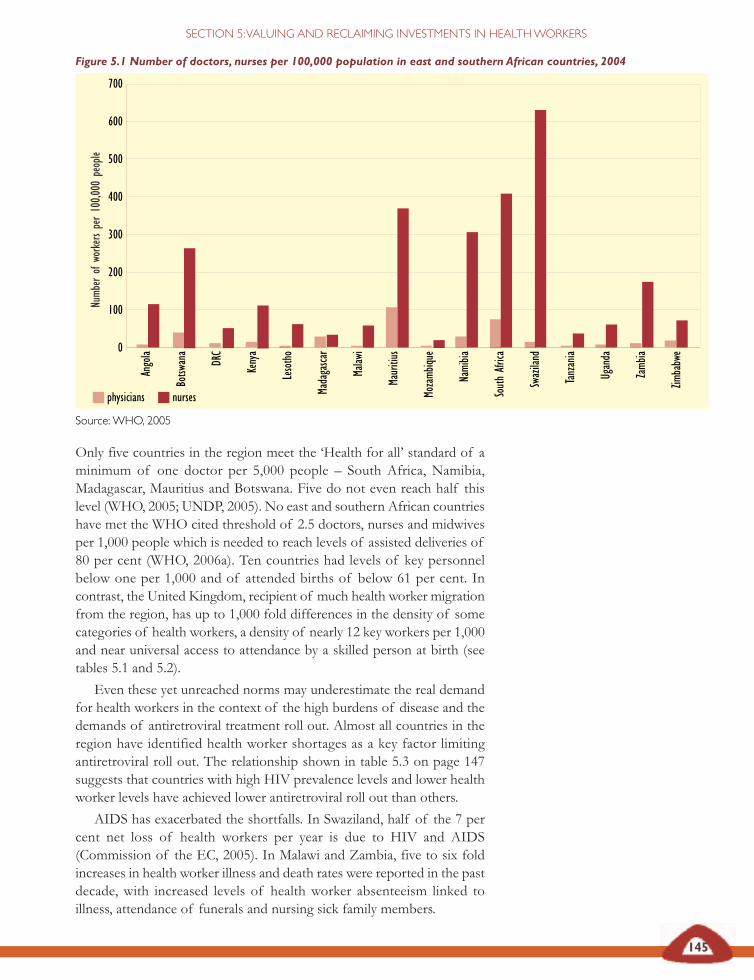
Only five countries in the region meet the ‘Health for all’ standard of aminimum of one doctor per 5,000 people – South Africa, Namibia,Madagascar, Mauritius and Botswana. Five do not even reach half thislevel (WHO, 2005; UNDP, 2005). No east and southern African countrieshave met the WHO cited threshold of 2.5 doctors, nurses and midwivesper 1,000 people which is needed to reach levels of assisted deliveries of80 per cent (WHO, 2006a). Ten countries had levels of key personnelbelow one per 1,000 and of attended births of below 61 per cent. Incontrast, the United Kingdom, recipient of much health worker migrationfrom the region, has up to 1,000 fold differences in the density of somecategories of health workers, a density of nearly 12 key workers per 1,000and near universal access to attendance by a skilled person at birth (seetables 5.1 and 5.2).
Even these yet unreached norms may underestimate the real demandfor health workers in the context of the high burdens of disease and thedemands of antiretroviral treatment roll out. Almost all countries in theregion have identified health worker shortages as a key factor limitingantiretroviral roll out. The relationship shown in table 5.3 on page 147suggests that countries with high HIV prevalence levels and lower healthworker levels have achieved lower antiretroviral roll out than others.
AIDS has exacerbated the shortfalls. In Swaziland, half of the 7 percent net loss of health workers per year is due to HIV and AIDS(Commission of the EC, 2005). In Malawi and Zambia, five to six foldincreases in health worker illness and death rates were reported in the pastdecade, with increased levels of health worker absenteeism linked toillness, attendance of funerals and nursing sick family members.
physicians nurses
145
SECTION 5:VALUING AND RECLAIMING INVESTMENTS IN HEALTHWORKERS
Figure 5.1 Number of doctors, nurses per 100,000 population in east and southern African countries, 2004
Source:WHO, 2005
700
600
500
400
300
200
100
0
Angola
Botsw
ana
DRC
Kenya
Lesotho
Madagasca
r
Malaw
i
Mauritius
Mozamb
ique
Namibia
SouthAfrica
Swaziland
Tanzania
Uganda
Zamb
ia
Zimbabwe
Numb
erof
workersper100,0
00people
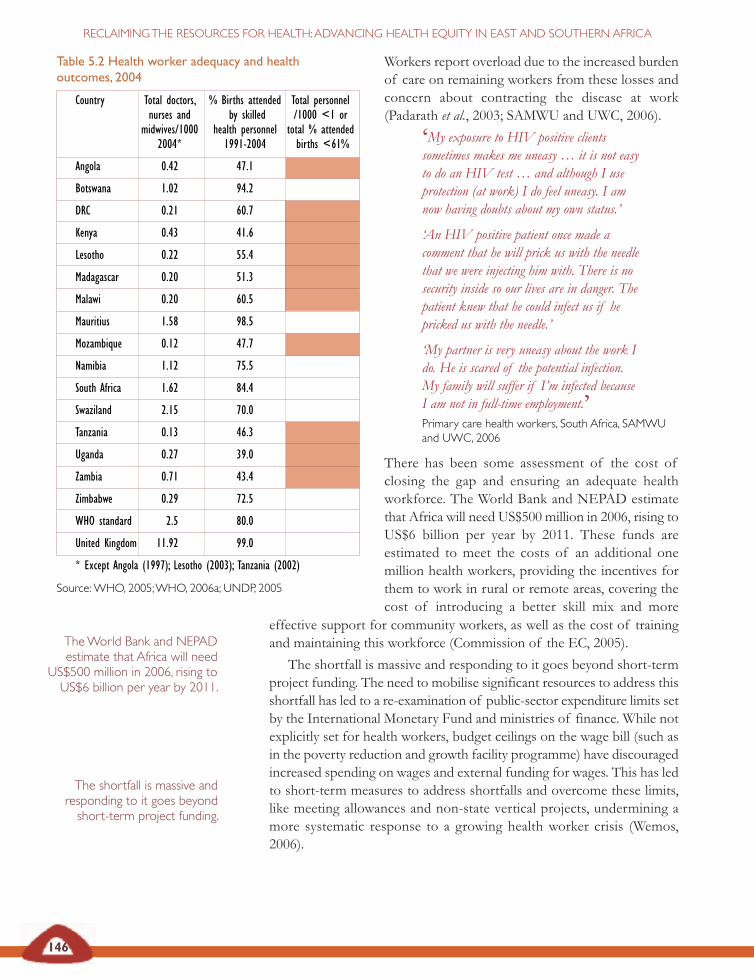
146
RECLAIMINGTHE RESOURCES FOR HEALTH:ADVANCING HEALTH EQUITY IN EAST AND SOUTHERN AFRICA
Workers report overload due to the increased burdenof care on remaining workers from these losses andconcern about contracting the disease at work(Padarath et al., 2003; SAMWU and UWC, 2006).
‘My exposure to HIV positive clientssometimes makes me uneasy … it is not easyto do an HIV test … and although I useprotection (at work) I do feel uneasy. I amnow having doubts about my own status.’
‘An HIV positive patient once made acomment that he will prick us with the needlethat we were injecting him with. There is nosecurity inside so our lives are in danger. Thepatient knew that he could infect us if hepricked us with the needle.’
‘My partner is very uneasy about the work Ido. He is scared of the potential infection.My family will suffer if I’m infected becauseI am not in full-time employment.’Primary care health workers, South Africa, SAMWUand UWC, 2006
There has been some assessment of the cost ofclosing the gap and ensuring an adequate healthworkforce. The World Bank and NEPAD estimatethat Africa will need US$500 million in 2006, rising toUS$6 billion per year by 2011. These funds areestimated to meet the costs of an additional onemillion health workers, providing the incentives forthem to work in rural or remote areas, covering thecost of introducing a better skill mix and more
The shortfall is massive andresponding to it goes beyondshort-term project funding.
TheWorld Bank and NEPADestimate that Africa will need
US$500 million in 2006, rising toUS$6 billion per year by 2011.
effective support for community workers, as well as the cost of trainingand maintaining this workforce (Commission of the EC, 2005).
The shortfall is massive and responding to it goes beyond short-termproject funding. The need to mobilise significant resources to address thisshortfall has led to a re-examination of public-sector expenditure limits setby the International Monetary Fund and ministries of finance. While notexplicitly set for health workers, budget ceilings on the wage bill (such asin the poverty reduction and growth facility programme) have discouragedincreased spending on wages and external funding for wages. This has ledto short-term measures to address shortfalls and overcome these limits,like meeting allowances and non-state vertical projects, undermining amore systematic response to a growing health worker crisis (Wemos,2006).
Table 5.2 Health worker adequacy and healthoutcomes, 2004
Country Total doctors, % Births attended Total personnelnurses and by skilled /1000 <1 or
midwives/1000 health personnel total % attended2004* 1991-2004 births <61%
Angola 0.42 47.1
Botswana 1.02 94.2
DRC 0.21 60.7
Kenya 0.43 41.6
Lesotho 0.22 55.4
Madagascar 0.20 51.3
Malawi 0.20 60.5
Mauritius 1.58 98.5
Mozambique 0.12 47.7
Namibia 1.12 75.5
South Africa 1.62 84.4
Swaziland 2.15 70.0
Tanzania 0.13 46.3
Uganda 0.27 39.0
Zambia 0.71 43.4
Zimbabwe 0.29 72.5
WHO standard 2.5 80.0
United Kingdom 11.92 99.0
* Except Angola (1997); Lesotho (2003); Tanzania (2002)
Source:WHO, 2005;WHO, 2006a; UNDP, 2005
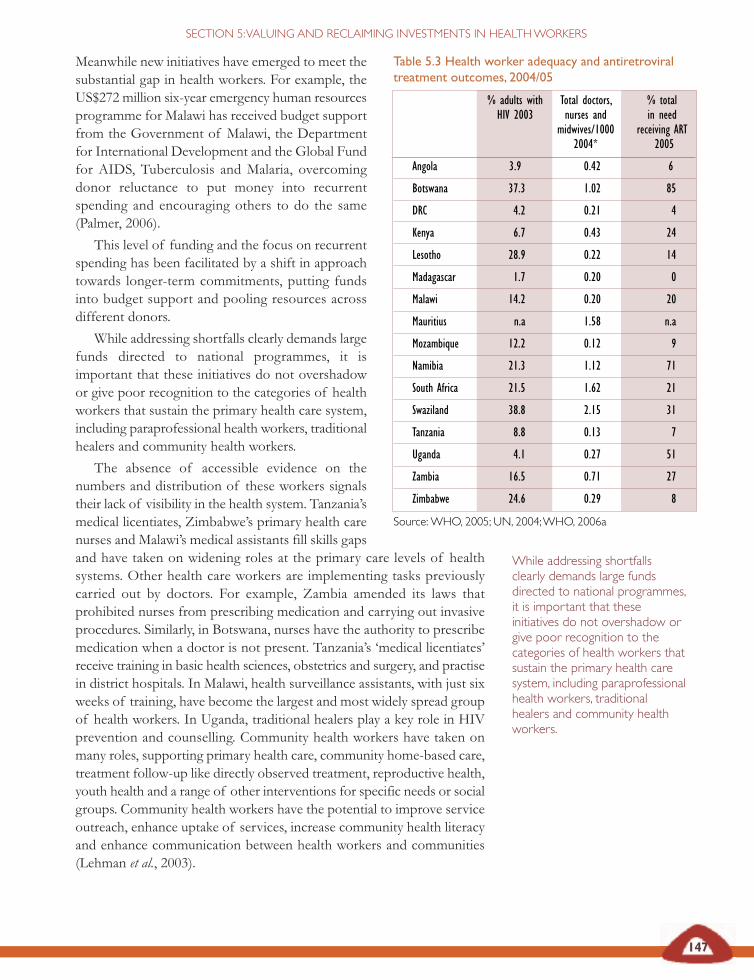
147
Meanwhile new initiatives have emerged to meet thesubstantial gap in health workers. For example, theUS$272 million six-year emergency human resourcesprogramme for Malawi has received budget supportfrom the Government of Malawi, the Departmentfor International Development and the Global Fundfor AIDS, Tuberculosis and Malaria, overcomingdonor reluctance to put money into recurrentspending and encouraging others to do the same(Palmer, 2006).
This level of funding and the focus on recurrentspending has been facilitated by a shift in approachtowards longer-term commitments, putting fundsinto budget support and pooling resources acrossdifferent donors.
While addressing shortfalls clearly demands largefunds directed to national programmes, it isimportant that these initiatives do not overshadowor give poor recognition to the categories of healthworkers that sustain the primary health care system,including paraprofessional health workers, traditionalhealers and community health workers.
The absence of accessible evidence on thenumbers and distribution of these workers signalstheir lack of visibility in the health system. Tanzania’smedical licentiates, Zimbabwe’s primary health carenurses and Malawi’s medical assistants fill skills gapsand have taken on widening roles at the primary care levels of healthsystems. Other health care workers are implementing tasks previouslycarried out by doctors. For example, Zambia amended its laws thatprohibited nurses from prescribing medication and carrying out invasiveprocedures. Similarly, in Botswana, nurses have the authority to prescribemedication when a doctor is not present. Tanzania’s ‘medical licentiates’receive training in basic health sciences, obstetrics and surgery, and practisein district hospitals. In Malawi, health surveillance assistants, with just sixweeks of training, have become the largest and most widely spread groupof health workers. In Uganda, traditional healers play a key role in HIVprevention and counselling. Community health workers have taken onmany roles, supporting primary health care, community home-based care,treatment follow-up like directly observed treatment, reproductive health,youth health and a range of other interventions for specific needs or socialgroups. Community health workers have the potential to improve serviceoutreach, enhance uptake of services, increase community health literacyand enhance communication between health workers and communities(Lehman et al., 2003).
While addressing shortfallsclearly demands large fundsdirected to national programmes,it is important that theseinitiatives do not overshadow orgive poor recognition to thecategories of health workers thatsustain the primary health caresystem, including paraprofessionalhealth workers, traditionalhealers and community healthworkers.
Table 5.3 Health worker adequacy and antiretroviraltreatment outcomes, 2004/05
% adults with Total doctors, % totalHIV 2003 nurses and in need
midwives/1000 receiving ART2004* 2005
Angola 3.9 0.42 6
Botswana 37.3 1.02 85
DRC 4.2 0.21 4
Kenya 6.7 0.43 24
Lesotho 28.9 0.22 14
Madagascar 1.7 0.20 0
Malawi 14.2 0.20 20
Mauritius n.a 1.58 n.a
Mozambique 12.2 0.12 9
Namibia 21.3 1.12 71
South Africa 21.5 1.62 21
Swaziland 38.8 2.15 31
Tanzania 8.8 0.13 7
Uganda 4.1 0.27 51
Zambia 16.5 0.71 27
Zimbabwe 24.6 0.29 8
Source:WHO, 2005; UN, 2004;WHO, 2006a
SECTION 5:VALUING AND RECLAIMING INVESTMENTS IN HEALTHWORKERS
148
RECLAIMINGTHE RESOURCES FOR HEALTH:ADVANCING HEALTH EQUITY IN EAST AND SOUTHERN AFRICA
Do International Monetary Fund budget rules threatenfunding for health workers?
Since the controversy first arose in Uganda, in May 2002, the InternationalMonetary Fund has stated that it would never actually insist that countriesreject grants for health care. But it also qualified its statements by saying, forexample, ‘there is a level at which the management of aid flows and theirimpact on the economy, needs to be monitored’, or ‘very occasionally, thereare ceilings that affect total government employment’.
In Uganda, the finance minister insisted that the country could not accept aUS$52 million grant from the Global Fund for AIDS, Tuberculosis andMalaria because doing so would exceed the established health budget for2002. The International Monetary Fund, he said, would not tolerate such amove as exceeding budgeted expenditures encourages inflation or anunsupportable rise in the value of the national currency. It was a catch-22: toaccept the Global Fund for AIDS, Tuberculosis and Malaria grant, Ugandawould have to cut an identical amount from its existing health budget but theprogramme requires that its funds supplement, rather than substitute,budgeted national funds. The International Monetary Fund’s resistance toincreased spending comes largely from its insistence on low inflation rates.While economists debate on how much inflation a country can toleratewithout threatening growth, many, including some at the World Bank, saythat a growing economy can sustain an inflation rate of up to 20 per cent(others say 40 per cent). The International Monetary Fund almost alwaysrequires that countries maintain an inflation rate of 5 per cent or less in orderto stay ‘on-track’ with their programmes.
Ugandan activists learned of this situation at a time when United Statestreasury secretary, Paul O’Neill, and the rock star, Bono, were touring Africaand were due to stop in Kampala. The activists secured a detailed letter fromthe prominent United States economist, Jeffrey Sachs, denouncing theInternational Monetary Fund’s alleged prescriptions, which was read at publicforums. O’Neill termed the International Monetary Fund’s concerns ‘bogus’and ‘baloney’, and raised the issue with President Yoweri Museveni. TheInternational Monetary Fund representative in Kampala at the time declinedto comment. In December 2003, the Ugandan finance ministry finally brokethe stalemate by accepting the first US$18 million of the grant.
In response to critics of its policies, the International Monetary Fund says thatways can be found to accept funds without creating inflation risks. However,it has yet to issue firm guidelines. Health and treatment activists have in themeantime called on finance institutions to encourage flexibility in budgetceilings in health, education and other sectors central to human development,as well as to urge that countries implement a moratorium on any restrictionson recruitment, salary and benefits in these sectors to adequately respond tosocial demands, such as those of the HIV and AIDS epidemic.
Ambrose, 2004

149
SECTION 5:VALUING AND RECLAIMING INVESTMENTS IN HEALTHWORKERS
But they may also, if poorly resourced and supported, take on unfairburdens, both for themselves and for the poor households and individualsthey work with (AU, 2006; Padarath et al., 2003).
If new resources for health workers are to improve household health,they need to reach and have impact on health workers at community,primary care and district hospital levels. The negative impacts of healthworker and health system shortfalls are most strongly felt by poorhouseholds who largely depend on this level of services for care. Hence,for example, while there is a general relationship between inadequatenumbers of health workers and poor attendance of births by qualifiedpersonnel in east and southern African countries, poor households aretwo to five times more likely to experience this than wealthy households(see table 5.4).
The differentials in health care, described in Section 1, are affected bythe unequal distribution of health workers between public and privatehealth sectors, urban and rural areas and across different levels of thehealth system. As we found in Section 1, aggregate national wealth doesnot always improve this situation and can worsen it where economicinequality is high. The inequitable distribution of health personnelbetween public and private sectors is more intense the more developed theprivate sector. In South Africa, where the private sector consumes 58 percent of total health expenditure, private health services capture 73 percent of general practitioners, catering for less than 20 per cent of thepopulation (Padarath et al., 2003). Within the public sector, healthpersonnel – especially those with higher skills – are more likely to be found
Health worker- client communication, health centre,MalawiSource: B Goddard
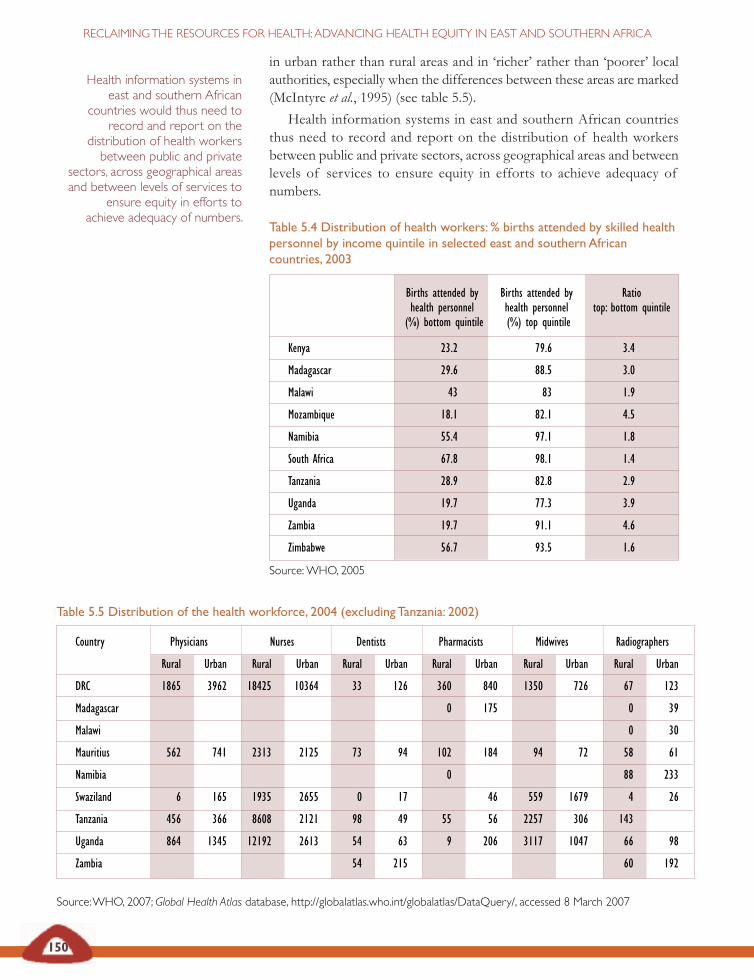
Table 5.5 Distribution of the health workforce, 2004 (excludingTanzania: 2002)
Country Physicians Nurses Dentists Pharmacists Midwives Radiographers
Rural Urban Rural Urban Rural Urban Rural Urban Rural Urban Rural Urban
DRC 1865 3962 18425 10364 33 126 360 840 1350 726 67 123
Madagascar 0 175 0 39
Malawi 0 30
Mauritius 562 741 2313 2125 73 94 102 184 94 72 58 61
Namibia 0 88 233
Swaziland 6 165 1935 2655 0 17 46 559 1679 4 26
Tanzania 456 366 8608 2121 98 49 55 56 2257 306 143
Uganda 864 1345 12192 2613 54 63 9 206 3117 1047 66 98
Zambia 54 215 60 192
Source:WHO, 2007; Global Health Atlas database, http://globalatlas.who.int/globalatlas/DataQuery/, accessed 8 March 2007
Table 5.4 Distribution of health workers: % births attended by skilled healthpersonnel by income quintile in selected east and southern Africancountries, 2003
Births attended by Births attended by Ratiohealth personnel health personnel top: bottom quintile(%) bottom quintile (%) top quintile
Kenya 23.2 79.6 3.4
Madagascar 29.6 88.5 3.0
Malawi 43 83 1.9
Mozambique 18.1 82.1 4.5
Namibia 55.4 97.1 1.8
South Africa 67.8 98.1 1.4
Tanzania 28.9 82.8 2.9
Uganda 19.7 77.3 3.9
Zambia 19.7 91.1 4.6
Zimbabwe 56.7 93.5 1.6
Source:WHO, 2005
150
RECLAIMINGTHE RESOURCES FOR HEALTH:ADVANCING HEALTH EQUITY IN EAST AND SOUTHERN AFRICA
in urban rather than rural areas and in ‘richer’ rather than ‘poorer’ localauthorities, especially when the differences between these areas are marked(McIntyre et al., 1995) (see table 5.5).
Health information systems in east and southern African countriesthus need to record and report on the distribution of health workersbetween public and private sectors, across geographical areas and betweenlevels of services to ensure equity in efforts to achieve adequacy ofnumbers.
Health information systems ineast and southern African
countries would thus need torecord and report on the
distribution of health workersbetween public and private
sectors, across geographical areasand between levels of services to
ensure equity in efforts toachieve adequacy of numbers.
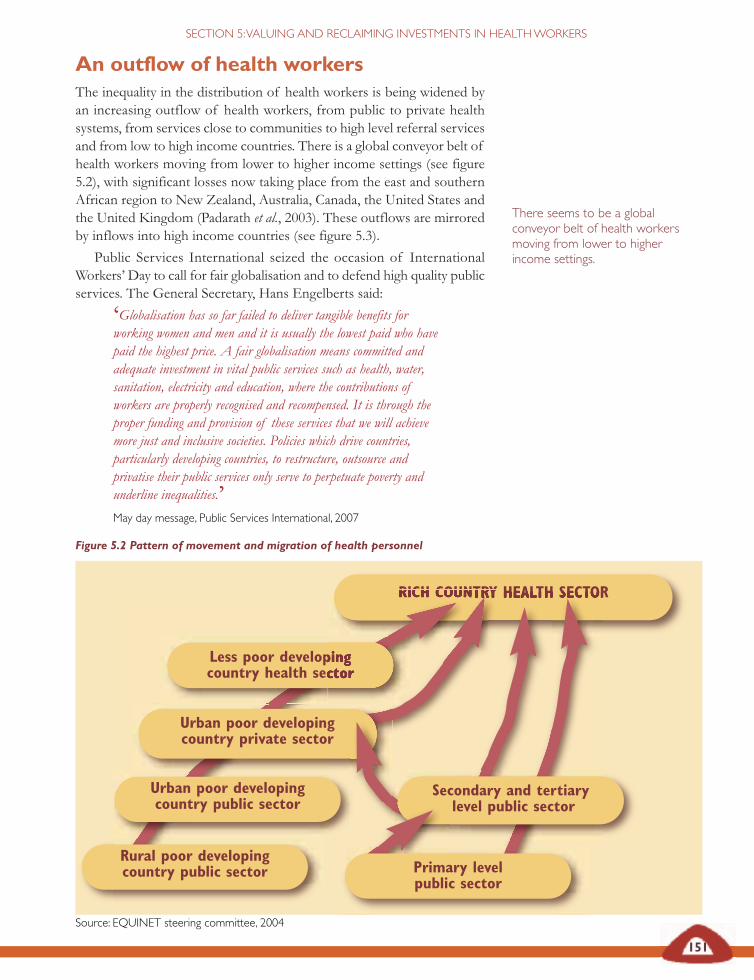
Figure 5.2 Pattern of movement and migration of health personnel
Source: EQUINET steering committee, 2004
151
SECTION 5:VALUING AND RECLAIMING INVESTMENTS IN HEALTHWORKERS
An outflow of health workersThe inequality in the distribution of health workers is being widened byan increasing outflow of health workers, from public to private healthsystems, from services close to communities to high level referral servicesand from low to high income countries. There is a global conveyor belt ofhealth workers moving from lower to higher income settings (see figure5.2), with significant losses now taking place from the east and southernAfrican region to New Zealand, Australia, Canada, the United States andthe United Kingdom (Padarath et al., 2003). These outflows are mirroredby inflows into high income countries (see figure 5.3).
Public Services International seized the occasion of InternationalWorkers’ Day to call for fair globalisation and to defend high quality publicservices. The General Secretary, Hans Engelberts said:
‘Globalisation has so far failed to deliver tangible benefits forworking women and men and it is usually the lowest paid who havepaid the highest price. A fair globalisation means committed andadequate investment in vital public services such as health, water,sanitation, electricity and education, where the contributions ofworkers are properly recognised and recompensed. It is through theproper funding and provision of these services that we will achievemore just and inclusive societies. Policies which drive countries,particularly developing countries, to restructure, outsource andprivatise their public services only serve to perpetuate poverty andunderline inequalities.’May day message, Public Services International, 2007
There seems to be a globalconveyor belt of health workersmoving from lower to higherincome settings.
RICH COUNTRY HEALTH SECTOR
Rural poor developingcountry public sector
Urban poor developingcountry public sector
Less poor developingcountry health sector
Urban poor developingcountry private sector
Secondary and tertiarylevel public sector
Primary levelpublic sector
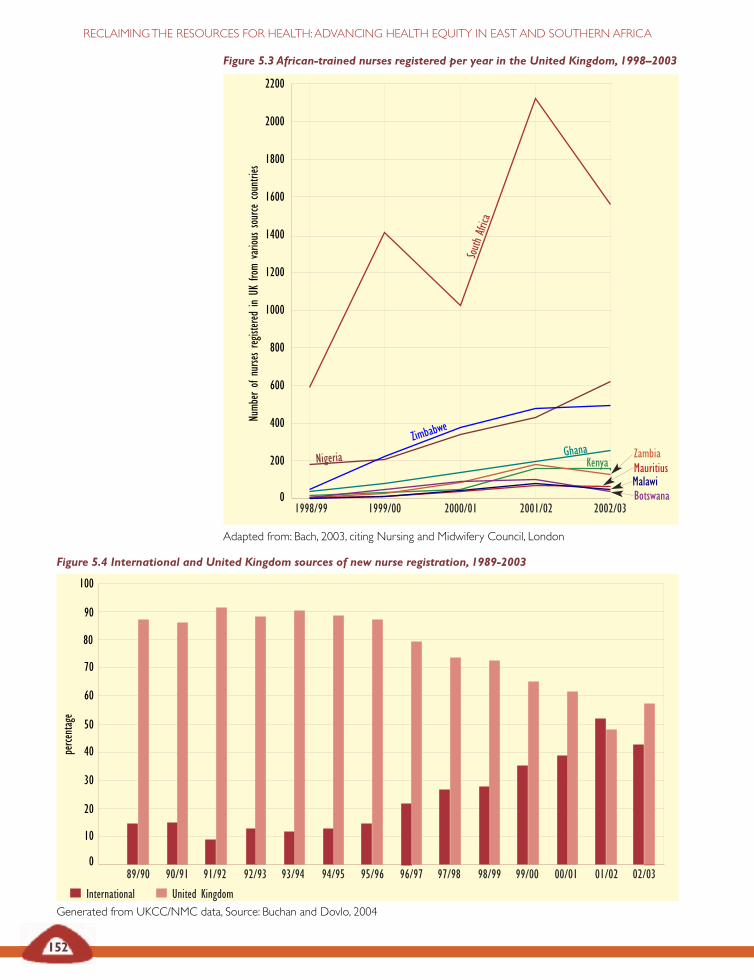
Figure 5.3 African-trained nurses registered per year in the United Kingdom, 1998–2003
Adapted from: Bach, 2003, citing Nursing and Midwifery Council, London
152
RECLAIMINGTHE RESOURCES FOR HEALTH:ADVANCING HEALTH EQUITY IN EAST AND SOUTHERN AFRICA
2200
2000
1800
1600
1400
1200
1000
800
600
400
200
01998/99 1999/00 2000/01 2001/02 2002/03
South
Africa
GhanaZimbab
we
ZambiaMauritiusMalawiBotswana
Numb
erof
nursesreg
istered
inUK
from
various
source
countries
Figure 5.4 International and United Kingdom sources of new nurse registration, 1989-2003
Generated from UKCC/NMC data, Source: Buchan and Dovlo, 2004
100
90
80
70
60
50
40
30
20
10
089/90 90/91 91/92 92/93 93/94 94/95 95/96 96/97 97/98 98/99 99/00 00/01 01/02 02/03
perce
ntage
International United Kingdom
Nigeria Kenya
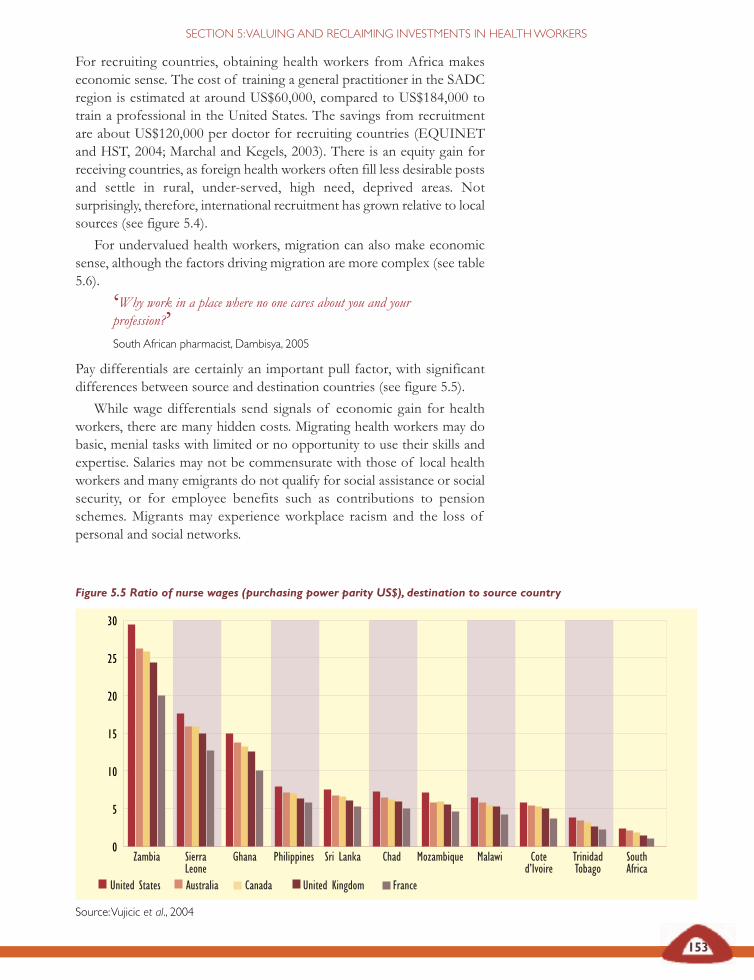
153
SECTION 5:VALUING AND RECLAIMING INVESTMENTS IN HEALTHWORKERS
For recruiting countries, obtaining health workers from Africa makeseconomic sense. The cost of training a general practitioner in the SADCregion is estimated at around US$60,000, compared to US$184,000 totrain a professional in the United States. The savings from recruitmentare about US$120,000 per doctor for recruiting countries (EQUINETand HST, 2004; Marchal and Kegels, 2003). There is an equity gain forreceiving countries, as foreign health workers often fill less desirable postsand settle in rural, under-served, high need, deprived areas. Notsurprisingly, therefore, international recruitment has grown relative to localsources (see figure 5.4).
For undervalued health workers, migration can also make economicsense, although the factors driving migration are more complex (see table5.6).
‘Why work in a place where no one cares about you and yourprofession?’South African pharmacist, Dambisya, 2005
Pay differentials are certainly an important pull factor, with significantdifferences between source and destination countries (see figure 5.5).
While wage differentials send signals of economic gain for healthworkers, there are many hidden costs. Migrating health workers may dobasic, menial tasks with limited or no opportunity to use their skills andexpertise. Salaries may not be commensurate with those of local healthworkers and many emigrants do not qualify for social assistance or socialsecurity, or for employee benefits such as contributions to pensionschemes. Migrants may experience workplace racism and the loss ofpersonal and social networks.
Figure 5.5 Ratio of nurse wages (purchasing power parity US$), destination to source country
Source:Vujicic et al., 2004
30
25
20
15
10
5
0Zambia Sierra
LeoneGhana Philippines Sri Lanka Chad Mozambique Malawi Cote
d’IvoireTrinidadTobago
SouthAfrica
United States Australia Canada United Kingdom France
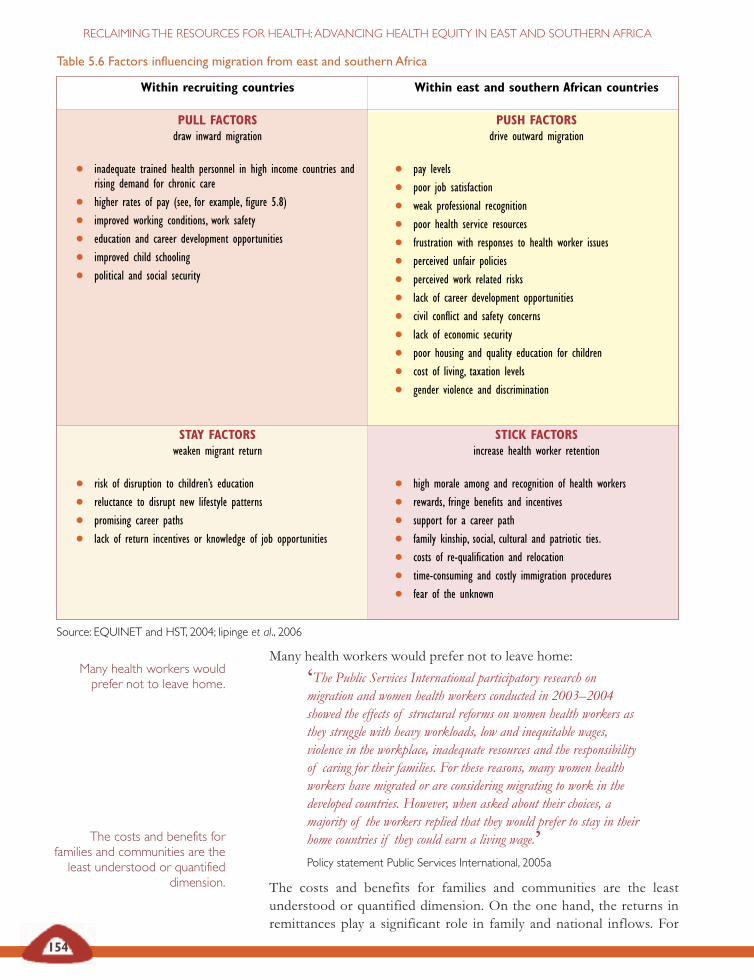
Table 5.6 Factors influencing migration from east and southern Africa
,
Source: EQUINET and HST, 2004; Iipinge et al., 2006
Within recruiting countries
PULL FACTORSdraw inward migration
• inadequate trained health personnel in high income countries andrising demand for chronic care
• higher rates of pay (see, for example, figure 5.8)
• improved working conditions, work safety
• education and career development opportunities
• improved child schooling
• political and social security
Within east and southern African countries
PUSH FACTORSdrive outward migration
• pay levels
• poor job satisfaction
• weak professional recognition
• poor health service resources
• frustration with responses to health worker issues
• perceived unfair policies
• perceived work related risks
• lack of career development opportunities
• civil conflict and safety concerns
• lack of economic security
• poor housing and quality education for children
• cost of living, taxation levels
• gender violence and discrimination
STAY FACTORSweaken migrant return
• risk of disruption to children’s education
• reluctance to disrupt new lifestyle patterns
• promising career paths
• lack of return incentives or knowledge of job opportunities
STICK FACTORSincrease health worker retention
• high morale among and recognition of health workers
• rewards, fringe benefits and incentives
• support for a career path
• family kinship, social, cultural and patriotic ties.
• costs of re-qualification and relocation
• time-consuming and costly immigration procedures
• fear of the unknown
154
RECLAIMINGTHE RESOURCES FOR HEALTH:ADVANCING HEALTH EQUITY IN EAST AND SOUTHERN AFRICA
Many health workers would prefer not to leave home:
‘The Public Services International participatory research onmigration and women health workers conducted in 2003–2004showed the effects of structural reforms on women health workers asthey struggle with heavy workloads, low and inequitable wages,violence in the workplace, inadequate resources and the responsibilityof caring for their families. For these reasons, many women healthworkers have migrated or are considering migrating to work in thedeveloped countries. However, when asked about their choices, amajority of the workers replied that they would prefer to stay in theirhome countries if they could earn a living wage.’Policy statement Public Services International, 2005a
The costs and benefits for families and communities are the leastunderstood or quantified dimension. On the one hand, the returns inremittances play a significant role in family and national inflows. For
Many health workers wouldprefer not to leave home.
The costs and benefits forfamilies and communities are theleast understood or quantified
dimension.
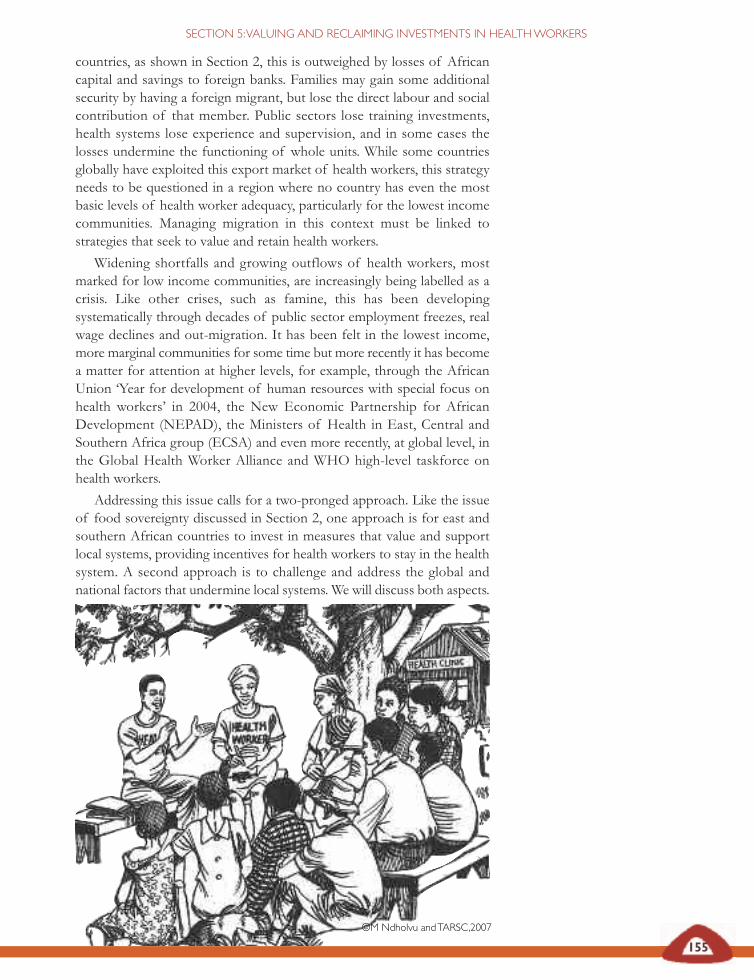
155
SECTION 5:VALUING AND RECLAIMING INVESTMENTS IN HEALTHWORKERS
countries, as shown in Section 2, this is outweighed by losses of Africancapital and savings to foreign banks. Families may gain some additionalsecurity by having a foreign migrant, but lose the direct labour and socialcontribution of that member. Public sectors lose training investments,health systems lose experience and supervision, and in some cases thelosses undermine the functioning of whole units. While some countriesglobally have exploited this export market of health workers, this strategyneeds to be questioned in a region where no country has even the mostbasic levels of health worker adequacy, particularly for the lowest incomecommunities. Managing migration in this context must be linked tostrategies that seek to value and retain health workers.
Widening shortfalls and growing outflows of health workers, mostmarked for low income communities, are increasingly being labelled as acrisis. Like other crises, such as famine, this has been developingsystematically through decades of public sector employment freezes, realwage declines and out-migration. It has been felt in the lowest income,more marginal communities for some time but more recently it has becomea matter for attention at higher levels, for example, through the AfricanUnion ‘Year for development of human resources with special focus onhealth workers’ in 2004, the New Economic Partnership for AfricanDevelopment (NEPAD), the Ministers of Health in East, Central andSouthern Africa group (ECSA) and even more recently, at global level, inthe Global Health Worker Alliance and WHO high-level taskforce onhealth workers.
Addressing this issue calls for a two-pronged approach. Like the issueof food sovereignty discussed in Section 2, one approach is for east andsouthern African countries to invest in measures that value and supportlocal systems, providing incentives for health workers to stay in the healthsystem. A second approach is to challenge and address the global andnational factors that undermine local systems. We will discuss both aspects.
©M Ndholvu andTARSC,2007
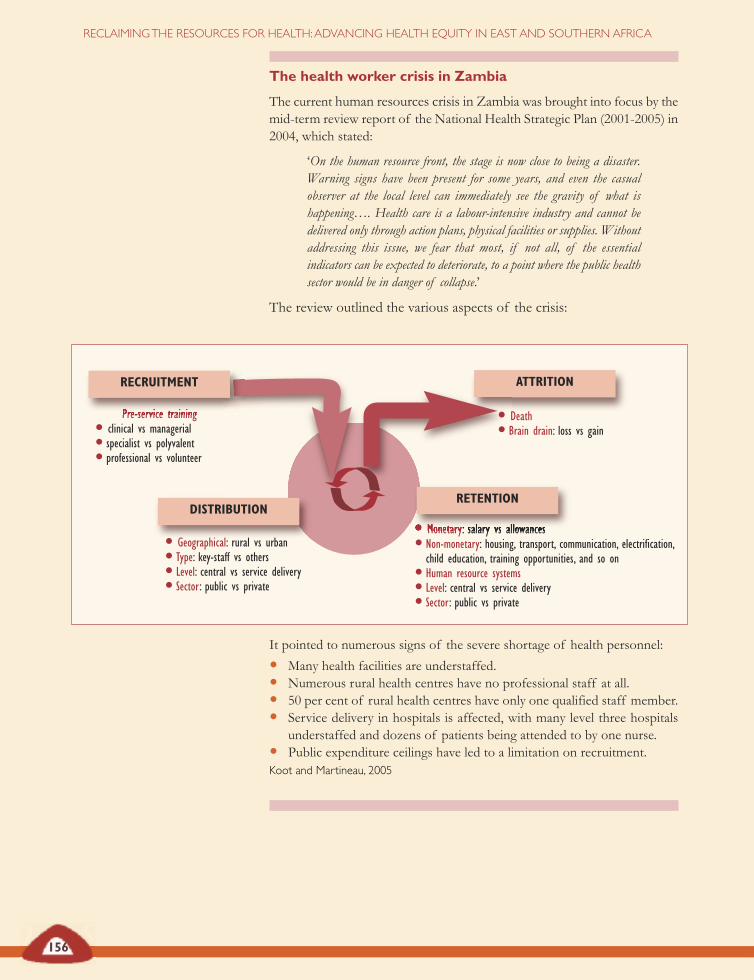
The health worker crisis in Zambia
The current human resources crisis in Zambia was brought into focus by themid-term review report of the National Health Strategic Plan (2001-2005) in2004, which stated:
‘On the human resource front, the stage is now close to being a disaster.Warning signs have been present for some years, and even the casualobserver at the local level can immediately see the gravity of what ishappening…. Health care is a labour-intensive industry and cannot bedelivered only through action plans, physical facilities or supplies. Withoutaddressing this issue, we fear that most, if not all, of the essentialindicators can be expected to deteriorate, to a point where the public healthsector would be in danger of collapse.’
The review outlined the various aspects of the crisis:
It pointed to numerous signs of the severe shortage of health personnel:
• Many health facilities are understaffed.• Numerous rural health centres have no professional staff at all.• 50 per cent of rural health centres have only one qualified staff member.• Service delivery in hospitals is affected, with many level three hospitals
understaffed and dozens of patients being attended to by one nurse.• Public expenditure ceilings have led to a limitation on recruitment.Koot and Martineau, 2005
156
RECLAIMINGTHE RESOURCES FOR HEALTH:ADVANCING HEALTH EQUITY IN EAST AND SOUTHERN AFRICA
DISTRIBUTION
ATTRITION
Pre-service training• clinical vs managerial• specialist vs polyvalent• professional vs volunteer
• Geographical: rural vs urban• Type: key-staff vs others• Level: central vs service delivery• Sector: public vs private
• Death• Brain drain: loss vs gain
• Monetary: salary vs allowances• Non-monetary: housing, transport, communication, electrification,
child education, training opportunities, and so on• Human resource systems• Level: central vs service delivery• Sector: public vs private
RETENTION
RECRUITMENT
157
SECTION 5:VALUING AND RECLAIMING INVESTMENTS IN HEALTHWORKERS
Valuing and retaining health workersIntervening in the crisis may not start with following the trail of migratinghealth workers. It may rather begin with giving focus to the health workersremaining in many levels of the system. These workers form the core ofa functioning health system, but are also exhausted, overworked, facedifficult working conditions, fear the risk of HIV and other infections,are unable to access treatment and encounter obstacles in accessinghousing and education.
‘How does one care for someone when we do not care aboutourselves? Health care workers have kept silent for so long. Do youknow what silence is? Silence is the absence of sound. Sound is whenyou make an impression and from us as nurses there is no sound orimpression. That is why the government can make legislation withoutasking the health workers. The message of silence – it is ‘unagreed’,but everyone accepts it as a YES. I appeal to everyone to consideryour silence because if you don’t want to say yes, raise your voice andsay NO!’Industrial Health Research Group, 2006
To take action, some governments have set up new institutionalmechanisms giving themselves the flexibility to address health workerissues within the often stringent civil service rules. Zambia, for example,created autonomous health boards, not bound by civil service rules, withthe flexibility to hire personnel on contract rather than as civil servants(Koot and Martineau, 2005). Zimbabwe recently set up a Health ServicesBoard to separate health worker employment from the direct control ofthe public services commission (Health Reporter, 2004).
The first, immediate steps are often financial – we need to address realwage declines and improve real earnings. Formal improvements throughsalary increases, top-ups and allowances replace (or sometimescomplement) more informal measures health workers have taken tomitigate falling real wages. Research in Malawi found that such informalmeasures included additional locum, part-time and overtime work, treatingprivate patients during official work hours, consultancies, selling medicinesand adding income from workshop per diems (Muula and Maseko, 2005).In the last decade, countries in the region have introduced or allowed arange of financial incentives for health workers to improve incomes,including some less planned, informal incentives (see table 5.7).
Some measures, like dual practice, have created new problems. Inpractice, the measure can be difficult to regulate and resources may leakfrom public to private sector work.
However, more significantly, all of these financial measures call forstable macro-economic conditions to retain value. With annual inflationin east and southern Africa ranging in 2003 from 1 per cent (Namibia) to263 per cent (Zimbabwe)(a range that has since widened), inflation erodesfinancial incentives in the very environments where they are most needed.
The first, immediate steps areoften financial – we need toaddress real wage declines andimprove real earnings.
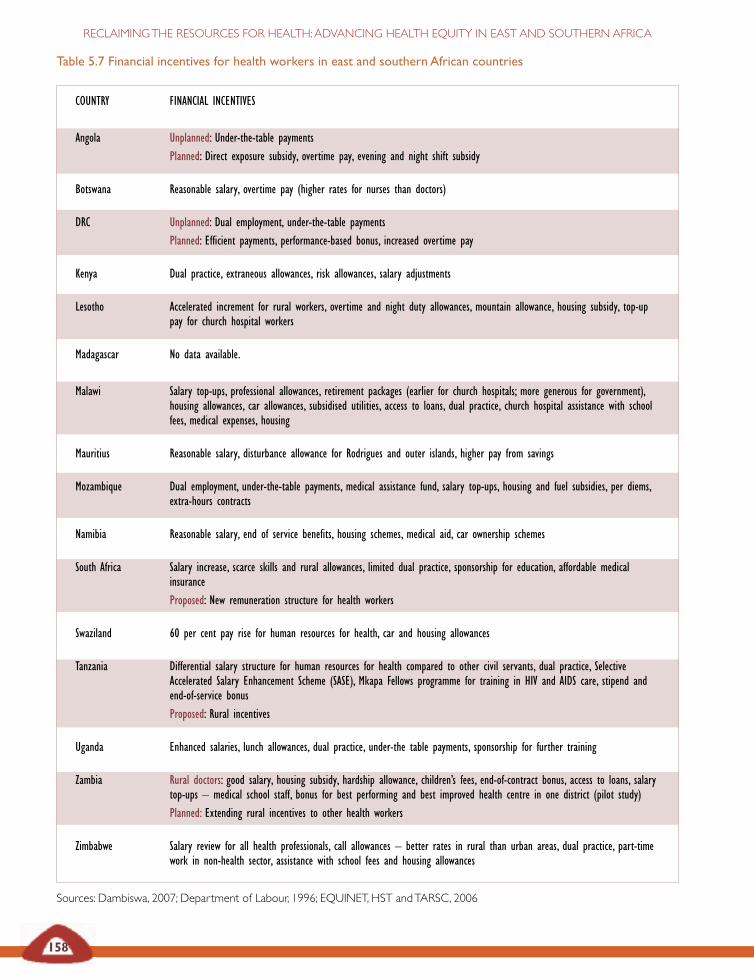
Table 5.7 Financial incentives for health workers in east and southern African countries
COUNTRY FINANCIAL INCENTIVES
Angola Unplanned: Under-the-table paymentsPlanned: Direct exposure subsidy, overtime pay, evening and night shift subsidy
Botswana Reasonable salary, overtime pay (higher rates for nurses than doctors)
DRC Unplanned: Dual employment, under-the-table paymentsPlanned: Efficient payments, performance-based bonus, increased overtime pay
Kenya Dual practice, extraneous allowances, risk allowances, salary adjustments
Lesotho Accelerated increment for rural workers, overtime and night duty allowances, mountain allowance, housing subsidy, top-uppay for church hospital workers
Madagascar No data available.
Malawi Salary top-ups, professional allowances, retirement packages (earlier for church hospitals; more generous for government),housing allowances, car allowances, subsidised utilities, access to loans, dual practice, church hospital assistance with schoolfees, medical expenses, housing
Mauritius Reasonable salary, disturbance allowance for Rodrigues and outer islands, higher pay from savings
Mozambique Dual employment, under-the-table payments, medical assistance fund, salary top-ups, housing and fuel subsidies, per diems,extra-hours contracts
Namibia Reasonable salary, end of service benefits, housing schemes, medical aid, car ownership schemes
South Africa Salary increase, scarce skills and rural allowances, limited dual practice, sponsorship for education, affordable medicalinsuranceProposed: New remuneration structure for health workers
Swaziland 60 per cent pay rise for human resources for health, car and housing allowances
Tanzania Differential salary structure for human resources for health compared to other civil servants, dual practice, SelectiveAccelerated Salary Enhancement Scheme (SASE), Mkapa Fellows programme for training in HIV and AIDS care, stipend andend-of-service bonusProposed: Rural incentives
Uganda Enhanced salaries, lunch allowances, dual practice, under-the table payments, sponsorship for further training
Zambia Rural doctors: good salary, housing subsidy, hardship allowance, children’s fees, end-of-contract bonus, access to loans, salarytop-ups – medical school staff, bonus for best performing and best improved health centre in one district (pilot study)Planned: Extending rural incentives to other health workers
Zimbabwe Salary review for all health professionals, call allowances – better rates in rural than urban areas, dual practice, part-timework in non-health sector, assistance with school fees and housing allowances
Sources: Dambiswa, 2007; Department of Labour, 1996; EQUINET, HST andTARSC, 2006
158
RECLAIMINGTHE RESOURCES FOR HEALTH:ADVANCING HEALTH EQUITY IN EAST AND SOUTHERN AFRICA
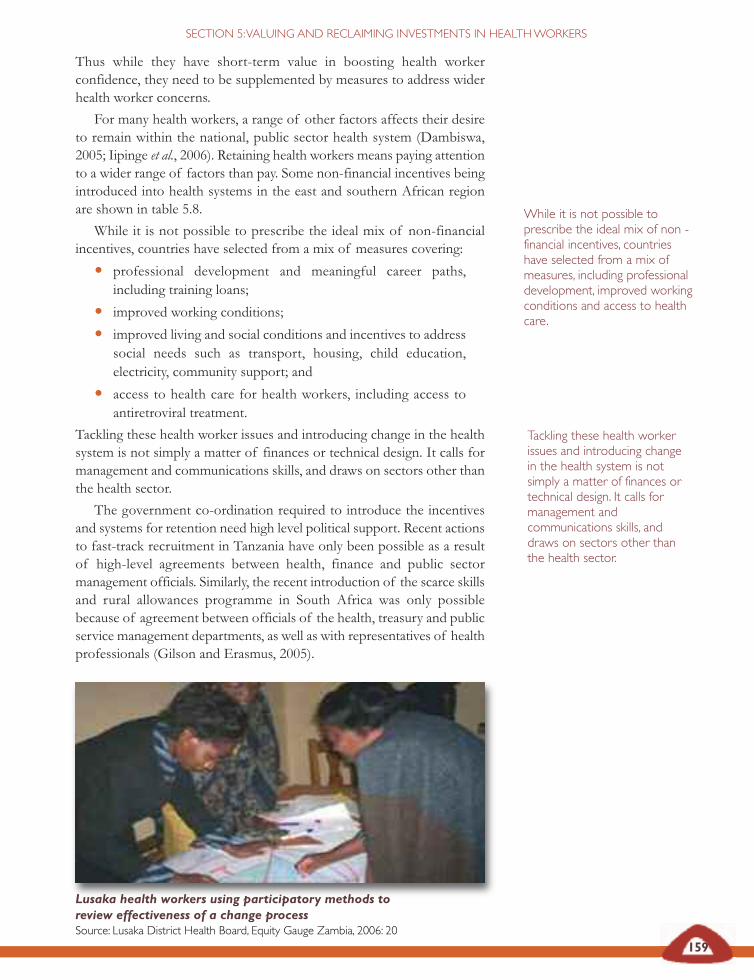
159
SECTION 5:VALUING AND RECLAIMING INVESTMENTS IN HEALTHWORKERS
Thus while they have short-term value in boosting health workerconfidence, they need to be supplemented by measures to address widerhealth worker concerns.
For many health workers, a range of other factors affects their desireto remain within the national, public sector health system (Dambiswa,2005; Iipinge et al., 2006). Retaining health workers means paying attentionto a wider range of factors than pay. Some non-financial incentives beingintroduced into health systems in the east and southern African regionare shown in table 5.8.
While it is not possible to prescribe the ideal mix of non-financialincentives, countries have selected from a mix of measures covering:
• professional development and meaningful career paths,including training loans;
• improved working conditions;
• improved living and social conditions and incentives to addresssocial needs such as transport, housing, child education,electricity, community support; and
• access to health care for health workers, including access toantiretroviral treatment.
Tackling these health worker issues and introducing change in the healthsystem is not simply a matter of finances or technical design. It calls formanagement and communications skills, and draws on sectors other thanthe health sector.
The government co-ordination required to introduce the incentivesand systems for retention need high level political support. Recent actionsto fast-track recruitment in Tanzania have only been possible as a resultof high-level agreements between health, finance and public sectormanagement officials. Similarly, the recent introduction of the scarce skillsand rural allowances programme in South Africa was only possiblebecause of agreement between officials of the health, treasury and publicservice management departments, as well as with representatives of healthprofessionals (Gilson and Erasmus, 2005).
Lusaka health workers using participatory methods toreview effectiveness of a change processSource: Lusaka District Health Board, Equity Gauge Zambia, 2006: 20
Tackling these health workerissues and introducing changein the health system is notsimply a matter of finances ortechnical design. It calls formanagement andcommunications skills, anddraws on sectors other thanthe health sector.
While it is not possible toprescribe the ideal mix of non -financial incentives, countrieshave selected from a mix ofmeasures, including professionaldevelopment, improved workingconditions and access to healthcare.
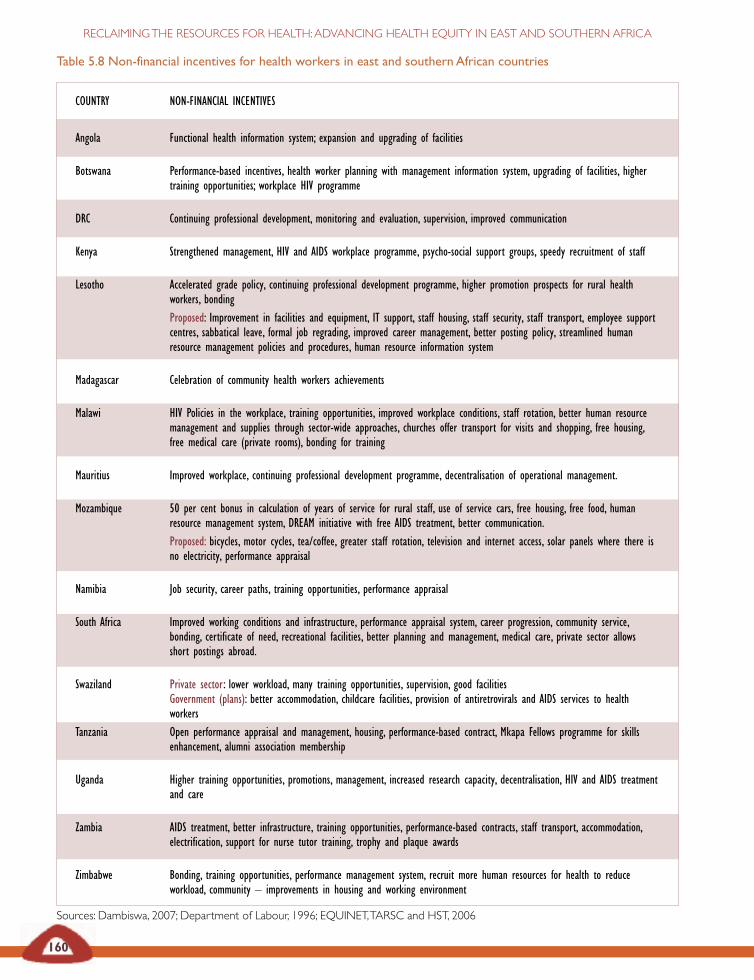
Table 5.8 Non-financial incentives for health workers in east and southern African countries
COUNTRY NON-FINANCIAL INCENTIVES
Angola Functional health information system; expansion and upgrading of facilities
Botswana Performance-based incentives, health worker planning with management information system, upgrading of facilities, highertraining opportunities; workplace HIV programme
DRC Continuing professional development, monitoring and evaluation, supervision, improved communication
Kenya Strengthened management, HIV and AIDS workplace programme, psycho-social support groups, speedy recruitment of staff
Lesotho Accelerated grade policy, continuing professional development programme, higher promotion prospects for rural healthworkers, bondingProposed: Improvement in facilities and equipment, IT support, staff housing, staff security, staff transport, employee supportcentres, sabbatical leave, formal job regrading, improved career management, better posting policy, streamlined humanresource management policies and procedures, human resource information system
Madagascar Celebration of community health workers achievements
Malawi HIV Policies in the workplace, training opportunities, improved workplace conditions, staff rotation, better human resourcemanagement and supplies through sector-wide approaches, churches offer transport for visits and shopping, free housing,free medical care (private rooms), bonding for training
Mauritius Improved workplace, continuing professional development programme, decentralisation of operational management.
Mozambique 50 per cent bonus in calculation of years of service for rural staff, use of service cars, free housing, free food, humanresource management system, DREAM initiative with free AIDS treatment, better communication.Proposed: bicycles, motor cycles, tea/coffee, greater staff rotation, television and internet access, solar panels where there isno electricity, performance appraisal
Namibia Job security, career paths, training opportunities, performance appraisal
South Africa Improved working conditions and infrastructure, performance appraisal system, career progression, community service,bonding, certificate of need, recreational facilities, better planning and management, medical care, private sector allowsshort postings abroad.
Swaziland Private sector: lower workload, many training opportunities, supervision, good facilitiesGovernment (plans): better accommodation, childcare facilities, provision of antiretrovirals and AIDS services to healthworkers
Tanzania Open performance appraisal and management, housing, performance-based contract, Mkapa Fellows programme for skillsenhancement, alumni association membership
Uganda Higher training opportunities, promotions, management, increased research capacity, decentralisation, HIV and AIDS treatmentand care
Zambia AIDS treatment, better infrastructure, training opportunities, performance-based contracts, staff transport, accommodation,electrification, support for nurse tutor training, trophy and plaque awards
Zimbabwe Bonding, training opportunities, performance management system, recruit more human resources for health to reduceworkload, community – improvements in housing and working environment
Sources: Dambiswa, 2007; Department of Labour, 1996; EQUINET,TARSC and HST, 2006
160
RECLAIMINGTHE RESOURCES FOR HEALTH:ADVANCING HEALTH EQUITY IN EAST AND SOUTHERN AFRICA
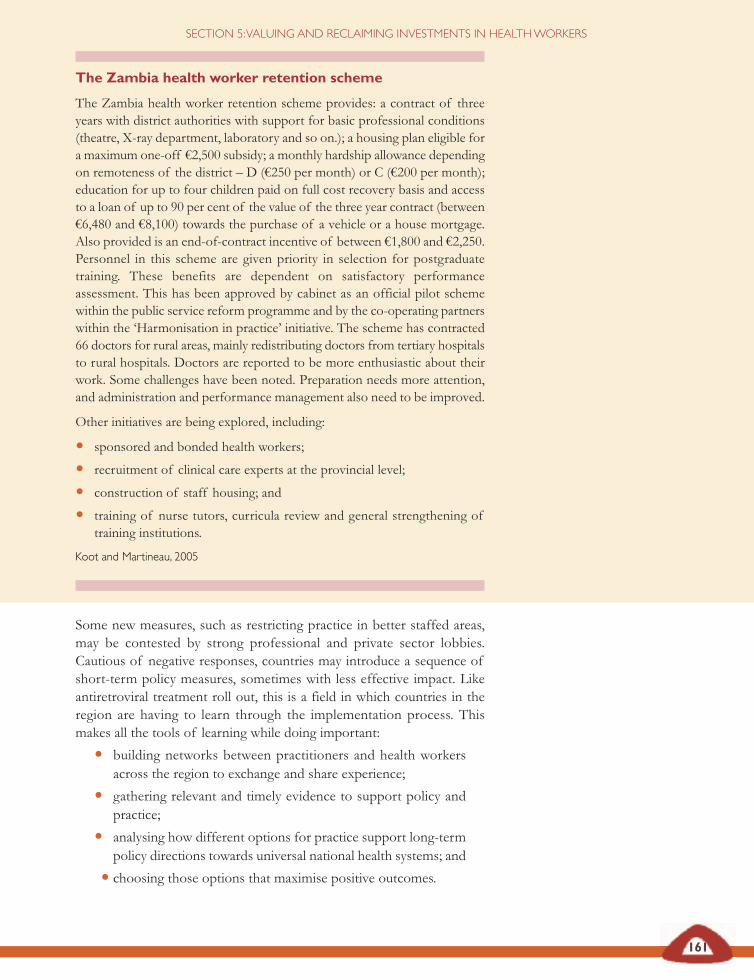
161
SECTION 5:VALUING AND RECLAIMING INVESTMENTS IN HEALTHWORKERS
The Zambia health worker retention scheme
The Zambia health worker retention scheme provides: a contract of threeyears with district authorities with support for basic professional conditions(theatre, X-ray department, laboratory and so on.); a housing plan eligible fora maximum one-off €2,500 subsidy; a monthly hardship allowance dependingon remoteness of the district – D (€250 per month) or C (€200 per month);education for up to four children paid on full cost recovery basis and accessto a loan of up to 90 per cent of the value of the three year contract (between€6,480 and €8,100) towards the purchase of a vehicle or a house mortgage.Also provided is an end-of-contract incentive of between €1,800 and €2,250.Personnel in this scheme are given priority in selection for postgraduatetraining. These benefits are dependent on satisfactory performanceassessment. This has been approved by cabinet as an official pilot schemewithin the public service reform programme and by the co-operating partnerswithin the ‘Harmonisation in practice’ initiative. The scheme has contracted66 doctors for rural areas, mainly redistributing doctors from tertiary hospitalsto rural hospitals. Doctors are reported to be more enthusiastic about theirwork. Some challenges have been noted. Preparation needs more attention,and administration and performance management also need to be improved.
Other initiatives are being explored, including:
• sponsored and bonded health workers;
• recruitment of clinical care experts at the provincial level;
• construction of staff housing; and
• training of nurse tutors, curricula review and general strengthening oftraining institutions.
Koot and Martineau, 2005
Some new measures, such as restricting practice in better staffed areas,may be contested by strong professional and private sector lobbies.Cautious of negative responses, countries may introduce a sequence ofshort-term policy measures, sometimes with less effective impact. Likeantiretroviral treatment roll out, this is a field in which countries in theregion are having to learn through the implementation process. Thismakes all the tools of learning while doing important:
• building networks between practitioners and health workersacross the region to exchange and share experience;
• gathering relevant and timely evidence to support policy andpractice;
• analysing how different options for practice support long-termpolicy directions towards universal national health systems; and
• choosing those options that maximise positive outcomes.
162
RECLAIMINGTHE RESOURCES FOR HEALTH:ADVANCING HEALTH EQUITY IN EAST AND SOUTHERN AFRICA
These approaches all rely on reasonably accurate and availableinformation. Information systems focusing on health workers are stillweak and remain a vital area for investment. The paucity of regionalinformation on health workers other than doctors and nurses is evidentand brings the completeness of information systems into question. Asfigure 5.6 on page 164 shows, there is a large difference between datarecorded in east and southern Africa sending countries (in this case SouthAfrica) and data in receiving countries, with much lower rates ofemigration recorded in the former (Stilwell et al., 2003).
Management practices send signals to health workers about whetherthey are cared for and recognised, and many health workers feel uncaredfor and unrecognised. Management capacities are often strongest in therichest, urban areas that are able to motivate effectively, with clearlystructured plans and budgets for additional resources. In order to promoteequity in decentralised systems, increased central government support ofmanagement capacities is essential, particularly in historicallydisadvantaged areas (Makan et al., 1997). This includes supervisionguidelines, job descriptions and induction guidelines, health managementinformation systems and support for negotiation and leadership skills.
On a country–by-country basis, auditing and action on the systems forintroducing and managing change are as essential as the incentivesthemselves.
Institutional changes to support retention strategies inMalawi
Malawi human resources for health strategies are supported by strengthenedpolicy and systems across the health sector, through:
• a human resources for health strategic framework and plan, encompassingall plans and interventions related to human resources for health in theprivate and public sectors;
• review of existing recruitment and deployment policies, strategies andpractices;
• a national recruitment and deployment policy and plan;
• review of the human resources for health function at all levels across thehealth sector (Human Resource Management Section D, Ministry ofHealth directorates, regulatory bodies, Health Services Council, treasury,and so on);
• strengthened information systems at all levels to adequately and accuratelyinform human resources for health policy, planning and practice; and
• regular analysis and use of data to inform human resources for healthpolicy and strategic and operational decision making.
EQUINET, TARSC and HST, 2006
163
SECTION 5:VALUING AND RECLAIMING INVESTMENTS IN HEALTHWORKERS
Introducing these changes also demands meaningful participation byprofessional organisations and unions to support the leadership,communication and institutional trust needed for change.
‘I just wish our employer would consult us more as health workersbecause we do have a say in these issues as they affect us directly.They should consult us before decision-making so that they couldknow our opinions, feelings and views before deciding on the thingsthat should be done. If they did this I would trust my employermore.’South African nurse, Gilson et al., 2004
Some regard strong labour relations and union or employer bargainingcouncils as an obstacle to change; others view them as essential innegotiating change. Beyond the institutional changes to give governmentsgreater flexibility in responding to health worker issues, deeperinstitutional processes re-orient health workers, rebuild trust betweenhealth workers and authorities, and encourage collective forms of workorganisation and supportive management practices. The processes andexpertise of labour market institutions present potential assets for theseprocesses, not obstacles.
Reclaiming resources from healthworker migration
‘The migration of skilled health sector workers reflects the globalinequity in the investment and distribution of scarce humanresources. The failure of many rich countries to develop their ownhuman resources for health has led them to resort to large-scaleinternational recruitment to address their health staffing needs. Atthe same time, failed reforms and decreased spending in public healthin both home and host countries have led to the departure of healthcare workers to find other employment, or to work abroad.’Public Services International, 2005b
While the major task is for east and southern African countries to organisethe resources and systems to value and retain health workers, this isundermined by the lost experience and resources due to out-migration.This is not simply an issue for the region; it involves recruiting countriesand the wider global community.
Responses to the losses include various ‘ethical recruitment codes’being negotiated, several of which apply in the east and southern Africanregion. While these recognise the right of freedom of movement and thedemand to protect the rights of migrant workers, they also recognise theneed to protect countries with vulnerable health systems. Generally, thecodes focus on and seek to limit active recruitment or to subject it tobilateral agreements.
Codes, such as those listed on page 165, set out intention and carrysome political weight, but experience problems regarding monitoring andenforceability.
Introducing these changes alsodemands meaningfulparticipation by professionalorganisations and unions tosupport the leadership,communication and institutionaltrust needed for change.
Codes set out intention andcarry some political weight butexperience problems regardingmonitoring and enforceability.
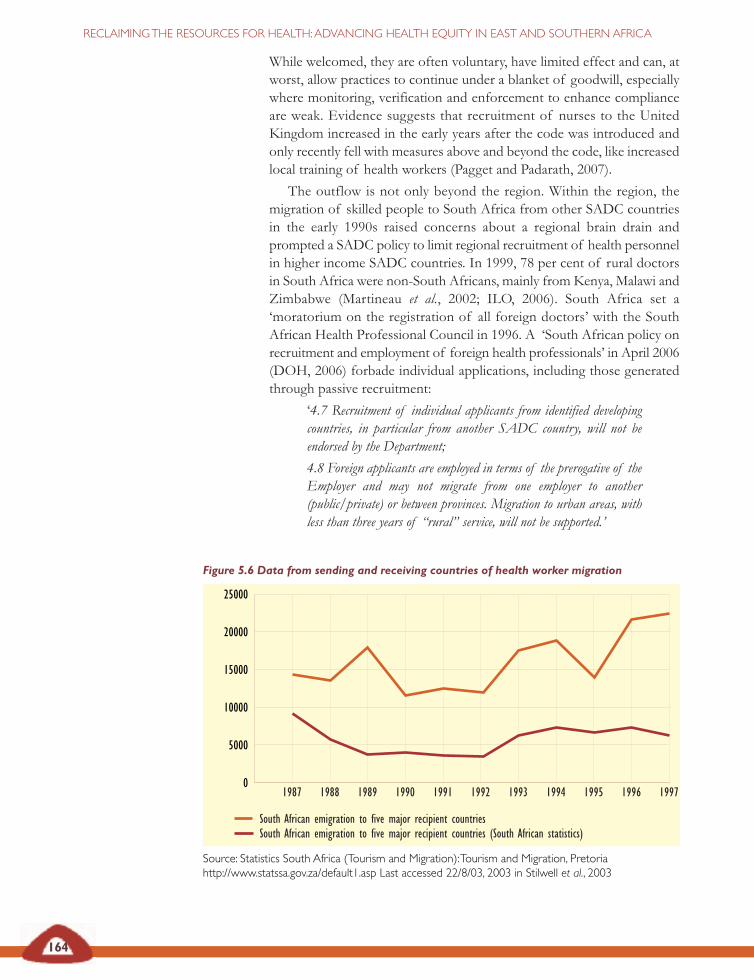
164
RECLAIMINGTHE RESOURCES FOR HEALTH:ADVANCING HEALTH EQUITY IN EAST AND SOUTHERN AFRICA
While welcomed, they are often voluntary, have limited effect and can, atworst, allow practices to continue under a blanket of goodwill, especiallywhere monitoring, verification and enforcement to enhance complianceare weak. Evidence suggests that recruitment of nurses to the UnitedKingdom increased in the early years after the code was introduced andonly recently fell with measures above and beyond the code, like increasedlocal training of health workers (Pagget and Padarath, 2007).
The outflow is not only beyond the region. Within the region, themigration of skilled people to South Africa from other SADC countriesin the early 1990s raised concerns about a regional brain drain andprompted a SADC policy to limit regional recruitment of health personnelin higher income SADC countries. In 1999, 78 per cent of rural doctorsin South Africa were non-South Africans, mainly from Kenya, Malawi andZimbabwe (Martineau et al., 2002; ILO, 2006). South Africa set a‘moratorium on the registration of all foreign doctors’ with the SouthAfrican Health Professional Council in 1996. A ‘South African policy onrecruitment and employment of foreign health professionals’ in April 2006(DOH, 2006) forbade individual applications, including those generatedthrough passive recruitment:
‘4.7 Recruitment of individual applicants from identified developingcountries, in particular from another SADC country, will not beendorsed by the Department;
4.8 Foreign applicants are employed in terms of the prerogative of theEmployer and may not migrate from one employer to another(public/private) or between provinces. Migration to urban areas, withless than three years of “rural” service, will not be supported.’
Figure 5.6 Data from sending and receiving countries of health worker migration
Source: Statistics South Africa (Tourism and Migration):Tourism and Migration, Pretoriahttp://www.statssa.gov.za/default1.asp Last accessed 22/8/03, 2003 in Stilwell et al., 2003
25000
20000
15000
10000
5000
01987 1988 1989 1990 1991 1992 1993 1994 1995 1996 1997
South African emigration to five major recipient countriesSouth African emigration to five major recipient countries (South African statistics)
165
SECTION 5:VALUING AND RECLAIMING INVESTMENTS IN HEALTHWORKERS
An overview of international codes of practice andagreements in east and southernAfrica
The United Kingdom Code of Practice on Ethical InternationalRecruitment of Health Personnel, 1999 (revised in 2004) precludes theactive recruitment of health care professionals from developing countries,unless there is a government-to-government agreement to supportrecruitment activities. It applies to the United Kingdom National HealthService and independent (private) sector agencies. It has no legal force.
The Commonwealth Code of Practice for the InternationalRecruitment of HealthWorkers, 2003 covers the 54 Commonwealthcountries and discourages the targeted recruitment of health workers fromcountries which are themselves experiencing shortages. It refers to the needfor workers to have completed their obligations in the source countries beforemigrating, for recruiters to ‘consider ways in which they could provideassistance to source countries and for source countries to develop retentionstrategies for workers’. Certain phrases on compensating source countries forworker losses proved to go a step too far and Australia, Canada and theUnited Kingdom declined to sign the code.
The 2004World Health Assembly resolution 57.19 calls for memberstates to develop more effective human resources policies that address issuesof retention, planning and management, salaries and incentive schemes, andbilateral agreements for exchange programmes. It tasks WHO to support thiswith information systems for monitoring human resources issues, researchand an international instrument.
The International Council of Nurses, representing 124 nursingassociations, including many in Africa, developed a position statement onethical nurse recruitment in 2001. While recognising the right of individualnurses to migrate, the statement emphasises the adverse effects ofinternational migration of nurses on health care quality in some sourcecountries. It lists key principles for ethical nurse recruitment, focusing on:credible nursing regulation; access to full employment; family-friendlyenvironments and re-insertion programmes in receiving countries; freedomof movement; freedom from discrimination; good faith contracting; equalpay for work of equal value; and ethical regulation of recruitment.
The 2005 General Assembly of the World Federation of PublicHealthAssociation proposed a position statement on ethical restrictions oninternational recruitment of health professionals from low-income countriesand calls for source countries to try to mitigate push factors, includingthrough adequate and regular payment, professional developmentopportunities, sabbatical time, career pathways and opportunities for research.
TheWorld Conference of Family Doctors Code of Practice for theInternational Recruitment of Health Care Professionals,2002 coverslargely the same ground as the International Council of Nurses, PublicServices International and Commonwealth statements and codes and suggeststhat countries only recruit and advertise from another country when a bilateralagreement exists.
166
RECLAIMINGTHE RESOURCES FOR HEALTH:ADVANCING HEALTH EQUITY IN EAST AND SOUTHERN AFRICA
Arguably, enabling some migration within the region is preferable toclosing these options, if it leads to losses beyond the region. Othercountries in the region have managed migration agreements. For example,Namibia has an agreement with Kenya and Cuba to employ specificcategories of health workers – nurses from Kenya and Cuba, and doctorsfrom Cuba. However it is still unclear how these agreements link tonational strategies to ensure adequacy and retention, and closing this loopwould be important.
At international level, the policies are less clear. The weak impact ofethical codes makes these a useful signal of policy intent but not effectivefor managing costs and benefits. Countries in the region have had long-standing agreements with several governments, church organisations andother non-state organisations to obtain health workers, such as doctorsfrom Cuba and China, faith-based organisation personnel from Europeand Iran, and non-governmental organisation personnel from Europe andthe United States. Increasingly countries are entering into multilateralagreements, such as the European Union economic partnership agreementdescribed in Section 2, that provide a means to address these issues:
‘Bilateral and multilateral agreements are considered by some to bepreferable to the ‘code of practice route’, since they ensure a morepredictable and transparent process for both countries, shift the costof migration from the individual migrant to the final client, canincorporate a variety of provisions and could create a ‘genuinepartnership between countries which could tip the terms of trade morein favour of the source country’.’Bach, 2003:24
The World Conference of Family Doctors suggests the following areasfor bilateral agreements:
• how this recruitment will be done;
• the benefits to each country;
• the nature and degree of compensation that should be paid tocontribute to the support and training of health workers in theircountry of origin;
• the steps required to ensure that any recruitment by agencies orgovernment is conducted and monitored according to this codeof practice;
• the inclusion of health workers recruited from abroad underthe receiving country’s employment laws;
• the provision of full and accurate information to potentialrecruits regarding the nature of the job, selection proceduresand their contractual rights and obligations;
• the support, further education, training and continuingprofessional development available to recruited health workersthat is equivalent to that provided to other health workers;
• the support and encouragement of nationals to return to workin their country of origin (WONCA, 2002).
167
Such agreements would need to incorporate the issue of lost public sectorinvestment in training health personnel in east and southern Africa. SADChealth ministers in June 2001 noted that the ‘active and vigorousrecruitment’ of their health professionals could be seen as looting fromthese countries and is similar to that experienced during colonisation whenall resources, including minerals, were looted to industrialised countries’.The statement also pointed out that the pattern of movement of skilledpeople ‘further entrenches inequitable wealth and resources’ (Gilson andErasmus, 2005:4).
Ministers of health from the region continue to assert that high incomecountries recruiting health workers trained in African public sectorsystems constitutes an unfair and perverse subsidy from poor to richcountry health systems that needs to be addressed.
SECTION 5VALUING AND RECLAIMING INVESTMENTS IN HEALTHWORKERS
East, Central and SouthernAfrican Health Community
The 42nd Regional health ministers’ conference 6–11 February 2006Resolutions of the 42nd Regional Health Minister’s ConferenceRHMC/42/R4 Human Resources for Health
• Noting that several recommendations made during previous regionalhealth ministers’ conferences continue to be pertinent human resourcesissues that need full implementation and periodic evaluation;
• Acknowledging that the HIV and AIDS pandemic adversely impacts onhuman resource and quality health care;
• Recognising that adequate human resources are critical for the effectiveimplementation of HIV and AIDS interventions;
• Recognising that out-migration of scarce health professionals from theeast, central and southern African region is a growing problem whichcontinues to deplete the existing health care workforce;
• Recognising that without accurate, current data for human resourcepolicies, planning and management, meaningful development in the regionis difficult:
The 42nd regional health ministers’ conference urges member states to:
• develop national systems of continuing professional development thatpromote on-the-job and team-based training;
• develop a system for tracking continuing professional development;
• develop and strengthen innovative mechanisms for staff recruitmentbased on norms that are regularly reviewed;
• adopt a common position on compensation for health workers recruitedby developed countries;
• adopt a common position on ethical recruitment of health workers;
• develop financial and non-financial strategies to encourage retention ofhealth professionals.
Ministers of health from east andsouthern African countriescontinue to assert that highincome countries recruitinghealth workers trained in Africanpublic sector systems constitutesan unfair and perverse subsidyfrom poor to rich country healthsystems that needs to beaddressed.
168
RECLAIMINGTHE RESOURCES FOR HEALTH:ADVANCING HEALTH EQUITY IN EAST AND SOUTHERN AFRICA
Addressing this concern through bilateral and multilateral agreements isnot simply a matter of equity. These agreements can address real costs ofrecruitment, encourage investment in local training and, if linked toinvestments that value and retain health workers, will reduce migration asan escape from hostile conditions.
There is growing policy pressure for this redistributive investment inhealth systems. The 2004 World Health Assembly resolution called formember states to establish mechanisms to mitigate the adverse impact ondeveloping countries of the loss of health personnel through migrationbut did not make direct proposals for investment funds. After pressurefrom African countries, the 2006 59th World Health Assembly articulatedthe principle of investing in the training of health workers (Tayob, 2006).It is time to shift the question from whether to make these investments tohow to make these investments.
As noted earlier, there are new opportunities and approaches toaddress this issue in international agreements. The provision of budgetsupport for expanding and retaining health workers, like that in Malawi,signals that external funders have moved away from a blanket disapprovalof recurrent spending and have found measures to manage the risks. Theenergy of the regional and global community needs to focus onmobilising, organising and applying substantial public resources to investin health workers. For east and southern African countries, this situationprovides further rationale for controlling the wider outflows through debtand other means. These resources are vital to support and intensify themeasures that the region has begun to take to value, orient and retainhealth workers. Without the health workers, there is no health system.
…there are new opportunitiesand approaches to address costsof health worker migration ininternational agreements.The
provision of budget support forexpanding and retaining healthworkers signals that external
funders have moved away from ablanket disapproval of recurrent
spending and have foundmeasures to manage the risks.
169
SECTION 5:VALUING AND RECLAIMING INVESTMENTS IN HEALTHWORKERS
African Union (2006) ‘Best practice case studies onHIV/AIDS, tuberculosis and malaria’, Special Summit ofAfrican Union on HIV/AIDS, Tuberculosis and Malaria, 2-4 May2006, Abuja, Nigeria, AU, Abuja.
Ambrose S (2004) ‘IMF budget rules threaten health funding:Grants from Global Fund for AIDS, Tuberculosis andMalaria in danger’, Economic Justice News Online 7(3), ‘50 yearsis enough’, Washington DC, downloaded 2 March 2007 athttp://www.50years.org/cms/ejn/story/171
Bach S (2003) International migration of health workers: Labour andsocial issues, International Labour Organisation, Geneva.
Buchan J and Dovlo D (2004) ‘International recruitment ofhealth workers to the UK: A report for DfID’, DfID HealthSystems Resource Centre, London, at http://www.dfidhealthrc.org/Shared/publications/reports/int_rec/int-rec-main.pdf
Commonwealth Secretariat (2003a) Commonwealth Code ofPractice for the International Recruitment of Health Workers,Commonwealth, London.– (2003b) Companion document to the Commonwealth Code ofPractice for the International Recruitment of Health Workers,Commonwealth, London.
Commission of the European Communities (2005) ‘EUstrategy for action on the crisis in human resources for healthin developing countries’, communication from theCommission to the Council and the European Parliament,EU, Luxembourg.
Dambiswa Y (2005) ‘The distribution of pharmacists trainedat the University of the North, South Africa’, EQUINETdiscussion paper 31, EQUINET, Harare.–(2007) ‘A review of non-financial incentives for healthworker retention in east and southern Africa’, EQUINETdiscussion paper 44, EQUINET, Harare.
Dept of Health, South Africa (2006) Policy on recruitment andemployment of foreign health professionals in the Republic of SouthAfrica, 1 April 2006, Govt of South Africa, Pretoria.
Dept of Health, United Kingdom (2002) Guidance oninternational nursing recruitment: Delivering the NHS plan: Nextsteps on investment, next steps on reform, Govt of UK, London.– (2004) Code of Practice for the International Recruitment ofHealthcare Professionals, Govt of UK, London, atwww.dh.gov.uk/publications
Dept of Labour, Namibia (1996) Labour Act No. 2, Govt ofNambia, Windhoek.
East, Central and Southern African Health Community(2006) ‘Resolutions of the 42nd Regional Health Minister’sConference’, 42nd Regional Health Minister’s Conference6-11 February 2006, Human Resources for Health, ECSA,Arusha.
EQUINET steering committee (2004) ‘Reclaiming the state:Advancing people’s health, challenging injustice’, EQUINETpolicy paper 15, EQUINET, Harare.
EQUINET, TARSC and Health Systems Trust (2004) ‘Equityin the distribution of health personnel’, Regional research reviewmeeting report, Johannesburg, South Africa, 15-17 April 2004,EQUINET, Harare.– (2006) ‘Report of a regional planning meeting on equity inhealth workers, Lusaka, Zambia, 3 April 2006’, EQUINETmeeting report, EQUINET, Harare.
Gilson L, Khumalo G, Erasmus E, Mbatsha S, McIntyre D(2004) ‘Exploring the influence of workplace trust overhealth worker performance’, Preliminary national overview report:South Africa, Health economics and financing programme,London School of Hygiene and Tropical Medicine, London,available at www.lshtm.ac.uk/hpu/hefp, www.wits.ac.za/chp
Gilson L and Erasmus E (2005) ‘Supporting the retention ofhealth resources for health: SADC policy context’,EQUINET discussion paper 26, EQUINET, Harare.
Health Professions Council, Dept of Health, South Africa(1995) ‘Moratorium on the registration of all foreign doctors’,Govt of South Africa, Pretoria, at http://saqa.org.za/doh/docs/pr/1995/pr1025.html
Health reporter (2004) ‘Gazetting of Health Services Billhailed’, The Herald, 22 Nov, Harare.
Iipinge S, van der Westhuizen L, Hofnie K, Pendukeni M(2006) ‘Perceptions of health workers about conditions ofservice: A Namibian case study’, EQUINET discussion paper35, EQUINET, Harare.
Industrial Health Research Group (2006) ‘Raising our voice,breaking our silence: Health workers’ experiences and needsaround occupational health services in Cape Town, SouthAfrica’, EQUINET PRA project report, EQUINET, Harare.
International Council of Nurses (2001) Ethical nurse recruitmentposition statement, ICN, Geneva.
International Labour Organisation (ILO) (2006) Migrant healthworkers: Is one country’s gain another’s pain?, ILO, Geneva,downloaded 20 Sept 2006 at http://www.ilo.org/public/english/bureau/inf/features/03/healthworkers.htm
Koot J and Martineau T (2005) ‘Mid-term review: Zambianhealth workers retention scheme 2003-2004’, RoyalNetherlands Govt/Govt of Zambia, Lusaka.
Lehmann U, Friedman I, Sanders D (2003) ‘Review of theutilisation and effectiveness of community-based healthworkers in Africa’, Joint Learning Initiative paper 4-1, HumanResources for Health Development, Geneva.
Lusaka District Health Board, Equity Gauge Zambia (2006)‘Strengthening community–health centre partnership andaccountability in Zambia’, EQUINET PRA report,EQUINET, Harare.
Makan B, Morar R, McIntyre D (1997) District health systemsdevelopment in the Eastern Cape province: District financing andfinancial management capacity, District Financing in Support ofEquity, Univ. of Cape Town, Health Economics Unit, CapeTown.
REFERENCES
170
RECLAIMINGTHE RESOURCES FOR HEALTH:ADVANCING HEALTH EQUITY IN EAST AND SOUTHERN AFRICA
Marchal B and Kegels G (2003) ‘Health workforceimbalances in times of globalisation: Brain drain orprofessional mobility?’, International Journal of Health Planningand Management 18 (supp 1):89-101.
Martineau T, Decker K, Bundred P (2002) ‘Levelling theplaying field for developing country health systems’, Briefingnote on international migration of health professionals, LiverpoolSchool of Tropical Medicine, Liverpool, at www.liv.ac.uk/lstm/hsrhome.html
McIntyre D, Bloom G, Doherty J, Brijlal P (1995) Healthexpenditure and finance in South Africa, Health Systems Trust andWorld Bank, Durban.
Muula A and Maseko F (2005) ‘Survival and retentionstrategies for Malawian health professionals’, EQUINETdiscussion paper 32, EQUINET, Harare.
Padarath A, Chamberlain C, McCoy D, Ntuli A, Rowson Mand Loewenson R (2003) ‘Health personnel in southernAfrica: Confronting maldistribution and brain drain’,EQUINET discussion paper 3, EQUINET, Harare.
Pagget C, Padarath A (2007) ‘A review of codes andprotocols in relation to the migration of health workers ineast and southern Africa’, EQUINET discussion paper 42,EQUINET, Harare.
Palmer D (2006) ‘Tackling Malawi’s human resources crisis’,Reproductive Health Matters 14(27):27-39.
Public Services International (2005a) Policy statement oninternational migration with particular reference to health services, PSI,Ferney-Voltaire Cedex, France, available athttp://www.world-psi.org/– (2005b) PSI statement on defending women health workers’ rightsand equity in the global healthcare workforce, PSI, Ferney-VoltaireCedex, France, at http://www.world-psi.org– (2007) May Day press release, PSI, Ferney-Voltaire Cedex,France, at http://www.world-psi.org/Template. cfm?Section=Home&CONTENTID=17257&TEMPLATE=/ContentManagement/ContentDisplay.cfm
South African Municipal Workers Union (SAMWU) andSchool of Public Health, Univ. of the Western Cape (2006)‘Issues facing primary care health workers in delivering HIVand AIDS related treatment and care in South Africa’,EQUINET discussion paper 36, EQUINET, Harare.
Statistics South Africa (2003) Tourism and migration, Govt ofSouth Africa, Pretoria, accessed 22 August 2003 athttp://www.statssa.gov.za/default1.asp
Stilwell B, Diallo K, Zurn P, Dal Poz M, Adams O, Buchan J(2003) ‘Developing evidence-based ethical policies on themigration of health workers: Conceptual and practicalchallenges’, Human Resources for Health 1(1):8.
Tayob R (2006) ‘Editorial: Developing country trade andhealth issues demand attention at the 59th World HealthAssembly’, EQUINET Newsletter 65 (1 July 2006), at http://www.equinetafrica.org/newsletter/index. php?issue=65.
UNDP (2005) Human development report 2005: International co-operation at a crossroads: Aid, trade and security in an unequal world,UNDP, New York.
United Nations (2004) Millennium Development Goals database,UN, New York.
Vujicic M, Zurn P, Diallo P, Adams O and Dal Poz M (2004)‘The role of wages in slowing the migration of health careprofessionals from developing countries’, Human Resources forHealth 2(3): 3, WHO, Geneva.
Wemos (2006) IMF macroeconomic policies and health sector budgets,WEMOS, Amsterdam, at www.wemos.nl/Documents/wemos_synthesis_report.pdf
World Federation of Public Health Associations (2005)‘Ethical restrictions on international recruitment of healthprofessionals from low-income countries’, Proposal by theAmerican Public Health Association at the General Assembly of theWFPHA, May 16, 2005, World Federation of Public HealthAssociations, Washington DC.
World Health Assembly (2004) International migration of healthpersonnel: A challenge for health systems in developing countries, WHO,Geneva.
World Health Organisation (WHO) (2005)World health report2005: Make every mother and child count, WHO, Geneva.– (2006a)World health report 2006: Working for health, WHO,Geneva.– (2007)WHO Global health atlas database, WHO, Geneva,accessed 8 March 8, 2007 at http://www.who.int/globalatlas/DataQuery/default.asp
WHO AFRO (2007) Country health profiles, WHO AFRO,Brazzaville, at www.afro.who.int/home/countryprofiles.html
World Organisation of National Colleges, Academies andAcademic Associations of General Practitioners/FamilyPhysicians (WONCA) (2002) The Melbourne manifesto: A code ofpractice for the international recruitment of health care professionals,WONCA, Victoria, at www.srpc.ca/librarydocs/Melbourn.htm.
ORGANISING
PEOPLECENTREDhealth systems
SECTION
6
Our concept of equity includes people (individually and asgroups) having the power to direct resources to theirhealth needs – particularly people with the greatest health
needs. This collective capability means people can assert their ownneeds and interests, influence the allocation of societal resourcestowards those needs and challenge the distribution of power andresources that block their development.
Health systems that address equity thus need to overcome barriersto people’s involvement in accessing, using and deciding on theirservices. Barriers arise when administrative systems and processesand health worker attitudes disempower people. Health systemsovercome barriers through the way services are organised,financed, provided and reached by communities; through theorientation of health workers; through the process ofcommunication; and through the mechanisms they provide fordialogue between and interaction with communities. When healthsystems are organised to involve and empower people, as ‘people-centred health systems’, they can create powerful constituencies toprotect public interests in health.
Reclaiming the resources for health calls for a state that is able toclaim the space to protect and advance public interests in the globalenvironment, a more robust form of participatory democracywithin the national environment and a more collectively organisedand informed society.
Achieving a redistribution of the resources for health in the face ofpowerful competing forces demands a strong alliance of publicinterests in health. There are many examples in east and southernAfrica of the health gains that occur when state and civil society,parliament, state and health workers and other public–publicinterests co-operate. These examples show how alliances of publicinterests can protect public health in global negotiations and canlever a more equitable and effective distribution of resources inrelation to health needs.
KEY ISSUES
SECTION
6
173
SECTION 6: ORGANISING PEOPLE-CENTRED HEALTH SYSTEMS
Empowering communities for healthThe previous sections describe how health systems can organise to meethealth needs against underlying counter-currents that lead to outflows ofresources from households and the region. As discussed in Section 3,when health systems do this they are not only in a better position to deliverrelevant comprehensive health services, they also send powerful signalsabout the social values of the people who shape and work within thesystem and the role of society in health.
The disparities described in Section 1 and the market reforms in healthcare described in Section 2 not only leave people vulnerable to untreatedill health but also marginalise communities who cannot afford or accessthe health system. This undermines their right to health, creatingindividual struggles over basic entitlements and disrupting social cohesionand integration. In contrast, the primary health care approach to universalhealth systems, described in Section 3, backed by fair financing measuresand health workers who are valued, as described in Sections 4 and 5, senda powerful message of social solidarity and foster social inclusion.
Equity is not simply about organising services and resources for apassive population. If people themselves are not organised to use anddefend their services, the services will be poorly exploited and can be easilywithdrawn, even when they are vital to health.
Equity also includes the power and ability people (and social groups)have to direct resources to their health needs, particularly for those withthe worst health.
This understanding of equity recognises that social disadvantage andpowerlessness underlies the social stratification that generates healthinequity (London, 2004; Marmot, 2006), as well as the improvements inhealth that are possible when people are able to strengthen their socialnetworking, organisation and influence (Wallerstein and Duran, 2006).
Community participation and social empowerment are often talkedabout in health systems. However, as discussed in this section, unless socialpower is clearly understood, organised towards health and supported bypeople-centred health systems, the actions we take to participate in healthmay make little real difference to the resources for health. On the otherhand, health systems organised around social participation andempowerment create powerful constituencies to protect public interestsin health.
By ‘empowerment’ we refer to the collective capability of people toassert their own needs and interests, to influence the allocation ofresources towards their needs and to challenge the distribution of powerand resources and the actions that block their development.
The inequalities and challenges described in the previous sections ofthis analysis, and the policies and programmes we outline to deal withthese inequalities, demand strong, redistributive states that act in the publicinterest. In Section 2, for example, we discussed how governments needthe power, authority and democratic legitimacy to confront strong global
Equity also includes the powerand ability people (and socialgroups) have to direct resourcesto their health needs, particularlyfor those with the worst health.
By ‘empowerment’ we refer tothe collective capability of peopleto assert their own needs andinterests, to influence theallocation of resources towardstheir needs and to challenge thedistribution of power andresources and the actions thatblock their development.
174
RECLAIMINGTHE RESOURCES FOR HEALTH:ADVANCING HEALTH EQUITY IN EAST AND SOUTHERN AFRICA
Control of breast milk substitutes in Zimbabwe
At independence in 1980, Zimbabwe had inherited high levels of malnutritionamong children under the age of five years. The ministry recognised that oneimportant factor affecting nutrition was breastfeeding patterns and that afactor affecting this was the role of the manufacturers of infant formula inpromoting the use of their products. The 1994 Zimbabwe demographic healthsurvey found, for example, that exclusive breastfeeding was being practised onaverage for only two weeks longer in rural areas than in urban areas.
In 1981, Zimbabwe adopted the WHO International Code on the Marketingof Breast milk Substitutes that aimed to protect infant health by stopping thepromotion of breast milk substitutes and bottle-fed complementary foods. Asan entry point to implementing the code, government carried out a study onhealth workers’ knowledge levels and bottle feeding practices as well as therole of baby milk companies in promoting their products. The study raisedawareness among health workers who reported that one in ten mothers wereusing infant formula and breast milk and that the use of infant formula wasincreasing. The major baby food company at the time, Food SpecialitiesPrivate Limited – generally known by its brand name, Nestlé – had ‘medicaldelegates’ who frequently visited health institutions, spoke with staff and thepublic, including pregnant women and mothers, and demonstrated the useof formula with the help of a nurse. This gave professional legitimacy to theuse of infant formula. Samples of baby food products were also left at thehealth units visited. While company delegates insisted these were for researchand training purposes, they were often used by health staff and others forinfant feeding.
In 1982 the Ministry of Health issued a Circular Minute No. 80 of 1982 whichforbade health staff from receiving free samples, gratuities, hospitality,calendars or advertising materials from companies that promoted breast milksubstitutes. Health workers were also trained to promote breastfeeding. A1984 primary health care evaluation found that this had an important effecton stopping these practices. Parliament was also involved in this process,incorporating the Code on the Marketing of Breast Milk Substitutes into thePublic Health Act in 1985, followed by the drafting of regulations on the
and corporate forces. Taking strong public interest positions is not,however, equivalent to more authoritarian politics nationally. Communitieswant robust states but not states that seek to dominate. Hence whenstructural adjustment programmes were introduced in a ‘top-down’manner, with the position ‘there is no alternative’, citizen–state relationswere damaged, not only by citizens being marginalised and impoverisheddue to weakening state services, but also by the loss of confidence in anauthoritarian state that did not listen to local views (Olukoshi, 1998;Mkandawire, 2006). In contrast, states acting with society have been ableto achieve significant advances in health.
175
SECTION 6: ORGANISING PEOPLE-CENTRED HEALTH SYSTEMS
code. The Public Health (Breast milk and Substitutes and Infant Nutrition)Regulations, 1998, Statutory Instrument 46 of 1998 took over ten years to beinstituted. This was a result of the need for extensive advocacy and educationfor all stakeholders, including health workers, civil society and industry, withan inter-ministerial committee, that included representatives from baby foodmanufacturers, managing the process of developing the regulations, creatingmutual understanding and ensuring transparency.
Bringing industry into the process and clarifying the scope of the regulationsthrough information briefs avoided obstacles. While the regulations did notstop the sale of infant formula and other infant food products, they preventedthe marketing of breast milk substitutes in a way that interfered with breastfeeding. The regulations prohibited donating free samples to mothers andrequired labelling in all three national languages on the importance, benefitsand superiority of breast milk to substitutes, clearly stating the adverse effectson breastfeeding of bottle feeding. In amendments the regulations alsorecognised the circumstances where breastfeeding substitutes may benecessary, such as for cases of multiple births or destitute orphans. The codecaters for all infants regardless of their HIV status and while it acknowledgesthat mothers with HIV may choose not to breastfeed, it emphasises thatparents have a right to make informed choices regarding infant feeding basedon scientific and factual information and not commercial pressure.
An infants nutrition committee involving all stakeholders, including therepresentatives of the baby milk manufacturers, monitors implementationcompliance. In 2006, 25 code monitors were trained and compliance hasimproved, with a challenge noted of imported baby food items not meetingstandards set in the regulations.
While no study has been undertaken to directly evaluate the outcome, the1999 Zimbabwe demographic health survey finding that the duration of exclusivebreastfeeding had more than doubled (1.3 months) compared with the 1994levels (0.5 months), suggests the positive effect of the law and wider effortsmade in promoting breast milk.
Chanetsa, 2007
The example of control of breast milk substitutes in Zimbabwe belowhighlights the potential for public health progress when states are backedby global policies and work with health workers, civil society andparliaments to encourage, regulate and enforce responsible corporatepractice in health.
Losing social confidence and action for health deprives health systemsof one of the region’s most abundant and powerful assets – its people.Despite the high levels of poverty, people in the region have high levelsof social capabilities, literacy (see figure 6.1) and strong social networks.
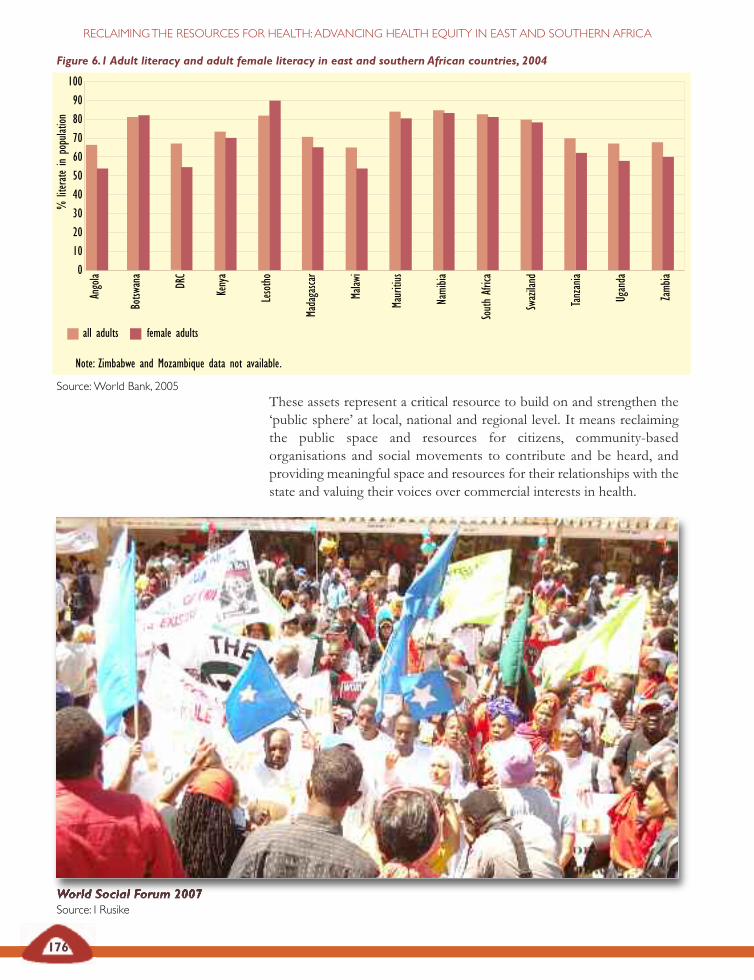
176
RECLAIMINGTHE RESOURCES FOR HEALTH:ADVANCING HEALTH EQUITY IN EAST AND SOUTHERN AFRICA
These assets represent a critical resource to build on and strengthen the‘public sphere’ at local, national and regional level. It means reclaimingthe public space and resources for citizens, community-basedorganisations and social movements to contribute and be heard, andproviding meaningful space and resources for their relationships with thestate and valuing their voices over commercial interests in health.
Figure 6.1 Adult literacy and adult female literacy in east and southern African countries, 2004
Note: Zimbabwe and Mozambique data not available.
Source:World Bank, 2005
World Social Forum 2007Source: I Rusike
100
90
80
70
60
50
40
30
20
10
0
Angola
Botsw
ana
DRC
Kenya
Lesotho
Madagascar
Malaw
i
Mauritius
Namibia
SouthAfrica
Swaziland
Tanzania
Uganda
Zambia
all adults female adults
%literateinpopulation
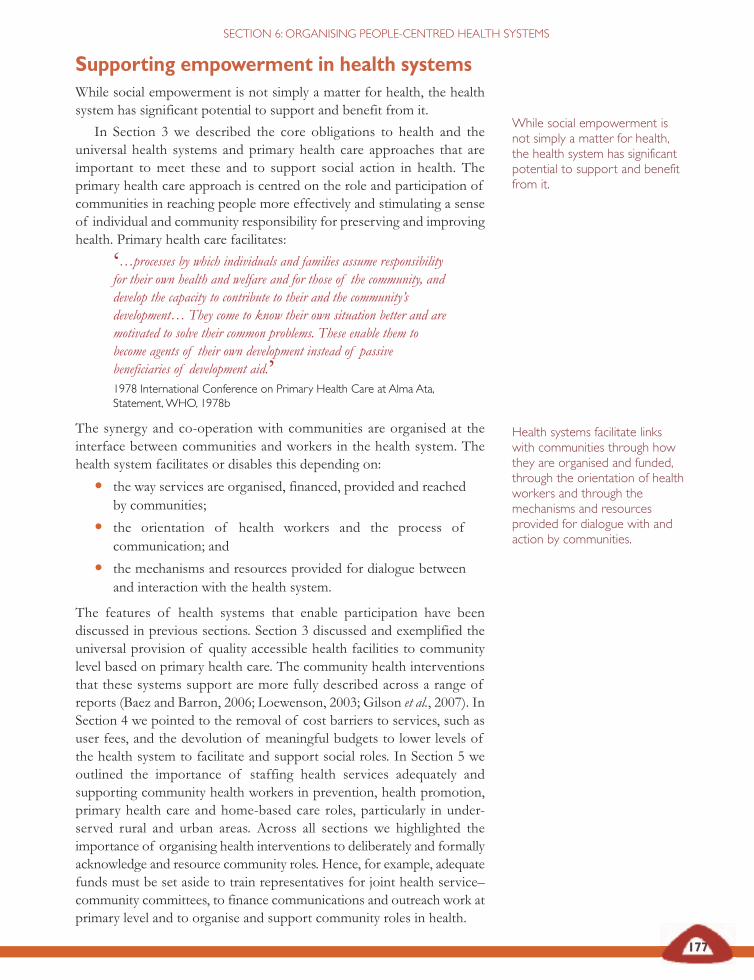
177
SECTION 6: ORGANISING PEOPLE-CENTRED HEALTH SYSTEMS
Supporting empowerment in health systemsWhile social empowerment is not simply a matter for health, the healthsystem has significant potential to support and benefit from it.
In Section 3 we described the core obligations to health and theuniversal health systems and primary health care approaches that areimportant to meet these and to support social action in health. Theprimary health care approach is centred on the role and participation ofcommunities in reaching people more effectively and stimulating a senseof individual and community responsibility for preserving and improvinghealth. Primary health care facilitates:
‘…processes by which individuals and families assume responsibilityfor their own health and welfare and for those of the community, anddevelop the capacity to contribute to their and the community’sdevelopment… They come to know their own situation better and aremotivated to solve their common problems. These enable them tobecome agents of their own development instead of passivebeneficiaries of development aid.’1978 International Conference on Primary Health Care at Alma Ata,Statement,WHO, 1978b
The synergy and co-operation with communities are organised at theinterface between communities and workers in the health system. Thehealth system facilitates or disables this depending on:
• the way services are organised, financed, provided and reachedby communities;
• the orientation of health workers and the process ofcommunication; and
• the mechanisms and resources provided for dialogue betweenand interaction with the health system.
The features of health systems that enable participation have beendiscussed in previous sections. Section 3 discussed and exemplified theuniversal provision of quality accessible health facilities to communitylevel based on primary health care. The community health interventionsthat these systems support are more fully described across a range ofreports (Baez and Barron, 2006; Loewenson, 2003; Gilson et al., 2007). InSection 4 we pointed to the removal of cost barriers to services, such asuser fees, and the devolution of meaningful budgets to lower levels ofthe health system to facilitate and support social roles. In Section 5 weoutlined the importance of staffing health services adequately andsupporting community health workers in prevention, health promotion,primary health care and home-based care roles, particularly in under-served rural and urban areas. Across all sections we highlighted theimportance of organising health interventions to deliberately and formallyacknowledge and resource community roles. Hence, for example, adequatefunds must be set aside to train representatives for joint health service–community committees, to finance communications and outreach work atprimary level and to organise and support community roles in health.
While social empowerment isnot simply a matter for health,the health system has significantpotential to support and benefitfrom it.
Health systems facilitate linkswith communities through howthey are organised and funded,through the orientation of healthworkers and through themechanisms and resourcesprovided for dialogue with andaction by communities.

Table 6.1Tuberculosis control ineast and southern African countries,2003
% TB cases % TB casesdetected cured
under DOTS under DOTS
Angola 100 74
Botswana 68 71
DRC 63 78
Kenya 46 79
Lesotho 70 52
Madagascar 77 74
Malawi 35 72
Mauritius 28 92
Mozambique 45 78
Namibia 86 62
South Africa 100 68
Swaziland 35 47
Tanzania 43 80
Uganda 44 60
Zambia 65 83
Zimbabwe 42 67
Sources:WHO, 2004; UNDP, 2005
178
RECLAIMINGTHE RESOURCES FOR HEALTH:ADVANCING HEALTH EQUITY IN EAST AND SOUTHERN AFRICA
Investment in communications, skills and knowledge transfer and socialroles in health systems is vital for the performance of health services, andshould be earmarked and ensured at all levels.
A synergy between the community and primary health care can makean important contribution to improvements in health, especially in themore marginalised communities. This is identified in Section 1, andexemplified through the role of immunisation outreach, treatment literacyand directly observed treatment strategies in the treatment and care fortuberculosis and other key health interventions (see the contribution ofdirectly observed treatment strategies to tuberculosis control in table 6.1).
The orientation of health workers and communication between healthworkers and communities have proved central in building more people-centred health systems. Despite this, investment in communication is oftenpoor and training for health workers may not include skills in facilitatingand supporting dialogue. Yet experience in the region shows that whenthis investment is made, the partnerships between health workers andcommunities improve, to the benefit of both.
Recognising this, in recent years EQUINET has, through theinstitutions in the network, implemented work to strengthen skills forparticipatory reflection and action in health.
Child participation, community health meeting,TanzaniaSource: M Masaiganah
Investment in communications,skills and knowledge transfer andsocial roles in health systems is
vital for the performance ofhealth services, and should beearmarked and ensured at all
levels.
Recognising this, in recent yearsEQUINET has through theinstitutions in the network
implemented work to strengthenskills for participatory reflection
and action in health.
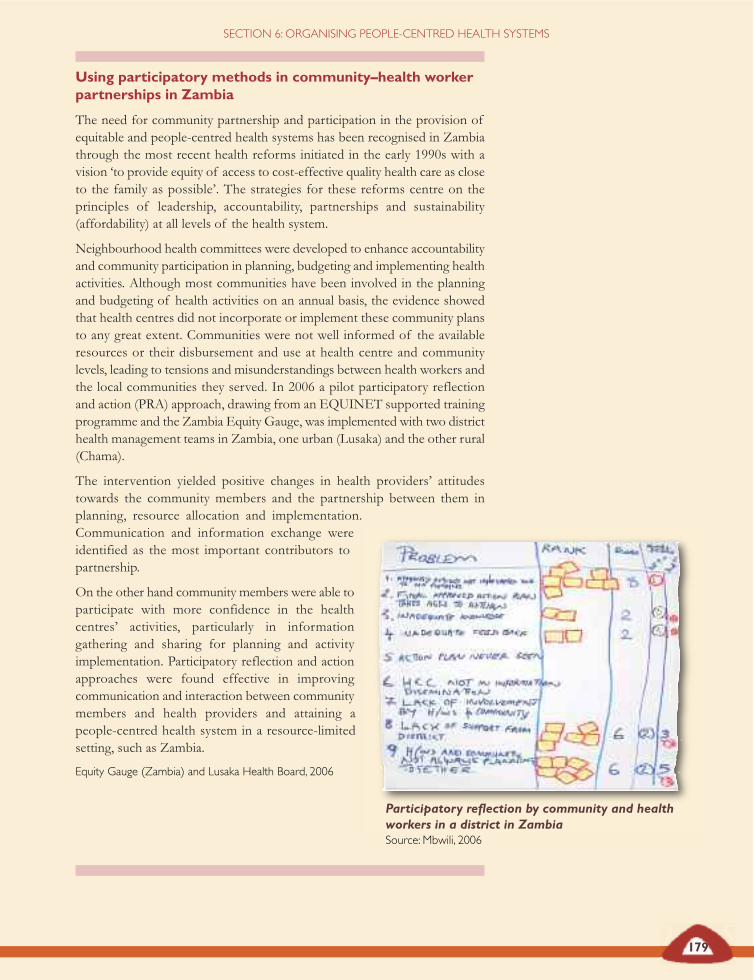
Using participatory methods in community–health workerpartnerships in Zambia
The need for community partnership and participation in the provision ofequitable and people-centred health systems has been recognised in Zambiathrough the most recent health reforms initiated in the early 1990s with avision ‘to provide equity of access to cost-effective quality health care as closeto the family as possible’. The strategies for these reforms centre on theprinciples of leadership, accountability, partnerships and sustainability(affordability) at all levels of the health system.
Neighbourhood health committees were developed to enhance accountabilityand community participation in planning, budgeting and implementing healthactivities. Although most communities have been involved in the planningand budgeting of health activities on an annual basis, the evidence showedthat health centres did not incorporate or implement these community plansto any great extent. Communities were not well informed of the availableresources or their disbursement and use at health centre and communitylevels, leading to tensions and misunderstandings between health workers andthe local communities they served. In 2006 a pilot participatory reflectionand action (PRA) approach, drawing from an EQUINET supported trainingprogramme and the Zambia Equity Gauge, was implemented with two districthealth management teams in Zambia, one urban (Lusaka) and the other rural(Chama).
The intervention yielded positive changes in health providers’ attitudestowards the community members and the partnership between them inplanning, resource allocation and implementation.Communication and information exchange wereidentified as the most important contributors topartnership.
On the other hand community members were able toparticipate with more confidence in the healthcentres’ activities, particularly in informationgathering and sharing for planning and activityimplementation. Participatory reflection and actionapproaches were found effective in improvingcommunication and interaction between communitymembers and health providers and attaining apeople-centred health system in a resource-limitedsetting, such as Zambia.
Equity Gauge (Zambia) and Lusaka Health Board, 2006
179
SECTION 6: ORGANISING PEOPLE-CENTRED HEALTH SYSTEMS
Participatory reflection by community and healthworkers in a district in ZambiaSource: Mbwili, 2006
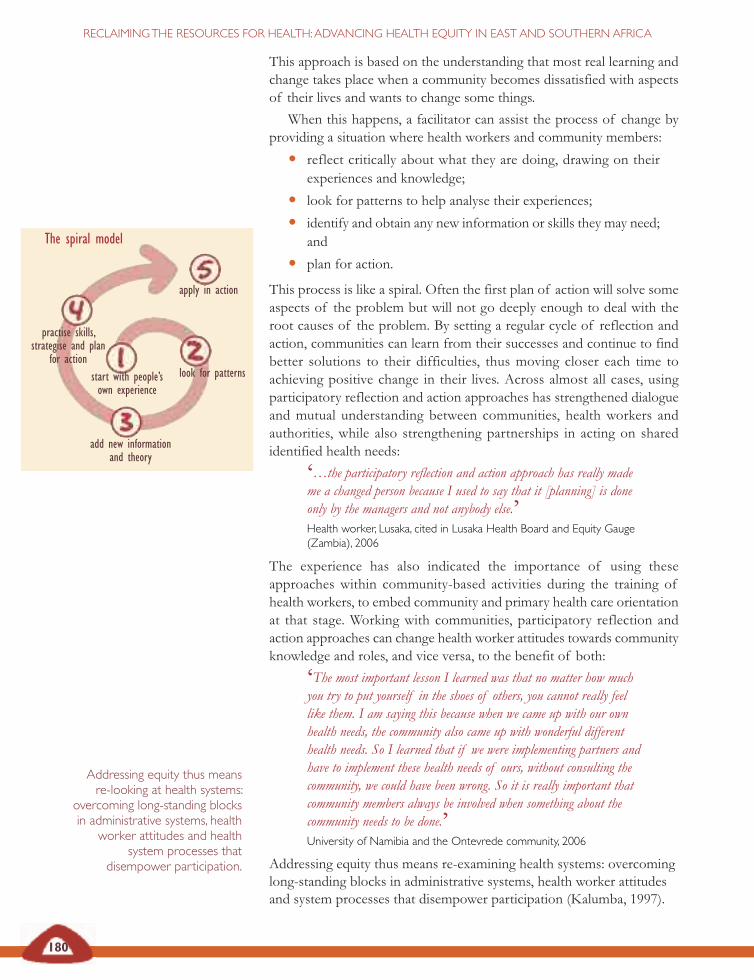
180
RECLAIMINGTHE RESOURCES FOR HEALTH:ADVANCING HEALTH EQUITY IN EAST AND SOUTHERN AFRICA
This approach is based on the understanding that most real learning andchange takes place when a community becomes dissatisfied with aspectsof their lives and wants to change some things.
When this happens, a facilitator can assist the process of change byproviding a situation where health workers and community members:
• reflect critically about what they are doing, drawing on theirexperiences and knowledge;
• look for patterns to help analyse their experiences;
• identify and obtain any new information or skills they may need;and
• plan for action.
This process is like a spiral. Often the first plan of action will solve someaspects of the problem but will not go deeply enough to deal with theroot causes of the problem. By setting a regular cycle of reflection andaction, communities can learn from their successes and continue to findbetter solutions to their difficulties, thus moving closer each time toachieving positive change in their lives. Across almost all cases, usingparticipatory reflection and action approaches has strengthened dialogueand mutual understanding between communities, health workers andauthorities, while also strengthening partnerships in acting on sharedidentified health needs:
‘…the participatory reflection and action approach has really mademe a changed person because I used to say that it [planning] is doneonly by the managers and not anybody else.’Health worker, Lusaka, cited in Lusaka Health Board and Equity Gauge(Zambia), 2006
The experience has also indicated the importance of using theseapproaches within community-based activities during the training ofhealth workers, to embed community and primary health care orientationat that stage. Working with communities, participatory reflection andaction approaches can change health worker attitudes towards communityknowledge and roles, and vice versa, to the benefit of both:
‘The most important lesson I learned was that no matter how muchyou try to put yourself in the shoes of others, you cannot really feellike them. I am saying this because when we came up with our ownhealth needs, the community also came up with wonderful differenthealth needs. So I learned that if we were implementing partners andhave to implement these health needs of ours, without consulting thecommunity, we could have been wrong. So it is really important thatcommunity members always be involved when something about thecommunity needs to be done.’University of Namibia and the Ontevrede community, 2006
Addressing equity thus means re-examining health systems: overcominglong-standing blocks in administrative systems, health worker attitudesand system processes that disempower participation (Kalumba, 1997).
Addressing equity thus meansre-looking at health systems:
overcoming long-standing blocksin administrative systems, health
worker attitudes and healthsystem processes that
disempower participation.
The spiral model
start with people’sown experience
look for patterns
add new informationand theory
practise skills,strategise and plan
for action
apply in action
181
SECTION 6: ORGANISING PEOPLE-CENTRED HEALTH SYSTEMS
Much attention is often given to structures and activities set up to promoteparticipation in health systems (Baez and Barron, 2006). This sectionargues that these are important, but not sufficient.
Structures need to be backed by resources directed to the level ofhealth systems where this interaction with the public takes place and byproviding earmarked, sustained resources for social roles in health.
While the discussion in Section 4 explored how community financingand community-based health insurance has been used to mobiliseresources for health systems from communities, equally importantdiscussion needs to take place within health systems on how theseresources are allocated to support public roles in health. Budgets ofteninclude some allocations to stakeholder boards and mechanisms forconsultation within services. However, these funds are often inadequatefor meaningful levels of communication, technical work or outreach. Thisundermines the role of these mechanisms, or leaves vital socialcomponents of health systems to be funded by international agencies.Countries have set up community health funds for specific budget supportof health activities within communities but these are also often dependenton external funding. Even parliamentary committees in the region havelimited resources for their role in health in some countries in the region,as discussed later.
The structures set up to promote community involvement also needto use participatory processes that draw on and use local experience andthat provide opportunities for collective reflection, analysis and decisionmaking on actions.
As noted earlier, health workers often need further support andorientation to enable such processes.
The global and national conditions discussed in Section 2 directly affectthe opportunities for these forms of empowerment. The growth ininformation through the internet, telecommunications and the mediaappears to offer significant new means for people to assert their ownneeds and interests but often people living below poverty levels do notaccess even a radio. Despite the commitments to the rights and goalsoutlined in Section 3, the reality of global, national and local interests,mechanisms and environments can present challenges to the distributionof power and resources, particularly when the institutional systems fordecision making do not fairly represent poor people or low-incomecountries. Section 2 describes how wider policies and systems at globaland national level are often well organised to protect wealth, includingcorporate wealth, marginalising poor communities.
Health systems are deeply affected by these wider environments.However, obligations to protect health rights set out in laws andconventions and their goal to improve health gives health systems themandate and the opportunity to challenge conditions that underminehealth, including those conditions that lead to social exclusion anddisempowerment.
Structures need to be backed byresources directed to the level ofhealth systems where thisinteraction with the public takesplace and by providingearmarked, sustained resourcesfor social roles in health.
The structures set up topromote communityinvolvement also need to useparticipatory processes thatdraw on and use localexperience and that provideopportunities for collectivereflection, analysis and decisionmaking on actions.
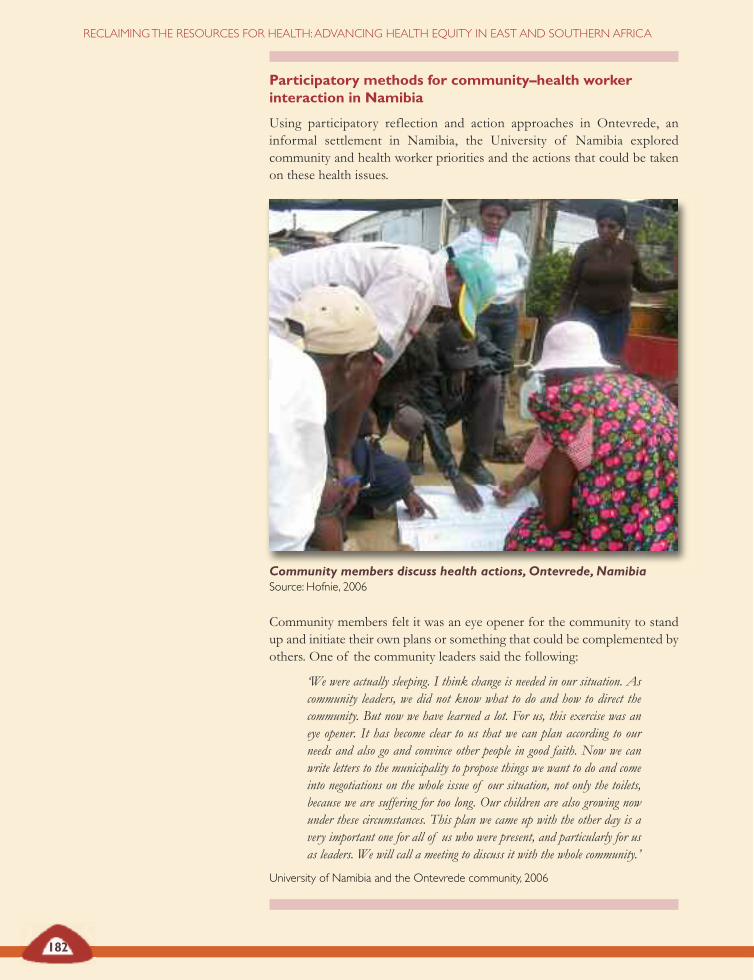
182
RECLAIMINGTHE RESOURCES FOR HEALTH:ADVANCING HEALTH EQUITY IN EAST AND SOUTHERN AFRICA
Participatory methods for community–health workerinteraction in Namibia
Using participatory reflection and action approaches in Ontevrede, aninformal settlement in Namibia, the University of Namibia exploredcommunity and health worker priorities and the actions that could be takenon these health issues.
Community members felt it was an eye opener for the community to standup and initiate their own plans or something that could be complemented byothers. One of the community leaders said the following:
‘We were actually sleeping. I think change is needed in our situation. Ascommunity leaders, we did not know what to do and how to direct thecommunity. But now we have learned a lot. For us, this exercise was aneye opener. It has become clear to us that we can plan according to ourneeds and also go and convince other people in good faith. Now we canwrite letters to the municipality to propose things we want to do and comeinto negotiations on the whole issue of our situation, not only the toilets,because we are suffering for too long. Our children are also growing nowunder these circumstances. This plan we came up with the other day is avery important one for all of us who were present, and particularly for usas leaders. We will call a meeting to discuss it with the whole community.’
University of Namibia and the Ontevrede community, 2006
Community members discuss health actions,Ontevrede, NamibiaSource: Hofnie, 2006
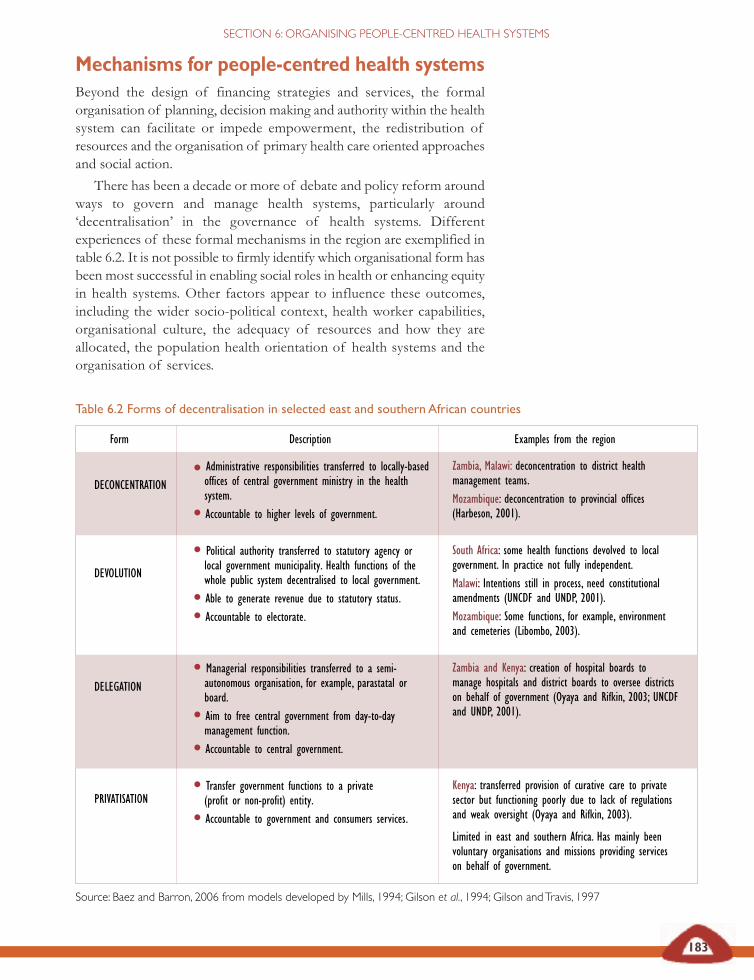
Table 6.2 Forms of decentralisation in selected east and southern African countries
Source: Baez and Barron, 2006 from models developed by Mills, 1994; Gilson et al., 1994; Gilson andTravis, 1997
183
SECTION 6: ORGANISING PEOPLE-CENTRED HEALTH SYSTEMS
Mechanisms for people-centred health systemsBeyond the design of financing strategies and services, the formalorganisation of planning, decision making and authority within the healthsystem can facilitate or impede empowerment, the redistribution ofresources and the organisation of primary health care oriented approachesand social action.
There has been a decade or more of debate and policy reform aroundways to govern and manage health systems, particularly around‘decentralisation’ in the governance of health systems. Differentexperiences of these formal mechanisms in the region are exemplified intable 6.2. It is not possible to firmly identify which organisational form hasbeen most successful in enabling social roles in health or enhancing equityin health systems. Other factors appear to influence these outcomes,including the wider socio-political context, health worker capabilities,organisational culture, the adequacy of resources and how they areallocated, the population health orientation of health systems and theorganisation of services.
DECONCENTRATION
DEVOLUTION
DELEGATION
PRIVATISATION
Form Description Examples from the region
Zambia, Malawi: deconcentration to district healthmanagement teams.Mozambique: deconcentration to provincial offices(Harbeson, 2001).
South Africa: some health functions devolved to localgovernment. In practice not fully independent.Malawi: Intentions still in process, need constitutionalamendments (UNCDF and UNDP, 2001).Mozambique: Some functions, for example, environmentand cemeteries (Libombo, 2003).
Zambia and Kenya: creation of hospital boards tomanage hospitals and district boards to oversee districtson behalf of government (Oyaya and Rifkin, 2003; UNCDFand UNDP, 2001).
Kenya: transferred provision of curative care to privatesector but functioning poorly due to lack of regulationsand weak oversight (Oyaya and Rifkin, 2003).
Limited in east and southern Africa. Has mainly beenvoluntary organisations and missions providing serviceson behalf of government.
• Administrative responsibilities transferred to locally-basedoffices of central government ministry in the healthsystem.
• Accountable to higher levels of government.
• Political authority transferred to statutory agency orlocal government municipality. Health functions of thewhole public system decentralised to local government.
• Able to generate revenue due to statutory status.
• Accountable to electorate.
• Managerial responsibilities transferred to a semi-autonomous organisation, for example, parastatal orboard.
• Aim to free central government from day-to-daymanagement function.
• Accountable to central government.
• Transfer government functions to a private(profit or non-profit) entity.
• Accountable to government and consumers services.
184
RECLAIMINGTHE RESOURCES FOR HEALTH:ADVANCING HEALTH EQUITY IN EAST AND SOUTHERN AFRICA
Effectiveness of district health boards in Zambia
In 1992 the government of Zambia facilitated community involvement inhealth care delivery through legislation establishing district health boards andneighbourhood health committees.
District health boards look after community health interests by approvingdistrict health plans which reflect community needs, ensuring equitableallocation of resources and ensuring accountability of the health care systemto the community. The boards approve all health development plans in thedistrict and the reports on these plans, including initiatives to mobilisefinancial and other resources for health locally. Such plans are expected tostart from the neighbourhood health committees. They monitor and evaluateprogress of all health-related activities and report to the Central Board ofHealth. They ensure the sound use of resources, oversee human resourcesand promote good working environments. The district health boards promoteintersectoral co-operation and support community involvement throughcommunity-based volunteer health workers and neighbourhood healthcommittees.
A cross-sectional survey in two provinces of Zambia found, however, thatdespite legal provision and policy intention to cover these roles, informationflow between the community and district health boards was weak, links wereinformal or non-functional and meetings were held irregularly. The districthealth boards lacked involvement and consultation with the community. Somesocial groups, like women, were poorly represented and did not know how tobecome involved. Procedural issues were unclear to members – what theywere expected to do, how to remove non-functional board members fromoffice or how to challenge decisions of technical experts in the district healthmanagement team. Little guidance was provided on their roles fromgovernment and few resources made available to support their activities.Community members were not aware of the district health boards and theirfunctions and had little outreach to neighbourhood health committees. Planssubmitted from neighbourhood health committees could be changed athigher levels without feedback to the community and communities had weakcapabilities in developing plans and funding proposals.
The survey team proposed options to ensure that district health boardmember selection included women, that board members were trained tounderstand and perform their roles and that information flow to and fromdistrict health boards and neighbourhood health committees was improved.They also propose that district health boards be monitored formally and atcommunity level to assess and support their effective functioning.
Macwan’gi and Ngwengwe, 2004
185
SECTION 6: ORGANISING PEOPLE-CENTRED HEALTH SYSTEMS
Decentralising authority within the health system cannot be simplyequated with having stronger partnerships between health services andcommunities, nor can it be assumed that such partnerships are used toenhance equity in the performance of health systems. For the governanceof health systems to play a role in reclaiming the resources for health,attention has to be given to the level of communication and joint planningtaking place and the tools used to organise this communication to directresources towards health needs.
Experiences from Zambia suggest that ‘representative’ mechanismscannot be assumed to represent communities, especially vulnerablegroups. These mechanisms really involve and ‘talk to’ only a portion of thepopulation – often a third or less of communities. Specific and explicitadditional investments are needed to avoid representation becomingstultified and to reach groups more widely, especially those groups that arealready marginalised.
There are many features of health systems documented thatundermine participation. Top-down policy formulation, weak informationflow and user charges that place barriers to access can alienate communitymembers (Baez and Barron, 2006; EQUINET/ TARSC/ CHESSORE,2005b; TARSC, EQUINET, WHOAfro, 2000). Health workers have beenreported to feel that community members have poor knowledge or weakcompetencies on health issues (Macwan’gi and Ngwengwe, 2004;University of Namibia and Ontevrede, 2006). Health workers andauthorities may be reluctant to ‘give up’ their power or control over healthsystems. They may use bureaucratic and hierarchical ways of working thatmake it difficult for communities to interact, and health workers maythemselves get few formal rewards and face potential political risks fordoing so (Ngulube et al, 2004). A Zambia study of the context forparticipatory mechanisms found that health managers often cascadedecisions from national to lower levels in an authoritarian way, usinggovernance structures primarily to rubber stamp decisions, irrespectiveof local priorities. Community inputs, while received, were often perceivedas less useful (Ngulube et al., 2005).
There are also various examples documented of how health systemshave put in place processes or mechanisms to facilitate social roles, drawsocial input or encourage social action. Some of these are described intable 6.3 on page 186. These often work better when processes are alsotaking place within communities to prepare and organise them for theseroles.
Information exchange is vital in the interaction between health systemsand communities. Yet often evidence used in planning is inaccessible tocommunities and difficult to understand. The local health informationsystem is often not analysed locally to support local planning. Some healthsystems make this an important area of job performance for healthworkers. In South Africa, for example, the primary health care supervisors’job description includes the use and discussion of information at clinicand sub-district level to improve services and programmes. Later, anadditional task was added – to attend clinic committee meetings to share
Decentralising authority withinthe health system cannot besimply equated with havingstronger partnerships betweenhealth services and communities,nor can it be assumed that suchpartnerships are used toenhance equity in theperformance of health systems.For the governance of healthsystems to play a role inreclaiming the resources forhealth, attention has to be givento the level of communicationand joint planning taking placeand the tools used to organisethis communication to directresources towards health needs.
There are also various examplesdocumented of how healthsystems have put in placeprocesses or mechanisms tofacilitate social roles, draw socialinput or encourage social action.These often work better whenprocesses are also taking placewithin communities to prepareand organise them for theseroles.
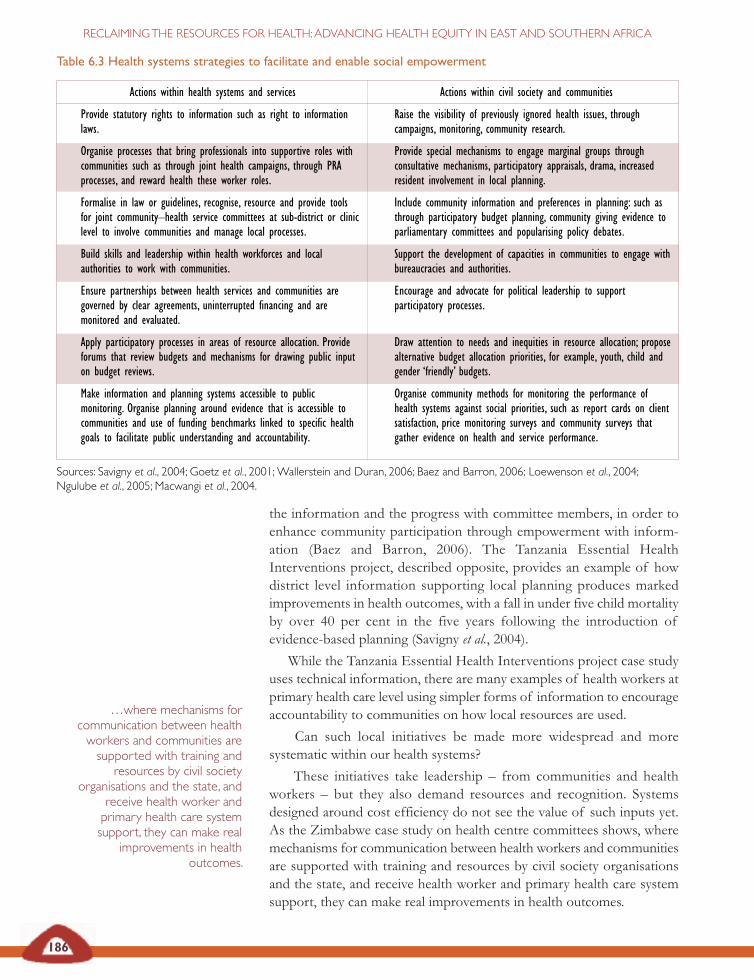
Actions within health systems and services
Provide statutory rights to information such as right to informationlaws.
Organise processes that bring professionals into supportive roles withcommunities such as through joint health campaigns, through PRAprocesses, and reward health these worker roles.
Formalise in law or guidelines, recognise, resource and provide toolsfor joint community–health service committees at sub-district or cliniclevel to involve communities and manage local processes.
Build skills and leadership within health workforces and localauthorities to work with communities.
Ensure partnerships between health services and communities aregoverned by clear agreements, uninterrupted financing and aremonitored and evaluated.
Apply participatory processes in areas of resource allocation. Provideforums that review budgets and mechanisms for drawing public inputon budget reviews.
Make information and planning systems accessible to publicmonitoring. Organise planning around evidence that is accessible tocommunities and use of funding benchmarks linked to specific healthgoals to facilitate public understanding and accountability.
Actions within civil society and communities
Raise the visibility of previously ignored health issues, throughcampaigns, monitoring, community research.
Provide special mechanisms to engage marginal groups throughconsultative mechanisms, participatory appraisals, drama, increasedresident involvement in local planning.
Include community information and preferences in planning: such asthrough participatory budget planning, community giving evidence toparliamentary committees and popularising policy debates.
Support the development of capacities in communities to engage withbureaucracies and authorities.
Encourage and advocate for political leadership to supportparticipatory processes.
Draw attention to needs and inequities in resource allocation; proposealternative budget allocation priorities, for example, youth, child andgender ‘friendly’ budgets.
Organise community methods for monitoring the performance ofhealth systems against social priorities, such as report cards on clientsatisfaction, price monitoring surveys and community surveys thatgather evidence on health and service performance.
Table 6.3 Health systems strategies to facilitate and enable social empowerment
Sources: Savigny et al., 2004; Goetz et al., 2001;Wallerstein and Duran, 2006; Baez and Barron, 2006; Loewenson et al., 2004;Ngulube et al., 2005; Macwangi et al., 2004.
186
RECLAIMINGTHE RESOURCES FOR HEALTH:ADVANCING HEALTH EQUITY IN EAST AND SOUTHERN AFRICA
the information and the progress with committee members, in order toenhance community participation through empowerment with inform-ation (Baez and Barron, 2006). The Tanzania Essential HealthInterventions project, described opposite, provides an example of howdistrict level information supporting local planning produces markedimprovements in health outcomes, with a fall in under five child mortalityby over 40 per cent in the five years following the introduction ofevidence-based planning (Savigny et al., 2004).
While the Tanzania Essential Health Interventions project case studyuses technical information, there are many examples of health workers atprimary health care level using simpler forms of information to encourageaccountability to communities on how local resources are used.
Can such local initiatives be made more widespread and moresystematic within our health systems?
These initiatives take leadership – from communities and healthworkers – but they also demand resources and recognition. Systemsdesigned around cost efficiency do not see the value of such inputs yet.As the Zimbabwe case study on health centre committees shows, wheremechanisms for communication between health workers and communitiesare supported with training and resources by civil society organisationsand the state, and receive health worker and primary health care systemsupport, they can make real improvements in health outcomes.
…where mechanisms forcommunication between healthworkers and communities aresupported with training and
resources by civil societyorganisations and the state, and
receive health worker andprimary health care systemsupport, they can make real
improvements in healthoutcomes.
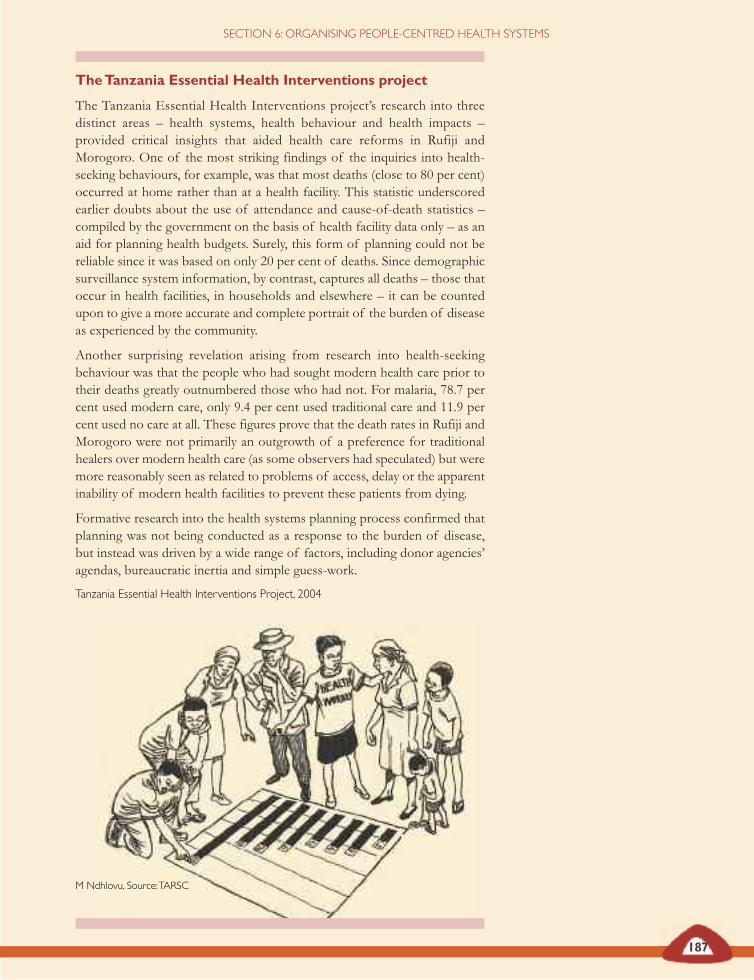
187
SECTION 6: ORGANISING PEOPLE-CENTRED HEALTH SYSTEMS
TheTanzania Essential Health Interventions project
The Tanzania Essential Health Interventions project’s research into threedistinct areas – health systems, health behaviour and health impacts –provided critical insights that aided health care reforms in Rufiji andMorogoro. One of the most striking findings of the inquiries into health-seeking behaviours, for example, was that most deaths (close to 80 per cent)occurred at home rather than at a health facility. This statistic underscoredearlier doubts about the use of attendance and cause-of-death statistics –compiled by the government on the basis of health facility data only – as anaid for planning health budgets. Surely, this form of planning could not bereliable since it was based on only 20 per cent of deaths. Since demographicsurveillance system information, by contrast, captures all deaths – those thatoccur in health facilities, in households and elsewhere – it can be countedupon to give a more accurate and complete portrait of the burden of diseaseas experienced by the community.
Another surprising revelation arising from research into health-seekingbehaviour was that the people who had sought modern health care prior totheir deaths greatly outnumbered those who had not. For malaria, 78.7 percent used modern care, only 9.4 per cent used traditional care and 11.9 percent used no care at all. These figures prove that the death rates in Rufiji andMorogoro were not primarily an outgrowth of a preference for traditionalhealers over modern health care (as some observers had speculated) but weremore reasonably seen as related to problems of access, delay or the apparentinability of modern health facilities to prevent these patients from dying.
Formative research into the health systems planning process confirmed thatplanning was not being conducted as a response to the burden of disease,but instead was driven by a wide range of factors, including donor agencies’agendas, bureaucratic inertia and simple guess-work.
Tanzania Essential Health Interventions Project, 2004
M Ndhlovu, Source:TARSC
188
RECLAIMINGTHE RESOURCES FOR HEALTH:ADVANCING HEALTH EQUITY IN EAST AND SOUTHERN AFRICA
Mtaa dispensary health information system,Kwale, Kenya
The key figure in developing and operating the health managementinformation system at Mtaa was a volunteer and a district health committeemember. She had been trained as a nurse-aid and then attended the trainingcourse for district health committee members and became particularlyinterested in what was said about health management information systems.She started collecting data for the Mtaa dispensary and writing it up on ablackboard and on charts, using information taken from the registerscompleted by the nurse-in-charge.
At the end of each month, she notes how many patients have been treatedfor different health problems and writes the figures for the top five diseasesup on the board. She also gets the figures for growth monitoring andimmunisation from the health action days implemented by the dispensary andthe villages. For the main health activities the Mtaa district health committeesets targets and the board shows whether the dispensary is achieving thistarget every month.
The information is used in the district health committee meetings and isavailable to the public to see what the committee is doing about their healthproblems. As she says:
‘The people know how many patients have been seen and the amount ofmoney collected, and what we did with it.’
After two years, there were encouraging indicators that, not only at Mtaa butacross all six dispensaries, there was a positive impact: use for preventive careincreased by 54 per cent and curative care by 15 per cent. None of thedispensaries was without drugs for even a single day.
Kwale Health System Strengthening Project (KHSSP), 2005as cited in Baez and Barron, 2006
Reviews of experience in and beyond east and southern Africa suggestthat these approaches work best where there is more sustained contactbetween communities and service providers, where communities arelocally organised and physically concentrated, and where there are clearincentives to collective action (Goetz et al., 2001; Gilson et al., 2007;Loewenson, 2007). They are also more effective where there are adequateresources and staff in the health system. These resources need to bedirected at the level of interface with civil society, in information flows and
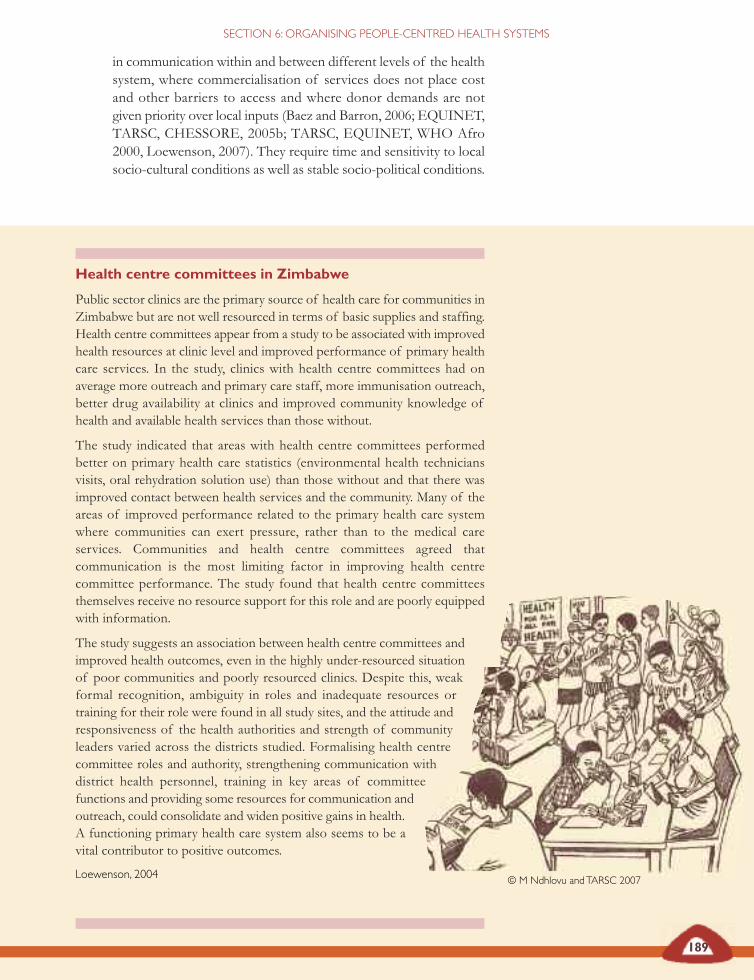
189
SECTION 6: ORGANISING PEOPLE-CENTRED HEALTH SYSTEMS
Health centre committees in Zimbabwe
Public sector clinics are the primary source of health care for communities inZimbabwe but are not well resourced in terms of basic supplies and staffing.Health centre committees appear from a study to be associated with improvedhealth resources at clinic level and improved performance of primary healthcare services. In the study, clinics with health centre committees had onaverage more outreach and primary care staff, more immunisation outreach,better drug availability at clinics and improved community knowledge ofhealth and available health services than those without.
The study indicated that areas with health centre committees performedbetter on primary health care statistics (environmental health techniciansvisits, oral rehydration solution use) than those without and that there wasimproved contact between health services and the community. Many of theareas of improved performance related to the primary health care systemwhere communities can exert pressure, rather than to the medical careservices. Communities and health centre committees agreed thatcommunication is the most limiting factor in improving health centrecommittee performance. The study found that health centre committeesthemselves receive no resource support for this role and are poorly equippedwith information.
The study suggests an association between health centre committees andimproved health outcomes, even in the highly under-resourced situationof poor communities and poorly resourced clinics. Despite this, weakformal recognition, ambiguity in roles and inadequate resources ortraining for their role were found in all study sites, and the attitude andresponsiveness of the health authorities and strength of communityleaders varied across the districts studied. Formalising health centrecommittee roles and authority, strengthening communication withdistrict health personnel, training in key areas of committeefunctions and providing some resources for communication andoutreach, could consolidate and widen positive gains in health.A functioning primary health care system also seems to be avital contributor to positive outcomes.
Loewenson, 2004
in communication within and between different levels of the healthsystem, where commercialisation of services does not place costand other barriers to access and where donor demands are notgiven priority over local inputs (Baez and Barron, 2006; EQUINET,TARSC, CHESSORE, 2005b; TARSC, EQUINET, WHO Afro2000, Loewenson, 2007). They require time and sensitivity to localsocio-cultural conditions as well as stable socio-political conditions.
© M Ndhlovu andTARSC 2007
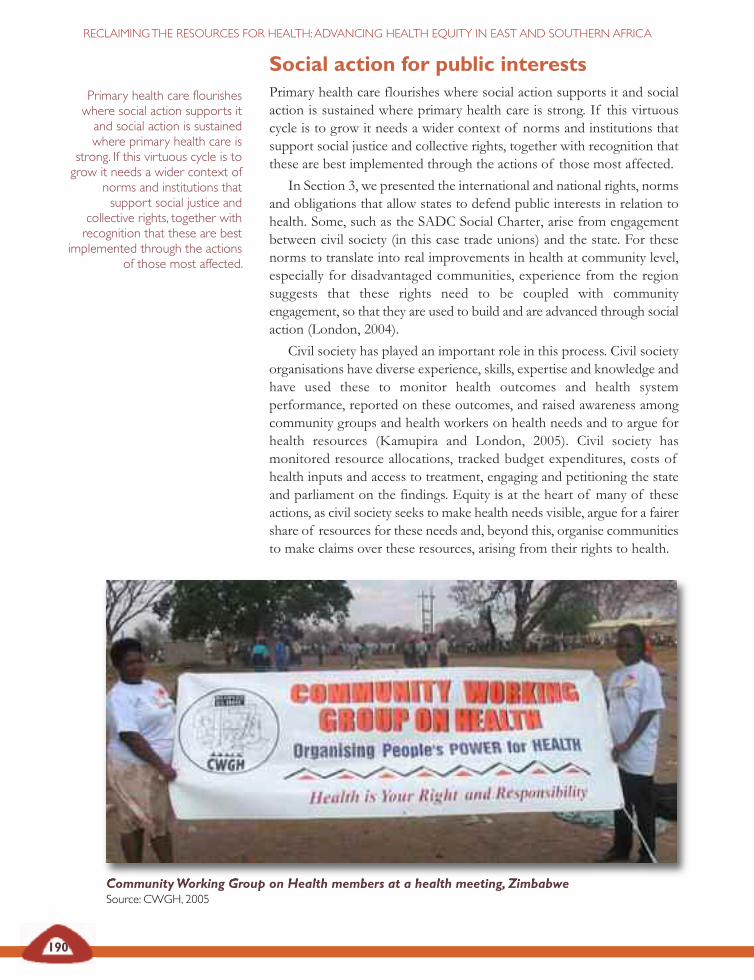
190
RECLAIMINGTHE RESOURCES FOR HEALTH:ADVANCING HEALTH EQUITY IN EAST AND SOUTHERN AFRICA
Social action for public interestsPrimary health care flourishes where social action supports it and socialaction is sustained where primary health care is strong. If this virtuouscycle is to grow it needs a wider context of norms and institutions thatsupport social justice and collective rights, together with recognition thatthese are best implemented through the actions of those most affected.
In Section 3, we presented the international and national rights, normsand obligations that allow states to defend public interests in relation tohealth. Some, such as the SADC Social Charter, arise from engagementbetween civil society (in this case trade unions) and the state. For thesenorms to translate into real improvements in health at community level,especially for disadvantaged communities, experience from the regionsuggests that these rights need to be coupled with communityengagement, so that they are used to build and are advanced through socialaction (London, 2004).
Civil society has played an important role in this process. Civil societyorganisations have diverse experience, skills, expertise and knowledge andhave used these to monitor health outcomes and health systemperformance, reported on these outcomes, and raised awareness amongcommunity groups and health workers on health needs and to argue forhealth resources (Kamupira and London, 2005). Civil society hasmonitored resource allocations, tracked budget expenditures, costs ofhealth inputs and access to treatment, engaging and petitioning the stateand parliament on the findings. Equity is at the heart of many of theseactions, as civil society seeks to make health needs visible, argue for a fairershare of resources for these needs and, beyond this, organise communitiesto make claims over these resources, arising from their rights to health.
Primary health care flourisheswhere social action supports itand social action is sustainedwhere primary health care is
strong. If this virtuous cycle is togrow it needs a wider context of
norms and institutions thatsupport social justice and
collective rights, together withrecognition that these are best
implemented through the actionsof those most affected.
CommunityWorking Group on Health members at a health meeting, ZimbabweSource: CWGH, 2005
191
SECTION 6: ORGANISING PEOPLE-CENTRED HEALTH SYSTEMS
The right to health care campaign
The People’s Health Movement is a global social movement for health. Themovement recognised the urgent need to address the global health systemcrisis characterised by:
• weakening public health systems;
• privatisation and promotion of private insurance;
• failure to implement comprehensive primary health care;
• unresponsive, fragmented and often donor-driven healthprogrammes; and
• a shortage of health care personnel.
All these factors were seen to lead to the denial of quality health care for alarge proportion of the world’s population.
The People’s Health Movement initiated a global right to health carecampaign, developed in collaboration with various networks, coalitions andorganisations sharing a similar perspective. This campaign documentsviolations of health rights, presents country level assessments of the right tohealth care and advocates for fulfillment of commitments to the right tohealth care at the national, regional and global levels.
The People’s Health Movement perspective is ‘right to health – health for all’.The right to health includes rights to a range of social determinants of health(for example, clean water, food security and nutrition, education, housing,clean and safe environments) as well as, importantly, the right to health care.
People’s Health Movement, 2007
Civil society supporting rights to health in Malawi
The Local Initiatives for Health project in Malawi has used a communityscorecard to put the rights-based approach into action. A participatory rights-based methodology supported rural communities in identifying priority healthissues and using their scorecard on these issues to build dialogue betweenthemselves and the providers. Social mapping was used to identify vulnerablegroups in communities and link them to health service providers and othersocial support systems. Through this, communities were able to promote non-discrimination in drug dispensing, in the overall treatment of patients and inthe provision of supplementary feeding and clinical care.
Kalumba cited in EQUINET, 2004
People’s Health Movement
192
RECLAIMINGTHE RESOURCES FOR HEALTH:ADVANCING HEALTH EQUITY IN EAST AND SOUTHERN AFRICA
This action can connect local needs to national or even global resources,and raise claims from local to global level.
‘The economic partnership agreement between the EuropeanCommission and African countries will impact on households whoare surviving on small-scale farming. Chicken imported from Europeis cheaper than chicken produced locally. In Chad and Cameroon wegrow rice but the rice imported from India is cheaper. So localfarming suffers. We think we should give a chance to Africa. We arenow signing petitions, where we collect millions of signatures andtake them to our head of state, so he may have a reason not to signthe agreement and will see that our populations are against thisprocess. So far we have succeeded in collecting four million signaturesat the grassroots level.’ACORD Cameroon in an interview with I Rusike,World Social Forum, 2007
Civil society organisations in east and southern Africa have supported thisvirtuous cycle between primary health care and social action by:
• organising evidence and giving voice to low-income communityissues;
• raising the visibility of the health conditions of poorcommunities;
• facilitating service outreach and use by informing andorganising communities;
• supporting services to respond to community values andcultural norms;
• promoting transparency and accountability of services to low-income communities; and
• making services more responsive to the perceptions of poorpeople (Loewenson, 2003).
These positive features, observed in some studies, are not uniform to allcivil society organisation interventions. Civil society organisations haveinternal weaknesses that impede their work in poor communities. Theyhave, for example, complex internal politics; unclear legal authority;unstable funding; donor dependency; and weak mechanisms formonitoring and scaling up work. Civil society organisation leadership isoften reported to be dominated by men and higher-income groups, whoact to secure their own self-interest and may be unwilling to confront stateor funding bureaucracies in the interests of poor people. These internalweaknesses diminish civil society organisations’ willingness or capacity toengage with or challenge the state to address the needs of the poor andundermine their ability to reach the poorest groups, serve their agenda orstrengthen advocacy of their interests (Loewenson, 2003). Not all theobstacles confronting pro-poor civil society organisation interventions areinternal. These organisations may meet resistance from corporate andstate interests, authoritarian styles of business and government, and poorlydeveloped media and communications systems.
193
SECTION 6: ORGANISING PEOPLE-CENTRED HEALTH SYSTEMS
Single issue campaigns, while powerful, can split vision, efforts andresources. Yet major networks of civil society in east and southern Africaidentified a unified aspiration for equity and social justice through people-led and people-centred health systems, outlined on page 194.
These actions within civil society resonate with those of otherinstitutions in east and southern Africa that have the potential and powerto organise social action for public interests in health.
Parliaments have, for example, contributed to policy space and publicdebate in support of health equity through their representative, legislativeand oversight roles, including budget supervision.
Parliaments have a role in ensuring that ratified international treatiesthat promote health are implemented through domestic laws (such asTRIPS flexibilities and the Convention on the Elimination of All Formsof Discrimination against Women) and that those with potential negativeimpacts (such as GATS) are not signed or ratified. These roles have beenused in east and southern Africa to protect or advance equity-orientedpublic policy, promote health system reforms or prioritise allocations tospecific areas of health systems. Parliamentary processes offer theopportunity for public input even in polarised political environments(Chebundo, 2006).
For example:
• In Kenya, civil society, medicine distributors, government andsome public health conscious members of parliamentchallenged areas of the intellectual property law that did notgive adequate authority to government to procure essentialdrugs at reasonable cost (HAI Africa, 2006).
• In South Africa and Zimbabwe, equity-oriented budgetmonitoring has both raised attention to areas of health systemperformance that need to be strengthened through increasedresource allocation, and prioritised equity-oriented areas ofhealth spending under conditions of scarcity (Chebundo, 2006;Ngomane and Ntuli, 2006).
• In South Africa, portfolio committees on health and finance,legislators from each provincial parliament and from theNational Association of Local Government were supported bya technical partner (Health Systems Trust) to: develop a strongerunderstanding of equity issues in health and health care in SouthAfrica; to understand trade-offs involved; develop and reviewindicators of equitable resource allocation; and to analyse policyand legislative proposals. Visits linked budgets to systemweaknesses and health workers’ views:
‘Parliamentarians contributed towards ensuring that the need toredress inequity was kept high on the public agenda’ (Ngomaneand Ntuli, 2006:11).
Parliaments have, for example,contributed to policy space andpublic debate in support ofhealth equity through theirrepresentative, legislative andoversight roles, including budgetsupervision.

194
RECLAIMINGTHE RESOURCES FOR HEALTH:ADVANCING HEALTH EQUITY IN EAST AND SOUTHERN AFRICA
Resolutions of the Health Civil Society Network,October 2005
We are united, together with health civil society in the region, around thecore principles and values of:
• the fundamental right to health and life;
• equity and social justice;
• people-led and people-centred health systems;
• public over commercial interests in health (health before profits);
• people-led and grassroots-driven regional integration.
To take these values forward we are reclaiming the state in health and haveidentified the five priorities listed below:
1 Building a national people’s health system
• We are struggling to build integrated health systems underpinned bythe principles of equity that address our lives, not just our illnessesand that keep us healthy.
• We will link, network and foster strategic alliances with partners, insideand outside the health sector, to develop a unified voice.
2 Organising people’s power for health
• We are organising people’s power to amplify our voice, claim our rightto health and control our resources for health.
3 Having adequate fairly-treated health workers
• Our health systems need adequate, well-trained and fairly-distributedhealth workers at all levels of our systems, in places where people needthem most.
• Health workers in the public sector need to be motivated throughdecent conditions, training, incentives, living wages and safe workenvironments, in a way that promotes gender equity.
4 Sufficient and equitable funding of our health systems
• We demand sustained increased investments in the public sector inhealth. We expect our governments to meet their Abuja commitmentto allocate at least 15 per cent of government spending to health.
• We demand an end to African wealth unfairly flowing out of thecontinent so that we have the resources for our health.
• We demand an end to unfair charges for poor people for health.
5 Global solidarity for economic and trade justice
• We expect our parliamentarians to ensure our countries have theindependence and sovereignty to protect our right to health.
• We remind those who go to the World Trade Organisation that:‘No deal is better than a bad deal.’
Health Civil Society Network in East, Central and Southern Africa, 2005
People’s Health Movement
PATAM
195
• In Kenya the African Population Health Research Centre usedevidence on differentials in access to reproductive healthservices and health outcomes to lever parliamentary support inrepositioning family planning and reproductive health in healthpriorities. Parliamentarians were able to ‘negotiate’ a line item inthe budget for family planning and reproductive health that gavethem the basis to mobilise support for the resources, monitoringperformance and increasing resource allocation to this areathrough a specific coalition of members of parliament(Mugisha, 2006).
• Tanzania’s parliament has, through a coalition of parliamentarycommittees, taken a number of positions and initiatives topromote poverty reduction. These include the expansion ofbasic primary education, focusing on poverty reduction inbudget oversight and participating in ‘community scorecards’and ‘citizen report cards’ to give participatory field assessmentsof service delivery and policy results in key areas identified foraction in national strategies. These actions have been facilitatedby strong, experienced committee chairs, a clear policy focusand consensus-building around key goals (Draman andLangdon, 2005; Eberlei and Henn, 2003).
These examples are among many that demonstrate the potential impact ofparliamentary roles on the design and performance of health systems. Areview of parliamentary experience suggests that equity-orientedoutcomes are most likely to happen when national policy is orientedtowards equity, when parliamentary reforms have opened the policy spaceand means for parliamentary action, and where parliamentarians activelyvisit constituencies and interact directly with health workers andcommunities (Ngomane and Ntuli, 2006; Chebundo, 2006; Mataure, 2003;Musuka and Chingombe, 2006).
Regional networks have played a supporting role (Musuka, 2005;Chebundo, 2006), including the SADC Parliamentary Forum, the EastAfrican Assembly, the East African Legislative Assembly, theCommonwealth Parliamentary Association and the Association ofParliamentary Committees on Health in East and Southern Africa. Thelatter, formed by parliamentarians and clerks from parliamentarycommittees on health in east and southern Africa in 2005, has begun toexchange experience and share technical inputs in health (Chebundo,2006).
There have been constraints. For example, parliaments may onlybecome involved in budget processes at a late stage when it may bedifficult to reorient measures towards more equitable options.Parliamentarians sometimes feel unprepared for this work and thecommittees often change membership in five-year intervals or less.
SECTION 6 ORGANISING PEOPLE-CENTRED HEALTH SYSTEMS
196
RECLAIMINGTHE RESOURCES FOR HEALTH:ADVANCING HEALTH EQUITY IN EAST AND SOUTHERN AFRICA
Parliamentary input to health budgets in Zimbabwe
Before 2000, Zimbabwe’s budget was crafted exclusively by the executivewithout input from parliament and civil society. Public involvement waslimited to budget briefings and parliament’s role was limited to debating thebudget as presented. The fifth Parliament of Zimbabwe, beginning in 2000,implemented parliamentary reforms to change the course of parliamentaryprocesses. This changed parliament’s legislative functions, oversight role overexecutive programmes and policy implementation, representationalapproaches and its budgetary process. The committee system, where onecommittee works with one sector ministry, was introduced.
Following this, a re-engineered budget process was introduced. AroundMarch/April each year, the portfolio committees call for budget meetingswith the relevant ministry officials and stakeholders from civil society,business, local authorities and professional groups for the sectors. Thesemeetings provide the opportunity for the committee and the stakeholders toindicate to the ministry what they consider to be the priority areas forinclusion in the budget. In the health sector, an ‘all-stakeholder’, full-daybudget consultative meeting is organised at the beginning of the budgetformulation stage. Stakeholders present both oral and written submissionsof their envisaged priority areas to the ministry and the committee. Theconsultations are supported by technical input.
Through this process the committee has:
• shifted from simply calling for increased allocations from treasury tofocusing on prioritising targets and considering equity implications;
• compared health allocations against set equity goals and benchmarks setby both national policies and international standards; and
• tracked quarterly spending and compared spending to priorities inresource allocation.
After consultations the committee contributes ideas to the ministry team whodrafts their bids, with inputs from its various departments. InAugust/September the committee requests the ministry to provide itsconsolidated draft bids and holds further all-stakeholder consultation to seewhether priority areas are reflected in the bids. The Ministry of Health andChild Welfare then sends its bids to treasury, with detailed justification, andwaits for its share when the national budget is presented to parliament. Theparliamentary committee on health also prepares its findings andrecommendations for presentation of a composite report from all portfoliocommittees to parliament.
This experience has shown that health resources can best be influencedthrough collective input and strong representation during the early prioritysetting stage with the respective ministries, rather that at the late stage oftreasury presentation. The process has had some impact in Zimbabwe, withthe preventive budget share rising from 9 per cent to 12 per cent in 2006, astand-alone budget for mental health and an increasing share of the nationalbudget going to health.Chebundo, 2006
197
SECTION 6: ORGANISING PEOPLE-CENTRED HEALTH SYSTEMS
The fundamentals of policy orientation emerge upstream from partyideologies and constitutional frameworks (Sekgoma et al., 2006). Resourceconstraints and the inaccessibility of some areas may bias the opportunitypeople have to engage parliaments towards higher-income urban groups.Electoral systems based on proportional representation may makeindividual members of parliament unwilling to criticise governmentpolicies even where they see problems for health equity at constituencylevel.
Reclaiming the resources for health thus calls for both a more robust,effective state in the global environment and a more robust form ofparticipatory democracy in the national environment.
This section highlights both the potential for the practical experiencesin working towards this and the local, national and global impediments toachieving it. It emphasises that organising participatory democracy at localand national level is not a resource-intensive exercise – it can be done andhas been done with limited resources. It has more to do with how poweris organised, shared and used.
One impediment identified and a key area for action to address thescale of the public health challenge in the region, is the currentfragmentation of public interests in health. At the same time, this sectionhas many examples of health gains that occur when state, civil society,parliament, health workers and other public interests co-operate. Thissuggests there are much wider health gains to be made in systematicallyorganising and strengthening the wider collective alliance of publicinterests across state, government and society.
In the final section, drawing together the major findings of thisanalysis, we discuss the commitments and actions that such an alliance ofpublic interests in health in and beyond the region can pursue to advancehealth and health equity in east and southern Africa.
Reclaiming the resources forhealth thus calls for both a morerobust, effective state in theglobal environment and a morerobust form of participatorydemocracy in the nationalenvironment.
One impediment identified and akey area for action to addressthe scale of the public healthchallenge in the region, is thecurrent fragmentation of publicinterests in health.At the sametime, this section has manyexamples of health gains thatoccur when state, civil society,parliament, health workers andother public interests co-operate.This suggests there are muchwider health gains to be made insystematically organising andstrengthening the widercollective alliance of publicinterests across state,government and society.
198
RECLAIMINGTHE RESOURCES FOR HEALTH:ADVANCING HEALTH EQUITY IN EAST AND SOUTHERN AFRICA
REFERENCESBaez C and Barron P (2006) ‘Community voice and role indistrict health systems in east and southern Africa: Aliterature review’, EQUINET discussion paper 39, EQUINET,Harare.
Chanetsa J (May 2007) ‘Control of breast milk substitutes inZimbabwe’, Case study report produced for EQUINET, Harare.
Chebundo B (2006) ‘Parliaments in the re-engineered budgetprocess in health: Case study’, unpublished paper, Harare.– (2006b) ‘Regional networking of parliamentary committeeson health, SEAPACOH case study’, unpublished paper,Harare.
Draman R and Langdon S (2005) ‘PRSPs in Africa:Parliaments and economic policy performance’, Project onDemocracy and the Rule of Law, mimeo, State and DemocracyDivision, Deutsche Gesellschaft fur TechnischeZusammanarbeit, Eschborn.
Eberlei W and Henn H (2003) Parliaments in sub-SaharanAfrica: Actors in poverty reduction?, Division 42, State andDemocracy, Planning and Development Dept, SectionEconomic Affairs, PRSP/Africa Department, DeutscheGesellschaft fur Technische Zusammenarbeit, Eschborn.
EQUINET (2004) ‘Reclaiming the state: Advancing people’shealth, challenging injustice’, Meeting report of the RegionalConference on Equity in Health, Durban, South Africa, June 2004,EQUINET, Harare.
Equity Gauge (Zambia) and Lusaka Health Board (2006)‘Strengthening community–health centre partnership andaccountability in Zambia’, EQUINET PRA project report,EQUINET, Harare.
EQUINET, TARSC and CHESSORE (2005b)‘Strengthening community voice and agency in health’,EQUINET meeting report, Zambia, EQUINET, Harare.
Gilson L, Kilima P and Tanner M (1994) ‘Local governmentdecentralisation and the health sector in Tanzania’, PublicAdministration and Development 14: 451-477.
Gilson L and Travis P (1997) ‘Health system decentralisationin Africa: An overview of experiences in eight countries’,WHO Regional Seminar on Decentralisation, Bamako, January 1997,WHO, Geneva.
Gilson L, Doherty J, Loewenson R, Francis V (2007) Finalreport of the Knowledge Network on Health Systems WHOCommission on the Social Determinants of Health, WHO CSDH,Geneva.
Goetz AM, Gaventa J and Jenkins R (2001) ‘Bringing citizenvoice and client focus into service delivery’, IDS working paper138, Institute of Development Studies, Brighton.
Harbeson L (2001) ‘Rebuilding local capacities inMozambique: The national health system and civil society’,Civil society and political renaissance, Kumarian Press, Bloomfield,available at http://www.idrc.ca/en/ev-87954-201-1-DO_TOPIC.html.
Health Action International (HAI) Africa (2006) Health ActionInternational Africa Network Update 4, July/Aug 2006, HAIAfrica, Nairobi.
Health Civil Society in East and Southern Africa Network(2005) ‘Resolutions of the Health Civil Society in Southernand East Africa meeting, 13 October 2005,’ presented at theSouthern African Social Forum, Harare, 13 October 2005,EQUINET, Harare.– (2005b) ‘Health civil society in east and southern Africa:Towards a unified agenda and action for people’s health,equity and justice’, EQUINET meeting report, EQUINET,Harare.
Kalumba K (1997) ‘Towards an equity-oriented policy ofdecentralisation in health systems under conditions ofturbulence: The case of Zambia’,WHO discussion paper 6,World Health Organisation, Zambia.
Kamupira M and London L (2005) ‘Human rightscommitments relevant to health made by states in southernAfrica: Implications for health equity’, EQUINET discussionpaper 25, EQUINET, Harare.
Libombo A (2003) ‘Health systems development andreproductive health, experience of Mozambique’, speech atMaking the Link: Sexual-Reproductive Health and Health SystemsConference, 9–11 September, Univ. of Leeds, Leeds.
Loewenson R (2003) Civil society – state interactions in nationalhealth systems: Annotated bibliography on civil society and health,WHO/TARSC, accessed 2 June 2007 athttp://www.tarsc.org/WHOCSI/– (2007) ‘Building voice and agency in health: public actionwithin health systems’, in Bennett S, Gilson L and Mills A(eds), Health, economic development and household poverty,Routledge, London.
Loewenson R, Rusike I and Zulu M (2004) ‘Assessing theimpact of health centre committees on health systemperformance and health resource allocation’, EQUINETdiscussion paper 18, TARSC, CWGH and EQUINET, Harare.
London L (2004) ‘Can human rights tools serve as a tool forequity?’, EQUINET policy paper 14, School of Public Healthand Family Medicine, Univ. of Cape Town, South Africa andEQUINET, Harare.
Macwan’gi M and Ngwengwe A (2004) ’Effectiveness ofdistrict health boards in interceding for the community’,EQUINET discussion paper 19, EQUINET and Univ. ofZambia, Harare.
Marmot M (2006) ‘Health in an unequal world’, the Lancet368 (9552): 2081-2094.
Mataure M (2003) ‘Parliamentary functions and reforms andtheir application in promoting health equity in southernAfrica’, EQUINET discussion paper 16, Public Affairs andParliamentary Support Trust and EQUINET, Harare.
199
SECTION 6: ORGANISING PEOPLE-CENTRED HEALTH SYSTEMS
Mills A (1994) ‘Decentralisation and accountability in thehealth sector from an international perspective: What are thechoices?’, Public Administration and Development 14: 281–292,accessed 15 August 2006 at http://www.wits.ac.za/whp/rightsandreforms/docs/Africa.pdf
Mkandawire T (2006) ‘Disempowering new democracies andthe persistence of poverty’, Democracy, Governance and HumanRights programme paper 21, UNRISD, Geneva.
Mugisha F (2006) The Nairobi Equity Gauge work withparliaments: Case study, African Population Health ResearchCentre, Nairobi.
Musuka G (2005) ‘'Descriptive study of debates on healthequity matters in the Zimbabwean National LegislativeAssembly’, unpublished research paper, TARSC, EQUINET,Harare.
Musuka G and Chingombe I (2006) ‘The role ofparliamentary committees on health in east and southernAfrica in building equitable, people-centred national healthsystems’, unpublished paper, Centre for Health Policy andEQUINET, Harare.
Ngomane T and Ntuli A (2006) ‘Parliamentary roles inequitable health budgets: Case study’, unpublished paper,South Africa.
Ngulube TJ, Mdhluli L, Gondwe K and Njobvu C (2004)‘Governance, participatory mechanisms and structures inZambia’s health system: An assessment of the impact ofhealth centre committees on equity in health and health care’,EQUINET discussion paper 21, CHESSORE, EQUINET,Harare.
Ngulube TJ, Mdhluli L and Gondwe K (2005) ‘Planning andbudgeting for primary health care in Zambia: A policyanalysis’, EQUINET discussion paper 29, CHESSORE,EQUINET, Harare.
Olukoshi A (1998) The elusive Prince of Denmark: Structuraladjustment and the crisis of governance in Africa, NordiskaAfrikainstitutet, Uppsala.
Oyaya CO and Rifkin SB (2003) ‘Health sector reforms inKenya: An examination of district level planning’, HealthPolicy 64: 113, 127.
People’s Health Movement (2007) Right to health care campaign,PHM, Cairo, available at http://www.phmovement.org/en/campaigns/righttohealth
Rusike I (2007) ‘Interview with ACORD Cameroon’,unpublished, World Social Forum, Nairobi, Kenya.
Savigny D, Kasale H, Conrad M and Reid G (2004) ‘Fixinghealth systems’, In Focus, IDRC, Ottawa, available athttp://www.idrc.ca/in_focus
SADC heads of state (August 2003) SADC Social Charter, Dares Salaam.
Sekgoma B, Afuba MD, Eba PM (2006) Handbook on gender,human rights and HIV and AIDS, SADC PF, Gaborone.
Tanzania Essential Health Interventions Project (2004)Tanzania Essential Health Interventions Project, IDRC, Ottawa.
TARSC, EQUINET, WHO Afro (2000) ‘Public participationin health systems’ Regional meeting report, Pangolin Lodge, Harare,17-19 May 2000, EQUINET with WHO Afro, Harare.
United Nations Capital Development Fund (UNCDF) andUNDP (2001) ‘Malawi concept paper: Empowermentthrough governance and development management as astrategy towards poverty alleviation’, Malawi on the move: The re-orientation of UNDP and UNCDF/UNDP support to the Malawidecentralisation process (2002-2006), UNDP, New York.
UNDP (2005) Human development report: International cooperationat a crossroads: Aid, trade and security in an unequal world, UNDP,New York, available at http://hdr.undp.org/reports/global/2005/
Univerity of Namibia and Ontevrede Community (2006)‘Creating nurse student awareness on community knowledgeon health in Ontevrede (unsatisfied) informal settlement,Namibia’, EQUINET PRA report, EQUINET, Harare.
Wallerstein NB and Duran B (2006) ‘Using community-basedparticipatory research to address health disparities’, HealthPromotion Practice 7:312.
World Bank (2005)World development indicators database, 2005,World Bank, Washington, accessed 2 June 2007 athttp://devdata.worldbank.org/wdi2005/index2.htm
WHO (1978) Primary health care, joint report of the DirectorGeneral of the WHO and the Executive Director ofUNICEF, WHO, Geneva.– (1978b) ‘Declaration of Alma-Ata’, International Conference onPrimary Health Care, Alma-Ata, USSR, 6-12 September 1978,WHO, Geneva.– (2004) ‘3 by 5’ progress report, WHO, Geneva.

Taking actionTO RECLAIM THE RESOURCES
FOR HEALTH
SECTION
7
The first six sections of the analysis frame the issues thataffect equity in health in east and southern Africa, presentand analyse evidence on these issues and propose strategies
for acting on them.
This section consolidates this analysis. It summarises the policymeasures and actions that would advance equity to enable poorhouseholds and communities to claim a fairer share of nationalresources, for east and southern African countries to claim a morejust return from the global economy and for redistributive healthsystems to claim a larger share of national resources. There isgrowing opportunity for a win-win resolution between measuresthat reduce a drain of resources from east and southern Africaneconomies, and national measures that redistribute these resourcesfor wider economic and social gain. We propose ways for publicleadership and social action to facilitate this.
These equity values and measures need to be championed. Towardsthis, as EQUINET, we have identified indicators that reflectprogress in four key dimensions of equity, drawn from our analysis.We argue for these to be monitored and reported on to assessprogress in implementing commitments and as inputs for strategicreviews of the policies, investments and processes used to advancehealth and to build universal and equitable health systems.
This section outlines the debates and knowledge gaps arising in theanalysis and invites contribution to these. EQUINET, as a networkof institutions within the region, remains committed to generatingknowledge, facilitating dialogue and analysis, and supportingpractice to deliver on equity goals.
KEY ISSUES
SECTION
7
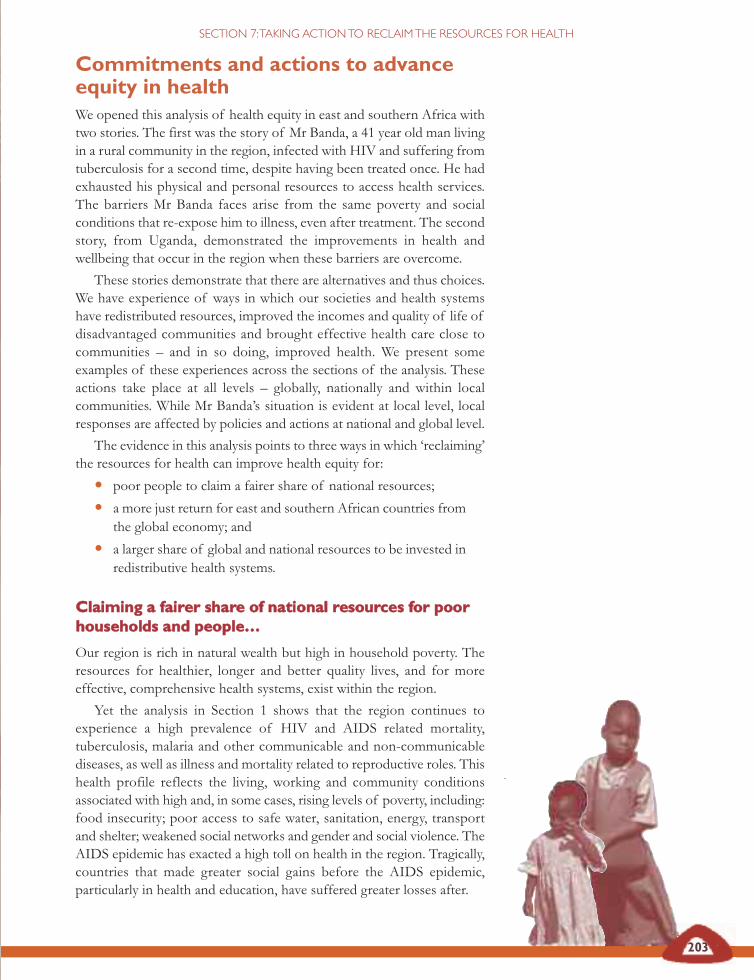
Commitments and actions to advanceequity in healthWe opened this analysis of health equity in east and southern Africa withtwo stories. The first was the story of Mr Banda, a 41 year old man livingin a rural community in the region, infected with HIV and suffering fromtuberculosis for a second time, despite having been treated once. He hadexhausted his physical and personal resources to access health services.The barriers Mr Banda faces arise from the same poverty and socialconditions that re-expose him to illness, even after treatment. The secondstory, from Uganda, demonstrated the improvements in health andwellbeing that occur in the region when these barriers are overcome.
These stories demonstrate that there are alternatives and thus choices.We have experience of ways in which our societies and health systemshave redistributed resources, improved the incomes and quality of life ofdisadvantaged communities and brought effective health care close tocommunities – and in so doing, improved health. We present someexamples of these experiences across the sections of the analysis. Theseactions take place at all levels – globally, nationally and within localcommunities. While Mr Banda’s situation is evident at local level, localresponses are affected by policies and actions at national and global level.
The evidence in this analysis points to three ways in which ‘reclaiming’the resources for health can improve health equity for:
• poor people to claim a fairer share of national resources;
• a more just return for east and southern African countries fromthe global economy; and
• a larger share of global and national resources to be invested inredistributive health systems.
CCllaaiimmiinngg aa ffaaiirreerr sshhaarree ooff nnaattiioonnaall rreessoouurrcceess ffoorr ppoooorrhhoouusseehhoollddss aanndd ppeeooppllee……
Our region is rich in natural wealth but high in household poverty. Theresources for healthier, longer and better quality lives, and for moreeffective, comprehensive health systems, exist within the region.
Yet the analysis in Section 1 shows that the region continues toexperience a high prevalence of HIV and AIDS related mortality,tuberculosis, malaria and other communicable and non-communicablediseases, as well as illness and mortality related to reproductive roles. Thishealth profile reflects the living, working and community conditionsassociated with high and, in some cases, rising levels of poverty, including:food insecurity; poor access to safe water, sanitation, energy, transportand shelter; weakened social networks and gender and social violence. TheAIDS epidemic has exacted a high toll on health in the region. Tragically,countries that made greater social gains before the AIDS epidemic,particularly in health and education, have suffered greater losses after.
SECTION 7: TAKING ACTION TO RECLAIM THE RESOURCES FOR HEALTH
203

204
RECLAIMING THE RESOURCES FOR HEALTH: ADVANCING HEALTH EQUITY IN EAST AND SOUTHERN AFRICA
Our first indicator of asustainable basis for improved
health in the region is, therefore,for disadvantaged individuals andhouseholds to access a largershare of national resources.
Within countries in the region and across communities, groups withdifferent levels of income, assets, rural or urban residence, mother’seducation and other socio-economic conditions have different healthoutcomes. They also have different levels of access to health care. Whileaccess to health care has improved in the region over the past two decades,relative disadvantage in access by income, place of residence and maternaleducation persist.
The evidence shown in Section 1 indicates that these differentials havenot been reduced by aggregate national gross domestic product growthand that, in some cases, they have even widened. It appears thatinequalities in wealth, assets, in the returns to employment and in socialfactors like education, affect how much households benefit from growthin the national economy and are able to translate this into improvedwellbeing. Poor opportunities for health continue to be passed acrossgenerations through this vicious cycle. What is most problematic forhealth is that this appears to have been intensifying since 1995, addingnew challenges to historical legacies.
Unless we can break the cycle and improve the benefits thathouseholds with previous disadvantage obtain from growth, mosthouseholds will continue to lack the basic resources for health.
Our first indicator of a sustainable basis for improved health in theregion is, therefore, for disadvantaged individuals and householdsto access a larger share of national resources.
We would measure this change not only through indicators ofpoverty and income distribution but, more importantly, throughthe extent to which disadvantaged social groups and householdscan access national resources. From the factors related to health,this calls for measures that widen the distribution of control overassets and wealth (such as land, housing and production capital), theeconomic and social returns people get from employment(improving the ratio between wages and profits), and the accessdisadvantaged people, especially women, have to health andeducation services.
Breaking a vicious cycle of economic and social inequality is not simple.All countries in the region have expressed a commitment to it. Twoimportant policy dimensions affect delivery on this, however, that wediscuss later:
• The first, identified in Sections 1 and 2, relates to how countriesin the region engage with a process of globalisation that isassociated with widening inequalities globally, with Africa in ahighly disadvantaged position.
• The second, identified in Sections 3 to 5, relates to the optionsthat countries have, particularly within health systems, toredistribute resources nationally.
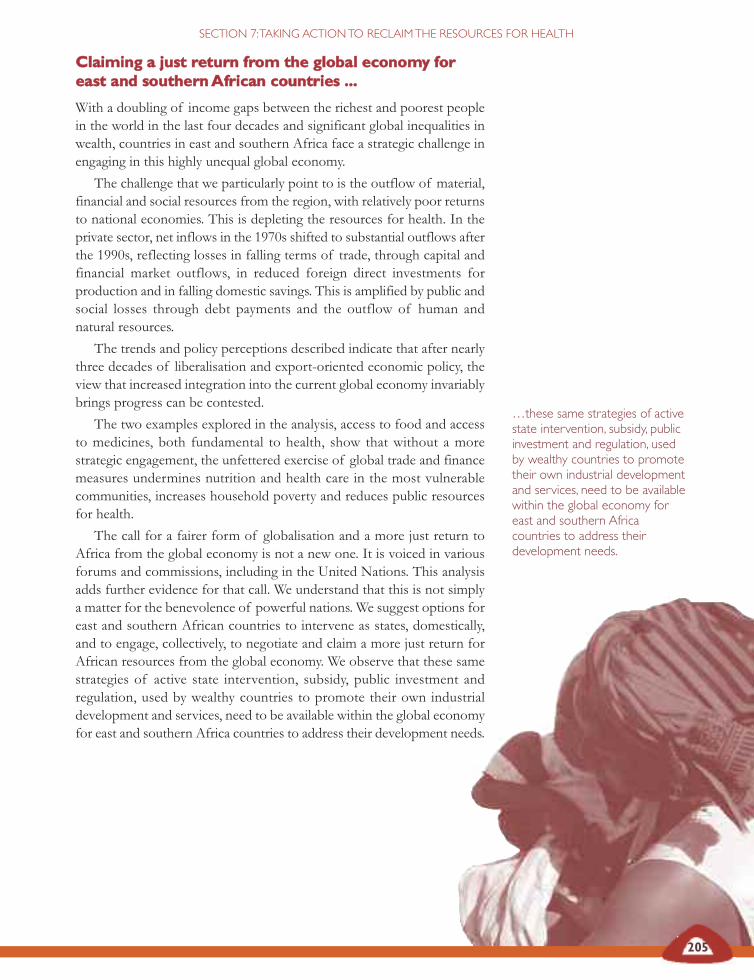
205
SECTION 7: TAKING ACTION TO RECLAIM THE RESOURCES FOR HEALTH
CCllaaiimmiinngg aa jjuusstt rreettuurrnn ffrroomm tthhee gglloobbaall eeccoonnoommyy ffoorreeaasstt aanndd ssoouutthheerrnn AAffrriiccaann ccoouunnttrriieess ......
With a doubling of income gaps between the richest and poorest peoplein the world in the last four decades and significant global inequalities inwealth, countries in east and southern Africa face a strategic challenge inengaging in this highly unequal global economy.
The challenge that we particularly point to is the outflow of material,financial and social resources from the region, with relatively poor returnsto national economies. This is depleting the resources for health. In theprivate sector, net inflows in the 1970s shifted to substantial outflows afterthe 1990s, reflecting losses in falling terms of trade, through capital andfinancial market outflows, in reduced foreign direct investments forproduction and in falling domestic savings. This is amplified by public andsocial losses through debt payments and the outflow of human andnatural resources.
The trends and policy perceptions described indicate that after nearlythree decades of liberalisation and export-oriented economic policy, theview that increased integration into the current global economy invariablybrings progress can be contested.
The two examples explored in the analysis, access to food and accessto medicines, both fundamental to health, show that without a morestrategic engagement, the unfettered exercise of global trade and financemeasures undermines nutrition and health care in the most vulnerablecommunities, increases household poverty and reduces public resourcesfor health.
The call for a fairer form of globalisation and a more just return toAfrica from the global economy is not a new one. It is voiced in variousforums and commissions, including in the United Nations. This analysisadds further evidence for that call. We understand that this is not simplya matter for the benevolence of powerful nations. We suggest options foreast and southern African countries to intervene as states, domestically,and to engage, collectively, to negotiate and claim a more just return forAfrican resources from the global economy. We observe that these samestrategies of active state intervention, subsidy, public investment andregulation, used by wealthy countries to promote their own industrialdevelopment and services, need to be available within the global economyfor east and southern Africa countries to address their development needs.
…these same strategies of activestate intervention, subsidy, publicinvestment and regulation, usedby wealthy countries to promotetheir own industrial developmentand services, need to be availablewithin the global economy foreast and southern Africacountries to address theirdevelopment needs.

206
RECLAIMING THE RESOURCES FOR HEALTH: ADVANCING HEALTH EQUITY IN EAST AND SOUTHERN AFRICA
Some of the options for this, raised in Sections 2 to 5, include:
• improved disclosure of financial flows, controlling capital flightand profit or dividend outflows and taxing currency transfers;
• debt cancellation;
• using tariffs and subsidies and canvassing for investments todevelop, protect and diversify infant industries and smallholderagricultural production;
• negotiating foreign direct investment that adds value to naturalresources and stimulates local industry;
• widening population access to land, water, forests, fishing areasand other productive resources through genuine redistribution;
• meeting the SADC commitment to a budgetary allocation of‘at least 10 per cent of national budgetary resources’ toagriculture and rural development within five years,preferentially allocated to smallholder and women’s production,and stimulating local market links, especially for smallholder andwomen producers;
• resisting the commercialisation and privatisation of publicgoods, including health care, water and other essential services,and not making irreversible commitments under the GeneralAgreement on Trade in Services to liberalise these services;
• enacting and using Trade-related Intellectual Property Rights(TRIPS) flexibilities in full for access to medicines, includingthrough regional co-operation to procure, compulsorily licenseand stimulate local production of pharmaceuticals and othermedical technology;
• ensuring that trade agreements explicitly recognise and includeclauses to protect health, support capacities for this, compensatefor public revenues lost, involve health officials in negotiationsand include health impact assessments where relevant;
• avoiding commitments to liberalise health services andproviding for full use of TRIPS flexibilities; and
• negotiating, through bilateral agreements, for investment inpublic sector training and retention incentives for healthworkers to address the out-migration of skilled health workersfrom Africa.
These measures draw support from regional co-operation and south-southnetworks.
The analysis points to the loss of public confidence in states and theirloss of legitimacy that occur when the benefits of globalisation are felt bya diminishing group of people, with wider social decline. This happenedunder the World Bank and International Monetary Fund sponsored
207
SECTION 7: TAKING ACTION TO RECLAIM THE RESOURCES FOR HEALTH
The political leadership thatnegotiates improved returnsfrom the global economy is thusalso called upon to distribute thereturns from this more fairly tothe wider population.
structural adjustment reforms. The political leadership that negotiatesimproved returns from the global economy is thus also called upon todistribute the returns from this more fairly to the wider population.
There is growing opportunity for a win-win balance between measuresthat reduce a drain of resources from east and southern Africa economies,and national measures that redistribute these resources for widereconomic and social gain. Efforts to widen access to prevention, treatmentand care for HIV and AIDS, as outlined in Section 3, demand full use ofTRIPS flexibilities. Increased public sector financing for health tostrengthen district health systems that are free at point of care, as outlinedin Section 4, provides clear pathways for equitable use of funds releasedfrom debt cancellation. Measures to produce, value and retain healthworkers at the levels of the health system they are most needed, asoutlined in Section 5, provide an effective channel for bilateral funds thatcompensate for perverse subsidies from out-migration.
CCllaaiimmiinngg aa llaarrggeerr sshhaarree ooff nnaattiioonnaall aanndd gglloobbaallrreessoouurrcceess ffoorr rreeddiissttrriibbuuttiivvee hheeaalltthh ssyysstteemmss ......
There are many ways east and southern African countries can deliver ontheir long-standing commitment to overcome unfair differences in healthand allocate more resources to those with greater health needs. In Section3 we show, for example, how measures to improve access to land andproduction inputs for smallholder and women producers are associatedwith improved nutrition. In Section 1 we show the importance of women’seducation for a range of health outcomes. Most of these measures lieoutside the health sector.
Health systems can, however, make a difference in these areas byproviding leadership, shaping wider social norms and values, providingpublic health motivation and working across sectors in a shared approach.
We describe, in Section 3, the comprehensive, primary health careoriented, people-centred and publicly-led health systems that havebeen found to improve health, particularly for the mostdisadvantaged people with greatest health needs. These systems arebased on the universal right to health and founded on policy valuesof universality and equity. They are advanced and protected againstchallenge by political and public health leadership and publicalliances.
The primary health care strategy orients the whole health system towardspromoting health and preventing ill health as the first line of action andtowards providing relevant, accessible care – areas of health interventionthat are often lost when systems are driven by more specialised responsesto disease. The multiple challenges to health experienced in the poorestcommunities call for comprehensive approaches, integrated within levelsof care closest to these communities.
208
RECLAIMING THE RESOURCES FOR HEALTH: ADVANCING HEALTH EQUITY IN EAST AND SOUTHERN AFRICA
East and southern African countries made considerable progress in healththrough health care systems based on primary health care. Resourcescarcities, rather than public health effectiveness, drive more selective,vertically-organised approaches, with reduced investment in the systemsto support these approaches. Yet lessons learned from the roll out ofprevention and treatment for HIV and AIDS, described in Section 3,indicate that the most equitable and sustainable way to achieve goals fortreatment and prevention is through universal, comprehensive, people-centred health systems, particularly at district level.
While many sectors contribute to health, the analysis presents evidenceof the important contribution that health systems have continued to maketo overcoming differentials in health, even in the face of wider challengesfrom economic inequality, poverty and AIDS.
The persistence of disadvantage in access to health care by income,place of residence and maternal education, however, weakens thiscontribution. It means, unacceptably, that those with highest health needshave poorer health care access, when the opposite should apply.
In Sections 3 to 6, we identify some reasons why this is happening:
• the higher share of spending on health goes to the highestincome groups in the population so they capture the greatershare of public spending on health;
• people lack the power to overcome the barriers that arise totheir use of health services at different stages, particularly aspoverty and inequalities in wealth widen;
• the investment in and integration of comprehensive primaryhealth care in Africa is declining;
• decentralisation reforms have not successfully supportedprimary health care approaches;
• urban, higher level hospitals, less used by poor communities,continue to receive a greater and, in some cases, increasing shareof resources; and
• private for-profit and commercialised health services havegrown and user charges have risen.
SSttrroonngg,, rriigghhttss--bbaasseedd,, aaccccoouunnttaabbllee aanndd eeqquuiittyy--oorriieenntteeddppuubblliicc lleeaaddeerrsshhiipp iinn hheeaalltthh ......
Public policy choices can, however, address these problems. We argue thatthis calls for public leadership in health systems to define strategies foruniversality and equity and to lever the role of all sectors – includingexternal funders – towards national health goals. Leadership needs toinvest in and support the community and social roles in health, managingthe pressures for commercialisation and linking short-term resources tolong-term health system plans, to ensure adequate investment in primaryhealth care and district health systems. This demands a strengthenedpublic sector in health.
While many sectors contributeto health, the analysis presentsevidence of the important
contribution that health systemshave continued to make to
overcoming differentials in health,even in the face of widerchallenges from economic
inequality, poverty and AIDS.
209
SECTION 7: TAKING ACTION TO RECLAIM THE RESOURCES FOR HEALTH
The major elements of healthsystems cannot be organisedthrough the market. Health is auniversal human right, calling fora foundation of rights andobligations to protect people’shealth.
We argue for ‘Abuja PLUS’ – thatis for government commitmentsto health to be matched byinternational delivery on debtcancellation, releasing theresources currently going to debtservicing to be used to develophealth systems. We also arguefor a significantly greater share ofthis government spending to beallocated to district healthservices.
As we present in Section 4, the current average spending of US$29 percapita on health in the region is well below the US$60 per capita WHOestimates as essential for a functional health system – or even the US$34per capita estimated by the Macroeconomic Commission on Health tocover the most basic interventions for major public health burdens.
To start with, governments are called on to increase their ownfinancing to health to reach at least the 15 per cent commitmentmade in Abuja, excluding external financing.
We argue, however, for ‘Abuja PLUS’ – that is for governmentcommitments to health to be matched by international delivery ondebt cancellation, releasing the resources currently going to debtservicing to be used to develop health systems.
We also argue for a significantly greater share of thisgovernment spending to be allocated to district health services. Anindicative target to aim towards would be 50 per cent ofgovernment spending to district health services (up to andincluding level 1 hospital services), of which half (25 per cent oftotal) should be on primary level health care.
Public leadership calls for a stronger and more sustained assertion ofpublic interest in health, with regulation of commercial interests that areharmful to health, and resistance to privatisation and commercialisation ofservices essential for health.
The major elements of health systems cannot be organised throughthe market. Health is a universal human right, calling for a foundation ofrights and obligations to protect people’s health.
As we detail in Section 3, this demands that countries ratify regionaland international conventions, such as the African Charter on Human andPeoples’ Rights (1986), the SADC Social Charter and the InternationalCovenant on Economic, Social and Cultural Rights (1976). Countries canintegrate these conventions into national law and provide for obligationsin the constitution to protect the health and health care of the population,specifically of vulnerable groups, like children.
The analysis draws attention to ways to progressively translate theserights into real entitlements. We also argue that this will not happenwithout a strong alliance of public interests in health through state andcivil society, parliament, health workers and other public interests.
Across the analysis we present examples from the region of the healthgains that occur when such alliances of public interests protect andadvance public health, whether in global negotiations, in levering a moreequitable and effective distribution of resources for and within healthsystems or in enhancing use of health systems. This calls for an enablingstate and particularly one that facilitates a more robust form ofparticipatory democracy in the national environment.
210
RECLAIMING THE RESOURCES FOR HEALTH: ADVANCING HEALTH EQUITY IN EAST AND SOUTHERN AFRICA
There are many ways to exercise this leadership and organise healthsystems to overcome inequalities in health. In this analysis we have focusedon three that we consider important at this stage: how fairly we financehealth systems; how we organise, value and retain our health workers; andthe role we give to people and social action.
GGuuaarraanntteeeeiinngg uunniivveerrssaall aacccceessss tthhrroouugghh ffaaiirr ffiinnaanncciinngg ......
No one who needs health services should be denied access due to inabilityto pay and the costs of health care should not threaten livelihoods. Withinthe context of poverty and inequality in east and southern Africa, thismeans that those with greater ability to pay should contribute a higherproportion of their income than those with lower incomes, and thosewith higher levels of health need should get a greater share of healthresources.
A number of measures are proposed in Section 4 to achieve this:
• a steady increase in progressive tax funding as the core touniversal coverage;
• clear measures to bring various forms of health insurancewithin a strategic plan for universal coverage;
• tax and regulatory measures to improve efficiency and equity inthe private health sector;
• use of all funds collected to improve equitable access to definedentitlements to comprehensive, primary health care orientedhealth services, planned for and monitored to ensure thatentitlements equate to real access; and
• equity measures in resource allocation of national budgets, withincreased allocations to district and primary health care systems.
One of the areas of increased spending is on health workers. Withouthealth workers there is no health system. There is a massive shortfall inhealth workers in east and southern Africa, with losses due to AIDS,significant outflows in health worker migration and many health workersfound in urban hospitals and private services. There seems to be a globalconveyor belt of health workers moving from lower to higher incomesettings and out-migration, whose costs to communities or health systemsare still poorly understood or quantified. Yet, many health workers wouldprefer not to leave home.
IInnvveessttmmeennttss tthhaatt vvaalluuee aanndd rreettaaiinn hheeaalltthh wwoorrkkeerrss......
Delivering equitable health systems calls for immediate and longer-termmeasures to train and retain and ensure effective and motivated work fromhealth workers, especially those within the public sector district andprimary health care systems.
211
SECTION 7: TAKING ACTION TO RECLAIM THE RESOURCES FOR HEALTH
Our concept of equity includesthe power and ability people(and social groups) have todirect resources to their healthneeds, particularly for those withworst health. This refers topeople’s collective ability toassert their own needs andinterests, influence the allocationof societal resources towardstheir needs, and challenge thedistribution of power andresources that block theirdevelopment.
Drawing on the region’s experience, the strategies for this include:
• immediate financial measures, to address real wage declines andimprove real earnings, particularly for public sector healthworkers;
• a mix of non-financial incentives that address continuousprofessional development, working, living and social conditionsand needs, including safe work and access to antiretrovirals;
• additional resources to finance all forms of incentives needed;
• investment in and improvement of strategic managementcapacities and systems and in information and monitoringsystems;
• dialogue with health workers to improve communication andtrust between themselves and both their employing institutionsand the communities they serve; and
• bilateral agreements providing compensatory investments toeast and southern African countries for perverse subsidies dueto out-migration, directed to measures to produce, value andretain health workers.
PPaarrttiicciippaattoorryy hheeaalltthh ssyysstteemmss,, eemmppoowweerriinngg ssoocciiaall aaccttiioonnffoorr hheeaalltthh ......
Implementing and defending these features of health systems is notsimply a matter for technocrats, health workers or state officials. Ourconcept of equity includes the power and ability people (and socialgroups) have to direct resources to their health needs, particularly for thosewith worst health. This refers to people’s collective ability to assert theirown needs and interests, influence the allocation of societal resourcestowards their needs, and challenge the distribution of power and resourcesthat block their development.
The market reforms in health care described in Section 2 and thedisparities described in Section 1 do not only leave people vulnerable tountreated ill health, they also marginalise communities who cannot affordor access the health system. They create individual struggles over basicentitlements and disrupt social cohesion and integration. In contrast, theprimary health care approach to universal health systems, described inSection 3, backed by fair financing measures and health workers who arevalued, as described in Sections 4 and 5, send a powerful message of socialsolidarity and foster social inclusion.
Hence the call for a robust state to resist encroachments on health anddefend public interests in global engagements. This is not equated with anauthoritarian state that does not listen to local views, particularly if we areto tap one of the region’s most abundant and powerful assets – its people.
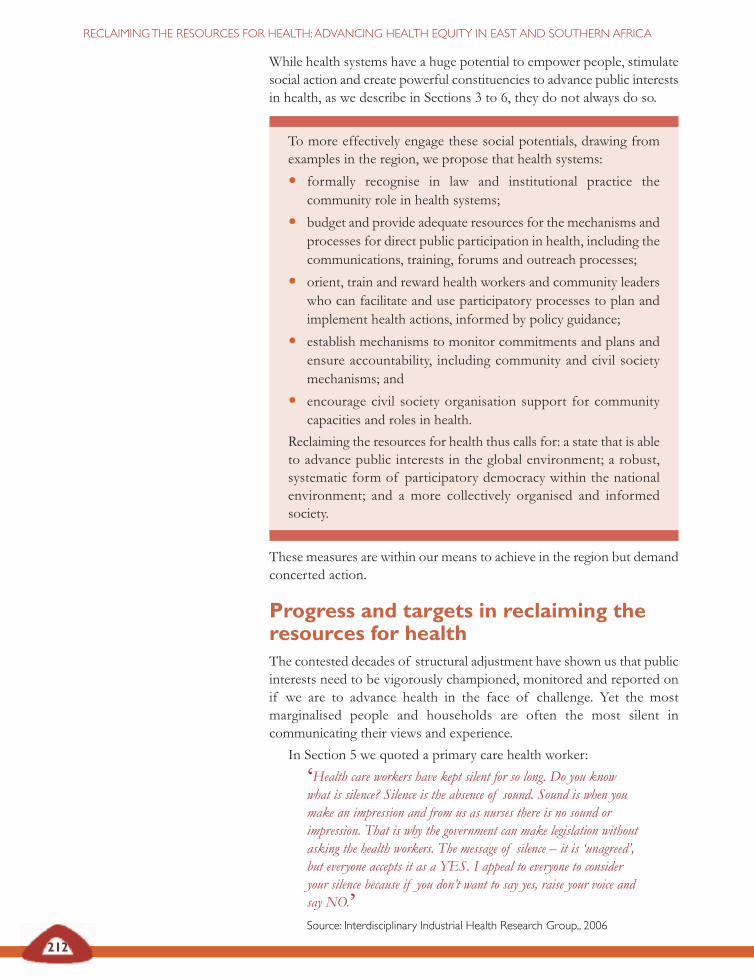
212
RECLAIMING THE RESOURCES FOR HEALTH: ADVANCING HEALTH EQUITY IN EAST AND SOUTHERN AFRICA
While health systems have a huge potential to empower people, stimulatesocial action and create powerful constituencies to advance public interestsin health, as we describe in Sections 3 to 6, they do not always do so.
To more effectively engage these social potentials, drawing fromexamples in the region, we propose that health systems:
• formally recognise in law and institutional practice thecommunity role in health systems;
• budget and provide adequate resources for the mechanisms andprocesses for direct public participation in health, including thecommunications, training, forums and outreach processes;
• orient, train and reward health workers and community leaderswho can facilitate and use participatory processes to plan andimplement health actions, informed by policy guidance;
• establish mechanisms to monitor commitments and plans andensure accountability, including community and civil societymechanisms; and
• encourage civil society organisation support for communitycapacities and roles in health.
Reclaiming the resources for health thus calls for: a state that is ableto advance public interests in the global environment; a robust,systematic form of participatory democracy within the nationalenvironment; and a more collectively organised and informedsociety.
These measures are within our means to achieve in the region but demandconcerted action.
Progress and targets in reclaiming theresources for health The contested decades of structural adjustment have shown us that publicinterests need to be vigorously championed, monitored and reported onif we are to advance health in the face of challenge. Yet the mostmarginalised people and households are often the most silent incommunicating their views and experience.
In Section 5 we quoted a primary care health worker:
‘Health care workers have kept silent for so long. Do you knowwhat is silence? Silence is the absence of sound. Sound is when youmake an impression and from us as nurses there is no sound orimpression. That is why the government can make legislation withoutasking the health workers. The message of silence – it is ‘unagreed’,but everyone accepts it as a YES. I appeal to everyone to consideryour silence because if you don’t want to say yes, raise your voice andsay NO.’Source: Interdisciplinary Industrial Health Research Group,, 2006
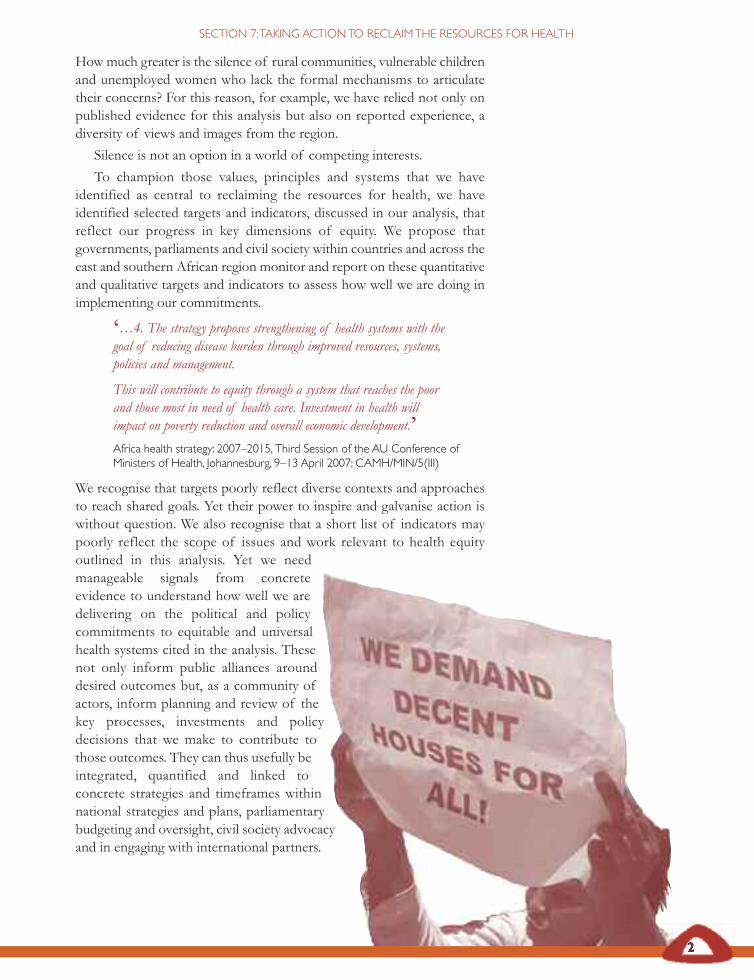
How much greater is the silence of rural communities, vulnerable childrenand unemployed women who lack the formal mechanisms to articulatetheir concerns? For this reason, for example, we have relied not only onpublished evidence for this analysis but also on reported experience, adiversity of views and images from the region.
Silence is not an option in a world of competing interests.
To champion those values, principles and systems that we haveidentified as central to reclaiming the resources for health, we haveidentified selected targets and indicators, discussed in our analysis, thatreflect our progress in key dimensions of equity. We propose thatgovernments, parliaments and civil society within countries and across theeast and southern African region monitor and report on these quantitativeand qualitative targets and indicators to assess how well we are doing inimplementing our commitments.
‘…4. The strategy proposes strengthening of health systems with thegoal of reducing disease burden through improved resources, systems,policies and management.
This will contribute to equity through a system that reaches the poorand those most in need of health care. Investment in health willimpact on poverty reduction and overall economic development.’Africa health strategy: 2007–2015, Third Session of the AU Conference of Ministers of Health, Johannesburg, 9–13 April 2007; CAMH/MIN/5(III)
We recognise that targets poorly reflect diverse contexts and approachesto reach shared goals. Yet their power to inspire and galvanise action iswithout question. We also recognise that a short list of indicators maypoorly reflect the scope of issues and work relevant to health equityoutlined in this analysis. Yet we needmanageable signals from concreteevidence to understand how well we aredelivering on the political and policycommitments to equitable and universalhealth systems cited in the analysis. Thesenot only inform public alliances arounddesired outcomes but, as a community ofactors, inform planning and review of thekey processes, investments and policydecisions that we make to contribute tothose outcomes. They can thus usefully beintegrated, quantified and linked toconcrete strategies and timeframes withinnational strategies and plans, parliamentarybudgeting and oversight, civil society advocacyand in engaging with international partners.
213
SECTION 7: TAKING ACTION TO RECLAIM THE RESOURCES FOR HEALTH
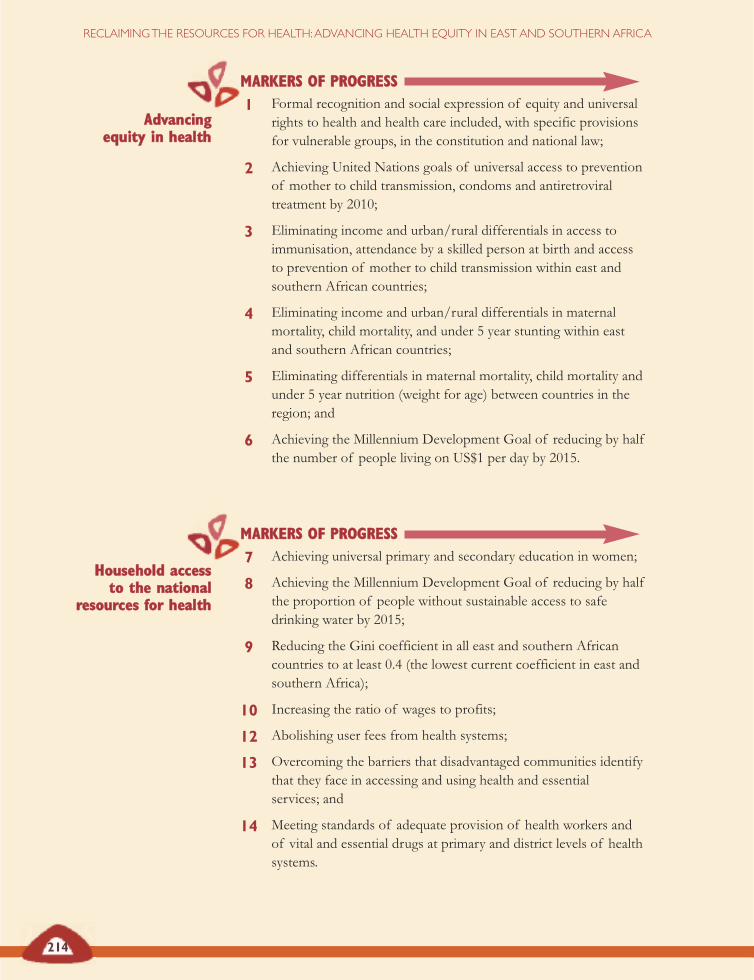
1 Formal recognition and social expression of equity and universalrights to health and health care included, with specific provisionsfor vulnerable groups, in the constitution and national law;
2 Achieving United Nations goals of universal access to preventionof mother to child transmission, condoms and antiretroviraltreatment by 2010;
3 Eliminating income and urban/rural differentials in access toimmunisation, attendance by a skilled person at birth and accessto prevention of mother to child transmission within east andsouthern African countries;
4 Eliminating income and urban/rural differentials in maternalmortality, child mortality, and under 5 year stunting within eastand southern African countries;
5 Eliminating differentials in maternal mortality, child mortality andunder 5 year nutrition (weight for age) between countries in theregion; and
6 Achieving the Millennium Development Goal of reducing by halfthe number of people living on US$1 per day by 2015.
7 Achieving universal primary and secondary education in women;
8 Achieving the Millennium Development Goal of reducing by halfthe proportion of people without sustainable access to safedrinking water by 2015;
9 Reducing the Gini coefficient in all east and southern Africancountries to at least 0.4 (the lowest current coefficient in east andsouthern Africa);
10 Increasing the ratio of wages to profits;
12 Abolishing user fees from health systems;
13 Overcoming the barriers that disadvantaged communities identifythat they face in accessing and using health and essential services; and
14 Meeting standards of adequate provision of health workers andof vital and essential drugs at primary and district levels of healthsystems.
214
RECLAIMING THE RESOURCES FOR HEALTH: ADVANCING HEALTH EQUITY IN EAST AND SOUTHERN AFRICA
AAddvvaanncciinngg eeqquuiittyy iinn hheeaalltthh
HHoouusseehhoolldd aacccceessssttoo tthhee nnaattiioonnaall
rreessoouurrcceess ffoorr hheeaalltthh
MMAARRKKEERRSS OOFF PPRROOGGRREESSSS
MMAARRKKEERRSS OOFF PPRROOGGRREESSSS
RReessoouurrcciinnggrreeddiissttrriibbuuttiivvee
hheeaalltthh ssyysstteemmss
15 Achieving the Abuja commitment of 15 per cent governmentspending on health – excluding external funding;
16 Achieving the WHO target of US$60 per capita spending onhealth systems;
17 Increasing progressive tax funding to health to a significantly largershare, with a reducing share of out-of-pocket financing in health;
18 Establishing a plan and strategy for harmonising the various healthfinancing schemes into one framework for universal coverage;
19 Establishing a clear set of comprehensive health care entitlementsfor the population;
20 Allocating at least 50 per cent of government spending on healthto district health systems (including level 1 hospitals) and 25 percent of government spending on primary health care;
21 Implementing a mix of non-financial incentives agreed with health workers organisations, including access to antiretroviraltreatment; and
22 Formally recognising in law and earmarking budgets for training,communication and mechanisms for direct public participation inall levels of the health system.
23 Debt cancellation;
24 Reducing the global Gini coefficient across countries to at least 0.4(halving the current coefficient);
25 Allocating at least 10 per cent of budget resources to agriculture,with a majority share used for investments in and subsidies forsmallholder and women producers;
26 No new health service commitments in the General Agreement onTrade in Services (GATS) and inclusion of all TRIPS flexibilitiesin national laws;
27 Inclusion of health officials in trade negotiations and inclusion ofexplicit clauses and measures to protect health in all relevant tradeagreements; and
28 Establishing bilateral and multilateral agreements to fund healthworker training and retention measures, especially involvingrecipient countries of health worker migration from east andsouthern Africa.
215
SECTION 7: TAKING ACTION TO RECLAIM THE RESOURCES FOR HEALTH
AA mmoorree jjuusstt rreettuurrnnffoorr eeaasstt aanndd
ssoouutthheerrnn AAffrriiccaannccoouunnttrriieess ffrroomm tthhee
gglloobbaall eeccoonnoommyy
MMAARRKKEERRSS OOFF PPRROOGGRREESSSS
MMAARRKKEERRSS OOFF PPRROOGGRREESSSS
A review of progress on these indicators provides a stimulus for exchangeof experience and promising practice within the region. The processenhances the accountability of public and private sectors and externalfunders for these outcomes and ensures that our policy measures, such asbudget processes, usefully contribute to these outcomes.
While the indicators are selected for their availability in existing datasources, discussing progress along these parameters would usefully revealhow well our information and management systems are able to providetimely and publicly accessible information on key dimensions of equity.This may act as a stimulus and strengthen systems to generate and reviewthis type of information, including through the participatory engagementof communities.
These targets and indicators relate to global, continental and regionalcommitments, to national policies and processes and to community levelperspectives and experience. We see them all as key to meetingcommitments made to the Millennium Development Goals by 2015, butalso see that all of them demand greater urgency and priority due to theirimpact on the survival and quality of life of the large majority of peoplein the region.
A focus for action ‘Health must therefore constitute a central pillar of any coherentvision of African development…’The African regional health report 2006, WHO-Afro Region, 2006, Brazzaville
One challenge identified to concerted action for health equity in the regionis building the shared message and organisation of the wider collectivealliance of public interests for health that exist within the region. There isopportunity for this, given the political and policy level initiative inorganisations like the African Union, SADC, Regional Health Ministersfor East, Central and Southern Africa as well as the many technical, civilsociety, professional, research, parliamentary and academic forums. Thereare many examples of local alliances around issues, whether treatmentaccess, malaria control, adolescent or workers’ health.
This analysis seeks to contribute to that alliance.
216
RECLAIMING THE RESOURCES FOR HEALTH: ADVANCING HEALTH EQUITY IN EAST AND SOUTHERN AFRICA
A review of progress on theseindicators provides a stimulus for
exchange of experience andpromising practice within the
region.
217
SECTION 7: TAKING ACTION TO RECLAIM THE RESOURCES FOR HEALTH
DDeebbaatteess aanndd ccoonnfflliiccttiinngg vviieewwss ......
As in all regions, we are aware that we are not a homogenous community,even among those involved in health. There are many areas raised in theanalysis which are subjects of continued debate within and beyond theregion.
There is debate about the strategic options for engaging in the globaleconomy, including the role of new global powers such as China in Africa.
There are debates about how to deal with resource outflows. Forexample, there is debate about how to balance the rights of health workersto migrate and the benefits of remittance and other returns frommigration, with the measures to deal with as yet unquantified losses tocommunities and health systems from migration, including losses toadequate care.
There are differing views about the role of the diverse for-profit healthsector in east and southern African countries, with its range from largecorporates managing hospitals to small local shops and individual healthworkers. There are strong competing positions on whether and how tosupport, control or co-ordinate this sector across these diverse forms.
Differing approaches are advanced on how to close the gap betweenrich and poor, whether targeting poor communities is sufficient orwhether more comprehensive approaches to universal systems that closethe gradients between rich and poor are more effective and or feasible.Debates continue about the relative virtues of applying resources tofocused vertical programmes versus wider investments in morecomprehensive services.
There is a diversity of views about what kind of state is best able tomanage these challenges, with differences in position around the level ofcentralised authority or participatory functioning of the state.
We welcome these debates. The positions we have taken on them in theanalysis derive from shared values and the evidence we have found.
The analysis has not explored all aspects central to our health andhealth systems. For example, the roles of indigenous knowledge,traditional health systems and local biodiversity are central to health ineast and southern Africa, and while referred to in Sections 2 and 3, merittheir own focus for their contribution to health equity. We would, however,argue that the broader challenges we describe of the global systems forintellectual property rights, the significant outflow of resources and theweak investment in the community level of health systems equally affectthese areas of health.
We have also encountered gaps in evidence and knowledge that wouldbe important to address in consolidating and developing shared messagesand policy.
As in all regions, we are awarethat we are not a homogenouscommunity, even among thoseinvolved in health. There aremany areas raised in the analysiswhich are subjects of continueddebate within and beyond theregion.
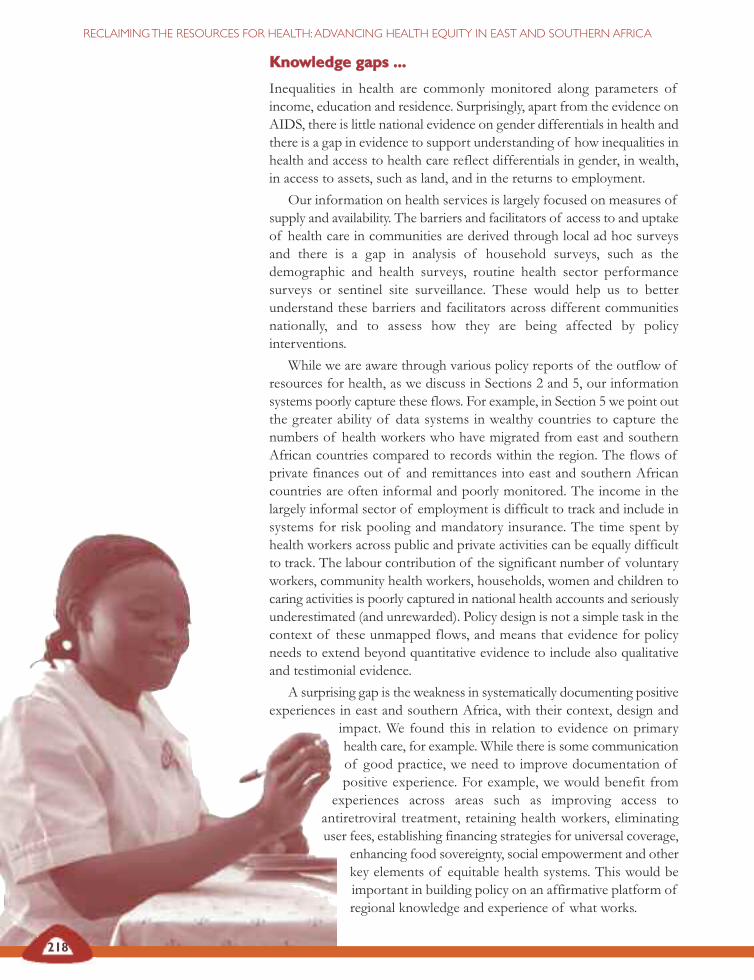
KKnnoowwlleeddggee ggaappss ......
Inequalities in health are commonly monitored along parameters ofincome, education and residence. Surprisingly, apart from the evidence onAIDS, there is little national evidence on gender differentials in health andthere is a gap in evidence to support understanding of how inequalities inhealth and access to health care reflect differentials in gender, in wealth,in access to assets, such as land, and in the returns to employment.
Our information on health services is largely focused on measures ofsupply and availability. The barriers and facilitators of access to and uptakeof health care in communities are derived through local ad hoc surveysand there is a gap in analysis of household surveys, such as thedemographic and health surveys, routine health sector performancesurveys or sentinel site surveillance. These would help us to betterunderstand these barriers and facilitators across different communitiesnationally, and to assess how they are being affected by policyinterventions.
While we are aware through various policy reports of the outflow ofresources for health, as we discuss in Sections 2 and 5, our informationsystems poorly capture these flows. For example, in Section 5 we point outthe greater ability of data systems in wealthy countries to capture thenumbers of health workers who have migrated from east and southernAfrican countries compared to records within the region. The flows ofprivate finances out of and remittances into east and southern Africancountries are often informal and poorly monitored. The income in thelargely informal sector of employment is difficult to track and include insystems for risk pooling and mandatory insurance. The time spent byhealth workers across public and private activities can be equally difficultto track. The labour contribution of the significant number of voluntaryworkers, community health workers, households, women and children tocaring activities is poorly captured in national health accounts and seriouslyunderestimated (and unrewarded). Policy design is not a simple task in thecontext of these unmapped flows, and means that evidence for policyneeds to extend beyond quantitative evidence to include also qualitativeand testimonial evidence.
A surprising gap is the weakness in systematically documenting positiveexperiences in east and southern Africa, with their context, design and
impact. We found this in relation to evidence on primaryhealth care, for example. While there is some communicationof good practice, we need to improve documentation ofpositive experience. For example, we would benefit from
experiences across areas such as improving access toantiretroviral treatment, retaining health workers, eliminatinguser fees, establishing financing strategies for universal coverage,
enhancing food sovereignty, social empowerment and otherkey elements of equitable health systems. This would beimportant in building policy on an affirmative platform ofregional knowledge and experience of what works.
218
RECLAIMING THE RESOURCES FOR HEALTH: ADVANCING HEALTH EQUITY IN EAST AND SOUTHERN AFRICA
219
SECTION 7: TAKING ACTION TO RECLAIM THE RESOURCES FOR HEALTH
Globally
Eastern andsouthern Africa
SADC
KKeeyy aarreeaass ffoorr ffuuttuurree eeqquuiittyy oorriieenntteedd rreesseeaarrcchh iinnhheeaalltthh??
• National level assessment of inequalities in health and accessto health care along differentials in gender, wealth, access toassets and returns to employment.
• Analysis of national data sets and national surveys on thebarriers and facilitators that communities face in accessing andusing health care, and how they are being affected by policyinterventions.
• Routine monitoring and specific surveys of the relative in andout flow of natural and financial resources and human resourcesfor health to and from east and southern African countries.
• Improved assessment of the policy and system implications ofthe informal sector in health, for example, how to organiseinsurance and risk pools where there is high informalemployment, how to recognise and reward informal healthsector work in communities and households or how to managea growing informal private sector market in health services.
• Documenting the many positive experiences in east andsouthern Africa, including their context, design and impact,specifically in implementing primary health care, improvingaccess to antiretroviral treatment, retaining health workers,eliminating user fees, establishing financing strategies foruniversal coverage, enhancing food sovereignty, socialempowerment and other key elements of equitable healthsystems.
OOuurr oowwnn ccoommmmiittmmeenntt ttoo aaccttiioonn ......
While this analysis organises knowledge and perspective, it also drawsfrom, and aims to contribute to the use of this knowledge for practice.EQUINET was born out of the 1997 Kasane meeting and the SADChealth sector commitment to equity in health. Institutions from withineast and southern Africa, from government, civil society, research,parliament and other spheres have carried out, supported, mentored anddisseminated research and policy analysis, held forums for skillsdevelopment, analysis, dialogue, learning and engagement, andstrengthened networks and alliances towards achieving health equity.These activities jointly have contributed to the affirmative vision of thehealth systems that we would want to build to deliver on the equity goalsreported in this analysis. The bibliography to the analysis is testimony toan extensive network of actors working on equity in health that we havecollectively interacted with, engaged, involved, shared with and learnedfrom within the region.
220
RECLAIMING THE RESOURCES FOR HEALTH: ADVANCING HEALTH EQUITY IN EAST AND SOUTHERN AFRICA
Through this work we have identified a shared commitment to addressingdifferences in health status that are unnecessary, avoidable and unfair, andto promoting interventions that seek to allocate resources preferentially tothose with the worst health status. From different disciplines and areas ofwork we seek to understand and motivate the redistribution of social andeconomic resources for equity oriented interventions, and to understandand inform the power and ability people (and social groups) have to makechoices over health inputs and their capacity to use these choices towardshealth.
We will continue to contribute as organisations within the regiontowards this goal. The conclusions we draw are as much a challenge andan opportunity for us in EQUINET, as for any institutional network in theregion. As a network of institutions, we will continue to support dialogue,analysis and debate to strengthen the exchange of knowledge and learningwithin the region. This analysis is disseminated to elicit feedback and wewill listen to and share that feedback. There are important sites of learningwithin the region, and gains to be made in widening the communicationon these. We will continue, with others, to carry out and support researchand gather evidence to close knowledge gaps, including the knowledgethat comes from the experience of disadvantaged communities, and fromprogrammes that strengthen equity. We will share and communicateevidence, learning and knowledge, as one of the key resources for health.We will network and interact to support the transfer of skills, experience,knowledge and capacities to strengthen institutional practice to deliver onequity goals. As a network of institutions, we will engage to moveknowledge into practice and into policy. We will monitor and reviewprogress towards shared goals.
Will we have any impact on Mr Banda’s life? In practice, this narratedexperience draws from a report by one of the institutions in the networkworking to overcome barriers in access to health care in communities. Thestruggle continues. The experience presented in this analysis of gains andreversals in addressing equity in health suggest that struggles for equityand social justice demand robust engagement with powerful global forces,effective implementation of affirmative national policies and systems, and,perhaps most importantly, the strengthened capabilities and power ofpeople like Mr Banda and his community to collectively claim and use theresources for health.
REFERENCESAfrican Union (2007) Third Session of the African Union Conference of Ministers ofHealth, Johannesburg, South Africa, 9-13 April 2007, CAMH/MIN/5(III), accessed 2June 2007 at http://www.doh.gov.za/camh3/
Industrial Health Research Group (IHRG) (2006) ‘Raising our voice, breaking oursilence: Health workers’ experiences and needs around occupational health servicesin Cape Town, South Africa’, EQUINET PRA project report, EQUINET, Harare.
WHO Afro (2006) The African regional health report 2006, WHO-Afro Region,Brazzaville, accessed 2 June 2007 at http://www.afro.who.int/regionaldirector/african_regional_health_report2006.pdf
The conclusions we draw are asmuch a challenge and an
opportunity for us in EQUINET,as for any institutional network in
the region. As a network ofinstitutions, we will continue tosupport dialogue, analysis and
debate to strengthen theexchange of knowledge andlearning within the region.

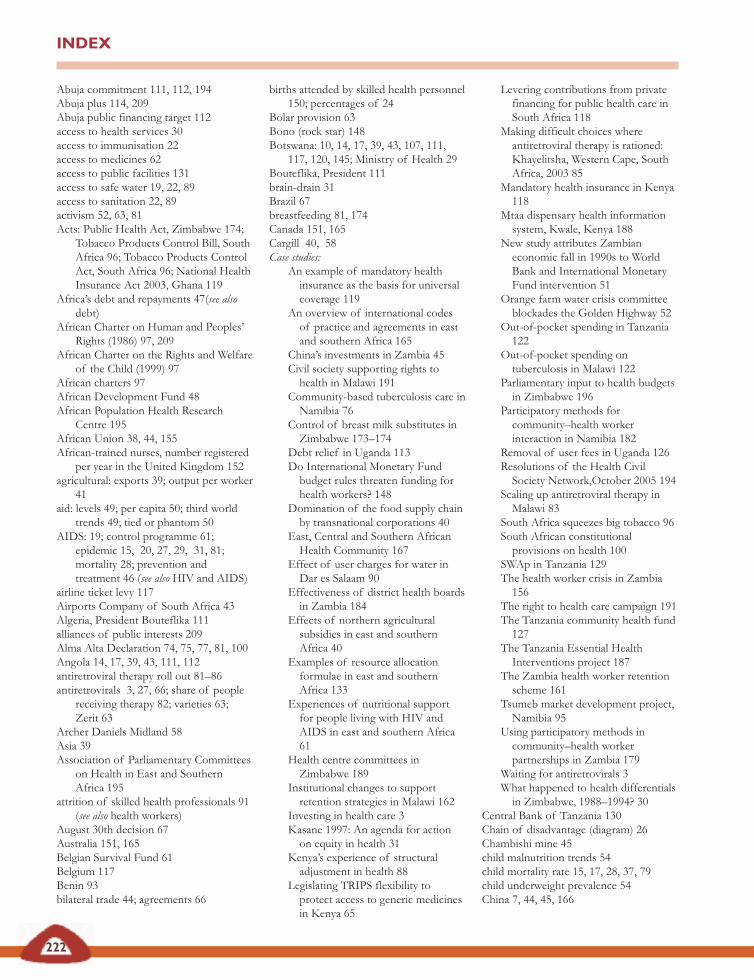
Abuja commitment 111, 112, 194Abuja plus 114, 209Abuja public financing target 112access to health services 30access to immunisation 22access to medicines 62access to public facilities 131access to safe water 19, 22, 89access to sanitation 22, 89activism 52, 63, 81Acts: Public Health Act, Zimbabwe 174;
Tobacco Products Control Bill, SouthAfrica 96; Tobacco Products ControlAct, South Africa 96; National HealthInsurance Act 2003, Ghana 119
Africa’s debt and repayments 47(see alsodebt)
African Charter on Human and Peoples’Rights (1986) 97, 209
African Charter on the Rights and Welfareof the Child (1999) 97
African charters 97African Development Fund 48African Population Health Research
Centre 195African Union 38, 44, 155African-trained nurses, number registered
per year in the United Kingdom 152agricultural: exports 39; output per worker
41aid: levels 49; per capita 50; third world
trends 49; tied or phantom 50AIDS: 19; control programme 61;
epidemic 15, 20, 27, 29, 31, 81;mortality 28; prevention andtreatment 46 (see also HIV and AIDS)
airline ticket levy 117Airports Company of South Africa 43Algeria, President Bouteflika 111alliances of public interests 209Alma Alta Declaration 74, 75, 77, 81, 100Angola 14, 17, 39, 43, 111, 112antiretroviral therapy roll out 81–86 antiretrovirals 3, 27, 66; share of people
receiving therapy 82; varieties 63;Zerit 63
Archer Daniels Midland 58Asia 39Association of Parliamentary Committees
on Health in East and SouthernAfrica 195
attrition of skilled health professionals 91(see also health workers)
August 30th decision 67Australia 151, 165Belgian Survival Fund 61Belgium 117Benin 93bilateral trade 44; agreements 66
births attended by skilled health personnel150; percentages of 24
Bolar provision 63Bono (rock star) 148Botswana: 10, 14, 17, 39, 43, 107, 111,
117, 120, 145; Ministry of Health 29Bouteflika, President 111brain-drain 31Brazil 67breastfeeding 81, 174Canada 151, 165Cargill 40, 58Case studies:
An example of mandatory healthinsurance as the basis for universalcoverage 119
An overview of international codesof practice and agreements in eastand southern Africa 165
China’s investments in Zambia 45Civil society supporting rights to
health in Malawi 191Community-based tuberculosis care in
Namibia 76Control of breast milk substitutes in
Zimbabwe 173–174Debt relief in Uganda 113Do International Monetary Fund
budget rules threaten funding forhealth workers? 148
Domination of the food supply chainby transnational corporations 40
East, Central and Southern AfricanHealth Community 167
Effect of user charges for water inDar es Salaam 90
Effectiveness of district health boardsin Zambia 184
Effects of northern agriculturalsubsidies in east and southernAfrica 40
Examples of resource allocationformulae in east and southernAfrica 133
Experiences of nutritional supportfor people living with HIV andAIDS in east and southern Africa61
Health centre committees inZimbabwe 189
Institutional changes to supportretention strategies in Malawi 162
Investing in health care 3Kasane 1997: An agenda for action
on equity in health 31 Kenya’s experience of structural
adjustment in health 88Legislating TRIPS flexibility to
protect access to generic medicinesin Kenya 65
Levering contributions from privatefinancing for public health care inSouth Africa 118
Making difficult choices whereantiretroviral therapy is rationed:Khayelitsha, Western Cape, SouthAfrica, 2003 85
Mandatory health insurance in Kenya118
Mtaa dispensary health informationsystem, Kwale, Kenya 188
New study attributes Zambianeconomic fall in 1990s to WorldBank and International MonetaryFund intervention 51
Orange farm water crisis committeeblockades the Golden Highway 52
Out-of-pocket spending in Tanzania122
Out-of-pocket spending ontuberculosis in Malawi 122
Parliamentary input to health budgetsin Zimbabwe 196
Participatory methods forcommunity–health workerinteraction in Namibia 182
Removal of user fees in Uganda 126Resolutions of the Health Civil
Society Network,October 2005 194Scaling up antiretroviral therapy in
Malawi 83South Africa squeezes big tobacco 96South African constitutional
provisions on health 100SWAp in Tanzania 129The health worker crisis in Zambia
156The right to health care campaign 191The Tanzania community health fund
127The Tanzania Essential Health
Interventions project 187The Zambia health worker retention
scheme 161Tsumeb market development project,
Namibia 95Using participatory methods in
community–health workerpartnerships in Zambia 179
Waiting for antiretrovirals 3What happened to health differentials
in Zimbabwe, 1988–1994? 30 Central Bank of Tanzania 130Chain of disadvantage (diagram) 26Chambishi mine 45child malnutrition trends 54child mortality rate 15, 17, 28, 37, 79child underweight prevalence 54China 7, 44, 45, 166
INDEX
222
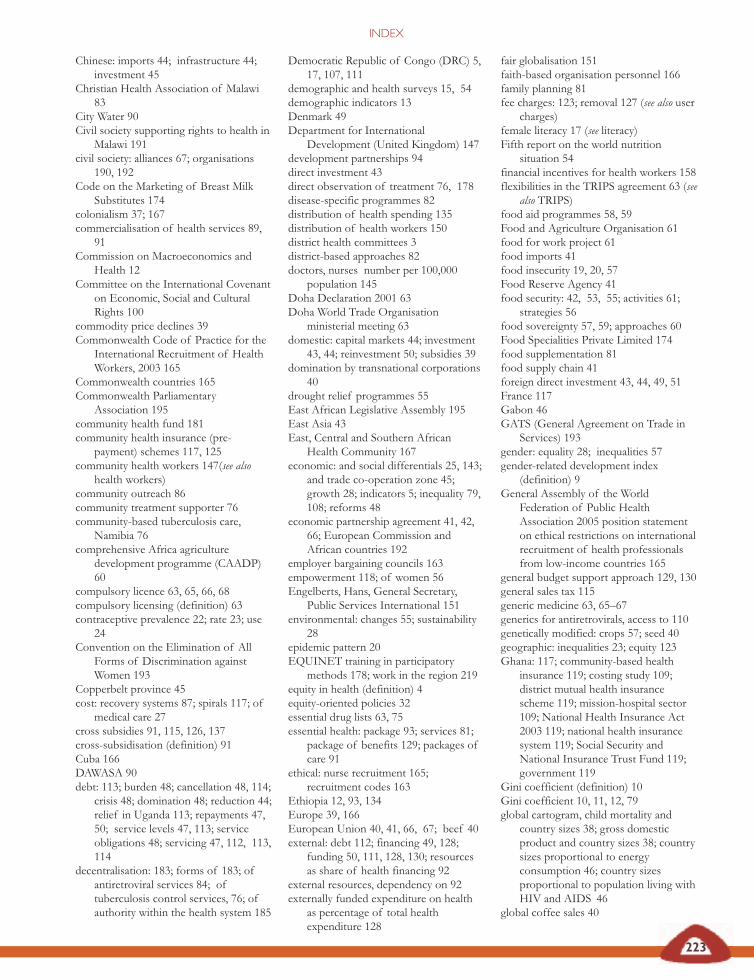
Chinese: imports 44; infrastructure 44;investment 45
Christian Health Association of Malawi83
City Water 90Civil society supporting rights to health in
Malawi 191civil society: alliances 67; organisations
190, 192Code on the Marketing of Breast Milk
Substitutes 174colonialism 37; 167commercialisation of health services 89,
91Commission on Macroeconomics and
Health 12Committee on the International Covenant
on Economic, Social and CulturalRights 100
commodity price declines 39Commonwealth Code of Practice for the
International Recruitment of HealthWorkers, 2003 165
Commonwealth countries 165Commonwealth Parliamentary
Association 195community health fund 181community health insurance (pre-
payment) schemes 117, 125community health workers 147(see also
health workers)community outreach 86community treatment supporter 76community-based tuberculosis care,
Namibia 76comprehensive Africa agriculture
development programme (CAADP)60
compulsory licence 63, 65, 66, 68compulsory licensing (definition) 63contraceptive prevalence 22; rate 23; use
24Convention on the Elimination of All
Forms of Discrimination againstWomen 193
Copperbelt province 45cost: recovery systems 87; spirals 117; of
medical care 27cross subsidies 91, 115, 126, 137cross-subsidisation (definition) 91Cuba 166DAWASA 90debt: 113; burden 48; cancellation 48, 114;
crisis 48; domination 48; reduction 44;relief in Uganda 113; repayments 47,50; service levels 47, 113; serviceobligations 48; servicing 47, 112, 113,114
decentralisation: 183; forms of 183; ofantiretroviral services 84; oftuberculosis control services, 76; ofauthority within the health system 185
Democratic Republic of Congo (DRC) 5,17, 107, 111
demographic and health surveys 15, 54demographic indicators 13Denmark 49Department for International
Development (United Kingdom) 147development partnerships 94direct investment 43direct observation of treatment 76, 178disease-specific programmes 82distribution of health spending 135distribution of health workers 150district health committees 3district-based approaches 82doctors, nurses number per 100,000
population 145Doha Declaration 2001 63Doha World Trade Organisation
ministerial meeting 63 domestic: capital markets 44; investment
43, 44; reinvestment 50; subsidies 39domination by transnational corporations
40drought relief programmes 55East African Legislative Assembly 195East Asia 43East, Central and Southern African
Health Community 167economic: and social differentials 25, 143;
and trade co-operation zone 45;growth 28; indicators 5; inequality 79,108; reforms 48
economic partnership agreement 41, 42,66; European Commission andAfrican countries 192
employer bargaining councils 163empowerment 118; of women 56Engelberts, Hans, General Secretary,
Public Services International 151environmental: changes 55; sustainability
28epidemic pattern 20EQUINET training in participatory
methods 178; work in the region 219equity in health (definition) 4equity-oriented policies 32essential drug lists 63, 75essential health: package 93; services 81;
package of benefits 129; packages ofcare 91
ethical: nurse recruitment 165;recruitment codes 163
Ethiopia 12, 93, 134Europe 39, 166European Union 40, 41, 66, 67; beef 40external: debt 112; financing 49, 128;
funding 50, 111, 128, 130; resourcesas share of health financing 92
external resources, dependency on 92externally funded expenditure on health
as percentage of total healthexpenditure 128
fair globalisation 151faith-based organisation personnel 166family planning 81fee charges: 123; removal 127 (see also user
charges)female literacy 17 (see literacy)Fifth report on the world nutrition
situation 54financial incentives for health workers 158flexibilities in the TRIPS agreement 63 (see
also TRIPS)food aid programmes 58, 59Food and Agriculture Organisation 61food for work project 61food imports 41food insecurity 19, 20, 57Food Reserve Agency 41food security: 42, 53, 55; activities 61;
strategies 56food sovereignty 57, 59; approaches 60Food Specialities Private Limited 174food supplementation 81food supply chain 41foreign direct investment 43, 44, 49, 51France 117Gabon 46GATS (General Agreement on Trade in
Services) 193gender: equality 28; inequalities 57 gender-related development index
(definition) 9General Assembly of the World
Federation of Public HealthAssociation 2005 position statementon ethical restrictions on internationalrecruitment of health professionalsfrom low-income countries 165
general budget support approach 129, 130general sales tax 115generic medicine 63, 65–67generics for antiretrovirals, access to 110genetically modified: crops 57; seed 40geographic: inequalities 23; equity 123Ghana: 117; community-based health
insurance 119; costing study 109;district mutual health insurancescheme 119; mission-hospital sector109; National Health Insurance Act2003 119; national health insurancesystem 119; Social Security andNational Insurance Trust Fund 119;government 119
Gini coefficient (definition) 10Gini coefficient 10, 11, 12, 79global cartogram, child mortality and
country sizes 38; gross domesticproduct and country sizes 38; countrysizes proportional to energyconsumption 46; country sizesproportional to population living withHIV and AIDS 46
global coffee sales 40
INDEX
223
global commitments to humandevelopment 32
global commons (definition) 46global disease burden 14Global Fund for AIDS, Tuberculosis and
Malaria 49, 85, 93, 128, 131, 147, 148global health spending 14Global Health Watch 2005 134Global Health Worker Alliance 155global health workforce 14global income 12global inequalities 32, 37, 163global lottery 117global rankings 8global resource allocation 46global right to health care campaign 191global wealth 12globalisation 48, 57, 143; policies 37government expenditure as a percentage
of total expenditure on health 108Government of Malawi, 147Government of Uganda 114government spending on health 78, 108,
113; as share of total expenditure112green field investments 43 gross domestic product 5, 6, 8, 9, 10, 15,
28, 37, 43, 44, 46, 80, 107, 108; shareof 78, 107, 108; world 12
gross national income 49growth monitoring 81harmonisation in practice initiative 161Hassan, Mrs 90health and treatment activists 148health centre committees in Zimbabwe
189Health Civil Society Network 194health financing 107, 115 (see also
government spending and externalfunding)
Health for all standard 145health information system 185health management information systems
188health personnel, movement and
migration 151 (see also migration)health service utilisation 125health status 19; indicators 13health systems (definition) 68Health Systems Trust 193health workers: 144; absenteeism 145;
access to health care 159; adequacy146, 147, 155; distribution of 150;financial incentives for 157; improvedliving and social conditions 159;improved working conditions 159;information systems on 162; losses in27; migration 145; migration records164; non-financial incentives 159;professional development 159;regional information on 162;shortages 145
health-related infrastructure 21
Heavily Indebted Poor Countries anddebt relief initiatives 48, 114
HIV and AIDS: 13, 19, 28, 61, 145; data20; epidemic 148; high-riskenvironments 20; infection, adultprevalence of 18; interventions 167;number of people living with 19;pandemic 167; statistics 19; incidenceand prevalence 14 (see also AIDS andHIV)
HIV: prevalence 14, 19; prevention andcounselling 147; seroprevalence rates19
hospital and primary care expenditurecomparison 135
human development 8, 9, 12, 13, 28, 37;ranking 51
human development index (definition) 7human development index 6, 7, 8, 13, 14,
50, 133human poverty index (definition) 9human poverty index 9, 120human resources for health 94human rights treaties 93immunisation 81; international financing
facility for 117; measles 23income: differentials 23, 24, 25; inequality
12, 78; poverty levels 9India 44, 67indicators of equity, 86indicators of human development, gender
development and poverty 9indigenous medicines 68inequalities 12, 15, 20, 25; in health 55, 75;
in wealth 27, 42, 73; in access topublic services 19; in assets 12; in thedistribution of health workers 151; innutrition and mortality 16
infant and child mortality 14, 15infants nutrition committee 175inflation rates 148infrastructure investments 44integration 38; into the global economy
50International Council of Nurses position
statement on ethical nurserecruitment, 2001 165
International Covenant on Economic,Social and Cultural Rights 97, 101,209
International Development Association48
International Monetary Fund 41, 48, 49,51, 88, 146, 148
International Workers’ Day 151Iran 166islands of excellence 85Jesuit Centre for Theological Reflections
45Jubilee 2000 campaign 114junior farmer field and life schools 61Kampala 148
Kasane meeting 219Kasane, Botswana 29, 31Kenya: 17, 42, 61, 111, 112, 117, 123,
132, 134, 166, 193, 195; health carecrisis 88; Assistant MinisterKibunguchy 88; children with stuntedgrowth 88; health action days 188;infant mortality 88; Kwale 188; lifeexpectancy 88; Member ofParliament, Alfred Nderitu 88; Mtaadispensary 188; Mtaa district healthcommittee 188; national healthinsurance 118; processed milkproduction 40; under-five mortality88; law 65; non-governmentalorganisation programmes 61
Kenyatta National Hospital, Nairobi 88Kuznets’ hypothesis 10Latin America 39, 68least developed country status 63Lesotho 10, 39, 54, 112, 120, 144liberalisation 38, 41, 87, 116; policies 76,
87; of currency markets 47liberation movement policies 29life expectancy 13, 14, 15, 29literacy, adult 17; rates 176; adult female
rates 176livestock marketing enterprise project 61London market 43Luxembourg 49Macroeconomic Commission on Health
209macro-economic: conditionalities 44;
stabilisation policies 42Madagascar 15, 17, 75, 117, 144, 145malaria 14, 19, 28; deaths 87Malawi: 14, 15, 54, 58, 59, 93, 107, 144,
157, 168; human resources for healthstrategies 162; accessing public healthcare 122; antiretroviral therapy 83;community scorecard 191; free netretreatment policies 124; healthsurveillance assistants 147; humanresources emergency relief plan 83;Local Initiatives for Health project191; sector-wide approach 93; six-yearemergency human resourcesprogramme 147; tuberculosisdiagnosis in urban Lilongwe 122;medical assistants 147; national foodreserve agency 41
Malaysia 7 mandatory social health insurance 117; in
Kenya 118Maputo African Union Declaration of
July 2003 56market reforms 28, 30, 54, 87, 143maternal health 3, 28maternal mortality 3, 15, 79; rate 80Mauritius 13, 14, 17, 19, 111, 145measles: cases and deaths 3, 75, 77;
immunisation 23, 24
INDEX
224
Médecins Sans Frontières 85micro-credit support 61migration 154; and movement of health
personnel 151; agreements 166(see alsohealth workers)
Millennium Development Goals 12, 28,42, 46, 54, 108, 110, 134
Ministers of Finance, 1999 50Ministers of Health in East, Central and
Southern Africa group 155Monsanto 40mortality 14, 15mother’s education 16, 17, 25Mozambique 12, 13, 17, 54, 61, 63, 112,
120, 132, 144Mtaa dispensary, Kwale, Kenya 188multi-micronutrient supplements 61Museveni, President Yoweri 148mutual health organisations 125Muweme Muweme 45Namibia 10, 12, 14, 145, 157, 166;
allocating resources; research 133;clinic health committees 76;community-based tuberculosis care in76; Let’s build a sink’ project 95;market development project 95;Ministry of Health and SocialServices 76; Nomtsoub 95; Omahekeregion 76; Ontevrede 182; Tsumebmarket project 94; Tsumebmunicipality 95; tuberculosis ; meatcanning industry 40
neo-liberalism 48NEPAD (New Economic Partnership for
African Development) 60, 146, 155Nestlé 174Netherlands 49New Zealand 151Nigeria 43; President Obasanjo 111 non-financial incentives for health
workers 160 (see also health workers)non-governmental organisations 58;
personnel 166north-south flows 44Norway 49nurse wages comparison 153nutrition: levels 53; status 54; of children
55Nyanza healthy water project 61 official development aid 49; as percentage
of gross domestic income 49Okapana Action Force 95Orange farm 52; water crisis committee
52Organisation for Economic Co-operation
and Development 49outflow of: health workers 151; resources
47; skilled people 44; social resources143 (see also migration and healthworkers)
out-of-pocket, government and externalfunding levels 121
out-of-pocket: financing 115; payments125; spending 120, 121, 122
parallel importation (definition) 63parallel importation 63, 65paraprofessional health workers 147parliamentary: processes 193; reforms
195; roles 195participatory reflection and action
approaches 178, 180Patel, Ramesh 51patentability, exceptions from 63patents (definition) 63people living with HIV and AIDS 14, 60,
61, 81 (see also HIV and AIDS)People’s Health Movement 191per capita spending on health 109, 116 (see
also expenditure on health)perverse subsidy 167Pharco Mozambique Ltd 63portfolio investment 43position statement on ethical restrictions
on international recruitment of healthprofessionals from low-incomecountries (General Assembly of theWorld Federation of Public HealthAssociation 2005) 165
positive discrimination 135post-independence economic policies 42poverty: 10, 12, 15, 43; action fund 114;
reduction 10, 12, 28, 56; reductionbudget support approach 130;strategy paper, 88
preferential trade treatment 44prevention of mother to child
transmission 27, 82primary health care 73, 74, 76; access 22;
approach 75, 77; input 23;interventions 25; outreach 21;selective 81, services 29; specific costcentre 135
primary school enrolments 17, 18private expenditure on health 107private insurance 116private sector: resources 89; use 125private voluntary health insurance 117privatisation 43, 51, 87, 89, 91production for export 38progressive health care financing 137progressive tax funding 116, 120; systems
116pro-poor service delivery 130protectionist tariffs 39Protocol to the African Charter on
Human and Peoples’ Rights on theRights of Women in Africa (2003) 97
public expenditure and Gini coefficientcorrelation 79
public health expenditure and investment:29, 41, 47, 48, 78, 79, 107, 110; cuts91, 92
public interest in health 94
public service reform programme 161Public Services International 151 public spending on health as percentage
of gross domestic product: and under5 mortality 80; and maternal mortalityrate 80
public–public partnerships 94regional co-operation 52, 68regional health ministers’ conference, east,
central and southern Africa 167regional meeting on ‘Equity in Health –
policies for survival in southernAfrica’ 31
regional networks 195regulating financial transfers 50remittances 154resolutions of the Health Civil Society
Network 194resource allocation formulae 132, 134risk pooling (definition) 91risk pools 116, 115, 117, 126roll out of antiretrovirals 27(see also
antiretrovirals)rural/urban divides 16Sachs, Jeffrey, United States economist
148SADC Parliamentary Forum 195SADC Social Charter 190, 209SADC (Southern African Development
Community): 29, 31; business plan onAIDS 86; commitment 60; healthministers 167; public expenditure andGini coefficient correlation 79;ministers of agriculture 56; region 153
safe water and sanitation, access to 19, 2289
San population 76sanitation 19, 21; coverage 22school enrolment 17, 18school feeding programme 59, 60sector-wide approaches 85, 128, 130Siaya-Busia household livelihood security
project 61Sikazwe, Emily 45Sirte Declaration 111skilled assistance at delivery 24 (see also
births attended by skilled healthpersonnel)
slavery 37smallholder: and women producers 60;
producers 42; production 55social: action 190, 192; differentials 17;
empowerment 177, 186; inequality42; roles 74
social health insurance schemes 117socio-economic: differences 25;
differentials 79Sourcebook on community-driven
development in the Africa region 91sources of new nurse registration 152
INDEX
225
INDEX
South Africa 5, 10, 12, 14, 15, 17, 39, 40,42, 43, 46, 59, 66, 75, 107, 117, 124,125, 132, 134, 145, 149, 162; access tobasic facilities 17; budget monitoring193; civil society action on tobacco96; constitutional provisions on health100; health care financing 118; healthsector charter 118; Khayelitsha CapeTown 85; measles cases and deaths77; medical aid schemes 118; NationalAssociation of Local Government193; policy on recruitment andemployment of foreign healthprofessionals 164; portfoliocommittees on health and finance193; President Mbeki 111; publichealth enhancement fund 118; rightsto health 100; scarce skills and ruralallowances programme 159;supervisors job description 185; taxreforms 136; tobacco action group96; tobacco consumption 96;tobacco-related disease and death 96;canned fruit and vegetables 40;companies 44; government 118
South African Health ProfessionalCouncil 164
South African Medical Research Council,96
Southern African Customs Union (SACU)66
Southern African DevelopmentCommunity (SADC) ministers ofagriculture 56
south-south: co-operation 68; dialogue 52;flows 44; governmental pressures 63
stamp duty on currency transactions 117stock exchanges 44structural adjustment: policies 88;
programme 30, 38, 41, 87student retention 17subsidies: from public to private care 135;
on imports 42; removal of 51; state39
subsidised supplementary feeding 55Swaziland 13, 14, 19, 39, 54, 111, 117Sweden 49Tabata Women’s Group, 90Tanzania 15, 17, 25, 39, 107, 117, 144;
community health fund 127; fast-trackhealth worker recruitment 159; cause-of-death statistics 187; citizen reportcards 195: community scorecards 195;Dar es Salaam 90, 124; demographicand health survey 24; demographicsurveillance system information 187;district managers 127; EssentialHealth Interventions project 186, 187;health facility data 187; formula,allocation of basket funds 133;malaria cases 122; medical licentiates147; modern health care use 187;
Morogoro 187; parliament 195;participatory field assessments 195;Rufiji 187; sector-wide approach(SWAp) 130; Tabata, Dar es Salaam90; traditional healers 187
tariff reductions 42tax: funding 115; holidays 45; indirect
115; rates 115; revenues 42; wealth116
technical co-operation 49textile manufacturing firms 51Thailand 7, 67tobacco control laws 96Tobin tax 51, 117trade liberalisation 42 (see also
liberalisation)Trade Related Intellectual Property Rights
(TRIPS) 63; agreement 63, 67;compliance 63; flexibilities 64, 66,193; -plus rules 66
trade tariffs 42trade-related integration 42trade-related technical assistance 66traditional healers 147transfer pricing 51transnational corporation 41, 43treated bed nets 24Tsumeb market development project,
Namibia 95tuberculosis 14, 19; and joint HIV
activities; control 178; treatment andcare 178
Tulongeni Pamwe 95Uganda 12, 14, 17, 19, 39, 61, 77, 107,
124, 144, 148; activists 148; debt relief114; health management informationsystem 126; health serviceutilisation125; Kisoro district 125;Ministry of Health 126; nationalhousehold surveys 126; nationalquality assurance programme 3;primary health care budget 133;sector-wide approach 126; traditionalhealers 147; user fees 126
Uganda Debt Network 114under-five mortality 16, 80under-nutrition: chronic 53; in children
54 ; maternal 54underweight children 53, 54; prevalence
trends 55United Kingdom 145, 151, 164, 165;
Chesterfield Borough council 95;Department for InternationalDevelopment 130; National HealthService 165
United Kingdom Code of Practice onEthical International Recruitment ofHealth Personnel, 1999 165
United Nations 28, 54United Nations Commission on Social
Development 107
United Nations Economic Commissionfor Africa 41
United States 151, 166; treasury secretary,Paul O’Neill 148
United States Agency for InternationalDevelopment (USAID) 58
universal access to prevention, treatmentand care 81, 82
universal coverage 27, 119, 120universal primary education 28University of Cape Town 96University of Namibia 182Urban Trust of Namibia 95user charges 38, 89, 121, 124; private
sector 125; abolition 124, 125value added tax 115value-added processing 43vertical: equity 31; programmes 81, 85, 93voucher systems 91wage differentials 153water and sanitation coverage 21, 22water services, privatisation and
commercialisation 89WHO 165; action programme on
essential drugs 101; Africa regionalcommittee meeting (2006) 76; citedthreshold 145; defined level (funding)112; estimated minimum level(funding), 110; high-level taskforce onhealth workers 155
WHO Commission on Macroeconomicsand Health
WHO Framework Convention onTobacco Control 96
WHO International Code on theMarketing of Breast milk Substitutes174
Women for Change 45World Bank 10, 41, 42, 46, 51, 88, 91,
114, 146, 148; global developmentfinance report 44
World Conference of Family Doctors:166; Code of Practice for theInternational Recruitment of HealthCare Professionals, 2002 165
World Development Movement 51world food imports 41World Food Programme 59, 61World Health Assembly 2006 (59th
conference) 168; resolution, 2004165, 168
World Trade Organisation 39, 41, 53, 63,66, 67, 194; agreements 62; status 64
world wealth 12Year for development of human
resources with special focus on healthworkers 155
Zambia 17, 39, 41, 42, 45, 51, 54, 54, 123,124, 125; autonomous health boards157; Central Board of Health 184; ,Chama 179; district health boards184; health reform 179; government
226
INDEX
227
41; grain marketing authority 41;health worker retention scheme 161;human resources crisis 156; Lusaka179; levy on financial transactions 86;National Health Strategic Plan (2001-2005)156; neighbourhood healthcommittees 179, 184; participatoryreflection and action approach 179;per capita formula 134; PresidentLevy Mwanawasa 51; structuraladjustment programme 50; study onparticipatory mechanisms 185; verticalprogrammes 129
Zambia Equity Gauge 179Zimbabwe 10, 19, 39, 54, 61, 112, 116,
117, 144, 157; AIDS levy 86; breastmilk substitutes campaign 175; budgetconsultative meeting 196; CircularMinute No. 80 of 1982 174;contracted HIV testing andcounselling services 91; demographichealth survey 1994 174; demographichealth survey 1999 175; fifthParliament 196; health centrecommittees 186, 189; Health ServicesBoard 157; health status 30; Ministry
of Health and Child Welfare 174, 196;national emergency on HIV andAIDS 63; parliamentary committeeon health 117, 196; parliamentaryreforms 196; portfolio committeesystem 196; primary health carenurses 147; Public Health (Breast milkand Substitutes and Infant Nutrition)Regulations, 1998 175; Public HealthAct 174; public sector clinics 189;study 135
ABOUT EQUINET
The Regional Network on Equity in Health in east and southern Africa (EQUINET)(www.equinetafrica.org) is a network of professionals, civil society members, policy makers, state officialsand others within the region who have come together as an equity catalyst, to promote and realise sharedvalues of equity and social justice in health.
EQUINET networks people to overcome isolation, give voice and promote exchange and co-operationusing bottom-up approaches built on shared values. We have come together in a spirit of selfdetermination and collective self reliance working through existing government, civil society, research andother mechanisms and institutions in Southern and East Africa. Several thousand people have beeninvolved in EQUINET training, research, policy dialogue and information activities over the past sevenyears. The network fosters forums for dialogue, learning, sharing of information and experience andcritical analysis. We do this to build knowledge and perspectives, shape effective strategies, strengthen ourvoice nationally, regionally and globally and our strategic alliances to influence policy, politics and practicetowards health equity and social justice. The network website provides information on the activities.EQUINET produces, with technical support from its secretariat, a monthly newsletter and a searchableweb database with information and publications on equity in health in east and southern Africa.
EQUINET is governed by a steering committee involving institutions co-ordinating the network’s work.Over the period of production of the analysis the steering committee has included:Policy analysis: Centre for Health Policy, South Africa; Trade and Health: Southern and Eastern African Trade Information and Negotiations
Institute (SEATINI), Zimbabwe and Uganda;Economic policy and Health: Centre for Economic Justice, Municipal Services Project, South Africa;Nutrition and food sovereignty: Medical Research Council, South Africa; Equity in responses to AIDS: REACH Trust, Malawi;District health systems: Ifakara Health Research Development Centre, Tanzania;Fair financing: Health Economics Unit, University of Cape Town, South Africa; Health workers: Health Systems Trust, South Africa; University of Namibia, Namibia (in
co-operation with the East, Central and Southern African HealthCommunity);
Participation in health: Training and Research Support Centre, Zimbabwe; CHESSORE,Zambia; Ifakara Health Research Development Centre, Tanzania;
Health rights: University of Cape Town, University of Western Cape, South Africa; Civil society alliances: Community Working Group on Health, Zimbabwe; Southern African
Trade Union Co-ordinating Council, Botswana; People’s HealthMovement, Tanzania;
Monitoring health equity: University of Zimbabwe Medical School, Zimbabwe;Parliamentary Alliances: Association of Parliamentary Committees in east and southern
Africa (SEAPACOH);Country networking: TANESA, Tanzania; Malawi Health Equity Network, Malawi.EQUINET has also received significant support since 1998 in its information and website work fromFahamu, UK and South Africa.
The secretariat for the network is at Training and Research Support Centre (TARSC) (www.tarsc.org) . For further information on EQUINET please contact the secretariat:TARSC, Box CY2720, Causeway, Harare, Zimbabwe Tel + 263 4 705108/708835 Fax + 263-4- 737220Email: [email protected] Website: www.equinetafrica.org

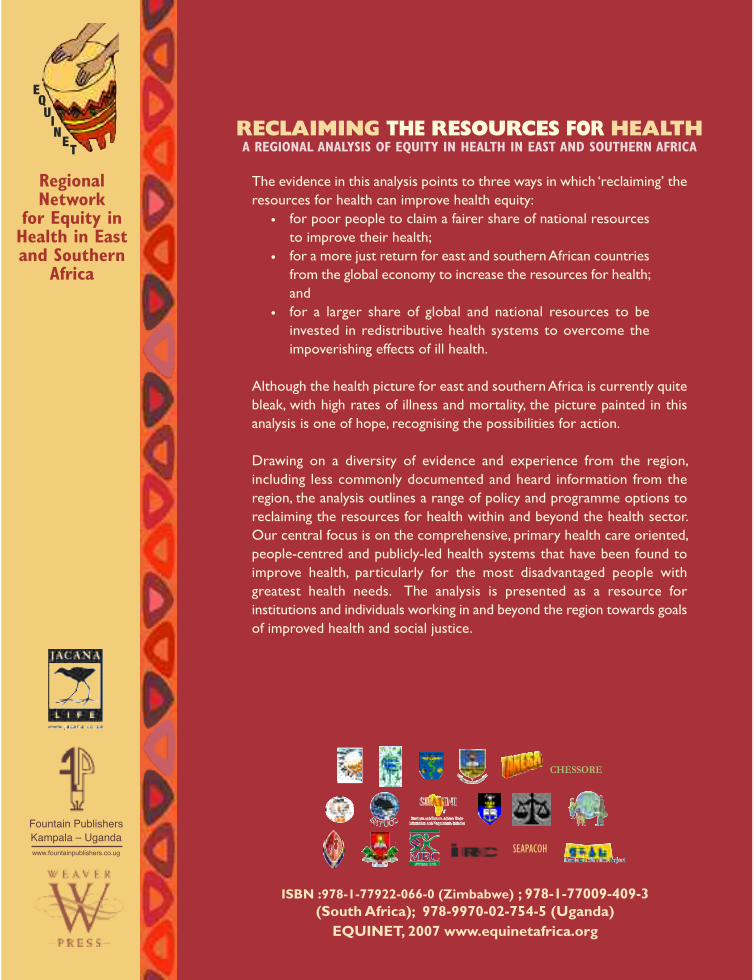
RegionalNetwork
for Equity inHealth in Eastand Southern
Africa
ISBN :978-1-77922-066-0 (Zimbabwe) ; 978-1-77009-409-3(SouthAfrica); 978-9970-02-754-5 (Uganda)EQUINET, 2007 www.equinetafrica.org
RECLAIMING THE RESOURCES FOR HEALTHA REGIONAL ANALYSIS OF EQUITY IN HEALTH IN EAST AND SOUTHERN AFRICA
The evidence in this analysis points to three ways in which ‘reclaiming’ theresources for health can improve health equity:• for poor people to claim a fairer share of national resourcesto improve their health;
• for a more just return for east and southernAfrican countriesfrom the global economy to increase the resources for health;and
• for a larger share of global and national resources to beinvested in redistributive health systems to overcome theimpoverishing effects of ill health.
Although the health picture for east and southernAfrica is currently quitebleak, with high rates of illness and mortality, the picture painted in thisanalysis is one of hope, recognising the possibilities for action.
Drawing on a diversity of evidence and experience from the region,including less commonly documented and heard information from theregion, the analysis outlines a range of policy and programme options toreclaiming the resources for health within and beyond the health sector.Our central focus is on the comprehensive, primary health care oriented,people-centred and publicly-led health systems that have been found toimprove health, particularly for the most disadvantaged people withgreatest health needs. The analysis is presented as a resource forinstitutions and individuals working in and beyond the region towards goalsof improved health and social justice.
EQUINET
CHESSORE
SEAPACOH
Fountain PublishersKampala – Ugandawww.fountainpublishers.co.ug