Reassessing the Orientalist Gaze: Lalla Essaydi’s "Les Femmes du Maroc"
Upload
independentCategory
view
3download
0
Auburn University
Department of Economics
Working Paper Series
Reassessing the Link between the Japanese Yen
and Emerging Asian Currencies
Bong-Han Kima, Hyeongwoo Kimb, and Hong-Ghi Minc
aKongju National University; bAuburn University; cKAIST
AUWP 2011-05
This paper can be downloaded without charge from:
http://media.cla.auburn.edu/economics/workingpapers/
http://econpapers.repec.org/paper/abnwpaper/

Reassessing the Link between the Japanese Yen and
Emerging Asian Currencies
Bong-Han Kim∗, Hyeongwoo Kim†, and Hong-Ghi Min‡
April 2011
Abstract
We reassess the degree of exchange rate co-movement between the Japanese yen and 5
emerging Asian currencies relative to the US dollar in the 2000s. It is often claimed that these
currencies have been closely tied with the Japanese yen possibly due to active interactions
of Japan and emerging Asian economies. We question the validity of such claims, reporting
substantially lower, even negative, dynamic conditional correlations between these currencies
and the yen-dollar exchange rate in the second half of the 2000s. Our novel multivariate GARCH
framework identifies the liquidity deterioration, measured by the TED spread, and the elevated
risk aversion, measured by the sovereign CDS premium, in international capital markets as the
two major driving forces of such decoupling phenomena.
Keywords: Yen-Dollar Exchange Rate, Emerging Asian Currencies, Dynamic Conditional Cor-
relation, DCCX-MGARCH
JEL Classification: C32, F31, G15
∗Department of International Economics, Kongju National University, Gongju, Chungnam, South Korea. Tel:82-41-850-8391. Fax: 82-41-850-8390. Email: [email protected].
†Department of Economics, Auburn University, Auburn, AL 36849. Tel: 1-334-844-2928. Fax: 1-334-844-4615.Email: [email protected].
‡Department of Management Science, KAIST, Gwahang-Ro 447, Yusong, Daejun, Republic of Korea. E-mail:[email protected].
1

1 Introduction
Japan has close economic ties with emerging Asian economies through trade, foreign direct invest-
ment, and foreign portfolio investment. These emerging countries, therefore, may have an incentive
to maintain a stable bilateral exchange rate with the Japanese yen (JPY, hereafter), which may
help stabilize their domestic prices and current account and promote long-term economic growth.
Many researchers attempted to assess the importance of the JPY in Asian currencies’ exchange rate
determination in the 1980s and 1990s. See, among others, Frankel (1993), Aggarwal and Mougoue
(1993, 1996), Frankel and Wei (1994), Kwan (1994), Tse and Ng (1997), and Zhou (1998). These
studies, using either standard least squares regressions or cointegration techniques, reported an in-
fluential role of the JPY, though overall being less important than the US dollar (USD, hereafter),
in determination of emerging Asian currencies’ exchange rate.1 These findings are quite appealing
especially for emerging Asian countries that is known as a loose dollar zone (Frankel 1993, Frankel
and Wei 1994) that maintained a de facto dollar peg until the 1997 Asian crisis.
After the Asian financial crisis, however, an array of researches report an increased influence of
JPY on some of the emerging Asian currencies such as the Korean won and the Philippines peso
that abandoned the managed floating system, but not on China and Malaysia that continued either
a dollar peg or a dirty float system. See, among others, Gan (2000), Hernandez and Montiel (2002),
Bowman (2005), and Kearney and Muckley (2007).
Since those studies use data up to 2003, it is unknown whether such increased influence of the
JPY on emerging Asian currencies is still valid, say, even after the US financial crisis in 2007.2 We
attempt to fill this gap in the present paper.
For this purpose, we reassess the degree of exchange rate co-movements between the JPY and
5 emerging Asian currencies, the Indonesian ruphia, the Korean won, the Philippines peso, the
1The work of Aggarwal and Mougoue (1996) is an exception. They found greater effect of the JPY than the USD
in the late 1980s and the ealry 1990s.2Following the sub-prime mortgage crisis in the summer of 2007, emerging economies could not insulate themselves
from adverse shocks originated from the US (Dooley and Hutchison, 2009). From the end of 2007 to the end of 2008,
the Korean won depreciated against the USD by 34.9% and Thai Baht depreciated by 3.5% while JPY appreciated
by 18.7% as global risk aversion spurred demand for a safe asset.
2
Taiwanese dollar, and the Thai baht, vis-à-vis the US dollar during the 2000s. We exclude some
major Asian currencies such as the Chinese yuan and the Malaysian ringgit, focusing on exchange
rate synchronization across countries that allow exchange rates to be freely determined in the
market. We are particularly interested in the following questions: (1) Is there continuing empirical
evidence of a close link between emerging Asian currencies’ JPY exchange rates with the yen-dollar
exchange rate?; (2) If not, how and when the degree of exchange rate synchronization has changed?;
(3) More importantly, what caused such changes and what policy implications can we draw?
To answer the first two questions, we employ an array of multivariate generalized autoregressive
conditional heteroskedasticity (MGARCH) models including Engle’s (2002) dynamic conditional
correlation (DCC) model and a smooth transition MGARCH (STCC-MGARCH) model. Over-
all, we find very weak, even negative, conditional correlations between these currencies and the
yen/dollar rate in the latter half of the 2000s, while significantly positive correlations were observed
in the first half. For the third question, we use Kim and Kim’s (2011) DCC-MGARCH-type model
that extracts information from exogenous variables (DCCX-MGARCH). The DCCX-MGARCH
method can help identify key economic factors that play important role for determining the time-
varying conditional correlations over time.
Previous studies point out that both the real and financial factors affect the co-movement of
Asian currencies with JPY. Heavier economic dependence of Asian countries on Japan through the
international trade, FDI and portfolio investment would make the degree of co-movement higher.
Kim et al. (2010) show that yen synchronization is driven not by increased exports and imports in
this area but by increased export similarity in the region and FDI between Japan and southeast
Asian countries.
Exchange rate movements can be generated by financial factors, especially during the global
financial crisis of 2007-2009. The crisis has affected emerging Asian currency values mainly through
increasing risk aversion, the evaporation of liquidity and the unwinding of carry-trade (Kohler, 2009;
Melvin and Taylor, 2009). We use proxies for riskiness, liquidity, carry-trade and the trade share
with Japan as the economic fundamentals determining the co-movement between emerging Asian
3

currencies and yen relative to US dollar.
Our estimation results reveals an important role of the TED spread, a global liquidity measure,
for understanding recent decoupling phenomena between emerging Asian currencies’ JPY exchange
rates from the yen/dollar exchange rates, which implies that the recent liquidity crunch strength-
ened the JPY while weakening these emerging Asian currencies, resulting in weak conditional
correlations. We also find that the sovereign credit default swap (CDS) premium tends to lower the
conditional correlations. This may be true if elevated global risk aversion has asymmetric effects
across countries, favoring the JPY over other Asian currencies. Such a decoupling phenomenon
during the global crisis may result from safe haven effects. Higher liquidity and credit risk during
the crisis have made emerging Asian currencies weaker and yen stronger. Interestingly, recent de-
creases in the trade share with Japan, a real activity variable, seem to contribute substantially to
lowering the degree of exchange rate synchronization.
The remainder of the present paper is organized as follows. Section 2 provides a quick literature
review. In section 3, we present our empirical models and discuss estimation methodologies. Section
4 describes the data and presents our main empirical results. Concluding remarks and policy
implications are reported in the last section.
2 Previous Studies
The current literature on the synchronization of bilateral exchange rates in emerging Asian countries
includes the following three groups of research work.
First, an array of researchers analyzes the relative importance of USD and JPY in determina-
tion of Asian countries’ exchange rates after the Asian financial crisis. Using Frankel and Wei’s
(1994) methodology, they analyze the relative importance of USD and JPY in determination of
Asian currencies exchange rates. For instance, Baig (2001), for the sample period of 1995 to 2000,
evaluates the relative importance of the USD, German Mark, and JPY in emerging Asian curren-
cies’ exchange rates and reports a relatively more important and stable role of JPY. McKinnon and
Schnable (2004) report, however, that the USD is still dominant currency in exchange rate deter-
4
mination in this area. Their analysis, therefore, imply that maintaining the stable USD exchange
rate should be a key objective of the foreign exchange rate policy in emerging Asian currencies.
Following the approach of Frankel and Wei (1994), Bowman (2005) shows that the Australian
dollar, in addition to JPY, has increased its influence in exchange rates of East Asian countries
during the 1990s. Kearny and Muckley (2007) show that the relative importance of JPY is increas-
ing for the determination of Korean won and Taiwan dollar exchange rates, while JPY and USD
have been increasingly more important for the Thailand Bhat exchange rate. Recently, Ogawa and
Yang (2008) claim that those countries do not have the pure floating exchange rate system and it
is the USD not JPY which plays the most dominant role in this area.
Second group of studies focused on estimating cross-market correlation coefficients for the pre-
and post-crisis period, including King and Wadhwani (1990), Lee and Kim (1993), Calvo and
Reinhart (1996), and Baig and Goldfajn (1999). Many of these papers find sizable differences in
correlation coefficients and conclude that there are increased correlations after the Asian financial
crisis.
Forbes and Rigobon (2002) claim, however, that such findings may not be reliable, because
statistical tests for the change in the correlation coefficient may be severely biased due to het-
eroskedasticity. They find no substantial changes in the correlation coefficient when they correct
for the bias. Boyer et al. (1999) and Loretan and English (2000) provide similar bias-correction
methods. Corsetti et al. (2005) point out, however, that those tests by Boyer et al. (1999) and
Forbes and Rigobon (2002) are biased towards the null hypothesis of no contagion.
Final group of researchers, including the present paper, employs the dynamic conditional cor-
relation (DCC) model of Engle (2002) to estimate time-varying conditional correlations using the
MGARCH framework. This approach is desirable in the sense that it does not require any arbitrary
assumption on the timing of turmoil periods. See, among others, Chiang et al. (2007), Frank and
Hesse (2009), and Hwang et al. (2010).
The literature on studying exchange rate movements during global financial crisis of 2007-2008
are closely related to our work. Fratzscher (2009) finds that negative US-specific macroeconomic
5

shocks have triggered a substantial spike in the value of the US dollar, while countries that have
low foreign exchange reserves or that suffer from weak current account positions have experienced
substantial currency depreciations. Melvin and Taylor (2009) point out the four factors, carry-
trade, liquidity, de-leveraging, and counterpart risk, that play a dominant role in exchange rate
determination in emerging Asian countries.
It should be noted that the sharp depreciation of a number of currencies that were not at
the center of the turmoil during the global crisis can be related to the rise in uncertainty and
risk aversion. Kohler (2010) points out that flows to safe haven currencies may explain some of the
depreciation.3 The USD, the JPY and the Swiss franc are often considered as such currencies.4 The
safe haven effect may explain the depreciation of emerging Asian currencies and the appreciation
of JPY against USD during the global crisis.
Carry trade is a strategy of taking a long position in high interest rate currencies, funded by
taking a short position in low interest rate currencies. Such a trade is profitable if the interest
differential is not completely offset by an appreciation of the low interest currency. Unwinding
larger carry trade positions due to the depreciation of target currencies played a bigger role in
explaining some of the crisis-related exchange rate movements (Kohler, 2009; Melvin and Taylor,
2009)
While most of earlier studies show the increased importance of JPY in emerging Asian curren-
cies’ exchange rate determination after the Asian financial crisis, they provide little knowledge on
the causes and implications of the synchronization (or de-synchronization) of exchange rates in this
region during the latter half of the 2000s and after the onset of the US financial crisis. The present
paper attempts to fill this gap.
3Kohler (2009) points out that the relative price of such a safe haven asset tends to increase during crises.4Ranaldo and Söderlind (2010) find that periods of low risk aversion are usually associated with an appreciation
of the US dollar, and periods of high risk aversion with a depreciation of the dollar against the yen and the Swiss
franc. They attribute this finding to the status of the latter two currencies as safe havens. Similarly, Cairns et al.
(2007) find that the franc, the euro and, to some degree, the yen tend to strengthen against the dollar when volatility
rises. However, they also find that the US dollar tends to appreciate during these periods against a number of other
currencies, especially those from emerging markets, making it a safe haven relative to them.
6

3 The Econometric Model
3.1 The Dynamic Conditional Correlation Model
In addition to the conventional GARCH-BEKK model (Engle and Kroner, 1995), we employ the
dynamic conditional correlation (DCC) estimator proposed by Engle (2002). The DCC model is a
flexible yet parsimonious parametric model that has been popularly employed.
Let y = [∆1 ∆2]0be a 2 × 1 vector of log exchange rate () depreciation rates against
the US dollar that obeys the following stochastic process.
y = Γ()y−1 + e (1)
where the conditional distribution of e is bivariate normal,
e|Ω−1 ∼ N (0H) (2)
Γ() is a lag polynomial matrix and Ω−1 is the adaptive information set at time − 1. Theconditional covariance matrix H is defined,
H = DRD (3)
where D is a diagonal matrix with the conditional variances along the diagonal, D = ³12
´and R is the time-varying correlation matrix.
5
The equation (3) can be re-parameterized as follows with standardized returns, = D−1 e,
E−10 = D
−1 HD
−1 = R = (4)
Engle proposes the following mean-reverting conditional correlations with the GARCH(1 1) speci-
5 If R is time-invariant, the DCC estimator coincides with the Bollerslev (1990) Constant Conditional Correlation
(CCC) estimator.
7

fication.
12 =12√
1122 (5)
where
= (1− − ) + −1−1 + −1 (6)
and is the unconditional correlation between and . and are non-negative scalars that
satisfy + 1.6 In matrix form,
Q = Q (1− − )+−10−1 + Q−1 (7)
where Q is the unconditional correlation matrix of . R is obtained by
R = (Q∗ )−12
Q (Q∗ )−12 (8)
where Q∗ = Q.It turns out that the log-likelihood function for this model can be expressed as,
L ( ) = L ()+L ( ) (9)
where is a vector of parameters in D and denotes a vector of parameters in R. Engle proposes
a two-step approach for estimating the DCC model. That is, one may first obtain the parameter
estimates by maximizing L () by univariate GARCH estimations. Then, given , maximizationof L
³
´yields the estimates for .
3.2 The Smooth Transition Conditional Correlation Model
The DCC-MGARCH model estimates time-varying correlations continuously, therefore, may not be
useful if one is interested in detecting potential regime shifts in the conditional correlation. Allowing
6When + = 1, is nonstationary and the exponential smoothing estimator can apply.
8

a structural break in conditional correlations may be desirable when one wishes to examine whether
there is a significant change in the conditional correlation in the statistical sense without having to
rely on the eyeball metric. Such considerations lead us to employ a smooth transition conditional
correlation MGARCH (STCC-MGARCH) model proposed by Berben and Jansen (2005).
The conditional covariance matrixH in (2) is assumed to obey the following stochastic process.
11 = 1 + 121−1 + 111−1 (10)
22 = 2 + 222−1 + 222−1
12 = () (1122)12
and
() = [1− (; )] + (; ) (11)
where −1 1 = denotes the correlation coefficient in the low and high correlation
regimes, respectively. (·) is the probability/transition function of the high correlation regime, is the time-dependent transition variable, and denotes a vector of parameters.
Following Berben and Jansen (2005), we assume a logistic smooth transition function,
(; ) =1
1 + exp [− ( − )] = [ ]
0 0 (12)
where = , denotes a smoothness parameter that determines how quickly transitions occur,
and is a location parameter in a unit interval [0 1]. This specification is simple yet useful in
modeling a permanent change (structural break) in the conditional correlation. We estimate the
unknown parameters of the STCC-MGARCH model by maximizing the following log-likelihood
function with respect to all parameters.
L= −12
X=1
³2 log(2) + log |H|+ e0H
−1e´
9

3.3 The DCCX-MGARCH Model
We now introduce a MGARCH-type model (Kim and Kim, 2011) where the conditional correlation
coefficient is determined by exogenous variables (DCCX-MGARCH). We assume the following.
12 = (x) (1122)12 (13)
where −1 (x) 1 is an monotonic increasing function of x, a × 1 vector of economicfundamental variables that affect the size of the conditional correlation. This approach can provide
useful policy implications when policy makers wish to identify such economic factors.
We propose the following parameterization for such a conditional correlation function.
(x) = 2
⎡⎣ exp³0x
´1 + exp (
0x)
⎤⎦− 1 (14)
where x = [1 2 · · · ]0and = [1 2 · · · ]
0is a vector of coefficients that measures the
effects of x on the conditional correlation.
4 Empirical Results
4.1 Data and Preliminary Analysis
We utilize 6 foreign exchange rates obtained from DataStream from January 1, 2002 to December 30,
2009, the Indonesian ruphia, the Japanese yen, the Korean won, the Philippines peso, the Taiwanese
dollar, and the Thai baht, vis-à-vis the US dollar during the 2000s. For the sake of stationarity,
rates of exchange rate depreciation are calculated by taking two-day difference of natural logarithm
of exchange rates and then multiplied by 100. Table 1 provides summary statistics for the daily
depreciation rates of these currencies.
Table 1 about here
10

From the first column of figure 1 we can see that the exchange rates of the emerging Asian
currencies exhibit overall co-movements with the yen-dollar rate in the first half of the 2000s with
a notable exception of the Philippines peso. However, in the latter half of the 2000s, it is likely
that decoupling phenomena could be observed especially for the Indonesia, Korea, Taiwan and
Thailand. We can see abrupt depreciations of emerging Asian currencies against USD during the
Lehman episode except Philippines. Note that the triangular arbitrage condition implies that the
national currency price of the JPY should be stable if the dollar exchange rate is synchronized to
the yen-dollar exchange rate. As can be seen in the second column of figure 1, this may be the case
only for the first half of 2000s again with an exception of the Philippines peso.
Figure 1 about here
We also implement the Lijung-Box test, Bollerslev test and Tse test to check the constancy
of correlation coefficients during the sample period for five emerging Asian countries. Test results
are reported in Table 2. All three tests reject the null hypothesis of no change in the correlation
coefficient at the 1% critical level for all five countries. As a further preliminary analysis, we
estimate sub-sample correlation coefficients for two bilateral exchange rates and report in figure
2. The estimated correlation coefficients clearly demonstrate weaker (even negative) links between
those currencies and JPY in the second half of the 2000s.
Table 2 and Figure 2 about here
To examine whether such a decoupling phenomenon is to specific for these currencies, we esti-
mated the common components of 13 emerging Asian exchange rates and associated factor load-
ings.7 Figure 3 shows common components of 13 bilateral exchange rates extracted from the panel
7We use the daily cross exchange rate of the USD relative to 13 emerging Asian countries, China, Hong Kong,
India, Indonesia, Japan, Korea, Malaysia, Pakistan, Philippines, Singapore, Sri Lanka, Taiwan, and Thailand for
January 1, 2002 to July 22, 2009,
11
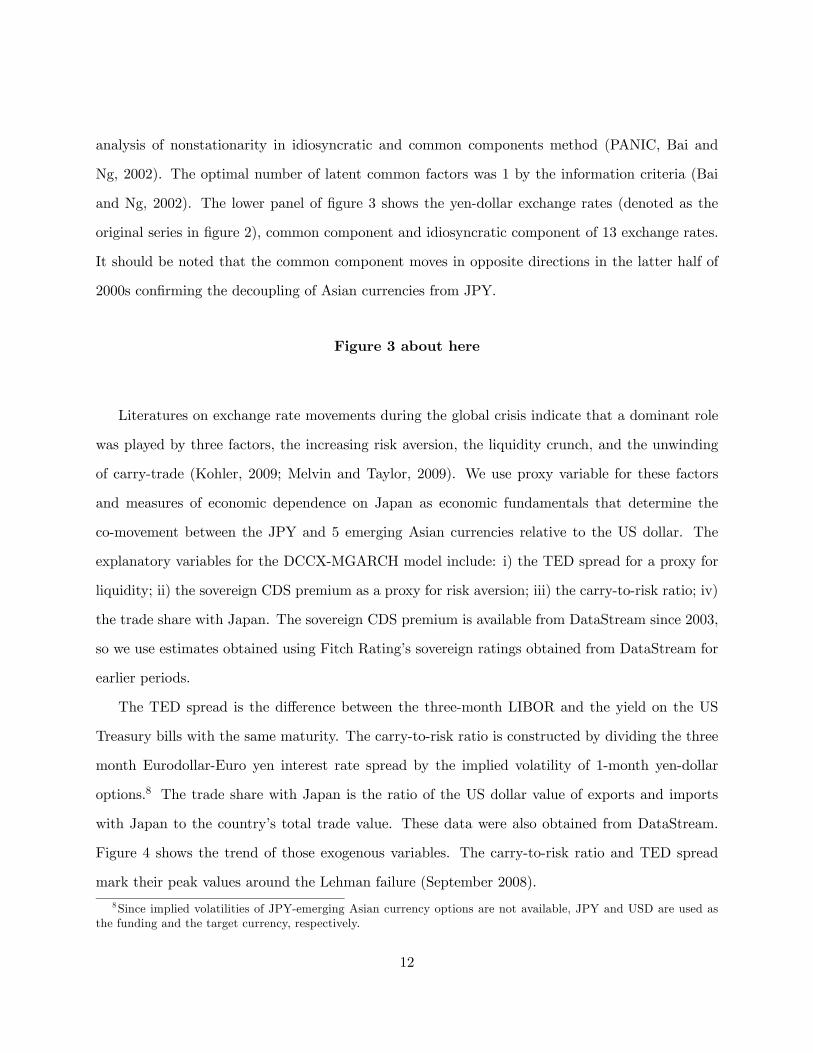
analysis of nonstationarity in idiosyncratic and common components method (PANIC, Bai and
Ng, 2002). The optimal number of latent common factors was 1 by the information criteria (Bai
and Ng, 2002). The lower panel of figure 3 shows the yen-dollar exchange rates (denoted as the
original series in figure 2), common component and idiosyncratic component of 13 exchange rates.
It should be noted that the common component moves in opposite directions in the latter half of
2000s confirming the decoupling of Asian currencies from JPY.
Figure 3 about here
Literatures on exchange rate movements during the global crisis indicate that a dominant role
was played by three factors, the increasing risk aversion, the liquidity crunch, and the unwinding
of carry-trade (Kohler, 2009; Melvin and Taylor, 2009). We use proxy variable for these factors
and measures of economic dependence on Japan as economic fundamentals that determine the
co-movement between the JPY and 5 emerging Asian currencies relative to the US dollar. The
explanatory variables for the DCCX-MGARCH model include: i) the TED spread for a proxy for
liquidity; ii) the sovereign CDS premium as a proxy for risk aversion; iii) the carry-to-risk ratio; iv)
the trade share with Japan. The sovereign CDS premium is available from DataStream since 2003,
so we use estimates obtained using Fitch Rating’s sovereign ratings obtained from DataStream for
earlier periods.
The TED spread is the difference between the three-month LIBOR and the yield on the US
Treasury bills with the same maturity. The carry-to-risk ratio is constructed by dividing the three
month Eurodollar-Euro yen interest rate spread by the implied volatility of 1-month yen-dollar
options.8 The trade share with Japan is the ratio of the US dollar value of exports and imports
with Japan to the country’s total trade value. These data were also obtained from DataStream.
Figure 4 shows the trend of those exogenous variables. The carry-to-risk ratio and TED spread
mark their peak values around the Lehman failure (September 2008).
8Since implied volatilities of JPY-emerging Asian currency options are not available, JPY and USD are used as
the funding and the target currency, respectively.
12

One motivation of including the sovereign CDS premium is based on a conjecture that elevated
global risk aversion triggered by the recent US financial crisis may have asymmetric effects across
these countries, because the JPY is considered to be safe asset while the emerging Asian currencies
are not. The TED spread may be relevant because it reflects liquidity constraints in international
capital markets. The carry-to-risk ratio is employed because the higher the ratio is the less attractive
the JPY is. An increase in the ratio may weaken the Yen not necessarily affecting other Asian
currencies, leading to weaker correlations. Lastly, the trade share with Japan may serve as a proxy
for the degree of economic integrations with Japanese economy. Though still important, the shares
have declined since the latter half of the 2000s, possibly due to higher dependence on Chinese
economy.
Figure 4 about here
4.2 Estimation Results
4.2.1 DCC Estimation
Parameter estimates for DCC-MGARCH (Engle, 2002) and MGARCH-BEKK (Engle and Kroner,
1995) models are reported in Tables 3 and 4, respectively. Conditional correlation coefficients
estimates are plotted in Figures 5 and 6, respectively.
Notwithstanding overall qualitative similarity, the BEKK estimates of the conditional correla-
tion tend to exhibit higher variability covering a wider range of estimates than the DCC estimates.
For instance, the conditional correlation between the Korean won and the JPY exchange rates
ranges between about -0.6 to 0.7 when the BEKK method is applied, while it ranges about -0.2 to
0.4 when we use the DCC-MGARCH method.
Those estimates confirm the earlier findings in our preliminary analysis in previous section. As
it can be shown in Figures 5 and 6, we observe substantial decreases, even negative, in conditional
13

correlations in the latter half of the 2000s for all 5 countries. We also note that all five currencies
show substantial decrease in their correlations with JPY during the US financial crisis period in
September 2008 triggered by the Lehman failure. Note also that the Indonesian rupiah and the
Philippines peso exhibit overall weaker correlations than other countries.
Tables 3, 4, Figures 5, 6 about here
4.2.2 STCC-MGARCH Model Estimation
Findings in previous section suggest a possibility of nonlinear movements of correlation coefficients.
To this end, we implement an STCC-MGARCH estimation that allows a permanent time-dependent
regime shift, i.e., a structural break, in the conditional correlations. The parameter estimates are
reported in Tables 5 and estimated conditional correlations are shown in Figure 6.
The first finding is that estimates are quite different from the estimates especially for the
Korean won, the Taiwanese dollar, and the Thai baht. The estimates are statistically significant
at the 5% level for all countries, while the estimates are overall estimated with less precision.
The estimates for Korea, Taiwan, and Thailand are quite big, which implies that the transition
occurred fairly abruptly, while gradually for the other two countries. The location parameter ()
estimates are about the same around 2006. In a nutshell, our results imply that the degree of the
exchange rate synchronization becomes much lower in the last half of the 2000s.
Table 5 and Figure 6 about here
4.2.3 DCCX-MGARCH Model Estimation
We next turn to the DCCX-MGARCH estimation. Estimation results are reported in Table 6 and
conditional correlation estimates appear in Figure 7. To answer what factors explain the degree of
14

synchronization between the JPY and 5 emerging Asian currencies relative to the US dollar, we
consider the sovereign CDS premium, the carry-to-risk ratio, the TED spread, and the trade share
with Japan in total trade as exogenous variables.
Table 6 and Figure 7 about here
First, the sovereign CDS (credit default swap) premium is a factor variable that is related
to the financial and economic conditions of the emerging Asian countries. The sovereign CDS
premium is a measure of potential financial fragility in emerging Asian countries and this may
represent investors’ perceived riskiness of the country and their risk aversion. Given the fact that
the JPY is normally considered as a safe currency, it is highly likely that elevated global risk
aversion has asymmetric effects on Asian exchange rates. As a consequence, safe haven effects can
partly explain such a decoupling phenomenon. Note also that estimates of CDS coefficient (1)
for Korea, Philippines and Thailand are significant and negative. This implies that increased CDS
in those countries may have caused “flight to quality” in this area and this resulted in decoupling
of exchange rates movement from JPY. Figure 4 shows that the CDS premium of Korea, Taiwan,
and Thailand increased substantially since 2006 and it seems that sudden decoupling phenomena
of these currencies from JPY are highly attributable to changes in the CDS premium.
Second, the carry-to-risk ratio measures perceived ex ante profitability of the yen carry trade.
When the ratio is high, we expect more market participants to short the JPY buying other curren-
cies, aiming higher expected returns, resulting in a depreciation of the JPY, and lower correlation
between Asian currencies and JPY. Ceteris paribus, the conditional correlation between the JPY,
the funding currency and target currencies will become more likely to be negative as the ratio goes
up.9
9 If the ratio were so low that large carry trade positions unwind, the correlation between funding and target
currency value would decrease as the ratio went down. In this case, the relation between the ratio and co-movements
between related currency values will be positive.
15

As we can see from Figure 4, there is a big swing of this ratio centered around 2006. Put
it differently, the profitability of yen-carry-trade increased (peaked around the end of 2006) and
then declined rapidly afterward. Galati at al. (2007) indicates that the build-up of carry trade
positions featured prominently during 2005-2007. In August and September of 2008, these positions
were unwounded rapidly, exacerbating any crisis-related depreciations of the affected currencies
(McCauley and McGuire, 2009; Melvin and Taylor, 2009). Unwinding larger carry trade positions
may partly explain why representative funding currency like the Japanese yen appreciated and
typical target currencies such as the Australian dollar depreciated in late 2008 (Kohler, 2010). The
estimated coefficients of carry-to-risk ratio (2) were negative and significant for Indonesia and
Thailand but insignificant for the rest countries. This estimation result imply that carry trade does
not affect consistently co-movements between 5 emerging Asian currencies and JPY.
Third, the TED spread seems to play a crucially important role for determining the size of
the conditional correlation between the emerging Asian currencies and the yen-dollar exchange
rate. Note that estimates of the TED spread (3) are negative and significant at the 5% level for
all countries. Such results are intuitively appealing since the TED spread tends to go up as the
global liquidity deteriorates (Brunnermeier, 2009). Unlike Japan that has a plethora of US dollars
reserves from a chronic current account surplus, emerging countries may suffer huge from liquidity
deterioration and this can cause rapid depreciations of their currencies. In this way, as the TED
spread increases the conditional correlation between emerging Asian currencies and the yen-dollar
exchange rate can be weakened.
Finally, the higher trade share with Japan, a real activity variable, may cause stronger con-
ditional correlation of two bilateral rates. From table 6, we can see that estimates of the trade
share coefficients (4) are positive and significant at the 1% level for Indonesia, Korea, Taiwan and
Thailand. As we can see in Figure 4, the trade share becomes substantially low for all countries,
possibly due to higher dependence on the trade with other partners such as China. Changes in real
activities tend to be more persistent than those of financial variables. Therefore, it is quite likely
the recent decoupling from the yen-dollar rate may not be a transient phenomenon.
16

Estimation results of our DCCX-MGARCH model are consistent with Brunnermeier et al.
(2008) and Fratzscher (2009). They claim that a sudden reversal in global capital flows played a
seminal role for the global foreign exchange rate dynamics. They conclude that a repatriation of
capital to the US by US investors, a flight-to-safety (and flight-to-liquidity) phenomenon by US
and non-US investors, and increased need for US dollar liquidity and an unwinding of yen carry
trade may all have played a role in the sharp appreciation of the US dollar.
5 Concluding Remarks
We use an array of MGARCH models to estimate dynamic conditional correlations of 5 emerging
Asian currencies’ dollar exchange rates with the yen-dollar rate during the 2000s. A number of
researchers report empirical evidence of a close link between these exchange rates possibly due to
an important role of Japan in Asian economies since Asian crisis in 1997. We question the validity
of such claims and find no or negligible support for such claims during the second half of the 2000s.
Our major findings are as follows.
First, estimated dynamic conditional correlations (Engle, 2002) exhibit clear declines for all
countries. To see if such patterns are temporary phenomena, we employ the STCC-MGARCH
model (Berben and Jansen, 2005). We find some evidence of a regime shift around 2006 from a
high correlation to a low, even negative, correlation in these countries. We further find that the
regime shift occurred fairly quickly in Korea, Taiwan, and Thailand.
Second, our novel DCCX-MGARCH model reveals major factors that determine the size of
conditional correlations. It is shown that decreasing correlations in this region can be explained
by the substantial increase in the TED spread triggered by the US financial crisis. As the global
liquidity condition deteriorates, emerging Asian countries, unlike Japan with a plethora of dollars,
may find it difficult to raise enough US dollars to maintain their economic activities, which may
have asymmetric effects on the value of their currencies relative to the US dollar. We also find a
substantial negative effect of the sovereign CDS premium on the size of the conditional correlation.
Elevated global risk aversion due to the US crisis steered exchange market participants toward
17
the demand for safe assets such as the Japanese yen, resulting in weak exchange rate correlations.
In other words, safe haven effects during the global crisis caused decoupling between emerging
southeast Asian currencies and yen. The carry-to-risk ratio that reflects relative profitability of the
JPY carry trade adds some explanatory power for the Indonesia and Thailand cases.
Third, it seems that the decoupling phenomenon in the latter half of the 2000s may not be
short-lived. Even though financial factors seem important to explain weaker correlations in this
period, we also find some evidence of an important role of the trade share with Japan, a real activity
variable, which exhibits a constant and persistent decline for all five countries, possibly due to a
rise of other rival trading partners such as China. It is quite possible that the degree of exchange
rate synchronization with the JPY became weaker not only due to a change in financial condition
but also because economic fundamental has changed.
We can draw important policy implications from those findings. Our DCCX-MGARCH model
estimations show that there have been asymmetric spillover effects from the global financial crisis
to the five emerging Asian countries’ currencies and the Japanese yen. It is shown that global liq-
uidity deterioration, increased sovereign CDS premium, and unwinding of yen-carry trade played
important transmission channels of the global financial crisis to this area. This implies that emerg-
ing Asian currency values relative to yen are quite vulnerable to external shocks. Even though
their economic fundamentals are sound, volatilities of exchange rate of emerging Asian currencies
against yen can increase sharply due to even small turmoil of financial centers, like US subprime
mortgage crisis. Increase in volatility of exchange rate of emerging Asian currencies against yen will
contribute to destabilizing exports and the business cycle in Asia and provide an unfavorable envi-
ronment for a common currency area as claimed by McKinnon and Schnabel (2003).10 Decreased
yen synchronization will magnify the exchange rate risk of yen- denominated assets in East Asia.
This possibility calls for a need to construct a financial stabilization mechanism to prevent hikes
in volatility of exchange rate of emerging Asian currencies against yen in case of financial contagion
10McKinnon and Schnabel (2003) show that the business cycles of Japan and her neighbors have been highly
synchronized and that these cycles have been closely linked to fluctuations in the yen-dollar exchange rate. They
recommend East Asian countries to keep their currency values in line with the yen value in order to reduce the
instability of business cycles caused by volatile movements of the yen-dollar rate.
18

originating outside the region. It is necessary for those countries to have certain institutional
arrangements which can provide sufficient liquidity in this area, such as currency swap agreements.
However, to some degree, external shocks are transmitted through long-run economic interlinkage,
such as trade, and any attempt to reduce this linkage could not be possible and be extremely costly.
19

References
1. Aggarwal, R., A. Montañes, and M. Ponz (2000), "Evidence of Long-Run Purchasing Power
Parity: Analysis of Real Asian Exchange Rates in Terms of the Japanese Yen," Japan and
the World Economy 12(4), 351-361.
2. _____ and M. Mougoue (1996), "Cointegration among Asian Currencies: Evidence of the
Increasing Influence of the Japanese Yen," Japan and the World Economy 8(3), 219-308.
3. Bai, J. and S. Ng (2002), "A PANIC Attack on Unit Roots and Cointegration," Econometrica
72(4), 1127-1177.
4. Baig, T. (2001), "Characterizing Exchange Rate Regimes in Post-Crisis East Asia", IMF
Working Paper 01/125.
5. _____ and I. Goldfajn. (1999), "Financial Market Contagion in the Asian Crisis," IMF
Staff Papers 46, 167-195.
6. Bowman, C. (2005), "Yen Bloc or Koala Bloc? Currency Relationships after the East Asian
Crisis", Japan and the World Economy 17(1), 83-96.
7. Boyer, B.H., M.S. Gibson, and M. Loretan. (1999), "Pitfalls in Tests for Changes in Corre-
lations," International Finance Discussion Papers No. 597R, Board of Governors of Federal
Reserve System.
8. Brunnermeier, M.K., (2009), "Deciphering the Liquidity and Credit Crunch 2007-2008," Jour-
nal of Economic Perspective 23, 77-100.
9. _____, S. Nagel, and L.H. Pedersen (2008), "Carry Trade and Currency Crashes," NBER
Macroeconomics Annual 23, 313-247.
10. Cairns, J., C. Ho, and R. McCauley (2007), "Exchange Rates and Global Volatility: Impli-
cations for Asia-Pacific Currencies," BIS Quarterly Review, March, 41-52.
20

11. Calvo, S. and C. Reinhart (1996), "Capital Flows to Latin America: Is There Evidence of
Contagion Effects?" in G. Calvo, M. Goldstein, and E. Hochreiter (eds.), Private Capital
Flows to Emerging Markets after the Mexican Crisis, Institute for International Economics.
12. Corsetti, G., M. Pericoli, and M. Sbracia (2005), "Some Contagion, Some Interdependence:
More Pitfalls in Tests of Financial Contagion," Journal of International Money and Finance
24, 1177-1199.
13. Dooley, M. and M. Hutchison (2009), "Transmission of the U.S. Subprime Crisis to Emerg-
ing Markets: Evidence on the Decoupling-Recoupling Hypothesis," Journal of International
Money and Finance 28, 1331-1349.
14. Engle, R.F. (2002), "Dynamic Conditional Correlation: A Simple Class of Multivariate Gener-
alized Autoregressive Conditional Heteroskedasticity Models," Journal of Business and Eco-
nomic Statistics 20, 339-350.
15. _____ and K.F. Kroner (1995), "Multivariate Simultaneous Generalized ARCH," Econo-
metric Theory 11, 122—150.
16. Forbes, K. and R. Rigobon (2002), "No Contagion, Only Interdependence: Measuring Stock
Markets Comovements," Journal of Finance 57, 2223-2261.
17. Frank, N. and H. Hesse (2009), "Financial Spillovers to Emerging Markets During the Global
Financial Crisis," IMF Working Paper No. 09/104.
18. Frankel, J.A. (1993), "Is Japan Creating a Yen Bloc in East Asia and the Pacific," in Frankel
and Kahler (eds.), Regionalism and Rivalry: Japan and the United States in Pacific Asia,
Chicago: University of Chicago Press.
19. _____ and S.J. Wei (1994), "Yen Bloc or Dollar Bloc? Exchange Rate Policies of the
East Asian Countries", in Takatoshi Ito and Anne Krueger (eds.), Macroeconomic Linkage:
Savings, Exchange Rates, and Capital Flows, Chicago: University of Chicago.
21

20. Fratzscher, M. (2009), "What Explains Global Exchange Rate Movements During the Finan-
cial Crisis," Journal of International Money and Finance 28, 1390-1407.
21. Galati, G., A. Heath, and P. McGuire (2007), "Evidence of Carry Trade Activity," BIS
Quarterly Review, September, 27-1.
22. Gan, W.B. (2000), "Exchange-Rate Policy in East Asia after the Fall: How Much Have Things
Changed?" Journal of Asian Economics 11(4), 403—430.
23. Hernandez, L. and P.J. Montiel (2003), "Post-Crisis Exchange Rate Policy in Five Asian
Countries: Filling in the ‘Hollow Middle’", Journal of the Japanese and International Eco-
nomics 17(3), 336-369.
24. Hwang, I., F.H. In, and T. Kim (2010), "Contagion Effects of the U.S. Subprime Crisis on
International Stock Markets," Mimeo.
25. Kwan, C.H. (1994), Economic independence in the Asia-Pacific region. New York, Routledge
26. Kearney, C. and C. Muckley (2007), "Is North and Southeast Asia Becoming a Yen Blocks?"
International Journal of Finance and Economics 12(3), 337-351.
27. Kim, B.H. and H. Kim (2011), "Spillover Effects of the US Financial Crisis on Financial
Markets in Emerging Asian Countries," Auburn Economics Working Paper Series.
28. _____, S.E. Jeong, and H.G. Min (2010), "Export Similarity, FDI and yen-synchronization
of East Asian currencies: Regime Switching Regression Model and Microstructural Analysis,"
Mimeo.
29. King, M., and S. Wadhwani (1990), "Transmission of Volatility between Stock Markets,"
Review of Financial Studies 3, 5-33.
30. Kohler, M. (2010), "Exchange Rates during Financial Crises," BIS Quarterly Review, March,
39-50.
22

31. Lee, S. and K. Kim (1993), "Does the October 1987 Crash Strengthen the Co-movements
Among National Stock Markets?" Review of Financial Economics 3, 89-102.
32. Loretan, M. and W.B. English (2000), "Evaluating ‘Correlation Breakdowns’ During Periods
of Market Volatility," International Finance Discussion Papers No. 658, Board of Governors
of Federal Reserve System.
33. McCauley, R. and P. McGuire (2009), "Dollar Appreciation in 2008: Safe Haven, Carry
Trades, Dollar Shortage and Overhedging," BIS Quarterly Review, December, 85-3.
34. McKinnon, R. and G. Schnabl (2003), "Synchronizied Business Cycles in East Asia and
Fluctuations in the Yen/Dollar Exchange Rate," World Economy 26, 1067-88.
35. _____ and _____ (2004), "The East Asian Dollar Standard, Fear of Floating and Orig-
inal Sin," Review of Development Economics 8(3), 331-360.
36. Melvin, M. and M.P. Taylor (2009), "The Crisis in the Foreign Exchange Market," Journal
of International Money and Finance 28, 1317-1330.
37. Ogawa, E. and D.Y. Yang (2008) "The Dilemma of Exchange Rate Arrangements in East
Asia," Japan and the World Economy 20(2), 217-235.
38. Ranaldo, A. and P. Söderlind (2010), "Safe Haven Currencies," Review of Finance 14, 385-
407.
39. Tse, Y.K. and L.K. Ng, (1997), "The Cointegration of Asian Currencies Revisited," Japan
and the World Economy 9(1), 109-114.
40. Zhou, S. (1998), "Exchange Rate Systems and Linkages in the Pacific Basin," Atlantic Eco-
nomic Journal 26(1), 66-84.
23

Table 1. Summary Statistics
Indonesia Japan Korea Philippines Taiwan Thailand
Mean −000003 −000015 −000002 −000005 −000004 −000013Median −000008 −000001 −000001 −000004 000000 −000007Maximum 007480 002760 010810 001810 001540 006170
Minimum −005860 −004290 −010410 −001740 −002230 −005130Std. Dev. 000670 000680 000840 000370 000280 000480
Skewness 103310 −042140 056100 −003120 −028290 107180
Kurtosis 190786 613010 432799 539530 329278 875100
Table 2. Specification Tests
Ljung Box Test Bollerslev Test Tse Test
Indonesia 13207(0000)
11916(0000)
22707(0000)
Korea 93833(0000)
13565(0000)
25259(0000)
Philippines 19220(0000)
26463(0000)
34712(0000)
Taiwan 6085(0000)
336167(0000)
25701(0000)
Thailand 5475(0000)
1128(0000)
29305(0000)
Note: i) p-values are reported in parentheses.
24

Table 3. Estimation Results of the DCC-MGARCH Model"1
2
#=
"1
2
#+
"11 12
21 22
#"1−12−1
#+
"1
2
#11 = 1 + 1
21−1 + 111−1
22 = 2 + 221−1 + 211−1
Q = Q (1− − )+ε−1ε0−1 + Q−1
Mean Equation
Indonesia Korea Philippines Taiwan Thailand
1 −00091(−0666)
−00071(−0529)
−00060(−0446)
00002(0016)
−00058(−0420)
11 −00323(−1282)
−00205(−0813)
−00324(−1234)
−00344(−1256)
−00405(−1561)
12 00252(0797)
00216(0616)
−00222(−1070)
01048(1671)
01163∗(2185)
2 −00051(−0551)
−00148∗(−2104)
00093(0586)
−00044(−0881)
−00134∗(−2434)
21 00297(0997)
02304∗(1082)
−01415∗(−4618)
00048(0525)
−00398∗(−3865)
22 −00296(−0727)
01417∗(5801)
−01465∗(−5769)
01071∗(3086)
01510∗(2998)
Variance-Covariance Equation
Indonesia Korea Philippines Taiwan Thailand
1 00065∗(2122)
00069∗(2174)
00068∗(2205)
00064∗(2284)
00070∗(2194)
1 00451∗(33111)
00478∗(3382)
00465∗(3461)
00471∗(3787)
00501∗(3409)
1 09399∗(5042)
09363∗(4884)
09375∗(5003)
09378∗(5506)
09339∗(4767)
1 00341∗(2658)
00039∗(2188)
00012(0924)
00102(1041)
00075∗(3184)
2 03401∗(3711)
01321∗(3640)
00172∗(4182)
01985∗(4598)
03344∗(3271)
2 06213∗(8856)
08567∗(2200)
09810∗(1927)
06779∗(4574)
06540∗(1177)
00106∗(3437)
00023(0221)
00158∗(2372)
00310(0945)
00308(1033)
09881∗(2678)
09102∗(4998)
09582∗(4894)
09598∗(1933)
09606∗(1973)
− log 323034 286049 385432 168098 190891
Notes: i) -values are reported in parentheses. ii) * indicates statistical significance at the 5% level.
25

Table 4. Estimation Results of the BEKK Model"1
2
#=
"1
2
#+
"11 12
21 22
#"1−12−1
#+
"1
2
#H =M+A
0e0−1e−1A+BH−1B
0
M =
"1 3
3 2
# A =
"1 0
0 2
# B =
"1 0
0 2
#
Mean Equation
Indonesia Korea Philippines Taiwan Thailand
1 −00169(−1047)
−00089(−0566)
−00158(−1083)
−00140(−0944)
−00180(−1303)
11 00375(1170)
00221(0915)
−00059(−0270)
00357(0587)
−00543∗(−2150)
12 −00481(−1920)
−00866∗(−3762)
−00430(−1841)
−00547∗(−2462)
−00302(−1372)
2 −00126(−0757)
−00177(−1712)
−00034(−0559)
−00064(−1406)
−00104(−1677)
21 −01467∗(−5308)
−00314(−1248)
−00074(−0357)
−00058(−0304)
−00210(−0688)
22 −00060(−0153)
00892∗(5326)
00611∗(6246)
00447∗(5962)
00227∗(2199)
Variance-Covariance Equation
Indonesia Korea Philippines Taiwan Thailand
1 00002(1305)
00006(1879)
00002(0539)
00011∗(2351)
00039∗(4036)
2 00073∗(3839)
00050∗(4545)
00007∗(2698)
00008∗(3633)
00027∗(4632)
3 00009∗(2320)
00017∗(3299)
00002(0922)
00033∗(5059)
00008∗(3526)
1 00130∗(5148)
00220∗(4986)
00162∗(4693)
00201∗(5255)
00304∗(7221)
2 00624∗(7580)
00968∗(7845)
00866∗(7826)
01231∗(9976)
01810∗(8144)
1 09871∗(4238)
09776∗(2608)
09842∗(3298)
09781∗(2975)
09614∗(2152)
2 09249∗(1005)
08923∗(6931)
09141∗(9244)
08857∗(9525)
08320∗(4732)
− log 382157 342080 254766 199832 251825
Notes: i) -values are reported in parentheses. ii) * indicates statistical significance at the 5% level.
26

Table 5. Estimation Results of the STCC-MGARCH Model
11 = 1 + 121−1 + 111−1
22 = 2 + 222−1 + 222−1
12 = () (1122)12
() = [1− (;θ)] + (;θ)
(;θ) =1
1 + exp [− ( − )] θ =[ ]
0
Variance Equation
Indonesia Korea Philippines Taiwan Thai
1 00046∗(2380)
00046∗(2381)
00047∗(2421)
00052∗(2550)
00054∗(2479)
2 00066∗(3711)
00056∗(4747)
00005∗(2486)
00005∗(3417)
00037∗(4949)
1 00319∗(4065)
00307∗(4115)
00330∗(4255)
00345∗(4316)
00320∗(4225)
2 00622∗(1623)
01068∗(8346)
00715∗(7626)
00892∗(8750)
02222∗(8519)
1 09582∗(8066)
09596∗(9347)
09569∗(9140)
09544∗(8824)
09565∗(8725)
2 09262∗(6523)
08813∗(6726)
09290∗(1068)
09137∗(1083)
07961∗(4092)
Correlation Coefficient Equation
Indonesia Korea Philippines Taiwan Thai
−00757(−1784)
−01597∗(−4626)
−01239(−1889)
−00230(−0679)
00330(0944)
02258∗(5928)
03999∗(6443)
01303∗(4291)
03336∗(1271)
05842∗(3057)
19201∗(2143)
18575∗(2112)
30048∗(2537)
10578∗(1989)
90460∗(2075)
06021∗(1021)
06442∗(5820)
06593∗(9127)
06555∗(2659)
05946∗(5031)
102306 022307 040907 032707 091906
− log 379679 338518 251735 196318 249799
Notes: i) -values are reported in parentheses. ii) * indicates statistical significance at the 5% level.
iii) denotes the historical date that corresponds to .
27

Table 6. Estimation Results of the DCCX-MGARCH Model
11 = 1 + 121−1 + 111−1
22 = 2 + 222−1 + 222−1
12 = (x) (1122)12
(x) = 2
⎡⎣ exp³θ0x
´1 + exp
³θ0x
´⎤⎦− 1 θ = [1 2 · · · ]0
Variance Equation
Indonesia Korea Philippines Taiwan Thai
1 00046∗(2353)
00055∗(2715)
00047∗(2537)
00052∗(2526)
00058∗(2591)
2 00065∗(3729)
00060∗(4864)
00005∗(2459)
00005∗(3370)
00034∗(4918)
1 00316∗(4011)
00354∗(4484)
00335∗(4384)
00344∗(4252)
00364∗(4355)
2 00617∗(8124)
01112∗(8342)
00717∗(7639)
00886∗(8712)
02184∗(8567)
1 09583∗(8863)
09529∗(9010)
09563∗(9424)
09548∗(8763)
09516∗(8229)
2 09268∗(1096)
08758∗(6428)
09287∗(1062)
09144∗(1091)
07997∗(4212)
Correlation Coefficient Equation
Indonesia Korea Philippines Taiwan Thai
1 −00479(−0879)
−02136∗(−1319)
−00046(−0512)
−02824∗(−3322)
−01375∗(−2011)
2 −02078∗(−3210)
01126(0297)
01960(1105)
−01915(−0670)
−07701∗(−4105)
3 −03059∗(−4393)
−02479∗(−6580)
−02837∗(−4795)
−01290∗(−2350)
−04800∗(−5798)
4 42741∗(3050)
11326∗(8409)
09949(1451)
12063∗(4748)
10944∗(7001)
− log 379352 340748 251808 196253 252120
Note: i) x1, x2, x3, x4denote the sovereign CDS premium, the carry-to-risk ratio, the TED spread,
and the trade share with Japan, respectively. ii) -values are reported in parentheses. iii) * indicates
statistical significance at the 5% level.
28

Table 7. Estimation Results of the DCCX-MGARCH Model: A Subsample Analysis
11 = 1 + 121−1 + 111−1
22 = 2 + 222−1 + 222−1
12 = (x) (1122)12
(x) = 2
⎡⎣ exp³θ0x
´1 + exp
³θ0x
´⎤⎦− 1 θ = [1 2 · · · ]0
Variance Equation
Indonesia Korea Philippines Taiwan Thai
1 00047∗(2300)
00045∗(2409)
00039∗(2058)
00047∗(2300)
00034(1868)
2 00010∗(2658)
00069∗(4360)
00007(1668)
00010∗(2658)
00016∗(2559)
1 00444∗(4281)
00444∗(4461)
00396∗(4191)
00444∗(4281)
00414∗(4134)
2 00722∗(5266)
01313∗(6947)
00515∗(4667)
00722∗(5266)
02056∗(6258)
1 09477∗(8058)
09480∗(8519)
09534∗(8617)
09477∗(8058)
09537∗(8433)
2 09224∗(6924)
08559∗(4694)
09459∗(8377)
09224∗(6924)
08294∗(3678)
Correlation Coefficient Equation
Indonesia Korea Philippines Taiwan Thai
1 −02158∗(−2896)
−02044∗(−2623)
−00001(−0000)
−02158∗(−2896)
−04276∗(−4003)
2 −00521(−0315)
01807(0201)
04664(0828)
−00521(−0315)
−16780∗(−4971)
3 −01786∗(−2833)
−02422∗(−4578)
−02373∗(−2446)
−01786∗(−2833)
−04426∗(−5205)
4 99778∗(5727)
10547(1492)
00001(0001)
99778∗(5727)
21118∗(6263)
− log 241316 340748 183319 140878 178661
Note: i) x1, x2, x3, x4denote the sovereign CDS premium, the carry-to-risk ratio, the TED spread,
and the trade share with Japan, respectively. ii) -values are reported in parentheses. iii) * indicates
statistical significance at the 5% level. iv) Observations span from February 1, 2005 to December 30,
2009..
29

Figure 1. Exchange Rates
Note: i) For the first column graphs, the solid line is the national currency price of the US dollar
and the dashed line is the Yen/Dollar exchange rate. ii) The second column graphs are the national
currency price of the Japanese Yen. iii) All exchange rates are normalized to 100 in January 2000.
30
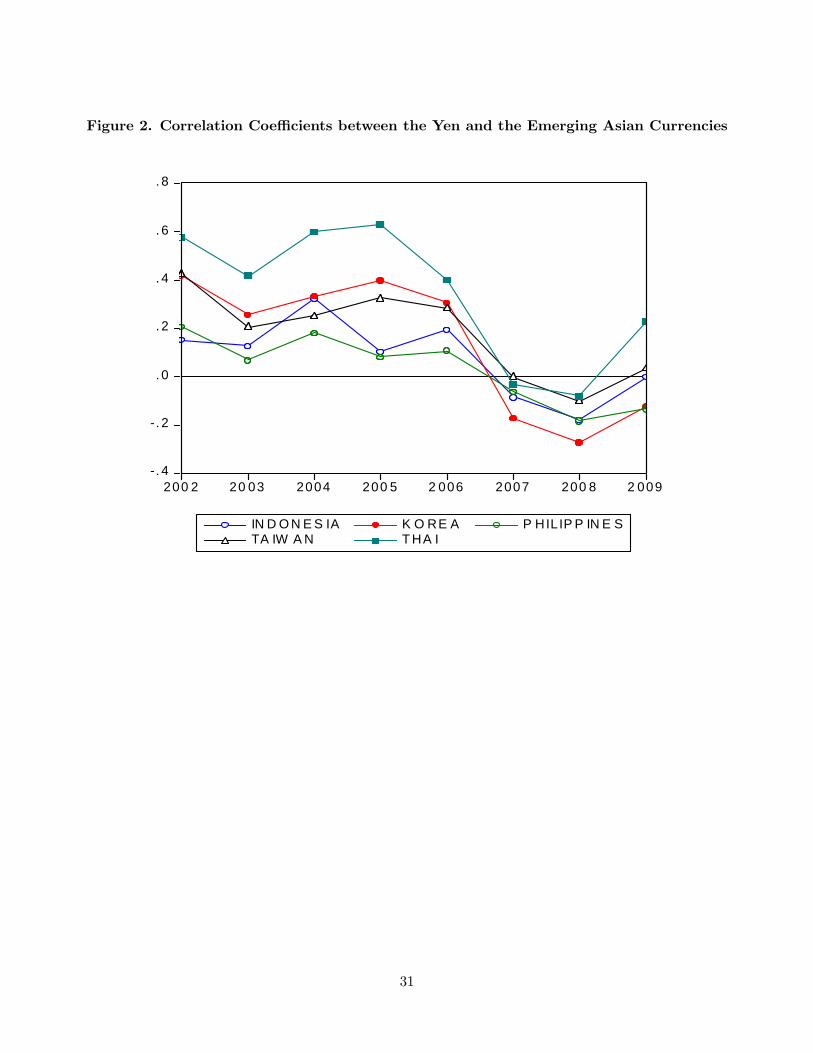
Figure 2. Correlation Coefficients between the Yen and the Emerging Asian Currencies
-. 4
-. 2
. 0
. 2
. 4
. 6
. 8
200 2 20 03 2004 200 5 2 006 2007 200 8 2 009
IN D O N E S IA K O RE A P HILIP P IN E STA IW A N T HA I
31

Figure 3. The PANIC Estimates
Note: i) The optimal number of latent factors was 1 by Bai and Ng’s (2002) criteria. ii) Following
Bai and Ng (2004), we use the method of principal components to the standardized first-differenced
variables, then recumulate to obtain the common and idiosyncratic components. iii) The common
component in panel (b) denotes the product of common factor and the factor loading coefficient of
Japan.
32

Figure 4. Explanatory Variables
-.2
.0
.2
.4
.6
.8
2002.01.02 2004.05.20 2006.10.12 2009.03.04
the Carry-to-Risk Ratio
0
1
2
3
4
5
2002.01.02 2004.05.20 2006.10.12 2009.03.04
TED
CDS Premium
2
3
4
5
6
7
8
2002.01.02 2004.05.20 2006.10.12 2009.03.04
Indones ia K orea P hilippinesTaiw an Thai
Trade Share with Japan
.08
.10
.12
.14
.16
.18
.20
.22
2 00 2 2 0 03 2 004 200 5 20 0 6 2 00 7 2 00 8 2 00 9
Ind on e s ia Ko re a Ph ilip p in esTa iw a n Th a i
33

Figure 5. DCC Estimates
-.3
-.2
-.1
.0
.1
.2
.3
2002.01.02 2004.05.20 2006.10.12 2009.03.04
Indonesia
-.2
-.1
.0
.1
.2
.3
.4
.5
2002.01.02 2004.05.20 2006.10.12 2009.03.04
Korea
-.3
-.2
-.1
.0
.1
.2
2002.01.02 2004.05.20 2006.10.12 2009.03.04
Philippines
-.1
.0
.1
.2
.3
.4
.5
2002.01.02 2004.05.20 2006.10.12 2009.03.04
Taiwan
-.1
.0
.1
.2
.3
.4
.5
.6
2002.01.02 2004.05.20 2006.10.12 2009.03.04
Thai
34

Figure 6. Conditional Correlations from the GARCH-BEKK and the STCC-MGARCH
- .6
- .4
- .2
.0
.2
.4
.6
2002.01.02 2004.05.20 2006.10.12 2009.03.04
DCC_IndonesiaSTCC_Indonesia
- .6
- .4
- .2
.0
.2
.4
.6
.8
2002.01.02 2004.05.20 2006.10.12 2009.03.04
DCC_KoreaSTCC_Korea
- .6
- .4
- .2
.0
.2
.4
.6
2002.01.02 2004.05.20 2006.10.12 2009.03.04
DCC_PhilippinesSTCC_Philippines
- .6
- .4
- .2
.0
.2
.4
.6
.8
2002.01.02 2004.05.20 2006.10.12 2009.03.04
DCC_TaiwanSTCC_Taiwan
-0.6
-0.4
-0.2
0.0
0.2
0.4
0.6
0.8
1.0
2002.01.02 2004.05.20 2006.10.12 2009.03.04
DCC_ThaiSTCC_Thai
Note:
35
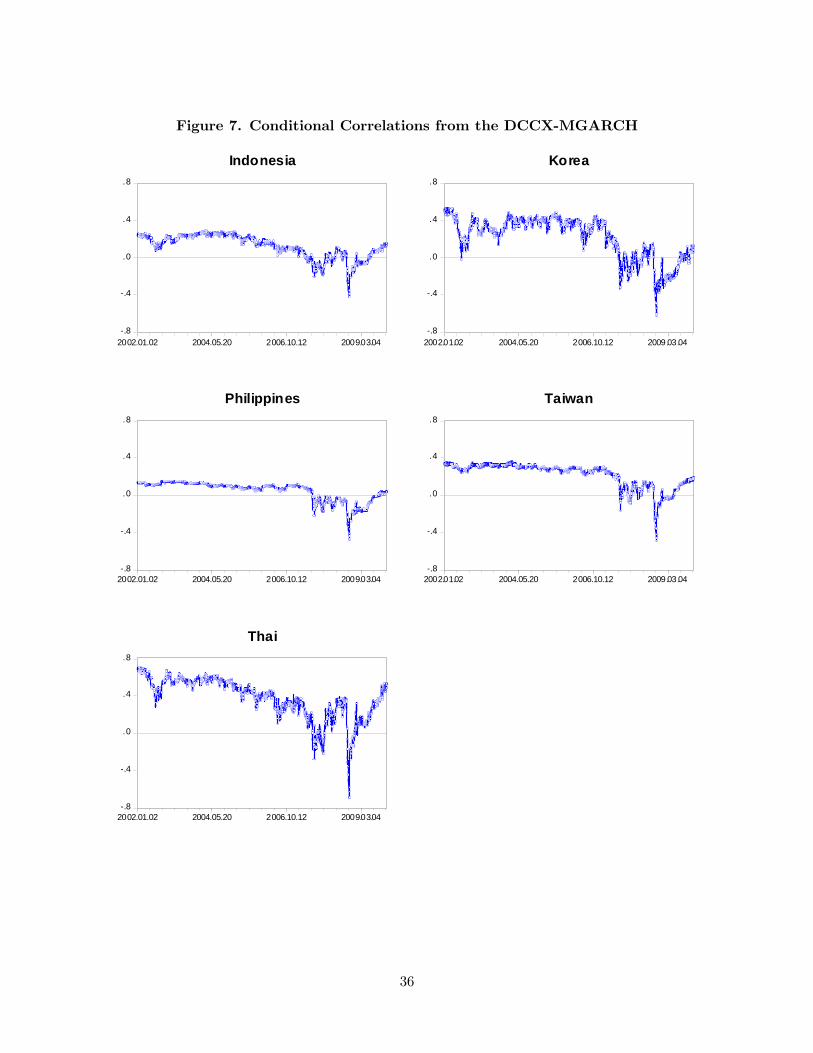
Figure 7. Conditional Correlations from the DCCX-MGARCH
-.8
-.4
.0
.4
.8
2002.01.02 2004.05.20 2006.10.12 2009.03.04
Indonesia
-.8
-.4
.0
.4
.8
2002.01.02 2004.05.20 2006.10.12 2009.03.04
Korea
-.8
-.4
.0
.4
.8
2002.01.02 2004.05.20 2006.10.12 2009.03.04
Philippines
-.8
-.4
.0
.4
.8
2002.01.02 2004.05.20 2006.10.12 2009.03.04
Taiwan
-.8
-.4
.0
.4
.8
2002.01.02 2004.05.20 2006.10.12 2009.03.04
Thai
36
Copyright © 2022 FDOKUMEN