Ontologies et relations spatiales dans une image: application aux images de lettrines
Upload
univ-paris5Category
view
4download
0
Reasoning with spatial relations over high-content images
Nicolas Lomenie
Abstract— Spatial relation and configuration modeling issuesare gaining momentum in image analysis and pattern recog-nition fields in the perspective of mining high-content imagesor large scale image databases in a more expressive way thanpurely statistically. Continuing our previous efforts whereby wedeveloped specific efficient morphological tools performing onmesh representation like Delaunay triangulations, we proposeto formalize spatial relation modeling techniques dedicated tounorganized point sets. We provide an original mesh latticeframework more convenient for structural representations oflarge amount of image data by the means of interest points setsand their morphological analysis. The set of designed numericaloperators is based on a specific dilation operator making itpossible the representation of concepts like “between” or “leftof” over sparse representations such as graphs. Then, for thesake of illustration and discussion, we apply these new tools tohigh-level queries in microscopic histo-pathological images andstructural analysis of macroscopic images.
I. I NTRODUCTION
Visual cognition or cognitive vision is a long-term goalaiming at putting together computer vision analysis toolsand artificial intelligence reasoning methodologies in orderto design robust systems for smart vision-based interfaces.As a first step towards this ambitious integrated researchpurpose, image understanding modules providing high-levelimage descriptions is a cornerstone, at least for the final userto seamlessly interact with visual data.
The major issue can be referred as the semantic gapfilling that is the coincidence between low-level featuresgiven by the signal and the high-level concepts used todescribe and handle images at a semantic level. Few works[1], [2] have dealt with such an issue in a sound theoreticalway. For instance, in the field of spatial relation modeling,[7], [4] made a great extent of work for radiometric imagemodeling defined over regular grids, that is the mainstreamway in which visual data are handled. In this work, wemade an attempt to extend these seminal ideas to visual datarepresented over sparse representations such as interest pointsets. In particular, Delaunay triangulation representations arefavored for the neighborhood embedding of these visual datadefined over irregular grids (see Fig. 1).
These mathematically well defined tools make it possibleto consider enhanced visual systems with enabled reasoningcapabilities. Not only they provide relevant algorithms toexplore large images for instance in a more formal way as arobot would be expected to do by anchoring spatial relationconcepts into the signal representation either as an image or apoint set visual data. In addition, they open new opportunities
Nicolas Lomenie is with the Department of Computer Sciences, Univer-sity of Paris Descartes and with CNRS - IPAL, I2R, National University ofSingapore; email: [email protected]
(a) (b)
Fig. 1. Different representations of the same object: (a) gray intensityimageI and (b) geometric meshM
to perform high-level queries over large image databasesfeaturing specific spatial organization requirements.
Last, coming with the challenging great amount of visualdata to process due to dramatic progress in both resolutionand speed of the acquisition devices, satellite image aswell as medical image end-users urge for more interactive,qualitative ways of interaction with the visual data they use toassess or diagnose daily critical situations. Even at the levelof more long-term biological research, smart interactionswith visual data such as microscopic information turn tobecome practical requirements due to the high-content -partly related to the size - of these images (see below Fig.2 and Table I for an illustration of the amount of data fora single patient biopsy in histopathological imaging). Ofcourse, satellite imaging with new resolution up to 0.7 cm apixel over 24000x24000 pixel size images will have to facethe same kind of issues in the near future.
TABLE I
HISTOPATHOLOGICAL IMAGE DATA
Size (pixels) Size (bytes)x1 1018x768 3.05 Mox10 3664x2763 39.54 Mox20 14657x11054 632.48 Mox40 58630x44216 7.77 Go
As image size scales up exponentially according to theprogress in the field of optics, interactive time applicationscan not use mainstream image analysis algorithms for com-putational complexity issues. Working on sparse represen-tations such as interest point sets can be a solution to thiskind of real time issues by focusing on informative parts onthe image. For instance, working on points of interest in theimage of Fig. 2(a) scales down the size of visual data from7.77 Go up to 1.5 Go. In that perspective, the adaptationof existing techniques to point set representations and soon to graph related representation should be a prospectivefield of research [5], [10]. Section II presents the theoretical

(a)
(b)
Fig. 2. (a) Whole Slide Image at resolution x1 (b) Sample image atresolution x40 out of over 2000 tiling the histopathological image
framework of the proposed operators including mathematicalmorphology and its adaptation to graph-based representa-tions. Section III illustrates the relevance of these toolsforimage understanding and visual cognition modeling. Last,Section IV draws research perspectives both from practicaland theoretical standpoints.
II. M ORPHOLOGICAL TOOLBOX
Image analysis and computer vision in general are stillconsidered as brittle technologies [6]. However, impressiveachievements have been reached so far with a small amountof commercial product providing robust interfaces. Even therecently released Google Goggle tool performs quite well aslong as the end-user does not go beyond strict limitations ofusage such as natural object recognition. This is partly dueto these tools relying on statistical representations and sub-optimal optimization processes. Yet in a non-closed worldsuch as the Internet, such a framework needs endless andcontinuous learning procedures to proceed in a steady way.At the opposite, structural approaches are less dependent to
the closed-world assumption to provide stable and robusttools to interact with visual data. In particular, mathematicalmorphology is one of the only sound original theory thatemerged from the image analysis community. As so, itconstitutes a natural framework to put down the basis ofa visual cognitive prospective theory.
A. Mathematical morphology
Mathematical morphology relies on the definition of rele-vant lattice structures with an order relation while statisticalapproaches mainly remain on vectorial space structures.By nature, its operators perform highly non linear typeof filtering keen at delivering structural and morphologicalinformation and analysis about the visual entities in theimages. Theoretically, the so-called structuring elementis atthe core of these flexible structural analysis capabilitieseventhough in practice most of the processing lines use symmetriccentered structuring elements such as open ball of a fixedradius.
Besides this, once a basic adjunction operator such asan erosion is defined over the specific lattice structureequipped with an involution operator, a raft of sophisticatedmathematically sound operators can be easily built uponby composition within what is known as the pyramid ofmorphological operators. From that perspective, the usageofsuch a toolbox can be tailored to adapt to specific situationswithout a lot of additional theoretical developments. Onceagain, that makes mathematical morphology a suitable theoryto lay down first fundamental steps towards a cognitive visiontheory.
B. Adaptation to point sets
Let us consider now the case of an unorganized point setS in ℜ2. Let del(S) be the Delaunay triangulation of thispoint set defining an embedded neighborhood structure.
Lattice structures.M(S) is the set of meshes on the Delaunay triangulation
of S del(S), i.e., the set of mappings from the trianglesT indel(S) to φT values.T stands for any triangle indel. A meshM ∈ M(S) is defined by{(T, φ)}T∈del(S) or equivalentlyby a mappingφ : T ∈ del(S) → [0, 1].
We define one complete lattice structure for a point setincluding an order relation, within the functional theoryframe, calledL = (M(S),≤), where the partial ordering≤ is defined by:∀M1 and M2 ∈ M(S), M1 ≤ M2 ⇐⇒∀T ∈ del(S), φ1
T ≤ φ2T
Point set and mesh binarization.Let us also define thebinarization operatorbinθ as follows :
∀M ∈ M(S),
binθ(M) = {T ∈ del(S) , 1 if φT > θ, 0 elsewhere} (1)
.Point set and mesh morphological operators.
The rank filtering operators need the computation of twoadditional valueseT anddT for each triangleT , defined by:
eT = min{φT ′ |T ′∈ν(T )}
dT = max{φT ′ |T ′∈ν(T )} (2)
.The neighborhoodν(T ), playing the key role of a struc-
turing entity, is the set of all trianglesT of del(S) sharingat least one vertex with the triangleT , that is:
ν(T ) = {T ′ ∈ Del|T ′ ∩ T 6= ∅} (3)
Then, in the lattice framework, we define two operatorse(M) andd(M) on the complete latticeL by :
∀M ∈ M(S),
e(M) = {T ∈ Del, eT} and d(M) = {T ∈ Del, dT} (4)
with eT anddT defined in Eq. 2.We proved in [3] thate(M) and d(M) are respectively
erosion and dilation morphological operators onL. We candefine various operators now like openingo(M) end closingc(M):
∀M ∈ M(S)),
o(M) = d ◦ e(M) and c(M) = e ◦ d(M) (5)
and benefits of all the inherited operators based on theerosion and the involution operatorsc:
∀M ∈ M(Del(S)), M c = {T ∈ Del, 1 − φT } (6)
Thus, as expected,
∀M ∈ M(Del(S)), e(M) = d(M c)c (7)
C. Modeling spatial relations
1) The directional dilation:The whole set of spatial re-lation concepts modeling is based on the directional dilationoperator. Letα be the directional angle with regard to thehorizontal axis of the representation plane. For any meshM ∈ L, the definition of the neighborhoodν(T ) of a meshtriangleT acts as a directional structural element of directionα:
να(T ) = {T ′ ∈ Del|T ′∩T 6= ∅ and 6 (T, T ′) < α+ ǫ} (8)
with6 (T, T ′) = 6 (
−−−−→BT BT ′ , (O−→x )) (9)
whereBT is the barycenter of the triangleT .Eq. 8 defines an anisotropic neighborhood referred as
να, to be put in parallel with the isotropic neighborhooddefinition νiso of equation 3, whereα stand for the anglewith the horizontal axis(O−→x ) andǫ is the width or toleranceangle of the structuring element.
We can define the directional dilation as:
∀M ∈ M(S), dα,ǫ(M) = dνα(M) (10)
wheredneighborood stands for the computation ofdT valuesover a specific system ofneighborhood. When ǫ is notwritten, ǫ = π/8.0 anddα,ǫ = dα.
Qualitative concepts like spatial relations depend both onthe context and on the reference object. A fuzzy versionof for all the morphological operators acting on meshesfollowing the algorithmic procedure in Alg. 1 can delivermore flexible results for reasoning purposes. From this fun-damental spatial relation, by composition, we can define abunch of qualitative spatial relation in a quantitative waysuchas “between” as briefly illustrated in the following section.
Algorithm 1 Fuzzy Dilationdf
INPUT: a meshM defined over the latticeLfor all i = 0 to N + 1 do
for all T ∈ del(S) dodT = 0;dT = max{dT , max
T ′∈ν(T ){(φT , φT ′ + (1 − i/N) − 1}};
end forfor all T ∈ del(S) do
φT = dT ;end for
end forOUTPUT a resulting meshdf (M)
2) The relation “South East”: Directional relations cannow be defined in a crisp or a fuzzy mode over any pointset. For instance, the absolute directional spatial relation like“south east of” is defined as follows:
SouthEastdil(M1) = dn7π/4(M1)
with n/dn7π/4(M1) = dn+1
7π/4(M1) (11)
wheredn stands ford◦d◦...◦d n times. TheSouthEastf
fuzzy operator is directly obtained by combining the defini-tions 10 and 11 associated with the directional neighborhoodνα into the algorithmic procedure used to computedf . Inthe following Sec. III, we extent both the scope of spatialrelations and of use cases for microscopic as well formacroscopic images.
III. R ESULTS AND APPLICATIONS
In this section, we illustrate the efficiency of these toolseither to perform automatic analysis or to interact in a semi-automatic way with the visual data in the perspective of avisual cognition paradigm. We achieved structural analysisresults over a variety of images (macroscopic/microscopic,natural/document) to assess the effectiveness of the proposedtoolbox.
A. Structural analysis
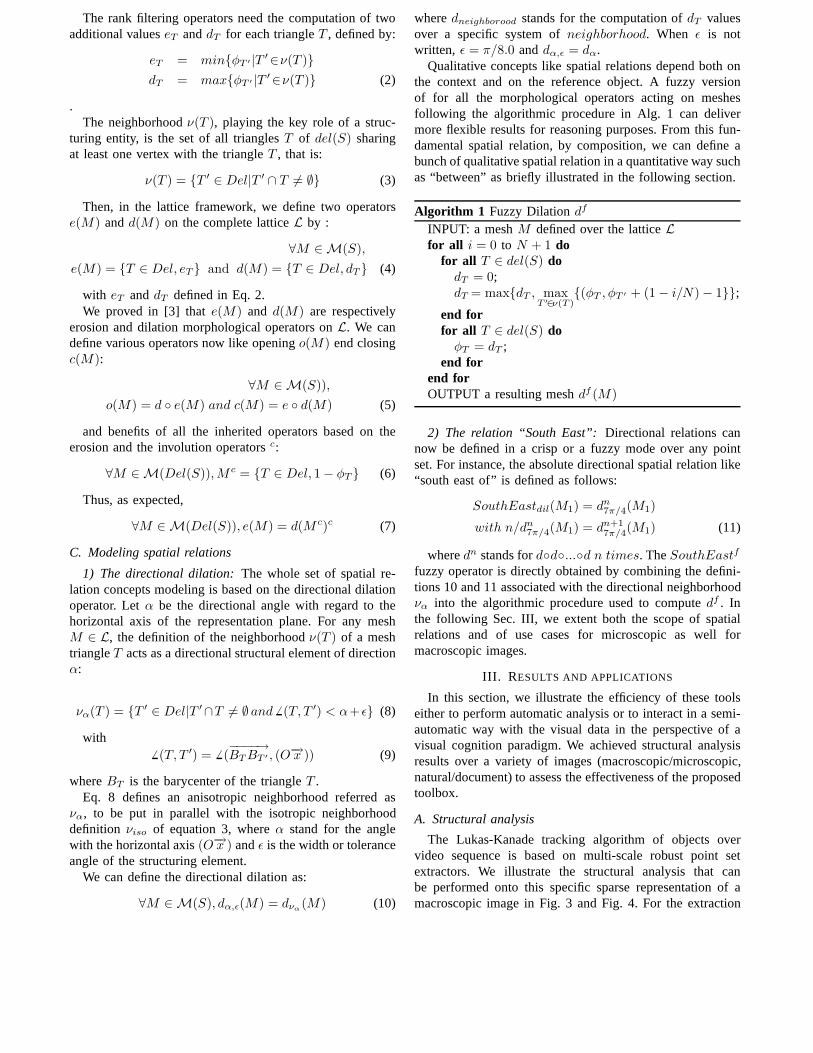
The Lukas-Kanade tracking algorithm of objects overvideo sequence is based on multi-scale robust point setextractors. We illustrate the structural analysis that canbe performed onto this specific sparse representation of amacroscopic image in Fig. 3 and Fig. 4. For the extraction

of the starting sub-mesh of interest, we use the concept ofα − objects [9], [8], [3]. The mappingφ associates to eachtriangleT a φT value corresponding to intrinsic properties ofthe triangles. For Fig. 3(b),φT corresponds to a measure ofthe size of the triangleT defined by its three vertices A,B,C:φT = max(AB, AC, BC) . For Fig. 4(a),φT correspondsto a measure of the shape of the triangle:φT = 1/ρT ,with ρT the radius of the circumscribed sphere toT . Thestarting sub-mesh corresponds to the simplicial complexC(S) = T ∈ Del(S), φT . Then, theθ threshold is chosen asa median value:θopt = 0.5∗medianT∈Del(φT ). The startingsub-mesh of interest isM = binθ(C(S). Then, variousmorphological operators based on the basic erosion (anddilation) operator can derive relevant structural outcomes, inparticular outlining face features such as the eyes and themouth regions (see Fig. 3(d) and (f)). Note that the operatorswork as well on triangles as on edges in a contour mode [3].The mouth region and eyes region are obtained in Fig. 3(f)as open-like mesh filtered:
MouthAndEyes(M) = d ◦ e ◦ e(C) (12)
Fig. 4 illustrates an another result if we choose the shapecriterion for φT .
(a) (b)
Fig. 4. (a) Thresholding with the Shape CriteriaMshape (b) Order 5opening-like filtering ofMshape: d ◦ e5(C(S)
B. Document analysis
In [14], the logical structure of a document image withirregular layout - like the location of title and author regions- is determined by the way of a Delaunay triangulation-basedmethod. This method is very robust and can also establishthe major threshold values, such as the line space and theinter-character space, automatically, from a document imageitself. Some features are measured from different classi-fied Delaunay triangle groups in the Delaunay triangulationmodel. These feature measures can be improved by the useof morphological mesh operators to clean out the shape ofthe various regions in the document.
Based on the mass centers of the connected components,Fig. 5 presents such ideas. The gray area corresponds tothe dilated mesh for anθ threshold of θopt = 0.75 ∗medianT∈Del(φ
sizeT ) and extracts the specific text area in
the document not related to the title areas.
(a) (b)
Fig. 5. (a)Mass centers of the connected components, (b) thegray areacorresponds to the dilated of the meshbinθ(C(S))
C. High-level spatial relation queries
In histopathological images, the need to explore high-content, large images to draw a diagnosis makes it relevantthe development of smart interfaces to perform high-levelsemantic queries involving spatial relations [12]. The diag-nosis of breast cancer for instance is based on the analysisof spatial distributions of cells and lumina, which are themammal ducts to be short. The answer to the query “Showme the cells around the lumina” or the action “Digitalizethe cell images between the lumina1 and the lumina2” inthe case of a motorized microscope are of major importanceto enhance the diagnosis process and to make it possiblethe digitalized exploration of such data. As for now, theφT = 1 values will be displayed white triangles and theφT = 0 values will be displayed as transparent triangles.Fig. 6 illustrates two such biological lumina under the formof two meshesM1 andM2 (Fig. 6 (b)).
(a) (b)
Fig. 6. (a) A small 1024x1024 pixel size images out of a Whole SlideImage (b) Two sub-meshes of interestM1 and M2 corresponding to twobiological lumina objects.
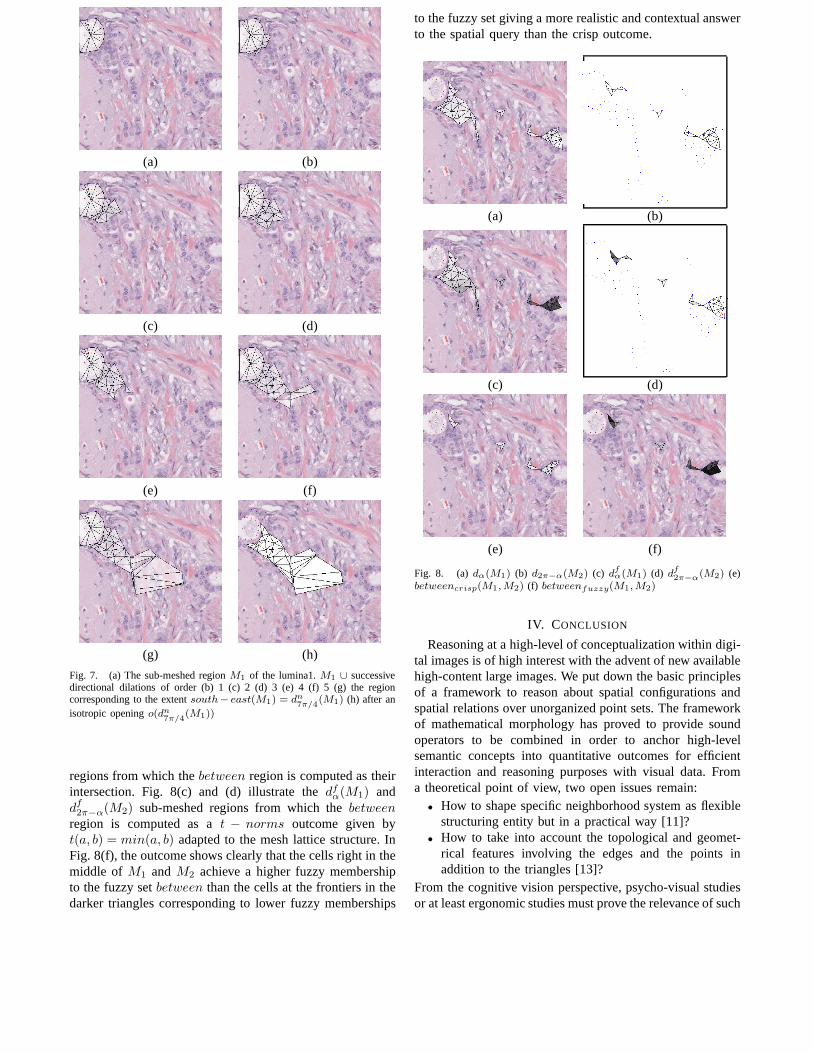
Fig. 7 illustrates the successive directional dilations oftherelation SouthEast(M1) until stabilization yielding to thesouth-east crisp region of the luminaM1. In Fig. 7(h) afiltered version by an final isotropic opening is provided:oνiso
(dn7π/4(M1)).
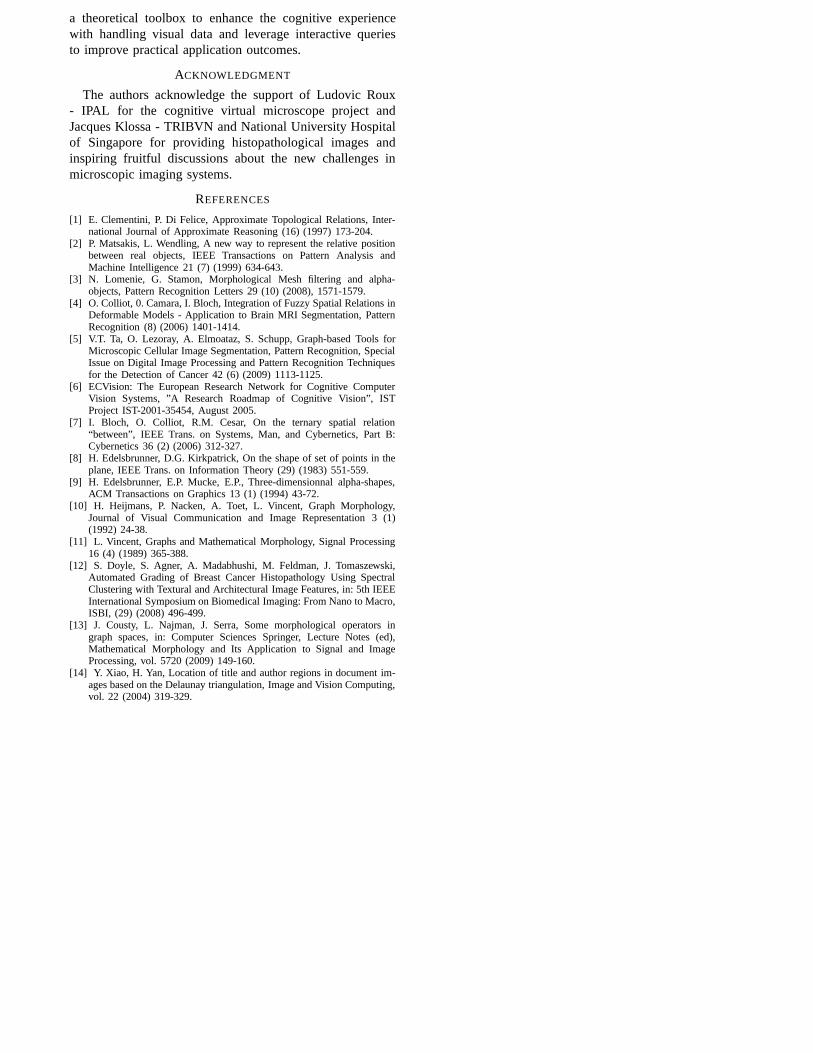
Fig. 8 illustrates thebetween relation betweenM1 andM2 in a crisp definition (Fig. 8(e)) and in a fuzzy definition(Fig. 8(f)). Let α be the angle between thex axis and theline joining the centers of gravity ofM1 andM2. Fig. 8(a)and (b) illustrate thedn
α(M1) and dn2π−α(M2) sub-meshed
(a) (b)
(c) (d)
(e) (f)
Fig. 3. (a) Kanade-Lukas point set extraction (b) Thresholding with the Size CriteriaMsize. In black, (c) order 1 erosion-like filtering ofMsize, (d)order 2 erosion-like filtering ofMsize, (e) order 3 erosion-like filtering ofMsize, (f) order 2 opening-like filtering ofMsize
(a) (b)
(c) (d)
(e) (f)
(g) (h)
Fig. 7. (a) The sub-meshed regionM1 of the lumina1.M1 ∪ successivedirectional dilations of order (b) 1 (c) 2 (d) 3 (e) 4 (f) 5 (g) the regioncorresponding to the extentsouth− east(M1) = dn
7π/4(M1) (h) after an
isotropic openingo(dn7π/4
(M1))
regions from which thebetween region is computed as theirintersection. Fig. 8(c) and (d) illustrate thedf
α(M1) anddf2π−α(M2) sub-meshed regions from which thebetween
region is computed as at − norms outcome given byt(a, b) = min(a, b) adapted to the mesh lattice structure. InFig. 8(f), the outcome shows clearly that the cells right in themiddle of M1 and M2 achieve a higher fuzzy membershipto the fuzzy setbetween than the cells at the frontiers in thedarker triangles corresponding to lower fuzzy memberships
to the fuzzy set giving a more realistic and contextual answerto the spatial query than the crisp outcome.
(a) (b)
(c) (d)
(e) (f)
Fig. 8. (a)dα(M1) (b) d2π−α(M2) (c) dfα(M1) (d) d
f2π−α(M2) (e)
betweencrisp(M1, M2) (f) betweenfuzzy(M1, M2)
IV. CONCLUSION
Reasoning at a high-level of conceptualization within digi-tal images is of high interest with the advent of new availablehigh-content large images. We put down the basic principlesof a framework to reason about spatial configurations andspatial relations over unorganized point sets. The frameworkof mathematical morphology has proved to provide soundoperators to be combined in order to anchor high-levelsemantic concepts into quantitative outcomes for efficientinteraction and reasoning purposes with visual data. Froma theoretical point of view, two open issues remain:
• How to shape specific neighborhood system as flexiblestructuring entity but in a practical way [11]?
• How to take into account the topological and geomet-rical features involving the edges and the points inaddition to the triangles [13]?
From the cognitive vision perspective, psycho-visual studiesor at least ergonomic studies must prove the relevance of such
a theoretical toolbox to enhance the cognitive experiencewith handling visual data and leverage interactive queriesto improve practical application outcomes.
ACKNOWLEDGMENT
The authors acknowledge the support of Ludovic Roux- IPAL for the cognitive virtual microscope project andJacques Klossa - TRIBVN and National University Hospitalof Singapore for providing histopathological images andinspiring fruitful discussions about the new challenges inmicroscopic imaging systems.
REFERENCES
[1] E. Clementini, P. Di Felice, Approximate Topological Relations, Inter-national Journal of Approximate Reasoning (16) (1997) 173-204.
[2] P. Matsakis, L. Wendling, A new way to represent the relative positionbetween real objects, IEEE Transactions on Pattern Analysis andMachine Intelligence 21 (7) (1999) 634-643.
[3] N. Lomenie, G. Stamon, Morphological Mesh filtering and alpha-objects, Pattern Recognition Letters 29 (10) (2008), 1571-1579.
[4] O. Colliot, 0. Camara, I. Bloch, Integration of Fuzzy Spatial Relations inDeformable Models - Application to Brain MRI Segmentation,PatternRecognition (8) (2006) 1401-1414.
[5] V.T. Ta, O. Lezoray, A. Elmoataz, S. Schupp, Graph-basedTools forMicroscopic Cellular Image Segmentation, Pattern Recognition, SpecialIssue on Digital Image Processing and Pattern Recognition Techniquesfor the Detection of Cancer 42 (6) (2009) 1113-1125.
[6] ECVision: The European Research Network for Cognitive ComputerVision Systems, ”A Research Roadmap of Cognitive Vision”, ISTProject IST-2001-35454, August 2005.
[7] I. Bloch, O. Colliot, R.M. Cesar, On the ternary spatial relation“between”, IEEE Trans. on Systems, Man, and Cybernetics, Part B:Cybernetics 36 (2) (2006) 312-327.
[8] H. Edelsbrunner, D.G. Kirkpatrick, On the shape of set ofpoints in theplane, IEEE Trans. on Information Theory (29) (1983) 551-559.
[9] H. Edelsbrunner, E.P. Mucke, E.P., Three-dimensionnalalpha-shapes,ACM Transactions on Graphics 13 (1) (1994) 43-72.
[10] H. Heijmans, P. Nacken, A. Toet, L. Vincent, Graph Morphology,Journal of Visual Communication and Image Representation 3(1)(1992) 24-38.
[11] L. Vincent, Graphs and Mathematical Morphology, Signal Processing16 (4) (1989) 365-388.
[12] S. Doyle, S. Agner, A. Madabhushi, M. Feldman, J. Tomaszewski,Automated Grading of Breast Cancer Histopathology Using SpectralClustering with Textural and Architectural Image Features, in: 5th IEEEInternational Symposium on Biomedical Imaging: From Nano to Macro,ISBI, (29) (2008) 496-499.
[13] J. Cousty, L. Najman, J. Serra, Some morphological operators ingraph spaces, in: Computer Sciences Springer, Lecture Notes (ed),Mathematical Morphology and Its Application to Signal and ImageProcessing, vol. 5720 (2009) 149-160.
[14] Y. Xiao, H. Yan, Location of title and author regions in document im-ages based on the Delaunay triangulation, Image and Vision Computing,vol. 22 (2004) 319-329.
Copyright © 2022 FDOKUMEN