REASON-FOR-ABSENCE-OF-EMPLOYEES.pdf - Commerce ...
57
1 1.1 INTRODUCTION TO THE STUDY It refers to workers absence from their regular task when he is normally schedule to work. The according to Webster’s dictionary “Absenteeism is the practice or habit of being an absentee and an absentee is one who habitually stays away from work.” According to Labor Bureau of Shimla: Absenteeism is defined as the total man shifts lost because of absence as percentage of total number of man shifts scheduled to work In other words, it signifies the absence of an employee from work when he is scheduled to be at work. Any employee may stay away from work if he has taken leave to which he is entitled or on ground of sickness or some accident or without any previous sanction of leave. Thus absence may be authorised or unauthorised, willful or caused by circumstances beyond one’s control. Maybe even worse than absenteeism, it is obvious that people such as malingerers and those unwilling to play their part in the workplace can also have a decidedly negative impact. Such team members need individual attention from front line supervisors and management. Indeed, as prevention is better than cure, where such a problem occurs, it is always important to review recruitment procedures to identify how such individuals came to be employed in the first place. For any business owner or manager, to cure excessive absenteeism, it is essential to find and then eliminate the causes of discontent among team members. If they find their supervisor or job unpleasant -really unpleasant - they look for legitimate excuses to stay home and find them with things such as upset stomachs or splitting headaches. Any effective absentee control program has to locate the causes of discontent and modify those causes or eliminate them entirely. In other words, if we deal with the real reasons team members stay home it can become unnecessary for them to stay away. Any investigation into absenteeism needs to look at the real reasons for it. Sometimes team members call in sick when they really do not want to go to work. They would not call you up and say, “I’m not coming in today because my supervisor abuses me. Or,
-
Upload
khangminh22 -
Category
Documents
-
view
0 -
download
0
Transcript of REASON-FOR-ABSENCE-OF-EMPLOYEES.pdf - Commerce ...

1
1.1 INTRODUCTION TO THE STUDY
It refers to workers absence from their regular task when he is normally schedule to work.
The according to Webster’s dictionary
“Absenteeism is the practice or habit of being an absentee and an absentee is one who
habitually stays away from work.”
According to Labor Bureau of Shimla: Absenteeism is defined as the total man shifts
lost because of absence as percentage of total number of man shifts scheduled to work
In other words, it signifies the absence of an employee from work when he is scheduled
to be at work. Any employee may stay away from work if he has taken leave to which he
is entitled or on ground of sickness or some accident or without any previous sanction of
leave. Thus absence may be authorised or unauthorised, willful or caused by
circumstances beyond one’s control. Maybe even worse than absenteeism, it is obvious
that people such as malingerers and those unwilling to play their part in the workplace
can also have a decidedly negative impact. Such team members need individual attention
from front line supervisors and management. Indeed, as prevention is better than cure,
where such a problem occurs, it is always important to review recruitment procedures to
identify how such individuals came to be employed in the first place. For any business
owner or manager, to cure excessive absenteeism, it is essential to find and then eliminate
the causes of discontent among team members. If they find their supervisor or job
unpleasant -really unpleasant - they look for legitimate excuses to stay home and find
them with things such as upset stomachs or splitting headaches. Any effective absentee
control program has to locate the causes of discontent and modify those causes or
eliminate them entirely. In other words, if we deal with the real reasons team members
stay home it can become unnecessary for them to stay away.
Any investigation into absenteeism needs to look at the real reasons for it. Sometimes
team members call in sick when they really do not want to go to work. They would not
call you up and say, “I’m not coming in today because my supervisor abuses me. Or,

2
“I’m not coming in today because my chair is uncomfortable. Or, “I’m not coming in
today because the bathrooms are so filthy; it makes Mesick to walk into them.”
There are a few essential questions to consider at the outset if you want to make a
measurable improvement to your absenteeism figures.
Why is your present absenteeism policy ineffective?
Where and when is excessive absenteeism occurring? In many cases, under – trained
supervisors could be a contributing factor.
What are the real causes for absences?
It is commonly expected that low pay, poor benefits and high workloads will be the major
causes.
However, in numerous employee surveys absenteeism generally has been identified as a
symptom of low job satisfaction, sub-standard working conditions and Consistent
negative and unfair treatment received by first -line supervisors
How much formal training have your supervisors received on absenteeism?
Containment and reduction. If your answer is none or very little, may be you have found
the solution. As with every other element within your organization, you cannot ask a
person to do a job he or she has never been trained to do.
Many human resources specialists have found that repetitive, boring jobs coupled with
uncaring supervisors and/or physically unpleasant workplaces are likely to lead workers
to make up excuses for not coming to work.
If your team members perceive that your company is indifferent to their needs, they are
less likely to be motivated, or even to clock on at all.
One way to determine the causes of absenteeism is to question your supervisors about
excessive absenteeism, including what causes it and how to reduce it.
Of course, if your supervisors have made no efforts to get to know the team members in
their respective departments, they may not be able to provide reasons.

3
1.2 STATEMENT OF THE PROBLEM
Absenteeism is a serious problem for the management because it involves heavy
additional expenses. It is one of the most persistent obstacles to productivity, profitability
and competitiveness. It causes overtime, late delivers, dissatisfied customers and decline
morale amongst the workers. Absenteeism is a very real problem the effect of which
significant to both the Employer and Employee suffer from low morale, stress, decreased
wages etc. so one of the important consideration for the management is to identify what
are the main cause of absenteeism.
1.3 OBJECTIVES OF THE STUDY
• To identify the reasons for absenteeism
• To measure employee absenteeism level
• To identify steps required to decrease the absenteeism
• To identify factors that motivates the employees, which minimise the absenteeism
1.4 SCOPE OF THE STUDY
The development of any organisation depends on regularity of employees. The study is
conducted to know various levels and reasons for absence of employees in an
organisation. By looking it, one can adopt corrective measures to decrease irregularities
in the organisation, leads to organisational growth.
1.5 RESEARCH METHODOLOGY
Research is a systematic and scientific search for pertinent information on a specific
topic. Research methodology is a way to solve the research problem. It may be
understood of Studying how research done scientifically. Research is a common parlance
is referred to search for knowledge. One can be also define research as a scientific and
systematic search for pertinent information on a specific topic.

4
D.slesingner and M.stephenson in an encyclopedia of social science define research “as
the manipulation of things concept, or symbols for the purpose of generalizing to extend,
correct or verify the knowledge, whether that knowledge aids in construction of theory or
in the practice of an art”.
In short research for knowledge through objective and systematic method of finding
solution to a problem is research.
1.8.1 CONCEPTS AND TERMS USED
Research design
The study is descriptive in nature. Descriptive study is taken up when the researcher is
interested in knowing the present status regarding the particular area of interest. The
conclusion is arrived from the collected data. Statistical tools are to be used for the
analysis (Chi square test)
of collected data that the survey.
Sampling Design
Convenient sampling was taken for collecting the samples from the population.
Population for this research is set of workers in Nellara Food Industries, Edappal.
1.8.2 DATA COLLECTION
Primary data
The primary data was collected than the respondents by administering a structured
questionnaire.
Secondary data
Apart from primary data the secondary data is being collected through text books,
records, journals and internet, used for this study.

5
Period of study
The study was conducted for a period of 21 days. And all the objectives should be
attained with in this given period only.
1.8.3 SAMPLING
SAMPLE UNITS:
The sampling units used for this research are those who are working in Nellara Food
Industries
SAMPLE SIZE
The number of samples collected for the study is 50 workers.
DATA COLLECTION METHODOLOGY
Survey method is used to collect the primary data
SAMPLING METHOD
Simple random sampling would be used to select some workers.
1.8.4 TOOLS FOR ANALYSIS
The data collected from questionnaire are analyzed using simple percentage analysis
method and percentage can be computed by dividing the no. of respondents by total
samples and multiplying it by 100.
• Simple percentage
• Chi - Square test

6
1.6 LIMITATIONS OF THE STUDY
1. The workers were busy with their work therefore could not get enough time to interact.
2. The personal biases of the respondents might have entered in to their response
3. Some of the respondents give no answer to the questions which may affect the
analysis.

7
2.1REVIEW OF LITERATURE
Ernest B. Akyeampong has written a research paper Trends and seasonality in
Absenteeism. In this paper the author focus on that at which time period the employees
are more absent. In this paper he said that illness-related absences are highly seasonal,
reaching a peak during the winter months (December to February) and a trough during
the summer (June to August). The high incidence in winter is likely related to the
prevalence of communicable diseases at that time, especially colds and influenza. The
low incidence during the summer may be partly because many employees take their
vacation during these months. Because of survey design, those who fall ill during
vacation will likely report „vacation rather than „sickness or disability as the main reason
for being away from work. Compared with the annual average, part-week absences are
roughly 30% more relevant in the winter months and almost 20% less so during the
summer months. Seasonality is much less evident in full-week absences.
Maria José Romero and Young-Sun Lee has written a research paper A National
Portrait of Chronic Absenteeism in the Early Grades. In this paper he focused on the
following points:
(i) How widespread is the Problem of Early Absenteeism
(ii) Does Family Incomes Impact Early Absenteeism
(iii) What is the Impact of Early Absenteeism on Academic Achievement?
Morton Nordberg and Knut Roedhas wrote a research paper Absenteeism, Health
Insurance, and Business Cycles. In this he wants to evaluate how the economic
environment affects worker absenteeism and he also isolate the causal effects of business
cycle developments on work-resumption prospects for ongoing absence spells, by
conditioning on the state of the business cycle at the moment of entry into sickness
absence.

8
The author finds that
(i) That business cycle improvements yield lower work-resumption rates for persons who
are absent, and higher relapse rates for persons who have already resumed work.
(ii) That absence sometimes represents a health investment, in the sense that longer
absence now‟ reduces the subsequent relapse propensity.
(iii) That the work-resumption rate increases when sickness benefits are exhausted, but
that work-resumptions at this point tend to be short-lived.
Robbins (2003:24)defines absenteeism simply as “The failure to report to work “.
Absenteeism is further divided into voluntary and involuntary absenteeism. Voluntary
absenteeism is associated with the employee’s motivation to be absent (Deeryet al.1995)
and refers to non-attendance attributed to reasons with in the absentee’s control the
individual makes a conscious choice not to attend. Involuntary absenteeism on the other
hand refers to non-attendance attributed to reasons outside of the absentee’s control.
Brooke and Price (1989) however choose to define absenteeism as employee non-
attendance for schedule work. According to these writers, this definition does not only set
absenteeism apart from other forms of non-attendance (e.g.: vacation, public holiday) ,but
it also “avoid judgments of legitimacy associated with absent events that are implied by
distinctions between ‘voluntary’ and ‘involuntary) non-attendance or classification such
as sick leave”. (Brooke and Price 1989:2), Brooke(1986) describes the voluntary or
involuntary typology as a continuum of degrees of employees choice, at one end of the
continuum is voluntary absenteeism, at the other end is involuntary absenteeism.
“Although the extremes of the continuum are readily conceptualized, it is generally
recognized that attempts to develop “pure” measure of either form will encounter in

9
evitable “criterion contamination” between the two( Hammer and
Landall,1981)”,(Brooke,1986:351).
Absenteeism is also operationalised into absence frequency and absence duration.
Absenteeism frequency refers to the total number of occasions when an employee is
absent over a period of time regardless of duration. Absence duration on the other hand
refers to the number of absences accumulated over a period of time (Scott and Taylor ,
1981).These components are also brought into question , with Ramsey et al.
(2008)suggesting that absence frequency to measure voluntary absences and absence
duration to measure involuntary absences However ,Adler and Golan (1981 as cited by
sagie , 1998) and Driver and Watson (1989 as cited by sagie , 1998) criticized that this
tendency leads to research bias and contamination .
Harrison and Price (2003:2004) however, prefer to define absenteeism in terms of its
social context. They view it as a social outcome and not as a behavior. For this reason
they define it as a” lack of physical presence at a behavior setting when and where one is
expected to be”. According to these writers,’behaviour setting’ refers to social behavior
occurring in time and space and is critical to the definition. Equally as “ is the social
expectation . As Harrison and Price note , attendance conforms to social expectations ;
absenteeism violates this ,without the social expectation absenteeism would cease to exist
.In essence ,the meaning of absenteeism “depends upon the motivation attributed to this
behavior , its timing , the frequency of its occurrence , and the social setting in which it
occurs ( Johns and Nicholson , 1990 ; Rosse and Miller , 1984 ) . “ ( Hanebuth , 2005 ) .
Absenteeism has been variously defined by different authorities . Absenteeism is the
total man shifts lost because of the absences as a percentage of the total number. of man
shifts scheduled to work . In other words it signifies the absence of an employee from
work when he is scheduled to at work . Absenteeism is the practice or habit of being an
absentee and an absentee is one who habitually stay away .

10
Absenteeism is one of major problems of Indian industries . It result in dislocation of
work , increase in labor cost , reduction in productivity and if unchecked increase in
indiscipline . Absenteeism is a title given to a condition that exists when a person fails to
come to work when properly scheduled to “
More specifically absenteeism refers to unauthorized absence from work.
Unauthorized absence includes all causes where the work is available the worker knows
about it but fails to report for duty and the employer has no prior information on worker s
not reporting for work . In literature on absenteeism, a distinction is often made between
‘absence’ and ‘absenteeism ‘The term absence refers to all stay away from work whether
authorized or unauthorized while absenteeism refers to only unauthorized absence.
Post –industrial era is characterized by increasing knowledge by arising from
individuals need for change, through complex relationships between organization’s
individual’s responsibilities increasing global competitiveness. This new environment of
accelerating change,globalization and reliance on individual knowledge as its primary
resource for economic success brought about abundant theories, models and studies
dealing with various aspects of improving (organizational) effectiveness.
Literature reviews are acknowledged as valuable contributions to advancement of
research. When done well, they help researchers sum up where have been and where they
need to go next they identify gaps in knowledge and suggesting new directions for future
research that such endeavors are considered useful is reflected in the number published
each year. Previous of research literature are carried out for several reasons. One reason
is no assess state of current knowledge. Relatedly literature reviews assess what is not
know the gaps in knowledge. It is quite common in published literature reviews to find a
discussion of what direction ought to the taken by future research on a topic. Such
discussions define productive lines of research and promote integration of future findings
with current knowledge. A third reason is to advance theory. Good literature reviews
make strong statements about validity of theories and stimulating new theoretical

11
development. A fourth reason is to answer the ‘so what’ question so often put in
behavioral science research. That is, literature reviews provide statements about
published implications of research findings, practices that can be justified on the basis of
research.
The purpose of this paper is to review the literature on employee absenteeism as a form
of withdrawal behavior apart from turnover. Studies examining the psychometric
properties absence measures are reviewed, along with the relationship between
absenteeism and present attitudinal, and organizational variables. Studies exploring the
relationship between absenteeism and turnover are examined according to the unit of
analysis studied in the research. Programmatic efforts to reduce employee absenteeism
are also reviewed. Throughout the emphasis is placed on the indices used by investigators
to measure absenteeism, and problems that have arisen in the literature through the use of
multiple inductance of absenteeism the review concludes with suggestions for research
that are of both theoretical and practical concern.
Source:
JOURNALS
• Impact of job satisfaction on absenteeism
• Absenteeism and collective bargaining agreement
• Aversive workplace conditions and absenteeism
• Employee absenteeism: The Role of Ease of Movement

12
3.1 INDUSTRY PROFILE
3.1.1 INDUSTRY HISTORY
India is the world’s second largest production of food after china and has the potential of
being the biggest with the food and agricultural sector. The total food production in India
is likely to double in the next ten years and there is an opportunity for large investments
in food processing technologies skills and equipment, especially in areas of Canning,
Dairy and good processing. Specialty processing, Packaging, Frozen Food/Refrigeration
and Thermo processing, Fruits & Vegetables, Fisheries, Milk and Milk product, Meat and
Poultry, Packaged/Convenience foods, Alcoholic Beverages and Soft drinks and Grains
are important sub-sectors of the food processing industry. Health food and health food
supplements are another rapidly rising segment of this industry which is gaining vast
popularity amongst the health conscious.
In spite of being one of the world’s major food producers, India accounts for less than 1.5
per cent of international food trade. This indicates vast scope for both investors and
exporters. Food exports in 1998 stood at US $ 5.8 billion whereas the world total was US
$ 438 billion. The Indian food industries sales turnover is Rs.140000 crore (1 crore = 10
million) annually as at the start of year 2000. The industry has highest number of plants
approved by the US Food and Drug Administration (FDA) outside the USA.
India’s food processing sector covers fruits and vegetables; meat and poultry; milk and
milk products, alcoholic beverages, fisheries, plantation, grain processing and other
consumer product groups like confectionery, chocolates and cocoa products, Soya-based
product, mineral water, high protein foods etc.
The most promising sub-sectors include soft-drink bottling, Confectionery manufacture,
Fishing, Aquaculture, Grain-milling and grain-based products, Meat and poultry
processing, Alcoholic beverages, milk processing, Tomato paste, Fast-food, ready-to-eat
breakfast cereals, Food additives, flavors etc.
13
Throughout history rice has been one of man’s important foods. Today, this unique grain
helps sustain two thirds of the world population. Archaeological evidence suggests that
rice has been feeding mankind for more than 500 years. Today agriculture is the
backbone of India’s economy, providing direct employment to about 70% of working
people in the country. It forms the basis of many premier industries in India, including
the textile, sugar industries.
India is one of the world’s major food producers, but accountants for less than 1.5 percent
of international food rate. Food processing involve any type of value addition to
agriculture or horticulture produce and also include processes such as grading, sorting,
packaging, etc. which enhance shelf life of food products. The food processing industry
provides vital linkage and synergies between industries and agriculture. The food
processing industry sector in India is one of largest in terms of production, consumption,
export, and growth prospects. The government has accorded it has a high priority, with a
number of fiscal incentives to encourage commercialization and value addition to
agriculture produce, for minimizing pre post-harvest, wastage, generating employment
and exporting growth. India’s food processing sector covers a wide range of products like
fruits and vegetables, meat and poultry, milk and milk products beverage etc.
Food processing involves any type of value addition to agricultural or horticultural
produce and also includes processes such as grading, sorting and packaging which
enhance shelf life of food products. The food processing industry provides vital linkage
and synergies between industry and agriculture. The Food Processing Industry sector in
India is one of the largest in term of production, consumption, export and growth
prospects. The government has accorded it a high priority, with a number of fiscal relief’s
and incentives, to encourage commercialization and value addition to agriculture
produce, for minimizing pre/post-harvest wastage, generating employment and export
growth. Indian’s food processing sector covert a wide range of products fruit and
vegetable, meat and poultry, milk and milk products, alcoholic beverages, fisheries,
plantation, grain processing and other consumer product groups like confectionery,

14
chocolates and cocoa products, Soya-based products, mineral water, high protein foods
etc.
Indian food processing industry is widely recognized as a ‘sunrise industry’ having huge
potential for uplifting agricultural economy, creation of large scale processed food
manufacturing and food chain facilities, and the resultant generation of employment and
export earnings. The industry is estimated to be worth around US$ 67 billion and
employing about 13 million people and about 35 million peopleindirectly. The food
producing sector in India is geared to meet the International Standards. Food Safety and
Standards Authority of India has the mandate to develop standards and also to harmonies
the same with International Standards consistent with food hygiene and food safety
requirement and to the conditions of India’s food industry.
Two nodal agencies, Agriculture & Processed food products Export Development
Authority (APEDA) and Marine Product Export Development Authority (MPEDA), we
formed for promoting exports from India. MPEDA is responsible for overseeing all fish
and fishery product exports, APEDA, on the other hand, holds responsibility for the
exports of other processed food products.
India’s Position in World’s Production
• Largest producer of milk in the world (105 million tons per annum)
• Largest livestock population (485 million tons per annum)
• Second largest producer of fruits & vegetables (150 million tons per annum)
• Third largest producer of food grain (230 million tons per annum)
• Third largest producer of fish (7 million tons per annum)
• 52% cultivable land compared to 11% world average
• All 15 major 46 out of 60 soil types exist in India
Key Growth Drivers of Food Processing Sector in India

15
• Increasing spending on health and nutritional foods.
• Increasing number of nuclear families and working women
• Changing lifestyle
• Functional foods, fresh or processed foods
• Organized retail and private label penetration
• Changing demographics and rising disposable incomes
16
3.1.2 PLAYERS IN THE INDUSTRY
Kohinoor Foods Ltd
Kohinoor started its journey in 1989. Presently, in India and in over 60 countries,
consumers' lives have been touched by not only some of the finest basmati rice brands,
but also a wide assortment of food products that include wheat flour, ready-to-eat curries
and meals, simmer sauces, cooking pastes to spices, seasonings and frozen food.
At present, the company has customers in the USA, Canada, Australia, New Zealand and
the UK, as well as the Middle East and Southeast Asian countries. The company has two
100 per cent fully owned subsidiaries - Kohinoor Foods Inc, operating from New Jersey,
USA that looks after the North American and Canadian markets; and Indo European
Foods Ltd, in the UK with headquarters in London, which looks after the European
markets. The company also assists Indian farmers in bringing up their crops in good
vigour and health and also possesses a state-of-the-art rice manufacturing facility at
Haryana, India.
Source: http://www.kohinoorfoods.in/
MTR Foods
Started in 1924 with the establishment of the MTR restaurant, MTR Foods today
stands tall as an Indian heritage brand. A household name, MTR Foods has consolidated
its market leadership in the south of the country and is all set for a strong pan-India
presence, beginning with forays into the northern, western and eastern regions.
In February 2007, MTR Foods announced its official partnership with Nordic
conglomerate Orkla. The Orkla global conglomerate comprises four business units: Orkla
Foods Nordic, Orkla Brands Nordic, Orkla Food Ingredients and Orkla Brands
International.
Post this joint venture (JV), MTR Foods has taken major steps to revitalise its brand
appeal and establish its presence in the homes of modern consumers across India. With
an all-new brand presence and a unique brand identity, MTR Foods seeks to own the
instant food category in India, with Spices as a constant focus in the southern regions.

17
Source: http://www.mtrfoods.com/
McCain Foods
McCain Foods (India) is a wholly-owned subsidiary of McCain Foods Limited in
Canada. Since 1998, the company has been engaged in agriculture research and
development (R&D) and in the development of the frozen food market in India and other
countries of the subcontinent.
The company's products are used by leading fast food chains, hotels, restaurants, catering
companies and are popular for in-home consumption.
McCain focuses on providing great variety to customers and consumers. It offers a range
of products such as McCain French Fries and McCain Smiles; local delights such as
McCain AlooTikki and IdliSambar Combo; and real cheese appetisers such as McCain
Cheese and Jalapeno Nuggets and Potato Cheese Shotz.
Source: http://www.mccainindia.com
Eastern Pvt Ltd
Eastern Pvt Ltd is a flagship company of the Rs.650-cr Eastern Group. They are
the undisputed leaders in the country engaged in the manufacturing and marketing of
spice powders, including masala mixes, breakfast staples and a host of other products.
They are also the largest exporters of spices in the country as supply arms reach the US,
Europe, African and Middle East countries.By 1995, Eastern Condiments had grown its
wings and it was ready to fly higher and forayed into Bangalore and Chennai markets.
It’s today a household name across South India, Maharashtra, Gujarat and Delhi. From a
small stationery business in 1960, the Eastern Group by 2010 had grown globally tying
up with Mc.Cormick in its pursuit for greater achievements. And, it was from Adimali – a
non-descript town – Eastern Group’s international journey started!
Manjilas, Double Horse
Manjilas, the mother brand of Double Horse, was founded in the year 1959, as a
rice milling company selling high-quality rice grains. The brand, on the strength of its

commitment to deliver only the best to its customers have witnessed
growth over the years. It revolutionized the food sector in Kerala becoming the first ISO
9001:2000 certified Rice Mill in the state and the first food brand to introduce sortex rice,
stoneless rice and colour grading.
Inspired by the support of its customers and foreseeing the potential for traditional food
that’s made easy to suit today’s busy, modern lifestyle, Manjilas Double Horse started
introducing products- from rice powders
products, curry powders and condiments made using ‘Perfect Blend technology’,
naturally preserved pickles, health foods, ready
traditional preserves, coconut products and more; and is dedicatedly developing new and
innovative product ranges, to keep up with its promise to deliver good food and in turn,
inculcate a healthy eating habit.
3.1.3 CURRENT & FUTURE TRENDS
Source: http://www.ibef.org/industry/food
During FY06-12, the food processing industry expanded at a CAGR of 7.1 per cent; in
FY12 alone, the industry grew 15.7 per cent. Food processing is an important segment in
18
commitment to deliver only the best to its customers have witnessed
growth over the years. It revolutionized the food sector in Kerala becoming the first ISO
9001:2000 certified Rice Mill in the state and the first food brand to introduce sortex rice,
stoneless rice and colour grading.
of its customers and foreseeing the potential for traditional food
that’s made easy to suit today’s busy, modern lifestyle, Manjilas Double Horse started
from rice powders- breakfast mixes to instant mixes, wheat
ers and condiments made using ‘Perfect Blend technology’,
naturally preserved pickles, health foods, ready-to-cook & ready-to
traditional preserves, coconut products and more; and is dedicatedly developing new and
o keep up with its promise to deliver good food and in turn,
inculcate a healthy eating habit.
3.1.3 CURRENT & FUTURE TRENDS
http://www.ibef.org/industry/food-industry-presentation
12, the food processing industry expanded at a CAGR of 7.1 per cent; in
FY12 alone, the industry grew 15.7 per cent. Food processing is an important segment in
commitment to deliver only the best to its customers have witnessed a phenomenal
growth over the years. It revolutionized the food sector in Kerala becoming the first ISO
9001:2000 certified Rice Mill in the state and the first food brand to introduce sortex rice,
of its customers and foreseeing the potential for traditional food
that’s made easy to suit today’s busy, modern lifestyle, Manjilas Double Horse started
breakfast mixes to instant mixes, wheat
ers and condiments made using ‘Perfect Blend technology’,
to-eat products,
traditional preserves, coconut products and more; and is dedicatedly developing new and
o keep up with its promise to deliver good food and in turn,
12, the food processing industry expanded at a CAGR of 7.1 per cent; in
FY12 alone, the industry grew 15.7 per cent. Food processing is an important segment in

19
terms of contribution to GDP, and share in the agriculture and manufacturing sectors. In
FY12, India had as many as 51,877 registered food processing units with total foreign
direct investment of approximately USD170.2 million, which more than doubled to
USD401.5 million in FY13. According to MOFPI in FY11, capital investments in India’s
food processing sector have increased a significant 28.6 per cent over the last year

20
3.2 COMPANY PROFILE
3.2.1 INCEPTION OF THE COMPANY
Nellara present before you a line of vibrant, fresh tasting condiments in cool and
trendy packs. Nellara also bring you international quality Pickles, Rice, fine powdered
rice and wheat powder. Company is very keen to procure high quality rice and wheat
from the best fields of India and process it with distinct Kerala style.
Nellara journey began under a strong leadership in 2004 with the idea of catering
to the present daily needs and hectic lifestyle of the customer. There has been no looking
back since then. The company expanded its activities, innovating new products and
improving operations, with every passing phase.
VISION
To deliver quality products to the customers at the right value.
MISSION
To be more competitive in the global market to deliver quality products to the customers
that satisfies their budget and daily needs. The world tasting Indian spices aroma through
the basket of Nellara products
OBJECTIVES OF THE FIRM
• To attain customer satisfaction
• Attain maximum profit
• Produce quality goods
• Development of rural areas
• To provide employment opportunities to semi-skilled workers
• To face competition successfully
• To create goodwill
• To obtain the support of trade union and other associations

21
MANUFACTORING UNIT
Nellara have fragrance retained processing flavor lock system which will help to
sustain products good smell and quality.
It is the high quality of their products in an increasingly competitive global marketplace
that has kept as going. Food safety is a global concern: hence they have a management
system which us to identify, document, maintain and review food hazards that occur
during the food production process. Each and every stage of the manufacturing process is
monitored by expert.
ISO QUALIFICTION
Nellara is an ISO 9001 & HACCP Certified, family owned company of Kerala
state. It has experience of 25 years in spices field.
EMPLOYEES
There are 300 employees working Nellara Food Industries in Nellissery.
ADVERTISEMENT
Advertisement is main motive for the consumers. The company makes advertisement
through different media. It helps the organization to promote its products. The company
mainly advertises through radio, television, clipboards etc.
HR DETAILS
Ms. RoshniBalakrishnan, HR Manager heads the HR department. The staffs of
HR department include the junior HR executive and administrator. The organisation
employs 370 employees.

22
HR VISION
“Build with resources that are dynamically matched with strong commitment to
excellence in products and processes, through a team of dedicated people while ensuring
a clean environment for our planet, the Earth. All to serve the customer better”.
FUNCTIONS PERFORMED BY HR DEPARTMENT
• Recruitment
• Induction
• Time office
• Wage and salary administration
• Industrial relations
• Safety and welfare
3.2.2 HISTORY OF THE COMPANY
Nellara food products, made by a family owned company of India’s Kerala State,
this high quality Curry powder, Rice powder, Rice, Pickles and Wheat powder have a
wonderfully delicate homemade taste. Spurred on by Kerala’s fascination with curry
making, Nellara developed these great line of relishes and food products. Nellara’s whole
range is processed and packed in Dubai to give you more freshness and shelf life. It is the
first brand processed and marketed in Middle East countries with authentic Kerala blend.
Nellara has all the multiple products for Kerala Breakfasts, lunch and dinner. It is
the high quality of our products in increasingly competitive global market place that has
kept us going. Food safety is global concern, hence we have a management system which
allows us to identify, document, maintain and review food hazards that occur during the

23
food production process. Each and every stage of the manufacturing process is monitored
by experts.
Nellara supply its products to the retail sectors in India, UAE, Oman, Qatar, Saudi,
Arabia, Kuwait, Bahrain, USA, Canada, UK and Europe.
Nellara have fragrance retained processing flavor lock system which will help to
sustain product’s good smell and quality. It is the high quality of our products in an
increasingly competitive global marketplace that has kept us going. Food safety is a
global concern, hence we have a management system which allows us to identify,
document, maintain and review food hazards that occur during the food production
process. Each and every stage of the manufacturing process is monitored by experts.
ADVERTISEMENT
Advertisement is main motive for the consumers. The company makes
advertisement through different media. It helps the organization to promote its products.
The company mainly advertises through radio, television, clipboards etc..
FUTURE PLAN OF THE ORGANIZATION IN ABROAD
By interesting Dh6 million in a new processing plant and head office in Al Qusais, the
Nellara group has moved closer to its growing consumer base in Dubai.
The maker of spices and flavors a stable in southern Indian cuisine, is also working on a
parallel strategies to find favor with other consumer demographics. “If have good spices,
you will have good dishes, no meal is considered to be complete without the tangy and
delectable flavor of masala”.
While this sentiment will instinctively find flavor with the vast resident base in the gulf
hailing from southern India, the I Nellara group, with more than 300 varieties of food
ingredients, now wants other nationalities to be swayed by the same flavors. Spice usage

24
growing year-on-year due to demand on Arabs, who has started to flavor spicy foods
never before.
“The gulf contributes 75% to our (overseas) business and 25%: the UAE represents about
25% while Saudi Arabians share is 20%”.
The group now operates a processing and packaging plant in Ajman. There is even a
fragrance retaining processing flavor lock system in place.
“As demand for spices, rice and wheat products, and pickles are picking up not only in
the gulf but also globally; we need to cater to the growing demand”.
Apart from spices, it has extended the product category into rice and wheat, which are
sourced from India processed in Dubai.
3.2.3 TYPE OF ORGANIZATION
Name of organization: Nellara food industries
Type : Private
Industry type : Production industry
Location : Edappal
Key people : ShamsudeenKarimbanakkal, Managing Director
Area : Production, Food processing
3.2.4 NATURE OF THE BUSINESS
Production, Food processing, Packaging, these are all the different services provided by
NELLARA FOOD PRODUCTS, Edappal.
25
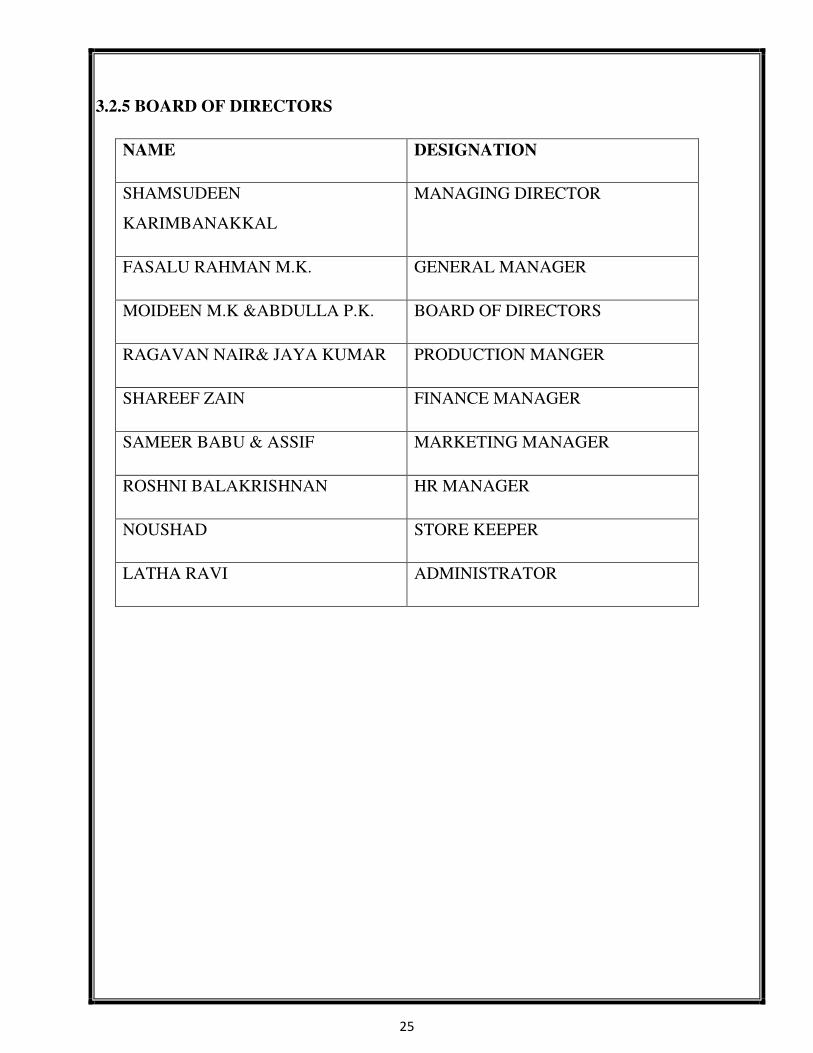
3.2.5 BOARD OF DIRECTORS
NAME DESIGNATION
SHAMSUDEEN
KARIMBANAKKAL
MANAGING DIRECTOR
FASALU RAHMAN M.K. GENERAL MANAGER
MOIDEEN M.K &ABDULLA P.K. BOARD OF DIRECTORS
RAGAVAN NAIR& JAYA KUMAR PRODUCTION MANGER
SHAREEF ZAIN FINANCE MANAGER
SAMEER BABU & ASSIF MARKETING MANAGER
ROSHNI BALAKRISHNAN HR MANAGER
NOUSHAD STORE KEEPER
LATHA RAVI ADMINISTRATOR

26
ORGANIZATIONAL CHART

27
3.2.6 BUSINESS OPERATIONS
Nellara have operations in different countries. They have management and work
force from different nation and distributions bases extending over the UAE, Oman, Qatar,
Kuwait, Bahrain, Yemen, Saudi Arabia, India, Kenya, Thailand, USA and UK.
3.2.7 PRODUCT PROFILE
Product is the thing possessing utility. It is the bundle of value the marketers
offers to the potential customers. Nellara food industries are realizing the customers
expect more than just the basic products. Therefore the firm produces the product that
satisfies the customer’s needs. This firm first of all decides the design, packaging etc of
the products to be produced. The best advertisement is the introduction of a good product.
Nellara gives importance to product planning in order to avoid product failure
Nellara food industries provide a wide range of products which ensures taste of
homely made food. Nellara present before us a line of vibrant, fresh tasting condiments in
cool and trendy packs. Nellara also bring us international quality pickles, rice, fine
powdered rice and wheat powder. Company is very keen to produce high quality rice and
wheat from the best fields of India and process it with District Kerala style.
The delicious taste of Kerala foods have been spread to the foreign countries with
the help of Nellara brand. The various items in their product line are Masalas, Jams,
Instant coconut milk, coconut oil, etc. Nellara food products are the largest brand and
fastest growing in this category in Gulf countries.
Nellara food industries initially produced only rice powder and spices. Gradually it
extends its production to various pickles, James, Masalas etc. the company has been able
to live up to the customer expectation by providing packaged food product that is
consistent both in terms of quality and taste. The firm prints the expiry date on the

28
product in order to avoid the bad health of consumers. The firm takes all the measures to
produce a quality product. The firm provides their product in safely packs and bottles.
Today Nellara has made to the international standards and is the fastest growing brand
in the Gulf countries. Nellara brings their products in to the market at reasonable price in
high quality. The firm’s policy is to keep the freshness of the products and charge an
affordable price, with their attractive policies. Nellara food products have a good image
in the mind of customers
� BREAK FAST PRODUCTS
A perfect dish demands carefully selected and perfectly powdered rice. It is hard to
design a single day without having a rice delicacy. Nellara produce have lots of breakfast
products like Wheat puttu powder, Chembaputtu powder, Dosa powder, White rice
flakes, Matta rice flakes, Tapioca puttu powder, Raggiputtu powder etc.
� RICE ITEMS
Nellara Rice is hygienically processed, cleaned & packed. They avoid the use of
chemicals and the freshness of the rice retained till it is consumed. Each product is made
from first grade rice. The rice items of Nellara are: Briyani rice, Basumathi rice, Ghee
rice, Broaken rice, ThanjavoorPonni rice, PalakkadanMatta rice etc
� MASALAS(CURRY POWDERS)
Nellara masalas are for every occation. Surrender to the state, in the recipes used in
their masalas. Their wide range of products consist of Chicken masala, Meat masala, fish
masala, sambar powder, egg roast masala, Chilly powder, coriander powder, turmeric
powder, Crushed Chilly, Kashmeeri chilly packed using technology that lock in the
freshness.
A melegs of aromas resulting from the use of Nellara masalas will be memorable. Some
of them are Chicken masala, meat masala, fish masala, rasam masala, Mutton masala,
29
Vegetable masala, Biriyani masala, Garam masala, Chat masala, egg roast masala,
channa masala, Chicken fry etc.
� PICKLES AND PASTES
Nellara ranges of ready to serve pickles are made from handpicked items, using
freshly ground spices. Nellara pickle can single handily transform an ordinary meal into
an irresistible delicacy.
PICKLES: Cut mango, Tender Mango, Lime, Ginger, Mixed Vegetable, Goosseberry,
Bitter guard, Green chili, Tomato, White lemon, Prawn etc.
PASTES: Garlic, Ginger, Ginger garlic
� COCONUT AND OIL PRODUCTS
Nellara coconut products can be used in various food preparations as a substitute to
raw coconut. All of their coconut products are made only from organic coconuts.
Coconut products are: coconut milk powders, coconut milk liquid, desiccated coconut,
coconut oil etc
� NELTEA & LOVELY TEA/COFFEE PRODUCTS
Tea and Coffee brands of Nellara are: Neltea, Lowely Tea, VayanadanKappi powder etc.
� OTHER ITEMS
Nellara offers almost all types of assorted products that are necessary ingredients for
cooking in its purest form. These are: Tarmarind, Combodge, Lovely Corn, etc.
3.2.8 MARKET SHARE
Nellara food industries is having vast market in India and also in Middle East and
European countries. So the market share of the company cannot be able to measure fully.
The annual turnover is 300 crore.

30
3.2.9 MAJOR COMPETITORS
� Priyan food products
� Nirapara
� Double horse etc.
3.2.10 FUTURE PROSPECTS AND GROWTH
By investing Dh6 million in a new processing plant and head office in Al Qusais,
the Nellara group has moved closer to its growing consumer base in Dubai.
The maker of spices and flavours a stable in southern Indian cuisine, is also working on a
parallel strategies to find flavour with other consumer demographics. “If have good
spices, you will have good dishes, no meal is considered to be complete without the tangy
and delectable flavour of masala”.While this sentiment will instinctively find flavour with
the vast resident base in the gulf hailing from southern India, the I Nellara group, with
more than 300 varieties of food ingredients, now wants other nationalities to be swayed
by the same flavours.
Spice usage growing year-on-year due to demand on Arabs, who has started to flavour
spicy foods never before.The group now operates a processing and packaging plant in
Ajman. There is even a fragrance retaining processing flavour lock system in place.“As
demand for spices, rice and wheat products, and pickles are picking up not only in the
gulf but also globally; they need to cater to the growing demand”.Apart from spices, it
has extended the product category into rice and wheat, which are sourced from India
processed in Dubai.

31
TABLE 4.1 SHOWS EMPOLYEE SATISFACTION WITH LEAVE POLICY OF
NELLARA FOOD INDUSTRIES
Particulars Number of Respondents Percentage
Highly Satisfied 22 44
Satisfied 19 48
Neutral 7 14
Dissatisfied 2 4
Highly Dissatisfied 0 0
Source: Primary Data
INTERPRETATION
Above table shows that 48% of the employees are satisfied with the leave policy of
Nellara Food Industries, 44% highly satisfied. 14% showed neutral response.
0
10
20
30
40
50
60
Highly Satisfied Satisfied Neutral Dissatisfied Highly Dissatisfied
PE
RC
EN
TA
GE
OPINION

32
TABLE 4.2 SHOWS EMPLOYEESWORK / JOB RESPONSIBILITIES
Particulars Number of Respondents Percentage
Highly Satisfied 15 30
Satisfied 30 60
Neutral 4 8
Fair clear 1 2
Don’t know 0 0
Source: Primary Data
INTERPRETATION
Above table shows that 60% are satisfied that they are clear about the job/responsibilities
and 30% of employees are highly satisfied. 8% showed neutral response.
0
10
20
30
40
50
60
70
Highly Satisfied Satisfied Neutral Fair clear Don’t know
PE
RC
EN
TA
GE
OPINION

33
TABLE 4.3 SHOWS EMPLOYEES OPINION ABOUT TRAINING
FACILITITEIES
Particulars Number of Respondents Percentage
Highly Satisfied 12 24
Satisfied 24 48
Neutral 10 20
Dissatisfied 3 6
Highly Dissatisfied 1 2
Source: Primary Data
INTERPRETATION
Above table shows that 48% of employees are satisfied with their training facilities and
24% responded that they are highly satisfied. 20% show neutral response.
0
10
20
30
40
50
60
Highly Satisfied Satisfied Neutral Dissatisfied Highly Dissatisfied
PE
RC
EN
TA
GE
OPINION

34
TABLE 4.4 SHOWS EMPLOYEES OPINION TOWARDS BREAK TIME GIVEN
Particulars Numberof Respondents Percentage
Highly Satisfied 16 32
Satisfied 21 42
Neutral 7 14
Dissatisfied 4 8
Highly Dissatisfied 2 4
Source: Primary Data
INTERPRETATION
Above table shows that 42% are satisfied with the break time given to employees and
32% are highly satisfied. 14% showed neutral response and 8% are dissatisfied with
break time given to employees.
0
5
10
15
20
25
30
35
40
45
Highly Satisfied Satisfied Neutral Dissatisfied Highly Dissatisfied
PE
RC
EN
TA
GE
OPINION
35
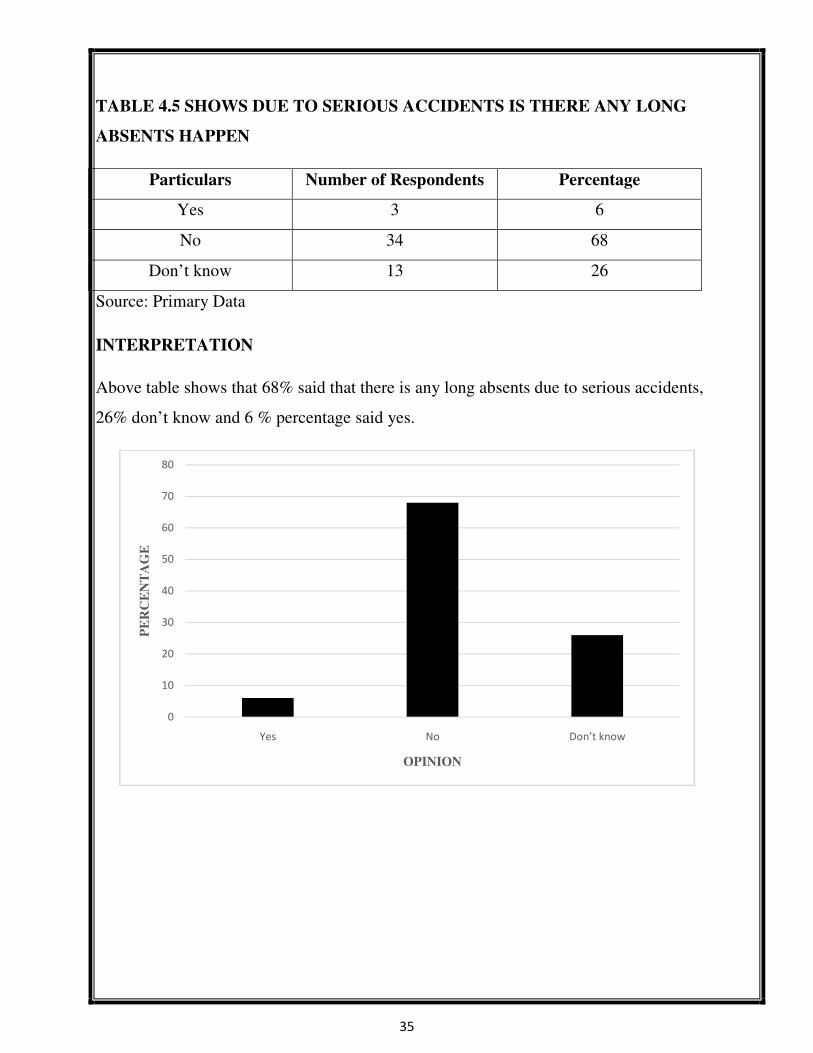
TABLE 4.5 SHOWS DUE TO SERIOUS ACCIDENTS IS THERE ANY LONG
ABSENTS HAPPEN
Particulars Number of Respondents Percentage
Yes 3 6
No 34 68
Don’t know 13 26
Source: Primary Data
INTERPRETATION
Above table shows that 68% said that there is any long absents due to serious accidents,
26% don’t know and 6 % percentage said yes.
0
10
20
30
40
50
60
70
80
Yes No Don’t know
PE
RC
EN
TA
GE
OPINION

36
TABLE 4.6 SHOWS REASONS FOR EMPLOYEES ABSENCE
Particulars Number of Respondents Percentage
Sick 25 50
Financial 17 34
Marital 5 10
Child care 3 6
Source: Primary Data
INTERPRETATION
Above table shows that 50% of employees take leave due to sick, 34% due to financial
reasons, 10% due to marital and 6% for child care.
0
10
20
30
40
50
60
Sick Financial Marital Child care
PE
RC
EN
TA
GE
OPINION

37
TABLE 4.7 WORKING ENVIRONMENT OF NELLARA FOOD INDUSTRIES
Particulars Number of Respondents Percentage
Highly Satisfied 24 48
Satisfied 17 34
Neutral 8 16
Dissatisfied 1 2
Highly Dissatisfied 0 0
Source: Primary Data
INTERPRETATION
Above table shows that 48% are highly satisfied with working environment of Nellara
food Industries, 34% satisfied. 16% showed neutral response.
0
10
20
30
40
50
60
Highly Satisfied Satisfied Neutral Dissatisfied Highly Dissatisfied
PE
RC
EN
TA
GE
OPINION

38
TABLE 4.8 WHICH SHIFT ABSENTEEISM LEVEL IS HIGH
Particulars Number of Respondents Percentage
6am – 2 pm 11 22
2 pm – 10 pm 16 32
10 pm – 6am 23 46
Source: Primary Data
INTERPRETATION
Above table shows that 46% says that absenteeism level is high in shift of 10pm – 6am,
32% says absenteeism is high in shift of 2pm – 10pm and 22% says absenteeism is high
in the shift of 6am – 2pm
0
5
10
15
20
25
30
35
40
45
50
6am – 2 pm 2 pm – 10 pm 10 pm – 6am
PE
RC
EN
TA
G
OPINION

39
TABLE 4.9 RELATIONSHIP WITH YOUR SUPERIORS / CO-WORKERS
Particulars Number of Respondents Percentage
Highly Satisfied 16 32
Satisfied 27 54
Neutral 5 10
Dissatisfied 2 4
Highly Dissatisfied 0 0
Source: Primary Data
INTERPRETATION
Above table shows that 54% of employees are satisfied with relationship with their
superiors / co-workers, 32% are highly satisfied and 10% showed neutral. 4%
dissatisfied.
0
10
20
30
40
50
60
Highly Satisfied Satisfied Neutral Dissatisfied Highly Dissatisfied
PE
RC
EN
TA
GE
OPINION

40
TABLE 4.10 FACILITIES PROVIDEDE BY THE COMPANY IS BECOMING
CAUSES OF ABSENTEEISM
Particulars Number of Respondents Percentage
Strongly agree 0 0
Agree 3 6
Neutral 18 36
Disagree 22 44
Strongly disagree 7 14
Source: Primary Data
INTERPRETATION
Above table shows that 44% disagreed that the facilities provided by the company
becoming causes of absenteeism and 14% strongly disagreed. 36% showed neutral
response.
0
5
10
15
20
25
30
35
40
45
50
Strongly agree Agree Neutral Disagree Strongly disagree
PE
RC
EN
TA
GE
OPINION

41
TABLES 4.11 FEEL ABOUT UNITY IN WORKPLACE IN THE
ORGANIZATION
Particulars Number Of Respondents Percentage
Highly Satisfied 17 34
Satisfied 26 52
Neutral 6 12
Dissatisfied 1 2
Highly Dissatisfied 0 0
Source: Primary Data
INTERPRETATION
Above table shows that 52% satisfied with unity in workplace and 34% are highly
satisfied. 12% percentage showed neutral response.
0
10
20
30
40
50
60
Highly Satisfied Satisfied Neutral Dissatisfied Highly Dissatisfied
PE
RC
EN
TA
GE
OPINION
42
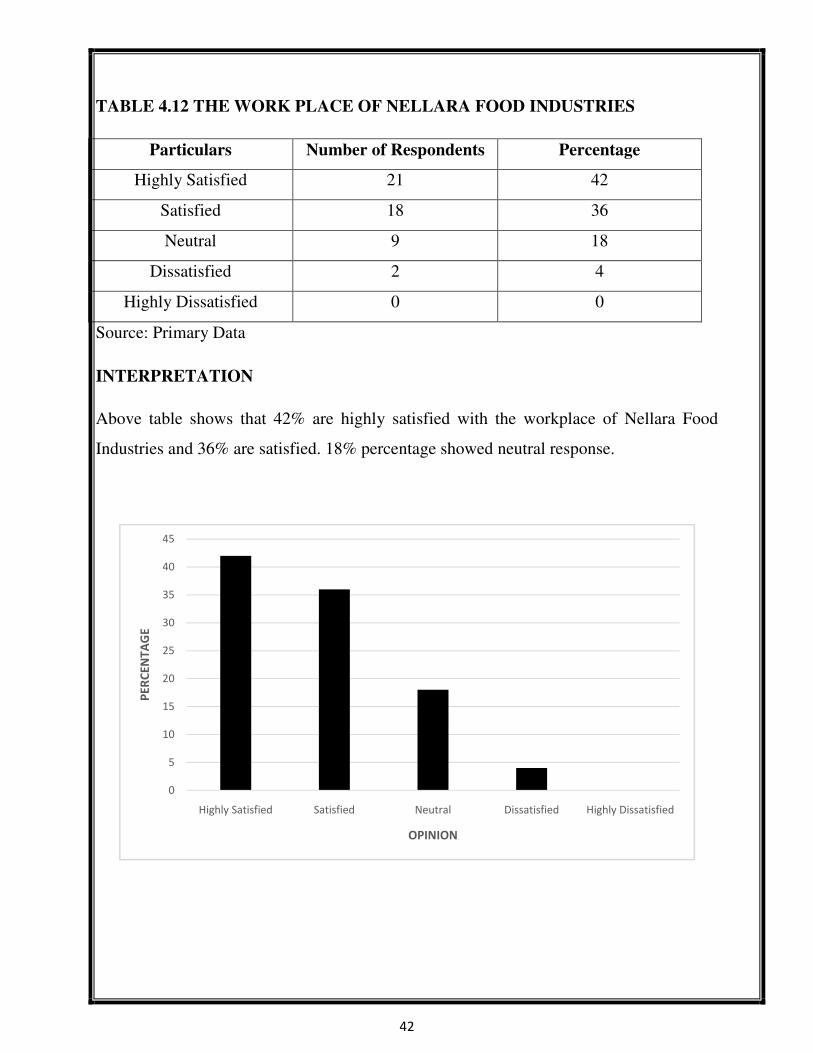
TABLE 4.12 THE WORK PLACE OF NELLARA FOOD INDUSTRIES
Particulars Number of Respondents Percentage
Highly Satisfied 21 42
Satisfied 18 36
Neutral 9 18
Dissatisfied 2 4
Highly Dissatisfied 0 0
Source: Primary Data
INTERPRETATION
Above table shows that 42% are highly satisfied with the workplace of Nellara Food
Industries and 36% are satisfied. 18% percentage showed neutral response.
0
5
10
15
20
25
30
35
40
45
Highly Satisfied Satisfied Neutral Dissatisfied Highly Dissatisfied
PE
RC
EN
TA
GE
OPINION

43
TABLE 4.13 THE ABSENCE PREVENTING POLICY IS STRICT
Particulars Numberof Respondents Percentage
Strongly agree 1 2
Agree 7 14
Neutral 28 56
Disagree 12 24
Strongly disagree 2 4
Source: Primary Data
INTERPRETATION
Above table shows that 24% disagreed that the absence prevents policy is strict and 4%
strongly disagreed. 56% showed neutral response.
0
10
20
30
40
50
60
Strongly agree Agree Neutral Disagree Strongly disagree
PE
RC
EN
TA
GE
OPINION

44
TABLE 4.14 SHOWS SATISFIED WITH JOB SECURITY
Particulars Number of Respondents Percentage
Highly Satisfied 16 32
Satisfied 20 40
Neutral 13 26
Dissatisfied 1 2
Highly Dissatisfied 0 0
Source: Primary Data
INTERPRETATION
Above table shows that 40% of employees are satisfied with their job security provided
by Nellara Food Industries, 32% are highly satisfied. 26% showed neutral response.
0
5
10
15
20
25
30
35
40
45
Highly Satisfied Satisfied Neutral Dissatisfied Highly Dissatisfied
PE
RC
EN
TA
GE
OPINION

45
TABLE 4.15 THERE IS ABSENTS DUE TO TRANSPORTATION PROBLEM
Particulars Number. Of Respondents Percentage
Strongly agree 12 24
Agree 18 36
Neutral 9 18
Disagree 8 16
Strongly disagree 3 6
Source: Primary Data
INTERPRETATION
Above table shows that 36% of employees agree that there is absence due to
transportation problem. 24% strongly disagrees with this. 18% showed neutral response.
0
5
10
15
20
25
30
35
40
Strongly agree Agree Neutral Disagree Strongly disagree
PE
RC
EN
TA
GE
OPINION

46
TABLE 4.16 SATISFIED WITH REMUNERATION GIVEN
Particulars Number of Respondents Percentage
Highly Satisfied 9 18
Satisfied 34 68
Neutral 4 8
Dissatisfied 3 6
Highly Dissatisfied 0 0
Source: Primary Data
INTERPRETATION
Above table shows that68% of employees are stisfied with their remuneration and 18%
are highly satisfied. 6% are dissatisfied and 8% showed neutral response.
0
10
20
30
40
50
60
70
80
Highly Satisfied Satisfied Neutral Dissatisfied Highly Dissatisfied
PE
RC
EN
TA
GE
OPINION

47
CHI – SQUARE TEST
• Null hypothesis (H0):
Years of working of employees and their remuneration are not related
• Alternate hypothesis (H1):
The working years of employees and their remuneration are related
Satisfied with remuneration Total
Highly satisfied Satisfied Neutral Dissatisfied
0 – 1 year
1 – 2 year
2 – 5 year
Above 5 year
0
1
2
6
9
1
5
20
8
34
0
1
1
2
4
2
1
0
0
3
3
8
23
16
50
TABLE 3.16 CALCULATION OF CHI SQUARE TEST
O E (O-E)2 (O-E)2/E
0 0.54 0.292 0.54
1 1.44 0.194 0.13
2 4.14 4.580 1.11
6 2.88 9.730 3.38
1 2.04 1.081 0.53
5 5.44 0.193 0.03
20 15.64 19.009 1.22

48
8 10.88 8.294 0.76
0 0.24 0.057 0.24
1 0.64 0.129 0.20
1 1.84 0.705 0.38
2 1.28 0.518 0.40
2 0.18 3.312 18.40
1 0.48 0.270 0.56
0 1.38 1.904 1.38
0 0.96 0.921 0.96
TOTAL 30.22
Table value
1. Level of significance = 0.05
2. Degree of freesom = (r-1) (c-1)
(4-1) (4-1) = 9
16.919
INTERPRETATION
Here the calculated value is greater than table value hence H1 accepted that is working
years of employees and their remuneration are related. Calculated value is 30.22 and
table value is 16.919.

49
FINDINGS
Finding and analysis reveals the following conclusion
• In my research found that major cause of being absent is due to sick. The workers
also take leaves because of their personnel needs. More than 34% of employees
strongly agrees financial reason is the another cause of absenteeism.
• Overtime is also one the factor for absenteeism because of which the level of
stress increases and in frustration many of the employees take leave or skip their
routine.
• On the other side 94% are clear about their responsibility and 62% of the workers
are fully satisfied with their work and 6% of the workers in Nellara Food
Industries thinks their work as good.
• The workers of the Nellara Food Industries also stated that the leave policy,
welfare facilities and the remuneration provide by the company is satisfied.
Nellara Food industries is having a strong relationship among their workers
because of which it is having workers who having experience more the 10years.
• In Nellara Food Industries the majority of the workers are satisfied with the
relation between the co-workers and also among their superiors. They all maintain
a good relationship and also stated that they are very supportive to each other.
• Absenteeism level is high in night shift which is from 10 PM to 6 AM.
• Transportation was another factor that I noticed during my research in Nellara
Food Industries. Here like the workers who coming from the backward area that is
villages where their transport facility is not developed are not able to come to their
work mainly in the time of the monsoons, due to which they have to quite from
going to the work.

50
SUGGESTIONS
Absenteeism is a serious problem for management because it involves heavy additional
expenses. The management should take the following measures to reduce the rate of
absenteeism:-
• An incentive provides an employee with a boost to their motivation and avoids
unnecessary absenteeism. Incentives like two hours of bonus pay for every month
of perfect attendance can improve a lot.
• If you confront an employee about his or her frequent absenteeism and you find
out that it is due to personal problems refer them to EAP (Employee Assistance
Program).
• In case of sickness reporting employees they must phone in as early as possible
to advise why they are unable to make it to work and when they expect to return
• Put a performance improvement plan in placethe tactic above doesn’t work, then
you need to put a performance review plan in place that sets specific goals for
improvement, attendance being one of them. Put the plan in writing and clearly
explain the timeframe of the plan and the consequences of not fulfilling its
requirements
• Assess your Management Style it’s hard to acknowledge, but one of the more
common reasons for employee dissatisfaction is management style. Could your
style be encouraging employees to harbor grudges or lose morale Step back and
assess what you can do differently, is your open door policy really that open Do
employees really feel valued? Plan on setting side more management time for your
team, discuss their professional goals, and share your vision for the continued
growth of your business and their role in it.
• Terminating Repeat Offenders if you’ve exhausted all these intervention measures
and aren’t seeing improvement, then termination may be your only option. Follow
your HR policy to the letter on this one and refer to the law as it pertains
to terminating employees, final pay checks, and more.

51
CONCLUSION
The project report titled’ EMPLOYEE ABSENTEEISM , at ‘NELLARA FOOD
INDUSTRIES’ in EDAPPAL, is a result of my work done through market survey,
interview with the company executives, and other secondary sources of information
referred; the kind of information reflected from my study is to put in the report my best
knowledge.
In the end to conclude this report I would like to specify that the project allotted to
me on ABSENTEEISM was of immense help to me in understanding the working
environment of an organization, thereby providing a firsthand practical experience. In
this project while identifying the reasons of absenteeism of the workers of Nellara Food
Industries Edappal. I got an opportunity to interact with workers to observe their
behavior and attitude.
In the end I would once again like to thank the people of Nellara Food industries
who helped me in accomplishing this project and boosting my morale by appreciating
and recognizing my efforts.

52
BIBLIOGRAPHY
BOOKS
• C. R .Kothari (2004) “Research methodology methods and techniques” New age
international publisher’s, 2nd Revised edition.
• VPS Rao, (2004) “Human resource management”, New Delhi, Excel publications,
3rd edition
• Ashwathappa. K (1996), “Human Resource Management”, Tata McGraw Hill
Publishing Company Ltd.
JOURNALS
• Gary J.Blau, Journal of management, Employee Absenteeism Eism,organizational
commitment and Job Satification:Anotherlook,wAveinter 1986,volume.12 no.4
577-584.
• A Sagie, Journal of vocational behavior, Job involvement and organizational
commitment as interactive predictors of tardiness and absenteeism, vol.52,issue
2,April 1998,pages 156-171
• Paul M Muchinsky, Journal of vocational behavior, Employee absenteeism:A
review of literature,vol. 10, issue 3, june 1977, pages 316-340
• Arthur Gerestenfeld, journal of business horizons, Employee
absenteeism:newinsights:Data reveal external factor, vol.12, issue 5,
octomber1969, pages 51-57
WEBSITES
• http://www.nellara.com/contact_us.htm
• https://www.scribd.com/doc/17026384/Project-on-Employee-Absenteeism
• http://www.hrguide.com
• http://www.slideshare.net/

53
APPENDIX
QUESTIONAIRE
Name:
Age:
Gender: Male Female
Martial Status: Married Unmarried
1) For how many years you are working Nellara Food Industries ?
(a) 0 – 1 yr (b) 1 – 2 yr
(c)2 – 5 yr (d) < 5 yr
2) In which shift you are working in Nellara Food Industries ?
(a) 6 am – 2 pm (b) 2 pm – 10 pm
(c) 10 pm – 6 am
3) How often you remain absent in a month ?
(a) Nil (b) Once
(c) Twice (d) < Twice
54
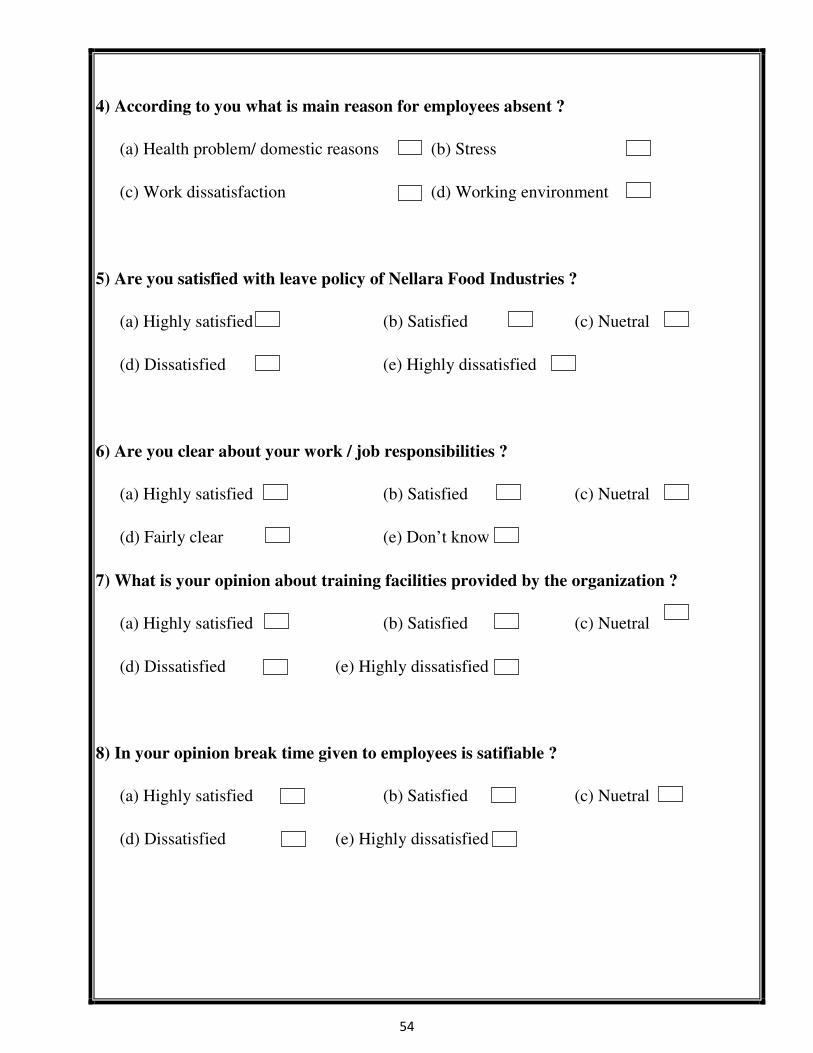
4) According to you what is main reason for employees absent ?
(a) Health problem/ domestic reasons (b) Stress
(c) Work dissatisfaction (d) Working environment
5) Are you satisfied with leave policy of Nellara Food Industries ?
(a) Highly satisfied (b) Satisfied (c) Nuetral
(d) Dissatisfied (e) Highly dissatisfied
6) Are you clear about your work / job responsibilities ?
(a) Highly satisfied (b) Satisfied (c) Nuetral
(d) Fairly clear (e) Don’t know
7) What is your opinion about training facilities provided by the organization ?
(a) Highly satisfied (b) Satisfied (c) Nuetral
(d) Dissatisfied (e) Highly dissatisfied
8) In your opinion break time given to employees is satifiable ?
(a) Highly satisfied (b) Satisfied (c) Nuetral
(d) Dissatisfied (e) Highly dissatisfied
55
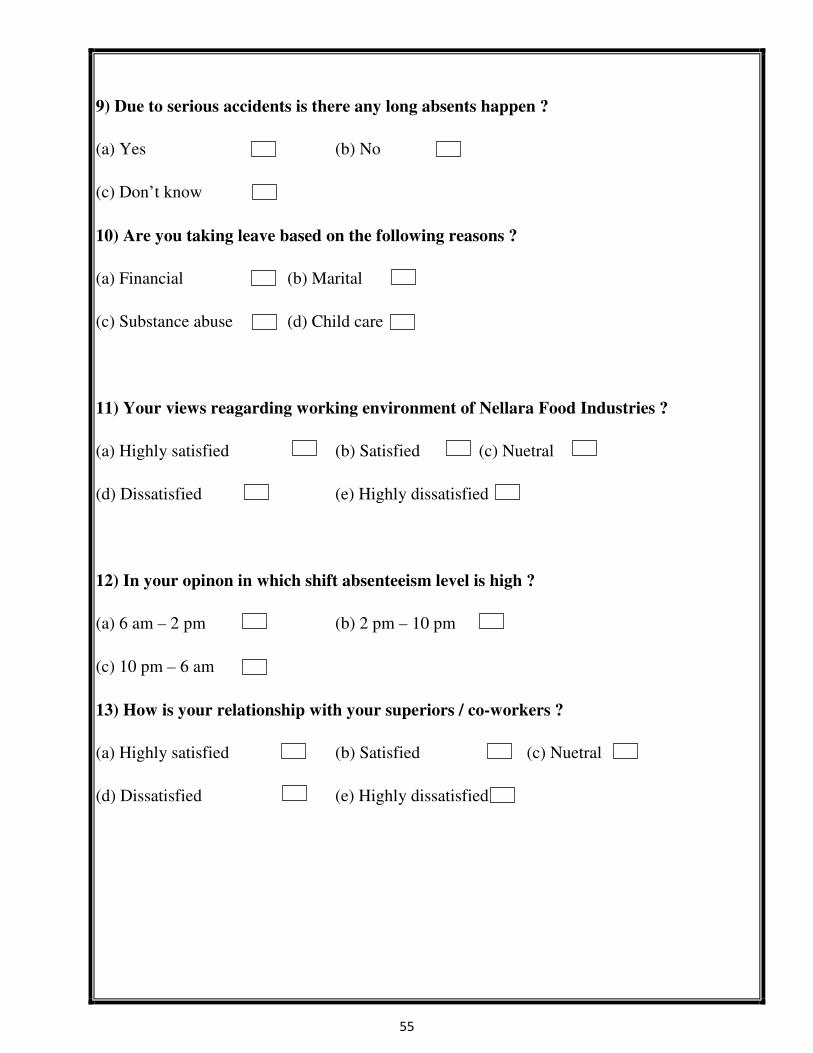
9) Due to serious accidents is there any long absents happen ?
(a) Yes (b) No
(c) Don’t know
10) Are you taking leave based on the following reasons ?
(a) Financial (b) Marital
(c) Substance abuse (d) Child care
11) Your views reagarding working environment of Nellara Food Industries ?
(a) Highly satisfied (b) Satisfied (c) Nuetral
(d) Dissatisfied (e) Highly dissatisfied
12) In your opinon in which shift absenteeism level is high ?
(a) 6 am – 2 pm (b) 2 pm – 10 pm
(c) 10 pm – 6 am
13) How is your relationship with your superiors / co-workers ?
(a) Highly satisfied (b) Satisfied (c) Nuetral
(d) Dissatisfied (e) Highly dissatisfied

56
14) Did you agree the facilities providede by the company is becoming causes of
absenteeism ?
(a) Strongly agree (b) Agree (c) Nuetral
(d) Disagree (e) Strongly disagree
15)Are you satisfied with unity in workplace in the organization ?
(a) Highly satisfied (b) Satisfied (c) Neutral
(d) Dissatisfied (e) Highly dissatisfied
16) Your view about the work place of Nellara Food Industries?
(a) Highly satisfied (b) Satisfied (c) Neutral
(d) Dissatisfied (e) Highly dissatisfied
17) Here the absence preventing policy is strict, are you agree?
(a) Strongly agree (b) Agree (c) Neutral
(d) Satisfactory (e) Strongly disagree

57
18) Are you satisfied with job security by Nellara Food Industries?
(a) Highly satisfied (b) Satisfied (c) Neutral
(d) Dissatisfied (e) Highly dissatisfied
19) Do you agree is there absents due to transportation problem?
(a) Strongly agree (b) Strongly disagree (c) Neutral
(d) Never (e) Don’t know
20) Do you satisfied with your remuneration?
(a) Highly satisfied (b) Satisfied (c) Neutral
(d) Dissatisfied (e) Highly dissatisfied
Signature of the Respondent
Date: - / / 2015.