Real Exchange Rate Dynamics in Macedonia: Old Wisdoms and New Insights
22
econstor www.econstor.eu Der Open-Access-Publikationsserver der ZBW – Leibniz-Informationszentrum Wirtschaft The Open Access Publication Server of the ZBW – Leibniz Information Centre for Economics Nutzungsbedingungen: Die ZBW räumt Ihnen als Nutzerin/Nutzer das unentgeltliche, räumlich unbeschränkte und zeitlich auf die Dauer des Schutzrechts beschränkte einfache Recht ein, das ausgewählte Werk im Rahmen der unter → http://www.econstor.eu/dspace/Nutzungsbedingungen nachzulesenden vollständigen Nutzungsbedingungen zu vervielfältigen, mit denen die Nutzerin/der Nutzer sich durch die erste Nutzung einverstanden erklärt. Terms of use: The ZBW grants you, the user, the non-exclusive right to use the selected work free of charge, territorially unrestricted and within the time limit of the term of the property rights according to the terms specified at → http://www.econstor.eu/dspace/Nutzungsbedingungen By the first use of the selected work the user agrees and declares to comply with these terms of use. zbw Leibniz-Informationszentrum Wirtschaft Leibniz Information Centre for Economics Bogoev, Jane; Bojceva Terzijan, Sultanija; Égert, Balázs; Petrovska, Magdalena Article Real Exchange Rate Dynamics in Macedonia: Old Wisdoms and New Insights Economics - The Open-Access, Open-Assessment E-Journal, No. 2008-18 Provided in Cooperation with: Kiel Institute for the World Economy (IfW) Suggested Citation: Bogoev, Jane; Bojceva Terzijan, Sultanija; Égert, Balázs; Petrovska, Magdalena (2008) : Real Exchange Rate Dynamics in Macedonia: Old Wisdoms and New Insights, Economics - The Open-Access, Open-Assessment E-Journal, No. 2008-18, Economics: The Open-Access, Open-Assessment E-Journal, Vol. 2, Iss. 2008-18, pp. 1-19, http://dx.doi.org/10.5018/economics-ejournal.ja.2008-18 This Version is available at: http://hdl.handle.net/10419/18031
-
Upload
independent -
Category
Documents
-
view
0 -
download
0
Transcript of Real Exchange Rate Dynamics in Macedonia: Old Wisdoms and New Insights

econstor www.econstor.eu
Der Open-Access-Publikationsserver der ZBW – Leibniz-Informationszentrum WirtschaftThe Open Access Publication Server of the ZBW – Leibniz Information Centre for Economics
Nutzungsbedingungen:Die ZBW räumt Ihnen als Nutzerin/Nutzer das unentgeltliche,räumlich unbeschränkte und zeitlich auf die Dauer des Schutzrechtsbeschränkte einfache Recht ein, das ausgewählte Werk im Rahmender unter→ http://www.econstor.eu/dspace/Nutzungsbedingungennachzulesenden vollständigen Nutzungsbedingungen zuvervielfältigen, mit denen die Nutzerin/der Nutzer sich durch dieerste Nutzung einverstanden erklärt.
Terms of use:The ZBW grants you, the user, the non-exclusive right to usethe selected work free of charge, territorially unrestricted andwithin the time limit of the term of the property rights accordingto the terms specified at→ http://www.econstor.eu/dspace/NutzungsbedingungenBy the first use of the selected work the user agrees anddeclares to comply with these terms of use.
zbw Leibniz-Informationszentrum WirtschaftLeibniz Information Centre for Economics
Bogoev, Jane; Bojceva Terzijan, Sultanija; Égert, Balázs; Petrovska,Magdalena
Article
Real Exchange Rate Dynamics in Macedonia: OldWisdoms and New Insights
Economics - The Open-Access, Open-Assessment E-Journal, No. 2008-18
Provided in Cooperation with:Kiel Institute for the World Economy (IfW)
Suggested Citation: Bogoev, Jane; Bojceva Terzijan, Sultanija; Égert, Balázs; Petrovska,Magdalena (2008) : Real Exchange Rate Dynamics in Macedonia: Old Wisdoms andNew Insights, Economics - The Open-Access, Open-Assessment E-Journal, No. 2008-18,Economics: The Open-Access, Open-Assessment E-Journal, Vol. 2, Iss. 2008-18, pp. 1-19,http://dx.doi.org/10.5018/economics-ejournal.ja.2008-18
This Version is available at:http://hdl.handle.net/10419/18031

Vol. 2, 2008-18 June 12, 2008
Special Issue "Recent Developments in International Money and Finance" Editor: Ronald MacDonald
Real Exchange Rate Dynamics in Macedonia: Old Wisdoms and New Insights
Jane Bogoev Research Department, National Bank of the Republic of Macedonia
Sultanija Bojceva Terzijan Research Department, National Bank of the Republic of Macedonia
Balázs Égert OECD, Economics Department; CESifo; University of Paris X-Nanterre;
and the William Davidson Institute
Magdalena Petrovska Research Department, National Bank of the Republic of Macedonia
Abstract: The ambition of this paper is to analyse real exchange rate dynamics in Macedonia relying on a highly disaggregated dataset. We complement the indirect evidence reported in Loko and Tuladhar (2005) and we provide direct evidence on the irrelevance of the Balassa-Samuelson effect for overall inflation via service prices in the CPI. Furthermore, we estimate variants of the BEER model. We show that alternative econometric techniques and data definitions bear an impact on the robustness of the estimation results. Overall, productivity, government consumption and the openness variables were found to be fairly robust in terms of sign and size. An increase/decrease in the productivity variables is associated with an appreciation/depreciation of the real effective exchange rate. Given that the B-S effect admittedly has a very limited role to play through nontradable prices in the CPI, this relationship could be explained by the (inverse) quality effect proposed by Loko and Tuladhar and, possibly in addition to that, by the nontradable component of tradable prices.
JEL: E31, F31, O11, P17 Keywords: Real exchange rate; Balassa-Samuelson; Macedonia
Correspondence: E-mail: [email protected], [email protected] and [email protected]. This is a revised version of an earlier draft using an updated dataset. Balázs Égert was with the Oesterreichische Nationalbank when this work started. The paper was prepared in the framework of a technical cooperation between the National Bank of the Republic of Macedonia and the Oesterreichische Nationalbank. The authors would like to thank two referees for their valuable comments.
www.economics-ejournal.org/economics/journalarticles/2008-18
© Author(s) 2008. This work is licensed under a Creative Commons License - Attribution-NonCommercial 2.0 Germany

Economics: The Open-Access, Open-Assessment E-Journal 1
1 Introduction
A general perception in the economic profession is that catching-up economies tend to experience an appreciation of their real exchange rate. The Balassa-Samuelson effect is commonly thought to be underlying the trend appreciation during periods of rapid real convergence. According to this view, productivity gains in the tradable sector are higher than those in the nontradable sector, and lead to a positive inflation differential and thus to real appreciation - through the increase in market-based non-tradable prices.
Real appreciation was and remains a prominent feature in some of the fast growing countries of Central and Eastern Europe. As Figure 1 below indicates, the pace of the appreciation of the real exchange rate, constructed using the consumer price index (CPI), reached about 6 % between 1990 and 2005 in the Baltic countries and has been also sizeable in the CEE-5. The dynamics of real exchange rates differs, however, considerably among CEE economies. In some countries, the bulk of the appreciation occurred during the early and mid-1990s and flattened afterwards. Some consider it as a proof for a so-called initial undervaluation (Halpern and Wyplosz, 1997) that was followed by a rapid correction back to levels in line with fundamentals.
In other countries, the appreciation proved to be a long-lasting and steady phenomenon. For these cases, there is ample empirical evidence that the appreciation can be only partially explained by the direct Balassa-Samuelson effect. Other sources of appreciation that are identified in the literature are the positive inflation differential of administrative prices (MacDonald and Wojcik, 2004), and, most importantly, the trend appreciation of the real exchange rate of the tradable sector, measured by means of the producer price index (PPI), that accounted for most of the overall appreciation. Why did then the PPI-based real exchange rate appreciate? One argument relates to the constant upgrade of the quality of goods that shows up in inflation rates (see e.g. DeBroeck and Slok, 2006, and Égert et al., 2006 for empirical evidence and Bruha and Podpiera, 2007, for a DSGE model theoretically explaining the phenomenon). A second possible explanation is the non-tradable content of goods that can be thought of as an indirect Balassa-Samuelson effect.
Against this background, real exchange rate behaviour in Macedonia appears rather peculiar because the officially published real exchange rate has been depreciating rather than appreciating during the last ten years or so. Loko and Tuladhur (2005) argue that falling relative prices of non-tradable goods relative to the foreign trading partners, i.e. an inverted Balassa-Samuelson effect, was not to be blamed for the observed depreciation. Instead, they put forward that an inverse quality effect was at play. As Macedonia did not achieve substantial productivity gains in the tradable sector mainly due to the slow process of economic transformation, the argument goes, the only way to preserve export market shares was to specialise in low quality products. As a result, the tradable price inflation grew slower in Macedonia than abroad leading to the depreciation of the real exchange rate. Gutierrez (2006) also comes to the conclusion that the depreciation was caused by low productivity growth although she does not elaborate on the potential channels.
The shortcoming of the analysis of Loko and Tuladhur (2005) and Gutierrez (2006) is that they proxy productivity differential with GDP per capita. It is far to be obvious that GDP per capita accurately captures productivity differentials because GDP per capita increases may be not only due productivity increases in the tradable sector but
www.economics-ejournal.org

2 Economics: The Open-Access, Open-Assessment E-Journal
also due to productivity gains in the non-tradable sector or due to labour market participation increases (see e.g. Spain). In both cases, GDP per capita is clearly a biased measure of the true productivity differential. Furthermore, both studies use real exchange rate measures where the CPI and PPI are composed in line with the national weights. What this means for countries at very different stages of economic development is that goods and especially food and energy items will have much higher shares in the less developed country’s price index, while services will be given more weight in the more developed countries, since weights in the CPI reflect final consumption expenditures. Consequently, similar underlying development of the CPI subcomponents will show up in different overall inflation rates. In this paper, we make an attempt to remedy the aforementioned problems by using a new dataset on highly disaggregated sectoral productivity and by correcting for the obvious bias in the construction of the real exchange rate. In addition to that, we carry out a series of sensitivity analysis as we use several alternative measures for sectoral productivity and as we employ a variety of time series cointegration techniques.
The paper is structured along the following lines. Section 2 presents stylised facts for Macedonia. Section 3 describes the data, discusses conceptual issues relating to data construction and presents the battery of estimation techniques used in the paper. Section 4 displays the estimation results. Finally, Section 5 draws some concluding remarks.
2 Stylised Facts in Macedonia
The starting point of our analysis is purchasing power parity (PPP). When using absolute price levels (expressed in units of the foreign and domestic currencies), absolute PPP would imply that the domestic price level expressed in terms of the foreign currency (P/E)1 is equal to the foreign price level (P*). Put differently, the real exchange rate, obtained as the foreign to domestic price level should be 1 ((P/E=P* => P*/(P/E)=EP*/P=1). Yet it is widely acknowledged that the real exchange rate of less developed countries are undervalued in terms of absolute PPP because lower non-tradable prices, and also because goods prices are cheaper due to lower quality and lower non-tradable component.(see e.g. Égert, Halpern and MacDonald, 2006, for more details on this issue).
Real exchange rates constructed using absolute price levels and against the euro, displayed on Figure 1 below, are different to 1 in all Central and Eastern European economies. The fact that the figures exceed unity indicates substantial undervaluations in terms of PPP for all transition economies of Central and Eastern Europe (CEE). At the same time, a convergence towards absolute PPP took place from 1993 to 2005 in line with progress achieved in real convergence in general, and in productivity levels in particular. Macedonia is no exception to this rule: real exchange rate fell from around 4 in 1993 to below 3 in 2005. However, the real exchange rate was among the most undervalued in 2005. In other words, Macedonia’s price level was one of the lowest in Central and Eastern Europe when compared to the euro area.
_________________________ 1 The exchange rate is expressed as domestic currency units over one unit of foreign currency. Hence, a rise (fall) in the exchange rate indicates a depreciation (appreciation).
www.economics-ejournal.org

Economics: The Open-Access, Open-Assessment E-Journal 3
Figure 1: Real Exchange Rates in Levels vis-à-vis the Euro Area (based on absolute price levels)
0123456789
10
Ukr
aine
Bulg
aria
Mac
edon
ia
Serb
ia
Bosn
iaH
erz
Alba
nia
Rom
ania
Mon
tene
gro
Rus
sia
Lith
uani
a
Latv
ia
Pola
nd
Slov
akia
Cze
ch R
ep
Esto
nia
Cro
atia
Hun
gary
Slov
enia
1993
2005
Source: Authors’ calculations based on data obtained from the WIIW’s annual database 2006.
Figure 2: Real Exchange Rates in Levels vis-à-vis the Euro Area (based on absolute price levels)
2
2.5
3
3.5
4
4.5
5
1990
1991
1992
1993
1994
1995
1996
1997
1998
1999
2000
2001
2002
2003
2004
2005
RER
_lev
el
1
1.05
1.1
1.15
1.2
1.25
1.3
1.35
RE
ER_i
ndex
RER_levelREER_index
Source: Authors’ calculations based on data obtained from the WIIW’s annual database 2006 and based on the real effective real exchange rate published by the National Bank of the Republic of Macedonia (corrected for the devaluation of the Serbian dinar in December 2000)2.
The observed appreciation on Figure 1 seems to be chiefly a result of a sharp appreciation between 1992 and 1995 (see Figure 2). Nevertheless, the real exchange rate
_________________________ 2 In December 2000, the Serbian dinar was officially devaluated by 80%. It was a formal devaluation in order to equalize the official exchange rate (announced by the central bank) and the exchange rate on the black market and in practice did not have an impact on the market exchange rate.
www.economics-ejournal.org

4 Economics: The Open-Access, Open-Assessment E-Journal
vis-à-vis the euro has been on a moderate appreciation trend starting in 1998 as the Macedonian denar strengthened by an annual average of 1.1% in real terms.
This stands in sharp contrast with the development of the real effective exchange rate of the Macedonian denar, obtained from the official statistics of the National Bank of the Republic of Macedonia, that depreciated by some 30 percent from 1997 to 2005 (Figure 2). The striking divergence could be explained by two facts relating to the composition of the data. First, the Serbian denar occupies a central role in the effective exchange rate (with a weight of 18.4% in 2003), and it appreciated strongly against the Macedonian denar as a result of high inflation rates. Second, the different composition and the different weights used in the consumer price indexes and in the GDP-based price levels can also yield diverging outcomes. The subsequent sections will explore these two composition effects.
3 Visual Inspection: Caught Red Handed?
3.1 Conceptual Issues
The productivity differential is often found in empirical investigation to be the single most important determinant of the real exchange rate. Against this background, we investigate the link between the productivity differential and the real exchange rate. In a first step, we analyse the productivity differential and the behaviour of the relative price of non-tradables in Macedonia. In a second step, we study the relation between the productivity differential compared to the foreign benchmark and various real exchange rate measures.
Turning to the productivity variable, we first computed annual productivity growth rates for the different sectors from using data from 1997 to 2007. Productivity growth for the eight sectors, i.e. 1) agriculture und mining, 2) industry, 3) construction, 4) wholesale und retail trade, 5) hotel and restaurants, 6) transport, storage and telecommunication, 7) financial intermediation, real estate and other business activities, 8) public administration and defence, compulsory social security, education, health and social work.
In accordance with Figure 3, productivity growth has been strong in agriculture, industry, construction and trade. The unusually high growth rate in hotel and restaurant is a statistical artefact and is due to a change in classification in 2002 that affect hotels& restaurants and the transport and telecommunication sectors. This in turn is also reflected in the very low growth rates in the latter sector. Finally, it merits mention that productivity growth remained moderate in financial services and close to zero in public services.
Given that the core tradable sector, industry, did not record productivity gains substantially higher than the other sectors, it is not very surprising to find that the various productivity differentials tend to be negative. We indeed calculated 4 alternative measures of productivity differentials based on the following considerations (obtained using four alternative measures for productivity in tradables and three variants in nontradables):
www.economics-ejournal.org

Economics: The Open-Access, Open-Assessment E-Journal 5
Figure 3: Annual Average Sectoral Productivity Growth, 1998–2007
Source: State Statistical Office and authors' own calculations.
First, only those sectors are considered where prices are established on the market. The intuition behind is that in order for productivity to be reflected in wages and prices, wages and prices need to be determined by market forces. This is obviously not the case for public administration and defence, compulsory social security, education, health and social work that are disregarded in our analysis. Therefore, these sectors are excluded from our analysis.
Second, the tradable sector comprises either only industry (PROD1_T) or industry and agriculture (PROD2_T). Using the rule of thumb established by Canzoneri et al. 1999, agriculture is more likely to be tradable than not as agricultural exports account for more than 10% of agricultural output (around 16% from 2004 to 2006). Nevertheless, the reason for not considering agriculture is that it still to a certain extent receives government subsidies. So we either include agriculture into the tradable sector or omit it completely from the analyses. Recently, some voiced the view that services are increasingly becoming tradable in nature (see e.g. Randveer and Rell, 2002; Hinnosar et al, 2003; MacDonald and Wójcik, 2004 and Mihaljek and Klau, 2004). For this reason, service sectors are included in the third and the fourth variant, such as shown in Table 1a (PROD3_T and PROD4_T). Table 1b below gives a detailed overview of the composition of the four different measures of the productivity differential for Macedonia. The productivity measures for the foreign countries follow the same logic. The difference is that for Macedonia’s largest trade partners, we do not have disaggregated data for trade&retail&repair + hotels&restaurants + transport&storage&communications and these sectors are treated together.
www.economics-ejournal.org

6 Economics: The Open-Access, Open-Assessment E-Journal
Table 1a: Definition of Sectoral Productivity TRADABLES MARKET NON-
TRADABLES
Macedonia
PROD1_T_M Industry
PROD1_NT_M Construction + wholesale trade&retail&repair
+ hotels&restaurants +
transport&storage&communications +
financial intermediation+real estate&business
activity (excluding public sectors and
agriculture)
PROD2_T_M Industry + agriculture
PROD1_NT_M Construction + wholesale trade&retail&repair
+ hotels&restaurants +
transport&storage&communications +
financial intermediation+real estate&business
activity (excluding public sectors)
PROD3_T_M Industry + agriculture + wholesale
trade&retail&repair +
hotels&restaurants +
transport&storage&communications
PROD2_NT_M Construction + financial intermediation&real
estate&business activity (excluding public
sectors)
PROD4_T_M Industry + agriculture +
hotels&restaurants +
transport&storage&communications
PROD3_NT_M Construction + wholesale trade&retail&repair
+ financial intermediation&real
estate&business activity (excluding public
sectors)
Foreign benchmark
PROD1_T_F Industry
PROD1_NT_F Construction + wholesale trade&retail&repair
+ hotels&restaurants +
transport&storage&communications +
financial intermediation&real estate&business
activity (excluding public sectors and
agriculture)
PROD2_T_F Industry + agriculture
PROD1_NT_F Construction + wholesale trade&retail&repair
+ hotels&restaurants +
transport&storage&communications +
financial intermediation&real estate&business
activity (excluding public sectors)
PROD3_T_F Industry + agriculture + wholesale
trade&retail&repair +
hotels&restaurants +
transport&storage&communications
PROD2_NT_F Construction + financial intermediation&real
estate&business activity (excluding public
sectors)
www.economics-ejournal.org

Economics: The Open-Access, Open-Assessment E-Journal 7
Table 1b: Definition of Productivity Differentials TRADABLES MARKET NON-
TRADABLES Macedonia
PROD DIFF1 M PROD1 T M PROD1 NT M PROD DIFF2 M PROD2 T M PROD1 NT M PROD DIFF3 M PROD3 T M PROD2 NT M PROD DIFF4 M PROD4 T M PROD3 NT M
Foreign benchmarkPROD DIFF1 F PROD1 T F PROD1 NT F PROD DIFF2 F PROD2 T F PROD1 NT F PROD DIFF3 F PROD3 T F PROD2 NT F
Macedonia - Foreign benchmarkD PROD DIFF1 PROD DIFF1 M - PROD DIFF1 FD PROD DIFF2 PROD DIFF2 M – PROD DIFF2 FD PROD DIFF3 PROD DIFF3 F – PROD DIFF3 FD PROD DIFF4 PROD DIFF4 F – PROD DIFF3 F
3.2 Balassa-Samuelson Effect (Re)Visiting Macedonia
Loko and Tuladhar (2005) argued that the Balassa-Samuelson effect is of negligible importance for real exchange rate dynamics in Macedonia. This conclusion is based on indirect evidence. They regressed the CPI-based real exchange rate and the PPI-deflated real exchange rates on their productivity variables proxied by per capita GDP - in accordance with Egert and Lommatzsch (2004) - and found that productivity had similar effects on both exchange rate series. Nevertheless, if PPI were a good measure for tradable prices, then productivity should not have any effect on the PPI-based real exchange rate given that in the Balassa-Samuelson framework, the real exchange rate of the tradable sector is pinned down by the Purchasing Power Parity condition.3
We provide here with more direct evidence with regard to the empirical relevance of the Balassa-Samuelson effect for Macedonia. Our starting point is that the Balassa-Samuelson effect assumes that the productivity differential bears a link to the relative price of nontradables – computed as services prices in the CPI over goods prices in the CPI. Applying eyeball econometrics to the data displayed in Figure 4 suggests that the link is either nonexistent or at the very best very fragile when considering the various definitions of the productivity differential. Generally, relative prices rose steadily while the productivity differentials remained rather flat with substantial short-term variations. Obviously, service prices increased due to other factors than the Balassa-Samuelson effect.4
_________________________ 3 Models drawing on the tradition of New Open Economy Macroeconomcs (NOEM) provide a theoretical link running from productivity to the tradable sector’s real exchange rate. However, in such a case, productivity gains in tradables lead to a depreciation and not to an appreciation of the real exchange rate (Benigno and Thoenissen, 2004). 4 We also ran cointegration tests such as set out in Section 4.2 between the log-transformed relative price of nontradables and the log-transformed alternative productivity differential measures. The results indicated very robustly that the null hypothesis of no cointegration cannot be rejected for any of the bivariate relationships. The results are available from the authors upon request.
www.economics-ejournal.org

8 Economics: The Open-Access, Open-Assessment E-Journal
Figure 4: Relative Prices and Various Productivity Differentials (left-hand side) and Tradable, Nontradable and Overall Price Inflation (right-hand side), 1997–2007
Source: Authors’ calculations based on data obtained from the National Bank of the Republic of Macedonia and the State Statistical Office.
But even if we found a robust relation running from productivity to relative prices, the overall impact on the consumer price index would crucially depend on the share of nontradables in the CPI basket. The weight structure of the CPI is given by final household consumption expenditures. In turn, how much households spend from their budget on goods and services is usually strongly correlated to overall economic development of the country considered. Poorer households tend to spend more on foodstuff and richer household consume more services. This phenomenon that came to be known as Engel’s law can be also observed in the Macedonian data. In 2006, the share of services amounted to 19% in the total CPI. In other words, the possible contribution of nontradables to overall inflation and thus to real exchange rate appreciation seems to be fairly limited in Macedonia. The case for a low impact is strengthened when comparing overall inflation with its two main components: services and goods. The steady rise of services from 2000 onwards appears to have a negligible influence on the CPI. By contrast, the consumer price index exhibits an extremely strong comovement with goods price inflation.
Overall, it is fair to conclude that the Balassa-Samuelson effect bleeds from two wounds. First, rises in service prices were not connected to developments in the productivity differential in Macedonia from 1997 to 2005. Second, service price inflation has potentially little impact on overall inflation because of the modest weight of services in final household expenditures.
www.economics-ejournal.org

Economics: The Open-Access, Open-Assessment E-Journal 9
3.3 Real Exchange Rate Measures and Productivity Differentials
We stressed earlier the caveats related to the construction of real exchange rate series. In particular, we showed that while the officially published real effective exchange rate depreciated sharply between 1997 and 2005, the real exchange rate based on absolute price levels recorded small but steady appreciation during the same period. It is clear, however, that none of those variables is perfect.
The real effective exchange rate index suffers from differing weights in the CPI of Macedonia and of main industrialised trading partners. As a matter of fact, goods and foodstuff have more weight in Macedonia and services more weight in the main trading partners. As a result, low goods price inflation and higher service price inflation in the foreign benchmark possibly overestimates the true depreciation of the real exchange rate.
We attempted to correct this bias and constructed two kinds of CPI series. First, the weights were set to equal in all countries to the ones observed in Macedonia. Second, average weights of the foreign countries were applied to recalculate the CPI for Macedonia.
We were able to reconstruct the effective exchange rate for the main industrialised countries where weights were derived on the basis of the ratio export and imports over total foreign trade.5 The drawback is that we did not have detailed data on CPI for Serbia (& Montenegro), a country that accounted for 13.7% of the overall foreign trade in 2005.
Figure plots and compares the old series (REER_CORR)6 and the newly calculated ones: REER1 based on Macedonian weights and REER2 based on the average weights of the foreign effective benchmark. The depreciation is substantially lower than for the official real effective exchange rate series. Furthermore, and as expected, using weights of the foreign benchmark results in an even less depreciation of the real exchange rate.
While the real exchange rate series based on absolute price level data is broadly in line with the dynamics of the newly calculated real exchange rate series, it shows a moderate appreciation from 1999 onwards whereas the new series point more in the direction of stability. This difference is likely to be connected with the construction of the absolute price level data: absolute price data are basically not fully consistent over time given that new goods and quality upgrades are not controlled for at all7, while at least efforts are made to filter out those effects from the CPI.
Now, let us take a look at how different productivity differentials relate to the real exchange rate series. Figure 5 testifies forcefully the absence of any link if using the official real exchange rate series, whilst the newly constructed real exchange rate series seem to move tandem with the productivity differential.
_________________________ 5 We used data for the five largest trading partners from the EU to proxy the euro area: Germany, Greece, Italy, France and the Netherlands. Note that our basket covers almost half of Macedonian foreign trade. 6 An increase implies appreciation and a decrease indicates depreciation.
7 See .e.g. Eurostat-OECD methodological manual on purchasing power parities, http://www.oecd.org/document/0,2340,en_2649_34357_37961859_1_1_1_1,00.html
www.economics-ejournal.org

10 Economics: The Open-Access, Open-Assessment E-Journal
Figure 5: Real Exchange Rate Measures (left-hand side) and Productivity Differential and Real Exchange Rate Measures (right-hand side), 1997–2007
Source: Authors’ calculations based on data obtained from the National Bank of the Republic of Macedonia.
The intriguing question is now how to explain this finding, i.e. the relation between the real exchange rate and productivity, given the quasi irrelevance of the Balassa-Samuelson effect and that productivity developments are reflected in the evolution of the real exchange rate of tradables.
We think that there are two plausible explanations. The first one is given by Loko and Tuladhar (2005). Productivity gains may be reflected in the quality of the produced and consumed goods. One caveat is that the overlap between the producer price index and the consumer price index is possibly fairly limited. Consumer goods and foodstuff included in the CPI have little in common with intermediate and final industrial goods included in the PPI. So, while it may be well true that Macedonia specialises in low quality and thus low price goods, it does not necessarily need to show up in the CPI. In the CPI, what really matters is the final consumption of households that in turn is a function of disposable income. Goods of lower quality relative to the foreign benchmark concern the CPI if final consumptions patterns become divergent.
Another explanation would consist in saying that goods contain an important chunk of local inputs. Local inputs may be local services. In addition, goods prices may be also predominantly determined by local wages in labour intensive sectors and if prices are not subject to international trade. If productivity increases less in Macedonia than in its trading partners, prices of local inputs contained in tradable goods prices will increase less, resulting in a real depreciation of the denar’s exchange rate.
www.economics-ejournal.org

Economics: The Open-Access, Open-Assessment E-Journal 11
4 Estimations
4.1 Conceptual Issues
Because we are interested in the general impact of conventional fundamentals on the real exchange rate in Macedonia, we use a general single-equation approach, proposed among others by MacDonald (1997) and Clark and MacDonald (1998) that also came to be known as the Behavioural Equilibrium Exchange Rate approach. Such a framework is related to the real interest parity:
*1 )( ttttt rrqqE −=−+ (1)
where , represent the domestic and foreign ex ante real interest rates, stands for the expected real exchange rate in for , and
t is the observed real exchange rate in period t. Rearranging equation (1) allows us to express the observed real exchange rate as a function of the expected value of the real exchange rate in for and the ex ante real interest differential.
)( 1+Δ−= tttt pEir )( *1
**+Δ−= tttt pEir
)( 1+tt qE t 1+tq
t 1+t
)()( 1∗
+ −−= ttttt rrqEq (2)
)( 1+tt qE can be assumed to be the outcome of the expected values of the fundamentals, so that
)()( 1∗
+ −−= ttttt rrxEq (3)
where x is the vector of fundamentals. Besides the productivity variable, the list of fundamentals usually analyzed in the empirical literature are net foreign assets, openness, a variable capturing government finances and terms of trade (MacDonald, 1997, and Clark and MacDonald, 1998)
As equation (3) shows, the usual BEER specification includes the interest rate differential to capture short-term real exchange rate movements due to capital flows. Given the low degree of liberalisation of capital movements over the period under study and the shallowness of financial markets in Macedonia, we drop the interest rate for our empirical analysis. Another reason for dropping the interest rate differential from the model is because by including this variable into the regression, the series were not cointegrated8.
We discussed at length the relationship between productivity and the real exchange rate. It suffices to summarise that increases in the productivity differential would lead to a real appreciation through the Balassa-Samuelson effect. In addition productivity gains could also lead to appreciation of the tradable sector’s real exchange rate via the quality channel and via the non-tradable component of goods. On the other hand, NOEM models suggest a possible negative relationship between productivity and the real exchange rate of tradables.
Net foreign assets, expressed in terms of GDP is not an unambiguous variable. Generally, an increase in the NFA position is usually associated with an appreciation of the real exchange rate in developed countries because it is the appreciation that corrects
_________________________ 8 This results are available from the authors upon request.
www.economics-ejournal.org

12 Economics: The Open-Access, Open-Assessment E-Journal
current account surpluses and because of the capital inflows related to increasing payments received on NFA. However, in transition economies, the relationship may be inverted at least in the medium term. Indeed, domestic savings may be insufficient to finance the high growth potential. Thus, foreign savings are needed, the inflow of which reduce the net foreign assets and, at the same time, causes the real exchange rate REER to depreciate. In the longer run, servicing the accumulated foreign liabilities needs real exchange rate depreciation.
It has been argued recently that remittances may play an important role in real exchange rate movements in developing countries. Lopez, Molina and Bussolo (2007) argue that workers’ remittances can have an influence on the exchange rate because they are reflected in capital inflows. We do not introduce remittances as a separate variable because they are indirectly included in our net foreign assets variable.
The openness variable, measured as export +import / GDP ratio affects the real exchange rate in a not straightforward manner. If openness reflects trade liberalization, an increase in openness should lead to a deterioration of the current account position and real depreciation of the currency should follow suit. On the other hand, the more open an economy is, the more links it has to international markets, making the distortions arising from tariffs less significant. Moreover, an open country would benefit more from comparative advantage, which would enable the whole economy to become more efficient. This could, in turn, justify a real appreciation via the productivity channel.
An improvement in the terms of trade (increase in the price of exports relative to that of imports) can generate two effects. The first one is the substitution effect, when the domestic sector shifts the production towards the tradable (exportable) goods resulting in higher wages in the tradable sector relative to the non-tradable sector. Assuming sufficient labour mobility this will induce increase in the overall domestic price level and appreciation of the domestic currency (through the improvement in the current account). The second effect or the income effect comes as the improvement in the trade balance raises income of the domestic economy and higher demand for the non-tradable goods emerges. To restore the internal equilibrium the real exchange rate is required to depreciate. The relative magnitudes of the substitution and income effect hinge on relative price elasticity of the demands for imports and exports.
Finally, the effect of fiscal policy is fairly straightforward. In the short to medium run, an increase in public consumption leads to increased demand for both goods and services. Thus, an increase in government consumption leads to a real exchange rate appreciation through higher demand and the resulting surge in inflation. However, in the long run, the budget deficit causes higher government indebtedness, which could destabilise the economy, drains it from the potential growth path, and lead to real exchange rate depreciation.
Our baseline specification includes the real effective exchange rate as dependent variable, and the productivity differential and government consumption as a proportion of GDP:
),( govcprodfqt = (4)
Since we have a limited number of observations (around 40) and as we are using dynamics equations including leads and lags of the first differenced dependent and independent variables, we add the other fundamentals one by one:
www.economics-ejournal.org

Economics: The Open-Access, Open-Assessment E-Journal 13
),,( nfagovcprodfqt = (4a)
),,( opengovcprodfqt = (4b)
),,( totgovcprodfqt = (4c)
We use three measures of the real effective exchange rate such as described earlier and four alternative measures for the productivity differential. For details of the definitions of productivity differentals see tables 1a and 1b.
4.2 Econometric Issues
Long-term cointegration relationships that connect the real exchange rate to the fundamentals are estimated using four alternative cointegration techniques: the Engle and Granger (EG) method (Engle and Granger, 1987), the Dynamic OLS (DOLS) due to Stock and Watson (1993), the error correction representation of the Autoregressive Distributed Lags (ARDL) model of Pesaran et al. (2001) and the VAR-based cointegration technique developed by Johansen (1995). For the EG and DOLS techniques, residual-based cointegration tests are conducted, whereas the so-called bounds testing approach proposed by Pesaran et al (2001) is used for the ARDL model. The trace-statistics are employed for the VAR model to investigate possible cointegration vectors. As an additional check to the standard cointegration tests, error correction terms are also analysed. In what follows, only those models are reported for which the formal cointegration tests reject the null of no cointegration and where the error correction terms are negative and statistically significant.
In addition, a battery of specification tests including tests looking into serial correlation, heterscedasticity and normality is carried out for the error correction models. For the VAR model, the inverted roots should be lay within the unit circle in order to ensure the stability of the model.
We stick to this systematic assessment in order to check for the sensitivity of the results regarding different econometric specifications.
4.3 Estimation Results
We first check the order of integration of the rough data series (see appendix for detailed data sources). Standard unit root and stationarity tests are used for this purpose: the augmented Dickey-Fuller (ADF), Phillips-Perron (PP) and the Elliott-Rothenberg-Stock (ERS) point optimal unit root tests and the Kwiatkowski, Phillips, Schmidt, and Shin (KPSS) stationarity test. For the real effective exchange rate series, the tests provide with conflicting results. However, they never indicate unambiguously that the series are stationary in level. This is why we conclude that the series are I(1). Overall, we can rely on the time series cointegration techniques as the series are I(1) processes (see appendix for the results).
Table 2 presents the estimation results when the formal cointegration tests (residual based tests for Engle-Granger and DOLS, and F-test and residual based test for ARDL) and the error correction terms indicated that the variables studied are linked via a long-
www.economics-ejournal.org

14 Economics: The Open-Access, Open-Assessment E-Journal
www.economics-ejournal.org
term relationship. Generally speaking, we found it difficult to establish cointegration for the specification (4) through (4c) when using the DOLS and Engle-Granger methods, but were more successful when relying on the error correction model of the ARDL proposed by Pesaran et al. (2001). These models are well specified in terms of the residuals that turn out to be well behaved. An exception is model 6 for which the null of normality could be rejected.
We did a cross-check and used the Johansen cointegration technique to make sure that only one cointegration vector is present in the data. Out of the 6 models identified by the ARDL model, five were confirmed by the VAR-based Johansen test. All these five models have problems in terms of the residuals when normality and serial correlation is checked on the residuals of the VAR and VECM, respectively. Only two models passed the residual checks for the VAR and none of them for the VECM. So, overall, single equation models seem to be more robust in meeting the basic hypothesis of well behaved residuals than the VAR-based estimations.
Turning to the interpretation of the results, several observations merit attention.
• First, we barely managed to establish cointegration between the officially published real effective exchange rate series and the fundamentals. By contrast, using the real exchange rate series we constructed yielded more encouraging results, even though it did matter which definition of the real exchange rate we took (weights in the CPI normalised to Macedonia or to the foreign benchmark).
• Second, the productivity differential, the government consumption and the openness variables were found to be fairly robust in terms of sign and size. Net foreign assets and terms of trade enter less often the cointegrating vectors.

ARDL JOHANSEN Model1 Model2 Model3 Model4 Model5 Model6 Model1 Model2 Model3 Model4 Model5 Model6 REER1 REER2 REER1 REER1 REER1 REER2 REER1 REER2 REER1 REER1 REER1 REER2
lags 2 , 2 2 , 2 2, 2 2 , 2 2 , 0 2 , 2 Model M4 M4 M2 M2 M2 M2 ECT -0.303** -0.251** -0.554** -0.588** -0.301** -0.868** p-values for trace-test statistics UR -4.211** -4.149** -5.166** -5.214** -4.313** -6.026** R=0 0.00 0.00 0.00 0.00 0.00 0.13 F-test 5.587** 6.323** 6.323** 7.352** 5.885** 11.386** R=1 0.62 0.54 0.69 0.67 0.69 0.86 R=2 0.62 0.56 0.62 0.74 0.83 0.77 R=3 0.49 0.44 0.39 0.55 0.72 0.63 C -0.148** -0.139** -1.816** -1.966** -1.956** -0.014 PRODDIFF_1 0.277** 0.128** 0.179** PRODDIFF_2 0.349** 0.231** PRODDIFF_3 0.628** 0.731** 0.239** 0.211** PRODDIFF_4 0.246** 0.135** GOVCON 0.250** 0.249** 0.118** 0.118** 0.152** 0.087** 0.049** 0.019 0.098** 0.100** 0.080** OPEN 0.183** 0.190** 0.176** 0.077** 0.089** 0.043** NFA 0.040** 0.068** 0.046** 0.058** TOT -0.114** AUTO(4) (p-values) 0.71 0.68 0.53 0.53 0.80 0.82 ARCH(4) (p-values) 0.68 0.44 0.65 0.92 0.90 0.76 J-B normality (p-value) 0.60 0.72 0.55 0.58 0.50 0.01 Root OK OK OK OK OK AUTOCORRELATION
VAR OK OK OK OK NO VECM NO NO NO NO NO
Multivariate J-B normality (p-value)
VAR 0.00 0.04 0.15 0.06 0.00 VECM 0.31 0.27 0.28 0.41 0.00
Notes: * and ** indicate statistical significance at the 10% and 5% levels, respectively. ECT, UR and F-test refer to the error correction term, the cointegration tests based on the residuals of the long-term coefficients and the F-test proposed in Pesaran et al. (2001), respectively. “lags” indicates the lag structure of the error correction representation of the ARDL. The first number is the lag of the first differenced dependent variable, the second number is the lag used for the first differenced explanatory variables. For the Johansen approach, M4:the series and the cointegrating equation have a trend, M2: series have non-zero mean, the cointegrating vector contains an intercept. The models are selected using the Schwarzinformation criterion. “OK” (“NO”) indicates that the inverse roots of the model are lower than 1 and the absence (presence) of serial correlation in the residuals of all equations (any of the equations). J-B normality for the Johansen method stands for the Jarque-Bera multivariate normality tests. A figure higher than 0.05 indicates that the null hypothesis of normalitycannot be rejected at the 5% level.
, Open-Assessment E-Journal 15
www.economics-ejournal.org
Table 2: Estimation Results, Q1:1997 to Q4:2007
Economics: The Open-Access

16 Economics: The Open-Access, Open-Assessment E-Journal
5 Conclusions
The ambition of this paper was to analyse real exchange rate dynamics in Macedonia relying on a highly disaggregated dataset. We complement the indirect evidence reported in Loko and Tuladhar (2005), we provide direct evidence on the irrelevance of the Balassa-Samuelson effect for overall inflation via service prices in the CPI. We also estimate variants of the BEER model. We show that alternative econometric techniques and data definitions bear an impact on the robustness of the estimation results.
Overall, productivity and other explanatory variables such as government consumption, openness and net foreign assets were found to be fairly robust both in terms of sign and size. The productivity variable has a positive sign. This means that an increase/decrease in the productivity variables is associated with an appreciation/depreciation of the real effective exchange rate. Given that the B-S effect obviously has a very limited role to play through nontradable prices in the CPI, this relationship could be explained by the (inverse) quality effect proposed by Loko and Tuladhar and, possibly in addition to that, by the nontradable component of tradable prices. Furthermore, increases in public expenditures lead to real appreciation probably through the same channel, namely through the relative price of tradable goods. A rise/fall in openness is reflected in real exchange rate appreciation/depreciation. Finally, increasing net foreign assets tend to generate a currency appreciation that is in line with finding for established market economies (see e.g. Égert, Lommatzsch and Lahrèche-Révil, 2006).
References
Bruha, J. and J. Podpiera (2007), Transition Economy Convergence in a Two-Country Model – Implications for Monetary Integration, European Central Bank Working Paper No. 740.
Canzoneri, M. B., Cumby R. and B. Diba (1999), Relative Labor Productivity and the Real Exchange Rate in the Long Run: Evidence for a Panel of OECD Countries, Journal of International Economics, 47(2), pp. 245–266.
Clark, P. and R. MacDonald (1998), Exchange Rates and Economic Fundamentals: A Methodological Comparison of BEERs and FEERs, IMF Working Paper, No. 98-67
DeBroeck, M. and T. Slok (2006), Interpreting Real Exchange Rate Movements in Transition Economies, Journal of International Economics, 68(2), 368–383.
Égert, B. and K. Lommatzsch (2004), Equilibrium Exchange Rates in the Transition: The Tradable Price-Based Real Appreciation and Estimation Uncertainty, William Davidson Institute Working Paper No. 676.
Égert, B., Halpern, L. and R. MacDonald (2006), Equilibrium Exchange Rates in Transition Economies: Taking Stock of the Issues, Journal of Economic Surveys, 20(2), 253–324.
Égert, B., Lommatzsch K. and A. Lahreche-Revil (2006), Real Exchange Rates in Small Open OECD and Transition Economies: Comparing Apples with Oranges? Journal of Banking and Finance, 30(12), 3393–3406.
Engle, R.E. and C.W.J.Granger. (1987), Cointegration and Error-Correction: Representation, Estimation, and Testing, Econometrica, 50, pp.987–1007.
www.economics-ejournal.org

Economics: The Open-Access, Open-Assessment E-Journal 17
Gutierrez, E. (2006), Export Performance and External Competitiveness in the Former Yugoslav Republic of Macedonia, IMF Working Paper No. 06-261.
Halpern, L. and C. Wyplosz (1997), Equilibrium Exchange Rates in Transition Countries, IMF Staff Papers, 44(4), pp. 430–461.
Hinnosar, M., R. Juks, H. Kaadu and L. Uusküla (2003), Estimating the Equilibrium Exchange Rate of the Estonian Kroon, Bank of Estonia, Mimeo.
Loko, B. and A. Tuladhar (2005), Labor Productivity and Real Exchange Rate: The Balassa-Samuelson Disconnect in the Former Yugoslav Republic of Macedonia, IMF Working Paper No. 05-113.
Lopez, Humberto, Luiz Molina and Maurizio Bussolo (2007), ‘Remittances and the real exchange rate’, World Bank Policy Research Paper No. 4213.
MacDonald, R. (1997), What Determines Real Exchange Rates? The Long and Short of It, IMF Working Paper, No. 97-21.
MacDonald, R. and C. Wójcik (2004), Catching up: The Role of Demand, Supply and Regulated Price Effects on the Real Exchange Rates of Four Accession Countries, Economics of Transition, 12(1), pp. 153–179.
Mihaljek, D. and M. Klau (2004), The Balassa-Samuelson Effect in Central Europe: A Disaggregated Analysis, Comparative Economic Studies, 46(1), 63–94
Pesaran, M. Hashem, Youngcheol Shin, and Richard J. Smith (2001), Bounds Testing Approaches to the Analysis of Level Relationships, Journal of Applied Econometrics, 16(3), pp.289–326.
Randveer, M. and M. Rell (2002), The Relationship Between Competitiveness and Real Exchange Rate in Estonia, Bank of Estonia Research Paper.
Stock, J. H. and M. W.Watson (1993), A Simple Estimator of Cointegrating Vectors in Higher Order Integrated Systems, Econometrica, 61(4), pp.783–820.
www.economics-ejournal.org
18 Economics: The Open-Access, Open-Assessment E-Journal
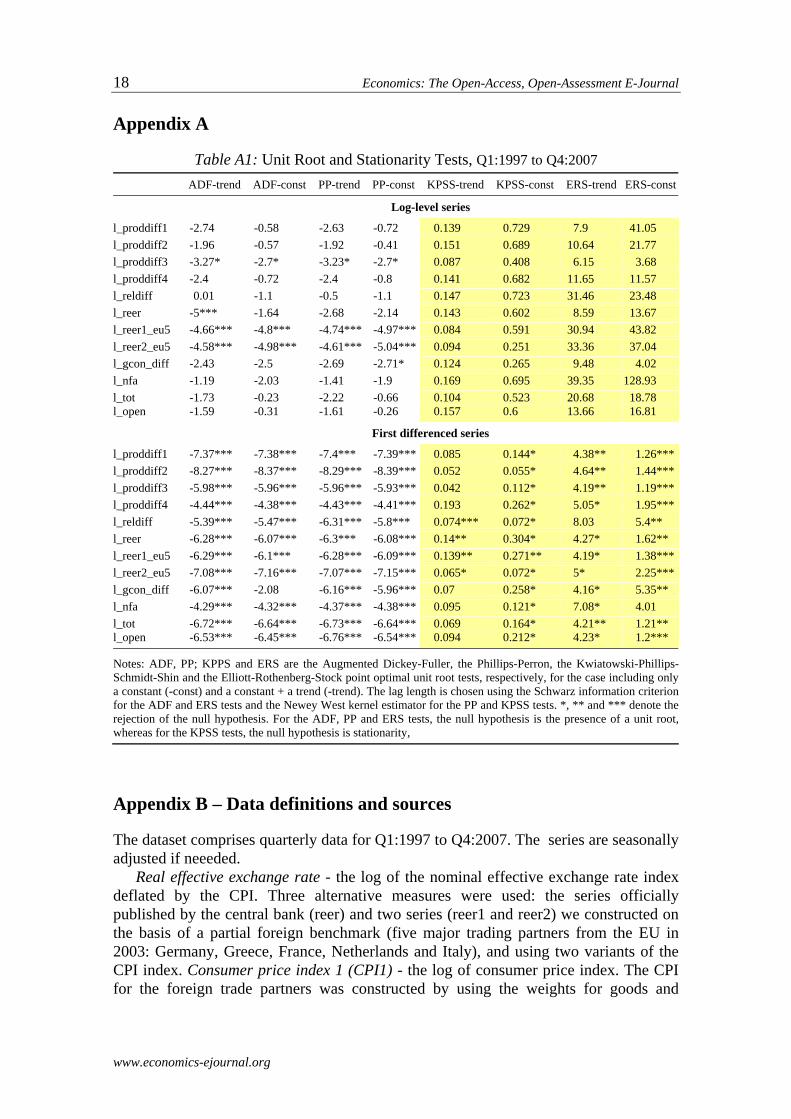
Appendix A
Table A1: Unit Root and Stationarity Tests, Q1:1997 to Q4:2007 ADF-trend ADF-const PP-trend PP-const KPSS-trend KPSS-const ERS-trend ERS-const
Log-level series
l_proddiff1 -2.74 -0.58 -2.63 -0.72 0.139 0.729 7.9 41.05 l_proddiff2 -1.96 -0.57 -1.92 -0.41 0.151 0.689 10.64 21.77 l_proddiff3 -3.27* -2.7* -3.23* -2.7* 0.087 0.408 6.15 3.68 l_proddiff4 -2.4 -0.72 -2.4 -0.8 0.141 0.682 11.65 11.57 l_reldiff 0.01 -1.1 -0.5 -1.1 0.147 0.723 31.46 23.48 l_reer -5*** -1.64 -2.68 -2.14 0.143 0.602 8.59 13.67 l_reer1_eu5 -4.66*** -4.8*** -4.74*** -4.97*** 0.084 0.591 30.94 43.82 l_reer2_eu5 -4.58*** -4.98*** -4.61*** -5.04*** 0.094 0.251 33.36 37.04 l_gcon_diff -2.43 -2.5 -2.69 -2.71* 0.124 0.265 9.48 4.02 l_nfa -1.19 -2.03 -1.41 -1.9 0.169 0.695 39.35 128.93 l_tot -1.73 -0.23 -2.22 -0.66 0.104 0.523 20.68 18.78 l_open -1.59 -0.31 -1.61 -0.26 0.157 0.6 13.66 16.81
First differenced series
l_proddiff1 -7.37*** -7.38*** -7.4*** -7.39*** 0.085 0.144* 4.38** 1.26***l_proddiff2 -8.27*** -8.37*** -8.29*** -8.39*** 0.052 0.055* 4.64** 1.44***l_proddiff3 -5.98*** -5.96*** -5.96*** -5.93*** 0.042 0.112* 4.19** 1.19***l_proddiff4 -4.44*** -4.38*** -4.43*** -4.41*** 0.193 0.262* 5.05* 1.95***l_reldiff -5.39*** -5.47*** -6.31*** -5.8*** 0.074*** 0.072* 8.03 5.4** l_reer -6.28*** -6.07*** -6.3*** -6.08*** 0.14** 0.304* 4.27* 1.62** l_reer1_eu5 -6.29*** -6.1*** -6.28*** -6.09*** 0.139** 0.271** 4.19* 1.38***l_reer2_eu5 -7.08*** -7.16*** -7.07*** -7.15*** 0.065* 0.072* 5* 2.25***l_gcon_diff -6.07*** -2.08 -6.16*** -5.96*** 0.07 0.258* 4.16* 5.35** l_nfa -4.29*** -4.32*** -4.37*** -4.38*** 0.095 0.121* 7.08* 4.01 l_tot -6.72*** -6.64*** -6.73*** -6.64*** 0.069 0.164* 4.21** 1.21** l_open -6.53*** -6.45*** -6.76*** -6.54*** 0.094 0.212* 4.23* 1.2***
Notes: ADF, PP; KPPS and ERS are the Augmented Dickey-Fuller, the Phillips-Perron, the Kwiatowski-Phillips-Schmidt-Shin and the Elliott-Rothenberg-Stock point optimal unit root tests, respectively, for the case including only a constant (-const) and a constant + a trend (-trend). The lag length is chosen using the Schwarz information criterionfor the ADF and ERS tests and the Newey West kernel estimator for the PP and KPSS tests. *, ** and *** denote therejection of the null hypothesis. For the ADF, PP and ERS tests, the null hypothesis is the presence of a unit root,whereas for the KPSS tests, the null hypothesis is stationarity,
Appendix B – Data definitions and sources
The dataset comprises quarterly data for Q1:1997 to Q4:2007. The series are seasonally adjusted if neeeded.
Real effective exchange rate - the log of the nominal effective exchange rate index deflated by the CPI. Three alternative measures were used: the series officially published by the central bank (reer) and two series (reer1 and reer2) we constructed on the basis of a partial foreign benchmark (five major trading partners from the EU in 2003: Germany, Greece, France, Netherlands and Italy), and using two variants of the CPI index. Consumer price index 1 (CPI1) - the log of consumer price index. The CPI for the foreign trade partners was constructed by using the weights for goods and
www.economics-ejournal.org

Economics: The Open-Access, Open-Assessment E-Journal 19
services of the Macedonian CPI. Consumer price index 2 (CPI2) - the log of consumer price index. CPI for Macedonia was constructed by using the geometric average of the weights for goods and services from the major five trading partners from the EU. Data source: National Bank of the Republic. of Macedonia and Eurostat.
Productivity differential (prod_ diff2) - log of the relative productivity differential between Macedonia and its five major trade partners from the EU, calculated as a ratio of the corresponding productivity in the open (tradable) and the closed sector (non-tradable) sector. Productivity was calculated by dividing value added in the corresponding sector by the number of employed workers in that sector. Four different classifications were used for calculation of the open and the closed sector. Data source: State Statistical Office of Republic. of Macedonia, Eurostat, Greek state statistical office and OECD.
Government consumption differential (govcon_diff) - log of domestic government consumption over GDP related to foreign government consumption over GDP. Government consumption for Macedonia was deflated with the GDP deflator, while the real GDP in constant prices from 1997 was used because quarterly nominal GDP data are not available. Government consumption for the five major trading partners from the EU was calculated as geometric average by using the trade weights from 2003, where the nominal value of government consumption over nominal GDP was taken. Data sources: State Statistical Office of the Republic of Macedonia, Eurostat, Greek state statistical office and OECD.
Net foreign assets (nfa) - net foreign assets (of the monetary system) relative to GDP, both in Denars. Data source: State Statistical Office of Republic of .Macedonia and the National Bank of the Republic. of Macedonia.
Openness (open) - the ratio of exports and imports relative to GDP, both in Denars. Data source: State Statistical Office of the Republic of .Macedonia and the National Bank of the Republic. of Macedonia.
Terms of trade (tot) - the ratio of export to import prices. Data source: State Statistical Office of the Republic of .Macedonia.
www.economics-ejournal.org

Please note:
You are most sincerely encouraged to participate in the open assessment of this article. You can do so by either rating the article on a scale from 5 (excellent) to 1 (bad) or by posting your comments.
Please go to:
www.economics-ejournal.org/economics/journalarticles/2008-18
The Editor
www.economics-ejournal.org
© Author(s) 2008. This work is licensed under a Creative Commons License - Attribution-NonCommercial 2.0 Germany