Reagent Free Electrochemical-Based Detection of Silver Ions ...
33
doi.org/10.26434/chemrxiv.12631727.v1 Reagent Free Electrochemical-Based Detection of Silver Ions at Interdigitated Micro Electrodes Using in Situ pH Control Luiza Adela Wasiewska, Ian Seymour, Bernardo Patella, Catherine Burgess, Geraldine Duffy, Alan O'Riordan Submitted date: 09/07/2020 • Posted date: 10/07/2020 Licence: CC BY-NC-ND 4.0 Citation information: Wasiewska, Luiza Adela; Seymour, Ian; Patella, Bernardo; Burgess, Catherine; Duffy, Geraldine; O'Riordan, Alan (2020): Reagent Free Electrochemical-Based Detection of Silver Ions at Interdigitated Micro Electrodes Using in Situ pH Control. ChemRxiv. Preprint. https://doi.org/10.26434/chemrxiv.12631727.v1 Silver ions, the most toxic form of silver, can be present in drinking water due to their release from silver nanoparticles which are widely used in consumer products. Due to their adverse health effects, a quick portable approach for detection in drinking water is needed. Herein we report on the development of an electrochemical sensor for silver ions detection in tap water using linear sweep voltammetry with in situ pH control; enabled by closely space interdigitated electrode arrays. The in situ pH control approach, allows the pH of a test solution to be tailored to pH 3 thereby eliminating the current need for acid addition. A calibration curve between 0.2 - 10 µM was established for silver detection in sodium acetate when 1.25 V and 1.65 V was applied at the protonator electrode during deposition and stripping, respectively, as a proof of concept study. For the final application in tap water, 1.65 V was applied at the protonator electrode during deposition and stripping. The chlorine ions, present in tap water as a consequence of the disinfection process, facilitated the silver detection and no additional electrolyte had to be added. Combination of complexation of silver ions with chlorine coupled with in situ pH control resulted in linear calibration range between 0.25 and 2 µM in tap water without the need for acidification. File list (2) download file view on ChemRxiv 2020.07.02 Reagent free detection of silver ions using squ... (1.70 MiB) download file view on ChemRxiv Supporting information_Final.pdf (699.90 KiB)
-
Upload
khangminh22 -
Category
Documents
-
view
0 -
download
0
Transcript of Reagent Free Electrochemical-Based Detection of Silver Ions ...

doi.org/10.26434/chemrxiv.12631727.v1
Reagent Free Electrochemical-Based Detection of Silver Ions atInterdigitated Micro Electrodes Using in Situ pH ControlLuiza Adela Wasiewska, Ian Seymour, Bernardo Patella, Catherine Burgess, Geraldine Duffy, Alan O'Riordan
Submitted date: 09/07/2020 • Posted date: 10/07/2020Licence: CC BY-NC-ND 4.0Citation information: Wasiewska, Luiza Adela; Seymour, Ian; Patella, Bernardo; Burgess, Catherine; Duffy,Geraldine; O'Riordan, Alan (2020): Reagent Free Electrochemical-Based Detection of Silver Ions atInterdigitated Micro Electrodes Using in Situ pH Control. ChemRxiv. Preprint.https://doi.org/10.26434/chemrxiv.12631727.v1
Silver ions, the most toxic form of silver, can be present in drinking water due to their release from silvernanoparticles which are widely used in consumer products. Due to their adverse health effects, a quickportable approach for detection in drinking water is needed. Herein we report on the development of anelectrochemical sensor for silver ions detection in tap water using linear sweep voltammetry with in situ pHcontrol; enabled by closely space interdigitated electrode arrays. The in situ pH control approach, allows thepH of a test solution to be tailored to pH 3 thereby eliminating the current need for acid addition. A calibrationcurve between 0.2 - 10 µM was established for silver detection in sodium acetate when 1.25 V and 1.65 V wasapplied at the protonator electrode during deposition and stripping, respectively, as a proof of concept study.For the final application in tap water, 1.65 V was applied at the protonator electrode during deposition andstripping. The chlorine ions, present in tap water as a consequence of the disinfection process, facilitated thesilver detection and no additional electrolyte had to be added. Combination of complexation of silver ions withchlorine coupled with in situ pH control resulted in linear calibration range between 0.25 and 2 µM in tap waterwithout the need for acidification.
File list (2)
download fileview on ChemRxiv2020.07.02 Reagent free detection of silver ions using squ... (1.70 MiB)
download fileview on ChemRxivSupporting information_Final.pdf (699.90 KiB)
Reagent free electrochemical-based detection of silver ions at
interdigitated micro electrodes using in situ pH control.
Luiza Adela Wasiewskaa,b; Ian Seymoura, Bernardo Patellac, Catherine Burgessb, Geraldine
Duffyb, Alan O’Riordan*a
a Nanotechnology group, Tyndall National Institute - University College Cork, Dyke Parade, Cork,
Ireland
b Food Safety Department, Ashtown Food Research Centre, Teagasc, Dublin, Ireland
c Laboratorio di Chimica Fisica Applicata, Dipartimento dell'Innovazione Industriale e
DigitaleIngegneria Chimica Gestionale Informatica Meccanica, Università di Palermo, Viale delle
Scienze, Palermo, Italy
* Corresponding author
E-mail address: [email protected]
Abstract
Silver ions, the most toxic form of silver, can be present in drinking water due to their release
from silver nanoparticles which are widely used in consumer products. Due to their adverse
health effects, a quick portable approach for detection in drinking water is needed. Herein we
report on the development of an electrochemical sensor for silver ions detection in tap water
using linear sweep voltammetry with in situ pH control; enabled by closely space interdigitated
electrode arrays. The in situ pH control approach, allows the pH of a test solution to be tailored
to pH 3 thereby eliminating the current need for acid addition. A calibration curve between 0.2
- 10 µM was established for silver detection in sodium acetate when 1.25 V and 1.65 V was
applied at the protonator electrode during deposition and stripping, respectively, as a proof of
concept study. For the final application in tap water, 1.65 V was applied at the protonator
electrode during deposition and stripping. The chlorine ions, present in tap water as a
consequence of the disinfection process, facilitated the silver detection and no additional
electrolyte had to be added. Combination of complexation of silver ions with chlorine coupled
with in situ pH control resulted in linear calibration range between 0.25 and 2 µM in tap water
without the need of acidification.

Key Words:
silver ions detection, tap water, square wave voltammetry, local pH control, interdigitated
gold microband electrodes
Highlights
Applying 1.65 V at the protonator electrode allowed lowering local pH at the
electrode to pH 3 which was an optimal pH for silver ions detection
In situ pH control eliminated the need for addition of mineral acids to a solution prior
to analysis
Chlorine present in tap water caused a sharpening of the silver stripping peak due to
formation of silver chloride which helped in detection
Detection of up to 200 nM of silver ions in tap water in less than 3 minutes without
need for additional electrolytes

1. Introduction
Silver nanoparticles have become ubiquitous in a wide variety of products ranging from
electronic & medical devices, textiles, cosmetics through to home disinfectants, due to their
antimicrobial effect and physical properties [1]. Their increased use in consumer products has,
however, resulted in their unwanted release into the environment, particularly into water
sources [2]. Dumont, Johnson [3] have reported the “predicted levels” of silver nanoparticles
present in surface water across the European countries. It was observed that the highest levels
occur in the areas with a high population density; especially in East & Central Europe,
Germany, England and around Madrid in Spain.
The antimicrobial activity of silver nanoparticles involves the slow release of silver ions into
solution, which is the most toxic form of silver [4]. Silver toxicity to aquatic life has been well
documented, while bioaccumulation in humans may lead to a disease called argyria [5]. Despite
the lack of robust data on silver toxicity in humans, the World Health Organisation (WHO)
have, suggested 0.1 mg/L (~ 0.93 µM) as upper limits for silver in drinking water. It has been
suggested that higher concentrations would constitute health risks with long-term consumption
[6]. Accordingly, in recent Drinking Water Standards and Health Advisories Tables, the United
States Environmental Protection Agency (EPA) have proposed the same permissible (0.1
mg/L) concentration of silver in drinking water [7]. There is therefore a need, on health
grounds, for rapid methods for monitoring of silver concentrations in drinking water.
Several instrumental and non-instrumental methods for detection of silver in aqueous solutions
have been described to date. These include: atomic absorbance spectroscopy, colorimetric,
fluorescent, and electrochemical methods [8-11]. Recently, much attention has focused on
electrochemistry as a detection technique, due to its low cost, suitability to device
miniaturization & portability as well as simplicity of use [12-14]. Anodic sweep voltammetry
is a popular electrochemical technique that have been employed for silver detection with

various authors reporting very low limits of detection. Typically, carbon paste or glassy carbon
electrodes modified with a variety of different ligands, such as, for example: N,N0-bis(2-
hydroxybenzylidene)-2,20(aminophenylthio) ethane [15]; CNT and (E)-4-(2-
hydroxyethylimino) pentan-2-one (EHPO) [16]; phenylthiourea-functionalized high ordered
nanoporous silica gel [17] or 8-Mercaptoquinoline [18], are employed. The principal role of
these ligands is to pre-concentrate the silver ions at the surface of an electrode and therefore
increase its overall sensitivity [19]. However, the modification of the electrodes is laborious,
of variable quality and reproducibility, and may be expensive.
As a first step, experimental conditions including the buffer, pH or deposition potential must
be optimised. Optimising the pH of both the metal deposition and stripping steps is crucial for
the development of an electrochemical based detection method [20, 21]. The optimal
concentration of H+ ions can delay side reactions, e.g., a metal’s complexation with other
species and thus increase the availability of the metal for electrodeposition and consequently
the final measured signal [22]. However, in many deployment scenarios, for real-time silver
detection, pH adjustment of a solution prior to a measurement remains unfeasible. The optimal
pH for silver detection is strongly affected by: electrode material composition, type of ligand,
modification process, and the supporting electrolyte. The optimal pH for silver detection,
reported by other authors, varied between pH 1.1 and 9.5 [15, 23, 24] depending on the
parameters used. Tap water pH, typically varies between 6.5 and 8.5, thus prior to detection in
real samples, reagents for example nitric acid or acetic acid are usually added [17, 25]. Ideally,
an electrochemical-based sensor for tap water should allow for detection and automatically
correct within this pH range without manual adjustment.
Mineral acids are usually used to adjust the pH. However, more recently, an electrochemical
based in situ pH adjustment method, using a boron-doped ring disc electrode system, was
demonstrated for detection of mercury in water [22]. This approach was based on

electrochemical driven decomposition of water achieved by applying a sufficiently high
oxidising potential to the ring electrode. During this process, hydrogen ions were anodically
produced at the ring electrode which caused acidification of the solution in the region of the
‘sensing’ disk electrode. In this work, we extend this approach by developing solid-state
sensors on silicon chip substrates that incorporate interdigitated microelectrodes for detection
of silver ions in tap water. Each sensor comprised two interdigitated electrodes arrays (IDA),
one of gold and one of platinum. In our approach, the platinum IDA was used to electro-
generating H+ ions i.e. a protonator electrode (for local pH control), while the other gold IDA
was used to detect the silver (I) ions. Each chip contained six different sensors, each comprising
two IDA microband electrodes. Using this approach, electrochemical based in situ pH control
eliminated the requirement for addition of reagents, e.g., nitric acid, prior to measurement. By
applying a constant potential to a pronator electrode, the in situ pH surrounding an electrode
could be easily tailored within a range of pH 2–10. In addition, complexation of silver with
chlorine ions, present in tap water following the disinfection process, created significantly
sharper peaks that aide detection [23]. Finally, due to their low RC constants, the use of ultra
microelectrode systems eliminated the need for additional electrolytes to be added to solution.

2. Material and methods
2.1. Reagents
Sodium acetate, silver nitrate, nitric acid, ferrocenecarboxylic acid, PBS tablets and potassium
chloride were obtained from Sigma Aldrich Ireland. DNS Platinum Plating solution was
obtained from Johnston Matthey chemical products. Stock solutions of 20 mM silver nitrate
were prepared using ultra-pure Milli-Q water (18.2 MΩ cm−1, Milli-Q) and stored in a fridge
at 4 ºC. Standards were made by diluting the stock solution with selected electrolyte (sodium
acetate, potassium chloride or tap water) before each measurement. Sodium acetate and
potassium chloride solutions were prepared by diluting them at desired concentration with
ultra-pure Milli-Q water (18.2 MΩ cm−1, Milli-Q). If needed, 1 M nitric acid was added
dropwise until desired pH was obtained.
2.2. Apparatus
All the electrochemical measurements were undertaken using a CHI 920 potentiostat with a
bipotentiostat function. A three electrode cell configuration was used for the silver detection in
acidified solutions while a four electrode bipotentiostat cell configuration was used for silver
detection employing in-situ electrochemical pH control. Gold interdigitated microband
electrodes were employed as a working electrode and while platinum modified electrodes were
used as protonator electrode, gold on-chip wire as a counter electrode and an external Ag/AgCl
as a reference electrode.
2.3. Silicon chips fabrication
Interdigitated electrodes array (IDA) electrodes at silicon chips were designed and fabricated
for silver detection. Fabrication of the chips were similar to those described by Wahl, Barry
[26], [27]. Briefly, gold microband electrodes were fabricated on four-inch silicon wafer
substrates bearing a ~300 nm layer of thermally grown silicon dioxide; see Fig 2. (A). IDAs

were first fabricated using a combination of optical lithography, metal evaporation (Ti 5 nm
/Au 50 nm Temescal FC-2000 E-beam evaporator) and lift-off techniques to yield well-defined,
stacked metallic (Ti/Au) nanoband (1 µm width, 50 nm height, 80 µm length) structures. Each
chip consisted of six independent sensors. A second optical lithographic and metal deposition
(Ti 10 nm/Au 100 nm) process was then undertaken to define a MicroSD pinout,
interconnection tracks as well as counter electrodes (500 µm wide x 10 mm long), see Fig. 2.
(B). In this work, an on-chip microSD style electrical pin-out was included to permit facile
electrical connection to external electronics. In this manner, chips could be easily swapped in
and out with the potentiostat enabling rapid analysis of multiple samples. A custom built cell
was designed and fabricated so that when screwed together, the microSD primary contact pads
protruded out of the holder to allow connection with a PCB mounted microSD port, see Fig. 2.
(C). As platinum is known to catalyse water electrolysis effectively, platinum was
electrodeposited as a protonator on one IDA to promote proton flux production at lower over
potentials. Platinum deposition was undertaken by immersing a chip with electrical connection
made to one interdigitated comb in DNS plating solution and applying -0.5V (Vs Ag/AgCl) for
6 seconds.
2.4.Electrode characterisation
Following fabrication, optical microscopy was employed to identify any obvious defects or
faults with faulty chips being discarded. Chips were cleaned by immersion and sonication for
ten minutes, first in ethanol, then in de-ionized water, and dried in a flow of nitrogen.
Electrochemical characterisation was undertaken using a CHI 920 potentiostat. Cyclic
voltammograms (CV) were performed from 0 V to 0.6 V at 100 mV/s in 1 mM ferrocene
carboxylic acid (FCA). Generator–collector scans where the protonator IDA were held at 0 V
and the working electrode swept as above, were also undertaken. All electrochemical
characterisation measurements were recorded versus an Ag/AgCl external reference electrode.

2.5.Silver detection method
Fig. 1. Scheme showing the silver detection process.
Electrochemical detection of silver was undertaken as shown schematically in Fig. 1. (i) Firstly
sample introduction: typically 500 µL aliquots of the test solution was deposited onto a sensor
chip. (ii) then silver ions were electrodeposited to form bulk silver on the surface of a gold
working IDA electrode according to equation 1.
𝐴𝑔+ + 𝑒− → 𝐴𝑔0 (1)
(iii) Finally, square wave stripping voltammetry was then used to strip the silver from the
underlying gold electrode (see equation 2) with the corresponding oxidation peak current
proportional to concentration of silver pre-deposited on a sensor.
𝐴𝑔0 − 𝑒− → 𝐴𝑔+ (2)
In brief, the method comprised the following steps: a) acidification of the test solution either
using (i) addition of mineral acid or (ii) in situ electrochemical based pH control. (b) Applying
a bias of -0.2 V (vs Ag/AgCl) for 2-5 minutes (depending on the medium used, i.e. buffer or

tap water) to reduce the silver ions at the working electrode. c) Square wave stripping
voltammetry was recorded between -0.2 and 0.8 V vs Ag/AgCl, using following conditions:
frequency 15 Hz, increment potential 0.004 V, amplitude 0.025 V and the silver strip peak was
recorded. d) After the measurement, the electrode was potientio-dynamically cleaned by
replacing the sample with 0.01 M sodium acetate solution and applying the potential of 0.5 V
for 150 s, which is a slightly more oxidative potential than observed for silver stripping in
sodium acetate. e) Square wave voltammetry was recorded between -0.2 and 0.8 V in blank,
sodium acetate solution to confirm that all the silver was oxidised from the electrode and
prevent carry over from previous experiments.
2.6.Silver detection method using pH control
For the silver detection using in-situ electrochemical pH control in tap water, the same
conditions for deposition and stripping as described above were applied. In addition, a constant
oxidising potential was applied to the protonator electrode, to produce protons (H+ ions)
according to equation 3, thus tailoring the pH in the vicinity of the sensor IDA.
2𝐻2𝑂 → 𝑂2 + 4𝐻+ + 4𝑒− (3)

3. Results and discussions
3.1.Sensor Characterisation.
Fig 2 (A) shows a schematic of the fabrication process, as described in the experimental section,
to fabricate the sensor chips. Each chip contained six sensors, comprising two separate
microband IDAs, and a gold counter electrode shown in Fig. 2. (B). While a platinum pseudo
reference electrode was also fabricated on-chip, an eternal Ag/AgCl electrode was used in this
work for better stability. A microSD pin-out was implemented to allow facile and rapid
interconnection with external instrumentation. Each sensor comprised two fully passivated
IDAs; the protonator IDA comprised 14 tines while the working IDA comprised 13 tines. Each
IDA tine was 50 nm high, 1 µm wide, and 45 long (defined by the width of the passivation
window opening) while the gap between the tines in the neighbouring IDAs was 2 μm. Fig. 2
(C) shows a sensor chip in a chip holder, prior to insertion into a PCB mounted microSD
connector. The well in the centre has a volume of ~500 µL, sealed onto the chip using an o-
ring, and aligned over the on-chip sensor electrodes.
Fig. 2. (A) Schematic of the fabrication steps employed in sensor fabrication. (B) Picture of a
fully integrated silicon sensor chip. (C) Electrochemical cell with sensor chip and a PCB
microSD connector.
Following fabrication, sensor chips were first optically inspected using microscopy. Following
the optical inspection, electrodes were then characterized by undertaking cyclic voltammetry

(CV) of a model REDOX probe: 1 mM FcCOOH (FCA) dissolved in 10 mM PBS buffer. In
this analysis, each individual IDA was cycled from 0 V to 0.6 V while the other IDA comb was
allowed to electrically float. In Fig. 3. (A), a typical CV voltammogram obtained using a
pristine cleaned gold IDA electrode containing 14 tines is shown. The observed voltammogram
exhibited a diffusion-limited behaviour consistent with a large microelectrode. This diffusion
limited characteristic arose from the radial diffusion profiles surrounding individual tines of an
IDA overlapping, thus resulting in an overall time-dependent behaviour [26]. The measured
current value of ~10 nA is typical for these interdigitated electrodes. It indicated that
electrochemistry only occurred at an IDA and the metallisation interconnection tracks were
sufficiently passivated to not be exposed to the measurement solution. The 115 mV offset
between the oxidation and reduction peaks confirms the near Nernstian behaviour typical of
the reversible behaviour of the mediator molecule.
Sensors were then characterised in Generator-Collector mode undertaken with the protonator
IDA held at 0 V and the working IDA swept from 0.0 to 0.6 V, at 50 mV/s. A typical
voltammogram is presented in Fig. 3 (B). In this approach, the generator IDA first oxidised
FCA to FCA+ species which then diffused across the gap to the collector electrode where it
was subsequently reduced back to FCA establishing redox cycling; resulting in higher
measured currents. As a result of redox cycling, the Generator–Collector voltammograms
exhibited a quasi steady state, time independent behaviour typically associated with ultra-
microelectrodes [27]. The generator IDA voltammogram shows a maximum current of 31 nA,
which is significantly higher comparing to a single CV mode (~10 nA). The voltammogram
also exhibited a small hysteresis in current between the forward and reverse scans. This
hysteresis arose form an additional capacitance current component arising from the high scan
rate applied. The collector IDA voltammogram exhibited a lower maximum current of -26 nA
when compared to the protonator IDA. The difference between the two measured currents was

due to some oxidised FCA+ diffusing away from the sensor into the bulk solution.
Consequently, the collection efficiency of the sensor, which is a ratio of the collector to the
generator currents, was determined to be ~84%. This thus suggested that 84% of protons,
produced at a protonator IDA, would diffuse to the working IDA, and tailor the pH as desired.
No hysteresis in current between the forward and reverse scans was observed at the collector
IDA, as it was held at a constant potential throughout the experiment. As a result, a much lower
capacitive current component can be observed, which dissipated quickly after initial biasing.
Fig. 3. (A) Typical cyclic voltammogram in 1 mM FcCOOH and 10 mM PBS measured at an
interdigitated electrode comb. Inset: optical micrograph of a sensor electrode comprising two
interdigitated electrode arrays. The central dark rectangle region is the passivation window
opening (B) CVs at generator and collector IDAs of 1 mM FcOOH in 10 mM PBS at a scan
rate of 50 mV/s. The generator electrode (i) was cycled between 0 V and 0.6 V (vs Ag/AgCl)
while the collector (ii) was held at 0 V. A current of 31 nA indicated a fully working array while
a current of 26 nA was measured at the collector electrode.
3.2. Deposition optimisation
The influence of solution pH on silver deposition was evaluated by varying buffer pH between
pH 2 and pH 4.5. 1 µM AgNO3 dissolved in 10 mM sodium acetate at different pH was
deposited at the working electrode at -0.2 V for 3 minutes. Following deposition, the silver was
then stripped using linear sweep voltammetry and the peak current was recorded. In Error!

Reference source not found.. (A), representative stripping current peak heights measured for
silver stripping at different pHs are presented. The measurements were undertaken in duplicate
for each pH and the average value with standard deviation were plotted. Decreasing the pH
from 4.5 led to a change in the measured stripping current with the maximum stripping peak
current found to be between pH 2.5 and 3.0. The corresponding deposition currents are
presented in Fig. S1. (A) with a change in deposition current magnitude observed with different
pHs. The highest deposition currents (measured at 100 seconds) were observed for pH 3,
followed by pH 2 and 3.5, respectively. pH 3 was selected as the pH of choice for further
experiments as the most optimal pH for silver detection.
Fig. 4. (A) Influence of pH of solution on measured stripping current (peak height) for 1 µM
of AgNO3 in 10 mM sodium acetate when -0.2 V was applied for 3 minutes. Dotted line is a
guide to the eye only. (B) Influence of deposition potential on measured stripping current (peak
height) for 1 µM of AgNO3 in 10 mM sodium acetate, pH 3, when deposition done for 3
minutes. Dotted line is a guide to the eye only.
Following optimisation of pH, the influence of reduction potential on the peak height was
evaluated and optimised. A series of silver electro-reduction voltages were assessed by first
electro-depositing silver at a selected voltage followed by a square wave stripping voltammetry
where the peak current was measured. Electro-reduction was undertaken in the voltage range

of -0.1 V and -0.5 V. It can be seen in Error! Reference source not found.4. (B) a maximum
peak current was observed when using a reduction potential of -0.2 V. Although higher currents
were measured at more cathodic potentials, this increase arose from superimposition of an
oxygen reduction signal onto the electrodeposition current; see Fig. S1. (B). To this end, -0.2
V was selected as the optimal for silver detection and used in the further studies.
The duration used for silver ion deposition depended on the expected concentration of silver in
solution. In theory, the longer the deposition time, the lower limit of detection for silver
detection can be achieved. However, this must be offset and balanced by an electrode
potentially becoming saturated at higher silver concentrations during longer deposition times.
A series of deposition times were explored. Fig. 5. shows the calibration line for silver in 10
mM sodium acetate, pH 3, when deposition was done for 4 minutes. The linear region was
recorded between 0.2 - 2 µM. Increasing the deposition time to 5 minutes decreased the limit
of detection to 0.1 µM. However, the response became nonlinear above 1 µM, consistent with
an electrode beginning to saturate. In result, the calibration line with 5 minutes deposition time
was between 0.1 - 1 µM; see Fig. S2.

Fig. 5. Linear calibration curve corresponding to silver ions detection in 0.01 M sodium
acetate, pH 3 for an unmodified gold electrode. Deposition time: 4 minutes at -0.2 V.
3.3. In situ electrochemical pH control: potential selection
As discussed previously, the pH of the solution greatly influenced the silver deposition process.
Typically, nitric acid would be manually added to a sample to adjust the solution pH to create
the optimal conditions for metal detection. However, this step requires trained personnel,
proper protective equipment as well as special storage/carriage requirements for concentrated
acids. Therefore, this approach is not very suitable for real time detection outside of the
laboratory.
Electro-generated in situ pH control was explored, to eliminate the requirement of sample
acidification prior to analysis. By applying a constant oxidizing potential to the protonator
electrode, sufficient hydrogen ions (protons) can be produced to tailor the local pH surrounding
an electrode. First, the right potential to be applied at the protonator electrode was selected. It
is well known that when undertaking cyclic voltammetry at a gold electrode, the positions of
the gold oxide and reduction peaks vary, depending on the solution’s pH [28]. In this manner,
the voltage at which the gold oxide reduction peak maximum occurs, may be used as an

indicative measure of the pH of the solution at a sensor. To confirm this, cyclic voltammetry
in 10 mM sodium acetate in the voltage range of 0.2 to 1.2 V was performed at pH 3 and pH
7.5 (the selected pH for silver detection and pH of sodium acetate without acidification,
respectively). The CVs are presented in Fig. 6. (A). At pH 7.5 the gold oxide reduction peak
maximum was observed at 0.55 V. On addition of nitric acid to acidify the sodium acetate
buffer to pH 3, the gold oxide reduction peak moved to 0.76 V, as expected. The decrease in
the reduction peak area arose from a limited amount of gold oxide formed due to the narrow
potential window used; as the gold oxidation process would also have shifted to higher anodic
voltages at this lower pH value.
Fig. 6. (B) shows a portion of cyclic voltammograms recorded at the working IDA in 10 mM
sodium acetate solution when different potentials (1.55 to 1.7 V) were applied to the protonator
IDA. On increasing the protonator potential, the gold oxide reduction peak was observed to
move to higher anodic voltages consistent with a decrease in pH. In these experiments, an
applied potential of 1.65 V yielded a maximum gold reduction peak at 0.76 V; which was the
same location as the acidified pH 3 sodium acetate as showed by the dashed line in Fig. 6. (B).
Although the acetate buffer has a solution pH of 7.5 in the bulk away from the electrode, the
local in situ pH in the vicinity of the electrode was electrochemically tailored to pH 3.0 using
this approach. Thus an applied voltage of 1.65 V was selected as the protonator voltage of
choice.

Fig. 6. (A) Cyclic voltammograms recorded in 10 mM sodium acetate at i) pH 3 and ii) 7.5 (B)
Selected regions of the cycling voltammogram recorded in different solutions of 10 mM sodium
acetate showing the gold oxide reduction peak at i) pH 3 when acidified with nitric acid and
at pH 7.5 and also when applying potentials ii) 1.55; iii) 1.6; iv) 1.65V; and v) 1.7 V to the
protonator electrode. The dashed line shows the location of gold oxide reduction peak
maximum when 1.65 V was applied to the protonator occurring in the same position as when
the solution is acidified to pH 3 with nitric acid.
3.4. In situ pH control: Acetate buffer
The initial experiments to assess and optimise in situ pH control were undertaken in 10 mM
sodium acetate, as described previously. However, as shown in Fig. 7. (A), when 1.65 V was
applied to a protonator IDA and a cathodic potential of -0.2 V was applied to the working IDA
(during silver electrodeposition), the stripping peak for silver was significantly lower when
compared to the stripping peak obtained using chemically acidified silver solutions. In addition,
the measured current during deposition was significantly higher when using pH control (~ -40
nA at 100 s) compared to the deposition current in chemically acidified sodium acetate (~ -0.6
nA at 100 s); see Fig. S4. To explain this observation, we believe that this discrepancy may
have arisen from parallel competitive electrochemical processes occurring at the sensors
electrode in sodium acetate: namely silver electrodeposition and direct oxygen reduction. To

explore this further, CVs were undertaken in 0.01 M sodium acetate using pristine gold
working electrodes both with and without the protonator IDA biased at +1.65 V. The
corresponding voltammograms are presented in Fig. S3. A significant increase in anodic
current is observed at ~ 1.2 V without the pH control and ~ 1.5 V when in situ pH control (i.e.,
biasing the protonator) was applied. This current increase corresponds to the formation of a
gold oxide layer at the gold IDA, which is in accordance with Burke and Nugent [28]. This
suggests that setting the protonator IDA to 1.65 V during silver detection could lead to the
production of a significant amount of molecular oxygen at the protonator. This argument is
strongly supported by the significant current increase corresponding to gold oxide reduction at
potential ~ 0.6 V when pH control was applied. The cyclic voltammogram in sodium acetate,
with applied pH control, also exhibits an increase of cathodic current starting around -0.2 V
corresponding to the potential at which the oxygen begins to be reduced in the acidic conditions
[29]. Consequently, applying a bias of 1.65 V to a protonator IDA, results in the generation of
molecular oxygen which diffuse to, and is reduced at, a sensor IDA biased at -0.2 V. This can
explain the observed increase in the magnitude of deposition current (Fig. S4.). Concerning
analyte mass transfer transport, diffusion of silver ions to a working electrode is diffusion
limited, as shown in Fig. 3 (A). However, diffusion of oxygen, generated along the entire length
of a protonator IDA, to a sensing IDA will be radial in nature and will thus be more efficient.
These competitive processes may thus result in the lower concentrations of silver deposited at
the working IDA even though the observed deposition was higher
Consequently, a trade off was required between applied protonator voltage versus the
associated molecular oxygen formation. To this end, 1 µM AgNO3 dissolved in 10 mM sodium
acetate at pH 7.5 was deposited at a working IDA while different potentials, varying from 1.25
V to 1.65 V, were applied to protonator IDA during deposition, followed by SWV, see Fig. 7.

(A). It can be observed that the lowest applied voltage of 1.25 V during deposition yielded the
maximum stripping peak current and thus was selected for further experiments. The potential
applied to a protonator IDA during stripping of silver electrodeposited at the working IDA was
also optimised. It can be seen in Fig. 7. (B) that resetting the protonator voltage back to 1.65 V
during SWV resulted in the highest stripping peak. This further supports the thesis that
molecular oxygen formation during silver deposition was an interferent during deposition, as
the applied anodic potentials during stripping were too positive to enable oxygen reduction.
Fig. 5. Square Wave Voltammograms for 1 µM of AgNO3 in 10 mM sodium acetate pH 7.5
when (A) i) 1.65 V; ii) 1.45 V; iii) 1.35 V; iv) 1.25 V and v) no potential was applied to
protonator electrode during silver deposition, while 1.65 V was applied during stripping (B)
1.25 V was applied to the protonator electrode during deposition while i) 1.55 V; ii) 1.65 V
and iii) 1.75 V was applied during stripping.
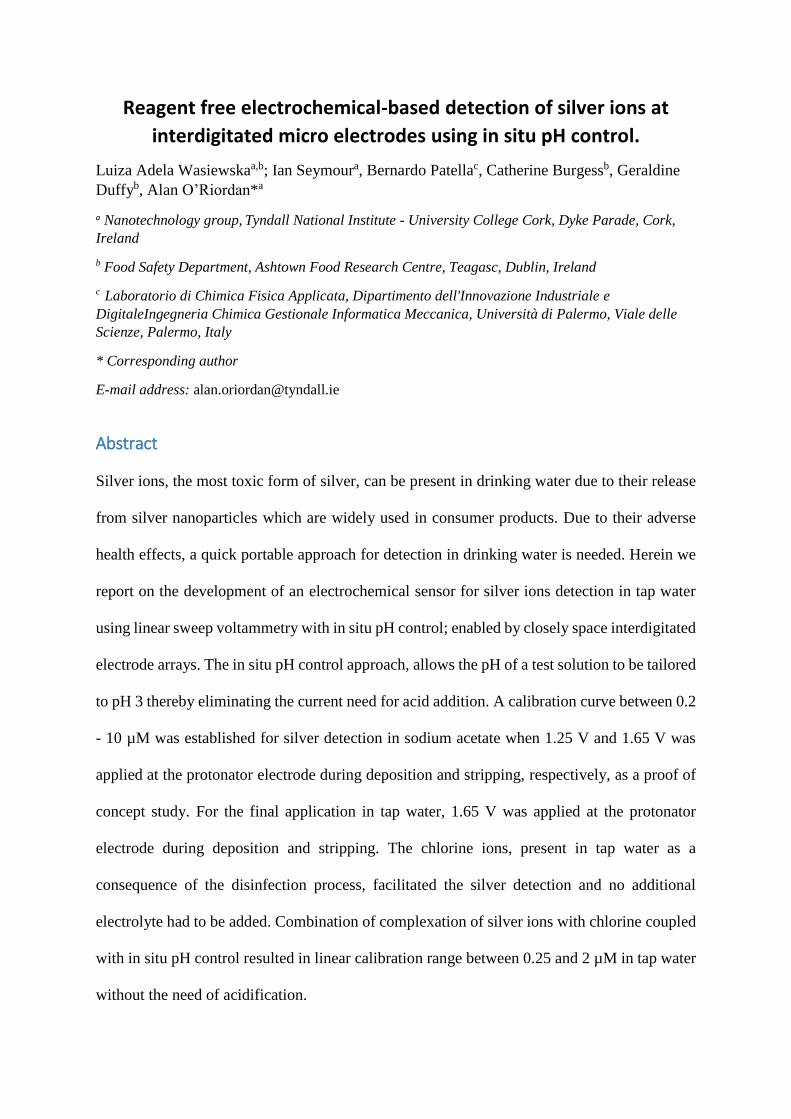
A silver detection calibration was then undertaken in the concertation range of 0.2 and 10 µM
(10 mM sodium acetate, deposition time: three minutes) using in situ electro-generated pH
control method and the resulting plot is presented in Fig. 8. The data points represent the mean
value of three replicate measurements with the error bars representing 1 standard deviation.
The calibration curve exhibited excellent linearity with R2 of 0.999 and a wide linear dynamic
range of 0.2–10 µM. Fig. 8.: inset shows the corresponding stripping voltammograms for the
different concentrations. These results highlight the suitability of the proposed approach to
electrochemical detection of silver using the in situ pH control
Fig. 6. Linear calibration curve corresponding to silver ions detection using the pH control.
The measurements were done in 10 mM sodium acetate pH 7.5 with 1.25 V applied at
protonator electrode during deposition and 1.65 V during stripping. Deposition time: 3 minutes
at -0.2 V.
3.5. In situ pH control: Tap Water
Having showed a proof of concept of silver detection using pH control in sodium acetate buffer
as described above, the developed method was applied and optimised for potable tap water.
Typically, pH of drinking water varies between 6.5 to 8.5 [30]. and may need to be adjusted
and optimised prior to silver detection, i.e., pH 3. CVs was undertaken in tap water with 1.65
V applied to the protonator IDA; see Fig. S5. It was observed that oxygen reduction in tap
water requires a more cathodic potential (~ -0.5 V) compared to sodium acetate (~ -0.2 V)
which suggested that the competitive process, described above, should not significantly
interfere with silver deposition. To this end, in situ pH control was undertaken by, applying the
desired 1.65 V to the protonator during both silver deposition and stripping steps.

For the optimisation process, tap water was spiked with 1 µM AgNO3 required as silver was
not present in tap-water in our lab. No additional supporting electrolyte was added to test
solutions in order to verify that the sensor could be used for a real time tap water detection.
Fig. 9.Error! Reference source not found. shows the stripping peak SWVs in tap water both
with and without pH control. The silver stripping peaks shifted to more cathodic values, and
the peaks became higher and sharper when compared to measurement undertaken in sodium
acetate buffer. The silver stripping peaks measured in sodium acetate with and without pH
control are included in Fig. 9. for comparison. We believe, that the cathodic shift and change
in the voltammetric profile are attributed to chlorine, typically present in tap water as a
sterilising agent. Therefore, the stripping peak in tap water corresponded to AgCl-, instead of
Ag+ recorded in sodium acetate, following the mechanism previously described by Saterlay,
Marken [23]:
𝐴𝑔(𝑠) + 𝐶𝑙− − 𝑒− ↔ 𝐴𝑔𝐶𝑙(𝑠) (4)
𝐴𝑔𝐶𝑙(𝑠) + 𝐶𝑙− ↔ 𝐴𝑔𝐶𝑙2(𝑎𝑞)− (5)
𝐴𝑔𝐶𝑙2(𝑎𝑞)− → 𝑏𝑢𝑙𝑘 𝑠𝑜𝑙𝑢𝑡𝑖𝑜𝑛 (6)
It is well known that chlorine ions are very reactive, especially with regard to silver. The
process of a peak sharpening upon complexation of silver with chlorine, as well as its beneficial
analytical applications, has been previously described by Saterlay, Marken [23]. In their work,
chlorine in the form of 12.5 mM KCl was added as an electrolyte reagent to test solutions to
improve the signal results for ASV. Other authors have also reported chlorine additions, e.g,
using 0.1 M HCl as an electrolyte for the optimisation of silver detection [16, 31]. In this work,
chlorine was naturally present in tap water thus, no additional reagent had to be added to
enhance silver detection in tap water as chlorine remains the most commonly used water
disinfectant worldwide [32]. Despite the form of chlorine used (gaseous chlorine, calcium

hypochlorite or sodium hypochlorite), a combination of hypochlorous acid (HOCl) and
hypochlorite ion (OCl-) will be present in tap water as “free available chlorine” in line with
statutory regulations. In acidic conditions, the HOCl species dominates, which is a more
reactive form of chlorine [33, 34].
Fig. 7. Square Wave Voltammograms of 1 µM AgNO3 in i) 10 mM sodium acetate pH 3; ii) 10
mM sodium acetate at pH 7.5 when pH control was applied (1.25 V at the protonator electrode
during deposition and 1.65 V during stripping); iii) tap water at pH 7; iv) tap water when pH
was applied (1.65 V at the protonator electrode during deposition and stripping). Conditions
for the experiment were: deposition at -0.2 V for 3 minutes.
3.6. Calibration line in tap water using in situ pH control
Experiments were undertaken in tap water spiked with different concentrations of silver nitrate
to benchmark the presented in situ pH control detection method. Concerning calibration and
dynamic range, it was observed that a deposition time of three minutes (as used previously)
resulted in an electrode becoming saturated with silver chloride at concentrations above 1 µM
of AgNO3. For this reason, we reduced the deposition time to two minutes. This resulted in
both a wider linear dynamic range and provided a faster time to result. A silver calibration plot
(between 0.25 and 2 µM) in tap water, using in situ electro-generated pH control, is presented

in Fig. 10. The data points represent the mean value of three replicate measurements, with the
error bars representing 1 standard deviation. The calibration curve exhibited excellent with R2
of 0.992. The EPA suggested limit of 0.93 M fits well within this linear dynamic range. Fig.
10.: inset shows the associated stripping voltammograms for the different concentrations.
Fig. 10. Linear calibration curve corresponding to silver ions detection in tap water.
Conditions for the experiment were: deposition at -0.2 V for 2 minutes, 1.65 V at protonator
electrode during deposition and stripping.
Although several authors have reported electrochemical approaches for silver detection in real
water samples, most of these reports had to (i) first acidify the solution using an acid or (ii) add
additional electrolyte prior to performing the measurements [15-17, 35]. To the best of our
knowledge, none of these papers to date have reported silver detection using in situ pH control.
Moreover, our results have suggested that silver detection efficiency was improved with the
chlorine ions present in tap water. Based on Saterlay, Marken [23] the intensity of AgCl peak
will depend on the concentration of chlorine in water which they have showed by undertaking
measurements with different concentration of KCl. This suggests that the concentration of
chlorine in the tap water could be a limiting factor for the presented technique. Based on WHO

guidelines, chlorine is present in most disinfected tap water at a concentration between 0.2
mg/L and 1 mg/L [6]. This means there would be sufficient amount of chlorine present to allow
detection of the target silver concentrations (0.1 mg/L). Using this approach and the sensors
developed herein, silver detection may be undertaken in previously chlorinated tap water
without addition of electrolyte, acid or base with a prior calibration is done depending on the
chlorine concentration.
4. Conclusions
We present an easy and quick technique that employs IDA electrodes for silver detection in tap
water using a electrogenerated in situ pH control method. Silver detection was undertaken
using square wave voltammetry at a working IDA with simultaneous production of hydrogen
ions at a protonator IDA which allowed the pH to be tailored in the vicinity of the sensor. In
addition, complexation of the silver ions with chlorine enabled more sensitive detection and
faster time-to-result without the need of electrolytes addition. The sensors have the potential to
be deployed for real time detection in water utility systems as well as in estuarine or marine
waters with the need for pre conditioning of a sample.

Acknowledgements

5. References
1. Oberdörster, G., V. Stone, and K. Donaldson, Toxicology of nanoparticles: a historical perspective. Nanotoxicology, 2007. 1(1): p. 2-25.
2. Behra, R., et al., Bioavailability of silver nanoparticles and ions: from a chemical and biochemical perspective. Journal of the Royal Society Interface, 2013. 10(87): p. 20130396.
3. Dumont, E., et al., Nano silver and nano zinc-oxide in surface waters–Exposure estimation for Europe at high spatial and temporal resolution. Environmental pollution, 2015. 196: p. 341-349.
4. Yu, S.-j., Y.-g. Yin, and J.-f. Liu, Silver nanoparticles in the environment. Environmental Science: Processes & Impacts, 2013. 15(1): p. 78-92.
5. Rosenman, K.D., A. Moss, and S. Kon, Argyria: clinical implications of exposure to silver nitrate and silver oxide. Journal of occupational medicine.: official publication of the Industrial Medical Association, 1979. 21(6): p. 430-435.
6. WHO, Guidelines for Drinking-Water Quality: Incorporating the First Addendum. Geneva, Switzerland. World Health Organization, 2017.
7. US EPA, Edition of the Drinking Water Standards and Health Advisories Tables (EPA 822-F-18-001). 2018, US Environmental Protection Agency Washington, DC.
8. Anand, T., et al., Colorimetric and turn-on fluorescence detection of Ag (I) ion. Tetrahedron Letters, 2014. 55(3): p. 671-675.
9. Karimi, M., et al., Determination of silver (I) by flame atomic absorption spectrometry after separation/preconcentration using modified magnetite nanoparticles. Scientia Iranica, 2011. 18(3): p. 790-796.
10. Gao, Z., et al., Facile colorimetric detection of silver ions with picomolar sensitivity. Analytical chemistry, 2017. 89(6): p. 3622-3629.
11. Lin, Y.-H. and W.-L. Tseng, Highly sensitive and selective detection of silver ions and silver nanoparticles in aqueous solution using an oligonucleotide-based fluorogenic probe. Chemical communications, 2009(43): p. 6619-6621.
12. Waheed, A., M. Mansha, and N. Ullah, Nanomaterials-based electrochemical detection of heavy metals in water: current status, challenges and future direction. TrAC Trends in Analytical Chemistry, 2018. 105: p. 37-51.
13. Barrett, C., et al., Development of low cost rapid fabrication of sharp polymer microneedles for in vivo glucose biosensing applications. ECS Journal of Solid State Science and Technology, 2015. 4(10): p. S3053-S3058.
14. Dawson, K., et al., Fully integrated on-chip nano-electrochemical devices for electroanalytical applications. Electrochimica Acta, 2014. 115: p. 239-246.
15. Nadiki, H.H., et al., Fabrication of a new multi-walled carbon nanotube paste electrode for stripping voltammetric determination of Ag (I). Analyst, 2012. 137(10): p. 2431-2436.
16. Jahandari, S., et al., Anodic stripping voltammetry of silver (I) using a carbon paste electrode modified with multi-walled carbon nanotubes. Microchimica Acta, 2013. 180(5-6): p. 347-354.
17. Javanbakht, M., et al., Determination of picomolar silver concentrations by differential pulse anodic stripping voltammetry at a carbon paste electrode modified with phenylthiourea-functionalized high ordered nanoporous silica gel. Electrochimica acta, 2009. 54(23): p. 5381-5386.
18. Guo, S.X. and S.B. Khoo, Highly selective and sensitive determination of silver (I) at a poly (8‐mercaptoquinoline) film modified glassy carbon electrode. Electroanalysis: An International Journal Devoted to Fundamental and Practical Aspects of Electroanalysis, 1999. 11(12): p. 891-898.

19. Sanz, V.C., et al., Development of a tyrosinase biosensor based on gold nanoparticles-modified glassy carbon electrodes: Application to the measurement of a bioelectrochemical polyphenols index in wines. Analytica Chimica Acta, 2005. 528(1): p. 1-8.
20. Zhang, Y., et al., Electrochemical sensor based on electrodeposited graphene-Au modified electrode and nanoAu carrier amplified signal strategy for attomolar mercury detection. Analytical chemistry, 2015. 87(2): p. 989-996.
21. Zeng, A., et al., Stripping Voltammetric Analysis of Heavy Metals at Nitrogen Doped Diamond‐Like Carbon Film Electrodes. Electroanalysis: An International Journal Devoted to Fundamental and Practical Aspects of Electroanalysis, 2002. 14(18): p. 1294-1298.
22. Read, T.L., et al., In situ control of local pH using a boron doped diamond ring disk electrode: optimizing heavy metal (mercury) detection. Analytical chemistry, 2014. 86(1): p. 367-371.
23. Saterlay, A.J., et al., Sonoelectrochemical investigation of silver analysis at a highly boron-doped diamond electrode. Talanta, 2000. 53(2): p. 403-415.
24. Mohadesi, A. and M.A. Taher, Stripping voltammetric determination of silver (I) at carbon paste electrode modified with 3-amino-2-mercapto quinazolin-4 (3H)-one. Talanta, 2007. 71(2): p. 615-619.
25. Radulescu, M.-C., et al., Determination of silver (i) by differential pulse voltammetry using a glassy carbon electrode modified with synthesized N-(2-Aminoethyl)-4, 4'-Bipyridine. Sensors, 2010. 10(12): p. 11340-11351.
26. Wahl, A., et al., Electroanalysis at ultramicro and nanoscale electrodes: a comparative study. Journal of The Electrochemical Society, 2014. 161(2): p. B3055-B3060.
27. Wahl, A.J., et al., Diffusion profile simulations and enhanced iron sensing in generator-collector mode at interdigitated nanowire electrode arrays. Electrochimica Acta, 2018. 277: p. 235-243.
28. Burke, L. and P. Nugent, The electrochemistry of gold: I the redox behaviour of the metal in aqueous media. Gold Bulletin, 1997. 30(2): p. 43-53.
29. Alexeyeva, N., et al., Oxygen reduction on gold nanoparticle/multi-walled carbon nanotubes modified glassy carbon electrodes in acid solution. Electrochemistry communications, 2006. 8(9): p. 1475-1480.
30. WHO, pH in Drinking-water. Revised background document for development of WHO Guidelines for Drinking-water Quality 2007.
31. Rohani, T. and M.A. Taher, Preparation of a carbon ceramic electrode modified by 4-(2-pyridylazo)-resorcinol for determination of trace amounts of silver. Talanta, 2010. 80(5): p. 1827-1831.
32. Jacangelo, J.G. and R.R. Trussell, International report: Water and wastewater disinfection-trends, issues and practices. Water science and technology: water supply, 2002. 2(3): p. 147-157.
33. EPA Ireland, Water treatment manual: disinfection. 2011. 34. O'Riordan, A., et al., Electrochemical Detection of Free-Chlorine in Water Samples Facilitated
by In-Situ pH Control Using Interdigitated Microelectrodes. 2020. 35. Li, Y.-H., H.-Q. Xie, and F.-Q. Zhou, Alizarin violet modified carbon paste electrode for the
determination of trace silver (I) by adsorptive voltammetry. Talanta, 2005. 67(1): p. 28-33.

download fileview on ChemRxiv2020.07.02 Reagent free detection of silver ions using squ... (1.70 MiB)

Supporting information for
Reagent free electrochemical-based detection of silver ions at
interdigitated micro electrodes using in situ pH control.
Luiza Adela Wasiewskaa,b; Ian Seymoura, Bernardo Patellac, Catherine Burgessb, Geraldine
Duffyb, Alan O’Riordan*a
a Nanotechnology group, Tyndall National Institute - University College Cork, Dyke Parade, Cork,
Ireland
b Food Safety Department, Ashtown Food Research Centre, Teagasc, Dublin, Ireland
c Laboratorio di Chimica Fisica Applicata, Dipartimento dell'Innovazione Industriale e
DigitaleIngegneria Chimica Gestionale Informatica Meccanica, Università di Palermo, Viale delle
Scienze, Palermo, Italy
* Corresponding author
E-mail address: [email protected]
Fig. S1. (A) Influence of different pH of a solution on corresponding silver deposition currents
recorded for 1 µM of AgNO3 in 10 mM sodium acetate, deposited at -0.2 V for 3 minutes at i)
pH 2; ii) pH 3; iii) pH 3.5; iv) pH 4; v) pH 4.5 (B) Influence of different potential applied during
silver deposition on corresponding currents recorded for 1 µM of AgNO3 in 10 mM sodium
acetate, pH 3, deposited for 3 minutes at i) -0.1 V; ii) -0.2 V; iii) -0.3 V; iv) -0.4 V; v) -0.5 V.

Fig. S2. Linear calibration curve corresponding to silver ions detection in 0.01 M sodium
acetate, pH 3 at an unmodified gold electrode. Deposition time: 5 minutes at -0.2 V.
Fig. S3. Cyclic voltammograms recorded in i) 10 mM sodium acetate, pH 7.5 and ii) 10 mM
sodium acetate, pH 7.5 with 1.65 V applied at the protonator electrode.

Fig. S4. Influence of potential applied to the protonator IDA during deposition of 1 µM of
AgNO3 in 10 mM sodium acetate, pH 7.5 at -0.2 V for 3 minutes on corresponding current
when i) 1.65 V; ii) 1.45 V; iii) 1.35 V; iv) 1.25 V; v) no potential; was applied; while v) current
during deposition of 1 µM of AgNO3 in 10 mM sodium acetate, pH 3 at -0.2 V for 3 minutes.
Fig. S5. Cyclic voltammograms recorded in a) 10 mM sodium acetate, pH 7.5 with 1.65 V
applied at the protonator electrode and b) tap water with 1.65 V applied at the protonator
electrode.

download fileview on ChemRxivSupporting information_Final.pdf (699.90 KiB)