Reaching the Goal: The Applicability and Importance of the Common Core State Standards to College...
240
Reaching the Goal: The Applicability and Importance of the Common Core State Standards to College and Career Readiness David T. Conley Kathryn V. Drummond Alicia de Gonzalez Jennifer Rooseboom Odile Stout
Transcript of Reaching the Goal: The Applicability and Importance of the Common Core State Standards to College...

Chapter One • 1
Reaching the Goal: The Applicability and Importance of the Common Core State Standards to College and Career Readiness
David T. ConleyKathryn V. DrummondAlicia de GonzalezJennifer RooseboomOdile Stout

Chapter One • 2
This report is based on research funded in part by the Bill & Melinda Gates Foundation. The findings and conclusions contained within are those of the authors and do not necessarily reflect positions or policies of the Bill & Melinda Gates Foundation.
Prepared and published by the Educational Policy Improvement Center.720 E. 13th Avenue, Eugene, Oregon 97401www.epiconline.orgCopyright © 2011 Educational Policy Improvement Center. All rights reserved.
Acknowledgements
The study could not have occurred without the ratings and reflections from the 1815 postsecondary instructors who completed the survey. These individuals were nominated by 1758 postsecondary liaisons, to whom we are also indebted. We are extremely grateful for the time and energy contributions from both of these groups. The fact that so many postsecondary educators across the United States gave of their time for this effort is a testament to the importance they place on the issue of students being well prepared for college.
The study’s external reviewers provided valuable insights on an early version of the report. We thank John Kendall, David Stern, and Andrea Venezia for their helpful comments and questions. Rich Brown gave methodological feedback and advice in earlier stages of project planning and data collection.
Beyond those listed as authors of the report, additional EPIC staff made significant contributions. Charis McGaughy and Mary Seburn worked on the initial design and proposal for the study. A number of individuals, including Carla Anderson, Jan Tully, Mckenzie Gambee, Sara Frain, and Alanna Crabaugh helped with contacting and recruiting potential participants. Carl Green and Anne Irvine-Gordon assisted with the coding of the open-ended responses. Karin Klinger, Alison Rich, Tina Kerrigan, and Cara Strazzo collaborated to edit and prepare the document.
The Authors

Executive Summary
The stated aim of the Common Core State Standards is to
define the knowledge and skills students should achieve
in order to graduate from high school ready to succeed
in entry-level, credit-bearing academic college courses
and in workforce training programs.
In June 2010, the National Governors Association Center for Best Practices
(NGA Center) and the Council of Chief State School Officers (CCSSO)
released the Common Core State Standards©. The stated aim of the Common
Core State Standards is to define the knowledge and skills students should
achieve in order to graduate from high school ready to succeed in entry-
level, credit-bearing academic college courses and in workforce training
programs (Common Core State Standards Initiative, 2010a).
The Common Core State Standards gave states an opportunity to voluntarily
adopt common expectations in English language arts and literacy, and
mathematics. With common standards in place, states could more easily
and efficiently share best practices in curriculum and assessments, while
still retaining flexibility on how best to teach these subjects locally (Phillips &
Wong, 2010). As of July 2011, 44 states had taken up this invitation
and had adopted the standards.
Major questions remain to be answered about these standards, chief
among them the degree to which they reflect what is necessary to
be ready for college and careers. To help answer this question,
the Educational Policy Improvement Center (EPIC) designed and
conducted this study. It examines the degree to
which the knowledge and skills contained in the Common
Core State Standards are applicable to and important for
postsecondary readiness.
Our method was to have postsecondary instructors from a wide
range of postsecondary courses and institutions rate each
standard on its applicability and importance to their course.
We began by recruiting a national sample of instructors from
two- and four-year institutions in 25 course categories. A total
of 1897 responses were received. First, we asked them to
rate the applicability of each Common Core standard to their
course. If the standard was applicable, we asked them to
rate the standard’s importance to success in the course.
Executive Summary •
Instructors Rate Applicability
The study examines the degree to which
the knowledge and skills contained
in the Common Core State Standards
are applicable to and important for
postsecondary readiness. The study
asked postsecondary instructors from
a wide range of postsecondary courses
and institutions to rate each standard
on its applicability and importance to
their course.

Each instructor was given the opportunity to rate both
(English language arts [ELA] and literacy, and mathematics).
Responses to these two questions and several supplemental
questions provide the basis for our findings.
The 25 course categories include 14 from courses commonly
associated with general education requirements for a
bachelor’s degree and 11 that might be better considered
as career-oriented, often required for two-year certificates or,
in some cases, a bachelor’s degree in a career area. EPIC
has collected this type of self-reported information previously
and has found 70% to 90% consistency of instructor
ratings of the standards with independent third-party expert
analysis of course syllabi from these instructors (Conley,
Aspengren, Gallagher, Stout, & Veach, 2006; Educational
Policy Improvement Center, 2008). Given the exploratory
nature of this study, this method of data collection was
deemed appropriate. Caution is taken throughout the report
not to overgeneralize or place excessive weight on any
individual data point. Instead, the findings and conclusions
are summarized at a relatively high level of aggregation, while
the interested reader can still examine the more detailed
standards ratings.
We selected courses to be representative examples of
common offerings in seven major subject areas: English
language arts, mathematics, science, social science,
business management, computer technology, and healthcare.
The study does not cover the whole landscape of personnel
who could provide information on college- and career-
readiness, nor do the selected courses comprehensively
cover all content areas. The data does, however, give insight
on the Common Core standards from college instructors in a
number of different fields and contexts.
Study Overview
Participants
Data were collected from college instructors using an online
instrument. In order to ensure the most suitable participants,
we used a nomination process in which we asked liaisons —
department chairs, deans, provosts, and/or chief academic
officers — to nominate individuals who either currently taught
or had recently taught a course or courses from one of the
25 course categories. The course categories are contained
in Table ES.1 Liaisons nominated instructors for 3625 distinct
courses. The study includes data from the 1815 instructors
who rated 1897 separate courses.1 Figure ES.1 shows the
distribution of courses across the seven content areas.
Instructors from all states and the District of Columbia
participated in the survey. Nearly 64% of respondents came
from public institutions, with 36% from private institutions.
There were 66 instructors (4% of the sample) who were nominated for and completed the survey for more than one course.
Executive Summary • 4
Table ES.1. Course Categories Represented in Study
Content area Course category
English language arts
Composition I
Composition II
English Literature
Mathematics
Calculus
College Algebra
Statistics
Science
Biology
Chemistry
Physics
Social science
Introduction to Economics
Introduction to Psychology
Introduction to Sociology
U.S. History
U.S. Government
Business management
Human Resource Management
Introduction to Accounting
Introduction to Business Management
Introduction to Marketing
Computer technology
Computer Science I
Database Management Systems
Fundamentals of Programming
Healthcare
Anatomy and Physiology
Foundations of Nursing
Human Development
Pharmacology

ELA !16.4%!
Math !15.9%!
Science !14.8%!
Social science !22.1%!
Business management !
12.8%!
Computer technology !
8.1%!
Healthcare !9.8%!
Responses were geographically
well balanced across regions of
the U.S. Approximately 60% of
the courses were taught at four-
year institutions, the other 40% at
two-year institutions. More than
50% of respondents had taught
the course 10 or more times.
Participating instructors, therefore,
knew their course and content
area extremely well.
Because the Common Core
standards were written with
the intention of being broadly
applicable across a range
of coursework and content
areas — not only to English and
mathematics courses — we
asked respondents to rate both
the ELA and literacy standards
and the mathematics standards,
regardless of the subject area in
which they taught. We grouped
the Common Core standards
such that respondents rated 113
statements for ELA and literacy and 200
statements for mathematics.
Survey
If respondents rated a standard as applicable (in other words,
if it represented prerequisite knowledge and skills, content
that would be reviewed in the course, or new information that
would be introduced in the course), they were then asked
to rate the importance of the standard on a 4-point scale
that ranged from least to most important. They also had an
opportunity to answer five optional questions that asked
them to reflect on the standards as a whole. These questions
focused on several dimensions, including cognitive challenge
level of the standards, whether they included all of the
important knowledge and skills used in their course, as well
as their general impression of the standards.
Findings
How applicable are the Common Core standards to
postsecondary courses?
In general, we found that for the ELA and literacy standards,
applicability ratings for non-literary reading and writing
standards are very high, particularly when results from the
English language arts strands of Reading for Informational
Texts and Writing are combined with results from the literacy,
subject-specific versions of these same strands. With few
exceptions, a large percent of instructors across all content
areas rated the Speaking and Listening strand and Language
strand as applicable. Given the broad applicability of these
standards to a wide range of postsecondary courses, the
Speaking and Listening standards seem particularly important
to teach and assess at the classroom level and to be included
in some form by the two consortia of states working on
common assessments of the Common Core standards.
For the mathematics standards, the applicability ratings
varied according to the categories included in the standards.
For example, the Standards for Mathematical Practice
were relevant to a large majority of the sample, whereas
Functions and Geometry were applicable to a relatively small
percentage of the sample.
For a majority of instructors in almost all content areas rated
the Mathematical Practices as applicable.
Not every standard is applicable to every one of the 25 course
categories. This should hardly be surprising given the wide
range of courses we intentionally included in the study and
the fact that we made all standards available for review by all
respondents. Also not surprising, when applicability ratings
are grouped by content area, they show that instructors of
different content areas place varying degrees of emphasis on
the eight ELA and literacy strands and the five mathematics
Executive Summary •
Figure ES.1. Percent of Participants by Subject Area

conceptual categories and Mathematical Practices.
How important are the Common Core standards to success
in a wide range of postsecondary courses?
Almost every standard received a mean rating well above 2.5,
the midpoint between “less important” and “more important”
on the 4-point scale. Most exceeded 3, “more important.”
Therefore, interpretation of the importance ratings is relatively
straightforward: respondents who considered a particular
standard applicable also considered it to be important. The
ELA and literacy standards on the whole received higher
importance ratings than did the mathematics standards.
Mathematics had more standards below 2.5, 25 of 200. Some
of these were standards identified as being more specialized
in nature. Only two of 113 English language arts (ELA) and
literacy standards had means below 2.5.
Importance of the ELA and Literacy Standards
Instructors who taught courses in the English content area
comprised the majority of respondents in all ELA and literacy
strands except speaking and listening, and language for
which responses were distributed more representatively
across all course categories. Social science instructors
made up the large majority of respondents in the Reading
Standards in History/Social Studies, while respondents in the
Reading Standards in Science and Technical Subjects were
more broadly distributed, with about a quarter of respondents
teaching science courses. The importance ratings for the
Writing Standards for Literacy in History/Social Studies,
Science, and Technical Subjects were also distributed
representatively, with social science and science instructors
providing just over half of the responses. The Language
strand, while receiving high applicability ratings, also received
the lowest importance ratings. These standards relate to use
of the English language and include spelling, punctuation,
and usage conventions and are very specific in nature, more
specific than other ELA and literacy standards.
Standards that relate to students mastering comprehension
of nonfiction text with grade-appropriate complexity were
highly rated, both generally and as they apply to specific
content areas. Instructors placed relatively greater emphasis
on standards that require students to extract key ideas and
details from text, possess general writing skills — especially
the writing process — use research to support written
analysis, and write routinely over both extended and shorter
periods of time.
Importance of the Mathematics Standards
Mathematics and science instructors comprise the majority
of respondents in Number and Quantity, Algebra, Functions,
and Geometry, in which they make up 85% of respondents.
They are less than a majority in Statistics, where science and
social science respondents make up a majority. Mathematical
Practices had the widest range of respondents. For these
standards, math and science instructors make up 43%
of respondents, and social science instructors comprise
an additional 17%, with three other content areas each
contributing more than 10% of the responses.
Mathematics standards with the highest ratings include
standards related to reasoning quantitatively and interpreting
functions. Three algebraic concepts also received high
ratings. These contain standards that expect students to
create equations that describe numbers or relationships,
interpret the structure of expressions, and solve problems
with different equations. All respondents rated the Geometry
category relatively lower. This finding suggests that the
Geometry category may be a candidate for further review
in order to increase its applicability and importance by
eliminating or consolidating some standards. The Standards
for Mathematical Practice, which authors of the Common Core
standards stated should be applied across all applicable
standards, are noteworthy because they received the highest
importance ratings and because the ratings came from a very
broad cross-section of respondents. These findings suggest
that, as intended, the Standards for Mathematical Practice
should indeed be implemented and assessed across subject
Executive Summary • 6

areas in a wide range of contexts and courses in secondary
schools and in state and consortia assessments.
Supplemental Questions
Further reinforcing the conclusion that the standards were
broadly applicable to entry-level courses were the results from
the supplemental questions. When asked if the standards as
a whole were sufficiently cognitively challenging to prepare
students for their classes, nearly 96% of respondents said
they were. In responses to the question of whether the
standards omitted key knowledge and skills, nearly 84%
responded no, they did not.
Of the more than 90% of respondents who answered the
question asking whether the ELA and literacy standards
were a coherent representation of the fields of knowledge
necessary for success in their course, nearly 84% indicated
they were, and 62% of the more than 90% of respondents
answering the mathematics standards question indicated they
were coherent. This somewhat lower number in mathematics
suggests the mathematics standards, with their greater
specificity and number of standards, may have sacrificed a
modicum of coherence in the eyes of some
postsecondary instructors.
A final open-ended question gave respondents an opportunity
to offer opinions on the Common Core standards. The largest
proportion of responses actually detailed ways that students
are not well prepared for college, rather than commenting
directly on the Common Core standards. The open-ended
questions are one more place where questions about the
applicability of the standards might have arisen but did not.
Conclusion
The study suggests that students who are generally proficient
in the Common Core standards will likely be ready for a wide
range of postsecondary courses, and the more Common Core
standards in which they are proficient, the wider the range of
postsecondary-level classes they will be ready to undertake.
We note the danger in assuming that this finding is
synonymous with the idea that students who have learned
the Common Core standards are fully ready for college and
careers. Other important dimensions of readiness exist,
upon which the Common Core standards are necessarily
silent. Careful attention should be given to comprehensive
conceptions of college and career readiness when
considering which aspects of readiness the
standards address.
Executive Summary •

Table of Contents • i
Table of Contents
Executive Summary ....................................... Executive Summary 3 Study Overview ............................................................................................ES 4 Participants ..................................................................................................ES 4 Survey ..........................................................................................................ES 5 Findings .......................................................................................................ES 5
How applicable are the Common Core standards to postsecondary courses? ................................................................ES 5
How important are the Common Core standards to success in a wide range of postsecondarycourses? .............................................................................................ES 6
Importance of the Mathematics Standards .............................................ES 5Supplemental Questions ...............................................................................ES 7Conclusion .....................................................................................................ES 7
Chapter 1: Introduction .................................................................... 1
Chapter 2: Methodology .................................................................. 3Participants ........................................................................................................3
Nomination Process .....................................................................................3The Survey ..........................................................................................................9
Rating of Common Core English Language Arts and Literacy Standards ...........................................................................9
Rating of Common Core Mathematics Standards ......................................10Ratings of Applicability and Importance ....................................................11
Chapter 3: Findings for Ratings of Common CoreEnglish Language Arts and Literacy Standards ............................ 13Applicability for English Language Arts and Literacy Standards ....................13
Overall Applicability ...................................................................................13Applicability by Content Area ....................................................................15
Importance Ratings of Common Core English Language Arts and Literacy Standards .....................................................17
Reading Standards for Literature .....................................................................18Respondents ..............................................................................................18Average Importance Ratings .....................................................................18 Importance Ratings by Standard ...............................................................19Summary ....................................................................................................21
Reading Standards for Informational Texts ......................................................22Respondents ..............................................................................................22Average Importance Ratings .....................................................................23Importance Ratings by Standard ...............................................................23Summary ....................................................................................................24
Writing Standards .............................................................................................25Respondents ..............................................................................................25Average Importance Ratings .....................................................................25Importance Ratings by Standard ...............................................................26Summary ....................................................................................................28

Table of Contents • ii
Table of Contents
Speaking and Listening Standards ..................................................................29Respondents ..............................................................................................29Average Importance Ratings .....................................................................29Importance Ratings by Standard ...............................................................30Summary ....................................................................................................31
Language Standards ........................................................................................32Respondents ..............................................................................................32Average Importance Ratings .....................................................................32Importance Ratings by Standard ...............................................................33Summary ....................................................................................................35
Reading Standards for Literacy in History/Social Studies ................................36Respondents ..............................................................................................36Average Importance Ratings .....................................................................36Importance Ratings by Standard ...............................................................37Summary ....................................................................................................38
Reading Standards for Literacy in Science and Technical Subjects .....................................................................................39Respondents ..............................................................................................39Average Importance Ratings .....................................................................39Importance Ratings by Standard ...............................................................40Summary ....................................................................................................41
Writing Standards for Literacy in History/Social Studies,Science, and Technical Subjects ...............................................................42Respondents ..............................................................................................42Average Importance Ratings .....................................................................42Importance Ratings by Standard ...............................................................43Summary ....................................................................................................45
Chapter 4: Findings for Ratings of Common CoreMathematics Standards ....................................................................... 46Applicability ......................................................................................................46
Overall Applicability ...................................................................................46Applicability by Content Area ....................................................................48
Importance Ratings ..........................................................................................49Number and Quantity Standards .....................................................................51
Respondents ..............................................................................................51Average Importance Ratings .....................................................................51Importance Ratings by Standard ...............................................................52Summary ....................................................................................................54
Algebra Standards ...........................................................................................55Respondents ..............................................................................................55Average Importance Ratings .....................................................................55Importance Ratings by Standard ...............................................................56Summary ....................................................................................................59
Functions Standards ........................................................................................60Respondents ..............................................................................................60Average Importance Ratings .....................................................................60Importance Ratings by Standard ...............................................................61Summary ....................................................................................................65

Table of Contents • iii
Geometry Standards ........................................................................................66Respondents ..........................................................................................66Average Importance Ratings .................................................................66Importance Ratings by Standard ...........................................................67Summary ................................................................................................71
Statistics and Probability Standards ................................................................72Respondents ..........................................................................................72Average Importance Ratings .................................................................72Importance Ratings by Standard ...........................................................73Summary ................................................................................................76
Standards for Mathematical Practices .............................................................77Respondents ..........................................................................................77Average Importance Ratings .................................................................77Importance Ratings by Standard ...........................................................78Summary ................................................................................................78
Chapter 5: Findings from Additional QuestionsAbout the Common Core Standards ................................................. 79Process for Coding Open-Ended Comments ..................................................79Respondents Views of the English Language Arts and
Literacy Standards .....................................................................................79Respondents Views of the Mathematical Standards ........................................82Respondents Views of Cognitive Demand .......................................................85Respondents Views of Omitted Components ..................................................87Respondent Additional Comments ..................................................................89Summary of Respondent Views and Comments ..............................................93
Chapter 6: Summary and Discussion ............................................... 94Discussion of Methodology ..............................................................................94How applicable are the Common Core standards to
college courses? ........................................................................................95How important are the Common Core standards to
success in a wide range of postsecondary courses? ................................97Do the standards prepare students for both college
and career? ................................................................................................98Will students who do well on the common assessments
be ready for college? .................................................................................99Future directions for subsequent research and analysis ...............................100
Appendix A: Sample Recruitment .......................................................... 104Appendix B: Level of Courses ............................................................... 106Appendix C: Demographics of the Sample ............................................ 108Appendix D: Summary of ELA and Literacy Applicability Ratings ...........111Appendix E: Individual Ratings for the ELA and Literacy Standards ...... 116Appendix F: Summary of Mathematics Applicability Ratings ................. 158Appendix G: Individual Ratings for the Mathematics Standards ............ 161
Table of Contents

The effort by states to develop the Common Core State Standards© was coordinated by the National Governors Association Center for Best Practices (NGA Center) and the Council of Chief State School Officers (CCSSO). With involvement and participation from teachers, school administrators, and national experts, the organizations developed the Common Core State Standards in order to provide a clear and consistent framework that prepares students with the knowledge and skills necessary for college and careers. The Common Core State Standards were developed with the intention that states would be free to adopt them voluntarily.
According to the Common Core State Standards Initiative (2010a), the standards are designed to:
� Align with college and work expectations; � Be clear, understandable, and consistent; � Include rigorous content and application of knowledge through high-order skills;
� Build upon the strengths and lessons of current state standards;
� Be informed by other top-performing countries; and � Be evidence based.
The standards aim to define the knowledge and skills students should achieve in order to graduate from high school ready to succeed in entry-level, credit-bearing academic college courses and in workforce training programs. They make no distinction between college and career readiness (King, 2011). To examine how well the standards achieve their stated aim of preparing students for college and careers, the Educational Policy Improvement Center (EPIC) undertook this study. It examines the relationship between the standards and the requirements and expectations set by instructors of entry-level postsecondary courses. The study is designed to examine the degree to which the knowledge and skills applicable to and important for postsecondary readiness are represented by the Common Core State Standards (called Common Core standards throughout the rest of this report).
We recruited a national sample of entry-level college instructors and asked them to rate each standard in the highest-grade band for each of the two subject areas that the Common Core standards currently cover: (a) English language arts and literacy and (b) mathematics. Data from their ratings address two research questions:
1. How applicable are the Common Core standards to college courses?
2. When they are perceived as applicable, how important are the Common Core standards to college courses?
Though there are a number of questions that we could have asked college instructors about the Common Core standards, in this study we asked instructors to make two straightforward determinations on a per-standard basis. First, we asked them to rate the applicability of the standard to their course. If the standard was applicable, we asked them to rate its importance. Given the number of statements the Common Core standards include and the number of course categories in the survey, these two basic questions provide a wealth of preliminary information about the validity of the Common Core standards in relation to the claims of its authors and sponsors that the standards prepare students well for a range of postsecondary futures.
The study analyzes ratings from instructors of courses from 25 categories at two- and four-year degree-granting institutions. Table 1 shows the categories. Fourteen of those course categories — in English language arts, mathematics, science, and social science — are common
Chapter 1 | Introduction
The Common Core
State Standards
The standards were developed
in order to provide a clear and
consistent framework that prepares
students with the knowledge and
skills necessary for college and
careers.
Chapter One • 1

Chapter One • 2
Chapter 1 | Introduction
general education requirements associated with a bachelor’s degree. The other 11 — in business management, computer technology, and healthcare — have a stronger association with career pathways. Many courses with the same or similar titles can be found at both two- and four-year institutions and could be used to meet certificate, associate, or baccalaureate requirements. However, these 11 course categories present a test of the claim that the Common Core standards are valid in relation to career preparation. The study does not attempt to cover the entire range of career pathways available in postsecondary education. We sought to identify a range of courses associated with several career areas for which future job prospects are solid and that would require at least some mathematics and literacy skills. We established the overall content areas based on the most common bachelor’s degrees identified in the National Center for Education Statistics report, The Condition of Education 2009 – Undergraduate Fields of Study (Planty, Kena, & Hanes, 2009). Then within each field, the most common entry-level, credit-bearing courses were identified (U.S. Department of Education, 2004). EPIC also explored undergraduate degree and certificate programs from a variety of institutions, including technical schools, community colleges, and universities, to identify course requirements for these fields. Although these requirements differed by institution, there was considerable overlap among degree programs (i.e., certificate, Associate, Baccalaureate), enabling us to pinpoint common entry-level courses that serve as central or core requirements. The course categories selected in the seven content areas were not intended to cover these areas comprehensively. In general, the courses represent classes of the type a student would be likely to take upon entry to a postsecondary institution. In some cases, however, the courses have prerequisites.
To make final selections of career and technical education courses, we used labor market data that identifies three fields of study in which growth is forecasted at a significant rate (greater than 20% over the next 10 years). These subject areas include business management, nursing, and computer technology (U.S. Department of Labor). Within the computer technology field of study, there are two distinct pathways: programming and information systems. The courses selected for computer technology represent the most common entry-level courses for each track.
Next, we describe the survey methods and findings and then return to answer the questions posed by the study. Chapter 2, Methodology, describes selection criteria for instructors, a profile of respondents, and decisions made about data inclusion and analysis. Chapter 3 provides summaries of key
results of respondent ratings for the Common Core English language arts and literacy standards. Chapter 4 continues with the ratings for the mathematics standards. Next, Chapter 5 offers results from several open-ended questions respondents were asked and the comments they made regarding the Common Core standards. Finally, Chapter 6 considers the research questions the study was designed to answer and offers discussion of some of the key study findings and implications. Appendices provide more detailed information about the sample and further information on the ratings, including Appendices E and G, which provide descriptive statistics for the individual ratings for every standard.1
Whereas the current study compares content of the Common Core standards with expectations for college courses, another EPIC-conducted study compares content of the Common Core standards with content of existing high-school standards (see Conley, Drummond, Seburn, de Gonzalez, Stout, & Rooseboom, 20).
Table 1. Course Categories Represented in Study
Content area Course category
English language arts
Composition I
Composition II
English Literature
Mathematics
Calculus
College Algebra
Statistics
Science
Biology
Chemistry
Physics
Social science
Introduction to Economics
Introduction to Psychology
Introduction to Sociology
U.S. History
U.S. Government
Business management
Human Resource Management
Introduction to Accounting
Introduction to Business Management
Introduction to Marketing
Computer technology
Computer Science I
Database Management Systems
Fundamentals of Programming
Healthcare
Anatomy and Physiology
Foundations of Nursing
Human Development
Pharmacology

Participants
Nomination Process
In order to identify college instructors to complete the survey, we used a nomination process. In this process, we asked department chairs, deans, provosts, and/or chief academic officers to nominate instructors who either currently taught or had recently taught at an entry level the course or courses for which the institution had been randomly selected to represent.
In the spring of 2009, a list was obtained from the Carnegie Classification of Institutions of Higher Education™ containing information for the 3468 institutions of higher education in the United States offering associate and undergraduate degrees at that time.2 Project staff placed the names of the institutions on lists for each content area and then sorted the lists so the institutions would be in random order. Project staff began contacting relevant liaisons (e.g., a chemistry department head to identify a chemistry instructor) according to their order on the list. We also attempted to replicate, as closely as possible, Carnegie’s percentage breakdown of the 3468 institutions of education in terms of size, whether they are private or public, and whether they are two-year or four-year institutions. Therefore, the lists were sometimes reordered to prioritize certain school characteristics (e.g., if enough four-year institutions had been attained for a certain course, we may have prioritized contacting additional two-year institutions even if they were not the next on the list). Appendix A shows the Carnegie percentage breakdowns that served as goals, compared with the breakdown of the actual sample attained.
Between December 2009 and November 2010, liaisons were contacted via email and phone. The purpose of the study was explained to them and, if they wished to participate, they were directed to a nomination webpage created to collect instructor information. Liaisons accessed the webpage by logging in with a unique password provided to them by project staff and then entered the nominated instructor’s name, course, and contact information. We contacted over 7200 potential liaisons asking them to identify potential instructor participants. By the end of the study, 1758 liaisons responded. Liaisons, in turn, nominated instructors for 3625 courses.
2 We did not include institutions located in U.S. territories.
Beginning in April 2010, nominees were contacted via email and phone to inform them of their nomination and request their participation in the upcoming survey. The final version of the Common Core standards was released in June 2010, and the survey opened for responses in July. Instructors who agreed to participate completed their survey online. They were offered a token of appreciation when they completed the survey. As an extra incentive for participation, at several times during the recruitment process, instructors were offered a chance at winning a handheld electronic device in a lottery. The study team continued contacting nominees to complete the survey until December 2010. The study includes data from 1815 instructors who rated 1897 courses. The instructors came from 944 different institutions. The fulfillment rate, or the percent of courses that had a survey completed after being nominated, ranged from 38% to 66% across courses with an average of 52%.
Chapter 2 | Methodology
Study DataThe study includes data from 1815 instructors from 944 different institutions who rated 1897 courses.
Chapter Two •

Chapter Two • 4
Figures 1 through 3 provide information about the distribution of participating instructors at public versus private institutions, institutions of different size, and institutions in different geographic regions. Nearly 64% of instructors came from public institutions, while the other 36% came from private institutions (see Figure 1). Figure 2 shows the geographic breakdown of the instructors’ institutions. As the figure illustrates, 28% of the instructors came from institutions in both the South and Midwest, 16% of the instructors came from institutions in both the West and East, while 12% came from institutions in the Southwest.
In terms of the size of the institutions where the instructors worked, 11% were very small, 36% were small, 29% were medium, 16% were large, and 3% were very large.
The Carnegie size categories include slightly different size ranges depending on whether the school is a two- or four-year institution (see Table 2). Another 5% of instructors came from what Carnegie calls “special focus” institutions. These are four-year institutions for which more than 75% of degrees are a single field or set of related fields (e.g., a seminary school); they have no size specification.
Chapter 2 | Methodology
Public "63.9%"
Private"36.1%"
Figure 1. Breakdown of Respondents (n = 1815) by Institution Type: Public vs. Private "Figure 1. Respondents (n = 1815) by
Institution Type: Public vs. Private
East!15.8%!
Midwest!27.7%!
South!28.0%!
Southwest!12.3%!
West!16.2%!
Figure 2. Breakdown of Respondents (n = 1815) by Geographic Location of Institution!
Figure 2. Breakdown of Respondents (n = 1815) by Geographic Location of Institution
Very small !11.4%!
Small !36.3%!
Medium !28.6%!
Large !16.3%!
Very large !2.5%!
Special focus!4.9%!
Figure 3. Breakdown of Respondents (n = 1815) by Size of Institution!Figure 3. Breakdown of Respondents (n = 1815) by Size of Institution
Table 2. Size Classifications for Postsecondary Institutions
Size
Institution type
2-year 4-year
Very small 0-00 0-000
Small 0-999 00-2999
Medium 2000-4999 000-9999
Large 000-9999 0000+
Very large 0000+ N/A
Source. Carnegie Foundation (20). Retrieved from http://classifications.carnegiefoundation.org/descriptions/size_setting.php

Chapter Two • 5
Chapter 2 | Methodology
Figure 4 shows the location of respondents’ institutions by state. All states and the District of Columbia were represented in the survey, with less populous states having fewer respondents (for example, Alaska, Delaware, Nevada, and Wyoming had between one and three respondents). More populous states had a greater number of respondents, such as California (99 respondents) and Texas (151 respondents).
Figure 4. Breakdown of Respondents (n = 1815) by State

Chapter Two • 6
Table 3. Breakdown of Course Categories (n = 1897)
Content area Course category Number Percent
English language arts
Composition I 29 6.8
Composition II 94 .0
English Literature 89 4.
Mathematics
Calculus 0 .
College Algebra 08 .
Statistics 9 4.9
Science
Biology 0 .4
Chemistry 00 .
Physics 8 4.
Social science
Introduction to Economics 6 .2
Introduction to Psychology 0 .4
Introduction to Sociology .9
U.S. History 96 .
U.S. Government 8 4.6
Business management
Human Resource Management 4 2.
Introduction to Accounting 9 4.2
Introduction to Business Management 62 .
Introduction to Marketing 9 .
Computer technology
Computer Science I 66 .
Database Management Systems 40 2.
Fundamentals of Programming 4 2.
Healthcare
Anatomy and Physiology 62 .
Foundations of Nursing 2.9
Human Development .6
Pharmacology 8 2.0
Total 1897 100.0
Chapter 2 | Methodology
Table 3 shows the number of each course type that was represented in the final sample. Six of the 25 courses had 100 or more respondents (Composition I, Calculus, College Algebra, Biology, Chemistry, and Introduction to Psychology). Seven courses had between 75 and 99 respondents (Composition II, English Literature, Statistics, Physics, U.S. Government, U.S. History, and Introduction to Accounting). An additional seven courses had between 50 and 74 respondents (Introduction to Economics, Introduction to Sociology, Introduction to Business Management, Introduction to Marketing, Computer Science I, Anatomy and Physiology, and Foundations of Nursing). Some courses that were more rare or harder to recruit, including Human Resource Management (n = 43), Database Management Systems (n = 40), Fundamentals of Programming (n = 47), Human Development (n = 31), and Pharmacology (n = 38).
A total of 66 instructors (4% of the sample) were nominated for and completed the survey for more than one course. Of these, 50 completed the survey for two courses and 16 for three courses. This occurred most frequently in mathematics (n = 20) and English language arts (n = 18). Some respondents from business management (n = 10) and computer technology (n = 10) also completed the survey for more than one course. Very few respondents for healthcare (n = 5), social science (n = 2), and science (n = 1) did so.

Chapter Two • 7
Figures 5 and 6 provide information about the distribution by two- and four-year institutions for the courses as a whole and by content area. Approximately 60% of the courses came from four-year institutions, with the other 40% from two-year institutions. This pattern was fairly consistent for each content area as well, with two exceptions. For the social science courses, the percentage at four-year institutions was slightly higher (66% vs. 34% at two-year institutions). For healthcare courses, the percentage at two-year institutions was higher (55% vs. 45% at four-year institutions).
In order to obtain context for the perceptions of instructors in our sample, we asked several questions about the nature of the courses. Figures 7 through 9 and Table 4 show the demographic information about the courses. Figure 7 shows the level of the course. The survey was intended to capture perceptions of instructors of courses that students encounter at the beginning of their college careers; however, 10% of the respondents considered their
188 175 171
278
144 91 83
124 127 110
142
99
62 103
0
100
200
300
400
500
English language arts
Mathematics Science Social science Business management
Computer technology
Healthcare
Figure 6. Breakdown of Courses (n = 1897) by Content Area and Type of Institution: 2-Year vs. 4-Year
2-year
4-year
Figure 6. Breakdown of Courses (n = 1897) by Content Area and Type of Institution: 2-year vs. 4-year
Entry level/lower division!
89.9%!
Upper division!10.1%!
Figure 7. Level of Course, Reported by Respondent!Figure 7. Level of Course, Reported by Respondent
Chapter 2 | Methodology
2-year !40.4%!
4-year!59.6%!
Figure 5. Breakdown of Courses (n = 1897) by Institution Type: 2-year vs. 4-year Figure 5. Breakdown of Courses (n
= 1897) by Institution Type: 2-year vs. 4-year
course to be upper level. We conducted an analysis of their responses separately from the rest of the sample. We determined that their responses were not sufficiently different to warrant systematic exclusion from the sample and that excluding them would not affect the overall findings. Appendix B includes more detail about these analyses and shows the breakdown of course level by content area, and the information respondents gave about whether or not their course has prerequisites.

Chapter Two • 8
Figure 8 displays the range in the number of students in the courses of participating instructors.
A majority of courses fell in the two smallest ranges of class size, between 1 and 25 or 26 and 50 students. Appendix C shows the breakdown of class sizes by content area. There was a tendency for English language arts and computer technology classes to be smaller (between 64% and 73% of courses had fewer than 26 students). Science, social science, and healthcare courses tended to be larger (more than 25% of courses with more than 50 students).
Table 4 displays the method faculty reported they use for delivering instruction. Most courses include a lecture component. Laboratory and online modes of delivery are part of approximately one-third of courses. Respondents in many content areas listed “other” modes of delivery in addition to
the choices provided. Many respondents listed interactive modes, such as group work or projects, class discussions, writing workshops, or peer tutoring. Some respondents mentioned activities such as clinical experiences or hands-on practice. Again, Appendix C shows the breakdown for modes of delivery by content area. The appendix also provides information about the modes of assessment that respondents report using in their course.
Figure 9 shows the number of times the instructor had taught the course. For a majority of courses (68%), the instructor had taught it 10 or more times. For only 3% of courses, the instructor had taught the course once. Respondents, therefore, knew their course and content area relatively well. Appendix C shows the breakdown of teaching experience by content area.
1-25!students!
39.2%!
26-50!students!
36.3%!
51-100 students!
11.5%!
101-500 students!
10.2%!
501-1000 students!
2.0%!1001+ students!
0.8%!
Figure 8. Number of Students Enrolled in Courses (n = 1897), Reported by Respondent!
Figure 8. Number of Students Enrolled in Courses (n = 1897), Reported by Respondent
Table 4. Mode of Delivery for Course (n = 1897), Reported by Respondent
Mode of delivery Number
Seminar 0
Lecture
Lab 6
Online 64
Teleconference 2
Other 2
Note. Respondents could select all applicable modes.
1 time!3.1%!
2-5 times!16.8%!
6-9 times!12.1%!
10+ times!68.0%!
Figure 9. Number of Times Teaching Course, Reported by Respondent!
Figure 9. Number of Times Teaching Course, Reported by Respondent
Chapter 2 | Methodology

Chapter Two • 9
Chapter 2 | Methodology
The Survey
The Common Core standards were written with the intention of being broadly applicable across a range of coursework and content areas. Therefore, we planned our survey so that respondents viewed both the English language arts and literacy standards and the mathematics standards, regardless of the course they taught.
Rating Common Core English Language Arts and Literacy Standards
First, respondents viewed content from the Common Core English language arts (ELA) and literacy standards for grades 11–12. They saw a summary of content from each of the eight groups of related standards (we use the term strand to refer to each of the eight groups).
Within the Common Core standards, each ELA and literacy strand is based on 6 to 10 statements, called College and Career Readiness (CCR) Anchor Standards. The CCR Anchor Standards aim to describe cross-disciplinary literacy expectations that should be met in order for students to be prepared for success in college and workforce training programs. For each strand, the CCR standards present broad
concepts (applied to all grade levels) that are broken up into two to four organizing categories or topics. For the different grade levels or grade bands, specific standards spell out how the CCR Anchor Standards should be approached. Our study used the standards for the highest-grade band (grades 11–12).
Respondents read a summary of the strand along with the prompt “One or more of the statements below are relevant to my course.” If respondents chose the “no” option, then the whole strand (and every standard within it) was considered to be not applicable. If respondents chose the “yes” option, then they were presented each standard to rate.
Figure 10 displays the eight strands, along with the number of ratings that respondents made if they deemed the strand relevant to their course. Half of the Common Core ELA and literacy strands contain statements that are organized below the standard level, as sub-standards. For the purposes of the study, these were rated as though they were on the same level as standards. Thus, the Common Core standards for ELA and literacy comprised 113 ratable statements.
In some cases, the grade-specific standard is identical to the College and Career Readiness anchor standard.
Common Core standard statements rated for
ELA and literacy (113)
Reading for Literature (9)
Reading for Informational Texts (10)
Writing (28)
Speaking and Listening (10)
Language (17)
Reading for Literacy in History/Social Studies (10)
18 sub-standards
4 sub-standards
11 sub-standards
9 standards
10 standards
10 standards
6 standards
6 standards
10 standards
Figure 10. Common Core English Language Arts and Literacy Standards for Grades 11 and 12: Number of Rated Statements
Reading for Literacy in Science and Technical Subjects(10)
Writing for Literacy in History/Social Studies, Science, and Technical
Subjects (19)
10 standards
9 standards
10 sub-standards
Figure 10. Common Core English Language Arts and Literacy Standards for Grades 11 and 12: Number of Rated Statements

Chapter Two • 10
Chapter 2 | Methodology
Rating Common Core Mathematics Standards
The process for rating mathematics standards was very similar. Respondents viewed content from the Common Core mathematics standards for high school. They saw a summary of content from each group of related standards. The Common Core authors refer to this largest category of related content as conceptual categories. The mathematics standards do not have anchor standards as do ELA and literacy. Mathematics is organized into groupings beneath the conceptual category level labeled domains and clusters. Because many mathematics topics and skills are interconnected across domains, standards from these groupings may sometimes be closely related.
Mathematics standards marked with a (+) represent advanced content and are intended to prepare students for higher-level courses. While not all students would be expected to complete these standards, their content might appear in courses designed for all students. The advanced content standards appear throughout the domains. One conceptual category, Modeling, is explained as being related to many other standards and therefore appears throughout the standards as indicated by a star symbol (H). Because of the way the Common Core standards organize the Modeling standards, we calculated ratings for them as part of the ratings for the category into which they are integrated, rather than as a separate conceptual category.
As with ELA and literacy, respondents read a summary of the conceptual category with the prompt about the content being relevant to their course. Only respondents who chose the “yes” option were presented with all the standards for the conceptual category to rate. There was one exception to this parent question approach for mathematics. The Common Core mathematics standards include eight Standards for Mathematical Practice. These hone in on “processes and proficiencies with longstanding importance in mathematics education” (Common Core State Standards Initiative, 2010b), such as problem solving, reasoning and proof, communication, representation, adaptive reasoning, strategic competence, conceptual understanding, procedural fluency, and the inclination to see mathematics as sensible and useful. The Standards for Mathematical Practice are explained at the beginning of the Common Core standards document and then presented again on each conceptual
Rated Standards
Respondents viewed content from the
Common Core English language arts
and literacy standards for grades 11-12
and the Common Core mathematics
standards for high school.
category overview page. Because the Mathematical Practices were designed to apply across all domains, each instructor rated each of the individual practices. They did not have the option to read a summary and deem the whole area as not relevant, although they could have rated each individual statement as not applicable.

Chapter Two • 11
Chapter 2 | Methodology
Figure 11 displays the five conceptual categories along with the number of ratings that respondents made if they deemed the category relevant to their course. All conceptual categories contain sub-standards that were rated as though they were on the same level as standards. Thus, together the Common Core standards for mathematics and the Mathematical Practices comprised 200 ratable statements.
Ratings of Applicability and Importance
Respondents rated each standard statement on applicability to their course using the following scale4:
� Prerequisite: Not covered in course. Prerequisite mastery of this standard is imperative for success in this course.
� Reviewed: Reviewed as a regular component of this course. Some prerequisite knowledge is helpful in succeeding in this course.
� Introduced: Standard is introduced as new material in this course.
� Subsequent: Standard is not required knowledge for this course because it will be covered later in a subsequent course in this course sequence.
� Not Applicable: Standard is not relevant to this course. It is neither a prerequisite nor covered in course material.
4 Another set of standards was also included in data collection. These were a set of “essential skills” that were created collaboratively by EPIC and the Center on Research and Evaluation of Standards and Student Testing (CRESST) to capture cognitive strategies beyond academic content knowledge that are necessary for college and career success. Results from these ratings are not found in this report but rather another EPIC-prepared report on the Essential Skills.
Respondents who marked a standard as falling into one of the first three categories — prerequisite, reviewed, or introduced — were then asked to rate the importance level of that standard using a 4-point scale:
� Most: This element is critical for success in the course. � More: This element is important for success in the course. � Less: Student knowledge of and familiarity with this element may be helpful.
� Least: Students need only minimal knowledge of and familiarity with this element.
Once respondents finished rating the individual Common Core standards statements, they were asked to answer five optional questions. These questions asked them to reflect on the standards as a whole and provide open-ended feedback. Each of the first four questions included a yes/no response and then an open text box for comments. Question 5 had only a text box.
1. Are the English standards, taken as a whole, a coherent representation of the fields of knowledge necessary for success in your course?
2. Are the mathematics standards, taken as a whole, a coherent representation of the knowledge and skills necessary for success in your course?
3. Do the standards reflect a level of cognitive demand sufficient for students who meet the standards to be prepared to succeed in your course?
Common Core standard statements rated for mathematics (200)
Number and Quantity (32)
Algebra (34)
Functions (45)
Geometry (45)
Statistics and Probability (36)
Mathematical Practices (8)
5 sub-standards
7 sub-standards
17 sub-standards
2 sub-standards
5 sub-standards
27 standards
27 standards
28 standards
43 standards
31 standards
8 standards
Figure 11. Common Core Mathematics Standards for High School: Number of Rated Statements
Figure 11. Common Core Mathematics Standards for High School: Number of Rated Statements

Chapter Two • 12
Chapter 2 | Methodology
4. Do the standards you just reviewed omit key knowledge and skills?
5. Overall, please provide any additional comments you have about the standards, such as potential usefulness, content, or format, and any questions you have about the standards.
The majority of respondents took between 30 and 90 minutes to complete the survey (45% took 30 to 60 minutes and 24% took between 61 and 90 minutes). Another 15% took less than 30 minutes and 15% took more than 90 minutes5. The average time was one hour.
Next, Chapters 3 and 4 present the results of the standards ratings.
5 A number of respondents logged over three hours. However, we assume that they remained logged into the survey while taking breaks and participating in other activities.
Respondents rated each standard statement on applicability to their course using the following scale:• Prerequisite: Not covered in course. Prerequisite mastery
of this standard is imperative for success in this course.
• Reviewed: Reviewed as a regular component of this course. Some prerequisite knowledge is helpful in succeeding in this course. • Introduced: Standard is introduced as new material in this
course. • Subsequent: Standard is not required knowledge for this
course because it will be covered later in a subsequent course in this course sequence. • Not Applicable: Standard is not relevant to this course. It is
neither a prerequisite nor covered in course material. Respondents who marked a standard as falling into one of the first three categories — prerequisite, reviewed, or introduced — were then asked to rate the importance level of that standard using a 4-point scale:• Most: This element is critical for success in the course.• More: This element is important for success in the course.
• Less: Student knowledge of and familiarity with this element may be helpful.• Least: Students need only minimal knowledge of and
familiarity with this element.

Chapter Three • 13
In the body of the report, we offer summary presentations of key data but do not present the frequencies for all applicability and importance ratings by standard. Ratings and related statistics at the individual standard level can be located in Appendix E.
Applicability for English Language Arts and Literacy Standards
Overall Applicability
We first present respondent answers to the parent question for each strand. Figure 12 provides the number of respondents within the total sample who, after reading a summary of the strand, said the content was relevant to their course. Only respondents who answered yes were presented with all the standards within the strand to rate. Respondents who answered no bypassed that section.
Chapter 3 | Findings for Ratings of Common Core English Language Arts and Literacy Standards
543!
488!
504!
1518!
1554!
571!
1069!
1276!
0! 500! 1000! 1500! 2000!
Reading for Literature!
Reading for !Informational Text *!
Writing *!
Speaking and Listening!
Language!
Reading for History/Social!Studies *!
Reading for Science and Technical Subjects *!
Writing for History/Social Studies, Science, and Technical Subjects!
aFour strands have slightly fewer than 1897 respondents because, due to a system error, these strands and their standards statements were not presented to one or two respondents.!
Figure 12. Response from Sample (n = 1897) to Overall Relevancy Question for English Language Arts and Literacy Strands !
Yes!No!
Figure 12. Response from Entire Sample (n = 1897) to Overall Relevancy Question for English Language Arts and Literacy Strands
aFour strands have slightly fewer than 89 respondents because, due to a system error, these strands and their standards statements were not presented to one or two respondents.
Reading for Literature
Reading for Informational Texta
Writinga
Speaking and Listening
Language
Reading for History/Social Studiesa
Reading for Science and Technical Subjectsa
Writing for History/Social Studies, and Technical Subjects
Although a sub-sample of respondents completed a survey for more than one course, from here to the end of the report, we use “respondents” or “the sample” to mean the sum of instructors for every unique course (n = 89).

Chapter Three • 14
Applicability Criterion
In presenting summative data for this chapter, we chose to use the criterion of a minimum of one standard match within a strand as indicating applicability of the strand. This criterion has been established in alignment studies as appropriate (Cook, 200; Cook & Wilmes, 200) and it eliminates the need to set an arbitrary criterion point that must be met. In other words, if the criterion for achieving applicability is more than one standard per strand, it must either be a fixed number or a percent of all standard statements in the strand. Neither is adequate when the number of standards per strand varies as significantly as it does across the Common Core strands (from to 9 to 28 standard statements). For further context, Table shows additional applicability informa-tion — the mean and modal number of standards that respondents for the strand rated as applicable. So, as an example, the respondents who completed ratings in the Reading Standards for Literature strand rated, on average, six standards as applicable, with a mode response of nine standards (out of a possible nine standards). As the means and modes across all strands show, those respondents who completed ratings for a strand tended to rate a majority, if not all, of the standards in that strand as ap-plicable. Appendix D contains additional information about the number of standards in each strand that were rated as applicable.
Chapter 3 | Findings for Ratings of Common Core English Language Arts and Literacy Standards
Next, we present related data; Figure 13 presents the percent of all respondents who rated at least one standard as either prerequisite, reviewed, introduced, or subsequent, after indicating a strand was relevant. Nearly every respondent who answered yes to the parent question went on to rate at least one standard as applicable.
Four strands were applicable to 25–30% of the sample: � Reading Standards for Literature � Reading Standards for Informational Texts � Writing Standards � Reading Standards for Literacy in History/Social Studies
Two strands were applicable to 55–70% of the sample: � Reading Standards for Literacy in Science and Technical Subjects
� Writing Standards for History/Social Studies, Science, and Technical Subjects
Two strands were applicable to approximately 80% of the sample:
� Speaking and Listening Standards � Language Standards
Figure 13 also shows the percent of English language arts (ELA) respondents who rated at least one standard as applicable for the five ELA strands.
Figure 13. Percent of Respondents Rating at Least One Standard within the ELA and Literacy Strand as Applicablea to their Course
Note. The graphic shows ratings for the 2 respondents of English language arts courses separately for the five ELA strands.a Applicable is considered a rating of prerequisite, reviewed, introduced, or subsequent.
28! 26! 27!
79! 82!
30!
56!
67!
94 96 99
85
100
0
20
40
60
80
100
Reading for Literature
Reading for Informational
Texts
Writing Speaking and Listening
Language Reading for History/Social
Studies
Reading for Science and
Technical Subjects
Writing for History/Social
Studies, Science, and
Technical Subjects
Percent
a Applicable is considered a rating of prerequisite, reviewed, introduced, or subsequent.
Figure 13. Percent of Respondents Rating at Least One Standard within the ELA and Literacy Strands as Applicablea to their Course
All (1897 respondents)
ELA (312 respondents)

Chapter Three • 15
Chapter 3 | Findings for Ratings of Common Core English Language Arts and Literacy Standards
Applicability by Content Area
As would be expected, the percent of respondents who rated at least one standard as applicable shifts fairly dramatically when parsed out by the seven content areas included in the
Figures 14 and 15 require careful interpretation. The low ratings for Reading Standards for Informational Texts and Writing Standards by respondents outside of ELA do not necessarily mean these respondents do not value reading or writing. Rather, these two topics are captured explicitly in the discipline-specific standards for which these respondents indicated much higher applicability.
Figure 14 shows strand-level applicability ratings for content areas often associated with general education requirements to
earn a bachelor’s degree. Figure 15 represents strand-level applicability ratings for three content areas that are somewhat more directly associated with career pathways: business management, computer technology, and healthcare.
The overall pattern of ratings by healthcare respondents is similar to the pattern by science respondents in which they rate most highly the following two strands: Reading Standards in Science and Technical Subjects and Writing Standards in History/Social Studies, Science, and Technical Subjects strands. The pattern of ratings for computer technology respondents was somewhat similar; however, their applicability ratings were lower on the Writing Standards in History/Social Studies, Science, and Technical Subjects strand. Business management respondents were slightly more likely to rate
Table 5. Number of Standards Rated as Applicable for English Language Arts and Literacy Strands
Strand Number of respondents
Number of standards
Total in strand
Rated as applicable
Mean Standard deviation Mode Minimum Maximum
Reading for Literature 9 . 2. 9 9
Reading for Informational Texts 488 0 .2 2.0 0
Writing 04 28 22. .29 26 28
Speaking and Listening 0 0 .9 2.9 0 0
Language 2 2. 4.0
Reading for Literacy in History/Social Studies 0 8.6 .94 0 0
Reading for Literacy in Science and Technical Subjects
068 0 8.4 2. 0 0
Writing for Literacy in History/Social Studies, Science, and Technical Subjects
26 9 . 4. 9 9
0
20
40
60
80
100
Reading for Literature
Reading for Informational Texts
Writing Speaking and Listening
Language Reading for History/Social
Studies
Reading for Science and
Technical Subjects
Writing for History/Social Studies, Science, and
Technical Subjects aApplicable is considered a rating of prerequisite, reviewed, introduced, or subsequent.
Figure 14. Percent of Respondents Rating at Least One Standard within the ELA and Literacy Strand as Applicablea to their Course, for ELA, Math, Science, and Social Science Instructors
ELA (312 respondents) Math (302 respondents) Science (281 respondents) Social science (420 respondents)
Figure 14. Percent of Respondents Rating at least One Standard within the ELA and Literacy Strand as Applicablea to their Course, for ELA, Math, Science, and Social Science
aApplicable is considered a rating of prerequisite, reviewed, introduced, or subsequent.
Percent

Chapter Three • 16
Chapter 3 | Findings for Ratings of Common Core English Language Arts and Literacy Standards
as applicable the Reading Standards for Literature, Reading Standards for Informational Texts, and Writing Standards strands. They also placed somewhat more emphasis on the Reading Standards in History/Social Studies strand and slightly less emphasis on the Reading Standards in Science and Technical Subjects strand than instructors of other career-preparatory courses.
With few exceptions, a large percent (82–100%) of respondents across all content areas rated the Speaking and Listening Standards strand and Language Standards strand as applicable. For two content areas, mathematics and computer technology, fewer, though still a majority, rated these strands as applicable. For mathematics, 56% and 54% of respondents rated the Speaking and Listening Standards and Language Standards strands, respectively, as applicable. For computer technology, 74% and 63% rated the Speaking and Listening and Language strands, respectively, as applicable.
Mathematics and computer technology instructors were less likely, comparatively speaking, to rate writing skills as applicable to their courses than other content areas. Though a majority of respondents in these two content areas still rated one of the two writing strands as applicable, respondents (as many as 75%) in all other content areas rated at least one of the writing strands as applicable. For mathematics, 7% and 52% of respondents rated as applicable the Writing Standards strand and Writing Standards in History/Social Studies, Science, and Technical Subjects strand, respectively. For computer technology, 7% and 67% of respondents rated as applicable the Writing Standards strand and Writing Standards in History/Social Studies, Science, and Technical Subjects strand, respectively.
A majority of business management, healthcare, or computer technology respondents rated as applicable Reading Standards in Science and Technical Subjects and Writing Standards in History/Social Studies, Science, and Technical Subjects. Three ELA strands (Reading Standards for Literature, Reading Standards for Informational Texts, and Writing Standards) were rated as applicable by one-fourth or less of respondents in these three content areas.
More information on applicability ratings for each content area and each strand can be found in Appendix D.
0
20
40
60
80
100
Reading for Literature
Reading for Informational
Texts
Writing Speaking and Listening
Language Reading for History/Social
Studies
Reading for Science and
Technical Subjects
Writing for History/Social
Studies, Science, and Technical
Subjects aApplicable is considered a rating of prerequisite, reviewed, introduced, or subsequent.
Figure 15. Percent of Respondents Rating at Least One Standard within the ELA and Literacy Strand as Applicablea to their Course, for Business Management, Computer Technology, and Healthcare Instructors
Business management (243 respondents) Computer technology (153 respondents) Healthcare (186 respondents)
Figure 15. Percent of Respondents Rating at least One Standard within the ELA and Literacy Strand as Applicablea to their Course, for Business Management, Computer Technology, and Healthcare
aApplicable is considered a rating of prerequisite, reviewed, introduced, or subsequent.
Percent

Chapter Three • 17
Importance Ratings for English Language Arts and Literacy Standards
Importance ratings are presented below but with the following caveat. In all cases, the importance ratings come from a subset of respondents: those who rated a strand and then a standard as applicable. This is also a subset of all respondents within a content area. For this reason, importance ratings should be viewed with caution until they are situated relative to their proportion of all applicability responses and of responses in the content area. They are included here for informational purposes to help present an initial indication of the validity of the Common Core standards relative to a range of postsecondary course categories and not to reach a definitive conclusion regarding the importance of any given standard or strand.
Recall that if respondents selected a standard as prerequisite, reviewed, or introduced, they were then asked to rate the importance of that standard on a 4-point scale. The scale consisted of the options most (defined as critical for success in the course), more (important for success), less (familiarity may be helpful), and least (only minimal knowledge needed). Respondents who did not rate a standard’s applicability in those three categories were not presented with the importance rating and instead were directed to the next standard. Although we present importance ratings as means, it is worth noting that the importance categories are ordinal. Caution should be exercised when interpreting the precise value of any mean in relation to the categorical category underlying it.
Below, for each strand, we provide a descriptive summary of the importance ratings. We first show the breakdown by content area of those respondents who rated importance and their average ratings rolled up to the strand level. These are the averages of 9 to 28 standard statements, depending on the strand, weighted to account for the varying number of respondents for each standard. It was not our goal to look for statistically significant differences among the strands (nor do any likely exist). We include these results only to show general patterns in ratings.
Next, we show several summary-level presentations of the importance data. We present the average importance ratings at the topic level (the two to four organizing categories or sub-areas) within each strand. Then, we present the importance ratings for each standard. These are presented as dichotomous findings, showing percentage breakdown for the
standard statement rated either (1) as more or most important or (2) as less or least important. In this view of the data, every standard is presented (in the order the standards appear in the Common Core standards documents), but the responses are collapsed into just two categories. Finally, to help provide a summary overview, we list individual standard statements that had means that were somewhat higher or lower than the mean of all standards in that strand. We include these results once again to illuminate general patterns, not to suggest that the comparison of these standards to others is statistically significant and not to suggest the need for specific actions based on these ratings.
We chose these presentations of the data to give summary-level information about the findings that would be relatively easy and meaningful to view. The body of the report does not present the frequencies for all importance categories for individual standards. This potentially important information is contained in Appendix E.
Chapter 3 | Findings for Ratings of Common Core English Language Arts and Literacy Standards
Ratings Summary Overall, ELA and literacy importance rating averages were high and consistent across all strands, generally at or just above the “more important” rating.

Chapter Three • 18
Chapter 3 | Findings for Ratings of Common Core English Language Arts and Literacy Standards
Reading Standards for Literature
Respondents to Importance Ratings for the Reading Standards for Literature Strand
Figure 16 shows how respondents who completed importance ratings for the Reading Standards for Literature strand are distributed across the seven content areas. Of the 532 respondents (28% of the sample) rating at least one standard in the strand as applicable and therefore conducting importance ratings, a majority (n = 292) were English language arts (ELA) respondents. Social science (n = 72) and business management (n = 69) respondents composed the next largest groups of respondents.
Average Importance Ratings for the Reading Standards for Literature Strand
The standard statements within the Reading Standards for Literature strand had an average importance rating of 3.2 (SD = .71), just above the “more important” rating. Figure 17 shows that importance ratings were similar across the content areas. The strand contains four topics with between one and three standards statements each. Table 6 shows the average rating for each of the four topics.
Figure 16. Respondents Rating Importance for Reading Standards for Literature Strand (n = 532), Percent by Content Area
1.00
2.00
3.00
4.00
English language arts
(n = 292)
Mathematics (n = 26)
Science (n = 24)
Social science (n = 72)
Business management
(n = 69)
Computer technology
(n = 20)
Healthcare (n = 29)
Overall meana 3.2
Note. Lighter shading indicates that respondents from the content area compose less than 5% of respondents for the strand. aThe nine standard statements were weighted to account for the varying number of respondents for each standard.
Figure 17. Mean Importance Ratings for Reading Standards for Literature Respondents (n = 532), by Content Area Figure 17. Mean Importance Ratings for Reading Standards for Literature Respondents (n = 532), by Content Area
Note. Lighter shading indicates that respondents from the content area compose less than % of respondents for the strand. aThe nine standard statements were weighted to account for the varying number of respondents for each standard.
English language arts
(n = 292)
Mathematics (n = 26)
Science (n = 24)
Social science (n = 72)
Business management
(n = 69)
Computer technology
(n = 20)
Healthcare (n = 29)
ELA!54.9%!
Math!4.9%!
Science!4.5%!
Social Science!13.5%!
Business Management!
13.0%!
Computer Technology!
3.8%!
Healthcare!5.5%!

Chapter Three • 19
Below is a summary of those topics with the lowest and highest ratings, including a description of the type of standards they contain:
� Two topics, Key Ideas and Details (an average of three statements) and Range of Reading Level of Text Complexity (one statement), had the highest ratings. The Key Ideas and Details standards address issues such as providing textual evidence to support analysis and inferences, determining themes and central ideas of text, and analyzing the author’s choices on developing and relating elements of a story. The Range of Reading Level of Text Complexity standard is a general one, ensuring that students can read and comprehend different types of literature with grade-appropriate complexity.
� The Integration of Knowledge and Ideas topic (an average of the two statements) had the lowest rating; however, importance was still perceived as high. The Integration of Knowledge and Ideas statements address analyzing multiple interpretations of literature compared to source text (including at least one Shakespeare play and one play by an American dramatist) and demonstrating knowledge of eighteenth-, nineteenth-, and early-twentieth-century works of American literature.
Importance Ratings by Standard Statement for the Reading Standards for Literature Strand
Next, we collapse the four importance ratings categories into a dichotomous ratings for each standard: (1) more or most important, or (2) less or least important. Every standard is presented in Table 7 in the order the standards appear in the Common Core standards documents. A large proportion (> 75%) of respondents rated most of the nine standard statements as being more or most important.
Chapter 3 | Findings for Ratings of Common Core English Language Arts and Literacy Standards
Table 6. Importance Ratings for Topics in Reading Standards for Literature Strand, Presented as Weighted Means and Standard Deviations
Topic Meana Standard deviation
Number of standards
Key Ideas and Details . 0.6
Craft and Structure . 0.
Integration of Knowledge and Ideas .0 0.82 2
Range of Reading and Level of Text Complexity . 0.2
Overall .2 0. 9aRespondents rated importance on an ordinal scale. Means are presented only to summarize trends; caution should be exercised when interpreting the precise value of any mean in relation to the categorical system underlying it. Values assigned to the scale were 4 = most, = more, 2 = less, and = least.

Chapter Three • 20
Chapter 3 | Findings for Ratings of Common Core English Language Arts and Literacy Standards
Table 7. Percent of Respondents with Importance Ratings of More or Most versus Less or Least, for Reading Standards for Literature
Standard More/most percent
Less/least percent
Key Ideas and Details
. Cite strong and thorough textual evidence to support analysis of what the text says explicitly as well as inferences drawn from the text, including determining where the text leaves matters uncertain.
92 8
2. Determine two or more themes or central ideas of a text and analyze their development over the course of the text, including how they interact and build on one another to produce a complex account; provide an objective summary of the text.
89
. Analyze the impact of the author’s choices regarding how to develop and relate elements of a story or drama (e.g., where a story is set, how the action is ordered, how the characters are introduced and developed).
8 22
Craft and Structure
4. Determine the meaning of words and phrases as they are used in the text, including figurative and connotative meanings; analyze the impact of specific word choices on meaning and tone, including words with multiple meanings or language that is particularly fresh, engaging, or beautiful. (Include Shakespeare as well as other authors.)
8
. Analyze how an author’s choices concerning how to structure specific parts of a text (e.g., the choice of where to begin or end a story, the choice to provide a comedic or tragic resolution) contribute to its overall structure and meaning as well as its aesthetic impact.
9 2
6. Analyze a case in which grasping point of view requires distinguishing what is directly stated in a text from what is really meant (e.g., satire, sarcasm, irony, or understatement).
2
Integration of Knowledge and Ideas
. Analyze multiple interpretations of a story, drama, or poem (e.g., recorded or live production of a play or recorded novel or poetry), evaluating how each version interprets the source text. (Include at least one play by Shakespeare and one play by an American dramatist.)
2
9.a Demonstrate knowledge of eighteenth-, nineteenth-, and early-twentieth-century foundational works of American literature, including how two or more texts from the same period treat similar themes or topics.
6
Range of Reading and Level of Text Complexity
0. By the end of grade , read and comprehend literature, including stories, dramas, and poems, in the grades –CCR text complexity band proficiently, with scaffolding as needed at the high end of the range. By the end of grade 2, read and comprehend literature, including stories, dramas, and poems, at the high end of the grades –CCR text complexity band independently and proficiently.
86 4
aFor the Reading Standards for Literature, the eighth college and career readiness anchor standard is listed as not applicable to literature.

Chapter Three • 21
Table 8. Standard Statements with Means Above and Belowa the Strand Average, for Reading Standards for Literature
Meanb Standard deviation
Strand average .2 0.
Standard statements above average
Cite strong and thorough textual evidence to support analysis of what the text says explicitly as well as inferences drawn from the text, including determining where the text leaves matters uncertain.
.4 0.6
Standard statements below average
Demonstrate knowledge of eighteenth-, nineteenth-, and early-twentieth-century foundational works of American literature, including how two or more texts from the same period treat similar themes or topics.
2.8 0.88
Note. Values assigned to the scale were 4 = most, = more, 2 = less, and = least. aStatements that are . standard deviations above or below the mean of the strand average are displayed. This metric was selected as a way to systematically view trends in the dispersion of standard ratings. Overall, differences in ratings were minimal; displaying standards here does not indicate that comparing their ratings to the overall mean is statistically significant. bMeans and standard deviations at the strand level are weighted to account for the different number of respondents for each standard statement.
Summary of the Importance Ratings for the Reading Standards for Literature
The importance ratings were high for the subset of instructors who responded that a Reading Standards for Literature standard was applicable to their course. Average ratings exceeded 3, the “more important” category. English language arts respondents composed approximately half of the respondent pool, with social science and business management composing another quarter. Ratings show that respondents emphasize general concepts such as providing textual evidence to support analysis and inferences. They place less emphasis on the importance of demonstrating knowledge of American literature works from particular time frames.
Chapter 3 | Findings for Ratings of Common Core English Language Arts and Literacy Standards
A review of the ratings of individual standard statements reveals that one statement, involving analysis of text, had a higher importance rating, and one statement, involving knowledge of particular American literature, had a lower importance rating. Table 8 shows the means and standard deviations of these two standards compared to the average of statements in the strand as a whole.

Chapter Three • 22
ELA!61.6%!
Math!3.5%!
Science!3.3%!
Social Science!10.5%!
Business Management!
12.9%!
Computer Technology!
2.7%!Healthcare!
5.5%!
Reading Standards for Informational Texts
Respondents to Importance Ratings for the Reading Standards for Informational Texts Strand
Figure 18 shows how the respondents who completed importance ratings for the Reading Standards for Informational Text strand are distributed across the seven content areas. Of the 487 respondents (26% of the sample), a large majority were ELA respondents (n = 300). As with the Reading Standards for Literature strand, business management (n = 63) and social science (n = 51) respondents composed the next largest groups of respondents.
Average Importance Ratings for the Reading Standards for Informational Texts Strand
The standard statements within the Reading Standards for Informational Texts strand had an average rating of 3.3 (SD = .71), above the “more important” rating. Figure 19 shows that importance ratings were similar across the content areas. The strand has four topics with between one and three standards statements each. Table 9 shows the average rating for each of the four topics.
Chapter 3 | Findings for Ratings of Common Core English Language Arts and Literacy Standards
Figure 18. Respondents Rating Importance for Reading Standards for Informational Texts Strand (n = 487), Percent by Content Area
Table 9. Importance Ratings for Topics in Reading Standards for Informational Texts Strand, Presented as Weighted Means and Standard Deviations
Topic Meanb Standard deviation
Number of standards
Key Ideas and Details .4 0.6
Craft and Structure .2 0.2
Integration of Knowledge and Ideas . 0.9
Range of Reading and Level of Text Complexity .4 0.6
Overall . 0. 0aRespondents rated importance on an ordinal scale. Means are presented only to summarize trends; caution should be exercised when interpreting the precise value of any mean in relation to the categorical system underlying it. Values assigned to the scale were 4 = most, = more, 2 = less, and = least.
Figure 19. Mean Importance Ratings for Reading Standards for Informational
Texts Respondents (n = 487), by Content Area
1.00
2.00
3.00
4.00
English language arts
(n = 300)
Mathematics (n = 17)
Science (n = 16)
Social science (n = 51)
Business management
(n = 63)
Computer technology
(n = 13)
Healthcare (n = 27)
Overall meana 3.3
Note. Lighter shading indicates that respondents from the content area compose less than 5% of respondents for the strand. aThe 10 standard statements were weighted to account for the varying number of respondents for each standard.
Figure 19. Mean Importance Ratings for Reading Standards for Informational Texts Respondents (n = 487), by Content Area
English language arts
(n = 300)
Mathematics (n = 17)
Science (n = 16)
Social science (n = 51)
Business management
(n = 63)
Computer technology
(n = 13)
Healthcare (n = 27)
Note. Lighter shading indicates that respondents from the content area compose less than % of respondents for the strand. aThe 0 standard statements were weighted to account for the varying number of respondents for each standard.

Chapter Three • 23
Chapter 3 | Findings for Ratings of Common Core English Language Arts and Literacy Standards
Below is a summary of those topics with the lowest and highest ratings, including a description of the type of standards they contain:
� Similar to the Reading Standards for Literature, two topics, Key Ideas and Details (an average of three statements) and Range of Reading Level of Text Complexity (one statement), had the highest ratings. As with the Reading Standards for Literature, the Key Ideas and Details standards address issues such as citing textual evidence to support analysis and inferences, determining central ideas, and analyzing. The topic also includes reference to explaining how ideas and events develop over the course of the text. The Range of Reading Level of Text Complexity reads very identical to the standard under the Literature strand but with reference to nonfiction.
� One topic, Integration of Knowledge and Ideas (an average of the three statements), had the lowest rating, though
respondents still considered importance to be high. The Integration of Knowledge and Ideas standards refer to specific genres of text and evaluating reasoning in seminal U.S. texts, including application of constitutional principles in works of public advocacy and analyzing seventeenth-, eighteenth-, and nineteenth-century foundational U.S. documents.
Importance Ratings by Standard Statement for the Reading
Standards for Informational Texts Strand
Next, we collapse the four importance ratings categories into a dichotomous rating for each standard; (1) more or most important, or (2) less or least important. Every standard is presented in Table 10 in the order the standards appear in the Common Core standards documents. Similar to the ratings for reading literature, a large majority (>75%) of respondents rated most of the 10 standards statements as being more or most important.
Table 10. Percent of Respondents with Importance Ratings of More or Most versus Less or Least, for Reading Standards for Informational Texts
Standard More/most percent
Less/least percent
Key Ideas and Details
. Cite strong and thorough textual evidence to support analysis of what the text says explicitly as well as inferences drawn from the text, including determining where the text leaves matters uncertain.
92 8
2. Determine two or more central ideas of a text and analyze their development over the course of the text, including how they interact and build on one another to provide a complex analysis; provide an objective summary of the text.
9 9
. Analyze a complex set of ideas or sequence of events and explain how specific individuals, ideas, or events interact and develop over the course of the text.
8
Craft and Structure
4. Determine the meaning of words and phrases as they are used in a text, including figurative, connotative, and technical meanings; analyze how an author uses and refines the meaning of a key term or terms over the course of a text (e.g., how Madison defines faction in Federalist No. 0).
8
. Analyze and evaluate the effectiveness of the structure an author uses in his or her exposition or argument, including whether the structure makes points clear, convincing, and engaging.
8
6. Determine an author’s point of view or purpose in a text in which the rhetoric is particularly effective, analyzing how style and content contribute to the power, persuasiveness, or beauty of the text.
82 8
Integration of Knowledge and Ideas
. Integrate and evaluate multiple sources of information presented in different media or formats (e.g., visually, quantitatively) as well as in words in order to address a question or solve a problem.
82 8
8. Delineate and evaluate the reasoning in seminal U.S. texts, including the application of constitutional principles and use of legal reasoning (e.g., in U.S. Supreme Court majority opinions and dissents) and the premises, purposes, and arguments in works of public advocacy (e.g., The Federalist, presidential addresses).
69
9. Analyze seventeenth-, eighteenth-, and nineteenth-century foundational U.S. documents of historical and literary significance (including The Declaration of Independence, the Preamble to the Constitution, the Bill of Rights, and Lincoln’s Second Inaugural Address) for their themes, purposes, and rhetorical features.
0 0
Range of Reading and Level of Text Complexity
0. By the end of grade , read and comprehend literary nonfiction in the grades –CCR text complexity band proficiently, with scaffolding as needed at the high end of the range. By the end of grade 2, read and comprehend literary nonfiction at the high end of the grades –CCR text complexity band independently and proficiently.
89

Chapter Three • 24
A review of ratings of individual standard statements reveals that two standards had lower importance ratings compared to other statements in the strand. These standards refer to specific United States documents or texts. Table 11 shows the means and standard deviations of those two standards compared to the average of statements in the strand as a whole. No standard statement that had a relatively higher rating compared to other statements.
Table 11. Standard Statements with Means Above and Belowa the Strand Average, for Reading Standards for Informational Texts
Meanb Standard deviation
Strand average . 0.
Standard statements above average
None
Standard statements below average
Delineate and evaluate the reasoning in seminal U.S. texts, including the application of constitutional principles and use of legal reasoning (e.g., in U.S. Supreme Court majority opinions and dissents) and the premises, purposes, and arguments in works of public advocacy (e.g., The Federalist, presidential addresses).
.0 0.82
Analyze seventeenth-, eighteenth-, and nineteenth-century foundational U.S. documents of historical and literary significance (including The Declaration of Independence, the Preamble to the Constitution, the Bill of Rights, and Lincoln’s Second Inaugural Address) for their themes, purposes, and rhetorical features.
.0 0.8
Note. Values assigned to the scale were 4 = most, = more, 2 = less, and = least. aStatements that are . standard deviations above or below the mean of the strand average are displayed. This metric was selected as a way to systematically view trends in the dispersion of standard ratings. Overall, differences in ratings were minimal; displaying standards here does not indicate that comparing their ratings to the overall mean is statistically significant. bMeans and standard deviations at the strand level are weighted to account for the different number of respondents for each standard statement.
Summary of the Importance Ratings for the Reading Standards for Informational Texts
Overall, importance ratings of the Reading Standards for Informational Text were among the highest ELA and literacy ratings, with an average rating above the 3, or “more important,” level. The ratings were completed predominantly by ELA respondents and, to a lesser degree, social science and business management respondents. These ratings again show that respondents tend to emphasize general concepts such as providing textual evidence to support analysis and determining central ideas of a text. They emphasize less the evaluation or analysis of specific U.S. texts and documents.
Chapter 3 | Findings for Ratings of Common Core English Language Arts and Literacy Standards

Chapter Three • 25
ELA!61.5%!
Math!4.0%!
Science!3.4%!
Social Science!10.7%!
Business Management!
13.3%!
Computer Technology!
2.0%!Healthcare!
5.2%!
Writing Standards
Respondents to Importance Ratings for the Writing Standards Strand
Figure 20 shows how the respondents who completed importance ratings for the Writing Standards strand are distributed across the seven content areas. There were 504 respondents (27% of the sample) who rated at least one standard statement within the Writing Standards strand as applicable and therefore conducted importance ratings. A majority (n = 310) were once again ELA respondents. Social science (n = 54) and business management (n = 67) respondents again composed the next largest groups of respondents.
Average Importance Ratings for the Writing Standards Strand
The standard statements within the Writing Standards strand had an average rating of 3.3 (SD = .72), above the “more important” rating. Figure 21 shows that importance ratings were similar across the content areas. The strand contains four topics with between 1 and 19 standards statements each. Table 12 shows the average rating for each of the four topics.
Table 12. Importance Ratings for Topics in Writing Standards Strand, Presented as Weighted Means and Standard Deviations
Topic Meana Standard deviation
Number of standards
Text Types and Purposes .2 0.4 9
Production and Distribution of Writing . 0.6
Research to Build and Present Knowledge .4 0.6
Range of Writing .4 0.
Overall . 0.2 28aRespondents rated importance on an ordinal scale. Means are presented only to summarize trends; caution should be exercised when interpreting the precise value of any mean in relation to the categorical system underlying it. Values assigned to the scale were 4 = most, = more, 2 = less, and = least.
Chapter 3 | Findings for Ratings of Common Core English Language Arts and Literacy Standards
1.00
2.00
3.00
4.00
English language arts
(n = 310)
Mathematics (n = 20)
Science (n = 17)
Social science (n = 54)
Business management
(n = 67)
Computer technology
(n = 10)
Healthcare (n = 26)
Overall meana 3.3
Note. Lighter shading indicates that respondents from the content area compose less than 5% of respondents for the strand. aThe 28 standard statements were weighted to account for the varying number of respondents for each standard.
Figure 21. Mean Importance Ratings for Writing Standards Respondents (n = 504), by Content Area Figure 21. Mean Importance Ratings for Writing Standards Respondents (n = 504), by Content Area
English language arts
(n = 310)
Mathematics (n = 20)
Science (n = 17)
Social science (n = 54)
Business management
(n = 67)
Computer technology
(n = 10)
Healthcare (n = 26)
Note. Lighter shading indicates that respondents from the content area compose less than % of respondents for the strand. aThe 28 standard statements were weighted to account for the varying number of respondents for each standard.
Figure 20. Respondents Rating Importance for Writing Standards Strand (n = 504), Percent by Content Area

Chapter Three • 26
Chapter 3 | Findings for Ratings of Common Core English Language Arts and Literacy Standards
Below is a summary of those topics with the lowest and highest ratings, including a description of the type of standards they contain:
� Three topics tended to have higher ratings: Production and Distribution of Writing (an average of three statements), Research to Build and Present Knowledge (an average of five statements), and Range of Writing (one statement). The Production and Distribution of Writing topic generally outlines the writing process, referring to the production of clear and coherent writing appropriate to the task; using a planning, revising, editing, and rewriting process; as well as using technology to produce and update writing products. The Research to Build and Present Knowledge topic involves drawing evidence from different sources and analyzing and synthesizing them. The Range of Writing statement involves writing over extended and shorter time frames for a range of purposes.
The average of the 19 statements for Text Types and Purposes had the lowest rating in the strand, although the rating average
is still above 3, “most important.” The standard statements in Text Types and Purposes fall under three overarching standards: (1) writing arguments to support claims in the analysis of topics, using valid reasoning and sufficient evidence; (2) writing informative/explanatory text to examine and convey complex ideas; and (3) writing narratives to develop real or imagined experiences or events.
Importance Ratings by Standard Statement for the Writing
Standards Strand
Next, we collapse the four importance ratings categories into a dichotomous rating for each standard; (1) more or most important, or (2) less or least important. Every standard is presented in Table 13 in the order the standards appear in the Common Core standards documents. The Writing Standards have many more sub-standards for a total of 28 statements. All but three of the statements were rated as being more or most important by a large proportion (>70%) of respondents.
Table 13. Percent of Respondents with Importance Ratings of More or Most versus Less or Least, for Writing Standards
Standard More/most percent
Less/least percent
Text Types and Purposes
. Write arguments to support claims in an analysis of substantive topics or texts, using valid reasoning and relevant and sufficient evidence.
9
a. Introduce precise, knowledgeable claim(s), establish the significance of the claim(s), distinguish the claim(s) from alternate or opposing claims, and create an organization that logically sequences claim(s), counterclaims, reasons, and evidence.
9 9
b. Develop claim(s) and counterclaims fairly and thoroughly, supplying the most relevant evidence for each while pointing out the strengths and limitations of both in a manner that anticipates the audience’s knowledge level, concerns, values, and possible biases.
88 2
c. Use words, phrases, and clauses as well as varied syntax to link the major sections of the text, create cohesion, and clarify the relationships between claim(s) and reasons, between reasons and evidence, and between claim(s) and counterclaims.
84 6
d. Establish and maintain a formal style and objective tone while attending to the norms and conventions of the discipline in which they are writing.
82 8
e. Provide a concluding statement or section that follows from and supports the argument presented. 8 9
2. Write informative/explanatory texts to examine and convey complex ideas, concepts, and information clearly and accurately through the effective selection, organization, and analysis of content.
89
a. Introduce a topic; organize complex ideas, concepts, and information so that each new element builds on that which precedes it to create a unified whole; include formatting (e.g., headings), graphics (e.g., figures, tables), and multimedia when useful to aiding comprehension.
8
b. Develop the topic thoroughly by selecting the most significant and relevant facts, extended definitions, concrete details, quotations, or other information and examples appropriate to the audience’s knowledge of the topic.
94 6
c. Use appropriate and varied transitions and syntax to link the major sections of the text, create cohesion, and clarify the relationships among complex ideas and concepts.
8 9
Continued on next page

Chapter Three • 27
Table 13. continued
Standard More/most percent
Less/least percent
Text Types and Purposes
d. Use precise language, domain-specific vocabulary, and techniques such as metaphor, simile, and analogy to manage the complexity of the topic.
4 26
e. Establish and maintain a formal style and objective tone while attending to the norms and conventions of the discipline in which they are writing.
2
f. Provide a concluding statement or section that follows from and supports the information or explanation presented (e.g., articulating implications or the significance of the topic).
8 9
. Write narratives to develop real or imagined experiences or events using effective technique, well-chosen details, and well-structured event sequences.
64 6
a. Engage and orient the reader by setting out a problem, situation, or observation and its significance, establishing one or multiple point(s) of view, and introducing a narrator and/or characters; create a smooth progression of experiences or events.
0 0
b. Use narrative techniques, such as dialogue, pacing, description, reflection, and multiple plot lines, to develop experiences, events, and/or characters.
0 0
c. Use a variety of techniques to sequence events so that they build on one another to create a coherent whole and build toward a particular tone and outcome (e.g., a sense of mystery, suspense, growth, or resolution).
9 4
d. Use precise words and phrases, telling details, and sensory language to convey a vivid picture of the experiences, events, setting, and/or characters.
0 0
e. Provide a conclusion that follows from and reflects on what is experienced, observed, or resolved over the course of the narrative.
2 28
Production and Distribution of Writing
4. Produce clear and coherent writing in which the development, organization, and style are appropriate to task, purpose, and audience. (Grade-specific expectations for writing types are defined in standards – above.)
9
. Develop and strengthen writing as needed by planning, revising, editing, rewriting, or trying a new approach, focusing on addressing what is most significant for a specific purpose and audience. (Editing for conventions should demonstrate command of Language standards –, up to and including grades –2 on page 4 [of Common Core State Standards document].)
9 8
6. Use technology, including the Internet, to produce, publish, and update individual or shared writing products in response to ongoing feedback, including new arguments or information.
2
Research to Build and Present Knowledge
. Conduct short as well as more sustained research projects to answer a question (including a self-generated question) or solve a problem; narrow or broaden the inquiry when appropriate; synthesize multiple sources on the subject, demonstrating understanding of the subject under investigation.
94 6
8. Gather relevant information from multiple authoritative print and digital sources, using advanced searches effectively; assess the strengths and limitations of each source in terms of the task, purpose, and audience; integrate information into the text selectively to maintain the flow of ideas, avoiding plagiarism and overreliance on any one source and following a standard format for citation.
92 8
9. Draw evidence from literary or informational texts to support analysis, reflection, and research. 92 8
a. Apply grades –2 Reading standards to literature (e.g., “Demonstrate knowledge of eighteenth-, nineteenth-, and early-twentieth-century foundational works of American literature, including how two or more texts from the same period treat similar themes or topics”).
29
b. Apply grades –2 Reading standards to literary nonfiction (e.g., “Delineate and evaluate the reasoning in seminal U.S. texts, including the application of constitutional principles and use of legal reasoning [e.g., in U.S. Supreme Court Case majority opinions and dissents] and the premises, purposes, and arguments in works of public advocacy [e.g., The Federalist, presidential addresses]”).
2
Range of Writing
0. Write routinely over extended time frames (time for research, reflection, and revision) and shorter time frames (a single sitting or a day or two) for a range of tasks, purposes, and audiences.
8
Chapter 3 | Findings for Ratings of Common Core English Language Arts and Literacy Standards

Chapter Three • 28
Chapter 3 | Findings for Ratings of Common Core English Language Arts and Literacy Standards
Table 14. Standard Statements with Means Above and Belowa the Strand Average, for Writing Standards
Meanb Standard deviation
Strand average . 0.2
Standard statements above average
Write arguments to support claims in an analysis of substantive topics or texts, using valid reasoning and relevant and sufficient evidence.
. 0.
Produce clear and coherent writing in which the development, organization, and style are appropriate to task, purpose, and audience. (Grade-specific expectations for writing types are defined in standards – above.)
. 0.
Develop and strengthen writing as needed by planning, revising, editing, rewriting, or trying a new approach, focusing on addressing what is most significant for a specific purpose and audience. (Editing for conventions should demonstrate command of Language standards –, up to and including grades –2 on page 4 [of Common Core State Standards document].)
.6 0.64
Gather relevant information from multiple authoritative print and digital sources, using advanced searches effectively; assess the strengths and limitations of each source in terms of the task, purpose, and audience; integrate information into the text selectively to maintain the flow of ideas, avoiding plagiarism and overreliance on any one source and following a standard format for citation.
.6 0.6
Develop the topic thoroughly by selecting the most significant and relevant facts, extended definitions, concrete details, quotations, or other information and examples appropriate to the audience’s knowledge of the topic.
. 0.6
Conduct short as well as more sustained research projects to answer a question (including a self-generated question) or solve a problem; narrow or broaden the inquiry when appropriate; synthesize multiple sources on the subject, demonstrating understanding of the subject under investigation.
. 0.62
Standard statements below average
Use narrative techniques, such as dialogue, pacing, description, reflection, and multiple plot lines, to develop experiences, events, and/or characters.
2. 0.89
Use a variety of techniques to sequence events so that they build on one another to create a coherent whole and build toward a particular tone and outcome (e.g., a sense of mystery, suspense, growth, or resolution).
2. 0.8
Write narratives to develop real or imagined experiences or events using effective technique, well-chosen details, and well-structured event sequences.
2.9 0.90
Use precise words and phrases, telling details, and sensory language to convey a vivid picture of the experiences, events, setting, and/or characters.
2.9 0.8
Engage and orient the reader by setting out a problem, situation, or observation and its significance, establishing one or multiple point(s) of view, and introducing a narrator and/or characters; create a smooth progression of experiences or events.
2.9 0.80
Provide a conclusion that follows from and reflects on what is experienced, observed, or resolved over the course of the narrative. .0 0.8
Apply grades –2 Reading standards to literature (e.g., “Demonstrate knowledge of eighteenth-, nineteenth-, and early-twentieth-century foundational works of American literature, including how two or more texts from the same period treat similar themes or topics”).
.0 0.8
Use precise language, domain-specific vocabulary, and techniques such as metaphor, simile, and analogy to manage the complexity of the topic.
.0 0.9
Note. Values assigned to the scale were 4 = most, = more, 2 = less, and = least. aStatements that are . standard deviations above or below the mean of the strand average are displayed. This metric was selected as a way to systematically view trends in the dispersion of standard ratings. Overall, differences in ratings were minimal; displaying standards here does not indicate that comparing their ratings to the overall mean is statistically significant. bMeans and standard deviations at the strand level are weighted to account for the different number of respondents for each standard statement.
Summary of the Importance Ratings for the Writing Standards
Importance ratings of the Writing Standards, on average, were among the highest of the ELA and literacy ratings, with an average rating above the “more important” category. The ratings were completed predominantly by ELA instructors and, to a lesser degree, social science and business management instructors. The ratings show that respondents emphasize students’ skills in writing arguments to support claims, produce clear and coherent writing, and use the writing process. They place less importance on students’ use of narrative techniques to develop events and characters and to sequence events to build toward a particular tone.
A review of the ratings of individual standard statements reveals that there were six standard statements that had higher importance ratings compared to other statements in the strand. Eight standard statements had lower importance ratings. Table 14 shows the means and standard deviations of those standards compared to the average of all statements in the strand.

Chapter Three • 29
ELA!17.7%!
Math!11.2%!
Science!15.3%!Social
Science!24.7%!
Business Management!
13.5%!
Computer Technology!
7.4%! Healthcare!10.2%!
Chapter 3 | Findings for Ratings of Common Core English Language Arts and Literacy Standards
Speaking and Listening Standards
Respondents to Importance Ratings for the Speaking and Listening Standards Strand
Figure 22 shows how the instructors who completed importance ratings for the Speaking and Listening Standards strand are distributed across the seven content areas. The 1500 respondents (79% of the sample) were fairly well distributed across the content areas with social science respondents (n = 370) composing the largest group of respondents. ELA instructors (n = 265), science instructors (n = 230), and business management instructors (n = 203) composed the next two largest groups of respondents.
Average Importance Ratings for the Speaking and Listening Standards Strand
The standard statements within the Speaking and Listening Standards strand had an average rating of 3.1 (SD = .74), exceeding slightly the “more important” rating. Figure 23 shows that importance ratings were similar across the content areas. The strand has two topics with between three and seven standards statements each. Table 15 shows the average rating for each of the two topics.
Figure 22. Respondents Rating Importance for Speaking and Listening Standards Strand (n = 1500), Percent by Content Area
Table 15. Importance Ratings for Topics in Speaking and Listening Standards Strand, Presented as Weighted Means and Standard Deviations
Topic Meana Standard deviation
Number of standards
Comprehension and Collaboration . 0.
Presentation of Knowledge and Ideas .0 0.9 .0
Overall . 0.4 0aRespondents rated importance on an ordinal scale. Means are presented only to summarize trends; caution should be exercised when interpreting the precise value of any mean in relation to the categorical system underlying it. Values assigned to the scale were 4 = most, = more, 2 = less, and = least.
Figure 23. Mean Importance Ratings for Speaking and Listening Standards Respondents (n = 1500), by Content Area
English language arts
(n = 265)
Mathematics (n = 168)
Science (n = 230)
Social science (n = 370)
Business management
(n =203)
Computer technology (n = 111)
Healthcare (n = 153)
aThe 0 standard statements were weighted to account for the varying number of respondents for each standard.
1.00
2.00
3.00
4.00
English language arts
(n = 265)
Mathematics (n = 168)
Science (n = 230)
Social science (n = 370)
Business management
(n = 203)
Computer technology (n = 111)
Healthcare (n = 153)
Overall meana 3.1
aThe 10 standard statements were weighted to account for the varying number of respondents for each standard.
Figure 23. Mean Importance Ratings for Speaking and Listening Standards Respondents (n = 1500), by Content Area

Chapter Three • 30
Chapter 3 | Findings for Ratings of Common Core English Language Arts and Literacy Standards
The average of the two topics was similar: � The Comprehension and Collaboration topic (an average of seven statements) includes standard statements relating to participating effectively in a range of discussions, integrating multiple sources of information, and evaluating a speaker’s point of view. The Presentation of Knowledge and Ideas (an average of three standard statements) includes standards referring to the presentation of information with a clear perspective, making strategic use of digital media, and adapting speech to the context.
Importance Ratings by Standard Statement for the Speaking and Listening Standards Strand
Next, we collapse the four importance ratings categories into a dichotomous rating for each standard; (1) more or most important, or (2) less or least important. Every standard is presented in Table 16 in the order the standards appear in the Common Core standards documents. A large proportion (>70%) of respondents rated 9 of the 10 standard statements as being more or most important.
Table 16. Percent of Respondents with Importance Ratings of More or Most versus Less or Least, for Speaking and Listening Standards
Standard More/most percent
Less/least percent
Comprehension and Collaboration
. Initiate and participate effectively in a range of collaborative discussions (one-on-one, in groups, and teacher-led) with diverse partners on grades -2 topics, texts, and issues, building on others’ ideas and expressing their own ideas clearly and persuasively.
8 22
a. Come to discussions prepared, having read and researched material under study; explicitly draw on that preparation by referring to evidence from texts and other research on the topic or issue to stimulate a thoughtful, well-reasoned exchange of ideas.
9 9
b. Work with peers to promote civil, democratic discussions and decision-making, set clear goals and deadlines, and establish individual roles as needed.
2
c. Propel conversations by posing and responding to questions that probe reasoning and evidence; ensure a hearing for a full range of positions on a topic or issue; clarify, verify, or challenge ideas and conclusions; and promote divergent and creative perspectives.
8
d. Respond thoughtfully to diverse perspectives; synthesize comments, claims, and evidence made on all sides of an issue; resolve contradictions when possible; and determine what additional information or research is required to deepen the investigation or complete the task.
82 8
2. Integrate multiple sources of information presented in diverse formats and media (e.g., visually, quantitatively, orally) in order to make informed decisions and solve problems, evaluating the credibility and accuracy of each source and noting any discrepancies among the data.
8
. Evaluate a speaker’s point of view, reasoning, and use of evidence and rhetoric, assessing the stance, premises, links among ideas, word choice, points of emphasis, and tone used.
29
Presentation of Knowledge and Ideas
4. Present information, findings, and supporting evidence, conveying a clear and distinct perspective, such that listeners can follow the line of reasoning, alternative or opposing perspectives are addressed, and the organization, development, substance, and style are appropriate to purpose, audience, and a range or formal and informal tasks.
82 8
. Make strategic use of digital media (e.g., textual, graphical, audio, visual, and interactive elements) in presentations to enhance understanding of findings, reasoning, and evidence and to add interest.
6 9
6. Adapt speech to a variety of contexts and tasks, demonstrating a command of formal English when indicated or appropriate. (See grades –2 Language standards and on page 4 [of Common Core State Standards document] for specific expectations.)
29

Chapter Three • 31
Chapter 3 | Findings for Ratings of Common Core English Language Arts and Literacy Standards
Table 17. Standard Statements with Means Above and Belowa the Strand Average, for Speaking and Listening Standards
Meanb Standard deviation
Strand average . 0.4
Standard statements above average
Come to discussions prepared, having read and researched material under study; explicitly draw on that preparation by referring to evidence from texts and other research on the topic or issue to stimulate a thoughtful, well-reasoned exchange of ideas.
.4 0.6
Standard statements below average
Make strategic use of digital media (e.g., textual, graphical, audio, visual, and interactive elements) in presentations to enhance understanding of findings, reasoning, and evidence and to add interest.
2.8 0.8
Note. Values assigned to the scale were 4 = most, = more, 2 = less, and = least. aStatements that are . standard deviations above or below the mean of the strand average are displayed. This metric was selected as a way to systematically view trends in the dispersion of standard ratings. Overall, differences in ratings were minimal; displaying standards here does not indicate that comparing their ratings to the overall mean is statistically significant. bMeans and standard deviations at the strand level are weighted to account for the different number of respondents for each standard statement.
In terms of the ratings of individual standards, one statement, preparing for discussions and using evidence, had a higher average importance rating compared to other statements in the strand. One standard, use of digital media in presentations, had a lower-than-average importance rating (see Table 17).
Summary of the Importance Ratings for the Speaking and Listening Standards
The standard statements within the Speaking and Listening Standards strand had an average rating just exceeding 3, the “more important” rating. Respondents were distributed fairly evenly across the content areas. The ratings show that respondents place importance on the skill or practice of coming to discussions having read and researched material and of using texts and research as evidence during discussions. The respondents do not place as much emphasis on using digital media during presentations to enhance understanding and add interest.

Chapter Three • 32
ELA!20.1%!
Math!10.5%!
Science!15.2%!
Social Science!24.3%!
Business Management!
13.1%!
Computer Technology!
6.2%! Healthcare!10.7%!
Chapter 3 | Findings for Ratings of Common Core English Language Arts and Literacy Standards
Language Standards
Respondents to Importance Ratings for the Language Standards Strand
Figure 24 shows how the respondents who completed importance ratings for the Language Standards strand are distributed across the seven content areas. There were 1549 respondents (82% of the sample) rating at least one standard statement as applicable and therefore conducting importance ratings. The breakdown of respondents across content areas was similar to the Speaking and Listening strand. Respondents were fairly well distributed across the content areas with social science instructors (n = 376) composing the largest group of respondents.
English language arts (ELA) instructors (n = 311), science instructors (n = 236), and business management instructors (n = 203) composed the next three largest groups of respondents.
Average Importance Ratings for the Language Standards Strand
The standard statements within the Language Standards strand had an average rating of 2.9 (SD = .84), just below the “more important” rating. Figure 25 shows that importance ratings were similar across the content areas. The strand has three topics with between two and nine standards statements each. Table 18 shows the average rating for each topic.
1.00
2.00
3.00
4.00
English language arts
(n = 311)
Mathematics (n = 162)
Science (n = 236)
Social science (n = 376)
Business management
(n = 203)
Computer technology
(n = 96)
Healthcare (n = 165)
Overall meana 2.9
aThe 17 standard statements were weighted to account for the varying number of respondents for each standard.
Figure 25. Mean Importance Ratings for Language Standards Respondents (n = 1549), by Content Area Figure 25. Mean Importance Ratings for Language Standards Respondents
(n = 1549), by Content Area
English language arts
(n = 311)
Mathematics (n = 162)
Science (n = 236)
Social science (n = 376)
Business management
(n = 203)
Computer technology
(n = 96)
Healthcare (n = 165)
aThe standard statements were weighted to account for the varying number of respondents for each standard.
Figure 24. Respondents Rating Importance for Language Standards Strand (n = 1549), Percent by Content Area

Chapter Three • 33
Chapter 3 | Findings for Ratings of Common Core English Language Arts and Literacy Standards
As the means show, these topics are rated highly but on the lower end compared to topics in other strands (explaining why the strand as a whole has a relatively lower average). The averages of the three topics were similar to each other:
� The Conventions of Standard English topic (an average of six statements) includes standard statements that relate to demonstrating command of standard English grammar, resolving issues of complex or contested usage, and, when writing, demonstrating command of capitalization, punctuation, and spelling. The two Knowledge of Language statements refer to applying knowledge of language to make effective choices for meaning or style, including varying syntax for effect. The nine Vocabulary Acquisition and Use statements refer to determining the meaning of words, using a range of strategies, and demonstrating understanding of figurative language, word relationships, and word meaning nuances. This group of standards also includes acquiring general academic and domain-specific word knowledge and independence in gathering vocabulary knowledge.
Importance Ratings by Standard Statement for the Language Standards Strand
Next, we collapse the four importance ratings categories into a dichotomous rating for each standard; (1) more or most important, or (2) less or least important. Every standard is presented in Table 19 in the order the standards appear in the Common Core standards documents. Compared to other strands, fewer of the Language Standards statements (7 of 17) were rated as being more or most important by a large proportion (>70%) of respondents.
Table 18. Importance Ratings for Topics in Language Standards Strand, Presented as Weighted Means and Standard Deviations
Topic Meana Standard deviation
Number of standards
Conventions of Standard English .0 0.8 6
Knowledge of Language 2.9 0.8 2
Vocabulary Acquisition and Use 2.9 0.8 9
Overall 2.9 0.84 aRespondents rated importance on an ordinal scale. Means are presented only to summarize trends; caution should be exercised when interpreting the precise value of any mean in relation to the categorical system underlying it. Values assigned to the scale were 4 = most, = more, 2 = less, and = least.

Chapter Three • 34
Chapter 3 | Findings for Ratings of Common Core English Language Arts and Literacy Standards
Table 19. Percent of Respondents with Importance Ratings of More or Most versus Less or Least, for Language Standards
Standard More/most percent
Less/least percent
Conventions of Standard English
. Demonstrate command of the conventions of standard English grammar and usage when writing or speaking. 84 6
a. Apply the understanding that usage is a matter of convention, can change over time, and is sometimes contested.
64 6
b. Resolve issues of complex or contested usage, consulting references (e.g., Merriam-Webster’s Dictionary of English Usage, Garner’s Modern American Usage) as needed.
6 9
2. Demonstrate command of the conventions of standard English capitalization, punctuation, and spelling when writing.
2
a. Observe hyphenation conventions. 6
b. Spell correctly. 6 24
Knowledge of Language
. Apply knowledge of language to understand how language functions in different contexts, to make effective choices for meaning or style, and to comprehend more fully when reading or listening.
6 24
a. Vary syntax for effect, consulting references (e.g., Tufte’s Artful Sentences) for guidance as needed; apply an understanding of syntax to the study of complex texts when reading.
4
Vocabulary Acquisition and Use
4. Determine or clarify the meaning of unknown and multiple-meaning words and phrases based on grades -2 reading and content, choosing flexibly from a range of strategies.
4 26
a. Use context (e.g., the overall meaning of a sentence, paragraph, or text; a word’s position or function in a sentence) as a clue to the meaning of a word or phrase.
4 26
b. Identify and correctly use patterns of word changes that indicate different meanings or parts of speech (e.g., conceive, conception, conceivable).
6 9
c. Consult general and specialized reference materials (e.g., dictionaries, glossaries, thesauruses), both print and digital, to find the pronunciation of a word or determine or clarify its precise meaning, its part of speech, its etymology, or its standard usage.
64 6
d. Verify the preliminary determination of the meaning of a word or phrase (e.g., by checking the inferred meaning in context or in a dictionary).
64 6
. Demonstrate understanding of figurative language, word relationships, and nuances in word meanings. 6
a. Interpret figures of speech (e.g., hyperbole, paradox) in context and analyze their role in the text. 4
b. Analyze nuances in the meaning of words with similar denotations. 8 42
6. Acquire and use accurately general academic and domain-specific words and phrases, sufficient for reading, writing, speaking, and listening at the college- and career-readiness level; demonstrate independence in gathering vocabulary knowledge when considering a word or phrase important to comprehension or expression.
89

Chapter Three • 35
Summary of the Importance Ratings for the Language Standards
Although the standards were applicable to a wide range of respondents, importance ratings for the Language Standards were lower than other ELA and literacy strands. However, respondents still rated these standards as important, with the average falling just below the “more important” category. The ratings show that respondents tend to emphasize the use of academic words and phrases, including independence in acquiring vocabulary knowledge. They also consider command of standard English grammar and usage as highly important. They attribute the least importance to specific hyphenation conventions.
Compared to other statements in the strand, two statements received higher importance ratings: acquiring and using vocabulary knowledge of academic words and phrases, and demonstrating command of standard English grammar and usage. One statement, applying hyphenation conventions, was rated by less than a majority of respondents as important (see Table 20). It should be noted that the hyphenation statement is a sub-statement of the standard referring to conventions of standard English capitalization and punctuation.
Table 20. Standard Statements with Means Above and Belowa the Strand Average, for Language Standards
Meanb Standard deviation
Strand average 2.9 0.84
Standard statements above average
Acquire and use accurately general academic and domain-specific words and phrases, sufficient for reading, writing, speaking, and listening at the college- and career-readiness level; demonstrate independence in gathering vocabulary knowledge when considering a word or phrase important to comprehension or expression.
. 0.69
Demonstrate command of the conventions of standard English grammar and usage when writing or speaking.
. 0.8
Standard statements below average
Observe hyphenation conventions. 2. 0.96
Note. Values assigned to the scale were 4 = most, = more, 2 = less, and = least. aStatements that are . standard deviations above or below the mean of the strand average are displayed. This metric was selected as a way to systematically view trends in the dispersion of standard ratings. Overall, differences in ratings were minimal; displaying standards here does not indicate that comparing their ratings to the overall mean is statistically significant. bMeans and standard deviations at the strand level are weighted to account for the different number of respondents for each standard statement.
Chapter 3 | Findings for Ratings of Common Core English Language Arts and Literacy Standards

Chapter Three • 36
ELA!14.5%!
Math!2.1%!
Science!2.5%!
Social Science!61.8%!
Business Management!
11.7%!
Computer Technology!
1.1%!Healthcare!
6.3%!
Chapter 3 | Findings for Ratings of Common Core English Language Arts and Literacy Standards
Reading Standards for Literacy in History/Social Studies
Respondents to Importance Ratings for the Reading Standards in History/Social Studies
Strand
Figure 26 shows how the respondents who completed importance ratings for the Reading Standards in History/Social Studies strand are distributed across the seven content areas. There were 571 respondents (30% of the sample) who completed importance ratings. Not surprisingly, a majority (n = 353) were social science instructors. ELA (n = 83) and business management (n = 67) instructors composed the next largest groups of respondents.
Average Importance Ratings for the Reading Standards in History/Social Studies Strand
The standard statements within the Reading Standards for Literacy in History/Social Studies strand had an average rating of 3.3 (SD = .72), above the “more important” rating. Figure 27 shows that importance ratings were relatively similar across the content areas. Within the strand, four topics have between one and three standards statements each. Table 21 shows the average rating for each of the four topics.
Table 21. Importance Ratings for Topics in Reading Standards for Literacy in History/Social Studies Strand, Presented as Weighted Means and Standard Deviations
Topic Meana Standard deviation
Number of standards
Key Ideas and Details .4 0.69
Craft and Structure . 0.
Integration of Knowledge and Ideas . 0.
Range of Reading and Level of Text Complexity . 0.68
Overall . 0.2 0aRespondents rated importance on an ordinal scale. Means are presented only to summarize trends; caution should be exercised when interpreting the precise value of any mean in relation to the categorical system underlying it. Values assigned to the scale were 4 = most, = more, 2 = less, and = least.
English language arts
(n = 83)
Mathematics (n = 12)
Science (n = 14)
Social science (n = 353)
1.00
2.00
3.00
4.00
English language arts
(n = 83)
Mathematics (n = 12)
Science (n = 14)
Social science (n = 353)
Business management
(n = 67)
Computer technology
(n = 6)
Healthcare (n = 36)
Overall meana 3.3
Note. Lighter shading indicates that respondents from the content area compose less than 5% of respondents for the strand. aThe 10 standard statements were weighted to account for the varying number of respondents for each standard.
Figure 27. Mean Importance Ratings for Reading Standards for Literacy in History/Social Studies Respondents (n = 571), by Content Area
Figure 27. Mean Importance Ratings for Reading Standards for Literacy in History/Social Studies Respondents (n = 571), by Content Area
Business management
(n = 67)
Computer technology
(n = 6)
Healthcare (n = 36)
Note. Lighter shading indicates that respondents from the content area compose less than % of respondents for the strand. aThe 0 standard statements were weighted to account for the varying number of respondents for each standard.
Figure 26. Respondents Rating Importance for Reading Standards for Literacty in History/Social Studies Strand (n = 571), Percent by Content Area

Chapter Three • 37
Chapter 3 | Findings for Ratings of Common Core English Language Arts and Literacy Standards
Below is a summary of those topics with the lowest and highest ratings, including a description of the type of standards they contain:
� Two topics were at the higher end of the ratings. These are the Range of Reading and Level of Text Complexity topic (one statement) and the Key Ideas and Details topic (average of three statements). The Range of Reading and Level of Text Complexity standard addresses students’ ability to read and comprehend different types of science and technical texts with grade-appropriate complexity. This standard is similar to the Range of Reading and Level of Text Complexity topics within the literature and informational texts strands. The Key Ideas and Details topic expects students to cite specific textual evidence from science and technical texts, determine central ideas of the text, and follow complex, multistep procedures when carrying out experiments and analyzing results based on explanations in text.
� Although one topic, Craft and Structure (an average of three statements), had the lowest rating, the rating still exceeds 3, “more important.” The Craft and Structure topic includes standards relating to determining the meaning of symbols, terms, and domain-specific words as well as analyzing text structures and the author’s purpose in providing explanation or discussion.
Importance Ratings by Standard Statement for the Reading
Standards in History/Social Studies Strand
Next, we collapse the four importance ratings categories into a dichotomous rating for each standard; (1) more or most important, or (2) less or least important. Every standard is presented in Table 22 in the order the standards appear in the Common Core standards documents. With one exception, a large proportion (>75%) of respondents rate the 10 standard statements as being more or most important.
Table 22. Percent of Respondents with Importance Ratings of More or Most versus Less or Least, for Reading Standards for Literacy in History/Social Studies
Standard More/most percent
Less/least percent
Key Ideas and Details
. Cite specific textual evidence to support analysis of primary and secondary sources, connecting insights gained from specific details to an understanding of the text as a whole.
9 9
2. Determine the central ideas or information of a primary or secondary source; provide an accurate summary that makes clear the relationships among the key details and ideas.
92 8
. Evaluate various explanations for actions or events and determine which explanation best accords with textual evidence, acknowledging where the text leaves matters uncertain.
8
Craft and Structure
4. Determine the meaning of words and phrases as they are used in a text, including analyzing how an author uses and refines the meaning of a key term over the course of a text (e.g., how Madison defines faction in Federalist No. 0).
82 8
. Analyze in detail how a complex primary source is structured, including how key sentences, paragraphs, and larger portions of the text contribute to the whole.
69
6. Evaluate authors’ differing points of view on the same historical event or issue by assessing the authors’ claims, reasoning, and evidence.
8
Integration of Knowledge and Ideas
. Integrate and evaluate multiple sources of information presented in diverse formats and media (e.g., visually, quantitatively, as well as in words) in order to address a question or solve a problem.
84 6
8. Evaluate an author’s premises, claims, and evidence by corroborating or challenging them with other information. 84 6
9. Integrate information from diverse sources, both primary and secondary, into a coherent understanding of an idea or event, noting discrepancies among sources.
8
Range of Reading and Level of Text Complexity
0. By the end of grade 2, read and comprehend history/social studies texts in the grades –2 text complexity band independently and proficiently.
92 8

Chapter Three • 38
Chapter 3 | Findings for Ratings of Common Core English Language Arts and Literacy Standards
In terms of ratings of individual standard statements, one standard, analysis of the structure of a primary text, had a lower average importance rating. No standards had an importance rating above average (see Table 23).
Table 23. Standard Statements with Means Above and Belowa the Strand Average, for Reading Standards for Literacy in History/Social Studies
Meanb Standard deviation
Strand average . 0.2
Standard statements above average
None
Standard statements below average
Analyze in detail how a complex primary source is structured, including how key sentences, paragraphs, and larger portions of the text contribute to the whole.
2.9 0.8
Note. Values assigned to the scale were 4 = most, = more, 2 = less, and = least. aStatements that are . standard deviations above or below the mean of the strand average are displayed. This metric was selected as a way to systematically view trends in the dispersion of standard ratings. Overall, differences in ratings were minimal; displaying standards here does not indicate that comparing their ratings to the overall mean is statistically significant. bMeans and standard deviations at the strand level are weighted to account for the different number of respondents for each standard statement.
Summary of the Importance Ratings for the Reading Standards in History/Social Studies
Overall, importance ratings of the Reading Standards for Literacy in History/Social Studies were among the highest ELA and literacy ratings, above the “most important” rating category. Within these standards, respondents tend to emphasize general concepts such as students being able to provide textual evidence to support analysis and to determine central ideas of a text (similar to the findings for Reading for Informational Standards). They place less emphasis on students’ analysis of how primary sources are structured and how the parts contribute to a whole.

Chapter Three • 39
ELA!3.5%!
Math!20.0%!
Science!24.6%!
Social Science!10.0%!
Business Management!
14.8%!
Computer Technology!
11.9%!
Healthcare!15.1%!
Chapter 3 | Findings for Ratings of Common Core English Language Arts and Literacy Standards
Figure 28. Respondents Rating Importance for Reading Standards for Literacty in Science and Technical Subjects Strand (n = 1063), Percent by Content Area
Reading Standards for Literacy in Science and Technical Subjects
Respondents to Importance Ratings for the Reading Standards in Science and Technical
Subjects Strand
Figure 28 shows how the respondents who completed importance ratings for the Reading Standards in Science and Technical Subjects strand are distributed across the seven content areas. There were 1063 respondents (56% of the sample) rating at least one standard statement as applicable and therefore conducting importance ratings. Respondents were fairly well distributed across the content areas with science instructors (n = 262) composing the largest group of respondents. Mathematic instructors (n = 213) were the next largest group of respondents.
Average Importance Ratings for the Reading Standards in Science and Technical Subjects
Strand
The standard statements within the Reading Standards in Science and Technical Subjects strand had an average rating of 3.3 (SD =.71), above the “more important” rating. Figure 29 shows that importance ratings were similar across the content areas. The strand has four topics with between one and three standards statements each. Table 24 shows the average rating for each topic.
1.00
2.00
3.00
4.00
English language arts
(n = 37)
Mathematics (n = 213)
Science (n = 262)
Social science (n = 106)
Business management
(n = 157)
Computer technology (n = 127)
Healthcare (n = 161)
Overall meana 3.3
Note. Lighter shading indicates that respondents from the content area compose less than 5% of respondents for the strand. aThe 10 standard statements were weighted to account for the varying number of respondents for each standard.
Figure 29. Mean Importance Ratings for Reading Standards for Literacy in Science and Technical Subjects Respondents (n = 1063), by Content Area
Figure 29. Mean Importance Ratings for Reading Standards for Literacy in
Science and Technical Subjects Respondents (n = 1063), by Content Area
English language arts
(n = 37)
Mathematics (n = 213)
Science (n = 262)
Social science (n = 106)
Business management
(n = 157)
Computer technology (n = 127)
Healthcare (n = 161)
Note. Lighter shading indicates that respondents from the content area compose less than % of respondents for the strand. aThe 0 standard statements were weighted to account for the varying number of respondents for each standard.
Table 24. Importance Ratings for Topics in Reading Standards for Literacy in Science and Technical Subjects Strand, Presented as Weighted Means and Standard Deviations
Topic Meana Standard deviation
Number of standards
Key Ideas and Details . 0.68
Craft and Structure .2 0.
Integration of Knowledge and Ideas .2 0.
Range of Reading and Level of Text Complexity . 0.6
Overall . 0. 0aRespondents rated importance on an ordinal scale. Means are presented only to summarize trends; caution should be exercised when interpreting the precise value of any mean in relation to the categorical system underlying it. Values assigned to the scale were 4 = most, = more, 2 = less, and = least.

Chapter Three • 40
Chapter 3 | Findings for Ratings of Common Core English Language Arts and Literacy Standards
Below is a summary of the topics: � Range of Reading and Level of Text Complexity had the highest average rating in this strand. As with similar topics in other strands, the Range of Reading and Level of Text Complexity statement involves reading and comprehending texts — in this case, history and social studies texts — with grade-appropriate complexity.
� Three other topics had averages that were similar to each other and above the “most important” category: Key Ideas and Details (the average of three statements), Craft and Structure (the average of three statements), and Integration of Knowledge and Ideas (the average of three statements).
Importance Ratings by Standard Statement for the Reading
Standards in Science and Technical Subjects Strand
Next, we collapse the four importance ratings categories into a dichotomous rating for each standard: (1) more or most important, or (2) less or least important. Every standard
is presented in Table 25 in the order the standards appear in the Common Core standards documents. With only one exception, a large proportion (>75%) of respondents rated the 10 standard statements as more or most important.
One standard, following a multistep procedure when conducting experiments, measurements, or technical tasks, received a higher average importance rating than others. Two standards received lower-than-average importance ratings: analyzing the author’s purpose in describing procedures or experiments and citing specific textual evidence to support analysis of science and technical texts. Table 26 shows the means and standard deviations of these three standards compared to the average of statements in the strand as a whole.
Table 25. Percent of Respondents with Importance Ratings of More or Most versus Less or Least, for Reading Standards for Literacy in Science and Technical Subjects
Standard More/most percent
Less/least percent
Key Ideas and Details
. Cite specific textual evidence to support analysis of science and technical texts, attending to important distinctions the author makes and to any gaps or inconsistencies in the account.
9 2
2. Determine the central ideas or conclusions of a text; summarize complex concepts, processes, or information presented in a text by paraphrasing them in simpler but still accurate terms.
90 0
. Follow precisely a complex multistep procedure when carrying out experiments, taking measurements, or performing technical tasks; analyze the specific results based on explanations in the text.
9
Craft and Structure
4. Determine the meaning of symbols, key terms, and other domain-specific words and phrases as they are used in a specific scientific or technical context relevant to grades -2 texts and topics.
94 6
. Analyze how the text structures information or ideas into categories or hierarchies, demonstrating understanding of the information or ideas.
80 20
6. Analyze the author’s purpose in providing an explanation, describing a procedure, or discussing an experiment in a text, identifying important issues that remain unresolved.
29
Integration of Knowledge and Ideas
. Integrate and evaluate multiple sources of information presented in diverse formats and media (e.g., quantitative data, video, multimedia) in order to address a question or solve a problem.
9 2
8. Evaluate the hypotheses, data, analysis, and conclusions in a science or technical text, verifying data when possible and corroborating or challenging conclusions with other sources of information.
8
9. Synthesize information from a range of sources (e.g., texts, experiments, simulations) into a coherent understanding of a process, phenomenon, or concept, resolving conflicting information when possible.
8
Range of Reading and Level of Text Complexity
0. By the end of Grade 2, read and comprehend science/technical texts in the grades –2 text complexity band independently and proficiently.
94 6

Chapter Three • 41
Chapter 3 | Findings for Ratings of Common Core English Language Arts and Literacy Standards
Table 26. Standard Statements with Means Above and Belowa the Strand Average, for Reading Standards for Literacy in Science and Technical Subjects
Meanb Standard deviation
Strand average . 0.
Standard statements above average
Follow precisely a complex multistep procedure when carrying out experiments, taking measurements, or performing technical tasks; analyze the specific results based on explanations in the text.
.6 0.60
Standard statements below average
Analyze the author’s purpose in providing an explanation, describing a procedure, or discussing an experiment in a text, identifying important issues that remain unresolved.
2.9 0.8
Cite specific textual evidence to support analysis of science and technical texts, attending to important distinctions the author makes and to any gaps or inconsistencies in the account.
.0 0.6
Note. Values assigned to the scale were 4 = most, = more, 2 = less, and = least. aStatements that are . standard deviations above or below the mean of the strand average are displayed. This metric was selected as a way to systematically view trends in the dispersion of standard ratings. Overall, differences in ratings were minimal; displaying standards here does not indicate that comparing their ratings to the overall mean is statistically significant. bMeans and standard deviations at the strand level are weighted to account for the different number of respondents for each standard statement.
Summary of the Importance Ratings for the Reading Standards in Science and Technical Subjects
Importance ratings of the Reading Standards for Literacy in Science and Technical Subjects, on average, were also among the highest ELA and literacy ratings, just above the 3, or “more important” level. Respondents were distributed across the content areas consistent with overall response patterns. Respondents’ ratings show that they tend to emphasize skills relating to following complex multistep procedures when doing technical tasks and analyzing technical results based on explanations in the text. They emphasize less the importance of the author’s purpose within the text and citing specific textual evidence while attending to the distinctions that the author makes.

Chapter Three • 42
ELA!2.9%!
Math!12.5%!
Science!19.6%!
Social Science!30.1%!
Business Management!
14.5%!
Computer Technology!
8.1%!Healthcare!
12.3%!
Chapter 3 | Findings for Ratings of Common Core English Language Arts and Literacy Standards
Writing Standards for Literacy in History/Social Studies, Science, and Technical Subjects
Respondents to Importance Ratings for the Writing Standards in History/Social Studies,
Science, and Technical Subjects Strand
Figure 30 shows how the respondents who completed importance ratings for the Writing Standards in History/Social Studies, Science, and Technical Subjects strand are distributed across the seven content areas. Of the 1257 respondents (66% of the sample), the largest group of respondents was social science instructors (n = 378). Science (n = 247) and business management (n = 182) instructors composed the next two largest groups of respondents.
Average Importance Ratings for the Writing Standards in History/Social Studies, Science,
and Technical Subjects Strand
The standard statements within the Writing Standards for Literacy in History/Social Studies, Science, and Technical Subjects strand had an average rating of 3.0 (SD =.78), at the “more important” level. Figure 31 shows that importance ratings were similar across the content areas. The strand has four topics with 1 to 12 standards statements each. As with the other writing strand, this one has many more sub-standards for a total of 19 statements. Table 27 shows the average rating for each topic.
Figure 30. Respondents Rating Importance for Writing Standards for Literacty in History/Social Studies, Science and Technical Subjects Strand (n = 1257), Percent by Content Area
1.00
2.00
3.00
4.00
English language arts
(n = 37)
Mathematics (n = 157)
Science (n = 247)
Social science (n = 378)
Business management
(n = 182)
Computer technology (n = 102)
Healthcare (n = 154)
Overall meana 3.0
Note. Lighter shading indicates that respondents from the content area compose less than 5% of respondents for the strand. aThe 19 standard statements were weighted to account for the varying number of respondents for each standard.
Figure 31. Mean Importance Ratings for Writing Standards for Literacy in History/Social Studies, Science, and Technical Subjects Respondents (n = 1257), by Content Area
Figure 31. Mean Importance Ratings for Writing Standards for Literacy in History/Social Studies, Science and Technical Subjects Respondents (n = 1257), by Content Area
English language arts
(n = 37)
Mathematics (n = 157)
Science (n = 247)
Social science (n = 378)
Business management
(n = 182)
Computer technology (n = 102)
Healthcare (n = 154)
Note. Lighter shading indicates that respondents from the content area compose less than % of respondents for the strand. aThe 9 standard statements were weighted to account for the varying number of respondents for each standard.

Chapter Three • 43
Chapter 3 | Findings for Ratings of Common Core English Language Arts and Literacy Standards
Each of the topics had relatively similar ratings to each other: Text Types and Purposes (an average of 12 statements), Production and Distribution of Writing (an average of three statements), Research to Build and Present Knowledge (an average of three statements), and Range of Writing (one statement) all had average ratings at or very near the “more important” level.
In general, these topics contain standard statements that are similar to the Writing Standards in that they require students to produce clear and coherent writing appropriate to the task; to use a process to plan, revise, edit and rewrite; and to use technology to produce and update writing products. They expect students to write routinely over both shorter and extended periods of time and to gather relevant information, synthesize sources, and draw evidence from texts to support analysis. Because the strand is content specific, the Text Types and Purposes topic focuses on writing that is discipline specific, including the use of claims and counterclaims, formal style and objective tone, precise language, and domain-specific vocabulary.
Importance Ratings by Standard Statement for the Writing Standards in History/Social
Studies, Science, and Technical Subjects Strand
Next, we collapse the four importance ratings categories into a dichotomous rating for each standard; (1) more or most important, or (2) less or least important. Every standard is presented in Table 28 in the order the standards appear in the Common Core standards documents. The strand has a total of 19 statements. Because the writing strands make greater use of sub-standards, there are more and, in some cases, finer-grained statements than other strands.
Most of the statements (16) were rated as being more or most important by a large proportion (>70%) of respondents.
Table 27. Importance Ratings for Topics in Writing Standards for Literacy in History/Social Studies, Science, and Technical Subjects Strand, Presented as Weighted Means and Standard Deviations
Topic Meana Standard deviation
Number of standards
Text Types and Purposes .0 0.8 2
Production and Distribution of Writing . 0.9
Research to Build and Present Knowledge . 0.
Range of Writing .0 0.8
Overall .0 0.8 9aRespondents rated importance on an ordinal scale. Means are presented only to summarize trends; caution should be exercised when interpreting the precise value of any mean in relation to the categorical system underlying it. Values assigned to the scale were 4 = most, = more, 2 = less, and = least.

Chapter Three • 44
Chapter 3 | Findings for Ratings of Common Core English Language Arts and Literacy Standards
Table 28. Percent of Respondents with Importance Ratings of More or Most versus Less or Least, for Writing Standards for Literacy in History/Social Studies, Science, and Technical Subjects
Standard More/most percent
Less/least percent
Text Types and Purposes
. Write arguments focused on discipline-specific content. 84 6
a. Introduce precise, knowledgeable claim(s), establish the significance of the claim(s), distinguish the claim(s) from alternate or opposing claims, and create an organization that logically sequences the claim(s), counterclaims, reasons, and evidence.
82 8
b. Develop claim(s) and counterclaims fairly and thoroughly, supplying the most relevant data and evidence for each while pointing out the strengths and limitations of both claim(s) and counterclaims in a discipline-appropriate form that anticipates the audience’s knowledge level, concerns, values, and possible biases.
9 2
c. Use words, phrases, and clauses as well as varied syntax to link the major sections of the text, create cohesion, and clarify the relationships between claim(s) and reasons, between reasons and evidence, and between claim(s) and counterclaims.
68 2
d. Establish and maintain a formal style and objective tone while attending to the norms and conventions of the discipline in which they are writing.
0 0
e. Provide a concluding statement or section that follows from or supports the argument presented. 9 22
2. Write informative/explanatory texts, including the narration of historical events, scientific procedures/ experiments, or technical processes.
6 24
a. Introduce a topic and organize complex ideas, concepts, and information so that each new element builds on that which precedes it to create a unified whole; include formatting (e.g., headings), graphics (e.g., figures, tables), and multimedia when useful to aiding comprehension.
80 20
b. Develop the topic thoroughly by selecting the most significant and relevant facts, extended definitions, concrete details, quotations, or other information and examples appropriate to the audience’s knowledge of the topic.
80 20
c. Use varied transitions and sentence structures to link the major sections of the text, create cohesion, and clarify the relationships among complex ideas and concepts.
60 40
d. Use precise language, domain-specific vocabulary and techniques such as metaphor, simile, and analogy to manage the complexity of the topic; convey a knowledgeable stance in a style that responds to the discipline and context as well as to the expertise of likely readers.
68 2
e. Provide a concluding statement or section that follows from and supports the information or explanation provided (e.g., articulating implications or the significance of the topic).
2
Production and Distribution of Writing
4.a Produce clear and coherent writing in which the development, organization, and style are appropriate to task, purpose, and audience.
8
. Develop and strengthen writing as needed by planning, revising, editing, rewriting, or trying a new approach, focusing on addressing what is most significant for a specific purpose and audience.
2
6. Use technology, including the Internet, to produce, publish, and update individual or shared writing products in response to ongoing feedback, including new arguments or information.
0 0
Research to Build and Present Knowledge
. Conduct short as well as more sustained research projects to answer a question (including a self-generated question) or solve a problem; narrow or broaden the inquiry when appropriate; synthesize multiple sources on the subject, demonstrating understanding of the subject under investigation.
80 20
8. Gather relevant information from multiple authoritative print and digital sources, using advanced searches effectively; assess the strengths and limitations of each source in terms of the specific task, purpose, and audience; integrate information into the text selectively to maintain the flow of ideas, avoiding plagiarism and overreliance on any one source and following a standard format for citation.
80 20
9. Draw evidence from informational texts to support analysis, reflection, and research. 82 8
Range of Writing
0. Write routinely over extended time frames (time for reflection and revision) and shorter time frames (a single sitting or a day or two) for a range of discipline-specific tasks, purposes, and audiences.
2 28
aFor the Writing Standards for Literacy in History/Social Studies, Science, and Technical Subjects, the third standard is listed as not applicable as separate requirement.

Chapter Three • 45
Chapter 3 | Findings for Ratings of Common Core English Language Arts and Literacy Standards
One standard statement, on the use of varied transitions and sentence structures, had a lower rating. This is a sub-statement of the standard referring to writing informative/explanatory texts. Table 29 shows the mean and standard deviation of this standard statement compared to the average of statements in the strand as a whole.
Table 29. Standard Statements with Means Above and Belowa the Strand Average, for Writing Standards for Literacy in History/Social Studies, Science, and Technical Subjects
Meanb Standard deviation
Strand average .0 0.8
Standard statements above average
None
Standard statements below average
Use varied transitions and sentence structures to link the major sections of the text, create cohesion, and clarify the relationships among complex ideas and concepts.
2. 0.8
Note. Values assigned to the scale were 4 = most, = more, 2 = less, and = least. aStatements that are . standard deviations above or below the mean of the strand average are displayed. This metric was selected as a way to systematically view trends in the dispersion of standard ratings. Overall, differences in ratings were minimal; displaying standards here does not indicate that comparing their ratings to the overall mean is statistically significant. bMeans and standard deviations at the strand level are weighted to account for the different number of respondents for each standard statement.
Summary of the Importance Ratings for the Writing Standards in History/Social Studies, Science, and Technical Subjects
The average importance rating across all importance ratings for the Writing Standards for Literacy in History/Social Studies, Science, and Technical Subjects strand was “more important.” Social science and science instructors comprised about half of the respondents for this strand, with the rest of the respondents distributed across the other content areas. Respondents tend to identify as important the writing of arguments on discipline-specific content that includes precise, knowledgeable, significant claims. Respondents also indicate as important students’ ability to create organization that logically sequences the claim, counterclaims, reasons, and evidence. Respondents find student use of varied transitions and sentence structures not to reach the level of “more important.”

Chapter Four • 46
For mathematics, we organize the data presentation in the same fashion as we did for English language arts and literacy. Frequencies for applicability and importance categories for individual standards can be found in Appendix G.
Applicability for Mathematics Standards
Overall Applicability
Figure 32 shows how the study’s 1897 respondents answered the overall relevancy question for each mathematics conceptual category. Respondents who, after reading a summary, said the conceptual category was relevant to their course were given the opportunity to rate all of the standards within the category. Only respondents who answered yes were presented with all the standards within the category to rate. Respondents who answered no bypassed the section. All respondents viewed each of the Standards for Mathematical Practice.
Chapter 4 | Findings for Ratings of Common Core Mathematics Standards
Figure 32. Response from Sample (n = 1897) to Overall Relevancy Question for Mathematics Conceptual Categories
aGeometry has 896 rrespondents because, due to a system error, this conceptual category and its standards statements were not presented to one respondent.
800!
796!
607!
339!
751!
0! 500! 1000! 1500! 2000!
Number and !Quantity!
Algebra!
Functions!
Geometry *!
Statistics and !Probability!
aGeometry has 1896 respondents because, due to a system error, this conceptual category and its standards statements were not presented to one respondent.
Figure 32. Response from Sample (n = 1897) to Overall Relevancy Question for Mathematics Conceptual Categories!
Yes!No!
Number and Quantity
Algebra
Functions
Geometrya
Statistics and Probability

Chapter Four • 47
Chapter 4 | Findings for Ratings of Common Core Mathematics Standards
Next, we present related data; Figure 33 shows the percent of all respondents who rated at least one standard within the mathematics conceptual category as either prerequisite, reviewed, introduced, or subsequent. Nearly every instructor who answered yes to the parent question (Figure 32) went on to rate at least one standard as applicable (Figure 33). Figure 33 also shows the percent of mathematics respondents who rated at least one standard as applicable in each category.
Two categories were applicable to 18–32% of the sample: � Functions � Geometry
Three categories were applicable to approximately 40% of the sample: � Number and Quantity � Algebra � Statistics and Probability
For the Mathematical Practices section, at least one standard was applicable to 73% of respondents. Recall that respondents did not see an overall relevancy question for Mathematical Practices. Instead, each respondent saw all eight individual standard statements in this category. This means that 73% of the sample rated at least one of the eight standards as applicable.
Applicability Criterion
In presenting summative data for this chapter, we chose to use the criterion of a minimum of one standard match within a conceptual category as indicating applicability of the category. This eliminates the need to set an arbitrary criterion point, either a fixed number or a percent of all standard statements in the category (which vary from to 8 to 4 standard statements). For example, Table 0 shows that the 9 respondents who completed ratings for Number and Quantity rated, on average, 4 stan-dard statements as applicable, with a mode response of three standards (out of a possible 2 standard statements). Appendix F contains additional information about the number of standards in each conceptual category that were rated as applicable.
Figure 33. Percent of Respondents Rating at Least One Standard within the Mathematical Conceptual Categories and Mathematical Practices as Applicablea to their Course
Note. The graphic shows the ratings for the 02 respondents of mathematics courses separately.aApplicable is considered a rating of prerequisite, reviewed, introduced, or subsequent.
42! 42!32!
18!
40!
73!
93 94 89
50 49
100
0
20
40
60
80
100
Number and Quantity
Algebra Functions Geometry Statistics and Probability
Mathematical Practices
Percent
aApplicable is considered a rating of prerequisite, reviewed, introduced, or subsequent.
Figure 33. Percent of Respondents Rating at Least One Standard within the Mathematical Conceptual Categories and Mathematical Practices as Applicablea to their Course
All (1897 respondents)
Math (302 respondents)

Chapter Four • 48
Chapter 4 | Findings for Ratings of Common Core Mathematics Standards
Applicability by Content Area
As with English language arts and literacy, when we divided results by the seven content areas included in the survey, contrasts were revealed in applicability ratings among respondents from different content areas (Figure 34 shows English language arts, mathematics, science, and social science; Figure 35 shows business management, computer technology, and healthcare). As Figure 34 shows and as would be expected, very few respondents from English language arts (ELA) courses find the mathematics conceptual categories applicable to their course. In contrast and predictably, 89–94% of mathematics respondents rate as applicable the Number and Quantity, the Algebra, and the Functions categories. Fewer mathematics respondents (49–50%) rate as applicable the Geometry and the Statistics and Probability categories.
For science, 75–84% of respondents rate as applicable the Number and Quantity, the Algebra, and the Statistics and Probability categories. Fewer science respondents (46–56%) rate as applicable the Functions and Geometry categories. Few social science respondents find the conceptual categories applicable, with the exception of Statistics and Probability, which 44% rated as applicable.
Figure 34 shows conceptual category-level applicability ratings for ELA, mathematics, science, and social science respondents — courses often associated with general education requirements to earn a bachelor’s degree. Figure 35 shows conceptual category-level applicability ratings for the other three content areas that are somewhat more associated with career pathways: business management, computer technology, and healthcare.
0
20
40
60
80
100
Number and Quantity
Algebra Functions Geometry Statistics and Probability
Mathematical Practices
aApplicable is considered a rating of prerequisite, reviewed, introduced, or subsequent.
Figure 34. Percent of Respondents Rating at Least One Standard within the Mathematics Conceptual Category as Applicablea to their Course, for ELA, Math, Science, and Social Science
ELA (312 respondents) Math (302 respondents) Science (281 respondents) Social science (420 respondents)
Figure 34. Percent of Respondents Rating at Least One Standard within the Mathematics Conceptual Category as Applicablea to their Course, for ELA, Math, Science, and Social Science
aApplicable is considered a rating of prerequisite, reviewed, introduced, or subsequent.
Table 30. Number of Standards Rated as Applicable for Mathematics Conceptual Categories
Conceptual category Number of respondents
Number of standards
Total in category
Rated as applicable
Mean Standard deviation Mode Minimum Maximum
Number and Quantity 9 2 . 0.8 2
Algebra 9 4 9. 0.46 4 4
Functions 606 4 26.9 4.9 4 4
Geometry 4 9.4 4.8 4 4
Statistics and Probability 6 9. .8 6 6
Mathematical Practices 80 8 6. 2.20 8 8
Percent

Chapter Four • 49
0
20
40
60
80
100
Number and Quantity
Algebra Functions Geometry Statistics and Probability
Mathematical Practices
Percent
aApplicable is considered a rating of prerequisite, reviewed, introduced, or subsequent.
Figure 35. Percent of Respondents Rating at Least One Standard within the Mathematics Conceptual Category as Applicablea to their Course, for Business Management, Computer Technology, and Healthcare
Business management (243 respondents)
Computer technology (153 respondents)
Healthcare (186 respondents)
Chapter 4 | Findings for Ratings of Common Core Mathematics Standards
Computer technology respondents indicated the highest applicability of mathematics of the three more application-oriented content areas. Most highly applicable were Number and Quantity, Algebra, and Functions, with about 50% each. Fewer computer technology respondents rated as applicable the Geometry and the Statistics and Probability categories (16% and 31%, respectively).
Respondents from business management and heatlhcare courses, on average, showed relatively similar patterns to each other, in that both found most applicable Number and Quantity, Algebra, and Statistics and Probability. Averages ranged from 31–35% for business management and from 35–37% for healthcare. Both content areas had low ratings for Functions (11% and 10%) and Geometry (4% and 3%).
As mentioned earlier, the Mathematical Practices standards were more widely applicable than any individual mathematics conceptual category. For almost all content areas, a large percent (77–100%) of respondents rated Mathematical Practices as applicable. The two content area categories with the lowest applicability rate were social science at 59% and ELA at 22%.
Appendix F contains more information on applicability ratings for each content area and each conceptual category.
Importance Ratings for Mathematics Standards
Importance ratings are presented below but with the same caveat that was given for the English language arts and literacy section. In all cases, the importance ratings come from a subset of respondents — those who rated a conceptual category and then a standard as applicable. This is also a subset of all respondents within a content area. For this reason, importance ratings should be viewed with caution until they are situated relative to their proportion of all applicability responses. They are included here for informational purposes to help present an initial indication of the validity of the Common Core standards relative to a range of postsecondary course categories and not to reach a definitive conclusion regarding the importance of any given standard or conceptual category.
If respondents selected a standard as prerequisite, reviewed, or introduced, they were then asked to rate the importance of that standard on a 4-point scale. The scale consisted of the options most (defined as critical for success in the course), more (important for success), less (familiarity may be helpful), and least important (only minimal knowledge needed). Respondents who did not rate a standard’s applicability in those three categories were not presented with the importance rating and instead were directed to the next standard. Although we present importance ratings as means, it is worth noting that the importance categories are ordinal. Caution should be exercised when interpreting the precise value of any mean in relation to the categorical category underlying it.
Figure 35. Percent of Respondents Rating at Least One Standard within the Mathematics Conceptual Category as Applicablea to their Course, for Business Management, Computer Technology and Healthcare
aApplicable is considered a rating of prerequisite, reviewed, introduced, or subsequent.

Chapter Four • 50
Chapter 4 | Findings for Ratings of Common Core Mathematics Standards
Below, for each conceptual category, we provide a descriptive summary of the importance ratings. We first show the breakdown by content area of those respondents who rated importance and their average ratings rolled up to the conceptual category level. These are the averages of 32 to 45 standard statements, depending on the category, weighted to account for the varying number of respondents for each standard. It was not our goal to look for statistically significant differences among the categories (nor do any likely exist). We include these results only to show general patterns in ratings.
As in the results section of the English language arts and literacy chapter, we then show several summary-level presentations of the importance data. We present the average importance ratings at the domain level (the four to six organizing categories or subareas) within each conceptual category. Then, we present the importance ratings for each standard. These are presented as dichotomous findings, showing percentage breakdown for the standard statement rated either (1) as more or most important, or (2) as less or least important. In this view of the data, every standard is presented (in the order the standards appear in the Common Core standards documents), but the responses are collapsed into just two categories. Finally, to help provide a summary overview, we list individual standard statements that had means that were somewhat higher or lower than the mean of all standards in that conceptual category. We include these results once again to illuminate general patterns, not to suggest that the comparison of these standards to others is statistically significant and not to suggest the need for specific actions based on these ratings.
The presentations of the data were designed to give summary-level information about the findings that would be relatively easy and meaningful to view. The body of the report does not present the frequencies for all importance categories for individual standards. This potentially important information is contained in Appendix G.
Ratings Summary Overall, mathematics importance rating averages were high for all conceptual categories and Mathematical Practices, generally just below the “more important” rating.

Chapter Four • 51
ELA!0.1%!
Math!35.2%!
Science!29.8%!
Social Science!
7.5%!
Business Management!
9.5%!
Computer Technology!
9.4%!
Healthcare!8.4%!
Number and Quantity Standards
Respondents to Importance Ratings for the Number and Quantity Conceptual Category
Figure 36 shows how the instructors who completed importance ratings for the Number and Quantity conceptual category are distributed across the seven content areas. Of the 796 respondents (42% of the sample) rating at least one standard statement within the Number and Quantity conceptual category as applicable and therefore conducting importance ratings, mathematics (n = 280) and science (n = 237) respondents composed the majority of respondents. The other content areas had a similar number of respondents to each other, just under 10%, with the exception of English language arts (ELA), which had only one respondent.
Average Importance Ratings for the Number and Quantity Conceptual Category
The standard statements within the Number and Quantity conceptual category had an average rating of 2.9 (SD = .89), just below the “more important” rating. Figure 37 shows the importance ratings across instructors from the different content areas. The conceptual category has four domains that have between 3 and 17 standards statements each. Table 31 shows the average rating for each domain.
Figure 36. Respondents Rating Importance for Number and Quantity Conceptual Category (n = 796), Percent by Content Area
Chapter 4 | Findings for Ratings of Common Core Mathematics Standards
Table 31. Importance Ratings for Domains in Number and Quantity Conceptual Category, Presented as Weighted Means and Standard Deviations
Domain Meana Standard deviation
Number of standards
The Real Number System 2.9 0.89
Quantities . 0.80
The Complex Number System 2. 0.9 9
Vector and Matrix Quantities 2.9 0.94
Overall 2.9 0.89 2aRespondents rated importance on an ordinal scale. Means are presented only to summarize trends; caution should be exercised when interpreting the precise value of any mean in relation to the categorical system underlying it. Values assigned to the scale were 4 = most, = more, 2 = less, and = least.
1.00
2.00
3.00
4.00
English language arts
(n = 1)
Mathematics (n = 280)
Science (n = 237)
Social science (n = 60)
Business management
(n = 76)
Computer technology
(n = 75)
Healthcare (n = 67)
Overall meana 2.9
Note. Because there was only one English language arts respondent, the rating is not displayed. aThe 32 standard statements were weighted to account for the varying number of respondents for each standard.
Figure 37. Mean Importance Ratings for Number and Quantity Respondents (n = 796), by Content Area Figure 37. Mean Importance Ratings for Number and Quantity Respondents (n =
796), by Content Area
English language arts
(n = 1)
Mathematics (n = 280)
Science (n = 237)
Social science (n = 60)
Business management
(n = 76)
Computer technology
(n = 75)
Healthcare (n = 67)
Note. Because there was only one English language arts respondent, the rating is not displayed. aThe 2 standard statements were weighted to account for the varying number of respondents for each standard.

Chapter Four • 52
Chapter 4 | Findings for Ratings of Common Core Mathematics Standards
Below is a summary of the domain ratings, including a description of the type of standards they contain:
� One domain, Quantities (an average of three statements), had the highest rating. These standards refer to reasoning quantitatively and using units to solve problems.
� The Complex Number System domain (an average of nine statements) had the lowest rating, above the midpoint between “less important” and “more important.” These standards (six of which are marked as advanced) refer to performing arithmetic operations with complex numbers, representing complex numbers and operations on the complex plane, and using complex numbers in polynomial identities and equations.
Importance Ratings by Standard Statement for the Number
and Quantity Conceptual Category
Next, we collapse the four importance ratings categories into a dichotomous rating for each standard: (1) more or most important, or (2) less or least important. Every standard is presented in Table 32 in the order the standards appear in the Common Core standards documents. Many of the Number and Quantity statements (28 of 32) were rated as being more or most important by a significant proportion (between 50 and 75%) of respondents.
Table 32. Percent of Respondents with Importance Ratings of More or Most versus Less or Least, for Number and Quantity Standards
Standard More/most percent
Less/least percent
The Real Number System: Extend the properties of exponents to rational exponents.
. Explain how the definition of the meaning of rational exponents follows from extending the properties of integer exponents to those values, allowing for a notation for radicals in terms of rational exponents. For example, we define / to be the cube root of because we want (/) = (/) to hold, so (/) must equal .
2 28
2. Rewrite expressions involving radicals and rational exponents using the properties of exponents. 29
The Real Number System: Use properties of rational and irrational numbers.
. Explain why the sum or product of two rational numbers is rational; that the sum of a rational number and an irrational number is irrational; and that the product of a nonzero rational number and an irrational number is irrational.
0 0
Quantities: Reason quantitatively and use units to solve problems.
. Use units as a way to understand problems and to guide the solution of multi-step problems; choose and interpret units consistently in formulas; choose and interpret the scale and the origin in graphs and data displays.
82 8
2. Define appropriate quantities for the purpose of descriptive modeling. 6 24
. Choose a level of accuracy appropriate to limitations on measurement when reporting quantities. 2 28
The Complex Number System: Perform arithmetic operations with complex numbers.
. Know there is a complex number i such that i2 = –, and every complex number has the form a + bi with a and b being real.
4
2. Use the relation i2 = – and the commutative, associative, and distributive properties to add, subtract, and multiply complex numbers.
4
. (+) Find the conjugate of a complex number; use conjugates to find moduli and quotients of complex numbers.
2 48
The Complex Number System: Represent complex numbers and their operations on the complex plane.
4. (+) Represent complex numbers on the complex plane in rectangular and polar form (including real and imaginary numbers), and explain why the rectangular and polar forms of a given complex number represent the same number.
46 4
. (+) Represent addition, subtraction, multiplication, and conjugation of complex numbers geometrically on the complex plane; use properties of this representation for computation. For example, ( – √i) = 8 because ( – √i) has modulus 2 and argument 20°.
46 4
6. (+) Calculate the distance between numbers in the complex plane as the modulus of the difference, and the midpoint of a segment as the average of the numbers at its endpoints.
4
Continued on next page

Chapter Four • 53
Chapter 4 | Findings for Ratings of Common Core Mathematics Standards
Table 32. continued
Standard More/most percent
Less/least percent
The Complex Number System: Use complex numbers in polynomial identities and equations.
. Solve quadratic equations with real coefficients that have complex solutions. 68 2
8. (+) Extend polynomial identities to the complex numbers. For example, rewrite x2 + 4 as (x + 2i)(x – 2i). 4 46
9. (+) Know the Fundamental Theorem of Algebra; show that it is true for quadratic polynomials. 6 9
Vector and Matrix Quantities: Represent and model with vector quantities.
. (+) Recognize vector quantities as having both magnitude and direction. Represent vector quantities by directed line segments, and use appropriate symbols for vectors and their magnitudes (e.g., v, |v|, ||v||, v).
69
2. (+) Find the components of a vector by subtracting the coordinates of an initial point from the coordinates of a terminal point.
68 2
. (+) Solve problems involving velocity and other quantities that can be represented by vectors. 4 26
Vector and Matrix Quantities: Perform operations on vectors.
4. (+) Add and subtract vectors. 69
a. Add vectors end-to-end, component-wise, and by the parallelogram rule. Understand that the magnitude of a sum of two vectors is typically not the sum of the magnitudes.
68 2
b. Given two vectors in magnitude and direction form, determine the magnitude and direction of their sum. 0 0
c. Understand vector subtraction v – w as v + (–w), where –w is the additive inverse of w, with the same magnitude as w and pointing in the opposite direction. Represent vector subtraction graphically by connecting the tips in the appropriate order, and perform vector subtraction component-wise.
69
. (+) Multiply a vector by a scalar. 69
a. Represent scalar multiplication graphically by scaling vectors and possibly reversing their direction; perform scalar multiplication component-wise, e.g., as c(v
x, v
y) = (cv
x, cv
y).
64 6
b. Compute the magnitude of a scalar multiple cv using ||cv|| = |c|v. Compute the direction of cv knowing that when |c|v ≠ 0, the direction of cv is either along v (for c > 0) or against v (for c < 0).
68 2
Vector and Matrix Quantities: Perform operations on matrices and use matrices in applications.
6. (+) Use matrices to represent and manipulate data, e.g., to represent payoffs or incidence relationships in a network.
4
. (+) Multiply matrices by scalars to produce new matrices, e.g., as when all of the payoffs in a game are doubled.
4
8. (+) Add, subtract, and multiply matrices of appropriate dimensions. 62 8
9. (+) Understand that, unlike multiplication of numbers, matrix multiplication for square matrices is not a commutative operation, but still satisfies the associative and distributive properties.
8 42
0. (+) Understand that the zero and identity matrices play a role in matrix addition and multiplication similar to the role of 0 and in the real numbers. The determinant of a square matrix is nonzero if and only if the matrix has a multiplicative inverse.
9 4
. (+) Multiply a vector (regarded as a matrix with one column) by a matrix of suitable dimensions to produce another vector. Work with matrices as transformations of vectors.
9 4
2. (+) Work with 2 × 2 matrices as transformations of the plane, and interpret the absolute value of the determinant in terms of area.
4
Note. Values assigned to the scale were 4 = most, = more, 2 = less, and = least. aStatements that are . standard deviations above or below the mean of the conceptual category average are displayed. This metric was selected as a way to systematically view trends in the dispersion of standard ratings. Overall, differences in ratings were minimal; displaying standards here does not indicate that comparing their ratings to the overall mean is statistically significant. bMeans and standard deviations at the conceptual category level are weighted to account for the different number of respondents for each standard statement.

Chapter Four • 54
Chapter 4 | Findings for Ratings of Common Core Mathematics Standards
Table 33. Standard Statements with Means Above and Belowa the Conceptual Category Average, for Number and Quantity
Meanb Standard deviation
Conceptual category average 2.9 0.89
Standard statements above average
Use units as a way to understand problems and to guide the solution of multi-step problems; choose and interpret units consistently in formulas; choose and interpret the scale and the origin in graphs and data displays.
. 0.
Standard statements below average
(+) Represent complex numbers on the complex plane in rectangular and polar form (including real and imaginary numbers), and explain why the rectangular and polar forms of a given complex number represent the same number.
2. 0.94
(+) Represent addition, subtraction, multiplication, and conjugation of complex numbers geometrically on the complex plane; use properties of this representation for computation. For example, ( – √i) = 8 because ( – √i) has modulus 2 and argument 20°.
2. 0.9
(+) Calculate the distance between numbers in the complex plane as the modulus of the difference, and the midpoint of a segment as the average of the numbers at its endpoints.
2.6 0.8
Explain why the sum or product of two rational numbers is rational; that the sum of a rational number and an irrational number is irrational; and that the product of a nonzero rational number and an irrational number is irrational.
2.6 0.89
(+) Work with 2 × 2 matrices as transformations of the plane, and interpret the absolute value of the determinant in terms of area.
2.6 0.9
Note. Values assigned to the scale were 4 = most, = more, 2 = less, and = least. aStatements that are . standard deviations above or below the mean of the conceptual category average are displayed. This metric was selected as a way to systematically view trends in the dispersion of standard ratings. Overall, differences in ratings were minimal; displaying standards here does not indicate that comparing their ratings to the overall mean is statistically significant. bMeans and standard deviations at the conceptual category level are weighted to account for the different number of respondents for each standard statement.
Summary of the Importance Ratings for Number and Quantity
The standard statements within the Number and Quantity conceptual category had an average rating of 2.9, just below the “more important” level. Mathematics and science respondents comprised the large majority of respondents, with the remainder of respondents distributed across all content areas, except ELA. The importance ratings for Number and Quantity show that respondents find as most important quantitative reasoning standard using units as a way to understand problems that guides the solution of problems, including choosing and interpreting both units in formulas and scales in graphs. Respondents do not place as much importance on the three advanced standards in the complex numbers domain. They also do not find as important students’ ability to explain sums and products of rational and irrational numbers, nor do they find as important the advanced standards relating to operations and matrices.
A review of the ratings of individual standard statements reveals that one standard, the use and interpretation of units as a way to understand problems, received a higher average importance rating. Five statements (four of which were
advanced standards) received lower average importance ratings. Table 33 shows those standards and their means and standard deviations compared to the average of statements in the conceptual category as a whole.

Chapter Four • 55
Math!36.0%!
Science!27.1%!
Social Science!
7.3%!
Business Management!
10.5%!
Computer Technology!
10.9%!
Healthcare!8.2%!
Chapter 4 | Findings for Ratings of Common Core Mathematics Standards
Algebra Standards
Respondents to Importance Ratings for the Algebra Standards Conceptual Category
Figure 38 shows how the instructors who completed importance ratings for the Algebra conceptual category are distributed across the seven content areas. Of the 792 respondents (42% of the sample), mathematics respondents (n = 285) and science respondents (n = 215) formed the majority of respondents. The other content areas had a similar number of respondents to each other, with the exception of ELA, which had no respondents.
Average Importance Ratings for the Algebra Conceptual Category
The standard statements within the Algebra conceptual category had an average rating of 3.0 (SD = .87), at the “more important” level. Figure 39 shows the importance ratings across instructors from the different content areas. The conceptual category has four domains that comprise between 4 and 14 standards statements. Table 34 shows the average rating for these domains.
Figure 38. Respondents Rating Importance for Algebra Conceptual Category (n = 792), Percent by Content Area
1.00
2.00
3.00
4.00
English language arts
(n = 0)
Mathematics (n = 285)
Science (n = 215)
Social science (n = 58)
Business management
(n = 83)
Computer technology
(n = 86)
Healthcare (n = 65)
Overall meana 3.0
aThe 34 standard statements were weighted to account for the varying number of respondents for each standard.
Figure 39. Mean Importance Ratings for Algebra Respondents (n = 792), by Content Area Figure 39. Mean Importance Ratings for Algebra Respondents (n = 792), by Content Area
English language arts
(n = 0)
Mathematics (n = 285)
Science (n = 215)
Social science (n = 58)
Business management
(n = 83)
Computer technology
(n = 86)
Healthcare (n = 65)
aThe 4 standard statements were weighted to account for the varying number of respondents for each standard.

Chapter Four • 56
Chapter 4 | Findings for Ratings of Common Core Mathematics Standards
Below is a summary of the domain ratings and a description of each: � Three domains tended to have ratings at or very near the “more important” level: Creating Equations, with four standards, had the highest average rating. Creating Equations standards, not surprisingly, focus on the creation of equations that describe numbers or relationships. Seeing Structure in Expressions (nine standards) and Reasoning with Equations and Inequalities (14 standards) have similar average ratings. Seeing Structure in Expressions includes standards that expect students to interpret the structure of expressions and write expressions in equivalent forms in order to solve problems. Reasoning with Equations and Inequalities involves solving equations. This includes solving equations as a process of reasoning and explaining the reasoning, solving equations and inequalities in one variable, solving systems of equations, and solving equations and inequalities graphically.
� Arithmetic with Polynomials and Rational Expressions, comprising seven statements, had the lowest average rating but was still above the midpoint (2.5) of the scale. Standards statements expect students to perform arithmetic operations on polynomials, understand the relationship between zeros and factors of polynomials, use polynomial identities to solve problems, and rewrite rational expressions.
Importance Ratings by Standard Statement for the Algebra Standards Conceptual
Category
Next, we collapse the four importance ratings categories into a dichotomous rating for each standard: (1) more or most important, or (2) less or least important. Every standard is presented in Table 33 in the order the standards appear in the Common Core standards documents. Nearly 90% of the Algebra statements (30 out of 34) were rated as being more or most important by 50% or more of respondents.
Table 34. Importance Ratings for Domains in Algebra Conceptual Category, Presented as Weighted Means and Standard Deviations
Domain Meana Standard deviation
Number of standards
Seeing Structure in Expressions .0 0.8 9
Arithmetic with Polynomials and Rational Expressions 2. 0.92
Creating Equations . 0.82 4
Reasoning with Equations and Inequalities .0 0.88 4
Overall .0 0.8 4aRespondents rated importance on an ordinal scale. Means are presented only to summarize trends; caution should be exercised when interpreting the precise value of any mean in relation to the categorical system underlying it. Values assigned to the scale were 4 = most, = more, 2 = less, and = least.

Chapter Four • 57
Table 35. Percent of Respondents with Importance Ratings of More or Most versus Less or Least, for Algebra Standards
Standard More/most percent
Less/least percent
Seeing Structure in Expressions: Interpret the structure of expressions
1. Interpret expressions that represent a quantity in terms of its context.H 8
a. Interpret parts of an expression, such as terms, factors, and coefficients. 9 2
b. Interpret complicated expressions by viewing one or more of their parts as a single entity. For example, interpret P(+r)n as the product of P and a factor not depending on P.
0 0
2. Use the structure of an expression to identify ways to rewrite it. For example, see x4 – y4 as (x2)2 – (y2)2, thus recognizing it as a difference of squares that can be factored as (x2 – y2)(x2 + y2).
68 2
Seeing Structure in Expressions: Write expressions in equivalent forms to solve problems
. Choose and produce an equivalent form of an expression to reveal and explain properties of the quantity represented by the expression.
4 26
a. Factor a quadratic expression to reveal the zeros of the function it defines. 2
b. Complete the square in a quadratic expression to reveal the maximum or minimum value of the function it defines.
4
c. Use the properties of exponents to transform expressions for exponential functions. For example the expression .t can be rewritten as (./2)2t ≈ .022t to reveal the approximate equivalent monthly interest rate if the annual rate is %.
64 6
4. Derive the formula for the sum of a finite geometric series (when the common ratio is not ), and use the formula to solve problems. For example, calculate mortgage payments.
60 40
Arithmetic with Polynomials and Rational Expressions: Perform arithmetic operations on polynomials
. Understand that polynomials form a system analogous to the integers, namely, they are closed under the operations of addition, subtraction, and multiplication; add, subtract, and multiply polynomials.
64 6
Arithmetic with Polynomials and Rational Expressions: Understand the relationship between zeros and factors of polynomials
2. Know and apply the Remainder Theorem: For a polynomial p(x) and a number a, the remainder on division by x – a is p(a), so p(a) = 0 if and only if (x – a) is a factor of p(x).
6 44
. Identify zeros of polynomials when suitable factorizations are available, and use the zeros to construct a rough graph of the function defined by the polynomial.
68 2
Arithmetic with Polynomials and Rational Expressions: Use polynomial identities to solve problems
4. Prove polynomial identities and use them to describe numerical relationships. For example, the polynomial identity (x2 + y2) 2 = (x2 – y2) 2 + (2xy) 2 can be used to generate Pythagorean triples.
42 8
. (+) Know and apply the Binomial Theorem for the expansion of (x + y)n in powers of x and y for a positive integer n, where x and y are any numbers, with coefficients determined for example by Pascal’s Triangle. (The Binomial Theorem can be proved by mathematical induction or by a combinatorial argument.)
0 0
Arithmetic with Polynomials and Rational Expressions: Rewrite rational expressions
6. Rewrite simple rational expressions in different forms; write a(x)/b(x) in the form q(x) + r(x)/b(x), where a(x), b(x), q(x), and r(x) are polynomials with the degree of r(x) less than the degree of b(x), using inspection, long division, or, for the more complicated examples, a computer algebra system.
6 44
. (+) Understand that rational expressions form a system analogous to the rational numbers, closed under addition, subtraction, multiplication, and division by a nonzero rational expression; add, subtract, multiply, and divide rational expressions.
8 42
Creating Equations: Create equations that describe numbers or relationships
. Create equations and inequalities in one variable and use them to solve problems. Include equations arising from linear and quadratic functions, and simple rational and exponential functions.
8 22
Chapter 4 | Findings for Ratings of Common Core Mathematics Standards
Continued on next page

Chapter Four • 58
Table 35. continued
Standard More/most percent
Less/least percent
2. Create equations in two or more variables to represent relationships between quantities; graph equations on coordinate axes with labels and scales.
8 22
. Represent constraints by equations or inequalities, and by systems of equations and/or inequalities, and interpret solutions as viable or nonviable options in a modeling context. For example, represent inequalities describing nutritional and cost constraints on combinations of different foods.
66 4
4. Rearrange formulas to highlight a quantity of interest, using the same reasoning as in solving equations. For example, rearrange Ohm’s law V =IR to highlight resistance R.
8 22
Reasoning with Equations and Inequalities: Understand solving equations as a process of reasoning and explain the reasoning
. Explain each step in solving a simple equation as following from the equality of numbers asserted at the previous step, starting from the assumption that the original equation has a solution. Construct a viable argument to justify a solution method.
6 24
2. Solve simple rational and radical equations in one variable, and give examples showing how extraneous solutions may arise.
2
Reasoning with Equations and Inequalities: Solve equations and inequalities in one variable
. Solve linear equations and inequalities in one variable, including equations with coefficients represented by letters. 80 20
4. Solve quadratic equations in one variable. 9 2
a. Use the method of completing the square to transform any quadratic equation in x into an equation of the form (x – p)2 = q that has the same solutions. Derive the quadratic formula from this form.
4
b. Solve quadratic equations by inspection (e.g., for x2 = 49), taking square roots, completing the square, the quadratic formula and factoring, as appropriate to the initial form of the equation. Recognize when the quadratic formula gives complex solutions and write them as a ± bi for real numbers a and b.
2
Reasoning with Equations and Inequalities: Solve systems of equations
. Prove that, given a system of two equations in two variables, replacing one equation by the sum of that equation and a multiple of the other produces a system with the same solutions.
6 9
6. Solve systems of linear equations exactly and approximately (e.g., with graphs), focusing on pairs of linear equations in two variables.
66 4
. Solve a simple system consisting of a linear equation and a quadratic equation in two variables algebraically and graphically. For example, find the points of intersection between the line y = -x and the circle x2 +y2 = .
4
8. (+) Represent a system of linear equations as a single matrix equation in a vector variable. 48 2
9. (+) Find the inverse of a matrix if it exists and use it to solve systems of linear equations (using technology for matrices of dimension × or greater).
4 46
Reasoning with Equations and Inequalities: Represent and solve equations and inequalities graphically
0. Understand that the graph of an equation in two variables is the set of all its solutions plotted in the coordinate plane, often forming a curve (which could be a line).
2
. Explain why the x-coordinates of the points where the graphs of the equations y = f(x) and y = g(x) intersect are the solutions of the equation f(x) = g(x); find the solutions approximately, e.g., using technology to graph the functions, make tables of values, or find successive approximations. Include cases where f(x) and/or g(x) are linear, polynomial, rational, absolute value, exponential, and logarithmic functions.H
29
2. Graph the solutions to a linear inequality in two variables as a halfplane (excluding the boundary in the case of a strict inequality), and graph the solution set to a system of linear inequalities in two variables as the intersection of the corresponding half-planes.
8 42
Chapter 4 | Findings for Ratings of Common Core Mathematics Standards

Chapter Four • 59
Chapter 4 | Findings for Ratings of Common Core Mathematics Standards
There were four statements (two of which were advanced standards) that had lower average importance ratings. Table 36 shows those standards, along with their means and standard deviations, compared to the average of statements in the conceptual category as a whole.
Table 36. Standard Statements with Means Above and Belowa the Conceptual Category Average, for Algebra
Meanb Standard deviation
Conceptual category average .0 0.8
Standard statements above average
None
Standard statements below average
Prove polynomial identities and use them to describe numerical relationships. For example, the polynomial identity (x2 + y2) 2 = (x2 – y2) 2 + (2xy) 2 can be used to generate Pythagorean triples.
2.4 0.88
(+) Know and apply the Binomial Theorem for the expansion of (x + y)n in powers of x and y for a positive integer n, where x and y are any numbers, with coefficients determined for example by Pascal’s Triangle. (The Binomial Theorem can be proved by mathematical induction or by a combinatorial argument.)
2. 0.88
Use the method of completing the square to transform any quadratic equation in x into an equation of the form (x – p)2 = q that has the same solutions. Derive the quadratic formula from this form.
2.6 0.94
(+) Find the inverse of a matrix if it exists and use it to solve systems of linear equations (using technology for matrices of dimension × or greater).
2. 0.9
Note. Values assigned to the scale were 4 = most, = more, 2 = less, and = least. aStatements that are . standard deviations above or below the mean of the conceptual category average are displayed. This metric was selected as a way to systematically view trends in the dispersion of standard ratings. Overall, differences in ratings were minimal; displaying standards here does not indicate that comparing their ratings to the overall mean is statistically significant. bMeans and standard deviations at the conceptual category level are weighted to account for the different number of respondents for each standard statement.
Summary of the Importance Ratings for Algebra
The importance ratings for Algebra had an average rating at the “more important” level. Mathematics and science respondents composed the largest proportion of respondents with the rest of the respondents distributed across all content areas, except ELA. The rating means indicate that respondents found as most important interpreting expressions that represent a quantity in terms of their context, including interpreting parts of an expression such as terms, factors, and coefficients. They also rate as important creating equations that describe numbers or relationships, solving linear equations and inequalities in one variable, and solving quadratic equations in one variable. Respondents rate standards relating to the use of polynomial identities to solve problems between the “more important” and “less important” levels.
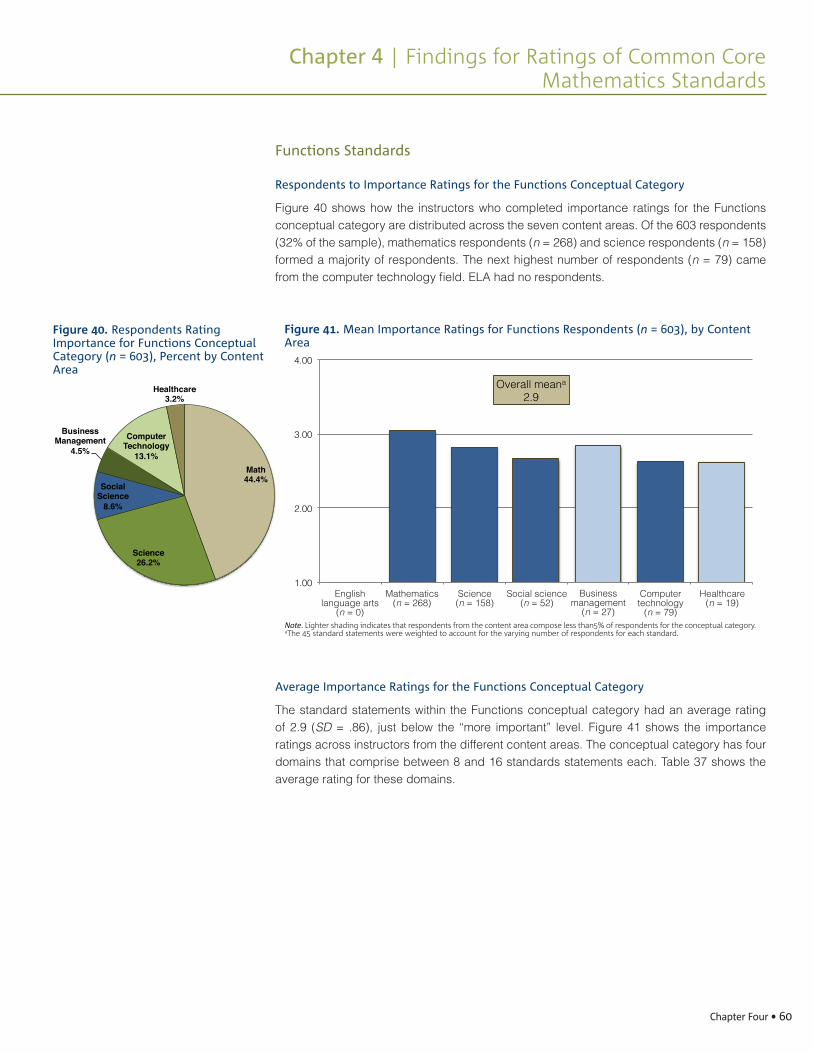
Chapter Four • 60
Math!44.4%!
Science!26.2%!
Social Science!
8.6%!
Business Management!
4.5%!Computer
Technology!13.1%!
Healthcare!3.2%!
Functions Standards
Respondents to Importance Ratings for the Functions Conceptual Category
Figure 40 shows how the instructors who completed importance ratings for the Functions conceptual category are distributed across the seven content areas. Of the 603 respondents (32% of the sample), mathematics respondents (n = 268) and science respondents (n = 158) formed a majority of respondents. The next highest number of respondents (n = 79) came from the computer technology field. ELA had no respondents.
Average Importance Ratings for the Functions Conceptual Category
The standard statements within the Functions conceptual category had an average rating of 2.9 (SD = .86), just below the “more important” level. Figure 41 shows the importance ratings across instructors from the different content areas. The conceptual category has four domains that comprise between 8 and 16 standards statements each. Table 37 shows the average rating for these domains.
Figure 40. Respondents Rating Importance for Functions Conceptual Category (n = 603), Percent by Content Area
Chapter 4 | Findings for Ratings of Common Core Mathematics Standards
1.00
2.00
3.00
4.00
English language arts
(n = 0)
Mathematics (n = 268)
Science (n = 158)
Social science (n = 52)
Business management
(n = 27)
Computer technology
(n = 79)
Healthcare (n = 19)
Overall meana 2.9
Note. Lighter shading indicates that respondents from the content area compose less than 5% of respondents for the conceptual category. aThe 45 standard statements were weighted to account for the varying number of respondents for each standard.
Figure 41. Mean Importance Ratings for Functions Respondents (n = 603), by Content Area Figure 41. Mean Importance Ratings for Functions Respondents (n = 603), by Content
Area
English language arts
(n = 0)
Mathematics (n = 268)
Science (n = 158)
Social science (n = 52)
Business management
(n = 27)
Computer technology
(n = 79)
Healthcare (n = 19)
Note. Lighter shading indicates that respondents from the content area compose less than % of respondents for the conceptual category.aThe 4 standard statements were weighted to account for the varying number of respondents for each standard.

Chapter Four • 61
Chapter 4 | Findings for Ratings of Common Core Mathematics Standards
Below is a summary of the domain ratings and a description of each: � Three domains tended to have ratings very near the “more important” level. The Interpreting Functions domain includes standard statements relating to understanding the concept of a function and using function notation, interpreting functions that arise in applications in terms of the context, and analyzing functions using different representations. Building Functions (12 standard statements) involves standard statements surrounding building a function that models a relationship between two quantities and building new functions from existing functions. Trigonometric Functions (nine standard statements) involve extending the domain of trigonometric functions using the unit circle, modeling periodic phenomena with trigonometric functions, and proving and applying trigonometric identities.
� One domain, Linear and Exponential Models (comprising eight statements), had a slightly lower rating. The average was still above the midpoint of the scale. These standard statements expect students to construct and compare linear, quadratic, and exponential models and interpret expressions for functions in terms of the situation they model.
Importance Ratings by Standard Statement for the Functions Conceptual Category
Next, we collapse the four importance ratings categories into a dichotomous rating for each standard: (1) more or most important, or (2) less or least important. Every standard is presented in Table 38 in the order the standards appear in the Common Core standards documents. Nearly 90% of the Functions standard statements (40 of 45) were rated as being more or most important by 50% or more of respondents.
Table 37. Importance Ratings for Domains in Functions Conceptual Category, Presented as Weighted Means and Standard Deviations
Domain Meana Standard deviation
Number of standards
Interpreting Functions .0 0.86 6
Building Functions 2.9 0.84 2
Linear, Quadratic, and Exponential Models 2. 0.8 8
Trigonometric Functions 2.9 0.9 9
Overall 2.9 0.86 4aRespondents rated importance on an ordinal scale. Means are presented only to summarize trends; caution should be exercised when interpreting the precise value of any mean in relation to the categorical system underlying it. Values assigned to the scale were 4 = most, = more, 2 = less, and = least.

Chapter Four • 62
Chapter 4 | Findings for Ratings of Common Core Mathematics Standards
Table 38. Percent of Respondents with Importance Ratings of More or Most versus Less or Least, for Functions Standards
Standard More/most percent
Less/least percent
Interpreting Functions: Understand the concept of a function and use function notation
. Understand that a function from one set (called the domain) to another set (called the range) assigns to each element of the domain exactly one element of the range. If f is a function and x is an element of its domain, then f(x) denotes the output of f corresponding to the input x. The graph of f is the graph of the equation y = f(x).
6 24
2. Use function notation, evaluate functions for inputs in their domains, and interpret statements that use function notation in terms of a context.
9 2
. Recognize that sequences are functions, sometimes defined recursively, whose domain is a subset of the integers. For example, the Fibonacci sequence is defined recursively by f(0) = f() = , f(n+) = f(n) + f(n-) for n ≥ .
62 8
Interpreting Functions: Interpret functions that arise in applications in terms of the context
4. For a function that models a relationship between two quantities, interpret key features of graphs and tables in terms of the quantities, and sketch graphs showing key features given a verbal description of the relationship. Key features include: intercepts; intervals where the function is increasing, decreasing, positive, or negative; relative maximums and minimums; symmetries; end behavior; and periodicity.H
8
. Relate the domain of a function to its graph and, where applicable, to the quantitative relationship it describes. For example, if the function h(n) gives the number of person-hours it takes to assemble n engines in a factory, then the positive integers would be an appropriate domain for the function.H
0 0
6. Calculate and interpret the average rate of change of a function (presented symbolically or as a table) over a specified interval. Estimate the rate of change from a graph.H
2
Interpreting Functions: Analyze functions using different representations
. Graph functions expressed symbolically and show key features of the graph, by hand in simple cases and using technology for more complicated cases.H
82 8
a. Graph linear and quadratic functions and show intercepts, maxima, and minima. 8 22
b. Graph square root, cube root, and piecewise-defined functions, including step functions and absolute value functions.
69
c. Graph polynomial functions, identifying zeros when suitable factorizations are available, and showing end behavior.
4 26
d. (+) Graph rational functions, identifying zeros and asymptotes when suitable factorizations are available, and showing end behavior.
0 0
e. Graph exponential and logarithmic functions, showing intercepts and end behavior, and trigonometric functions, showing period, midline, and amplitude.
2
8. Write a function defined by an expression in different but equivalent forms to reveal and explain different properties of the function.
6
a. Use the process of factoring and completing the square in a quadratic function to show zeros, extreme values, and symmetry of the graph, and interpret these in terms of a context.
6
b. Use the properties of exponents to interpret expressions for exponential functions. For example, identify percent rate of change in functions such as y = (.02)t, y = (0.9)t, y = (.0)2t, y = (.2)t/0, and classify them as representing exponential growth or decay.
64 6
9. Compare properties of two functions each represented in a different way (algebraically, graphically, numerically in tables, or by verbal descriptions). For example, given a graph of one quadratic function and an algebraic expression for another, say which has the larger maximum.
6 44
Continued on next page

Chapter Four • 63
Table 38. continued
Standard More/most percent
Less/least percent
Building Functions: Build a function that models a relationship between two quantities
. Write a function that describes a relationship between two quantities.H 82 8
a. Determine an explicit expression, a recursive process, or steps for calculation from a context. 6 24
b. Combine standard function types using arithmetic operations. For example, build a function that models the temperature of a cooling body by adding a constant function to a decaying exponential, and relate these functions to the model.
0 0
c. (+) Compose functions. For example, if T(y) is the temperature in the atmosphere as a function of height, and h(t) is the height of a weather balloon as a function of time, then T(h(t)) is the temperature at the location of the weather balloon as a function of time.
2 28
2. Write arithmetic and geometric sequences both recursively and with an explicit formula, use them to model situations, and translate between the two forms.H
9 4
Building Functions: Build new functions from existing functions
. Identify the effect on the graph of replacing f(x) by f(x) + k, k f(x), f(kx), and f(x + k) for specific values of k (both positive and negative); find the value of k given the graphs. Experiment with cases and illustrate an explanation of the effects on the graph using technology. Include recognizing even and odd functions from their graphs and algebraic expressions for them.
68 2
4. Find inverse functions. 66 4
a. Solve an equation of the form f(x) = c for a simple function f that has an inverse and write an expression for the inverse. For example, f(x) =2 x for x > 0 or f(x) = (x+)/(x–) for x ≠ .
68 2
b. (+) Verify by composition that one function is the inverse of another. 4
c. (+) Read values of an inverse function from a graph or a table, given that the function has an inverse. 2 48
d. (+) Produce an invertible function from a non-invertible function by restricting the domain. 4
. (+) Understand the inverse relationship between exponents and logarithms and use this relationship to solve problems involving logarithms and exponents.
4 26
Linear, Quadratic, and Exponential Models: Construct and compare linear and exponential models and solve problems
. Distinguish between situations that can be modeled with linear functions and with exponential functions. 62 8
a. Prove that linear functions grow by equal differences over equal intervals, and that exponential functions grow by equal factors over equal intervals.
9 4
b. Recognize situations in which one quantity changes at a constant rate per unit interval relative to another.
62 8
c. Recognize situations in which a quantity grows or decays by a constant percent rate per unit interval relative to another.
60 40
2. Construct linear and exponential functions, including arithmetic and geometric sequences, given a graph, a description of a relationship, or two input-output pairs (include reading these from a table).
6 9
. Observe using graphs and tables that a quantity increasing exponentially eventually exceeds a quantity increasing linearly, quadratically, or (more generally) as a polynomial function.
6 44
4. For exponential models, express as a logarithm the solution to abct = d where a, c, and d are numbers and the base b is 2, 0, or e; evaluate the logarithm using technology.
64 6
Chapter 4 | Findings for Ratings of Common Core Mathematics Standards
Continued on next page

Chapter Four • 64
Chapter 4 | Findings for Ratings of Common Core Mathematics Standards
Table 38. continued
Standard More/most percent
Less/least percent
Linear, Quadratic, and Exponential Models: Interpret expressions for functions in terms of the situation they model
. Interpret the parameters in a linear or exponential function in terms of a context. 6
Trigonometric Functions: Extend the domain of trigonometric functions using the unit circle
. Understand radian measure of an angle as the length of the arc on the unit circle subtended by the angle. 2
2. Explain how the unit circle in the coordinate plane enables the extension of trigonometric functions to all real numbers, interpreted as radian measures of angles traversed counterclockwise around the unit circle.
29
. (+) Use special triangles to determine geometrically the values of sine, cosine, tangent for π/, π/4 and π/6, and use the unit circle to express the values of sine, cosine, and tangent for x, π+x, and 2π–x in terms of their values for x, where x is any real number.
2
4. (+) Use the unit circle to explain symmetry (odd and even) and periodicity of trigonometric functions. 6 44
Trigonometric Functions: Model periodic phenomena with trigonometric functions
. Choose trigonometric functions to model periodic phenomena with specified amplitude, frequency, and midline.H
6
6. (+) Understand that restricting a trigonometric function to a domain on which it is always increasing or always decreasing allows its inverse to be constructed.
6
. (+) Use inverse functions to solve trigonometric equations that arise in modeling contexts; evaluate the solutions using technology, and interpret them in terms of the context.H
69
Trigonometric Functions: Prove and apply trigonometric identities
8. Prove the Pythagorean identity sin2(q) + cos2(q) = and use it to calculate trigonometric ratios. 60 40
9. (+) Prove the addition and subtraction formulas for sine, cosine, and tangent and use them to solve problems. 48 2

Chapter Four • 65
Chapter 4 | Findings for Ratings of Common Core Mathematics Standards
Table 39. Standard Statements with Means Above and Belowa the Conceptual Category Average, for Functions
Meanb Standard deviation
Conceptual category average 2.9 0.86
Standard statements above average
For a function that models a relationship between two quantities, interpret key features of graphs and tables in terms of the quantities, and sketch graphs showing key features given a verbal description of the relationship. Key features include: intercepts; intervals where the function is increasing, decreasing, positive, or negative; relative maximums and minimums; symmetries; end behavior; and periodicity.H
.2 0.8
Use function notation, evaluate functions for inputs in their domains, and interpret statements that use function notation in terms of a context.
.2 0.8
Graph functions expressed symbolically and show key features of the graph, by hand in simple cases and using technology for more complicated cases.H
.2 0.9
Write a function that describes a relationship between two quantities.H .2 0.9
Standard statements below average
(+) Produce an invertible function from a non-invertible function by restricting the domain. 2. 0.9
Observe using graphs and tables that a quantity increasing exponentially eventually exceeds a quantity increasing linearly, quadratically, or (more generally) as a polynomial function.
2.6 0.8
(+) Prove the addition and subtraction formulas for sine, cosine, and tangent and use them to solve problems. 2.6 0.8
(+) Read values of an inverse function from a graph or a table, given that the function has an inverse. 2.6 0.90
Note. Values assigned to the scale were 4 = most, = more, 2 = less, and = least. aStatements that are . standard deviations above or below the mean of the conceptual category average are displayed. This metric was selected as a way to systematically view trends in the dispersion of standard ratings. Overall, differences in ratings were minimal; displaying standards here does not indicate that comparing their ratings to the overall mean is statistically significant. bMeans and standard deviations at the conceptual category level are weighted to account for the different number of respondents for each standard statement.
Summary of the Importance Ratings for Functions
The importance ratings for Functions had an average rating at the “more important” level. Again, mathematics and science respondents composed the large majority of respondents and no ELA respondents contributed to the importance ratings. The importance ratings for Functions show that respondents tend to emphasize general concepts such as modeling the relationship between two quantities and interpreting key features of graphs and tables, graphing functions expressed symbolically, writing a function, and using function notation. They assign less importance to advanced standards related to inverse functions and proving addition and subtraction formulas for sine, cosine, and tangent. They also did not emphasize as much students’ abilities to observe, in graphs and tables, quantities that increase exponentially versus quantities that increase linearly, quadratically, or as a polynomial function.
Four statements had higher average importance ratings. Three of these involve modeling. Four statements (three of which were advanced standards) had lower average importance ratings. Table 39 shows these standards, along with their means and standard deviations, compared to the average of statements in the conceptual category as a whole.

Chapter Four • 66
Math!45.3%!
Science!39.0%!
Social Science!
3.9%!
Business Management!
2.4%!
Computer Technology!
7.6%!
Healthcare!1.8%!
Geometry Standards
Respondents to Importance Ratings for the Geometry Conceptual Category
Figure 42 shows how the instructors who completed importance ratings for the Geometry conceptual category are distributed across the seven content areas. Of the 331 respondents (17% of the sample), mathematics respondents (n = 150) and science respondents (n = 129) formed the majority of respondents. There were very few social science (n = 13), business management (n = 8), or healthcare (n = 6) respondents; ELA again had no respondents.
Average Importance Ratings for the Geometry Conceptual Category
The standard statements within the Geometry conceptual category had an average rating of 2.6 (SD = .94), in between the “less important” and “more important” level. Figure 43 shows the importance ratings across instructors from the different content areas. The conceptual category has six domains that comprise between 3 and 13 standards statements. Table 40 shows the average rating for these domains.
Chapter 4 | Findings for Ratings of Common Core Mathematics Standards
Figure 42. Respondents Rating Importance for Geometry Conceptual Category (n = 331), Percent by Content Area
1.00
2.00
3.00
4.00
English language arts
(n = 0)
Mathematics (n = 150)
Science (n = 129)
Social science (n = 13)
Business management
(n = 8)
Computer technology
(n = 25)
Healthcare (n = 6)
Overall meana 2.6
Note. Lighter shading indicates that respondents from the content area compose less than 5% of respondents for the conceptual category. aThe 45 standard statements were weighted to account for the varying number of respondents for each standard.
Figure 43. Mean Importance Ratings for Geometry Respondents (n = 331), by Content Area Figure 43. Mean Importance Ratings for Geometry Respondents (n = 331), by Content
Area
English language arts
(n = 0)
Mathematics (n = 150)
Science (n = 129)
Social science (n = 13)
Business management
(n = 8)
Computer technology
(n = 25)
Healthcare (n = 6)
Note. Lighter shading indicates that respondents from the content area compose less than % of respondents for the conceptual category. aThe 4 standard statements were weighted to account for the varying number of respondents for each standard.

Chapter Four • 67
Chapter 4 | Findings for Ratings of Common Core Mathematics Standards
Respondents tended to rate statements in three domains slightly higher and statements in three domains slightly lower.
� Higher: Similarity, Right Triangles, and Trigonometry (13 statements), Geometric Measurement and Dimension (four statements), and Modeling with Geometry (three statements). Statements for Similarity, Right Triangles, and Trigonometry pertain to understanding similarity transformations, proving theorems involving similarity, defining trigonometric ratios, and applying trigonometry to triangles. Geometric Measurement and Dimension standards involve explaining volume formulas and using them to solve problems as well as visualizing relationships between two-dimensional and three-dimensional objects and applying geometric concepts in modeling.
� Lower: Congruence (13 statements), Circles (five statements), and Expressing Geometric Properties with Equations (seven statements). The Congruence standard statements refer to experimenting with transformations in the plane, understanding congruence in terms of rigid motions, proving geometric theorems, and making geometric constructions. The Circles domain focuses on understanding theorems about circles and finding arc lengths and areas of sectors of circles. The Expressing Geometric Properties with Equations domain includes standards that require students to translate between the geometric description and the equation for a conic section and to use coordinates to prove simple geometric theorems algebraically.
Importance Ratings by Standard Statement for the Geometry Conceptual Category
Next, we collapse the four importance ratings categories into a dichotomous rating for each standard: (1) more or most important, or (2) less or least important. Every standard is presented in Table 41 in the order the standards appear in the Common Core standards documents. Of the 45 Geometry standard statements, 18 of the statements were rated as more or most important by a majority (>50%) of respondents; another 19 were rated as more or most important by 40–40% of respondents. No statements were rated as more or most important by a large majority of respondents.
Table 40. Importance Ratings for Domains in Geometry Conceptual Category, Presented as Weighted Means and Standard Deviations
Domain Meana Standard deviation
Number of standards
Congruence 2. 0.98
Similarity, Right Triangles, and Trigonometry 2. 0.94
Circles 2.4 0.9
Expressing Geometric Properties with Equations 2. 0.9
Geometric Measurement and Dimension 2.8 0.9 4
Modeling with Geometry 2. 0.88
Overall 2.6 0.94 4aRespondents rated importance on an ordinal scale. Means are presented only to summarize trends; caution should be exercised when interpreting the precise value of any mean in relation to the categorical system underlying it. Values assigned to the scale were 4 = most, = more, 2 = less, and = least.

Chapter Four • 68
Table 41. Percent of Respondents with Importance Ratings of More or Most versus Less or Least, for Geometry Standards
Standard More/most percent
Less/least percent
Congruence: Experiment with transformations in the plane
. Know precise definitions of angle, circle, perpendicular line, parallel line, and line segment, based on the undefined notions of point, line, distance along a line, and distance around a circular arc.
64 6
2. Represent transformations in the plane using, e.g., transparencies and geometry software; describe transformations as functions that take points in the plane as inputs and give other points as outputs. Compare transformations that preserve distance and angle to those that do not (e.g., translation versus horizontal stretch).
4
. Given a rectangle, parallelogram, trapezoid, or regular polygon, describe the rotations and reflections that carry it onto itself.
42 8
4. Develop definitions of rotations, reflections, and translations in terms of angles, circles, perpendicular lines, parallel lines, and line segments.
48 2
. Given a geometric figure and a rotation, reflection, or translation, draw the transformed figure using, e.g., graph paper, tracing paper, or geometry software. Specify a sequence of transformations that will carry a given figure onto another.
48 2
Congruence: Understand congruence in terms of rigid motions
6. Use geometric descriptions of rigid motions to transform figures and to predict the effect of a given rigid motion on a given figure; given two figures, use the definition of congruence in terms of rigid motions to decide if they are congruent.
4
. Use the definition of congruence in terms of rigid motions to show that two triangles are congruent if and only if corresponding pairs of sides and corresponding pairs of angles are congruent.
4
8. Explain how the criteria for triangle congruence (ASA, SAS, and SSS) follow from the definition of congruence in terms of rigid motions.
4
Congruence: Prove geometric theorems
9. Prove theorems about lines and angles. Theorems include: vertical angles are congruent; when a transversal crosses parallel lines, alternate interior angles are congruent and corresponding angles are congruent; and points on a perpendicular bisector of a line segment are exactly those equidistant from the segment’s endpoints.
48 2
0. Prove theorems about triangles. Theorems include: measures of interior angles of a triangle sum to 80°; base angles of isosceles triangles are congruent; the segment joining midpoints of two sides of a triangle is parallel to the third side and half the length; and the medians of a triangle meet at a point.
46 4
. Prove theorems about parallelograms. Theorems include: opposite sides are congruent, opposite angles are congruent, the diagonals of a parallelogram bisect each other, and conversely, rectangles are parallelograms with congruent diagonals.
6 64
Congruence: Make geometric constructions
2. Make formal geometric constructions with a variety of tools and methods (compass and straightedge, string, reflective devices, paper folding, dynamic geometric software, etc.). Examples include: copying a segment; copying an angle; bisecting a segment; bisecting an angle; constructing perpendicular lines, including the perpendicular bisector of a line segment; and constructing a line parallel to a given line through a point not on the line.
4
. Construct an equilateral triangle, a square, and a regular hexagon inscribed in a circle. 4 66
Chapter 4 | Findings for Ratings of Common Core Mathematics Standards
Continued on next page

Chapter Four • 69
Table 41. continued
Standard More/most percent
Less/least percent
Similarity, Right Triangles, and Trigonometry: Understand similarity in terms of similarity transformations
. Verify experimentally the properties of dilations given by a center and a scale factor: 40 60
a. A dilation takes a line not passing through the center of the dilation to a parallel line, and leaves a line passing through the center unchanged.
9 6
b. The dilation of a line segment is longer or shorter in the ratio given by the scale factor. 4 9
2. Given two figures, use the definition of similarity in terms of similarity transformations to decide if they are similar; explain using similarity transformations the meaning of similarity for triangles as the equality of all corresponding pairs of angles and the proportionality of all corresponding pairs of sides.
0 0
. Use the properties of similarity transformations to establish the AA criterion for two triangles to be similar. 40 60
Similarity, Right Triangles, and Trigonometry: Prove theorems involving similarity
4. Prove theorems about triangles. Theorems include: a line parallel to one side of a triangle divides the other two proportionally, and conversely; the Pythagorean Theorem proved using triangle similarity.
44 6
. Use congruence and similarity criteria for triangles to solve problems and to prove relationships in geometric figures. 4
Define trigonometric ratios and solve problems involving right triangles
6. Understand that by similarity, side ratios in right triangles are properties of the angles in the triangle, leading to definitions of trigonometric ratios for acute angles.
69
. Explain and use the relationship between the sine and cosine of complementary angles. 29
8. Use trigonometric ratios and the Pythagorean Theorem to solve right triangles in applied problems. 2
Similarity, Right Triangles, and Trigonometry: Apply trigonometry to general triangles
9. (+) Derive the formula A = /2 ab sin(C) for the area of a triangle by drawing an auxiliary line from a vertex perpendicular to the opposite side.
6
0. (+) Prove the Laws of Sines and Cosines and use them to solve problems. 48 2
. (+) Understand and apply the Law of Sines and the Law of Cosines to find unknown measurements in right and non-right triangles (e.g., surveying problems, resultant forces).
4
Circles: Understand and apply theorems about circles
. Prove that all circles are similar. 0 0
2. Identify and describe relationships among inscribed angles, radii, and chords. Include the relationship between central, inscribed, and circumscribed angles; inscribed angles on a diameter are right angles; and the radius of a circle is perpendicular to the tangent where the radius intersects the circle.
4
. Construct the inscribed and circumscribed circles of a triangle, and prove properties of angles for a quadrilateral inscribed in a circle.
6
4. (+) Construct a tangent line from a point outside a given circle to the circle. 48 2
Circles: Find arc lengths and areas of sectors of circles
. Derive using similarity the fact that the length of the arc intercepted by an angle is proportional to the radius, and define the radian measure of the angle as the constant of proportionality; derive the formula for the area of a sector.
2 48
Chapter 4 | Findings for Ratings of Common Core Mathematics Standards
Continued on next page

Chapter Four • 70
Chapter 4 | Findings for Ratings of Common Core Mathematics Standards
Table 41. continued
Standard More/most percent
Less/least percent
Expressing Geometric Properties with Equations: Translate between the geometric description and the equation for a conic section
. Derive the equation of a circle of given center and radius using the Pythagorean Theorem; complete the square to find the center and radius of a circle given by an equation.
49
2. Derive the equation of a parabola given a focus and directrix. 42 8
. (+) Derive the equations of ellipses and hyperbolas given foci and directrices. 6
Expressing Geometric Properties with Equations: Use coordinates to prove simple geometric theorems algebraically
4. Use coordinates to prove simple geometric theorems algebraically. For example, prove or disprove that a figure defined by four given points in the coordinate plane is a rectangle; prove or disprove that the point (, √) lies on the circle centered at the origin and containing the point (0, 2).
6 64
. Prove the slope criteria for parallel and perpendicular lines and use them to solve geometric problems (e.g., find the equation of a line parallel or perpendicular to a given line that passes through a given point).
64 6
6. Find the point on a directed line segment between two given points that partitions the segment in a given ratio.
4 9
. Use coordinates to compute perimeters of polygons and areas of triangles and rectangles, e.g., using the distance formula.H
4
Geometric Measurement and Dimension: Explain volume formulas and use them to solve problems
. Give an informal argument for the formulas for the circumference of a circle, area of a circle, volume of a cylinder, pyramid, and cone. Use dissection arguments, Cavalieri’s principle, and informal limit arguments.
4
2. (+) Give an informal argument using Cavalieri’s principle for the formulas for the volume of a sphere and other solid figures.
4
. Use volume formulas for cylinders, pyramids, cones, and spheres to solve problems.H 68 2
Geometric Measurement and Dimension: Visualize relationships between two-dimensional and three-dimensional objects
4. Identify the shapes of two-dimensional cross-sections of three-dimensional objects, and identify three-dimensional objects generated by rotations of two-dimensional objects.
6
Modeling with Geometry: Apply geometric concepts in modeling situations
. Use geometric shapes, their measures, and their properties to describe objects (e.g., modeling a tree trunk or a human torso as a cylinder).H
4
2. Apply concepts of density based on area and volume in modeling situations (e.g., persons per square mile, BTUs per cubic foot).H
64 6
. Apply geometric methods to solve design problems (e.g., designing an object or structure to satisfy physical constraints or minimize cost; working with typographic grid systems based on ratios).H
62 8

Chapter Four • 71
Table 42. Standard Statements with Means Above and Belowa the Conceptual Category Average, for Geometry
Meanb Standard deviation
Conceptual category average 2.6 0.94
Standard statements above average
Understand that by similarity, side ratios in right triangles are properties of the angles in the triangle, leading to definitions of trigonometric ratios for acute angles.
2.9 0.9
Use volume formulas for cylinders, pyramids, cones, and spheres to solve problems.H
2.9 0.9
Standard statements below average
Construct an equilateral triangle, a square, and a regular hexagon inscribed in a circle.
2.2 .02
Prove that all circles are similar. 2.2 .04
(+) Derive the equations of ellipses and hyperbolas given foci and directrices.
2. 0.96
Use coordinates to prove simple geometric theorems algebraically. For example, prove or disprove that a figure defined by four given points in the coordinate plane is a rectangle; prove or disprove that the point (, √) lies on the circle centered at the origin and containing the point (0, 2).
2. 0.89
Note. Values assigned to the scale were 4 = most, = more, 2 = less, and = least. aStatements that are . standard deviations above or below the mean of the conceptual category average are displayed. This metric was selected as a way to systematically view trends in the dispersion of standard ratings. Overall, differences in ratings were minimal; displaying standards here does not indicate that comparing their ratings to the overall mean is statistically significant. bMeans and standard deviations at the conceptual category level are weighted to account for the different number of respondents for each standard statement.
Chapter 4 | Findings for Ratings of Common Core Mathematics Standards
Summary of the Importance Ratings for Geometry
In general, the importance ratings for Geometry were lower than other mathematics conceptual categories, with an average rating in between the “less important” and “more important” levels. Mathematics and science respondents composed nearly 85% of respondents; no ELA respondents contributed to the importance ratings. Within Geometry, respondents tend to place more importance on standards related to defining trigonometric ratios and solving problems with right triangles in addition to the modeling standard of using volume formulas to solve problems. There was less emphasis on students’ skills related to proving all circles are similar or constructing geometric figures inscribed in a circle. Respondents did not place as much emphasis on the advanced standard relating to deriving equations of ellipses and hyperbolas or on the standard about using coordinates to prove geometric theorems.
Two standards, involving trigonometric ratios for acute angles and volume formulas for three-dimensional figures, had higher importance ratings compared to other statements in the domain. Four statements had lower importance ratings. Table 42 shows these standards, along with their means and standard deviations compared to the average of the conceptual category.

Chapter Four • 72
ELA!1.1%!
Math!19.8%!
Science!28.7%!
Social Science!24.8%!
Business Management!
11.2%!
Computer Technology!
6.1%!
Healthcare!8.4%!
Statistics and Probability Standards
Respondents to Importance Ratings for the Statistics and Probability Standards
Conceptual Category
Figure 44 shows how the instructors who completed importance ratings for the Statistics and Probability Standards conceptual category are distributed across the seven content areas. There were 739 respondents (39% of the sample) rating at least one standard statement within Statistics and Probability as applicable and therefore conducting importance ratings. The respondent pool was predominantly comprised of science (n = 212), social science (n = 183), and mathematics respondents (n = 146). Business management (n = 83) respondents composed the next largest group of respondents. A small number of ELA instructors (n = 8) responded.
Average Importance Ratings for the Statistics and Probability Conceptual Category
The standard statements within the Statistics and Probability conceptual category had an average rating of 2.9 (SD = .89), just below the “more important” level. Figure 45 shows the importance ratings across instructors from the different content areas. The conceptual category has four domains that comprise between 6 and 12 standards statements. Table 43 shows the average rating for these domains.
Chapter 4 | Findings for Ratings of Common Core Mathematics Standards
Figure 44. Respondents Rating Importance for Statistics and Probablity Conceptual Category (n = 739), Percent by Content Area
1.00
2.00
3.00
4.00
English language arts
(n = 8)
Mathematics (n = 146)
Science (n = 212)
Social science (n = 183)
Business management
(n = 83)
Computer technology
(n = 45)
Healthcare (n = 62)
Overall meana 2.9
Note. Lighter shading indicates that respondents from the content area compose less than 5% of respondents for the conceptual category. aThe 36 standard statements were weighted to account for the varying number of respondents for each standard.
Figure 45. Mean Importance Ratings for Statistics and Probability Respondents (n = 739), by Content Area Figure 45. Mean Importance Ratings for Statistics and Probability Respondents (n = 739), by Content Area
English language
arts (n = 8)
Mathematics (n = 146)
Science (n = 212)
Social science
(n = 183)
Business management
(n = 83)
Computer technology
(n = 45)
Healthcare (n = 62)
Note. Lighter shading indicates that respondents from the content area compose less than % of respondents for the conceptual category. aThe 6 standard statements were weighted to account for the varying number of respondents for each standard.

Chapter Four • 73
Chapter 4 | Findings for Ratings of Common Core Mathematics Standards
Respondents tended to rate standard statements in three domains slightly higher and statements in three domains slightly lower.
� Three domains tended to have higher ratings: Interpreting Categorical and Quantitative Data (12 statements), Making Inferences and Justifying Conclusions (six statements), and Conditional Probability and the Rules of Probability (nine statements). The Interpreting Categorical and Quantitative Data domain standards expect students to summarize, represent, and interpret data on a single count or measurement variable and on two categorical and quantitative variables. They also involve the interpretation of linear models. The Making Inferences and Justifying Conclusions domain focuses on student understanding and evaluating random processes underlying statistical experiments, and making inferences and justifying conclusions from sample surveys, experiments, and observational studies. The Conditional Probability and the Rules of Probability standard statements refer to understanding independence and conditional probability and using them to interpret data and using the rules of probability to compute probabilities of compound events in a uniform probability model.
� The domain Using Probability to Make Decisions (the average of nine statements) tended to have lower ratings, though still very near the “more important” level. These standards (all of which are marked as advanced) involve calculating expected values and using them to solve problems, using probability to evaluate outcomes of decisions.
Importance Ratings by Standard Statement for the Statistics and Probability Standards
Conceptual Category
In Table 44, we collapse the four importance ratings categories into a dichotomous rating for each standard; (1) more or most important, or (2) less or least important. Every standard is presented in the order the standards appear in the Common Core standards documents. Of the 36 Statistics and Probability standard statements, all statements were rated as being more or most important by >50% of respondents.
Table 43. Importance Ratings for Domains in Statistics and Probability Conceptual Category, Presented as Weighted Means and Standard Deviations
Domain Meana Standard deviation
Number of standards
Interpreting Categorical and Quantitative Data 2.9 0.90 2
Making Inferences and Justifying Conclusions 2.9 0.88 6
Conditional Probability and the Rules of Probability 2.9 0.9 9
Using Probability to Make Decisions 2. 0.8 9
Overall 2.9 0.89 6aRespondents rated importance on an ordinal scale. Means are presented only to summarize trends; caution should be exercised when interpreting the precise value of any mean in relation to the categorical system underlying it. Values assigned to the scale were 4 = most, = more, 2 = less, and = least.

Chapter Four • 74
Chapter 4 | Findings for Ratings of Common Core Mathematics Standards
Table 44. Percent of Respondents with Importance Ratings of More or Most versus Less or Least, for Statistics and Probability Standards
Standard More/most percent
Less/least percent
Interpreting Categorical and Quantitive Data: Summarize, represent, and interpret data on a single count or measurement variable
. Represent data with plots on the real number line (dot plots, histograms, and box plots).H 2 28
2. Use statistics appropriate to the shape of the data distribution to compare center (median, mean) and spread (interquartile range, standard deviation) of two or more different data sets.H
6
. Interpret differences in shape, center, and spread in the context of the data sets, accounting for possible effects of extreme data points (outliers).H
6 9
4. Use the mean and standard deviation of a data set to fit it to a normal distribution and to estimate population percentages. Recognize that there are data sets for which such a procedure is not appropriate. Use calculators, spreadsheets, and tables to estimate areas under the normal curve.H
68 2
Interpreting Categorical and Quantitive Data: Summarize, represent, and interpret data on two categorical and quantitative variables
. Summarize categorical data for two categories in two-way frequency tables. Interpret relative frequencies in the context of the data (including joint, marginal, and conditional relative frequencies). Recognize possible associations and trends in the data.H
64 6
6. Represent data on two quantitative variables on a scatter plot, and describe how the variables are related.H 69
a. Fit a function to the data; use functions fitted to data to solve problems in the context of the data. Use given functions or choose a function suggested by the context. Emphasize linear, quadratic, and exponential models.
68 2
b. Informally assess the fit of a function by plotting and analyzing residuals. 60 40
c. Fit a linear function for a scatter plot that suggests a linear association. 4 26
Interpreting Categorical and Quantitive Data: Interpret linear models
. Interpret the slope (rate of change) and the intercept (constant term) of a linear model in the context of the data.H 4 26
8. Compute (using technology) and interpret the correlation coefficient of a linear fit.H 68 2
9. Distinguish between correlation and causation.H 2
Making Inferences and Justifying Conclusions: Understand and evaluate random processes underlying statistical experiments
. Understand statistics as a process for making inferences about population parameters based on a random sample from that population.H
0 0
2. Decide if a specified model is consistent with results from a given data-generating process, e.g., using simulation. For example, a model says a spinning coin falls heads up with probability 0.. Would a result of tails in a row cause you to question the model?H
9 4
Making Inferences and Justifying Conclusions: Make inferences and justify conclusions from sample surveys, experiments, and observational studies
. Recognize the purposes of and differences among sample surveys, experiments, and observational studies; explain how randomization relates to each.H
0 0
4. Use data from a sample survey to estimate a population mean or proportion; develop a margin of error through the use of simulation models for random sampling.H
0 0
. Use data from a randomized experiment to compare two treatments; use simulations to decide if differences between parameters are significant.H
68 2
6. Evaluate reports based on data.H 2
Continued on next page

Chapter Four • 75
Chapter 4 | Findings for Ratings of Common Core Mathematics Standards
Table 44. continued
Standard More/most percent
Less/least percent
Conditional Probability and the Rules of Probability: Understand independence and conditional probability and use them to interpret data
. Describe events as subsets of a sample space (the set of outcomes) using characteristics (or categories) of the outcomes, or as unions, intersections, or complements of other events (“or,” “and,” “not”).H
64 6
2. Understand that two events A and B are independent if the probability of A and B occurring together is the product of their probabilities, and use this characterization to determine if they are independent.H
64 6
. Understand the conditional probability of A given B as P(A and B)/P(B), and interpret independence of A and B as saying that the conditional probability of A given B is the same as the probability of A, and the conditional probability of B given A is the same as the probability of B.H
66 4
4. Construct and interpret two-way frequency tables of data when two categories are associated with each object being classified. Use the two-way table as a sample space to decide if events are independent and to approximate conditional probabilities. For example, collect data from a random sample of students in your school on their favorite subject among mathematics, science, and English. Estimate the probability that a randomly selected student from your school will favor science given that the student is in tenth grade. Do the same for other subjects and compare the results.H
62 8
. Recognize and explain the concepts of conditional probability and independence in everyday language and everyday situations. For example, compare the chance of having lung cancer if you are a smoker with the chance of being a smoker if you have lung cancer.H
6
Conditional Probability and the Rules of Probability: Use the rules of probability to compute probabilities of compound events in a uniform probability model
6. Find the conditional probability of A given B as the fraction of B’s outcomes that also belong to A, and interpret the answer in terms of the model.H
6
. Apply the Addition Rule, P(A or B) = P(A) + P(B) – P(A and B), and interpret the answer in terms of the model.H 6
8. (+) Apply the general Multiplication Rule in a uniform probability model, P(A and B) = P(A)P(B|A) = P(B)P(A|B), and interpret the answer in terms of the model.H
68 2
9. (+) Use permutations and combinations to compute probabilities of compound events and solve problems.H 6 9
Using Probability to Make Decisions: Calculate expected values and use them to solve problems
. (+) Define a random variable for a quantity of interest by assigning a numerical value to each event in a sample space; graph the corresponding probability distribution using the same graphical displays as for data distributions.H
6
2. (+) Calculate the expected value of a random variable; interpret it as the mean of the probability distribution.H 6
. (+) Develop a probability distribution for a random variable defined for a sample space in which theoretical probabilities can be calculated; find the expected value. For example, find the theoretical probability distribution for the number of correct answers obtained by guessing on all five questions of a multiple-choice test where each question has four choices, and find the expected grade under various grading schemes.H
6
4. (+) Develop a probability distribution for a random variable defined for a sample space in which probabilities are assigned empirically; find the expected value. For example, find a current data distribution on the number of TV sets per household in the United States, and calculate the expected number of sets per household. How many TV sets would you expect to find in 00 randomly selected households?H
60 40
Using Probability to Make Decisions: Use probability to evaluate outcomes of decisions
. (+) Weigh the possible outcomes of a decision by assigning probabilities to payoff values and finding expected values.H
4 46
a. Find the expected payoff for a game of chance. For example, find the expected winnings from a state lottery ticket or a game at a fast-food restaurant.
6 44
b. Evaluate and compare strategies on the basis of expected values. For example, compare a high-deductible versus a low-deductible automobile insurance policy using various, but reasonable, chances of having a minor or a major accident.
4 46
6. (+) Use probabilities to make fair decisions (e.g., drawing by lots, using a random number generator).H 4
. (+) Analyze decisions and strategies using probability concepts (e.g., product testing, medical testing, pulling a hockey goalie at the end of a game).H
6

Chapter Four • 76
Chapter 4 | Findings for Ratings of Common Core Mathematics Standards
One statement had relatively lower importance ratings compared to other statements in the domain. The statement relates to assigning probabilities to payoff values to weigh possible outcomes of a decision. It is marked as both an advanced standard and one that involves modeling. Table 45 shows the standard and its mean and standard deviation compared to the average of the conceptual category.
Table 45. Standard Statements with Means Above and Belowa the Conceptual Category Average, for Statistics and Probability
Meanb Standard deviation
Conceptual category average 2.9 0.89
Standard statements above average
None
Standard statements below average
(+) Weigh the possible outcomes of a decision by assigning probabilities to payoff values and finding expected values.H
2.6 0.90
Note. Values assigned to the scale were 4 = most, = more, 2 = less, and = least. aStatements that are . standard deviations above or below the mean of the conceptual category average are displayed. This metric was selected as a way to systematically view trends in the dispersion of standard ratings. Overall, differences in ratings were minimal; displaying standards here does not indicate that comparing their ratings to the overall mean is statistically significant. bMeans and standard deviations at the conceptual category level are weighted to account for the different number of respondents for each standard statement.
Summary of the Importance Ratings for Statistics and Probability
The standard statements within the Statistics and Probability conceptual category had an average rating just below the “more important” rating category. Respondents for the category were distributed across all course categories, but very few ELA respondents contributed to the importance ratings. Respondents place less emphasis on students’ skills in weighing the possible outcomes of a decision by assigning probabilities to payoff values and finding expected values.

Chapter Four • 77
ELA!4.7%!
Math!22.6%!
Science!20.4%!Social
Science!16.7%!
Business Management!
14.0%!
Computer Technology!
10.8%!
Healthcare!10.9%!
Chapter 4 | Findings for Ratings of Common Core Mathematics Standards
Figure 46. Respondents Rating Importance for Mathematical Practices (n = 1339), Percent by Content Area
Standards for Mathematical Practices
Respondents to Importance Ratings for the Mathematical Practices
Figure 46 shows the distribution across the content areas of respondents rating at least one statement within the Mathematical Practices as applicable (n = 1339; 71% of the sample). The respondents were fairly well distributed across the content areas, with mathematics respondents (n = 302), science respondents (n = 273), social science respondents (n = 223), and business management respondents (n = 187) composing the largest groups of respondents. Even for ELA, there was a modest group of respondents (n = 63).
Average Importance Rating for Standards for the Mathematical Practices
The eight standard statements within the Mathematical Practices had an average rating of 3.2 (SD = .88), just above “more important” level. Figure 47 shows the importance ratings across instructors from the different content areas. Since the Practices are not a conceptual category, there is no breakdown into domains.
1.00
2.00
3.00
4.00
English language arts
(n = 63)
Mathematics (n = 302)
Science (n = 273)
Social science (n = 223)
Business management
(n = 187)
Computer technology (n = 145)
Healthcare (n = 146)
Overall meana 3.2
Note. Lighter shading indicates that respondents from the content area compose less than 5% of respondents for the conceptual category. aThe eight standard statements were weighted to account for the varying number of respondents for each standard.
Figure 47. Mean Importance Ratings for Standards for Mathematical Practice Respondents (n = 1339), by Content Area
Figure 47. Mean Importance Ratings for Mathematical Practice Respondents (n = 1339),
by Content Area
English language arts
(n = 63)
Mathematics (n = 302)
Science (n = 273)
Social science (n = 223)
Business management
(n = 187)
Computer technology (n = 145)
Healthcare (n = 146)
Note. Lighter shading indicates that respondents from the content area compose less than % of respondents for the conceptual category. aThe eight standard statements were weighted to account for the varying number of respondents for each standard.

Chapter Four • 78
Table 47. Standard Statements with Means Above and Belowa the Average, for Mathematical Practices
Meanb Standard deviation
Standards for Mathematical Practices Average .2 0.
Standard statements above average
Make sense of problems and persevere in solving them. . 0.
Standard statements below average
None
Note. Values assigned to the scale were 4 = most, = more, 2 = less, and = least. aStatements that are . standard deviations above or below the mean of the conceptual category average are displayed. This metric was selected as a way to systematically view trends in the dispersion of standard ratings. Overall, differences in ratings were minimal; displaying standards here does not indicate that comparing their ratings to the overall mean is statistically significant. bMeans and standard deviations at the conceptual category level are weighted to account for the different number of respondents for each standard statement.
Chapter 4 | Findings for Ratings of Common Core Mathematics Standards
Importance Ratings by Standard Statement for the Mathematical Practices
Next, we collapse the four importance ratings categories into a dichotomous rating for each standard: (1) more or most important, or (2) less or least important. Every standard is presented in Table 46 in the order the standards appear in the Common Core standards documents. For the Mathematical Practices, all of the statements were rated as being more or most important by a large majority (>75%) of respondents.
Compared to other Mathematical Practices, there was one standard about making sense of problems and persevering in solving them that tended to receive higher importance ratings. Table 47 shows the mean and standard deviation of the statement compared to the average of statements in the Mathematical Practices.
Summary of the Importance Ratings for the Mathematical Practices
The Mathematical Practices had an average rating above the “more important” level, which was higher than any of the conceptual categories. They were also considered more applicable to a wider variety of respondents; respondents for the ratings were distributed across the different content areas. Respondents placed high importance on every Mathematical Practice, with the standard about making sense of problems and persevering in solving them rated the most highly.
Table 46. Percent of Respondents with Importance Ratings of More or Most versus Less or Least, for Standards for Mathematical Practices
Standard More/most percent
Less/least percent
. Make sense of problems and persevere in solving them. 90 0
2. Reason abstractly and quantitatively. 86 4
. Construct viable arguments and critique the reasoning of others. 8 22
4. Model with mathematics. 8
. Use appropriate tools strategically. 8 9
6. Attend to precision. 84 6
. Look for and make use of structure. 8 22
8. Look for and express regularity in repeated reasoning. 2

Chapter Five • 79
Yes!83.8%!
No!16.2%!
Chapter 5 | Findings from Additional Questions About the Common Core Standards
After rating standards, respondents had the opportunity to answer five general questions regarding the content coverage and cognitive demand of the Common Core standards. The first four included a dichotomous (yes/no) question and space for comments. These questions covered (a) the English language arts and literacy standards, (b)
the mathematics standards, (c) the cognitive demand of the standards, and (d) whether the standards omit key knowledge and skills. The final question was an opportunity to give additional comments. All five questions were optional and, as a result, the number of responses varied for each question.
Process for Coding Open-Ended Comments
We used a grounded theory approach to code the open-ended questions. Three coders initially reviewed approximately one-quarter of the responses for each question. They independently identified themes and developed code categories. The coders then met to compare their separate processes and resulting codes. The categories were edited, renamed, and sometimes combined in order to attain the fewest, clearest number of codes that adequately covered the variety of responses. A codebook was developed and turned over to a fourth coder who coded the same responses to check the codes. Edits were made in this process.
A pilot coding phase was then initiated, wherein six individuals practiced coding and then met to discuss. Additional minor edits were made to the codebook. Then two coders were assigned to each question. First, both coders independently coded the entire set of responses to a particular question. Then the two coders talked through any discrepant codes until a final coding decision was reached. Throughout the process, responses that did not fit any existing category were tagged and new codes were developed when necessary.
During the development process, coders noticed that, although there were differences in the respondents’ answers based on the particular question, there were similar patterns across all questions. Therefore, we were able to place all comments into one of four categories, either (1) reiterates answer (respondent reiterated their answer to the dichotomous yes/no question), (2) mismatch with course (respondent said that some aspect of the standards did not fit with their course), (3) deficiency/weakness (respondent said that some aspect of the standards could be improved), or (4) strength (respondent praised some aspect of the standards). Depending on the primary code, up to two secondary codes were assigned in order to further detail the answer. Comments that simply reiterated the yes or no answer (“the standards seem appropriate”) were not given a secondary code. Many of the secondary codes were unique, occurring only once. For some questions, a surprisingly large number of respondents addressed issues other than the Common Core standards, such as aspects of the individual instructor’s course. In some cases, it was unclear what the response was addressing. We placed any response that fell outside the scope of the question into an “uncodeable” category.
Respondent Views of the English Language Arts and Literacy Standards
The first question asked respondents about the Common Core English language arts and literacy standards: are the English standards, taken as a whole, a coherent representation of the fields of knowledge necessary for success in your course? There were 1769 responses, which are shown in Figure 48.
There were 502 respondents who gave comments. Of these, 174 respondents gave 181 comments that were deemed codeable. The other comments did not speak directly to the question about the English language arts (ELA) and literacy Common Core standards.
Figure 48. Answer from Respondents (n = 1769) to Question “Are the English standards, taken as a whole, a coherent representation of the fields of knowledge necessary for success in your course?”

Chapter Five • 80
Mismatch with course!53.6%!Deficiency/
weakness!24.9%!
Strength!3.9%!
Reiterates answer!17.7%!
Chapter 5 | Findings from Additional Questions About the Common Core Standards
Regardless of whether they answered yes or no, many respondents commented that there was a mismatch between their course and the standards or that they saw a particular deficiency of the Common Core ELA and literacy standards. A small number noted a particular strength. There was not necessarily a correlation between answering no to the coherence question and then identifying a deficiency or answering yes to the coherence question and then identifying a strength. If answers fell into three of the four primary categories (mismatch with course, deficiency/weakness, or strength), they were then coded with one or more secondary codes in order to further describe the nature of the comment. Comments that simply reiterated the answer to the dichotomous question were not given a secondary code. Figure 49 shows how comments were divided among the four primary code categories.
Figure 49. Percent of Comments (n = 181) Four Primary Code Categories for Open-Ended Question about English Language Arts and Literacy Standards
Mismatch Codes
Responses coded in the mismatch category indicate that some portion of the standards were either not relevant or not a match to their course. In these comments, respondents mentioned that the standards did not apply to their course because of the type of course they taught and included remarks about some portion of the ELA and literacy standards being not applicable or beyond what was required for their course or field of study. For example:
� “There is very little language knowledge required for this course. The most important thing is to be able to understand technical texts with lots of new vocabulary.”
� “The class has an emphasis on argumentative writing; therefore, any kind of narrative writing standard does not really apply. Further, the class is more interdisciplinary than literature-based.”
� “Many of the English standards were not applicable. In the course, students do not write a formal scientific paper.”
� “Those standards were not applicable to my course.”
� “This particular course does not require a research or a significant writing component.”
� “This is not extremely critical for chemistry.”
“
“
• The class has an emphasis on argumentative writing; therefore, any kind of narrative writing standard does not really apply. Further, the class is more interdisciplinary than literature-based.• I find some of them a bit difficult to understand, and I’m not always clear on what they’re trying to measure.• The view of language standards as nuanced, artful, and requiring constant evaluation by writers and readers matches well with the knowledge and understanding I expect my students to grasp to succeed in my class, yes.
Example Comments: ELA and literacy

Chapter Five • 81
Chapter 5 | Findings from Additional Questions About the Common Core Standards
Deficiency/Weakness Codes
Approximately 25% of the codeable responses fit into the deficiency category. Here, respondents named aspects of the standards that they thought were missing from, underemphasized in, or weak within the standards. These aspects were coded into the secondary categories shown in Table 48.
These responses ranged from naming broader ideas (e.g., creative thinking or international awareness) to very specific ELA concepts (e.g., technical and historical elements of English). In some cases, the Common Core standards do address the concept that the instructor mentioned (e.g., essay writing, literary interpretation, reading for information, writing instruction). Presumably, the instructor felt that further depth or breadth was needed in the domain; however, the answers were not generally precise enough to understand the exact intention. As Table 48 shows, most comments had very low frequencies with only one or two respondents naming the particular area. There were two domains with slightly higher frequencies: criticisms about the wording of the standards and criticisms that they do not contain enough problem-solving or critical-thinking components.
Some examples from this category include: � “I have to be honest: I find some of them a bit difficult to
understand, and I’m not always clear on what they’re trying to measure.” (wording of standards)
� “Too much literature, not enough critical thinking, not NEARLY enough emphasis on reading to obtain, use, and evaluate information.” (problem solving/critical thinking/reasoning and reading for information)
� “Some relate to skills not needed in this class. There appears to be a lack of intellectual life-of-mind standards...most appear mechanical more than intellectual.” (affective learning)
Strengths Codes
For responses coded in the strength category (approximately 4% of codeable responses), respondents praised specific areas of content within the standards or the approach of the standards. Table 49 presents the secondary categories for the named strengths. While not many respondents used this as an opportunity to name strengths of the standards, some of the strengths respondents mentioned were the exact dimensions that other faculty had mentioned as weaknesses.
Table 49. Strengths Named by Respondents for Open-Ended Question about English Language Arts and Literacy Standards
Strength Number Percent
Information interpretation and summarization 2 28.6
Analysis 4.
Constant evaluation 4.
Grammar 4.
Reading comprehension 4.
Problem solving/critical thinking/ reasoning 4.
Total 7 100.0
Table 48. Deficiencies Named by Respondents for Open-Ended Question about English Language Arts and Literacy Standards
Deficiency/weakness Number Percent
Wording of standards 9 20.0
Problem solving/critical thinking/ reasoning 4 8.9
Affective learninga 2 4.4
Cross-disciplinary skills 2 4.4
Technical writing 2 4.4
Worldview/international awareness 2 4.4
Argumentation 2.2
Author critique 2.2
Complex sentences 2.2
Composition 2.2
Creative thinking 2.2
Data analysis/research skills 2.2
Essay writing 2.2
Information interpretation and summarization
2.2
Literary interpretation 2.2
Non-fiction reading 2.2
Non-literary texts 2.2
Objective argumentation 2.2
Practical application 2.2
Practical perspective 2.2
Psychomotor skills 2.2
Reading for information 2.2
Relationship between literature and society 2.2
Rhetoric 2.2
Scientific language 2.2
Sentence structure and essay writing 2.2
Technical and historical elements of English 2.2
Vocabulary 2.2
World literature 2.2
Writing instruction 2.2
Total 45 100.0
aAspects related to attitudes, motivation or values.

Chapter Five • 82
Mismatch with course!79.2%!
Deficiency/weakness!
11.3%!
Strength!5.0%!
Reiterates answer!4.5%!
Chapter 5 | Findings from Additional Questions About the Common Core Standards
Some examples from this category include: � “The view of language standards as nuanced, artful, and requiring constant evaluation by writers and readers matches well with the knowledge and understanding I expect my students to grasp to succeed in my class, yes.” (constant evaluation)
� “The standards related to reading comprehension, vocabulary, grammar and usage, writing in different disciplines, and reasoning are especially important skills for success in English Composition I.” (grammar and problem solving/critical thinking/reasoning)
� “Reading comprehension is most important.” (reading comprehension)
Respondent Views of the Mathematics Standards
The next question was similar to the first but pertained to the Common Core mathematics standards: are the mathematics standards, taken as a whole, a coherent representation of the knowledge and skills necessary for success in your course? There were 1706 responses; these are shown in Figure 50.
Within the 615 comments, 374 respondents provided 382 comments that were codeable. As before, the other comments did not speak directly to the question about the mathematics Common Core standards.
For the dichotomous question, a greater percentage of respondents selected no (not coherent) than for the ELA and literacy question (38% vs. 16%). Furthermore, the percentage of comments that indicated a mismatch between the standards and the course was 79% (vs. 54% of respondents on the ELA and literacy question), reiterating that the mathematics standards were viewed as less applicable to courses included in this study than the English language arts and literacy standards.
Again, regardless of how they answered the yes/no question, many respondents (303 of the codeable responses) commented that there was a mismatch in some way between their course and the standards. Some respondents (43) noted a particular deficiency of the standards. A small number (19) noted a particular strength they perceived in the standards. As with the first question, some comments (17) reiterated the answer to the parent question; these were not given a secondary code. Figure 51 shows the primary categories broken down as percentages.
Mismatch Codes
For comments coded in the mismatch category, respondents indicated that they thought the mathematics standards, or certain portions of the standards, were inapplicable or beyond what was called for in their course or field of study. Some examples from this category include the following:
� “While I expect my students to be logical and attentive to detail, they do not need to have math knowledge per se to be successful in the course.”
� “Most of the mathematic standards listed were not applicable. For my course, students need to be able to graph data, calculate means and standard deviations, use Chi-square, solve Hardy-Weinberg equilibrium equations, and perform metric conversions, and use very basic algebra to solve for unknowns.”
� “I do not rely on quantitative analysis in this lower-level history course.”
Figure 51. Percent of Comments (n = 382) Four Primary Code Categories for Open-Ended Question about Mathematics Standards
No!38.2%!
Yes!61.8%!
Figure 50. Answer from Respondents (n = 1706) to Question “Are the mathematics standards, taken as a whole, a coherent representation of the fields of knowledge necessary for success in your course?”

Chapter Five • 83
“
“
• A proficiency in logic and reasoning rather than quantitative skills is needed for this course.• I would like to see more real-world, word-problem-type problem solving in the standards. • The underlying thinking emphasized in many of the questions posed under math ability are important and would definitely help students better make the distinctions and make them more open to projects where they would collect quantitative data.
Chapter 5 | Findings from Additional Questions About the Common Core Standards
Deficiency/Weakness Codes
In comments coded in the deficiency category (11%), respondents either named specific areas of content they thought were missing from the standards or noted other weaknesses of the standards (see Table 50).
Table 50. Deficiencies Named by Respondents for Open-Ended Question about Mathematics Standards
Deficiency/weakness Number Percent
Problem solving/critical thinking/reasoning 2 2.9
Cross-disciplinary skills 4 9.
Calculus .0
Practical application .0
Academic behaviorsa 2 4.
Functions 2 4.
Wording of standards 2 4.
Accounting calculations 2.
Marketing: assessing price elasticity and predicting sales 2.
Clearer separation between understanding and usage 2.
Cognitive demand 2.
Discrete math 2.
Formal reasoning and abstract algebraic representation 2.
Information interpretation and summarization 2.
Logarithms 2.
Probability 2.
Proportional reasoning 2.
Psychomotor skills 2.
Ratio interpretation 2.
Set theories 2.
Trigonometry 2.
Word problems 2.
Total 43 100.0
aGeneral skills related to academic success (i.e., study habits, memorization skills).
Some of the comments about weaknesses related to wanting to see more representation of a particular type of math (e.g., calculus, discrete math, probability, trigonometry). Other comments related to the way mathematics is applied (e.g., problem solving/critical thinking/reasoning, cross-disciplinary skills, clearer separation between understanding and usage). Again, in some cases, the Common Core standards do address the concept that the instructor mentioned (e.g., functions). As with ELA and literacy, the instructor presumably felt that further depth or breadth was needed in the domain; however, the answers were not generally precise enough to understand the exact intention. Also similar to the question about the ELA and literacy standards, most comments had very low frequencies, with only one or two respondents giving the particular answer. The types of answers that tended to have slightly higher occurrence
Example Comments: Mathematics

Chapter Five • 84
Chapter 5 | Findings from Additional Questions About the Common Core Standards
were criticisms that the standards do not contain enough problem-solving or critical-thinking components and that they should be more cross-disciplinary in nature.
Some examples from the deficiency category include the following: � “General problem-solving skills are not emphasized enough.” (problem solving/critical thinking/reasoning)
� “A proficiency in logic and reasoning rather than quantitative skills is needed for this course.” (problem solving/critical thinking/reasoning)
� “I would like to see more real-world, word-problem-type problem solving in the standards. Students need more practice using math to solve real problems as well as being able to do a typical math problem that only deals with numbers and not real physical quantities.” (practical application)
Table 51. Strengths Named by Respondents for Open-Ended Question about Mathematics Standards
Strength Number Percent
Problem solving/critical thinking/reasoning 8 42.
Information interpretation and summarization .8
Cross-disciplinary skills 2 0.
Application of course content .
Apply algebra and trigonometry to physical situation .
Data analysis and probability .
Graphs .
Interpret and analyze quantitative data .
Statistics .
Total 19 100.0
Strengths Codes
For responses categorized in the strength category, respondents praised specific areas of content within the standards or the approach of the standards (see Table 51).
Some examples from this category include: � “They translate into critical-thinking components applicable to the English class and assignments.” (problem solving/critical thinking/reasoning)
� “Yes, they incorporate a lot of logic and problem-solving skills, which is a very underrated topic in writing circles.” (problem solving/critical thinking/reasoning)
� “The conceptual understanding of research designs and the ability to interpret the types of conclusions drawn from studies is very important to this class. Therefore, the underlying thinking emphasized in many of the questions posed under math ability are important and would definitely help students better make the distinctions and make them more open to projects where they would collect quantitative data.” (information interpretation and summarization)
Interestingly, the same types of responses were sometimes given as both a deficiency and a

Chapter Five • 85
Mismatch with course!11.9%!
Deficiency!19.0%!
Strength!5.6%!
Reiterates answer!63.5%!
Yes!95.7%!
No!4.3%!
Chapter 5 | Findings from Additional Questions About the Common Core Standards
strength (by different respondents). For instance, comments about how well the mathematics standards involve problem-solving, critical-thinking, and/or reasoning content were both the most commonly mentioned deficit and most commonly mentioned strength.
Respondent Views of Cognitive Demand
The third question addressed the general topic of cognitive demand: do the standards reflect a level of cognitive demand sufficient for students who meet the standards to be prepared to succeed in your course? Respondents answered for 1798 courses (95% of the sample); Figure 52 shows the frequencies for each response. Most respondents (96%) said that the standards were sufficiently cognitively demanding. There were 279 respondents who gave comments; of those, 120 respondents gave 126 comments that were deemed codeable.
This question differed from the first two in that it asked respondents to assess the level of cognitive demand of the standards in general as opposed to considering specific subject matter; however, respondents once again gave the same type of answers. That is, respondents named specific areas of deficiency or strength, and general mismatches between the standards and the course they teach. The percent breakdown of the four primary categories is shown in Figure 53.
Mismatch Codes
In the instances of mismatch, respondents mostly noted that the standards were at a higher level than what was required:
� “They are actually much higher than what is needed for students to succeed in my course.”
� “The standards exceed the expectation for a successful student.”
Deficiency/Weakness Codes
For responses coded in the deficiency category, respondents named specific knowledge or
Figure 52. Answer from Respondents (n = 1798) to Question “Do the Standards Reflect a Level of Cognitive Demand Sufficient for Students Who Meet the Standards to be Prepared to Succeed in Your Course?”
Figure 53. Percent of Comments (n = 126) Four Primary Code Categories for Open-Ended Question about Cognitive Demand of Standards

Chapter Five • 86
Chapter 5 | Findings from Additional Questions About the Common Core Standards
skills they thought were missing from the standards or other weaknesses of the standards. Some respondents commented on subject-specific (math or ELA) content. Table 52 shows the codes and frequencies for the deficiencies/weaknesses.
Examples for this category include: � “While both sets of standards sum to a list of detailed mechanistic elements beyond what is needed, what is missing is the intellectual context, the love of learning, etc. You are trying to put numbers on Picasso. I am interested
in students developing love of field and interests and skills from the intellectual company they keep (teacher and classmates.) It is not here. What is here, is deadening.” (affective learning)
� “Some standards reflect a sufficient level of cognitive demand, some standards were confusingly worded, other standards were not applicable.” (wording of standards)
� “There’s a lot of excellent materials. One component that is missing is prediction.” (prediction)
Table 52. Deficiencies Named by Respondents for Open-Ended Question about Cognitive Demand
Deficiency/weakness Number Percent
Wording of standards 4 6.
Problem solving/critical thinking/reasoning 2 8.
Data analysis and research skills 2 8.
Academic behaviorsa 4.2
Basic math 4.2
Cognitive demand 4.2
Computation 4.2
Confidence intervals 4.2
Factoring 4.2
General nonfiction needs more emphasis 4.2
Hypothesis testing 4.2
Information interpretation and summarization skills 4.2
Affective learningb 4.2
Prediction 4.2
Process skills need more emphasis 4.2
Too much emphasis on graphing calculators 4.2
Trigonometry 4.2
Word problems need more emphasis 4.2
Worldview/ international awareness 4.2
Total 24 100.0aGeneral skills related to academic success (i.e., study habits, memorization skills). bAspects related to attitudes, motivation or values.

Chapter Five • 87
Mismatch with course!0.7%!
Deficiency/weakness!
91.8%!
Strength!0.7%!
Reiterates answer!
6.8%!
Yes!16.3%!
No!83.7%!
Chapter 5 | Findings from Additional Questions About the Common Core Standards
Strengths Codes
Again, the responses categorized in the strength category were ones where faculty named specific areas of content within the standards or the approach of the standards. Table 53 shows codes and frequencies of strengths. The most common (n = 4) fell into the problem solving/critical thinking/reasoning category.
An example from the strength category: � “These standards appropriately address areas of identifying problems, researching solutions, taking into account the opinions of team members, and being willing to explore alternative explanations — all vital to management.” (problem solving/critical thinking/reasoning and collaboration and teamwork)
Respondent Views of Omitted Components
The fourth open-ended question specifically asked respondents whether the standards omitted components: do the standards you just reviewed omit key knowledge and skills? Of the 1785 respondents answering the question, 16% said that the standards did omit key knowledge or skills. The other 84% said they did not (see Figure 54).
There were 313 respondents who gave comments. Of those, 232 provided 278 comments that could be coded. Figure 55 shows how these comments were coded.
Mismatch Codes
Just two responses indicated a mismatch with the course. Both responses are provided here: � “It was hard to relate the standards to this course.”
� “Really does not reflect a nursing course.”
Deficiency/Weakness Codes
The vast majority of responses indicated one or more deficiencies in the Common Core standards as a whole. Approximately 40% of responses fell into four categories (see Table 54). The first was problem solving/critical thinking/reasoning, in which the respondents mentioned the lack of logical, systematic, problem-solving, or critical-reasoning skills. This was a weakness mentioned for previous questions as well. The second was affective learning, in which the respondents mentioned a lack of behaviors or items related to attitudes, motivations, or values (i.e., opinions or assessment of worth). The third was the academic behaviors category, in which the respondents mentioned lack of general skills related to academic success (i.e., study habits, memorization skills). The fourth most commonly mentioned category was computer literacy.
Figure 54. Answer from Respondents (n = 1785) to Question “Do the Standards You Just Reviewed Omit Key Knowledge and Skills?”
Figure 55. Percent of Comments (n = 278) Four Primary Code Categories for Open-Ended Question about Omitting Key Knowledge and Skills
Table 53. Strengths Named by Respondents for Open-Ended Question about Cognitive Demand
Strength Number Percent
Problem solving/critical thinking/ reasoning 4 .
Academic Behaviorsa 4.
Collaboration and Teamwork 4.
Metacognitive skills 4.
Total 7 100.0aGeneral skills related to academic success (i.e., study habits, memorization skills).

Chapter Five • 88
Deficiencies
Response Number Percent
Problem solving/critical thinking/reasoning
4 6.
Affective learninga 26 0.2
Academic behaviorsb 2 9.0
Computer literacy .9
Basic math 2 4.
Data analysis and research skills 2 4.
Collaboration and teamwork 4.
Practical application 9 .
Cross-disciplinary skills 8 .
Information interpretation and summarization
8 .
Reading comprehension 6 2.4
Wording of standards 2.0
Worldview/international awareness 2.0
Cognitive demand 4 .6
Rhetoric 4 .6
Calculus .2
Word problems .2
Computer programming skills 2 0.8
Factoring 2 0.8
Functions 2 0.8
Presentation skills 2 0.8
Psychomotor skills 2 0.8
Algorithms/algorithmic thinking and 2 0.8
Social awareness 2 0.8
Audience and purpose 0.4
Aural comprehension 0.4
Basic writing 0.4
British literature 0.4
Classical works 0.4
Comprehension 0.4
Computational thinking 0.4
Confidence intervals 0.4
Contextual thinking 0.4
Correctly use mathematical symbols 0.4
Creativity 0.4
Cultural awareness 0.4
Current events 0.4
Chapter 5 | Findings from Additional Questions About the Common Core Standards
Table 54. Deficiencies Named by Respondents for Open-Ended Question about Omitting Key Knowledge and Skills
Deficiencies
Response Number Percent
Determinants (calculus) 0.4
Discrete math 0.4
Distributions 0.4
Diverse literature 0.4
Drawing/sketching 0.4
Emphasis on dimensional analysis 0.4
Essay writing 0.4
Grammar 0.4
Graphing (with and without technology)
0.4
Historical and social context 0.4
Identifying main idea 0.4
Imagination 0.4
Integration and synthesis 0.4
Interpersonal interaction 0.4
Interpretation of controls 0.4
Inventiveness 0.4
Knowledge of key texts and authors 0.4
Literary currents and theory 0.4
Maturity 0.4
Meta-cognitive skills 0.4
Non-literary nonfiction interpretation 0.4
Paragraph writing 0.4
Proofs 0.4
Properties of real numbers, set operations
0.4
Ratios 0.4
Relational operators 0.4
Revision in writing 0.4
Sentential logic and predicate logic 0.4
Sentence and paragraph writing 0.4
Systems of equations 0.4
Think and speak statistically 0.4
Vector multiplication 0.4
Writing across genre and for a variety of purposes
0.4
Total 255 100.0aAspects related to attitudes, motivation or values. bGeneral skills related to academic success (i.e., study habits, memorization skills).

Chapter Five • 89
Some example deficiencies/weaknesses include: � “I believe that the portion on responsibility and self-initiation should be reviewed. Many of our students expect you to keep track of their grade and assignments without taking any ownership of the course.” (affective learning)
� “Planning study time; reading assignment instructions; self-awareness of study demands (i.e., how long it takes to read a page of text, etc.). Intercultural and/or worldview differences could be highlighted better.” (academic behaviors and worldview/international awareness)
� “Some basic standards for how to use technology would be useful, as there are a number of NPR, PBS, APM, and BBC clips that I assign for the class. It would also be nice to see some standards in global awareness. Many students come into the class (which has a strong global focus) unaware of the world around them. The earth is shrinking economically, politically, and socially, so it is important for students to make contact with, or at least understand, people in other parts of the world.” (computer literacy and worldview/international awareness)
� “Basic computer skills and understanding.” (computer literacy)
Strengths Codes
Although the question asked if skills were omitted, two responses actually gave strengths of the standards. These are presented in Table 55.
Responses were the following: � “Logical thinking is so useful in accounting. I think the standards often related to students thinking things through and coming up with a solution. My students often don’t seem to have that skill and just want to be told what numbers to write or where to put them.” (problem solving/critical thinking/reasoning)
� “All elements are covered and are broad enough to allow wide interpretation in different disciplines.” (cross-disciplinary skills)
Respondent Additional Comments
The final question simply asked for any remaining comments and questions on the Common Core standards: overall, please provide any additional comments you have about the standards, such as potential usefulness, content, or format, and any questions you have about the standards. There were 447 respondents who provided additional comments. Of these, 159 respondents gave 184 comments that were deemed codeable. The other comments did not speak directly about the Common Core standards.
The codeable responses fell into the same pattern as other
questions in which respondents identified deficiencies, strengths, and mismatches with their courses. In addition, there were a significant number of responses (40%) identifying ways in which students are currently entering courses underprepared for success (see Figure 56). Many of the skills that respondents noted aligned with secondary categories in the coding scheme, such as academic behaviors, problem solving/critical thinking/reasoning, and grammar, among others (see Table 56). In some cases, respondents stated or implied that implementation of the Common Core or standards like them would likely help prepare students in ways that they currently are not.
Chapter 5 | Findings from Additional Questions About the Common Core Standards
Table 55. Strengths Named by Respondents for Open-Ended Question about Omitting Key Knowledge and Skills
Strength Number Percent
Cross-disciplinary skills 0.0
Problem solving/critical thinking/reasoning
0.0
Total 2 100.0
Students are unprepared!
40.2%!
Mismatch with course!
7.1%!
Deficiency/weakness!
29.9%!
Strength!22.8%!
Figure 56. Type of Response to Open-Ended Question about Additional Comments and Questions on the Common Core Standards (n = 184)

Chapter Five • 90
Chapter 5 | Findings from Additional Questions About the Common Core Standards
Table 56. Ways in Which Students are Unprepared, Named by Respondents in Open-Ended Question about Additional Comments on the Common Core Standards
Unprepared Area Number Percent
Academic behaviorsa 4.9
Problem solving/critical thinking/reasoning 4.9
Affective learningb 6 2.8
Basic math 4 8.
Grammar 6.4
Basic writing 2 4.
Practical application 2 4.
Reading comprehension 2 4.
Cognitive demand 2.
Collaboration and teamwork 2.
Computer literacy 2.
Data analysis/research skills 2.
In-depth reading skills 2.
Interpret meanings of words in context 2.
Math skills 2.
Presentation skills 2.
Process skills 2.
Purpose of reading 2.
Sentence and paragraph writing 2.
Synthesis and analysis 2.
Transfer of knowledge 2.
Verbal communication and writing 2.
Total 47 100.0aGeneral skills related to academic success (i.e., study habits, memorization skills). bAspects related to attitudes, motivation or values.
Students are Unprepared Codes
Some example quotes that identified ways in which students are underprepared include: � “I find that most students have reasonably adequate academic skills, but only about half have adequate work ethic, motivation, and organizational skills.” (academic skills)
� “The key thing missing from incoming students: proficiency in basic computation/manipulation (solving equations in one variable, adding fractions, basic triangle trig, etc…). Perhaps in crafting and implementing global standards, we don’t do enough ‘drills’ or other activities aimed at the core skills, as opposed to the global standards that the skills fit into?” (basic math)
� “My experience with high school graduates is that even the good ones lack some of the basics: grammar, use of sources without plagiarizing, the math skills mentioned above. The standards in this survey are not at all what my college freshmen enter with.” (grammar and data analysis/research skills)

Chapter Five • 91
Chapter 5 | Findings from Additional Questions About the Common Core Standards
� “I do not see any standards missing, but the primary issue we encounter with students is the challenge of critical thinking and applying knowledge to specific situations. Students are very good at memorizing, but need more help with synthesis, analysis, and application of information.” (problem solving/critical thinking/reasoning, and practical application)
Deficiency/Weakness Codes
As with other questions, comments that were coded in the deficiencies category (30% of codeable responses) tended to criticize the wording of the Common Core standards or mention specific missing content (see Table 57).
Table 57. Deficiencies Named by Respondents for Open-Ended Question Soliciting Additional Comments
Deficiency/weakness Number Percent
Wording of standards 0.9
Problem solving/critical thinking/reasoning 4 .
Academic behaviorsa .
Computer literacy .
Affective learningb 2 .6
Cognitive demand 2 .6
Continuing education/non-traditional students 2 .6
Grammar 2 .6
Basic math .8
Cultural awareness/issues .8
Different documentation/citation styles .8
Discrete math .8
Distinction between fact, opinion and interpretation .8
Information interpretation and summarization .8
Information literacy .8
Integrate standards into a conceptual whole .8
Interconnection among math problems .8
Math standards need to be broken out for different sciences .8
Mathematical maturity .8
Maturity .8
Need focus on process over product .8
Objectives need to be more defined .8
Practical application .8
Reading needs more emphasis .8
Technology standards should be separate .8
Thesis writing .8
Worldview/international awareness .8
Writing needs more emphasis .8
Total 55 100.0aGeneral skills related to academic success (i.e., study habits, memorization skills). bAspects related to attitudes, motivation or values.

Chapter Five • 92
Chapter 5 | Findings from Additional Questions About the Common Core Standards
Examples of the deficiencies respondents noted include:
� “Standards could be written in more concise language.” (wording of standards)
� “In general, the language here does not quite fit the way I think and talk about these concepts. This may simply reflect the difficulty of defining in general terms the practices of critical reading and interpretation, which don’t easily boil down to simple language.” (wording of standards)
� “There is too much emphasis on innate or mostly intuitive skills and not enough on the basics of grammar and composition.” (grammar)
� “Although I do not feel the standards omitted key knowledge, I felt there was a lack of emphasis on time management, effective study skills, etc. In my experience, students are capable of succeeding even in the absence of some of the educational standards listed. They have a much greater risk of failing if they do not effectively manage their time or realize that the increased level of difficulty in a college-level course requires more time be spent studying.” (academic behaviors)
� “The standards themselves are quite exhaustive. However, they miss some of the more significant issues with regard to student readiness for success at the collegiate level. The biggest deficiency I find in my students has less to do with the breadth of their technical preparation, and more to do with the rigor. In other words, students are held to very low standards in high school. Hence, they come to college expecting it to be an extension of high school, with, for example, target dates for assignments instead of due dates, and professors who will continually remind them about course requirements and expectations (surrogate parents, if you will). In addition, students’ expectations with regard to workload are woefully inadequate. Thus, while students may have taken the prerequisites for my course, their facility with such material is simply insufficient for continued success (despite receiving an ‘A’ in their H.S. coursework). And, they are quite disappointed when they realize that success at the collegiate level requires *gasp* up to 40 hours per week of studying...” (academic behaviors and cognitive demand)
� “Technology should be separated from other questions and standards, in case the course is taught without it. (I do encourage and require the students to use technology in higher-level courses, but in the very basic courses, I prefer them to learn without it.)” (technology standards should be separate)
Strengths Codes
Table 58 displays responses coded in the strengths category. These praised specific areas of content within the standards or the approach of the standards. The highest number of responses (24%) focused on reasoning skills/content. The next most frequent category of answers (17%) focused on academic behaviors.
Table 58. Strengths Named by Respondents for Open-Ended Question Soliciting Additional Comments
Strength Number Percent
Problem solving/critical thinking/reasoning
24.
Academic behaviorsa .2
Metacognitive skills 2 6.8
Affective learningb .4
Analyze and synthesize primary source text
.4
Cognitive demand .4
Expressing situation, methods, results and conclusions (math)
.4
Individual work .4
Information interpretation and summarization
.4
Language skills .4
Presentation skills .4
Read critically .4
Reading skills .4
Rhetoric .4
Skills list is very detailed .4
Technology .4
Address content and processes .4
Rigorous competencies appropriate for business literacy
.4
Total 29 100.0aGeneral skills related to academic success (i.e., study habits, memorization skills). bAspects related to attitudes, motivation or values.

Chapter Five • 93
Chapter 5 | Findings from Additional Questions About the Common Core Standards
Examples in this category include: � “I want my students to be able to read critically and think critically about a reading, empathize with other points of view, and understand that most of our knowledge is provisional. I think the standards reflect those ideals.” (read critically and problem solving/critical thinking/reasoning)
� “The standards that relate to logic, reasoning, and critical thinking apply most for my course. Additionally, understanding the use of rhetoric and strategy are helpful for students.” (problem solving/critical thinking/reasoning, and rhetoric)
Summary of Respondent Views and Comments
In general, respondents said that they thought the Common Core standards were a coherent representation of their course when it came to the ELA and literacy standards (84% of respondents to the question) and, to a lesser degree, for the mathematics standards (62% of respondents to the question). A large number of respondents (96% of respondents to the question) gave feedback that the Common Core standards are sufficient in terms of cognitive demand.
Respondents noted that there were areas in which the Common Core standards could be improved. Responding to a question about whether the Common Core standards omit key knowledge and skills, there were nearly 300 respondents who said they did. In terms of what the standard omit, answers were wide-ranging. Across all questions, when respondents mentioned a deficit of the standards, they were most likely to mention that the wording of the standards could be improved or that they should include more focus on problem solving and critical thinking. It is interesting to note that this second aspect was also mentioned as a strength. In their comments, respondents emphasized the importance of concepts that fall outside of content learning, that is, issues such as student attitude or motivation, developing a love of learning, and honing academic behaviors such as study habits; they commented that the Common Core standards do not sufficiently address these aspects. Respondents also shared a number of areas in which they feel their students enter college courses unprepared. In these comments, they implied that if students could master the Common Core standards, they would be better prepared for the challenge of post-secondary courses.

Chapter 6 | Summary and Discussion
In this chapter we review the major purposes of the study, the method chosen to obtain data necessary to answer our two research questions, and the major findings regarding applicability and importance of the Common Core standards. The chapter concludes with the recommendation to conceive of college and career readiness as more complex than the knowledge represented by the Common Core standards, and suggestions for future research.
This study addresses two research questions:
1. How applicable are the Common Core standards to college courses?
2. When they are perceived as applicable, how important are the Common Core standards to college courses?
The reason for asking these questions is that the Common Core standards sponsors explicitly intended the standards to be indicators of readiness for college and careers. According to the authors, the English language arts and literacy standards are anchored by the concept of “college and career readiness” and do not simply represent high school completion standards (Common Core State Standards Initiative, 2010c). The intent of the Common Core standards is to ensure that all students “meet college and career readiness expectations no later than the end of high school” (Common Core State Standards Initiative, 2010b, p. 4). The mathematics standards are slightly less explicit about end goals, describing the intent of standards to be to “provide clear signposts along the way to the goal of college and career readiness for all students” (Common Core State Standards Initiative, 2010b, p. 4).
Discussion of Methodology
We chose self-reports from postsecondary faculty who teach entry-level or first-in-sequence courses as our primary source of data for answering these two questions. We asked them whether each Common Core standard was applicable to their course. If the standard was applicable, we asked them to rate the standard’s importance to success in the course. We also included several additional questions about their perceptions of the standards’ coherence and intellectual challenge level. Finally, we requested that they submit the syllabus for the course they were using as the reference point for their responses. Although we did not use the syllabi in analyses for the current report, they are an additional potential resource for understanding the specific content and expectations students encounter in postsecondary courses and how these relate to the Common Core standards. Future plans call for analyzing syllabus content against the Common Core standards, which should help add a level of understanding and context to the findings contained in this report.
While self-reported data have limitations, EPIC has collected this type of information several times previously and has been able to cross-reference instructor responses against third-party document analysis of course syllabi.1 In those studies, independent judgment of whether syllabi aligned with a set of standards correlated with instructor reports in the 70–90% range. This means that external reviewers independently found evidence of 70% to 90% of the standards the instructors self-reported. This is especially noteworthy given the fact that some standards do not lend themselves to being stated explicitly in a course syllabus. We take the findings from
1These studies include the College Board Advanced Placement® best practices course study (Conley, Aspengren, Gallagher, Stout, & Veach, 2006) and an alignment of the Texas College and Career Readiness Standards (Educational Policy Improvement Center, 2008).
Additional Syllabi Data
Although we did not use the syllabi in analyses for the current report, they are an additional potential resource for understanding the specific content and expectations students encounter in postsecondary courses and how these relate to the Common Core standards. Future plans call for analyzing syllabus content against the Common Core standards, which should help add a level of understanding and context to the findings contained in this report.
Chapter Six • 94

Chapter Six • 95
Chapter 6 | Summary and Discussion
previous studies to indicate that instructor self-reports are sufficiently accurate and reliable to constitute the basis for an overall judgment of the applicability of the Common Core standards to their courses.
We might add parenthetically that this general method of querying college instructors regarding what they expect of students or what they teach in their courses is well established and has been employed for years by both ACT and the College Board as a primary means for ascertaining the content of the ACT and SAT assessments. For this study, we believe our initial attention to instructor selection, our relatively high yield and response rates, and the broad range of course categories we queried provide us with a respondent pool sufficient to answer the questions posed.
This study employs basic descriptive statistics to create response tallies. Such methods are not intended to answer the research questions with statistical certainty. We therefore and necessarily answer our two basic questions on the basis of an overall judgment of the quantity and consistency of the evidence that the Common Core standards consist of knowledge and skills that are applicable and important to a wide range of postsecondary courses. This approach is consistent with evidence-centered design approaches used to validate the claims made for standards or assessments (Behrens, Mislevy, DiCerbo, & Levy, 2010; Mislevy, Steinberg, & Almond, 2002; 2003).
In the preceding results chapters, we provide summative data that rolls applicability findings up to the strand level (for ELA and literacy) or the conceptual category level (for mathematics). For that view of the data, we chose to use the criterion of a minimum of one standard match within the strand or conceptual category as the indicator that the strand or category was applicable. Generally accepted alignment methodology requires that the criterion level be established a priori (Webb 1997; 2002), and this particular criterion level has been set in previous standards-to-standards alignment studies (Cook, 2005; Cook & Wilmes, 2007). The one-standard criterion eliminates the need to select an arbitrary number of standards that must match in order to call the strand or category applicable. In other words, if the criterion for achieving applicability is more than one standard per strand, it must be consistent for all strands, in the form of either a fixed number or a percent of all standards. Neither is adequate when the number of standard and sub-standard statements per strand or category varies as significantly as the Common Core standards vary (from 9 to 28 statements in ELA and literacy; from 8 to 45 statements in mathematics).
We also examined the mean and modal number of standards found to be applicable by respondents who completed ratings for a strand or category. The proportion of respondents indicating only the minimum criterion of one standard is in the low single digit percentage range for every strand in ELA and literacy and every conceptual category in mathematics. Respondents tended to rate a majority, if not all, of the standards in the strand as applicable (see Tables 5 and 30). Appendix D (ELA and literacy) and Appendix F (mathematics) provide detailed breakdowns of the number of standards that respondents selected as applicable.
How applicable are the Common Core standards to college courses?
Answering this question is relatively straightforward because of the way we asked the question. We did not ask whether students need all of the Common Core standards to be college and career ready. Therefore, we can report the degree of applicability of each standard individually or roll up to a higher level to represent the entire set of standards for an area (ELA and literacy strand or mathematics conceptual category) or for a topic or domain within that area. We can then offer an overall judgment about the degree to which the Common Core standards are applicable to college courses in general or to particular college courses. By applicable, we mean that the content is a prerequisite for, reviewed in, or introduced in the course. In other words, knowledge of the content is necessary and useful for success in the course
Based on our analysis, not every standard is applicable to every one of the 25 course categories. This should hardly be
MethodThis general method of querying college instructors regarding what they expect of students or what they teach in their courses is well established.

Chapter Six • 96
surprising given the wide range of courses we intentionally included in the study and the fact that we made all standards available for review by all respondents. This was done on the theory that the two sets of Common Core standards are not designed for just two single subjects. Because of the nature of their courses, however, a large proportion of respondents were likely to have found an entire set of standards to be less relevant. Generally, English teachers and those from courses with strong emphasis on language arts would not be expected to find mathematics standards applicable, and those who teach courses with a strong emphasis on quantitative knowledge and skills may not find reading and writing standards to be as applicable. This was largely true, although we did find notable exceptions to both of these statements.
What immediately stands out in the ELA and literacy standards is the large proportion of respondents across all course types who found standards in the Speaking and Listening strand to be applicable. Given the broad applicability of these standards to a wide range of postsecondary courses, they take on a particular importance in terms of their inclusion in curriculum and instruction and their assessment at the classroom level and by the two consortia developing assessments of the Common Core standards.
Applicability ratings for non-literary reading and writing standards are very high, particularly when results from the English language arts strands of Reading for Informational Texts and Writing are combined with results from the literacy, subject-specific versions of these same strands. Recall that all reading standards and all writing standards — whether in ELA or in literacy — are based on the same anchor standards. This means that the two sets of standards need to be combined when determining overall applicability of informational texts and writing. When this is done, these two areas become much more universally applicable, at a level comparable with the Speaking and Listening strand.
The notable outlier is the Reading for Literature strand, for which no comparable set of standards was developed for the subject areas, for obvious reasons. While these standards are certainly important in their own right, they were viewed as applicable by only a minimal proportion of respondents (15%, on average) in content areas outside of English language arts. Nearly all the English language arts respondents (94%), on the other hand, found the strand applicable.
Further reinforcing the conclusion that the standards were broadly applicable to entry-level courses are the results from supplemental questions that all respondents had the opportunity to answer. When asked if the standards as a whole are sufficiently challenging cognitively to prepare students for their classes, nearly 96% of respondents said they are, and at least some of those who responded “no” did so because they felt the standards are more challenging than they need to be, not insufficiently challenging. In responses to the question of whether the standards omit key knowledge and skills, nearly 84% responded no, they do not. These responses were high across all of the course categories.
Over 90% of all respondents chose to answer the question of whether the English language arts (ELA) and literacy standards are a coherent representation of the fields of knowledge necessary for success in their course. Of those who answered the question, nearly 84% indicated they are. When the same question was asked about the mathematics standards, the response rate was also 90%, with 62% of these respondents indicating that the standard are coherent. This somewhat lower number in mathematics suggests the mathematics standards, with their greater specificity and number of standards, may have sacrificed coherence somewhat for a sizeable number of postsecondary instructors. However, it is worth noting the agreement rate that they are coherent still approached two-thirds of those who answered the question.
Chapter 6 | Summary and Discussion
A large proportion of respondents across all course types found standards in the Speaking and Listening strand to be applicable. Given the broad applicability of these standards to a wide range of
postsecondary courses, they take on particular importance in terms of their inclusion in curriculum, instruction, and assessment.

Chapter Six • 97
A final open-ended question gave respondents an opportunity to offer their opinions on the Common Core standards. Of the 184 codeable comments, the largest category, just over 40%, detailed ways that students are not well prepared for college rather than issues related directly to the standards themselves. Just under 30% of comments noted deficiencies in the standards. The open-ended questions are one more place where general dissatisfaction with the applicability of the standards might have been noted but was not.
In terms of applicability, it appears the Common Core standards are applicable to a wide range of postsecondary entry-level courses, although to varying degrees. It is worth stating explicitly that this is not the same as saying that all Common Core standards are necessary for success in all of the 25 course categories. In particular, we found no evidence that somewhat varying profiles of student mastery of the Common Core standards would preclude student success in initial postsecondary courses.
What can be concluded regarding applicability based on the findings of this study is that students who are generally proficient in the Common Core standards will likely be ready for a wide range of postsecondary courses, and the more Common Core standards in which they are proficient, the wider the range of postsecondary-level classes they will be ready to undertake.
How important are the Common Core standards to success in a wide range of postsecondary courses?
Almost every standard received a mean rating that exceeds 2.5 on a 4-point scale, and most exceed 3. Therefore, interpretation of the importance ratings is relatively easy: respondents who consider a particular standard applicable also consider it to be important. Some math standards (25) fall below 2.5. The means of two English language arts (ELA) and literacy standards also are below 2.5, but the ELA and literacy standards on the whole received higher importance ratings than did the math standards, with all strands except one at or above 3 for their cumulative mean.
Instructors who taught courses in the English content area comprised the majority of respondents in all strands except Speaking and Listening, and Language. Responses in these two strands were distributed more representatively among all respondent categories, which means their importance ratings are more reflective of a wide range of courses. Social science instructors made up the large majority of respondents
in the Reading Standards in History/Social Studies, while respondents in the Reading Standards in Science and Technical Subjects was more broadly distributed, with about a quarter of respondents teaching science courses. The importance ratings responses for the Writing Standards for Literacy in History/Social Studies, Science, and Technical Subjects were also distributed representatively, with social science and science instructors making up just over half of the respondents.
These results indicate that the responses to the questions about the importance of the ELA and literacy standards are broadly representative of the instructors who also find these standards to be applicable. This suggests that the importance ratings are reasonably good indicators of the perceptions of postsecondary instructors from a wide range of course categories and institution types.
Although it received high applicability ratings, the strand with the lowest importance ratings in ELA and literacy is the Language strand. These standards relate to use of the English language and include spelling, punctuation, and usage conventions. One possible explanation of this finding is that the Language standards are very detailed in nature and contain at least a few standard statements that are rated among the lowest of all of the ELA and literacy standards, perhaps because they are so specific. Some of these specific statements are actually sub-standards that fall under some broader concept. In
ImportanceAlmost every standard received a mean rating that exceeds 2.5 on a 4-point scale, and most exceed 3.
Chapter 6 | Summary and Discussion

Chapter Six • 98
general, across strands, respondents tended to place the most importance on broad reading and writing concepts.
The mathematics standards are rated somewhat lower overall in terms of importance and also demonstrate a wider range in importance (as they also do in applicability). Only the average rating of Mathematical Practices exceeds the 3, or “more important,” level on the scale. Respondents rated, on average, four conceptual categories, Number and Quantity, Algebra, Functions, and Statistics and Probability, just below “more important.” Geometry is the lowest-rated category. However, it is still above 2.5, the midpoint between “more important” and “less important.”
Mathematics and science instructors comprise the majority of respondents in several conceptual categories: Number and Quantity, Algebra, Functions, and Geometry, in which they make up 85% of respondents. They are less than a majority in two strands: Statistics and Probability, where science and social science respondents make up a majority, and the Mathematical Practices, for which mathematics and science instructors make up 43% of respondents and social science instructors comprise an additional 17%. The three other content areas each have more than 10% of the responses.
It is interesting to note that even math and science respondents rated the Geometry category relatively lower. This finding suggests that the Geometry category may be a candidate for further review in order to increase its applicability and importance by eliminating or consolidating some standards.
The Standards for Mathematical Practice, which authors of the Common Core standards stated are to be applied across all applicable standards, deserve special attention for two reasons; first, because these standards received the highest importance ratings and, second, because the ratings come from a very broad cross-section of respondents. These findings suggest that, as intended, these particular standards should indeed be implemented and assessed in a wide range of contexts and courses in secondary schools and in state and consortia assessments.
Do the standards prepare students for both college and career?
This study did not explicitly attempt to answer this question. However, by including a number of courses that are not typically included in general education requirements for a bachelor’s degree, it is possible to gain at least a glimmer of insight into this important question. Therefore, we spend some time reporting on responses from instructors in the three content areas that are more commonly associated with a career pathway and are found with relatively higher frequency in two-year institutions. These are business management, computer technology, and health care. We do not break out importance ratings by course categories due in part to low n’s in some categories. We do report the percent of respondents from each content area.
Instructors in these three areas gave the Speaking and Listening, and Language strands applicability ratings comparable to instructors in general education-related courses. Similarly, instructors in the more career-oriented course categories tended to rate the reading and writing standards at the same applicability level as instructors from most of the non-mathematics general education content areas (recalling here that these standards appear in different but comparable strands across the ELA and literacy sections). Importance ratings of the teaching and writing standards in the subject areas evidence a similar pattern, with high importance ratings and broad participation across subject areas.
In mathematics, the respondents from the more career-oriented course categories gave applicability ratings to the Standards for Mathematical Practice that are nearly as high as those given by mathematics and science instructors in general education
Chapter 6 | Summary and Discussion
The Standards for Mathematical Practice deserve special attention because these standards received the highest importance ratings, and because the ratings come from a very broad cross-section of respondents. These findings suggest that, as intended, these particular standards should indeed be implemented and assessed in a wide range of contexts.

Chapter Six • 99
Chapter 6 | Summary and Discussion
content areas. The Standards for Mathematical Practice were also rated as “more important” by a wide cross-section of respondents, including sizeable numbers from the career-oriented course categories.
These preliminary and very general findings suggest some important overlaps may exist between many general education courses and courses taken for a certificate or associate’s degree. Much additional research is necessary in this area before any definitive conclusion is reached. For instance, we limit our exploration to just three potential career paths and do so only at the postsecondary level. Further work needs to be done to solicit ratings of the standards instructors in additional career pathway areas and in workforce training programs, and to compare the Common Core standards to analyses of job skills contained in sources such as O*NET Level 3.
Will students who do well on the common assessments be ready for college?
This study examines the Common Core standards’ applicability to and importance for success in college courses. While the standards fare very well on these two criteria, this is not the same as saying students who test well on assessments of the Common Core standards will necessarily be fully ready for college or careers.
As we have noted elsewhere (Conley, 2007; 2010), college and career readiness is a multidimensional construct, and content knowledge is only one of several key dimensions. The Common Core standards represent an important set of content knowledge and potentially of cognitive strategies, but caution should be exercised when describing them as a complete specification for college and career readiness. Achieving the goal of a college- and career-ready student is dependent on other factors and dimensions as well, factors that are not addressed by the Common Core standards and that, in all likelihood, will not be assessed by the common assessments currently under development by two consortia of states, the Partnership for the Assessment of Readiness for College and Careers (PARCC) and SMARTER Balanced Assessment Consortium (SBAC).
Beyond content knowledge, a second and equally important dimension is the cognitive strategies students possess when they enter college. These strategies allow them to apply content they are using in novel and nonroutine ways to solve problems and attack important questions of the discipline. In short, they require deeper learning skills (Conley, 2011). The Common Core standards were rated as sufficient in terms of cognitive challenge, which is an indicator that they have the potential to develop student thinking skills and cognitive strategies. These, however, are dependent on how the standards are taught and then subsequently assessed. Some of the comments to the open-ended questions suggest that postsecondary instructors think the Common Core standards could do more to develop thinking skills.
A third important dimension of college and career readiness are the associated learning skills and techniques students develop as they engage with challenging academic material. The Common Core standards are necessarily silent on these skills, which include time management, goal setting, persistence, study skills, collaboration, and other important behaviors associated with managing academic learning tasks successfully and independently. Here, again, the ways in which students are taught the standards will affect the degree to which they acquire and develop these necessary college- and career-readiness skills.
The final dimension in college and career knowledge consists of the specific knowledge and skills students need to make a successful transition from high school to postsecondary education. In the U.S., the transition process is complex and multi-step and includes numerous requirements, deadlines, forms, and pieces of information. The Common Core standards
Important OverlapsThese preliminary and very general
findings suggest some important
overlaps may exist between many general
education courses and courses taken for
a certificate or associate’s degree. Much
additional research is necessary in this
area before any definitive conclusion is
reached.

Chapter Six • 100
do not and cannot address this dimension, but it is important to note that defining a set of standards as “college and career ready” that overlook the three dimensions beyond content knowledge will result in assuming that students who have achieved a particular score on the common assessments are fully ready for college and career studies when, in fact, they may possess only a subset of the knowledge and skills, strategies and techniques necessary to be fully ready for postsecondary success.
Future directions for subsequent research and analysis
We recommend several directions for continued analysis of and reflection on the current Common Core standards. First, from the data we have in hand from this survey, we intend to look further at subgroup findings. We have the opportunity to look more in-depth at elements such as the ratings from specific content areas or from specific types of institutions (e.g., selectivity). As previously mentioned, we intend to analyze the syllabus content of respondents from this survey against the Common Core standards, which should add a level of understanding and context to the findings contained in this report. We will also compare the results from this survey with findings from other surveys that ask postsecondary faculty about the preparation of high school students (e.g., ACT, 2009; College Board, 2005).
Whereas this study compares content of the Common Core standards with expectations for college courses, another study that EPIC conducted concurrently compares content of the Common Core standards with content of existing high school standards (see Conley, Drummond, Seburn, de Gonzalez, Stout, & Rooseboom, 2011). This additional study offers additional insight into the implementation of the Common Core, particularly how similar or different the Common Core are from current standards, and it adds to the developing body of literature in this area (Porter, McMaken, Hwang, & Yang, 2011a; 2011b; Beach, 2011; Cobb & Jackson, 2011).
We also recommend that others with interests in these areas, including state education departments and postsecondary agencies, undertake additional analyses of career pathways in relation to the Common Core standards to gain greater insight into the specific profiles of knowledge and skills that students need for each of a range of postsecondary career programs. We did not look specifically at the applicability and importance of the Common Core standards in relation to job readiness, which we define as what is necessary to enter the workforce
directly from secondary school. This may be worthwhile to undertake to help confirm the degree to which postsecondary learning is necessary for all students to be prepared to enter the workforce and to identify the types of jobs that do not require mastery of the Common Core standards. Similarly, the knowledge and skill level necessary to succeed in employer and military training programs should be determined in relation to the Common Core standards. Finally, the relationship between the Common Core standards and the new version of the General Education Development (GED) certificate that is currently under design should be determined. This full set of studies is necessary to ensure that there are not “shortcuts” around the Common Core standards, particularly if a program purports to be equivalent to the standards.
Additional Research
We recommend that others, including state
education departments and postsecondary
agencies, undertake additional analyses of
career pathways in relation to the Common
Core standards to gain greater insight into
the specific profiles of knowledge and
skills that students need for a range of
postsecondary career programs.
Chapter 6 | Summary and Discussion

| References
ACT. (2009). National Curriculum Survey. Iowa city, IA; Author. Retrieved from http://www.act.org/research/curricsurvey.htmlBeach, R.W. (2011). Issues in analyzing alignment of the language arts Common Core standards with state standards.
Educational Researcher, 40, 183-185.Behrens, J.T., Mislevy, R.J., DiCerbo, K.E., & Levy, R. (2010). An evidence centered design for learning and assessment in
the digital world. (CRESST Report 778). Los Angeles, CA: University of California, National Center for Research on Evaluation, Standards, and Student Testing (CRESST).
Carnegie Foundation. (2009a). The Carnegie Classification of Institutions of Higher Education™. [Data file]. Available from http://classifications.carnegiefoundation.org/lookup_listings/custom.php.
Carnegie Foundation. (2009b). [Description of size and setting classification]. The Carnegie Classification of Institutions of Higher Education™. Retrieved from http://classifications.carnegiefoundation.org/descriptions/size_setting.php
Cobb, P., & Jackson, K. (2011). Assessing the quality of the Common Core State Standards for mathematics. Educational Researcher, 40, 103-116.
College Board. (2005). A survey to evaluate the alignment of the new SATÒ writing and critical reading sections to curricula and instructional practices. New York, NY: College Entrance Examination Board.
College Board. (2009). [Map of the United States broken into regions]. College Board regions and offices. Retrieved from http://about.collegeboard.org/
Common Core State Standards Initiative (2010a). Introduction to the Common Core State Standards. Retrieved from http://www.corestandards.org/assets/ccssi-introduction.pdf
Common Core State Standards Initiative (2010b). Common Core State Standards for mathematics. Retrieved from http://www.corestandards.org/assets/CCSSI_Math%20Standards.pdf
Common Core State Standards Initiative (2010c). Common Core State Standards for English language arts and literacy in history/social studies, science, and technical subjects. Retrieved from http://www.corestandards.org/assets/CCSSI_ELA%20Standards.pdf
Conley, D.T. (2003). Understanding university success: A report from Standards for Success, a project of the Association of American Universities and The Pew Charitable Trusts. Eugene, OR: Center for Educational Policy Research.
Conley, D.T., Aspengren, K., Gallagher, K., Stout, O., Veach, D. (2006). College Board Advanced Placement® best practices course study. Eugene, OR: Center for Educational Policy Research,
Conley, D.T. (2007). Redefining college readiness, Volume 5. Eugene, OR: Educational Policy Improvement Center. Conley, D.T. (2010). College and career ready: Helping all students succeed beyond high school. San Francisco, CA:
Jossey-Bass. Conley, D.T., Drummond, K.V., Seburn, M., de Gonzalez, A., Rooseboom, J., & Stout O. (2011). How well do the Common
Core State Standards align to five sets of comparison standards? An analysis of high school-level standards in English language arts and literacy, and mathematics. Manuscript in preparation.
Conley, D.T. (2011). Crosswalk analysis of Deeper Learning Skills to Common Core State Standards. Manuscript in preparation.
Cook, H.G. (2005). Research Report #0504: Milwaukee Public Schools alignment study of Milwaukee Public Schools’ Learning Targets in reading and math to Wisconsin student assessment system criterion-referenced test frameworks in reading and math. Milwaukee, WI: Milwaukee Public Schools Office of Assessment and Accountability.
Cook, H.G., & Wilmes, K. (2007). Alignment between the Kentucky Core Content for assessment and the WIDA Consortium English Language Proficiency Standards. Madison, WI: Wisconsin Center for Education Research.
Educational Policy Improvement Center (2008). Validation Study I: Alignment of the Texas College and Career Readiness Standards with entry-level general education courses at Texas postsecondary institutions.
King, J.E. (2011). Implementing the Common Core State Standards: An action agenda for higher education. American Council on Education. Retrieved from http://www.acenet.edu/links/pdfs/cpa/ImplementingTheCommonCoreStateStandards_2011.html
Validity Study • 101

Validity Study • 102
| References
Mislevy, R.J., Steinberg, L.S., Almond, R.G. (2002). Design and analysis in task-based language assessment. Los Angeles, CA: Center for Research on Evaluation, Standards, and Student Testing.
Mislevy, R.J., Steinberg, L.S., Almond, R.G. (2003). On the structure of educational assessments, CSE technical report. Los Angeles, CA: Center for Research on Evaluation, Standards, and Student Testing.
Phillips V., & Wong C. (2010). Tying together the common core of standards, instruction, and assessments. Phi Delta Kappan, 91(5), 37-42.
Planty, M., Kena, G., & Hannes, G. (Eds.) (2009). The condition of education 2009 in brief (NCES 2009-082). Washington, DC: National Center for Education Statistics, Institute of Education Sciences, U.S. Department of Education.
Porter, A., McMaken, J., Hwang, J., & Yang, R. (2011a). Common Core Standards: The new U.S. intended curriculum. Educational Researcher, 40, 103-116.
Porter, A., McMaken, J., Hwang, J., & Yang, R. (2011b). Assessing the Common Core Standards: Opportunities for improving measures of instruction. Educational Researcher, 40, 186-188.
U.S. Department of Education, National Center for Education Statistics. (2004). The condition of education 2004 (NCES 2004–077). Washington, DC: U.S. Government Printing Office.
U.S. Department of Education, (2010, June 2). Statement on National Governors Association and state education chiefs Common Core standards. Retrieved from http://www.ed.gov/news/press-releases/statement-national-governors-association-and-state-education-chiefs-common-core-.
U.S. Department of Labor. Bureau of Labor Statistics 2008-2018 employment projections. Retrieved from http://www.bls.gov/emp/
Webb, N.L. (1997). Criteria for alignment of expectations and assessments in mathematics and science education. Council of Chief State School Officers and National Institute for Science Education Research Monograph No. 6. Madison, WI: University of Wisconsin, Wisconsin Center for Education Research.
Webb, N.L. (2002). Alignment study in language arts, mathematics, science, and social studies of state standards and assessments for four states. A study of the State Collaborative on Assessment & Student Standards (SCASS) Technical Issues in Large-Scale Assessment (TILSA). Washington, DC: Council of Chief State School Officers.

Appendices to
Reaching the Goal: The Applicability and Importance of the Common Core State
Standards to College and Career Readiness

Appendix A shows the percentage breakdowns from the Carnegie Classification of Institutions of Higher Education™ (Carnegie Foundation, 2009) that served as rough recruitment goals for the study. In order to identify college instructors to complete the survey, a list was obtained from the Carnegie website in the spring of 2009. It contained information for the 3468 institutions of higher education in the United States offering associate and undergraduate degrees at that time1. As we recruited, we attempted to replicate in our sample, as closely as possible, the proportions of all institutions in terms of size, whether they are private or public, and whether they are two-year or four-year institutions. Tables A1 through A4 show the percentage breakdowns that served as recruitment goals compared to the percentage breakdown of the actual study sample.
1We did not include institutions located in U.S. territories.
Sample Recruitment | Appendix A
Table A. Comparison of All U.S. Institutions of Higher Educationa Compared to Study Respondents by Type: Public vs. Private
Institution Type
All institutions n
All institutions percent
Study n
Study percent
Private 6 .6 688 6.
Public 9 48.4 209 6.
Total 3468 100.0 1897 100.0
aThe data on all institutions of higher education were calculated from information obtained from the Carnegie Foundation (2009).
Table A2. Comparison of All U.S. Institutions of Higher Educationa Compared to Study Respondents by Type: 2-year vs. 4-year
Institution Type All institutions n
All institutions percent
Study n
Study percent
2-year 6 .9 6 40.4
4-year or above 2292 66. 0 9.6
Total 3468 100.0 1897 100.0
aThe data on all institutions of higher education were calculated from information obtained from the Carnegie Foundation (2009).
Table A. Comparison of All U.S. Institutions of Higher Educationa Compared to Study Respondents by Size and Setting Category
Size and setting All institutions n
All institutions percent
Study n
Study percent
2-year
Very small 2 6. 8 .
Small 402 .6 28 .0
Medium 9 . 29 .
Large 4.4 29 6.8
Very large 2.0 48 2.
4-year
Very small, highly residential
9 4.6 88 4.6
Very small, primarily nonresidential
4 .0 2.0
Ap
pe
nd
ix A
Appendix A • 104
Continued on next page

Validity Study • 105
Table A3. continued
Size and setting All institutions n
All institutions percent
Study n
Study percent
Very small, primarily residential
6 .8 .
Small four-year, highly residential
08 8.9 8 9.9
Small, primarily nonresidential
4. 9 4.2
Small, primarily residential
4.9 .2
Medium, highly residential
. 4.
Medium, primarily nonresidential
48 4. 94 .0
Medium, primarily residential
4. 2 .9
Large, highly residential
2 0.9 0.4
Large, primarily nonresidential
24 .6 6.0
Large, primarily residential
8 2. 6 .2
Other (4-year)
Special focus institution
2 . 9 4.9
Total 3468 100.0 1897 100.0
aThe data on all institutions of higher education were calculated from information obtained from the Carnegie Foundation (2009).
Sample Recruitment
Table A4. Comparison of All U.S. Higher Education Institutionsa Compared to Study Respondents by Geographic Location
Geographic Location All institutions n
All institutions percent
Study n
Study percent
East 82 22. 29 .6
Midwest 894 2.8 2 28.0
South 849 24. 24 2.6
Southwest 296 8. 29 2.6
West 64 8. 0 6.2
Total 3468 100.0 1897 100.0
aThe data on all institutions of higher education were calculated from information obtained from the Carnegie Foundation (2009). The Carnegie list contained the state for all institutions. The geographic regions were derived from regions that the College Board specifies (College Board, 2009); however, we combined two College Board regions — Middle States and New England — to create the East category.
Appendix A
Ap
pe
nd
ix A

Valid
ity
Stud
y •
106
Leve
l of
Co
urs
es |
Ap
pen
dix
B
App
endi
x B
pre
sent
s in
form
atio
n ab
out
the
leve
l of
the
cou
rses
rep
rese
nted
in
our
sam
ple.
Spe
cific
ally
, Ta
bles
B1
and
B2
pres
ent
addi
tiona
l in
form
atio
n ab
out
how
man
y tim
es r
espo
nden
ts h
ad t
augh
t th
eir
cour
ses
and
whe
ther
the
cou
rses
had
pre
requ
isite
s. T
he s
urve
y w
as in
tend
ed
to c
aptu
re th
e pe
rcep
tions
of i
nstru
ctor
s of
ent
ry-le
vel c
ours
es, h
owev
er, t
here
was
10%
of t
he s
ampl
e th
at c
onsi
dere
d th
eir
cour
se to
be
uppe
r le
vel.
This
is
beca
use
stud
ents
do
not
ordi
naril
y ta
ke s
ome
of t
he s
ome
of t
he c
ours
e ca
tego
ries
we
chos
e un
til t
hey
are
esta
blis
hed
in t
heir
post
seco
ndar
y ed
ucat
ion.
How
ever
, th
e co
urse
s w
ere
still
firs
t in
the
seq
uenc
e in
the
sub
ject
are
a an
d, t
here
fore
, re
pres
ente
d an
acc
epta
ble
mea
sure
of
the
appl
icab
ility
and
impo
rtan
ce o
f th
e C
omm
on C
ore
stan
dard
s. W
e di
d co
mpa
re t
he m
eans
of
resp
onse
s fro
m in
stru
ctor
s w
hose
co
urse
s w
ere
beyo
nd t
he e
ntry
leve
l with
tho
se a
t th
e en
try
leve
l, an
d w
e fo
und
little
not
able
sta
tistic
al d
iffer
ence
. W
e th
eref
ore
incl
uded
the
se
cour
ses
in a
naly
ses
in th
e bo
dy o
f the
repo
rt.
Tabl
e B
1 sh
ows
the
leve
l of t
he c
ours
e. T
he 1
0% o
f cas
es th
at w
ere
uppe
r lev
el te
nded
to b
e co
ncen
trate
d in
bus
ines
s m
anag
emen
t and
hea
lthca
re
and,
to a
less
er d
egre
e, in
com
pute
r tec
hnol
ogy
and
mat
hem
atic
s.
Tab
le B
. L
evel
of
Co
urs
e (n
=
89)
Rep
ort
ed b
y Re
spo
nd
ent
Leve
lEn
glis
h la
ng
uag
e ar
tsM
ath
emat
ics
Scie
nce
So
cial
sci
ence
Bu
sin
ess
man
agem
ent
Co
mp
ute
r te
chn
olo
gy
Hea
lth
care
Tota
l
n%
n%
n%
n%
n%
n%
n%
n%
Entr
y le
vel/
low
er d
ivis
ion
28
9.
266
88.
24
9.
44
98.6
9
9.4
29
84.
44
.4
0
89.9
Up
per
div
isio
n2
8.
6
.9
2.
.
20
20.6
24
.42
22.6
9
0.
Tota
l31
210
0.0
302
100.
028
110
0.0
420
99.8
a24
310
0.0
153
100.
018
610
0.0
1896
99.9
a
a Du
e to
a s
yste
m e
rro
r, o
ne
per
son
fro
m a
so
cial
sci
ence
co
urs
e d
id n
ot
answ
er t
he
qu
esti
on
.
App
endi
x B
Ap
pe
nd
ix B

Valid
ity
Stud
y •
107
Leve
l of
Co
urs
es
Tabl
e B
2 di
spla
ys re
spon
ses
to th
e qu
estio
n ab
out w
heth
er o
r not
the
cour
se h
as p
rere
quis
ites.
The
sam
ple
as a
who
le w
as fa
irly
even
ly s
plit,
with
55
% r
epor
ting
that
the
cou
rse
did
have
a p
rere
quis
ite.
A m
ajor
ity o
f En
glis
h la
ngua
ge a
rts,
mat
hem
atic
s, c
ompu
ter
tech
nolo
gy,
and
heal
thca
re
resp
onde
nts
repo
rted
that
thei
r co
urse
s ha
d pr
ereq
uisi
tes.
Soc
ial s
cien
ce r
espo
nden
ts w
ere
muc
h le
ss li
kely
to r
epor
t a p
rere
quis
ite. E
xam
inin
g th
e sy
llabi
of t
hese
cou
rses
sho
w th
at th
ey w
ere
inde
ed g
ener
ally
firs
t-in-
sequ
ence
cou
rses
but
som
e di
d re
quire
cou
rses
from
a r
elat
ed c
onte
nt
area
, con
curr
ent e
nrol
lmen
t in
a co
urse
, or a
hig
h sc
hool
-leve
l pre
requ
isite
.
Tab
le B
2. A
nsw
er t
o Q
ues
tio
n A
bo
ut
Wh
eth
er o
r N
ot
Co
urs
es (
n =
89
) H
ave
On
e o
r M
ore
Sp
ecifi
c P
rere
qu
isit
es, R
epo
rted
by
Resp
on
den
t
Resp
on
seEn
glis
h la
ng
uag
e ar
tsM
ath
emat
ics
Scie
nce
So
cial
sci
ence
B
usi
nes
s m
anag
emen
t C
om
pu
ter
tech
no
log
yH
ealt
hca
reTo
tal
n%
n%
n%
n%
n%
n%
n%
n%
Yes
2
68.9
26
86.4
80
64.
6.
499
40.
84
.24
8
.00
404
.8
No
9
.4
.6
0
.9
62
86.2
44
9.
04
.84
22.0
86
4.
Tota
l31
210
0.0
302
100.
028
110
0.0
420
99.8
a24
310
0.0
153
100.
018
610
0.0
1896
99.9
a
a Du
e to
a s
yste
m e
rro
r, o
ne
per
son
fro
m a
so
cial
sci
ence
co
urs
e d
id n
ot
answ
er t
he
qu
esti
on
.
App
endi
x B
Ap
pe
nd
ix B

Valid
ity
Stud
y •
108
App
endi
x C
pre
sent
s in
form
atio
n ab
out t
he d
emog
raph
ics
of th
e sa
mpl
e. In
ord
er to
obt
ain
cont
ext f
or th
e sa
mpl
e, w
e as
ked
resp
onde
nts
seve
ral
ques
tions
abo
ut th
eir
cour
ses.
The
bod
y of
the
repo
rt s
how
s in
form
atio
n ab
out t
he le
vel,
size
, and
mod
e of
del
iver
y fo
r co
urse
s, r
epor
ted
for
the
sam
ple
as a
who
le.
Tabl
es C
1 th
roug
h C
3 sh
ow t
he in
form
atio
n br
oken
dow
n by
con
tent
are
a. T
able
C4
show
s ad
ditio
nal i
nfor
mat
ion
abou
t th
e m
odes
of a
sses
smen
t tha
t res
pond
ents
repo
rted
usi
ng in
thei
r cou
rses
.
Tabl
e C
1 di
spla
ys th
e nu
mbe
r of
stu
dent
s in
res
pond
ents
’ cou
rses
, by
cont
ent a
rea.
All
cont
ent a
reas
had
a m
ajor
ity o
f cou
rses
fall
into
the
two
smal
lest
rang
es o
f cla
ss s
ize,
bet
wee
n 1
and
25 o
r 26
and
50 s
tude
nts.
The
re w
as a
tend
ency
for E
nglis
h la
ngua
ge a
rts
and
com
pute
r tec
hnol
ogy
clas
ses
to b
e sm
alle
r; be
twee
n 64
% a
nd 7
3% o
f cou
rses
had
few
er th
an 2
6 st
uden
ts. S
cien
ce, s
ocia
l sci
ence
, and
hea
lthca
re c
ours
es te
nded
to
be la
rger
, with
mor
e th
an 2
5% o
f cou
rses
enr
ollin
g m
ore
than
50
stud
ents
.
Tab
le C
. N
um
ber
of
Stu
den
ts E
nro
lled
in C
ou
rses
(n
=
89)
, Rep
ort
ed b
y Re
spo
nd
ent
Nu
mb
er o
f st
ud
ents
Eng
lish
lan
gu
age
arts
Mat
hem
atic
s Sc
ien
ce
Soci
al s
cien
ce
Bu
sin
ess
Man
agem
ent
Co
mp
ute
r te
chn
olo
gy
Hea
lth
care
Tota
l
n%
n%
n%
n%
n%
n%
n%
n%
–2
22
2.8
8.
8028
.99
2.6
886
.298
64.
69
.44
9
.2
26–
06
20.8
26
4.
860
.620
48
.0
04
.229
9.0
942
.68
86
.
–
009
2.9
24.
949
.4
2
.628
.
.9
2.0
29
.
0–
00
2.
22
8.
9
.6
.6
.
0
4.6
2
.49
0
.2
0–
000
4.
8
2.6
2.
.
2.
90
0.0
2.
8
2.0
00
+0
0.0
4.
4
.4
0.
2
.2
2.
2
.
60.
8
Tota
l31
210
0.0
302
100.
028
110
0.0
420
100.
024
310
0.0
153
100.
018
610
0.0
1897
100.
0
Tabl
e C
2 di
spla
ys t
he w
ays
in w
hich
res
pond
ents
in e
ach
cont
ent
area
rep
orte
d th
at t
hey
deliv
er in
stru
ctio
n in
the
ir co
urse
s. M
ost
resp
onde
nts
incl
ude
a le
ctur
e co
mpo
nent
. Sc
ienc
e, c
ompu
ter
tech
nolo
gy,
and
heal
thca
re c
ours
es a
re l
ikel
y to
inc
lude
lab
orat
orie
s. M
ore
than
50%
of
the
Engl
ish
lang
uage
art
s co
urse
s us
e se
min
ar fo
rmat
s. In
mos
t con
tent
are
as, a
ppro
xim
atel
y on
e-th
ird o
f cou
rses
use
som
e ty
pe o
f onl
ine
lear
ning
co
mpo
nent
. Res
pond
ents
in m
any
cont
ent a
reas
che
cked
“ot
her”
mod
es o
f del
iver
y, in
add
ition
to th
e ch
oice
s pr
ovid
ed. I
n ex
plai
ning
thes
e ot
her
mod
es, m
any
resp
onde
nts
liste
d in
tera
ctiv
e ac
tiviti
es, s
uch
as g
roup
wor
k or
pro
ject
s, c
lass
dis
cuss
ions
, writ
ing
wor
ksho
ps, o
r pee
r tut
orin
g. S
ome
resp
onde
nts
liste
d su
ch a
ctiv
ities
as
clin
ical
exp
erie
nces
or h
ands
-on
prac
tice.
Dem
og
rap
hic
s o
f th
e Sa
mp
le |
Ap
pen
dix
C
App
endi
x C
Ap
pe
nd
ix C

Valid
ity
Stud
y •
109
Dem
og
rap
hic
s o
f th
e Sa
mp
le
Tabl
e C
3 sh
ows
the
num
ber o
f tim
es in
stru
ctor
in e
ach
cont
ent a
rea
had
taug
ht th
e co
urse
. For
a re
lativ
ely
smal
l per
cent
age
of c
ours
es (f
rom
2–6
%
acro
ss d
iffer
ent
cont
ent
area
s),
the
inst
ruct
or h
ad o
nly
taug
ht t
he c
ours
e on
ce.
For
a m
ajor
ity o
f co
urse
s (fr
om 5
4–76
% a
cros
s di
ffere
nt c
onte
nt
area
s), t
he in
stru
ctor
had
taug
ht it
10
or m
ore
times
.
Tab
le C
2. M
od
e o
f D
eliv
ery
for
Co
urs
es (
n =
89
), R
epo
rted
by
Resp
on
den
t
Mo
de
Eng
lish
lan
gu
age
arts
(n
=
2)
Mat
hem
atic
s
(n
=
02)
Scie
nce
(n
= 2
8)
Soci
al s
cien
ce
(n =
420
)
Bu
sin
ess
man
agem
ent
(n =
24
)
Co
mp
ute
r te
chn
olo
gy
(n
=
)
Hea
lth
care
(n
=
86)
n%
n%
n%
n%
n%
n%
n%
Sem
inar
62
.9
44.
62
4.
.42
.
9.
9
.0
Lect
ure
24
.2
29
9.0
26
98.2
96
94.
22
9.8
4
92.2
8
9.
Lab
26
.
2.
246
8.
2.
02
.2
20
8.4
6.8
On
line
98
.49
.
602
.4
4
.9
246
.2
4.0
6
.9
Tele
con
fere
nce
6.
9
2.
00.
00
2.4
2.
92
.
00.
0
Oth
er8
8.6
09.
9
2.
.29
.9
4.
69
2.0
Tota
l re
spo
nse
s61
751
062
968
943
033
141
1
No
te. T
ota
ls a
dd
to
mo
re t
han
00
% b
ecau
se in
stru
cto
rs c
ou
ld s
elec
t al
l ap
plic
able
mo
des
.
Tab
le C
. N
um
ber
of
Tim
es T
each
ing
Co
urs
e, R
epo
rted
by
Resp
on
den
t
Nu
mb
er o
f ti
mes
Eng
lish
lan
gu
age
arts
Mat
hem
atic
s Sc
ien
ceSo
cial
sci
ence
B
usi
nes
s m
anag
emen
t C
om
pu
ter
tech
no
log
yH
ealt
hca
reTo
tal
n%
n%
n%
n%
n%
n%
n%
n%
8
2.6
9.
0
2.
.
4
.8
2.
0
2.
9.
2–
44
.4
6.9
8
.92
2.4
64
.84
22.2
482
.8
96
.8
6–9
0
.6
2.
4
.
8.
20
.2
.0
.22
92
.
0+
226
2.4
20
6.9
8
6.
9
6.0
68
69.
960
.80
0
.82
896
.9
Tota
l31
210
0.0
302
100.
028
110
0.0
420
99.8
a24
310
0.0
153
100.
018
610
0.0
1896
99.9
a
a Du
e to
a s
yste
m e
rro
r, o
ne
per
son
fro
m a
so
cial
sci
ence
co
urs
e d
id n
ot
answ
er t
he
qu
esti
on
.
App
endi
x C
Ap
pe
nd
ix C

Valid
ity
Stud
y •
110
Dem
og
rap
hic
s o
f th
e Sa
mp
le
Tabl
e C
4 sh
ows
the
diffe
rent
mod
es o
f ass
essm
ent t
hat r
espo
nden
ts r
epor
ted
usin
g in
thei
r co
urse
s, b
y co
nten
t are
a. R
espo
nden
ts c
ould
sel
ect
all t
hat w
ere
appl
icab
le. T
ests
and
qui
zzes
wer
e co
mm
only
repo
rted
acr
oss
all c
onte
nt a
reas
in th
e sa
mpl
e. T
ests
and
qui
zzes
are
the
pred
omin
ant
met
hod
of a
sses
smen
t fo
r m
athe
mat
ics
cour
ses.
Sci
ence
, so
cial
sci
ence
, bu
sine
ss m
anag
emen
t, an
d he
alth
care
cou
rses
com
mon
ly a
lso
use
shor
t an
swer
for
mat
s. N
ot s
urpr
isin
gly,
nea
rly e
very
Eng
lish
lang
uage
art
s co
urse
invo
lves
ess
ay w
ritin
g; a
maj
ority
of
thes
e co
urse
s al
so u
se
rubr
ics
and
peer
eva
luat
ion.
A m
ajor
ity o
f soc
ial s
cien
ce c
ours
es a
lso
use
essa
ys. P
erfo
rman
ce ta
sks
are
used
for a
maj
ority
of s
cien
ce, b
usin
ess
man
agem
ent,
com
pute
r tec
hnol
ogy,
and
hea
lthca
re c
ours
es.
Tab
le C
4. M
od
es o
f A
sses
smen
t fo
r C
ou
rses
(n
=
89)
, Rep
ort
ed b
y Re
spo
nd
ent
Mo
de
Eng
lish
la
ng
uag
e ar
ts
(n =
2
)
Mat
hem
atic
s
(n =
02
)Sc
ien
ce
(n =
28
)So
cial
sci
ence
(n
= 4
9)
Bu
sin
ess
man
agem
ent
(n =
24
)
Co
mp
ute
r te
chn
olo
gy
(n =
)
Hea
lth
care
(n =
86
)To
tal
n%
n%
n%
n%
n%
n%
n%
n%
Ob
serv
atio
n
48
.4
06
.42
4
.2
6
.99
40.
.90
.49
842
.
Essa
ys0
999
.024
.9
426
.29
9
.40
4
.62
.8
66
.88
46
.
Inte
rvie
ws
00.
00
0.0
00.
00
0.0
00.
00
0.0
00.
00
0.0
Perf
orm
ance
ta
sks
4.
9
46.0
6
9.4
.
46
60.
0
66.0
04
.9
92
48.8
Exh
ibit
ion
s/d
emo
nst
rati
on
s6
9.6
444
.6
8.
94
.46
8.9
824
.82
8.
9.6
Port
folio
s0
4
.9
.0
.
88
4.
04.
0
6.
94.
86
88.
9
Jou
rnal
s2
640
.42
4.0
24.
9
9.
.
0
4.6
820
.42
.2
Rub
rics
200
64.
68
.82
29.2
20
28.6
6
.4
0.
84
.96
94
.8
Self
an
d p
eer
eval
uat
ion
s2
6
.62
0.6
4
.6
.
6
.22
4.4
424
.249
426
.
Sho
rt a
nsw
ers
8
44.2
46
48.
89
6.
2
60.9
6.4
.
9
.0
24
.2
Test
s an
d
qu
izze
s9
96
.80
99
.2
999
.40
9
.2
9
.94
94
.88
29
.8
409
.8
Ora
l p
rese
nta
tio
n6
6
.24
4.2
8229
.2
2
.0
844
.42
.0
28
.6
.
Ind
ivid
ual
p
roje
cts
64
2.6
0
.4
0
6.
82
4.4
4
8.8
2
8.0
844
.29
048
.0
Gro
up
pro
ject
s2
640
.490
29.8
24
44.
6
2.
4.
644
.888
4.
4
9.
Tota
l re
spo
nse
s20
9311
1313
3819
7713
2570
210
5296
00
No
te. T
ota
ls a
dd
to
mo
re t
han
00
% b
ecau
se in
stru
cto
rs c
ou
ld s
elec
t al
l ap
plic
able
mo
des
.
App
endi
x C
Ap
pe
nd
ix C

Summary of ELA and Literacy Applicability Ratings | Appendix D
Appendix D presents additional information on respondents’ applicability ratings in English language arts (ELA) and literacy to supplement the data presented in Chapter 3. The first set of tables show the number of standards that respondents rated as applicable in each ELA and literacy strand (Tables D1 through D8). Table D9 shows the number of standards that were rated as applicable across the four strands that cover reading (two in ELA and two in literacy) and D10 shows the standards that were rated across the three strand that cover non-literary reading (one in ELA and two in literacy). Table D11 shows the number of standards that were rated as applicable across the two strands that involve writing (one in ELA and one in literacy). Finally, Table D12 shows applicability information by content area, specifically the number of respondents in each content area who rated at least one standard in a strand as applicable. Table D13 presents the percent of responses that fall into each of the four applicable categories, by strand and for all the strands combined.
Table D. Number of Standard Statements Rated as Applicable for Reading for Literature Strand
Number of statements (out of 9)
Number of respondents
Percent of all respondents
(n = 89)
Percent of respondents
who rated any standard in strand
(n = )
26 .4 4.9
2 2 2. 9.
60 .2 .2
4 9 . .0
4 2. 8.0
6 8 . 0.8
60 .2 .2
8 84 4.4 .
9 9 4.9 .4
Total 535 28.2 100.0
Table D2. Number of Standard Statements Rated as Applicable for Reading for Informational Texts Strand
Number of statements (out of 0)
Number of respondents
Percent of all respondents
(n = 89)
Percent of respondents
who rated any standard in
strand (n = 488)
4 0.2 0.8
2 2 0.6 2.
2 .4 .
4 0.9 .
26 .4 .
6 4 2.4 9.2
24 6. 2.4
8 2 .9 2.0
9 8 . .9
0 6 . 2.9
Total 488 25.7 100.0
Table D. Number of Standard Statements Rated as Applicable for Writing Strand
Number of statements (out of 28)
Number of respondents
Percent of all respondents
(n = 89)
Percent of respondents
who rated any standard in strand
(n = 04)
– 9 0. .8
8–4 44 2. 8.
–2 4 .4 28.0
22–28 0 6. 6.
Total 504 26.6 100.0
Table D4. Number of Standard Statements Rated as Applicable for Speaking and Listening Strand
Number of statements (out of 0)
Number of respondents
Percent of all respondents
(n = 89)
Percent of respondents
who rated any standard in
strand (n = 0)
2 . .4
2 4 2. 2.9
4 2.4 .0
4 0 . 4.6
84 4.4 .6
6 2 .9 .4
64 8.6 0.9
8 9. .
9 28 2. .8
0 29.4 .0
Total 1507 79.4 100.0
Ap
pe
nd
ix D
Appendix D • 111

Validity Study • 112
Table D6. Number of Standard Statements Rated as Applicable for Reading for Literacy in History/Social Studies Strand
Number of statements (out of 0)
Number of respondents
Percent of all respondents
(n = 89)
Percent of respondents
who rated any standard in strand
(n = )
4 0.2 0.
2 6 0. .
0 0. .8
4 0 0. .8
0.9 .0
6 28 . 4.9
49 2.6 8.6
8 2.9 9.6
9 .9 9.4
0 28 4.8 49.2
Total 571 30.1 100.0
Table D. Number of Standard Statements Rated as Applicable for Reading for Literacy in Science and Technical Subjects Strand
Number of statements (out of 0)
Number of respondents
Percent of all respondents
(n = 89)
Percent of respondents
who rated any standard in strand
(n = 068)
0. 0.
2 0.8 .4
2 .2 2.2
4 40 2. .
4 2.2 .8
6 4 .9 6.9
6 4.0 .
8 22 6.4 .4
9 6 8.8 .6
0 0 26.6 4.
Total 1068 56.3 100.0
Table D8. Number of Standard Statements Rated as Applicable for Writing for Literacy in History/Social Studies, Science, and Technical Subjects Strand
Number of statements (out of 9)
Number of respondents
Percent of all respondents
(n = 89)
Percent of respondents
who rated any standard in strand
(n = 26)
— 68 .6 .4
6—0 2 9. .6
— 242 2.8 9.
6—9 8 4. 6.9
Total 1265 66.7 100.0
Summary of English Language Arts and Literacy Applicability Ratings
Table D. Number of Standard Statements Rated as Applicable for Language Strand
Number of statements (out of )
Number of respondents
Percent of all respondents
(n = 89)
Percent of respondents
who rated any standard in strand
(n = 2)
–4 9 4.8 .9
–8 2 4. .
9–2 02 .9 9.
– 888 46.8 .2
Total 1552 81.8 100.0
Appendix D
Ap
pe
nd
ix D

Validity Study • 113
Table D0. Number of Standard Statements Rated as Applicable Across the Three Non-literary Reading Strands: Informational Texts, History/Social Studies, Science and Technical Subjects
Number of statements (out of 0)
Number of respondents
Percent of all respondents
(n = 89)
Percent of respondents
who rated any standard in three strands (n = 66)
–8 4 28. 2.
9–6 90 49.0 .
–24 6 8.8 0.0
2–0 8 2.0 2.
Total 1676 88.4 100.0
Table D. Number of Standard Statements Rated as Applicable Across Two Writing Strands
Number of statements (out of 4)
Number of respondents
Percent of all respondents
(n = 89)
Percent of respondents
who rated any standard in two
strands (n = 64)
–2 298 . 9.
–24 940 49.6 60.
2–6 20 0.6 2.9
–4 2 6.6 8.0
Total 1564 82.4 100.0
Summary of English Language Arts and Literacy Applicability Ratings
Table D9. Number of Standard Statements Rated as Applicable Across Four Reading Strands
Number of statements (out of 9)
Number of respondents
Percent of all respondents
(n = 89)
Percent of respondents
who rated any standard in four
strands (n = 69)
–0 2 9. 66.
–20 40 2.6 24.2
2–0 .0 .8
–9 . .9
Total 1697 89.5 100.0
The following tables show the standards that were rated across the Reading and Writing strands.
Appendix D
Ap
pe
nd
ix D

Valid
ity
Stud
y •
114
Tab
le D
2. N
um
ber
of
Resp
on
den
ts W
ho
Rat
ed A
t Le
ast
On
e St
and
ard
in S
tran
d a
s A
pp
licab
le, b
y Su
bje
ct A
rea
Co
mm
on
Co
re
Eng
lish
lan
gu
age
arts
str
and
ELA
(n
=
2)
Mat
hem
atic
s
(n =
02
)Sc
ien
ce
(n =
28
)So
cial
sci
ence
(n
= 4
20)
Bu
sin
ess
man
agem
ent
(n =
24
)
Co
mp
ute
r te
chn
olo
gy
(n
=
)
Hea
lth
care
(n
=
86)
n%
n%
n%
n%
n%
n%
n%
Read
ing
fo
r Li
tera
ture
29
9.9
28.
924
8.
2
.69
28.4
20
.0
6.
Read
ing
fo
r In
form
atio
nal
Te
xts
0
96.
.
66
.
2
.6
2.9
8.
2
4.
Wri
tin
g
0
99.4
206.
6
6.0
42
.96
2.6
06.
26
4.0
Spea
kin
g a
nd
Li
sten
ing
26
84
.96
96
.02
08
.9
88
.20
484
.0
.9
8
.
Lan
gu
age
99.
62
.6
26
84.0
89.8
204
84.0
96
.46
88
.
Read
ing
fo
r Li
tera
cy in
His
tory
/So
cial
Stu
die
s8
26.6
24.
04
.0
84.0
62
.66
.9
69
.4
Read
ing
fo
r Li
tera
cy in
Sci
ence
an
d T
ech
nic
al
Sub
ject
s
82
.22
40
.926
29
.20
2
.
96
.42
8
.06
86
.6
Wri
tin
g f
or
Lite
racy
in H
isto
ry/
Soci
al S
tud
ies,
Sc
ien
ce, a
nd
Te
chn
ical
Su
bje
cts
.9
82
.24
988
.6
990
.28
24
.90
6
.
84
.4
App
endi
x D
Ap
pe
nd
ix D
Sum
mar
y o
f En
gli
sh L
ang
uag
e A
rts
and
Lit
erac
y A
pp
lica
bil
ity
Rat
ing
s

Valid
ity
Stud
y •
115
App
endi
x D
Tab
le D
. P
erce
nt
of
Resp
on
ses
in F
ou
r A
pp
licab
ility
Cat
ego
ries
Acr
oss
Eac
h S
tran
d
Stra
nd
(n
um
ber
of
resp
on
den
ts)
Nu
mb
er o
f Ra
tin
gs
Prer
equ
isit
eRe
view
edIn
tro
du
ced
Sub
seq
uen
tTo
tal
Read
ing
fo
r Li
tera
ture
(
)0
8
.6
.9
.6.
80
0.0
Read
ing
fo
r In
form
atio
nal
Tex
ts (
488)
49
8.6
.4
40.
.9
00.
0
Wri
tin
g (
04)
820
.98
.
.4.
0
0.0
Spea
kin
g a
nd
Lis
ten
ing
(
0)
8
82
.4
.82
.0.
60
0.0
Lan
gu
age
(
2)9
42
8.2
2.0
.8
.
00.
0
Read
ing
fo
r H
isto
ry/S
oci
al S
tud
ies
(
)49
26
.4
.6
.4.
60
0.0
Read
ing
fo
r Sc
ien
ce a
nd
Tec
hn
ical
Su
bje
cts
(06
8)89
428
.
.84
.4.
00
0.0
Wri
tin
g f
or
His
tory
/So
cial
Stu
die
s, S
cien
ce, a
nd
Te
chn
ical
Su
bje
cts
(26
)9
6
2.6
.4
2.
0.
00.
0
All
str
and
s (1
793)
8197
332
.233
.328
.65.
910
0.0
Ap
pe
nd
ix D
Sum
mar
y o
f En
gli
sh L
ang
uag
e A
rts
and
Lit
erac
y A
pp
lica
bil
ity
Rat
ing
s

Individual Ratings for the English Language Arts and Literacy Standards | Appendix E
Reading Standards for LiteratureStandard (Key Ideas and Details). Cite strong and thorough textual evidence to support analysis of what the text says explicitly as well as inferences drawn from the text, including determining where the text leaves matters uncertain.
Applicability Ratings Importance Ratingsa Importance Mean
Category Number PercentValid percentb
(n = 516)Category Number Percent Meanc
Standard
deviation
Prerequisite 8 4.6 6.9 Most 26 0. .42 0.6
Reviewed 94 0.2 .6 More 2 4.
Introduced 228 2.0 44.2 Less 4 8.
Subsequent 0.4 .4 Least 0.2
Not applicable 8 2.8 Total 509 100.0
Total 1897 100.0 100.0
Standard 2 (Key Ideas and Details). Determine two or more themes or central ideas of a text and analyze their development over the course of the text, including how they interact and build on one another to produce a complex account; provide an objective summary of the text.
Applicability Ratings Importance Ratingsa Importance Mean
Category Number PercentValid percentb
(n = 475)Category Number Percent Meanc
Standard
deviation
Prerequisite 8 4.4 . Most 82 9. .28 0.66
Reviewed 8 9.6 8. More 20 49.
Introduced 9 0.4 4. Less 49 0.6
Subsequent 2 0.6 2. Least 2 0.4
Not applicable 422 .0 Total 463 100.0
Total 1897 100.0 100.0
Standard (Key Ideas and Details). Analyze the impact of the author’s choices regarding how to develop and relate elements of a story or drama (e.g., where a story is set, how the action is ordered, how the characters are introduced and developed).
Applicability Ratings Importance Ratingsa Importance Mean
Category Number PercentValid percentb
(n = 296)Category Number Percent Meanc
Standard
deviation
Prerequisite 0 .6 0. Most 28.0 .04 0.4
Reviewed 2 6. 42.9 More 8 0.2
Introduced 8 6.2 9.9 Less 20.0
Subsequent 2 . . Least .8
Not applicable 60 84.4 Total 275 100.0
Total 1897 100.0 100.0
a Respondents completed an importance rating if they indicated the content of the standard was either (a) prerequisite to, (b) reviewed in, or (c) introduced during their course. The mode rating is shaded.
b The valid percent indicates percent of respondents of those who indicated the standard was applicable. c The mean importance rating is calculated by assigning the following values to the ordinal scale: least=1; less=2; more=3; most=4. Caution should be exercised
when interpreting the precise value of any mean in relation to the categorical system underlying it.
Appendix E provides descriptive statistics for the individual ratings of every standard statement in the Common Core standards for English language arts (ELA) and literacy. Recall that, for the purposes of the study, respondents rated sub-standards and standards as though they were on the same level; therefore, the ELA and literacy standards comprised 113 ratable statements.
Ap
pe
nd
ix E
Appendix E • 116

Validity Study • 117
ELA and Literacy: Reading Standards for LiteratureStandard 4 (Craft and Structure). Determine the meaning of words and phrases as they are used in the text, including figurative and connotative meanings; analyze the impact of specific word choices on meaning and tone, including words with multiple meanings or language that is particularly fresh, engaging, or beautiful. (Include Shakespeare as well as other authors.)
Applicability Ratings Importance Ratingsa Importance Mean
Category Number PercentValid percentb
(n = 436)Category Number Percent Meanc
Standard
deviation
Prerequisite 82 4. 8.8 Most 0 . .8 0.2
Reviewed 9 0. 44. More 20 4.8
Introduced 48 .8 .9 Less 69 6.2
Subsequent 0.6 2. Least 0.
Not applicable 46 .0 Total 425 100.0
Total 1897 100.0 100.0
Standard (Craft and Structure). Analyze how an author’s choices concerning how to structure specific parts of a text (e.g., the choice of where to begin or end a story, the choice to provide a comedic or tragic resolution) contribute to its overall structure and meaning as well as its aesthetic impact.
Applicability Ratings Importance Ratingsa Importance Mean
Category Number PercentValid percentb
(n = 327)Category Number Percent
Meanc
Standard
deviation
Prerequisite 28 . 8.6 Most 2 2.6 .02 0.68
Reviewed 6.9 40. More 0 .
Introduced 46 . 44.6 Less 6 20.0
Subsequent 22 .2 6. Least 2 0.
Not applicable 0 82.8 Total 305 100.0
Total 1897 100.0 100.0
Standard 6 (Craft and Structure). Analyze a case in which grasping point of view requires distinguishing what is directly stated in a text from what is really meant (e.g., satire, sarcasm, irony, or understatement).
Applicability Ratings Importance Ratingsa Importance Mean
Category Number PercentValid percentb
(n = 375)Category Number Percent
Meanc
Standard
deviation
Prerequisite 42 2.2 .2 Most 86 24.4 2.9 0.4
Reviewed 0 6.9 4. More 8 0.4
Introduced 8 9. 48. Less 8 2.
Subsequent 22 .2 .9 Least 6 .
Not applicable 22 80.2 Total 353 100.0
Total 1897 100.0 100.0
Appendix E
Ap
pe
nd
ix E

Validity Study • 118
ELA and Literacy: Reading Standards for LiteratureStandard (Integration of Knowledge and Ideas). Analyze multiple interpretations of a story, drama, or poem (e.g., recorded or live production of a play or recorded novel or poetry), evaluating how each version interprets the source text. (Include at least one play by Shakespeare and one play by an American dramatist.)
Applicability Ratings Importance Ratingsa Importance Mean
Category Number PercentValid percentb
(n = 222)Category Number Percent
Meanc
Standard
deviation
Prerequisite 4 0. 6. Most 8 2.8 .06 0.9
Reviewed 6 .4 29. More 42.4
Introduced 98 .2 44. Less 4 2.2
Subsequent 4 2.4 20. Least .
Not applicable 6 88. Total 177 100.0
Total 1897 100.0 100.0
For the Reading Standards for Literature, the eighth College and Career Readiness anchor standard is listed as not relevant to literature.
Standard 9 (Integration of Knowledge and Ideas). Demonstrate knowledge of eighteenth-, nineteenth-, and early-twentieth-century foundational works of American literature, including how two or more texts from the same period treat similar themes or topics.
Applicability Ratings Importance Ratingsa Importance Mean
Category Number PercentValid percentb
(n = 159)Category Number Percent
Meanc
Standard
deviation
Prerequisite 2 0.6 . Most 2 2.2 2.9 0.88
Reviewed 0 .6 8.9 More 9 9.4
Introduced .0 .8 Less 0 0.
Subsequent 60 .2 . Least .
Not applicable 8 9.6 Total 99 100.0
Total 1897 100.0 100.0
Standard 0 (Range of Reading and Level of Text Complexity). By the end of grade , read and comprehend literature, including stories, dramas, and poems, in the grades –CCR text complexity band proficiently, with scaffolding as needed at the high end of the range. By the end of grade 2, read and comprehend literature, including stories, dramas, and poems, at the high end of the grades –CCR text complexity band independently and proficiently.
Applicability Ratings Importance Ratingsa Importance Mean
Category Number PercentValid percentb
(n = 232)Category Number Percent
Meanc
Standard
deviation
Prerequisite 8.2 66.8 Most 0 4.8 . 0.2
Reviewed 48 2. 20. More 86 8.4
Introduced 2 . 9. Less 0 .4
Subsequent 8 0.4 .4 Least 0.4
Not applicable 66 8.8 Total 224 100.0
Total 1897 100.0 100.0
a Respondents completed an importance rating if they indicated the content of the standard was either (a) prerequisite to, (b) reviewed in, or (c) introduced during their course. The mode rating is shaded.
b The valid percent indicates percent of respondents of those who indicated the standard was applicable. c The mean importance rating is calculated by assigning the following values to the ordinal scale: least=1; less=2; more=3; most=4. Caution should be exercised
when interpreting the precise value of any mean in relation to the categorical system underlying it.
Appendix E
Ap
pe
nd
ix E

Validity Study • 119
Reading Standards for Informational Texts
Standard (Key Ideas and Details). Cite strong and thorough textual evidence to support analysis of what the text says explicitly as well as inferences drawn from the text, including determining where the text leaves matters uncertain.
Applicability Ratings Importance Ratingsa Importance Mean
Category Number PercentValid percentb
( = 464)Category Number Percent Meanc
Standard
deviation
Prerequisite 8 4.6 8.8 Most 20 . .4 0.6
Reviewed 86 9.8 40. More 68 .0
Introduced 8 9. 9.0 Less .
Subsequent 0 0. 2.2 Least .2
Not applicable 42 . Total 454 100.0
Missing 0.
Total 1897 100.0 100.0
Standard 2 (Key Ideas and Details). Determine two or more central ideas of a text and analyze their development over the course of the text, including how they interact and build on one another to provide a complex analysis; provide an objective summary of the text.
Applicability Ratings Importance Ratingsa Importance Mean
Category Number PercentValid percentb
( = 434)Category Number Percent Meanc
Standard
deviation
Prerequisite 69 .6 .9 Most 6 4.6 .2 0.6
Reviewed 8 9.8 42.6 More 20 48.9
Introduced 69 8.9 8.9 Less 8 9.0
Subsequent 0.6 2. Least 2 .
Not applicable 462 . Total 423 100.0
Missing 0.
Total 1897 100.0 100.0
Standard (Key Ideas and Details). Analyze a complex set of ideas or sequence of events and explain how specific individuals, ideas, or events interact and develop over the course of the text.
Applicability Ratings Importance Ratingsa Importance Mean
Category Number PercentValid percentb
( = 426)Category Number Percent Meanc
Standard
deviation
Prerequisite .0 .4 Most 64 9.8 .26 0.0
Reviewed 9.2 4. More 9 4.
Introduced 80 9. 42. Less 49 .9
Subsequent 4 0. . Least 4 .0
Not applicable 40 . Total 412 100.0
Missing 0.
Total 1897 100.0 100.0
ELA and Literacy
a Respondents completed an importance rating if they indicated the content of the standard was either (a) prerequisite to, (b) reviewed in, or (c) introduced during their course. The mode rating is shaded.
b The valid percent indicates percent of respondents of those who indicated the standard was applicable. c The mean importance rating is calculated by assigning the following values to the ordinal scale: least=1; less=2; more=3; most=4. Caution should be exercised
when interpreting the precise value of any mean in relation to the categorical system underlying it.
Appendix E
Ap
pe
nd
ix E

Validity Study • 120
ELA and Literacy: Reading Standards for Informational Texts
Standard 4 (Craft and Structure). Determine the meaning of words and phrases as they are used in a text, including figurative, connotative, and technical meanings; analyze how an author uses and refines the meaning of a key term or terms over the course of a text (e.g., how Madison defines faction in Federalist No. 0).
Applicability Ratings Importance Ratingsa Importance Mean
Category Number PercentValid percentb
( = 452)Category Number Percent Meanc
Standard
deviation
Prerequisite 86 4. 9.0 Most 6 .9 .22 0.
Reviewed 82 9.6 40. More 208 4.2
Introduced 9. 8. Less 62 4.
Subsequent 0.6 2.4 Least 4 .9
Not applicable 444 6. Total 441 100.0
Missing 0.
Total 1897 100.0 100.0
Standard (Craft and Structure). Analyze and evaluate the effectiveness of the structure an author uses in his or her exposition or argument, including whether the structure makes points clear, convincing, and engaging.
Applicability Ratings Importance Ratingsa Importance Mean
Category Number PercentValid percentb
( = 383)Category Number Percent Meanc
Standard
deviation
Prerequisite 9 . .4 Most 6 4. .2 0.
Reviewed 4 .4 6.8 More 6 4.6
Introduced 4 9.2 4.4 Less 4 4.4
Subsequent 9 0. 2. Least .
Not applicable 9.8 Total 374 100.0
Missing 0.
Total 1897 100.0 100.0
Standard 6 (Craft and Structure). Determine an author’s point of view or purpose in a text in which the rhetoric is particularly effective, analyzing how style and content contribute to the power, persuasiveness, or beauty of the text.
Applicability Ratings Importance Ratingsa Importance Mean
Category Number PercentValid percentb
( = 357)Category Number Percent Meanc
Standard
deviation
Prerequisite 4 .8 9. Most 40 40.6 .22 0.4
Reviewed 48 .8 4. More 4 4.4
Introduced 6 8.6 4. Less 6 .
Subsequent 2 0.6 .4 Least .
Not applicable 9 8. Total 345 100.0
Missing 0.
Total 1897 100.0 100.0
Appendix E
Ap
pe
nd
ix E

Validity Study • 121
ELA and Literacy: Reading Standards for Informational Texts
Standard (Integration of Knowledge and Ideas). Integrate and evaluate multiple sources of information presented in different media or formats (e.g., visually, quantitatively) as well as in words in order to address a question or solve a problem.
Applicability Ratings Importance Ratingsa Importance Mean
Category Number PercentValid percentb
( = 432)Category Number Percent Meanc
Standard
deviation
Prerequisite 4 2.8 2. Most 6 42.4 .2 0.
Reviewed 9 . 2.2 More 6 9.8
Introduced 222 . .4 Less 68 6.4
Subsequent 0.9 .9 Least 6 .4
Not applicable 464 .2 Total 415 100.0
Missing 0.
Total 1897 100.0 100.0
Standard 8 (Integration of Knowledge and Ideas). Delineate and evaluate the reasoning in seminal U.S. texts, including the application of constitutional principles and use of legal reasoning (e.g., in U.S. Supreme Court majority opinions and dissents) and the premises, purposes, and arguments in works of public advocacy (e.g., The Federalist, presidential addresses).
Applicability Ratings Importance Ratingsa Importance Mean
Category Number PercentValid percentb
( = 154)Category Number Percent Meanc
Standard
deviation
Prerequisite 0. 8.4 Most 6 28. 2.9 0.82
Reviewed 44 2. 28.6 More 2 40.9
Introduced 0 . 4. Less 6 28.
Subsequent 2 .4 . Least 2.4
Not applicable 42 9.8 Total 127 100.0
Missing 0.
Total 1897 100.0 100.0
Standard 9 (Integration of Knowledge and Ideas). Analyze seventeenth-, eighteenth-, and nineteenth-century foundational U.S. documents of historical and literary significance (including The Declaration of Independence, the Preamble to the Constitution, the Bill of Rights, and Lincoln’s Second Inaugural Address) for their themes, purposes, and rhetorical features.
Applicability Ratings Importance Ratingsa Importance Mean
Category Number PercentValid percentb
( = 112)Category Number Percent Meanc
Standard
deviation
Prerequisite 0 0. 8.9 Most 29 .9 .0 0.8
Reviewed 8 2.0 .9 More 8.
Introduced 4 2. Less 26 28.6
Subsequent 2 . 8.8 Least .
Not applicable 84 94.0 Total 91 100.0
Missing 0.
Total 1897 100.0 100.0
Appendix E
Ap
pe
nd
ix E

Validity Study • 122
ELA and Literacy: Reading Standards for Informational TextsStandard 0 (Range of Reading and Level of Text Complexity). By the end of grade , read and comprehend literary nonfiction in the grades –CCR text complexity band proficiently, with scaffolding as needed at the high end of the range. By the end of grade Standard 2, read and comprehend literary nonfiction at the high end of the grades –CCR text complexity band independently and proficiently.
Applicability Ratings Importance Ratingsa Importance Mean
Category Number PercentValid percentb
( = 279)Category Number Percent Meanc
Standard
deviation
Prerequisite 82 9.6 6.2 Most 6 49. .9 0.6
Reviewed 68 .6 24.4 More 0 40.0
Introduced 2 . 9.0 Less 29 0.
Subsequent 4 0.2 .4 Total 275 100.0
Not applicable 6 8.2
Missing 0.
Total 1897 100.0 100.0
a Respondents completed an importance rating if they indicated the content of the standard was either (a) prerequisite to, (b) reviewed in, or (c) introduced during their course. The mode rating is shaded.
b The valid percent indicates percent of respondents of those who indicated the standard was applicable. c The mean importance rating is calculated by assigning the following values to the ordinal scale: least=1; less=2; more=3; most=4. Caution should be exercised
when interpreting the precise value of any mean in relation to the categorical system underlying it.
Appendix E
Ap
pe
nd
ix E

Validity Study • 123
ELA and LiteracyWriting Standards
Standard (Text Types and Purposes). Write arguments to support claims in an analysis of substantive topics or texts, using valid reasoning and relevant and sufficient evidence.
Applicability Ratings Importance Ratingsa Importance Mean
Category Number PercentValid percentb
(n = 485)Category Number Percent Meanc
Standard
deviation
Prerequisite 04 . 2.4 Most 2 0.2 .6 0.
Reviewed 6 8.6 .6 More 2 26.8
Introduced 206 0.9 42. Less 4 .0
Subsequent 2 0.6 2. Total 473 100.0
Not applicable 4 4.4
Missing 0.
Total 1897 100.0 100.0
Standard a (Text Types and Purposes). Introduce precise, knowledgeable claim(s), establish the significance of the claim(s), distinguish the claim(s) from alternate or opposing claims, and create an organization that logically sequences claim(s), counterclaims, reasons, and evidence.
Applicability Ratings Importance Ratingsa Importance Mean
Category Number PercentValid percentb
(n = 459)Category Number Percent Meanc
Standard
deviation
Prerequisite 69 .6 .0 Most 22 .4 .42 0.6
Reviewed 9 8.4 4.6 More 40.0
Introduced 20 . 4.8 Less 8.4
Subsequent 2 . 4.6 Least 0.2
Not applicable 4 .8 Total 438 100.0
Missing 0.
Total 1897 100.0 100.0
Standard b (Text Types and Purposes). Develop claim(s) and counterclaims fairly and thoroughly, supplying the most relevant evidence for each while pointing out the strengths and limitations of both in a manner that anticipates the audience’s knowledge level, concerns, values, and possible biases.
Applicability Ratings Importance Ratingsa Importance Mean
Category Number PercentValid percentb
(n = 445)Category Number Percent Meanc
Standard
deviation
Prerequisite 60 .2 . Most 9 4. .4 0.
Reviewed 46 . 2.8 More 6 40.2
Introduced 209 .0 4.0 Less 48 .6
Subsequent 0 .6 6. Least .
Not applicable 4 6. Total 415 100.0
Missing 0.
Total 1897 100.0 100.0
a Respondents completed an importance rating if they indicated the content of the standard was either (a) prerequisite to, (b) reviewed in, or (c) introduced during their course. The mode rating is shaded.
b The valid percent indicates percent of respondents of those who indicated the standard was applicable. c The mean importance rating is calculated by assigning the following values to the ordinal scale: least=1; less=2; more=3; most=4. Caution should be exercised
when interpreting the precise value of any mean in relation to the categorical system underlying it.
Appendix E
Ap
pe
nd
ix E

Validity Study • 124
ELA and Literacy: Writing Standards
Standard c (Text Types and Purposes). Use words, phrases, and clauses as well as varied syntax to link the major sections of the text, create cohesion, and clarify the relationships between claim(s) and reasons, between reasons and evidence, and between claim(s) and counterclaims.
Applicability Ratings Importance Ratingsa Importance Mean
Category Number PercentValid percentb
(n = 441)Category Number Percent Meanc
Standard
deviation
Prerequisite 0 . 2.8 Most 6 9.9 .2 0.
Reviewed 6 9. 9.9 More 8 44.2
Introduced 8 . . Less 6 .0
Subsequent 22 .2 .0 Least 4 .0
Not applicable 4 6. Total 419 100.0
Missing 0.
Total 1897 100.0 100.0
Standard d (Text Types and Purposes). Establish and maintain a formal style and objective tone while attending to the norms and conventions of the discipline in which they are writing.
Applicability Ratings Importance Ratingsa Importance Mean
Category Number PercentValid percentb
(n = 470)Category Number Percent Meanc
Standard
deviation
Prerequisite 9 4.9 9.8 Most 8 4.8 . 0.4
Reviewed 9 0. 4. More 2 46.9
Introduced 66 8.8 . Less .0
Subsequent 6 0.8 .4 Least 6 .
Not applicable 426 .2 Total 454 100.0
Missing 0.
Total 1897 100.0 100.0
Standard e (Text Types and Purposes). Provide a concluding statement or section that follows from and supports the argument presented.
Applicability Ratings Importance Ratingsa Importance Mean
Category Number PercentValid percentb
(n = 471)Category Number Percent Meanc
Standard
deviation
Prerequisite 0 .4 21.9 Most 6 8. .9 0.6
Reviewed 9 0. 41.4 More 9 42.
Introduced 9 8.4 33.8 Less 8 .
Subsequent 4 0. 3.0 Least .
Not applicable 42 . Total 457 100.0
Missing 0.
Total 1897 100.0 100.0
Appendix E
Ap
pe
nd
ix E

Validity Study • 125
ELA and Literacy: Writing StandardsStandard 2 (Text Types and Purposes). Write informative/explanatory texts to examine and convey complex ideas, concepts, and information clearly and accurately through the effective selection, organization, and analysis of content.
Applicability Ratings Importance Ratingsa Importance Mean
Category Number PercentValid percentb
(n = 470)Category Number Percent Meanc
Standard
deviation
Prerequisite .9 2.6 Most 2 0. .40 0.68
Reviewed 9.2 .2 More 8.8
Introduced 0 9.0 6.2 Less 4 0.
Subsequent 4 0. .0 Least .2
Not applicable 426 .2 Total 456 100.0
Missing 0.
Total 1897 100.0 100.0
Standard 2a (Text Types and Purposes). Introduce a topic; organize complex ideas, concepts, and information so that each new element builds on that which precedes it to create a unified whole; include formatting (e.g., headings), graphics (e.g., figures, tables), and multimedia when useful to aiding comprehension.
Applicability Ratings Importance Ratingsa Importance Mean
Category Number PercentValid percentb
(n = 454)Category Number Percent Meanc
Standard
deviation
Prerequisite 9 4.8 20.0 Most 8 42.2 .28 0.
Reviewed 6 9. 8.8 More 94 44.
Introduced 9.0 . Less 2.6
Subsequent 6 0.8 . Least 4 .9
Not applicable 442 6.0 Total 438 100.0
Missing 0.
Total 1897 100.0 100.0
Standard 2b (Text Types and Purposes). Develop the topic thoroughly by selecting the most significant and relevant facts, extended definitions, concrete details, quotations, or other information and examples appropriate to the audience’s knowledge of the topic.
Applicability Ratings Importance Ratingsa Importance Mean
Category Number PercentValid percentb
(n = 460)Category Number Percent Meanc
Standard
deviation
Prerequisite 82 4. .8 Most 249 .6 .0 0.6
Reviewed 89 0.0 4. More 8.6
Introduced 9. 8. Less 2 .6
Subsequent 2 0.6 2.6 Least .2
Not applicable 46 . Total 448 100.0
Missing 0.
Total 1897 100.0 100.0
Appendix E
Ap
pe
nd
ix E

Validity Study • 126
ELA and Literacy: Writing StandardsStandard 2c (Text Types and Purposes). Use appropriate and varied transitions and syntax to link the major sections of the text, create cohesion, and clarify the relationships among complex ideas and concepts.
Applicability Ratings Importance Ratingsa Importance Mean
Category Number PercentValid percentb
(n = 451)Category Number Percent
Meanc
Standard
deviation
Prerequisite 6. 2. Most 8 6. . 0.8
Reviewed 98 0.4 4.9 More 92 44.
Introduced 20 6. 26.6 Less 2 6.6
Subsequent 8 0.9 4.0 Least 2.
Not applicable 44 6.2 Total 433 100.0
Missing 0.
Total 1897 100.0 100.0
Standard 2d (Text Types and Purposes). Use precise language, domain-specific vocabulary, and techniques such as metaphor, simile, and analogy to manage the complexity of the topic.
Applicability Ratings Importance Ratingsa Importance Mean
Category Number PercentValid percentb
(n = 437)Category Number Percent Meanc
Standard
deviation
Prerequisite 82 4. 8.8 Most 4 2.8 2.99 0.9
Reviewed 8 9.4 40. More 88 4.9
Introduced 0 .9 4. Less 9 2.
Subsequent 2 .4 6.2 Least 2.
Not applicable 49 6.9 Total 410 100.0
Missing 0.
Total 1897 100.0 100.0
Standard 2e (Text Types and Purposes). Establish and maintain a formal style and objective tone while attending to the norms and conventions of the discipline in which they are writing.
Applicability Ratings Importance Ratingsa Importance Mean
Category Number PercentValid percentb
(n = 467)Category Number Percent Meanc
Standard
deviation
Prerequisite 82 4. .6 Most 44 2.0 .08 0.
Reviewed 20 0.9 44. More 20 4.
Introduced 6 8. 4. Less 96 2.
Subsequent 0.9 .6 Least .6
Not applicable 429 . Total 450 100.0
Missing 0.
Total 1897 100.0 100.0
Appendix E
Ap
pe
nd
ix E

Validity Study • 127
ELA and Literacy: Writing StandardsStandard 2f (Text Types and Purposes). Provide a concluding statement or section that follows from and supports the information or explanation presented (e.g., articulating implications or the significance of the topic).
Applicability Ratings Importance Ratingsa Importance Mean
Category Number PercentValid percentb
(n = 472)Category Number Percent Meanc
Standard
deviation
Prerequisite 0 . 2.4 Most 9 4.6 . 0.
Reviewed 26 .4 4.8 More 2 46.
Introduced 4 . 0. Less 6.
Subsequent 2 0.6 2. Least 2.4
Not applicable 424 . Total 460 100.0
Missing 0.
Total 1897 100.0 100.0
Standard (Text Types and Purposes). Write narratives to develop real or imagined experiences or events using effective technique, well-chosen details, and well-structured event sequences.
Applicability Ratings Importance Ratingsa Importance Mean
Category Number PercentValid percentb
(n = 297)Category Number Percent Meanc
Standard
deviation
Prerequisite 6 4.0 2.6 Most 8 28.8 2.8 0.90
Reviewed 92 4.8 .0 More 99 .2
Introduced 6.0 8.0 Less 84 29.9
Subsequent 6 0.8 .4 Least 6.0
Not applicable 99 84. Total 281 100.0
Missing 0.
Total 1897 100.0 100.0
Standard a (Text Types and Purposes). Engage and orient the reader by setting out a problem, situation, or observation and its significance, establishing one or multiple point(s) of view, and introducing a narrator and/or characters; create a smooth progression of experiences or events.
Applicability Ratings Importance Ratingsa Importance Mean
Category Number PercentValid percentb
(n = 304)Category Number Percent Meanc
Standard
deviation
Prerequisite 6 .0 8.4 Most 2.6 2.9 0.80
Reviewed 99 .2 2.6 More 24 44.8
Introduced 22 6.4 40. Less 4 26.
Subsequent 2 .4 8.9 Least 8 2.9
Not applicable 92 8.9 Total 277 100.0
Missing 0.
Total 1897 100.0 100.0
Appendix E
Ap
pe
nd
ix E

Validity Study • 128
ELA and Literacy: Writing Standards
Standard b (Text Types and Purposes). Use narrative techniques, such as dialogue, pacing, description, reflection, and multiple plot lines, to develop experiences, events, and/or characters.
Applicability Ratings Importance Ratingsa Importance Mean
Category Number PercentValid percentb
(n = 216)Category Number Percent Meanc
Standard
deviation
Prerequisite 8 2.0 .6 Most 29 .8 2.4 0.89
Reviewed 6 . .0 More 6 4.2
Introduced 9 4.2 6.6 Less 8.6
Subsequent 2 . 4.8 Least 2 .4
Not applicable 680 88.6 Total 184 100.0
Missing 0.
Total 1897 100.0 100.0
Standard c (Text Types and Purposes). Use a variety of techniques to sequence events so that they build on one another to create a coherent whole and build toward a particular tone and outcome (e.g., a sense of mystery, suspense, growth, or resolution).
Applicability Ratings Importance Ratingsa Importance Mean
Category Number PercentValid percentb
(n = 256)Category Number Percent Meanc
Standard
deviation
Prerequisite 46 2.4 8.0 Most 8 6.8 2.69 0.8
Reviewed 89 4. 4.8 More 9 42.0
Introduced 9 4.8 . Less 4.
Subsequent 0 .6 . Least 6 .
Not applicable 640 86. Total 226 100.0
Missing 0.
Total 1897 100.0 100.0
Standard d (Text Types and Purposes). Use precise words and phrases, telling details, and sensory language to convey a vivid picture of the experiences, events, setting, and/or characters.
Applicability Ratings Importance Ratingsa Importance Mean
Category Number PercentValid percentb
(n = 304)Category Number Percent Meanc
Standard
deviation
Prerequisite 6 . 20. Most 2.4 2.92 0.8
Reviewed 6 6. 8.2 More 20 42.
Introduced 02 .4 .6 Less 69 24.6
Subsequent 2 .2 .6 Least .
Not applicable 92 8.9 Total 281 100.0
Missing 0.
Total 1897 100.0 100.0
Appendix E
Ap
pe
nd
ix E

Validity Study • 129
ELA and Literacy: Writing StandardsStandard e (Text Types and Purposes). Provide a conclusion that follows from and reflects on what is experienced, observed, or resolved over the course of the narrative.
Applicability Ratings Importance Ratingsa Importance Mean
Category Number PercentValid percentb
(n = 338)Category Number Percent Meanc
Standard
deviation
Prerequisite 8 4. 2. Most 92 28.9 2.96 0.8
Reviewed 2 6. .6 More 4.
Introduced 6.0 .4 Less 2 22.6
Subsequent 20 . .9 Least .
Not applicable 8 82. Total 318 100.0
Missing 0.
Total 1897 100.0 100.0
Standard 4 (Production and Distribution of Writing). Produce clear and coherent writing in which the development, organization, and style are appropriate to task, purpose, and audience. (Grade-specific expectations for writing types are defined in standards – above.)
Applicability Ratings Importance Ratingsa Importance Mean
Category Number PercentValid percentb
(n = 484)Category Number Percent Meanc
Standard
deviation
Prerequisite 8. .6 Most 2 69. .66 0.
Reviewed 206 0.9 42.6 More 2.
Introduced 4 6.0 2.6 Less 4 .0
Subsequent 0.6 2. Least 0.2
Not applicable 42 4.4 Total 473 100.0
Missing 0.
Total 1897 100.0 100.0
Standard (Production and Distribution of Writing). Develop and strengthen writing as needed by planning, revising, editing, rewriting, or trying a new approach, focusing on addressing what is most significant for a specific purpose and audience. (Editing for conventions should demonstrate command of Language standards –, up to and including grades –2 on page 4 [of Common Core State Standards document].)
Applicability Ratings Importance Ratingsa Importance Mean
Category Number PercentValid percentb
(n = 454)Category Number Percent Meanc
Standard
deviation
Prerequisite 2 6.6 2. Most 28 6.9 .6 0.64
Reviewed 96 0. 4.2 More 26 28.6
Introduced 9 6. 26.2 Less 2 .
Subsequent 4 0. . Least 0.2
Not applicable 442 6.0 Total 440 100.0
Missing 0.
Total 1897 100.0 100.0
Appendix E
Ap
pe
nd
ix E

Validity Study • 130
ELA and Literacy: Writing Standards
Standard 6 (Production and Distribution of Writing). Use technology, including the Internet, to produce, publish, and update individual or shared writing products in response to ongoing feedback, including new arguments or information.
Applicability Ratings Importance Ratingsa Importance Mean
Category Number PercentValid percentb
(n = 384)Category Number Percent Meanc
Standard
deviation
Prerequisite 90 4. 2.4 Most 29 . .09 0.8
Reviewed 2 .0 4.4 More 4 9.9
Introduced 4 .4 6. Less 8 22.
Subsequent 2 . . Least 8 2.2
Not applicable 2 9. Total 363 100.0
Missing 0.
Total 1897 100.0 100.0
Standard (Research to Build and Present Knowledge). Conduct short as well as more sustained research projects to answer a question (including a self-generated question) or solve a problem; narrow or broaden the inquiry when appropriate; synthesize multiple sources on the subject, demonstrating understanding of the subject under investigation.
Applicability Ratings Importance Ratingsa Importance Mean
Category Number PercentValid percentb
(n = 453)Category Number Percent Meanc
Standard
deviation
Prerequisite 6 . .9 Most 228 .6 .49 0.62
Reviewed 8. .8 More 6 8.0
Introduced 94 0.2 42.8 Less 2 6.
Subsequent 4 2. 9. Least 0.2
Not applicable 44 6. Total 410 100.0
Missing 0.
Total 1897 100.0 100.0
Standard 8 (Research to Build and Present Knowledge). Gather relevant information from multiple authoritative print and digital sources, using advanced searches effectively; assess the strengths and limitations of each source in terms of the task, purpose, and audience; integrate information into the text selectively to maintain the flow of ideas, avoiding plagiarism and overreliance on any one source and following a standard format for citation.
Applicability Ratings Importance Ratingsa Importance Mean
Category Number PercentValid percentb
(n = 442)Category Number Percent Meanc
Standard
deviation
Prerequisite 69 .6 .6 Most 248 62.8 . 0.6
Reviewed 4 .6 2.8 More 29.6
Introduced 8 9. 4.0 Less 0 .6
Subsequent 4 2. 0.6 Total 395 100.0
Not applicable 44 6.6
Missing 0.
Total 1897 100.0 100.0
Appendix E
Ap
pe
nd
ix E

Validity Study • 131
ELA and Literacy: Writing StandardsStandard 9 (Research to Build and Present Knowledge). Draw evidence from literary or informational texts to support analysis, reflection, and research.
Applicability Ratings Importance Ratingsa Importance Mean
Category Number PercentValid percentb
(n = 461)Category Number Percent Meanc
Standard
deviation
Prerequisite 6 .4 4. Most 244 6.0 .4 0.66
Reviewed 9 9.4 8.8 More 8 6.2
Introduced 92 0. 4.6 Less .
Subsequent 2 . .4 Least 0.
Not applicable 4 .6 Total 436 100.0
Missing 0.
Total 1897 100.0 100.0
Standard 9a (Research to Build and Present Knowledge). Apply grades –2 Reading standards to literature (e.g., “Demonstrate knowledge of eighteenth-, nineteenth-, and early-twentieth-century foundational works of American literature, including how two or more texts from the same period treat similar themes or topics”).
Applicability Ratings Importance Ratingsa Importance Mean
Category Number PercentValid percentb
(n = 143)Category Number Percent Meanc
Standard
deviation
Prerequisite 49 2.6 4. Most . 2.98 0.8
Reviewed 4 2.2 28. More 44 9.
Introduced 22 .2 .4 Less 29 2.9
Subsequent .6 2. Least 4 .6
Not applicable 92.4 Total 112 100.0
Missing 0.
Total 1897 100.0 100.0
Standard 9b (Research to Build and Present Knowledge). Apply grades –2 Reading standards to literary nonfiction (e.g., “Delineate and evaluate the reasoning in seminal U.S. texts, including the application of constitutional principles and use of legal reasoning [e.g., in U.S. Supreme Court Case majority opinions and dissents] and the premises, purposes, and arguments in works of public advocacy [e.g., The Federalist, presidential addresses]”).
Applicability Ratings Importance Ratingsa Importance Mean
Category Number PercentValid percentb
(n = 162)Category Number Percent Meanc
Standard
deviation
Prerequisite 0 2.6 0.9 Most 44 .4 .0 0.82
Reviewed 9 . 6.4 More 6 4.6
Introduced .6 9. Less 0 2.4
Subsequent 22 .2 .6 Least .6
Not applicable 4 9.4 Total 140 100.0
Missing 0.
Total 1897 100.0 100.0
Appendix E
Ap
pe
nd
ix E

Validity Study • 132
ELA and Literacy: Writing StandardsStandard 0 (Range of Writing). Write routinely over extended time frames (time for research, reflection, and revision) and shorter time frames (a single sitting or a day or two) for a range of tasks, purposes, and audiences.
Applicability Ratings Importance Ratingsa Importance Mean
Category Number PercentValid percentb
(n = 438)Category Number Percent Meanc
Standard
deviation
Prerequisite 0 .6 24.4 Most 24 .2 . 0.
Reviewed 66 8.8 .9 More 49 .6
Introduced 4 .6 . Less 2 2.4
Subsequent 20 . 4.6 Least 0.
Not applicable 48 6.9 Total 418 100.0
Missing 0.
Total 1897 100.0 100.0
a Respondents completed an importance rating if they indicated the content of the standard was either (a) prerequisite to, (b) reviewed in, or (c) introduced during their course. The mode rating is shaded.
b The valid percent indicates percent of respondents of those who indicated the standard was applicable. c The mean importance rating is calculated by assigning the following values to the ordinal scale: least=1; less=2; more=3; most=4. Caution should be exercised
when interpreting the precise value of any mean in relation to the categorical system underlying it.
Appendix E
Ap
pe
nd
ix E

Validity Study • 133
ELA and LiteracySpeaking and Listening Standards
Standard (Comprehension and Collaboration). Initiate and participate effectively in a range of collaborative discussions (one-on-one, in groups, and teacher-led) with diverse partners on grades -2 topics, texts, and issues, building on others’ ideas and expressing their own ideas clearly and persuasively.
Applicability Ratings Importance Ratingsa Importance Mean
Category Number PercentValid percentb
(n = 1266)Category Number Percent Meanc
Standard
deviation
Prerequisite 498 26. 9. Most 6 2.0 .0 0.4
Reviewed 40 22. 4.0 More 60 0.
Introduced 6.6 24.9 Less 22 20.
Subsequent 2 .2 .8 Least 2 2.0
Not applicable 6 . Total 1243 100.0
Total 1897 100.0 100.0
Standard a (Comprehension and Collaboration). Come to discussions prepared, having read and researched material under study; explicitly draw on that preparation by referring to evidence from texts and other research on the topic or issue to stimulate a thoughtful, well-reasoned exchange of ideas.
Applicability Ratings Importance Ratingsa Importance Mean
Category Number PercentValid percentb
(n = 1381)Category Number Percent Meanc
Standard
deviation
Prerequisite 90 . 42. Most 680 0. .4 0.6
Reviewed 40 24.8 4.0 More 40.9
Introduced 29 . 2. Less 4 8.4
Subsequent 24 . . Least 8 0.6
Not applicable 6 2.2 Total 1357 100.0
Total 1897 100.0 100.0
Standard b (Comprehension and Collaboration). Work with peers to promote civil, democratic discussions and decision-making, set clear goals and deadlines, and establish individual roles as needed.
Applicability Ratings Importance Ratingsa Importance Mean
Category Number PercentValid percentb
(n = 1082)Category Number Percent Meanc Standard
deviation
Prerequisite 6. 28.9 Most 28 26.9 .00 0.6
Reviewed 4 2.8 8.2 More 499 48.
Introduced 0 6.2 28.4 Less 2 22.9
Subsequent 49 2.6 4. Least 9 .8
Not applicable 8 4.0 Total 1033 100.0
Total 1897 100.0 100.0
a Respondents completed an importance rating if they indicated the content of the standard was either (a) prerequisite to, (b) reviewed in, or (c) introduced during their course. The mode rating is shaded.
b The valid percent indicates percent of respondents of those who indicated the standard was applicable. c The mean importance rating is calculated by assigning the following values to the ordinal scale: least=1; less=2; more=3; most=4. Caution should be exercised
when interpreting the precise value of any mean in relation to the categorical system underlying it.
Appendix E
Ap
pe
nd
ix E

Validity Study • 134
ELA and Literacy: Speaking and Listening Standards
Standard c (Comprehension and Collaboration). Propel conversations by posing and responding to questions that probe reasoning and evidence; ensure a hearing for a full range of positions on a topic or issue; clarify, verify, or challenge ideas and conclusions; and promote divergent and creative perspectives.
Applicability Ratings Importance Ratingsa Importance Mean
Category Number PercentValid percentb
(n = 1279)Category Number Percent Meanc
Standard
deviation
Prerequisite 06 6. 2.9 Most 94 2. . 0.2
Reviewed 4 24.9 .0 More 622 0.6
Introduced 40 2. .2 Less 96 .9
Subsequent 0 2.6 .9 Least .4
Not applicable 68 2.6 Total 1229 100.0
Total 1897 100.0 100.0
Standard d (Comprehension and Collaboration). Respond thoughtfully to diverse perspectives; synthesize comments, claims, and evidence made on all sides of an issue; resolve contradictions when possible; and determine what additional information or research is required to deepen the investigation or complete the task.
Applicability Ratings Importance Ratingsa Importance Mean
Category Number PercentValid percentb
(n = 1259)Category Number Percent Meanc
Standard
deviation
Prerequisite 22 . 20.0 Most 404 4.0 . 0.
Reviewed 48 24. 6.4 More 0 48.0
Introduced 48 2.2 8.0 Less 98 6.
Subsequent . .6 Least 6 .
Not applicable 68 .6 Total 1188 100.0
Total 1897 100.0 100.0
Standard 2 (Comprehension and Collaboration). Integrate multiple sources of information presented in diverse formats and media (e.g., visually, quantitatively, orally) in order to make informed decisions and solve problems, evaluating the credibility and accuracy of each source and noting any discrepancies among the data.
Applicability Ratings Importance Ratingsa Importance Mean
Category Number PercentValid percentb
(n = 1363)Category Number Percent Meanc
Standard
deviation
Prerequisite 2 4.6 20. Most 49 .6 .8 0.2
Reviewed 49 24.2 . More 64 4.6
Introduced 29. 40. Less 20 .9
Subsequent 2 .8 . Least .0
Not applicable 4 28. Total 1291 100.0
Total 1897 100.0 100.0
Appendix E
Ap
pe
nd
ix E

Validity Study • 135
ELA and Literacy: Speaking and Listening StandardsStandard (Comprehension and Collaboration). Evaluate a speaker’s point of view, reasoning, and use of evidence and rhetoric, assessing the stance, premises, links among ideas, word choice, points of emphasis, and tone used.
Applicability Ratings Importance Ratingsa Importance Mean
Category Number PercentValid percentb
(n = 944)Category Number Percent Meanc
Standard
deviation
Prerequisite 9. 8. Most 224 26. 2.9 0.9
Reviewed .4 . More 82 44.8
Introduced 48 8. 6.9 Less 226 26.
Subsequent 92 4.8 9. Least 20 2.
Not applicable 9 0.2 Total 852 100.0
Total 1897 100.0 100.0
Standard 4 (Presentation of Knowledge and Ideas). Present information, findings, and supporting evidence, conveying a clear and distinct perspective, such that listeners can follow the line of reasoning, alternative or opposing perspectives are addressed, and the organization, development, substance, and style are appropriate to purpose, audience, and a range or formal and informal tasks.
Applicability Ratings Importance Ratingsa Importance Mean
Category Number PercentValid percentb
(n = 1259)Category Number Percent Meanc
Standard
deviation
Prerequisite 26 .8 20. Most 428 6. .8 0.
Reviewed 44 2.4 .2 More 4.
Introduced 46 24.6 . Less 200 .
Subsequent 88 4.6 .0 Least 0 0.9
Not applicable 68 .6 Total 1171 100.0
Total 1897 100.0 100.0
Standard (Presentation of Knowledge and Ideas). Make strategic use of digital media (e.g., textual, graphical, audio, visual, and interactive elements) in presentations to enhance understanding of findings, reasoning, and evidence and to add interest.
Applicability Ratings Importance Ratingsa Importance Mean
Category Number PercentValid percentb
(n = 1081)Category Number Percent Meanc
Standard
deviation
Prerequisite 22 .2 9.6 Most 99 20.6 2.6 0.8
Reviewed 60 9.0 . More 8 40.0
Introduced 9 20.8 6. Less 4 4.
Subsequent 4 6.0 0. Least 4 4.9
Not applicable 86 4.0 Total 967 100.0
Total 1897 100.0 100.0
Appendix E
Ap
pe
nd
ix E

Validity Study • 136
ELA and Literacy: Speaking and Listening StandardsStandard 6 (Presentation of Knowledge and Ideas). Adapt speech to a variety of contexts and tasks, demonstrating a command of formal English when indicated or appropriate. (See grades –2 Language standards and on page 4 [of Common Core State Standards document] for specific expectations.)
Applicability Ratings Importance Ratingsa Importance Mean
Category Number PercentValid percentb
(n = 944)Category Number Percent Meanc
Standard
deviation
Prerequisite 82 20. 40. Most 22 2.6 2.9 0.80
Reviewed 29 .6 . More 92 4.4
Introduced 8 9.9 9.8 Less 22 2.6
Subsequent 80 4.2 8. Least 0 .
Not applicable 9 0.2 Total 864 100.0
Total 1897 100.0 100.0
a Respondents completed an importance rating if they indicated the content of the standard was either (a) prerequisite to, (b) reviewed in, or (c) introduced during their course. The mode rating is shaded.
b The valid percent indicates percent of respondents of those who indicated the standard was applicable. c The mean importance rating is calculated by assigning the following values to the ordinal scale: least=1; less=2; more=3; most=4. Caution should be exercised
when interpreting the precise value of any mean in relation to the categorical system underlying it.
Appendix E
Ap
pe
nd
ix E

Validity Study • 137
ELA and LiteracyLanguage Standards
Standard (Conventions of Standard English). Demonstrate command of the conventions of standard English grammar and usage when writing or speaking.
Applicability Ratings Importance Ratingsa Importance Mean
Category Number PercentValid percentb
(n = 1500)Category Number Percent Meanc
Standard
deviation
Prerequisite 09 .6 2.9 Most 2 49.0 . 0.8
Reviewed 0 6. 20. More 9 .2
Introduced 2 .8 4.8 Less 20 4.0
Subsequent 2 . . Least 26 .8
Not applicable 9 20.9 Total 1475 100.0
Total 1897 100.0 100.0
Standard a (Conventions of Standard English). Apply the understanding that usage is a matter of convention, can change over time, and is sometimes contested.
Applicability Ratings Importance Ratingsa Importance Mean
Category Number PercentValid percentb
(n = 1070)Category Number Percent
Meanc
Standard
deviation
Prerequisite 420 22. 9. Most 2 24. 2.82 0.8
Reviewed 82 20. . More 406 9.
Introduced 20 2. 2. Less 0.
Subsequent 8 2.0 .6 Least 64 6.2
Not applicable 82 4.6 Total 1032 100.0
Total 1897 100.0 100.0
Standard b (Conventions of Standard English). Resolve issues of complex or contested usage, consulting references (e.g., Merriam-Webster’s Dictionary of English Usage, Garner’s Modern American Usage) as needed.
Applicability Ratings Importance Ratingsa Importance Mean
Category Number PercentValid percentb
(n = 907)Category Number Percent Meanc
Standard
deviation
Prerequisite 4 22. 4. Most 9 22.9 2. 0.88
Reviewed 266 4.0 29. More 28 8.
Introduced 6 8. 8.2 Less 2 .9
Subsequent 4 2.4 .0 Least 62 .2
Not applicable 990 2.2 Total 862 100.0
Total 1897 100.0 100.0
a Respondents completed an importance rating if they indicated the content of the standard was either (a) prerequisite to, (b) reviewed in, or (c) introduced during their course. The mode rating is shaded.
b The valid percent indicates percent of respondents of those who indicated the standard was applicable. c The mean importance rating is calculated by assigning the following values to the ordinal scale: least=1; less=2; more=3; most=4. Caution should be exercised
when interpreting the precise value of any mean in relation to the categorical system underlying it.
Appendix E
Ap
pe
nd
ix E

Validity Study • 138
ELA and Literacy: Language StandardsStandard 2 (Conventions of Standard English). Demonstrate command of the conventions of standard English capitalization, punctuation, and spelling when writing.
Applicability Ratings Importance Ratingsa Importance Mean
Category Number PercentValid percentb
(n = 1450)Category Number Percent Meanc
Standard
deviation
Prerequisite 08 .8 .0 Most 64 4.0 .6 0.8
Reviewed 298 . 20.6 More 482 .8
Introduced 2 .8 .0 Less 2 9.
Subsequent 22 .2 . Least 4.0
Not applicable 44 2.6 Total 1428 100.0
Total 1897 100.0 100.0
Standard 2a (Conventions of Standard English). Observe hyphenation conventions.
Applicability Ratings Importance Ratingsa Importance Mean
Category Number PercentValid percentb
(n = 1028)Category Number Percent Meanc
Standard
deviation
Prerequisite 6 .4 6. Most 2 . 2. 0.96
Reviewed 24 2. 22.8 More 2 2.
Introduced 88 4.6 8.6 Less 4 4.4
Subsequent .8 .4 Least 9 9.6
Not applicable 869 4.8 Total 993 100.0
Total 1897 100.0 100.0
Standard 2b (Conventions of Standard English). Spell correctly.
Applicability Ratings Importance Ratingsa Importance Mean
Category Number PercentValid percentb
(n = 1489)Category Number Percent Meanc
Standard
deviation
Prerequisite 2 9.2 .4 Most 84 9.9 . 0.88
Reviewed 2 4. 8. More 28 6.0
Introduced 6 . 4. Less 28 9.2
Subsequent 24 . .6 Least 2 4.9
Not applicable 408 2. Total 1465 100.0
Total 1897 100.0 100.0
Appendix E
Ap
pe
nd
ix E

Validity Study • 139
ELA and Literacy: Language StandardsStandard (Knowledge of Language). Apply knowledge of language to understand how language functions in different contexts, to make effective choices for meaning or style, and to comprehend more fully when reading or listening.
Applicability Ratings Importance Ratingsa Importance Mean
Category Number PercentValid percentb
(n = 1201)Category Number Percent Meanc
Standard
deviation
Prerequisite 0.4 48.0 Most 64 .2 .0 0.9
Reviewed 9.9 .4 More 26 4.0
Introduced 24 . .8 Less 246 2.
Subsequent . 2. Least 2 2.
Not applicable 696 6. Total 1168 100.0
Total 1897 100.0 100.0
Standard a (Knowledge of Language). Vary syntax for effect, consulting references (e.g., Tufte’s Artful Sentences) for guidance as needed; apply an understanding of syntax to the study of complex texts when reading.
Applicability Ratings Importance Ratingsa Importance Mean
Category Number PercentValid percentb
(n = 848)Category Number Percent Meanc
Standard
deviation
Prerequisite 8 20.2 4.2 Most 6 .4 2.68 0.84
Reviewed 20 .2 29. More 0 9.4
Introduced 4 . . Less 286 6.
Subsequent 68 .6 8.0 Least 6.
Not applicable 049 . Total 780 100.0
Total 1897 100.0 100.0
Standard 4 (Vocabulary Acquisition and Use). Determine or clarify the meaning of unknown and multiple-meaning words and phrases based on grades -2 reading and content, choosing flexibly from a range of strategies.
Applicability Ratings Importance Ratingsa Importance Mean
Category Number PercentValid percentb
(n = 1229)Category Number Percent Meanc
Standard
deviation
Prerequisite 26 8. 9. Most 9 0.0 .0 0.8
Reviewed .4 26.9 More 44.
Introduced 4 .4 . Less 268 22.4
Subsequent .6 2. Least 8 .2
Not applicable 668 .2 Total 1198 100.0
Total 1897 100.0 100.0
Appendix E
Ap
pe
nd
ix E

Validity Study • 140
ELA and Literacy: Language StandardsStandard 4a (Vocabulary Acquisition and Use). Use context (e.g., the overall meaning of a sentence, paragraph, or text; a word’s position or function in a sentence) as a clue to the meaning of a word or phrase.
Applicability Ratings Importance Ratingsa Importance Mean
Category Number PercentValid percentb
(n = 1271)Category Number Percent Meanc
Standard
deviation
Prerequisite 9 4.9 62. Most 9 28.8 .00 0.80
Reviewed 40 .9 26.8 More 62 4.
Introduced 0 .8 8. Less 289 2.2
Subsequent 26 .4 2.0 Least 2.8
Not applicable 626 .0 Total 1245 100.0
Total 1897 100.0 100.0
Standard 4b (Vocabulary Acquisition and Use). Identify and correctly use patterns of word changes that indicate different meanings or parts of speech (e.g., conceive, conception, conceivable).
Applicability Ratings Importance Ratingsa Importance Mean
Category Number PercentValid percentb
(n = 1011)Category Number Percent Meanc
Standard
deviation
Prerequisite 669 . 66.2 Most 99 20. 2. 0.8
Reviewed 240 2. 2. More 40 40.9
Introduced 2 .8 . Less 6 2.2
Subsequent 0 .6 .0 Least 6 6.6
Not applicable 886 46. Total 981 100.0
Total 1897 100.0 100.0
Standard 4c (Vocabulary Acquisition and Use). Consult general and specialized reference materials (e.g., dictionaries, glossaries, thesauruses), both print and digital, to find the pronunciation of a word or determine or clarify its precise meaning, its part of speech, its etymology, or its standard usage.
Applicability Ratings Importance Ratingsa Importance Mean
Category Number PercentValid percentb
(n = 1113)Category Number Percent Meanc
Standard
deviation
Prerequisite 688 6. 6.8 Most 2 2. 2.82 0.89
Reviewed 28 4.8 2.2 More 42 9.
Introduced 2 .9 0. Less 06 28.
Subsequent 2 . 2.9 Least 8 .
Not applicable 84 4. Total 1081 100.0
Total 1897 100.0 100.0
Appendix E
Ap
pe
nd
ix E

Validity Study • 141
ELA and Literacy: Language Standards
Standard 4d (Vocabulary Acquisition and Use). Verify the preliminary determination of the meaning of a word or phrase (e.g., by checking the inferred meaning in context or in a dictionary).
Applicability Ratings Importance Ratingsa Importance Mean
Category Number PercentValid percentb
(n = 1115)Category Number Percent Meanc
Standard
deviation
Prerequisite 0 . 6.4 Most 24 22. 2.9 0.8
Reviewed 282 4.9 2. More 449 4.
Introduced 98 .2 8.8 Less 4 28.9
Subsequent 28 . 2. Least 9 .
Not applicable 82 4.2 Total 1087 100.0
Total 1897 100.0 100.0
Standard (Vocabulary Acquisition and Use). Demonstrate understanding of figurative language, word relationships, and nuances in word meanings.
Applicability Ratings Importance Ratingsa Importance Mean
Category Number PercentValid percentb
(n = 1014)Category Number Percent Meanc
Standard
deviation
Prerequisite 4 2. 0. Most 2 22. 2.9 0.86
Reviewed 42 8.0 . More 9 40.
Introduced 9 6. . Less 02 .0
Subsequent 9 2. .8 Least 6 6.
Not applicable 88 46. Total 975 100.0
Total 1897 100.0 100.0
Standard a (Vocabulary Acquisition and Use). Interpret figures of speech (e.g., hyperbole, paradox) in context and analyze their role in the text.
Applicability Ratings Importance Ratingsa Importance Mean
Category Number PercentValid percentb
(n = 797)Category Number Percent Meanc
Standard
deviation
Prerequisite 82 20. 4.9 Most 4 20. 2.66 0.9
Reviewed 2 . 2.2 More 26 4.8
Introduced .9 .9 Less 264 .2
Subsequent 4 2. .9 Least 2 9.6
Not applicable 00 8.0 Total 751 100.0
Total 1897 100.0 100.0
Appendix E
Ap
pe
nd
ix E

Validity Study • 142
ELA and Literacy: Language StandardsStandard b (Vocabulary Acquisition and Use). Analyze nuances in the meaning of words with similar denotations.
Applicability Ratings Importance Ratingsa Importance Mean
Category Number PercentValid percentb
(n = 909)Category Number Percent Meanc
Standard
deviation
Prerequisite 44 2.8 4. Most .9 2. 0.8
Reviewed 29 . 6.2 More 2 40.6
Introduced 24 6. .6 Less 28 2.4
Subsequent 42 2.2 4.6 Least 9 9.
Not applicable 988 2. Total 867 100.0
Total 1897 100.0 100.0
Standard 6 (Vocabulary Acquisition and Use). Acquire and use accurately general academic and domain-specific words and phrases, sufficient for reading, writing, speaking, and listening at the college- and career-readiness level; demonstrate independence in gathering vocabulary knowledge when considering a word or phrase important to comprehension or expression.
Applicability Ratings Importance Ratingsa Importance Mean
Category Number PercentValid percentb
(n = 1473)Category Number Percent Meanc
Standard
deviation
Prerequisite 66 4.6 44. Most 640 44.4 . 0.69
Reviewed 44 2.4 0. More 640 44.4
Introduced 4 8.0 2.2 Less 49 0.
Subsequent . 2.2 Least 0.8
Not applicable 424 22.4 Total 1440 100.0
Total 1897 100.0 100.0
a Respondents completed an importance rating if they indicated the content of the standard was either (a) prerequisite to, (b) reviewed in, or (c) introduced during their course. The mode rating is shaded.
b The valid percent indicates percent of respondents of those who indicated the standard was applicable. c The mean importance rating is calculated by assigning the following values to the ordinal scale: least=1; less=2; more=3; most=4. Caution should be exercised
when interpreting the precise value of any mean in relation to the categorical system underlying it.
Appendix E
Ap
pe
nd
ix E

Validity Study • 143
ELA and LiteracyReading Standards in History/Social Studies
Standard (Key Ideas and Details). Cite specific textual evidence to support analysis of primary and secondary sources, connecting insights gained from specific details to an understanding of the text as a whole.
Applicability Ratings Importance Ratingsa Importance Mean
Category Number PercentValid percentb
(n = 537)Category Number Percent Meanc
Standard
deviation
Prerequisite 20 6. 22. Most 22 2. .4 0.6
Reviewed 222 . 4. More 200 8.
Introduced 8 9.4 . Less 4 8.
Subsequent 0.9 .2 Least 0.6
Not applicable 9 .6 Total 520 100.0
Missing 0.
Total 1897 100.0 100.0
Standard 2 (Key Ideas and Details). Determine the central ideas or information of a primary or secondary source; provide an accurate summary that makes clear the relationships among the key details and ideas.
Applicability Ratings Importance Ratingsa Importance Mean
Category Number PercentValid percentb
(n = 547)Category Number Percent Meanc
Standard
deviation
Prerequisite 6 8.2 28. Most 29 . .4 0.6
Reviewed 229 2. 4.9 More 9 6.
Introduced 0 .9 2.4 Less 44 8.2
Subsequent 2 0.6 2.2 Least 0.2
Not applicable 49 . Total 535 100.0
Missing 0.
Total 1897 100.0 100.0
Standard (Key Ideas and Details). Evaluate various explanations for actions or events and determine which explanation best accords with textual evidence, acknowledging where the text leaves matters uncertain.
Applicability Ratings Importance Ratingsa Importance Mean
Category Number PercentValid percentb
(n = 512)Category Number Percent Meanc
Standard
deviation
Prerequisite 6.0 22. Most 22 4.2 .2 0.4
Reviewed 99 0. 8.9 More 204 4.
Introduced 9 9.4 .0 Less 0 4.
Subsequent 2 . 4. Least .0
Not applicable 84 .0 Total 491 100.0
Missing 0.
Total 1897 100.0 100.0
a Respondents completed an importance rating if they indicated the content of the standard was either (a) prerequisite to, (b) reviewed in, or (c) introduced during their course. The mode rating is shaded.
b The valid percent indicates percent of respondents of those who indicated the standard was applicable. c The mean importance rating is calculated by assigning the following values to the ordinal scale: least=1; less=2; more=3; most=4. Caution should be exercised
when interpreting the precise value of any mean in relation to the categorical system underlying it.
Appendix E
Ap
pe
nd
ix E

Validity Study • 144
ELA and Literacy: Reading Standards in History/Social StudiesStandard 4 (Craft and Structure). Determine the meaning of words and phrases as they are used in a text, including analyzing how an author uses and refines the meaning of a key term over the course of a text (e.g., how Madison defines faction in Federalist No. 0).
Applicability Ratings Importance Ratingsa Importance Mean
Category Number PercentValid percentb
(n = 490)Category Number Percent Meanc
Standard
deviation
Prerequisite 40 .4 28.6 Most 4 29. .0 0.
Reviewed 20 0.6 4.0 More 22 2.
Introduced .2 28.0 Less 8 6.
Subsequent 2 0.6 2.4 Least .
Not applicable 406 4. Total 478 100.0
Missing 0.
Total 1897 100.0 100.0
Standard (Craft and Structure). Analyze in detail how a complex primary source is structured, including how key sentences, paragraphs, and larger portions of the text contribute to the whole.
Applicability Ratings Importance Ratingsa Importance Mean
Category Number PercentValid percentb
(n = 430)Category Number Percent Meanc
Standard
deviation
Prerequisite 0 . 2. Most 9 2.9 2.9 0.8
Reviewed 8. 6. More 8 4.
Introduced 40 .4 2.6 Less 2 28.
Subsequent 2 . .4 Least 0 2.
Not applicable 466 . Total 398 100.0
Missing 0.
Total 1897 100.0 100.0
Standard 6 (Craft and Structure). Evaluate authors’ differing points of view on the same historical event or issue by assessing the authors’ claims, reasoning, and evidence.
Applicability Ratings Importance Ratingsa Importance Mean
Category Number PercentValid percentb
(n = 464)Category Number Percent Meanc
Standard
deviation
Prerequisite 84 4.4 8. Most 4 40.0 .22 0.6
Reviewed 9 9.4 8.6 More 9 44.8
Introduced 2 9. . Less 2.6
Subsequent 29 . 6. Least 2.
Not applicable 42 . Total 435 100.0
Missing 0.
Total 1897 100.0 100.0
Appendix E
Ap
pe
nd
ix E

Validity Study • 145
ELA and Literacy: Reading Standards in History/Social Studies
Standard (Integration of Knowledge and Ideas). Integrate and evaluate multiple sources of information presented in diverse formats and media (e.g., visually, quantitatively, as well as in words) in order to address a question or solve a problem.
Applicability Ratings Importance Ratingsa Importance Mean
Category Number PercentValid percentb
(n = 521)Category Number Percent Meanc
Standard
deviation
Prerequisite 09 . 20.9 Most 9 8.8 .2 0.4
Reviewed 9 0.4 .8 More 222 44.
Introduced 9 0. 6. Less 6 .
Subsequent 24 . 4.6 Least 6 .2
Not applicable 2. Total 497 100.0
Missing 0.
Total 1897 100.0 100.0
Standard 8 (Integration of Knowledge and Ideas). Evaluate an author’s premises, claims, and evidence by corroborating or challenging them with other information.
Applicability Ratings Importance Ratingsa Importance Mean
Category Number PercentValid percentb
(n = 500)Category Number Percent Meanc
Standard
deviation
Prerequisite 88 4.6 .6 Most 9 4.8 .24 0.6
Reviewed 98 0.4 9.6 More 9 42.
Introduced 80 9. 6.0 Less 66 4.2
Subsequent 4 .8 6.8 Least 8 .
Not applicable 96 .6 Total 466 100.0
Missing 0.
Total 1897 100.0 100.0
Standard 9 (Integration of Knowledge and Ideas). Integrate information from diverse sources, both primary and secondary, into a coherent understanding of an idea or event, noting discrepancies among sources.
Applicability Ratings Importance Ratingsa Importance Mean
Category Number PercentValid percentb
(n = 515)Category Number Percent Meanc
Standard
deviation
Prerequisite 94 .0 8. Most 206 4. .0 0.0
Reviewed 86 9.8 6. More 206 4.
Introduced 94 0.2 . Less 60 2.
Subsequent 4 2.2 8.0 Least 2 0.4
Not applicable 8 2.8 Total 474 100.0
Missing 0.
Total 1897 100.0 100.0
Appendix E
Ap
pe
nd
ix E

Validity Study • 146
ELA and Literacy: Reading Standards in History/Social Studies
Standard 0 (Range of Reading and Level of Text Complexity). By the end of grade 2, read and comprehend history/social studies texts in the grades –2 text complexity band independently and proficiently.
Applicability Ratings Importance Ratingsa Importance Mean
Category Number PercentValid percentb
(n = 415)Category Number Percent Meanc
Standard
deviation
Prerequisite 299 .8 2.0 Most 24 9.6 .0 0.68
Reviewed 8 4.6 2.0 More 2.
Introduced 22 .2 . Less 29 .
Subsequent 0.4 . Least .2
Not applicable 48 8. Total 408 100.0
Missing 0.
Total 1897 100.0 100.0
a Respondents completed an importance rating if they indicated the content of the standard was either (a) prerequisite to, (b) reviewed in, or (c) introduced during their course. The mode rating is shaded.
b The valid percent indicates percent of respondents of those who indicated the standard was applicable. c The mean importance rating is calculated by assigning the following values to the ordinal scale: least=1; less=2; more=3; most=4. Caution should be exercised
when interpreting the precise value of any mean in relation to the categorical system underlying it.
Appendix E
Ap
pe
nd
ix E

Validity Study • 147
ELA and Literacy Reading Standards in Science and Technical Subjects
Standard (Key Ideas and Details). Cite specific textual evidence to support analysis of science and technical texts, attending to important distinctions the author makes and to any gaps or inconsistencies in the account.
Applicability Ratings Importance Ratingsa Importance Mean
Category Number PercentValid percentb
(n = 849)Category Number Percent Meanc
Standard
deviation
Prerequisite 22 .6 26.0 Most 22 28.0 .04 0.6
Reviewed 24 4.4 2. More 40 0.6
Introduced 02 .9 .6 Less 48 8.6
Subsequent 2 2. 6. Least 2 2.9
Not applicable 046 . Total 797 100.0
Missing 2 0.
Total 1897 100.0 100.0
Standard 2 (Key Ideas and Details). Determine the central ideas or conclusions of a text; summarize complex concepts, processes, or information presented in a text by paraphrasing them in simpler but still accurate terms.
Applicability Ratings Importance Ratingsa Importance Mean
Category Number PercentValid percentb
(n = 974)Category Number Percent Meanc
Standard
deviation
Prerequisite 2 . .4 Most 448 46.9 .6 0.68
Reviewed 42 8.0 . More 4 4.2
Introduced 289 .2 29. Less 86 9.0
Subsequent 8 0.9 .8 Least 9 0.9
Not applicable 92 48.6 Total 956 100.0
Missing 2 0.
Total 1897 100.0 100.0
Standard (Key Ideas and Details). Follow precisely a complex multistep procedure when carrying out experiments, taking measurements, or performing technical tasks; analyze the specific results based on explanations in the text.
Applicability Ratings Importance Ratingsa Importance Mean
Category Number PercentValid percentb
(n = 913)Category Number Percent Meanc
Standard
deviation
Prerequisite 9. 9.4 Most 4 64. .9 0.60
Reviewed 29 . 6.0 More 20 0.
Introduced 86 20. 42. Less 4 .0
Subsequent 2 . 2. Least 0.
Not applicable 982 .8 Total 892 100.0
Missing 2 0.
Total 1897 100.0 100.0
a Respondents completed an importance rating if they indicated the content of the standard was either (a) prerequisite to, (b) reviewed in, or (c) introduced during their course. The mode rating is shaded.
b The valid percent indicates percent of respondents of those who indicated the standard was applicable. c The mean importance rating is calculated by assigning the following values to the ordinal scale: least=1; less=2; more=3; most=4. Caution should be exercised
when interpreting the precise value of any mean in relation to the categorical system underlying it.
Appendix E
Ap
pe
nd
ix E

Validity Study • 148
ELA and Literacy: Reading Standards in Science and Technical SubjectsStandard 4 (Craft and Structure). Determine the meaning of symbols, key terms, and other domain-specific words and phrases as they are used in a specific scientific or technical context relevant to grades -2 texts and topics.
Applicability Ratings Importance Ratingsa Importance Mean
Category Number PercentValid percentb
(n = 952)Category Number Percent Meanc
Standard
deviation
Prerequisite 28 4. 29.2 Most 4 4. .48 0.6
Reviewed .8 .4 More 9.
Introduced 28 . 4. Less .6
Subsequent 9 0. 0.9 Least 0.
Not applicable 94 49. Total 943 100.0
Missing 2 0.
Total 1897 100.0 100.0
Standard (Craft and Structure). Analyze how the text structures information or ideas into categories or hierarchies, demonstrating understanding of the information or ideas.
Applicability Ratings Importance Ratingsa Importance Mean
Category Number PercentValid percentb
(n = 907)Category Number Percent Meanc
Standard
deviation
Prerequisite 00 .8 . Most 28 2. .0 0.6
Reviewed 8 6.8 . More 42 4.4
Introduced 2 4. 29.9 Less 64 8.4
Subsequent 8 0.9 2.0 Least .9
Not applicable 988 2. Total 889 100.0
Missing 2 0.
Total 1897 100.0 100.0
Standard 6 (Craft and Structure). Analyze the author’s purpose in providing an explanation, describing a procedure, or discussing an experiment in a text, identifying important issues that remain unresolved.
Applicability Ratings Importance Ratingsa Importance Mean
Category Number PercentValid percentb
(n = 797)Category Number Percent Meanc
Standard
deviation
Prerequisite 9 0.4 24. Most 88 2.0 2.92 0.8
Reviewed 28 .0 .8 More 44 4.8
Introduced 269 4.2 .8 Less 89 2.2
Subsequent 46 2.4 .8 Least 0 4.0
Not applicable 098 .9 Total 751 100.0
Missing 2 0.
Total 1897 100.0 100.0
Appendix E
Ap
pe
nd
ix E

Validity Study • 149
ELA and Literacy: Reading Standards in Science and Technical SubjectsStandard (Integration of Knowledge and Ideas). Integrate and evaluate multiple sources of information presented in diverse formats and media (e.g., quantitative data, video, multimedia) in order to address a question or solve a problem.
Applicability Ratings Importance Ratingsa Importance Mean
Category Number PercentValid percentb
(n = 943)Category Number Percent Meanc
Standard
deviation
Prerequisite 9 0.2 20. Most 296 2.6 .0 0.
Reviewed 2 . .2 More 42 46.
Introduced 84 20.2 40. Less 2 8.9
Subsequent 4 .8 .6 Least 8 2.0
Not applicable 92 0.2 Total 909 100.0
Missing 2 0.
Total 1897 100.0 100.0
Standard 8 (Integration of Knowledge and Ideas). Evaluate the hypotheses, data, analysis, and conclusions in a science or technical text, verifying data when possible and corroborating or challenging conclusions with other sources of information.
Applicability Ratings Importance Ratingsa Importance Mean
Category Number PercentValid percentb
(n = 859)Category Number Percent Meanc
Standard
deviation
Prerequisite 2 6. 4.8 Most 60 4.6 .28 0.6
Reviewed 29 .6 4. More 299 .8
Introduced 68 9.4 42.8 Less 2 .6
Subsequent 69 .6 8.0 Least 8 .0
Not applicable 06 4.6 Total 790 100.0
Missing 2 0.
Total 1897 100.0 100.0
Standard 9 (Integration of Knowledge and Ideas). Synthesize information from a range of sources (e.g., texts, experiments, simulations) into a coherent understanding of a process, phenomenon, or concept, resolving conflicting information when possible.
Applicability Ratings Importance Ratingsa Importance Mean
Category Number PercentValid percentb
(n = 910)Category Number Percent Meanc
Standard
deviation
Prerequisite 4 . 4. Most 62 4. .28 0.4
Reviewed 24 . .6 More 66 4.6
Introduced 8 20. 4.9 Less 9 .
Subsequent . .8 Least 6 .9
Not applicable 98 .9 Total 839 100.0
Missing 2 0.
Total 1897 100.0 100.0
Appendix E
Ap
pe
nd
ix E

Validity Study • 150
ELA and Literacy: Reading Standards in Science and Technical Subjects
Standard 0 (Range of Reading and Level of Text Complexity). By the end of Grade 2, read and comprehend science/technical texts in the grades –2 text complexity band independently and proficiently.
Applicability Ratings Importance Ratingsa Importance Mean
Category Number PercentValid percentb
(n = 870)Category Number Percent Meanc
Standard
deviation
Prerequisite 0.2 6.9 Most 468 4.9 .49 0.6
Reviewed 98 0.4 22.8 More 6 9.4
Introduced 8 4. 9. Less 4 .
Subsequent 8 0.9 2. Least 0.4
Not applicable 02 4.0 Total 852 100.0
Missing 2 0.
Total 1897 100.0 100.0
a Respondents completed an importance rating if they indicated the content of the standard was either (a) prerequisite to, (b) reviewed in, or (c) introduced during their course. The mode rating is shaded.
b The valid percent indicates percent of respondents of those who indicated the standard was applicable. c The mean importance rating is calculated by assigning the following values to the ordinal scale: least=1; less=2; more=3; most=4. Caution should be exercised
when interpreting the precise value of any mean in relation to the categorical system underlying it.
Appendix E
Ap
pe
nd
ix E

Validity Study • 151
ELA and Literacy
a Respondents completed an importance rating if they indicated the content of the standard was either (a) prerequisite to, (b) reviewed in, or (c) introduced during their course. The mode rating is shaded.
b The valid percent indicates percent of respondents of those who indicated the standard was applicable. c The mean importance rating is calculated by assigning the following values to the ordinal scale: least=1; less=2; more=3; most=4. Caution should be exercised
when interpreting the precise value of any mean in relation to the categorical system underlying it.
Writing Standards in History/Social Studies, Science, and Technical Subjects
Standard (Text Types and Purposes). Write arguments focused on discipline-specific content.
Applicability Ratings Importance Ratingsa Importance Mean
Category Number PercentValid percentb
(n = 1088)Category Number Percent Meanc
Standard
deviation
Prerequisite 9 0.2 . Most 4 4.2 .24 0.
Reviewed 0 8. 2.2 More 42 42.6
Introduced 49 24.2 42.2 Less 4 .4
Subsequent 86 4. .9 Least 8 0.8
Not applicable 809 42.6 Total 1002 100.0
Total 1897 100.0 100.0
Standard a (Text Types and Purposes). Introduce precise, knowledgeable claim(s), establish the significance of the claim(s), distinguish the claim(s) from alternate or opposing claims, and create an organization that logically sequences the claim(s), counterclaims, reasons, and evidence.
Applicability Ratings Importance Ratingsa Importance Mean
Category Number PercentValid percentb
(n = 1049)Category Number Percent Meanc
Standard
deviation
Prerequisite 9 8.4 .2 Most 44 6.4 . 0.4
Reviewed 8. . More 4 4.8
Introduced 46 2.0 4.6 Less 6.6
Subsequent 0 .4 9.8 Least 2 .
Not applicable 848 44. Total 946 100.0
Total 1897 100.0 100.0
Standard b (Text Types and Purposes). Develop claim(s) and counterclaims fairly and thoroughly, supplying the most relevant data and evidence for each while pointing out the strengths and limitations of both claim(s) and counterclaims in a discipline-appropriate form that anticipates the audience’s knowledge level, concerns, values, and possible biases.
Applicability Ratings Importance Ratingsa Importance Mean
Category Number PercentValid percentb
(n = 998)Category Number Percent Meanc
Standard
deviation
Prerequisite 40 .4 4.0 Most 28 0.4 .0 0.6
Reviewed 02 .9 0. More 42 48.
Introduced 40 2. 40.8 Less 9 8.
Subsequent 49 .9 4.9 Least 20 2.4
Not applicable 899 4.4 Total 849 100.0
Total 1897 100.0 100.0
Appendix E
Ap
pe
nd
ix E

Validity Study • 152
ELA and Literacy: Writing Standards in History/Social Studies, Science and Technical Subjects
Standard c (Text Types and Purposes). Use words, phrases, and clauses as well as varied syntax to link the major sections of the text, create cohesion, and clarify the relationships between claim(s) and reasons, between reasons and evidence, and between claim(s) and counterclaims.
Applicability Ratings Importance Ratingsa Importance Mean
Category Number PercentValid percentb
(n = 985)Category Number Percent Meanc
Standard
deviation
Prerequisite 22 2.2 2.6 Most 8 2.4 2.86 0.8
Reviewed 6 6. 2. More 40 46.2
Introduced 24 . 2.9 Less 28 29.6
Subsequent 6.0 . Least 24 2.8
Not applicable 92 48. Total 872 100.0
Total 1897 100.0 100.0
Standard d (Text Types and Purposes). Establish and maintain a formal style and objective tone while attending to the norms and conventions of the discipline in which they are writing.
Applicability Ratings Importance Ratingsa Importance Mean
Category Number PercentValid percentb
(n = 1058)Category Number Percent Meanc
Standard
deviation
Prerequisite 24 2.9 2.2 Most 2 24.0 2.89 0.82
Reviewed 0 8. . More 440 4.
Introduced 6 9. 4. Less 24 2.
Subsequent 96 . 9. Least 46 4.8
Not applicable 89 44.2 Total 962 100.0
Total 1897 100.0 100.0
Standard e (Text Types and Purposes). Provide a concluding statement or section that follows from or supports the argument presented.
Applicability Ratings Importance Ratingsa Importance Mean
Category Number PercentValid percentb
(n = 1069)Category Number Percent Meanc
Standard
deviation
Prerequisite 28 4. 26.0 Most 294 29.4 .0 0.6
Reviewed 86 20. 6. More 49 49.
Introduced 6 . .4 Less 90 9.0
Subsequent 69 .6 6. Least 2 2.
Not applicable 828 4.6 Total 1000 100.0
Total 1897 100.0 100.0
Appendix E
Ap
pe
nd
ix E

Validity Study • 153
ELA and Literacy: Writing Standards in History/Social Studies, Science and Technical Subjects
Standard 2 (Text Types and Purposes). Write informative/explanatory texts, including the narration of historical events, scientific procedures/ experiments, or technical processes.
Applicability Ratings Importance Ratingsa Importance Mean
Category Number PercentValid percentb
(n = 993)Category Number Percent Meanc
Standard
deviation
Prerequisite 22 .2 2. Most 249 2. .00 0.8
Reviewed . . More 46 48.2
Introduced 8.8 6.0 Less 90 2.0
Subsequent 89 4. 9.0 Least 29 .2
Not applicable 904 4. Total 904 100.0
Total 1897 100.0 100.0
Standard 2a (Text Types and Purposes). Introduce a topic and organize complex ideas, concepts, and information so that each new element builds on that which precedes it to create a unified whole; include formatting (e.g., headings), graphics (e.g., figures, tables), and multimedia when useful to aiding comprehension.
Applicability Ratings Importance Ratingsa Importance Mean
Category Number PercentValid percentb
(n = 1036)Category Number Percent Meanc
Standard
deviation
Prerequisite 206 0.9 9.9 Most 290 .9 .0 0.6
Reviewed 4 8.0 2.9 More 4 4.
Introduced 6 9.0 4.8 Less 68 8.
Subsequent 28 6. 2.4 Least .9
Not applicable 86 4.4 Total 908 100.0
Total 1897 100.0 100.0
Standard 2b (Text Types and Purposes). Develop the topic thoroughly by selecting the most significant and relevant facts, extended definitions, concrete details, quotations, or other information and examples appropriate to the audience’s knowledge of the topic.
Applicability Ratings Importance Ratingsa Importance Mean
Category Number PercentValid percentb
(n = 1038)Category Number Percent Meanc
Standard
deviation
Prerequisite 22 .9 2. Most .4 . 0.4
Reviewed 9.8 6. More 49 4.
Introduced 2 . 2.0 Less 2 8.
Subsequent 06 .6 0.2 Least 0 .
Not applicable 89 4. Total 932 100.0
Total 1897 100.0 100.0
Appendix E
Ap
pe
nd
ix E

Validity Study • 154
ELA and Literacy: Writing Standards in History/Social Studies, Science and Technical Subjects
Standard 2c (Text Types and Purposes). Use varied transitions and sentence structures to link the major sections of the text, create cohesion, and clarify the relationships among complex ideas and concepts.
Applicability Ratings Importance Ratingsa Importance Mean
Category Number PercentValid percentb
(n = 890)Category Number Percent Meanc
Standard
deviation
Prerequisite 0 6.2 4. Most 4 8.4 2. 0.8
Reviewed 286 . 2. More 2 4.
Introduced 84 9. 20. Less 2 .4
Subsequent 6.0 2. Least 8 4.9
Not applicable 00 . Total 777 100.0
Total 1897 100.0 100.0
Standard 2d (Text Types and Purposes). Use precise language, domain-specific vocabulary and techniques such as metaphor, simile, and analogy to manage the complexity of the topic; convey a knowledgeable stance in a style that responds to the discipline and context as well as to the expertise of likely readers.
Applicability Ratings Importance Ratingsa Importance Mean
Category Number PercentValid percentb
(n = 937)Category Number Percent Meanc
Standard
deviation
Prerequisite 2 2.2 24. Most 94 2.4 2.86 0.84
Reviewed 0 6.0 2. More 69 44.
Introduced 29 .6 . Less 22 26.
Subsequent 08 . . Least 4 .4
Not applicable 960 0.6 Total 829 100.0
Total 1897 100.0 100.0
Standard 2e (Text Types and Purposes). Provide a concluding statement or section that follows from and supports the information or explanation provided (e.g., articulating implications or the significance of the topic).
Applicability Ratings Importance Ratingsa Importance Mean
Category Number PercentValid percentb
(n = 1069)Category Number Percent Meanc
Standard
deviation
Prerequisite 29 . 2.8 Most 28 28.8 .0 0.9
Reviewed 8 20. 6.0 More 44 4.9
Introduced 08 6.2 28.8 Less 222 22.4
Subsequent 9 4.2 .4 Least 29 2.9
Not applicable 828 4.6 Total 990 100.0
Total 1897 100.0 100.0
Appendix E
Ap
pe
nd
ix E

Validity Study • 155
ELA and Literacy: Writing Standards in History/Social Studies, Science and Technical SubjectsFor the Writing Standards for Literacy in History/Social Studies, Science, and Technical Subjects, the third College and Career Readiness anchor standard is listed as not applicable as a separate requirement.
Standard 4 (Production and Distribution of Writing). Produce clear and coherent writing in which the development, organization, and style are appropriate to task, purpose, and audience.
Applicability Ratings Importance Ratingsa Importance Mean
Category Number PercentValid percentb
(n = 1142)Category Number Percent Meanc
Standard
deviation
Prerequisite 449 2. 9. Most 449 4.0 .22 0.6
Reviewed 94 20.8 4. More 49 42.0
Introduced 2 .2 22.0 Less 69 .4
Subsequent 48 2. 4.2 Least .6
Not applicable 9.8 Total 1094 100.0
Total 1897 100.0 100.0
Standard (Production and Distribution of Writing). Develop and strengthen writing as needed by planning, revising, editing, rewriting, or trying a new approach, focusing on addressing what is most significant for a specific purpose and audience.
Applicability Ratings Importance Ratingsa Importance Mean
Category Number PercentValid percentb
(n = 954)Category Number Percent Meanc
Standard
deviation
Prerequisite 28 . 4.4 Most 2 .8 .0 0.80
Reviewed 46 8.2 6. More 4.
Introduced 9 9.4 8.8 Less 8 2.9
Subsequent 0 . 0.6 Least 22 2.6
Not applicable 94 49. Total 853 100.0
Total 1897 100.0 100.0
Standard 6 (Production and Distribution of Writing). Use technology, including the Internet, to produce, publish, and update individual or shared writing products in response to ongoing feedback, including new arguments or information.
Applicability Ratings Importance Ratingsa Importance Mean
Category Number PercentValid percentb
(n = 897)Category Number Percent Meanc
Standard
deviation
Prerequisite 222 . 24. Most 2 26.4 2.9 0.82
Reviewed 02 .9 . More 4.9
Introduced 2 4. 0. Less 206 2.8
Subsequent 98 .2 0.9 Least .9
Not applicable 000 2. Total 799 100.0
Total 1897 100.0 100.0
Appendix E
Ap
pe
nd
ix E

Validity Study • 156
ELA and Literacy: Writing Standards in History/Social Studies, Science and Technical Subjects
Standard (Research to Build and Present Knowledge). Conduct short as well as more sustained research projects to answer a question (including a self-generated question) or solve a problem; narrow or broaden the inquiry when appropriate; synthesize multiple sources on the subject, demonstrating understanding of the subject under investigation.
Applicability Ratings Importance Ratingsa Importance Mean
Category Number PercentValid percentb
(n = 1020)Category Number Percent Meanc
Standard
deviation
Prerequisite 4 . 4.4 Most 288 2.9 .0 0.
Reviewed 298 . 29.2 More 409 46.
Introduced 4 22. 42. Less 60 8.
Subsequent 44 .6 4. Least 9 2.2
Not applicable 8 46.2 Total 876 100.0
Total 1897 100.0 100.0
Standard 8 (Research to Build and Present Knowledge). Gather relevant information from multiple authoritative print and digital sources, using advanced searches effectively; assess the strengths and limitations of each source in terms of the specific task, purpose, and audience; integrate information into the text selectively to maintain the flow of ideas, avoiding plagiarism and overreliance on any one source and following a standard format for citation.
Applicability Ratings Importance Ratingsa Importance Mean
Category Number PercentValid percentb
(n = 993)Category Number Percent Meanc
Standard
deviation
Prerequisite 80 9. 8. Most 288 4. .2 0.8
Reviewed 29 . . More 6 4.
Introduced 2 . 2. Less 49 .9
Subsequent 9 8.4 6.0 Least 2 2.
Not applicable 904 4. Total 834 100.0
Total 1897 100.0 100.0
Standard 9 (Research to Build and Present Knowledge). Draw evidence from informational texts to support analysis, reflection, and research.
Applicability Ratings Importance Ratingsa Importance Mean
Category Number PercentValid percentb
(n = 1086)Category Number Percent Meanc
Standard
deviation
Prerequisite 242 2.8 22. Most 2 6. .6 0.6
Reviewed 82 20. .2 More 44 4.
Introduced 4 8.2 .8 Less 9 6.4
Subsequent 6.2 0.8 Least .8
Not applicable 8 42.8 Total 969 100.0
Total 1897 100.0 100.0
Appendix E
Ap
pe
nd
ix E

Validity Study • 157
ELA and Literacy: Writing Standards in History/Social Studies, Science and Technical Subjects
Standard 0 (Range of Writing). Write routinely over extended time frames (time for reflection and revision) and shorter time frames (a single sitting or a day or two) for a range of discipline-specific tasks, purposes, and audiences.
Applicability Ratings Importance Ratingsa Importance Mean
Category Number PercentValid percentb
(n = 834)Category Number Percent Meanc
Standard
deviation
Prerequisite 224 .8 26.9 Most 20 28.4 2.98 0.80
Reviewed 2 .4 0.6 More 9 44.
Introduced 244 2.9 29. Less 8 2.0
Subsequent .9 . Least 8 2.
Not applicable 06 6.0 Total 723 100.0
Total 1897 100.0 100.0
a Respondents completed an importance rating if they indicated the content of the standard was either (a) prerequisite to, (b) reviewed in, or (c) introduced during their course. The mode rating is shaded.
b The valid percent indicates percent of respondents of those who indicated the standard was applicable. c The mean importance rating is calculated by assigning the following values to the ordinal scale: least=1; less=2; more=3; most=4. Caution should be exercised
when interpreting the precise value of any mean in relation to the categorical system underlying it.
Appendix E
Ap
pe
nd
ix E

Table F. Number of Standard Statements Rated as Applicable for Number and Quantity Conceptual Category
Number of statements (out of 2)
Number of respondents
Percent of all respondents
(n = 89)
Percent of respondents
who rated any standard in strand
(n = 9)
–8 80 20.0 4.
9–6 49 .9 8.
–24 8 4.4 0.4
2–2 8 9.8 2.2
Total 797 42.0 100.0
Table F. Number of Standard Statements Rated as Applicable for Statistics and Probability Conceptual Category
Number of statements (out of 6)
Number of respondents
Percent of all respondents
(n = 89)
Percent of respondents
who rated any standard in
strand (n = )
–9 208 .0 2.
0–8 98 0.4 26.4
9–2 9 . 2.9
28–6 248 . .0
Total 751 39.6 100.0
Table F2. Number of Standard Statements Rated as Applicable for Algebra Conceptual Category
Number of statements (out of 4)
Number of respondents
Percent of all respondents
(n = 89)
Percent of respondents
who rated any standard in strand
(n = 9)
–8 4 8. 9.4
9–6 9 0. 24.6
–24 6 .2 .2
2–4 08 6.2 8.8
Total 793 41.8 100.0
Table F. Number of Standard Statements Rated as Applicable for Functions Conceptual Category
Number of statements (out of 4)
Number of respondents
Percent of all respondents
(n = 89)
Percent of respondents
who rated any standard in strand
(n = 606)
– 9 6. 9.6
2–22 4 .4 2.
2– 9 . 6.0
4–4 249 . 4.
Total 606 31.9 100.0
Table F4. Number of Standard Statements Rated as Applicable for Geometry Conceptual Category
Number of statements (out of 4)
Number of respondents
Percent of all respondents
(n = 89)
Percent of respondents
who rated any standard in
strand (n = )
– 9 . 4.
2–22 8 4. 2.4
2– 6 .9 0.
4–4 4.0 22.4
Total 335 17.7 100.0
Summary of Mathematics Applicability Ratings | Appendix F
Appendix F presents additional information on respondents’ applicability ratings in mathematics to supplement the data presented in Chapter 4. The first set of tables show the number of standards that respondents rated as applicable in each mathematics conceptual category and for the Mathematical Practices (Tables F1 through F6). Table F7 shows applicability information by content area, specifically the number of respondents in each content area who rated at least one standard in a conceptual category as applicable. Table F8 presents the percent of responses that fall into each of the four applicable categories, by category and for all the categories and the Mathematical Practices combined.
Ap
pe
nd
ix F
Appendix F • 158

Valid
ity
Stud
y •
159
Sum
ma
ry o
f M
ath
ema
tics
Ap
plic
ab
ility
Ra
tin
gs
Tab
le F
6. N
um
ber
of
Stan
dar
d S
tate
men
ts R
ated
as
Ap
plic
able
fo
r St
and
ard
s fo
r M
ath
emat
ical
Pra
ctic
e
Nu
mb
er o
f st
atem
ents
(o
ut
of
8)
Nu
mb
er o
f re
spo
nd
ents
Perc
ent
of
all
resp
on
den
ts
(n =
89
)
Perc
ent
of
resp
on
den
ts
wh
o r
ated
an
y st
and
ard
in s
tran
d
(n =
8
0)
68
.6
4.9
26
.
4.9
.
.
46
.
4.6
82
4.
.9
60
.
6.
8
4
4.
60
.4
8
84
.06
.4
Tota
l13
8072
.710
0.0
Tab
le F
. N
um
ber
of
Resp
on
den
ts W
ho
Rat
ed A
t Le
ast
On
e St
and
ard
in C
on
cep
tual
Cat
ego
ry a
s A
pp
licab
le, b
y Su
bje
ct A
rea
Co
mm
on
Co
re
mat
hem
atic
s co
nce
ptu
al
cate
go
ry
ELA
(n =
2
)M
ath
emat
ics
(n
=
02)
Scie
nce
(n =
28
)So
cial
sci
ence
(n
= 4
20)
Bu
sin
ess
man
agem
ent
(n =
24
)
Co
mp
ute
r te
chn
olo
gy
(n
=
)
Hea
lth
care
(n =
86
)
n%
n%
n%
n%
n%
n%
n%
Nu
mb
er
and
Q
uan
tity
0.
28
092
.2
84
.60
4.
6
.
49.0
686
.6
Alg
ebra
00.
028
94
.42
6
.9
4.0
84
.286
6.2
64
.9
Fun
ctio
ns
00.
026
989
.
86
.22
2.4
2
.8
2.9
90
.2
Geo
met
ry0
0.0
2
0.
29
4.9
4.
9
.
26
.6
.2
Stat
isti
cs
and
P
rob
abili
ty8
2.6
48
49.0
22
.4
8
44.0
844
.648
.4
66
.
Mat
he
mat
ica
l P
ract
ices
682
.80
20
0.0
24
9.
24
8.8
88
.4
46
9.4
8.
Ap
pe
nd
ix F
App
endi
x F

Valid
ity
Stud
y •
160
Sum
ma
ry o
f M
ath
ema
tics
Ap
plic
ab
ility
Ra
tin
gs
Ap
pe
nd
ix F
App
endi
x F
Tab
les
F8. P
erce
nt
of
Resp
on
ses
in F
ou
r A
pp
licab
ility
Cat
ego
ries
Acr
oss
Eac
h C
on
cep
tual
Cat
ego
ry
Co
nce
ptu
al c
ateg
ory
(n
um
ber
of
resp
on
den
ts)
Nu
mb
er o
f Ra
tin
gs
Perc
ent
Prer
equ
isit
eRe
view
edIn
tro
du
ced
Sub
seq
uen
tTo
tal
Nu
mb
er a
nd
Qu
anti
ty (
9)
08
26
.824
.02
.82
.40
0.0
Alg
ebra
(9
)
68
4.9
.9
.
8.9
00.
0
Fun
ctio
ns
(606
)6
28
29.0
0.4
2.4
.2
00.
0
Geo
met
ry (
)
6498
.
2.0
2.6
.
00.
0
Stat
isti
cs a
nd
Pro
bab
ility
(
)4
60
.4
6.
40.6
29.
00.
0
Mat
hem
atic
al P
ract
ices
(
80)
89
29.
.9
26.4
6.6
00.
0
All
cate
go
ries
(14
18)
7280
330
.527
.025
.916
.610
0.0

Individual Ratings for the Mathematics Standards | Appendix G
Notes. Where (H) is shown, it is an indication in the Common Core mathematics standards document to indicate a modeling mathematics practice.Where (+) is shown, it is an indication from the Common Core Mathematics standards document that some mathematics standards represent advanced content and are intended to prepare students for advanced courses.aRespondents completed an importance rating if they indicated that the content of the standards was either (a) prerequisite to, (b) reviewed in, or (c) introduced during their course. The mode rating is shaded. bValid percent values indicate percentages of respondents who indicated the standard was applicable to their course. cThe mean importance rating is calculated by assigning the following values to the ordinal scale ratings: least = 1, less = 2, more = 3, most = 4. Caution should be exercised when interpreting the precise value of any mean in relation to the categorical system underlying it.
Mathematical PracticesStandard . Make sense of problems
Applicability Ratings Importance Ratingsa Importance Mean
Category Number PercentValid percentb
(n = 1166)Category Number Percent Meanc
Standard
deviation
Prerequisite 8 20.4 .2 Most 62 9.9 .49 0.
Reviewed 460 24.2 9. More 8 0.2
Introduced 24 4.4 2. Less 94 8.4
Subsequent 4 2.4 .9 Least .
Not applicable 8. Total 1121 100.0
Total 1897 100.0 100.0
Standard 2. Reason abstractly and quantitatively
Applicability Ratings Importance Ratingsa Importance Mean
Category Number PercentValid percentb
(n = 1205)Category Number Percent Meanc
Standard
deviation
Prerequisite 6 . 2.9 Most 8 0.8 .6 0.
Reviewed 4 24. .9 More 408 .
Introduced 8. 29. Less 8 2.
Subsequent 6 .2 . Least .
Not applicable 692 6. Total 1144 100.0
Total 1897 100.0 100.0
Standard . Construct and critique arguments
Applicability Ratings Importance Ratingsa Importance Mean
Category Number PercentValid percentb
(n = 1183)Category Number Percent Meanc
Standard
deviation
Prerequisite 269 4.2 22. Most 0 .0 .0 0.
Reviewed 44 2.8 .0 More 02 4.2
Introduced 8 20. 2.2 Less 20 9.
Subsequent 9 6. 0. Least 22 2.
Not applicable 4 .6 Total 1064 100.0
Total 1897 100.0 100.0
Appendix G provides descriptive statistics for the individual ratings of every standard statement in the Common Core standards for mathematics. Recall that, for the purposes of the study, respondents rated sub-standards and standards as though they were on the same level; therefore, the mathematics standards comprised 200 ratable statements.
Ap
pe
nd
ix G
Appendix G • 161

Appendix G • 162
Ap
pe
nd
ix G
Mathematics: Mathematical PracticesStandard 4. Model
Applicability Ratings Importance Ratingsa Importance Mean
Category Number PercentValid percentb
(n = 1132)Category Number Percent Meanc
Standard
deviation
Prerequisite 280 4.8 24. Most 49 44. .2 0.8
Reviewed 48 22.0 6.9 More 409 9.
Introduced 42 8.0 0.2 Less 0 4.4
Subsequent 92 4.8 8. Least 22 2.
Not applicable 6 40. Total 1040 100.0
Total 1897 100.0 100.0
Standard . Use appropriate tools
Applicability Ratings Importance Ratingsa Importance Mean
Category Number PercentValid percentb
(n = 1129)Category Number Percent Meanc
Standard
deviation
Prerequisite 22 .0 28. Most 42 9. . 0.80
Reviewed 40 2.2 . More 44 4.4
Introduced 24 . 28. Less 6.
Subsequent 80 4.2 . Least 0 2.9
Not applicable 68 40. Total 1049 100.0
Total 1897 100.0 100.0
Standard 6. Attend to precision
Applicability Ratings Importance Ratingsa Importance Mean
Category Number PercentValid percentb
(n = 1185)Category Number Percent Meanc
Standard
deviation
Prerequisite 8. 0.0 Most 499 44. .28 0.4
Reviewed 482 2.4 40. More 40 40.0
Introduced 289 .2 24.4 Less 6 4.8
Subsequent 9 . .0 Least 0 0.9
Not applicable 2 . Total 1126 100.0
Total 1897 100.0 100.0

Appendix G • 163
Ap
pe
nd
ix G
Mathematics: Mathematical PracticesStandard . Look for and use structure
Applicability Ratings Importance Ratingsa Importance Mean
Category Number PercentValid percentb
(n = 1005)Category Number Percent Meanc
Standard
deviation
Prerequisite 6 9. 6. Most 6 8. .4 0.82
Reviewed 8 9.9 .6 More 9.
Introduced 98 0.4 9. Less 82 9.
Subsequent 62 . 6.2 Least 2 2.
Not applicable 892 4.0 Total 943 100.0
Total 1897 100.0 100.0
Standard 8. Look for and express regularity in repeated reasoning
Applicability Ratings Importance Ratingsa Importance Mean
Category Number PercentValid percentb
(n = 946)Category Number Percent Meanc
Standard
deviation
Prerequisite 290 . 0. Most 268 0.8 .02 0.8
Reviewed 6 9.8 9. More 8 44.0
Introduced 20 0.8 2. Less 9 22.2
Subsequent 4.0 .9 Least 2 .
Not applicable 9 0. Total 871 100.0
Total 1897 100.0 100.0
Notes. Where (H) is shown, it is an indication in the Common Core mathematics standards document to indicate a modeling mathematics practice.Where (+) is shown, it is an indication from the Common Core Mathematics standards document that some mathematics standards represent advanced content and are intended to prepare students for advanced courses.aRespondents completed an importance rating if they indicated that the content of the standards was either (a) prerequisite to, (b) reviewed in, or (c) introduced during their course. The mode rating is shaded. bValid percent values indicate percentages of respondents who indicated the standard was applicable to their course. cThe mean importance rating is calculated by assigning the following values to the ordinal scale ratings: least = 1, less = 2, more = 3, most = 4. Caution should be exercised when interpreting the precise value of any mean in relation to the categorical system underlying it.

Appendix G • 164
Ap
pe
nd
ix G
MathematicsNumber and Quantity
The Real Number System: Standard . Explain how the definition of the meaning of rational exponents follows from extending the properties of integer exponents to those values, allowing for a notation for radicals in terms of rational exponents. For example, we define / to be the cube root of because we want (/) = (/) to hold, so (/) must equal .
Applicability Ratings Importance Ratingsa Importance Mean
Category Number PercentValid percentb
(n = 494)Category Number Percent Meanc
Standard
deviation
Prerequisite 20 4.2 4. Most .0 .00 0.86
Reviewed 4 .4 28. More 82 8.8
Introduced 8 . . Less 2.
Subsequent 2 . . Least 2 4.
Not applicable 40 4.0 Total 469 100.0
Total 89 00.0 00.0
The Real Number System: Standard 2. Rewrite expressions involving radicals and rational exponents using the properties of exponents.
Applicability Ratings Importance Ratingsa Importance Mean
Category Number PercentValid percentb
(n = 512)Category Number Percent Meanc
Standard
deviation
Prerequisite 26 .9 .4 Most . .00 0.92
Reviewed 6 8. .4 More .
Introduced 64 .4 2. Less 22.
Subsequent 24 . 4. Least 6.4
Not applicable 8 .0 Total 488 100.0
Total 1897 100.0 100.0
The Real Number System: Standard . Explain why the sum or product of two rational numbers is rational; that the sum of a rational number and an irrational number is irrational; and that the product of a nonzero rational number and an irrational number is irrational.
Applicability Ratings Importance Ratingsa Importance Mean
Category Number PercentValid percentb
(n = 383)Category Number Percent Meanc
Standard
deviation
Prerequisite 20 0.9 4.0 Most 6 9. 2.6 0.89
Reviewed 9 . 2. More 08 .
Introduced 4 2. .2 Less 4 4.2
Subsequent 6 .9 9.4 Least 29 8.4
Not applicable 4 9.8 Total 347 100.0
Total 1897 100.0 100.0
Notes. Where (H) is shown, it is an indication in the Common Core mathematics standards document to indicate a modeling mathematics practice.Where (+) is shown, it is an indication from the Common Core Mathematics standards document that some mathematics standards represent advanced content and are intended to prepare students for advanced courses.aRespondents completed an importance rating if they indicated that the content of the standards was either (a) prerequisite to, (b) reviewed in, or (c) introduced during their course. The mode rating is shaded. bValid percent values indicate percentages of respondents who indicated the standard was applicable to their course. cThe mean importance rating is calculated by assigning the following values to the ordinal scale ratings: least = 1, less = 2, more = 3, most = 4. Caution should be exercised when interpreting the precise value of any mean in relation to the categorical system underlying it.

Appendix G • 165
Ap
pe
nd
ix G
Mathematics: Number and QuantityQuantities: Standard . Use units as a way to understand problems and to guide the solution of multi-step problems; choose and interpret units consistently in formulas; choose and interpret the scale and the origin in graphs and data displays.
Applicability Ratings Importance Ratingsa Importance Mean
Category Number PercentValid percentb
(n = 777)Category Number Percent Meanc
Standard
deviation
Prerequisite 26 . 2.9 Most 4 44. .2 0.
Reviewed 44 8. 44. More 284 .
Introduced 66 8.8 2.4 Less .4
Subsequent 0.6 .4 Least 8 .0
Not applicable 20 9.0 Total 766 100.0
Total 1897 100.0 100.0
Quantities: Standard 2. Define appropriate quantities for the purpose of descriptive modeling.
Applicability Ratings Importance Ratingsa Importance Mean
Category Number PercentValid percentb
(n = 724)Category Number Percent Meanc
Standard
deviation
Prerequisite 9 0.2 26. Most 22 . .0 0.9
Reviewed 6. 4.8 More 00 42.9
Introduced 90 0.0 26.2 Less 2.9
Subsequent 24 . . Least 2.
Not applicable 6.8 Total 700 100.0
Total 1897 100.0 100.0
Quantities: Standard . Choose a level of accuracy appropriate to limitations on measurement when reporting quantities.
Applicability Ratings Importance Ratingsa Importance Mean
Category Number PercentValid percentb
(n = 713)Category Number Percent Meanc
Standard
deviation
Prerequisite 84 9. 2.8 Most 204 29.9 2.9 0.8
Reviewed 0 6.0 42. More 286 4.9
Introduced 96 0. 2. Less 6 2.6
Subsequent 0 .6 4.2 Least 2 4.
Not applicable 84 62.4 Total 683 100.0
Total 1897 100.0 100.0

Appendix G • 166
Ap
pe
nd
ix G
Mathematics: Number and QuantityThe Complex Number System: Standard . Know there is a complex number i such that i2 = –, and every complex number has the form a + bi with a and b being real.
Applicability Ratings Importance Ratingsa Importance Mean
Category Number PercentValid percentb
(n = 301)Category Number Percent Meanc
Standard
deviation
Prerequisite 0 .8 6. Most 8 2. 2.69 0.9
Reviewed 4.0 24.9 More 80 .9
Introduced 66 . 2.9 Less 90 .9
Subsequent 0 2.6 6.6 Least 2 9.2
Not applicable 96 84. Total 251 100.0
Total 1897 100.0 100.0
The Complex Number System: Standard 2. Use the relation i2 = – and the commutative, associative, and distributive properties to add, subtract, and multiply complex numbers.
Applicability Ratings Importance Ratingsa Importance Mean
Category Number PercentValid percentb
(n = 294)Category Number Percent Meanc
Standard
deviation
Prerequisite .9 .8 Most 22. 2. 0.92
Reviewed 66 . 22.4 More 84 4.
Introduced 6 .4 22. Less 80 .
Subsequent 2 2. . Least 2 9.
Not applicable 60 84. Total 242 100.0
Total 1897 100.0 100.0
The Complex Number System: Standard . (+) Find the conjugate of a complex number; use conjugates to find moduli and quotients of complex numbers.
Applicability Ratings Importance Ratingsa Importance Mean
Category Number PercentValid percentb
(n = 274)Category Number Percent Meanc
Standard
deviation
Prerequisite 90 4. 2.8 Most 4 20. 2.62 0.9
Reviewed 6 .2 22. More 68 .
Introduced 6 .4 2. Less 8 .
Subsequent 8 . 2.2 Least 2 0.6
Not applicable 62 8.6 Total 217 100.0
Total 1897 100.0 100.0

Appendix G • 167
Ap
pe
nd
ix G
Mathematics: Number and QuantityThe Complex Number System: Standard 4. (+) Represent complex numbers on the complex plane in rectangular and polar form (including real and imaginary numbers), and explain why the rectangular and polar forms of a given complex number represent the same number.
Applicability Ratings Importance Ratingsa Importance Mean
Category Number PercentValid percentb
(n = 225)Category Number Percent Meanc
Standard
deviation
Prerequisite 6 .4 28.9 Most 22 . 2.48 0.94
Reviewed 26 .4 .6 More 28.
Introduced 8 2.0 6.9 Less 9.
Subsequent 96 . 42. Least 9 4.
Not applicable 62 88. Total 129 100.0
Total 1897 100.0 100.0
The Complex Number System: Standard . (+) Represent addition, subtraction, multiplication, and conjugation of complex numbers geometrically on the complex plane; use properties of this representation for computation. For example, ( – √i) = 8 because ( – √i) has modulus 2 and argument 20°.
Applicability Ratings Importance Ratingsa Importance Mean
Category Number PercentValid percentb
(n = 218)Category Number Percent Meanc
Standard
deviation
Prerequisite 64 .4 29.4 Most 2 6.8 2.0 0.9
Reviewed 2 . . More 6 28.8
Introduced 6 .9 6. Less 42.4
Subsequent 9 4.9 42. Least 2.0
Not applicable 69 88. Total 125 100.0
Total 1897 100.0 100.0
The Complex Number System: Standard 6. (+) Calculate the distance between numbers in the complex plane as the modulus of the difference, and the midpoint of a segment as the average of the numbers at its endpoints.
Applicability Ratings Importance Ratingsa Importance Mean
Category Number PercentValid percentb
(n = 241)Category Number Percent Meanc
Standard
deviation
Prerequisite 66 . 2.4 Most 22 4. 2.60 0.8
Reviewed 44 2. 8. More 9 8.8
Introduced 42 2.2 .4 Less 9 8.8
Subsequent 89 4. 6.9 Least 2 .9
Not applicable 66 8. Total 152 100.0
Total 1897 100.0 100.0

Appendix G • 168
Ap
pe
nd
ix G
Mathematics: Number and QuantityThe Complex Number System: Standard . Solve quadratic equations with real coefficients that have complex solutions.
Applicability Ratings Importance Ratingsa Importance Mean
Category Number PercentValid percentb
(n = 348)Category Number Percent Meanc
Standard
deviation
Prerequisite 6.9 .6 Most 89 29.0 2.9 0.89
Reviewed 02 .4 29. More 2 9.4
Introduced .8 2.0 Less 8 2.4
Subsequent 42 2.2 2. Least 9 6.2
Not applicable 49 8. Total 307 100.0
Total 1897 100.0 100.0
The Complex Number System: Standard 8. (+) Extend polynomial identities to the complex numbers. For example, rewrite x2 + 4 as (x + 2i)(x – 2i).
Applicability Ratings Importance Ratingsa Importance Mean
Category Number PercentValid percentb
(n = 275)Category Number Percent Meanc
Standard
deviation
Prerequisite 86 4. . Most 46 2. 2.66 0.9
Reviewed .0 20. More 69 2.2
Introduced . 2.8 Less 80 .4
Subsequent 6 .2 22.2 Least 9 8.9
Not applicable 622 8. Total 214 100.0
Total 1897 100.0 100.0
The Complex Number System: Standard 9. (+) Know the Fundamental Theorem of Algebra; show that it is true for quadratic polynomials.
Applicability Ratings Importance Ratingsa Importance Mean
Category Number Percent Valid percentb (n = 328) Category Number Percent Meanc Standard
deviation
Prerequisite 2 .0 40.2 Most 2 2.6 2.9 0.9
Reviewed 64 .4 9. More 00 .6
Introduced 8 4. 2.9 Less 88 .
Subsequent 4 2. 4. Least 2 .
Not applicable 69 82. Total 281 100.0
Total 1897 100.0 100.0

Appendix G • 169
Ap
pe
nd
ix G
Mathematics: Number and QuantityVector and Matrix Quantities: Standard . (+) Recognize vector quantities as having both magnitude and direction. Represent vector quantities by directed line segments, and use appropriate symbols for vectors and their magnitudes (e.g., v, |v|, ||v||, v).
Applicability Ratings Importance Ratingsa Importance Mean
Category Number PercentValid percentb
(n = 326)Category Number Percent Meanc
Standard
deviation
Prerequisite 48 2. 4. Most 82 8. .02 0.92
Reviewed 6 .2 8. More 66 0.8
Introduced 0 . 2.2 Less 2.
Subsequent 2 .9 4.4 Least .
Not applicable 82.8 Total 214 100.0
Total 1897 100.0 100.0
Vector and Matrix Quantities: Standard 2. (+) Find the components of a vector by subtracting the coordinates of an initial point from the coordinates of a terminal point.
Applicability Ratings Importance Ratingsa Importance Mean
Category Number PercentValid percentb
(n = 306)Category Number Percent Meanc
Standard
deviation
Prerequisite 44 2. 4.4 Most 4 8.9 .0 0.9
Reviewed 9 . 9. More 6 29.
Introduced 8 4.6 28.4 Less 48 2.
Subsequent 6 6. .9 Least 2 6.
Not applicable 9 8.9 Total 190 100.0
Total 1897 100.0 100.0
Vector and Matrix Quantities: Standard . (+) Solve problems involving velocity and other quantities that can be represented by vectors.
Applicability Ratings Importance Ratingsa Importance Mean
Category Number PercentValid percentb
(n = 315)Category Number Percent Meanc
Standard
deviation
Prerequisite 4 2.2 .0 Most 86 4. .09 0.94
Reviewed 64 .4 20. More 6 2.
Introduced 0 . 2. Less 9 8.9
Subsequent 09 . 4.6 Least 4 6.8
Not applicable 82 8.4 Total 206 100.0
Total 1897 100.0 100.0

Appendix G • 170
Ap
pe
nd
ix G
Mathematics: Number and QuantityVector and Matrix Quantities: Standard 4. (+) Add and subtract vectors.
Applicability Ratings Importance Ratingsa Importance Mean
Category Number PercentValid percentb
(n = 324)Category Number Percent Meanc
Standard
deviation
Prerequisite 2 2. 6.0 Most 8 42.6 .02 .00
Reviewed 60 .2 8. More 26.0
Introduced 92 4.8 28.4 Less 46 22.
Subsequent 20 6. .0 Least 8 8.8
Not applicable 82.9 Total 204 100.0
Total 1897 100.0 100.0
Vector and Matrix Quantities: Standard 4a. Add vectors end-to-end, component-wise, and by the parallelogram rule. Understand that the magnitude of a sum of two vectors is typically not the sum of the magnitudes.
Applicability Ratings Importance Ratingsa Importance Mean
Category Number PercentValid percentb
(n = 300)Category Number Percent Meanc
Standard
deviation
Prerequisite 4 2. 4. Most 2 40. 2.99 .0
Reviewed .0 9.0 More 49 2.
Introduced 4. 2. Less 9 22.0
Subsequent 2 6. 4.0 Least 9.6
Not applicable 9 84.2 Total 177 100.0
Total 1897 100.0 100.0
Vector and Matrix Quantities: Standard 4b. Given two vectors in magnitude and direction form, determine the magnitude and direction of their sum.
Applicability Ratings Importance Ratingsa Importance Mean
Category Number PercentValid percentb
(n = 303)Category Number Percent Meanc
Standard
deviation
Prerequisite 9 2. 2.9 Most 42. .0 0.98
Reviewed .0 8.8 More 28.0
Introduced 86 4. 28.4 Less 40 22.0
Subsequent 2 6.4 9.9 Least 4 .
Not applicable 94 84.0 Total 182 100.0
Total 1897 100.0 100.0

Appendix G • 171
Ap
pe
nd
ix G
Mathematics: Number and Quantity
Vector and Matrix Quantities: Standard 4c. Understand vector subtraction v – w as v + (–w), where –w is the additive inverse of w, with the same magnitude as w and pointing in the opposite direction. Represent vector subtraction graphically by connecting the tips in the appropriate order, and perform vector subtraction component-wise.
Applicability Ratings Importance Ratingsa Importance Mean
Category Number PercentValid percentb
(n = 290)Category Number Percent Meanc
Standard
deviation
Prerequisite 4 2.2 4. Most 64 .9 2.96 .00
Reviewed 48 2. 6.6 More 2 0.8
Introduced 80 4.2 2.6 Less 6 2.
Subsequent 2 6.4 4. Least 0.
Not applicable 60 84. Total 169 100.0
Total 1897 100.0 100.0
Vector and Matrix Quantities: Standard . (+) Multiply a vector by a scalar.
Applicability Ratings Importance Ratingsa Importance Mean
Category Number PercentValid percentb
(n = 291)Category Number Percent Meanc
Standard
deviation
Prerequisite 4 2. 4.8 Most 68 9. 2.99 .00
Reviewed 48 2. 6. More 0 29.
Introduced 8 4. 2.8 Less 8 22.
Subsequent 9 6. 40.9 Least 6 9.
Not applicable 606 84. Total 172 100.0
Total 1897 100.0 100.0
Vector and Matrix Quantities: Standard a. Represent scalar multiplication graphically by scaling vectors and possibly reversing their direction; perform scalar multiplication component-wise, e.g., as c(v
x , v
y ) = (cv
x , cv
y ).
Applicability Ratings Importance Ratingsa Importance Mean
Category Number PercentValid percentb
(n = 266)Category Number Percent Meanc
Standard
deviation
Prerequisite 9 2. 4. Most 4 .0 2.9 0.98
Reviewed 2.0 .9 More 9 26.
Introduced 0 . 26. Less 42 28.8
Subsequent 20 6. 4. Least .
Not applicable 6 86.0 Total 146 100.0
Total 1897 100.0 100.0

Appendix G • 172
Ap
pe
nd
ix G
Mathematics: Number and QuantityVector and Matrix Quantities: Standard b. Compute the magnitude of a scalar multiple cv using ||cv|| = |c|v. Compute the direction of cv knowing that when |c|v ≠ 0, the direction of cv is either along v (for c > 0) or against v (for c < 0).
Applicability Ratings Importance Ratingsa Importance Mean
Category Number PercentValid percentb
(n = 258)Category Number Percent Meanc
Standard
deviation
Prerequisite .8 .6 Most 6 40.6 2.99 .0
Reviewed 4 .8 .2 More 8 2.
Introduced 69 .6 26. Less 22.
Subsequent 20 6. 46. Least 9.4
Not applicable 69 86.4 Total 138 100.0
Total 1897 100.0 100.0
Vector and Matrix Quantities: Standard 6. (+) Use matrices to represent and manipulate data, e.g., to represent payoffs or incidence relationships in a network.
Applicability Ratings Importance Ratingsa Importance Mean
Category Number PercentValid percentb
(n = 285)Category Number Percent Meanc
Standard
deviation
Prerequisite 4 2.2 4.4 Most 0 8. 2.6 0.8
Reviewed 2 . .2 More 64 9.0
Introduced 9 4.8 .9 Less 6 4.
Subsequent 2 6.4 42. Least 4 8.
Not applicable 62 8.0 Total 164 100.0
Total 1897 100.0 100.0
Vector and Matrix Quantities: Standard . (+) Multiply matrices by scalars to produce new matrices, e.g., as when all of the payoffs in a game are doubled.
Applicability Ratings Importance Ratingsa Importance Mean
Category Number PercentValid percentb
(n = 248)Category Number Percent Meanc
Standard
deviation
Prerequisite 4 .8 . Most 2 .6 2.6 0.8
Reviewed 2 . 2.9 More 6 4.
Introduced 69 .6 2.8 Less 0 .0
Subsequent 6.0 4.6 Least 8 .9
Not applicable 649 86.9 Total 135 100.0
Total 1897 100.0 100.0

Appendix G • 173
Ap
pe
nd
ix G
Mathematics: Number and QuantityVector and Matrix Quantities: Standard 8. (+) Add, subtract, and multiply matrices of appropriate dimensions.
Applicability Ratings Importance Ratingsa Importance Mean
Category Number PercentValid percentb
(n = 261)Category Number Percent Meanc
Standard
deviation
Prerequisite 9 2. 4.9 Most 29 9. 2.6 0.8
Reviewed . 2.6 More 62 42.2
Introduced 4.0 28. Less 48 2.
Subsequent 4 6.0 4. Least 8 .4
Not applicable 66 86.2 Total 147 100.0
Total 1897 100.0 100.0
Vector and Matrix Quantities: Standard 9. (+) Understand that, unlike multiplication of numbers, matrix multiplication for square matrices is not a commutative operation, but still satisfies the associative and distributive properties.
Applicability Ratings Importance Ratingsa Importance Mean
Category Number PercentValid percentb
(n = 235)Category Number Percent Meanc
Standard
deviation
Prerequisite 2 . .6 Most 2 20. 2.69 0.90
Reviewed 2 .2 9.8 More 4 .2
Introduced 66 . 28. Less 40 .
Subsequent 4 6.0 48. Least 9.
Not applicable 662 8.6 Total 121 100.0
Total 1897 100.0 100.0
Vector and Matrix Quantities: Standard 0. (+) Understand that the zero and identity matrices play a role in matrix addition and multiplication similar to the role of 0 and in the real numbers. The determinant of a square matrix is nonzero if and only if the matrix has a multiplicative inverse.
Applicability Ratings Importance Ratingsa Importance Mean
Category Number PercentValid percentb
(n = 233)Category Number Percent Meanc
Standard
deviation
Prerequisite . 4.2 Most 20 6. 2.6 0.8
Reviewed 22 .2 9.4 More 42.
Introduced 66 . 28. Less 8 .4
Subsequent 2 .9 48. Least 2 9.9
Not applicable 664 8. Total 121 100.0
Total 1897 100.0 100.0

Appendix G • 174
Ap
pe
nd
ix G
Mathematics: Number and QuantityVector and Matrix Quantities: Standard . (+) Multiply a vector (regarded as a matrix with one column) by a matrix of suitable dimensions to produce another vector. Work with matrices as transformations of vectors.
Applicability Ratings Importance Ratingsa Importance Mean
Category Number PercentValid percentb
(n = 215)Category Number Percent Meanc
Standard
deviation
Prerequisite 2 .4 2.6 Most 20 22.0 2. 0.92
Reviewed 8 0.9 8.4 More 4 .4
Introduced 46 2.4 2.4 Less 28 0.8
Subsequent 24 6. . Least 9 9.9
Not applicable 682 88. Total 91 100.0
Total 1897 100.0 100.0
Vector and Matrix Quantities: Standard 2. (+) Work with 2 × 2 matrices as transformations of the plane, and interpret the absolute value of the determinant in terms of area.
Applicability Ratings Importance Ratingsa Importance Mean
Category Number PercentValid percentb
(n = 218)Category Number Percent Meanc
Standard
deviation
Prerequisite 29 . . Most 9 20.4 2.6 0.9
Reviewed 6 0.8 . More 2 4.4
Introduced 48 2. 22.0 Less 29 .2
Subsequent 2 6.6 . Least 4.0
Not applicable 69 88. Total 93 100.0
Total 1897 100.0 100.0
Notes. Where (H) is shown, it is an indication in the Common Core mathematics standards document to indicate a modeling mathematics practice.Where (+) is shown, it is an indication from the Common Core Mathematics standards document that some mathematics standards represent advanced content and are intended to prepare students for advanced courses.aRespondents completed an importance rating if they indicated that the content of the standards was either (a) prerequisite to, (b) reviewed in, or (c) introduced during their course. The mode rating is shaded. bValid percent values indicate percentages of respondents who indicated the standard was applicable to their course. cThe mean importance rating is calculated by assigning the following values to the ordinal scale ratings: least = 1, less = 2, more = 3, most = 4. Caution should be exercised when interpreting the precise value of any mean in relation to the categorical system underlying it.

Appendix G • 175
Ap
pe
nd
ix G
Mathematics
Algebra
Seeing Structure in Expressions: Standard . Interpret expressions that represent a quantity in terms of its context.H
Applicability Ratings Importance Ratingsa Importance Mean
Category Number PercentValid percentb
(n = 749)Category Number Percent Meanc
Standard
deviation
Prerequisite 9.6 49. Most 292 9.4 .2 0.
Reviewed 2 4. 6.2 More 2 4.9
Introduced 99 .2 .2 Less 4 .4
Subsequent 8 0.4 . Least 0 .
Not applicable 48 60. Total 741 100.0
Total 1897 100.0 100.0
Seeing Structure in Expressions: Standard a. Interpret parts of an expression, such as terms, factors, and coefficients.
Applicability Ratings Importance Ratingsa Importance Mean
Category Number PercentValid percentb
(n = 717)Category Number Percent Meanc
Standard
deviation
Prerequisite 9 20.9 .4 Most 2 8. .4 0.82
Reviewed 228 2.0 .8 More 284 40.
Introduced 8 4. 0.9 Less 2 .8
Subsequent 4 0. 2.0 Least 24 .4
Not applicable 80 62.2 Total 704 100.0
Total 1897 100.0 100.0
Seeing Structure in Expressions: Standard b. Interpret complicated expressions by viewing one or more of their parts as a single entity. For example, interpret P(+r)n as the product of P and a factor not depending on P.
Applicability Ratings Importance Ratingsa Importance Mean
Category Number PercentValid percentb
(n = 571)Category Number Percent Meanc
Standard
deviation
Prerequisite 2 4. 4. Most 62 29.8 2.94 0.8
Reviewed 82 9.6 .9 More 28 40.
Introduced 9 4.8 .9 Less 6 2.0
Subsequent 2 .4 4. Least 28 .
Not applicable 26 69.9 Total 544 100.0
Total 1897 100.0 100.0
Notes. Where (H) is shown, it is an indication in the Common Core mathematics standards document to indicate a modeling mathematics practice.Where (+) is shown, it is an indication from the Common Core Mathematics standards document that some mathematics standards represent advanced content and are intended to prepare students for advanced courses.aRespondents completed an importance rating if they indicated that the content of the standards was either (a) prerequisite to, (b) reviewed in, or (c) introduced during their course. The mode rating is shaded. bValid percent values indicate percentages of respondents who indicated the standard was applicable to their course. cThe mean importance rating is calculated by assigning the following values to the ordinal scale ratings: least = 1, less = 2, more = 3, most = 4. Caution should be exercised when interpreting the precise value of any mean in relation to the categorical system underlying it.

Appendix G • 176
Ap
pe
nd
ix G
Mathematics: AlgebraSeeing Structure in Expressions: Standard 2. Use the structure of an expression to identify ways to rewrite it. For example, see x4 – y4 as (x2)2 – (y2)2, thus recognizing it as a difference of squares that can be factored as (x2 – y2)(x2 + y2).
Applicability Ratings Importance Ratingsa Importance Mean
Category Number PercentValid percentb
(n = 520)Category Number Percent Meanc
Standard
deviation
Prerequisite 246 .0 4. Most 40 28.2 2.88 0.90
Reviewed 82 9.6 .0 More 9 9.
Introduced 68 .6 . Less 24 2.0
Subsequent 24 . 4.6 Least .
Not applicable 2.6 Total 496 100.0
Total 1897 100.0 100.0
Seeing Structure in Expressions: Standard . Choose and produce an equivalent form of an expression to reveal and explain properties of the quantity represented by the expression.
Applicability Ratings Importance Ratingsa Importance Mean
Category Number PercentValid percentb
(n = 632)Category Number Percent Meanc
Standard
deviation
Prerequisite 24 .0 9. Most 92 .4 .0 0.84
Reviewed 2 .4 40. More 29 42.
Introduced 0 .8 .4 Less 4 2.9
Subsequent 20 . .2 Least 2 4.4
Not applicable 26 66. Total 612 100.0
Total 1897 100.0 100.0
Seeing Structure in Expressions: Standard a. Factor a quadratic expression to reveal the zeros of the function it defines.
Applicability Ratings Importance Ratingsa Importance Mean
Category Number PercentValid percentb
(n = 434)Category Number Percent Meanc
Standard
deviation
Prerequisite 206 0.9 4. Most 69 4.8 .2 0.90
Reviewed 8.0 4.8 More 6 .
Introduced 4 2. 0.8 Less 8 9.
Subsequent 0 .6 6.9 Least 2 .2
Not applicable 46 . Total 404 100.0
Total 1897 100.0 100.0

Appendix G • 177
Ap
pe
nd
ix G
Mathematics: AlgebraSeeing Structure in Expressions: Standard b. Complete the square in a quadratic expression to reveal the maximum or minimum value of the function it defines.
Applicability Ratings Importance Ratingsa Importance Mean
Category Number PercentValid percentb
(n = 375)Category Number Percent Meanc
Standard
deviation
Prerequisite 2 8.0 40. Most 86 2. 2. 0.96
Reviewed 20 6. 2.0 More 0 2.
Introduced . 8.9 Less 09 .8
Subsequent 2 . 8. Least 8 .
Not applicable 22 80.2 Total 343 100.0
Total 1897 100.0 100.0
Seeing Structure in Expressions: Standard c. Use the properties of exponents to transform expressions for exponential functions. For example the expression .t can be rewritten as (./2)2t ≈ .022t to reveal the approximate equivalent monthly interest rate if the annual rate is %.
Applicability Ratings Importance Ratingsa Importance Mean
Category Number PercentValid percentb
(n = 394)Category Number Percent Meanc
Standard
deviation
Prerequisite 46 . . Most 89 2. 2.8 0.9
Reviewed 28 6. 2. More 6 8.6
Introduced 8 4. 9.8 Less 99 28.
Subsequent 42 2.2 0. Least 28 8.0
Not applicable 0 9.2 Total 352 100.0
Total 1897 100.0 100.0
Seeing Structure in Expressions: Standard 4. Derive the formula for the sum of a finite geometric series (when the common ratio is not ), and use the formula to solve problems. For example, calculate mortgage payments.
Applicability Ratings Importance Ratingsa Importance Mean
Category Number PercentValid percentb
(n = 310)Category Number Percent Meanc
Standard
deviation
Prerequisite 69 .6 22. Most 4 9.4 2. 0.86
Reviewed 6 4.0 24. More 9 4.0
Introduced 4. 24.8 Less 2 2.4
Subsequent 88 4.6 28.4 Least 6 .2
Not applicable 8 8. Total 222 100.0
Total 1897 100.0 100.0

Appendix G • 178
Ap
pe
nd
ix G
Mathematics: AlgebraArithmetic with Polynomials and Rational Expressions: Standard . Understand that polynomials form a system analogous to the integers, namely, they are closed under the operations of addition, subtraction, and multiplication; add, subtract, and multiply polynomials.
Applicability Ratings Importance Ratingsa Importance Mean
Category Number PercentValid percentb
(n = 428)Category Number Percent Meanc
Standard
deviation
Prerequisite 229 2. . Most 04 2.2 2.8 0.94
Reviewed 0 . 2.6 More 4 6.8
Introduced 2.8 2.4 Less 0 26.4
Subsequent 4 2.4 0. Least 9.
Not applicable 469 .4 Total 383 100.0
Total 1897 100.0 100.0
Arithmetic with Polynomials and Rational Expressions: Standard 2. Know and apply the Remainder Theorem: For a polynomial p(x) and a number a, the remainder on division by x – a is p(a), so p(a) = 0 if and only if (x – a) is a factor of p(x).
Applicability Ratings Importance Ratingsa Importance Mean
Category Number PercentValid percentb
(n = 321)Category Number Percent Meanc
Standard
deviation
Prerequisite 2 6.4 . Most 2. 2.68 0.99
Reviewed . 22. More 8 0.
Introduced 9 4.8 28. Less 89 .4
Subsequent 8 2.0 .8 Least 6 2.
Not applicable 6 8. Total 283 100.0
Total 1897 100.0 100.0
Arithmetic with Polynomials and Rational Expressions: Standard . Identify zeros of polynomials when suitable factorizations are available, and use the zeros to construct a rough graph of the function defined by the polynomial.
Applicability Ratings Importance Ratingsa Importance Mean
Category Number PercentValid percentb
(n = 349)Category Number Percent Meanc
Standard
deviation
Prerequisite . 8. Most 00 .4 2.92 0.92
Reviewed 84 4.4 24. More 6.8
Introduced 99 .2 28.4 Less 24.2
Subsequent .6 8.9 Least 24 .
Not applicable 48 8.6 Total 318 100.0
Total 1897 100.0 100.0

Appendix G • 179
Ap
pe
nd
ix G
Mathematics: AlgebraArithmetic with Polynomials and Rational Expressions: Standard 4. Prove polynomial identities and use them to describe numerical relationships. For example, the polynomial identity (x2 + y2)2 = (x2 – y2)2 + (2xy)2 can be used to generate Pythagorean triples.
Applicability Ratings Importance Ratingsa Importance Mean
Category Number PercentValid percentb
(n = 230)Category Number Percent Meanc
Standard
deviation
Prerequisite 8 4.6 .8 Most 22 2.8 2.42 0.88
Reviewed 0 2.6 2. More 29.
Introduced .8 .2 Less 6 44.2
Subsequent 8 . 2.2 Least 2 .4
Not applicable 66 8.9 Total 172 100.0
Total 1897 100.0 100.0
Arithmetic with Polynomials and Rational Expressions: Standard . (+) Know and apply the Binomial Theorem for the expansion of (x + y)n in powers of x and y for a positive integer n, where x and y are any numbers, with coefficients determined for example by Pascal’s Triangle. (The Binomial Theorem can be proved by mathematical induction or by a combinatorial argument.)
Applicability Ratings Importance Ratingsa Importance Mean
Category Number PercentValid percentb
(n = 308)Category Number Percent Meanc
Standard
deviation
Prerequisite 86 4. 2.9 Most 4 4. 2.2 0.88
Reviewed 8 4.4 26.9 More 84 .
Introduced 69 .6 22.4 Less 92 8.
Subsequent 0 . 22. Least 28 .8
Not applicable 89 8.8 Total 238 100.0
Total 1897 100.0 100.0
Arithmetic with Polynomials and Rational Expressions: Standard 6. Rewrite simple rational expressions in different forms; write a(x)/b(x) in the form q(x) + r(x)/b(x), where a(x), b(x), q(x), and r(x) are polynomials with the degree of r(x) less than the degree of b(x), using inspection, long division, or, for the more complicated examples, a computer algebra system.
Applicability Ratings Importance Ratingsa Importance Mean
Category Number PercentValid percentb
(n = 378)Category Number Percent Meanc
Standard
deviation
Prerequisite 2 .0 4.9 Most 68 20.0 2.69 0.8
Reviewed 6.9 4. More 22 .9
Introduced 4. 20.4 Less 2 .4
Subsequent 8 2.0 0. Least 2 6.8
Not applicable 9 80. Total 340 100.0
Total 1897 100.0 100.0

Appendix G • 180
Ap
pe
nd
ix G
Mathematics: Algebra
Arithmetic with Polynomials and Rational Expressions: Standard . (+) Understand that rational expressions form a system analogous to the rational numbers, closed under addition, subtraction, multiplication, and division by a nonzero rational expression; add, subtract, multiply, and divide rational expressions.
Applicability Ratings Importance Ratingsa Importance Mean
Category Number PercentValid percentb
(n = 348)Category Number Percent Meanc
Standard
deviation
Prerequisite 44 .6 4.4 Most 64 20.8 2.68 0.92
Reviewed 08 . .0 More 4 .
Introduced 2.9 .8 Less 9 .6
Subsequent 4 2.2 .8 Least 2 0.4
Not applicable 49 8. Total 307 100.0
Total 1897 100.0 100.0
Creating Equations: Standard . Create equations and inequalities in one variable and use them to solve problems. Include equations arising from linear and quadratic functions, and simple rational and exponential functions.
Applicability Ratings Importance Ratingsa Importance Mean
Category Number PercentValid percentb
(n = 684)Category Number Percent Meanc
Standard
deviation
Prerequisite 268 4. 9.2 Most 2 8. .4 0.8
Reviewed 264 .9 8.6 More 266 9.8
Introduced . 9. Less 2 9.0
Subsequent 0.9 2. Least 8 2.
Not applicable 2 6.9 Total 668 00.0
Total 1897 100.0 100.0
Creating Equations: Standard 2. Create equations in two or more variables to represent relationships between quantities; graph equations on coordinate axes with labels and scales.
Applicability Ratings Importance Ratingsa Importance Mean
Category Number PercentValid percentb
(n = 636)Category Number Percent Meanc
Standard
deviation
Prerequisite 222 . 4.9 Most 244 40. . 0.82
Reviewed 246 .0 8. More 229 .6
Introduced 4 .4 22.2 Less 22 20.0
Subsequent 2 .4 4.2 Least 4 2.
Not applicable 26 66. Total 609 100.0
Total 1897 100.0 100.0

Appendix G • 181
Ap
pe
nd
ix G
Mathematics: AlgebraCreating Equations: Standard . Represent constraints by equations or inequalities, and by systems of equations and/or inequalities, and interpret solutions as viable or nonviable options in a modeling context. For example, represent inequalities describing nutritional and cost constraints on combinations of different foods.
Applicability Ratings Importance Ratingsa Importance Mean
Category Number PercentValid percentb
(n = 493)Category Number Percent Meanc
Standard
deviation
Prerequisite 4 . 29.0 Most 04 24. 2.8 0.84
Reviewed 64 8.6 . More 82 42.
Introduced 2 6.6 2.4 Less 2 28.9
Subsequent 6 .2 2.4 Least 2 4.9
Not applicable 404 4.0 Total 432 100.0
Total 1897 100.0 100.0
Creating Equations: Standard 4. Rearrange formulas to highlight a quantity of interest, using the same reasoning as in solving equations. For example, rearrange Ohm’s law V =IR to highlight resistance R.
Applicability Ratings Importance Ratingsa Importance Mean
Category Number PercentValid percentb
(n = 619)Category Number Percent Meanc
Standard
deviation
Prerequisite 2 4. 4.8 Most 24 42. .8 0.8
Reviewed 22 2.2 . More 2 .
Introduced 92 4.8 4.9 Less 9.
Subsequent 24 . .9 Least 2.
Not applicable 28 6.4 Total 595 100.0
Total 1897 100.0 100.0
Reasoning with Equations and Inequalities: Standard . Explain each step in solving a simple equation as following from the equality of numbers asserted at the previous step, starting from the assumption that the original equation has a solution. Construct a viable argument to justify a solution method.
Applicability Ratings Importance Ratingsa Importance Mean
Category Number PercentValid percentb
(n = 632)Category Number Percent Meanc
Standard
deviation
Prerequisite 29 . 4.0 Most 226 6. .08 0.8
Reviewed 22 .8 . More 240 9.0
Introduced 9 .0 .0 Less 24 20.2
Subsequent 0.9 2. Least 2 4.
Not applicable 26 66. Total 615 100.0
Total 1897 100.0 100.0

Appendix G • 182
Ap
pe
nd
ix G
Mathematics: AlgebraReasoning with Equations and Inequalities: Standard 2. Solve simple rational and radical equations in one variable, and give examples showing how extraneous solutions may arise.
Applicability Ratings Importance Ratingsa Importance Mean
Category Number PercentValid percentb
(n = 517)Category Number Percent Meanc
Standard
deviation
Prerequisite 22 2.0 4.9 Most 64 .6 .0 0.88
Reviewed 8 9.4 4.4 More 9 9.
Introduced 8 4.4 6. Less 0 2.
Subsequent 29 . .6 Least 28 .
Not applicable 80 2. Total 488 100.0
Total 1897 100.0 100.0
Reasoning with Equations and Inequalities: Standard . Solve linear equations and inequalities in one variable, including equations with coefficients represented by letters.
Applicability Ratings Importance Ratingsa Importance Mean
Category Number PercentValid percentb
(n = 675)Category Number Percent Meanc
Standard
deviation
Prerequisite 6 8.8 2. Most 28 4. .20 0.8
Reviewed 29 . 2.4 More 28 6.6
Introduced 4.0 . Less 0 6.
Subsequent 2 . . Least 22 .4
Not applicable 222 64.4 Total 650 100.0
Total 1897 100.0 100.0
Reasoning with Equations and Inequalities: Standard 4. Solve quadratic equations in one variable.
Applicability Ratings Importance Ratingsa Importance Mean
Category Number PercentValid percentb
(n = 508)Category Number Percent Meanc
Standard
deviation
Prerequisite 22 . 49.6 Most 20 42.8 .8 0.86
Reviewed 8 9.4 .0 More 6.
Introduced 49 2.6 9.6 Less 8 6.9
Subsequent 29 . . Least 20 4.2
Not applicable 89 .2 Total 479 100.0
Total 1897 100.0 100.0

Appendix G • 183
Ap
pe
nd
ix G
Mathematics: AlgebraReasoning with Equations and Inequalities: Standard 4a. Use the method of completing the square to transform any quadratic equation in x into an equation of the form (x – p)2 = q that has the same solutions. Derive the quadratic formula from this form.
Applicability Ratings Importance Ratingsa Importance Mean
Category Number PercentValid percentb
(n = 340)Category Number Percent Meanc
Standard
deviation
Prerequisite 42 . 4.8 Most 6 20. 2.64 0.94
Reviewed 0 . 0.9 More 0 4.9
Introduced 60 .2 .6 Less 99 2.2
Subsequent . 9. Least 8 2.4
Not applicable 82. Total 307 100.0
Total 1897 100.0 100.0
Reasoning with Equations and Inequalities: Standard 4b. Solve quadratic equations by inspection (e.g., for x2 = 49), taking square roots, completing the square, the quadratic formula and factoring, as appropriate to the initial form of the equation. Recognize when the quadratic formula gives complex solutions and write them as a ± bi for real numbers a and b.
Applicability Ratings Importance Ratingsa Importance Mean
Category Number PercentValid percentb
(n = 438)Category Number Percent Meanc
Standard
deviation
Prerequisite 2 .4 49. Most 0 2. .00 0.88
Reviewed 0 6.9 29. More 66 4.2
Introduced 6 .0 2.8 Less 82 20.
Subsequent .8 8.0 Least 2 6.2
Not applicable 49 6.9 Total 403 100.0
Total 1897 100.0 100.0
Reasoning with Equations and Inequalities: Standard . Prove that, given a system of two equations in two variables, replacing one equation by the sum of that equation and a multiple of the other produces a system with the same solutions.
Applicability Ratings Importance Ratingsa Importance Mean
Category Number PercentValid percentb
(n = 395)Category Number Percent Meanc
Standard
deviation
Prerequisite 68 8.9 42. Most 8 2.8 2. 0.90
Reviewed 6.2 29.6 More 0 .2
Introduced 64 .4 6.2 Less 0 .
Subsequent 46 2.4 .6 Least 26 .4
Not applicable 02 9.2 Total 349 100.0
Total 1897 100.0 100.0

Appendix G • 184
Ap
pe
nd
ix G
Mathematics: AlgebraReasoning with Equations and Inequalities: Standard 6. Solve systems of linear equations exactly and approximately (e.g., with graphs), focusing on pairs of linear equations in two variables.
Applicability Ratings Importance Ratingsa Importance Mean
Category Number PercentValid percentb
(n = 451)Category Number Percent Meanc
Standard
deviation
Prerequisite 9 0. 42.4 Most 6 28. 2.89 0.88
Reviewed 42 . . More 4 .8
Introduced 4 .9 6.4 Less 4 28.0
Subsequent 44 2. 9.8 Least 2 .
Not applicable 446 6.2 Total 407 100.0
Total 1897 100.0 100.0
Reasoning with Equations and Inequalities: Standard . Solve a simple system consisting of a linear equation and a quadratic equation in two variables algebraically and graphically. For example, find the points of intersection between the line y = –x and the circle x2 +y2 = .
Applicability Ratings Importance Ratingsa Importance Mean
Category Number PercentValid percentb
(n = 363)Category Number Percent Meanc
Standard
deviation
Prerequisite 26 6.6 4. Most 62 20. 2.68 0.9
Reviewed 98 .2 2.0 More 08 6.
Introduced 4.0 20. Less 0 .8
Subsequent 64 .4 .6 Least 28 9.4
Not applicable 4 80.9 Total 299 100.0
Total 1897 100.0 100.0
Reasoning with Equations and Inequalities: Standard 8. (+) Represent a system of linear equations as a single matrix equation in a vector variable.
Applicability Ratings Importance Ratingsa Importance Mean
Category Number PercentValid percentb
(n = 243)Category Number Percent Meanc
Standard
deviation
Prerequisite 2.8 2.8 Most 24 . 2. 0.90
Reviewed 26 .4 0. More 4 0.9
Introduced 60 .2 24. Less 4.0
Subsequent 04 . 42.8 Least 0.8
Not applicable 64 8.2 Total 139 100.0
Total 1897 100.0 100.0

Appendix G • 185
Ap
pe
nd
ix G
Mathematics: Algebra
Reasoning with Equations and Inequalities: Standard 9. (+) Find the inverse of a matrix if it exists and use it to solve systems of linear equations (using technology for matrices of dimension × or greater).
Applicability Ratings Importance Ratingsa Importance Mean
Category Number PercentValid percentb
(n = 224)Category Number Percent Meanc
Standard
deviation
Prerequisite 4 2.2 8. Most 2 22. 2.6 0.9
Reviewed 24 . 0. More 8 .4
Introduced 6 .0 2.0 Less 4 .
Subsequent 0 .4 46.0 Least 0.
Not applicable 6 88.2 Total 121 100.0
Total 1897 100.0 100.0
Reasoning with Equations and Inequalities: Standard 0. Understand that the graph of an equation in two variables is the set of all its solutions plotted in the coordinate plane, often forming a curve (which could be a line).
Applicability Ratings Importance Ratingsa Importance Mean
Category Number PercentValid percentb
(n = 565)Category Number Percent Meanc
Standard
deviation
Prerequisite 244 2.9 4.2 Most 20 .6 .06 0.88
Reviewed 9 0. 4. More 92 .9
Introduced 96 . .0 Less 2.9
Subsequent 0 .6 . Least 2 4.
Not applicable 2 0.2 Total 535 100.0
Total 1897 100.0 100.0
Reasoning with Equations and Inequalities: Standard . Explain why the x-coordinates of the points where the graphs of the equations y = f(x) and y = g(x) intersect are the solutions of the equation f(x) = g(x); find the solutions approximately, e.g., using technology to graph the functions, make tables of values, or find successive approximations. Include cases where f(x) and/or g(x) are linear, polynomial, rational, absolute value, exponential, and logarithmic functions.H
Applicability Ratings Importance Ratingsa Importance Mean
Category Number PercentValid percentb
(n = 468)Category Number Percent Meanc
Standard
deviation
Prerequisite 8 9.6 9. Most 0.8 2.96 0.8
Reviewed 40 .4 29.9 More 2 40.
Introduced 02 .4 2.8 Less 98 2.
Subsequent 4 2. 9.2 Least 24 .6
Not applicable 429 . Total 425 100.0
Total 1897 100.0 100.0

Appendix G • 186
Ap
pe
nd
ix G
Mathematics: AlgebraReasoning with Equations and Inequalities: Standard 2. Graph the solutions to a linear inequality in two variables as a halfplane (excluding the boundary in the case of a strict inequality), and graph the solution set to a system of linear inequalities in two variables as the intersection of the corresponding half-planes.
Applicability Ratings Importance Ratingsa Importance Mean
Category Number PercentValid percentb
(n = 303)Category Number Percent Meanc
Standard
deviation
Prerequisite 09 . 6.0 Most 2 2. 2. 0.86
Reviewed 8 4. 2. More 90 6.6
Introduced 9 . 9. Less 90 6.6
Subsequent .0 8.8 Least 4 .
Not applicable 94 84.0 Total 246 100.0
Total 1897 100.0 100.0
Notes. Where (H) is shown, it is an indication in the Common Core mathematics standards document to indicate a modeling mathematics practice.Where (+) is shown, it is an indication from the Common Core Mathematics standards document that some mathematics standards represent advanced content and are intended to prepare students for advanced courses.aRespondents completed an importance rating if they indicated that the content of the standards was either (a) prerequisite to, (b) reviewed in, or (c) introduced during their course. The mode rating is shaded. bValid percent values indicate percentages of respondents who indicated the standard was applicable to their course. cThe mean importance rating is calculated by assigning the following values to the ordinal scale ratings: least = 1, less = 2, more = 3, most = 4. Caution should be exercised when interpreting the precise value of any mean in relation to the categorical system underlying it.

Appendix G • 187
Ap
pe
nd
ix G
MathematicsFunctions
Interpreting Functions: Standard . Understand that a function from one set (called the domain) to another set (called the range) assigns to each element of the domain exactly one element of the range. If f is a function and x is an element of its domain, then f(x) denotes the output of f corresponding to the input x. The graph of f is the graph of the equation y = f(x).
Applicability Ratings Importance Ratingsa Importance Mean
Category Number PercentValid percentb
(n = 530)Category Number Percent Meanc
Standard
deviation
Prerequisite 249 . 4.0 Most 224 4.9 . 0.90
Reviewed 9. 2.6 More 62 .8
Introduced 88 4.6 6.6 Less 98 9.2
Subsequent 20 . .8 Least 26 .
Not applicable 66 2.0 Total 510 100.0
Missing 0.
Total 1897 100.0 100.0
Interpreting Functions: Standard 2. Use function notation, evaluate functions for inputs in their domains, and interpret statements that use function notation in terms of a context.
Applicability Ratings Importance Ratingsa Importance Mean
Category Number PercentValid percentb
(n = 514)Category Number Percent Meanc
Standard
deviation
Prerequisite 2 2. 4. Most 22 4.9 .2 0.8
Reviewed 66 8.8 2. More 66 .
Introduced 96 . 8. Less 8 6.4
Subsequent 9 .0 . Least 2 4.2
Not applicable 82 2.9 Total 495 100.0
Missing 0.
Total 1897 100.0 100.0
Notes. Where (H) is shown, it is an indication in the Common Core mathematics standards document to indicate a modeling mathematics practice.Where (+) is shown, it is an indication from the Common Core Mathematics standards document that some mathematics standards represent advanced content and are intended to prepare students for advanced courses.aRespondents completed an importance rating if they indicated that the content of the standards was either (a) prerequisite to, (b) reviewed in, or (c) introduced during their course. The mode rating is shaded. bValid percent values indicate percentages of respondents who indicated the standard was applicable to their course. cThe mean importance rating is calculated by assigning the following values to the ordinal scale ratings: least = 1, less = 2, more = 3, most = 4. Caution should be exercised when interpreting the precise value of any mean in relation to the categorical system underlying it.

Appendix G • 188
Ap
pe
nd
ix G
Mathematics: FunctionsInterpreting Functions: Standard . Recognize that sequences are functions, sometimes defined recursively, whose domain is a subset of the integers. For example, the Fibonacci sequence is defined recursively by f(0) = f() = , f(n+) = f(n) + f(n-) for n ≥ .
Applicability Ratings Importance Ratingsa Importance Mean
Category Number PercentValid percentb
(n = 311)Category Number Percent Meanc
Standard
deviation
Prerequisite . 22.8 Most 48 2.2 2. 0.88
Reviewed 68 .6 2.9 More 9 4.2
Introduced 8 4.6 28.0 Less 66 29.2
Subsequent 8 4. 2. Least 9 8.4
Not applicable 8 8.6 Total 226 100.0
Missing 0.
Total 1897 100.0 100.0
Interpreting Functions: Standard 4. For a function that models a relationship between two quantities, interpret key features of graphs and tables in terms of the quantities, and sketch graphs showing key features given a verbal description of the relationship. Key features include: intercepts; intervals where the function is increasing, decreasing, positive, or negative; relative maximums and minimums; symmetries; end behavior; and periodicity.H
Applicability Ratings Importance Ratingsa Importance Mean
Category Number PercentValid percentb
(n = 533)Category Number Percent Meanc
Standard
deviation
Prerequisite 60 8.4 0.0 Most 228 4.9 .24 0.8
Reviewed 86 9.8 4.9 More 202 8.9
Introduced 9. 2. Less 2 .9
Subsequent 4 0. 2.6 Least .
Not applicable 6 .9 Total 519 100.0
Missing 0.
Total 1897 100.0 100.0
Interpreting Functions: Standard . Relate the domain of a function to its graph and, where applicable, to the quantitative relationship it describes. For example, if the function h(n) gives the number of person-hours it takes to assemble n engines in a factory, then the positive integers would be an appropriate domain for the function.H
Applicability Ratings Importance Ratingsa Importance Mean
Category Number PercentValid percentb
(n = 485)Category Number Percent Meanc
Standard
deviation
Prerequisite 2 9. . Most 44 0.6 2.9 0.92
Reviewed 9. 6. More 86 9.
Introduced 22 6.4 2.2 Less 04 22.
Subsequent 4 0. 2.9 Least .9
Not applicable 4 4.4 Total 471 100.0
Missing 0.
Total 1897 100.0 100.0

Appendix G • 189
Ap
pe
nd
ix G
Mathematics: Functions
Interpreting Functions: Standard 6. Calculate and interpret the average rate of change of a function (presented symbolically or as a table) over a specified interval. Estimate the rate of change from a graph.H
Applicability Ratings Importance Ratingsa Importance Mean
Category Number PercentValid percentb
(n = 482)Category Number Percent Meanc
Standard
deviation
Prerequisite 06 .6 22.0 Most 9 . .0 0.8
Reviewed 82 9.6 .8 More 80 9.9
Introduced 6 8.6 .8 Less 9 2.
Subsequent .6 6.4 Least .
Not applicable 44 4. Total 451 100.0
Missing 0.
Total 1897 100.0 100.0
Interpreting Functions: Standard . Graph functions expressed symbolically and show key features of the graph, by hand in simple cases and using technology for more complicated cases.H
Applicability Ratings Importance Ratingsa Importance Mean
Category Number PercentValid percentb
(n = 516)Category Number Percent Meanc
Standard
deviation
Prerequisite 8. 0.4 Most 206 4.4 .2 0.9
Reviewed 94 0.2 .6 More 202 40.6
Introduced 46 . 28. Less 6 .
Subsequent 9 .0 . Least 2.6
Not applicable 80 2. Total 497 100.0
Missing 0.
Total 1897 100.0 100.0
Interpreting Functions: Standard a. Graph linear and quadratic functions and show intercepts, maxima, and minima.
Applicability Ratings Importance Ratingsa Importance Mean
Category Number PercentValid percentb
(n = 487)Category Number Percent Meanc
Standard
deviation
Prerequisite 69 8.9 4. Most 84 9.8 . 0.84
Reviewed 84 9. .8 More 8 8.
Introduced 09 . 22.4 Less 84 8.2
Subsequent 2 . . Least 6 .
Not applicable 409 4. Total 462 100.0
Missing 0.
Total 1897 100.0 100.0

Appendix G • 190
Ap
pe
nd
ix G
Mathematics: FunctionsInterpreting Functions: Standard b. Graph square root, cube root, and piecewise-defined functions, including step functions and absolute value functions.
Applicability Ratings Importance Ratingsa Importance Mean
Category Number PercentValid percentb
(n = 352)Category Number Percent Meanc
Standard
deviation
Prerequisite 4 6.0 2.4 Most 99 .6 2.9 0.88
Reviewed 0 .4 29. More 6 .
Introduced 96 . 2. Less 82 26.2
Subsequent 9 2. . Least 6 .
Not applicable 44 8.4 Total 313 100.0
Missing 0.
Total 1897 100.0 100.0
Interpreting Functions: Standard c. Graph polynomial functions, identifying zeros when suitable factorizations are available, and showing end behavior.
Applicability Ratings Importance Ratingsa Importance Mean
Category Number PercentValid percentb
(n = 346)Category Number Percent Meanc
Standard
deviation
Prerequisite 9 . 28.0 Most 2 . .08 0.8
Reviewed 0 .4 29.8 More 2 .
Introduced 02 .4 29. Less 69 22.8
Subsequent 44 2. 2. Least 9 .0
Not applicable 0 8. Total 302 100.0
Missing 0.
Total 1897 100.0 100.0
Interpreting Functions: Standard d. (+) Graph rational functions, identifying zeros and asymptotes when suitable factorizations are available, and showing end behavior.
Applicability Ratings Importance Ratingsa Importance Mean
Category Number PercentValid percentb
(n = 325)Category Number Percent Meanc
Standard
deviation
Prerequisite 84 4.4 2.8 Most 00 . 2.99 0.9
Reviewed 9 4.8 28.0 More 96 4.0
Introduced 0 .6 2.9 Less 0 24.8
Subsequent 4 2. .2 Least 6 .
Not applicable 82.8 Total 282 100.0
Missing 0.
Total 1897 100.0 100.0

Appendix G • 191
Ap
pe
nd
ix G
Mathematics: Functions
Interpreting Functions: Standard e. Graph exponential and logarithmic functions, showing intercepts and end behavior, and trigonometric functions, showing period, midline, and amplitude.
Applicability Ratings Importance Ratingsa Importance Mean
Category Number PercentValid percentb
(n = 388)Category Number Percent Meanc
Standard
deviation
Prerequisite 9 4.9 24.0 Most 4 4.2 .04 0.8
Reviewed 26 6.6 2. More 29 8.
Introduced 4 6.0 29.4 Less 8 2.4
Subsequent 2.9 4.2 Least 2 .6
Not applicable 08 9. Total 333 100.0
Missing 0.
Total 1897 100.0 100.0
Interpreting Functions: Standard 8. Write a function defined by an expression in different but equivalent forms to reveal and explain different properties of the function.
Applicability Ratings Importance Ratingsa Importance Mean
Category Number PercentValid percentb
(n = 357)Category Number Percent Meanc
Standard
deviation
Prerequisite 89 4. 24.9 Most 64 20.2 2. 0.8
Reviewed 28 6. .9 More 4.2
Introduced 00 . 28.0 Less 9 0.0
Subsequent 40 2. .2 Least 2 6.6
Not applicable 9 8. Total 317 100.0
Missing 0.
Total 1897 100.0 100.0
Interpreting Functions: Standard 8a. Use the process of factoring and completing the square in a quadratic function to show zeros, extreme values, and symmetry of the graph, and interpret these in terms of a context.
Applicability Ratings Importance Ratingsa Importance Mean
Category Number PercentValid percentb
(n = 307)Category Number Percent Meanc
Standard
deviation
Prerequisite 9 . .6 Most 2. 2.90 0.8
Reviewed 8 4.6 28. More 0 9.8
Introduced 8 4. 2. Less 28.6
Subsequent 8 2.0 2.4 Least 2 4.
Not applicable 89 8.8 Total 269 100.0
Missing 0.
Total 1897 100.0 100.0

Appendix G • 192
Ap
pe
nd
ix G
Mathematics: FunctionsInterpreting Functions: Standard 8b. Use the properties of exponents to interpret expressions for exponential functions. For example, identify percent rate of change in functions such as y = (.02)t, y = (0.9)t, y = (.0)2t, y = (.2)t/0, and classify them as representing exponential growth or decay.
Applicability Ratings Importance Ratingsa Importance Mean
Category Number PercentValid percentb
(n = 341)Category Number Percent Meanc
Standard
deviation
Prerequisite 86 4. 2.2 Most 6 2.0 2.80 0.82
Reviewed 00 . 29. More 24 42.6
Introduced 0 . 0.8 Less 9 2.0
Subsequent 0 2.6 4. Least 4.
Not applicable 82.0 Total 291 100.0
Missing 0.
Total 1897 100.0 100.0
Interpreting Functions: Standard 9. Compare properties of two functions each represented in a different way (algebraically, graphically, numerically in tables, or by verbal descriptions). For example, given a graph of one quadratic function and an algebraic expression for another, say which has the larger maximum.
Applicability Ratings Importance Ratingsa Importance Mean
Category Number PercentValid percentb
(n = 323)Category Number Percent Meanc
Standard
deviation
Prerequisite 86 4. 26.6 Most 2 .9 2.66 0.8
Reviewed 6.0 .0 More 8.
Introduced 9 4.8 28.2 Less 0 .
Subsequent . 0.2 Least 24 8.
Not applicable 82.9 Total 290 100.0
Missing 0.
Total 1897 100.0 100.0
Building Functions: Standard . Write a function that describes a relationship between two quantities.H
Applicability Ratings Importance Ratingsa Importance Mean
Category Number PercentValid percentb
(n = 534)Category Number Percent Meanc
Standard
deviation
Prerequisite 2 9. 2.2 Most 208 40. .20 0.9
Reviewed 89 0.0 .4 More 26 4.9
Introduced 8.2 29.0 Less 8 .
Subsequent 8 0.9 .4 Least 4 2.
Not applicable 62 .8 Total 516 100.0
Missing 0.
Total 1897 100.0 100.0

Appendix G • 193
Ap
pe
nd
ix G
Mathematics: FunctionsBuilding Functions: Standard a. Determine an explicit expression, a recursive process, or steps for calculation from a context.
Applicability Ratings Importance Ratingsa Importance Mean
Category Number PercentValid percentb
(n = 435)Category Number Percent Meanc
Standard
deviation
Prerequisite 09 . 2. Most 4 28.8 .04 0.
Reviewed 4 . .8 More 88 4.
Introduced 40 .4 2.2 Less 89 22.
Subsequent 9 2. 9.0 Least .
Not applicable 46 .0 Total 396 100.0
Missing 0.
Total 1897 100.0 100.0
Building Functions: Standard b. Combine standard function types using arithmetic operations. For example, build a function that models the temperature of a cooling body by adding a constant function to a decaying exponential, and relate these functions to the model.
Applicability Ratings Importance Ratingsa Importance Mean
Category Number PercentValid percentb
(n = 389)Category Number Percent Meanc
Standard
deviation
Prerequisite 8 4. 20.8 Most 84 2. 2.92 0.80
Reviewed 26 6.6 2.4 More 0 44.9
Introduced 2 6. 2.6 Less 90 26.9
Subsequent 2.9 4. Least 0 .0
Not applicable 0 9.4 Total 334 100.0
Missing 0.
Total 1897 100.0 100.0
Building Functions: Standard c. (+) Compose functions. For example, if T(y) is the temperature in the atmosphere as a function of height, and h(t) is the height of a weather balloon as a function of time, then T(h(t)) is the temperature at the location of the weather balloon as a function of time.
Applicability Ratings Importance Ratingsa Importance Mean
Category Number PercentValid percentb
(n = 403)Category Number Percent Meanc
Standard
deviation
Prerequisite 88 4.6 2.8 Most 06 0.2 2.98 0.8
Reviewed 2 6. . More 4 4.
Introduced 6 .2 . Less 88 2.
Subsequent 2 2. 2.9 Least 2 .4
Not applicable 49 8. Total 351 100.0
Missing 0.
Total 1897 100.0 100.0

Appendix G • 194
Ap
pe
nd
ix G
Mathematics: FunctionsBuilding Functions: Standard 2. Write arithmetic and geometric sequences both recursively and with an explicit formula, use them to model situations, and translate between the two forms.H
Applicability Ratings Importance Ratingsa Importance Mean
Category Number PercentValid percentb
(n = 283)Category Number Percent Meanc
Standard
deviation
Prerequisite 46 2.4 6. Most 0 .0 2.69 0.8
Reviewed 2.9 9.4 More 4.
Introduced 4.0 26. Less 62 .2
Subsequent 0 .6 .8 Least 6.
Not applicable 6 8.0 Total 176 100.0
Missing 0.
Total 1897 100.0 100.0
Building Functions: Standard . Identify the effect on the graph of replacing f(x) by f(x) + k, k f(x), f(kx), and f(x + k) for specific values of k (both positive and negative); find the value of k given the graphs. Experiment with cases and illustrate an explanation of the effects on the graph using technology. Include recognizing even and odd functions from their graphs and algebraic expressions for them.
Applicability Ratings Importance Ratingsa Importance Mean
Category Number PercentValid percentb
(n = 336)Category Number Percent Meanc
Standard
deviation
Prerequisite 89 4. 26. Most 88 29. 2.92 0.89
Reviewed 0 . . More 2 .8
Introduced 02 .4 0.4 Less 9 26.
Subsequent 40 2. .9 Least .
Not applicable 60 82.2 Total 296 100.0
Missing 0.
Total 1897 100.0 100.0
Building Functions: Standard 4. Find inverse functions.
Applicability Ratings Importance Ratingsa Importance Mean
Category Number PercentValid percentb
(n = 355)Category Number Percent Meanc
Standard
deviation
Prerequisite 98 .2 2.6 Most 9 2. 2.82 0.9
Reviewed 02 .4 28. More 28 40.6
Introduced 6. 2.4 Less 80 2.4
Subsequent 40 2. . Least 28 8.9
Not applicable 4 8.2 Total 315 100.0
Missing 0.
Total 1897 100.0 100.0

Appendix G • 195
Ap
pe
nd
ix G
Mathematics: Functions
Building Functions: Standard 4a. Solve an equation of the form f(x) = c for a simple function f that has an inverse and write an expression for the inverse. For example, f(x) =2 x for x > 0 or f(x) = (x+)/(x–) for x ≠ .
Applicability Ratings Importance Ratingsa Importance Mean
Category Number PercentValid percentb
(n = 316)Category Number Percent Meanc
Standard
deviation
Prerequisite 0 .4 2.6 Most 6 2. 2.86 0.84
Reviewed 84 4.4 26.6 More 26 4.2
Introduced 92 4.8 29. Less 2.4
Subsequent 2.0 . Least 6.
Not applicable 80 8. Total 279 100.0
Missing 0.
Total 1897 100.0 100.0
Building Functions: Standard 4b. (+) Verify by composition that one function is the inverse of another.
Applicability Ratings Importance Ratingsa Importance Mean
Category Number PercentValid percentb
(n = 288)Category Number Percent Meanc
Standard
deviation
Prerequisite 8 4. 2. Most 4 8.9 2.6 0.89
Reviewed 6 4.0 26.4 More 90 6.
Introduced 9 .0 .0 Less 89 .
Subsequent 9 2. . Least 2 9.2
Not applicable 608 84.8 Total 249 100.0
Missing 0.
Total 1897 100.0 100.0
Building Functions: Standard 4c. (+) Read values of an inverse function from a graph or a table, given that the function has an inverse.
Applicability Ratings Importance Ratingsa Importance Mean
Category Number PercentValid percentb
(n = 296)Category Number Percent Meanc
Standard
deviation
Prerequisite . 24.0 Most 2 20. 2.64 0.90
Reviewed 89 4. 0. More 82 2.0
Introduced 96 . 2.4 Less 0 9.
Subsequent 40 2. . Least 2 8.2
Not applicable 600 84. Total 256 100.0
Missing 0.
Total 1897 100.0 100.0

Appendix G • 196
Ap
pe
nd
ix G
Mathematics: FunctionsBuilding Functions: Standard 4d. (+) Produce an invertible function from a non-invertible function by restricting the domain.
Applicability Ratings Importance Ratingsa Importance Mean
Category Number PercentValid percentb
(n = 241)Category Number Percent Meanc
Standard
deviation
Prerequisite 9 . 24. Most 8.0 2. 0.9
Reviewed 2.9 22.8 More 6 28.9
Introduced 80 4.2 .2 Less 8.
Subsequent 4 2. 9. Least 28 4.4
Not applicable 6 8.2 Total 194 100.0
Missing 0.
Total 1897 100.0 100.0
Building Functions: Standard . (+) Understand the inverse relationship between exponents and logarithms and use this relationship to solve problems involving logarithms and exponents.
Applicability Ratings Importance Ratingsa Importance Mean
Category Number PercentValid percentb
(n = 356)Category Number Percent Meanc
Standard
deviation
Prerequisite 9 . 2.2 Most 0 4. .04 0.86
Reviewed 0 .4 28.9 More 24 9.
Introduced 2 .9 . Less 6 2.
Subsequent 44 2. 2.4 Least 4 4.
Not applicable 40 8.2 Total 312 100.0
Missing 0.
Total 1897 100.0 100.0
Linear, Quadratic, and Exponential Models: Standard . Distinguish between situations that can be modeled with linear functions and with exponential functions.
Applicability Ratings Importance Ratingsa Importance Mean
Category Number PercentValid percentb
(n = 444)Category Number Percent Meanc
Standard
deviation
Prerequisite 0 . 2.6 Most 8 22. 2.6 0.89
Reviewed 09 . 24. More 4 40.
Introduced 0 9.0 8. Less 29.4
Subsequent 60 .2 . Least 2 8.
Not applicable 42 6. Total 384 100.0
Missing 0.
Total 1897 100.0 100.0

Appendix G • 197
Ap
pe
nd
ix G
Mathematics: FunctionsLinear, Quadratic, and Exponential Models: Standard a. Prove that linear functions grow by equal differences over equal intervals, and that exponential functions grow by equal factors over equal intervals.
Applicability Ratings Importance Ratingsa Importance Mean
Category Number PercentValid percentb
(n = 366)Category Number Percent Meanc
Standard
deviation
Prerequisite 96 . 26.2 Most 8 9. 2.0 0.88
Reviewed 0 . 2.6 More 8 9.
Introduced 00 . 2. Less 9 2.0
Subsequent 69 .6 8.9 Least 26 8.8
Not applicable 0 80. Total 297 100.0
Missing 0.
Total 1897 100.0 100.0
Linear, Quadratic, and Exponential Models: Standard b. Recognize situations in which one quantity changes at a constant rate per unit interval relative to another.
Applicability Ratings Importance Ratingsa Importance Mean
Category Number PercentValid percentb
(n = 478)Category Number Percent Meanc
Standard
deviation
Prerequisite .9 2.2 Most 84 9.0 2.4 0.84
Reviewed 9 9.4 .4 More 89 42.8
Introduced 2 8.0 .8 Less 4 .9
Subsequent 6 .9 . Least 28 6.
Not applicable 48 4. Total 442 100.0
Missing 0.
Total 1897 100.0 100.0
Linear, Quadratic, and Exponential Models: Standard c. Recognize situations in which a quantity grows or decays by a constant percent rate per unit interval relative to another.
Applicability Ratings Importance Ratingsa Importance Mean
Category Number PercentValid percentb
(n = 412)Category Number Percent Meanc
Standard
deviation
Prerequisite 8 4. 20.6 Most 64 . 2.0 0.84
Reviewed 6 .2 .0 More 42.
Introduced 4 .4 4.2 Less 9 2.9
Subsequent 0 2.6 2. Least 26 .2
Not applicable 484 8.2 Total 362 100.0
Missing 0.
Total 1897 100.0 100.0

Appendix G • 198
Ap
pe
nd
ix G
Mathematics: FunctionsLinear, Quadratic, and Exponential Models: Standard 2. Construct linear and exponential functions, including arithmetic and geometric sequences, given a graph, a description of a relationship, or two input-output pairs (include reading these from a table).
Applicability Ratings Importance Ratingsa Importance Mean
Category Number PercentValid percentb
(n = 389)Category Number Percent Meanc
Standard
deviation
Prerequisite 82 4. 2. Most 8 8. 2.2 0.84
Reviewed 0 . 2.0 More 6 42.
Introduced .0 4.2 Less 04 2.
Subsequent 69 .6 . Least 22 6.9
Not applicable 0 9.4 Total 320 100.0
Missing 0.
Total 1897 100.0 100.0
Linear, Quadratic, and Exponential Models: Standard . Observe using graphs and tables that a quantity increasing exponentially eventually exceeds a quantity increasing linearly, quadratically, or (more generally) as a polynomial function.
Applicability Ratings Importance Ratingsa Importance Mean
Category Number PercentValid percentb
(n = 373)Category Number Percent Meanc
Standard
deviation
Prerequisite 8 4. 22.8 Most 46 4. 2.6 0.8
Reviewed 02 .4 2. More 29 4.2
Introduced 26 6.6 .8 Less 09 4.8
Subsequent 60 .2 6. Least 29 9.
Not applicable 2 80. Total 313 100.0
Missing 0.
Total 1897 100.0 100.0
Linear, Quadratic, and Exponential Models: Standard 4. For exponential models, express as a logarithm the solution to abct = d where a, c, and d are numbers and the base b is 2, 0, or e; evaluate the logarithm using technology.
Applicability Ratings Importance Ratingsa Importance Mean
Category Number PercentValid percentb
(n = 345)Category Number Percent Meanc
Standard
deviation
Prerequisite 4 .9 2.4 Most 6 2. 2.82 0.8
Reviewed 0 .4 29.9 More 6 40.
Introduced .9 2.2 Less 90 .
Subsequent .0 6. Least .2
Not applicable 8.8 Total 288 100.0
Missing 0.
Total 1897 100.0 100.0

Appendix G • 199
Ap
pe
nd
ix G
Mathematics: FunctionsLinear, Quadratic, and Exponential Models: Standard . Interpret the parameters in a linear or exponential function in terms of a context.
Applicability Ratings Importance Ratingsa Importance Mean
Category Number PercentValid percentb
(n = 448)Category Number Percent Meanc
Standard
deviation
Prerequisite 0 . 2.4 Most 9 9. 2.82 0.80
Reviewed 8 8. . More 9 48.2
Introduced 46 . 2.6 Less 2 2.4
Subsequent 9 2. 8. Least 2 .
Not applicable 448 6. Total 409 100.0
Missing 0.
Total 1897 100.0 100.0
Trigonometric Functions: Standard . Understand radian measure of an angle as the length of the arc on the unit circle subtended by the angle.
Applicability Ratings Importance Ratingsa Importance Mean
Category Number PercentValid percentb
(n = 278)Category Number Percent Meanc
Standard
deviation
Prerequisite 09 . 9.2 Most 86 9.8 .09 0.9
Reviewed 6 4.0 2. More .6
Introduced .6 .2 Less 40 8.
Subsequent 62 . 22. Least 6.0
Not applicable 68 8. Total 216 100.0
Missing 0.
Total 1897 100.0 100.0
Trigonometric Functions: Standard 2. Explain how the unit circle in the coordinate plane enables the extension of trigonometric functions to all real numbers, interpreted as radian measures of angles traversed counterclockwise around the unit circle.
Applicability Ratings Importance Ratingsa Importance Mean
Category Number PercentValid percentb
(n = 260)Category Number Percent Meanc
Standard
deviation
Prerequisite 0 .6 4.2 Most 2 6.2 .02 0.90
Reviewed 6 .4 2.0 More 69 4.
Introduced 2 .4 0.4 Less 48 24.
Subsequent 6 .2 2. Least 0 .0
Not applicable 66 86.2 Total 199 100.0
Missing 0.
Total 1897 100.0 100.0

Appendix G • 200
Ap
pe
nd
ix G
Mathematics: FunctionsTrigonometric Functions: Standard . (+) Use special triangles to determine geometrically the values of sine, cosine, tangent for π/, π/4 and π/6, and use the unit circle to express the values of sine, cosine, and tangent for x, π+x, and 2π–x in terms of their values for x, where x is any real number.
Applicability Ratings Importance Ratingsa Importance Mean
Category Number PercentValid percentb
(n = 262)Category Number Percent Meanc
Standard
deviation
Prerequisite 0 .6 40.8 Most 9 9. .08 0.90
Reviewed .8 2.9 More 6 .
Introduced 20 . .6 Less 44 22.0
Subsequent 62 . 2. Least 0 .0
Not applicable 64 86. Total 200 100.0
Missing 0.
Total 1897 100.0 100.0
Trigonometric Functions: Standard 4. (+) Use the unit circle to explain symmetry (odd and even) and periodicity of trigonometric functions.
Applicability Ratings Importance Ratingsa Importance Mean
Category Number PercentValid percentb
(n = 242)Category Number Percent Meanc
Standard
deviation
Prerequisite 0 . 4. Most 44 24. 2.2 0.9
Reviewed 2.8 2.9 More 8 2.0
Introduced 2 .4 .2 Less 64 .4
Subsequent 6 .2 2.2 Least 8.
Not applicable 64 8.2 Total 181 100.0
Missing 0.
Total 1897 100.0 100.0
Trigonometric Functions: Standard . Choose trigonometric functions to model periodic phenomena with specified amplitude, frequency, and midline.H
Applicability Ratings Importance Ratingsa Importance Mean
Category Number PercentValid percentb
(n = 266)Category Number Percent Meanc
Standard
deviation
Prerequisite 80 4.2 0. Most 60 0. 2.86 0.94
Reviewed 6 . 2. More 6 2.8
Introduced 2.9 20. Less 8 29.
Subsequent 68 .6 2.6 Least .6
Not applicable 60 8.9 Total 198 100.0
Missing 0.
Total 1897 100.0 100.0

Appendix G • 201
Ap
pe
nd
ix G
Mathematics: FunctionsTrigonometric Functions: Standard 6. (+) Understand that restricting a trigonometric function to a domain on which it is always increasing or always decreasing allows its inverse to be constructed.
Applicability Ratings Importance Ratingsa Importance Mean
Category Number PercentValid percentb
(n = 219)Category Number Percent Meanc
Standard
deviation
Prerequisite 66 . 0. Most 4 22.8 2.8 0.88
Reviewed 0 2.6 22.8 More 6 42.
Introduced . . Less 4 2.
Subsequent 0 . 2.0 Least .4
Not applicable 6 88.4 Total 149 100.0
Missing 0.
Total 1897 100.0 100.0
Trigonometric Functions: Standard . (+) Use inverse functions to solve trigonometric equations that arise in modeling contexts; evaluate the solutions using technology, and interpret them in terms of the context.H
Applicability Ratings Importance Ratingsa Importance Mean
Category Number PercentValid percentb
(n = 222)Category Number Percent Meanc
Standard
deviation
Prerequisite 66 . 29. Most 44 28.8 2.92 0.88
Reviewed 2. 2.0 More 6 9.9
Introduced 6 .9 6.2 Less 9 2.
Subsequent 69 .6 . Least 9 .9
Not applicable 64 88.2 Total 153 100.0
Missing 0.
Total 1897 100.0 100.0
Trigonometric Functions: Standard 8. Prove the Pythagorean identity sin2(θ) + cos2(θ) = and use it to calculate trigonometric ratios.
Applicability Ratings Importance Ratingsa Importance Mean
Category Number PercentValid percentb
(n = 229)Category Number Percent Meanc
Standard
deviation
Prerequisite 0 .4 4.0 Most 4 .2 2.80 .00
Reviewed 48 2. 2.0 More 0 28.9
Introduced 22 .2 9.6 Less 0 28.9
Subsequent 6 .0 24. Least 9 .0
Not applicable 66 8.9 Total 173 100.0
Missing 0.
Total 1897 100.0 100.0

Appendix G • 202
Ap
pe
nd
ix G
Mathematics: FunctionsTrigonometric Functions: Standard 9. (+) Prove the addition and subtraction formulas for sine, cosine, and tangent and use them to solve problems.
Applicability Ratings Importance Ratingsa Importance Mean
Category Number PercentValid percentb
(n = 223)Category Number Percent Meanc
Standard
deviation
Prerequisite 8 4.6 9.0 Most 26 6. 2.6 0.8
Reviewed 46 2.4 20.6 More 49 .4
Introduced 2 .2 0. Less 68 4.6
Subsequent 6 . 0.0 Least 8.
Not applicable 6 88.2 Total 156 100.0
Missing 0.
Total 1897 100.0 100.0
Notes. Where (H) is shown, it is an indication in the Common Core mathematics standards document to indicate a modeling mathematics practice.Where (+) is shown, it is an indication from the Common Core Mathematics standards document that some mathematics standards represent advanced content and are intended to prepare students for advanced courses.aRespondents completed an importance rating if they indicated that the content of the standards was either (a) prerequisite to, (b) reviewed in, or (c) introduced during their course. The mode rating is shaded. bValid percent values indicate percentages of respondents who indicated the standard was applicable to their course. cThe mean importance rating is calculated by assigning the following values to the ordinal scale ratings: least = 1, less = 2, more = 3, most = 4. Caution should be exercised when interpreting the precise value of any mean in relation to the categorical system underlying it.

Appendix G • 203
Ap
pe
nd
ix G
MathematicsGeometry
Congruence: Standard . Know precise definitions of angle, circle, perpendicular line, parallel line, and line segment, based on the undefined notions of point, line, distance along a line, and distance around a circular arc.
Applicability Ratings Importance Ratingsa Importance Mean
Category Number PercentValid percentb
(n = 263)Category Number Percent Meanc
Standard
deviation
Prerequisite 99 0. . Most 8 .6 2.88 0.9
Reviewed 46 2.4 . More 84 2.8
Introduced 0.6 4.2 Less 2.
Subsequent 0.4 2. Least 20 .8
Not applicable 62 86.0 Total 256 100.0
Missing 2 0.
Total 1897 100.0 100.0
Congruence: Standard 2. Represent transformations in the plane using, e.g., transparencies and geometry software; describe transformations as functions that take points in the plane as inputs and give other points as outputs. Compare transformations that preserve distance and angle to those that do not (e.g., translation versus horizontal stretch).
Applicability Ratings Importance Ratingsa Importance Mean
Category Number PercentValid percentb
(n = 157)Category Number Percent Meanc
Standard
deviation
Prerequisite 4.0 4.8 Most 28 2. 2.66 0.94
Reviewed 29 . 8. More 44 .8
Introduced 26 .4 6.6 Less 44 .8
Subsequent 2 .4 .2 Least 4 0.8
Not applicable 8 9.6 Total 130 100.0
Missing 2 0.
Total 1897 100.0 100.0
Notes. Where (H) is shown, it is an indication in the Common Core mathematics standards document to indicate a modeling mathematics practice.Where (+) is shown, it is an indication from the Common Core Mathematics standards document that some mathematics standards represent advanced content and are intended to prepare students for advanced courses.aRespondents completed an importance rating if they indicated that the content of the standards was either (a) prerequisite to, (b) reviewed in, or (c) introduced during their course. The mode rating is shaded. bValid percent values indicate percentages of respondents who indicated the standard was applicable to their course. cThe mean importance rating is calculated by assigning the following values to the ordinal scale ratings: least = 1, less = 2, more = 3, most = 4. Caution should be exercised when interpreting the precise value of any mean in relation to the categorical system underlying it.

Appendix G • 204
Ap
pe
nd
ix G
Mathematics: GeometryCongruence: Standard . Given a rectangle, parallelogram, trapezoid, or regular polygon, describe the rotations and reflections that carry it onto itself.
Applicability Ratings Importance Ratingsa Importance Mean
Category Number PercentValid percentb
(n = 125)Category Number Percent Meanc
Standard
deviation
Prerequisite 66 . 2.8 Most 4 4. 2. 0.99
Reviewed 8 0.9 4.4 More 26 2.4
Introduced 0.6 8.8 Less 4 .8
Subsequent 0 .6 24.0 Least 2 22.
Not applicable 0 9. Total 95 100.0
Missing 2 0.
Total 1897 100.0 100.0
Congruence: Standard 4. Develop definitions of rotations, reflections, and translations in terms of angles, circles, perpendicular lines, parallel lines, and line segments.
Applicability Ratings Importance Ratingsa Importance Mean
Category Number PercentValid percentb
(n = 147)Category Number Percent Meanc
Standard
deviation
Prerequisite 6 4.0 . Most 20 .4 2.0 0.96
Reviewed 22 .2 .0 More 0.4
Introduced 0.9 .6 Less 42 6.
Subsequent 2 . 2.8 Least 8 .
Not applicable 48 92. Total 115 100.0
Missing 2 0.
Total 1897 100.0 100.0
Congruence: Standard . Given a geometric figure and a rotation, reflection, or translation, draw the transformed figure using, e.g., graph paper, tracing paper, or geometry software. Specify a sequence of transformations that will carry a given figure onto another.
Applicability Ratings Importance Ratingsa Importance Mean
Category Number PercentValid percentb
(n = 140)Category Number Percent Meanc
Standard
deviation
Prerequisite 68 .6 48.6 Most .9 2.46 0.96
Reviewed 2 . .0 More 4 .8
Introduced 8 0.9 2.9 Less 4.6
Subsequent . 2.6 Least 9 .8
Not applicable 92. Total 107 100.0
Missing 2 0.
Total 1897 100.0 100.0

Appendix G • 205
Ap
pe
nd
ix G
Mathematics: GeometryCongruence: Standard 6. Use geometric descriptions of rigid motions to transform figures and to predict the effect of a given rigid motion on a given figure; given two figures, use the definition of congruence in terms of rigid motions to decide if they are congruent.
Applicability Ratings Importance Ratingsa Importance Mean
Category Number PercentValid percentb
(n = 117)Category Number Percent Meanc
Standard
deviation
Prerequisite . 60. Most . 2.44 0.92
Reviewed 0.8 2.8 More 2 2.8
Introduced 0.6 9.4 Less 4 42.
Subsequent 20 . . Least 4 4.4
Not applicable 8 9. Total 97 100.0
Missing 2 0.
Total 1897 100.0 100.0
Congruence: Standard . Use the definition of congruence in terms of rigid motions to show that two triangles are congruent if and only if corresponding pairs of sides and corresponding pairs of angles are congruent.
Applicability Ratings Importance Ratingsa Importance Mean
Category Number PercentValid percentb
(n = 121)Category Number Percent Meanc
Standard
deviation
Prerequisite 80 4.2 66. Most 8 . 2.49 0.96
Reviewed 0. 0. More 29.8
Introduced 0.6 9. Less 9 .
Subsequent 0.9 4.0 Least 6 .4
Not applicable 4 9. Total 104 100.0
Missing 2 0.
Total 1897 100.0 100.0
Congruence: Standard 8. Explain how the criteria for triangle congruence (ASA, SAS, and SSS) follow from the definition of congruence in terms of rigid motions.
Applicability Ratings Importance Ratingsa Importance Mean
Category Number PercentValid percentb
(n = 108)Category Number Percent Meanc
Standard
deviation
Prerequisite 2 .8 66. Most 4 .4 2.40 0.99
Reviewed 0.6 0.2 More 2 29.
Introduced 8 0.4 .4 Less 4.
Subsequent 0.9 . Least 9 20.9
Not applicable 8 94.2 Total 91 100.0
Missing 2 0.
Total 1897 100.0 100.0

Appendix G • 206
Ap
pe
nd
ix G
Mathematics: GeometryCongruence: Standard 9. Prove theorems about lines and angles. Theorems include: vertical angles are congruent; when a transversal crosses parallel lines, alternate interior angles are congruent and corresponding angles are congruent; and points on a perpendicular bisector of a line segment are exactly those equidistant from the segment’s endpoints.
Applicability Ratings Importance Ratingsa Importance Mean
Category Number PercentValid percentb
(n = 115)Category Number Percent Meanc
Standard
deviation
Prerequisite 82 4. . Most 20 20.2 2.49 .02
Reviewed 0 0. 8. More 28 28.
Introduced 0.4 6. Less 2 2.
Subsequent 6 0.8 .9 Least 9 9.2
Not applicable 80 9.8 Total 99 100.0
Missing 2 0.
Total 1897 100.0 100.0
Congruence: Standard 0. Prove theorems about triangles. Theorems include: measures of interior angles of a triangle sum to 80°; base angles of isosceles triangles are congruent; the segment joining midpoints of two sides of a triangle is parallel to the third side and half the length; and the medians of a triangle meet at a point.
Applicability Ratings Importance Ratingsa Importance Mean
Category Number PercentValid percentb
(n = 122)Category Number Percent Meanc
Standard
deviation
Prerequisite 84 4.4 68.9 Most 24 22.4 2.0 .04
Reviewed 4 0. . More 2 2.4
Introduced 9 0. .4 Less 8 .
Subsequent 0.8 2. Least 20 8.
Not applicable 9. Total 107 100.0
Missing 2 0.
Total 1897 100.0 100.0
Congruence: Standard . Prove theorems about parallelograms. Theorems include: opposite sides are congruent, opposite angles are congruent, the diagonals of a parallelogram bisect each other, and conversely, rectangles are parallelograms with congruent diagonals.
Applicability Ratings Importance Ratingsa Importance Mean
Category Number PercentValid percentb
(n = 105)Category Number Percent Meanc
Standard
deviation
Prerequisite 6 4.0 2.4 Most 8. 2.2 .0
Reviewed 8 0.4 .6 More 6 .6
Introduced 0.4 6. Less 40.
Subsequent 4 0. . Least 2 2.
Not applicable 90 94.4 Total 91 100.0
Missing 2 0.
Total 1897 100.0 100.0

Appendix G • 207
Ap
pe
nd
ix G
Mathematics: GeometryCongruence: Standard 2. Make formal geometric constructions with a variety of tools and methods (compass and straightedge, string, reflective devices, paper folding, dynamic geometric software, etc.). Examples include: copying a segment; copying an angle; bisecting a segment; bisecting an angle; constructing perpendicular lines, including the perpendicular bisector of a line segment; and constructing a line parallel to a given line through a point not on the line.
Applicability Ratings Importance Ratingsa Importance Mean
Category Number PercentValid percentb
(n = 112)Category Number Percent Meanc
Standard
deviation
Prerequisite 4 .9 66. Most 22 22.4 2.44 .0
Reviewed 0. .6 More 20 20.4
Introduced 0.6 9.8 Less .
Subsequent 4 0. 2. Least 2 2.4
Not applicable 8 94.0 Total 98 100.0
Missing 2 0.
Total 1897 100.0 100.0
Congruence: Standard . Construct an equilateral triangle, a square, and a regular hexagon inscribed in a circle.
Applicability Ratings Importance Ratingsa Importance Mean
Category Number PercentValid percentb
(n = 95)Category Number Percent Meanc
Standard
deviation
Prerequisite 6 .4 68.4 Most 2 4.6 2.20 .02
Reviewed 0.6 .6 More 6 9.
Introduced 6 0. 6. Less 0 6.6
Subsequent 0. . Least 24 29.
Not applicable 800 94.9 Total 82 100.0
Missing 2 0.
Total 1897 100.0 100.0
Similarity, Right Triangles, and Trigonometry: Standard . Verify experimentally the properties of dilations given by a center and a scale factor.
Applicability Ratings Importance Ratingsa Importance Mean
Category Number PercentValid percentb
(n = 82)Category Number Percent Meanc
Standard
deviation
Prerequisite 4 2.8 6.9 Most 2 .6 2. .0
Reviewed 0.4 8. More 22.
Introduced 0.4 8. Less 2 .8
Subsequent 4 0. . Least 8 26.
Not applicable 8 9.6 Total 68 100.0
Missing 2 0.
Total 1897 100.0 100.0

Appendix G • 208
Ap
pe
nd
ix G
Mathematics: GeometrySimilarity, Right Triangles, and Trigonometry: Standard a. A dilation takes a line not passing through the center of the dilation to a parallel line, and leaves a line passing through the center unchanged.
Applicability Ratings Importance Ratingsa Importance Mean
Category Number PercentValid percentb
(n = 71)Category Number Percent Meanc
Standard
deviation
Prerequisite 46 2.4 64.8 Most 9 . 2.29 .02
Reviewed 6 0. 8. More 4 2.
Introduced 0.4 9.9 Less 2 .6
Subsequent 2 0.6 6.9 Least 2.4
Not applicable 824 96.2 Total 59 100.0
Missing 2 0.
Total 1897 100.0 100.0
Similarity, Right Triangles, and Trigonometry: Standard b. The dilation of a line segment is longer or shorter in the ratio given by the scale factor.
Applicability Ratings Importance Ratingsa Importance Mean
Category Number PercentValid percentb
(n = 73)Category Number Percent Meanc
Standard
deviation
Prerequisite 4 2. 64.4 Most 8.0 2.4 .0
Reviewed 8 0.4 .0 More 4 2.0
Introduced 6 0. 8.2 Less 2 4.4
Subsequent 2 0.6 6.4 Least 24.6
Not applicable 822 96.0 Total 61 100.0
Missing 2 0.
Total 1897 100.0 100.0
Similarity, Right Triangles, and Trigonometry: Standard 2. Given two figures, use the definition of similarity in terms of similarity transformations to decide if they are similar; explain using similarity transformations the meaning of similarity for triangles as the equality of all corresponding pairs of angles and the proportionality of all corresponding pairs of sides.
Applicability Ratings Importance Ratingsa Importance Mean
Category Number PercentValid percentb
(n = 131)Category Number Percent Meanc
Standard
deviation
Prerequisite 8 4.4 6.4 Most 9 6.2 2.0 0.9
Reviewed 2 .2 .6 More 9 .
Introduced 0.6 8.4 Less 40 4.2
Subsequent 4 0. 0. Least 9 6.2
Not applicable 64 9.0 Total 117 100.0
Missing 2 0.
Total 1897 100.0 100.0

Appendix G • 209
Ap
pe
nd
ix G
Mathematics: Geometry
Similarity, Right Triangles, and Trigonometry: Standard . Use the properties of similarity transformations to establish the AA criterion for two triangles to be similar.
Applicability Ratings Importance Ratingsa Importance Mean
Category Number PercentValid percentb
(n = 100)Category Number Percent Meanc
Standard
deviation
Prerequisite 66 . 66.0 Most 2.6 2.2 0.9
Reviewed 4 0. 4.0 More 24 2.6
Introduced 0.4 .0 Less 4 9.
Subsequent 0. .0 Least 8 20.
Not applicable 9 94.6 Total 87 100.0
Missing 2 0.
Total 1897 100.0 100.0
Similarity, Right Triangles, and Trigonometry: Standard 4. Prove theorems about triangles. Theorems include: a line parallel to one side of a triangle divides the other two proportionally, and conversely; the Pythagorean Theorem proved using triangle similarity.
Applicability Ratings Importance Ratingsa Importance Mean
Category Number PercentValid percentb
(n = 104)Category Number Percent Meanc
Standard
deviation
Prerequisite 4.0 2. Most 8 9.4 2.4 .0
Reviewed 0. 2. More 2 24.
Introduced 0. 4.8 Less .6
Subsequent 0.6 0.6 Least 8.
Not applicable 9 94.4 Total 93 100.0
Missing 2 0.
Total 1897 100.0 100.0
Similarity, Right Triangles, and Trigonometry: Standard . Use congruence and similarity criteria for triangles to solve problems and to prove relationships in geometric figures.
Applicability Ratings Importance Ratingsa Importance Mean
Category Number PercentValid percentb
(n = 152)Category Number Percent Meanc
Standard
deviation
Prerequisite 99 .2 6. Most 26 8.4 2.6 0.9
Reviewed 29 . 9. More 2 6.9
Introduced 0. 8.6 Less 4 .9
Subsequent 0.6 .2 Least 8 2.8
Not applicable 4 9.9 Total 141 100.0
Missing 2 0.
Total 1897 100.0 100.0

Appendix G • 210
Ap
pe
nd
ix G
Mathematics: Geometry
Similarity, Right Triangles, and Trigonometry: Standard 6. Understand that by similarity, side ratios in right triangles are properties of the angles in the triangle, leading to definitions of trigonometric ratios for acute angles.
Applicability Ratings Importance Ratingsa Importance Mean
Category Number PercentValid percentb
(n = 194)Category Number Percent Meanc
Standard
deviation
Prerequisite 4 6.0 8.8 Most .2 2.94 0.9
Reviewed 6 .9 8.6 More 6 8.2
Introduced 20 . 0. Less 40 2.
Subsequent 24 . 2.4 Least 2 .
Not applicable 0 89. Total 170 100.0
Missing 2 0.
Total 1897 100.0 100.0
Similarity, Right Triangles, and Trigonometry: Standard . Explain and use the relationship between the sine and cosine of complementary angles.
Applicability Ratings Importance Ratingsa Importance Mean
Category Number PercentValid percentb
(n = 197)Category Number Percent Meanc
Standard
deviation
Prerequisite 0 . . Most 44 2.9 2.8 0.9
Reviewed 4 2. 2.9 More 4.
Introduced 22 .2 .2 Less 2 8.8
Subsequent 2 .4 . Least 0.0
Not applicable 698 89. Total 170 100.0
Missing 2 0.
Total 1897 100.0 100.0
Similarity, Right Triangles, and Trigonometry: Standard 8. Use trigonometric ratios and the Pythagorean Theorem to solve right triangles in applied problems.
Applicability Ratings Importance Ratingsa Importance Mean
Category Number PercentValid percentb
(n = 222)Category Number Percent Meanc
Standard
deviation
Prerequisite 8 6.2 .2 Most 9 4.8 .2 0.88
Reviewed 66 . 29. More 9 29.
Introduced 9 .0 8.6 Less 40 9.
Subsequent 9 .0 8.6 Least .4
Not applicable 6 88.2 Total 203 100.0
Missing 2 0.
Total 1897 100.0 100.0

Appendix G • 211
Ap
pe
nd
ix G
Mathematics: Geometry
Similarity, Right Triangles, and Trigonometry: Standard 9. (+) Derive the formula A = /2 ab sin(C) for the area of a triangle by drawing an auxiliary line from a vertex perpendicular to the opposite side.
Applicability Ratings Importance Ratingsa Importance Mean
Category Number PercentValid percentb
(n = 128)Category Number Percent Meanc
Standard
deviation
Prerequisite 69 .6 .9 Most 0.8 2.2 0.8
Reviewed 2 . 6.4 More 2 26.
Introduced 2 0.6 9.4 Less 48 4.
Subsequent 26 .4 20. Least 6 .
Not applicable 6 9. Total 102 100.0
Missing 2 0.
Total 1897 100.0 100.0
Similarity, Right Triangles, and Trigonometry: Standard 0. (+) Prove the Laws of Sines and Cosines and use them to solve problems.
Applicability Ratings Importance Ratingsa Importance Mean
Category Number PercentValid percentb
(n = 156)Category Number Percent Meanc
Standard
deviation
Prerequisite 4 .9 4.4 Most 2 6. 2. 0.92
Reviewed 8 2.0 24.4 More 40 .
Introduced 0.8 9.6 Less 49 8.6
Subsequent 29 . 8.6 Least .4
Not applicable 9 9. Total 127 100.0
Missing 2 0.
Total 1897 100.0 100.0
Similarity, Right Triangles, and Trigonometry: Standard . (+) Understand and apply the Law of Sines and the Law of Cosines to find unknown measurements in right and non-right triangles (e.g., surveying problems, resultant forces).
Applicability Ratings Importance Ratingsa Importance Mean
Category Number PercentValid percentb
(n = 178)Category Number Percent Meanc
Standard
deviation
Prerequisite 8 4. 4. Most 2 2.8 2.66 0.96
Reviewed 4 2. 26.4 More 2 .4
Introduced 9 .0 0. Less 44 29.9
Subsequent .6 .4 Least 9 2.9
Not applicable 90. Total 147 100.0
Missing 2 0.
Total 1897 100.0 100.0

Appendix G • 212
Ap
pe
nd
ix G
Mathematics: Geometry
Circles: Standard . Prove that all circles are similar.
Applicability Ratings Importance Ratingsa Importance Mean
Category Number PercentValid percentb
(n = 86)Category Number Percent Meanc
Standard
deviation
Prerequisite 6 .4 .6 Most 4 8.2 2.2 .04
Reviewed 0.4 8. More 9 .
Introduced 0. .8 Less 42.9
Subsequent 9 0. 0. Least 2 2.
Not applicable 809 9.4 Total 77 100.0
Missing 2 0.
Total 1897 100.0 100.0
Circles: Standard 2. Identify and describe relationships among inscribed angles, radii, and chords. Include the relationship between central, inscribed, and circumscribed angles; inscribed angles on a diameter are right angles; and the radius of a circle is perpendicular to the tangent where the radius intersects the circle.
Applicability Ratings Importance Ratingsa Importance Mean
Category Number PercentValid percentb
(n = 128)Category Number Percent Meanc
Standard
deviation
Prerequisite 84 4.4 6.6 Most .0 2.40 0.96
Reviewed 20 . .6 More 2 28.
Introduced 9 0. .0 Less 4 8.
Subsequent 0.8 . Least 2 8.6
Not applicable 6 9. Total 113 100.0
Missing 2 0.
Total 1897 100.0 100.0
Circles: Standard . Construct the inscribed and circumscribed circles of a triangle, and prove properties of angles for a quadrilateral inscribed in a circle.
Applicability Ratings Importance Ratingsa Importance Mean
Category Number PercentValid percentb
(n = 81)Category Number Percent Meanc
Standard
deviation
Prerequisite 4 2.8 66. Most 0 4. 2.29 0.96
Reviewed 0 0. 2. More 4 20.
Introduced 0. 6.2 Less 44.9
Subsequent 2 0.6 4.8 Least 4 20.
Not applicable 84 9.6 Total 69 100.0
Missing 2 0.
Total 1897 100.0 100.0

Appendix G • 213
Ap
pe
nd
ix G
Mathematics: Geometry
Circles: Standard 4. (+) Construct a tangent line from a point outside a given circle to the circle.
Applicability Ratings Importance Ratingsa Importance Mean
Category Number PercentValid percentb
(n = 110)Category Number Percent Meanc
Standard
deviation
Prerequisite 6 . . Most 6 .2 2. 0.9
Reviewed 20 . 8.2 More 29 .2
Introduced 0 0. 9. Less 4 6.6
Subsequent 0.9 . Least 4 .
Not applicable 8 94. Total 93 100.0
Missing 2 0.
Total 1897 100.0 100.0
Circles: Standard . Derive using similarity the fact that the length of the arc intercepted by an angle is proportional to the radius, and define the radian measure of the angle as the constant of proportionality; derive the formula for the area of a sector.
Applicability Ratings Importance Ratingsa Importance Mean
Category Number PercentValid percentb
(n = 153)Category Number Percent Meanc
Standard
deviation
Prerequisite 4. 0. Most 26 20.0 2.8 0.96
Reviewed 2 . 20.9 More 4 .
Introduced 2 . . Less 4 4.6
Subsequent 2 .2 .0 Least 8 .8
Not applicable 42 9.8 Total 130 100.0
Missing 2 0.
Total 1897 100.0 100.0
Expressing Geometric Properties with Equations: Standard . Derive the equation of a circle of given center and radius using the Pythagorean Theorem; complete the square to find the center and radius of a circle given by an equation.
Applicability Ratings Importance Ratingsa Importance Mean
Category Number PercentValid percentb
(n = 181)Category Number Percent Meanc
Standard
deviation
Prerequisite 8 4. 4.0 Most 28 6. 2. 0.9
Reviewed 4 2. 26.0 More .9
Introduced 6 .9 9.9 Less 6 .
Subsequent 0. .2 Least 20 .9
Not applicable 4 90.4 Total 168 100.0
Missing 2 0.
Total 1897 100.0 100.0

Appendix G • 214
Ap
pe
nd
ix G
Mathematics: GeometryExpressing Geometric Properties with Equations: Standard 2. Derive the equation of a parabola given a focus and directrix.
Applicability Ratings Importance Ratingsa Importance Mean
Category Number PercentValid percentb
(n = 148)Category Number Percent Meanc
Standard
deviation
Prerequisite 8 . 9.2 Most . 2.2 0.9
Reviewed 2 . 2.6 More 6 0.8
Introduced 2 .4 8.2 Less 44 .6
Subsequent .6 20.9 Least 24 20.
Not applicable 4 92. Total 117 100.0
Missing 2 0.
Total 1897 100.0 100.0
Expressing Geometric Properties with Equations: Standard . (+) Derive the equations of ellipses and hyperbolas given foci and directrices.
Applicability Ratings Importance Ratingsa Importance Mean
Category Number PercentValid percentb
(n = 137)Category Number Percent Meanc
Standard
deviation
Prerequisite 2. .2 Most 2.6 2.26 0.96
Reviewed 29 . 2.2 More 2 24.
Introduced 2 .2 6.8 Less 4 9.8
Subsequent 4 .8 24.8 Least 24 2.
Not applicable 8 92. Total 103 100.0
Missing 2 0.
Total 1897 100.0 100.0
Expressing Geometric Properties with Equations: Standard 4. Use coordinates to prove simple geometric theorems algebraically. For example, prove or disprove that a figure defined by four given points in the coordinate plane is a rectangle; prove or disprove that the point (, √) lies on the circle centered at the origin and containing the point (0, 2).
Applicability Ratings Importance Ratingsa Importance Mean
Category Number PercentValid percentb
(n = 129)Category Number Percent Meanc
Standard
deviation
Prerequisite 6 .4 0.4 Most 9.8 2.26 0.89
Reviewed 2 . 9.4 More 29 2.9
Introduced 22 .2 . Less 0 44.6
Subsequent 0.9 .2 Least 22 9.6
Not applicable 66 9. Total 112 100.0
Missing 2 0.
Total 1897 100.0 100.0

Appendix G • 215
Ap
pe
nd
ix G
Mathematics: Geometry Expressing Geometric Properties with Equations: Standard . Prove the slope criteria for parallel and perpendicular lines and use them to solve geometric problems (e.g., find the equation of a line parallel or perpendicular to a given line that passes through a given point).
Applicability Ratings Importance Ratingsa Importance Mean
Category Number PercentValid percentb
(n = 182)Category Number Percent Meanc
Standard
deviation
Prerequisite 8 4. 46. Most 4 2. 2.82 0.88
Reviewed .0 . More 66 8.6
Introduced 29 . .9 Less 29.8
Subsequent 0.6 6.0 Least 6.4
Not applicable 90. Total 171 100.0
Missing 2 0.
Total 1897 100.0 100.0
Expressing Geometric Properties with Equations: Standard 6. Find the point on a directed line segment between two given points that partitions the segment in a given ratio.
Applicability Ratings Importance Ratingsa Importance Mean
Category Number PercentValid percentb
(n = 135)Category Number Percent Meanc
Standard
deviation
Prerequisite .8 4. Most 6 .6 2.2 0.9
Reviewed 2 .4 20.0 More 2 2.
Introduced 8 0.9 . Less 44 .
Subsequent 0.9 2.6 Least 26 22.0
Not applicable 60 92.8 Total 118 100.0
Missing 2 0.
Total 1897 100.0 100.0
Expressing Geometric Properties with Equations: Standard . Use coordinates to compute perimeters of polygons and areas of triangles and rectangles, e.g., using the distance formula.H
Applicability Ratings Importance Ratingsa Importance Mean
Category Number PercentValid percentb
(n = 151)Category Number Percent Meanc
Standard
deviation
Prerequisite 9 4.2 2. Most 20 4.6 2.4 0.88
Reviewed 4 .8 22. More 4 29.9
Introduced 24 . .9 Less 60 4.8
Subsequent 4 0. 9. Least 6 .
Not applicable 44 9.9 Total 137 100.0
Missing 2 0.
Total 1897 100.0 100.0

Appendix G • 216
Ap
pe
nd
ix G
Mathematics: GeometryGeometric Measurement and Dimension: Standard . Give an informal argument for the formulas for the circumference of a circle, area of a circle, volume of a cylinder, pyramid, and cone. Use dissection arguments, Cavalieri’s principle, and informal limit arguments.
Applicability Ratings Importance Ratingsa Importance Mean
Category Number PercentValid percentb
(n = 140)Category Number Percent Meanc
Standard
deviation
Prerequisite 6 . 4.9 Most 2 8.4 2.60 0.92
Reviewed 4 2.2 29. More 4 4.4
Introduced 6 0.8 .4 Less 4 6.0
Subsequent 6 0.8 .4 Least 4 .2
Not applicable 92. Total 125 100.0
Missing 2 0.
Total 1897 100.0 100.0
Geometric Measurement and Dimension: Standard 2. (+) Give an informal argument using Cavalieri’s principle for the formulas for the volume of a sphere and other solid figures.
Applicability Ratings Importance Ratingsa Importance Mean
Category Number PercentValid percentb
(n = 93)Category Number Percent Meanc
Standard
deviation
Prerequisite 9 2. 4.9 Most 2 .6 2.8 0.89
Reviewed 2 . 22.6 More 0 9.0
Introduced 0.9 8. Less 26 .8
Subsequent 6 0.8 .2 Least 9 .
Not applicable 802 9.0 Total 77 100.0
Missing 2 0.
Total 1897 100.0 100.0
Geometric Measurement and Dimension: Standard . Use volume formulas for cylinders, pyramids, cones, and spheres to solve problems.H
Applicability Ratings Importance Ratingsa Importance Mean
Category Number PercentValid percentb
(n = 258)Category Number Percent Meanc
Standard
deviation
Prerequisite 2 6.6 48.4 Most 4 0. 2.90 0.9
Reviewed 9 .0 6.8 More 9 .8
Introduced 26 .4 0. Less 9 24.0
Subsequent 2 0.6 4. Least 20 8.
Not applicable 6 86. Total 246 100.0
Missing 2 0.
Total 1897 100.0 100.0

Appendix G • 217
Ap
pe
nd
ix G
Mathematics: Geometry
Geometric Measurement and Dimension: Standard 4. Identify the shapes of two-dimensional cross-sections of three-dimensional objects, and identify three-dimensional objects generated by rotations of two-dimensional objects.
Applicability Ratings Importance Ratingsa Importance Mean
Category Number PercentValid percentb
(n = 198)Category Number Percent Meanc
Standard
deviation
Prerequisite 6 .2 0.8 Most 2.9 2.9 0.90
Reviewed 4 2. 2. More 6 9.4
Introduced 2. 2.8 Less 44 28.4
Subsequent 4 2. 2. Least 8.4
Not applicable 69 89. Total 155 100.0
Missing 2 0.
Total 1897 100.0 100.0
Modeling with Geometry: Standard . Use geometric shapes, their measures, and their properties to describe objects (e.g., modeling a tree trunk or a human torso as a cylinder).H
Applicability Ratings Importance Ratingsa Importance Mean
Category Number PercentValid percentb
(n = 243)Category Number Percent Meanc
Standard
deviation
Prerequisite 82 4. . Most 44 9.6 2.66 0.9
Reviewed 90 4. .0 More 8 .
Introduced 2 2. 2.4 Less 2.6
Subsequent 9 .0 .8 Least 24 0.
Not applicable 62 8. Total 224 100.0
Missing 2 0.
Total 1897 100.0 100.0
Modeling with Geometry: Standard 2. Apply concepts of density based on area and volume in modeling situations (e.g., persons per square mile, BTUs per cubic foot).H
Applicability Ratings Importance Ratingsa Importance Mean
Category Number PercentValid percentb
(n = 255)Category Number Percent Meanc
Standard
deviation
Prerequisite .8 28.6 Most 4 2.6 2.80 0.88
Reviewed 0 . 9.6 More 92 40.2
Introduced 2.9 2.6 Less 6 29.
Subsequent 26 .4 0.2 Least 6 .0
Not applicable 640 86. Total 229 100.0
Missing 2 0.
Total 1897 100.0 100.0

Appendix G • 218
Ap
pe
nd
ix G
Mathematics: GeometryModeling with Geometry: Standard . Apply geometric methods to solve design problems (e.g., designing an object or structure to satisfy physical constraints or minimize cost; working with typographic grid systems based on ratios). H
Applicability Ratings Importance Ratingsa Importance Mean
Category Number PercentValid percentb
(n = 175)Category Number Percent Meanc
Standard
deviation
Prerequisite 48 2. 2.4 Most 0 9. 2.6 0.84
Reviewed 4 2. 26.9 More 64 42.
Introduced .0 2.6 Less 49 2.2
Subsequent 2 .2 . Least 9 .9
Not applicable 20 90. Total 152 100.0
Missing 2 0.
Total 1897 100.0 100.0
Notes. Where (H) is shown, it is an indication in the Common Core mathematics standards document to indicate a modeling mathematics practice.Where (+) is shown, it is an indication from the Common Core Mathematics standards document that some mathematics standards represent advanced content and are intended to prepare students for advanced courses.aRespondents completed an importance rating if they indicated that the content of the standards was either (a) prerequisite to, (b) reviewed in, or (c) introduced during their course. The mode rating is shaded. bValid percent values indicate percentages of respondents who indicated the standard was applicable to their course. cThe mean importance rating is calculated by assigning the following values to the ordinal scale ratings: least = 1, less = 2, more = 3, most = 4. Caution should be exercised when interpreting the precise value of any mean in relation to the categorical system underlying it.

Appendix G • 219
Ap
pe
nd
ix G
MathematicsStatistics and ProbabilityH
Interpreting Categorical and Quantitative Data: Standard . Represent data with plots on the real number line (dot plots, histograms, and box plots).H
Applicability Ratings Importance Ratingsa Importance Mean
Category Number PercentValid percentb
(n = 632)Category Number Percent Meanc
Standard
deviation
Prerequisite 8 9.8 29. Most 0.4 2.98 0.86
Reviewed 80 9. 28. More 29 4.6
Introduced 20 . .2 Less 2.
Subsequent .0 9.0 Least 28 4.9
Not applicable 26 66. Total 575 100.0
Total 1897 100.0 100.0
Interpreting Categorical and Quantitative Data: Standard 2. Use statistics appropriate to the shape of the data distribution to compare center (median, mean) and spread (interquartile range, standard deviation) of two or more different data sets.H
Applicability Ratings Importance Ratingsa Importance Mean
Category Number PercentValid percentb
(n = 614)Category Number Percent Meanc
Standard
deviation
Prerequisite 29 6.8 2.0 Most 48 28. 2.88 0.90
Reviewed 8. 2.6 More 98 8.
Introduced 24 2. 8. Less 9 26.
Subsequent 94 .0 . Least 6.
Not applicable 28 6.6 Total 520 100.0
Total 1897 100.0 100.0
Interpreting Categorical and Quantitative Data: Standard . Interpret differences in shape, center, and spread in the context of the data sets, accounting for possible effects of extreme data points (outliers).H
Applicability Ratings Importance Ratingsa Importance Mean
Category Number PercentValid percentb
(n = 529)Category Number Percent Meanc
Standard
deviation
Prerequisite 8 4.6 6.4 Most 2.4 2.8 0.92
Reviewed 0 .8 20.8 More 4 .6
Introduced 22 .8 42.2 Less .
Subsequent 09 . 20.6 Least .4
Not applicable 68 2. Total 420 100.0
Total 1897 100.0 100.0
Notes. Where (H) is shown, it is an indication in the Common Core mathematics standards document to indicate a modeling mathematics practice.Where (+) is shown, it is an indication from the Common Core Mathematics standards document that some mathematics standards represent advanced content and are intended to prepare students for advanced courses.aRespondents completed an importance rating if they indicated that the content of the standards was either (a) prerequisite to, (b) reviewed in, or (c) introduced during their course. The mode rating is shaded. bValid percent values indicate percentages of respondents who indicated the standard was applicable to their course. cThe mean importance rating is calculated by assigning the following values to the ordinal scale ratings: least = 1, less = 2, more = 3, most = 4. Caution should be exercised when interpreting the precise value of any mean in relation to the categorical system underlying it.

Appendix G • 220
Ap
pe
nd
ix G
Mathematics: Statistics and Probability
Interpreting Categorical and Quantitative Data: Standard 4. Use the mean and standard deviation of a data set to fit it to a normal distribution and to estimate population percentages. Recognize that there are data sets for which such a procedure is not appropriate. Use calculators, spreadsheets, and tables to estimate areas under the normal curve.H
Applicability Ratings Importance Ratingsa Importance Mean
Category Number PercentValid percentb
(n = 523)Category Number Percent Meanc
Standard
deviation
Prerequisite 8 4. 4.9 Most . 2.9 0.94
Reviewed 96 . 8.4 More 26 2.6
Introduced 22 .2 40. Less 9 2.
Subsequent .2 26.2 Least 26 6.
Not applicable 4 2.4 Total 386 100.0
Total 1897 100.0 100.0
Interpreting Categorical and Quantitative Data: Standard . Summarize categorical data for two categories in two-way frequency tables. Interpret relative frequencies in the context of the data (including joint, marginal, and conditional relative frequencies). Recognize possible associations and trends in the data.H
Applicability Ratings Importance Ratingsa Importance Mean
Category Number PercentValid percentb
(n = 444)Category Number Percent Meanc
Standard
deviation
Prerequisite 6 . 4.2 Most 8 2.0 2.82 0.89
Reviewed 66 . 4.9 More 2 8.8
Introduced 8 9.6 4.2 Less 9 29.2
Subsequent 2 .0 29. Least 22 .
Not applicable 4 6.6 Total 312 100.0
Total 1897 100.0 100.0
Interpreting Categorical and Quantitative Data: Standard 6. Represent data on two quantitative variables on a scatter plot, and describe how the variables are related.H
Applicability Ratings Importance Ratingsa Importance Mean
Category Number PercentValid percentb
(n = 560)Category Number Percent Meanc
Standard
deviation
Prerequisite 8 4. 4. Most 46 2. 2.94 0.92
Reviewed 26 6.6 22. More 62 6.
Introduced 242 2.8 4.2 Less 09 24.
Subsequent .9 9.8 Least 2 .
Not applicable 0. Total 449 100.0
Total 1897 100.0 100.0

Appendix G • 221
Ap
pe
nd
ix G
Mathematics: Statistics and ProbabilityInterpreting Categorical and Quantitative Data: Standard 6a. Fit a function to the data; use functions fitted to data to solve problems in the context of the data. Use given functions or choose a function suggested by the context. Emphasize linear, quadratic, and exponential models.
Applicability Ratings Importance Ratingsa Importance Mean
Category Number PercentValid percentb
(n = 443)Category Number Percent Meanc
Standard
deviation
Prerequisite 6 .0 2.6 Most 96 0.0 2.92 0.89
Reviewed 8 4.6 9.6 More 2 8.4
Introduced 9. 40.0 Less 8 2.
Subsequent 2 6. 2.8 Least 20 6.
Not applicable 44 6.6 Total 320 100.0
Total 1897 100.0 100.0
Interpreting Categorical and Quantitative Data: Standard 6b. Informally assess the fit of a function by plotting and analyzing residuals.
Applicability Ratings Importance Ratingsa Importance Mean
Category Number PercentValid percentb
(n = 358)Category Number Percent Meanc
Standard
deviation
Prerequisite 4 2. . Most 2.6 2. 0.92
Reviewed 46 2.4 2.8 More 82 6.4
Introduced 2 .0 6.9 Less 0 .
Subsequent .0 .2 Least 20 8.9
Not applicable 9 8. Total 225 100.0
Total 1897 100.0 100.0
Interpreting Categorical and Quantitative Data: Standard 6c. Fit a linear function for a scatter plot that suggests a linear association.
Applicability Ratings Importance Ratingsa Importance Mean
Category Number PercentValid percentb
(n = 470)Category Number Percent Meanc
Standard
deviation
Prerequisite 2.9 . Most 2.9 .02 0.86
Reviewed 9 .0 20.2 More 44 4.
Introduced 200 0. 42.6 Less 20.9
Subsequent 20 6. 2. Least 8 .
Not applicable 42 .2 Total 350 100.0
Total 1897 100.0 100.0

Appendix G • 222
Ap
pe
nd
ix G
Mathematics: Statistics and Probability
Interpreting Categorical and Quantitative Data: Standard . Interpret the slope (rate of change) and the intercept (constant term) of a linear model in the context of the data.H
Applicability Ratings Importance Ratingsa Importance Mean
Category Number PercentValid percentb
(n = 529)Category Number Percent Meanc
Standard
deviation
Prerequisite 99 .2 8. Most . .0 0.90
Reviewed 4 . 2.0 More 64 .8
Introduced 92 0. 6. Less 88 20.
Subsequent 9 .0 8.0 Least 2 6.2
Not applicable 68 2. Total 434 100.0
Total 1897 100.0 100.0
Interpreting Categorical and Quantitative Data: Standard 8. Compute (using technology) and interpret the correlation coefficient of a linear fit.H
Applicability Ratings Importance Ratingsa Importance Mean
Category Number PercentValid percentb
(n = 465)Category Number Percent Meanc
Standard
deviation
Prerequisite 46 2.4 9.9 Most 92 0. 2.9 0.92
Reviewed 9 4.2 .0 More .4
Introduced 9. 8. Less 24.8
Subsequent 6 8.6 . Least 22 .
Not applicable 42 . Total 302 100.0
Total 1897 100.0 100.0
Interpreting Categorical and Quantitative Data: Standard 9. Distinguish between correlation and causation.H
Applicability Ratings Importance Ratingsa Importance Mean
Category Number PercentValid percentb
(n = 548)Category Number Percent Meanc
Standard
deviation
Prerequisite 64 .4 . Most 8 9.0 .0 0.9
Reviewed 26 6.6 2.0 More 9 4.
Introduced 24 4.4 0.0 Less 98 2.
Subsequent 84 4.4 . Least 26 .6
Not applicable 49 . Total 464 100.0
Total 1897 100.0 100.0

Appendix G • 223
Ap
pe
nd
ix G
Mathematics: Statistics and ProbabilityMaking Inferences and Justifying Conclusions: Standard . Understand statistics as a process for making inferences about population parameters based on a random sample from that population.H
Applicability Ratings Importance Ratingsa Importance Mean
Category Number PercentValid percentb
(n = 588)Category Number Percent Meanc
Standard
deviation
Prerequisite 9 .0 6.2 Most 69 .9 2.98 0.90
Reviewed 0 . .2 More 9 .9
Introduced 02 .9 .4 Less 22 24.4
Subsequent 90 4. . Least 29 .8
Not applicable 09 69.0 Total 499 100.0
Total 1897 100.0 100.0
Making Inferences and Justifying Conclusions: Standard 2. Decide if a specified model is consistent with results from a given data-generating process, e.g., using simulation. For example, a model says a spinning coin falls heads up with probability 0.. Would a result of tails in a row cause you to question the model?H
Applicability Ratings Importance Ratingsa Importance Mean
Category Number PercentValid percentb
(n = 460)Category Number Percent Meanc
Standard
deviation
Prerequisite 6 . . Most 8 2.9 2.4 0.92
Reviewed 2 .8 . More 4 .0
Introduced 9 0. 4. Less 06 2.
Subsequent 4 . 29. Least 28 8.6
Not applicable 4 .8 Total 326 100.0
Total 1897 100.0 100.0
Making Inferences and Justifying Conclusions: Standard . Recognize the purposes of and differences among sample surveys, experiments, and observational studies; explain how randomization relates to each.H
Applicability Ratings Importance Ratingsa Importance Mean
Category Number PercentValid percentb
(n = 527)Category Number Percent Meanc
Standard
deviation
Prerequisite 60 .2 .4 Most 9 2.4 2.9 0.86
Reviewed 84 4.4 .9 More 8 42.
Introduced 29 . .2 Less 0 24.
Subsequent 92 4.8 . Least 26 6.0
Not applicable 0 2.2 Total 435 100.0
Total 1897 100.0 100.0

Appendix G • 224
Ap
pe
nd
ix G
Mathematics: Statistics and ProbabilityMaking Inferences and Justifying Conclusions: Standard 4. Use data from a sample survey to estimate a population mean or proportion; develop a margin of error through the use of simulation models for random sampling.H
Applicability Ratings Importance Ratingsa Importance Mean
Category Number PercentValid percentb
(n = 450)Category Number Percent Meanc
Standard
deviation
Prerequisite 4 2. 0.4 Most 8 29.8 2.9 0.88
Reviewed 2.9 2.2 More 6 9.
Introduced 90 0.0 42.2 Less 2 24.
Subsequent 8 8. . Least .8
Not applicable 44 6. Total 292 100.0
Total 1897 100.0 100.0
Making Inferences and Justifying Conclusions: Standard . Use data from a randomized experiment to compare two treatments; use simulations to decide if differences between parameters are significant.H
Applicability Ratings Importance Ratingsa Importance Mean
Category Number PercentValid percentb
(n = 454)Category Number Percent Meanc
Standard
deviation
Prerequisite 4 2. 9. Most 6 26.9 2.88 0.88
Reviewed 4 2.8 .9 More 6 4.0
Introduced 86 9.8 4.0 Less 2.8
Subsequent 9.0 . Least 8 6.4
Not applicable 44 6. Total 283 100.0
Total 1897 100.0 100.0
Making Inferences and Justifying Conclusions: Standard 6. Evaluate reports based on data.H
Applicability Ratings Importance Ratingsa Importance Mean
Category Number PercentValid percentb
(n = 616)Category Number Percent Meanc
Standard
deviation
Prerequisite 82 4. . Most 60 0.6 2.98 0.86
Reviewed 2 .0 2.4 More 22 42.6
Introduced 09 6. 0.2 Less 2.2
Subsequent 9 4.9 . Least 29 .
Not applicable 28 6. Total 523 100.0
Total 1897 100.0 100.0

Appendix G • 225
Ap
pe
nd
ix G
Mathematics: Statistics and ProbabilityConditional Probability and the Rules of Probability: Standard . Describe events as subsets of a sample space (the set of outcomes) using characteristics (or categories) of the outcomes, or as unions, intersections, or complements of other events (“or,” “and,” “not”).H
Applicability Ratings Importance Ratingsa Importance Mean
Category Number PercentValid percentb
(n = 334)Category Number Percent Meanc
Standard
deviation
Prerequisite 44 2. .2 Most 2. 2.84 0.8
Reviewed 44 2. .2 More 8 .9
Introduced 26 6.6 . Less 6 .
Subsequent 20 6. .9 Least .
Not applicable 6 82.4 Total 214 100.0
Total 1897 100.0 100.0
Conditional Probability and the Rules of Probability: Standard 2. Understand that two events A and B are independent if the probability of A and B occurring together is the product of their probabilities, and use this characterization to determine if they are independent.H
Applicability Ratings Importance Ratingsa Importance Mean
Category Number PercentValid percentb
(n = 350)Category Number Percent Meanc
Standard
deviation
Prerequisite 8 2.0 0.9 Most 6 2. 2.86 0.89
Reviewed 2.8 . More 80 6.4
Introduced 29 6.8 6.9 Less 66 0.0
Subsequent 0 6.9 . Least .9
Not applicable 4 8. Total 220 100.0
Total 1897 100.0 100.0
Conditional Probability and the Rules of Probability: Standard . Understand the conditional probability of A given B as P(A and B)/P(B), and interpret independence of A and B as saying that the conditional probability of A given B is the same as the probability of A, and the conditional probability of B given A is the same as the probability of B.H
Applicability Ratings Importance Ratingsa Importance Mean
Category Number PercentValid percentb
(n = 303)Category Number Percent Meanc
Standard
deviation
Prerequisite 28 . 9.2 Most 6 2.2 2.9 0.9
Reviewed 9 2. 2.9 More 8 .
Introduced 0 .6 . Less 29.
Subsequent 29 6.8 42.6 Least 9 .2
Not applicable 94 84.0 Total 174 100.0
Total 1897 100.0 100.0

Appendix G • 226
Ap
pe
nd
ix G
Mathematics: Statistics and ProbabilityConditional Probability and the Rules of Probability: Standard 4. Construct and interpret two-way frequency tables of data when two categories are associated with each object being classified. Use the two-way table as a sample space to decide if events are independent and to approximate conditional probabilities. For example, collect data from a random sample of students in your school on their favorite subject among math, science, and English. Estimate the probability that a randomly selected student from your school will favor science given that the student is in tenth grade. Do the same for other subjects and compare the results.H
Applicability Ratings Importance Ratingsa Importance Mean
Category Number PercentValid percentb
(n = 313)Category Number Percent Meanc
Standard
deviation
Prerequisite 6 .9 . Most 42 24.4 2.8 0.9
Reviewed 2 .4 8.6 More 6 .8
Introduced 09 . 4.8 Less 29.
Subsequent 4 .4 4.0 Least 4 8.
Not applicable 84 8. Total 172 100.0
Total 1897 100.0 100.0
Conditional Probability and the Rules of Probability: Standard . Recognize and explain the concepts of conditional probability and independence in everyday language and everyday situations. For example, compare the chance of having lung cancer if you are a smoker with the chance of being a smoker if you have lung cancer.H
Applicability Ratings Importance Ratingsa Importance Mean
Category Number PercentValid percentb
(n = 377)Category Number Percent Meanc
Standard
deviation
Prerequisite 49 2.6 .0 Most 6 24. 2.8 0.92
Reviewed 2 2. .8 More 9 8.6
Introduced 0 .9 9.8 Less 69 2.
Subsequent 26 6.6 .4 Least 24 9.6
Not applicable 20 80. Total 251 100.0
Total 1897 100.0 100.0
Conditional Probability and the Rules of Probability: Standard 6. Find the conditional probability of A given B as the fraction of B’s outcomes that also belong to A, and interpret the answer in terms of the model.H
Applicability Ratings Importance Ratingsa Importance Mean
Category Number PercentValid percentb
(n = 270)Category Number Percent Meanc
Standard
deviation
Prerequisite 2 .4 0.0 Most 4 0.0 2.88 0.9
Reviewed 2 . 9. More .
Introduced 98 .2 6. Less 4 2.
Subsequent 20 6. 44.4 Least .
Not applicable 62 8.8 Total 150 100.0
Total 1897 100.0 100.0

Appendix G • 227
Ap
pe
nd
ix G
Mathematics: Statistics and ProbabilityConditional Probability and the Rules of Probability: Standard . Apply the Addition Rule, P(A or B) = P(A) + P(B) – P(A and B), and interpret the answer in terms of the model.H
Applicability Ratings Importance Ratingsa Importance Mean
Category Number PercentValid percentb
(n = 273)Category Number Percent Meanc
Standard
deviation
Prerequisite 2 . 9.2 Most 2. 2.94 0.9
Reviewed 2 .4 9.9 More 4 4.4
Introduced 0 . 8. Less 4 2.4
Subsequent 6 6. 42. Least 9 .
Not applicable 624 8.6 Total 157 100.0
Total 1897 100.0 100.0
Conditional Probability and the Rules of Probability: Standard 8. (+) Apply the general Multiplication Rule in a uniform probability model, P(A and B) = P(A)P(B|A) = P(B)P(A|B), and interpret the answer in terms of the model.H
Applicability Ratings Importance Ratingsa Importance Mean
Category Number PercentValid percentb
(n = 267)Category Number Percent Meanc
Standard
deviation
Prerequisite 2 . 9.4 Most 46 0. 2.92 0.90
Reviewed 29 . 0.9 More 8 8.2
Introduced 98 .2 6. Less 8 2.0
Subsequent 6. 4. Least 0 6.6
Not applicable 60 8.9 Total 152 100.0
Total 1897 100.0 100.0
Conditional Probability and the Rules of Probability: Standard 9. (+) Use permutations and combinations to compute probabilities of compound events and solve problems.H
Applicability Ratings Importance Ratingsa Importance Mean
Category Number PercentValid percentb
(n = 261)Category Number Percent Meanc
Standard
deviation
Prerequisite 28 . 0. Most 8 26.4 2.80 0.92
Reviewed 2 . 9.6 More 0 4.
Introduced 9 4.8 4.9 Less 4 .
Subsequent 6.2 44.8 Least .6
Not applicable 66 86.2 Total 144 100.0
Total 1897 100.0 100.0

Appendix G • 228
Ap
pe
nd
ix G
Mathematics: Statistics and ProbabilityUsing Probability to Make Decisions: Standard . (+) Define a random variable for a quantity of interest by assigning a numerical value to each event in a sample space; graph the corresponding probability distribution using the same graphical displays as for data distributions.H
Applicability Ratings Importance Ratingsa Importance Mean
Category Number PercentValid percentb
(n = 298)Category Number Percent Meanc
Standard
deviation
Prerequisite 28 . 9.4 Most 44 2. 2.86 0.84
Reviewed 28 . 9.4 More 0 40.0
Introduced 9 6. 9.9 Less 4 0.9
Subsequent 2 6. 4. Least 4.0
Not applicable 99 84. Total 175 100.0
Total 1897 100.0 100.0
Using Probability to Make Decisions: Standard 2. (+) Calculate the expected value of a random variable; interpret it as the mean of the probability distribution.H
Applicability Ratings Importance Ratingsa Importance Mean
Category Number PercentValid percentb
(n = 306)Category Number Percent Meanc
Standard
deviation
Prerequisite 0 .6 9.8 Most 48 2. 2.90 0.86
Reviewed . 0.8 More 0 9.8
Introduced 6.0 6.9 Less 0 28.4
Subsequent 0 6.9 42. Least 8 4.
Not applicable 9 8.9 Total 176 100.0
Total 1897 100.0 100.0
Using Probability to Make Decisions: Standard . (+) Develop a probability distribution for a random variable defined for a sample space in which theoretical probabilities can be calculated; find the expected value. For example, find the theoretical probability distribution for the number of correct answers obtained by guessing on all five questions of a multiple-choice test where each question has four choices, and find the expected grade under various grading schemes.H
Applicability Ratings Importance Ratingsa Importance Mean
Category Number PercentValid percentb
(n = 275)Category Number Percent Meanc
Standard
deviation
Prerequisite 29 . 0. Most 4 26. 2.84 0.90
Reviewed 2 .2 8.4 More 60 8.
Introduced 04 . .8 Less 44 28.2
Subsequent 9 6. 4. Least .
Not applicable 622 8. Total 156 100.0
Total 1897 100.0 100.0

Appendix G • 229
Ap
pe
nd
ix G
Mathematics: Statistics and Probability
Using Probability to Make Decisions: Standard 4. (+) Develop a probability distribution for a random variable defined for a sample space in which probabilities are assigned empirically; find the expected value. For example, find a current data distribution on the number of TV sets per household in the United States, and calculate the expected number of sets per household. How many TV sets would you expect to find in 00 randomly selected households?H
Applicability Ratings Importance Ratingsa Importance Mean
Category Number PercentValid percentb
(n = 286)Category Number Percent Meanc
Standard
deviation
Prerequisite 2 . .2 Most 6 22.8 2.6 0.88
Reviewed 2 . 8. More 9 .
Introduced 0 . . Less 2 2.9
Subsequent 28 6. 44.8 Least .0
Not applicable 6 84.9 Total 158 100.0
Total 1897 100.0 100.0
Using Probability to Make Decisions: Standard . (+) Weigh the possible outcomes of a decision by assigning probabilities to payoff values and finding expected values.H
Applicability Ratings Importance Ratingsa Importance Mean
Category Number PercentValid percentb
(n = 313)Category Number Percent Meanc
Standard
deviation
Prerequisite .8 .2 Most 0 6.0 2.8 0.90
Reviewed 40 2. 2.8 More 2 8.
Introduced 6.0 6. Less 6 .
Subsequent 2 6.6 9.9 Least 2 2.2
Not applicable 84 8. Total 188 100.0
Total 1897 100.0 100.0
Using Probability to Make Decisions: Standard a. Find the expected payoff for a game of chance. For example, find the expected winnings from a state lottery ticket or a game at a fast-food restaurant.
Applicability Ratings Importance Ratingsa Importance Mean
Category Number PercentValid percentb
(n = 289)Category Number Percent Meanc
Standard
deviation
Prerequisite .6 0. Most 2 4. 2.6 0.84
Reviewed 0 .6 0.4 More 4 4.8
Introduced 6 6. 40. Less 62 .0
Subsequent 2 .9 8.8 Least 6 9.0
Not applicable 608 84.8 Total 177 100.0
Total 1897 100.0 100.0

Appendix G • 230
Ap
pe
nd
ix G
Mathematics: Statistics and Probability
Using Probability to Make Decisions: Standard b. Evaluate and compare strategies on the basis of expected values. For example, compare a high-deductible versus a low-deductible automobile insurance policy using various, but reasonable, chances of having a minor or a major accident.
Applicability Ratings Importance Ratingsa Importance Mean
Category Number PercentValid percentb
(n = 290)Category Number Percent Meanc
Standard
deviation
Prerequisite 2 . .0 Most 2 .6 2.60 0.8
Reviewed 2.0 2.8 More 68 40.2
Introduced 00 . 4. Less 66 9.
Subsequent 2 6.4 4. Least 2 .
Not applicable 60 84. Total 169 100.0
Total 1897 100.0 100.0
Using Probability to Make Decisions: Standard 6. (+) Use probabilities to make fair decisions (e.g., drawing by lots, using a random number generator).H
Applicability Ratings Importance Ratingsa Importance Mean
Category Number PercentValid percentb
(n = 319)Category Number Percent Meanc
Standard
deviation
Prerequisite 2.0 .6 Most 6.0 2.62 0.8
Reviewed 4 .8 0. More 9 40.
Introduced 2 6. 8.6 Less 64 .0
Subsequent 2 6.6 9.2 Least 20 0.
Not applicable 8 8.2 Total 194 100.0
Total 1897 100.0 100.0
Using Probability to Make Decisions: Standard . (+) Analyze decisions and strategies using probability concepts (e.g., product testing, medical testing, pulling a hockey goalie at the end of a game).H
Applicability Ratings Importance Ratingsa Importance Mean
Category Number PercentValid percentb
(n = 336)Category Number Percent Meanc
Standard
deviation
Prerequisite 2.0 .0 Most 4 9. 2. 0.9
Reviewed 8 2.0 . More 90 4.
Introduced .0 9.6 Less 2.
Subsequent 28 6. 8. Least 24 .
Not applicable 6 82. Total 208 100.0
Total 1897 100.0 100.0
Notes. Where (H) is shown, it is an indication in the Common Core mathematics standards document to indicate a modeling mathematics practice.Where (+) is shown, it is an indication from the Common Core Mathematics standards document that some mathematics standards represent advanced content and are intended to prepare students for advanced courses.aRespondents completed an importance rating if they indicated that the content of the standards was either (a) prerequisite to, (b) reviewed in, or (c) introduced during their course. The mode rating is shaded. bValid percent values indicate percentages of respondents who indicated the standard was applicable to their course. cThe mean importance rating is calculated by assigning the following values to the ordinal scale ratings: least = 1, less = 2, more = 3, most = 4. Caution should be exercised when interpreting the precise value of any mean in relation to the categorical system underlying it.