Palynological evidence for gradual vegetation and climate ...
Upload
jamescookuniversityCategory
view
1download
0
ilable at ScienceDirect
Toxicon 80 (2014) 17–26
Contents lists ava
Toxicon
journal homepage: www.elsevier .com/locate/ toxicon
Rapid short term and gradual permanent cardiotoxic effectsof vertebrate toxins from Chironex fleckeri (Australian boxjellyfish) venom
Stephanie Chaousis a,b,d,*, Michael Smout a,b, David Wilson a,b, Alex Loukas a,b,Jason Mulvenna b, Jamie Seymour a,b,c
aQueensland Tropical Health Alliance (QTHA), Building E4, James Cook University, McGregor Road, QLD 4878, AustraliabCentre for Biodiscovery and Molecular Development of Therapeutics (CBMDT), James Cook University, McGregor Road, Cairns 4878,Australiac School of Public Health, Tropical Medicine and Rehabilitation Sciences, James Cook University, McGregor Road, Cairns 4878, Australiad School of Marine and Tropical Biology, James Cook University, Smithfield, QLD, Australia
a r t i c l e i n f o
Article history:Received 24 July 2013Received in revised form 29 November 2013Accepted 14 January 2014Available online 22 January 2014
Keywords:Chironex fleckeriVenomCardiotoxicxCELLigenceHuman cardiomyocytesHuman skeletal muscle cells
* Corresponding author. James Cook University, STropical Biology, Smithfield, QLD 4878, Australia. Tefax: þ61 4042 1492.
E-mail addresses: [email protected], schaChaousis).
0041-0101/$ – see front matter � 2014 Elsevier Ltdhttp://dx.doi.org/10.1016/j.toxicon.2014.01.007
a b s t r a c t
The vertebrate cardiotoxic components of the venom produced by the Australian boxjellyfish, Chironex fleckeri, have not previously been isolated. We have uncovered for thefirst time, three distinct cytotoxic crude fractions from within the vertebrate cardiotoxicpeak of C. fleckeri venom by monitoring viability of human muscle cells with an impedancebased assay (ACEA xCELLigence system) measuring cell detachment as cytotoxicity whichwas correlated with a reduction in cell metabolism using a cell proliferation (MTS) assay.When the effects of the venom components on human cardiomyocytes and human skeletalmuscle cells were compared, two fractions were found to specifically affect cardiomyocyteswith distinct temporal profiles (labelled Crude Toxic Fractions (CTF), a and b). A thirdfraction (CTF-g) was toxic to both muscle cell types and therefore not cardio specific. Thevertebrate, cardio specific CTF-a and CTF-b, presented distinct activities; CTF-a causedrapid but short term cell detachment and reduction in cell metabolism with enhancedactivity at lower concentrations than CTF-b. This activity was not permanent, with cellreattachment and subsequent increased metabolism of heart muscle cells observed whenexposed to all but the highest concentrations of CTF-a tested. The cytotoxic effect of CTF-btook twice as long to act on the cells compared to CTF-a, however, the activity was per-manent. Furthermore, we showed that the two fractions combined have a synergistic ef-fect causing a much stronger and faster cell detachment (death) when combined than thesum of the individual effects of each toxin. These data presented here improves the currentunderstanding of the toxic mechanisms of the Australian box jellyfish, C. fleckeri, andprovides a basis for in vivo research of these newly isolated toxic fractions.
� 2014 Elsevier Ltd. All rights reserved.
chool of Marine andl.: þ61 07 4042 1862;
. All rights reserved.
1. Introduction
The venom of the box jellyfish, Chironex fleckeri, likemany other venoms, is a complex mixture of bioactiveproteins and peptides (Brinkman et al., 2012). Despite over40 years of research (e.g. Baxter and Marr, 1969; Endean,1987; Ramasamy et al., 2004) the mechanisms of actionof the toxic proteins in this venom are yet to be elucidated.

S. Chaousis et al. / Toxicon 80 (2014) 17–2618
The toxic activity of C. fleckeri venom components is ofgreat interest because of its rapidity of action in enve-nomed humans (Currie, 2000; Kintner et al., 2005) with thecapacity to cause death within minutes of envenomation(Ramasamy et al., 2004; Winter, 2010). The main cause ofdeath is believed to be due to cardiac toxicity (Mustafaet al., 1995). There are approximately 50–200 stings re-ported in Australia every year with an average of one deatha year over the past 70 years (Huynh et al., 2003; O’Reillyet al., 2001) and possibly 50 or more deaths annuallyfrom similar species in neighbouring countries such as thePhilippines (Fenner and Harrison, 2000). Despite thecontinuing presence of these animals in the waters ofpopular beaches in tropical northern Australia, a reliableeffective treatment is still not available (Bailey et al., 2003;Winter et al., 2006). Understanding venom toxicity at acellular level leads the way for whole system investigationson toxic venom components and their mechanisms as wellas providing a basis for development of a treatment tocounteract these mechanisms.
Previous studies have failed to isolate the toxic com-ponents of C. fleckeri venom or elucidate the mechanism ofaction due to a focus on improving treatment of humanenvenomation by examining whole, unfractionated venom(e.g. Bloom et al., 1999; Konstantakopoulos et al., 2009;Ramasamy et al., 2004; Winter et al., 2009). The first stepin understanding the mechanism is to isolate the compo-nents responsible for the toxicity. The cause of death fromC. fleckeri envenomation is due to cardiac failure (Mustafaet al., 1995) and previous in vitro and in vivo studies haveobserved and closely examined the cardiotoxic effects ofthe whole venom (e.g. Bailey et al., 2005;Konstantakopoulos et al., 2009; Ramasamy et al., 2004;Ramasamy et al., 2005; Winter et al., 2009). Only recentlyhave the crude protein groups responsible for both thevertebrate and invertebrate cardiotoxicity, been isolatedfrom fractionated venom (Brinkman et al., 2012;McClounan and Seymour, 2012; Saggiomo and Seymour,2012; Winter, 2010).
The present study isolated crude toxic fractions in thevenom, specifically targeting the vertebrate cardiotoxicactivity to further elucidate the possible mechanisms of C.fleckeri vertebrate toxicity in humans using xCELLigence, ahigh throughput cellular assay system. This relatively newtechnology can be used to examine cytotoxicity inconjunction with other cell viability assays (Diemert et al.,2012; Urcan et al., 2010) which are a valuable techniquefor investigating the pharmacology of venoms (Bailey et al.,2005; Konstantakopoulos et al., 2009).
2. Materials and methods
2.1. Venom acquisition
Adult (greater than 10 cm bell width) C. fleckeri werecaught in Weipa, Australia (lat. 12.40�S, long. 141. 50�E) inNovember 2011 and nematocysts were extracted from thetentacles as per Bloom et al. (1998) and then lyophilised.Venom was then extracted from the nematocysts as perCarrette and Seymour (2004). In brief, to separate nema-tocysts from tentacle debris and other impurities,
nematocysts were rehydrated and centrifuged at 3000 rpmfor two minutes and the supernatant removed, this pro-cedure was repeated four times before purified nemato-cysts were lyophilised. Venom was extracted from thenematocyst in order to obtain Crude Venom Extract (CVE)by rehydrating freeze-dried nematocysts in RO water insmall vials with 0.5 mm diameter glass beads. Vials werethen shaken at 5000 rpm for 30 s in a bead beater at 4 �C.This process was repeated six times to maximise thenumber of disrupted nematocysts. Vials were then centri-fuged at 3000 rpm for one minute and the supernatantremoved. This CVE was lyophilised and stored at �80 �Cuntil required. Rehydrated venom samples were consis-tently kept on ice slurry when handling for experimenta-tion hereafter to preserve activity of toxins (Winter et al.,2007a).
2.2. Protein purification using Size Exclusion Chromatography(SEC)
A Superdex� 200 10/300 GL Column (SD200) in a FastProtein Liquid Chromatography (FPLC) AKTA system (GEhealthcare) was used to separate proteins in the venomaccording to size within a range of 600 kDa–10 kDa. Toestimate the molecular weight of venom proteins beingeluted by the column, standard proteins provided by themanufacturer; Blue dextran (2000 kDa), Conalbumin(75 kDa) Ovalbumin (43 kDa) and Ribonuclease (13.7 kDa)were processed through the FPLC, under the same condi-tions as the venom (detailed below), a maximum of 1 weekbefore venom sample was processed. From these results, astandard curve was generated for comparison of followingvenom size exclusion results to obtain eluate protein sizes.
The maximum amount of lyophilised CVE (18 mg dryweight) which would completely dissolve in 500 ml ofDulbecco’s Phosphate Buffered Saline (DPBS; 2.7 mM KCl,1.5 mM KH2PO4, 136.9 mM NaCl, 8.9 mM Na2HPO4) wasused to obtain a high protein concentration of eluate afterFPLC processing. This solution was vortexed for 15 s andthen centrifuged at 1200 rpm and filtered using a 0.22 mMsyringe filter (Millipore) to separate any remaining celldebris from the sample. The sample was run in DPBS bufferthrough the column at 4 �C at a flow rate of 0.3 mL/min andeluted in 500 ml fractions into a 1 mL-96 deep well plate.Absorbance at 280 nM (A280nm) was used to obtain a venomprotein profile. The vertebrate cardiotoxic crude fraction“Peak 2” (Saggiomo and Seymour, 2012) was identifiedfrom within the venom profile and the eluted sampleswhich correlated with this peak were stored at 4 �C. Proteinconcentration of the venom and extracted fractions werefinally determined using the Bradford Lowry technique.
2.3. Cell culture
Human Cardiomyocytes (HCM) and Human SkeletalMuscle cells (HSkMC) were obtained from ScienCell andcultured in HCM and HSkMC media with 10% Foetal BovineSerum at 37 �C and 5% CO2 in 75 cm2 monolayer flasks asper manufacturer’s instructions. Briefly, once cell culturehad reached 80% confluence, cells were detached using0.2% Bovine trypsin solution (Sigma) in DPBS for five

S. Chaousis et al. / Toxicon 80 (2014) 17–26 19
minutes at 37 �C. The number of cells in the solution wasthen calculated using a haemocytometer. Cell growth wasmonitored using an xCELLigence system (ACEA) for moni-toring cell attachment in real time. A baseline reading wasestablished using 96 well E-plates (ACEA) to which 50 ml ofpre-warmed HCM or HSkMC media (Sciencell) was added.Approximately 2000 cells in 100 ml of media was thenadded into each well for a final volume of 150 ml. Cells wereincubated in the E-Plate for a minimum of 24 h at 37 �C and5% CO2 before venom fractions were added to ensureadherence to the base of the wells.
2.4. Toxic fractions from within the vertebrate toxic “Peak 2”
The Crude Toxic Fractions (CTFs) within vertebrate car-diotoxic “Peak 2” of the venom were located by applying20 ml of each individual fraction obtained from the A280nmtrace of Peak 2 (in addition to controls, detailed below) intriplicate to HCM cells in 150 ml of culture media. A negativecontrol (20 ml DPBS) and a positive control (20 ml whole C.fleckeri venom at lethal concentration, 46 mg/mL (Saggiomoand Seymour, 2012)) were applied in all experiments.Cytotoxic effects of fractions (measured as cell detachment)were recorded using the xCELLigence� system as per themanufacturer’s instructions. In short, the base of the 96well E-plate is covered in micro electrodes that detect theadhesion of cells to the base of each well. Cell adhesion ismonitored over an extended period of time and measuredin as little as 15 s increments. For this experiment,detachment of cells from the base of the well was used as ameasure of cytotoxicity as per Saggiomo and Seymour(2012) and is recorded as a reduced “cell index” by theReal Time Cell Assay Software (RTCA) (ACEA). Cells weremonitored with the xCELLigence plate reader for at least10 h with cell attachment measured every 15 s for the firsthour, every two minutes for the 2nd and 3rd hour andevery 15 min for the remaining hours. Cell detachment wasalso confirmed by observing changes in cell morphologyunder a microscope. Toxic fractions were labelled as CrudeToxic Fractions (CTFs) sequentially, using the Greek alpha-bet, as they eluted from SEC. In addition to protein sizeestimation using the standard curve (Section 2.2), the twocardio specific CTFs were run on a 15% agarose gel tovisualise purity of the sample (not shown).
2.4.1. Effect of Crude Toxic Fractions on cell metabolism (MTScell proliferation assay)
A cell proliferation assay was performed to verify thatthe change in morphology of cells, read as cell detachmenton the xCELLigence system, was accurately representingcytotoxicity of CTFs and to further examine the toxic effectsof the CTFs over time.
The Cell titre 96 Aqueous One Solution Cell ProliferationAssay (MTS assay) was purchased from Promega (Mel-bourne, Australia). To produce a standard curve of cellmetabolic output vs. cell number/well, HCMwere plated ona flat bottom 96 well assay plate at a range (82 � 103–1 � 102 HCM per well) of serially diluted (1.5 fold) celldensities in quadruplicate and left to incubate at 37 �C in 5%CO2 for 24 h. After incubation, 30 ml MTS was added andcells were left to incubate with MTS solution for 90 min to
allow colour to develop. Absorbance was then measured at490 nm in a POLARstar Omega spectrophotometer (BMGLabtech). Results from the following MTS assays wereconverted to percent metabolising cells/well equivalentusing the standard curve.
HCM were seeded in a 96 well assay plate as describedabove and incubated for 24 h at 37 �C in 5% CO2. The car-diospecific CTFs were serially diluted six times (2 fold di-lutions) and applied to cells (20 ml) in quadruplicate.Additionally, negative controls (20 ml PBS) and positive con-trols (20 ml whole venom(46 mg/mL))were added to the cells.The cells were incubated for 60min at 37 �C in 5% CO2 beforeaddition of 30 ml of pre-warmed MTS assay fluid. The platewas then left to incubate again at 37 �C in 5% CO2 for 90 minbefore absorbance was read at 490 nm. In conjunction, anxCELLigence assaywas performed (as described above) usingthe same samples on HCM as utilized in the MTS assay forcomparison. A two-way repeated measures ANOVA wasperformedusingGraphPadPrismV5.04 (GraphPadSoftwareInc.). A paired t-test was used to compare ConcentrationResponse Curves (CRCs) of the same samples applied in theMTS assay and the xCELLigence assay.
2.5. Concentration Response Curves of toxins
The effect of the CTFs on HCM in relation to concentra-tion (Concentration Response Curves (CRC)) was generatedusing two-fold serial dilutions (1:2–1:124 of original elutedconcentration) and assayed for activity as detailed above. ACRC of each CTF was generated after 10min of cell exposureto the venom. This time frame was chosen as cardiotoxicsymptoms in humans are often evident in less than 15 minafter envenomation (Learmont, 2006; Lumley et al., 1988;Ramasamy et al., 2004). Protein concentrations of CTFswere determined using the area under the A280nm curve andcalculated using theUnicorn 5.0 software (GEHealthcare) ofthe AKTA system. A best fit sigmoidal curve was used togenerate a CRC for each CTF on both HCM and HSkM cells.
2.6. Activity of toxins over time
2.6.1. Effect on cell adherence over time (impedance-basedassay-xCELLigence)
The CTFs were further analysed by observing the toxicactivity over time. The CTFs were serially diluted from 1:4to 1:124 (neat concentrations defined as the concentrationof the CTFs obtained directly from SEC of concentratedwhole venom, as described in 2.2) in cold DPBS. Eachconcentration was applied to HCM seeded in a 96 well E-plate (20 ml of each sample in triplicate) and monitoredalongside positive and negative controls as previouslydescribed in Section 2.4. The total in-well concentration ofthe toxic CTFs was calculated and used hereafter whenreferring to the “concentration” of toxins to which cellswere exposed.
2.7. Synergistic toxicity
The two cardio-specific CTFs were tested for potentialsynergistic toxicity using the xCELLigence system. Neatsamples of CTF-a (0.56 mg/mL) and CTF-b (1.25 mg/mL),
S. Chaousis et al. / Toxicon 80 (2014) 17–2620
from SEC, were combined in a 96 well plate (10 ml of each)and the solution serially diluted two-fold 6 times, pro-ducing solutions with concentrations of (CTF-a: 0.28 mg/mL–0.0043 mg/mL; CTF-b: 0.62 mg/mL–0.009 mg/mL). Eachdilution was mixed well before 20 ml was added to HCMpre-seeded in a 96 well E plate (as described above) intriplicate. Negative controls of 20 ml PBS and positive con-trols of 20 ml of serially diluted CTF-a (0.28 mg/mL–0.0043 mg/mL) and CTF-b (0.62 mg/mL–0.09 mg/mL) werealso added. It was assumed that no interaction occurredwhen the CTFs were mixed and that the combined effect ofthe samples would be additive (Talladria, 2001) so a pre-dicted additive effect curve was developed after experi-mentation by simply adding the individual effects of CTFs ateach dilution point (e.g. If CTF-a caused a 20% reduction incell adherence and CTF-b caused a 10% reduction in celladherence, the additive effect of the combinationwill cause30% reduction in cell adherence). Cell attachment wasmonitored as per Section 2.4. For analysis, concentrationsof the toxins were not compared using the actual proteinconcentration because the two CTFs have different con-centrations in fractionated whole venom. Therefore, con-centrations were ‘normalised’ so that ‘neat’ concentrationsof CTF-a and CTF-b from whole venom were labelled con-centration ‘1’ and subsequent dilutions of these concen-trations labelled in accordance (0.5–0.01). This allowed foranalysis of potential synergy which, was otherwise difficultusing two different concentration values at each dilutionpoint. A curve was fit and an extra sum-of-squares F testcomparing IC50 values was performed using Graph PadPrism V 5.04 (GraphPad Software Inc.).
2.8. Analysis
2.8.1. Toxicity over timeData were analysed using SPSS v 20 (SPSS Inc.). A two-
way repeated measures analysis of variance was used toanalyse the interaction effects between both cell type (HCMand HSkMC) and exposure time (10, 30, 60, 90 & 180 min)based on percentage cell attachment within each treat-ment. If sphericity was violated, a Greenhouse–Geissercorrection factor was applied. An analysis of covariancewasused to analyse differences between the effect of cell typeon percentage cell attachment for CRCs of all CTFs. Datawasgraphed and all curves fitted using Graph Pad Prism V 5.04(GraphPad Software Inc.).
2.8.2. Time vs. concentration toxicityThe percentage cell attachment of HCM exposed to each
CTF was plotted at different time points over a range ofdiffering concentrations to visualise how concentration ofCTF-a and CTF-b and time of exposure, affected the attach-ment of HCM. Percent attachment was plotted at 30 minintervals within a five hour time period starting at 30 minafter application of sample (percent cell attachment did notvary dramatically outside of this time period whenobserving activity over five hours). The percentage attach-ment of HCM was compared for CTF-a and CTF-b over fourdifferent concentrations (CTF-a: 0.36–0.5 mg/mL, CTF-b;0.08–0.67 mg/mL) at different time points of exposure. Theconcentrations at which the two CTFs were analysed in
detail (CTF-a 0.15 mg/mL, CTF-b 0.67 mg/mL) reflected thequantities of each CTF in whole venom (CTF-b, as definedhere, had a protein concentrationw 4� the concentration ofCTF-a inwhole venom). These concentrations were a further1:8 dilution of the direct eluted sample and were chosen foranalysis because the cytotoxic activities were most apparentat these concentrations (lower concentrations of CTF-b hadlittle or no effect on cells).
2.8.3. Half maximal response (IC50)The concentration required to cause 50% of the maximal
response (IC50) of each CTF on HCM was calculated byproducing a CRC of each CTF (using the RTCA Software(AECA)) and from this CRC we determined the concentra-tion of each CTF that was required to cause 50% celldetachment (maximal response being 100% cell detach-ment). The IC50 was determined for each CTF at differenttime points (within a time frame of one minute to fivehours) to observe the relative toxicity of the CTFs to eachother and the effect of time on toxicity.
2.8.4. Time to initial effectThe time taken for each CTF to demonstrate an initial
negative effect on HCM attachment was measured andcompared over a range of concentrations (CTF-a 0.15–0.02 mg/mL; CTF-b 0.67–0.08 mg/mL). Analysis was not con-ducted on concentrations above this range because imme-diate cell detachment occurred and was thereforeimmeasurable. The first reading of cell detachment afteraddition of the CTFs to the cells was defined as time point0 (t0). The time (in seconds) between t0 and the first readingatwhich cell attachment declined (and continued todecline),was measured. Resulting data points were plotted and acurve fitted. The effects of the CTFs were compared at bothproportional to their concentrations in thewhole venom, andat equivalent actual concentrations to each other. Data wereanalysed using SPSS v. 20 (SPSS Inc.) and plotted using GraphPad Prism V 5.04 (GraphPad Software Inc.).
3. Results
3.1. Protein purification using Size Exclusion Chromatography(SEC)
Whole venom separated with an SD200 column pro-duced an A280 trace consistent with the previous work ofSaggiomo and Seymour, 2012 (Fig. 1). A comparison of thistrace with the previous study determined the vertebratecardiotoxic protein group (crude Peak 2) to be distributedbetween fractions B1-C6. The protein concentration of thewhole venom sample prior to being processed through thecolumn was 2.73 mg/mL. Crude Peak 2 (as defined bySaggiomo and Seymour, 2012) constituted 22% of thewholevenom with a protein concentration of 0.6 mg/mL andspanned a protein size range of approximately 87 kDa(13 kDa–100 kDa) based on the elution of standards.
3.2. Activity curve
Three distinct groups of proteins (individual fractionsfrom the SD200 SEC) that caused maximum cell

Fig. 1. A280 trace of 18 mg of whole C. fleckeri venom from an SD200 size exclusion column. The vertebrate cardiotoxic crude fraction “Peak 2” is identifiedwithin the trace. Protein sizes from the standard curve are marked with C. Numbers below the x axis display eluate volume in millilitres; labels above the x axisare eluate designations.
S. Chaousis et al. / Toxicon 80 (2014) 17–26 21
detachment were identified within the vertebrate car-diotoxic peak (Peak 2) when tested on HCM (Fig. 2). Thefractions containing these toxic protein groups were storedseparately and labelled as outlined in Section 2.4. The threefractions were herein referred to as CTF-a, CTF-b and CTF-g.CTF-a had a concentration of 24 mg/mL and comprisedapproximately 4% of Peak 2, CTF-b (102 mg/mL) was presentat approximately four fold the concentration of CTF-acomposing 17% of Peak 2, and CTF-g (77 mg/mL) constituted12% of Peak 2.
3.3. Effect of Crude Toxic Fractions on cell metabolism (MTSassay)
Cell metabolism was dramatically decreased if notcompletely absent when HCM were exposed to high
Fig. 2. Activity curve of crude vertebrate toxic peak from C. fleckeri venom. Effecton percent cell attachment of Human Cardiomyocytes after 15 min exposure to theCTF-b and CTF-g. Error bars at each point indicate SD of mean cell survival, n ¼ 3 fofleckeri venom purified through SD200 size exclusion chromatography (right y axis
concentrations of CTF-b (2.7 mg/mL–0.52 mg/mL) for 2.5 h(the mean percent of metabolising cells was calculatedusing a standard curve of serially diluted cell solutionsexposed to MTS; all figures were normalised to the control(set at 100%)) (Fig. 3). Cells exposed to the same samplesmonitored for adherence in the xCELLigence system did notshow a significantly different value of viability (percent cellattachment normalised to control set at 100%) at all con-centrations to cell viability measured in the MTS assay(t ¼ 1.729, df 5, p > 0.05) (Fig. 3).
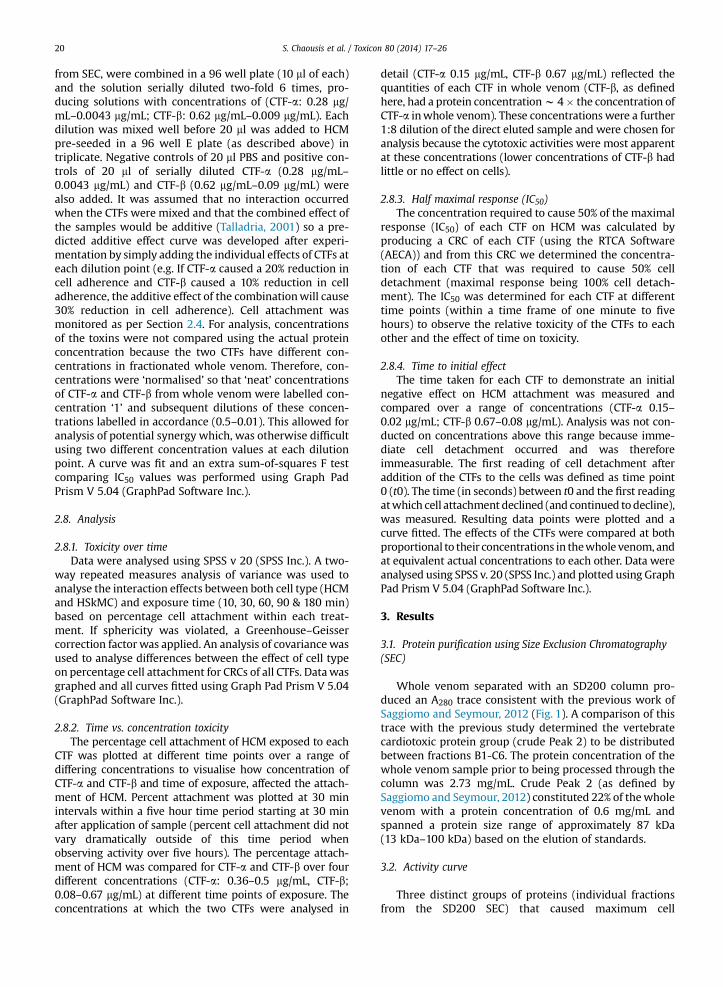
Cell detachment and death was additionally confirmedby visual observation. Healthy cardiomyoctes visualisedunder the microscope before addition of venom appearedhealthy with normal morphology seen by the outline of thecell membranes (Fig. 4A), after 20min of exposure towholevenom it can be seen that the morphology has significantly
of individual fractions from vertebrate cardiotoxic Peak 2 of C. fleckeri venom,samples. The points of lowest percent cell attachment were labelled CTF-a,r all data points. - - A280nm trace of vertebrate cardiotoxic Peak 2 of whole C.).
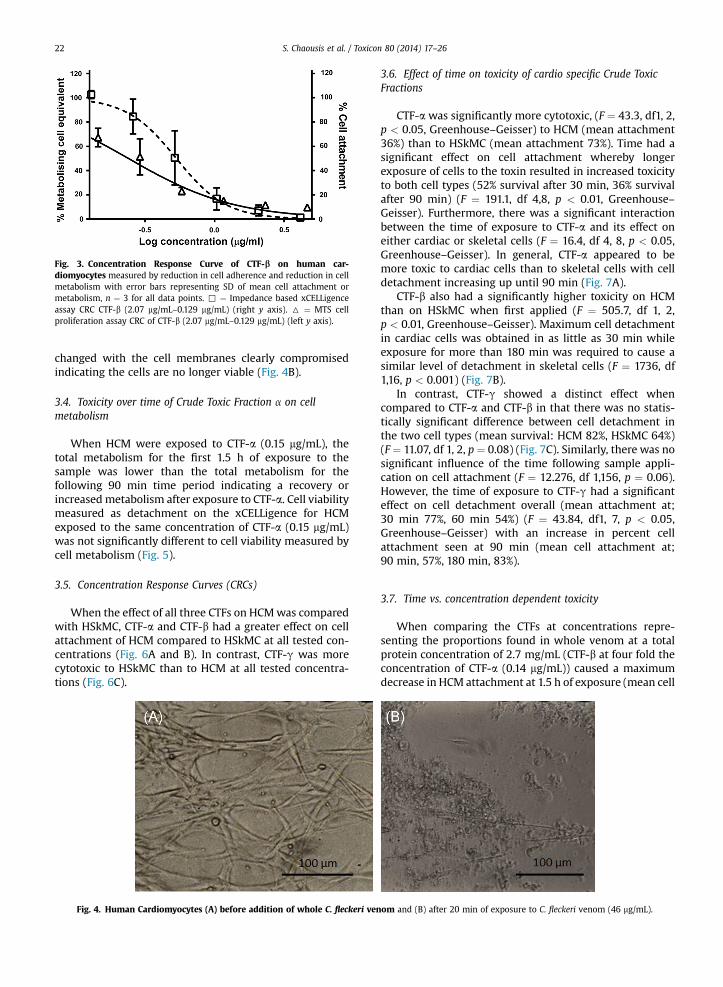
Fig. 3. Concentration Response Curve of CTF-b on human car-diomyocytes measured by reduction in cell adherence and reduction in cellmetabolism with error bars representing SD of mean cell attachment ormetabolism, n ¼ 3 for all data points. , ¼ Impedance based xCELLigenceassay CRC CTF-b (2.07 mg/mL–0.129 mg/mL) (right y axis). 6 ¼ MTS cellproliferation assay CRC of CTF-b (2.07 mg/mL–0.129 mg/mL) (left y axis).
S. Chaousis et al. / Toxicon 80 (2014) 17–2622
changed with the cell membranes clearly compromisedindicating the cells are no longer viable (Fig. 4B).
3.4. Toxicity over time of Crude Toxic Fraction a on cellmetabolism
When HCM were exposed to CTF-a (0.15 mg/mL), thetotal metabolism for the first 1.5 h of exposure to thesample was lower than the total metabolism for thefollowing 90 min time period indicating a recovery orincreased metabolism after exposure to CTF-a. Cell viabilitymeasured as detachment on the xCELLigence for HCMexposed to the same concentration of CTF-a (0.15 mg/mL)was not significantly different to cell viability measured bycell metabolism (Fig. 5).
3.5. Concentration Response Curves (CRCs)
When the effect of all three CTFs on HCMwas comparedwith HSkMC, CTF-a and CTF-b had a greater effect on cellattachment of HCM compared to HSkMC at all tested con-centrations (Fig. 6A and B). In contrast, CTF-g was morecytotoxic to HSkMC than to HCM at all tested concentra-tions (Fig. 6C).
Fig. 4. Human Cardiomyocytes (A) before addition of whole C. fleckeri ven
3.6. Effect of time on toxicity of cardio specific Crude ToxicFractions
CTF-a was significantly more cytotoxic, (F ¼ 43.3, df1, 2,p < 0.05, Greenhouse–Geisser) to HCM (mean attachment36%) than to HSkMC (mean attachment 73%). Time had asignificant effect on cell attachment whereby longerexposure of cells to the toxin resulted in increased toxicityto both cell types (52% survival after 30 min, 36% survivalafter 90 min) (F ¼ 191.1, df 4,8, p < 0.01, Greenhouse–Geisser). Furthermore, there was a significant interactionbetween the time of exposure to CTF-a and its effect oneither cardiac or skeletal cells (F ¼ 16.4, df 4, 8, p < 0.05,Greenhouse–Geisser). In general, CTF-a appeared to bemore toxic to cardiac cells than to skeletal cells with celldetachment increasing up until 90 min (Fig. 7A).
CTF-b also had a significantly higher toxicity on HCMthan on HSkMC when first applied (F ¼ 505.7, df 1, 2,p < 0.01, Greenhouse–Geisser). Maximum cell detachmentin cardiac cells was obtained in as little as 30 min whileexposure for more than 180 min was required to cause asimilar level of detachment in skeletal cells (F ¼ 1736, df1,16, p < 0.001) (Fig. 7B).
In contrast, CTF-g showed a distinct effect whencompared to CTF-a and CTF-b in that there was no statis-tically significant difference between cell detachment inthe two cell types (mean survival: HCM 82%, HSkMC 64%)(F ¼ 11.07, df 1, 2, p ¼ 0.08) (Fig. 7C). Similarly, there was nosignificant influence of the time following sample appli-cation on cell attachment (F ¼ 12.276, df 1,156, p ¼ 0.06).However, the time of exposure to CTF-g had a significanteffect on cell detachment overall (mean attachment at;30 min 77%, 60 min 54%) (F ¼ 43.84, df1, 7, p < 0.05,Greenhouse–Geisser) with an increase in percent cellattachment seen at 90 min (mean cell attachment at;90 min, 57%, 180 min, 83%).
3.7. Time vs. concentration dependent toxicity
When comparing the CTFs at concentrations repre-senting the proportions found in whole venom at a totalprotein concentration of 2.7 mg/mL (CTF-b at four fold theconcentration of CTF-a (0.14 mg/mL)) caused a maximumdecrease in HCM attachment at 1.5 h of exposure (mean cell
om and (B) after 20 min of exposure to C. fleckeri venom (46 mg/mL).

Fig. 5. Comparison of the effect of CTF-a and CTF-b from C. fleckeri venomover time on Human Cardiomyocytes using a cell proliferation (MTS) assayand impedance based assay (xCELLigence). Error bars representing SD aroundthemean,n¼3 for all data points.,¼% cell attachment (right yaxis) of CTF-a(0.15 mg/mL) measured by impedance (xCELLigence).B¼ %metabolising cellequivalent (left y axis) CTF-a (0.15 mg/mL) measured by proliferation assay(MTS). 7 ¼ % metabolising cell equivalent (left y axis) of CTF-b (2.07 mg/mL)measured by proliferation assay (MTS). ☓ ¼ Control (MTS).
Fig. 6. Concentration Response Curves of three toxic protein groups
S. Chaousis et al. / Toxicon 80 (2014) 17–26 23
attachment 38.3%) however reattachment of cells to nearcontrol levels was seen after 4 h (mean cell attachmentCTF-a (70.1%, Control; 84.5%) (Fig. 8A)). CTF-b (0.67 mg/mL)caused a cell detachment maximumwithin 1 h of exposuresimilar to that shown for the whole venom (mean cellattachment CTF-b: 19%; Whole Venom: 8.6%) (Fig. 8B). Incontrast to CTF-a, no recovery was observed for CTF-bduring 5 h of exposure.
A comparison of the two CTFs at similar concentrations,(CTF-a: 0.07 mg/mL, CTF-b: 0.08 mg/mL) showed that thetwo CTFs have distinct activities. CTF-b displayed little toxicactivity with percent cell attachment remaining above 77%whereas CTF-a caused cell attachment to decrease below33% before typical recovery was seen with cell attachmentreturning to 79% after 5 h (Fig. 8).
CTF-a and CTF-b showed distinctly different activities atmost concentrations tested, however, the highest concen-tration tested of CTF-a (0.5 mg/mL) caused permanent celldeath (Fig. 8A) similar to that seen with CTF-b and, did notshow any recovery within five hours of exposure (Fig. 8B).At all other concentrations, CTF-a caused a decrease inpercent cell attachment at 1.5 h (mean cell attachment 43%)with cell attachment increasing significantly until pla-teauing at 5 h of exposure (mean cell survival 73%) (Fig. 7A).In contrast, CTF-b showed a significant decrease in percentcell attachment at the highest concentration tested (meancell attachment 14%) however toxic activity decreasedrapidly with each decrease in concentration (mean cellattachment for concentrations 0.34 mg/mL–0.08 mg/mL ¼ 74.4%) (see Fig. 8B). Slight recovery was seen at lowerconcentrations however this recovery was not as nearlydramatic as the recovery seen with CTF-a.
isolated from the vertebrate cardiotoxic peak of C. fleckeri venom onHuman Cardiomyocytes and Human Skeletal Muscle cells generated aftercells had been exposed to the sample for 10 min. Error bars on each datapoint indicate 95% CI around the mean, n ¼ 3 for all data points. B ¼ humancardiomyocytes , ¼ human skeletal muscle cells. Panel A: CTF-a (HCMr2 ¼ 0.898, HSkMCr2 ¼ 0.612). Panel B: CTF-b (HCM r2 ¼ 0.951,HSkMCr2 ¼ 0.936). Panel C: CTF-g (HCM r2 ¼ 0.627, HSkMCr2 ¼ 0.856).
3.8. Half maximal response (IC50)
A comparison of the concentration of each CTF requiredfor 50% of the maximal response (IC50) showed that CTF-a
is more potent than CTF-b (Fig. 9). The IC50 valuescompared within a restricted time frame (i.e. within thefirst 20 min of exposure) (Barnes, 1966; Currie, 1994),showed that CTF-a was distinctly lower (i.e. more toxic)than CTF-b within this time frame. As time of exposureincreased, the IC50 of CTF-b decreased (CTF-b becamecomparatively more toxic). However, the IC50 of CTF-bdecreased as time of exposure increased. The data pointswithin the first few minutes were selected to be examinedmore closely because the onset of systemic symptoms is
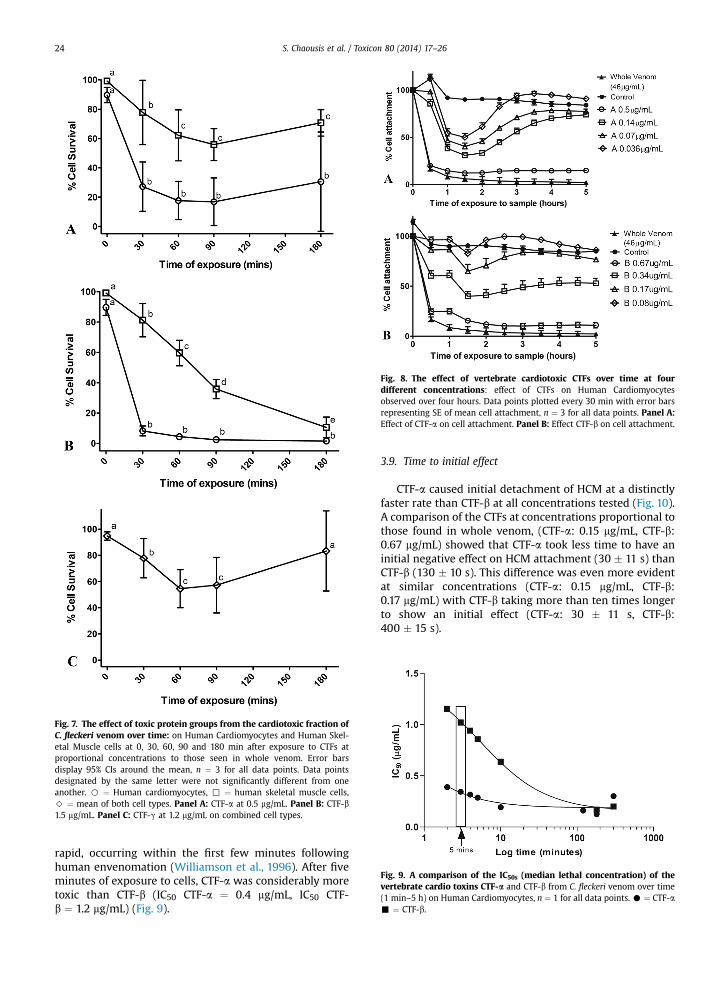
Fig. 7. The effect of toxic protein groups from the cardiotoxic fraction ofC. fleckeri venom over time: on Human Cardiomyocytes and Human Skel-etal Muscle cells at 0, 30, 60, 90 and 180 min after exposure to CTFs atproportional concentrations to those seen in whole venom. Error barsdisplay 95% CIs around the mean, n ¼ 3 for all data points. Data pointsdesignated by the same letter were not significantly different from oneanother. B ¼ Human cardiomyocytes, , ¼ human skeletal muscle cells,> ¼ mean of both cell types. Panel A: CTF-a at 0.5 mg/mL. Panel B: CTF-b1.5 mg/mL. Panel C: CTF-g at 1.2 mg/mL on combined cell types.
Fig. 8. The effect of vertebrate cardiotoxic CTFs over time at fourdifferent concentrations: effect of CTFs on Human Cardiomyocytesobserved over four hours. Data points plotted every 30 min with error barsrepresenting SE of mean cell attachment, n ¼ 3 for all data points. Panel A:Effect of CTF-a on cell attachment. Panel B: Effect CTF-b on cell attachment.
Fig. 9. A comparison of the IC50s (median lethal concentration) of thevertebrate cardio toxins CTF-a and CTF-b from C. fleckeri venom over time(1 min–5 h) on Human Cardiomyocytes, n ¼ 1 for all data points. C ¼ CTF-a- ¼ CTF-b.
S. Chaousis et al. / Toxicon 80 (2014) 17–2624
rapid, occurring within the first few minutes followinghuman envenomation (Williamson et al., 1996). After fiveminutes of exposure to cells, CTF-a was considerably moretoxic than CTF-b (IC50 CTF-a ¼ 0.4 mg/mL, IC50 CTF-b ¼ 1.2 mg/mL) (Fig. 9).
3.9. Time to initial effect
CTF-a caused initial detachment of HCM at a distinctlyfaster rate than CTF-b at all concentrations tested (Fig. 10).A comparison of the CTFs at concentrations proportional tothose found in whole venom, (CTF-a: 0.15 mg/mL, CTF-b:0.67 mg/mL) showed that CTF-a took less time to have aninitial negative effect on HCM attachment (30 � 11 s) thanCTF-b (130 � 10 s). This difference was even more evidentat similar concentrations (CTF-a: 0.15 mg/mL, CTF-b:0.17 mg/mL) with CTF-b taking more than ten times longerto show an initial effect (CTF-a: 30 � 11 s, CTF-b:400 � 15 s).

Fig. 10. Time to initial effect CTF-a and CTF-b compared on Human Car-diomyocytes at varying concentrations (0.67 mg/mL–0.02 mg/mL) (r2 CTF-a ¼ 0.98, r2 CTF-b ¼ 0.90). Error bars around the data points represent 95% CIaround the mean, n ¼ 3 for all data points. C ¼ CTF-a - ¼ CTF-b. Thehighlighted rectangle indicates both CTFs at the same concentration. *CTFsat the relevant concentrations as found in whole venom.
S. Chaousis et al. / Toxicon 80 (2014) 17–26 25
3.10. Synergistic toxicity
The IC50 of the combined samples of CTF-a and CTF-bwas significantly lower than that of the predicted additivecurve (IC50; 0.28 normalised value) (F ¼ 272.6, df 6, 64,p< 0.0001) (Fig. 11) after 20 min of exposure to the venom.
4. Discussion
The results of the cell proliferation assay indicate thatchange in cell morphology, as seen as a decrease in celladherence to the xCELLigence plate, is indicative of cyto-toxicity. We have revealed for the first time that C. fleckerivenom contains at least two distinct vertebrate cardiotoxicprotein groups, designated CTF-a and CTF-b, and one gen-eral vertebrate cytotoxin, CTF-g, within the previously
Fig. 11. Concentration Response Curves of CTF-a and CTF-b (at normalisedconcentration values across a range of 1–0.03) applied to Human Car-diomyocytes as individual samples and combined samples. The predictiveadditive effect curve of the two CTFs combined (i.e. if no synergistic orinhibitory effect was occurring between CTF-a and CTF-b) is also included.Error bars represent 95% C.I. around the mean n ¼ 3 for all for all data points., ¼ CTF a & b combined, B ¼ CTF-a, 6 ¼ CTF-b, C ¼ Predicted additiveeffect of CTF-a & b combined.
described vertebrate cardiotoxic peak (Saggiomo andSeymour, 2012). When the effects of CTF-a and CTF-bwere compared, both were more lethal to HCM than toHSkMC at all concentrations tested and within the chosentime frame. CFT-b causes permanent loss of cell meta-bolism and CTF-a causes a temporary decrease in cellmetabolism with an increase seen after a few hours.Viability, as measured by cell metabolism, was not signifi-cantly different from viability measured by adherencetherefore confirming that activity of the toxin representedby xCELLigence is reflective of cytotoxicity.
In contrast to CFT-a and CTF-b, CTF-g was not cardiospecific and any cardiotoxic activity took over 1 h to takefull effect. When envenomation occurs, onset of symptomsoccurs almost immediately and death can occur withinminutes (Willamson et al., 1996) with cardiac failure usu-ally reported as the main cause of death. As a result, theeffects of any of the CTFs tested here which did not have asignificant effect on cells within 60 min (e.g. CTF-b onHSkMC) are unlikely to play a role in death of envenomedvictims.
The mechanism of action of C. fleckeri venom has beenpreviously deliberated in many investigations (e.g. Baxterand Marr, 1969; Mustafa et al., 1995; Ramasamy et al.,2005) and while some research has shed light on poten-tial mechanisms, there is still debate as to how the venomacts on a cellular level (Winter et al., 2007b). Many studieshave given evidence that a sudden influx of Caþ into heartmuscle cells is the reason for cardiovascular collapse (Baileyet al., 2005; Endean and Henderson, 1969; Mustafa et al.,1995). Some investigations have suggested that the mech-anism is mechanical pore formation and therefore thevenom causes toxicity through damage to the cell mem-brane causing the influx of Caþ into cells (Bailey et al.,2005). Additionally, a recent investigation suggested hae-molysis was the main cause of death due to a release ofintracellular Caþ ions which in turn resulted in theobserved cardiovascular collapse (Yanagihara and Shohet,2012). Interestingly, these previous studies used wholeunfractionated venoms in contrast to this present studywhich observed two separate components with distinctactivity, one of these showing cell recovery within threehours, sometimes returning to control levels, which seemsunlikely for a cell inflicted with a mechanical pore formingtoxin. Furthermore, effect of these toxic fractions isolatedfrom the vertebrate cardiotoxic peak of the venom dis-played specificity to cardiac muscle cells. If it is a poreforming mechanism or haemolysis, it is interesting to findtwo rapidly acting toxic components which specificallytarget cardiac muscle. Alternatively, CTF-a presented in thisstudy caused a significant initial decrease in cell viability;however cells recovered to full functionality after sometime in the presence of the CTF. This suggests that the effectis reversible and mechanical pore formation is unlikely tobe a mechanism if cells are showing dramatic (up to 30percent) recovery in less than 3 h. Another study on hae-molysis in jellyfish venoms observed that haemolytictoxins were present in many jellyfish venoms and sug-gested that venoms may have evolved therefore this maybe a residual toxic effect from earlier ancestors and possiblyno longer the main mechanism currently effective in prey
S. Chaousis et al. / Toxicon 80 (2014) 17–2626
items. It may be possible that over time, the mechanism ofthe venom has evolved and while haemolysis/pore for-mation may previously have been the main mechanism forvertebrate prey procurement, the venom may have othermethods of toxicity (Wang et al., 2013).
It is also possible that multiple components within thevenom, such as those found in this study, cause synergistictoxicity in vertebrate prey (and humans). The results of thisinvestigation indicate synergistic toxicity occurring be-tween the CTF-a and CTF-b when effects of the toxinscombined on cell adherence were examined. The effect ofthe combined CTFs was greater than the predictive additiveeffect of the two individual toxins indicating synergistictoxicity (Talladria, 2001).
The use of cellular assays in this investigation provided ahigh throughput method for isolating toxic fractions of C.fleckeri venom in addition to an ethical alternative to in vivoobservation of the toxic activity of these CTFs over time.However, further in vivo experimentation is required toconfirm that the toxic activity of the CTFs as seen on cells isaccurately representative of toxic effects seen in a wholeorganism.
With the recent publication of the C. fleckeri venomproteome (Brinkman et al., 2012), we are now focussing onthe molecular identification of the major proteins withinthese cytotoxic components.
Acknowledgements
Queensland Emergency Medicine Research Foundation,Australia.
Australian Lions Foundation.
Conflicts of interest
The authors declare that there are no conflicts ofinterest.
References
Bailey, P.M., Little, M., Jelinek, G.A., Wilce, J.A., 2003. Jellyfish envenomingsyndromes: unknown toxic mechanisms and unproven therapies.Med. J. Aust. 178, 34–37.
Bailey, P.M., Bakker, A., Seymour, J., Wilce, J.A., 2005. A functional com-parison of the venom of three Australian jellyfishdChironex fleckeri,Chiropsalmus sp., and Carybdea xaymacanadon cytosolic Ca2þ, hae-molysis and Artemia sp. lethality. Toxicon 45 (2), 233–242.
Barnes, J.H., 1966. Studies on three venomous cubomedusae. In: TheCnidaria and Their Evolution. Symposium of the Zoological Society,London, No. 16. Academic Press, London, pp. 307–332.
Baxter, E.H., Marr, A.G.M., 1969. Sea Wasp (Chironex fleckeri) venom: le-thal, haemolytic and dermonecrotic properties. Toxicon 7, 195–210.
Bloom, D.A., Burnett, J.W., Alderslade, P., 1998. Partial purification of boxjellyfish (Chironex fleckeri) nematocyst venom isolated at beachside.Toxicon 36 (8), 1075–1085.
Bloom, D.A., Burnett, J.W., Hebel, R.J., Alderslade, P., 1999. Effects ofverapamil and CSL antivenom on Chironex fleckeri (Box-jellyfish)induced mortality. Toxicon 37 (11), 1621–1626.
Brinkman, D.L., Aziz, A., Loukas, A., Potriquet, J., Seymour, J., 2012. Venomproteome of the Box Jellyfish Chironex fleckeri. PLoS ONE 7 (12),e47866. http://dx.doi.org/10.1371/journal.pone.0047866.
Carrette, T., Seymour, J., 2004. A rapid and repeatable method for venomextraction from cubozoan nematocysts. Toxicon 44 (92), 135–139.
Currie, B., 1994. Clinical implications of research on the box-jellyfishChironex fleckeri. Toxicon 32, 1305–1313.
Currie, B.J., 2000. Clinical toxicology: a tropical Australian perspective.Therapeutic Drug Monitoring 22 (1), 73–78.
Diemert, S., Dolga, A.M., Tobaben, S., Grohm, J., Pfeifer, S., Oexler, E.,Culmsee, C., 2012. Impedance measurement for real time detection ofneuronal cell death. J. Neurosci. Methods 203, 69–77.
Endean, R., 1987. Separation of two myotoxins from nematocysts of thebox jellyfish (Chironex fleckeri). Toxicon 25 (5), 483–492.
Endean, R., Henderson, L., 1969. Further studies of toxic material fromnematocysts of the cubomedusan Chironex fleckeri Southcott. Toxicon7, 303–314.
Fenner, P.J., Harrison, L., 2000. Irukandji and Chironex fleckeri jellyfish en-venomation in tropical Australia.Wilderness Environ.Med.11, 233–240.
Huynh, T.T., Seymour, J., Pereira, P., Mulcahy, R., Cullen, P., Carrette, T.,Little, M., 2003. Severity of Irukandji syndrome and nematocystidentification from skin scrapings. Med. J. Aust. 178, 38–41.
Kintner, A.H., Seymour, J.E., Edwards, S.L., 2005. Variation in lethality andeffects of two Australian chirodropid jellyfish venoms in fish. Toxicon46 (6), 699–708.
Konstantakopoulos, N., Isbister, G.K., Seymour, J.E., Hodgson, W.C., 2009. Acell-based assay for screening of antidotes to, and antivenom againstChironex fleckeri (box jellyfish) venom. J. Pharmacol. Toxicol. Methods59 (3), 166–170.
Learmont, S.A., 2006. Chironex fleckeri (box jellyfish) envenomation: acase study. Australas. Emerg. Nurs. J. 9, 49–56.
Lumley, J., Williamson, J.A., Fenner, P.J., Burnett, J.W., Colquhoun, D.M.,1988. Fatal envenomation by Chironex fleckeri, the north Australianbox jellyfish: the continuing search for lethal mechanisms. Med. J.Aust. 148 (10), 527–534.
McClounan, S., Seymour, J.E., 2012. Venom and cnidome ontogeny of thecubomedusae Chironex fleckeri. Toxicon 60 (8), 1335–1341.
Mustafa, M.R., White, E., Hongo, K., Othman, I., Orchard, C.H., 1995. Themechanism underlying the cardiotoxic effect of the toxin from thejellyfish Chironex fleckeri. Toxicol. Appl. Pharmacol. 133, 196–206.
O’Reilly, G.M., Isbister, G.K., Lawrie, P.M., Treston, G.T., Currie, B.J., 2001.Prospective study of jellyfish stings from tropical Australia, includingthe major box jellyfish Chironex fleckeri. Med. J. Aust. 175, 652–655.
Ramasamy, S., Isbister, G.K., Seymour, J.E., Hodgson, W.C., 2004. Thein vivo cardiovascular effects of box jellyfish Chironex fleckeri venomin rats: efficacy of pre-treatment with antivenom, verapamil andmagnesium sulphate. Toxicon 43, 685–690.
Ramasamy, S., Isbister, G.K., Seymour, J.E., Hodgson, W.C., 2005. Phar-macologically distinct cardiovascular effects of box jellyfish (Chironexfleckeri) venom and tentacle-only extract in rats. Toxicology Letters155 (2), 219–226.
Saggiomo, S.L., Seymour, J.E., 2012. Cardiotoxic effects of venom fractionsfrom the Australian box jellyfish Chironex fleckeri. Toxicon 60 (3),391–395.
Talladria, R.J., 2001. Drug Synergism: its detection and applications. J.Pharmacol. Exp. Ther. 298 (3), 865–872.
Urcan, E., Haertel, U., Styllou, M., Hickel, R., Scherthan, H., Reichl, F.X.,2010. Real-time xCELLigence impedance analysis of the cytotoxicity ofdental composite components on human gingival fibroblasts. Dent.Mater. 26, 51–58.
Wang, T., Wen, X., Mei, X., Wang, Q., He, Q., Zheng, J., Zhao, J., Xiao, L.,Zhang, L., 2013. Lipid peroxidation is another potential mechanismbesides pore-formation underlying haemolysis of tentacle extractfrom the jellyfish Cyanea capillata. Mar. Drugs 11, 67–80.
Williamson, J.A., Fenner, P.J., Burnett, J.W., Rifkin, J.F. (Eds.), 1996.Venomous and Poisonous Marine Animalsd a Medical and BiologicalHandbook. University of New South Wales Press, Sydney.
Winter, K., Fernando, R., Ramamsamy, S., Seymour, J.E., Isbister, G.K.,Hodgson, W.C., 2006. The in vitro vascular effects of two chirodropid(Chironex fleckeri and Chiroopsella bronzie) venoms. Toxicology Letters168, 13–20.
Winter, K.L., Isbister, G.K., Seymour, J.E., Hodgson, W.C., 2007a. An in vivoexamination of the stability of venom from the Australian box jelly-fish Chironex fleckeri. Toxicon 49 (6), 804–809.
Winter, K.L., Fernando, R., Ramasamy, S., Seymour, J.E., Isbister, G.K.,Hodgson, W.C., 2007b. The in vitro vascular effects of two chirodropid(Chironex fleckeri and Chiropsella bronzie) venoms. Toxicol. Lett. 168(1), 13–20.
Winter, K.L., Isbister, G.K., Jacoby, T., Seymour, J.E., Hodgson, W.C., 2009.An in vivo comparison of the efficacy of CSL box jellyfish antivenomwith antibodies raised against nematocyst-derived Chironex fleckerivenom. Toxicol. Lett. 187, 94–98.
Winter, K.L., 2010. A Pharmacological and Biochemical Characterisation ofAustralianBox JellyfishVenoms (Ph.D. thesis).MonashUniversity, Facultyof Medicine, Nursing and Health Sciences, Department of Pharmacology.
Yanagihara, A., Shohet, R.V., 2012. Cubozoan venom-induced cardiovas-cular collapse is caused by hyperkalemia and prevented by zincgluconate in mice. PLoS ONE 7 (12), e51368.
Copyright © 2022 FDOKUMEN