RAPAD Report - Parliament of Australia
151
RAPAD Report Sustaining Outback Communities Aramac Shire, Barcaldine Shire, Barcoo Shire, Blackall Shire, Boulia Shire, Diamantina Shire, Ilfracombe Shire, Isisford Shire, Jericho Shire, Longreach Shire, Tambo Shire and Winton Shire May 2007
-
Upload
khangminh22 -
Category
Documents
-
view
1 -
download
0
Transcript of RAPAD Report - Parliament of Australia
RAPAD Report Sustaining Outback Communities
Aramac Shire, Barcaldine Shire, Barcoo Shire, Blackall Shire, Boulia Shire, Diamantina Shire, Ilfracombe Shire, Isisford Shire, Jericho Shire, Longreach Shire, Tambo Shire and Winton Shire
May 2007

RAPAD Report
Page i

RAPAD Report
Page ii
..................................................... Prepared by Professor Brian Dollery (MA, PhD) and Andrew Johnson (B.Ec (Acc) CPA MBA JP). Contact Brian Dollery on [email protected] Copyright © Brian Dollery and Andrew Johnson 2007. All rights reserved.
RAPAD Report
Page iii
Table of Content
ACRONYMS ............................................................................................... VI
LIST OF TABLES........................................................................................ VII
LIST OF FIGURES ..................................................................................... VIII
EXECUTIVE SUMMARY ................................................................... 1
CHAPTER 1: INTRODUCTION ......................................................................... 5
1.1 INTRODUCTION.......................................................................................5 1.2 OUTLINE OF THE REPORT ...........................................................................8
PART A: STRUCTURAL REFORM AND SHARED SERVICES.............. 11
CHAPTER 2: AUSTRALIAN LOCAL GOVERNMENT REFORM................................... 11
2.1 INTRODUCTION..................................................................................... 11 2.2 PROBLEMS CONFRONTING AUSTRALIAN LOCAL GOVERNMENT ............................... 11
2.2.1 Financial Pressures and Local Infrastructure Depletion ..................... 11 2.2.2 Operational Efficiency of Local Government.................................... 13 2.2.3 Expansion in the Role of Local Government .................................... 13 2.2.4 Complexities in Intergovernmental Relationships ............................ 15
2.3 STRUCTURAL REFORM AND COUNCIL AMALGAMATION ........................................ 16 2.3.1 Scepticism on the Results of Amalgamation ................................... 16 2.3.2 Reasons for Disappointing Outcomes of Local Government Amalgamation.................................................................................... 17
2.3.2.1 Economies of scale ...................................................................... 17 2.3.2.2 Economies of scope ..................................................................... 18 2.3.2.3 Local government capacity ........................................................... 18 2.3.2.4 Administration and compliance costs.............................................. 19 2.3.2.5 Coincidence of municipal and natural boundaries ............................. 20
2.3 CONCLUDING REMARKS ........................................................................... 20 CHAPTER 3: ALTERNATIVE MODELS OF AUSTRALIAN LOCAL GOVERNMENT............ 22
3.1 INTRODUCTION..................................................................................... 22 3.2 ALTERNATIVE MODELS FOR AUSTRALIAN LOCAL GOVERNMENT.............................. 22
3.2.1 Existing small councils ................................................................ 23 3.2.2 Ad hoc resource sharing models ................................................... 23 3.2.3 Regional organizations of councils................................................. 24 3.2.4 Area integration or joint board models .......................................... 24 3.2.5 Virtual local governments ............................................................ 25 3.2.6 Agency models .......................................................................... 26 3.2.7 Amalgamated large councils......................................................... 27
3.3 STRUCTURAL CHANGE VERSUS PROCESS CHANGE ............................................ 28 3.4 MODELS SUITABLE FOR REGIONAL QUEENSLAND COUNCILS ................................ 29
3.4.1 Riverina Regional Organization of Councils (REROC) ........................ 30
RAPAD Report
Page iv
3.4.2 Joint Board or Area Integration Model ........................................... 31 3.4.3 New England Strategic Alliance Model............................................ 32
3.5 CONCLUDING REMARKS ........................................................................... 33 CHAPTER 4: SHARED SERVICES IN LOCAL GOVERNMENT ................................... 35
4.1 INTRODUCTION..................................................................................... 35 4.2 AUSTRALIAN LOCAL GOVERNMENT PERSPECTIVES ON SHARED SERVICES .................35 4.3 ANALYTICAL FOUNDATION FOR SHARED MUNICIPAL SERVICES.............................. 37 4.4 ALTERNATIVE SHARED SERVICES MODELS ..................................................... 40 4.5 EMPIRICAL EVIDENCE.............................................................................. 42 4.6 CONCLUDING REMARKS ........................................................................... 45
PART B: LOCAL GOVERNMENT SUSTAINABILITY ......................... 46
CHAPTER 5: FINANCIAL SUSTAINABILITY ...................................................... 46
5.1 INTRODUCTION..................................................................................... 46 5.2 OFFICIAL APPROACHES TO LOCAL GOVERNMENT SUSTAINABILITY .......................... 47 5.3 ACADEMIC APPROACHES TO LOCAL GOVERNMENT SUSTAINABILITY ........................ 49 5.4 TAXONOMY OF LOCAL GOVERNMENT SUSTAINABILITY ........................................ 51
5.4.1 Demographic factors................................................................... 51 5.4.2 Council Revenue ........................................................................ 52 5.4.3 Council Expenditure.................................................................... 54 5.4.4 Financial Management................................................................. 55 5.4.5 Governance............................................................................... 56
5.5 CONCLUDING REMARKS ........................................................................... 56 CHAPTER 6: COMMUNITY SUSTAINABILITY .................................................... 58
6.1 INTRODUCTION..................................................................................... 58 6.2 DEFINING OVERALL COUNCIL SUSTAINABILITY ................................................ 58 6.3 FACTORS INFLUENCING OVERALL LOCAL GOVERNMENT SUSTAINABILITY ..................63
6.3.1 Vibrancy of Local Government Democracy ..................................... 63 6.3.2 Local Social Capital and Local Government..................................... 64 6.3.3 Local Government Capacity.......................................................... 65 6.3.4 Economic and Social Contribution of Local Councils ......................... 66
6.4 CONCLUDING REMARKS ........................................................................... 67
PART C: ANALYSIS OF RAPAD COUNCILS .................................... 69
CHAPTER 7: CHARACTERISTICS OF RAPAD COUNCILS ..................................... 69
7.1 INTRODUCTION..................................................................................... 69 7.2 SHIRE PROFILES ................................................................................... 69
Aramac Shire ..................................................................................... 70 Barcaldine Shire ................................................................................. 71 Barcoo Shire...................................................................................... 71 Blackall Shire..................................................................................... 72 Boulia Shire ....................................................................................... 73 Diamantina Shire................................................................................ 73 Ilfracombe Shire................................................................................. 74 Isisford Shire ..................................................................................... 74 Longreach ......................................................................................... 74

RAPAD Report
Page v
Tambo Shire ...................................................................................... 75 Winton Shire...................................................................................... 75
7.3 DEMOGRAPHIC CHARACTERISTICS............................................................... 76 7.4 SYNOPTIC STATISTICAL REVIEW OF THE SHIRE COUNCILS .................................. 79
7.4.1 Local Democracy and Local Representation .................................... 79 7.4.2 Local Government Finance........................................................... 79
7.5 FUTURE PROSPECTS ............................................................................... 85 7.6 CONCLUSION ....................................................................................... 85 CHAPTER 8: FINANCIAL SUSTAINABILITY OF CENTRAL WEST COUNCILS .............. 87
8.1 INTRODUCTION..................................................................................... 87 8.2 SOUTH AUSTRALIAN CRITERIA ................................................................... 87 8.3 NEW SOUTH WALES CRITERIA ................................................................... 90 8.4 QUEENSLAND TREASURY CORPORATION ANALYSIS............................................ 92 8.5 QUEENSLAND AUDIT OFFICE ..................................................................... 96 8.6 REMOTE AREA PLANNING AND DEVELOPMENT BOARD (RAPAD)............................ 98 8.7 CONCLUSION ..................................................................................... 103 CHAPTER 9: COMMUNITY SUSTAINABILITY AND RAPAD COUNCILS .................. 104
9.1 INTRODUCTION................................................................................... 104 9.2 FUNCTIONS OUTSIDE NORMAL COUNCIL RESPONSIBILITIES ............................... 104 9.3 AMALGAMATION AND CENTRAL WEST LOCAL COMMUNITIES ............................... 108 9.4 PROJECTS PREVENTED UNDER AMALGAMATION .............................................. 111 9.5 EFFECTS OF AMALGAMATION ON LOCAL SCHOOLS .......................................... 113 9.6 EFFECTS OF AMALGAMATION ON COMMUNITY ORGANISATIONS ........................... 114 9.7 LOCAL BUSINESS AND EMPLOYMENT UNDER AMALGAMATION.............................. 115 9.8 CONCLUDING REMARKS ......................................................................... 117
PART D: RECOMMENDATIONS.................................................... 118
CHAPTER 10: RECOMMENDATIONS ............................................................. 118
10.1 INTRODUCTION ................................................................................. 118 10.2 SYNOPTIC REVIEW OF THE REPORT .......................................................... 118
10.2.1 Part A ................................................................................... 118 10.2.2 Part B ................................................................................... 119 10.2.3 Part C ................................................................................... 119 10.2.4 Part D................................................................................... 120
10.3 GENERAL OBSERVATIONS ..................................................................... 120 10.4 RECOMMENDATIONS ........................................................................... 122
REFERENCES.............................................................................. 124
APPENDIX 1: REGIONAL STATISTICS ........................................ 133
APPENDIX 2: COUNCIL STAFF INVOLVED IN COMMUNITY
ORGANISATIONS....................................................................... 139
RAPAD Report
Page vi
Acronyms AAMD&C Alberta Association of Municipal Districts and Counties ABS Australian Bureau of Statistics ALGA Australian Local Government Association ANAO Australian National Audit Office AUMA Alberta Urban Municipalities Association CGC Commonwealth Grants Commission CLG Communities and Local Government CMAs Catchment Management Authorities COAG Council of Australian Governments CPI Consumer Price Index DCQ Desert Channels Queensland DLGPSR Department of Local Government, Planning, Sport and Recreation DOTARS Department of Transport and Regional Services FSRB Financial Sustainability Review Board GIS Geographic Information System HFI Horizontal Fiscal Imbalance HR Human Resources IRF Independent Review Facilitators IT Information Technology KMMC KM Management Consulting KPI Key Performance Indicators LGAQ Local Government Association of Queensland LGAT Local Government Association of Tasmania LGI Local Government Inquiry MAV Municipal Association of Victoria MOU Memorandum of Understanding NERAC New England Strategic Alliance of Councils PWC PriceWaterhouseCoopers RAPAD Remote Area Planning and Development Board QAO Queensland Audit Office QTC Queensland Treasury Corporation REROC Riverina Regional Organization of Councils R2R Roads to Recovery ROCs Regional Organizations of Councils TOR Terms of Reference SSS Size, Shape and Sustainability SWRED South West Regional Economic Development Association VFI Vertical Fiscal Imbalance WALGA Western Australian Local Government Association WQLGA West Queensland Local Government Association
RAPAD Report
Page vii
List of Tables Table 2.1 Growth in NSW Local Government Operating Expenditure (1995/96 =
100) ……………………………………………………………………………………………………………… 15 Table 4.1 Summary of Australian Empirical Evidence on Shared Service
Arrangements in Local Governments .………………………………………………….……. 43 Table 4.2 Summary of International Empirical Evidence on Shared Service
Arrangements in Local Governments …………………………………………………………. 43 Table 7.1 Labour Force Status by Local Government Area, Central West Division,
June Quarter 2006 ……………………………………………………………………………………… 77 Table 7.2 Average Individual Annual Taxable Income - Year Ended 30 June 2003 …. 77 Table 7.3 Industry Employed, Central West ………………………………………………………………. 78 Table 7.4 Relative Representation in the Central West ……………………………………………… 79 Table 7.5 Key Financial Ratios (2004/05) ………………………………………………………………….. 80 Table 8.1 Borrowing Costs 2005-06 …………………………………………………………………………… 88 Table 8.2 Operating Result Financial Year 2001-2015 ($’000) …………………………………. 88 Table 8.3 Capital Expense Ratio; Historical 2001/06; Forecast 2007-15 …………………. 89 Table 8.4 Key Financial Indicators 2004/05 ………………………………………………………………. 90 Table 8.5 Indicative Benchmark Values for Council Financial KPIs (2005/06) …………. 91 Table 8.6 QTC Sustainability Assessment …………………………………………………………………… 95 Table 8.7 Queensland Councils Considered Financially Vulnerable by the QAO ………. 96 Table 8.8 Unfunded Depreciation Ratio (unfunded depreciation/depreciation
expense) ……………………………………………………………………………………………………… 97 Table 8.9 Unfunded Depreciation in Queensland Local Government 2003-04 …………. 98 Table 9.1 School Students by Local Government Area, Central West Statistical
Division, 12 months Ending 31 December 2006 ……………………………………….. 114 Table 9.2 Amount Spent by Council in the Local District in 2005/06 ……………………….. 116 Table 9.3 Number of Staff and Annual Employee Costs ……………………………………………. 116
RAPAD Report
Page viii
List of Figures Figure 2.1 Local Government Outlays by Function ……………………………………………………... 14 Figure 3.1 Structural Change and Process Change ............................................... 29 Figure 5.1 Real Increase in Tax Revenue and State and Domestic Product – 1996 to
2004 ……………………………………………………………………………………………………………. 53 Figure 5.2 Cost Shifting Expense as a Percentage of Total Ordinary Revenue – By
Council Category ………………………………………………………………………………………….. 55 Figure 6.1 Competing Roles of Australian Local Government ……………………………………. 60 Figure 7.1 Map of RAPAD Councils ………………………………………………………………………………… 69 Figure 7.2 Population of RAPAD Councils ……………………………………………………………………… 70 Figure 7.3 Summary of the Councils’ Revenue 2005/06 ……………………………………………… 82 Figure 7.4 Summary of the Councils’ Expenditure 2005/06 ………………………………………… 84 Figure 7.5 Population Projections …………………………………………………………………………………. 85 Figure 8.1 Operating Results, 2001 to 2025 ($’000) …………………………………………………… 92 Figure 8.2 Cash Balances from 2001 to 2015 ($’000) ………………………………………………… 93 Figure 8.3 Capital Expense from 2001 to 2015 ($’000) ………………………………………………. 93 Figure 8.4 Unfunded Depreciation ………………………………………………………………………………… 94
RAPAD Report
Page 1
Executive Summary This Report is divided into four main parts. Part A considers theoretical and empirical evidence on amalgamation, outlines alternative models of local government and examines the potential for shared services in Queensland. Part B considers the question of financial sustainability in Australian local government and presents the case for the much broader concept of community sustainability. Part C provides a detailed analysis of the RAPAD local councils and the RAPAD organization in the light of the Queensland Reform Commission’s Terms of Reference (TOR). Part D examines the various options for reform of local council operations in the RAPAD area and makes several specific recommendations. The analysis conducted in Part A of the Report reached several firm conclusions on structural reform in local government. These conclusions may be summarized as follows:
Amalgamation is only one of several kinds of structural change that can enhance local government operational efficiency.
Compared to other structural arrangements, amalgamation carries very heavy costs in terms of the loss of local autonomy, local democracy and local representation and has seldom achieved its intended cost savings.
Other models of local governance that are based on shared services offer much greater promise since they protect local autonomy, local democracy and local representation and can generate significant cost savings.
Shared services can contribute significantly to improved local government service provision but by itself is not the ‘magic bullet’ that can cure all local council financial ills.
The analysis contained in Part B of the Report considered the question of financial sustainability in local government and the much broader concept of community sustainability. Various conclusions were reached:
No agreement exists on the meaning and measurement of financial sustainability in Australian local government.
Different approaches arrive at different conclusions on the financial status of individual local councils.
Financial sustainability per se has a very poor predictive efficacy in identifying which local councils fail.
Doubts surrounding the concept of financial sustainability mean policy makers have no reliable method of identifying ‘at risk’ councils and this precludes drawing firm policy implications from data on financial sustainability.
All recent national and state-based inquiries into local government unanimously agree that amalgamation will not solve the financial problems in local government.
Since these inquiries identified ongoing financial sustainability problems and severe infrastructure depletion in Victoria, South Australia and New South Wales, which have all undergone forced amalgamation, and the extent of these financial problems is no different from states like Queensland and Western Australia, which have not experienced forced amalgamation, this demonstrates that amalgamation cannot solve the financial problems of Australian councils.

RAPAD Report
Page 2
Financial sustainability is only part of the much broader concept of overall local community sustainability that includes local democracy, local social capital and local capacity.
While these and other attributes of the functioning of councils are difficult to define and measure, this does not reduce their vital importance.
Rural and remote local councils play a pivotal role in the long-run survival of small communities by providing crucial economic and social support to these communities and must be regarded as a ‘special case’ in Queensland local government.
These councils also represent a vital ingredient in local democracy and local representation.
Amalgamation of these small local councils typically undermines long-run community sustainability and threatens the very existence of small country communities.
Amalgamation would severely undermine local democracy and local representation to the detriment of local communities.
Alternatives to council amalgamation, like shared services, represent superior methods of improving efficiency while preserving local autonomy.
The analysis conducted in Part C of the Report derived some firm conclusions on the role local councils in the RAPAD area as well as the part played by RAPAD itself. These conclusions may be summarized as follows:
Local shire councils in the Central West have relatively small population and are spatially isolated from each other and major population centres in Queensland and have been extremely innovative under trying local circumstances.
The economic, demographic and social characteristics of RAPAD area local shire councils demonstrate that they are atypical in the broader Queensland local government context and these small councils should thus be seen as a ‘special case’ deserving of special treatment.
Local communities in the Central West each possess unique local attributes and provide a vibrant local economic and social context to their residents and to tourists.
The economic, demographic and social characteristics of Central West local shire councils lead inexorably to the conclusion that amalgamation will threaten the substantial economic and social gains made in these local communities.
All the councils have been assessed by Queensland Treasury Corporation as being able to meet their short and medium-term financial commitments (with one exception). However, in common with a very large number of other Australian local authorities, some may struggle to meet their long-term asset renewal obligations.
The RAPAD itself may have as yet untapped potential to increase its role in service provision in the region and as a vehicle to facilitate the provision of shared or cooperative service provision to member councils.
A detailed analysis in the Report of the economic and social impact of RAPAD area local shire councils on the long-run sustainability of local communities demonstrated conclusively that these local councils go far beyond traditional local government responsibilities.
This analysis also demonstrated that potentially devastating consequences for local community sustainability would ensue if forced amalgamation occurred in the Central West.
RAPAD Report
Page 3
Particularly vulnerable areas included recent projects that would not have been completed under a centralized amalgamated council; the detrimental effects of forced amalgamation on local schools; the expected repercussions on local community sustainability from the withdrawal of local councils from the small local towns; and the impact of amalgamation on local business and local employment.
Part D of the Report examined the various options for reform and made several recommendations. These can be summarized as follows:
Recommendation 10.4.1 strongly recommends that the Queensland Local Government Reform Commission find against any forced amalgamation of any RAPAD area local shire councils.
Recommendation 10.4.2 strongly recommends that the Queensland Local Government Reform Commission find in favour of the maintenance of the existing activities, structure and representation of RAPAD and the future strengthening of the RAPAD organization as the best means available to improve the service provision efficacy and operational efficiency of RAPAD area local shire councils.
Recommendation 10.4.3 recommends that the Queensland Local Government Reform Commission commend RAPAD area local shire councils and the RAPAD organization on their innovative and ‘can-do’ approach and remarkable achievements in overcoming the many difficulties imposed by their remote location, small size and debilitating cost differentials.
Recommendation 10.4.4 recommends some potential opportunities for additional service sharing initiatives that the affected local councils should investigate further. These may reduce the cost of service provision as well as avoid the devastating social consequences of other more drastic reform options, such as an amalgamation. However, not all of the services identified will necessarily easily lend themselves to be delivered in the form of cooperative or shared service due to the unique aspects of the Central West (such as the ‘tyranny of distance’, available technology, etc). However, these possibilities should each be investigated further.
Recommendation 10.4.5 holds that both Recommendation 10.4.1 and Recommendation 10.4.2 meet the objectives of the Reform Commission since they both fall squarely within the amended Queensland Local Government Act 1993 under new Section 159S of the Local Government Act 1993 (as amended) which specifies the functions of the Local Government Reform Commission and, in particular, its powers under Section 159S (1) (b) (iii) to make recommendations to the Minister.
Recommendation 10.4.6 holds that both Recommendation 10.4.1 and Recommendation 10.4.2 both have the additional advantage of meeting many of the aims of the Reform Commission as stated in its TOR. For example, it clearly meets TOR (2) where the Reform Commission ‘must consider the grouping of like communities of interest to maintain the social fabric and character of communities and areas of the State, and in particular, must consider – (a) review areas established under SSS review processes; and (b) boundaries of areas covered by the regions for which regional planning advisory committees have been established under the Integrated Planning Act 1997’. The strengthening of the RAPAD organization will allow for the fulfilment of TOR (3), particularly regarding the consolidation of ‘regional natural resource management areas, including for example water catchment areas, and environmental areas, including for example, coastal wetlands’. Furthermore, a strengthened RAPAD model facilitates TOR (4) ‘making a recommendation for creating a new local government area from 2 or more existing local government areas, the reform commission must give preference, to the extent practicable, to including all of the existing local government areas in the new area rather than parts of the existing areas’. Finally, the maintenance and strengthening of the existing RAPAD model also enables the

RAPAD Report
Page 4
Reform Commission to meet TOR (5) by identifying ‘options for community representation that reflect the diversity of the State’s regions and that promote representation of discrete communities’.

RAPAD Report
Page 5
Chapter 1: Introduction
1.1 Introduction For the past two decades, Australian local government as a whole has been under severe fiscal distress and the Queensland local government system is no exception to this general rule. Ongoing concern over the long run functioning of local councils in Australia has been reflected in a plethora of recent public inquiries into local government. At the national level, several official investigations have been conducted. These include the Commonwealth Grants Commission (CGC 2001), Commonwealth House of Representatives Standing Committee on Economics, Finance and Public Administration’s (Hawker Report) (2004) Rates and Taxes: A Fair Share for Responsible Local Government, and the Australian Local Government Association’s (ALGA) commissioned report by PriceWaterhouseCoopers (PWC) (2006) entitled the National Financial Sustainability Study of Local Government. In addition, a number of recent state local government associations have conducted a series of state-based inquiries which presented public reports: The South Australian Financial Sustainability Review Board’s (2005) Rising to the Challenge report; the Independent Inquiry into the Financial Sustainability of NSW Local Government’ s (2006) Final Report entitled Are Councils Sustainable; the Western Australian Local Government Association’s (WALGA) (2006) Systemic Sustainability Study: In Your Hands - Shaping the Future of Local Government in Western Australia Inquiry; and the Local Government Association of Tasmania’s (LGAT) (2007) A Review of the Financial Sustainability of Local Government in Tasmania. These inquiries shared a common interest in the problem of ‘financial sustainability’. They also all relied heavily on the ‘accounting approach’ to financial sustainability developed by Access Economics that undertook extensive consulting work for all of these inquiries. Queensland local government has also found itself under the spotlight. In 2004, the Local Government Association of Queensland (LGAQ) resolved to consider the financial and other pressures confronting councils in Queensland and to examine the various options for local government reform to ensure the long-run viability of local authorities. As a first step, a Discussion Paper entitled Size, Shape and Sustainability of Queensland Local Government was released on 3 March 2005 and a Special Conference of the LGAQ held in Brisbane in early June 2005, which formulated a Communique approving a ‘comprehensive reform blueprint’. A ‘ten point Action Plan’ followed from the Communique that was subsequently endorsed by both the LGAQ Executive and the Queensland Minister for Local Government and Planning. The Action Plan provided for a local government reform program embodying the Size, Shape and Sustainability (SSS) Review Framework, sustainability indicators, ‘options for change’, ‘Independent Review Facilitators’ (IRF), and funding arrangements for state government support. The reform program itself was outlined in the Size, Shape and Sustainability: Guidelines Kit (LGAQ 2006). The SSS review process outlined four main ‘options for change’:
Resource sharing through Service Agreements;
Resource sharing through Joint Enterprise;
Significant boundary change; and
Merger/amalgamation of adjoining councils.
It is significant that none of these options included the possibility of ‘business as usual’.
RAPAD Report
Page 6
By the latter half 2006, the SSS process was well under way and a number of councils across Queensland had engaged ‘Independent Review Facilitators’ and were in the process of conducting the SSS review for their respective areas. Unhappy with their inability to contract truly independent experts to assess their councils in the Central West Queensland Remote Area Planning and Development Board (RAPAD) jurisdiction, several small shires approached Professor Brian Dollery to conduct an investigation into their operations under the umbrella of RAPAD. In collaboration with highly experienced local government manager and certified public accountant Andrew Johnson, on 6 November 2006 Professor Dollery prepared a fully costed submission for Mayor Gary Peoples of the Aramac Shire Council and Chair of RAPAD to conduct an SSS-type investigation on behalf of RAPAD councils. This submission was still under consideration when the Queensland government made the shock announcement on 17 April 2007 that it had abandoned its collaboration with the LGAQ SSS process and decided instead to embark on a radical program of compulsory amalgamation. Under its new Local Government Reform Program, the Queensland state government appointed a seven-member Reform Commission to recommend local council amalgamations by August 2007 for the election of new councils on 15 March 2008. Submissions by councils and other affected organizations to the Reform Commission must be lodged by 25 May 2007. The Terms of Reference (TOR) for the deliberations and recommendations of the Queensland Reform Commission were published under section 159U of the legislation on 19 April 2007: Section 159U reads as follows: ‘159U Terms of reference (1) This section states terms of reference for the reform commission in performing its functions. (2) The reform commission must consider the grouping of like communities of interest to maintain the social fabric and character of communities and areas of the State, and in particular, must consider – (a) review areas established under SSS review processes; and (b) boundaries of areas covered by the regions for which regional planning advisory committees have been established under the Integrated Planning Act 1997. (3) The reform commission’s recommendations must be directed at – (a) consolidating, to the extent practicable, regional natural resource management areas, including for example water catchment areas, and environmental areas, including for example, coastal wetlands; and (b) creating local governments with improved financial sustainability. (4) In making a recommendation for creating a new local government area from 2 or more existing local government areas, the reform commission must give preference, to the extent practicable, to including all of the existing local government areas in the new area rather than parts of the existing areas. (5) The reform commission must identify options for community representation that reflect the diversity of the State’s regions and that promote representation of discrete communities. ‘(6) In making its recommendations for new arrangements, the reform commission must identify any issues requiring further consideration for successfully establishing the new arrangements’. This radical change of plan, together with the drastically shortened period of time to prepare and lodge submissions, meant that the original proposal prepared by Professor Dollery and Andrew Johnson was no longer feasible. After a brief period of negotiation with David Arnold, General Manager of RAPAD, and Mayor Gary Peoples, Chair of RAPAD, in consultation with affected councils in the RAPAD area, it was decided that Brian Dollery

RAPAD Report
Page 7
and Andrew Johnson would undertake a less time intensive and less ‘hands-on’ investigation into RAPAD area councils, given the harsh time constraints imposed by the Queensland government. Brian Dollery and Andrew Johnson would thus rely on affected councils themselves to provide the necessary data rather than seeking this information directly themselves. The sole reason for this change in modus operandi was severely reduced time available to prepare and write a thorough report. In consultation with the RAPAD Chair, RAPAD General Manager and RAPAD local shire councils, it was decided that the aims of the new investigation by Professor Dollery and Andrew Johnson were to:
Consider the efficacy of compulsory amalgamation as a means of improving the operations of local councils and their financial sustainability in the light of the international evidence and experience in other Australian states with amalgamation;
Consider alternative models and alternative methods to amalgamation of improving both the operational efficiency of local councils and the financial sustainability of these entities, taking into account the unique additional economic and social importance and responsibilities of local councils in remote areas of Queensland;
Consider alternative models of local government to amalgamation suitable for small, relatively isolated councils in regional, rural and remote areas where the ‘tyranny of distance’ is especially acute;
Consider all feasible options in terms of shared services, examine the available international and Australian evidence and draw out the relevant policy implications for local councils;
Consider the problem of financial sustainability in Australian local government and the manner in which it has been defined and measured with reference to the various recent state-based in South Australia, New South Wales, Western Australia and Tasmania, national investigations into financial sustainability, such as the 2006 PriceWaterhouseCoopers report, and any other relevant literature;
Consider other broader attributes of the long-run sustainability of local councils and their local communities, especially small local councils in regional, rural and remote parts of Queensland, bearing in mind the critical economic and social role of local government in these areas;
Consider local community sustainability rather than local financial sustainability as a superior method of evaluating the role of local councils in remote areas;
Consider the characteristics and structure of RAPAD councils;
Consider the current financial status of RAPAD councils;
Consider the role of the RAPAD organization
Consider the economic and social role of local councils in the RAPAD area;
Consider the impact of amalgamation on local community sustainability in the affected local council jurisdictions; and
Develop strategies that will improve the functioning of local government in these areas without the imposition of forced amalgamation.
Professor Dollery and Andrew Johnson agreed present a Final Report that reflects fully on these issues in a ‘camera-ready’ form suitable for publication by RAPAD by Sunday 20 May 2007 for consideration by RAPAD councils and subsequent submission to the Queensland Reform Commission.
RAPAD Report
Page 8
1.2 Outline of the Report This Report is divided into four main parts. Part A considers the efficacy amalgamation in the broader context of Australian local government reform, presents alternative models of local governance with better prospects of achieving desirable economic and social outcomes, and evaluates the potential of shared services as an instrument for enhancing efficiency while preserving local democracy and local communities. Part B considers financial sustainability in Australian local government, efforts by recent national and state-based inquiries to define and measure financial sustainability in other Australian local government jurisdictions, and salient academic literature on the determinants of local government in Australia. It identifies several intractable problems with the concept of financial sustainability, proposes a useful typology for evaluating the financial problems evident in Australian local government, and presents a broader concept of local government sustainability and local community sustainability especially applicable to small local councils in regional, rural and remote parts of Queensland. After assessing the characteristics of local councils in the RAPAD area, Part C considers the current financial standing of RAPAD councils and the critical economic and social role played by RAPAD local councils in sustaining their local communities in their respective jurisdictions and evaluates the probable impact of forced amalgamation on these local communities. Part D considers various policy options available to RAPAD councils and the Queensland Reform Commission and makes recommendations for improving the effectiveness of service delivery and financial sustainability among RAPAD councils while preserving local democracy, local representation and sustainable local communities. Part A comprises three substantive chapters 2, 3 and 4. Chapter 2 is divided into three main sections. Section 2.2 sets out the reasons for the current difficulties faced by Australian local government. Section 2.3 considers structural reform in local government, and especially council amalgamation, as the predominant policy instrument used by state and territory governments to enhance the effectiveness of local government. The chapter ends with some brief concluding remarks in section 2.4. Chapter 3 is divided into four main parts. Section 3.2 provides a brief outline of five promising alternative governance models, some of which have already been implemented in Australia. Section 3.3 provides a conceptual stem for considering alternative models of local governance involving structural change and process change more suited to councils in non-metropolitan areas. Section 3.4 seeks to determine which of the models developed by Dollery and Johnson (2005) are the most suitable vehicles for the structural reform in non-metropolitan Australia, with the focus falling on three recent examples drawn from the Riverina Regional Organization of Councils (REROC), the NSW Shires Association (2004) Joint Board model, and the New England Strategic Alliance. The chapter ends with some short concluding remarks on the policy implications of the analysis in section 3.5. Chapter 4 is comprised of five main sections. Section 4.2 provides a synoptic review of the views of recent national and state-based public inquiries into local government on council cooperation and shared services. Section 4.3 briefly sets out the analytical foundations for shared services. Section 4.4 considers alternative models of local government that could serve as conduits for shared service provision whereas section 4.5 summarizes available empirical evidence on shared services. The chapter ends with some brief concluding remarks in section 4.6. Part B of the Report examines financial sustainability in local government and comprises two substantive chapters 5 and 6. Chapter 5 is divided into four main sections. Section 5.2 critically examines the CGC (2001) report, the Hawker Report (2004), the various state-based inquiries and the PWC (2006) national report. Section 5.3 considers salient
RAPAD Report
Page 9
aspects of the embryonic Australian academic literature on sustainability. Section 5.4 develops a typology of local government sustainability using stylized empirical characteristics of Australian local councils. Chapter 5 ends in section 5.5 with some brief observations on the implications of the taxonomy for Queensland local government. Chapter 6 is divided into three main parts. Section 6.2 considers the problem of defining adequately local council sustainability and local community sustainability and identifying the chief determinants of this broader conception of local government sustainability. Section 6.3 examines each of the four putative attributes of community or social sustainability in local government and tries to develop operational measures for these four characteristics. The chapter ends with some brief concluding remarks in section 6.4. Part C of the Report applies the analysis developed in Part B of the Report against the background of the discussion of structural reform, alternative models of local government and shared services provided in Part A of the Report. Part C comprises three substantive chapters 7, 8, and 9. Chapter 7 is divided into five main parts. Section 7.2 provides a profile of each individual local shire in the Central West RAPAD region. Section 7.3 analyses the demographic composition of these local shires as well as considering the types of industries operating in region and the major sources of employment for its residents. Section 7.4 contains a preliminary discussion of the RAPAD councils themselves and sets the scene for the detailed analysis contained in Chapter 8 and Chapter 9 of this Report. Section 7.5 examines the future growth and prospects for the RAPAD shires. The chapter ends with some brief evaluative comments in section 7.6. Chapter 8 is divided into six main parts. Section 8.2 assesses the Central West local shires under the South Australian Financial Sustainability Review Board (2005) criteria for a sustainable local government authority. Section 8.3 focuses on applying the Independent Inquiry into the Financial Sustainability of NSW Local Government’s (LGI 2006) recommendations to determining sustainability in the case of RAPAD shires. Section 8.4 reviews the results and conclusions from the Queensland Treasury Corporation’s (QTC 2007 (a-d, h and i); 2006b) analysis of Central west shires. Section 8.5 considers the results from the annual audits of municipalities in Queensland undertaken by the Auditor General and his determination of financial viability. Section 8.6 considers the options available to enhance RAPAD to increase the financial sustainability of its eleven members. The chapter ends with some brief evaluative comments in section 8.7. Chapter 9 is divided into seven main parts. Section 9.2 sets out the services provided by the eleven RAPAD area councils that are unique to the Central West and it demonstrates that they go far beyond traditional local government responsibilities. Section 9.3 considers the potentially devastating results that would eventuate on local community sustainability if forced amalgamation occurred in the Central West. Section 9.4 discusses a number of recent projects that the local councils contend would not have been completed under a centralized structure due to the competing and conflicting priorities that would result from serving multiple autonomous communities. Section 9.5 examines the direct consequences of the withdrawal of a local government authority from a Central West town by considering its effect on local schools. Section 9.6 similarly analyses the expected repercussions on community sustainability deriving from the withdrawal of the local authority from the small towns in question. Section 9.7 considers the impact on local employment and local business following an exodus of people resulting from the loss of council jobs in the administration centres in these shires, if they were to amalgamate. The chapter ends with some brief evaluative comments in section 9.8. Part D draws on the analysis conducted in Part A, Part B and Part C of the Report. Part D is made up of a single substantive Chapter 10.

RAPAD Report
Page 10
Chapter 10 is divided into three main parts. Section 10.2 provides a synoptic review of the overall thrust of the Report. Section 10.3 sets out some general observations on the likely impact of forced amalgamation on the local councils in the RAPAD area and presents an alternative approach to improving the effectiveness of local governance to the people in the RAPAD area that preserves both local democracy and local communities. Section 10.4 advances a series of specific recommendations intended to (a) inform the Reform Commission (b) provide guidance to RAPAD councils on how to improve their performance should they be permitted to pursue the alternative approach to forced amalgamation and (c) demonstrate that these recommendations fit both the amended Local Government Act 1993 and the TOR of the Queensland Local Government Reform Commission.

RAPAD Report
Page 11
Part A: Structural Reform and Shared Services
Chapter 2: Australian Local Government Reform
2.1 Introduction The now defunct Size, Shape and Sustainability (SSS) project by the Queensland Government and the subsequent replacement by the Queensland Local Government Reform process, headed by the seven-member Reform Commission, forms part of a larger national drive by state and territory governments to reform local government across Australia by enhancing the efficiency and effectiveness of local councils. Since Queensland local government is subject to much the same forces as other Australian local government systems, the Queensland reform initiative is best understood when placed in national perspective. In this way, it is possible to evaluate not only the prospects of forced local council amalgamation in Queensland, but also to assess its likely prospects of success in the light of experience elsewhere in Australia and abroad. Chapter 2 thus seeks to locate the Queensland Local Government Reform process and the objectives of the Reform Commission within the broader national and international context. Chapter 2 is divided into three main sections. Section 2.2 sets out the reasons for the current difficulties faced by Australian local government. Section 2.3 considers structural reform in local government, and especially council amalgamation, as the predominant policy instrument used by state and territory governments to enhance the effectiveness of local government. The chapter ends with some brief concluding remarks in section 2.3.
2.2 Problems Confronting Australian Local Government Four distinct sets of economic and political factors have combined to produce the current impasse in all Australian local government systems, including Queensland local government. We shall examine each of these four factors in turn.
2.2.1 Financial Pressures and Local Infrastructure Depletion
Firstly, intensifying financial pressures mean that the status quo in local government simply cannot be sustained indefinitely. The Commonwealth Grants Commission (CGC 2001, pp. 52-53) has identified five main reasons for the current financial crisis in Australian local government:
‘Devolution’ – where a higher sphere of government gives local government responsibility for new functions;
‘Raising the Bar’ – where a higher tier of government, through legislative or other changes, raises the complexity and/or standard at which local government services must be provided, thereby increasing the cost of service provision;
‘Cost Shifting’ – either where a municipal council agrees to provide a service on behalf of a federal or state government (with funding subsequently reduced or stopped) or where some other tier of government ceases to provide an essential service thus forcing a local authority to take over;
RAPAD Report
Page 12
‘Increased community expectations’ – where a given community demands improvements in existing municipal services or the provision of a new service; and;
‘Policy Choice’ – where specific councils voluntarily expand and/or enhance their services.
Andrew Johnson (2003) has observed that in addition to these problems, local governments themselves are also partly responsible for their own financial plight. In particular, a number of councils are reluctant to set their rates and other charges at realistic and sustainable levels. Given these monetary pressures, it is no exaggeration to stress that existing arrangements have only been maintained at the cost of steadily depreciating physical infrastructure; an approach with ominous long-run implications. Indeed, in its final report entitled Rates and Taxes: A Fair Share for Responsible Local Government, the House of Representatives Standing Committee on Economics, Finance and Public Administration (2004, p. 59) observed that ‘there is a significant infrastructure renewal gap across the country and asset standards are decreasing’. This state of affairs has been repeatedly confirmed in several other recent inquiries into Australian local government, including the Commonwealth Grants Commission’s (CGC) (2001) Review of the Operation of Local Government (Financial Assistance) Act 1995, the South Australian Financial Sustainability Review Board’s (FSRB) (2005) Rising to the Challenge, the Independent Inquiry into the Financial Sustainability of NSW Local Government’s (LGI) (2006) Are Councils Sustainable, the Western Australian Local Government Association’s (WALGA) (2006) Systemic Sustainability Study: In Your Hands - Shaping the Future of Local Government in Western Australia Inquiry, the Local Government Association of Tasmania’s (LGAT) (2007) A Review of the Financial Sustainability of Local Government in Tasmania and the Australian Local Government Association (ALGA) commissioned report by the commercial company PriceWaterhouseCoopers (PWC) (2006) entitled the National Financial Sustainability Study of Local Government. While the main reasons for this financial distress are generally well understood, debate continues on how best to deal with the problem. It is also widely acknowledged that the financial plight of Australian local government would have been substantially worse had it not been for the introduction of the Commonwealth government’s Roads to Recovery (R2R) funding program. The R2R initiative began life as a response to the looming problem of a local road stock that was reaching the end of its useful life. The finance required to renew the declining network of local roads was deemed beyond the capacity of local government. As a consequence, in November 2000, the Commonwealth government announced that it would inject $1.2 billion into local road renewal, 70 per cent (or $850m) of which was to be spent in rural and regional Australia (DOTARS 2003, p. 1). The R2R program was initially designed to cover the period January 2001 through to June 2005. However, following a review of Commonwealth transport infrastructure funding in 2002, R2R was extended (under the banner of AusLink) and will now finish in 2009. In total, covering the period 2001 through 2009, the program will outlay about $2.55 billion in local road funding (DOTARS 2006, p. 7). The financial arrangements underlying R2R completely by-pass state and territory governments, and thus represent a direct grant from the Commonwealth to local councils. One of the many conditions placed on use of the funds is the maintenance of a weighted average of previous local road expenditure by recipient councils. This stipulation enables us to classify R2R grants as targeted close-ended conditional block grants. While the requirement to maintain previous funding levels makes it tempting to characterize the program as a matching grant, a matching rate is not explicitly stated.

RAPAD Report
Page 13
Despite the undoubted financial relief that the R2R program has brought to struggling local councils across Australia, it remains embroiled in controversy. In the first place, although the Commonwealth has been previously involved in the direct finance of local government through various programs, R2R has broken with longstanding tradition in Australian fiscal federalism by its sheer scale in bypassing state and territory governments that have typically redistributed federal funding to local government through their Local Government Grants Commissions. In addition, political opponents of the program have stigmatised it as ‘pork barrelling’ on a grand scale that has been calculated to secure the federal government partisan advantages in marginal electorates, particularly in non-metropolitan seats. Other critics have questioned the efficacy of R2R in achieving its stated aims of upgrading the local roads network (see, for example, ANAO (2006)).
2.2.2 Operational Efficiency of Local Government
Secondly, state and territory governments across Australia remain concerned over the operational efficiency of municipalities, particularly small regional and rural councils. The now defunct Size, Shape and Sustainability initiative by the Queensland Government represented an attempt to tackle the question of the efficiency and effectiveness of Queensland local councils using a multi-faceted approach. By contrast, the new Queensland Local Government Reform process and the Reform Commission have narrowed this broad focus down to a heavy reliance on compulsory local council amalgamation. It thus shares a key feature of other local government reform programs across Australia with its heavy emphasis on council amalgamations as the primary engine in the drive for more cost effective local services (Vince 1997). During the ‘nineties South Australia, Tasmania and Victoria all underwent episodes of municipal consolidation of differing degrees of intensity (May 2003). More recently, a program of compulsory amalgamation was conducted in NSW. It now appears that forced local council mergers loom large in Queensland. The question of the efficacy structural reform generally, and amalgamation in particular, will be taken up in Section 2.3 of this chapter in much greater detail.
2.2.3 Expansion in the Role of Local Government
In Australia, local councils have traditionally provided a comparatively narrow range of local ‘services to property’ - caricatured in the expression ‘roads, rates and rubbish’ – and financed through a complex mix of property taxes, local government grants, and fees and charges. However, amendment of the different Local Government Acts across all Australian state and territory local government systems have created the legislative scope for a much great role for municipalities. The powers of general competence embodied in these statutes has facilitated a dramatic transformation in the composition of local government service provision away from traditional services to property towards human services. In its Rates and Taxes: A Fair Share for Responsible Local Government, the Hawker Report (2004, p. 9) observed that it had discerned not only increasing diversity across Australian local government service provision, but also an ‘expansion of the roles beyond those traditionally delivered by the local sector’. This shift in of service delivery had two main characteristics: Firstly, local authorities had assumed responsibility many more social issues, including ‘health, alcohol and drug problems, community safety and improved planning and accessible transport’. Secondly, councils have been increasingly active in the application and monitoring of regulation, especially in ‘development and planning, public health and environmental management’. In its Local Government National Report, 2003-04, the Commonwealth Department of Transport and Regional Services (DOTARS) (2005, p. 2) has also recognized the
RAPAD Report
Page 14
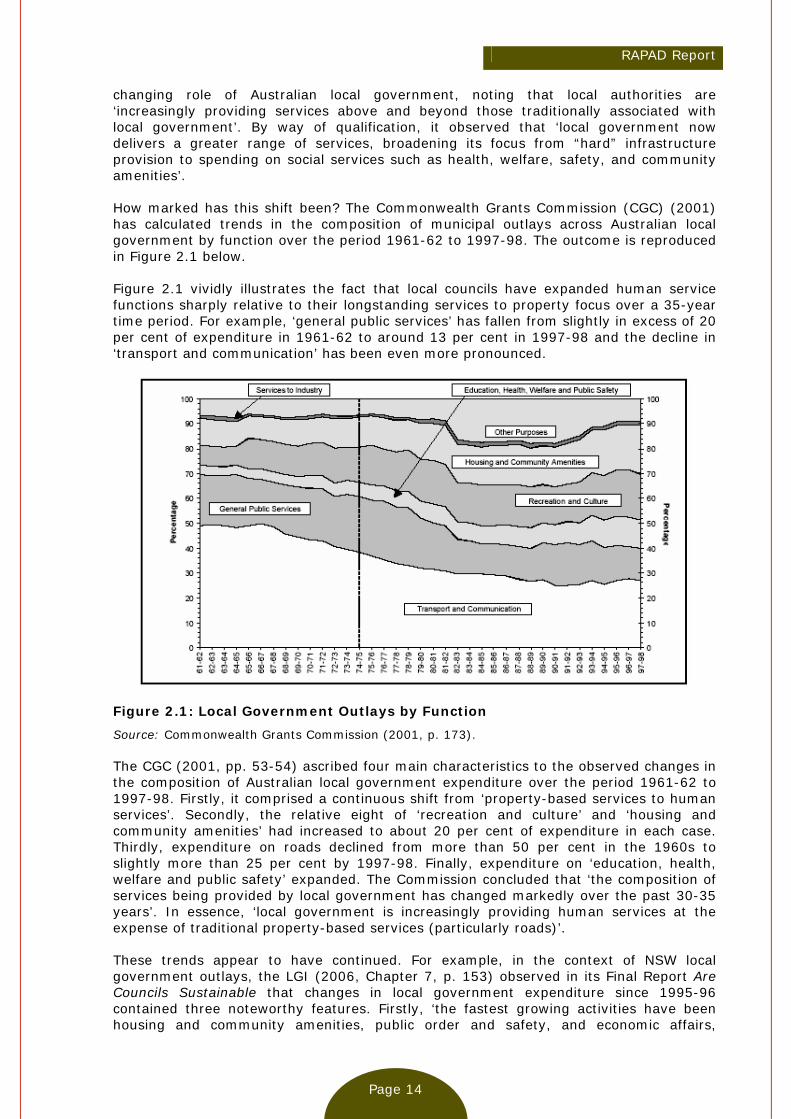
changing role of Australian local government, noting that local authorities are ‘increasingly providing services above and beyond those traditionally associated with local government’. By way of qualification, it observed that ‘local government now delivers a greater range of services, broadening its focus from “hard” infrastructure provision to spending on social services such as health, welfare, safety, and community amenities’. How marked has this shift been? The Commonwealth Grants Commission (CGC) (2001) has calculated trends in the composition of municipal outlays across Australian local government by function over the period 1961-62 to 1997-98. The outcome is reproduced in Figure 2.1 below. Figure 2.1 vividly illustrates the fact that local councils have expanded human service functions sharply relative to their longstanding services to property focus over a 35-year time period. For example, ‘general public services’ has fallen from slightly in excess of 20 per cent of expenditure in 1961-62 to around 13 per cent in 1997-98 and the decline in ‘transport and communication’ has been even more pronounced.
Figure 2.1: Local Government Outlays by Function
Source: Commonwealth Grants Commission (2001, p. 173). The CGC (2001, pp. 53-54) ascribed four main characteristics to the observed changes in the composition of Australian local government expenditure over the period 1961-62 to 1997-98. Firstly, it comprised a continuous shift from ‘property-based services to human services’. Secondly, the relative eight of ‘recreation and culture’ and ‘housing and community amenities’ had increased to about 20 per cent of expenditure in each case. Thirdly, expenditure on roads declined from more than 50 per cent in the 1960s to slightly more than 25 per cent by 1997-98. Finally, expenditure on ‘education, health, welfare and public safety’ expanded. The Commission concluded that ‘the composition of services being provided by local government has changed markedly over the past 30-35 years’. In essence, ‘local government is increasingly providing human services at the expense of traditional property-based services (particularly roads)’. These trends appear to have continued. For example, in the context of NSW local government outlays, the LGI (2006, Chapter 7, p. 153) observed in its Final Report Are Councils Sustainable that changes in local government expenditure since 1995-96 contained three noteworthy features. Firstly, ‘the fastest growing activities have been housing and community amenities, public order and safety, and economic affairs,
RAPAD Report
Page 15
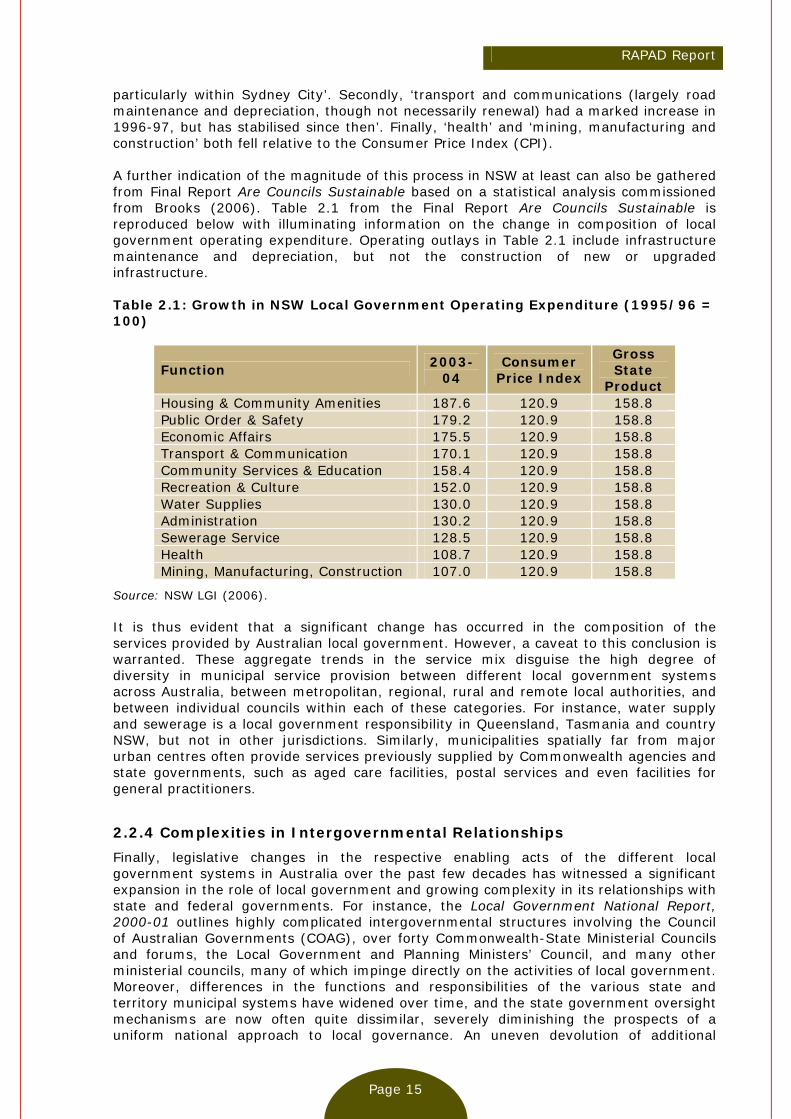
particularly within Sydney City’. Secondly, ‘transport and communications (largely road maintenance and depreciation, though not necessarily renewal) had a marked increase in 1996-97, but has stabilised since then’. Finally, ‘health’ and ‘mining, manufacturing and construction’ both fell relative to the Consumer Price Index (CPI). A further indication of the magnitude of this process in NSW at least can also be gathered from Final Report Are Councils Sustainable based on a statistical analysis commissioned from Brooks (2006). Table 2.1 from the Final Report Are Councils Sustainable is reproduced below with illuminating information on the change in composition of local government operating expenditure. Operating outlays in Table 2.1 include infrastructure maintenance and depreciation, but not the construction of new or upgraded infrastructure. Table 2.1: Growth in NSW Local Government Operating Expenditure (1995/96 = 100)
Function 2003-04
Consumer Price Index
Gross State
Product Housing & Community Amenities 187.6 120.9 158.8 Public Order & Safety 179.2 120.9 158.8 Economic Affairs 175.5 120.9 158.8 Transport & Communication 170.1 120.9 158.8 Community Services & Education 158.4 120.9 158.8 Recreation & Culture 152.0 120.9 158.8 Water Supplies 130.0 120.9 158.8 Administration 130.2 120.9 158.8 Sewerage Service 128.5 120.9 158.8 Health 108.7 120.9 158.8 Mining, Manufacturing, Construction 107.0 120.9 158.8
Source: NSW LGI (2006). It is thus evident that a significant change has occurred in the composition of the services provided by Australian local government. However, a caveat to this conclusion is warranted. These aggregate trends in the service mix disguise the high degree of diversity in municipal service provision between different local government systems across Australia, between metropolitan, regional, rural and remote local authorities, and between individual councils within each of these categories. For instance, water supply and sewerage is a local government responsibility in Queensland, Tasmania and country NSW, but not in other jurisdictions. Similarly, municipalities spatially far from major urban centres often provide services previously supplied by Commonwealth agencies and state governments, such as aged care facilities, postal services and even facilities for general practitioners.
2.2.4 Complexities in Intergovernmental Relationships
Finally, legislative changes in the respective enabling acts of the different local government systems in Australia over the past few decades has witnessed a significant expansion in the role of local government and growing complexity in its relationships with state and federal governments. For instance, the Local Government National Report, 2000-01 outlines highly complicated intergovernmental structures involving the Council of Australian Governments (COAG), over forty Commonwealth-State Ministerial Councils and forums, the Local Government and Planning Ministers’ Council, and many other ministerial councils, many of which impinge directly on the activities of local government. Moreover, differences in the functions and responsibilities of the various state and territory municipal systems have widened over time, and the state government oversight mechanisms are now often quite dissimilar, severely diminishing the prospects of a uniform national approach to local governance. An uneven devolution of additional
RAPAD Report
Page 16
functions to local government within and between the different state and territories further complicates an already incoherent network of intergovernmental relations.
2.3 Structural Reform and Council Amalgamation We have already seen that structural reform has almost always been the chief policy response by Australian state and territory governments to real and perceived problems with local governments. While other policy initiatives have also been attempted, perhaps most notably the redesign of the various state Local Government Acts over the past twenty years, structural reform has centred on compulsory and occasionally voluntary council amalgamations seem to have retained an iron grip on the imaginations of state government policy makers, despite not only disappointing results from amalgamation programs, but strong theoretical and empirical reasons to the contrary. The Queensland Local Government Reform process and the objectives of the Reform Commission fall squarely within this tradition. In section 2.3 of Chapter 2, we examine the various arguments surrounding amalgamation.
2.3.1 Scepticism on the Results of Amalgamation
Although the notion that that ‘bigger is better’ in local governance may still represent the bedrock of consensus amongst state and territory local government policy makers, successive episodes of council amalgamations in Australia over the years have eroded this consensus to the point where open scepticism amongst the broader local government community has become the order of the day, especially in non-metropolitan areas of the country. In large part, this cynicism derives from a deep disillusionment with the observed real-world outcomes of actual amalgamation programs. For example, despite extravagant claims from proponents of both South Australian and Victorian council mergers in the ‘nineties, the economic results of these programs have been most disappointing. Thus, while the Victorian state government claimed at the time that its radical reform process would generate direct cost savings of 20 per cent, the actual outcome has been a mere 8.5 per cent, most of which has flowed from competitive tendering and not the restructuring program (Allan 2003, p. 75). In much the same way, the South Australian authorities heralded savings of 17.4 per cent, but in fact only achieved 2.3 per cent (Allan 2003, p. 75). It should also be added that these realised savings did not take into account the massive indirect costs of council consolidations, such as lower economic activity and falling employment in rural and regional areas. As a consequence of these disappointing outcomes, many in the Australian local government community are no longer convinced that municipal restructuring based primarily on amalgamation represents an effective means of improving council performance. This scepticism is widespread. For instance, following the recent NSW Government Inquiry into the optimal structure of local government in the Sydney metropolitan area, Commissioner Kevin Sproats (2001, p. 36) concluded the purported benefits of amalgamation that were derived from empirical evidence were ‘suggestive rather than conclusive’. Moreover, in their analysis of both the international literature and Australian experience on municipal consolidation, Dollery and Crase (2004, p. 274) argued that ‘there are scant grounds for anticipating substantial financial benefits to flow from amalgamation, except possibly in terms of local government capacity and scope economies’. Along similar lines, in assessing the outcomes of recent council amalgamation programs in New Zealand, Australia (and more particularly Victoria and Tasmania), Britain and Canada (especially Nova Scotia and Ontario) in his Merger Mania, Andrew Sancton (2000, p. 83) concluded that ‘the efficient delivery of municipal services does not require large municipalities’. Finally, Percy Allan (2003, p. 80) has presented a strong case that in Australia ‘at the administrative level the efficiency and effectiveness of a local council is

RAPAD Report
Page 17
not a function of size’ and ‘all the empirical evidence suggests that big is not better when it comes to local government’. Similar sentiments have been expressed by Allan (2001), Bish (2000), Dollery (1997), Dollery (2003), Jones (1989), Katsuyama (2003), May (2003), Oakerson (1999), and Thornton (1995), amongst many others.
2.3.2 Reasons for Disappointing Outcomes of Local Government Amalgamation
Why has council amalgamation failed to improve the effectiveness of Australian local government? Dollery et al. (2006c) have identified five main economic arguments typically advanced in favour of amalgamation and assessed the problems surrounding these arguments in the Australian local government milieu. 2.3.2.1 Economies of scale In the first place, advocates of municipal amalgamation invariably premise their arguments on the existence of significant economies of scale in Australian local government. This has proved largely illusory. The term ‘economies of scale’ refers to a decrease in average cost as the quantity of output rises and are frequently cited as a rationale for larger council jurisdictions. Accordingly, the bigger the jurisdictional unit, the lower will be the per capita costs of service provision. In comparison to its counterparts in comparable countries, excepting New Zealand, Australian local government has a predominantly ‘services to property’ orientation in terms of the goods and services it provides. However, despite its relatively narrow range, Australian local governments still provide a wide range of goods and services that are produced by heterogeneous technological means. Thus, for a given benefit region for a given type of service, there is no a priori reason for different goods and services to exhibit the same cost characteristics. On the contrary, there is every reason to expect that no uniform pattern of economies of scale will emerge across the range of good and services produced by Australian councils. For example, it is highly unlikely that the optimal service district for libraries will coincide with, or even resemble, optimal service districts for, say, domestic garbage collection, public parks, or sewage treatment services (Dollery 1997). Thus while larger councils may capture economies of scale in some outputs, they could equally reap diseconomies of scale in other areas. Sancton (2000, p. 74) has crystallized the argument as follows: ‘There is no functionally optimal size for municipal governments because different municipal activities have quite different optimal areas’. After evaluating the international and Australian empirical evidence on economies of scale in municipal service provision, Byrnes and Dollery (2002a) drew three main conclusions. In the first place, ‘given the mixed results that emerge from the international evidence, it seems reasonable to conclude that considerable uncertainty exists as to whether economies of scale do or do not exist’ (Byrnes and Dollery 2002a, p. 405). Secondly, existing Australian empirical work was almost uniformly miss-specified and thus did not measure scale economies at all. Finally, from a policy perspective, the lack of rigorous evidence of significant economies of scale in municipal service provision casts ‘considerable doubt on using this as the basis for amalgamations’. Thus while ‘advocates of amalgamation have based their arguments on the proposition that substantial efficiency gains would flow from the formation of larger local authorities’, to the contrary ‘research on economies of scale in local government does not support this proposition’ (Byrnes and Dollery 2002a, p. 405). In this regard, it should be noted that the recent NSW amalgamation program invoked the work of Stephen Soul (2000) in his empirical analysis of the relationship between size and per capita service costs in NSW local government. However, as Byrnes and Dollery (2002a) have demonstrated, simple statistical correlation between population size and total council costs per capita does not properly measure economies of scale.
RAPAD Report
Page 18
Even where economies of scale are significant, this may still not be relevant to optimal municipal size if provision of the service can be separated from production of that service (the so-called purchaser-provider split), since scale economies typically only arise during the production phase. Municipal councils too small to achieve all economies of scale on their own can nevertheless accrue the advantages of any scale economies by purchasing the good or service in question from other public agencies or private firms that are large enough production units to secure economies of scale. By contracting with commercial firms or other governments (and through analogous joint purchasing agreements with other councils, such Regional Organizations of Councils (ROCs)), small councils can provide the quantity and quality of services desired by their limited number of constituents and simultaneously enjoy the cost advantages deriving from scale economies in production (Witherby et al. 1999). Some evidence exists to support this contention. For instance, Dollery et al. (2005b) have shown that the Riverina Eastern Regional Organization of Councils (REROC) has secured considerable economic advantages from the scale economies through joint arrangements between its members. Similarly, Oakerson (1999) cites several examples of the savings that can be reaped from separating provision from production through outsourcing and other analogous techniques. This theme will be taken up in greater detail in Chapter 3 and Chapter 4. 2.3.2.2 Economies of scope Economies of scope refer to the economic advantages that flow from providing a broad range of goods and services in a single organization, like a municipal council. In particular, economies of scope arise when the cost of producing a given set of services in a single organization is lower than the cost of those services being produced by a number of specialized organizations. The standard explanation for this lower cost of production derives from the fact that a single organization can attribute the cost of fixed inputs or ‘overheads’, like central administrative staff, computing facilities, and so forth, across many of the services it produces. Thus, if related services are provided by a single council, lower total production costs may follow (Dollery and Fleming 2006). In the context of the Australian local government amalgamation debate, scope economies represent an a priori theoretical argument against many small local authorities each providing their own services. It is also an argument against the fragmentation of existing large municipalities into several fully autonomous or privatised business units. However, as we shall see in Chapter 3, economies of scope can support the concept of several small and adjacent municipalities forming some umbrella organization, like ROCs, in an attempt to capture scope economies. 2.3.2.3 Local government capacity A proposition sometimes advanced in the Australian debate over amalgamation is that larger councils tend to possess greater levels of administrative and other expertise, in part due to the fact that their size permits the employment of specialist skills that cannot be acquired readily by smaller municipalities. Given the increasing burden placed on Australian local government by its state and federal counterparts, through cost shifting and other activities, it is held that this confers a significant advantage on larger municipal units because it enables them to accomplish a wider and more complex range of tasks in a more efficient manner. There seems to be considerable merit in this argument. Small regional and rural councils do struggle in terms of expertise and cannot always use consultants in an effective and prudent way. However, since it is in many respects a variant of the economies of scope argument for amalgamation, many of the same reservations apply. For instance, ROCs may also be able to pool their resources to acquire the skills in question, at no greater cost than to single and larger councils.

RAPAD Report
Page 19
2.3.2.4 Administration and compliance costs A fourth economic argument often put forward in support of local government amalgamation is that larger consolidated councils economize on their direct costs of administration and the compliance costs imposed on individuals who participate in the municipal political process. Administrative costs include the compensation paid to elected and appointed officials and staff and the overheads (buildings, supplies, utilities, etc.) required to support those officials. Compliance costs include the costs incurred by municipal voters to keep informed on issues and candidate positions and the potential cash and time costs of registering an opinion by participating in hearings, meetings, voting, etc. Few local governments can reduce these costs in aggregate. If it is argued that council amalgamations will reduce administrative costs, then this is analogous to arguing that there are economies of scale in the administration of local government, just as there may be scale economies in the production of public services. However, there is obviously no guarantee that such opportunities will always, or even usually, exist. It could just as easily be argued that administrators become less effective the further removed they are from their constituents and operations they are supposed to coordinate. If this is the case, then diseconomies of scale could result, with larger governments requiring proportionately more administrators (perhaps with more layers in the administrative hierarchy). Administrative scale economies could thus be a factor in favour of both larger and smaller local government units. In this instance, administrative economies become an empirical issue. However, it can be argued on grounds of public choice theory that greater difficulties are involved in monitoring large municipalities. Ratepayers, as voters, cannot easily acquire the necessary information to assess whether or not councils are providing ‘value for money’. By contrast, smaller councils are often less complex operations with a greater degree of transparency and consequently more amenable to scrutiny by ratepayers. If smaller municipalities are indeed subject to closer and more informed scrutiny, then it can be anticipated that they could experience greater public pressures to deliver local public goods more efficiently (see, for example, Boyne 1998 and Bailey 1999). Empirical support exists for this contention. An implication that derives from the public choice paradigm, amenable to empirical analysis, is that a ‘fragmented’ local government system, containing numerous municipal entities, should be more efficient than a ‘concentrated’ system, with a few, large councils. After a study examining American empirical evidence on this question, Boyne (1998, p. 252) concluded that ‘the broad pattern of evidence suggests that lower spending is a feature of fragmented and deconcentrated local government systems’. By contrast, ‘consolidated and concentrated tend to be associated with higher spending’. This may mean that ‘the technical benefits of large units with big market shares, such as economies of scale and scope, are outweighed by competitive and political costs, such as disincentives toward fiscal migration and problems of public scrutiny’. After his analysis of the empirical literature, Andrew Sancton reached the same conclusion: ‘The public choice perspective shows us that it is no longer obvious that the existence of many municipalities within the same city-region causes wasteful overlap and duplication’ (Sancton 2000, p. 75). It need hardly be added that numerous other problems also arise from amalgamation, especially in rural and regional areas, an issue that will be addressed in depth in this Report. Chief amongst these are a reduction in the vibrancy of local democracy, less political representation and lower public participation, various deleterious effects on local economic development, including decreased economic activity, rising unemployment and the formation of ‘ghost’ towns, and a loss of ‘sense of place’ on the part of local residents.

RAPAD Report
Page 20
2.3.2.5 Coincidence of municipal and natural boundaries A comparatively new administrative argument advanced in the NSW debate on municipal amalgamation rests on the proposition that economic, environmental and other largely unspecified advantages accrue from an alignment of local government boundaries with natural boundaries (Dollery and Crase 2004). Given that this argument is likely to gain currency in future Australian amalgamation debates with the apparent persuasiveness of ‘deep green’ arguments with state government policy elites, it is thus worth considering this proposition in further detail. Indeed, the Queensland Reform Commission is obliged under its term of reference (3)(a) to consider ‘consolidating’ ‘regional natural resource management areas’ ‘to the extent practicable’ in its deliberations. In his submission to the NSW Legislative Council’s (2003, p. 94) Inquiry into Local Government Amalgamation, Brunckhorst outlined three ‘principles’ for ‘drawing boundaries that best reflect the social functions of regional communities as well as the ecological functions of the landscape’. In the first place, ‘the region should capture the place that is the social capital…the landscape area that is of greatest interest to the region or local residents’. Secondly, ‘that the region maximizes or captures the greatest similarities of environmental landscape, which reflects land uses, management of ecological resources, water supply, and so on’. Finally, jurisdictional boundaries drawn on these grounds must be capable of ‘being scaled up and scaled down for integration for other kinds of service delivery or management’. In essence, this argument proposes a move away from current tests of economic and sociological ‘communities of interest’ in municipal boundary determinations by state local government boundary commissions to physical ecological ‘communities of interest’ and contends that ecological, economic, and other benefits will result. It is difficult to understand why natural or ecological boundaries should coincide exactly with local government boundaries. After all, the fact that the same argument could be raised with respect to national, state and metropolitan council boundaries, but never is raised in these broader contexts, surely demonstrates its spurious nature. Moreover, this notion has many additional shortcomings: it ignores the cultural and historical legacy embodied in existing council boundaries; it neglects the critical concept of the economic ‘community of interest’ of the people involved; it disregards that massive costs that would derive from drastic restructuring of council boundaries and headquarters, and it overlooks the impact of council boundaries on the efficient delivery of council services, especially since environmental considerations form only a small part of overall municipal responsibilities. The primary argument for the exact coincidence of natural boundaries and council boundaries, at least in the NSW debate over local government restructuring, seems to derive exclusively from the recently created Catchment Management Authorities (CMAs). Thus, to link local government boundaries to CMA boundaries to the exclusion of all else, including ratepayers, roads, townships and communities, seems to demonstrate a peculiar narrowness of focus and a neglect of the totality of contemporary local governance. Indeed, this approach is surely akin to ‘the tail waving the dog’! Adequate environmental protection can be secured through the cooperation of state agencies and vibrant local governments working in concert, rather than through the destruction of small councils attendant upon forced amalgamation. Moreover, spatially large natural catchment areas, typical of the Australian landscape, can also be managed by means of ROCs of affected municipalities.
2.3 Concluding Remarks Given the crisis facing all Australian local government systems, solutions must be found to the current impasse. For this reason, the earlier Size, Shape and Sustainability (SSS) policy initiative by the Queensland Government and the subsequent Queensland Local Government Reform process with its Reform Commission should be welcomed by local

RAPAD Report
Page 21
authorities in that state, provided full cognizance is taken of experience with local government reform elsewhere in Australia. We have argued that structural change programs that simply rely on the blunt instrument of council amalgamations have not been effective in other local government jurisdictions. Moreover, we have shown that most of the arguments presented in favour of amalgamation are generally misconceived. Even when weight can be placed on these arguments, we have argued that alternative methods of reform involving partnerships between councils are in any event likely to be much more effective in achieving the same aims. This conclusion draws further strength when considered in the light of the five sources of the current financial crisis in local government identified by the Commonwealth Grants Commission (CGC 2001) are taken into account. For example, it is not at all clear how amalgamation can prevent or even reduce the extent of cost shifting from higher tiers of government. Much the same can be said for ‘raising of the bar’ through state and Commonwealth regulation. ‘Increased community expectations’, ‘policy choice’, and ‘devolution’ all cannot be tackled adequately simply through structural reform. Obviously, other policy instruments must be brought into play. Chapter 3 will take up the theme of local government partnerships as an alternative to the drastic measure of forced amalgamation. It will be argued that both state government policy makers and regional and rural councils alike should focus on models of local governance involving cooperative relationships with neighbouring municipalities and improved institutional processes rather than forced consolidations. Not only can these models achieve better economic results that forced consolidation, but the can also preserve that vital fabric of vibrant local democracy that is threatened by amalgamation. Chapter 4 will focus on the potential role shared services can play in this context.
RAPAD Report
Page 22
Chapter 3: Alternative Models of Australian Local Government
3.1 Introduction Chapter 2 considered the thorny question of municipal amalgamation in Australian local government. On the basis of both theory and empirics, it was argued that amalgamation had seldom achieved its intended aims of enhancing the operational effectiveness of local councils and lowering the costs of service provision. Moreover, even in those instances where some economic gains have been made, this has come at a high price in terms of local representation and the community’s indefinable but nonetheless real sense of ‘loss of place’. A central theme running through the discussion in Chapter 2 stressed the fact that many of the advantages that could flow from larger municipal entities, emphasised by proponents of council consolidation programs, can be realised by less expensive and destructive partnership arrangements between councils, without the harsh social costs that almost inevitably follow from amalgamation programs, especially in non-metropolitan settings. Put differently, a ‘one-size-fits-all’ model of local government reform premised on ‘bigger is always better’ ignores alternative models of local government that can reap economies of scale and scope and administrative capacity, where these are available, whilst retaining vibrant local democracy, maintaining small community neighbourly solidarity, and preserving the psychologically important ‘sense of place’. Chapter 3 takes up this line of argument and outlines three promising alternative models of local government, together with contemporary Australian examples of these three models. Chapter 3 is divided into four main parts. Section 3.2 provides a brief outline of five promising alternative governance models, some of which have already been implemented in Australia. Section 3.3 provides a conceptual stem for considering alternative models of local governance involving structural change and process change more suited to councils in non-metropolitan areas. Section 3.4 seeks to determine which of the models developed by Dollery and Johnson (2005) are the most suitable vehicles for the structural reform in non-metropolitan Australia, with the focus falling on three recent examples drawn from the Riverina Regional Organization of Councils (REROC), the NSW Shires Association (2004) Joint Board model, and the New England Strategic Alliance. The chapter ends with some short concluding remarks on the policy implications of the analysis in section 3.5.
3.2 Alternative Models for Australian Local Government In their taxonomy of generic models of municipal governance specifically adapted to the narrow range of ‘services to property’ characteristic of Australian local government, Dollery and Johnson (2005) identified seven discrete alternative organizational types based on the notion that existing and potential models feasible in the Australian local government milieu can be located along a bipolar continuum given by the degrees to which political and operational control can be centralized or decentralized between local councils and the new organizational entity they join. In this topology, the degree of centralization indicates the extent of concentration of control vested in the new governance structure as opposed to the original small councils that comprise the new arrangement. By contrast, operational control refers to the ability to administer and undertake local service provision and delivery, whereas political control focuses on the capacity to make decisions over the domain and mix of local services.
RAPAD Report
Page 23
We now briefly describe the seven alternative models in the Dollery and Johnson (2005) typology that are located along this continuum:
3.2.1 Existing small councils
Australian local government is characterized by tremendous diversity (Worthington and Dollery 2001) with the considerable constraints imposed by state government legislature. Australian councils nevertheless enjoy a high degree of political autonomy and operational autonomy over their own affairs. Political autonomy is ensured by regular democratic elections and the ratio of elected representatives to voters is comparatively low. Operational autonomy is also ensured since elected councils hire managerial, administrative and other staff, determine the delivery of goods and services within the admittedly constraining parameters of enabling legislation, and decide on how to adjust service delivery to meet changed circumstances. Of course, existing small councils are subject to sharp financial constraints in terms of revenue-raising capacity and limitations on grants from the Commonwealth and state governments. However, these constraints would apply to all other models of Australian local government as well.
3.2.2 Ad hoc resource sharing models
The most limited and flexible alternative to municipal amalgamation resides in voluntary arrangements between geographically adjacent councils to share resources on an ad hoc basis whenever and wherever the perceived need arises. Resource sharing of this kind can encompass a wide range of possibilities, including specialised employees, such as environmental experts, town planners and skilled consultants, capital equipment, like earth-moving machinery and mainframe computing facilities, administrative services, such as information technology systems, and entire operational services, like domestic garbage removal and disposal. The economic imperative to reduce the costs of service delivery in local councils has provided a powerful incentive for municipalities, and especially smaller regional and rural councils, to investigate any potential advantages that may flow from entering into voluntary resource sharing agreements with their neighbours. However, it must be added that cost saving alone has not been the only motive for ad hoc resource sharing. It has also been used to improve the quality of existing services as well as augment the range of current service provision. The ad hoc resource sharing model enjoys several advantages compared with other models. Firstly, it arises spontaneously between volunteering councils, without the need for any centralised legislative change or state government administrative directives. It can thus be expected to embody detailed localized knowledge with the real prospect of genuine cost savings for the councils involved. If this were not the case, adjacent councils would presumably not enter into any ad hoc agreements. Moreover, the inherent flexibility of this kind of agreement means they can be applied to specific projects or to a more general range of activities. Secondly, ad hoc resource sharing arrangements do not compromise the independence of participating councils in any way and thus do not impinge on either democratic representation or citizen participation. Thirdly, where ad hoc resource sharing arrangements do not yield economic benefits, they can be terminated quickly and cheaply through agreement between participating councils. However, ad hoc resource sharing arrangements also have disadvantages. For example, the fact that voluntary agreements can easily be modified or terminated makes them vulnerable to the idiosyncratic characteristics of local governance. Thus the election of new councillors or the employment of a new general manager can disrupt and even destroy the basis for ad hoc agreements because they do not have any solid institutional foundations. Moreover, for the same reason, temporary disputes over the operation of ad hoc arrangements can readily disrupt or even end their operation.
RAPAD Report
Page 24
3.2.3 Regional organizations of councils
Regional Organizations of Councils (ROCs) are voluntary groupings of spatially adjacent councils. They usually consist of between five and fifteen councils, with considerable diversity in both geographic size and population, and are typically financed by a set fee from each member council as well as a pro rata contribution based on rate income, population, or some other proxy for size. ROCs are usually governed by a board consisting of two members from constituent municipalities, normally the mayor and one other representative, characteristically an elected councillor or a general manager, supported by either an administrative structure or specialist committees (Dollery and Marshall 2003). Membership of a ROC confers several potential benefits to participating councils. Firstly, meetings encourage the exchange of common concerns and potential solutions and tend to engender a sense of common destiny. Secondly, joint forums foster the development of common policy positions that may be better informed as a consequence of the combined expertise of member councils. Thirdly, ROCs facilitate the coordination and rationalization of the activities of member councils. Fourthly, ROCs promote cost saving joint purchasing, resource sharing, and other mutually beneficial schemes that may reap economies of scale, economies of scope and enhance capacity. Finally, ROCs can play a critical political role as a regional lobbying group interacting with state and Commonwealth governments (Marshall et al. 2003). However, ROCs also have potential disadvantages. For example, ‘it remains uncertain just what combination of characteristics is necessary to create a high-performing ROC’. For instance, ‘there is no clear mix of such variables as rates income, geographical size, population density, cultural homogeneity, length of time since establishment, or industry type, which might help explain why some ROCs are more successful than others’. It thus seems that ‘the critical attributes which contribute to a successful ROC are the intangible factors of commitment, teamwork, regional vision, trust, openness, communication, leadership, and a willingness to cooperate’ (Marshall and Dollery 2003, p. 244).
3.2.4 Area integration or joint board models
The Shires Association of NSW (2004) developed a ‘joint board model’ of local government that has attracted much interest. The joint board model is based on the retention of autonomous existing councils and their current spatial boundaries, but with a shared administration and operations overseen by a joint board of elected councilors from each of the member municipalities. Member councils retain their political independence, thus preserving existing local democracy, whilst simultaneously merging their administrative staff and resources into a single enlarged bureau, in order to reap any scale economies, scope economies, or other benefits that may derive from a bigger administration. Local government models in the area integration tradition, like the joint board model, rest on two assumptions. Firstly, small councils usually facilitate effective representation, but may not use resources in an efficient manner. Secondly, large municipal authorities are deemed to diminish effective democratic representation and at the same time typically employ resources relatively effectively. In contrast to amalgamation that deals with this trade-off by placing a greater priority on resource efficiency concerns than on questions of representational effectiveness, thus generating bigger local governments, the joint board model seeks to ‘break’ the ostensible trade-off between democracy and efficiency by retaining the desirable democratic characteristics of small councils and agglomerating their separate administrative structures in order to capture purportedly efficiency-enhancing attributes of larger municipal bureaucracies. Thornton (1995, p. 1) argued that this is best achieved by area integration models that sever the ‘traditional connection between physical function and geographical boundary, thus capturing the best of all worlds: functional areas big enough to provide economies of (large) scale for the
RAPAD Report
Page 25
delivery of services and regional coherence, together with political areas small enough to provide intimacy of (small) scale for effective representation and sense of community’. An essential feature of area integration models resides the assumption that each council would largely preserve ownership of its existing assets. Thus, in the joint board variation of this kind of model, ‘each member council would retain ownership of all assets, but over time, assessment of usage would determine economic viabilities with potential to dispose of underutilised assets’ (Shires Association of NSW 2004, p. 7). Nevertheless, according to this conception of an area integration model, ‘transfer of ownership to the Joint Board of assets such as office furniture, equipment, I/T, depots and motor vehicles would be required’. It has been argued that this attribute imbues the model with the decided advantage of reversibility (Thornton 1995): If things go wrong, it is feasible to reinstate the earlier status quo. Additional advantages ascribed to area integration models include ‘increased accountability, public scrutiny and citizen involvement’; ready access to elected representatives; the separation of policy decision making from policy execution; realization of scale and scope economies; social cohesion deriving from small constituent communities; a ‘balance between the social and economic dimensions of municipal governance’; a higher degree of ‘policy coherence’ over a larger spatial area; greater regional participation; a ‘respect for history of communities and preservation of sense of place’; and avoidance of the pooling of reserves and accumulated debts between ‘provident’ and ‘improvident’ member councils (Thornton 1995). Moreover, under the Joint Board model every constituent council would continue to enjoy full autonomy; ‘it would have the power to determine its range of works and services, and to determine its financial plans to provide the necessary funding’ (Shires Association of NSW 2004, p. 7). Area integration models also have potential shortcomings. For instance, organizational complexity would increase substantially and ambiguity might arise over the appropriate institutional site for some decisions with system-wide externalities. Similarly, competing and irreconcilable demands by different member councils can induce conflict. Finally, there exists ‘potential for problems of demarcation and definition between the wide area committee [or joint board] and the integrated local area councils’ (Thornton 1995).
3.2.5 Virtual local governments
The basic model of virtual local government tailored to Australian conditions was developed by Percy Allan (2001) and further refined by Allan (2003), Dollery (2003) and May (2003). The model rests in two fundamental presumptions about Australian local government. Firstly, small councils, with limited populations and a low ratio of elected representatives to constituents, provide superior decision-making units in terms of the appropriateness and effectiveness of service provision since they are ‘closer to the people’. Secondly, drawing on the work of Oakerson (1999) on the relationship between the degree of municipal fragmentation (i.e., the ratio of local government entities to population in given metropolitan areas) and the per capita cost of services, Allan (2001) contends that large councils may enjoy economies of scale in the provision of some, but not all, local public goods and services. Allan (2001, p. 27) concludes that ‘the main lesson to draw from Oakerson’s research is that a distinction should be made between the provision of council services and their production’ since ‘the long held assumption that a council must perform both tasks is wrong’. On the basis of these two assumptions, Allan (2001) argues that it is possible to remove potential trade-offs between council size and council efficiency. This forms the basis for his model of virtual local government that combines the most attractive features of small and large municipalities. Accordingly, ‘if cost efficiency improves for some tasks, but policy appropriateness and service effectiveness deteriorates the bigger a municipality becomes, then an obvious solution is to separate council decision making from council administration’ (Allan 2003, p. 27).
RAPAD Report
Page 26
A virtual council tailored to Australian conditions would thus consist of two main elements. Firstly, relatively small councils would encompass elected councilors and a small permanent secretariat. They would decide on questions of policy formulation and monitor service delivery to determine its effectiveness. In a specific metropolitan area several small adjacent virtual councils would share a common administrative structure or ‘shared service centre’ that would provide the necessary administrative capacity to undertake the policies decided upon by individual councils. Service delivery itself would be contracted out either to private companies or to the service centre depending on the relative costs of service provision and the feasibility of using private firms.
3.2.6 Agency models
Australian local authorities enjoy no constitutional recognition and are thus creatures of their respective state government acts. This means that state governments have final responsibility for efficacious delivery of municipal services. For example, when particular councils ‘fail’ for various reasons, including inept and corrupt conduct or financial incapacity, then the state government in question can intervene by dissolving an elected council and appointing an administrator to run the council for a designated period. In this sense, municipalities are, in effect, service delivery agencies for state governments that possess a high degree of autonomy over a defined range of functions so long as they carry out their allotted responsibilities adequately. Given these features of Australian local government, it is possible to conceive of councils as bearing a principal/agent relationship to state governments, charged with delivering services on behalf of state governments in an efficient manner. Along analogous lines, area health boards are elected bodies that oversee the administration of state-financed health services, without producing the services directly themselves. This conception of the role of councils could be termed the ‘agency model’. Under an agency model, municipalities would surrender completely operational control of the services they direct, but at the same time still enjoy political autonomy as elected bodies for a spatially defined jurisdiction. Thus, all service functions would be run by state government agencies with state government funds and state government employees in the same way as state police forces or state emergency services presently operate. Elected councils would act as advisory bodies to these state agencies charged with determining the specific mix of services over their particular geographical jurisdictions. For instance, domestic waste removal and disposal would be conducted and managed by a state garbage agency, but the actual frequency of garbage removals would be determined by democratically elected councils. With a predetermined ‘global budget’ for a given council area, individual local governments could express the preferences of their voters in determining the mix of services. Thus, less frequent garbage removal could be traded off against more opulent public parks and recreation zones, depending on the decisions of the council. The composition of municipal services would therefore be chosen by the council whereas the production and provision of these services would be carried out by the respective state government agencies. In comparison with virtual local government, agency model municipalities would have even less operational control, but roughly the same degree of political autonomy. At least two advantages of an organizational arrangement of this kind can be identified. In the first place, elected and largely amateur councilors could focus exclusively on ascertaining the tastes and preferences of their constituents, without having to struggle with the complexities of actual service delivery, which would be left in the hands of professional specialist bureaucrats. This would capture the respective comparative advantages of both groups; elected representatives could exploit their skills in local ‘grass roots’ democracy and identify community wants whereas career public servants employ their professional abilities to operate efficient service delivery systems. Secondly, uniformity in the provision of services might be able to reap scale and scope economies, develop technical capacities, synchronize delivery systems, and enjoy considerable purchasing power.

RAPAD Report
Page 27
However, relative to virtual local governments, none of the immense advantages attendant upon competition between prospective service providers, drawn from the private sector, public agencies, and voluntary organizations, would accrue to agency model councils. They would be entirely captive to large state bureaucracies, equivalent to current state education departments or health departments, with a questionable record of cost-effective service delivery.
3.2.7 Amalgamated large councils
The most extreme form of centralization occurs when several small councils are amalgamated into a single large municipality. Under this model, constituent councils surrender completely all political autonomy and operational control to the new entity. We saw in Chapter 2 that the case for amalgamation rests on the proposition that ‘bigger is better’ in local governance since large councils provide services more efficiently and this involves only a negligible tradeoff in terms of less efficacious political representation (Soul 2000). A synopsis of the case for amalgamation has been developed by Katsuyama (2003, p. 2): ‘Proponents of consolidation argue that fewer and larger local governments will be more efficient and effective than many small governments [because] costs can be held down and perhaps reduced through the elimination of duplicative services, personnel, and equipment’. Moreover, ‘larger governments may also be able to take advantage of “economies of scale” or lower per-unit costs for government services’. In addition, ‘a single unified government will be able to coordinate policies and decisions for activities, such as regional planning and economic development, than several independent governments’. With numerous small councils, ‘some services may benefit citizens in adjoining areas who neither pay for the service nor share in the effort involved in its delivery’. Accordingly, ‘“spillover effects” like this will be eliminated when the boundaries of the service area are the same as the boundaries of the taxing jurisdiction’, and thus ‘the tax burdens within communities can be equalized through the creation of governments that more clearly match area needs. An additional argument overlooked by Katsuyama (2003), but much in vogue in the recent NSW amalgamation debate, is the notion that representational costs fall in larger councils since there are fewer elected councillors for a given population (see, for instance, Varden (2003)). The case against amalgamation for Australian local government was also examined in Chapter 2 of this Report. The main arguments were as follows: Firstly, opponents of municipal amalgamation dispute the existence of significant economies of scale, on both theoretical and empirical grounds (Byrnes and Dollery 2002a). In his Merger Mania, Sancton (2000, p. 74) has put this argument in a nutshell: ‘There is no functionally optimal size for municipal government because different municipal activities have quite different optimal areas’. Secondly, it is argued that while economies of scope may be realized, there are cheaper alternative methods of capturing scope economies, like ROCs. Thirdly, although amalgamation may well boost administrative capacity, it can also be acquired by other means at a lower cost. Public choice considerations are advanced to argue that the more effective representation characteristic of small councils enhances information flows between constituents and voters and thus exposes municipal expenditure to more intense scrutiny by ratepayers. As a consequence, small councils typically produce services at lower per capita costs. With numerous exceptions, this position is strongly supported by the weight of empirical evidence. For instance, after a study of the American evidence on this question, Boyne (1998, p. 252) concluded that ‘the broad pattern of evidence suggests that lower spending is a feature of fragmented and deconcentrated local government systems’, whereas ‘consolidated and concentrated tend to be associated with higher spending’. This implies that ‘the technical benefits of large units with big market shares, such as economies of scale and scope, are outweighed by competitive and political costs, such as disincentives toward fiscal migration and problems of scrutiny’. Along similar lines, Sancton (2000, p. 75) argued that ‘the public choice perspective shows us that it is no longer obvious that the existence of many municipalities within the same city-region

RAPAD Report
Page 28
causes wasteful overlap and duplication’. A final critique of amalgamation emphasizes the deleterious impact that it has on the vibrancy of local democracy, with a higher ratio of elected representatives to voters ‘distancing’ councils from their citizens. Given the arguments both for and against amalgamation, it seems fair to that the burden of evidence strongly favours opponents of municipal consolidation. Moreover, the recent pattern of local government failures in Australia appears to support the contention that there is no systematic relationship between council size and council efficiency.
3.3 Structural Change versus Process Change If council amalgamation is flawed as a method of enhancing the efficiency of local government in outside of large Australian capital cities, as we argued in Chapter 2, then how should local government policy makers tackle the problem? One way of examining the problem is to distinguish between structural change and process change as methods of improving the operational efficiency of municipal service delivery. Structural change involves a reorganization of the machinery of local government whereas process change refers to modifications in the methods employed by municipalities. Although it is often very difficult to measure the long-term consequences of either structural change or process change in complex organizations, like local councils, that provide a wide range of services in a milieu that inevitably trades-off economic efficiency against various aspects of representative democracy, there can be little doubt that little doubt that the costs involved in structural change are typically far greater than those associated with process change. The costs involved in structural change include ‘the direct financial costs of reorganization (including the costs of consultants’ reports, departmental submissions, redundancy pay, redeployment and retraining, etc.), the costs of disruption to the ongoing business of government, and the social and psychological costs (including the stresses and strains caused by extra work pressures, job insecurity, the loss of morale, redundancy, etc.) (Boston et al. 1996, p. 88). In the context of regional Australian local government, often afflicted by the tyranny of distance, the planning and management of structural change also impose significant travel costs. Moreover, division and bitterness between residents of different country communities that frequently accompany the amalgamation of regional and rural councils, typically involving the migration of municipal employees from small outlying towns to regional centres cannot be stressed too much. Accordingly, Boston et al. (1996) contend that ‘given that any major reorganization is likely to prove disruptive and costly, that certain teething problems are inevitable, and that a new organization might take a year or more to become fully effective, it is always worth asking whether a proposed structural adjustment is really necessary or whether a change in policy or personnel might not be a better, cheaper, or simpler solution to the identified problem’. This suggests that confronted by a choice between structural solutions or process solutions to a particular problem, such as enhancing the operational efficiency of municipal service delivery, where the eventual outcome is not only difficult to determine ex ante but also problematical to measure ex post, policy makers should avoid structural change unless there are compelling reasons to the contrary. This conclusion is considerably strengthened by the earlier discussion of council amalgamation outcomes in Australia in Chapter 2. After all, as we saw, despite extravagant claims by the advocates of municipal consolidation in South Australia and Victoria on the benefits of structural change, the results have been largely illusory. However, as we shall see, the various alternative models of local governance to council amalgamations in regional and rural Australia almost all involve a combination of
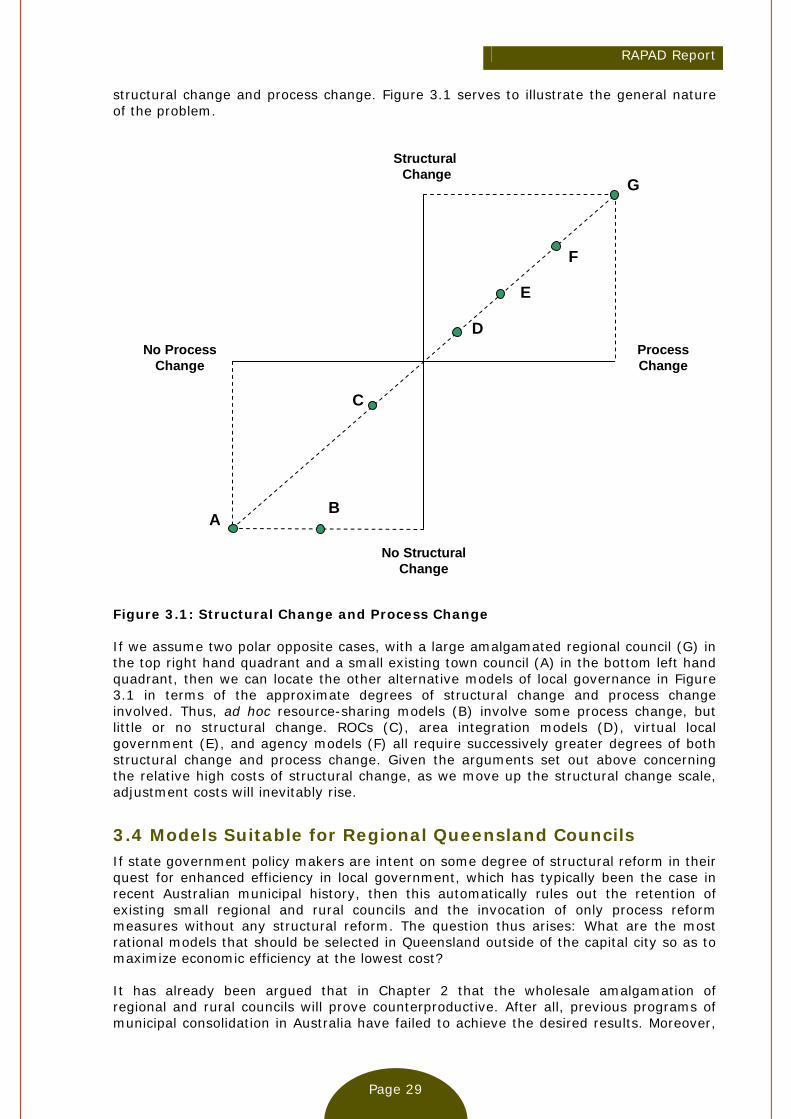
RAPAD Report
Page 29
structural change and process change. Figure 3.1 serves to illustrate the general nature of the problem.
No Structural Change
Structural Change
Process Change
A B
C
D
E
F
G
No Process Change
Figure 3.1: Structural Change and Process Change If we assume two polar opposite cases, with a large amalgamated regional council (G) in the top right hand quadrant and a small existing town council (A) in the bottom left hand quadrant, then we can locate the other alternative models of local governance in Figure 3.1 in terms of the approximate degrees of structural change and process change involved. Thus, ad hoc resource-sharing models (B) involve some process change, but little or no structural change. ROCs (C), area integration models (D), virtual local government (E), and agency models (F) all require successively greater degrees of both structural change and process change. Given the arguments set out above concerning the relative high costs of structural change, as we move up the structural change scale, adjustment costs will inevitably rise.
3.4 Models Suitable for Regional Queensland Councils If state government policy makers are intent on some degree of structural reform in their quest for enhanced efficiency in local government, which has typically been the case in recent Australian municipal history, then this automatically rules out the retention of existing small regional and rural councils and the invocation of only process reform measures without any structural reform. The question thus arises: What are the most rational models that should be selected in Queensland outside of the capital city so as to maximize economic efficiency at the lowest cost? It has already been argued that in Chapter 2 that the wholesale amalgamation of regional and rural councils will prove counterproductive. After all, previous programs of municipal consolidation in Australia have failed to achieve the desired results. Moreover,
RAPAD Report
Page 30
both international experience and the relevant empirical and theoretical literature on the topic offer a bleak prognosis for the success of further structural reform programs in Australia based on municipal amalgamation. Accordingly, given the high transitional costs attendant upon structural reform processes, which of the remaining five models identified by Dollery and Johnson (2005) contain the best prospects for local government reform in regional and rural councils? In the first place, it seems reasonable to remove the agency model from the list of promising candidates. The primary reason for this argument resides in the fact that if state governments assume all the current service provision activities of existing small regional and rural councils, then this will not involve the creation of several entirely new state government departments, but also imply a drastic restructuring of all the municipalities concerned. It need hardly be stressed that this will mean huge transitional costs, with all the associated economic and social costs flowing from such a radical program. Secondly, while the virtual local governance model certainly appears inviting in an urban context, many of the assumptions on which it rests are not met in non-metropolitan areas. For instance, Dollery (2003, p. 86) has shown that the Allan (2001; 2003) model of virtual local municipalities envisaged ‘the creation of a large number of neighbouring local governments within densely populated cities that enjoyed ready access to competing private and public suppliers of local goods and services and were unencumbered by the “tyranny of distance”’. However, ‘the vast Australian continent and significant number of rural and regional councils clearly do not meet these requirements’. Accordingly, a ‘one-size-fits-all’ structural solution to the problems of non-metropolitan councils ‘is simply not feasible, even in terms of prescribed service delivery’, especially in very large state jurisdictions, such as Western Australia, the Northern Territory and Queensland. Three potentially promising models in the Dollery and Johnson (2005) taxonomy remain; ad hoc voluntary arrangements between small councils, ROCs and area integration models. We will now briefly examine each of these possibilities in the light of three actual analyses of alternative models.
3.4.1 Riverina Regional Organization of Councils (REROC)
REROC is located in the Riverina district of southern NSW, comprising 13 local government authorities with a combined population of over 120,000 residents spread across 41,000 square kilometers, with Wagga Wagga is its urban centre. REROC was established in 1994 for the specific purpose of bulk purchasing, but soon expanded to embrace resource sharing, joint policymaking and problem solving. The REROC Board consists of an elected member (usually the mayor) from each member council as well as the general manager. It meets every second month with decisions being taken on a consensual basis and is supported by an Executive Committee that convenes on alternate months to the Board. The Executive Committee, consisting of the Chair of REROC, four mayors and three general managers, establishes general strategic directions. Both REROC’s chief executive officer and secretariat functions are outsourced on a contractual basis. At the beginning of 2004 the secretariat consisted of four full-time personnel. REROC itself does not employ any staff. REROC membership fees are calculated on a combined pro-rata population basis: Fifty per cent of the budget is recovered by dividing the sum across all members evenly with the other 50 per cent being recovered on a per capita basis. The Executive Committee determines the budget for the year. The operations of REROC were comprehensively examined by the University of New England’s Centre for Local Government in Regional Capacity Building: How Effective is REROC? (Dollery et al. 2004) after a study was undertaken over the period October 2003 to March 2004 involving an examination of published sources and substantive interviews with 13 general managers and 13 elected representatives from member councils.
RAPAD Report
Page 31
Regional Capacity Building: How Effective is REROC? argued that the success of REROC could largely be ascribed to the effectiveness of the network structure it had created. REROC had three main ‘formal networks’: Member councils of REROC itself and the various sub-groups and working parties set up to consider particular issues; the broader networks that individual member councils have joined and which extend beyond the confines of the REROC structure; and the regional, state and commonwealth agencies that REROC engages with and associated networks, including the Riverina Regional Development Board, the NSW Department of Youth and Recreation, and the Commonwealth Department of Local Government and Regional Services. Moreover, three important ‘informal networks’ augmented these formal networks: General managers of the member councils; professional officers employed within the member councils networking with colleagues from surrounding municipalities; and mayors. But how effective has REROC been from the perspective of economic efficiency? REROC’s official evaluation of its own performance estimates that it has achieved savings in the order of $4.5 million over the five and a half year period covering 1998 to 2003. These savings have occurred over a variety of activities, including reduced duplication through the common approach to implementing new legislative requirements; joint tendering; regional lobbying; and the co-operative sharing of resources, such as a regional waste officer and shared Road Safety Officers. These estimated savings of $4.5 million represent a total of $360,000 per REROC council member over the five and a half years under review (or some $65,000 per council per year). Dollery et al. (2004) examined the validity of the savings identified by REROC and compared these reported savings against the costs of providing the same services by other comparable local authorities. They contended that these savings are ‘real and measurable and an accurate reflection of the organization’s performance’ (Dollery et al. 2004, p. 12). In general, they concluded that ‘ROCs seem to offer a superior alternative to conventional forms of municipal restructuring, like council amalgamation, since they provide most of the economic and financial benefits with few of the drawbacks’ (Dollery et al. 2004, p. 14).
3.4.2 Joint Board or Area Integration Model
As we have seen, the Shires Association of NSW (2004) advanced the Joint Board model as a response to the NSW state government’s structural reform program aimed at amalgamating numerous regional and rural councils regardless of their individual performance and financial viability. The Joint Board concept thus represents a compromise that seeks to defend the interests of small councils by presenting an economic case for their continued existence as independent democratic organizations, simultaneously acknowledging the NSW state government’s intention to embark on comprehensive structural reform. In order to ‘retain economic local government activity to the fullest extent possible in country areas’, the Shires Association of NSW (2004, p. 2) proposed the Joint Board model based on the continuation of existing councils, but with a shared administration and operations overseen by a joint board of elected councilors from each of the member municipalities. Member councils would thus retain political independence, preserving local democracy, while simultaneously combining administrative staff and resources into a single enlarged organization, and thereby securing scale economies, scope economies, and any other benefits that may flow from a larger administration.
The Joint Board Model represents an outstanding simulation exercise in municipal modelling that will set the standard for similar analyses of Australian local government. The model itself is built on eleven ‘structural considerations’ that define the hypothetical Joint Board council: Three pre-existing councils (X, Y and Z) combine their current administration and operations, with each retaining its original boundaries as well as its autonomy, independence and separate legal status. The number of elected councillors is reduced (and better remunerated), but still elected separately for councils X, Y and Z. An
RAPAD Report
Page 32
‘overarching’ Joint Board (or County Council) is created with its own general manager and attendant staff to run the new entity. Each council still receives its own grant income, rates revenue, and other charges and fees, but contributes to the Joint Board on a pro rata basis. In the early stages, ‘each constituent council would continue to determine its own service standards, policies and planning instruments, but over time, they would be rationalised’. Moreover, ‘each council maintain[s] its Management Plan, Long Term Financial and Rating Plan, but over time the Management Plan [is] consolidated into one document’ (Shires Association of NSW 2004, p.6). In order determine the extent of the savings that could flow from the Joint Board model, analysts from the Centre for Local Government at the University of New England conducted a simulation analysis of data from three hypothetical NSW country councils. With the caveat that ‘savings estimates are likely to vary between groups of councils considering implementing the board model as a result of the diversity among councils and the different methods available for implementing the model’, they nevertheless argued ‘that it would not be unrealistic for a group of local authorities adopting the Joint Board model to achieve savings in excess of 10 per cent pa’ (Dollery and Johnson 2004, p. 10). Following their financial simulations, Dollery and Johnson (2004) drew some general conclusions regarding the Joint Board model. In particular, ‘the Joint Board model itself facilitates a split between the provider of services (i.e., the Joint Board) and the purchasers of services (i.e., the constituent individual councils) and can therefore assist in assessing additional alternative competitive providers that may arise in due course’. Various other advantages are evident: ‘The model is reversible if everything falls apart and there is not sufficient cooperation; predetermined service level agreements can be formed between individual councils and the Board to ensure higher levels of services and to increase accountability; the model has the potential to remove the duplication between the respective councils with the board undertaking common task and functions; it provides the ability to quarantine finances and projects to ensure differential levels of fees, charges, rates, loan borrowings and services that can be maintained without the understandable fear of the largest centre dominating the projects undertaken and being able to relate fees paid to level of service which is not achievable under amalgamation with one budget and management plan; and it yields a regional focus on service where appropriate that is not readily available in smaller council operating individually’(Dollery and Johnson 2004, pp.23-24). Notwithstanding these advantages, Dollery and Johnson (2004) contend that the key to the success of the Joint Board model seems to reside in the ability of the Board and individual councils to cooperate ‘amicably’. If this is lacking, then they foresee severe problems. Other problems identified by Dollery and Johnson (2004, pp. 24-25) were summarised as follows:
Individual council’s set priorities, policy issues, fees and charges, but are at the mercy of the Board to determine the implementation program and to determine respective priorities among the councils; it provides a steeper organisational structure than smaller individual councils; the ability of individual council voters and councillors to influence the activities of the Board may be questionable and thus accountability is further removed; and there is the potential for indirect economic and social costs, like local unemployment and local reductions in economic activity, to intensify if employees are redeployed to the largest council area.
3.4.3 New England Strategic Alliance Model
The New England Strategic Alliance model, in the New England region of northern NSW, which came into being as the result of a political compromise by the NSW state government in its 2003-04 forced amalgamation program, represents an amalgam of various models. It consists of the Armidale Dumaresq Council, the Guyra Shire Council,
RAPAD Report
Page 33
the Uralla Shire Council and the Walcha Shire Council. The Strategic Alliance model has been examined by Dollery et al. (2005a). The key characteristic of the Strategic Alliance model is that each member council maintains its political autonomy as if it was an autonomous municipality, while the employees and resources of all participating councils are pooled, and divided into nineteen functional units that provide services to all of the councils. Each council funds its existing resources, recovering the cost of resources used in the provision of shared services from the other local authorities on an agreed basis, such as hourly rates, transactions processed, equal shares, etc. The model thus seeks to maximize the advantages that a large amalgamated municipality could provide, like enhanced technical capacity and scope economies, simultaneously avoiding the disadvantages associated with big councils, such as the loss of local autonomy and democracy and the inefficient ‘one size fits all’ approach to service delivery, thereby improving decision making by decentralising it to the local level. In this sense, the Strategic Alliance exhibits numerous parallels with current business practice adopted by Qantas, various credit unions and other financial institutions, and more recently by several state governments. The Strategic Alliance model lies between ROCs and area integration models in the Dollery and Johnson (2005) taxonomy, involving substantially more than the ad hoc sharing of resources associated with ROCs, but falling short of creating an additional entity to provide centralized shared administration along the lines of the Joint Board model. The Strategic Alliance model thus alleviates the need for an additional separate political and bureaucratic structure associated with managing this additional entity and its attendant costs. The Strategic Alliance model also exhibits some of the characteristics of Allan’s (2001; 2003) virtual local government with political independence maintained by each council, but many services generated by a ‘shared service centre’. The essential difference between the two concepts is that member councils in the Alliance model keep all existing staff and other resources, and the ‘shared service centre’ represents a virtual centre since it is not a separate entity, but rather existing staff are grouped into functional areas to provide services to all participating members. The retention of existing staff by the individual councils assists in scaling services to ensure their most efficient and effective provision. Put differently, a given service might be provided by each individual council locally, or a service could be provided between two councils, or the services may be provided on behalf of all participating councils. In essence, the model seeks to achieve ‘aggressive reform with local voices’. The Strategic Alliance is not yet settled and it is thus far too early to gauge its effectiveness. Yet the initial indications appear promising. After their initial analysis of the prognosis for the model, Dollery et al. (2005a) have argued as follows:
The Strategic Alliance model has planned to go much further than other comparable cooperative models in pursuit of cost efficiencies. The original goal was to achieve $1.7m in recurrent savings in the short term, and $3.2m in the longer term out of a current combined budget of the four councils of approximately $50m. The areas that were identified as potentially contributing towards the required savings may be termed ‘quick wins’ [i.e. plant utilization, investments, risk management and Geographical Information Systems (GIS)], reduced duplication, works productivity, and streamlined council administration.
3.5 Concluding Remarks This chapter has sought to demonstrate that if state government policymakers are intent on at least some degree of structural reform as part of an overall strategy to improve the efficiency of local government, then two of the generic models contained in the Dollery and Johnson (2005) taxonomy are the best suited for regional and rural Australia; regional organizations of councils and area integration models. The three New South Wales local government examples cited in this chapter necessarily stressed the cost
RAPAD Report
Page 34
savings that they had achieved. However, it must be underlined that structural reform is concerned with efficiency objectives far greater than simply cost savings, usually in terms of improvements in the quality and range of service delivery. It must thus be emphasized that the focus on cost savings in these three examples should not be taken to imply that cost savings should have priority as a criterion to evaluate structural reform. Although Australian municipal reform programs have typically used council amalgamation as their primary policy instrument, it is now clear that this approach has been flawed, especially in non-metropolitan areas dominated by the ‘tyranny of distance’ and other impediments. Other approaches involving fundamental structural change, such as agency models or virtual local government, are also likely to impose prohibitive transitional costs. By contrast, joint board models and regional organizations of council not only provide a better combination of process change and structural change, with lower transformation costs, but also appear better able to accommodate the varied needs of regional and rural municipalities.

RAPAD Report
Page 35
Chapter 4: Shared Services in Local Government
4.1 Introduction For more than a century, structural reform has been the primary policy instrument for enhancing the operational efficiency of Australian local government (Vince 1997). However, in a recent analysis of national and state-based local government inquiries in Australia, Dollery et al. (2007a) have demonstrated that the longstanding Australian consensus on efficacy of amalgamation has finally broken down. The reasons for this seismic shift in policy maker perspectives are manifold, but include a growing disillusionment with the economic and social effects of previous municipal merger programs. The proof of the pudding has indeed been in the eating! An important consequence of this transformation in attitudes has been a change in emphasis away from council consolidation towards shared services as a potentially successful method of improving the operational effectiveness of local government service provision. However, this policy shift has unfortunately not been accompanied by an adequate analysis of the economic basis for shared services, feasible alternative models for shared service arrangements and available empirical evidence on the economic efficacy of shared services, with the partial exception of the now defunct Local Government Association of Queensland (LGAQ) Size, Shape and Sustainability Review Framework as outlined in the Size, Shape and Sustainability: Guidelines Kit (LGAQ 2006). Accordingly, this chapter seeks to remedy this neglect by examining these aspects of the problem. Chapter 4 is comprised of five main sections. Section 4.2 provides a synoptic review of the views of recent national and state-based public inquiries into local government on council cooperation and shared services. Section 4.3 briefly sets out the analytical foundations for shared services. Section 4.4 considers alternative models of local government that could serve as conduits for shared service provision whereas section 4.5 summarizes available empirical evidence on shared services. The chapter ends with some brief concluding remarks in section 4.6.
4.2 Australian Local Government Perspectives on Shared Services Despite the newfound enthusiasm for shared services as a means of enhancing service provision and reducing the costs of service delivery, a disappointing feature of the Australian debate on shared municipal services has been the comparative neglect of the economic and political rationale for a shared service model as opposed to other methods of achieving the same outcome, most notably structural reform in the guise of council amalgamations. However, at least some thought has been directed at this important question in some of the recent state-based inquiries into local government as well as other documents. For instance, a Commonwealth House of Representatives Standing Committee on Economics, Finance and Public Administration (Hawker Report) (2004), entitled Rates and Taxes: A Fair Share for Responsible Local Government, initially set up to investigate the problem of ‘cost-shifting’, briefly considered the potential for shared services in the Australian local government milieu from the perspective of the Commonwealth government. After a review of submissions made to the Committee in Chapter 5, the Hawker Report (2004, p. 97) concluded that ‘the efficiencies of local government can be improved through a mixture of changes that may include partnerships, regional cooperation and/or amalgamations’, although it stressed that ‘one answer does not fit all’. It recommended that the federal government should engage ‘established ROCs and other regional bodies

RAPAD Report
Page 36
which have demonstrated their capacity to be involved in the regional planning and delivery of federal and state government programs’. Secondly, the South Australian Financial Sustainability Review Board (FSRB) (2005) Rising to the Challenge report, while primarily concerned with local government sustainability, nonetheless addressed the shared services question in passing. The South Australian Report (2005, p. 85) contended that cooperation through shared service provision ‘can be a practical and cost-effective way for councils to share experience and resources, tackle common tasks, or take advantage of economies of scale’. It argued that existing ROCs and area integration models represented the best institutional vehicles for this purpose. In addition, the South Australian Report identified seven ‘financial and non-financial benefits for councils working together: Lower ‘staff costs’; ‘access to skills and expertise’; ‘exchange of best practice’; ‘procurement savings’ from scale economies; improved ‘community outcomes’; ‘coordinated services’; and ‘improved compliance with legislation and standards’. Recommended areas for cooperation included ‘many administrative services such as IT, payroll and rate administration’. Thirdly, after questioning the efficacy of council mergers, the wide-ranging New South Wales Independent Inquiry into the Financial Sustainability of Local Government’s (LGI) (2006) Are Councils Sustainable report commissioned work by Byrnes (2005) and Allan (2006) to investigate the types of services most amenable to sharing between councils. In his report, Byrnes (2005) found that in regional and rural councils could feasibly ‘either pool or share service provision on a regional basis’ in ‘fire protection’, ‘emergency services’, ‘health administration and inspection’, ‘noxious plants’, museums’, ‘water and wastewater’, ‘tourism and area promotion’, and ‘saleyards and markets’. Moreover, Allan (2006) identified numerous ‘back office’ and ‘front office’ activities suitable for sharing. In general, the LGI (2006, p. 262) specified the characteristics of local government functions amenable to outsourcing, ‘shared service centres’ or ‘independent specialist providers’. These were ‘low core capability’; ‘high supplier availability’; low task complexity’; high economies of scale; highly ‘specialised technology’; and low asset specificity where a ‘limited term contract does not require a supplier buying an expensive asset’. In a very broad approach to contemporary local government, the LGAQ has developed a now defunct local government reform program embodying a Size, Shape and Sustainability Review Framework, which is outlined in the Size, Shape and Sustainability: Guidelines Kit (LGAQ, 2006). As part of its endeavour, the LGAQ commissioned KM Management Consulting (KMMC) (2005) to consider the problem of shared services. The KMMC Report (2005, p. 2) argued that five major benefits could flow from a shared service arrangement: Scale economies; ‘leveraging of technology investments to achieve cost savings and improved service delivery’; ‘standardisation, consistency and continuous improvement of processes’ to provide improved service provision; ‘achievement of a customer service focus’; and greater concentration on ‘strategic outcomes’. The Report contends that three main institutional vehicles are suitable for shared service provision: A ‘specific shared services centre’; outsourcing; and partnerships with private firms. Four criteria are proposed to identify ‘appropriate’ services for shared delivery: (a) Strategic services requiring expert local knowledge should be retained ‘in-house’; (b) ‘Non-strategic, low-risk, rule-based’ and ‘high volume transaction processing’ services could be shared; (c) Services requiring ‘access to [the] latest technology without ongoing significant capital investment or a requirement for specialist expertise’ could be shared; and (d) services in which expert skills not readily attainable by councils should be garnered through service sharing or outsourcing. The Western Australian Local Government Association’s (WALGA) (2006) Systemic Sustainability Study briefly canvassed the question of shared services. It maintained that ‘there is much greater scope for resource sharing in the Western Australian local government sector’. While it cautioned that claims concerning scale economies may be exaggerated, it nonetheless contended that ‘we see particular advantages to the industry
RAPAD Report
Page 37
of agreed regional pool arrangements for key staff back office services and for some whole-of-region infrastructure services’ (WALGA 2006, p. 68). Finally, at the national level, a PriceWaterhouseCoopers (PWC) (2006) report, entitled the National Financial Sustainability Study of Local Government, commissioned by the Australian Local Government Association (ALGA) considered shared services as a potentially fruitful avenue for improving municipal efficiency. It identified three methods of approaching the problem. Firstly, cooperative cross-council efforts in the areas of ‘bulk purchase or procurement of goods and services’. Secondly, the development of ‘specialised lead service provider’ in groups of councils, where each member local authority specialises in a particular service and contracts its services to other member municipalities. Thirdly, ‘shared corporate services’ with joint ‘back-office’ services, including ‘human resources’, ‘finances’, information technology, and ‘administration’ (PWC 2006, pp. 118-119). These approaches could generate ‘cost savings, productivity improvements and better training for staff’. However, the PWC Report stressed that ‘in remote and regional areas regional service delivery can be limited by large distances between councils’.
4.3 Analytical Foundation for Shared Municipal Services From our synoptic review of recent national and state-based inquiries into contemporary Australian local government, it seems clear that only the NSW LGI (2006) and the now defunct Queensland LGAQ (2006) program paid any attention to the desired attributes of shared council services. While all other reports viewed shared service models in a benevolent light, almost no attention was directed at determining the analytical foundations for this approach to local government service provision. We now briefly consider the essential features this important question. The conceptual case for shared services rests on two main propositions. In the first place, strong equity and efficiency arguments can be made in favour of the continuation of decentralized democratic decision-making in the form of local political autonomy for municipal councils. These arguments are typically subsumed under the generic term ‘subsidiarity’ implying that ‘government powers should be exercised at the lowest level of government possible’ (Bailey 1999, p. 18). Put differently, in equity terms, existing local councils, quintessentially exemplifying democracy at the local level, are legitimate institutions for the political aspirations of small communities and thus represent a justified source of public expenditure. The exact nature of local democracy still requires further qualification. For instance, should we have direct democracy, representative democracy, or some combination of the two? But the answer to these questions does not impinge on the problem of shared services. In efficiency terms, the continued existence of local autonomous councils can also be readily defended using the conventional theory of fiscal federalism (Oates 1972). For example, by means of the well-known decentralization theorem, it easily be demonstrated that spatial variations in community preferences are best accommodated through decentralized decision-making thereby enhancing social welfare. Similarly, local councils are likely to possess superior knowledge of both local demand side and local supply conditions. In addition, Moreover, scholars writing in the tradition of competitive federalism, such as Tiebout (1956) and Breton (1995), as well as public choice theorists, like Boyne (1998), also provide convincing efficiency arguments in favour of the principle of subsidiarity and the concomitant continuity of small local councils. Once we have established the case for the continued existence of small autonomous councils, the second key proposition underpinning the analytical foundations of shared services derives from the pioneering work of Oakerson (1999) in his Governing Local Public Economies. Oakerson (1999, p. 7) drew a fundamental distinction between local service ‘provision’ and local service ‘production’ and demonstrated that different criteria apply to these conceptually different functions. The provision of local services involves

RAPAD Report
Page 38
determining whether to provide a particular service, the regulation of local activities, local revenue raising, the quantity and quality of local services provided, and how these services should be produced. By contrast, production involves the actual creation of a product or the rendering of a service rather than its financial provision. Compared with the services typically delivered by higher tiers of government, Oakerson (1999, p. 15) argued that ‘almost all’ local public goods and services ‘depend upon the availability of specific time-and-place information, such as neighbourhood conditions, to support effective production choices’. This implies that ‘the scale and organization of the production process should allow producers to make locally informed judgments’. If provision is separated from production, it follows that council size and production scale are not necessarily related. Oakerson (1999, pp. 15-16) argued that local public goods and services possessed three characteristics that differentiated them to varying degrees from other goods and services. In the first place, the phenomenon of ‘co-production’ is especially important. Co-production refers to ‘productive efforts of citizen-consumers as an integral part of the production process’ and must thus be distinguished from the ‘citizen-voter’ role of residents in service provision. In this role, citizens act as the ‘eyes-and-ears’ of local councils and their willing participation is therefore essential to the quality of service delivery. Secondly, Oakerson (1999) draws a distinction between ‘local public goods’ and ‘local public services’. Local public goods are usually capital-intensive and thus often exhibit economies of scale, as perhaps best exemplified by water and wastewater systems. By contrast, local public services, like development approvals and public toilet maintenance, are typically labour-intensive and scale economies are quickly exhausted. In general, economies of scale thus differ widely between different municipal activities. In his Merger Mania, Andrew Sancton (2000, p. 74) encapsulated the main implication of these observations by noting that ‘there is no functionally optimal size for municipal government because different municipal activities have different optimal areas’. At a more detailed level, Oakerson (1999, p. 16) shows that in an analogous fashion to large differences in scale economies between different goods and services, ‘much different economies may also be involved in increasing the level of production per capita as opposed to extending the same level of production per capita to a larger population’. These considerations have significant consequences for the organization of production. Thirdly, coordination or management costs also play a crucial role in the way in which production should be tackled. Oakerson (1999, p. 16) summarized this characteristic of local goods and services as follows:
The production and delivery of goods and services can be broken down into a large number of components, distinguishing direct service components delivered to citizens from various support-service components to direct service producers. Each component may be associated with a different economy of scale (although services typically exhibit constant returns over a broad range). Yet different components of service production require coordination to varying degrees. Coordination is costly, mainly in terms of time and effort devoted to transactions.
These transactions costs thus serve to limit the number of separate production entities within a council as well as the number of separate services. Accordingly, the optimal number of production units depends on the trade-off between scale economies and coordination economies. The conceptual separation of provision from production allows for choice between different vehicles for actually producing services. Oakerson (1999, pp. 17-18) has identified seven generic possibilities for linking provision with production:
RAPAD Report
Page 39
(a) ‘In-house production’ occurs where a local council arranges its own production. For example, an individual council organizes its own production units along traditional grounds;
(b) ‘Coordinated production’ takes place where councils coordinate production activities. For instance, the health inspection departments of two adjoining councils cooperate on activities affecting both jurisdictions;
(c) ‘Joint production’ where two adjacent councils organize a single production unit as in, say, joint rates processing;
(d) ‘Intergovernmental contracting’ takes the form of one council contracting services from another council or state or federal government agency;
(e) ‘Private contracting’ where a private firm undertakes production for a council; (f) ‘Franchising’ where a council gives a commercial producer the exclusive right to
produce a given service from which residents can purchase the service; and (g) ‘Vouchering’ where a council sets standards and the level of provision, but allows
households to select their own producer using a voucher. Shared services in their purest form are represented by option (c). However, other possibilities may also be considered more broadly to fall under the generic rubric of shared services. For example, option (b) represents a ‘weak’ form of shared service; option (d) can also be defined as a shared service model where a group of councils jointly contract with a state government agency; option (e) is much the same where a constellation of councils deal with the same private firm in a joint contract; and a similar arguments can be applied to option (f) and option (g) provided joint arrangements are made. The next obvious question concerns the characteristics of local goods and services that lend themselves to a shared service model. Drawing on seminal work by Percy Allan (2001; 2003), as we have seen, the NSW LGI (2006) identified the characteristics of services suitable for a shared service arrangement as follows: ‘Low core capability’ of councils; ‘high supplier availability’; low task complexity’; substantial scale economies; ‘specialized technology’; and ‘low asset specificity’. We now consider each of these elements in turn: Low core capability: ‘Core capability’ refers to the ‘steering’ and not ‘rowing’ capabilities of local councils and includes ‘community consultation, policy planning, general governance, service monitoring, regulating private activity and funding public purposes’ and not the actual ‘production and delivery of services’ (Allan 2001, p. 39). It is commonly argued that without core capability local councils cannot adequately discharge their statutory responsibilities. Even where core capability is ceded to a shared service centre, this still carries the danger that in the event of the unsatisfactory performance, or even collapse, of a shared service arrangement with other like-minded councils, a given council will be able to evaluate the problem, extricate itself and continue functioning. Accordingly, core capabilities should only be relinquished with extreme care. It follows that low core capabilities should be shared first. High supplier availability: Allan (2001, p. 40) considered ‘supplier availability’ as a criterion for deciding on whether or not to outsource a specific local council function and concluded that the ‘competitiveness of the tender’ represented the crucial issue. Tender competitiveness in turn depended on whether ‘there are a large number of potential contractors with the experience, skills and equipment to meet the specific needs of the council’. If these attributes are not present, as we may expect in many regional, rural and remote areas, then outsourcing was unlikely to succeed. However, a shared service arrangement may still be possible through either resource sharing or the establishment of a joint shared service centre, provided the requisite ‘experience, skills and equipment’ could be found.
RAPAD Report
Page 40
Low task complexity: The question of task complexity is also an important consideration for either outsourcing or shared service arrangements. Allan (2001, p. 40) argued that ‘complex tasks are difficult to monitor, hard to measure for inputs and require unique expertise to monitor’ and are therefore unsuitable to outsourcing. However, since it is precisely these attributes that make complex tasks comparatively expensive to perform, ‘task complexity’ in itself should not rule out shared service arrangements. Substantial scale economies: Allan (2001, p. 40) contends that scale economies are typically associated with ‘specialized products and services that are mass produced and highly standardized’. Byrnes and Dollery (2002a) have demonstrated that the existence or otherwise of significant scale economies is difficult to establish and evidence on the matter is mixed for Australian local government. However, as we have seen, Allan (2006) has identified several ‘back office’ and ‘front office’ activities that promise substantial scale economies and thus represent good candidates for shared service models. Specialized technology: Information technology represent a quintessential and ubiquitous type of specialized applied technology in local government. The costs involved in acquiring IT hardware and software and subsequently maintaining, upgrading and operating this equipment are substantial. Since capital costs are high, IT thus constitutes perhaps the best example of a service suited to shared service arrangements. Low asset specificity: Allan (2001, p. 40) has argued that ‘where a task requires an expensive and specific asset it may be more cost effective for the council to provide the asset than require a contractor to invest in something that may outlive its contractual life’. However, for precisely these same reasons, shared service models may be suitable. Allan (2001, p. 46) has drawn the following conclusion to his analysis of shared service models:
In the context of local government there is no reason to why most core community services (e.g. road maintenance, garbage collection, town planning, recreation facilities and welfare relief services), in addition to backroom support services (e.g. finance, IT, HR) could not be delivered or arranged by a central administration unit owned and controlled by several councils.
However, Allan (2001) added two caveats to this general conclusion: (a) Individual councils must negotiate performance agreements with a shared service centre that stipulate specific rights and obligations; and (b) a shared service centre must be governed by a board of directors representing each of the participating councils. While numerous Australian local councils have established various types of shared service centres, unfortunately these have been largely neglected in the debate on the topic. However, an embryonic literature does exist which includes the New England Regional Alliance of Councils (NERAC) (Dollery et al. 2005a), joint board models (Dollery and Johnson 2007), the Walkerville model (Dollery and Byrnes 2005), the Gilgandra model (Dollery et al. 2006d) and the Riverina East Regional Organization of Councils (REROC) (Dollery et al. 2005b). This literature provides useful ‘case studies’ of shared service models.
4.4 Alternative Shared Services Models As we have seen in Chapter 3, two theoretical efforts aimed at classifying Australian local governance in terms of generic municipal models have been developed. In the first place, the LGAQ (2005, p. 15) advanced a typology that distinguishes between four different conceptual models of local government reform: ‘Merger/amalgamation’ involving the consolidation of small councils into a larger municipal entity; ‘significant boundary change’ that involves the re-delimitation of local government jurisdictions; ‘resource sharing through service agreements’ involving one local council undertaking specific

RAPAD Report
Page 41
functions for other partner councils; and ‘resource sharing thorough joint enterprise’, where a group of municipalities combines to perform a given service function. Secondly, Dollery and Johnson (2005) have developed a taxonomic classification of alternative models of municipal governance specifically adapted to the narrow range of ‘services to property’ characteristic of Australian local government. The conceptual basis for this typology rests on the proposition that existing and potential models feasible in the Australian local government milieu can be located along a bipolar continuum given by the degrees to which political and operational control can be centralized or decentralized between local councils and the new organizational entity they join. In terms of this system, operational control refers to the ability to administer and undertake local service provision and delivery, whereas political control focuses on the capacity to make decisions over the domain and mix of local services. On the other hand, the degree of centralization indicates the extent of concentration of control vested in the new governance structure as opposed to the original small councils that comprise the new arrangement. As we have seen in Chapter 3, the Dollery and Johnson (2005) typology comprised seven alternative models of local governance. Firstly, existing small councils possess the most operational and political autonomy as well as highest degree of decentralization within the constraints of their respective state government acts and are thus located at one end of the continuum. Secondly, the next most autonomous and decentralized model resides in voluntary arrangements between geographically adjacent councils to share resources on an ad hoc basis whenever and wherever the perceived need arises (Ernst and Young 1993; Dollery et al. 2006c). Thirdly, Regional Organizations of Councils (ROCs) (Dollery et al. 2005b) constitute a formalization of the ad hoc resource sharing model, typically financed by a fee levied on each member council as well as a pro rata contribution based on rate income, population, or some other proxy for size, which provides shared services to member councils. Fourthly, area integration or joint board models retain autonomous existing councils with their current boundaries, but create a shared administration overseen by a joint board of elected councillors (Thornton 1995; Shires Association of NSW 2004; Dollery and Johnson 2007). Fifthly, virtual local government (Allan 2001; 2003; Dollery 2003; May 2003) consists of several small adjacent ‘virtual’ councils with a common administrative structure or ‘shared service centre’ that would provide the necessary administrative capacity to undertake the policies decided upon by individual councils, with service delivery itself contracted out either to private companies or to the shared service centre depending on the relative costs of service provision and the feasibility of using private firms. The sixth model in the Dollery and Johnson (2005) system is the agency model in which all service functions are run by state government agencies with state government funds and state government employees in the same way as state police forces or state emergency services presently operate. Elected councils would act as advisory bodies to these state agencies charged with determining the specific mix of services over their particular geographical jurisdictions (Dollery et al. 2006c). Finally, the most extreme form of centralization occurs when several small councils are amalgamated into a single large municipality. Under amalgamation, constituent councils surrender completely all political autonomy and operational control to the new entity and cease to exist (Dollery et al. 2006c). Both the LGAQ (2005) typology and the more finely calibrated Dollery and Johnson (2005) taxonomy represent useful conceptual tools for scholars of Australian local government. It is possible to locate shared services within these typologies. For example, under the LGAQ (2005) typology, shared service in its purest form takes place in the form of ‘resource sharing through service agreements’ and ‘resource sharing thorough joint enterprise’. By contrast, under the Dollery and Johnson (2005) taxonomy ad hoc resource sharing models, ROCs, area integration models, virtual local councils and agency models all represent institutional vehicles for accommodating shared services to a greater or lesser degree.
RAPAD Report
Page 42
4.5 Empirical Evidence An additional unfortunate feature of the Australian debate on shared services in local government has been the paucity of work directed at establishing the empirical outcomes of shared service models in actual practice. At present, only one comprehensive study has been undertaken as part of the now defunct LGAQ (2006) Size, Shape and Sustainability Review Framework in the form of a commissioned report by KMMC (2005). On the basis of its review of both Australian and international evidence on the economic consequences of the implementation of shared services, the KMMC Report (2005, p. 12) concluded that ‘the overwhelming evidence locally and internationally is that there are cost/performance gains to be achieved through shared services’, but cautioned that the establishment of a shared service centre generally requires a significant up-front investment’ (KMMC 2005, p. 13). It identified the following local service functions that could successfully be produced by means of a shared service model: Information technology; procurement; human resources; finance; call centres; and ‘rates/billing’. However, these sentiments were qualified with the caveat that none of these functions ‘has any greater advantage in being delivered on a regional basis than a state or national basis’ (KMMC 2005, p. 12). In addition, the KMMC Report (2005, p. 12) observed that the ‘services most suited to being delivered on a regional basis are those that are related to regional operational service delivery’, with ‘obvious contenders’ including ‘water, sewerage, planning, building and economic development’; engineering services, such as road construction, ‘general construction’, and parks and gardens maintenance; and ‘co-ordination of all services associated with urban development, like waste collection, roads, drainage and sewerage services. Finally, in order to secure the full economic advantages from shared services, their implementation should be accompanied by (a) the use of ‘standard technology’; (b) best-practice processes; and (c) the inculcation of a ‘service culture’. However, the KMMC Report (2005) is deficient in several respects. In the first place, the authors frequently and erroneously confuse the entirely separate concepts of scale economies and shared services. In fact, shared services represent only one of a number of ways of reaping economies of scale. For instance, amalgamation is an alternative to shared service arrangements, which has proved to be less than successful in the Australian context. Moreover, shared services may bring many other benefits in addition to cost savings induced through scale economies. Secondly, many references cited in the KMMC Report (2005) do not provide any actual empirical evidence on the success of implementation of shared services, but rather simply assert desirable outcomes. Thirdly, it is implicitly assumed that demonstrated benefits of shared services in private firms and central government agencies will automatically extend to the local services provided by local councils. This ‘leap of faith’ may not be warranted. Finally, this confusion extends to the conclusion the Report draws on the candidate services suggested for shared services arrangements. It is thus important to establish more accurate picture of available Australian and international evidence on the economic effects of shared services. Table 4.1 provides a synoptic review of ‘hard’ evidence on shared local services in Australia whereas Table 4.2 contains a summary of analogous international evidence.
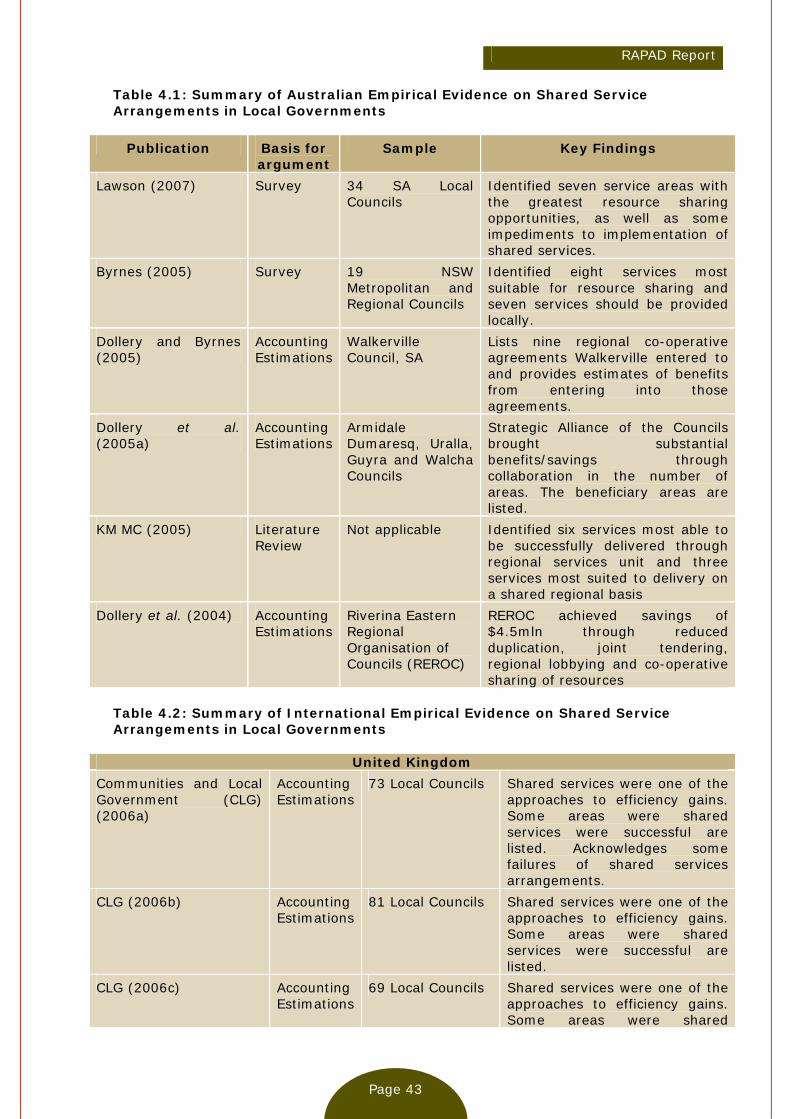
RAPAD Report
Page 43
Table 4.1: Summary of Australian Empirical Evidence on Shared Service Arrangements in Local Governments
Publication Basis for argument
Sample Key Findings
Lawson (2007) Survey 34 SA Local Councils
Identified seven service areas with the greatest resource sharing opportunities, as well as some impediments to implementation of shared services.
Byrnes (2005) Survey 19 NSW Metropolitan and Regional Councils
Identified eight services most suitable for resource sharing and seven services should be provided locally.
Dollery and Byrnes (2005)
Accounting Estimations
Walkerville Council, SA
Lists nine regional co-operative agreements Walkerville entered to and provides estimates of benefits from entering into those agreements.
Dollery et al. (2005a)
Accounting Estimations
Armidale Dumaresq, Uralla, Guyra and Walcha Councils
Strategic Alliance of the Councils brought substantial benefits/savings through collaboration in the number of areas. The beneficiary areas are listed.
KM MC (2005) Literature Review
Not applicable Identified six services most able to be successfully delivered through regional services unit and three services most suited to delivery on a shared regional basis
Dollery et al. (2004) Accounting Estimations
Riverina Eastern Regional Organisation of Councils (REROC)
REROC achieved savings of $4.5mln through reduced duplication, joint tendering, regional lobbying and co-operative sharing of resources
Table 4.2: Summary of International Empirical Evidence on Shared Service Arrangements in Local Governments
United Kingdom Communities and Local Government (CLG) (2006a)
Accounting Estimations
73 Local Councils Shared services were one of the approaches to efficiency gains. Some areas were shared services were successful are listed. Acknowledges some failures of shared services arrangements.
CLG (2006b) Accounting Estimations
81 Local Councils Shared services were one of the approaches to efficiency gains. Some areas were shared services were successful are listed.
CLG (2006c) Accounting Estimations
69 Local Councils Shared services were one of the approaches to efficiency gains. Some areas were shared
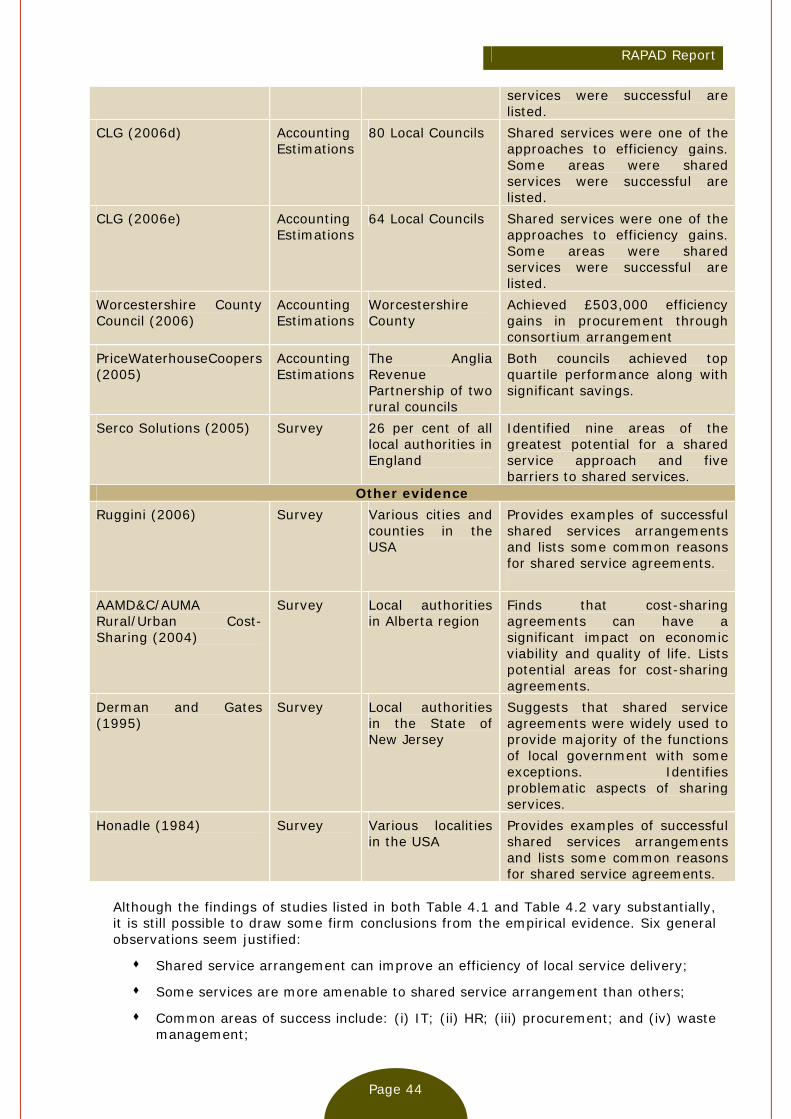
RAPAD Report
Page 44
services were successful are listed.
CLG (2006d) Accounting Estimations
80 Local Councils Shared services were one of the approaches to efficiency gains. Some areas were shared services were successful are listed.
CLG (2006e) Accounting Estimations
64 Local Councils Shared services were one of the approaches to efficiency gains. Some areas were shared services were successful are listed.
Worcestershire County Council (2006)
Accounting Estimations
Worcestershire County
Achieved £503,000 efficiency gains in procurement through consortium arrangement
PriceWaterhouseCoopers (2005)
Accounting Estimations
The Anglia Revenue Partnership of two rural councils
Both councils achieved top quartile performance along with significant savings.
Serco Solutions (2005) Survey 26 per cent of all local authorities in England
Identified nine areas of the greatest potential for a shared service approach and five barriers to shared services.
Other evidence Ruggini (2006) Survey Various cities and
counties in the USA
Provides examples of successful shared services arrangements and lists some common reasons for shared service agreements.
AAMD&C/AUMA Rural/Urban Cost-Sharing (2004)
Survey Local authorities in Alberta region
Finds that cost-sharing agreements can have a significant impact on economic viability and quality of life. Lists potential areas for cost-sharing agreements.
Derman and Gates (1995)
Survey Local authorities in the State of New Jersey
Suggests that shared service agreements were widely used to provide majority of the functions of local government with some exceptions. Identifies problematic aspects of sharing services.
Honadle (1984) Survey Various localities in the USA
Provides examples of successful shared services arrangements and lists some common reasons for shared service agreements.
Although the findings of studies listed in both Table 4.1 and Table 4.2 vary substantially, it is still possible to draw some firm conclusions from the empirical evidence. Six general observations seem justified:
Shared service arrangement can improve an efficiency of local service delivery;
Some services are more amenable to shared service arrangement than others;
Common areas of success include: (i) IT; (ii) HR; (iii) procurement; and (iv) waste management;

RAPAD Report
Page 45
However, even in these promising service areas, the degree of success varies dramatically from case to case;
There are identifiable barriers to the implementation of shared service arrangements, which are difficult to overcome; and
Common barriers to shared services include: (i) loss of ‘municipal identity’; (ii) complexity of the process; (iii) conflicting objectives; and (iv) uncertain benefits.
4.6 Concluding Remarks This chapter has sought to provide a preliminary attempt at remedying the neglect of shared services that has come to characterize the Australian debate on shared service provision arrangements. We have shown that it is possible to establish an analytical framework for the economic appraisal of shared services that hinges on the distinction drawn by Oakerson (1999) between service provision and service production in contemporary local government. Moreover, judicious application of the Allan (2001) attributes of municipal services has allowed us to identify potentially fruitful candidates for shared service delivery. In addition, both the LGAQ typology and the Dollery and Johnson (2005) taxonomy of alternative models of Australian local government yield insights into how shared services could be developed in practice. However, the prospect that shared services can indeed generate substantial cost savings and enhanced service provision depends critically on available empirical evidence. Chapter 4 thus also attempted to provide a preliminary synoptic review of Australian and international evidence that could shed light on the potential benefits and costs of shared services. In common with much other policy analysis of real-world arrangements, we are obliged to draw the modest conclusion that while the thoughtful selection and application of shared service arrangements would almost certainly induce cost savings, it would not by itself solve the acute problems of financial sustainability confronting a majority of Australian local councils.

RAPAD Report
Page 46
Part B: Local Government Sustainability
Chapter 5: Financial Sustainability
5.1 Introduction As we have seen in Part A of this report, the last two decades of the twentieth century witnessed strong concern over the operational effectiveness of Australian local government. Policy measures to address this concern rested primarily on structural reform, particularly in New South Wales, South Australia, Tasmania and Victoria, but also included redrafted Local Government Acts in all jurisdictions, the application of New Public Management techniques to most local councils, and performance monitoring by state Departments of Local Government. The new century has seen a shift in the fulcrum of concern to the question of local council sustainability, especially financial sustainability, in the light of an apparently deepening financial crisis in Australian local government. As we saw in Chapter 2, the first official indication of this shift in emphasis came in the form of the landmark Commonwealth Grants Commission (CGC 2001) report into the underlying causes of financial distress. This report was followed by a Commonwealth House of Representatives Standing Committee on Economics, Finance and Public Administration (Hawker Report) (2004), entitled Rates and Taxes: A Fair Share for Responsible Local Government, initially set up to investigate the problem of ‘cost-shifting’, but subsequently broadened to consider virtually the entire spectrum of Australian local government activity, including sustainability. In addition to these federal government investigations, several state-based inquiries initiated by state local government associations have ensued. For instance, the South Australian Financial Sustainability Review Board’s (2005) Rising to the Challenge report attempted to define the concept of financial sustainability and then assess South Australian councils against this measure. Similarly, the Independent Inquiry into the Financial Sustainability of NSW Local Government’s (2006) produced a comprehensive Final Report entitled Are Councils Sustainable that also sought to determine financial sustainability in NSW local government. The Western Australian Local Government Association’s (WALGA) (2006) Systemic Sustainability Study: In Your Hands - Shaping the Future of Local Government in Western Australia Inquiry grappled with financial sustainability in its local government system. Finally, the Local Government Association of Tasmania’s (LGAT) (2007) A Review of the Financial Sustainability of Local Government in Tasmania considered financial sustainability in that state. At the national level, the Australian Local Government Association (ALGA) commissioned a report which was undertaken by the commercial company PriceWaterhouseCoopers (PWC) (2006), entitled the National Financial Sustainability Study of Local Government, which considered the problem of financial sustainability in local government across the nation. These deliberations were augmented by the Local Government National Report, 2004-05, prepared by the Local Government Section of the Department of Transport and Regional Services (DOTARS) (2006), which highlighted the significance now placed long-run financial sustainability by state government policy makers by considering the notion of a ‘structural gap’ induced by ‘the unbalanced growth of revenues and expenditures’ that results in fiscal distress in local government. Finally, an embryonic but growing academic literature has arisen on the problems confronting Australian local councils. This literature has three main strands. In the first

RAPAD Report
Page 47
place, scholars have critically examined the appropriateness of the methods adopted in the state-based inquiries and the PWC (2006) report and advanced broader definitions of sustainability in local government (Dollery et al. 2006b; Dollery and Crase 2006). Secondly, the predictive capacity of performance monitoring of local council outcomes has been assessed (see Murray and Dollery 2005; 2006; Walker and Jones 2006; and Dollery 2006). Thirdly, scholars have considered the problem of ‘local government failure’ and developed a taxonomic approach to its causes (see, for example, Dollery and Wallis 2001; Byrnes and Dollery 2002b). In Chapter 5, we provide a brief synoptic review of these various approaches to the question of local government sustainability. In essence, we argue that while much has been learned about the causes of the current financial crisis in Australian local government, operational methods of defining and measuring sustainability, and the shortcomings of these methods, a comprehensive conceptual framework for developing remedial policy is still incomplete. An important reason for this deficiency in the literature on Australian local government sustainability seems to be the excessive emphasis that many analysts have accorded financial sustainability to the exclusion of other forms of sustainability (Dollery et al. 2006b). This is problematic because observed council ‘failures’ in real-world Australian local government jurisdictions are often due to non-financial factors, most frequently conflict-riddled elected councils and concomitant policy deadlock. One way of approaching the design of a comprehensive conceptual framework for analysing the question of local government sustainability is to invoke the methodology developed in welfare economics. The famous market failure paradigm has long served as a fruitful technique for diagnosing the ills of competitive markets and an analogous conceptual framework in the form of the theory of government failure has performed essentially the same role in the analysis of public sector organisations (see, for example, Wallis and Dollery 1999). This approach has already been employed in the literature on Australian local government by Byrnes and Dollery (2002b) but – as we shall see – their taxonomy of local government failure suffered from the principal defect that it focused exclusively on the ‘internal’ workings of local councils, without considering the external environment. What is therefore required is a typology of local government sustainability that simultaneously embraces both internal factors and external forces that impinge on the long-run sustainability of municipal authorities. A taxonomy of this kind could prove most useful in not only diagnosing the problems of contemporary Australian local government, but also in developing a prognosis and possible policy remediation. In Chapter 5, we thus attempt to construct a typology of the sources of local council sustainability. Chapter 5 is divided into four main sections. Section 5.2 critically examines the CGC (2001) report, the Hawker Report (2004), the various state-based inquiries and the PWC (2006) national report. Section 5.3 considers salient aspects of the embryonic Australian academic literature on sustainability. Section 5.4 develops a typology of local government sustainability using stylized empirical characteristics of Australian local councils. Chapter 5 ends in section 5.5 with some brief observations on the implications of the taxonomy for Queensland local government.
5.2 Official Approaches to Local Government Sustainability The genesis of contemporary concern with local government sustainability in Australia can be traced back to the Commonwealth Grants Commission (CGC 2001) annual report Review of the Operation of Local Government (Financial Assistance) Act 1995. As we have seen in Chapter 2, in this pioneering document, the CGC (2001, pp. 52-53) identified five main reasons for the acute level of financial stress faced by many local authorities, especially in non-metropolitan areas. These factors include the devolution of responsibility for service delivery from higher tiers of government; ‘cost-shifting’;
RAPAD Report
Page 48
increasing the complexity and standard of local government services by state governments; ‘raised community expectations’ of municipal services; and ‘policy choice’ involving the voluntary improvement and expansion of municipal services. This analysis is by no means complete. For example, as Johnson (2003) has observed, the CGC list does not include the fact that local councils have also added to these financial problems by artificially holding their rates and charges at unsustainably low levels. The CGC (2001) list also ignores ‘internal’ governance and management factors that are potentially crucial. Nevertheless, the CGC report did serve to lay the foundations for subsequent investigations into local government sustainability. Although originally intended to focus exclusively on the problem of cost-shifting, the Hawker Report (2004) Rates and Taxes: A Fair Share for Responsible Local Government steadily added to its terms of reference and eventually considered almost the entire spectrum of local government activity. Rates and Taxes ultimately consisted of six substantive chapters dealing with the roles and responsibilities of Australian local government, cost shifting, the maintenance of municipal infrastructure, capacity building, including performance monitoring and structural reform, the funding of local government, and the question of inter-governmental financial relations and the need for a ‘Summit’ respectively. The Final Report contained eighteen specific recommendations dealing with ‘roles and responsibilities’ (three recommendations), ‘cost shifting’ (five recommendations), ‘infrastructure’ (two recommendations), ‘capacity building in our regions’ (four recommendations), ‘Commonwealth funding of local government’ (two recommendations), and the ‘way forward’ (two recommendations). Characterised by a singular lack of original research and reliant solely on submissions by interested bodies for its information, the Hawker Report nonetheless reiterated many of the concerns raised in the CGC (2001) report and thereby added impetus to the growing awareness of financial distress in Australian local government. However, the chief methodological underpinnings of the contemporary emphasis on financial sustainability came in the form of the South Australian Financial Sustainability Review Board (FSRB) (2005) Rising to the Challenge report. This document embodied the ‘accounting’ approach to local government sustainability developed by Access Economics that undertook the primary research for the report. It can thus be considered together with the Independent Inquiry into the Financial Sustainability of NSW Local Government’s (LGI) (2006) Are Councils Sustainable, the Western Australian Local Government Association’s (WALGA) (2006) Systemic Sustainability Study and the Local Government Association of Tasmania’s (LGAT) (2007) A Review of the Financial Sustainability of Local Government in Tasmania since these reports also employed Access Economics, which prepared essentially the same accounting analysis of their respective local government systems (see Access Economics 2006a; 2006b). In essence, all four inquiries adopted the approach of first proposed in the FRSB (2005, p. 10) report that proposed the following definition of financial sustainability in local government:
A council’s long-term financial performance and position is sustainable where: (i) continuation of the council’s present spending and funding policies; (ii) likely developments in the council’s revenue-raising capacity and the demand for and costs of its services and infrastructure; and (iii) normal financial risks and financial shocks, altogether are unlikely to necessitate substantial increases in council rates (or, alternatively, disruptive service cuts).
This measure of financial sustainability has serious shortcomings. For example, it does not place sufficient weight on the ‘external’ environment in which local authorities operate; no account is taken of demographic trends, distance, population composition, topographical factors, and the like, all of which are ‘non-discretionary’ in the sense that

RAPAD Report
Page 49
individual councils have no control over these forces (Worthington and Dollery 2000). In addition, internal governance and management are neglected, except indirectly in the form of adequate asset management. At the national level, the PriceWaterhouseCoopers (PWC) (2006) National Financial Sustainability Study of Local Government report was commissioned by the Australian Local Government Association to determine ‘key financial issues’ affecting financial sustainability and develop recommendations for improving sustainability. Three main problems prevented the PWC (2006, pp. 6-7) from using a common sustainability index across all Australian councils: ‘Mixed approaches to measuring and recording financial data’ and ‘inconsistencies between states’; ‘infrequent’ asset valuations and differences in assumed asset lives; and ‘incomplete’ financial and asset management records, especially in smaller councils. These problems obliged the PWC report to adopt two techniques in their assessment of financial. Firstly, the PWC applied financial ratio analysis to a sample of 100 local councils appropriately weighted by state and stratified in proportion to the number of councils in each of the DOTARS seven categories. Secondly, PWC ‘extrapolated’ from the Access Economics and Municipal Association of Victoria (MAV) (2005) approaches in the FSRB (2005), LGI (2006) and WALGA (2006) state inquiries and the MAV ‘viability index’. The PWC (2006, p. 95) defined ‘financial sustainability’ as follows: ‘The financial sustainability of a council is determined by its ability to manage expected financial requirements and financial risks and shocks over the long term without the use of disruptive revenue or expenditure measures’. This definition involved two elements: Councils should maintain ‘healthy finances’, given current expenditure and revenue policies and foreseeable future developments; and councils must ensure infrastructure expenditure ‘matches’ asset planning. It is evident that this approach is very similar to the Access Economics methodology underlying the SA, NSW and WA inquiries and accordingly suffers from the same shortcomings.
5.3 Academic Approaches to Local Government Sustainability We have already observed that a small but growing academic literature exists on the problems confronting Australian local councils with three main strands. In the first place, scholars have critically examined the methods adopted in the state-based inquiries and the PWC (2006) report and advanced broader definitions of sustainability in local government (see Dollery et al. 2006b; Dollery and Crase 2006). The major conclusions from this exploratory work have already been considered above and essentially amount to a claim that the accounting approach to sustainability is too narrow. Secondly, a literature has been constructed on the predictive capacity of Key Performance Indicators (KPIs) for diagnosing local council unsustainability used by the Department of Local Government in NSW and mutatis mutandum other Australian local government jurisdictions (see Woodbury et al. 2003). For example, Murray and Dollery (2006, p. 59) explored the basis of performance appraisal in NSW and the approach used to classify individual councils as ‘at risk’. They concluded that:
Monitoring lists within NSW are created through an analysis of financial and corporate results, which at best can be described as a measure of financial soundness. However, the present construction methods provide little to indicate that an adequate analysis has occurred. It seems that the monitoring lists are being constructed on a primarily subjective basis. Moreover, as a means of attributing financial soundness or otherwise to councils, the present monitoring lists must be treated with a considerable degree of caution. This is due in part to councils lacking control over their own revenue levels owing to rate capping and the application of restrictive regulations and statutes over user charges and fees.
RAPAD Report
Page 50
In addition, Murray and Dollery (2005) explored the manner in which NSW local councils are assessed by the NSW Department of Local Government and identified as either ‘at risk’ or not ‘at risk’. They argued that the Department used KPIs drawn from its comparative performance tables from information supplied by individual municipalities. In its construction of ‘monitoring lists’, the Department subjectively considers these indicators as well as other information to determine whether a council should be classified as ‘at risk’ or not ‘at risk’. Murray and Dollery (2005, p. 332) undertook an econometric evaluation of these lists to determine whether ‘the indicators employed and the results published by the DLG are sufficiently robust to withstand analytical scrutiny’. They asked the question: ‘Are municipal councils deemed to be “at risk” on the basis of the DLG analysis of selected key performance indicators (KPIs) really “at risk” or have they merely been erroneously classified as “at risk”’? In other words, Murray and Dollery (2005) approached the problem of the efficacy of KPIs in predicting council performance from an empirical angle buy examining whether councils with poor KPIs end up as being considered ‘at risk’. Their results undermine the adequacy of KPI analysis for local government. Murray and Dollery (2005, pp. 342-343) observed that ‘the findings of our paper suggest that those councils that have been publicly identified as “at risk” may in fact not be in a parlous financial state at all’. If KPI analysis is a poor predictor of actual council financial performance, then the question arises as to what factors really do explain local government financial failure? Murray and Dollery (2005, p. 343) ‘speculated’ that ‘governance issues (broadly defined)’ appear to have been the most ‘critical factors’ in most recent NSW local government ‘failure episodes’ since ‘failed entrepreneurial projects by councils or councils in partnership with private organizations; factional “infighting” amongst elected councillors and the attendant resignation of frustrated experienced professional staff; a preponderance of ill-informed and unwise elected councillors; poor quality professional staff, especially in rural and remote areas; and a lack of adequate internal controls all seem to have played a critical role in municipal failure’. Walker and Jones (2006) developed two main criticisms of Murray and Dollery (2005; 2006). Firstly, they argued that by assuming published KPIs represented the basis of the NSW ‘watch list’ of ‘at risk’ councils, Murray and Dollery (2006) had attacked ‘a straw man’, since the NSW Department of Local Government did not rely exclusively on published KPIs to determine which councils ‘at risk’, but also employed other sources of information; a argument accepted by Dollery (2006) in a rejoinder to Walker and Jones (2006). Secondly, Walker and Jones (2006) advanced various criticisms at the econometric analysis by Murray and Dollery (2005). However, the major contribution of the Walker and Jones (2006) paper lay in the development of an alternative approach to financial sustainability in Australian local government. They argued that ‘if the basic operating objectives of local councils are to provide services to the community’, then ‘it follows that a relevant concept of council distress’ would be ‘an inability to deliver services at pre-existing levels’ In other words, financial sustainability should be defined as the capacity of councils to deliver some current level of service provision to their residents. It is immediately apparent that this definition differs from the methodology developed in both the state-based inquiries based on the Access Economics approach. However, Dollery (2006, p. 360) argued that this definition is flawed since it requires the user to heroically assume that ‘“yesteryear’s” levels of service will be acceptable to “tomorrow’s” local government community’. He observed that ‘it is easy to think of instances where this procedure will fail’ and cited the example of the environmental regulation of local councils and the continual ‘raising the bar’ that has occurred. Finally, drawing on the ‘local government failure’ approach first advanced by Dollery and Wallis (2001), Byrnes and Dollery (2002b) developed a taxonomic system embodying five main sources of local government failure: ‘Voter apathy’, where constituents are
RAPAD Report
Page 51
typically disinterested in their local councils; ‘asymmetric information and councillor capture’, where part-time elected councillors are dominated by better informed professional bureaucrats; ‘iron triangles’, where elected standing committees, bureaucrats and private contractors develop informal collusive arrangements excluding potential competitors; ‘fiscal illusion’, where voters cannot determine whether they receive ‘value for money’ from council services due to the fiscal complexities involved; and ‘political entrepreneurship’, where councillors intent on political office in higher tiers of government use municipal activities to advance their careers. Byrnes and Dollery (2002b) assessed this typology using evidence from NSW local government and found significant empirical support for their typology. However, the Byrnes and Dollery (2002b) typology is open to criticism that it considers only ‘internal’ factors to the exclusion of the external environment. For instance, important financial considerations, such as the value of grants, revenue from rates, etc., are ignored. Moreover, demographic, spatial and other influences are entirely neglected.
5.4 Taxonomy of Local Government Sustainability Given the deficiencies in the Byrnes and Dollery (2002b) typology, as well as the demonstrated success of the ‘institutional failure’ approach to policy analysis, there are thus firm grounds for developing a new taxonomy of Australian local government failure that considers both ‘external’ and ‘internal’ factors that influence the long-run sustainability of local councils in Australia. We thus now attempt to construct a new typology along these lines. The exploratory taxonomy developed in Chapter 5 hinges on five main sources of local government sustainability: Demographic factors; council revenue; expenditure; financial management; and governance. It is immediately evident that this constellation of influences combines both ‘external’ and ‘internal’ factors thereby removing a central objection to the earlier Byrnes and Dollery (2002b) typology. Each of these elements of the tentative new typology is now considered in turn, using the contemporary milieu of NSW local government to provide illustrative examples.
5.4.1 Demographic factors
The claim that demographic characteristics play a decisive role in local government sustainability is uncontroversial. After all population trends have profound implications for the composition of local government services, its sources of revenue, infrastructure utilization and future infrastructure needs, expenditure patterns and almost all other aspects of local governance. While local councils can exert some influence over population flows and population density directly and indirectly through efforts to attract or deter new residents, planning regulations, local economic growth strategies, and so forth, in the main demographic characteristics should be considered ‘non-discretionary’ variables in the sense that they lie beyond the control of individual municipalities. A few examples can serve to illustrate the contention that important linkages exist between local government sustainability and demographic trends:
Population relative to the local housing stock can have a powerful impact on housing prices. For instance, a shrinking population and a stagnant housing stock can lead to declining in property prices and falling rate revenue as well as vice versa.
Infrastructure utilization is related to population since physical infrastructure, by its very nature, is a fixed asset. For example, roads are rarely ripped up in response to a population decline while a population trend increase is typically required to justify connecting new homes to water and sewerage systems. Similarly, rapidly changing population size is a critical factor in determining the need for expensive new infrastructure.
RAPAD Report
Page 52
Population density and the rate of growth population are not only intrinsically intertwined but also represent key determinants of local government sustainability; a point emphasized in the South Australian FSRB (2005) Rising to the Challenge report. This report established that regardless of whether a given council was located in a metropolitan zone or a regional area in South Australia, the rate of growth in population seemed to determine the extent of its operating deficit. Moreover, net financial liabilities were also closely related to population growth. Population density had the same predictive capacity.
While these examples illustrate the pervasive impact of demographic change on local government, its effects are further complicated by the fact that recent Australian population trends are both complex and spatially uneven (Burnley and Murphy 2002, p. 149). For instance, in the context of NSW local government, whereas general population growth has centred on the coastal fringe and areas immediately adjacent to Sydney, Sydney itself has seen consistent net out-migration. Growth has also occurred in North and South NSW coastal communities, resort and retirement areas, some larger regional centres, along the Hume Highway between Sydney and Melbourne, selected mining towns, and in regions with significant indigenous populations (Hugo 2002, p. 5). The one constant in NSW population movements has been an almost universal loss of population in the sheep and wheat belts of the state. These complicating factors are further exacerbated by associated changes in population densities. For example, low-income household movement has clearly been an important component in migration to coastal regions in NSW (Hugo and Bell 1998). This has important ramifications for local government largely due to the range of partially council-funded concessions in place for low-income recipients. For instance, pensioner concessions represent a significant drain on the resources of local government in particular areas and Dollery et al. (2007b) found that the councils in NSW that had the lowest per capita incomes also had the highest per capita expenditure on pensioner rebates. If potentially poor ‘baby boomers’ retire on the coast, where average incomes are already relatively low, this will have serious implications for the future financial sustainability of coastal councils. Population change is thus multifaceted and may have far-reaching effects on local government sustainability. Given long-standing out-migration trends from the NSW sheep and wheat belts, some rural shires will never be financially sustainable because of low population densities and negligible or even negative population growth rates. This raises a central policy conundrum requiring explicit value judgment. What weight should be accorded rural local councils in their role as the only local democratic institution? Put differently, which is more important: the financial sustainability of a council or its role as a local voice in Australian democracy?
5.4.2 Council Revenue
Australian local government has three main sources of revenue: Property taxes; fees and charges; and intergovernmental grants. By international standards, this is a comparatively narrow range of potential sources of finance. Moreover, Dollery et al. (2006c, p. 30) have observed that ‘there are two broad revenue pressures’ confronting Australian local councils; ‘legislative restrictions on its ability to raise revenue’ and ‘limited access to a sufficiently broad range of revenue’, including the ‘holy grail of a growth tax’. It must therefore be acknowledged that not only do Australian councils survive on a relatively narrow revenue base, but that even within this narrow range, most revenue raising has important ‘non-discretionary’ elements. These general propositions can be readily illustrated in the financial milieu of NSW local government. For example, Figure 5.1 demonstrates that local government income in New South Wales has not kept pace with either the growth in state or federal income or
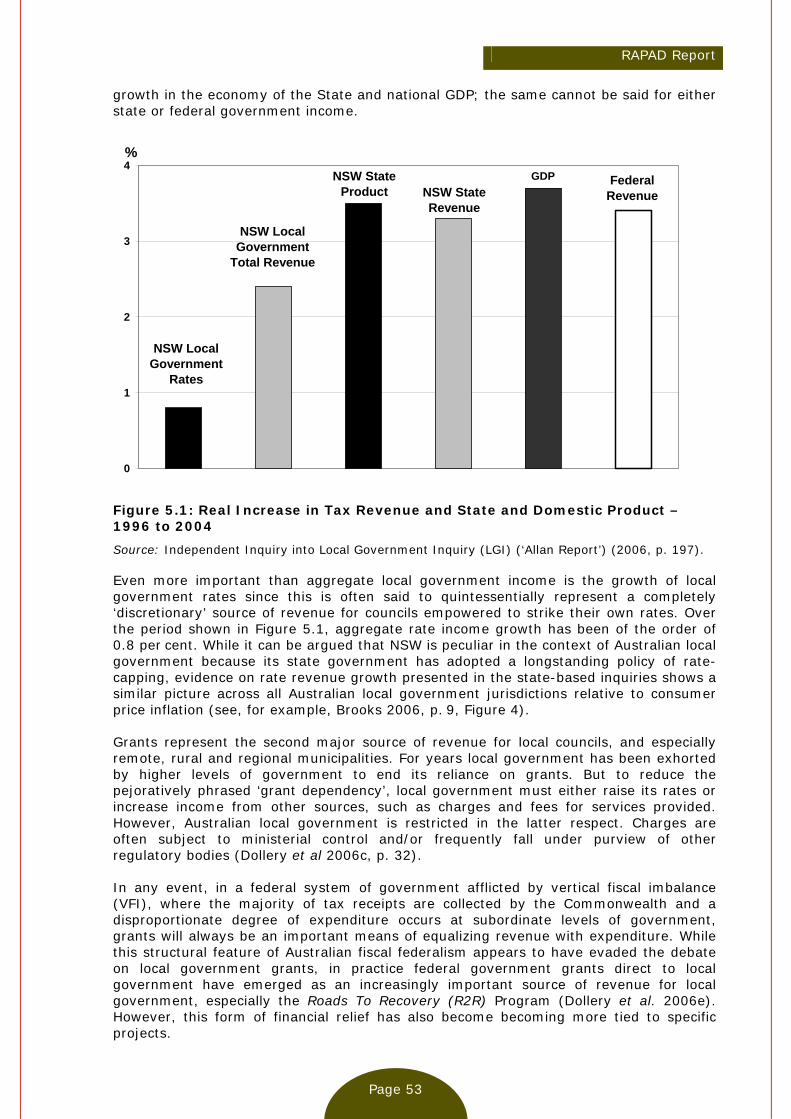
RAPAD Report
Page 53
growth in the economy of the State and national GDP; the same cannot be said for either state or federal government income.
0
1
2
3
4%
NSW Local Government
Rates
NSW State Product
GDP NSW State Revenue
NSW Local Government
Total Revenue
Federal Revenue
Figure 5.1: Real Increase in Tax Revenue and State and Domestic Product – 1996 to 2004
Source: Independent Inquiry into Local Government Inquiry (LGI) (‘Allan Report’) (2006, p. 197). Even more important than aggregate local government income is the growth of local government rates since this is often said to quintessentially represent a completely ‘discretionary’ source of revenue for councils empowered to strike their own rates. Over the period shown in Figure 5.1, aggregate rate income growth has been of the order of 0.8 per cent. While it can be argued that NSW is peculiar in the context of Australian local government because its state government has adopted a longstanding policy of rate-capping, evidence on rate revenue growth presented in the state-based inquiries shows a similar picture across all Australian local government jurisdictions relative to consumer price inflation (see, for example, Brooks 2006, p. 9, Figure 4). Grants represent the second major source of revenue for local councils, and especially remote, rural and regional municipalities. For years local government has been exhorted by higher levels of government to end its reliance on grants. But to reduce the pejoratively phrased ‘grant dependency’, local government must either raise its rates or increase income from other sources, such as charges and fees for services provided. However, Australian local government is restricted in the latter respect. Charges are often subject to ministerial control and/or frequently fall under purview of other regulatory bodies (Dollery et al 2006c, p. 32). In any event, in a federal system of government afflicted by vertical fiscal imbalance (VFI), where the majority of tax receipts are collected by the Commonwealth and a disproportionate degree of expenditure occurs at subordinate levels of government, grants will always be an important means of equalizing revenue with expenditure. While this structural feature of Australian fiscal federalism appears to have evaded the debate on local government grants, in practice federal government grants direct to local government have emerged as an increasingly important source of revenue for local government, especially the Roads To Recovery (R2R) Program (Dollery et al. 2006e). However, this form of financial relief has also become becoming more tied to specific projects.
RAPAD Report
Page 54
The trend towards more specific grants, taken together with the inevitability of a system of local government grant disbursement in a federal system characterized by VFI, places local council autonomy under threat and once again raises the question of the value accorded local democracy. Indeed, it might not be alarmist to argue that that tied grants essentially reduce local government to expenditure agencies devoid of decision-making power, thereby violating the principle of subsidiarity in fiscal federalism. Finally, almost all local government systems are troubled by horizontal fiscal imbalance (HFI) and Australian local government jurisdictions are no exception. In essence, HFI implies that different councils have different revenue raising abilities and the costs of service provision vary between councils. Unless HFI is addressed, marked differences in local services between different councils will emerge. In Australia this almost inevitably implies that people in poor remote, rural and regional areas will enjoy a far lower level of service provision than their metropolitan counterparts. This problem has traditionally been tackled in Australian states and territories through ‘equalization grants’ by state-based local government grants commissions. However, the decline in the real value of these grants across Australia has threatened this system and thus bred a growing differentiation in local service provision (Brooks 2006).
5.4.3 Council Expenditure
The third element in our proposed taxonomy of local government sustainability focuses on the expenditure dimension of local government activity. A critical feature of the cost structure of contemporary Australian local government resides in the impact of cost-shifting; a factor recognized by the CGC (2001), the Hawker Report (2004) and the LGI (2006). While the monetary magnitudes involved in cost-shifting are difficult, if not impossible, to compute with any degree of precision, in the context of NSW local government the phenomenon is undoubtedly significant. For example, the LGI (2006, p. 69) commissioned a survey in order to gain some quantitative measure of its impact. The results of this exercise are summarized in Figure 5.2. Figure 5.2 shows that the drain on resources associated with cost-shifting is far from trivial for all councils, and especially metropolitan councils. The chief problem with cost-shifting is not the shifting of expenditure functions per se but rather the lack of adequate accompanying funding. It often makes perfect sense for local government to carry out various functions, such as engaging rural doctors or managing the local rural Fire Service since local councils typically possess superior information on local needs. The problem is that adequate matching funding is usually not transferred along with the functional responsibilities. Accordingly, unfunded cost-shifting by higher levels of government all but guarantee that many councils will be unsustainable in the long run.

RAPAD Report
Page 55
0
1
2
3
4
5
6
7
8
9
%
Metropolitan
Regional Rural
Figure 5.2: Cost Shifting Expense as a Percentage of Total Ordinary Revenue – By Council Category
Source: Independent Inquiry into Local Government Inquiry (LGI) (‘Allan Report’) (2006, p. 69).
5.4.4 Financial Management
All state-based inquiries as well as the PWC (2006) national report identified a severe local infrastructure depletion problem in Australian local government. Two aspects of this problem are important in the present context. Firstly, all of these inquiries found that inadequate financial management, and particularly asset management, had played a significant role in the creation of this problem. In the NSW context, the Allan Report (2006) sets out in great detail the requirements for satisfactory financial management system and how this system should be implemented. The problems involved should not be underestimated. In particular, it is very difficult to place a value on an asset that cannot be sold. Secondly, the infrastructure problem is so large that many local authorities will never be able to bear the financial burden of rectifying it, leading to calls for alternative methods of financing reconstruction, including a Commonwealth infrastructure fund (Dollery et al. 2006a). In order to understand how the local infrastructure crisis has arisen, it must be acknowledged that most local infrastructure was simply given to local government in the immediate post-World War Two era. Local government thus did not finance its development and the local government revenue model was never designed to pay for its renewal. In the same vein, it should also be acknowledged that a significant proportion of the stock of local infrastructure is reaching the end of its economic life largely around the same time. Since local councils are already struggling to remain solvent in their day-to-day operations, it is widely recognized that local government cannot fund all of the infrastructure renewal programs that will be required over the next decade. Indeed, for each year that the problem is left unattended, the financial burden grows by around $400 to $600m in NSW alone (LGI 2006). While arguments rage over how to determine the extent of the infrastructure renewal task, attention may drift from the much more important task of implementing systems that will put aside reserves so that a future crisis will not reoccur. The long-run sustainability of local government should thus rest on the management of renewed local infrastructure and not the funding of current asset renewal.
RAPAD Report
Page 56
5.4.5 Governance
In order to develop our exploratory typological framework for evaluating sustainability in contemporary Australian local government, we have considered local government demographics, revenue, expenditure and cost-shifting and financial management. These three elements focus exclusively on the ‘external’ environment facing local councils, while financial management combines features of both the ‘internal’ and ‘external’ context. By contrast, governance deals solely with the internal dynamics of municipal operations. The need for an internal perspective is warranted by the fact that the overwhelming majority of council ‘failures’, as epitomized by the dissolution of local authorities by their respective Department of Local Government, are caused by internal factors, especially conflicted elected bodies. An excellent starting point for a diagnostic analysis of governance is the taxonomy of ‘local government failure’ advanced by Dollery and Wallis (2001) and Byrnes and Dollery (2002b). As we have seen, the Byrnes and Dollery (2002b) fivefold typology of ‘voter apathy’, ‘asymmetric information and councillor capture’, ‘iron triangles’, ‘fiscal illusion’ and ‘political entrepreneurship’ encompasses most internal sources of unsustainability. In addition to this capstone, Dollery et al. (2006b) have identified three critical dimensions of local government sustainability: local democracy, local social capital and local capacity. Local democracy refers to the sense in which local government can be differentiated from other levels of government; the very existence of local government suggests that it will make decisions differently from higher tiers of government by giving a voice to local preferences. This is sometimes encapsulated by the term ‘vibrancy’. If a council fails to embrace local preferences, then there is little reason for it to exist and its ongoing sustainability as an ‘independent’ entity comes into question. Although the notion of ‘social capital’ is beset by conceptual problems (Quibria 2003), in the municipal context we contend that social capital engenders a local civic awareness that manifests itself in community projects, ranging local social associations and sports clubs to local business initiatives. Moreover, local social capital breeds a ‘sense of community’ and a ‘sense of place’ that derive from living in a small and distinctive local government area, with community size and community social capital therefore intrinsically linked. It follows that if a council does not play a positive role in facilitating the formation of social capital, its long-term sustainability must be called into question. Finally, local government capacity influences local council sustainability. Dollery et al. (2006b) argue that local government cannot command the respect of its constituents if it is unable to formulate agreed policy and implement decisions effectively. Local government capacity thus has three features: Functioning elected leadership; adequate administrative and technical expertise; and the ability to make autonomous decisions. These three attributes of local government capacity are thus crucial to council sustainability.
5.5 Concluding Remarks The tentative typology for examining local government sustainability advanced in this chapter is thus not only much broader than its Dollery and Wallis (2001) and Byrnes and Dollery (2002b) predecessors, but also overcomes the ‘internal’ bias of these earlier attempts to provide an analytical framework for assessing local government failure. Because it combines all the major elements involved in the long-run sustainability it has the added advantage of greater explanatory power. A common thread running through the discussion of demographic factors, council revenue, expenditure, as well as part of financial management was the ‘non-discretionary’ nature of the external environment in which Australian local government is placed. Constraints imposed by higher tiers of government in the Australian federation thus account for a good deal of non-sustainability amongst local councils. Accordingly, all
RAPAD Report
Page 57
the state-based inquiries and the PWC (2006) report all found that large numbers of Australian municipalities are unsustainable if present trends continue. This serves to illustrate a dismal truth about Australian local government; unless dramatic change occurs, unsustainability will become the rule rather than the exception. All taxonomic systems of institutional failure run the risk of instilling a bias towards ‘perfection’ in the analysis of real-world organizations and our exploratory taxonomy is no different. This problem has long been recognized in the theory of market failure where Demsetz (1969, p. 1) coined the term ‘Nirvana fallacy’ to describe the danger that ‘much public policy economics implicitly presents the relevant choice as between an ideal norm and an existing “imperfect” institutional arrangement’. This can lead to unnecessary and costly policy intervention bound to fall short. It is thus imperative to bear in mind Ronald Coase’s (1964, p. 195) dictum that ‘until we realise that we are choosing between social arrangements that are all more or less failures, we are not likely to make much headway’. A beneficial aspect of our exploratory taxonomy is that it obliges policy makers to recognize that due to the predominantly ‘non-discretionary’ nature of demographic factors, council revenue, expenditure, as well as part of financial management, there are environmental limits on the extent to which individual local councils can be held responsible for their own long-term sustainability. Moreover, given the high degree of VFI in Australian fiscal federalism and the fact that additional expenditure responsibilities can be loaded on local government, it is inevitable that higher tiers of government will always have to assist local councils financially, and in the short-run, this means that immediate local infrastructure crisis will have to be resolved by extensive subsidies from the Commonwealth and state governments. In other words, in the absence of additional taxation powers, local government sustainability is inextricably dependent on fiscal transfers from higher levels of government. For the majority of Australian local authorities, including Queensland local councils, self-secured long-term sustainability is simply not feasible.

RAPAD Report
Page 58
Chapter 6: Community Sustainability
6.1 Introduction Chapter 5 considered the thorny question of financial sustainability in Australian local government by critically examining the CGC (2001) report, the Hawker Report (2004), the various state-based inquiries and the PWC (2006) national report. Chapter 5 also considered salient aspects of the embryonic Australian academic literature on sustainability. In addition, it developed a typology of local government sustainability using stylized empirical characteristics of Australian local councils. Various important conclusions were drawn from the analysis conducted in Chapter 5. In the first place, it is clear that no agreed definition of financial sustainability exists in Australia. Secondly, as we saw, recent attempts at determining the financial sustainability of local councils all adopted the ‘accounting approach’ developed by Access Economics but applied it differently without distinguishing between factors that individual councils can and cannot influence. Thirdly, the South Australian, NSW, WA and PWC investigations into financial sustainability all employed Key Performance Indicators (KPI) (most commonly in the form of financial ratios), Chapter 5 highlighted numerous problems with the KPI method of performance appraisal, including the fact that the observed incidence of local government failure bears no statistical relationship to KPI scores, at least in the NSW local government milieu (Murray and Dollery 2005). Finally, the taxonomy of local government failure developed in Chapter 5 demonstrated that many crucial determinants of financial sustainability lay outside the ability of individual local councils to control since they were essentially ‘non-discretionary’ in nature. It follows that Queensland local government policy makers should be very wary of making far-reaching decisions based disputed definitions of financial sustainability and flawed KPIs with almost no predictive capacity. But quite apart from the doubt surrounding the meaning and measurement of financial sustainability, a second important question that must be taken into account deals with the ‘non-financial’ aspects of sustainability in local government. Put differently, aside from direct financial considerations, what factors determine the broader long-run sustainability of Australian local councils? In other words, can we identify overall local government sustainability and define its characteristics? This forms the subject matter of Chapter 6. Chapter 6 is divided into three main parts. Section 6.2 considers the problem of defining adequately council sustainability and community sustainability and identifying the chief determinants of this broader conception of local government sustainability. Section 6.3 examines each of the four putative attributes of community or social sustainability in local government and tries to develop operational measures for these four characteristics. The chapter ends with some brief concluding remarks in section 6.4.
6.2 Defining Overall Council Sustainability In common with the conceptual and factual difficulties of defining financial sustainability, the problem of defining overall council sustainability presents similar analytical challenges. In all Westminster-style advanced democracies, local government plays a dual role. Aulich (2005, p. 198) has described this twin function in some detail. In the first place, local government ‘provides a voice to local aspirations for decentralized governance’. What can be termed the ‘local democracy approach’ thus places fundamental value on ‘local differences and system diversity’ and encourages directed activities and policy reforms aimed at improving ‘local choice and local voice’. This is premised on the notion that a local council ‘can and will make choices that will differ from

RAPAD Report
Page 59
those made by others’. According to this view, ‘a premium is placed upon traditional democratic values’ that fully embrace ‘access’, ‘accountability’, ‘representativeness’ and ‘responsiveness’ (Stewart 1997). The ‘vibrancy’ of local democracy thus becomes a desired outcome in its own right. In addition to these attributes of the local democracy approach, it is possible to identify other dimensions that may be important. In this respect, the concept of ‘social capital’ is crucial. First conceived by Coleman (1988) and later popularized by Putnam (1993), social capital refers to those features of social life that enable participants to act together more effectively to pursue shared objectives. In the local government context, social capital engenders local civic awareness that manifests itself in a variety of community projects, ranging from the formation of local social associations and sports clubs to local business initiatives. The determinants of local social capital are complex and not well understood (Quibria 2003), but include a ‘sense of community’ and a ‘sense of place’ that derive from living in a small and distinctive community, such as a local government area. Community size and community social capital are therefore intrinsically linked together. The local democracy approach necessarily implies support for ‘collaborative or pluralist processes of reform’ rather than top-down ‘technocratic’ policy intervention that overrides local opinion. Instead of being viewed as a burdensome financial impost on the local exchequer, representative local government is seen as a worthy policy goal on its own merit. The costs associated with local governance, including local elections, consultation processes, ‘democratic audits’, community participation, elected councillors, their supporting secretariat and the whole gamut local democratic autonomy, can thus be justified the same way as financial outlays on any other bona fide council service. Accordingly, public policy should not simply seek efficient service local provision, but also effective local democracy. Political process becomes as important as economic outcome. The result is an emphasis on ‘bottom-up’ local consultation and local policy formulation. The second primary role of local government in a Westminster-type democratic constitutional milieu focuses on local councils as ‘a mechanism for [the] efficient delivery of local services to local communities’. In terms of this perspective, in its role as a provider of local public and quasi-public goods and services, local government must focus on efficient service delivery above all else (Tucker 1997). In other words, local government is not regarded as a representative entity in its own right, but rather as an instrument for meeting local needs through local services in the most cost effective manner possible. This instrumentalist conception of the role of local government in a federal system thus stresses the importance of policy reform aimed exclusively at enhancing the efficiency of local government, regardless of the impact this might have on the vibrancy of local democracy. Put differently, in the instrumentalist service provision approach ‘fiscal and economic issues override other social and political concerns’ and ‘tradition-bound or value-orientated forms of political and social organization are replaced by purely instrumentally rational institutions’ (Aulich 2005, p. 199). Economic outcomes thus take precedence over political processes. The main policy implications of this ‘local service delivery approach’ have been described by Aulich (2005, p. 199) as follows:
Such an approach encourages state intervention to assert control over the local sphere of government to ensure that the mechanisms are in place to advance efficiency and economy. There are inevitably greater pressures for uniformity and conformity and less tolerance for diverse outcomes. In this environment, lower value is placed on collaborative processes, with top-down technocratic processes being more typical.
Obvious tensions exist between the two primary roles of local government in a Westminster-style democratic polity and these are perhaps best exemplified in the diametrically opposed policy implications that derive from the local democracy approach and the local service approach. Steyvers et al. (2006, p. 429) draw a distinction between
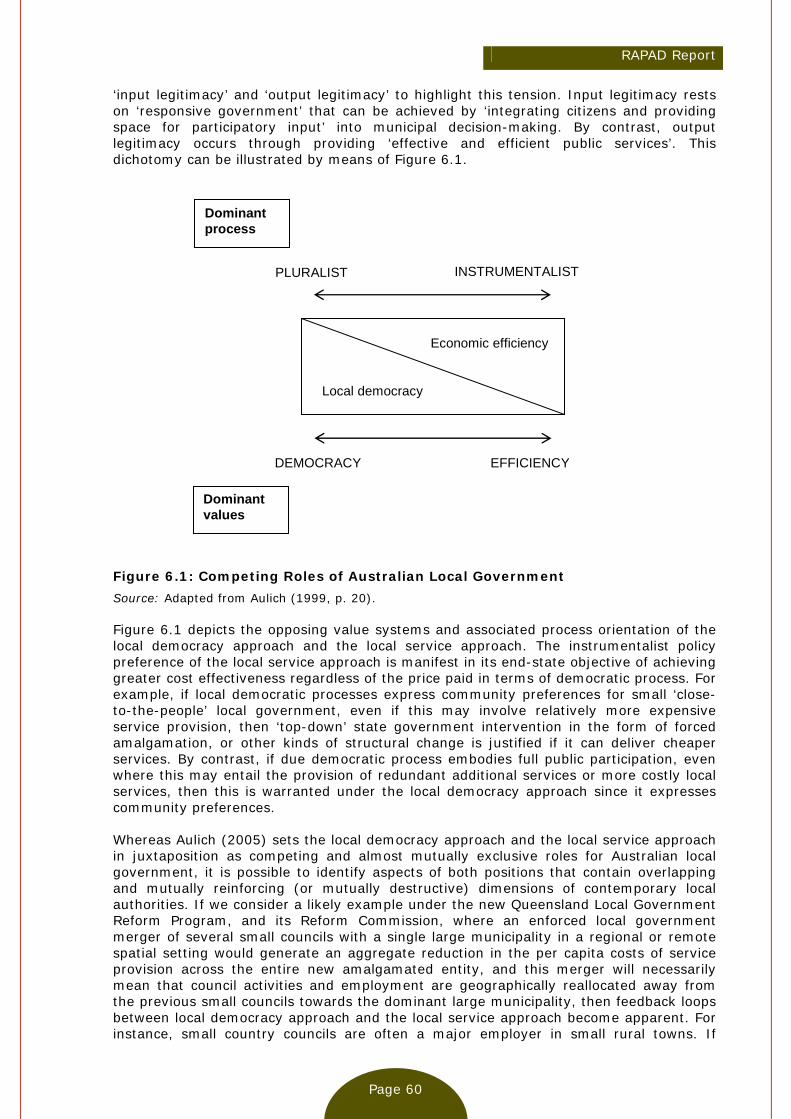
RAPAD Report
Page 60
‘input legitimacy’ and ‘output legitimacy’ to highlight this tension. Input legitimacy rests on ‘responsive government’ that can be achieved by ‘integrating citizens and providing space for participatory input’ into municipal decision-making. By contrast, output legitimacy occurs through providing ‘effective and efficient public services’. This dichotomy can be illustrated by means of Figure 6.1.
Local democracy
Economic efficiency
INSTRUMENTALIST
DEMOCRACY EFFICIENCY
PLURALIST
Dominant values
Dominant process
Figure 6.1: Competing Roles of Australian Local Government
Source: Adapted from Aulich (1999, p. 20). Figure 6.1 depicts the opposing value systems and associated process orientation of the local democracy approach and the local service approach. The instrumentalist policy preference of the local service approach is manifest in its end-state objective of achieving greater cost effectiveness regardless of the price paid in terms of democratic process. For example, if local democratic processes express community preferences for small ‘close-to-the-people’ local government, even if this may involve relatively more expensive service provision, then ‘top-down’ state government intervention in the form of forced amalgamation, or other kinds of structural change is justified if it can deliver cheaper services. By contrast, if due democratic process embodies full public participation, even where this may entail the provision of redundant additional services or more costly local services, then this is warranted under the local democracy approach since it expresses community preferences. Whereas Aulich (2005) sets the local democracy approach and the local service approach in juxtaposition as competing and almost mutually exclusive roles for Australian local government, it is possible to identify aspects of both positions that contain overlapping and mutually reinforcing (or mutually destructive) dimensions of contemporary local authorities. If we consider a likely example under the new Queensland Local Government Reform Program, and its Reform Commission, where an enforced local government merger of several small councils with a single large municipality in a regional or remote spatial setting would generate an aggregate reduction in the per capita costs of service provision across the entire new amalgamated entity, and this merger will necessarily mean that council activities and employment are geographically reallocated away from the previous small councils towards the dominant large municipality, then feedback loops between local democracy approach and the local service approach become apparent. For instance, small country councils are often a major employer in small rural towns. If
RAPAD Report
Page 61
council employees are forced to work in the former large council in the new amalgamated structure, then this will set in motion powerful negative multiplier effects that can lower population, reduce economic activity, and threaten the viability of other public and private services, like public schools and banking facilities. Secondly, if we invoke attributes of the local democracy approach neglected by Aulich (2005), such as the historically, psychologically and sociologically crucial concepts of ‘sense of community’ and ‘sense of place’, that form an important part of the social capital of small country towns, then this will also have substantial economic effects. After all, a municipal council often represents the ‘heart’ of a community and serves to symbolize its character and independence. The abolition of these councils could thus severely damage a ‘sense of community’ built up over the generations. The economic consequences of this loss may be felt in different retail shopping patterns, altered school enrolment, changed sporting club allegiances, and so forth, that will have ramifications for the structure of economic activity and the strength of the rate base of the former small council areas. Finally, and perhaps most importantly, process and outcome are inextricably linked through democratic representation in local government. Thus, the merger of small councils with a larger municipality can have obvious and severe resource implications for residents of the small merged towns. For example, if a previously autonomous local council is compulsorily amalgamated with a larger, adjacent regional centre, then its elected representation automatically falls as a proportion of all councillors. This may mean relatively fewer resources will be directed towards the needs of residents of the small councils relative to their counterparts living in the dominant larger regional centre. Moreover, where service provision preferences differ between the citizenry of small and large councils, the pattern of service provision can also shift to the detriment of residents of small towns. These effects will be even more acute if electoral wards are abolished since this may mean no representation at all for minority ratepayers living in sparsely populated areas on the outskirts of the new local government structure. In essence, the local democracy approach and the local service approach thus overlap in some respects and this affects the nature of trade-offs between the two perspectives. In other words, single-minded pursuit of economic gain regardless of political process can have the unintended effects of reducing the aggregate economic benefits through the spatial redistribution of economic activity and council service operations within the new amalgamated entity. Political process thus cannot be entirely divorced from economic outcome. The tensions between input legitimacy and output legitimacy stressed by Steyvers et al. (2006) has focused attention on the need to reconcile these two imperatives. Some scholars have pursued this line of inquiry, including Kersting and Vetter (2003), and have sough to close the ‘gap’ between service efficiency and participatory democracy. However, the fruits of this debate have yet to appear. The identification of two contending primary roles for Australian local government by Aulich (2005), and the augmentation of this dichotomized approach with the recognition that in some respects outcome and process are inextricably linked (since service efficiency cannot be entirely from service distribution), can shed considerable light on the problem of local government sustainability. We have already considered the thorny question of ‘financial sustainability’ – a critical component of the local service approach - in Chapter 5. But what are the chief elements of ‘community sustainability’ (as distinct from financial sustainability) that comprise the essence of the local democracy approach? Four clusters of factors suggest themselves. The first constellation of attributes will centre on the vibrancy of local democracy in the sense that it engages maximum public participation. Local democratic processes obviously play a central role in overall council sustainability and these include democratic ‘access’, ‘accountability’, ‘representativeness’ and ‘responsiveness’ outlined by Aulich (2005).
RAPAD Report
Page 62
The second cluster of attributes revolves around local social capital and its relationship with local councils. Although little is known about the genesis of social capital, it seems to spring from a well-developed ‘sense of community’ and a ‘sense of place’ that flow from living in a small community whose members interact frequently. While these abstract and somewhat ‘ethereal’ factors are very difficult to measure, this does not diminish their importance. The third constellation of factors that influence local government sustainability focus on the capacity of local government. Local government cannot command the respect of its constituents if it is unable to effectively formulate agreed policy positions and implement these decisions into concrete action. The capacity of local government thus has two dimensions: Well-functioning elected leadership and sufficient administrative and technical expertise. These two attributes of local government capacity are crucial to council sustainability. In the first place, there must be effective functioning of an elected council free of personal ranquor and disruptive factionalism. Although the Australian literature has not addressed this aspect of local councils empirically, current research in progress at the Centre for Local Government at the University of New England suggests that dysfunctional elected councils are the single most important cause of local government failure in NSW local government. This is hardly surprising since efficacious and cooperative elected councils represent the bedrock of ‘local choice and local voice’ that underpin local government leadership. The fourth factor that crucially affects local government sustainability in regional, rural and remote areas is the economic and social significance of local councils for community sustainability. In local government areas that suffer from the ‘tyranny of distance’, in the sense of being far from metropolitan centres, local government takes on an especially crucial role. For instance, in regional, rural and remote areas local councils offer numerous services outside of the normal range of functions performed by Australian councils. These include services that should be provided by state and federal governments, like aged care facilities, childcare facilities and general medical practitioner services, but also many functions that are taken for granted in larger communities, such as banking facilities, internet services and even council-owned and operated general stores, butcheries and the like. In addition, local councils are often the biggest employers in small towns and the goods and services they purchase play a pivotal role in the survival of the local economy. Council employees typically represent the ‘backbone’ of local service organizations, like Rotary and charitable organizations, as well as key members of local sporting and community clubs. Moreover, the children of council employees almost always attend local schools and often account for the continued viability of these schools in terms of student numbers. In sum, local councils and their employees and families usually represent the ‘heart’ of small communities. Accordingly, when local council activity and employment is diminished through amalgamation and the resultant migration of expenditure and employment to larger centres, this typically ‘rips the heart out’ of small towns and begins a permanent downward spiral of depopulation that can end in ‘ghost towns’. Each of these four elements will now be considered in greater detail. Amongst other things, we will consider the problem of how to measure these attributes. It must be stressed that since almost nothing has been written on this question in the literature on Australian local government, the discussion is exploratory and the conclusions tentative.
RAPAD Report
Page 63
6.3 Factors Influencing Overall Local Government Sustainability The four constellations of factors identified above should not be regarded as definitive. With that caveat in mind, we now consider each cluster in turn.
6.3.1 Vibrancy of Local Government Democracy
Scholars of local government have charted a steady transformation in the nature of government within the local sector over the past decade. The term ‘governance’, which became fashionable in the late 1990s, has been used to describe the new relationship between government and the governed that emphasizes ‘steering and not ‘rowing’. Unfortunately, a confusing array of meanings has been attached to the term. In the present context, we adopt the definition advanced by Goodin (1996, p. 7) in which governance represents ‘nothing less than the steering of society by officials in control of what are organizationally “the commanding heights” of society’. Another way of approaching governance was formulated by Keohane and Nye (2000, p. 37): ‘By governance we mean the processes and institutions, both formal and informal, that guide and restrain the collective activities of a group’. Thus ‘government is the subset that acts with authority and creates formal obligations’. However, governance is not the exclusive domain of governments themselves, but also involves private organizations, nonprofit institutions, and a host of other social structures. Denters and Rose (2005, p. 6) have described the new relationship between local government and its various client groups as follows:
These changes imply a dual challenge for local governments. On the one hand, the rise of more output-orientated, more demanding, more critical and more action-prone citizens forces local governments to improve their capacity for effective and efficient governance. In many respects this has made them more receptive for the adoption of many innovative management techniques and may have also have led to attempts to increase the system’s problem-solving capacity by engaging various actors from within the local community in partnerships. On the other hand, new participatory demands and the partial decline of traditional party linkages between local government and the local community require municipalities to reconsider channels of communication with the local community, and to consider new forms of local democracy.
The recent Systemic Sustainability Study: In Your Hands - Shaping the Future of Local Government in Western Australia report produced under the auspices of the Western Australian Local Government Association (WALGA 2006, pp. 1-2) stressed the importance of ‘good governance’. It defined this quality as ‘the ability of local government to operate with integrity and to assure the community that efficient and effective management is applied in the community interest’. In the Western Australian context, the Report argued that ‘good governance’ had not always been manifest in that state, especially insofar as ‘large intergenerational equity transfers’ in asset management had taken place and the general competence powers in the Western Australian Local Government Act had not been fully understood. However, apart from these issues, the Systemic Sustainability Study did not provide any indicators to measure this attribute of local government. The now defunct SSS Guidelines Kit (LGAQ 2006, Chapter 3) did provide some implicit measures of good governance. For instance, Indicator Category #4 dealt with ‘standards of governance’ and proposed two indicators. ‘Decision Making and Management’ sought to measure three formal aspects of the ‘level of competence’ of a given council: ‘Corporate planning’; ‘risk management’; and ‘delegations’ (LGAQ 2006, p. 20). In a similar vein, ‘Accountability’ concerned itself with ‘how a council accounts for its key activities and what systems and processes are in place to support this accountability’ (LGAQ 2006, p. 21). Two separate indicators were put forward to gauge this kind of
RAPAD Report
Page 64
‘accountability’: ‘Performance management’ as measured by the performance management process in place; and ‘internal audit process’ as captured by the nature of the internal audit process. It could also be argued that the redundant SSS Guidelines Kit (LGAQ 2006, Chapter 3) contained some other measures that indirectly touch on good governance. For example, Indicator Category #3 focused on ‘planning’. Two specific indicators were outlined: ‘Service coordination and efficiency’ which considered the question of whether ‘key infrastructure’ is ‘coordinated’ and yields ‘efficient services’ (LGAQ 2006, p. 18); and ‘growth management’ that attempted to gauge ‘how well a council is able to respond to and manage population growth impacting on its area’ (LGAQ 2006, p. 19).
6.3.2 Local Social Capital and Local Government
The concept of social capital is based on the notion that ‘social interactions matter’ since they ‘create social networks, foster trust and values, sustain norms and culture and create community’ (Quibria 2003, p. 19). Coleman (1990, p. 302) conceived of social capital as analogous to ‘other forms of capital’ because it makes ‘possible the achievement of certain ends that would not be attainable in its absence’. In much the same vein, Putnam (1993, p. 7) defined social capital as ‘features of social organization, such as trust, norms, and networks, that can improve the efficiency of society by facilitating coordinated actions’. The key components of social capital identified by all these scholars are ‘networks of civic engagement’, ‘norms of generalized reciprocity’, and ‘relations of social trust’. Quite apart from the significance of social capital for economic development and social integration, it also has important public policy implications for local government. Various mechanisms have been proposed that link the performance of local councils to social capital. In the first place, Putnam (1993) argued that municipal performance may be enhanced by high levels of social capital since it encourages greater monitoring of the behaviour of council officials. This process occurs directly because council employees care about their reputations with people among whom they interact frequently. It also occurs indirectly because monitoring council performance is a public good and thus prone to the well-known free rider problem in collective action; social capital assists in overcoming free riding. If Putnam (1993) is correct in identifying informal performance monitoring as the link between local government performance and social capital, then what are the policy implications of this view for local government? We have seen that social capital is likely to be high when people interact frequently with each other. Moreover, the reputational impact of monitoring by people who have regular dealings with the council employees in question will be stronger than in the case of comparative strangers. It follows that small councils in small local government areas characterized by small populations will be the most effective in fostering social capital, frequent interaction between council workers and elected representatives and the public, and thereby more efficacious monitoring of council performance. Putnam (1993; 2000), Aarts (1995) and other scholars have suggested a second mechanism that may link social capital to the performance of municipalities. It is argued that various factors, especially increased urbanization, have contributed to a decline in organizational participation by citizens. This in turn has led a reduction in the linkages between the public and local authorities and altered the relationship between the two for the worse. Unfortunately, little is known about the empirical attributes of social capital and therefore on appropriate policy responses to increase social capital. However, some work has been done on this aspect of social capital. For instance, in Bowling Alone, Putnam (2000) established evidence that points to a decline in social capital in the United States over

RAPAD Report
Page 65
the past three decades. Similarly, Knack and Keefer (1997) found that social capital is a measurable determinant of economic performance in international terms. The empirical basis for policy formulation on local government and social capital is very limited. This necessarily means that any policy proposals must be speculative. But it does seem clear that small communities in small local government areas are best placed to engender high levels of social capital since interaction between citizens and local government representatives and employees will be higher under these circumstances. Furthermore, it is highly likely that a well-developed ‘sense of community’ and a ‘sense of place’ will be most pronounced in small local government areas where people are acquainted with a relatively high proportion of their fellow citizens. What policy implication does this have for local government reform in general, and the Queensland Reform Commission in particular? As we have seen in Chapter 3, the now defunct SSS Guidelines Kit (LGAQ 2006, Chapter 1, pp. 6-7) prescribed four ‘options for change’ that could be followed by local councils: ‘Resource sharing through Service Agreements’; ’resource sharing through Joint Enterprise’; ‘significant boundary change’; and the ‘merger/amalgamation of adjoining councils’. The last two of these options involve modification to the size, shape and population of an affected local government area and thereby influence adversely both the ‘sense of community’ and a ‘sense of place’ among residents. In this respect, these two options might serve to damage social capital, damage the associated monitoring aspect of social interaction, and thus impair the efficacy of local government. Since both forms of resource sharing leave the boundaries and population of a participating local council intact, it can be argued that they will leave both the ‘sense of community’ and a ‘sense of place’ untouched.
6.3.3 Local Government Capacity
In section 6.2, it was argued that local government capacity had two separate dimensions. Firstly, the political capacity derived from the democratic legitimacy and effective decision making abilities of elected representatives comprising local councils. Although no comprehensive empirical research has yet been undertaken in Australian local government, Chapter 5 demonstrated that the primary cause of the failure and ultimate dissolution of local councils by state governments lies in dysfunctional elected councils rather than financial distress and other problems. Where councils are plagued by bitter personal animosities, ‘infighting’ between councillors, intransigent factionalism, and disruptive meetings, ‘policy gridlock’ typically occurs that can effectively stall the smooth running a local authority. A secondary effect of dysfunctional elected councils resides in the loss of public confidence in their elected representatives and a diminution of collaborative partnerships between community organizations and local government. In other words, the most important element in local government sustainability can be found in cooperative functional elected bodies. It follows that an attempt to assess the long-run viability should first establish whether sound relations exist between mayors and elected councilors and amongst elected representatives themselves. In practice, this can only be established by observing the workings of council meetings and the relationships between elected representatives. No abstract performance indicator can replace observation and judgment. The Systemic Sustainability Study (WALGA) (2006) stressed the importance of effective and cohesive elected councils. It emphasized the key role of ‘leadership capacity’ by observing that ‘the experience, competence, and passion of elected members’ is essential ‘to represent the desires and aspirations of local communities’ (WALGA 2006, p. 2). However, no definite statistical measures were proposed to assess empirically these attributes. The administrative and technical ability of council staff forms the second dimension of local government capacity. The importance of this type of council capacity can hardly be overstated. In this regard, Dollery et al.(2006c, p. 148) made the following observation:

RAPAD Report
Page 66
‘A proposition sometimes advanced in the Australian debate over amalgamation is that larger councils tend to have greater levels of administrative and other expertise, in part due to the fact that their size permits the employment of specialist skills that cannot be readily acquired by smaller municipalities’. But they hasten to add that while this argument has ‘considerable merit’, partnership agreements between small councils can achieve the same outcome in terms of acquiring specialist skills. The Systemic Sustainability Study (WALGA 2006, p. 2) also underlined the importance the capacity of local government employees to the efficient functioning of local councils. Insufficient administrative capacity in Western Australia had resulted in two identifiable problems. Firstly, ‘innovation’ had occurred in the local government sector in that state, but had not been implemented ‘from a systematic perspective’. Secondly, ‘asset management practice’ was unsatisfactory and had masked ‘exposures for communities and councils’. The question of whether or not an individual council is sustainable by virtue of its administrative and technical expertise can only be settled with certainty by empirical examination of staffing levels relative to need. In this sense, local government administrative capacity is amenable to measurement through selected performance indicators. For instance, an informative ratio could compute the proportion of vacancies for professional and technical staff. This would provide a simple and robust statistic that would allow for comparisons between different councils.
6.3.4 Economic and Social Contribution of Local Councils
In section 6.2, it was argued that local councils play a critical economic and social role in small communities. Indeed, if the role of local councils is diminished in any way, such as through amalgamation with larger municipalities situated some distance away, this can literally result in the complete withering away of previously sustainable small communities. The powerful negative economic and social multipliers that are set in motion can inexorably reduce the economic and social viability of small communities to the point where they no longer exist at all. The potentially catastrophic consequences for small communities of forced amalgamation are so grim that it is essential that local government policymakers, such as the Queensland Reform Commission, examine the potential effects of compulsory council mergers and try to get some statistical appreciation of the magnitudes of the negative economic and social multipliers involved. With respect to the economic impact of local councils in small communities, information can be sought from local council annual reports and budgets on total council expenditure, estimates of funds expended through local business enterprises, total wage expenditure (decomposed between management; administration and works staff), indirect wage expenditure on contractors and other local services purchased by councils, the number of council employees as a percentage of total employment in each council area. This can provide at least a tangible estimate of the economic value of local councils to local communities. The impact of council employees on local organizations is also crucial to long-run community sustainability. Accordingly, information on the number of council staff and their families involved in community and sporting organizations, the number of employees’ children attending local schools, these children as a proportion of the minimum threshold required for the survival of local schools and the number of kids in the local school, and so forth, can indicate the probable impact of amalgamation that will reduce (at least in smaller towns) the total number of employees. Unlike their larger counterparts in metropolitan and regional urban centres, small local councils in small communities provide numerous services outside the normal range of council activities for the simple reason that these services would not otherwise be
RAPAD Report
Page 67
available. Information can be gathered listing functions outside normal council duties performed, such council shops, banking services, age care services, GP services, etc., that can be used to estimate the effects of forced amalgamations. In addition, the actual activities of Regional Organizations of Councils (ROCs) should be assessed relative to the potential of ROCs for delivering regional functions and shared services need to be examined. This will provide an estimate of what can be achieved by ROCs in the absence of amalgamation.
6.4 Concluding Remarks It has been argued in this chapter that not only does ‘financial sustainability’ have no agreed meaning in Australian local government, but also it represents only a single dimension of overall council sustainability. Indeed, Chapter 5 suggested that the primary cause of local government failure lies in ‘infighting’ in elected councils and related ‘policy gridlock’. This means that an accurate assessment of aggregate ‘overall sustainability’ in local government must also include other attributes of contemporary local authorities. Apart from the intractable difficulties in determining financial sustainability, especially given the presence of ‘non-discretionary’ factors that impinge much more heavily on rural councils, two main problems have been identified with evaluating overall local government sustainability. In the first place, the abstract and ephemeral of the concept of overall sustainability make it hard to define with any degree of precision. Many factors clearly play an important role: Local government democracy; local government capacity; ‘sense of place’; community sustainability; local social capital; local preference diversity; local leadership; and economic development all seem relevant. In this chapter, we have argued that four main ‘clusters’ of attributes of overall local council sustainability seem apposite: The ‘vibrancy of local democracy’ that has become even more essential in the new local governance paradigm; ‘local social capital’ that can enhance the good working of effective local authorities; ‘local government capacity’ in both the political and technical aspects of local governance; and the economic and social contribution of small local councils to small local communities. However, given the exploratory nature off the analysis in this chapter, this classification may not be exhaustive. Other factors could also easily be included, perhaps most notably ‘environmental sustainability’. However, an obvious constraint on the inclusive of a large ‘wish list’ of additional attributers of overall sustainability is the extent of council control over these factors. For example, in the Australian federal system of government, several functions formally handled by local government are in fact strictly governed by state and Commonwealth regulation and their effective discharge often determined by finance controlled by these higher tiers of government. Local government thus has little discretionary power of these functions, regardless of how well it operates. It is therefore misplaced to seek to embrace attributes of overall sustainability that councils cannot influence and then evaluate councils on this basis. A second constraint on the determination of overall local government sustainability resides in the thorny problem of measurement. The four clusters of overall sustainability proposed in this chapter - the ‘vibrancy of local democracy’, ‘local social capital’, ‘local government capacity’ and the economic and social contribution of small councils– cannot be measured directly. This means that proxy variables must be used to try to capture key elements of these clusters and none of these variables is exact. It follows that subjective judgment and inference are unavoidable. Despite the obvious need to evaluate local government sustainability from a broader perspective than simply financial sustainability, these two problems seem to have deterred some earlier state local government sustainability investigations from adopting
RAPAD Report
Page 68
this wider perspective. As we have seen in Chapter 5, the South Australian FSRB’s (2005) Rising to the Challenge report, the Financial Sustainability of NSW Local Government’s (2006) Are Councils Sustainable, the LGAT’s (2007) A Review of the Financial Sustainability of Local Government in Tasmania and the PWC’s (2006) National Financial Sustainability Study of Local Government, pay lip service to the importance of overall sustainability, but do not attempt to assess it in their work. By contrast, to their credit, the now defunct LGAQ’s (2006) Size, Shape and Sustainability program and the recent Final Report of the Western Australian Local Government Association (WALGA 2006) Systemic Sustainability Study: In Your Hands - Shaping the Future of Local Government in Western Australia do recognize that financial sustainability alone is insufficient.
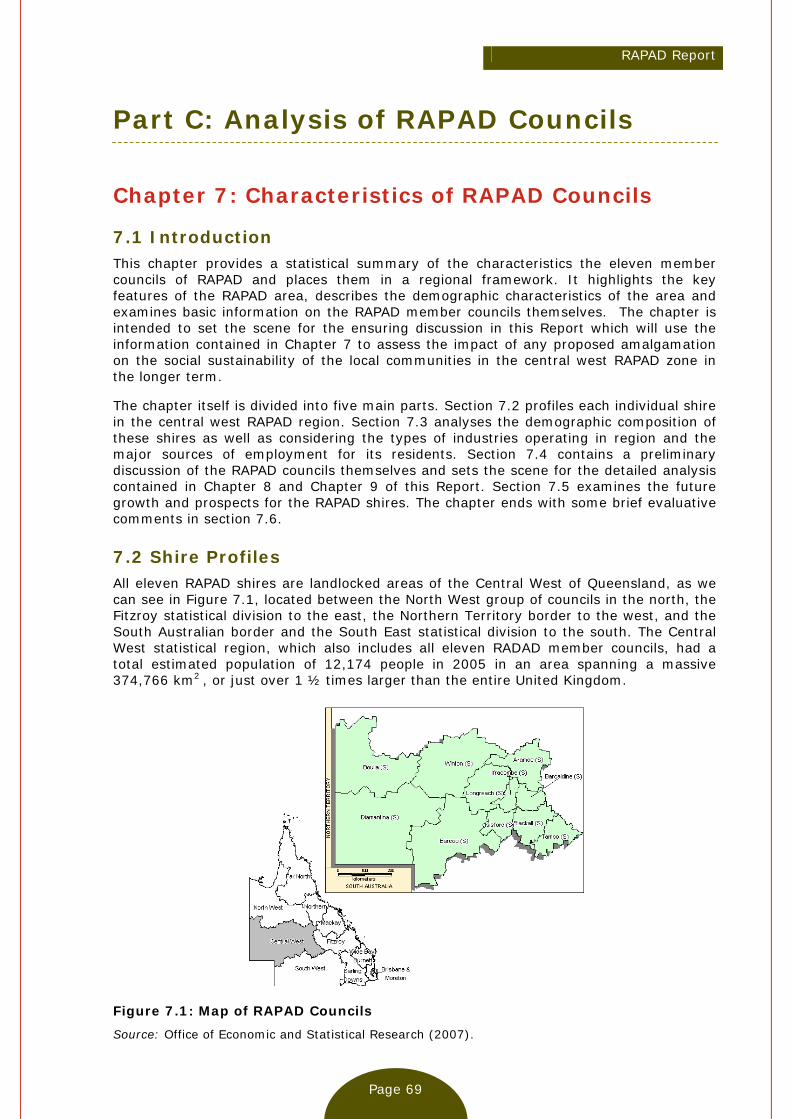
RAPAD Report
Page 69
Part C: Analysis of RAPAD Councils
Chapter 7: Characteristics of RAPAD Councils
7.1 Introduction This chapter provides a statistical summary of the characteristics the eleven member councils of RAPAD and places them in a regional framework. It highlights the key features of the RAPAD area, describes the demographic characteristics of the area and examines basic information on the RAPAD member councils themselves. The chapter is intended to set the scene for the ensuring discussion in this Report which will use the information contained in Chapter 7 to assess the impact of any proposed amalgamation on the social sustainability of the local communities in the central west RAPAD zone in the longer term. The chapter itself is divided into five main parts. Section 7.2 profiles each individual shire in the central west RAPAD region. Section 7.3 analyses the demographic composition of these shires as well as considering the types of industries operating in region and the major sources of employment for its residents. Section 7.4 contains a preliminary discussion of the RAPAD councils themselves and sets the scene for the detailed analysis contained in Chapter 8 and Chapter 9 of this Report. Section 7.5 examines the future growth and prospects for the RAPAD shires. The chapter ends with some brief evaluative comments in section 7.6.
7.2 Shire Profiles All eleven RAPAD shires are landlocked areas of the Central West of Queensland, as we can see in Figure 7.1, located between the North West group of councils in the north, the Fitzroy statistical division to the east, the Northern Territory border to the west, and the South Australian border and the South East statistical division to the south. The Central West statistical region, which also includes all eleven RADAD member councils, had a total estimated population of 12,174 people in 2005 in an area spanning a massive 374,766 km2 , or just over 1 ½ times larger than the entire United Kingdom.
Figure 7.1: Map of RAPAD Councils
Source: Office of Economic and Statistical Research (2007).
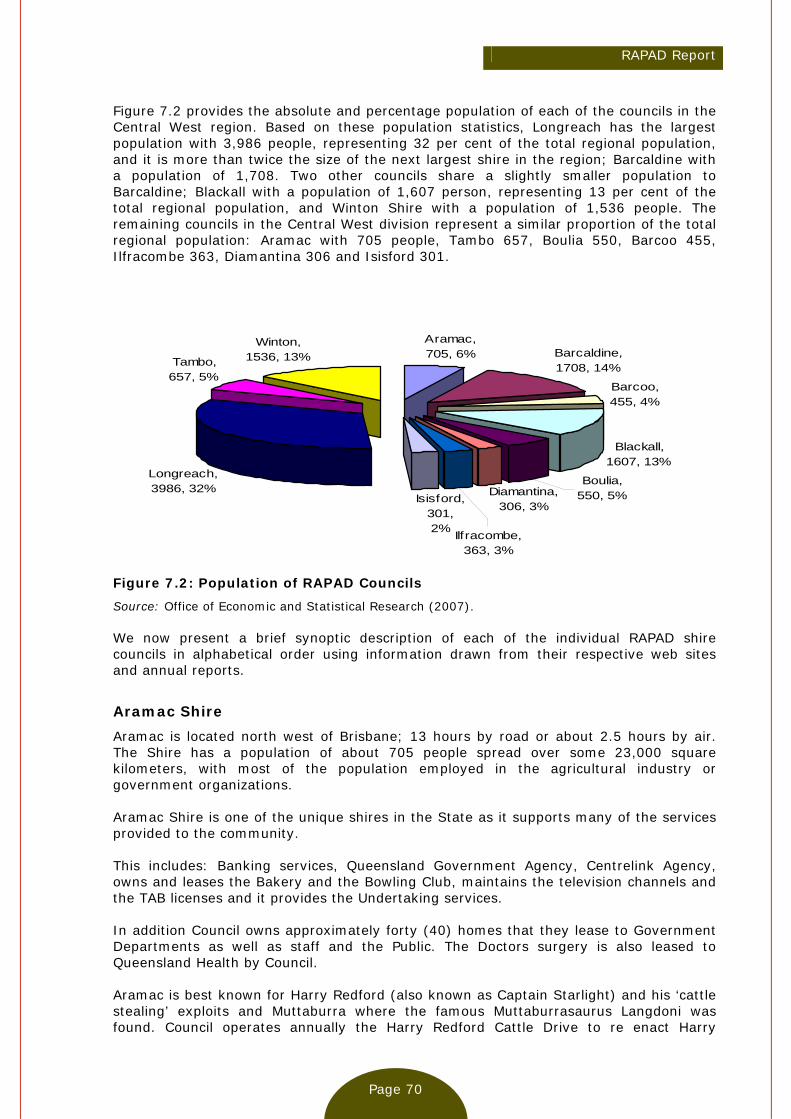
RAPAD Report
Page 70
Figure 7.2 provides the absolute and percentage population of each of the councils in the Central West region. Based on these population statistics, Longreach has the largest population with 3,986 people, representing 32 per cent of the total regional population, and it is more than twice the size of the next largest shire in the region; Barcaldine with a population of 1,708. Two other councils share a slightly smaller population to Barcaldine; Blackall with a population of 1,607 person, representing 13 per cent of the total regional population, and Winton Shire with a population of 1,536 people. The remaining councils in the Central West division represent a similar proportion of the total regional population: Aramac with 705 people, Tambo 657, Boulia 550, Barcoo 455, Ilfracombe 363, Diamantina 306 and Isisford 301.
Blackall, 1607, 13%
Barcaldine, 1708, 14%
Aramac, 705, 6%
Winton, 1536, 13%Tambo,
657, 5%
Longreach, 3986, 32%
Boulia, 550, 5%Diamantina,
306, 3%
Ilfracombe, 363, 3%
Isisford, 301, 2%
Barcoo, 455, 4%
Figure 7.2: Population of RAPAD Councils
Source: Office of Economic and Statistical Research (2007). We now present a brief synoptic description of each of the individual RAPAD shire councils in alphabetical order using information drawn from their respective web sites and annual reports.
Aramac Shire
Aramac is located north west of Brisbane; 13 hours by road or about 2.5 hours by air. The Shire has a population of about 705 people spread over some 23,000 square kilometers, with most of the population employed in the agricultural industry or government organizations. Aramac Shire is one of the unique shires in the State as it supports many of the services provided to the community. This includes: Banking services, Queensland Government Agency, Centrelink Agency, owns and leases the Bakery and the Bowling Club, maintains the television channels and the TAB licenses and it provides the Undertaking services. In addition Council owns approximately forty (40) homes that they lease to Government Departments as well as staff and the Public. The Doctors surgery is also leased to Queensland Health by Council. Aramac is best known for Harry Redford (also known as Captain Starlight) and his ‘cattle stealing’ exploits and Muttaburra where the famous Muttaburrasaurus Langdoni was found. Council operates annually the Harry Redford Cattle Drive to re enact Harry
RAPAD Report
Page 71
Redford’s cattle stealing journey through the Shire incorporating both towns in the Shire. The drive spans for three weeks for people, (overseas, interstate and intrastate) to experience a true authentic outback adventure. The Aramac/Muttaburra area is an excellent vacation destination with many local attractions, including historical museums, aboriginal carvings and paintings at Gray Rock and Horsetailers Gorge, The Lake & Broadwater Water holes for fishing, skiing, birdwatching and relaxation. The area holds Race days 4 times a year with Campdrafts/Rodeos annually. These attractions are a MUST see for everyone. The primary role of the Aramac Shire Council is to assume responsibility for ‘good rule and government’ in the Shire. In order to perform this role in a satisfactory manner, elected members and Shire staff must work together to plan and address the present and future needs of the shire. The Council’s mission is encapsulated in the motto ‘pride, provide and progress’. The Council ‘vision’ for the future centres on progressive planning, community consultation and leadership. In essence, Council policy has adopted the old adage ‘that a progressive society is one that plants trees knowing they will never benefit from the shade’. In addition, the Council is committed to maintaining the Shire’s friendly, safe communities and the maintenance of the Shire as a desirable place to visit.
Barcaldine Shire
Barcaldine is well known as the ‘Garden City of the West’ and it is located in the geographical centre of Queensland, 1052 km north west of Brisbane, and 600 km west of Rockhampton. Barcaldine Shire has an area of 8430 square kilometers and a population of 1708. Local residents consider Barcaldine to be one of the best towns in the Central West, with excellent gardens, parks and playgrounds, sporting fields, an Olympic-size swimming pool, attractive tree-lined streets, hospital amenities, unrestricted water and electricity supplies and an overall tenor of civic pride. The southern and eastern approaches to the town are geologically sandy, but also timbered and known as the ‘desert country’. The northern and western approaches to the town are essentially black-soil country and are referred to locally as ‘the downs’. In 1998, there were 66 grazing properties in the Shire. These comprised 15 cattle properties, 13 mixed sheep/cattle properties and 37 sheep properties, plus a single deer farming enterprise (which has since ceased operation). The gross value of agricultural production in Barcaldine Shire in 1998/99 was $16.0 million, and it has since increased to around $24.4 million in 2001. Barcaldine is noted for its strong local community spirit which reflected in the considerable number of local sporting clubs and local cultural associations present in the Shire. Residents enjoy a comparatively safe lifestyle; crime statistics in the Central West Statistical Division show that property offences are lower than the Queensland state average, while other crime rates are around average for the state. Barcaldine has a hot summer climate, with temperatures reaching 400C, and mild winters, with occasional cold snaps. Nearly all of the Shire rainfall occurs during the summer months, averaging around 500mm per annum. However, in common with much of Australia, rainfall is extremely variable and the region is subject to periodic droughts.
Barcoo Shire Barcoo Shire is a remote rural shire located in Central Western Queensland. It incorporates the towns of Jundah, Stonehenge and Windorah. The population of the Shire is approximately 455. The administrative centre of the Barcoo Shire is 220 kilometres south of Longreach, located in the township of Jundah. Barcoo Shire covers an expanse of 60,901 square kilometres and borders with the shires of Longreach, Winton,

RAPAD Report
Page 72
Diamantina, Quilpie, Isisford and Bulloo, as well as the North-East South Australian border. The Shire's primary river systems are the Thomson and Barcoo, which join together above Windorah to become Cooper's Creek. All rivers and creeks within the Shire merge and flow southwest towards South Australia, terminating at Lake Eyre. The Shire's main industry is beef production and, to a lesser extent, wool production, opal mining, earthmoving works, and tourism and hospitality. The recent discovery of reserves of oil and gas within the Shire boundaries has led to considerable development in the local extraction industry. Barcoo Shire sees itself as an active forward-looking community with a diverse and sustainable economy based on the natural resources. The Shire Council’s mission is to provide a better quality of life for the people of the Shire by inter alia:
Committing to the objectives of their Corporate Plan;
Empowering the local communities;
Creating and taking advantage of opportunities as they arise; and
Being a leader and innovator in local government and the region.
The Council’s priorities include:
The growth and well being of the local community;
The responsible and sustainable development of the Shire;
The integrity of the Shire and the preservation of the individual nature of the towns in the Shire;
Youth; and
Education and skills development.
Blackall Shire
Blackall is located approximately 950km north west of Brisbane and has an attractive ‘clean-green’ local setting with a tree-lined main street lined with heritage buildings and well-kept gardens. Blackall is a small remote community with a population of 1607 within the Shire boundary of 16,363 square km. The economy of Blackall has a strong rural agricultural orientation, thriving retail businesses and a rapidly growing tourism industry. The local climate is varied. The most congenial period in Blackall occurs during autumn, winter and spring with cool evenings and temperate days. By contrast, summer is characterized by a dry heat with minimal humidity. Blackall is able to offer many services required by families to enjoy a fulfilling, safe and healthy lifestyle, including programs for youth, families, aged care, education and sport. In addition, Blackall is situated within an artesian basin and it is thus able to supply an abundance of high quality water suitable for drinking. Blackall is situated along the banks of the Barcoo River. The major industries in the Shire are sheep and cattle production, with tourism a new and rapidly growing local industry. Blackall Shire Council’s stated mission is ‘to provide facilities and services to enhance the lifestyle, and promote economic, social and cultural development in consultation with the community’. The Shire Council has stressed that the achievement of its mission requires

RAPAD Report
Page 73
a united co-operative approach by the elected representatives and the workforce alike. Accordingly, the Council aims to create and foster an organisation where:
The quality of service delivery to the community is a major focus and priority, and citizens are treated with respect, courtesy and fairness;
Management and staff are encouraged to be creative and innovative, and to constantly seek new methods of improving services to the community;
Recognition that Council employees are its greatest asset, and that their contribution and commitment to the promotion of the mission of the Shire Council is highly valued; and
Community consultation and customer relations are highly valued for the continued viability and well-being of both the Shire and the local community.
Boulia Shire
The town of Boulia is considered by many to be the pivotal point of the far west of Queensland, with Mount Isa 300 kilometres to the north and Winton 370 kilometres to the east. It is linked to Alice Springs by the Donohue Highway and the town is acknowledged as being the ‘Capital of the Channel Country’, which gives rise to the great rivers that flow west to Lake Eyre. Boulia is the centre of a prosperous beef and wool industry, with cattle generally grazed in the western and northern areas and sheep properties to the east. The Shire shares a 320 km common border with the Northern Territory and its western boundary marks the eastern edge of the mighty Simpson Desert. The Council’s vision has been decomposed into four key areas:
Population – maintaining and increasing the population of the Shire, as well as encouraging greater numbers of tourists to the surrounding outback;
Infrastructure – maintenance of current infrastructure levels with an emphasis on continual quality improvement and the timely replacement of aging assets;
Economic Base – maintenance of the current primary production economic base together with increased development in commerce and tourism activities; and
Lifestyle and Environment – to provide a relaxed, affordable and secure lifestyle in a caring local community and a friendly local environment.
In order to help achieve this vision, the Shire Council will provide leadership, direction, representation and services to ensure that Boulia Shire is both attractive and prosperous, providing a high quality of life to its residents.
Diamantina Shire
The Diamantina Shire encompasses two main towns, Birdsville and Bedourie, as well as a third smaller town of Betoota. Bedourie is located 1600 km west of Brisbane, while Birdsville is 200 km south of Bedourie and 1200 km from Adelaide. The Shire’s towns have four aircraft links per week on the Brisbane- Mount Isa circuit. Flights are also provided regularly between Port Augusta and Birdsville each week. Birdsville is a famous destination for many Australian and international visitors. The town hosts an annual race meeting, which regularly attracts over 6,000 people. Birdsville is also the start of the renowned Birdsville Track, which originally was used as a stock route for moving cattle from Queensland to the markets in southern Australia.

RAPAD Report
Page 74
Bedourie represents administrative centre of the Diamantina Shire. Over the past 10 years, the population of Bedourie has double to 120 people. The town boasts many new amenities, including an aquatic centre, artesian spa and a large community hall. The Shire's economic foundations lie firmly in its thriving cattle industry and rich natural environment. Located within Queensland's Channel Country, bordering South Australia and the Northern Territory, this area is renowned for producing prime quality beef. The natural irrigation from the Diamantina and Georgina River systems has also assisted with the development an organic cattle industry. The Shire has extensive areas of designated National Parks within its boundaries; indeed, these areas comprise a total of 25 per cent of the Shire's overall spatial area. The Simpson Desert, Diamantina Lakes and Astrebla National Parks all offer unique scenery and wildlife for tourists to experience.
Ilfracombe Shire
Ilfracombe is situated in the middle of the Central West region of Queensland, approximately 1136 km from Brisbane by the Landsborough Highway. The town began in 1891 as a transport nucleus for Wellshot Station, the largest sheep station in the world at the time (in terms of stock numbers). Before the railway reached the town in the late 19th century, horse-drawn wagons carried the wool to the nearest port at Rockhampton. Each wagon, carrying up to 20 tonnes of wool, was drawn by 26 to 30 horses and took 3 months to reach the coast. Ilfracombe Shire covers an area of 6566 square km and serves many large sheep and cattle stations and has a total Shire population of 385 with 190 living in town The Ilfracombe Shire Council’s vision is ‘to maintain our long-term viability as an independent shire’, while its mission for ‘members of the Ilfracombe Shire Council is dedicated to the provision of effective management, community services and amenities; having regard for the requirements and aspirations of the shire residents.’
Isisford Shire
Isisford Shire is made up of the three hamlets of Isisford, Emmet and Yaraka, with a population of approximately 131 people. Isisford Shire covers an area of 10,585 square km and it is situated approximately 1200 km from Brisbane. The town was established in 1877 by William and James Whitman, who were travelling hawkers. They broke an axle on their wagon crossing the Barcoo River and decided to remain. They built a store, hotel, butchery, saddlery and blacksmith's shop. This first settlement was called Wittown, but in 1880 it was changed to its present name after the ‘ford’ in the river and proximity to Isis Downs Station. Yaraka is significant as the terminus of the railway line from Jericho. Large numbers of cattle from the Channel Country are railed from here to meatworks on the coast. The hills of the Grey Ranges provide an attractive backdrop to the area
Longreach
Longreach is located 1205 km north west of Brisbane and 689km west of Rockhampton on the Tropic of Capricorn. It was settled in the 1870's and it is now the largest town in the Central West region of Queensland. With a population of around 4000, the town was built around the sheep and cattle industries that thrive on the vast Mitchell Grass plains. However, tourism is now also a major local industry. The world's first Flying Surgeon Service began at Longreach in 1959. It provides specialised medical attention to hospitals in remote communities. The Qantas hangar at Longreach airport was the first Qantas first operational base from 1922 to 1934. It was in

RAPAD Report
Page 75
this hangar (which is now known as the Qantas Founder's Memorial Museum) that Australia's first six aircraft were built between 1926 and 1930. During World War Two, Longreach was used by the United States Flying Fortresses as a base for their operations in the Pacific area. Stage 2 of Qantas Founders Outback Museum was officially opened in March 2002. The Australian Stockman's Hall of Fame was built as a national tribute to the people who pioneered and developed Outback Australia. The centre honours explorers, pioneers, stockmen, rough riders, as well as the poets, writers and artists who have helped to record the history and people of inland Australia. The complex was officially opened by Queen Elizabeth II on 29th of April, 1988. Longreach Shire Council endeavours to provide the local community and local business sector with a healthy, safe, habitable and sustainable environment through the provision of social and cultural services and essential infrastructure. The Longreach Shire Council aims to provide these services through community and regional collaboration and transparent processes within the bounds of sound financial practices. Economic and social growth are encouraged through progressive, innovative and responsible management and planning strategies. A high standard of professionalism is developed and maintained through the Shire’s code of ethics, equal opportunity practices and ongoing training opportunities.
Tambo Shire
Tambo is located on the Landsborough Highway approximately 860km north west of Brisbane. The town was settled in 1863 and it is considered to be the oldest town in central Queensland. Tambo’s history is etched in historic buildings and natural heritage within the town. Tambo shire comprises 14,109Km2. Tambo is noted for its relaxed atmosphere and friendly people. Tambo is regarded as a town that provides a quality lifestyle that is quiet, peaceful and safe. Tambo is home to some outstanding tourist attractions, including the Tambo Teddies, which is renowned Australia-wide for its range of sheepskin products. The Tranquil Lake dominates Tambo’s natural environment. Visitors can also enjoy ‘a taste of nature’ on the Coolibah Walk, which offers a riverside stroll along the Barcoo River amongst gum trees, native birds and local plants. Coolibah is the local Aboriginal name for trees. The Tambo Shire Council's stated mission is ‘to sustain and further enhance the appealing rural lifestyle within this Western Queensland area by managing resources and providing the leadership necessary to ensure its residents and visitors enjoy a quality of life to the highest possible standard.’
Winton Shire
The Winton Shire has an area of 53,820 square kilometers, services a population of 1,536 persons, and maintains 2,385 kilometers of roads. Its major industries consist of cattle, sheep, livestock, transport, opal mining, gypsum and tourism. Winton is situated 470 km south east of Mt Isa and approximately 1500 km from Brisbane. The region's low annual rainfall made it ideal for sheep and up to 1.5 million sheep have been grazed during past good seasons. However, a series of recent recessions in the pastoral industry have forced residents to consider new economic opportunities. Originally known as the ‘Pelican Waterhole’, Winton was first settled in 1875. During the 1891 Shearer’s Strike, around 500 men camped on the common south of the town; today a cairn marks this site. The iconic melody ‘Waltzing Matilda’ was written on
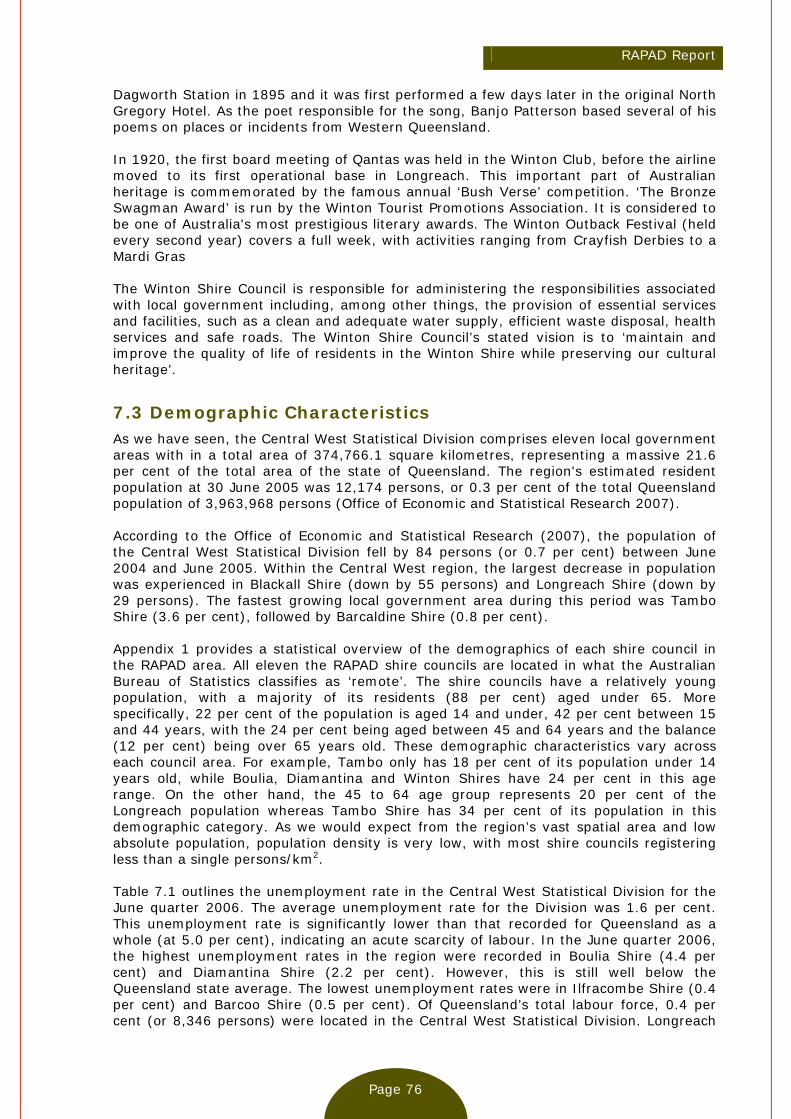
RAPAD Report
Page 76
Dagworth Station in 1895 and it was first performed a few days later in the original North Gregory Hotel. As the poet responsible for the song, Banjo Patterson based several of his poems on places or incidents from Western Queensland. In 1920, the first board meeting of Qantas was held in the Winton Club, before the airline moved to its first operational base in Longreach. This important part of Australian heritage is commemorated by the famous annual ‘Bush Verse’ competition. ‘The Bronze Swagman Award’ is run by the Winton Tourist Promotions Association. It is considered to be one of Australia's most prestigious literary awards. The Winton Outback Festival (held every second year) covers a full week, with activities ranging from Crayfish Derbies to a Mardi Gras The Winton Shire Council is responsible for administering the responsibilities associated with local government including, among other things, the provision of essential services and facilities, such as a clean and adequate water supply, efficient waste disposal, health services and safe roads. The Winton Shire Council’s stated vision is to ‘maintain and improve the quality of life of residents in the Winton Shire while preserving our cultural heritage’.
7.3 Demographic Characteristics As we have seen, the Central West Statistical Division comprises eleven local government areas with in a total area of 374,766.1 square kilometres, representing a massive 21.6 per cent of the total area of the state of Queensland. The region's estimated resident population at 30 June 2005 was 12,174 persons, or 0.3 per cent of the total Queensland population of 3,963,968 persons (Office of Economic and Statistical Research 2007). According to the Office of Economic and Statistical Research (2007), the population of the Central West Statistical Division fell by 84 persons (or 0.7 per cent) between June 2004 and June 2005. Within the Central West region, the largest decrease in population was experienced in Blackall Shire (down by 55 persons) and Longreach Shire (down by 29 persons). The fastest growing local government area during this period was Tambo Shire (3.6 per cent), followed by Barcaldine Shire (0.8 per cent). Appendix 1 provides a statistical overview of the demographics of each shire council in the RAPAD area. All eleven the RAPAD shire councils are located in what the Australian Bureau of Statistics classifies as ‘remote’. The shire councils have a relatively young population, with a majority of its residents (88 per cent) aged under 65. More specifically, 22 per cent of the population is aged 14 and under, 42 per cent between 15 and 44 years, with the 24 per cent being aged between 45 and 64 years and the balance (12 per cent) being over 65 years old. These demographic characteristics vary across each council area. For example, Tambo only has 18 per cent of its population under 14 years old, while Boulia, Diamantina and Winton Shires have 24 per cent in this age range. On the other hand, the 45 to 64 age group represents 20 per cent of the Longreach population whereas Tambo Shire has 34 per cent of its population in this demographic category. As we would expect from the region’s vast spatial area and low absolute population, population density is very low, with most shire councils registering less than a single persons/km2. Table 7.1 outlines the unemployment rate in the Central West Statistical Division for the June quarter 2006. The average unemployment rate for the Division was 1.6 per cent. This unemployment rate is significantly lower than that recorded for Queensland as a whole (at 5.0 per cent), indicating an acute scarcity of labour. In the June quarter 2006, the highest unemployment rates in the region were recorded in Boulia Shire (4.4 per cent) and Diamantina Shire (2.2 per cent). However, this is still well below the Queensland state average. The lowest unemployment rates were in Ilfracombe Shire (0.4 per cent) and Barcoo Shire (0.5 per cent). Of Queensland’s total labour force, 0.4 per cent (or 8,346 persons) were located in the Central West Statistical Division. Longreach
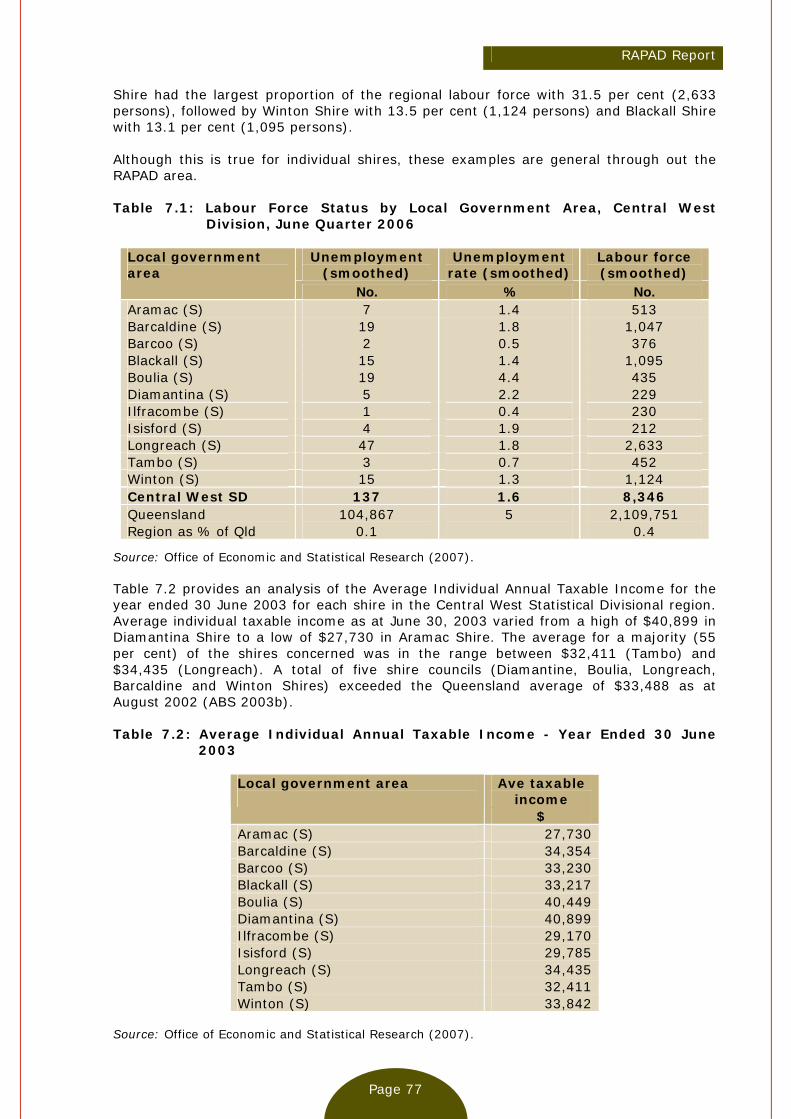
RAPAD Report
Page 77
Shire had the largest proportion of the regional labour force with 31.5 per cent (2,633 persons), followed by Winton Shire with 13.5 per cent (1,124 persons) and Blackall Shire with 13.1 per cent (1,095 persons). Although this is true for individual shires, these examples are general through out the RAPAD area. Table 7.1: Labour Force Status by Local Government Area, Central West
Division, June Quarter 2006
Unemployment (smoothed)
Unemployment rate (smoothed)
Labour force (smoothed)
Local government area
No. % No. Aramac (S) 7 1.4 513 Barcaldine (S) 19 1.8 1,047 Barcoo (S) 2 0.5 376 Blackall (S) 15 1.4 1,095 Boulia (S) 19 4.4 435 Diamantina (S) 5 2.2 229 Ilfracombe (S) 1 0.4 230 Isisford (S) 4 1.9 212 Longreach (S) 47 1.8 2,633 Tambo (S) 3 0.7 452 Winton (S) 15 1.3 1,124 Central West SD 137 1.6 8,346 Queensland 104,867 5 2,109,751 Region as % of Qld 0.1 0.4
Source: Office of Economic and Statistical Research (2007). Table 7.2 provides an analysis of the Average Individual Annual Taxable Income for the year ended 30 June 2003 for each shire in the Central West Statistical Divisional region. Average individual taxable income as at June 30, 2003 varied from a high of $40,899 in Diamantina Shire to a low of $27,730 in Aramac Shire. The average for a majority (55 per cent) of the shires concerned was in the range between $32,411 (Tambo) and $34,435 (Longreach). A total of five shire councils (Diamantine, Boulia, Longreach, Barcaldine and Winton Shires) exceeded the Queensland average of $33,488 as at August 2002 (ABS 2003b). Table 7.2: Average Individual Annual Taxable Income - Year Ended 30 June
2003
Ave taxable income
Local government area
$ Aramac (S) 27,730 Barcaldine (S) 34,354 Barcoo (S) 33,230 Blackall (S) 33,217 Boulia (S) 40,449 Diamantina (S) 40,899 Ilfracombe (S) 29,170 Isisford (S) 29,785 Longreach (S) 34,435 Tambo (S) 32,411 Winton (S) 33,842
Source: Office of Economic and Statistical Research (2007).
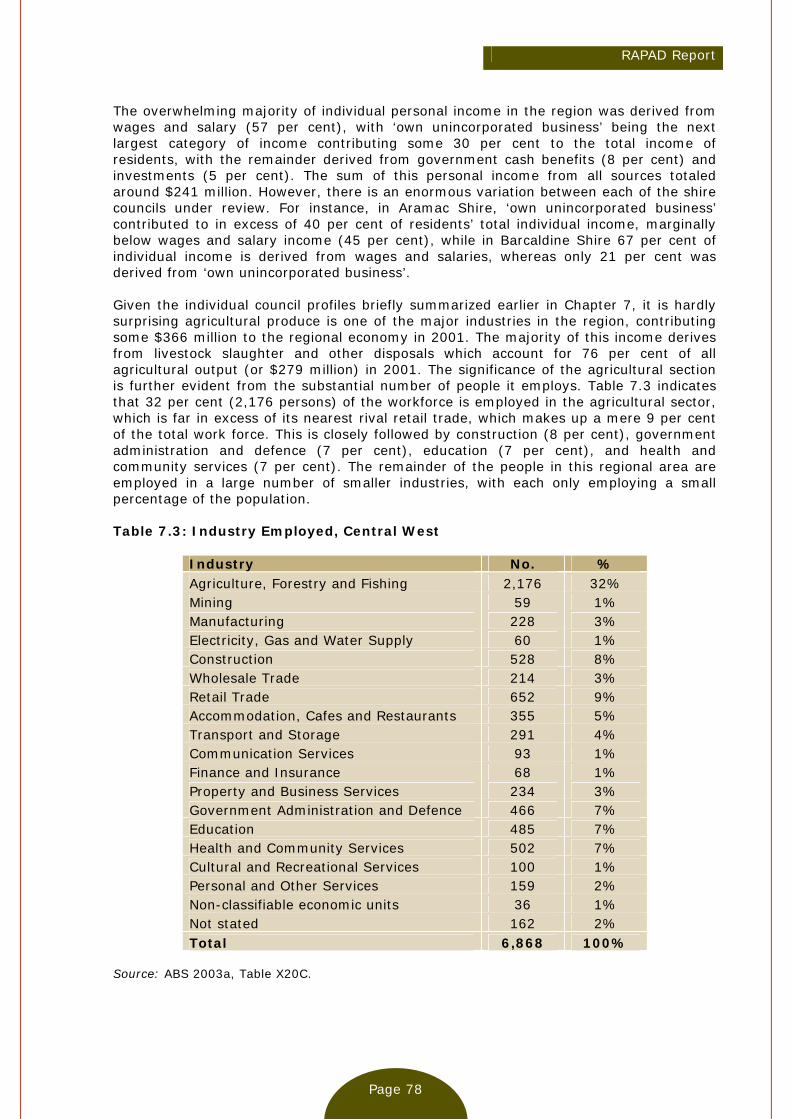
RAPAD Report
Page 78
The overwhelming majority of individual personal income in the region was derived from wages and salary (57 per cent), with ‘own unincorporated business’ being the next largest category of income contributing some 30 per cent to the total income of residents, with the remainder derived from government cash benefits (8 per cent) and investments (5 per cent). The sum of this personal income from all sources totaled around $241 million. However, there is an enormous variation between each of the shire councils under review. For instance, in Aramac Shire, ‘own unincorporated business’ contributed to in excess of 40 per cent of residents’ total individual income, marginally below wages and salary income (45 per cent), while in Barcaldine Shire 67 per cent of individual income is derived from wages and salaries, whereas only 21 per cent was derived from ‘own unincorporated business’. Given the individual council profiles briefly summarized earlier in Chapter 7, it is hardly surprising agricultural produce is one of the major industries in the region, contributing some $366 million to the regional economy in 2001. The majority of this income derives from livestock slaughter and other disposals which account for 76 per cent of all agricultural output (or $279 million) in 2001. The significance of the agricultural section is further evident from the substantial number of people it employs. Table 7.3 indicates that 32 per cent (2,176 persons) of the workforce is employed in the agricultural sector, which is far in excess of its nearest rival retail trade, which makes up a mere 9 per cent of the total work force. This is closely followed by construction (8 per cent), government administration and defence (7 per cent), education (7 per cent), and health and community services (7 per cent). The remainder of the people in this regional area are employed in a large number of smaller industries, with each only employing a small percentage of the population. Table 7.3: Industry Employed, Central West
Industry No. % Agriculture, Forestry and Fishing 2,176 32% Mining 59 1% Manufacturing 228 3% Electricity, Gas and Water Supply 60 1% Construction 528 8% Wholesale Trade 214 3% Retail Trade 652 9% Accommodation, Cafes and Restaurants 355 5% Transport and Storage 291 4% Communication Services 93 1% Finance and Insurance 68 1% Property and Business Services 234 3% Government Administration and Defence 466 7% Education 485 7% Health and Community Services 502 7% Cultural and Recreational Services 100 1% Personal and Other Services 159 2% Non-classifiable economic units 36 1% Not stated 162 2% Total 6,868 100%
Source: ABS 2003a, Table X20C.

RAPAD Report
Page 79
7.4 Synoptic Statistical Review of the Shire Councils
7.4.1 Local Democracy and Local Representation
An outstanding characteristic of each of the eleven shires under review is that they all provide a very effective level of representation within their respective local communities. Indeed, all of the shire councils overtly pride themselves on their ability to represent their constituents in a meaningful way. Local representation is central to local government in the region. This is evident from Table 7.4. Table 7.4 compares the level of representation within the region. Table 7.4 indicates that Isisford Shire has the highest level of representation with one elected councillor per 52 persons, compared to Longreach Shire, which has one councillor representing 397 people. Across the region there are a total of 89 elected officials in eleven councils representing 12,174 people. Thus on average there is one councillor per 137 persons. Table 7.4: Relative Representation in the Central West
Council Population No of Councillors
Level of Representation
Aramac 705 8 88 Barcaldine 1,708 9 190 Barcoo 455 7 65 Blackall 1,607 10 161 Boulia 550 8 69 Diamantina 306 6 51 Ilfracombe 363 7 52 Isisford 301 7 43 Longreach 3,986 10 397 Tambo 657 7 94 Winton 1,536 10 154 Total 12,174 89 137
7.4.2 Local Government Finance
There are six key performance indicators that are generally used by local government analysts to access the state of a given council’s finances. These are:
Revenue Ratio: This ratio shows the percentage of a council’s total operating income that is derived from rates and charges. This indicates reliance on rates and charges (or internally generated income) as opposed to other external income (such as grants and subsidies). In general, the greater the reliance on this former stream of income (i.e. rates and charges), the more financially sustainable the council is held to be and the greater control it has over its income sources.
Operating Efficiency Ratio: This ratio measures a council’s operating income relative to its operating expenditure. A ratio of greater than one indicates that the council receives more operating income that it commits to operating expenditure and thus achieves an operating surplus.
Working Capital Ratio: This ratio measures a council’s current assets (e.g. cash and inventory) relative to its current liabilities (e.g. creditors) and thereby highlights its ability to meet current commitments. A ratio of greater than two is considered acceptable. This implies that the council has more than $2 of current assets to pay for each $1 of current liabilities.
Capital Expense Ratio: This ratio compares a council’s capital expenditure for a given financial year relative to its depreciation expenditure. It is designed to measure whether the council is replacing its assets at least at the rate at which
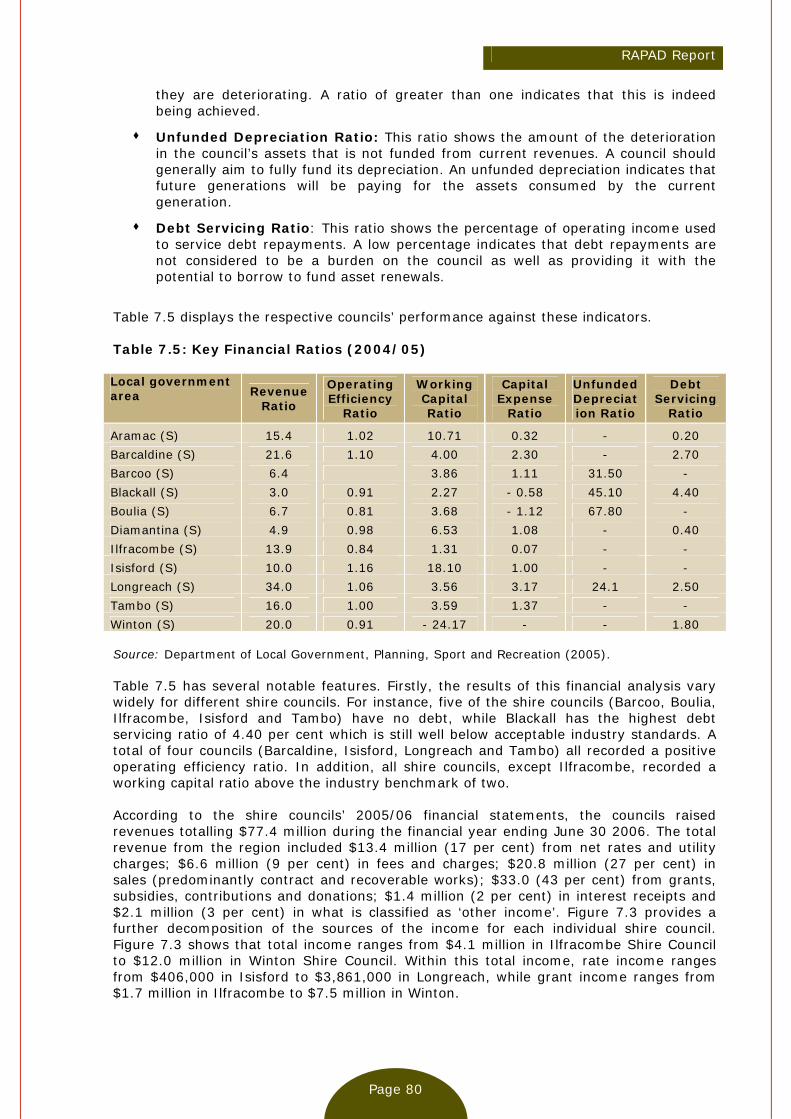
RAPAD Report
Page 80
they are deteriorating. A ratio of greater than one indicates that this is indeed being achieved.
Unfunded Depreciation Ratio: This ratio shows the amount of the deterioration in the council’s assets that is not funded from current revenues. A council should generally aim to fully fund its depreciation. An unfunded depreciation indicates that future generations will be paying for the assets consumed by the current generation.
Debt Servicing Ratio: This ratio shows the percentage of operating income used to service debt repayments. A low percentage indicates that debt repayments are not considered to be a burden on the council as well as providing it with the potential to borrow to fund asset renewals.
Table 7.5 displays the respective councils’ performance against these indicators. Table 7.5: Key Financial Ratios (2004/05) Local government area Revenue
Ratio
Operating Efficiency
Ratio
Working Capital Ratio
Capital Expense
Ratio
Unfunded Depreciation Ratio
Debt Servicing
Ratio
Aramac (S) 15.4 1.02 10.71 0.32 - 0.20 Barcaldine (S) 21.6 1.10 4.00 2.30 - 2.70 Barcoo (S) 6.4 3.86 1.11 31.50 - Blackall (S) 3.0 0.91 2.27 - 0.58 45.10 4.40 Boulia (S) 6.7 0.81 3.68 - 1.12 67.80 - Diamantina (S) 4.9 0.98 6.53 1.08 - 0.40 Ilfracombe (S) 13.9 0.84 1.31 0.07 - - Isisford (S) 10.0 1.16 18.10 1.00 - - Longreach (S) 34.0 1.06 3.56 3.17 24.1 2.50 Tambo (S) 16.0 1.00 3.59 1.37 - - Winton (S) 20.0 0.91 - 24.17 - - 1.80 Source: Department of Local Government, Planning, Sport and Recreation (2005). Table 7.5 has several notable features. Firstly, the results of this financial analysis vary widely for different shire councils. For instance, five of the shire councils (Barcoo, Boulia, Ilfracombe, Isisford and Tambo) have no debt, while Blackall has the highest debt servicing ratio of 4.40 per cent which is still well below acceptable industry standards. A total of four councils (Barcaldine, Isisford, Longreach and Tambo) all recorded a positive operating efficiency ratio. In addition, all shire councils, except Ilfracombe, recorded a working capital ratio above the industry benchmark of two. According to the shire councils’ 2005/06 financial statements, the councils raised revenues totalling $77.4 million during the financial year ending June 30 2006. The total revenue from the region included $13.4 million (17 per cent) from net rates and utility charges; $6.6 million (9 per cent) in fees and charges; $20.8 million (27 per cent) in sales (predominantly contract and recoverable works); $33.0 (43 per cent) from grants, subsidies, contributions and donations; $1.4 million (2 per cent) in interest receipts and $2.1 million (3 per cent) in what is classified as ‘other income’. Figure 7.3 provides a further decomposition of the sources of the income for each individual shire council. Figure 7.3 shows that total income ranges from $4.1 million in Ilfracombe Shire Council to $12.0 million in Winton Shire Council. Within this total income, rate income ranges from $406,000 in Isisford to $3,861,000 in Longreach, while grant income ranges from $1.7 million in Ilfracombe to $7.5 million in Winton.
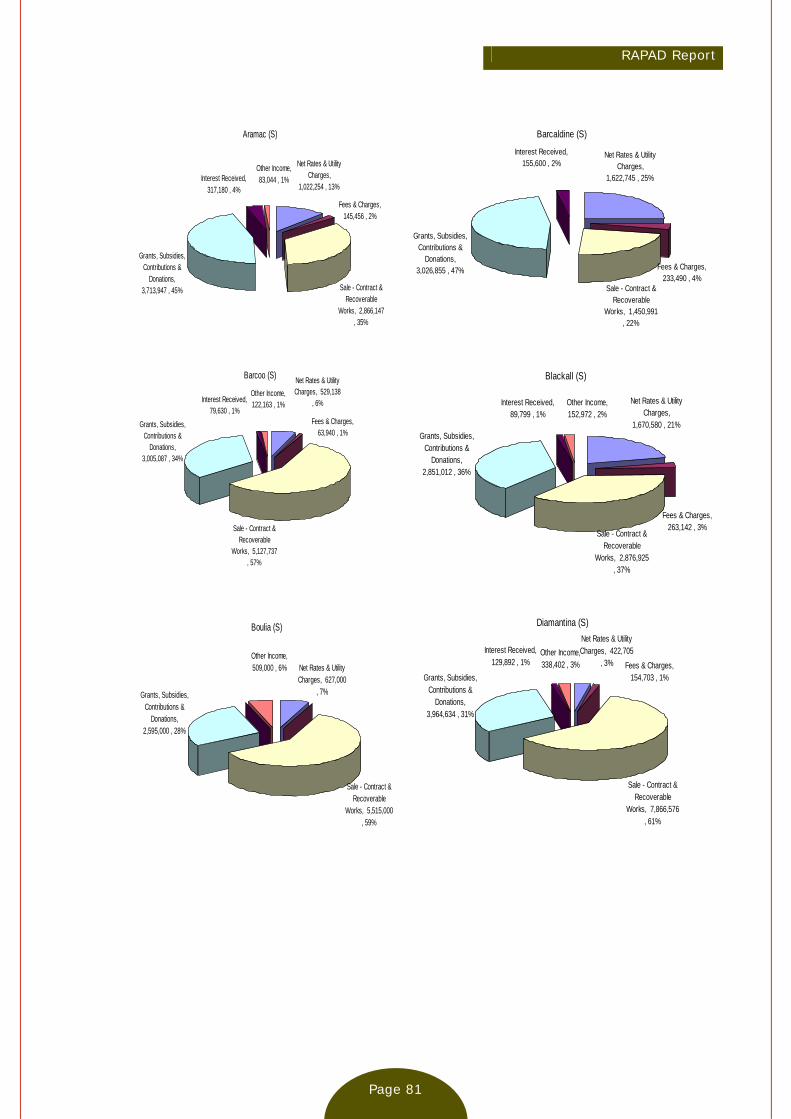
RAPAD Report
Page 81
Aramac (S)
Grants, Subsidies, Contributions &
Donations, 3,713,947 , 45%
Net Rates & Utility Charges,
1,022,254 , 13%
Sale - Contract & Recoverable
Works, 2,866,147 , 35%
Fees & Charges, 145,456 , 2%
Other Income, 83,044 , 1%Interest Received,
317,180 , 4%
Barcaldine (S)
Grants, Subsidies, Contributions &
Donations, 3,026,855 , 47%
Interest Received, 155,600 , 2%
Fees & Charges, 233,490 , 4%
Sale - Contract & Recoverable
Works, 1,450,991 , 22%
Net Rates & Utility Charges,
1,622,745 , 25%
Barcoo (S)
Grants, Subsidies, Contributions &
Donations, 3,005,087 , 34%
Net Rates & Utility Charges, 529,138
, 6%
Sale - Contract & Recoverable
Works, 5,127,737 , 57%
Fees & Charges, 63,940 , 1%
Other Income, 122,163 , 1%Interest Received,
79,630 , 1%
Blackall (S)
Grants, Subsidies, Contributions &
Donations, 2,851,012 , 36%
Net Rates & Utility Charges,
1,670,580 , 21%
Sale - Contract & Recoverable
Works, 2,876,925 , 37%
Fees & Charges, 263,142 , 3%
Other Income, 152,972 , 2%
Interest Received, 89,799 , 1%
Boulia (S)
Grants, Subsidies, Contributions &
Donations, 2,595,000 , 28%
Other Income, 509,000 , 6%
Sale - Contract & Recoverable
Works, 5,515,000 , 59%
Net Rates & Utility Charges, 627,000
, 7%
Diamantina (S)
Grants, Subsidies, Contributions &
Donations, 3,964,634 , 31%
Interest Received, 129,892 , 1%
Other Income, 338,402 , 3% Fees & Charges,
154,703 , 1%
Sale - Contract & Recoverable
Works, 7,866,576 , 61%
Net Rates & Utility Charges, 422,705
, 3%
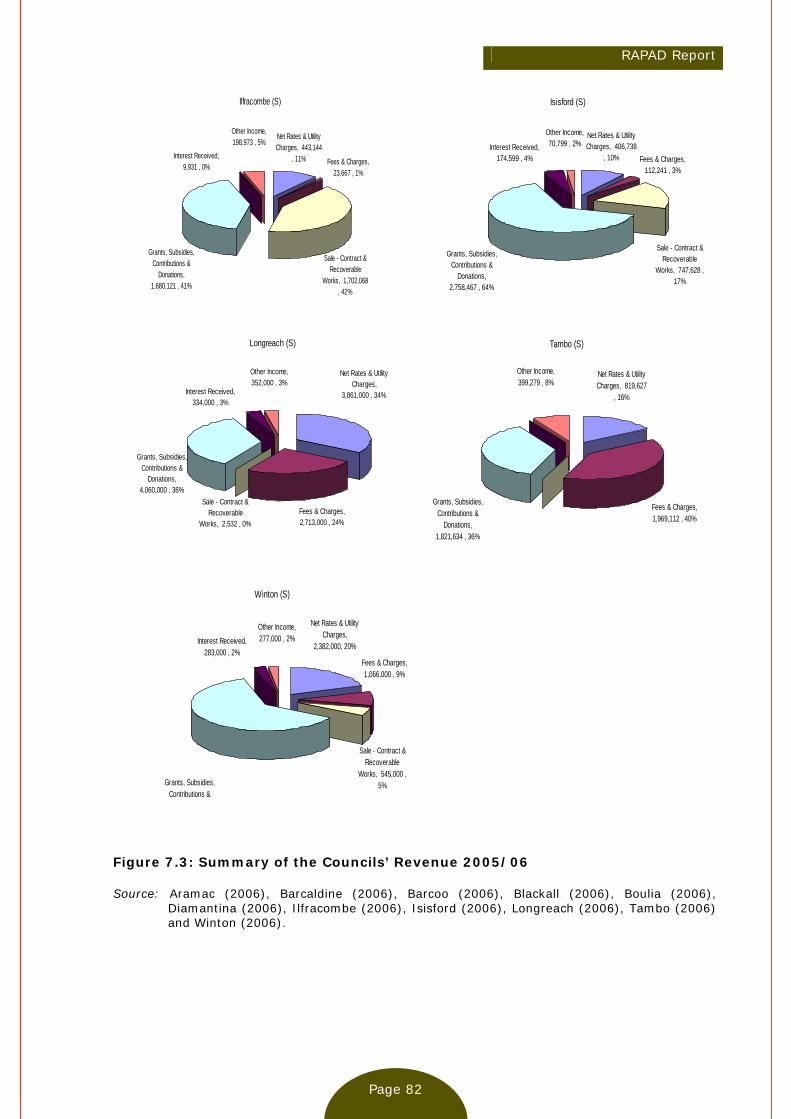
RAPAD Report
Page 82
Ilfracombe (S)
Grants, Subsidies, Contributions &
Donations, 1,680,121 , 41%
Net Rates & Utility Charges, 443,144
, 11%
Sale - Contract & Recoverable
Works, 1,702,068 , 42%
Fees & Charges, 23,667 , 1%
Other Income, 198,973 , 5%
Interest Received, 9,931 , 0%
Isisford (S)
Interest Received, 174,599 , 4%
Other Income, 70,799 , 2%
Fees & Charges, 112,241 , 3%
Sale - Contract & Recoverable
Works, 747,628 , 17%
Net Rates & Utility Charges, 406,738
, 10%
Grants, Subsidies, Contributions &
Donations, 2,758,467 , 64%
Longreach (S)
Interest Received, 334,000 , 3%
Other Income, 352,000 , 3%
Fees & Charges, 2,713,000 , 24%
Sale - Contract & Recoverable
Works, 2,532 , 0%
Net Rates & Utility Charges,
3,861,000 , 34%
Grants, Subsidies, Contributions &
Donations, 4,060,000 , 36%
Tambo (S)
Grants, Subsidies, Contributions &
Donations, 1,821,634 , 36%
Net Rates & Utility Charges, 819,627
, 16%
Fees & Charges, 1,969,112 , 40%
Other Income, 399,279 , 8%
Winton (S)
Grants, Subsidies, Contributions &
Net Rates & Utility Charges,
2,382,000, 20%
Sale - Contract & Recoverable
Works, 545,000 , 5%
Fees & Charges, 1,066,000 , 9%
Other Income, 277,000 , 2%Interest Received,
283,000 , 2%
Figure 7.3: Summary of the Councils’ Revenue 2005/06
Source: Aramac (2006), Barcaldine (2006), Barcoo (2006), Blackall (2006), Boulia (2006), Diamantina (2006), Ilfracombe (2006), Isisford (2006), Longreach (2006), Tambo (2006) and Winton (2006).
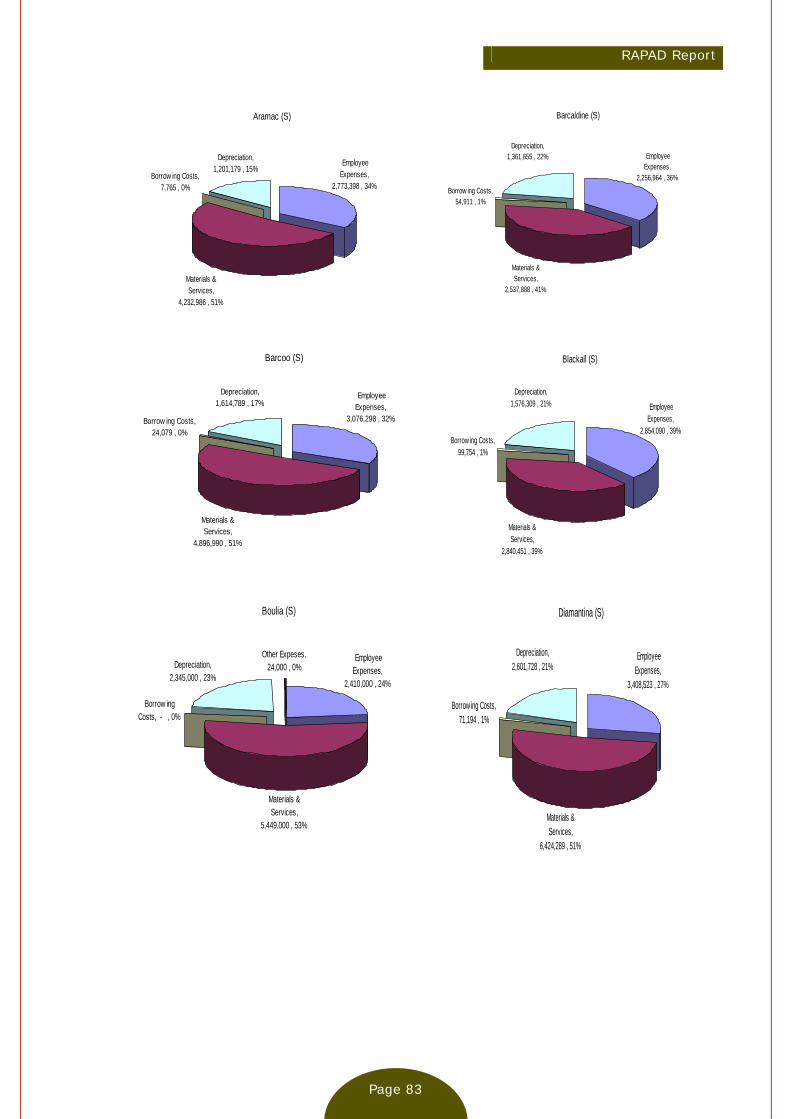
RAPAD Report
Page 83
Aramac (S)
Materials & Services,
4,232,986 , 51%
Borrow ing Costs, 7,765 , 0%
Employee Expenses,
2,773,398 , 34%
Depreciation, 1,201,179 , 15%
Barcaldine (S)
Materials & Services,
2,537,888 , 41%
Borrow ing Costs, 54,911 , 1%
Depreciation, 1,361,655 , 22% Employee
Expenses, 2,256,964 , 36%
Barcoo (S)
Materials & Services,
4,896,990 , 51%
Borrow ing Costs, 24,079 , 0%
Employee Expenses,
3,076,298 , 32%
Depreciation, 1,614,789 , 17%
Blackall (S)
Materials & Services,
2,840,451 , 39%
Borrow ing Costs, 99,754 , 1%
Depreciation, 1,576,309 , 21% Employee
Expenses, 2,854,090 , 39%
Boulia (S)
Employee Expenses,
2,410,000 , 24%
Materials & Services,
5,449,000 , 53%
Depreciation, 2,345,000 , 23%
Other Expeses, 24,000 , 0%
Borrow ing Costs, - , 0%
Diamantina (S)
Materials & Services,
6,424,289 , 51%
Borrow ing Costs, 71,194 , 1%
Depreciation, 2,601,728 , 21%
Employee Expenses,
3,408,523 , 27%
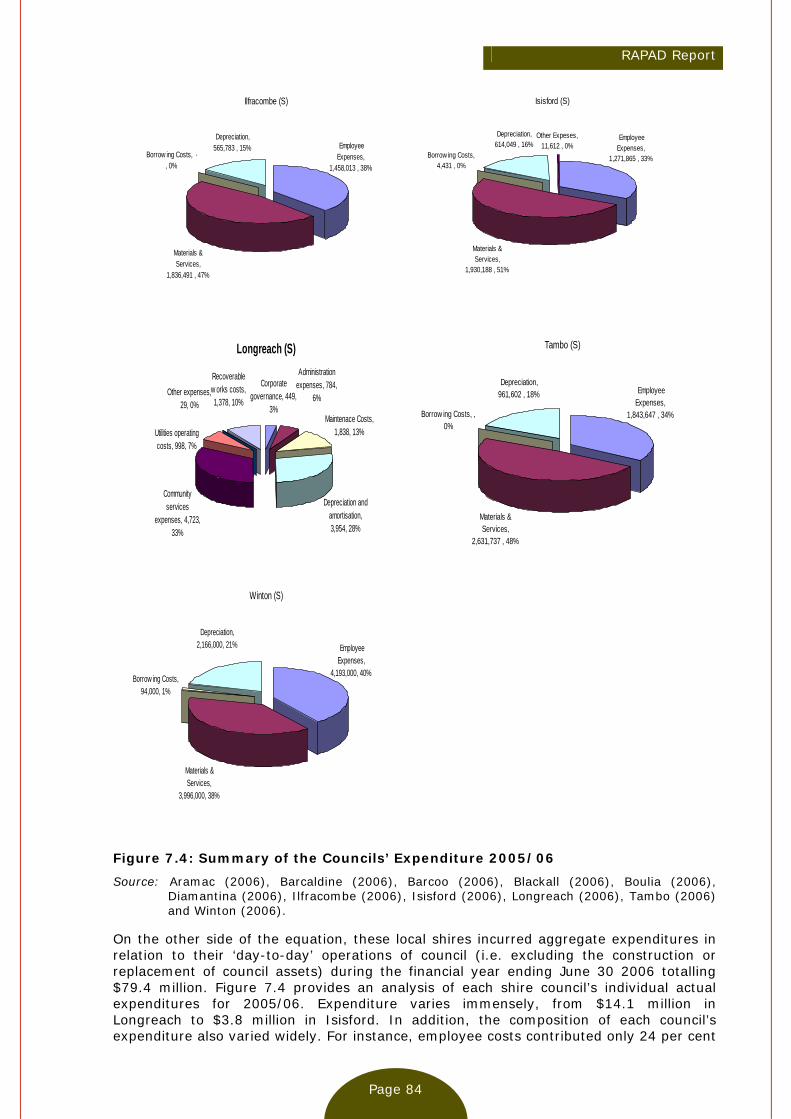
RAPAD Report
Page 84
Ilfracombe (S)
Materials & Services,
1,836,491 , 47%
Borrow ing Costs, -, 0%
Employee Expenses,
1,458,013 , 38%
Depreciation, 565,783 , 15%
Isisford (S)
Materials & Services,
1,930,188 , 51%
Borrow ing Costs, 4,431 , 0%
Other Expeses, 11,612 , 0%
Depreciation, 614,049 , 16%
Employee Expenses,
1,271,865 , 33%
Longreach (S)
Maintenace Costs, 1,838, 13%
Depreciation and amortisation, 3,954, 28%
Community services
expenses, 4,723, 33%
Utilities operating costs, 998, 7%
Other expenses, 29, 0%
Recoverable w orks costs, 1,378, 10%
Corporate governance, 449,
3%
Administration expenses, 784,
6%
Tambo (S)
Materials & Services,
2,631,737 , 48%
Borrow ing Costs, , 0%
Employee Expenses,
1,843,647 , 34%
Depreciation, 961,602 , 18%
Winton (S)
Materials & Services,
3,996,000, 38%
Borrow ing Costs, 94,000, 1%
Depreciation, 2,166,000, 21% Employee
Expenses, 4,193,000, 40%
Figure 7.4: Summary of the Councils’ Expenditure 2005/06
Source: Aramac (2006), Barcaldine (2006), Barcoo (2006), Blackall (2006), Boulia (2006), Diamantina (2006), Ilfracombe (2006), Isisford (2006), Longreach (2006), Tambo (2006) and Winton (2006).
On the other side of the equation, these local shires incurred aggregate expenditures in relation to their ‘day-to-day’ operations of council (i.e. excluding the construction or replacement of council assets) during the financial year ending June 30 2006 totalling $79.4 million. Figure 7.4 provides an analysis of each shire council’s individual actual expenditures for 2005/06. Expenditure varies immensely, from $14.1 million in Longreach to $3.8 million in Isisford. In addition, the composition of each council’s expenditure also varied widely. For instance, employee costs contributed only 24 per cent
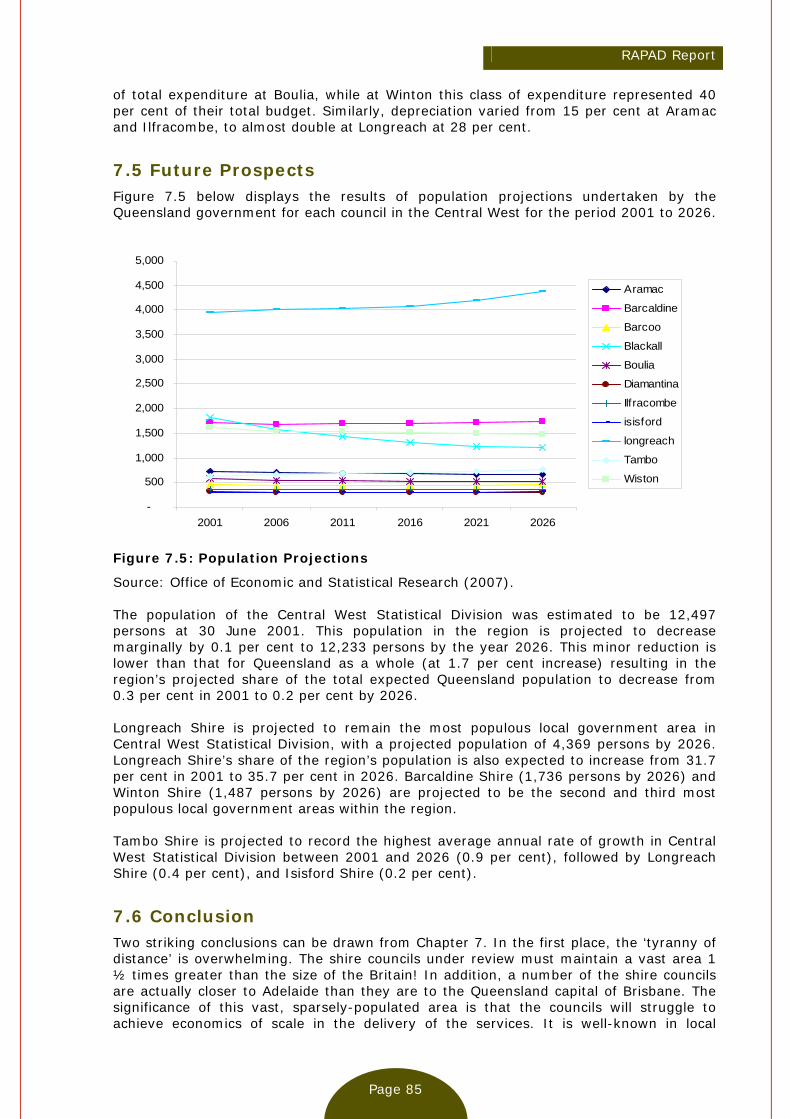
RAPAD Report
Page 85
of total expenditure at Boulia, while at Winton this class of expenditure represented 40 per cent of their total budget. Similarly, depreciation varied from 15 per cent at Aramac and Ilfracombe, to almost double at Longreach at 28 per cent.
7.5 Future Prospects Figure 7.5 below displays the results of population projections undertaken by the Queensland government for each council in the Central West for the period 2001 to 2026.
-
500
1,000
1,500
2,000
2,500
3,000
3,500
4,000
4,500
5,000
2001 2006 2011 2016 2021 2026
Aramac
Barcaldine
Barcoo
Blackall
Boulia
Diamantina
Ilfracombe
isisford
longreach
Tambo
Wiston
Figure 7.5: Population Projections
Source: Office of Economic and Statistical Research (2007). The population of the Central West Statistical Division was estimated to be 12,497 persons at 30 June 2001. This population in the region is projected to decrease marginally by 0.1 per cent to 12,233 persons by the year 2026. This minor reduction is lower than that for Queensland as a whole (at 1.7 per cent increase) resulting in the region’s projected share of the total expected Queensland population to decrease from 0.3 per cent in 2001 to 0.2 per cent by 2026. Longreach Shire is projected to remain the most populous local government area in Central West Statistical Division, with a projected population of 4,369 persons by 2026. Longreach Shire’s share of the region’s population is also expected to increase from 31.7 per cent in 2001 to 35.7 per cent in 2026. Barcaldine Shire (1,736 persons by 2026) and Winton Shire (1,487 persons by 2026) are projected to be the second and third most populous local government areas within the region. Tambo Shire is projected to record the highest average annual rate of growth in Central West Statistical Division between 2001 and 2026 (0.9 per cent), followed by Longreach Shire (0.4 per cent), and Isisford Shire (0.2 per cent).
7.6 Conclusion Two striking conclusions can be drawn from Chapter 7. In the first place, the ‘tyranny of distance’ is overwhelming. The shire councils under review must maintain a vast area 1 ½ times greater than the size of the Britain! In addition, a number of the shire councils are actually closer to Adelaide than they are to the Queensland capital of Brisbane. The significance of this vast, sparsely-populated area is that the councils will struggle to achieve economics of scale in the delivery of the services. It is well-known in local

RAPAD Report
Page 86
government systems across the world that servicing small massively spatially separated populations will generally be very costly, regardless of the organizational structure delivering the service. This ‘tyranny of distance’ will thus be likely to drastically increase an organisation’s cost if a centralised organisational structure is adopted. Vast distances mean greater expenditure if service provision is centralised. This inescapable fact is acknowledged by the Queensland state government itself, given the substantial number of functions and responsibilities the shire councils under review already carry out on behalf of the state government, such health services. This problem is discussed in more depth in Chapter 9. The second major conclusion that can be drawn from Chapter 7 is that while the eleven shire councils appear fairly similar on the surface, upon further investigation great differences emerge. Each shire council services a different number of constituents, each maintains a different size shire spatial area, each has different levels of representation, residents have different levels of average incomes, population grows at different rates in every shire, and each council is in a different financial position. This is not at all surprising. The National Office of Local Government (2003, p. 6) observed that one of the most striking characteristics of Australia’s 726 local government bodies is their diversity. Indeed, local councils differ markedly almost in every aspect, including:
Size and area of population represented;
Range and scale of function;
Fiscal position (including wide disparities in revenue raising capacity), resources and skill base;
Physical, economic, social and cultural environment of local government areas;
Attitudes and aspirations of local communities;
Structure of power and influence within local communities and the extent to which elected representatives reflect a broad range of opinions; and
The varying state legislative frameworks within which councils operate, including voting rights and electoral systems.
In addition, municipalities vary according to their level of financial self-sufficiency and the degree of remoteness from major urban centres (Worthington and Dollery 2001). They also vary markedly in the democratic representation they receive from elected officials. Each local government body also has different degrees of financial capacity, human resources, responsibilities and service provision capacities (Johnson 2006). The diversity in local government is extremely important, particularly when considering the implementation of uniform state government policies, such as forced council mergers. Just as there are many and diverse councils, so too there may be many and diverse solutions to any given problem (Johnson 2006). Moreover, this means that ‘one-size-fits-all’ local government reform policies, like state-wide forced amalgamation programs, are not appropriate for all local authorities. Indeed, it is most unlikely that one solution will work for all councils to meet a given policy objective. Consideration will therefore need to be given to the individual circumstances of each council when determining any policy. It is nonetheless clear that the concerted application of uniform policy standards, such as forced council amalgamations, which neglect local diversity, run the risk of the ‘lowest common denominator’ and thus being ineffective in addressing the fundamental policy objectives of the state government in question. This problem is taken up at length in this Report.

RAPAD Report
Page 87
Chapter 8: Financial Sustainability of Central West Councils
8.1 Introduction Chapter 8 seeks to apply the various concepts of financial sustainability in local government, together with the various measurements of financial sustainability discussed in this Report, especially in Chapter 5, to the Central West local shires in order to determine whether these shires can be considered financially sustainable. A comprehensive evaluation of each local council is undertaken using no fewer than five different methods to establish whether the operations of the council are indeed financially sustainable. The chapter itself is divided into six main parts. Section 8.2 assesses Central West shires under the South Australian Financial Sustainability Review Board (FSRB) (2005) criteria for a sustainable local government authority. Section 8.3 focuses on applying the Independent Inquiry into the Financial Sustainability of NSW Local Government’s (LGI 2006) recommendations to determine sustainability in the case of RAPAD shires. Section 8.4 reviews the results and conclusions from the Queensland Treasury Corporation (QTC 2007 (a-d, h, and i); 2006b) analysis of Central West shires. Section 8.5 considers the results from the annual audits of municipalities in Queensland undertaken by the Auditor General and his determination of financial viability. Section 8.6 considers the options available to enhance the RAPAD organization itself to increase the financial sustainability of its eleven member councils. The chapter ends with some brief evaluative comments in section 8.7.
8.2 South Australian Criteria The current interest into the sustainability of local government in Australia originated with the Independent Inquiry into Sustainability of Local Government in South Australia. The FSRB (2005, p. 19-20) drew its major conclusion in the form of Recommendation 2.3(1), in which it determined a ‘statement of principles’ governing ‘key financial sustainability indicators’. The six key ingredients of these indicators are discussed below, together with details as to how the Central West shires fared against them. The first indicator states that a local council is financially sustainable financial if ‘its net financial liabilities are at levels at which the associated interest payments (less interest income) can be met comfortably from a council’s annual income (i.e. by current ratepayers) without the prospects of rates increases which ratepayers would find unacceptable (or disruptive service cuts)’. As we saw in Chapter 7, a significant number of the councils in the Central West are actually debt free (Barcoo, Boulia, Ilfracombe, Isisford and Tambo). Of those councils that had outstanding loans, the annual borrowing costs (predominately interest) ranged from $4,431 in Isisford to $131,000 in Longreach (as shown in Table 8.1). In this regard, each council could be considered comfortably able to meet its financial liabilities from its annual income, due to the low level of debt, and hence low annual repayments that are required.
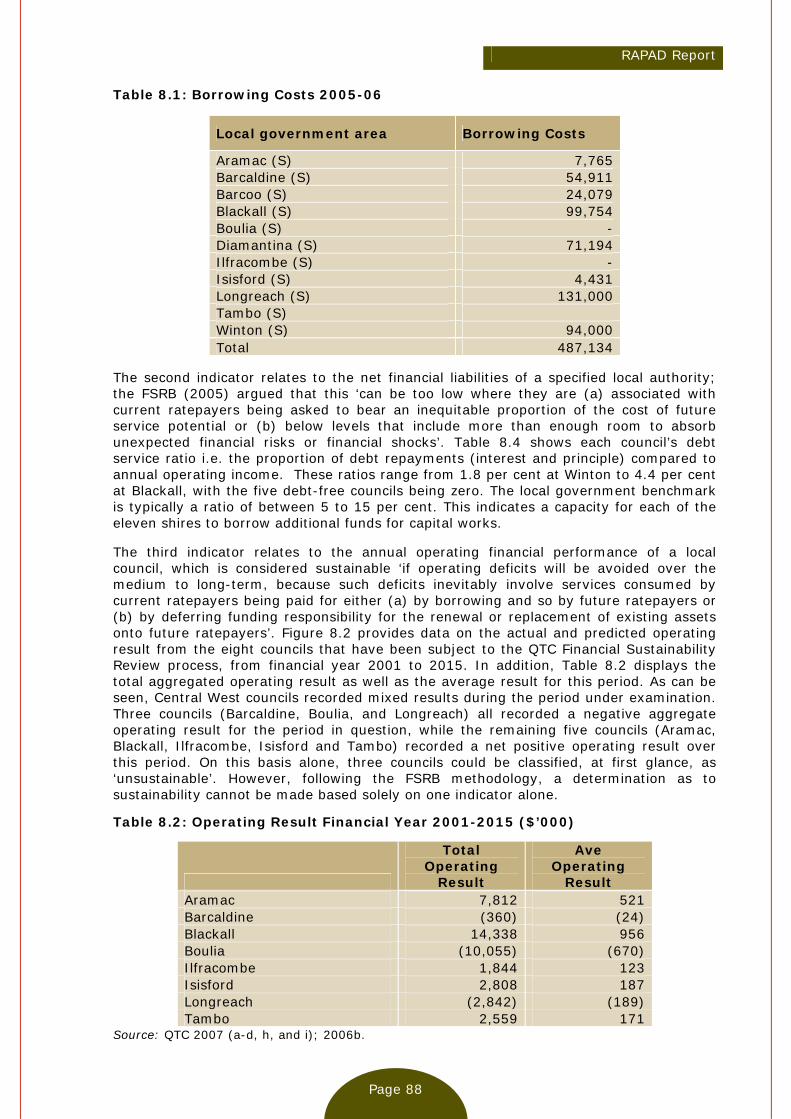
RAPAD Report
Page 88
Table 8.1: Borrowing Costs 2005-06
Local government area Borrowing Costs
Aramac (S) 7,765 Barcaldine (S) 54,911 Barcoo (S) 24,079 Blackall (S) 99,754 Boulia (S) - Diamantina (S) 71,194 Ilfracombe (S) - Isisford (S) 4,431 Longreach (S) 131,000 Tambo (S) Winton (S) 94,000 Total 487,134
The second indicator relates to the net financial liabilities of a specified local authority; the FSRB (2005) argued that this ‘can be too low where they are (a) associated with current ratepayers being asked to bear an inequitable proportion of the cost of future service potential or (b) below levels that include more than enough room to absorb unexpected financial risks or financial shocks’. Table 8.4 shows each council’s debt service ratio i.e. the proportion of debt repayments (interest and principle) compared to annual operating income. These ratios range from 1.8 per cent at Winton to 4.4 per cent at Blackall, with the five debt-free councils being zero. The local government benchmark is typically a ratio of between 5 to 15 per cent. This indicates a capacity for each of the eleven shires to borrow additional funds for capital works. The third indicator relates to the annual operating financial performance of a local council, which is considered sustainable ‘if operating deficits will be avoided over the medium to long-term, because such deficits inevitably involve services consumed by current ratepayers being paid for either (a) by borrowing and so by future ratepayers or (b) by deferring funding responsibility for the renewal or replacement of existing assets onto future ratepayers’. Figure 8.2 provides data on the actual and predicted operating result from the eight councils that have been subject to the QTC Financial Sustainability Review process, from financial year 2001 to 2015. In addition, Table 8.2 displays the total aggregated operating result as well as the average result for this period. As can be seen, Central West councils recorded mixed results during the period under examination. Three councils (Barcaldine, Boulia, and Longreach) all recorded a negative aggregate operating result for the period in question, while the remaining five councils (Aramac, Blackall, Ilfracombe, Isisford and Tambo) recorded a net positive operating result over this period. On this basis alone, three councils could be classified, at first glance, as ‘unsustainable’. However, following the FSRB methodology, a determination as to sustainability cannot be made based solely on one indicator alone.
Table 8.2: Operating Result Financial Year 2001-2015 ($’000)
Total Operating
Result
Ave Operating
Result Aramac 7,812 521 Barcaldine (360) (24) Blackall 14,338 956 Boulia (10,055) (670) Ilfracombe 1,844 123 Isisford 2,808 187 Longreach (2,842) (189) Tambo 2,559 171
Source: QTC 2007 (a-d, h, and i); 2006b.
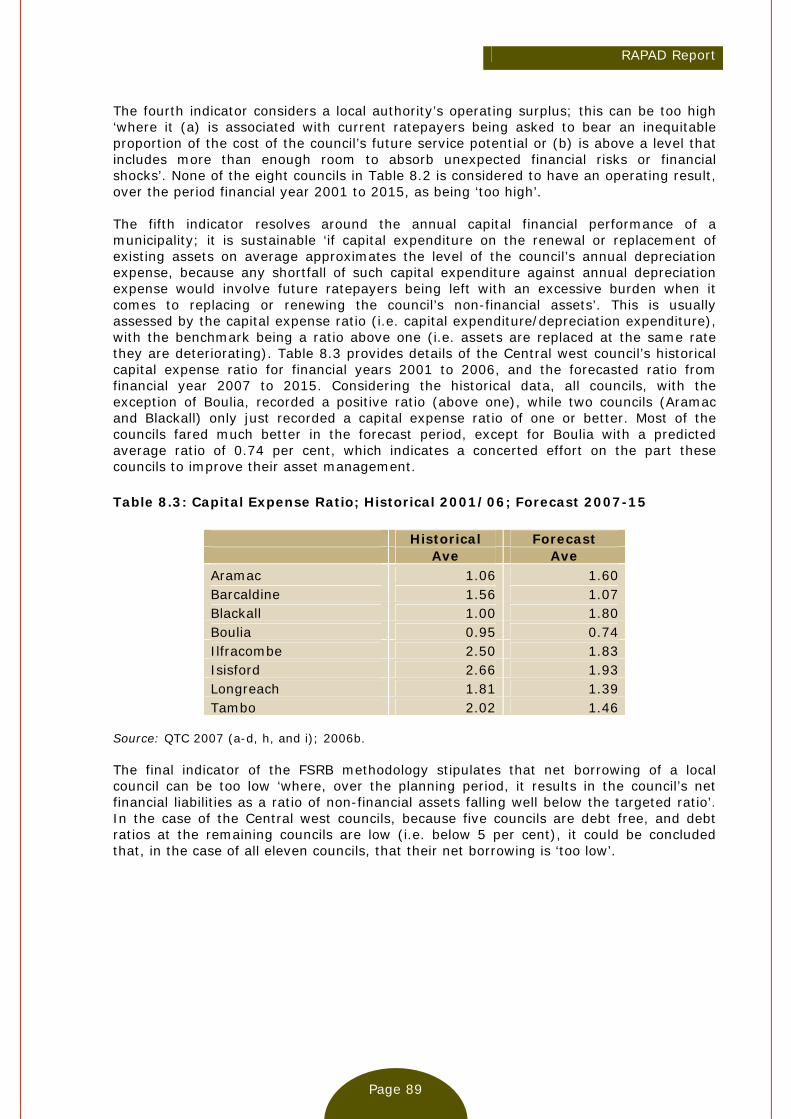
RAPAD Report
Page 89
The fourth indicator considers a local authority’s operating surplus; this can be too high ‘where it (a) is associated with current ratepayers being asked to bear an inequitable proportion of the cost of the council’s future service potential or (b) is above a level that includes more than enough room to absorb unexpected financial risks or financial shocks’. None of the eight councils in Table 8.2 is considered to have an operating result, over the period financial year 2001 to 2015, as being ‘too high’. The fifth indicator resolves around the annual capital financial performance of a municipality; it is sustainable ‘if capital expenditure on the renewal or replacement of existing assets on average approximates the level of the council’s annual depreciation expense, because any shortfall of such capital expenditure against annual depreciation expense would involve future ratepayers being left with an excessive burden when it comes to replacing or renewing the council’s non-financial assets’. This is usually assessed by the capital expense ratio (i.e. capital expenditure/depreciation expenditure), with the benchmark being a ratio above one (i.e. assets are replaced at the same rate they are deteriorating). Table 8.3 provides details of the Central west council’s historical capital expense ratio for financial years 2001 to 2006, and the forecasted ratio from financial year 2007 to 2015. Considering the historical data, all councils, with the exception of Boulia, recorded a positive ratio (above one), while two councils (Aramac and Blackall) only just recorded a capital expense ratio of one or better. Most of the councils fared much better in the forecast period, except for Boulia with a predicted average ratio of 0.74 per cent, which indicates a concerted effort on the part these councils to improve their asset management. Table 8.3: Capital Expense Ratio; Historical 2001/06; Forecast 2007-15
Historical Forecast Ave Ave Aramac 1.06 1.60 Barcaldine 1.56 1.07 Blackall 1.00 1.80 Boulia 0.95 0.74 Ilfracombe 2.50 1.83 Isisford 2.66 1.93 Longreach 1.81 1.39 Tambo 2.02 1.46
Source: QTC 2007 (a-d, h, and i); 2006b. The final indicator of the FSRB methodology stipulates that net borrowing of a local council can be too low ‘where, over the planning period, it results in the council’s net financial liabilities as a ratio of non-financial assets falling well below the targeted ratio’. In the case of the Central west councils, because five councils are debt free, and debt ratios at the remaining councils are low (i.e. below 5 per cent), it could be concluded that, in the case of all eleven councils, that their net borrowing is ‘too low’.

Page 90
RAPAD Report
Table 8.4: Key Financial Indicators 2004/05
Local government area
Revenue Ratio
Operating Efficiency
Ratio
Working Capital Ratio
Capital Expense
Ratio
Unfunded Depreciation
Ratio
Debt Servicing
Ratio Aramac (S)1 15.4 1.02 10.71 0.32 - 0.2 Barcaldine (S) 21.6 1.10 4.00 2.30 - 2.70 Barcoo (S) 6.4 0.99 3.86 1.11 31.50 - Blackall (S) 3.0 0.91 2.27 - 0.58 45.10 4.40 Boulia (S) 6.7 0.81 3.68 - 1.12 67.80 - Diamantina (S) 1 4.9 0.98 6.53 1.08 - 0.4 Ilfracombe (S) 13.9 0.84 1.31 0.07 - - Isisford (S) 10.0 1.16 18.10 1.00 - - Longreach (S) 34.0 1.06 3.56 3.17 24.10 2.50 Tambo (S) 16.0 1.00 3.59 1.37 - - Winton (S) 02.0 0.91 - 24.17 - - 1.80
Source: Department of Local Government, Planning, Sport and Recreation (2005). Note: 1 2003/04 After assessing the councils against the South Australian FSRB’s indicators of financial sustainability, it is clear these councils perform reasonably well on their levels of debt, with most having significant capacity to use borrowing to fund future asset replacement and renewal. This indicates that most Central West councils were replacing their assets at a rate equivalent to their rate of deterioration. However, three out of the eight councils predicted a net positive operating result for the period between financial years 2001 to 2015. We thus would suggest that these forecasts be reviewed by those councils who did not meet these benchmarks. Once these minor alterations have been made to the forecasts, each of these councils would receive ‘full marks’ against all of the FSRB indicators and would thus be considered sustainable in South Australia.
8.3 New South Wales Criteria The New South Wales Independent Inquiry into the Financial Sustainability of NSW Local Government (LGI) took the assessment of sustainability one step further by not only developing a set of financial performance indicators to evaluate a given council’s level of sustainability, but also by specifying a range that these indicators should fall between. The LGI (2006, p. 274) stressed that ‘if used, each of these ratios should be adhered to, not just some of them’. Table 8.5 provides an overview of the indicators used by the LGI to assess a council’s sustainability, together with the average result achieved by New South Wales councils, the LGI-determined benchmark target, and the upper and lower range of the indicators. Table 8.5 also includes the relevant assessment for each Central West council against the LGI indicators. Based on the LGI benchmarks, all Central West councils fell short on most of the proposed targets for each indicator, mainly due to the low levels of debt held by each council. The LGI ‘solution’ to local government sustainability was broadly based on local councils carrying higher than normal levels of debt, as well as various other factors. In addition, there was insufficient information available to calculate the infrastructure renewal backlog. It must immediately be observed that this is a pervasive problem in all Australian local government systems On a more positive note, due to the higher than average reliance on grants (hence the low levels of own-source income) of the Central West councils, those councils that recorded an operating surplus in 2005/06 generally recorded a good ratio of operating surplus to own-source income. Therefore, based on the LGI assessment of financial sustainability, all of the Central West councils, like the average NSW council, would be considered financially unsustainable in the long term.
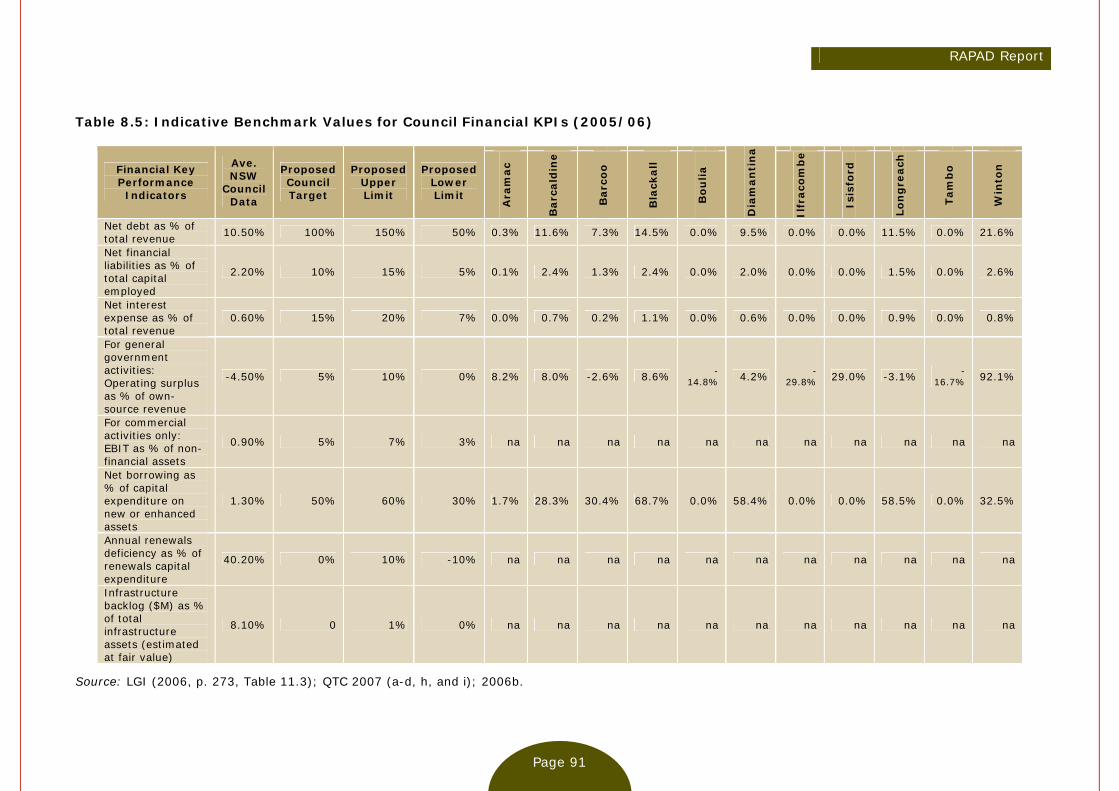
RAPAD Report
Page 91
Table 8.5: Indicative Benchmark Values for Council Financial KPIs (2005/06)
Financial Key Performance
Indicators
Ave. NSW
Council Data
Proposed Council Target
Proposed Upper Limit
Proposed Lower Limit
Ara
mac
Barc
ald
ine
Barc
oo
Bla
ckall
Bo
ulia
Dia
man
tin
a
Ilfr
aco
mb
e
Isis
ford
Lon
gre
ach
Tam
bo
Win
ton
Net debt as % of total revenue 10.50% 100% 150% 50% 0.3% 11.6% 7.3% 14.5% 0.0% 9.5% 0.0% 0.0% 11.5% 0.0% 21.6%
Net financial liabilities as % of total capital employed
2.20% 10% 15% 5% 0.1% 2.4% 1.3% 2.4% 0.0% 2.0% 0.0% 0.0% 1.5% 0.0% 2.6%
Net interest expense as % of total revenue
0.60% 15% 20% 7% 0.0% 0.7% 0.2% 1.1% 0.0% 0.6% 0.0% 0.0% 0.9% 0.0% 0.8%
For general government activities: Operating surplus as % of own-source revenue
-4.50% 5% 10% 0% 8.2% 8.0% -2.6% 8.6% -14.8% 4.2% -
29.8% 29.0% -3.1% -16.7% 92.1%
For commercial activities only: EBIT as % of non-financial assets
0.90% 5% 7% 3% na na na na na na na na na na na
Net borrowing as % of capital expenditure on new or enhanced assets
1.30% 50% 60% 30% 1.7% 28.3% 30.4% 68.7% 0.0% 58.4% 0.0% 0.0% 58.5% 0.0% 32.5%
Annual renewals deficiency as % of renewals capital expenditure
40.20% 0% 10% -10% na na na na na na na na na na na
Infrastructure backlog ($M) as % of total infrastructure assets (estimated at fair value)
8.10% 0 1% 0% na na na na na na na na na na na
Source: LGI (2006, p. 273, Table 11.3); QTC 2007 (a-d, h, and i); 2006b.

RAPAD Report
Page 92
This analysis indicates that all the Central West shires should borrow additional funds to support their asset renewal programs and that the councils should address the situation relating to their intention to record an operating deficit over the next ten years, in line with the NSW LGI recommendation.
8.4 Queensland Treasury Corporation Analysis The most comprehensive assessment of the financial sustainability of each of the eleven Central West councils was undertaken recently by the Queensland Treasury Corporation (QTC). The QTC provided councils with an independent evaluation of their financial future and the effectiveness of each council’s ten-year financial plans. The QTC assessment of local council financial sustainability involved reviewing the following matters:
‘Council’s five-year historical financial, operating and cash-flow position and benchmarking the results against other similar councils;
Council’s ten-year forecasts (financial performance, financial position and cash flow) with a particular focus on Council’s operating position (and its fiscal flexibility), capex program and its overall liquidity position;
The appropriateness of the assumptions used in Council’s ten-year forecasts and conducting sensitivity analysis on key variables and risks;
The Shire’s economic outlook; and
Council’s strengths and any risks facing Council in the future’;
Figure 8.1 shows the operating results for the eight councils undertaken by the QTC. Each council recorded various operating results from a deficit at $2.0 million at Boulia in 2005 to an estimated surplus of $3.2 million at Blackall in 2007.
-
1,000
2,000
3,000
4,000
(3,000 )
(2,000 )
(1,000 )
Aramac
Barcaldine
Blackall
BouliaIlfracombe
IsisfordLongreach
Tambo
2001
2002
2003
2004
2005
2006
2007
2008
2009
2010
2011
2012
2013
2014
2015
Figure 8.1: Operating Results, 2001 to 2025 ($’000)
Source: QTC 2007 (a-d, h, and i); 2006b.
Figure 8.2 displays the estimated cash balance of the eight councils for the financial years 2001 to 2015. Each council is expected to record a steady increase in their cash

RAPAD Report
Page 93
holding over the period, with Blackall expected to reach a balance of $20.4 million by 2015 and Ilfracombe expecting a balance of $2.1 million.
-
5,000
10,000
15,000
20,000
25,000
2001 2002 2003 2004 2005 2006 2007 2008 2009 2010 2011 2012 2013 2014 2015
Aramac
Barcaldine
Blackall
Boulia
Ilfracombe
Isisford
Longreach
Tambo
Figure 8.2: Cash Balances from 2001 to 2015 ($’000)
Source: QTC 2007 (a-d, h, and i); 2006b. Figure 8.3 illustrates the level of capital works each council expects to carry out between financial years 2001 and 2015.
-
1,000
2,000
3,000
4,000
5,000
6,000
7,000
8,000
9,000
10,000
Aramac
Barcaldine
Blackall
BouliaIlfracombe
Isisford
Longreach
Tambo
2001
2002
2003
2004
2005
2006
2007
2008
2009
2010
2011
2012
2013
2014
2015
Figure 8.3: Capital Expense from 2001 to 2015 ($’000)
Source: QTC 2007 (a-d, h, and i); 2006b. Figure 8.4 highlights the level of unfunded depreciation of the Central West local shires between financial years 2001 to 2015. Figure 8.4 shows mixed results for the group as a whole, with Tambo recording an unfunded depreciation in two of the years under review while Boulia recorded unfunded depreciation in all but one year (2001).

RAPAD Report
Page 94
-
500
1,000
1,500
2,000
2,500
Aramac
BarcaldineBlackall
Boulia
Ilfracombe
Isisford
LongreachTambo
2001
2002
2003
2004
2005
2006
2007
2008
2009
2010
2011
2012
2013
2014
2015
Figure 8.4: Unfunded Depreciation Source: QTC 2007 (a-d, h, and i); 2006b. Table 8.6 provides details of the overall assessment made by the QTC on the eight councils they have evaluated to date. The QTC maintain that four of the councils (Aramac, Tambo, Longreach, and Isisford) were assessed as being in a ‘moderate’ financial position, three councils (Barcaldine, Blackall, Boulia) were considered to be ‘weak’ and finally one council (Ilfracombe) was considered to be in the ‘very weak’ category. The QTC (2007 (a-d, h, and i); 2006b) provided the following definitions to explain their rating philosophy:
Moderate: A local government with a high capacity to meet its financial commitments in the short to medium-term and an acceptable capacity in the long-term. It is expected to be able to manage unforeseen financial shocks and any adverse changes in its business and in general economic conditions, with minor to moderate revenue or expense adjustments. Its capacity to manage core business risks is acceptable.
Weak: A local government with an acceptable capacity to meet its financial commitments in the short to medium-term and a limited capacity in the long-term. It is unlikely to be able to manage unforeseen financial shocks and any adverse changes in its business and in general economic conditions, without the need for significant revenue or expense adjustments. It may experience difficulty in managing core business risks.
Very weak: A local government with a limited capacity to meet its financial commitments in the short and medium-term, and a very limited capacity long-term. It is highly unlikely to be able to manage unforeseen financial shocks and any adverse changes in its business and in general economic conditions without the need for some structural reform and major revenue and expense adjustments. Managing core business risks may test its capacity.
Upon careful review of these definitions, even those councils assessed as being ‘weak’ are still considered as having ‘an acceptable capacity to meet its financial commitments in the short to medium-term’. It is only in the long term that these councils are believed to experience difficulties. Accordingly, on the QTC criteria ‘weak’ Central West councils are in a similar condition to most Australian councils throughout the country and have the potential for long-term sustainability, provided they put in place plans to address their long-term financial situation.
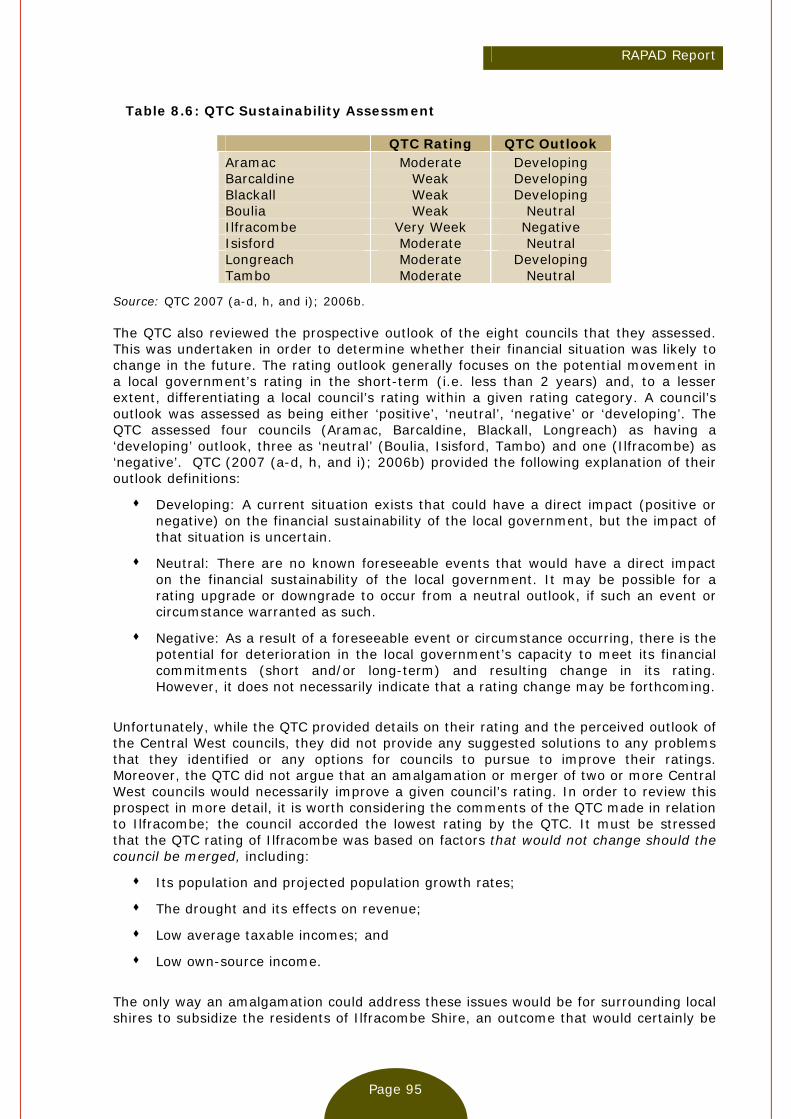
RAPAD Report
Page 95
Table 8.6: QTC Sustainability Assessment
QTC Rating QTC Outlook Aramac Moderate Developing Barcaldine Weak Developing Blackall Weak Developing Boulia Weak Neutral Ilfracombe Very Week Negative Isisford Moderate Neutral Longreach Moderate Developing Tambo Moderate Neutral
Source: QTC 2007 (a-d, h, and i); 2006b. The QTC also reviewed the prospective outlook of the eight councils that they assessed. This was undertaken in order to determine whether their financial situation was likely to change in the future. The rating outlook generally focuses on the potential movement in a local government’s rating in the short-term (i.e. less than 2 years) and, to a lesser extent, differentiating a local council’s rating within a given rating category. A council’s outlook was assessed as being either ‘positive’, ‘neutral’, ‘negative’ or ‘developing’. The QTC assessed four councils (Aramac, Barcaldine, Blackall, Longreach) as having a ‘developing’ outlook, three as ‘neutral’ (Boulia, Isisford, Tambo) and one (Ilfracombe) as ‘negative’. QTC (2007 (a-d, h, and i); 2006b) provided the following explanation of their outlook definitions:
Developing: A current situation exists that could have a direct impact (positive or negative) on the financial sustainability of the local government, but the impact of that situation is uncertain.
Neutral: There are no known foreseeable events that would have a direct impact on the financial sustainability of the local government. It may be possible for a rating upgrade or downgrade to occur from a neutral outlook, if such an event or circumstance warranted as such.
Negative: As a result of a foreseeable event or circumstance occurring, there is the potential for deterioration in the local government’s capacity to meet its financial commitments (short and/or long-term) and resulting change in its rating. However, it does not necessarily indicate that a rating change may be forthcoming.
Unfortunately, while the QTC provided details on their rating and the perceived outlook of the Central West councils, they did not provide any suggested solutions to any problems that they identified or any options for councils to pursue to improve their ratings. Moreover, the QTC did not argue that an amalgamation or merger of two or more Central West councils would necessarily improve a given council’s rating. In order to review this prospect in more detail, it is worth considering the comments of the QTC made in relation to Ilfracombe; the council accorded the lowest rating by the QTC. It must be stressed that the QTC rating of Ilfracombe was based on factors that would not change should the council be merged, including:
Its population and projected population growth rates;
The drought and its effects on revenue;
Low average taxable incomes; and
Low own-source income.
The only way an amalgamation could address these issues would be for surrounding local shires to subsidize the residents of Ilfracombe Shire, an outcome that would certainly be
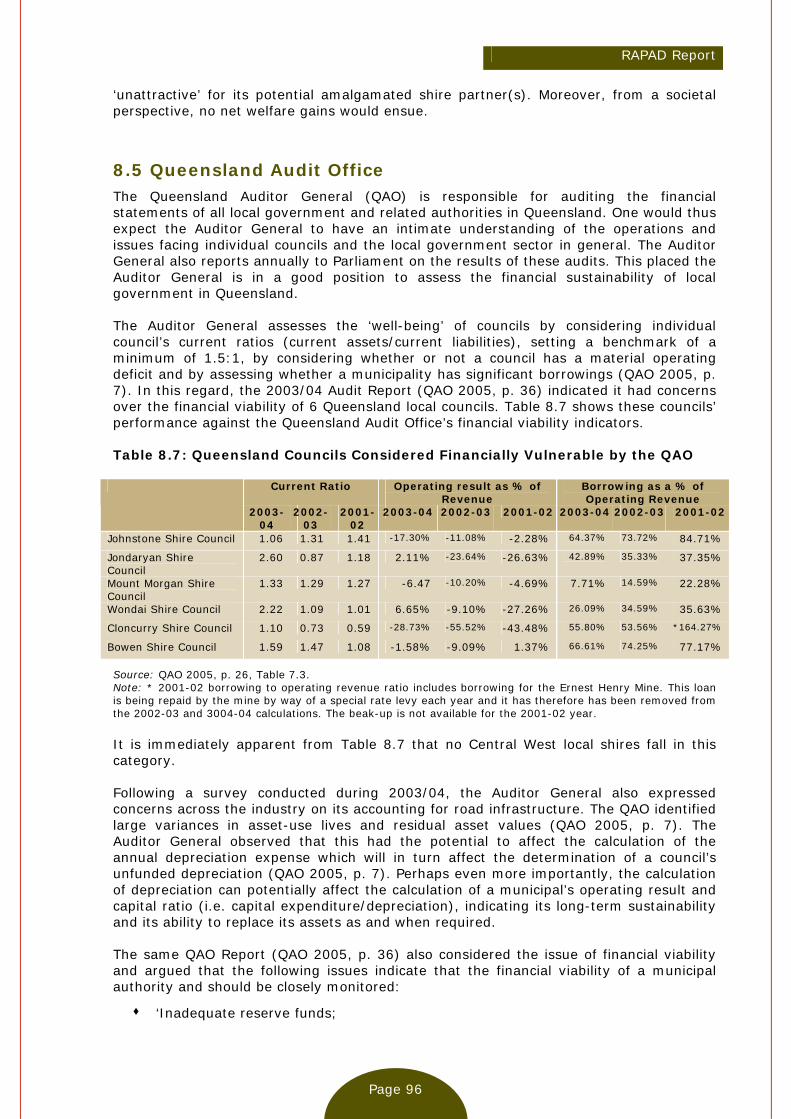
RAPAD Report
Page 96
‘unattractive’ for its potential amalgamated shire partner(s). Moreover, from a societal perspective, no net welfare gains would ensue.
8.5 Queensland Audit Office The Queensland Auditor General (QAO) is responsible for auditing the financial statements of all local government and related authorities in Queensland. One would thus expect the Auditor General to have an intimate understanding of the operations and issues facing individual councils and the local government sector in general. The Auditor General also reports annually to Parliament on the results of these audits. This placed the Auditor General is in a good position to assess the financial sustainability of local government in Queensland. The Auditor General assesses the ‘well-being’ of councils by considering individual council’s current ratios (current assets/current liabilities), setting a benchmark of a minimum of 1.5:1, by considering whether or not a council has a material operating deficit and by assessing whether a municipality has significant borrowings (QAO 2005, p. 7). In this regard, the 2003/04 Audit Report (QAO 2005, p. 36) indicated it had concerns over the financial viability of 6 Queensland local councils. Table 8.7 shows these councils’ performance against the Queensland Audit Office’s financial viability indicators. Table 8.7: Queensland Councils Considered Financially Vulnerable by the QAO
Current Ratio Operating result as % of Revenue
Borrowing as a % of Operating Revenue
2003-04
2002-03
2001-02
2003-04 2002-03 2001-02 2003-04 2002-03 2001-02
Johnstone Shire Council 1.06 1.31 1.41 -17.30% -11.08% -2.28% 64.37% 73.72% 84.71%
Jondaryan Shire Council
2.60 0.87 1.18 2.11% -23.64% -26.63% 42.89% 35.33% 37.35%
Mount Morgan Shire Council
1.33 1.29 1.27 -6.47 -10.20% -4.69% 7.71% 14.59% 22.28%
Wondai Shire Council 2.22 1.09 1.01 6.65% -9.10% -27.26% 26.09% 34.59% 35.63%
Cloncurry Shire Council 1.10 0.73 0.59 -28.73% -55.52% -43.48% 55.80% 53.56% *164.27%
Bowen Shire Council 1.59 1.47 1.08 -1.58% -9.09% 1.37% 66.61% 74.25% 77.17%
Source: QAO 2005, p. 26, Table 7.3. Note: * 2001-02 borrowing to operating revenue ratio includes borrowing for the Ernest Henry Mine. This loan is being repaid by the mine by way of a special rate levy each year and it has therefore has been removed from the 2002-03 and 3004-04 calculations. The beak-up is not available for the 2001-02 year. It is immediately apparent from Table 8.7 that no Central West local shires fall in this category. Following a survey conducted during 2003/04, the Auditor General also expressed concerns across the industry on its accounting for road infrastructure. The QAO identified large variances in asset-use lives and residual asset values (QAO 2005, p. 7). The Auditor General observed that this had the potential to affect the calculation of the annual depreciation expense which will in turn affect the determination of a council’s unfunded depreciation (QAO 2005, p. 7). Perhaps even more importantly, the calculation of depreciation can potentially affect the calculation of a municipal’s operating result and capital ratio (i.e. capital expenditure/depreciation), indicating its long-term sustainability and its ability to replace its assets as and when required. The same QAO Report (QAO 2005, p. 36) also considered the issue of financial viability and argued that the following issues indicate that the financial viability of a municipal authority and should be closely monitored:
‘Inadequate reserve funds;
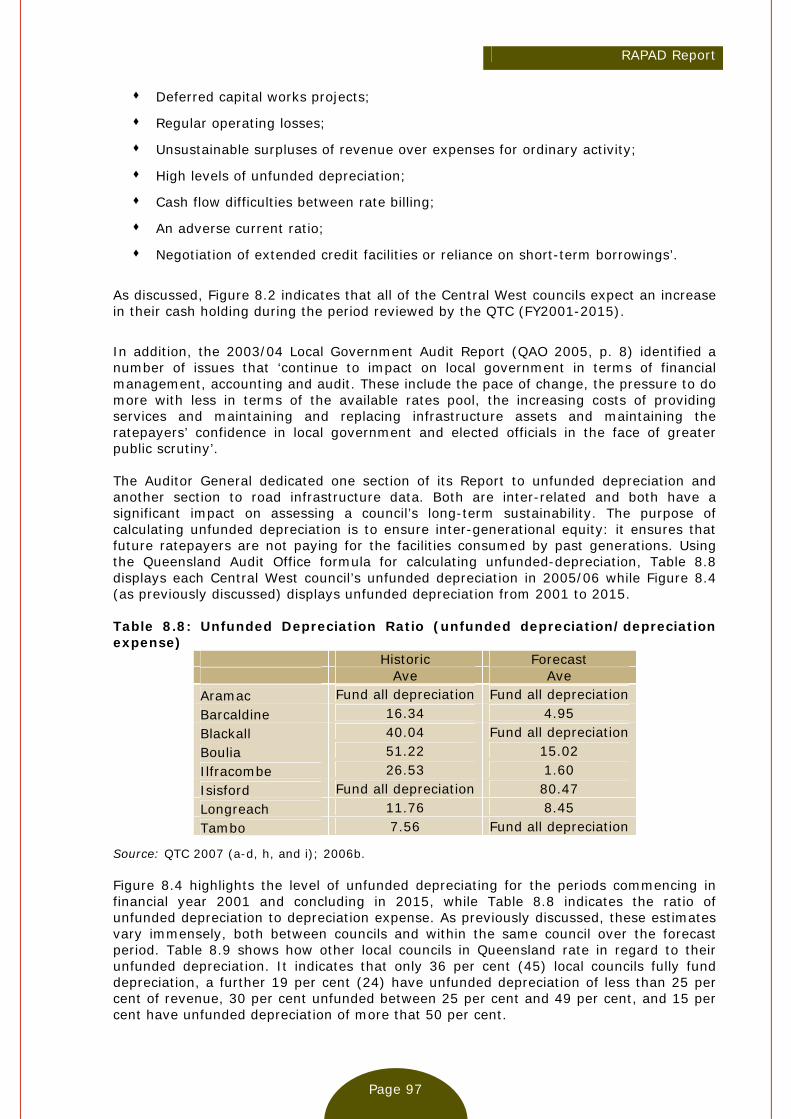
RAPAD Report
Page 97
Deferred capital works projects;
Regular operating losses;
Unsustainable surpluses of revenue over expenses for ordinary activity;
High levels of unfunded depreciation;
Cash flow difficulties between rate billing;
An adverse current ratio;
Negotiation of extended credit facilities or reliance on short-term borrowings’.
As discussed, Figure 8.2 indicates that all of the Central West councils expect an increase in their cash holding during the period reviewed by the QTC (FY2001-2015).
In addition, the 2003/04 Local Government Audit Report (QAO 2005, p. 8) identified a number of issues that ‘continue to impact on local government in terms of financial management, accounting and audit. These include the pace of change, the pressure to do more with less in terms of the available rates pool, the increasing costs of providing services and maintaining and replacing infrastructure assets and maintaining the ratepayers’ confidence in local government and elected officials in the face of greater public scrutiny’. The Auditor General dedicated one section of its Report to unfunded depreciation and another section to road infrastructure data. Both are inter-related and both have a significant impact on assessing a council’s long-term sustainability. The purpose of calculating unfunded depreciation is to ensure inter-generational equity: it ensures that future ratepayers are not paying for the facilities consumed by past generations. Using the Queensland Audit Office formula for calculating unfunded-depreciation, Table 8.8 displays each Central West council’s unfunded depreciation in 2005/06 while Figure 8.4 (as previously discussed) displays unfunded depreciation from 2001 to 2015. Table 8.8: Unfunded Depreciation Ratio (unfunded depreciation/depreciation expense)
Historic Forecast Ave Ave Aramac Fund all depreciation Fund all depreciation Barcaldine 16.34 4.95 Blackall 40.04 Fund all depreciation Boulia 51.22 15.02 Ilfracombe 26.53 1.60 Isisford Fund all depreciation 80.47 Longreach 11.76 8.45 Tambo 7.56 Fund all depreciation
Source: QTC 2007 (a-d, h, and i); 2006b. Figure 8.4 highlights the level of unfunded depreciating for the periods commencing in financial year 2001 and concluding in 2015, while Table 8.8 indicates the ratio of unfunded depreciation to depreciation expense. As previously discussed, these estimates vary immensely, both between councils and within the same council over the forecast period. Table 8.9 shows how other local councils in Queensland rate in regard to their unfunded depreciation. It indicates that only 36 per cent (45) local councils fully fund depreciation, a further 19 per cent (24) have unfunded depreciation of less than 25 per cent of revenue, 30 per cent unfunded between 25 per cent and 49 per cent, and 15 per cent have unfunded depreciation of more that 50 per cent.

RAPAD Report
Page 98
Table 8.9: Unfunded Depreciation in Queensland Local Government 2003-04 No. of local government with more that 75% of depreciation charge unfunded
5 4% Isisford (F),
No. of local government with between 50% and 75% of depreciation charge unfunded
14 11% Boulia (H)
No. of local government with between 25% and 49% of depreciation charge unfunded
37 30% Ilfracombe (H), Boulia (F). Blackall (H)
No. of local government with less than 25% of depreciation charge unfunded
24 19% Aramac (H&F), Isisford (H), Blackall (F) Tambo (F)
No. of local government with a surplus of current revenue after allowing for transfers to reserve
45 36% Aramac (H&F), Isisford (H), Blackall (F) Tambo (F)
Total 125 100%
Source: QAO 2005, p. 38, Table 7.4. Note: F- Forecast; H- Historical. Table 8.9 above takes the data from Table 8.8 and places the councils in their respective categories according to the percentage of depreciation that is unfunded. Table 8.9 indicates a number of Central West councils have a surplus of unfunded depreciation (Aramac (historical (H) and forecast (F)), Isisford (historical), Blackall (forecast), Tambo (forecast)); and also that Tambo (historical), Longreach (historical and forecast), Ilfracombe (forecast) Barcaldine (forecast and historical) all were in the 25 per cent or less category, while only one council had an unfunded depreciation of more that 75 per cent.
8.6 Remote Area Planning and Development Board (RAPAD) The previous sections of Chapter 8 provided a brief financial overview of the eleven central west Queensland councils. This analysis attempted to review a number of key financial indicators developed by the South Australian FSRB and NSW LGI and the reports prepared by QTC and QAO which were undertaken to provide an assessment of these local councils financial sustainability. However, none of these indicators provided any details of how to improve the financial performance of the Central West councils, which is most unfortunate. As discussed in earlier chapters in this Report, the traditional Australian approach employed to address financial sustainability has been through council amalgamation. The Report demonstrated that, in general, the results of previous local government amalgamation programs had not met expectations. Indeed, as both the recent national inquiries and state-based reports have shown, financial sustainability remains a problem even in those states which had amalgamated large numbers of councils, notably Victoria, South Australia and New South Wales. Chapter 9 will also demonstrate that due to the ‘tyranny of distance’, remoteness, low population densities, and the enormous range non-traditional services provided by Central West councils an amalgamation of RAPAD local shires will have a devastating effect on the local communities in the Central West. As we have noted in Chapter 1, an objective of this Report was to provide options to the Central west councils as to how they can improve their financial performance, gain any efficiencies that may be available from economics of scale, without the drastic local community problems that would result from a forced amalgamation. Since all Central West local shires are members of the Remote Area Panning and Development Board (RAPAD), it is thus essential to explore the options that this organisation may be able to provide these councils in the region. RAPAD is a not-for-profit, ASIC listed, incorporated organisation working for and with Central West Queensland shire councils. RAPAD has a board of directors, representing the member shire councils, which presently stands at eleven. RAPAD covers an area of

RAPAD Report
Page 99
some 385,000km2, encompassing 17 towns, some 1,300 rural properties, in 11 local government areas: Aramac, Barcaldine, Barcoo, Blackall, Boulia, Diamantina, Ilfracombe, Isisford, Longreach, Tambo and Winton. RAPAD is also a Regional Organisation of Councils (ROC) and thus has an operating protocol with the Local Government Association of Queensland (LGAQ). RAPAD Board members of the Central West ROC (in effect the RAPAD members) have resolved to confer all roles and responsibilities of their ROC upon RAPAD. RAPAD also has a Memorandum of Understanding (MOU) with the South West Regional Economic Development Association (SWRED) as well as Desert Channels Queensland (DCQ), which are the peak natural resource management groups for the Lake Eyre Basin in Queensland. Several RAPAD Directors hold executive positions with the West Queensland Local Government Association (WQLGA) and the LGAQ. RAPAD has a vision of ‘a united regional organisation proactively shaping and creating a prosperous future for outback Queensland’. The RAPAD mission is ‘to plan, facilitate and encourage sustainable growth for the future of outback Queensland’. It intends achieving this by:
Being future orientated;
Being a consultative advocate and lobbyist;
Proactively networking and communicating with all shires, as well as private and public sector organisations;
Adding value to individual shires and other regional organisations in a non-duplicative manner;
Coordinating and facilitating the provision of relevant research to the region; and
Supporting all members and their respective communities.
RAPAD's activities are all aimed at sustainable growth for Central West Queensland. ‘Core focus areas’ identified under the RAPAD strategic plan are:
Transport;
Regional planning;
Capacity building;
Natural resource management;
Maintenance and further development of all services;
Technology and communication;
Maintenance and development of sustainable industries; and
Investment attraction and business opportunities.
RAPAD undertakes a number projects at the regional level as well as lobbying on behalf of the region in the core focus areas identified above. Significant achievements to date include:
Health and Human Services Blueprint - The Blueprint maps health and human services across the region and recommends strategies to improve current services, and plan for future service delivery.
Regional Marketing Plan – This Plan aims to engage Central West Queensland communities, businesses and government agencies in the deployment of a regional marketing plan to attract investment and professional/skilled labour to the region.
RAPAD Report
Page 100
Rural financial counselling – This provides a service to Central West Queensland families and businesses requiring assistance in financial planning and management.
Migration – It is registered as a regional certifying body to assist migrants with relocation.
Water infrastructure – This involves assessing and facilitating regional needs under the federal government water fund.
Community Reference Panel Member – This includes the ‘Blueprint for the Bush’, the LGAQ and state government housing study, and Desert Channels Queensland.
RAPAD SkillsConnect Project - This aims to identify skilled labour shortages in Central Western Queensland and then use this information to develop strategies focused on attracting skilled workers and their families to the region helping to address labour shortages, as well as to provide information and links to employment programs (including immigration programs) and employment agencies.
Broadband in the Bush – The RAPAD Connect is a project undertaken by RAPAD shires and facilitated and managed through the RAPAD Office. Consistent with RAPAD’s strategic plan, this project is designed to increase the reach and penetration of broadband infrastructure and services within the region.
Regional Brand - A regional brand is being developed that will promote Central West Queensland as an excellent place to live, work and invest. This brand will be used in all promotion of the region for business investment, staff attraction and tourism. A steering committee made up of representatives from all eleven shires in the Central West has been formed
Lobbying and policy development – This includes geothermal power legislation (i.e. hot rocks), health, country racing, and subsidized air routes.
In addition, RAPAD also prepared numerous submissions on various issues that affect their constituents. Recent submissions include:
RAPAD Response: Developing a Consumer Health Council for Queensland.
RAPAD Submission to the Department of Natural Resources, Mines & Water GAB Resource Operations Plan.
RAPAD Submission to the Senate Economics Legislation Committee Inquiry into the Price of Petrol in Australia.
Objection to the AEC on the proposed seat of Wright.
RAPAD Submission to DCITA Discussion Paper on Broadband Connect/Clever Networks.
RAPAD Submission to Blueprint for the Bush Discussion Paper.
RAPAD Review of Health & Human Services: A Blueprint for the Future.
RAPAD Submission - ICT Infrastructure.
RAPAD Submission - Building & Developing our Rural Communities.
RAPAD Submission - Geothermal Power, HDFR.
RAPAD Submission - Education, Central West Learning Community Cooperative
Open Letter: Zonal Taxation Reform.

RAPAD Report
Page 101
RAPAD Review of Health & Human Services: Impacts & Recommendations for Government & Community; Blueprint for the Future.
Health Review.
Queensland Health Systems Review.
RAPAD Summary of Foster Report.
RAPAD Response to Options for Future Community Engagement in Regional Natural Resource Management.
RAPAD Response GAB Paper.
Size, Shape & Sustainability.
Maternity Services Review.
These projects, submissions, lobbying and other activities demonstrate a high level of cooperation and interaction between the eleven RAPAD councils and their desire to assist each other in a common cause. This established platform of cooperation raises the question as to whether this existing level of co-operation could be expanded and for RAPAD to undertake an even greater proactive role in coordinating services in either a cooperative or shared manner in order to improve efficiency by achieving an increased scale of operations where feasible, without the severe disadvantages that amalgamation would bring. There are many options available to increase the resource sharing efforts of RAPAD. RAPAD has established a good working relationship between participating members who appear to be receptive to looking at new cooperative initiatives to improve service delivery to their respective communities. The only limitations on the future resource sharing by RAPAD members are (a) the preferences of members on how much autonomy they are prepared to sacrifice to achieve feasible cost savings; and (b) whether proposed resource sharing initiatives show promise of worthwhile cost savings. These matters can only be decided on a voluntary basis by members. Any attempts at coercive ‘top-down’ policy intervention by outside bodies, like the Queensland Reform Commission, are certain to fail. With these important caveats in mind, the NSW Department of Local Government’s (1995, p. 8) criteria for selecting resource sharing opportunities are important:
The major areas of council expenditure in which promising resource sharing opportunities are likely to exist;
Council’s Management Plan objectives in terms of service delivery (specifically those affecting current and future resource requirements);
Resources that are available to councils and what level of performance could be reasonably expected of them; and
Resources other councils have which are not currently available to the council question but could be well utilized.
In addition, RAPAD should also give consideration to the following items:
Skills and expertise that individual councils have that other councils may be able to utilize;
Resources (both physical and human) that are currently under-utilized that may be able to be offered to other councils;
Specialized resources, which a council would like to have, but cannot currently justify on its own, but may be able to be jointly owned; and

RAPAD Report
Page 102
Currently unfilled services that the local community needs that may be able to be cooperatively provided.
The RAPAD model already allows local decisions to be implemented utilizing the advantages offered by economics of scale. The RAPAD model also enables both decision making and local employment to be retained locally. In line with the RAPAD model, resource sharing has many benefits including (NSW DLG 1995, p. 7):
It allows councils to maintain their independence at the local level;
It allows councils to provide services to a larger population;
It spreads costs and risks;
It encourages greater use of all available resources;
It allows financial savings in service delivery;
It releases savings for other service areas;
It provides for both broader and more specialized services;
It permits more equitable distribution of services for residents and ratepayers; and
It attracts a financial contribution from non-resident users.
It is thus suggested that the RAPAD model has thus far been successful in providing regional solution to collective local problems and that a full review of the services provided by its member councils be carried out to determine which of these are most likely to benefit from some form of resource sharing. A suggested starting point for RAPAD is to review the expenditure that individual councils currently outsource to external organisations and determine which items could be jointly provided. The next step could be to review all large budgetary expenditure items, current equipment and staff that are under-utilized as well as those items that are over-utilized. The review of the individual councils current cost of providing services, whether tendered out or individually provided, could be benchmarked against other councils to determine whether resource sharing could be used to reduce these costs. Areas that lend themselves readily to cooperative or share services models include:
Financial Management;
Plant and Fleet Management;
Information Systems;
Human Resources;
Regulatory and Planning;
Works Support;
Revenue Management;
Supply and Procurement;
Records;
Treasury;
Land Information and GIS; and
Internal Audit and Risk Management.
RAPAD Report
Page 103
This Report freely acknowledges that there is no ‘one size fits all’ solution to the problems confronting Central West local councils and the RAPAD organization in the unique and testing environment in which they operate. Shared and cooperative services will thus obviously not fit every circumstance or every function listed above. However, this Report recommends that RAPAD and its member councils investigate what opportunities there are for undertaking any of these services cooperatively or through shared service agreements. Moreover, opportunities may also exist for a given council to operate a ‘centre of excellence’ model whereby that council specializes in the provision of one function and undertakes this function for a number of other councils. Each of these items represents a potential opportunity that this Report suggests is worthy of further investigation.
8.7 Conclusion Chapter 8 has attempted to determine the financial sustainability of the eleven Central West Councils in the long-term. It sought to use various methodologies available in the Australian local government literature that can evaluate financial sustainability in local government and apply them to the Central West group of council’s financial data. The South Australian FSRB evaluation in this Report of these local shires indicated the councils have little to no debt, and generally a small deficit, with the ability, at least in the short-term, to meet their capital replacement requirements. A comparison of the councils’ KPIs against the highly prescriptive NSW LGI criteria revealed that the councils are unsustainable in an analogous manner to the average New South Wales local council. The Queensland Treasury Corporation analysis painted a neutral image of the councils, for all but Ilfracombe. The remaining six councils accessed by the QTC could all meet their financial commitments in the short to medium term. The Queensland Audit Office assessment of financial viability indicated that the Central West local shires were not identified as having particular problems. However, the general level of unfunded depreciation of Central West shires is of concern; if this is not reduced in future years, it may cause concerns for at least some of the councils. However, against the background of this analyses, all financial sustainability assessments fail to consider external issues that affect the ongoing viability of councils, such as the rapidly rising expectations of constituents; unfunded mandates or cost shifting from other spheres of government; increased costs of service delivery; constraints on local government’s ability to raise revenue; and variability and inadequacy of grants from higher spheres of government. These factors have been all identified as key issues affecting all Australian local government jurisdictions in the recent reports conducted into the local sector, which were discussed in Chapter 5 of this Report. Chapter 8 has attempted to provide some suggested options for the RAPAD member councils to investigate further, such enhancing the use of the RAPAD organization as a vehicle for coordinating shared and cooperative service delivery. This may provide viable options for the councils to achieve scope economies and scale economies in their operations without the harmful consequences on local community sustainability that would inevitably flow from forced amalgamation.

RAPAD Report
Page 104
Chapter 9: Community Sustainability and RAPAD Councils
9.1 Introduction Chapter 9 considers the special role of local shire councils in the Central West of Queensland which provide far more than the customary range of local government services to their respective jurisdictions. The chapter also explores the social role and community networks supported by these councils as well as the unintended and potentially catastrophic effects of council amalgamation in the Central West. Chapter 9 is divided into seven main parts. Section 9.2 sets out the services provided by the eleven RAPAD area councils that are unique to the Central West and it demonstrates that they go far beyond traditional local government responsibilities. Section 9.3 considers the potentially devastating results that would eventuate on community sustainability if forced amalgamation occurred in the Central West. Section 9.4 discusses a number of recent projects that the local councils contend would not have been completed under a centralized structure due to the competing and conflicting priorities that would result from serving multiple autonomous communities. Section 9.5 examines the direct consequences of the withdrawal of a local government authority from a Central West town by considering its effect on local schools. Section 9.6 similarly analyses the expected repercussions on community sustainability deriving from the withdrawal of the local authority from the small towns in question. Section 9.7 considers the impact on local employment and local business following an exodus of people resulting from the loss of council jobs in the administration centres in these shires, if they were to amalgamate. The chapter ends with some brief evaluative comments in section 9.8.
9.2 Functions outside Normal Council Responsibilities If one was to review all the roles, responsibilities, and services provided by the eleven central west councils, it would soon become evident that the unilateral decision by the Queensland state government to undertake wholesale amalgamations of local authorities in Queensland has not considered the ramifications on small communities in the far west of the state. The eleven shires in the RAPAD district do much more than provide local governance and the range of public goods and services that are typical of any other local authority in the Australia. Indeed, these small councils literally hold their respective communities together. They provide numerous services that would normally be supplied by other government agencies and the private sector. However, the limited size of small local communities, separated by great distances, necessarily means that scale economies in most operations cannot be achieved. In the absence of any other feasible service providers, local councils must provide a large range of essential services. For instance, there are not many councils in Australia that provide the postal services (as in Barcoo and Ilfracombe); a café (as in Boulia, Isisford and Winton); undertaker services (Barcoo, Blackall, Boulia, Ilfracombe and Tambo); real-estate agency activities (Diamantina); operate general stores (Ilfracombe and Isisford); provide freight services (Isisford); offer banking facilities (Blackall, Boulia, Tambo and Winton); or operate the local newspaper (Blackall). These councils also assist other levels of government by providing services on their behalf, including community and low-income housing (Blackall and Boulia, Diamantina, Ilfracombe and Winton); health services (Barcaldine, Barcoo, Blackall, Diamantina, Isisford and Tambo); Centerlink (Blackall and Winton); as well as provide assistance to the Queensland Education Department (Barcoo and Isisford,). If a locally elected council ceased to have a presence in these towns, due to the inevitable centralization that would result from an amalgamation of these council areas, many of these services will not be supplied to these local communities. In addition, each council provides extensive support to the numerous community and sporting organisations in

RAPAD Report
Page 105
their boundaries. It should be remembered that these same communities have already been long forgotten by successive state and federal governments. The following discussion is a detailed analysis of the ‘non-traditional’ services provided by each of these small local shire councils, especially those councils that are not expected to continue if the administration centre of these councils is centralized across the Central West, which will inevitably be the case if these local authorities are forcibly amalgamated. For example, Aramac Shire either directly of indirectly provides a range of non-traditional services, such as a bakery, Home and Community Care programs, and a rural transactions centre. Similarly, Barcaldine Shire delivers a number of state government programs, including rural family support, 60 & Better, Home Assist Secure and a HACC program. Barcoo Shire Council provides a vast array of non-traditional services including the Jundah Post Office, which is Council-owned and operated; the Council provides a bus service and a 4WD vehicle for the three schools in the Shire for the transportation of school children (i.e. a traditional state government responsibility); the Council provided land for the Windorah Medical Clinic (another state responsibility); it provided land for state community housing; it has undertaker services and provides burial services; and the council supplied a building for the playgroup in Jundah. Barcoo Shire has also set up a bursary system for Shire residents undertaking tertiary, diploma or trade qualifications. This program includes an apprentice electrician working externally to the Shire who is unable to obtain his trade qualification within the Shire. The annual cost of this program is $25,000. In addition, the Council provides training opportunities for three trainees and two apprentices in the Shire. Blackall Shire assists its residents by providing an ‘in-store’ Westpac Bank facility in the Council Office and it acts as a ‘developer’ by providing an industrial estate as well as residential land for sale. The Council also provides work for the Queensland Corrective Services under their WORK Camp program in which sixteen offenders are located at Blackall and undertake community work for Blackall, Tambo and Isisford Shires. The demise of this important program would leave a substantial void in these communities. Furthermore, the Blackall Council runs an extensive local economic development program, such as a visitor information centre; a business expansion and retention program; it co-ordinates a television advertising program; undertakes festival co-ordination; and it participate in a number of other regional economic development activities. In a centralized structure with competing priorities, these actives would have to compete with similar programs in other towns. In addition, the Shire’s private works program provides a vital service assisting individuals and business, such as Ergon Energy, Telstra and subsidiaries; the Queensland Main Roads (maintenance and capital works); state government departments and agencies; local businesses and companies; as well as private individuals. Some other non-traditional services provided by Blackall Council include: stock route maintenance and improvements; wild dog eradication programs; weed eradication programs; rental of pensioner units; the 60 & Better program (ex Queensland health); family day care (ex Queensland communities); rural in-home family care (ex-Queensland Communities); community services coordination (ex-Queensland Communities); disability services (ex-Queensland Communities); community housing (ex-Queensland Housing); saleyards and selling facilities; undertaking services; an airport (with 3 commercial flights per week); SBS radio retransmission; youth development services, including employment initiatives; and office space for Centrelink.
RAPAD Report
Page 106
In addition to this extensive list of services, the Council operates the local newspaper (the Barcoo Independent) in partnership with the business owners; it administers the Multipurpose Sport and Recreation Association (of which 18 local clubs are members); and it organizes community celebrations for Australia Day, ANZAC Day, Clean Up Australia day; as well as support to every local organization, including the annual show, Woolscour, sporting organisations, cultural organisations, community organizations, etc. In the case of Boulia Shire, the Council operates the local credit union; the butcher shop is owned and leased out by Council; the café/kiosk is owned, staffed and operated by Council; the coffee shop is owned and leased out by Council; the funeral services are staffed and operated by Council; and the Council leases out housing to employees, contractors and pensioners. Diamantina Shire Council also provides many services which lie outside traditional local council functions, with the most significant being the provision of a health care service for the Shire as well as maintaining the local airstrip. In addition, the Council performs the role of undertaker; real estate agent by developing land and supplying housing; and it maintains and manages housing stock for the Department of Housing. The Diamantina Shire Council has also been proactive in developing its community by moving homes into Birdsville and Bedourie and making them available for sale to the community. Ilfracombe Shire operates the local Post Office and a rural transaction centre. It is involved in the operations of the railway, the general store, the information and tourism centre; the day-care centre; the sporting and recreational centre; it provides rental housing to residents; and it acts as the local undertaker. The Isisford Shire Council purchased the local general store and assisted with purchase of initial stock. The Shire is responsible for the fees and charges on the EFTPOS facility and leased the store free of charge and pays for the maintenance and garbage collection costs of the store. The store owner’s partner is also employed by Council as a labourer in order to assist the couple financially in the day-to-day running of the shop. In addition, the Council also sourced funding to establish the Outer Barcoo Interpretation Centre/Café. It also provided management support and pays an annual retainer as well as supplies all of the merchandise with an agreement to pay a commission on any sales. The Council also assisted in the initial purchase of stock with a flexible and tailored repayment plan. This has allowed for the provision of a great tourist and visitor destination as well as a venue which is available for meals for local residents. Isisford Shire also sourced funding to set up a rural transaction centre at the local Post Office (which is privately owned). This has facilitated the establishment of an EPOST facility for the public to gain access to cash as well as billpay accounts. The Council has also helped to furbish the building with updated air-conditioning and floor coverings. The Council also assisted in reimbursing the local business with fees for all transactions. Isisford Council has agreed to contribute to a weekly freight service, from Longreach to Yaraka return, by paying an annual retainer fee which would help the local community and local business to receive stock and items of need. The Council supplies assistance to maintain the community bus which provides services for HACC, the local school, the general public and for private use. Council helped by contributing financial to support the purchase of the bus for the community in partnership with the local museum committee which sourced funding from the Jupiters Casino Community Benefit Fund. Council is also responsible for the ongoing maintenance of the bus. The local community has now purchased a second bus under the same funding arrangements. In a similar vein, the Shire assists with the maintenance of the Yaraka Troop Carrier which provides services to HACC, the school and for general public use. The Council purchased a Toyota Troop Carrier with the support of PCAP and is responsible for the ongoing maintenance and housing of the vehicle. This has helped the small community
RAPAD Report
Page 107
from the local town of Yaraka, especially enabling school children to go on excursions and camps. Council employees at Isisford assist the ambulance service to drive the town ambulance. Since the Shire has no full-time paid ambulance drivers, it is reliant on the volunteers to drive the ambulance, who are mainly council workers who both drive the ambulance in or outside normal hours of duty. In addition, the council assists with all funding and external grant applications made under the Isisford Industry & Recreation Development Association. This is a club consisting of volunteers that liaise with Council to develop ideas for the improvement of the Shire’s facilities which is timed to co-inside with the updating of Council’s Corporate Plan and Budget. The Council also helps provide insurance cover for many community events. Moreover, the Isisford Council provides assistance to many community organizations, including the local primary school’s P & C meetings, shows, gymkhanas, the Golf Club, sporting groups, etc. The former Railway Buildings at Emmet and Yaraka are now owned by the Shire to enable the community to use these facilities as museums to display exhibits from the district’s past. Finally, the Council purchases the fuel which is supplied by local people at the Yaraka Store which in the past was purchased by Council. These local people sell this fuel on behalf of the Council for full personal use in exchange for the running of the local store. The Tambo Shire Council provides a number of functions on behalf of other public agencies including: the Multi-Purpose Centre; the Home and Community Care Program; the community aged-care program; and it also provides accommodation for the aged. The Council provides the facilities at the Tambo Education Centre, manages the Tambo child care centre; supplies a youth worker to support the local youth as well as organizes youth activities; offers administrative support to local sporting clubs; offers a bus service for the aged, youth and sporting clubs; assists with funerals and burials; as well as helps with funding applications for community and sporting groups. The Council organises and sponsors a large number of community events including: Australia Day celebrations; Anzac Day celebrations; a Garden Competition; a Tidy Towns Competition; Keep Australia Beautiful Campaign; Fallen Soldiers Medal – Graduation night; Volunteer Group Christmas Party; Senior Citizen’s Christmas Lunch; Regional Arts Development Fund; Christmas in the Park; and the Christmas Lights Competition. In addition, the Tambo Shire supplies financial support to local sporting and community clubs through their annual contribution program and provides ‘in-kind’ support to a number of clubs and organisations including: Tambo Polocrosse Club; Tambo Rodeo Association; Tambo Heritage Group; Tambo Golf Club; Tambo ICPA Association; Tambo Rugby League Club; Tambo Netball Association; Tambo Catholic Church; Tambo Anglican Church; Tambo Parents and Citizens Association; Tambo Pony Club; Tambo Voluntary Health & Community Organisation; Tambo Sports Club; Tambo Swimming Club; Tambo Country Women’s Association; Tambo Cemetery Restoration Committee; Tambo Clay Target Club; Scrubby Creek Sports Club; Tambo Arts & Crafts; Tambo & District Race Club; Tambo Junior Rugby League; Tambo Masonic Lodge; Tambo Business and Tourism Association; Tambo Child Care; Tambo Arts Council; Tambo Senior Citizens; Blue Light Committee; and the Tambo Stock Show. In addition, the Council has an excellent economic development program that offers incentives to businesses in order to assist in attracting new businesses to town and has facilitated the establishment of the Tambo Sawmill by providing the land and weighbridge to assist the new business. It has also built a new retail outlet in the main street of Tambo. The Council has actively approached a number of businesses for expressions of interest in this facility resulting in two retailers trading from the premises (Tower

RAPAD Report
Page 108
Hardware & Home Service Centre). In addition, the Bank of Queensland was approached by Tambo Shire leading to the bank renting premises from Council to provide a banking service to the community. Council’s funds are also held with the Bank of Queensland. It is believed that if the Council was amalgamated the local Bank of Queensland branch would become unviable and close. The Tambo Teddies was also initially supported by Council with the supply of rent-free premises. Winton Shire assists other government agencies by undertaking services on their behalf including: Centrelink; the provision of a youth worker; child-care facilities; HACC services, including veterans affairs, aged-care, domiciliary nurse and meals on wheels; the Diamantina Gardens aged-care facility; Pelican aged-care units; rural family support and the 60’s & Better program. The Council also operates the Waltzing Matilda Centre which includes a restaurant, bank, Visitor Information Centre, art gallery, and is a local cultural attraction. In addition, it assists the community by supplying the services of an undertaker; a gym; a distributor for avgas; as well as providing housing for youth, the disadvantaged and some staff. Finally, the Winton Shire assists its residents by organizing and supporting a large number of community events such as: Anzac Day; a local car rally; Australia Day; a Pentathlon; Clean Up Australia Day; an Ag Force Conference; Outback Festival; annual Lions Dinner; Bush Poetry Competitions; Kids Alive Do the 5; the Winton Show; the Corfield Race Club; Winton Campdraft; St. Patrick’s School; the Winton Rodeo; the Winton State School; Boulder Opal Association; Winton Players; Diamantina Droughtmaster Sale and the Santa Bull Sale.
9.3 Amalgamation and Central West Local Communities In order to gain an understanding of the possible repercussions of a forced amalgamation of the local authorities in the Central West, we surveyed the councils involved to determine the effects that an amalgamation might have on their respective local communities. As we argued in Chapter 6 of this Report, local community sustainability is a key attribute of small local councils in remote areas. Barcaldine Shire emphasized the real prospect of losing Barcaldine’s ‘local identity’ and local ‘sense of place’; a concern echoed by all of the councils in the Central West. The Shire also expressed concern about local residents becoming ‘disconnected’ from their local council as well as a sharp reduction in local service levels. The Shire expressed concern with the potential loss of expertise of the current elected Councillors and Mayors who will not be re-elected to an amalgamated larger local authority and indicated that Barcaldine residents may not be represented at all on a new amalgamated large council. Barcoo Shire held that an amalgamation of their Council would lead to the ‘death’ of the small towns in the Shire, particularly Jundah which is considered as being a wholly ‘Council’ town. The Council similarly expressed concerns about the possible lose of its identity if Barcoo Shire Council is amalgamated and the administration centre of the new entity was to be located in a large and distant centre. In addition, the Council stressed the pervasive involvement of its staff in the local community by pointing to the fact that in Jundah all residents are employed by the Shire, with the exception of those employed by the general store, hotel and school. The Council also believes that representation in an amalgamated organisation would also be a major issue; the local community would struggle to provide even one elected official to a much larger centralized council. Blackall Shire argued that an amalgamation would ‘distance’ the local community from its local council resulting in a complete loss of democratic due process; the demise of a ‘dependable social backbone’ of the community; the loss of essential services necessary to maintain and sustain the small local community; the loss of independent local decision making that is respectful of local people, local preferences, local conditions and local lifestyle; the loss or lack of respect shown to individual local community members from a

RAPAD Report
Page 109
‘local’ government not known and very far removed from local people; the potential lack of respect for local tradition and local history; a reduction in the level of local services offered; a reduction in the level of local representation on local, regional and state agencies and boards; a loss of local identity; and a loss of the impetus for constant local improvement particularly in economic, environmental, community and local development. Blackall also pointed to the services it provides on behalf of other government agencies which would cease under a centralized organization, such as Queensland Health; Education Queensland; Department Primary Industries and Fisheries; Department Natural Resources and Water; Department Communities; Department Families; Environmental Protection Agency; Queensland Housing; and State Development. Concerns were also expressed over the reduced community confidence that would result from an amalgamation. Other worries were expressed in the areas of employment; education; loans and banking; the future of the local community; the future of aged people when family structures change due to members leaving the Shire to seek alternate employment; the substantial decrease in real estate values; the loss of community organisations; the loss of confidence by financial providers; reduced investment in businesses; reduced spending by residents; the reduction in the rate of home renovations and repairs; major purchases from local businesses being deferred; increased levels of stress in the community potentially leading to increased social problems; the loss of population; the loss of skilled employees; the loss of local contractors; the loss of skilled personnel who volunteer for SES, fire brigade, ambulance, etc.; and the reduction of health services. The Council has also advised that many of these concerns have already eventuated as businesses are currently reviewing their investment in the Shire in light of a possible amalgamation. On the subject of representation, Blackall contends that this will be diminished to such an extent that the local service standards which have been set and achieved over many decades will not be able to be met in the future. This will the lead to a local community feeling of disengagement from the level of government that is meant to represent the interests of ‘locals’. The local community is also concerned that an amalgamation will lead to a decrease in elected member representation; that they will have to travel great distances to other centres to attend Council meetings and that this will significantly increase the workload of elected members inevitability leading to a reduction in the quality of candidates who are prepared to stand for elections. Furthermore, residents in Blackall also have expressed concerns that the current system of the community electing the Mayor may be changed to enable the elected members to choose the Mayor which could permanently ensure that the Mayor comes from a larger community. Boulia Shire Council stressed its local community’s concerns for a potential reduction in the quantity and quality of local services provided; a loss of community identity; a loss of jobs; the loss of residents from town and the Shire; a reduction in property values; less support for local community groups; that roads would not be maintained; that emergency response times would drastically increase; that tourists will not visit the Shire; that an amalgamation will mean fewer locally-elected representatives; and finally they believed that the new ‘hub’ community will retain complete control over the Council’s funds. Diamantina raised serious concerns over the level of representation; they believe that it would be very unfair if it was structured based on the number of people living within the new shire. They contend that the level of local representation should consider issues such the size of the shire, the number of visitors that move through the area each year, the standard of road infrastructure (bitumen or gravel), etc. Based on the current method of determining local Divisions based on population, Diamantina felt that they would struggle to have any representation at all on an amalgamated large distant council.

RAPAD Report
Page 110
The next biggest concern of Diamantina was with the loss of employment; the Council is currently the biggest employer in the Shire. It pointed to the fact that people rely on Council for work. The Council stressed that the social committees in the Shire would not survive without Council support; that roads would take longer to get bitumen and other vital attention; and that the local road infrastructure would also suffer due to the greater size of the amalgamated shire. It pointed to its current efforts to secure a sealed road to link the Shire towns, which might not proceed under a centralised local authority operating from a distance larger centre. Diamantina also questioned what other local services would close as they become unviable as a result of a massive withdrawal of labour from their towns, since an amalgamation would see the centralisation of municipal staff. For example, the health service may become defunct; the information centres would not be provided; schools would close down; police service cease; with the inevitable eventual consequence of the Shire towns closing down altogether. Ilfracombe Shire, like all other councils in the Central West, expressed concerns about the likely loss of jobs; the reduction in population; the loss of services such as education, police, fire, SES, etc.; the closure of local businesses; the inevitable death of sporting clubs and social functions; and the reduction in real estate values as a result of owners who have to sell and relocated. In addition, the Council holds that there would be a far greater responsibility on elected members as they will have an greater area to cover resulting in elected members being more difficult to find as their workloads increase. Isisford Shire felt certain that negative lifestyle changes for people in the shires would be inevitable. For instance, if the Council was amalgamated, the Shire’s natural competitive advantage - a safe and secure environment with employment opportunities - would no longer exist. In addition, families who presently live in the community will have to be separated to find other employment and close existing community ties will become weaker. Concerns were also expressed over individuals and families that have invested money into their homes, and the liability burden that these families would have if they had to move to find employment elsewhere, not to mention the large expected drop in property values resulting from the mass exodus from town. The negative effect on the community, business, schools, clubs and weekly childcare services were also expressed to us in the event of a potential amalgamation. The Council also advised that their administration staff virtually run and operate the following clubs and events in the Shire: Annual Fishing Competition; Management & Operation; Isisford Golf Club; Secretarial duties for Isisford Sheep & Wool Show Committee; Fire Brigade; State Emergency Service; Isisford Race Club management and operation; Symphony in the Shearing Shed; and other functions and events. The Council also feared for the future of small events which it management and sponsors, such as Gymkhanas, Motorcross and Major Mitchell Horse Rides. In addition, Isisford believed that any loss of people, such as administration staff, will have a devastating negative multiplier effect on the local community. These flow-on effects include the loss of employees, the loss of businesses and then the further loss of government services, such as health and police. Isisford pointed to the irony that the Shire has spent most of the past twelve months preparing to celebration its centenary in 2008; a landmark time in the district’s history which may now not eventuate. Concerns were also expressed over the lack of maintenance and support for show grounds; and voters being disenfranchised in a ‘Super Shire’ since residents of the Isisford Shire area would not have a ‘local’ voice in their local council. Longreach Shire stressed the inevitable disruption of existing initiatives (for at least two years) as significant resources are diverted to setting up a new local authority. This is believed to represent a significant (if unquantifiable) cost to the community. Concern was also expressed over the loss of funding from the local government grants commission on

RAPAD Report
Page 111
a regional basis since the basis of calculations would change. There would also be a dilution of local representation on regional matters on regional forums. Concerns were also expressed by Longreach in relation to the interim local transition committee arrangements since they believe they are not representative of the relevant constituents and yet have significant interim powers. They also stressed that little to no information is available as to how various representatives on interim local transition committees will be determined; there is no evidence that such committees will operate within the ambit of the traditional separation of powers protocols (i.e. elected representatives versus appointed officials); and finally that local communities will have no say (through elected representation or otherwise) on the composition of the representation mechanism in their local area. Tambo Shire considered the major consequences of an amalgamation to include the loss of local identity and its unique character; limited access to elected representatives; the loss of local representation; the loss of qualified professionals in the district; the loss of accountability; the loss of local knowledge; and highlighted the stress on the elderly who are now so heavily dependent on local council services and support. Tambo worried about job losses from the inevitable centralization of local council services and the flow-on effects, including families leaving town; the numbers of school children dropping at the local schools leading to fewer teachers and the loss of school bus runs; a fall in child care numbers; community and sporting organisations struggling financially with depleted membership; and the loss of outsourcing income in the community (i.e. Council employees outsourcing ironing, housecleaning, lawn mowing, child care etc.); health services diminishing; the local grocery store becoming unviable; hotels becoming marginal; and local tradesmen leaving the area. The Council also expressed concerns about the depletion of essential services and the increase in the time taken to respond to complaints; the distances and time taken to travel between communities; and the direct evidence of unsuccessful and expensive amalgamations in New South Wales and Victoria.
9.4 Projects Prevented under Amalgamation In a larger amalgamated organisation, the aggregate income of the previous councils would generally be placed into the new organisation’s consolidated revenue. As previously discussed, a newly amalgamated council would have less income available to it (due to the formula used to distribute the financial assistance grant), and have significant additional costs associated with implementing the new structural arrangements. In addition, all existing projects and activities of the councils, as well as any new services and capital works, would have to all compete for the same limited funds. This would inevitably lead to cost cutting, a reduction in local services and a number of projects not being implemented as funds are diverted to the more populous areas, due to their favourable levels of representation. In fact, some of the existing councils may not even have a single representative on a newly amalgamated ‘super’ council. The result is that the more sparsely population areas will struggle to attract funding for projects that would ordinarily be funded under their pre-amalgamated structure. In order to provided their respective local communities with at least some idea of the range and type of services that would not be funded if amalgamated, we asked the councils to supply us with a list of projects that they have recently completed that they believe would not be given priority - and hence not have proceeded - if their council had been amalgamated. Various striking examples were cited. For instance, Barcaldine Shire contends that their town streets sealing program; the sealing of rural roads; and recent airport upgrades
RAPAD Report
Page 112
would not have occurred if they were competing for funds in a larger organisation. Barcoo pointed to their contribution of $2 million to the state road system (between 2003 to 2006) which accelerated the completion of the sealing of the road between the towns of Jundah and Windorah. They believe that a regional ‘super’ council would more than likely not considered this as a priority. In a similar manner, Blackall highlighted various projects, such as the upgrade of the Blackall airport, including the complete reconstruction and raising of the main runway and security improvements at the terminal building. Blackall maintain that a centralised regional government may support a centralised air service thereby reducing the services to their Shire. In addition, they point to the Jericho to Windorah Road Project, involving the removal of the rail line from Jericho to Yaraka and the bitumen sealing of the road from Jericho to Windorah; the design and development of the industrial estate at Blackall; the upgrade of the Blackall saleyards complex and the establishment of the transshipment centre at the saleyards complex; the refurbishment of the shed for the guides; the construction of McLean Place (a fourteen-bed nursing home); and the ‘artist in residence’ program; as other projects that they feel would not have been completed if the Council was amalgamation. In the event of amalgamation, the Diamantina Shire Council has doubts whether a larger organisation would have taken over the responsibilities of the health services within the its Shire, which provides services not only to the communities of Birdsville and Bedourie, but also to the many visitors that travel within the region each year. The Shire also questioned whether the $1.7 million health-care centre which Council recently built (and currently manages) in Birdsville would have occurred. In addition, they doubt whether an amalgamation would have seen the development of a plan to build and transport in some twenty homes into the Shire’s towns, which has occurred over the past few years, thereby giving local people the opportunity to own their own home which was previously financially unattainable. This also has had the added benefit of creating a more settled and permanent community base within the region. Bedourie had 10 houses in 1985, 22 houses in 1995 and now there are 55 houses in Bedourie as well as 50 houses in Birdsville; this occurred because of the Council has firm plans for the development of the Shire. Diamantina Shire Council also believes that it would also have been unlikely that they would have been able to continue with the planning and development of the new residential estates in Birdsville and Bedourie or to develop a road infrastructure plan that will see their local communities with a sealed road link in the near future. Other projects which Diamantina considered would not have been completed if the council was amalgamated included: improvements to the race tracks and clubs, including the famous ‘Birdsville races’; the building of two new rodeo grounds; the Birdsville Caravan Park; building of the Bedourie town stables; the tourist information centre; the restoration of the ‘mudhut’ in Bedourie; the Bedourie Artesian Spa and Swimming Complex; playgrounds built in both Bedourie and Birdsville; sporting fields (ovals) established in Bedourie and Birdsville; and the sporting facilities which have been developed (for instance indoor cricket in Birdsville and indoor tennis in Bedourie.) Ilfracombe have recently secured funding totalling $560,000 for a motel. However, it is now unlikely to proceed as investors are concerned of the implications of an amalgamation on the viability of this project. In addition, the Blueprint for the Bush Weedstop grant to establish wash-down facilities for trucks and vehicles may not be completed if amalgamation proceeds. Isisford Shire held that the Outer Barcoo Interpretation Centre, built to house Isisfordia Duncani, the world’s oldest and most complete crocodile skeleton, would not have proceeded under amalgamation. This project has provided confidence to the Shire residents in the worst drought in living memory. Other projects that may not have proceeded in Isisford Shire include: the development of Mt. Slowcombe as a

RAPAD Report
Page 113
tourist/recreation park (presently in progress); the establishment of facilities at Yaraka to conduct campdraft and other horse events; the establishment of community housing; the commissioning of a book on the Shire’s history; the use of the privately-owned Isis Downs Shearing Shed as a tourist attraction; and the establishment of a boat ramp, shower and toilets at the Oma waterhole for use by both local people and visitors. Tambo Shire identified a number of projects that would not have proceeded under amalgamation: the building of the new retail outlet building in the centre of the business area now leased to two independent businesses; the building of the new Multi-Purpose Building which will incorporate a bank, medical rooms and professional suites in the heart of the business centre; the Reg Barry Memorial restoration; the air-conditioning of the Tambo Shire Hall; town guttering and footpaths; the development of the combined sports facility catering for six sporting groups; the main street upgrade; the provision of additional houses; the development of the industrial estate; the development of the local museum; the ongoing operation of the Visitor Information Centre; and the Tambo Dam development for which the local community donated plants and Council gave fuel to desilt the town dam.
9.5 Effects of Amalgamation on Local Schools The previous three sections have discussed the multitude of concerns that have been expressed by the local residents of Central West Queensland should their Council be amalgamated. The next three sections of Chapter 9 will consider a number of specific issues that are providing local residents with the greatest anxiety over the potential demise of their quality of life, commencing with a review of the effects on schools should the Reform Commission recommend the amalgamation the local councils in their area. We have already seen that a number of local councils provide considerable help and support to the schools in their respective shires. Examples of the assistance provided by local councils to the Education Department include the provision of buses and a troop carrier (Barcoo and Isisford), support for the various P and C committee’s, as well as access to council halls and sporting facilities. It is hard to see this level of assistance continue to be provided in a larger ‘super’ council since the new ‘super shire’ would become inundated with requests to provide similar support to all areas within the new amalgamated boundaries. The inevitable rise of the philosophy of ‘if you provide it to one, you must provide it to all’ will see less local services being provided rather than more local services, for the obvious reason that ‘providing it to all’ becomes cost prohibitive. It need hardly be added that the current level of assistance provided to the local school system from the local shires has alleviated considerable expenditure imposts on the Queensland state government budget. While the possibility of the schools losing this existing and outstanding level of support from their local council was a key concern to residents, they were generally more worried about the ramification of a significant reduction in student numbers as council families migrated out of town in search of work elsewhere. In particular, deep concern was expressed as to the viability of a number of schools, the possibility of reduced teacher numbers and further difficulties in accessing school buses and school equipment, should student numbers fall significantly. The Office of Economic and Statistical Research (2007) provided details on current student numbers in each affected local council area. They observed that in the 12 months ending 31 December 2006, there were 1,838 school students in Central West Statistical Division (see Table 9.1). The local government area in the region with the largest number of school students was Longreach Shire with 855. This was followed by Barcaldine Shire (336) and Blackall Shire (199). Diamantina Shire and Isisford Shire had the lowest numbers of students, with 19 and 21 respectively.
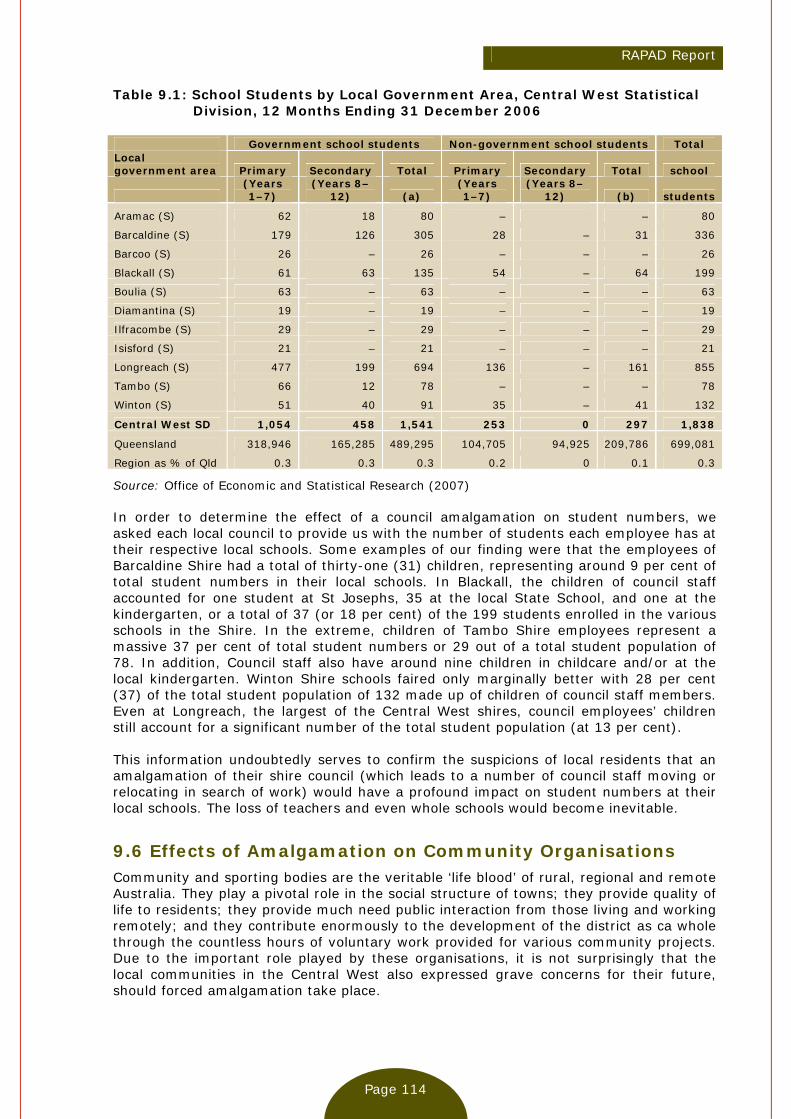
RAPAD Report
Page 114
Table 9.1: School Students by Local Government Area, Central West Statistical Division, 12 Months Ending 31 December 2006
Government school students Non-government school students Total Local government area Primary Secondary Total Primary Secondary Total school
(Years 1–7)
(Years 8–12) (a)
(Years 1–7)
(Years 8–12) (b) students
Aramac (S) 62 18 80 – – 80
Barcaldine (S) 179 126 305 28 – 31 336
Barcoo (S) 26 – 26 – – – 26
Blackall (S) 61 63 135 54 – 64 199
Boulia (S) 63 – 63 – – – 63
Diamantina (S) 19 – 19 – – – 19
Ilfracombe (S) 29 – 29 – – – 29
Isisford (S) 21 – 21 – – – 21
Longreach (S) 477 199 694 136 – 161 855
Tambo (S) 66 12 78 – – – 78
Winton (S) 51 40 91 35 – 41 132
Central West SD 1,054 458 1,541 253 0 297 1,838
Queensland 318,946 165,285 489,295 104,705 94,925 209,786 699,081
Region as % of Qld 0.3 0.3 0.3 0.2 0 0.1 0.3
Source: Office of Economic and Statistical Research (2007) In order to determine the effect of a council amalgamation on student numbers, we asked each local council to provide us with the number of students each employee has at their respective local schools. Some examples of our finding were that the employees of Barcaldine Shire had a total of thirty-one (31) children, representing around 9 per cent of total student numbers in their local schools. In Blackall, the children of council staff accounted for one student at St Josephs, 35 at the local State School, and one at the kindergarten, or a total of 37 (or 18 per cent) of the 199 students enrolled in the various schools in the Shire. In the extreme, children of Tambo Shire employees represent a massive 37 per cent of total student numbers or 29 out of a total student population of 78. In addition, Council staff also have around nine children in childcare and/or at the local kindergarten. Winton Shire schools faired only marginally better with 28 per cent (37) of the total student population of 132 made up of children of council staff members. Even at Longreach, the largest of the Central West shires, council employees’ children still account for a significant number of the total student population (at 13 per cent). This information undoubtedly serves to confirm the suspicions of local residents that an amalgamation of their shire council (which leads to a number of council staff moving or relocating in search of work) would have a profound impact on student numbers at their local schools. The loss of teachers and even whole schools would become inevitable.
9.6 Effects of Amalgamation on Community Organisations Community and sporting bodies are the veritable ‘life blood’ of rural, regional and remote Australia. They play a pivotal role in the social structure of towns; they provide quality of life to residents; they provide much need public interaction from those living and working remotely; and they contribute enormously to the development of the district as ca whole through the countless hours of voluntary work provided for various community projects. Due to the important role played by these organisations, it is not surprisingly that the local communities in the Central West also expressed grave concerns for their future, should forced amalgamation take place.
RAPAD Report
Page 115
Concerns expressed by local residents in relation to the future of community and sporting groups centred on two key areas. Firstly, at present local shires provide extensive financial and other support to these organisations. Most of the local councils assist with the provision of direct funding; they assist with completing funding applications to other levels of government; the councils assist with the maintenance of facilities; and they typically provide plant, labour and loans for major projects. The second area of concern, similar to the local school problem, is that residents feared for the viability of many of these organisations if their council was amalgamated, because council employees and their families made up a significant proportion of the total membership of these bodies. In order to investigate this issue in more detail, we questioned a number of the local councils on the involvement that their staff have in the numerous community and sporting clubs within their municipal boundaries. The results of this exercise were astounding and are outlined in Appendix 2 in detail. For instance, Aramac staff occupied 320 positions in 34 different organisations in the Shire. In Barcaldine there are 55 sporting and community groups with an average membership of 50 people, with council employees making up a significant proportion of these numbers; at Barcoo the number of council staff and their partners account for 44 members in 16 different community/sporting organizations; in the Blackall case council staff and their families represent 350 member in 61 different organisation, and the figures at Isisford are 265 members in 11 different organisation. It is thus crystal clear is that council staff form the ‘backbone’ of the local communities in which they work. They are in fact an integral part of the operations of their respective community. Many council employees are members of multiple clubs and organisations, as is evident from the statistical profile above. This being the case, a reduction of council employees as a result of an amalgamation will leave a catastrophic gap in many of these organisations and the local community in general.
9.7 Local Business and Employment under Amalgamation The third major concern expressed by the residents of the eleven RAPAD shires was in relation to the effect on existing local businesses if there was to be forced council amalgamations in the region. These fears existed on a number of different levels. For instance, as we saw earlier in section 9.2, a number of the existing local councils directly provide a numerous services to their local communities which would usually be provided by private firms or individuals, and not by a local government authority. In addition, most local councils have significantly assisted local businesses to become operational or have provided them with a guaranteed income by way of an annual retainer. Indeed, the extraordinary lengths that most of these local councils have gone to in order to ensure that their local residents have access to the standard services that most other Australian communities would take for granted is most commendable. It is therefore understandable that local residents are extremely angry and fearful for the future of these businesses following a forced amalgamation. However, these innovative initiatives form only part of the eleven Shires’ total support for local businesses within their boundaries. These local councils also support many of the businesses that operate within their boundaries by purchasing goods and services from them. This assists the council by providing ready access to these products and assists the businesses with regular sales, thus supporting the ongoing viability of the enterprises. Table 9.2 indicates the eleven councils spend around $21 million at more than 346 different firms located with in their respective shire boundaries. As can be seen from Table 9.2, this local spending is significant, with all shires preferring to support their local businesses wherever possible. While the time available to undertake this research has been limited by the harsh deadlines set by the Queensland state government, which precluded a more detailed study of the effects of local councils’ local expenditure on local businesses, it is evident that the effect is enormous. For instance, a reduction of $2.3 million dollars per annum for the 22 businesses in Aramac Shire would represent a fatal

RAPAD Report
Page 116
blow to these enterprises. The same can be said for the reduction of income to local businesses totaling $2.6 million in Winton; $1.2 in Barcaldine and the $1.5 million in Blackall Shires. Table 9.2: Amount Spent by Council in the Local District in 2005/06
Local Spend
No of Businesses
Aramac 2,352,824 22 Barcaldine 1,283,601 55 Barcoo 863,043 27 Blackall 1,521,559 NP Boulia 6,584,184 NP Diamantina 554,247 19 Ilfracombe 100,757 7 Isisford 788,673 NP Longreach 2,636,306 44 Tambo 1,244,317 98 Winton 2,634,569 74 Total: 20,564,081 346
Source: As provided by each Council The final fear expressed by residents centred on the viability of existing businesses when the population inevitably declines as a result of council employees relocating to other towns for work. Table 9.3 illustrates this problem. As we have seen, council employees make up a significant proportion of the population of many of the Central West shires. For instance, in Diamantina, council employees represent 18.63 per 100 persons; in Barcoo the corresponding figure is 10.77, with 9.3 at Isisford. It should be noted that these figures are a proportion of the shire-wide population, and the impact of depopulation will thus be even more significant within the urban areas of the shires. Table 9.3: Number of Staff and Annual Employee Costs
Local Government
Area
Indoor Staff1
Outdoor Staff1
Total Staff1
Employees per 100 Capita1
Admin Wages2
Management Wages2
Works Wages2
Total Wages2
Aramac (S) 26% 74% 58 6.35 448,884 127,745 1,817,827 2,394,456 Barcaldine (S) 36% 64% 52 3.02 486,993 278,700 1,430,917 2,196,610 Barcoo (S) 37% 63% 49 10.77 192,269 233,482 2,559,892 2,985,643 Blackall (S) 30% 70% 49 3.55 539,775 99,503 1,732,124 2,371,402 Boulia (S) 37% 63% 43 7.82 314,493 635,537 1,074,390 2,371,402 Diamantina (S) 33% 67% 55 18.63 520,014 353,656 2,026,765 2,900,435 Ilfracombe (S) 18% 82% 28 7.71 219,392 100,000 890,782 1,210,174 Isisford (S) 18% 82% 28 9.3 257,899 1,056,108 1,314,007 Longreach (S) 46% 54% 108 2.71 530,000 233,000 3,192,000 3,955,000 Tambo (S) 40% 60% 48 7.31 462,665 386,506 802,624 1,651,796 Winton (S) 18% 82% 62 4.04 394,010 172,874 2,116,673 2,683,557 31% 69% 569 7.38 4,366,394 2,621,003 18,700,102 26,034,482 Source: 1 QTC 2007 (e, f and g) and QTC 2006 (a and c).
2 As provided by each Council. Table 9.3 also highlights the total wage expenditure of each local shire, decomposed into administration staff, management and works staff. Table 9.3 shows the amount of money in wages that could be expected to be withdrawn from the respective local communities following an amalgamation. It is reasonable to expect, following the centralization of services, that all administration and management staff would be re-located to the central office. In this case, one could expect over a $½ million reduction in local wages in
RAPAD Report
Page 117
Aramac with its intrinsic multiplier effect (excluding council employees’ spousal income). This figure is closer to $1 million at Diamantina and Tambo Shire. This money would be lost to the local community and thus not available to be spent at local businesses and to support local sporting and community organisations. It is thus abundantly clear the effects on local employment and local business if the local councils were to be compulsorily amalgamated would be devastating for the simple and obvious reason that Central Western Queensland local councils employ a large percentage of the total workforce within their respective communities.
9.8 Concluding Remarks Central West local councils provide many services to their residents that fall outside of the normal responsibilities of local government, due largely to the limited public and private service providers within their boundaries. All local shires have always endeavoured to respond proactively to community needs as they have arisen or been identified regardless of which level of government traditionally had jurisdiction. The councils in the Central West are thus far more than mere local service providers; they are an essential and integral part of their respective communities. Local government in the Central West does significantly more than simply deliver a range of traditional local government services and implement the regulatory requirements of the state government. They build sustainable local communities and provide the social fabric of their respective local communities. These small local councils are thus essential to the very survival of their small local communities. The non-traditional services provided by Central West councils, as highlighted in section 9.2, emphasized the innovative solutions that can be found when the local council, working closely in with the local community, can identify a local service deficiency and find a local low-cost solution. As local councils get bigger and more centralized, local knowledge and local enthusiasm evaporate, and local innovative and effective local solutions inevitably disappear. The analysis undertaken in Chapter 9 has decisively demonstrated that to dismantle the extensive social network that has arisen in small local communities integrally connected with small local councils in favour of a centralized structure would be a literal ‘death sentence’ for many of these small local communities. The withdrawal of non-traditional government services delivered by local shires, fewer consumers for local business, less local school enrolments, and many other negative imposts of amalgamation will see many of these small local communities become ‘ghost towns’ with those remaining becoming second-class citizens living with third-world services; all this in a prosperous state that is in the midst of an historic economic boom. Existing population projections will need to be revised, property prices will crash and the decline in services and facilities will make it next to impossible to attract people to replace current council employees who have been relocated to the centralized administration facility of the amalgamated council. This would undo all the hard work of the current small local councils and the RAPAD organization and what they have managed to achieve against very difficult odds. In sum, forced amalgamation would amount to an act of economic and social vandalism unequalled in Queensland local government history. Compulsory council mergers are not only destructive in Central West Queensland; they are also completely unnecessary. As this Final report shows, more economically and socially viable alternative solutions exist which are also much more humane.

RAPAD Report
Page 118
Part D: Recommendations
Chapter 10: Recommendations
10.1 Introduction This Report is based on a full examination of the official and academic literature on Australian local government reform, with a strong emphasis on structural reform and its chief instrument local council amalgamation. In addition, the Report has carefully considered the present state of RAPAD area local councils and their overall contribution to the local communities that they serve. The Report has been deliberately designed to act as a formal submission to the Queensland Reform Commission in order to inform its deliberations on structural and other reform in Queensland local government under its Terms of Reference (TOR) derived from the new Queensland Local Government Reform program announced by the Premier on 17 April 2007. Chapter 10 is divided into three main parts. Section 10.2 provides a synoptic review of the overall thrust of the Report. Section 10.3 advances some general observations on the optimal approach to reform of the local councils in the RAPAD area. The chapter concludes in section 10.4 with a set of specific recommendations for the RAPAD area local councils and the RAPAD organization itself and how these recommendations fall within the TOR of the Queensland Local Government Reform Commission.
10.2 Synoptic Review of the Report The Final Report fell into four main parts. Part A considered the question of structural reform through forced amalgamation and promising alternative models of local government to compulsory council mergers, including shared service arrangements. Part B focused on financial sustainability in Australian local government, the measurement of financial sustainability, and problems with the application of this concept to local councils, especially the poor predictive capacity of KPIs and the ‘non-discretionary’ nature of much local authority revenue and costs. A far broader concept of local community sustainability was developed to replace the more limited notion of financial sustainability which considered the crucial economic and social impact of small local councils in small local communities in remote areas, such as the Central Western RAPAD area of Queensland. Part C conducted a detailed statistical analysis of the economic, demographic and social characteristics of RAPAD area local shire councils. It considered the financial performance of RAPAD area local shire councils as well as the constructive role that the RAPAD organization itself has played in enhancing local government service provision in the region. It also assessed the critical broader economic and social impact of these local shire councils on the long-run sustainability of local communities in the vast and sparsely populated RAPAD spatial area. Part D concludes the Final Report by providing a brief synoptic review of the main findings of the Report, considering the best policy options available to the RAPAD area local shire councils, and assessing the merits of these options in terms of the TOR of the Queensland Local Government Reform Commission.
10.2.1 Part A
Part A comprised three chapters. Chapter 2 examined Australian local government reform and difficulties faced by Australian local government. In particular, the question structural reform in local government, and especially compulsory council amalgamation, was examined in detail. It was argued that amalgamation represented only one of

RAPAD Report
Page 119
several alternative models of structural reform that could be followed. Moreover, available theoretical and empirical evidence on municipal amalgamation strongly suggested that it seldom achieved its intended economic aims and came at an unacceptably high price in terms of local government democracy. Chapter 3 focussed on the problem of alternative models suitable for contemporary local councils in non-metropolitan Australia and outlined five promising alternative governance models, some of which have already been implemented. It sought to provide a conceptual system for evaluating these alternative models of local governance that involved structural change and process change. By way of concrete examples of current models, the chapter described research on the Riverina Regional Organization of Councils (REROC), the NSW Shires Association (2004) Joint Board model, and the New England Strategic Alliance. Chapter 4 dealt with shared services as an alternative method of enhancing the operational effectiveness of local government without endangering local democracy, local representation and the sustainability of local communities. The chapter outlined the analytical foundations for shared services, examined empirical evidence on the efficacy of shared services as a means of educing the costs of service provision, and considered the policy implications of shared services as an alternative to the blunt instrument of local council amalgamation. It found that shared services offered considerable promise, even in the context of rural and remote local councils afflicted by the ‘tyranny of distance’. However, given the fact that both cost pressures and revenue constraints are acute in Australian local government, by themselves shared service models are insufficient to cure all the current ills of many local authorities.
10.2.2 Part B
Part B comprised two chapters. Chapter 5 focussed on the problem of financial sustainability in Australian local government. It critically examined the CGC (2001) report, the Hawker Report (2004), the various state-based inquiries and the PWC (2006) national report, all of which were centrally concerned with defining, measuring and applying an ‘accounting approach’ to local councils. In addition, the chapter examined the embryonic Australian academic literature on local council sustainability and the poor predictive capacity of KPIs in explaining local council failure. In order to place the discussion of financial sustainability in a realistic factual framework, the chapter went on to develop a typology of local government sustainability using the empirical characteristics of Australian local councils. It was demonstrated that the sources of most of the financial difficulties confronting local government in both Australia at large and Queensland in particular lay largely beyond the control of individual local councils since cost drivers and revenue constraints are mostly ‘non-discretionary’ in nature and cannot thus be influenced by the actions of local councils. The chapter concluded with a brief assessment of the implications of the taxonomy for Queensland local government. Chapter 6 considered the broader concept of community sustainability and the critical role played by small rural and remote councils in determining community sustainability. The chapter examined the problem of defining adequately council sustainability and community sustainability and identifying the chief determinants of this broader conception of local government sustainability: Local democracy; local social capital; local government capacity; and the economic and social contribution of local councils to local community sustainability. It was established that remote and rural councils played a key role in sustaining local communities. Accordingly, amalgamation or any other policy that sought to remove small rural and remote councils threatened local community sustainability and the very existence of small local communities in these areas.
10.2.3 Part C
Part C comprised three chapters devoted to an empirical analysis of local councils in the RAPAD area. Chapter 7 considered the economic, demographic and social characteristics
RAPAD Report
Page 120
of RAPAD area local shire councils and provided a synoptic profile of each individual local shire in the Central West RAPAD region. It also analysed the demographic composition of these local shires as well as considered the types of industries operating in region and the major sources of employment for its residents. Chapter 7 advanced a preliminary discussion of the RAPAD councils themselves and set the scene for the detailed analysis contained in Chapter 8 and Chapter 9 of this Report. Chapter 8 examined the financial performance of the Central West local shire councils as well as the constructive role that the RAPAD organization has played in enhancing local government service provision in the region. Chapter 8 found that on each of the various sustainability measures used, such as the QTC assessment, the NSW LGI criteria, and the SAFSRB methodology, produced differing result for the different local councils. In general, the eleven councils are characterized as having ‘low to nil’ debt, low populations, low own-source income, and most importantly, all local councils, except for Ilfracombe Shire Council, have been assessed by QTC as having the ability to meet their financial commitment in the short to medium term. Like most councils in Australia, the Central West councils will have to consider their long-term financial sustainability, particularly in the area of asset renewals, as well as the external factors affecting their ongoing viability, such as increasing community expectations, reduced grant funding, unfunded mandates from the state and federal governments, and cost shifting etc. Chapter 8 also argued that the RAPAD organization itself may be in a position to assist its member councils improve their financial position by being used as a vehicle to coordinate an investigation into the viability of providing cooperative or shared services within region. This has the potential to provide similar advantages to that provided in an amalgamation, without the catastrophic economic and social consequence that such a severe form of structural reform would inevitably bring about. Chapter 9 analysed the economic and social impact of RAPAD area local shire councils on the long-run sustainability of local communities in the vast and sparsely populated RAPAD spatial area and it demonstrated conclusively that these local councils go far beyond traditional local government responsibilities. Chapter 9 assessed the potentially devastating results that would eventuate on local community sustainability if forced amalgamation occurred in the Central West. In so doing Chapter 9 discussed a number of recent projects that would not have been completed under a centralized amalgamated large council; the probable direct consequences of the withdrawal of a local government authority from a Central West town through its effects on local schools; the expected repercussions on community sustainability from the withdrawal of the local authority from the small towns; and the impact on local employment and local business.
10.2.4 Part D
Part D comprises a single chapter. Chapter 10 considers various options for reform open to RAPAD local councils that will preserve local representation and local community sustainability while at the same time improving the operational efficiency of RAPAD local councils. Chapter 10 also presents the chief recommendations derived from the deliberations of this Report and evaluates these options in terms of the TOR of the Queensland Local Government Reform Commission.
10.3 General Observations The analysis conducted in Part A of the Report led to several firm conclusions on structural reform in local government. These conclusions may be summarized as follows:
Amalgamation is only one of several kinds of structural change that can enhance local government operational efficiency.
Compared to other structural arrangements, amalgamation carries very heavy costs in terms of the loss of local autonomy, local democracy and local representation and has seldom achieved substantial cost savings.

RAPAD Report
Page 121
Other models of local governance that are based on shared services offer much greater promise since they protect local autonomy, local democracy, local representation and local community sustainability and can generate significant cost savings.
These alternative models are particularly significant for small local councils in remote areas of Queensland.
The analysis conducted in Part B of the Report led to several concrete conclusions on financial sustainability, problems associated with the meaning, measurement and applicability of financial sustainability and the broader concept of local community sustainability in local government. These conclusions may be summarized as follows:
No agreement exists on the meaning and measurement of financial sustainability in Australian local government.
Different approaches arrive at different conclusions on the financial status of individual local councils and in any event have a very poor predictive efficacy in identifying which municipalities will fail.
The inability to determine accurately the financial sustainability of individual councils means that policy makers have no reliable method of identifying ‘at risk’ local councils and this precluded drawing firm policy implications from data on financial sustainability.
Financial sustainability is only part of the much broader concept of overall council sustainability that includes local democracy, local social capital, local capacity and local community sustainability.
While these and other attributes of the functioning of councils are difficult to define and measure, this does not reduce their vital importance, especially in rural and remote areas dominated by the ‘tyranny of distance’.
The analysis conducted in Part C of the Report allowed us to derive some firm conclusions on both RAPAD area local shire councils as well as the RAPAD organization. These conclusions may be summarized as follows:
Local shire councils in the Central West have a relatively small population, are geographically isolated from each other and major centres in Queensland and extremely innovative under trying local circumstances.
The economic, demographic and social characteristics of RAPAD area local shire councils demonstrate that they are atypical in the broader Queensland local government milieu and these small councils should thus be seen as a ‘special case’ deserving of special treatment.
Local communities in the Central West each possess unique local properties and provide a vibrant local economic and social context to their residents.
The economic, demographic and social characteristics of Central West local shire councils lead inexorably to the conclusion that ‘policy shocks’, such as amalgamation, will damage the hard-won and fragile economic and social gains made in these local communities.
All the local councils are able to meet their short and medium-term financial obligations, but will struggle to meet their asset renewal obligations in the long term.
RAPAD is a dynamic and progressive organisation that has served the interests of its member local councils by undertaking projects of regional significance as well as represented the views of these councils through its various submissions and lobbying efforts.
RAPAD Report
Page 122
The regional cooperation and trust that RAPAD has facilitated may assist in it playing a greater role in achieving cost reductions and scale economies in operation in some services undertaken by the councils through a regional transition to more cooperative and shared services.
A detailed analysis the economic and social impact of RAPAD area local shire councils on the long-run sustainability of local communities demonstrated conclusively that these local councils go far beyond traditional local government responsibilities.
This analysis also demonstrated that potentially devastating consequences for local community sustainability would ensue if forced amalgamation occurred in the Central West.
Particularly vulnerable areas included recent projects that would not have been completed under a centralized amalgamated council; the detrimental effects of forced amalgamation on local schools; the expected repercussions on community sustainability from the withdrawal of local councils from the small local towns; and the impact of amalgamation on local business and local employment.
Part D of the Report spells out the best options for reform open to RAPAD local councils that will preserve local representation and local community sustainability while at the same time improving the operational efficiency of RAPAD local councils. Chapter 10 also presents the chief recommendations derived from the deliberations of this Report and frames them in the context of the TOR of the Queensland Local Government Reform Commission.
10.4 Recommendations 10.4.1 This Report strongly recommends that the Queensland Local Government Reform Commission find against any forced amalgamation of any RAPAD area local shire councils. 10.4.2 This Report strongly recommends that the Queensland Local Government Reform Commission find in favour of the maintenance of the existing activities, structure and representation of RAPAD and the future strengthening of the RAPAD organization as the best means available to improve the service provision efficacy and operational efficiency of RAPAD area local shire councils. 10.4.3 This Report recommends that the Queensland Local Government Reform Commission commend RAPAD area local shire councils and the RAPAD organization on their innovative and ‘can-do’ approach and remarkable achievements in overcoming the many difficulties imposed by their remote location, sparse population and disadvantageous cost differentials. 10.4.4 This Report recommends some additional service sharing initiatives that RAPAD should consider investigating further, particularly in the areas of:
Financial Management;
Plant and Fleet Management;
Information Systems;
Human Resources;
Regulatory and Planning;
Works Support;
Revenue Management;
RAPAD Report
Page 123
Supply and Procurement;
Records;
Treasury;
Land Information and GIS; and
Internal Audit and Risk Management.
10.4.5 Recommendation 10.4.1 and Recommendation 10.4.2 meet the objectives of the Reform Commission since they both fall squarely within the amended Queensland Local Government Act 1993 under new Section 159S of the Local Government Act 1993 (as amended) which specifies the functions of the Local Government Reform Commission and, in particular, its powers under Section 159S (1) (b) (iii) to make recommendations to the Minister. 10.4.6 Recommendation 10.4.1 and Recommendation 10.4.2 both have the additional advantage of meeting many of the aims of the Reform Commission as stated in its TOR. For example, it clearly meets TOR (2) where the Reform Commission ‘must consider the grouping of like communities of interest to maintain the social fabric and character of communities and areas of the State, and in particular, must consider – (a) review areas established under SSS review processes; and (b) boundaries of areas covered by the regions for which regional planning advisory committees have been established under the Integrated Planning Act 1997’. The strengthening of the RAPAD organization will allow for the fulfilment of TOR (3), particularly regarding the consolidation of ‘regional natural resource management areas, including for example water catchment areas, and environmental areas, including for example, coastal wetlands’. Furthermore, a strengthened RAPAD model facilitates TOR (4) ‘making a recommendation for creating a new local government area from 2 or more existing local government areas, the reform commission must give preference, to the extent practicable, to including all of the existing local government areas in the new area rather than parts of the existing areas’. Finally, the maintenance and strengthening of the existing RAPAD model also enables the Reform Commission to meet TOR (5) by identifying ‘options for community representation that reflect the diversity of the State’s regions and that promote representation of discrete communities’.

RAPAD Report
Page 124
References AAMD&C/AUMA Rural/Urban Cost-Sharing Task Force (2004), Cost-sharing for Success:
A Pro-active Approach, Alberta Association of Municipal Districts and Counties and Alberta Urban Municipalities Association, Alberta.
Aarts, K. (1995), ‘Intermediate Organizations and Interest Representation’, in H. D.
Klingeman and D. Fuchs (eds), Citizens and the State, Oxford University Press, Oxford, pp. 227-257.
Access Economics (2006a), Local Government Finances in NSW: An Assessment,
Research Report for the Independent Inquiry into the Financial Sustainability of NSW Local Government, Access Economics, Sydney.
Access Economics (2006b), Local Government Finances in Western Australia, Western
Australian Local Government Association, Perth. Allan, P. (2001), Secession: A Manifesto for an Independent Balmain Local Council,
Balmain Secession Movement, Balmain. Allan, P. (2003), ‘Why Smaller Councils Make Sense’, Australian Journal of Public
Administration, 62(3), pp. 74-81. Allan, P. (2006), What Drives Councils’ Efficiency: Population Size or Density,
Independent Inquiry into Local Government Inquiry (LGI), NSW Local Government and Shires Association, Sydney.
Aulich, C. (1999), ‘From Convergence to Divergence: Reforming Australian Local
Government’, Australian Journal of Public Administration, 58(1), pp. 12-23. Aulich, C. (2005), ‘Australia: Still a Story of Cinderella’, in B. Denters and E. Rose (eds),
Comparing Local Governance: Trends and Developments, Palgrave Macmillan, Basingstoke, pp. 193-210.
Australian Bureau of Statistics (ABS) (2003a), Expanded Community Profile Marina (s)
(LGA 35050), 2001 Census Community profile Services, Catalogue No. 2005.0, Commonwealth of Australia.
Australian Bureau of Statistics (ABS) (2003b), Monthly Summary of Statistics
Queensland, Catalogue No. 1304.3, Commonwealth of Australia. Australian Bureau of Statistics (ABS) (2006a), National Regional Profile, 2000 to 2004
ABS Catalogue No. 1379.0.55.001, Aramac Shire, Selected Characteristics, Commonwealth of Australia.
Australian Bureau of Statistics (ABS) (2006b), National Regional Profile, 2000 to 2004
ABS Catalogue No. 1379.0.55.001, Barcaldine Shire, Selected Characteristics, Commonwealth of Australia.
Australian Bureau of Statistics (ABS) (2006c), National Regional Profile, 2000 to 2004
ABS Catalogue No. 1379.0.55.001, Barcoo Shire, Selected Characteristics, Commonwealth of Australia.

RAPAD Report
Page 125
Australian Bureau of Statistics (ABS) (2006d), National Regional Profile, 2000 to 2004 ABS Catalogue No. 1379.0.55.001, Blackall Shire, Selected Characteristics, Commonwealth of Australia.
Australian Bureau of Statistics (ABS) (2006e), National Regional Profile, 2000 to 2004
ABS Catalogue No. 1379.0.55.001, Boulia Shire, Selected Characteristics, Commonwealth of Australia.
Australian Bureau of Statistics (ABS) (2006f), National Regional Profile, 2000 to 2004
ABS Catalogue No. 1379.0.55.001, Diamantina Shire, Selected Characteristics, Commonwealth of Australia.
Australian Bureau of Statistics (ABS) (2006g), National Regional Profile, 2000 to 2004
ABS Catalogue No. 1379.0.55.001, Ilfracombe Shire, Selected Characteristics, Commonwealth of Australia.
Australian Bureau of Statistics (ABS) (2006h), National Regional Profile, 2000 to 2004
ABS Catalogue No. 1379.0.55.001, Isisford Shire, Selected Characteristics, Commonwealth of Australia.
Australian Bureau of Statistics (ABS) (2006i), National Regional Profile, 2000 to 2004
ABS Catalogue No. 1379.0.55.001, Longreach Shire, Selected Characteristics, Commonwealth of Australia.
Australian Bureau of Statistics (ABS) (2006j), National Regional Profile, 2000 to 2004
ABS Catalogue No. 1379.0.55.001, Tambo Shire, Selected Characteristics, Commonwealth of Australia.
Australian Bureau of Statistics (ABS) (2006k), National Regional Profile, 2000 to 2004
ABS Catalogue No. 1379.0.55.001, Winton Shire, Selected Characteristics, Commonwealth of Australia.
Australian National Audit Office (ANAO) (2006), Roads to Recovery, Audit Report No. 31
2005-06 Performance Audit, Canberra. URL: http://www.anao.gov.au/WebSite.nsf/Publications/32110625262CFB72CA25712200789C25 [Consulted 3 July 2006].
Bailey, S. (1999), Local Government Economics: Principles and Practice, Macmillan,
Basingstoke. Bish, R. (2000), Local Government Amalgamations: 19th Century Ideas for the 21st
Century, Howe Institute, Toronto. Boston, J., Martin, J., Pallot, J. and P. Walsh (1996), Public Management: The New
Zealand Model, Oxford University Press, Auckland. Boyne, G. A. (1998), Public Choice Theory and Local Government, Macmillan,
Basingstoke. Breton, A. (1995), Competitive Governments, Cambridge University Press, Cambridge. Brooks, J. (2006), New South Wales Local Government Expenditure and Revenue
Analysis, Research Report to the Independent Inquiry into Local Government Inquiry, Proteus Management Group, Sydney.
Burnley, I.H. and P.A. Murphy (2002), ‘Change, Continuity or Cycles: The Population
Turnaround in New South Wales’, Journal of Population Research, 19(2), pp. 137-54.
RAPAD Report
Page 126
Byrnes, J. D. (2005), Local Government Service Provision – A Survey of Council General Managers, Commissioned Report for the Independent Inquiry into the Financial Sustainability of Local government in New South Wales, NSW Local Government and Shires Association, Sydney.
Byrnes, J. D and B. E. Dollery (2002a), ‘Do Economies of Scale Exist in Australian Local
Government? A Review of the Research Evidence’, Urban Policy and Research, 20(4), pp. 391-414.
Byrnes, J. D and B. E. Dollery (2002b), ‘Local Government Failure in Australia: An
Empirical Analysis of New South Wales’, Australian Journal of Public Administration, 61(3), pp. 54-64.
Coase, R. H. (1964), ‘Regulated Industries: Discussion’, American Economic Review,
62(4), pp. 777-795. Coleman, J. S. (1988), ‘Social Capital in the Creation of Human Capital’, American
Journal of Sociology, 94(1), pp. 95-120. Coleman, J. S. (1990), Foundations of Social Theory, Harvard University Press,
Cambridge, MA. Commonwealth Grants Commission (CGC) (2001), Review of the Operation of Local
Government (Financial Assistance) Act 1995, Australian Government, Canberra. Communities and Local Government (CLG) (2006a), Local Authorities Efficiency
Statements: Adur to Cumbria, Communities and Local Government, London. Communities and Local Government (CLG) (2006b), Local Authorities Efficiency
Statements: Dacorum to Lancs, Communities and Local Government, London. Communities and Local Government (CLG) (2006c), Local Authorities Efficiency
Statements: Lancaster to Northants, Communities and Local Government, London.
Communities and Local Government (CLG) (2006d), Local Authorities Efficiency
Statements: Northumberland to Stockport, Communities and Local Government, London.
Communities and Local Government (CLG) (2006e), Local Authorities Efficiency
Statements: Stockton on Tees to York, Communities and Local Government, London.
Demsetz, H. (1969), ‘Information and Efficiency: Another Viewpoint’, Journal of Law and
Economics, 12(1), pp. 1-22. Denters B. and E. Rose (eds) (2005), Comparing Local Governance: Trends and
Developments, Palgrave Macmillan, Basingstoke. Department of Local Government, Planning, Sport and Recreation (DLGPSR) (2005),
Queensland Local Government Comparative Information 2003/04, Queensland Government, Brisbane.
Department of Transport and Regional Services (DOTARS) (2003), Local Government
National Report, 2001-02, Australian Government, Canberra. Department of Transport and Regional Services (DOTARS) (2005), Local Government
National Report, 2003-04, Australian Government, Canberra.
RAPAD Report
Page 127
Department of Transport and Regional Services (DOTARS) (2006), Local Government National Report, 2004-05, Australian Government, Canberra.
Derman, H. and B. Gates (1995), Local Government Shared Services and Municipal
Consolidation: A Report and An Agenda, Department of Community Affairs, Trenton, NJ.
Dollery, B. E. (1997), ‘Reforming Australian Local Government: Forced or Voluntary
Amalgamations?’, Agenda, 4(4), pp. 445-454. Dollery, B. E. (2003), ‘A Critical Evaluation of Virtual Local Government in Australia’,
Australian Journal of Public Administration, 62(3), pp. 82-91. Dollery, B. E. (2006), ‘An Alternative Approach to Identifying Councils “At Risk”: A
Rejoinder to Bob Walker and Stewart Jones’, Economic Papers, 25(4), pp. 358-361.
Dollery, B. E., Burns, S. and A. Johnson (2005a), ‘Structural Reform in Australian Local
Government: The Armidale Dumaresq-Guyra-Uralla-Walcha Strategic Alliance Model’, Sustaining Regions, 5(1), pp.5-13.
Dollery, B. E. and J. D. Byrnes (2005), Alternatives to Amalgamation in Australian Local
Government: the Case of Walkerville, School of Economics Working Papers Series, #2005-4, University of New England, Armidale.
Dollery, B. E., Byrnes, J.D. and L. Crase (2006a), ‘Resolving the Australian Local
Infrastructure Crisis through a Federal Asset Infrastructure Fund’, Working Paper 04-2006, Centre for Local Government, University of New England.
Dollery, B. E., Byrnes, J. D. and L. Crase (2007a), ‘An Analysis of the New Perspective on
Amalgamation in Australian Local Government’, Working Paper 02-2007, Centre for Local Government, University of New England.
Dollery, B. E. and L. Crase (2004), ‘Is Bigger Local Government Better? An Evaluation of
the Case for Australian Municipal Amalgamation Programs’, Urban Policy and Research, 22(3), pp. 265-276.
Dollery, B. E. and L. Crase (2006), ‘A Comparative Perspective on Financial Sustainability
in Australian Local Government’, Working Paper 01-2006, Centre for Local Government, University of New England, Armidale.
Dollery, B. E., Crase, L. and J. D. Byrnes (2006b), ‘Overall Local Council Sustainability in
Australian Local Government’, Working Paper 02-2006, Centre for Local Government, University of New England, Armidale.
Dollery, B. E., Crase, L. and A. Johnson (2006c), Australian Local Government
Economics, UNSW Press, Sydney Dollery, B. E. and E. Fleming (2006), ‘A Conceptual Note on Scale Economies, Size
Economies and Scope Economies in Australian Local Government’, Urban Policy and Research, 24(2), (forthcoming).
Dollery, B. E. and A. Johnson (2004), ‘An Analysis of the Joint Board or Area Integration
Model as the Structural Basis for Effective Australian Local Government’, School of Economics Working Papers, 2004-13, University of New England, Armidale. URL: http://www.une.edu.au/febl/Economics/Publications/econ_2004_13.pdf [Consulted 2 May 2007].

RAPAD Report
Page 128
Dollery, B. E. and A. Johnson (2005), ‘Enhancing Efficiency in Australian Local Government: An Evaluation of Alternative Models of Municipal Governance’, Urban Policy and Research, 23(1), pp.73-86.
Dollery, B. E. and A. Johnson (2007), ‘An Analysis of the Joint Board or County Model as
the Structural Basis for Effective Australian Local Government’, Australian Journal of Public Administration (forthcoming).
Dollery, B. E., Johnson, A., Marshall, A. and A. Witherby (2005b), ‘ROCs as Governing
Frameworks for Sustainable Regional Economic Development: A Case Study’, Sustaining Regions, 4(3), pp.15-21.
Dollery, B. E., Johnson, A. K. and J. D. Byrnes (2007b), ‘An Assessment of Pensioner
Rebates in New South Wales’, Working Paper 03-2007, Centre for Local Government, University of New England, Armidale.
Dollery, B. E. and N. A. Marshall (2003), ‘Future Directions for Australian Local
Government’, in B. E. Dollery, N. A. Marshall and A. C. Worthington (eds), Reshaping Australian Local Government: Finance, Governance and Reform, UNSW Press, Sydney, pp. 231-250.
Dollery, B. E., Marshall, N. A., Johnson, A. and A. Witherby (2004), Regional Capacity
Building: How Effective is REROC? Riverina Eastern Regional Organization of Councils, Wagga Wagga.
Dollery, B. E., Moppett, W. and L. Crase (2006d), ‘Spontaneous Structural Reform in
Australian Local Government: The Case of the Gilgandra Cooperative Model’, Australian Geographer, 37(3), pp.395-409.
Dollery, B. E., Pape, B. and J.D. Byrnes (2006e), ‘An Assessment of the Australian
Government's Roads to Recovery Program’, Working Paper 03-2006, Centre for Local Government, University of New England, Armidale.
Dollery, B. E. and J. L. Wallis (2001), The Political Economy of Local Government, Edward
Elgar Publishers, Cheltenham. Ernst and Young (1993), Resource Sharing Study: Town of St. Peters, Town of
Walkerville, and City of Kensington and Norwood, Office of Local Government, Commonwealth Department of Housing and Regional Development, Canberra.
Financial Sustainability Review Board (FSRB) (2005), Rising to the Challenge, South
Australian Local Government Association, Adelaide. Goodin, R. (1996), The Theory of Institutional Design, Cambridge University Press,
Cambridge. Honadle, B. W. (1984), ‘Alternative service delivery strategies and improvement of local
government productivity’, Public Productivity Review, 8(4), pp.201-313. House of Representatives Standing Committee on Economics, Finance and Public
Administration (2004), Rates and Taxes: A Fair Share for Responsible Local Government (Hawker Report), Commonwealth of Australia, Canberra.
Hugo, G. (2002), ‘Changing Patterns of Population Distribution in Australia’, in
Carmichael, G.A. and A. Dharmalingam (eds), Populations of New Zealand and Australia at the Millennium: A Joint Special Issue of the Journal of Population Research and the New Zealand Population Review, (Sept 2002) pp. 1-22.

RAPAD Report
Page 129
Hugo, G. and M. Bell (1998), ‘The Hypothesis of Welfare Led Migration to Rural Areas: The Australian Case’ in Boyle, P. and K. Halfacree (eds), Migration into Rural Areas: Theories and Issues, John Wiley and Sons, Chichester.
Independent Inquiry into Local Government Inquiry (LGI) (‘Allan Report’) (2006), Are
Councils Sustainable? Final Report: Findings and Recommendations, NSW Local Government and Shires Association, Sydney.
Johnson, A. K. (2003), ‘Financing Local Government in Australia’, in B. E. Dollery, N. A.
Marshall and A. C. Worthington (eds), Reshaping Australian Local Government: Finance, Governance and Reform, UNSW Press, Sydney, pp. 37-63.
Johnson, A.K. (2006), Unfunded Intergovernmental Mandates in Australia, unpublished
PhD thesis submitted for examination December 2006, University of New England, Armidale.
Jones, M. A. (1989), Managing Local Government, Hargreen, Melbourne. Katsuyama, B. (2003), ‘Is Municipal Consolidation the Answer?’ Municipal Research and
Services Center of Washington, Summer, pp. 1-3. Keohane, R. and J. Nye (eds) (2000), Governance in a Globalized World, Brookings
Institute, Washington. Kersting, N. and A. Vetter (2003) (eds), Reforming Local Government in Europe: Closing
the Gap between Democracy and Efficiency, Leske and Budrich, Opladen. KM Management Consulting (KMMC) (2005), Shared Services in Queensland Local
Government, Local Government Association of Queensland, Brisbane. Knack, S. and P. Keefer (1997), ‘Does Social Capital Have an Economic Payoff? A Cross-
Country Investigation’, Quarterly Journal of Economics, 72(4), pp. 1250-1281. Lawson, T. (2007), Review of South Australian Local Government Joint Service Delivery
Opportunities: Analysis of Council Responses to a Survey and Options for Implementation of Various Resource Sharing Measures, Tony Lawson Consulting, Adelaide.
Local Government Association of Queensland (LGAQ) (2005), Size, Shape and
Sustainability of Queensland Local Government, Discussion Paper, Local Government Association of Queensland Inc., Brisbane.
Local Government Association of Queensland (LGAQ) (2006), Size, Shape and
Sustainability: Guidelines Kit, Local Government Association of Queensland Inc., Brisbane.
Local Government Association of Tasmania (LGAT) (2007), A Review of the Financial
Sustainability of Local Government in Tasmania, Local Government Association of Tasmania, Hobart.
Marshall, N. A., Dollery, B. E. and A. Witherby (2003), ‘Regional Organisations of
Councils (ROCs): The Emergence of Network Governance in Metropolitan and Rural Australia?’, Australasian Journal of Regional Studies, 9(3), pp.169-188.
May, P. (2003), ‘Amalgamation and Virtual Local Government’ in B. E. Dollery, N. A.
Marshall and A. C. Worthington (eds), Reshaping Australian Local Government: Finance, Governance and Reform, UNSW Press, Sydney, pp.79-98.
RAPAD Report
Page 130
Municipal Association of Victoria (MAV) (2005), Trends in Local Government Finance, Municipal Association of Victoria, Melbourne.
Murray, D. R. and B. E. Dollery (2005) ‘Local Council Performance Monitoring in New
South Wales: Are “At Risk” Councils Really at Risk?’, Economic Papers, 24(4), pp. 332-345.
Murray, D. R. and B. E. Dollery (2006) ‘An Evaluation of Performance Measurement and
the Identification of “At Risk” Municipal Councils in NSW Local Government’, Public Administration Today, 6, pp.46-61.
National Office of Local Government (2003) Local Government National Report, 2002-03
Report on the Operation of the Local Government (Financial Assistance) Act 1995, Department of Transport and Regional Services, Canberra.
NSW Department of Local Government (DLG) (1995), Resources Sharing for Local
Government, Practice Note no. 12, NSW Government Printer, Sydney. NSW Legislative Council (2003), Inquiry into Local Government Amalgamation: Report
19(2003), NSW Government Printer, Sydney. Oakerson, R. J. (1999), Governing Local Public Economies: Creating the Civic Metropolis,
ICS Press, Oakland. Oates, W. E. (1972), Fiscal Federalism, Harcourt, Brace Janonovich, New York. Office of Economic and Statistical Research (2007), Queensland Regional Profiles: Central
West Statistical Division, Profiles generated on 12 February 2007. PriceWaterhouseCoopers (PWC) (2005), Shared Services for Even Greater Efficiency in
Local Government, PriceWaterhouseCoopers, London. PriceWaterhouseCoopers (PWC) (2006), National Financial Sustainability Study of Local
Government, PriceWaterhouseCoopers, Sydney. Putnam, R. (1993), Making Democracy Work: Civic Traditions in Modern Italy, Princeton
University Press, Princeton. Putnam, R. (2000), Bowling Alone: The Collapse and Revival of American Community,
Simon and Schuster, New York. Quibria, M. G. (2003), ‘The Puzzle of Social Capital’, Asian Development Review, 20(2),
pp. 19-39. Queensland Audit Office (2005), Results of Local Government Audits for 2003/04, Report
no. 1 for 2005, prepared under Part 6 Division 3 of the Financial Administration and Audit Act 1977, Auditor-General of Queensland April 8, 2005 Brisbane.
Queensland Treasury Corporation (2006a), Benchmarking Report: Prepared for
Barcaldine Shire Council (Draft), December 2006, Brisbane. Queensland Treasury Corporation (2006b), Financial Sustainability Review: Prepared for
Ilfracombe Shire Council (Draft), An assessment of Ilfracombe Shire Council‘s capacity to meet its financial commitments in the short, medium and long-term, November 2006, Brisbane.
Queensland Treasury Corporation (2006c), Benchmarking Report: Prepared for
Ilfracombe Shire Council (Draft), October 2006, Brisbane.
RAPAD Report
Page 131
Queensland Treasury Corporation (2007a), Financial Sustainability Review: Prepared for Longreach Shire Council (Draft), An assessment of Longreach Shire Council‘s capacity to meet its financial commitments in the short, medium and long-term, May 2007, Brisbane.
Queensland Treasury Corporation (2007b), Financial Sustainability Review: Prepared for
Tambo Shire Council (Draft), An assessment of Tambo Shire Council‘s capacity to meet its financial commitments in the short, medium and long-term, April 2007, Brisbane.
Queensland Treasury Corporation (2007c), Financial Sustainability Review: Prepared for
Barcaldine Shire Council (Draft), An assessment of Barcaldine Shire Council‘s capacity to meet its financial commitments in the short, medium and long-term, April 2007, Brisbane.
Queensland Treasury Corporation (2007d), Financial Sustainability Review: Prepared for
Blackall Shire Council (Draft), An assessment of Blackall Shire Council‘s capacity to meet its financial commitments in the short, medium and long-term, April 2007, Brisbane.
Queensland Treasury Corporation (2007e), Benchmarking Report: Prepared for Tambo
Shire Council, April 2007, Brisbane. Queensland Treasury Corporation (2007f), Benchmarking Report: Prepared for Longreach
Shire Council (Draft), April 2007, Brisbane. Queensland Treasury Corporation (2007g), Benchmarking Report: Prepared for Boulia
Shire Council, March 2007, Brisbane. Queensland Treasury Corporation (2007h), Financial Sustainability Review: Prepared for
Boulia Shire Council, An assessment of Boulia Shire Council‘s capacity to meet its financial commitments in the short. Medium and long-term, March 2007, Brisbane.
Queensland Treasury Corporation (2007i), Financial Sustainability Review: Prepared for
Isisford Shire Council, An assessment of Isisford Shire Council‘s capacity to meet its financial commitments in the short, medium and long-term, January 2007, Brisbane.
Ruggini, J. (2006), ‘Making local government more workable through shared services’,
Government Finance Review, February issue. Sancton, A. (2000), Merger Mania, McGill-Queens University Press, Montreal. Serco Solutions (2005), Shared Services as a Long-term Soltuion for Local Government:
Delivering on the Gershon Report, Serco Solutions, Birmingham. Shires Association of NSW (2004), A Joint Board Model, Draft Discussion Paper, Shires
Association of NSW, Sydney. Soul, S. (2000), Population Size and Economic and Policy Performance of Local
Government Jurisdictions, Unpublished doctoral thesis, Southern Cross University, Lismore.
Sproats, K. (2001), Inquiry into the Structure of Local Government in Eight Council Areas
in the Inner City and Eastern Suburbs of Sydney, NSW Department of Local Government, Sydney.
Page 132
RAPAD Report
Stewart, J. (1997), ‘The Governance of Difference’, in M. Chisholm, R. Hale and D. Thomas (eds), A Fresh Start for Local Government, Public Finance Foundation, London, pp. 65-78.
Steyvers, K., Reynaert, H., De Cuerninck, C. and T. Valckew (2006), ‘Mayors in
Governance: Heading for Efficiency and Democracy’, Local Government Studies, 32(4), pp. 429-446.
Thornton, J. (1995), The Urban Parish: An Alternative Approach to Local Government
Amalgamation, Local Government Development Program Research Series, Office of Local Government, Commonwealth Department of Housing and Regional Development, Canberra.
Tiebout, C. M. (1956), ‘A Pure Theory of Local Government Expenditure’, Journal of
Political Economy, 64(5), pp.416-424. Tucker, D. (1997), ‘From Administration to Management’ in B. E. Dollery and N. A.
Marshall (eds), Australian Local Government: Reform and Renewal, Macmillan, Melbourne, pp. 69-88.
Varden, C. (2003), Proposal for the Creation of the New England Regional Council, NSW
Department of Local Government, Sydney. Vince, A. (1997), ‘Amalgamations’, in B. E. Dollery and N. A. Marshall (eds), Australian
Local Government: Reform and Renewal, Macmillan, Melbourne, pp. 151-171. Walker, R. and S. Jones (2006), ‘An Alternative Approach to Identifying Councils “At
Risk”’, Economic Papers, 25(4), pp. 347-357. Wallis, J. L. and B. E. Dollery (1999), Market Failure, Government Failure, Leadership and
Public Policy, Macmillan, London. Western Australian Local Government Association (WALGA) (2006), Systemic
Sustainability Study: In Your Hands - Shaping the Future of Local Government in Western Australia, Western Australian Local Government Association, Perth.
Witherby, A., Dollery, B. E., Marshall, N. A. and M. Auster (1999), Is Bigger Better?
Towards a Model Process for Local Government Structural Reform, Australian Institute of Urban Studies, Sydney.
Woodbury, K., Dollery, B. E. and K. S. Prasada Rao (2003), ‘Is Local Government
Efficiency Measurement in Australia Adequate? An Analysis of the Evidence’, Public Productivity and Management Review, 27(2), pp. 77-91.
Worcestershire Country Council (2006), Annual Efficiency Statement: Backward Look,
Worcestershire Country Council, Worcester. Worthington, A. C. and B. E. Dollery (2000), ‘Measuring Efficiency in Local Government’s
Planning and Regulation Function’, Public Productivity and Management Review, 23(4), pp. 469-485.
Worthington, A. C. and B. E. Dollery (2001), ‘Diversity in Australian Local Government:
The Case Against the Imposition of National Uniform Standards’, International Review of Public Administration, 6(1), pp.49-58.
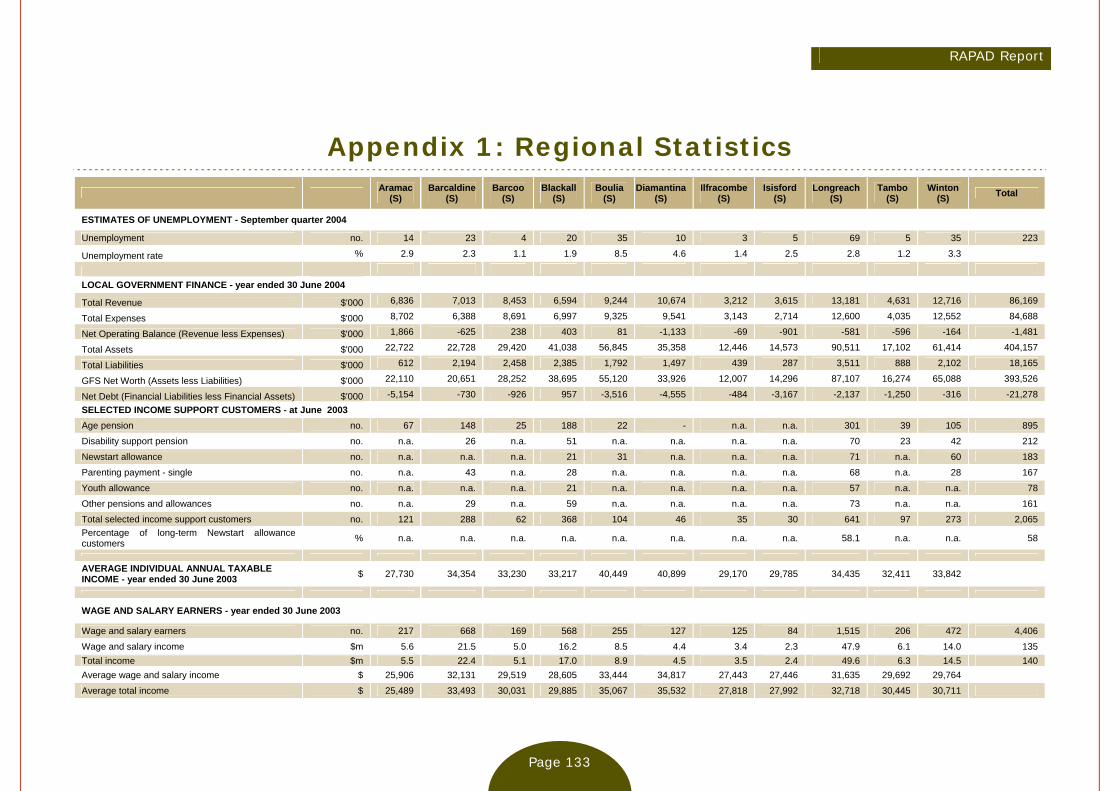
RAPAD Report
Page 133
Appendix 1: Regional Statistics Aramac
(S) Barcaldine
(S) Barcoo
(S) Blackall
(S) Boulia
(S) Diamantina
(S) Ilfracombe
(S) Isisford
(S) Longreach
(S) Tambo
(S) Winton
(S) Total
ESTIMATES OF UNEMPLOYMENT - September quarter 2004
Unemployment no. 14 23 4 20 35 10 3 5 69 5 35 223
Unemployment rate % 2.9 2.3 1.1 1.9 8.5 4.6 1.4 2.5 2.8 1.2 3.3
LOCAL GOVERNMENT FINANCE - year ended 30 June 2004
Total Revenue $'000 6,836 7,013 8,453 6,594 9,244 10,674 3,212 3,615 13,181 4,631 12,716 86,169
Total Expenses $'000 8,702 6,388 8,691 6,997 9,325 9,541 3,143 2,714 12,600 4,035 12,552 84,688
Net Operating Balance (Revenue less Expenses) $'000 1,866 -625 238 403 81 -1,133 -69 -901 -581 -596 -164 -1,481
Total Assets $'000 22,722 22,728 29,420 41,038 56,845 35,358 12,446 14,573 90,511 17,102 61,414 404,157
Total Liabilities $'000 612 2,194 2,458 2,385 1,792 1,497 439 287 3,511 888 2,102 18,165
GFS Net Worth (Assets less Liabilities) $'000 22,110 20,651 28,252 38,695 55,120 33,926 12,007 14,296 87,107 16,274 65,088 393,526
Net Debt (Financial Liabilities less Financial Assets) $'000 -5,154 -730 -926 957 -3,516 -4,555 -484 -3,167 -2,137 -1,250 -316 -21,278
SELECTED INCOME SUPPORT CUSTOMERS - at June 2003
Age pension no. 67 148 25 188 22 - n.a. n.a. 301 39 105 895
Disability support pension no. n.a. 26 n.a. 51 n.a. n.a. n.a. n.a. 70 23 42 212
Newstart allowance no. n.a. n.a. n.a. 21 31 n.a. n.a. n.a. 71 n.a. 60 183
Parenting payment - single no. n.a. 43 n.a. 28 n.a. n.a. n.a. n.a. 68 n.a. 28 167
Youth allowance no. n.a. n.a. n.a. 21 n.a. n.a. n.a. n.a. 57 n.a. n.a. 78
Other pensions and allowances no. n.a. 29 n.a. 59 n.a. n.a. n.a. n.a. 73 n.a. n.a. 161
Total selected income support customers no. 121 288 62 368 104 46 35 30 641 97 273 2,065 Percentage of long-term Newstart allowance customers % n.a. n.a. n.a. n.a. n.a. n.a. n.a. n.a. 58.1 n.a. n.a. 58
AVERAGE INDIVIDUAL ANNUAL TAXABLE INCOME - year ended 30 June 2003 $ 27,730 34,354 33,230 33,217 40,449 40,899 29,170 29,785 34,435 32,411 33,842
WAGE AND SALARY EARNERS - year ended 30 June 2003
Wage and salary earners no. 217 668 169 568 255 127 125 84 1,515 206 472 4,406
Wage and salary income $m 5.6 21.5 5.0 16.2 8.5 4.4 3.4 2.3 47.9 6.1 14.0 135 Total income $m 5.5 22.4 5.1 17.0 8.9 4.5 3.5 2.4 49.6 6.3 14.5 140 Average wage and salary income $ 25,906 32,131 29,519 28,605 33,444 34,817 27,443 27,446 31,635 29,692 29,764
Average total income $ 25,489 33,493 30,031 29,885 35,067 35,532 27,818 27,992 32,718 30,445 30,711

RAPAD Report
Page 134
Aramac (S)
Barcaldine (S)
Barcoo (S)
Blackall (S)
Boulia (S)
Diamantina (S)
Ilfracombe (S)
Isisford (S)
Longreach (S)
Tambo (S)
Winton (S) Total
SOURCE OF PERSONAL INCOME - year ended 30 June 2001
Wage and salary % 44.8 65.6 60.9 50.1 66.2 56.6 59.3 55.9 64.2 43.9 44.3
Own unincorporated business % 40.2 20.9 28.4 34.6 22.2 34.2 28.4 32.0 22.4 43.7 41.1
Investment % 5.1 3.9 3.2 4.3 2.2 2.5 6.9 4.4 4.9 6.1 5.8
Superannuation and annuity % 0.3 0.5 0.0 0.6 0.0 0.0 0.0 0.0 0.3 0.0 0.6
Government cash benefit % 9.4 8.8 7.1 10.3 9.3 6.5 4.9 7.4 7.8 6.1 7.8
Other income % 0.4 0.3 0.4 0.1 0.1 0.2 0.5 0.3 0.3 0.2 0.4
Total income from all sources $m 16.0 31.0 8.0 35.0 12.0 6.0 5.0 4.0 78.0 13.0 33.0 241
LAND AREA km2 23,360.8 8,443.4 61,974.2 16,384.3 61,092.8 94,832.3 6,575.7 10,501.4 23,561.2 14,105.2 53,934.7 374,766
BUILDING APPROVALS - year ended 3 0June 2004
Private sector houses no. 0 3 0 0 0 0 0 0 3 0 2 8
Total dwelling units no. 0 3 0 0 0 0 0 0 5 0 2 10
Value of total residential building $m 0.0 0.5 0.0 0.0 0.0 0.0 0.0 0.0 1.4 0.1 0.3 2
Value of total non-residential building $m 0.0 0.5 0.0 0.5 1.9 0.0 0.0 0.0 1.1 0.0 0.1 4
Value of total building $m 0.0 1.0 0.0 0.5 1.9 0.0 0.0 0.0 2.5 0.1 0.4 6
NEW MOTOR VEHICLE SALES - year ended 30 June 2004
Passenger vehicles no. 1 22 2 8 6 2 3 1 72 3 9 129
Other vehicles no. 27 60 13 51 46 13 15 10 142 36 54 467
Total vehicles no. 28 82 15 59 52 15 18 11 214 39 63 596
VALUE OF AGRICULTURAL PRODUCTION - year ended 30 June 2004
Value of crops $m * * 0.0 0.2 1.1 0.0 * 0.1 0.2 * 0.1 2
Value of livestock slaughterings and other disposals $m 16.4 15.5 44.9 30.8 40.4 25.7 5.5 9.3 26.0 25.1 39.1 279
Value of livestock products $m 10.3 7.9 4.2 9.7 1.3 0.0 7.7 7.0 18.2 3.4 14.3 84
Total value of agricultural production $m 26.8 24.4 49.2 40.7 42.8 25.7 13.2 16.3 44.4 28.6 53.6 366
POPULATION BY AGE AND SEX- at 30 June 2004 Males - 0 to 4 years no. 24 63 17 54 22 12 15 8 165 16 78 474
Males - 5 years to 9 years no. 33 63 12 55 17 20 16 9 191 19 68 503
Males - 10 years to 14 years no. 25 76 5 60 32 8 8 12 156 19 61 462
Males - 15 years to 19 years no. 12 48 16 56 35 8 13 5 185 12 28 418
Males - 20 years to 24 years no. 20 42 35 37 32 10 23 9 172 21 52 453
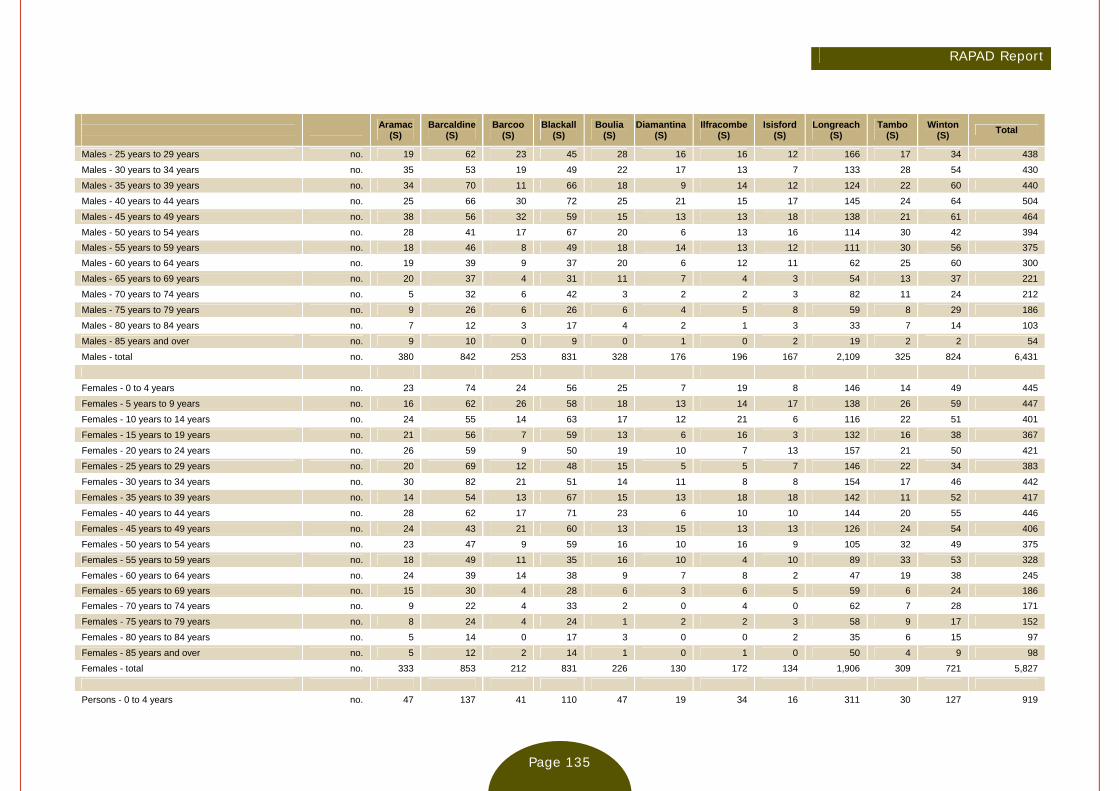
RAPAD Report
Page 135
Aramac (S)
Barcaldine (S)
Barcoo (S)
Blackall (S)
Boulia (S)
Diamantina (S)
Ilfracombe (S)
Isisford (S)
Longreach (S)
Tambo (S)
Winton (S) Total
Males - 25 years to 29 years no. 19 62 23 45 28 16 16 12 166 17 34 438
Males - 30 years to 34 years no. 35 53 19 49 22 17 13 7 133 28 54 430
Males - 35 years to 39 years no. 34 70 11 66 18 9 14 12 124 22 60 440
Males - 40 years to 44 years no. 25 66 30 72 25 21 15 17 145 24 64 504
Males - 45 years to 49 years no. 38 56 32 59 15 13 13 18 138 21 61 464
Males - 50 years to 54 years no. 28 41 17 67 20 6 13 16 114 30 42 394 Males - 55 years to 59 years no. 18 46 8 49 18 14 13 12 111 30 56 375 Males - 60 years to 64 years no. 19 39 9 37 20 6 12 11 62 25 60 300
Males - 65 years to 69 years no. 20 37 4 31 11 7 4 3 54 13 37 221
Males - 70 years to 74 years no. 5 32 6 42 3 2 2 3 82 11 24 212
Males - 75 years to 79 years no. 9 26 6 26 6 4 5 8 59 8 29 186
Males - 80 years to 84 years no. 7 12 3 17 4 2 1 3 33 7 14 103
Males - 85 years and over no. 9 10 0 9 0 1 0 2 19 2 2 54
Males - total no. 380 842 253 831 328 176 196 167 2,109 325 824 6,431
Females - 0 to 4 years no. 23 74 24 56 25 7 19 8 146 14 49 445
Females - 5 years to 9 years no. 16 62 26 58 18 13 14 17 138 26 59 447
Females - 10 years to 14 years no. 24 55 14 63 17 12 21 6 116 22 51 401
Females - 15 years to 19 years no. 21 56 7 59 13 6 16 3 132 16 38 367
Females - 20 years to 24 years no. 26 59 9 50 19 10 7 13 157 21 50 421
Females - 25 years to 29 years no. 20 69 12 48 15 5 5 7 146 22 34 383
Females - 30 years to 34 years no. 30 82 21 51 14 11 8 8 154 17 46 442
Females - 35 years to 39 years no. 14 54 13 67 15 13 18 18 142 11 52 417
Females - 40 years to 44 years no. 28 62 17 71 23 6 10 10 144 20 55 446
Females - 45 years to 49 years no. 24 43 21 60 13 15 13 13 126 24 54 406
Females - 50 years to 54 years no. 23 47 9 59 16 10 16 9 105 32 49 375
Females - 55 years to 59 years no. 18 49 11 35 16 10 4 10 89 33 53 328
Females - 60 years to 64 years no. 24 39 14 38 9 7 8 2 47 19 38 245 Females - 65 years to 69 years no. 15 30 4 28 6 3 6 5 59 6 24 186 Females - 70 years to 74 years no. 9 22 4 33 2 0 4 0 62 7 28 171
Females - 75 years to 79 years no. 8 24 4 24 1 2 2 3 58 9 17 152
Females - 80 years to 84 years no. 5 14 0 17 3 0 0 2 35 6 15 97
Females - 85 years and over no. 5 12 2 14 1 0 1 0 50 4 9 98
Females - total no. 333 853 212 831 226 130 172 134 1,906 309 721 5,827
Persons - 0 to 4 years no. 47 137 41 110 47 19 34 16 311 30 127 919
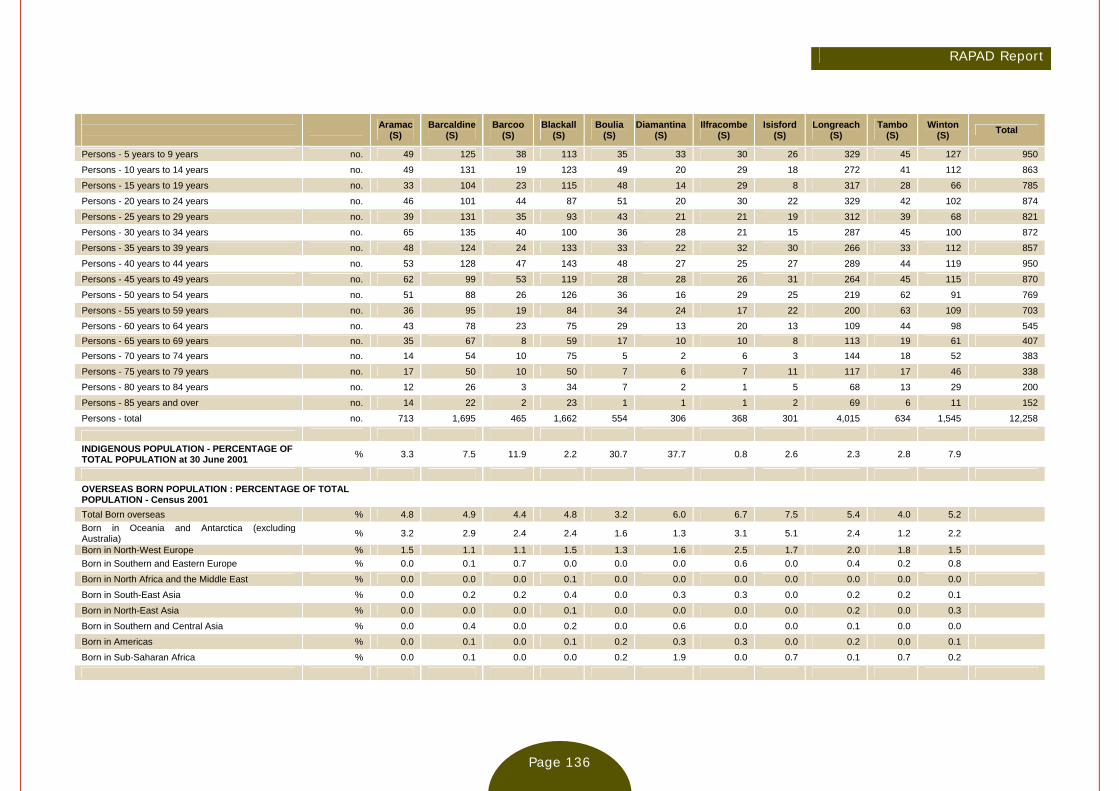
RAPAD Report
Page 136
Aramac (S)
Barcaldine (S)
Barcoo (S)
Blackall (S)
Boulia (S)
Diamantina (S)
Ilfracombe (S)
Isisford (S)
Longreach (S)
Tambo (S)
Winton (S) Total
Persons - 5 years to 9 years no. 49 125 38 113 35 33 30 26 329 45 127 950
Persons - 10 years to 14 years no. 49 131 19 123 49 20 29 18 272 41 112 863
Persons - 15 years to 19 years no. 33 104 23 115 48 14 29 8 317 28 66 785
Persons - 20 years to 24 years no. 46 101 44 87 51 20 30 22 329 42 102 874
Persons - 25 years to 29 years no. 39 131 35 93 43 21 21 19 312 39 68 821
Persons - 30 years to 34 years no. 65 135 40 100 36 28 21 15 287 45 100 872
Persons - 35 years to 39 years no. 48 124 24 133 33 22 32 30 266 33 112 857
Persons - 40 years to 44 years no. 53 128 47 143 48 27 25 27 289 44 119 950
Persons - 45 years to 49 years no. 62 99 53 119 28 28 26 31 264 45 115 870
Persons - 50 years to 54 years no. 51 88 26 126 36 16 29 25 219 62 91 769
Persons - 55 years to 59 years no. 36 95 19 84 34 24 17 22 200 63 109 703
Persons - 60 years to 64 years no. 43 78 23 75 29 13 20 13 109 44 98 545 Persons - 65 years to 69 years no. 35 67 8 59 17 10 10 8 113 19 61 407 Persons - 70 years to 74 years no. 14 54 10 75 5 2 6 3 144 18 52 383
Persons - 75 years to 79 years no. 17 50 10 50 7 6 7 11 117 17 46 338
Persons - 80 years to 84 years no. 12 26 3 34 7 2 1 5 68 13 29 200
Persons - 85 years and over no. 14 22 2 23 1 1 1 2 69 6 11 152
Persons - total no. 713 1,695 465 1,662 554 306 368 301 4,015 634 1,545 12,258
INDIGENOUS POPULATION - PERCENTAGE OF TOTAL POPULATION at 30 June 2001 % 3.3 7.5 11.9 2.2 30.7 37.7 0.8 2.6 2.3 2.8 7.9
OVERSEAS BORN POPULATION : PERCENTAGE OF TOTAL POPULATION - Census 2001
Total Born overseas % 4.8 4.9 4.4 4.8 3.2 6.0 6.7 7.5 5.4 4.0 5.2 Born in Oceania and Antarctica (excluding Australia) % 3.2 2.9 2.4 2.4 1.6 1.3 3.1 5.1 2.4 1.2 2.2
Born in North-West Europe % 1.5 1.1 1.1 1.5 1.3 1.6 2.5 1.7 2.0 1.8 1.5 Born in Southern and Eastern Europe % 0.0 0.1 0.7 0.0 0.0 0.0 0.6 0.0 0.4 0.2 0.8
Born in North Africa and the Middle East % 0.0 0.0 0.0 0.1 0.0 0.0 0.0 0.0 0.0 0.0 0.0
Born in South-East Asia % 0.0 0.2 0.2 0.4 0.0 0.3 0.3 0.0 0.2 0.2 0.1
Born in North-East Asia % 0.0 0.0 0.0 0.1 0.0 0.0 0.0 0.0 0.2 0.0 0.3
Born in Southern and Central Asia % 0.0 0.4 0.0 0.2 0.0 0.6 0.0 0.0 0.1 0.0 0.0
Born in Americas % 0.0 0.1 0.0 0.1 0.2 0.3 0.3 0.0 0.2 0.0 0.1
Born in Sub-Saharan Africa % 0.0 0.1 0.0 0.0 0.2 1.9 0.0 0.7 0.1 0.7 0.2
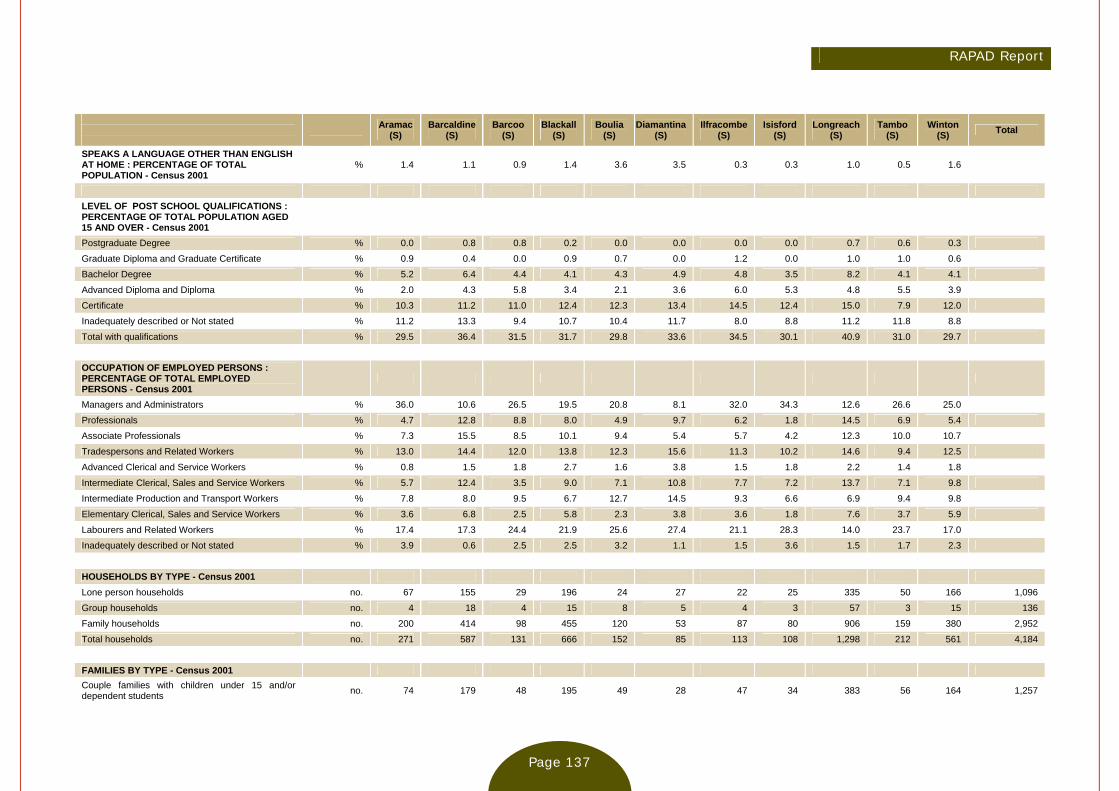
RAPAD Report
Page 137
Aramac (S)
Barcaldine (S)
Barcoo (S)
Blackall (S)
Boulia (S)
Diamantina (S)
Ilfracombe (S)
Isisford (S)
Longreach (S)
Tambo (S)
Winton (S) Total
SPEAKS A LANGUAGE OTHER THAN ENGLISH AT HOME : PERCENTAGE OF TOTAL POPULATION - Census 2001
% 1.4 1.1 0.9 1.4 3.6 3.5 0.3 0.3 1.0 0.5 1.6
LEVEL OF POST SCHOOL QUALIFICATIONS : PERCENTAGE OF TOTAL POPULATION AGED 15 AND OVER - Census 2001
Postgraduate Degree % 0.0 0.8 0.8 0.2 0.0 0.0 0.0 0.0 0.7 0.6 0.3
Graduate Diploma and Graduate Certificate % 0.9 0.4 0.0 0.9 0.7 0.0 1.2 0.0 1.0 1.0 0.6
Bachelor Degree % 5.2 6.4 4.4 4.1 4.3 4.9 4.8 3.5 8.2 4.1 4.1
Advanced Diploma and Diploma % 2.0 4.3 5.8 3.4 2.1 3.6 6.0 5.3 4.8 5.5 3.9
Certificate % 10.3 11.2 11.0 12.4 12.3 13.4 14.5 12.4 15.0 7.9 12.0
Inadequately described or Not stated % 11.2 13.3 9.4 10.7 10.4 11.7 8.0 8.8 11.2 11.8 8.8
Total with qualifications % 29.5 36.4 31.5 31.7 29.8 33.6 34.5 30.1 40.9 31.0 29.7
OCCUPATION OF EMPLOYED PERSONS : PERCENTAGE OF TOTAL EMPLOYED PERSONS - Census 2001
Managers and Administrators % 36.0 10.6 26.5 19.5 20.8 8.1 32.0 34.3 12.6 26.6 25.0
Professionals % 4.7 12.8 8.8 8.0 4.9 9.7 6.2 1.8 14.5 6.9 5.4
Associate Professionals % 7.3 15.5 8.5 10.1 9.4 5.4 5.7 4.2 12.3 10.0 10.7
Tradespersons and Related Workers % 13.0 14.4 12.0 13.8 12.3 15.6 11.3 10.2 14.6 9.4 12.5
Advanced Clerical and Service Workers % 0.8 1.5 1.8 2.7 1.6 3.8 1.5 1.8 2.2 1.4 1.8
Intermediate Clerical, Sales and Service Workers % 5.7 12.4 3.5 9.0 7.1 10.8 7.7 7.2 13.7 7.1 9.8
Intermediate Production and Transport Workers % 7.8 8.0 9.5 6.7 12.7 14.5 9.3 6.6 6.9 9.4 9.8
Elementary Clerical, Sales and Service Workers % 3.6 6.8 2.5 5.8 2.3 3.8 3.6 1.8 7.6 3.7 5.9
Labourers and Related Workers % 17.4 17.3 24.4 21.9 25.6 27.4 21.1 28.3 14.0 23.7 17.0
Inadequately described or Not stated % 3.9 0.6 2.5 2.5 3.2 1.1 1.5 3.6 1.5 1.7 2.3
HOUSEHOLDS BY TYPE - Census 2001
Lone person households no. 67 155 29 196 24 27 22 25 335 50 166 1,096
Group households no. 4 18 4 15 8 5 4 3 57 3 15 136
Family households no. 200 414 98 455 120 53 87 80 906 159 380 2,952
Total households no. 271 587 131 666 152 85 113 108 1,298 212 561 4,184
FAMILIES BY TYPE - Census 2001 Couple families with children under 15 and/or dependent students no. 74 179 48 195 49 28 47 34 383 56 164 1,257

RAPAD Report
Page 138
Aramac (S)
Barcaldine (S)
Barcoo (S)
Blackall (S)
Boulia (S)
Diamantina (S)
Ilfracombe (S)
Isisford (S)
Longreach (S)
Tambo (S)
Winton (S) Total
Couple families with non-dependent children only no. 21 29 10 36 8 3 4 5 50 17 33 216
Couple families without children no. 86 155 35 177 43 19 28 36 346 71 146 1,142 One parent families with children under 15 and/or dependent students no. 7 31 5 35 13 5 6 3 90 8 24 227
One parent families with non-dependent children only no. 9 16 0 10 7 3 3 3 35 5 10 101
Other families no. 5 5 0 3 0 0 0 3 14 0 6 36
Total families no. 202 415 98 456 120 58 88 84 918 157 383 2,979
PROPORTION OF POPULATION IN REMOTENESS AREA - Census 2001
Major cities % 0.0 0.0 0.0 0.0 0.0 0.0 0.0 0.0 0.0 0.0 0.0
Inner regional % 0.0 0.0 0.0 0.0 0.0 0.0 0.0 0.0 0.0 0.0 0.0
Outer regional % 0.0 0.0 0.0 0.0 0.0 0.0 0.0 0.0 0.0 0.0 0.0
Remote % 0.0 0.0 0.0 0.0 0.0 0.0 0.0 0.0 0.0 0.0 0.0
Very remote % 100.0 100.0 100.0 100.0 100.0 100.0 100.0 100.0 100.0 100.0 100.0 100
POPULATION DENSITY - at 30 June 2004 persons/km2 0.0 0.2 0.0 0.1 0.0 0.0 0.1 0.0 0.2 0.0 0.0
BIRTHS AND DEATHS
Births - year ended 31 December 2004 no. 7 23 4 20 7 7 n.p. n.p. 51 12 19 150
Crude birth rate rate 9.8 13.5 8.6 12.0 12.6 22.8 n.p. n.p. 12.7 18.9 12.2
Deaths - year ended 31 December 2004 no. 6 15 n.p. 10 3 3 n.p. n.p. 37 3 10 87
Crude death rate rate 8.4 8.8 n.p. 6.0 5.4 9.8 n.p. n.p. 9.2 4.7 6.4 GOVERNMENT SCHOOLS - at August 2004 Schools no. 2 1 3 1 2 2 1 2 4 1 1 20
Students no. 70 282 33 153 71 21 34 22 662 82 106 1,536
NON-GOVERNMENT SCHOOLS - at August 2004
Schools no. 0 1 0 1 0 0 0 0 1 0 1 4
Students no. 0 39 0 58 0 0 0 0 136 0 30 263
HOUSING SALES - Calendar year 2004
Number of sales no. 5 35 n.p. 39 n.p. n.p. 7 n.p. 52 n.p. 26 164
Prices - median value $ 16,100 63,793 n.p. 54,554 n.p. n.p. 79,170 n.p. 106,438 n.p. 60,921
Prices - average value $ 14,000 60,000 n.p. 50,000 n.p. n.p. 73,650 n.p. 103,500 n.p. 60,000
Source: Australian Bureau of Statistics (2006a-k).
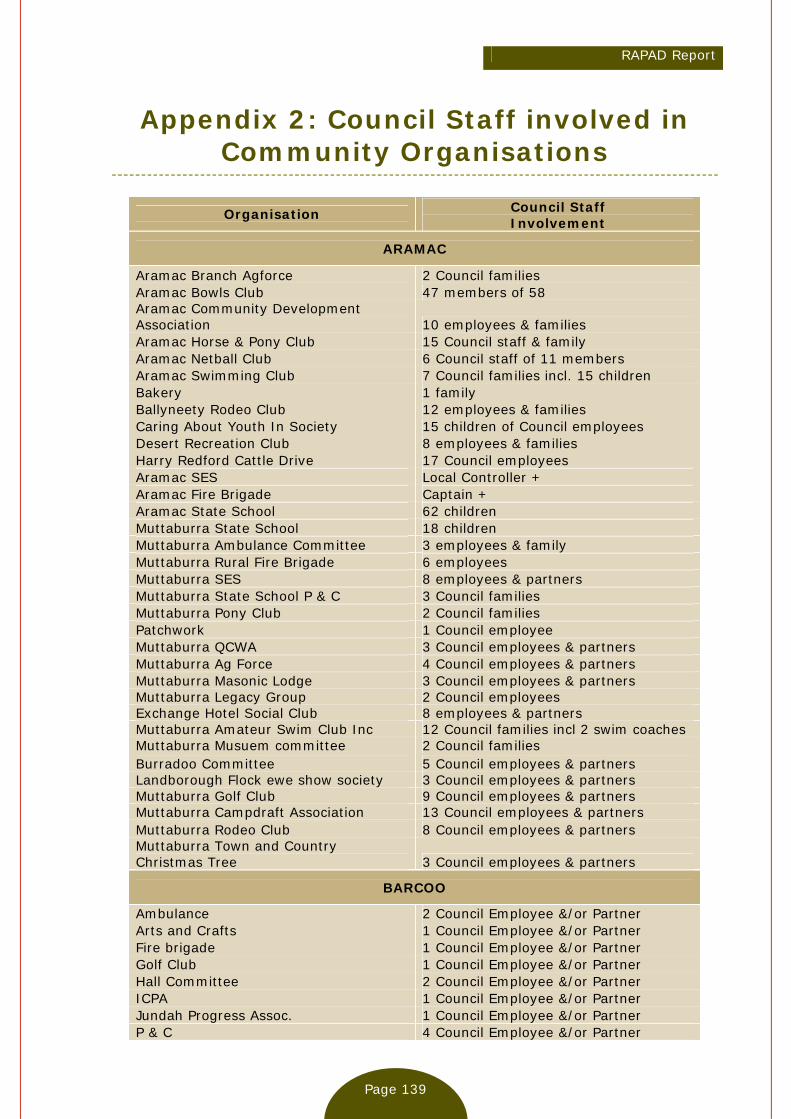
RAPAD Report
Page 139
Appendix 2: Council Staff involved in Community Organisations
Organisation Council Staff Involvement
ARAMAC
Aramac Branch Agforce 2 Council families Aramac Bowls Club 47 members of 58 Aramac Community Development Association 10 employees & families Aramac Horse & Pony Club 15 Council staff & family Aramac Netball Club 6 Council staff of 11 members Aramac Swimming Club 7 Council families incl. 15 children Bakery 1 family Ballyneety Rodeo Club 12 employees & families Caring About Youth In Society 15 children of Council employees Desert Recreation Club 8 employees & families Harry Redford Cattle Drive 17 Council employees Aramac SES Local Controller + Aramac Fire Brigade Captain + Aramac State School 62 children Muttaburra State School 18 children Muttaburra Ambulance Committee 3 employees & family Muttaburra Rural Fire Brigade 6 employees Muttaburra SES 8 employees & partners Muttaburra State School P & C 3 Council families Muttaburra Pony Club 2 Council families Patchwork 1 Council employee Muttaburra QCWA 3 Council employees & partners Muttaburra Ag Force 4 Council employees & partners Muttaburra Masonic Lodge 3 Council employees & partners Muttaburra Legacy Group 2 Council employees Exchange Hotel Social Club 8 employees & partners Muttaburra Amateur Swim Club Inc 12 Council families incl 2 swim coaches Muttaburra Musuem committee 2 Council families Burradoo Committee 5 Council employees & partners Landborough Flock ewe show society 3 Council employees & partners Muttaburra Golf Club 9 Council employees & partners Muttaburra Campdraft Association 13 Council employees & partners Muttaburra Rodeo Club 8 Council employees & partners Muttaburra Town and Country Christmas Tree 3 Council employees & partners
BARCOO
Ambulance 2 Council Employee &/or Partner Arts and Crafts 1 Council Employee &/or Partner Fire brigade 1 Council Employee &/or Partner Golf Club 1 Council Employee &/or Partner Hall Committee 2 Council Employee &/or Partner ICPA 1 Council Employee &/or Partner Jundah Progress Assoc. 1 Council Employee &/or Partner P & C 4 Council Employee &/or Partner

RAPAD Report
Page 140
Race Club 7 Council Employee &/or Partner RADF 4 Council Employee &/or Partner Rodeo Club 6 Council Employee &/or Partner SES 4 Council Employee &/or Partner Sports Club 7 Council Employee &/or Partner STAG 1 Council Employee &/or Partner WDB 1 Council Employee &/or Partner Windorah Development Board Rodeo 1 Council Employee &/or Partner
BLACKALL
Blackall Bowls Club 9 Council Employees and/or Partners Blackall Campdraft 6 Council Employees and/or Partners Blackall Darts 2 Council Employees and/or Partners Blackall Golf 10 Council Employees and/or Partners Blackall Gun Club 3 Council Employees and/or Partners Blackall Netball 6 Council Employees and/or Partners Blackall Pistol Club 4 Council Employees and/or Partners Blackall Polocrosse 1 Council Employees and/or Partners Blackall Pony Club 4 Council Employees and/or Partners Blackall Race Club 4 Council Employees and/or Partners Blackall Rodeo 3 Council Employees and/or Partners Blackall Swimming 10 Council Employees and/or Partners Blackall Tennis Club 10 Council Employees and/or Partners Blackall Volleyball 1 Council Employees and/or Partners Conebreak Pony Club 1 Council Employees and/or Partners Cricket - country 1 Council Employees and/or Partners Cricket - junior 2 Council Employees and/or Partners Football - Junior Rugby League 9 Council Employees and/or Partners Football - Senior Rugby League 16 Council Employees and/or Partners Football - Touch 1 Council Employees and/or Partners Multi-Purpose Sport & Rec 6 Council Employees and/or Partners Netball - Junior 4 Council Employees and/or Partners Soccer - Junior 2 Council Employees and/or Partners Anzac Day 15 Council Employees and/or Partners Arts West Committee 2 Council Employees and/or Partners Australia Day 12 Council Employees and/or Partners B & S Committee 1 Council Employees and/or Partners Blackall 60 & Better Seniors 1 Council Employees and/or Partners Blackall Ambulance Voluntary 3 Council Employees and/or Partners Blackall Club 9 Council Employees and/or Partners Blackall Cultural & Arts Assoc 5 Council Employees and/or Partners Blackall Dance Group 4 Council Employees and/or Partners Blackall Fire Brigade 11 Council Employees and/or Partners Blackall Heartland Festival 5 Council Employees and/or Partners Blackall Hospital Auxiliary 8 Council Employees and/or Partners Blackall Kindergarten 2 Council Employees and/or Partners Blackall Local Arts Council 2 Council Employees and/or Partners Blackall Meals on Wheels 3 Council Employees and/or Partners Blackall Newspaper Group 1 Council Employees and/or Partners Blackall RSL 2 Council Employees and/or Partners Blackall Show 8 Council Employees and/or Partners Blackall State School P & C 8 Council Employees and/or Partners Blackall Woolscour 2 Council Employees and/or Partners Bluelight Disco 3 Council Employees and/or Partners Churches 7 Council Employees and/or Partners Clean up Australia Day 2 Council Employees and/or Partners
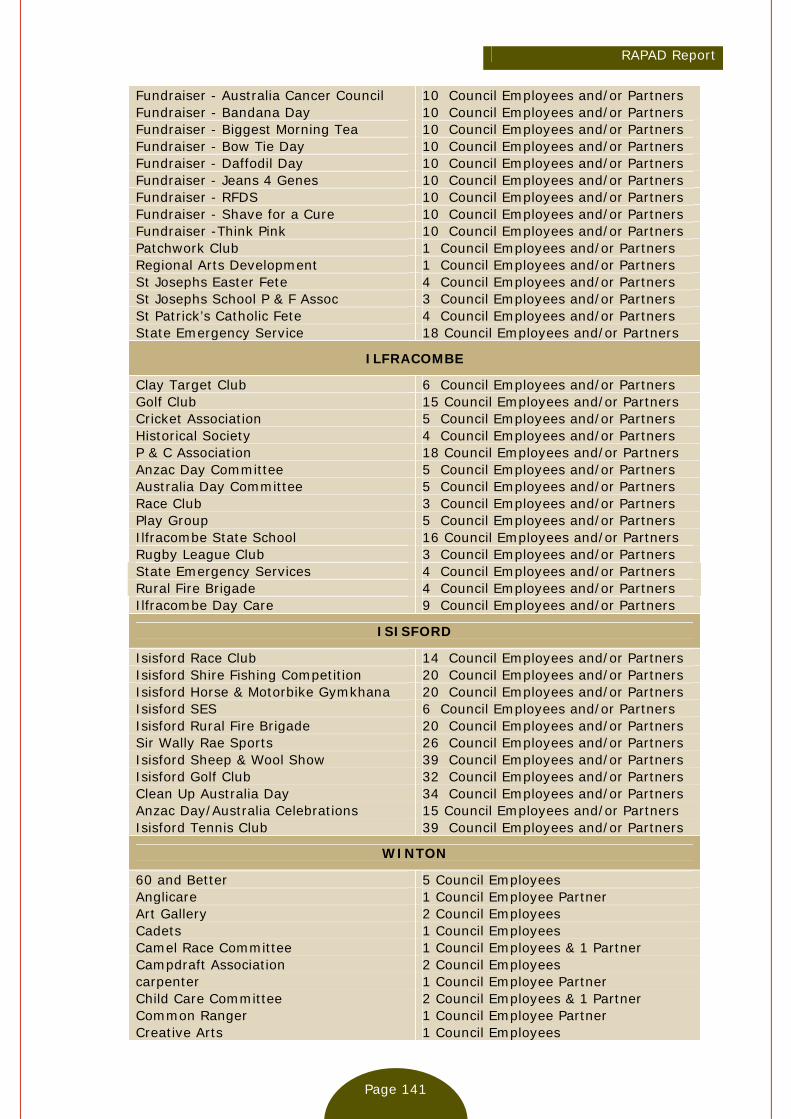
RAPAD Report
Page 141
Fundraiser - Australia Cancer Council 10 Council Employees and/or Partners Fundraiser - Bandana Day 10 Council Employees and/or Partners Fundraiser - Biggest Morning Tea 10 Council Employees and/or Partners Fundraiser - Bow Tie Day 10 Council Employees and/or Partners Fundraiser - Daffodil Day 10 Council Employees and/or Partners Fundraiser - Jeans 4 Genes 10 Council Employees and/or Partners Fundraiser - RFDS 10 Council Employees and/or Partners Fundraiser - Shave for a Cure 10 Council Employees and/or Partners Fundraiser -Think Pink 10 Council Employees and/or Partners Patchwork Club 1 Council Employees and/or Partners Regional Arts Development 1 Council Employees and/or Partners St Josephs Easter Fete 4 Council Employees and/or Partners St Josephs School P & F Assoc 3 Council Employees and/or Partners St Patrick’s Catholic Fete 4 Council Employees and/or Partners State Emergency Service 18 Council Employees and/or Partners
ILFRACOMBE
Clay Target Club 6 Council Employees and/or Partners Golf Club 15 Council Employees and/or Partners Cricket Association 5 Council Employees and/or Partners Historical Society 4 Council Employees and/or Partners P & C Association 18 Council Employees and/or Partners Anzac Day Committee 5 Council Employees and/or Partners Australia Day Committee 5 Council Employees and/or Partners Race Club 3 Council Employees and/or Partners Play Group 5 Council Employees and/or Partners Ilfracombe State School 16 Council Employees and/or Partners Rugby League Club 3 Council Employees and/or Partners State Emergency Services 4 Council Employees and/or Partners Rural Fire Brigade 4 Council Employees and/or Partners Ilfracombe Day Care 9 Council Employees and/or Partners
ISISFORD
Isisford Race Club 14 Council Employees and/or Partners Isisford Shire Fishing Competition 20 Council Employees and/or Partners Isisford Horse & Motorbike Gymkhana 20 Council Employees and/or Partners Isisford SES 6 Council Employees and/or Partners Isisford Rural Fire Brigade 20 Council Employees and/or Partners Sir Wally Rae Sports 26 Council Employees and/or Partners Isisford Sheep & Wool Show 39 Council Employees and/or Partners Isisford Golf Club 32 Council Employees and/or Partners Clean Up Australia Day 34 Council Employees and/or Partners Anzac Day/Australia Celebrations 15 Council Employees and/or Partners Isisford Tennis Club 39 Council Employees and/or Partners
WINTON
60 and Better 5 Council Employees Anglicare 1 Council Employee Partner Art Gallery 2 Council Employees Cadets 1 Council Employees Camel Race Committee 1 Council Employees & 1 Partner Campdraft Association 2 Council Employees carpenter 1 Council Employee Partner Child Care Committee 2 Council Employees & 1 Partner Common Ranger 1 Council Employee Partner Creative Arts 1 Council Employees

RAPAD Report
Page 142
Dept. Mines and Energy 1 Council Employee Partner Dress shop owner 1 Council Employee Partner Elders 1 Council Employee Partner Festival Committee 1 Council Employees & 1 Partner Fire Brigade 1 Council Employee Partner Golf Club Committee 2 Council Employees & 1 Partner Grader operator 1 Council Employee Partner Grey Nomads Committee 2 Council Employees Junior cricket 1 Council Employees Karate Club 1 Council Employees Lioness Club 1 Council Employees Lions Club 3 Council Employees & 1 Partner Main Roads 1 Council Employee Partner Meals on Wheels 2 Council Employees mechanic – own business 1 Council Employee Partner Netball 1 Council Employee Partner Nurse Aide 1 Council Employee Partner operator 1 Council Employee Partner Outback Festival Committee 1 Council Employees & 1 Partner Pistol Club 3 Council Employees & 1 Partner Pony Club 2 Council Employees & 1 Partner Post Office 1 Council Employee Partner Race Club 1 Council Employees Road Trains Australia co-ordinator 1 Council Employee Partner Rodeo Committee 2 Council Employees & 1 Partner RSL/Legacy 1 Council Employees & 1 Partner Saleyards Manager 1 Council Employee Partner Searles Store 1 Council Employee Partner SES 1 Council Employees & 1 Partner Shop owner 1 Council Employee Partner Show Committee 1 Council Employees Singing club 1 Council Employees Squash Club 2 Council Employees St Patrick’s School P & F 2 Council Employees & 3 Partner Swim Club Committee 2 Council Employees & 3 Partner Swimming Pool Lessee 1 Council Employee Partner Teacher Aide 1 Council Employee Partner Teacher Winton State School 2 Council Employee Partner Touch football 1 Council Employee Partner Truck Museum Committee 1 Council Employees & 1 Partner Volunteer Music to Hospital 1 Council Employees WHAT Committee 2 Council Employees & 1 Partner Winton Business and Tourism Association 2 Council Employees Winton District Historical Society 1 Council Employees Winton Hospital 4 Council Employee Partner Winton Junior Rugby League 5 Council Employees & 2 Partner Winton Junior Rugby League Coach 1 Council Employees Winton Senior Rugby League 3 Council Employees Winton Senior Rugby League Referee 1 Council Employees Winton State School P&C 2 Council Employee Partner WMC Board Director 1 Council Employee Partner