
Random projection for dimensionality reduction—Applied to time-of-flight secondary ion mass...
8
Analytica Chimica Acta 705 (2011) 48–55 Contents lists available at ScienceDirect Analytica Chimica Acta jo u rn al hom epa ge: www.elsevier.com/locate/aca Random projection for dimensionality reduction—Applied to time-of-flight secondary ion mass spectrometry data Kurt Varmuza a,∗ , Cécile Engrand b , Peter Filzmoser c , Martin Hilchenbach d , Jochen Kissel d , Harald Krüger d , Johan Silén e , Mario Trieloff f a Institute of Chemical Engineering, Vienna University of Technology, A-1060 Vienna, Austria b CSNSM, CNRS – Université Paris Sud, Bâtiment 104, F-91405 Orsay Campus, Paris, France c Institute of Statistics and Probability Theory, Vienna University of Technology, A-1040 Vienna, Austria d Max Planck Institute for Solar System Research, D-37191 Katlenburg-Lindau, Germany e Finnish Meteorological Institute, FIN-00560 Helsinki, Finland f Institut für Geowissenschaften, Universität Heidelberg, D-69120 Heidelberg, Germany a r t i c l e i n f o Article history: Received 28 December 2010 Accepted 16 March 2011 Available online 24 March 2011 Keywords: Chemometrics Time-of-flight secondary ion mass spectrometry Minerals Projection Simulation a b s t r a c t Random projection (RP) is a simple and fast linear method for dimensionality reduction of high- dimensional multivariate data, independent from the data. The method is briefly described and a new memory-saving algorithm is presented for the generation of random projection vectors. Application of RP to data from scanning experiments with a time-of-flight secondary ion mass spectrometer (TOF-SIMS) showed that data reduced by RP have a satisfying discriminant property for separating target material and minerals without using any knowledge about the composition of the sample. A selection method – based on low dimensional RP data – is described and successfully tested for automatic recognition of characteristic, diverse locations of a sample surface. RP is demonstrated as an unbiased, powerful method, especially for large data sets, severe hardware restrictions (such as in space experiments) or the need for fast data evaluation of hyperspectral data. © 2011 Elsevier B.V. All rights reserved. 1. Introduction Random projection (RP) is a linear method for a projection from a high-dimensional space into a low-dimensional space, using projection vectors (loading vectors) with random numbers as vector components [1]. RP is based on the fact that pairs of high-dimensional vectors with randomly chosen vector compo- nents have a high probability being “almost orthogonal” [2,3]. Some RP methods apply orthogonalization of the projection vectors. RP makes a statistical unbiased sampling of the high dimensional space into a tractable low dimensional one where properties like dis- tances between points and certain other features are conserved as defined by the Johnson–Lindenstrauss lemma [4]. RP projection uses loading vectors which are independent of the data to be projected. RP is very simple and fast in computation, and is especially useful for large data sets and/or in situations with severe hardware restrictions. Successful applications have been reported for clustering and classification of textual documents and image data [5,6]; recently, RP was introduced into chemoinformat- ∗ Corresponding author. Tel.: +43 1 58801 16060; fax: +43 1 58801 15999. E-mail address: [email protected] (K. Varmuza). ics and chemometrics [7]. The present study was partly motivated by planned investigations of dust particles near a comet by a time- of-flight secondary ion mass spectrometer (TOF-SIMS) on board of the European Space Agency mission Rosetta [8]. We report on appli- cations of RP to data obtained by a laboratory twin instrument. We discuss some methodical aspects of RP and focus on a strategy for an automatic selection of relevant spectra in TOF-SIMS scanning experiments without the need for storing many full spectra. 2. Methods 2.1. Random projection The components of projection vectors in RP are random num- bers from a distribution with a mean of zero, e.g., normally distributed numbers from N(0, 1), uniformly distributed numbers from U[−1, +1] as used in this work, or fixed values randomly selected from e.g., {−1, 0, +1}. The projection vectors are normal- ized to unit lengths. For a reduction of an original dimensionality of m to a – typically much – lower dimensionality k a projection matrix B(m × k) is used containing k loading vectors, b, each with m components. Projection of a matrix X(n × m) containing n objects is performed by U = XB resulting in a projection score matrix U(n × k). 0003-2670/$ – see front matter © 2011 Elsevier B.V. All rights reserved. doi:10.1016/j.aca.2011.03.031
Transcript of Random projection for dimensionality reduction—Applied to time-of-flight secondary ion mass...
Rs
KHa
b
c
d
e
f
a
ARAA
KCTsMPS
1
fuahnRmitd
tasri
0d
Analytica Chimica Acta 705 (2011) 48– 55
Contents lists available at ScienceDirect
Analytica Chimica Acta
jo u rn al hom epa ge: www.elsev ier .com/ locate /aca
andom projection for dimensionality reduction—Applied to time-of-flightecondary ion mass spectrometry data
urt Varmuzaa,∗, Cécile Engrandb, Peter Filzmoserc, Martin Hilchenbachd, Jochen Kisseld,arald Krügerd, Johan Siléne, Mario Trieloff f
Institute of Chemical Engineering, Vienna University of Technology, A-1060 Vienna, AustriaCSNSM, CNRS – Université Paris Sud, Bâtiment 104, F-91405 Orsay Campus, Paris, FranceInstitute of Statistics and Probability Theory, Vienna University of Technology, A-1040 Vienna, AustriaMax Planck Institute for Solar System Research, D-37191 Katlenburg-Lindau, GermanyFinnish Meteorological Institute, FIN-00560 Helsinki, FinlandInstitut für Geowissenschaften, Universität Heidelberg, D-69120 Heidelberg, Germany
r t i c l e i n f o
rticle history:eceived 28 December 2010ccepted 16 March 2011vailable online 24 March 2011
a b s t r a c t
Random projection (RP) is a simple and fast linear method for dimensionality reduction of high-dimensional multivariate data, independent from the data. The method is briefly described and a newmemory-saving algorithm is presented for the generation of random projection vectors. Application ofRP to data from scanning experiments with a time-of-flight secondary ion mass spectrometer (TOF-SIMS)
eywords:hemometricsime-of-flight secondary ion masspectrometryinerals
showed that data reduced by RP have a satisfying discriminant property for separating target materialand minerals without using any knowledge about the composition of the sample. A selection method– based on low dimensional RP data – is described and successfully tested for automatic recognition ofcharacteristic, diverse locations of a sample surface. RP is demonstrated as an unbiased, powerful method,especially for large data sets, severe hardware restrictions (such as in space experiments) or the need for
persp
rojectionimulationfast data evaluation of hy
. Introduction
Random projection (RP) is a linear method for a projectionrom a high-dimensional space into a low-dimensional space,sing projection vectors (loading vectors) with random numberss vector components [1]. RP is based on the fact that pairs ofigh-dimensional vectors with randomly chosen vector compo-ents have a high probability being “almost orthogonal” [2,3]. SomeP methods apply orthogonalization of the projection vectors. RPakes a statistical unbiased sampling of the high dimensional space
nto a tractable low dimensional one where properties like dis-ances between points and certain other features are conserved asefined by the Johnson–Lindenstrauss lemma [4].
RP projection uses loading vectors which are independent ofhe data to be projected. RP is very simple and fast in computation,
nd is especially useful for large data sets and/or in situations withevere hardware restrictions. Successful applications have beeneported for clustering and classification of textual documents andmage data [5,6]; recently, RP was introduced into chemoinformat-∗ Corresponding author. Tel.: +43 1 58801 16060; fax: +43 1 58801 15999.E-mail address: [email protected] (K. Varmuza).
003-2670/$ – see front matter © 2011 Elsevier B.V. All rights reserved.oi:10.1016/j.aca.2011.03.031
ectral data.© 2011 Elsevier B.V. All rights reserved.
ics and chemometrics [7]. The present study was partly motivatedby planned investigations of dust particles near a comet by a time-of-flight secondary ion mass spectrometer (TOF-SIMS) on board ofthe European Space Agency mission Rosetta [8]. We report on appli-cations of RP to data obtained by a laboratory twin instrument. Wediscuss some methodical aspects of RP and focus on a strategy foran automatic selection of relevant spectra in TOF-SIMS scanningexperiments without the need for storing many full spectra.
2. Methods
2.1. Random projection
The components of projection vectors in RP are random num-bers from a distribution with a mean of zero, e.g., normallydistributed numbers from N(0, 1), uniformly distributed numbersfrom U[−1, +1] as used in this work, or fixed values randomlyselected from e.g., {−1, 0, +1}. The projection vectors are normal-
ized to unit lengths. For a reduction of an original dimensionalityof m to a – typically much – lower dimensionality k a projectionmatrix B(m × k) is used containing k loading vectors, b, each with mcomponents. Projection of a matrix X(n × m) containing n objects isperformed by U = XB resulting in a projection score matrix U(n × k).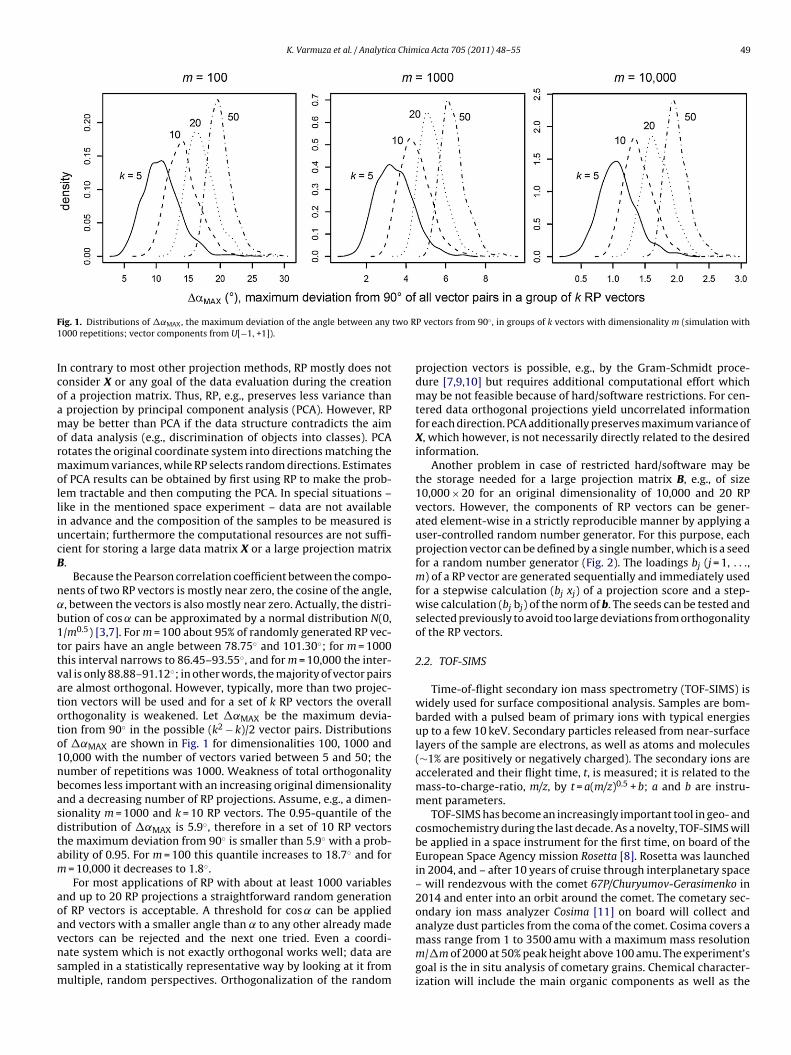
K. Varmuza et al. / Analytica Chimica Acta 705 (2011) 48– 55 49
F two R1
IcoamormolliucB
n˛b1ttvatoto1nbasdtam
aoavnsm
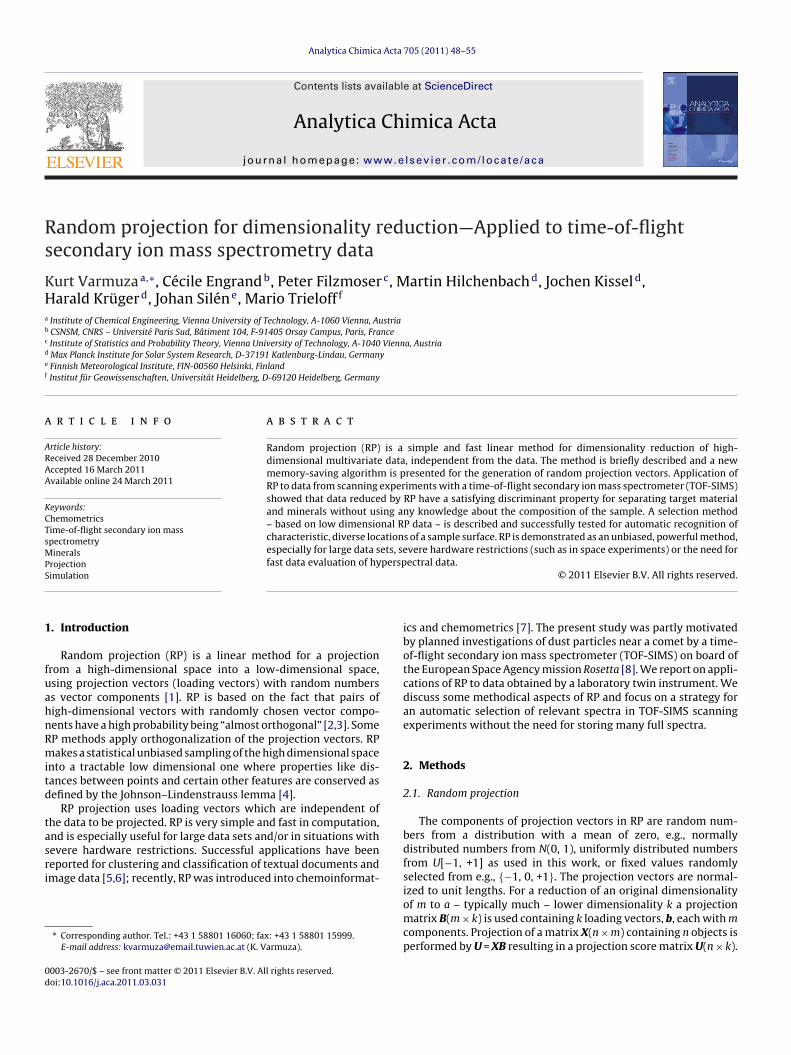
ig. 1. Distributions of �˛MAX, the maximum deviation of the angle between any
000 repetitions; vector components from U[−1, +1]).
n contrary to most other projection methods, RP mostly does notonsider X or any goal of the data evaluation during the creationf a projection matrix. Thus, RP, e.g., preserves less variance than
projection by principal component analysis (PCA). However, RPay be better than PCA if the data structure contradicts the aim
f data analysis (e.g., discrimination of objects into classes). PCAotates the original coordinate system into directions matching theaximum variances, while RP selects random directions. Estimates
f PCA results can be obtained by first using RP to make the prob-em tractable and then computing the PCA. In special situations –ike in the mentioned space experiment – data are not availablen advance and the composition of the samples to be measured isncertain; furthermore the computational resources are not suffi-ient for storing a large data matrix X or a large projection matrix.
Because the Pearson correlation coefficient between the compo-ents of two RP vectors is mostly near zero, the cosine of the angle,, between the vectors is also mostly near zero. Actually, the distri-ution of cos ̨ can be approximated by a normal distribution N(0,/m0.5) [3,7]. For m = 100 about 95% of randomly generated RP vec-or pairs have an angle between 78.75◦ and 101.30◦; for m = 1000his interval narrows to 86.45–93.55◦, and for m = 10,000 the inter-al is only 88.88–91.12◦; in other words, the majority of vector pairsre almost orthogonal. However, typically, more than two projec-ion vectors will be used and for a set of k RP vectors the overallrthogonality is weakened. Let �˛MAX be the maximum devia-ion from 90◦ in the possible (k2 − k)/2 vector pairs. Distributionsf �˛MAX are shown in Fig. 1 for dimensionalities 100, 1000 and0,000 with the number of vectors varied between 5 and 50; theumber of repetitions was 1000. Weakness of total orthogonalityecomes less important with an increasing original dimensionalitynd a decreasing number of RP projections. Assume, e.g., a dimen-ionality m = 1000 and k = 10 RP vectors. The 0.95-quantile of theistribution of �˛MAX is 5.9◦, therefore in a set of 10 RP vectorshe maximum deviation from 90◦ is smaller than 5.9◦ with a prob-bility of 0.95. For m = 100 this quantile increases to 18.7◦ and for
= 10,000 it decreases to 1.8◦.For most applications of RP with about at least 1000 variables
nd up to 20 RP projections a straightforward random generationf RP vectors is acceptable. A threshold for cos ̨ can be applied
nd vectors with a smaller angle than ̨ to any other already madeectors can be rejected and the next one tried. Even a coordi-ate system which is not exactly orthogonal works well; data areampled in a statistically representative way by looking at it fromultiple, random perspectives. Orthogonalization of the randomP vectors from 90◦ , in groups of k vectors with dimensionality m (simulation with
projection vectors is possible, e.g., by the Gram-Schmidt proce-dure [7,9,10] but requires additional computational effort whichmay be not feasible because of hard/software restrictions. For cen-tered data orthogonal projections yield uncorrelated informationfor each direction. PCA additionally preserves maximum variance ofX, which however, is not necessarily directly related to the desiredinformation.
Another problem in case of restricted hard/software may bethe storage needed for a large projection matrix B, e.g., of size10,000 × 20 for an original dimensionality of 10,000 and 20 RPvectors. However, the components of RP vectors can be gener-ated element-wise in a strictly reproducible manner by applying auser-controlled random number generator. For this purpose, eachprojection vector can be defined by a single number, which is a seedfor a random number generator (Fig. 2). The loadings bj (j = 1, . . .,m) of a RP vector are generated sequentially and immediately usedfor a stepwise calculation (bj xj) of a projection score and a step-wise calculation (bj bj) of the norm of b. The seeds can be tested andselected previously to avoid too large deviations from orthogonalityof the RP vectors.
2.2. TOF-SIMS
Time-of-flight secondary ion mass spectrometry (TOF-SIMS) iswidely used for surface compositional analysis. Samples are bom-barded with a pulsed beam of primary ions with typical energiesup to a few 10 keV. Secondary particles released from near-surfacelayers of the sample are electrons, as well as atoms and molecules(∼1% are positively or negatively charged). The secondary ions areaccelerated and their flight time, t, is measured; it is related to themass-to-charge-ratio, m/z, by t = a(m/z)0.5 + b; a and b are instru-ment parameters.
TOF-SIMS has become an increasingly important tool in geo- andcosmochemistry during the last decade. As a novelty, TOF-SIMS willbe applied in a space instrument for the first time, on board of theEuropean Space Agency mission Rosetta [8]. Rosetta was launchedin 2004, and – after 10 years of cruise through interplanetary space– will rendezvous with the comet 67P/Churyumov-Gerasimenko in2014 and enter into an orbit around the comet. The cometary sec-ondary ion mass analyzer Cosima [11] on board will collect and
analyze dust particles from the coma of the comet. Cosima covers amass range from 1 to 3500 amu with a maximum mass resolutionm/�m of 2000 at 50% peak height above 100 amu. The experiment’sgoal is the in situ analysis of cometary grains. Chemical character-ization will include the main organic components as well as the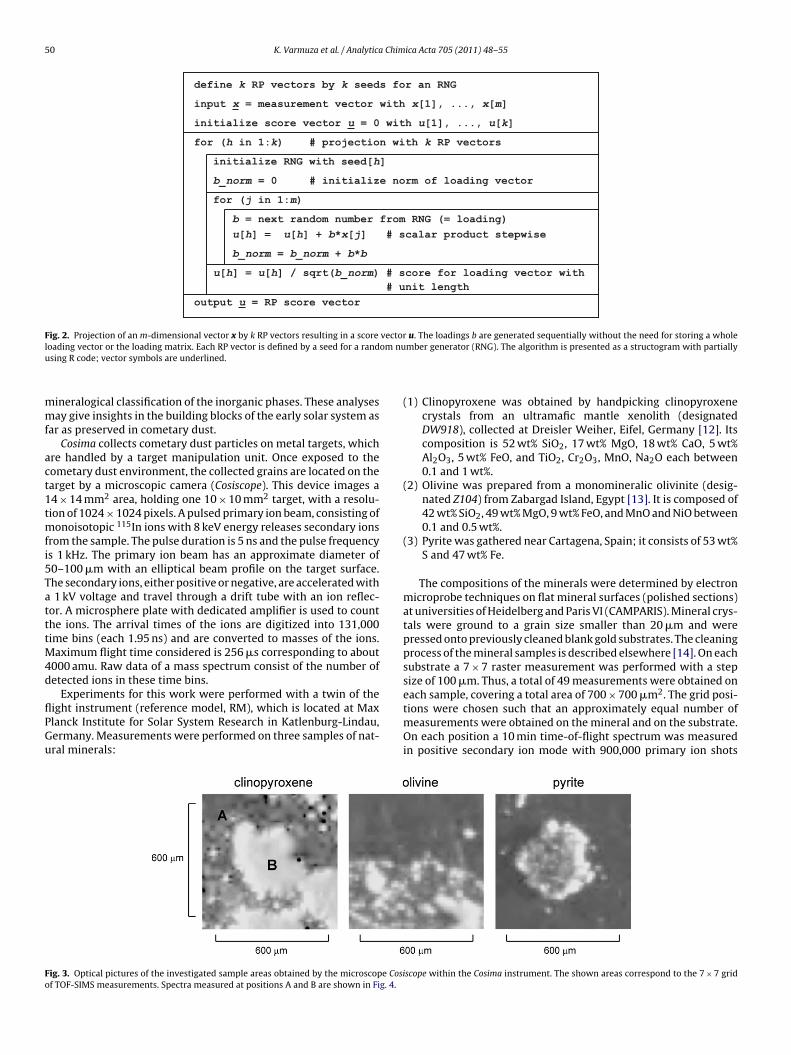
50 K. Varmuza et al. / Analytica Chimica Acta 705 (2011) 48– 55
define k RP vectors by k seeds for an RNG
input x = measurement vector with x[1], ... , x[m]
initialize sco re vector u = 0 with u[1], ..., u[k]
for (h in 1:k) # projection with k RP vector s
initialize RNG with see d[h]
b_norm = 0 # initialize norm of loading vector
for (j in 1:m)
b = next rando m number from RNG (= loadin g)u[h] = u[h] + b*x[j] # scalar product stepwis e
b_norm = b_norm + b*b
u[h] = u[h] / sqr t(b_nor m) # scor e for loading vecto r wit h# unit leng th
output u = RP score vector
F vectorl om nuu
mmf
act1tmfi5TatttM4d
flPGu
Fo
ig. 2. Projection of an m-dimensional vector x by k RP vectors resulting in a score
oading vector or the loading matrix. Each RP vector is defined by a seed for a randsing R code; vector symbols are underlined.
ineralogical classification of the inorganic phases. These analysesay give insights in the building blocks of the early solar system as
ar as preserved in cometary dust.Cosima collects cometary dust particles on metal targets, which
re handled by a target manipulation unit. Once exposed to theometary dust environment, the collected grains are located on thearget by a microscopic camera (Cosiscope). This device images a4 × 14 mm2 area, holding one 10 × 10 mm2 target, with a resolu-ion of 1024 × 1024 pixels. A pulsed primary ion beam, consisting of
onoisotopic 115In ions with 8 keV energy releases secondary ionsrom the sample. The pulse duration is 5 ns and the pulse frequencys 1 kHz. The primary ion beam has an approximate diameter of0–100 �m with an elliptical beam profile on the target surface.he secondary ions, either positive or negative, are accelerated with
1 kV voltage and travel through a drift tube with an ion reflec-or. A microsphere plate with dedicated amplifier is used to counthe ions. The arrival times of the ions are digitized into 131,000ime bins (each 1.95 ns) and are converted to masses of the ions.
aximum flight time considered is 256 �s corresponding to about000 amu. Raw data of a mass spectrum consist of the number ofetected ions in these time bins.
Experiments for this work were performed with a twin of theight instrument (reference model, RM), which is located at Maxlanck Institute for Solar System Research in Katlenburg-Lindau,ermany. Measurements were performed on three samples of nat-ral minerals:
ig. 3. Optical pictures of the investigated sample areas obtained by the microscope Cosif TOF-SIMS measurements. Spectra measured at positions A and B are shown in Fig. 4.
u. The loadings b are generated sequentially without the need for storing a wholember generator (RNG). The algorithm is presented as a structogram with partially
(1) Clinopyroxene was obtained by handpicking clinopyroxenecrystals from an ultramafic mantle xenolith (designatedDW918), collected at Dreisler Weiher, Eifel, Germany [12]. Itscomposition is 52 wt% SiO2, 17 wt% MgO, 18 wt% CaO, 5 wt%Al2O3, 5 wt% FeO, and TiO2, Cr2O3, MnO, Na2O each between0.1 and 1 wt%.
(2) Olivine was prepared from a monomineralic olivinite (desig-nated Z104) from Zabargad Island, Egypt [13]. It is composed of42 wt% SiO2, 49 wt% MgO, 9 wt% FeO, and MnO and NiO between0.1 and 0.5 wt%.
(3) Pyrite was gathered near Cartagena, Spain; it consists of 53 wt%S and 47 wt% Fe.
The compositions of the minerals were determined by electronmicroprobe techniques on flat mineral surfaces (polished sections)at universities of Heidelberg and Paris VI (CAMPARIS). Mineral crys-tals were ground to a grain size smaller than 20 �m and werepressed onto previously cleaned blank gold substrates. The cleaningprocess of the mineral samples is described elsewhere [14]. On eachsubstrate a 7 × 7 raster measurement was performed with a stepsize of 100 �m. Thus, a total of 49 measurements were obtained on
each sample, covering a total area of 700 × 700 �m2. The grid posi-tions were chosen such that an approximately equal number ofmeasurements were obtained on the mineral and on the substrate.On each position a 10 min time-of-flight spectrum was measuredin positive secondary ion mode with 900,000 primary ion shotsscope within the Cosima instrument. The shown areas correspond to the 7 × 7 grid
K. Varmuza et al. / Analytica Chimica Acta 705 (2011) 48– 55 51
F inera
pg
2
si
3
3
ofasbNiaiwt
hvs(rttsos
3
taa
a
minerals these ion sum markers indicate well the area of themineral when comparing with the optical pictures in Fig. 3.
b. Another marker is the score of the first principal component(PC1) obtained by a PCA with all 7900 variables (normalized toconstant sum of the variables). It is instructive to look at the
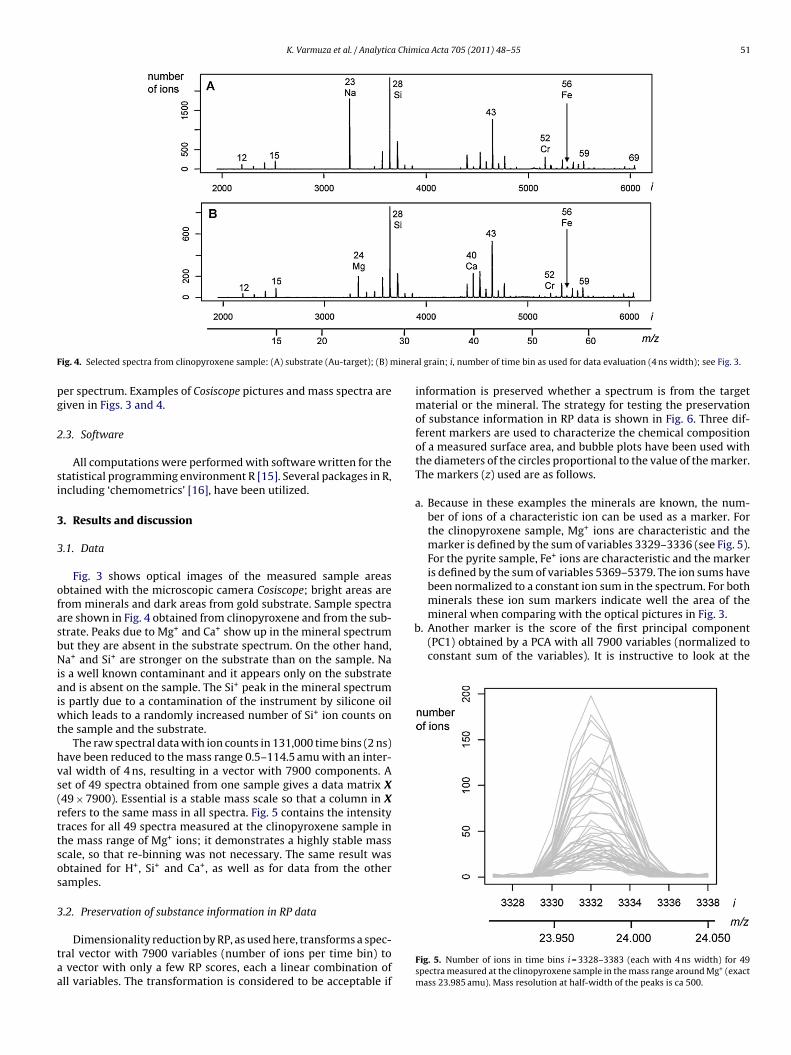
ig. 4. Selected spectra from clinopyroxene sample: (A) substrate (Au-target); (B) m
er spectrum. Examples of Cosiscope pictures and mass spectra areiven in Figs. 3 and 4.
.3. Software
All computations were performed with software written for thetatistical programming environment R [15]. Several packages in R,ncluding ‘chemometrics’ [16], have been utilized.
. Results and discussion
.1. Data
Fig. 3 shows optical images of the measured sample areasbtained with the microscopic camera Cosiscope; bright areas arerom minerals and dark areas from gold substrate. Sample spectrare shown in Fig. 4 obtained from clinopyroxene and from the sub-trate. Peaks due to Mg+ and Ca+ show up in the mineral spectrumut they are absent in the substrate spectrum. On the other hand,a+ and Si+ are stronger on the substrate than on the sample. Na
s a well known contaminant and it appears only on the substratend is absent on the sample. The Si+ peak in the mineral spectrums partly due to a contamination of the instrument by silicone oil
hich leads to a randomly increased number of Si+ ion counts onhe sample and the substrate.
The raw spectral data with ion counts in 131,000 time bins (2 ns)ave been reduced to the mass range 0.5–114.5 amu with an inter-al width of 4 ns, resulting in a vector with 7900 components. Aet of 49 spectra obtained from one sample gives a data matrix X49 × 7900). Essential is a stable mass scale so that a column in Xefers to the same mass in all spectra. Fig. 5 contains the intensityraces for all 49 spectra measured at the clinopyroxene sample inhe mass range of Mg+ ions; it demonstrates a highly stable masscale, so that re-binning was not necessary. The same result wasbtained for H+, Si+ and Ca+, as well as for data from the otheramples.
.2. Preservation of substance information in RP data
Dimensionality reduction by RP, as used here, transforms a spec-ral vector with 7900 variables (number of ions per time bin) to
vector with only a few RP scores, each a linear combination ofll variables. The transformation is considered to be acceptable if
l grain; i, number of time bin as used for data evaluation (4 ns width); see Fig. 3.
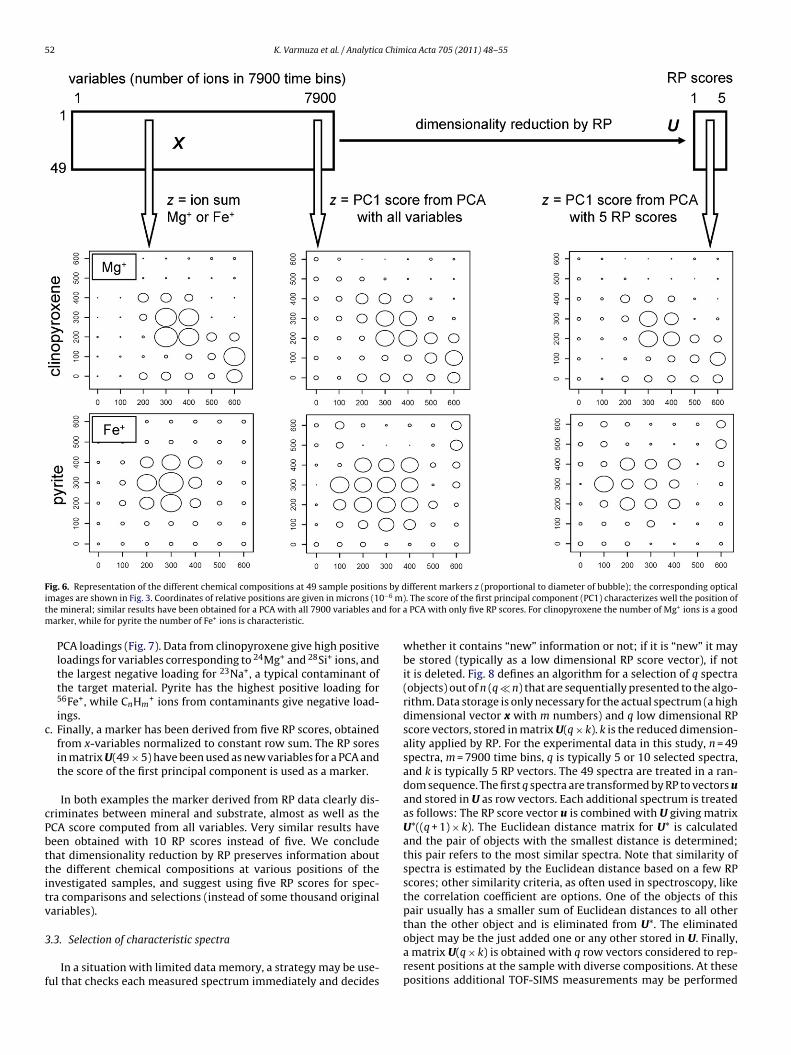
information is preserved whether a spectrum is from the targetmaterial or the mineral. The strategy for testing the preservationof substance information in RP data is shown in Fig. 6. Three dif-ferent markers are used to characterize the chemical compositionof a measured surface area, and bubble plots have been used withthe diameters of the circles proportional to the value of the marker.The markers (z) used are as follows.
. Because in these examples the minerals are known, the num-ber of ions of a characteristic ion can be used as a marker. Forthe clinopyroxene sample, Mg+ ions are characteristic and themarker is defined by the sum of variables 3329–3336 (see Fig. 5).For the pyrite sample, Fe+ ions are characteristic and the markeris defined by the sum of variables 5369–5379. The ion sums havebeen normalized to a constant ion sum in the spectrum. For both
Fig. 5. Number of ions in time bins i = 3328–3383 (each with 4 ns width) for 49spectra measured at the clinopyroxene sample in the mass range around Mg+ (exactmass 23.985 amu). Mass resolution at half-width of the peaks is ca 500.
52 K. Varmuza et al. / Analytica Chimica Acta 705 (2011) 48– 55
F s by di 0−6 m)t d for am
c
cPbttitv
3
f
ig. 6. Representation of the different chemical compositions at 49 sample positionmages are shown in Fig. 3. Coordinates of relative positions are given in microns (1he mineral; similar results have been obtained for a PCA with all 7900 variables an
arker, while for pyrite the number of Fe+ ions is characteristic.
PCA loadings (Fig. 7). Data from clinopyroxene give high positiveloadings for variables corresponding to 24Mg+ and 28Si+ ions, andthe largest negative loading for 23Na+, a typical contaminant ofthe target material. Pyrite has the highest positive loading for56Fe+, while CnHm
+ ions from contaminants give negative load-ings.
. Finally, a marker has been derived from five RP scores, obtainedfrom x-variables normalized to constant row sum. The RP soresin matrix U(49 × 5) have been used as new variables for a PCA andthe score of the first principal component is used as a marker.
In both examples the marker derived from RP data clearly dis-riminates between mineral and substrate, almost as well as theCA score computed from all variables. Very similar results haveeen obtained with 10 RP scores instead of five. We concludehat dimensionality reduction by RP preserves information abouthe different chemical compositions at various positions of thenvestigated samples, and suggest using five RP scores for spec-ra comparisons and selections (instead of some thousand originalariables).
.3. Selection of characteristic spectra
In a situation with limited data memory, a strategy may be use-ul that checks each measured spectrum immediately and decides
ifferent markers z (proportional to diameter of bubble); the corresponding optical. The score of the first principal component (PC1) characterizes well the position of
PCA with only five RP scores. For clinopyroxene the number of Mg+ ions is a good
whether it contains “new” information or not; if it is “new” it maybe stored (typically as a low dimensional RP score vector), if notit is deleted. Fig. 8 defines an algorithm for a selection of q spectra(objects) out of n (q � n) that are sequentially presented to the algo-rithm. Data storage is only necessary for the actual spectrum (a highdimensional vector x with m numbers) and q low dimensional RPscore vectors, stored in matrix U(q × k). k is the reduced dimension-ality applied by RP. For the experimental data in this study, n = 49spectra, m = 7900 time bins, q is typically 5 or 10 selected spectra,and k is typically 5 RP vectors. The 49 spectra are treated in a ran-dom sequence. The first q spectra are transformed by RP to vectors uand stored in U as row vectors. Each additional spectrum is treatedas follows: The RP score vector u is combined with U giving matrixU*((q + 1) × k). The Euclidean distance matrix for U* is calculatedand the pair of objects with the smallest distance is determined;this pair refers to the most similar spectra. Note that similarity ofspectra is estimated by the Euclidean distance based on a few RPscores; other similarity criteria, as often used in spectroscopy, likethe correlation coefficient are options. One of the objects of thispair usually has a smaller sum of Euclidean distances to all other
than the other object and is eliminated from U*. The eliminatedobject may be the just added one or any other stored in U. Finally,a matrix U(q × k) is obtained with q row vectors considered to rep-resent positions at the sample with diverse compositions. At thesepositions additional TOF-SIMS measurements may be performed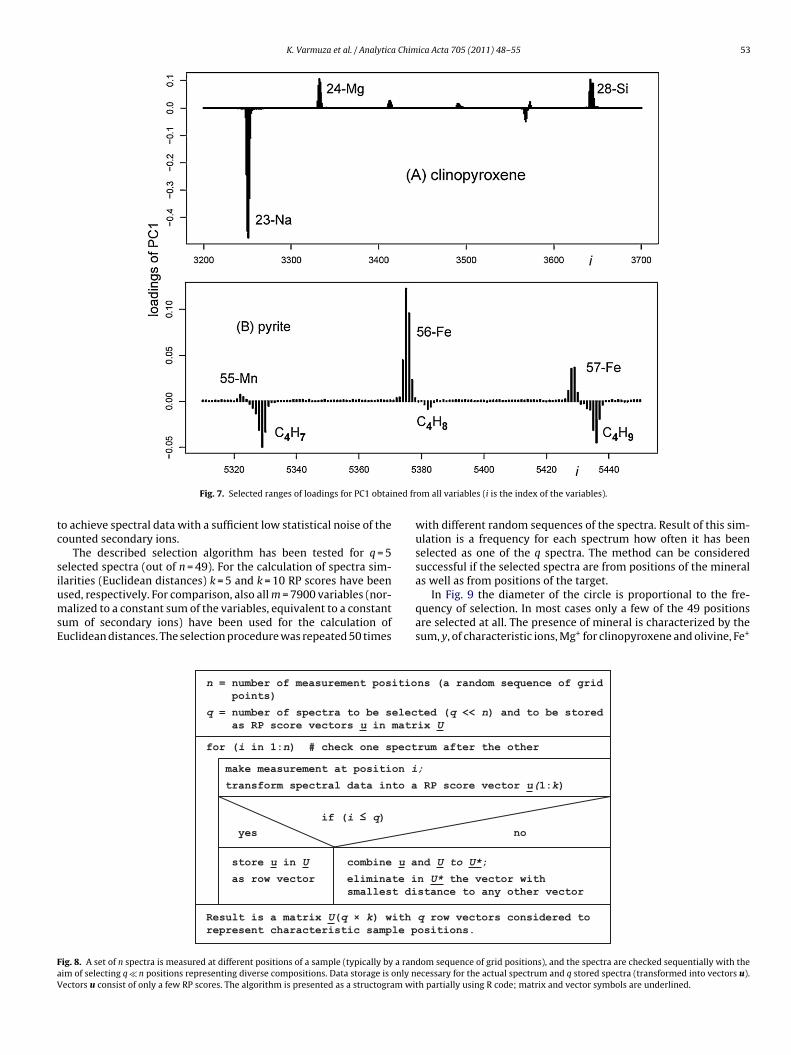
K. Varmuza et al. / Analytica Chimica Acta 705 (2011) 48– 55 53
ned fr
tc
siumsE
FaV
Fig. 7. Selected ranges of loadings for PC1 obtai
o achieve spectral data with a sufficient low statistical noise of theounted secondary ions.
The described selection algorithm has been tested for q = 5elected spectra (out of n = 49). For the calculation of spectra sim-
larities (Euclidean distances) k = 5 and k = 10 RP scores have beensed, respectively. For comparison, also all m = 7900 variables (nor-alized to a constant sum of the variables, equivalent to a constantum of secondary ions) have been used for the calculation ofuclidean distances. The selection procedure was repeated 50 times
n = number of measurement positiopoints)
q = numbe r of spectra to be selec as RP score vectors u in matr
for (i in 1:n) # chec k one spe ct
make measurement at position i
transform spectra l data into a
if (i ≤ q)yes
store u in U combi ne u a as row vecto r eliminate i
smallest di
Result is a matri x U(q × k) with represent characteristic sample p
ig. 8. A set of n spectra is measured at different positions of a sample (typically by a ranim of selecting q � n positions representing diverse compositions. Data storage is only nectors u consist of only a few RP scores. The algorithm is presented as a structogram wi
om all variables (i is the index of the variables).
with different random sequences of the spectra. Result of this sim-ulation is a frequency for each spectrum how often it has beenselected as one of the q spectra. The method can be consideredsuccessful if the selected spectra are from positions of the mineral
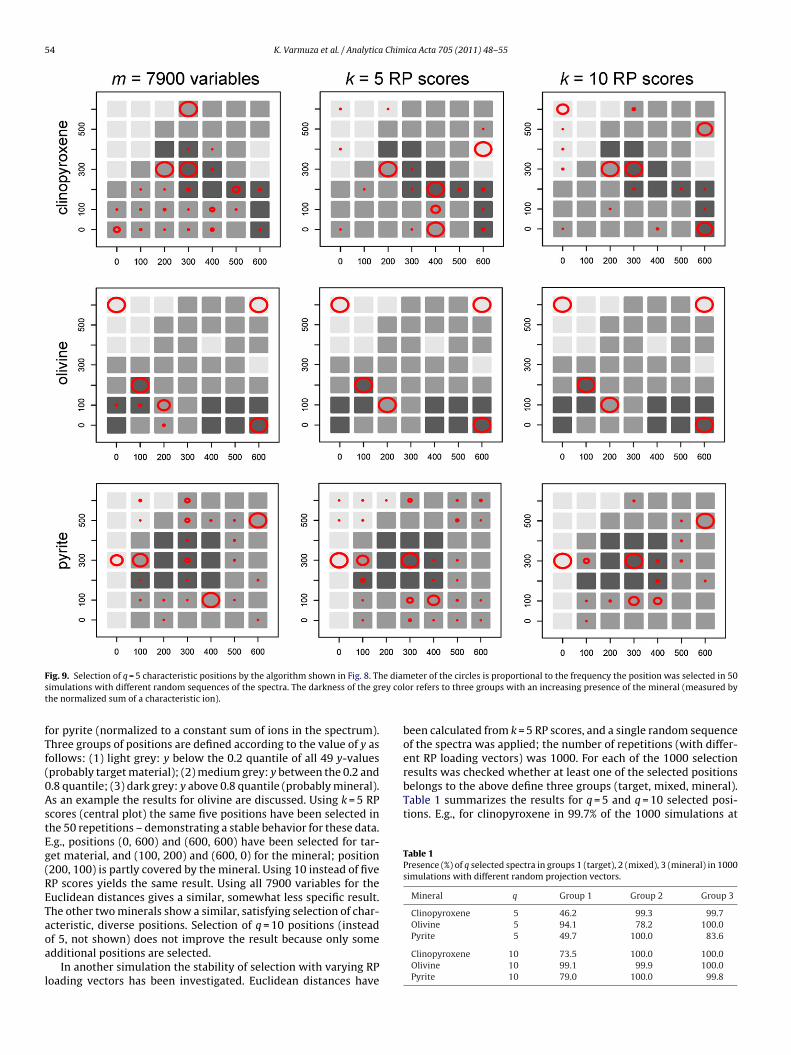
as well as from positions of the target.In Fig. 9 the diameter of the circle is proportional to the fre-quency of selection. In most cases only a few of the 49 positionsare selected at all. The presence of mineral is characterized by thesum, y, of characteristic ions, Mg+ for clinopyroxene and olivine, Fe+
ns (a random sequence of grid
ted ( q << n) and to be store dix U
rum after the oth er
;
RP score vector u(1:k)
no
nd U to U *;
n U* the vector wit hstance to any oth er vector
q row vectors considered toositions.
dom sequence of grid positions), and the spectra are checked sequentially with theecessary for the actual spectrum and q stored spectra (transformed into vectors u).th partially using R code; matrix and vector symbols are underlined.
54 K. Varmuza et al. / Analytica Chimica Acta 705 (2011) 48– 55
F e diams ey colt
fTf(0AstEg(RETaoa
l
results was checked whether at least one of the selected positionsbelongs to the above define three groups (target, mixed, mineral).Table 1 summarizes the results for q = 5 and q = 10 selected posi-tions. E.g., for clinopyroxene in 99.7% of the 1000 simulations at
Table 1Presence (%) of q selected spectra in groups 1 (target), 2 (mixed), 3 (mineral) in 1000simulations with different random projection vectors.
Mineral q Group 1 Group 2 Group 3
Clinopyroxene 5 46.2 99.3 99.7
ig. 9. Selection of q = 5 characteristic positions by the algorithm shown in Fig. 8. Thimulations with different random sequences of the spectra. The darkness of the grhe normalized sum of a characteristic ion).
or pyrite (normalized to a constant sum of ions in the spectrum).hree groups of positions are defined according to the value of y asollows: (1) light grey: y below the 0.2 quantile of all 49 y-valuesprobably target material); (2) medium grey: y between the 0.2 and.8 quantile; (3) dark grey: y above 0.8 quantile (probably mineral).s an example the results for olivine are discussed. Using k = 5 RPcores (central plot) the same five positions have been selected inhe 50 repetitions – demonstrating a stable behavior for these data..g., positions (0, 600) and (600, 600) have been selected for tar-et material, and (100, 200) and (600, 0) for the mineral; position200, 100) is partly covered by the mineral. Using 10 instead of fiveP scores yields the same result. Using all 7900 variables for theuclidean distances gives a similar, somewhat less specific result.he other two minerals show a similar, satisfying selection of char-
cteristic, diverse positions. Selection of q = 10 positions (insteadf 5, not shown) does not improve the result because only somedditional positions are selected.In another simulation the stability of selection with varying RPoading vectors has been investigated. Euclidean distances have
eter of the circles is proportional to the frequency the position was selected in 50or refers to three groups with an increasing presence of the mineral (measured by
been calculated from k = 5 RP scores, and a single random sequenceof the spectra was applied; the number of repetitions (with differ-ent RP loading vectors) was 1000. For each of the 1000 selection
Olivine 5 94.1 78.2 100.0Pyrite 5 49.7 100.0 83.6
Clinopyroxene 10 73.5 100.0 100.0Olivine 10 99.1 99.9 100.0Pyrite 10 79.0 100.0 99.8

K. Varmuza et al. / Analytica Chim
Table 2Presence (%) of q selected spectra in groups 1 (target), 2 (mixed), 3 (mineral) in 100simulations with low intensity data including Poisson noise. f, factor for intensityreduction.
Mineral f Group 1 Group 2 Group 3
Clinopyroxene 0.1 92 98 1000.033 83 98 1000.01 85 99 94
Olivine 0.1 100 98 1000.033 100 98 1000.01 99 95 100
l9galp
laawSgrstngtbofdgrPisatma
4
tpa
[
[
[
[
[
Pyrite 0.1 89 100 900.033 81 100 890.01 83 99 78
east one of five selected positions belongs to group 3 (mineral), in9.3% at least one is in group 2 (mixed), and in 46.2% in group 1 (tar-et). As expected, for 10 selected spectra the success rate is highernd reaches (almost) 100%, that means from 10 selected spectra ateast one is from the mineral – independent from the used randomrojection vectors.
Finally, the selection procedure has been tested with simulatedow intensity spectra. Aim is a fast measurement at n positions of
target, followed by a selection of characteristic, diverse positionst which extensive measurements are performed to obtain spectraith a sufficient low statistical noise of the counted secondary ions.
imulated low intensity spectra with intensities xLOW have beenenerated from original intensities x by xLOW = rpois(f × x). Functionpois from R [15] returns an integer random number ≥0 from a Pois-on distribution with an average value of f × x with f being a factorhat defines the intensity reduction (e.g., 0.1). Thus the increasedoise at low ion counts is considered. Values for xLOW have beenenerated separately for each of the 7900 ion sums in the 49 spec-ra for f = 0.1, 0.033, and 0.01, respectively. Euclidean distances haveeen calculated from k = 5 RP scores, and a single random sequencef the spectra was applied; the number of repetitions (with dif-erent low intensity data) was 100. Evaluation was performed asescribed above by counting of at least one selected position inroups 1–3. Table 2 summarizes the result. E.g., the olivine dataeduced to only 1% mean intensity of the original intensity (f = 0.01,oisson noise added) yield a selected position in the three groupsn 95–100%. As expected, low intensities make the selection lessignificant. In general, the results show, that for the available data
reduction of the intensity to about 1–3% still allows a good selec-ion of characteristic positions (discrimination between target and
ineral) by using a RP dimensionality reduction to five RP scoresnd the Euclidean distance as similarity criterion.
. Conclusions
RP is a very fast and simple method for dimensionality reduc-ion. If necessary, with appropriate software the loadings ofrojection vectors can be reproducibly generated value by valuend thus considerably saving data memory. TOF-SIMS data from
[
[
ica Acta 705 (2011) 48– 55 55
scanning experiments with 7900 numbers per spectrum have beenreduced by RP to five or 10 numbers. The reduced data (RP scores)contain information for a discrimination of target material and min-erals not requiring any presumptions about characteristic ions. Incontrary a manual analysis by empirically selecting certain peaksin a spectrum, is a biased estimate using a priori information fromexperience or assumptions. In this sense, RP is unbiased. RP is aniche method, however, especially useful in situations with severerestrictions for data memory or the need of fast data evaluation.Parameters for dimensionality reduction are independent from thedata and can be defined in advance. A method has been successfullytested for the selection of characteristic, diverse positions of a sam-ple with the measured TOF-SIMS spectra evaluated sequentially.This approach was also successful with artificial low intensity data.In this context, RP seems to be a promising method also for eval-uation of other hyperspectral data, and for fast searches of imagesin databases.
Acknowledgement
This work is supported by CNES in France.
References
[1] S.S. Vempala, The Random Projection Method, vol. 65, American MathematicalSociety, Providence, RI, 2004.
[2] D. Achlioptas, J. Comput. Syst.Sci. 66 (2003) 671–687.[3] S. Kaski, Dimensionality reduction by random mapping: Fast similarity compu-
tation for clustering, in: Proceedings of the 1998 International Joint Conferenceon Neural Networks, vol. 1, Piscataway, NJ, 1998, pp. 413–418.
[4] W.B. Johnson, J. Lindenstrauss, Contemp. Math. 26 (1984) 189–206.[5] E. Bingham, H. Mannila, Random projection in dimensionality reduction: appli-
cations to image and text data, in: Proceedings of the 7th ACM SIGKDDInternational Conference on Knowledge Discovery and Data Mining, Associ-ation for Computing Machinery (ACM), San Francisco, CA, 2001, pp. 245–250.
[6] N. Goel, G. Bebis, A. Nefian, Face recognition experiments with random projec-tion, Proc. SPIE 5776 (2005) 426.
[7] K. Varmuza, P. Filzmoser, B. Liebmann, J. Chemom. 24 (2010) 209–217.[8] R. Schulz, A.C. Boehnhardt, K.H. Glassmeier (Eds.), Rosetta: ESA’s Mission to the
Origin of the Solar System, Springer, New York, 2009.[9] R.A. Johnson, D.W. Wichern, Applied Multivariate Statistical Analysis, 5th ed.,
Prentice Hall, Upper Saddle River, NJ, USA, 2002.10] D.L. Massart, B.G.M. Vandeginste, L.C.M. Buydens, S. De Jong, J. Smeyers-
Verbeke, Handbook of Chemometrics and Qualimetrics: Part A, Elsevier,Amsterdam, The Netherlands, 1997.
11] J. Kissel, K. Altwegg, B.C. Clark, L. Colangeli, H. Cottin, S. Czempiel, J. Eibl, C.Engrand, H.M. Fehringer, B. Feuerbacher, M. Fomenkova, A. Glasmachers, J.M.Greenberg, E. Grün, G. Haerendel, H. Henkel, M. Hilchenbach, H. von Hoerner,H. Höfner, K. Hornung, E.K. Jessberger, A. Koch, H. Krüger, Y. Langevin, P. Parig-ger, F. Raulin, F. Rüdenauer, J. Rynö, E.R. Schmid, R. Schulz, J. Silén, W. Steiger,T. Stephan, L. Thirkell, R. Thomas, K. Torkar, N.G. Utterback, K. Varmuza, K.P.Wanczek, W. Werther, H. Zscheeg, Space Sci. Rev. 128 (2007) 823–867.
12] H.A. Witt-Eickschen, K. Seck, S.M. Mezger, R.A. Eggins, J. Petrol. 44 (2003)1077–1095.
13] G. Kurat, H. Palme, A. Embey-Isztin, J. Touret, T. Ntaflos, B. Spettel, F. Brandstät-ter, C. Palme, G. Dreibus, M. Prinz, Mineral. Petrol. 48 (1993) 309–341.
14] C. Höfer, Preparation and analysis of analogous material for extraterrestrial dust(in German), Bachelor thesis, University of Heidelberg, Heidelberg, Germany,
2010.15] R, A language and environment for statistical computing, R DevelopmentCore Team, Foundation for Statistical Computing, www.r-project.org, Vienna,Austria, 2010.
16] K. Varmuza, P. Filzmoser, Introduction to Multivariate Statistical Analysis inChemometrics, CRC Press, Boca Raton, FL, 2009.