Raise the Grade Symposium - Oklahoma State Department of ...
376
Raise the Grade Symposium Bill Daggett, Founder and Chairman September 12‐13, 2012
-
Upload
khangminh22 -
Category
Documents
-
view
1 -
download
0
Transcript of Raise the Grade Symposium - Oklahoma State Department of ...

Raise the Grade Symposium
Bill Daggett, Founder and ChairmanSeptember 12‐13, 2012

School Improvement
Growing Gap
Readiness

1983
Who Lead the Charge

1983NCLB
Who Lead the Charge

1983NCLBCCSS
Who Lead the Charge

1983
Increase the Pressure

1983NCLB
Increase the Pressure

1983NCLBCCSS
Increase the Pressure

1. Common Core State Standards
Challenges

1. Common Core State Standards2. Next Generation Assessment
Challenges

1. Common Core State Standards2. Next Generation Assessment3. Teacher Evaluation
Challenges

1. Common Core State Standards2. Next Generation Assessment3. Teacher Evaluation 4. Instruction
Challenges

A Look to the Future
Will Require aComprehensive Solution

Agenda
RESEARCH

Agenda
RESEARCHMODELSCHOOLS

Agenda
RESEARCHMODELSCHOOLS
STRUCTURE

Agenda
RESEARCHMODELSCHOOLS
BEST PRACTICES
STRUCTURE

Agenda
RESEARCHMODELSCHOOLS
ACTION PLAN
BEST PRACTICES
STRUCTURE

Agenda
RESEARCH
MODELSCHOOLS
ACTION PLAN
BEST PRACTICES
STRUCTURE

Agenda
RESEARCH

Focus
•What is effective?

Research on Effectiveness1. Data‐rich, analysis‐poor
– Meta‐analysis

Research on Effectiveness1. Data‐rich, analysis‐poor
– Meta‐analysis
2. Visible Learning by John Hattie– 52,637– 800 meta‐analyses

Focus
•What is effective?•What you can impact?•What is most efficient?

Effectiveness and Efficiency Framework
High Cost
Low Cost

Effectiveness and Efficiency Framework
High Cost
Low Cost
High Student Performance
Low Student Performance
Effectiveness

Effectiveness and Efficiency Framework
High Cost
Low Cost
High Student Performance
Low Student Performance
C D
A B
Effectiveness
Student Teacher Relationship
0.72
0
0 .2
0 .4
0 .6
0 .8
1
0.90
0
0 .2
0 .4
0 .6
0 .8
1
Effective Efficient

Application of Knowledge
0.65
0
0 .2
0 .4
0 .6
0 .8
1
0.80
0
0 .2
0 .4
0 .6
0 .8
1
Effective Efficient

Professional Development
0.62
0
0 .2
0 .4
0 .6
0 .8
1
0.75
0
0 .2
0 .4
0 .6
0 .8
1
Effective Efficient

Teacher Expectations and Clarity
0.75
0
0 .2
0 .4
0 .6
0 .8
1
0.90
0
0 .2
0 .4
0 .6
0 .8
1
Effective Efficient

1.28
0
0 .2
0 .4
0 .6
0 .8
1
Plan Instruction based on how Students Learn
0.70
0
0 .2
0 .4
0 .6
0 .8
1
Effective Efficient1.28

Assessment to Inform and Differentiate Instruction
0.65
0
0.2
0.4
0.6
0.8
1
0.80
0
0.2
0.4
0.6
0.8
1
Effective Efficient

Literacy Strategies
0.61
0
0 .2
0 .4
0 .6
0 .8
1
0.65
0
0 .2
0 .4
0 .6
0 .8
1
Effective Efficient

Peer Tutoring
0.65
0
0 .2
0 .4
0 .6
0 .8
1
0.75
0
0 .2
0 .4
0 .6
0 .8
1
Effective Efficient

What is less effective and efficient

Class Size
0.210
0 .2
0 .4
0 .6
0 .8
1
0.200
0 .2
0 .4
0 .6
0 .8
1
Effective Efficient

Summer School
0.230
0 .2
0 .4
0 .6
0 .8
1
0.200
0 .2
0 .4
0 .6
0 .8
1
Effective Efficient

0.72
0.90
0.62
0.75
0.40
0.67
0.90
0.60
0.75
0.90
0.69
0.80
0.60
0.65
0.55
0.75
0.21
0.20
0.30
0.55
0.22
0.90
0.23
0.20
Stud
ent
Teacher
PD
Prior
Achieve
Form
.
Eval.
Teacher
Clarity
Meta
Strats.
Literacy
Strats.
Peer
Tutor
Class
Size
Ability
Group
Teach
Test
Summer
Scho
ol

Agenda
RESEARCH

Agenda
RESEARCHMODELSCHOOLS

School Improvement
Growing Gap
Readiness

School Improvement
Growing Gap

School Improvement
Growing Gap

School Improvement
Growing Gap

No Formula


Agenda
RESEARCHMODELSCHOOLS
STRUCTURE

Agenda
RESEARCHMODELSCHOOLS
BEST PRACTICES
STRUCTURE

Agenda
RESEARCHMODELSCHOOLS
ACTION PLAN
BEST PRACTICES
STRUCTURE


Doctor
Pilot


Instructional Leadership

Discussion Question
• Does an adequate culture of high expectations exist in your school(s)?
• What actions, if any, need to be taken to raise the expectations for studentsin your school(s)?

1. Standards will be higher
Challenges

600
800
1000
1400
1600
1200
Text
Lex
ile M
easu
re (L
)
HighSchool
Literature
CollegeLiterature
HighSchool
Textbooks
CollegeTextbooks
Military PersonalUse
Entry-LevelOccupations
SAT 1,ACT,AP*
* Source of National Test Data: MetaMetrics
Reading Study SummaryInterquartile Ranges Shown (25% - 75%)

Reading Requirements Findings
• Entry‐level– Highest in 6/16– Second Highest in 7/16
• Consistent Across Country

Adv
ance
d
Lexile Reading Level Range: 850-930
Inte
rmed
iate
Lexile Reading Level Range: 940-1090
Ent
ry L
evel
Lexile Reading Level Range: 1000-1140
Human Services

A
dvan
ced
Lexile Reading Level Range: 1310-1390
Inte
rmed
iate
Lexile Reading Level Range: 1250-1340
Ent
ry L
evel
Lexile Reading Level Range: 1310-1350
Construction

Adv
ance
d
Lexile Reading Level Range: 1310-1440
Inte
rmed
iate
Lexile Reading Level Range: 1280-1310
Ent
ry L
evel
Lexile Reading Level Range: 1280-1330
Manufacturing

2005 ProficiencyGrade 4 Reading
ProficientRequired
NAEP ScoreMississippi 88 %Georgia 87 %Wisconsin 83 %Texas 81 %Ohio 77 %Florida 71%Oklahoma 52 %Massachusetts 48 %

2005 ProficiencyGrade 4 Reading
ProficientRequired
NAEP ScoreMississippi 88 % 161Georgia 87 % 175Wisconsin 82 % 189Texas 81 % 190Ohio 77 % 199Florida 71% 202Oklahoma 52 % 182Massachusetts 48 % 234

2009 ProficiencyGrade 4 Reading
ProficientRequired
NAEP ScoreGeorgia 87 %Texas 84 %Ohio 82 %Wisconsin 82 %Florida 74%Oklahoma 62 %Massachusetts 54 %Mississippi 52 %

2009 ProficiencyGrade 4 Reading
ProficientRequired
NAEP ScoreGeorgia 87 % 178Texas 84 % 188Ohio 82 % 192Wisconsin 82 % 189Florida 74% 206Oklahoma 62 % 211Massachusetts 54 % 234Mississippi 52 % 210

2009 ProficiencyGrade 4 Reading
ProficientRequired
NAEP ScoreGeorgia 87 % (0) 178 (+3)Texas 84 % (+3) 188 (-2)Ohio 82 % (+5) 192 (-7)Wisconsin 82 % (-1) 189 (0)Florida 74% (+3) 206 (+4)Oklahoma 62 % (+10) 211 (+29)Massachusetts 54 % (+6) 234 (0)Mississippi 52 % (-36) 210 (+49)

2009 ProficiencyGrade 8 Reading
ProficientRequired
NAEP ScoreTexas 94 % (+11) 201 (-24)Wisconsin 85 % (-1) 232 (+3)Georgia 77 % (-6) 209 (-15)Ohio 72 % (-8) 251 (+10)Arkansas 71 % (+14) 241 (-13)Oklahoma 66 % (-5) 249 (+5)Mississippi 48 % (-10) 254 (+7)California 48 % (+9) 259 (-3)

2009 ProficiencyGrade 4 Mathematics
ProficientRequired
NAEP ScoreTexas 85 % (+3) 214 (-5)Wisconsin 81 % (+7) 219 (16)Mississippi 58 % (-21) 223 (+17)Georgia 75 % (0) 218 (+3)Ohio 78 % (+13) 219 (-14)Florida 75 % (+12) 225 (-5)Arkansas 78 % (+25) 216 (-20)Oklahoma 66 % (-8) 228 (+10)

2009 ProficiencyGrade 8 Mathematics
ProficientRequired
NAEP ScoreTexas 83 % (+22) 254 (-19)Illinois 82 % (+28) 251 (-15)New York 80 % (+24) 249 (-26)Florida 66 % (+8) 266 (-3)Oklahoma 59 % (-8) 269 (+11)Mississippi 54 % (+1) 264 (+2)Massachusetts 49 % (+7) 300 (-1)Missouri 47 % (+32) 287 (-24)

National Essential Skills Study (NESS)

NESS StudySubgroup Rankings
ELA Skill: Write clear and concise directions or procedures.
Group Rank
Overall 9
Business/Industry 2
Other Non-educators 10
English Language Arts Teachers 25
Other Educators 8

NESS StudySubgroup Rankings
ELA Skill: Give clear and concise oral directions.
Group Rank
Overall 7
Business/Industry 3
Other Non‐educators 9
English Language Arts Teachers 28
Other Educators 7

NESS StudySubgroup Rankings
Math Skill: Apply the Pythagorean Theorem to right triangles.
Group Rank
Overall 20
Business/Industry 29
Other Non‐educators 31
Mathematics Teachers 4
Other Educators 24

NESS StudySubgroup Rankings
Math Skill: Understand accuracy and precision of measurement, round off numbers according to the correct number of significant figures, and determine percent error.
Group Rank
Overall 12
Business/Industry 3
Other Non‐educators 10
Mathematics Teachers 30
Other Educators 8

•4 year bachelor’s within 8 years ‐60.6%•2 year associate within 4 years – 18.8%•1 year certificate within 2 years – 27.8%
Source ‐ USDOE
Completion Rates

Public Institutions
Private Institutions
1980‐81 $5,881 $13,5551990‐91 7,625 20,6932000‐01 9,300 26,1972010‐11 13,314 33,471
College Tuition (2010‐11 dollars)

A four year degree isn’t necessarily a way to get a good job but it’s a
requirement to get an interview for a good job

What you major inmatters a lot

Available Resources
•Power Point•White Papers•Research Project (Lexile and Quantile)

Discussion Question
• Does an adequate culture of high expectations exist in your school(s)?
• What actions, if any, need to be taken to raise the expectations for studentsin your school(s)?

Organizational Leadership

Discussion Question
• Does your school(s) support maintaining the 20th Century SystemOR creating a 21st Century System?
• What actions, if any, need to be taken to create a culture to support change?

A Look to the Future
Information is Everywhere…

• Analyze Documentso Keywords and Headers (Google)
• Meaning / Conceptso Wolfram Alpha
• Complete Task
Semantic Web

2 + 2Integrate x^2 sin^3 x dxgdp francewhat is the gdp of france?what is the gdp of france / italyinternet users in europespringfieldWeather Springfield

• Homework
Implications

• Homework• Term Paper
Implications


• Integrated Projection• Projection Keyboard
SPOT

Projection Keyboard

Projection Keyboard and Monitor

Technology should work for you—to be there when you need it and get out of your way when you don’t.
Google X started Project Glass to build this kind of technology, one that helps you explore and share your world, putting you back in the moment.
Project Glass

Download any movie, website, or piece of information into your glasses or
contact lenses

•Students will be able to surf the Internet via their contact lenses.
•How will you deal with this in your schools?
In the Near Future…

Today’s students live in a hyper‐connected world,
except in schoolOR
are they also connected in school but we just don’t know it?

Information is everywhere. In this changing world, sense‐making and the ability to evaluate the credibility
of information are paramount.

School Improvement
Growing Gap

School Improvement
Growing Gap

School Improvement
Growing Gap

No Formula


Instructional Leadership

600
800
1000
1400
1600
1200
Text
Lex
ile M
easu
re (L
)
HighSchool
Literature
CollegeLiterature
HighSchool
Textbooks
CollegeTextbooks
Military PersonalUse
Entry-LevelOccupations
SAT 1,ACT,AP*
* Source of National Test Data: MetaMetrics
Reading Study SummaryInterquartile Ranges Shown (25% - 75%)

Discussion Question
• Does an adequate culture of high expectations exist in your school(s)?
• What actions, if any, need to be taken to raise the expectations for studentsin your school(s)?


Instructional Leadership

Organizational Leadership

Discussion Question
• Does your school(s) support maintaining the 20th Century SystemOR creating a 21st Century System?
• What actions, if any, need to be taken to create a culture to support change?

The Third Great Revolution
• Agricultural• Industrial• Information

Technology should work for you—to be there when you need it and get out of your way when you don’t.
Google X started Project Glass to build this kind of technology, one that helps you explore and share your world, putting you back in the moment.
Project Glass

2012 and growing at 40% per year
• Every minute YouTube stores 24 hours of new video
• Twitter replays 155 million tweets a day• Facebook has 50 billion photos stored in
its records

Google and Facebook are worth more than $300 billion.
They could buy every newspaper, TV and radio station in the world.

Google and Facebook are worth more than $300 billion.
They could buy every newspaper, TV and radio station in the world.
WHERE DID THE OTHERS GO WRONG?

WHERE DID THE OTHERS GO WRONG?

•Ruth Fresmon, The New York Times

•www.kidzworld.com


• Technology• Financial
The Changing Landscape


Federal Obligations•$534,000 per household•More than 5 times
—Mortgages —Car Loans—College Loans—Credit Cards

Federal Obligations•Medicare 24.8T•Social Security 21.4T•Debt 9.4T•Retirements 5.6T •Other 0.4T
TOTAL 61.6T

2011 US Federal Budget
Borrowing 41% of every dollar it is spending.

Student loan debt is nearly $1 Trillion – higher than the total of
all credit debt
Source ‐ USDOE

When you lose control of your finances you lose control of
your future

• Technology• Financial• Globalization
The Changing Landscape


Shenzhen
•1980 - Fishing Village
•2012 -

1 / Second
24 / 7
Port of Shenzen
•Source: Atlantic Monthly

• Largest corporation• 8 times the size of Microsoft• 2 % of GDP• 1.4 million employees• More employees than:
o GM, Ford, GE, and IBM combined
Walmart

• “China today exports in a single day more than it exported in all of 1978.”

• Only Superpower• Highest per Capita Income• 1st in Economic Growth• 5 % of Population Greater than 24 % of
Consumption
U.S. – 2nd Half of 20th Century
•Source: National Academy of Science

Chinese Science
•Source: Ed Week 06/06/07
Elementary Schools
6 Years Integrated Science
Biology / Chemistry Grade 7
Biology / Physics Grade 8
Physics / Chemistry Grade 9
Integrated Science Grades 10 ‐ 12

PISA 2009
1 Shanghai-China 5562 Korea 5393 Finland 5364 Hong Kong-China 5335 Singapore 5266 Canada 5247 New Zealand 5218 Japan 520
9 Australia 515
10 Netherlands 50817 United States 50020 Germany 49721 Ireland 49622 France 49625 United Kingdom 49433 Spain 48143 Russian Federation 45948 Mexico 42553 Brazil 41257 Indonesia 402
•Overall Reading Scale
Significantly Above OECD Average
Not Significantly Different
(OECD Average 493)Significantly below
OECD Average

PISA 2009
•Overall Math Scale
Significantly Above OECD Average
Not Significantly Different
(OECD Average 496)Significantly below
OECD Average
1 Shanghai-China 600
2 Singapore 562
3 Hong Kong-China 555
4 Korea 546
6 Finland 541
9 Japan 529
10 Canada 527
11 Netherlands 526
13 New Zealand 519
15 Australia 514
16 Germany 513
22 France 497
28 United Kingdom 492
31 United States 487
32 Ireland 487
34 Spain 483
38 Russian Federation 468
51 Mexico 419
57 Brazil 386
61 Indonesia 371

PISA 2009
•Overall Science Scale
Significantly Above OECD Average
Not Significantly Different
(OECD Average 501)Significantly below
OECD Average
1 Shanghai-China 575
2 Finland 554
3 Hong Kong-China 549
4 Singapore 542
5 Japan 539
6 Korea 538
7 New Zealand 532
8 Canada 529
10 Australia 527
11 Netherlands 522
13 Germany 520
16 United Kingdom 514
20 Ireland 508
23 United States 502
27 France 498
36 Spain 488
39 Russian Federation 478
50 Mexico 416
53 Brazil 405
60 Indonesia 383

Innovation will wane do to…
• Military budget cuts reduce R/D• NASA budget cuts dramatically reduced
R/D• Business hurting so little invested in R/D

• Technology• Financial• Globalization• Demographics
The Changing Landscape

FemaleMale
1950
2010
2050

Baby Boomers Impact• 1950’s
strollers, station wagons, washing machines, clothes

Baby Boomers Impact• 1950’s• 1970’s
‐spent, borrowed, lead to increased interest rates and inflation

Baby Boomers Impact• 1950’s• 1970’s
‐Spent and borrowed, which lead to increased interest rates and inflation
–but unemployment went up

Baby Boomers Impact• 1950’s• 1970’s• 1990’s
Lead innovation, creativity and economic growth

Baby Boomers Impact
• 1950’s• 1970’s• 1990’s• 2010’s
Will require end of life care

Baby Boomers Impact
• 1950’s• 1970’s• 1990’s• 2010’s

Discussion Question
• Does your school(s) support maintaining the 20th Century SystemOR creating a 21st Century System?
• What actions, if any, need to be taken to create a culture to support change?

32
1
1 – Incremental Change (Improving Core Practices)
2 – Innovative Change (Fundamental Change of Core Practice)
3 – Transformational Change (Affect Entire System)
Evolution of Change Model

32
1
1 – Saddle
2 – Horse and Wagon
3 – Car
Transportation

A Look to the Future
Information is Everywhere…

1
1 – Google Search
Smart Technology

21
1 – Google Search
2 – Google Glasses
Smart Technology

32
1
1 – Google Search
2 – Google Glasses
3 – Google Car
Smart Technology

32
1
K‐12 Education – High Impact Factors

School Improvement
Growing Gap

School Improvement
Growing Gap

School Improvement
Growing Gap

• Gaming• Online Instruction• Blended Learning
K‐12 Education – High Impact Factors

Gaming is increasingly being built based upon brain research.

Gaming is increasingly being built based upon brain research.
What is the implication to education?

• Downloaded 1 billion times• Average of 800 bird launches per
download• Collectively 800 billion birds launched• Over 600 million minutes played per day• 400,000 years of time played
Angry Birds

1
1 – Sushi Monster
Game Theory in Education

• Continuous improvement• Immediate feedback• Addictive
Game‐based Programs

How do you feel about students being addicted to learning?

• Continuous improvement• Immediate feedback• Addictive• Today’s education games are often a
technologically enhanced version of drill and practice
• Enabling more personalized learning
Game‐based Programs

650,000 Apps in the App Store

• Personalization
Technology Provides

• Personalization
• Repetition• Volume
Technology Provides
Critical to Move from Working to Stored Memory –
Needed for Fluency

• FASTT Math Next Generation• 18 Games
A Look to the Future

21
1 – Sushi Monster(FASTT Math Next Generation)
Game Theory in Education

A Look to the Future
iRead

• Beastie Hall ‐ A School for Monsters
iRead

• Beastie Hall ‐ A School for Monsters• Phonics
iRead

• Beastie Hall ‐ A School for Monsters• Phonics• Embedded Assessments
iRead

21
1 – Sushi Monster(FASTT Math Next Generation)
2 – iRead
Game Theory in Education

21
1 – Sushi Monster(FASTT Math Next Generation)
2 – iRead‐Math 180
Game Theory in Education

MCAT

Online Instruction

• 30 states have full‐time online schools• 96% of LEAs have students enrolled in
distance education courses at the HS level
Online Learning Facts

• Fully online model ‐ $6,400• Blended‐learning model ‐ $8,900• Traditional school model ‐ $10,000
US Average per Pupil Expenditures

32
1
1 – Sushi Monster (FASTT MATH)
2 – iRead Math 180
3 – Online Game‐based Learning
Game Theory in Education

32
1
1 – Computer Labs
2 – One‐to‐One Computing
3 – Bring Your Own Technology (BYOT)
Technology in Schools

Pencil Budget

Mobile Devices
• What you want• Where you want it• When you want it

WHERE DID THE OTHERS GO WRONG?

Technology needs to do to education what it has done to countless other
industries: Disrupt It

32
1
1 – Project‐based Learning
2 – Flipped Classroom
3 – Online Game‐based System
Instruction

32
1
1 – Training all teachers to grade essays
2 – Computer grading of essays
3 – Computer‐based grading and immediate instruction based on performance
Grading of Papers

1
1 – Learning Together
Learning

32
1
1 – Student‐run technology P.D. (survey/3 levels)
2 – Teachers are given technology IEP with students as their mentors
3 – Top 1/3rd students and teachers create alternative instructional delivery system
Professional Development

32
1
1 – Curriculum Matrix
2 – Next Network
3 – Online Game‐based System
CCSS NGA

32
1
1 – Teaching
2 – Learning
3 – Personalization of Learning
Our Mission

Available Resources
•Power Point•White Papers•Presentation to Staff, Board Community

Discussion Question
• Does your school(s) support maintaining the 20th Century SystemOR creating a 21st Century System?
• What actions, if any, need to be taken to create a culture to support change?

Raise the Grade Symposium
Bill Daggett, Founder and ChairmanSeptember 12‐13, 2012

Agenda
RESEARCH

Agenda
RESEARCHMODELSCHOOLS

Agenda
RESEARCHMODELSCHOOLS
STRUCTURE

Agenda
RESEARCHMODELSCHOOLS
BEST PRACTICES
STRUCTURE

Agenda
RESEARCHMODELSCHOOLS
ACTION PLAN
BEST PRACTICES
STRUCTURE


Action Plan

• Consultants for Professional Development• Executive Coaching• Leadership Academy• Model School Conference• Next Network• Print/Digital Materials
REQUEST

Instructional Leadership

600
800
1000
1400
1600
1200
Text
Lex
ile M
easu
re (L
)
HighSchool
Literature
CollegeLiterature
HighSchool
Textbooks
CollegeTextbooks
Military PersonalUse
Entry-LevelOccupations
SAT 1,ACT,AP*
* Source of National Test Data: MetaMetrics
Reading Study SummaryInterquartile Ranges Shown (25% - 75%)

Organizational Leadership


Teaching

1. Knowledge in one discipline2. Application within discipline3. Application across disciplines4. Application to real‐world
predictable situations5. Application to real‐world
unpredictable situations
Application Model

1. Awareness2. Comprehension3. Application4. Analysis5. Synthesis6. Evaluation
Knowledge Taxonomy

Levels
1 2 3 4 5
Bloom’s
C D
A B456
321
Application

Rigor/Relevance Framework
1
23
456
1 2 3 4 5
A B
DCExpress probabilities as fractions, percents, or decimals.
Classify triangles according to angle size and/or length of sides.
Calculate volume of simple three‐dimensional shapes.
Given the coordinates of a quadrilateral, plot the quadrilateral on a grid.
Analyze the graphs of the perimeters and areas of squares having different‐length sides.
Determine the largest rectangular area for a fixed perimeter.
Identify coordinates for ordered pairs that satisfy an algebraic relation or function.
Determine and justify the similarity or congruence for two geometric shapes.
Obtain historical data about local weather to predict the chance of snow, rain, or sun during year.
Test consumer products and illustrate the data graphically.
Plan a large school event and calculate resources (food, decorations, etc.) you need to organize and hold this event.
Make a scale drawing of the classroom on grid paper, each group using a different scale.
Calculate percentages of advertising in a newspaper.
Tour the school building and identify examples of parallel and perpendicular lines, planes, and angles.
Determine the median and mode of real data displayed in a histogram
Organize and display collected data, using appropriate tables, charts, or graphs.

Rigor/Relevance Framework
1
23
456
1 2 3 4 5
A B
DCAnalyze the graphs of the perimeters
and areas of squares having different‐length sides.
Determine the largest rectangular area for a fixed perimeter.
Identify coordinates for ordered pairs that satisfy an algebraic relation or function.
Determine and justify the similarity or congruence for two geometric shapes.
Obtain historical data about local weather to predict the chance of snow, rain, or sun during year.
Test consumer products and illustrate the data graphically.
Plan a large school event and calculate resources (food, decorations, etc.) you need to organize and hold this event.
Make a scale drawing of the classroom on grid paper, each group using a different scale.
Calculate percentages of advertising in a newspaper.
Tour the school building and identify examples of parallel and perpendicular lines, planes, and angles.
Determine the median and mode of real data displayed in a histogram
Organize and display collected data, using appropriate tables, charts, or graphs.
Express probabilities as fractions, percents, or decimals.
Classify triangles according to angle size and/or length of sides.
Calculate volume of simple three‐dimensional shapes.
Given the coordinates of a quadrilateral, plot the quadrilateral on a grid.

Rigor/Relevance Framework
1
23
456
1 2 3 4 5
A B
DCExpress probabilities as fractions, percents, or decimals.
Classify triangles according to angle size and/or length of sides.
Calculate volume of simple three‐dimensional shapes.
Given the coordinates of a quadrilateral, plot the quadrilateral on a grid.
Analyze the graphs of the perimeters and areas of squares having different‐length sides.
Determine the largest rectangular area for a fixed perimeter.
Identify coordinates for ordered pairs that satisfy an algebraic relation or function.
Determine and justify the similarity or congruence for two geometric shapes.
Obtain historical data about local weather to predict the chance of snow, rain, or sun during year.
Test consumer products and illustrate the data graphically.
Plan a large school event and calculate resources (food, decorations, etc.) you need to organize and hold this event.
Make a scale drawing of the classroom on grid paper, each group using a different scale.
Calculate percentages of advertising in a newspaper.
Tour the school building and identify examples of parallel and perpendicular lines, planes, and angles.
Determine the median and mode of real data displayed in a histogram.
Organize and display collected data, using appropriate tables, charts, or graphs.

A B
DC

Performance Task drawn from the Ohio Performance Assessment Project.
Available at, www.ModelSchoolsConference.com/handouts12.html

Teaching

1
2
3
1 2 3 4 5
A B
DC
• Calculate with numbers, including decimals, ratios, percents, and fractions.
• Understand two‐dimensional motion and trajectories by separating the motion of an object into x and y components.
Rigor/Relevance Framework
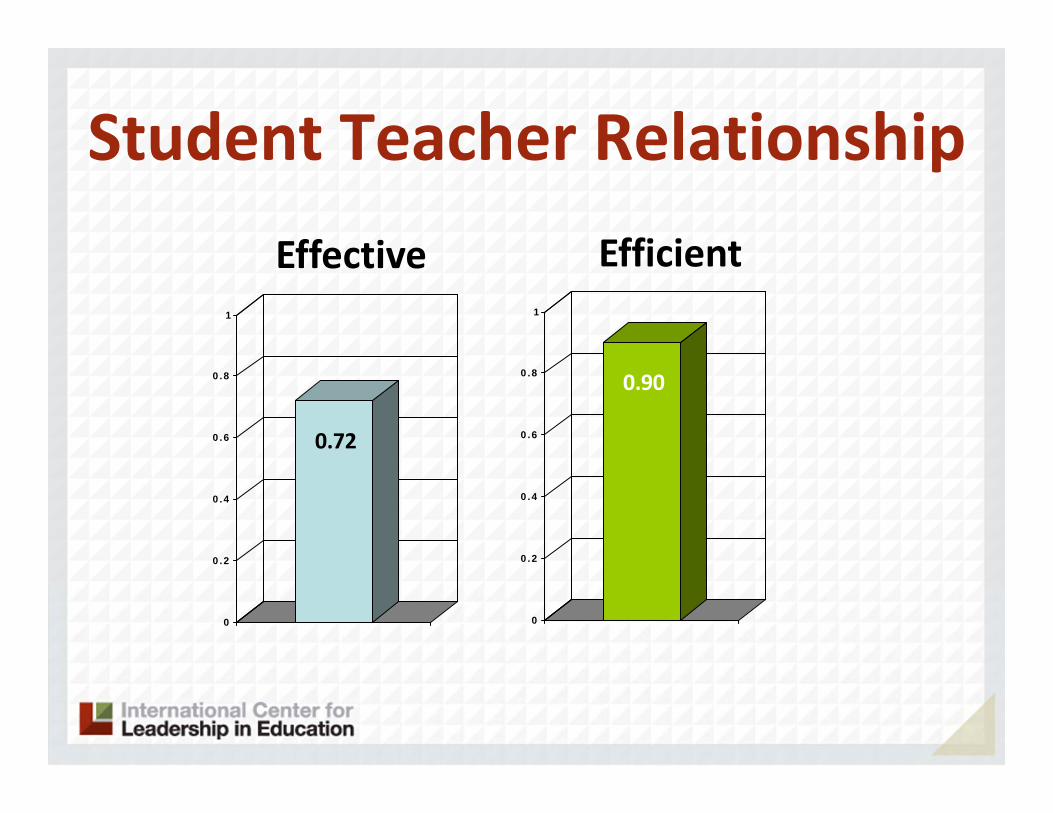
1
2
3
1 2 3 4 5
A BDC
• Know the characteristics and phenomena of sound waves and light waves.
• Understand the effect of sounds, words, and imagery on a listening audience.
Rigor/Relevance Framework

Available Resources
•Power Point•White Papers•“Rigor and Relevance – From Concept to Reality”
•Presentation to Staff•Instructional Materials

RIGOR
RELEVANCE
A B
DC
Rigor/Relevance Framework
Teacher Works
StudentThinks
Student Thinks and Works
StudentWorks
High
HighLow
Low
Teacher/Student Roles

Rigorand
RelevanceHandbook

Selection of Strategies Based on Rigor/Relevance Framework

Instructional Strategies: How to Teach for Rigor and Relevance

Discussion Question
• In what Quadrant (A, B, C, D) would most of your instruction fall in your core academic courses?
• In what Quadrant (A, B, C, D) would your instruction be least likely to be found in your core academic courses?
Organizational Leadership

• Foundation Learning (Achievement in the core subjects of English language arts, math and science, and others identified by the school)
Learning Criteria

• Foundation Learning (Achievement in the core subjects of English language arts, math and science, and others identified by the school)
• Stretch Learning (Demonstration of rigorous and relevant learning beyond the minimum requirements)
Learning Criteria

• Foundation Learning (Achievement in the core subjects of English language arts, math and science, and others identified by the school)
• Stretch Learning (Demonstration of rigorous and relevant learning beyond the minimum requirements)
• Learner Engagement (The extent to which students are motivated and committed to learning; have a sense of belonging and accomplishment; and have relationships with adults, peers, and parents that support learning)
• Personal Skill Development (Measures of personal, social, service, and leadership skills and demonstrations of positive behaviors and attitudes)
Learning Criteria

Guiding Principles
• Responsibility• Contemplation• Initiative• Perseverance• Optimism• Courage
• Respect• Compassion• Adaptability• Honesty• Trustworthiness• Loyalty

• Foundation Learning (Achievement in the core subjects of English language arts, math and science, and others identified by the school)
• Stretch Learning (Demonstration of rigorous and relevant learning beyond the minimum requirements)
• Learner Engagement (The extent to which students are motivated and committed to learning; have a sense of belonging and accomplishment; and have relationships with adults, peers, and parents that support learning)
• Personal Skill Development (Measures of personal, social, service, and leadership skills and demonstrations of positive behaviors and attitudes)
Learning Criteria

Rubrics

Where our students come from should not predetermine were they are going. We can and we
must make their future brighter.

Our greatest responsibility is to our most most needy students

Next Steps

Survey Tools for Rigor, Relevance and Relationships
We Learn Student Survey
We Teach Instructional Staff Survey
We LeadWhole Staff Survey

Teacher vs. Student Comparison
T – Students can apply what I am teaching to their everyday lives. 92%
S – I can apply what I learn to my everyday life. 58%

Teacher vs. Student Comparison
T – Students in my classroom engage in hands‐on activities. 88%
S – We do lots of hands‐on activities in my classes. 45%

Teacher vs. Student Comparison
T – I make learning exciting for my students. 84%
S – My teachers make learning exciting. 40%

Teacher vs. Student Comparison
T – I recognize students when they demonstrate positive behavior in school. 95%
S – Good citizenship is rewarded in this school. 40%

Available Resources
•Power Point•White Papers• Resource Guide• WE surveys

Discussion Question• How accurate is the “Not on the Test” song for your school(s)?
• Would staff and students agree with your assessment?
• How do you report success on each ofthe four Learning Criteria (Foundation,Stretch, Learner Engagement and Guiding Principles)?


Instructional Leadership

600
800
1000
1400
1600
1200
Text
Lex
ile M
easu
re (L
)
HighSchool
Literature
CollegeLiterature
HighSchool
Textbooks
CollegeTextbooks
Military PersonalUse
Entry-LevelOccupations
SAT 1,ACT,AP*
* Source of National Test Data: MetaMetrics
Reading Study SummaryInterquartile Ranges Shown (25% - 75%)

Instructional Leadership

Instructional Leadership

Instructional Leadership

Take off the plate

Next Network

1 2 3 4 5

Road Map
• State Standards to State Test

StateTests
StateStandards
A
A

Oklahoma English LA CSAP
High Medium Low Grade 3 5 6 47 Grade 4 5 5 44 Grade 5 31 5 24 Grade 6 5 6 41 Grade 7 3 9 44 Grade 8 25 8 19 Grade 10 15 15 15 Grade 11 18 16 16

NESS &
Lexile
StateTests
StateStandards
A

National Essential Skills Study (NESS)

NESS StudySubgroup Rankings
ELA Skill: Write clear and concise directions or procedures.
Group Rank
Overall 9
Business/Industry 2
Other Non-educators 10
English Language Arts Teachers 25
Other Educators 8

NESS StudySubgroup Rankings
ELA Skill: Give clear and concise oral directions.
Group Rank
Overall 7
Business/Industry 3
Other Non‐educators 9
English Language Arts Teachers 28
Other Educators 7

NESS StudySubgroup Rankings
Math Skill: Apply the Pythagorean Theorem to right triangles.
Group Rank
Overall 20
Business/Industry 29
Other Non‐educators 31
Mathematics Teachers 4
Other Educators 24

NESS StudySubgroup Rankings
Math Skill: Understand accuracy and precision of measurement, round off numbers according to the correct number of significant figures, and determine percent error.
Group Rank
Overall 12
Business/Industry 3
Other Non‐educators 10
Mathematics Teachers 30
Other Educators 8

Proficiency

Reading Study Summary
600
800
1000
1400
1600
1200
Text
Lex
ile M
easu
re (L
)
HighSchool
Literature
CollegeLiterature
HighSchool
Textbooks
CollegeTextbooks
Military PersonalUse
Entry-LevelOccupations
SAT 1,ACT,AP*
* Source of National Test Data: MetaMetrics
Interquartile Ranges Shown (25% - 75%)

NESS &
Lexile
StateTests
StateStandards
A

CommonCore
Standards
NESS&
Lexile
StateTests
StateStandards
A

Road Map
• State Standards to State Test• State Standards to Research• State Standards to CCSS• CCSS to State Standard
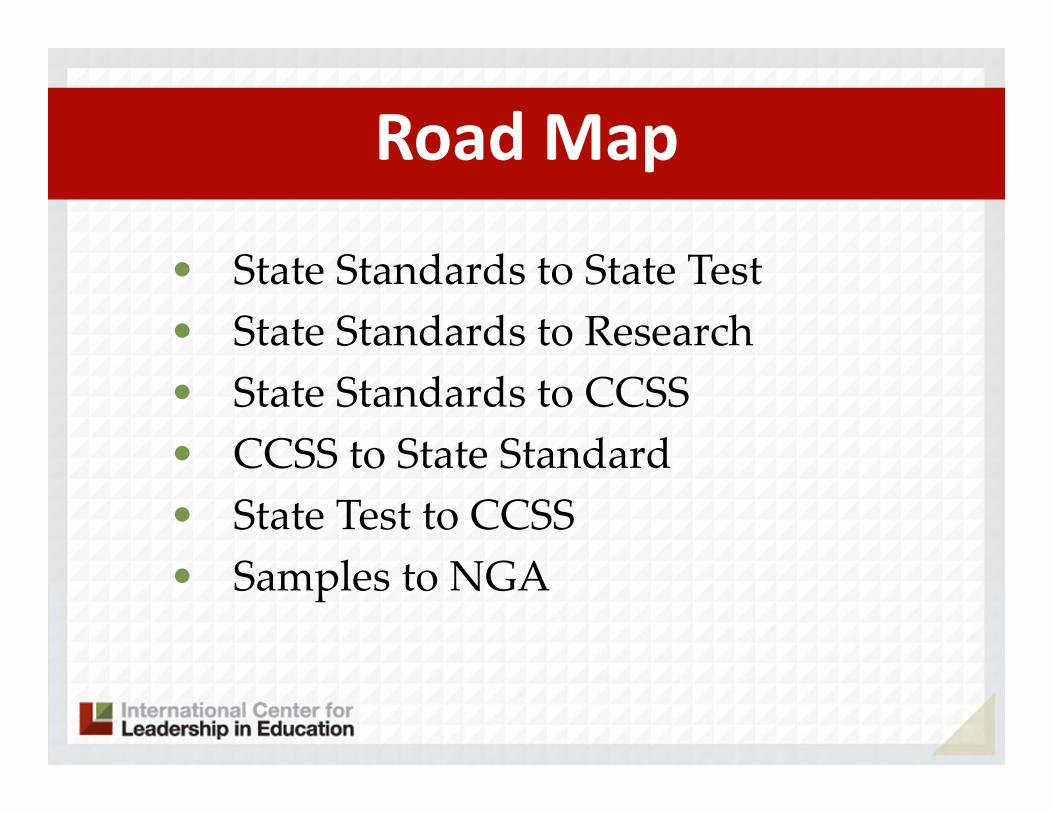
Road Map
• State Standards to State Test• State Standards to Research• State Standards to CCSS• CCSS to State Standard• State Test to CCSS• Samples to NGA

Road Map
• State Standards to State Test• State Standards to Research• State Standards to CCSS• CCSS to State Standard• State Test to CCSS• Samples to NGA

Performance Task drawn from the Ohio Performance Assessment Project.
Available at, www.ModelSchoolsConference.com/handouts12.html

State Test NGACreate a large spinner for a game that has at least eight sectors. Each sector should be assigned a different ‘prize’. Prizes should range in value from most appealing to least appealing.
Vary the sectors so that the probability to win a desired prize is much less that the probability to win a lesser desired prize. Calculate the theoretical probability of landing on each prize.
Conduct multiple trials with the spinner and determine the experimental probability of landing on each prize. Which price has the greatest probability and which prize has the least probability?

CommonCore
Standards
NESS&
Lexile
StateTests
StateStandards
ConsortiumAssessment
DA

Gold Seal Lessons

Net Network Resources
• Professional Development

Net Network Resources
• Professional Development• Verb Analyzer
‐continuous improvement

Net Network Resources
• Professional Development• Verb Analyzer
‐continuous improvement • Video Cast

Net Network Resources
• Professional Development• Verb Analyzer
‐continuous improvement • Video Cast• Case Studies

Net Network Resources
• Professional Development• Verb Analyzer
‐continuous improvement • Video Cast• Case Studies• Bulletins/Updates

Oklahoma Career & Technical Education
Oklahoma Language ArtsPriority Academic Student Skills
Strands/Standards/ObjectivesEnglish II
End of Instruction (E
OI)
(Reading)
Agriculture, Food& Natural Resources
Architecture&
Construction
Arts, A/V Technology& Communications
Food Products &
Processing Systems
Agribusiness System
s
Power, Structural &
T
echnical Systems
Environm
ental Service System
s
Plant Systems
Natural R
esource System
s
Anim
al Systems
Design/
Pre-Construction
Construction
Maintenance/
Operations
Performing A
rts
Visual A
rts
Printing Technology
Journalism &
B
roadcasting
A/V
Technology
& Film
Telecom
munications
1. Apply a knowledge of Greek (e.g.; tele/phone, micro/phone), Latin (e.g., flex/ible), and Anglo-Saxon (e.g.,un/friend/ly) roots, prefixes, and suffixes to determine word meanings.
H
*2. Research word origins as an aid to understanding meaning, derivations, and spelling as well as influences on the English language.
L
3. Use reference material such as glossary, dictionary, thesaurus, and available technology to determine precise meaning and usage.
H
4. Discriminate between connotative and denotative meanings and interpret the connotative power of words. H
5. Use word meanings within the appropriate context and verify these meanings by definition, restatement, example, and analogy.
H

Oklahoma Arts EducationOklahoma Language Arts
Priority Academic Student Skills
Grade 8
OCCTGrade 8Reading/ Writing
Visual Arts Dance Music Theatre
a. Idioms: expressions that cannot be understood just by knowing the meanings of the words in the expression, such as Rush hour traffic moves at a snail's pace or as plain as day.
H H H H H
b. Analogies: comparisons of the similar aspects of two different things. H H H H H
c. Metaphors: implies comparisons, such as, The cup of hot tea was the best medicine for my cold. H H H H H
d. Similes: comparisons that use like or as, such as, The ice was smooth as glass before the skaters entered the rink.
H H H H H
4. Read silently for increased periods of time. L L L L L
b. Show understanding by asking questions and supporting answers with literal information from text. M M M M M
a. Make inferences and draw conclusions supported by text evidence and student experiences. H M M M M
a. Determine the main (or major) idea and how those ideas are supported with specific details. M H H H H

Available Resources•Power Point•White Papers• Next Network• Gold Seal Lessons• CTE Curriculum Matrix• Art Curriculum Matrix

Discussion Question• Identify specific actions your school(s)should take to provide staff information, tools and skills to best prepare them for the CCSS and Next Generation Assessments?

Instructional Leadership

Discussion Question• What should be included in your Professional Development program over the next 24 month?
• Who should be included in Professional Development?

Available Resources• Consultants from the nations most rapidly improving schools
• Next Network• Model Schools Conference (June 30‐July 3)
• Site visits to nations most rapidly improving schools

Organizational Leadership

• Looping
Organizational Changes

• Looping• Interdisciplinary Chairs
Organizational Changes

Repeating Grades 2010‐11
SOURCE: US Department of Education

• Looping• Interdisciplinary Chairs• 9th Grade Electives
Organizational Changes
Discussion Question• What, if any, organizational changes should you make in your school(s)?
• What barriers will you encounter when attempting to make these chances?
• How might you overcome these barriers?

Available Resources•Consulting Services• Executive Coaches

Organizational Leadership

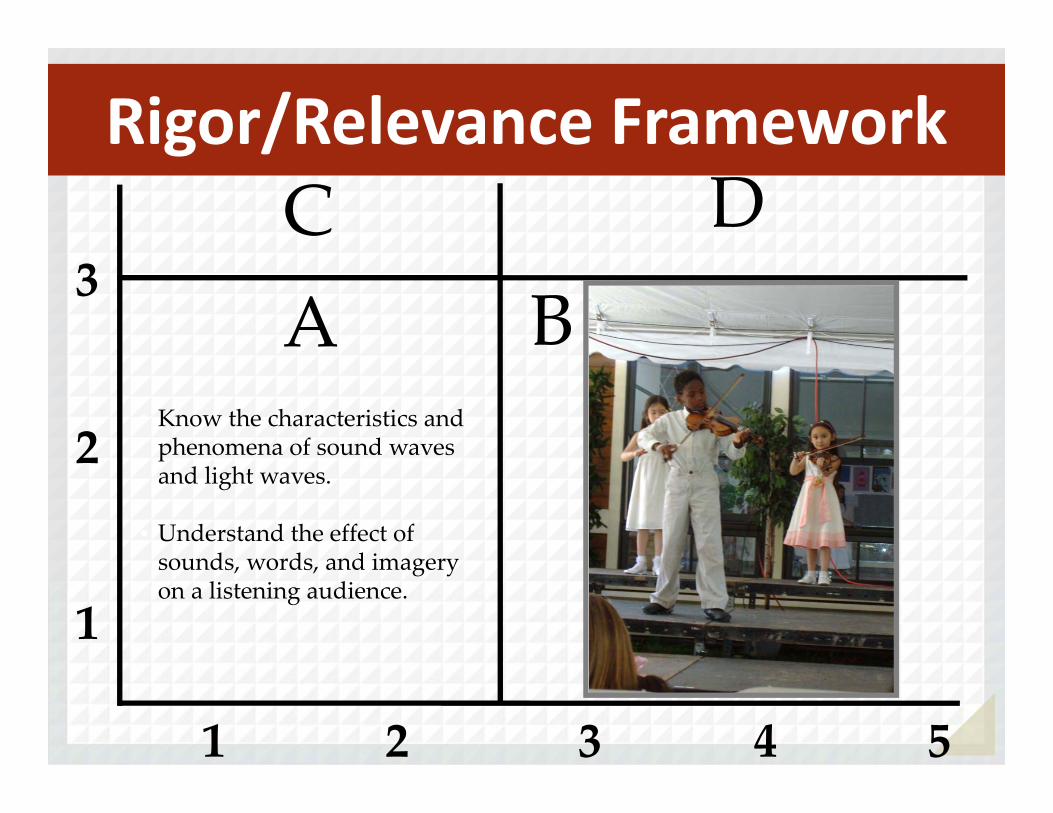
Top‐down support for bottom‐up success

Empower Leadership Teams

• Coherent Vision• Empowerment
Leadership Teams

Today’s Leaders
Must visualized, understand, decide and direct.
Trained to only decide and direct.

C o n t r o l
Vision Driven
Low
HighLow
High
Transformational Leadership Framework

C o n t r o l
Vision Driven
A
Low
HighLow
High
Transformational Leadership Framework

C o n t r o l
Vision Driven
A B
Low
HighLow
High
Transformational Leadership Framework

C o n t r o l
Vision Driven
A B
CLow
HighLow
High
Transformational Leadership Framework
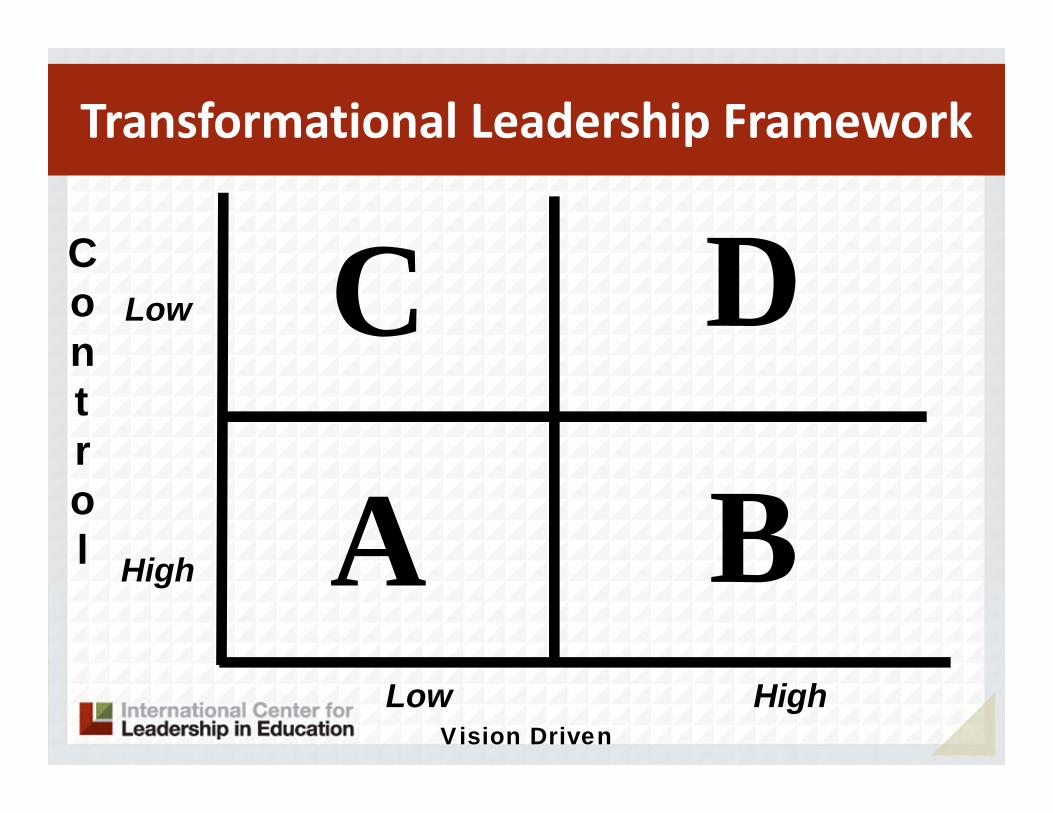
C o n t r o l
Vision Driven
A B
DCLow
HighLow
High
Transformational Leadership Framework

A
C D
B
Rules
Results
Leadership

A
C D
B
Control
Empower
Rules
Results
Leadership

A
C D
B
Teaching / Teachers
Learning / Students
Rules Control
Results Empower
Leadership

A
C D
B
Compliance
Engaged
Rules Control Teaching/Teachers
Results Empower Learning / Students
Leadership

A
C D
B
Inputs
Outputs
Compliance Rules Control Teaching/Teachers
Engage Results Empower Learning / Students
Leadership

Innovation that happens from the top down tends to be orderly, but dumb.
Innovation that happens from the bottom up tends to be chaotic
and smart.

Practical strategies to support school and district leaders:• Supporting teachers in changing instruction to meet the requirements of the
Common Core State Standards and Next Generation Assessments • Approaching evaluation from the broader perspective of selection, support, and
evaluation of all educators • Providing meaningful Teacher Evaluations even with limited time and resources

Lead from Respect

Organizational Leadership

Organizational Leadership

• Foundation Learning (Achievement in the core subjects of English language arts, math and science, and others identified by the school)
• Stretch Learning (Demonstration of rigorous and relevant learning beyond the minimum requirements)
• Learner Engagement (The extent to which students are motivated and committed to learning; have a sense of belonging and accomplishment; and have relationships with adults, peers, and parents that support learning)
• Personal Skill Development (Measures of personal, social, service, and leadership skills and demonstrations of positive behaviors and attitudes)
Learning Criteria

Discussion Question• Is your new Teacher Evaluation program tied to selection and support?
• Do you evaluate staff on all four Learning Criteria?

Available Resources•Consulting Services• Executive Coaches

Organizational Leadership

Reading Study Summary
600
800
1000
1400
1600
1200
Text
Lex
ile M
easu
re (L
)
HighSchool
Literature
CollegeLiterature
HighSchool
Textbooks
CollegeTextbooks
Military PersonalUse
Entry-LevelOccupations
SAT 1,ACT,AP*
* Source of National Test Data: MetaMetrics
Interquartile Ranges Shown (25% - 75%)

Lexile Framework® ‐ Student ProfileMatt ‐ Age 15, Grade 10, Lexile 1090, GPA 3.0
600
800
1000
1400
1600
1200
Text
Lex
ile M
easu
re (L
)
Matt
910
* Source of National Test Data: MetaMetrics

Lexile Framework® ‐ Student Profile
600
800
1000
1400
1600
1200
Text
Lex
ile M
easu
re (L
)
HighSchool
Literature
CollegeLiterature
HighSchool
Textbooks
CollegeTextbooks
Military PersonalUse
Entry-LevelOccupations
SAT 1,ACT,AP*
* Source of National Test Data: MetaMetrics
Matt600
800
1000
1400
1600
1200
HighSchool
LiteratureCollege
Literature
HighSchool
TextbooksCollege
Textbooks
Military
PersonalUse
Entry-LevelOccupations
SAT 1,ACT,AP*
1st
Quarter2nd
Quarter3rd
Quarter4th
Quarter

• Foundation Learning (Achievement in the core subjects of English language arts, math and science, and others identified by the school)
• Stretch Learning (Demonstration of rigorous and relevant learning beyond the minimum requirements)
• Learner Engagement (The extent to which students are motivated and committed to learning; have a sense of belonging and accomplishment; and have relationships with adults, peers, and parents that support learning)
• Personal Skill Development (Measures of personal, social, service, and leadership skills and demonstrations of positive behaviors and attitudes)
Learning Criteria

Discussion Question• Of the four Learning Criteria (Foundation, Stretch, Student Engagement and Guiding Principles) which ones should be included in yourdata reporting systems?
•Should you report student performance and growth in Lexiles?

Available Resources• Rubrics• Consultant Services


Teaching

Teaching

A B
DC

How Students Learn

A B
DC

Discussion Question• Is instruction in your school(s) based on how teachers are comfortable teaching or how the 21st Century student learns?
• What, if anything, should be done to address this issue?

Available Resources• White papers• “What Brain Research Teaches About Rigor, Relevance and Relationaship”
• Consultant Services

Teaching

Rigorand
RelevanceHandbook

Selection of Strategies Based on Rigor/Relevance Framework

Instructional Strategies: How to Teach for Rigor and Relevance

Teaching

Available Resources• Next Network• Smarter Balanced Assessments• PARCC
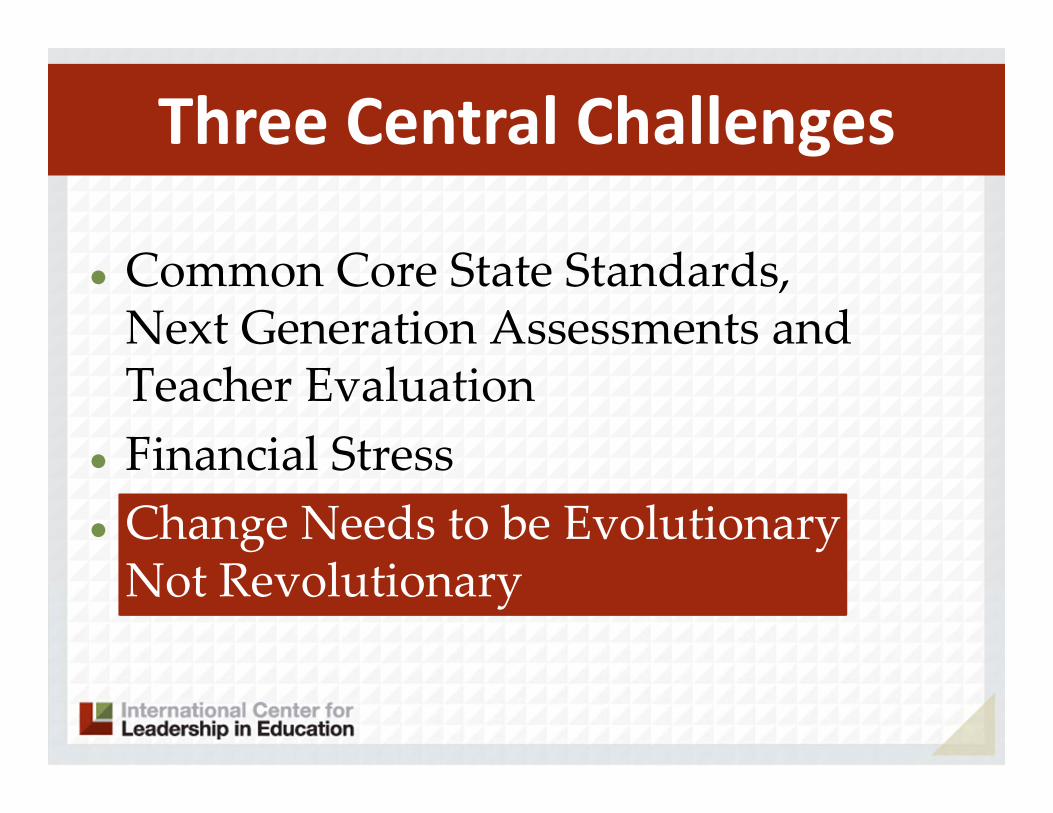
Common Core State Standards, Next Generation Assessments and Teacher Evaluation
Financial Stress Change Needs to be Evolutionary Not Revolutionary
Three Central Challenges

• Professional Development for R/R‐ Create the Culture
Next Steps

• Professional Development for R/R• Next Network with Professional
Development
Next Steps

• Professional Development for R/R• Next Network with Professional
Development• Gold Seal Lessons
Next Steps

• Professional Development for R/R• Next Network with Professional
Development• Gold Seal Lessons• Needs Assessment
Next Steps

• Professional Development for R/R• Next Network with Professional
Development• Gold Seal Lessons• Needs Assessment• Executive Coaching on DSEI
Next Steps

• Professional Development for R/R• Next Network with Professional
Development• Gold Seal Lessons• Needs Assessment• Executive Coaching on DSEI• Special Education and ESL
Next Steps

• Professional Development for R/R• Next Network with Professional
Development• Gold Seal Lessons• Needs Assessment• Executive Coaching on DSEI• Special Education and ESL• Leadership Academy and Model Schools
Conference
Next Steps

Needs Assessments


It is often easier…..
• To build a new house...

It is often easier…..
• To build a new house...• Create a new company…

It is often easier…..
• To build a new house...• Create a new company…• Transform an undeveloped nation…

It is often easier…..
• To build a new house...• Create a new company…• Transform an undeveloped nation…• Create a new school…

1587 Route 146Rexford, NY 12148Phone (518) 399‐2776Fax (518) 399‐7607E‐mail: [email protected]
International Center for Leadership in Education