
Rainfall its - Kendall ARTICLE CITATIONS 3 4 : Musa Northwest / Univers… 12 SEE Mohd. Ikhwan...
11
See discussions, stats, and author profiles for this publication at: http://www.researchgate.net/publication/268146997 Rainfall Dynamics of Terengganu Malaysia and its Recent Trends Analysis Using the Mann- Kendall Test ARTICLE · NOVEMBER 2014 CITATIONS 3 4 AUTHORS: Musa Garba Abdullahi Northwest University Kano Nigeria/ Univers… 12 PUBLICATIONS 3 CITATIONS SEE PROFILE Mohd. Ikhwan Toriman Universiti Sultan Zainal Abidin | UniSZA 97 PUBLICATIONS 145 CITATIONS SEE PROFILE Muhammad Barzani Gasim Universiti Sultan Zainal Abidin 28 PUBLICATIONS 30 CITATIONS SEE PROFILE Hafizan Juahir Universiti Sultan Zainal Abidin | UniSZA 78 PUBLICATIONS 303 CITATIONS SEE PROFILE Available from: Musa Garba Abdullahi Retrieved on: 22 August 2015
-
Upload
jallahaeyjay -
Category
Documents
-
view
4 -
download
0
Transcript of Rainfall its - Kendall ARTICLE CITATIONS 3 4 : Musa Northwest / Univers… 12 SEE Mohd. Ikhwan...

Seediscussions,stats,andauthorprofilesforthispublicationat:http://www.researchgate.net/publication/268146997
RainfallDynamicsofTerengganuMalaysiaanditsRecentTrendsAnalysisUsingtheMann-KendallTest
ARTICLE·NOVEMBER2014
CITATIONS
3
4AUTHORS:
MusaGarbaAbdullahi
NorthwestUniversityKanoNigeria/Univers…
12PUBLICATIONS3CITATIONS
SEEPROFILE
Mohd.IkhwanToriman
UniversitiSultanZainalAbidin|UniSZA
97PUBLICATIONS145CITATIONS
SEEPROFILE
MuhammadBarzaniGasim
UniversitiSultanZainalAbidin
28PUBLICATIONS30CITATIONS
SEEPROFILE
HafizanJuahir
UniversitiSultanZainalAbidin|UniSZA
78PUBLICATIONS303CITATIONS
SEEPROFILE
Availablefrom:MusaGarbaAbdullahi
Retrievedon:22August2015

ISSN 2348-6201
372 | P a g e N o v e m b e r 0 4 , 2 0 1 4
Rainfall Dynamics of Terengganu Malaysia and its Recent Trends Analysis Using the Mann-Kendall Test.
Musa G. Abdullahi1 MSc. (in view), Mohd Ekhwan Toriman2 PhD ,
Mohd Barzani Gasim2 PhD, Hafizan Juahir2 PhD 1Department of Biotechnology (East cost) Universiti Sultan Zainal Abidin, Terengganu, Malaysia
2Department of Biotechnology (East cost) Universiti Sultan ZainalAbidin, Terengganu, Malaysia
2Director (East Cost) Department of Biotechnology Universiti Sultan ZainalAbidin Terengganu, Malaysia
2Department of Biotechnology (East cost) Universiti Sultan Zainal Abidin, Terengganu, Malaysia
E-mail: [email protected]
Abstract
This study investigated the pattern and trends of the daily rainfall data in Terengganu Malaysia based on seasonal rainfall indices. The statistics of rainfall indices were calculated in terms of their means for seven stations in Terengganu Malaysia for the period 2000 to 2012. The findings indicate that the trend in the study area has no significant changes in stations (1, 4 and 6) while station (2, 3, 5 and 7) shows significant changes and southwest monsoon had the greatest impact on the whole stations, particularly in characterizing the rainfall pattern of the area. During this season, the study area could be considered as the wettest region since all rainfall indices tested are higher than in other neighboring state of the Peninsula. Otherwise, the northwest of the area is denoted as the driest part of the state during the northeast monsoon period. The northwest of the state is less influenced by the northeast monsoon because of the existence of the Titiwangsa Range, which blocks some part of the region from receiving heavy rainfall. On the other hand, it is found that the areas with lowlands are strongly characterized by the northeast monsoonal flow.The results of the Mann-Kendall test, shows that, trends of the total amount of rainfall during the southwest monsoon decrease at some of the stations. The rainfall intensity increases in contrast, increasing trends in the total amount of rainfall were observed at three stations during the northeast monsoon, which give rise to the increasing trend of rainfall intensity. The results for the combined stations in both seasons indicate that there are no significant changes in trends during the extreme events for the Terengganu Malaysia. However, a smaller number of significant trends were found for extreme intensity.
Keywords:
Monsoon season, frequency of wet days; Mann-Kendall test; homogeneity test; rainfall intensity, total amount of rainfall.
Council for Innovative Research
Peer Review Research Publishing System
Journal: JOURNAL OF ADVANCES IN BIOTECHNOLOGY Vol .4, No. 2.
www.cirjbt.org , [email protected]

ISSN 2348-6201
373 | P a g e N o v e m b e r 0 4 , 2 0 1 4
Introduction
Rainfall is vital natural resources on the earth which can be seen as the major backbone of all the water resources in the earth, and is one of the key climatic variables that affect both the spatial and temporal pattern of water variability.One of the challenges posed by climate change/climate variability is ascertainment, identification and quantification of trends in rainfall and their implications on surface water, river flow and groundwater in order to assist in formulation of adaptation measures through appropriate strategies for water resources management. It is also recognized that rainfall is one of the key climatic variables that affect both the spatial and temporal patterns on water availability (De Luis et al.; 2000). Studies on rainfall behavior have attracted a lot of attention from scientists throughout the world.This study of rainfall behavior will help us to determine the expected level and condition of our surface water as well as groundwater in the region where we live. Many scientists investigate the changes in rainfall pattern and trends in different location in the world.Some of their results show significant positive trends in rainfall such as the study carried out in northern and central Italy, while thestudies involving Italian long records confirm a strongdecrease in precipitation trends over Italy, with a rainfall reduction of about 135 mm in the southern regions duringthe last 50 years (Palmieriet al., 1991; Brunettiet al., 2004; Brunettiet al., 2006). Study of rainfall trend in Nigeria also revealed that there is decrease in trend in some part of the country especially in Akwa-Ibom state (Hess et al. 1995). In addition, a decrease in rainfall can also be found in some parts of the world such as in Kenya (Kipkorir, 2002), in the northern China (Gong et al. 2004) in Sicily region (Cannarozzo, et al. 2006)
Like the other state of Malaysia, Terengganu being exposed to the coast receives heavy rainfall when the north-east monsoon blows between Novembers to January; some areas suffer flooding at this time of year. However the annual rainfall was found to decrease in the area and even in the whole of Southeast Asia region between 1961 and 1998, and the number of rainy days has decreased significantly throughout most of the countries of Southeast Asia (Manton et al.2001), also between 1901 to 1989 studies carried out in Ganga Basin in India showed a decreasing trend (Kothyari and Singh, 1996). In addition to this, the recent studies carried out in the central mountainous region of Sri Lanka indicated that the annual rainfall decreased between 1964 and 1993 while the highest decrease was detected in March-April (Herath and Ratnayake, 2004) these also lead to the decreased in the number of rainy days in the region which give rise to an increase in trend in rainfall intensity.
Juneng et al; (2007) stated that, in Malaysia several events have been reported in recent years which is an extreme and drought events. For example, an extreme rainfall event from 9 to 11 December 2004 caused severe floods over the east-coast of Peninsula Malaysia and the effect was very worst in Terengganu state. These activities are mostly occurred between November and January due to heavies rainfall caused by cold surges of the north-east monsoon (Meteorological Department, 2006). Also in some part of the state drought occurred significantly which affect the environment and sometimes caused extensive wild forest fire like other parts of the country.
This present study endeavor to provide the dynamics and trend analysis of the behavior of seasonal rainfall in Terengganu east coast of peninsular Malaysia over the past of 13years, the large variability in time and space requires that, for accurate unbiased results long-term climate analyses be based on homogeneous data. Homogeneity is the one in which variations are caused only by variations in weather and climate (Conrad and Pollak, 1950). Change in instruments, station location, station environment and other non climatic factors can also affect the homogeneity of the data. Therefore some test and adjustment is needed to detect the non- homogeneities.
Study Area
Terengganu is a state of Malaysia; it is situated in the coordinate 4045
1N latitude and 103
00
1E longitude which is located in
the north-eastern of Peninsula Malaysia. Terengganu is about 500km northeast Kuala Lumpur and is bordered in the northwest by Kelantan, the southwest by Pahang and the east by South China Sea. Several outlying islands including Pulau Perhention, Pulau Kapas and Pulau Redang are also a part of the state. Like the other states of the country, Terengganu has tropical monsoon climate which is generally fairly hot and humid all year around. The temperature is relatively uniform within the range of 21
0C to 32
0C throughout the year. During the months of January to April, the weather
is generally dry and warm. Humidity is consistently high which approximately 80% in day time and slightly cooler after sunset nevertheless, the sea breeze from south China Sea has somehow moderating the humidity in offshore areas while altitude and lush forest trees and plants has cooled the mountain and rural areas.
Terengganu has characterized by two main types of monsoon, the southwest monsoon season which is usually established in the latter half of May or early June and end in September, and the northeast monsoon season which is usually starts in early November and ends in March. During this season steady easterly or northeasterly winds of 10 to 20 knots prevail. The winds over the east coast states of Peninsular Malaysia may reach up to 30 knots or more during period of strong surges of cold air from the north (cold surges).Terengganu being exposed to the coast receives heavy rainfall of approximately between 2034mm to 2504mm per year which can easily break the bank of the rivers and cause overbank discharge. When the northeast monsoon blows between Novembers to January some areas suffer flooding at this time of year and still in some clear sunny days during the monsoon season, surprisingly east coast is always presented with clear blue sky and cooling wind.
However in the whole of Peninsular Malaysia, the north-east monsoon is the major rainy season which develops in conjunction with cold air outbreaks from Siberia produce heavy rains which often cause severe floods along the east coast states of Terengganu, Kelantan, Pahang and east Johor in Peninsular Malaysia (www.terengganutourism.com/weather.htm). The figure one below shows the district/stations were the selected rainfall stations for this study are located.

ISSN 2348-6201
374 | P a g e N o v e m b e r 0 4 , 2 0 1 4
Fig.1: The Map of the Study area; showing different District/Stations where data are collected.
Materials and Methods
The daily rainfall data from seven rain gauge stations collected from the Department of Irrigation and Drainage Terengganu (DID) for the period of 2000 to 2012 were sorted and arranged in an excel for different homogeneity test. The list of the stations, codes and their coordinates is given in Table 1 below.
Codes Stations Latitude Longitude
5524001 Besut 5044
’20
’’N 102
029
’35”E
4832011 Dungun 4047’00”N 103
026’00”E
4234109 Kemaman 4014’00”N 103
027’00”E
5229430 Nerus at Bukit 5017’30”N 102
055’20”E
4733084 Paka 4039’00”N 103
026’00”E
4131001 Cherul at Ho, Tereng. 4021’56”N 103
017’50”E
4930038 Menerong 4056’20”N 103
003’45”E
Table 1: Showing the stations with their codes and coordinates
Data Quality and Analysis
The data was sorted and arranged in Excel and checked the homogeneity of it using the standard normal homogeneity test and Von Neumann ratio test. The data series from these seven stations that were used in this study were found to be homogeneous. And the data was dully completed with only a missing data of less than 5% for the period of 2000 to 2012. Weighing method such as correlation and inverse distance was used to estimate the missing data during this analysis as suggested by (Suhaila et al. 2008). Next XLSTAT Mann-Kendall test was employed to analyze the trends in both rainfalls for all the seven stations using the monthly data of period 2000 to 2012. The test is to identify whether or not a statistically significant decreasing or increasing trends or none could be found in a data set. Mann-Kendall test is a nonparametric test for identifying trends in a series of data. Confidence levels of 90 and 95 percent were taken as thresholds to classify the significance of the trends, p-values smaller than 0.05 must to be fulfilled before the trend test was concluded to be significant.
Mann-Kendall Test
Mann (1945) presented a non-parametric statistical test for randomness against time, which constitute a particular application of Kendall’s test for correlation commonly called “Mann-Kendall” or Kendall t test (Kendall, 1962). This method has been applied in many studies to determine whether trends (Monotonic) exist in hydro-metrological data such as rainfall and stream flow. This method is very essential as it has no assumption were made in the data to be tested. Letting be a sequence of measurements over a time, Mann proposed to test the null hypothesis, Ho, that the data

ISSN 2348-6201
375 | P a g e N o v e m b e r 0 4 , 2 0 1 4
come from a population where the random variables are independent and identically distributed (that there is no trend). The alternative hypothesis H1,is that the data follow a monotonic trend over time (that there is trend). Under Ho, the Mann-Kendall test statistics is given by:
Where and are the consecutive series of data values, and is the length of the dataset.
Under the hypothesis of independent and randomly distributed random variables, when the S statistic is
approximately normally distributed with zero mean and variance as:
As a consequence, the standardized Z statistics follow a normal standardized distribution:
It follow that, the hypothesis that there is no trend is rejected when the Z value computed by the equation above is greater in absolute value than the critical value , at a chosen level of significant α.
Results and Discussion
The rainfall data for the period of 13 years (2000 to 2012) of all the stations was checked for homogeneity as explained in data quality above, and found it to be homogeneous. The results of Mann-Kendall t test carried out for the individual stations included in this analysis shows that, there is positive increasing trend in station 3, 5 and 7 which are Kemaman, Paka and Menerong, while the station 2 (Dungun) shows a decreasing trend. The remainder stations 1, 4 and 6 also show no trend that is Besut, Nerus at Bukit and Cherul at Ho, Terengganu. The analysis tables and chart of Mann-Kendall and Sen’s slope estimator has been used for the determination of trend.These were discussed according to stations below.
Station 1 (Besut)
Table 1:Mann-Kendall trend test / Two-tailed test (RAINFALL DATA (mm):
Kendall's tau 0.013
S 157.000
Var(S) 425827.667
p-value (Two-tailed) 0.811
alpha 0.05
The table 1 above is explaining that the computed p-value is greater than the significance level alpha value= 0.05. Therefore the condition is, the null hypothesis cannot be rejected, and the null hypothesis explaining that there is no trend in the analysis. Here for the station 1 above the computed p-value is 0.811 which is greater than 0.05, showing that there is no trend.The risk to reject the null hypothesis H0 while it is true is 81.11% which is a greater percentage. The Sen’s slope below is further explaining this condition, the confidence interval is -26.013, 27.30.

ISSN 2348-6201
376 | P a g e N o v e m b e r 0 4 , 2 0 1 4
0
200
400
600
800
1000
1200
1400
0 20 40 60 80 100 120 140 160
RA
INFA
LL D
ATA
(m
m)
Time step
Time step / RAINFALL DATA (mm)
Sen’s slope:0.063
Station 2 (Dungun)
Table 2:Mann-Kendall trend test / Two-tailed test (RAINFALL DATA (mm)):
Kendall's tau -0.152
S -1839.000
Var(S) 425835.667
p-value (Two-tailed) 0.005
Alpha 0.05
The table 2 above indicated that the computed p-value is less than the significance level alpha value=0.05. The condition here is that, the null hypothesis must to be rejected and accept the alternative hypothesis , and the alternative
hypothesis explaining that there is trend in the analysis. For the station 2 above the computed p-value is 0.005 which is less than 0.05, showing the existence of trend in the analysis of the Dungun district/station.The risk to reject the null hypothesis H0 while it is true is lower than 0.49% which is very small percentage. The Sen’s slope for this station is given below which shows that the trend is decreasing (negative), and the confidence interval is -33.9183, 29.089.
0
500
1000
1500
2000
2500
0 20 40 60 80 100 120 140 160
RA
INFA
LL D
ATA
(m
m)
Time step
Time step / RAINFALL DATA (mm)
Sen's slope: -0.957

ISSN 2348-6201
377 | P a g e N o v e m b e r 0 4 , 2 0 1 4
Station 3 (Kemaman)
Table 3:Mann-Kendall trend test / Two-tailed test (RAINFALL DATA (mm)):
Kendall's tau 0.214
S 2580.000
Var(S) 425818.000
p-value (Two-tailed) < 0.0001
alpha 0.05
The table 3 above shows a trend in this study area asthe computed p-value is less than the significance level alpha value=0.05, the computed p-value in this station is <0.0001 which is less than 0.05, showing the existence of trend in Kemaman district/station.The risk to reject the null hypothesis H0 while it is true is lower than 0.01% which is very small percentage. The Sen’s slope for this station is given below which shows that the trend is increasing (positive), and the confidence interval is -25.844, 29.539.
Sen’s slope: 1.0854928
Station 4 (Nerus at Bukit)
Table 4: Mann-Kendall trend test / Two-tailed test (RAINFALL DATA (mm)):
Kendall's tau 0.043
S 515.000
Var(S) 425825.000
p-value (Two-tailed) 0.431
alpha 0.05
The table 4 above explained that, the computed p-value is greater than the significance level alpha value= 0.05.. Here the computed p-value is 0.431 which greater than 0.05, showing that trend does not exist in this station.The risk to reject the null hypothesis H0 while it is true is 43.09% which is a reasonable percentage.The Sen’s slope below is further explaining this condition, the confidence interval is -25.5451, 260765.
0
200
400
600
800
1000
1200
1400
1600
0 20 40 60 80 100 120 140 160
RA
INFA
LL D
ATA
(m
m)
Time step
Time step / RAINFALL DATA (mm)

ISSN 2348-6201
378 | P a g e N o v e m b e r 0 4 , 2 0 1 4
0
200
400
600
800
1000
1200
1400
0 20 40 60 80 100 120 140 160
RA
INFA
LL D
ATA
(m
m)
Time step
Time step / RAINFALL DATA (mm)
Station 5 (Paka)
Table 5: Mann-Kendall trend test / Two-tailed test (RAINFALL DATA (mm)):
Kendall's tau 0.130
S 1572.000
Var(S) 425816.667
p-value (Two-tailed) 0.016
alpha 0.05
The table 5 above also indicated the existence of trend, asthe computed p-value is less than the significance level alpha value=0.05. The condition here is that, the null hypothesis must to be rejected and accept the alternative
hypothesis , and the alternative hypothesis explaining that there is trend in the analysis. The computed p-value in this
station is 0.016 which is less than 0.05, showing the existence of trend in Paka district/station. But the trend is not as strong as in station 3 (Kemaman), the risk to reject the null hypothesis H0 while it is true is lower than 1.61% which is negligible amount. The Sen’s slope below is further explaining this condition, the confidence interval is -27.3790, 31.7730.
Sen's slope: 0.787
0
200
400
600
800
1000
1200
1400
1600
0 20 40 60 80 100 120 140 160
RA
INFA
LL D
ATA
(m
m)
Time step
Time step / RAINFALL DATA (mm)
Sen's slope: 0.185
ISSN 2348-6201
379 | P a g e N o v e m b e r 0 4 , 2 0 1 4
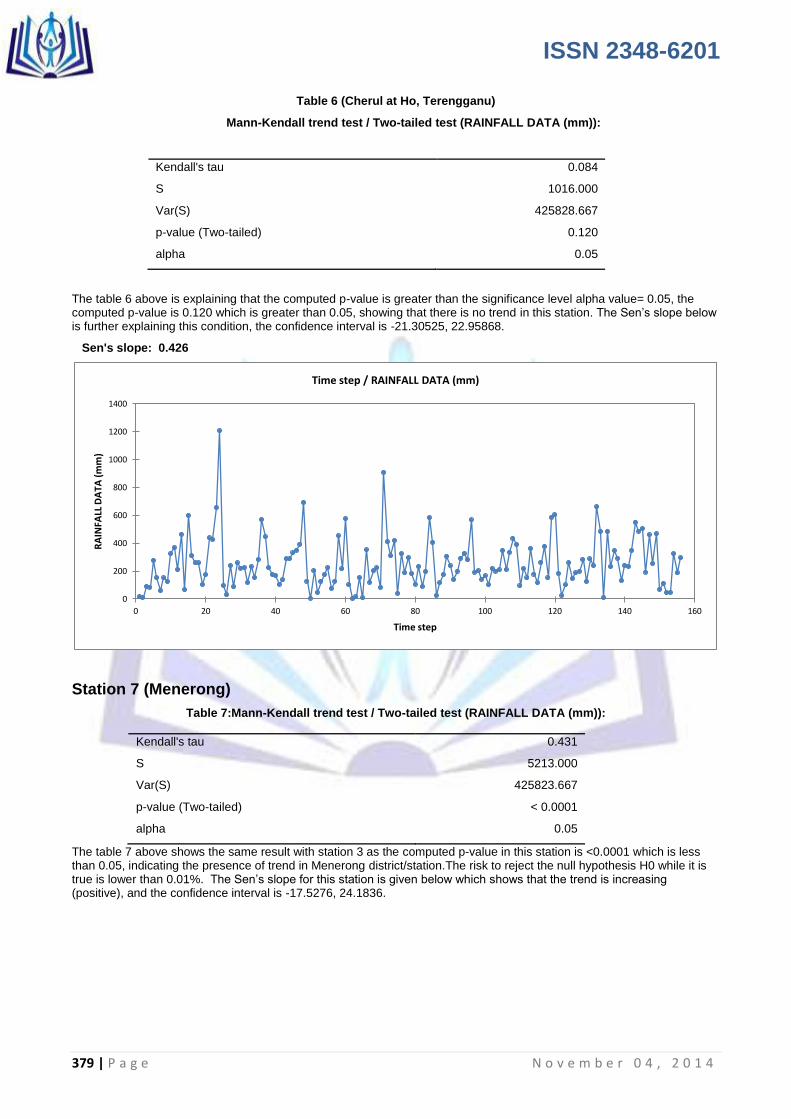
Table 6 (Cherul at Ho, Terengganu)
Mann-Kendall trend test / Two-tailed test (RAINFALL DATA (mm)):
Kendall's tau 0.084
S 1016.000
Var(S) 425828.667
p-value (Two-tailed) 0.120
alpha 0.05
The table 6 above is explaining that the computed p-value is greater than the significance level alpha value= 0.05, the computed p-value is 0.120 which is greater than 0.05, showing that there is no trend in this station. The Sen’s slope below is further explaining this condition, the confidence interval is -21.30525, 22.95868.
Sen's slope: 0.426
Station 7 (Menerong)
Table 7:Mann-Kendall trend test / Two-tailed test (RAINFALL DATA (mm)):
Kendall's tau 0.431
S 5213.000
Var(S) 425823.667
p-value (Two-tailed) < 0.0001
alpha 0.05
The table 7 above shows the same result with station 3 as the computed p-value in this station is <0.0001 which is less than 0.05, indicating the presence of trend in Menerong district/station.The risk to reject the null hypothesis H0 while it is true is lower than 0.01%. The Sen’s slope for this station is given below which shows that the trend is increasing (positive), and the confidence interval is -17.5276, 24.1836.
0
200
400
600
800
1000
1200
1400
0 20 40 60 80 100 120 140 160
RA
INFA
LL D
ATA
(m
m)
Time step
Time step / RAINFALL DATA (mm)

ISSN 2348-6201
380 | P a g e N o v e m b e r 0 4 , 2 0 1 4
Slope: 2.106
The overall stations (1-7)
Table 8: Mann-Kendall trend test / Two-tailed test (RAINFALL DATA (mm)):
Kendall's tau 0.003
S 1776.000
Var(S) 144883768.000
p-value (Two-tailed) 0.883
alpha 0.05
The table 8 above is the overall results for the station 1-7 which shows that the null hypothesis cannot be rejected, that is there is no trend in the combine analyses, asthe computed p-value is greater than the significant level alpha= 0.05, and The risk to reject the null hypothesis H0 while it is true is 88.28% which is significant amount. Hence the Sen’s slope for the station 1-7 is given below which shows that there is no trend and the confidence interval is -3.975, 4.136
Sen's slope:0.002
0
200
400
600
800
1000
1200
1400
1600
1800
0 20 40 60 80 100 120 140 160
RA
INFA
LL D
ATA
(m
m)
Time step
Time step / RAINFALL DATA (mm)
0
500
1000
1500
2000
2500
0 200 400 600 800 1000 1200
RA
INFA
LL D
ATA
(m
m)
Time step
Time step / RAINFALL DATA (mm)

ISSN 2348-6201
381 | P a g e N o v e m b e r 0 4 , 2 0 1 4
Conclusion
The rainfall variations and trends have been assessed using Mann-Kendall t test in Terengganu, Malaysia. The analysis shows that, station 7 (Menerong), has the greatest impact in characterizing the rainfall patterns for the selected stations in the study area, and station 2 has the negative influence as the trend decreasing down. While the remainder that is station 1, 4 and 6 (Besut, Nerus at Bukit and Cherul at Ho, Terengganu) shows no trends, possibly because they are almost in the same geographical coordinates.Some of the researches carried out shows decreases in rainfall trend in Terengganu and Malaysia in general, such as Jamaluden et al. (2010) which used data from 1975 to 2004, Mantol et al. (2001) which covered the period of 1961 to 98. But this research used to find recent trend from 2000 to 2012 so that to see whether the trends are continuously decreasing or remain constant, As the state suffer from risk of flood the decreases in rainfall will reduced the high rate of occurrence, however it can a affect the farm product. The overall analysis of all the seven stations indicated that the trend is constant that is there is no trend from 2000 to 2012 in the study area, as the result of Mann-Kendall test show’s (computed p-value is greater than the alpha value (0.05)). Whereas the individual analysis shows the positive increases in trend in station 3, 5 and 7 and decreasing trend in station 2, while station 1, 4 and 6 indicated that there is no trends.
The findings of this research can provide some information to the government on water management and for predicting future climatic events. Nevertheless, further studies should be conducted to consider more characteristics of rainfall occurrences as well as other climate variables. Further analyses such as bootstrap and permutation test can also be suggested for further verification of the existence of trends whether it occurred by chance in these stations.
Acknowledgments
The authors will like to thanks the entire staff of the Department of Irrigation and Drainage (DID) Terengganu, Malaysia for the providing the daily rainfall data for this study, and the UniSZA postgraduate school for the whole transportations they provided during the site visit and collection of data.
REFERENCES
[1] A.A. Boling, D.P. Garrity, D.T. Franco and A.M. Ramirez (1991). Historical Trends in Rainfall Distribution in the Philippines. Philip j. Crop Sci., 1991 16(3):113-119
[2] Brunette, M., Buffoni, L., Maugeri, M. and Nanni, T.(2000). Precipitation intensity trends in northern Italy. International Jouirnal of Climatology 20:1017-1031.
[3] Cannarozzo, M., Nato, L.V. and Viala, F. (2006). Spatial distribution of rainfall trends in Sicily (1921-2000).Physics and Chemistry of the earth 31:1201-1211
[4] Doing JeongYik, Subramanian Moten, MunirahAriffin and Siva ShangariGovindan (2011). Trends in Intensity and frequency of precipitation extremes in Malaysia from 1951-2009.
[5] Hylock, M. and Nicholls, N. (2000). Trends in Extreme Rainfall Indices for an updated high quality data set for Australia, (1910-1998). International Journal of Climatology 20:1533-1541
[6] JamaludinSuhaila, SayangMuhdDeni, WanzawiahWanzin and Abdul Aziz Jemain (2010). Trends in Peninsular Malaysia Rainfall Data during the Southwest Monsoon and Northeast Monsoon Seasons: (1975-2004). SainsMalaysiana 39(4) (2010): 533-542.
[7] Kothyri, U.C. and Singh, V.P. (1996). Rainfall and Temperature trends in India. Hydrological Processes 10:357-372.
[8] Kundell, J. (2007). Water profile of Malaysia. In: Encyclopedia of Earth. Eds. Cleveland, C.J. http://www.eoearth.org/article/Water_of_Malaysia.
[9] Mann, H.B. (1945). Nonparametric tests against trend. Econometrica 13:245-259
[10] Manton, M.J., Della-Marta, P.M., Haylock, M.R., Hennessy, K.J., Nicholls, N., Chambers, L.E., Collins, D.A., Daw, G., Finet, A., Gunawan, D., Inape, K., Isobe, H., Kestin, T.S., Lefale, P., Lyu, C.H., Lwin, T., Maitrepierre, L., Ouprasitwong, N., Page, C.M., Pahaland, J., Plummer, N., Salinger, M.J., Suppiah, R., Tran, V.L., Trewin, B., Tibig, I. and Yee, D. (2001). Trends in extreme daily rainfall and temperature in Southeast Asia and south Pacific (1961-1998). International Journal of Climatology, 21:269-284
[11] New, M., et al.(2006). Evidence of trends in daily climate extremes over southern and West Africa. Journal of Geophysical Research, 111, D14102.
[12] Srikanthan, R. and Stewart, B.J. (1991). ‘Analysis of Australian rainfall data with respect to climate variability and change’, Aust. Meteorol. Maj., 39, 11-20.
[13] Weather Bill, Inc. (2007). Precipitation Average, Seasonality Volatility and Trends in the United States. Precipitation in the U.S Weather Bill.
[14] Wijngaard, J.B., Klein Tank, A.M.G., and Konnen, G.P. (2003). Homogeneity of 20th
Century European daily temperature and precipitation series. International Journal of Climatology, 21:679-692.