Radical Discrimination in the Death Penalty in Tennessee
19
Tennessee Journal of Law and Policy Tennessee Journal of Law and Policy Volume 5 Issue 1 Article 3 April 2014 Radical Discrimination in the Death Penalty in Tennessee: An Radical Discrimination in the Death Penalty in Tennessee: An Empirical Assessment Empirical Assessment John M. Scheb II University of Tennessee, Knoxville Kristin A. Wagers Follow this and additional works at: https://trace.tennessee.edu/tjlp Part of the Law Commons Recommended Citation Recommended Citation Scheb, John M. II and Wagers, Kristin A. (2014) "Radical Discrimination in the Death Penalty in Tennessee: An Empirical Assessment," Tennessee Journal of Law and Policy: Vol. 5 : Iss. 1 , Article 3. Available at: https://trace.tennessee.edu/tjlp/vol5/iss1/3 This Article is brought to you for free and open access by Volunteer, Open Access, Library Journals (VOL Journals), published in partnership with The University of Tennessee (UT) University Libraries. This article has been accepted for inclusion in Tennessee Journal of Law and Policy by an authorized editor. For more information, please visit https://trace.tennessee.edu/tjlp.
-
Upload
khangminh22 -
Category
Documents
-
view
0 -
download
0
Transcript of Radical Discrimination in the Death Penalty in Tennessee

Tennessee Journal of Law and Policy Tennessee Journal of Law and Policy
Volume 5 Issue 1 Article 3
April 2014
Radical Discrimination in the Death Penalty in Tennessee: An Radical Discrimination in the Death Penalty in Tennessee: An
Empirical Assessment Empirical Assessment
John M. Scheb II University of Tennessee, Knoxville
Kristin A. Wagers
Follow this and additional works at: https://trace.tennessee.edu/tjlp
Part of the Law Commons
Recommended Citation Recommended Citation Scheb, John M. II and Wagers, Kristin A. (2014) "Radical Discrimination in the Death Penalty in Tennessee: An Empirical Assessment," Tennessee Journal of Law and Policy: Vol. 5 : Iss. 1 , Article 3.
Available at: https://trace.tennessee.edu/tjlp/vol5/iss1/3
This Article is brought to you for free and open access by Volunteer, Open Access, Library Journals (VOL Journals), published in partnership with The University of Tennessee (UT) University Libraries. This article has been accepted for inclusion in Tennessee Journal of Law and Policy by an authorized editor. For more information, please visit https://trace.tennessee.edu/tjlp.

5:1 Tennessee Journal of Law and Policy 9
ESSAY
RACIAL DISCRIMINATION IN THE DEATH
PENALTY IN TENNESSEE: AN EMPIRICAL
ASSESSMENT
John M Scheb II* & Kristin A. Wagers"
The intense media coverage of the United StatesSupreme Court's recent decisions in Baze v. Rees' andKennedy v. Louisiana2 highlights the ongoing saliency ofthe death penalty in American politics. In this article, weuse empirical evidence to shed light on this controversy.Our analysis utilizes data from 1,068 first-degree murderconvictions rendered in Tennessee between 1977 and2007. 3 The questions animating our research are: 1) Whatfactors led prosecutors to seek the death penalty? and 2)What factors led juries to impose it? In particular, we areinterested in the role that race plays in these decisions.Does the system operate in a racially-neutral fashion, or isit hopelessly infected with discrimination, as some priorstudies in other states have suggested?
*Professor and Interim Head Department of Political Science,
University of Tennessee, Knoxville**Doctoral Candidate, Department of Political Science, University ofTennessee, Knoxville'Baze v. Rees, 553 U.S. ; 128 S. Ct. 1520 (2008).
2 Kennedy v. Louisiana, 554 U.S. _; 128 S. Ct. 2641 (2008).3 This data is taken from reports submitted by trial judges across thestate in compliance with Supreme Court Rule 12, which requires judgesto complete detailed reports on cases in which defendants are convictedof first-degree murder. SUP. CT. R. 12.
1
5:1 Tennessee Journal of Law and Policy 10
Race and the Death Penalty
In Furman v. Georgia, the Supreme Court
invalidated Georgia's death penalty statute and effectivelyimposed a five-year national moratorium on capital
punishment.4 Concurring in Furman, Justice William 0.
Douglas characterized capital punishment in Georgia as
being "pregnant with discrimination." 5 Early social science
research has found substantial racial disparities in the
administration of the death penalty.6 "These studies found
that blacks were indicted, charged, convicted, andsentenced to death in disproportionate numbers .... 7
However, these early studies were criticized for failing to
utilize adequate statistical controls. 8 Modem social science
research has found less evidence of discrimination due to
the race of capital defendants, but considerable evidence of
discrimination based on the race of murder victims.9
4 408 U.S. 238, 238-40 (1972).5 Id. at 257 (Douglas, J., concurring).6 See, generally, CHARLES S. MANGUM, JR., THE LEGAL STATUS OF THE
NEGRO 368-70 (University of North Carolina Press 1940); Harold
Garfinkel, Research Note on Inter-and Intra-Racial Homicides, 27
Soc. FORCES 369 (1949); Elmer H. Johnson, Selective Forces in
Capital Punishment, 36 Soc. FORCES 165, 169 (1957).7 WILLIAM J. BOWERS & GLENN L. PIERCE, LEGAL HOMICIDE: DEATH
AS PUNISHMENT IN AMERICA, 1864-1982, 69-70 (NortheasternUniversity Press 1984).8 See Gary Kleck, Racial Discrimination in Criminal Sentencing: A
Critical Evaluation of the Evidence with Additional Evidence on the
Death Penalty, 46 AM. SOC. REv. 783, 786-92 (1981).
9 See, e.g., Sheldon Ekland-Olson, Structured Discretion, Racial Bias,
and the Death Penalty: The First Decade After Furman in Texas, 69
SOC. SCI. Q. 853, 853 (1988); Richard Lempert, Capital Punishment in
the '80s: Reflections on the Symposium, 74 J. CRIM. L. &
CRIMINOLOGY 1101, 1106-07 (1983); Michael L. Radelet & Glenn L.
Pierce, Race and Prosecutorial Discretion in Homicide Cases, 19 LAW
& SOC'Y REV. 587, 590-91 (1985); M. Dwayne Smith, Patterns of
Discrimination in Assessments of the Death Penalty: The Case of
2
5:1 Tennessee Journal of Law and Policy 11
Encapsulating this research, one author concluded that "thedeath penalty is between three and four times more likely tobe imposed in cases in which the victim is white rather thanblack.' Intersecting the race of defendants with that ofvictims, researchers have found that black defendantsaccused of killing white victims are most likely to besentenced to death." Some argue, however, that apparentracial differences in the administration of the death penaltycan be explained in terms of other factors-that racialdifferences disappear when appropriate statistical controlsare introduced. 12 Such control variables include the numberof victims, the defendant's criminal history, the relationship
Louisiana, 15 J. CRIM. JUST. 279, 280 (1987); Gennaro F. Vito &Thomas J. Keil, Capital Sentencing in Kentucky: An Analysis of theFactors Influencing Decision Making in the Post-Gregg Period, 79 J.CRIM. L. & CRIMINOLOGY 483, 487-88 (1988).10 Michael L. Radelet & Marian J. Borg, The Changing Nature ofDeath Penalty Debates, 26 ANN. REV. Soc. 43, 47 (2000) (citationsomitted)." See, e.g., David C. Baldus et al., Comparative Review of DeathSentences: An Empirical Study of the Georgia Experience, 74 J. CRIM.L. & CRIMINOLOGY 661, 707-10 (1983); David C. Baldus et al.,Arbitrariness and Discrimination in the Administration of the DeathPenalty: A Challenge to State Supreme Courts, 15 STETSON L. REV.133, 157-65 (1986); Raymond Paternoster, Race of Victim andLocation of Crime: The Decision to Seek the Death Penalty in SouthCarolina, 74 J. CRIM. L. & CRIMINOLOGY 754, 766-78 (1983);Raymond Paternoster, Prosecutorial Discretion in Requesting theDeath Penalty: A Case of Victim-Based Racial Discrimination, 18LAW & SOC'Y REV. 437, 450-70 (1984).12 See, e.g., PUBLIC POLICY AND STATISTICS: CASE STUDIES FROMRAND (SALLY C. MORTON & JOHN E. ROLPH eds., 2000); David C.Baldus et al., Arbitrariness and Discrimination in the Administration ofthe Death Penalty: A Legal and Empirical Analysis of the NebraskaExperience (1973-1999), 81 NEB. L. REV. 486, 498-500 (2002-2003);Alfred B. Heilbrun, Jr. et al., The Death Sentence in Georgia, 1974-1987: Criminal Justice or Racial Injustice?, 16 CRIM. JUST. & BEHAV.139, 151 (1989); Stephen P. Klein & John E. Rolph, Relationship ofOffender and Victim Race to Death Penalty Sentences in California, 32JURIMETRICS J. 33, 44 (1991-1992).
3

5:1 Tennessee Journal of Law and Policy 12
of the defendant to the victim, the method of killing, thelocation of the murder, the vulnerability of the victim, andthe "atrociousness" of the murder. 13
Indeed, some have argued that the way to minimizethe prospect of racial discrimination in the death penalty isto ensure that it is applied only in the most atrociouscrimes. 14 Dissenting in McCleskey v. Kemp, Justice John P.Stevens observed that
there exist certain categories ofextremely serious crimes for whichprosecutors consistently seek, and juriesconsistently impose, the death penaltywithout regard to the race of the victim orthe race of the offender. If [the State] wereto narrow the class of death-eligibledefendants to those categories, the dangerof arbitrary and discriminatory impositionof the death penalty would be significantlydecreased, if not eradicated.15
Justice Stevens' view, at least until recently,1 6 was that aninfrequently administered death penalty, limited to only the
13 See, e.g., PUBLIC POLICY AND STATISTICS: CASE STUDIES FROM
RAND (SALLY C. MORTON & JOHN E. ROLPH eds., 2000); David C.Baldus et al., Arbitrariness and Discrimination in the Administration ofthe Death Penalty: A Legal and Empirical Analysis of the NebraskaExperience (1973-1999), 81 NEB. L. REv. 486, 498-500 (2002-2003);Alfred B. Heilbrun, Jr. et al., The Death Sentence in Georgia, 1974-1987: Criminal Justice or Racial Injustice?, 16 CRIM. JUST. & BEHAV.139, 151 (1989); Stephen P. Klein & John E. Rolph, Relationship ofOffender and Victim Race to Death Penalty Sentences in California, 32JURIMETRICS J. 33, 44 (1991-1992).14 See, e.g., McCleskey v. Kemp, 481 U.S. 279 (1987).15 Id. at 367 (Stevens, J., dissenting).16 See Baze v. Rees, 553 U.S. _, 128 S. Ct. 1520, 1551 (2008)(Stevens, J., concurring).
4

5:1 Tennessee Journal of Law and Policy 13
most heinous of murders, could be purged of racialdiscrimination.
17
The Tennessee Data
We turn now to an examination of the death penaltyin Tennessee. We must stipulate at the outset that thedatabase we have employed in this research is far fromperfect. Evidently, some first-degree murder convictionsare not included in the database. 18 Also, there are variableswithin the database for which a nontrivial number of casesare missing. 19 It should be recognized, though, that in the"real world" of social science research, datasets built fromofficial records are often less than perfect. After workingclosely with these data for the past year, we do not believethat these problems pose a serious threat to the validity ofour findings.
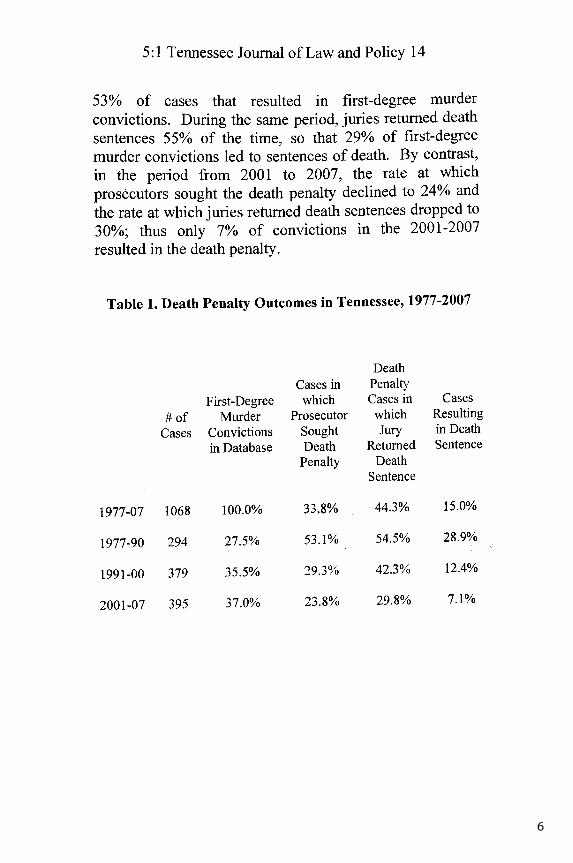
An initial examination of the data reveals thatTennessee prosecutors sought the death penalty in 34% ofthe 1,068 cases. In those 361 capital trials, juries returneddeath sentences 44% of the time (160 cases). Thus, 15% ofthe first-degree murder convictions we studied resulted insentences of death. In looking at these outcomes over time,what is most striking is the decline in the proportion ofcases resulting in death sentences (see Table 1). Between1977 and 1990, prosecutors sought the death penalty in
17 James S. Liebman & Lawrence C. Marshall, Less Is Better: Justice
Stevens and the Narrowed Death Penalty, 74 FORDHAM L. REV. 1607,1646 (2006).18 John Shiffitan, Missing Files Raise Doubts About Death Sentences,
THE TENNESSEAN, Jul. 22, 2001, available athttp://www.hwylaw.com/CM/Articles/Missing%20files%20raise%20doubts%20about%20death%20sentences%2007.22.01 .pdf.'9 For example, the race of 26 defendants contained in the database iscurrently unknown. With respect to the race of the victim, the race of65 victims contained in the database is currently unknown. However,with a large number of observations, the missing data have relativelylittle impact.
5
5:1 Tennessee Journal of Law and Policy 14
53% of cases that resulted in first-degree murderconvictions. During the same period, juries returned deathsentences 55% of the time, so that 29% of first-degreemurder convictions led to sentences of death. By contrast,in the period from 2001 to 2007, the rate at whichprosecutors sought the death penalty declined to 24% andthe rate at which juries returned death sentences dropped to
30%; thus only 7% of convictions in the 2001-2007resulted in the death penalty.
Table 1. Death Penalty Outcomes in Tennessee, 1977-2007
First-Degree# of Murder
Cases Convictionsin Database
Cases inwhich
ProsecutorSoughtDeath
Penalty
DeathPenaltyCases in
whichJury
ReturnedDeath
Sentence
CasesResultingin DeathSentence
1977-07 1068 100.0%
1977-90 294
1991-00 379
2001-07 395
27.5%
35.5%
37.0%
33.8% 44.3% 15.0%
53.1% 54.5% 28.9%
29.3% 42.3% 12.4%
23.8% 29.8% 7.1%
6
5:1 Tennessee Journal of Law and Policy 15
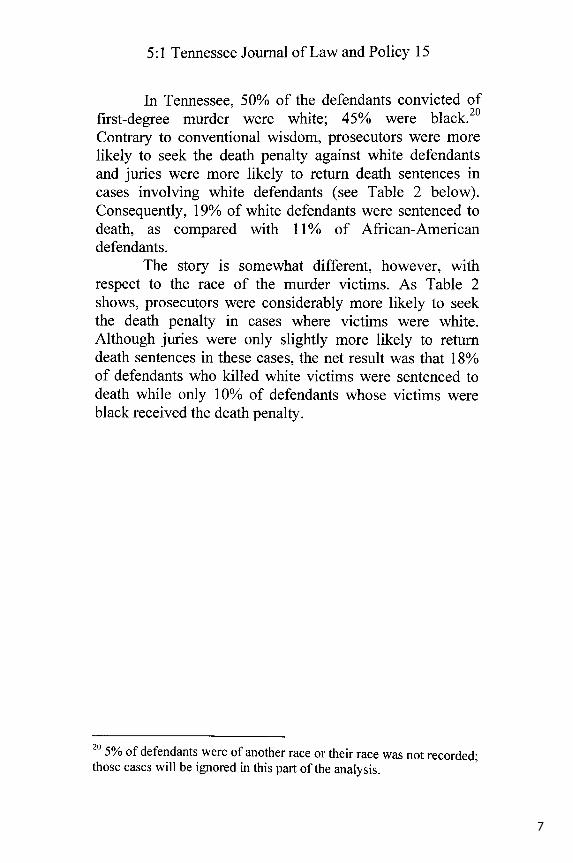
In Tennessee, 50% of the defendants convicted of20first-degree murder were white; 45% were black.
Contrary to conventional wisdom, prosecutors were morelikely to seek the death penalty against white defendantsand juries were more likely to return death sentences incases involving white defendants (see Table 2 below).Consequently, 19% of white defendants were sentenced todeath, as compared with 11% of African-Americandefendants.
The story is somewhat different, however, withrespect to the race of the murder victims. As Table 2shows, prosecutors were considerably more likely to seekthe death penalty in cases where victims were white.Although juries were only slightly more likely to returndeath sentences in these cases, the net result was that 18%of defendants who killed white victims were sentenced todeath while only 10% of defendants whose victims wereblack received the death penalty.
20 5% of defendants were of another race or their race was not recorded;
those cases will be ignored in this part of the analysis.
7

5:1 Tennessee Journal of Law and Policy 16
Table 2. Racial Classification of Defendants andVictims
DeathCases in Penalty
First-Degree which Cases in CasesMurder Prosecutor which Resulting
Convictions Sought Jury in Deathin Database Death Returned Sentence
Penalty DeathSentence
White A* 50.4% 38.5% 48.8% 18.8%Black A 44.9% 28.1% 37.8% 10.6%
White V** 64.0% 39.4% 44.7% 17.6%Black V 33.0% 23.1% 41.0% 9.5%
White A/White V 52.4% 39.4% 51.8% 19.0%White A/Black V 2.0% 21.1% 50.0% 10.5%Black A/Black V 32.7% 23.2% 41.1% 9.5%Black A/White V 12.9% 37.9% 29.8% 11.3%
Intersecting the race of defendants and victimsproduces some interesting results (again, see Table 2).Prosecutors were much more likely to seek the deathpenalty when victims were white irrespective of the race ofthe accused. Yet juries were much less likely to returndeath sentences in cases involving black defendants andwhite victims. The upshot is white defendants whosevictims were white were almost twice as likely as otherdefendants to receive the death penalty. Obviously, other
* A = Defendant
** V= Victim
8

5:1 Tennessee Journal of Law and Policy 17
factors beyond race are in play here. We turn now to thoseother factors.
As shown in Table 3 below, there is an inverserelationship between the frequency of a type of homicideand the likelihood that it will result in a death sentence.For example, nearly 40% of the first-degree murderconvictions involved killings committed in conjunctionwith burglaries or robberies; yet less than 20% of theseconvictions result in death sentences. Similarly, spousal ordomestic killings account for 17% of first-degree murderconvictions but only 12% of such convictions result incapital punishment. On the other hand, prison killings arevery infrequent (less than 1% of our first-degree murdercases), yet half the convictions of this type result in deathsentences. Killings by escapees are also rare types of first-degree murder cases; yet convictions of this type are themost likely to result in capital punishment.
There also appears to be a relationship between"atrociousness" and the death penalty. Thus, homicidesstemming from sexual assaults on children and the elderlyare more than four times more likely to result in deathsentences than are drug-related killings and gang-relatedkillings. Prosecutors and juries may mirror communityattitudes in this regard-that murder victims who wereinvolved in gang or drug activity deserve less sympathy orrequire less retribution than elderly persons and childrenkilled during violent sexual assaults.
9

5:1 Tennessee Journal of Law and Policy 18
Table 3. Nature of Homicide
Killing by anEscapee
Prison KillingChild SexualAssault
Witness KillingKilling LawOfficer/OtherOfficialConvenienceStore KillingElderly SexualAssault
Rape Killing
Contract KillingKidnappingKilling
Elderly KillingTorture/DepravedKillingBurglary/RobberyKillingSpousal/DomesticKillingDrug RelatedKillingChild AbuseKillingGang-RelatedKilling
Death
First- Cases in Penaltywhich Cases in Cases
Degree Prosecutor which ResultingMurder Sought Jury in Death
Cnvitios Death Returned SentencePenalty Death
Sentence
1.3% 76.9% 90.0% 69.2%
0.4% 50.0% 100.0% 50.0%
1.3% 64.3% 66.7% 42.9%
2.0% 57.1% 75.0% 42.9%
2.1%
1.9%
0.5%
3.8%
2.3%
4.2%
10.1%
2.3%
38.7%
16.7%
7.7%
2.2%
2.4%
54.5%
60.0%
60.0%
65.0%
41.7%
61.4%
57.1%
25.0%
41.5%
26.0%
28.8%
13.0%
20.0%
75.0% 40.9%
66.7% 40.0%
66.7% 40.0%
57.7% 37.5%
90.0% 37.5%
51.9% 31.8%
45.0% 25.7%
100.0% 25.0%
46.1% 19.2%
46.7% 12.1%
34.8% 10.0%
66.7% 9.0%
20.0% 4.0%
10

5:1 Tennessee Journal of Law and Policy 19
As Table 4 shows, the behavior of prosecutors andjuries also varies according to the defendant's motive.Murders to escape apprehension or punishment, for sexualpleasure or other gratification, or to silence a witness aremuch more likely to result in the death penalty. On theother hand, homicides motivated by racial or religious bias,jealously, or hatred of the victim are least likely to result incapital punishment.
11

5:1 Tennessee Journal of Law and Policy 20
Table 4. Motive
First-DegreeMurder
Convictionsin Database
EscapeApprehension orPunishmentSexual or OtherPleasureSilence a WitnessPecuniary or OtherGainRevenge orRetaliationObsession, Control
Senseless KillingPossible DrugInfluenceRacial, Religiousor Other BiasJealousyLong-Term Hatredof Victim
3.4%
4.8%3.0%
40.0%
6.5%4.6%
3.4%
2.2%
7.0%2.8%
1.0%
Cases inwhich
ProsecutorSoughtDeathPenalty
DeathPenaltyCases in
whichJury
ReturnedDeath
Sentence
CasesResultingin DeathSentence
66.7% 75.0% 50.0%
68.6% 57.1% 39.2%56.3% 61.1% 34.4%
41.7% 52.2% 21.8%
36.2%34.7%
19.4%
52.0%41.2%
71.4%
18.8%14.3%13.9%
45.8% 27.3% 12.5%
28.0% 38.0% 10.7%
23.3% 42.9% 10.0%
18.2% 50.0% 9.1%
12

5:1 Tennessee Journal of Law and Policy 21
The method of killing also appears to be important(see Table 5 below). Shooting, by far the most commonmeans of committing murder, is much less likely to resultin the death penalty than most other methods of killing.Murders by drowning and throat slashing, which arerelatively rare, are most likely to lead to death sentences.
Table 5. Method of Killing
First-DegreeMurder
Convictionsin Database
Cases inwhich
ProsecutorSoughtDeath
Penalty
DeathPenaltyCases inwhichJury
ReturnedDeath
Sentence
CasesResultingin DeathSentence
Drowning
Throat Slashing
Other
Strangling/Suffocating
Stabbing
Beating/Blunt Trauma
Shooting
Burning
1.3%
1.9%
1.1%
8.5%
12.3%
16.5%
63.8%
2.0%
78.6% 54.5% 42.9%
60.0% 66.7% 40.0%
50.0% 66.7% 33.3%
46.2% 45.2% 20.9%
38.2% 50.0% 19.1%
34.7% 49.2% 17.0%
31.4% 39.7% 12.5%
47.6% 10.0% 4.8%
13

5:1 Tennessee Journal of Law and Policy 22
As shown in Table 6 below, the location of thehomicide also affects the likelihood of capital punishment.Murders committed in a field, the woods or some rural areaand those committed at the victim's workplace are mostlikely to result in death sentences; while homicidescommitted "on the street" and in vehicles are least likely toreceive capital punishment.
Table 6. Location of Crime
First-DegreeMurder
Convictionsin Database
Cases inwhich
ProsecutorSoughtDeath
Penalty
DeathPenaltyCases in
whichJury
ReturnedDeath
Sentence
CasesResultingin DeathSentence
Field, Woods,or Rural AreaVictim'sWorkplaceJail or PrisonCommercialEstablishmentHotel or MotelVictim'sResidenceDefendant'sResidence orWorkplacePark or SchoolGroundsStreet,Sidewalk, orParking LotPublic orPrivate Vehicle
7.0%
5.0%1.1%
7.5%1.6%
31.9%
5.4%
2.9%
10.0%
2.5%
56.0% 71.4% 40.0%
52.8% 71.4% 37.7%41.7% 80.0% 33.3%
50.0% 52.5% 26.3%35.3% 66.7% 23.5%
31.4% 44.9% 14.1%
25,9% 40.0% 10.3%
19.4% 50.0% 9.7%
21.5% 34.8% 7.5%
22.2% 16.7% 3.7%
14

5:1 Tennessee Journal of Law and Policy 23
The number of victims, too, has a substantial impact,especially on the prosecutor's decision to seek the deathpenalty (see Table 7 below). The net result is that whenthere are three or more victims, the convicted murderer isroughly twice as likely to receive a death sentence thanwhen there are only one or two victims.
Table 7. Number of Victims
First-DegreeMurder
Convictionsin Database
86.9%
10.3%
2.8%
P
DeathCases in Penaltywhich Cases inrosecutor whichSought JuryDeath Returned
Penalty DeathSentence
32.1% 44.1%
38.2%73.3%
CasesResultingin DeathSentence
14.1%
47.6% 18.2%
40.9% 30.0%
1 Victim
2 Victims
3+ Victims
15

5:1 Tennessee Journal of Law and Policy 24
Not surprisingly, the defendant's criminal historyalso plays a significant role (see Table 8 below) in thelikelihood of receiving a death sentence. In particular,three or more prior felony convictions greatly increase thechances of a defendant receiving a death sentence. This isinfluenced more by jury behavior as opposed toprosecutorial decision making. Interestingly enough, whenthe prosecution sought the death penalty against individualswith no prior criminal history (the majority of all first-degree murder defendants), juries were least likely tosentence such defendants to death.
Table 8. Defendant's Criminal History
First-DegreeMurder
Convictionsin Database
No CriminalRecord
Juvenile RecordRecord ofMisdemeanorsOne or Two PriorFeloniesThree or MorePrior Felonies
24.6%
10.8%
33.5%
24.5%
18.1%
Cases inwhich
ProsecutorSoughtDeath
Penalty
DeathPenaltyCases inwhichJury
ReturnedDeath
Sentence
26.6% 30.0%
23.5% 51.9%
28.2%
38.9%
CasesResultingin DeathSentence
8.0%
12.2%
44.6% 12.6%
50.0% 19.5%
44.0% 69.4% 30.6%
16
5:1 Tennessee Journal of Law and Policy 25
Conclusions
Ultimately, the best way to determine the impact ofrace, or any other independent variable, on the behavior ofprosecutors and juries is to develop a multivariate modelincorporating various controls simultaneously. That projectis beyond the scope of this paper but will be the centerpieceof a paper currently in development. For now, based on theforegoing cross-tabulations, we can draw the followingconclusions with respect to the role of race in theadministration of capital punishment in Tennessee. First,there are racial discrepancies, both with regard todefendants and victims. However, the discrepancy withregard to defendants runs counter to conventional wisdomin that white defendants are significantly more likely to beselected for and to receive the death penalty. Thediscrepancy with respect to victims runs in the directionsuggested by the literature--defendants whose victims arewhite are more substantially likely to be selected for capitalpunishment by prosecutors. However, juries appear to beless influenced by the race of victims in deciding whichdefendants will be sentenced to death. Second, the datasuggest that numerous other factors influence prosecutorsand juries with respect to the death penalty. It may well be,that once these other factors are incorporated into amultivariate model, the effect of race will be substantiallyattenuated.
17

5:1 Tennessee Journal of Law and Policy 26
18