RACE Project 2116 TOMQAT - CiteSeerX
113
RACE Project 2116 TOMQAT Project Title: Total Management of Service Quality for Multimedia Applications on IBC Infrastructure Title of Deliverable : Approach to Dynamic Total Quality Management of IBCN Networks Deliverable Number : R2116/ICOM/WP2/DS/R/005/b1 Contractual Date of Delivery to CEC : August 31, 1994 Actual Date of Delivery to CEC : August 31, 1994 Editor : INTRACOM S.A. Authors : Don Cohrane, CRAY Panagiotis Demestichas, NTUA Andreas Gehring, TUB Panos Georgatsos, ALPHA Juergen Kawalek, TUB Nikos Karatzas, ALPHA Kostas A. Kassapakis, ALPHA Patric Legand, Alcatel ISR Zisis Lioupas, NTUA Nick Mandich, CRAY Yannis Manolessos, NTUA Klaus Nagel, TUB Evi Papachristou, INTRACOM Ina Schieferdecker, GMD-Fokus Manfred Scholz, W&G Henning Schulzrinne, GMD-Fokus George D. Stamoulis, INTRACOM Michael Theologou, NTUA Tianning Zhang, GMD-Fokus Deliverable Type : R–Restricted Deliverable Nature : Report Workpackage Contributing : WP2 Abstract: The TOMQAT project enchances the concept of Dynamic Total Quality Management in the context of IBC networks, and investigates the resulting performance benefits. The present deliverable analyses the requirements to be fulfilled by Total Quality Management, and suggests an approach to meet such requirements, including QoS parameters to be managed and appropriate management mechanisms. Keywords: Total Quality Management, QoS parameters, TQM Requirements, TQM Approach
-
Upload
khangminh22 -
Category
Documents
-
view
2 -
download
0
Transcript of RACE Project 2116 TOMQAT - CiteSeerX

RACE Project 2116TOMQAT
Project Title: Total Management of Service Qualityfor Multimedia Applications on IBC Infrastructure
Title of Deliverable : Approach to Dynamic Total Quality Managementof IBCN Networks
Deliverable Number : R2116/ICOM/WP2/DS/R/005/b1Contractual Date of Delivery to CEC : August 31, 1994Actual Date of Delivery to CEC : August 31, 1994Editor : INTRACOM S.A.
Authors : Don Cohrane, CRAYPanagiotis Demestichas, NTUAAndreas Gehring, TUBPanos Georgatsos, ALPHAJuergen Kawalek, TUBNikos Karatzas, ALPHAKostas A. Kassapakis, ALPHAPatric Legand, Alcatel ISRZisis Lioupas, NTUANick Mandich, CRAYYannis Manolessos, NTUAKlaus Nagel, TUBEvi Papachristou, INTRACOMIna Schieferdecker, GMD-FokusManfred Scholz, W&GHenning Schulzrinne, GMD-FokusGeorge D. Stamoulis, INTRACOMMichael Theologou, NTUATianning Zhang, GMD-Fokus
Deliverable Type : R–RestrictedDeliverable Nature : ReportWorkpackage Contributing : WP2
Abstract: The TOMQAT project enchances the concept of Dynamic Total Quali ty Management in thecontext of IBC networks, and investigates the resulting performance benefits. The present deliverableanalyses the requirements to be fulfill ed by Total Quali ty Management, and suggests an approach tomeet such requirements, including QoS parameters to be managed and appropriate managementmechanisms.
Keywords: Total Quality Management, QoS parameters, TQM Requirements, TQM Approach

Deliverable 5 Page 2
© RACE Project R2116 - TOMQAT
(c) l994 by the TOMQAT Consortium. Organizations in the TOMQAT consortium are: ALPHA SYSTEMSANALYSIS INTEGRATION LTD., ALCATEL ISR SA, CRAY COMMUNICATIONS LTD, GMD-FOKUS,INTRACOM SA, NATIONAL TECHNICAL UNIVERSITY OF ATHENS, TECHNICAL UNIVERSITYBERLIN, TELMAT COMMUNICATIONS, WANDEL & GOLTERMANN

Deliverable 5 Page 3
© RACE Project R2116 - TOMQAT
xecutive Summary
The main objective of project TOMQAT is to enhance the Total Quali ty Management (TQM) conceptand adapt/apply it in the context of IBC networks serving Multimedia applications. The presentdeliverable (namely, Deliverable 5 of TOMQAT) analyzes the requirements for TQM as arising in theIBC context, and studies the approach to meet such requirements. This approach is to be finalized inthe final version of Deliverable 5, which is to be issued in November 1994.
In particular, the deliverable presents a discussion on the TQM concept as well as of on itsramifications with respect to its application on IBC. Moreover, a justification of using TQM in the IBCNetworks is presented, together with a discussion on the expected impact of TQM. The managementarchitecture (organized in four levels) is discussed, and the corresponding TQM functions are presentedin detail.
Furthermore, an identification and analysis follows, concerning requirements posed to TQM by certainactors involved in IBC, as well as the expectations of such actors when employing Total Management ofQoS. Since QoS is of primary importance to end-users (who are actually to judge the achieved levels ofsatisfaction), an extensive analysis of the requirements of the end-users is presented. The requirementson and expectations from TQM by other actors involved in IBC are also studied; the actors consideredare Value-Added Service Providers (VASPs) and Public Network Operators (PNOs). This discussionfocuses on the motivation of these actors to employ and/or to evoke TQM, on the actions they require(and expect) that TQM applications should be capable to undertake, and on the desirable impactthereof.
Finally, the TQM approach is discussed within the IBC framework. In particular, QoS parameters thatneed to be managed are selected for all four levels of the management architecture (namely, application,orchestration, transport, and network); the various selections are justified according to the requirementsposed on TQM, to the impact of the various QoS parameters, and to the functions (includingmanagement and control) of each individual level of the architecture. Discussed also are managementmechanisms affecting such QoS parameters; this approach will be finalized in the final version of thedeliverable.
CopyrightThis present document (R2116/ICOM/WP2/DS/R/005/b1) has been produced by the contractors of theRACE project R2116 (TOMQAT) and is given to the CEC as provided for in the contract between theTOMQAT Contractors and the CEC.
Therefore the CEC, as provided for in Article 10.2 of the CEC Contract, is granted by the Contractorsthe right to publish all or part of this document.
The copyright of this document shall remain with the TOMQAT Contractors who can transfer it to athird party for publication.
The TOMQAT contractors are:
Alpha Systems Analysis Integration Ltd. (GR)Alcatel ISR SA (F)GMD–Gesellschaft fur Mathematik und Datenverarbeitung FOKUS (D)Technical University of Berlin (D)Intracom SA (GR)National Technical University of Athens (GR)Cray Communications Ltd. (UK)Telmat Communications Ltd. (F)Wandel & Goltermann (D)
Deliverable 5 Page 4
© RACE Project R2116 - TOMQAT
TABLE OF CONTENTS
1. INTRODUCTION AND SCOPE 5
2. THE TOTAL QUALITY MANAGEMENT CONCEPT 6
2.1. Introduction 6
2.2. Total Quality Management 62.2.1. Total Quality Management: Why? 62.2.2. Total Quality Management: What? 72.2.3. Total Quality Management: How? 7
2.3. Relation of Dynamic TQM to the Timeline Model 92.3.1. The "Dynamic" Aspect 92.3.2. Dynamic Total Quality Management 9
2.4. The Multimedia Interactions Architecture 10
2.5. Classification of the dynamic TQM functions 12
2.6. QoS Management Functions 142.6.1. QoS Management Functions issued from [M3400] 142.6.2. QoS Management Functions proposed in TOMQAT 14
References 15
3. REQUIREMENTS BY VARIOUS ACTORS 17
3.1. Introduction 17
3.2. End-User's Requirements 173.2.1. Introduction 173.2.2. Definition of QoS and usability 183.2.3. Differentiation of basic services, information types and task types 193.2.4. Description of user oriented studies related to QoS 203.2.5. Summary 253.2.6. The TOMQAT-approach to user oriented QoS 303.2.7. Methodological considerations: Focus of evaluation and types of measures 32
3.3. Requirements by Value Added-Service Provider (VASP) 333.3.1. Customers/Users and VASPs 333.3.2. VASP Requirements and Expectations 343.3.3. VASP Requirements on Total Quality Management 36
3.4. Requirements by Public Network Operators (PNO) 383.4.1. PNO Requirements and Expectations 383.4.2. PNO Requirements to TQM 393.4.3. VASPs and PNOs 40
3.5. Requirements and Management Services 403.5.1. Decomposition of Management Services 403.5.2. Management Service Model 40
References 41
4. QOS PARAMETERS TO BE MANAGED 43
Deliverable 5 Page 5
© RACE Project R2116 - TOMQAT
4.1. QoS Parameters vs. Performance Parameters 43
4.2. QoS/SP Relations 444.2.1. Scope 444.2.2. Types of mappings 45
4.3. Baseline Architecture 45
4.4. Working Approach 46
4.5. Management Mechanisms 474.5.1. Introduction 474.5.2. Management architecture 474.5.3. Management mechanisms 48
4.6. Parameters 554.6.1. Application Level 554.6.2. Orchestration Level 574.6.3. Transport Level 594.6.4. Network Level 634.6.5. SDH Layer 69
4.7. Mapping 724.7.1. AAL to ATM Layer 724.7.2. QoS Parameters of the Multimedia Application 75
References 77
5. CONCLUDING REMARKS 78
APPENDIX A 79
1. TQM and Performance Management 791.1. Performance Management Services in TMN 791.2. Detailed Functional Specification 83
2. TQM and Fault Management 93
3. TQM and Configuration Management 953.1. Configuration Management (User Generic Functions) 95
4. TQM and Accounting Management 1004.1. Introduction 1004.2. Accounting management 1004.3. TQM and Accounting management 102

Deliverable 5 Page 6
© RACE Project R2116 - TOMQAT
1. INTRODUCTION AND SCOPEThis deliverable is the fifth of a sequence of seven deliverables to be prepared till the end of theyear 1994. The structure of TOMQAT deliverables for year 1994 is ill ustrated in figure 1.1.Deliverable 1 presented a list of project dependencies and relationships, thus positioningTOMQAT within the framework of RACE projects. In Deliverable 2, an extensive study of thenetwork infrastructure, of multimedia applications and of possible management platforms wascarried out. The constituent components thereof are analyzed in further detail in Deliverable 3;this analysis is to be revisited in Deliverable 6. Deliverable 4 identified the requirements posedon Total Quality Management (TQM) when applied in an IBC context, and gave a firstpresentation of the approach to meet these requirements. This approach is presented in furtherdetail in the present deliverable, namely D5. (D4 may be taken as a preliminary version of D5.)The final version of Deliverable 5 is expected to be issued at the end of November 1994. Thegoal of both Deliverables 4 and 5 is to identify the requirements to be satisfied and thefunctional capabili ties to be possessed by the TQM Module to be developed by TOMQAT.The specification of this module will be presented in Deliverable 7.
D1: List of Project Dependencies and Relationships
D2: Selection of Networks, Applications and Platforms
D3/D6: Architecture of the TOMQAT System and Definition of Net Infrastructure
/D5: Requirements Analysis and Approach for Dynamic Total Quality Management
D7: TQM Module Specification
D4
Figure 1.1The present Deliverable analyzes the requirements on TQM from the viewpoint of severalactors involved in IBCN (i.e., End-Users, Value-Added Service Providers, Public NetworkOperators etc.), and discusses their motivation and expectations when employing TQM. As aresult, a set of QoS parameters that need to be managed is identified, for every level of themanagement architecture. The necessary management functions, as well as their impact onQoS, are also studied. The TQM approach is to be finalized in the final version of Deliverable5. To this end, management algorithms and strategies for these parameters are also to bedeveloped in the project. The relation between the present Deliverable (together with D4) andDeliverable 7 is obviously a very close one, since the latter is to contain an epitome of theTQM requirements and approach, expressed as the specification of the TQM Module.
Deliverable 5 Page 7
© RACE Project R2116 - TOMQAT
1. THE TOTAL QUALITY MANAGEMENT CONCEPT
1.1. Introduction
The purpose of this chapter is to clarify the notion of Total Quality Management and takesome steps further the definition provided in Deliverable 3. Specifically the text hereafterprovides:
• An overview of the benefits expected from the integration of a TQM system inbroadband communications
• A formal definition of TQM along with comments on the concepts involved• A way forward in structuring the TQM application• An overview of the baseline architecture which serves multimedia/groupware
communications• An overview of functions for dynamic (real-time) TQM in all levels of the baseline
architecture.
1.2. Total Quality Management
1.2.1. Total Quality Management: Why?
The concept of TQM is a long existing one within the product manufacturing or serviceprovisioning arena. Recently, the competitive environment within which telecommunicationsoperators are bound to operate has forced managers of the telecommunications industry toembrace TQM and to invest in the opportunities it grants for increased quality and cost-effectiveness.
On the other hand, the advent of B-ISDN has gained numerous supporters through theexpectation it has nurtured for an integrated and homogeneous service platform. The increasedrequirements imposed by multimedia applications in terms of high speed and bandwidth seemto find excellent support on a broadband infrastructure. The complexity, however, arising fromthe multiple types of services which are likely to be offered by broadband networks,necessitates a sophisticated tool to tackle issues related to service quality, at all layers of thecommunications architecture. Managers are in need of services for end-to-end QoS negotiationand management, and of mechanisms allowing assessment of the achieved quality and of thecosts involved in implementing QoS-driven management actions. There is further arequirement that the accumulated experience from operation of the network is compiled intoarguments contributing to decision making at the administrative level, where the network isseen as a revenue making enterprise with a wider social role to fulfill.
The former thoughts portray the motivation for employing TQM techniques and the problemsfor which solutions have to be devised. To summarise, the benefits to be expected from animplementation of a TQM system in the context of broadband communications are:
Deliverable 5 Page 8
© RACE Project R2116 - TOMQAT
• enhanced service quality and therefore higher marketplace acceptance for broadbandservices,
• development of "best practices" enabling optimal resource utili sation and henceleading to full customer satisfaction at the most economical levels,
• assistance in the decision making and planning exercises through the provision ofarguments resulting from a Cost/Benefit analysis.
1.2.2. Total Quality Management: What?
QoS modeling and verification techniques have in the recent past received significant attentionand have become core points for research activities. There are still , however, several steps totake before guidelines for the engineering of an end-to-end quality management system becomeavailable. Modern management procedures need to be devised for the purpose of maximisingcustomer satisfaction and raising the quality of service planning and service engineering. Theformer functions are grouped under the Total Quality Management concept which is defined as[1]:
"The set of actions by means of which a manager can: a) fulfill the contractedrequirements of a customer for end-to-end performance of a service in an economic wayand b) improve in the long term the performance of the system he is in charge of, by takinginto account the experience recorded in past periods."
The term service is used to denote all telecommunication services likely to be supported bybroadband networks. This covers both bearer services and teleservices, and in particular multi-media applications. Hence the required set of actions must provide means to exercise controlover all layers of the OSI stack.
It has also to be underlined that the above definition, assigns a twofold dimension to TQM. Onone hand TQM comprises dynamic tasks, such as the real-time management of qualityparameters for services which are in use at a given moment. On the other hand, it serves theneed for knowledge based management of the network and particularly the use of its resourcesand the planning of its growth. Finally, the definition associates TQM with the management ofa network's performance. The term performance is used herein in a broader sense than thePerformance Management functional area defined by ISO and CCITT (focusing mostly onTraffic management or Network Element management), since it includes management aspectsrelated to network evolution, service planning, cost/benefit analysis, etc.
1.2.3. Total Quality Management: How?
There are quite a few popular and effective models and methods for quality and processimprovement which differ in the tools they make use of, or the features they place emphasisupon. They all hold however, several characteristics in common:
• All place primary importance to the customer, including knowledge of whencustomers and their requirements are being satisfied and of when the desired resultsin the marketplace are achieved.
• All have a basis in applied measurement, using data from the application of theprocesses to help determine what changes to make.
• All are closed loop; that is, there is a clear path for feeding back observations toimprove the current state of the process.
Deliverable 5 Page 9
© RACE Project R2116 - TOMQAT
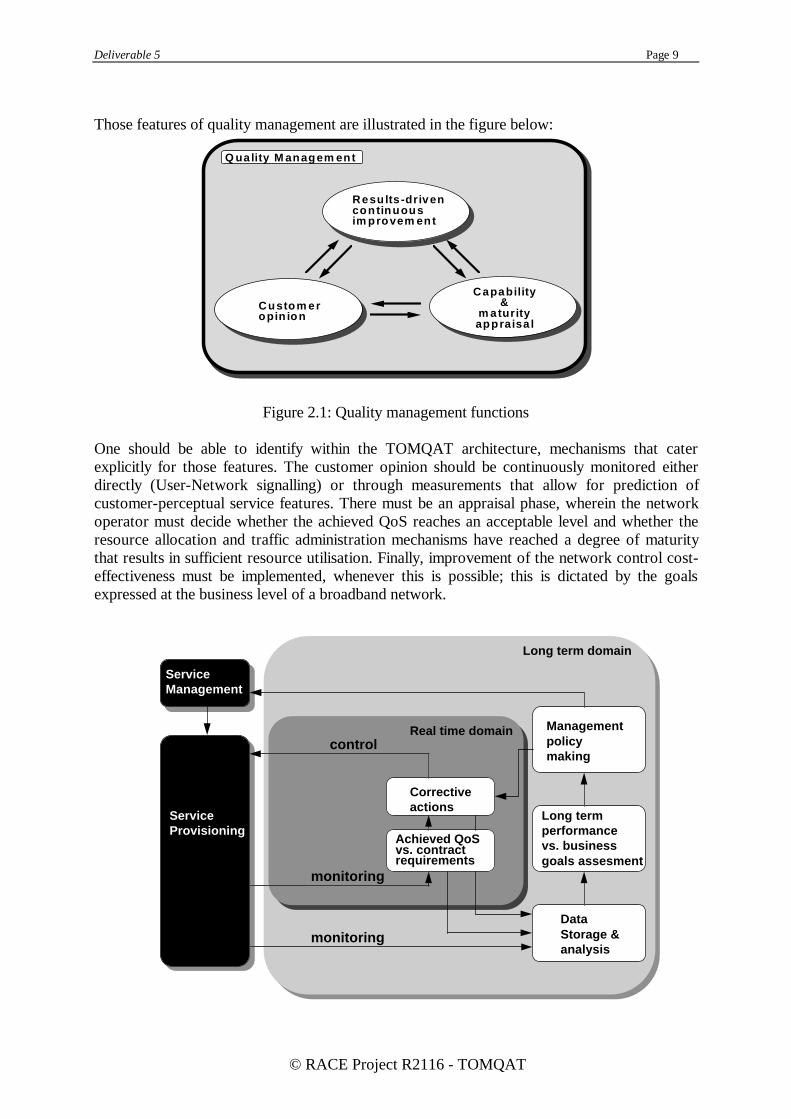
Those features of quality management are illustrated in the figure below:
Results -drivencontinuousim provem ent
Custom eropin ion
Capability&
m aturityappraisa l
Q ua lity M anagem ent
Figure 2.1: Quality management functions
One should be able to identify within the TOMQAT architecture, mechanisms that caterexplicitly for those features. The customer opinion should be continuously monitored eitherdirectly (User-Network signalli ng) or through measurements that allow for prediction ofcustomer-perceptual service features. There must be an appraisal phase, wherein the networkoperator must decide whether the achieved QoS reaches an acceptable level and whether theresource allocation and traffic administration mechanisms have reached a degree of maturitythat results in sufficient resource utili sation. Finally, improvement of the network control cost-effectiveness must be implemented, whenever this is possible; this is dictated by the goalsexpressed at the business level of a broadband network.
monitoring
Achieved QoSvs. contract requirements
Correctiveactions
control
DataStorage &analysis
Long termperformance vs. businessgoals assesment
Managementpolicymaking
monitoring
Long term domain
Real time domain
ServiceManagement
ServiceProvisioning
Deliverable 5 Page 10
© RACE Project R2116 - TOMQAT
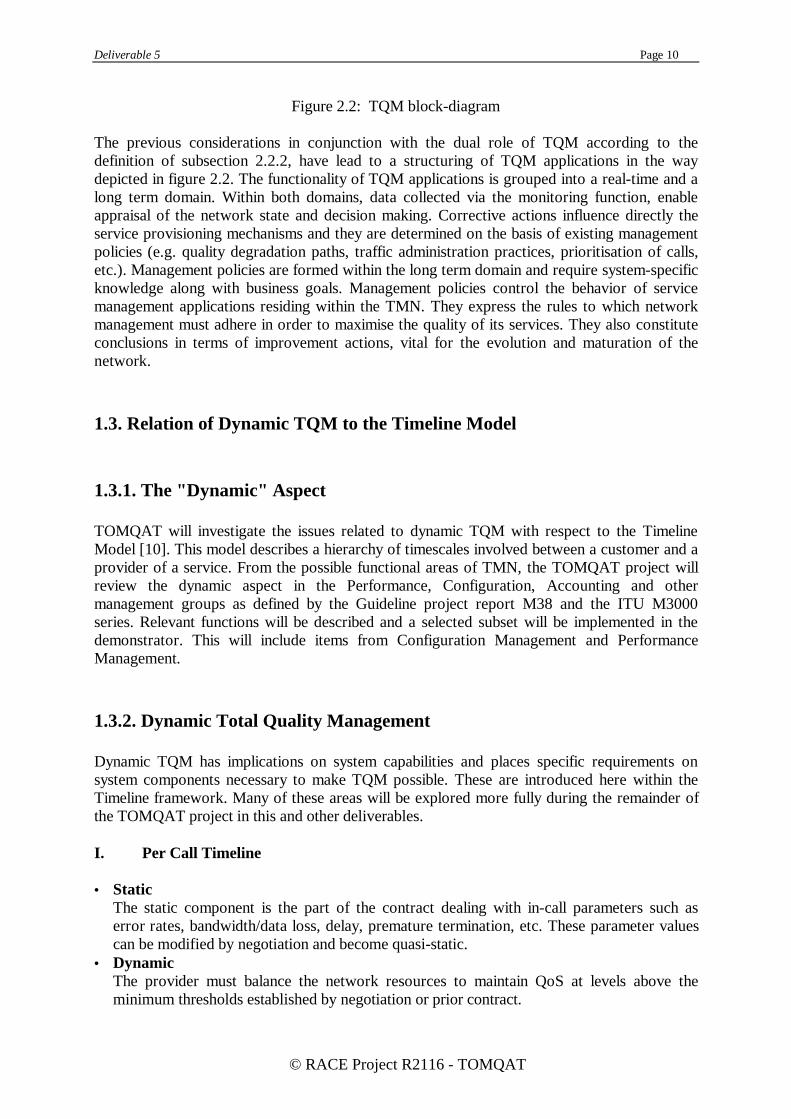
Figure 2.2: TQM block-diagram
The previous considerations in conjunction with the dual role of TQM according to thedefinition of subsection 2.2.2, have lead to a structuring of TQM applications in the waydepicted in figure 2.2. The functionality of TQM applications is grouped into a real-time and along term domain. Within both domains, data collected via the monitoring function, enableappraisal of the network state and decision making. Corrective actions influence directly theservice provisioning mechanisms and they are determined on the basis of existing managementpolicies (e.g. quality degradation paths, traffic administration practices, prioritisation of calls,etc.). Management policies are formed within the long term domain and require system-specificknowledge along with business goals. Management policies control the behavior of servicemanagement applications residing within the TMN. They express the rules to which networkmanagement must adhere in order to maximise the quality of its services. They also constituteconclusions in terms of improvement actions, vital for the evolution and maturation of thenetwork.
1.3. Relation of Dynamic TQM to the Timeline Model
1.3.1. The "Dynamic" Aspect
TOMQAT will i nvestigate the issues related to dynamic TQM with respect to the TimelineModel [10]. This model describes a hierarchy of timescales involved between a customer and aprovider of a service. From the possible functional areas of TMN, the TOMQAT project willreview the dynamic aspect in the Performance, Configuration, Accounting and othermanagement groups as defined by the Guideline project report M38 and the ITU M3000series. Relevant functions will be described and a selected subset will be implemented in thedemonstrator. This will i nclude items from Configuration Management and PerformanceManagement.
1.3.2. Dynamic Total Quality Management
Dynamic TQM has implications on system capabili ties and places specific requirements onsystem components necessary to make TQM possible. These are introduced here within theTimeline framework. Many of these areas will be explored more fully during the remainder ofthe TOMQAT project in this and other deliverables.
I. Per Call Timeline
• StaticThe static component is the part of the contract dealing with in-call parameters such aserror rates, bandwidth/data loss, delay, premature termination, etc. These parameter valuescan be modified by negotiation and become quasi-static.
• DynamicThe provider must balance the network resources to maintain QoS at levels above theminimum thresholds established by negotiation or prior contract.

Deliverable 5 Page 11
© RACE Project R2116 - TOMQAT
• End-to-endEnd-to-end includes problems due to the multi-network, multi-provider, multi-vendor andmulti-service environment.
• ConfigurationThis is the timeline within which configuration is the principal solution and tool to solveQoS problems.
• Performance ManagementPerformance Management includes performance monitoring used by the provider toestablish whether the customer has received the agreed QoS. Performance Managementshould also establish the degree of liabili ty of the Provider and any penalty in the event ofunsatisfactory-performance.
II. Per Customer / Contract Timeline
• StaticQoS parameters in this timeline are the ones set out in the contract since the contract is bydefinition static. They include Help Desk, Mean Time to Repair (MTTR), Mean TimeBetween Failures (MTBF), accounting accuracy, etc.
• DynamicThe dynamic aspect of this timeline comes from the provider constantly monitoring failurerates, repair costs and times, etc. Provided the cost of these improvements does not exceedthe benefits accrued or loss saved (determined at the Per Service Timeline), the trend is toconstantly attempt to improve.
• End-to-endAs for the Per Call Timeline, this includes problems due to the multi-network, multi-provider, multi-vendor and multi-service environment. Here the problems are at the level ofinter-provider administration and problems due to vendor compatibility issues.
• ConfigurationThis has far less effect in this timeline than in the Per Call one. There is a small involvement,especially concerning provisioning of new customers and services.
III. Per Service Timeline
• StaticA service will have its initial business goals, as will use of a service by the customers. Theseare initially static but will be reviewed in the light of experience. They are, nevertheless,essentially static.
• DynamicThere are no dynamic TQM aspects in this Timeline, except possibly for enhancement andreconfiguration of complementary service features.
• End-to-endThe problem space is the same as for the other timelines but the issues are more strategicconcerning alliances, business relationships, interconnections and how these are working.
• ConfigurationThis includes service provisioning equipment set-up by the service provider and networkinterconnection between this and other service providers.
Specific requirements for TQM are presented in the following chapters. These includerequirements placed by the various actors (including VASP and Bearer Network Provider andthe VASP and Bearer Network Customer and user); configurabili ty requirements; requirements

Deliverable 5 Page 12
© RACE Project R2116 - TOMQAT
on the management platform; applications; measurement tools; protocols; interfaces; andcommunications infrastructure.
1.4. The Multimedia Interactions Architecture
The attempt to embed principles of TQM in the context of broadband networks supportingmultimedia services, requires a thorough consideration of the individual sub-systems involvedin implementing and delivering such services. There is currently a tendency to neglect aspectswhich have an impact on service quality but which are not strictly related to the networkinfrastructure.
An overview of the ISO work [QoS Framework] on QoS, yields a contemplation of servicequality as a feature associated not only with reliable data transfer, but also with aspects whichhave little to do with system performance such as Security, Cost or Priority. Parameters for thedescription of service quality are classified into performance and non-performance orientedones, and clearly the control of non-performance oriented parameters cannot take place at thenetwork level.
Figure 2.3 provides the complete picture in terms of levels involved in groupwarecommunications and the exchange of multiple media. As shown in the figure there are fourindividual levels:
Application
Orchestration
Transport
Network
Application
Orchestration
Transport
Network
NODE NODE
Figure 2.3: Layered multimedia communications architecture
The Application Level encapsulates the applications which run on the end-user systems andgenerate the data streams to be accommodated by transport level connections. They may bedistributed and equipped with mechanisms to provide several levels of transparency such asdistribution or failure transparency. Table 2.1 summarises the types of media produced bymultimedia applications as well as the processing and coding mechanisms by means of whichdata streams are formed and delivered to the communication sub-system.
Below the Application Level there exists a set of services which add value to transport levelservices and which correspond approximately to the Session Layer in OSI terms. The primaryrole of this level (Orchestration Level) is to provide jitter and rate control for continuous

Deliverable 5 Page 13
© RACE Project R2116 - TOMQAT
media groupware sessions. It is also intended to perform cross-stream synchronisation, formultiple connections associated with the same application. The term orchestration resultsexactly from the need to co-ordinate media flowing in separate (non-multiplexed) but relatedconnections. An example where such co-ordination is required, is lip-synchronisation betweenvideo and audio channels. To support the synchronisation relationship of distinct channels, theorchestration services must apply a nominal rate control to cells within each connection andsubsequently adjust the rates of associated channels, especially in the event of discrepancies.This may require even the discarding of cells within an associated channel, in the occurrenceof excessive delays or corrupted cells in a multiple connection session.
Computer Media Real-time mediaImage Graphics Text Voice Video
Hypermediastructure
Hyper ODA MHEG
Processing andcoding
JPEGSGML
SGML MPEG
Communicationprotocol
ODA G3, G4 CGM
ODA extension(H.261)
Table 2.1: Multimedia protocol and coding format standardisation
The Transport Level accommodates the needs for multimedia and real-time communicationsand therefore constitutes an extension of classical transport protocols such as OSI TransportClass 4 or TCP/IP. Services within this level must be designed to accommodate bulk datatransfer, continuous media interchange and transaction oriented connection establishment andcontrol. This entails highly efficient and configurable mechanisms which will support prioritycontrol for packets, selective retransmission, and optional checksum for the data field.
At the bottom of the stack one can find the Network Level, which represents thecommunications infrastructure of a broadband network. The network level can be furthersubdivided in the ATM and AAL layers in the case of ATM networks. The services of thislevel are classical bearer services (connectionless or connection oriented with variable orconstant bit rates) and are specified according to upper level requests. Of greatest concernwithin this level is to achieve high resource utili sation and implement robust source policingfunctions. The first can be achieved through statistical multiplexing whereas for the latter one,necessitates resolving of traffic characterisation and monitoring issues.
1.5. Classification of the dynamic TQM functions
The former layering is introduced to enable a separation of concerns in the attempt to deal withall factors affecting QoS for multimedia service users. Apparently the TQM architecturedescribed in subsection 2.2.3 must enable influencing of the performance of all levels. Thegreatest diff iculty lies perhaps in the selection of a specific route to improve the qualityparameters of a service instance, among several possibili ties granted by the mechanismsavailable within different levels. Combinations of separate functions for achieving an agreedlevel of quality make the mission of the quality control system even more complicated andrather impossible without an integrated and abstract view of all levels. The purpose of thissection is to identify and categorise control functions required for performing dynamic TQM.This is expected to eventually lead to a better understanding of the quality management system.

Deliverable 5 Page 14
© RACE Project R2116 - TOMQAT
Dynamic TQM functions can be partitioned into four main areas: monitoring, analysis, controland negotiation.
• Monitoring functions
The role of monitoring functions is network observation and measurements. They provide themeans to access measurable parameters which affect the performance of the managed systemand, consequently, the achieved QoS. Filtering, summarization or other processing functionsperformed upon measured values can be considered as part of the monitoring functions.
• Analysis functions
Analysis functions take as input the results of the monitoring functions. They analyse the datacollected (directly measured or calculated) and make decisions concerning QoS contractviolations, based on real-time requirements. In case of QoS degradation, analysis functionsdetect the potential sources of malfunction or anomaly and suggest solution(s) according to apre-defined policy. A key requirement on analysis is the speed with which decisions have to bemade. Hence, efficiency and timeliness requirements must be taken into account for theengineering of decision making algorithms.
• Control functions
Control functions manipulate and adjust system parameters according to the decisions orsuggestions made by the analysis functions. Issues such as accessing the managed parametersand the corresponding adjusting mechanisms are taken into account in control functions.
• Negotiation functions
Negotiation between the service user and the service provider is carried out by means ofnegotiation functions. This kind of functions enable and facili tate the user and the provider tonegotiate on the quality of the offered service. Negotiation functions may be triggered by bothuser or provider.The layering introduced in section 2.3 enables an enhancement of the TQM function taxonomyby incorporating monitoring, analysis and control functions within all four levels of thearchitecture. In the following, we outline a summary of TQM functions, per level. The list is byno means exhaustive and will need to be completed as the mechanisms for supporting therequired functionality mature and shape more clearly.
1. Application level• QoS Inquiry functions• Contract conformance appraisal functions• QoS (re-)negotiation functions• Application performance monitoring functions• Operating system performance monitoring functions• Operating system control functions• End-user equipment control functions
2. Orchestration level• Application-to-Orchestration contract mapping function• Contract conformance appraisal functions• QoS parameters (re-)negotiation functions• Temporal relationship monitoring functions• Interstream synchronisation functions• Intrastream synchronisation functions
Deliverable 5 Page 15
© RACE Project R2116 - TOMQAT
3. Transport level• Application-to-Transport contract mapping function• Contract conformance appraisal functions• QoS parameters (re-)negotiation functions• Multicast/broadcast control functions• Error recovery• Flow control• Priority control
4. Network level• Application-to-Network contract mapping function• Contract conformance appraisal functions• Traffic management functions• Resource allocation functions• QoS parameters (re-)negotiation functions• Error recovery mechanisms• Network performance parameters monitoring functions• Call admission control (CAC) functions• User parameter control (UPC) functions
It should be outlined that some of the functions identified above, usually exist in a manageabletelecommunication network even if no TQM considerations have been taken into account.Among such functions are Call Admission Control and User Parameter Control algorithms,error recovery and flow control mechanisms, traffic management functions, functions providedby the operating system etc. However the high reliance of the TQM system on those functionsnecessitates their inclusion in the list above. Another point on which attention must be drawn isthe extension that certain functions have to undergo in order to meet the TQM systemrequirements. For instance, traffic management and resource allocation functions should beextended so as to take under consideration the TQM-specific criteria according to whichdecisions will be made, other than the classical "shortest path" routing algorithms or plain oldtelephony conservative resource allocation mechanisms.
Finally it should be stressed that all functions above are to be carried out under strict timeconstraints. In some cases, certain functions will appear both in the real time and the long-termTQM domain. However, they have been included in this list solely as part of the overall realtime domain functions.
1.6. QoS Management Functions
The QoS Management Functions proposed by TOMQAT to implement the TQMFramework can be issued either from:
• The set of TMN Management Functions already documented in the Recommendation[M3400]
• A set of new Management Functions proposed by the TOMQAT project itself toperform the necessary capabili ties to cover a full management of the QoS at the variouslevels, as explained in section 2.5.
Deliverable 5 Page 16
© RACE Project R2116 - TOMQAT
1.6.1. QoS Management Functions issued from [M3400]
[M3400] is a starting point; it is therefore important to note that the overall li st of MFs(Management functions) identified in [M3400] deal with either generic and specificfunctionalities needed for telecommunication activities; then, some of them are notappropriate to QoS at all. On the other side it is likely that some specific needed QoSMFs are not listed in this recommendation, and must then be proposed in the TOMQATframework; it can be noticed for instance that the MFs specified by [M3400] are speciallyrelated to the NE layer (telecommunication equipment), while TOMQAT addresses theNetwork and Service Layers (BALI, XTPX, JVTOS).
1.6.2. QoS Management Functions proposed in TOMQAT
Due to the early stage of the study, the purpose of this section is not to propose acomplete list of additional QoS MFs relevant to Total QoS Management. It is more abrief overview of possible guidelines that can be used to identify the set of QoS MFsneeded at the various layers, and includes some example of possible ones that will beincluded in the final version of this deliverable.A first point would be to generalise the use of some of existing QoS MFs (issued from[M3400]) to the upper layers (evolution of [M3400]). Some of the QoS MFs related tothe NE layer can fit into the other layers too; for instance the "Terminate testmeasurements" MF is still valid to terminate the measurements of application level QoSparameters. After having agreed on a list of [M3400] MFs related to QoS, the workwould consist on selecting those that are relevant to the Network and Service layers.A next approach would be to enrich the existing set of MFs at the Network Element andthe Network layers to deal with the specific aspects of ATM (as stated in [M3400], someof already identified MFs are only related to a very specific context); it would be forinstance helpful if MFs that can provide information on ATM Links, Virtual PathConnections, virtual Channel Connections, may be available from the TMN (connectionsaccepted, released, rejected, number of cells transmitted on a VPC, bandwidth currentlyallocated on a VPC, effective used bandwidth on a link, etc...).Then, it would be necessary to postulate new QoS MFs at higher levels, i.e. more relatedto high level Network / Service layers issues. These would be in relation with QoSmanagement of the overall system, global strategies for QoS. In that case the terminologyof "Management Functions" can probably move to the one of "Management Services"related to QoS.The following is a short representation of possible MFs related to the total managementof QoS:
QoS verification• Performance verification (create / modify / schedule / display performance measurement
reports), current load measurement reporting• For each layer, measurements of the value of the selected QoS parameters and
evaluation, per layer and at the overall system level, of the achieved QoS.• Comparison between the achieved and planned QoS
QoS Prediction• Analysis of the system behavior, based on prior statistic analysis and diagnostics, to
elaborate QoS predictions

Deliverable 5 Page 17
© RACE Project R2116 - TOMQAT
• QoS prediction strategies• Predicted Usage Model
QoS improvement• Bandwidth allocation: related to the network level. Modify the allocated bandwidth so
that the network resources are better used (create / modify display bandwidth allocationreport, ...).
• Bandwidth tuning, bandwidth distribution• Route design: related to the network level. Defines a network of VPCs which satisfies
the predicted usage requirements• Load balancing• Bandwidth reservation: management of bursty traffic (videoconferencing systems),
allocation of bandwidth on demand
QoS Testing• QoS parameters testing: this facili ty could be offered during the process of validation of
the QoS Management model; it is aimed at selecting, among the overall li st of proposedQoS parameters, a representative set of QoS parameters to test their real influence on theQoS level, so that the actual list of relevant QoS parameters can be identified.
• Traffic generation: request issued from the TMN to the ATM 100
References
[1] Armand Feigenbaum, "Total Quali ty Control", McGraw-Hill International Editions, ThirdEdition, 1991
[2] CCITT Recommendation (M.3010), Principles for a Telecommunications ManagementNetwork- Version R5 and subsequent versions
[3] ISO/IEC JTC1/SC21, Open Systems Interconnection, data management and Open DistributedProcessing, Quality of Service Framework
[4] M.E.Anagnostou, et al, "Quali ty of Service Requirements in ATM-Based B-ISDNs", ComputerNetworks and ISDN systems, Vol 14/No 4, May 1991
[5] A.Campbell et al, "Integrated Quality of Service for Multimedia Communications",Proceedings of INFOCOM 1993
[6] Campbell et al, "Orchestration Services for Distributed Multimedia Synchronisation", HighPerformance Networking, 1992
[7] TOMQAT project (RACE 2116), "Selection of Networks, Applications and Platforms", April1994
[8] CIO project (RACE 2060) , "Specification of the Broadband Transport Protocol XTPX",February 1993
[9] G. Dermler et al, "JVTOS - A Reference Model for a New Multimedia Service", HighPerformance Networking, 1992
[10] RACE Common Functional Specification D510, "General Aspects of QoS and SP"
[11] RACE Common Functional Specification H406, "Performance Management Services inTMN"
Deliverable 5 Page 18
© RACE Project R2116 - TOMQAT
2. REQUIREMENTS BY VARIOUS ACTORS
2.1. Introduction
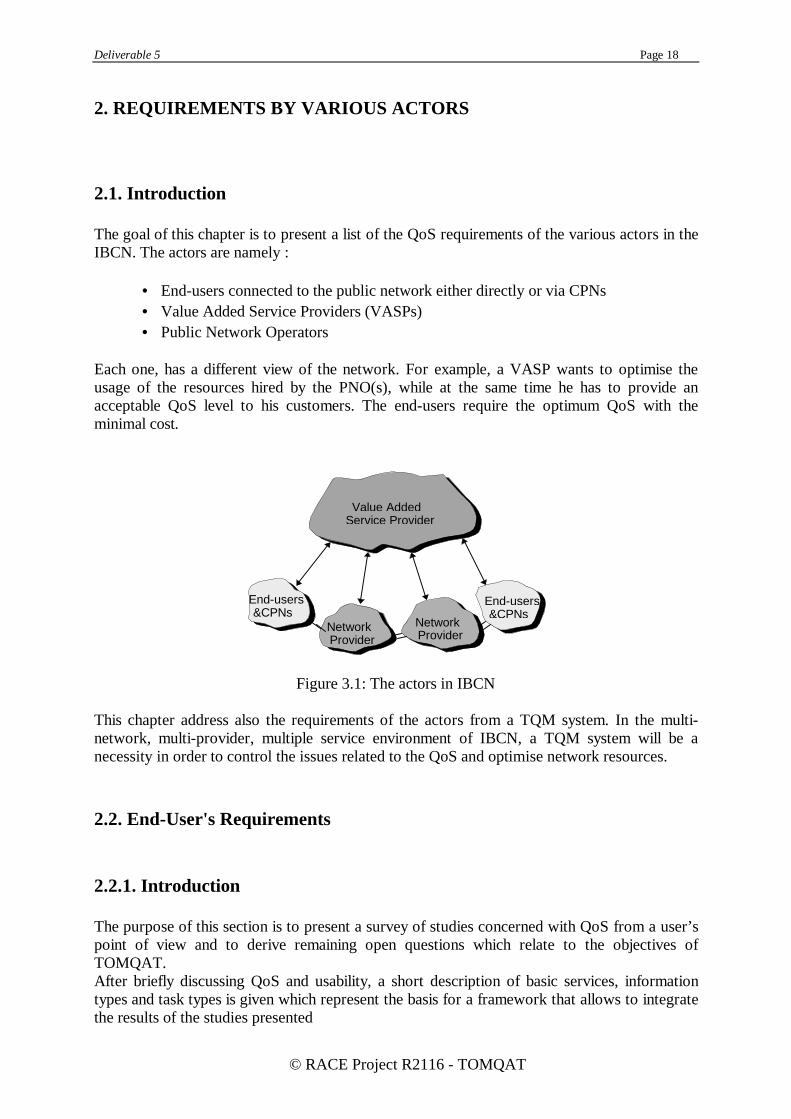
The goal of this chapter is to present a list of the QoS requirements of the various actors in theIBCN. The actors are namely :
• End-users connected to the public network either directly or via CPNs• Value Added Service Providers (VASPs)• Public Network Operators
Each one, has a different view of the network. For example, a VASP wants to optimise theusage of the resources hired by the PNO(s), while at the same time he has to provide anacceptable QoS level to his customers. The end-users require the optimum QoS with theminimal cost.
Value AddedService Provider
Network Provider
Network Provider
End-users&CPNs
End-users&CPNs
Figure 3.1: The actors in IBCN
This chapter address also the requirements of the actors from a TQM system. In the multi-network, multi-provider, multiple service environment of IBCN, a TQM system will be anecessity in order to control the issues related to the QoS and optimise network resources.
2.2. End-User's Requirements
2.2.1. Introduction
The purpose of this section is to present a survey of studies concerned with QoS from a user’spoint of view and to derive remaining open questions which relate to the objectives ofTOMQAT.After briefly discussing QoS and usabili ty, a short description of basic services, informationtypes and task types is given which represent the basis for a framework that allows to integratethe results of the studies presented
Deliverable 5 Page 19
© RACE Project R2116 - TOMQAT
This chapter also presents a survey of studies that are concerned with QoS from a user’s pointof view and to derive remaining open questions which relate to the objectives of TOMQAT.Afterwards remaining open questions are discussed and the TOMQAT approach is presented.This part finishes with some methodological considerations concerning the user orientedapproach followed in TOMQAT.
2.2.2. Definition of QoS and usability
The definition of QoS according to the CFS D510 (Dec. 1993) is:
" QoS ... is described in terms of a set of user-perceived characteristics ofthe performance of a service. It is expressed in user-understandablelanguage and manifests itself as a number of parameters, all of whichhave either subjective or objective values” .
There are two aspects which underline an user oriented approach to QoS:First the term “set of user-perceived characteristics” implies that improvements of systemperformance (SP) parameters must enhance the perceived QoS or support to enhance it.Second the term “number of parameters, all of which have either subjective or objectivevalues” suggests that a total management of services needs a mapping of both sets ofparameters in order to undertake corrective actions which will improve the perceived QoS.In other words: QoS as defined by RACE is both subjective perception based and objectivemeasurable in terms of system performance parameters.
Furthermore the CFS D510 states that QoS must be expressed in terms which are relevant tousers. These terms are "meaningful" and "relevant". "Meaningful" means the user can perceivethe QoS and "relevant" implies that users can verify the QoS statements.It should always be kept in mind that the use of teleconferencing systems is not a goal itself butshould help the user to fulfill a specific task. In other words: QoS determines to a certaindegree the usability of service.
The idea of usability has been defined by ISO (1992) (see CFS P 100):
Usability: The effectiveness, efficiency and satisfaction with which specified users can achievespecified goals in a particular environment.
Effectiveness: The accuracy and completeness with which specified users can achievespecified goals in particular environments.
Efficiency: The resources expended with the accuracy and completeness of goals achieved.
Satisfaction: The comfort and acceptabili ty of the work system to its users and other peopleaffected by its use.
It is important to stress that usabili ty depends on system features as well as on user’s tasks aswell as on the user itself and his/her environment.
Usabili ty can be regarded to be a broader concept than QoS. The criterion "satisfaction" is theoverlap between both concepts, but from work and organizational research on work attitudes itis well known, that the feeling of efficiency and effectiveness also contributes to satisfaction.
Deliverable 5 Page 20
© RACE Project R2116 - TOMQAT
Satisfaction with the QoS itself is of no practicable relevance because this perspective does nottake user’s goals and their related requirements into account. Satisfaction with QoS could be asingle criterion if it is guaranteed that the qualities for all services provided will always bebeyond a certain standard and there will never be fallbacks and if not task specific requirementsmust be taken into consideration.Very important is the fact that the subjective evaluations of users depend not only on theachieved QoS, but also on other aspects as costs, fashion etc (see CFS D510) which will notbe discussed in this paper. Furthermore the task context media are used for and former userexperiences with different quality levels affects also the perceived QoS. The above mentioneddefinitions suggest that both QoS and usabili ty are task related concepts and that satisfactionitself is just one of a set of possible criteria. Another important criterion is the effectiveness ortask-performance of the user of telecommunication services. Performance is defined as acombination of desired task product and task execution costs (CFS P100, p. 5).According to CFS P100 IBC will support tasks because it allows to choose the media and themedia quality that make services appropriate. This implies a quality-management becauseservices and their qualities should be adaptable to specific tasks and user requirements.A second important aspect is the trade-off between different performance parameters. Theexample given concerns the evaluation of transmission time for still image and its resolution: ifthe transmission time is short a low resolution could be judged positive or the quality as good.The reverse holds true, too: if the transmission time is too long the quality of a high resolutionstill picture will be judged medium or low (Usage Reference Model (URM1), 1992).
2.2.3. Differentiation of basic services, information types and task types
The CFS P170 (December 1993, p. 4) differentiates between the following basic service types:• Distribution and Retrieval• Distribution and Conferencing• Retrieval and Conferencing• Conferencing, Distribution and Retrieval
The URM1 describes the following information types• audio• moving image• still image (raster)• graphic (geometric)• text (character)• data
URM differentiates between 9 task types:1. human to human conversation2. human to machine conversation3. machine to machine conversation4. human to human send5. human to machine send6. machine to machine send7. human to human retrieve
1 URM was a RACE project (R1077) which collected user oriented data and results from different
application pilots.
Deliverable 5 Page 21
© RACE Project R2116 - TOMQAT
8. human to machine retrieve9. machine to machine retrieve
Open questions refer to the task minimum standards: up to what level of QoS users'performance and satisfaction will not be affected? In TOMQAT an answer will be given forconferencing tools used for collaboration tasks.According to URM and CFS P100 / P170 we will refer to tasks 1, 4 and 7 and to audio-/moving image information-types. The usabili ty issues (CFS P171) addressed in TOMQATrelate primarily to Service Dropping/Alteration and Fallback. In terms of the CFS the principlesof concern are controllability and flexibility.Controllabili ty means that facili ties provided should allow to change service by request.Flexibili ty is concerned with fallbacks of different services (for example a videoconferencingfallback can be either video or audio). One implication is that there should be user configuredstandard settings for fallbacks.Therefore one goal of TOMQAT is to define task specific standard settings for differentinformation types.In the following section some investigations related to QoS will be described. For reasons ofcomparability all studies presented will follow the same scheme:
1. Description of information types (audio, still and/or moving video, data)2. Service types (conferencing, distribution and/or retrieval of information)3. Independent variables (goal of the study)4. Criteria (e.g. satisfaction with the conference system and/or the communication, interest)5. Tasks used in the investigation6. Type (field or laboratory)7. Results
The application used in TOMQAT will be JVTOS that is described in detail in deliverable 2.JVTOS is not only a conferencing tool allowing human-to-human-communication with the helpof audio- and videochannels. About these features JVTOS allows also the sharing ofapplications which designates it to become a collaboration tool.To compare and to integrate the studies presented below a framework is needed which takesboth the capabili ties of JVTOS and a user perspective of telecommunication services intoaccount. According to these premises 3 information types will be differentiated:
♦ audio♦ video♦ data
These categories shall help to compare the results of different user oriented studies. Thereforethe "data category" comprises raster and geometric graphic, text and - because of the JVTOSsharing feature - system response times (SRT).Background is a user’s point of view that is different from technical considerations. Theobjective to summarize graphics, text and SRT to data is to create a framework for integratinguser oriented QoS studies.
2.2.4. Description of user oriented studies related to QoS
The following chapter presents studies which emphasises user requirements fortelecommunication services or in other words: they are related with QoS from a user’s point ofview.
Study 1: Comparison of 12 Videoconferences and 1 Audioconference [1]1. Information types: audio-video, audio only2. Service types: conferencing

Deliverable 5 Page 22
© RACE Project R2116 - TOMQAT
3. Independent variables: comparison of 2 bandwidth (1 MHz and 5 MHz) and 13 differentconference scenarios (1 audio only, 3 audio and still image, 9 audio and moving image)
4. Criteria: satisfaction with conference situation5. Tasks: discussion6. Type: laboratory7. Results
1. Bandwidth:No differences between 1 MHz and 5 Mhz2. Scenarios:
- Still image was evaluated worst, but if still image is the only possiblevideotransmission, a permanent still image is preferred over changing still images (newimage every 12,5 or 60 seconds)- Audio only was judged better than audio-still image
Study 2: Comparison of different terminals for multipoint-conferences [2]1. Information types: audio, video (moving and still image), data (facsimile)2. Service types: conferencing, distribution of information3. Independent variables: audio-only conference (HiFi-quality) compared to still-image-audio
(TV-quality) and moving-image-audio-conference (TV-quality).4. Criteria: satisfaction with communication, interest, feeling, that communication partners
were present.5. Tasks: distribution of person or document oriented information6. Type: Laboratory7. Results:
1. Quality (HiFi) of sound was the most important feature2. Moving images make teleconferencing more interesting3. For multipoint audio-videoconferencing the audio quality should be stereo4. Still image transmission should be below 2 seconds per frame
Study 3: Review of Usability Aspects [3]1. Information types: audio, video, data2. Service types: point-to-point or multipoint-conference, distribution of information3. Independent variables:
Video: bandwidth (1 MHz or 5 MHz), image sizeAudio: bandwidth (3 kHz, 7 kHz, 15 kHz)Data: fax
4. Criteria: satisfaction5. Tasks: conferencing, discussion,6. Type: literature review7. Results
Video:1. No effects of bandwidth2. The availability of moving images enhanced the attractivity of teleconferencing but not
the performance of users3. A continuos visual presence is advisable, but if not possible, an individually controlled
transmission of single videos (participants) should be possibleSound quality:1. An audio bandwidth of 7 kHz seems to be advisable, also stereo transmission
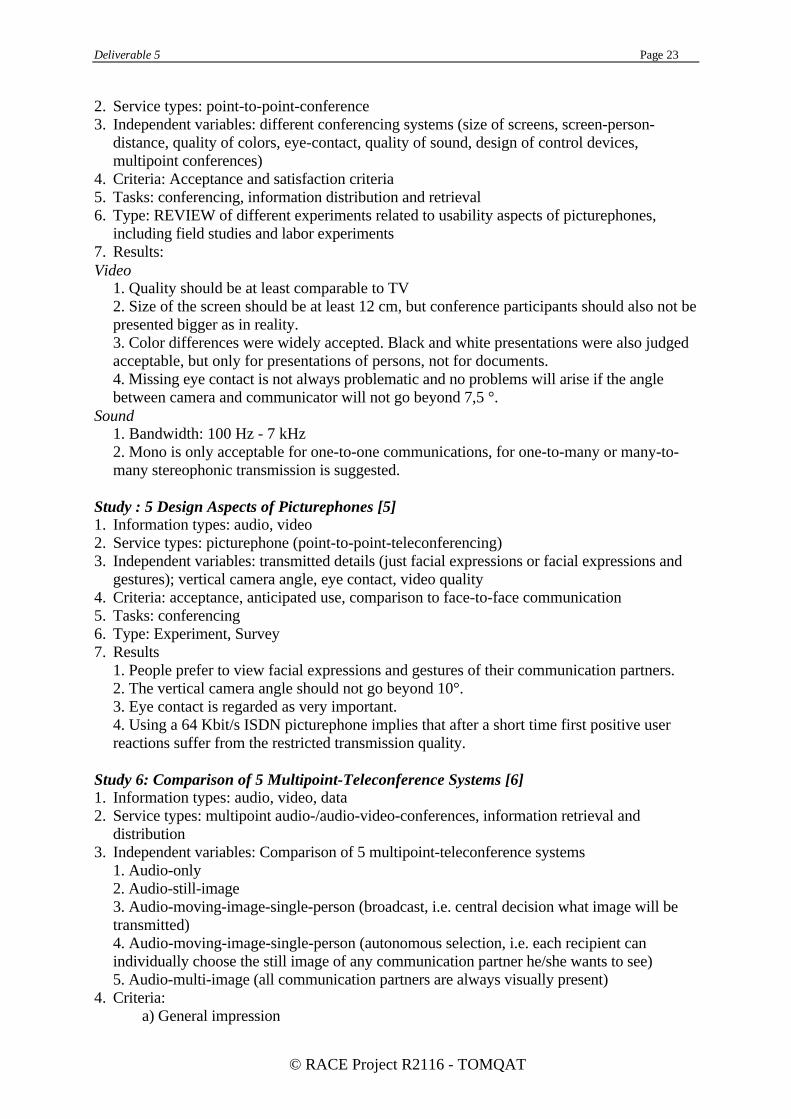
Study 4: Design Aspects of Picturephones [4]1. Information types: Audio, Video
Deliverable 5 Page 23
© RACE Project R2116 - TOMQAT
2. Service types: point-to-point-conference3. Independent variables: different conferencing systems (size of screens, screen-person-
distance, quality of colors, eye-contact, quality of sound, design of control devices,multipoint conferences)
4. Criteria: Acceptance and satisfaction criteria5. Tasks: conferencing, information distribution and retrieval6. Type: REVIEW of different experiments related to usability aspects of picturephones,
including field studies and labor experiments7. Results:Video
1. Quality should be at least comparable to TV2. Size of the screen should be at least 12 cm, but conference participants should also not bepresented bigger as in reality.3. Color differences were widely accepted. Black and white presentations were also judgedacceptable, but only for presentations of persons, not for documents.4. Missing eye contact is not always problematic and no problems will arise if the anglebetween camera and communicator will not go beyond 7,5 °.
Sound1. Bandwidth: 100 Hz - 7 kHz2. Mono is only acceptable for one-to-one communications, for one-to-many or many-to-many stereophonic transmission is suggested.
Study : 5 Design Aspects of Picturephones [5]1. Information types: audio, video2. Service types: picturephone (point-to-point-teleconferencing)3. Independent variables: transmitted details (just facial expressions or facial expressions and
gestures); vertical camera angle, eye contact, video quality4. Criteria: acceptance, anticipated use, comparison to face-to-face communication5. Tasks: conferencing6. Type: Experiment, Survey7. Results
1. People prefer to view facial expressions and gestures of their communication partners.2. The vertical camera angle should not go beyond 10°.3. Eye contact is regarded as very important.4. Using a 64 Kbit/s ISDN picturephone implies that after a short time first positive userreactions suffer from the restricted transmission quality.
Study 6: Comparison of 5 Multipoint-Teleconference Systems [6]1. Information types: audio, video, data2. Service types: multipoint audio-/audio-video-conferences, information retrieval and
distribution3. Independent variables: Comparison of 5 multipoint-teleconference systems
1. Audio-only2. Audio-still-image3. Audio-moving-image-single-person (broadcast, i.e. central decision what image will betransmitted)4. Audio-moving-image-single-person (autonomous selection, i.e. each recipient canindividually choose the still image of any communication partner he/she wants to see)5. Audio-multi-image (all communication partners are always visually present)
4. Criteria:a) General impression

Deliverable 5 Page 24
© RACE Project R2116 - TOMQAT
b) Satisfactionc) User friendlinessd) Perception of nonverbal signalse) Course of teleconferencesf) Performance of users
5. Tasks:I Delivery of person informationa) Brainstorming (cooperative)b) Rank decision (conflict)II Delivery of document informationc) Planning of a sightseeing tour (cooperative)6. Type: Experiment7. Results
a. General impression- The conference type where all participants were always visually present was judged to bethe most interesting one.- Ranks:
1. Moving-image-conference with continuos visual presence of all participants2. Moving-image-single-person
- Distribution of person oriented information: autonomous selection forrecipients- Distribution of document oriented information: broadcast
3. Still imageb) Satisfaction:
No differences between all conference types could be observed. Assumed explanation:the high quality audio system, which was the same in all conditions.
c) User friendliness- Depends on the task to be fulfilled- The handling of the audio-only system is much easier than the handling of moving-image-single-person-teleconferences
d + e) Perception of nonverbal signals and Course of the conference- Moving-images help to take the floor or to perceive the reactions of thecommunication partners
f) Performance:- For the delivery of person oriented information no differences between audio-only oraudio-plus-visual-channel could be observed.- Audio-plus-fax-teleconferences are as good as audio-video-conferences- No performance advantages for moving-image-teleconferences
Study 7: Comparison of Different System Response-Times [7]1. Information types: Data2. Service types: human-machine-interaction3. Independent variables: response times (2 and 8 seconds) and response time variations
(average 2 or 8 seconds).4. Criteria: performance (time, errors), physiological stress data, subjective wellbeing-ratings5. Tasks: simple Sterzinger tasks6. Type: experiment7. Results:
Performance and physiological variables are primarily influenced by response time. Longerresponse times (8 sec) are related also to less errors.
Deliverable 5 Page 25
© RACE Project R2116 - TOMQAT
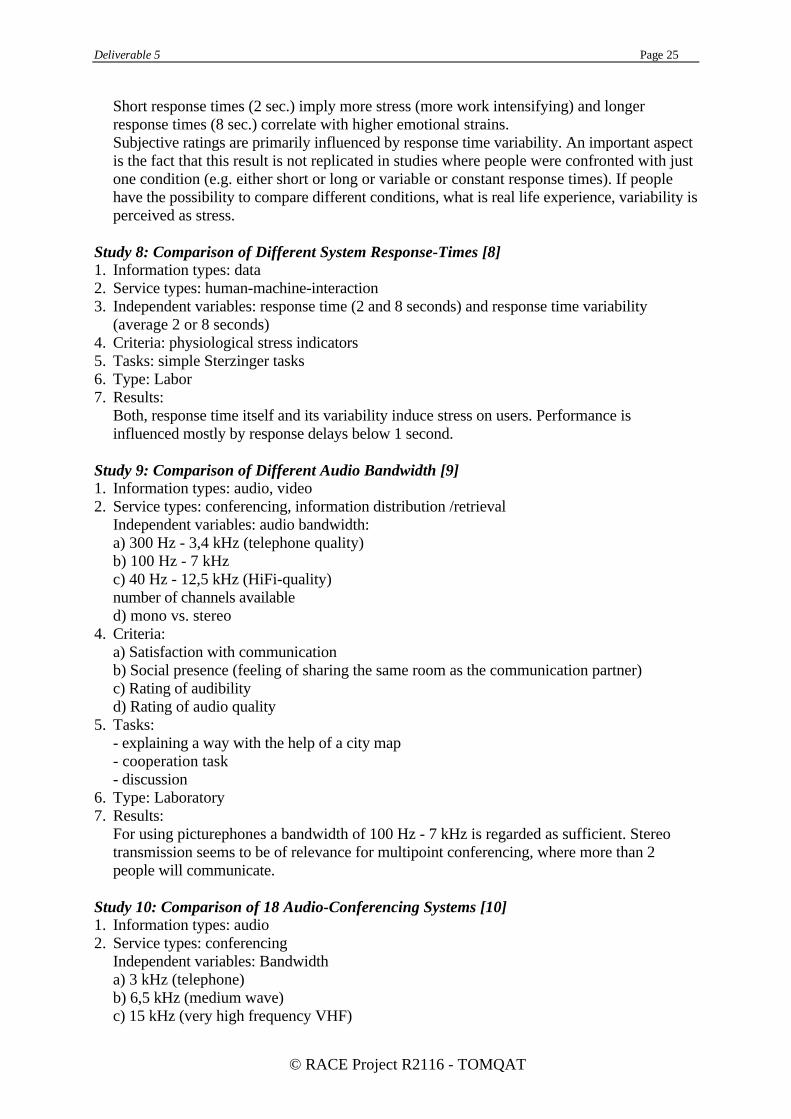
Short response times (2 sec.) imply more stress (more work intensifying) and longerresponse times (8 sec.) correlate with higher emotional strains.Subjective ratings are primarily influenced by response time variability. An important aspectis the fact that this result is not replicated in studies where people were confronted with justone condition (e.g. either short or long or variable or constant response times). If peoplehave the possibility to compare different conditions, what is real life experience, variability isperceived as stress.
Study 8: Comparison of Different System Response-Times [8]1. Information types: data2. Service types: human-machine-interaction3. Independent variables: response time (2 and 8 seconds) and response time variability
(average 2 or 8 seconds)4. Criteria: physiological stress indicators5. Tasks: simple Sterzinger tasks6. Type: Labor7. Results:
Both, response time itself and its variability induce stress on users. Performance isinfluenced mostly by response delays below 1 second.
Study 9: Comparison of Different Audio Bandwidth [9]1. Information types: audio, video2. Service types: conferencing, information distribution /retrieval
Independent variables: audio bandwidth:a) 300 Hz - 3,4 kHz (telephone quality)b) 100 Hz - 7 kHzc) 40 Hz - 12,5 kHz (HiFi-quality)number of channels availabled) mono vs. stereo
4. Criteria:a) Satisfaction with communicationb) Social presence (feeling of sharing the same room as the communication partner)c) Rating of audibilityd) Rating of audio quality
5. Tasks:- explaining a way with the help of a city map- cooperation task- discussion
6. Type: Laboratory7. Results:
For using picturephones a bandwidth of 100 Hz - 7 kHz is regarded as sufficient. Stereotransmission seems to be of relevance for multipoint conferencing, where more than 2people will communicate.
Study 10: Comparison of 18 Audio-Conferencing Systems [10]1. Information types: audio2. Service types: conferencing
Independent variables: Bandwidtha) 3 kHz (telephone)b) 6,5 kHz (medium wave)c) 15 kHz (very high frequency VHF)

Deliverable 5 Page 26
© RACE Project R2116 - TOMQAT
3. Criteria: Satisfaction4. Tasks: economic case study (discussion)5. Type: Laboratory6. Results:
Bandwidth:6,5 kHz bandwidth was judged much better than telephone quality and nearly as good asVHF quality.Number of channels:A stereo-transmission allows to identify the communication partners more easily because oftheir localisation.
Study 11: Effects of 3-D Videoconferences [11]1. Information types: audio, video2. Service types: conferencing3. Independent variables:
a) conference type (2-D Vs 3-D)b) Eye contact
4. Criteria:Feeling of sharing the same roomSatisfactionanticipated use (acceptance)
5. Tasks:cooperative problem solvingconflictful bargainingcooperation tasks
6. Type: Laboratory7. Results:
Conference typeIn 3D-videoconferences participants had much more the impression to share the same roomas in 2D-videoconferences. Therefore, the anticipated use (acceptance) was higher. But90% of the participants judged the shutterglasses which were necessary for 3D-videoconferencing as disturbing.
Eye contactThe only significant result for conference types where eye contact was possible was a higherdegree of feeling of sharing the same room. But this result had no consequence for user’ssatisfaction or his anticipated use. In other words: the acceptance of videoconferences isindependent from the possibility of gaining eye-contact.
Study 12: Comparison of Different System Response Times [12]1. Information types: data2. Service types: man-machine-interaction3. Independent variable: different system-response times and its variability4. Criteria: performance, stress5. Tasks used in the investigation: simple and complex6. Type: review of field and laboratory experiments7. Results
The greatest impact on performance measures were observed for SRT between 0,5 and 1,5seconds.The following rule of thumbs were given:
- SRT should be minimized

Deliverable 5 Page 27
© RACE Project R2116 - TOMQAT
- Variability of SRT should be reduced even if the consequence is a longer SRT- A variation of 50% of the average SRT has no performance impacts
Study 13: Consequences of Different Interval Between Frames [13]1. Information type: audio, moving video)2. Service types: conferencing3. Independent variables: Different video transmission rates4. Criteria: understanding, regulation of the communication process, perception of emotions5. Tasks: conferencing6. Type: laboratory7. Results
• Understanding:If there is a delay of 2000 ms between two frames understanding is reduced, but less orno restrictions could be observed when a still picture was used.
• Regulation of communication processesThere are slightly more interruptions if the delay between two frames is 1500 ms or ifan audio-only transmission is used.Subjective ratings concerning "feeling comfortable", "harmony" and "easiness ofcommunication" showed no differences. Only the feeling of "misunderstanding"increased if the quality of the video sank below standard-video.
• Perception of emotionsThe certainty of correctly interpreting emotions and the judged naturalness ofcommunication partners is independent of different frame rates. The perceived intensityof emotions decreases if frame-rate is below standard video transmission.
2.2.5. Summary
The next section will give a summary of tasks, criteria and scenarios used in the above citedstudies. A further step will summarize the most important results of all studies separated foreach service: audio-, video-, data-transmission.
Table 1: Tasks used in QoS related studies:Name of Task No. of Study Type of Task ContentConferencing 1, 4, 5, 9, 10, discussionInformation distribution 2, 4, 6, 9, cooperative
conflictperson orientedinformation documentoriented information
Information retrieval 4, 11Sterzinger tasks2 7, 8, 12Cooperation 9, 11 to build something
with remote helpProblem solving 11 conflictBargaining 11 cooperative
2 Sterzinger tasks are very simple tasks (looking for errors) which are used in highly standardized
psychological experiments.

Deliverable 5 Page 28
© RACE Project R2116 - TOMQAT
Table 1 shows that conferencing is the most often used task in user related QoS studies,followed by information distribution. Information retrieval was explicitly mentioned just twotimes, but the question is whether conferencing can work without the distribution and retrievalof information. Important distinctions are between cooperative and conflictfull tasks and alsobetween the delivery of person- or document-oriented information. Especially conflict tasks(where bargaining also belongs to) are very sensitive for the use of telecommunicationtechnologies. The fact that most studies cited above are experiments implies that nearly no“real users” were involved. So one problem is the emphasis on conferencing tasks and the lackof typical CSCW-(Computer Supported Cooperative Work) applications. But neverthelesstasks as e.g. joint editing - which is a CSCW task - were the background for what is called“Cooperation” (studies 9,11) or “Problem solving” (study 11).
Table 2: Criteria used in QoS related studiesCriteria No. of Study SpecificationSatisfaction 1 conference situation
2 communication4, 6, 10, 11 no specification given
Direct quality ratings 9 quality of sound, audibilityPerformance 6, 7, 12 time, no of errorsAcceptance 5, 11 anticipated useStress 7, 8, 12General impression 6User friendliness 6Social presence 6, 11 feeling of sharing the same roomPerception of nonverbal signals 6, 13
The most often used criterion is satisfaction (7 studies). Performance and stress measures wereof relevance especially in system response time studies. All other criteria depend on the specificscenario or the specific tasks to be fulfilled with the help of the system.
Table 3: Audio QoSNo. ofStudy
Results Specification
2/ 6 Q.of Sound is the mostimportant feature
A high quality audio transmission is able toequalize possible differences of different videotransmission qualities and/or scenarios
2/ 3/ 9/10
“Pseudo”-Stereo transmission issuggested for multipointteleconferences
Pseudo-stereo means the mixing of source audiomono-signals at the destination site which allowsthe acoustic localisation of conferenceparticipants.
4 Mono transmission is acceptablefor one-to-one-communications
3/ 4/ 9/10
The bandwidth should be 100Hz- 7kHz
In case of quality fallbacks telephone quality isalso acceptable
Deliverable 5 Page 29
© RACE Project R2116 - TOMQAT
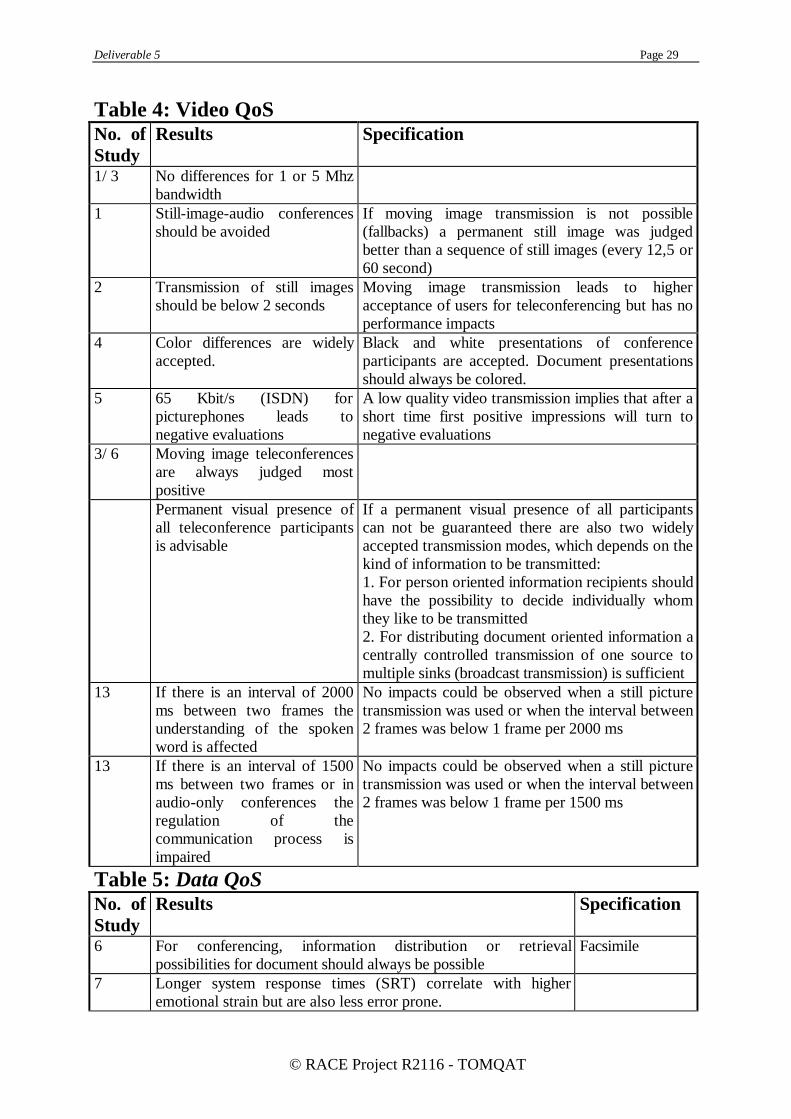
Table 4: Video QoSNo. ofStudy
Results Specification
1/ 3 No differences for 1 or 5 Mhzbandwidth
1 Still -image-audio conferencesshould be avoided
If moving image transmission is not possible(fallbacks) a permanent still image was judgedbetter than a sequence of still images (every 12,5 or60 second)
2 Transmission of still imagesshould be below 2 seconds
Moving image transmission leads to higheracceptance of users for teleconferencing but has noperformance impacts
4 Color differences are widelyaccepted.
Black and white presentations of conferenceparticipants are accepted. Document presentationsshould always be colored.
5 65 Kbit/s (ISDN) forpicturephones leads tonegative evaluations
A low quality video transmission implies that after ashort time first positive impressions will turn tonegative evaluations
3/ 6 Moving image teleconferencesare always judged mostpositivePermanent visual presence ofall teleconference participantsis advisable
If a permanent visual presence of all participantscan not be guaranteed there are also two widelyaccepted transmission modes, which depends on thekind of information to be transmitted:1. For person oriented information recipients shouldhave the possibili ty to decide individually whomthey like to be transmitted2. For distributing document oriented information acentrally controlled transmission of one source tomultiple sinks (broadcast transmission) is sufficient
13 If there is an interval of 2000ms between two frames theunderstanding of the spokenword is affected
No impacts could be observed when a still picturetransmission was used or when the interval between2 frames was below 1 frame per 2000 ms
13 If there is an interval of 1500ms between two frames or inaudio-only conferences theregulation of thecommunication process isimpaired
No impacts could be observed when a still picturetransmission was used or when the interval between2 frames was below 1 frame per 1500 ms
Table 5: Data QoSNo. ofStudy
Results Specification
6 For conferencing, information distribution or retrievalpossibilities for document should always be possible
Facsimile
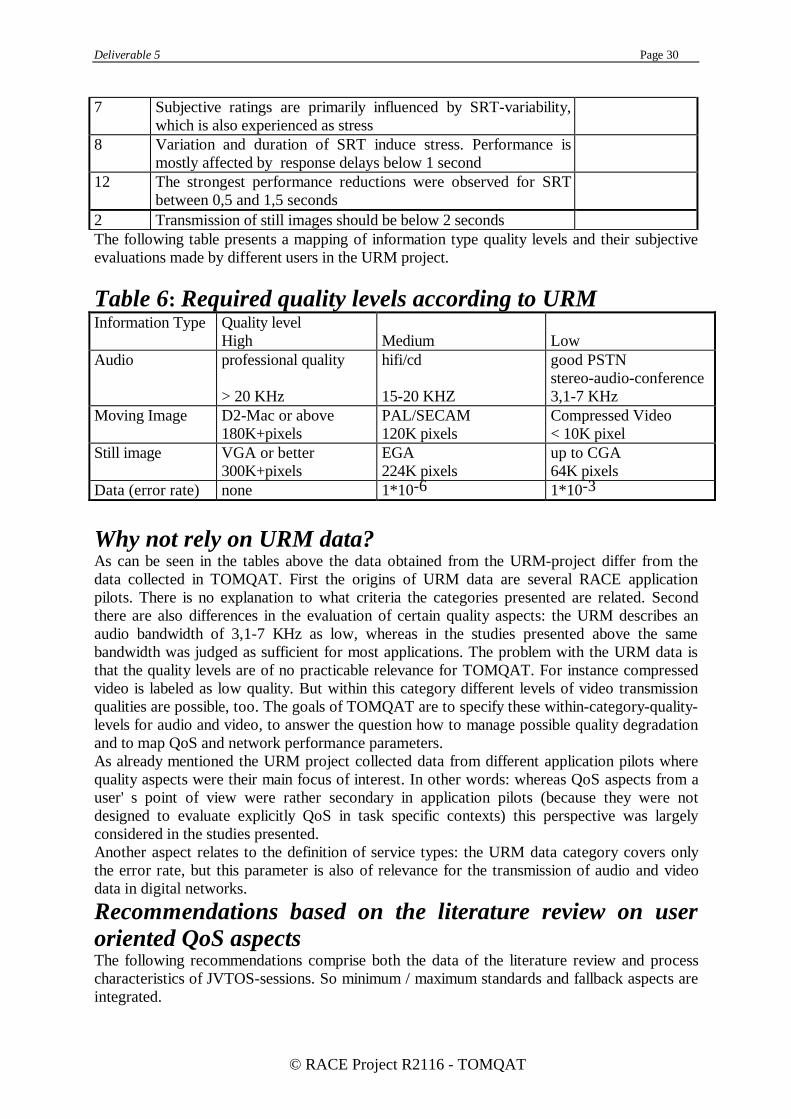
7 Longer system response times (SRT) correlate with higheremotional strain but are also less error prone.
Deliverable 5 Page 30
© RACE Project R2116 - TOMQAT
7 Subjective ratings are primarily influenced by SRT-variabili ty,which is also experienced as stress
8 Variation and duration of SRT induce stress. Performance ismostly affected by response delays below 1 second
12 The strongest performance reductions were observed for SRTbetween 0,5 and 1,5 seconds
2 Transmission of still images should be below 2 secondsThe following table presents a mapping of information type quality levels and their subjectiveevaluations made by different users in the URM project.
Table 6: Required quality levels according to URMInformation Type Quality level
High Medium LowAudio professional quality
> 20 KHz
hifi/cd
15-20 KHZ
good PSTNstereo-audio-conference3,1-7 KHz
Moving Image D2-Mac or above180K+pixels
PAL/SECAM120K pixels
Compressed Video< 10K pixel
Still image VGA or better300K+pixels
EGA224K pixels
up to CGA64K pixels
Data (error rate) none 1*10-6 1*10-3
Why not rely on URM data?As can be seen in the tables above the data obtained from the URM-project differ from thedata collected in TOMQAT. First the origins of URM data are several RACE applicationpilots. There is no explanation to what criteria the categories presented are related. Secondthere are also differences in the evaluation of certain quality aspects: the URM describes anaudio bandwidth of 3,1-7 KHz as low, whereas in the studies presented above the samebandwidth was judged as sufficient for most applications. The problem with the URM data isthat the quality levels are of no practicable relevance for TOMQAT. For instance compressedvideo is labeled as low quality. But within this category different levels of video transmissionqualities are possible, too. The goals of TOMQAT are to specify these within-category-quality-levels for audio and video, to answer the question how to manage possible quality degradationand to map QoS and network performance parameters.As already mentioned the URM project collected data from different application pilots wherequality aspects were their main focus of interest. In other words: whereas QoS aspects from auser' s point of view were rather secondary in application pilots (because they were notdesigned to evaluate explicitly QoS in task specific contexts) this perspective was largelyconsidered in the studies presented.Another aspect relates to the definition of service types: the URM data category covers onlythe error rate, but this parameter is also of relevance for the transmission of audio and videodata in digital networks.
Recommendations based on the literature review on useroriented QoS aspectsThe following recommendations comprise both the data of the literature review and processcharacteristics of JVTOS-sessions. So minimum / maximum standards and fallback aspects areintegrated.

Deliverable 5 Page 31
© RACE Project R2116 - TOMQAT
The most important feature is a good sound quality. Videotransmission is more important foracceptance (Mühlbach, 1990), but not for performance reasons. These results are based onlaboratory research in the wide area of collaboration. For other user groups, e.g. for peoplewith special needs, the quality of the videotransmission can be of major importance.Furthermore the task a conference system is used for determines the specific qualityrequirements for different services: some tasks need a high quality video transmission (e.g.conflictfull tasks, bargaining), some tasks do not need it. Sometimes there is a trade-offbetween different performance parameters: e.g. a medium or low quality still picture will bejudged good if the transmission time is short and the other way round: a high quality stillpicture will be judged poor, if the transmission takes too long. Sometimes no tradeoffs arepossible, if for instance x-rays will be transmitted.Conclusions: QoS depends heavily on the task to be fulfill ed with the help oftelecommunication systems and on the specific needs of the users. SRT should be minimizedand SRT-variability, too - even if the average SRT increases.
Audio
Table 7: Recommendations for audio transmissionGeneral recommendations Comments/SpecificationQuality of audio is the most important featureConferencing without an at least
understandable audio channel is impossible.And moreover a high quality audio channelcan compensate low quality videotransmissions
For multipoint desktop conferences a“pseudo-stereo” transmission is recommended
“Pseudo-stereo” means that each conferenceparticipant can be localised acoustically duringthe whole session. It does not mean to send astereo signal from each localisation but amixing of mono signals from differentconference places so that each sender has itsown place in the “acoustic room” of thereceiver.
The bandwidth should be between 100 Hz and7kHz
Because of the absolute priority of the audiochannel a worse audio quality (e.g. telephonequality) will also be accepted..
In general: because the audio quality (exceptions as people with special needs will be discussedin the video section) is the most relevant feature for conferencing the network managementshould take this aspect into account. In case of quality fallbacks (e.g. overload) themanagement should - if tradeoffs between different information types are possible - concedethe priority of the audio quality.
VideoThe transmission of moving images is recommended for acceptance but not for performancereasons. If possible all conference participants should be permanent visual present. In case ofquality fallbacks a single person video transmission is also accepted if participants have thepossibili ty to decide individually who of the other conference members should be visible. Thisaspect is important for delivering person oriented information. In case of document orientedinformation a broadcast transmission is sufficient.

Deliverable 5 Page 32
© RACE Project R2116 - TOMQAT
Table 8: Recommendations for video transmissionGeneral recommendations Comments/SpecificationIn general: video transmission and therefore itsquality is in most cases secondary
For special tasks (conflictfull tasks e.g.bargaining) and special client groups (e.g.people with special needs) the video channeland its QoS is very important, but theseaspects are outside the scope of the useroriented part of TOMQAT.
All conference participants should always bevisual presentThe time between 2 frames should be below1,5 secondsBlack and white presentations of conferenceparticipants will be accepted64 Kbits/s (ISDN) is not sufficientIn case of quality fallbacks a still imagevideoconference is not always recommended
If conference participants desire a still imagevideoconference - and not an audio-only-one -there should be transmitted just one permanentstill picture
DataIn teleconferences the possibili ty for transmitting documents, graphics or other kind of data is a"must". The only data available related to the transmission of this kind of data refers to stillimages, where 2 seconds were judged acceptable.
Table 9: Recommendations for data transmissionGeneral recommendations Comments/SpecificationSystem response time (SRT) variabili ty shouldbe reduced even if the consequence is anaverage longer response time
The variation should not exceed 50% of theaverage SRT
The possibili ty of transmitting graphics, textetc. is definitely necessary
Transmission time (e.g. for still images) shouldbe below 2 seconds
Users should be informed of possible SRTincreases
Long SRT are accepted if commands areknown as powerful and the system presentsinformation about it.
Note: the data category comprises raster and geometric graphic, text and system response time (SRT)
In general: the importance of different features is specific for different tasks and different usergroups. This suggests that providers should offer users possibili ties to choose betweendifferent QoS levels or to change the priority for different information types according to theirspecial requirements.
2.2.6. The TOMQAT-approach to user oriented QoS
The conclusions from the above cited studies can be summarized under the following topics:·• ·Problems of generalization• ·General psychological aspects related to TOMQAT
- process characteristics
Deliverable 5 Page 33
© RACE Project R2116 - TOMQAT
- user control
Problems of generalizationThe data presented in different studies differ very often in criteria, tasks and settings. Thereforethe results are hardly to generalize, because the describing categories are on the one hand verybroad (for example cooperative vs. conflictfull or person vs. document information) and on theother hand there will be not any application that is limited to just one of the above mentionedcategories. ·
General psychological aspects related to TOMQAT: process characteristicsAnother important aspect concerns the process of teleconference sessions. Results from studiesabout system response times (SRT) suggests that the expectation of specific SRT limits to acertain degree the perceived stress and subjective evaluations. In other words: if there is acontinuous increase of SRT or SRT are varying strongly the user perceived QoS will be less asif sessions start with an average SRT but without remarkable increase or strong variations.Similar results could also be true for conferencing: starting a conference with the best QoSavailable could cause acceptance problems if there are quality degradation. Communicationitself is a highly redundant process and communication partners are to a great extend able tocompensate quality restrictions. However acceptance may be much more negatively affectedfrom a reduction of QoS during sessions than positively from its increase. ·
General psychological aspects related to TOMQAT:user controlAnother process related aspect concerns the question how to handle fallbacks. The results pre-sented suggest that for certain tasks (e.g. delivering person oriented information) users shouldhave the possibili ty to control themselves how to handle fallbacks (e.g. if permanent visualpresence of all participants would lead to a strong decrease in transmission quality the usersshould have the possibili ty to select individually a single person video picture or to switch tostill image transmission). Another example for user control in quality management is to makequality tradeoffs user-selectable: users of low-bit-rate-videophones sometimes have the optionto choose between clear pictures at low transmission rates or blurred pictures at high framerate.In other words quality management of telecommunication services should taken both processaspects and user control needs into account. Therefore a dynamic QoS management isrequired.Beside these general conclusions - which are of relevance to VASP and/or end users, but willnot be studied in TOMQAT - there are a number of open questions related to the identificationof critical teleservice quality thresholds for users and the mapping of subjective user’sevaluation and objective network performance parameters. Figure 3.2 demonstrates theapproach of Seitz, N.B. et al. (1994), which will be followed in TOMQAT, too.
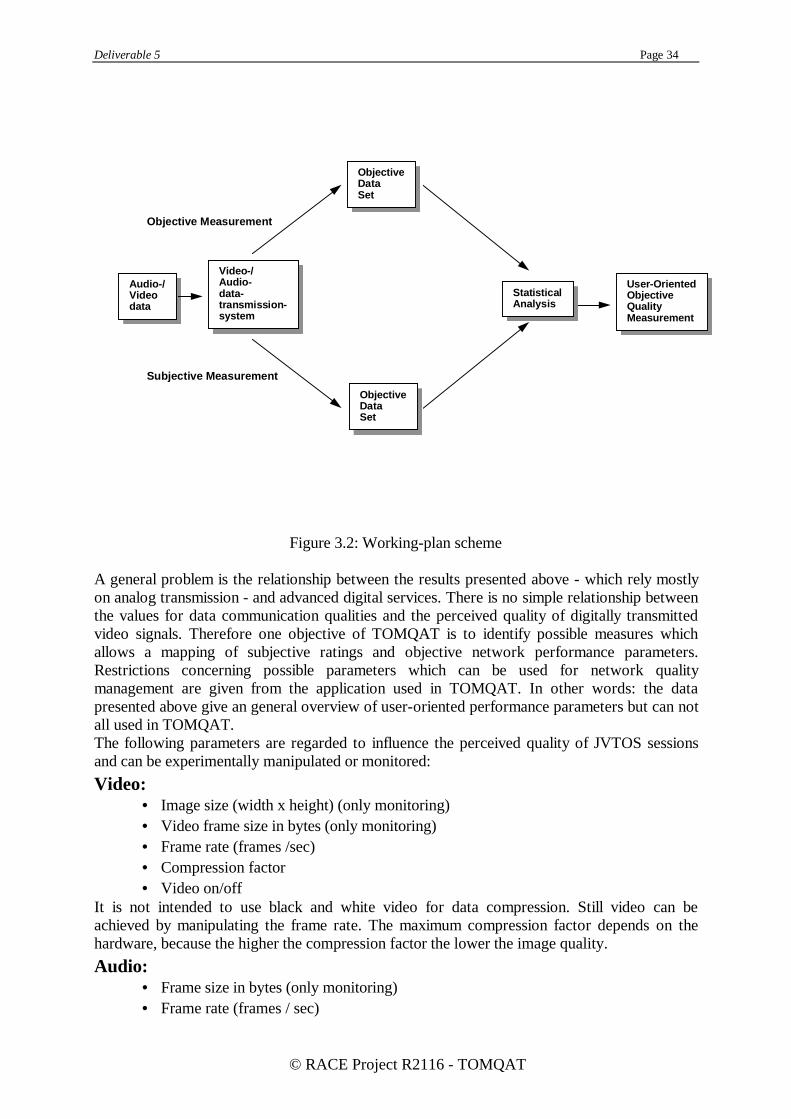
Deliverable 5 Page 34
© RACE Project R2116 - TOMQAT
Audio-/Videodata
Video-/Audio-data-transmission-system
ObjectiveDataSet
ObjectiveDataSet
StatisticalAnalysis
User-OrientedObjectiveQualityMeasurement
Objective Measurement
Subjective Measurement
Figure 3.2: Working-plan scheme
A general problem is the relationship between the results presented above - which rely mostlyon analog transmission - and advanced digital services. There is no simple relationship betweenthe values for data communication qualities and the perceived quality of digitally transmittedvideo signals. Therefore one objective of TOMQAT is to identify possible measures whichallows a mapping of subjective ratings and objective network performance parameters.Restrictions concerning possible parameters which can be used for network qualitymanagement are given from the application used in TOMQAT. In other words: the datapresented above give an general overview of user-oriented performance parameters but can notall used in TOMQAT.The following parameters are regarded to influence the perceived quality of JVTOS sessionsand can be experimentally manipulated or monitored:
Video:• Image size (width x height) (only monitoring)• Video frame size in bytes (only monitoring)• Frame rate (frames /sec)• Compression factor• Video on/off
It is not intended to use black and white video for data compression. Still video can beachieved by manipulating the frame rate. The maximum compression factor depends on thehardware, because the higher the compression factor the lower the image quality.
Audio:• Frame size in bytes (only monitoring)• Frame rate (frames / sec)
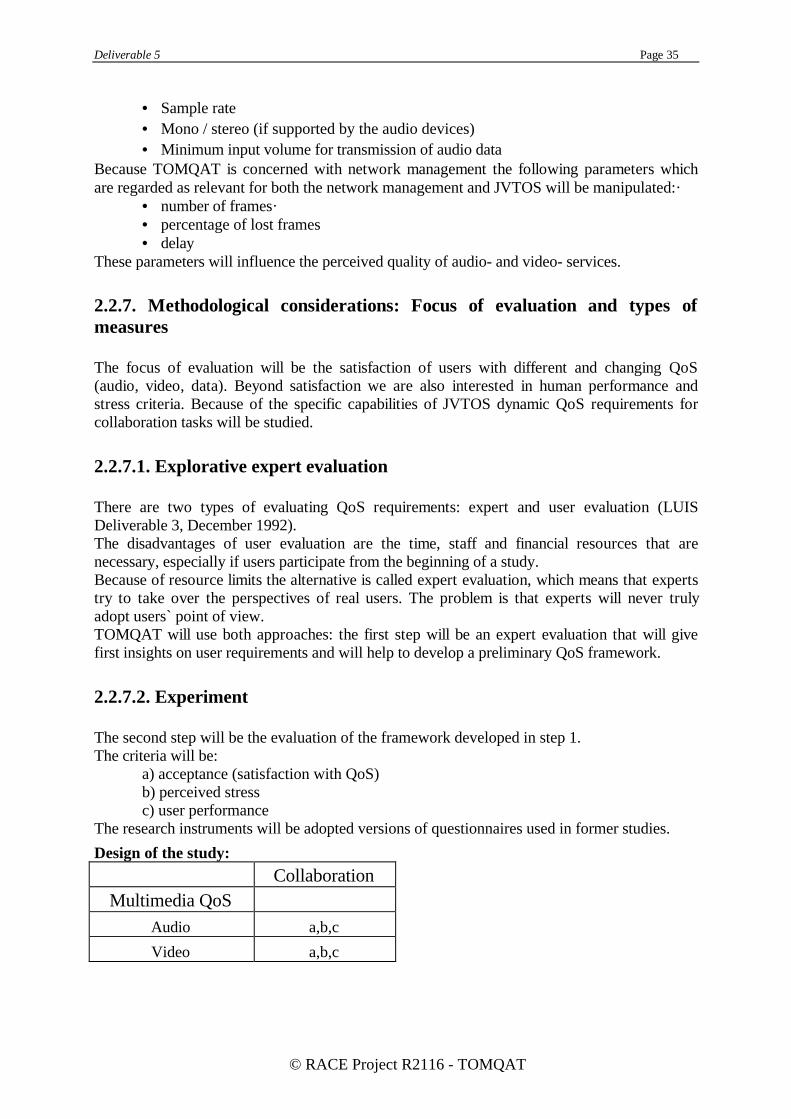
Deliverable 5 Page 35
© RACE Project R2116 - TOMQAT
• Sample rate• Mono / stereo (if supported by the audio devices)• Minimum input volume for transmission of audio data
Because TOMQAT is concerned with network management the following parameters whichare regarded as relevant for both the network management and JVTOS will be manipulated:·
• number of frames·• percentage of lost frames• delay
These parameters will influence the perceived quality of audio- and video- services.
2.2.7. Methodological considerations: Focus of evaluation and types ofmeasures
The focus of evaluation will be the satisfaction of users with different and changing QoS(audio, video, data). Beyond satisfaction we are also interested in human performance andstress criteria. Because of the specific capabili ties of JVTOS dynamic QoS requirements forcollaboration tasks will be studied.
2.2.7.1. Explorative expert evaluation
There are two types of evaluating QoS requirements: expert and user evaluation (LUISDeliverable 3, December 1992).The disadvantages of user evaluation are the time, staff and financial resources that arenecessary, especially if users participate from the beginning of a study.Because of resource limits the alternative is called expert evaluation, which means that expertstry to take over the perspectives of real users. The problem is that experts will never trulyadopt users` point of view.TOMQAT will use both approaches: the first step will be an expert evaluation that will givefirst insights on user requirements and will help to develop a preliminary QoS framework.
2.2.7.2. Experiment
The second step will be the evaluation of the framework developed in step 1.The criteria will be:
a) acceptance (satisfaction with QoS)b) perceived stressc) user performance
The research instruments will be adopted versions of questionnaires used in former studies.
Design of the study:
CollaborationMultimedia QoS
Audio a,b,c
Video a,b,c
Deliverable 5 Page 36
© RACE Project R2116 - TOMQAT
2.3. Requirements by Value Added-Service Provider (VASP)
VASPs are essentially the players perceived by end-users as the providers of usable services.VASP players sell such services to end-users according to the One-Stop Shopping concept[20]. That is, they constitute the unique organizational entity responsible for all contract, billi ngand reporting of faults. Although value-added services are largely based on the provision ofbearer services and/or resources by Public Network Operators (PNOs), this fact is essentiallytransparent to end-users. Typical cases of Value Added Services are as follows:
• Virtual Private Network (VPN): This service provides the customer with a private telecomsystem without resorting to the use of leased lines. (That would constitute an "actual"private network.) Thus, several calli ng parties involved in the VPN may communicate witheach other by employing their own numbering discipline. (Appropriate provision is mostoften taken in order that communication with external parties be made possible through thepublic network.) A detailed analysis of the advantages of using a VPN service instead ofleased lines, as well as of special features that a VPN may possess, is presented in [21].
• Videoconferencing: Such a service provides exchange of both image and audio real-timeinformation among several parties engaged in a common session; e.g., executives discussinga decision to be taken by a corporation, without being in a meeting room. Similarly to VPN,videoconferencing may also be viewed as establishing closed-group communication.However, "conferencing"-type services mainly aim to offer simultaneous exchange ofinformation (either video/audio or simply audio, as in teleconferencing), as opposed to thepairwise communication arising in VPNs.
• Joint-Viewing and Tele-Collaboration: Such services involve multimedia applications (of the"conferencing"-type) and offer an environment for remote co-operation (in editing a text,running some software program etc.) together with audio- and video-conferencing. TheJVTOS application, which is of particular importance to TOMQAT, falls into this type ofvalue-added service.
2.3.1. Customers/Users and VASPs
Therefore, the customer/user resorting to the services offered by a VASP has certainrequirements/expectations thereby, which precisely reflect the additional value put to theservice by the VASP; such are presented below. As demonstrated later, it is the application ofTotal Quality Management that would result in these requirements/expectations being met
• User-friendliness and flexibili ty during service provision (i.e., in-service), as well as in thepre-service and post-service phases (i.e., in call set-up and release). Indeed, customers/users(especially the non high-tech oriented ones) would definitely opt for services that are easyand convenient to subscribe for, to ask for, to use, and to hang up. A help desk (equippedwith appropriate data-bases) is usually indispensable, especially for services with manyoptions, and many parties that can possibly be engaged thereto. Customers/users wouldrefer to such a desk for queries related to inquiring on, using, and upgrading the existingservice features, as well as on the various parties that can be accessed through the service. Itshould be noted that even ease in subscription suspension would be appreciated bycustomers, since subscription would seem less of a commitment (thus being moreattractive).
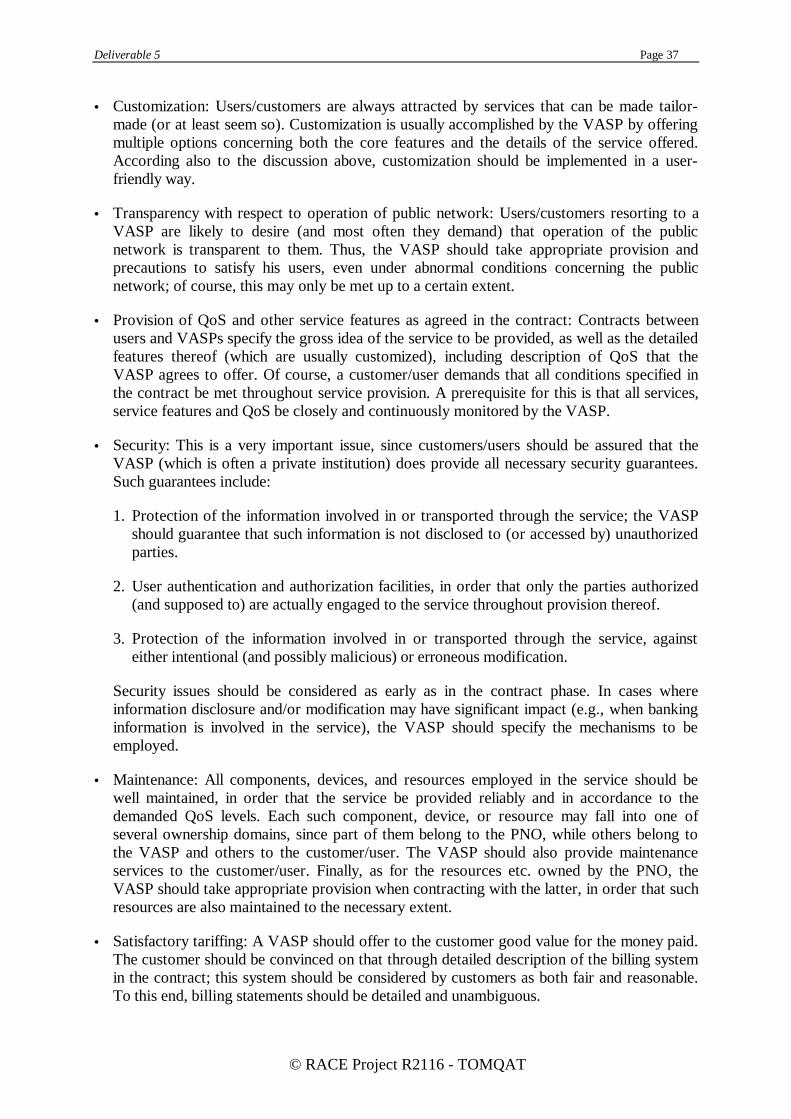
Deliverable 5 Page 37
© RACE Project R2116 - TOMQAT
• Customization: Users/customers are always attracted by services that can be made tailor-made (or at least seem so). Customization is usually accomplished by the VASP by offeringmultiple options concerning both the core features and the details of the service offered.According also to the discussion above, customization should be implemented in a user-friendly way.
• Transparency with respect to operation of public network: Users/customers resorting to aVASP are likely to desire (and most often they demand) that operation of the publicnetwork is transparent to them. Thus, the VASP should take appropriate provision andprecautions to satisfy his users, even under abnormal conditions concerning the publicnetwork; of course, this may only be met up to a certain extent.
• Provision of QoS and other service features as agreed in the contract: Contracts betweenusers and VASPs specify the gross idea of the service to be provided, as well as the detailedfeatures thereof (which are usually customized), including description of QoS that theVASP agrees to offer. Of course, a customer/user demands that all conditions specified inthe contract be met throughout service provision. A prerequisite for this is that all services,service features and QoS be closely and continuously monitored by the VASP.
• Security: This is a very important issue, since customers/users should be assured that theVASP (which is often a private institution) does provide all necessary security guarantees.Such guarantees include:
1. Protection of the information involved in or transported through the service; the VASPshould guarantee that such information is not disclosed to (or accessed by) unauthorizedparties.
2. User authentication and authorization facili ties, in order that only the parties authorized(and supposed to) are actually engaged to the service throughout provision thereof.
3. Protection of the information involved in or transported through the service, againsteither intentional (and possibly malicious) or erroneous modification.
Security issues should be considered as early as in the contract phase. In cases whereinformation disclosure and/or modification may have significant impact (e.g., when bankinginformation is involved in the service), the VASP should specify the mechanisms to beemployed.
• Maintenance: All components, devices, and resources employed in the service should bewell maintained, in order that the service be provided reliably and in accordance to thedemanded QoS levels. Each such component, device, or resource may fall into one ofseveral ownership domains, since part of them belong to the PNO, while others belong tothe VASP and others to the customer/user. The VASP should also provide maintenanceservices to the customer/user. Finally, as for the resources etc. owned by the PNO, theVASP should take appropriate provision when contracting with the latter, in order that suchresources are also maintained to the necessary extent.
• Satisfactory tariff ing: A VASP should offer to the customer good value for the money paid.The customer should be convinced on that through detailed description of the billi ng systemin the contract; this system should be considered by customers as both fair and reasonable.To this end, billing statements should be detailed and unambiguous.

Deliverable 5 Page 38
© RACE Project R2116 - TOMQAT
It should be noted that the customer/user of a VASP may in fact be another VASP (as opposedto an end-customer/user). The requirements/expectations described above also apply to thiscase.
2.3.2. VASP Requirements and Expectations
In the previous subsection, we have described what the VASP should offer to customers/users,based on their expectations. We now discuss some additional expectations/requirements by theVASP; these contrast to the ones described above, which are imposed by the customer/user tothe VASP. However, both kinds of requirements/expectations are to be met by application ofTotal Quality Management.
• High Profit: Obviously, increased profit is one of the main objectives for a VASP to run thebusiness. This goal is attained through the following objectives:
1. High profit margin; i.e., a good (considering the market condition) proportion of the feespaid by customers for the service received should constitute the profit gained by the VASP.
2. High market penetration; i.e., as many customers as possible (or close to that) shouldsubscribe to the value-added service (while all being satisfied thereby).
Regarding the profits of a VASP, careful short-term and long-term planning is definitelyrequired. Of course, there are several factors influencing (either directly or indirectly) howprofitable a VASP would be. For example, profit margin increases by good exploitation of theresources/services paid for by the VASP to other players (such as the PNO; see below).Factors influencing the profits by a VASP can possibly be associated to the Total QualityManagement concept; such factors are associated to some of the requirements/expectationspresented below. Some of these factors are of no interest to TOMQAT, although they do notfall into the scope of TQM (e.g., productivity of the VASP organization employees!)
• High utili zation of external resources/services: As already mentioned a VASP has to pay forthe provision of services and resources by other players; e.g., a VASP makes use oftelecommunication links as well as of bearer services provided by the PNO and has to pay afee for that. Thus, the VASP has to receive high return for investments of this kind, as wellas for the resources/equipment owned by him/herself. To this end, careful planning isnecessary, in order that the VASP hires an ample amount of external resources/services sothat customer/user demand be met, without exceeding this amount by much (in order forexternal resources not being underutili zed). Moreover, the VASP should have the abili ty toverify that the external resources and services paid for are actually provided to the agreeddegree and under the appropriate tariff; e.g., a VASP hiring a 155Mbps channel should beable to verify that this amount of bandwidth is always available to him/her.
• Accurate estimation and prediction of demand: Related to the above issue is the capabili tyfor a VASP to accurately estimate the present demand and to predict the future demandbased on system history, on market trends etc. Apart from preventing under-utili zation ofthe various resources/services either purchased or hired by the VASP, this will also enableintroduction of new customers/users (without affecting the ones already subscribed; see alsobelow). Apparently, demand estimation/prediction may be viewed as part of Total QualityManagement.
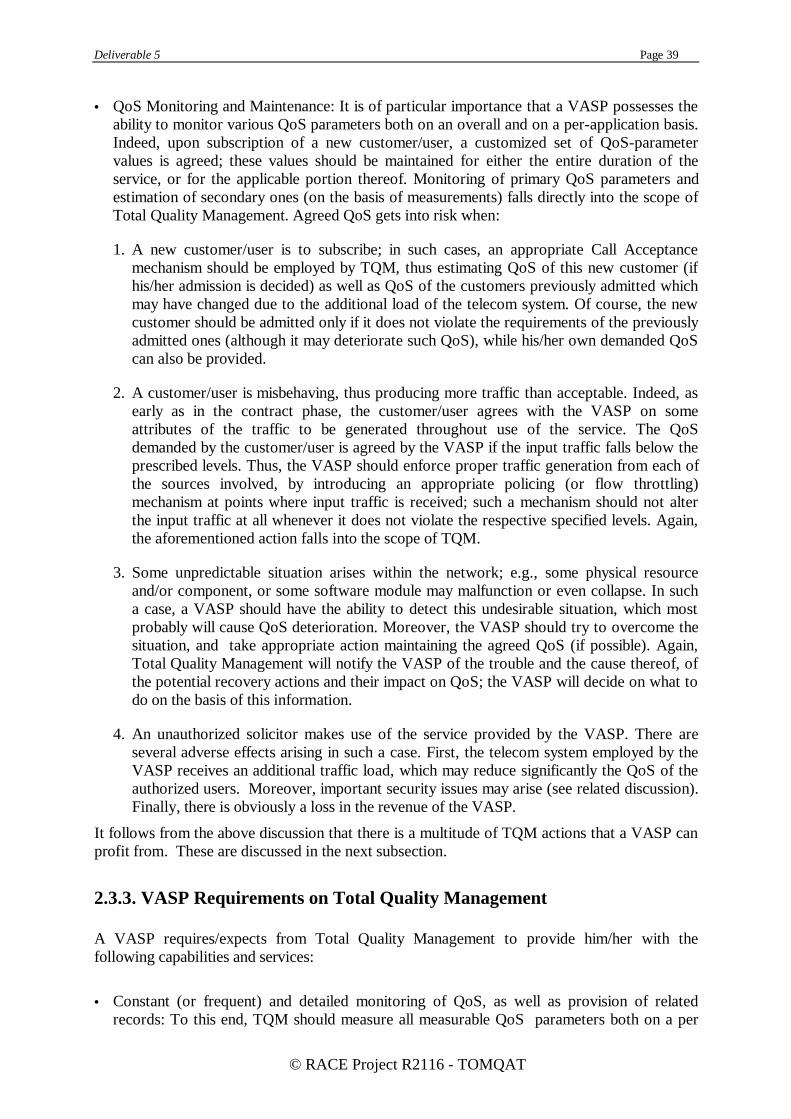
Deliverable 5 Page 39
© RACE Project R2116 - TOMQAT
• QoS Monitoring and Maintenance: It is of particular importance that a VASP possesses theabili ty to monitor various QoS parameters both on an overall and on a per-application basis.Indeed, upon subscription of a new customer/user, a customized set of QoS-parametervalues is agreed; these values should be maintained for either the entire duration of theservice, or for the applicable portion thereof. Monitoring of primary QoS parameters andestimation of secondary ones (on the basis of measurements) falls directly into the scope ofTotal Quality Management. Agreed QoS gets into risk when:
1. A new customer/user is to subscribe; in such cases, an appropriate Call Acceptancemechanism should be employed by TQM, thus estimating QoS of this new customer (ifhis/her admission is decided) as well as QoS of the customers previously admitted whichmay have changed due to the additional load of the telecom system. Of course, the newcustomer should be admitted only if it does not violate the requirements of the previouslyadmitted ones (although it may deteriorate such QoS), while his/her own demanded QoScan also be provided.
2. A customer/user is misbehaving, thus producing more traffic than acceptable. Indeed, asearly as in the contract phase, the customer/user agrees with the VASP on someattributes of the traffic to be generated throughout use of the service. The QoSdemanded by the customer/user is agreed by the VASP if the input traffic falls below theprescribed levels. Thus, the VASP should enforce proper traffic generation from each ofthe sources involved, by introducing an appropriate policing (or flow throttling)mechanism at points where input traffic is received; such a mechanism should not alterthe input traffic at all whenever it does not violate the respective specified levels. Again,the aforementioned action falls into the scope of TQM.
3. Some unpredictable situation arises within the network; e.g., some physical resourceand/or component, or some software module may malfunction or even collapse. In sucha case, a VASP should have the abili ty to detect this undesirable situation, which mostprobably will cause QoS deterioration. Moreover, the VASP should try to overcome thesituation, and take appropriate action maintaining the agreed QoS (if possible). Again,Total Quality Management will notify the VASP of the trouble and the cause thereof, ofthe potential recovery actions and their impact on QoS; the VASP will decide on what todo on the basis of this information.
4. An unauthorized solicitor makes use of the service provided by the VASP. There areseveral adverse effects arising in such a case. First, the telecom system employed by theVASP receives an additional traffic load, which may reduce significantly the QoS of theauthorized users. Moreover, important security issues may arise (see related discussion).Finally, there is obviously a loss in the revenue of the VASP.
It follows from the above discussion that there is a multitude of TQM actions that a VASP canprofit from. These are discussed in the next subsection.
2.3.3. VASP Requirements on Total Quality Management
A VASP requires/expects from Total Quality Management to provide him/her with thefollowing capabilities and services:
• Constant (or frequent) and detailed monitoring of QoS, as well as provision of relatedrecords: To this end, TQM should measure all measurable QoS parameters both on a per
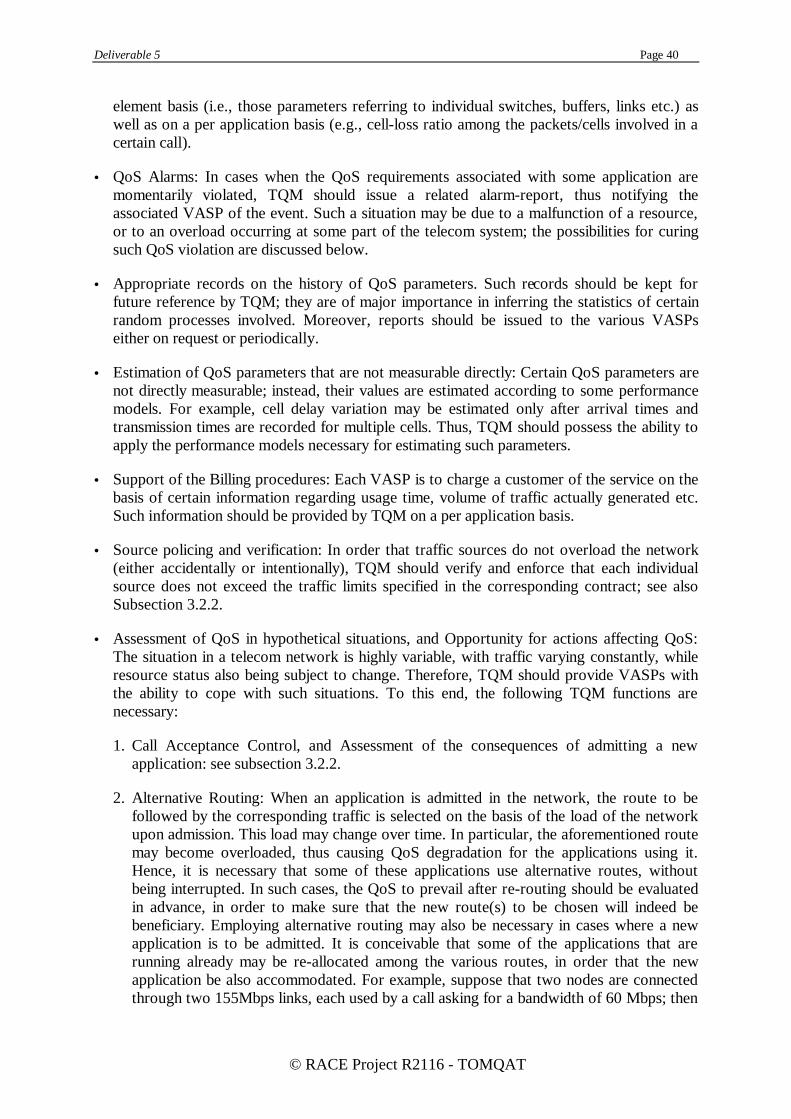
Deliverable 5 Page 40
© RACE Project R2116 - TOMQAT
element basis (i.e., those parameters referring to individual switches, buffers, links etc.) aswell as on a per application basis (e.g., cell-loss ratio among the packets/cells involved in acertain call).
• QoS Alarms: In cases when the QoS requirements associated with some application aremomentarily violated, TQM should issue a related alarm-report, thus notifying theassociated VASP of the event. Such a situation may be due to a malfunction of a resource,or to an overload occurring at some part of the telecom system; the possibili ties for curingsuch QoS violation are discussed below.
• Appropriate records on the history of QoS parameters. Such records should be kept forfuture reference by TQM; they are of major importance in inferring the statistics of certainrandom processes involved. Moreover, reports should be issued to the various VASPseither on request or periodically.
• Estimation of QoS parameters that are not measurable directly: Certain QoS parameters arenot directly measurable; instead, their values are estimated according to some performancemodels. For example, cell delay variation may be estimated only after arrival times andtransmission times are recorded for multiple cells. Thus, TQM should possess the abili ty toapply the performance models necessary for estimating such parameters.
• Support of the Billi ng procedures: Each VASP is to charge a customer of the service on thebasis of certain information regarding usage time, volume of traffic actually generated etc.Such information should be provided by TQM on a per application basis.
• Source policing and verification: In order that traffic sources do not overload the network(either accidentally or intentionally), TQM should verify and enforce that each individualsource does not exceed the traffic limits specified in the corresponding contract; see alsoSubsection 3.2.2.
• Assessment of QoS in hypothetical situations, and Opportunity for actions affecting QoS:The situation in a telecom network is highly variable, with traffic varying constantly, whileresource status also being subject to change. Therefore, TQM should provide VASPs withthe abili ty to cope with such situations. To this end, the following TQM functions arenecessary:
1. Call Acceptance Control, and Assessment of the consequences of admitting a newapplication: see subsection 3.2.2.
2. Alternative Routing: When an application is admitted in the network, the route to befollowed by the corresponding traffic is selected on the basis of the load of the networkupon admission. This load may change over time. In particular, the aforementioned routemay become overloaded, thus causing QoS degradation for the applications using it.Hence, it is necessary that some of these applications use alternative routes, withoutbeing interrupted. In such cases, the QoS to prevail after re-routing should be evaluatedin advance, in order to make sure that the new route(s) to be chosen will i ndeed bebeneficiary. Employing alternative routing may also be necessary in cases where a newapplication is to be admitted. It is conceivable that some of the applications that arerunning already may be re-allocated among the various routes, in order that the newapplication be also accommodated. For example, suppose that two nodes are connectedthrough two 155Mbps links, each used by a call asking for a bandwidth of 60 Mbps; then
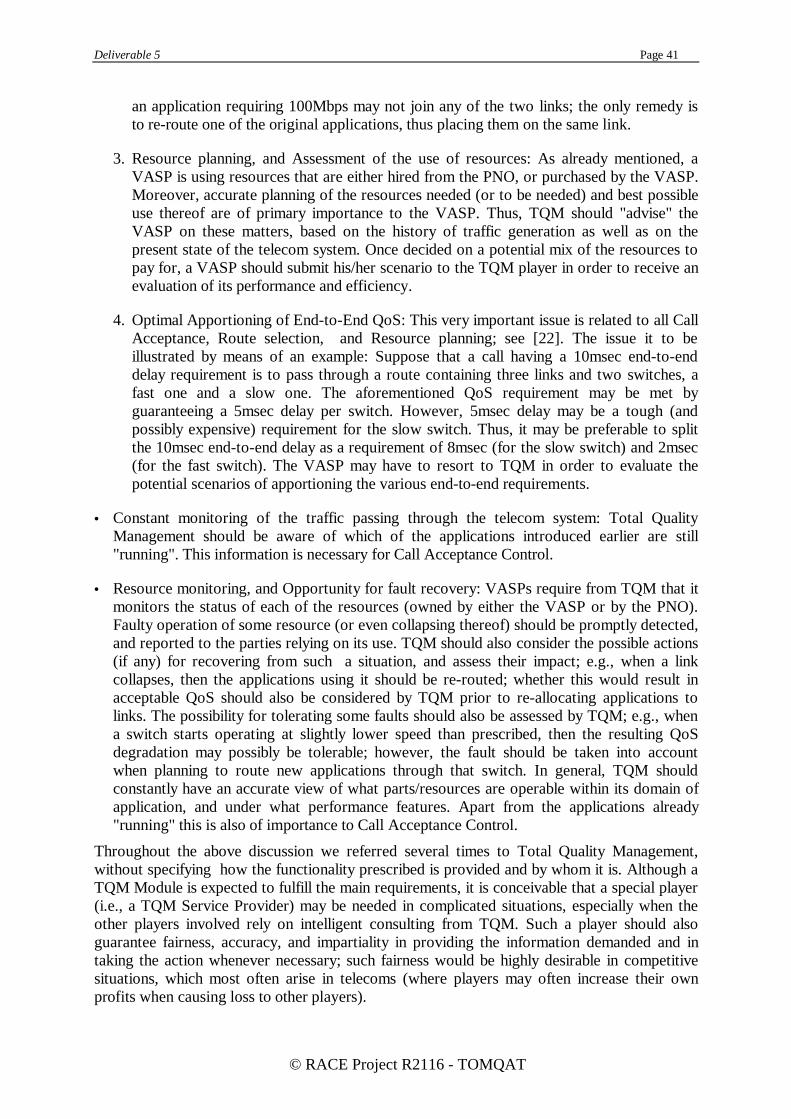
Deliverable 5 Page 41
© RACE Project R2116 - TOMQAT
an application requiring 100Mbps may not join any of the two links; the only remedy isto re-route one of the original applications, thus placing them on the same link.
3. Resource planning, and Assessment of the use of resources: As already mentioned, aVASP is using resources that are either hired from the PNO, or purchased by the VASP.Moreover, accurate planning of the resources needed (or to be needed) and best possibleuse thereof are of primary importance to the VASP. Thus, TQM should "advise" theVASP on these matters, based on the history of traffic generation as well as on thepresent state of the telecom system. Once decided on a potential mix of the resources topay for, a VASP should submit his/her scenario to the TQM player in order to receive anevaluation of its performance and efficiency.
4. Optimal Apportioning of End-to-End QoS: This very important issue is related to all CallAcceptance, Route selection, and Resource planning; see [22]. The issue it to beill ustrated by means of an example: Suppose that a call having a 10msec end-to-enddelay requirement is to pass through a route containing three links and two switches, afast one and a slow one. The aforementioned QoS requirement may be met byguaranteeing a 5msec delay per switch. However, 5msec delay may be a tough (andpossibly expensive) requirement for the slow switch. Thus, it may be preferable to splitthe 10msec end-to-end delay as a requirement of 8msec (for the slow switch) and 2msec(for the fast switch). The VASP may have to resort to TQM in order to evaluate thepotential scenarios of apportioning the various end-to-end requirements.
• Constant monitoring of the traffic passing through the telecom system: Total QualityManagement should be aware of which of the applications introduced earlier are still"running". This information is necessary for Call Acceptance Control.
• Resource monitoring, and Opportunity for fault recovery: VASPs require from TQM that itmonitors the status of each of the resources (owned by either the VASP or by the PNO).Faulty operation of some resource (or even collapsing thereof) should be promptly detected,and reported to the parties relying on its use. TQM should also consider the possible actions(if any) for recovering from such a situation, and assess their impact; e.g., when a linkcollapses, then the applications using it should be re-routed; whether this would result inacceptable QoS should also be considered by TQM prior to re-allocating applications tolinks. The possibili ty for tolerating some faults should also be assessed by TQM; e.g., whena switch starts operating at slightly lower speed than prescribed, then the resulting QoSdegradation may possibly be tolerable; however, the fault should be taken into accountwhen planning to route new applications through that switch. In general, TQM shouldconstantly have an accurate view of what parts/resources are operable within its domain ofapplication, and under what performance features. Apart from the applications already"running" this is also of importance to Call Acceptance Control.
Throughout the above discussion we referred several times to Total Quality Management,without specifying how the functionality prescribed is provided and by whom it is. Although aTQM Module is expected to fulfill the main requirements, it is conceivable that a special player(i.e., a TQM Service Provider) may be needed in complicated situations, especially when theother players involved rely on intelli gent consulting from TQM. Such a player should alsoguarantee fairness, accuracy, and impartiality in providing the information demanded and intaking the action whenever necessary; such fairness would be highly desirable in competitivesituations, which most often arise in telecoms (where players may often increase their ownprofits when causing loss to other players).
Deliverable 5 Page 42
© RACE Project R2116 - TOMQAT
2.4. Requirements by Public Network Operators (PNO)
PNOs are the owners of the transport network infrastructure and offer the bearer services totheir customers. The network is usually referred to as Public Network even though it may beowned by a private institution, because it may be used by several parties, possibly engaged inindependent services at the same time. The customers of a PNO may be either end-users orVASPs. The former case arises (among others) in classical telephony whenever publicmonopoly is still applicable; the latter case reflects the present telecom trend of another playerenhancing and customizing bearer services offered by the PNO.
2.4.1. PNO Requirements and Expectations
PNOs have certain requirements/expectations when running their business. In brief, suchrequirements/expectations are as follows:
• Attain high profits, and high market penetration, while maintaining customer/user andVASP satisfaction.
• Efficient exploitation of resources, as well as long-term planning for expanding theresources and scope of the public network; such planning should involve marketanalysis, forecasting methods etc.
• Ability to accommodate new VASPs and the services offered by them.
• Ability to maintain the network performance levels.
• Ability to monitor the network operation, maintain it and recover from fault situations
• Abili ty to expand and accommodate new customers (either end-users or VASPcustomers).
Requirements such as the above are to be met by employing Total Quality Management inorder to ensure both performance and quality of service to the end-users. Therefore, PNOspose there own requirements to the TQM designers; this issue is dealt with in the nextsubsection.
2.4.2. PNO Requirements to TQM
A network operator/provider expects from a Total Quality Management system to address theissues mentioned in 3.3.1 and provide solutions. A non-exhaustive list of requirements of thePNO follows:
• Abili ty to perform monitoring of their network infrastructure, by obtaining relatedinformation. Traffic status, congestion indicators, service availabili ty, operational status ofthe network infrastructure equipment should be available to the PNO on request. Theinformation (traffic, performance, notifications, alarms) should be kept in records/logs inorder to be used for statistics of incoming and outgoing traffic, load measurements,congestion measurements etc. A history record of the equipment should be also available onrequest.
• Abili ty to perform traffic management by collecting and reporting traffic informationconcerning network status, connection information (per interface, per VC/VP, policing

Deliverable 5 Page 43
© RACE Project R2116 - TOMQAT
traffic descriptors, the operational status etc.). Furthermore, a set of traffic managementcontrol and protective/corrective actions should be available to the PNO in order to preventnetwork performance degradation. Several methods are currently investigated byTOMQAT:
• instructing the actors how to use the network (via signalling).• inhibiting excessive traffic (via policing)• alternative routing could also be performed in case of arrangement with higher
priorities.• Abili ty to perform QoS Management by detecting and reporting possibili ties of network
degradation and propose solutions for recovery. This may be accomplished for example, bydetecting switching errors such as packet errors (cell error and cell insertion ratios) or dropof packets due to traffic congestion (cell loss). Furthermore, a TQM system should have theabili ty to police and supervise the network resources to prevent malicious users to affectexisting connections or the bandwidth allocation. Also, a TQM system should provide thePNO with assessments of possible reconfiguration and reallocation of resources in thecontext of the offered QoS.
• To perform alarm surveill ance by having the abili ty to collect alarm information, and afteralarm correlation to be able to detect faults and fault recovery. Alarms also should bereported accompanied by severity level along with instructions for corrective actions. Analarm history record database should also be maintained and be available on request byPNO.
• Abili ty to offer assistance to the PNO on issues regarding QoS and traffic billi ng. Also topresent to the PNO alternatives on use of optimal QoS parameters in the network duringthe peak times (per day, per location) to help him compromise, between the offered QoSand the network resources utilisation.
• Abili ty to monitor security in the Network, to guarantee protection against unauthorizedusers, and to employ security alarms in case of Security violation.
• Abili ty to assist in planning the introduction and the deployment of new services offered byVASPs and the PNO himself. Also abili ty to support the installation and maintenance ofequipment in the network infrastructure.
• Abili ty to perform management of the transport network by carrying out management oftransmission paths, management of leased lines and circuits in the network. Configurationof the signaling network may also required by the PNO. The TQM system should also beable to notify PNO about fault conditions regarding signaling. Also, TQM should performsignaling load measurements and signaling congestion measurements in order to preventfailures.
2.4.3. VASPs and PNOs
A VASP is the customer of a PNO. Thus, the requirements to a PNO posed by a VASPcomprise all those presented in Subsection 3.3.1, in terms of security, provision andmaintenance of agreed Network Performance (which constitutes the VASP's QoS), flexibili tyand customization etc. (Actually, the discussion therein also covers the case where a VASP isthe customer of another VASP, which is typical nowadays.) Furthermore, since a VASP is notan "end-customer", and has also to deal with customers of his own, he also poses someadditional requirements to the PNO; these are as follows:
• Abili ty both to maintain agreed QoS and to vary it on request by the VASP. While theformer requirement is self-evident the latter stems from the highly dynamic QoS demands ofthe VASP's customers/users.

Deliverable 5 Page 44
© RACE Project R2116 - TOMQAT
• Abili ty that the PNO accommodates new customers of the VASP on request of the latter;this may involve fast provision of new resources to the VASP if necessary.
• Abili ty of efficient and flexible handling both of the bandwidth and of the resources. This isagain motivated by the dynamic nature of the VASP's customers/users. Thus, when thetraffic generated as a result of the VASP's service is modified, then the PNO should be ableto respond promptly to this situation (possibly driven by the VASP's demands).
• Abili ty to obtain information on traffic conditions and of the network status in general.Thus, it would be possible to verify satisfactory operation of the network, with all QoSparameter values being at the prescribed levels; if this is not indeed the case, then the PNOwould be notified and act appropriately on the basis of the information on traffic and onnetwork status.
• Protection of billi ng information and of the related records, for security and for privacyreasons.
2.5. Requirements and Management Services
Management Services are implemented in a Management System which a Service Provideruses to manage the Service which he provides to his customers. This section presents how aManagement Services are structured and how User requirements determine the structure ofManagement Services. This section is based on material from CFS M201, issue D [23].
2.5.1. Decomposition of Management Services
Management services are assemblies of reusable functional entities called Management ServiceComponents (MSCs). A Management Service (MS) is typically composed of several MSCs,and the MSCs are designed to support flexibly several MSs which means that there is a many-to-many mapping between MSs and MSCs.The structure of MSs can vary and is determined by requirements of users whose service theManagement System manages.The first step in designing management systems is the assignment of user requirements to MSs.This is followed MSs and MSCs are then decomposed into Management Functions (MFs).Specification identifies and relates Managed Objects (MOs) to MSCs and MFs.
2.5.2. Management Service Model
The Management Service Model (MSM) is defined to meet three objectives:• Describe the User Interface (UI) of a service in a structured manner• Indicate the relationship of the UI to the system components which actually implement the
service.• Provide an object-oriented internal structure of services
The model aims to provide a clear demarcation between the user’s view of the system and theactual implementation of the system. The Enterprise view of the MSM describes thecapabilities of the system.MSs, MSCs and MFs are interface components visible to, and accessible by the user (subject toaccess restrictions). MSs can be pre-defined by a provider or can be user-designed assembly of
Deliverable 5 Page 45
© RACE Project R2116 - TOMQAT
MSCs. MSCs can be decomposed into lower level MSCs and MFs. The particular assembly oflower level MSCs and MFs that go to make a specific MSC is fixed and not changeable by theuser.The User’s requirements are met by relating them to the functions and components of theMSM.
References
[1] Schwarz, E. & Tilse, U. (1980). Die Benutzerzufriedenheit mit 12 verschiedenenVideokonferenzsystemen und einer Audiokonferenz im Vergleich zu normalenKonferenzen. ntz Archiv Bd.2, 5, 87-94.
[2] Romahn, G. & Mühlbach, L. (1988). Endgeräte für Mehrpunkt-Telekonferenzen. InVDE (Hrsg.), ITG-Fachbereicht 101. Nutzung und Technik vonKommunikationsendgeräten (S. 193-204). Berlin: vde-verlag GmbH.
[3] Mühlbach, L. (1990). Nutzungsaspekte von Videokonferenzsystemen. In H. Ohnsorge(Hrsg.), Benutzerfreundliche Kommunikation (S. 217-233). Berlin: Springer.
[4] Mühlbach, L. (1987). Nutzergerechte Bildfernsprechendgeräte. ntz Bd. 40, 7, 506-511.
[5] Flohrer, W. (1988). Benutzergesichtspunkte des Bildtelefons. In VDE (Hrsg.), ITG-Fachbericht 101. Nutzung und Technik von Kommunikationsendgeräten (S. 393-407).Berlin: vde-verlag GmbH.
[6] Mühlbach, L., Arif, M., Hopf, K. & Romahn, G. (1989). Mehrpunkt-Telekonferenzen.nzt Bd.42, 1, 8-12
[7] Kuhmann, W., Schaefer, F. & Boucsein, W. (1990). Effekte von Wartezeiten innerhalbeinfacher Aufgaben: Eine Analogie zu Wartzeiten in der Mensch-Computer-Interaktion.Zeitschrift für experimentelle und angewandte Psychologie, Band XXXVII, 2, 242-265.
[8] Holli ng, H., Schnettberg, N. & Albers, M. (1988). Handlungsunterbrechungen beicomputergestützten Tätigkeiten. In H. Methner & A. Gebert (Hrsg.), Arbeits- undBetriebspsychologie- Verantwortung und Leistung (S. 252-263). Bonn: DeutscherPsychologen Verlag.
[9] Mühlbach, L. & Keller, B. (1987). Zur Tonqualität beim Bildfernsprechen - Ergebnisseexperimenteller Untersuchungen. ntz Archiv Bd.9, 7, 177-184.
[10] Schwarz, E. & Wilkens, H. (1981). Die Benutzerzufriedenheit mit 18 verschiedenenAudio-Konferenzsystemen im Vergleich zu normalen Konferenzen. ntz Archiv Bd.3, 10,271-276.
[11] Mühlbach, L., Prussog, A. & Böcker, M. (1993). Videokonferenzen mit 3D-Technik. ntzBd. 46, 11, 818-823.
[12] Holli ng, H. (1989). Psychische Beanspruchung durch Wartezeiten in der Mensch-Computer-Interaktion. Berlin: Springer.

Deliverable 5 Page 46
© RACE Project R2116 - TOMQAT
[13] Schwan, S. (1992). Die Konsequenzen medialer Eigenschaften für denKommunikationsprozeß am Beispiel der Bildwiedergabefrequenz beim Bildtelefon(Unveröffent.Diss.d.Fakultät f.Sozial- und Verhaltenswissenschaften der Eberhard-Karls-Uni.). Tübingen.
[14] CFS (1993). RACE Common Functional Specifications and Common PracticeRecommendations. ISSUE D December 1993.
[15] URM (1992). IBC Usage Reference Model. In RACE (Ed.), RACE Research Review.Issue B, December 1992.
[16] Short, J., Willi ams, E. & Christie, B. (1976). The Social Psychology ofTelecommunications. London: John Wiley & Sons.
[17] Willi ams, E. (1977). Experimental Comparisons of Face-to-Face and MediatedCommunication: A Review. Psychological Bulletin, Vol.84, 5, 963-976.
[18] LUSI (1992). Methodological Considerations of Usabili ty Assessment. In CEC (Ed.),Deliverable Number 3. December 1992.
[19] Seitz, N.B., Wolf, S, Voran, S, Bloomfield, R. (1994). User-Oriented Measures ofTelecommunication Quality. IEEE Communication Magazine, Jan. 1994, 56-66.
[20] PRISM Deliverable 2, "Service and Network Management: Requirements and ReferenceConfiguration".
[21] TOMQAT, Deliverable 3, "Architecture of TOMQAT System, and Definition ofNetwork Infrastructure".
[22] R.Nagarajan, J.Kurose, and D.Towsley, "Local Allocation of End-to-End Quality ofService in HighSpeed Networks", preprint.
[23] RACE CFS, M201, TMN Reference Configuration for Integrated Services Management.
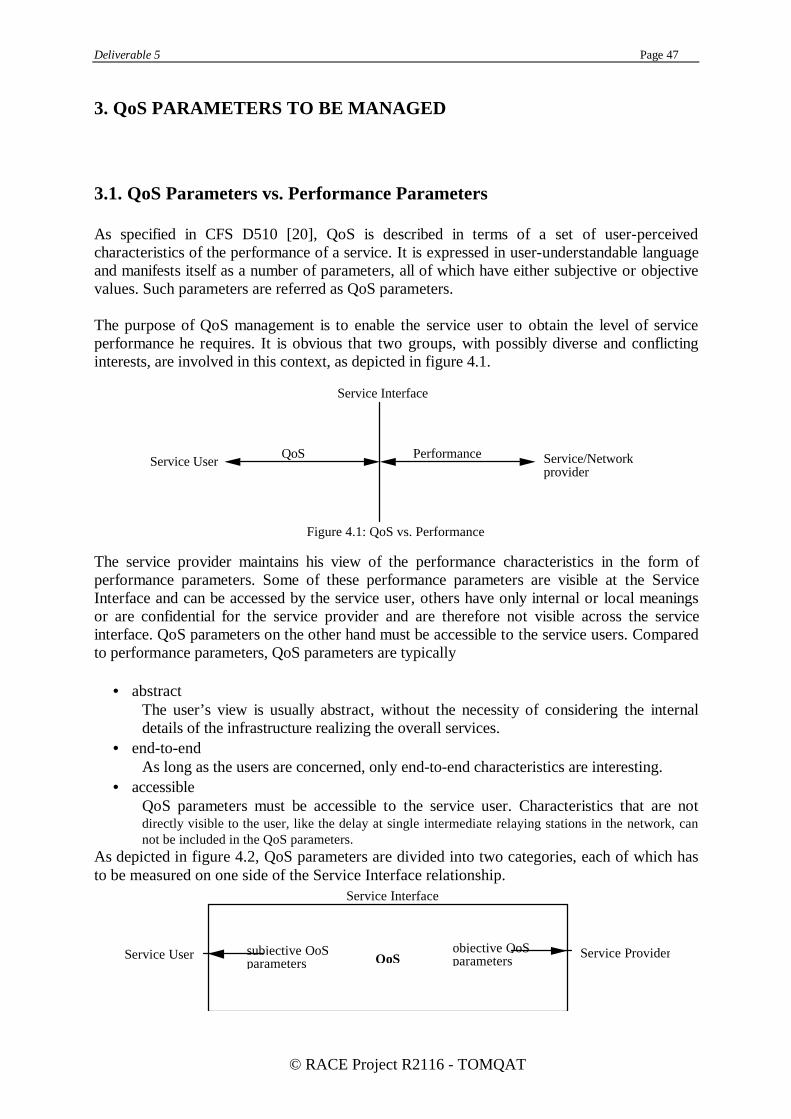
Deliverable 5 Page 47
© RACE Project R2116 - TOMQAT
3. QoS PARAMETERS TO BE MANAGED
3.1. QoS Parameters vs. Performance Parameters
As specified in CFS D510 [20], QoS is described in terms of a set of user-perceivedcharacteristics of the performance of a service. It is expressed in user-understandable languageand manifests itself as a number of parameters, all of which have either subjective or objectivevalues. Such parameters are referred as QoS parameters.
The purpose of QoS management is to enable the service user to obtain the level of serviceperformance he requires. It is obvious that two groups, with possibly diverse and conflictinginterests, are involved in this context, as depicted in figure 4.1.
Service/Networkprovider
Service User
Service Interface
QoS Performance
Figure 4.1: QoS vs. Performance
The service provider maintains his view of the performance characteristics in the form ofperformance parameters. Some of these performance parameters are visible at the ServiceInterface and can be accessed by the service user, others have only internal or local meaningsor are confidential for the service provider and are therefore not visible across the serviceinterface. QoS parameters on the other hand must be accessible to the service users. Comparedto performance parameters, QoS parameters are typically
• abstractThe user’s view is usually abstract, without the necessity of considering the internaldetails of the infrastructure realizing the overall services.
• end-to-endAs long as the users are concerned, only end-to-end characteristics are interesting.
• accessibleQoS parameters must be accessible to the service user. Characteristics that are notdirectly visible to the user, li ke the delay at single intermediate relaying stations in the network, cannot be included in the QoS parameters.
As depicted in figure 4.2, QoS parameters are divided into two categories, each of which hasto be measured on one side of the Service Interface relationship.
Service User
Service Interface
QoSsubjective QoSparameters
objective QoSparameters
Service Provider

Deliverable 5 Page 48
© RACE Project R2116 - TOMQAT
Figure 4.2: Accessing the QoS Parameters
Subjective QoS are usually derived from the subjective opinion of the human service user, andmust be therefore obtained on the user side. Such parameters will not be very important forlower layers like ATM layer or AAL, but would be very important for assessing the QoS ofhigher layer multimedia applications. Objective parameters, on the other hand, must beprovable and measurable from the performance of the service provider. As a result theobjective QoS parameters have to be measured at the service interface by monitoring theperformance of the service provider.
It follows from this observation that, for each subjective QoS parameter, we can envisage ameaningful performance parameter with the same semantics, as anything numericallymeasurable at the service interface is also measurable within the provider domain. On the otherhand, for every performance parameter, which is end-to-end significant at the service interfaceand accessible to the customer, we can always specify a useful QoS parameter at the customerside. I.e. specifications of QoS parameters should be derived from the specifications ofperformance parameters, for which plenty of results have already been achieved by differentstandardization bodies.
Another result is that due to the layered model of the user/provider relationship in the opensystem context, QoS parameters can be specified at any communication layer, usually the layerwhich the user is working within. As the performance parameters are also measured andsupported at different layers, one QoS parameter at one layer does not have to be supported bythe service provider at the same layer. Therefore, the mapping between QoS parameters ofadjacent layers is an important task that TOMQAT has to carry out. This kind of mapping canbe repeated until
• the QoS parameter is supported by the service provider at that layer, i.e. the serviceprovider has the ability to interpret and maintain the QoS level required
• some QoS management facili ties which support the QoS parameter are implemented atthat layer
• the QoS parameter can be mapped into some other (performance) parameters that aresupported at that layer
In the following, we address both the problem of identifying QoS parameters within theTOMQAT QoS management context at different layers, and the problem of mapping amongsuch QoS parameters.
3.2. QoS/SP Relations
The purpose of this section is to indicate that the relationship between QoS and SystemPerformance (SP) can be modeled by a set of mappings. These mappings are relevant to QoSmanagement and are therefore relevant to TOMQAT. This section is an introduction to theissue mentioned and will be further studied. Material in this section derives from CFS D510,issue D [23].
Deliverable 5 Page 49
© RACE Project R2116 - TOMQAT
3.2.1. Scope
Mappings are restricted to the call timeline; mappings for the contract and service timelines arenot yet available. The mappings are:
• restricted to objective QoS• permit statements of QoS to be derived from statements of SP• involve individual parameter values, rather than composite values.
3.2.2. Types of mappings
3.2.2.1. SP Intra-plane mappings
This is concerned with predicting the aggregate effect connecting a set of network elementsand is a NEP (Network Element Performance) to SP (or NP) mapping. This is a peer mapping.There is also an inverse peer mapping which decomposes end-to-end SP into individualcontributing NEPs of the elements and is used to determine individual node performances. Theinverse mapping is not explored in [23]. Intra-plane mappings typically come into play at thenetwork (or service) design and planning stage and are of marginal relevance to TOMQAT.
3.2.2.2. Inter-plane mappings
The various mappings under this heading include:Initial NP to QoS mapping
are for the static case and within service layer.QoS to NP mapping
This is the inverse of the above and is non deterministic.Example of mapping
The effects of different QoS requirements on NPs is complex. The multiple dependenciesbetween lower layer SP and Higher Layer QoS are given in [23] and is not reproduced here (as anexample, Higher layer QoS “Delay” is affected by Lower Layer SP: “Delay” , “ InformationError” , “ Information Loss” , Information Insertion” and “Premature Termination” , is an exampleof a dependency).
Formulas may not be appropriate for this mapping.
3.2.2.3. QoS intra-plane mappings
This is a mapping from QoS of a lower layer, inferred by a Service Provider or measured by acustomer, to QoS at a higher layer, as seen by the user of the higher layer service. SP,Received Lower Layer QoS, Received Peer QoS, and internal SP are all related.A service layer may transform a Received QoS parameter value into a new value of a differentQoS parameter. [23] lists guidelines to be used for mapping from Received QoS to ProvidedQoS for each of the phases of the Call Timeline.It is significant to note that the CFS states that QoS parameters such as video/audiosynchronisation, pertinent to Multi-Media services, are not considered within the scope of theNP/QoS Mapping, but that it may be considered in future iterations of the source document[23].

Deliverable 5 Page 50
© RACE Project R2116 - TOMQAT
3.3. Baseline Architecture
The present section discusses a core challenge of managing quality of service in a multilayerednetwork architecture: identifying and mapping quality of service parameters. In section 2.4 weproposed a layered architecture that comprises of four levels, namely the application,orchestration, transport and the network levels (see Fig. 2.3). Note that these levels do notcorrespond to the traditional OSI seven-layer model. In particular, the OSI reference modeldoes not know the orchestration level, and the network level comprises (roughly) the networklayer, data link and physical layers. Note also that the splitting into levels does not imply thatan application is actually structured along these lines. Finally, although a single protocol mayencompass several layers, it may be considered that it implements the functionality of a singlelevel, for example XTP covers both the transport and network layers.We proceed then, to identify common parameters and their relationship. Translation ofparameters is primarily an issue concerning the data transfer phase but not the establishment ortear-down phase, since higher-layer protocol sessions will not be established unless the lower-layer session has been successfully established.Generally, we can define generic parameters as described below. The importance andapplicabili ty of these measures will clearly differ in the context of bulk data, interactive dataand real-time services: throughput, absolute delay, delay variation (jitter), loss, insertion,misordering. Reliable transport protocols transform loss into delay and decreased throughputthrough retransmission or into decreased throughput through forward-error correction. Lossalso varies from layer to layer if packets are segmented and reassembled (under the assumptionthat a single error in a lower-level PDU makes the higher-level PDU useless). Intra-media(playout) and inter-media synchronization translate delay variation and misordering intoabsolute delay. Other relationships are not as clear. Inserted PDUs may cause loss ofthroughput.
3.4. Working Approach
The following table lists some typical events, the place where the events are observed, possiblecause and some proposed action as a response to the event. The last column proposes the testequipment required for verification of the success of the management operation.
Event Detected by Cause Action Performed by Verification byCell Loss Physical Layer:
(FORE MIB)Header Errors Protection Switching Real-Time
OAM ProceduresATM/SDHTransmission Tester
Cell Loss ATM Layer:Allocated BW exceeded,Burst Statistics,(FORE MIB)
Policing Reduce Source Activity UNI Signalling ATM/SDHTransmission Testercombined with ATMprotocol Analyser
Cell Loss Switch:Queue Length (FORE MIB)
Congestion Re-Routing
Reduce Source Activity
SS 7 (B-ISUP)
UNI Signalling
ATM/SDHTransmission Testercombined with SS7Analyser
Cell Block Errors F4, F5 OAM cells Bit Errors Protection Switching Real-TimeOAM Procedures
ATM/SDHTransmission Tester
Cell Misinsertion F4, F5 OAM cellsAAL (Seq. Numbers)
Undetectable HeaderErrors
Check Routing Tables SS 7 (B-ISUP) as above
Cell Delay Variation F4, F5 OAM cells
AAL (Playout Buffer)
Congestion Re-Routing ATM TransmissionTester:Recording of OAMcells; CDVmeasurements
Absolute Cell Delay F4, F5 OAM cells Propagation DelayPacketizing Delay
Use partially filled cells User-User Signalling as above
Excessive ResponseTimes
Application
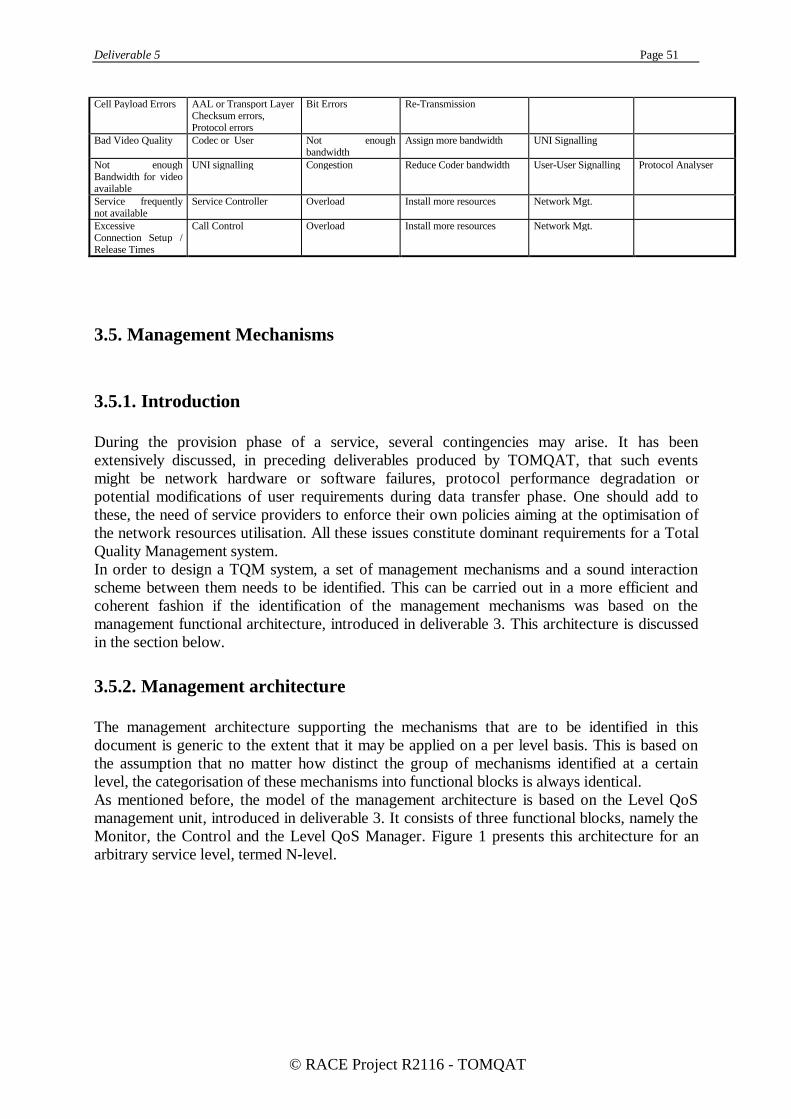
Deliverable 5 Page 51
© RACE Project R2116 - TOMQAT
Cell Payload Errors AAL or Transport LayerChecksum errors,Protocol errors
Bit Errors Re-Transmission
Bad Video Quality Codec or User Not enoughbandwidth
Assign more bandwidth UNI Signalling
Not enoughBandwidth for videoavailable
UNI signalling Congestion Reduce Coder bandwidth User-User Signalling Protocol Analyser
Service frequentlynot available
Service Controller Overload Install more resources Network Mgt.
ExcessiveConnection Setup /Release Times
Call Control Overload Install more resources Network Mgt.
3.5. Management Mechanisms
3.5.1. Introduction
During the provision phase of a service, several contingencies may arise. It has beenextensively discussed, in preceding deliverables produced by TOMQAT, that such eventsmight be network hardware or software failures, protocol performance degradation orpotential modifications of user requirements during data transfer phase. One should add tothese, the need of service providers to enforce their own policies aiming at the optimisation ofthe network resources utili sation. All these issues constitute dominant requirements for a TotalQuality Management system.In order to design a TQM system, a set of management mechanisms and a sound interactionscheme between them needs to be identified. This can be carried out in a more efficient andcoherent fashion if the identification of the management mechanisms was based on themanagement functional architecture, introduced in deliverable 3. This architecture is discussedin the section below.
3.5.2. Management architecture
The management architecture supporting the mechanisms that are to be identified in thisdocument is generic to the extent that it may be applied on a per level basis. This is based onthe assumption that no matter how distinct the group of mechanisms identified at a certainlevel, the categorisation of these mechanisms into functional blocks is always identical.As mentioned before, the model of the management architecture is based on the Level QoSmanagement unit, introduced in deliverable 3. It consists of three functional blocks, namely theMonitor, the Control and the Level QoS Manager. Figure 1 presents this architecture for anarbitrary service level, termed N-level.

Deliverable 5 Page 52
© RACE Project R2116 - TOMQAT
N + 1 level
N level
N - 1 level
LevelQoSMgmt Level
Service
Monitor
Control
AN
A : Analysis block, N : Negotiation block
Figure 4.3: Management Mechanisms Architecture
The N-level Monitor block enhances measurement capabili ties, enabling the assessment ofinformation on the quality of service achieved by the N-level protocol. The adoption of ageneric-oriented detailed design methodology is envisaged so as to simplify the interactionswith the other functional blocks as well as the expansions of the block functionalities.
The N-level Control block is the implementor of the decisions taken by the N-Level QoSManager. It provides the means for intervening at the N-level, for the purpose of re-configuring the provided services. As far as the design methodology is concerned, theaforementioned argument may be applied.
The N-Level QoS Manager is certainly the most complex block in the managementarchitecture. In order to perform its functionalities it requires interacting with the other twofunctional blocks of the N-level, as well as the Level QoS Managers of levels (N+1) and (N-1).In addition the nature of these functionalities impose a further decomposition of a Level QoSManager into a Negotiation and an Analysis functional block.
The Negotiation functional block communicates with the corresponding blocks at the adjacentlevels. The aim is to settle agreements on the quality of the service that N-level provides tolevel (N+1) and the service provided by level (N-1). Primitives enabling relevant data flows areencompassed.
The Analysis functional block decides on the specific actions to be taken by the Control, forthe purpose of maintaining the services provided by the N-level above a certain threshold, onthe basis of data provided by the Monitor and the Negotiation block.
More specifically, the interactions of the Analysis block with the Monitor block involverequests for information. These are expressed in terms of parameters necessary for instantiatingmeasurement scenarios. For example, such a request could include the QoS parameters ofinterest, the connections to be monitored or the duration of the measurements.
The accumulated information is expected to be signalled to the Analysis block for furtherprocessing. A possible outcome of this phase could be an indication, stating which of thecontracted requirements are not being met. In such a case it is the responsibili ty of the Analysisblock to provide the list of corrective actions to be taken. Applying such actions merely impliesinteracting with either the Negotiation or the Control block.

Deliverable 5 Page 53
© RACE Project R2116 - TOMQAT
In the first case the Analysis block indicates that inter-level renegotiation is required, in orderto maintain the desired level of QoS or in order to set new standards. However this is not theonly possible communication scenario among the component blocks of the Level QoSManager. The Negotiation block will i nform the Analysis block about the agreement to whichthe inter-level negotiation scheme has concluded. The Analysis block will again see to theidentification of the corrective actions to be taken.
After taking all the above into account a natural conclusion is, that the interactions of theAnalysis block with the Control block occur at a final stage. It is assumed that both thecontracted requirements that are not met and the set of actions for recovering from thissituation must have been identified. The remainder involves invoking the correspondingfunctions of the Control block, implementing these actions.
3.5.3. Management mechanisms
As alluded to in the previous section, we are going to proceed on a per level basis. Thus,management mechanisms will be identified for each individual level, conforming to the alreadypresented categorisation into monitoring, control and level QoS management. Furthermore, ithas to be outlined that the corresponding level's QoS management mechanisms that follow aregrouped according to the QoS parameters which are capable of adjusting at each level.
3.5.3.1. Network level mechanisms
3.5.3.1.1. Network level controlRouting
Alternative routing constitutes one of the most powerful management mechanisms. Itstrongly relies on the fact that, usually, different transmission paths present diversecharacteristics, in terms of transit delay, error rate, traffic load, etc. This diversity springsout from the potential variety of configurations that transmission paths may have (e.g.,number of switches in tandem), topological reasons (i.e., distance between adjacent nodes)as well as space and temporal distribution of traffic load.
Call admission controlAccording to the RFC 1633, Call admission control (CAC) is called the decision aboutresource availabili ty. In generic terms, we can consider two main categories of CACalgorithms. The first one, which we name conservative, assesses resource availabili ty bymeans of the peak values, i.e., flows are considered to demonstrate the worst behaviorthey have specified in the contract. Hence, peak throughput, maximum delay and jitter,minimum error rate, etc. form the basis upon which decisions are being drawn. The secondcategory, which we name statistical, takes into consideration the statistical nature of thedata flows. Key aim of statistical CAC algorithms is to maximize resource utili sation byefficiently sharing network resources among various data flows.
Bandwidth allocationBandwidth allocation mechanisms are responsible for notifying switches on the exactamount of bandwidth needed by a connection. This kind of mechanisms is needed toprovide adequately fast reservation of resources. Flows should be allowed to manifesttheir bandwidth requirements in the more detailed way possible. Other considerationsinclude sharing of resources among different protocols, QoS classes or users.
Packet scheduling

Deliverable 5 Page 54
© RACE Project R2116 - TOMQAT
As stated in RFC 1633, the basic function of packet scheduling is to reorder the outputqueue. There have been numerous queue management schemes proposed (round-robin,FIFO, weighted fair queuing etc.).
PolicingPolicing is the set of actions taken to ensure that the behavior and amount of the trafficgenerated by a given user or set of users complies with the traffic characteristicsmanifested in the contract. Policing is a packet-by-packet process. Policing enforcementmechanisms are spacing (decoupling of source rate and transmission rate) and packetdropping (discard of packets characterised as inconformant to the traffic contract, orpackets belonging to a adequately low QoS class).
QoS classificationClassification enables the logical grouping of flows presenting similar behaviors, in termsof traffic characteristics and intrinsic QoS requirements (e.g., error tolerance, end-to-enddelay requirements, etc). As a result, distinct QoS classes are liable to differentmanipulation by the network. QoS classification may be static, where class assignment iscompleted by the end of the connection set-up phase, or dynamic, where class assignmentis a task re-considered continuously or at pre-specified time intervals. This mechanismserves as a basis for the rest of the Network level management mechanisms.
3.5.3.1.2. Network level QoS managementi) ThroughputCall admission control
Call admission control is considered to be the most important preventive managementmechanism. Given that, if according to the measured throughput performance remedialadjustment of the CAC becomes necessary, some of the following steps can be followed:
-Switch from statistical (conservative) to conservative (statistical) mode of operation-Modify the parameters according to which admission is judged (qualitativeadjustment)-Modify min/max/mean values and/or thresholds of those parameters (quantitativeadjustment).
PolicingIf judged necessary, policing may be modified so that new throughput bounds can bemaintained.
Packet schedulingPacket scheduling disciplines can be changed if throughput targets are not met or if newones are specified. Through packet scheduling mechanisms, priorities can be assigned, thuspermitting to higher-throughput connections to be served in a more privileged manner.
QoS classificationThroughput can be managed by means of QoS classification, e.g., by assigning a specificflow to a throughput guarantying class.
ii) DelayRouting
Alternative paths can be sought and followed, based on the delay characteristics theyprovide. Considerations related to routing, with respect to delay, comprise switch-to-switch distance, switch processing delays, etc.
Packet schedulingDelay performance can also be affected by the packet scheduling algorithm assigned toevery switch. As with throughput, connections posing more stringent delay requirementsshould be served first.
QoS classification

Deliverable 5 Page 55
© RACE Project R2116 - TOMQAT
Delay can be managed by means of QoS classification, e.g., by assigning a specific flow toa delay guarantying class.
iii) JitterRouting
Routing can be used for jitter control as well. Key considerations, concerning jitterminimization, include the number of switches intervened along a specified transmissionpath,
Packet schedulingJitter can also be controlled by properly programming the packet scheduler. Key objectiveis to keep the fluctuation of the waiting times of queued packets within a pre-specifiedrange.
QoS classificationJitter can be managed by means of QoS classification, e.g., by assigning a specific flow toa jitter guarantying class.
iv) Error rateRouting
In the event a link is observed to be prone to error generation (or anomalies in general)alternative path routing may provide a solution.
The following table depicts the Network level QoS parameters mentioned above and theassociated mechanisms employed for their management.
Throughput Delay Jitter Error rateCAC •
Scheduling • •
Policing • •
Routing • • •
Classification • • •
Table 4.1
3.5.3.2. Transport level mechanisms
3.5.3.2.1. Transport level controlRetransmission control
Retransmission constitutes one of the key functionalities of the Transport level. For thispurpose, a variety of retransmission techniques have been introduced. A representative setof them includes Stop-and-Wait, Go-Back-N, selective retransmission and cyclicpreventive retransmission. However, each retransmission technique behaves differentlyunder a given situation, i.e., underload, moderate or congestion conditions. Hence,transport level control mechanisms should be employed in order to access theretransmission mechanisms, which are inherent part of the Transport level protocol, andadequately adjust the proper protocol parameters. It should be mentioned that puttingretransmission out of service is considered to be an option for this type of controlmechanisms.
Error handling control

Deliverable 5 Page 56
© RACE Project R2116 - TOMQAT
Transport level protocols should have at hand a repertoire of error handling options. Forinstance, protocol may offer error correction capabili ties (e.g., forward error correction)or indications of error occurrences. As with the preceding case, transport levelmechanisms are needed to manipulate error handling mechanisms parameters.
Segmentation-reassembly and concatenation-separation controlAdditional control mechanisms are needed for the management ofsegmentation/reassembly or concatenation/separation of T-SDUs. Apart from thetriggering or aborting segmentation/concatenation itself, more refined adjustment may berequired, such as T-PDU length modification, packet padding rules specification etc.
Splitting-multiplexing of Transport connectionsTransport level may split a Transport connection into several Network, or multiplexseveral Transport connections in a single Network. A control mechanism should directlyintervene in the relevant decision, based on the overall requirements of the Transport level.
3.5.3.2.2. Transport level QoS managementi) Throughput and DelayRetransmission control
Depending on the specific requirements each Transport connection poses, severalmodifications can be decided concerning the operation of the retransmission techniques.Loss-sensitive applications may need utili sation of the most persistent kind ofretransmission algorithms, whereas to real time applications, retransmission may introducean unacceptably heavy overhead. Moreover selecting the proper retransmission algorithmfor a given QoS class may, as well, lead to higher efficiency, not to say in some cases,feasibility.
Error handling controlSimilarly to retransmission control, error handling affects both the accuracy and the speedof a service. In this case, throughput and delay can be affected by initiating or abortingerror detection and recovery algorithms.
Segmentation / Concatenation controlThroughput and delay can be managed by means of a proper configuration ofsegmentation or concatenation mechanisms, probably assisted by an underlyingmultiplexing-demultiplexing scheme.
Splitting-multiplexing of Transport connectionsThe overall performance of the Transport level is dependent on the performance of theunderlying level. Thus, changing the relation pattern of Transport to Networkconnections, is a method for affecting Quality of Service parameters
ii) JitterRetransmission control
Some retransmission algorithms are expected to provide a smoother delay distribution,namely smaller jitter values. Hence, Transport level QoS management mechanismshave to decide if their use becomes an exigency.
iv) Error rateError handling
It is evident that error rate can be controlled via appropriate adjustment of adequate errorhandling mechanisms. In case, a given connection presents an excessively high error rate,forward error control may be triggered. On the contrary, if errors counted do not excessthe connection QoS class requirements on error rate, error control may be suspended orended.
The following table depicts the Transport level QoS parameters mentioned above and theassociated mechanisms employed for their management.

Deliverable 5 Page 57
© RACE Project R2116 - TOMQAT
Throughput Delay Jitter Error rateRetransmission • • •
Error handling • • •
Segmentation /Concatenation
• •
Multiplexing / Splitting • • •
Table 4.2
3.5.3.3. Orchestration level mechanisms
3.5.3.3.1. Orchestration level ControlFlow Control
Flow control is employed in order to ensure rate adjustment among sources and sinks. It isalso assumed to provide reactive mechanisms in cases a party fails to keep up. Thenecessity for such functionalities at the Orchestration level derives from the requirementsof the broad variety of applications supported. For instance, lets consider a multi-mediaservice supporting a data and a synchronised audio-video connection. Excessively delayedvideo frames may be replaced by re-displaying the previous ones, whereas excessivelydelayed audio frames may be discarded. On the other hand retransmission should berequested in case data frames fail to arrive within a predefined time interval. Controlli ngthis functionality may be envisaged as providing the means for determining specific flowcontrol policies.
Synchronisation ControlThis is actually a core functionality of the Orchestration level, providing synchronisationamong the component data streams of a multimedia service and timely deliveries ofmultimedia streams to groups of receivers. Since poor synchronisation is the reason mostlikely to provoke degraded Orchestration services, the reason for controlli ng appearsstraightforward. The nature of control is determined after the synchronisation ensuringmechanism has been established. In general, such mechanisms are expected to computedelay values that have to be inserted in the distinct component streams before thepresentation of the multimedia stream. Adopting a mechanism is a means for applyingcontrol.
Splitting-Multiplexing of Orchestration connections.Apart from being the provider of the above mentioned functionalities, Orchestration levelmay be thought of as an application analyzer, resulting in the establishment of a set ofTransport connections, each supporting a component data stream of the multimediaservice. This set of connections may be altered, during an Orchestration session, in orderto support dynamically re-configurable calls or in order to cope with underlyingconnection inadequacies.
Segmentation-Reassembly of O-PDUsA desirable approach is to make the Application level, as less concerned as possible withparameters such as the length of frames passed to the Orchestration level. Nevertheless,the Orchestration level having to communicate with the Transport level, should be able toadjust the length of the O-PDUs.
3.5.3.3.2. Orchestration level QoS managementi) ThroughputFlow Control

Deliverable 5 Page 58
© RACE Project R2116 - TOMQAT
The objective to provide rate adjustment among multiple sources and sinks, has a directimpact on the throughput parameter. A proper selection of a flow control scheme shouldtake into account the target throughput values and vice versa.
Synchronisation ControlThe effect on throughput is apparent since a means for maintaining synchronisation may bediscarding packets. Thus, the "tightness" (i.e. delays imposed before presentation) of thespecific synchronisation control scheme could be decided in accordance with the targetthroughput values.
Splitting-Multiplexing of Orchestration connectionsAn Orchestration connection is an entity relying and controlli ng a set of Transportconnections. Therefore, its overall performance is dependent on the individualperformance of every transport connection.
ii) DelayFlow Control
Flow control algorithms are partly means of imposing delays on frames originating fromvery fast sources. Obviously different schemes introduce different delays.
Synchronisation ControlSynchronisation control algorithms aim at maintaining the timing relations, existing amongdata streams. This may be accomplished through direct control of delays accompanying acertain data stream.
Splitting-Multiplexing of Orchestration connectionsThe amount of processing that a frame undertakes by a Transport protocol reflects on itsdelay.
Segmentation-Reassembly of O-PDUsSince segmenting at the source and subsequently reassembling at the receiver involves anamount of processing, there will be an impact on the delay.
iii) JitterFlow Control
Different flow control schemes and the cases to which they apply augment delay variation.Splitting-Multiplexing of Orchestration connections
The different amount of processing that frames may undertake by a Transport protocolresults in delay variation.
Segmentation-Reassembly of O-PDUsSince these functions impose a different amount of processing per frame, there will be animpact on jitter.
iv) Error rateFlow control
Flow control at the Orchestration level as a provider of reacting mechanisms that handlerate adjustment failures, leads to a reduction of the error rate presented at the Applicationservice level.
Synchronisation controlSince it is the main service provided to the Orchestration level users, its failures will be themain factor contributing to the error rate.
v) Synchronisation failure probabilitySynchronisation control
An obvious relation exists among the parameter and the management mechanism.Splitting-Multiplexing of Orchestration connections.
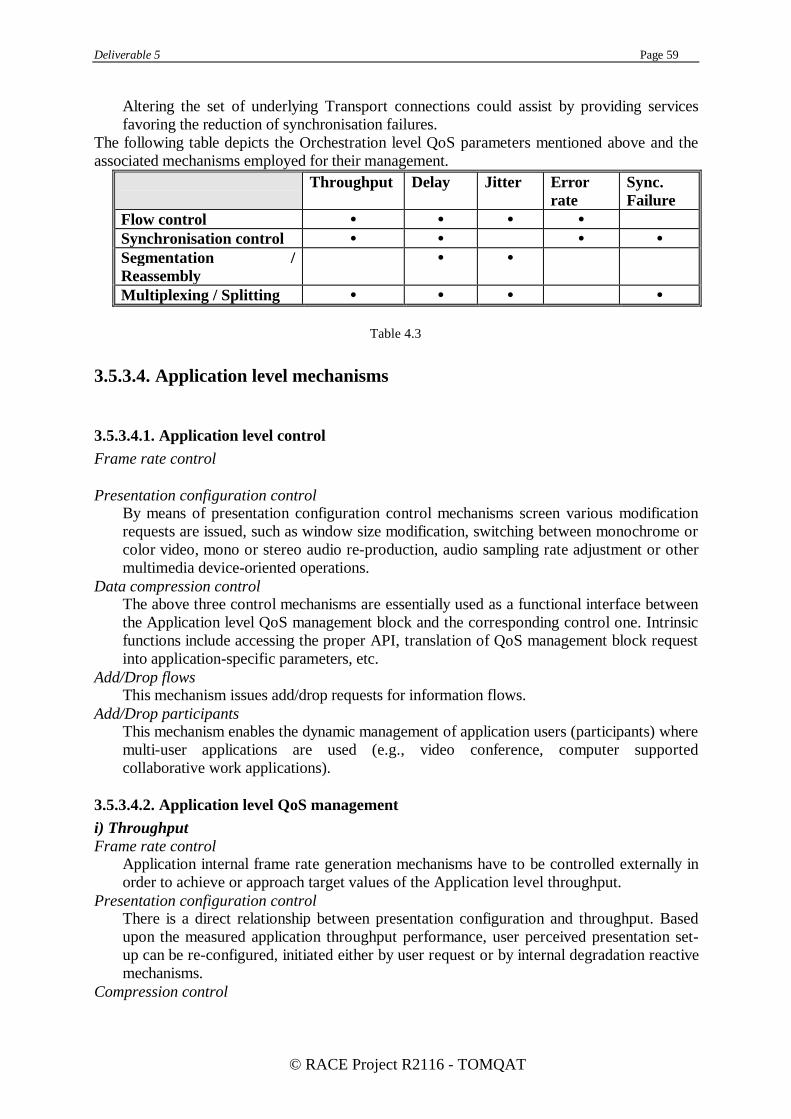
Deliverable 5 Page 59
© RACE Project R2116 - TOMQAT
Altering the set of underlying Transport connections could assist by providing servicesfavoring the reduction of synchronisation failures.
The following table depicts the Orchestration level QoS parameters mentioned above and theassociated mechanisms employed for their management.
Throughput Delay Jitter Errorrate
Sync.Failure
Flow control • • • •
Synchronisation control • • • •
Segmentation /Reassembly
• •
Multiplexing / Splitting • • • •
Table 4.3
3.5.3.4. Application level mechanisms
3.5.3.4.1. Application level controlFrame rate control
Presentation configuration controlBy means of presentation configuration control mechanisms screen various modificationrequests are issued, such as window size modification, switching between monochrome orcolor video, mono or stereo audio re-production, audio sampling rate adjustment or othermultimedia device-oriented operations.
Data compression controlThe above three control mechanisms are essentially used as a functional interface betweenthe Application level QoS management block and the corresponding control one. Intrinsicfunctions include accessing the proper API, translation of QoS management block requestinto application-specific parameters, etc.
Add/Drop flowsThis mechanism issues add/drop requests for information flows.
Add/Drop participantsThis mechanism enables the dynamic management of application users (participants) wheremulti-user applications are used (e.g., video conference, computer supportedcollaborative work applications).
3.5.3.4.2. Application level QoS managementi) ThroughputFrame rate control
Application internal frame rate generation mechanisms have to be controlled externally inorder to achieve or approach target values of the Application level throughput.
Presentation configuration controlThere is a direct relationship between presentation configuration and throughput. Basedupon the measured application throughput performance, user perceived presentation set-up can be re-configured, initiated either by user request or by internal degradation reactivemechanisms.
Compression control
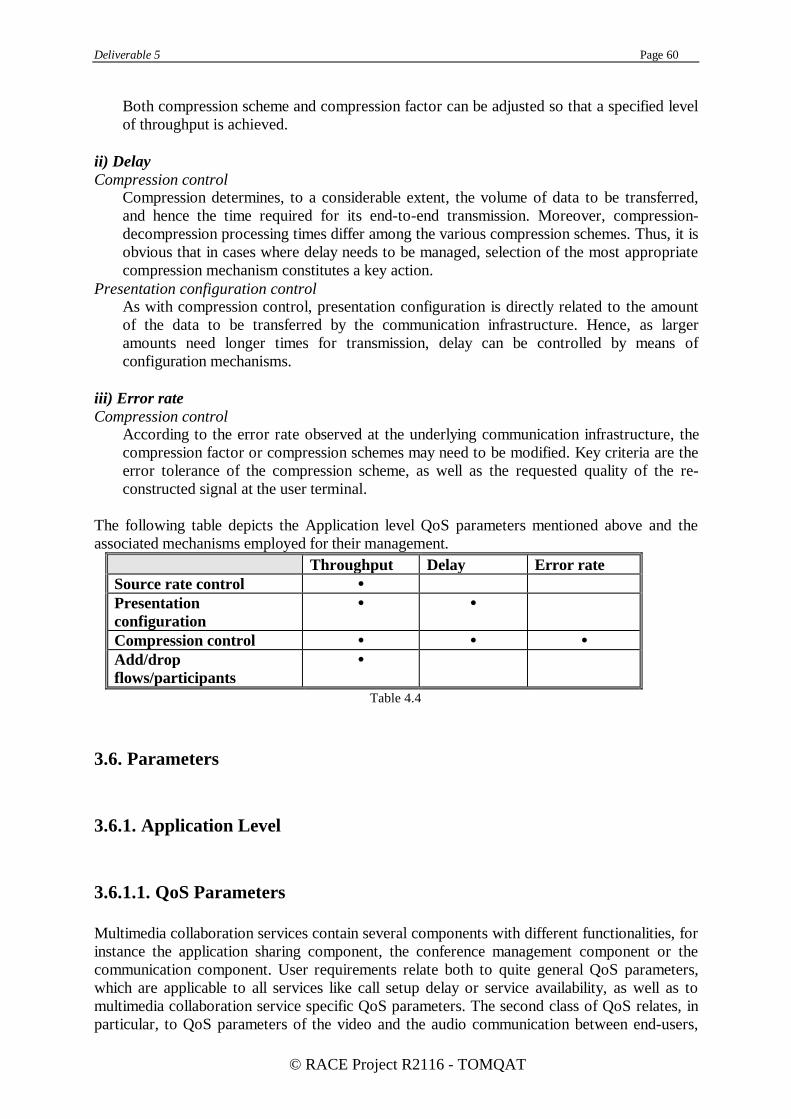
Deliverable 5 Page 60
© RACE Project R2116 - TOMQAT
Both compression scheme and compression factor can be adjusted so that a specified levelof throughput is achieved.
ii) DelayCompression control
Compression determines, to a considerable extent, the volume of data to be transferred,and hence the time required for its end-to-end transmission. Moreover, compression-decompression processing times differ among the various compression schemes. Thus, it isobvious that in cases where delay needs to be managed, selection of the most appropriatecompression mechanism constitutes a key action.
Presentation configuration controlAs with compression control, presentation configuration is directly related to the amountof the data to be transferred by the communication infrastructure. Hence, as largeramounts need longer times for transmission, delay can be controlled by means ofconfiguration mechanisms.
iii) Error rateCompression control
According to the error rate observed at the underlying communication infrastructure, thecompression factor or compression schemes may need to be modified. Key criteria are theerror tolerance of the compression scheme, as well as the requested quality of the re-constructed signal at the user terminal.
The following table depicts the Application level QoS parameters mentioned above and theassociated mechanisms employed for their management.
Throughput Delay Error rateSource rate control •
Presentationconfiguration
• •
Compression control • • •
Add/dropflows/participants
•
Table 4.4
3.6. Parameters
3.6.1. Application Level
3.6.1.1. QoS Parameters
Multimedia collaboration services contain several components with different functionalities, forinstance the application sharing component, the conference management component or thecommunication component. User requirements relate both to quite general QoS parameters,which are applicable to all services like call setup delay or service availabili ty, as well as tomultimedia collaboration service specific QoS parameters. The second class of QoS relates, inparticular, to QoS parameters of the video and the audio communication between end-users,
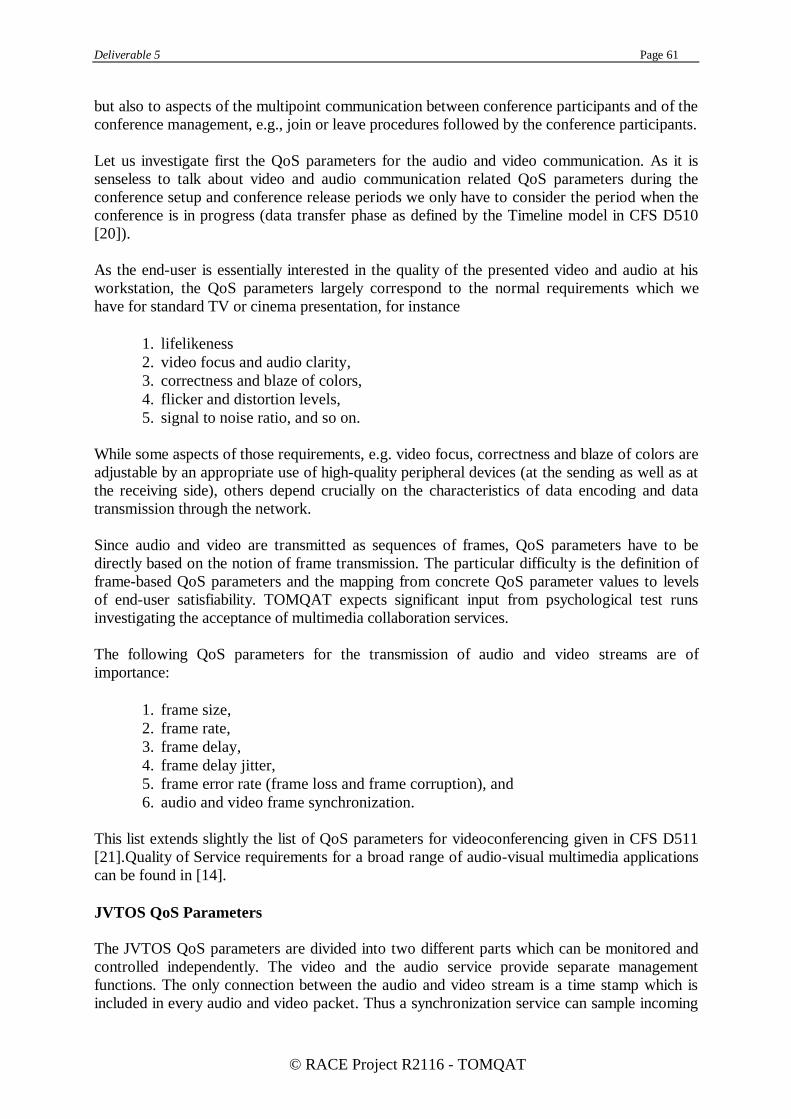
Deliverable 5 Page 61
© RACE Project R2116 - TOMQAT
but also to aspects of the multipoint communication between conference participants and of theconference management, e.g., join or leave procedures followed by the conference participants.
Let us investigate first the QoS parameters for the audio and video communication. As it issenseless to talk about video and audio communication related QoS parameters during theconference setup and conference release periods we only have to consider the period when theconference is in progress (data transfer phase as defined by the Timeline model in CFS D510[20]).
As the end-user is essentially interested in the quality of the presented video and audio at hisworkstation, the QoS parameters largely correspond to the normal requirements which wehave for standard TV or cinema presentation, for instance
1. lifelikeness2. video focus and audio clarity,3. correctness and blaze of colors,4. flicker and distortion levels,5. signal to noise ratio, and so on.
While some aspects of those requirements, e.g. video focus, correctness and blaze of colors areadjustable by an appropriate use of high-quality peripheral devices (at the sending as well as atthe receiving side), others depend crucially on the characteristics of data encoding and datatransmission through the network.
Since audio and video are transmitted as sequences of frames, QoS parameters have to bedirectly based on the notion of frame transmission. The particular diff iculty is the definition offrame-based QoS parameters and the mapping from concrete QoS parameter values to levelsof end-user satisfiabili ty. TOMQAT expects significant input from psychological test runsinvestigating the acceptance of multimedia collaboration services.
The following QoS parameters for the transmission of audio and video streams are ofimportance:
1. frame size,2. frame rate,3. frame delay,4. frame delay jitter,5. frame error rate (frame loss and frame corruption), and6. audio and video frame synchronization.
This list extends slightly the list of QoS parameters for videoconferencing given in CFS D511[21].Quality of Service requirements for a broad range of audio-visual multimedia applicationscan be found in [14].
JVTOS QoS Parameters
The JVTOS QoS parameters are divided into two different parts which can be monitored andcontrolled independently. The video and the audio service provide separate managementfunctions. The only connection between the audio and video stream is a time stamp which isincluded in every audio and video packet. Thus a synchronization service can sample incoming
Deliverable 5 Page 62
© RACE Project R2116 - TOMQAT
audio and video data and resynchronize the data streams. Time synchronization on the networklevel is not planned for JVTOS 3.0.
The following video parameters will be provided for monitoring only:
• image size (width * height)• video frame size in bytes
The image size should not be manipulated automatically in order to avoid confusing of theusers. The video frame size may be modified by varying the compression factor (see below).
The following video parameters will be accessible for monitoring and manipulation by theTMN:
• compression factor• frame rate (frames / sec)• video on/off
It is not intended to use black&white video for data compression. Still video can be achievedby manipulating the frame rate. The maximum compression factor depends on the hardwareand the user acceptance. The higher the compression factor the lower the image quality.
The following audio parameters will be provided for monitoring only:
• frame size in bytes
Four audio service parameters can be modified and monitored:
• frame rate (frames / sec)• sample rate• mono / stereo (if supported by the audio devices)• minimum input volume for transmission of audio data
The sample rate can only be modified if the audio devices support different sample rates. Thestandard SUN audio device supports only ISDN quality. Setting a minimum volume levelallows to reduce network traffic by suppressing background noise. Thus less audio packetshave to be transmitted through the network.
3.6.2. Orchestration Level
3.6.2.1. Functionality
With the introduction of multimedia, groupware and client-server oriented applications severalnew requirements have emerged. One of the most complicated issues to deal with issynchronisation. The number of scenarios describing possible interrelations between users andinformation streams is impressively large, e.g. one user receiving several streams, several users

Deliverable 5 Page 63
© RACE Project R2116 - TOMQAT
receiving a common stream, several users receiving and sending several streams etc. Keyconsiderations related to synchronisation include the following:
1. Streams or events originating from one or separate sources need to be timelydelivered to the receiver (e.g. lip-sync).
2. Streams or events originating from one or separate sources need to be timelydelivered to a group of receivers (e.g. videoconference).
It is not rare for Transport, and even lower layer, protocols to assert that they providesynchronisation functions or other similar ones, coping with the timing relationship betweensender and receiver. However, what those protocols are actually providing is source clock rateretrieval, a function which by its own can not successfully deal with the time-related issues ofthe magnitude of complexity encountered in groupware and multimedia services.
The main cause of loss of synchronisation is the different transit delay induced by differentpaths, and transit delay variation (jitter) and loss which frames experience traversing thenetwork, as well as discrepancies between remote clock rates.
The aforementioned issues, not adequately supported by existing communications sub-systems,provide a rough description of the required functionality of the Orchestration level, in the sensethat it has to (more or less) deal with them. Orchestration level has to control the transit delayand jitter by means of dynamic management of information flows and QoS in a multimediasession involving a set of connections and end-devices. As already mentioned, orchestrationcan be considered to reside at the Session layer of the OSI Reference Model. However itsfunctionality does not restrict to traditional dialog and activity management. Its role calls for avariety of co-ordination functions over multiple transport connections. Although there isalways the option of multiplexing different media onto a single connection, this solution oftenproves to be inadequate because the overhead and the complexity of (de-)multiplexing issignificant, the opportunity to process separate connections in parallel is lost, multiplexingleads to a combined QoS and after all multiplexing is not feasible where media originate fromdifferent sources.
3.6.2.2. Functions
The functions needed to be supported by the Orchestration level are the following:
1. Flow control (rate control, rate enforcement)Although flow control is performed by the Transport level, extensions have to beimplemented within the Orchestration level, taking under consideration the stringenttemporal requirements imposed by the Application level. For instance, in case of videotransmission, an excessively delayed frame can be replaced by re-displaying the previousone. Mechanisms of this function should also compensate for excessive transit delay andjitter indicated by the corresponding monitoring functions of the Transport level. This setof functions may be characterised as Intra-stream synchronisation functions.
2. Synchronisation controlAlthough the Transport level may provide synchronisation functions, their capabili typroves to be limited (remote clock rate retrieval, single connection synchronisation controletc.) compared to the strict and complicated requirements imposed by multimediaapplications. Extensions have to be devised, based on the consideration that theOrchestration level has to deal with cases where numerous information flows from and to

Deliverable 5 Page 64
© RACE Project R2116 - TOMQAT
numerous end-users demonstrate stringent temporal associations between them, i.e. cross-stream synchronisation issue. The synchronisation control functions are responsible fortaking proper preventive and corrective actions so that synchronisation between a groupof connections is maintained. The scope of the aforementioned functions may be extendedin order to perform policy-driven actions (e.g. in the case of two associated channels -audio and video- it may be decided that on improper reception of a video frame by theOrchestration level, the associated audio frame(s) should be dropped).
3. Selection of Transport level functionsIt is the responsibili ty of the Orchestration level to pick out the most adequate servicesthat may be offered by the Transport level. The selection should be based on the QoSrequirements as stated by the Application to the Orchestration level, possibly after anegotiation, (e.g. select the most appropriate guarantee class offered by the Transportlevel in order to transfer media of a specific type). Since the aforementioned selection maynot be possible to be fulfilled, a negotiation with the Transport level should take place.
4. Connection ManagementOrchestration level functions of connection establishment, modification and release, areincluded in connection management.
5. Expedited data transferSpecial communication mechanisms are needed in order to exchange messages of vitalimportance (e.g. alarm indications).
6. Session managementSession management comprises functions which provide flexibili ty and transparency to theusers of groupware services to join or leave a running session, without affecting (at leastnot negatively) the QoS provided to the remaining participants. In case this kind offunctions is carried out by the Application level, then the Orchestration level may need notdeal with it any further.
3.6.2.3. QoS Parameters
The Orchestration level QoS parameters needed to be managed are presented in the followingtable. It has to be noted that the list below is not exhaustive, and that QoS parameters are stillunder further study.
QoS parameter(Performance oriented)
Description
Throughput number of O-SDUs successfully sent or received during aspecified time interval
Transit Delay elapsed interval between the issuance of O-SDU request anda corresponding O-SDU indication.
Transit Delay Variation difference between the maximum and minimum transit delaySynchronisation type type of the synchronisation required by the media transferred
(e.g. event-driven, continuous)
QoS parameter(Non-performance oriented)
Description
Guarantee class the kind of the QoS provided to the Application level (besteffort or guaranteed)
Deliverable 5 Page 65
© RACE Project R2116 - TOMQAT
Cost the cost of the orchestration service provided
3.6.3. Transport Level
3.6.3.1. Functionality
The main role of the Transport level is the enhancement of service quality provided by theunderlying network infrastructure, so that specific QoS requirements (performance, availabili tyetc.) imposed by the user application, are met to the highest possible extent. The Transportlayer is the lowest layer in which the communication sub-system itself does not participate, andat the same time it is the highest layer which deals with purely communication-related problemsin open systems connections.
The main characteristics of the Transport level is its end-to-end scope. Independent by thecapabili ties offered by the underlying network, the Transport level has to transparently provideon-demand reliable and/or cost-efficient connections, compensate for incorrectly delivered orlost data units and tackle network failures or anomalies.
The establishment of a network connection can not usually guarantee the QoS attributes thatthe application requires. The statistical nature of the traffic as well as the stochastic behavior ofthe network components makes the overall communication system more or less unpredictable.This is where the Transport level intervenes and absolves the Application level from detailsconcerning connection attributes such as throughput, reliability, error handling, etc..
The functionality of the Transport level may be reminiscent of that of the (OSI) Data Linklayer. Although this holds true, this duplication of functionality is not redundant, because theData Link layer is operated by the public network operator (at least in WANs), while theTransport level is operated by users (who in turn may actually be Value-Added ServiceProviders). Thus, the latter may pose more stringent requirements on performance/reliabili tythan the requirements satisfied by the former. In such cases, Data Link layer is not sufficient.
Apart from the typical functionality of the Transport level as described above, newconsiderations should also be made on the requirements imposed by the evolution of thecomputer communications. As already mentioned, multimedia, groupware and client-serveroriented services are to be typical of the future telecommunications. Such services demonstraterequirements which are derived not only from each of the individual constituent services (e.g.multimedia services may comprise audio-, video- and data-related services) but also new oneswhich reflect their need to be provided in a coordinated manner (e.g. synchronisation). Othernew features that transport protocols should incorporate are means to quantitatively requestand negotiate with the network infrastructure in terms of QoS parameters, functionality tosupport multicast as well as extended addressing capabili ties. Older transport protocols (e.g.TCP, OSI-TP4) provide no means to perform such tasks. On the contrary new transportprotocols (e.g. XTPX) have taken under consideration those burgeoning requirements andhave been expanded towards that direction.
Indeed, original transport protocols, such as TCP, aimed at accommodating file-transfer trafficand low-bandwidth interactive communications. However, as mentioned above, therequirements on multimedia communications are different (not just more stringent). Thus,completely reliable transfer (as achieved by TCP) is not necessary in multimedia, while it
Deliverable 5 Page 66
© RACE Project R2116 - TOMQAT
defeats the timeliness required in real-time media communications. By the same token, somenew protocols support QoS re-negotiation, which is employed when the originally agreed QoSlevels are violated. This reflects the fact that it may be tolerable (and/or preferable) for, say,some video-conference session to continue without high-quality sound, rather than besuspended completely.It has to be outlined that potentially significant diversity of Application level requirements maybe the implementation of more than one Transport protocol at the Transport level. Forinstance, separate transport protocols may be used for bulk data transfer and audio-videostreams.
3.6.3.2. Functions
The functions which need to be provided by transport protocols are listed below. It should bementioned that the following set of functions comprises those which are dictated by theintroduction of multimedia and other pertinent services.
1. Error controlError control functions provide the adequate means to detect and recover from errorsgenerated during the transmission. Forward Error control may be used (especially forservices such as coded video or audio which impose stringent delay requirements) orAutomatic Repeat Request techniques such as Stop-and-Wait, Go-Back-N, SelectiveRepeat etc. A combination of the aforementioned mechanisms is also highly probable.
2. Flow controlMain concern of the flow control is to prevent a fast sender from overrunning a slowreceiver. Most common mechanisms are windowing and back-pressure control.
3. SequencingSequencing enables the detection of and recovery from lost or misordered data units.
4. MulticastMulticast is a case of point-to-multipoint connections where, using group addressing, datawhich was originally sent once over a network reach the entitled receivers without anyreplication of the data.
5. Concatenation-Separation of T-PDUsThe sender concatenates several T-PDUs in one T-SDU, while at the other side thereverse procedure takes place (separation). Concatenation may provide gateways to lessexpensive connections since one network connection serves several transport ones. Theremight be also cases where concatenation may ensure the synchronisation of a bundle ofconnections.
6. Segmentation-Reassembly of T-PDUsSegmentation is advised in cases of unreliable network services or, ultimately, in caseswhere the maximum length of the N-PDUs are smaller than the length of the frames sentby the application.
7. Multiplexing-Demultiplexing of T-connectionsTransport level may multiplex several Transport connections in one Network connection.Again, it is evident that cost considerations are the driving force for such an action.
8. Splitting-Recombining of T-connectionsSplitting is the reverse analogue to multiplexing. Here, one T-connection is split intoseveral N-connections. In this case a criterion might be the transit delay requirements.
9. Expedited data transferSpecial communication mechanisms are needed in order to exchange special messages ofvital importance (e.g. alarm indications).

Deliverable 5 Page 67
© RACE Project R2116 - TOMQAT
10. Selection of Network level servicesIt is responsibili ty of a Transport protocol to pick out the most adequate services that maybe offered by the underlying network. The selection should be based on the QoSrequirements as stated at the Transport level. Since the aforementioned selection can notbe possibly fulfilled, a negotiation with the Network level may take place.
11. Connection-oriented, connectionless (or transactional) mode functionsBoth transfer modes, connection-oriented and connectionless, are encountered inTransport protocols. New Transport protocols (e.g. XTPX) provide also a third mode, thetransactional.
12. Quantitative requests and negotiation for QoS parametersThe user-application needs to have the means to quantitatively express its ownrequirements. Moreover, in the meantime of a transport connection various QoSnegotiation functions may be needed in order to gracefully handle potential degradation orextraordinary events.
13. Extended addressing capabilitiesExtended addressing capabili ties are needed in the course of groupware communications,since a single address may specify a whole group of individual user addresses.
3.6.3.3. QoS Parameters
In the sequel, a list of QoS parameters of the Transport level is presented.
QoS parameter(Performance-oriented)
Description
T-SDU length length of the T-SDU which will be transferredThroughput number of T-SDUs successfully sent or received during a
specified time intervalTransit Delay elapsed interval between the issuing of T-SDU request and a
corresponding T-SDU indication.Transit Delay Variation difference between the maximum and minimum transit delayTransfer FailureProbability
ratio of the total transfer failures to total transfer samplesobserved during a performance measurement
Residual Error Rate ratio of total incorrect, lost and duplicated T-SDUs to total T-SDUs transferred across the Transport level boundary during ameasurement period
Connection set-up delay elapsed time between the T-CONNECT request and thecorresponding T-CONNECT confirm
Connection set-up failureprobability
probability that a requested connection is not established withinthe maximum acceptable set-up delay
Resilience the estimated probability that the transport provider will on itsown release the connection or reset it within a specified intervalof time
Connection release delay the maximum acceptable delay between a TS- user initiated T-DISCONNECT request and the successful release of thetransport connection at the peer TS-user
Connection release failureprobability
the probability that the service provider is unable to release theconnection within a specified maximum release delay

Deliverable 5 Page 68
© RACE Project R2116 - TOMQAT
QoS parameter(Non-performance)
Description
Error Handling defines options for processing of TSDU errors of connection(i.e. ignore, indicate or correct)
Guarantee class the kind of the QoS provision for the connection (best effortor guaranteed)
Priority the relative importance of the transport connectionSecurity extent to which the service provider attempts to prevent
unauthorized monitoring or manipulation of data of theconnection
Cost the cost of the communication resources used for theconnection
3.6.3.4. Examples of Transport protocols
Examples of transport protocols already implemented and in use are the following:
3.6.3.4.1. TCP (Transport Control Protocol)TCP provides limited QoS related support, because it was designed to support file-transfer andlow-bandwidth interactive communications, prior to the introduction of multimedia. Inparticular, when combined with IP as the network layer protocol (which is the prevalent case),TCP supports IP's Type of Service (ToS) specified in each IP Datagram by certain bits. Thesebits indicate the corresponding priority class, as well as specify the requirements for delay(either normal or low) for the throughput (either normal or high), and for reliabili ty (eithernormal or high). In certain IP implementations it is not permissible for more than onerequirements not to be at the normal level, while another Type of Service (requiring cost-efficiency) is introduced. When TCP/IP is employed, TCP should support the user in specifyingthe ToS bits of the data segments to be transported, and may possibly allow for updating thesebits during service. There is neither negotiation of the QoS parameter values nor monitoringthereof (i.e., it is not even specified what the value corresponding to "low" delay is).
3.6.3.4.2. TPX (Transport Protocol classes X)The OSI 95 ESPRIT project analysed the requirements on high speed transport services formultimedia applications, and developed the TPX transport protocol. Particular emphasis wasplaced by OSI 95 on QoS related issues. An enhanced view of QoS was adopted, including thenotions of "Maximal QoS Value", "Threshold QoS Value" and "Compulsory QoS value" foreach QoS parameter. "Compulsory QoS" corresponds to the poorest tolerable value,"Threshold QoS" corresponds to a value which (when reached) implies considerable QoSdegradation, and may result to a decision for service suspension; such a decision would beimmediate in case of violation of "Compulsory QoS". The QoS parameters supported by TPXare as follows:
i) throughputii) end-to-end delayiii) jitteriv) error ratev) priority (non-performance)
Deliverable 5 Page 69
© RACE Project R2116 - TOMQAT
Compared to XTPX and classic OSI, apparently TPX supports only in-service QoSparameters, and in particular those that both pertain to multimedia applications and aremanageable (not necessarily by the transport level, since delay and jitter are controlled withinthe orchestration level). A QoS negotiation phase for the performance parameters is alsosupported by TPX, with the possibility of re-negotiation during service.
3.6.3.4.3. VMTP (Versatile Message Transaction Protocol)This transport protocol is destined to accommodate only transactional (i.e. response/request)and connection-less communications, without providing connections. It also allows formulticast transactions (i.e. one-to-many). VMTP provides no support for QoS parameters.While the protocol does support 4 priority levels, as well as transmission rate control (forcongestion avoidance), these have no QoS-related implications.
3.6.3.4.4. Network Block Transfer (NETBLT) protocolThis transport level protocol is destined to accommodate fast transfer of large data quantities.It employs transmission rate control which is negotiated during connection set-up phase, withthe option for re-negotiation during data transfer. No other QoS-related activity is supportedby NETBLT.
3.6.3.4.5. XTPX (eXpress Transport Protocol eXtended)The XTPX protocol provides functions of both the Transport and Network layers of the OSIBasic Reference Model. However, being one of the most powerful transport and networkprotocols, XTPX has the capabili ty to provide enhanced functions as well as additionalfeatures, not described in the OSI model. Those characteristics can be summarised in thefollowing list:
1. Sender/Receiver synchronisation (remote clock rate retrieval)2. TS-user QoS parameters mapping onto the XTPX procedures and parameters.3. In-service QoS renegotiation4. Extended QoS parameter monitoring
The specific QoS parameters supported, i.e. negotiable or just monitorable, by XTPX can befound in the section titled "QoS Parameters of Transport level". The values by means of whichthe QoS parameters may be described are: minimum, target, maximum, lower threshold andupper threshold.In the XTPX implementation of CIO the following XTPX parameters can be monitored:
• delay (min, max and target)• jitter (min, max and target)
The list below contains the QoS parameters which are accessible for monitoring andconfiguration:
• throughput (min, max and target for both directions)• PDU size
Deliverable 5 Page 70
© RACE Project R2116 - TOMQAT
3.6.4. Network Level
3.6.4.1. ATM Adaptation Layer
Corresponding to the QoS parameters in ATM layer, we have at the AAL the following QoSparameters concerning frames:
Frame Error RatioFrame Loss RatioFrame Transfer DelayFrame Delay VariationFrame RateFrame Rate BurstinessAAL Connection Establishment DelayAAL Connection Establishment Failure Probability
3.6.4.1.1. Frame Error RatioFrame Error Ratio for an AAL connection is defined as follows:
Errored Frames
Successfully Transferred Frames + Errored Frames
As the contractual QoS parameter at the time of connection establishment, the Maximum ErrorRatio will be used, which will be defined as the upper bound on the error ratio.
3.6.4.1.2. Frame Loss RatioThe Frame Loss Ratio is defined for an ATM connection as:
Lost Frames
Total Transmitted Frames
As the contractual QoS parameter at the time of connection establishment, the MaximumFrame Loss Ratio will be used instead, which will be defined as the upper bound on the lossratio.
3.6.4.1.3. Frame Transfer DelayThe Frame Transfer Delay is defined as the elapsed time between a frame exit event at themeasurement point 1 (e.g. at the source UNI) and the corresponding frame entry atmeasurement point 2 (e.g. the destination UNI) for a particular connection.For Frame Transfer Delay the following two parameters are actually more useful in the contextof QoS management:
• Maximal Frame Transfer Delayis defined as the maximum over the Frame Transfer Delays for all frames on a connection
• Mean Frame Transfer Delayis defined as the arithmetic average of Frame Transfer Delays for one connection

Deliverable 5 Page 71
© RACE Project R2116 - TOMQAT
3.6.4.1.4. Frame Delay Variation (FDV)Similar to the case of CDV, we can also defined FDV on frames.There are two parameters associated with frame delay variation: 1-point Frame DelayVariation (1-point FDV) and the 2-point Frame Delay Variation (2-point FDV).The 1-point FDV describes variabili ty in the pattern of frame arrival events observed at a singlemeasurement point with reference to the negotiated peak rate 1/T.The 2-point FDV describes variabili ty in the pattern of frame arrival event observed at theoutput of a connection portion with reference to the pattern of the corresponding eventsobserved at the input to the connection portion.The following two parameters about FDV will be more useful in the context of QoSmanagement:
• Maximal FDVis defined as the maximum of FDV over all cells of a connection.
• Mean FDVis defined as the average of FDV over all cells of a connection.
3.6.4.1.4.1. 1-point FDVThe 1-point FDV for frame k (yk) at a measurement point is defined as the difference betweenthe frames reference arrival time (fk) and actual time (ak) at the measurement point: yk = fk - ak.The reference arrival time (fk) is defined as follows:
f0 a0 0= =
fk+1 = { fk + T if fk >= ak
+ T otherwiseak
where 1 / T is the negotiated peak rate. Positive values of the 1-point FDV correspond toframe clumping; negative values of the 1-point FDV correspond to gaps in the cell stream. Thereference arrival time defined above eliminates the effect of gaps and provides a measurementof frame clumping.
3.6.4.1.4.2. 2-point FDVThe 2-point FDV for Frame k (yk) between two measurement points (MP1 and MP2) is thedifference between the absolute cell transfer delay of frame k (xk) between the two MPs and adefined reference frame transfer delay (d1,2) between MP1 and MP2: vk = xk-d1,2.
3.6.4.1.5. Frame RateFrame Rate is defined as the Rate at which the frames pass through a connection:
Transmitted Frames within a time Interval
Time Interval
Frame Ratio can be used instead of rate, in which case the lifetime of the connection is used asthe Time Interval.
Deliverable 5 Page 72
© RACE Project R2116 - TOMQAT
For the purpose of connection establishment, we usually use the following contractualparameters:
• Peak Frame Rate• Minimum Frame Rate• Mean Frame Rate
3.6.4.1.6. Frame Rate BurstinessFrame Rate Burstiness can be specified similarly to the Cell Burstines:
• Frame Burst Rate
Frame Burst Rate is defined asPeak Frame Rate
Mean Frame Rate• Frame Burst Length
Frame Burst Length is defined as the temporal length (length of the time interval) of aburst, where a burst can be either the period during which the source is actively sendingframes, or the period during which the source is sending frames at a frame rate above acertain specified value.
• Frame Burst SizeFrame Burst Size is defined as the number of frames sent or received in a burst, where theburst is defined above.
In the application, we usually use the following parameters:• Maximum Frame Burst• Mean Frame Burst
3.6.4.1.7. AAL Connection Establishment DelayThis is the elapsed time between the connection request and the confirmation. For contractualQoS parameter we can use
Maximum AAL Connection Establishment Delay
3.6.4.1.8. AAL Connection Establishment Failure ProbabilityThis is defined as the probabili ty that a connection request is rejected due to, e.g. excessivedelay. For contractual QoS parameter we usually use
Maximal AAL Connection Establishment Failure Probability
3.6.4.2. ATM Layer
In case of ATM network context, i.e. AAL and ATM layer, subjective QoS parameters do nothave any significant role. In the following, therefore, we will j ust discuss objective QoSparameters.For ATM layer resource management, the following QoS parameters will be very important insupporting QoS management based on [19]:
Cell Error RatioSeverely-Errored Cell Block Ratio

Deliverable 5 Page 73
© RACE Project R2116 - TOMQAT
Cell Loss RatioCell Misinsertion RateCell Transfer DelayCell Delay VariationCell RateCell Rate BurstinessATM Connection Establishment DelayATM Connection Establishment Failure Probability
3.6.4.2.1. Cell Error RatioCell Error Ratio, for an ATM connection is defined as follows
Errored Cells
Successfully Transferred Cells + Errored Cells
Successfully Transferred Cells and Errored Cells contained in cell blocks counted as SeverelyError Cell Blocks should be excluded from the population used in calculating Cell Error Ratio.
As the contractual QoS parameter at the time of connection establishment, the Maximal ErrorRatio will be used, which will be defined as the upper bound on the error ratio.
3.6.4.2.2. Severely Errored Cell Block RatioThe Severely Errored Cell Block Ratio for an ATM connection is defined as:
Severely Errored Cell Blocks
Total Transmitted Cell Blocks
A cell block is a sequence of N cells transmitted consecutively on a given connection. Aseverely errored cell block outcome occurs when more than M Error Cells, Lost Cells, ormisinserted cell outcomes are observed in a received cell block.For practical measurement purposes, a Cell Block will normally correspond to the number ofuser information cells transmitted between successive OAM cells.As the contractual QoS parameter at the time of connection establishment, the MaximumSeverely Errored Cell Block Ratio will be used, which is defined as the upper bound of theratio.
3.6.4.2.3. Cell Loss RatioThe Cell Loss Ratio is defined for an ATM connection as:
Lost Cells
Total Transmitted Cells
Lost and transmitted cells counted in severely errored cell blocks should be excluded from thecell population in computing cell loss ratio.As the contractual QoS parameter at the time of connection establishment, the Maximum CellLoss Ratio will be used instead, which will be defined as the upper bound of the loss ratio.
Deliverable 5 Page 74
© RACE Project R2116 - TOMQAT
3.6.4.2.4. Cell Misinsertion RateThe Cell Misinsertion rate for an ATM connection is defined as:
Misinserted Cells
Time Interval
Cell misinsertion on a particular connection is most often caused by an undetected error in theheader of a cell being transmitted on a different connection. This QoS parameter is defined as arate since the mechanism producing misinserted cells is independent of the number oftransmitted cells received on the corresponding connection.As the contractual QoS parameter at the time of connection establishment, the Maximal CellMisinsertion Rate will be used instead, which will be defined as the upper bound on the CellMisinsertion Rate.
3.6.4.2.5. Cell Transfer DelayThe Cell Transfer Delay is defined as the elapsed time between a cell exit event at themeasurement point 1 (e.g. at the source UNI) and the corresponding cell entry at measurementpoint 2 (e.g. the destination UNI) for a particular connection.For Cell Transfer Delay the following two parameters are actually more useful in the context ofQoS management:
• Maximum Cell Transfer Delaywhich is defined as the maximum over the Cell Transfer Delays of all cells
• Mean Cell Transfer Delayis defined as the arithmetic average of a specific number of Cell Transfer Delays for one ormore connections according to the ATM Forum.
3.6.4.2.6. Cell Delay Variation (CDV)There are two parameters associated with cell delay variation: 1-point Cell Delay Variation (1-point CDV) and the 2-point Cell Delay Variation (2-point CDV).The 1-point CDV describes variabili ty in the pattern of cell arrival events observed at a singlemeasurement point with reference to the negotiated peak rate 1/T.The 2-point CDV describes variabili ty in the pattern of cell arrival event observed at the outputof a connection portion with reference to the pattern of the corresponding events observed atthe input to the connection portion.The following two parameters about CDV will be more useful in the context of QoSmanagement:
• Maximum CDVwhich will be defined as the maximum of CDV over all cells of a connection.
• Mean CDVwhich will be defined as the average of CDV over all cells of a connection.
3.6.4.2.6.1. 1-point CDVThe 1-point CDV for cell k (yk) at a measurement point is defined as the difference betweenthe cells reference arrival time (ck) and actual time (ak) at the measurement point: yk=ck- ak.The reference arrival time (ck) is defined as follows:
Deliverable 5 Page 75
© RACE Project R2116 - TOMQAT
c0 a0 0= =
ck+1 = { ck + T if ck >= ak
+ T otherwiseak
with T as defined above. Positive values of the 1-point CDV correspond to cell clumping;negative values of the 1-point CDV correspond to gaps in the cell stream. The reference arrivaltime defined above eliminates the effect of gaps and provides a measurement of cell clumping.
3.6.4.2.6.2. 2-point CDVThe 2-point CDV for cell k (yk) between two measurement points (MP1 and MP2) is thedifference between the absolute cell transfer delay of cell k (xk) between the two MPs and adefined reference cell transfer delay (d1,2) between MP1 and MP2: vk = xk-d1,2.
3.6.4.2.7. Cell Rate/RatioCell Rate is defined as the rate at which the cells are passing through a connection:
Transmitted Cells within a time Interval
Time Interval
Cell Ratio can be used instead of rate, in which case the lifetime of the connection is used asthe Time Interval.For the purpose of connection establishment, we usually use the following contractualparameters:
• Peak Cell Rate• Minimum Cell Rate• Mean Cell Rate
3.6.4.2.8. Cell Rate BurstinessBurstiness can be specified in different ways (c.f. [15]):
• Cell Burst RateBurst Rate is defined as
Peak Cell Rate
Mean Cell Rate
• ·Cell Burst LengthCell Burst length is defined as the duration (length of the time interval) of a burst, where aburst can be either the period during which the source is actively sending cells, or theperiod during which the source is sending cells at a cell rate above certain specified value.
• Cell Burst Size
Deliverable 5 Page 76
© RACE Project R2116 - TOMQAT
Cell Burst Size is defined as the number of cells sent or received in a burst, where theburst is defined above.
In the application, we usually use the following parameters:• Maximum Cell Burst• Mean Cell Burst
3.6.4.2.9. ATM Connection Establishment DelayThis is the elapsed time between the connection request and the confirmation. For contractualQoS parameter we can use
Maximum ATM Connection Establishment Delay
3.6.4.2.10. ATM Connection Establishment Failure ProbabilityThis is defined as the probabili ty that a connection request is rejected due to, e.g. excessivedelay. For contractual QoS parameter we usually use
Maximal ATM Connection Establishment Failure Probability
3.6.5. SDH Layer
Assessment of the end-to-end error performance of SDH systems is based on ITU-TRecommendation. G.826.Recommendation G.826 has applications on international digital circuits having a constant bitrate lying at or above the rate of the primary systems (1544 or 2048 kbit/s). These digitalcircuits can be transported via any transmission system (e.g. plesiochronous, synchronous, cell-based).The parameters specified in G.826 apply to an end-to-end connection on a hypotheticalreference path (HRP) having a length of 27500 km. They must be fulfill ed no matter whattransmission media are used (e.g. copper cables, optical fibers or radio/satellite systems).
3.6.5.1. Block error measurement
From the very start, the aim of work on G.826 was to allow in-service quality assessmentwhich makes use of the error monitoring devices present in the transmission systems. To dothis, a transition from bit error measurements (as applied for 64 kbit/s circuits) to block errormeasurements was required.A block is defined as a group of successive bits which can be assigned to the path under test.Each bit belongs to one and only one block.Block monitoring is handled using the error monitoring devices present in modern transmissionsystems. This entails use of the CRC (cyclic redundancy check) and monitoring of the bitinterleaved parity (BIP-n).
3.6.5.2. Definition of error events and error parameters
Recommendation G.826 is based on observation of four error events. The definition of theseevents takes into account the anomalies detected by the block error evaluation mentionedabove and defects detected by monitoring functions in the Network Elements. A defect is acondition under which the network has lost its ability to transport bits.
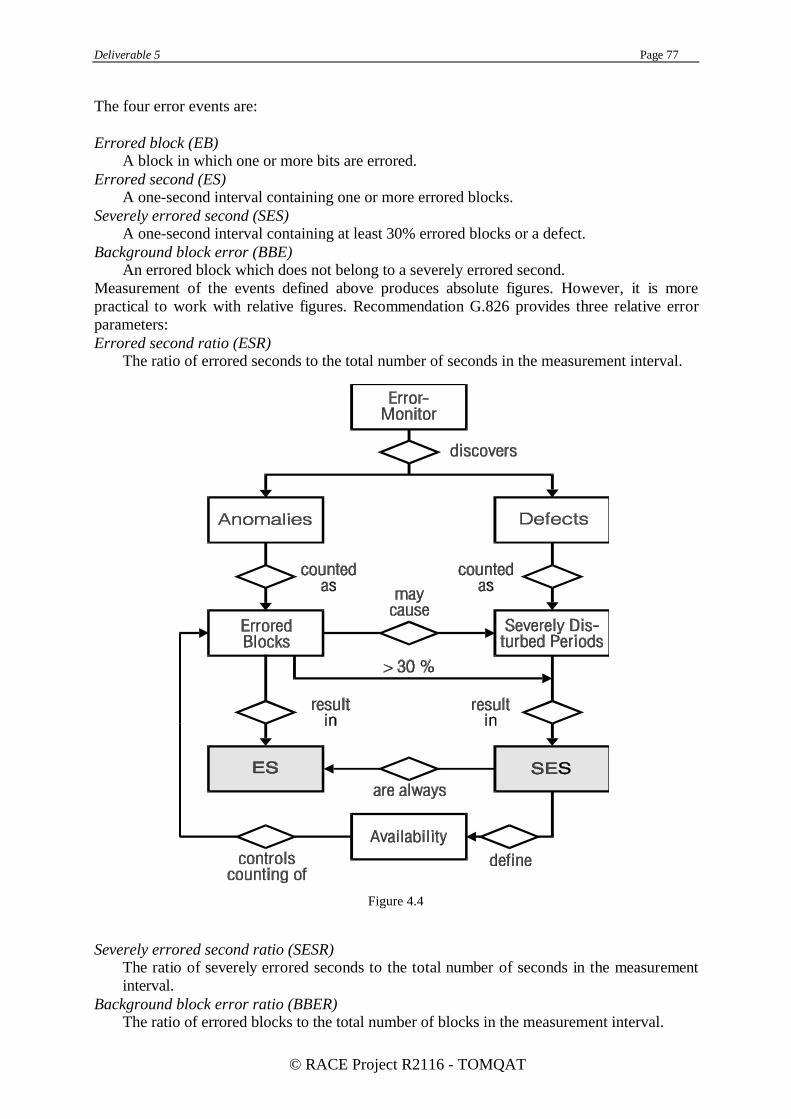
Deliverable 5 Page 77
© RACE Project R2116 - TOMQAT
The four error events are:
Errored block (EB)A block in which one or more bits are errored.
Errored second (ES)A one-second interval containing one or more errored blocks.
Severely errored second (SES)A one-second interval containing at least 30% errored blocks or a defect.
Background block error (BBE)An errored block which does not belong to a severely errored second.
Measurement of the events defined above produces absolute figures. However, it is morepractical to work with relative figures. Recommendation G.826 provides three relative errorparameters:Errored second ratio (ESR)
The ratio of errored seconds to the total number of seconds in the measurement interval.
Figure 4.4
Severely errored second ratio (SESR)The ratio of severely errored seconds to the total number of seconds in the measurementinterval.
Background block error ratio (BBER)The ratio of errored blocks to the total number of blocks in the measurement interval.

Deliverable 5 Page 78
© RACE Project R2116 - TOMQAT
For these three definitions, it should be noted that only the times in which the transmissionsystem is available may be taken into account when forming the ratio.Fig. 4.4 gives a rough outline of the rules in G.826 for calculating ES and SES from anomaliesand defects.
3.6.5.3. Criteria for SDH systems
SDH systems use, as a basic element, a frame-oriented error monitoring device (BIP-n = bitinterleaved parity over n bits). It is thus obvious to equate the SDH frames with G.826 blocks.Using a one-to-one correspondence, a recognized BIP violation is interpreted directly as anerrored block (and thus an errored second).
Block Size for Monitoring SDH Paths
The block sizes for in-service performance monitoring of SDH Paths as specified inRecommendation G.709 are given in Table 1/A3 - G.826.
Bit Rate ofSDH Path
Path Type Block Size according toTable 1/G.826
SDH Block Sizeused in G.826
EDC
1 664 kbit/s VC-11 2 000 - 8 000 bits 832 bits BIP-22 240 kbit/s VC-12 2 000 - 8 000 bits 1 120 bits BIP-26 848 kbit/s VC-2 2 000 - 8 000 bits 3 424 bits BIP-248 960 kbit/s VC-3 4 000 - 20 000 bits 6 120 bits BIP-8150 336 kbit/s VC-4 6 000 - 20 000 bits 18 792 bits BIP-834 240 kbit/s VC-2-5c 6 000 - 20 000 bits 17 120 bits BIP-2601 344 000 kbit/s VC-4-4c 15 000 - 30 000 bits 75 168 bits BIP-8
Table 4.5: Block Sizes for SDH Path Performance MonitoringAnomalies
In-service anomaly conditions are used to determine the error performance of an SDH pathwhen the path is not in a defect state. The following anomaly is defined:
a1 an EB as indicated by an EDC.
Defects
In-service defect conditions are used in Recommendations G.709 and G.783 relevant to SDHequipment to determine the change of performance state which may occur on a path. Thefollowing categories of defects are defined:
d1 Higher order Path AIS; Recommendation G.709
d2 Lower order Path AIS; Recommendation G.709
d3 Loss of AU pointer; Recommendation G.783
d4 Loss of TU pointer; Recommendation G.783
d5 Higher order Path Trace Identifier Mismatch; Recommendation G.783
d6 Lower order Path Trace Identifier Mismatch; Recommendation G.783

Deliverable 5 Page 79
© RACE Project R2116 - TOMQAT
d7 Signal Label Mismatch (Under Study); Recommendation G.783
d8 Loss of TU Multiframe Alignment. Recommendation G.783
3.7. Mapping
3.7.1. AAL to ATM Layer
The AAL for ATM is divided into the Segmentation and Reassembly Sublayer (SAR) which iscommon to all AAL types, and the Convergence Sublayer (CS) which should be specificallydefined for the supported higher level applications. For AAL type 3/4 and type 5, the CS isfurther divided into SSCS (Service Specific CS) and CPCS (Common Part CS).The SARs for AAL type 1, type 3/4, type 5, and CPCS for type 3/4, type 5 are currently fairlystandardized. Some definitions of the CS for type 1 are also provided. It is therefore possibleto specify mapping based on such standardized specifications.The mapping of QoS parameters from AAL type 1 to ATM layer can be partly found in thepaper [13], we will l ater integrate the results from this paper into TOMQAT D4 and extend theresults with e.g. extra parameters, other CS types etc. In the sequel we will first discuss themapping on AAL Type 5 QoS parameters, as AAL Type 5 plays an important role inTOMQAT (current JVTOS runs over AAL Type 5)
3.7.1.1. Overview of AAL Type 5
AAL Type 5 is specified for the support of packet-oriented data transfer and optimal(especially compared to type 3/4) in terms of minimized transmission overhead.According to the ITU-T I.363 [22], AAL type 5 has the structure depicted in figure 4.5.
Service Specific CS(may be Null)
SSCS
CPCS
SAR
Common Part CS
SAR
Figure 4.5: Structure of the AAL Type 5
SSCS is not specified by the standards, we will therefore assume it to be Null in the followingdiscussion. This is also realistic because we expect most current AAL 5 implementations tohave a Null SSCS. With this assumption we also avoid the difficulty of considering the possiblemultiplexing at AAL, as multiplexing can only occur at SSCS.The SAR-PDU for AAL Type 5 has the format in figure 4.6,
SAR-PDU PayloadCell Header
Cell

Deliverable 5 Page 80
© RACE Project R2116 - TOMQAT
Figure 4.6: SAR-PDU Format for AAL Type 5
where the SAR layer information is encoded in the Payload Type field of the Cell Header. Thelast bit of this field is used to signal whether the cell is the end of the packet.
For CPCS the PDU format in figure 4.7 is used.
CPCS-PDU payload( up to 65,535 octets ) PAD
CPCS-UU
CPI Length CRC
CPCS-PDU trailer (8 octets)
PAD: PADding ( 0 to 47 octets )CPCS-UU: CPCS User-to-CPCS User indication ( 2 octets )CPI: Common Part Indicator ( 1 octets )Length: Length of CPCS-PDU payload ( 2 octets )CRC: Cyclic Redundancy Check ( 4 octets )
Figure 4.7: CPCS-PDU Format
3.7.1.2. QoS Parameter Mapping
3.7.1.2.1.Frame Error RatioAt the SAR sublayer, one SAR-PDU is mapped into one ATM cell, therefore we have
Cell_Error_Ratio (SAR) = Cell_Error_Ratio (ATM_layer)As the CPCS, a frame is considered as errored if any of the corresponding SAR-PDUs areerrored, i.e. either the cell is lost or is errored. Here we will not count the misinserted cells asthey will be deleted immediately and will not affect the assembly of the frames.As a result, we can say
Frame_Error_Ratio (CPCS)= 1 - {1 - { Cell_Error_Ratio (ATM_layer) + Cell_Loss_Ratio (ATM_layer) }} M
≈ M * { Cell_Error_Ratio(ATM_layer) +Cell_Loss_Ratio (ATM_layer) }(assuming { Cell_Error_Ratio (ATM_layer) +Cell_Loss_Ratio (ATM_layer) } << 1)
where M is the length (average if suitable) of the CPCS-PDU in cells.As Cell Loss in an ATM network is usually resulted from overflow, and can be influenced bythe QoS management facili ties, while Cell_Error_Ratio is usually not influenced by suchfacility, the following equation is more important for the purpose of QoS management:
Maximum_Cell_Loss_Ratio (ATM_layer)<= Maximum_Frame_Error_Ratio(CPCS) / M - Cell_Error_Ratio(ATM_layer)
3.7.1.2.2. Frame Loss RatioFor AAL, a frame is usually dropped if an error is discovered. As a result, the Frame LossRatio at AAL interface is just the detected Frame_Error_Ratio, i.e.
Deliverable 5 Page 81
© RACE Project R2116 - TOMQAT
Frame_Loss_Ratio (CPCS)=Frame_Error_Ratio (CPCS)*{1 -(Probability_of_Errors_Undetected_by_CRC) }
3.7.1.2.3. Frame Transfer DelayAt AAL, the delay of the ATM layer will be further increased by AAL processing overheadlike SAR segmentation/reassembly, and by the buffers that are usually used at the userinterfaces. We have therefore
Cell_Transfer_Delay (ATM_layer)= Frame_Transfer_Delay (CPCS) - I (M-1) - Delay (buffers)
where I is the time interval at which the SAR-PDUs are generated, and M is the length(average) of the CPCS-PDUs in cells.
3.7.1.2.4. Frame Delay VariationDelay variation can be compensated by a playout buffer at the receiver side. For this parameteronly the upper bound is meaningful during the derivation.
Maximum_Frame_Delay_Variation (CPCS)<= M * Maximum_Cell_Delay_Variation (ATM_layer) - Minimal_Compensation(playout)
M is specified as above.
3.7.1.2.5. Frame RateCell Rate can be derived from Frame Rate as follows:
Cell Rate (ATM_layer) = Frame_Rate (CPCS) * MM is specified as above.
3.7.1.2.6. Frame BurstinessFor Burstiness we have
Cell_Burst_Size_Bound (ATM_layer) = Maximal_Frame_Burst_Size (CPCS) * MCell_Burst_Length_Bound (ATM_layer) = Maximal_Frame_Burst_Length (CPCS)Cell_Burst_Rate_Bound (ATM_layer) = Maximal_Frame_Burst_Rate (CPCS)
3.7.1.2.7. AAL Connection Establishment DelayThe AAL Connection Establishment Delay is just the ATM layer delay plus the AAL processoverhead, i.e.
ATM_Connection_Establishment_Delay= AAL_Connection_Establishment_Delay - Processing_Delay
3.7.1.2.8. AAL Connection Establishment Failure Probability
The Failure probability should be the same at the two layers, i.e.

Deliverable 5 Page 82
© RACE Project R2116 - TOMQAT
AAL_Connection_Establishment_Failure_Probability= ATM_Connection_Establishment_Failure_Probability
3.7.2. QoS Parameters of the Multimedia Application
The management agent for the multimedia application JVTOS realizes the necessary protocolconversions from the private JVTOS application protocol to SNMP protocol elements. Theapplication supports monitoring and control functions for specific QoS parameters on differentlevels of the network layers which may be accessed via the agent.The first part of this chapter describes the high level JVTOS information base, the second partconcentrates on the transport layer parameters.
3.7.2.1. JVTOS QoS Parameters
The JVTOS QoS parameters are divided into two different parts which can be monitored andcontrolled independently. The video and the audio service provide separate managementfunctions. The only connection between the audio and video stream is a time stamp which isincluded in every audio and video packet. Thus a synchronization service can sample incomingaudio and video data and resynchronize the data streams. Time synchronization on the networklayer is not planned for JVTOS 3.0.The following video parameters will be provided for monitoring only:
• image size (width * height)• average video frame size in bytes• end to end frame loss• end to end delay
The image size should not be manipulated automatically in order to avoid confusing of theusers. The video frame size may be modified by varying the compression factor (see below).The frame size parameter represents an average value for a certain time period. Frame sizesvary due to the JPEG compression algorithm. The frame size parameter may be retrieved withan implicit zeroing of the frame size object of the MIB.The following video parameters will be accessible for monitoring and manipulation by theTMN:
• compression / quality factor• frame rate (frames / sec)• video pause on/off
It is not intended to use black&white video for data compression. Still video can be achievedby manipulating the frame rate. The maximum compression factor depends on the hardwareand the user acceptance. The higher the compression the lower the image quality.The following audio parameters will be provided for monitoring only:
• end to end frame loss• end to end delay
Four audio service parameters can be modified and monitored:• block size in bytes• sample rate (if supported by the audio device) (8kHz/11 kHz/22kHz)• mono / stereo (if supported by the audio devices)• muting limit
The block size defines the size of audio tranfer units in bytes. It depends on the sample rate andthe number frames to be transmitted in a second. The sample rate can only be modified if the
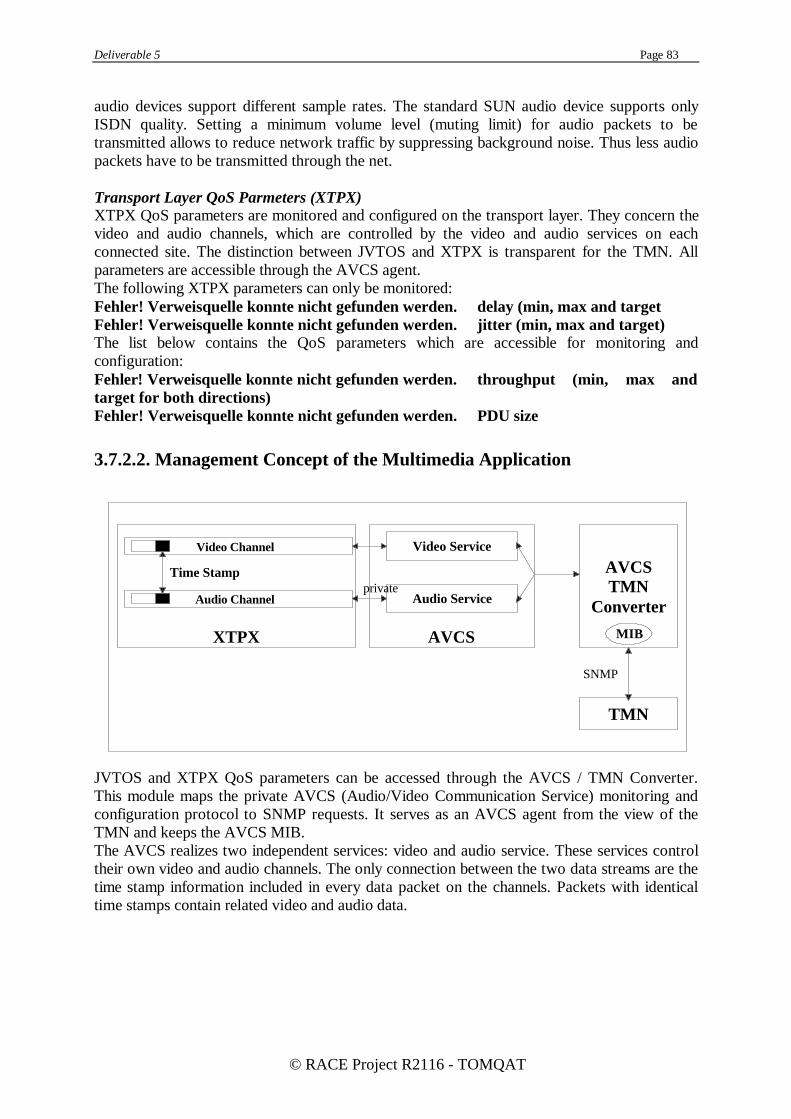
Deliverable 5 Page 83
© RACE Project R2116 - TOMQAT
audio devices support different sample rates. The standard SUN audio device supports onlyISDN quality. Setting a minimum volume level (muting limit) for audio packets to betransmitted allows to reduce network traffic by suppressing background noise. Thus less audiopackets have to be transmitted through the net.
Transport Layer QoS Parmeters (XTPX)XTPX QoS parameters are monitored and configured on the transport layer. They concern thevideo and audio channels, which are controlled by the video and audio services on eachconnected site. The distinction between JVTOS and XTPX is transparent for the TMN. Allparameters are accessible through the AVCS agent.The following XTPX parameters can only be monitored:Fehler! Verweisquelle konnte nicht gefunden werden. delay (min, max and targetFehler! Verweisquelle konnte nicht gefunden werden. jitter (min, max and target)The list below contains the QoS parameters which are accessible for monitoring andconfiguration:Fehler! Verweisquelle konnte nicht gefunden werden. throughput (min, max andtarget for both directions)Fehler! Verweisquelle konnte nicht gefunden werden. PDU size
3.7.2.2. Management Concept of the Multimedia Application
JVTOS and XTPX QoS parameters can be accessed through the AVCS / TMN Converter.This module maps the private AVCS (Audio/Video Communication Service) monitoring andconfiguration protocol to SNMP requests. It serves as an AVCS agent from the view of theTMN and keeps the AVCS MIB.The AVCS realizes two independent services: video and audio service. These services controltheir own video and audio channels. The only connection between the two data streams are thetime stamp information included in every data packet on the channels. Packets with identicaltime stamps contain related video and audio data.
Video Service
Audio Service
AVCSXTPX
Video Channel
Audio Channel
Time Stamp AVCSTMN
Converterprivate
MIB
TMN
SNMP
Deliverable 5 Page 84
© RACE Project R2116 - TOMQAT
3.7.2.3. Mapping of JVTOS QoS Parameters to Orchestration Layer QoSParameters
The audio and video frame rates will directly influence the throughput parameter of XTPX andthus map to the Throughput parameter of the orchestration layer QoS. The XTPX delayparameter maps to the Transit Delay of O-SDUs, the XTPX jitter corresponds to theorchestration layer Transit Delay Variation. The Synchronization type of both - video andaudio - is continuous.
References
[1] A. Cambell, G. Coulson et al., "Orchestration Services for Distributed MultimediaSynchronisation", High Performance Networking 1992.
[2] A. Cambell, G. Coulson et al., "A Continuous Media Transport and OrchestrationService: a Contribution to Discussion on the new ISO Work Item", LancasterUniversity, 1992.
[3] A. Cambell, G. Coulson et al., "Integrated Quality of Service for MultimediaCommunications", Proceedings INFOCOM 1993.
[4] A. Tanenbaum, "Computer Networks", Prentice-Hall, 2nd edition.[5] B. Metzler, I. Miloucheva, "Specification of the Broadband Transport Protocol
XTPX", Technical University of Berlin, CIO project, 1993.[6] K. Vlakos, E. Protonotarios, "The XTP Transport Protocol", National Technical
University of Athens, UNOM project, 1993.[7] A. Danthine, Y. Baguette et al., "The OSI 95 Connection-Mode Transport Service -
The Enhanced QoS", High Performance Networking 92, IFIP, 1992.[8] A. Cramer, M. Farber et al., "Experiences with the Heidelberg Multimedia
Communication System", High Performance Networking 92, IFIP, 1992[9] H.Leopold, A. Campbell et al., "Towards an Integrated Quality of Service Architecture
(QoS-A) for Distributed Multimedia Communications", High PerformanceNetworking 92, IFIP, 1992.
[10] U. Black, "TCP/IP and Related Protocols", Mc-Graw-Hill, 1992.[11] D. Cheriton, "VMTP: Versatile Message Transaction Protocol - Protocol
Specification", RFC 1045, 1988.[12] D. Clark, M. Lambert ,L. Zhang, "NETBLT: A Bulk Data Transfer Protocol", RFC
998, 1987.[13] D. Seret and J. Jung, "Translation of QoS Parameters into ATM Performance
Parameters in B-ISDN".[14] M. Schwartz, D. Beaumont: "Quality of Service Requirements for Audio-Visual
Multimedia Services", July 1994.[15] R. Onvural, "Asynchronous Transfer Mode Networks: Performance Issues", 1994.[16] TOMQAT project (RACE 2116), Deliverable 3, "Selection of Networks, Applications
and Platforms", April 1994[17] RFC 1633, "Integrated Services in the Internet Achitecture: an Overview", June 1994.[18] Recommendation G.826 (Revised Draft), "Error performance parameters and
objectives for international, constant bit rate digital paths at or above the primary rate".[19] ATM-Forum, "ATM User-Network Interface Specification - Version 3.0", 1993.[20] CFS D510, "General Aspects of Quality of Service and Network Performance in IBC",
1993.[21] CFS D511, "Quality of Service for Video Conferencing", 1993.
Deliverable 5 Page 85
© RACE Project R2116 - TOMQAT
[22] ITU-T I.363, "B-ISDN ATM Adaptation Layer (AAL) Specification".[23] RACE CFS, D510, Issue D. General Aspects of Quality of Service and Network
Performance for IBC.

Deliverable 5 Page 86
© RACE Project R2116 - TOMQAT
4. CONCLUDING REMARKS
The present Deliverable analyses the requirements and approach on dynamic Total QualityManagement when applied to IBC. First we discuss the requirements from the viewpoint ofseveral actors involved in IBCN including End-Users, Value-Added Service Providers, PublicNetwork Operators etc, together with their motivation and expectations when employingTQM. Of special interest to the project are the requirements of potential system End-Users.TOMQAT intends to perform a detailed investigation and analyse in further detail therequirements from such users.As a result, a set of QoS parameters that need to be managed is identified, for every level ofthe management architecture. Moreover, management mechanisms and functions arepresented, together, while their impact on QoS parameters is still under investigation. Thisinvestigation will be concluded before the end of November when the final version of thisdeliverable will be presented. To this end, management algorithms and strategies for theseparameters are also to be developed in the project. This Deliverable is closely related toDeliverables 7, since the latter is to contain an epitome of the TQM requirements andapproach, expressed as the specification of the TQM Module.

Deliverable 5 Page 87
© RACE Project R2116 - TOMQAT
APPENDIX A
TQM AND TMN FUNCTIONAL AREAS
This appendix aims to identify subsets of the TMN functional areas relevant to Total QualityManagement. The list is not complete and is expected to be completed in the final version ofthis deliverable.
1. TQM and Performance Management
1.1. Performance Management Services in TMN
This Functional Specification is largely extracted from that in RACE CFS H406 Issue B.
1.1.1. Introduction
Performance Management is required to regulate the IBC so that levels of performance, agreedwith the Customers, will be achieved.Performance Management is required to try to optimise the cost effective use of resources on anetwork-wide basis.Performance Management is required to provide these and related facili ties as services tousers, who may be end-users, value added service providers, or bearer service providers.The degree of optimization achievable in a multi-operator environment where each operator isattempting to satisfy his customer, even at the expense of others, is unknown. Perhapsagreements between operators on how to handle global problems such as congestion willprovide a means to solve this kind of problem.Two main groups of activity have been identified, namely, Objectives Management and UserService Management. Objectives Management refers to the continual management of networkperformance by adjustment of resources. An example would be the re-distribution of traffic toremove congestion after an unexpected major equipment failure. User Service Provision,however, refers to the servicing of requests from users where the response pattern can bepredicted in advance, such as the servicing of a customer request to provide a report on QOSvalues.Objectives Management ensures that the key services marketed by the IBC will be maintainedto a level which has been contracted with customers. It is expected that this activity will befocused on Connection Types, (and later Call Types) describing the IBC services which aremarketed.User Service Management includes authorised access to the status information withinPerformance Management, and also to the active gathering of such information. Details ofNetwork Performance characteristics, present and past, of services and equipment is neededfor other functional areas.Requests from users for allocation of resources and reconfiguration of their allocated resourcesare also included in User Service Management.
Deliverable 5 Page 88
© RACE Project R2116 - TOMQAT
1.1.2. Scope
This document specifies Performance Management within a Network Management system. Ageneric description, suitable for the management of teleservices and bearer networks isprovided. The degree to which human assistance is needed by Performance Management canbe described within the framework used, but does not appear at the highest level ofabstraction.For an indication of the various Network Performance Parameters, which it is necessary tomonitor, as well as the techniques used for the measurement of these parameters, refer to CFSH531.These parameters are based on general principles established in CFS D510 (General aspects ofQuality of Service and Network Performance in IBC) and D530 (Network PerformanceParameters).Performance management has two roles: the continual management of the performance ofteleservices and networks (Objectives Management); the provision of performancemanagement services to a user on demand (User service Management).Objectives management is the set of functions to evaluate, report on and correct the behaviourand the effectiveness of IBC services, network and network elements:
∗ gather statistical data on services, network, network elements, the IBC users, for thepurpose of monitoring, reporting and correcting the behaviour and the effectiveness ofthe IBC.
∗ use both feed back and feed forward control to maintain specified QOS and performancevalues in the IBC.
∗ maintain and examine logs of system behaviour and effectiveness histories for purposessuch as planning, analysis and contractual obligations.
User Service Management is the set of functions to:∗ to perform service interpretation and service request analysis.∗ to provide information retrieval and information gathering.∗ to enable the user to request the allocation of service or network resources or to request
the reconfiguration, within defined limits, of existing allocated resources.
1.1.3. Preamble
There is no universal agreement on the meaning of the term performance management. CCITTRecommendation M.30, restricts it to monitoring performance, traffic and QOS. Theperformance monitoring functions are used by many of the ETSI Application Services.(1) AnISO Document includes monitoring, analysis and tuning as part of performance managementbut not configuration management, which is a separate functional area.(2) Analysis and tuningare not the subject of OSI standardisation.RACE Project NEMESYS defines performance management to include performancemonitoring and analysis but not resource optimization which is considered a separate function.However the NEMESYS project consider traffic and Quality of Service management toinclude monitoring, management (decision making processes) and implementation functions.This also applies to the ETSI traffic management application service.In this specification, performance management is taken to include the analysis, tuning andconfiguration parts of the control loop. Monitoring is considered to be a User GenericFunction for the purposes of TOMQAT. Traffic management and Quality of Servicemanagement are considered part of performance management.

Deliverable 5 Page 89
© RACE Project R2116 - TOMQAT
When specifying a performance management system, it is necessary to consider the managedtelecommunications system. This may be decomposed using the orthogonal concepts ofstratification (layering) and network partitioning (Figure 1, “Orthogonal concepts ofstratification and partitioning”). The strata are associated by client-server relationships. Theword stratum is used as a synonym for layer in order to avoid confusion with the ISO sevenlayer model and the layers of the management system. Each stratum has its own partitions,although there is likely to be some correlation between the partitions in adjacent strata.Partitioning is an important concept, since it is related to the apportionment of performanceobjectives to individual links.
Stratum n
Stratum n + 1
Stratum n - 1
Client/Server relationship
Client/Server relationship
Sub-networks Links
Stratification Concept Partitioning ConceptRH406F01.DRW
Figure 1: Orthogonal Concepts of Stratification and Partitioning
In general a bearer network may support many teleservices and there are services using morethan one network. Consequently there may be a many to many relationship between servicemanagers. If the networks are partitioned, then there is the possibili ty of separate networklayer managers for sub-networks. This may result in network layer managers beinginterconnected. The possibili ty of network element layer managers being interconnected is forfurther study.The ATM and SDH networks may be decomposed into sub-strata. The implication of this onthe management system is for further study.
1.1.4. Dependence on TMN platform Services
OS to User Interaction Support ServicesPerformance and QoS statistics will be displayed on a workstation. Requests from users forPerformance Management Services will be passed to performance management via OS toUser Interaction Support Services. Performance management will then respond to the userusing these services.
MIB Manager/Agent Support ServicesThese are essential in order to allow Performance Management to interact with other OSs.
Object Management Support ServicesThese provide an object oriented view of the environment in which PerformanceManagement operates.
Deliverable 5 Page 90
© RACE Project R2116 - TOMQAT
Distribution Transparency Support ServicesThese are required to allow Performance Management to access local and remote entitiesin an identical manner.
Directory Support ServicesThese also provide support for the access of local and remote entities in an identicalmanner.
1.1.5. Objects
Service management level:User; Customer; Service Family Specification; Service Component Specification; ServiceControl Element Specification; Access Point; Service Complaint Log; Service ComplaintRecord; QOS Log; QOS Record; Alarm Log; Alarm Record.
Network management level:Network; Sub-network; Link; Crossconnect; Trail Termination Point; ConnectionTermination Point; Trail; Connection; Routeing Table; Log; Log Record; Alarm Log;Alarm Record.
Network element management level:Network Element; Equipment; Hardware; Software; Termination Point; Log; Log Record;Alarm Log; Alarm Record.
1.1.6. Static Description
InputsQOS and performance data from the managed network, inputs from the externalenvironment, performance and QOS objectives. Inputs from other functional areas asspecified previously, from other Telecommunications Management (TM) systems andrequests from TM Users.
OutputsInstructions to control monitoring and reconfigure network to maintain performance;Statistical data to other functional areas as specified previously;Response to users requests.
1.1.7. Dynamic Description
ISO uses a very simplified single layer performance management monitoring and tuning model.This contains three processes: monitoring; analysis and performance control.(2) This logicalpartition is one of convenience and is not subject to OSI standardisation.Figure 78, “Service, network and NE layer performance management” gives a functionalarchitecture for performance management. It uses the responsibili ty model to dividemanagement into the following layers: service; network and network element. The functionalarchitecture excludes the business layer as being outside the scope of TelecommunicationsManagement.Service Layer
Negotiations take place with users before allowing service access and with the networklayer before using network resources. The main activity is QOS verification andimprovement. Predictions are made of future QOS and network load values. Service anduser profiles are generated.

Deliverable 5 Page 91
© RACE Project R2116 - TOMQAT
Network LayerNetwork resources are managed and configured to provide end to end connectivity. Thisinvolves analysis and diagnosis. Another activity is the management of traffic controlfunctions, e.g. connection acceptance control and usage parameter control. Network usageprofiles are generated.
Element LayerNetwork element performance is analysed and diagnosed. Unacceptable elementperformance is reported to the network layer so that traffic may be restricted or rerouted.In the case of a suspected fault a report is sent to Maintenance. Network elements arenormally reconfigured as a result of decisions made at the network layer. There is apossibili ty of using local resource management to reconfigure the more complex networkelements to improve their performance. Network element usage profiles are generated.Monitoring is assumed to be a user generic function which acts on behalf of all themanagement layers. The user and control planes of the managed system and the externalenvironment are monitored. Monitored values are transmitted from one layer to anothereither directly or after being analysed, filtered and summarised. Control of monitoringflows in the reverse direction. Alarms are sent to Maintenance.Objectives management ensures that the managed system achieves specified objectives. Themonitored values are compared with normative values. If the former are unsatisfactory,then after analysis and diagnosis, decisions are made on how to reduce the load, reallocateresources or request additional resources. In order to do this an operational model of themanaged system is required. To complete the feed-back control loop the managed systemis reconfigured. Before reconfiguration the administrative, operational or usage state of aresource may be requested. Feed-forward effects are obtained by supplying predictedfuture values to the management system. This enables the managed system to bereconfigured in anticipation of a future event (e.g. a predicted overload condition). At anystage it is possible to request additional monitoring.Control loops exist in all three management layers. At the service layer QOS may beimproved by requesting additional or different network resources. If these are refused, thenit may be necessary to restrict the use of services or in extreme cases disconnect users. Atthe network layer, network performance may be maintained by restricting access to thenetwork, by reallocation of resources or less likely by obtaining additional resources.Control loops will only exist in the NE layer for the more complex network elements.Some network elements will have their own internal control loops. Analysis of the effect ofa proposed reconfiguration should be performed before the actual reconfiguration takesplace.User Service Management enables a user to employ a management service or to subscribeto a transport service. Performance management services include retrieval of informationfrom stored profiles and reconfiguration of services, networks or network elements. Nonavailabili ty of the information will activate further monitoring or requests for configurationstates.The links to other managers may be to other strata or sub-network performance managersor to other functional areas within the same management system or to other managementsystems (owned by the same or another operator).

Deliverable 5 Page 92
© RACE Project R2116 - TOMQAT
1.2. Detailed Functional Specification
1.2.1. Service Performance Management sub-function
IntroductionService Performance Management has two roles: the continual management of theperformance of IBC services (Objectives Management); the provision of performancemanagement services to a user on demand. The user may be either an end user or anotherservice manager.Objectives Management gathers statistical data on the services and the users, for the purposeof reporting on and correcting the behaviour and the effectiveness of the services and storesthis data in service profiles and user profiles. It ensures that Quality of Service (QOS) valueswill be maintained at a level which has been contracted with customers. This may involverestricting access to certain services or the negotiation of additional network resources (e.g. anincrease of allocated bandwidth).Performance management services include: authorised access to all types of profile; the activegathering of information; the processing of requests to subscribe to an IBC service; thereconfiguration of IBC services.
ScopeIn the multi-service IBC environment there is a clear distinction between services andnetworks. The services and networks may be managed by different administrations. Theproposed management system is sufficiently generic to apply to the performance of all serviceclasses, including value-added services, teleservices and bearer network services. It includesthe complete management cycle, i.e. monitoring, analysis, decision making and implementation.QOS management is an important aspect of Service Performance Management.Service Performance Management distinguishes between different service classes, each havinga different profile. A service class may use or modify existing generic service profiles.Examples of generic services are: PCM telephone; bulk file transfer; interactive data; videobroadcast; video conference; multimedia document transfer etc.In general a bearer network will support many services. A service will use one or more trails ofthe same or different connection type. These trails will normally be in the same network but theservice provider is free to use any available network. It is the responsibili ty of the service andnot the network to synchronise different trail information flows. In general there will bedifferent service managers for different services or groups of related services and these willneed to communicate with each other. There will also be many to many relationships betweenservice layer and network layer managers.
PreambleAn important aspect of Service Performance Management is the maintenance of serviceprofiles and user profiles. A service profile contains details of the service requirements (e.g. therequired bandwidth). For each performance parameter it contains: the average value of theparameter experienced over a given amount of time; the wanted value of the parameter asnegotiated with the bearer network and the accepted value if the bearer network is for sometime not able to meet the negotiated value. In addition usage statistics are accumulated, e.g.average call duration, the average number of yearly, monthly, daily and hourly calls. The userprofile contains information about individual users and identifies all the IBC and management

Deliverable 5 Page 93
© RACE Project R2116 - TOMQAT
services a user has subscribed to. For each service it includes the activity pattern, how theservice is used and the QOS values that have been negotiated with the user. Parameters specifythe intervals at which the profiles should be refined and at which the QOS values should beverified.The Service Performance Management function uses models of the managed services. Thelatter are defined using the following service definition objects: service family specification;service component specification; service control element specification.
ObjectsService management level:
User Profile; Service Profile; Service Family Specification; Service ComponentSpecification; Service Control Element Specification; Service Complaint Log; ServiceComplaint Record; QOS Log; QOS Record.
Network management level:Trail; Network Profile.
Static DescriptionInputsFrom a user: request to use a performance management service; service complaints.From a network level manager: response to the request to perform a network performancemanagement service; response to the request to set up a semi-permanent trail; the trail(s)assigned to a call; change of trail bandwidth; time interval for load estimation; QOS basic.Indirectly from the managed system: performance parameters; service usage.Inputs from the external environment: events likely to cause an overload.OutputsTo a user: response to users requests or complaints; request to reduce data rate.To a network layer manager: request to perform a network performance management service;request to set up a semi-permanent trail; negotiate trail bandwidth; load estimate; performancecomplaint; instructions to control monitoring.Indirectly to the managed network: call acceptance control operating parameters; cancel call.
Dynamic DescriptionObjectives Management uses the QOS Verification and Improvement sub-function to ensurethat the specified QOS objectives are achieved. The user and control planes of the managedsystem and the external environment are monitored. Control of monitoring flows in the reversedirection. The bearer networks and the service components are monitored to ensure that theyprovide the negotiated performance values. If they do not, complaints are sent to the relevantnetwork layer managers. The periodically monitored QOS values are compared with thewanted and the accepted values, for each user and each service class. If the QOS values areunsatisfactory or there are user complaints, then after analysis and diagnosis, decisions aremade on the action to be taken. This may involve renegotiation with a bearer network toincrease the bandwidth of existing allocated trails or to use additional or alternative trails andthis may require the assistance of a network layer manager. For some service classes it ispossible to request the user to reduce the data rate. If a bearer network is overloaded, it maybe necessary to reduce the use of services. This is done by changing the operating parametersused by the call acceptance control function. In extreme cases it may be necessary todisconnect users based on priority. At any stage of the analysis, diagnosis or decision makingprocess it is possible to request additional monitoring.As background activities, load prediction, QOS prediction and profile handling are performed.The predicted future loads are supplied to network layer managers, to reduce the risk of

Deliverable 5 Page 94
© RACE Project R2116 - TOMQAT
network overloading. Predictions of future QOS are sent to users, so that appropriate actionmay be taken.Service Access Management enables a user, with the necessary authority, to employ aperformance management service, including retrieval of information from stored profiles andreconfiguration of an IBC service. This may need the assistance of network and element layermanagers. Non availabili ty of the information will activate further monitoring or requests forconfiguration states. Another management service is the setting up of dedicated semi-permanent trails for the user. This requires negotiation with the network layer manager.Negotiations take place with provisioning before allowing users to subscribe to an IBC orperformance management service. The service profiles and the network profiles are consultedto reduce the risk of overloading.Different services or groups of services may have separate service managers in which case theywill be interconnected and the service management functionality distributed.The dynamic behaviour is summarised in the following table, which is structured according tothe ADI model.Awareness Decision ImplementationUnsatisfactory QOS. Receipt ofuser complaint. There is aservice/network problem.
If there is a service problemdecide on action to be taken. Ifundecided may request furthermonitoring.
If for a network problem;complain to a network layermanager. For a service problemeither: negotiate moreresources; request users toreduce load;reduce callacceptance rate; disconnectusers.
Monitored service requests.QOS values.
Predict load; predict QOS;manage service profiles.
Request to use a performancemanagement service.
Decide if request needsforwarding to a network orelement manager. If serviceinformation is not availablerequest further monitoring.
Retrieve information fromstored profiles. Reconfigure IBCservice.

Deliverable 5 Page 95
© RACE Project R2116 - TOMQAT
Further Decomposition of the Service Performance Management Sub-FunctionService Access ManagementThis manages access to services and prevents overloading. Negotiations take place with serviceusers on the details of the service to be provided. The user may be another service manager(which could be owned by another operator). Service Access Management (SAM) has stronglinks with the Provisioning functional area and a user is not allowed to use a service untilprovisioning has performed the service activation phase. The Customer Query and Controlfunctional area pre-processes some of the customer service requests.Performance management services are accessed using SAM. IBC services are subscribed tousing SAM and thereafter accessed using call/connection control. In this case, SAM providescall acceptance control with a list of authorised users and details of the permitted serviceusage. SAM also receives service complaints and decides whether these are justified (e.g. Isthe QOS below the negotiated value?). These complaints are stored in a service complaint log,which contains service complaint records.If it is impossible to provide the service, then negotiations may take place with other serviceaccess managers to see whether they can assist.The following functions are part of the lower levels of decomposition. They are exampleswhich are not complete and are for further study. They may be similar to those alreadydescribed under these names in CFS D110.Service InterpretationService Request AnalysisThese activities screen the user so that only those with authority will be permitted to proceed.A service request analysis will be carried out to determine how and whether the requestedservice can proceed.Network Usage ManagementDetermines the network resources that are needed to meet the request of a service user. In thecase of an immediate service request, negotiations take place with a network layer manager toprovide the required network resources. In the case of a service subscription request,negotiations take place with a network layer manager to ensure that the required resources arelikely to be available when required.Network Usage Management may request access to network profiles or request additionalmonitoring.QOS Verification and ImprovementQOS values are monitored (in some cases derived from network performance parameters). Thereasons for possible degradation in QOS are diagnosed. The cause could be excessive demandson network resources, in which case the demands are reduced or additional resources arerequested. If the network is the cause, a request for action is sent to a network layer manager(possibly with further diagnostic information). This function is not allowed to change networkparameters or resources directly.QOS PredictionPredictions are made of the QOS values the user can be expected to experience in the future,which are based on user profiles and service profiles. This gives the user a chance to anticipatepossible future QOS degradation.Load PredictionIt is assumed that the number of service requests, between nominated sources and destinationsduring representative time slots, are stored for each service class. Predictions are made offuture service requests. One of the following procedures can be applied:
* Use the average stored values.* Extrapolate from the stored time slot values to the current time.* More sophisticated procedures using additional rules for special cases.

Deliverable 5 Page 96
© RACE Project R2116 - TOMQAT
The predicted service requests are converted to the expected loading of the network trails.This gives the network a chance to anticipate possible future load increases.Service User Profile HandlingThe establishment, refinement and evaluation of user profiles and service profiles lies at theheart of service management, since all other service functions depend on the informationrecorded within the profiles. The general procedure for profile establishment is the monitoringof the characteristics of the traffic presented by the users and of the QOS they receive. A QOSlog is maintained, which contains QOS records
References
[1] Neumeier-Mackert, I.B. and Stern, P-B, “Service Management for an IBCNetwork”, Proc. of the Fourth RACE TMN Conference, p. 75 (1990).
[2] Harksen, U., “Service Modelling in NEMESYS”, Proc. of the Fifth RACE TMNConference, I.1/4 (1991).
[3] Mann, A. and Pavlou, G., “Quality of Service Management in IBC: an ISO BasedPrototype”, Proc. of the Fifth RACE TMN Conference, I.3/3 (1991).
1.2.2. Network Performance Management sub-function
IntroductionNetwork Performance Management has two roles: the continual management of networkperformance (Objectives Management); the provision of network performance managementservices to a user on demand. The user gains access to these services using ServicePerformance Management.Objectives Management gathers statistical data on the network, for the purpose of reporting onand correcting the behaviour and the effectiveness of the network and stores this data in anetwork profile. It ensures that network performance values are maintained at an agreed level.If the network is overloaded this may involve restricting access to the network, optimising theuse of existing network resources or obtaining additional resources.Network performance management services include: authorised access to network profiles; theactive gathering of information; the processing of requests to set up a semi-permanent trail; thereconfiguration of the network.
ScopeIn the multi-service IBC environment there is a clear distinction between services andnetworks. The services and networks may be managed by different administrations. Theproposed management system is sufficiently generic to apply to the performance of manydifferent types of network. The IBC services will be supported by ATM networks. Theseprovide flexibili ty and allow statistical multiplexing of cells, which gives rise to a number ofspecialised management functions. There is the possibili ty of one network being supported byanother network, using a client-server relationship (stratified networks). For example, an ATMnetwork may use SDH transmission links. The complete management cycle is included, i.e.monitoring, analysis, decision making and implementation. Traffic management is an importantaspect of Network Performance Management.A bearer network will i n general support many services and for this purpose provides a largenumber of trails. Virtual channels and virtual paths are examples of trails for an ATM network.
Deliverable 5 Page 97
© RACE Project R2116 - TOMQAT
Trails can be classified according to their resource requirements and their performance targets.These classifications are called connection types.In general there will be different network layer managers for different networks or groups ofrelated networks and these will need to communicate with each other. There will also be manyto many relationships between network layer and service layer managers.
PreambleAn important aspect of Network Performance Management is the maintenance of the followingmodels: physical network model; logical network model; usage model; load model.Network models contain details of the network topology and connectivity, using the conceptsof network stratification and partitioning. The models are defined using the following objects:network; sub-network; link; crossconnect; trail termination point; connection terminationpoint; trail; connection. In an ATM network, the logical network model defines the virtualchannels and the virtual paths. A network profile contains details of each semi-permanent trail,its related connection type and for each network performance parameter: the average value ofthe parameter experienced over a given amount of time; the required value of the parameterand the accepted value if the network is for some time not able to meet the required value. Thisnetwork profile also contains information about representative switched trails. Parametersspecify the intervals at which network profiles should be refined and at which the networkperformance should be verified.The usage model is used to accumulate usage statistics. It details the number of trails of eachconnection type required between source-destination pairs. It includes the average usage ofsuch trails and the average yearly, monthly, daily and hourly variations. Future usage ispredicted using load estimates supplied by client services or networks.The load model details the active client connections each server trail supports. For example, inan ATM network it gives the number of virtual channels of each connection type supported byeach virtual path.
ObjectsNetwork management level:Network; Sub-network; Link; Crossconnect; Trail Termination Point; Connection TerminationPoint; Trail; Connection; Routeing Table; Log; Log Record; Alarm Log; Alarm Record;Network Profile.
Static DescriptionInputsFrom a service layer manager: request to use a network performance management service;request to set up a semi-permanent trail; request to negotiate trail bandwidth; load estimate;performance complaint; instructions to control monitoring.From a network element manager (forwarded from monitoring): network performanceparameters; traffic loads; real and virtual buffer queue lengths.Inputs from the external environment: events likely to cause an overload.OutputsTo a service layer manager: response to the request to use a network performancemanagement service; response to the request to set-up a semi-permanent trail; the trail(s)assigned to a call; change of trail bandwidth; time interval for load estimation; QOS basic.To a network element manager: complaints about poor network element performance;configure network element; request access to network element profile; control of monitoring;operating parameters for connection admission control and usage parameter control.
Deliverable 5 Page 98
© RACE Project R2116 - TOMQAT
Dynamic DescriptionNetwork Layer Analysis and Diagnosis examines all incoming messages and does somepreliminary processing. After analysis and filtering, many messages are forwarded to morespecialised sub-functions.Objectives Management uses the Network Resource Management and Traffic ControlManagement sub-functions to ensure that the specified network performance objectives areachieved. The user and control planes of the managed network are monitored. Control ofmonitoring flows in the reverse direction. The network elements are monitored to ensure thatthey provide the required element performance values. If they do not, complaints are sent tothe relevant element layer managers. The periodically monitored network performance valuesare compared with the wanted and the accepted values. If the network performance values areunsatisfactory or there are complaints from service layer managers, then after analysis anddiagnosis, decisions are made on the action to be taken. This involves use of the network,usage and load models. At any stage of the analysis, diagnosis and decision making process itis possible to request additional monitoring.If the network is overloaded, there are three basic ways of maintaining network performance:optimise use of existing network resources; restrict access to the network; in some cases it ispossible to obtain the use of additional resources (e.g. a transmission link with a largercapacity).Network Resource Management optimises the use of network resources on a network widebasis. This includes Routeing Management which is responsible for maintaining routeing tablesand distributing them via the appropriate element managers to crossconnects and switches. Re-routeing can be done on a planned periodic basis, as a response to a future special event (feedforward effect) or as a result of resource failure. Analysis of the effect of any proposed re-routeing is performed before the actual re-routeing takes place. In the case of ATM networks,it is possible to dynamically optimise the virtual path bandwidth allocation. Virtual PathBandwidth Management enables the network load to be increased, without compromisingnetwork performance.Traffic Control Management is used to limit the network load. In the case of ATM networksthis is done by changing the operating parameters used by the connection admission controlfunction and in extreme cases it may be necessary to discard cells based on priority. TrafficControl Management also supplies operating parameters to the usage parameter (sourcepolicing) control function.Network profile handling occurs as a background activity. The usage and load models areupdated periodically. This takes account of predicted future usage and loading which issupplied by service or other network layer managers.A user may use a service layer manager to gain access to network performance managementservices, including retrieval of information from stored network profiles. Non availabili ty of theinformation will activate further monitoring or requests for configuration states. This may needthe assistance of element layer managers. Another management service is the setting up ofdedicated semi-permanent trails for the user. Before doing this the usage and load models areconsulted to reduce the risk of overloading. Any requests which involve reconfiguration of thenetwork are analysed before the reconfiguration takes place.A network may be partitioned and some sub-networks may have separate network layermanagers in which case they will be interconnected and the network layer managementfunctionality is distributed.The dynamic behaviour is summarised by the following table which is structured according tothe ADI model.Awareness Decision Implementation
Deliverable 5 Page 99
© RACE Project R2116 - TOMQAT
Poor Network Performance.Receipt of complaint fromservice manager. Load estimate.Future special events. There is anetwork/element problem.
If there is a network problemdecide on action to be taken.This may involve theoptimisation of the use ofnetwork resources or restrictingaccess to the network orrequesting additional resources.If action is undecided mayrequest further monitoring.
For an element problem;complain to an element layermanager. For a networkproblem either: reconfigurenetwork; reduce connectionacceptance rate; negotiate moreresources.
Network usage. Load estimate. Update usage and load models.Manage network profiles.
Request to use a performancemanagement service.
Decide if request needsforwarding to an elementmanager. If networkinformation is not availablerequest further monitoring.
Retrieve information fromstored profiles. Reconfigurenetwork.
Further decomposition of The Network Performance Management Sub-FunctionNetwork Layer Analysis and DiagnosisNetwork performance values, alarm notifications and service layer complaints are analysed andreduced in volume. The analysed values are compared with the required and accepted valuescontained in a network profile, to detect whether a problem exists. This may involve requestsfor additional monitoring. Different threshold values are used for early problem detection andfor the raising of alarms. Alarms are stored in an alarm log, which contains alarm records. If aproblem exists, diagnosis attempts to locate the cause of the problem, if it is not alreadyknown. Some human intelli gence may be required. Alarm reports are prepared and sent toother sub-functions for corrective action to be taken.Requests to use network performance user services are analysed, in order to avoid possibledegradation of network performance.Network Resource ManagementThe objectives are to optimise the use of network resources on a network wide basis and toachieve the levels of performance agreed with network users in a cost effective way. A localoptimum with a flat peak may be preferable to a global optimum with a sharp peak. If this doesnot prove possible, there are a number of corrective management actions which can be taken.These may be classified as: protective (limit or prevent access to critical network resources);restrictive (limit user access) and expansive (request additional resources).Static and dynamic operational models of the managed network are needed. These are used topredict the changes which restore the network to its optimum state. This is an area for furtherstudy. Advanced information processing techniques will be used. When a slow response time ispermissible, this function may include a man machine interface and use human intelligence.Long term optimisation may be performed off-line, using simulation to perform a detailedinvestigation. On the other hand, tuning implies an on-line activity performed in real time.ISO document N4079 identifies the requirement for performance tuning functions, e.g.modification of resource configuration parameters, replacement of inadequate resources byadequate ones, redistribution of network traffic. These aspects are beyond the scope of OSIstandardisation.The ETSI report on traffic management divides traffic management actions into protectiveactions:
* Temporary removal of circuits from service∗ Inhibit overflow traffic∗ Inhibit direct traffic∗ Inhibit traffic to a particular destination∗ Circuit reservation and expansive actions:
Deliverable 5 Page 100
© RACE Project R2116 - TOMQAT
∗ Establish temporary alternative routeing∗ Temporarily reorganising the distribution of outgoing or incoming transit traffic.
Routeing Management and Virtual Path Bandwidth Management are aspects of NetworkResource Management.Routeing ManagementIn an ATM network crossconnects are used to establish a virtual network which satisfies theusage requirements, subject to the constraints imposed by the physical resources. Virtual paths(VPs) are defined which provide a set of routes, with the required bandwidth, between source-destination pairs. Some VPs are dedicated for the exclusive use of a user, although the majorityare used to support switched virtual channels. The virtual network is implemented by down-loading routeing tables to the crossconnects. The routeing tables map the virtual path identifier(VPI) of cells on an incoming link to the corresponding VPI on an outgoing link. Thisidentifies part of the overall connectivity of a particular VP. Routeing Management isresponsible for the creation of the virtual network and the maintenance of the routeing tableswhich reside in the crossconnects. Depending on the amount by which usage patterns change,it may be necessary to introduce new VPs, change the routeing of existing VPs or disconnectVPs. This may be done on a planned periodic basis, as a response to a special event or as aresult of a resource failure.Connection control uses a number of switches to establish a virtual channel between a sourceand destination. Although connection control is not a management function, it is theresponsibili ty of Routeing Management to maintain the routeing tables which are used by theswitches.The routeing tables at switches contain entries for each destination and connection type,identifying which VP should be used. There are a number of alternatives and a priority field isincluded in the tables to dictate the order in which VPs are used during the connection set upphase. At the access switch the connection control function searches the local routeing tablefor entries satisfying the destination for the requested connection type. This search will result ina list of suitable virtual paths (VPs) which will be ordered according to the priority field. TheVPs will be investigated to find the VP with the highest priority that has capacity to accept theconnection. If one is found the new connection information is stored and the connectionrequest is forwarded to the next switch, where the process is repeated until the destinationswitch is reached. If at any point along the route a VP cannot be found, the connection will berejected by that switch and the previous switch will be notified so that it can try an alternativeroute with a lesser priority. If no routes can be found the connection will be rejected. NetworkPerformance Management is notified of the number of accepted and rejected connections.Depending on the amount by which usage patterns change, it may be necessary to change theswitch routeing tables. This may be done on a planned periodic basis, as a response to a specialevent or as a result of a resource failure.Virtual Path Bandwidth ManagementIf a constant bandwidth VP is under-utili sed, then the spare capacity is wasted. However, if theVP bandwidths can be adjusted, then the spare capacity can be redistributed to other VPs,which share the same links. Virtual Path Bandwidth Management (VPBM) performs thisadjustment dynamically. VPBM bases its decisions on the monitored usage of the VPs and theperiodic predictions of usage sent by the usage model.Traffic Control ManagementIt is assumed that the traffic control will be performed by functions which are part of themanaged network. However these will be managed by the downloading of tables and operatingparameters. Traffic control is defined in CCITT Draft Recommendation I.311 to include thefollowing:

Deliverable 5 Page 101
© RACE Project R2116 - TOMQAT
Connection admission control is defined as the set of actions taken by the network at theconnection set up phase (or during connection renegotiation phase) in order to establishwhether a connection can be accepted or rejected.Priority Control. In ATM networks the user may specify different priority levels by using thecell loss priority bit.Congestion Control. Congestion is defined as a state of network elements in which due totraffic overload and/or control resource overload, the network is not able to guarantee thenegotiated QOS to the already established connections and to the new connection requests.Usage Parameter Control is defined as the set of actions taken by the network to monitor andcontrol (user’s) traffic in terms of traffic volume and call routeing validity. Its main purpose isto protect network resources from malicious as well as unintentional misbehaviour which canaffect the QOS of already established connections by detecting violations of negotiatedparameters. Usage parameter control contributes to optimum utili sation of network resources.An offender may be excluded or a penal charge made depending on the circumstances. In thelatter case the accounting functional area is informed.Network Parameter Control. This is defined in (11) as the set of actions taken by the networkto monitor and control traffic in terms of traffic volume and cell routeing validity at thenetwork access. It performs policing functions on the trunk links between network elementsand not between the network and the user, its purpose being to protect the network againstmalfunction of the NEs themselves.Connection admission control (CAC) is often known as connection acceptance control andusage parameter control as source policing. The constraints on accepting a new connection arebased on:
* The current traffic on the network.* The available resources.* The resource requirements of the connection, e.g. routeing requirements, bandwidth
requirements.One method used by CAC is the Linear Weights Method. Each connection type is assigned aweight between 0 and 1 which represents the proportion of total link bandwidth consumed bythat connection type. For a constant bit-rate connection type the weight will be proportional tothe actual bit rate, whereas for a variable bit rate connection type it will be proportional to avalue lying somewhere between the mean and the peak bit rate. Each VP is allocated a certainproportion of the link bandwidth and will be assigned a weight-total to reflect this. The CACsimply has to sum the weights of the existing connections on a VP together with the weight ofthe proposed connection. If the sum is less than the weight-total of the VP the connection canbe accepted.Although CAC is not a management function, it is the responsibili ty of Traffic ControlManagement to determine the weights to be used by CAC. This involves a comparison of thecomputed and real loads, followed by weight adjustment to ensure that they agree. TrafficControl Management also determines the operating parameters used by usage parametercontrol.Configure NetworkImplements the effects of management actions throughout the network. For example, thedistribution of revised routeing tables to many different switches. This requires the assistanceof Configure NE.The connectivity of the network can be reconfigured using crossconnects. Long term changesto the static network topology are the responsibility of planning and installation.ISO document N4079 identifies the need to be able to change resource allocation (e.g. bufferallocation method), to modify resource attributes and to reassign resource attribute values toprovide better performance. For example, routeing tables may be changed to balance orredistribute traffic load during times of peak usage or when a bottle-neck is identified.

Deliverable 5 Page 102
© RACE Project R2116 - TOMQAT
Network Profile HandlingHandles the establishment, refinement and evaluation of network profiles. The networkmodels, the usage model and the load model are special cases of network profiles. Alsoincluded are network performance logs, which contain history and statistics.
References
“TMN Application Service “Traffic Management” ETSI/STC NA4.“Information Processing - Open System Interconnection - Performance Management WorkingDocument” (JTC 1/SC21 N 4079).“B-ISDN General Network Aspects”, CCITT Draft Recommendation I.311.Patel P. and Griffin, D., “Traffic Management for IBC Networks” , Proc. of the Fifth RACETMN Conference, III.1/4 (1991).
1.2.3. Element Performance Management sub-function
The following decomposition of this sub-function has been identified.Further decomposition of Performance Management Sub-FunctionNetwork Element Layer Analysis and DiagnosisData and alarm reports, which are received from the Monitoring function, are analysed andreduced in volume. The analysed data is compared with normative data to detect whether aproblem exists. This may involve requests for additional monitoring. Different values ofnormative data are used for early problem detection and for the raising of alarms. If a problemexists diagnosis attempts to locate the cause of the problem. Some human intelli gence may berequired. Requests to reconfigure a network element are analysed before granting permission.Alarm reports are prepared and sent to other sub-functions for corrective action to be taken.Statistical results are produced to add to the network element profiles.Network Element Resource ManagementThe objectives are to optimise the availabili ty of network element resources without referenceto adjacent network elements. This function will only be required for the more critical networkelements and may need specialised functions. Examples are load balancing within a switch,duplication of essential components and the reservation of spare capacity.Configure Network ElementConfigures network elements on behalf of Network Element Resource Management orConfigure Network. It interprets high level instructions into detailed messages, which changethe state and/or parameters of a network element. Configure Network Element may requestthe administrative, operational or usage state of a network element.Network Element Profile HandlingHandles the establishment, refinement and evaluation of network element profiles. Theseinclude element performance logs, which contain history and statistics.
References
1. DataPro Network Management, Vol.1, McGraw-Hill, 19892. TERRACE DEL. 8, 21 Dec. 19903. Local Networks, William Stallings, Macmillan Publishing Company, New York.4. CCITT, M.30 Rec.5. Radiolinks, Quality Monitoring System, ALCATEL.6. SMDS study, BELLCORE, Annex 3 of NETMAN Deliverable 10.7. SDH, CCITT draft G series Recommendation.

Deliverable 5 Page 103
© RACE Project R2116 - TOMQAT
8. AXE10 AOM Management System, ERICSSON9. H 531 - Network Performance Monitoring10. ISO document N 407911. CCITT Draft recommendation I.371. Melbourne December 1991
2. TQM and Fault Management
The following diagram represents the list of Management Functions already defined in[M3400] on Fault Management; Some specific management functions have beenhighlighted (gray background); these MFs are considered to relate with QoSManagement, and constitute a first list of potential QoS MFs issued from [M3400].
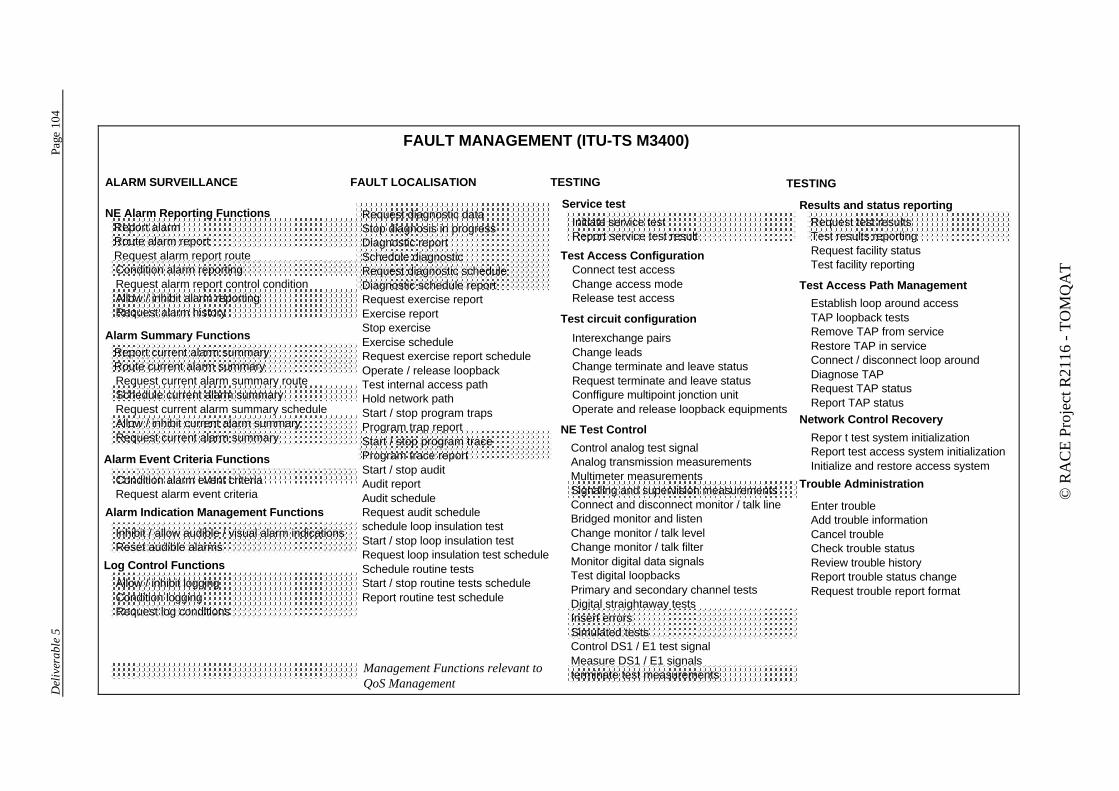
Del
iver
abl
e 5
Pa
ge 1
04
© R
AC
E P
roje
ct R
2116
- T
OM
QA
T
TESTING
Results and status reportingRequest test results Test results reporting Request facility status Test facility reporting
Test Access Path Management
Establish loop around access TAP loopback tests Remove TAP from service Restore TAP in service Connect / disconnect loop around Diagnose TAP Request TAP status Report TAP status
Network Control Recovery
Repor t test system initialization Report test access system initialization Initialize and restore access system
Trouble Administration
Enter trouble Add trouble information Cancel trouble Check trouble status Review trouble history Report trouble status change Request trouble report format
ALARM SURVEILLANCE
NE Alarm Reporting FunctionsReport alarm Route alarm report Request alarm report route Condition alarm reporting Request alarm report control condition Allow / inhibit alarm reporting Request alarm history
Alarm Summary FunctionsReport current alarm summary Route current alarm summary Request current alarm summary route Schedule current alarm summary Request current alarm summary schedule Allow / inhibit current alarm summary Request current alarm summary
Alarm Event Criteria Functions
Condition alarm event criteria Request alarm event criteria
Alarm Indication Management Functions
Inhibit / allow audible / visual alarm indications Reset audible alarms
Log Control Functions
Allow / inhibit logging Condition logging Request log conditions
TESTING
Service test
Initiate service test Report service test result
Test Access ConfigurationConnect test access Change access mode Release test access
Test circuit configuration
Interexchange pairs Change leads Change terminate and leave status Request terminate and leave status Conffigure multipoint jonction unit Operate and release loopback equipments
NE Test Control
Control analog test signal Analog transmission measurements Multimeter measurements Signaling and supervision measurements Connect and disconnect monitor / talk line Bridged monitor and listen Change monitor / talk level Change monitor / talk filter Monitor digital data signals Test digital loopbacks Primary and secondary channel tests Digital straightaway tests Insert errors Simulated tests Control DS1 / E1 test signal Measure DS1 / E1 signals terminate test measurements
FAULT LOCALISATION
Request diagnostic data Stop diagnosis in progress Diagnostic report Schedule diagnostic Request diagnostic schedule Diagnostic schedule report Request exercise report Exercise report Stop exercise Exercise schedule Request exercise report schedule Operate / release loopback Test internal access path Hold network path Start / stop program traps Program trap report Start / stop program trace Program trace report Start / stop audit Audit report Audit schedule Request audit schedule schedule loop insulation test Start / stop loop insulation test Request loop insulation test schedule Schedule routine tests Start / stop routine tests schedule Report routine test schedule
FAULT MANAGEMENT (ITU-TS M3400)
Management Functions relevant to QoS Management
Deliverable 5 Page 105
© RACE Project R2116 - TOMQAT
3. TQM and Configuration Management
3.1. Configuration Management (User Generic Functions)
3.1.1. Introduction
Configuration management functions are required in the TMN:∗ to exercise control over data from NEs,∗ to identify data from NEs,∗ to collect data from NEs,∗ to provide data to NEs.
Configuration management has the following objectives:∗ to bring an equipment into service, not including installation,∗ to provide the capability to monitor and control certain aspects of the NE on demand,∗ to enable the exclusion of faulty equipment from operation and as a result it may
rearrange equipment or re-route traffic, to enable the entry of a proposed configurationin order to automatically analyse the feasibility of that design before implementing it.
3.1.2. Scope
Configuration management is responsible for managing the details of the configuration ofparticular NEs in order for a specific network configuration to be set. As such it of generalutili ty to a large number of User Specific Functional Areas, in particular: Provisioning;Maintenance and Fault Management; and Test Management.
3.1.3. Preamble
In this specification configuration management is taken to include provisioning functions e.g.the state of the unit (in service, out of service, stand-by, reserved), and initiate diagnostics testswithin the NE.
3.1.4. Dependence on TMN platform Services
OS to USER Interaction Support ServiceInteractions occur to allow the current configuration of one or a number of NEs to bedisplayed on a workstation, or to allow the user to set the current configuration parameters ofan NE.Q3 Manager/Agent Support ServicesThese are used to enable Configuration management to communicate with elements of thenetwork such that, for example, configuration parameters in an NE can be read or set.MIB Manager/Agent Support ServicesThese are essential in order to allow Configuration Management to interact with other OSs.Object Management Support Services

Deliverable 5 Page 106
© RACE Project R2116 - TOMQAT
These provide an object oriented view of the environment in which Configuration Managementoperates.Storage Support ServicesThese allow Configuration Management to keep backup copies of the configuration of NEs insome database or storage device.Distribution Transparency ServicesThese allow Configuration Management to manage remote NEs or OSs.
3.1.5. Objects
Service Management Level:Customer, User, Service Plan, Access Control System, Operator, Provider, Security Plan,Installation Plans, Maintenance Plan, QoS Record, Maintenance Reports.Network Management Level:Network, Network Configuration, Logical Configuration, Network Maintenance Plan,Network Tests.Network Element Management Level:Network Elements, Sub Networks, Equipment, Replaceable Units, Spare Parts, PhysicalResources, Element Tests.
3.1.6. Static Description
Inputs:Requests from users and other TMFAs for Configuration Management services, configurationand status data reports/logs from Network Elements, configuration parameters.Outputs:Instructions to NEs to report on their configuration/status or to change theirconfiguration/status, configuration parameters, configuration/status reports/logs.
3.1.7. Dynamic Description
Awareness Decision ImplementationProvisioning: NE ConfigurationGet ConfigurationUser requests the configurationstate of an NE
Identify NE TMN requests NE to report currentconfiguration of each entity.Configuration report is generated
GrowInstallation notifies configurationof the presence of a newly installedentity
Identify NE, entity NE is notified of the presence of a newlyinstalled entity
PruneA TMN user or other TMFAnotifies configuration of thedisconnection of an entity
Identify NE, entity NE is notified of the disconnection of anentity
RestoreA TMN user or other TMFAnotifies configuration of thedisconnection of an entity
Identify, entity NE is instructed to begin monitoring anewly installed entity

Deliverable 5 Page 107
© RACE Project R2116 - TOMQAT
AssignA TMN user or other TMFAnotifies configuration that apreviously unequipped entity isnow equipped
Identify NE, entity NE is notified that a previouslyunequipped entity is now equipped
DeleteA TMN user or other TMFAnotifies configuration that apreviously equipped entity is nowunequipped
Identify NE, entity NE is notified that a previously equippedentity is now unequipped
Set Service StateA TMN user or other TMFAnotifies configuration to place anNE in a given service state
Identify servicestate to place NEin: in service, out ofservice, standby,reserved.
NE is placed in given service state.
Request Assignment ReportsUser of other TMFA requestsidentity of assigned entity
Identify is requestis for specifiedentity or for allequipped entities
NE is directed to report the identity ofeach assigned entity. Assignment reportsis generated
Set ParametersA TMN user or other TMFAdirects configuration to set certainconfiguration parameters of aspecified entity
Identifyconfigurationparameters, theirvalues, andNE/entity to whichthese apply.
NE is directed to set parametersassociated with a specified entity
Set Service ThresholdsA TMN user or other TMFAdirects configuration to setperformance thresholds for aspecified channel.
Identify NE,channel, andthresholds
NE is directed to set performancethresholds for the specified channel.
Add/DropA TMN user or other TMFAdirects configuration to insert orremove a channel from a from thecomplement of through channels
Identify NE andchannel.
NE is directed to insert or remove achannel from a from the complement ofthrough channels
Cross-connectA TMN user or other TMFAdirects configuration tointerconnect two specifiedchannels operating at the same rate
Identify NE andchannels. Check ifchannels areoperating at samerate.
NE is instructed to interconnectchannels.
DisconnectA TMN user or other TMFAdirects configuration to remove theinterconnection between twospecified channels
Identify NE andchannels.Check if channelsare interconnected.
Instruct NE to disconnect channels.
Start Transmission TestTest management instructsconfiguration to start transmissiontest.
Identify NE andcircuit on whichtest is to be carriedout.
NE is instructed to commence test ongiven circuit.
BalanceTest management instructsconfiguration to perform balancetest/adjustment.
Identify NE NE is directed to perform a balancetest/adjustment.
Start Transponder TestTest management instructsconfiguration to start transpondertest.
Identify NE andcircuit
NE is instructed to look for transpondersignal on the given circuit
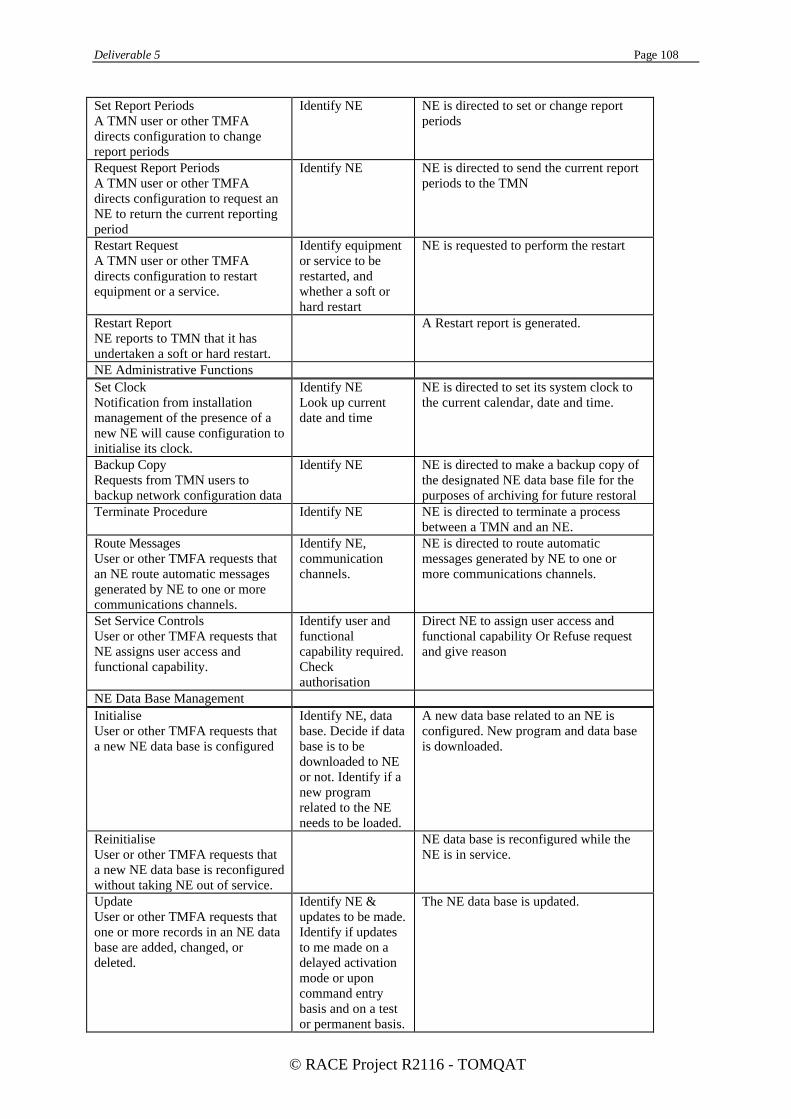
Deliverable 5 Page 108
© RACE Project R2116 - TOMQAT
Set Report PeriodsA TMN user or other TMFAdirects configuration to changereport periods
Identify NE NE is directed to set or change reportperiods
Request Report PeriodsA TMN user or other TMFAdirects configuration to request anNE to return the current reportingperiod
Identify NE NE is directed to send the current reportperiods to the TMN
Restart RequestA TMN user or other TMFAdirects configuration to restartequipment or a service.
Identify equipmentor service to berestarted, andwhether a soft orhard restart
NE is requested to perform the restart
Restart ReportNE reports to TMN that it hasundertaken a soft or hard restart.
A Restart report is generated.
NE Administrative FunctionsSet ClockNotification from installationmanagement of the presence of anew NE will cause configuration toinitialise its clock.
Identify NELook up currentdate and time
NE is directed to set its system clock tothe current calendar, date and time.
Backup CopyRequests from TMN users tobackup network configuration data
Identify NE NE is directed to make a backup copy ofthe designated NE data base file for thepurposes of archiving for future restoral
Terminate Procedure Identify NE NE is directed to terminate a processbetween a TMN and an NE.
Route MessagesUser or other TMFA requests thatan NE route automatic messagesgenerated by NE to one or morecommunications channels.
Identify NE,communicationchannels.
NE is directed to route automaticmessages generated by NE to one ormore communications channels.
Set Service ControlsUser or other TMFA requests thatNE assigns user access andfunctional capability.
Identify user andfunctionalcapability required.Checkauthorisation
Direct NE to assign user access andfunctional capability Or Refuse requestand give reason
NE Data Base ManagementInitialiseUser or other TMFA requests thata new NE data base is configured
Identify NE, database. Decide if database is to bedownloaded to NEor not. Identify if anew programrelated to the NEneeds to be loaded.
A new data base related to an NE isconfigured. New program and data baseis downloaded.
ReinitialiseUser or other TMFA requests thata new NE data base is reconfiguredwithout taking NE out of service.
NE data base is reconfigured while theNE is in service.
UpdateUser or other TMFA requests thatone or more records in an NE database are added, changed, ordeleted.
Identify NE &updates to be made.Identify if updatesto me made on adelayed activationmode or uponcommand entrybasis and on a testor permanent basis.
The NE data base is updated.

Deliverable 5 Page 109
© RACE Project R2116 - TOMQAT
QueryUser or other TMFA requests thatNE data base be read.
Identify NE, andwhich parts of database are to be read.
Read data base. Generates configurationlog file detailing data base contents.
BackupUser or other TMFA requests thatNE data base is backed up.
Identify NE. Generates backup configuration log filedetailing data base contents.
NE Status and ControlRequest StatusUser or other TMFA requestsstatus information about an NE.
Identify NE, statusinformationrequired.
TMN requests NE to send current statusinformation.
Status ReportUser or other TMFA requests thatNE reports the value of amonitored parameter. NE reportsvalue of parameter to TMN on ascheduled basis.
Identify NE andparameter to bereported.
TMN requests a report from an NE.
Schedule Status ReportUser or other TMFA requests thatNE establish a schedule for thereporting of status information.
Identify NE,information to bereported andreporting interval.
TMN directs the NE to establish areporting schedule.
Request Status Report ScheduleUser or other TMFA requests acopy of an NEs reporting schedule
Identify NE TMN directs NE to send the currentschedule of status reporting; NE respondswith the schedule.
Service Availability Timetable Identify NE TMN sends NE timetable of when aspecified service is to be available foruse.
Allow/inhibit automatic restorationUser or other TMFA requests thatautomatic restoration is allowed orinhibited in an M+N or Duplexsystem
Identify NE andwhether restorationis allowed orinhibited.
TMN directs NE to allow or inhibitautomatic restoration.
Operator/release automaticrestoration. User or other TMFArequests that a specified line orequipment is switched to theredundant unit or is released fromit.
Identify NE.Identify if system isM+N or duplex.
TMN directs NE to switch a specifiedline or equipment to the redundant unitor release it from the redundant unit. Foran M+N system, service is placed on theredundant unit and taken off the workingunit. For a duplex system the main unitbecomes standby and the standby unitbecomes the main unit.
Message Handling SystemsNetwork StatusRequest Message Storage StatusDataUser or other TMFA requests themessage storage status of store andforward communication to theTMN.
Identify NE. TMN request NE to transmit the messagestorage status data of store and forwardcommunication to the TMN. The NEresponds with a Message storage statusdata report, which is sent to the TMN.
Leased Circuit Network StatusRequest Status of DynamicProvisioning of Leased CircuitNetwork. User or other TMFArequests the status of dynamicprovisioning of leased circuitnetwork.
Identify NE TMN requests NE to transmit the statusof dynamic provisioning to the TMN. NEresponds by sending the current status tothe TMN.
Transmission Network Status
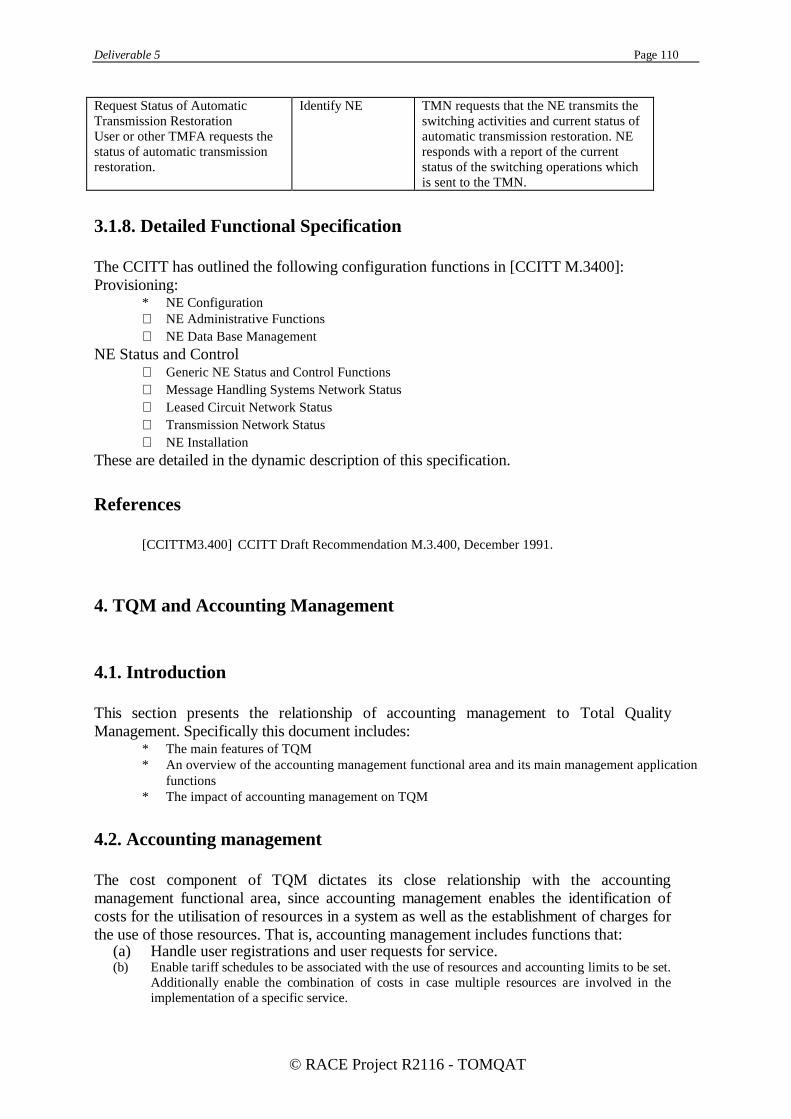
Deliverable 5 Page 110
© RACE Project R2116 - TOMQAT
Request Status of AutomaticTransmission RestorationUser or other TMFA requests thestatus of automatic transmissionrestoration.
Identify NE TMN requests that the NE transmits theswitching activities and current status ofautomatic transmission restoration. NEresponds with a report of the currentstatus of the switching operations whichis sent to the TMN.
3.1.8. Detailed Functional Specification
The CCITT has outlined the following configuration functions in [CCITT M.3400]:Provisioning:
* NE Configuration∗ NE Administrative Functions∗ NE Data Base Management
NE Status and Control∗ Generic NE Status and Control Functions∗ Message Handling Systems Network Status∗ Leased Circuit Network Status∗ Transmission Network Status∗ NE Installation
These are detailed in the dynamic description of this specification.
References
[CCITTM3.400] CCITT Draft Recommendation M.3.400, December 1991.
4. TQM and Accounting Management
4.1. Introduction
This section presents the relationship of accounting management to Total QualityManagement. Specifically this document includes:
* The main features of TQM* An overview of the accounting management functional area and its main management application
functions* The impact of accounting management on TQM
4.2. Accounting management
The cost component of TQM dictates its close relationship with the accountingmanagement functional area, since accounting management enables the identification ofcosts for the utili sation of resources in a system as well as the establishment of charges forthe use of those resources. That is, accounting management includes functions that:
(a) Handle user registrations and user requests for service.(b) Enable tariff schedules to be associated with the use of resources and accounting limits to be set.
Additionally enable the combination of costs in case multiple resources are involved in theimplementation of a specific service.

Deliverable 5 Page 111
© RACE Project R2116 - TOMQAT
(c) Gather accounting information from the network. Mainly, this can be envisagedas accumulating the service and resource usage made by a user while running hisapplication.
(d) Based on the previous functionality, perform customer billi ng, eg generateinvoices or send reminders to customers, record payments made from customersor refund customers in case the agreed contract was not met because of networkinadequacies. Furthermore, actions could be suggested such as user disconnectionin case of non-payment.
(e) Provide supplementary accounting management services such as advice of charge,instant pay, reverse charging etc.
(f) Collect, process and store information related to the cost of every serviceprovided by the network. Normally this includes the cost of the new resourcesrequired for the implementation of the service and the installation, operation andmaintenance costs.
(g) In the case of provision of services by a network operator or VASP to anothernetwork operator or VASP, functionalities catering for the negotiation,establishment and settlement of such services.
Management functions that are expected to be included in the accounting managementapplications of a management system are:Recording and generating user information
Functions for registrating, updating and deleting user records, in a file system or adatabase. Additional requirements imposed are retrieving part of this information orgenerating new types of data (eg statistics) based on the ones originally stored.
Recording and generating accounting information
Functions which collect accounting information on a per user basis by performingmeasurements and subsequent calculations. The results form accounting messages, whichare then forwarded for storage in files specified by the management system.
Specifying accounting information to be collected
Functions which enable managers to specify the accounting information to be collected.This may include the type of information to be acquired, accounting information sources,the duration of the collection period, criteria by means of which those time intervals areestimated etc.
Controlling the storage of and access to accounting information
Standard procedures which facili tate accounting information storage and retrieval. Also,naming functions for the management of archived accounting information files.
Reporting accounting information
This function allows the management system to specify information to be reported, alongwith its format, and the user accounting profile or the output device to report it. Similarly,mechanisms of this function allow managers to create and transmit selectively or broadcast,as appropriate, accounting news such as billi ng rate changes for network resources, oraccounting limit changes.
Setting and modifying accounting limits
The manager is able, by use of this function, to read, set and modify accounting limits forvarious groups of users. Mechanisms allow the network manager to change the prioritiesassigned to network users for access to network resources, including, for example, thepriorities in using various classes of network services.
Defining accounting metrics
In order to obtain and use the accounting information, standard metrics and types ofaccounting information are being established. The type of accountable units could bedefined as the call duration or the number of bits, characters, blocks or files transmitted. A

Deliverable 5 Page 112
© RACE Project R2116 - TOMQAT
standard method for the definition of those accounting metrics will allow expansion ormodification of accounting metrics.
Interact with other components of a management system.
Process accounting information for the purpose of responding to requests for data comingfrom the other components of the management system.
Exchange accounting information with other accounting management systems.Different accounting management systems should exchange accounting information so asto enable the provision of services among network operators or VASPs.
4.3. TQM and Accounting management
From the description above the following relations between TQM and Accountingmanagement can be observed:
Real time domain
User’s point of view
User satisfaction, as far as accounting is concerned, is highly related to the fair chargingcorresponding to the actual utili sation of network resources by the user. An additional andmore justified user requirement, is the reduction of charges if the contracted quality can notbe offered or achieved at certain periods of time (e.g. per call, per month). Those userrequirements dictate: a) the employment of more intelli gent mechanisms for recording andcollecting the utili sation-related information, and b) intensive monitoring of the offeredservice quality in order to be combined to the levied charges.Manager’s point of view
Dynamic, end-to-end QoS management is heavily based on monitoring mechanisms.Recording the achieved QoS for charging and accounting purposes may turn out to bea very complicated task. Thus, attention should be paid in minimising the effect onnetwork performance and consequently the part of the QoS that depends on networkperformance.
TQM must provide guidance to network management applications for the efficient andcost effective utili sation of network resources. The impact of such guiding principles(or policies) should be identifiable by the cost accounting processes. In other wordsthere is a requirement that the benefit from attaining quality becomes visible at the costaccounting level.Setting and modification of tariffs and accounting limits for groups of users, affectstheir behaviour and can be used as a means to embed policies. For example, dependingon the overall network load, accounting policy may change to encourage or discouragecalls, thus leading to more balanced resource utilisation.
Long term domain
The improvement of the long term performance of the network depends on the followingaccounting management related items:
(a) the accounting information collected and the format in which it is stored, as wellas the duration of the acquisition period, or the criteria used to determine theduration of the acquisition period.
(b) the procedures to retrieve, store, process and present accounting information.(c) the capabili ty of accounting management to report the degree of service usage
and resource usage charges at a level specified by the manager. That is, thecapabili ty of the existing mechanisms in accounting management to create
Deliverable 5 Page 113
© RACE Project R2116 - TOMQAT
reports on events or accounting metrics such as network resource billi ng ratechanges or accounting limit changes.
TQM applications need to combine the data available through accounting management andanalyse these from a costs and benefits perspective, in order to determine improvementactions. Introduction of new network elements or engineering of new services must bethoroughly justified through evaluation.References
[1] RACE CFS, H408, Accounting management services in TMN.[2] TOMQAT, Deliverable 3, “Architecture of the TOMQAT system & definition of network
infrastructure” , chapter 2, “Total Quality Management Applications”