Race and health disparities among seniors in urban areas in Brazil
45
RACE AND HEALTH DISPARITIES AMONG SENIORS IN URBAN AREAS IN BRAZIL Antonio J. Trujillo John A. Vernon Laura Rodriguez Wong Gustavo Angeles Working Paper 11690
-
Upload
independent -
Category
Documents
-
view
1 -
download
0
Transcript of Race and health disparities among seniors in urban areas in Brazil
RACE AND HEALTH DISPARITIES AMONG SENIORSIN URBAN AREAS IN BRAZIL
Antonio J. TrujilloJohn A. Vernon
Laura Rodriguez WongGustavo Angeles
Working Paper 11690
NBER WORKING PAPER SERIES
RACE AND HEALTH DISPARITIES AMONG SENIORSIN URBAN AREAS IN BRAZIL
Antonio J. TrujilloJohn A. Vernon
Laura Rodriguez WongGustavo Angeles
Working Paper 11690http://www.nber.org/papers/w11690
NATIONAL BUREAU OF ECONOMIC RESEARCH1050 Massachusetts Avenue
Cambridge, MA 02138October 2005
The views expressed herein are those of the author(s) and do not necessarily reflect the views of the NationalBureau of Economic Research.
©2005 by Antonio J. Trujillo, John A. Vernon, Laura Rodriguez Wong, and Gustavo Angeles. All rightsreserved. Short sections of text, not to exceed two paragraphs, may be quoted without explicit permissionprovided that full credit, including © notice, is given to the source.
Race and Health Disparities Among Seniors in Urban Areas in BrazilAntonio J. Trujillo, John A. Vernon, Laura Rodriguez Wong, and Gustavo AngelesNBER Working Paper No. 11690October 2005JEL No. J1, I1, I3
ABSTRACT
White seniors report better health than Black seniors in urban areas in Sao Paulo, Brazil. This is the
case even after controlling for baseline health conditions and several demographic, socio-economic
and family support characteristics. Furthermore, adjusted racial disparities in self-reported health are
larger than the disparities found using alternative measures of functional health. Our empirical
research in this paper suggests that the two most important factors driving racial disparities in health
among seniors (in our sample) are historical differences in rural living conditions and current
income. Present economic conditions are more relevant to racial disparities among poor seniors
than among rich seniors. Moreover, racial differences in health not attributable to observable
characteristics are more important when comparing individuals in the upper half of the income
distribution.
Antonio J. TrujilloCollege of Public AffairsUniversity of Central [email protected]
John A. VernonUniversity of ConnecticutDepartment of Finance2100 Hillside RoadStorrs, CT 06269and [email protected]
Laura Rodriguez WongCEDEPLAR/UFMG
Gustavo AngelesCollege of HealthUniversity of North Carolina at Chapel Hill

4
I. Introduction
Policy makers today consider the social exclusion, or marginalization, of
ethnic groups to be one reason for the existence of disparities in human capital in
Latin America. Racial and ethnic inequality in the provision and utilization of
health care, taken together with the global issues of controlling cost and
increasing access, is frequently reported as one of the most important problems
facing the health care sector in Latin America (WHO 2001).
In Brazil, these racial disparities in health status have been widening. For
example, at all ages, Blacks report higher mortality rates than Whites, lower life
expectancies, lower survival rates for all causes, and a higher incidence (and
earlier onset) of disease. Racial disparities in health have been persistent and
broadening at older ages despite economic progress and overall increases in
health (World Bank Report 2003). The evidence suggests that the population of
Brazil is aging at a faster rate than the populations of most developed countries
(Vaupel 1998, Seabrook, 2003). Health care in old age absorbs an ever-
increasing share of GDP, and the demand for increased services for seniors is
increasingly apparent in the region's crowded urban areas. At the same time, the
Brazilian public has become aware of growing racial disparities in health in old
age and in the medical care available to the elderly.
In this paper we will first examine the health disparities among the elderly
in Sao Paulo, the largest city in Brazil. Following this, we will present a
framework that may help explain and better understand the sources of these
health differences. Lastly, we recommend policies initiatives that may help
mitigate these racial disparities in health. Our analysis is conducted using the

5
newly available SABE1 dataset which addresses several dimensions of individual
health.
Two racial groups are compared: the control group includes those
individuals who declared themselves “White”, while the treatment group includes
those individuals who declared themselves “Black,” as well as those individuals
who reported themselves to be “Mulatto”2. Regardless of this classification, one
should keep in mind that race may be a difficult variable to measure. Race and
ethnicity are, to some extent, individual characteristics that may have elements in
common with nativity and even religious affiliation3. For instance, two individuals
in different race groups could share similar cultural values because of their
common country of origin. Furthermore, the self -identification of race could
differ from the group identification of an individual’s race. Finally, classification of
individuals with mixed parents could pose some additional problems in the
assignment of race. Assuming that race can be measured with some degree of
accuracy, it has been identified in health research as an important risk factor that
measures a combination of socio-economic, cultural and biological
characteristics, which explain the accumulation and deterioration of health capital
over the life span of an individual (Lillie-Blanton, M and Lavesist, 1996).
* Mailing address: 400 East Colonial Dr, Apt. 802, Orlando, FL 32803, USA. Telephone: (407) 823-4238; Fax: (407) 823-6138 E-mail: [email protected]. 1 The acronym SABE is short for Salud, Bienestar, and Envejecimiento—Health, Well Being, and Aging, a 2000 survey conducted in 7 representative cities in Latin American countries. The SABE web page (www.ssc.wisc.edu/sabe) lists complete information on the agencies and researchers who participated in the project. 2 The SABE dataset does not include the interviewer’s perception of an individual’s race. The survey relies on an individual’s self-perception of race based on the following question…“could you please tell me what your race and ethnic background is”?. Telles (2002) investigates the disparities that may arise between interviewers’ and respondents’ classification of race. This study reports that answers are consistent in almost 80% of all cases. Individual factors such as gender, age, education, and region could explain partially the inconsistencies. For instance, a more educated person tends to “whiten” her race; but this result could vary with region. 3 According to Mejia and Moncada (2000), for the purpose of the national census, ethnic groups have been identified in Brazil using a self-identification question since 1982. The given options are Branca (White), Preta (Black), Parda (Brown), Indigena, Amarela (Yellow which includes individuals of Asian origin) and others.
6
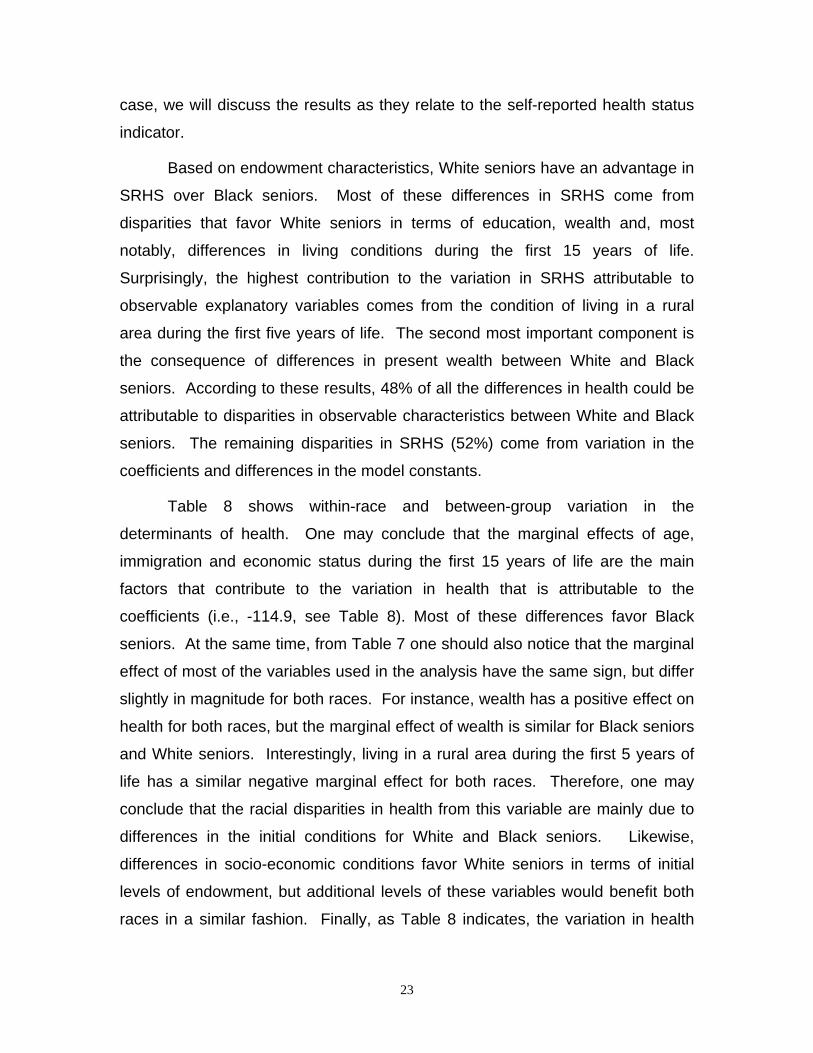
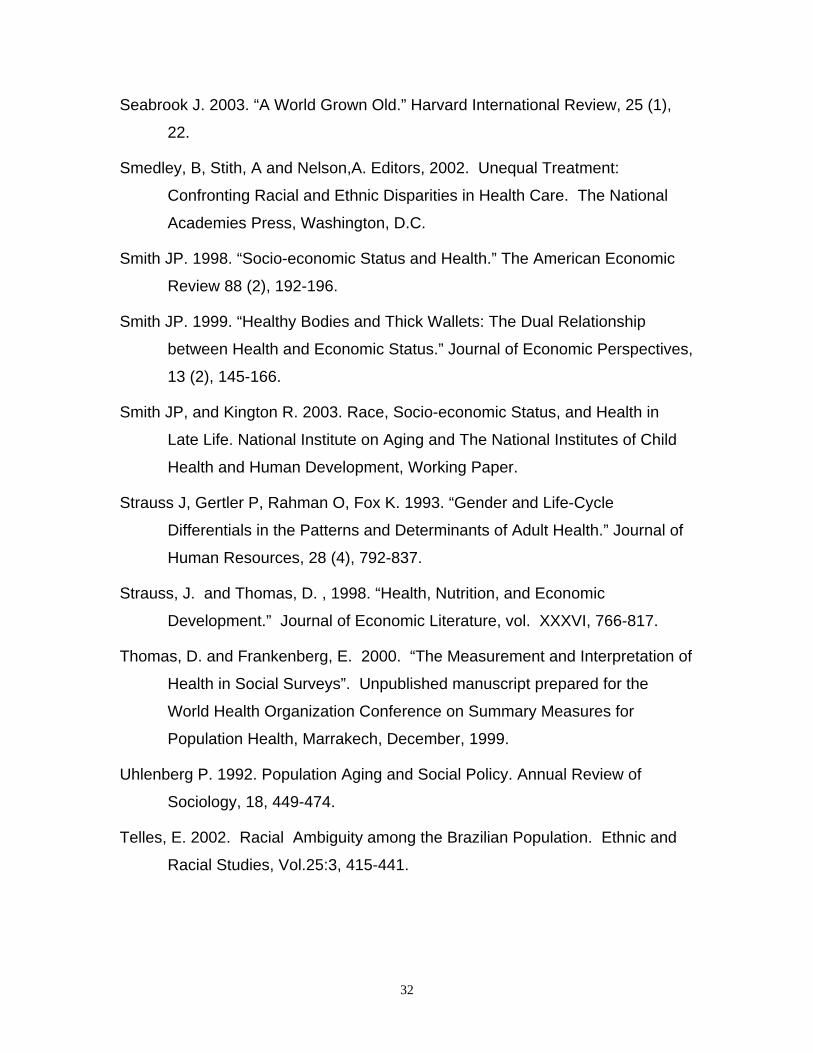
Figure 14 shows the gradient of health deterioration by age group
according to race in Sao Paulo. As expected, for both Whites and Blacks, health
deteriorates as an individual ages. The gap in health differences between
Whites and Blacks declines in older groups. Nevertheless, at all ages, Blacks
have poorer self-reported health status than Whites. Surprisingly, the differences
are less pronounced when one uses ADL and IADL as measures of health. The
reduction in the differences between racial groups with increasing age could be
the consequence of a cross-over in the mortality rate among Blacks and Whites
at later ages.
To better understand the reasons for these differences in health, it needs
to be determined whether the health gap among race groups remains after one
controls for the relevant variables, other than race, that are hypothesized to
impact health status. Adding successive control variables to the analysis will help
identify the channels through which race may influence health in old age (LaVeist
1994 and Wagstaff & Van Doorslaer, 2000). Observed racial disparities in health
could be due to three factors: differences in the level of endowment or
observable individual characteristics (e.g. White seniors may have higher income
and education than Black seniors); differences in the marginal effect that each
factor has on an individual’s health; and differences in unobservable individual
characteristics (e.g., genetic composition). This analysis also presents a
framework for understanding the underlying factors that account for racial
disparities in health among seniors.
It has been documented in the health economics literature (see Wenzlow
et al., 2004, Wagstaff et al., 2003 and Case and Deaton, 2004, among others)
that even at older ages the health of an individual is related to her or his socio-
economic condition. Clearly, the relationship extends in the opposite direction; at
more advanced ages, one may expect that health affects income. (See Smith,
1998). Numerous studies have suggested that there is a link between health and
labor outcomes in terms of productivity, labor supply and wages. (See Strauss
4 Larger numbers indicate better health in terms of SRHS, ADL and IADL.

7
and Thomas, 1998, for a discussion of this topic.) This complex relationship
between income and health has been reported in both developed and developing
countries, and across different measures of income and health. The expected
socio-economic gradient in health also has been documented using aggregate
community data. (See Krieger et al., 2003, for an example in the U.S.) Strong
correlations between income conditions and racial disparities in mortality have
been documented in the literature. Because Whites tend to report higher income
than Blacks, one might expect that there would be a gap between the health of
Whites and Blacks across income rankings, but this gap tends to decline as
income increases.
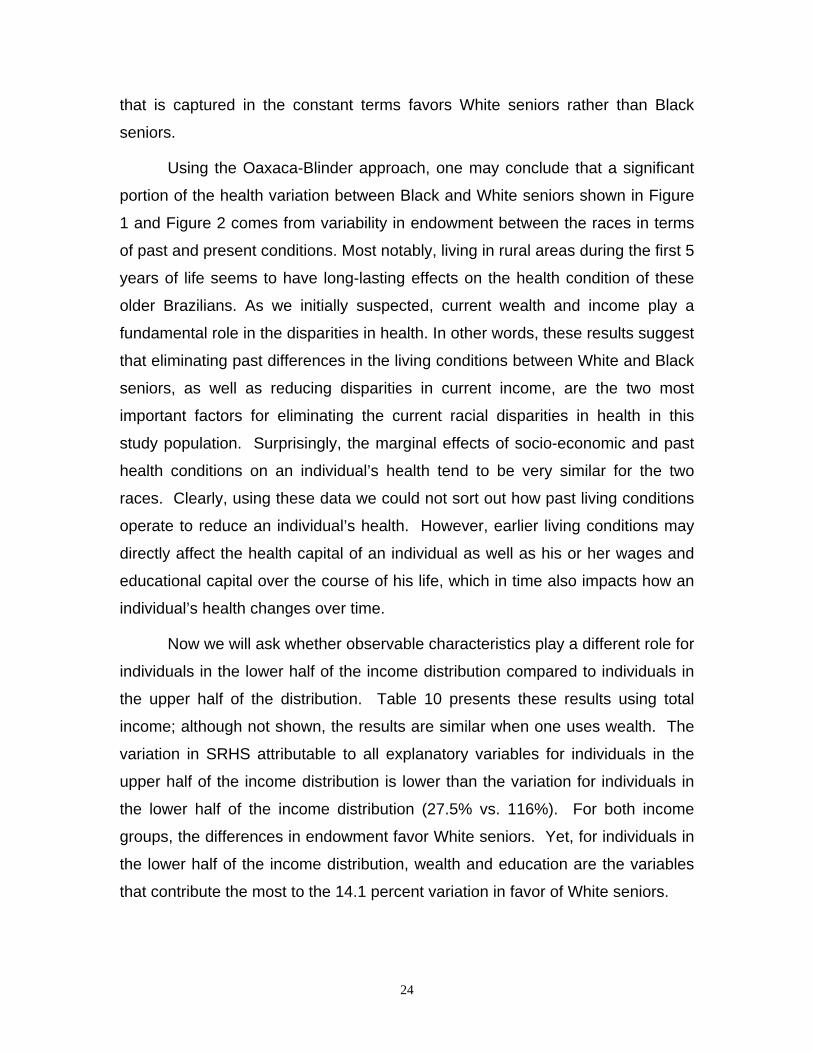
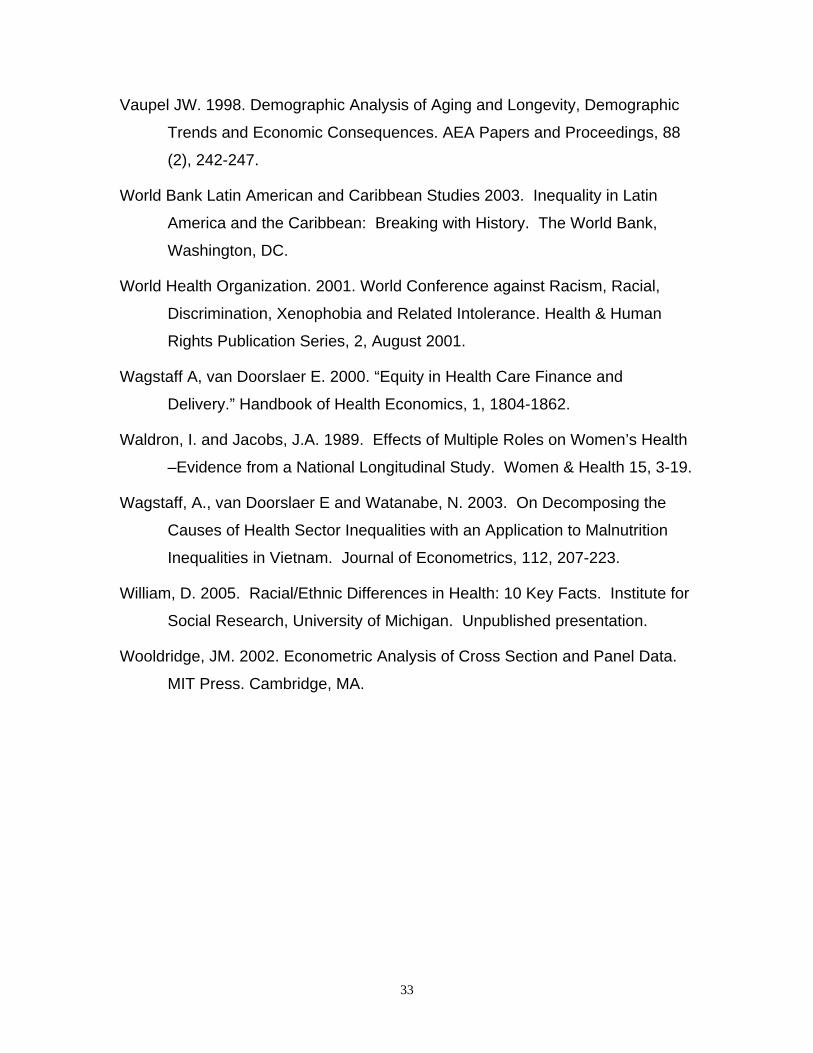
Figure 2 shows a relationship partially consistent with these previous
empirical findings. For the case of Sao Paulo, Brazil, both Whites and Blacks
report an increase in self-reported health between the first quartile and the fourth
quartile of the income distribution. Interestingly, the relationship between income
and health is not linear. Blacks in the third quartile of the income distribution
have lower SRHS than Blacks in the second quartile. This gradient in health and
income level at the extremes of the distribution is also consistent for ADL and
IADL measures. Whites also report higher income than Blacks, which may in part
explain the gap between self-reported health for these groups. However, these
differences in health may also be driven by other differences across racial
groups, such as education, occupation history, and/or past health status.
Furthermore, different measures of income may create alternative rankings of
individuals. For instance, using wealth as an alternative measure of well-being
may result in different disparities in the health of Whites and Blacks.
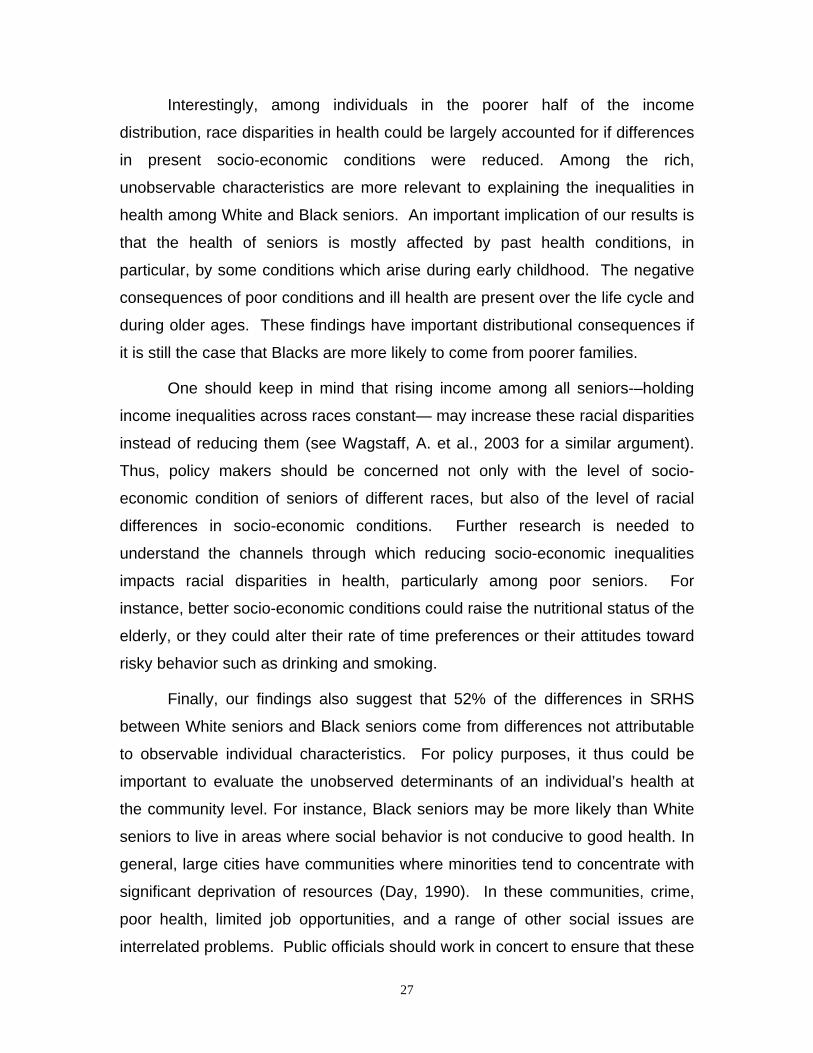
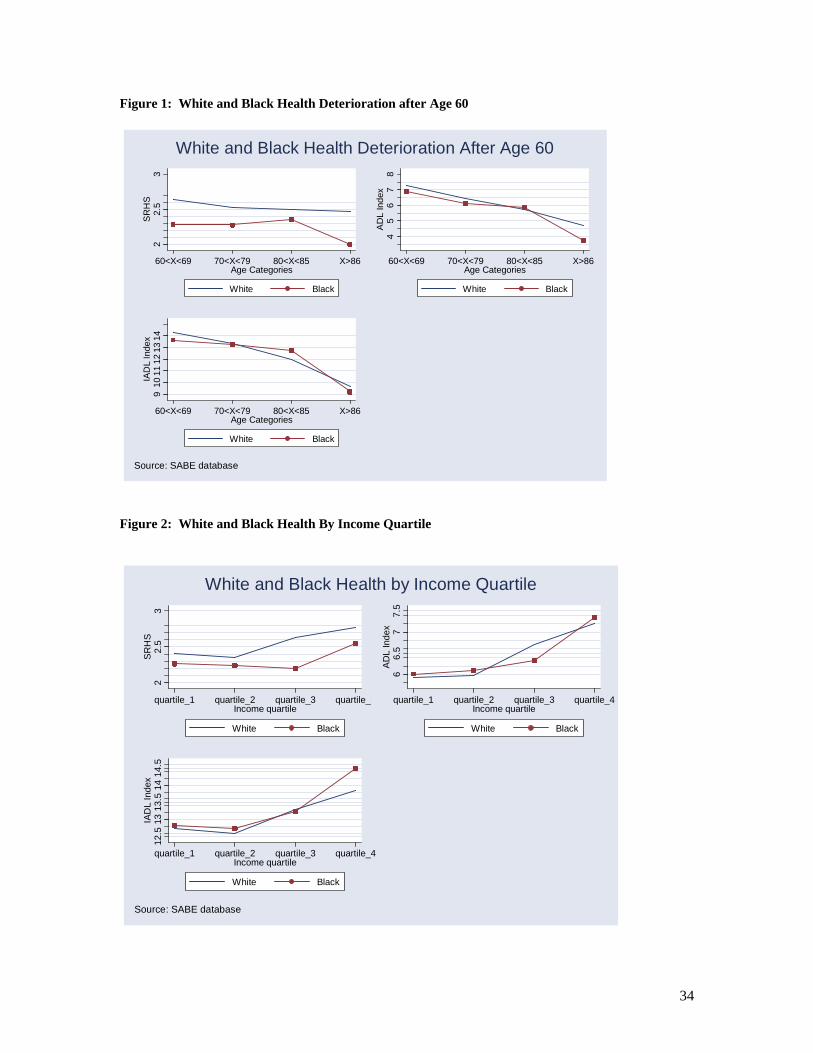
Socio-economic differences have been reported to be crucial risk factors
in explaining racial disparities in health, but they are not the sole factor (William,
2005). Differences in the distribution of diseases among Whites and Blacks
(Figure 3) could be due in part to a genetic predisposition. Blacks are more likely
than Whites to report strokes and psychiatric problems, while Whites are more
likely than Blacks to report having arthritis and cancer. In addition, the marginal
benefit from a particular medical treatment could differ by race due to a specific
8
genetic condition (e.g. organ transplants are more successful in Whites, perhaps
because Blacks have greater genetic variation, making matches more difficult).
However, the vast majority of the literature on racial disparities in health suggests
that differences in socio-economic and cultural environments rather than racial
differences in biological factors provide the main explanations for these
disparities. (For a review of the literature, see Smedley, B, Stith, A and Nelson,
A., 2002.)
In addition to differences in socio-economic conditions, and genetic
predisposition, other factors associated with geographic marginalization, the
mechanisms of racism, social context, and access to medical care and quality
have been linked to racial disparities in health. Discrimination could reduce
access to the labor market and to other goods and services which, over time,
may affect the health of the individuals. Furthermore, discrimination itself may
affect the mental health and well-being of an individual by leading to stress,
depression, or other mental problems. Blacks may also suffer from discrimination
in access to certain health services. Finally, the social context may influence the
variation in timing of care and risk aversion among Blacks and Whites. Notice
that the roles of discrimination and social context could differ by cohort.
Individuals of different ages could have different life experiences in terms of what
race meant in their particular social context.
In this paper, we will address three fundamental questions. (1) Are the
racial disparities in health as displayed in Figure 1, Figure 2 and Figure 3,
eliminated once one controls for the relevant observable individual characteristics
included in the SABE database?; (2) What are the main sources of these racial
disparities in health?; and (3) Are differences in endowment equally relevant to
racial disparities in health among poor Black and White seniors compared to race
disparities in health among rich Black and White seniors?
In the next section, we will describe in more detail the racial disparities in
income, wealth, and health. Section III documents additional differences between
Whites and Blacks besides those differences in income and wealth that could

9
account for the racial disparities in health among the elderly in Sao Paulo, Brazil.
Section IV presents the econometric strategy to disentangle the effect of
differences in endowment, or observable individual characteristics, from the
effect of differences in the marginal impact of each risk factor. Section V
presents the main findings; and section VI concludes and establishes the main
policy implications we draw from these results.
II. The Extent of Racial Disparities in Health and Income Among the Elderly in Sao Paulo, Brazil
Table 1 presents weighted summary statistics of the disparities in health
conditions by gender for Whites and Blacks in old age. This preliminary analysis
helps to motivate the development of a full econometric model to explain the
effects of race on health inequalities. As Table 1 shows, for both males and
females, SRHS is better and the ADL and IADL indices are higher among White
seniors than Black seniors. Black females report the lowest functional health
status among all groups. Although not shown, these differences persist across
all age groups. The gradients of health deterioration differ between the two racial
groups. For instance, SRHS declines at a slower rate for Black seniors than for
White seniors.
Black females are more likely to report life-threatening conditions including
hypertension, diabetes, and stroke, while White females are more likely to report
cancer and lung disease. Black males are more likely to report hypertension and
stoke. Hypertension is usually associated with other dangerous medical
conditions that differ by race such as stress and obesity. A higher prevalence of
hypertension and diabetes are also factors that may explain the higher
prevalence of stroke among Black males. These differences in health conditions
are consistent with reports of race disparities in health among the elderly in the
U.S. Williams (2005) reported a higher unadjusted mortality rate for Blacks than
for Whites for several causes of death: heart disease, cancer, stroke,
hypertension, and diabetes, among others. Day (1990) also reported that ethnic
10
minorities are more likely to inherit blood disorders, coronary heart disease,
diabetes, and perinatal mortality.
Interestingly, the lower prevalence of some disabling conditions among
Blacks in the SABE data set may be the consequence of later diagnoses of
disease. Yet, both Black males and Black females are more likely than White
males and females to report a fall in the last 12 months; and Black males are
twice as likely to report an incontinence problem as White males. Taking these
results together suggest that Black seniors may have more severe untreated
health problems than White seniors. This delay could be related to less frequent
use of medical services and lower quality of care available for Black seniors. As
Table 1 shows, Blacks are less likely to use hospital and physician services.
Factors related to access to healthcare and quality could be additional underlying
explanations for these differences in health.
Blacks are more likely than Whites to report lower cognitive scores5 and
higher prevalence of emotional, nervous or psychiatric problems that could
translate into a diminished ability to conduct their normal activities and to seek
medical care. The lower mental health status among Black seniors could be due
to chronically higher levels of stress. These results contradict findings reported
in the U.S., where Black seniors are more likely to report better mental health
than White seniors (Smedley, Stith, and Nelson, 2002).
Weight and height have also been suggested as measures of individual’s
health. Using time-series data from developed and developing countries, greater
height and weight have been consistently associated with lower mortality rates.
The main advantage of these indicators is that errors measuring these variables
would not be correlated with any individual’s characteristics. As expected, on
average, males are taller and heavier than females; however, once one controls
for gender, White and Black seniors show very similar height and weight.
5 In the SABE survey, the evaluation of an individual’s cognitive capacity was performed combining the Mini Mental State Examination developed by Folstein et al., 1975 with the Pfeffer Scale (1982).

11
Exploring income and wealth differences among racial groups could be
informative in disentangling disparities in functional health and morbidity
outcomes among racial groups. Contemporaneous income and wealth correlate
directly with an individual’s present health (e.g., economic status may alter an
individual’s choice of risky behavior, an individual’s level of investment in
preventive healthcare, or determine one’s living conditions); those who are poor
have fewer resources to afford healthcare or health insurance. Fortunately, the
SABE data set contains information about an individual’s total financial
resources, from both working and non-working sources, as well as a measure of
total assets in the household. The wealth variable provides useful information
regarding available financial resources in the long-run, particularly in the case of
seniors who are already retired and report no working income. This variable was
constructed using a principal component index of a list of assets in the
household. The income variable was constructed by the summation of income
from the following sources: current salary if she/he is working; resources coming
from retirement funds or pensions, resources from family members, rental or
banking income, and income from social welfare subsidies. Wealth and income
measures were both adjusted for household size.
Table 2 shows that a Black senior in Sao Paulo is more likely to report
lower income as well as lower wealth than a White senior6. Furthermore, a Black
senior is more likely to be in the lower half of the income and wealth distribution
than a White senior. These findings are consistent with other results reported for
Brazil. For instance, Olinto & Olinto (2002) report that regardless of age, Black
and Brown women have less education, lower family income, and poorer housing
conditions than White women. Burgard (2004) reports that the geographic
history of slavery and European immigration lead to a concentration of Whites in
more affluent and metropolitan areas, while Non-Whites were more likely to live
in poor and less developed areas. Although the information is not reported in the
6 The sampling design in the SABE data set accounts for potential problems of under-representation in the final sample of individuals over 80 years of age as well as institutionalized individuals. Thus, the sample represents all seniors in Sao Paulo, Brazil.
12
SABE data set, it has been reported elsewhere (Beato, 2004) that the racial gap
between household income and wealth also exists during early childhood and
working years. Beato (2004) also compares Blacks and Whites using the Human
Development Index (which is an index based on income, education and life
expectancy); Blacks report lower HDI than Whites, and no State reports a higher
HDI for Blacks than for Whites. According to the same author, poverty
(measured by per capita income) is concentrated in the Black community and
remained stable over the past ten years. Blacks represent 63% of the poor
population in Brazil. The current racial disparities in health among the elderly
could be the consequence of accumulated differences in income and wealth
during earlier years.
Table 3 indicates that higher income and wealth translates into better
SRHS, ADL and IADL scores. Poorer people are more likely to report higher
morbidity than affluent people. This strong correlation between income, wealth
and functional health status remains when one looks within each race.
According to these findings, a poor (based on income and wealth) White senior
has a better SRHS than a poor Black senior. Likewise, a wealthy White senior
has a better SRHS than a wealthy Black senior (based on income as well as a
wealth index). However, one should keep in mind that SRHS is a measure
adapted to each individual’s reality; therefore, there may be individual differences
in self-perception of poverty and personal health within seniors of different races.
Furthermore, measurement errors in SRHS could be correlated with
socioeconomic conditions and education.
Despite the fact that a strong association between income and health
exists in the data, these findings are not conclusive evidence of the causal effect
between income and health. Feedbacks from health to income may still be
present even at old ages. For instance, as shown in Table 4, individuals who
report poor health have lower wealth than individuals who report very good and
excellent health. Individuals in poor health could be more likely to retire earlier,
which in time explains fewer available financial resources. The same positive

13
gradient between health and financial resources also happens when one
considers income.
In sum, the previous analysis suggests that there are important racial
disparities in health, income, and wealth. Yet, the racial disparities in health
among the elderly reported in Table 3 could reflect a complex web of factors that
interconnect differences in income, wealth, and other individual characteristics.
Reverse causation from health to income could also be present in the data.
III Other Potential Demographic, Socio-economic, Family Support and Baseline Health Differences Among Race Groups
Despite income level, other individual and community characteristics may
also influence these racial differences in health. Table 5 presents a comparison
of White and Black demographic, socio-economic condition, family support and
baseline health conditions.
Blacks and Whites have similar age and gender compositions. Also, a
similar percentage for both race groups report living alone. Given these
similarities, one might expect that the main racial disparities in health are not
driven by differences in age, gender, or even living alone. Nevertheless, one
should keep in mind that although the age and gender composition of both racial
groups is similar, an additional year of life could impact the health deterioration of
White seniors differently from Black seniors. Gender may play a role in the racial
disparities in health, since females are more likely to live longer than males.
Furthermore, widowhood could also explain the disparities in health; for instance,
a Black widow may report a different health status than an asset-similar White
widow.
Black seniors are more likely to report themselves to be immigrants and
less likely to be married. The ethnic background of an individual could help to
explain variations in health both within-race and between-race (LaVeist, 1994).
Individuals of the same race but from different countries of origin could have
14
different dietary practices that affect their health. Current marital status could
have a different protective effect on health by race among the elderly. Rushing
et al., 1992 reported that marriage is more beneficial for White women than Black
women.
Table 5 also shows that Black seniors are less educated and report a
lower literacy rate than White seniors. Less educated individuals could have less
knowledge about medical treatment and the risk factors associated with certain
behavior, be less able to provide self-care to prevent future health problems, and
be less aware of environmental risks. Also, more years of education translate into
better economic conditions, which may also affect an individual’s health. It is
important to keep in mind that education in the SABE dataset is based on years
of education attained; we do not have a way to control for quality of education.
According to the World Bank Report (2003) for Brazil, Blacks of working
age had less education, higher unemployment rates, were more likely to be
employed in the informal sector, had fewer assets, reduced access to public
services and occupied lower positions in the occupational structure of the
society.7 Taken together, these factors may imply that life experiences for Blacks
are less positive than the experiences of Whites. This could be relevant, since
the cohort of individuals included in this analysis are men and women born in the
early decades of the last century, in a context where education, employment and
other social opportunities were less available to Black individuals in Brazil than
they are now.
Although not shown in Table 5, White seniors are more likely to be
currently employed than Black seniors. It has been reported in the literature that
seniors working outside the home tend to be healthier than non-workers. This
effect has been established to be different for Black and White seniors (Waldron
and Jacob, 1989). Furthermore, previous studies found that job satisfaction and 7 Some researchers have used type of occupation as a proxy for current socio-economic conditions for the elderly. However, problems associated with measurement of the variable during the senior years, and racial variation in the role of each occupation on an individual’s health suggest that a better alternative to capture the impact of available economic resources on an individual’s health would be to use wealth and total income.
15
type of job were mediators of the impact of employment on an individual’s health.
Interestingly, Rushing et al., 1992, reported that employment was a much better
predictor of health for Blacks than for Whites. Yet, this relationship could also be
causal, from health to employment status. Healthier people could be more likely
to work longer hours and have higher earnings. A sick senior may be inclined to
leave the work force in order to receive government financial support.
Exploring the data, one finds that both races have a similar proportion of
individuals with public insurance. In Brazil, there are explicit policies to
guarantee access to medical care to all seniors. Healthcare is heavily subsidized
in the public sector and usually can be purchased at very low, or zero cost.
However, Whites are more likely than Blacks to report having private health
insurance (See Table 5). In this context of universal access, the availability of
private health insurance could imply access to better quality of healthcare, and
better health outcomes for White seniors than for Black seniors.
Differences in access to healthcare due to low income or lack of health
insurance may be associated with poorer health outcome. Even after adjusting
for racial inequalities in socio-economic conditions, circumstances at both the
provider and the patient level could create potential sources of racial disparities
in access to healthcare. Availability of insurance could make a specific patient
more attractive than another. On the other hand, geographic areas with low
reimbursement rates from insurance companies might reduce the quality of
supply where Blacks and poor individuals are more likely to live. Using the SABE
data set, we could not evaluate the supply factors that may explain the observed
racial inequalities in healthcare.
Black seniors have a larger number of people living with them, as well as
larger numbers of siblings. Given the potential positive effect on health of larger
numbers of household members, one may argue that these differences in
endowment of family support could mitigate the racial disparities in health that
would have otherwise existed. On the other hand, larger household size may
imply that more individuals are dependent on the income of the seniors. As a
16
consequence, the net effect of larger families on health could be mitigated. This
is potentially the case in Brazil where many households depend solely or mostly
on the income of senior individuals. As Table 5 shows, Black seniors share their
income with more individuals than do White seniors (2.68 vs. 2.29).
Interestingly, Blacks are more likely than White seniors to be past or
present smokers, come from a poor family background, have worse health during
the first 15 years of their life, and suffer from starvation during their first 15 years
of their life. Caloric intakes predict better health and greater longevity if one
survives the first years of life. All of these factors clearly have a long-lasting
negative impact on an individual’s health over his lifetime. In their seminal
article, Rosenzweigh and Shultz (1983) developed a model that incorporates how
these past family background factors, which often arise during childhood, may
impact an individual’s health. Contemporaneous racial disparities in health and
health-related behavior could be due to present differences in income and wealth
between both races, but they also may be due to the cumulative effects of initial
disadvantages in environment and socio-economic conditions during early
childhood.
IV. Conceptual framework and empirical strategy A) Conceptual framework
In this research, we will implement the conceptual framework proposed by
LaVeist (1994). In that framework, race is a latent (unobserved) factor, and skin
color is the most common manifest indicator. Societal norms determine how an
individual’s race is derived from his or her skin color. It is common for an
individual to self-identify as one race based on his or her cultural ties and yet
have another race ascribed to her/him based upon outward appearance, for
example, upon admittance to a hospital. In LaVeist’s view, risk exposure, illness
factors, and both societal and cultural elements are presumed to affect an
individual’s observed health outcome in ways that may coincide with, or span
race. Societal factors refer to external elements of an individual or household

17
which affect health (e.g., poor sanitation in poor communities, rate of homicide,
and availability of other public services or access to medical care and quality of
care). Cultural factors refer to internal elements related to individual or intra-
group behavior (e.g., dietary practices, smoking, drinking, or the custom of
providing a home to one’s parents). Risk exposure captures environmental
elements such as the geological condition of an area, or the availability of
resources such as water and air, among others. Illness factors capture biological
conditions such as genetic predisposition and/or risk exposure to specific
illnesses. In this framework, there is an assumption of homogeneity within socio-
economic and demographic groups. The key contribution of this conceptual
framework is that the most important manifest indicator may or may not be the
one normally associated with race in a society. For example, societal and cultural
factors may differently influence the health outcomes of a “white” individual of
European background and those of another “white” individual whose skin color is
the same as the first, but whose background is indigenous.
To implement this framework empirically, we will follow the model
specification suggested by Wagstaff and van Doorslaer (2000). For estimation
purposes, a model where the latent variable race is measured with an error term
is considered. For simplicity, instead of presenting one health equation for each
racial group, one structural health equation for the entire population (linear in its
parameters), is presented here:
µββββ +×+++= RaceControlControlRaceHealth 3210 (1)
The measurement error in the population is due to the differences between race
and the skin color indicator, and is defined to be: RaceSkin −=ε . Therefore, the
equation to be estimated will be:
ηββββ +×+++= SkinControlControlSkinHealth 3210 (2)
18
where skin is the manifest dummy indicator of race, control is a vector of current
and cumulative observable random variables, the last variable in the series
represents a vector of the interaction between the dummy variable skin and each
relevant observable variable, and η is the error term, which accounts for
unobservable individual characteristics in health (µ ) and the error in
measurement (ε ). Notice that one may estimate a different equation for each
race, and therefore the interaction between covariate and skin is no longer
necessary. Examples of variables that measure current information include:
current marital status, age, gender, individual income, household assets,
occupation, age at retirement, family support, and the number of children.
Variables that measure cumulative effects include, among others: number of past
marriages, past health conditions and occupational history.
The parameters to be estimated are 0β , 1β , 2β , and 3β . 2β and 3β are
vectors of parameters themselves; how many parameters are included in each
depends on the number of control variables incorporated in the model. It is
important to realize that running equation (2) with only the skin variable will give
biased estimates of racial disparities in health. Using additional control variables
one can determine the sources of health disparities. For instance, if the influence
of the skin variable declines after controlling for socio-economic condition, one
may conclude that the initial aggregate racial disparities in health are due to
differences in socio-economic characteristics among the racial groups.
B) Econometric strategy
Two approaches are implemented in this analysis. First, a multi-stage
analysis similar to the one proposed by Wagstaff and van Doorslaer (2000) helps
to pinpoint the effect of each vector of covariates on racial disparities in health.
Second, the previous framework is used to explore the sources of racial
disparities in health using the Oaxaca-Blinder decomposition. Table 6 lists each
vector and the list of variables inclusive in each. One should notice that these

19
covariates capture past and present individual characteristics that affect the
health of White and Black seniors.
For the first part of the analysis, Equation (2) is estimated for three
dependent variables, SRHS and the ADL and IADL indices. Six estimations are
performed. The first set of estimates uses the skin variable with no controls. A
second set of estimates uses skin plus the vector of basic individual
characteristics such as age, gender, immigration status, marital status and living
conditions. The third, fourth and fifth sets of estimates sequentially incorporate,
along with skin and the vector of demographic characteristics, each of the
remaining vectors. For instance, the third set of estimates includes the following:
the skin variable, the vector of individual characteristics and the vector of socio-
economic characteristics. The last set of estimates includes the skin variable
with all of the vectors used in the empirical analysis. Given the size of the
treatment and control groups, the estimation will not be conducted separately for
males and females. Simple OLS models will be implemented.
The second approach (Oaxaca-Blinder decomposition) also takes
advantage of the framework developed in the previous section. In particular, the
health equation (2) is first estimated separately for each skin group. Then the
method quantifies the variation in health according to three sources: (i)
differences coming from each covariate (i.e. variation in endowment); (ii)
differences coming from the marginal effect of each risk factor on the health of
White and Black seniors (i.e. variation in marginal effect); and (iii) unexplained
differences coming from non-observable covariates (i.e. variation in the constant
model). Lastly, in this analysis, calculations of the proportion of racial disparities
due to endowment, marginal effect and differences in the constant of each model
are done separately for those individuals in the lower half of the income
distribution and for individuals in the upper half of the income distribution.
This analysis uses only the data collected in Brazil. The final response
rate in this country was 84.6%, which included a total of 2,142 observations in
the database. For more details of the sampling design, see the User’s Manual

20
for the SABE databases (Pan American Health Organization). Table 6 describes
all dependent variables, the independent skin variable, and some of the control
variables to be incorporated in our statistical analysis.
V. Sources of racial disparities in health
A) Multi-stage analysis
Table 7 shows the estimated coefficient for the skin variable (i.e., the
proxy for race) under six scenarios. When one controls only for the skin variable
(Scenario 1), race seems to be an important factor for explaining differences in
health only in the case of self-reported health status; for the other two measures
of functional health (ADL and IADL), race is not an important explanatory
variable. For all measures of functional health, the estimated negative
coefficients imply that Black seniors have lower functional health than White
seniors. In this section, only the results using SRHS are discussed. SRHS has
been reported consistently as a strong predictor of an individual’s subsequent
morbidity and mortality (Allison and Foster, 2004; Sadana, 2001, and Strauss
and Thomas, 1998). This strong relationship between SRHS and subsequent
mortality has been attributed to the fact that SRHS may capture the onset and
severity of future medical conditions (Sadana, 2001; Thomas and Frankenberg,
2000).
As initially expected, Black seniors have a lower SRHS than White seniors
even after controlling for fundamental individual characteristics (Scenario 2). The
overall effect of race on health is thus less than in previous estimates. Since the
control and treatment groups are very similar in terms of gender, age, and living
alone status, this result suggests that the differences between Black and White
seniors, in terms of the protective effect of marriage as well as in terms of
immigration diversity, could play a role in explaining the racial disparities that are
primary interest to us. Since the skin coefficient is still significant, one may argue
that there are still other factors that account for these disparities.
21
When one controls for different dimensions of the economic resources
available, the effect of race on health is reduced. According to our results (see
Scenario 3), reducing present socio-economic differences in education, literacy,
income, wealth, insurance availability and home ownership (among other
socioeconomic factors) would reduce the racial disparities in health more than
they would be affected by reducing race differences in endowment related to
family support and baseline health conditions. This suggests that much of the
racial difference in health among the elderly comes from current socio-economic
conditions. Yet, even after controlling for socio-economic differences among
these Brazilian seniors, race remains an important factor for explaining the
variation in health across senior individuals. Finally, given the cross-sectional
nature of the dataset, it is not possible to establish the exact causal pathway
between socio-economic conditions and health.
Incorporating control variables for family support conditions also narrows
the health differences. In this calculation, the skin coefficient declines from -0.329
to -0.282. Interestingly, in this case, since Black seniors have stronger family
support than White seniors, we might expect that the skin coefficient would be of
a higher magnitude (in absolute value) than the race coefficient in Scenario (2).
Instead, this result suggests that weaker family support, having more siblings,
may have a protective effect on the health of White seniors. Although the SABE
dataset does not have the necessary variables to test this hypothesis, this result
may imply that White seniors who are already in good health tend to stay in
smaller households. On the other hand, larger households could imply that the
help among household members is diffused away from the seniors in the house
and shared among the rest of the family members.
As previously mentioned, Black seniors tend to come from poorer
environments, have a poorer nutritional status, and face more severe health
problems early in life than do White seniors. Controlling for initial baseline health
also reduces the racial disparities in health among seniors. These results are
consistent with previous research in the U.S. where empirical findings suggest
that health among seniors is partially explained by living conditions in the first 15

22
years of an individual’s life. Yet, race is still an important risk factor for explaining
health variation across these seniors after accounting for baseline conditions.
Racial health disparities do not disappear even if one controls
simultaneously for all covariates in the model; the estimated skin coefficient
declines but is still statistically significant at -0.164 (p value < 0.01). This
suggests that Black seniors report lower SRHS even after taking differences in
endowment into consideration. This remaining gap in health between the two
races comes from unobservable individual or community characteristics which
are not fully captured in the SABE data. For instance, one might argue that
Blacks have less access to medical care and good quality of care which, in time,
explains the remaining disparities in health and health outcomes. Social
discrimination and geographic marginalization could also play a role in explaining
the racial gap. Alternatively, the estimated race coefficient could still be
significant because of inherent genetic differences between Blacks and Whites.
However, given the cross-sectional nature of the data, we can only speculate
about the possible reasons for the remaining differences in health for these Black
and White seniors.
B) Oaxaca-Blinder decomposition
In this section, we will discuss the Oaxaca-Blinder decomposition results.
Table 9 summarizes the sources of racial disparities in health when one uses
SRHS, ADL and IADL. Table 10 presents the results when the analysis is
conducted by income group. One needs to keep in mind, prior to any
interpretation, that the number in Table 9 (e.g., for SRHS, it is 14.6) represents
the net sum of positive and negative effects of each variable used in the analysis.
Although available, the separate result for each variable is not shown. In
addition, the second row, Part (a) represents the differences due to coefficients.
The third row, Part (b) represents differences in the model constants. In all
cases, a positive number indicates an advantage for White seniors, while a
negative number indicates an advantage for Black seniors. As in the previous
23
case, we will discuss the results as they relate to the self-reported health status
indicator.
Based on endowment characteristics, White seniors have an advantage in
SRHS over Black seniors. Most of these differences in SRHS come from
disparities that favor White seniors in terms of education, wealth and, most
notably, differences in living conditions during the first 15 years of life.
Surprisingly, the highest contribution to the variation in SRHS attributable to
observable explanatory variables comes from the condition of living in a rural
area during the first five years of life. The second most important component is
the consequence of differences in present wealth between White and Black
seniors. According to these results, 48% of all the differences in health could be
attributable to disparities in observable characteristics between White and Black
seniors. The remaining disparities in SRHS (52%) come from variation in the
coefficients and differences in the model constants.
Table 8 shows within-race and between-group variation in the
determinants of health. One may conclude that the marginal effects of age,
immigration and economic status during the first 15 years of life are the main
factors that contribute to the variation in health that is attributable to the
coefficients (i.e., -114.9, see Table 8). Most of these differences favor Black
seniors. At the same time, from Table 7 one should also notice that the marginal
effect of most of the variables used in the analysis have the same sign, but differ
slightly in magnitude for both races. For instance, wealth has a positive effect on
health for both races, but the marginal effect of wealth is similar for Black seniors
and White seniors. Interestingly, living in a rural area during the first 5 years of
life has a similar negative marginal effect for both races. Therefore, one may
conclude that the racial disparities in health from this variable are mainly due to
differences in the initial conditions for White and Black seniors. Likewise,
differences in socio-economic conditions favor White seniors in terms of initial
levels of endowment, but additional levels of these variables would benefit both
races in a similar fashion. Finally, as Table 8 indicates, the variation in health
24
that is captured in the constant terms favors White seniors rather than Black
seniors.
Using the Oaxaca-Blinder approach, one may conclude that a significant
portion of the health variation between Black and White seniors shown in Figure
1 and Figure 2 comes from variability in endowment between the races in terms
of past and present conditions. Most notably, living in rural areas during the first 5
years of life seems to have long-lasting effects on the health condition of these
older Brazilians. As we initially suspected, current wealth and income play a
fundamental role in the disparities in health. In other words, these results suggest
that eliminating past differences in the living conditions between White and Black
seniors, as well as reducing disparities in current income, are the two most
important factors for eliminating the current racial disparities in health in this
study population. Surprisingly, the marginal effects of socio-economic and past
health conditions on an individual’s health tend to be very similar for the two
races. Clearly, using these data we could not sort out how past living conditions
operate to reduce an individual’s health. However, earlier living conditions may
directly affect the health capital of an individual as well as his or her wages and
educational capital over the course of his life, which in time also impacts how an
individual’s health changes over time.
Now we will ask whether observable characteristics play a different role for
individuals in the lower half of the income distribution compared to individuals in
the upper half of the distribution. Table 10 presents these results using total
income; although not shown, the results are similar when one uses wealth. The
variation in SRHS attributable to all explanatory variables for individuals in the
upper half of the income distribution is lower than the variation for individuals in
the lower half of the income distribution (27.5% vs. 116%). For both income
groups, the differences in endowment favor White seniors. Yet, for individuals in
the lower half of the income distribution, wealth and education are the variables
that contribute the most to the 14.1 percent variation in favor of White seniors.

25
Exploring the variation for individuals in the upper half of the income
distribution, one notices that variability in endowment due to observables is not
only smaller as a percentage of the total disparities in health, but the source of
the disparities also varies with respect to the group at the bottom of the income
distribution. In fact, the principal differences in endowment between affluent
White and affluent Black seniors (12.2) come from risk factors such as living in
rural areas during the first 5 years and self-reported health during the first 15
years of life. The role of current wealth and present socio-economic condition in
explaining racial variation in health among individuals in the upper half of the
income distribution is smaller than the role among individuals in the bottom half
of the income distribution. Furthermore, disparities not attributable to observable
characteristics are more significant for reducing the health disparities among
wealthy seniors than among poor seniors
VI) Concluding remarks
This research contributes to the health economics literature in developing
countries by presenting evidence of racial disparities in health among seniors in
Sao Paulo, Brazil according to functional health status, the prevalence of some
chronic and acute conditions, and disabling conditions. Unexpectedly, these
results are consistent with the extensive literature on developed countries related
to racial disparities in health, where many have argued that some, but not all, of
the racial disparities in health could be accounted for by eliminating current
socio-economic differences. The aim of this paper was not to identify the causal
pathways for each race from health and socio-economic conditions to health.
Instead, the goal was to describe potential underlying factors behind the racial
disparities in health that we observed.
The fact that inequalities in health among these two races persist even
after controlling for several covariates could be a consequence of several factors.
To improve the decision-making process for designing policies for seniors, one
important issue we must address is the influence of geographic variation in terms
of the availability of care and the quality of care in Sao Paulo among seniors of

26
different races. Diverse geographical mechanisms could operate to explain
racial disparities in health. For instance, it could be the case that, even after
controlling for case mix and other patient characteristics, Black seniors are
under-served compared to White seniors. Under-representation of Blacks and
minorities as health professionals may result in different treatment patterns for
patients of different races. Additionally, Blacks could be more likely to live in
areas where the quality of care for all types of patients is lower than in areas
where White seniors are more likely to live. Notice that in both cases, a policy to
ensure equal access among seniors of different races within the same
geographic boundaries would do little to reduce the disparities in health. (See
Chandra and Skinner, 2003, for an evaluation of this issue.)
On the other hand, disparities could arise because the quality of health
care decisions may differ by race. For instance, Black seniors could be more
likely to refuse treatment, poorly follow their prescribed treatment regimen, or
even to delay seeking for care. Although using the SABE data set one could not
fully explore these hypotheses, the data used in this analysis indicate that Blacks
have fewer visits to the hospital and physicians, regardless of the fact that they
report a higher prevalence of some chronic and life threatening conditions. In this
case, policies to enhance the availability of information would be effective in
reducing racial disparities in health among these seniors. Alternative policies
could also include greater emphasis on the prevention of those illnesses most
prevalent among Blacks seniors, and the development of economic incentives to
reduce inequalities in the quality of care provided to Blacks seniors.
In this paper, we also propose a method to unravel the sources of racial
differences in health among these Brazilian seniors. According to our results,
48% of the total differences in SRHS among seniors of both races come from
observable individual characteristics. The decomposition indicates that racial
disparities are not only the consequence of variation in current socio-economic
conditions, but also of variation in living conditions during the first 15 years of
one’s life. Of particular relevance is living in rural areas during the first 5 years of
life, which may have long-lasting effects on elders’ health.
27
Interestingly, among individuals in the poorer half of the income
distribution, race disparities in health could be largely accounted for if differences
in present socio-economic conditions were reduced. Among the rich,
unobservable characteristics are more relevant to explaining the inequalities in
health among White and Black seniors. An important implication of our results is
that the health of seniors is mostly affected by past health conditions, in
particular, by some conditions which arise during early childhood. The negative
consequences of poor conditions and ill health are present over the life cycle and
during older ages. These findings have important distributional consequences if
it is still the case that Blacks are more likely to come from poorer families.
One should keep in mind that rising income among all seniors-–holding
income inequalities across races constant— may increase these racial disparities
instead of reducing them (see Wagstaff, A. et al., 2003 for a similar argument).
Thus, policy makers should be concerned not only with the level of socio-
economic condition of seniors of different races, but also of the level of racial
differences in socio-economic conditions. Further research is needed to
understand the channels through which reducing socio-economic inequalities
impacts racial disparities in health, particularly among poor seniors. For
instance, better socio-economic conditions could raise the nutritional status of the
elderly, or they could alter their rate of time preferences or their attitudes toward
risky behavior such as drinking and smoking.
Finally, our findings also suggest that 52% of the differences in SRHS
between White seniors and Black seniors come from differences not attributable
to observable individual characteristics. For policy purposes, it thus could be
important to evaluate the unobserved determinants of an individual’s health at
the community level. For instance, Black seniors may be more likely than White
seniors to live in areas where social behavior is not conducive to good health. In
general, large cities have communities where minorities tend to concentrate with
significant deprivation of resources (Day, 1990). In these communities, crime,
poor health, limited job opportunities, and a range of other social issues are
interrelated problems. Public officials should work in concert to ensure that these

28
services are provided to individuals of all ethnic origins. Over-all improvement of
the health and economic conditions of the population would not correct racial
inequalities in health unless public officials address ethnic disparities directly.
Acknowledgements
An earlier version of this paper benefited from comments by Claudia Pereira and
Antonio Guiffrida, as well as the participants in a seminar at the Inter-American
Development Bank during April, 2005. We also would like to thank Valerie
Danesh for assistance in securing some of the data used in this project. The
authors take sole responsibility for any remaining errors. We would like to thank
the Inter-American Development Bank for the financial support provided for this
investigation throughout the Project “Race and Ethnic Inequalities in Health and
Health Care in Latin American Countries”. We also would like to acknowledge the
principal investigators who participated in the SABE project, and the Pan-
American Health organization for providing the data used in this analysis.

29
VII) References
Adda J, Chandola T, Marmot M. 2003. “Socio-economic Status and Health:
Causality and Pathway.” Journal of Econometrics 112, 57–63.
Allison, R.A. and Foster, J.E. 2004. “Measuring Health Inequalities Using
Qualitative Data. “ Journal of Health Economic 23, 505-524.
Banks A, Blundell R, Marmot M, Nazroo J. 2002. “ Economic Measures in Health
Surveys” . Institute for Fiscal Studies and Department of Economics,
UCLA.
Beato, L.B. 2004. “Inequality and Human Rights of African Descendants in
Brazil”. Journal of Black Studies 34 (6), 766-786.
Burgard S. 2005. “Race and Pregnancy-Related Care in Brazil and South Africa”.
Social Science & Medicine, In Press.
Case A. 2001. “Does Money Protect Health Status? Evidence from South African
Pensions.” Princeton University and the NBER.
Case A, Deaton A. 2003. “Broken Down by Work and Sex: How our Health
Declines”. Research Program in Development Studies. Princeton
University.
Chandra A, Skinner J. 2003. “Geography and Racial Health Disparities”. National
Bureau of Economic Research, Working Paper 9513.
Corder LS, Manton KG. 1991. “National Surveys and the Health and Functioning
of the Elderly: The Effects of Design and Content.” Journal of the
American Statistical Association, 86 (414), 513-525.
Day M. 1990. “Race and Health of Inner Cities.” The Statistician, 39 (2), 157-161.
Deaton A. 1999. “Aging and Inequality in Income and Health. Demographic
Trends and Economic Consequences.” AEA Papers and Proceedings, 88
(2), 248-253.
30
Deb P, Trivedi P. 1997. “Demand for Medical Care by the Elderly: A Finite
Mixture Approach.” Journal of Applied Econometrics, 12 (3), 313-336.
Ettner SL, Grzywacz J. 2003. “Socio-economic Status and Health Among
Californians: An Examination of Multiple Pathways.” American Journal of
Public Health, 93 (3), 441-444.
Folstein Mf., Folstein S., Mchugh Pr. 1975.” Mini-Mental State: A practical
Method for Grading the Clinician”. Journal Psychiatric Research 12, 189-
198.
Grossman M. 1972. “On the Concept of Health Capital and the Demand for
Health.” Journal of Political Economy 80, 223-255.
Krieger N, Chen JT, Waterman, PD, Rebkoff DH, Subrarmanian SV. 2003.
“Race/ethnicity, Gender, and Monitoring Socio-economic Gradients in
Health: a Comparison of Area-Based Socio-economic Measures---The
Public Health Disparities Geocoding Project.” American Journal of Public
Health, 93 (10), 1655-1671.
Lauridsen J, Christiansen T, Hakkinen U. 2003. “Measuring Inequality in Self-
reported Health—Discussions of a Recently Suggested Approach Using
Finnish data.” Health Economics.
LaVeist, TA. 1994. “Beyond Dummy Variables and Sample Selection: What
Health Services Researchers Ought to Know about Race as a Variable.”
Health Services Research, 29 (1), 1-16.
Lillie-Blannton M, LaVeist T. 1996. “Race/Ethnicity, the Social Environment, and
Health.” Social Science Medicine, 43 (1), 83-91.
Mejia JA, Moncada G. 2000. “Las Variables de Etnia y Raza Encuestas de
Hogares en América Latina y el Caribe.” Ponencia Presentada en el
Primer Encuentro Internacional “Todos Contamos. Los Grupos Étnicos en
los Censos.”

31
Olinto, M.T.A and Olinto, B.A. 2000. “Race and Inequality among Women: An
example in Southern Brazil”. Cadernos de Saude Publica 16 (4), 1137-
1142.
Palloni A. 1999. “SABE Project: Health, Well-Being, and Aging in the Latin
America and the Caribbean.” Pan American Health Organization.
Research in Public Health. Technical Papers.
Pappas G. 1994. “Elucidating the Relationships between Race, Socio-economic
Status, and Health.” American Journal of Public Health, 84 (6), 892-893.
Pelaez M, Palloni A, Albala C, Alfonso JC, Ham-Chande R, Hennis A, Lebrao
ML, Leon-Diaz E, Pantelides E, Prats O. 2003. Survey on Aging, Health,
and Wellbeing, 2000. Pan American Health Organization (PAHO/WHO).
Pfeffer, R.I., Kurosaki, T.T., Harrah, C, Jr. Chance, J,M., Filos, S. 1982.
“Measurement of Functional Activities in older adults in the community”.
Journal of Gerontology 37:3, 323-329.
Pritchett L, Summers L. 1996. “Wealthier is Healthier.” Journal of Human
Resources, 31 (4), 841-868.
Rosenzweig, M.R., and T.P. Schultz. 1983. “Estimating a Household Production
Function: Heterogeneity, the Demand for Health Inputs, and Their Effects
on Birth Weight”. Journal of Political Economy 91:5, 723-746.
Rushing B, Ritter C, Burton RPD. 1992. “Race Differences in the Effects of
Multiple Roles in Health: Longitudinal Evidence from a National Sample of
Older Men.” Journal of Health and Social Behavior, 33, 126-139.
Sadana, R., 2001. “Self-report Versus Observed Health Status: Evaluation of
Cross-population Comparability. Prepared for Global Conferences on
Summary Measures of Population Health, Geneva: World Health
Organization.
Salas C. 2002. “On the Empirical Association between Poor Health and Low
Socio-economic Status at Old Age.” Health Economics 11, 207–220.
32
Seabrook J. 2003. “A World Grown Old.” Harvard International Review, 25 (1),
22.
Smedley, B, Stith, A and Nelson,A. Editors, 2002. Unequal Treatment:
Confronting Racial and Ethnic Disparities in Health Care. The National
Academies Press, Washington, D.C.
Smith JP. 1998. “Socio-economic Status and Health.” The American Economic
Review 88 (2), 192-196.
Smith JP. 1999. “Healthy Bodies and Thick Wallets: The Dual Relationship
between Health and Economic Status.” Journal of Economic Perspectives,
13 (2), 145-166.
Smith JP, and Kington R. 2003. Race, Socio-economic Status, and Health in
Late Life. National Institute on Aging and The National Institutes of Child
Health and Human Development, Working Paper.
Strauss J, Gertler P, Rahman O, Fox K. 1993. “Gender and Life-Cycle
Differentials in the Patterns and Determinants of Adult Health.” Journal of
Human Resources, 28 (4), 792-837.
Strauss, J. and Thomas, D. , 1998. “Health, Nutrition, and Economic
Development.” Journal of Economic Literature, vol. XXXVI, 766-817.
Thomas, D. and Frankenberg, E. 2000. “The Measurement and Interpretation of
Health in Social Surveys”. Unpublished manuscript prepared for the
World Health Organization Conference on Summary Measures for
Population Health, Marrakech, December, 1999.
Uhlenberg P. 1992. Population Aging and Social Policy. Annual Review of
Sociology, 18, 449-474.
Telles, E. 2002. Racial Ambiguity among the Brazilian Population. Ethnic and
Racial Studies, Vol.25:3, 415-441.
33
Vaupel JW. 1998. Demographic Analysis of Aging and Longevity, Demographic
Trends and Economic Consequences. AEA Papers and Proceedings, 88
(2), 242-247.
World Bank Latin American and Caribbean Studies 2003. Inequality in Latin
America and the Caribbean: Breaking with History. The World Bank,
Washington, DC.
World Health Organization. 2001. World Conference against Racism, Racial,
Discrimination, Xenophobia and Related Intolerance. Health & Human
Rights Publication Series, 2, August 2001.
Wagstaff A, van Doorslaer E. 2000. “Equity in Health Care Finance and
Delivery.” Handbook of Health Economics, 1, 1804-1862.
Waldron, I. and Jacobs, J.A. 1989. Effects of Multiple Roles on Women’s Health
–Evidence from a National Longitudinal Study. Women & Health 15, 3-19.
Wagstaff, A., van Doorslaer E and Watanabe, N. 2003. On Decomposing the
Causes of Health Sector Inequalities with an Application to Malnutrition
Inequalities in Vietnam. Journal of Econometrics, 112, 207-223.
William, D. 2005. Racial/Ethnic Differences in Health: 10 Key Facts. Institute for
Social Research, University of Michigan. Unpublished presentation.
Wooldridge, JM. 2002. Econometric Analysis of Cross Section and Panel Data.
MIT Press. Cambridge, MA.
34
Figure 1: White and Black Health Deterioration after Age 60
22.
53
SR
HS
60<X<69 70<X<79 80<X<85 X>86Age Categories
White Black
45
67
8A
DL
Inde
x
60<X<69 70<X<79 80<X<85 X>86Age Categories
White Black
910
1112
1314
IAD
L In
dex
60<X<69 70<X<79 80<X<85 X>86Age Categories
White Black
Source: SABE database
White and Black Health Deterioration After Age 60
Figure 2: White and Black Health By Income Quartile
22.
53
SR
HS
quartile_1 quartile_2 quartile_3 quartile_4Income quartile
White Black
66.
57
7.5
AD
L In
dex
quartile_1 quartile_2 quartile_3 quartile_4Income quartile
White Black
12.5
1313
.514
14.5
IAD
L In
dex
quartile_1 quartile_2 quartile_3 quartile_4Income quartile
White Black
Source: SABE database
White and Black Health by Income Quartile
35
Figure 3: Comparison of White and Black Health Conditions
Diabetes
Cancer
Lung Disease
Heart Disease
Stroke
Arthritis
Fall last year
Incontinence
Psychiatric problem
0.0
5.1
.2.3
% o
f Whi
te w
ith H
ealth
Con
ditio
n
0 .05 .1 .2 .3% of Black with Health Condition
Source: SABE database
Comparison of White and Black Health Conditions

Table 1. BrazilComparison of White and Black health in old ageWeighted summary statistics.
Health IndicatorsMean Std err Mean Std err Mean Std err Mean Std err
Health functional statusSelf-reported Health Status 2.602 (0.046) 2.362 (0.068) 2.595 (0.035) 2.221 (0.070)ADL index 7.644 (0.136) 7.211 (0.267) 6.351 (0.108) 6.214 (0.187)IADL index 11.061 (0.116) 9.403 (0.261) 12.381 (0.104) 11.334 (0.235)
Life threatening conditionsHypertension 0.478 (0.023) 0.589 (0.047) 0.543 (0.017) 0.631 (0.035)Diabetes 0.171 (0.021) 0.163 (0.038) 0.187 (0.015) 0.202 (0.029)Cancer 0.038 (0.007) 0.019 (0.015) 0.039 (0.006) 0.024 (0.117)Chronic Lung Disease 0.146 (0.015) 0.133 (0.032) 0.114 (0.012) 0.106 (0.025)Heart Disease 0.217 (0.019) 0.193 (0.038) 0.202 (0.016) 0.202 (0.026)Stroke 0.078 (0.012) 0.109 (0.027) 0.057 (0.009) 0.065 (0.023)
Disabling conditionsArthritis, Rheumatism or Osteoarthritis 0.217 (0.019) 0.144 (0.037) 0.411 (0.017) 0.373 (0.032)Fall in the last 12 months 0.206 (0.022) 0.253 (0.039) 0.334 (0.018) 0.347 (0.032)Incontinence 0.091 (0.013) 0.182 (0.032) 0.264 (0.014) 0.267 (0.042)Cognitive scores 0.964 (0.008) 0.857 (0.039) 0.941 (0.009) 0.887 (0.022)Emotional, Nervous or psychiatric problem 0.126 (0.016) 0.194 (0.038) 0.179 (0.015) 0.198 (0.032)
Anthropometry measuresHeight (cms) 165.6 (0.336) 164.9 (1.161) 151.9 (0.259) 152.8 (0.424)Weight (kgs) 70.1 (0.685) 69.3 (1.591) 64.2 (0.597) 63.1 (1.316)
Notes 1) Self-reported Health Status was coded 5= Excellent, 4=Very Good, 3=Good, 2=Fair and 1=Poor2) ADL is an indicator from 0 to 10 (0 = worst condition)3) IADL is an indicator from 0 to 15 (0 = worst condition)4) Each health condition refers to whether a doctor or nurse ever told the individual that he or she had the condition. A dummy indicator was constructed where 1= existence of the condition, 0 otherwise.5) Cognitive score represents the percentage of individuals with an score higher than 13 (that is, in good cognitive condition)
White (n = 628) Black (n = 137)Males (765) Females (1,086)
White (n = 894) Black (n = 192)
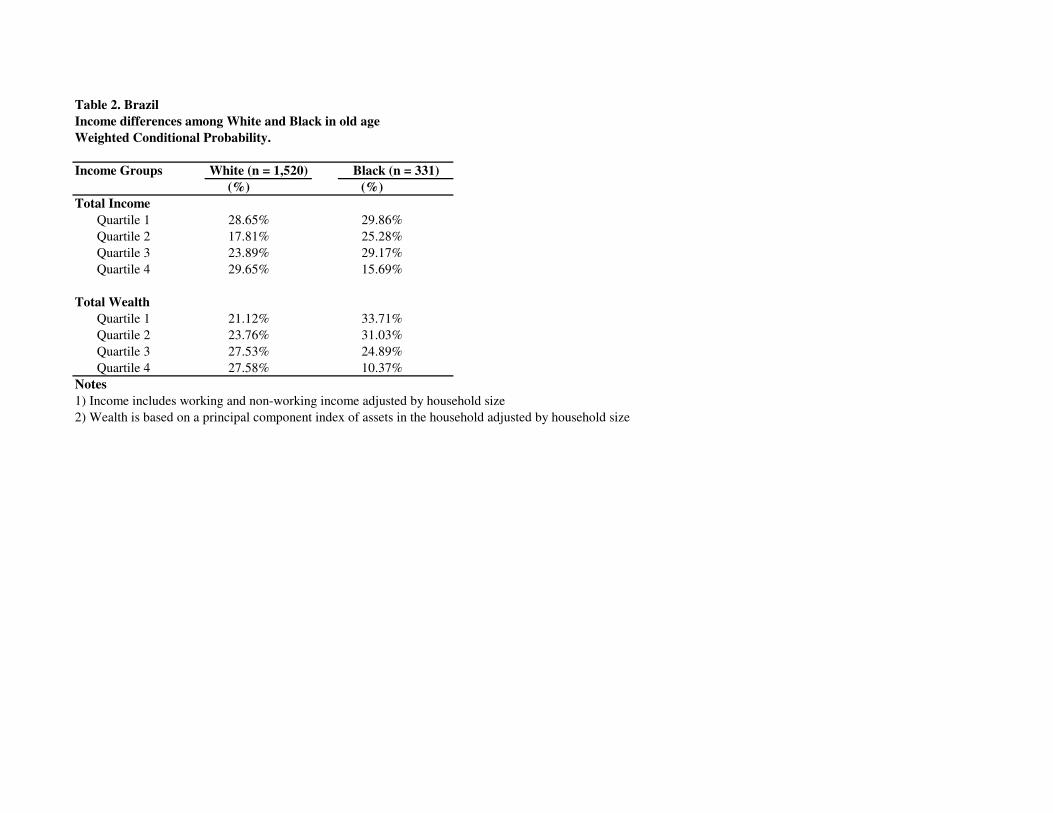
Table 2. BrazilIncome differences among White and Black in old ageWeighted Conditional Probability.
Income Groups(%) (%)
Total IncomeQuartile 1 28.65% 29.86%Quartile 2 17.81% 25.28%Quartile 3 23.89% 29.17%Quartile 4 29.65% 15.69%
Total WealthQuartile 1 21.12% 33.71%Quartile 2 23.76% 31.03%Quartile 3 27.53% 24.89%Quartile 4 27.58% 10.37%
Notes 1) Income includes working and non-working income adjusted by household size2) Wealth is based on a principal component index of assets in the household adjusted by household size
White (n = 1,520) Black (n = 331)
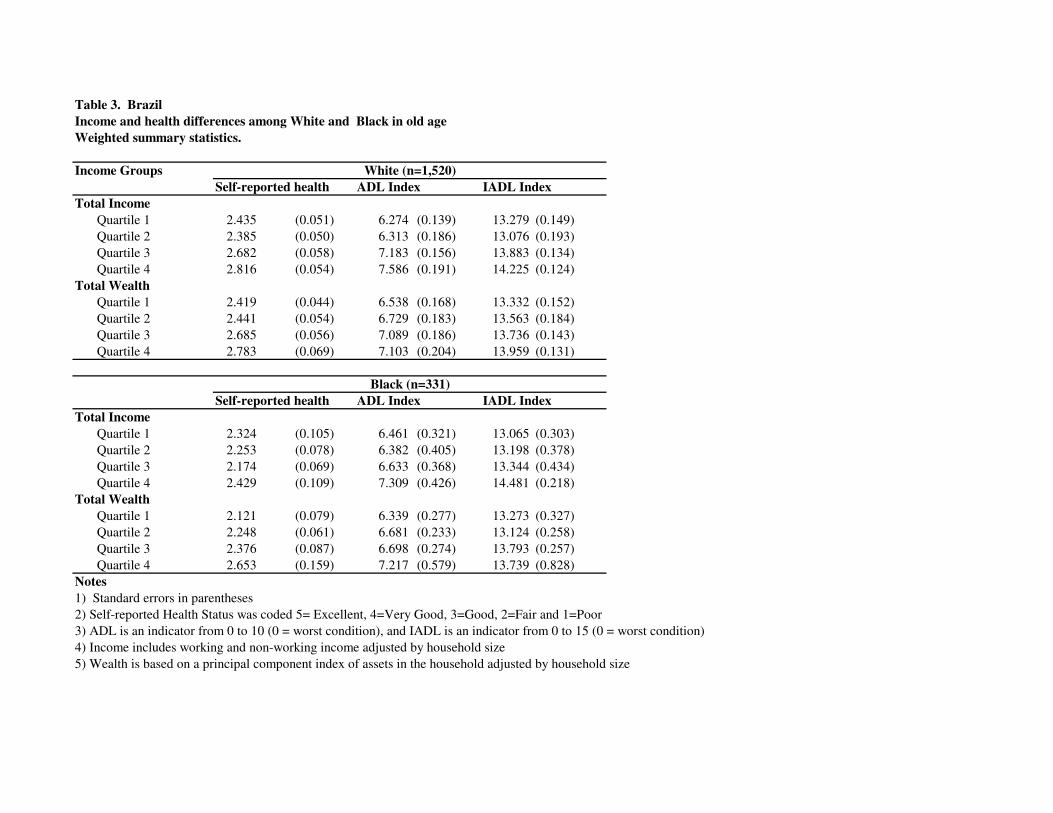
Table 3. BrazilIncome and health differences among White and Black in old ageWeighted summary statistics.
Income GroupsADL Index IADL Index
Total IncomeQuartile 1 2.435 (0.051) 6.274 (0.139) 13.279 (0.149)Quartile 2 2.385 (0.050) 6.313 (0.186) 13.076 (0.193)Quartile 3 2.682 (0.058) 7.183 (0.156) 13.883 (0.134)Quartile 4 2.816 (0.054) 7.586 (0.191) 14.225 (0.124)
Total WealthQuartile 1 2.419 (0.044) 6.538 (0.168) 13.332 (0.152)Quartile 2 2.441 (0.054) 6.729 (0.183) 13.563 (0.184)Quartile 3 2.685 (0.056) 7.089 (0.186) 13.736 (0.143)Quartile 4 2.783 (0.069) 7.103 (0.204) 13.959 (0.131)
ADL Index IADL IndexTotal Income
Quartile 1 2.324 (0.105) 6.461 (0.321) 13.065 (0.303)Quartile 2 2.253 (0.078) 6.382 (0.405) 13.198 (0.378)Quartile 3 2.174 (0.069) 6.633 (0.368) 13.344 (0.434)Quartile 4 2.429 (0.109) 7.309 (0.426) 14.481 (0.218)
Total WealthQuartile 1 2.121 (0.079) 6.339 (0.277) 13.273 (0.327)Quartile 2 2.248 (0.061) 6.681 (0.233) 13.124 (0.258)Quartile 3 2.376 (0.087) 6.698 (0.274) 13.793 (0.257)Quartile 4 2.653 (0.159) 7.217 (0.579) 13.739 (0.828)
Notes 1) Standard errors in parentheses2) Self-reported Health Status was coded 5= Excellent, 4=Very Good, 3=Good, 2=Fair and 1=Poor3) ADL is an indicator from 0 to 10 (0 = worst condition), and IADL is an indicator from 0 to 15 (0 = worst condition) 4) Income includes working and non-working income adjusted by household size5) Wealth is based on a principal component index of assets in the household adjusted by household size
White (n=1,520)
Black (n=331)
Self-reported health
Self-reported health
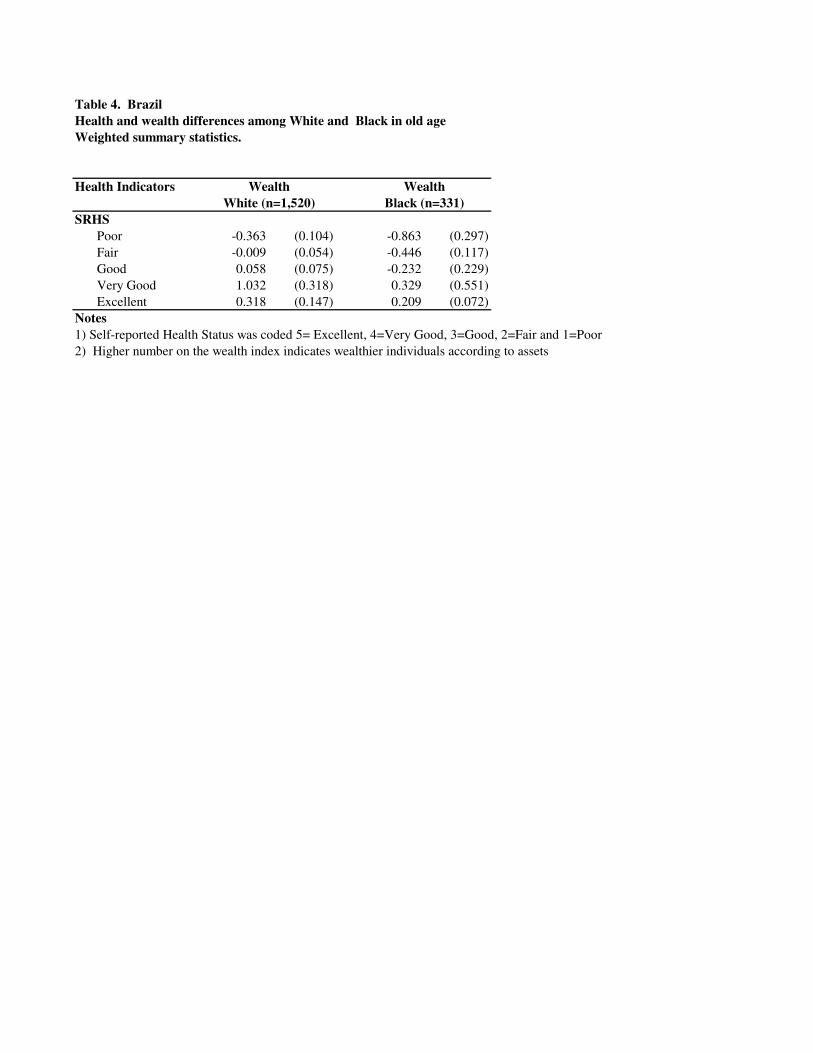
Table 4. BrazilHealth and wealth differences among White and Black in old ageWeighted summary statistics.
Health Indicators
SRHSPoor -0.363 (0.104) -0.863 (0.297)Fair -0.009 (0.054) -0.446 (0.117)Good 0.058 (0.075) -0.232 (0.229)Very Good 1.032 (0.318) 0.329 (0.551)Excellent 0.318 (0.147) 0.209 (0.072)
Notes 1) Self-reported Health Status was coded 5= Excellent, 4=Very Good, 3=Good, 2=Fair and 1=Poor2) Higher number on the wealth index indicates wealthier individuals according to assets
Wealth WealthBlack (n=331)White (n=1,520)
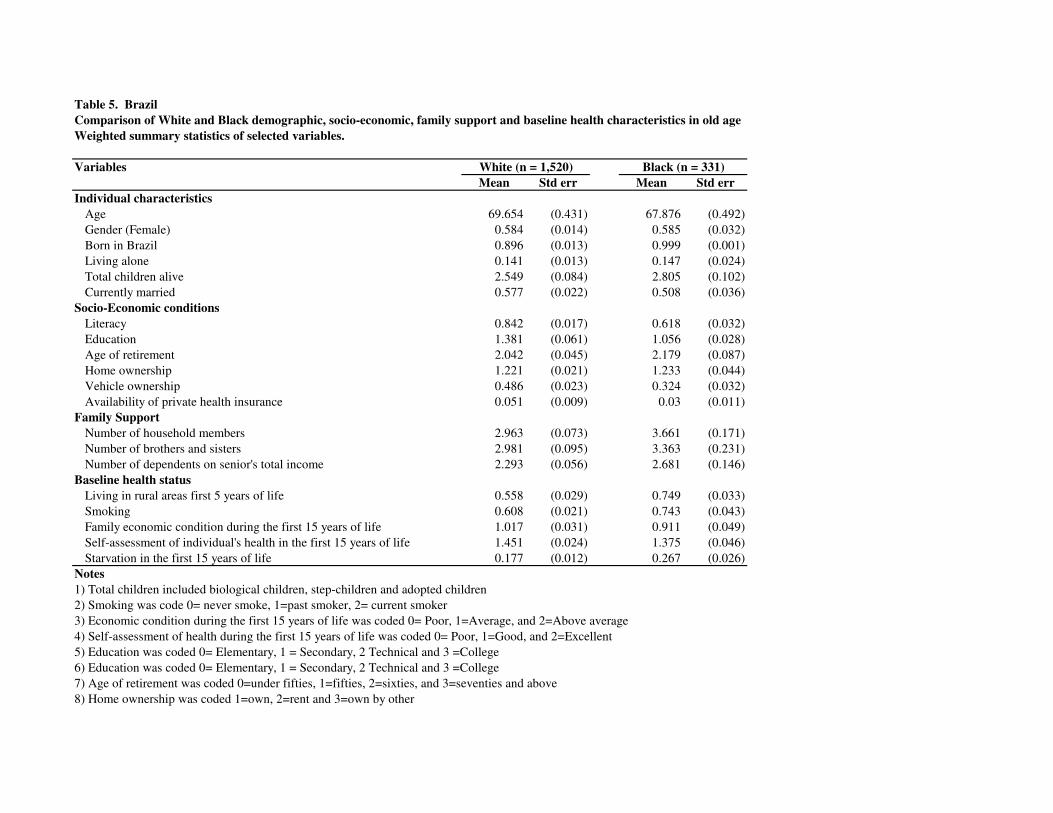
Table 5. BrazilComparison of White and Black demographic, socio-economic, family support and baseline health characteristics in old ageWeighted summary statistics of selected variables.
VariablesMean Std err Mean Std err
Individual characteristicsAge 69.654 (0.431) 67.876 (0.492)Gender (Female) 0.584 (0.014) 0.585 (0.032)Born in Brazil 0.896 (0.013) 0.999 (0.001)Living alone 0.141 (0.013) 0.147 (0.024)Total children alive 2.549 (0.084) 2.805 (0.102)Currently married 0.577 (0.022) 0.508 (0.036)
Socio-Economic conditionsLiteracy 0.842 (0.017) 0.618 (0.032)Education 1.381 (0.061) 1.056 (0.028)Age of retirement 2.042 (0.045) 2.179 (0.087)Home ownership 1.221 (0.021) 1.233 (0.044)Vehicle ownership 0.486 (0.023) 0.324 (0.032)Availability of private health insurance 0.051 (0.009) 0.03 (0.011)
Family Support Number of household members 2.963 (0.073) 3.661 (0.171)Number of brothers and sisters 2.981 (0.095) 3.363 (0.231)Number of dependents on senior's total income 2.293 (0.056) 2.681 (0.146)
Baseline health statusLiving in rural areas first 5 years of life 0.558 (0.029) 0.749 (0.033)Smoking 0.608 (0.021) 0.743 (0.043)Family economic condition during the first 15 years of life 1.017 (0.031) 0.911 (0.049)Self-assessment of individual's health in the first 15 years of life 1.451 (0.024) 1.375 (0.046)Starvation in the first 15 years of life 0.177 (0.012) 0.267 (0.026)
Notes1) Total children included biological children, step-children and adopted children2) Smoking was code 0= never smoke, 1=past smoker, 2= current smoker3) Economic condition during the first 15 years of life was coded 0= Poor, 1=Average, and 2=Above average4) Self-assessment of health during the first 15 years of life was coded 0= Poor, 1=Good, and 2=Excellent5) Education was coded 0= Elementary, 1 = Secondary, 2 Technical and 3 =College6) Education was coded 0= Elementary, 1 = Secondary, 2 Technical and 3 =College7) Age of retirement was coded 0=under fifties, 1=fifties, 2=sixties, and 3=seventies and above8) Home ownership was coded 1=own, 2=rent and 3=own by other
White (n = 1,520) Black (n = 331)

Table 6. BrazilDescription of variables in the SABE Database
Variables DescriptionDependent Variables
Cognitive evaluation A vector of 10 different variables (e.g., memory at the present time, able to manage money, shopping alone, remember family events, etc).
Self-reported health status A question that includes the following options: excellent, very good, good, fair, and poor.
Existence of chronic and Different questions about the existence of hypertension, diabetes, cancer, lung disease,acute conditions heart attack, coronary heart disease, angina, or other heart problems, cerebral embolism,
arthritis, rheumatism, or osteoarthritis.
ADL / IADL scores Variables to measure current ADL and IADL scores. This excludes any difficulties that an individual expects to last more than three months.
Mental Health Variables to measure emotional, nervous or psychiatric problems in the last 12 months
Health Risk Factors Smoking, drinking, and eating behaviors
Medical Care Use Several questions which capture hospital, outpatient, and preventive care use
Independent VariableSkin Includes the following categories: White, Mestizo (combination of white and indigenous), Mulatto
(combination of black and white), Black, Indigenous, Asian, Other.
Control VariablesVector of current demographic Age, gender, religion, immigration status, living with someone, number of children, number of step-children, characteristics total number of individuals in the household, number of an individual's children not living at home,
number of brothers and sisters, age cohort, current marital status, number of marriages, duration of each marriage, characteristics of each transition in marital status in the individual's life.
Vector of current socio-economic Level of schooling, illiteracy, age when started to work, current work status, age at characteristics retirement, type of occupation, total income from different sources (pension,
family transfers, banking income, welfare subsidy), total expenditures on goods, home characteristics, home ownership, list of household assets (e.g.., refrigerator, washer, water heater, microwave, television, telephone, VCR, radio player, heating, air conditioning, fan), availability of social security, private insurance, other public insurance.
Vector of family of support Number of members in the household, number of sibblings, number of children who live outside home, and other family and friends
Vector of baseline health status Father or mother alive, father or mother's age at death, living in rural areas first 5 years of lifeage when first diagnosed with cancer, past smoker, current smoker, family economic condition during the first 15 years of life, self-assessment of individual's health in the first 15 years of life, existence of any of the following illnesses during the first 15 years of life: kidney disease, hepatitis, measlestuberculosis, rheumatic fever, asthma, bronchitis.

Table 7. BrazilOLS estimates of the effects of skin (proxy for race) on health status in old ageSkin coefficient and standard error. Weighted sample (N=1,851)
Vector IncludedI) Only the skin variable included -0.329 (0.048) *** -0.255 (0.185) -0.264 (0.189)
R_Squared 0.03 0.002 0.001F-value 46.57 *** 1.90 1.95
II) Vector of individual characteristics -0.305 (0.053) *** -0.352 (0.176) -0.383 (0.187) **R_Squared 0.04 0.12 0.13F-value 12.47 *** 26.46 *** 24.68 ***
III) Vector of socio-economic conditions -0.211 (0.046) *** -0.215 (0.159) -0.206 (0.152)R_Squared 0.13 0.16 0.15F-value 7.31 *** 17.64 *** 13.95 ***
IV) Vector of family support conditions -0.282 (0.051) *** -0.294 (0.175) * -0.273 (0.186)R_Squared 0.05 0.13 0.16F-value 7.83 *** 15.35 *** 22.53 ***
V) Vector of baseline health conditions -0.239 (0.052) *** -0.256 (0.173) -0.269 (0.188)R_Squared 0.08 0.13 0.14F-value 12.65 *** 12.41 *** 13.84 ***
VI) All variables included -0.164 (0.050) *** -0.113 (0.164) -0.052 (0.154)R_Squared 0.15 0.18 0.18F-value 22.01 *** 20.09 *** 8.45 ***
(**) significant at p < 0.05 , (***) significant at p<0.01Notes1) Skin was coded 0=White, 1= Black; Self-reported Health Status was coded 5= Excellent, 4=Very Good, 3=Good, 2=Fair and 1=Poor2) IADL is an indicator from 0 to 15 (0 = worst condition) and ADL is an indicator from 0 to 10 (0= worst condition)3) Each regression includes a vector of basic individual characteristics such as: age, gender, living alone, married, immigrant, and total children alive4) The vector of socio-economic condition includes: level of schooling, literacy, age when started to work, age at retirement, type of occupationtotal income from different sources, home characteristics, home ownership, wealth index, and availability of health insurance5) The vector of family support includes: number of household members, number of brothers and sisters, number of children living outside home6) The vector of baseline health includes: living in rural areas first 5 years of life, economic condition during the first 15 years of life, self-assessment of health in the 15 years of life, existence of a serious health problem during the first 15 years of life
Self-reported health ADL Index IADL Index
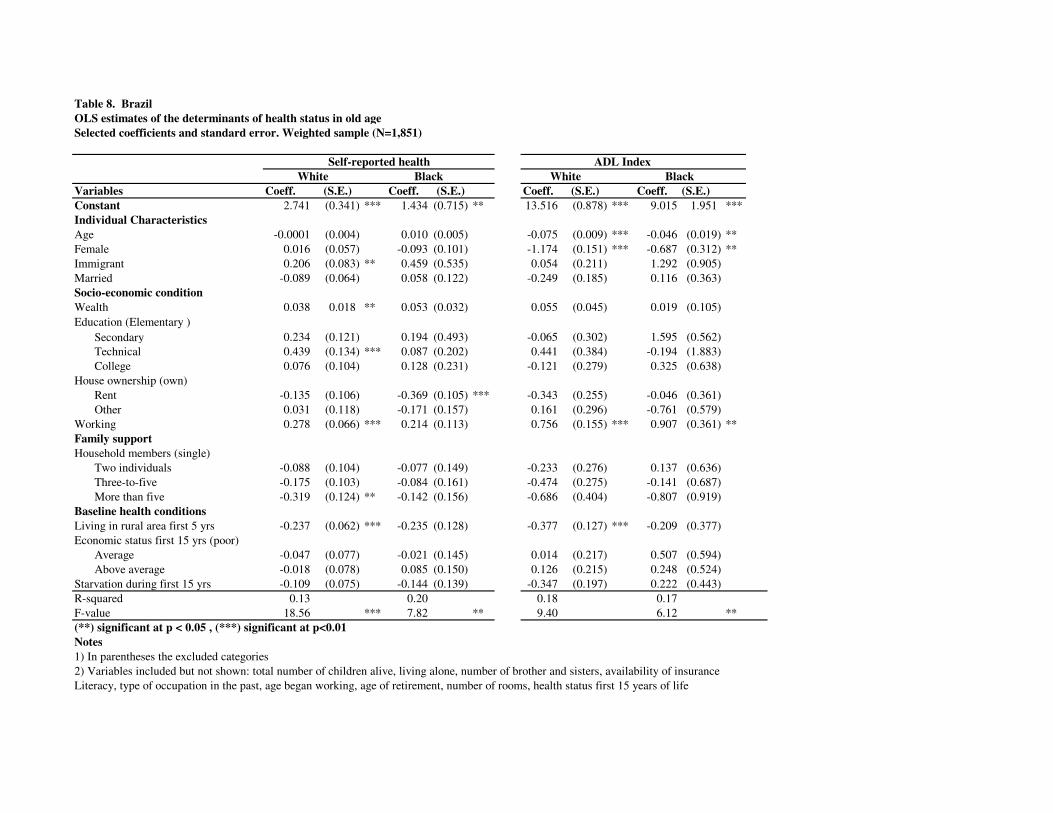
Table 8. BrazilOLS estimates of the determinants of health status in old ageSelected coefficients and standard error. Weighted sample (N=1,851)
Variables Coeff. (S.E.) Coeff. (S.E.) Coeff. (S.E.) Coeff. (S.E.)Constant 2.741 (0.341) *** 1.434 (0.715) ** 13.516 (0.878) *** 9.015 1.951 ***Individual CharacteristicsAge -0.0001 (0.004) 0.010 (0.005) -0.075 (0.009) *** -0.046 (0.019) **Female 0.016 (0.057) -0.093 (0.101) -1.174 (0.151) *** -0.687 (0.312) **Immigrant 0.206 (0.083) ** 0.459 (0.535) 0.054 (0.211) 1.292 (0.905)Married -0.089 (0.064) 0.058 (0.122) -0.249 (0.185) 0.116 (0.363)Socio-economic conditionWealth 0.038 0.018 ** 0.053 (0.032) 0.055 (0.045) 0.019 (0.105)Education (Elementary )
Secondary 0.234 (0.121) 0.194 (0.493) -0.065 (0.302) 1.595 (0.562)Technical 0.439 (0.134) *** 0.087 (0.202) 0.441 (0.384) -0.194 (1.883)College 0.076 (0.104) 0.128 (0.231) -0.121 (0.279) 0.325 (0.638)
House ownership (own)Rent -0.135 (0.106) -0.369 (0.105) *** -0.343 (0.255) -0.046 (0.361)Other 0.031 (0.118) -0.171 (0.157) 0.161 (0.296) -0.761 (0.579)
Working 0.278 (0.066) *** 0.214 (0.113) 0.756 (0.155) *** 0.907 (0.361) **Family supportHousehold members (single)
Two individuals -0.088 (0.104) -0.077 (0.149) -0.233 (0.276) 0.137 (0.636)Three-to-five -0.175 (0.103) -0.084 (0.161) -0.474 (0.275) -0.141 (0.687)More than five -0.319 (0.124) ** -0.142 (0.156) -0.686 (0.404) -0.807 (0.919)
Baseline health conditionsLiving in rural area first 5 yrs -0.237 (0.062) *** -0.235 (0.128) -0.377 (0.127) *** -0.209 (0.377)Economic status first 15 yrs (poor)
Average -0.047 (0.077) -0.021 (0.145) 0.014 (0.217) 0.507 (0.594)Above average -0.018 (0.078) 0.085 (0.150) 0.126 (0.215) 0.248 (0.524)
Starvation during first 15 yrs -0.109 (0.075) -0.144 (0.139) -0.347 (0.197) 0.222 (0.443)R-squared 0.13 0.20 0.18 0.17F-value 18.56 *** 7.82 ** 9.40 6.12 **(**) significant at p < 0.05 , (***) significant at p<0.01Notes1) In parentheses the excluded categories2) Variables included but not shown: total number of children alive, living alone, number of brother and sisters, availability of insuranceLiteracy, type of occupation in the past, age began working, age of retirement, number of rooms, health status first 15 years of life
Self-reported health ADL IndexWhite Black White Black
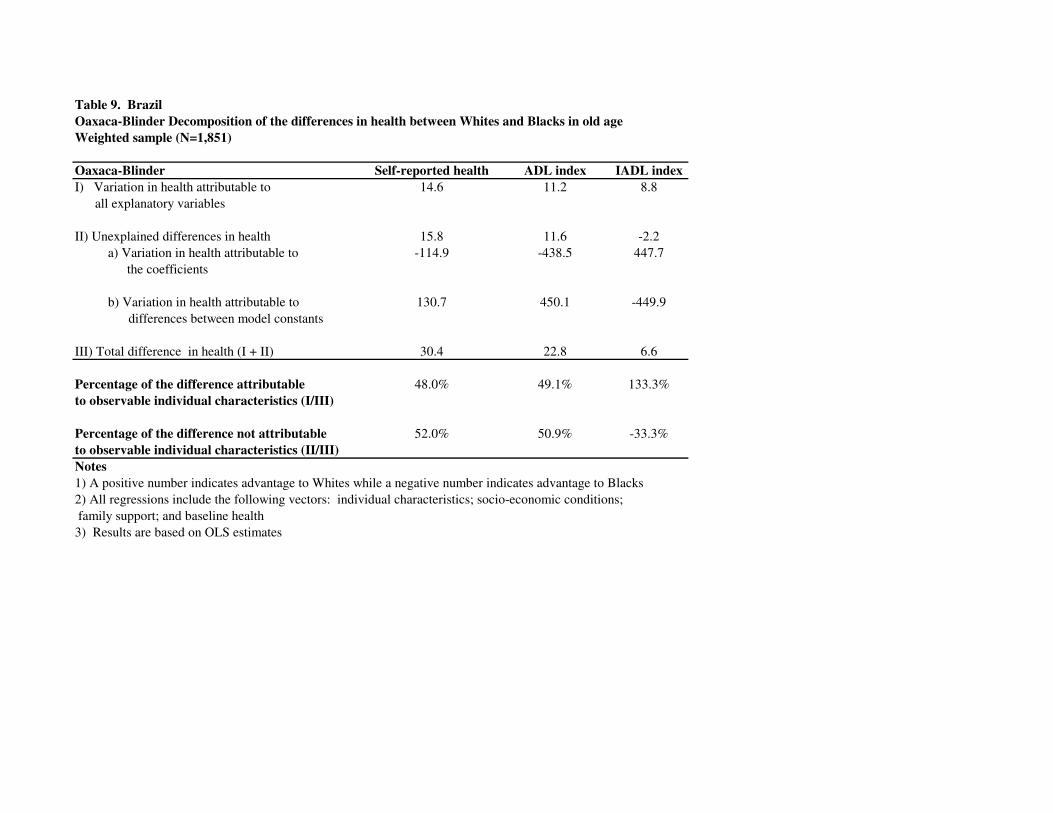
Table 9. BrazilOaxaca-Blinder Decomposition of the differences in health between Whites and Blacks in old ageWeighted sample (N=1,851)
Oaxaca-Blinder Self-reported health ADL index IADL indexI) Variation in health attributable to 14.6 11.2 8.8 all explanatory variables
II) Unexplained differences in health 15.8 11.6 -2.2a) Variation in health attributable to -114.9 -438.5 447.7
the coefficients
b) Variation in health attributable to 130.7 450.1 -449.9 differences between model constants III) Total difference in health (I + II) 30.4 22.8 6.6
Percentage of the difference attributable 48.0% 49.1% 133.3%to observable individual characteristics (I/III)
Percentage of the difference not attributable 52.0% 50.9% -33.3%to observable individual characteristics (II/III)Notes1) A positive number indicates advantage to Whites while a negative number indicates advantage to Blacks2) All regressions include the following vectors: individual characteristics; socio-economic conditions; family support; and baseline health 3) Results are based on OLS estimates
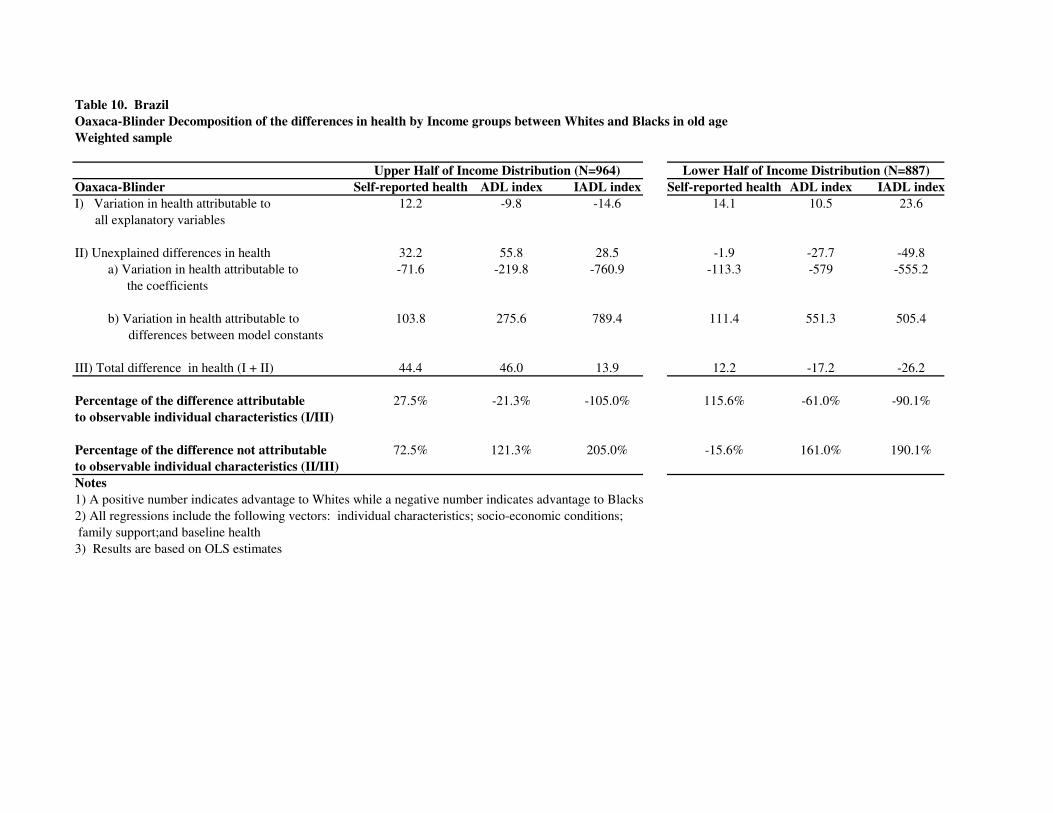
Table 10. BrazilOaxaca-Blinder Decomposition of the differences in health by Income groups between Whites and Blacks in old ageWeighted sample
Oaxaca-Blinder Self-reported health ADL index IADL index Self-reported health ADL index IADL indexI) Variation in health attributable to 12.2 -9.8 -14.6 14.1 10.5 23.6 all explanatory variables
II) Unexplained differences in health 32.2 55.8 28.5 -1.9 -27.7 -49.8a) Variation in health attributable to -71.6 -219.8 -760.9 -113.3 -579 -555.2
the coefficients
b) Variation in health attributable to 103.8 275.6 789.4 111.4 551.3 505.4 differences between model constants III) Total difference in health (I + II) 44.4 46.0 13.9 12.2 -17.2 -26.2
Percentage of the difference attributable 27.5% -21.3% -105.0% 115.6% -61.0% -90.1%to observable individual characteristics (I/III)
Percentage of the difference not attributable 72.5% 121.3% 205.0% -15.6% 161.0% 190.1%to observable individual characteristics (II/III)Notes1) A positive number indicates advantage to Whites while a negative number indicates advantage to Blacks2) All regressions include the following vectors: individual characteristics; socio-economic conditions; family support;and baseline health 3) Results are based on OLS estimates
Upper Half of Income Distribution (N=964) Lower Half of Income Distribution (N=887)