R Evolutionary patterns and processes in the radiation of phyllostomid bats
24
RESEARCH ARTICLE Open Access Evolutionary patterns and processes in the radiation of phyllostomid bats Leandro R Monteiro 1,2* and Marcelo R Nogueira 3 Abstract Background: The phyllostomid bats present the most extensive ecological and phenotypic radiation known among mammal families. This group is an important model system for studies of cranial ecomorphology and functional optimisation because of the constraints imposed by the requirements of flight. A number of studies supporting phyllostomid adaptation have focused on qualitative descriptions or correlating functional variables and diet, but explicit tests of possible evolutionary mechanisms and scenarios for phenotypic diversification have not been performed. We used a combination of morphometric and comparative methods to test hypotheses regarding the evolutionary processes behind the diversification of phenotype (mandible shape and size) and diet during the phyllostomid radiation. Results: The different phyllostomid lineages radiate in mandible shape space, with each feeding specialisation evolving towards different axes. Size and shape evolve quite independently, as the main directions of shape variation are associated with mandible elongation (nectarivores) or the relative size of tooth rows and mandibular processes (sanguivores and frugivores), which are not associated with size changes in the mandible. The early period of phyllostomid diversification is marked by a burst of shape, size, and diet disparity (before 20 Mya), larger than expected by neutral evolution models, settling later to a period of relative phenotypic and ecological stasis. The best fitting evolutionary model for both mandible shape and size divergence was an Ornstein-Uhlenbeck process with five adaptive peaks (insectivory, carnivory, sanguivory, nectarivory and frugivory). Conclusions: The radiation of phyllostomid bats presented adaptive and non-adaptive components nested together through the time frame of the family’s evolution. The first 10 My of the radiation were marked by strong phenotypic and ecological divergence among ancestors of modern lineages, whereas the remaining 20 My were marked by stasis around a number of probable adaptive peaks. A considerable amount of cladogenesis and speciation in this period is likely to be the result of non-adaptive allopatric divergence or adaptations to peaks within major dietary categories. Background The Phyllostomidae (leaf-nosed bats) is the dominant family of bats in Central and South America. This family has undergone an adaptive radiation unparalleled among other mammals in terms of ecological and morphologi- cal diversity [1]. Starting from an insectivore ancestor in the late Eocene [2-4], the 53 extant genera in this family have diversified into specialized forms for insectivory, carnivory, frugivory, granivory, nectarivory, and sanguiv- ory (although many species have mixed diets) [5-7]. This ecological diversity and specialisation originates from an intricate partitioning of resources [8,9], and is probably responsible for the high local species richness (ranging between 31-49 syntopic species [10,11]) observed for leaf-nosed bats. The evolution of specia- lised diets created functional demands, apparently deter- mining changes in cranial and mandibular shape [1,12]. The magnitude of skull form (shape + size) variation among phyllostomid lineages is large and has been assessed by correlational studies both qualitatively and quantitatively, using measurement ratios of func- tional relevance or traditional distance measurements [1,12-16]. One important aspect of phenotypic variation in the family is the snout elongation associated with * Correspondence: [email protected] 1 Department of Biological Sciences and Hull York Medical School, The University of Hull, Hull, HU6 7RX, UK Full list of author information is available at the end of the article Monteiro and Nogueira BMC Evolutionary Biology 2011, 11:137 http://www.biomedcentral.com/1471-2148/11/137 © 2011 Monteiro and Nogueira; licensee BioMed Central Ltd. This is an Open Access article distributed under the terms of the Creative Commons Attribution License (http://creativecommons.org/licenses/by/2.0), which permits unrestricted use, distribution, and reproduction in any medium, provided the original work is properly cited.
-
Upload
independent -
Category
Documents
-
view
0 -
download
0
Transcript of R Evolutionary patterns and processes in the radiation of phyllostomid bats

RESEARCH ARTICLE Open Access
Evolutionary patterns and processes in theradiation of phyllostomid batsLeandro R Monteiro1,2* and Marcelo R Nogueira3
Abstract
Background: The phyllostomid bats present the most extensive ecological and phenotypic radiation knownamong mammal families. This group is an important model system for studies of cranial ecomorphology andfunctional optimisation because of the constraints imposed by the requirements of flight. A number of studiessupporting phyllostomid adaptation have focused on qualitative descriptions or correlating functional variables anddiet, but explicit tests of possible evolutionary mechanisms and scenarios for phenotypic diversification have notbeen performed. We used a combination of morphometric and comparative methods to test hypothesesregarding the evolutionary processes behind the diversification of phenotype (mandible shape and size) and dietduring the phyllostomid radiation.
Results: The different phyllostomid lineages radiate in mandible shape space, with each feeding specialisationevolving towards different axes. Size and shape evolve quite independently, as the main directions of shapevariation are associated with mandible elongation (nectarivores) or the relative size of tooth rows and mandibularprocesses (sanguivores and frugivores), which are not associated with size changes in the mandible. The earlyperiod of phyllostomid diversification is marked by a burst of shape, size, and diet disparity (before 20 Mya), largerthan expected by neutral evolution models, settling later to a period of relative phenotypic and ecological stasis.The best fitting evolutionary model for both mandible shape and size divergence was an Ornstein-Uhlenbeckprocess with five adaptive peaks (insectivory, carnivory, sanguivory, nectarivory and frugivory).
Conclusions: The radiation of phyllostomid bats presented adaptive and non-adaptive components nestedtogether through the time frame of the family’s evolution. The first 10 My of the radiation were marked by strongphenotypic and ecological divergence among ancestors of modern lineages, whereas the remaining 20 My weremarked by stasis around a number of probable adaptive peaks. A considerable amount of cladogenesis andspeciation in this period is likely to be the result of non-adaptive allopatric divergence or adaptations to peakswithin major dietary categories.
BackgroundThe Phyllostomidae (leaf-nosed bats) is the dominantfamily of bats in Central and South America. This familyhas undergone an adaptive radiation unparalleled amongother mammals in terms of ecological and morphologi-cal diversity [1]. Starting from an insectivore ancestor inthe late Eocene [2-4], the 53 extant genera in this familyhave diversified into specialized forms for insectivory,carnivory, frugivory, granivory, nectarivory, and sanguiv-ory (although many species have mixed diets) [5-7].
This ecological diversity and specialisation originatesfrom an intricate partitioning of resources [8,9], and isprobably responsible for the high local species richness(ranging between 31-49 syntopic species [10,11])observed for leaf-nosed bats. The evolution of specia-lised diets created functional demands, apparently deter-mining changes in cranial and mandibular shape [1,12].The magnitude of skull form (shape + size) variationamong phyllostomid lineages is large and has beenassessed by correlational studies both qualitativelyand quantitatively, using measurement ratios of func-tional relevance or traditional distance measurements[1,12-16]. One important aspect of phenotypic variationin the family is the snout elongation associated with
* Correspondence: [email protected] of Biological Sciences and Hull York Medical School, TheUniversity of Hull, Hull, HU6 7RX, UKFull list of author information is available at the end of the article
Monteiro and Nogueira BMC Evolutionary Biology 2011, 11:137http://www.biomedcentral.com/1471-2148/11/137
© 2011 Monteiro and Nogueira; licensee BioMed Central Ltd. This is an Open Access article distributed under the terms of the CreativeCommons Attribution License (http://creativecommons.org/licenses/by/2.0), which permits unrestricted use, distribution, andreproduction in any medium, provided the original work is properly cited.

nectarivory. This elongation is thought to be responsiblefor a trade-off between two functional demands: tonguesupport and bite force [8,9,17]. Bats with longer snoutsmight have longer operational tongue lengths [18], butare known to have weaker bites than bats with shortsnouts, what might restrict the dietary range accessibleto them [9] and lead to seasonal migrations [19].Nogueira et al. (2009) [17] have shown that apart fromthe general elongation, other skull and mandible shapechanges are associated with (size-independent) biteforce, such as the relative size of mandibular processes(coronoid, angular), zygomatic arch position and robust-ness and the relative position and sizes of tooth rows.The feeding behaviour is also relevant to the under-standing of the biomechanics of feeding and resourcepartitioning in bats [14,20], but is less studied thanmorphology.The ecomorphological diversification of phyllostomids
has long been considered the result of an adaptive radia-tion, but no specific tests of the responsible mechanismshave been performed, apart from the correlational stu-dies mentioned before (most of them not using com-parative methods). An analysis of diversification ratesindicated a significant shift at the base of the phyllosto-mid tree [21], that could be associated with an adaptivediversification, but increased speciation is not anunequivocal evidence of adaptive radiation [22,23].Monteiro and Nogueira (2010) [24] provide indirect evi-dence of adaptive evolution, assessing the integrationpatterns in the phyllostomid mandible during evolution-ary shape changes. The interspecific integration patterns(correlated shape changes among mandibular compo-nents) were independent from pooled within-speciesintegration patterns (which mirrored mammalian devel-opmental genetics patterns), as expected during adaptiveevolution on an adaptive landscape [25,26]. Long termselection on species means (macroevolutionary changes)is expected to be independent from the structure ofgenetic correlations among morphological variables,depending only on selection gradients [25,26] associatedwith specific adaptive peaks. In this context, we canmove beyond the usual phenotype-ecology correlationapproach, assessing the likelihood of different evolution-ary scenarios through recent model-based approachesfor comparative analyses [27,28]. It is possible to selectbetween alternative adaptive models with different pos-tulated selective agents or adaptive peaks [29]. It is alsopossible to estimate optimal phenotypic values for eachadaptive peak to use as a basis for testing hypothesesregarding the adaptive evolution of lineages [29], and tocast light on the evolutionary processes responsible forspecies diversity [30].We focus our study on the variation of mandible form
(shape and size), which is a model for the evolution of
complex morphological structures [31]. The mandiblecan be used as a proxy for the facial skull due to devel-opmental integration of jaw (mandible-maxilla) parts[32]. Unlike other parts of the skull that harbour differ-ent functions (protecting the brain and sensory organs),the mandible’s main functional demands are related tofeeding, and dietary changes are expected to be themain selective agent for this structure. We combine eco-morphological correlations, patterns of disparity throughtime and a model-based comparative analysis to testevolutionary mechanisms and scenarios during theradiation of phyllostomid bats.
ResultsStructure of morphological and dietary variationThe distribution of dietary preferences along the phyloge-netic tree of phyllostomids (Figure 1) indicate that mostdietary shifts occurred only once during the evolution ofthe family, but nectarivory seems to have evolved twiceindependently and a return to insectivory is observed inthe ancestor of Trinycteris and Glyphonycteris. Dietaryspecialisation has been a major theme in phyllostomidevolution, but the data from our literature review sug-gests that many species present mixed diets and will useboth plant and animal food items, with geographical andseasonal variation in relative importance. Sanguivores andsome frugivores are more strict. A principal componentanalysis (PCA) of dietary preferences (not shown here,but published in [24], see also the Additional file 1),shows a strong correlation between carnivory and insec-tivory as a feature of the first diet PC, suggesting thatthey might be considered a single group of animalivores.The first diet PC contrasts animalivory and frugivory asopposite trends. The summarisation of three diet vari-ables in the first diet PC explains why there was strongmulticollinearity in preliminary analyses of the diet data(see methods), justifying the PCA transformation. Thesecond diet PC separates sanguivores from the rest andthe third diet PC separates the nectarivores from the rest(the two remaining PCs were not clearly interpretable assimple diet contrasts).The shape space for phyllostomid mandible evolution
was assessed by superimposed coordinates of landmarksand semilandmarks (Figure 2). A principal componentanalysis (PCA) of superimposed coordinates returnedfive over-dispersed shape principal components, accord-ing to a parallel analysis (a Monte Carlo approach thatcompares observed eigenvalues with a distribution ofeigenvalues from PCAs of random data sets with uncor-related variables). The first five shape PCs explained90.6% of total shape variation and are strongly asso-ciated with the divergence among dietary groups (Figure3, see also Additional file 2 for an animation of the ordi-nation with names of genera). Mapping the phylogenetic
Monteiro and Nogueira BMC Evolutionary Biology 2011, 11:137http://www.biomedcentral.com/1471-2148/11/137
Page 2 of 23

Figure 1 Phylogenetic relationships among phyllostomid bats with dietary preferences. Phylogeny based on concatenated mtDNA andRAG2 data (modified from Baker et al. [2003-2010] [3,33]). Branch lengths are proportional to time since divergence (in millions of years). Piegraphics depicted at tree tips depict approximate contribution of different diet items according to our ranked estimates from the literature (seemethods section).
Monteiro and Nogueira BMC Evolutionary Biology 2011, 11:137http://www.biomedcentral.com/1471-2148/11/137
Page 3 of 23

tree (with maximum likelihood ancestral characterestimation) onto the space of the first three shape PCs(Figure 3A), each dietary group represents an indepen-dent direction of shape variation, with few convergencesin the separate lineages (Figure 3A also depicts modelOU.5 from the model-based analysis, see below). This isobserved both considering the dietary groups as discretecategories (Figure 3A) and the relative contribution ofdiet items by multivariate regression (Figure 3B). Theregression of the five shape PCs on dietary PCs andskull length (used as a more familiar and intuitive proxyfor mandible centroid size - see methods) was signifi-cant at the multivariate level, but the fifth shape PC wasnot particularly associated with any dietary PC or skulllength (Table 1). The principal component analysis ofdietary variables worked satisfactorily to remove multi-collinearity among independent variables, as indicatedby the low variance inflation factors (≤ 1.271). It shouldbe emphasised that the principal components of speciesmeans depict the major axes of shape change amongspecies, without the constraint to depict shape changesassociated with diet (as differences among dietary typescould be aligned with none of the PCs). However, thestrong association of dietary PCs with independentlyderived shape PCs suggests common evolutionary pro-cesses behind the ordination patterns.The first shape vector is mostly associated with the sec-ond (sanguivory) and third (nectarivory) diet PCs inopposite directions (Figure 3B, Table 1). The patterns ofshape change associated with the first shape PC aredominated by a relative lengthening (positive direction -
associated with nectarivory) and shortening or deepen-ing (negative direction - associated with sanguivory) ofthe mandible (Figure 4). This is not a uniform shapechange, as the mandibular elongation is not evenly dis-tributed throughout the mandible (e.g. the region belowthe premolars is more elongated and shortened than theregion below the molars and incisors). The secondshape PC is the only shape axis significantly associatedwith all three diet PCs (and the model with larger coeffi-cient of determination R2). It is mostly associated withdiet PCs 2 and 3 (sanguivory and nectarivory) (Table 1),but showing a shared morphological change, rather thana contrast. This axis of shape change is more closelyassociated with sanguivory in its negative direction (Fig-ure 3B, Table 1), depicting a noticeable relative decreaseof the molar row and a relative decrease of the coronoidprocess (Figure 4). This decrease in the coronoid pro-cess is also evident in nectarivores hence its significantassociation with diet PC3. The diets with stronger mas-ticatory demands (frugivory and animalivory) presentpositive scores along shape PC2. This direction of shapechange is dominated by relatively larger molar rows andlarger coronoids (Figure 4). The relative increase in themolar row is a feature of animalivores, hence the weak(but significant) correlation observed between the sec-ond shape PC and the first diet PC (Table 1). The thirdshape PC is strongly associated with the first diet PC(Table 1), which contrasts animalivores and frugivores.The shape change depicted by this shape axis is domi-nated by a change in the shapes of mandibular processesand relative differences in relative sizes of molar teeth(Figure 4). In the positive direction (associated with ani-malivory), the coronoid is wider, the angular relativelylarger and the molar teeth row longer. In the negativedirection (associated with frugivory), the coronoid isnarrower, slightly curved posteriorly, the angular is rela-tively smaller and the molar teeth row shorter (but pre-molars row longer). There is also a weak but significantpartial correlation of the third shape PC and the thirddiet PC (nectarivory). The fourth shape PC explains asmall, but still over-dispersed, amount of the variationamong species (Figure 4). The multivariate regressionresults indicate that this shape feature is correlated withmean size differences (evolutionary allometry) and thefirst diet PC. The scatter of PC scores (not shown, butscores available in Additional file 1) ordinates apart sixshort-faced frugivore species (Ametrida, Sphaeronycteris,Pygoderma, Centurio, Stenoderma, Ariteus) comprisingthe clade Stenodermatina from Baker et al. (2003) [33].These species are strict frugivores and present highpositive scores on shape PC4. High negative scores onshape PC4 are observed among insectivores and thelarge carnivore bats (Vampyrum, Chrotopterus). Theshape changes depicted by the fourth shape PC (Figure
Figure 2 Phyllostomid mandible showing reference pointsused for morphometric analysis. (A) Mandible of Phyllostomushastatus, showing landmarks (squares) and semilandmarks (circles).Landmark descriptions as in [17]. (B) Average shape calculated byProcrustes superimposition over all 49 species.
Monteiro and Nogueira BMC Evolutionary Biology 2011, 11:137http://www.biomedcentral.com/1471-2148/11/137
Page 4 of 23

4) are related to the mandibular processes (similar tothose observed along shape PC 3) and the anteriorregion. A noticeable aspect of the shape change is the“chin” formed in these short-faced frugivores, as well aschanges in the relative sizes of molar and premolarrows. The fifth shape PC was not associated with anydietary PC or skull length.
Patterns of phenotypic and ecological disparity throughtimeThe scatterplot of morphometric (Procrustes) distancesversus genetic distances shows a combination of twoscatter patterns (Figure 5A). For larger genetic distances(> 0.10), there is a positive linear relationship betweenthe two types of distances, whereas for small genetic
distances (< 0.10) there seems to be no relationship.This distance plot suggests at least two different evolu-tionary processes operating at different moments alongthe evolution of phyllostomids. The inference of evolu-tionary modes can be made qualitatively by comparisonwith Polly’s simulated patterns of morphological diver-gence (see Figure 16 in Polly (2004) [34]). The linearrelationship between distances with a steep slope isexpected under directional selection, and the lack ofrelationship is expected under stabilising selection. Thescatterplot comparing morphometric distances and timesince divergence (Figure 5B) shows a less clear patternat large times since divergence due to species that arephenotypically and (to a certain extent) genetically simi-lar but diverged early (27-30 Mya) during phyllostomid
Figure 3 Scatterplots of first three shape Principal Components with superimposed phylogenetic tree and diet variables. (A) Thephylogeny tips (species mean shapes) are depicted as spheres, coloured according to major dietary preferences (green - insectivores, yellow -carnivores, red - frugivores, purple - sanguivores, blue - nectarivores). Connecting lines determined by phylogeny branches, where nodescorrespond to estimated ancestral shapes. The tree root shape is depicted as a black sphere. Branch colours correspond to estimated ancestraldiets. (B) Scatterplot of first three shape PCs with associated diet PCs. Diet PC vectors directions based on partial correlations from themultivariate PGLS regression. Names in parentheses after diet PCs indicate the main dietary item associated with that PC direction.
Monteiro and Nogueira BMC Evolutionary Biology 2011, 11:137http://www.biomedcentral.com/1471-2148/11/137
Page 5 of 23

evolution (Macrotus, Lampronycteris, Micronycteris andthe other insectivores - see Figure 1). This pattern sug-gests that the early period of phyllostomid divergencewas marked by a combination of directional and stabilis-ing selection.The disparity through time (DTT) plots provide further
evidence of a two-mode evolutionary history for shapeand diet (Figures 5C and 5E). These plots show averagesums of morphometric and dietary distances (relative tothe total sum or total disparity) for lineages of a given(relative) age range through the phylogenetic tree. Theearly evolution of phyllostomid lineages is marked bylarger disparity (blue solid line) than expected by 1000
neutral evolution simulations (median and 95% confi-dence intervals of simulations depicted as solid anddashed red lines, respectively). During this initial period,there is a high average disparity within existing lineages.Both shape and diet disparities peak above the expectedneutral disparity around 25 Mya. There is also a turningpoint after this early diversification (around 20 Mya),when observed disparity within lineages is smaller thanexpected under neutral evolution, suggesting that stabilis-ing selection was the main evolutionary force constrain-ing diversification within lineages after the mainecological divergence had taken place. Size disparitythrough time follows a similar pattern initially, but thereis a second peak above expected median disparitybetween 16-7 Mya. This second peak is unique for sizedisparity and takes place after the main dietary categorieswere established. The relevance of this pattern is not soclear because the confidence limits for univariate charac-ters are considerably large and much of the size disparityfluctuation within lineages falls inside the confidenceintervals. The five panels (Figure 5A, B, C, D, E) are com-plementary in the sense that they are indicating a dualityof evolutionary processes at different times during thephyllostomid radiation, and that shape and size did nothave a correlated pattern of disparity through time. Thesteep slopes observed in the right hand extremity ofFigures 5A and 5B are consistent with the larger thanexpected shape disparity in the deeper parts of the tree(between 30 and 20 Mya - Figure 5C), and both are pre-dicted under directional selection. The near zero slopesin the left hand extremity of Figures 5A and 5B are con-sistent with the lower than expected disparity withinyounger clades (Figures 5C and 5D), and both patternsare likely under stabilising selection.
Evolutionary models of phenotypic divergenceWe tested five alternative models of the evolution ofmandible shape (Figure 6, Table 2). The first model(BM) was a neutral Brownian motion along the phyllos-tomid phylogenetic tree, whereas the remaining models(OU.2-OU.5) incorporated a deterministic component(selection) similar to adaptive radiations with varyingnumbers of fitness peaks (2 to 5), according to increas-ingly complex ecological assumptions, causing dietarytypes to be lumped together or split into separate peaks.The model-fitting results are summarised in Tables 2and 3. The phenotypic variables used were the firstthree or five shape PCs (multivariate models were usedfor fitting all PCs at the same time). Fitting multivariatemodels with different numbers of variables allowed forsome insight into the sensitivity of results to modeldegrees of freedom. Using more shape variablesincreases the amount of information about variationpatterns in the model, but also increases the number of
Table 1 Multivariate PGLS regression results for theshape PCs on size and diet.
Shape PC1 R2 = 0.570
b r P
CL 0.0000 0.0022 0.9886
Diet PC1 0.0303 0.2242 0.1340
Diet PC2 -0.0903 0.5631 < 0.0001
Diet PC3 0.1162 0.6312 < 0.0001
Shape PC2 R2 = 0.807
b r P
CL -0.0010 -0.2116 0.1581
Diet PC1 0.0190 0.2998 0.0429
Diet PC2 -0.1047 -0.8650 < 0.0001
Diet PC3 -0.0754 -0.7549 < 0.0001
Shape PC3 R2 = 0.444
b r P
CL -0.0008 -0.1592 0.2907
Diet PC1 0.0545 0.6420 < 0.0001
Diet PC2 0.0079 -0.1201 0.4264
Diet PC3 -0.0226 -0.3049 0.0394
Shape PC4 R2 = 0.440
b r P
CL -0.0020 -0.4482 0.0018
Diet PC1 -0.0233 -0.4031 0.0054
Diet PC2 -0.0003 -0.0056 0.9705
Diet PC3 -0.0016 -0.0273 0.8573
Shape PC5 R2 = 0.159
b r P
CL -0.0008 -0.1974 0.1884
Diet PC1 0.0151 0.2877 0.0525
Diet PC2 -0.0007 -0.0142 0.9255
Diet PC3 0.0140 0.2484 0.0960
The partial regression (b) and partial correlation (r) coefficients and theirsignificances (P) are depicted for each independent variable: CL -Condylobasal Length, and diet principal components. Diet PC1 is a contrastbetween animalivores (positive) and frugivores (negative). Diet PC2 separatessanguivores (positive scores) from the rest. Diet PC3 separates nectarivores(positive) from the rest. The variance inflation factors were small, ranging from1.249 (Diet PC1) to 1.007 (Diet PC2). The multivariate model was significant(Wilk’s Λ = 0.0092, F = 15.23, df1 = 25, df2 = 150.1, P < 0:00001).
Monteiro and Nogueira BMC Evolutionary Biology 2011, 11:137http://www.biomedcentral.com/1471-2148/11/137
Page 6 of 23

parameters, causing problems for estimation. The cri-teria used for model selection: weights of Akaike infor-mation criteria corrected for sample size w(AICc) andweights of Schwarz information criteria w(SIC) for aparticular model Mi can be interpreted as the probabil-ity of Mi being the “best” model given the data and theset of candidate models (the SIC being more conserva-tive in relation to model complexity than AICc). For the
models with three PCs, according to all criteria used,the best fitting model was OU.4, an Ornstein-Uhlenbeckprocess (stabilising selection) with four adaptive peaks(frugivores, nectarivores, sanguivores and animalivores).For the models with five shape PCs, however, theincreased complexity of the models (as measured by thenumber of parameters being estimated (the degrees offreedom in Table 2) caused the model OU.5 (the most
Figure 4 Mandible shape variation associated with Principal Components. Shape icons depicted as grid deformations relative to the grandaverage shape (Fig. 2B). Shape changes correspond to maximum observed range of scores. Numbers in parentheses indicate the amount oftotal shape variation explained by each PC.
Monteiro and Nogueira BMC Evolutionary Biology 2011, 11:137http://www.biomedcentral.com/1471-2148/11/137
Page 7 of 23

Figure 5 Patterns of morphological, dietary and genetical divergence through time. (A) Scatterplot between shape distances (Procrustes)between pairs of species and genetic distances (percent sequence divergence [33]) for the same pairs. (B) Scatterplot between shape distances(Procrustes) between pairs of species and time since divergence. (C) Line plot showing changes in relative morphological disparity through time(DTT). Relative morphological disparity measured as average squared Euclidean distances (with the full set of shape PCs) among existing cladesat a given point in relative time. The blue solid line shows the observed disparity, and the red dashed line shows the expected disparity under aneutral evolution model as the average of 1000 simulations. (D) Same as C, but showing changes in relative size disparity through time. (E) Sameas C, but showing changes in relative dietary disparity through time. Relative dietary disparity measured as average Manhattan distances usingrelative importance of diet items for each species.
Monteiro and Nogueira BMC Evolutionary Biology 2011, 11:137http://www.biomedcentral.com/1471-2148/11/137
Page 8 of 23

Figure 6 Adaptive regime models for association between mandible shape and diet. Model OU.2 discriminates two adaptive optima, onefor species with feeding modes that involve a considerable amount of mastication (Insectivory, Carnivory and Frugivory), and species withfeeding modes involving little or no mastication (Sanguivory and Nectarivory). Model OU.3 discriminates three adaptive optima: two with little orno mastication, but with fundamental differences (Sanguivory and Nectarivory), and one involving mastication (lumping Insectivory, Carnivoryand Frugivory). Model OU.4 discriminates four dietary adaptive optima, lumping Insectivores and Carnivores in the Animalivore category. ModelOU.5 discriminates optima for the five main dietary groups. All ancestral states estimated by a maximum likelihood algorithm (see methods).
Monteiro and Nogueira BMC Evolutionary Biology 2011, 11:137http://www.biomedcentral.com/1471-2148/11/137
Page 9 of 23
complex model) to have the higher w(AICc), but theBrownian motion (the simplest model) to have thehigher w(SIC). This is an expected result of modeldimensionality, since the SIC criterion penalises morecomplex models more severely than the AICc.The 95% confidence ellipsoids for predicted optimal
shapes (θi) from model OU.5 do not overlap in the
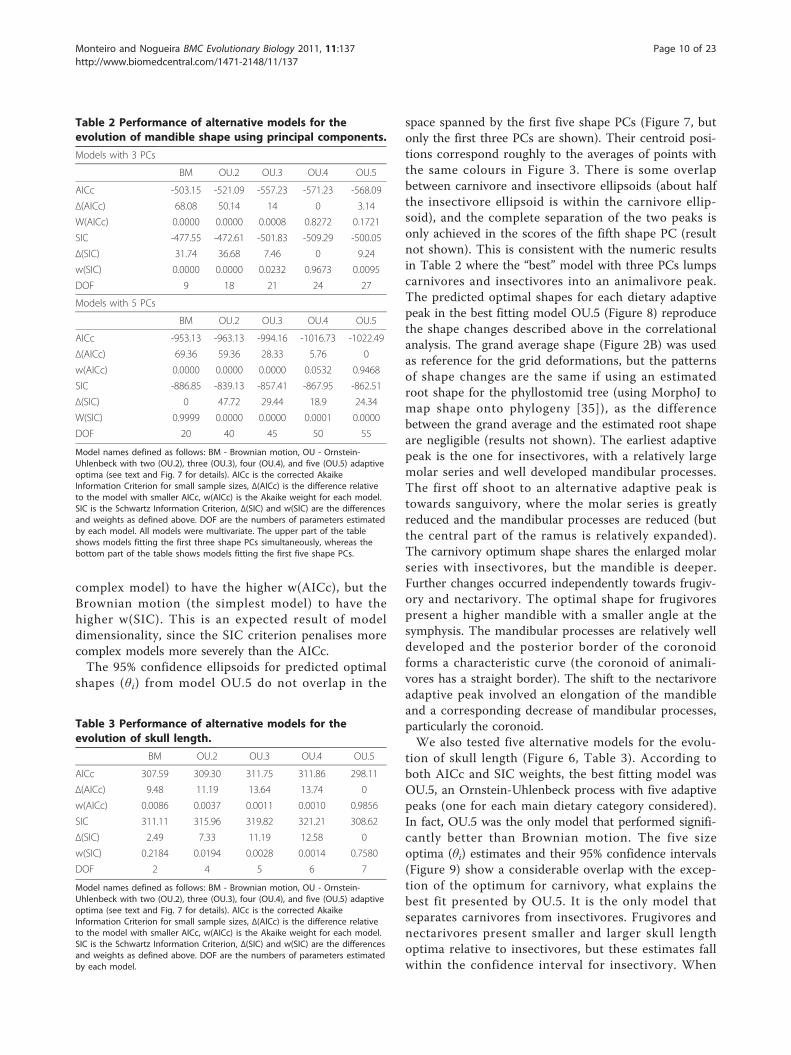
space spanned by the first five shape PCs (Figure 7, butonly the first three PCs are shown). Their centroid posi-tions correspond roughly to the averages of points withthe same colours in Figure 3. There is some overlapbetween carnivore and insectivore ellipsoids (about halfthe insectivore ellipsoid is within the carnivore ellip-soid), and the complete separation of the two peaks isonly achieved in the scores of the fifth shape PC (resultnot shown). This is consistent with the numeric resultsin Table 2 where the “best” model with three PCs lumpscarnivores and insectivores into an animalivore peak.The predicted optimal shapes for each dietary adaptivepeak in the best fitting model OU.5 (Figure 8) reproducethe shape changes described above in the correlationalanalysis. The grand average shape (Figure 2B) was usedas reference for the grid deformations, but the patternsof shape changes are the same if using an estimatedroot shape for the phyllostomid tree (using MorphoJ tomap shape onto phylogeny [35]), as the differencebetween the grand average and the estimated root shapeare negligible (results not shown). The earliest adaptivepeak is the one for insectivores, with a relatively largemolar series and well developed mandibular processes.The first off shoot to an alternative adaptive peak istowards sanguivory, where the molar series is greatlyreduced and the mandibular processes are reduced (butthe central part of the ramus is relatively expanded).The carnivory optimum shape shares the enlarged molarseries with insectivores, but the mandible is deeper.Further changes occurred independently towards frugiv-ory and nectarivory. The optimal shape for frugivorespresent a higher mandible with a smaller angle at thesymphysis. The mandibular processes are relatively welldeveloped and the posterior border of the coronoidforms a characteristic curve (the coronoid of animali-vores has a straight border). The shift to the nectarivoreadaptive peak involved an elongation of the mandibleand a corresponding decrease of mandibular processes,particularly the coronoid.We also tested five alternative models for the evolu-
tion of skull length (Figure 6, Table 3). According toboth AICc and SIC weights, the best fitting model wasOU.5, an Ornstein-Uhlenbeck process with five adaptivepeaks (one for each main dietary category considered).In fact, OU.5 was the only model that performed signifi-cantly better than Brownian motion. The five sizeoptima (θi) estimates and their 95% confidence intervals(Figure 9) show a considerable overlap with the excep-tion of the optimum for carnivory, what explains thebest fit presented by OU.5. It is the only model thatseparates carnivores from insectivores. Frugivores andnectarivores present smaller and larger skull lengthoptima relative to insectivores, but these estimates fallwithin the confidence interval for insectivory. When
Table 2 Performance of alternative models for theevolution of mandible shape using principal components.
Models with 3 PCs
BM OU.2 OU.3 OU.4 OU.5
AICc -503.15 -521.09 -557.23 -571.23 -568.09
Δ(AICc) 68.08 50.14 14 0 3.14
W(AICc) 0.0000 0.0000 0.0008 0.8272 0.1721
SIC -477.55 -472.61 -501.83 -509.29 -500.05
Δ(SIC) 31.74 36.68 7.46 0 9.24
w(SIC) 0.0000 0.0000 0.0232 0.9673 0.0095
DOF 9 18 21 24 27
Models with 5 PCs
BM OU.2 OU.3 OU.4 OU.5
AICc -953.13 -963.13 -994.16 -1016.73 -1022.49
Δ(AICc) 69.36 59.36 28.33 5.76 0
w(AICc) 0.0000 0.0000 0.0000 0.0532 0.9468
SIC -886.85 -839.13 -857.41 -867.95 -862.51
Δ(SIC) 0 47.72 29.44 18.9 24.34
W(SIC) 0.9999 0.0000 0.0000 0.0001 0.0000
DOF 20 40 45 50 55
Model names defined as follows: BM - Brownian motion, OU - Ornstein-Uhlenbeck with two (OU.2), three (OU.3), four (OU.4), and five (OU.5) adaptiveoptima (see text and Fig. 7 for details). AICc is the corrected AkaikeInformation Criterion for small sample sizes, Δ(AICc) is the difference relativeto the model with smaller AICc, w(AICc) is the Akaike weight for each model.SIC is the Schwartz Information Criterion, Δ(SIC) and w(SIC) are the differencesand weights as defined above. DOF are the numbers of parameters estimatedby each model. All models were multivariate. The upper part of the tableshows models fitting the first three shape PCs simultaneously, whereas thebottom part of the table shows models fitting the first five shape PCs.
Table 3 Performance of alternative models for theevolution of skull length.
BM OU.2 OU.3 OU.4 OU.5
AICc 307.59 309.30 311.75 311.86 298.11
Δ(AICc) 9.48 11.19 13.64 13.74 0
w(AICc) 0.0086 0.0037 0.0011 0.0010 0.9856
SIC 311.11 315.96 319.82 321.21 308.62
Δ(SIC) 2.49 7.33 11.19 12.58 0
w(SIC) 0.2184 0.0194 0.0028 0.0014 0.7580
DOF 2 4 5 6 7
Model names defined as follows: BM - Brownian motion, OU - Ornstein-Uhlenbeck with two (OU.2), three (OU.3), four (OU.4), and five (OU.5) adaptiveoptima (see text and Fig. 7 for details). AICc is the corrected AkaikeInformation Criterion for small sample sizes, Δ(AICc) is the difference relativeto the model with smaller AICc, w(AICc) is the Akaike weight for each model.SIC is the Schwartz Information Criterion, Δ(SIC) and w(SIC) are the differencesand weights as defined above. DOF are the numbers of parameters estimatedby each model.
Monteiro and Nogueira BMC Evolutionary Biology 2011, 11:137http://www.biomedcentral.com/1471-2148/11/137
Page 10 of 23

interpreting these results, it is important to bear in mindthat skull length is not a proxy for body mass and willbe influenced by patterns of cranial elongation orshortening.
DiscussionThe combination of ecomorphological correlations, dis-parity analysis and model-based comparative techniquesprovided strong evidence for the evolutionary mechan-isms responsible for the phyllostomid radiation. Althoughthere are a few instances of convergence in phyllostomids[3,4], the dietary divergence presents a strong phyloge-netic structure [24,36], where most specialisationsoccurred only once and many of the main lineages(recognised as subfamilies in most taxonomic studies[33]) are relatively homogeneous morphologically and
ecologically. Convergence is an important part of thestudy of adaptation [37], and its absence makes it harderto infer the role of natural selection in biological diversifi-cation. One has to be particularly careful with the com-parative methods and evolutionary model assumptions,for using the wrong models or methods are likely to leadto erroneous conclusions [28,38,39]. For example, in thepresent study, forcing a Brownian model of evolutioninto the phylogenetic regression model would lead tonon-significant associations among shape and diet princi-pal components (results not shown). Flexible approachesallowing for different evolutionary models [27,28,40]provide more sophisticated and interpretable results [39],as well as more interesting questions to be explored.The model-based approach used in this study shed lighton the evolutionary mechanisms responsible for the
Figure 7 Bootstrap confidence ellipsoids for dietary adaptive optima (θi) in shape space. Confidence ellipsoids (95%) calculated afterbootstrap resampling under model OU.5 for five shape PCs (only the first three PCs shown). Dietary optima ellipsoids are colour-coded followingkey in Figs. 3 and 6 (OU.5).
Monteiro and Nogueira BMC Evolutionary Biology 2011, 11:137http://www.biomedcentral.com/1471-2148/11/137
Page 11 of 23

evolutionary radiation of phyllostomid bats and makes itpossible to generate predictions of optimal shapes (orratios of functional relevance) for dietary specialisationsthat can be used in the future to test hypotheses of bio-mechanical optimisation [41].The major axis of shape variation among phyllostomid
species (first shape principal component) ordinates spe-cies with contrasting degrees of rostral elongation. Thisshape change is regarded by Freeman (2000) [1] as oneof the “cheap tricks” of mammal diversification, and stu-dies on other groups of mammals such as domestic dogs[42] suggest that this pattern of shape variation can arisein a microevolutionary scale (~10000 years) as a responseto selective processes. Rostral elongation in phyllostomidsis associated with a trade-off between support for theelongated tongue and bite force (species with shorter ros-tra usually have stronger bites) [17,43,44]. This reduced
bite force is a result not only of the increased out-lever[44], but also of the relative decrease of muscle insertionareas and robustness of elongated skulls and mandibles[17]. The bite force constraint caused by morphologicalspecialisation is known to limit the dietary scope [8,9]and might have important ecological consequences, parti-cularly regarding patterns of resource use and foragingstrategies within guilds [19].Mandible and palate length are generally good predic-
tors of operational tongue length in most nectarivores[18] (but see [45,46] for an alternative adaptation inAnoura fistulata). Longer tongues are considered anadaptation for nectar extraction, not only because thesewill reach flowers with longer corollas [46], but becausethey allow the nectar specialists to explore a larger varietyof plant species more efficiently (avoiding seasonalchanges to insects and fruit when local nectar abundance
Figure 8 Shape changes associated with dietary adaptive optima (θi) for the best fitting evolutionary model. Shape icons for each dietoptimum depicted as grid deformations relative to the grand average shape (Fig. 2B). Shape changes obtained by shape principal componentscores estimated as θi by the model OU.5 (Fig. 6). Arrows indicate directions of evolutionary change between adaptive peaks according toancestral diet estimates.
Monteiro and Nogueira BMC Evolutionary Biology 2011, 11:137http://www.biomedcentral.com/1471-2148/11/137
Page 12 of 23

decreases) [19,47], and possibly to maintain a longer dis-tance from the flower during feeding (reducing predationrisk) [18]. It is currently established that nectarivory hasevolved twice independently within phyllostomids [3,4],and despite a superficial phenotypic convergence (bothlineages do present the mandibular elongation), there aremany anatomical differences, particularly in tongue mor-phology [4]. All this morphological variation suggeststhat, in this system, there are many ways to achieve thesame function (many-to-one relationships [48]) and thatthere is more variation in diet and foraging strategiesamong nectarivores than implied by the common use ofsuch category. Brachyphylla is a singular nectarivore inthe sense that it presents a short mandible (the bluesphere with negative score on shape PC1 - Figure 3A, seealso Additional file 2) and is phenotypically similar toPhylloderma and Sturnira, being ordinated between frugi-vore and insectivore species. The similarity betweenBrachyphylla and the frugivore Stenodermatine lineagehas been recognised for other morphological charactersin the dentition and cranial shape [1,49] and could be theresult of dietary changes to exploit open niches duringisland colonisation, as suggested by Griffiths (1985) [49].The second principal component of interspecific shape
variation depicts a common pattern of shape change fordiets with low mastication (shared features between nec-tarivores and sanguivores) versus high mastication(shared features between animalivores and frugivores).Both sanguivore and nectarivore specialists do presentlower bite forces than expected for their sizes [8].Although nectarivores and sanguivores are in extreme
opposites regarding the mandibular elongation patternof shape PC1, they do present similarities in the relativereduction of mandibular processes (particularly the cor-onoid) and molar series (more pronounced in sangui-vores). These shared features are consistent withdevelopmental consequences of selection for morpholo-gical specialisations [24]. This is clear for nectarivores,where selection for a longer, narrower skull has limitedthe relative size of muscles and their areas of attach-ment [17]. The explanation for the pattern of shapechanges in sanguivores is not as direct as that for nec-tarivores, as the evolution of different mandibular com-ponents towards this adaptive peak has been shown todisagree with expected developmental patterns [24],where tooth bearing components and mandibular pro-cesses form almost independent modules. This isbecause the two tooth bearing components seem tochange their shapes independently: a relative increase inthe anterior alveolar (incisives and canines), combinedwith a relative decrease in the posterior alveolar (molarseries). This emphasis in anterior dentition is alsoobserved in tooth development as well, and washypothesised to be the result of selection to sanguivory[50]. Therefore, even though a reduction of bite forceand muscle masses is observed in both sanguivores andnectarivores [8,51], the developmental consequences ofthese changes are more localised (in the posteriormandible) in sanguivores than in nectarivores. This isprobably due to stronger stabilising selection in theanterior region of the mandible of sanguivores [24]. Theevolution of sanguivory has been discussed in the litera-ture, but the current limitations of available data makeit difficult to get past the delineation of general scenar-ios and hypotheses [3] to actually testing functional pre-dictions about agents of selection and phenotypicvariation. Sanguivore skulls did not evolve according toexpected developmental integration patterns [24], anddo not meet traditional biomechanical predictions basedon models of mastication [16]. The functional demandson the skull associated with sanguivory are not knownin detail, but should include not only biting off fleshand lapping blood, but also sensorial tasks in findingand approaching potential bloodmeal sources. Sangui-vores are unique among phyllostomids in that there areno known intermediate forms (both in diet and pheno-type), whereas for the species that specialised in plantitems (frugivores and nectarivores) there are plenty ofintermediate species with mixed diets. This pattern sug-gests that the divergence of frugivores and nectarivoresmight have occurred along ridges and local maxima onthe adaptive landscape, but the evolution of sanguivoreshas probably occurred via a leap over a fitness valley ina short period of time (between 31 and 21 Mya [3]).Because the transition period was very short, useful
Figure 9 Cranial size adaptive optima (θi) for the best fittingevolutionary model. Size optima (Condylobasal Length) andconfidence intervals for each dietary adaptive peak in model OU.5.Circles represent median and whiskers represent 95% confidenceintervals of bootstrap resampling estimates for each θ.
Monteiro and Nogueira BMC Evolutionary Biology 2011, 11:137http://www.biomedcentral.com/1471-2148/11/137
Page 13 of 23

fossils documenting it would need to be obtained fromthis specific window on the late Oligocene. However, allknown fossils of vampire bats are Plio-Pleistocenic Des-modus and Diphylla [52], which are the same or verysimilar to extant vampire species.The first and second major axes of variation in the
mandibular shape space of phyllostomids mostly con-trast groups that present high and low masticatorydemands. The phenotypic differences between dietaryspecialists with high masticatory demands (frugivoresand animalivores) are depicted only on the third andfourth principal components of shape. These differencesare associated with relative positions and sizes of man-dibular processes (lower condyle, smaller angular in fru-givores), tooth row lengths (longer molar rows inanimalivores), and the anterior region of the mandible(mandible shorter and deeper, forming a “chin” in frugi-vores). Aside from large beetles (which seem to beharder than any other food item processed by bats [9]),insects and fruit do not present significantly differenthardnesses and there is a lot of variation within thesegeneral groups, mostly due to size differences of thedietary items (larger items are harder [9,15,53]). Animal-ivores and frugivores do not present noticeable differ-ences in size-independent bite forces [9,17], and there isa considerable amount of behavioural plasticity thatallows them to modulate the bite force according tofood hardness [20]. The extensive shape changes in theskull, mandible and dentition [1,13] observed in the evo-lutionary transition towards frugivory did not seem tobe associated with changes in bite force [17]. Differentfrom sanguivores and nectarivores, frugivores needed tomaintain the bite strength for mastication, while adjust-ing for their specific functional needs (which are varied,according to the main type of fruit consumed[6,13,15,54]). The morphological changes observed infrugivores seem to sacrifice precision of dental occlusion(a feature apparently more important in animalivores) tofavour skull and mandible robustness [13], while main-taining a small body size [15], particularly in the shorter,deeper mandibles observed in the small clade of specia-list frugivores (the Stenodermatina).Allometric variation is a controversial theme in phyl-
lostomid evolution and ecology. There is no doubt thatbody size is the main factor causing differences of abso-lute bite force [8] and will have a consequence on thedietary scope of particular species [9,12]. On the otherhand, small frugivores, such as Centurio are able to pro-duce higher bite forces than expected for their sizes [43]due to cranial shape changes. Carnivory is traditionallyassociated with an increase in body size and is consid-ered an allometric extrapolation of insectivory [36]. Onesmall group of strict frugivores (Stenodermatina, seeabove) presents small average size, but it is not clear
whether their size evolution was associated with diet orwith the postulated insular origin of the clade [55] (see[56] for a review of insular size patterns in vertebrates).No obvious size trends can be associated with nectari-vores or sanguivores. The ecological evidence for size asa structuring influence in phyllostomid communities isequivocal [57], even when considering more detaileddietary compositions. Our results do show that the evo-lutionary trajectories followed by diverging phyllostomidlineages in mandible shape space were too complex tobe explained by simple allometric changes, and theshape changes associated with size differences, as mea-sured by skull length (towards extreme frugivores andcarnivores) were small, when compared to the drasticshape changes associated with nectarivory and sanguiv-ory, which did not involve significant size changes.Shape and size divergence patterns seem to bedecoupled in phyllostomid evolution (see also discussionbelow), but size is nevertheless a relevant dimension inthe phyllostomid adaptive landscape. A measure of bodysize would probably be more suited for such ecologicalassociations than cranial length.The patterns of morphological and ecological diver-
gence over time were informative regarding possibleevolutionary mechanisms in the radiation of phyllosto-mid bats. When considering the parallel evolution ofmandibular shape and diet, one sees clearly a two stepradiation, marked by strong directional selection anddivergence in the first phase (30-20 Mya) followed bystabilising selection and stasis in the second phase, afterthe main phyllostomid lineages (and diet specialities)appeared. The scatterplots comparing morphometricdistances with genetic distances and time since diver-gence can be qualitatively compared to patterns fromPolly’s simulations [34] of evolutionary mechanisms.Different mechanisms are expected to leave distinctiveimprints in the patterns of morphological divergenceover time. In real data, noisy patterns are expected fromthe juxtaposition or superimposition of different evolu-tionary processes and it is harder to extricate the pro-cesses from the patterns. The scatterplots of geneticdistances (percentage of sequence divergence), timesince divergence and morphometric distances in Figures5A, B show a two-phase pattern, which is more obviousin Figure 5A (genetic distances) than in Figure 5B (timesince divergence) because of species that are phenotypi-cally and genetically similar (insectivores) but havediverged in beginning of the radiation. The disparitythrough time plots for mandible shape and diet suggestalso a two-phased radiation, marked initially by largerdisparity than expected by neutral evolution simulationsand changing lo lower disparity than expected by neu-tral evolution after around 20 Mya (the transitionbetween Oligocene and Miocene - see discussion of the
Monteiro and Nogueira BMC Evolutionary Biology 2011, 11:137http://www.biomedcentral.com/1471-2148/11/137
Page 14 of 23
time frame for the phyllostomid diversification in [3,4]).At this transition point, the main lineages leading todietary specialisations were established and most shapeand diet disparity is observed among these lineages. Sizedisparity presents a different pattern from shape anddiet, with at least two distinctive peaks at different timesin phyllostomid evolution. The first peak occurringbetween 30 and 20 Mya, and it was probably caused bythe large carnivores sharing the same branch with othergroups until nearly 20 Mya (these are very different inskull length but not so different in mandible shape).The second peak happens between 16-7 Mya and islikely to be caused by disparity within Stenodermatinae[33] (The clade in Figure 1 joining species from Sturnirato Ametrida). The Stenodermatina (the clade joiningspecies from Ariteus to Ametrida) have the shorterskulls among the phyllostomids (all of them smallerthan 14 mm average - see Additional file 1), the withinlineage disparity only decreases after they separate fromthe other Stenodermatinae (which have skull lengthscomparable to the remaining lineages) around 10 Mya.Because the confidence limits for the neutral simulationsare very wide, the fluctuation of size disparity throughtime never exceeds the expected disparity. On the otherhand, it is not clear whether these confidence limits aretoo conservative or realistic. Therefore we have inter-preted and discussed the size disparity results. This pat-tern of size disparity is clearly not associated with themandibular shape disparity and dietary disparity. Fromthe other analyses performed in this study, it is clearthat evolutionary allometry is a significant but minorinfluence in mandibular shape diversification. On theother hand, the lack of correspondence between dietdisparity and size disparity might also be explainedby the lack of detail of the diet data within majorcategories.The radiation of phyllostomid bats has commonly
been referred to as an adaptive radiation [1,16]. How-ever, a complete test of this hypothesis has not beenthoroughly performed (although different criteria havebeen examined separately). According to Schluter (2000)[22], there are four criteria to determine if a radiationwas adaptive: common ancestry, phenotype-environmentcorrelation, trait utility and rapid speciation. The mono-phyly of phyllostomids (common ancestry criterion) waslong established by a number of studies using molecularand morphological data sets [3-5,21,33]. The rapid spe-ciation criterion has been assessed by Jones et al [21]whose findings indicate a statistically significant shift indiversification rates in phyllostomids (a hypothesis thatwould not be testable with the incomplete tree used inthe present study). These authors found two significantshifts in phyllostomids: one just after the vampire bats(Desmodontinae) branch out and one within the genus
Artibeus. The first diversification rate shift observed byJones et al [21] within phyllostomids coincides with themorphological and ecological disparity peak observed byus at the base of the phylogenetic tree. The phenotype-environment correlation and trait utility criteria havebeen discussed before in the literature and in thepresent study. The radiation of phyllostomids in man-dibular shape space occurred along axes leading to pos-tulated adaptive peaks determined by the relativeimportance of dietary items. The shape changes alongthese main axes of variation have a clear functional rele-vance for the acquisition and processing of food, as dis-cussed above and in the literature [1,16,17,24,58].The model-based analysis presented in this study pro-
vided quantitative evidence of evolutionary mechanismsand scenarios. The models describing phenotypic evolu-tion on an adaptive landscape with five different peaksfit the data better than the neutral evolution model(Brownian motion) and simpler models with less peaks.The favoured scenario combining all analyses would beone early burst of phenotypic and ecological diversifica-tion caused by directional selection towards five differ-ent adaptive peaks (insectivory, carnivory, sanguivory,nectarivory and frugivory). In our interpretations, wegave more weight to the Akaike information criteria cor-rected for sample size because in simulations, it per-forms better than the Schwarz information criteria whenreality is assumed to be infinitely dimensional and thetrue model is not in the candidate set [59]. The resultsfor models with different numbers of variables (shapePCs) show how sensitive the methods are to the numberof parameters being estimated. In the models with thefirst three shape PCs, the number of parameters beingestimated (DOF in Table 2) is never larger than thenumber of species (49), whereas with the first five shapePCs, OU.4 and OU.5 (the best fitting models otherwise)do exceed the number of species and are severely pena-lised by the more conservative criterion (SIC, whichassumes that the true model is in the candidate set andis low dimensional [59]). As a consequence, Brownianmotion is suggested as the best fitting model because itrequires estimation of the smallest number of para-meters. These results indicate that we were working atthe limit of model complexity given our sample size,and more complex models would require considerablylarger data sets (in terms of number of species) to avoidproblems in estimation and model comparisons.When using the first three shape PCs, model OU.4
was favoured, whereas model OU.5 was favoured by themodels with five PCs. The separation of the carnivorefrom the insectivore peak is only accomplished whenthe fifth PC is added to the models. One might expectthat five groups would span a space with four dimen-sions, however, because principal components do not
Monteiro and Nogueira BMC Evolutionary Biology 2011, 11:137http://www.biomedcentral.com/1471-2148/11/137
Page 15 of 23

maximise among group differences, there will be pro-cesses other than diet-related adaptive changes contri-buting to the observed interspecific variation patterns.These could be associated with neutral evolution orchanges related to factors not measured in this study. Inany case, it is a noticeable point that Horn’s parallelanalysis used to choose the number of principal compo-nents to be considered in the comparative analyses,independently indicated the number of componentsneeded to discern all possible adaptive peaks in themost complex model. Parallel analysis is often shown bystatistical simulations to be the best performing methodto choose principal components [60,61].The early burst of phyllostomid divergence was fol-
lowed by consistent stabilising selection keeping mand-ible shape relatively constant around postulated dietaryoptima. The apparent phenotypic and ecological stasisthat persists from the early Miocene (20 Mya) to thepresent was not followed by a lack of speciation, andthe lineages of specialist nectarivores and frugivoresseem to be particularly speciose [4]. This pattern sug-gests either a non-adaptive radiation [22] or agents ofselection not specifically examined in the present study.Allopatry and biogeographic distribution patternsaccount for a considerable proportion of speciationwithin diverse phyllostomid genera where stabilisingselection seems to constrain phenotypic and ecologicalvariation [62-64]. In fact, niche conservatism and stabi-lising selection are expected to play a significant role inallopatric speciation processes [65], what seems to fitwell with the environmental changes during the Tertiary[4,66], when the global temperature decrease, tectonicprocesses (Andes uplift) and sea level fluctuations cre-ated large expanses of dry open areas in South Americaand are linked with the diversification of many othermammal clades [67-69]. On the other hand, furtherselective episodes cannot be discarded, as there mightbe smaller adaptive peaks within the main dietarygroups and the temporal and spatial variation inresource availability (particularly fruits and flowers)might generate randomly fluctuating selection that ishardly discernible from a Brownian motion [25,34]. Fru-givore phyllostomid species are known to largely occurin sympatry [10,15], possibly due to further specialisa-tion, such as the dichotomy between ground-story frugi-vores and fig-feeders [15], or the recently discoveredgranivory [6] associated with functional and morpholo-gical specialisations [58]. Nectarivore guilds can also bediverse [19] due to nomadic behaviour, seasonal andspatial changes in resource use [18,47] and differentdegrees of specialisation and dietary item mixtures [70].The radiation of phyllostomid bats is actually a numberof radiation episodes nested within each other, causedby a mixture of adaptive and non-adaptive evolutionary
mechanisms. This is expected as real data is more likelyto fall along a continuum caused by a mixture of evolu-tionary processes, rather than fit yes/no definitions forthe adaptive radiation metaphor [71].The radiation of phyllostomid bats is a unique exam-
ple among mammals in terms of ecological and pheno-typic diversity, and should be considered an importantmodel system for studies of the evolution of functionaloptimisation due to the ecological diversity under theconstraints imposed by powered flight [72]. Furtherresearch should provide a deeper understanding of themyriad of evolutionary mechanisms at work in this line-age. The foundations of phyllostomid ecomorphology,based on rather limited morphological, ecological, phy-logenetic and functional data painted an interesting pic-ture and provided important references and newquestions to be addressed. Recent contributions com-prise functional studies [41,73] that go beyond tradi-tional biomechanics to examine the functionalconsequences of shape change in terms of energy effi-ciency and structural resistance, comparative analyses ofdetailed morphological, functional, and ecological data[17,24], comparative analyses combining field data onfunction, behaviour and ecology [7-9,20,43,44,74] andphylogenetic diversification patterns using complete spe-cies-level trees [21]. Whereas a lot of attention has beenpaid to the biomechanics of mastication and bite force,the functional demands associated with nectar andblood-feeding are still underrepresented in the literature.Of particular importance would be the identification offunctionally relevant measurements (with fitness conse-quences) with regard to different dietary compositionsto be associated with phenotypic data. When comparingthe abundance of phyllostomid species in scientific col-lections, Freeman (2000) [1] has pointed out that specieswith specialised phenotypes and diets are rarer than thespecies with intermediate phenotypes and mixed diets.Are dietary specialisations equivalent to local optima onthe adaptive landscape with lower fitness than optimafor mixed diets? This is an important question for futureresearch with possible implications for the dynamics ofassemblages [7] and biodiversity conservation. Otherpromising areas are the ecological influences on cranialphenotypes outside dietary differences, such as echo-location and roost building [1,75]. The ever increasingliterature is producing a massive database of morpholo-gical, ecological, functional and phylogenetic data thatwill be instrumental to elucidate the questions in futurestudies of phyllostomid ecomorphology.
ConclusionsThe patterns of phenotypic and ecological divergenceare consistent with an evolutionary scenario with atleast five main adaptive peaks during the early radiation
Monteiro and Nogueira BMC Evolutionary Biology 2011, 11:137http://www.biomedcentral.com/1471-2148/11/137
Page 16 of 23

of phyllostomid bats. Starting from an insectivore ances-tor around 30 Mya, different lineages specialised intocarnivores, sanguivores, frugivores and nectarivores.Some species are strict diet specialists with extrememorphologies, but a considerable number present inter-mediate diets and phenotypes, possibly as a resultof adaptive ridges or multiple local optima (many phe-notypes with equivalent or similar fitness) and geogra-phical/temporal variation in resource availability.Nevertheless, some trade-offs are clear, such as themandibular elongation observed in specialised nectari-vores, which supports a longer tongue but decreasesbite force changing the scope of usable resources(increased variety of flowers versus harder fruit andinsects). Size and shape have evolved almost indepen-dently in this family, where the major axes of shapechange (towards nectarivory and sanguivory) in phyllos-tomid mandibular morphospace were not correlatedwith size differences. On the other hand, the mostimpressive size differences (towards carnivory) are asso-ciated with minor shape changes. After the early burstof ecomorphological divergence, when directional selec-tion was possibly a dominating evolutionary mechanism,some of the lineages went into a long period of stasis ornon-adaptive radiations, but further selective episodescannot be ruled out, particularly for size variationamong frugivores, although the role of diet as selectionagent is not entirely clear in this case. The radiation ofphyllostomid bats was marked by a complex mixture ofadaptive and non-adaptive mechanisms through a periodof extreme environmental changes when new ecologicalniches were probably emerging and disappearingquickly. This led the leaf-nosed bats to present unparal-leled morphological and ecological variation amongmammals, which, together with the vast amount ofinformation available in the literature, makes phyllosto-mids one of the most important model systems for thestudy of morphological, functional and ecologicaldiversification.
MethodsSamples, diet and morphological dataA total of 443 specimens representative of 49 genera ofphyllostomid bats were analysed (Figure 1). Sample sizesand species names are detailed in Additional file 1. Allspecimens were identified as adults based on the ossifi-cation of the basisphenoid region. Mandible imageswere obtained with a digital camera Nikon Coolpix8700. All specimens were photographed under the sameplane in relation to the camera lens (reference points inthe specimens were used to align the mandible with thefocal plane). To capture as much shape variation as pos-sible, 11 landmarks, and 25 semilandmarks were used(Figure 2). The reference points were digitalised in the
TpsDig software [76]. The landmark configurations weresuperimposed according to a least squares criterion(Procrustes superimposition) [77-79], first calculating amean for each species and then superimposing all con-figurations to calculate a grand average. The semiland-marks were slid to minimize the least squares criterion[80] in TPSRelw [81]. Even though slid semilandmarksdo not hold biological correspondence (just like type IIor III landmarks), there is a gain in the information onshape variation (as ascertained from a comparison ofsuperimposed warped images in the program TpsSuper[82] - results not shown), and the correlation of Pro-crustes distance matrices obtained from data sets withand without semilandmarks was 0.956. After Procrustessuperimposition, the aligned coordinates present moredimensions than the actual shape space (aside from thedegrees of freedom lost in superimposition, a maximumof 48 dimensions is needed to describe 49 speciesmeans). To reduce dimensionality, the aligned coordi-nates were transformed to shape principal components[78]. Principal component analyses of aligned coordi-nates and the visualisation of shape changes associatedwith each principal component (shape PC) axis wereperformed in MorphoJ (importing the aligned landmarksand semilandmarks from TPSRelw) [35]. We have usedHorn’s parallel analysis [60,61] to choose the number ofprincipal components to be retained. Parallel analysis isa method of consensus in the literature [61], and con-sists of generating a large number of random sampleswith the same number of variables (but uncorrelated)and specimens as the original data, and comparing theobserved eigenvalues to the distribution of randomeigenvalues. The observed PCs that presented eigenva-lues larger than a percentile (we used 95%) of the ran-dom eigenvalue distribution are retained. We used theparan package [83] in the R environment [84] to per-form the parallel analysis. Size was measured both asthe centroid size (square root of summed squared dis-tances from each landmark to the centroid of points)from mandible landmark configurations [77], and asCondylobasal Length (CL - from the anteriormost pointon the premaxilla to the condyle). These two measuresof size were highly correlated (r = 0.983), and all resultswere the same for both variables. Because cranial lengthis a more intuitive measure, and to facilitate furthercomparisons, we chose to report results using CLinstead of mandible centroid size.Dietary information was obtained from the literature
(modified and updated from [5]). We organized thequantitative and qualitative information for the 49 batspecies into five categories comprising the main fooditems identified in phyllostomid diets (insectivory[arthropods], carnivory [small vertebrates], frugivory,nectarivory [pollen and nectar], and sanguivory). With
Monteiro and Nogueira BMC Evolutionary Biology 2011, 11:137http://www.biomedcentral.com/1471-2148/11/137
Page 17 of 23

the exception of sanguivore bats, all phyllostomid spe-cies present mixed diets, with varying levels of speciali-zation and predominance of items from a givencategory. To compare the relative importance of structu-rally different items, such as nectar and arthropods inthe diet of a single species is a challenging task. Wedefined rank categories based on relative usage of fooditems (0 - absent, 1 - complementary, 2 - predominant,3 - strict), and a rank was attributed to each dietaryitem for each species (see Additional file 1). The distri-bution of diet variables along the phylogenetic tree used[33] is depicted in Figure 1. The diet variables wereused later as independent variables in a multivariateregression model. Preliminary analyses indicated strongmulticollinearity among the diet variables, mostly causedby a positive correlation between insectivory and carniv-ory (sometimes lumped as animalivory), and a negativecorrelation between frugivory and animalivory. To avoidmulticollinearity, we calculated the principal compo-nents (PCs) of a correlation matrix among the diet vari-ables [85]. Details of this analysis have been publishedelsewhere [24]. The former approach allows for testinggradual shape changes in species groups with mixeddiet. However, diet was also analysed as a discrete vari-able, using the predominant (or strict) diet item as cate-gory (see model-based analyses below).
Phylogenetic comparative analysis of ecomorphologicalassociationsShape variation among species was summarised by prin-cipal components (the major axes of shape variation).The shape PCs were fitted to a phylogeny by estimatingancestral character states (nodes) for each PC and plot-ting the scores for OTUs (operational taxonomic units -the species at tree tips) and HTUs (hypothetical taxo-nomic units - the nodes) along with the branches link-ing the tree nodes. Each OTU and tree branch wasplotted with a colour according to the predominant diet(estimated ancestral diet for the branches). A maximumlikelihood algorithm [86] was used in the estimation ofancestral states, using the function ace in the APE pack-age for the R environment for statistical computing[87,84]. The phylogeny of Baker et al. (2003; 2010)[3,33] (Figure 1), based on mtDNA and RAG2sequences, was used as a framework for all the com-parative analyses performed. The branch lengths usedwere the divergence time estimates obtained fromBaker et al. (2010) [3]. This phylogeny has been inde-pendently corroborated in a recent paper [4], althoughthe time estimates are slightly different between thepublications.Principal components of species average shapes depict
the major axes of variation among species in shapespace. These linear combinations of the original
superimposed coordinates ordinate species meansaccording to gradients formed by unknown latent fac-tors. Associations of PC scores with measured factorscan be performed a posteriori to aid in the interpreta-tion of ordinations. The linear associations betweenmandible shape and diet principal components weretested by multivariate regression (where each data pointis a species average), using a phylogenetic generalizedlinear model (PGLS - [40,88]). Generalized least squares(GLS) models allow for the phylogenetic non-indepen-dence to be incorporated into the error structure as anamong species covariance matrix. Unlike spatially orga-nised data (which share a similar problem of non-inde-pendence), where geographic distances among samplescan be measured with small error, the phylogenetic cov-ariances depend on the phylogenetic hypothesis theyderive from and the evolutionary model assumed forcharacter change. When phylogenetic covariances arebased on the sum of branch lengths from the root ofthe tree to the most recent ancestral for each pair ofspecies, a Brownian model of evolution is assumed,where the expected phenotypic differences amongOTUs are directly related to their distance to the lastcommon ancestor [88]. The Brownian model of evolu-tion has been increasingly considered an unlikelyassumption for comparative methods (particularly whendealing with adaptive radiations [28,38,39]). We usedthe estimate of covariance structure proposed by Mar-tins and Hansen [40], that results from an evolutionarymodel that incorporates stabilising selection as a con-straint. According to this model, covariances amongOTUs are determined as Vij = g exp(-atij), where a is aparameter determining the magnitude of a restrainingforce or pull towards an optimum phenotype, and g is aparameter loosely interpreted as the interspecific var-iance in equilibrium (due to the balance between selec-tive and neutral evolutionary forces). This model causesthe influence of a common ancestor to decrease expo-nentially with the sum of branch lengths leading to thatancestor, as a consequence of stabilising selection “eras-ing” the evolutionary history. The value of a was inter-actively estimated via maximum likelihood during modelfitting, providing flexibility of evolutionary modelsassumed. For the multivariate regression, the phyloge-netic covariance matrix was estimated via the APE pack-age [87] and the multivariate model fit with NTSYS-PC[89]. The shape PCs were included as dependent vari-ables and the first three diet PCs plus average cranialsize (Condylobasal Length - CL) were included as inde-pendent variables. The partial correlation coefficientsfrom the multivariate regression were used to producebiplots showing the species ordination within the shapePC space and the associated directions of variation ofdiet PC vectors.
Monteiro and Nogueira BMC Evolutionary Biology 2011, 11:137http://www.biomedcentral.com/1471-2148/11/137
Page 18 of 23

Patterns of phenotypic and ecological disparitythrough timeAdaptive radiations commonly generate a distinctivepattern of temporal change in disparity, where morpho-logical divergence increases quickly in the first phase,and slows down towards present time, as the niches arefilled [22]. The change in disparity patterns throughtime (DTT) is usually studied by the comparison of fos-sil taxa [90]. However, Harmon and colleagues [91] haveproposed and implemented (in the geiger package forthe R environment [92]) a method to evaluate thechanges in disparity patterns along a phylogenetic tree,using exclusively phenotypic measurements of terminaltaxa. Using the full space of shape principal components(including all components with non zero eigenvalues)for the mandible shape, disparity was calculated fromaverage pairwise Euclidean distances between species[91]. For this data set, this is equivalent to using averagepairwise Procrustes distances (summed squared dis-tances among corresponding landmarks after Procrustessuperimposition) [79]. Using the full shape space is pos-sible in this case because the data are reduced to pair-wise distances regardless of dimensionality, and noparameters are estimated. However, the number ofdimensions might have an effect in the simulationsdescribed below and the confidence intervals calculated,so it is more consistent to work with the full shapespace. Size disparity was calculated using the same pro-cedure, but using average Condylobasal Length as thesingle variable. Diet disparity was calculated as well,using the relative importance of dietary items (see Addi-tional file 1) as data and average pairwise Manhattandistances as measure of disparity. Disparity throughtime (DTT) plots can be generated by first calculatingthe disparities for the entire tree and for each subcladedefined by a node in the phylogeny. Relative disparitiesare obtained for each node by dividing its disparity bythe tree disparity. Moving up from the root of the phy-logeny, a mean disparity is calculated at each node(divergence event) as the average of the relative dispari-ties of all lineages whose ancestral lineages were presentat that point [91]. The DTT plots allow for insight onthe relative timing of phenotypic divergence whileavoiding the need of ancestral character estimation. Theinference of disparity deviations from a neutral evolutionpattern was performed by a comparison of observed pat-terns with the average of 1000 simulated DTT patternsafter evolving the shape variables according to Brownianmotion along the phylogenetic tree [91,93]. These simu-lations generate random phenotypes as phylogeneticindependent contrasts along the tree (for each node)using a multivariate normal distribution with zeromeans and a covariance matrix based on the obser-ved phylogenetic independent contrasts. A disparity
distribution based on a neutral evolutionary process isthen generated for each relative time (node) of the treeand the observed disparity can be compared to neutralconfidence intervals.A second approach to the investigation of evolutionary
processes via a comparison of shape variation and rela-tive time was based on Polly (2004) [34] simulationstudy. This author showed that different evolutionarymodels leave distinctive imprints on the distribution ofshape distances versus time of divergence. We havecompared the pairwise shape distances (Procrustes dis-tances) to pairwise genetic distances (proportional topercent sequence divergence from Baker et al. (2003)[33]), and estimated time since divergence (from Bakeret al. (2010) [3]) in a matrix scatterplot. This methodallowed for a qualitative comparison of the observedpattern to the expected under different evolutionarymodes by visual inspection [34].
Modelling phenotypic evolutionThe comparative methods based on GLS describedabove provide a direct test of linear relationships amongmajor axes of diet and shape variation. Whereas thisclass of comparative methods might provide a statisti-cally valid test of association, it provides no directinsight into the evolutionary processes responsible forthe observed variation. A more recent approach, basedon the simultaneous fit and comparison of evolutionaryhypotheses combining evolutionary models, phenotypicand ecological information has been proposed by Butlerand King (2004) [27] after Hansen’s (1997) [94] methodfor the estimation of selective factors on adaptiveoptima (see also [28]). The model-based approach fitsdistributions predicted under a number of evolutionaryhypothesis to observed data, allowing for simultaneousinference of model likelihood using information criteria.The simplest model of phenotypic evolution is the
neutral Brownian motion [25], where total evolutionarychange in a continuous character is distributed nor-mally, with a mean equal to the ancestral value for theentire tree and variance proportional to the amount oftime elapsed from tree root to tips. An alternative evolu-tionary model (or class of models) for phenotypicchange under stabilising selection that has gained popu-larity recently is based on the Ornstein-Uhlenbeck(O-U) process [27,28,40,94]. These models incorporate aconstraint as a constant pulling force (measured by aparameter a) towards a central point (θ) which canmimic the action of stabilising selection on the pheno-type. The central point can be interpreted as an adaptiveoptimum. In the approach proposed by Butler andKing [27], the O-U models can have any number ofadaptive optima (θi), which are proposed accordingto hypotheses of ecological diversification. The models
Monteiro and Nogueira BMC Evolutionary Biology 2011, 11:137http://www.biomedcentral.com/1471-2148/11/137
Page 19 of 23

then incorporate a specific evolutionary process, aphylogeny with branch lengths (assumed to be at leastproportional to time), and the selective regimes opera-tive in each branch (derived from ancestral estimationof ecological changes).All dietary ancestral states (branch colours in Figure 6)
were estimated using the maximum likelihood algorithmimplemented in the function ace in the APE package forthe R environment [87]. The ancestral states and the term-inal states form a design matrix that determines for eachlineage leading to a particular terminal branch whichoptima where influential and the length of influence per-iod. For example, in the lineage leading to Glyphonycterisin model OU.5 in Figure 6, the ancestors corresponding tothe earlier branches were insectivores (for 8 My), thenthey are postulated to have switched to frugivory foraround 5 My and switched back to insectivory for theremaining 17 My. The estimated phenotypic mean vectorfor Glyphonycteris would be a weighted sum of optima (θi)leading to the terminal branch (see equation 5 in [27]).The weights determine that the most influential optimawill be the ones closest to the terminal branch, and theinfluence reduces exponentially for optima that influenceda lineage near the root. In the case of Glyphonycteris, themost influential optimum would be insectivory (because ofthe terminal branch optimum, not the root), then frugiv-ory. The optima for nectarivory, sanguivory and carnivorywould have weight = 0 because there is no postulated Gly-phonycteris ancestor with these optima. The models werefitted to the mandible shape data (the first three and fiveshape PCs) in a multivariate fashion and to cranial size(Condylobasal Length - CL). We used different numbersof shape PCs to assess the sensitivity of the models to thedimensionality of the subspace, changing both the numberof parameters being estimated (see below) and the amountof variation being explained by the subspaces. Five PCswere indicated by parallel analysis to have larger eigenva-lues than the random distribution of eigenvalues, whereasthree PCs provide an optimal (maximum variance) visuali-sation of the shape subspace. In the Hansen model[27,94,95], the evolution of a multivariate phenotype withp variables assumes the form of the stochastic differentialequation
dx(t) = A(q − x(t))dt + S dB(t),
where A is a p × p square symmetric matrix ofa parameters that measure the strength of selection. thevector q is the optimum corresponding to the θi for theparticular branch, S is a p × p square symmetric matrixwith sigma parameters that can be interpreted as thestrength of random drift, and B(t) is a standard Wiener(Brownian motion) process [95]. The alpha and sigmamatrices have each p × (p + 1)/2 independent para-meters (one for each variable and one for each pair of
variables). These are estimated via an iterative optimisa-tion procedure (we used identity matrices as startingforms) minimising the error of a multivariate GLSmodel that uses the alpha and sigma matrices to esti-mate the vector of optima q and the expected multivari-ate phenotype for each species (terminal branches) inthe tree. Each model has to estimate 2 × p × (p + 1)/2+ p × nθ parameters, where nθ is the number of optimain the model. Because matrices of alpha and sigma para-meters are calculated, the models do not constrainselection strength and the random drift disturbances tobe isotropic in shape space. On the other hand, a sim-plification is accomplished because the same alphamatrix is used for all postulated adaptive optima, requir-ing the selective constraints to be the same for all peaks.This is true also for univariate models because they usea single a parameter for all adaptive peaks [27].The ecological (dietary) information available allowed
for the elaboration of five alternative models of evolu-tionary change (BM, OU.2, OU.3, OU.4, OU.5). Thefirst model only incorporates neutral evolution expecta-tions along the phylogenetic tree according to a Brow-nian motion (BM) process. The other models use theO-U process with a number of different optima (Figure6) according to postulated selective regimes. We startwith a simple discrimination of two adaptive optimarelated to high and low mastication regimes (ModelOU.2). Model OU.3 breaks the low mastication selectiveregimes into nectarivory and sanguivory, recognising thefundamental ecological and functional differencesbetween them. Model OU.4 separates all dietary optima,but lumps insectivory and carnivory together into theanimalivory category. A justification for this is thestrong correlation between insectivory and carnivoryobserved in the diet PCA [24]. It has been suggestedthat carnivory is just an allometric extension of insectiv-ory [36] and that these two categories share the sameadaptive peak [24]. Model OU.5 discriminates adaptiveoptima for five selective regimes associated with eachdietary category, representing the most complex hypoth-esis about the adaptive radiation of phyllostomid bats.The models were compared by information loss cri-
teria [59], such as the Akaike Information Criterion cor-rected for sample size (AICc) [29] and the moreconservative Schwarz or Bayesian information criterion(SIC or BIC) [27]. The Information criteria were firsttransformed into differences from the minimumobserved AICc value Δi (AICc) = AICci - min AICc.The differences are then transformed into AICc weights
wi(AICc) =exp [
−12
× �i(AICc)]
K∑
k=1exp [
−12
× �i(AICc)]
,
Monteiro and Nogueira BMC Evolutionary Biology 2011, 11:137http://www.biomedcentral.com/1471-2148/11/137
Page 20 of 23

for which ∑wi (AICc) = 1. The Akaike weight for aparticular model Mi can be interpreted as the probabil-ity of Mi being the “best” model given the data and theset of candidate models [59]. The same procedure wasapplied for the SIC to calculate SIC weights. TheSchwarz information criterion is more conservative thanthe AICc, because it imposes larger penalties for morecomplex models. The SIC also assumes that the truemodel is within the candidate set of models, and is lowdimensional, whereas the AICc assumes that the truemodel is not within the candidate set and is infinitelydimensional [59]. Confidence limits (ellipsoids) for adap-tive optima were estimated by a parametric bootstrap(resampled 5000 times). All model fitting procedureswere performed using package OUCH (version 2.7-1)[95] for the R environment.
Additional material
Additional file 1: Table of sample sizes, diet and shape variablesper species. File in pdf format with sample sizes, dietary preferences,cranial size and shape principal component scores for each species.
Additional file 2: Animation showing the principal componentordination of shape. File in gif format (animated gif) showing a rotatingshape principal component ordination with species names.
AcknowledgementsWe are thankful to A. L. Peracchi (Universidade Federal Rural do Rio deJaneiro), M. de Vivo (Museu de Zoologia, Universidade de São Paulo, Brazil),and N. B. Simmons (American Museum of Natural History, EUA) for allowingaccess to specimens under their care, to J. Barros and E. Westwig forassistance in finding specimens in their respective institutions. Financialsupport was provided by FAPERJ and CNPq (Brazil) and The University ofHull (UK). A. Cardini, C. P. Klingenberg and an anonymous reviewer providedimportant comments and suggestions that greatly improved the manuscript.We also would like to thank L. Harmon for help and discussions about thepackage geiger.
Author details1Department of Biological Sciences and Hull York Medical School, TheUniversity of Hull, Hull, HU6 7RX, UK. 2Laboratorio de Ciencias Ambientais,Universidade Estadual do Norte Fluminense, Av. Alberto Lamego 2000,Campos dos Goytacazes, RJ, Brazil. 3Departamento de Biologia Animal,Universidade Federal Rural do Rio de Janeiro, Seropedica, RJ, Brazil.
Authors’ contributionsBoth authors contributed to the design of the study. MRN collected theshape data (travelled to Museums, photographed specimens and digitizedlandmarks) and assembled the diet data from the literature. Both authorsperformed the analyses. LRM wrote a first draft with contributions fromMRN. Both authors read and approved the final manuscript.
Received: 1 November 2010 Accepted: 23 May 2011Published: 23 May 2011
References1. Freeman PW: Macroevolution in Microchiroptera: recoupling morphology
and ecology with phylogeny. Evol Ecol Res 2000, 2:317-33.2. Simmons NB: An Eocene big bang for bats. Science 2005, 307:527-528.3. Baker RJ, Bininda-Emonds ORP, Mantilla-Meluk H, Porter CA, Van den
Bussche RA: Molecular timescale of diversification of feeding strategyand morphology in new world leaf-nosed bats (Phyllostomidae): a
phylogenetic perspective. In Evolutionary history of bats: fossils, moleculesand morphogy, Cambridge Studies in Molecules and Morphology - NewEvolutionary Paradigms. Edited by: Gunnel GF, Simmons NB. CambridgeUniversity Press; 2010:.
4. Datzmann T, von Helversen O, Mayer F: Evolution of nectarivory inphyllostomid bats (Phyllostomidae Gray, 1825, Chiroptera: Mammalia).BMC Evol Biol 2010, 10:165.
5. Wetterer AL, Rockman MV, Simmons NB: Phylogeny of phyllostomid bats(Mammalia, Chiroptera): data from diverse morphological systems, sexchromosomes, and restriction sites. B Am Mus Nat Hist 2000, 248:1-200.
6. Nogueira MR, Peracchi AL: Fig-seed predation by two species ofChiroderma: discovery of a new feeding strategy in bats. J Mammal2003, 84:225-233.
7. Rex K, Czaczkes BI, Michener R, Kunz TH, Voigt C: Specialization andomnivory in diverse mammalian assemblages. Ecoscience 2010, 17:37-46.
8. Aguirre LF, Herrel A, van Damme R, Matthysen E: Ecomorphologicalanalysis of trophic niche partitioning in a tropical savannah batcommunity. Proc Roy Soc Lond B 2002, 269:1271-1278.
9. Aguirre LF, Herrel A, van Damme R, Matthysen E: The implications of foodhardness for diet in bats. Funct Ecol 2003, 17:201-212.
10. Simmons NB, Voss RS: The Mammals of Paracou, French Guiana: aNeotropical lowland rainforest fauna. Part 1 Bats. B Am Mus Nat Hist1998, 237:1-219.
11. Voss RS, Emmons LH: Mammalian diversity in neotropical lowlandrainforests: a preliminary assessment. B Am Mus Nat Hist 1996, 230:1-115.
12. Swartz SM, Freeman PW, Stockwell EF: Ecomorphology of bats:comparative and experimental approaches relating structural design toecology. In Bat Ecology. Edited by: Kunz TH, Fenton MB. Chicago: Universityof Chicago Press; 2003:580-621.
13. Freeman PW: Form, function, and evolution in skulls and teeth of bats. InBat biology and conservation. Edited by: Kunz TH, Racey PA. Washington,DC: Smithsonian Institution Press; 1998:140-156.
14. Dumont ER: The effect of food hardness on feeding behaviour infrugivorous bats (Phyllostomidae): an experimental study. J Zool 1999,248:219-229.
15. Dumont ER: Bats and fruit: an ecomorphological approach. In Bat Ecology.Edited by: Kunz TH, Fenton MB. Chicago: The University of Chicago Press;2003:298-429.
16. Van Cakenberghe V, Herrel A, Aguirre LF: Evolutionary relationshipsbetween cranial shape and diet in bats (Mammalia: Chiroptera). In Topicsin Functional and Ecological Vertebrate Morphology. Edited by: Aerts P,D’aout K, Herrel A, Van Damme R. Maastricht: Shaker Publishing;2002:205-236.
17. Nogueira MR, Peracchi AL, Monteiro LR: Morphological correlates of biteforce and diet in the skull and mandible of phyllostomid bats. Funct Ecol2009, 23:715-723.
18. Winter Y, von Helversen O: Operational tongue length in phyllostomidnectar-feeding bats. J Mammal 2003, 84:886-896.
19. Tschapka M: Energy density patterns of nectar resources permitcoexistence within a guild of Neotropical ower-visiting bats. J Zool Lond2004, 263:7-21.
20. Santana SE, Dumont ER: Connecting behaviour and performance: theevolution of biting behaviour and bite performance in bats. J Evol Biol2009, 22:2131-2145.
21. Jones KE, Bininda-Emonds ORP, Gittleman JL: Bats, clocks, and rocks:diversification patterns in Chiroptera. Evolution 2005, 59:2243-2255.
22. Schluter D: The ecology of adaptive radiation Oxford Univ. Press; 2000.23. Gavrilets S, Losos JB: Adaptive radiation: constrasting theory and data.
Science 2009, 323:732-737.24. Monteiro LR, Nogueira MR: Adaptive radiations, ecological specialization,
and the evolutionary integration of complex morphological structures.Evolution 2010, 64:724-744.
25. Felsenstein J: Phylogenies and quantitative characters. Annu Rev Ecol Syst1988, 19:455-471.
26. Zeng ZB: Long-term correlated response, interpopulation covariation,and interspecific allometry. Evolution 1988, 42:363-374.
27. Butler MA, King A: Phylogenetic comparative analysis: a modelingapproach for adaptive evolution. Am Nat 2004, 164:683-695.
28. Hansen TF, Pienaar J, Orzack SH: A comparative method for studyingadaptation to a randomly evolving environment. Evolution 2008,62:1965-1977.
Monteiro and Nogueira BMC Evolutionary Biology 2011, 11:137http://www.biomedcentral.com/1471-2148/11/137
Page 21 of 23

29. Scales JA, King AA, Butler MA: Running for your life or running for yourdinner: what drives fiber-type evolution in lizard locomotor muscles? AmNat 2009, 173:543-553.
30. Collar DC, O’Meara BC, Wainwright PC, Near TJ: Piscivory limitsdiversification of feeding morphology in centrarchid fishes. Evolution2009, 63:1557-1573.
31. Atchley WR, Hall BK: A model for the development and evolution ofcomplex morphological structures. Biol Rev 1991, 66:101-157.
32. Depew MJ, Simpson CA: 21st century neontology and the comparativedevelopment of the vertebrate skull. Dev Dyn 2006, 235:1256-1291.
33. Baker RJ, Hoofer SR, Porter CA, Van Den Bussche RA: Diversification amongNew World leaf-nosed bats: an evolutionary hypothesis andclassification inferred from digenomic congruence of DNA sequence.Occasional papers, Museum of Texas Tech University 2003, 230:1-32.
34. Polly D: On the simulation of the evolution of morphological shape:multivariate shape under selection and drift. Palaeontol Electron 2004,7(2;7A):1-28.
35. Klingenberg CP: MorphoJ. Faculty of Life Sciences, University of Manchester2008 [http://www.flywings.org.uk/MorphoJ_page.htm].
36. Giannini NP, Kalko EKV: The guild structure of animalivorous leaf-nosedbats of Barro Colorado Island, Panama, revisited. Acta Chiropterol 2005,7:131-146.
37. Harmon LJ, Kolbe JJ, Cheverud JM, Losos JB: Convergence and themultidimensional niche. Evolution 2005, 59:409-421.
38. Harvey PH, Rambaut A: Comparative analyses for adaptive radiations. PhilTrans R Soc Lond B 2000, 355:1599-1605.
39. Freckleton RP: The seven deadly sins of comparative analysis. J Evol Biol2009, 22:1367-1375.
40. Martins EP, Hansen TF: Phylogenies and the comparative method: ageneral approach to incorporating phylogenetic information into theanalysis of interspecific data. Am Nat 1997, 149:646-667.
41. Dumont ER, Grosse IR, Slater GF: Requirements for comparing theperformance of nite element models of biological structures. J Theor Biol2009, 256:96-103.
42. Drake AG, Klingenberg CP: Large-scale diversification of skull shape indomestic dogs: disparity and modularity. Am Nat 2010, 175:289-301.
43. Dumont ER, Herrel A, Medellin RA, Vargas-Contreras JA, Santana SE: Built tobite: cranial design and function in the wrinkle-faced bat. J Zool 2009,279:329-337.
44. Santana SE, Dumont ER, Davis JL: Mechanics of bite force production andits relationship to diet in bats. Funct Ecol 2010, 24:776-784.
45. Muchhala N: Nectar bat stows huge tongue in its rib cage. Nature 2006,444:701-702.
46. Muchhala N, Thomson JD: Going to great lengths: selection for longcorolla tubes in an extremely specialized bat- flower mutualism. Proc RoySoc Lond B 2009, 276:2147-2152.
47. Tschapka EBM, Sperr , Caballero-Martinez LA, Medellin RA: Diet and cranialmorphology of Musonycteris harrisoni, a highly specialized nectar-feeding bat in Western Mexico. J Mammal 2008, 89:924-932.
48. Wainwright PC: Functional versus morphological diversity inmacroevolution. Annu Rev Ecol Evol Syst 2007, 38:381-401.
49. Griffiths TA: Molar cusp patterns in the bat genus Brachyphylla: somefunctional and systematic observations. J Mammal 1985, 66:544-549.
50. Phillips CJ: A theoretical consideration of dental morphology, ontogeny,and evolution of bats. In Ontogeny, functional ecology and evolution ofbats. Edited by: Adams RA, Pedersen SC. Cambridge, UK: CambridgeUniversity Press; 2000:247-274.
51. Herrel A, De Smet A, Aguirre LF, Aerts P: Morphological and mechanicaldeterminants of bite force in bats: do muscles matter? J Exp Biol 2008,211:86-91.
52. Eiting T, Gunnel GF: Global completeness of the bat fossil record. JMammal Evol 2009, 16:151-173.
53. Freeman PW, Lemen CA: Using scissors to quantify hardness of insects:do bats select for size or hardness? J Zool 2007, 271:469-476.
54. Dumont : Patterns of diversity in cranial shape among plant-visitingbats. Acta Chiropterol 2004, 6:59-74.
55. Davalos LM: Short-faced bats (Phyllostomidae: Stenodermatina): aCaribbean radiation of strict frugivores. J Biogeogr 2007, 34:364-375.
56. Lomolino MV: Body size evolution in insular vertebrates: generality ofthe island rule. J Biogeogr 2005, 32:1683-1699.
57. Willig MR, Camilo GR, Noble S: Dietary overlap in frugivorous andinsectivorous bats from edaphic cerrado habitats of Brazil. J Mammal1993, 74:117-128.
58. Nogueira MR, Monteiro LR, Peracchi AL, de Araujo AFB: Ecomorphologicalanalysis of the masticatory apparatus in Chiroderma (Chiroptera:Phyllostomidae). J Zool 2005, 266:355-364.
59. Wagenmakers E, Farrel S: AIC model selection using Akaike weights.Psychon Bull Rev 2004, 11:192-196.
60. Peres-Neto PR, Jackson DA, Somers KM: How many principal components?stopping rules for determining the number of non-trivial axes revisited.Comput Stat Data Anal 2005, 49:974-997.
61. Dinno A: Exploring the sensitivity of Horn’s parallel analysis to thedistributional form of random data. Multivariate Behav Res 2009,44:362-388.
62. Redondo RAF, Brina LPS, Silva RF, Ditchfield AD, Santos F: Molecularsystematics of the genus Artibeus (Chiroptera: Phyllostomidae). Mol PhylEvol 2008, 49:44-58.
63. Velazco PM, Patterson BD: Phylogenetics and biogeography of the broad-nosed bats, genus Platyrrhinus (Chiroptera: Phyllostomidae). Mol PhylEvol 2008, 49:749-759.
64. Marchan-Rivadeneira MR, Phillips CJ, Strauss RE, Guerrero JA, Mancina CA,Baker RJ: Cranial differentiation of fruit-eating bats (genus Artibeus)based on size-standardized data. Acta Chiropterol 2010, 12:143-154.
65. Wiens JJ, Graham CH: Niche conservatism: integrating evolution, ecology,and conservation biology. Annu Rev Ecol Evol Syst 2005, 36:519-539.
66. Zachos J, Pagani M, Sloan L, Thomas E, Billups K: Trends, rhythms, andaberrations in global climate 65 Ma to present. Science 2001, 292:686-693.
67. Delsuc F, Vizcaino SF, Douzery EJP: Influence of Tertiarypaleoenvironmental changes on the diversification of South Americanmammals: a relaxed molecular clock study within xenarthrans. BMC EvolBiol 2004, 4:11.
68. Galewski T, Mauffrey JF, Leite YLR, Patton JL, Douzery EJP:Ecomorphological diversification among South American spiny rats(Rodentia; Echimyidae): a phylogenetic and chronological approach. MolPhyl Evol 2005, 34:601-615.
69. Poux C, Chevret P, Huchon D, de Jong WW, Douzery EJP: Arrival anddiversification of caviomorph rodents and platyrrhine primates in SouthAmerica. Syst Biol 2006, 55:228-244.
70. Soto-Centeno JA, Kurta A: Diet of two nectarivorous bats, Erophyllasezekorni and Monophylus redmani (Phyllostomidae), on Puerto Rico.J Mammal 2006, 87:19-26.
71. Olson ME, Arroyo-Santos A: Thinking in continua: beyond the “adaptiveradiation” metaphor. BioEssays 2009, 31:1337-1346.
72. Dumont ER: Feeding mechanisms in bats: variation within theconstraints of fiight. Integr Comp Biol 2007, 47:137-146.
73. Dumont ER, Piccirillo J, Grosse IR: Finite-element analysis of bitingbehavior and bone stress in the facial skeletons of bats. Anat Rec 2005,283A:319-330.
74. Dumont ER, Herrel A: The effects of gape angle and bite point on biteforce in bats. J Exp Biol 2003, 206:2117-2123.
75. Dechmann DKN, Santana SE, Dumont ER: Roost-making in bats -adaptations for excavating active termite nests. J Mammal 2009,90:1461-1468.
76. Rohlf FJ: TPSDig, Version 2.10. Department of Ecology and Evolution, StateUniversity of New York, Stony Brook 2004 [http://life.bio.sunysb.edu/morph/].
77. Monteiro LR, Reis SF: Princípios de morfometria geométrica Ribeirão Preto,Brazil: Holos Editora; 1999.
78. Dryden IL, Mardia KV: Statistical shape analysis New York: John Wiley & Sons;1998.
79. Rohlf FJ: Shape statistics: Procrustes superimpositions and tangentspaces. J Class 1999, 16:197-223.
80. Monteiro LR, Guillermo LH, Rivera LA, Di Beneditto APM: Geometricmethods combining contour and landmark information in the statisticalanalysis of biological shape. In Proceedings of the Third BrazilianSymposium on Mathematical and Computational BIology. Edited by:Mondaini R. E-papers; 2004:336-355.
81. Rohlf FJ: TPSRelw, Version 1.45. Department of Ecology and Evolution, StateUniversity of New York, Stony Brook 2007 [http://life.bio.sunysb.edu/morph/].
82. Rohlf FJ: TpsSuper. Version 1.14. Department of Ecology and Evolution, StateUniversity of New York, Stony Brook 2004 [http://life.bio.sunysb.edu/morph/].
Monteiro and Nogueira BMC Evolutionary Biology 2011, 11:137http://www.biomedcentral.com/1471-2148/11/137
Page 22 of 23

83. Dinno A: paran: Horn’s Test of Principal Components/Factors 2010 [http://CRAN.R-project.org/package=paran], [R package version 1.4.3].
84. R Development Core Team: R: A Language and Environment for StatisticalComputing R Foundation for Statistical Computing, Vienna, Austria; 2010[http://www.R-project.org/], [ISBN 3-900051-07-0].
85. Johnson RA, Wichern DW: Applied multivariate statistical analysis New York:Prentice-Hall; 1988.
86. Schluter D, Price T, Mooers AO, Ludwig D: Likelihood of ancestor states inadaptive radiation. Evolution 1997, 51:1699-1711.
87. Paradis E, Claude J, Strimmer K: APE: Analyses of phylogenetics andevolution in R language. Bioinformatics 2004, 20:289-290.
88. Rohlf FJ: Comparative methods for the analysis of continuous variables:geometric interpretations. Evolution 2001, 55:2143-2160.
89. Rohlf FJ: NTSYS-PC, Numerical Taxonomy and Multivariate Analysis System,V 2.1. Applied Biostatistics Inc 2000 [http://www.exetersoftware.com/cat/ntsyspc/ntsyspc.html].
90. Foote M: The evolution of morphological diversity. Annu Rev Ecol Syst1997, 28:129-152.
91. Harmon LJ, Schulte JA, Larson A, Losos JB: Tempo and mode ofevolutionary radiation in iguanian lizards. Science 2003, 301:961-964.
92. Harmon LJ, Weir JT, Brock CD, Glor RE, Challenger W: GEIGER: investigatingevolutionary radiations. Bioinformatics 2008, 24:129-131.
93. Kozak KH, Larson A, Bonnet RM, Harmon LJ: Phylogenetic analysis ofecomorphological divergence, community structure and diversificationrates in dusky salamanders (Plethodontidae Desmognathus). Evolution2005, 59:2000-2016.
94. Hansen TF: Stabilizing selection and the comparative analysis ofadaptation. Evolution 1997, 51:1341-1351.
95. King AA, Butler MA: ouch: Ornstein-Uhlenbeck models for phylogeneticcomparative hypotheses (R package) 2009 [http://ouch.r-forge.r-project.org].
doi:10.1186/1471-2148-11-137Cite this article as: Monteiro and Nogueira: Evolutionary patterns andprocesses in the radiation of phyllostomid bats. BMC Evolutionary Biology2011 11:137.
Submit your next manuscript to BioMed Centraland take full advantage of:
• Convenient online submission
• Thorough peer review
• No space constraints or color figure charges
• Immediate publication on acceptance
• Inclusion in PubMed, CAS, Scopus and Google Scholar
• Research which is freely available for redistribution
Submit your manuscript at www.biomedcentral.com/submit
Monteiro and Nogueira BMC Evolutionary Biology 2011, 11:137http://www.biomedcentral.com/1471-2148/11/137
Page 23 of 23

BioMed Central publishes under the Creative Commons Attribution License (CCAL). Under the CCAL, authors
retain copyright to the article but users are allowed to download, reprint, distribute and /or copy articles in
BioMed Central journals, as long as the original work is properly cited.