The Power of Affect in Mary Wollstonecraft's Mary, A Fiction by ...
Upload
khangminh22Category
view
3download
0
Queen Mary University of London Financial Statements
2019/20

Contents
Queen Mary at a glance ........................................................................................................... 01
Statement from the Chair of Council ........................................................................................ 02
Statement from the President and Principal ............................................................................. 03
Queen Mary 2030 Strategy ...................................................................................................... 04
Financial Review of 2019/20 .................................................................................................... 15
Statement of Corporate Governance and Internal Control ....................................................... 22
Independent Auditors' Report .................................................................................................. 33
Consolidated and Institution Statement of Comprehensive Income and
Expenditure ............................................................................................................................. 36
Consolidated and Institution Statement of Changes in Reserves ............................................. 37
Consolidated and Institution Statement of Financial Position ................................................... 38
Consolidated and Institution Statement of Cash Flows ............................................................ 39
Statement of Accounting Policies ............................................................................................. 40
Notes to the Financial Statements ........................................................................................... 47
Council and Audit and Risk Committee Membership ............................................................... 77
Senior Executive Team Membership ....................................................................................... 78

1
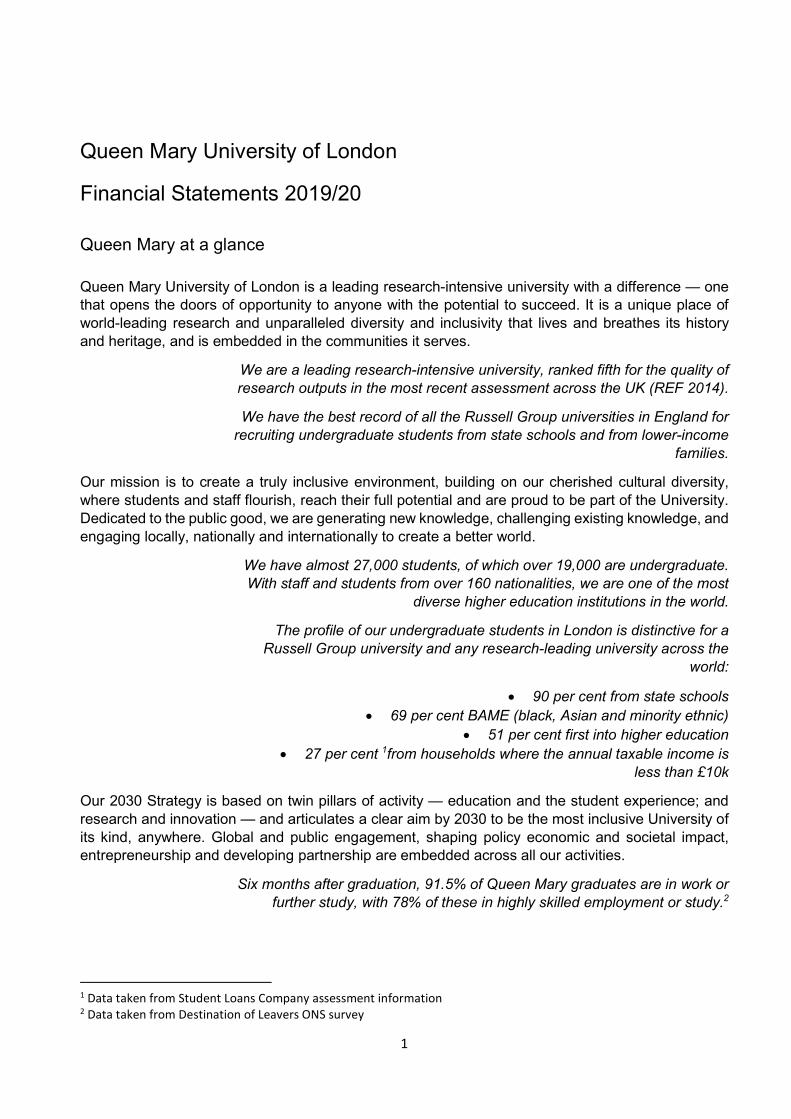
Queen Mary University of London
Financial Statements 2019/20
Queen Mary at a glance Queen Mary University of London is a leading research-intensive university with a difference — one that opens the doors of opportunity to anyone with the potential to succeed. It is a unique place of world-leading research and unparalleled diversity and inclusivity that lives and breathes its history and heritage, and is embedded in the communities it serves.
We are a leading research-intensive university, ranked fifth for the quality of research outputs in the most recent assessment across the UK (REF 2014).
We have the best record of all the Russell Group universities in England for recruiting undergraduate students from state schools and from lower-income
families.
Our mission is to create a truly inclusive environment, building on our cherished cultural diversity, where students and staff flourish, reach their full potential and are proud to be part of the University. Dedicated to the public good, we are generating new knowledge, challenging existing knowledge, and engaging locally, nationally and internationally to create a better world.
We have almost 27,000 students, of which over 19,000 are undergraduate. With staff and students from over 160 nationalities, we are one of the most
diverse higher education institutions in the world.
The profile of our undergraduate students in London is distinctive for a Russell Group university and any research-leading university across the
world:
90 per cent from state schools 69 per cent BAME (black, Asian and minority ethnic)
51 per cent first into higher education 27 per cent 1from households where the annual taxable income is
less than £10k
Our 2030 Strategy is based on twin pillars of activity — education and the student experience; and research and innovation — and articulates a clear aim by 2030 to be the most inclusive University of its kind, anywhere. Global and public engagement, shaping policy economic and societal impact, entrepreneurship and developing partnership are embedded across all our activities.
Six months after graduation, 91.5% of Queen Mary graduates are in work or further study, with 78% of these in highly skilled employment or study.2
1 Data taken from Student Loans Company assessment information 2 Data taken from Destination of Leavers ONS survey

2
Queen Mary graduates earn an average of £31,019 five years after graduation which places Queen Mary in the top 10% for the sector. Queen Mary offers access to
careers support from day one and for two years after graduation.
Total income in 2019/20 grew by £28.6m to £512.4m, whilst income, excluding capital grants, grew by £29.1m to £503.0m. Within this, research
income, excluding capital grants, grew by £7.5m to £112.4m.
Our values are central to all we do and have been co-created with our community of students and staff:
We will be inclusive and maintain our proud tradition of nurturing and supporting talented students and staff regardless of their background and circumstances, and continually enhance our strong engagement with our local and global communities.
We are proud of the difference we can all make when we work collectively.
We are ambitious and we will foster innovation and creativity, disrupt conventional thought, and respond with imagination to new opportunities to further our vision, mission and academic ambitions.
We will be collegial and promote a strong collegial community through openness, listening, understanding, co-operation and co-creation, ensuring focused delivery of our collective vision and strategy.
We will act with the highest ethical standards, and with integrity, in all that we do.
Statement from the Chair of Council
In my foreword to Queen Mary’s Strategy 2030 I wrote “never has it been more true that the only constant, for the higher education sector, is change” and that “it is impossible to predict what will happen over the course of the next few years”. This has been a year that, in terms of change and upheaval, has made the economic and political turmoil we talked of then seem trivial in comparison.
Covid-19 has stretched the fabric of our society and made us all question many things that we previously took for granted. At times like these, it is our fundamental values and strengths that we need to hold on to, and that is where Queen Mary can approach the challenges of the current global situation with confidence.
Queen Mary’s Strategy is based on our two core areas of activity: education and the student experience; and research and innovation. Global and public engagement, shaping policy, economic and societal impact, entrepreneurship and developing partnerships are embedded in all our activities.
More than that, though, it builds on the vision of our founders to provide ‘hope and opportunity’ for the communities we serve. At Queen Mary, through our values and actions, we open the doors of opportunity, and our Strategy embraces that and seeks to go even further.
In challenging times, this shared commitment to our heritage and our collective vision has been vital, and will be going forward in an environment that shows little sign of stabilising. As an institution, the diversity and strengths of our communities – of staff, students and friends – is our

3
unique strength. What makes it such a strength is that shared commitment to, and the ability to coalesce around, a shared set of values amidst a financial and political crisis.
The commitment of the staff at all levels of Queen Mary was clear over the spring and summer. As Chair of Council I worked with the Executive to establish formal ‘gateway reviews’, which on a monthly basis gave Council a detailed overview of the student recruitment situation and financial position of the University. This enabled us to place the sometimes difficult but always principled decisions taken by the University’s executive in context. At times, with restrictions on travel in place, government policies in relation to assessments and admissions changing by the week, and with commercial income streams reduced or removed entirely, these were challenging discussions.
This is a University and a Strategy with firm foundations, though, and these foundations provided the basis for engagement with our partners across the world. Our world-class research continued: we worked with our friends in China to provide PPE equipment to the NHS; we were the first UK University to release our students from their residential contracts to enable them to return home; and we made an additional 500 undergraduate places available during Confirmation and Clearing to open the doors of opportunity to more deserving students.
As a University our Strategy and vision guided our approach, and means that we can approach the coming year cautiously optimistic, with strong student recruitment and firm foundations for the coming years ahead.
Statement from the President and Principal
The Academic Year 2019/20 was my third as President and Principal of this wonderful University. It is fair to say that it was a year unlike any other I have experienced. Amidst that challenge, though, the resilience, and indeed brilliance of our community of staff and students has shone through, and I have never been more proud of Queen Mary as I have this year.
We enter the New Year cautiously optimistic. The tireless work of colleagues across the institution means that our student recruitment continues to be strong, with student recruitment targets for the four key cohorts (Home, International, Trans-national and Distance Learning) all exceeded for the key enrolment census date of December 2019, demonstrating the strength of our offer – pre-Covid-19.
We have worked hard to improve our financial situation over recent years, and we present here a strong set of results. The external environment was challenging even before the extent of the Covid-19 pandemic became clear. Without any significant endowments upon which to draw, we have had to focus on developing sources of income to invest strategically in our staff, as well as facilities, infrastructure and equipment, to deliver Strategy 2030. In the Spring of 2020 we were faced with a significant reduction in our commercial and residential income, as well as uncertainty around our September recruitment position, with restrictions on travel and in-person education continuing.
This meant having to take swift and decisive action, with an immediate halt on capital expenditure, non-essential staff recruitment, and a strict expenditure control process implemented at short-notice. We built on our previous work in this area, and managed to improve our underlying cash generation3 to £62m (from £59m).
For colleagues moving to remote education and research this was a process that involved sacrifice and hard work, and I am extremely grateful to our community for their phenomenal effort in ensuring that we emerged from the summer with a sector-leading blended learning offer in place, world-class
3 See page 14 for definition of underlying cash generation.

4
research that has continued through lockdown, and a group of professional services directorates that have maintained their outputs through a seismic shift in their working patterns. Indeed I would particularly like to highlight the contribution of our key workers in our security, residential and cleaning staff, who worked on site throughout lockdown. As pillars of our community, their contribution is so often made in the background. This year, however, their work keeping our staff, students and infrastructure safe has been nothing short of phenomenal, and I am personally grateful to them.
Notwithstanding the difficulties we have faced, in some cases the pandemic has accelerated key components of our Strategy 2030: the transition to blended learning over the summer was done at pace, with colleagues working throughout what in normal times would be an opportunity to pause and reflect on the academic year just gone. We reviewed our curriculum, resulting in a streamlined number of modules, and a more modern and coherent offer to our students. These achievements are exceptional, and place us in a strong position to deliver our Strategy.
At this point, however, it is clear that we are not ‘out of the woods’ yet, and the outlook for the sector remains uncertain. At the time of writing it appears likely that restrictions on travel will be in place for some time. This is a significant risk to the international research and students that help ensure we have such a diverse and dynamic global community, and that also provide a key source of income to the University. Brexit continues to be a key risk, threatening important supply chains, and damaging the UK as a centre of excellence and connectivity in higher education. While the current blended method of delivering education has brought incredible innovation and engagement with students, adopting this at pace has created new challenges and questions of our infrastructure: is a University estate based around delivering lectures to 200+ students in a single room fit for purpose in 2020, for instance, and what will the impact be on our long-term estates strategy?
These are key challenges which can add to the feeling that has been growing within the sector in recent years, and that I share with my colleagues, that – buffeted by strong winds - individual institutions like Queen Mary can feel as if we have limited agency over the direction of travel.
This year, though, our wonderful community has demonstrated a resilience, and ability to work together, that has convinced me that we can overcome whatever challenge is thrown at us. I am immensely proud to be part of this great University and of the progress and achievements that our staff and students registered once again during a year unlike any other.
Queen Mary 2030 Strategy
Strategy Highlights
2019/20 was the first full year of implementation of our 2030 Strategy. While the unprecedented challenges of the global pandemic required us to re-focus our short-term priorities in the first half of 2020, we have continued to concentrate on the ten-year horizon of our Strategy and maintained our focus on the fundamentals of education and the student experience, and research and innovation. Highlights from the year include:
accelerating our transition to blended learning for September 2020, with a high-quality online offering supplemented by innovative in-person activities;
5
a fundamental review and streamlining of our education portfolio, to create a more modern and streamlined curriculum with clearer pathways for student development;
the establishment of the Digital Environment Research Institute (DERI), our first multi-disciplinary flagship University Research Institute, under the leadership its inaugural Director Dr Greg Slabaugh;
renewing and resourcing our overriding focus on the support, development and nurturing of the Queen Mary community with the appointment of Sheila Gupta as our first Vice-Principal (People, Culture and Inclusion).
Enabling plans, objectives and key risks
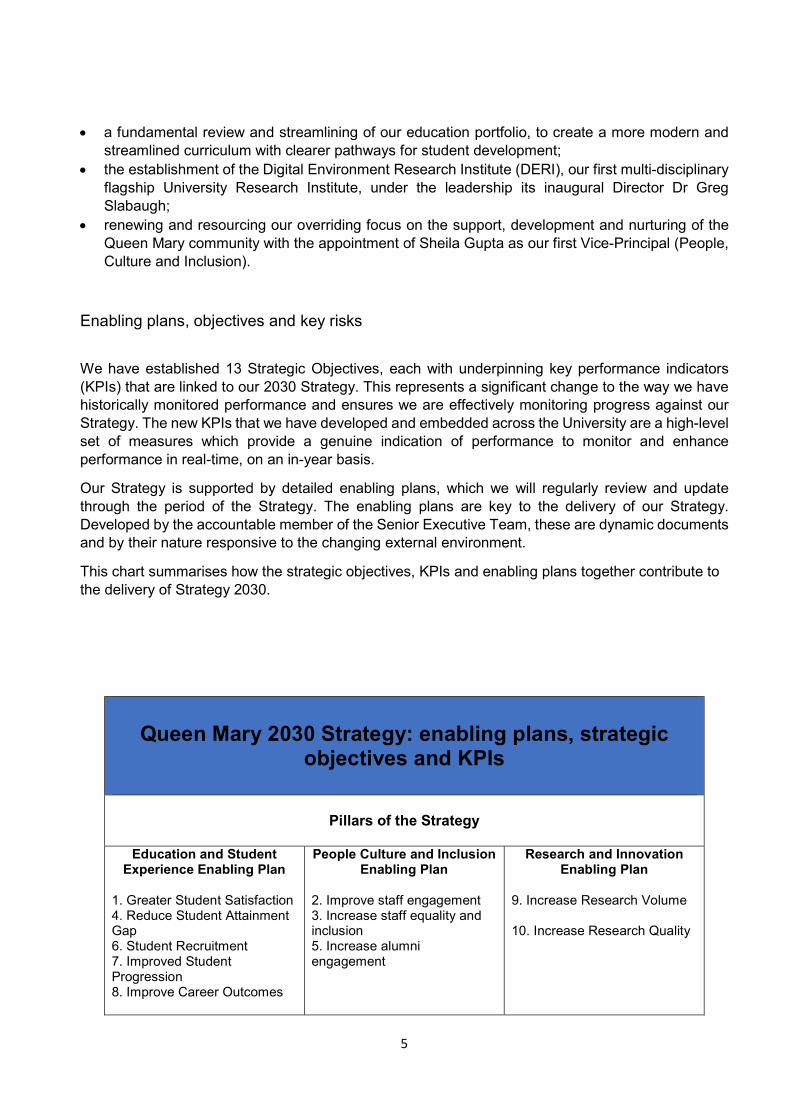
We have established 13 Strategic Objectives, each with underpinning key performance indicators (KPIs) that are linked to our 2030 Strategy. This represents a significant change to the way we have historically monitored performance and ensures we are effectively monitoring progress against our Strategy. The new KPIs that we have developed and embedded across the University are a high-level set of measures which provide a genuine indication of performance to monitor and enhance performance in real-time, on an in-year basis.
Our Strategy is supported by detailed enabling plans, which we will regularly review and update through the period of the Strategy. The enabling plans are key to the delivery of our Strategy. Developed by the accountable member of the Senior Executive Team, these are dynamic documents and by their nature responsive to the changing external environment.
This chart summarises how the strategic objectives, KPIs and enabling plans together contribute to the delivery of Strategy 2030.
Queen Mary 2030 Strategy: enabling plans, strategic
objectives and KPIs
Pillars of the Strategy
Education and Student Experience Enabling Plan
1. Greater Student Satisfaction 4. Reduce Student Attainment Gap 6. Student Recruitment 7. Improved Student Progression 8. Improve Career Outcomes
People Culture and Inclusion Enabling Plan
2. Improve staff engagement 3. Increase staff equality and inclusion 5. Increase alumni engagement
Research and Innovation Enabling Plan
9. Increase Research Volume 10. Increase Research Quality

6
Functional Enabling Plans
External Engagement
13. Improve academic
reputation
Professional Services
12. Improved cash generation PS transformation programme
Infrastructure
11. Delivery of enabling plans
Faculty Plans
Humanities and Social
Sciences
Science and Engineering
Medicine and Dentistry
Summary of progress against strategic objectives and key risks
Objective 1: Greater student satisfaction An excellent student experience is central to our mission and is also closely linked to our Strategic Objectives to increase our academic reputation and student recruitment. It remains an urgent priority to improve student satisfaction, and amidst ongoing industrial action and the pandemic it has been challenging to introduce the step-change in this area that our Strategy promises. Our overall KPI for student satisfaction is the ‘overall satisfaction’ measure in the National Student Survey (NSS). The 2020 result was 80.4% (99th in the sector), compared to 80.5% in 2019 (106th in the sector). A cross-university NSS Taskforce, led by the Vice-Principal (Education) has been established to understand the issues and identify ways of increasing student satisfaction urgently in 2020/21.
Key Risks: Disruption to the student experience from the pandemic is likely to increase throughout 2020/21, while there is a significant chance that the 2020 valuation of the USS pension scheme will lead to further industrial action. The Government has announced a root and branch review of the NSS. We will review the ongoing appropriateness of this KPI when the outcome of this review is known. At present this risk is considered to exceed Queen Mary’s risk tolerance.
Objective 2: Improving staff engagement We are dependent on having a fully-engaged workforce to deliver our 2030 Strategy in line with our Values. The Staff Engagement KPI is taken from an aggregate of a suite of questions within our all-staff survey. Following a pulse survey in 2018, due to the global pandemic a staff survey was not undertaken in 2019/20. The engagement score from the 2018/19 staff survey was 62%. A group was established that identified key concerns raised by staff and implemented a range of measures in response, including the establishment of staff groups, changes to promotions processes and a review of recruitment policies. These have informed the development of the People Culture and Inclusion Enabling Plan, which staff at all levels of the institution are now being consulted on.
Key Risks: Staff at all levels have had to work incredibly hard, in many cases in challenging personal situations, in response to the pandemic. Staff have in many cases had to completely overhaul established working practices and drastically change the mode of education delivery. There is a key risk at Queen Mary, and indeed across the sector, that staff will suffer burnout from this work, and that continued remote working will have a detrimental effect on staff engagement.

7
Objective 3: Increasing staff equality and inclusion In order to achieve our aim by 2030 to be the most inclusive University of its kind, anywhere, we need to develop a workforce that embodies the same diversity at all levels that we have in our student body. Progress against this objective is measured by the proportion of BAME and female staff at junior, middle and senior levels. The proportion of BAME staff at junior (grades 1-4), middle (grades 5 & 6) and senior (grades 7 & 8) levels was 44:26:18 in 2017/18, 47:27:18 in 2018/19 and 47:28:20 in 19/20. The proportion of female staff at junior, middle and senior levels was 58:53:39 in 2017/18 59:53:38 in 2018/19 and 59:53:39 in 2019/20. Our 2030 aspiration for each of these is 50:40:40 and 50:50:50 respectively, based on our local population and profile of our staff. As is clear the figures – particularly the proportion of BAME staff – are showing signs of improvement, and the People Culture and Inclusion Enabling Plan addresses how we can improve the profile of our workforce at more senior levels through recruitment, promotions and staff development activities. We have also made significant changes in the way that we report these figures externally, increasing transparency and providing robust data to enable conversations internally.
Key Risks: Recruitment and promotion to posts not deemed to be business-critical has been frozen as a result of the financial challenge of the pandemic. This is a risk to our ability to positively affect the composition of our workforce, particularly at senior level. It appears that restrictions on recruitment will remain in place for the coming year.
Objective 4: Reduce student attainment gap We want students from all backgrounds to reach their full potential. The KPI used to measure this Strategic Objective is that used by the Guardian League Table to inform their ‘value added’ measure, which compares student qualifications upon entry with the award a student receives at the end of their studies. The value added gap has decreased from 6% in 2019 to 5% in 2020 (placing us 36th in the sector in the Guardian League Table based on the 2019 graduating cohort). This improvement reflects significant efforts in this area, including:
A university-wide, student-led initiative to ensure that the curriculum is inclusive A HEFCE-funded catalyst project ‘Re-imagining Attainment For All’ The introduction of BAME studentships The overall curriculum review highlighted elsewhere as a key achievement of this year.
Key Risks: The impact of the pandemic on the outcomes for different cohorts of students in 2019/20 is not yet known, but there is a risk that it will disproportionately impact Queen Mary students due to the unique demographic within the Russell Group and our ongoing commitment to opening the doors of opportunity. The data will be carefully reviewed once it becomes available and appropriate mitigations will be developed if particular groups have been disproportionately affected.
Objective 5: Increase alumni engagement Our alumni across the globe have the potential to be ambassadors for the University and to contribute to the success of the current generation of students. This objective is measured through the number of unique alumni interactions. There was a slight decrease in interactions this year, from 17,811 in 2018/19 to 15,685 in 2019/20, largely due to resource in this area being reassigned to support student recruitment activities. We are aware that this figure is not sufficiently sophisticated to assign a value to each engagement, and are therefore in the process of developing a more sophisticated KPI for the Strategy 2030 that assigns different weightings to specific types of engagement. The sector as a whole is also working on developing an effective benchmark which will enable us to compare ourselves to others.
8
Key Risks: Queen Mary is starting from a low base in terms of our engagement with alumni and fundraising activity, and ongoing limitations on staff recruitment present a significant challenge to our desire to appropriately resource this area of activity. The External Engagement enabling plan will articulate a vision for increasing the maturity of our activities in this area.
Objective 6: Student recruitment that enables us to achieve our strategic objectives Student recruitment targets for the four key cohorts (Home, International, Trans-national and Distance Learning) were all exceeded for the key enrolment census date of December 2019. Considerable effort and investment have been made in our recruitment and admissions operations, and widening participation remains central to our approach to student recruitment.
Key Risks: The pandemic has had a significant impact on recruitment including on qualifications awarded, government policy and the ability of international students to travel to undertake their studies in the 2020/21 academic year. Mitigating the impact of the pandemic on international recruitment has been a key institutional priority but for as long as travel restrictions remain in place overseas recruitment will continue to be a challenge. Mitigations for student recruitment include an additional 500 Home/EU undergraduates recruited above the original target for 2020/21 and the option for a delayed January start in certain programmes. The impact on income will be mitigated via cost savings and further cash mitigation through reductions and delays to the capital programme for 2020/21. Alongside this, we remain concerned about the impact of Brexit on the UK as an attractive destination for overseas students, although the financial impact to the University of students from the EU no longer being eligible for home fees is likely to be low.
Objective 7: Improved student progression We want students from all backgrounds to flourish. The progression KPI measures the proportion of undergraduates who are not able to progress (NETP) at the end of their first year, most commonly through academic under-performance. We have seen considerable improvement in this measure over the last two years against our internally developed benchmarks – from 12.4% in 2017/18 to 11% in 2018/19 to 9.7% in 2019/20. A number of initiatives that have been implemented in the last year including a Queen Mary Advising Scheme and investment in sophisticated Learner Analytics, in conjunction with activity at School level, which should further improve progression.
Key Risks. The pandemic has caused disruption to the education and assessment of the academic year that commenced studies in September 2019. The impact of this will become clear in Autumn of 2020, but there is a risk that 2020 will see a decrease in progress towards this strategic objective.
Objective 8: Improved careers outcomes for students We want students from all backgrounds to go on to make meaningful and fulfilling contributions to society and the economy. The way in which careers outcomes are evaluated across the sector changed during this year with the introduction of the Graduate Outcomes Survey (GOS). We are in the process of amending our KPI to reflect this, but according to the KPI used across the sector previously - ‘careers after 15 months’ - in the Times League table released in 2020 Queen Mary was ranked 33rd in the sector on this measure.
Key Risks: The labour market for graduates is likely to be severely impacted by the economic effects of the pandemic. We have already seen an increase in interest in undertaking postgraduate taught studies and will continue to support our graduates in finding suitable employment. The development of our Careers Service will form a key part of our renewed External Engagement Enabling Plan, including targeted high-quality partnerships with industrial collaborators.
9
Objective 9: Increased research volume Research income for 2019/20 is £115m (15th in the Russell Group), an increase of £7m from 2018/19 and significantly above the target for 2019/20 of £108m.
Key Risks: While some new funding opportunities have arisen as a result of the pandemic, the research pipeline from some sources has been adversely impacted in particular in terms of grants awarded by charities, which Queen Mary has depended upon for a significant fraction of income, particularly in the School of Medicine and Dentistry. A key objective across our research portfolio to mitigate this risk is to increase the proportion of our research funded from core UKRI grants.
Objective 10: Increased research quality The production of the research quality KPI – field weighted citation impact – for 2020 has been delayed as a result of the pandemic. Preparations for the most significant external measure of research quality – the Research Excellence Framework (REF) – remained a key institutional priority, however, prior to the exercise in 2021. A REF dry run exercise was undertaken during the first half of the year, with the view of Queen Mary’s high-level REF strategy group, which includes significant external oversight, being that we are strongly placed to perform well in the 2021 REF exercise, with dedicated leadership in place at Deputy Vice-Principal level.
Key Risks: REF preparations remained an institutional priority throughout the year, and although there is a risk that key individual academics have had to prioritise education and student recruitment during the pandemic, this is being closely monitored and managed at School level.
Objective 11: Delivery of Enabling Plans There have been delays in the development and publication of some of the enabling plans that underpin the delivery of the 2030 strategy but we are now on course to have a full suite of enabling plans in place by the beginning of 2021, and all of them will now be reviewed in what is a significantly altered external environment. In particular, it became necessary to pause the development of the Infrastructure Enabling Plan as the extent of the pandemic became clear and it became apparent that investment in the digital rather than physical infrastructure would need to be urgently prioritised.
Key Risks. A clear project plan is in place to ensure that the full suite of enabling plans is in place by April 2021. There remains uncertainty and risk around the capital programme as this is dependent on the amount of cash that can be generated, as per objective 12.
Objective 12: Improved cash generation We understand that, in order to deliver our 2030 Strategy, we need to generate cash to invest in our infrastructure, people and services. Underlying cash generation4 increased from £59m in 2018/19 to £62m in 2019/20, largely as a result of the concerted institutional effort to preserve cash amidst the ongoing uncertainty of the pandemic. While this was a positive outcome in the circumstances, it will not provide the means to fund the upgrade of our infrastructure envisaged at the beginning of the Strategy period at present, and we will need to maintain focus on this as a priority through to 2030, notwithstanding the instability of the external environment.
Key Risks. A number of key financial risks emerged or became more significant during this year, including to some of our key income streams. These include overseas student recruitment, commercial income due to reduced numbers on campus and charity research funding. In addition, the 2020 valuation of the USS Pension Scheme is expected to show that the scheme is in significant deficit, highlighting the risk that contributions will increase. Ongoing controls on staff recruitment,
4 See page 14 for definition of underlying cash generation.
10
capital expenditure and 20% savings of operational budget in 2020/21 have been implemented to manage these risks, which require careful ongoing monitoring.
Objective 13: Improved academic reputation Our reputation nationally and internationally currently does not match the quality and distinctiveness of what we do. The KPI used to measure academic reputation is the survey result from the Times Higher Education academic reputation survey. Queen Mary saw a significant improvement in this survey in 2018/19 with the world ranking improving from 202 to 143. We fell by 32 places in the 2019/20 ranking to 175, reflecting to some extent the decision to prioritise student recruitment work over broader external communications during this period. The reputation working group is in place and will be taking forward the mitigations over the coming year.
Key Risks: Academic reputation is difficult to measure and requires a whole-university effort to influence. Efforts in this space will need to continue.
How we create value
Creating value for students and society through education
We aim to create a truly inclusive community in which students from all backgrounds can flourish, reach their full potential and go on to make a meaningful and fulfilling contribution to society and the economy.
Our status as the most inclusive Russell Group University puts us in an unrivalled position to address some of society’s long-standing issues with social mobility. For student entry in 2019/20, 91% of our undergraduate students were educated at non-selective state schools, 66% identified with BAME groups and 44% were the first in their family to attend university.
This year we launched the UK’s first Chartered Manager Degree Apprenticeship in social change, building on our distinctive approach to responsible management education. Students on this programme gain a full degree while earning a wage and getting real on-the-job experience.
Our community includes students and academics from over 160 nationalities, which enables us to deliver teaching with an international dimension and impact. Our students also recognise the contribution our global reputation makes to the value and portability of a Queen Mary degree. In 2019/20, 11% of our students were from the EU, 39% were from non-EU overseas countries and our QS Global ranking improved from 126 to 114.
We have launched new services to help current students connect with our global community of almost 180,000 alumni. This enhances the learning experience and augments the range of academic and career guidance, as well as mentoring opportunities, available to our diverse student body.
We take very seriously our regulatory duty to protect our students’ education. The 2019/20 academic year saw challenges in the form of industrial action and the Coronavirus pandemic. As the UK went into lockdown, we quickly moved our teaching and support services online and worked with our students to co-create the educational experience while undertaking a robust, meaningful and fair assessment of their academic achievements. We also provided an additional £660k in bursaries for students in financial hardship to access the necessary technology for online learning.

11
We established the Queen Mary Academy to provide development for our academic staff in delivering an inclusive educational offer and invested in technology to help our academics provide a richer online educational experience.
As part of our Strategy 2030, we set challenging KPIs to measure progress in supporting students from all backgrounds to achieve positive outcomes. Based on the latest available data:
we further reduced the attainment gap between white and BAME undergraduate students from 6% to 5%, although still short of our target of 4% in the context of our aim to eliminate the attainment gap altogether by 2021–22, and were the highest ranked multi-disciplinary University on the measure ‘black attainment gap’ in the Times/Sunday Times Good University Guide;
we reduced the percentage of our undergraduate students who were not eligible to progress after their first year from 11.0% to 9.7%;
our ranking in the Guardian League Table for graduate employability rose from 54th to 34th in the sector.
While these results show that we have delivered improvements for our students, we need to accelerate progress in future years to deliver a significant contribution to social mobility alongside academic outcomes in line with our status as a leading university.
Creating value for partners and society through research
We aim to generate new knowledge, challenge existing knowledge, and engage locally, nationally and internationally to create a better world.
East London Genes and Health is a long-term study of 100,000 people of Bangladeshi and Pakistani origin to find treatments for health conditions, including diabetes and cardiovascular disease,that particularly affect these communities. We could not have set up this significant study without our strong community relations
The quality of our research is recognised all over the world. In the most recent assessment of research across the UK we were ranked fifth for the quality of our research outputs (REF 2014), and are currently ranked eighth in the UK and 42nd globally based on citation levels (THE World Rankings). By attracting the best researchers and developing them to become leaders in research and innovation, we also ensure that the education we provide is led by world-class academics.
Our research into the long-term health effects of air pollution have led to policy developments at a local and national level. A leading Queen Mary researcher was the lead author for the Royal College of Physicians’ report which led to the introduction of the London Ultra Low Emission Zone scheme.
Public and community engagement is integrated into our research activity from the outset.
The Oral Health in Community Pharmacy Project is a collaboration between Queen Mary, Healthy London Partnership, NHS England and 1,861 community pharmacies across London to spot oral health issues in vulnerable children and guide parents to the right care. NHS England has extended the project across England.
Our academics are part of a lively and supportive research community who work closely with industry, government, business, communities and charities.
12
Led by Queen Mary, the Resilient Futures India Initiative is a dynamic partnership between academics and leaders in society, policy and industry concerned with identifying sustainable solutions to complex challenges in Indian society, such as domestic violence, youth mental health and access to healthcare.
Creating value for our local area
Recent UCU-funded research by Hatch Regeneris indicates that Queen Mary contributes £760m to the national economy and creates a total of 11,500 jobs in the UK directly and indirectly. As part of our commitment to create a Civic University Agreement we are also undertaking work to understand our current societal and economic impact as an anchor institution in East London. In 2018/19 (the most recent year for which information is available), for example:
we paid £9m to companies in London Borough of Tower Hamlets, representing 7% of our total spend on suppliers;
our Students’ Union supported over 1,000 students to commit 7,400 hours of local volunteering;
46% of our staff lived in East London and 16% of our students came from the area.
In the second half of 2020/21 we will carry out a community listening programme to understand our potential future impact in our local areas.
The Mile End Institute utilises its unique location as a Russell Group University situated in the East End of London to bring together Queen Mary academics, politicians, policymakers and the public to discuss and debate the major challenges facing the country in a fast-moving and ever-changing world. Issues discussed last year include the discourses surrounding immigration in the UK, data rights and Britain’s global role beyond Brexit.
Economy, efficiency and effectiveness
We aim to safeguard and utilise all our resources and assets, including public money and student fees, efficiently and effectively.
13
14
The Coronavirus pandemic presented new opportunities for making effective use of our resources. As we moved the majority of our teaching online, we kept our halls of residence open for both students and front line workers at nearby hospitals. We also kept some of our clinical laboratories open throughout the lockdown and made our specialist expertise, equipment and supplies available to support the national response.
Researchers at our Centre for Advanced Robotics worked with clinicians from the Royal London Dental Hospital to design and produce 3D printed visor holders with a more optimal PPE fit for front line medical workers.
Researchers in our School of Mathematical Sciences designed and implemented an algorithm to direct patients with Covid-19 requiring Intensive Care Units or ventilators within hospitals.
In each of the last three years we have met our target to achieve procurement savings of 5.5% of non-pay impactable spend.
Academic year 2017/18 2018/19 2019/20
Procurement savings target £3.8m £6.4m £6.1m
Procurement savings achieved £6.1m £7.2m £6.5m
We also increased and maintained our underlying cash generation so that we can reinvest in our infrastructure to support education and research in line with our Strategy 2030, taking a principled decision not to access the Government’s furlough scheme.
Academic year 2017/18 2018/19 2019/20
Underlying cash generation5 £45.9m £59.3m £61.5m
We put over £7m of capital investment into technology over the year, including a new, state of the art Big Data Analytics cluster for teaching, and a refresh of our High Performance Computing cluster, which is already being used for research into areas such as breast cancer prognosis and gaming algorithms.
Prior to the lockdown we invested £1m to refurbish and remodel our Antenna Measurement Laboratory. We also reopened our Mathematics Building after a £18m transformation programme to introduce state of the art teaching facilities and spaces for students to undertake group work.
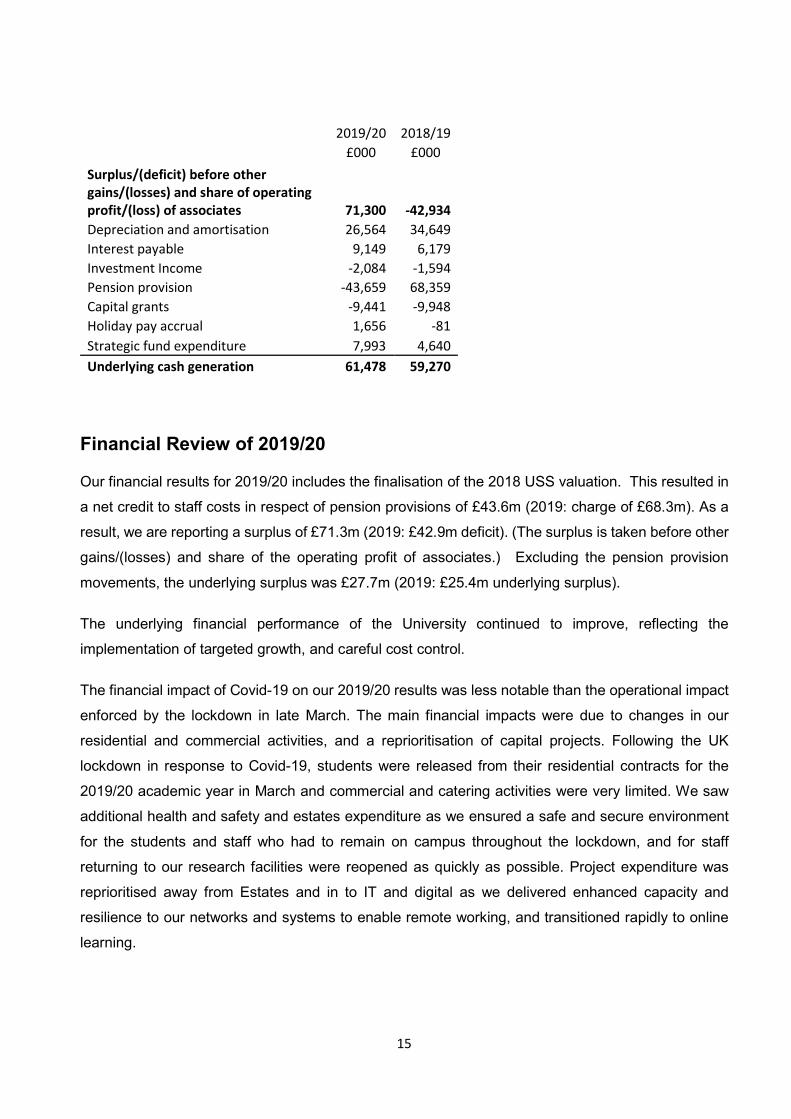
Definition of underlying cash generation
The definition of underlying cash generation has been agreed by Finance and Investment Committee as an accurate measure of underlying financial performance. This is calculated by adjusting the surplus/ (deficit) before other gains/(losses) and share of operating profit/(loss) of associates to exclude certain non-cash items, investment income and expenditure, capital grant receipts and strategic fund expenditure, see the reconciliation below:
5 See above for definition of underlying cash generation
15
2019/20 2018/19 £000 £000
Surplus/(deficit) before other gains/(losses) and share of operating profit/(loss) of associates 71,300 -42,934 Depreciation and amortisation 26,564 34,649 Interest payable 9,149 6,179 Investment Income -2,084 -1,594 Pension provision -43,659 68,359 Capital grants -9,441 -9,948 Holiday pay accrual 1,656 -81 Strategic fund expenditure 7,993 4,640 Underlying cash generation 61,478 59,270
Financial Review of 2019/20
Our financial results for 2019/20 includes the finalisation of the 2018 USS valuation. This resulted in
a net credit to staff costs in respect of pension provisions of £43.6m (2019: charge of £68.3m). As a
result, we are reporting a surplus of £71.3m (2019: £42.9m deficit). (The surplus is taken before other
gains/(losses) and share of the operating profit of associates.) Excluding the pension provision
movements, the underlying surplus was £27.7m (2019: £25.4m underlying surplus).
The underlying financial performance of the University continued to improve, reflecting the
implementation of targeted growth, and careful cost control.
The financial impact of Covid-19 on our 2019/20 results was less notable than the operational impact
enforced by the lockdown in late March. The main financial impacts were due to changes in our
residential and commercial activities, and a reprioritisation of capital projects. Following the UK
lockdown in response to Covid-19, students were released from their residential contracts for the
2019/20 academic year in March and commercial and catering activities were very limited. We saw
additional health and safety and estates expenditure as we ensured a safe and secure environment
for the students and staff who had to remain on campus throughout the lockdown, and for staff
returning to our research facilities were reopened as quickly as possible. Project expenditure was
reprioritised away from Estates and in to IT and digital as we delivered enhanced capacity and
resilience to our networks and systems to enable remote working, and transitioned rapidly to online
learning.

16
Direct impact of Covid-19 £m Lost commercial income 5.2 IT investment 0.8 Estates Covid-19 expenditure 0.7 Savings in commercial operations -0.4 Savings on exam costs -0.3
6.0
Year on year change in surplus before other gains / (losses) and share of operating profit/(loss) of
associates and pension provision movements
The University successfully concluded its private placement in 2019, securing £160m of proceeds.
The nature of the private placement loan notes means that £96.5m of the principal must be held at
fair value (due to the inclusion of a swap breakage clause in the Note Purchase Agreement for these
notes which exposes Queen Mary to foreign exchange risk in the event of default or early repayment
of the notes), with the remaining £63.5m recorded at amortised cost. The total fair value of these loans
at 31 July 2020 was £177.5m (2019: £171.2m), with a fair value increase of £6.3m being recognised
in the Statement of Comprehensive Income and Expenditure (2019: £11.2m). As the cashflows over
the life of the loan are contractually fixed, except in the event of an early repayment, the change in
fair value of the loan notes does not indicate any change in the cashflows payable by the University
over the life of the borrowings.
£25.4m £27.7m
£25.4m £3.7m £8.1m (£6.0m) (£0.5m) (£3.0m) £27.7m
£0.0m£5.0m
£10.0m£15.0m£20.0m£25.0m£30.0m£35.0m£40.0m
2018/19 Otherunderlyingfactors in2019/20
Decrease inDepreciation
Impact of CV19 Reduction inCapital Grants
Increase inInterest
Expense
2019/20
17
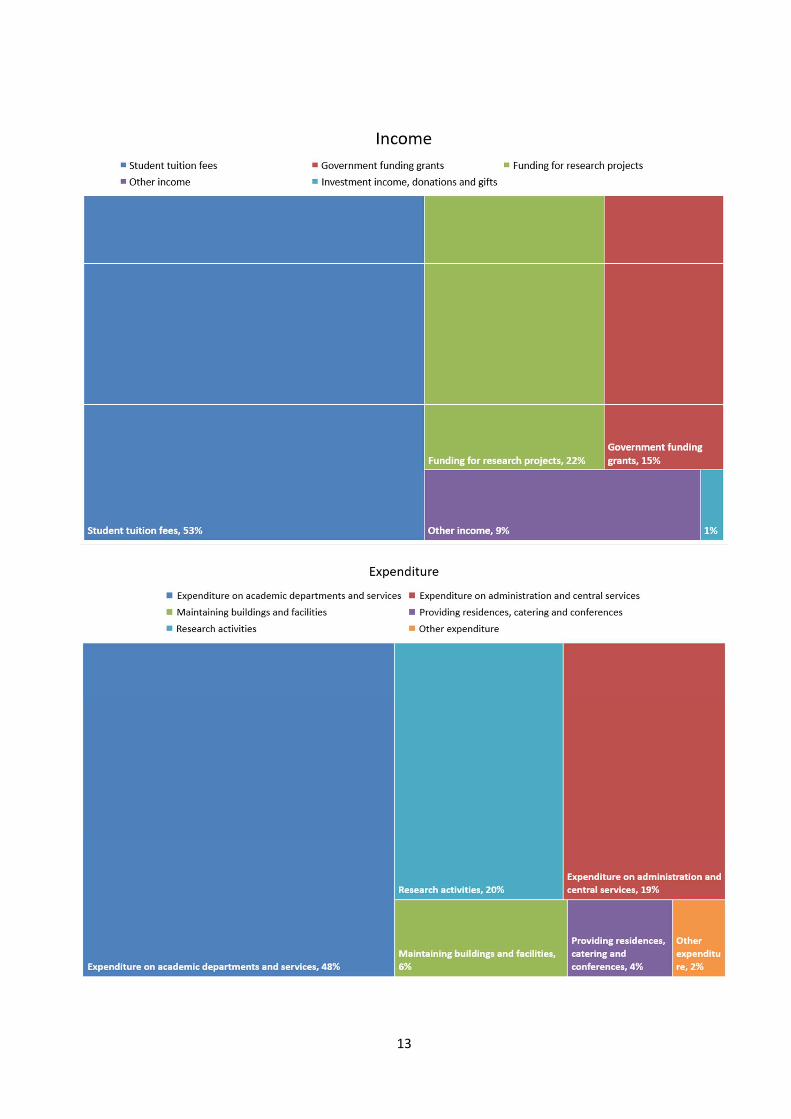
Income
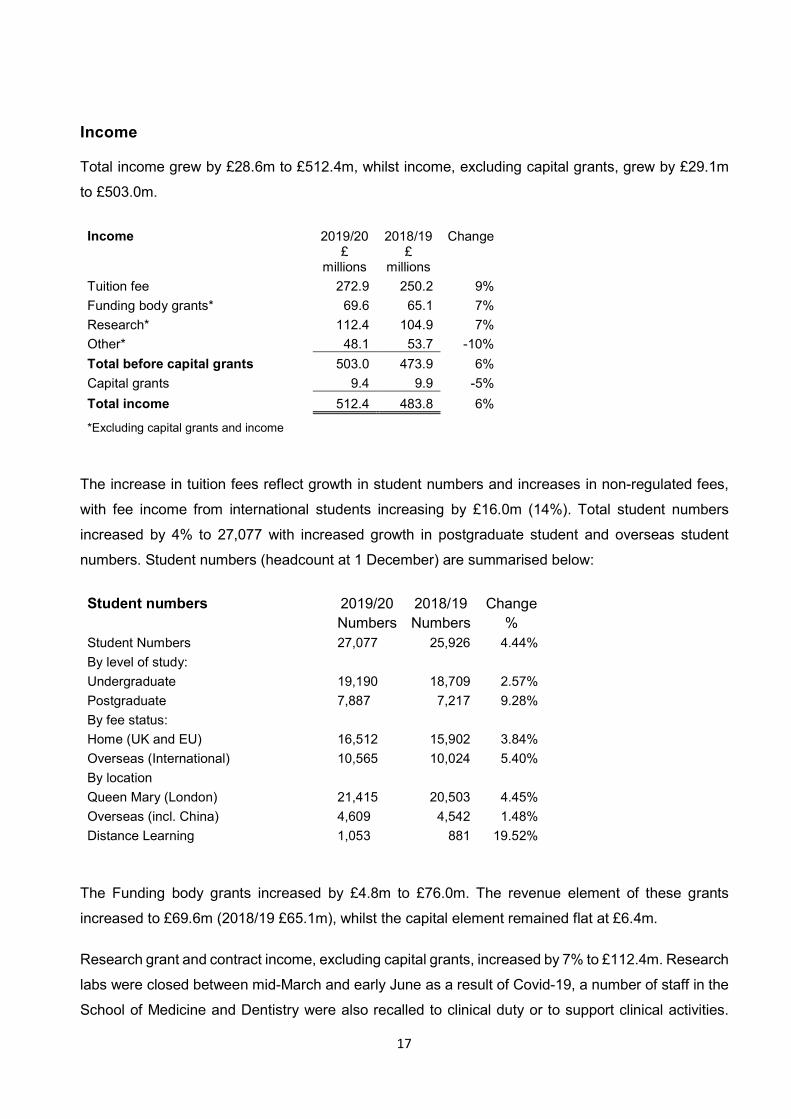
Total income grew by £28.6m to £512.4m, whilst income, excluding capital grants, grew by £29.1m
to £503.0m.
Income 2019/20 2018/19 Change
£
millions £
millions
Tuition fee 272.9 250.2 9%
Funding body grants* 69.6 65.1 7%
Research* 112.4 104.9 7%
Other* 48.1 53.7 -10%
Total before capital grants 503.0 473.9 6%
Capital grants 9.4 9.9 -5%
Total income 512.4 483.8 6%
*Excluding capital grants and income
The increase in tuition fees reflect growth in student numbers and increases in non-regulated fees,
with fee income from international students increasing by £16.0m (14%). Total student numbers
increased by 4% to 27,077 with increased growth in postgraduate student and overseas student
numbers. Student numbers (headcount at 1 December) are summarised below:
Student numbers 2019/20 2018/19 Change Numbers Numbers % Student Numbers 27,077 25,926 4.44%
By level of study:
Undergraduate 19,190 18,709 2.57%
Postgraduate 7,887 7,217 9.28%
By fee status:
Home (UK and EU) 16,512 15,902 3.84%
Overseas (International) 10,565 10,024 5.40%
By location
Queen Mary (London) 21,415 20,503 4.45%
Overseas (incl. China) 4,609 4,542 1.48%
Distance Learning 1,053 881 19.52%
The Funding body grants increased by £4.8m to £76.0m. The revenue element of these grants
increased to £69.6m (2018/19 £65.1m), whilst the capital element remained flat at £6.4m.
Research grant and contract income, excluding capital grants, increased by 7% to £112.4m. Research
labs were closed between mid-March and early June as a result of Covid-19, a number of staff in the
School of Medicine and Dentistry were also recalled to clinical duty or to support clinical activities.

18
Contractual changes with funders have been agreed for many research grants enabling extensions
to ensure the completion of funded research. With these mitigations, the vast majority of grants
should be successfully completed. The volume of grants applied for since March has been lower than
in previous years and work is being carried out to target relevant funders of research to increase the
research income pipeline.
Other income excluding capital grants, but which includes income from residences, catering and
services to the NHS fell by £5.6m primarily due to a reduction in residences income of £5.2m as a
result of Covid-19. There is a similar reduction in residences, catering and commercial lettings income
forecast for 2020/21.
Operating Expenditure
The finalisation of the USS 2018 Valuation resulted in a one-off credit to staff costs in the Income and
Expenditure account of £43.7m. Excluding this, and the release of the provision for the previous
deficit, expenditure increased by 6% to £484.8m.
Expenditure 2019/20 2018/19 Change
£
millions £
millions Staff costs 292.8 269.6 9%
Other operating expenses 156.3 148.0 6%
Depreciation and amortisation 26.6 34.6 -23%
Interest and other finance costs 9.1 6.2 47% Total expenditure before pension provisions 484.8 458.4 6%
Pension provision movements -43.6 68.4 Total expenditure before pension provisions 441.2 526.8 -16%
Staff costs increased by 9%, including the impact of inflationary and incremental pay increases, the
introduction of increased employers’ pension contributions, and increases in staff numbers.
Other operating costs increased by 6% to £156.3m including increased expenditure on IT equipment
and maintenance to enable digital working and increased spend on premises costs including cleaning.
This was offset by decreases in travel costs, catering costs and laboratory consumables due to a
reduction in activity caused by the Covid-19 pandemic.
Depreciation and amortisation decreased by £8m compared to last year. This was as a result of delays
to the completion of projects this year that were affected by Covid-19 along with a reduction in
19
depreciation due to the accelerated depreciation last year of £2m for buildings that were due to be
demolished as part of the school of business management building project.
Interest and finance costs increased by £2.9m reflecting the first full year of interest charged on the
£160m private placement loan notes which were issued in January 2019 and have an average interest
rate of 3.0%.
Tangible Assets and Intangible Assets
The University continued to invest in improvements to its estates and IT infrastructure. Capital spend
was reduced in the latter half of the financial year as a result of the impact of Covid-19 restrictions
and reduced from an original budget of £86.4m to an actual capital spend in the year of £31.2m.
Capital expenditure included the following major project spend:
1. Mathematics Building £1.8m as part of an £17.8m project to transform the Mathematical
Sciences building including a complete internal refurbishment and an extension. The project
was completed in August 2019 and the School of Mathematics moved back in to the building
in time for the start of the 2019/20 academic year.
2. Library building £2.2m as part of a £2.6m legacy project completed in March 2020.
3. £2.1m as part of an ongoing project to construct a new School of Business and Management
building with an overall budget of £62.5m.
4. Fit out costs of £1.5m at Empire House, a property held on a 20 year lease from November
2019. The total project cost £1.5m and was completed in August 2020.
5. John Vane Science Centre £2.5m including a £1.5m legacy project completed in May 2020
and an ongoing project to refurbish and reconfigure the Barts Cancer Institute at the John
Vane Science Centre where costs incurred were £1.2m.
6. Engineering building £1.3m as part of a £1.6m project costs for the Antenna Laboratory
completed in December 2019.
Investments
Non-current investments increased by £1.8m, which included a £2.9m increase in the fair value of the
managed endowment investment portfolio and a decrease of £1.1m in the fair value of other non-
current investments.
Current investments decreased by £21.2m in the year primarily due to more of Queen Mary’s funds
being held on shorter term deposit. There has therefore been a corresponding shift from current
investments to cash and cash equivalents.
20
Cash and Borrowings
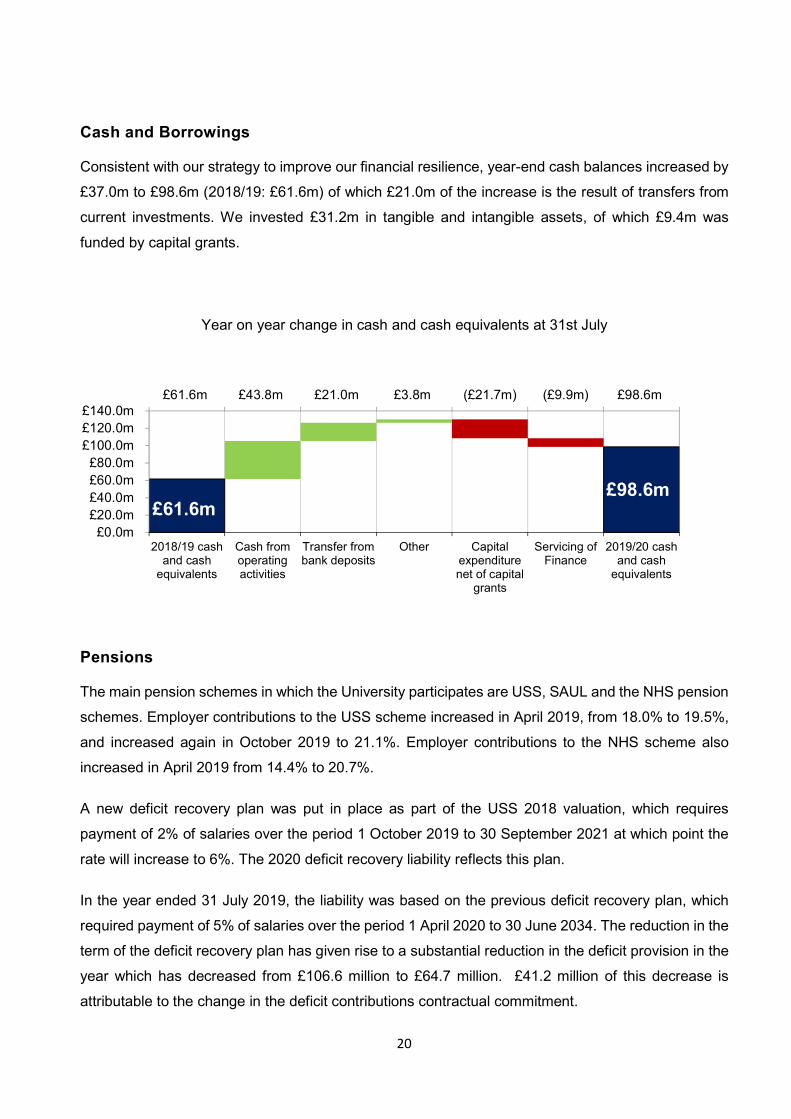
Consistent with our strategy to improve our financial resilience, year-end cash balances increased by
£37.0m to £98.6m (2018/19: £61.6m) of which £21.0m of the increase is the result of transfers from
current investments. We invested £31.2m in tangible and intangible assets, of which £9.4m was
funded by capital grants.
Year on year change in cash and cash equivalents at 31st July
Pensions
The main pension schemes in which the University participates are USS, SAUL and the NHS pension
schemes. Employer contributions to the USS scheme increased in April 2019, from 18.0% to 19.5%,
and increased again in October 2019 to 21.1%. Employer contributions to the NHS scheme also
increased in April 2019 from 14.4% to 20.7%.
A new deficit recovery plan was put in place as part of the USS 2018 valuation, which requires
payment of 2% of salaries over the period 1 October 2019 to 30 September 2021 at which point the
rate will increase to 6%. The 2020 deficit recovery liability reflects this plan.
In the year ended 31 July 2019, the liability was based on the previous deficit recovery plan, which
required payment of 5% of salaries over the period 1 April 2020 to 30 June 2034. The reduction in the
term of the deficit recovery plan has given rise to a substantial reduction in the deficit provision in the
year which has decreased from £106.6 million to £64.7 million. £41.2 million of this decrease is
attributable to the change in the deficit contributions contractual commitment.
£61.6m £98.6m
£61.6m £43.8m £21.0m £3.8m (£21.7m) (£9.9m) £98.6m
£0.0m£20.0m£40.0m£60.0m£80.0m
£100.0m£120.0m£140.0m
2018/19 cashand cash
equivalents
Cash fromoperatingactivities
Transfer frombank deposits
Other Capitalexpenditurenet of capital
grants
Servicing ofFinance
2019/20 cashand cash
equivalents
21
A further full valuation as at 31 March 2020 is currently underway and is due to be completed by 31
July 2021. It is anticipated that this valuation will result in a significant increase to the pension deficit
provision and ongoing increased future service contributions following the valuation conclusion.
Financial Outlook
May 2019 saw the launch of our 2030 strategy which sets out the institution’s ambitions for education,
research, engagement and resources. In support of our strategy we developed a strategic financial
plan which identified the inputs required to generate the growth in income, investment in research and
the increased underlying cash generation to support the capital investment required to provide the
infrastructure to sustain our strategy. Each year we review our 4 year budgets and forecasts and
consider any adjustments required to realign the success of delivering the strategy.
In March we approved the budget for 20/21 and following the outbreak of Covid-19 we revised our
income growth targets and modelled a number of scenarios, including 60% reduced overseas
students, and an agreed cost reduction plan to mitigate risks. To protect our cash we have reprioritised
our capital plans, as referenced earlier in this report, which has protected £50m of cash to provide
additional working capital liquidity capacity to respond to the short and mid-term impact of the
pandemic.
Student enrolment in semester 1 20/21 saw 18% reduction in postgraduate students offset by a 5%
increase in undergraduate students. Our budget for 20/21, revised following semester 1 recruitment,
looks to generate income of £486m and underlying cash £57.4m. New January start programme
applications look to offset any risk of attrition and reduced residencies in the short term.
In 21/22, taking account of the three year benefit of increased undergraduate recruitment in 20/21
and a slower recovery of postgraduate taught and overseas student recruitment, expectations are to
deliver 7% income growth and underlying cash of £60.5m. We have embedded £38m savings into
our 20/21 plans whilst protecting our employee base. Future savings if required in 21/22 would result
in a level of attrition.
Capital investment plans are delayed with circa £40m allocated in each of the next two years. We
have prioritised our capital spend by red, amber, green having agreed to continue with all green
projects we will continue to release amber projects in line with positive cash flow projections.
Considering the mid to long term view we anticipate that by 23/24 our financial plans will be back in
line with our 2030 strategy as student numbers recover and we further develop our international
partnerships and digital offering.

22
As part of our response to Covid-19 we negotiated a change to the terms of our Lloyds covenant
removing the impact of pension volatility. The current forecast projections indicate all covenants will
be met.
The sector is subject to various external risks as well as changes in government policy. The ongoing
decisions around the Auger review, BREXIT and impact on EU students from increased fees,
implications on funding in the sector re Covid-19 and on availability of research funding and the wider
economic health of countries our students are domiciled are all considered in our horizon planning
assumptions.
Whilst recognising these challenges management have modelled a number of scenarios and feel
confident given the strong balance sheet and healthy reserves position that Queen Mary is financially
sustainable over the next two years and beyond. Management has determined that there is no
material uncertainty that casts doubt on Queen Mary’s ability to continue as a going concern.
Statement of Corporate Governance and Internal Control
Purpose of this statement
The following statement is provided to enable readers of the Financial Statements of the Group, which
comprises the University and its subsidiaries, to obtain a better understanding of the governance,
management and legal structure of the University. This Statement of Corporate Governance and
Internal Control relates to the period covered by the Financial Statements and the period up to the
date of approval of the audited Financial Statements.
Queen Mary University of London is committed to conducting its business in accordance with the
seven principles identified by the Committee on Standards in Public Life. Queen Mary's governing
body is guided, but not limited, by the Committee of University Chairs’ (CUC) Higher Education Code
of Governance issued in 2014, revised in 2018. Queen Mary’s practices are consistent with the
provisions of the code.
In addition, Queen Mary corporately, through its arrangements for governance, is committed in a
demonstrable way to the principles of academic freedom and equality of opportunity, which are
enshrined in its Charter.
23
Constitution and Governing Body
Queen Mary University of London was established by Act of Parliament and granting of a Royal
Charter in 1989 following the merger of Queen Mary College (incorporated by Royal Charter in 1934)
and Westfield College (incorporated by Royal Charter in 1933). The Charter has been revised on a
number of occasions: 1995 to reflect the merger of Queen Mary with the Barts and the London School
of Medicine and Dentistry; 2008, following Queen Mary’s successful application to the Privy Council
for Degree Awarding Powers; July 2010, following a governance review which led to the deletion of
the Statutes in their entirety. In 2013 the University elected to change its name to Queen Mary
University of London and to exercise its degree awarding powers from 2014.
The Charter and Ordinances are the primary governing instruments of Queen Mary, and are the
framework within which the governance structure of the University operates. The Charter establishes
the Council and Senate, each with clearly defined functions and responsibilities detailed in the
Ordinances, to oversee and manage Queen Mary’s activities.
Council is Queen Mary’s governing body and is responsible for the strategic oversight of the
University. Its specific responsibility includes approval of the financial strategy and securing its assets.
Council comprises a majority of external members whose principal role is to bring independent
expertise from a range of sectors and professional spheres and to hold collectively the executive to
account.
The Chair of Council is required to be elected from among the external members of the Council. There
is provision for the election of members of the academic staff, and representatives of other staff
groups, to Council and for a Students’ Union representative. No members of Council receive
remuneration for their role, apart from staff members and the QMSU executive officer, solely in the
context of their employment.
Subject to the overall superintendence of Council, Senate has oversight of the academic affairs of
Queen Mary and draws its membership entirely from the academic staff and students, with a majority
of elected representatives. It is particularly concerned with issues relating to academic policy, setting
and maintaining academic standards, the quality of the student experience and academic freedom.
In accordance with the CUC Higher Education Code of Governance, Council keeps its effectiveness
under regular review. A full effectiveness review of Council was undertaken during 2018/19. It
concluded that the University may have a high level of confidence in the effectiveness of Council. The
implementation of the recommendations is in progress, overseen by the Governance Committee. In
addition, members’ opinions on the effectiveness of Council and its committees are sought regularly,
24
whether through an annual survey designed for this purpose, or through individual meetings held with
the Chair.
During 2015/16, an effectiveness review of Senate was undertaken and reported to the Council.
Recommendations implemented have included the presentation of extended reports of Senate
meetings to the Council.
Queen Mary maintains a Register of Interests of members of Council and of the Senior Executive
Team which is published on the Council and Governance web pages (www.qmul.ac.uk). The Register
is updated at least annually and includes details of charity trusteeships.
The Role of the President and Principal
The President and Principal is appointed by Council as chief academic and accounting officer to head
Queen Mary. The President and Principal is accountable to Council for the organisation, direction and
management of Queen Mary. Under the terms of the memorandum of assurance and accountability
between Queen Mary and the Office for Students (OfS), the President and Principal is the designated
officer of Queen Mary and in that capacity can be summoned to appear before the Public Accounts
Committee of the House of Commons.
The President and Principal exercises considerable influence upon the development of Queen Mary’s
strategy, the identification and planning of new developments and the shaping of the Queen Mary’s
ethos and values. The President and Principal is assisted in this by the Senior Executive comprising
the Vice-Principal & Executive Dean (Health), Vice-Principal & Executive Dean (Humanities and
Social Sciences), Vice-Principal & Executive Dean (Science and Engineering), Vice-Principal (Policy
and Strategic Partnerships), Vice-Principal (Research), Vice-Principal (Education), Vice-Principal
(International), the Vice-Principal (People, Culture and Inclusion), the Finance Director and the Chief
Governance Officer and University Secretary.
Committees of Council
Council meets at least five times in each academic year and members are invited to a full-day
conference each year attended by the Senior Executive (although this was not possible in 2019/20).
Council has five committees, laid down by Ordinance, to which it delegates much of its detailed work.
These committees are Finance and Investment Committee; Audit and Risk Committee; Governance
Committee; Remuneration Committee; and the Honorary Degrees and Fellowships Committee. Each
of these committees is formally constituted with written terms of reference and specified membership,
25
including a significant proportion of lay members, from whom the Chair is drawn; each reports
regularly to the Council.
As a result of Covid-19, meetings of Council and their committees have been held virtually since
March 2020. The frequency of meetings has also increased to provide more timely updates on
potential risks to the University:
six additional meetings of Council (12 in total);
two additional meetings of Finance and Investment Committee (six in total);
three additional meetings of Audit and Risk Committee (seven in total);
one additional meeting of Remuneration Committee (five in total).
The membership of Council and of Audit and Risk Committee are set out at the end of these Financial
Statements.
The Finance and Investment Committee focuses on oversight of the Senior Executive’s planning and
management of the finance, investments and assets of Queen Mary. It has a particular remit in respect
of the following:
recommends to Council a finance strategy;
recommends to Council the annual budgets and financial forecasts;
monitors the financial situation of Queen Mary, both capital and revenue;
considers and monitors the annual capital programme and proposals for major capital projects;
considers proposals affecting major Queen Mary assets, in particular the estate;
approves a strategy for borrowing, investment of funds and raising of monies.
The Audit and Risk Committee oversees Queen Mary’s procedures for external and internal audit,
financial control and risk management, and provides assurances in these key areas through its annual
report to the Council which is copied to the OfS. More specifically, the Committee:
oversees external and internal audit services, including receiving reports and
recommendations from both on the results of their work;
reviews the effectiveness of Queen Mary’s systems for submission of regulatory returns,
financial control, value for money, data assurance and responding to alleged financial
irregularities;
reviews the effectiveness of mechanisms operated by the Senior Executive for identifying,
assessing and mitigating risks;

26
oversees Queen Mary’s Public Interest Disclosure (whistle-blowing) policy and receives
regular reports from the Senior Executive on cases.
The Governance Committee exists, with a majority of external members, to recommend nomination
to the committees of Council and so fulfils the roles and expectations of a nominations committee
within the CUC guidance.
The Remuneration Committee is responsible for determining the salaries, emoluments, terms and
conditions (and, where appropriate, severance payments) of the President and Principal and
members of the Senior Executive. Decisions to change salaries and emoluments are made based on
appropriate benchmark information and a review of performance against previously agreed
objectives. It is also responsible for decisions in relation to the salaries, emoluments and terms and
conditions (and, where appropriate, severance payments) of other staff when these decisions exceed
a threshold which is reviewed and set by Council annually. In doing so we have followed CUC
guidance.
On an annual basis the Committee receives reports on the salary profiles, increases and other
payments including severance, for all professorial and grade 8 staff to advise with particular regard to
Queen Mary’s equality duties and retention and market factors.
The Remuneration Committee is chaired by the Vice-Chair of Council and has four other lay members,
one of whom is a tax and reward specialist, and an elected academic staff member. The Chief
Governance Officer and University Secretary is the Committee secretary and the Director of Human
Resources attends meetings on a regular basis. The President and Principal attends when invited to
discuss the performance and remuneration of other senior members of staff. One Committee meeting
each year is dedicated to a review of the performance and remuneration of the President and
Principal, which the President and Principal does not attend. The President of the Students’ Union is
invited to attend this meeting and to participate in the discussions and decisions.
The Honorary Degrees and Fellowship Committee makes recommendations to Senate and Council
on the conferment of Fellowships and Honorary Degrees of Queen Mary University of London, and
the award of the Queen Mary Medal.
An honorary degree may be conferred on a person of conspicuous merit, who is outstanding in their
field, commands international or at least national recognition, or who has given exceptional service to
Queen Mary. Fellowships of Queen Mary are conferred on persons of distinction or persons who
have, in the opinion of the Council and the Senate, rendered significant service to Queen Mary or to
the community, or with a demonstrable connection or affiliation to Queen Mary. A Queen Mary Staff
27
Medal may be awarded to individual members of staff on, or following retirement from employment at
Queen Mary, who in the opinion of the Council have made an exceptional, sustained contribution to
Queen Mary.
Equality, Diversity and Inclusion
Equality, diversity and inclusion (EDI) are central to Queen Mary’s identity and weaved through our
vision, mission and values.
In 2020 we were the highest scoring Russell Group university in the Social Inclusion Rankings (Times
and Sunday Times Good University Guide). While we are proud of what we have already achieved,
we recognise the need to embed EDI throughout all aspects of our University.
The five objectives of our new People, Culture and Inclusion (PCI) Enabling Plan articulate how we
intend to deliver on our ambition to be the most inclusive university of its kind anywhere. Specific
actions have been identified and KPIs established to ensure our objectives become a reality. Progress
will be monitored through Equality, Diversity and Inclusion Steering Group (EDISG) chaired by our
new Vice Principal (People, Culture and Inclusion).
To reflect the critical role that EDISG has in supporting the delivery of our Strategy, the membership
was revised to include wider representation. Within the governance structure there are now three sub-
committees: Race Equality Action Group; Gender Equality Self-Assessment Team; and Professional
Services EDI Steering Group.
Chaired by our Vice Principal, the Race Equality Action Group actualises our commitment to
progressing race equality and the membership brings together a wide range of backgrounds, grades
and experiences. It has established five sub-groups, with specific action-oriented remits. The work of
this Group is a precursor to future work on the Race Equality Charter Mark (REC).
We are one of 18 UK universities to hold a silver Athena Swan award and a key priority of Gender
Equality Self-Assessment Team (GESAT) is delivering the renewal in November 2022. The
appointment of our new EDI Manager (Gender) provided an opportune moment to review the
membership and remit of GESAT which has bolstered the strategic role of the group. At school level
we hold 10 School awards and several Schools are working towards their first successful bronze
award. Going forward, GESAT will have an overview of how schools are progressing with their Athena
Swan work.
We continue to be a Stonewall Diversity Champion and are working towards submitting to the next
Stonewall Workplace Equality Index in 2022.
28
While our success in receiving external acknowledgement is important, so too is the work undertaken
to obtain and maintain these accolades.
We continue to support our staff by facilitating the LGBTQ+ Staff Network (QMOut) and the recently
launched Parents and Carers Network and the Staff Disability Network.
We have taken significant steps to progress trans equality by launching our Trans Inclusion Policy
statement (2019) and publishing an additional internal FAQ document (2020).
We have put in place a range measures to allow anyone to report inappropriate behavior they
experience or witness, including our Report + Support tool (2019) and our Dignity Disclosure Officer
network (2020).
Our Gender and Ethnicity Pay Gap Reports and EDI Annual Report have been updated based on
good practice. Our new approach promotes transparency, openness and accountability.
Improvements have been made to the way we collect and report on protected characteristics data,
including creating interactive (Power BI) dashboards for equalities data.
EDI has also been a vital consideration in relation to Covid-19. We have introduced a range of
initiatives, notably; a dedicated temporary remote working site; Your community, your wellbeing –
themed weeks topics such as corona anxiety, work-home parent, work life balance, and positive
consequences of lockdown; and wellbeing workshop for managers, enabling managers to more
effectively support their staff while working remotely.
The work undertaken by the EDI team and by colleagues across the institution has created a strong
foundation for the Queen Mary community to build upon to reach our goal of being the most inclusive
university of its kind, anywhere and will be strengthened as we live through our Values of being
Inclusive, Proud, Ambitious, Collegial and Ethical in all that we do.
Internal Control and Management of Risk
Council, as the governing body of Queen Mary, has responsibility for maintaining a sound system of
internal control that supports the achievement of policies, aims and objectives, while safeguarding the
public and other funds and assets for which Council is responsible in accordance with the
responsibilities assigned to the governing body in the Charter and Ordinances and the OfS’ regulatory
framework.

29
The system of internal control is designed to manage rather than eliminate the risk of failure to achieve
the University’s 2030 Strategy; it can therefore only provide reasonable and not absolute assurance
of effectiveness. It is based on an ongoing process designed to identify the principal business,
operational, compliance and financial risks; to evaluate the nature and extent of those risks; and to
manage them efficiently and effectively.
This process was in place for the year ended 31 July 2020 and up to the date of the approval of the
Financial Statements, and accords with OfS guidance. Council has responsibility for reviewing the
effectiveness of the system of internal control. The following processes are in place to manage risk:
Council considers the plans and strategic direction of the University on an annual basis.
The Audit and Risk Committee independently reviews the effectiveness of internal control systems
and the risk-management process.
Council receives periodic reports from the Chair of Audit and Risk Committee concerning issues of
risk, internal controls and their effectiveness, which are informed by regular reports from Vice-
Principals and other managers on the steps they are taking to manage risks in their areas of
responsibility, including progress reports on key projects.
The Audit and Risk Committee reports to Council its findings in respect of the effectiveness of the
risk-management process. This is informed by the categorisation of risks and the maintenance of an
institution-wide strategic risk register.
Queen Mary procures its internal audit service from KPMG, which operates to standards defined in
the OfS Audit Code of Practice. The work of the internal audit service is informed by an analysis of
risks to which Queen Mary is exposed, and an annual internal audit plan is based on this analysis.
Audit and Risk Committee approves the internal audit plan.
KPMG submits regular reports to the Audit and Risk Committee that include an independent opinion
on the adequacy and effectiveness of the University’s system of internal control, based on work
undertaken in accordance with its approved audit plan, together with recommendations for
improvement.
30
During the 2019/20 year, the Senior Executive Team has acted as the Risk Management Committee
and had delegated responsibility for strategic risk and risk management processes throughout
management at Queen Mary.
The Strategic Risk Register is aligned to the 13 key objectives of the 2030 Strategy. A full review was
conducted of the nature of the risks to achieving each objective, of the mitigations that are in place
and planned and of the rating of each Risk by SET when the relevant individual annual KPI becomes
reportable.
A KPI scorecard has been developed. SET receives the KPI updates and associated risk profile of
each strategy objective when the KPI measure becomes reportable. Council receives termly updates
on KPI progress. For some KPIs lead indicators are also reported and in other cases lead indicators
are in the process of being developed.
The Audit and Risk Committee receives an annual report on legal compliance, based on the legal
compliance register which covers compliance areas that are relevant for Queen Mary’s current and
planned activities. The register is updated annually and is reviewed with external legal advice every
2-3 years. Based on the information received, the Committee was satisfied that Queen Mary has
appropriate processes in place to meet its legal requirements and obligations.
Council’s full review of the effectiveness of the system of internal control for the period under review
was informed by the Audit and Risk Committee, the work of the internal auditor and the executive
managers within the University who have responsibility for the development and maintenance of the
internal control framework. Council has not identified any significant control weaknesses.
Responsibilities of Council
Council is responsible for the appointment of the external auditor and approval of the Financial
Statements which are prepared in accordance with the Statement of Recommended Practice:
Accounting for Further and Higher Education and other relevant accounting standards. In addition,
within the terms and conditions of the memorandum of assurance and accountability between the OfS
and the Council of Queen Mary, Council, through its designated office holder, the President and
Principal, is required to prepare Financial Statements for each financial year which give a true and
fair view of the state of affairs of Queen Mary and of the surplus or deficit and cash flows for that year.
31
The Financial Statements are adopted by Council following review by the Finance and Investment
Committee and on the recommendation of the Audit and Risk Committee after it has received a report
from the external auditor.
In causing the Financial Statements to be prepared, Council is assured that:
suitable accounting policies are selected and applied consistently;
judgements and estimates are made that are reasonable and prudent;
applicable accounting standards have been followed, subject to any material departures
disclosed and explained in the Financial Statements; and
the Financial Statements are prepared on the going concern basis unless it is inappropriate to
presume that Queen Mary will continue in operation. Council is satisfied that it has adequate
resources (as considered in the going concern section of the Statement of Principal
Accounting Policies) to continue in operation for the foreseeable future; for this reason the
going concern basis continues to be adopted in the preparation of the Financial Statements.
As far as Council is aware, there is no relevant audit information of which the external auditor are
unaware. Relevant information is defined as information needed by the external auditor in connection
with preparing their report.
Council, through its designated officer, the President and Principal, has taken reasonable steps to:
ensure that funds from the OfS are used only for the purposes for which they have been given
and in accordance with the memorandum of assurance and accountability with the OfS and
any other conditions which the OfS may from time to time prescribe;
ensure that there are appropriate financial and management controls in place to safeguard
public funds and funds from other sources;
safeguard the assets of Queen Mary and prevent and detect corruption, fraud, bribery and
other irregularities; and
secure the economical, efficient and effective management of Queen Mary’s resources and
expenditure.
The key elements of Queen Mary’s system of internal financial control, designed to discharge these
responsibilities include the following:
clear definition of the responsibilities of, and the authority delegated to, heads of academic
and administrative departments;
32
clearly defined and formalised requirements for approval and control of expenditure, with
investment decisions involving capital or revenue expenditure being subject to formal detailed
appraisal and review according to approval levels set by Council;
comprehensive Financial Regulations, detailing financial controls and procedures, approved
by the Finance and Investment Committee under delegated authority from Council;
internal audit carried out by an external firm of auditors. The programme is approved by the
Audit and Risk Committee; and
regular reviews of financial performance involving variance reporting, sensitivity analysis and
updates of forecast out-turn.
Council’s review of the effectiveness of the system of internal financial control is informed by the work
of the internal auditor, the Audit and Risk Committee, the individual members of staff within the
University who have responsibility for the development and maintenance of the financial control
framework and comments made by the external auditor in the management letter and in other reports.
Any system of internal financial control can only provide reasonable, but not absolute, assurance
against material misstatement or loss.
33
Independent auditor’s report to the Council of the Queen Mary University of London
Report on the audit of the financial statements
Opinion
In our opinion the financial statements of Queen Mary University of London (the ‘university’) and its subsidiaries (the ‘group’):
give a true and fair view of the state of the group’s and the university’s affairs as at 31 July 2020 and of the group’s and the university’s income and expenditure, gains and losses and changes in reserves and cash flows for the year then ended; and
have been properly prepared in accordance with United Kingdom Generally Accepted Accounting Practice, including Financial Reporting Standard 102 “The Financial Reporting Standard applicable in the UK and Republic of Ireland” and the Statement of Recommended Practice: Accounting for Further and Higher Education.
We have audited the financial statements which comprise:
the group and university statement of comprehensive income and expenditure; the group and university balance sheet; the group and university statement of changes in reserves; the group cash flow statement; the statement of accounting policies; and the related notes 1 to 32.
The financial reporting framework that has been applied in their preparation is applicable law and United Kingdom Accounting Standards, including Financial Reporting Standard 102 “The Financial Reporting Standard applicable in the UK and Republic of Ireland” (United Kingdom Generally Accepted Accounting Practice) and the Statement of Recommended Practice: Accounting for Further and Higher Education (2019).
Basis for opinion We conducted our audit in accordance with International Standards on Auditing (UK) (ISAs(UK)) and applicable law. Our responsibilities under those standards are further described in the auditor's responsibilities for the audit of the financial statements section of our report.
We are independent of the group and the university in accordance with the ethical requirements that are relevant to our audit of the financial statements in the UK, including the Financial Reporting Council’s (the ‘FRC’s’) Ethical Standard, and we have fulfilled our other ethical responsibilities in accordance with these requirements. We believe that the audit evidence we have obtained is sufficient and appropriate to provide a basis for our opinion.
Conclusions relating to going concern We are required by ISAs (UK) to report in respect of the following matters where:
Council’s use of the going concern basis of accounting in preparation of the financial statements is not appropriate; or

34
Council has not disclosed in the financial statements any identified material uncertainties that may cast significant doubt about the group’s and the university’s ability to continue to adopt the going concern basis of accounting for a period of at least twelve months from the date when the financial statements are authorised for issue.
We have nothing to report in respect of these matters.
Other information Council is responsible for the other information. The other information comprises the information included in the annual report, other than the financial statements and our auditor’s report thereon. Our opinion on the financial statements does not cover the other information and we do not express any form of assurance conclusion thereon.
In connection with our audit of the financial statements, our responsibility is to read the other information and, in doing so, consider whether the other information is materially inconsistent with the financial statements or our knowledge obtained in the audit or otherwise appears to be materially misstated. If we identify such material inconsistencies or apparent material misstatements, we are required to determine whether there is a material misstatement in the financial statements or a material misstatement of the other information. If, based on the work we have performed, we conclude that there is a material misstatement of this other information, we are required to report that fact.
We have nothing to report in respect of these matters.
Responsibilities of Council As explained more fully in Council’s responsibilities statement, Council is responsible for the preparation of the financial statements that give a true and fair view, and for such internal control as Council determines is necessary to enable the preparation of financial statements that are free from material misstatement, whether due to fraud or error.
In preparing the financial statements, Council is responsible for assessing the group’s and the university’s ability to continue as a going concern, disclosing, as applicable, matters related to going concern and using the going concern basis of accounting unless Council either intends to liquidate the group or the university or to cease operations, or has no realistic alternative but to do so.
Auditor’s responsibilities for the audit of the financial statements Our objectives are to obtain reasonable assurance about whether the financial statements as a whole are free from material misstatement, whether due to fraud or error, and to issue an auditor's report that includes our opinion. Reasonable assurance is a high level of assurance, but is not a guarantee that an audit conducted in accordance with ISAs (UK) will always detect a material misstatement when it exists. Misstatements can arise from fraud or error and are considered material if, individually or in the aggregate, they could reasonably be expected to influence the economic decisions of users taken on the basis of these financial statements.
A further description of our responsibilities for the audit of the financial statements is located on the FRC’s website at: www.frc.org.uk/auditorsresponsibilities. This description forms part of our auditor’s report.
35
Report on other legal and regulatory requirements
Opinions on other matters prescribed by the Office for Students (OfS) “Regulatory Advice 9: Accounts Direction” In our opinion, in all material respects:
funds from whatever source administered by the university for specific purposes have been applied to those purposes and managed in accordance with relevant legislation;
funds provided by the OfS and UK Research and Innovation (including Research England), the Education and Skills Funding Agency and the Department for Education have been applied in accordance with the relevant terms and conditions; and
the requirements of the OfS’s accounts direction have been met.
Matters on which we are required to report by exception Under the OfS Regulatory Advice 9: Accounts Direction, we are required to report in respect of the following matters if, in our opinion:
the provider’s grant and fee income, as disclosed in the note 7 to the accounts, has been materially misstated; or
the provider’s expenditure on access and participation activities for the financial year, as disclosed in note 10 to the accounts, has been materially misstated.
We have nothing to report in respect of these matters.
Use of our report This report is made solely to Council in accordance with the Accounts Direction issued by the Office for Students dated 25 October 2019. Our audit work has been undertaken so that we might state to Council those matters we are required to state to it in an auditor’s report and for no other purpose. To the fullest extent permitted by law, we do not accept or assume responsibility to anyone other than the board of governors as a body, for our audit work, for this report, or for the opinions we have formed.
Deloitte LLP
Statutory Auditor
St Albans, United Kingdom
20 November 2020
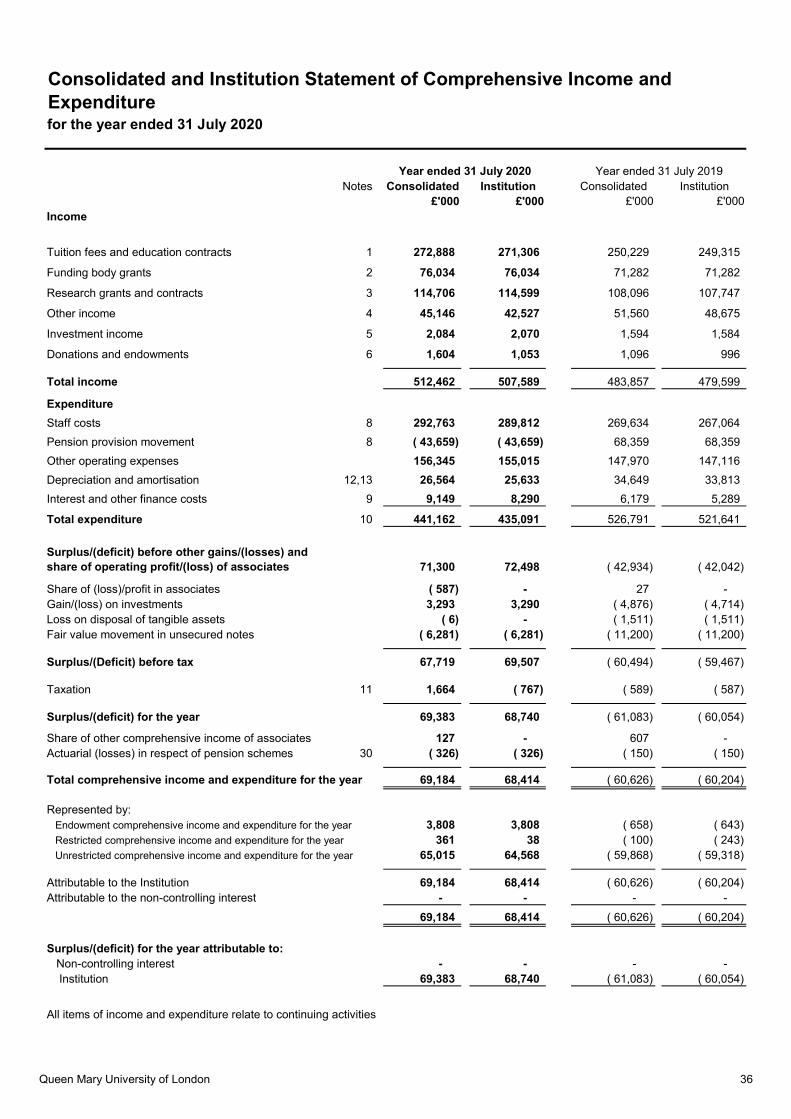
for the year ended 31 July 2020
Notes Consolidated Institution Consolidated Institution£'000 £'000 £'000 £'000
Income
Tuition fees and education contracts 1 272,888 271,306 250,229 249,315
Funding body grants 2 76,034 76,034 71,282 71,282
Research grants and contracts 3 114,706 114,599 108,096 107,747
Other income 4 45,146 42,527 51,560 48,675
Investment income 5 2,084 2,070 1,594 1,584
Donations and endowments 6 1,604 1,053 1,096 996
Total income 512,462 507,589 483,857 479,599
Expenditure
Staff costs 8 292,763 289,812 269,634 267,064
Pension provision movement 8 ( 43,659) ( 43,659) 68,359 68,359
Other operating expenses 156,345 155,015 147,970 147,116
Depreciation and amortisation 12,13 26,564 25,633 34,649 33,813
Interest and other finance costs 9 9,149 8,290 6,179 5,289
Total expenditure 10 441,162 435,091 526,791 521,641
Surplus/(deficit) before other gains/(losses) and share of operating profit/(loss) of associates 71,300 72,498 ( 42,934) ( 42,042)
Share of (loss)/profit in associates ( 587) - 27 - Gain/(loss) on investments 3,293 3,290 ( 4,876) ( 4,714)Loss on disposal of tangible assets ( 6) - ( 1,511) ( 1,511)Fair value movement in unsecured notes ( 6,281) ( 6,281) ( 11,200) ( 11,200)
Surplus/(Deficit) before tax 67,719 69,507 ( 60,494) ( 59,467)
Taxation 11 1,664 ( 767) ( 589) ( 587)
Surplus/(deficit) for the year 69,383 68,740 ( 61,083) ( 60,054)
Share of other comprehensive income of associates 127 - 607 - Actuarial (losses) in respect of pension schemes 30 ( 326) ( 326) ( 150) ( 150)
Total comprehensive income and expenditure for the year 69,184 68,414 ( 60,626) ( 60,204)
Represented by: Endowment comprehensive income and expenditure for the year 3,808 3,808 ( 658) ( 643) Restricted comprehensive income and expenditure for the year 361 38 ( 100) ( 243) Unrestricted comprehensive income and expenditure for the year 65,015 64,568 ( 59,868) ( 59,318)
Attributable to the Institution 69,184 68,414 ( 60,626) ( 60,204)Attributable to the non-controlling interest - - - -
69,184 68,414 ( 60,626) ( 60,204)
Surplus/(deficit) for the year attributable to: Non-controlling interest - - - -
Institution 69,383 68,740 ( 61,083) ( 60,054)
All items of income and expenditure relate to continuing activities
Year ended 31 July 2020 Year ended 31 July 2019
Consolidated and Institution Statement of Comprehensive Income and Expenditure
Queen Mary University of London 36

Consolidated and Institution Statement of Changes in Reservesfor the year ended 31 July 2020
Total excluding Non-controlling Total
Endowment (note 22)
Restricted (note 23)
Unrestrictednon-controlling
interestinterest
£'000 £'000 £'000 £'000 £'000 £'000
Consolidated
As at 1 August 2018 34,107 2,679 444,330 481,116 ( 5) 481,111
Surplus or (deficit) from the statement of comprehensive income and expenditure ( 658) ( 100) ( 60,325) ( 61,083) - ( 61,083)
Other comprehensive income or (expenditure) - - 457 457 - 457
Total comprehensive income or (expenditure) for the year ( 658) ( 100) ( 59,868) ( 60,626) - ( 60,626)
As at 1 August 2019 33,449 2,579 384,462 420,490 ( 5) 420,485Transfers between endowments, restricted and general reserves - - - - - -
Surplus or (deficit) from the statement of comprehensive income and expenditure 3,808 361 65,214 69,383 - 69,383
Other comprehensive income or (expenditure) - - ( 199) ( 199) - ( 199)
Total comprehensive income or (expenditure) for the year 3,808 361 65,015 69,184 - 69,184
As at 31 July 2020 37,257 2,940 449,477 489,674 ( 5) 489,669
Institution
As at 1 August 2018 34,092 2,451 450,497 487,040 - 487,040
Surplus or (deficit) from the statement of comprehensive income and expenditure ( 643) ( 243) ( 59,168) ( 60,054) - ( 60,054)
Other comprehensive income or (expenditure) - - ( 150) ( 150) - ( 150)
Total comprehensive income or (expenditure) for the year ( 643) ( 243) ( 59,318) ( 60,204) - ( 60,204)
As at 1 August 2019 33,449 2,208 391,179 426,836 - 426,836Transfers between endowments, restricted and general reserves - - - - - -
Surplus or (deficit) from the statement of comprehensive income and expenditure 3,808 38 64,894 68,740 - 68,740
Other comprehensive income or (expenditure) - - ( 326) ( 326) - ( 326)
Total comprehensive income or (expenditure) for the year 3,808 38 64,568 68,414 - 68,414
As at 31 July 2020 37,257 2,246 455,747 495,250 - 495,250
Income and expenditure account
Queen Mary University of London 37

Consolidated and Institution Statement of Financial PositionAs at 31 July 2020
As at 31 July 2020 As at 31 July 2019Notes Consolidated Institution Consolidated Institution
£'000 £'000 £'000 £'000 Non-current assetsIntangible assets 12 6,363 6,363 7,351 7,351Tangible assets 13 617,017 605,467 611,409 599,948Investments 14 29,902 33,307 28,082 31,489Investments in associates 15 756 298 917 298
654,038 645,435 647,759 639,086
Current assetsStock 336 336 274 274Trade and other receivables 16 70,175 73,342 61,441 64,644Investments 17 99,647 99,647 120,867 120,867Cash and cash equivalents 24 98,606 94,844 61,622 58,372
268,764 268,169 244,204 244,157Less: Creditors: amounts falling due within one year 18 ( 115,385) ( 115,647) ( 115,648) ( 116,428)
Net current assets/(liabilities) 153,379 152,522 128,556 127,729
Total assets less current liabilities 807,417 797,957 776,315 766,815
Creditors: amounts falling due after more than one year 19 ( 252,802) ( 237,761) ( 249,059) ( 233,208)
ProvisionsPension provisions 20 ( 64,897) ( 64,897) ( 106,742) ( 106,742)Other provisions 21 ( 49) ( 49) ( 29) ( 29)
Total net assets 489,669 495,250 420,485 426,836
Restricted Reserves
Income and expenditure reserve - endowment 22 37,257 37,257 33,449 33,449
Income and expenditure reserve - restricted 23 2,940 2,246 2,579 2,208
Unrestricted Reserves
Income and expenditure reserve - unrestricted 449,477 455,747 384,462 391,179
489,674 495,250 420,490 426,836
Non-controlling interest ( 5) - ( 5) -
Total Reserves 489,669 495,250 420,485 426,836
The financial statements were approved by Council on 19 November 2020 and were signed on its behalf
on that date by:
Lord Clement-Jones CBE, Chair Professor C Bailey, President and Principal
Queen Mary University of London 38
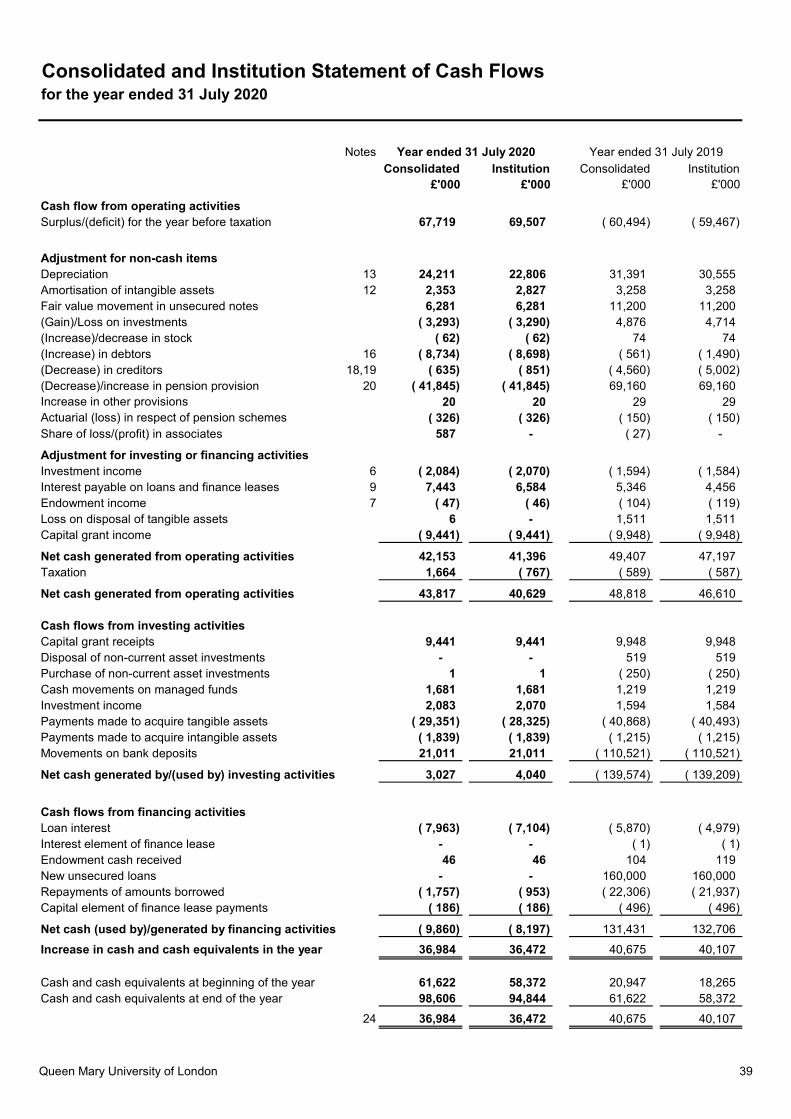
Consolidated and Institution Statement of Cash Flowsfor the year ended 31 July 2020
Notes
Consolidated Institution Consolidated Institution£'000 £'000 £'000 £'000
Cash flow from operating activitiesSurplus/(deficit) for the year before taxation 67,719 69,507 ( 60,494) ( 59,467)
Adjustment for non-cash itemsDepreciation 13 24,211 22,806 31,391 30,555Amortisation of intangible assets 12 2,353 2,827 3,258 3,258Fair value movement in unsecured notes 6,281 6,281 11,200 11,200(Gain)/Loss on investments ( 3,293) ( 3,290) 4,876 4,714(Increase)/decrease in stock ( 62) ( 62) 74 74(Increase) in debtors 16 ( 8,734) ( 8,698) ( 561) ( 1,490)(Decrease) in creditors 18,19 ( 635) ( 851) ( 4,560) ( 5,002)(Decrease)/increase in pension provision 20 ( 41,845) ( 41,845) 69,160 69,160Increase in other provisions 20 20 29 29Actuarial (loss) in respect of pension schemes ( 326) ( 326) ( 150) ( 150)Share of loss/(profit) in associates 587 - ( 27) -
Adjustment for investing or financing activitiesInvestment income 6 ( 2,084) ( 2,070) ( 1,594) ( 1,584)Interest payable on loans and finance leases 9 7,443 6,584 5,346 4,456Endowment income 7 ( 47) ( 46) ( 104) ( 119)Loss on disposal of tangible assets 6 - 1,511 1,511Capital grant income ( 9,441) ( 9,441) ( 9,948) ( 9,948)
Net cash generated from operating activities 42,153 41,396 49,407 47,197Taxation 1,664 ( 767) ( 589) ( 587)
Net cash generated from operating activities 43,817 40,629 48,818 46,610
Cash flows from investing activitiesCapital grant receipts 9,441 9,441 9,948 9,948Disposal of non-current asset investments - - 519 519Purchase of non-current asset investments 1 1 ( 250) ( 250)Cash movements on managed funds 1,681 1,681 1,219 1,219Investment income 2,083 2,070 1,594 1,584Payments made to acquire tangible assets ( 29,351) ( 28,325) ( 40,868) ( 40,493)Payments made to acquire intangible assets ( 1,839) ( 1,839) ( 1,215) ( 1,215)Movements on bank deposits 21,011 21,011 ( 110,521) ( 110,521)
Net cash generated by/(used by) investing activities 3,027 4,040 ( 139,574) ( 139,209)
Cash flows from financing activitiesLoan interest ( 7,963) ( 7,104) ( 5,870) ( 4,979)Interest element of finance lease - - ( 1) ( 1)Endowment cash received 46 46 104 119New unsecured loans - - 160,000 160,000Repayments of amounts borrowed ( 1,757) ( 953) ( 22,306) ( 21,937)Capital element of finance lease payments ( 186) ( 186) ( 496) ( 496)
Net cash (used by)/generated by financing activities ( 9,860) ( 8,197) 131,431 132,706
Increase in cash and cash equivalents in the year 36,984 36,472 40,675 40,107
Cash and cash equivalents at beginning of the year 61,622 58,372 20,947 18,265Cash and cash equivalents at end of the year 98,606 94,844 61,622 58,372
24 36,984 36,472 40,675 40,107
Year ended 31 July 2020 Year ended 31 July 2019
Queen Mary University of London 39
Statement of Principal Accounting Policiesfor the year ended 31 July 2020
Basis of preparationThese Financial Statements have been prepared on a going concern basis and in accordance with the Statement of Recommended Practice (SORP): Accounting for Further and Higher Education 2019 and in accordance with Financial Reporting Standard (FRS 102). They have also been prepared in accordance with the accounts direction issued by the Office for Students issued 25 October 2019. Queen Mary University of London is a public benefit entity and therefore has applied the relevant public benefit requirement of FRS 102. The Financial Statements are prepared in accordance with the historical cost convention, modified by the revaluation of tangible assets and the recognition of financial instruments at fair value.
Going ConcernQueen Mary has considered the potential uncertainties of the impact of the Covid-19 pandemic on the University, including around student recruitment and the potential impact on the covenants on the University's borrowings. After due consideration, there is a reasonable expectation that the University will have adequate resources to meet its liabilities as they fall due over the next 12 months, and the Financial Statements have therefore been prepared on a going concern basis.
Basis of consolidationThe consolidated financial statements include Queen Mary (the University) and all its subsidiaries for the financial year to 31 July 2020. Intra-group transactions are eliminated on consolidation. The consolidated financial statements do not include the income and expenditure of the Students' Union as the University does not exert control or dominant influence over policy decisions. Associated companies are accounted for using the equity method. The University is the ultimate controlling entity of the group.
Income recognitioni Income from the sale of goods or services is credited to the Consolidated Statement of Comprehensive Income and
Expenditure when the goods or services are supplied to the external customers or the terms of the contract have been satisfied.
ii Fee income is credited to the Consolidated Statement of Comprehensive Income and Expenditure over the period in which students are studying. Where the amount of the tuition fee is reduced by a prompt payment discount, a fee waiver or scholarships which reduce the tuition fee payable, the net amount is taken to income. Where bursaries and student support payments are customarily made, income receivable is stated net of the payments. All other bursaries and student support payments are accounted for gross as expenditure and not deducted from income.
iii Grant funding including funding body grants, research and other grants from government and non-government sources are recognised as income when the University is entitled to it and the performance related conditions have been met. Income received in advance of performance related conditions being met is recognised as deferred income within creditors on the statement of financial position and released to income as the conditions are met.
iv Donations and endowments are recognised in income when the University is entitled to the funds. Income from donations with donor imposed restrictions is retained within the restricted or endowment reserve until such time that it is utilised in line with the restrictions when the income is released to general reserves through a reserve transfer. Donations with no restrictions are recognised in income when the University is entitled to the funds and retained within unrestricted reserves.
There are four main types of donations and endowments identified within reserves:
a. Restricted donations - the donor has specified that the donation must be used for a particular objective.
b. Unrestricted permanent endowments - the donor has specified that the fund is to be permanently
invested to generate an income for the general purposes of the University.
c. Restricted expendable endowments - the donor has specified a particular objective other than the
purchase or construction of tangible assets, and the University has the power to use the capital.
d. Restricted permanent endowments - the donor has specified that the fund is to be permanently
invested to generate an income stream to be applied to a particular objective.
Queen Mary University of London 40

Statement of Principal Accounting Policies (Continued)for the year ended 31 July 2020
Income recognition (continued)
v Investment income is credited to the Consolidated Statement of Comprehensive Income and Expenditure
on a receivable basis as restricted or unrestricted income according to the terms of the donation or
endowment.
vi Increases or decreases in value arising on the revaluation or disposal of tangible asset investments are added to or subtracted from the investment concerned and recognised in the Consolidated Statement of Comprehensive Income and Expenditure.
vii Capital grants are recognised in income when the University is entitled to the funds subject to any performance related conditions being met. Where grant funded assets are in the course of construction, we consider on a case by case basis whether their construction constitutes a performance related condition. In the event that it does, income will be recognised as the expenditure to complete the asset is incurred.
viii Funds the University receives and disburses as paying agent on behalf of a funding body are excluded from the income and expenditure of the University where the University is exposed to minimal risk or enjoys minimaleconomic benefit related to the transaction.
Employment benefitsShort term employment benefits such as salaries and compensated absences are recognised as an expense in the year in which the employees render service to the University. Any unused benefits are accrued and measured as the additional amount the University expects to pay as a result of the unused entitlement.
Accounting for retirement benefitsAs described in note 31, Queen Mary is a member of three defined benefit pension schemes: the Superannuation Arrangements of the University of London (SAUL), the Universities Superannuation Scheme (USS), and the NHS Public Service Scheme (NHS). Queen Mary also operates a closed definedbenefit pension scheme for former non-teaching staff of the London Hospital and St Bartholomew's Hospital medical colleges.
The SAUL and USS schemes are defined benefit schemes which are externally funded and are valued every three years by professionally qualified independent actuaries. Both SAUL and USS are multi-employer schemes for which it is not possible to identify the assets and liabilities applying to Queen Mary’s membership due to the mutual nature of the scheme and therefore these schemes are accounted for as a defined contribution scheme. Contributions to the scheme are recognised as an expense in the Consolidated Statement of Comprehensive Income and Expenditure in the periods during which services are rendered by employees. In addition, a liability is recorded in the Consolidated Statement of Comprehensive Income and Expenditure when a contractual commitment to fund past deficits is made. The liability is held within provisions and released to expenditure to decrease pensionpayments made over the term of the commitment.
The NHS pension scheme is an unfunded multi-employer scheme. Contributions to the scheme are recognised as an expense in the Consolidated Statement of Comprehensive Income and Expenditure in the periods during which services are rendered by employees on the basis of contributions payable.
London Hospital and St Bartholomew's Hospital medical colleges pension scheme is a defined benefit plan. Queen Mary has an obligation to provide the agreed benefits to former employees, and actuarial risk (that benefits will cost more or less than expected) and investment risk (that returns on assets set aside to fund the benefits will differ from expectations) are borne, in substance, by the University. The University recognisesa liability for its obligations under defined benefit plans net of plan assets. This net defined benefit liability is measured as the estimated amount of benefit that employees have earned in return for their service in prior periods, discounted to determine its present value, less the fair value (at bid price) of plan assets. The calculation is performed by a qualified actuary using the projected unit credit method. Where the calculation results in a net asset, recognition of the asset is limited to the extent to which the University is able to recover the surplus through refunds from the plan.
Queen Mary University of London 41
Statement of Principal Accounting Policies (Continued)for the year ended 31 July 2020
Financial InstrumentsAs allowable under FRS 102 Queen Mary has adopted the option to apply the recognition, measurement and disclosure requirements of sections 11 and 12 of FRS 102.
Equity investments are recognised initially at fair value which is normally the transaction price. Subsequently, they are measured at fair value through Consolidated Statement of Comprehensive Income and Expenditure except for those equity investments that are not publicly traded and whose fair value cannot otherwise be measured reliably which are recognised at cost less impairment until a reliable measure of fair value becomes available. If a reliable measure of fair value is no longer available, the equity instrument’s fair value on the last date the instrument was reliably measurable is treated as the cost of the instrument. Investments in associates and subsidiaries are carried at cost less impairment.
The managed investment portfolio, a group of financial assets and debt instruments, is evaluated on a fair value basis through Consolidated Statement of Comprehensive Income and Expenditure.
Debtors and creditors with no stated interest rate and receivable or payable within one year are recorded at the undiscounted transaction price. Any losses arising from impairment are recognised in the Consolidated Statement of Comprehensive Income and Expenditure in other operating expenses.
All interest-bearing loans and borrowings which are basic financial instruments are initially recognised at the present value of cash payable to the bank (including interest). After initial recognition they are measured at amortised cost using the effective interest rate method, less impairment. The effective interest rate amortisation is included in the Consolidated Statement of Comprehensive Income and Expenditure. All interest-bearing loans and borrowings which are non-basic financial instruments are measured at fair value through the Consolidated Statement of Comprehensive Income and Expenditure. Fair value measurement: the best evidence of fair value is a quoted price for an identical asset in an active market. When quoted prices are unavailable, the price of a recent transaction for an identical asset provides evidence of fair value as long as there has not been a significant change in economic circumstances or a significant lapse of time since the transaction took place. If the market is not active and recent transactions of an identical asset on their own are not a good estimate of fair value, the fair value is estimated by using a valuation technique.
Cash and cash equivalents are included at amortised cost using the effective interest rate method.
Finance LeasesLeases in which Queen Mary assumes substantially all the risks and rewards of ownership of the leased asset are classified as finance leases. Leased assets acquired by way of finance lease and the corresponding lease liabilities are initially recognised at an amount equal to the lower of their fair value and the present value of the minimum lease payments at inception of the lease. Minimum lease payments are apportioned between the finance charge and the reduction of the outstanding liability. The finance charge is allocated to each period during the lease term so as to produce a constant periodic rate of interest on the remaining balance of the liability.
Operating leasesCosts in respect of operating leases are charged on a straight-line basis over the lease term. Any lease premiums or incentives are spread over the minimum lease term.
Foreign currencyTransactions denominated in foreign currencies are recorded at the rate of exchange ruling at the dates of the transactions. Monetary assets and liabilities in foreign currencies are translated into sterling at the rates of exchange ruling at the date of the Statement of Financial Position. Exchange differences arising have been included in the Consolidated Statement of Comprehensive Income and Expenditure.
The assets and liabilities of foreign operations, arising on consolidation, are translated into sterling at therate of exchange at the date of the Statement of Financial Position. The revenues and expenses of foreign operations are translated at an average rate for the year where this rate approximates to the foreign exchange rates ruling at the dates of the transactions. Exchange differences arising from this translation of foreign operations are reported in the Consolidated Statement of Comprehensive Income and Expenditure.
Queen Mary University of London 42

Statement of Principal Accounting Policies (Continued)for the year ended 31 July 2020
Intangible assetsIntangible assets are stated at cost less amortisation or at impaired value. Where it is considered that there has been any impairment in the value of an asset, the difference between the carrying value and the higher of its net realisable value or value in use is expensed in the Consolidated Statement of Comprehensive Income and Expenditure.
Third party software and the costs associated with its implementation costing less than £10,000 per individual item or group of related items is written off in the year of acquisition. All other costs are amortised over 3-8 years on a straight line basis, the period of its estimated useful life.
Tangible assetsFixed assets are stated at cost or deemed cost less accumulated depreciation. Depreciation is calculated on a straight line basis. Cost includes the original purchase price of the asset and the costs attributableto bringing the asset to its working condition for intended use. Where parts of a tangible assethave different useful lives, they are accounted for as separate items of tangible assets.
Land and buildings were revalued to fair value on 31 July 2014. The University has taken advantage of the transitional arrangements in FRS 102 to apply this valuation as deemed cost but not to adopt a valuation policy going forward. Additions to land and buildings since 1 August 2014 have been at cost.
i Buildings are depreciated over 50 years. Depreciation on leased buildings is calculated over the life of the lease if the lease is less than 50 years. No provision for depreciation is made against the value of land.
ii Assets in the course of construction are stated at cost and are not depreciated until they are transferred to the completed asset class when ready for use.
iii Freehold improvement works are depreciated over 20-40 years.
iv Leasehold improvement works are depreciated over 20-40 years or the term of the lease if shorter.
v Plant & Machinery is depreciated over 10-15 years.
vi Fixtures & Fittings are depreciated over 10 years.
vii Equipment is depreciated over 3-8 years.
viii Plant & Machinery, Equipment and Fixtures & Fittings costing less than £10,000 per individual item or group of related items is written off in the year of acquisition. All other items are capitalised.
ix Where assets are acquired with the aid of specific grants they are capitalised and depreciated over the shorter of the term of the grant or the depreciation terms as set out above.
x Assets held under finance leases are depreciated over the period of the finance lease or the depreciation terms as set out above whichever is shorter.
xi Improvements to properties held under short leases are depreciated over the life of the lease.
xii Expenditure on an asset after it is purchased is capitalised when the expected future benefits from that asset as a result of the expenditure are greater than those previously assessed.
Queen Mary University of London 43
Statement of Principal Accounting Policies (Continued)for the year ended 31 July 2020
Tangible assets (continued)xiii Where it is considered that there has been any impairment in the value of an asset, the difference
between the carrying value and the higher of its net realisable value or value in use is expensed in the Consolidated Statement of Comprehensive Income and Expenditure. Circumstances which could give rise to an impairment are reviewed annually.
xiv Queen Mary owns heritage assets, none of which either individually or collectively are material to theseFinancial Statements, which have not been capitalised.
xv Expenditure to ensure that a tangible asset maintains its previously recognised standard of performance is recognised in the Consolidated Statement of Comprehensive Income and Expenditure in the year it is incurred. The University has a planned maintenance programme which is reviewed annually.
Investmentsi Investments in associates and subsidiaries are shown at the lower of cost or net realisable value.
ii Associate undertakings are shown at Queen Mary’s attributable share of net assets in the Statementof Financial Position.
iii Listed investments held for the benefit of the endowment portfolio are shown at market valuation with movements recognised in the Consolidated Statement of Comprehensive Income and Expenditure.
iv Shares held in other non-current asset investments are initially held at their transaction price. Thereafter, they are measured at fair value through the Consolidated Statement of Comprehensive Income and Expenditure except for those equity investments that are not publicly traded and whose fair value cannot otherwise be measured reliably which are recognised at cost less impairment until a reliable measure of fair value becomes available. If a reliable measure of fair value is no longer available, the equity instrument’s fair value on the last date the instrument was reliably measurable is treated as the cost of the instrument.
v Current asset investments are held at fair value with movements recognised in the Consolidated Statement of Comprehensive Income and Expenditure.
StockStock is valued on a first in first out basis and stated at the lower of cost and net realisable value. Included in the valuation are stocks in the refectories and central and departmental stores. An annual review is undertaken of slow moving, obsolete and defective stock and the difference between the carrying value and the higher of its net realisable value or value in use is expensed in the Consolidated Statement of Comprehensive Income and Expenditure.
Cash and cash equivalentsCash includes cash in hand, deposits repayable on demand and overdrafts. Deposits are repayable on demand if they are in practice available within 24 hours without penalty. Cash equivalents are short term, highly liquid investments, typically with a maturity of up to 3 months from the initial investment, that are readily convertible to known amounts of cash with insignificant risk of change in value. Cash held on deposit for longer than three months is accounted for as current asset investments.
Queen Mary University of London 44
Statement of Principal Accounting Policies (Continued)for the year ended 31 July 2020
ProvisionsProvisions are recognised in the Financial Statements when:
i The University has a present obligation (legal or constructive) as a result of a past event;ii it is probable that an outflow of economic benefits will be required to settle the obligation; andiii a reliable estimate can be made of the amount of the obligation.
The amount recognised as a provision is determined by discounting the expected future cash flows at a pre-tax rate that reflects risks specific to the liability.
Contingent LiabilitiesA contingent liability arises from a past event that gives the University a possible obligation whose existence will only be confirmed by the occurrence or otherwise of uncertain future events not wholly within the control of the University or where it is not probable that an outflow of resources will be required or the amount of the obligation cannot be measured reliably. Contingent liabilities are not recognised in the Statement of FinancialPosition but are disclosed in the notes.
Accounting for Intercompany LoansThe University accounts for intercompany loans using the accounting treatment for public benefit entities in Section 34 of FRS 102.
Accounting for Jointly Controlled OperationsThe University accounts for its share of transactions from joint operations in the Consolidated Statement of Comprehensive Income and Expenditure.
TaxationQueen Mary is an exempt charity within the meaning of Schedule 3 of the Charities Act 2011 and is considered to pass the tests set out in Paragraph 1 Schedule 6 Finance Act 2010 and therefore meets the definition of a charity for corporation tax purposes. Accordingly, the University is potentially exempt from tax in respect of income or capital gains received within categories covered by Sections 478-488 CTA 2010 or Section 256 of the Taxation of Chargeable Gains Act 1992 to the extent that such income or gains are applied to exclusively charitable purposes. The University is registered for Value Added Tax (VAT) but is unable to recoverinput tax incurred on the majority of its expenditure, most education and research being exempt or outside the scope activities under VAT legislation. Irrecoverable VAT is included in the cost of the goods or service.
Deferred taxationDeferred tax arises from timing differences between the treatment of certain items for taxation and accounting purposes. Provision is made for deferred tax only to the extent that it is probable that an actual liability will crystallise for a subsidiary and deferred tax assets are only recognised to the extent that it is probable that they will be recovered against future taxable profits by a subsidiary. The deferred tax assets and liabilities are not discounted and are netted in the Statement of Financial Position.
ReservesReserves are classified as restricted or unrestricted.
i The restricted endowment reserve comprises endowments made to the University where the donor has specified that the fund is to be invested to generate an income stream to be applied to a specific purpose.
ii The restricted reserves include balances where the donor has designated a specific purpose and therefore the University is restricted in the use of these funds.
Queen Mary University of London 45
Statement of Principal Accounting Policies (Continued)for the year ended 31 July 2020
Accounting Estimates and Judgements
There were no critical judgements in the year made in the process of applying the accounting policies.
The following are key sources of uncertainty in the estimates that have the most significant effect on the amounts recognised in the Financial Statements:
Pension provision assumptionsIn the judgement of the University it is appropriate to account for the USS past deficit obligation in accordance with the deficit recovery plan agreed after the 2018 valuation. This requires payment of 2% of salaries over the period 1 October 2019 to 30 September 2021 at which point the rate will increase to 6% until 31 March 2028. The 2020 deficit recovery liability in the Financial Statements reflects this plan. The rate used to discount future contributions to the USS deficit recovery plan at the balance sheet date reflects the yield on high quality corporate bonds consistent with the currency and estimated period of future payments. The rates used are based on work commissioned by the British Universities Finance Directors’ Group (BUFDG) from Mercer for the HE sector as a whole. The other assumptions used for calculation of the provision are the estimated salary inflation in future years and estimated changes in number of staff who are members of the USS pension scheme in future years. These are both consistent with our internal financial forecasting assumptions. The sensitivity of the principal assumptions used to measure the USS deficit provision are set out in Note 20.
Queen Mary University of London 46

Notes to the Financial Statementsfor the year ended 31 July 2020
1 Tuition fees and education contracts
Consolidated Institution Consolidated Institution£'000 £'000 £'000 £'000
Full-time home and EU students 128,446 126,864 122,547 121,633Full-time international students 128,205 128,205 112,196 112,196Part-time students 6,701 6,701 5,908 5,908Short course fees 3,544 3,544 3,440 3,440Other fees and support grants 998 998 1,346 1,346Education contracts 4,994 4,994 4,792 4,792
272,888 271,306 250,229 249,315
2 Funding body grantsConsolidated Institution Consolidated Institution
£'000 £'000 £'000 £'000
Recurrent grant
RevenueOffice for Students 27,701 27,701 27,740 27,740Research England 35,375 35,375 31,690 31,690
CapitalOffice for Students 1,021 1,021 1,653 1,653Research England 4,120 4,120 3,743 3,743
Specific grants
RevenueOffice for Students 3 3 20 20Research England 3,275 3,275 1,485 1,485
CapitalOffice for Students 47 47 785 785Research England 1,236 1,236 - -
Higher Education Innovation FundResearch England 3,256 3,256 4,166 4,166
76,034 76,034 71,282 71,282
Year ended 31 July 2020 Year ended 31 July 2019
Year ended 31 July 2020 Year ended 31 July 2019
Queen Mary University of London 47
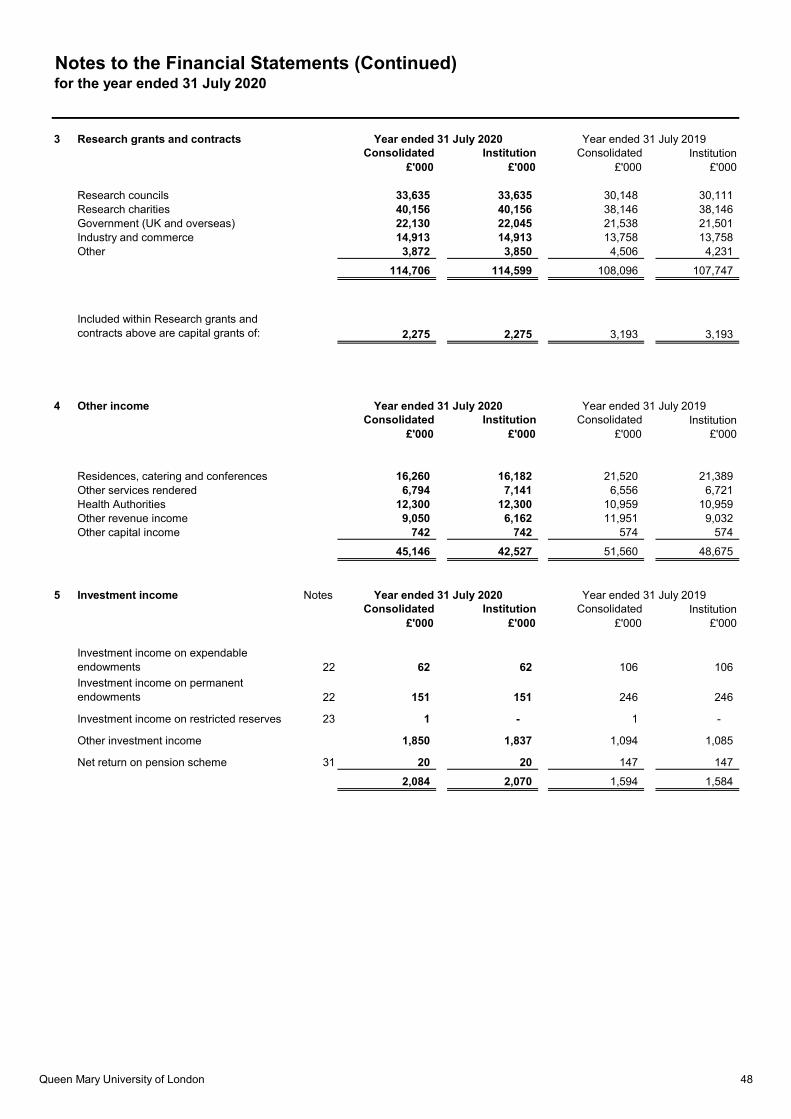
Notes to the Financial Statements (Continued)for the year ended 31 July 2020
3 Research grants and contractsConsolidated Institution Consolidated Institution
£'000 £'000 £'000 £'000
33,635 33,635 30,148 30,111 40,156 40,156 38,146 38,146
Government (UK and overseas) 22,130 22,045 21,538 21,501Industry and commerce 14,913 14,913 13,758 13,758Other 3,872 3,850 4,506 4,231
114,706 114,599 108,096 107,747
Included within Research grants and contracts above are capital grants of: 2,275 2,275 3,193 3,193
4 Other incomeConsolidated Institution Consolidated Institution
£'000 £'000 £'000 £'000
Residences, catering and conferences 16,260 16,182 21,520 21,389Other services rendered 6,794 7,141 6,556 6,721Health Authorities 12,300 12,300 10,959 10,959Other revenue income 9,050 6,162 11,951 9,032Other capital income 742 742 574 574
45,146 42,527 51,560 48,675
5 Investment income NotesConsolidated Institution Consolidated Institution
£'000 £'000 £'000 £'000
Investment income on expendable endowments 22 62 62 106 106
Investment income on permanent endowments 22 151 151 246 246
Investment income on restricted reserves 23 1 - 1 -
Other investment income 1,850 1,837 1,094 1,085
Net return on pension scheme 31 20 20 147 147
2,084 2,070 1,594 1,584
Research councils Research charities
Year ended 31 July 2020 Year ended 31 July 2019
Year ended 31 July 2020 Year ended 31 July 2019
Year ended 31 July 2020 Year ended 31 July 2019
Queen Mary University of London 48
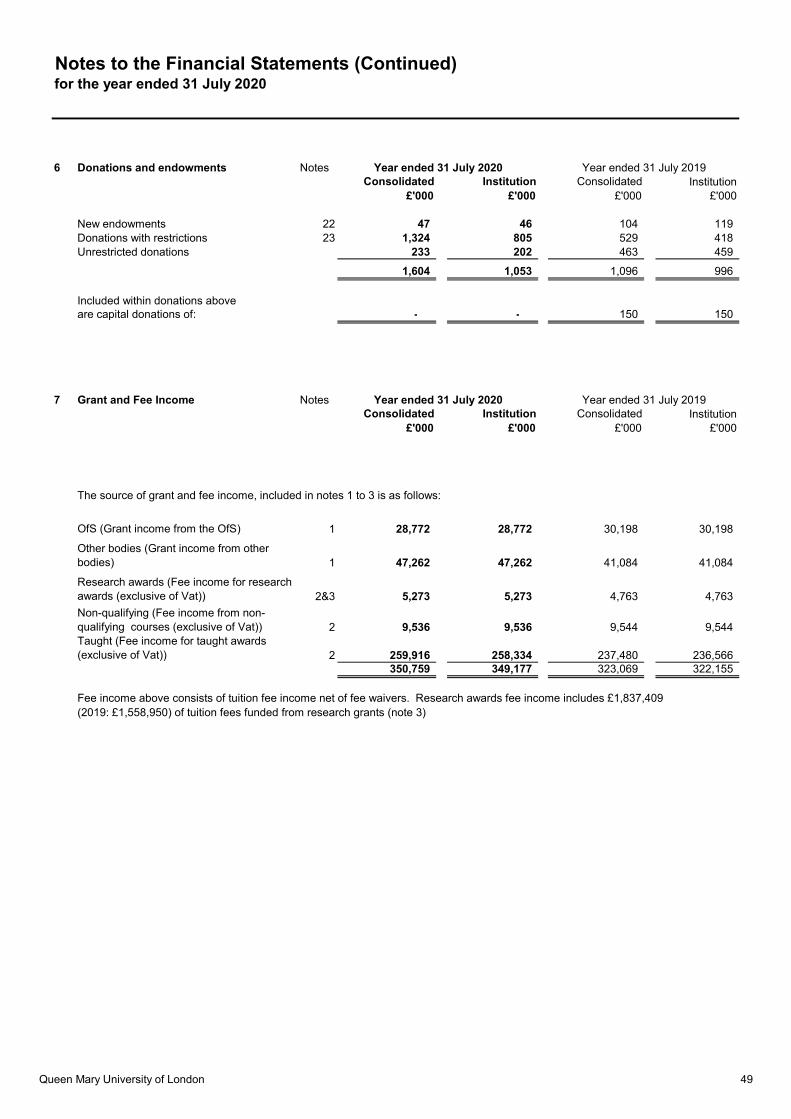
Notes to the Financial Statements (Continued)for the year ended 31 July 2020
6 Donations and endowments NotesConsolidated Institution Consolidated Institution
£'000 £'000 £'000 £'000
New endowments 22 47 46 104 119Donations with restrictions 23 1,324 805 529 418Unrestricted donations 233 202 463 459
1,604 1,053 1,096 996
Included within donations aboveare capital donations of: - - 150 150
7 Grant and Fee Income NotesConsolidated Institution Consolidated Institution
£'000 £'000 £'000 £'000
The source of grant and fee income, included in notes 1 to 3 is as follows:
OfS (Grant income from the OfS) 1 28,772 28,772 30,198 30,198
Other bodies (Grant income from other bodies) 1 47,262 47,262 41,084 41,084
Research awards (Fee income for research awards (exclusive of Vat)) 2&3 5,273 5,273 4,763 4,763
Non-qualifying (Fee income from non-qualifying courses (exclusive of Vat)) 2 9,536 9,536 9,544 9,544Taught (Fee income for taught awards (exclusive of Vat)) 2 259,916 258,334 237,480 236,566
350,759 349,177 323,069 322,155
Fee income above consists of tuition fee income net of fee waivers. Research awards fee income includes £1,837,409(2019: £1,558,950) of tuition fees funded from research grants (note 3)
Year ended 31 July 2020 Year ended 31 July 2019
Year ended 31 July 2020 Year ended 31 July 2019
Queen Mary University of London 49
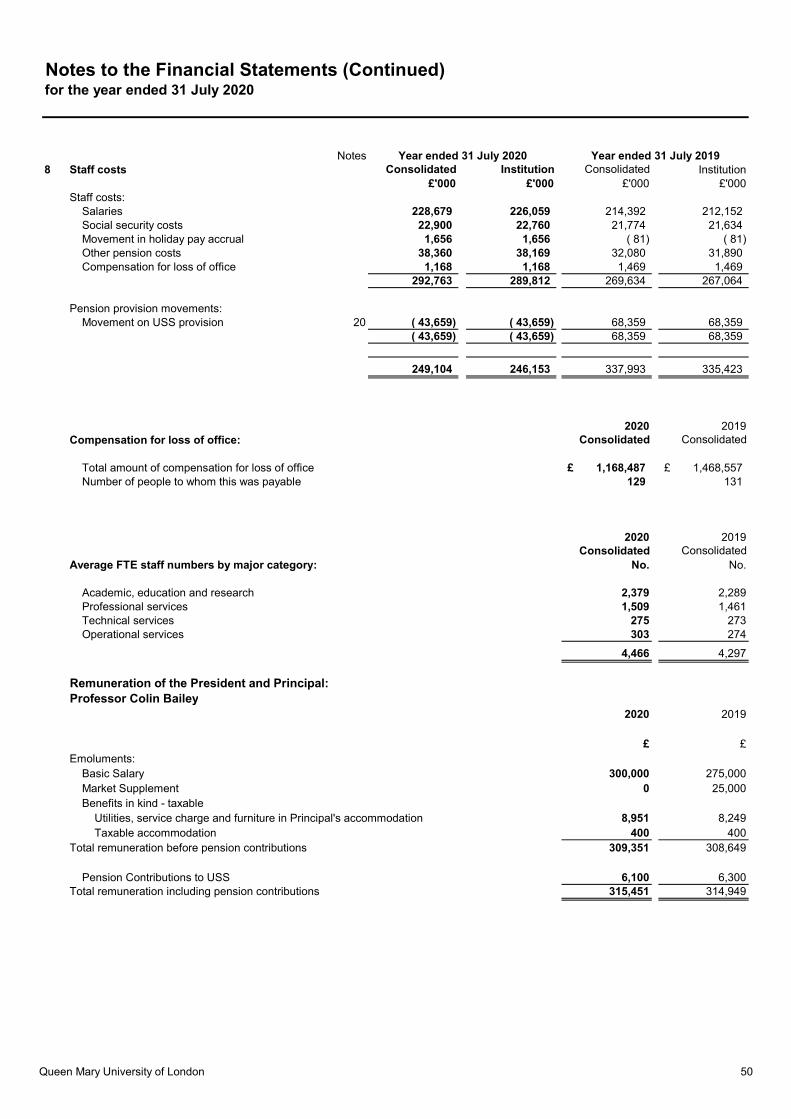
Notes to the Financial Statements (Continued)for the year ended 31 July 2020
Notes8 Staff costs Consolidated Institution Consolidated Institution
£'000 £'000 £'000 £'000Staff costs:
Salaries 228,679 226,059 214,392 212,152Social security costs 22,900 22,760 21,774 21,634Movement in holiday pay accrual 1,656 1,656 ( 81) ( 81)Other pension costs 38,360 38,169 32,080 31,890Compensation for loss of office 1,168 1,168 1,469 1,469
292,763 289,812 269,634 267,064
Pension provision movements:Movement on USS provision 20 ( 43,659) ( 43,659) 68,359 68,359
( 43,659) ( 43,659) 68,359 68,359
249,104 246,153 337,993 335,423
2020 2019Compensation for loss of office: Consolidated Consolidated
Total amount of compensation for loss of office 1,168,487£ 1,468,557£ Number of people to whom this was payable 129 131
2020 2019Consolidated Consolidated
Average FTE staff numbers by major category: No. No.
Academic, education and research 2,379 2,289Professional services 1,509 1,461Technical services 275 273Operational services 303 274
4,466 4,297
Remuneration of the President and Principal:Professor Colin Bailey
2020 2019
£ £Emoluments:
Basic Salary 300,000 275,000Market Supplement 0 25,000Benefits in kind - taxable
Utilities, service charge and furniture in Principal's accommodation 8,951 8,249Taxable accommodation 400 400
Total remuneration before pension contributions 309,351 308,649
Pension Contributions to USS 6,100 6,300Total remuneration including pension contributions 315,451 314,949
Year ended 31 July 2020 Year ended 31 July 2019
Queen Mary University of London 50
Notes to the Financial Statements (Continued)for the year ended 31 July 2020
8 Staff costs (continued)Remuneration of the President and Principal (continued)
Justification for the total remuneration package for Professor Colin Bailey
Queen Mary is a member of the Russell Group of 24 leading UK universities, which are committed to maintaining the very bestresearch, an outstanding teaching and learning experience and unrivalled links with business and the public sector. The Universityhas five campuses in London and significant operations overseas, notably in China, France and Malta. In the academic year 2019-20, it had approximately 27,000 students registered on its programmes, 4,400 members of staff, research income of £115m andtotal income of £512m. Queen Mary therefore competes with some of the best universities in the UK and internationally to recruitsenior members of staff.
The President and Principal is the chief academic and executive officer of the University and has ultimate responsibility for thedevelopment and delivery of the Queen Mary strategy, as well as for ensuring that the University has the financial strength andsustainability to achieve its ambitions. The post-holder is responsible for maintaining and promoting Queen Mary’s values anddistinctive identity, for overseeing the achievement of high international standards in education and research across all disciplines,and for protecting and developing the University’s reputation on a regional, national and international level.
Professor Colin Bailey has been Queen Mary’s President and Principal since September 2017. He was appointed following aninternational search, which was overseen by Council. A dedicated benchmarking exercise was undertaken as part of the recruitmentprocess to determine the appropriate level of remuneration for the role. Professor Bailey’s pay was set, and remains, close to themedian compared to other Russell Group universities.
The Chair of Council is responsible for conducting the President and Principal’s mid- and full-year appraisals. Following the full-yearappraisal, the Remuneration Committee held a dedicated meeting, which Professor Bailey did not attend, to review his performanceand remuneration. The Committee concluded that Professor Bailey’s achievements were significant in the academic year 2019–20,including his leadership of the University’s response to the Coronavirus pandemic while laying the foundations to deliver theUniversity Strategy, and his achievement of strategic objectives in relation to student recruitment, generating cash for investment,and building and developing the leadership team.
Since his appointment as President and Principal in September 2017, Professor Bailey has made clear to Remuneration Committeein advance his intention to waive any salary increase or bonus that the Committee may wish to award. Each year the Committee hasconsidered what pay uplift Professor Bailey should have been awarded had he not chosen to waive any such uplift. In light of hissignificant contribution as President and Principal, the Committee agreed in 2017/18 and 2018/19 that he should have beenawarded a pay uplift in line with the national cost of living pay offer (2.0% in 2018/19 and 1.8% in 2019/20). Given the wider financialsituation brought about by the Coronavirus pandemic, the higher education sector has not applied a cost of living increase in2020/21. In consideration of this and Professor Bailey’s request not to be awarded a pay uplift, the Committee decided not to awardhim a pay uplift in 2020/21. The notional effect of the previous increases, had they not been waived by Professor Bailey, would havebeen as follows.
2017/18 2018/19 2019/20 2020/21
Actual salary (basic salary plus £300,000 £300,000 £300,000 £300,000market supplement)
Notional salary (brought forward) £300,000 £306,000 £311,508Notional increase N/A 2.0% 1.8% 0.0%Notional salary (carried forward) £300,000 £306,000 £311,508 £311,508
Remuneration Committee has approved objectives for Professor Bailey in the academic year 2020/21 that are linked to the University Strategy. The objectives reflect the following strategic priorities:• leading the University’s response through the Coronavirus pandemic;• achievement of student recruitment targets;• achievement of cash generation targets for investment;• building and developing the leadership team to deliver the University Strategy, and embedding an effective distributed leadership
model;• overseeing the implementation of the University Strategy, with appropriate emphasis on the student experience, and people and
culture;• raising the profile of the University locally, nationally and internationally.
Queen Mary requires the President and Principal to reside in nearby accommodation, which it provides for the better performance ofthe duties and for official business. This is consistent with similar arrangements at other universities, especially in London. TheUniversity purchased the property outright in 1976 for £55,000. The gross rating value of the property used to calculate the cashequivalent of the accommodation benefit is £400 per year.
Queen Mary University of London 51

Notes to the Financial Statements (Continued)for the year ended 31 July 2020
8 Staff costs (continued)
Relationship between Professor Colin Bailey's emoluments and the median 2020 2019value for all staff employed by the University: Median Median
Basic Salary (median calculated as full-time equivalent for the salaries of all staff) 8.8 8.0Total remuneration (median calculated as full-time equivalent for the remuneration of all staff) 8.0 7.7
Key management personnelKey management personnel are those persons having authority and responsibility for planning, directing and controlling the activities of the University. Emoluments include any compensation paid to key management personnel. The President and Principal is included together with the other members of Queen Mary's Senior Executive who are listed onthe final page of the financial statements.
2020 2019Emoluments: £ £
Salary 1,984,133 1,911,920Benefits in kind 9,351 8,649Severance 0 88,900
Total remuneration before pension contributions 1,993,484 2,009,469Pension Contributions to USS 209,780 196,618
Total remuneration including pension contributions 2,203,264 2,206,087
Trustees (Council Members)The Trustees neither received nor waived any emoluments during the year (2019: £nil) in respect of their position as Trustees. AllTrustees are entitled to be reimbursed for reasonable travel and subsistence expenses incurred in the performance of their duties.In 2020 2 Trustees (2019: 3) were reimbursed a total of £859 (2019: £1,712).
The number of staff who earned a basic salary of over £100,000 in the year 2020 2019No. No.
£100,000 - £104,999 29 28£105,000 - £109,999 24 10£110,000 - £114,999 15 10£115,000 - £119,999 7 7£120,000 - £124,999 7 9£125,000 - £129,999 9 7£130,000 - £134,999 6 5£135,000 - £139,999 7 3£140,000 - £144,999 2 1£145,000 - £149,999 1 1£150,000 - £154,999 1 2£155,000 - £159,999 2 1£165,000 - £169,999 0 1£170,000 - £174,999 2 2£175,000 - £179,999 1 0£190,000 - £194,999 0 1£215,000 - £219,999 1 0£245,000 - £249,999 1 0£255,000 - £259,999 0 1£300,000 - £304,999 1 1
116 90
The Remuneration Committee publishes an Annual Remuneration Report at:www.arcs.qmul.ac.uk/governance/council/committees/remuneration-committee
Queen Mary University of London 52
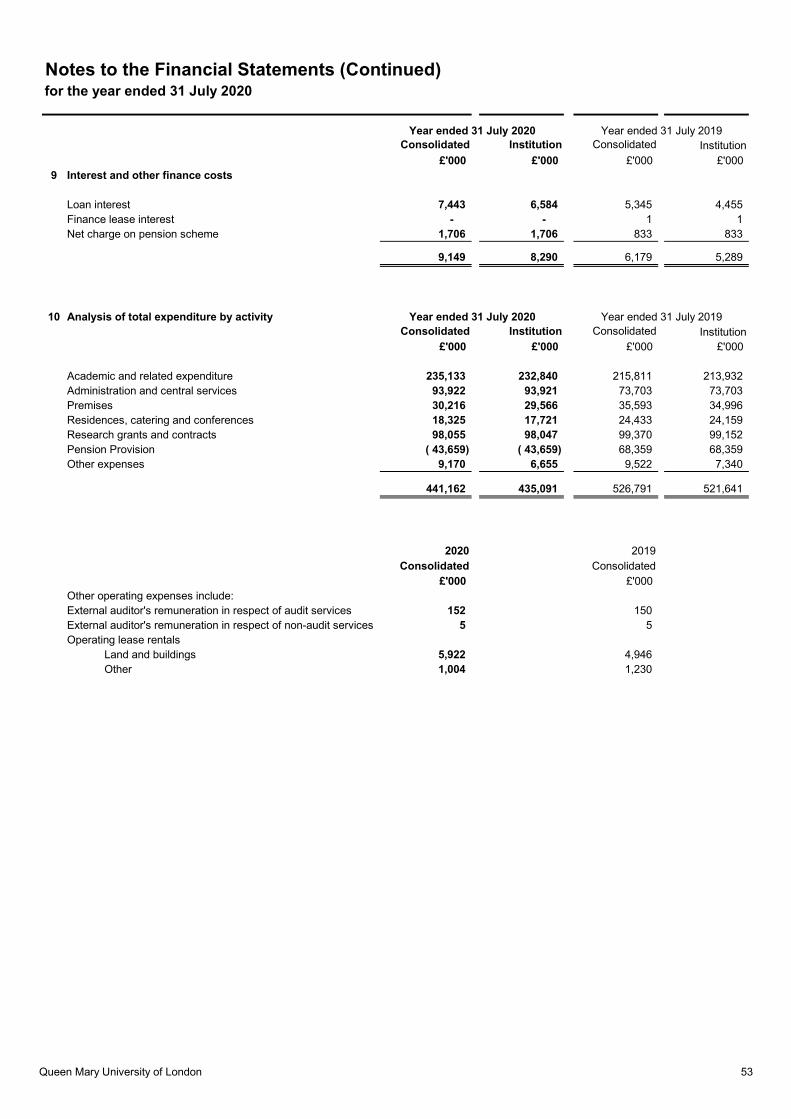
Notes to the Financial Statements (Continued)for the year ended 31 July 2020
Consolidated Institution Consolidated Institution£'000 £'000 £'000 £'000
9 Interest and other finance costs
Loan interest 7,443 6,584 5,345 4,455Finance lease interest - - 1 1Net charge on pension scheme 1,706 1,706 833 833
9,149 8,290 6,179 5,289
10 Analysis of total expenditure by activityConsolidated Institution Consolidated Institution
£'000 £'000 £'000 £'000
Academic and related expenditure 235,133 232,840 215,811 213,932Administration and central services 93,922 93,921 73,703 73,703Premises 30,216 29,566 35,593 34,996Residences, catering and conferences 18,325 17,721 24,433 24,159Research grants and contracts 98,055 98,047 99,370 99,152Pension Provision ( 43,659) ( 43,659) 68,359 68,359Other expenses 9,170 6,655 9,522 7,340
441,162 435,091 526,791 521,641
2020 2019Consolidated Consolidated
£'000 £'000 Other operating expenses include:External auditor's remuneration in respect of audit services 152 150External auditor's remuneration in respect of non-audit services 5 5Operating lease rentals
Land and buildings 5,922 4,946Other 1,004 1,230
Year ended 31 July 2020 Year ended 31 July 2019
Year ended 31 July 2020 Year ended 31 July 2019
Queen Mary University of London 53

Notes to the Financial Statements (Continued)for the year ended 31 July 2020
Consolidated Institution
£'000 £'000
Access and Participation
Access Investment 754 754Financial Support 8,189 8,189Support for Disabled Students 706 706Research and Evaluation 71 71
Total Spend 9,720 9,720
Of which staff costs 1,101 1,101
Year ended 31 July 2020
A copy of Queen Mary’s Access and Participation Plan for 2019/20 can be found at: https://apis.officeforstudents.org.uk/accessplansdownloads/1920/QueenMaryUniversityofLondon_APP_2019-2020_V1_10007775.pdf This sets out Queen Mary's approach to widening access and supporting students from under represented and disadvantaged communities. The figures above outline the University's central expenditure in 2019/20 to delivering the commitments in the plan.
Access Investment
The Access Investment outlined above is the central expenditure incurred by the Widening Participation Team, captured under centralcost centres. It excludes expenditure embedded in faculties and other professional service teams focused on supportingdisadvantaged and underrepresented groups to access the University.
In light of the Covid-19 pandemic, spend on this budget was lower than forecast. This is due to the postponement of all physical eventson and off-campus. Although a range of innovative digital events were offered in place, the overall delivery costs were less (due todecreased ambassador staffing, a reduction in logistic costs, and limited use of the Travel Bursary).
Financial Support
Queen Mary provides bursaries to all students whose household income, as assessed by Student Finance England, meet the criteria.Students with an assessed household income of less than £20,000 per annum receive a bursary of £1,700 per annum and studentswith a household income of between £20,000 and £35,000 receive a bursary of £1,000 per annum. The number of students eligible forbursaries in 2019/20 has been less than was modelled when setting the investment target in the Access Agreement, which has led toan underspend compared to the original plan. We review our modelling annually to best predict the number of students entitled tobursaries and the budget that should be allocated to this in the Access Agreement. We are committed to enabling under representedand disadvantaged groups to access the University and our Access Investment is designed to support this.
Queen Mary also provides targeted financial support including Article 26 Bursaries and a Financial Assistance Fund for students whorequire additional assistance.
Support for Disabled Students
The figures above for support for Disabled Students includes the expenditure by the central Dyslexia and Disability Service, includingthe student premium. Support for disabled students is considered in everything that we do, faculties and academic departments haveadditional direct expenditure supporting disabled students, this is not captured in the figures above.
Research and Evaluation
Research and Evaluation is a key part of our strategy to ensure all activities deliver impact. This spend supports our ongoingsubscription to HEAT, the delivery of student-led research projects to inform the development of our widening participation curriculumand the development of university business intelligence tools to more effectively monitor widening participation cohorts at every stageof the applicant funnel and overall student journey.
Staff
The staff figure includes staff working in the Disability and Dyslexia team and the proportion of individual staff time spent on Access inthe Widening Participation team. We know that staff from across the University will spend time supporting our approach to Access.This resource is not captured in the figures above.
Queen Mary University of London 54
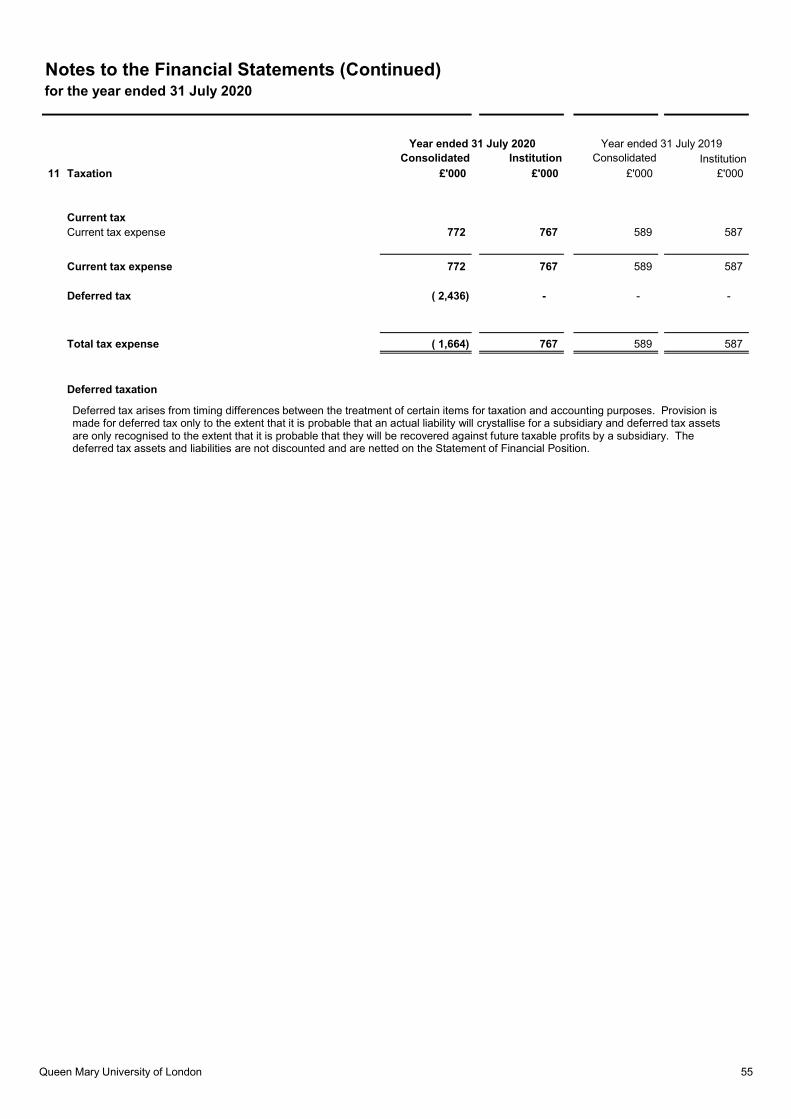
Notes to the Financial Statements (Continued)for the year ended 31 July 2020
Consolidated Institution Consolidated Institution11 Taxation £'000 £'000 £'000 £'000
Current taxCurrent tax expense 772 767 589 587
Current tax expense 772 767 589 587
Deferred tax ( 2,436) - - -
Total tax expense ( 1,664) 767 589 587
Deferred taxation
Year ended 31 July 2020 Year ended 31 July 2019
Deferred tax arises from timing differences between the treatment of certain items for taxation and accounting purposes. Provision is made for deferred tax only to the extent that it is probable that an actual liability will crystallise for a subsidiary and deferred tax assets are only recognised to the extent that it is probable that they will be recovered against future taxable profits by a subsidiary. The deferred tax assets and liabilities are not discounted and are netted on the Statement of Financial Position.
Queen Mary University of London 55
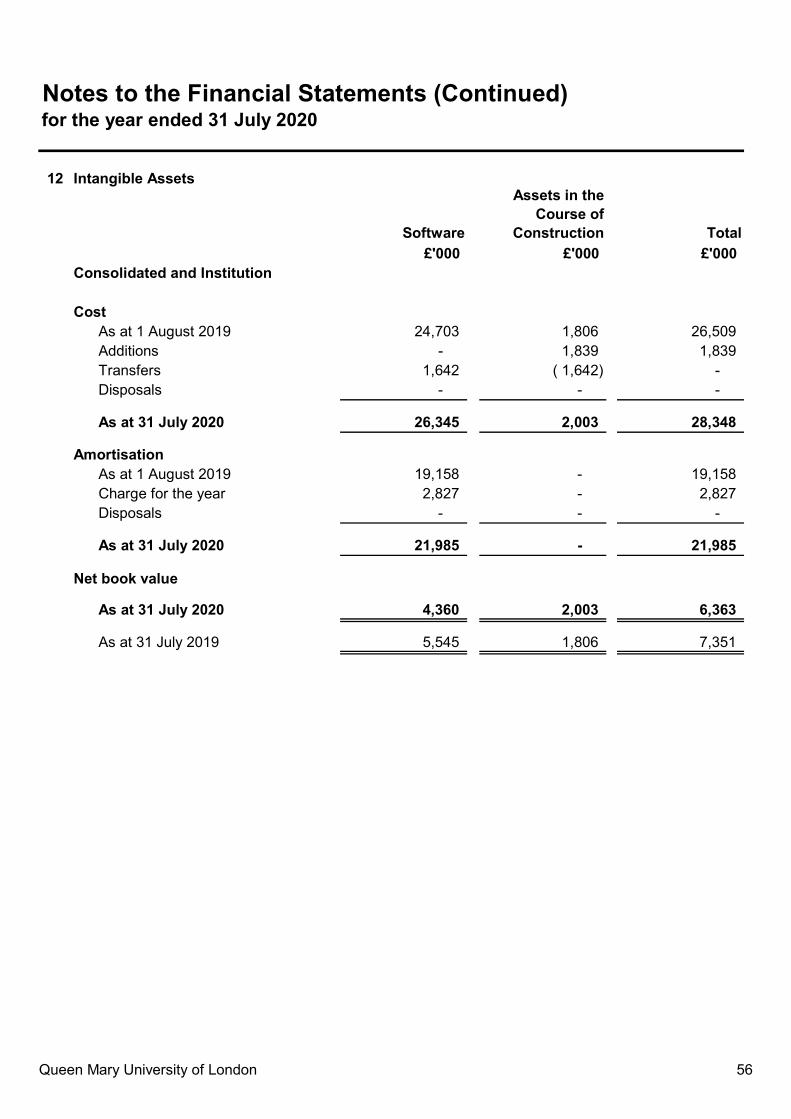
Notes to the Financial Statements (Continued)for the year ended 31 July 2020
12 Intangible Assets
Software
Assets in the Course of
Construction Total
£'000 £'000 £'000 Consolidated and Institution
CostAs at 1 August 2019 24,703 1,806 26,509Additions - 1,839 1,839Transfers 1,642 ( 1,642) - Disposals - - -
As at 31 July 2020 26,345 2,003 28,348
AmortisationAs at 1 August 2019 19,158 - 19,158Charge for the year 2,827 - 2,827Disposals - - -
As at 31 July 2020 21,985 - 21,985
Net book value
As at 31 July 2020 4,360 2,003 6,363
As at 31 July 2019 5,545 1,806 7,351
Queen Mary University of London 56
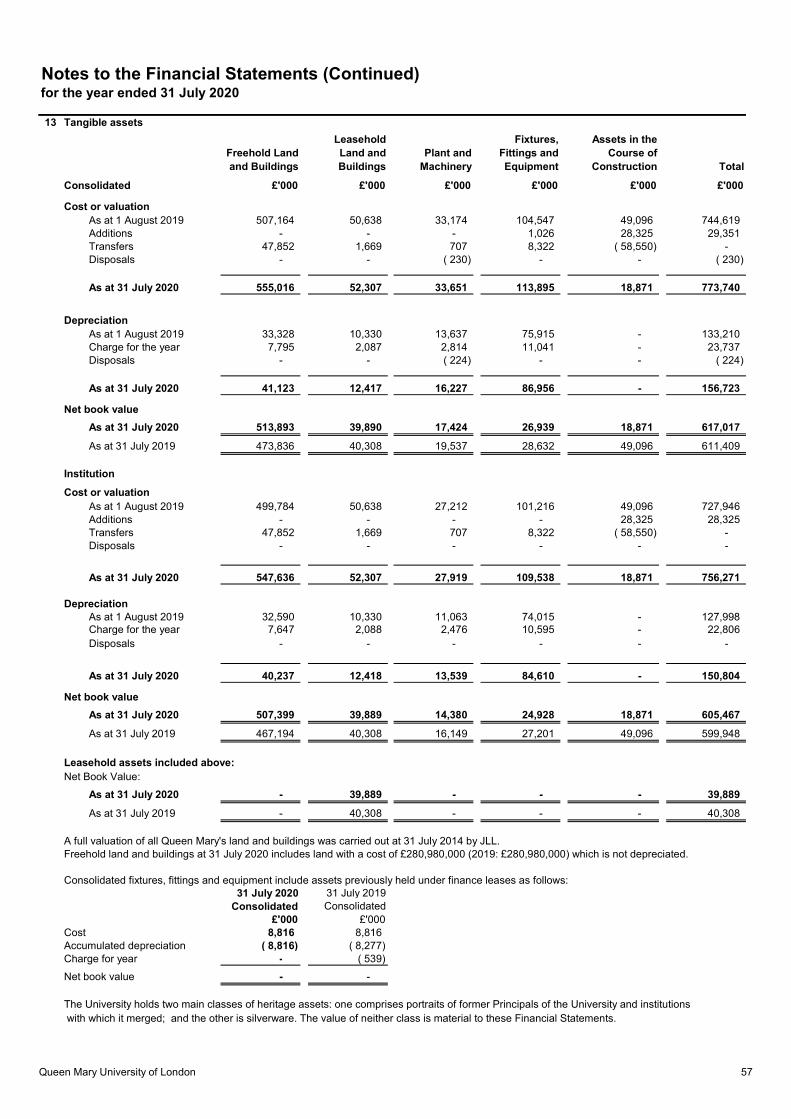
Notes to the Financial Statements (Continued)for the year ended 31 July 2020
13 Tangible assets
Freehold Land and Buildings
Leasehold Land and Buildings
Plant and Machinery
Fixtures, Fittings and Equipment
Assets in the Course of
Construction Total
Consolidated £'000 £'000 £'000 £'000 £'000 £'000
Cost or valuationAs at 1 August 2019 507,164 50,638 33,174 104,547 49,096 744,619Additions - - - 1,026 28,325 29,351Transfers 47,852 1,669 707 8,322 ( 58,550) - Disposals - - ( 230) - - ( 230)
As at 31 July 2020 555,016 52,307 33,651 113,895 18,871 773,740
DepreciationAs at 1 August 2019 33,328 10,330 13,637 75,915 - 133,210Charge for the year 7,795 2,087 2,814 11,041 - 23,737Disposals - - ( 224) - - ( 224)
As at 31 July 2020 41,123 12,417 16,227 86,956 - 156,723
Net book value
As at 31 July 2020 513,893 39,890 17,424 26,939 18,871 617,017
As at 31 July 2019 473,836 40,308 19,537 28,632 49,096 611,409
Institution
Cost or valuationAs at 1 August 2019 499,784 50,638 27,212 101,216 49,096 727,946Additions - - - - 28,325 28,325Transfers 47,852 1,669 707 8,322 ( 58,550) - Disposals - - - - - -
As at 31 July 2020 547,636 52,307 27,919 109,538 18,871 756,271
DepreciationAs at 1 August 2019 32,590 10,330 11,063 74,015 - 127,998Charge for the year 7,647 2,088 2,476 10,595 - 22,806Disposals - - - - - -
As at 31 July 2020 40,237 12,418 13,539 84,610 - 150,804
Net book value
As at 31 July 2020 507,399 39,889 14,380 24,928 18,871 605,467
As at 31 July 2019 467,194 40,308 16,149 27,201 49,096 599,948
Leasehold assets included above:Net Book Value:
As at 31 July 2020 - 39,889 - - - 39,889
As at 31 July 2019 - 40,308 - - - 40,308
A full valuation of all Queen Mary's land and buildings was carried out at 31 July 2014 by JLL.Freehold land and buildings at 31 July 2020 includes land with a cost of £280,980,000 (2019: £280,980,000) which is not depreciated.
Consolidated fixtures, fittings and equipment include assets previously held under finance leases as follows:31 July 2020 31 July 2019
Consolidated Consolidated£'000 £'000
Cost 8,816 8,816Accumulated depreciation ( 8,816) ( 8,277)Charge for year - ( 539)
Net book value - -
The University holds two main classes of heritage assets: one comprises portraits of former Principals of the University and institutions with which it merged; and the other is silverware. The value of neither class is material to these Financial Statements.
Queen Mary University of London 57

Notes to the Financial Statements (Continued)for the year ended 31 July 2020
14 Non-Current InvestmentsSubsidiary companies
Other Investments
Shared Equity Property
Total
£'000 £'000 £'000 £'000
Consolidated
As at 1 August 2019 - 26,832 1,250 28,082
Additions - 84 - 84Disposals - - - - Change in fair value of managed investment portfolio - 3,097 - 3,097Change in fair value of other investments - ( 1,146) - ( 1,146)Management fee on managed investment portfolio - ( 215) - ( 215)
As at 31 July 2020 - 28,652 1,250 29,902
Subsidiary companies
Other Investments
Shared Equity Property
Total
£'000 £'000 £'000 £'000
Institution
As at 1 August 2019 3,516 26,723 1,250 31,489
Additions - 84 - 84Disposals - - - - Change in fair value of managed investment portfolio - 3,097 - 3,097Change in fair value of other investments - ( 1,148) - ( 1,148)Management fee on managed investment portfolio - ( 215) - ( 215)
As at 31 July 2020 3,516 28,541 1,250 33,307
As at 31 July 2020
As at 31 July 2020 As at 31 July 2019 As at 31 July 2019
Consolidated Institution Consolidated InstitutionOther non-current investments consist of : £'000 £'000 £'000 £'000
Open Orphan (was hVIVO plc) 725 654 450 406
Actual Experience plc 2,299 2,259 3,719 3,654
Biomoti Limited 110 110 110 110
Chatterbox Labs Limited - - - -
Landr Audio Inc 263 263 263 263
Actu8 Vaccine Technologies Limited - - - -
Augmented Instruments Limited - - - -
Fxive Limited - - - -
Keratify Limited 83 83 - -
Newrotex Limited - - - -
Arbitrator Intelligence Inc. - - - -
CVCP Properties 53 53 53 53
Managed Investment Portfolio - Permanent Endowment Funds: - -
Fixed interest stocks 10,771 10,771 9,468 9,468
Equities 7,565 7,565 8,975 8,975
Other investments 6,783 6,783 3,794 3,794
28,652 28,541 26,832 26,723
Quoted investments are valued at market price at the date of the Statement of Financial Position.
Queen Mary University of London 58
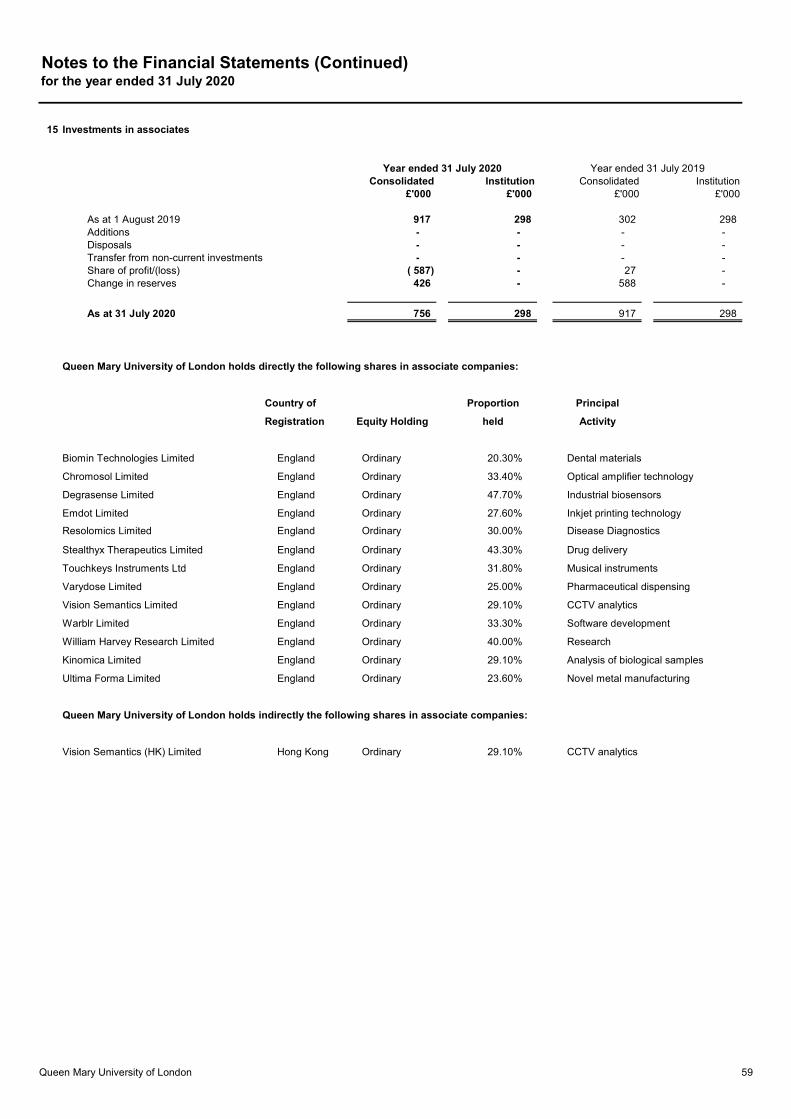
Notes to the Financial Statements (Continued)for the year ended 31 July 2020
15 Investments in associates
Consolidated Institution Consolidated Institution£'000 £'000 £'000 £'000
As at 1 August 2019 917 298 302 298Additions - - - - Disposals - - - - Transfer from non-current investments - - - - Share of profit/(loss) ( 587) - 27 - Change in reserves 426 - 588 -
As at 31 July 2020 756 298 917 298
Queen Mary University of London holds directly the following shares in associate companies:
Country of Proportion Principal
Registration Equity Holding held Activity
Biomin Technologies Limited England Ordinary 20.30% Dental materials
Chromosol Limited England Ordinary 33.40% Optical amplifier technology
Degrasense Limited England Ordinary 47.70% Industrial biosensors
Emdot Limited England Ordinary 27.60% Inkjet printing technology
Resolomics Limited England Ordinary 30.00% Disease Diagnostics
Stealthyx Therapeutics Limited England Ordinary 43.30% Drug delivery
Touchkeys Instruments Ltd England Ordinary 31.80% Musical instruments
Varydose Limited England Ordinary 25.00% Pharmaceutical dispensing
Vision Semantics Limited England Ordinary 29.10% CCTV analytics
Warblr Limited England Ordinary 33.30% Software development
William Harvey Research Limited England Ordinary 40.00% Research
Kinomica Limited England Ordinary 29.10% Analysis of biological samples
Ultima Forma Limited England Ordinary 23.60% Novel metal manufacturing
Queen Mary University of London holds indirectly the following shares in associate companies:
Vision Semantics (HK) Limited Hong Kong Ordinary 29.10% CCTV analytics
Year ended 31 July 2020 Year ended 31 July 2019
Queen Mary University of London 59

Notes to the Financial Statements (Continued)for the year ended 31 July 2020
Consolidated Institution Consolidated Institution
16 Trade and other receivables £'000 £'000 £'000 £'000
Amounts falling due within one year:Research grant receivables 34,023 34,023 32,172 32,172Other trade receivables 22,266 21,968 18,121 17,535Other receivables 1,183 1,183 1,312 1,300Prepayments and accrued income 10,214 10,316 9,807 9,625Amounts due from subsidiary companies - 5,800 - 3,983Amounts due from associate companies 52 52 29 29
67,738 73,342 61,441 64,644Amounts falling due after one year:
Other receivables 2,437 - - -
70,175 73,342 61,441 64,644
17 Current InvestmentsConsolidated Institution Consolidated Institution
£'000 £'000 £'000 £'000
As at 1 August 2019 120,867 120,867 11,384 11,384
Movements on managed funds ( 1,378) ( 1,378) ( 922) ( 922)Movements on deposits ( 21,011) ( 21,011) 110,520 110,520Transfers from non-current investments - - - - Gain/(loss) on revaluation 1,257 1,257 ( 21) ( 21)Management fees ( 88) ( 88) ( 94) ( 94)
As at 31 July 2020 99,647 99,647 120,867 120,867
Current investments consist of :Managed Investment Portfolio:
Equities 3,053 3,053 4,176 4,176Fixed interest stocks 4,347 4,347 4,405 4,405Other investments 2,738 2,738 1,765 1,765
Bank Deposits 89,509 89,509 110,521 110,521
99,647 99,647 120,867 120,867
Year ended 31 July 2019Year ended 31 July 2020
Year ended 31 July 2020 Year ended 31 July 2019
Amounts due from associate companies are trading balances.Amounts due from subsidiaries include inter-company balances of £5,560,280 with QMUL Malta Ltd and £177,727 with Queen Mary Innovation Ltd which are repayable on demand. Repayment of the inter-company balance with QMUL Malta Ltd is expected to commence in the 2021/22 financial year. The remaining £62,015 is a trading balance.
Queen Mary University of London 60
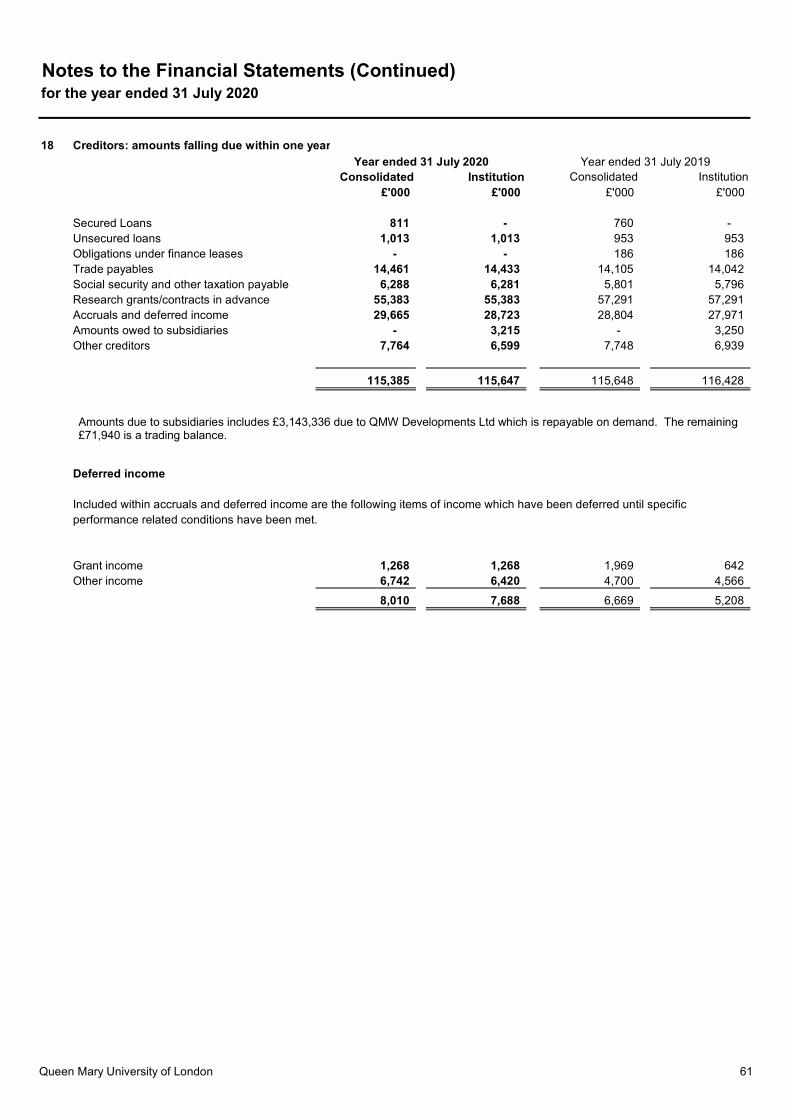
Notes to the Financial Statements (Continued)for the year ended 31 July 2020
18 Creditors: amounts falling due within one year
Consolidated Institution Consolidated Institution£'000 £'000 £'000 £'000
Secured Loans 811 - 760 - Unsecured loans 1,013 1,013 953 953Obligations under finance leases - - 186 186Trade payables 14,461 14,433 14,105 14,042Social security and other taxation payable 6,288 6,281 5,801 5,796Research grants/contracts in advance 55,383 55,383 57,291 57,291Accruals and deferred income 29,665 28,723 28,804 27,971Amounts owed to subsidiaries - 3,215 - 3,250Other creditors 7,764 6,599 7,748 6,939
115,385 115,647 115,648 116,428
Deferred income
Included within accruals and deferred income are the following items of income which have been deferred until specific performance related conditions have been met.
Grant income 1,268 1,268 1,969 642Other income 6,742 6,420 4,700 4,566
8,010 7,688 6,669 5,208
Year ended 31 July 2020 Year ended 31 July 2019
Amounts due to subsidiaries includes £3,143,336 due to QMW Developments Ltd which is repayable on demand. The remaining £71,940 is a trading balance.
Queen Mary University of London 61
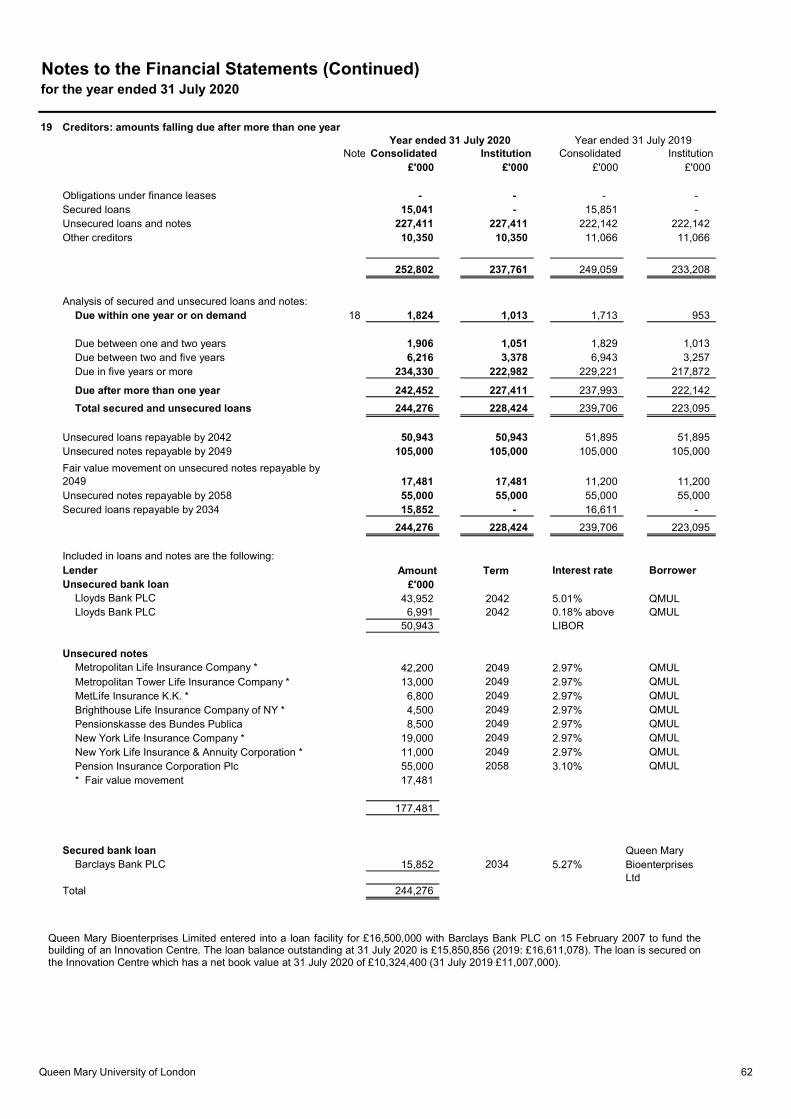
Notes to the Financial Statements (Continued)for the year ended 31 July 2020
19 Creditors: amounts falling due after more than one year
Note Consolidated Institution Consolidated Institution£'000 £'000 £'000 £'000
Obligations under finance leases - - - - Secured loans 15,041 - 15,851 - Unsecured loans and notes 227,411 227,411 222,142 222,142Other creditors 10,350 10,350 11,066 11,066
252,802 237,761 249,059 233,208
Analysis of secured and unsecured loans and notes:Due within one year or on demand 18 1,824 1,013 1,713 953
Due between one and two years 1,906 1,051 1,829 1,013Due between two and five years 6,216 3,378 6,943 3,257Due in five years or more 234,330 222,982 229,221 217,872
Due after more than one year 242,452 227,411 237,993 222,142
Total secured and unsecured loans 244,276 228,424 239,706 223,095
Unsecured loans repayable by 2042 50,943 50,943 51,895 51,895Unsecured notes repayable by 2049 105,000 105,000 105,000 105,000
Fair value movement on unsecured notes repayable by 2049 17,481 17,481 11,200 11,200Unsecured notes repayable by 2058 55,000 55,000 55,000 55,000Secured loans repayable by 2034 15,852 - 16,611 -
244,276 228,424 239,706 223,095
Included in loans and notes are the following:Lender Amount Term Interest rate BorrowerUnsecured bank loan £'000
Lloyds Bank PLC 43,952 2042 5.01% QMULLloyds Bank PLC 6,991 2042 0.18% above QMUL
50,943 LIBOR
Unsecured notesMetropolitan Life Insurance Company * 42,200 2049 2.97% QMULMetropolitan Tower Life Insurance Company * 13,000 2049 2.97% QMULMetLife Insurance K.K. * 6,800 2049 2.97% QMULBrighthouse Life Insurance Company of NY * 4,500 2049 2.97% QMULPensionskasse des Bundes Publica 8,500 2049 2.97% QMULNew York Life Insurance Company * 19,000 2049 2.97% QMULNew York Life Insurance & Annuity Corporation * 11,000 2049 2.97% QMULPension Insurance Corporation Plc 55,000 2058 3.10% QMUL* Fair value movement 17,481
177,481
Secured bank loan Queen MaryBarclays Bank PLC 15,852 2034 5.27% Bioenterprises
LtdTotal 244,276
Year ended 31 July 2020 Year ended 31 July 2019
Queen Mary Bioenterprises Limited entered into a loan facility for £16,500,000 with Barclays Bank PLC on 15 February 2007 to fund thebuilding of an Innovation Centre. The loan balance outstanding at 31 July 2020 is £15,850,856 (2019: £16,611,078). The loan is secured onthe Innovation Centre which has a net book value at 31 July 2020 of £10,324,400 (31 July 2019 £11,007,000).
Queen Mary University of London 62
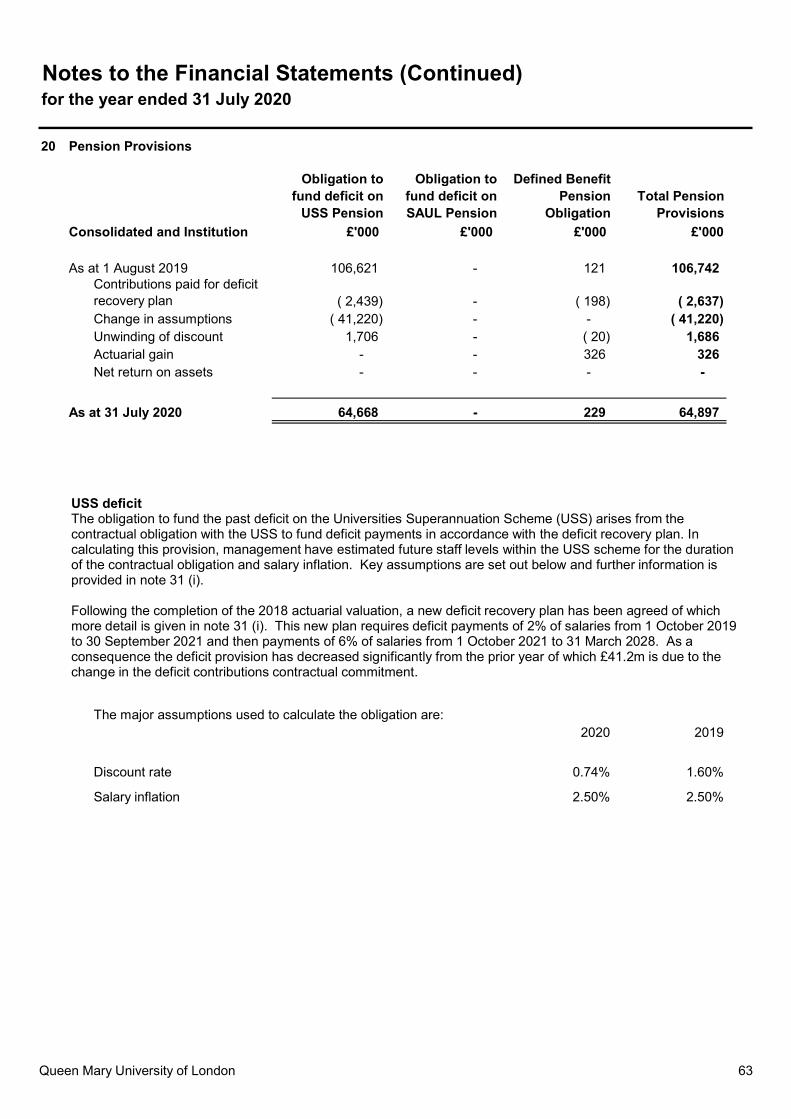
Notes to the Financial Statements (Continued)for the year ended 31 July 2020
20 Pension Provisions
Obligation to fund deficit on
USS Pension
Obligation to fund deficit on SAUL Pension
Defined Benefit Pension
ObligationTotal Pension
Provisions
Consolidated and Institution £'000 £'000 £'000 £'000
As at 1 August 2019 106,621 - 121 106,742Contributions paid for deficit recovery plan ( 2,439) - ( 198) ( 2,637)Change in assumptions ( 41,220) - - ( 41,220)Unwinding of discount 1,706 - ( 20) 1,686Actuarial gain - - 326 326Net return on assets - - - -
As at 31 July 2020 64,668 - 229 64,897
The major assumptions used to calculate the obligation are:2020 2019
Discount rate 0.74% 1.60%
Salary inflation 2.50% 2.50%
USS deficitThe obligation to fund the past deficit on the Universities Superannuation Scheme (USS) arises from the contractual obligation with the USS to fund deficit payments in accordance with the deficit recovery plan. In calculating this provision, management have estimated future staff levels within the USS scheme for the duration of the contractual obligation and salary inflation. Key assumptions are set out below and further information is provided in note 31 (i).
Following the completion of the 2018 actuarial valuation, a new deficit recovery plan has been agreed of which more detail is given in note 31 (i). This new plan requires deficit payments of 2% of salaries from 1 October 2019 to 30 September 2021 and then payments of 6% of salaries from 1 October 2021 to 31 March 2028. As a consequence the deficit provision has decreased significantly from the prior year of which £41.2m is due to the change in the deficit contributions contractual commitment.
Queen Mary University of London 63
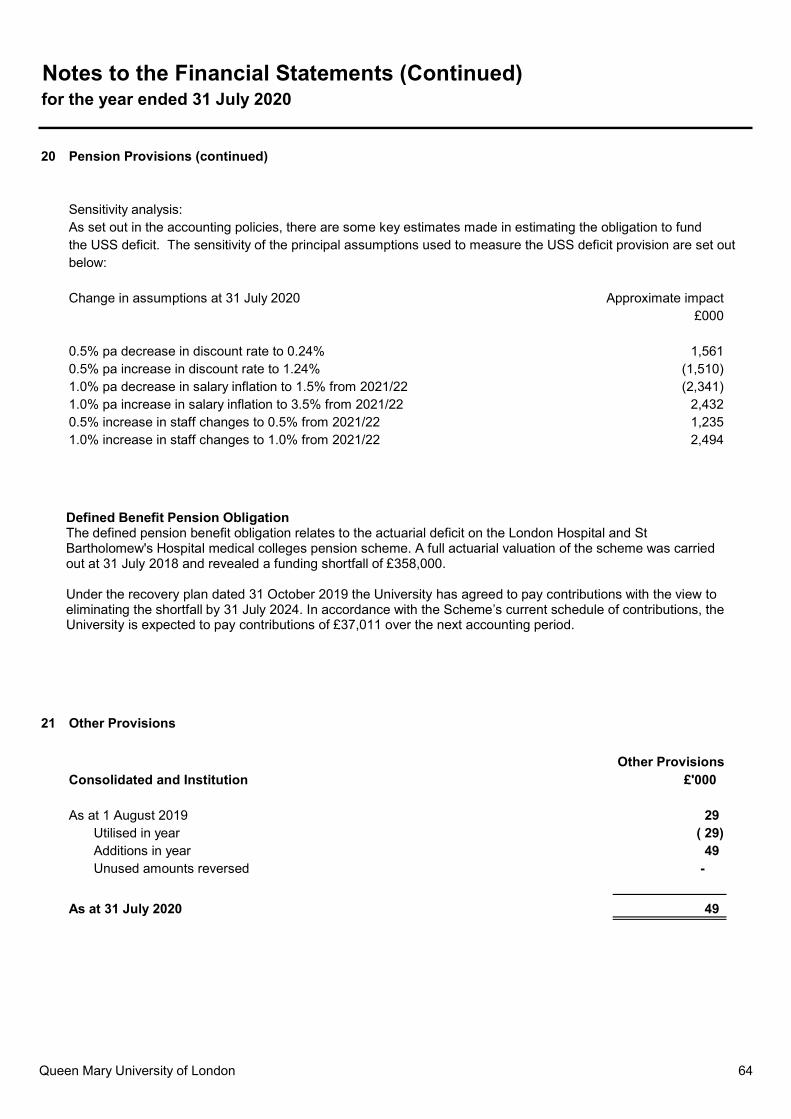
Notes to the Financial Statements (Continued)for the year ended 31 July 2020
20 Pension Provisions (continued)
Sensitivity analysis:As set out in the accounting policies, there are some key estimates made in estimating the obligation to fund the USS deficit. The sensitivity of the principal assumptions used to measure the USS deficit provision are set out below:
Change in assumptions at 31 July 2020 Approximate impact£000
0.5% pa decrease in discount rate to 0.24% 1,5610.5% pa increase in discount rate to 1.24% (1,510)1.0% pa decrease in salary inflation to 1.5% from 2021/22 (2,341)1.0% pa increase in salary inflation to 3.5% from 2021/22 2,4320.5% increase in staff changes to 0.5% from 2021/22 1,2351.0% increase in staff changes to 1.0% from 2021/22 2,494
21 Other Provisions
Other Other ProvisionsConsolidated and Institution £'000
As at 1 August 2019 29Utilised in year ( 29)Additions in year 49Unused amounts reversed -
As at 31 July 2020 49
Defined Benefit Pension ObligationThe defined pension benefit obligation relates to the actuarial deficit on the London Hospital and St Bartholomew's Hospital medical colleges pension scheme. A full actuarial valuation of the scheme was carried out at 31 July 2018 and revealed a funding shortfall of £358,000.
Under the recovery plan dated 31 October 2019 the University has agreed to pay contributions with the view to eliminating the shortfall by 31 July 2024. In accordance with the Scheme’s current schedule of contributions, the University is expected to pay contributions of £37,011 over the next accounting period.
Queen Mary University of London 64
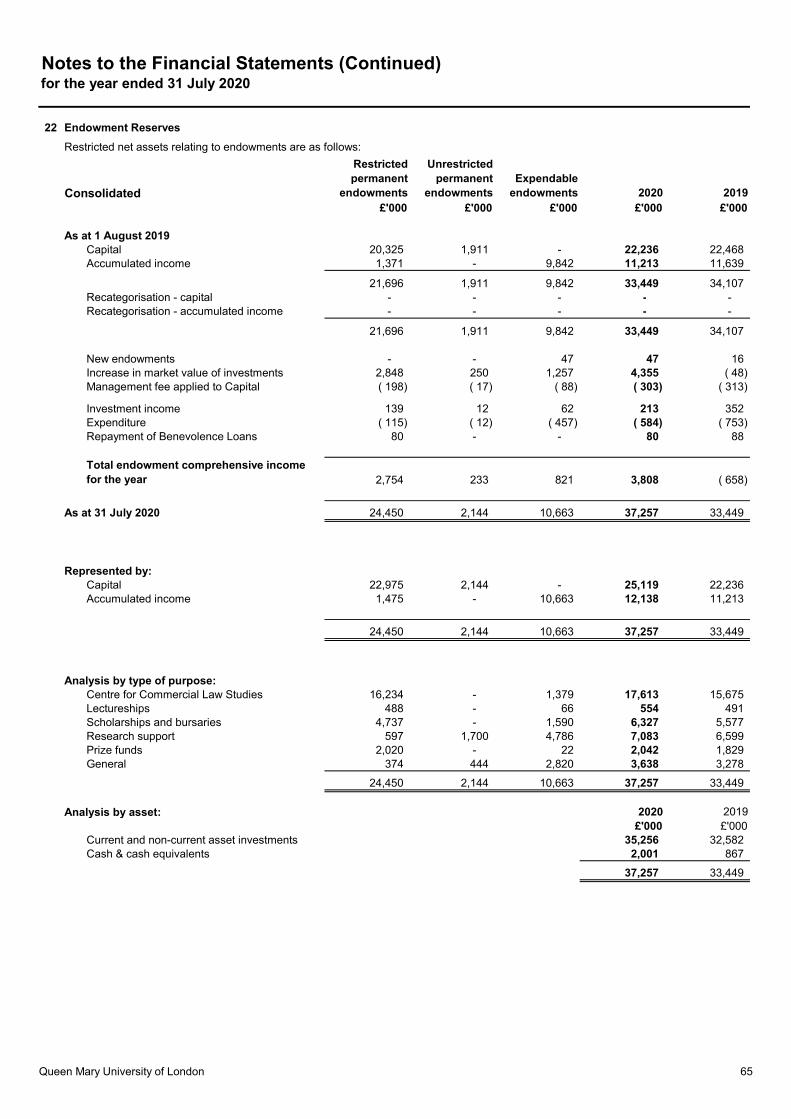
Notes to the Financial Statements (Continued)for the year ended 31 July 2020
22 Endowment Reserves
Restricted net assets relating to endowments are as follows:
Consolidated
Restricted permanent
endowments
Unrestricted permanent
endowmentsExpendable
endowments 2020 2019£'000 £'000 £'000 £'000 £'000
As at 1 August 2019Capital 20,325 1,911 - 22,236 22,468Accumulated income 1,371 - 9,842 11,213 11,639
21,696 1,911 9,842 33,449 34,107Recategorisation - capital - - - - - Recategorisation - accumulated income - - - - -
21,696 1,911 9,842 33,449 34,107
New endowments - - 47 47 16Increase in market value of investments 2,848 250 1,257 4,355 ( 48)Management fee applied to Capital ( 198) ( 17) ( 88) ( 303) ( 313)
Investment income 139 12 62 213 352Expenditure ( 115) ( 12) ( 457) ( 584) ( 753)Repayment of Benevolence Loans 80 - - 80 88
Total endowment comprehensive income for the year 2,754 233 821 3,808 ( 658)
As at 31 July 2020 24,450 2,144 10,663 37,257 33,449
Represented by:Capital 22,975 2,144 - 25,119 22,236Accumulated income 1,475 - 10,663 12,138 11,213
24,450 2,144 10,663 37,257 33,449
Analysis by type of purpose:Centre for Commercial Law Studies 16,234 - 1,379 17,613 15,675Lectureships 488 - 66 554 491Scholarships and bursaries 4,737 - 1,590 6,327 5,577Research support 597 1,700 4,786 7,083 6,599Prize funds 2,020 - 22 2,042 1,829General 374 444 2,820 3,638 3,278
24,450 2,144 10,663 37,257 33,449
Analysis by asset: 2020 2019£'000 £'000
Current and non-current asset investments 35,256 32,582Cash & cash equivalents 2,001 867
37,257 33,449
Queen Mary University of London 65
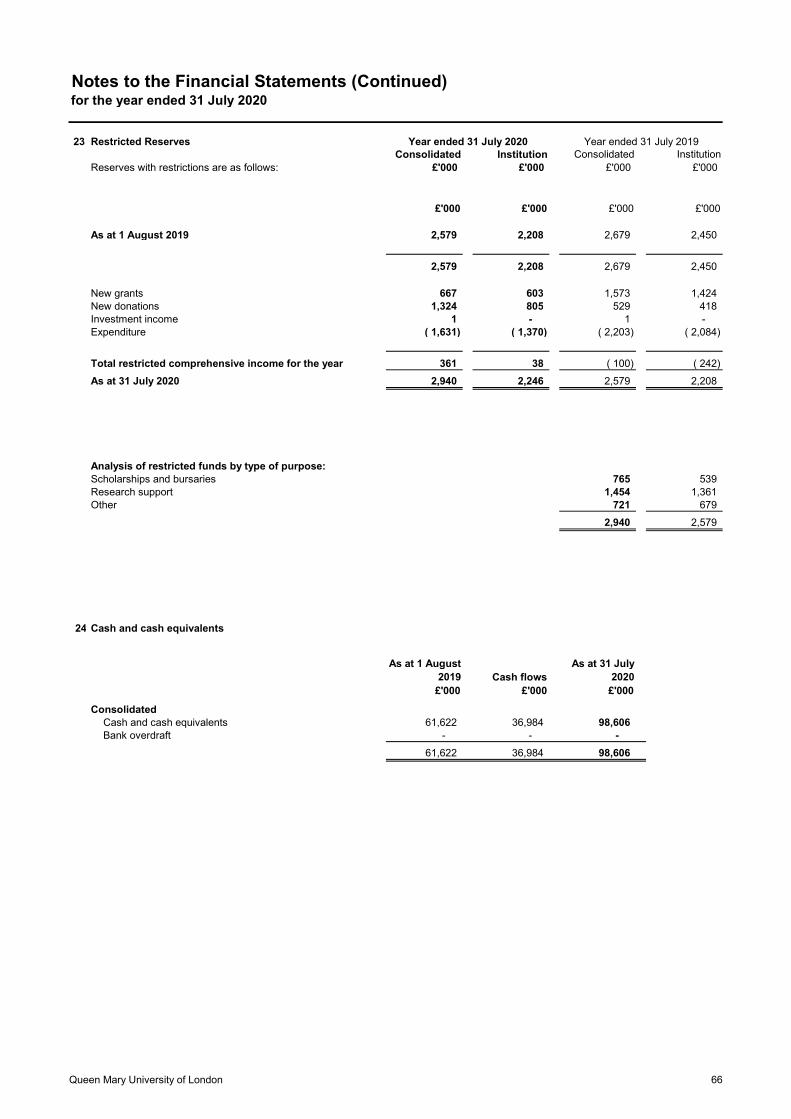
Notes to the Financial Statements (Continued)for the year ended 31 July 2020
23 Restricted ReservesConsolidated Institution Consolidated Institution
Reserves with restrictions are as follows: £'000 £'000 £'000 £'000
£'000 £'000 £'000 £'000
As at 1 August 2019 2,579 2,208 2,679 2,450
2,579 2,208 2,679 2,450
New grants 667 603 1,573 1,424New donations 1,324 805 529 418Investment income 1 - 1 - Expenditure ( 1,631) ( 1,370) ( 2,203) ( 2,084)
Total restricted comprehensive income for the year 361 38 ( 100) ( 242)
As at 31 July 2020 2,940 2,246 2,579 2,208
Analysis of restricted funds by type of purpose:Scholarships and bursaries 765 539Research support 1,454 1,361Other 721 679
2,940 2,579
24 Cash and cash equivalents
As at 1 August 2019 Cash flows
As at 31 July 2020
£'000 £'000 £'000
ConsolidatedCash and cash equivalents 61,622 36,984 98,606Bank overdraft - - -
61,622 36,984 98,606
Year ended 31 July 2020 Year ended 31 July 2019
Queen Mary University of London 66
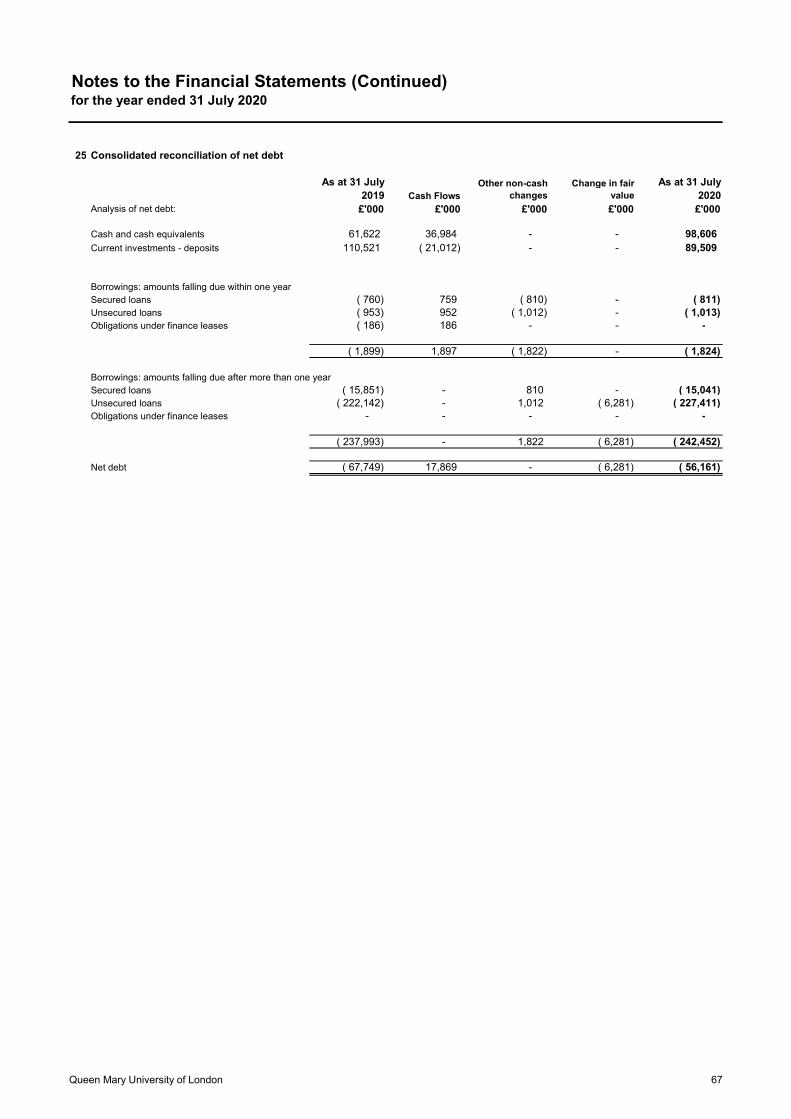
Notes to the Financial Statements (Continued)for the year ended 31 July 2020
25 Consolidated reconciliation of net debt
As at 31 July 2019 Cash Flows
Other non-cash changes
Change in fair value
As at 31 July 2020
Analysis of net debt: £'000 £'000 £'000 £'000 £'000
Cash and cash equivalents 61,622 36,984 - - 98,606Current investments - deposits 110,521 ( 21,012) - - 89,509
Borrowings: amounts falling due within one yearSecured loans ( 760) 759 ( 810) - ( 811)Unsecured loans ( 953) 952 ( 1,012) - ( 1,013)Obligations under finance leases ( 186) 186 - - -
( 1,899) 1,897 ( 1,822) - ( 1,824)
Borrowings: amounts falling due after more than one yearSecured loans ( 15,851) - 810 - ( 15,041)Unsecured loans ( 222,142) - 1,012 ( 6,281) ( 227,411)Obligations under finance leases - - - - -
( 237,993) - 1,822 ( 6,281) ( 242,452)
Net debt ( 67,749) 17,869 - ( 6,281) ( 56,161)
Queen Mary University of London 67
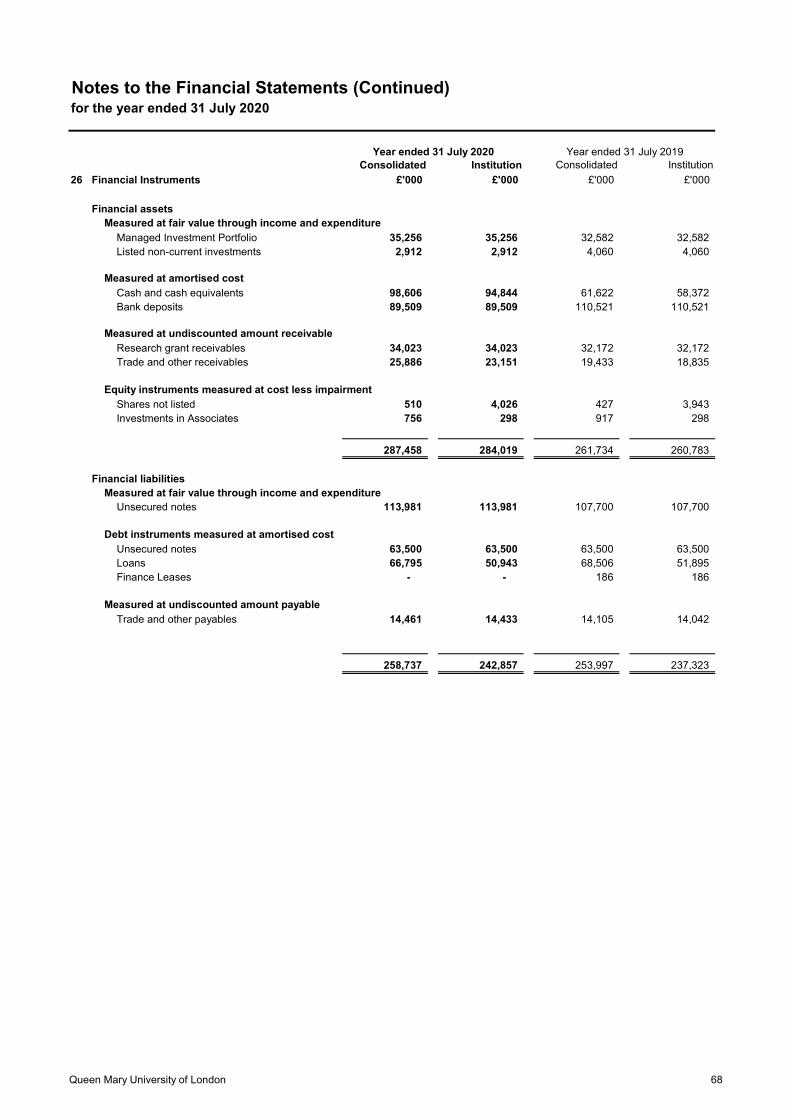
Notes to the Financial Statements (Continued)for the year ended 31 July 2020
Consolidated Institution Consolidated Institution
26 Financial Instruments £'000 £'000 £'000 £'000
Financial assetsMeasured at fair value through income and expenditure
Managed Investment Portfolio 35,256 35,256 32,582 32,582Listed non-current investments 2,912 2,912 4,060 4,060
Measured at amortised costCash and cash equivalents 98,606 94,844 61,622 58,372Bank deposits 89,509 89,509 110,521 110,521
Measured at undiscounted amount receivableResearch grant receivables 34,023 34,023 32,172 32,172Trade and other receivables 25,886 23,151 19,433 18,835
Equity instruments measured at cost less impairmentShares not listed 510 4,026 427 3,943Investments in Associates 756 298 917 298
287,458 284,019 261,734 260,783
Financial liabilitiesMeasured at fair value through income and expenditure
Unsecured notes 113,981 113,981 107,700 107,700
Debt instruments measured at amortised costUnsecured notes 63,500 63,500 63,500 63,500Loans 66,795 50,943 68,506 51,895Finance Leases - - 186 186
Measured at undiscounted amount payableTrade and other payables 14,461 14,433 14,105 14,042
258,737 242,857 253,997 237,323
Year ended 31 July 2020 Year ended 31 July 2019
Queen Mary University of London 68

Notes to the Financial Statements (Continued)for the year ended 31 July 2020
27 Capital and other commitments
Provision has not been made for the following capital commitments:
Consolidated Institution Consolidated Institution£'000 £'000 £'000 £'000
Commitments contracted for 7,265 7,265 7,861 7,861
Commitments contracted for above includes commitments for intangible assets and tangible assets.
28 Contingent liabilities
29 Lease obligations
Consolidated and InstitutionTotal rentals payable under operating leases:
As at 31 July 2019
Land and Buildings
Plant and Machinery
Total Total
£'000 £'000 £'000 £'000
Payable during the year 5,972 1,004 6,976 6,175
Future minimum lease payments due:Not later than 1 year 6,037 335 6,372 5,928Later than 1 year and not later than 5 years 21,883 180 22,063 19,815Later than 5 years 67,090 - 67,090 61,113
Total lease payments due 95,010 515 95,525 86,856
Year ended 31 July 2020 Year ended 31 July 2019
As at 31 July 2020
Queen Mary University of London has entered into a guarantee with Barclays Bank PLC to meet the liabilities arisingfrom a £16,500,000 loan to Queen Mary Bioenterprises Limited for the purpose of constructing a technologyinnovation centre at Whitechapel. As at 31 July 2020 the value of the loan balance stood at £15,850,856(2019: £16,611,078). The University's liability under the guarantee is contingent upon Queen Mary BioenterprisesLimited being unable to meet the schedule of loan repayments. At present it is expected that Queen MaryBioenterprises Limited should be able to meet the repayments.
Queen Mary University of London 69
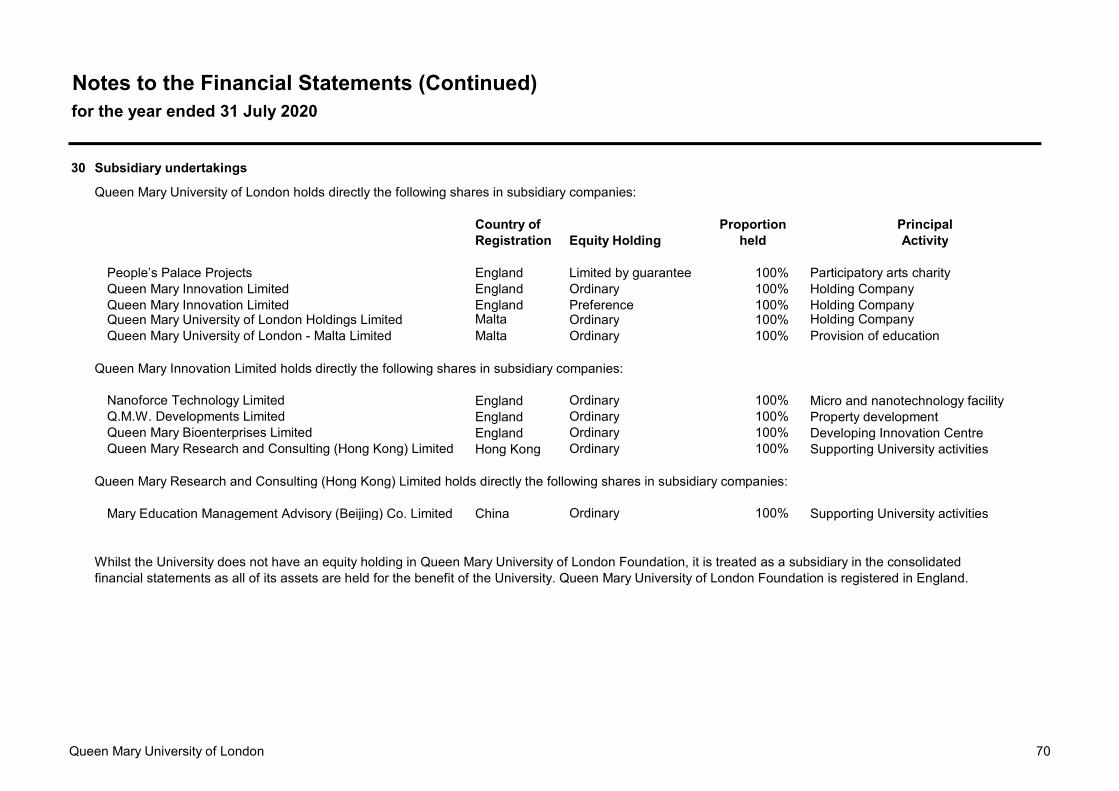
Notes to the Financial Statements (Continued)for the year ended 31 July 2020
30 Subsidiary undertakings
Queen Mary University of London holds directly the following shares in subsidiary companies:
Country of Proportion PrincipalRegistration Equity Holding held Activity
People’s Palace Projects England Limited by guarantee 100% Participatory arts charityQueen Mary Innovation Limited England Ordinary 100% Holding CompanyQueen Mary Innovation Limited England Preference 100% Holding CompanyQueen Mary University of London Holdings Limited Malta Ordinary 100% Holding CompanyQueen Mary University of London - Malta Limited Malta Ordinary 100% Provision of education
Queen Mary Innovation Limited holds directly the following shares in subsidiary companies:
Nanoforce Technology Limited England Ordinary 100% Micro and nanotechnology facilityQ.M.W. Developments Limited England Ordinary 100% Property developmentQueen Mary Bioenterprises Limited England Ordinary 100% Developing Innovation CentreQueen Mary Research and Consulting (Hong Kong) Limited Hong Kong Ordinary 100% Supporting University activities
Queen Mary Research and Consulting (Hong Kong) Limited holds directly the following shares in subsidiary companies:
Mary Education Management Advisory (Beijing) Co. Limited China Ordinary 100% Supporting University activities
Whilst the University does not have an equity holding in Queen Mary University of London Foundation, it is treated as a subsidiary in the consolidated financial statements as all of its assets are held for the benefit of the University. Queen Mary University of London Foundation is registered in England.
Queen Mary University of London 70

Notes to the Financial Statements (Continued)for the year ended 31 July 2020
31 Pension Schemes
The three principal pension schemes for the University's staff are the Superannuation Arrangements of the University of London (SAUL), the Universities Superannuation Scheme (USS) and the National Health Service Pension Scheme (NHS). The University also operates a closed scheme for the non teaching staff of the London Hospital and St Bartholomew's Hospital medical colleges (LHMC) prior to their merger with the University.
The contribution rates to the schemes are shown below:
USS SAUL NHS% % %
Employees' contributions - final salary scheme N/A N/A 5 - 14.5* Employees' contributions - career revalued benefits scheme 9.6 6.0 5 - 14.5* Employer's contributions 21.1 16.0 20.7
USS SAUL NHS% % %
Employees' contributions - final salary scheme N/A N/A 5 - 14.5* Employees' contributions - career revalued benefits scheme 8.8 6.0 5 - 14.5* Employer's contributions 19.5 16.0 20.7
* tiered contribution rates depending on salary
Consolidated Institution Consolidated InstitutionEmployer Pension Contributions £'000 £'000 £'000 £'000Contribution to USS 30,437 30,271 24,991 24,821Contribution to SAUL 4,837 4,832 4,442 4,434Contribution to NHS 3,084 3,066 2,644 2,635Contribution to other pension schemes 4 0 3 0
38,361 38,169 32,080 31,890
Consolidated Institution Consolidated Institution£'000 £'000 £'000 £'000
Statement of comprehensive income - net pension cost in yearUSS (11,516) (11,682) 94,168 93,998SAUL 4,837 4,832 4,442 4,434NHS 3,084 3,066 2,644 2,635LHMC (20) (20) (132) (132)Other 4 0 3 0
(3,612) (3,804) 101,125 100,935
The net pension cost in the year consists of the employer pension contributions and the movement in pension provision.
Other comprehensive income - actuarial loss in respect of pension schemesLHMC 326 326 150 150
Statement of Financial Position - Pension scheme liability (note 20)USS 64,668 64,668 106,621 106,621LHMC 229 229 121 121
64,897 64,897 106,742 106,742
(i) USS
Queen Mary participates in the Universities Superannuation Scheme. The assets of the scheme are held in a separate trustee administered fund. Because of the mutual nature of the scheme, the assets are not attributed to individual institutions and a scheme wide contribution rate is set. The University is therefore exposed to actuarial risks associated with other institutions' employees and is unable to identify its share of the underlying assets and liabilities of the scheme on a consistent and reasonable basis. As required by Section 28 of FRS 102 "Employee benefits", the University therefore accounts for the scheme as if it were a defined contribution scheme. As a result, the amount charged to the income and expenditure account represents the contributions payable to the scheme. Since the University has entered into an agreement (the Recovery Plan) that determines how each employer within the scheme will fund the overall deficit, the University recognises a liability for the contributions payable that arise from theagreement (to the extent that they relate to the deficit) with related expenses being recognised through the consolidated statement of comprehensive income and expenditure.
31 July 2019
31 July 2020 31 July 2019
At 31 July 2020
31 July 2020
At 31 July 2019
Queen Mary University of London 71
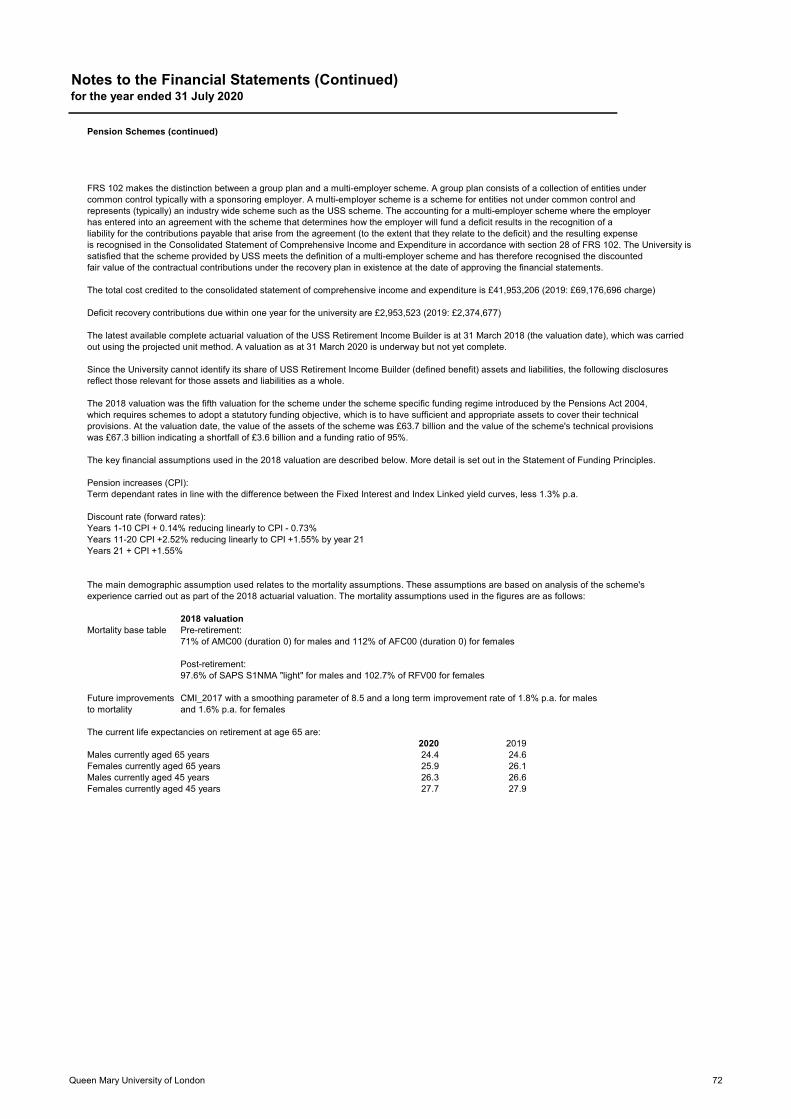
Notes to the Financial Statements (Continued)for the year ended 31 July 2020
Pension Schemes (continued)
FRS 102 makes the distinction between a group plan and a multi-employer scheme. A group plan consists of a collection of entities under common control typically with a sponsoring employer. A multi-employer scheme is a scheme for entities not under common control and represents (typically) an industry wide scheme such as the USS scheme. The accounting for a multi-employer scheme where the employer has entered into an agreement with the scheme that determines how the employer will fund a deficit results in the recognition of a liability for the contributions payable that arise from the agreement (to the extent that they relate to the deficit) and the resulting expense is recognised in the Consolidated Statement of Comprehensive Income and Expenditure in accordance with section 28 of FRS 102. The University is satisfied that the scheme provided by USS meets the definition of a multi-employer scheme and has therefore recognised the discounted fair value of the contractual contributions under the recovery plan in existence at the date of approving the financial statements.
The total cost credited to the consolidated statement of comprehensive income and expenditure is £41,953,206 (2019: £69,176,696 charge)
Deficit recovery contributions due within one year for the university are £2,953,523 (2019: £2,374,677)
The latest available complete actuarial valuation of the USS Retirement Income Builder is at 31 March 2018 (the valuation date), which was carriedout using the projected unit method. A valuation as at 31 March 2020 is underway but not yet complete.
Since the University cannot identify its share of USS Retirement Income Builder (defined benefit) assets and liabilities, the following disclosuresreflect those relevant for those assets and liabilities as a whole.
The 2018 valuation was the fifth valuation for the scheme under the scheme specific funding regime introduced by the Pensions Act 2004, which requires schemes to adopt a statutory funding objective, which is to have sufficient and appropriate assets to cover their technicalprovisions. At the valuation date, the value of the assets of the scheme was £63.7 billion and the value of the scheme's technical provisionswas £67.3 billion indicating a shortfall of £3.6 billion and a funding ratio of 95%.
The key financial assumptions used in the 2018 valuation are described below. More detail is set out in the Statement of Funding Principles.
Pension increases (CPI):Term dependant rates in line with the difference between the Fixed Interest and Index Linked yield curves, less 1.3% p.a.
Discount rate (forward rates):Years 1-10 CPI + 0.14% reducing linearly to CPI - 0.73%Years 11-20 CPI +2.52% reducing linearly to CPI +1.55% by year 21Years 21 + CPI +1.55%
The main demographic assumption used relates to the mortality assumptions. These assumptions are based on analysis of the scheme's experience carried out as part of the 2018 actuarial valuation. The mortality assumptions used in the figures are as follows:
2018 valuationMortality base table Pre-retirement:
71% of AMC00 (duration 0) for males and 112% of AFC00 (duration 0) for females
Post-retirement:97.6% of SAPS S1NMA "light" for males and 102.7% of RFV00 for females
Future improvements CMI_2017 with a smoothing parameter of 8.5 and a long term improvement rate of 1.8% p.a. for males to mortality and 1.6% p.a. for females
The current life expectancies on retirement at age 65 are:2020 2019
Males currently aged 65 years 24.4 24.6Females currently aged 65 years 25.9 26.1Males currently aged 45 years 26.3 26.6Females currently aged 45 years 27.7 27.9
Queen Mary University of London 72
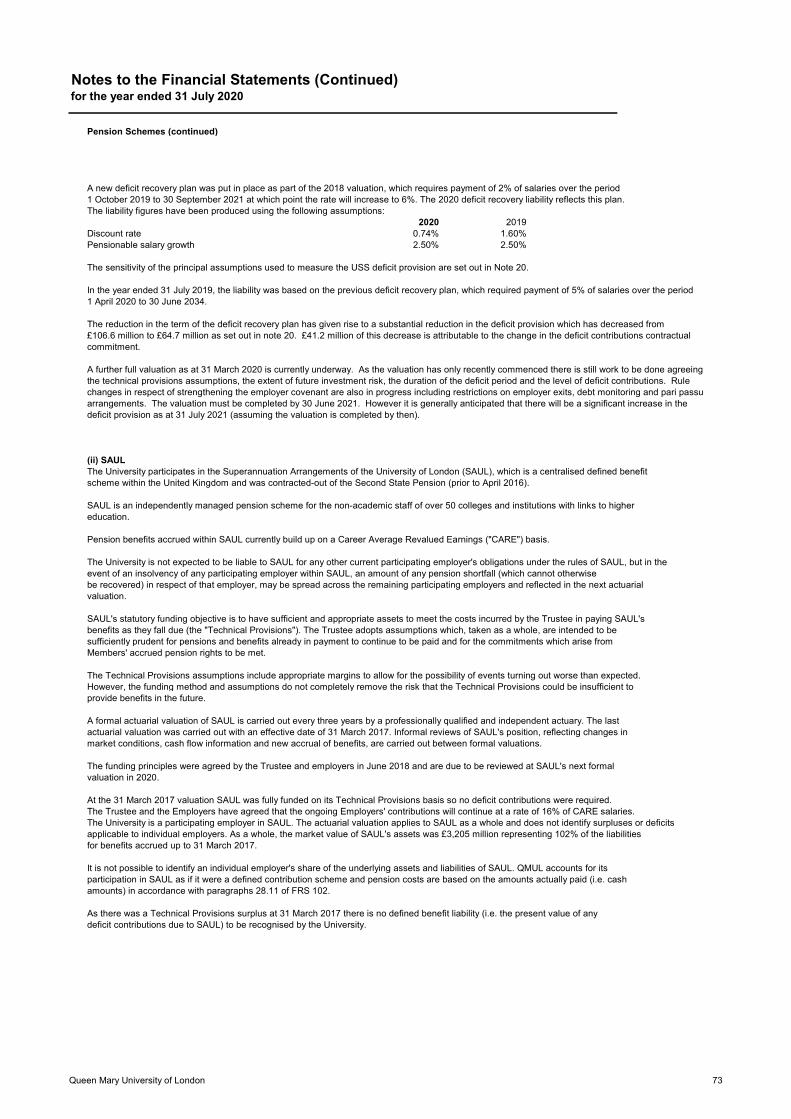
Notes to the Financial Statements (Continued)for the year ended 31 July 2020
Pension Schemes (continued)
A new deficit recovery plan was put in place as part of the 2018 valuation, which requires payment of 2% of salaries over the period 1 October 2019 to 30 September 2021 at which point the rate will increase to 6%. The 2020 deficit recovery liability reflects this plan. The liability figures have been produced using the following assumptions:
2020 2019Discount rate 0.74% 1.60%Pensionable salary growth 2.50% 2.50%
The sensitivity of the principal assumptions used to measure the USS deficit provision are set out in Note 20.
In the year ended 31 July 2019, the liability was based on the previous deficit recovery plan, which required payment of 5% of salaries over the period 1 April 2020 to 30 June 2034.
The reduction in the term of the deficit recovery plan has given rise to a substantial reduction in the deficit provision which has decreased from £106.6 million to £64.7 million as set out in note 20. £41.2 million of this decrease is attributable to the change in the deficit contributions contractual commitment.
A further full valuation as at 31 March 2020 is currently underway. As the valuation has only recently commenced there is still work to be done agreeing the technical provisions assumptions, the extent of future investment risk, the duration of the deficit period and the level of deficit contributions. Rule changes in respect of strengthening the employer covenant are also in progress including restrictions on employer exits, debt monitoring and pari passu arrangements. The valuation must be completed by 30 June 2021. However it is generally anticipated that there will be a significant increase in the deficit provision as at 31 July 2021 (assuming the valuation is completed by then).
(ii) SAULThe University participates in the Superannuation Arrangements of the University of London (SAUL), which is a centralised defined benefit scheme within the United Kingdom and was contracted-out of the Second State Pension (prior to April 2016).
SAUL is an independently managed pension scheme for the non-academic staff of over 50 colleges and institutions with links to highereducation.
Pension benefits accrued within SAUL currently build up on a Career Average Revalued Earnings ("CARE") basis.
The University is not expected to be liable to SAUL for any other current participating employer's obligations under the rules of SAUL, but in the event of an insolvency of any participating employer within SAUL, an amount of any pension shortfall (which cannot otherwise be recovered) in respect of that employer, may be spread across the remaining participating employers and reflected in the next actuarial valuation.
SAUL's statutory funding objective is to have sufficient and appropriate assets to meet the costs incurred by the Trustee in paying SAUL'sbenefits as they fall due (the "Technical Provisions"). The Trustee adopts assumptions which, taken as a whole, are intended to be sufficiently prudent for pensions and benefits already in payment to continue to be paid and for the commitments which arise from Members' accrued pension rights to be met.
The Technical Provisions assumptions include appropriate margins to allow for the possibility of events turning out worse than expected. However, the funding method and assumptions do not completely remove the risk that the Technical Provisions could be insufficient to provide benefits in the future.
A formal actuarial valuation of SAUL is carried out every three years by a professionally qualified and independent actuary. The last actuarial valuation was carried out with an effective date of 31 March 2017. Informal reviews of SAUL's position, reflecting changes in market conditions, cash flow information and new accrual of benefits, are carried out between formal valuations.
The funding principles were agreed by the Trustee and employers in June 2018 and are due to be reviewed at SAUL's next formalvaluation in 2020.
At the 31 March 2017 valuation SAUL was fully funded on its Technical Provisions basis so no deficit contributions were required.The Trustee and the Employers have agreed that the ongoing Employers' contributions will continue at a rate of 16% of CARE salaries.The University is a participating employer in SAUL. The actuarial valuation applies to SAUL as a whole and does not identify surpluses or deficits applicable to individual employers. As a whole, the market value of SAUL's assets was £3,205 million representing 102% of the liabilitiesfor benefits accrued up to 31 March 2017.
It is not possible to identify an individual employer's share of the underlying assets and liabilities of SAUL. QMUL accounts for itsparticipation in SAUL as if it were a defined contribution scheme and pension costs are based on the amounts actually paid (i.e. cashamounts) in accordance with paragraphs 28.11 of FRS 102.
As there was a Technical Provisions surplus at 31 March 2017 there is no defined benefit liability (i.e. the present value of any deficit contributions due to SAUL) to be recognised by the University.
Queen Mary University of London 73
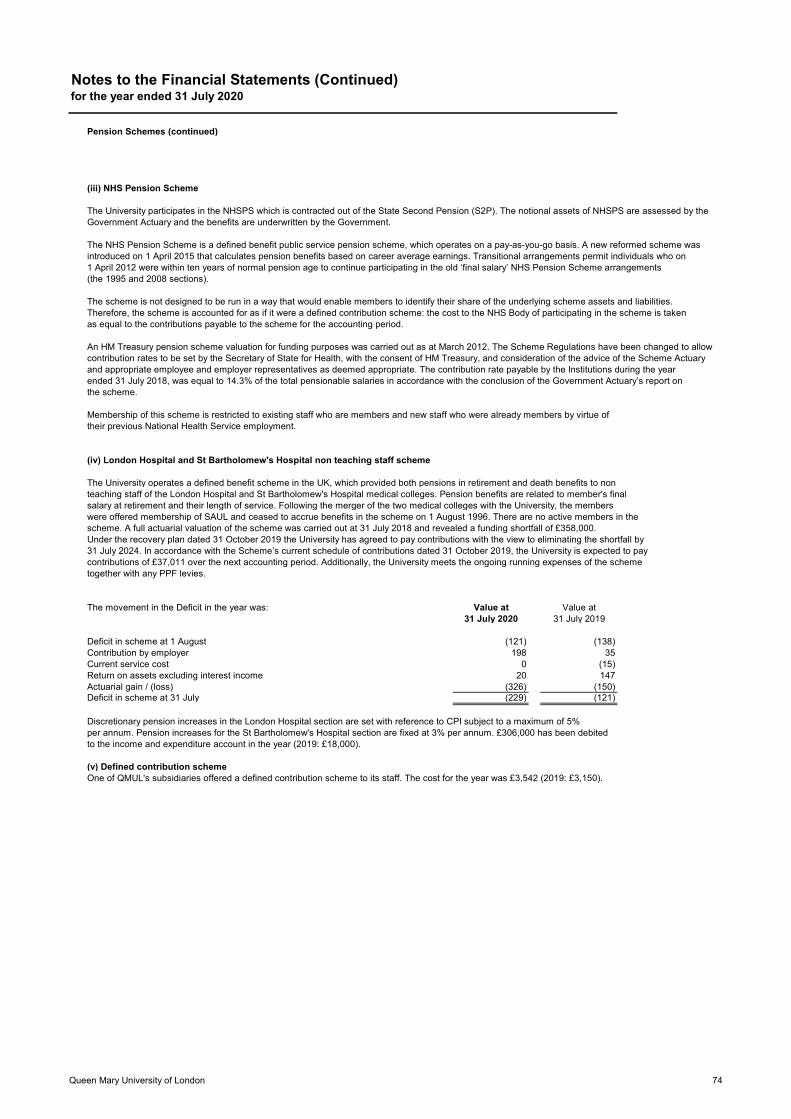
Notes to the Financial Statements (Continued)for the year ended 31 July 2020
Pension Schemes (continued)
(iii) NHS Pension Scheme
The University participates in the NHSPS which is contracted out of the State Second Pension (S2P). The notional assets of NHSPS are assessed by the Government Actuary and the benefits are underwritten by the Government.
The NHS Pension Scheme is a defined benefit public service pension scheme, which operates on a pay-as-you-go basis. A new reformed scheme was introduced on 1 April 2015 that calculates pension benefits based on career average earnings. Transitional arrangements permit individuals who on 1 April 2012 were within ten years of normal pension age to continue participating in the old ‘final salary’ NHS Pension Scheme arrangements (the 1995 and 2008 sections).
The scheme is not designed to be run in a way that would enable members to identify their share of the underlying scheme assets and liabilities. Therefore, the scheme is accounted for as if it were a defined contribution scheme: the cost to the NHS Body of participating in the scheme is taken as equal to the contributions payable to the scheme for the accounting period.
An HM Treasury pension scheme valuation for funding purposes was carried out as at March 2012. The Scheme Regulations have been changed to allow contribution rates to be set by the Secretary of State for Health, with the consent of HM Treasury, and consideration of the advice of the Scheme Actuary and appropriate employee and employer representatives as deemed appropriate. The contribution rate payable by the Institutions during the year ended 31 July 2018, was equal to 14.3% of the total pensionable salaries in accordance with the conclusion of the Government Actuary’s report on the scheme.
Membership of this scheme is restricted to existing staff who are members and new staff who were already members by virtue of their previous National Health Service employment.
(iv) London Hospital and St Bartholomew's Hospital non teaching staff scheme
The University operates a defined benefit scheme in the UK, which provided both pensions in retirement and death benefits to nonteaching staff of the London Hospital and St Bartholomew's Hospital medical colleges. Pension benefits are related to member's final salary at retirement and their length of service. Following the merger of the two medical colleges with the University, the members were offered membership of SAUL and ceased to accrue benefits in the scheme on 1 August 1996. There are no active members in thescheme. A full actuarial valuation of the scheme was carried out at 31 July 2018 and revealed a funding shortfall of £358,000.Under the recovery plan dated 31 October 2019 the University has agreed to pay contributions with the view to eliminating the shortfall by 31 July 2024. In accordance with the Scheme’s current schedule of contributions dated 31 October 2019, the University is expected to pay contributions of £37,011 over the next accounting period. Additionally, the University meets the ongoing running expenses of the scheme together with any PPF levies.
The movement in the Deficit in the year was: Value at Value at31 July 2020 31 July 2019
Deficit in scheme at 1 August (121) (138)Contribution by employer 198 35Current service cost 0 (15)Return on assets excluding interest income 20 147Actuarial gain / (loss) (326) (150)Deficit in scheme at 31 July (229) (121)
Discretionary pension increases in the London Hospital section are set with reference to CPI subject to a maximum of 5% per annum. Pension increases for the St Bartholomew's Hospital section are fixed at 3% per annum. £306,000 has been debited to the income and expenditure account in the year (2019: £18,000).
(v) Defined contribution schemeOne of QMUL's subsidiaries offered a defined contribution scheme to its staff. The cost for the year was £3,542 (2019: £3,150).
Queen Mary University of London 74

Notes to the Financial Statements (Continued)for the year ended 31 July 2020
32 Related Party Disclosures
Name Position at Queen Mary Description of Appointment Related Party Income Expenditure Debtor Creditor£'000 £'000 £'000 £'000
Dr Talhah Atcha The President of the Students' Union 2019-20 Director QMSU Services Ltd 308 141 395 1Ms Megan Annetts The President of the Students' Union 2019-20 (acting) DirectorMs Shamima Akter The President of the Students' Union 2020-21 DirectorSarah Cowls Member of Council Director
Dr Talhah Atcha The President of the Students' Union 2019-20 Chair of Trustees Queen Mary Students' Union 174 2,626 475 299Ms Megan Annetts The President of the Students' Union 2019-20 (acting) Chair of TrusteesMs Shamima Akter The President of the Students' Union 2020-21 Chair of Trustees
Prof Colin Bailey Principal Director The Russell Group of Universities 0 80 0 0
Prof Colin Bailey Principal Director UCL Partners 51 100 16 0
Prof Colin Bailey Principal Board member Universities UK 1 52 0 0
Prof Colin Bailey Principal Nominations Committee member Royal Academy of Engineering 0 48 0 0
Lord Clement-Jones CBE Chairman Board Member Corporate Finance Faculty of the Institute of Chartered Accountants in England and Wales
ICAEW 2 0 00
Lord Clement-Jones CBE Chairman Consultant DLA Piper UK LLP 0 8 0 0
Dr Veronique Bouchet Member of Council Member of Scientific Committee Breast Cancer Now 515 0 171 0
Sarah Cowls Member of Council Trustee University Schools Trust 0 152 0 0
Celia Gough Member of Council Director Veolia Group Companies 0 30 0 2
Prof Matthew Hilton Vice Principal Advisory Board Member AHRC 973 0 0 0
Professor Alison Blunt Member of Council VP (Research and Higher Education) Royal Geographical Society 0 6 0 0
Transactions between Queen Mary and its subsidiary undertakings have been eliminated on consolidation and therefore do not need to be disclosed in this note. Due to the nature of the University's operations and the composition of theCouncil and Senior Executive (being drawn from public and private sector organisations), it is inevitable that transactions will take place with organisations in which a member of Council or the Senior Executive will have an interest. All suchtransactions are conducted at arm's length and in accordance with the University's financial regulations and normal procurement procedures.
Queen Mary University of London 75
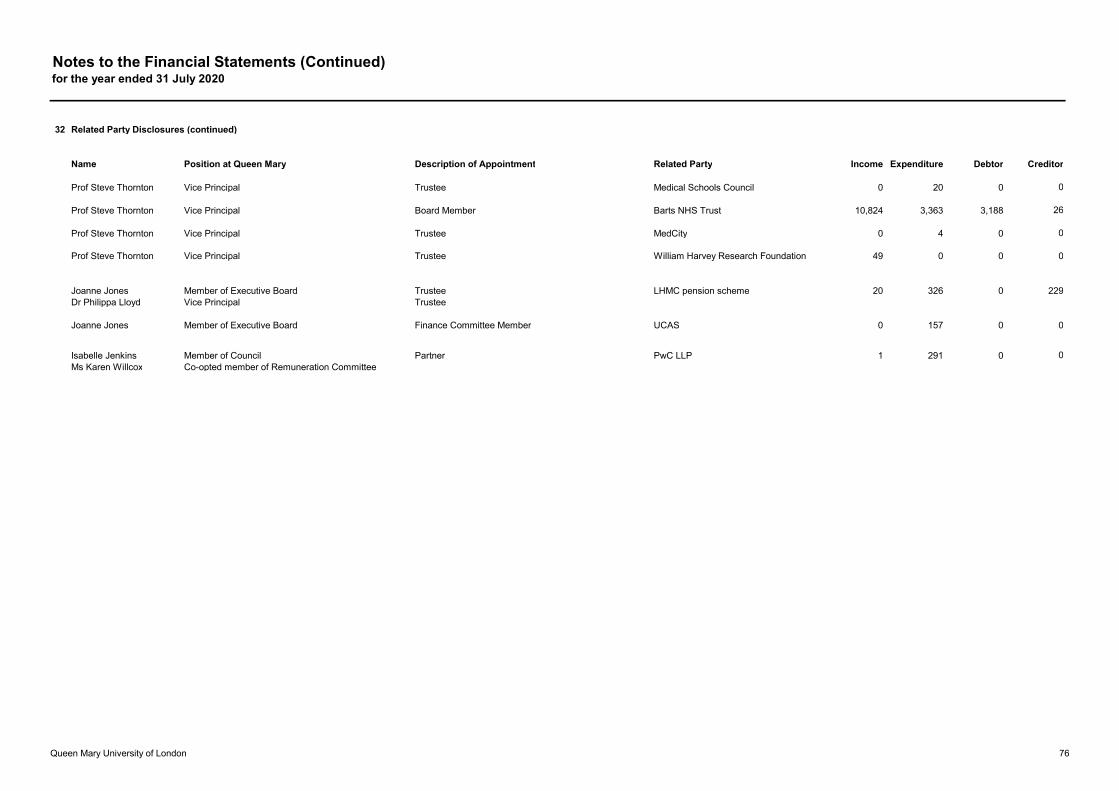
Notes to the Financial Statements (Continued)for the year ended 31 July 2020
32 Related Party Disclosures (continued)
Name Position at Queen Mary Description of Appointment Related Party Income Expenditure Debtor Creditor
Prof Steve Thornton Vice Principal Trustee Medical Schools Council 0 20 0 0
Prof Steve Thornton Vice Principal Board Member Barts NHS Trust 10,824 3,363 3,188 26
Prof Steve Thornton Vice Principal Trustee MedCity 0 4 0 0
Prof Steve Thornton Vice Principal Trustee William Harvey Research Foundation 49 0 0 0
Joanne Jones Member of Executive Board Trustee LHMC pension scheme 20 326 0 229Dr Philippa Lloyd Vice Principal Trustee
Joanne Jones Member of Executive Board Finance Committee Member UCAS 0 157 0 0
Isabelle Jenkins Member of Council Partner PwC LLP 1 291 0 0Ms Karen Willcox Co-opted member of Remuneration Committee
Queen Mary University of London 76

Council and Audit and Risk Committee Membership
COUNCIL MEMBERSHIP
Chair Lord Clement-Jones CBE
Treasurer Mr Luke Savage
Vice-Chair Ms Monica Chadha (resigned 17/09/20)
Ex Officio Members
The President and Principal Professor Colin Bailey
The President of the Students’ Union 2019/20 Dr Talhah Atcha (tenure 01/08/19 to 25/03/20)
The President of the Students' Union 2019/20 (Acting) Ms Megan Annetts (tenure 25/03/20 to 31/07/20)
The President of the Students’ Union 2020/21 Ms Shamima Akter (tenure 01/08/20 to 31/07/21)Tenure ends
Nominees of the President and PrincipalVice-Principal, International Professor Colin Grant (appointed 09/04/19) 09/04/23Vice-Principal, Policy and Strategic Partnerships Dr Philippa Lloyd (appointed 09/04/19) 09/04/23
Elected Members [Staff]Ms Sarah Cowls 01/09/24Professor Alison Blunt 30/09/22Dr Darryn Mitussis 30/09/21Professor Mangala Patel 30/09/21Professor Wen Wang 30/09/21
External MembersMr Ade Adefulu 04/03/23Ms Kathryn Barrow (resigned 31/12/19) 31/12/20Dr Veronique Bouchet (tenure ended 31/12/19) 31/12/19Ms Monica Chadha (resigned 17/09/20) 05/02/24Lord Clement-Jones CBE 30/04/21Ms Celia Gough 01/09/20Ms Stella Hall 06/07/19Ms Isabelle Jenkins 07/01/22Ms Bushra Nasir 31/08/21Dr Alix Pryde (from 01/01/20) 31/12/23Mr Luke Savage 31/01/22Ms Melissa Tatton (from 01/01/20) 31/12/23Mr Peter Thompson 29/11/21Mr David Willis 31/12/21
AUDIT AND RISK COMMITTEE MEMBERSHIP
Chairman [an external member of Council]
Mr David WillisUp to four other external members of Council
Ms Kathryn Barrow (resigned 31/12/19)Ms Monica Chadha (resigned 17/09/20)Dr Alix Pryde (from 01/01/20)Ms Melissa Tatton (from 01/01/20)Mr Peter Thompson
Up to two co-opted membersMs Simona Fionda (from 21/01/20)Ms Melissa Tatton (co-opted membership ended 31/12/19)
The members of Council and the members of Audit and Risk Committee who served in the financial year, or up to the date of signing of this report.
Queen Mary University of London 77

Senior Executive Team Membership
Chair
President and Principal Professor Colin Bailey
Other MembersVice-Principal and Executive Dean (Science and Engineering)
Professor Wen Wang
Vice-Principal and Executive Dean (Humanities and Social Sciences)
Professor Matthew Hilton
Vice-Principal (Education) Professor Stephanie Marshall
Vice-Principal (People, Culture and Inclusion) Ms Sheila Gupta (appointed 20/01/20)
Vice-Principal (International) Professor Colin Grant
Vice-Principal (Research and innovation) Professor Andrew Livingston (appointed 01/11/19)
Vice-Principal and Executive Dean (Health) Professor Steve Thornton
Vice-Principal (Policy and Strategic Partnerships) Dr Philippa Lloyd
Finance Director (Interim) Louise Parr-Morley (appointed 18/11/19, resigned 02/11/20)Director of Finance and Resources Ms Joanne Jones (resigned 10/01/20)
Academic Registrar and Council Secretary Mr Jonathan Morgan
The members of the Senior Executive who served in the financial year, or up to the date of signing of this report.
Queen Mary University of London 78
Queen Mary is a company incorporated by Royal Charter registered in England. Its registered address is:
Queen Mary University of LondonMile End RoadLondon
Copyright © 2022 FDOKUMEN


!["Thoroughly Post-Modern Mary" [A Biographic Narrative Interview With Mary Gergen]](https://static.fdokumen.com/doc/165x107/631608befc260b71021044ff/thoroughly-post-modern-mary-a-biographic-narrative-interview-with-mary-gergen.jpg)