Quantum Hi-Tech China Biological (300149 CH)
29
CMB International Securities | Equity Research | Coverage Initiation PLEASE READ THE ANALYST CERTIFICATION AND IMPORTANT DISCLOSURES ON LAST PAGE MORE REPORTS FROM BLOOMBERG: CMBR AND http://www.cmbi.com.hk 1 BUY (Initiation) 31 Jul 2020 Target Price RMB25.5 Up/Downside +26.4% Current Price RMB20.16 China Healthcare Sector Jill Wu, CFA (852) 3900 0842 [email protected] Sam Hu, PhD (852) 3900 0882 [email protected] Mkt. Cap. (RMB mn) 10,076 Avg. 3mths t/o (RMB mn) 140.66 52W High/Low (RMB) 22.28/ 10.63 Total Issued Shares (mn) 500 Source: Bloomberg Shareholding Structure Management 32.38% Hangzhou Cixuan Liangjia 11.82% HKSCC 5.71% Mega Star Centre 4.54% Others 45.55% Source: Wind Share performance Absolute Relative 1-mth 7.9% -5.3% 3-mth 82.0% 50.4% 6-mth 47.5% 26.2% Source: Bloomberg 12-mth price performance Source: Bloomberg Auditor: PWC Web-site: www.quantumbio.net.cn Please cast your valuable vote for CMBIS research team in the 2020 Asiamoney Brokers Poll: https://euromoney.com/brokers 0 5 10 15 20 25 Jul-19 Oct-19 Jan-20 Apr-20 300149 CH SHSZ300 (rebased) (RMB) We initiate coverage on Quantum Hi-Tech China Biological (“The Company” or “Quantum”) at BUY with TP of RMB25.5, given its fast-growing CRO/CDMO business and its leading position in prebiotics industry in China. Through the acquisition of ChemPartner in 2018, the Company has built integrated CRO/CDMO platforms for both chemistry drugs and biological drugs. Fast growing CRO/CDMO business. ChemPartner is one of the few China- based company offering a broad range of services, including pre-clinical CRO services and CDMO services for both small molecule drugs and biologics. ChemPartner has expanded its CRO capacity by over 30% to 24,000 m 2 from early 2020 thanks to the launch of a new laboratory facility in Shanghai, which will further strengthen the Company’s leading position in CRO industry. ChemPartner is aggressively expanding its CDMO capacity to meet the strong demand from customers. ChemPartner plans to expand its capacity of biologicals CDMO from current 450L to 4,950L by the end of 2020E, and further expand to 13,950L~18,450L in the coming 3 years. In addition, ChemPartner’s new cGMP facility in Fengxian, Shanghai will gradually commence operation from 2021E to fulfill manufacturing demand from clinical stage to commercial stage. Driven by the strong demand and expanding capacity, we forecast ChemPartner’s revenue to grow at a 27% CAGR in 2019-22E, contributing 84% of the Company’s total revenue in 2022E. Strengthening leadership in prebiotics industry. Prebiotics are substances which stimulate the growth of beneficial bacteria in the digestive system. As a conceptual intermediary between foods and drugs, prebiotics are added into different foods & beverages. The Company’s core products, FOS and GOS, are the two most widely used prebiotics. The Company is also one of the major drafters of the FOS and GOS national standards. According to Global Market Insights, global prebiotic market size grew from US$3.3bn in 2015 to over US$4.0bn in 2018, and is expected to growth to US$8.0bn in 2026E, representing a CAGR of 9.5%. Initiate at BUY with TP of RMB25.5. We expect the Company’s revenue to grow at a 26% CAGR in FY19-22E, driven by a 27% CAGR in CRO/CDMO business and a 23% CAGR in prebiotics business. We forecast the Company’s attributable net profit to increase 41%/45%/34% YoY in FY20/21/22E. We derive TP of RMB25.5 based on 10-year DCF model (WACC:10.2%, terminal growth rate: 3.0%). Catalysts: CDMO capacity expansion; Risks: slower-than-expected organic growth. Earnings Summary (YE 31 Dec) FY18A FY19A FY20E FY21E FY22E Revenue (RMB mn) 997 1,328 1,590 2,048 2,652 YoY growth (%) 262 33 20 29 30 Net income (RMB mn) 161 139 196 285 383 EPS (RMB) 0.35 0.28 0.39 0.57 0.77 YoY growth (%) 155 (20) 41 45 34 P/E (x) 56.5 71.0 50.2 34.6 25.8 P/B (x) 4.2 4.3 4.0 3.6 3.1 Yield (%) 9.9 0.0 0.0 0.0 0.0 ROE 7.3 5.9 7.8 10.2 12.0 Net gearing (%) 34.15 38.87 36.32 35.19 30.96 Source: Bloomberg, CMBIS estimates Quantum Hi-Tech China Biological (300149 CH) Establishing leading integrated CRO/CDMO platform
-
Upload
khangminh22 -
Category
Documents
-
view
1 -
download
0
Transcript of Quantum Hi-Tech China Biological (300149 CH)

CMB International Securities | Equity Research | Coverage Initiation
PLEASE READ THE ANALYST CERTIFICATION AND IMPORTANT DISCLOSURES ON LAST PAGE
MORE REPORTS FROM BLOOMBERG: CMBR AND http://www.cmbi.com.hk 1
BUY (Initiation)
31 Jul 2020
Target Price RMB25.5
Up/Downside +26.4%
Current Price RMB20.16
China Healthcare Sector
Jill Wu, CFA
(852) 3900 0842
Sam Hu, PhD
(852) 3900 0882
Mkt. Cap. (RMB mn) 10,076 Avg. 3mths t/o (RMB mn) 140.66 52W High/Low (RMB) 22.28/ 10.63 Total Issued Shares (mn) 500 Source: Bloomberg Shareholding Structure
Management 32.38% Hangzhou Cixuan Liangjia 11.82% HKSCC 5.71% Mega Star Centre 4.54% Others 45.55%
Source: Wind Share performance
Absolute Relative 1-mth 7.9% -5.3% 3-mth 82.0% 50.4% 6-mth 47.5% 26.2%
Source: Bloomberg
12-mth price performance
Source: Bloomberg
Auditor: PWC Web-site: www.quantumbio.net.cn
Please cast your valuable vote
for CMBIS research team in the
2020 Asiamoney Brokers Poll:
https://euromoney.com/brokers
0
5
10
15
20
25
Jul-19 Oct-19 Jan-20 Apr-20
300149 CH SHSZ300 (rebased)(RMB)
We initiate coverage on Quantum Hi-Tech China Biological (“The Company” or “Quantum”) at BUY with TP of RMB25.5, given its fast-growing CRO/CDMO business and its leading position in prebiotics industry in China. Through the acquisition of ChemPartner in 2018, the Company has built integrated CRO/CDMO platforms for both chemistry drugs and biological drugs.
Fast growing CRO/CDMO business. ChemPartner is one of the few China-based company offering a broad range of services, including pre-clinical CRO services and CDMO services for both small molecule drugs and biologics. ChemPartner has expanded its CRO capacity by over 30% to 24,000 m2 from early 2020 thanks to the launch of a new laboratory facility in Shanghai, which will further strengthen the Company’s leading position in CRO industry. ChemPartner is aggressively expanding its CDMO capacity to meet the strong demand from customers. ChemPartner plans to expand its capacity of biologicals CDMO from current 450L to 4,950L by the end of 2020E, and further expand to 13,950L~18,450L in the coming 3 years. In addition, ChemPartner’s new cGMP facility in Fengxian, Shanghai will gradually commence operation from 2021E to fulfill manufacturing demand from clinical stage to commercial stage. Driven by the strong demand and expanding capacity, we forecast ChemPartner’s revenue to grow at a 27% CAGR in 2019-22E, contributing 84% of the Company’s total revenue in 2022E.
Strengthening leadership in prebiotics industry. Prebiotics are substances which stimulate the growth of beneficial bacteria in the digestive system. As a conceptual intermediary between foods and drugs, prebiotics are added into different foods & beverages. The Company’s core products, FOS and GOS, are the two most widely used prebiotics. The Company is also one of the major drafters of the FOS and GOS national standards. According to Global Market Insights, global prebiotic market size grew from US$3.3bn in 2015 to over US$4.0bn in 2018, and is expected to growth to US$8.0bn in 2026E, representing a CAGR of 9.5%.
Initiate at BUY with TP of RMB25.5. We expect the Company’s revenue to grow at a 26% CAGR in FY19-22E, driven by a 27% CAGR in CRO/CDMO business and a 23% CAGR in prebiotics business. We forecast the Company’s attributable net profit to increase 41%/45%/34% YoY in FY20/21/22E. We derive TP of RMB25.5 based on 10-year DCF model (WACC:10.2%, terminal growth rate: 3.0%).
Catalysts: CDMO capacity expansion; Risks: slower-than-expected organic growth.
Earnings Summary
(YE 31 Dec) FY18A FY19A FY20E FY21E FY22E
Revenue (RMB mn) 997 1,328 1,590 2,048 2,652
YoY growth (%) 262 33 20 29 30
Net income (RMB mn) 161 139 196 285 383
EPS (RMB) 0.35 0.28 0.39 0.57 0.77
YoY growth (%) 155 (20) 41 45 34
P/E (x) 56.5 71.0 50.2 34.6 25.8
P/B (x) 4.2 4.3 4.0 3.6 3.1
Yield (%) 9.9 0.0 0.0 0.0 0.0
ROE 7.3 5.9 7.8 10.2 12.0
Net gearing (%) 34.15 38.87 36.32 35.19 30.96
Source: Bloomberg, CMBIS estimates
Quantum Hi-Tech China Biological (300149 CH)
Establishing leading integrated CRO/CDMO platform

31 Jul 2020
PLEASE READ THE ANALYST CERTIFICATION AND IMPORTANT DISCLOSURES ON LAST PAGE 2
Focus Charts
Figure 1: Services provided by ChemPartner
Source: Company data, CMBIS
Figure 2: Revenue mix of ChemPartner
Source: Company data, CMBIS
Figure 3: Global prebiotics market size forecast
Source: Global Market Insights, CMBIS
Figure 4: QHT’s prebiotic product sales
Source: Company data, CMBIS
Figure 5: Company’s revenue trend (FY18A-22E)
Source: Company data, CMBIS estimates
Figure 6: Company’s margin trend (FY18A-22E)
Source: Company data, CMBIS estimates
Chemistry CMC
Discovery Chemistry Biologics Discovery
DMPK/Exploratory Toxicology
Biology & Pharmacology
Biologics CMC
Discover and synthesize lead compounds and antibodies
Pharmacokinetics analysis, pharmacodynamics analysis
and screening of effective compounds and antibodies
Outsourcing of production process R&D and
manufacturing
308
413487
540 572329
341327
335 327
11
824
69 76
118
99
119
128 117
0
200
400
600
800
1,000
1,200
2015 2016 2017 2018 2019
Chemistry CMO Biologics CDMO
Chemsitry CRO Biology CRO
(RMB mn)
4.04.4
5.05.5
6.0
6.67.0
7.78.0
0.0
1.0
2.0
3.0
4.0
5.0
6.0
7.0
8.0
9.0
2018 2019E 2020E 2021E 2022E 2023E 2024E 2025E 2026E
(US$ bn)
220
247265
288
224
0
50
100
150
200
250
300
350
2015 2016 2017 2018 2019
(RMB mn)
997
1,3281,590
2,048
2,652
33.2%
19.7%
28.8% 29.5%
-30.1%
-20.1%
-10.1%
-0.1%
9.9%
19.9%
29.9%
0
500
1,000
1,500
2,000
2,500
3,000
2018 2019 2020E 2021E 2022E
Total revenue YoY
(RMB mn) 42.8%
38.2% 37.7%36.4% 36.1%
16.2%
10.5%12.4%
13.9% 14.4%
0.0%
5.0%
10.0%
15.0%
20.0%
25.0%
30.0%
35.0%
40.0%
45.0%
2018 2019 2020E 2021E 2022E
GPM NPM
31 Jul 2020
PLEASE READ THE ANALYST CERTIFICATION AND IMPORTANT DISCLOSURES ON LAST PAGE 3
Table of Contents
Focus Charts ..................................................................................... 2
Investment Summary ........................................................................ 4 Building a comprehensive CRO/CDMO service platform ...................................... 4
Capturing the fast-growing CRO and CMO/CDMO demand .................................. 4
Strengthening the leading position in prebiotics in China ................................... 5
Expect revenue/ attributable net profit to grow at 26%/40% CAGR in FY19-
22E .............................................................................................................................. 5
Risks ........................................................................................................................... 5
Successful merge of ChemPartner and Quantum Hi-Tech ............ 6
Building a comprehensive CRO/CDMO service platform .............. 8 Integrated pre-clinical CRO provider .....................................................................11
Fast CDMO capacity expansion to capture the growth opportunities ...............13
China CRO/CDMO demand to continue strong growth ............... 14 Rising global R&D spending ................................................................................14
Lengthy and costly drug development process drives outsourcing demand ..15
Larger fraction of R&D spending will be outsourced ..........................................16
Microecological nutrients demand grows with rising health
awareness ........................................................................................ 18 Prebiotics are important to human health ............................................................18
QHT is a leading prebiotic products provider in China .......................................20
Financial Analysis ........................................................................... 22 Strong growth outlook ............................................................................................22
Initiate at BUY with TP of RMB25.5 ................................................ 25
Financial Summary ......................................................................... 27
Risks ................................................................................................. 28

31 Jul 2020
PLEASE READ THE ANALYST CERTIFICATION AND IMPORTANT DISCLOSURES ON LAST PAGE 4
Investment Summary
Building a comprehensive CRO/CDMO service platform
Established in Guangdong, China in 2000, Quantum Hi-Tech (QHT) specializes in prebiotic
( 益 生 元 ) products research, production and promotion. Its core products,
Fructooligosaccharides (FOS, 低聚果糖) and Galactooligosaccharides (GOS, 低聚半乳糖),
are widely recognized as essential probiotics that have significant beneficial effects of a
properly balanced human digestive microbiome. QHT was listed on the Shenzhen Stock
Exchange in 2010 and has developed into a leading brand and benchmarking enterprise
in the microbiome health industry. QHT is the major proponent for Chinese approval of
FOS as a nutritional fortifier and the major drafter of the FOS and GOS national standards.
In 2018, QHT completed the merger with ChemPartner. QHT acquired 90% stake in
ChemPartner at a cost of RMB2,144mn in May 2018. Previously, in 2017, QHT has already
acquired 10% stake in ChemPartner at a cost of RMB238mn. After the merger,
ChemPartner’s management team remained intact, and its routine business continued to
operate as a standalone entity.
Based in China, ChemPartner is a full-service life science CRO (Contract Research
Organization) / CDMO (Contract Development & Manufacturing Organization) provider with
17 years of operation experiences. ChemPartner offers a broad range of CRO services
including biologics discovery, discovery chemistry, biology and pharmacology, DMPK and
exploratory toxicology.
Capturing the fast-growing CRO and CMO/CDMO demand
Established in Shanghai in 2003, ChemPartner is one of the few China-based CROs
offering a broad range of services, including pre-clinical CRO services and CDMO services
for both small molecule drugs and biological drugs.
In early 2020, ChemPartner announced the opening of a new, state-of-the-art, 24,000 m2
laboratory facility in Shanghai, China. The building houses approximately 700 employees
and new laboratories for ChemPartner’s discovery chemistry, biology and pharmacology,
and the DMPK and exploratory toxicology departments. It also has a nearly 2,000 m2,
AAALAC accredited animal facility. With the new facility, ChemPartner’s CRO capacity has
over 30% growth, which will further drive its CRO revenue growth.
ChemPartner is aggressively expanding its CDMO capacity to meet the strong demand
from customers. ChemPartner plans to expand its capacity of biologicals CDMO from
current 450L to 4,950L by the end of 2020E, and further expand to 13,950L-18,450L in the
coming three years. In addition, ChemPartner’s new cGMP facility in Fengxian, Shanghai
will have over 40 tons of production capacity for intermediates, small molecule APIs and
polypeptide APIs. The facility will gradually commence operation from 2021E to fulfill
manufacturing demand from clinical stage to commercial stage.
Driven by the strong demand and expanding capacity, we forecast ChemPartner’s revenue
to grow at a 27% CAGR in 2019-22E, and contribute 84% of the Company’s total revenue
in 2022E.
Global and China pharmaceutical companies have increased the proportion of R&D
outsourcing for better cost control and higher efficiency. Drug development process
includes early stage R&D, pre-clinical, clinical research, commercialized manufacturing,

31 Jul 2020
PLEASE READ THE ANALYST CERTIFICATION AND IMPORTANT DISCLOSURES ON LAST PAGE 5
etc. F&S estimates that, on average, development process of a new molecule takes more
than 10 years and requires over US$1bn costs while the success rate for developing a new
molecule from drug discovery to approval could be lower than 0.01%.
According to F&S, the China-based CRO market size will rise from US$5.9bn in 2018 to
US$21.4bn in 2023E, representing a CAGR of 29.6%. The penetration rate of the China-
based CRO market will increase from 35.8% in 2018 to 49.3% in 2023E.
F&S estimates that China-based CDMO market size will increase from US$2.4bn in 2018
to US$8.5bn in 2023E, indicating a 28.9% CAGR, mainly driven by strong growth in
biologics CDMO demand.
Strengthening the leading position in prebiotics in China
Strengthening leadership in prebiotics business. Prebiotics are substances which stimulate
the growth of beneficial bacteria in the digestive system. As a conceptual intermediary
between foods and drugs, prebiotics are added into different foods & beverages such as
health supplements, dairy, cereals, baked goods, fermented meat and dry foods.
The Company’s core products, FOS and GOS, are the two most widely used prebiotics.
The Company is also one of the major drafters of the FOS and GOS national standards.
According to Global Market Insights, global prebiotic market size grew from US$3.3bn in
2015 to over US$4.0bn in 2018, and is expected to grow to US$8.0bn in 2026E,
representing a CAGR of 9.5%.
Expect revenue/ attributable net profit to grow at 26%/40% CAGR in
FY19-22E
We expect the Company’s revenue to grow at 26% CAGR in FY19-22E, driven by 23%/
19%/ 61%/ 35% CAGR in biologics CRO services/ chemistry CRO services/ biologics
CDMO services/ chemistry CMO services and 23% CAGR in prebiotics business. We
expect the Company’s attributable net profit to grow at 40% CAGR in FY19-22E with 41%/
45%/ 34% YoY growth in FY20/21/22E, respectively.
Risks
1) Slower-than-expected organic earnings growth; 2) Failure to retain the Company’s
existing customers or expand its customer base; 3) Volatilities in prebiotics demand.

31 Jul 2020
PLEASE READ THE ANALYST CERTIFICATION AND IMPORTANT DISCLOSURES ON LAST PAGE 6
Successful merger of ChemPartner and Quantum Hi-
Tech
Established in Guangdong, China in 2000, Quantum Hi-Tech (QHT) specializes in prebiotic
( 益 生 元 ) products research, production and promotion. Its core products,
Fructooligosaccharides (FOS, 低聚果糖) and Galactooligosaccharides (GOS, 低聚半乳糖),
are widely recognized as essential probiotics that have significant beneficial effects of a
properly balanced human digestive microbiome.
QHT was listed on the Shenzhen Stock Exchange in 2010 and has developed into a leading
brand and benchmarking enterprise in the microbiome health industry. QHT is the major
proponent for Chinese approval of FOS as a nutritional fortifier and the major drafter of the
FOS and GOS national standards. In 2013 QHT was rated as one of Asia's 200 Best Small
and Mid-Sized Companies by Forbes magazine, which has further enhanced its reputation
and brand value. In 2015, QHT successfully released six FOS national standard samples.
In 2015, QHT got the International Arch of Europe (IAE) Award in the Gold category in
Frankfurt. And in 2017, QHT developed the Chinese national standard of four FOS
components and three GOS components.
In 2018, QHT completed the merger with ChemPartner. QHT acquired 90% stake in
ChemPartner at a cost of RMB2,144mn in May 2018. Previously, in 2017, QHT has already
acquired 10% stake in ChemPartner at a cost of RMB238mn. After the merger,
ChemPartner’s management team remained intact, and its routine business continued to
operate as a standalone entity.
Based in China, ChemPartner is a full-service life science CRO (Contract Research
Organization) / CDMO (Contract Development & Manufacturing Organization) provider with
17 years of operation experiences. ChemPartner offers a broad range of CRO services
including biologics discovery, discovery chemistry, biology and pharmacology, DMPK and
exploratory toxicology. ChemPartner also began to offer CDMO services for small
molecules in 2009 and biological drugs in 2015. ChemPartner plans to expand its capacity
of biologicals CDMO from current 450L to 4,950L by the end of 2020E, and further expand
to 13,950L-18,450L in the coming three years.
Figure 7: Development history of ChemPartner and Quantum Hi-Tech
Source: Company data, CMBIS
2003: Establishment of ChemPartner in
Shanghai
2007: Started to offer biology & DMPK
services
2010: Started to offer biologics discovery services. ShangPharma, parentco of
ChemPartner, completed IPO in NASDAQ
2013: ShangPharma delisted from
NASDAQ
2014: Opened a site in San Francisco
2015: ChemPartner started of offer
biologics CDMO serivces
2000: Establishment of Quantum Hi-Tech in
Guangdong
2002: Successful production of high purity
FOS
2009: QHT started producing GOS in large
scale
2010: QHT completed IPO in Shen Zhen Stock
Exchange
2015: Successfully developed FOS
National Reference Standards
2018: Merge of ChemPartner and
QHT
2019: New 24,000 m2
lab in Shanghai commenced operation
2020: ChemPartner's laboratory animaI centre received
AAALAC international accreditation

31 Jul 2020
PLEASE READ THE ANALYST CERTIFICATION AND IMPORTANT DISCLOSURES ON LAST PAGE 7
This strategic maneuver enables the Company to expand its global presence and access
new markets (CRO and CMO). After the merger, the Company provides CRO/CDMO,
prebiotics and medical service through three business units namely ChemPartner, QHT
and Quantum Medical, respectively.
Figure 8: Core business segments of Quantum Hi-Tech China Biological
Source: Company data, CMBIS

31 Jul 2020
PLEASE READ THE ANALYST CERTIFICATION AND IMPORTANT DISCLOSURES ON LAST PAGE 8
Building a comprehensive CRO/CDMO service platform
Established in Shanghai in 2003, ChemPartner is one of the few China-based CROs
offering a broad range of services, including pre-clinical CRO services and CDMO services
for both small molecule drugs and biologics. Its integrated service platform allows the
Company to cross-sell its services and enhances its service offerings.
ChemPartner now has over 110,000 m2 of laboratory areas and approximately 7,000 m2 of
AAALAC (Association for Assessment and Accreditation of Laboratory Animal Care)
accredited animal housing and breeding facility. The Company has established a global
operation network in Shanghai, Qidong, Chengdu, Horsholm of Denmark, Tokyo, San
Francisco and Boston.
In early 2020, ChemPartner announced the opening of a new, state-of-the-art, 24,000 m2
laboratory facility in Shanghai, China. The building houses approximately 700 employees
and new laboratories for ChemPartner’s discovery chemistry, biology and pharmacology,
and the DMPK and exploratory toxicology departments. It also has a nearly 2,000 m2,
AAALAC accredited animal facility. With the new facility, ChemPartner’s CRO capacity has
over 30% growth, which will further drive its CRO revenue growth.
ChemPartner’s CRO services mainly contains pre-clinical CRO services, including
discovery chemistry, biologics discovery, biology & pharmacology, DMPK / exploratory
toxicology. The Company has accumulated pre-clinical CRO experiences in a wide range
of therapeutic areas, such as oncology, CNS diseases, immune inflammation, etc.
ChemPartner’s CDMO services cover both biologics CMC services and chemistry CMC
services. Its biologics CMC services include stable cell line development, process
development, formulation development, analytic development and testing, GMP production,
etc. Its chemistry CMC services include process R&D, process safety, analytical
development, formulation development, manufacturing, etc.
Figure 9: Services provided by ChemPartner
Source: Company data, CMBIS
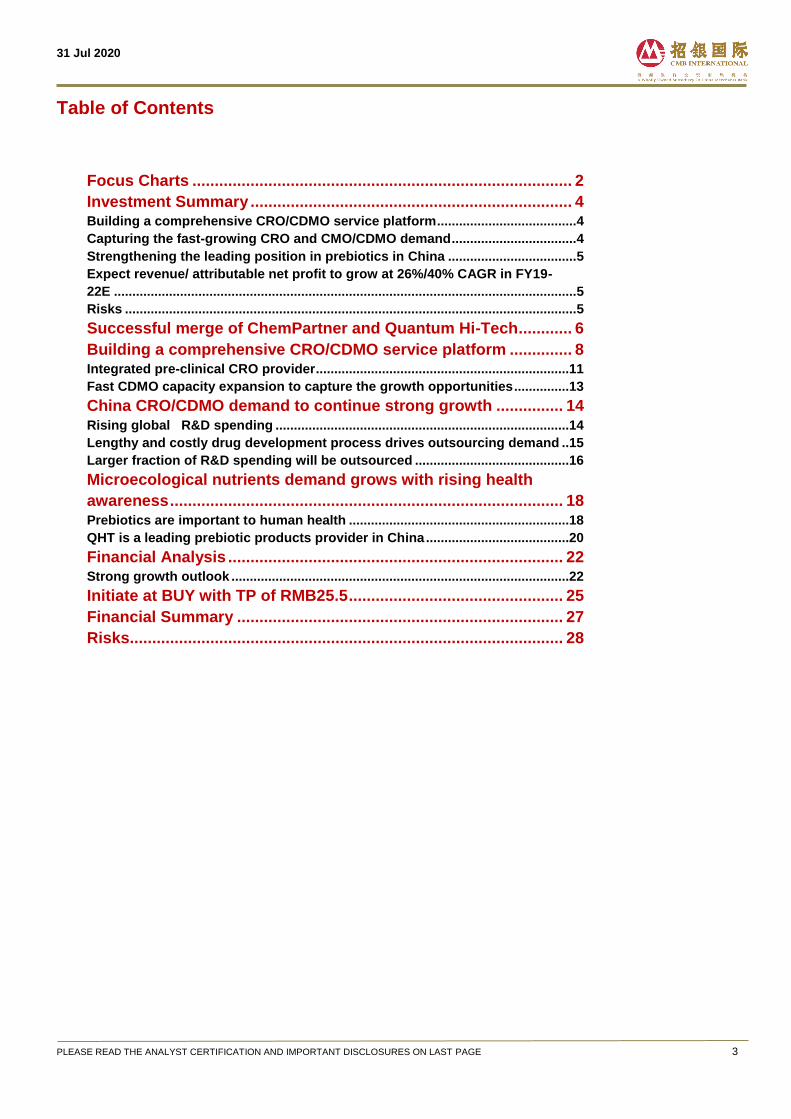
As of 2019, ChemPartner had 52% of total revenue from biology CRO services, 30% from
chemistry CRO services, 11% from chemistry CMO services and the remaining 7% from
biologics CDMO services. Currently, CRO business is more profitable than CDMO
business due to larger economies of scale. In 2019, biology CRO business recorded 48%
Chemistry CMC
Discovery Chemistry Biologics Discovery
DMPK/Exploratory Toxicology
Biology & Pharmacology
Biologics CMC
Discover and synthesize lead compounds and antibodies
Pharmacokinetics analysis, pharmacodynamics analysis
and screening of effective compounds and antibodies
Outsourcing of production process R&D and
manufacturing
31 Jul 2020
PLEASE READ THE ANALYST CERTIFICATION AND IMPORTANT DISCLOSURES ON LAST PAGE 9
gross profit margin and chemistry CRO reached 30% gross profit margin. Meanwhile,
biologics CDMO had 10% gross profit margin and chemistry CMO had 11% gross profit
margin in 2019. With improving facility utilization, we forecast significant room for margin
improvement of the CDMO business.
Figure 10: Revenue mix of ChemPartner
Source: Company data, CMBIS
Figure 11: Gross profit margin by segment
Source: Company data, CMBIS
Majority of ChemPartner’s revenue were from overseas customers. In 2019, overseas
customers contributed 63% of ChemPartner’s total revenue while the remaining 37% of
revenue were from domestic customers.
Through 17 years of operation, ChemPartner has established good reputation among
customers. Capitalizing on ChemPartner’s broad service offerings, the experience and
expertise of skilled scientists and state-of-the-art facilities, ChemPartner has accumulated
a diversified global customer base of over 1,600 customers, including 18 out of the top 20
pharmaceutical and biotechnology companies in the world. In addition, ChemPartner has
deep collaboration with top-level academic research institutes to support their innovative
research such as development of novel NMEs & therapies and novel technologies.
Figure 12: Selected customers of ChemPartner
Source: Company data, CMBIS
308
413487
540 572329
341327
335 327
11
824
69 76
118
99
119
128 117
0
200
400
600
800
1,000
1,200
2015 2016 2017 2018 2019
Chemistry CMO Biologics CDMO
Chemsitry CRO Biology CRO
(RMB mn)
-20%
-10%
0%
10%
20%
30%
40%
50%
60%
2017 2018 2019
Biology CRO Chemsitry CRO
Biologics CDMO Chemistry CMO

31 Jul 2020
PLEASE READ THE ANALYST CERTIFICATION AND IMPORTANT DISCLOSURES ON LAST PAGE 10
As a China-based CRO, ChemPartner is strategically positioned to benefit from the
advantages of doing business in China, including a large talent pool, relatively low-cost
labor, developed infrastructure and favorable government incentives.
As of end-2019, ChemPartner had over 2,100 staff, including 172 PhDs. In past years,
ChemPartner’s employee number has risen significantly from 1,263 in 2015 to 2,142 in
2019. Expanding staff size has supported the income growth for ChemPartner.
Figure 13: Staff mix of ChemPartner (as of end-2019)
Source: Company data, CMBIS
Figure 14: ChemPartner has rising staff number
Source: Company data, CMBIS
For China leading CRO/CDMOs, Porton Pharma (300363 CH, NR) Biologics recorded the
highest output per capital of RMB834k in FY19 while the industry average level was
RMB604k in FY19.
The average output per capita of ChemPartner was RMB516k in FY19, which was slightly
below industry average in China and approximately 60% below the average level of global
CRO/CDMO companies. This was mainly because ChemPartner’s current focus was on
CRO services which was labor intensive and generated lower revenue per capita than
CDMO services. With increasing contribution from CDMO business, improving operation
efficiency and market share gain from international players, we believe ChemPartner’s
output per capita will have significant room for growth in the long term.
Figure 15: China leading CRO/CDMO’s revenue per capita (FY19)
Source: Annual reports, CMBIS
Chemistry CRO37%
Biology CRO37%
Chemistry CMO15%
Biologics CDMO11%
(people)
1,2631,335
1,9792,086 2,142
0
500
1,000
1,500
2,000
2,500
2015 2016 2017 2018 2019
(people)
834 812
690652 633 627
554516
369 354
0
100
200
300
400
500
600
700
800
900
PortonPharma
WuxiBiologics
AsymchemLaboratories
WuXi AppTec Tigermed JoinnLaboratories
Pharmaron ChemPartner Medicilon GuangzhouBoji
RMB '000
Average: RMB604k

31 Jul 2020
PLEASE READ THE ANALYST CERTIFICATION AND IMPORTANT DISCLOSURES ON LAST PAGE 11
Compared with global peers, China-based CRO companies still have small scale in terms
of revenue size and employee size while China-based CRO companies also generate
lower revenue per capital vs global peers. For leading overseas CRO/CDMO players, the
average output per capita of selected CRO/CDMOs was US$183k in FY19, ranging from
US$165k to US$198k per capita.
Figure 16: Global leading CRO/CDMOs’ revenue per capital (FY19)
Source: Annual reports, CMBIS; Note: Covance was acquired by LabCorp in 2014. LabCorp’s data showed here include Covance’s
part.
Integrated pre-clinical CRO provider
ChemPartner provides a broad range of high-quality, integrated CRO services across the
drug discovery and development process to international and Chinese pharmaceutical and
biotechnology companies. ChemPartner’s CRO services mainly covers the pre-clinical
stage, including discovery chemistry, biologics discovery, biology & pharmacology and
DMPK / exploratory toxicology.
Figure 17: ChemPartner’s CRO business mainly focus on pre-clinical CRO services
Source: Company data, CMBIS
Discovery Chemistry
ChemPartner is one of the largest and most experienced chemistry service organizations
in China. ChemPartner’s chemists have designed and synthesized millions of molecules
for customers over its 17-year history. ChemPartner has also accumulated experiences in
discovery of over 200 drug targets. A number of these molecules have contributed to the
clinical development pipelines of ChemPartner’s customers.
ChemPartner excels at medicinal chemistry design, custom synthesis and library synthesis
as well as peptide, nucleoside and natural product chemistry. ChemPartner’s medicinal
198 195 183 181 177 165
0
50
100
150
200
250
ICON Syneos Health LabCorp PRA IQVIA Charles River
US$ '000
Average: US$183k
consultant
synthes
Pre-clinical CRO Clinical CRO
Indication Selection&
Target family selection
Target identification
High throughput Screening
Candidate compound
Pre-clinical studies
Ph I to Ph IIIclinical trials
NDA & Market
Post-market monitor&
Ph IV trial
Antibody expression
Target verification
Antibody candidates optimization
Biological drugs characterization
pharmacodynamics studies
Safety evaluation
Non-GLP Toxicpharmacokinetics
studies
Lead compounds screening and optimization
Compound design
Ph I to Ph IIIclinical trials
technical support
Clinical datamanagement and analysis
NDA services
Post-market monitor services
Marketing services
New drug development
process
CRO Services
Service provide by ChemPartner

31 Jul 2020
PLEASE READ THE ANALYST CERTIFICATION AND IMPORTANT DISCLOSURES ON LAST PAGE 12
chemists also worked closely with its biologists and DMPK staff to provide integrated pre-
clinical CRO services.
In 2015, ChemPartner introduced a US-based scientific team and opened a new site in
San Francisco. Working in close collaboration with the teams in China, scientists in the US
site offer clients diversified and state-of-the-art services.
Biologics Discovery
ChemPartner has world-class biologics drug discovery capabilities, with the experiences in
discovery, expressing, purifying, and analyzing monoclonal antibodies and recombinant
proteins. As of end-2019, ChemPartner has helped customers on near 80 antibody projects.
In terms of antibody discovery, ChemPartner has the capabilities to develop antibody-drug
conjugates, humanized mouse monoclonal antibodies and affinity matured monoclonal
antibodies. ChemPartner has also discovered novel high-affinity monoclonal antibodies by
hybridoma technology (including human antibodies from mice) and phage display
technology.
In addition, ChemPartner specializes in the expression of recombinant proteins in all
modern expression systems and purification of client targets. Besides, ChemPartner has
constructed production cell lines that can be used to express monoclonal antibodies in
large scale to support IND filings and clinical trials.
Biology & Pharmacology
ChemPartner started offering biology & pharmacology services in 2007. The Company
specializes in drug discovery services for several key bio-therapeutic areas: oncology, cell
biology, tumor immunology, immunology/inflammation, neuroscience/metabolic disorders
and histology/pathology.
ChemPartner provides customized designs of the needed in vitro & in vivo assays and
disease models for customers. ChemPartner has numerous validated key discovery
assays and assay panels for many different targets (e.g. extensive cancer cell panel (700+),
epigenetic enzyme panel, kinase panels, hERG QPatch).
ChemPartner owns over 7,000 m2 of Assessment and Accreditation of Laboratory Animal
Care (AAALAC) accredited, state-of-the-art animal housing and breeding facility. Thus, the
Company has in vivo models like patients-derived xenografts, cancer cell-derived
xenografts, syngeneic models, along with many CNS-related (5XFAD mice), or metabolic
disease-related (e.g. Ob/Ob, db/db mice) transgenic rodent models, etc.
DMPK / Exploratory Toxicology
ChemPartner’s Drug Metabolism Pharmacokinetic (DMPK) and Exploratory Toxicology
services consist of bioanalytical, in vitro ADME, pharmacokinetics and toxicology services.
ChemPartner also conducts studies for many Pharma and Biotech clients in support of their
Regulatory Filings.
ChemPartner has conducted extensive ADME profiling (>80,000) and PK & Exploratory
Toxicology studies (>10,000) for customers since 2007.
31 Jul 2020
PLEASE READ THE ANALYST CERTIFICATION AND IMPORTANT DISCLOSURES ON LAST PAGE 13
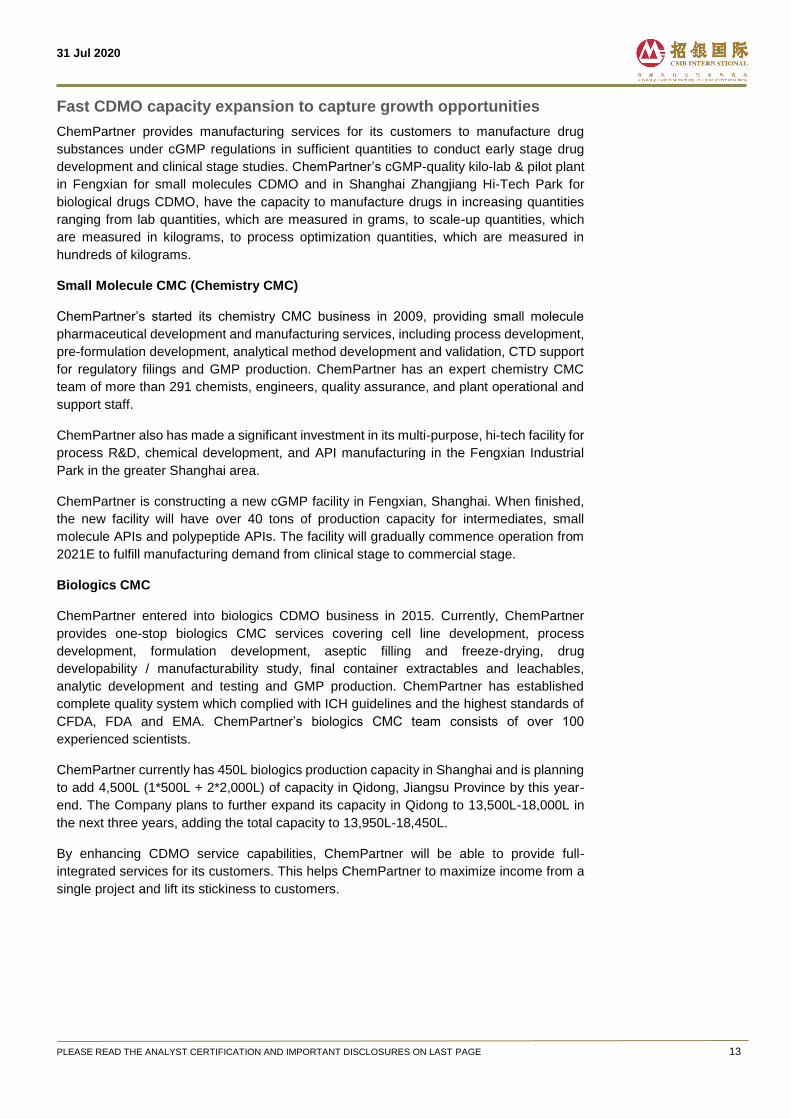
Fast CDMO capacity expansion to capture growth opportunities
ChemPartner provides manufacturing services for its customers to manufacture drug
substances under cGMP regulations in sufficient quantities to conduct early stage drug
development and clinical stage studies. ChemPartner’s cGMP-quality kilo-lab & pilot plant
in Fengxian for small molecules CDMO and in Shanghai Zhangjiang Hi-Tech Park for
biological drugs CDMO, have the capacity to manufacture drugs in increasing quantities
ranging from lab quantities, which are measured in grams, to scale-up quantities, which
are measured in kilograms, to process optimization quantities, which are measured in
hundreds of kilograms.
Small Molecule CMC (Chemistry CMC)
ChemPartner’s started its chemistry CMC business in 2009, providing small molecule
pharmaceutical development and manufacturing services, including process development,
pre-formulation development, analytical method development and validation, CTD support
for regulatory filings and GMP production. ChemPartner has an expert chemistry CMC
team of more than 291 chemists, engineers, quality assurance, and plant operational and
support staff.
ChemPartner also has made a significant investment in its multi-purpose, hi-tech facility for
process R&D, chemical development, and API manufacturing in the Fengxian Industrial
Park in the greater Shanghai area.
ChemPartner is constructing a new cGMP facility in Fengxian, Shanghai. When finished,
the new facility will have over 40 tons of production capacity for intermediates, small
molecule APIs and polypeptide APIs. The facility will gradually commence operation from
2021E to fulfill manufacturing demand from clinical stage to commercial stage.
Biologics CMC
ChemPartner entered into biologics CDMO business in 2015. Currently, ChemPartner
provides one-stop biologics CMC services covering cell line development, process
development, formulation development, aseptic filling and freeze-drying, drug
developability / manufacturability study, final container extractables and leachables,
analytic development and testing and GMP production. ChemPartner has established
complete quality system which complied with ICH guidelines and the highest standards of
CFDA, FDA and EMA. ChemPartner’s biologics CMC team consists of over 100
experienced scientists.
ChemPartner currently has 450L biologics production capacity in Shanghai and is planning
to add 4,500L (1*500L + 2*2,000L) of capacity in Qidong, Jiangsu Province by this year-
end. The Company plans to further expand its capacity in Qidong to 13,500L-18,000L in
the next three years, adding the total capacity to 13,950L-18,450L.
By enhancing CDMO service capabilities, ChemPartner will be able to provide full-
integrated services for its customers. This helps ChemPartner to maximize income from a
single project and lift its stickiness to customers.

31 Jul 2020
PLEASE READ THE ANALYST CERTIFICATION AND IMPORTANT DISCLOSURES ON LAST PAGE 14
China CRO/CDMO demand to continue strong growth
Rising global R&D spending
Both global and China R&D spending grow strongly in recent years, which is led by 1) a
more conducive regulatory environment with increase in FDA and NMPA drug approvals,
2) a shift by pharmaceutical companies towards externalized R&D models with around half
of pipelines externally sourced, 3) a robust biotech funding environment for biotech
companies, and 4) a smaller percentage of drug sales exposed to patent expirations.
Frost & Sullivan forecasts the global R&D expenditure to increase from US$174.1bn in
2018 to US$216.8bn in 2023E, representing a 4.5% CAGR. The increase in R&D
expenditures has laid a foundation for the continuous growth of the global pharmaceutical
R&D outsourcing services industry.
Figure 18: Global R&D expenditure and breakdown by discovery, preclinical and clinical
Source: F&S, CMBIS
The number of new drugs approved by the FDA has been steadily increasing in past 17
years, rising from 27 in 2013 to 48 in 2019. Notably, more new biological products obtained
approvals from the US FDA during recent years, which motivates pharmaceutical
companies investing more in biologicals R&D. In 2019, the US FDA approved 38 chemical
NMEs (new molecular entities) and 10 new biological products.
Figure 19: FDA approval of chemical NMEs and biologicals
Source: FDA, CMBIS
95.8 101.2 106.1 112.4 118.3 123.9 129.5 134.9 140.5 146.1
15.116.5 17.7
18.619.6
20.621.8 23.0
24.025.0
30.732.1
32.934.2
36.238.2
40.242.2
44.045.7
0.0
50.0
100.0
150.0
200.0
250.0
2014 2015 2016 2017 2018 2019E 2020E 2021E 2022E 2023E
(US$ bn)
Discovery Pre-clinical Clinical
141.6149.8 156.7
165.2 174.1182.7 191.5
200.1 208.5 216.8
11
15
31
18 1816
21 20
15
24
33
25
30
33
12
34
42
38
6 6 5
24
2 3
6 6 6 6
2
11 12
7
12
17
10
0
5
10
15
20
25
30
35
40
45
2002 2003 2004 2005 2006 2007 2008 2009 2010 2011 2012 2013 2014 2015 2016 2017 2018 2019
No. of chemical NMEs approved No. of biologics approved

31 Jul 2020
PLEASE READ THE ANALYST CERTIFICATION AND IMPORTANT DISCLOSURES ON LAST PAGE 15
Lengthy and costly drug development process drives outsourcing
demand
Global and China pharmaceutical companies have increased the proportion of R&D
outsourcing for better cost control and higher efficiency. Drug development process
includes early stage R&D, pre-clinical, clinical research, commercialized manufacturing,
etc. F&S estimates that, on average, development process of a new molecule takes more
than 10 years and requires over US$1bn costs while the success rate for developing a new
molecule from drug discovery to approval could be lower than 0.01%.
Figure 20: Drug development process
Source: Nature Review-Drug Discovery, CMBIS
As the patent protection period is usually 20 years for a certain innovative molecule,
shortened R&D cycle will directly lead to longer remaining patent protection period after
launch and higher return for pharmaceutical companies. Thus, it is expected that
pharmaceutical companies to be more reliant on CRO companies in order to save time and
money for drug R&D.
Pharmaceutical R&D outsourcing services mainly contain two types, namely 1) Contract
Research Organisations (CROs), and 2) Contract Development & Manufacturing
Organisations/Contract Manufacturing Organisations (CDMOs/CMOs, briefly referred to as
CDMOs).
CRO service providers usually help pharmaceutical companies to conduct a proportion of
R&D work or organise clinical trials. Thus, CRO services usually can be divided into two
types: 1) preclinical outsourcing services and 2) clinical outsourcing services.
Preclinical CROs mainly engaged in drug discovery and preclinical research services,
including new drug discovery, target lead identification and lead generation & optimization,
safety evaluation research services, pharmacokinetics, pharmacology and toxicology and
animal models, etc. Major pre-clinical CRO players in preclinical CRO field include WuXi
AppTec, Charles River, Pharmaron Beijing, ChemPartner, Joinn Lab, etc.

31 Jul 2020
PLEASE READ THE ANALYST CERTIFICATION AND IMPORTANT DISCLOSURES ON LAST PAGE 16
Clinical CROs mainly engaged in the provision of clinical trial services through Phase I to
IV, clinical data management and statistical analysis, new drug registration and others.
Major clinical CRO players include IQVIA, Covance, PRA Health, ICON, Tigermed, Boji
Medical, etc.
CDMOs provides drug manufacturing services for pre-clinical and clinical trial materials,
APIs and preparations, packaging and labeling. They also provide development-related
services such as process R&D, optimization, formula development, etc. Major CDMO
players include Lonza, Boehringer Ingelheim, Catalent, Samsung Biologics, WuXi AppTec,
WuXi Biologics, Asymchem Laboratories, Porton Pharma Solution, etc.
Figure 21: Pharmaceutical outsourcing service value chain
Source: F&S, CMBIS
Larger fraction of R&D spending will be outsourced
The CRO market includes R&D services provided for drug discovery, pre-clinical and
clinical stages. The global CRO market size is expected to grow from US$57.9bn in 2018
to US$95.2bn in 2023E, indicating a 10.6% CAGR, according to F&S.
The penetration rate of the global CRO services, measured as CRO market size as
percentage of total pharmaceutical R&D spending, increased from 32.6% in 2014 to 37.2%
in 2018 and may further rise to 48.0% in 2023E.
The CDMO market contains services for manufacturing of small molecule drugs and
biologics. F&S forecasts the global CDMO market size to increase from US$26.8bn in 2018
to US$51.8bn in 2023E, representing a 14.1% CAGR. In particular, the CDMO for biologics
may grow at a 22.9% CAGR to US$18.0bn in 2023E.

31 Jul 2020
PLEASE READ THE ANALYST CERTIFICATION AND IMPORTANT DISCLOSURES ON LAST PAGE 17
Figure 22: Global CRO market breakdown
Source: F&S, CMBIS
Figure 23: Global CDMO market breakdown
Source: F&S, CMBIS
Similar to the US market, Chinese pharmaceutical CRO and CDMO market is also driven
by 1) encouraging policies, such as NMPA’s accelerated review of drug and improving
reimbursement coverage, 2) pharmaceutical companies seeking for cost efficiencies, and
3) growing demand for high quality CROs from both Chinese pharmas’ overseas expansion
and increasing drug importation after China joining ICH.
According to F&S, the China-based CRO market size will rise from US$5.9bn in 2018 to
US$21.4bn in 2023E, representing a CAGR of 29.6%. The penetration rate of the China-
based CRO market will increase from 35.8% in 2018 to 49.3% in 2023E.
F&S estimates that China-based CDMO market size will increase from US$2.4bn in 2018
to US$8.5bn in 2023E, indicating a 28.9% CAGR, mainly driven by strong growth in
biologics CDMO demand.
Figure 24: China-based CRO market and breakdown
Source: F&S, CMBIS
Figure 25: China-based CDMO market and breakdown
Source: F&S, CMBIS
7.8 8.6 9.4 10.2 11.5 13 14.4 15.9 17.5 19.16.3 6.7 7.1 7.7 8.4 9.3 10.4 11.4 12.4 13.52629
32.434.6
37.941.9
47.152.3
57.562.5
0
20
40
60
80
100
120
2014 2015 2016 2017 2018 2019E 2020E 2021E 2022E 2023E
(US$ bn)
Clinical Pre-clinical Discovery
Discovery Pre-clinical Clinical Total
2014-18 10.3% 7.7% 9.9% 9.7%
2018-23E 10.6% 10.0% 10.5% 10.5%
14.7 15.6 16.9 18.4 20.4 22.525
27.830.7
33.93.13.9
4.55.4
6.47.8
9.6
12
14.9
18
0
10
20
30
40
50
60
2014 2015 2016 2017 2018 2019E 2020E 2021E 2022E 2023E
(US$ bn)
Biologics Small Molecule Drugs
Small Molecule drugs Biologics Total
2014-18 8.5% 19.6% 10.7%
2018-23E 10.6% 22.9% 14.1%
0.3 0.4 0.5 0.7 1.1 1.5 2 2.7 3.4 4.2
0.7 0.9 1 1.3 1.51.9
2.32.7
3.23.9
1.1 1.3 1.72.3
3.2
4.4
6
8
10.4
13.3
0
5
10
15
20
25
2014 2015 2016 2017 2018 2019E 2020E 2021E 2022E 2023E
(US$ bn)
Clinical Pre-clinical Discovery
Dis c o v e r y P r e - c lin ic a l C lin ic a l T o ta l
2014-18 35.4% 22.2% 31.3% 29.2%
2018-23E 30.1% 20.1% 33.2% 29.6%
0.9 1 1.1 1.4 1.6 1.9 2.22.7
3.34.1
0.2 0.30.5
0.60.8
1.1
1.6
2.3
3.2
4.4
0
1
2
3
4
5
6
7
8
9
2014 2015 2016 2017 2018 2019E 2020E 2021E 2022E 2023E
(US$ bn)
Biologics Small Molecule Drugs
S ma ll Mo le c u le d r u g s Bio lo g ic s T o ta l
2014-18 14.1% 38.9% 19.8%
2018-23E 20.8% 41.0% 28.9%

31 Jul 2020
PLEASE READ THE ANALYST CERTIFICATION AND IMPORTANT DISCLOSURES ON LAST PAGE 18
Microecological nutrients demand grows with rising
health awareness
Prebiotics are important to human health
Prebiotics are substances which stimulate the growth of beneficial bacteria in the digestive
system. They primarily consist of soluble fibers which feed intestinal microbes, and release
short-chain fatty acids that have a beneficial impact on the gastrointestinal tract and distant
organs. Prebiotics are non-digestible in the human gut, which allows them to pass through
intact into the large intestine, where they undergo fermentation. Prebiotics enhance the
concentration of healthy bacteria in the digestive system, stimulate the production of
essential vitamins and strengthen the immune system, which restrains the growth of
pathogenic bacteria.
The importance of probiotics, prebiotics and synbiotics have been widely studied in the
past few decades. Most commonly used probiotic strains are: Bifidobacterium, Lactobacilli,
S. boulardii, B. coagulans. Prebiotics like Fructooligosaccharides (FOS),
Galactooligosaccharides (GOS), Mannan-Oligosaccharide (MOS), Inulin and fructans are
the most commonly used fibers which when used together with probiotics are termed
synbiotics and are able to improve the viability of the probiotics.
Figure 26: Major ingredients of prebiotic
Source: Global Market Insights, CMBIS
FOS are made of plant sugars linked in chains and sourced from asparagus, Jerusalem
artichokes, onion and soybeans. FOS prebiotics are combined in probiotic supplements
with the species Lactobacilli and Bifidobacterium to support digestive system, and improve
health. As a dietary supplement, FOS is used to improve constipation, diarrhea, control
cholestrol level, and promote colon health.
GOS are indigestible compound carbohydrate complex with strong prebiotic and immunity
strengthening properties, increasing its application in food & beverage industry. It has effect
on gastro-intestinal microflora supporting growth of Bifidobacterium and lactobacillus spp.
GOS has high thermal stability, good solubility in water and non-carcinogenic. GOS when
used in bakery products attracts moisture with low calorific value, thereby improving texture
and taste.
MOS are non-digestible short-chain carbohydrates composed of up to 10 mannose
molecules, linked by alpha (1,3) and (1,6) bonds. These are nutritional based supplements
which are produced from the yeast Saccharomyces cerevisiaee. MOS provides a broad
spectrum of pathogen binding effect and can be phosphorylated to increase pathogen
binding capacity.
Prebiotics
OthersGalactoo-ligosaccharide
(GOS)Mannan-Oligosaccharide
(MOS) Fructo-Oligosaccharides
(FOS) Inulin

31 Jul 2020
PLEASE READ THE ANALYST CERTIFICATION AND IMPORTANT DISCLOSURES ON LAST PAGE 19
Inulin is a soluble plant fiber which is produced from chicory plant. It is a type of fructan
and oligofructose carbohydrate, considered as functional plant-based ingredient which
enhances digestion. These fibers are used to improve bowel function and gut health,
maintain heart rate and curb appetite which finds extensive application in the
pharmaceutical industry. Dietitians recommends intake of inulin in diets which helps in
decreasing appetite and weight loss.
Prebiotics exhibit several health benefits like reducing the prevalence and duration of
diarrhea, relief from inflammation and other symptoms associated with intestinal bowel
disorder and protective effects to prevent colon cancer. They are also implicated in
enhancing the bioavailability and uptake of minerals, lowering of some risk factors of
cardiovascular disease, and promoting satiety and weight loss thus preventing obesity.
Figure 27: Summary of health benefits imparted by prebiotics
Source: J Food Sci Technol. 2015 Dec; 52(12): 7577–7587, CMBIS
As a conceptual intermediary between foods and drugs, prebiotics are added into different
foods & beverages such as health supplements, dairy, cereals, baked goods, fermented
meat and dry foods.
Growing demand in dairy consumption along with health supplements should drive the
prebiotics market growth. According to Global Market Insights, global prebiotic market size
grew from US$3.3bn in 2015 to over US$4.0bn in 2018, and is expected to grow to
US$8.0bn in 2026E, representing a CAGR of 9.5%. Among all prebiotic products, FOS,
Inulin and GOS dominate the prebiotic market with over 70% market share. By region, EU
and Asia Pacific are the two largest markets with 39% and 36% market share in terms of
prebiotics consumption in 2018.
Prebiotics
Cancer prevention
Hyperchole-sterolemic
effect
Laxation and regularization
Enhanced mineral
bioavailability
Immunomodu-lation
Weight loss by increasedsateity feeling

31 Jul 2020
PLEASE READ THE ANALYST CERTIFICATION AND IMPORTANT DISCLOSURES ON LAST PAGE 20
Figure 28: Global prebiotics market size forecast (2019E-2026E)
Source: Global Market Insights, CMBIS
Figure 29: Global prebiotics consumption breakdown
by ingredients (2018)
Source: Global Market Insights, CMBIS
Figure 30: Global prebiotics consumption
breakdown by regions (2018)
Source: Global Market Insights, CMBIS
QHT is a leading prebiotic products provider in China
QHT is a pioneer in prebiotic industry in China. It specializes in prebiotic products research
and development, production and sales. Its core products, FOS and GOS, are widely
recognized as essential probiotics to help balance human digestive microbiome. The
Company is also one of the major drafters of the FOS and GOS national standards.
FOS and GOS are the two most widely used prebiotics. FOS and GOS occurs in
commercially available products such as food for both infants and adults.
FOS was officially classified as a soluble dietary fiber by US FDA, exists naturally in more
than 36,000 kinds of plants. FOS is recognized as an ideal prebiotic because of its
significant health benefits, excellent processability and good taste. As a result, it has been
used extensively in food industries.
GOS is galactooligosaccharide with great similarities to the composition of human milk,
which is the best nutrition for babies. Oligosaccharides are so important for mother’s milk,
which can keep babies' intestines healthy and enhance their immunity system. It is highly
4.04.4
5.05.5
6.0
6.67.0
7.78.0
0.0
1.0
2.0
3.0
4.0
5.0
6.0
7.0
8.0
9.0
2018 2019E 2020E 2021E 2022E 2023E 2024E 2025E 2026E
(US$ bn)
FOS12%
GOS17%
MOS10%
Inulin42%
Others19%
In 2018, global consumption of prebiotics reached 854.9 kilo tons.
North America
12%
EU39%
Asia Pacific36%
LATAM8%
MEA 5%
In 2018, global consumption of prebiotics reached 854.9 kilo tons.

31 Jul 2020
PLEASE READ THE ANALYST CERTIFICATION AND IMPORTANT DISCLOSURES ON LAST PAGE 21
recommended for use in infant formula and health foods because of its combination of
benefits and safety.
EUOLIGO FOS and GOSYAN GOS are the prebiotic brands under Quantum Hi-Tech (QHT,
the prebiotic sector of the Company after the merger). EUOLIGO and GOSYAN have been
the national leader in sales for 17 consecutive years and are widely used in food industry
such as health foods, dairy products, infant foods, beverages, bakery, etc. Quantum is the
only company that is able to manufacture both high-purity FOS and GOS.
Majority of QHT’s prebiotics sales were from China while income from overseas accounted
for 13% of the total sales in 2019. QHT has diversified customer base, including health
supplements manufacturers such as Wanmei (完美中国), Tianshi (天狮), Tangchenbeijian
(汤臣倍健) and dairy manufactures such as Mengiu (蒙牛), Yili (伊利), Yashili (雅士利),
Feihe (飞鹤), Junlebao (君乐宝), etc.
Figure 31: Selected customers of QHT
Source: Company data, CMBIS
In 2019, QHT recorded RMB224mn prebiotic sales, which declined 22% YoY. In 2019, the
“Quanjian scandal (权健传销门)” has led to a sharp decline in health supplements sales
and a shrink in prebiotics demand during the same period.
Thanks to a low base in 2019, people’s increasing health awareness during COVID-19
pandemic and recovery of health supplements, QHT’s prebiotics sales recorded a good
recovery of 14.1% YoY growth to RMB60.5mn in 1Q20. Meanwhile, prebiotic sector’s net
profit grew 25.1% YoY to RMB12.0mn in 1Q20.
Figure 32: QHT’s prebiotic product sales
Source: Company data, CMBIS
Figure 33: Prebiotics revenue breakdown
Source: Company data, CMBIS
220
247265
288
224
0
50
100
150
200
250
300
350
2015 2016 2017 2018 2019
(RMB mn)
73%
55% 51% 54%63%
16%
13% 22%29%
27%
0%
32% 26%17%
10%
0%
10%
20%
30%
40%
50%
60%
70%
80%
90%
100%
2015 2016 2017 2018 2019
End-products GOS FOS

31 Jul 2020
PLEASE READ THE ANALYST CERTIFICATION AND IMPORTANT DISCLOSURES ON LAST PAGE 22
Financial Analysis
Strong growth outlook
ChemPartner was consolidated from Jun 2018. The Company’s revenue record 262% YoY
and 33% YoY growth in 2018 and 2019, respectively.
The Company’s business operations were impacted in 1Q20 due to the COVID-19
pandemic. In 1Q20, the Company’s revenue was down 6.3% YoY to RMB278.7mn and it
recorded a net loss of RMB14.2mn vs RMB25.5mn net profit in 1Q19. However, the
Company experienced significant business recovery in 2Q20 thanks to the weakening
impact from COVID-19 in China. The Company announced a 0-25% YoY decline in net
profit in 1H20, indicating RMB36.9mn-49.2mn net profit in 1H20.
Driven by the release of new laboratory capacity and additional biological CDMO and
chemical CMO capacity, we expect the CRO/CDMO income growth to accelerate from
2020E. Meanwhile, we expect prebiotics revenue to continue steady growth thanks to
demand recovery from the “Quanjian scandal” in 2018, and the Company’s market share
gain from overseas markets.
We expect the Company’s revenue to grow at a 26% CAGR in FY19-22E, driven by a 27%
CAGR in CRO/CDMO business and a 23% CAGR in prebiotics business. We forecast the
Company’s total revenue to grow by 20%/ 29%/ 30% in FY20E/21E/22E.
Figure 34: Revenue forecasts for the Company (YE 31 Dec) (RMB mn) 2018 2019 2020E 2021E 2022E Outsourcing service 694 1,091 1,290 1,689 2,223 YoY -27.7% 57.2% 18.2% 30.9% 31.7%
Biology CRO 344 572 673 849 1,069 YoY -29.3% 66.2% 17.8% 26.0% 26.0% Chemistry CRO 205 327 369 450 548 YoY -37.4% 59.8% 12.7% 22.0% 22.0% Biologics CDMO 49 76 110 197 316 YoY 103.6% 53.2% 45.1% 80.0% 60.0% Chemistry CMO 96 117 138 193 289 YoY -19.0% 21.5% 17.8% 40.0% 50.0%
Prebiotics and medical service 288 224 287 344 413 YoY 8.7% -22.2% 27.9% 20.0% 20.0%
FOS 156 142 182 218 262 YoY 14.7% -8.7% 28.0% 20.0% 20.0% GOS 82 60 77 92 111 YoY 38.5% -27.0% 27.5% 20.0% 20.0% End-products 50 22 28 34 40 YoY -28.3% -56.5% 28.0% 20.0% 20.0%
Others 14 13 14 15 17 YoY 43.5% -13.4% 10.0% 10.0% 10.0% Total revenue 997 1,328 1,590 2,048 2,652 YoY 262.0% 33.2% 19.7% 28.8% 29.5%
Source: Company data, CMBIS estimates
31 Jul 2020
PLEASE READ THE ANALYST CERTIFICATION AND IMPORTANT DISCLOSURES ON LAST PAGE 23
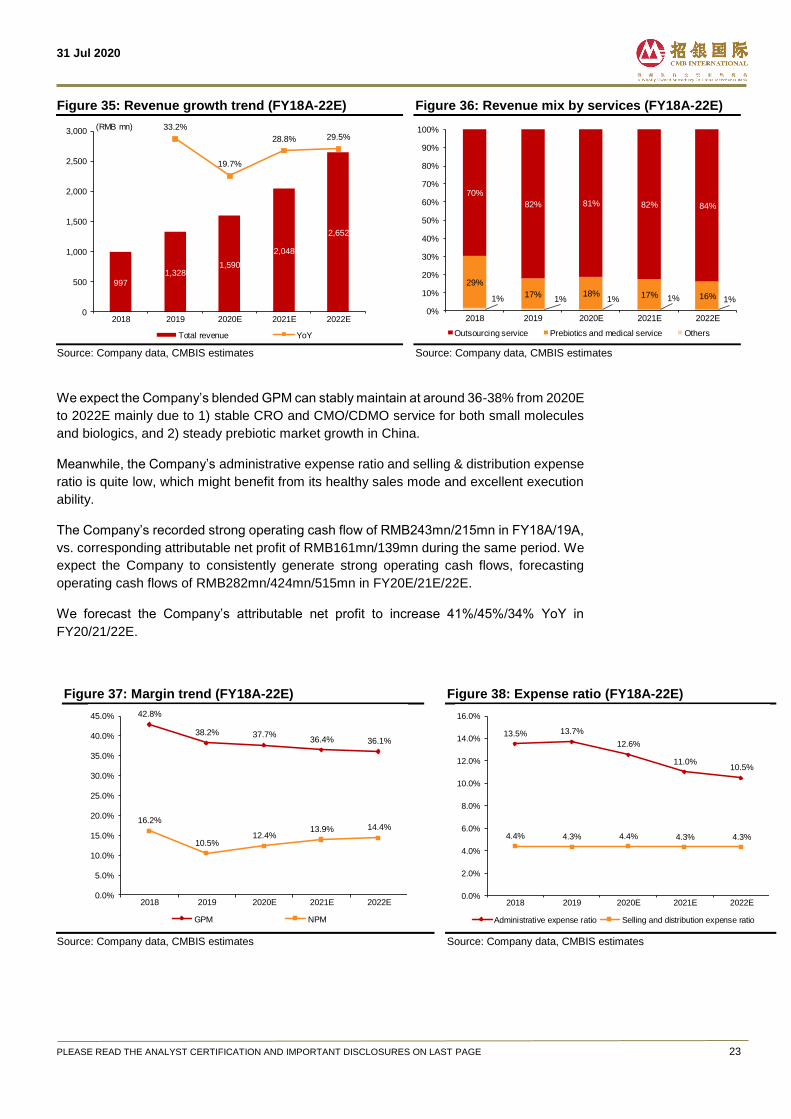
Figure 35: Revenue growth trend (FY18A-22E)
Source: Company data, CMBIS estimates
Figure 36: Revenue mix by services (FY18A-22E)
Source: Company data, CMBIS estimates
We expect the Company’s blended GPM can stably maintain at around 36-38% from 2020E
to 2022E mainly due to 1) stable CRO and CMO/CDMO service for both small molecules
and biologics, and 2) steady prebiotic market growth in China.
Meanwhile, the Company’s administrative expense ratio and selling & distribution expense
ratio is quite low, which might benefit from its healthy sales mode and excellent execution
ability.
The Company’s recorded strong operating cash flow of RMB243mn/215mn in FY18A/19A,
vs. corresponding attributable net profit of RMB161mn/139mn during the same period. We
expect the Company to consistently generate strong operating cash flows, forecasting
operating cash flows of RMB282mn/424mn/515mn in FY20E/21E/22E.
We forecast the Company’s attributable net profit to increase 41%/45%/34% YoY in
FY20/21/22E.
Figure 37: Margin trend (FY18A-22E)
Source: Company data, CMBIS estimates
Figure 38: Expense ratio (FY18A-22E)
Source: Company data, CMBIS estimates
997
1,3281,590
2,048
2,652
33.2%
19.7%
28.8% 29.5%
-30.1%
-20.1%
-10.1%
-0.1%
9.9%
19.9%
29.9%
0
500
1,000
1,500
2,000
2,500
3,000
2018 2019 2020E 2021E 2022E
Total revenue YoY
(RMB mn)
1% 1% 1% 1% 1%
29%
17% 18% 17% 16%
70%
82% 81% 82% 84%
0%
10%
20%
30%
40%
50%
60%
70%
80%
90%
100%
2018 2019 2020E 2021E 2022E
Outsourcing service Prebiotics and medical service Others
42.8%
38.2% 37.7%36.4% 36.1%
16.2%
10.5%12.4%
13.9% 14.4%
0.0%
5.0%
10.0%
15.0%
20.0%
25.0%
30.0%
35.0%
40.0%
45.0%
2018 2019 2020E 2021E 2022E
GPM NPM
13.5% 13.7%
12.6%
11.0%10.5%
4.4% 4.3% 4.4% 4.3% 4.3%
0.0%
2.0%
4.0%
6.0%
8.0%
10.0%
12.0%
14.0%
16.0%
2018 2019 2020E 2021E 2022E
Administrative expense ratio Selling and distribution expense ratio

31 Jul 2020
PLEASE READ THE ANALYST CERTIFICATION AND IMPORTANT DISCLOSURES ON LAST PAGE 24
Figure 39: Net profit trend (FY18A-22E)
Source: Company data, CMBIS estimates
Figure 40: Strong operating cash flows (FY18A-22E)
Source: Company data, CMBIS estimates
Figure 41: P&L forecasts (RMB mn) 2018 2019 2020E 2021E 2022E Revenue 997 1,328 1,590 2,048 2,652 YoY 262.0% 33.2% 19.7% 28.8% 29.5% Cost of services -570 -821 -991 -1,302 -1,696 % of revenue -57.2% -61.8% -62.3% -63.6% -63.9% Gross profit 427 507 599 745 956 GPM 42.8% 38.2% 37.7% 36.4% 36.1% Other gains 8 9 15 16 16 % of revenue 0.9% 0.7% 0.9% 0.8% 0.6% Investment gains 15 1 0 0 0 % of revenue 1.5% 0.1% 0.0% 0.0% 0.0% R&D expenses -55 -63 -77 -82 -106 % of revenue -6% -5% -5% -4% -4% Administrative expenses -135 -182 -200 -225 -279 % of revenue -13.5% -13.7% -12.6% -11.0% -10.5% Selling and distribution expenses -44 -58 -69 -88 -114 % of revenue -4.4% -4.3% -4.4% -4.3% -4.3% Finance cost -27 -51 -40 -37 -31 % of revenue -2.8% -3.8% -2.5% -1.8% -1.2% Profit before tax 178 144 221 322 433 PBT margin 17.9% 10.8% 13.9% 15.7% 16.3% Income tax expense -18 -8 -27 -39 -52 % tax rate 10.3% 5.6% 12.0% 12.0% 12.0% Total net profit 160 136 194 283 381 Minority Interests 1 3 2 2 2 Net profit attributable to shareholders 161 139 196 285 383 NPM 16.2% 10.5% 12.4% 13.9% 14.4% YoY 178.6% -13.8% 41.4% 45.1% 34.3%
Source: Company data, CMBIS estimates
161139
196
285
383
-13.8%
41.4%45.1%
34.3%
-90.0%
-70.0%
-50.0%
-30.0%
-10.0%
10.0%
30.0%
50.0%
0
50
100
150
200
250
300
350
400
450
2018 2019 2020E 2021E 2022E
Net profit attributable to shareholders YoY
(RMB mn)
189 198
43
130
214 243
215
282
424
515
0
100
200
300
400
500
600
2018 2019 2020E 2021E 2022E
Total cash on hand Operating cash flows
(RMB mn)

31 Jul 2020
PLEASE READ THE ANALYST CERTIFICATION AND IMPORTANT DISCLOSURES ON LAST PAGE 25
Initiate at BUY with TP of RMB25.5
Considering that DCF model is widely used for CRO and CMO/CDMO peers’ valuation.
Given the strong cash flow of the Company’s business, we believe DCF model is a
reasonable method to value the Company. We derive our TP of RMB25.5 assuming a
terminal growth rate of 3.0% and WACC of 10.2%. Our TP represents 65x / 45x FY20E /
21E P/E.
Figure 42: DCF model for valuation
DCF Valuation (Rmb mn) 2021E 2022E 2023E 2024E 2025E 2026E 2027E 2028E 2029E 2030E EBIT 358 464 638 778 945 1,144 1,378 1,654 1,976 2,351 Tax rate 12.0% 12.0% 12.0% 12.0% 12.0% 12.0% 12.0% 12.0% 12.0% 12.0% EBIT*(1-tax rate) 315 408 561 684 832 1,006 1,213 1,455 1,739 2,069 + D&A 170 193 201 221 242 264 286 309 332 355 - Change in working capital
(151) (198) (265) (292) (319) (348) (377) (408) (438) (469)
- Capx (300) (200) (200) (200) (200) (200) (200) (200) (200) (200) FCFF 35 204 297 414 554 722 921 1,156 1,433 1,756 Terminal value 25,269 Terminal growth rate 3.0% WACC 10.2% Cost of Equity 13.0% Cost of Debt 4.0% Equity Beta 1.0 Risk Free Rate 3.0% Market Risk Premium 10.0% Target Debt to Asset ratio 30.0% Effective Corporate Tax Rate 12.0% Terminal value 9,605 Total PV 13,322 Net debt 575 Minority interest 7 Equity value 12,740 # of shares (mn) 500 Price per share (in RMB) 25.5
Source: CMBIS estimates
Figure 43: Sensitivity analysis (RMB)
WACC
Terminal growth rate 9.2% 9.7% 10.2% 10.7% 11.2%
2.0% 27.6 25.1 23.0 21.1 19.4
2.5% 29.3 26.5 24.1 22.1 20.3
3.0% 31.2 28.1 25.5 23.2 21.2
3.5% 33.5 30.0 27.0 24.5 22.3
4.0% 36.3 32.2 28.8 26.0 23.5
Source: CMBIS estimates

31 Jul 2020
PLEASE READ THE ANALYST CERTIFICATION AND IMPORTANT DISCLOSURES ON LAST PAGE 26
Figure 44: Peers comparison
Price Mkt Cap Net profit YoY P/E (x) P/B (x) ROE (%)
Company Ticker Rating (LC)
(US$ mn) FY20E FY21E FY20E FY21E FY20E FY21E FY20E FY21E
H-share
WuXi AppTec 2359 HK NR 114.10 36,080 21.7% 30.3% 84.7 65.2 11.2 9.8 13.4 15.2
WuXi Biologics 2269 HK BUY 160.00 28,021 25.8% 40.3% 135.0 96.9 12.9 11.6 9.8 11.8
PharmaRon 3759 HK NR 84.00 11,653 63.1% 31.5% 68.7 51.6 6.9 6.0 10.2 11.9
Frontage 1521 HK NR 4.15 1,086 20.4% 31.2% 41.2 31.5 3.7 3.3 9.8 10.2
Viva 1873 HK NR 9.00 2,134 174.4% 38.5% 31.3 22.4 5.7 4.6 19.7 22.5
Average 61.1% 34.4% 72.2 53.5 8.1 7.1 12.6 14.3
A-share
Quantum Hi-Tech 300149 CH BUY 20.16 1,439 41.4% 45.1% 51.3 35.3 4.1 3.6 7.8 10.2
WuXi AppTec 603259 CH BUY 110.02 36,080 21.7% 30.3% 91.8 70.6 12.2 10.7 13.4 15.2
Tigermed 300347 CH BUY 107.28 11,481 33.0% 31.8% 77.1 58.7 15.3 12.3 20.4 21.7
Pharmaron 300759 CH NR 108.17 11,653 63.1% 31.5% 99.3 74.6 10.0 8.7 10.2 11.9
Joinn Laboratories 603127 CH NR 98.32 3,183 60.3% 35.3% 79.6 58.7 20.8 16.2 23.9 25.1
Asymchem Laboratories
002821 CH NR 217.20 7,175 29.2% 31.4% 69.1 52.9 13.3 10.7 19.3 20.2
Average 41.4% 34.2% 78.0 58.5 12.6 10.4 15.8 17.4
Source: Bloomberg, CMBIS estimates
31 Jul 2020
PLEASE READ THE ANALYST CERTIFICATION AND IMPORTANT DISCLOSURES ON LAST PAGE 27
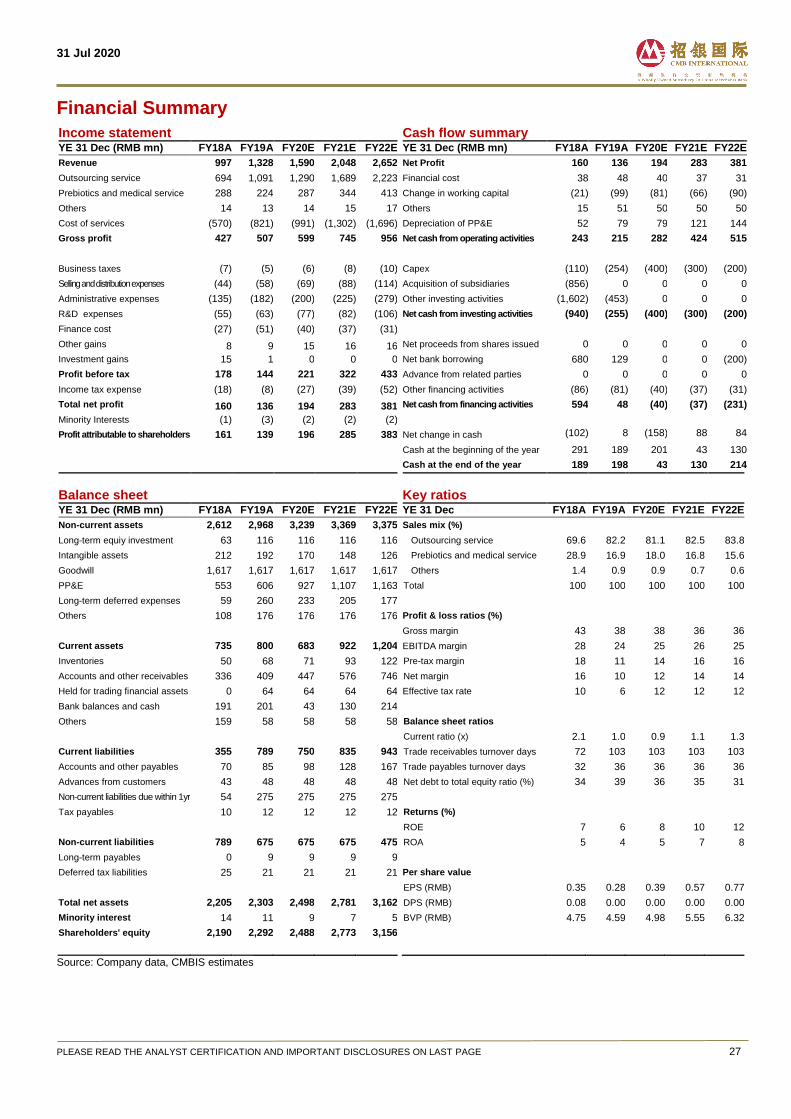
Financial Summary
Income statement Cash flow summary
YE 31 Dec (RMB mn) FY18A FY19A FY20E FY21E FY22E YE 31 Dec (RMB mn) FY18A FY19A FY20E FY21E FY22E
Revenue 997 1,328 1,590 2,048 2,652 Net Profit 160 136 194 283 381
Outsourcing service 694 1,091 1,290 1,689 2,223 Financial cost 38 48 40 37 31
Prebiotics and medical service 288 224 287 344 413 Change in working capital (21) (99) (81) (66) (90)
Others 14 13 14 15 17 Others 15 51 50 50 50
Cost of services (570) (821) (991) (1,302) (1,696) Depreciation of PP&E 52 79 79 121 144
Gross profit 427 507 599 745 956 Net cash from operating activities 243 215 282 424 515
Business taxes (7) (5) (6) (8) (10) Capex (110) (254) (400) (300) (200)
Selling and distribution expenses (44) (58) (69) (88) (114) Acquisition of subsidiaries (856) 0 0 0 0
Administrative expenses (135) (182) (200) (225) (279) Other investing activities (1,602) (453) 0 0 0
R&D expenses (55) (63) (77) (82) (106) Net cash from investing activities (940) (255) (400) (300) (200)
Finance cost (27) (51) (40) (37) (31)
Other gains 8 9 15 16 16 Net proceeds from shares issued 0 0 0 0 0
Investment gains 15 1 0 0 0 Net bank borrowing 680 129 0 0 (200)
Profit before tax 178 144 221 322 433 Advance from related parties 0 0 0 0 0
Income tax expense (18) (8) (27) (39) (52) Other financing activities (86) (81) (40) (37) (31)
Total net profit 160 136 194 283 381 Net cash from financing activities 594 48 (40) (37) (231)
Minority Interests (1) (3) (2) (2) (2)
Profit attributable to shareholders 161 139 196 285 383 Net change in cash (102) 8 (158) 88 84
Cash at the beginning of the year 291 189 201 43 130
Cash at the end of the year 189 198 43 130 214
Balance sheet Key ratios
YE 31 Dec (RMB mn) FY18A FY19A FY20E FY21E FY22E YE 31 Dec FY18A FY19A FY20E FY21E FY22E
Non-current assets 2,612 2,968 3,239 3,369 3,375 Sales mix (%)
Long-term equiy investment 63 116 116 116 116 Outsourcing service 69.6 82.2 81.1 82.5 83.8
Intangible assets 212 192 170 148 126 Prebiotics and medical service 28.9 16.9 18.0 16.8 15.6
Goodwill 1,617 1,617 1,617 1,617 1,617 Others 1.4 0.9 0.9 0.7 0.6
PP&E 553 606 927 1,107 1,163 Total 100 100 100 100 100
Long-term deferred expenses 59 260 233 205 177
Others 108 176 176 176 176 Profit & loss ratios (%)
Gross margin 43 38 38 36 36
Current assets 735 800 683 922 1,204 EBITDA margin 28 24 25 26 25
Inventories 50 68 71 93 122 Pre-tax margin 18 11 14 16 16
Accounts and other receivables 336 409 447 576 746 Net margin 16 10 12 14 14
Held for trading financial assets 0 64 64 64 64 Effective tax rate 10 6 12 12 12
Bank balances and cash 191 201 43 130 214
Others 159 58 58 58 58 Balance sheet ratios
Current ratio (x) 2.1 1.0 0.9 1.1 1.3
Current liabilities 355 789 750 835 943 Trade receivables turnover days 72 103 103 103 103
Accounts and other payables 70 85 98 128 167 Trade payables turnover days 32 36 36 36 36
Advances from customers 43 48 48 48 48 Net debt to total equity ratio (%) 34 39 36 35 31
Non-current liabilities due within 1yr 54 275 275 275 275
Tax payables 10 12 12 12 12 Returns (%)
ROE 7 6 8 10 12
Non-current liabilities 789 675 675 675 475 ROA 5 4 5 7 8
Long-term payables 0 9 9 9 9
Deferred tax liabilities 25 21 21 21 21 Per share value
EPS (RMB) 0.35 0.28 0.39 0.57 0.77
Total net assets 2,205 2,303 2,498 2,781 3,162 DPS (RMB) 0.08 0.00 0.00 0.00 0.00
Minority interest 14 11 9 7 5 BVP (RMB) 4.75 4.59 4.98 5.55 6.32
Shareholders' equity 2,190 2,292 2,488 2,773 3,156
Source: Company data, CMBIS estimates

31 Jul 2020
PLEASE READ THE ANALYST CERTIFICATION AND IMPORTANT DISCLOSURES ON LAST PAGE 28
Risks
Slower-than-expected organic earnings growth.
The growing demand for CRO and CMO/CDMO in China and worldwide may slow down due to
unexpected factors, such as pandemics like COVID-19.
Failure to retain the Company’s existing customers or expand its customer base.
The Company’s existing customers may not continue to generate significant revenues once its
engagements with them are concluded and the Company’s relationships with them may not
present further business opportunities.
Reduction in R&D budgets by pharmaceutical and biotechnology companies may result
in a reduction or discontinued outsourcing services.
Fluctuations in the R&D budgets of pharmaceutical and biotechnology industry participants
could significantly affect the demand for outsourcing services. R&D budgets fluctuate due to
pharmaceutical and biotechnology industry downturns, consolidation of pharmaceutical and
biotechnology companies, general economic conditions, and changes in available resources,
spending priorities and institutional budgetary policies. In addition, affected by COVID-19 in
2020, some R&D plans might be paused by pharms and biotech companies.

31 Jul 2020
PLEASE READ THE ANALYST CERTIFICATION AND IMPORTANT DISCLOSURES ON LAST PAGE 29
Disclosures & Disclaimers
Analyst Certification The research analyst who is primary responsible for the content of this research report, in whole or in part, certifies that with respect to the securities or issuer that the analyst covered in this report: (1) all of the views expressed accurately reflect his or her personal views about the subject securities or issuer; and (2) no part of his or her compensation was, is, or will be, directly or indirectly, related to the specific views expressed by that analyst in this report. Besides, the analyst confirms that neither the analyst nor his/her associates (as defined in the code of conduct issued by The Hong Kong Securities and Futures Commission) (1) have dealt in or traded in the stock(s) covered in this research report within 30 calendar days prior to the date of issue of this report; (2) will deal in or trade in the stock(s) covered in this research report 3 business days after the date of issue of this report; (3) serve as an officer of any of the Hong Kong listed companies covered in this report; and (4) have any financial interests in the Hong Kong listed companies covered in this report.
CMBIS Ratings BUY : Stock with potential return of over 15% over next 12 months HOLD : Stock with potential return of +15% to -10% over next 12 months SELL : Stock with potential loss of over 10% over next 12 months NOT RATED : Stock is not rated by CMBIS
OUTPERFORM : Industry expected to outperform the relevant broad market benchmark over next 12 months MARKET-PERFORM : Industry expected to perform in-line with the relevant broad market benchmark over next 12 months UNDERPERFORM : Industry expected to underperform the relevant broad market benchmark over next 12 months
CMB International Securities Limited Address: 45/F, Champion Tower, 3 Garden Road, Hong Kong, Tel: (852) 3900 0888 Fax: (852) 3900 0800
CMB International Securities Limited (“CMBIS”) is a wholly owned subsidiary of CMB International Capital Corporation Limited (a wholly owned subsidiary of China Merchants Bank)
Important Disclosures There are risks involved in transacting in any securities. The information contained in this report may not be suitable for the purposes of all investors. CMBIS does not provide individually tailored investment advice. This report has been prepared without regard to the individual investment objectives, financial position or special requirements. Past performance has no indication of future performance, and actual events may differ materially from that which is contained in the report. The value of, and returns from, any investments are uncertain and are not guaranteed and may fluctuate as a result of their dependence on the performance of underlying assets or other variable market factors. CMBIS recommends that investors should independently evaluate particular investments and strategies, and encourages investors to consult with a professional financial advisor in order to make their own investment decisions. This report or any information contained herein, have been prepared by the CMBIS, solely for the purpose of supplying information to the clients of CMBIS and/or its affiliate(s) to whom it is distributed. This report is not and should not be construed as an offer or solicitation to buy or sell any security or any interest in securities or enter into any transaction. Neither CMBIS nor any of its affiliates, shareholders, agents, consultants, directors, officers or employees shall be liable for any loss, damage or expense whatsoever, whether direct or consequential, incurred in relying on the information contained in this report. Anyone making use of the information contained in this report does so entirely at their own risk. The information and contents contained in this report are based on the analyses and interpretations of information believed to be publicly available and reliable. CMBIS has exerted every effort in its capacity to ensure, but not to guarantee, their accuracy, completeness, timeliness or correctness. CMBIS provides the information, advices and forecasts on an "AS IS" basis. The information and contents are subject to change without notice. CMBIS may issue other publications having information and/ or conclusions different from this report. These publications reflect different assumption, point-of-view and analytical methods when compiling. CMBIS may make investment decisions or take proprietary positions that are inconsistent with the recommendations or views in this report. CMBIS may have a position, make markets or act as principal or engage in transactions in securities of companies referred to in this report for itself and/or on behalf of its clients from time to time. Investors should assume that CMBIS does or seeks to have investment banking or other business relationships with the companies in this report. As a result, recipients should be aware that CMBIS may have a conflict of interest that could affect the objectivity of this report and CMBIS will not assume any responsibility in respect thereof. This report is for the use of intended recipients only and this publication, may not be reproduced, reprinted, sold, redistributed or published in whole or in part for any purpose without prior written consent of CMBIS. Additional information on recommended securities is available upon request. CMBIS or its affiliate(s) have investment banking relationship with the issuers covered in this report in preceding 12 months. For recipients of this document in the United Kingdom This report has been provided only to persons (I)falling within Article 19(5) of the Financial Services and Markets Act 2000 (Financial Promotion) Order 2005 (as amended from time to time)(“The Order”) or (II) are persons falling within Article 49(2) (a) to (d) (“High Net Worth Companies, Unincorporated Associations, etc.,) of the Order, and may not be provided to any other person without the prior written consent of CMBIS. For recipients of this document in the United States This report is intended for distribution in the US to "major US institutional investors", as defined in Rule 15a-6 under the US, Securities Exchange Act of 1934, and may not be furnished to any other person in the US. Each major US, institutional investor that receives a copy of this research report by its acceptance hereof represents and agrees that it shall not distribute or provide this research report to any other person. For recipients of this document in Singapore This report is distributed in Singapore by CMBI (Singapore) Pte. Limited (CMBISG) (Company Regn. No. 201731928D), an Exempt Financial Adviser as defined in the Financial Advisers Act (Cap. 110) of Singapore and regulated by the Monetary Authority of Singapore. CMBISG may distribute reports produced by its respective foreign entities, affiliates or other foreign research houses pursuant to an arrangement under Regulation 32C of the Financial Advisers Regulations. Where the report is distributed in Singapore to a person who is not an Accredited Investor, Expert Investor or an Institutional Investor, as defined in the Securities and Futures Act (Cap. 289) of Singapore, CMBISG accepts legal responsibility for the contents of the report to such persons only to the extent required by law. Singapore recipients should contact CMBISG at +65 6350 4400 for matters arising from, or in connection with the report.