Quantitative Traits Loci and candidate gene - Research Square
18
Page 1/18 Quantitative Traits Loci and candidate gene mapping for Quinones and Phenolic Biosynthesis in Nigella sativa L. using pseudo-chromosome Assembly Arusa Aftab, Zubaida Yousaf, Zill-e-Huma Aftab, Nadia Riaz, Bushra Shamsheer Madiha Rashid Lahore College for Women University Afa Younas Lahore College for Women University Zubaida Yousaf ( [email protected] ) Lahore College for Women University Zille Huma Aftab Lahore College for Women University Nadia Riaz Lahore College for Women University Bushra Shamsheer Lahore College for Women University Hamna Yasin Lahore College for Women University Research Article Keywords: Breeding, linkage, mapping, pseudo chromosome assembly, quantitative traits loci Posted Date: March 29th, 2022 DOI: https://doi.org/10.21203/rs.3.rs-1455502/v1 License: This work is licensed under a Creative Commons Attribution 4.0 International License. Read Full License
-
Upload
khangminh22 -
Category
Documents
-
view
0 -
download
0
Transcript of Quantitative Traits Loci and candidate gene - Research Square

Page 1/18
Quantitative Traits Loci and candidate genemapping for Quinones and Phenolic Biosynthesis inNigella sativa L. using pseudo-chromosomeAssembly Arusa Aftab, Zubaida Yousaf, Zill-e-HumaAftab, Nadia Riaz, Bushra ShamsheerMadiha Rashid
Lahore College for Women UniversityA�fa Younas
Lahore College for Women UniversityZubaida Yousaf ( [email protected] )
Lahore College for Women UniversityZille Huma Aftab
Lahore College for Women UniversityNadia Riaz
Lahore College for Women UniversityBushra Shamsheer
Lahore College for Women UniversityHamna Yasin
Lahore College for Women University
Research Article
Keywords: Breeding, linkage, mapping, pseudo chromosome assembly, quantitative traits loci
Posted Date: March 29th, 2022
DOI: https://doi.org/10.21203/rs.3.rs-1455502/v1
License: This work is licensed under a Creative Commons Attribution 4.0 International License. Read Full License

Page 2/18
AbstractQuantitative trait loci (QTL) mapping is a genome-wide inference of the relationship between genotype atvarious genomic locations and phenotype for a set of quantitative traits in terms of the number, genomicpositions, effects, and interaction of QTL. The Quinones and phenolics are the products of Geranyldiphospohate synthase (GPPS). Thymoquinone (TQ), dithymoquinone (DTQ), thymohydroquinone (THQ),and thymol (THY) are the most important pharmacologically active quinone based constituents in Nigellasativa (Black seed oil). Quantitative trait loci, candidate genes and associated morphological markers forthese traits have been identi�ed and located in the N.sativa genome. The breeding and geneticimprovement of N. sativa is highly restricted due to unexplored high-density genetic map. The study wasplanned to map the genes linked to quinonens ane phenolics biosynthesis in N. sativa. Two inbredparental lines W626529 and W626530 differing in some phenotypic characters were selected for thestudy. To construct genetic linkage map and locate QTLs, F1 population of 150 crossed individuals wasgrown and subsequently produced 50 recombinant inbred lines (RIL). Chromosomal linkage map wasconstructed using 719 polymorphic pairs; consisted of 14 morphological markers and 705 SSRs throughJoin Map ver. 3.0. Chromosomal mapping was done using pseudochromosome assembly using Win QTLCart Software. Single Marker Analysis was done to link QTLs with the morphological and molecularmarkers. Only 5 morphological traits out of 16 were found to be linked to the QTL. Chromosomal markerlinkage was ensured at a minimum likelihood of odds (LOD) > 1.5 and maximum distance 50 cM. Intervalmapping led to the detection of eight QTLs on 12 linkage groups; LG1, LG2, LG5, LG6, LG8, LG9 and LG11.The detection of eight QTLs on 12 linkage groups con�rmed the in�uence of both morphological andmolecular markers on linked traits and inheritance. The genetic map and improved pseudo-chromosomescale genome provide crucial foundations for marker-assisted selection (MAS) of QTL governingimportant agronomic traits as well as the accelerated molecular breeding of N. sativa in a cost-effectivepattern.
IntroductionQuantitative trait loci (QTL) are genetic regions that in�uence phenotypic variation of a complex trait,often through genetic interactions with each other and the environment. QTLs are utilized to de�ne thegeneral chromosomal position of genes or genetic variants that in�uence the magnitude of a measurabletrait. (Powder, 2020). Nigella is a genus of 18 species of annual plants in the family Ranunculaceae,native to Southern Europe, North Africa, South Asia, Southwest Asia and the Middle East. The plant iscommonly known as a Black seed and belongs to the family Ranunculaceae (Aftab et al., 2021). Thereare seventeen representative species in the Nigella genus including three diploid species. Black seed(Nigella sativa L., 2n = 2x = 12) has a big genome with 1C equal to 10.63 picograms (10.4 GBP).Repetitive DNA is tandem or dispersed repetitive sequences that compose 25 to 85% of the plant genome(Orooji and Mirzaghaderi, 2019). Genetic mapping is important for understanding the origin andrelationships among the genome of species and serves as a basis for genetic studies concerning various
Page 3/18
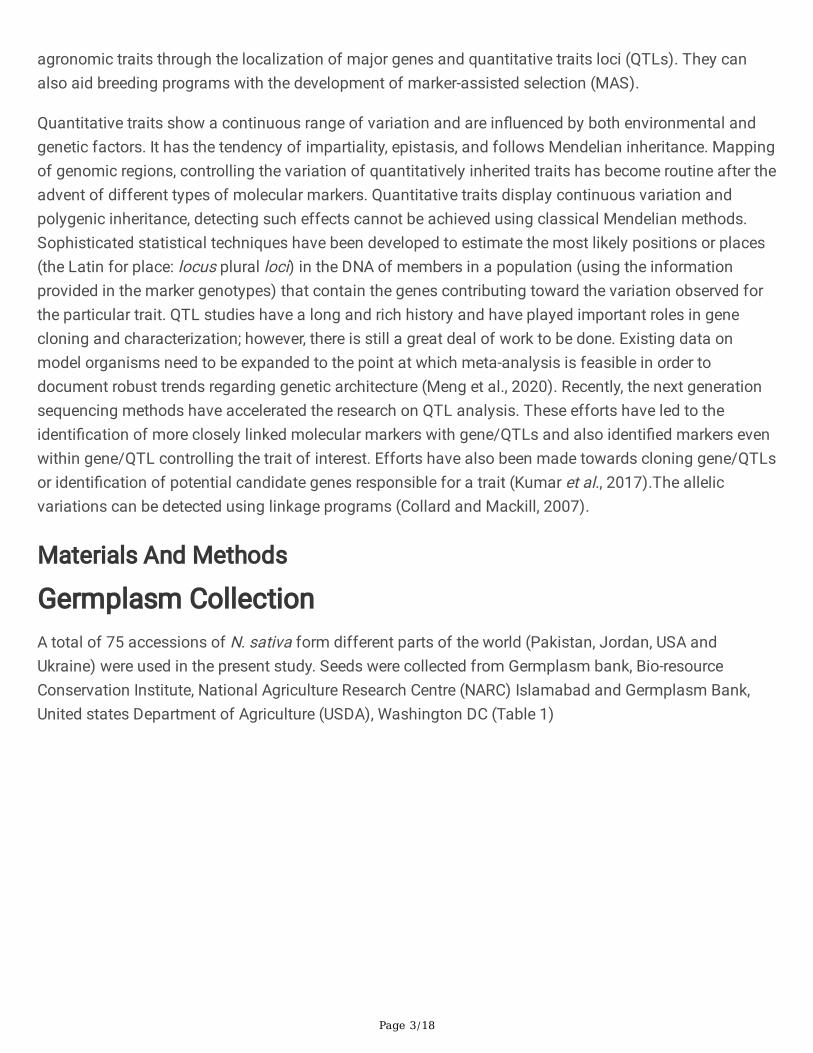
agronomic traits through the localization of major genes and quantitative traits loci (QTLs). They canalso aid breeding programs with the development of marker-assisted selection (MAS).
Quantitative traits show a continuous range of variation and are in�uenced by both environmental andgenetic factors. It has the tendency of impartiality, epistasis, and follows Mendelian inheritance. Mappingof genomic regions, controlling the variation of quantitatively inherited traits has become routine after theadvent of different types of molecular markers. Quantitative traits display continuous variation andpolygenic inheritance, detecting such effects cannot be achieved using classical Mendelian methods.Sophisticated statistical techniques have been developed to estimate the most likely positions or places(the Latin for place: locus plural loci) in the DNA of members in a population (using the informationprovided in the marker genotypes) that contain the genes contributing toward the variation observed forthe particular trait. QTL studies have a long and rich history and have played important roles in genecloning and characterization; however, there is still a great deal of work to be done. Existing data onmodel organisms need to be expanded to the point at which meta-analysis is feasible in order todocument robust trends regarding genetic architecture (Meng et al., 2020). Recently, the next generationsequencing methods have accelerated the research on QTL analysis. These efforts have led to theidenti�cation of more closely linked molecular markers with gene/QTLs and also identi�ed markers evenwithin gene/QTL controlling the trait of interest. Efforts have also been made towards cloning gene/QTLsor identi�cation of potential candidate genes responsible for a trait (Kumar et al., 2017).The allelicvariations can be detected using linkage programs (Collard and Mackill, 2007).
Materials And Methods
Germplasm CollectionA total of 75 accessions of N. sativa form different parts of the world (Pakistan, Jordan, USA andUkraine) were used in the present study. Seeds were collected from Germplasm bank, Bio-resourceConservation Institute, National Agriculture Research Centre (NARC) Islamabad and Germplasm Bank,United states Department of Agriculture (USDA), Washington DC (Table 1)

Page 4/18
Table 1Geographical Locations of N.sativa L. collected germplasm
Sr. No. Accession No. Region Geographical location
1 20545 Haripur 33°59′39″N 72°56′0″E
2 20567 Faisalabad 31°25′0″N 73°5′28″E
3 20576 Faisalabad 31°25′0″N 73°5′28″E
4 20585 Faisalabad 31°25′0″N 73°5′28″E
5 20592 Faisalabad 31°25′0″N 73°5′28″E
6 21208 Faisalabad 31°25′0″N 73°5′28″E
7 20609 Peshawar 34°01′N 71°35′E
8 20620 Peshawar 34°01′N 71°35′E
9 21805 Peshawar 34°01′N 71°35′E
10 20631 Narowal 32° 6′ 0″ N, 74° 52′ 29″ E
11 20662 Gujranwala 44''20' and 52''20' N and 22''5' and 41''15'E
12 20654 Gujranwala 32° 9′ 24″ N, 74° 11′ 24″ E
13 20699 D.I.KHAN 31° 49′ 53″ N, 70° 54′ 7″ E
14 20742 Mirpur 33° 9′ 0″ N, 73° 44′ 0″ E
15 20749 Chakwal 33° 40′ 38″ N, 72° 51′ 21″ E
16 20766 Multan 30° 11′ 52″ N, 71° 28′ 11″ E
17 20878 Lahore 31°15′—31°45′ N and 74°01′—74°39′ E
18 20780 Lahore 31°15′—31°45′ N and 74°01′—74°39′ E
19 20561 Lahore 31°15′—31°45′ N and 74°01′—74°39′ E
20 20781 Bahawalpur 29° 23′ 44″ N, 71° 41′ 1″ E
21 20896 Bahawalpur 29° 23′ 44″ N, 71° 41′ 1″ E
22 22293 Rawalpindi 33° 36′ 0″ N, 73° 2′ 0″ E
23 22301 Rawalpindi 33° 36′ 0″ N, 73° 2′ 0″ E
24 20874 Rawalpindi 33° 36′ 0″ N, 73° 2′ 0″ E
25 20877 Rawalpindi 33° 36′ 0″ N, 73° 2′ 0″ E
26 20879 Rawalpindi 33° 36′ 0″ N, 73° 2′ 0″ E
27 20880 Islamabad 33° 43′ 0″ N, 73° 4′ 0″ E

Page 5/18
Sr. No. Accession No. Region Geographical location
28 20881 Islamabad 33° 43′ 0″ N, 73° 4′ 0″ E
29 22083 Quetta 30° 11′ 0″ N, 67° 0′ 0″ E
30 20904 Quetta 30° 11′ 0″ N, 67° 0′ 0″ E
31 20976 Quetta 30° 11′ 0″ N, 67° 0′ 0″ E
32 22155 Quetta 30° 11′ 0″ N, 67° 0′ 0″ E
33 20985 Khushab 32° 17′ 55″ N, 72° 21′ 3″ E
34 20990 Sargodha 32° 5′ 1″ N, 72° 40′ 16″ E
35 21017 Mansehra 34° 20′ 2″ N, 73° 12′ 5″ E
36 21090 Mansehra 34° 20′ 2″ N, 73° 12′ 5″ E
37 21295 Jhang 31° 16′ 10″ N, 72° 18′ 58″ E
38 21355 Layyah 30° 57′ 36.72″ N, 70° 56′ 32.28″ E
39 21362 Layyah 30° 57′ 36.72″ N, 70° 56′ 32.28″ E
40 21382 Muzafargarh 30° 4′ 10″ N, 71° 11′ 39″ E
41 21395 Muzafargarh 30° 4′ 10″ N, 71° 11′ 39″ E
42 21416 Attock 33° 46′ 0″ N, 72° 22′ 0″ E
43 20783 Attock 33° 46′ 0″ N, 72° 22′ 0″ E
44 21428 Attock 33° 46′ 0″ N, 72° 22′ 0″ E
45 21432 Attock 33° 46′ 0″ N, 72° 22′ 0″ E
46 21475 T.T.Singh 30° 58′ 0″ N, 72° 29′ 0″ E
47 21612 T.T.Singh 30° 58′ 0″ N, 72° 29′ 0″ E
48 21724 Sialkot 32° 29′ 33″ N, 74° 31′ 52″ E
49 21753 Karachi 24° 51′ 36″ N, 67° 0′ 36″ E
50 21967 Karachi 24° 51′ 36″ N, 67° 0′ 36″ E
51 21762 Sanghar 26° 0′ 0″ N, 69° 15′ 0″ E
52 21774 Sukkar 27° 42′ 22″ N, 68° 50′ 54″ E
53 21776 Sukkar 27° 42′ 22″ N, 68° 50′ 54″ E
54 21775 Larkana 27° 33′ 30″ N, 68° 12′ 40″ E
55 21777 R.Y.Khan 28° 25′ 12″ N, 70° 18′ 0″ E

Page 6/18
Sr. No. Accession No. Region Geographical location
56 21778 Hyderabad 25° 22′ 45″ N, 68° 22′ 6″ E
57 21807 Swat 35° 12′ 0″ N, 72° 29′ 0″ E
58 22053 Mastung 29° 47′ 58.19″ N, 66° 50′ 48.58″ E
59 22099 Kohlu 29° 53′ 48″ N, 69° 15′ 12″ E
60 22115 Zhob 31° 20′ 30″ N, 69° 26′ 55″ E
61 22134 Kalat 29° 1′ 48″ N, 66° 35′ 20.4″ E
62 22147 Loralai 30° 22′ 0″ N, 68° 36′ 0″ E
63 21538 D.G.Khan 30° 1′ 59″ N, 70° 38′ 24″ E
64 21544 D.G.Khan 30° 1′ 59″ N, 70° 38′ 24″ E
65 25910 D.G.Khan 30° 1′ 59″ N, 70° 38′ 24″ E
66 25911 D.G.Khan 30° 1′ 59″ N, 70° 38′ 24″ E
67 25912 D.G.Khan 30° 1′ 59″ N, 70° 38′ 24″ E
68 25913 D.G.Khan 30° 1′ 59″ N, 70° 38′ 24″ E
69 25914 D.G.Khan 30° 1′ 59″ N, 70° 38′ 24″ E
70 25915 D.G.Khan 30° 1′ 59″ N, 70° 38′ 24″ E
71 W618859 U.S Idaho 45° 0′ 0″ N, 114° 0′ 0″ W
72 W626531 Jordan 31°00′N 36°00′E
73 W626529 Jordan 31°00′N 36°00′E
74 P1506432 Jordan 31°00′N 36°00′E
75 W626530 Ukraine 44''20' and 52''20' N and 22''5' and 41''15'E
Germplasm cultivation
Seed of all accessions were planted according to Randomized Complete Block Design (RCBD) at Botanicgarden Lahore College for Women University Lahore located (31.45° N and 74.39° E). Recommendedcultural practices and inputs were followed (Ahmad and Ghafoor, 2003).
Morphological Data Collection
Economically important morphological traits were selected on the basis of available literature (Iqbal et al.2015). Ten plants per accession were selected for data collection against seed length, seed width,number of days to germination, 50 percent germination, plant height from ground level to uppermostbranch, total number of branches per plant, number of days from date of sowing till formation of �rst

Page 7/18
bud, total number of �owers, variation in �ower and petal colors, number of petals, number of stamens,number of follicles produced per accession, follicle length, follicle width and total number of seedsproduced per follicle. The seeds produced from P1 of all accessions were cross pollinated using onehundred and �fty individuals from two accessions W626529 (white �owers) and W626530 (Blue �owers)selected from its centers of diversity was done by introducing honey bees. Of these P1 (W626529)belonged to Jordan (South West Asia, 31°00′N 36°00′E) while P2 (W626530) was from Ukraine (EasternEurope, 44''20' and 52''20' N and 22''5' and 41''15'E), whereas all other parental accessions were grownnormally. The seed was then collected from crossed and pure parental plants (F1). The collected seedwas re-sown for the next year and observed all morphological markers of both parental and recombinantplants of F2. Seeds viability and germination was checked after 30 and 60 days of sowing.
QTL Analysis
Phenotyping
Two inbred lines W626529 (white �owers) and W626530 (Blue �owers) were used as parental lines forthis study. To construct the genetic linkage map and locate QTLs, F1 population of 150 crossedindividuals was grown and subsequently produced 50 recombinant inbred lines (RIL). Young leaf tissuesfrom parents and F2 plants were harvested, immersed in liquid nitrogen and stored at -80ºC for geneticanalysis.
Alignment of the linkage groups to Nigella sativa pseudochrome assembly
QTL mapping and linkage map in N.sativa plant were built according to Yin et al. 2012 and Wullschlegeret al. 2016. The recombinant plant (light blue �owers) was produced by crossing W626529 (White�owers) and W626530 (Blue �owers). Several segregating markers were generated from 100 simplesequence repeat (SSR) primer pairs and fourteen morphological markers. Linkage map in N.sativa plantwas constructed using 719 polymorphic pairs; consisted of 14 morphological markers and 705 SSRsthrough Join Map ver. 3.0 (Zhang et al., 2013; Ooijen and Voorrips, 2001). Chromosomal mapping wasdone using pseudochromosome assembly (Wang et al. 2011). The map was divided into 12 linkagegroups equivalent to the number of chromosomes according to Wu et al. (2010). A high-density linkagemap was prepared with 719 polymorphic loci using Win QTL Cart Software (Windows QTL Cartographerver. 2.50). Single Marker Analysis was done to link QTLs with the morphological and molecular markersusing a linear regression model through. QTL linkage was also done through Interval Mapping (IM) andComposite interval mapping (CIM). The quantitative traits were selected according to quinone and phenolbiosynthesis sites cited in literature (Salama et al. 2011; Kamal et al. 2010; Boubertakh et al. 2013).
Results And Discussion
Quantitative Traits Loci (QTL) Analysis and LinkageMapping pattern

Page 8/18
Single Marker AnalysisThe analysis of all quantitative traits was done using a linear regression model that indicates the value ofb1. According to the model, if the value of b1 is quite different from zero, the trait would be linked to QTL.Accordingly, only 5 traits (morphological) out of 16 were found to be linked to the QTL and the remaining20 did not show any linkage. A few QTL traits like number of �owers, number of petals, number ofstamens, number of follicles, follicle length, follicle width and seeds per follicle were detected amongdifferent linkage groups. The phenotype of each individual is determined by the environment and anunknown number of genes, the genotype at the segregating QTLs cannot be inferred directly from thephenotype. Consequently, the location of QTLs in the linkagemaps cannot be based on the directestimation of recombination frequencies, as for Mendelianloci. In contrast, QTL positions are indirectlyinferred from linked markers, by using speci�cstatistical methods aiming to �nd and compareassociations between marker genotypic classesand the phenotypic trait (Blanco et al., 2006).
Qtl Analysis By Interval Mapping (Identi�cation OfCandidate Genes For Qtl Mapping)The morphological markers (traits) for QTL mapping were, 2 seed traits, 2 branch traits, 6 �ower traitsand 6 follicle traits. All the traits associated with QTLs were mapped on the chromosomes. The linkage ofmarkers on chromosomes was ensured at a minimum likelihood of odds (LOD) > 1.5 and maximumdistance 50CM. All the markers were initially analyzed through single marker analysis and then theirinterval and composite interval mapping was done. QTL analysis was done using Win QTL Cart ver. 2.5software. A total of 500 permutation tests were performed to establish empirical LOD threshold at asigni�cance level of 0.05. The position of all the morphological markers and the relevant LOD wereobserved and presented in box plots. All the characters below threshold value were not linked with QTLs.The QTL positions were shown in the chromosomal maps in darker regions.
Interval mapping showed linkage groups based on QTL linked markers on chromosome number 1, 2, 5, 6,8, 10 and 11. All linkage groups were determined with an LOD ≥ 2.1 (Zhang et al. 2013). N. sativa L. is thediploid (2n) plant with 12 chromosomes. The map was divided into 12 linkage groups equivalent to thenumber of chromosomes using pseudochromosome assembly. Chromosomal mapping was based onboth morphological and molecular markers. Interval mapping lead to the detection of eight QTLs on 12linkage groups; LG1, LG2, LG5, LG6, LG8, LG9 and LG11. QTL 1 was detected on Linkage group 1 betweenfollicle width (FW) and follicle length (FL) at 22.6cM distance with LOD value 3.45 and 3.42. Thepresence of QTL 2 was perceived on LG 2 at 23.8 cM between number of tentacles (NT) and follicle width(FW) with LOD values 3.68 and 5.42. QTL 3 was observed on LG5 at 20.3cM distance between �owersnumber (FN) and petals number (PN) and LOD values were 6.83 and 8.84. LG6 showed the presence ofQTL 4 between follicle width (FW) and number of tentacles (NT) at 36.0cM and their LOD values wererecorded as 8.06 and 9.28. QTL 5 existed at LG 8 at 28.7cM between petals number (PN) and number ofstamens (NS) with LOD values 9.96 and 8.86. QTL 6 was identi�ed at LG9 at 37.8cM between number of

Page 9/18
stamens (NS) and petals number (PN) with LOD 9.20 and 10.27. QTL 7 was noticed on LG1 betweenfollicle number (FN) and follicle length (FL) at 38.0cM and their LOD values were 13.82 and 14.63. FinallyQTL 8 was detected on LG11 within number of �owers (NF) and petals number (PN) at 29.8cMwith LODvalues 14.21 and 10.99.
Linkage Map ConstructionThe key step for QTL analysis is to map and position the QTLs on speci�c regions of chromosomes.Based on this QTL mapping, the phenotypes of the organisms could be analyzed, as in phenomics (Jin etal., 2016).Quantitative trait loci (QTL) mapping was done using �fteen morphological markers, whiletwelve among them showed close linkage with diversity and phytochemical aspects in the previoushistory (Kamal et al. 2012; Salama et al. 2011; Asif et al. 2016; Boubertakh et al. 2013). For QTL analysis,all the traits were studied but only 6 showed their linkage on chromosomes. The QTLs with su�cientlylarge phenotypic effects can be detected statistically, while QTL with smaller effects are di�cult to detectin most instances (Yunbi -Xu, 2010).
In a similar study, 15 QTLs were identi�ed in several populations derived from crosses between ricecultivars from Japan and India while 12 QTLs related to plant height and number of kernels were mappedon 7 chromosomes (Uga et al. 2012). Similarly, Hashida et al. (2013) used eight morphological traits forQTL detection but only six linked traits were found. A linkage group between follicle length (FL) andfollicle width (FW) showed the position on both chromosome 1 and chromosome 2. It has been observedthat when multiple QTLs control a trait, their alleles of positive or negative effect tend to be dispersedamong genetic stocks with positive alleles and where QTL alleles of similar effect are dispersed amonggenetic stocks is referred to as allele dispersion (Yunbi-Xu, 2010). Allele dispersion can also be identi�edbased on QTL mapping results (Tubesha et al., 2013) The genetic variation of a quantitative trait isassumed to be controlled by the collective effects of numerous genes, known as Quantitative Trait Loci(QTLs) and identi�cation of QTLs based only on conventional phenotypic evaluation is not possible. QTLanalysis removes the discrepancies of normal genetic analysis (Zhang et al. 2013). QTL analysis isalways done for a large population like in the present study the crop was grown for three consecutiveyears and both morphological and molecular markers were used for segregation analysis and QTLinvestigation. Likewise Iqbal et al. (2013) used very large population to detect QTLs in seed coat color oftwo inbred lines. W626529 and W626530 used in the present study were different in their center ofdiversity and in some phenotypic characters
QTL mapping can be applied when phenotypic differences between parents are not necessarily present.In some cases QTLs are still detected where no parental differences are found. One QTL was detected atthe mapping location of follicle width and follicle length morphological marker, as follicles are the sites ofseed storage and in previous literature (Ismail et al 2015) it has been mentioned that seeds of N.sativaare ironic source of thymoquine (Quinone category). Another QTL was detected at the linkage betweennumber of petals (PN) and number of stamens (NS) that could be because of the close association

Page 10/18
between both of these characters that lead to the production of fruit and seeds in the plant and ultimatelyquinones and phenolics production of N.sativa. Whether our QTL study does not provide the extact locusof quinone and phenol synthesis genes but SSR analysis and mapping predicts the estimated location ofspeci�c genes in the whole genome. It has been observed that several genes lying close together, eachwith a small effect on a trait, could appear to be a single QTL of large effect (Michelmore andShaw,1988). QTL through �ne mapping has been envisioned as an initial step in identifying single QTLthat ultimately could be manipulated using transformation technology. The marker related to number of�owers production was detected in three different linkage groups with variable LODs that may be anindication of the complex consisting of different or related components or sub-traits (Wang et al. 2013) Ithas been noticed that there are six direct component effects upon days to �ower factors, which regulatethree plant processes and one plant characteristic which modulate the ongoing gene action of �owerproduction (Lou et al. 2015).
ConclusionThe detection of eight QTLs on 12 linkage groups con�rmed the in�uence of both morphological andmolecular markers on linked traits and inheritance. Signi�cant markers like follicle length, follicle width,number of petals and number of stamens were found linked in most of the linkage groups. These�ndings will be helpful for further research into potential new mechanisms controlling seed size andweight in N. sativa. The genetic map and improved pseudo-chromosome scale genome provide crucialfoundations for marker-assisted selection (MAS) of QTL governing important agronomic traits, as well asthe accelerated molecular breeding of N. sativa in a cost-effective pattern
DeclarationsAcknowledgements
The acknowledgement goes to university for �nancial support and molecular taxonomy lab supportthroughout the study.
Con�icts of Interest
There are no con�icts of interest in the present study.
Data Availability statement
All data generated or analyzed during this study are included in this published article [and itssupplementary information �les].
Funding Sources
The study was compiled by post graduate student’s funds provided by Lahore College for WomenUniversity Lahore, Pakistan.

Page 11/18
References1. Aftab A, Yousaf Z, Shamsheer B, Riaz N, Rashid M, Younas A, Javaid A (2021) Thymoquinone:
Biosynthesis, Biological Activities and Therapeutic Potential from Natural and Synthetic Sources. IntJ Agric Biology 25(5):1024–1034
2. Alimi NA (2016) Statistical methods for QTL mapping and genomic prediction of multiple traits andenvironments: case studies in pepper. Theor Appl Genet 124:95–109
3. Bahmani M, Shirzad H, Majlesi M, Shahinfard N, Ra�eian-Kopaei M (2014) A review study onanalgesic applications of Iranian medicinal plants. Asian Pac J Trop Med 7:S43–S53
4. Blanco CA, Maarten K, Johan WVO (2006) Methods in Molecular Biology. QTL Analysis. Vol. 323:Arabidopsis Protocols, Second Edition, Edited by: J. Salinas and J. J. Sanchez-Serrano © HumanaPress Inc., Totowa
5. Boubertakh B, Liu XG, Cheng XL, Li P (2013) A spotlight on chemical constituents andpharmacological activities of Nigella glandulifera Freyn & Sint seeds. J Chem 820183:1–12
�. Collard BC, Mackill DJ (2007) Marker-assisted selection: an approach for precision plant breeding inthe twenty-�rst century. Phil Trans R Soc Lond B Biol Sci 363:557–572
7. Ghafoor A, Sharif A, Ahmad Z, Zahid M, Rabbani M (2001) Genetic diversity in blackgram (Vignamungo L. Hepper). Field Crops Research 69(2):183–190
�. Golkar PV, Nourbakhsh T (2019) Analysis of genetic diversity and population structure in Nigellasativa L. using agronomic traits and molecular markers (SRAP and SCoT). Ind Crops Prod 130:170–178
9. Hashida T, Nakatsuji R, Budahn H, Schrader O, Peterka H, Fujimura T, Kubo N, Hirai M (2013)Construction of a chromosome-assigned, sequence-tagged linkage map for the radish, Raphanussativus L. and QTL analysis of morphological traits. Breed Sci 63(2):218–226
10. Iqbal MS, Ghafoor A, Ahmad H (2013) Multivariate analysis and selection to enquire genetic variationpatterns in Nigella sativa. Int J Agric Biology 15(3):443–450
11. Isemura T, Kaga A, Konishi S, Ando T, Tomooka N, Han OK, Vaughan DA (2007) Genome dissectionof traits related to domestication in azuki bean (Vigna angularis) and comparison with other warm-season legumes. Ann Botany 100(5):1053–1071
12. Ismail H, Fahmi A, Doolaanea AA, Mohamed F, Mansor NI, Shafri M, Affendi M, Yusof FA (2015)Method development and validation using UV spectrophotometry for Nigella sativa oil microparticlesquanti�cation. J Appl Pharm Sci 5(9):082–088
13. Jatoi SA, Javaid A, Iqbal M, Sayal OU, Masood MS, Siddiqui SU (2011) Genetic diversity in radishgermplasm for morphological traits and seed storage proteins. Pak J Bot 43(5):2507–2512
14. Jin Y, Shikai L, Zihao Y, Yujia Y, Suxu T, Zhanjiang L (2016) Cat�sh genomic studies: progress andperspectives. Genomics in Aquaculture 4:73–104. https://doi.org/10.1016/B978-0-12-801418-9.00004-4

Page 12/18
15. Kumar J, Gupta DS, Gupta S, Dubey S, Gupta P, Kumar S (2017 Aug) Quantitative trait loci fromidenti�cation to exploitation for crop improvement. Plant Cell Rep 36(8):1187–1213. doi:10.1007/s00299-017-2127-y. Epub 2017 Mar 28. PMID: 28352970
1�. Lou Q, Liang C, Hanwei M, Haibin W, Fangjun F, Pei W, Hui X, Tiemei HYPERLINK, Lijun L (2015)Quantitative trait locus mapping of deep rooting by linkage and association analysis in rice. Journalof Experimental Botany, 66 (15): 4749–4757
17. Meng T, He N, He H, Liu K, Ke L, Liu H, Zhong L, Huang C, Yang A, Zhou C, Qian L, Xie C (2020) Thediagnostic performance of quantitative mapping in breast cancer patients: a preliminary study usingsynthetic MRI. Cancer Imaging. Dec 14;20(1):88. doi: 10.1186/s40644-020-00365-4. PMID
1�. Miles C, Wayne M (2008) Quantitative trait locus (QTL) analysis. Nat Educ 1(1):208
19. Mulualem T, Zelalem B (2016). Advances in Quantitative Trait Loci, Mapping and Importance ofMarkers in Plant Breeding Research,International Journal of Plant, Breeding and Genetics, 10 (2):58–68
20. Ooijen JW, Voorrips RE (2001) JoinMap 3.0 Software for the Calculation of Genetic Linkage Maps.Plant Research International, Wageningen, The Netherlands
21. Orooji F, Mirzaghaderi G (2019) Whole genome sequencing (WGS) and FISH to analysis therepeatome of Nigella sativa L. 3th International and 11th National Biotechnology. congress ofIslamic Republic of Tehran Iran
22. Powder KE (2020) Quantitative Trait Loci (QTL) Mapping. Methods Mol Biol. ;2082:211–229. doi:10.1007/978-1-0716-0026-9_15. PMID: 31849018
23. Salama RHM, Abd-El-Hameed N, Abd-El-Ghaffar S, Mohammed ZT, Ghandour NMA (2011)Nephroprotective effect of Nigella sativa and Matricaria chamomilla in cisplatin induced renal injury.Int J Clin Med 2(3):185–195
24. Tubesha Z, Imam M, Mahmud R, Ismail M (2013) Study on the potential toxicity of a thymoquinone-rich fraction nanoemulsion in Sprague Dawley rats. Molecules 18(7):7460–7472
25. Uga Y, Hanzawa E, Nagai S, Sasaki K, Yano M, Sato T (2012) Identi�cation of qSOR1, a major riceQTL involved in soil-surface rooting in paddy �elds. Theor Appl Genet 124:75–86
2�. Uptmoor R, Schrag T, Stützel H, Esch E (2008) Crop model based QTL analysis across environmentsand QTL based estimation of time to �oral induction and �owering in Brassica oleracea. MolBreeding 21:205–216
27. Wang H, Xiaoming X, Xiaodeng Z, Rongrong Z, Wu W, Xihong S, Gaoxing D, Liyong C, Shihua C(2013) Identi�cation of qRL7, a major quantitative trait locus associated with rice root length inhydroponic conditions. Breed Sci 63(3):267–274
2�. Wang X, Wang H, Long Y, Li D, Yin Y, Tian J, Chen L, Liu L, Zhao W, Zhao Y (2013) Identi�cation ofQTLs associated with oil content in a high-oil Brassica napus cultivar and construction of a high-density consensus map for QTLs comparison in B. napus. PLoS ONE 8(12):e80569
29. Wu GS, Guo JJ, Bao JL, Li XW, Chen XP, Lu JJ, Wang YT (2010) Anti-cancer properties oftriterpenoids isolated from Ganoderma lucidum–a review. Expert Opin Investig Drugs 22(8):981–992

Page 13/18
30. Yousuf M, Ajmal SU, Munir M, Ghafoor A (2011) Genetic diversity analysis for agro-morphologicaland seed quality traits in rapeseed (Brassica campestris L.). Pak J Bot 43(2):1195–1203
31. Zada M, Zakir N, Rabbani MA, Shinwari ZK (2013) Assessment of genetic variation in Ethiopianmustard (Brassica carinata A. Braun) germplasm using multivariate techniques. Pak J Bot45(S1):583–593
32. Zhang H, Miao H, Wei L, Li C, Zhao R, Wang C (2013) Genetic analysis and QTL mapping of seedcoat color in sesame (Sesamum indicum L.). PLoS ONE 8(5):e63898
33. Zhang J, Liu T, Feng R, Liu C, Chi S (2015) Genetic map construction and quantitative trait locus(QTL) detection of six economic traits using an F2 population of the hybrid from Saccharinalongissima and Saccharina japonica. PloS one, 10 (5): e0128588
Figures
Figure 1
Schematic diagram of the N.sativa L. populations used for QTL analysis

Page 14/18
Figure 2
(a) W626529), (b) W626530, (c) Recombinant Plant
Figure 3
The position of different Morphological Traits on the chromosomes

Page 15/18
Figure 4
Linkage of different morphological markers on Chromosomes and their LOD Values

Page 16/18
Figure 5
The position of QTLs on Genetic Map

Page 17/18
Figure 6
Linkage groups among Different Morphological Markers and their position on chromosomes

Page 18/18
Figure 7
Linkage groups with reference to their LOD Values