Quantitative Microscopy of Hepatic Changes Induced by Phenethyl Isothiocyanate in Fischer-344 Rats...
10
http://tpx.sagepub.com/ Toxicologic Pathology http://tpx.sagepub.com/content/23/6/644 The online version of this article can be found at: DOI: 10.1177/019262339502300602 1995 23: 644 Toxicol Pathol Robert H. Gray, Gabriela Adam-Rodwell, Dorina Maris, Jeffrey R. Haskins and Gary D. Stoner Rats Fed Either a Cereal-Based Diet or a Purified Diet Quantitative Microscopy of Hepatic Changes Induced by Phenethyl Isothiocyanate in Fischer-344 Published by: http://www.sagepublications.com On behalf of: Society of Toxicologic Pathology can be found at: Toxicologic Pathology Additional services and information for http://tpx.sagepub.com/cgi/alerts Email Alerts: http://tpx.sagepub.com/subscriptions Subscriptions: http://www.sagepub.com/journalsReprints.nav Reprints: http://www.sagepub.com/journalsPermissions.nav Permissions: http://tpx.sagepub.com/content/23/6/644.refs.html Citations: by guest on July 12, 2011 tpx.sagepub.com Downloaded from
Transcript of Quantitative Microscopy of Hepatic Changes Induced by Phenethyl Isothiocyanate in Fischer-344 Rats...

http://tpx.sagepub.com/Toxicologic Pathology
http://tpx.sagepub.com/content/23/6/644The online version of this article can be found at:
DOI: 10.1177/019262339502300602
1995 23: 644Toxicol PatholRobert H. Gray, Gabriela Adam-Rodwell, Dorina Maris, Jeffrey R. Haskins and Gary D. Stoner
Rats Fed Either a Cereal-Based Diet or a Purified DietQuantitative Microscopy of Hepatic Changes Induced by Phenethyl Isothiocyanate in Fischer-344
Published by:
http://www.sagepublications.com
On behalf of:
Society of Toxicologic Pathology
can be found at:Toxicologic PathologyAdditional services and information for
http://tpx.sagepub.com/cgi/alertsEmail Alerts:
http://tpx.sagepub.com/subscriptionsSubscriptions:
http://www.sagepub.com/journalsReprints.navReprints:
http://www.sagepub.com/journalsPermissions.navPermissions:
http://tpx.sagepub.com/content/23/6/644.refs.htmlCitations:
by guest on July 12, 2011tpx.sagepub.comDownloaded from

644
Quantitative Microscopy of Hepatic ChangesInduced by Phenethyl Isothiocyanate in
Fischer-344 Rats Fed Either aCereal-Based Diet or a Purified Diet*
ROBERT H. GRAY,1 GABRIELA ADAM-RODWELL,2 DORINA MARIS,1JEFFREY R. HASKINS,1 AND GARY D. STONER2,3
1Department of Environmental and Industrial Health, University of Michigan,Ann Arbor, Michigan 48109, and
2Department of Pathology, Medical College of Ohio, Toledo, Ohio 43699
* Address correspondence to: Dr. Robert H. Gray, Departmentof Environmental and Industrial Health, The University of Mich-igan, 3537 SPH-I, Ann Arbor, Michigan 48109-2029.
3 Present address: The Ohio State University, Department ofPreventive Medicine, Arthur James Cancer Hospital and Re-search Institute, Columbus, Ohio 43210.
ABSTRACT
Hepatic changes induced by phenethyl isothiocyanate (PEITC) in the liver of rats were determined byquantitative microscopy. Groups of male Fischer-344 rats were fed either a standard, cereal-based diet (Waynerodent meal) or a purified diet (AIN-76A) containing PEITC at concentrations of 0.75 and 6.0 mmol/kg for13 wk. Severe hepatic lipidosis was observed in control rats fed the purified diet. Addition of PEITC to thepurified diet significantly reduced lipid content in hepatocytes. In contrast, lipid content in the liver of therats fed the cereal-based diet containing PEITC was greater than in control rats maintained on the same diet.In addition, dose-related reductions in hepatocyte, lipid droplet, peroxisome, and mitochondrial volumeswere observed in PEITC-treated rats fed the cereal-based diet. These results indicate that PEITC exertsdifferential effects on the liver of rats fed either the cereal-based or purified diet.
Keywords. Morphometric analysis; AIN-76A purified diet; hepatic fatty change; liver; rat
INTRODUCTION
Phenethyl isothiocyanate (PEITC) occurs natu-rally as a glucosinolate (gluconasturtiin) in crucif-erous and other related plants (21, 22). Gluconas-turtiin yields PEITC upon hydrolysis catalyzed bythioglucosidase, an enzyme present in these plantsand in the intestinal flora of animals (15). Recentstudies have demonstrated that PEITC has a marked
inhibitory activity toward nitrosamine-induced lungtumorigenesis in rats and mice and esophageal tu-morigenesis in rats (13, 14, 20). Ideally, an inhibitorof chemical carcinogenesis should be effective atnontoxic concentrations. Previously reported dataon the potential toxic effects of PEITC are limited(1, 6, 14, 17). An earlier report (1) from this labo-ratory details the toxicological evaluation of PEITCin Fischer-344 (F-344) rats after single treatment by
gavage and continuous treatment in the diet for 13wk. The results of the dietary subchronic study sug-gested that the liver may be a target organ for PEITCeffects. Any potential toxic effects of PEITC weredifficult to assess because the AIN-76A purified diet,used extensively in carcinogenesis and chemoprev-ention research, caused a marked hepatic lipidosis,predominantly in the periportal region of the liver.The addition of PEITC to the purified diet resultedin a reduction of lipids in the periportal region anda mild to moderate increase of lipid deposition inhepatocytes around the central vein. Morphometricanalysis of rat liver from this 13-wk study furtherdemonstrated the attenuated fatty change associatedwith the presence of PEITC in the purified diet (6).
Based on these results, a morphometric study wasconducted to evaluate ultrastructural changes in theliver of rats administered PEITC in the Wayne ce-real-based diet or in the AIN-76A purified diet. Arandom panlobular morphometric sampling schemewas applied to standardize for the differential lob-ular response previously observed and to optimizethe chance of detecting significant compound-relat-ed effects.
by guest on July 12, 2011tpx.sagepub.comDownloaded from

645
METHODS AND MATERIALS
Chemicals and Diets. PEITC (99% purity, MW163.24, density 1.094) was purchased from AldrichChemical Company (Milwaukee, WI). The AIN-76Apurified diet was supplied by Teklad Diets (Madi-son, WI). Wayne rodent meal (#8640), the cereal-based diet, was purchased from Wayne ResearchAnimal Care (Chicago, IL).Animals. F-344 rats were obtained from Harlan
Sprague Dawley, Inc. (Indianapolis, IN). The ratswere 5-6 wk of age and weighed approximately 100g when the study was initiated. Animals were housed2 per cage in an environmentally controlled room(20° ± 2°C; 55 ± 15% relative humidity, 10-12 freshair changes per hour; and a 12-hr light/dark cycle).Rats were acclimated to the laboratory for 7 daysprior to initiation of experimental procedures.
Preparation of Test Diets. Specified amounts ofPEITC were added to the Wayne meal and the AIN-76A diet and mixed in a Hobart mixer to ensureproper homogeneity. Test diets were prepared every2 wk and stored at 4°C until use.
Experimental Design. Groups of 6 male rats werefed either the AIN-76A purified diet or the Waynerodent meal containing PEITC at a concentrationof 0, 0.75, or 6.0 mmol/kg for 13 wk. The dosagelevels of PEITC were selected based on a previous13-wk study of PEITC in F-344 rats (1, 6, 14). Cal-culated average daily intake of PEITC was 8 and 67mg/kg body weight in the groups fed the Wayne dietcontaining 0.75 and 6.0 mmol/kg PEITC, respec-tively. Correspondingly, the average daily intake was7 and 56 mg/kg body weight of PEITC in the treat-ment groups fed the AIN-76A diet. Diet and tapwater were provided ad libitum throughout the study.The rats were observed daily for overt signs of tox-icity. Body weight and food consumption were mea-sured weekly.
Tissue Preparation, Electron Microscopy, and
Morphometry. Following 13 wk of treatment, therats were sacrificed with carbon dioxide and nec-
ropsies were performed. Livers were weighed andexamined macroscopically. Liver tissue from 4 an-imals per group was collected and processed for elec-tron microscopic examination and morphometricanalysis. A small piece of tissue was removed fromthe liver of each animal; immersed in a modifiedKamovsky’s fixative consisting of 2% glutaralde-hyde, 2% paraformaldehyde in 0.2 M cacodylatebuffer at 705 milliosmoles and pH 7.3; minced into1-mm3 blocks; fixed in 1 % osmium tetroxide; de-hydrated in a graded ethanol series; and embeddedin Spurr’s resin. Thick sections ( Am) were cut usinga Reichert Om-U2 ultramicrotome with a glass knifeand stained with Toluidine blue. Thin sections werecut using a diamond knife, poststained with uranyl
acetate and lead citrate, and examined in a ZeissEM IOCA electron microscope at 80 kV.Four tissue blocks from each animal were selected
for the quantitative assessment of liver changes. Cel-lular parameters were measured by light microscopyat a final magnification of x 2,830 on 4 randomlyselected fields per thick section per block. A
BioQuant Advanced System IV image analysis sys-tem with a calibrated video overlay was utilized tointerface with the light microscope. Approximately8 electron micrographs per block, taken at x 4,000and enlarged to a final magnification of x 20,000,were used to determine subcellular parameters. Cal-ibration was monitored with a grating replica pho-tographed with each set of negatives. Approximately384 fields from the thick sections and 750 electron
micrographs were used to generate the data pre-sented. The morphometric formulas were based onWeibel et al (23) and adapted for our laboratorycomputer (7). Differences between groups were de-termined using one-way analysis of variance (ANO-VA) at a significance level of 5%.
RESULTS
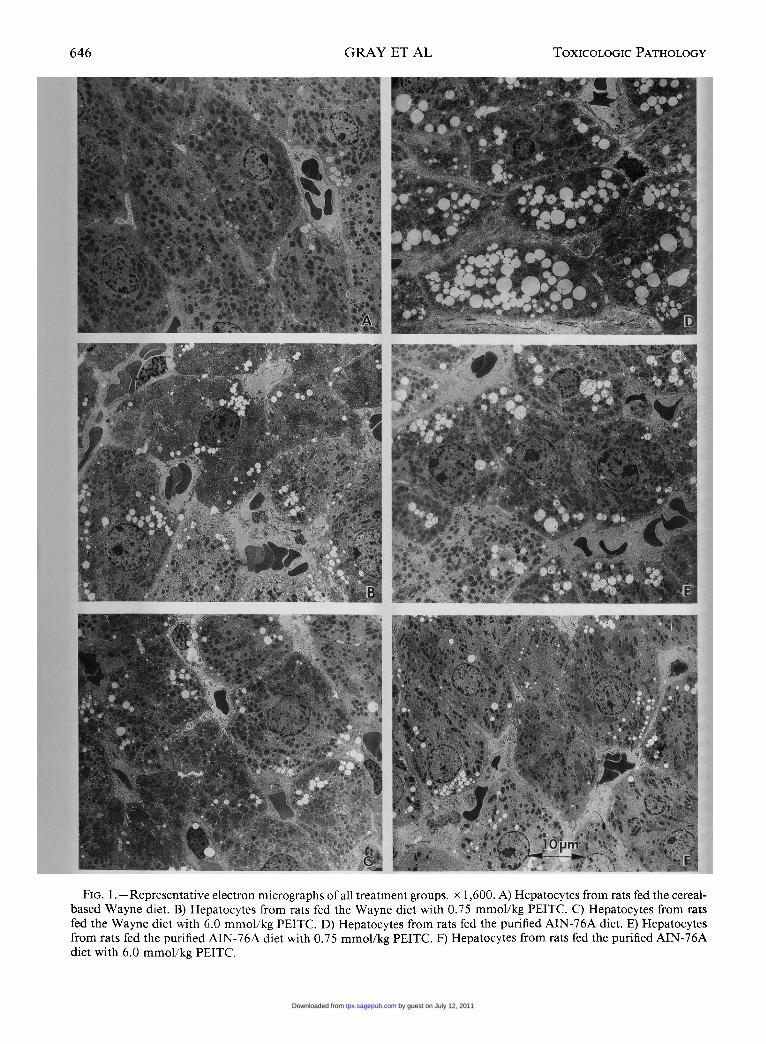
Hepatocyte MorphologyLow-magnification electron micrographs of rat
liver from each group are shown in Fig. 1. Hepa-tocytes from rats fed the control cereal-based Waynediet alone or with either 0.7 5 or 6.0 mmol/kg PEITCare shown in Fig. 1 A-C, respectively. Hepatocytesfrom the PEITC treatment groups had a higher lipiddroplet content than the control diet group (Fig. 1 A).Liver of animals from the 0.75-mmol/kg PEITCgroup had more lipid droplets than the 6.0-mmol/kg PEITC group. Hepatocytes from rats fed the con-trol purified AIN-76A diet are shown in Fig. 1 D.The AIN-76A diet produced a marked increase inhepatic lipid accumulation compared to the Waynediet-fed animals. Liver cells from rats fed the pu-rified AIN-76A diet with 0.75 mmol/kg PEITC areshown in Fig. 1 E. Addition of 0.7 5 mmol/kg PEITCreduced the quantity of lipid droplets compared tothe control animals in the same group (Fig. 1 D).Hepatocytes from rats fed the purified AIN-76A dietwith 6.0 mmol/kg PEITC (Fig. IF) showed a furtherreduction of lipid droplets compared to the 0.75-mmol/kg PEITC dose level or the AIN-76A controlgroups. A summary of the hepatic cellular and sub-cellular morphologic changes is provided in Table I.
Cell and Nuclear Ijolume MorphometricParameters
The mean hepatocyte volume was significantlyreduced by 14 and 23% in rats fed the Wayne dietcontaining PEITC at concentrations of 0.7 5 and 6.0mmollkg, respectively (Fig. 2A). Mean hepatocyte
by guest on July 12, 2011tpx.sagepub.comDownloaded from
646
FIG. 1.-Representative electron micrographs of all treatment groups. x 1,600. A) Hepatocytes from rats fed the cereal-based Wayne diet. B) Hepatocytes from rats fed the Wayne diet with 0.75 mmol/kg PEITC. C) Hepatocytes from ratsfed the Wayne diet with 6.0 mmol/kg PEITC. D) Hepatocytes from rats fed the purified AIN-76A diet. E) Hepatocytesfrom rats fed the purified AIN-76A diet with 0.75 mmol/kg PEITC. F) Hepatocytes from rats fed the purified AIN-76Adiet with 6.0 mmol/kg PEITC.
by guest on July 12, 2011tpx.sagepub.comDownloaded from

647
FIG. 2.-Morphometric hepatic changes induced by PEITC in F-344 rats. A) Comparison of the effects of PEITCtreatment on mean cell volume (>m3) and mean nuclear volume (AM3) in liver of rats fed either the Wayne or AIN-76Apurified diet. B) Comparison of the effects of PEITC treatment on lipid droplet volume (>m3) per cell and lipid volumefraction (%) per cell in the liver of rats fed PEITC in the Wayne diet or in the AIN-76A purified diet. C) Comparisonof the effects of PEITC treatment on peroxisome number per cell and the mean volume per peroxisome (gM3) inhepatocytes of rats administered PEITC in the Wayne diet or in the AIN-76A purified diet. D) Comparison of the effectsof PEITC treatment on peroxisome volume per cell (AM3) and the volume fraction percentage per cell in hepatocytes ofrats administered PEITC in the Wayne diet or in the AIN-76A purified diet. E) Comparison of the effects of PEITCtreatment on the mean number of mitochondria per cell and the mean volume per mitochondria (¡.Lm3) in hepatocytesof rats exposed to PEITC in the Wayne diet or in the AIN-76A purified diet. F) Comparison of the effects of PEITCtreatment on the mean mitochondria volume (>m3) per cell and the mean mitochondria volume fraction percentage percell in hepatocytes of rats fed PEITC in the Wayne diet or the AIN-76A purified diet. Error based on histograms represent±standard errors of the mean for each parameter measured. *Statistically significant versus the corresponding controlgroup (p < 0.05; one-way ANOVA); &dquo;Statistically significant versus the Wayne control diet group (p < 0.05: one-wayANOVA).
by guest on July 12, 2011tpx.sagepub.comDownloaded from

648
volume in the Wayne diet control animals was 7,085,urn3 compared to 6,101 and 5454 wm3, respectively,in the low- and high-dose PEITC-treated animals.Hepatocyte volume in control rats fed AIN-76A dietwas 5,561 ,um3, a significant reduction when com-pared to 7,085 wm3 observed in control rats fed theWayne diet. The AIN-76A-fed rats treated withPEITC did not show significant differences in meanhepatocyte volume from their respective controls.The mean nuclear volume decreased by 8 and
19% in rats fed the Wayne diet containing PEITCat 0.75 and 6.0 mmol/kg, respectively; the meannuclear volume in the high-dose PEITC group, 285~.m3, was significantly reduced when compared tocontrols, 352 ~,m3 (Fig. 2A). Addition of PEITC tothe AIN-76A diet did not induce significant changesin the cell or nuclear volume (Fig. 2A). The AIN-76A-fed group treated with PEITC did not show
significant differences from the control group fornuclear volume.
Lipid Droplet Morphometric Parameters
Figure 2B summarizes the results of morpho-metric lipid droplet parameters. Significant differ-ences in lipid droplet content were observed be-tween the control Wayne and control AIN-76A dietgroups as well as within groups administered PEITC.The mean lipid droplet volume per cell in rats fedthe Wayne diet was the lowest of any of the groups,that is, 2.8 ,m3 per cell or 0.04% of the total cellvolume. The addition of PEITC to the Wayne dietresulted in differential effects depending on the dose.At 0.75 mmol/kg PEITC, the mean lipid dropletvolume per cell increased to 17.7 ~,m3, or 0.30% ofthe total cell volume. In contrast, at 6.0 mmol/kgPEITC, the mean lipid droplet volume per cell de-creased to 10.9 ,m3, or 0.22% of the total cell vol-ume. The mean lipid droplet volume per hepatocyteof rats fed the AIN-76A diet was more than 70-fold
greater than that of rats fed the Wayne diet (Figs.1 A, D, and 2B). The mean lipid droplet volume percell increased from 2.8 to 211 ,um3, and the meanlipid droplet volume fraction increased from 0.4 to4.2% in rats fed the AIN-76A purified diet.PEITC in the AIN-76A diet caused an inverse
dose response for lipid droplet formation (Fig. 2B).The mean lipid droplet volume per cell was reducedfrom 211 AM3 in control animals to 45.5 ~m3 in ratstreated with 0.75 mmol/kg PEITC; these changescorrespond to a reduction in mean lipid droplet vol-ume per cell from 4.20% in controls to 0.80% in thelow-dose group. At 6.0 mmol/kg PEITC, the meanhepatocyte lipid droplet volume was further reducedto 12.7 gM3, corresponding to a 0.25% lipid dropletvolume per cell.
11
~4’)
sIT
d-
Wr.u~-4SP.~
~c~=!
8~s. Iwub4liCfs
U
I+~
wizN4
u’ Cu
s0
L~,0
so_;WramdH I
by guest on July 12, 2011tpx.sagepub.comDownloaded from

649
Peroxisome Morphometric ParametersPeroxisome morphometric parameters are shown
in Fig. 2C and D. In rats fed the Wayne diet, themean peroxisome number per cell was not signifi-cantly different after PEITC treatment. However,the mean number of peroxisomes per cell showedslight dose-related increases from 971 in controls to1,075 and 1,150 in the 0.75- and 6.0-mmol/kgPEITC dose groups, respectively (Fig. 2C). Meanperoxisome volume significantly decreased in thePEITC-treated groups. Mean peroxisome volumewas 0.117 AM3 in control animals and was reducedby 42 and 45% to 0.068 and 0.066 AM3 in the low-and high-dose PEITC groups, respectively (Fig. 2C).
In rats fed the AIN-76A diet, the mean numberof peroxisomes per cell was greater than in Waynediet animals, 1,306 compared to 971, respectively.AIN-76A-fed rats treated with PEITC showed aslight, but not statistically significant, change in themean number of peroxisomes per cell, from 1,306in control to 1,042 and 1,447 in the 0.75- and 6.0-mmol/kg PEITC dose levels, respectively (Fig. 2C).
In the Wayne-fed groups, the mean volume perperoxisome was reduced from 0.117 ,um3 in controlsto 0.068 and 0.066,4m’ in the 0.75- and 6.0-mmol/kg PEITC dose groups, respectively. The mean vol-ume per peroxisome of the AIN-76A group did notchange with PEITC treatment at either dose (Fig.2C). The mean volume per peroxisome in controlanimals of the AIN-76A diet was 0.057 wm3 com-pared to 0.117 4m’ in the Wayne-fed control rats(Fig. 2C). The mean peroxisome volume per cell inanimals fed the Wayne diet showed a reduction from105 ,um3 in control rats to 72 and 73 AM3 , respec-tively, in the 0.75- and 6.0-mmol/kg PEITC treat-ment groups (Fig. 2D). In the AIN-76A-fed controlrats, the mean peroxisome volume per cell was 74,um3, a significant reduction from the Wayne-fedanimals, 105 Mm3. The mean peroxisome volumeper cell was not significantly different in the rats fedthe AIN-76A diet containing PEITC.The mean peroxisome volume fraction per cell of
rats fed the control Wayne diet was 1.56% (Fig. 2D).The peroxisome volume fraction was not changedby the addition of PEITC to the diet. In the AIN-76A-fed rats, the 0.75-mmol/kg PEITC treatmentproduced a significant decrease in mean peroxisomevolume fraction per cell to 1.11 % compared to 1.47%in the control group (Fig. 2D). The mean peroxi-some volume percent fractions per cell of the Wayneand AIN-76A control groups were not statisticallydifferent.
Mitochondria Morphometric ParametersThe mitochondria morphometric parameters are
shown in Fig. 2E and F. The mean number of mi-
tochondria per hepatocyte in control rats fed Waynediet was 3,765 (Fig. 2E). Rats fed the Wayne dietcontaining PEITC showed no significant change inthe number of mitochondria per cell. In the Wayne-fed groups, the mean volume per mitochondria was
significantly decreased from 0.30 ¡.Lm3 in controls to0.23 and 0.20 AM3 in the 0.75- and 6.0-mmol/kgPEITC treatment groups (Fig 2E).Among the AIN-76A-fed rats, the mean number
of mitochondria per hepatocyte was increased inboth PEITC treatment groups; however, only the0.75-mmol/kg PEITC group showed a significantincrease, that is, 3,109 compared to 2,602 in thecontrol group (Fig. 2E). The mean number of mi-tochondria per cell in the AIN-76A control groupwas significantly lower than in the Wayne controlgroup, that is, 2,602 compared to 3,765, respec-tively.The mean volume per mitochondria in rats fed
AIN-76A diet decreased from 0.32 ~.m3 in the con-trols to 0.21 ,um3 in the 6-mmol/kg PEITC (Fig 2F).No significant differences were observed in the meanmitochondria volume between the control groupsof the Wayne- and AIN-76A-fed animals.
In rats fed the Wayne diet, PEITC treatmentcaused a dose-dependent decrease in the mean mi-tochondria volume per cell (Fig. 2F). The mean mi-tochondria volume per cell in the control group was
1,007 4m’ compared to 843 and 690 4m’ in the0.75- and 6.0-mmol/kg PEITC treated groups, re-spectively (Fig 2F). In rats fed the AIN-76A diet,only the 6.0-mmol/kg PEITC dose group showed adecrease in the mean mitochondrial volume per cell,669 AM3, compared to 813 ~,m3 per cell in the controlgroup. The mean mitochondria volume per cell inthe AIN-76A group, 813 UM3, was significantly low-er than in the Wayne-fed group, 1,007 ,um3.The mean mitochondria volume fraction per cell
was not significantly changed in any of the Waynediet groups (Fig. 2F). The mitochondria volumefractions were 15.0, 14.7, and 13.3% for the controland the 0.75- and 6.0-mmol/kg PEITC dose groups,respectively. In the AIN-76A groups, only the highPEITC dose group showed a significant decrease inthe mean mitochondria volume fraction, 13.0%compared to 16.4% observed in the control group(Fig. 2F). Comparison of the mean mitochondriavolume fraction per cell for the Wayne and AIN-76A diet control groups revealed no significant dif-ferences for this parameter.
DISCUSSION
A major observation in this study was severe fattychange in the liver of control rats fed the AIN-76Adiet compared to the cereal-based Wayne diet. Thepercentage of lipid droplet volume per cell was more
by guest on July 12, 2011tpx.sagepub.comDownloaded from

650
than 100-fold greater in rats fed the purified dietthan in control rats fed the Wayne diet. These resultswere consistent with previous reports on periportallipidosis in livers of rats fed the AIN-76A diet (8,12).AIN-76A purified diet, formulated by the Amer-
ican Institute for Nutrition (3), is widely used incarcinogenesis and chemoprevention studies. Thispurified diet contains 50% sucrose and 15% starchand is unsuitable for rodent studies in its presentformulation. Apparently, the excess sucrose is me-tabolized to lipids, leading to an imbalance betweensynthesis and secretion of lipoproteins from hepa-tocytes into circulating blood. Hamm et al (8) dem-onstrated that substitution of starch for sucroseeliminated hepatic lipidosis in both F-344 and CDrats. Addition of PEITC to the AIN-76A diet re-sulted in a substantial reduction of the lipid contentin hepatocytes. Other ultrastructural changes in-duced by PEITC in the liver of rats fed AIN-76Adiet included an increased number of mitochondria
per cell associated with a decreased mean absolutemitochondria volume per cell.
Ultrastructural changes induced by PEITC in theliver of rats fed the Wayne diet contrasted with thoseseen in rats fed the AIN-76A diet. Morphometricanalysis revealed a dose-dependent trend for re-duced hepatocyte volume in rats fed the Wayne dietcontaining PEITC at both low and high concentra-tions. No significant effects on liver weight wereobserved. We also found that the mean lipid dropletvolume per hepatocyte and the percentage of lipiddroplet volume per hepatocyte was significantly in-creased in the PEITC-treated groups.The underlying mechanisms responsible for
PEITC-induced changes in the liver are not known.Fatty change is a common lesion in the liver and ismorphological evidence of excess accumulation offat, which appears as intracytoplasmic vacuolation.Lipids reach the liver mainly as alimentary chylo-microns or fatty acids from adipose tissue and areutilized within the liver or are secreted as very low
density lipoproteins. There is evidence that fat ac-cumulates in the liver when there is an imbalance
among supply, utilization, and secretion of lipids(18). Different chemicals produce fatty change bydifferent means (2, 9, 11, 18). For example, carbontetrachloride (CC14) and phosphorus impair proteinsynthesis, resulting in reduced apoproteins availablefor very low density lipoprotein formation and se-cretion oftriglycerides by the liver (4, 16). In cholinedeficiency, phospholipid metabolism is impaired,resulting in reduced secretion of lipids into the plas-ma (16). In the current study, it appears that afterhepatic lipids are accumulating (Fig. 2B) abovebaseline of the Wayne-fed controls the higher dose
levels of PEITC result in lipid reduction. At the 6.0-mmol/kg PEITC dose level for both diet groups,lipid levels are reduced compared to the 0.7 5-mmol/kg PEITC dose. The exact mechanism of lipid re-duction or the possible role of PEITC in this re-duction is not evident from data collected and an-
alyzed in these experiments. The changes could bedue to inhibition of lipid synthesis or an inductionof lipid mobility to reduce the lipid content. In pre-vious studies (1), decreases in serum triglyceridesobserved following administration of PEITC for 7or 13 wk supports the possible involvement of PEITCin intracellular lipid reduction.The mechanisms by which PEITC alters hepa-
tocyte morphology and physiology are not known.It has been shown that isothiocyanates are reactiveelectrophiles, capable of covalent binding to mem-brane proteins at critical sites where transmembranefunctions may occur (5, 20). Investigations on cy-tological effects of allyl and benzyl isothiocyanatein isolated hepatocytes demonstrated that thiol
groups in the plasma membrane and other cellularmembrane systems are the primary target for thesecompounds (20). Cytomorphological changes ob-served in these experiments consisted of swellingand surface blebbing of mitochondria and dilationof the endoplasmic reticulum. Alteration of themembrane proteins appeared to affect the mono-valent cation and water balance of the cell organellesrather than divalent calcium homeostasis. It is pos-sible that PEITC binds to membrane proteins, re-sulting in reduced protein synthesis, altered lipidmetabolism, and excretory and secretory functionsof hepatocytes. Reduced hepatocyte and organellevolumes seen in rats fed the Wayne diet containingPEITC may indicate a reduced metabolic rate inwhich turnover of cellular components continueswhereas de novo synthesis decreases.The accumulation of lipids in hepatocytes of rats
fed the Wayne diet containing PEITC suggests animpaired hepatic secretory function, possibly due toa reduced level of lipoproteins. This supposition issupported by the results of 7- and 13-wk dietarytoxicity studies in which rats fed PEITC in a cereal-based diet had reduced plasma triglyceride levels atdose levels of 3.0 mmol/kg and higher (1). Lombardiand Recknagel (10) reported that an alteration intriglyceride secretion from the hepatocyte into theblood is a common factor in toxic liver injury. Sim-ilarly, diminished hepatic lipidosis observed in ratsadministered PEITC in AIN-76A purified diet couldbe a result of reduced synthesis of triglycerides as aconsequence of reduced metabolic rate. It is note-
worthy to remark that triglyceride levels in plasmawere reduced in rats fed PEITC in AIN-76A for 13wk (1).
by guest on July 12, 2011tpx.sagepub.comDownloaded from

651
As indicated in the Introduction of this paper, weconducted a 13-wk study to assess the potential tox-icity of PEITC in F-344 rats (1) where the PEITCwas administered in AIN-76A diet. Because the dietitself caused severe hepatic lipidosis, it was not pos-sible to detect any toxic effects in the liver that mayhave been caused by the PEITC. Therefore, we re-cently conducted a subsequent 13-wk toxicity studyin which PEITC was administered to F-344 rats inNIH-07 diet (personal communication). The resultsof this study showed that the NIH-07 diet itselfproduced no observable liver toxicity. Moreover,PEITC produced no observable hepatotoxicity whenadministered in doses ranging from 3 to 15 mmol/kg diet [i.e., up to 5 times the dose level used inAdam-Rodwell et al (1)]. Thus, under experimentalconditions where any potential hepatotoxicity couldbe ascertained, PEITC produced no apparent tox-icity. These results suggest that, with respect to theliver, PEITC can be tolerated at dose levels that farexceed doses that exhibit effective chemopreventiveactivity.
ACKNOWLEDGMENTS
The authors thank Dr. William Gunning for hishelpful comments and Mr. Edward Calomeni, Mr.Bradley Nelson and Ms. Kimberly Brosamer fortheir technical assistance. This study was supportedby National Cancer Institute grant CA46535.
REFERENCES
1. Adam-Rodwell G, Conran PB, Mandal S, and StonerGD (1990). 13-Week toxicity study of phenyl andphenethyl isothiocyanates in Fischer 344 rats fed AIN-76A diet. Toxicologist 10: 300.
2. Andrews LS and Snyder R (1986). Toxic effects ofsolvents and vapors. In: Casarett and Doull’s Toxi-
cology, 3rd ed., CD Klaassen, MO Amdur, and DoullJ (eds). Macmillan, New York, pp. 645-648.
3. Bieri JG, Stoews GS, Briggs GM, Phillips RW, Woo-dard JC, and Knapka JJ (1977). Report of the Amer-ican Institute of Nutrition Ad Hoc Committee onStandards for Nutritional Studies. J. Nutr. 107: 1340-1348.
4. Bratin WJ, Glende EA Jr, and Recknagel RO (1985).Pathological mechanisms in carbon tetrachloride
hepatotoxicity. Free Radicals Biol. Med. 1 : 27-38.5. Bruggeman IM, Temmink JHM, and van Bladeren
PJ (1986). Glutathione- and cysteine-mediated cy-totoxicity of allyl and benzyl isothiocyanate. Toxicol.Appl. Pharm. 83: 349-359.
6. Gray RH, Crowfoot SD, Randall J, Haskins JR,Adam-Rodwell G, and Stoner GD (1990). Hepaticultrastructural changes induced by phenyl and phe-nethyl isothiocyanates in rats fed AIN-76A diet. Tox-icologist 10: 300.
7. Gray RH and de la Iglesia FA (1984). Quantitativemicroscopy comparison of peroxisome proliferation
by the lipid-regulating agent gemfibrozil in severalspecies. Hepatology 4: 520-530.
8. Hamm TE Jr, Raynor T, and Caviston T (1982).Unsuitability of the AIN 76A diet for male F-344and CD rats and improvement by substituting starchfor sucrose. Lab. Anim. Sci. 32: 414.
9. Kyle ME and Farber JL (1991). Biochemical mech-anisms of toxic cell injury. In: Handbook of Toxi-cologic Pathology, WM Haschek and CG Rousseaux(eds). Academic Press, New York, pp. 71-89.
10. Lombardi B and Recknagel RO (1962). Interferencewith secretion of triglycerides by the liver as a com-mon factor in toxic liver injury. Am. J. Pathol. 40:571-586.
11. McGuire EJ, Lucas JA, Gray RH, and de la IglesiaFA (1991). Peroxisome induction potential and lipid-regulating activity in rats. Am. J. Pathol. 139: 217-229.
12. Medinsky MA, Popp JA, Hamm TE, and Dent JG(1982). Development of hepatic lesions in male Fish-er-344 rats fed AIN-76A purified diet. Toxicol. Appl.Pharm. 62: 111-120.
13. Morse MA, Amin SG, Hecht SS, and Chung FL (1989).Effects of aromatic isothiocyanates on tumorigenic-ity, O8-methylguanine formation, and metabolism ofthe tobacco-specific nitrosamine, 4-(methylnitro-samino)-1-(3-pyridyl)-1-butanone in A/J mouse lung.Cancer Res. 49: 2894-2897.
14. Morse MA, Wang CX, Stoner GD, Mandal S, ConranPB, Amin SG, Hecht SS, and Chung FL (1989). In-hibition of 4-(methylnitrosamino)-1-(3-pyridyl)-1-butanone-induced DNA adduct formation and tu-
morigenicity in the lung of F-344 rats by dietary phe-nethyl isothiocyanate. Cancer Res. 49: 549-553.
15. Oginsky EL, Stein AE, and Greer MA (1965). My-rosinase activity in bacteria as demonstrated by con-version of progoitrin to goitrin. Proc. Soc. Exp. Biol.Med. 119: 360-364.
16. Slater TF (1982). Activation of carbon tetrachloride:Chemical principles and biological significance. In:Free Radicals, Lipid Peroxidation and Cancer, DCHMcBrien and TF Slater (eds). Academic Press, NewYork, pp. 243-274.
17. Speijers GJA, Danse LHJC, Van Leeuwen FXR, andLoeber JG (1985). Four-week toxicity study of phenylisothiocyanate in rats. Fd. Chem. Toxic. 23: 1015-1017.
18. Stein O and Stein Y (1967). Lipid synthesis, intra-cellular transport, storage, and secretion. I. Electron
microscopic radioautographic study of liver after in-jection of tritiated palmitate or glycerol in fasted andethanol-treated rats. J. Cell Biol. 33: 319-339.
19. Stoner GD, Morrissey DT, Heur YH, Daniel EM,Galati AJ, and Wagner SA (1991). Inhibitory effectsof phenethyl isothiocyanate on N-nitrosobenzyl-methylamine carcinogenesis in the rat esophagus.Cancer Res. 51: 2063-2068.
20. Temmink JHM. Bruggeman IM. and van BladerenPJ (1986). Cytomorphological changes in liver cellsexposed to allyl and benzyl isothiocyanate and their
by guest on July 12, 2011tpx.sagepub.comDownloaded from

652
cysteine and glutathione conjugates. Arch. Toxicol.59: 103-110.
21. Tookey HL, VanEtten CH, and Daxenbichler ME(1980). Glucosinolates. In: Toxic Constituents of PlantFoodstuffs, IE Liener (ed). Academic Press, New York,pp. 103-142.
22. VanEtten CH, Daxenbichler ME, Williams PH, andKwolek, WF (1976). Glucosinolates and derived
products in cruciferous vegetables. Analysis of theedible part from twenty-two varieties of cabbage. J.Agric. Food. Chem. 24: 452-455.
23. Weibel ER, Staubi W, Gnagi HR, and Hess FA (1969).Correlated morphometric and biochemical studies onthe liver cell: I. Morphometric model, stereologicmethods, and normal morphometric data for rat liv-er. J. Cell Biol. 42: 68-91.
by guest on July 12, 2011tpx.sagepub.comDownloaded from