Photoswitchable Inhibitors of Microtubule Dynamics Optically Control Mitosis and Cell Death
Upload
johnshopkinsCategory
view
1download
0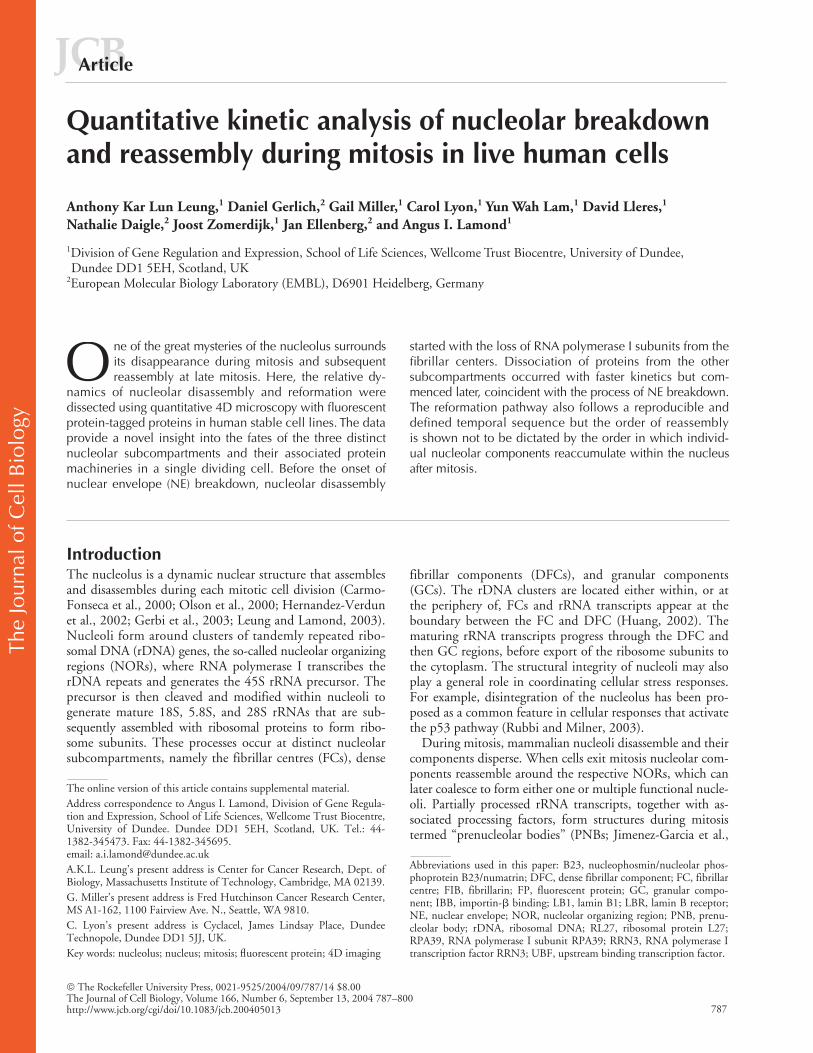
The
Jour
nal o
f Cel
l Bio
logy
©
The Rockefeller University Press, 0021-9525/2004/09/787/14 $8.00The Journal of Cell Biology, Volume 166, Number 6, September 13, 2004 787–800http://www.jcb.org/cgi/doi/10.1083/jcb.200405013
JCB
Article
787
Quantitative kinetic analysis of nucleolar breakdown and reassembly during mitosis in live human cells
Anthony Kar Lun Leung,
1
Daniel Gerlich,
2
Gail Miller,
1
Carol Lyon,
1
Yun Wah Lam,
1
David Lleres,
1
Nathalie Daigle,
2
Joost Zomerdijk,
1
Jan Ellenberg,
2
and Angus I. Lamond
1
1
Division of Gene Regulation and Expression, School of Life Sciences, Wellcome Trust Biocentre, University of Dundee, Dundee DD1 5EH, Scotland, UK
2
European Molecular Biology Laboratory (EMBL), D6901 Heidelberg, Germany
ne of the great mysteries of the nucleolus surroundsits disappearance during mitosis and subsequentreassembly at late mitosis. Here, the relative dy-
namics of nucleolar disassembly and reformation weredissected using quantitative 4D microscopy with fluorescentprotein-tagged proteins in human stable cell lines. The dataprovide a novel insight into the fates of the three distinctnucleolar subcompartments and their associated proteinmachineries in a single dividing cell. Before the onset ofnuclear envelope (NE) breakdown, nucleolar disassembly
O
started with the loss of RNA polymerase I subunits from thefibrillar centers. Dissociation of proteins from the othersubcompartments occurred with faster kinetics but com-menced later, coincident with the process of NE breakdown.The reformation pathway also follows a reproducible anddefined temporal sequence but the order of reassemblyis shown not to be dictated by the order in which individ-ual nucleolar components reaccumulate within the nucleusafter mitosis.
Introduction
The nucleolus is a dynamic nuclear structure that assemblesand disassembles during each mitotic cell division (Carmo-Fonseca et al., 2000; Olson et al., 2000; Hernandez-Verdunet al., 2002; Gerbi et al., 2003; Leung and Lamond, 2003).Nucleoli form around clusters of tandemly repeated ribo-somal DNA (rDNA) genes, the so-called nucleolar organizingregions (NORs), where RNA polymerase I transcribes therDNA repeats and generates the 45S rRNA precursor. Theprecursor is then cleaved and modified within nucleoli togenerate mature 18S, 5.8S, and 28S rRNAs that are sub-sequently assembled with ribosomal proteins to form ribo-some subunits. These processes occur at distinct nucleolarsubcompartments, namely the fibrillar centres (FCs), dense
fibrillar components (DFCs), and granular components(GCs). The rDNA clusters are located either within, or atthe periphery of, FCs and rRNA transcripts appear at theboundary between the FC and DFC (Huang, 2002). Thematuring rRNA transcripts progress through the DFC andthen GC regions, before export of the ribosome subunits tothe cytoplasm. The structural integrity of nucleoli may alsoplay a general role in coordinating cellular stress responses.For example, disintegration of the nucleolus has been pro-posed as a common feature in cellular responses that activatethe p53 pathway (Rubbi and Milner, 2003).
During mitosis, mammalian nucleoli disassemble and theircomponents disperse. When cells exit mitosis nucleolar com-ponents reassemble around the respective NORs, which canlater coalesce to form either one or multiple functional nucle-oli. Partially processed rRNA transcripts, together with as-sociated processing factors, form structures during mitosistermed “prenucleolar bodies” (PNBs; Jimenez-Garcia et al.,
The online version of this article contains supplemental material.Address correspondence to Angus I. Lamond, Division of Gene Regula-tion and Expression, School of Life Sciences, Wellcome Trust Biocentre,University of Dundee. Dundee DD1 5EH, Scotland, UK. Tel.: 44-1382-345473. Fax: 44-1382-345695. email: [email protected]. Leung’s present address is Center for Cancer Research, Dept. ofBiology, Massachusetts Institute of Technology, Cambridge, MA 02139.G. Miller’s present address is Fred Hutchinson Cancer Research Center,MS A1-162, 1100 Fairview Ave. N., Seattle, WA 9810.C. Lyon’s present address is Cyclacel, James Lindsay Place, DundeeTechnopole, Dundee DD1 5JJ, UK.Key words: nucleolus; nucleus; mitosis; fluorescent protein; 4D imaging
Abbreviations used in this paper: B23, nucleophosmin/nucleolar phos-phoprotein B23/numatrin; DFC, dense fibrillar component; FC, fibrillarcentre; FIB, fibrillarin; FP, fluorescent protein; GC, granular compo-nent; IBB, importin-
�
binding; LB1, lamin B1; LBR, lamin B receptor;NE, nuclear envelope; NOR, nucleolar organizing region; PNB, prenu-cleolar body; rDNA, ribosomal DNA; RL27, ribosomal protein L27;RPA39, RNA polymerase I subunit RPA39; RRN3, RNA polymerase Itranscription factor RRN3; UBF, upstream binding transcription factor.
788 The Journal of Cell Biology
|
Volume 166, Number 6, 2004
1994; Dundr et al., 2000; Savino et al., 2001). Compo-nents are subsequently transferred from the PNBs into thereforming nucleoli at NORs (Dundr et al., 2000; Savino etal., 2001). In contrast, the process of nucleolar disassemblywhen cells enter mitosis is not well characterized. Both thetiming and mechanism of breakdown is unclear although ithas been reported that a subset of nucleolar factors, includ-ing RNA polymerase I (Scheer and Rose, 1984; Gilbert etal., 1995) and the RNA Pol I upstream binding transcrip-tion factor (UBF) and transcription factor SL1 (Rousselet al., 1993; Jordan et al., 1996), remain associated withchromosomes at NORs, although no nascent rRNA tran-scripts are synthesized during mitosis (Weisenberger andScheer, 1995).
Fluorescent protein (FP)-tagged nuclear factors providemarkers in live cells for the location of specific nuclear bod-ies, such as nucleoli, or even subcompartments within nucle-oli (Gerlich and Ellenberg, 2003a; Janicki and Spector,2003). Proteins tagged with different spectral variants of ei-ther GFP, or RFP, can be coexpressed to detect two or moresubnuclear structures in a single cell. The 3D localization ofthese markers can be recorded and quantitated over time,i.e., “4D” imaging, to provide detailed information abouttheir dynamic movement and kinetic behavior (Gerlich etal., 2001; Dundr et al., 2002b; Gerlich and Ellenberg,2003a). Here, we have applied quantitative 4D imaging us-ing cell lines expressing different combinations of two orthree FP-tagged markers to analyze the processes of nucle-olar breakdown and reassembly during mitosis in live cellsand to correlate this with parallel events affecting other nu-clear structures.
Results
In vivo analysis of RNA polymerase I localization within nucleoli
A HeLa cell line termed HeLa
YFP-RPA39
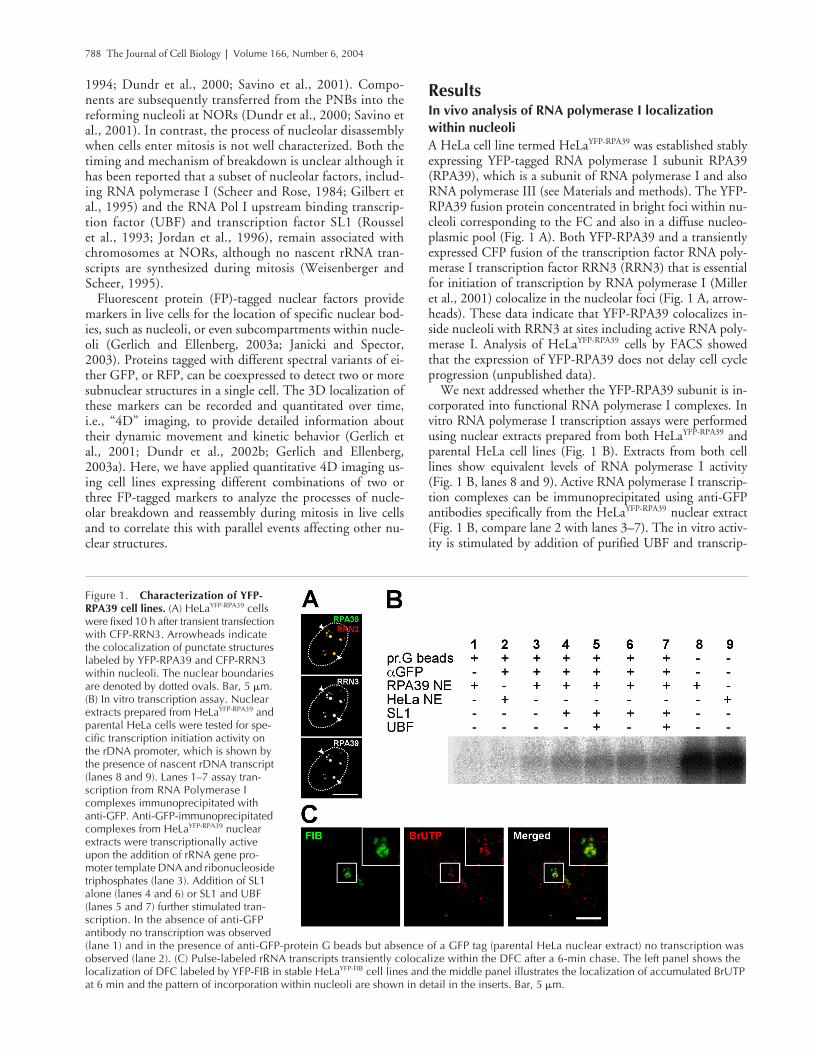
was established stablyexpressing YFP-tagged RNA polymerase I subunit RPA39(RPA39), which is a subunit of RNA polymerase I and alsoRNA polymerase III (see Materials and methods). The YFP-RPA39 fusion protein concentrated in bright foci within nu-cleoli corresponding to the FC and also in a diffuse nucleo-plasmic pool (Fig. 1 A). Both YFP-RPA39 and a transientlyexpressed CFP fusion of the transcription factor RNA poly-merase I transcription factor RRN3 (RRN3) that is essentialfor initiation of transcription by RNA polymerase I (Milleret al., 2001) colocalize in the nucleolar foci (Fig. 1 A, arrow-heads). These data indicate that YFP-RPA39 colocalizes in-side nucleoli with RRN3 at sites including active RNA poly-merase I. Analysis of HeLa
YFP-RPA39
cells by FACS showedthat the expression of YFP-RPA39 does not delay cell cycleprogression (unpublished data).
We next addressed whether the YFP-RPA39 subunit is in-corporated into functional RNA polymerase I complexes. Invitro RNA polymerase I transcription assays were performedusing nuclear extracts prepared from both HeLa
YFP-RPA39
andparental HeLa cell lines (Fig. 1 B). Extracts from both celllines show equivalent levels of RNA polymerase I activity(Fig. 1 B, lanes 8 and 9). Active RNA polymerase I transcrip-tion complexes can be immunoprecipitated using anti-GFPantibodies specifically from the HeLa
YFP-RPA39
nuclear extract(Fig. 1 B, compare lane 2 with lanes 3–7). The in vitro activ-ity is stimulated by addition of purified UBF and transcrip-
Figure 1. Characterization of YFP-RPA39 cell lines. (A) HeLaYFP-RPA39 cells were fixed 10 h after transient transfection with CFP-RRN3. Arrowheads indicate the colocalization of punctate structures labeled by YFP-RPA39 and CFP-RRN3 within nucleoli. The nuclear boundaries are denoted by dotted ovals. Bar, 5 �m. (B) In vitro transcription assay. Nuclear extracts prepared from HeLaYFP-RPA39 and parental HeLa cells were tested for spe-cific transcription initiation activity on the rDNA promoter, which is shown by the presence of nascent rDNA transcript (lanes 8 and 9). Lanes 1–7 assay tran-scription from RNA Polymerase I complexes immunoprecipitated with anti-GFP. Anti-GFP-immunoprecipitated complexes from HeLaYFP-RPA39 nuclear extracts were transcriptionally active upon the addition of rRNA gene pro-moter template DNA and ribonucleoside triphosphates (lane 3). Addition of SL1 alone (lanes 4 and 6) or SL1 and UBF (lanes 5 and 7) further stimulated tran-scription. In the absence of anti-GFP antibody no transcription was observed (lane 1) and in the presence of anti-GFP-protein G beads but absence of a GFP tag (parental HeLa nuclear extract) no transcription was observed (lane 2). (C) Pulse-labeled rRNA transcripts transiently colocalize within the DFC after a 6-min chase. The left panel shows the localization of DFC labeled by YFP-FIB in stable HeLaYFP-FIB cell lines and the middle panel illustrates the localization of accumulated BrUTP at 6 min and the pattern of incorporation within nucleoli are shown in detail in the inserts. Bar, 5 �m.
Nuclear dynamics in mitosis
|
Leung et al. 789
tion factor SL1 to the assays (Fig. 1 B, compare lane 3 withlanes 4–7). We analyzed further the relationship betweenYFP-RPA39 and transcription sites in vivo by performingpulse-chase incorporation of BrUTP in both HeLa
YFP-RPA39
and HeLa
YFP-FIB
cells, the latter being a cell line stably express-ing YFP-fibrillarin (FIB) as a marker for the DFC (Fig. 1C; see Online supplemental material). The localization ofBrUTP-labeled RNA within the nucleolus was analyzed byimmunofluorescence, after a 6-min chase after removingBrUTP from the culture medium (see Materials and meth-ods). These data show an accumulation of labeled RNA atthe periphery of the foci containing YFP-RPA39 (i.e., FC),within the boundary region between the FC and DFC, as de-tected by YFP-FIB (Fig. 1 C). At longer chase times, after re-moval of BrUTP, we observe the labeled RNA colocalizingwith the GC (within
�
20 min) and then appearing in the cy-toplasm (within
�
60 min; unpublished data). The appear-ance of labeled RNA is inhibited by Actinomycin D at lowlevels that inhibit selectively RNA polymerase I activity (un-published data). These data are consistent with previous stud-ies on the sites of rRNA transcription in nucleoli (Huang,2002). In summary, we conclude that YFP-RPA39 is incor-porated into active RNA polymerase I transcription com-plexes and serves in vivo as a valid marker for detecting siteswithin nucleoli containing active RNA polymerase I.
We next used the HeLa
YFP-RPA39
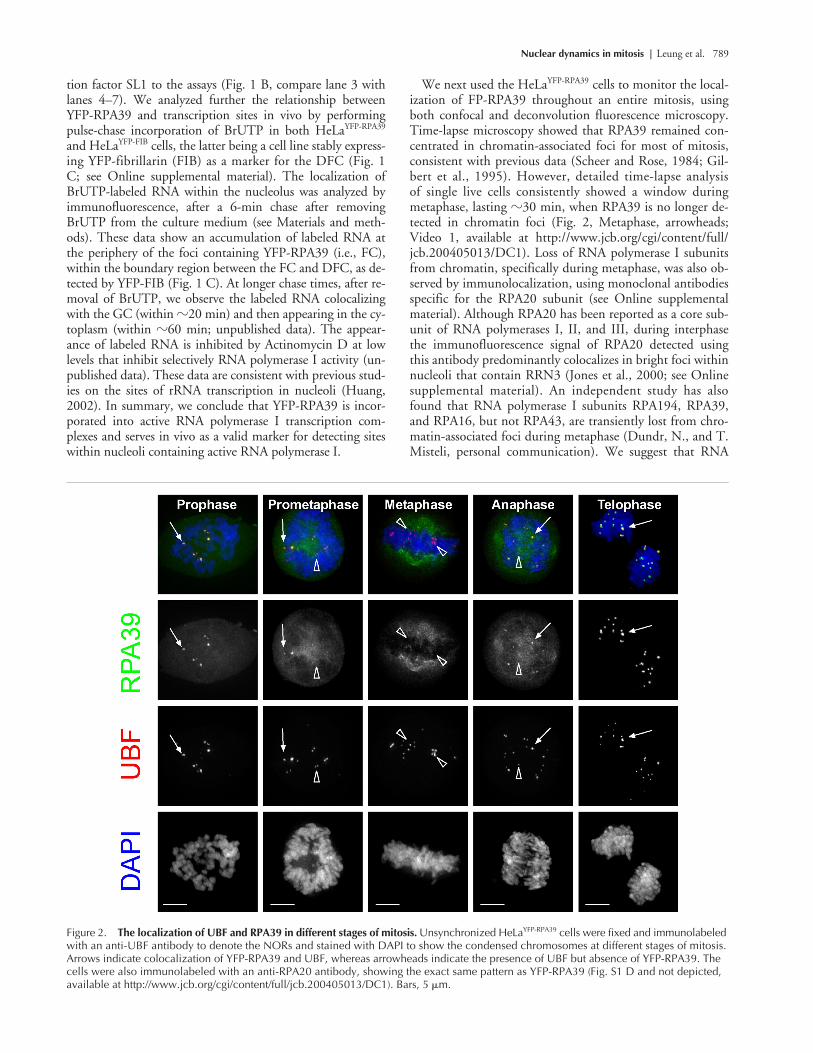
cells to monitor the local-ization of FP-RPA39 throughout an entire mitosis, usingboth confocal and deconvolution fluorescence microscopy.Time-lapse microscopy showed that RPA39 remained con-centrated in chromatin-associated foci for most of mitosis,consistent with previous data (Scheer and Rose, 1984; Gil-bert et al., 1995). However, detailed time-lapse analysisof single live cells consistently showed a window duringmetaphase, lasting
�
30 min, when RPA39 is no longer de-tected in chromatin foci (Fig. 2, Metaphase, arrowheads;Video 1, available at http://www.jcb.org/cgi/content/full/jcb.200405013/DC1). Loss of RNA polymerase I subunitsfrom chromatin, specifically during metaphase, was also ob-served by immunolocalization, using monoclonal antibodiesspecific for the RPA20 subunit (see Online supplementalmaterial). Although RPA20 has been reported as a core sub-unit of RNA polymerases I, II, and III, during interphasethe immunofluorescence signal of RPA20 detected usingthis antibody predominantly colocalizes in bright foci withinnucleoli that contain RRN3 (Jones et al., 2000; see Onlinesupplemental material). An independent study has alsofound that RNA polymerase I subunits RPA194, RPA39,and RPA16, but not RPA43, are transiently lost from chro-matin-associated foci during metaphase (Dundr, N., and T.Misteli, personal communication). We suggest that RNA
Figure 2. The localization of UBF and RPA39 in different stages of mitosis. Unsynchronized HeLaYFP-RPA39 cells were fixed and immunolabeled with an anti-UBF antibody to denote the NORs and stained with DAPI to show the condensed chromosomes at different stages of mitosis. Arrows indicate colocalization of YFP-RPA39 and UBF, whereas arrowheads indicate the presence of UBF but absence of YFP-RPA39. The cells were also immunolabeled with an anti-RPA20 antibody, showing the exact same pattern as YFP-RPA39 (Fig. S1 D and not depicted, available at http://www.jcb.org/cgi/content/full/jcb.200405013/DC1). Bars, 5 �m.
790 The Journal of Cell Biology
|
Volume 166, Number 6, 2004
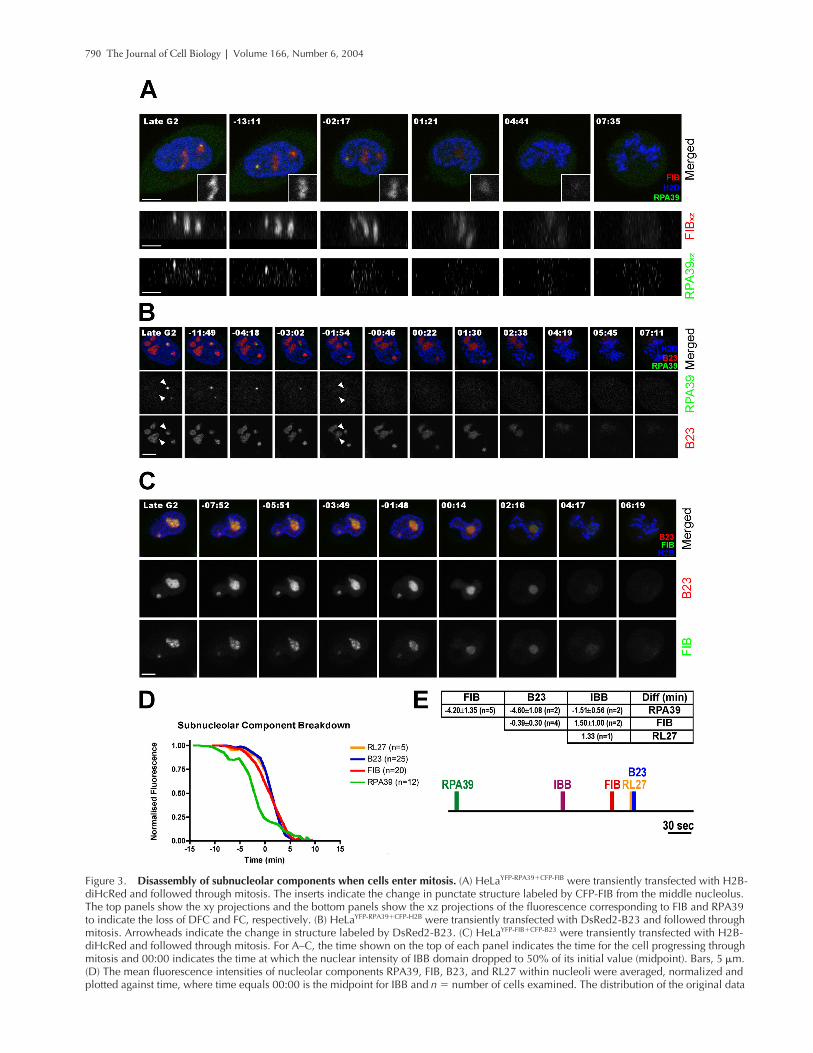
Figure 3.
Disassembly of subnucleolar components when cells enter mitosis.
(A) HeLa
YFP-RPA39
�
CFP-FIB
were transiently transfected with H2B-diHcRed and followed through mitosis. The inserts indicate the change in punctate structure labeled by CFP-FIB from the middle nucleolus. The top panels show the xy projections and the bottom panels show the xz projections of the fluorescence corresponding to FIB and RPA39 to indicate the loss of DFC and FC, respectively. (B) HeLa
YFP-RPA39
�
CFP-H2B
were transiently transfected with DsRed2-B23 and followed through mitosis. Arrowheads indicate the change in structure labeled by DsRed2-B23. (C) HeLa
YFP-FIB
�
CFP-B23
were transiently transfected with H2B-diHcRed and followed through mitosis. For A–C, the time shown on the top of each panel indicates the time for the cell progressing through mitosis and 00:00 indicates the time at which the nuclear intensity of IBB domain dropped to 50% of its initial value (midpoint). Bars, 5
�
m. (D) The mean fluorescence intensities of nucleolar components RPA39, FIB, B23, and RL27 within nucleoli were averaged, normalized and plotted against time, where time equals 00:00 is the midpoint for IBB and
n
�
number of cells examined. The distribution of the original data

Nuclear dynamics in mitosis
|
Leung et al. 791
polymerase I either transiently leaves chromosomes duringmetaphase, or else that multiple subunits dissociate tran-siently from the polymerase ternary complex. However, im-munolabeling with antibodies specific for the RNA poly-merase I UBF, which binds to the rRNA gene repeats,showed that UBF associated with chromatin foci through-out mitosis (Fig. 2, UBF). Thus, although UBF colocalizesin foci with RPA39 during prophase, prometaphase, ana-phase, and telophase, it remains in similar foci throughoutmetaphase when the RNA polymerase I subunits are nolonger detected (Fig. 2). The loss of RNA polymerase I sub-units from chromatin foci is therefore not a detection prob-lem at this stage of metaphase. In summary, the data indi-cate that the previous view that RNA polymerase I remainsassociated with chromatin throughout the entire period ofmitosis may need to be revised.
Disassembly of nucleolar subcompartments during mitosis
To study nucleolar disassembly, we performed 4D imagingon cell lines expressing combinations of three separatemarker proteins labeled with either CFP, YFP, HcRed orDsRed (see Materials and methods). Cells coexpressing YFP-RPA39 (FC), CFP-FIB (DFC), and HcRed histone H2B,showed that RNA polymerase I was consistently lost from
FCs before the dissociation of FIB from the DFC in all cellsexamined (Fig. 3 A). This is most clear in the xz side projec-tions for the YFP-RPA39 and CFP-FIB expressing cells (Fig.3 A, bottom). Interestingly, the punctate distribution of FIBwithin the DFC changed to a more diffuse pattern, thoughstill confined to the DFC, coincident with the loss of RNApolymerase I from nucleoli (Fig. 3 A, top, insets).
A similar 4D analysis was performed using cells coexpress-ing YFP-RPA39 (FC), DsRed-nucleophosmin (B23;GC)and CFP-H2B (Fig. 3 B). DsRed-B23 in the GC persists for
�
4–5 min after loss of RNA polymerase I from nucleoli. Asubtle change in the pattern of B23 distribution in the GC isvisible coincident with the loss of RNA polymerase I fromnucleoli (Fig. 3 B, arrowheads, compare
�
01:54 with lateG2). Similar kinetics were observed using FP-tagged riboso-mal protein L27 (RL27) as an alternative marker for the GC(Fig. 3 D; not depicted). To compare the timing of loss ofmarkers from the DFC and GC subcompartments, a 4Danalysis was performed on cells coexpressing CFP-B23 (GC),YFP-FIB (DFC), and HcRed-H2B (Fig. 3 C and Video 2,available at http://www.jcb.org/cgi/content/full/jcb.200405013/DC1). Both CFP-B23 and YFP-FIB leave the nucleolus atapproximately the same time. We conclude that nucleolardisassembly is initiated at the FC, whereas concurrent loss ofboth DFC and GC components occurs later.
is reported in Fig. S2 (available at http://www.jcb.org/cgi/content/full/jcb.200405013/DC1). (E) Pairwise midpoint-midpoint comparison between markers expressed within the same cell. For example, a negative value of
�
4.20
�
1.35 on the column FIB and the row RPA39 indicates that FIB reaches its midpoint 4.20 min later than RPA39, averaging from five experiments. A possible time line to summarize the relationship between all the nucleolar markers examined and IBB is represented in the bottom panel. If the midpoint for IBB is defined at time equals 00:00, then RPA, FIB, RL27, and B23 would be
�
02:04, 00:56, 01:20, and 01:20, respectively. Bar, 30 s. Note that although IBB is not present in this experiment, the time line correlation is made according to a set of multiple experiments.
Figure 4. Comparison of nucleolar disassembly and the structural disintegration of NE upon entering into mitosis. (A) HeLaYFP-LBR and (B) HeLaYFP-LB1 cells were transiently transfected with DsRed2-B23 for 16 h before imaging through mitosis. The location of nucleoli was denoted by DsRed2-B23 (green and in the bottom panel for xz projection) and condensing chromosomes by Hoechst 33234. The time shown on the top of each panel indicates the time for the cell progressing through mitosis and 00:00 indicates the time at which the nuclear intensity of IBB dropped to 50% of its initial value (midpoint). Bars, 5 �m.

792 The Journal of Cell Biology
|
Volume 166, Number 6, 2004
Nuclear dynamics in mitosis
|
Leung et al. 793
To quantitate the pathway of nucleolar disassembly, wemeasured the levels of FP-fluorescence in defined cellularstructures during mitotic progression (Fig. 3 D; see Onlinesupplemental material). Data obtained from 5 to 25 separateexperiments for each fluorescent marker show that the rateof loss of RPA39 from nucleoli is slower than either RL27 orB23, though comparable to FIB (Fig. 3 D). However, theloss of RPA39 is initiated earlier than any of the other mark-ers tested. A comparison of the times at which the levels offluorescence for each marker dropped to 50% of their initialvalues in nucleoli indicates that loss of RPA39 precedes theother markers by
�
4 min (Fig. 3, D and E). The loss ofRNA polymerase I subunits is therefore the earliest event wehave detected at the onset of nucleolar disassembly.
Comparison of nucleolar and nuclear envelope (NE) disassembly
We next compared the relative timing of nucleolar and NEdisassembly using stable cell lines expressing either YFP-Lamin B receptor (HeLa
YFP-LBR
), or YFP-lamin B1 (HeLa
YFP-LB1
).These are the first and last components, respectively, to disas-semble from NE during mitosis (Beaudouin et al., 2002).We performed 4D analyses using both these cell lines withDsRed-B23 expressed transiently (Fig. 4). Nucleoli contain-ing B23 are still detected when lamin B receptor (LBR) startsto dissociate from NE (Fig. 4 A). This is most clear on the xzprojection (Fig. 4 A, bottom). Loss of B23 from nucleoli oc-curs
�
1.5 min after the decrease in LBR signal from NE(Fig. 5 D). In contrast, analysis of HeLa
YFP-LB1
cells showsthat the loss of B23 from nucleoli occurs
�
2 min beforedissociation of lamin B1 (LB1) from NE (Fig. 4 B; Fig. 5 D).Therefore, nucleolar disassembly occurs predominantly withinthe window during which NE components dissociate.
Next, we compared the loss of NE function, as judged byleakage of HcRed-importin
�
binding (IBB) domain intothe cytoplasm, with the timing of loss of RPA39 (Fig. 5 A)and FIB from nucleoli (Fig. 5 B). Cytoplasmic IBB is ac-tively recruited to the nucleus by importin
�
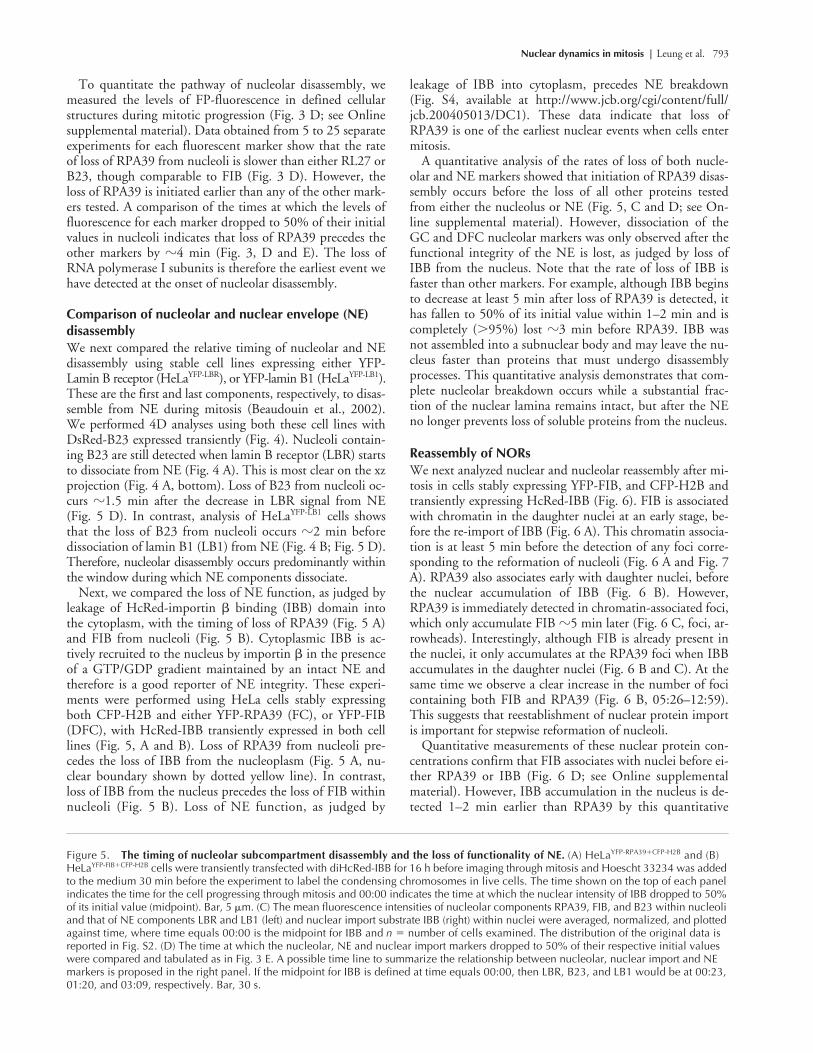
in the presenceof a GTP/GDP gradient maintained by an intact NE andtherefore is a good reporter of NE integrity. These experi-ments were performed using HeLa cells stably expressingboth CFP-H2B and either YFP-RPA39 (FC), or YFP-FIB(DFC), with HcRed-IBB transiently expressed in both celllines (Fig. 5, A and B). Loss of RPA39 from nucleoli pre-cedes the loss of IBB from the nucleoplasm (Fig. 5 A, nu-clear boundary shown by dotted yellow line). In contrast,loss of IBB from the nucleus precedes the loss of FIB withinnucleoli (Fig. 5 B). Loss of NE function, as judged by
leakage of IBB into cytoplasm, precedes NE breakdown(Fig. S4, available at http://www.jcb.org/cgi/content/full/jcb.200405013/DC1). These data indicate that loss ofRPA39 is one of the earliest nuclear events when cells entermitosis.
A quantitative analysis of the rates of loss of both nucle-olar and NE markers showed that initiation of RPA39 disas-sembly occurs before the loss of all other proteins testedfrom either the nucleolus or NE (Fig. 5, C and D; see On-line supplemental material). However, dissociation of theGC and DFC nucleolar markers was only observed after thefunctional integrity of the NE is lost, as judged by loss ofIBB from the nucleus. Note that the rate of loss of IBB isfaster than other markers. For example, although IBB beginsto decrease at least 5 min after loss of RPA39 is detected, ithas fallen to 50% of its initial value within 1–2 min and iscompletely (
�
95%) lost
�
3 min before RPA39. IBB wasnot assembled into a subnuclear body and may leave the nu-cleus faster than proteins that must undergo disassemblyprocesses. This quantitative analysis demonstrates that com-plete nucleolar breakdown occurs while a substantial frac-tion of the nuclear lamina remains intact, but after the NEno longer prevents loss of soluble proteins from the nucleus.
Reassembly of NORs
We next analyzed nuclear and nucleolar reassembly after mi-tosis in cells stably expressing YFP-FIB, and CFP-H2B andtransiently expressing HcRed-IBB (Fig. 6). FIB is associatedwith chromatin in the daughter nuclei at an early stage, be-fore the re-import of IBB (Fig. 6 A). This chromatin associa-tion is at least 5 min before the detection of any foci corre-sponding to the reformation of nucleoli (Fig. 6 A and Fig. 7A). RPA39 also associates early with daughter nuclei, beforethe nuclear accumulation of IBB (Fig. 6 B). However,RPA39 is immediately detected in chromatin-associated foci,which only accumulate FIB
�
5 min later (Fig. 6 C, foci, ar-rowheads). Interestingly, although FIB is already present inthe nuclei, it only accumulates at the RPA39 foci when IBBaccumulates in the daughter nuclei (Fig. 6 B and C). At thesame time we observe a clear increase in the number of focicontaining both FIB and RPA39 (Fig. 6 B, 05:26–12:59).This suggests that reestablishment of nuclear protein importis important for stepwise reformation of nucleoli.
Quantitative measurements of these nuclear protein con-centrations confirm that FIB associates with nuclei before ei-ther RPA39 or IBB (Fig. 6 D; see Online supplementalmaterial). However, IBB accumulation in the nucleus is de-tected 1–2 min earlier than RPA39 by this quantitative
Figure 5.
The timing of nucleolar subcompartment disassembly and the loss of functionality of NE.
(A) HeLa
YFP-RPA39
�
CFP-H2B
and (B) HeLa
YFP-FIB
�
CFP-H2B
cells were transiently transfected with diHcRed-IBB for 16 h before imaging through mitosis and Hoescht 33234 was added to the medium 30 min before the experiment to label the condensing chromosomes in live cells. The time shown on the top of each panel indicates the time for the cell progressing through mitosis and 00:00 indicates the time at which the nuclear intensity of IBB dropped to 50% of its initial value (midpoint). Bar, 5
�
m. (C) The mean fluorescence intensities of nucleolar components RPA39, FIB, and B23 within nucleoli and that of NE components LBR and LB1 (left) and nuclear import substrate IBB (right) within nuclei were averaged, normalized, and plotted against time, where time equals 00:00 is the midpoint for IBB and
n
�
number of cells examined. The distribution of the original data is reported in Fig. S2. (D) The time at which the nucleolar, NE and nuclear import markers dropped to 50% of their respective initial values were compared and tabulated as in Fig. 3 E. A possible time line to summarize the relationship between nucleolar, nuclear import and NE markers is proposed in the right panel. If the midpoint for IBB is defined at time equals 00:00, then LBR, B23, and LB1 would be at 00:23, 01:20, and 03:09, respectively. Bar, 30 s.

794 The Journal of Cell Biology
|
Volume 166, Number 6, 2004

Nuclear dynamics in mitosis
|
Leung et al. 795
analysis, even though by visual inspection of the correspond-ing micrographs the concentrated RPA39 in nuclear foci ismore striking than the diffuse nuclear accumulation of IBB.For comparison, we analyzed the rate of fluorescence in-crease over time within reforming nucleoli for both RPA39and FIB, as a fraction of total nuclear fluorescence (Fig. 6 E;see Online supplemental material). This shows that FIB as-sembles into nucleoli later than RPA39 (
�
4 min later for50% accumulation), although it had accumulated earlierwithin the total nuclear volume (Fig. 6, compare D with E).Moreover, FIB is only incorporated into foci containingRPA39 (i.e., the reforming NORs) when the increase in nu-clear RPA39 level is maximal. This suggests that the recruit-ment of FIB into the reforming nucleoli may require RNApolymerase I.
Interestingly, there is a close connection between the tim-ing of FIB accumulation in the DFC and the time at whicha functional NE is reestablished. Similarly, during nucleolardisassembly, loss of FIB from the DFC closely correlateswith the time at which the functional integrity of NE iscompromised (compare Fig. 5 with Fig. 6). This raises theinteresting possibility that one or more factors normally ex-cluded from the nucleus by an intact NE can contribute tosignaling the dissociation of FIB from the nucleolus.
Reassembly of functional nucleoli
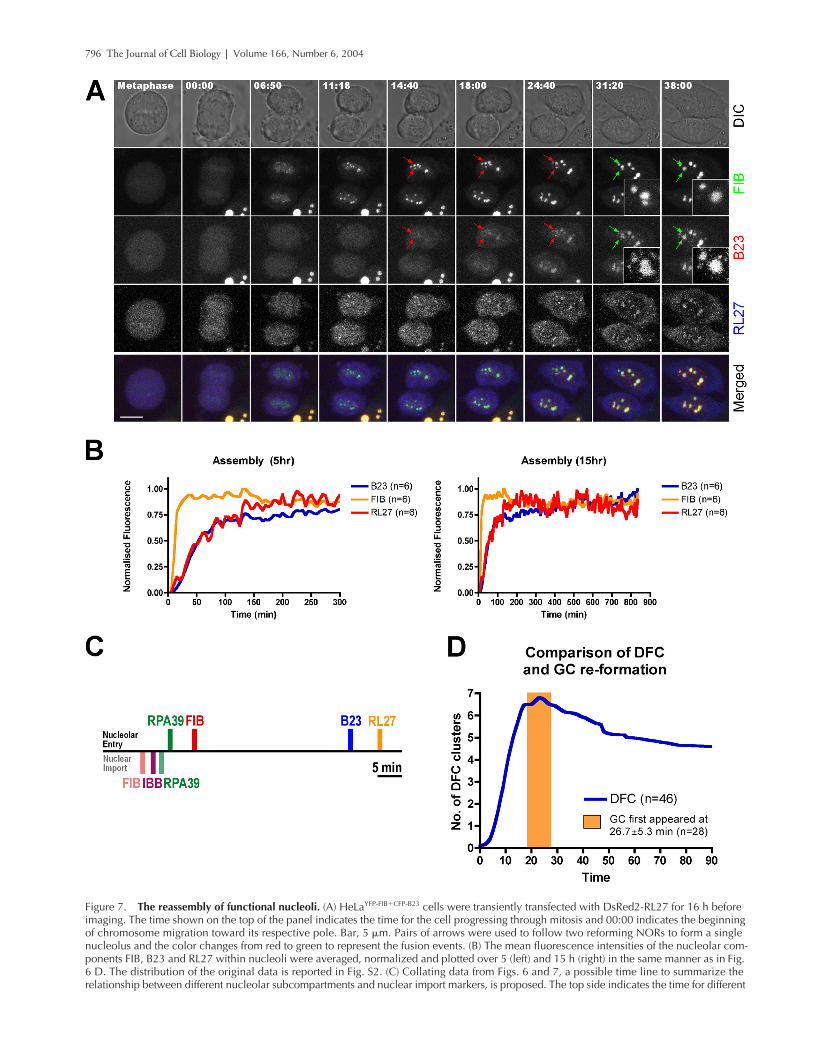
We define the reformation of functional nucleoli as requir-ing the presence of all the major interphase markers for theFC, DFC and GC subcompartments. To monitor this inlive cells we analyzed cell lines stably expressing both CFP-B23 and YFP-FIB and transiently expressing DsRed-RL27(Fig. 7). Together with the data from Fig. 6 showing thestepwise assembly of FC and DFC, these data showed forboth the B23 and RL27 markers that the GC forms laterthan either the FC or DFC, consistent with previous immu-nofluorescence data (Dundr et al., 2000; Savino et al.,2001). Quantitative analysis showed that the GC forms
�
18 min after the DFC and
�
27 min after the FC. The ap-pearance of the GC after mitosis correlates closely with thetime at which BrUTP-labeled RNA appears in the GC in in-terphase pulse-chase experiments (unpublished data). Next,we addressed quantitatively the concentration kinetics of nu-cleolar factors in cells exiting mitosis (Fig. 7 B). These exper-iments indicate that FIB accumulates before both GC mark-ers B23 and RL27, which reassemble with similar initialkinetics. In summary, these data support the view that thereassembly of nucleoli is normally coupled to the activationof ribosome subunit synthesis. The relationship between dif-
ferent nucleolar subcompartment markers in terms of theirtiming in nucleolar reassembly is summarized in Fig. 7 C.
To investigate spatial aspects of nucleolar formation, wequantitated the number of separate DFC clusters over timeas cells exit mitosis (Fig. 7 D; see Online supplemental ma-terial). We observed an increase in the mean number ofDFC clusters, up to
�
7 per nucleus, during the first 20 minafter mitosis (zero time defined as the time of chromosomeseparation during anaphase; Fig. 7 D). However, briefly af-ter the onset of GC formation, the mean number of DFCclusters decreased on average to
�
4.5, due to fusion eventsbetween neighboring clusters (Fig. 7 D; Fig. 7 A, green ar-rows). In the time-lapse micrographs it is apparent that theGC markers (e.g., B23) fuse before the fusion of the DFCmarker FIB (Fig. 7 A, compare inset 31:20 with inset 38:00). Therefore, the timing of the nucleolar fusion eventsmay be driven, at least in part, by the formation of the GCaround the DFCs. Intriguingly, we observed a statisticallysignificant variation in the number of FC foci and nucleoliformed in the two daughter nuclei, although they are moresimilar to each other than to unrelated nuclei exiting mitosis(Fig. S3, available at http://www.jcb.org/cgi/content/full/jcb.200405013/DC1). This raises the possibility that sto-chastic events can influence nucleolar reassembly.
Discussion
Here, we used a quantitative 4D imaging approach to ana-lyze the processes of nucleolar breakdown and reassemblyduring mitosis in single live cells. HeLa cell lines were con-structed that stably express either one or two FP-taggedmarkers for either different nucleolar subcompartments, nu-clear lamina components, nuclear transport reporters and/or chromatin. By establishing double-transformed stablecell lines and parallel transient transfection, we could per-form multi-wavelength 3D microscopy over time to correlatechanges in the relative distributions and concentrations ofmultiple nuclear marker proteins in the same live cell duringmitosis. The data for nucleolar disassembly and reassemblyduring mitosis (Fig. 8) show that nucleolar breakdown be-gins with the loss of RNA polymerase I subunits from FCs,before the onset of NE breakdown. The subsequent disas-sembly of the DFC and GC subcompartments coincideswith NE disassembly.
The RPA39 dissociates from the NORs during a brief pe-riod within metaphase, although the rRNA promoter bind-ing factor, UBF, remains bound (Fig. 2). The pathway ofnucleolar reformation in live cells after mitosis showed a
Figure 6.
The reassembly of NOR.
(A) HeLa
YFP-FIB
�
CFP-H2B
and (B) HeLa
YFP-RPA39
�
CFP-H2B
cells were transiently transfected with nuclear import substrate marker IBB-diHcRed for 16 h before imaging. The inserts in B represent the distribution of RPA39 signal within reforming NORs. Arrowheads indicate the development of the same FC foci over time. (C) HeLa
YFP-RPA39
�
CFP-FIB
cells were followed through mitosis. Arrowheads indicate the location of a reforming NOR over time. For A–C, the time shown on the top of each panel indicates the time for the cell progressing through mitosis and 00:00 indicates the beginning of chromosome migration toward its respective pole. Bars, 5
�
m. (D) The mean fluorescence intensities of nuclear import substrate IBB and nucleolar subcompartment marker RPA39 and FIB within the reforming nuclei were averaged, normalized and plotted against time, where time equals 00:00 when the chromosomes start to migrate toward respective poles and
n
�
the number of cells examined. (E) The total fluorescence intensities of nucleolar components RPA39 and FIB entering the reforming nucleoli as a fraction of the total nuclear fluorescence were averaged, normalized, and plotted against time in the same manner as of panel D and the curve for nuclear accumulation of IBB was used as a reference. The distribution of the original data is reported in Fig. S2.
796 The Journal of Cell Biology
|
Volume 166, Number 6, 2004
Figure 7.
The reassembly of functional nucleoli.
(A) HeLa
YFP-FIB
�
CFP-B23
cells were transiently transfected with DsRed2-RL27 for 16 h before imaging. The time shown on the top of the panel indicates the time for the cell progressing through mitosis and 00:00 indicates the beginning of chromosome migration toward its respective pole. Bar, 5
�
m. Pairs of arrows were used to follow two reforming NORs to form a single nucleolus and the color changes from red to green to represent the fusion events. (B) The mean fluorescence intensities of the nucleolar com-ponents FIB, B23 and RL27 within nucleoli were averaged, normalized and plotted over 5 (left) and 15 h (right) in the same manner as in Fig. 6 D. The distribution of the original data is reported in Fig. S2. (C) Collating data from Figs. 6 and 7, a possible time line to summarize the relationship between different nucleolar subcompartments and nuclear import markers, is proposed. The top side indicates the time for different

Nuclear dynamics in mitosis
|
Leung et al. 797
strictly defined and reproducible temporal sequence of in-corporation of markers in the order of FC, DFC, and finallyGC. However, this did not correlate with the order in whichthe factors were imported into nuclei, as the DFC markerFIB accumulated early in nuclei but only later was incorpo-rated into nucleolar foci, coincident with the maximal nu-clear import of RNA polymerase I.
The advantages of live cell imaging have recently been ap-plied to study several dynamic nuclear processes (Clute andPines, 1999; Gerlich et al., 2001; Beaudouin et al., 2002;Gerlich and Ellenberg, 2003a; Prasanth et al., 2003). A fea-ture of the live cell approach used here is that we can conductquantitative studies on nucleolar dynamics during mitosis atthe single cell level. Moreover, we have directly correlatedquantitatively the temporal changes in each of the separatenucleolar, NE and chromatin components within the nu-cleus. This has allowed us to detect small differences in thetiming of events that would not be apparent by conventionalimmunofluorescence approaches, where temporal informa-tion is not available. Similarly, biochemical methods samplethe mean properties of cell populations, rather than the be-havior or sequence of events in individual cells. For example,we could reproducibly detect a timing difference as small as
�
4 min in the loss of RPA39 from the FC, before loss ofDFC or GC markers during nucleolar breakdown. Quantita-tive analyses of these time-lapse data obtained from multiplecells in each experiment also provided information regardingthe kinetic behavior of nuclear proteins across the cell popu-lation and showed the degree of variation between nuclei.
Recent studies on the dynamics of nucleoli during mitosishave focused mainly on the process of postmitotic nucleolarreformation (Dundr et al., 2000; Savino et al., 2001). Twoprevious studies have included the use of live cell imaging toanalyze events during the formation of nucleoli (Dundr et al.,2000; Savino et al., 2001). Both studies used a combinationof immunofluorescence and cell lines expressing a singleGFP-tagged marker to analyze the temporal order of forma-tion of PNBs and nucleoli. In particular, both the composi-tion of PNBs, which accumulate partially processed rRNAprecursors and associated components, and how these com-ponents are subsequently transferred into NORs for nucle-olar assembly have been studied (Jimenez-Garcia et al., 1994;Dundr et al., 2000; Savino et al., 2001). Here, we have fo-cused on quantitating the temporal pathway of nucleologene-sis as well as studying the spatial organization of reformingNORs. In each of the live cells analyzed, multiple FP-taggedmarkers used for different nucleolar subcompartments allowsus to distinguish reforming NORs and nucleoli from PNBs.For example, PNBs do not contain RNA polymerase I, whichreassociates with the NOR early during nucleologenesis.Thus, we could perform a correlative as well as quantitative
analysis of components from all three nucleolar subcompart-ments in parallel. More importantly, we have extended theseanalyses by comparing the processes of nucleolar breakdownas well as reassembly in the same cells. A novel conclusionfrom this work is that RNA polymerase I subunits RPA39and RPA20 transiently leave the NORs during metaphase,whereas UBF remains associated with NORs throughout mi-tosis. Our findings are supported by the data from a recentindependent study showing that other RNA polymerase Isubunits, specifically, RPA194, RPA39, and RPA16, but notRPA43, also leave the NORs during metaphase (Dundr, M.,and T. Misteli, personal communication). These results differfrom the current view that RNA polymerase I, as well asUBF, remains associated with NORs throughout mitosis,based on immunofluorescence data using fixed cells, where itis difficult to detect a transient absence of RNA polymerase I.Our data in contrast indicate that multiple RNA polymeraseI subunits either leave the chromosomes transiently, or elsedecrease in concentration below our detection limit, for abrief period at metaphase. We note that this can explain theprevious observation based on high resolution in situ hybrid-ization studies that metaphase chromosomes do not containnascent rRNA (Weisenberger and Scheer, 1995). Our dataare also consistent with the findings from run-on assays thatrRNA genes in metaphase chromosomes, whereas still in thesame open configuration as interphase chromosomes, are lesstranscriptionally active (Conconi et al., 1989). Our presentdata therefore indicate that the mitotic behavior of RNApolymerase I may be more similar to RNA polymerase IIthan was previously apparent.
We observe distinct kinetic behavior of individual proteinsduring nucleolar disassembly (Fig. 3 D and Fig. 5 C). For ex-ample, although dissociation of B23 and RL27 from nucleoliinitiates later than RPA39 or FIB, their dissociation rate ishigher. Both GC components dissociate from nucleoli at sim-ilar rates, with comparable kinetics to cytoplasmic dispersal ofIBB upon NE breakdown, which is most likely a diffusion-limited event. Although the molecular mechanism of nucle-olar disassembly remains poorly understood, the present dataraise the possibility that distinct processes could operate se-quentially and/or independently during the disassembly ofFC, DFC, and GC subcompartments. We observe thatRPA39 leaves the nucleolus before breakdown of nuclearlamina components, whereas the DFC and GC markers arelost during the period of nuclear lamina breakdown. It isknown from previous studies that lamina disassembly is trig-gered via cyclin B-CDK1 mediated phosphorylation of mul-tiple components, including LB1 (Pines and Rieder, 2001;Burke and Ellenberg, 2002). Coincidently, the same cyclincomplex is involved in repression of mitotic ribosomal tran-scription and nucleolar reformation. For example, phosphor-
nucleolar components to reassemble into nucleoli, whereas the bottom side indicates the time required for nucleolar markers RPA39 and FIB as well as nuclear import markers IBB to enter nucleoli after mitosis. The time line begins at 00:00 when the chromosomes start to migrate toward its respective pole. For nucleolar entry, RPA39, FIB, B23, and RL27 reach 50% of its saturated value at 14:42, 19:00, 53:00, and 60:00, respectively. For nuclear import, FIB, IBB, and RPA39 reach 50% of its saturated value at 09:06, 11:18, and 13:48, respectively. Bar, 5 min. (D) The number of clusters represented by the DFC marker FIB was counted and plotted against time, where time equals 00:00 when the chromosomes start to migrate toward its respective pole and
n
�
the number of cells examined. An orange window was added in the same time scale to denote the first appearance of GC within the reforming nucleoli. The distribution of the original data counting the number of DFC clusters is reported in Fig. S3 A (available at http://www.jcb.org/cgi/content/full/jcb.200405013/DC1).

798 The Journal of Cell Biology
|
Volume 166, Number 6, 2004
ylation of UBF and transcription factor SL1 by CDK1 causesshut-off of RNA polymerase I transcription (Heix et al.,1998; Klein and Grummt, 1999). The CDK1 inhibitor ros-covitine also causes reactivation of RNA polymerase I tran-scription during mitosis but not the recruitment of rRNAprocessing factors to the rRNA gene repeats (Sirri et al., 2000,2002). Our data indicate that the loss of RNA polymerase Iand hence transcription of rRNA genes is likely to be the ini-tial event during mitotic disassembly of nucleoli. However,loss of rRNA gene transcription alone may not be sufficientto cause subsequent disassembly of the entire nucleolus. Forexample, although inhibition of ribosomal transcription dur-ing interphase causes RNA polymerase I subunits to leave nu-
cleoli in vivo (unpublished data), the inhibition of ribosomaltranscription by Actinomycin D in isolated nucleoli does notcause nucleoli to disintegrate in vitro (unpublished data).Therefore, we propose that the mitotic disassembly of theDFC and GC subcompartments is a result of an active mech-anism rather than an indirect effect of the loss of transcrip-tional activity. This is consistent with a recent study thatgerm cell proteins FRGY2a and FRGY2b can reversibly disas-semble somatic nucleoli in Xenopus egg cytoplasm indepen-dent of rRNA transcription (Gonda et al., 2003), suggestingthat transcription activity and nucleolar integrity may not beobligatorily coupled. It will thus be interesting in future totest whether molecular mechanisms such as phosphorylation
Figure 8. The dynamics of nucleolus during mitosis. The nucleolar disassembly and reassembly pathway are shown in a–c and d–i, respectively. During disassembly, (a and b) the RPA39 (blue) dissociates from the nucleoli �2 min before the loss of functional integrity of the NE as illustrated by the leakage of IBB (gray). (b and c) Within �4 min, the DFC (yellow) and GC (magenta) subcompartments disintegrate, within the period of NE breakdown and (c) subtle changes in the distribution of proteins localized to these two subcompartments are observed (Fig. 3 C). (d) A brief period during metaphase follows, in which the RPA39 is not associated with the NORs, whereas the UBF remains bound. (e) Before anaphase, the RNA polymerase I subunits reassociate with the UBF-containing NORs and at the same time FIB reassociates with the chromosomes (shown by a change of color on the chromosome). At this stage PNBs (orange dots), which consists of partially pro-cessed rRNA transcripts and associated processing factors, are formed in the nucleoplasm. (f) Within 5 min, FIB starts to reassociate with the reforming NORs and the number of reforming NORs increases upon the activation of nuclear import. (g and h) Within 27 min after step e, the GC reforms, coincident with the maximal number of DFC fusion events. (i) Variations in the number of nucleoli between daughter nuclei imply that stochastic events can influence nucleolar reassembly.

Nuclear dynamics in mitosis | Leung et al. 799
by the cyclin B–CDK1 complex may play a role in eitherRPA39 dissociation from FCs or in other steps in the nucle-olar breakdown pathway.
In contrast with the precise temporal regulation in the or-der of events during both disassembly and reformation ofnucleoli during mitosis, higher order aspects of nucleolo-genesis appear to be less strictly controlled. A statisticalevaluation of the number of FC foci and functional nucle-oli that appear after mitosis suggested that daughter nucleiare more similar to each other than to unrelated nuclei exit-ing mitosis elsewhere, consistent with the expected conser-vation in global chromosome positioning (Gerlich andEllenberg, 2003b; Walter et al., 2003). Nonetheless, we ob-serve statistically significant differences between the twodaughter nuclei. At least from the point at which RNApolymerase I subunits reassociate with NORs, it appearsthat local effects, which can differ between daughter nuclei,influence the overall pathway of nucleologenesis. Effectsacting at the level of the local chromosome environment,such as variations in chromosome orientation and decon-densation (Thomson et al., 2004), variable activation ofrRNA genes within the repeat clusters and variation in pro-tein concentration kinetics (Dundr et al., 2002a), may allinfluence both the association of RNA polymerase I withNORs and the probability of NOR fusion and hence thenumber of active nucleoli formed. It is interesting to com-pare this view with a recent FISH analysis on the process ofinduced RNA polymerase II gene activation at the singlecell level (Levsky et al., 2002). Both this FISH analysis andour work suggest that the pattern and level of gene activa-tion varies at the single cell level, which had not been ap-parent from previous biochemical studies from cell popula-tions. Although it is increasingly appreciated that nuclearstructure, including the relative 3D distribution of chromo-somes (Parada and Misteli, 2002; Bickmore and Chubb,2003), can influence gene expression by RNA polymeraseII, we infer from this work that nuclear structure may alsohave an important effect on events connected with RNApolymerase I transcription.
Materials and methodsCell culture, transfection, and establishment of stable cell lineHeLa cell lines were grown in DME supplemented with 10% FCS and 100U/ml penicillin and streptomycin (Invitrogen). Single and double stably-transformed cell lines were established using selection with G418 and/orblasticidin, after transfection with �2 �g of each respective plasmidconstruct (Table SI, available at http://www.jcb.org/cgi/content/full/jcb.200405013/DC1) per 100-mm dish. 24 independent clones were isolatedfor each cell line and three selected for analysis after further characteriza-tion. A description of each cell line is provided in Table SII. Plasmid trans-fection was performed using Effectene reagent (QIAGEN) according to themanufacturer’s instructions.
ImmunostainingTo prepare the fixation buffer, 2� PHEM buffer (18.14 g Pipes, 6.5 gHepes, 0.99 g MgSO4, 3.8 g EGTA in 500 ml H2O, pH 7.0) were added tofreshly prepared 37% PFA in 1:5 ratio. The fixation buffer was thenwarmed to 37C and added directly to the cells slowly after pouring themedia out of the dish. The cells were fixed for 10 min before being washedthrice with 1� PBS very gently. The cells were then permeabilized, stainedand mounted as previously published (Leung and Lamond, 2002). Primaryantibodies used were anti-UBF (1:5; Santa Cruz Biotechnology, Inc.) andanti-RPA20 (1:1; B6-2; Jones et al., 2000).
Immunoprecipitations and in vitro transcription assays50 �g of HeLaYFP-RPA39 or HeLa nuclear extract were precleared for 30 minwith 5 �l of protein G–Sepharose beads and used in immunoprecipitationswith 4 �g of anti-GFP antibodies bound to 7.5 �l of protein G–Sepharosebeads in 0.25 M KCl/TM10 (50 mM Tris–HCl, pH 7.9, 12.5 mM MgCl2, 1mM EDTA, 10% glycerol, 1 mM sodium metabisulfite and 1 mM DTT)buffer. The beads were incubated with nuclear extract for 1 h, with shak-ing, at 4C. After immunoprecipitation the beads were washed in TM10/0.25 M KCl buffer, then equilibrated in TM10/0.05 M KCl buffer and usedin in vitro transcription assays. In vitro transcription reactions were per-formed as described previously (Miller et al., 2001) at a final salt concen-tration of 50–70 mM KCl. Supercoiled prHu3 plasmid DNA, which con-tains the human rRNA gene promoter from �515 to �1548, were used astemplates in the transcription reaction. The resulting transcripts were ana-lyzed in an S1 nuclease protection assay after annealing the RNA to a 5-end–labeled oligonucleotide, which was identical to the region between�20 and �40 of the promoter template strand.
BrUTP incorporationCoverslips seeded with HeLa cells were rinsed with hypotonic KH buffer(30 mM KCl, 10 mM Hepes, pH 7.4) briefly and incubated with 50 �l KHbuffer containing 10 mM BrUTP (Sigma-Aldrich) for 5 min in a 5% CO2 in-cubator at 37C. The cells on coverslips were “chased” with DME contain-ing 20% FCS and 200 �g/ml (final concentration) G418 for a defined timein the incubator to chase the transcripts before fixation. Before methanolfixation for 20 min at �20C, the coverslips were rinsed with PBS. Thecells were then permeabilized with acetone for 30 s and air-dried for 10min, followed by rehydration with PBS for 5 min and immunostaining us-ing the anti-BrdU (1:5) antibody.
Mitotic studies of living cellsAt each time point a 3D image stack spanning the entire nuclear volumewas recorded for each of the three wavelengths. Low light imaging condi-tions were chosen to ensure that cells were able to progress through the en-tire mitosis. For these experiments a series of “double stable” cell lineswere established that express combinations of two FP-tagged markers (Ta-ble SII). The third marker in each experiment was expressed by transienttransfection (Table SI). Cells were seeded in a Labtek II chambered cover-glasses on the previous night before imaging and an imaging medium con-taining 20% FCS and 0.5 mg/ml L-ascorbic acid replaced the growthmedium for 3–4 h before imaging. 4D imaging was performed on a cus-tomized confocal laser scanning fluorescence microscope (model LSM510;Carl Zeiss MicroImaging, Inc.) kept at 37C and equipped with a z-scan-ning stage (HRZ 200) for fast 4D acquisition using a Plan Apochromat 63�DIC oil immersion objective. Triple-color imaging of CFP, YFP and DsRed/HcRed was achieved by alternating the 413 nm Kr, 514 nm Ar, and 543nm HeNe laser for selective excitation. Bidirectional scanning and detec-tion were performed as published previously (Gerlich et al., 2001).
Quantitation and statistical analysisFor object identification, a reference channel was chosen that representedthe structure of interest. For example, FP-H2B and FP-RPA39 are used todefine the nuclear volume and reforming NORs, respectively. The imagesin this channel were processed by an anisotropic diffusion filtering andsubsequent thresholding (Gerlich et al., 2001) to obtain a binary mask rep-resenting areas of interest. Mean fluorescence intensities were then mea-sured in all channels of the original unfiltered images within these areas.Automated analysis of 4D data was achieved by implementation of a com-puter macro, which was executed in the image processing toolbox Heu-risko 4.05 (Aeon). Importantly, a single threshold was selected for the anal-ysis of entire 4D images. Although the specific threshold chosen by theuser affects absolute values, the kinetics of protein concentrations mea-sured during mitotic progression were largely unaffected (Gerlich et al.,2001). The data collected were then normalized and analyzed usingGraphPad Prism 4.0 software.
Online supplemental materialFig. S1 includes (A) representative Western blots showing expression levelsof FP-fusion proteins in cell lines used, (B) FP-RPA39 localization at EMlevel, the localization of (C) pulsed labeled rRNA transcripts and (D)RPA20 in HeLaYFP-RPA39 cells. Distributions of quantitative measurements inFigs. 3, 5–7 are shown in Fig. S2. The statistical analysis for the differentialbehavior of daughter cells after mitosis is shown in Fig. S3. Fig. S4 showsthat the loss of functionality of the NE precedes its structural disintegration.The plasmid and stable cell lines used in this work are tabulated in Table

800 The Journal of Cell Biology | Volume 166, Number 6, 2004
S1. The localization of RPA39, FIB and B23 are shown in Videos 1 and 2.Online supplemental material is available at http://www.jcb.org/cgi/content/full/jcb.200405013/DC1.
We thank Drs. H. Kimura and P.R. Cook (University of Oxford, Oxford,UK) for the gift of mAbs B6-2, Mr. G. Rabut (EMBL) for providing macros toensure fast acquisition after multi-point visit and multi-wavelength time se-ries scanning as well as autofocussing during imaging of multi-point timeseries, and Ms. E. Zanin (EMBL) for making the IBB-FP fusion construct.
A.K.L. Leung was supported by a Croucher Foundation Scholarship, anEMBL Advanced Light Microscopy Fellowship and a Company of BiologistsLtd. travelling Fellowship. D. Gerlich is supported by an EMBO long-termfellowship. G. Miller was a Wellcome Trust Prize Student. A.I. Lamond is aWellcome Trust Principal Research Fellow. J. Zomerdijk is a WellcomeTrust Senior Research Fellow. The Human Frontier Science Program is ac-knowledged for a research grant entitled “Functional organization of thecell nucleus investigated through proteomics and molecular dynamics”.
Submitted: 4 May 2004Accepted: 23 July 2004
ReferencesBeaudouin, J., D. Gerlich, N. Daigle, R. Eils, and J. Ellenberg. 2002. Nuclear en-
velope breakdown proceeds by microtubule-induced tearing of the lamina.Cell. 108:83–96.
Bickmore, W.A., and J.R. Chubb. 2003. Dispatch. Chromosome position: now,where was I? Curr. Biol. 13:R357–R359.
Burke, B., and J. Ellenberg. 2002. Remodelling the walls of the nucleus. Nat. Rev.Mol. Cell Biol. 3:487–497.
Carmo-Fonseca, M., L. Mendes-Soares, and I. Campos. 2000. To be or not to bein the nucleolus. Nat. Cell Biol. 2:E107–E112.
Clute, P., and J. Pines. 1999. Temporal and spatial control of cyclin B1 destructionin metaphase. Nat. Cell Biol. 1:82–87.
Conconi, A., R.M. Widmer, T. Koller, and J.M. Sogo. 1989. Two different chro-matin structures coexist in ribosomal RNA genes throughout the cell cycle.Cell. 57:753–761.
Dundr, M., T. Misteli, and M.O. Olson. 2000. The dynamics of postmitotic reas-sembly of the nucleolus. J. Cell Biol. 150:433–446.
Dundr, M., U. Hoffmann-Rohrer, Q. Hu, I. Grummt, L.I. Rothblum, R.D. Phair,and T. Misteli. 2002a. A kinetic framework for a mammalian RNA poly-merase in vivo. Science. 298:1623–1626.
Dundr, M., J.G. McNally, J. Cohen, and T. Misteli. 2002b. Quantitation of GFP-fusion proteins in single living cells. J. Struct. Biol. 140:92–99.
Gerbi, S.A., A.V. Borovjagin, and T.S. Lange. 2003. The nucleolus: a site of ribo-nucleoprotein maturation. Curr. Opin. Cell Biol. 15:318–325.
Gerlich, D., and J. Ellenberg. 2003a. 4D imaging to assay complex dynamics inlive specimens. Nat. Cell Biol. 5:S14–S19.
Gerlich, D., and J. Ellenberg. 2003b. Dynamics of chromosome positioning dur-ing the cell cycle. Curr. Opin. Cell Biol. 15:664–671.
Gerlich, D., J. Beaudouin, M. Gebhard, J. Ellenberg, and R. Eils. 2001. Four-dimensional imaging and quantitative reconstruction to analyse complexspatiotemporal processes in live cells. Nat. Cell Biol. 3:852–855.
Gilbert, N., L. Lucas, C. Klein, M. Menager, N. Bonnet, and D. Ploton. 1995.Three-dimensional co-location of RNA polymerase I and DNA during in-terphase and mitosis by confocal microscopy. J. Cell Sci. 108:115–125.
Gonda, K., J. Fowler, N. Katoku-Kikyo, J. Haroldson, J. Wudel, and N. Kikyo.2003. Reversible disassembly of somatic nucleoli by the germ cell proteinsFRGY2a and FRGY2b. Nat. Cell Biol. 5:205–210.
Heix, J., A. Vente, R. Voit, A. Budde, T.M. Michaelidis, and I. Grummt. 1998.Mitotic silencing of human rRNA synthesis: inactivation of the promoter se-lectivity factor SL1 by cdc2/cyclin B-mediated phosphorylation. EMBO J.17:7373–7381.
Hernandez-Verdun, D., P. Roussel, and J. Gebrane-Younes. 2002. Emerging con-
cepts of nucleolar assembly. J. Cell Sci. 115:2265–2270.Huang, S. 2002. Building an efficient factory: where is pre-rRNA synthesized in
the nucleolus? J. Cell Biol. 157:739–741.Janicki, S.M., and D.L. Spector. 2003. Nuclear choreography: interpretations from
living cells. Curr. Opin. Cell Biol. 15:149–157.Jimenez-Garcia, L.F., M.L. Segura-Valdez, R.L. Ochs, L.I. Rothblum, R. Hannan,
and D.L. Spector. 1994. Nucleologenesis: U3 snRNA-containing prenucle-olar bodies move to sites of active pre-rRNA transcription after mitosis. Mol.Biol. Cell. 5:955–966.
Jones, E., H. Kimura, M. Vigneron, Z. Wang, R.G. Roeder, and P.R. Cook. 2000.Isolation and characterization of monoclonal antibodies directed against sub-units of human RNA polymerases I, II and III. Exp. Cell Res. 254:163–172.
Jordan, P., M. Mannervik, L. Tora, and M. Carmo-Fonseca. 1996. In vivo evi-dence that TATA-binding protein/SL1 colocalizes with UBF and RNApolymerase I when rRNA synthesis is either active or inactive. J. Cell Biol.133:225–234.
Klein, J., and I. Grummt. 1999. Cell cycle-dependent regulation of RNA polymer-ase I transcription: the nucleolar transcription factor UBF is inactive in mi-tosis and early G1. Proc. Natl. Acad. Sci. USA. 96:6096–6101.
Leung, A.K., and A.I. Lamond. 2002. In vivo analysis of NHPX reveals a novel nu-cleolar localization pathway involving a transient accumulation in splicingspeckles. J. Cell Biol. 157:615–629.
Leung, A.K., and A.I. Lamond. 2003. The dynamics of the nucleolus. Crit. Rev.Eukaryot. Gene Expr. 13:39–54.
Levsky, J.M., S.M. Shenoy, R.C. Pezo, and R.H. Singer. 2002. Single-cell gene ex-pression profiling. Science. 297:836–840.
Miller, G., K.I. Panov, J.K. Friedrich, L. Trinkle-Mulcahy, A.I. Lamond, and J.C.Zomerdijk. 2001. hRRN3 is essential in the SL1-mediated recruitment ofRNA Polymerase I to rRNA gene promoters. EMBO J. 20:1373–1382.
Olson, M.O., M. Dundr, and A. Szebeni. 2000. The nucleolus: an old factory withunexpected capabilities. Trends Cell Biol. 10:189–196.
Parada, L., and T. Misteli. 2002. Chromosome positioning in the interphase nu-cleus. Trends Cell Biol. 12:425–432.
Pines, J., and C.L. Rieder. 2001. Re-staging mitosis: a contemporary view of mi-totic progression. Nat. Cell Biol. 3:E3–E6.
Prasanth, K.V., P.A. Sacco-Bubulya, S.G. Prasanth, and D.L. Spector. 2003. Se-quential entry of components of the gene expression machinery into daugh-ter nuclei. Mol. Biol. Cell. 14:1043–1057.
Roussel, P., C. Andre, C. Masson, G. Geraud, and D. Hernandez-Verdun. 1993.Localization of the RNA polymerase I transcription factor hUBF during thecell cycle. J. Cell Sci. 104:327–337.
Rubbi, C.P., and J. Milner. 2003. Disruption of the nucleolus mediates stabiliza-tion of p53 in response to DNA damage and other stresses. EMBO J. 22:6068–6077.
Savino, T.M., J. Gebrane-Younes, J. De Mey, J.B. Sibarita, and D. Hernandez-Verdun. 2001. Nucleolar assembly of the rRNA processing machinery in liv-ing cells. J. Cell Biol. 153:1097–1110.
Scheer, U., and K.M. Rose. 1984. Localization of RNA polymerase I in interphasecells and mitotic chromosomes by light and electron microscopic immuno-cytochemistry. Proc. Natl. Acad. Sci. USA. 81:1431–1435.
Sirri, V., P. Roussel, and D. Hernandez-Verdun. 2000. In vivo release of mitotic si-lencing of ribosomal gene transcription does not give rise to precursor ribo-somal RNA processing. J. Cell Biol. 148:259–270.
Sirri, V., D. Hernandez-Verdun, and P. Roussel. 2002. Cyclin-dependent ki-nases govern formation and maintenance of the nucleolus. J. Cell Biol.156:969–981.
Thomson, I., S. Gilchrist, W.A. Bickmore, and J.R. Chubb. 2004. The radial posi-tioning of chromatin is not inherited through mitosis but is established denovo in early G1. Curr. Biol. 14:166–172.
Walter, J., L. Schermelleh, M. Cremer, S. Tashiro, and T. Cremer. 2003. Chromo-some order in HeLa cells changes during mitosis and early G1, but is stablymaintained during subsequent interphase stages. J. Cell Biol. 160:685–697.
Weisenberger, D., and U. Scheer. 1995. A possible mechanism for the inhibition ofribosomal RNA gene transcription during mitosis. J. Cell Biol. 129:561–575.
Copyright © 2022 FDOKUMEN