Quantitative In Vivo Measurement of Gyrification in the Human Brain: Changes Associated with Aging
10
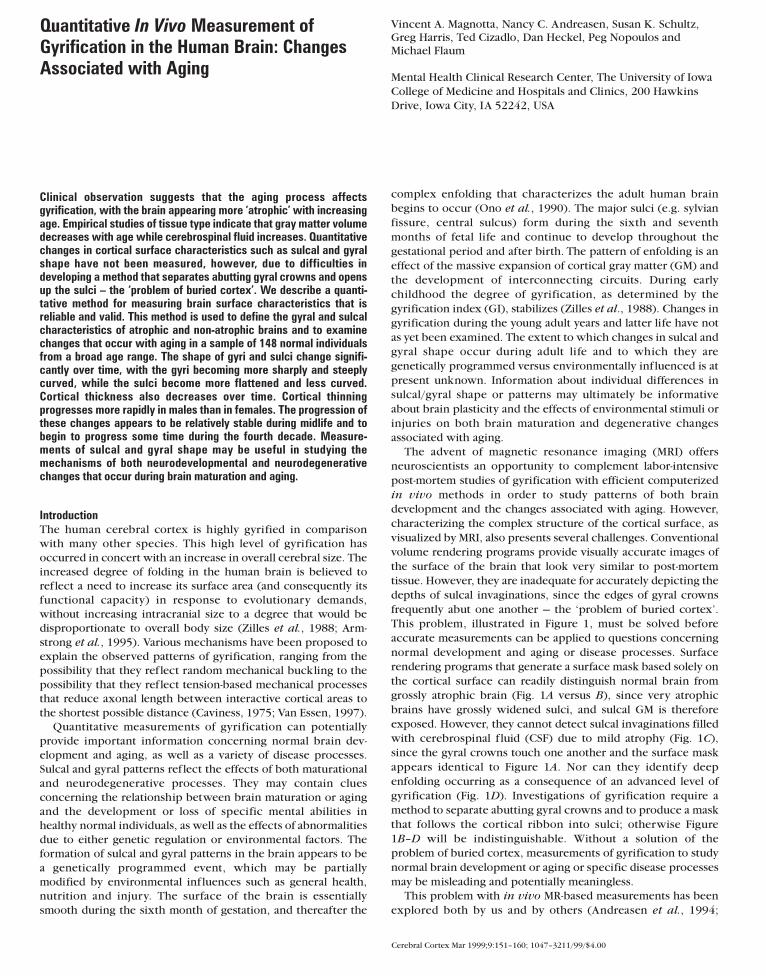
Clinical observation suggests that the aging process affects gyrification, with the brain appearing more ‘atrophic’ with increasing age. Empirical studies of tissue type indicate that gray matter volume decreases with age while cerebrospinal fluid increases. Quantitative changes in cortical surface characteristics such as sulcal and gyral shape have not been measured, however, due to difficulties in developing a method that separates abutting gyral crowns and opens up the sulci – the ‘problem of buried cortex’. We describe a quanti- tative method for measuring brain surface characteristics that is reliable and valid. This method is used to define the gyral and sulcal characteristics of atrophic and non-atrophic brains and to examine changes that occur with aging in a sample of 148 normal individuals from a broad age range. The shape of gyri and sulci change signifi- cantly over time, with the gyri becoming more sharply and steeply curved, while the sulci become more flattened and less curved. Cortical thickness also decreases over time. Cortical thinning progresses more rapidly in males than in females. The progression of these changes appears to be relatively stable during midlife and to begin to progress some time during the fourth decade. Measure- ments of sulcal and gyral shape may be useful in studying the mechanisms of both neurodevelopmental and neurodegenerative changes that occur during brain maturation and aging. Introduction The human cerebral cortex is highly gyrified in comparison with many other species. This high level of gyrification has occurred in concert with an increase in overall cerebral size. The increased degree of folding in the human brain is believed to ref lect a need to increase its surface area (and consequently its functional capacity) in response to evolutionary demands, without increasing intracranial size to a degree that would be disproportionate to overall body size (Zilles et al., 1988; Arm- strong et al., 1995). Various mechanisms have been proposed to explain the observed patterns of gyrification, ranging from the possibility that they ref lect random mechanical buckling to the possibility that they ref lect tension-based mechanical processes that reduce axonal length between interactive cortical areas to the shortest possible distance (Caviness, 1975; Van Essen, 1997). Quantitative measurements of gyrification can potentially provide important information concerning normal brain dev- elopment and aging, as well as a variety of disease processes. Sulcal and gyral patterns ref lect the effects of both maturational and neurodegenerative processes. They may contain clues concerning the relationship between brain maturation or aging and the development or loss of specific mental abilities in healthy normal individuals, as well as the effects of abnormalities due to either genetic regulation or environmental factors. The formation of sulcal and gyral patterns in the brain appears to be a genetically programmed event, which may be partially modified by environmental inf luences such as general health, nutrition and injury. The surface of the brain is essentially smooth during the sixth month of gestation, and thereafter the complex enfolding that characterizes the adult human brain begins to occur (Ono et al., 1990). The major sulci (e.g. sylvian fissure, central sulcus) form during the sixth and seventh months of fetal life and continue to develop throughout the gestational period and after birth. The pattern of enfolding is an effect of the massive expansion of cortical gray matter (GM) and the development of interconnecting circuits. During early childhood the degree of gyrification, as determined by the gyrification index (GI), stabilizes (Zilles et al., 1988). Changes in gyrification during the young adult years and latter life have not as yet been examined. The extent to which changes in sulcal and gyral shape occur during adult life and to which they are genetically programmed versus environmentally inf luenced is at present unknown. Information about individual differences in sulcal/gyral shape or patterns may ultimately be informative about brain plasticity and the effects of environmental stimuli or injuries on both brain maturation and degenerative changes associated with aging. The advent of magnetic resonance imaging (MRI) offers neuroscientists an opportunity to complement labor-intensive post-mortem studies of gyrification with efficient computerized in vivo methods in order to study patterns of both brain development and the changes associated with aging. However, characterizing the complex structure of the cortical surface, as visualized by MRI, also presents several challenges. Conventional volume rendering programs provide visually accurate images of the surface of the brain that look very similar to post-mortem tissue. However, they are inadequate for accurately depicting the depths of sulcal invaginations, since the edges of gyral crowns frequently abut one another — the ‘problem of buried cortex’. This problem, illustrated in Figure 1, must be solved before accurate measurements can be applied to questions concerning normal development and aging or disease processes. Surface rendering programs that generate a surface mask based solely on the cortical surface can readily distinguish normal brain from grossly atrophic brain (Fig. 1A versus B), since very atrophic brains have grossly widened sulci, and sulcal GM is therefore exposed. However, they cannot detect sulcal invaginations filled with cerebrospinal fluid (CSF) due to mild atrophy (Fig. 1C), since the gyral crowns touch one another and the surface mask appears identical to Figure 1A. Nor can they identify deep enfolding occurring as a consequence of an advanced level of gyrification (Fig. 1D). Investigations of gyrification require a method to separate abutting gyral crowns and to produce a mask that follows the cortical ribbon into sulci; otherwise Figure 1B–D will be indistinguishable. Without a solution of the problem of buried cortex, measurements of gyrification to study normal brain development or aging or specific disease processes may be misleading and potentially meaningless. This problem with in vivo MR-based measurements has been explored both by us and by others (Andreasen et al., 1994; Cerebral Cortex Mar 1999;9:151–160; 1047–3211/99/$4.00 Quantitative In Vivo Measurement of Gyrification in the Human Brain: Changes Associated with Aging Vincent A. Magnotta, Nancy C. Andreasen, Susan K. Schultz, Greg Harris, Ted Cizadlo, Dan Heckel, Peg Nopoulos and Michael Flaum Mental Health Clinical Research Center, The University of Iowa College of Medicine and Hospitals and Clinics, 200 Hawkins Drive, Iowa City, IA 52242, USA
Transcript of Quantitative In Vivo Measurement of Gyrification in the Human Brain: Changes Associated with Aging
Clinical observation suggests that the aging process affectsgyrification, with the brain appearing more ‘atrophic’ with increasingage. Empirical studies of tissue type indicate that gray matter volumedecreases with age while cerebrospinal fluid increases. Quantitativechanges in cortical surface characteristics such as sulcal and gyralshape have not been measured, however, due to difficulties indeveloping a method that separates abutting gyral crowns and opensup the sulci – the ‘problem of buried cortex’. We describe a quanti-tative method for measuring brain surface characteristics that isreliable and valid. This method is used to define the gyral and sulcalcharacteristics of atrophic and non-atrophic brains and to examinechanges that occur with aging in a sample of 148 normal individualsfrom a broad age range. The shape of gyri and sulci change signifi-cantly over time, with the gyri becoming more sharply and steeplycurved, while the sulci become more flattened and less curved.Cortical thickness also decreases over time. Cortical thinningprogresses more rapidly in males than in females. The progression ofthese changes appears to be relatively stable during midlife and tobegin to progress some time during the fourth decade. Measure-ments of sulcal and gyral shape may be useful in studying themechanisms of both neurodevelopmental and neurodegenerativechanges that occur during brain maturation and aging.
IntroductionThe human cerebral cortex is highly gyrified in comparison
with many other species. This high level of gyrification has
occurred in concert with an increase in overall cerebral size. The
increased degree of folding in the human brain is believed to
ref lect a need to increase its surface area (and consequently its
functional capacity) in response to evolutionary demands,
without increasing intracranial size to a degree that would be
disproportionate to overall body size (Zilles et al., 1988; Arm-
strong et al., 1995). Various mechanisms have been proposed to
explain the observed patterns of gyrification, ranging from the
possibility that they ref lect random mechanical buckling to the
possibility that they ref lect tension-based mechanical processes
that reduce axonal length between interactive cortical areas to
the shortest possible distance (Caviness, 1975; Van Essen, 1997).
Quantitative measurements of gyrification can potentially
provide important information concerning normal brain dev-
elopment and aging, as well as a variety of disease processes.
Sulcal and gyral patterns ref lect the effects of both maturational
and neurodegenerative processes. They may contain clues
concerning the relationship between brain maturation or aging
and the development or loss of specific mental abilities in
healthy normal individuals, as well as the effects of abnormalities
due to either genetic regulation or environmental factors. The
formation of sulcal and gyral patterns in the brain appears to be
a genetically programmed event, which may be partially
modified by environmental inf luences such as general health,
nutrition and injury. The surface of the brain is essentially
smooth during the sixth month of gestation, and thereafter the
complex enfolding that characterizes the adult human brain
begins to occur (Ono et al., 1990). The major sulci (e.g. sylvian
fissure, central sulcus) form during the sixth and seventh
months of fetal life and continue to develop throughout the
gestational period and after birth. The pattern of enfolding is an
effect of the massive expansion of cortical gray matter (GM) and
the development of interconnecting circuits. During early
childhood the degree of gyrification, as determined by the
gyrification index (GI), stabilizes (Zilles et al., 1988). Changes in
gyrification during the young adult years and latter life have not
as yet been examined. The extent to which changes in sulcal and
gyral shape occur during adult life and to which they are
genetically programmed versus environmentally inf luenced is at
present unknown. Information about individual differences in
sulcal/gyral shape or patterns may ultimately be informative
about brain plasticity and the effects of environmental stimuli or
injuries on both brain maturation and degenerative changes
associated with aging.
The advent of magnetic resonance imaging (MRI) offers
neuroscientists an opportunity to complement labor-intensive
post-mortem studies of gyrification with efficient computerized
in vivo methods in order to study patterns of both brain
development and the changes associated with aging. However,
characterizing the complex structure of the cortical surface, as
visualized by MRI, also presents several challenges. Conventional
volume rendering programs provide visually accurate images of
the surface of the brain that look very similar to post-mortem
tissue. However, they are inadequate for accurately depicting the
depths of sulcal invaginations, since the edges of gyral crowns
frequently abut one another — the ‘problem of buried cortex’.
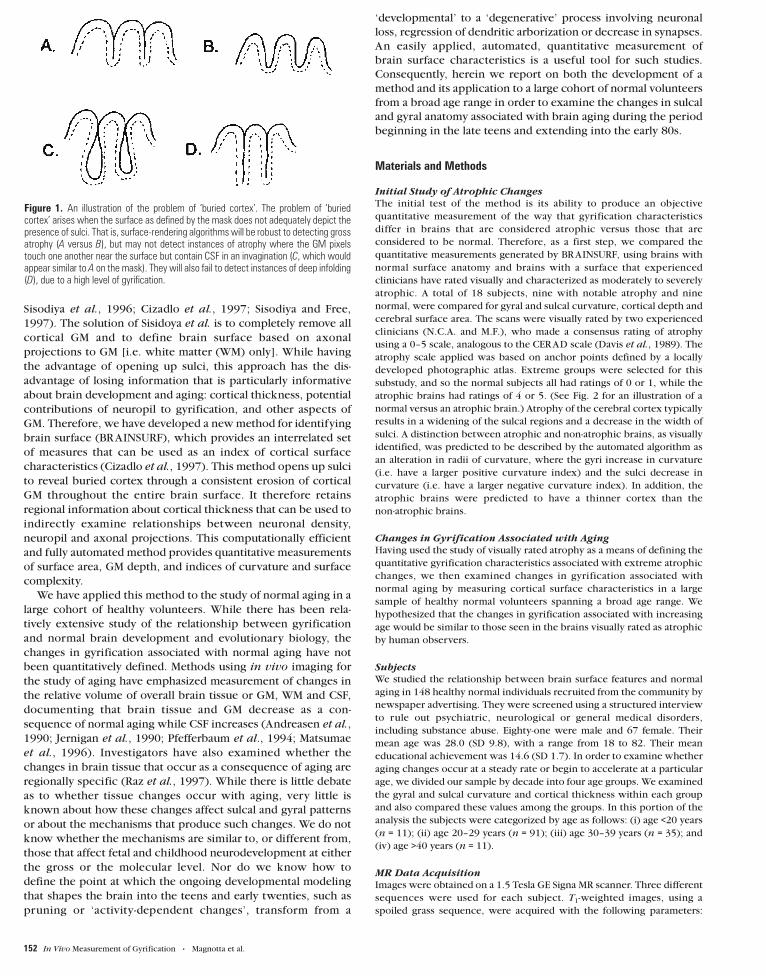
This problem, illustrated in Figure 1, must be solved before
accurate measurements can be applied to questions concerning
normal development and aging or disease processes. Surface
rendering programs that generate a surface mask based solely on
the cortical surface can readily distinguish normal brain from
grossly atrophic brain (Fig. 1A versus B), since very atrophic
brains have grossly widened sulci, and sulcal GM is therefore
exposed. However, they cannot detect sulcal invaginations filled
with cerebrospinal f luid (CSF) due to mild atrophy (Fig. 1C),
since the gyral crowns touch one another and the surface mask
appears identical to Figure 1A. Nor can they identify deep
enfolding occurring as a consequence of an advanced level of
gyrification (Fig. 1D). Investigations of gyrification require a
method to separate abutting gyral crowns and to produce a mask
that follows the cortical ribbon into sulci; otherwise Figure
1B–D will be indistinguishable. Without a solution of the
problem of buried cortex, measurements of gyrification to study
normal brain development or aging or specific disease processes
may be misleading and potentially meaningless.
This problem with in vivo MR-based measurements has been
explored both by us and by others (Andreasen et al., 1994;
Cerebral Cortex Mar 1999;9:151–160; 1047–3211/99/$4.00
Quantitative In Vivo Measurement ofGyrification in the Human Brain: ChangesAssociated with Aging
Vincent A. Magnotta, Nancy C. Andreasen, Susan K. Schultz,
Greg Harris, Ted Cizadlo, Dan Heckel, Peg Nopoulos and
Michael Flaum
Mental Health Clinical Research Center, The University of Iowa
College of Medicine and Hospitals and Clinics, 200 Hawkins
Drive, Iowa City, IA 52242, USA
Sisodiya et al., 1996; Cizadlo et al., 1997; Sisodiya and Free,
1997). The solution of Sisidoya et al. is to completely remove all
cortical GM and to define brain surface based on axonal
projections to GM [i.e. white matter (WM) only]. While having
the advantage of opening up sulci, this approach has the dis-
advantage of losing information that is particularly informative
about brain development and aging: cortical thickness, potential
contributions of neuropil to gyrification, and other aspects of
GM. Therefore, we have developed a new method for identifying
brain surface (BRAINSURF), which provides an interrelated set
of measures that can be used as an index of cortical surface
characteristics (Cizadlo et al., 1997). This method opens up sulci
to reveal buried cortex through a consistent erosion of cortical
GM throughout the entire brain surface. It therefore retains
regional information about cortical thickness that can be used to
indirectly examine relationships between neuronal density,
neuropil and axonal projections. This computationally efficient
and fully automated method provides quantitative measurements
of surface area, GM depth, and indices of curvature and surface
complexity.
We have applied this method to the study of normal aging in a
large cohort of healthy volunteers. While there has been rela-
tively extensive study of the relationship between gyrification
and normal brain development and evolutionary biology, the
changes in gyrification associated with normal aging have not
been quantitatively defined. Methods using in vivo imaging for
the study of aging have emphasized measurement of changes in
the relative volume of overall brain tissue or GM, WM and CSF,
documenting that brain tissue and GM decrease as a con-
sequence of normal aging while CSF increases (Andreasen et al.,
1990; Jernigan et al., 1990; Pfefferbaum et al., 1994; Matsumae
et al., 1996). Investigators have also examined whether the
changes in brain tissue that occur as a consequence of aging are
regionally specific (Raz et al., 1997). While there is little debate
as to whether tissue changes occur with aging, very little is
known about how these changes affect sulcal and gyral patterns
or about the mechanisms that produce such changes. We do not
know whether the mechanisms are similar to, or different from,
those that affect fetal and childhood neurodevelopment at either
the gross or the molecular level. Nor do we know how to
define the point at which the ongoing developmental modeling
that shapes the brain into the teens and early twenties, such as
pruning or ‘activity-dependent changes’, transform from a
‘developmental’ to a ‘degenerative’ process involving neuronal
loss, regression of dendritic arborization or decrease in synapses.
An easily applied, automated, quantitative measurement of
brain surface characteristics is a useful tool for such studies.
Consequently, herein we report on both the development of a
method and its application to a large cohort of normal volunteers
from a broad age range in order to examine the changes in sulcal
and gyral anatomy associated with brain aging during the period
beginning in the late teens and extending into the early 80s.
Materials and Methods
Initial Study of Atrophic Changes
The initial test of the method is its ability to produce an objective
quantitative measurement of the way that gyrification characteristics
differ in brains that are considered atrophic versus those that are
considered to be normal. Therefore, as a first step, we compared the
quantitative measurements generated by BRAINSURF, using brains with
normal surface anatomy and brains with a surface that experienced
clinicians have rated visually and characterized as moderately to severely
atrophic. A total of 18 subjects, nine with notable atrophy and nine
normal, were compared for gyral and sulcal curvature, cortical depth and
cerebral surface area. The scans were visually rated by two experienced
clinicians (N.C.A. and M.F.), who made a consensus rating of atrophy
using a 0–5 scale, analogous to the CERAD scale (Davis et al., 1989). The
atrophy scale applied was based on anchor points defined by a locally
developed photographic atlas. Extreme groups were selected for this
substudy, and so the normal subjects all had ratings of 0 or 1, while the
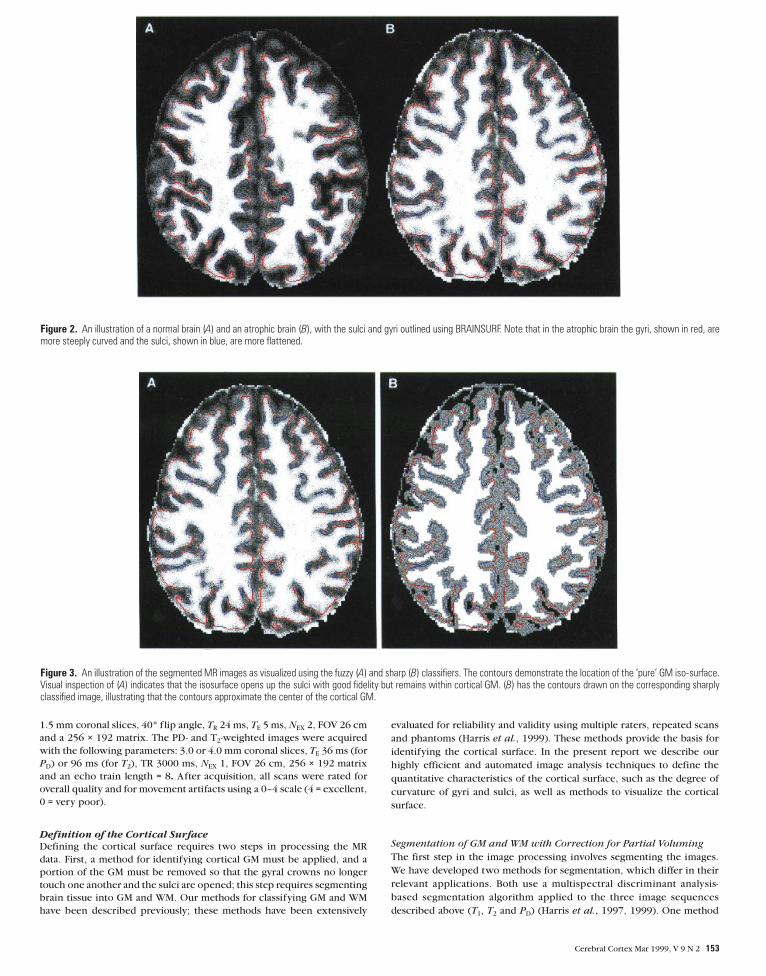
atrophic brains had ratings of 4 or 5. (See Fig. 2 for an illustration of a
normal versus an atrophic brain.) Atrophy of the cerebral cortex typically
results in a widening of the sulcal regions and a decrease in the width of
sulci. A distinction between atrophic and non-atrophic brains, as visually
identified, was predicted to be described by the automated algorithm as
an alteration in radii of curvature, where the gyri increase in curvature
(i.e. have a larger positive curvature index) and the sulci decrease in
curvature (i.e. have a larger negative curvature index). In addition, the
atrophic brains were predicted to have a thinner cortex than the
non-atrophic brains.
Changes in Gyrification Associated with Aging
Having used the study of visually rated atrophy as a means of defining the
quantitative gyrification characteristics associated with extreme atrophic
changes, we then examined changes in gyrification associated with
normal aging by measuring cortical surface characteristics in a large
sample of healthy normal volunteers spanning a broad age range. We
hypothesized that the changes in gyrification associated with increasing
age would be similar to those seen in the brains visually rated as atrophic
by human observers.
Subjects
We studied the relationship between brain surface features and normal
aging in 148 healthy normal individuals recruited from the community by
newspaper advertising. They were screened using a structured interview
to rule out psychiatric, neurological or general medical disorders,
including substance abuse. Eighty-one were male and 67 female. Their
mean age was 28.0 (SD 9.8), with a range from 18 to 82. Their mean
educational achievement was 14.6 (SD 1.7). In order to examine whether
aging changes occur at a steady rate or begin to accelerate at a particular
age, we divided our sample by decade into four age groups. We examined
the gyral and sulcal curvature and cortical thickness within each group
and also compared these values among the groups. In this portion of the
analysis the subjects were categorized by age as follows: (i) age <20 years
(n = 11); (ii) age 20–29 years (n = 91); (iii) age 30–39 years (n = 35); and
(iv) age >40 years (n = 11).
MR Data Acquisition
Images were obtained on a 1.5 Tesla GE Signa MR scanner. Three different
sequences were used for each subject. T1-weighted images, using a
spoiled grass sequence, were acquired with the following parameters:
Figure 1. An illustration of the problem of ‘buried cortex’. The problem of ‘buriedcortex’ arises when the surface as defined by the mask does not adequately depict thepresence of sulci. That is, surface-rendering algorithms will be robust to detecting grossatrophy (A versus B), but may not detect instances of atrophy where the GM pixelstouch one another near the surface but contain CSF in an invagination (C, which wouldappear similar to A on the mask). They will also fail to detect instances of deep infolding(D), due to a high level of gyrification.
152 In Vivo Measurement of Gyrification • Magnotta et al.
1.5 mm coronal slices, 40° f lip angle, TR 24 ms, TE 5 ms, NEX 2, FOV 26 cm
and a 256 × 192 matrix. The PD- and T2-weighted images were acquired
with the following parameters: 3.0 or 4.0 mm coronal slices, TE 36 ms (for
PD) or 96 ms (for T2), TR 3000 ms, NEX 1, FOV 26 cm, 256 × 192 matrix
and an echo train length = 8. After acquisition, all scans were rated for
overall quality and for movement artifacts using a 0–4 scale (4 = excellent,
0 = very poor).
Definition of the Cortical Surface
Defining the cortical surface requires two steps in processing the MR
data. First, a method for identifying cortical GM must be applied, and a
portion of the GM must be removed so that the gyral crowns no longer
touch one another and the sulci are opened; this step requires segmenting
brain tissue into GM and WM. Our methods for classifying GM and WM
have been described previously; these methods have been extensively
evaluated for reliability and validity using multiple raters, repeated scans
and phantoms (Harris et al., 1999). These methods provide the basis for
identifying the cortical surface. In the present report we describe our
highly efficient and automated image analysis techniques to define the
quantitative characteristics of the cortical surface, such as the degree of
curvature of gyri and sulci, as well as methods to visualize the cortical
surface.
Segmentation of GM and WM with Correction for Partial Voluming
The first step in the image processing involves segmenting the images.
We have developed two methods for segmentation, which differ in their
relevant applications. Both use a multispectral discriminant analysis-
based segmentation algorithm applied to the three image sequences
described above (T1, T2 and PD) (Harris et al., 1997, 1999). One method
Figure 2. An illustration of a normal brain (A) and an atrophic brain (B), with the sulci and gyri outlined using BRAINSURF. Note that in the atrophic brain the gyri, shown in red, aremore steeply curved and the sulci, shown in blue, are more flattened.
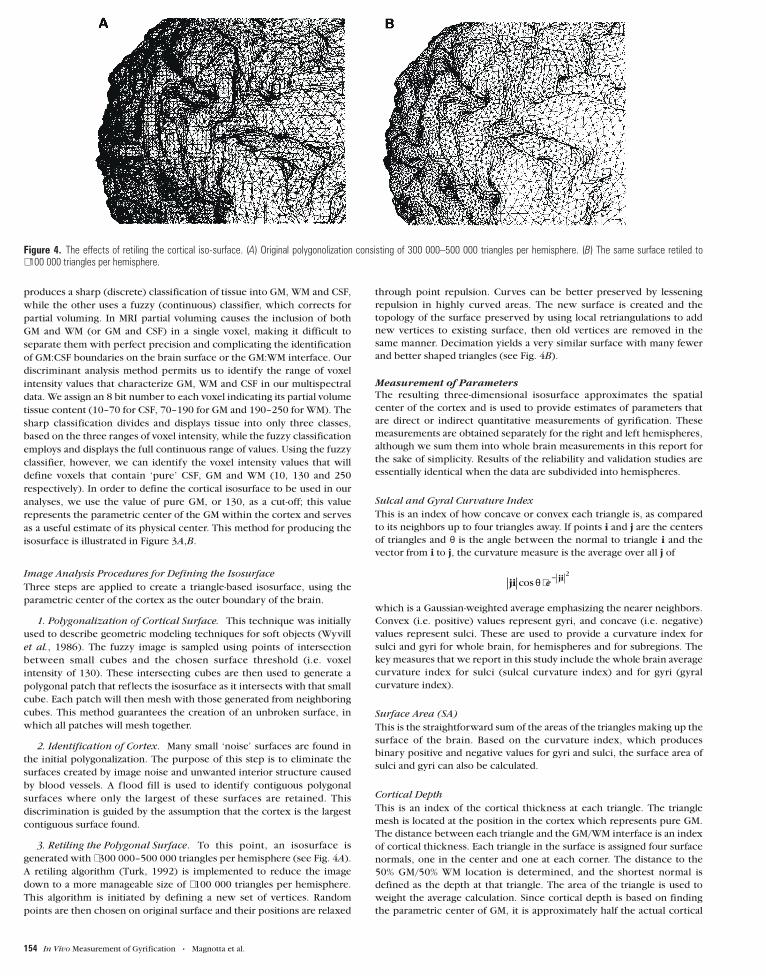
Figure 3. An illustration of the segmented MR images as visualized using the fuzzy (A) and sharp (B) classifiers. The contours demonstrate the location of the ‘pure’ GM iso-surface.Visual inspection of (A) indicates that the isosurface opens up the sulci with good fidelity but remains within cortical GM. (B) has the contours drawn on the corresponding sharplyclassified image, illustrating that the contours approximate the center of the cortical GM.
Cerebral Cortex Mar 1999, V 9 N 2 153
produces a sharp (discrete) classification of tissue into GM, WM and CSF,
while the other uses a fuzzy (continuous) classifier, which corrects for
partial voluming. In MRI partial voluming causes the inclusion of both
GM and WM (or GM and CSF) in a single voxel, making it difficult to
separate them with perfect precision and complicating the identification
of GM:CSF boundaries on the brain surface or the GM:WM interface. Our
discriminant analysis method permits us to identify the range of voxel
intensity values that characterize GM, WM and CSF in our multispectral
data. We assign an 8 bit number to each voxel indicating its partial volume
tissue content (10–70 for CSF, 70–190 for GM and 190–250 for WM). The
sharp classification divides and displays tissue into only three classes,
based on the three ranges of voxel intensity, while the fuzzy classification
employs and displays the full continuous range of values. Using the fuzzy
classifier, however, we can identify the voxel intensity values that will
define voxels that contain ‘pure’ CSF, GM and WM (10, 130 and 250
respectively). In order to define the cortical isosurface to be used in our
analyses, we use the value of pure GM, or 130, as a cut-off; this value
represents the parametric center of the GM within the cortex and serves
as a useful estimate of its physical center. This method for producing the
isosurface is illustrated in Figure 3A,B.
Image Analysis Procedures for Defining the Isosurface
Three steps are applied to create a triangle-based isosurface, using the
parametric center of the cortex as the outer boundary of the brain.
1. Polygonalization of Cortical Surface. This technique was initially
used to describe geometric modeling techniques for soft objects (Wyvill
et al., 1986). The fuzzy image is sampled using points of intersection
between small cubes and the chosen surface threshold (i.e. voxel
intensity of 130). These intersecting cubes are then used to generate a
polygonal patch that ref lects the isosurface as it intersects with that small
cube. Each patch will then mesh with those generated from neighboring
cubes. This method guarantees the creation of an unbroken surface, in
which all patches will mesh together.
2. Identification of Cortex. Many small ‘noise’ surfaces are found in
the initial polygonalization. The purpose of this step is to eliminate the
surfaces created by image noise and unwanted interior structure caused
by blood vessels. A f lood fill is used to identify contiguous polygonal
surfaces where only the largest of these surfaces are retained. This
discrimination is guided by the assumption that the cortex is the largest
contiguous surface found.
3. Retiling the Polygonal Surface. To this point, an isosurface is
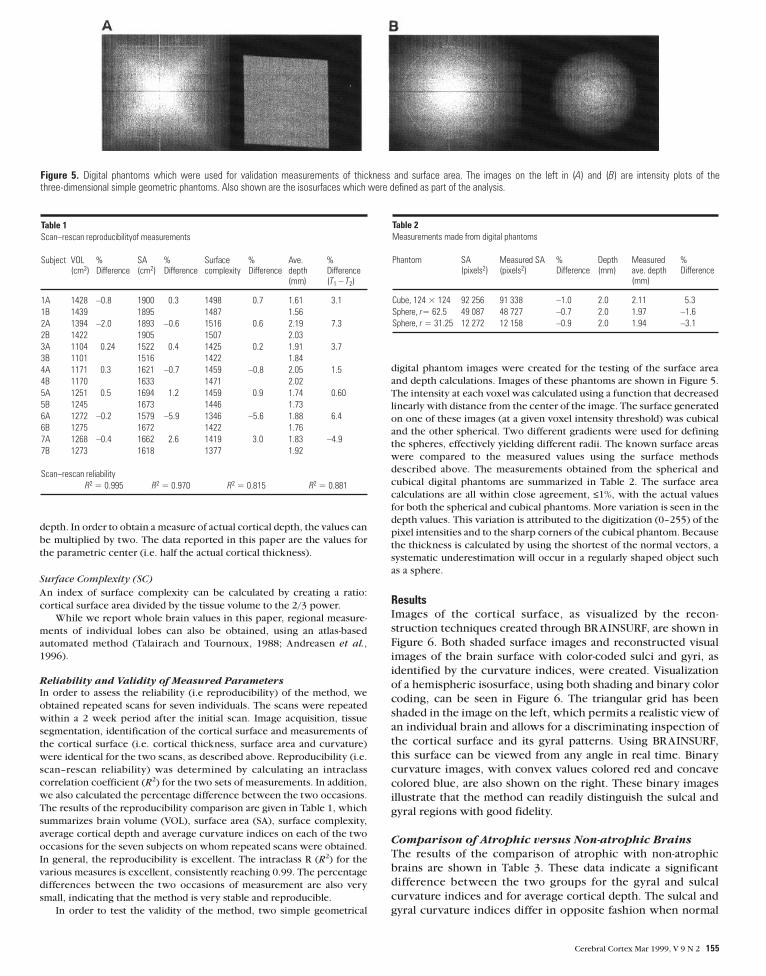
generated with ∼300 000–500 000 triangles per hemisphere (see Fig. 4A).
A retiling algorithm (Turk, 1992) is implemented to reduce the image
down to a more manageable size of ∼100 000 triangles per hemisphere.
This algorithm is initiated by defining a new set of vertices. Random
points are then chosen on original surface and their positions are relaxed
through point repulsion. Curves can be better preserved by lessening
repulsion in highly curved areas. The new surface is created and the
topology of the surface preserved by using local retriangulations to add
new vertices to existing surface, then old vertices are removed in the
same manner. Decimation yields a very similar surface with many fewer
and better shaped triangles (see Fig. 4B).
Measurement of Parameters
The resulting three-dimensional isosurface approximates the spatial
center of the cortex and is used to provide estimates of parameters that
are direct or indirect quantitative measurements of gyrification. These
measurements are obtained separately for the right and left hemispheres,
although we sum them into whole brain measurements in this report for
the sake of simplicity. Results of the reliability and validation studies are
essentially identical when the data are subdivided into hemispheres.
Sulcal and Gyral Curvature Index
This is an index of how concave or convex each triangle is, as compared
to its neighbors up to four triangles away. If points i and j are the centers
of triangles and θ is the angle between the normal to triangle i and the
vector from i to j, the curvature measure is the average over all j of
which is a Gaussian-weighted average emphasizing the nearer neighbors.
Convex (i.e. positive) values represent gyri, and concave (i.e. negative)
values represent sulci. These are used to provide a curvature index for
sulci and gyri for whole brain, for hemispheres and for subregions. The
key measures that we report in this study include the whole brain average
curvature index for sulci (sulcal curvature index) and for gyri (gyral
curvature index).
Surface Area (SA)
This is the straightforward sum of the areas of the triangles making up the
surface of the brain. Based on the curvature index, which produces
binary positive and negative values for gyri and sulci, the surface area of
sulci and gyri can also be calculated.
Cortical Depth
This is an index of the cortical thickness at each triangle. The triangle
mesh is located at the position in the cortex which represents pure GM.
The distance between each triangle and the GM/WM interface is an index
of cortical thickness. Each triangle in the surface is assigned four surface
normals, one in the center and one at each corner. The distance to the
50% GM/50% WM location is determined, and the shortest normal is
defined as the depth at that triangle. The area of the triangle is used to
weight the average calculation. Since cortical depth is based on finding
the parametric center of GM, it is approximately half the actual cortical
ji jicos θ ⋅ −
e2
Figure 4. The effects of retiling the cortical iso-surface. (A) Original polygonolization consisting of 300 000–500 000 triangles per hemisphere. (B) The same surface retiled to∼100 000 triangles per hemisphere.
154 In Vivo Measurement of Gyrification • Magnotta et al.
depth. In order to obtain a measure of actual cortical depth, the values can
be multiplied by two. The data reported in this paper are the values for
the parametric center (i.e. half the actual cortical thickness).
Surface Complexity (SC)
An index of surface complexity can be calculated by creating a ratio:
cortical surface area divided by the tissue volume to the 2/3 power.
While we report whole brain values in this paper, regional measure-
ments of individual lobes can also be obtained, using an atlas-based
automated method (Talairach and Tournoux, 1988; Andreasen et al.,
1996).
Reliability and Validity of Measured Parameters
In order to assess the reliability (i.e reproducibility) of the method, we
obtained repeated scans for seven individuals. The scans were repeated
within a 2 week period after the initial scan. Image acquisition, tissue
segmentation, identification of the cortical surface and measurements of
the cortical surface (i.e. cortical thickness, surface area and curvature)
were identical for the two scans, as described above. Reproducibility (i.e.
scan–rescan reliability) was determined by calculating an intraclass
correlation coefficient (R2) for the two sets of measurements. In addition,
we also calculated the percentage difference between the two occasions.
The results of the reproducibility comparison are given in Table 1, which
summarizes brain volume (VOL), surface area (SA), surface complexity,
average cortical depth and average curvature indices on each of the two
occasions for the seven subjects on whom repeated scans were obtained.
In general, the reproducibility is excellent. The intraclass R (R2) for the
various measures is excellent, consistently reaching 0.99. The percentage
differences between the two occasions of measurement are also very
small, indicating that the method is very stable and reproducible.
In order to test the validity of the method, two simple geometrical
digital phantom images were created for the testing of the surface area
and depth calculations. Images of these phantoms are shown in Figure 5.
The intensity at each voxel was calculated using a function that decreased
linearly with distance from the center of the image. The surface generated
on one of these images (at a given voxel intensity threshold) was cubical
and the other spherical. Two different gradients were used for defining
the spheres, effectively yielding different radii. The known surface areas
were compared to the measured values using the surface methods
described above. The measurements obtained from the spherical and
cubical digital phantoms are summarized in Table 2. The surface area
calculations are all within close agreement, ≤1%, with the actual values
for both the spherical and cubical phantoms. More variation is seen in the
depth values. This variation is attributed to the digitization (0–255) of the
pixel intensities and to the sharp corners of the cubical phantom. Because
the thickness is calculated by using the shortest of the normal vectors, a
systematic underestimation will occur in a regularly shaped object such
as a sphere.
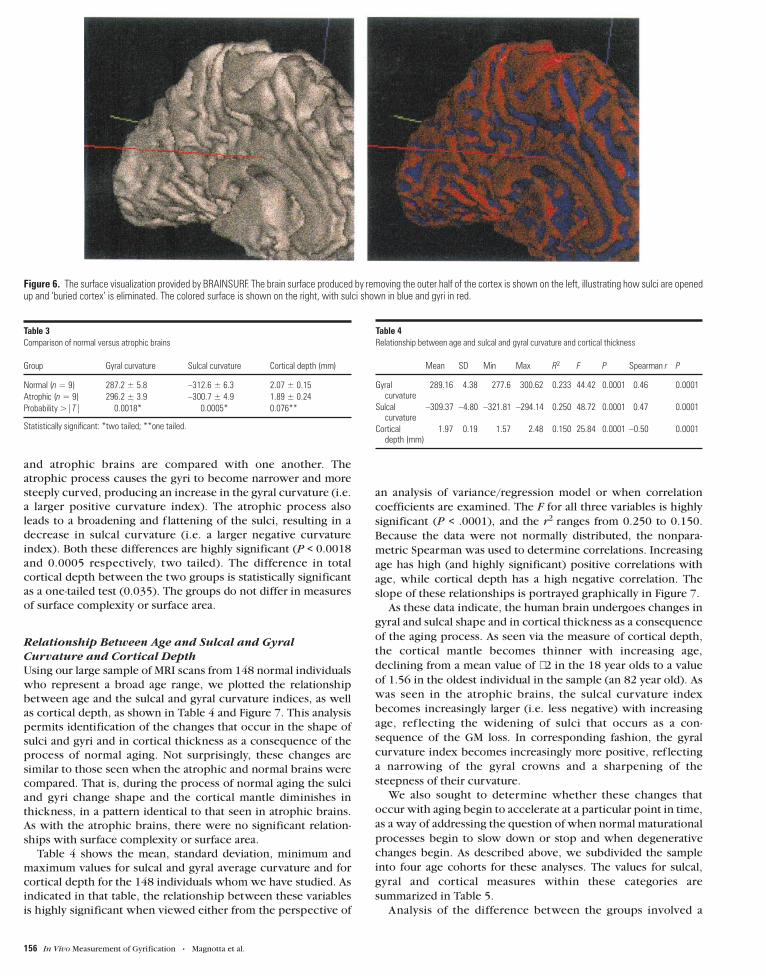
ResultsImages of the cortical surface, as visualized by the recon-
struction techniques created through BRAINSURF, are shown in
Figure 6. Both shaded surface images and reconstructed visual
images of the brain surface with color-coded sulci and gyri, as
identified by the curvature indices, were created. Visualization
of a hemispheric isosurface, using both shading and binary color
coding, can be seen in Figure 6. The triangular grid has been
shaded in the image on the left, which permits a realistic view of
an individual brain and allows for a discriminating inspection of
the cortical surface and its gyral patterns. Using BRAINSURF,
this surface can be viewed from any angle in real time. Binary
curvature images, with convex values colored red and concave
colored blue, are also shown on the right. These binary images
illustrate that the method can readily distinguish the sulcal and
gyral regions with good fidelity.
Comparison of Atrophic versus Non-atrophic Brains
The results of the comparison of atrophic with non-atrophic
brains are shown in Table 3. These data indicate a significant
difference between the two groups for the gyral and sulcal
curvature indices and for average cortical depth. The sulcal and
gyral curvature indices differ in opposite fashion when normal
Table 1Scan–rescan reproducibilityof measurements
Subject VOL(cm3)
%Difference
SA(cm2)
%Difference
Surfacecomplexity
%Difference
Ave.depth(mm)
%Difference(T1 – T2)
1A 1428 –0.8 1900 0.3 1498 0.7 1.61 3.11B 1439 1895 1487 1.562A 1394 –2.0 1893 –0.6 1516 0.6 2.19 7.32B 1422 1905 1507 2.033A 1104 0.24 1522 0.4 1425 0.2 1.91 3.73B 1101 1516 1422 1.844A 1171 0.3 1621 –0.7 1459 –0.8 2.05 1.54B 1170 1633 1471 2.025A 1251 0.5 1694 1.2 1459 0.9 1.74 0.605B 1245 1673 1446 1.736A 1272 –0.2 1579 –5.9 1346 –5.6 1.88 6.46B 1275 1672 1422 1.767A 1268 –0.4 1662 2.6 1419 3.0 1.83 –4.97B 1273 1618 1377 1.92
Scan–rescan reliabilityR2 = 0.995 R2 = 0.970 R2 = 0.815 R2 = 0.881
Figure 5. Digital phantoms which were used for validation measurements of thickness and surface area. The images on the left in (A) and (B) are intensity plots of thethree-dimensional simple geometric phantoms. Also shown are the isosurfaces which were defined as part of the analysis.
Table 2Measurements made from digital phantoms
Phantom SA(pixels2)
Measured SA(pixels2)
%Difference
Depth(mm)
Measuredave. depth(mm)
%Difference
Cube, 124 × 124 92 256 91 338 –1.0 2.0 2.11 5.3Sphere, r= 62.5 49 087 48 727 –0.7 2.0 1.97 –1.6Sphere, r = 31.25 12 272 12 158 –0.9 2.0 1.94 –3.1
Cerebral Cortex Mar 1999, V 9 N 2 155
and atrophic brains are compared with one another. The
atrophic process causes the gyri to become narrower and more
steeply curved, producing an increase in the gyral curvature (i.e.
a larger positive curvature index). The atrophic process also
leads to a broadening and f lattening of the sulci, resulting in a
decrease in sulcal curvature (i.e. a larger negative curvature
index). Both these differences are highly significant (P < 0.0018
and 0.0005 respectively, two tailed). The difference in total
cortical depth between the two groups is statistically significant
as a one-tailed test (0.035). The groups do not differ in measures
of surface complexity or surface area.
Relationship Between Age and Sulcal and Gyral
Curvature and Cortical Depth
Using our large sample of MRI scans from 148 normal individuals
who represent a broad age range, we plotted the relationship
between age and the sulcal and gyral curvature indices, as well
as cortical depth, as shown in Table 4 and Figure 7. This analysis
permits identification of the changes that occur in the shape of
sulci and gyri and in cortical thickness as a consequence of the
process of normal aging. Not surprisingly, these changes are
similar to those seen when the atrophic and normal brains were
compared. That is, during the process of normal aging the sulci
and gyri change shape and the cortical mantle diminishes in
thickness, in a pattern identical to that seen in atrophic brains.
As with the atrophic brains, there were no significant relation-
ships with surface complexity or surface area.
Table 4 shows the mean, standard deviation, minimum and
maximum values for sulcal and gyral average curvature and for
cortical depth for the 148 individuals whom we have studied. As
indicated in that table, the relationship between these variables
is highly significant when viewed either from the perspective of
an analysis of variance/regression model or when correlation
coefficients are examined. The F for all three variables is highly
significant (P < .0001), and the r2 ranges from 0.250 to 0.150.
Because the data were not normally distributed, the nonpara-
metric Spearman was used to determine correlations. Increasing
age has high (and highly significant) positive correlations with
age, while cortical depth has a high negative correlation. The
slope of these relationships is portrayed graphically in Figure 7.
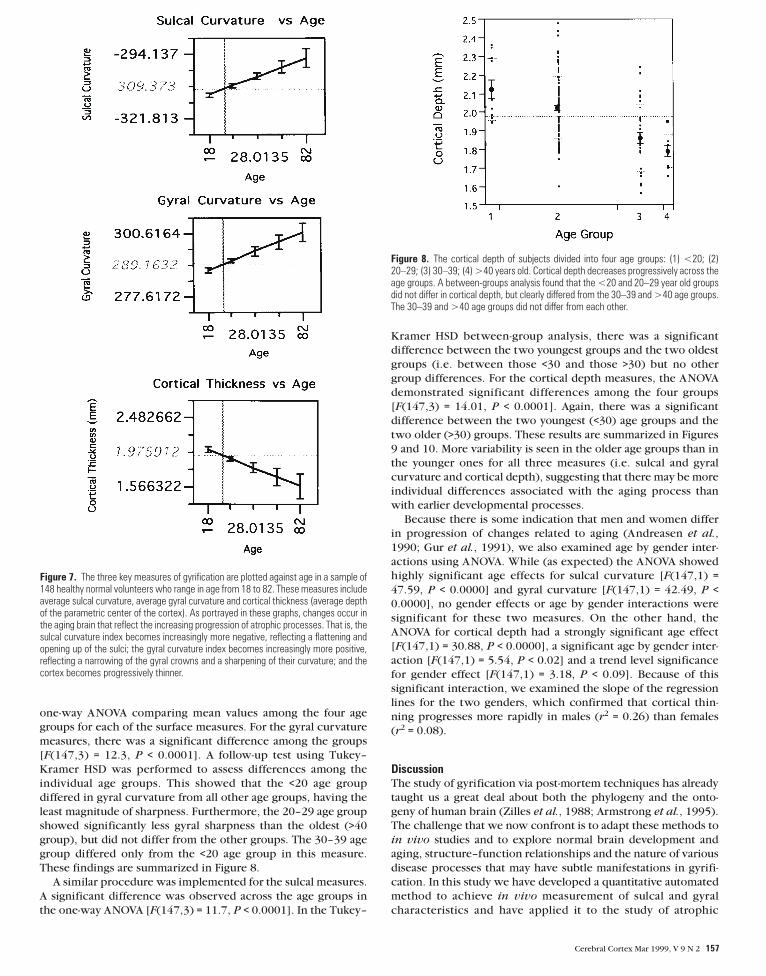
As these data indicate, the human brain undergoes changes in
gyral and sulcal shape and in cortical thickness as a consequence
of the aging process. As seen via the measure of cortical depth,
the cortical mantle becomes thinner with increasing age,
declining from a mean value of ∼2 in the 18 year olds to a value
of 1.56 in the oldest individual in the sample (an 82 year old). As
was seen in the atrophic brains, the sulcal curvature index
becomes increasingly larger (i.e. less negative) with increasing
age, ref lecting the widening of sulci that occurs as a con-
sequence of the GM loss. In corresponding fashion, the gyral
curvature index becomes increasingly more positive, ref lecting
a narrowing of the gyral crowns and a sharpening of the
steepness of their curvature.
We also sought to determine whether these changes that
occur with aging begin to accelerate at a particular point in time,
as a way of addressing the question of when normal maturational
processes begin to slow down or stop and when degenerative
changes begin. As described above, we subdivided the sample
into four age cohorts for these analyses. The values for sulcal,
gyral and cortical measures within these categories are
summarized in Table 5.
Analysis of the difference between the groups involved a
Figure 6. The surface visualization provided by BRAINSURF. The brain surface produced by removing the outer half of the cortex is shown on the left, illustrating how sulci are openedup and ‘buried cortex’ is eliminated. The colored surface is shown on the right, with sulci shown in blue and gyri in red.
Table 3Comparison of normal versus atrophic brains
Group Gyral curvature Sulcal curvature Cortical depth (mm)
Normal (n = 9) 287.2 ± 5.8 –312.6 ± 6.3 2.07 ± 0.15Atrophic (n = 9) 296.2 ± 3.9 –300.7 ± 4.9 1.89 ± 0.24Probability >|T| 0.0018* 0.0005* 0.076**
Statistically significant: *two tailed; **one tailed.
Table 4Relationship between age and sulcal and gyral curvature and cortical thickness
Mean SD Min Max R2 F P Spearman r P
Gyralcurvature
289.16 4.38 277.6 300.62 0.233 44.42 0.0001 0.46 0.0001
Sulcalcurvature
–309.37 –4.80 –321.81 –294.14 0.250 48.72 0.0001 0.47 0.0001
Corticaldepth (mm)
1.97 0.19 1.57 2.48 0.150 25.84 0.0001 –0.50 0.0001
156 In Vivo Measurement of Gyrification • Magnotta et al.
one-way ANOVA comparing mean values among the four age
groups for each of the surface measures. For the gyral curvature
measures, there was a significant difference among the groups
[F(147,3) = 12.3, P < 0.0001]. A follow-up test using Tukey–
Kramer HSD was performed to assess differences among the
individual age groups. This showed that the <20 age group
differed in gyral curvature from all other age groups, having the
least magnitude of sharpness. Furthermore, the 20–29 age group
showed significantly less gyral sharpness than the oldest (>40
group), but did not differ from the other groups. The 30–39 age
group differed only from the <20 age group in this measure.
These findings are summarized in Figure 8.
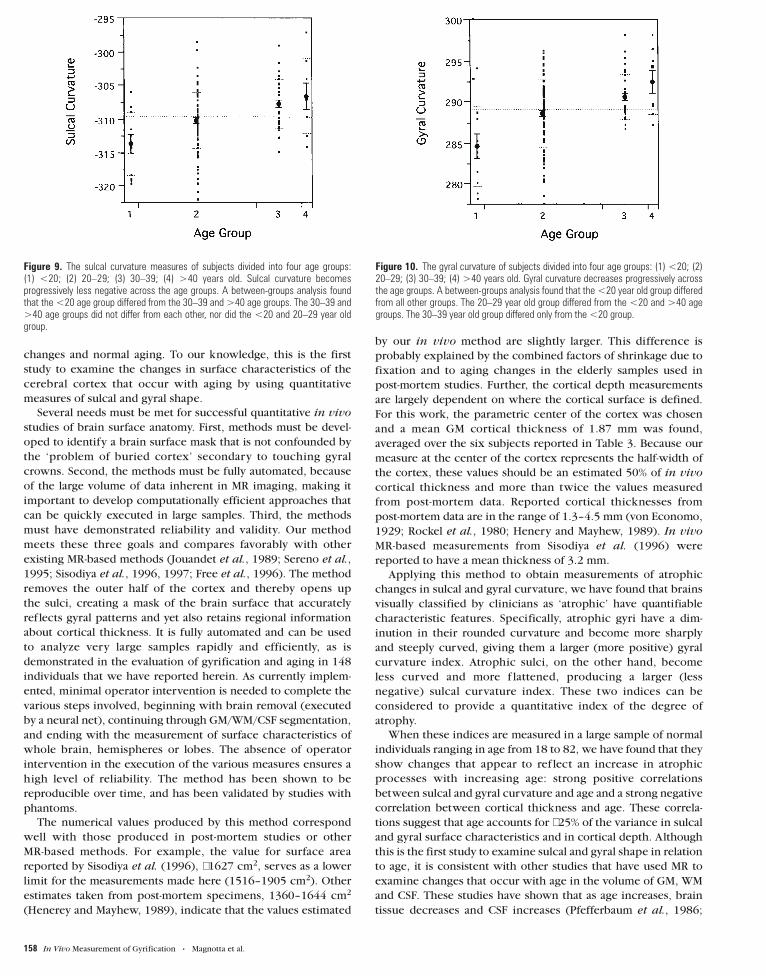
A similar procedure was implemented for the sulcal measures.
A significant difference was observed across the age groups in
the one-way ANOVA [F(147,3) = 11.7, P < 0.0001]. In the Tukey–
Kramer HSD between-group analysis, there was a significant
difference between the two youngest groups and the two oldest
groups (i.e. between those <30 and those >30) but no other
group differences. For the cortical depth measures, the ANOVA
demonstrated significant differences among the four groups
[F(147,3) = 14.01, P < 0.0001]. Again, there was a significant
difference between the two youngest (<30) age groups and the
two older (>30) groups. These results are summarized in Figures
9 and 10. More variability is seen in the older age groups than in
the younger ones for all three measures (i.e. sulcal and gyral
curvature and cortical depth), suggesting that there may be more
individual differences associated with the aging process than
with earlier developmental processes.
Because there is some indication that men and women differ
in progression of changes related to aging (Andreasen et al.,
1990; Gur et al., 1991), we also examined age by gender inter-
actions using ANOVA. While (as expected) the ANOVA showed
highly significant age effects for sulcal curvature [F(147,1) =
47.59, P < 0.0000] and gyral curvature [F(147,1) = 42.49, P <
0.0000], no gender effects or age by gender interactions were
significant for these two measures. On the other hand, the
ANOVA for cortical depth had a strongly significant age effect
[F(147,1) = 30.88, P < 0.0000], a significant age by gender inter-
action [F(147,1) = 5.54, P < 0.02] and a trend level significance
for gender effect [F(147,1) = 3.18, P < 0.09]. Because of this
significant interaction, we examined the slope of the regression
lines for the two genders, which confirmed that cortical thin-
ning progresses more rapidly in males (r2 = 0.26) than females
(r2 = 0.08).
DiscussionThe study of gyrification via post-mortem techniques has already
taught us a great deal about both the phylogeny and the onto-
geny of human brain (Zilles et al., 1988; Armstrong et al., 1995).
The challenge that we now confront is to adapt these methods to
in vivo studies and to explore normal brain development and
aging, structure–function relationships and the nature of various
disease processes that may have subtle manifestations in gyrifi-
cation. In this study we have developed a quantitative automated
method to achieve in vivo measurement of sulcal and gyral
characteristics and have applied it to the study of atrophic
Figure 7. The three key measures of gyrification are plotted against age in a sample of148 healthy normal volunteers who range in age from 18 to 82. These measures includeaverage sulcal curvature, average gyral curvature and cortical thickness (average depthof the parametric center of the cortex). As portrayed in these graphs, changes occur inthe aging brain that reflect the increasing progression of atrophic processes. That is, thesulcal curvature index becomes increasingly more negative, reflecting a flattening andopening up of the sulci; the gyral curvature index becomes increasingly more positive,reflecting a narrowing of the gyral crowns and a sharpening of their curvature; and thecortex becomes progressively thinner.
Figure 8. The cortical depth of subjects divided into four age groups: (1) <20; (2)20–29; (3) 30–39; (4) >40 years old. Cortical depth decreases progressively across theage groups. A between-groups analysis found that the <20 and 20–29 year old groupsdid not differ in cortical depth, but clearly differed from the 30–39 and >40 age groups.The 30–39 and >40 age groups did not differ from each other.
Cerebral Cortex Mar 1999, V 9 N 2 157
changes and normal aging. To our knowledge, this is the first
study to examine the changes in surface characteristics of the
cerebral cortex that occur with aging by using quantitative
measures of sulcal and gyral shape.
Several needs must be met for successful quantitative in vivo
studies of brain surface anatomy. First, methods must be devel-
oped to identify a brain surface mask that is not confounded by
the ‘problem of buried cortex’ secondary to touching gyral
crowns. Second, the methods must be fully automated, because
of the large volume of data inherent in MR imaging, making it
important to develop computationally efficient approaches that
can be quickly executed in large samples. Third, the methods
must have demonstrated reliability and validity. Our method
meets these three goals and compares favorably with other
existing MR-based methods (Jouandet et al., 1989; Sereno et al.,
1995; Sisodiya et al., 1996, 1997; Free et al., 1996). The method
removes the outer half of the cortex and thereby opens up
the sulci, creating a mask of the brain surface that accurately
ref lects gyral patterns and yet also retains regional information
about cortical thickness. It is fully automated and can be used
to analyze very large samples rapidly and efficiently, as is
demonstrated in the evaluation of gyrification and aging in 148
individuals that we have reported herein. As currently implem-
ented, minimal operator intervention is needed to complete the
various steps involved, beginning with brain removal (executed
by a neural net), continuing through GM/WM/CSF segmentation,
and ending with the measurement of surface characteristics of
whole brain, hemispheres or lobes. The absence of operator
intervention in the execution of the various measures ensures a
high level of reliability. The method has been shown to be
reproducible over time, and has been validated by studies with
phantoms.
The numerical values produced by this method correspond
well with those produced in post-mortem studies or other
MR-based methods. For example, the value for surface area
reported by Sisodiya et al. (1996), ∼1627 cm2, serves as a lower
limit for the measurements made here (1516–1905 cm2). Other
estimates taken from post-mortem specimens, 1360–1644 cm2
(Henerey and Mayhew, 1989), indicate that the values estimated
by our in vivo method are slightly larger. This difference is
probably explained by the combined factors of shrinkage due to
fixation and to aging changes in the elderly samples used in
post-mortem studies. Further, the cortical depth measurements
are largely dependent on where the cortical surface is defined.
For this work, the parametric center of the cortex was chosen
and a mean GM cortical thickness of 1.87 mm was found,
averaged over the six subjects reported in Table 3. Because our
measure at the center of the cortex represents the half-width of
the cortex, these values should be an estimated 50% of in vivo
cortical thickness and more than twice the values measured
from post-mortem data. Reported cortical thicknesses from
post-mortem data are in the range of 1.3–4.5 mm (von Economo,
1929; Rockel et al., 1980; Henery and Mayhew, 1989). In vivo
MR-based measurements from Sisodiya et al. (1996) were
reported to have a mean thickness of 3.2 mm.
Applying this method to obtain measurements of atrophic
changes in sulcal and gyral curvature, we have found that brains
visually classified by clinicians as ‘atrophic’ have quantifiable
characteristic features. Specifically, atrophic gyri have a dim-
inution in their rounded curvature and become more sharply
and steeply curved, giving them a larger (more positive) gyral
curvature index. Atrophic sulci, on the other hand, become
less curved and more f lattened, producing a larger (less
negative) sulcal curvature index. These two indices can be
considered to provide a quantitative index of the degree of
atrophy.
When these indices are measured in a large sample of normal
individuals ranging in age from 18 to 82, we have found that they
show changes that appear to ref lect an increase in atrophic
processes with increasing age: strong positive correlations
between sulcal and gyral curvature and age and a strong negative
correlation between cortical thickness and age. These correla-
tions suggest that age accounts for ∼25% of the variance in sulcal
and gyral surface characteristics and in cortical depth. Although
this is the first study to examine sulcal and gyral shape in relation
to age, it is consistent with other studies that have used MR to
examine changes that occur with age in the volume of GM, WM
and CSF. These studies have shown that as age increases, brain
tissue decreases and CSF increases (Pfefferbaum et al., 1986;
Figure 9. The sulcal curvature measures of subjects divided into four age groups:(1) <20; (2) 20–29; (3) 30–39; (4) >40 years old. Sulcal curvature becomesprogressively less negative across the age groups. A between-groups analysis foundthat the <20 age group differed from the 30–39 and >40 age groups. The 30–39 and>40 age groups did not differ from each other, nor did the <20 and 20–29 year oldgroup.
Figure 10. The gyral curvature of subjects divided into four age groups: (1) <20; (2)20–29; (3) 30–39; (4) >40 years old. Gyral curvature decreases progressively acrossthe age groups. A between-groups analysis found that the <20 year old group differedfrom all other groups. The 20–29 year old group differed from the <20 and >40 agegroups. The 30–39 year old group differed only from the <20 group.
158 In Vivo Measurement of Gyrification • Magnotta et al.
Andreasen et al., 1990; Jernigan et al., 1990; Gur et al., 1991).
GM in particular appears to decline as a consequence of the
aging process (Pfefferbaum et al., 1994; Matsumae et al., 1996).
Further, some regions appear to be more vulnerable to GM loss,
particularly the prefrontal cortex (Raz et al., 1997).
Several key questions arise concerning the mechanisms and
meaning of these observations. If aging is associated with GM
loss, cortical thinning, and changes in gyral and sulcal shape that
appear quantitatively atrophic, when does this process begin?
When do normal maturational processes end or stabilize, and
when do regressive changes ref lecting tissue loss begin? Several
previous studies, including our own, have suggested that tissue
volume remains relatively stable from the mid-twenties to some
time in the forties, that the regressive changes begin during the
fifth or sixth decade of life, and that males may begin to show
regressive changes earlier than females (Andreasen et al., 1990;
Gur et al., 1991; Raz et al., 1993; Cowell et al., 1994; Matsumae
et al., 1996). Coffey et al. (1992) examined a sample of 76 adults
from young adulthood to late life; they reported the odds ratio of
ventricular enlargement at age 40 to be 1.0, increasing by 7.7%
each year to 2.22 by the ninth decade of life. Similarly, most
studies examining CSF measures have largely not identified
changes before the age of 40.
These earlier studies have all used volume of CSF, GM or total
brain tissue as their primary measures. In this study, using
indices of sulcal and gyral shape, we found significant differ-
ences associated with aging occur across four age cohorts,
which include the late teens, the twenties, the thirties and the
over-forties. Our measures of sulcal and gyral curvature and
cortical thickness suggest that a break in the pattern of changes
seems to occur between the twenties and the thirties. Although
a similar pattern of change occurs in all four age cohorts, the
process appears to stabilize after the age of 30. The mechanism
behind this pattern cannot be determined from MR data of this
type, but the occurrence of changes in gyral shape and cortical
thickness in the teens and early twenties suggests a neuro-
developmental process such as pruning. The changes in the later
two cohorts are more likely to be due to a regressive process.
The fact that the cohort in their thirties do not differ signifi-
cantly from the over-forties cohort suggests that this process
may be relatively stable during midlife. This is consistent with
primate studies, indicating that synaptogenesis stabilizes during
adulthood and remains stable throughout much of adult life
(Bourgeois et al., 1994). The sample of individuals >50 is
relatively small, however, and so the changes that occur in the
‘young elderly’ and the ‘old elderly’ cannot be mapped in detail
from these data in order to determine precisely when or if
changes begin to accelerate. Our analysis of gender effects using
measures of sulcal and gyral curvature did not reveal signifi-
cant gender by age interactions, although they did indicate a
significant age by gender interaction for cortical depth, with
males having a more rapid progression of cortical thinning than
females, a finding consistent with earlier reports of gender
differences in aging. Our sample is at present too small to
determine the precise age at which this progression accelerates
in males.
The present study has some obvious limitations. First, it is
purely descriptive: it tells us what happens, but not why it
happens. The decreasing cortical thickness associated with
increasing age, taken in association with the other studies
reporting decreased GM volume with increasing age, indicates
that the changes primarily affect cortical GM. But we cannot
determine whether these changes ref lect developmental process
such as pruning (in the younger individuals) or degenerative
ones such neuronal loss or decrease in neuropil (in the older
individuals). The effects on sulcal and gyral shape are presu-
mably secondary to the changes in GM, but we also cannot
determine whether these ref lect simple mechanical processes
(e.g. shrinking and ‘caving in’) or whether they represent a more
active process effected by changes in axonal connectivity
between regions. Nor can we determine the cell or molecular
biology of these changes. Finally, the purely descriptive results
are based on the cross-sectional analysis of a large sample from a
relatively broad age range; they are therefore potentially subject
to age-cohort effects that might differentially affect the brain in
younger versus older individuals, such as nutrition. We also did
not have a large enough older sample to examine gender effects
or aging changes in the sixties or seventies. Ideally, within-
subject longitudinal studies of aging in both men and women are
needed, although these are logistically extremely difficult to
execute, particularly in a field where technology changes
relatively rapidly.
Subsequent studies are needed to address the significance of
these findings. This study and the others that have demonstrated
aging changes in the cerebral cortex raise many important
questions. Are these regressive changes associated with declin-
ing mental functions? What are the molecular and cellular
mechanisms that produce these changes? Why is there greater
variability in these cortical measures in older individuals than in
younger ones? Can protective factors be identified that slow the
changes, or vulnerability factors that worsen the changes? What
patterns are observed in disease processes such as schizo-
phrenia? The ability of measurements of sulcal and gyral shape to
separate atrophic from normal brains and to detect subtle
changes associated with aging suggests that they will be useful in
future studies designed to address these questions.
NotesThis research was supported in part by NIMH grants MH31593,
MH40856, and MHCRC43271; a Research Scientist Award, MH00625; and
an Established Investigator Award from NARSAD.
Address correspondence to Vincent A. Magnotta, Mental Health
Clinical Research Center, The University of Iowa College of Medicine
and Hospitals and Clinics, 200 Hawkins Drive, Iowa City, IA 52242, USA.
Email: [email protected].
ReferencesAndreasen NC, Swayze VW, Flaum M, Yates WR, Arndt S, McChesney C
(1990) Ventricular enlargement in schizophrenia evaluated with
computed tomographic scanning: effects of gender, age, and stage of
illness. Arch Gen Psychiat 47:1008–1015.
Andreasen NC, Harris G, Cizadlo T, Arndt S, O’Leary D, Swayze V, Flaum
M (1994) Techniques for measuring sulcal/gyral patterns in the brain
as visualized through magnetic resonance scanning: BRAINPLOT and
BRAINMAP. Proc Natl Acad Sci USA 90:93–97.
Andreasen NC, Rajarethinam R, Cizadlo T, Arndt S, Swayze VW II,
Flashman LA, O’Leary DS, Ehrhardt JC, Yuh WTC (1996) Automatic
atlas-based volume estimation of human brain regions from MR
images. J Comput Assist Tomogr 20:98–106.
Armstrong E, Schleicher A, Omran H, Curtis M, Zilles K (1995) The
ontogeny of human gyrification. Cereb Cortex 1:56–63.
Bourgeois JP, Goldman-Rakic PS, Rakic P (1994) Synaptogenesis in the
prefrontal cortex of rhesus monkeys. Cereb Cortex 4:78–96.
Caviness VS, Jr (1975) Mechanical model of brain convolutional devel-
opment. Science 189:18–21.
Cizadlo T, Harris G, Heckel D, Flaum M, Christian B, O’Leary DS,
Andreasen NC (1997) An automated method to quantify the area,
depth, and convolutions of the cerebral cortex from MR data:
(‘BRAINSURF’). NeuroImage 5:402.
Coffey CE, Wilkinson WE, Parashos IA, Soady SAR, Sullivan RJ, Patterson
LJ, Figiel GS, Webb MC, Spritzer CE, Djang WT (1992) Quantitative
Cerebral Cortex Mar 1999, V 9 N 2 159
cerebral anatomy of the aging human brain: a cross-sectional study
using magnetic resonance imaging. Neurology 42:527–536.
Cowell P, Turetsky BI, Gur RC, Grossman RI, Shtasel DL, Gur RE (1994)
Sex differences in aging of the human frontal and temporal lobes.
J Neurosci 14:4748–4755
Davis P, Gado M, Kuman A, Gray L, Maravilla K, Jolesz F, Albert M,
George AE (1989) CERAD neuroimaging protocol for the assessment
of Alzheimer’s disease. St Louis, Consortium to Establish a Registry for
Alzheimer’s Disease
Free SL, Sisodiya SM, Cook MJ, Fish DR, Shorvon SD (1996) Three-
dimensional fractal analysis of the white matter surface from magnetic
resonance images of the human brain. Cereb Cortex 6:830–836;
1047–3211.
Gur RC, Mozley PD, Resnick SM, Gottleib GL, Kohn M, Zimmerman R,
Herman G, Atlas S, Grossman R, Beretta D, Erwin R, Gur RE (1991)
Gender differences in age effect on brain atrophy measured by
magnetic resonance imaging Proc Natl Acad Sci USA 88:2845–2849
Harris G, Andreasen NC, Cizadlo T, Bailey J, Bockholt J, Travis K, Arndt S
(1997) Improving tissue segmentation in magnetic resonance
imaging: multiple pulse sequences and automated training class
selection. NeuroImage 5:402.
Harris G, Andreasen NC, Cizadlo T, Bailey J, Bockholt HJ, Magnotta V,
Arndt S (1999) Improving tissue classification in magnetic resonance
imaging: a three-dimensional multispectral discriminant analysis
method with automated training class selection. J Comput Assist
Tomogr (in press).
Henery CC, Mayhew TM (1989) The cerebrum and cerebellum of the
fixed human brain: efficient and unbiased estimates of volumes and
cortical surfaces areas. J Anat 167:167–180.
Jernigan TL, Press GA, Hesselink JR (1990) Methods for measuring brain
morphologic features on magnetic resonance images: validation and
normal aging. Arch Neurol 47:27–32.
Jouandet M, Tramo M, Herron D, Hermann A, Loftus W, Bazell J,
Gazzaniga M (1989) Brainprints: computer-generated two-
dimensional maps of the human cerebral cortex in vivo. J Cogn
Neurosci 1:88–117.
Matsumae M, Kikinis R, Morocz IA, Lorenzo AV, Sandor T, Albert MS,
Black PM, Jolesz FA (1996) Age-related changes in intracranial
compartment volumes in normal adults assessed by magnetic
resonance imaging J Neurosurg 84:982–991.
Ono M, Kubic S, Abernathy C (1990) Atlas of the cerebral sulci. New
York: Thieme.
Pfefferbaum A, Zatz LM, Jernigan TL (1986) Computer-interactive method
for quantifying cerebrospinal f luid and tissue in brain/CT scans. J
Comput Assist Tomogr 10:571–578.
Pfefferbaum A, Mathalon DH, Sullivan EV, Rawles JM, Zipursky RB,
Lim KO (1994) A quantitative magnetic resonance imaging study of
changes in brain morphology from infancy to late adulthood. Arch
Neurol 51:874–887.
Raz N, Torres IJ, Spencer WD, Baertschie JC, Millman D, Sarpel G (1993)
Neuroanatomic correlates of age-sensitive and age-invariant cognitive
abilities: an in vivo MR investigation. Intelligence 17:407–422.
Raz N, Gunning FM, Head D, Dupuis JH, McQuain J, Briggs SD, Loken WJ,
Thornton AE, Acker JD (1997) Selective aging of the human cerebral
cortex observed in vivo: differential vulnerability of the prefrontal
gray matter Cereb Cortex 7: 268–282.
Rockel AJ, Hiorns RW, Powel TP (1980) The basic uniformity in structure
of the neocortex. Brain 103:221–224.
Sereno MI, Dale AM, Reppas JB, Kwong KK, Belliveau JW, Brady TJ, Rosen
BR, Tootell RB (1995) Borders of multiple visual areas in humans
revealed by functional magnetic resonance imaging. Science
268:889–893.
Sisodiya S, Free S (1997) Disproportion of cerebral surface areas and
volumes in cerebral dysgenesis: MRI-based evidence for connectional
abnormalities. Brain 120:271–281.
Sisodiya S, Free S, Fish D, Shorvon S (1996) MRI-based surface area
estimates in the normal adult human brain: evidence for structural
organisation. J Anat 188:425–438.
Talairach J, Tournoux P (1988) Co-planar stereotaxic atlas of the human
brain. New York: Thieme.
Turk G (1992) Re-tiling polygonal surfaces. Comput Graphics 26:55–64.
Van Essen D (1997) A tension-based theory of morphogensis and compact
wiring in the central nervous system. Nature 385:313–318.
von Economo C (1929) The cytoarchitectonics of the human cerebral
cortex. London: Oxford University Press.
Wyvill G, McPheeters C, Wyvill B (1986) Data structures for soft objects.
Vis Comput 2:227–234.
Zilles K, Armstrong E, Schleicher A, Kretschmann HJ (1988) The human
pattern of gyrification in the cerebral cortex. Anat Embryol 179:
173–179.
160 In Vivo Measurement of Gyrification • Magnotta et al.