Quantitative evaluation of 10 tractography algorithms on a realistic diffusion MR phantom
15
Quantitative evaluation of 10 tractography algorithms on a realistic diffusion MR phantom Pierre Fillard a,b, ⁎, Maxime Descoteaux c , Alvina Goh d , Sylvain Gouttard e , Ben Jeurissen f , James Malcolm g , Alonso Ramirez-Manzanares h , Marco Reisert i , Ken Sakaie j , Fatima Tensaouti k , Ting Yo l , Jean-François Mangin b , Cyril Poupon m a Parietal Research Team, INRIA Saclay Île-de-France, Neurospin, France b Laboratory of Computer-Assisted Neuro-Imaging, CEA Saclay, Neurospin, France c MOIVRE Center, Computer Science Department, Université de Sherbrooke, Canada d Department of Mathematics, National University of Singapore, Singapore e Scientific Computing and Imaging Institute, University of Utah, USA f IBBT-VisionLab, Department of Physics, University of Antwerp, Belgium g Psychiatry Neuroimaging Laboratory, Brigham and Womens Hospital, Harvard Medical School, USA h Mathematics Department, University of Guanajuato, Mexico i Department of Radiology, Medical Physics, University Hospital Freiburg, Germany j Imaging Institute, The Cleveland Clinic, Cleveland, USA k National Institute for Medical Research, INSERM, U825, France l Max Planck Institute for Human Cognitive and Brain Sciences, Germany m Imaging and Spectroscopy Laboratory, CEA Saclay, Neurospin, France abstract article info Article history: Received 22 June 2010 Revised 22 November 2010 Accepted 12 January 2011 Available online 20 January 2011 As it provides the only method for mapping white matter fibers in vivo, diffusion MRI tractography is gaining importance in clinical and neuroscience research. However, despite the increasing availability of different diffusion models and tractography algorithms, it remains unclear how to select the optimal fiber reconstruction method, given certain imaging parameters. Consequently, it is of utmost importance to have a quantitative comparison of these models and algorithms and a deeper understanding of the corresponding strengths and weaknesses. In this work, we use a common dataset with known ground truth and a reproducible methodology to quantitatively evaluate the performance of various diffusion models and tractography algorithms. To examine a wide range of methods, the dataset, but not the ground truth, was released to the public for evaluation in a contest, the “Fiber Cup”. 10 fiber reconstruction methods were evaluated. The results provide evidence that: 1. For high SNR datasets, diffusion models such as (fiber) orientation distribution functions correctly model the underlying fiber distribution and can be used in conjunction with streamline tractography, and 2. For medium or low SNR datasets, a prior on the spatial smoothness of either the diffusion model or the fibers is recommended for correct modelling of the fiber distribution and proper tractography results. The phantom dataset, the ground truth fibers, the evaluation methodology and the results obtained so far will remain publicly available on: http://www.lnao.fr/spip.php? rubrique79 to serve as a comparison basis for existing or new tractography methods. New results can be submitted to fi[email protected] and updates will be published on the webpage. © 2011 Elsevier Inc. All rights reserved. Introduction The unique ability of diffusion weighted MRI (DW-MRI) based fiber tractography to map, in vivo, the architecture of white matter pathways has ignited strong interest in clinical and neuroscience research. Applications include improved assessment of a range of neurological and psychiatric disorders (Ciccarelli et al., 2008) and characterization of anatomical connections (Johansen-Berg and Rushworth, 2009). The potential of tractography to help map anatomical connections played a significant role in motivating an ambitious project to map the human “connectome”. 1 Despite the increasing availability of different diffusion models and tractography algorithms, it remains unclear how to select the optimal fiber reconstruction method, given certain imaging parameters. Notably, one objective of these methods is to model and track in the NeuroImage 56 (2011) 220–234 ⁎ Corresponding author at: Parietal Research Team, INRIA Saclay Île-de-France, Neurospin, Bât 145, Point Courrier 156, 91191 Gif/Yvette, France. E-mail address: [email protected] (P. Fillard). 1 http://www.humanconnectomeproject.org. 1053-8119/$ – see front matter © 2011 Elsevier Inc. All rights reserved. doi:10.1016/j.neuroimage.2011.01.032 Contents lists available at ScienceDirect NeuroImage journal homepage: www.elsevier.com/locate/ynimg
-
Upload
independent -
Category
Documents
-
view
1 -
download
0
Transcript of Quantitative evaluation of 10 tractography algorithms on a realistic diffusion MR phantom
NeuroImage 56 (2011) 220–234
Contents lists available at ScienceDirect
NeuroImage
j ourna l homepage: www.e lsev ie r.com/ locate /yn img
Quantitative evaluation of 10 tractography algorithms on a realistic diffusionMR phantom
Pierre Fillard a,b,⁎, Maxime Descoteaux c, Alvina Goh d, Sylvain Gouttard e, Ben Jeurissen f, James Malcolm g,Alonso Ramirez-Manzanares h, Marco Reisert i, Ken Sakaie j, Fatima Tensaouti k, Ting Yo l,Jean-François Mangin b, Cyril Poupon m
a Parietal Research Team, INRIA Saclay Île-de-France, Neurospin, Franceb Laboratory of Computer-Assisted Neuro-Imaging, CEA Saclay, Neurospin, Francec MOIVRE Center, Computer Science Department, Université de Sherbrooke, Canadad Department of Mathematics, National University of Singapore, Singaporee Scientific Computing and Imaging Institute, University of Utah, USAf IBBT-VisionLab, Department of Physics, University of Antwerp, Belgiumg Psychiatry Neuroimaging Laboratory, Brigham and Womens Hospital, Harvard Medical School, USAh Mathematics Department, University of Guanajuato, Mexicoi Department of Radiology, Medical Physics, University Hospital Freiburg, Germanyj Imaging Institute, The Cleveland Clinic, Cleveland, USAk National Institute for Medical Research, INSERM, U825, Francel Max Planck Institute for Human Cognitive and Brain Sciences, Germanym Imaging and Spectroscopy Laboratory, CEA Saclay, Neurospin, France
⁎ Corresponding author at: Parietal Research TeamNeurospin, Bât 145, Point Courrier 156, 91191 Gif/Yvett
E-mail address: [email protected] (P. Fillard).
1053-8119/$ – see front matter © 2011 Elsevier Inc. Aldoi:10.1016/j.neuroimage.2011.01.032
a b s t r a c t
a r t i c l e i n f oArticle history:Received 22 June 2010Revised 22 November 2010Accepted 12 January 2011Available online 20 January 2011
As it provides the only method for mapping white matter fibers in vivo, diffusion MRI tractography is gainingimportance in clinical and neuroscience research. However, despite the increasing availability of differentdiffusion models and tractography algorithms, it remains unclear how to select the optimal fiberreconstruction method, given certain imaging parameters. Consequently, it is of utmost importance to havea quantitative comparison of these models and algorithms and a deeper understanding of the correspondingstrengths and weaknesses. In this work, we use a common dataset with known ground truth and areproducible methodology to quantitatively evaluate the performance of various diffusion models andtractography algorithms. To examine a wide range of methods, the dataset, but not the ground truth, wasreleased to the public for evaluation in a contest, the “Fiber Cup”. 10 fiber reconstruction methods wereevaluated. The results provide evidence that: 1. For high SNR datasets, diffusion models such as (fiber)orientation distribution functions correctly model the underlying fiber distribution and can be used inconjunction with streamline tractography, and 2. For medium or low SNR datasets, a prior on the spatialsmoothness of either the diffusion model or the fibers is recommended for correct modelling of the fiberdistribution and proper tractography results. The phantom dataset, the ground truth fibers, the evaluationmethodology and the results obtained so far will remain publicly available on: http://www.lnao.fr/spip.php?rubrique79 to serve as a comparison basis for existing or new tractography methods. New results can besubmitted to [email protected] and updates will be published on the webpage.
, INRIA Saclay Île-de-France,e, France.
1 http://www.hum
l rights reserved.
© 2011 Elsevier Inc. All rights reserved.
Introduction
The unique ability of diffusion weighted MRI (DW-MRI) based fibertractography tomap, in vivo, the architecture of white matter pathwayshas ignited strong interest in clinical and neuroscience research.Applications include improved assessment of a range of neurologicaland psychiatric disorders (Ciccarelli et al., 2008) and characterization of
anatomical connections (Johansen-Berg and Rushworth, 2009). Thepotential of tractography to help map anatomical connections played asignificant role in motivating an ambitious project to map the human“connectome”.1
Despite the increasing availability of different diffusion models andtractography algorithms, it remains unclear how to select the optimalfiber reconstruction method, given certain imaging parameters.Notably, one objective of these methods is to model and track in the
anconnectomeproject.org.

221P. Fillard et al. / NeuroImage 56 (2011) 220–234
presence of complex fiber configurations such as crossings or kissings,but an objective comparison of their performance has yet to be made.Consequently, it is of upmost importance to have a quantitativecomparisonof thesemodels andalgorithmsandadeeper understandingof the corresponding strengths andweaknesses. To emphasize the needfor such comparative study, we briefly review the diffusion models andtractography algorithms available in the literature.
The role of the diffusionmodel is to characterize the underlying fiberdistribution at each voxel, indicating the number and orientation ofdistinct fiber compartments, and many choices are available. The mostcommonly used diffusion model is the diffusion tensor (DT) (Basser etal., 1994) as estimated from diffusion tensor imaging (DTI). DTI ispopular due to the simplicity of themodel andof the imaging acquisition,which requires as few as six diffusion weighted images (DWI) and iscompatible with clinical conditions. However, the DT can onlycharacterize one fiber compartment per voxel — a problem in regionsof crossing fiberswhere at least two are expected. Consequently, severalalternatives have been proposed to overcome this limitation. Most ofthem are based on high angular resolution diffusion imaging (HARDI)(Tuch, 2002), which uses several tens to a few hundreds of DWI. Anincomplete list includes the Q-ball model (Tuch, 2004), the compositehindered and restricted model of diffusion (CHARMED) (Assaf andBasser, 2005), the diffusion orientation transform (DOT) (Özarslan et al.,2006), multi-tensor distributions (Tuch, 2002; Liu et al., 2004), theorientationdistribution function (ODF) (Tuch, 2004), thefiberODFusingspherical deconvolution (SD) (Tournier et al., 2004, 2007; Descoteaux etal., 2009), the ball and stickmodel (Behrens et al., 2003), themixtures ofWisharts (Jian and Vemuri, 2007), and the persistent angular structureMRI (PAS-MRI) (Jansons and Alexander, 2003).
A large number of tractography algorithms have been developedto map fibers through the entire brain based on information from thevoxel-level diffusion models. The algorithms can be categorized intotwo main classes: deterministic and probabilistic. Deterministicalgorithms follow the main fiber directions as revealed by thediffusion model and generate sequences of points that are consideredas fibers. Probabilistic algorithms repeat the deterministic versionmany times by randomly perturbing the main fiber directions eachtime, and produce maps of connectivity. Such maps indicate theprobability that a given voxel is connected to a reference position. Asmall sampling of tractography algorithms indicates the dizzyingarray of choices. Among deterministic tractography algorithms,streamline algorithms were developed first (Mori et al., 1999b;Conturo et al., 1999; Basser et al., 2000), followed by more elaboratedtensor deflection algorithms (Weinstein et al., 1999; Lazar et al., 2003)or more global approaches (Poupon et al., 2001; Mangin et al., 2002).This list is not exhaustive and many other DT-based algorithms exist.HARDI-based techniques include the generalization of streamlinetracking to use ODFs computed from diffusion spectrum imaging(Tuch, 2002; Hagmann et al., 2004), multi-tensor tracking (Kreheret al., 2005; Bergmann et al., 2007), the q-ball tracking (Chao et al.,2007b), and ODF tracking (Campbell et al., 2006; Descoteaux et al.,2009). Probabilistic tractography methods include DT-based algo-rithms (Parker et al., 2003; Behrens et al., 2003; Lazar and Alexander,2005; Friman et al., 2006; Ramirez-Manzanares and Rivera, 2006;Savadjiev et al., 2008; Koch et al., 2002; Zhang et al., 2009), calculationof geodesics in a DT-warped space (Lenglet, 2006; Jbabdi et al., 2004),and numerous HARDI-based methods (Parker and Alexander, 2005;Perrin et al., 2005; Seunarine et al., 2006; Behrens et al., 2007; Jbabdiet al., 2007; Savadjiev et al., 2008; Chao et al., 2007a; Seunarine et al.,2007; Haroon and Parker, 2007; Kaden et al., 2007; Jeurissen et al.,2011). Once again, this list is not exhaustive.
The increasing number of diffusion models and tractographyalgorithms is both a blessing and a curse: while each diffusion modelhas the ability of modeling more complex diffusivity and eachtractography algorithm has the capability of obtaining previouslyundetectedfiber tracts, it is becoming obscure to decidewhich diffusion
model in conjunction to which tractography algorithm should be usedfor a particular application. More important, the performance of eachmethod may vary and one cannot ensure that the reconstructed fibersare effectively representative of the true fiber organization, or if they areartifacts produced by the method.
Lack of publicly available ground truth for validation makes itdifficult to objectively choose among the huge variety of diffusionmodels, tractography algorithms, and combinations thereof. Anumber of validation studies have been performed, but each has itsdrawbacks. Campbell et al. (2006) used two rat spinal cords to create abiological phantom. Unfortunatly, compared with the brain the fiberconfiguration was sparse. Other synthetic phantoms were proposed,for instance by Perrin et al. (2005) (two bundles crossing at 90°), andPullens et al. (2010), or by Moussavi et al. (2011) (two thick sphericalbundles crossing at either 45 or 90°). However, all of them lack thecomplex crossing and kissing fibers found in the brain. Recently,Fieremans et al. (2008) proposed the design of a realistic diffusion MRphantom made of complex structures similar to the white mattergeometry such as fiber crossings and curved fibers, which ischallenging for tractography algorithms. Heat-shrinking tubes wereused to pack and compress fibers to increase anisotropy. Complex 3Dgeometries can therefore be designed. Furthermore, Pullens et al.(2010) showed that fiber density and orientation could be controlledusing such design strategy. Nevertheless, the proposed phantomsexhibit only simple crossings, although having a rather realistic 3Dgeometry. In addition, attempts at validating diffusion MRI withhistological data have been presented by Leergaard et al. (2010) andAnderson et al. (2006). However, they are difficult to reproduce fornon-experts in histology and only address validation of diffusionmodels at the voxel level, not larger scale tractography. Identically,using neuronal tracers as done by Dauguet et al. (2007) is hardlygeneralizable to a large number of fiber bundles. By contrast,numerical simulations as in (Hall and Alexander, 2009) have well-defined ground truths at the price of anoversimplification of thephysicsof diffusion in tissues. Moreover, they often discard acquisition artifacts(such as noise and distortion), which are important parameters to takeinto account in practice.
The objectives of this study are to provide a qualitative andquantitative comparison of several tractographymethods on the samerealistic dataset with known ground truth and to freely distribute thisdataset along with the evaluation methodology so that new methodscan be easily evaluated and compared to existing ones. We thereforeconstructed a realistic diffusion MR phantom containing numerouscrossing, kissing, splitting and bending configurations that wepurposely developed to this end (Poupon et al., 2010). To compareas many different approaches as possible, we organized a tractographycontest, the Fiber Cup, during the Medical Image Computing andComputer Assisted Intervention (MICCAI) conference in London inSeptember 2009. Common datasets with known ground truth weredistributed publicly and researchers were invited to apply theirtractography methodologies to these datasets. Contestants wereblinded to the ground truth. Results were analyzed and ranked basedon several metrics. The contest format addresses several difficultiesassociated with comparing diffusion model and tractography methods.A huge number of methods have been published, and quite a fewsoftware implementations have been made publicly available forcomparison. A list of the most popular diffusion MRI processingsoftware packages includes FSL (Behrens et al., 2007), Trackvis (Wanget al., 2007), Camino (Cook et al., 2006), 3D Slicer (Pieper et al., 2006),Brainvisa (Rivière et al., 2009), MedINRIA (Toussaint et al., 2007),ExploreDTI (Leemans et al., 2009) and MRtrix (Tournier et al., 2007).While a single-site comparison similar to that performed by Klein et al.(2009) for registration algorithms is feasible, we opted for the reversesituation in order to obtain asmany contributions as possible, includingsome of themost recent algorithms whose implementation may not beavailable in a public package yet. Moreover, unlike Klein et al. who

2 We define SNR as the ratio between the signal magnitude and the noise power(i.e., standard deviation) (Kaufman et al., 1989). We used voxels in the center of thephantom branches (see Fig. 1) to estimate the signal magnitude, and voxels outsidethe phantom to estimate the noise power. Note that the SNR of the DWI was averagedover all gradients.
222 P. Fillard et al. / NeuroImage 56 (2011) 220–234
evaluated registration packages out-of-the-box without fine parametertuning, we preferred to extract the best from each method for a fairevaluation. It means that the expertise of an algorithm's author wasrequired to run it properly.
The rest of the paper is organized as follows. In the Materials andmethods section, we present the ground-truth dataset specificallydesigned for the contest followed by the evaluation methodology. Inthe Results section, we review the results by summarizing the 10received contributions before detailing their qualitative and quanti-tative evaluation. Finally, in the Discussion section we discuss aboutthe pros and cons of each method and give some recommendations.
Materials and methods
In this section, we will first briefly review the construction of arealistic diffusion MR ground truth dataset. We will then detail therules of the tractography competition and the methodology devel-oped to quantitatively evaluate and compare contributions.
Construction of a ground truth dataset
Design of a realistic diffusion MR phantomThe construction of diffusion phantoms is a challenging task
involving the following two steps (Poupon et al., 2008):
• Design of a realistic and practically feasible fiber configuration.• Mechanical conception: construction of a frame and container tohold the fibers under high tension in water. An adequate recipe tofill the container with a MRI compatible solution is also required.
In what follows, we depict those two steps that lead to theelaboration of our realistic diffusion MR phantom.
Fiber configuration. First, the desired fiber configuration must bedesigned. The configuration should be as realistic possible — contain-ing crossing and kissing fibers as well as bundles of differentcurvatures. However, the configuration must be practically feasible.In particular, fibers lie in-plane because they have to be squeezed inbetween two solid dies to ensure high density and diffusionanisotropy approaching that of tissue (Poupon et al., 2008).Consequently, complex 3D configurations are not permitted. More-over, bundles are stretchedwhile being squeezed to ensure fibers takea straight, smooth, trajectory within the phantom. Therefore, thebundles enter and leave the phantom, forbidding closed trajectories.
We opted for a configuration simulating a coronal section of thehuman brain, containing several fiber crossing and kissing configura-tions with different curvatures (see Fig. 1 left). The phantomcomprises seven distinct bundles, and contains 3 crossings, 1 kissing,and 3 bundles that split. For a fast text referencing, those regions werenumbered from 1 to 7 on Fig. 1 right. Several curvatures were alsoused. In particular, a U-shape bundle (Fig. 1 right, region 7) with highcurvature was placed to challenge methods with a strong prior on thestraightness of the bundles to achieve a perfect score: methodsassuming very straight fibers are likely to fail in reconstructing this U-shape structure.
Mechanical conception and manufacturing. To create large bundles,hydrophobic acrylic fibers whose diameter is of the same order as thediameter of myelinated axons were used (20 μm). Those fibers arevery common and can be found in any specialized clothing shopsunder the name “acrylic fibers for Boutis and Patchwork”. Polyure-thane negative and positive prints of the target bundles weremanufactured and used to strongly tighten the fibers together. Thediameter of the polyurethane device is of 14 cm. The phantom wasfilled to ensure that the same amount of fibers is found everywhere,including in the crossings. Fibers were carefully positioned such that
they rigorously follow the pathways sketched in Fig. 1. Bundles ofabout 100 fibers were used to progressively fill it. First, a layer ofbundles was placed everywhere in the phantom. Then, a second layerwas placed everywhere except at the intersections. Without thisoperation, intersections would have contained twice or three timesmore fibers than the branches, depending on how many bundles arecrossing. Finally, this process was reiterated until the desired numberof fibers was positioned.
The next step consists in compressing the fibers to increase theirdensity. Compression is carefully controlled to make sure that fibers arecaptured in 1 mm2 cross-section everywhere throughout the phantom.Practically, the positive and negative prints were squeezedwhile keepingthe fibers strongly tightened until the openings (i.e., where the fibersenter/leave the phantom) are exactly 1 cm thick. As they are distributedall over thephantom,weassume that the level of compression is the sameeverywhere. Since we know the number of fibers and the space they arecaptured in, we can deduce the density of fibers, which was close to1900 fibers/mm2 everywhere, including in the crossings.
A cylindrical container compatible with MRI head coil antennas wasdesigned to hold the phantom in themagnet. This containerwasmade upof a plexiglass cylinder ended at its extremities by two plastic caps,equipped with taps to fill it. As standard DW-MRI uses the ultra-fastechoplanar acquisition scheme that is extremely sensitive to phaseinhomogeneities, developing a filling process insuring the absence of anyair bubbles in the container is of upmost importance. To do so, a dedicatedplatform was designed that enables a preliminary degassing of thesolution, and a filling under vacuum conditions. An ultrasound beam isfinally used to destroy any remaining air bubbles. The containerwasfilledusing pure distilled water without any contrast agent.
Diffusion-weighted MRI acquisitionsDiffusion-weighted data of the phantom were acquired on the 3 T
Tim Trio MRI systems of the NeuroSpin centre, equipped with a wholebody gradient coil (40 mT/m, 200 T/m/s), and using a 12-channelreceive only head coil, in combination with the whole body transmitcoil of the MRI system.
A single-shot diffusion-weighted twice refocused spin echoechoplanar pulse sequence was used to perform the acquisitions,while compensating for the first order Eddy currents. Two datasetswere acquired at two different spatial resolutions: 3 mm isotropic and6 mm isotropic.
Parameters for the 3 mm isotropic acquisition were as follows: fieldof view FOV=19.2 cm, matrix 64×64, slice thickness TH=3mm, readbandwidth RBW=1775 Hz/pixel, partial Fourier factor 6/8, parallelreduction factor GRAPPA=2, repetition time TR=5 s, 2 repetitions.Three diffusion sensitizations at b-values b=650/1500/2000 s/mm2
corresponding to the echo times TE=77/94/102 ms respectively wereused. 3 slices were acquired. A SNR of 15.8 was measured for thebaseline (b=0) image. SNR of DWI at b-values 650/1500/2000 wereevaluated at respectively 9.1/2.6/1.1.2 ADC and FA values of the 3×3×3acquisition are reported in Fig. 2 for the three b-values.
Parameters for the 6 mm isotropic acquisition were as follows:field of view FOV=38.4 cm, matrix 64×64, slice thicknessTH=6 mm, read bandwidth RBW=1775 Hz/pixel, partial Fourierfactor 6/8, parallel reduction factor GRAPPA=2, repetition timeTR=5 s, 1 repetition. Three diffusion sensitization's at b-valuesb=650/1500/2650 s/mm2 corresponding to the echo times TE=77/94/110 ms respectively were used. 1 slice was acquired. A SNR of 22.6

Fig. 1. Sketch of the phantom that mimics a coronal section of the human brain. Left: Fiber pathways are highlighted in colors. Arrows indicate the directions of the synthetic fiberbundles. Right: The various crossing, splitting and kissing fiber configurations are numbered for a fast text referencing. Note that angles between crossing fibers were carefullydetermined, although not used during evaluation.
223P. Fillard et al. / NeuroImage 56 (2011) 220–234
was measured for the baseline (b=0) image. SNR of DWI at b-values650/1500/2650 were evaluated at respectively 18.9/17.6/4.5. ADC andFA values of the 6×6×6 acquisition are reported in Fig. 3 for the threeb-values.
The diffusion sensitizationwas applied along a set of 64 orientationsuniformly distributed over the sphere. Note that b-values were chosen
Fig. 2. ADC and FA images of the 3×3×3 phantom dataset. Top: The middle slice of the ADCmean (standard deviation) of the ADC values of the phantom. Bottom: The middle slice of ththe mean (standard deviation) of the FA values of the phantom.
such that phantom ADC compares to brain ADC at b-values ofrespectively 2000, 4000 and 6000 s/mm2.
Estimation of a ground truth datasetTo facilitate the evaluation of the different results submitted during
the contest, we chose to restrict the analysis to a set of 16fibers traversing
image is shown for the three b-values used for acquisition. The values reported are thee FA image is shown for the three b-values used for acquisition. The values reported are
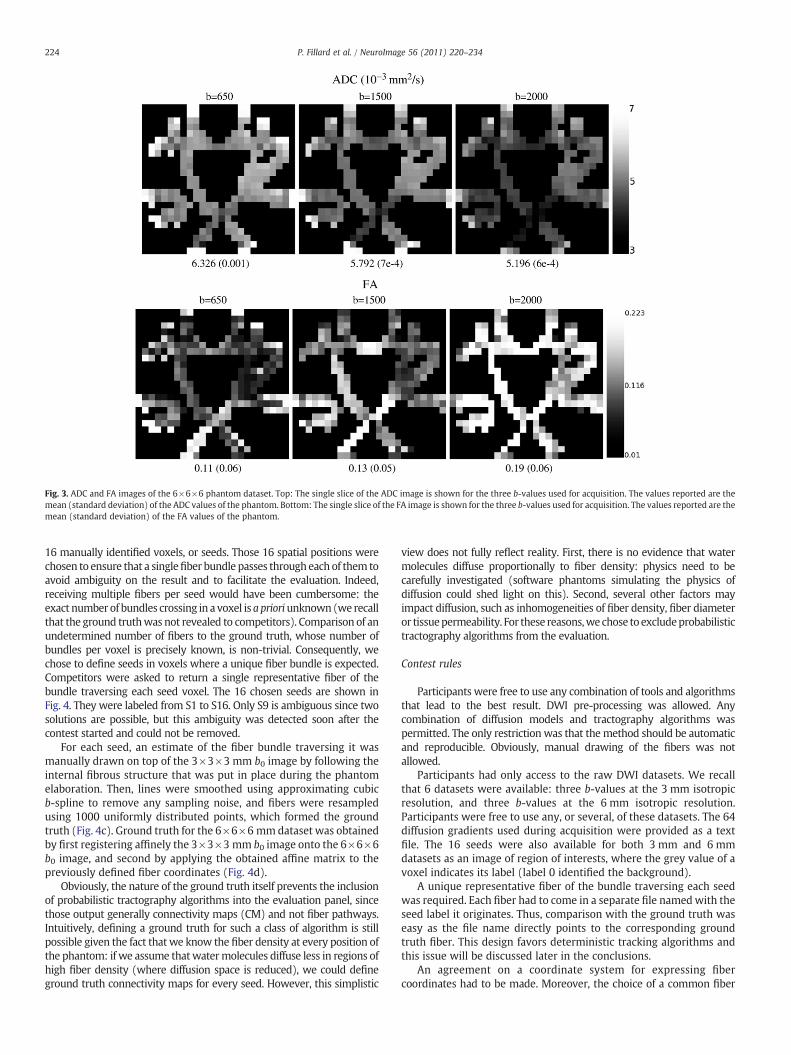
Fig. 3. ADC and FA images of the 6×6×6 phantom dataset. Top: The single slice of the ADC image is shown for the three b-values used for acquisition. The values reported are themean (standard deviation) of the ADC values of the phantom. Bottom: The single slice of the FA image is shown for the three b-values used for acquisition. The values reported are themean (standard deviation) of the FA values of the phantom.
224 P. Fillard et al. / NeuroImage 56 (2011) 220–234
16 manually identified voxels, or seeds. Those 16 spatial positions werechosen to ensure that a singlefiber bundle passes througheach of them toavoid ambiguity on the result and to facilitate the evaluation. Indeed,receiving multiple fibers per seed would have been cumbersome: theexact number of bundles crossing in a voxel is a prioriunknown(we recallthat the ground truthwas not revealed to competitors). Comparison of anundetermined number of fibers to the ground truth, whose number ofbundles per voxel is precisely known, is non-trivial. Consequently, wechose to define seeds in voxels where a unique fiber bundle is expected.Competitors were asked to return a single representative fiber of thebundle traversing each seed voxel. The 16 chosen seeds are shown inFig. 4. They were labeled from S1 to S16. Only S9 is ambiguous since twosolutions are possible, but this ambiguity was detected soon after thecontest started and could not be removed.
For each seed, an estimate of the fiber bundle traversing it wasmanually drawn on top of the 3×3×3 mm b0 image by following theinternal fibrous structure that was put in place during the phantomelaboration. Then, lines were smoothed using approximating cubicb-spline to remove any sampling noise, and fibers were resampledusing 1000 uniformly distributed points, which formed the groundtruth (Fig. 4c). Ground truth for the 6×6×6 mmdataset was obtainedby first registering affinely the 3×3×3 mm b0 image onto the 6×6×6b0 image, and second by applying the obtained affine matrix to thepreviously defined fiber coordinates (Fig. 4d).
Obviously, the nature of the ground truth itself prevents the inclusionof probabilistic tractography algorithms into the evaluation panel, sincethose output generally connectivity maps (CM) and not fiber pathways.Intuitively, defining a ground truth for such a class of algorithm is stillpossible given the fact that we know the fiber density at every position ofthe phantom: if we assume thatwatermolecules diffuse less in regions ofhigh fiber density (where diffusion space is reduced), we could defineground truth connectivity maps for every seed. However, this simplistic
view does not fully reflect reality. First, there is no evidence that watermolecules diffuse proportionally to fiber density: physics need to becarefully investigated (software phantoms simulating the physics ofdiffusion could shed light on this). Second, several other factors mayimpact diffusion, such as inhomogeneities of fiber density, fiber diameteror tissuepermeability. For these reasons,wechose toexcludeprobabilistictractography algorithms from the evaluation.
Contest rules
Participants were free to use any combination of tools and algorithmsthat lead to the best result. DWI pre-processing was allowed. Anycombination of diffusion models and tractography algorithms waspermitted. The only restriction was that themethod should be automaticand reproducible. Obviously, manual drawing of the fibers was notallowed.
Participants had only access to the raw DWI datasets. We recallthat 6 datasets were available: three b-values at the 3 mm isotropicresolution, and three b-values at the 6 mm isotropic resolution.Participants were free to use any, or several, of these datasets. The 64diffusion gradients used during acquisition were provided as a textfile. The 16 seeds were also available for both 3 mm and 6 mmdatasets as an image of region of interests, where the grey value of avoxel indicates its label (label 0 identified the background).
A unique representative fiber of the bundle traversing each seedwas required. Each fiber had to come in a separate file namedwith theseed label it originates. Thus, comparison with the ground truth waseasy as the file name directly points to the corresponding groundtruth fiber. This design favors deterministic tracking algorithms andthis issue will be discussed later in the conclusions.
An agreement on a coordinate system for expressing fibercoordinates had to be made. Moreover, the choice of a common fiber
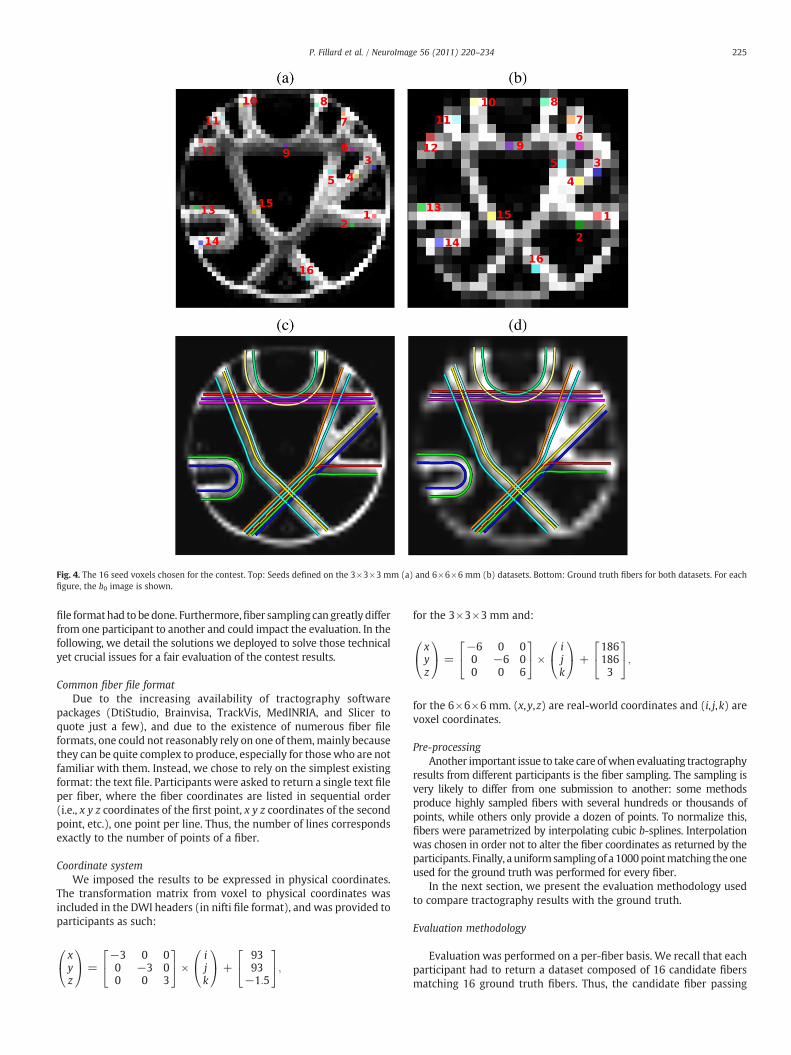
Fig. 4. The 16 seed voxels chosen for the contest. Top: Seeds defined on the 3×3×3 mm (a) and 6×6×6 mm (b) datasets. Bottom: Ground truth fibers for both datasets. For eachfigure, the b0 image is shown.
225P. Fillard et al. / NeuroImage 56 (2011) 220–234
file formathad to be done. Furthermore,fiber sampling can greatly differfrom one participant to another and could impact the evaluation. In thefollowing, we detail the solutions we deployed to solve those technicalyet crucial issues for a fair evaluation of the contest results.
Common fiber file formatDue to the increasing availability of tractography software
packages (DtiStudio, Brainvisa, TrackVis, MedINRIA, and Slicer toquote just a few), and due to the existence of numerous fiber fileformats, one could not reasonably rely on one of them,mainly becausethey can be quite complex to produce, especially for thosewho are notfamiliar with them. Instead, we chose to rely on the simplest existingformat: the text file. Participants were asked to return a single text fileper fiber, where the fiber coordinates are listed in sequential order(i.e., x y z coordinates of the first point, x y z coordinates of the secondpoint, etc.), one point per line. Thus, the number of lines correspondsexactly to the number of points of a fiber.
Coordinate systemWe imposed the results to be expressed in physical coordinates.
The transformation matrix from voxel to physical coordinates wasincluded in the DWI headers (in nifti file format), and was provided toparticipants as such:
xyz
0@
1A=
−3 0 00 −3 00 0 3
24
35 ×
ijk
0@
1A +
9393
−1:5
24
35;
for the 3×3×3 mm and:
xyz
0@
1A=
−6 0 00 −6 00 0 6
24
35 ×
ijk
0@
1A +
1861863
24
35;
for the 6×6×6 mm. (x,y,z) are real-world coordinates and (i, j,k) arevoxel coordinates.
Pre-processingAnother important issue to take care ofwhen evaluating tractography
results from different participants is the fiber sampling. The sampling isvery likely to differ from one submission to another: some methodsproduce highly sampled fibers with several hundreds or thousands ofpoints, while others only provide a dozen of points. To normalize this,fibers were parametrized by interpolating cubic b-splines. Interpolationwas chosen in order not to alter the fiber coordinates as returned by theparticipants. Finally, a uniformsamplingof a1000pointmatching theoneused for the ground truth was performed for every fiber.
In the next section, we present the evaluation methodology usedto compare tractography results with the ground truth.
Evaluation methodology
Evaluation was performed on a per-fiber basis. We recall that eachparticipant had to return a dataset composed of 16 candidate fibersmatching 16 ground truth fibers. Thus, the candidate fiber passing

226 P. Fillard et al. / NeuroImage 56 (2011) 220–234
through seed point N can be compared to the ground truth fiber goingthrough the same seed. Consequently, the evaluation methodologynarrows down to the evaluation of differences between pairs ofcurves.
In the following, we describe the evaluation measures of curvematching we used for this contest. In particular, we show how tocompute scores that evaluate not only the spatial matching of thecurves, but also compare their trajectories and smoothness.
Generic score of fiber matchThe optimal result is realized when the candidate fiber perfectly
matches the ground truth, i.e., when both fibers are superimposed.Thus, we chose to rely on the point-based Root Mean Square Error(RMSE) between the candidate fiber and the corresponding groundtruth:
RMSE f1; f2ð Þ =ffiffiffiffiffiffiffiffiffiffiffiffiffiffiffiffiffiffiffiffiffiffiffiffiffiffiffiffiffiffiffiffiffiffiffiffiffiffiffiffiffiffiffiffiffiffiffiffiffiffiffi∫1
0dist2 f1 sð Þ; f2 c sð Þð Þð Þds
r; ð1Þ
where f1 and f2 are the two fibers being compared (we recall that fibersare parametrizedwithb-splines so they can be expressed as functions oftheir arc length), s thearc length in the range [0,1], c a function giving foreach arc length s of f1 the corresponding arc length of f2, and dist ametricmeasuring how similar the points f1(s) and f2(c(s)) are.
The RMSE relies on a correspondence function c which isresponsible for providing the arc length of fiber f2 which correspondsto arc length s on fiber f1. The choice of c is obviously not unique, andwithout any prior knowledge there is no best choice for it. Withoutany prior on point correspondences, we chose to associate fiber pointswhich are the closest spatially, similarly to the work of (Fillard et al.,2007) on sulcal lines. Consequently, we search for the correspondencefunction c such that:
c = minc
∫1
0∥ f1 sð Þ−f2 c sð Þð Þ∥2ds:
Practically, c is obtained as follows. A distancematrix is built whereeach line gives the distance from a point of the first fiber to everysample points of the second. Then, following (Fillard et al., 2007),dynamic programming is used to determine the path of minimal costwithin this distance matrix, which gives us the final correspondencesbetween the arc length of both fibers. This procedure ensures that thefunction c is monotonically increasing, i.e., if s1N=s2,c(s1)N=c(s2),which ensures that two consecutive points of a fiber are associated totwo other consecutive points.
Nonetheless, themapping c is not guaranteed to be symmetric, i.e., ifwe denote by c1 (resp. c2) the mapping such that f1(s) (resp. f2(s))corresponds to f2(c1(s)) (resp. f1(c2(s))), nothing ensures that c2=c1
−1.The consequence is that the RMSE of Eq. (1) is not symmetric:RMSE f1 sð Þ; f2 sð Þð Þ≠RMSE f2 sð Þ; f1 sð Þð Þ. As there is no real justificationfor this asymmetry, we chose to define a symmetrized version of theRMSE, denoted by sRMSE (for symmetric Root Mean Square Error), asthe average between RMSE f1; f2ð Þ and RMSE f2; f1ð Þ:
sRMSE f1; f2ð Þ sð Þ = 12
RMSE f1 sð Þ; f2 sð Þð Þ + RMSE f2 sð Þ; f1 sð Þð Þ½ �
Finally, Eq. (1) can be reformulated into a symmetric version:
sRMSE f1; f2ð Þ = 12
ffiffiffiffiffiffiffiffiffiffiffiffiffiffiffiffiffiffiffiffiffiffiffiffiffiffiffiffiffiffiffiffiffiffiffiffiffiffiffiffiffiffiffiffiffiffiffiffiffiffiffiffiffi∫1
0dist2 f1 sð Þ; f2 c1 sð Þð Þð Þds
r+
ffiffiffiffiffiffiffiffiffiffiffiffiffiffiffiffiffiffiffiffiffiffiffiffiffiffiffiffiffiffiffiffiffiffiffiffiffiffiffiffiffiffiffiffiffiffiffiffiffiffiffiffiffi∫1
0dist2 f2 sð Þ; f1 c2 sð Þð Þð Þds
r !
ð2Þ
The sRMSE depends on the chosen metric dist. For instance, takingthe L2 norm for dist will result in high (resp. low) values when fibersare distant from (resp. close to) each other. On the contrary, by takingthe angular difference between tangents, the sRMSEwill be low (resp.
high) when fibers are parallel (resp. orthogonal). Thus, by changingthe metric, it is possible to evaluate how curves match not only interms of spatial positions but also trajectories and shape. In thefollowing, we express three metrics that were used for the contest:the spatial metric, the tangent metric and the curve metric.
The contest metrics
The spatial metric. The spatial metric is simply the L2 norm betweentwo corresponding fiber positions. If we denote by p1 and p2 twospatial positions, one can express it as:
dist p1;p2ð Þ =ffiffiffiffiffiffiffiffiffiffiffiffiffiffiffiffiffiffiffiffiffiffi∥ p2−p1∥2
q=
ffiffiffiffiffiffiffiffiffiffiffiffiffiffiffiffiffiffiffiffiffiffiffiffiffiffiffiffiffiffiffiffiffiffiffiffiffiffiffiffip2−p1ð Þ⊤ p2−p1ð Þ
q: ð3Þ
The sRMSE endowed with the spatial metric is expressed in mmand ranges from 0 (overlapping points) to infinity.
The tangent metric. Let υ1= f ′1(s)/∥ f ′1(s)∥ (resp. υ2= f ′2(s)/∥ f ′2(s)∥). υ1and υ2 are normalized tangent vectors to fiber points. We define thetangent metric as:
dist υ1;υ2ð Þ = jacos jυ⊤1υ2 j
� �180π j ð4Þ
The sRMSE endowed with the tangent metric is expressed indegrees and varies from 0° (parallel fibers) to 90° (orthogonal fibers).
The curve metric. The curvature at any position of a curve is given by:κ fð Þ = ∥ f′ × f″∥
∥ f′∥3 . The curve metric is expressed as the absolute
difference of the curvature between two fiber points:
dist κ1; κ2ð Þ = jκ2−κ1j ð5Þ
The sRMSE endowed with the curve metric is expressed in mm−1
and ranges from 0 to infinity.Note that the b-spline representation of the fibers gives us an
analytical expression of the first and second order derivativesnecessary to evaluate the three metrics.
In the next section, we present the results of the qualitative andquantitative evaluation of the 10 contributions received during theFiber Cup.
Results
A total of 9 individual submissions were received, including onewith 2 results, making a total of 10 tractography results. Results wereanalyzed following the methodology described in the previoussection. Computation of quantitative metrics was performed on aregular PC (Intel Core 2 Duo, 2 Gb of memory).
For the sake of completeness, we also included the result of theprobabilistic tractography algorithm implemented in FSL (Behrenset al., 2007), as this is one of most widely used algorithm within theneuroscience community. While probabilistic tractography does notcomply with the requirements of our quantitative evaluationmethodology, its qualitative evaluation can still inform its capabilitiesto infer the correct fiber bundles given a seed region. Moreover, itshows that the phantom dataset can be used to evaluate probabilistictractography algorithms. Results are presented in the SupplementarySection 1.
In this section, we first summarize the 10 contributions in terms ofdiffusionmodel and tractography algorithm chosen. Second, we give aqualitative overview of the results before presenting their in-depthquantitative analysis.

227P. Fillard et al. / NeuroImage 56 (2011) 220–234
Summary of contributions
An overview of the 10 tractography methods evaluated during thecontest is given in Table 1. Practical details for results reproducibilityare given in the Supplementary Section 2. Even with a rather lownumber of contributions, we obtained a good sampling of the variousdiffusion model and tractography algorithms available in theliterature. More precisely, the choice of the diffusion model appearedas more important than the tractography algorithm itself, oftenreduced to a streamline approach, although some variety can benoted.
One remark is that all participants except number 2 chose the3 mm dataset. The choice of the higher resolution/reduced SNRdataset is interesting since a common problem in real acquisitions isto know how much of the SNR should be sacrificed in favor of thespatial resolution. A b-value of 1500 was preferably chosen, veryprobably to mimic the real-case scenario where a b-value of about1000 is often used.
The rules of the contest imposed to return a single fiber per voxel.Some participants had to post-process their tractography results thatproduce in general multiple fibers per voxel. Interesting post-processingwasused to this end, fromselectionof the longestfiber toamoreelaborateclusteringmethod.While this was not expected, post-processing appearsas necessary to improve the raw result of tractography algorithms.
In the next section, we present a qualitative review of the 10contributions.
Table 1Overview of the 10 contributions. Details about the diffusion model, tractography method(resp. FOD) parameterized with spherical harmonics. MoG stands for mixture of Gaussian.
Id Diffusion model Tractography Dataset Remarks
1 1- or 2-DT Streamline with propagationdirection following tensor witheigenvector the closest to thecurrent direction
3×3×3,b=1500
The 2-tensor motensor in voxelscompartment isthe smallest.
2 FOD-SH Streamline with propagation directionfollowing the FOD peak closest toprevious direction
6×6×6,b=2650
An anisotropic destep is used befornon-negativity coFOD to be positiv
3 Single-DT Streamline with propagationdirection following tensor principaldirection of diffusion (PDD)
3×3×3,b=1500
A Runge–Kutta 4was used.
4 Single-DT Tensor deflection: propagationdirection follows direction resultingof the product between the currenttensor and the previous direction
3×3×3,b=1500
Tensors are poweincrease anisotropscheme was used
5 2-DT Streamline tractography with filteredestimation of propagation direction
3×3×3,b=1500
The diffusion modby the previous pusing unscented K
6 PAS-MRI Streamline with propagationdirection following the PAS peakclosest to previous direction(PAS amplitude was calculatedon 181 points over the sphere)
3×3×3,b=1500
PAS was calculate(Sakaie, 2009). Trthe Fact algorithmimplemented in (2007) from all phfibers going throueach seed, the lonthe candidate fibe
7 MoG Global tractography 3×3×3,b=2000
Every point and dparameter of thesingle isotropic G
8 Single-DT Streamline with propagation directionfollowing tensor PDD
3×3×3,b=1500
Tracking is perfovoxels and onlywere kept. Spatiperformed to ret
9 FOD-SH Streamline with propagationdirection following the FOD peakclosest to previous direction
3×3×3,b=1500
Tracking is perforvoxels and only fi
kept. A scoring fumost likely fiber tfiber/seed.
10 ODF-SH Streamline with propagationdirection following the FOD peakclosest to previous direction
3×3×3,b=1500
A positivity constregularity are useto make it more r
Qualitative evaluation
We present on Fig. 5 an overlap of the 10 contributions for eachground truth fiber (one image corresponding to one seed location),and on Fig. 6 the individual results for each contribution (one imagecorresponds to the 16 candidate fibers of one method). Note that theimage number does correspond to the method Id of Table 1. The firststriking finding concerns the inter-method variability, which isrelatively high depending on the seed location. It raises the fact thatchoosing one method or another can lead to completely differenttracking results, and strengthen the importance of such a comparativestudy to determine the optimal possibilities.
From Fig. 5, we can conclude that, except for S13 and S14 that arelocated on the isolated U-shape structure (Region 7, Fig. 1 right), atleast one contribution per seed fails at reconstructing the correctpathway. Very often the algorithm chose the wrong direction whengoing through crossing regions.
Seeds where only one contribution was mislead are S1, S3, S4 andS8. All contributions seem remarkably stable with those seeds. Themost successful reconstructed fibers include those passing throughS1, S3, and S4. Those fibers were somewhat easier to reconstruct asthe exact pathway traverses a single crossing region. Note that S2 alsocontains a single crossing but was less successful due to the fact thatthe seed was purposely located at the boundary of the phantom, thusleading to partial voluming effect, specially when reaching crossingarea 1 (Fig. 1 right) where three contributions chose the wrong
and chosen dataset are given for each method. ODF-SH (resp. FOD-SH) stands for ODFDetails for method reproducibility are given in Supplementary Section 2.
References Software Contact
del is dropped for singlewhere the largest fibertwice as important as
(Ramirez-Manzanareset al., 2009;Ramirez-Manzanareset al., 2007)
Matlabpackage
AlonsoRamirez-Manzanares
noising pre-processinge FOD estimation. Anstraint ensures thee.
(Jeurissen et al.,2009; Jeurissenet al., 2011)
ExploreDTI Ben Jeurissen
integration scheme (Tensaouti et al.,2009; Basseret al., 2000)
Sysiphe FatimaTensaouti
red by a factor of 4 toy. A Euler integration.
(Tensaouti et al.,2009; Lazaret al., 2003)
Sysiphe FatimaTensaouti
el estimation is guidedropagation directionalman filtering.
(Malcolm et al.,2009; Malcolmet al., 2010)
3D Slicer James Malcolm
d by a fast algorithmacking is performed withof (Mori et al., 1999a)
Wang andWedeen,antom voxels and onlygh seeds were kept. Forgest fiber was chosen asr.
(Sakaie, 2009; Moriet al., 1999a; Wangand Wedeen, 2007)
Camino andTrackVis
Ken Sakaie
irection of every fiber is amodel and contribute as aaussian model.
(Reisert et al.,2009)
Matlabpackage
Marco Reisert
rmed from all phantomfibers going through seedsal averaging of fibers wasurn a single fiber/seed.
(Gouttard et al.,2009; Fillardet al., 2003)
MedNIRIA andFiberTracking
SylvainGouttard
med from all phantombers going seeds werenction determines theo return a single
(Yo et al., 2009;Descoteaux et al.,2009)
Brainvisa andCamino
Ting Yo
raint and spatiald during ODF estimationobust to noise.
(Goh, 2009;Goh et al., 2009a,b)
Matlabpackage
Alvina Goh

Fig. 5. Panel of images showing the reconstructed fiber of all contributions passing through each seed selected for the context. The name below the image indicates the seed fibersoriginate (a color-method correspondence table is given below). Such overview allows to understand the variability of the results: some seeds (such as S3 and S4) were moresuccessful than others (such as S7) to be reconstructed.
228 P. Fillard et al. / NeuroImage 56 (2011) 220–234
branch. S8 was also very successful, as the seed was close to theboundary and trackingalgorithmswere able to correctly follow the largeU-shape structure, successfully passing branching 5 and 6 (Fig. 1 right).
Among the less successful reconstructed fibers, we denote S5, S6,S7, S11, S12, S15 and S16: those had at least two crossing regions totraverse and many contributions were confused by one or the other.

Fig. 6. Each of the 10 contributions is shown individually. Image (11) represents the ground truth for visual comparison. Fibers are colored by the seed they originate (see Fig. 4 formore information on the seeds location). Visually, methods 2 and 7 seem to perform the best. We refer the reader to Table 1 for the method — Id correspondence.
229P. Fillard et al. / NeuroImage 56 (2011) 220–234
Looking at the individual results presented on Fig. 6 permits amore comprehensive inspection of the performance of each contri-bution. Visually, methods 2 and 7 seem to achieve the bestreconstructions (we refer the reader to Table 1 for the Id–methodcorrespondence). Method 10 is performing well, while fibers lookvery tortuous. In such situation, we expect the spatial metric to givea good score but the tangent and curve metrics to point thisphenomenon out. Methods 1, 5, 6, and 9, although missing a few
crossings, are performing reasonably well. Method 8 has fiberdisruption in the central crossing area which is not a desirablefeature. Besides crossings, most fibers appear as nicely reconstructed.Finally, methods 3 and 4 appear to be mislead in almost all crossings,although exhibiting smoother, and consequently more realistic, fibersthan most of the other methods.
In the following, we present the quantitative evaluation of each ofthe 10 contributions.

230 P. Fillard et al. / NeuroImage 56 (2011) 220–234
Quantitative evaluation
The symmetric RMSE of the Evaluation methodology section wasevaluated for each of the three metrics and each of the 16 fibers ofeach method, which makes a total of: 3×16×10=480 sRMSEevaluated. One sRMSE comprises the evaluation of a metric on twotimes 1000 points, we end up with a total of 960,000 point-to-pointmetrics being tested. Results for the spatial, tangent and curve metricsare given on Fig. 7.
The quantitative evaluation confirms our qualitative review of theresults. Fig. 7 presents results of the quantitative evaluation for thespatial, tangent and curve metrics. The colder the color in the metricfigures, the better the performance of the algorithm. For the threemetrics, methods 2 and 7 seem to outperform the others. For the
Fig. 7. Quantitative comparison of the 10 contributions to the ground truth using the spatiaEq. (5) (right). Top: The metric scores for each method and each fiber. Units are in mm forBottom: Points attributed to each method. Color-coding is the following: dark blue: 0 point,each method and each metric is indicated below the x-axis.
spatial metrics, methods 1, 5, 9 and 10 performwell: fibers are indeedspatially very close to the ground truth, but some high values weredetected for fibers where the tracking was mislead in a crossingregion. This is the case, for instance, for S7 where all methods exceptM2 and M7 have chosen the wrong pathway (see Fig. 5 (7)).
The tangentmetric evaluates whether the fiber trajectory correctlyfollows the ground truth. Parallel fibers obtain a very good score forthis metric. By contrast, fibers that chose the wrong pathway within acrossing will be highly penalized since the trajectory is very likely tobecome orthogonal to the correct one. Results presented on Fig. 7middle confirms this: method 2 realizes an almost perfect score sincethis is the only method which was able to correctly reconstruct allcrossings. Method 7 got only mislead in S12 as shown on Fig. 6 (7).Then,methods 5, 8 and 9 also exhibit perfect reconstructions for about
l metric of Eq. (3) (left), the tangent metric of Eq. (4) (middle), and the curve metric ofthe spatial metric, in degree for the tangent metric and in mm−1 for the curve metric.light blue: 1 point, yellow: 2 points, and brown: 3 points. The total number of points for

231P. Fillard et al. / NeuroImage 56 (2011) 220–234
half of the seeds. Methods 1, 3, 4 and 10 which produced noisier fibersthan the others were penalized by this metric.
The curvemetric of Fig. 7 right penalizes fibers with high curvaturesince the ground truth contains only straight – or low-curved – fibers.It is a good indicator of the veracity of the result since fibers with highcurvature are very unlikely to appear in real situations. Moreover,during phantom elaboration synthetic fibers were strongly stretchedpreventing high curvature. Methods 2, 4, 5, 6 and 7 produced thefibers with the lowest curvature. Note that method 2 obtains badscores for S3 and S14. Indeed, from Fig. 6 (3), one can notice that S3has a non-smooth trajectory around branching 2 (Fig. 1 right) thatappears like an inflection point. S14 has a maximum curvature at thefar-right point of the U-shape structure (region 7, Fig. 1 right), whichhas been detected by the metric. Other methods, in particular method10, are penalized by this metric due to the high frequency noise oftheir fibers. Note that the curve metric is not redundant with thetangent metric. For instance, method 4 received bad results for thetangent metric since fibers were obviously wrong, but good results forthe curve metric since fibers were as smooth as the ground truth.
Ranking
Tractography results were ranked according to the following rule.For each fiber and eachmetric, the method realizing the best score (i.e.,the lowest metric value) was attributed 3 points. The second methodreceived 2 points, and the third 1 point. The other methods obtained 0point. The purpose of such point attribution is to give to eachcontribution a final and unique score to rank them. Obviously,improvements are possible since one may not desire to give the sameimportance to all metrics. However, this has the advantage to allow asimple comparison of the performance of different methods. Table 2presents thefinal ranking of the submissions received for the contest. Tofurther illustrate the performance of the tested algorithms in realsituations, we performed tractography on a brain dataset with the toptwo methods (methods 7 and 2) and compared them to a single-DTstreamline tractography algorithm (method 4). Results are presented inSupplementary Section 3.
Discussion
Comments on the methods
As expected, single tensor-based methods (Fig. 5 (3), (4) and (8))seem to performworse than others in crossing regions for the obviousreason that a single tensor is unable to correctly characterize thetwo-fiber compartment specific of those regions. In particular, in thelower crossing area (region 1, Fig. 1 right) methods 3 (Basser et al.,2000) and 4 (Lazar et al., 2003) chose to avoid it by contouring it,while method 8 (Fillard et al., 2003) stopped the tracking, very
Table 2Final score ranking of the 10 contributions. See Table 1 for more information about eachmethod.
Rank Method Score
1st Method 7: Global tractography 116 pts2nd Method 2: FOD-SH with constrained spherical deconvolution and
streamline tractography87 pts
3rd Method 5: Combined 2-DT model estimation andstreamline tractography
31 pts
4th Method 10: ODF-SH with positivity and regularity constraints andstreamline tractography
19 pts
5th Method 6: PAS-MRI and streamline tractography 16 pts6th Method 1: Adaptive 1 or 2-DT model and streamline tractography 5 pts6th Method 8: Single-DT and streamline tractography 5 pts6th Method 9: FOD-SH with streamline tractography 5 pts9th Method 4: Single-DT with tensor deflection 4 pts10th Method3:Single-DTwithstreamline tractographyandRK4 integration 0 pt
probably because the crossing yield a fiber curvature greater than theallowed maximum angular deviation.
Multi-tensor based approaches (Fig. 5 (1) and (5)) are clearly a bigimprovement compared to single-tensormethods.Multi-tensormodelscanbe expressed asaweighted sumof single tensorswith the sumof theweights equal to one, each weight being proportional to the contribu-tion of each tensorwithin a given voxel.However, those twoapproachesgreatly differ. Method 1 (Fig. 5 (1)) (Ramirez-Manzanares et al., 2007)uses a mixture of single- and 2-tensor models. The 2-tensor is droppedat theprofit of the single onewhen it is either detected as a single tensor,or when one of the tensor has a much larger importance than the other(i.e., the weight of one tensor is larger than twice the weight of thesecond). Indeed, in voxels with a single fiber bundle contribution, thesingle diffusion tensor model is often more reliable at evaluating thefiber direction. Then, a streamline tractography is used where the nextpropagation direction is chosen as the closest to the previous directionamong all available candidate directions given the single or 2-tensormodel.
Method 5 (Fig. 5 (5)) (Malcolm et al., 2010) elegantly combinesthe estimation of a 2-tensor model with tractography. Starting from aseed point, each fiber is traced by following the tensorwhose PrincipalDirection of Diffusion (PDD) is the closest to the previous direction.However, instead of using least-squares to fit the tensor parametersdirectly, this method uses filtered estimation given the results ofprevious positions along the fiber. Specifically, it employs anunscented Kalman filter to provide a robust estimate of the highlynonlinear 2-tensor model, and of the mean and covariance of bothtensor parameters. This produces a causal estimate of the localstructure at each point along the fiber. Nevertheless, the streamlinetractography algorithm used is the bottleneck of the method as errorsmay accumulate during the reconstruction, which may eventuallylead to erroneous pathways.
A fast persistent angular structure calculation (Sakaie, 2009) wasused in conjunction with a simple FACT tractography algorithm formethod 6 (Fig. 5 (6)) on the 3 mmdatasetwith a b-value of 1500. Fiberswere smooth, as indicated by good results of the curvemetric, but somecrossings weremissed (regions 1, 4 and 5 of Fig. 1 right) leading to highvalues for the spatial and tangent metrics. Results were not improvedwhen using the more extensive persistent angular structure calculationas implementedbyCamino (Cook et al., 2006).Wecan conclude that thehigh angular resolution and noise immunity of the persistent angularstructure are not sufficient to compensate for shortcomings of simplestreamline tractography in the presence of complex fiber geometries.
ODF- (Fig. 5 (10)) and FOD- (ODF with spherical deconvolution)based (Fig. 5 (2) and (9)) methods qualitatively give a good matchwith the ground truth. However, method 10 (Fig. 5 (10)) (Goh et al.,2009) produced a very irregular and tortuous result. This is very likelyto be caused by curve averaging as in a former submissioncompetitors returned several fibers per seed which was not compliantwith our requirements (a revised submission was then resent).Method 10 estimates the ODF using a probability density constraintand a spatial regularity prior (Goh et al., 2009a). The constraintenforces the ODF to be positive, while the spatial prior ensures theresulting field to be spatially smooth, and the method is consequentlyrobust to noise. Streamline tractography was then performed with asimple first order integration scheme and by detecting ODF maximaby thresholding over the sphere. In the revised submission, the finalcurve for each seed is obtained by first computing all the possiblefibers obtained from the ODF fields estimated from each repetition aswell as the mean Riemannian ODF field, as described in (Goh et al.,2009b), and then discretizing the path that contains the most numberof likely fibers. Such a tractography technique is noise-sensitive and atthe same time, highly dependent on accurate ODF estimation. In spiteof this limitation, the fact that only one fiber, going through S6, failedto cross region 3 (see Fig. 1 right), proves that the ODF estimationsucceeded.

232 P. Fillard et al. / NeuroImage 56 (2011) 220–234
Method 9 (Fig. 5 (9)) estimates the FOD using the sphericaldeconvolution of (Descoteaux et al., 2009) with the constrainedregularization of (Tournier et al., 2007). While this method gives anacceptable qualitative match with the ground truth, it failed inreconstructing crossing region 4 (Fig. 1 right), and missed a couple offibers in crossing region 1. Apparently, this method is noise-sensitiveand the streamline tracking used is mislead by erroneous FODmaxima, especially in crossing region 4 that exhibits a crossing with alow angular difference. Those regions require a diffusionmodel with agood angular resolution. At the level of SNR of the chosen dataset, theODF with spherical deconvolution was unable to correctly model thisconfiguration.
Method 2 (Fig. 5 (2)) (Jeurissen et al., 2009, 2011) presents verysmooth fibers. This is also the only method which chose to use the6×6×6 mm dataset instead of the 3×3×3 mm version. Apparently,the gain of SNR turned into a larger fiber regularity. Note also that allfibers take the correct pathway (no error in crossing or bendingregions). Method 2 implements the constrained spherical deconvolu-tion of Tournier et al. (2007), giving an estimate of the FOD.Tractography was then conducted using a simple streamline approachbased on an extraction of the FOD maxima using a Newtonoptimization, which tends to prove, given the quality of the results,that the combination of spatially-adaptive DWI denoising beforesharp FOD estimation and maxima extraction is a good choice ofprocessing steps. Indeed, the gain in SNR with the 6 mm dataset,further increased with the denoising, seems to overcome thedecreased precision of the fiber spatial positions induced by thediminished resolution. We may argue that SNR plays a key role indiffusion model estimation and should not always be sacrificed at theprofit of spatial resolution.
Method 7 (Fig. 5 (7)) (Reisert et al., 2009), which used globaltractography, realized the best scores for all metrics and was declaredthe winner of the contest. Global tractography is a class oftractography algorithms that can be seen as greedy algorithms:instead of reconstructing tracts one by one, those algorithmsreconstruct all fibers at the same time (Mangin et al., 2002; Kreheret al., 2008; Fillard et al., 2009). More precisely, in global tractographyeach segment of a fiber (i.e., an oriented point) is a parameter to beoptimized. Optimization is performed such that each segment tries toassociate with neighboring segments to form longer chains of lowcurvature while modelling the diffusion weighted data at best. Eachfiber segment contributes as a single isotropic Gaussian model, whicheventually results in a mixture of Gaussian in each voxel. Thosemethods are a lot more time-consuming than their deterministiccounterparts but seem to be well-adapted in real, noisy situations.
Recommendations
Although this evaluation is subject to some limitations (which arediscussed in the next section), it is still possible to make a fewrecommendations about methods which should be used and thosewhich should be avoided in tractography. The recommendations thatfollow are based on the tested implementations of each method.Other implementations could have led to different conclusions.Moreover, there is no guarantee that the results obtained on thephantom dataset can be directly transposed to real situations. WhileMR phantoms are undoubtedly a step towards the validation ofdiffusion MRI tractography, they should be complemented by othersources of known fiber pathways such as post-mortem data.
First, in the context of tractography, the single-tensor modelshould be used with extra-caution since tractography algorithms arevery likely to fail in reconstructing crossing fibers. However, thesingle-DT model is still able to correctly characterize numerous fiberbundles as shown in the real experiment of Supplementary Section 3.Notably, the DT model with only few degrees of freedom is by essence
less sensitive to noise than more complex models, which often makesit the unique alternative in clinical applications.
Second, in case of good quality datasets, the best option seems touse a fiber orientation distribution function in conjunction with astreamline tractography algorithm where the next direction ofpropagation is directly inferred from the FOD maxima. Indeed, withreasonable SNR datasets, FODs seem successful in modelling the fiberdirections within a voxel and can be trusted.
Finally, for datasets of medium and low quality as it is oftenencountered in real situations, several options are possible but all ofthem are using a spatial prior to make the model estimation morerobust to noise. For instance, method 5 constraints the estimation of a2-tensor model by the previous fiber direction, which gives somespatial regularity to the whole procedure. Method 10 explicitlyimposes a spatial regularity when estimating the ODF, whicheventually leads to good fiber pathways even using a streamlinetractography algorithm, which give some evidence that the fiberdirections were correctly modeled by the ODF. The global tracto-graphy of method 7 also uses a smoothness prior during fiberreconstruction (fiber segments associate to form chains of lowcurvature). Additional spatially adaptive smoothing of the DWI isalso beneficial, as shown by method 2. Conversely, without spatialprior, not any diffusion model was shown to correctly estimate thedifferent fiber contributions within a voxel, and consequently shouldbe used with extreme caution.
Limitations and future work
One of the caveats of the proposed quantitative evaluationmethodology is that it only applies to deterministic tractographyalgorithms. Probabilistic methods produce maps of 'connectivity', thatgive, at every voxel of a regular 3D grid, the probability of this voxel tobe connected to a reference position. A ground truth is more difficultto establish as intrinsic factors such as fiber density inhomogeneities,fiber diameter or tissue permeability may impact the motion of watermolecules. Thus, elaboration of a ground truth dataset for probabilistictractography requires careful investigation andwas out of scope of thepresent work. The purpose of this work is to give evidence thatreconstructed pathways are correctly representing the true fiberorganization, which is crucial for many applications like neurosurgeryplanning.
Furthermore, the synthetic phantom does not properly simulatethe physiology of the diffusion phenomenon as in living tissues.Indeed, only extra-cellular diffusion is simulated since no watermolecules diffuse within synthetic fibers (diffusion only occursaround). A side effect is that the values of the fractional anisotropywithin the fiber bundles are lower than those generally observed inbrain white matter, which tends to disadvantage tensor-basedmethods. However, methods based on diffusion models like ODFwith spherical deconvolution appears to be less sensitive to thisdiminished anisotropy and perform well at separating the variousbundle contributions, making the overall evaluation method stillvalid.
In addition, we would like to recall that the results presented hererely on a blind contest: competitors did not have access to the groundtruth and were not authorized to modify their results after the groundtruth was revealed. Consequently, results may be sub-optimal, as fineparameter tuning could have improved tractography accuracy. Nowthat the ground truth is revealed, it is possible that the ranking of themethods would be different if the analysis were to be repeated.Furthermore, this study was performed on a single dataset. Therefore,the recommendations we make are purely indications and should notbe considered as established truth. It is only by repeating this type ofanalysis on different datasets, and by analyzing the consistency of theresults, that we will be able to conclude about the superiority of onemodel/tractography algorithm compared to another.

233P. Fillard et al. / NeuroImage 56 (2011) 220–234
In the future, new evaluation criteria will be proposed. Notably,some characteristics of the phantom were left unexploited. Forinstance, it is possible to evaluate the angular differences betweencrossing bundles and compare these values to the ground truth (seeFig. 1). Another possibility is to evaluate whether the boundaries of abundle are correctly reconstructed by measuring the spatial distancein-between two tracts delimiting the bundle. Finally, adding newseeds to the evaluation would allow a rapid extension of the currentwork.
To conclude, we want to emphasize that, to the best of ourknowledge, this is the first quantitative evaluation of multipletractography methods on a common dataset with known groundtruth. We believe that such a common dataset along with themethodology proposed here can serve as an evaluation basis forexisting and new algorithms. To this end, the DWI, the ground truthfibers, the evaluationmethodology and the results obtained so far willremain freely available on a permanent website: http://www.lnao.fr/spip.php?rubrique79. New results can be submitted for evaluation byemailing them to [email protected]. Results will be ranked andpublished among others on the Fiber Cup website.
Acknowledgments
The mechanical conception of the phantom was supervised byCyril Poupon, Laurent Laribière, Grégory Tournier, and Denis Fournier.Its manufacturing was taken in charge by Jérémy Bernard, GrégoryTournier and Laurent Laribière from the mechanics lab of theNeuroSpin centre, under the supervision of Laurent Laribière. TheMRI acquisitions were realized under the supervision of Cyril Pouponand Irina Kezele. The organizers would like to thank Dr. GhislaineDehaene (LCOGN Lab, NeuroSpin Centre) for funding this project.
Appendix A. Supplementary data
Supplementary data to this article can be found online atdoi:10.1016/j.neuroimage.2011.01.032.
References
Anderson, A., Choe, A., Stepniewska, I., Colvin, D., 2006. Comparison of brain whitematter fiber orientation measurements based on diffusion tensor imaging and lightmicroscopy. Proceedings of the IEEE Engineering in Medicine and Biology Society,pp. 2249–2251.
Assaf, Y., Basser, P., 2005. Composite hindered and restricted model of diffusion(CHARMED) MR imaging of the human brain. Neuroimage 27 (1), 48–58.
Basser, P., Mattiello, J., LeBihan, D., 1994. Estimation of the effective self-diffusion tensorfrom the NMR spin echo. J. Magn. Reson. B 103 (3), 247–254.
Basser, P., Pajevic, S., Pierpaoli, C., Duda, J., Aldroubi, A., 2000. In vivo fiber tractographyusing DT-MRI data. Magn. Reson. Med. 44, 625–632.
Behrens, T.E.J., Woolrich, M.W., Jenkinson, M., Johansen-Berg, H., Nunes, R.G., Clare, S.,Matthews, P.M., Brady, J.M., Smith, S.M., 2003. Characterization and propagation ofuncertainty in diffusion-weighted MR imaging. Magn. Reson. Med. 50, 1077–1088.
Behrens, T., Johansen-Berg, H., Jbabdi, S., Rushworth, M., Woolrich, M., 2007a.Probabilistic diffusion tractography with multiple fibre orientations. what can wegain? Neuroimage 23, 144–155.
Behrens, T.E.J., Johansen-Berg, H., Jbabdi, S., Rushworth, M.F.S., Woolrich, M.W., 2007b.Probabilistic diffusion tractography with multiple fibre orientations. what can wegain? Neuroimage 34 (1), 144–155.
Bergmann, Ø., Kindlmann, G., Peled, S., Westin, C.-F., 2007. Two-tensor fibertractography. 4th International Symposium on Biomedical Imaging. IEEE, Arling-ton, Virginia, USA, pp. 796–799.
Campbell, J.S.W., Savadjiev, P., Siddiqi, K., Pike, G.B., 2006. Validation and regularizationin diffusion MRI tractography. Third IEEE International Symposium on BiomedicalImaging (ISBI): from Nano to Macro. IEEE, Arlington, Virginia, USA, pp. 351–354.
Chao, Y.-P., Yang, C.-Y., Cho, K.-H., Yeh, C.-H., Chou, K.-H., Chen, J.-H., Lin, C.-P., 2007a.Probabilistic anatomical connection derived from QBI with MFACT approach.International Conference on Functional Biomedical Imaging, Hangzhou, China.
Chao, Y.-P., Yeh, C.-H., Cho, K.-H., Chen, J.-H., Lin, C.-P., 2007b. Multiple streamlinetractography approach with high angular resolution diffusion imaging data.Proceedings of the International Society of Magnetic Resonance in Medicine.Berlin, Germany, p. 1550.
Ciccarelli, O., Catani, M., Johansen-Berg, H., Clark, C., Thompson, A., 2008. Diffusion-basedtractography in neurological disorders: concepts, applications, and future developments.Lancet Neurol. 7 (8), 715–727.
Conturo, T., Lori, N., Cull, T., Akbudak, E., Snyder, A., Shimony, J., McKinstry, R., Burton,H., Raichle, M., 1999. Tracking neuronal fiber pathways in the living human brain.Proc. Natl. Acad. Sci. 96, 10422–10427.
Cook, P., Bai, Y., Nedjati-Gilani, S., Seunarine, K., Hall, M., Parker, G., Alexander, D., 2006.Camino: open-source diffusion-MRI reconstruction and processing. Proceedings ofthe 14th Scientific Meeting of the International Society for Magnetic Resonance inMedicine.
Dauguet, J., Peled, S., Berezovskiic, V., Delzescaux, T., Warfield, S.K., Born, R., Westin, C.-F.,2007. Comparison of fiber tracts derived from in-vivo DTI tractography with 3Dhistological neural tract tracer reconstruction on amacaque brain.Neuroimage37 (2),530–538.
Descoteaux, M., Deriche, R., Knosche, T., Anwander, A., 2009. Deterministic andprobabilistic tractography based on complex fibre orientation distributions. IEEETrans. Med. Imaging 28 (2), 269–286.
Fieremans, E., Deene, Y., Delputte, S., Özdemir, M., Achten, E., Lemahieu, I., 2008. Thedesign of anisotropic diffusion phantoms for the validation of diffusion weightedmagnetic resonance imaging. Phys. Med. Biol. 53, 5405.
Fillard, P., Gilmore, J., Lin, W., Piven, J., Gerig, G., 2003. Quantitative analysis of whitematter fiber properties along geodesic paths. Proc of MICCAI'03, Part I, volume 2879of LNCS. Springer, pp. 16–23.
Fillard, P., Arsigny, V., Pennec, X., Hayashi, K.M., Thompson, P.M., Ayache, N., 2007.Measuring brain variability by extrapolating sparse tensor fields measured onsulcal lines. Neuroimage 34 (2), pp. 639–650 . Also as INRIA Research Report 5887 .April, PMID: 17113311.
Fillard, P., Poupon, C., Mangin, J.-F., 2009. A novel global tractography framework basedon an adaptive spin glass model. Proc. 12th MICCAI.
Friman, O., Farneback, G., Westin, C.-F., 2006. A bayesian approach for stochastic whitematter tractography. IEEE Trans. Med. Imaging 25 (8), 965–977.
Goh, A., 2009. Deterministic tractography using orientation distribution functionsestimated with probability density constraints and spatial regularity. MICCAIworkshop on Diffusion Modelling and the Fiber Cup (DMFC'09), London, UnitedKingdom.
Goh, A., Lenglet, C., Thompson, P.M., Vidal, R., 2009a. Estimating orientation distributionfunctions with probability density constraints and spatial regularity. Proc. ofMICCAI, volume 12, pp. 877–885.
Goh, A., Lenglet, C., Thompson, P.M., Vidal, R., 2009b. A nonparametric Riemannianframework for processing high angular resolution diffusion images (HARDI). IEEEComputer Society Conference on Computer Vision and Pattern Recognition, pp.2496–2503.
Gouttard, S., Sharma, A., Gerig, G., 2009. Fiber challenge — SCI Utah solution. MICCAIworkshop on Diffusion Modelling and the Fiber Cup (DMFC'09), London, UnitedKingdom.
Hagmann, P., Reese, T.G., Tseng, W.-Y.I., Meuli, R., Thiran, J.-P., Wedeen, V.J., 2004.Diffusion spectrum imaging tractography in complex cerebral white matter: aninvestigation of the centrum semiovale. Proceedings of the International Society ofMagnetic Resonance in Medicine. International Society for Magnetic Resonance inMedicine, p. 623.
Hall, M., Alexander, D., 2009. Convergence and parameter choice for Monte-Carlosimulations of diffusion MRI. IEEE Trans. Med. Imaging 28 (9), 1354–1364.
Haroon, H.A., Parker, G.J., 2007. Using the wild bootstrap to quantify uncertainty in fibreorientations from q-ball analysis. Proceedings of the International Society ofMagnetic Resonance in Medicine, p. 903. Berlin, Germany.
Jansons, K.M., Alexander, D.C., 2003. Persistent angular structure: new insights fomdiffusion magnetic resonance imaging data. Inverse Prob. 19, 1031–1046.
Jbabdi, S., Bellec, P., Marrelec, G., Perlbarg, V., Benali, H., 2004. A level set method forbuilding anatomical connectivity paths between brain areas using DTI. InternationalSymposium on Biomedical Imaging. IEEE, Washinton DC, USA, pp. 1024–1027.
Jbabdi, S., Woolrich, M., Andersson, J., Behrens, T., 2007. A bayesian framework forglobal tractography. Neuroimage 37, 116–129.
Jeurissen, B., Leemans, A., Tournier, J.D., Sijbers, J., 2009. Fiber tracking on the‘fiber cupphantom’ using constrained spherical deconvolution. MICCAI workshop onDiffusion Modelling and the Fiber Cup (DMFC'09), London, United Kingdom.
Jeurissen, B., Leemans, A., Jones, D.K., Tournier, J.D., Sijbers, J., 2010. Probabilistic fibertracking using the residual bootstrap with constrained spherical deconvolution.Hum. Brain Mapp. 32. doi:10.1002/hbm.21032.
Jian, B., Vemuri, B.C., 2007. Multi-fiber reconstruction from diffusion MRI using mixtureof wisharts and sparse deconvolution. International Conference on InformationProcessing in Medical Imaging (IPMI).
Johansen-Berg, H., Rushworth, M., 2009. Using diffusion imaging to study humanconnectional anatomy. Lancet Neurol. 32, 75–94.
Kaden, E., Knosche, T.R., Anwander, A., 2007. Parametric spherical deconvolution:inferring anatomical connectivity using diffusion MR imaging. Neuroimage 37,474–488.
Kaufman, L., Kramer, D., Crooks, L., Ortendahl, D., 1989. Measuring signal-to-noise ratiosin MR imaging. Radiology 173, 265–267.
Klein, A., Andersson, J., Ardekani, B.A., Ashburner, J., Avants, B., Chiang, M.-C.,Christensen, G.E., Collins, L., Hellier, P., Song, J.H., Jenkinson, M., Lepage, C.,Rueckert, D., Thompson, P., Vercauteren, T., Woods, R.P., Mann, J.J., Parsey, R.V.,2009. Evaluation of 14 nonlinear deformation algorithms applied to human brainMRI registration. Neuroimage.
Koch, M., Norris, D., Hund-Georgiadis, M., 2002. An investigation of functional andanatomical connectivity using magnetic resonance imaging. Neuroimage 16,241–250.
Kreher, B.W., Schneider, J.F., Mader, J., Martin, E., J, H., Il'yasov, K., 2005. Multitensorapproach for analysis and tracking of complex fiber configurations. Magn. Reson.Med. 54, 1216–1225.

234 P. Fillard et al. / NeuroImage 56 (2011) 220–234
Kreher, B., Madeer, I., Kiselev, V., 2008. Gibbs tracking: a novel approach for thereconstruction of neuronal pathways. MRM 60, 953–963.
Lazar, M., Alexander, A.L., 2005. Bootstrap white matter tractography (boot-tract).Neuroimage 24, 524–532.
Lazar, M., Weinstein, D., Tsuruda, J., Hasan, K., Arfanakis, K., Meyerand, M., Badie, B.,Rowley, H., Haughton, V., Field, A., Alexander, A., 2003. White matter tractographyusing diffusion tensor deflection. Human Brain Mapping, volume 18, pp. 306–321.
Leemans, A., Jeurissen, B., Sijbers, J., Jones, D.K., 2009. Exploredti: a graphical toolbox forprocessing, analyzing, and visualizing diffusion mr data. Proc. of the 17th AnnualMeeting of Intl Soc Mag Reson Med.
Leergaard, T.B., White, N.S., de Crespigny, A., Bolstad, I., D'Arceuil, H., Bjaalie, J.G., Dale,A.M., 2010. Quantitative histological validation of diffusion mri fiber orientationdistributions in the rat brain. PLoS ONE 5 (1).
Lenglet, C. (2006). Geometric and Variational Methods for Diffusion Tensor MRIProcessing. PhD thesis, Université de Nice-Sophia Antipolis.
Liu, C., Bammer, R., Acar, B., Moseley, M.E., 2004. Characterizing non-Gaussian diffusionby using generalized diffusion tensors. Magn. Reson. Med. 51, 924–937.
Malcolm, J.G., Shenton, M.E., Rathi, Y., 2009. Filtered tractography: validation on aphysical phantom. MICCAI workshop on Diffusion Modelling and the Fiber Cup(DMFC'09), London, United Kingdom.
Malcolm, J.G., Shenton, M.E., Rathi, Y., 2010. Filtered multi-tensor tractography. IEEETrans. Med. Imaging 29, 1664–1675.
Mangin, J.-F., Poupon, C., Cointepas, Y., Rivière, D., Papadopoulos-Orfanos, D., Clark, C.A.,Ris, J., Le Bihan, D., 2002. A framework based on spin glass models for the inference ofanatomical connectivity fromdiffusion-weightedMRdata.NMRBiomed.15, 481–492.
Mori, S., Crain, B., Chacko, V., van Zijl, P., 1999a. Three-dimensional tracking of axonalprojections in the brain by magnetic resonance imaging. Ann. Neurol. 45, 265–269.
Mori, S., Crain, B., Chacko, V., Zijl, P.V., 1999b. Three-dimensional tracking of axonalprojections in the brain by magnetic resonance imaging. Ann. Neurol. 45, 265–269.
Moussavi-Biugui, A., Stieltjes, B., Fritzsche, K., Semmler, W., Laun, F.B., 2011. Novelspherical phantoms for q-ball imaging under in vivo conditions. Magn. Reson. Med.65 (1), 190–194.
Özarslan, E., Shepherd, T., Vemuri, B., Blackband, S., Mareci, T., 2006. Resolution ofcomplex tissue microarchitecture using the diffusion orientation transform (DOT).Neuroimage 31 (3), 1086–1103.
Parker, G.J.M., Alexander, D.C., 2005. Probabilistic anatomical connectivity derived fromthe microscopic persistent angular structure of cerebral tissue. Philos. Trans. R. Soc. B360, 893–902.
Parker, G.J.M., Haroon, H.A., Wheeler-Kingshott, C.A.M., 2003. A framework forstreamline-based probabilistic index of connectivity (PICo) using structuralinterpretation ofMRI diffusionmeasurements. J.Magn. Reson. Imaging 18, 242–254.
Perrin, M., Poupon, C., Cointepas, Y., Rieul, B., Golestani, N., Pallier, C., Riviere, D.,Constantinesco, A., Bihan, D.L., Mangin, J.-F., 2005. Fiber tracking in q-ball fields usingregularized particle trajectories. Information Processing in Medical Imaging, pp. 52–63.
Pieper, S., Lorensen, B., Schroeder, W., Kikinis, R., 2006. The NA-MIC kit: ITK, VTK,pipelines, grids and 3D Slicer as an open platform for the medical image computingcommunity. Proceedings of the 3rd IEEE International Symposium on BiomedicalImaging: From Nano to Macro, volume 1, pp. 698–701.
Poupon, C., Mangin, J.-F., Clark, C., Frouin, V., Régis, J., LeBihan, D., Bloch, I., 2001. Towardinference of human brain connectivity fromMRdiffusion tensor data.Media 5 (1), 1–15.
Poupon, C., Rieul, B., Kezele, I., Perrin, M., Poupon, F., cois Mangin, J.-F., 2008. Newdiffusion phantoms dedicated to the study and validation of HARDI models. Magn.Reson. Med. 60, 1276–1283.
Poupon, C., Guevara, P., Laribière, L., Tournier, G., Bernard, J., Fillard, P., Descoteaux, M.,Mangin, J.-F., 2010. A human-like coronal tractography phantom. Proceedings ofthe Joint ISMRM/ESMRMB Conference.
Pullens, P., Roebroeck, A., Goebel, R., 2010.Ground truth hardwarephantoms for validationof diffusion-weighted mri applications. J. Magn. Reson. Imaging 32, 482–488.
Ramirez-Manzanares, A., Rivera, M., 2006. Basis tensor decomposition for restoring intra-voxel structure and stochastic walks for inferring brain connectivity in DT-MRI. Int. J.Comput. Vision 69 (1), 77–92.
Ramirez-Manzanares, A., Rivera, M., Vemuri, B., Carney, P., Mareci, T., 2007. Diffusionbasis functions decomposition for estimating white matter intravoxel fibergeometry. IEEE Trans. Med. Imaging 26 (8), 1091–1102.
Ramirez-Manzanares, A., Rivera, M., Gee, J.C., 2009. Depicting axon fibers on a diffusionphantom by means of hybrid DBF-DT data. MICCAI Workshop on DiffusionModelling and the Fiber Cup (DMFC'09), London, United Kingdom.
Reisert, M., Mader, I., Kiselev, V., 2009. Tracking a physical phantom by global fibrereconstruction. MICCAI Workshop on Diffusion Modelling and the Fiber Cup(DMFC'09), London, United Kingdom.
Rivière, D., Geffroy, D., Denghien, I., Souedet, N., Cointepas, Y., 2009. BrainVISA: anextensible software environment for sharing multimodal neuroimaging data andprocessing tools. Proc. 15th HBM.
Sakaie, K., 2009. Fast persistent angular structure based streamline tractography.MICCAI Workshop on Diffusion Modelling and the Fiber Cup (DMFC'09), London,United Kingdom.
Savadjiev, P., Campbell, J.S.W., Descoteaux, M., Deriche, R., Pike, G.B., Siddiqi, K., 2008.Labeling of ambiguous sub-voxel fibre bundle configurations in high angularresolution diffusion MRI. Neuroimage 41 (1), 58–68.
Seunarine, K.K., Cook, P.A., Embleton, K., Parker, G.J.M., Alexander, D.C., 2006. A generalframework for multiple-fibre PICo tractography. Medical Image Understanding andAnalysis.
Seunarine, K.K., Cook, P.A., Hall, M.G., Embleton, K.V., Parker, G.J.M., Alexander, D.C.,2007. Exploiting peak anisotropy for tracking through complex structures.Mathematical Methods in Biomedical Image Analysis (MMBIA 2007), Held inConjuncture with the 11th International Conference on Computer Vision, pp. 1–8.
Tensaouti, F., Lotterie, J.A., Berry, I., 2009. Fiber tracking on the phantom dataset byusing Sisyphe software. MICCAI workshop on Diffusion Modelling and the FiberCup (DMFC'09), London, United Kingdom.
Tournier, J.-D., Calamante, F., Gadian, D., Connelly, A., 2004. Direct estimation of thefiber orientation density function from diffusion-weighted MRI data usingspherical deconvolution. Neuroimage 23, 1176–1185.
Tournier, J.-D., Calamante, F., Connelly, A., 2007. Robust determination of the fibreorientation distribution in diffusion MRI: non-negativity constrained super-resolved spherical deconvolution. Neuroimage 35 (4), 1459–1472.
Toussaint, N., Souplet, J., Fillard, P., 2007. Medinria: medical image navigation andresearch tool by INRIA. Proc. of MICCAI'07 Workshop on Interaction in medicalimage analysis and visualization, Brisbane, Australia.
Tuch, D.S., 2002. Diffusion MRI of Complex Tissue Structure. PhD thesis, HarvardUniversity and Massachusetts Institute of Technology.
Tuch, D., 2004. Q-ball imaging. Magn. Reson. Med. 52 (6), 1358–1372.Wang, R., Wedeen, V., 2007. A software package for diffusion imaging data processing
and tractography. Proceedings of the 15th Scientific Meeting of the InternationalSociety for Magnetic Resonance in Medicine.
Wang, R., Benner, T., Sorensen, A.G., Wedeen, V.J., 2007. Diffusion toolkit: a softwarepackage for diffusion imaging data processing and tractography. Proceedings of the15th Scientific Meeting of the International Society for Magnetic Resonance inMedicine.
Weinstein, D.M., Kindlmann, G.L., Lundberg, E.C., 1999. Tensorlines: advection–diffusionbased propagation through diffusion tensor fields. IEEE Vis. 00, 40.
Yo, T.-S., Anwander, A., Knösche, T.R., 2009. Fiber Cup 2009: reconstructing fibers fromthe phantom data. MICCAI workshop on Diffusion Modelling and the Fiber Cup(DMFC'09), London, United Kingdom.
Zhang, F., Hancock, E.R., Goodlett, C., Gerig, G., 2009. Probabilistic white matter fibertracking using particle filtering and von Mises–Fisher sampling. Med. Image Anal.13 (1), 5–18.