Quantitative assessment of view from within high density development using a perverted light...
22
1 Quantitative assessment of view from within high density development using a perverted light modelling approach Dr Marcus White Faculty of Architecture, Building and Planning The University of Melbourne VIC 3010, AUSTRALIA T: +61 403 439 494 E: [email protected] Nano Langenheim Faculty of Architecture, Building and Planning The University of Melbourne VIC 3010, AUSTRALIA T: +61 421 217 569 E: [email protected] Paper Presented at the 7th Making Cities Liveable Conference Kingscliff (NSW), 10 – 11 July 2014
Transcript of Quantitative assessment of view from within high density development using a perverted light...

1
Quantitative assessment of view from within high density development using a perverted
light modelling approach
Dr Marcus White
Faculty of Architecture, Building and Planning
The University of Melbourne
VIC 3010, AUSTRALIA
T: +61 403 439 494
Nano Langenheim
Faculty of Architecture, Building and Planning
The University of Melbourne
VIC 3010, AUSTRALIA
T: +61 421 217 569
Paper Presented at the
7th Making Cities Liveable Conference
Kingscliff (NSW), 10 – 11 July 2014
2
Quantitative assessment of view from within high density development using a perverted
light modelling approach
Abstract: Cities throughout the world are currently experiencing increased levels of
urbanisation resulting in pressure for densification. Questions about the impact on mental
health and general liveability are being raised in response to very dense developments
proposed in many cities including Melbourne, Australia. In some cases, high density towers in
close proximity are proposed with anticipated ‘views’ facing directly into other residential
towers. Though not a problem for ‘off-the-plan’ investors, ongoing users may be impacted,
potentially not able see water, any form of vegetation or even glimpse the sky.
As city densities increase, ‘view-quality’ becomes increasingly important. There is a
growing need for tools which can quantify how much water, sky or vegetation can be seen
from each dwelling to assess and guide the form of development.
This paper explores a new analysis and design approach which perverts light
simulation modelling within animation and game production software, combined with Java
based raster image-processing software ImageJ, to calculate the quality of view from within
buildings at a precinct scale.
This approach results in the quantification of view-quality based on visual access to
these specific elements either separately or simultaneously. The approach can weight view
elements depending on preference using different weighting. Existing urban morphology can
be assessed, as can potential urban form of proposed developments.
The approach could be used by urban designers and planners when setting up
precinct design guidelines to respond to the ‘visual amenity’ aspect of liveability; by
architects and developers during design process; by mental health researchers exploring
benefits of water, vegetation and sky views. The approach also has potential for application at
ground level in assessing the visual amenity of streets as a contributing factor of walkability.
Key words: Sky View Factor; Aspect; Outlook; urban modelling; liveability.

3
Introduction
Cities throughout the world are currently experiencing increased levels of urbanisation
resulting in pressure for densification of urban form (DOIT 2013, pp.9, 211). Questions about
the impact on quality of life; mental health; and general liveability are being raised in
response to dense developments proposed in many cities including Melbourne, Australia
(COM 2013, p.63). In some cases, high density towers in close proximity are proposed with
anticipated ‘views’ facing directly into other residential towers due to a ‘lack of regulation’
(Johanson & Perkins 2012).
As city densities increase, aspect or ‘view-quality’ becomes increasingly important
(Zhang et al. 2012). There is a growing need for tools to assess and guide the form of
development which can quantify how much sky, water or vegetation can be seen from each
dwelling.
In the first half of this paper we give a brief background into the growing pressure for
high density apartment development in Melbourne and the impact on visual amenity within
these dwellings. We discuss the complex relationship between the developer and investor
driven market; touch on the current legislative protection of visual amenity; the potential
impact of view on real-estate values; and the impact views of vegetation, sky and water have
on liveability and health.
In the second half of this paper, we go on to outline our method of ‘perverted light
modelling’ for view analysis, describing the steps involved. We report the preliminary results
of the new method applied to a large scale test case in the Melbourne central activity district
and continue with a brief discussion and conclusion based on the findings.
Background
Melbourne’s Growing Pains – urbanisation, densification, apartments and liveability:
Melbourne is experiencing rapid urbanisation and densification with over 600,000 new
residences in the past decade (DTPLI 2014, pp.6, 9, 18). The population is expected to grow
from approximately 4 million to between 5.6 and 6.4 million people by 2050 (MPSM 2012,
p.6) or potentially even higher - 7.7 million people by 2051 (DTPLI 2014, p.5). The bulk of
the future development of Melbourne will be concentrated in inner urban renewal areas as
medium to high density development (DTPLI 2014, p.60).

4
There is also an aspiration to provide suitable new housing for an ageing population and a
desire for this population to downsize from their detached housing and ‘age in place’ in high
density apartments within their local area (DTPLI 2014, p.65).
There is growing concern about the liveability of very dense developments being
constructed in many cities including Melbourne, Australia. Birrell and Heally suggest that the
the apartment boom is degrading the city’s liveability (2013, p.7). They suggest that the high
density development areas where towers are built adjacent other towers are ‘little better than
dog boxes […] Those buying off-the-plan may imagine panoramic views across the Bay but
things change however, when banks of these towers are built. They obscure each other’s
view. They collectively create a great wall’ (Birrell & Healy 2013, p.31).
As city densities increase, there is a need for tower locations, shapes and sizes to be
considered collectively and, as suggested by the City of Melbourne in its recent document
Future Living: A discussion paper identifying issues and options for housing our community,
there is a need for good internal amenity, for towers to be well-spaced to equitably distribute
access to sunlight and outlook (veiw from within apartments) (COM 2013, p.63).
The Victorian State Government shares the City of Melbourne concerns, with the
recently released document Plan Melbourne, stating in the section titled Initiative 2.1.5
Improve the Quality of Amenity of Residential Apartments that “there are major concerns
about apartment developments which include”:
• the small size of many apartments
• the tendency for a large number of apartments to be designed with habitable rooms (notably bedrooms) that have no direct access to daylight and ventilation
• lack of consideration of the amenity impacts of adjacent apartment development (DTPLI 2014, p.69)
Though the impact on adjacent development is listed as a ‘major concern’, measures to
mitigate this concern are not detailed other than to suggest that improvements to ResCode
(Clause Clauses 54, 55, 56 of the Victoria Planning Provisions) need to be made and that local
governments will need to review and refresh their housing strategies in line with Plan
Melbourne Objectives (DTPLI 2014, p.67). The City of Melbourne’s document suggests
controlling distance between buildings to address the critical issues of privacy, sunlight,
daylight and outlook (COM 2013, p.65). To set minimum front and side setbacks or set
minimum distances between towers may improve view-quality from within apartments, but as
Melbourne architect Callum Fraser argues, the key is how the buildings and neighbouring

5
buildings are designed. There are many ways of achieving the sharing of light, views and
ventilation, not necessarily having 25-metre spaces between the buildings’ (Johanson &
Perkins 2012). Fraser’ practice illustrates this point in the Watergate twin-tower development
in the Melbourne Docklands which comprises two separate towers less than eight metres apart
with wedge shaped building ends that allow all apartments to maintain high quality views
despite their close proximity. Though Fraser may be correct in his assertion that good
architects can design high quality buildings that can be shaped to allow close proximity
without loss of internal visual amenity, it is difficult for council town-planners to assess
individual tower forms against the complex three-dimensional urban context of the city.
Real estate and view-quality – a complex relationship:
The relationship between real estate markets and quality of views from within high density
dwellings is not straight forward. Though there is evidence that suggests that high quality
views of water, sky and vegitation attract a premium (D’Acci 2014; Luttik 2000), reliance on
this potential premium involves substantial risk.
Though the uncertainty of views might be seen as a major deterant to this housing
typology, the majority of apartments in Melbourne are a result of Asian developers and
investors (Birrell & Healy 2013, p.5), with only 31% of apartments currently owner-occupier
(COM 2013, p.56). Liveability, visual outlook amenity and quality of urban living is not a
major concern for those purchasing and financing contextless ‘off-the-plan’ investments as
the ultimate occupiers are predominantly renters (Cramer 2012, p.29). ‘Unlike
owner-occupiers, who would be strongly motivated to assess their purchase from a future
resident’s perspective, these investors are primarily concerned about the financial [short term]
consequences of their purchase’ (Birrell & Healy 2013, p.14).
If stricter controls over high density tower development proximity were implemented
such as those proposed by the City of Melbourne (COM 2013, p.65), it might be possible to
capture and quantify value associated with view-quality from apartments, as is the case in
other forms of real estate where methods such as Hedonic Pricing can be used.
The Hedonic Pricing Method has been applied to house pricing since the middle of the
20th Century to determine the impact of ‘bads’ (e.g. pollution), or ‘goods’ (e.g. access to
public parks) (D’Acci 2014). By using multiple regression analysis of a collection of complex
data sets including variables such as house price; house size; house age; pollution; distance

6
from school or parks; views of green open space and views of water, it is possible to assess
the financial impacts of each variable.
Real estate and water views:
Water is a highly prized component of a view. In a hedonic pricing study of house
transactions in the Netherlands, Luttik (2000) found that ‘the most influential environmental
attribute in the study is the presence of water features’ and that a view of water attracted a
price premium of 8 to 10% (D’Acci 2014; Luttik 2000) but could be as much an additional
65% for panoramic water views (D’Acci 2014).
There are a number of hedonic pricing studies seeking to value scenic amenity in an
Australian context (Ambrey & Fleming 2011), with river views found to have a particularly
strong positive influence on the selling price of housing in Perth, Western Australia. Pearson
et al. (2002) found that views of the ocean had a greater impact on pricing than views of the
parkland in Noosa National Park, Queensland.
Real estate and vegetation views:
Human ‘responses to trees and other vegetation relate to economic benefits of visual quality’
(Ulrich 1986). Proximity and access to green space has long been recognised as important in
planning for health and social reasons (Ulrich 1979) and has been empirically demonstrated to
impact house pricing up to 117% (D’Acci 2014). Views of vegetation at the scale of a single tree
through to private gardens, urban parks, reserves and large scale national parks have also been
shown to increase real estate prices from 4 to 23% and a generalized ‘pleasant view’
increasing house prices by up to 50% (D’Acci 2014).
In the study by Ambrey and Fleming (2011) the view of the National Park is shown to
increase property values by approximately 7% while access to the National Park had no effect
on the price.
Impact of view on health and liveability:
While most studies treat the real estate and health benefits of views separately, D’Acci (2014)
suggest that the Hedonic Pricing Method can also be used to measure urban quality of life
based on the ‘willingness to pay’. There is a quantifiable relationship between the health of
residents and increase in property value attributed to the view from their living quarters.
Studies concerned with the physical and emotional health impacts of both ‘pleasant’ and
‘unpleasant’ views provide empirical evidence that residents in prisons display a decreased

7
level of violence (Moore 1981); hospitals patients have decreased medication requirements
and recovery rates improve (Ulrich 1984); elderly citizens have a greater sense of wellbeing
and shorter recovery times when injured (Raanaas et al. 2012); and offices workers who’s
desks were located facing natural views take less sick days (Farley & Veitch 2001).
Liveability and water views:
A study by Volker and Kistermann (2011) reviews the small pool of literature on the benefits
of ‘blue space’ (water view) found that the health benefits of water as part of therapeutic
landscapes in urban environments could clearly be identified and that ‘blue space has
manifold influences on human health and wellbeing’(Völker & Kistemann 2011). The review
shows the strong predilection humans have for landscapes which contain water.
There is a need for disciplines such as urban planning and landscape architecture to
recognise and design for maximising both the environmental and health impacts of blue
spaces not only in health facilities and institutions but in residential situations also (Völker &
Kistemann 2011).
Liveability and sky views:
The impacts of decreased exposure to the sky leads to a reduction in visual comfort, requiring
extensive artificial lighting during day time (Zhang et al. 2012). From a psychological
perspective, being able to see the sky and experience natural light and to determine day from
night is an important aspect of wellbeing with ‘natural light denial’ even used as an extreme
form of torture (Ojeda 2006). Reduced exposure to the sky ‘may lead to [the] increase in
perceived confinement of space that may have negative impacts on people's satisfaction to the
living environment’ (Zhang et al. 2012).
Liveability and vegetation views:
The belief that viewing vegetation, water and other natural elements reduces stress and has an
impact on the speed of healing dates as far back as the earliest large cities in Persia, China and
Greece (Ambrey & Fleming 2011; Velarde et al. 2007)
Studies performed by Ulrich (1984) where patients were given either a ‘wall view’ or
a ‘vegetation view’ location for their post-operative recovery revealed substantial health
benefits for the ‘vegetation view’ patients, who recovered more quickly, required less
frequent and lower strength doses of pain relief and received less negative comments in
nurses notes than patients with the ‘wall view’ (Raanaas et al. 2012).

8
Kaplan’s study of the psychological benefits of the view from the home (2001)
suggests that there is strong evidence that well-being and neighbourhood satisfaction can be
partially attributed to the ‘window effect’ where views of ‘even a few trees’ can have ‘micro
restorative’ effects.
Aim
In the above paragraphs, we have outlined how as cities densify, protection of visual amenity
in apartment developments is needed for health and wellbeing as well as real estate value.
The aim of this study is to develop and test a new three-dimensional analysis approach
to assess internal ‘visual amenity’ or ‘view-quality’ of apartment developments providing
rapid visual and numeric feedback in a 3D modelling and visualisation environment. The
approach is to be used by urban designers and architects working with planners when setting
up precinct design guidelines to maximise the quality of views and thus liveability of dense
urban development.
Method
The second part of this paper explores a new analysis and design approach which perverts
light simulation modelling within animation and game production software, combined with
Java based raster (pixels) image-processing software ImageJ, to calculate the amount of
water, vegetation or sky visible from within buildings at a precinct scale.
The approach we have used to develop and test this rapid three-dimensional
view-quality analysis technique involved six parts – firstly to model polygon meshes of urban
precincts to test; secondly to apply a ‘sky-globe’ light based sky view factor assessment
method; thirdly to apply an ‘objects as light source’ method to assess visibility of water and
vegetation; fourthly to ‘bake’ resulting light levels onto polygon meshes outputting results to
a flattened raster image; and finally, to assess the raster outputs using image-processing
software ImageJ. We then tested this approach on a large scale urban model to validate the
applicability in precinct development scenario modelling.
Results
Creating
Firstly,
‘potenti
(2012).
and visu
it allow
capabili
‘manual
generate
2005) o
Measur
The sec
Sky Vie
modelli
The me
Sky Vie
opennes
the sky
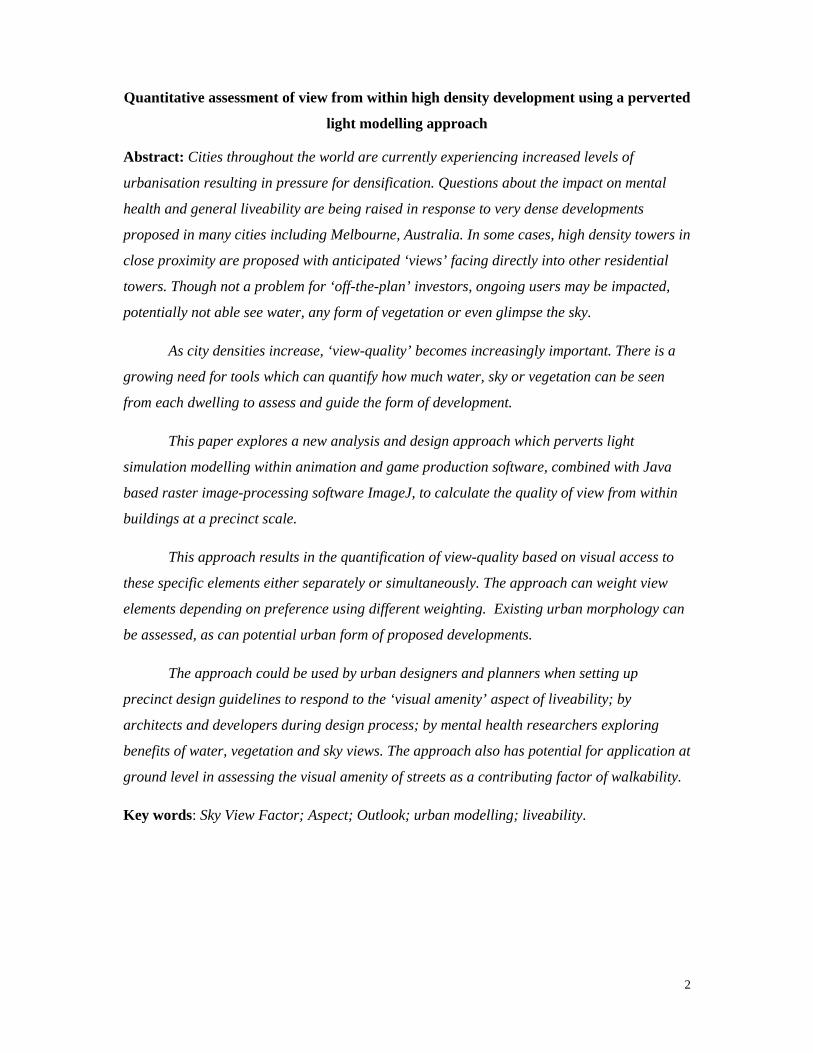
Figurethrough
there ar
(2009) a
s
g mesh geo
we modelle
ial’ of the in
We modell
ualisation pr
ed us to test
ities needed
lly’ modelle
ed from eith
of existing c
ring visible s
cond step inv
ew Factor (S
ng system t
asurement o
ew Factor (S
ss between
is complete
1: ‘Urban cah the single p
SVF has tra
e however s
and the auth
metry:
ed buildings
nterior behin
led polygon
rogram com
t different d
d for the visu
ed our mesh
her photogra
ites.
sky from ap
volved mea
SVF) mode
to create a ‘
of the amou
SVF) (Wats
0 and 1, rep
ely unobstru
anyon’ or ‘skoint and surr
aditionally b
several meth
hors of this
s as three-di
nd the façad
n-mesh enve
mmonly fou
design optio
ual assessm
hes, but it w
ammetry or
partments us
asuring the a
lling proces
sky dome li
unt of sky vi
son and Joh
presenting to
ucted by obs
ky view factorounding bui
of ‘op
been very d
hods for mo
paper (Whi
imensional
des as per th
elopes withi
und within a
ons quickly
ment (discus
would be equ
r suitably pr
sing Sky Vie
amount of s
ss we develo
ight’ (White
isible from
hnson, 1987)
otally obscu
stacles (Fig
or’ calculateilding form, ipenness to th
ifficult to m
odelling and
ite & Lange
polygon-me
he method d
in Autodesk
architectural
and has ‘sp
sed in the n
ually possib
repared Lida
ew Factor (
sky visible f
oped involv
e & Langen
a given poi
). SVF is a
ured spaces
ure 1) (Brow
d for a distinintersecting we sky’.
measure (Gr
d assessing
enheim 2014
esh envelop
described by
k’s 3dsMax™
l and urban
pecial-effect
next section)
ble to use m
ar scans (Sh
(SVF):
from apartm
ving a ‘hack
nheim 2014)
nt is comm
dimensionle
as Ψsky=0 a
wn et al. 20
nct location uwith a hemis
immond et
SVF as des
4) which inc
pes represen
y Zhang et a
™, an anim
design prac
ts’ lighting
). In this stu
mesh models
han & Samp
ments by app
ked’ dayligh
).
only calcula
ess measure
and Ψsky=1
001).
using projectsphere to ass
al. 2001), th
scribed by U
clude scale
9
nting the
al.
mation
ctice as
udy, we
s
path
plying a
ht
ated as
e of
where
ted rays ess level
hough
Unger
models

(Oke 19
1984); m
Bradley
2005; S
T
light sou
photons
SVF in
2009).
A
hemisph
by surro
(Ψsky=0
level du
(2014))
surfaces
Figure 2
Object l
Thirdly
perceiva
projecte
building
objects
objects
the ‘qua
building
Figure 3
981); angle
manual and
y et al. 2001
ouza et al. 2
The method
urce –‘sky-
s (light) from
seconds ins
Areas of a m
here) the su
ounding geo
0) (see Figur
ue to the dir
, as our met
s (building f
2: Sequence high
light source
, instead of
able locatio
ed in all dire
gs. To do th
as light sou
such as neo
ality of view
gs - the mor
3 - Figure 6
measureme
computer e
; Holmer et
2003).
d adopted fo
dome’ or ‘S
m the globe
stead of mor
model that r
urface appea
ometry it ap
re 2). Thoug
ect relation
thod is fully
facades and
of test screenher the boxe
e:
calculating
on within ap
ections cast
his we used
urces – a ligh
on- lights or
w’ by measu
re light hitti
).
ents (Bottya
evaluation o
t al. 2001);
or this study
Skylight Illu
e towards th
re computat
received ful
ars white (Ψ
ppears as sha
gh SVF is c
ship with th
y three dime
d windows).
n grabs of fos, the darker
g the amoun
partment bui
from the ve
the animati
hting ‘speci
r glowing la
uring the am
ng a surface
an & Unger
of fisheye ph
and comput
y is based on
umination’ a
e point of in
tionally inte
ll global illu
Ψsky=1) whe
ades of grey
commonly u
he urban hea
ensional, it c
.
our boxes (bur the shadowi
nt of water o
ildings, the
egetation or
on and visu
ial effect’ c
amp shades.
mount of lig
e of an adja
2003; John
hotos (Blan
tationally (B
n previously
approach by
nterest. Thi
ensive meth
umination (f
n rendered.
y or black w
used in micr
at island eff
can be used
uildings) withing and lowe
or vegetation
logic was r
r water ‘obj
ualisation so
ommonly u
Using this
ht hitting th
acent buildin
son 1985; J
nkenstein &
Brown et al
y developed
y projecting
s method ra
hods (Gal et
full 180deg
Where the
where it rece
roclimate m
fect (see Wh
d to assess S
h height paraer the SVF le
n visible fro
reversed, an
ects’ toward
oftware’s ab
used to simu
method, we
he surfaces o
ng, the bette
Johnson & W
Kuttler 200
. 2001; Lind
d hemispher
g and tracing
apidly calcu
t al. 2009; U
of light fro
surface is s
eives no lig
modelling at
hite & Lang
SVF on vert
ameter changevel.
om every
nd rays of lig
ds surround
bility to use
ulate glowin
e could asce
of the adjac
er the view
10
Watson
04;
dberg
rical
g
ulates
Unger
om the
shaded
ht
ground
genheim
tical
ged – the
ght were
ding
mesh
ng
ertain
cent
(see
D
order fo
separate
prioritie
intensity
accordin
intensity
not ‘bou
The mo
a separa
vegetati
be asses
Figsurroun
good
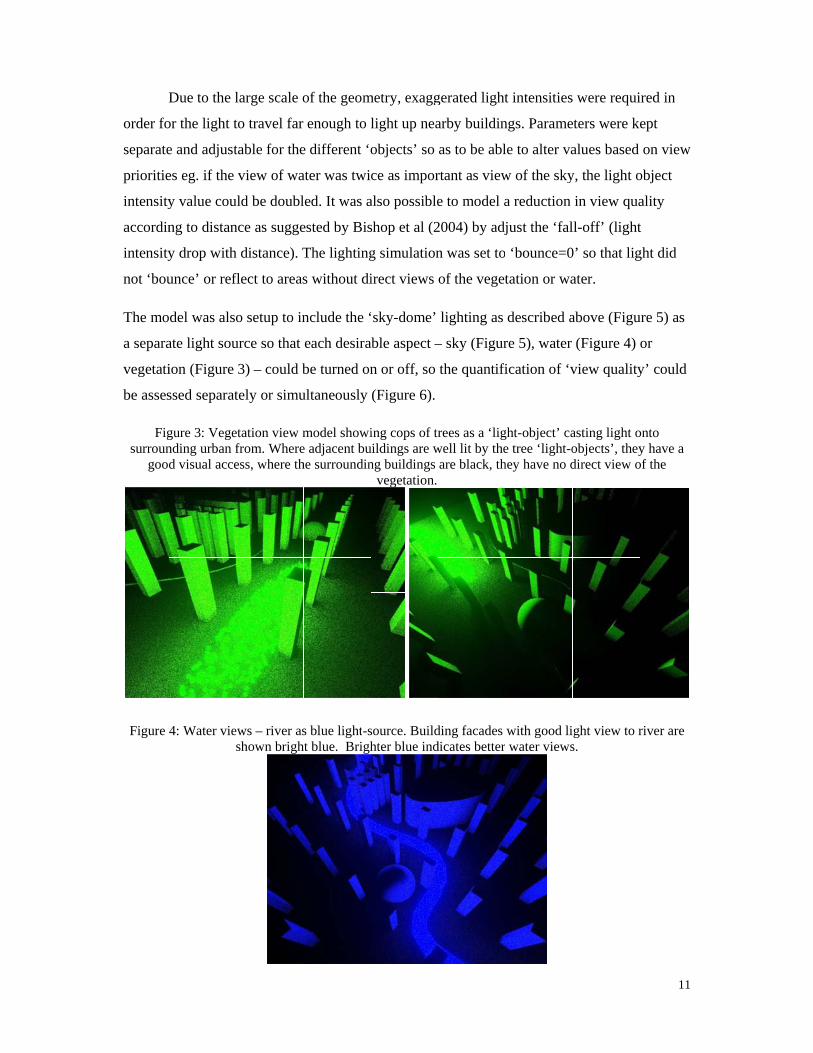
Figure 4
Due to the l
or the light t
e and adjust
es eg. if the
y value cou
ng to distan
y drop with
unce’ or ref
del was also
ate light sou
ion (Figure
ssed separat
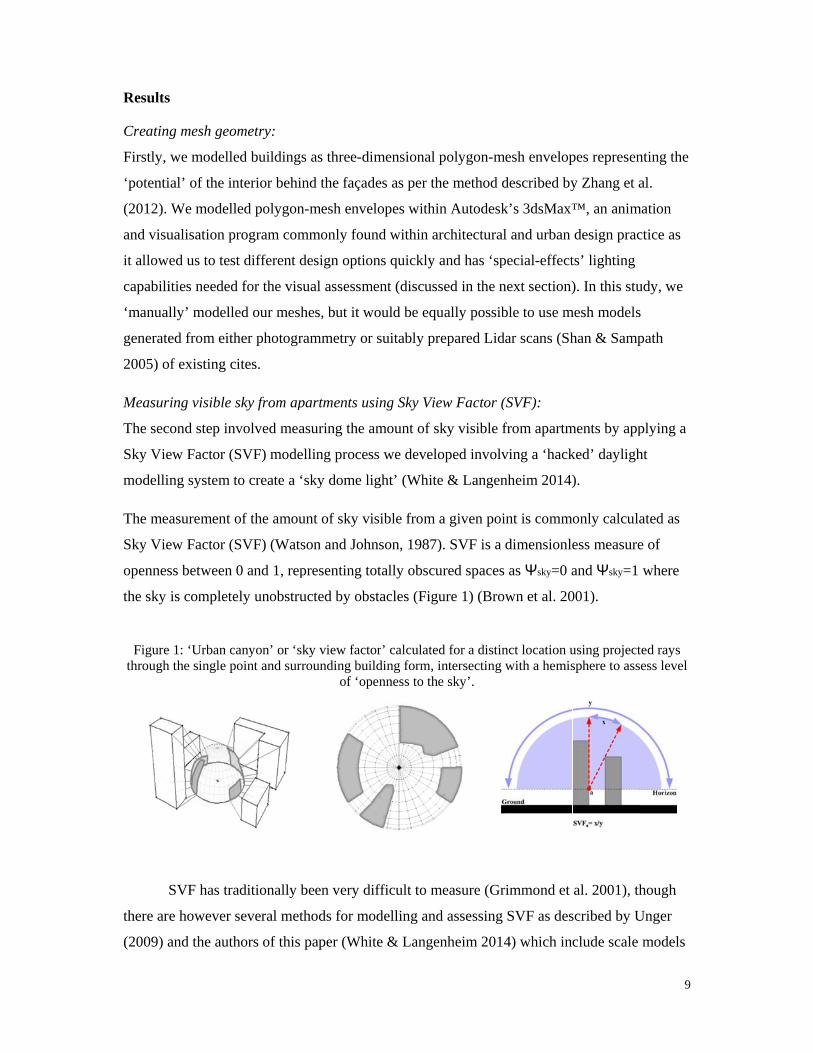
gure 3: Vegending urban fd visual acce
4: Water vies
large scale o
to travel far
table for the
view of wa
uld be doubl
nce as sugge
h distance). T
flect to areas
o setup to in
urce so that
3) – could b
tely or simu
etation view mfrom. Whereess, where th
ews – river asshown brigh
of the geom
enough to
e different ‘o
ater was twi
led. It was a
ested by Bis
The lighting
s without di
nclude the ‘
each desira
be turned on
ultaneously
model showie adjacent buhe surroundin
s blue light-sht blue. Brigh
metry, exagg
light up nea
objects’ so
ce as impor
also possible
shop et al (2
g simulation
irect views
‘sky-dome’
able aspect –
n or off, so
(Figure 6).
ing cops of truildings are wng buildings
vegetation.
source. Buildhter blue ind
gerated light
arby buildin
as to be abl
rtant as view
e to model a
2004) by adj
n was set to
of the veget
lighting as
– sky (Figur
the quantifi
rees as a ‘ligwell lit by theare black, th
ding facades dicates better
t intensities
ngs. Parame
le to alter va
w of the sky
a reduction
just the ‘fal
‘bounce=0
tation or wa
described a
re 5), water
fication of ‘v
ght-object’ cae tree ‘light-ohey have no d
with good liwater views
were requi
eters were ke
alues based
y, the light o
in view qua
ll-off’ (light
0’ so that lig
ater.
above (Figu
(Figure 4)
view quality
asting light oobjects’, theydirect view o
ght view to rs.
11
ired in
ept
on view
object
ality
t
ght did
ure 5) as
or
y’ could
onto y have a
of the
river are

Figure
Figure 6
Capturi
The abo
differen
necessa
this we
T
material
image a
animatio
been do
The pro
e 5: Sky viewfaçade o
6: Model sho
ing view qua
ove modellin
nt aspects of
ary to captur
used a proc
Texture bak
l colour; lig
as a ‘materia
on render ti
one, the com
ocess involv
w analysis – ur roof have h
owing simult
ality using
ng provides
f view-quali
re view-qua
cess called ‘
king is a pro
ghting and s
al texture’ (
imes or prep
mplex ray-tra
ves renderin
using sky-dohigh levels o
taneous analy
‘texture-bak
s good, almo
ity. To use t
ality levels (
texture-bak
ocess of pre
hading leve
Joviši & Ri
pare files fo
aced light a
ng mesh poly
ome light souf SVF and ar
ysis with veg
king’:
ost instant v
this modelli
(light levels
king’.
e-calculating
els; and stor
izvi 2008). T
or gaming en
and shadow
ygons (for e
urce for SVF reas that are
getation, wat
visual feedb
ing as more
) on each o
g specific in
ring this info
This proces
ngines as on
calculation
example the
calculation. dark have lo
ter and sky v
back on the
e than visual
f the buildin
nformation f
formation in
ss is primari
nce the ‘tex
ns do not nee
e side of a b
Bright red aow levels.
view light sou
quality of th
l assessmen
ng’s facade
for example
n a simple ra
ily used to s
xture-baking
ed to be rep
building Fig
12
areas of
urces on.
he three
nt, it was
s. To do
e
aster
speed up
g’ has
peated.
gure 7),

creating
object.
Figur'baking
T
their ge
flattened
Raster i
To quan
ImageJ.
dental im
and sim
processi
water, v
it was p
outputs
also pos
– for ex
‘very go
g an unfolde
re 7: Texture g’ the rendere
So
The texture
ometry capt
d raster ima
image proce
ntify view-q
. This softw
maging; tum
mulation of c
ing method
vegetation o
possible to q
such as ave
ssible to spe
xample it wa
ood’, ‘good
ed raster im
baking proced result to alanki and Am
e-baking pro
turing the d
ages files (.j
essing using
quality, we u
ware is used
mour and so
cell growth
described b
or sky visibl
quantify inte
erage view-
ecify output
as possible t
d’ and ‘bad’
age (image
cess involvesan ‘unfolded’mineh in Stu
ocess was th
different lev
jpg) for pixe
g ImageJ:
used open-s
in a wide v
oft tissue me
patterns (A
by Labno (2
le from the f
ensity of lig
level for bu
ts as a range
to produce o
(no view) (
file such as
s rendering th’ flat raster im
udio B subjec
hen applied
vels of light
el value ass
source Java
variety of ap
easurement
bràmoff et a
2013) to ana
façade of th
ght (view) o
uildings and
e of intensit
outputs with
(Figure 9).
s .jpg) that i
he object witmage texturect University
to various b
hitting the o
sessment.
based raste
pplications i
; neuroscien
al. 2004), b
alyse the pix
he buildings
ver facades
d best view (
ties using di
h a ranking
is then rema
th lights and e (diagram pr
of Melbourn
building obj
objects – pr
er image-pro
including as
nce; retinal
but in this ca
xel ‘lightne
s (Figure 9).
with a vari
(highest ligh
ifferent pixe
or out of 5
apped onto t
materials anroduced by Bne).
jects to ‘unf
roducing a s
ocessing sof
ssessment o
image analy
ase we used
ss’ to measu
. Using this
iety of possi
ht level). It
el colour thr
(see Figure
13
the
nd then Burman,
fold’
series of
ftware
f cells;
ysis;
d the
ure
method
ible
was
resholds
e 8) or

Figure (diagra
Figure 9scenario
Large s
To test t
model o
mix of m
We crea
environ
scene. F
applicat
10), gre
light ma
image ‘
seconds
8: Thresholdam produced
9: ImageJ pixo studies (dia
cale test Me
the applicab
of Melbourn
modelling d
ated a preco
nment and th
From there t
tion of light
een light to v
aterials wer
channels’. E
s each rende
d adjusted tod by Burman
xel value assegram by Sar
elbourne ce
bility of the
ne’s central
done in Trim
onfigured ‘s
hen merged
the applicat
t source mat
vegetation l
e then turne
Each of thes
er.
o identify five, Solanki and
essment of brah Skillingto
entral activi
tool at a lar
activity dis
mble’s Sketc
scene’ with
the geomet
tion of the to
terials to the
layer (Figur
ed on and of
se tests was
e levels of vid Amineh in
aked texture
on as part of
ity district:
rge scale, w
strict. We us
chup™ Aut
appropriate
try of the M
ool was rela
e correct lay
re 11) red lig
ff separately
s extremely
iew from ‘5’Studio B sub
e to quantify the Universi
we conducte
sed a polygo
todesk’s Au
e modelling
Melbourne ce
atively strai
yers – water
ght to the S
y to create t
rapid with f
being the bebject Univer
view allowinity of Melbou
ed a quick te
on mesh mo
utoCAD™ a
materials a
entral activi
ght forward
r light to wa
SVF globe (F
the differen
feedback gi
est and ‘1’ thrsity of Melb
ng comparatiurne FDUM
est using a 3
odel created
and 3DS Ma
and lighting
ity district i
d, requiring
ater layer (F
Figure 12).
t view analy
iven in less
14
he worst bourne).
ive urban subject).
3D
d using a
ax™.
nto the
the
Figure
The
ysis
than 30
Figure
Figure central
10: Aerial te
11: Aerial tel activity dist
est render of activity dis
est render of Vtrict. Areas th
lig
water-view trict – showi
Vegetation-vhat receive gght levels at
analysis apping visual im
view model tgreen light hastreet level a
lied to 3D mmpact of the Y
tool applied tave visual coare also show
mesh model oYarra River.
to 3D mesh monnection witwn.
of Melbourne
model of Meth vegetation
15
e central
elbourne n. Note:

Figure
Discuss
Speed a
The spe
approac
a compu
feedbac
analysis
of a des
allowing
compare
commun
T
for mor
necessa
propriet
be appli
could al
e 12: Aerial r
sion
and accuracy
eed of visua
ch was exce
uter’s graph
ck within a f
s coupled w
signer being
g the analys
e design op
nicating wit
The numeri
e complex b
ary to develo
tary systems
ied as a ‘bat
lso be stream
render of SVNot
cy:
l feedback f
ptionally fa
hics card an
few seconds
with the mod
g able to test
sis to be inte
tions also h
th clients, d
ic assessmen
building for
op a scripted
s such as Fl
tch process’
mlined.
VF tool applite the dark ar
for the 3D m
ast. Though
d ram, a rel
s even for fa
delling being
t many diffe
egrated into
have the pot
developers, c
nt of the vie
rms and not
d method fo
latiron 2.00™
’ assessing m
ed to 3D mereas have low
modelling li
the visual f
latively low
fairly large c
g conducted
erent design
o a design p
ential of be
councils an
ews was ho
t yet attemp
or ‘baking’
™. Though
many baked
sh model of w levels of S
ighting anal
feedback wa
w end laptop
complex are
d within a d
n options wi
process. The
ing a power
d the comm
wever more
ted at the sc
materials fo
h it was poss
d/flattened b
Melbourne CSVF.
lysis compo
as dependen
could prod
eas of city. T
design progr
ith extreme
e ability to p
rful advoca
munity.
e time consu
cale of a cit
or multiple
sible for the
buildings ra
CBD – aerial
onent of this
nt on the qu
duce visual
This speed o
ram, has the
ly rapid fee
produce and
cy tool whe
uming – par
ty. It may be
objects or to
e ImageJ pro
apidly, this p
16
l view.
s
uality of
of
e benefit
edback
d
en
rticular
e
o utilise
ocess to
process

17
As reported in previous study (White & Langenheim 2014), the level of accuracy for
the SVF modelling was found to be very good – with a maximum error of ± 0.03. The level of
accuracy of the ‘object as light source’ for direct an-attenuated (no fall-off) was found have a
similar level of accuracy to the SVF modelling, though further verification is required here.
Weighting of variables and a potential view-quality rating system:
The amount of fall-off according to distance was not interrogated in detail and we feel that
there is a need for more research in this area to answer questions such as – what is the
relationship between distance of water or vegetation and how much it improves a view? And,
does a very large tree that is far away improve a view as much as a small tree that is very
close?
The weightings for the different light channels also raises questions – is a water
preferable than a view of vegetation? Is a view with a lot of water worth more than a view
that has some water but also some vegetation? How much sky does one need to see to
experience physiological benefits? It may be that the weighting of these variables would
depend on the purpose of assessment – purely real estate value or liveability.
For these reasons, a simple star rating system has not yet been defined, though there
seems to great potential to develop such a system. With further research, it may be possible to
develop a view-quality rating system that could be used by policy makers, urban designers,
architects in developing high density dwelling guidelines and then by planners in assessing
design proposals.
Ground level assessment:
Though the aim of this study was focused on apartment view amenity, the level of
view-quality at street level was also displayed. The impact on view was apparent in each of
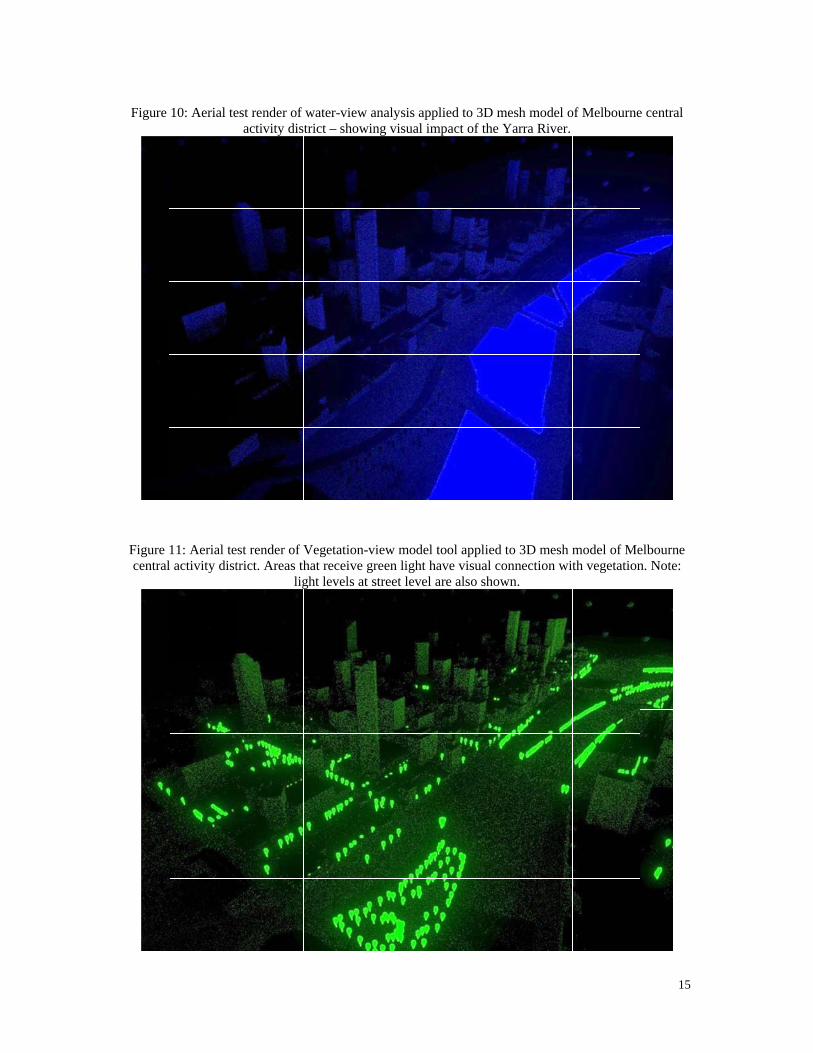
the city renders for sky-view and vegetation (Figure 11 and Figure 12), though the impact of
water at ground level was less evident (Figure 10). There is potential for view-quality
assessment tools to used when considering public open space and be incorporated into
walkability assessment tools such as those developed by Badland et al (2013).
Views from punch windows?
For the initial studies we have we have worked at an urban design massing scale, using highly
simplified abstractions of building facades that represent only the potential of views from
within the buildings as though they were entirely floor to ceiling clear glass curtain walls.
18
Though fully curtain walled residential towers do occur, they not common in Melbourne. In
future testing, we will investigate individual buildings in more detail looking at window
opening sizes and shapes; distance from windows (if an occupier stands two metres from a
window do they still get a view?); and solid balcony balustrades versus transparent.
Complex three dimensional:
The method described has the potential benefits of being truly three-dimensional, allowing
view-quality analysis of complex urban scenarios allowing urban designers to have a greater
understanding of existing city forms and identifying potential impacts of urban additions or
subtractions as well as the impact of complex forms of urbanism including cantilevering
buildings, stepped or sloping building forms, buildings with holes or ‘cut outs’.
Potential to extend previous research on real estate and health:
There is potential to use this view-quality assessment approach to extend many of the existing
view related studies. More highly detailed hedonic analysis would be possible if view-quality
model outputs could be brought into GIS environment and used as part of the regression
analysis.
It is also possible that by developing more detailed hedonic models, a greater understanding
of relationships and weighting of the aforementioned variables could be gained. It may be
possible to use these findings to further inform a view-quality rating system.
Conclusion
To encourage downsizing, owner-occupying and emotionally healthy occupants, it is essential
to offer high density housing that retains value, but more importantly, provides liveable and
healthy conditions for occupants with high quality views of the sky and vegetation or water.
The perverted light modelling approach described in this paper has the potential to be
used by urban designers, architects and planners when setting up precinct design guidelines to
respond to the ‘visual amenity’ aspect of liveability; by architects and developers during
design process to maximise the quality of views to maximise profits; and by mental health
researchers to maximise health and liveability in dense urban developments.

19
Figures
Figure 1: ‘Urban canyon’ or ‘sky view factor’ calculated for a distinct location using
projected rays through the single point and surrounding building form, intersecting with a
hemisphere to assess level of ‘openness to the sky’. .................................................................. 9
Figure 2: Sequence of test screen grabs of four boxes (buildings) with height parameter
changed – the higher the boxes, the darker the shadowing and lower the SVF level. ............. 10
Figure 3: Vegetation view model showing cops of trees as a ‘light-object’ casting light onto
surrounding urban from. Where adjacent buildings are well lit by the tree ‘light-objects’, they
have a good visual access, where the surrounding buildings are black, they have no direct
view of the vegetation. ............................................................................................................. 11
Figure 4: Water views – river as blue light-source. Building facades with good light view to
river are shown bright blue. Brighter blue indicates better water views. ................................ 11
Figure 5: Sky view analysis – using sky-dome light source for SVF calculation. Bright red
areas of façade or roof have high levels of SVF and areas that are dark have low levels. ...... 12
Figure 6: Model showing simultaneous analysis with vegetation, water and sky view light
sources on. ................................................................................................................................ 12
Figure 7: Texture baking process involves rendering the object with lights and materials and
then 'baking’ the rendered result to an ‘unfolded’ flat raster image texture (diagram produced
by Burman, Solanki and Amineh in Studio B subject University of Melbourne). .................. 13
Figure 8: Threshold adjusted to identify five levels of view from ‘5’ being the best and ‘1’ the
worst (diagram produced by Burman, Solanki and Amineh in Studio B subject University of
Melbourne). .............................................................................................................................. 14
Figure 9: ImageJ pixel value assessment of baked texture to quantify view allowing
comparative urban scenario studies (diagram by Sarah Skillington as part of the University of
Melbourne FDUM subject). ..................................................................................................... 14
Figure 10: Aerial test render of water-view analysis applied to 3D mesh model of Melbourne
central activity district – showing visual impact of the Yarra River. ....................................... 15

20
Figure 11: Aerial test render of Vegetation-view model tool applied to 3D mesh model of
Melbourne central activity district. Areas that receive green light have visual connection with
vegetation. Note: light levels at street level are also shown. .................................................... 15
Figure 12: Aerial render of SVF tool applied to 3D mesh model of Melbourne CBD – aerial
view. Note the dark areas have low levels of SVF. .................................................................. 16
References
Abràmoff, M.D., Magalhães, P.J. & Ram, S.J., 2004. Image processing with ImageJ. Biophotonics international, 11(7), pp.36–43.
Ambrey, C.L. & Fleming, C.M., 2011. Valuing scenic amenity using life satisfaction data. Ecological Economics, 72, pp.106–115.
Badland, H. et al., 2013. Using simple agent-based modeling to inform and enhance neighborhood walkability. International journal of health geographics, 12(1), p.58.
Birrell, B. & Healy, E., 2013. Melbourne’s High Rise Apartment Boom. Melbourne, Monash University Centre for Population Research.
Bishop, I., Lange, E. & Mahbubul, A., 2004. Estimation of the influence of view components on high-rise apartment pricing using a public survey and GIS modeling. Environment and Planning B: Planning and Design, 31, pp.439–452.
Blankenstein, S. & Kuttler, W., 2004. Impact of street geometry on downward longwave radiation and air temperature in an urban environment. Meteorologische Zeitschrift, 13(5), pp.373–379.
Bottyan, Z. & Unger, J., 2003. A multiple linear statistical model for estimating the mean maximum urban heat island. Theoretical and Applied climatology, 75(3-4), pp.233–243.
Bradley, A., Thornes, J. & Chapman, L., 2001. A method to assess the variation of urban canyon geometry from sky view factor transects. Atmospheric Science Letters, 2(1-4), pp.155–165.
Brown, M.J., Grimmond, S. & Ratti, C., 2001. Comparison of methodologies for computing sky view factor in urban environments. In International Society of Environmental Hydraulics Conference, Tempe, AZ.
COM, 2013. Future Living: A discussion paper identifying issues and options for housing our community., City of Melbourne.
Cramer, C.K., 2012. Making the Numbers Stack Up, A Study into Major Residential Urban Renewal in Melbourne. Property Council of Australia.

21
D’Acci, L., 2014. Monetary, Subjective and Quantitative Approaches to Assess Urban Quality of Life and Pleasantness in Cities (Hedonic Price, Willingness-to-Pay, Positional Value, Life Satisfaction, Isobenefit Lines). Social Indicators Research, 115(2), pp.531–559.
DOIT, 2013. State of Australian Cities 2013. Department of Infrastructure and Transport, Major Cities Unit.
DTPLI, 2014. Plan Melbourne, Victrian State Government.
Farley, K.M. & Veitch, J.A., 2001. A room with a view: a review of the effects of windows on work and well-being.
Gal, T., Lindberg, F. & Unger, J., 2009. Computing continuous sky view factors using 3D urban raster and vector databases: comparison and application to urban climate. Theoretical and applied climatology, 95(1-2), pp.111–123.
Grimmond, C. et al., 2001. Rapid methods to estimate sky-view factors applied to urban areas. International Journal of Climatology, 21(7), pp.903–913.
Holmer, B., Postgård, U. & Eriksson, M., 2001. Sky view factors in forest canopies calculated with IDRISI. Theoretical and Applied Climatology, 68(1-2), pp.33–40.
Johanson & Perkins, 2012. No room for a view. Sunday Morning Herald.
Johnson, D., 1985. Urban modification of diurnal temperature cycles in Birmingham, UK. Journal of climatology, 5(2), pp.221–225.
Johnson, G.T. & Watson, I.D., 1984. The determination of view-factors in urban canyons. Journal of Climate and Applied Meteorology, 23(2), pp.329–335.
Joviši, V. & Rizvi, S., 2008. Photorealistic reconstruction and multimedia presentation of the medieval fortress in Travnik. Review of the National Center for Digitization, (13), pp.65–73.
Kaplan, R., 2001. The nature of the view from home psychological benefits. Environment and Behavior, 33(4), pp.507–542.
Labno, C., 2013. Basic Intensity Quantification with ImageJ. Available at: http://www.unige.ch/medecine/bioimaging/tricks/imagejtutorials/Quantification.pdf.
Lindberg, F., 2005. Towards the use of local governmental 3-D data within urban climatology studies. Mapping and Image Science.
Luttik, J., 2000. The value of trees, water and open space as reflected by house prices in the Netherlands. Landscape and Urban Planning, 48(3), pp.161–167.
Moore, E.O., 1981. A prison environment’s effect on health care service demands. Journal of environmental systems, 11(1), pp.17–34.
MPSM, 2012. Melbourne: Let’s talk about the future, The Ministerial Adisory Committee for the Metripolitan Planning Strategy of Melbourne.

22
Ojeda, A.E., 2006. What Is Psychological Torture. The Trauma of Psychological Torture.
Oke, T.R., 1981. Canyon geometry and the nocturnal urban heat island: comparison of scale model and field observations. Journal of Climatology, 1(3), pp.237–254.
Pearson, L., Tisdell, C. & Lisle, A., 2002. The impact of Noosa National Park on surrounding property values: An application of the hedonic price method. Economic Analysis and Policy, 32, pp.155–172.
Raanaas, R.K., Patil, G.G. & Hartig, T., 2012. Health benefits of a view of nature through the window: a quasi-experimental study of patients in a residential rehabilitation center. Clinical rehabilitation, 26(1), pp.21–32.
Shan, J. & Sampath, A., 2005. Urban DEM generation from raw lidar data: A labeling algorithm and its performance. Photogrammetric Engineering & Remote Sensing, 71(2), pp.217–226.
Souza, L.C.L., Rodrigues, D.S. & Mendes, J.F., 2003. A 3D-gis extensionf for sky view factors assessment in urban environment.
Ulrich, R., 1984. View through a window may influence recovery. Science, 224(4647), pp.224–225.
Ulrich, R.S., 1986. Human responses to vegetation and landscapes. Landscape and urban planning, 13, pp.29–44.
Ulrich, R.S., 1979. Visual landscapes and psychological well‐being. Landscape Research, 4(1), pp.17–23. Available at: http://www.tandfonline.com/doi/abs/10.1080/01426397908705892.
Unger, J., 2009. Connection between urban heat island and sky view factor approximated by a software tool on a 3D urban database. International Journal of Environment and Pollution, 36(1), pp.59–80.
Velarde, M.D., Fry, G. & Tveit, M., 2007. Health effects of viewing landscapes–Landscape types in environmental psychology. Urban Forestry & Urban Greening, 6(4), pp.199–212.
Völker, S. & Kistemann, T., 2011. The impact of blue space on human health and well-being–Salutogenetic health effects of inland surface waters: A review. International journal of hygiene and environmental health, 214(6), pp.449–460.
White, M. & Langenheim, N., 2014. Measuring Urban Canyons with real-time light based Sky View Factor Modelling. In International Seminar on Urban Form (pending). Porto, Portugal.: International Seminar on Urban Form (pending).
Zhang, J. et al., 2012. Evaluating environmental implications of density: A comparative case study on the relationship between density, urban block typology and sky exposure. Automation in construction, 22, pp.90–101.