Quantitative Analysis of the Conservation of the Tertiary Structure of Protein Segments
15
Quantitative Analysis of the Conservation of the Tertiary Structure of Protein Segments Jishou Ruan, 1, * Ke Chen, 4, # Jack A. Tuszynski , 2,3, and Lukasz A. Kurgan 4,5 The publication of the crystallographic structure of calmodulin protein has offered an example leading us to believe that it is possible for many protein sequence segments to exhibit multiple 3D structures referred to as multi-structural segments. To this end, this paper presents statistical analysis of uniqueness of the 3D-structure of all possible protein sequence segments stored in the Protein Data Bank (PDB, Jan. of 2003, release 103) that occur at least twice and whose lengths are greater than 10 amino acids (AAs). We refined the set of segments by choosing only those that are not parts of longer segments, which resulted in 9297 segments called a sponge set. By adding 8197 signature segments, which occur uniquely in the PDB, into the sponge set we have generated a benchmark set. Statistical analysis of the sponge set demonstrates that rotating, missing and disarranging operations described in the text, result in the segments becoming multi- structural. It turns out that missing segments do not exhibit a change of shape in the 3D-structure of a multi-structural segment. We use the root mean square distance for unit vector sequence (URMSD) as an improved measure to describe the characteristics of hinge rotations, missing, and disarranging segments. We estimated the rate of occurrence for rotating and disarranging segments in the sponge set and divided it by the number of sequences in the benchmark set which is found to be less than 0.85%. Since two of the structure changing operations concern negligible number of segment and the third one is found not to have impact on the structure, we conclude that the 3D-structure of proteins is conserved statistically for more than 98% of the segments. At the same time, the remaining 2% of the sequences may pose problems for the sequence alignment based structure prediction methods. KEY WORDS: Multi-structural segments; protein structure; protein structure comparison; protein structure conservation; URMSD. 1. INTRODUCTION In the past, it has been commonly assumed that a protein can only adopt a unique 3D structure that corresponds to the minimal value of the free energy (Anfinsen, 1973). With over twenty thousand 3D pro- tein structures determined, it has become clear that some proteins may adopt multiple equilibrium ter- tiary structures, at least partially due to the influence of the surrounding environment (Drum et al., 2002; Elhorst et al., 1999; Meador et al., 1992; Schumacher et al., 2004; Yap et al., 2003). In a recent study we 1 Chern Institute of Mathematics, College of Mathematical Science & LPMC, Nankai University, Tianjin, 300071. P. R. China. 2 Department of Physics, University of Alberta, Edmonton, AB, Canada, T6G 2J1. 3 Department of Experimental Oncology, Cross Cancer Institute, Edmonton, AB, Canada, T6G 2J1. 4 Department of Electrical and Computer Engineering, University of Alberta, Edmonton, AB, Canada, T6G 2V4. 5 To whom correspondence should be addressed. E-mail: lkurgan@ ece.ualberta.ca * Jishou Ruan research was supported by Liuhui Center for Ap- plied Mathematics, China-Canada exchange program adminis- tered by MITACS and NSFC (10271061). # Ke Chen and Lukasz A. Kurgan research was partially supported by NSERC Canada. Jack A. Tuszynkski research has been supported by MITACS, NSERC Canada and the Allard Foundation. Abbreviations: amino acid, AA; Protein Data Bank, PDB; root mean square distance, RMSD; root mean square distance for unit vector sequence, URMSD; three-dimensional, 3D. 301 1572-3887/06/0700-0301/0 ȑ 2006 Springer Science+Business Media, Inc. The Protein Journal, Vol. 25, No. 5, July 2006 (ȑ 2006) DOI: 10.1007/s10930-006-9016-5 Published Online: September 7, 2006
-
Upload
independent -
Category
Documents
-
view
5 -
download
0
Transcript of Quantitative Analysis of the Conservation of the Tertiary Structure of Protein Segments

Quantitative Analysis of the Conservation of the TertiaryStructure of Protein Segments
Jishou Ruan,1,* Ke Chen,4,# Jack A. Tuszynski �,2,3, and Lukasz A. Kurgan4,5
The publication of the crystallographic structure of calmodulin protein has offered an example
leading us to believe that it is possible formany protein sequence segments to exhibit multiple 3Dstructures referred to as multi-structural segments. To this end, this paper presents statisticalanalysis of uniqueness of the 3D-structure of all possible protein sequence segments stored in the
Protein Data Bank (PDB, Jan. of 2003, release 103) that occur at least twice and whose lengthsare greater than 10 amino acids (AAs). We refined the set of segments by choosing only thosethat are not parts of longer segments, which resulted in 9297 segments called a sponge set. Byadding 8197 signature segments, which occur uniquely in the PDB, into the sponge set we have
generated a benchmark set. Statistical analysis of the sponge set demonstrates that rotating,missing and disarranging operations described in the text, result in the segments becomingmulti-structural. It turns out thatmissing segments do not exhibit a change of shape in the 3D-structure
of a multi-structural segment. We use the root mean square distance for unit vector sequence(URMSD) as an improved measure to describe the characteristics of hinge rotations, missing,and disarranging segments. We estimated the rate of occurrence for rotating and disarranging
segments in the sponge set and divided it by the number of sequences in the benchmark set whichis found to be less than 0.85%. Since two of the structure changing operations concern negligiblenumber of segment and the third one is found not to have impact on the structure, we conclude
that the 3D-structure of proteins is conserved statistically formore than 98%of the segments. Atthe same time, the remaining 2%of the sequencesmay pose problems for the sequence alignmentbased structure prediction methods.
KEY WORDS: Multi-structural segments; protein structure; protein structure comparison; proteinstructure conservation; URMSD.
1. INTRODUCTION
In the past, it has been commonly assumed that aprotein can only adopt a unique 3D structure thatcorresponds to the minimal value of the free energy(Anfinsen, 1973). With over twenty thousand 3D pro-tein structures determined, it has become clear thatsome proteins may adopt multiple equilibrium ter-tiary structures, at least partially due to the influenceof the surrounding environment (Drum et al., 2002;Elhorst et al., 1999; Meador et al., 1992; Schumacheret al., 2004; Yap et al., 2003). In a recent study we
1 Chern Institute of Mathematics, College of Mathematical Science
& LPMC, Nankai University, Tianjin, 300071. P. R. China.2 Department of Physics, University of Alberta, Edmonton, AB,
Canada, T6G 2J1.3 Department of Experimental Oncology, Cross Cancer Institute,
Edmonton, AB, Canada, T6G 2J1.4 Department of Electrical and Computer Engineering, University
of Alberta, Edmonton, AB, Canada, T6G 2V4.5 To whom correspondence should be addressed. E-mail: lkurgan@
ece.ualberta.ca
* Jishou Ruan research was supported by Liuhui Center for Ap-plied Mathematics, China-Canada exchange program adminis-tered by MITACS and NSFC (10271061).
# Ke Chen and Lukasz A. Kurgan research was partially supportedby NSERC Canada.
� Jack A. Tuszynkski research has been supported by MITACS,NSERC Canada and the Allard Foundation.
Abbreviations: amino acid, AA; Protein Data Bank, PDB; root
mean square distance, RMSD; root mean square distance for unit
vector sequence, URMSD; three-dimensional, 3D.
3011572-3887/06/0700-0301/0 � 2006 Springer Science+Business Media, Inc.
The Protein Journal, Vol. 25, No. 5, July 2006 (� 2006)DOI: 10.1007/s10930-006-9016-5Published Online: September 7, 2006

have demonstrated that for the calmodulin protein(Chen et al., 2006). The existence of multiple-struc-ture proteins, with a greater preponderance forspecific primary sequences, may be an intrinsic prop-erty even though it may be tempting to explain this asa result of the surrounding environment. Predictionmethods for the tertiary structures based on theprimary sequences alone use the statistical tools wherethe uniqueness of the 3D structures of proteins isassumed. The present paper attempts to shed light onthe problem of the existence of multi-structuralelements in proteins which may open new vistas in thearea of protein structure prediction in general. Theoutline of this paper is as follows:
1. In Section 2, we construct the benchmark setand describe three causes for a given protein se-quence segment to become multi-structural, i.e.rotating, missing and disarranging.
2. In Section 3, we describe the method in detailthat includes
A. Finding the numerical algorithm to describethe characteristics of the three causes of pro-teins to become multi-structural.
B. Finding threshold values for the three charac-teristics mathematically.
C. Constructing the indicator sequences for seg-ments, and using it to describe quantitativecharacteristics of the rotating, missing anddisarranging segments.
D. Estimating the upper bounds on the rate ofthe rotating and disarranging segments re-lated to the benchmark set.
3. In Section 4, we discuss implications of ourfindings.
In contrast to the recent study of protein segmentsby Kihara and Skolnick (Kihara and Skolnick,2003), which concentrates on the similarity of struc-tures between segments sharing low sequencehomology, we discuss the native characteristic ofthe multi-structural protein segments with respect tothe conservation of their 3D structures.
2. CLASSIFICATION OF THE MULTI-
STRUCTURAL SEGMENTS
2.1. Searching the Benchmark Set Based on the
PDB database
In order to analyze multi-structural segmentsof proteins, we need to construct the benchmark
set. To this end, we use all chains in the PDB data-base (release # 103) (Berman et al., 2000), whichnumber approximately 53,000. Among these chains8197 occur in the PDB database only once. We col-lect all these segments whose lengths are more than10 AAs and which occur at least in two chains.This is a time-consuming task that requires a hugeamount of memory space if we use a naı̈ve method.To save space we use Shen’s method (Shen et al.,2004), which is summarized it as follows:
• We search for all of the 10-residue segmentsthat occur at least twice in the PDB data-base and denote this set by S(10). Whensearching for the second segment identicalto the one selected, we examine any positionin a sequence.
• For each segment s in S(10), we randomlyadd an AA at its end, to generate 20 possi-ble 11-residue segments. If none of the 20segments can be found in the PDB databasemore than twice, then we remove s fromS(10) to form S1(10). Otherwise, we delete sfrom S(10), and for all of these enlargedsegments occurring in the PDB database atleast twice, we store them in S(11). Contin-uing this procedure until S(10) becomesempty, we end up having two sets: S1(10)and S(11). It can be readily verified thatS(11) is just the set consisting of all 11-resi-due segments that occur at least twice in thePDB database.
• With the same argument applied to S(11),we obtain two new sets: S1(11) and S(12).
• We continue this procedure to get S1(m)and S(m + 1) for an arbitrary value of m.
• The procedure terminates when S(m + 1) isfound to be empty.
Since the longest segments that occur at least twicein PDB database are the D and N chains of 1IW7,
with a length of 1524, the setS1524
m¼10S1ðmÞ contains all
the segments that occur in the PDB database at leasttwice. Therefore, all segments drawn from the44,813 chains are collected in the set and some seg-ments drawn form the 8,197 chains are also col-lected in the set if they occur twice. However, theactual number of elements contained in the setS1524
m¼10S1ðmÞ is too large for us to check. Note also
that there are many redundant segments in the set.For example, segment ‘‘LVETRPAGD GTFQ
302 Ruan, Chen, Tuszynski, and Kurgan

KWA’’ and segment ‘‘RPAGDGTFQKWA’’ both
belong toS1524
m¼10S1ðmÞ, while the latter is a sub-seg-
ment of the former. We say that a shorter segment isabsorbed by a longer one if we delete the shorter one
fromS1524
m¼10S1ðmÞ. After this additional processing, the
total number of the remaining segments in the setS1524
m¼10S1ðmÞ is found to be 9297. We regard the set
consisting of these 9297 segments as a block of
sponge that can sponge all the segments inS1524
m¼10SðmÞ,
and denote it by Sp. It is important to note that Sp
absorbs all protein sequences occurring at least twicein the PDB database piece-wise. Thus, Sp can spongeall protein segments drawn from the 44,813 chains.We define the signature segment as a segment thatuniquely occurs in the PDB database and is morethan 10 AAs long. Therefore, if a segment is drawnfrom the 8197 chains, then Sp will absorb it unless itis a signature. Since the 8197 chains occur in PDBonly once, this implies that every protein chain has atleast one signature. Thus, it is imperative that we in-clude all signatures drawn from the 8197 chains in Sp
together with all the remaining signatures as thebenchmark set. Then any protein in the PDB data-base will be absorbed by the benchmark set in apiece-wise fashion.
The concept of the sponge segment is a keyaspect of this paper so we elucidate it further usingFig. 1 showing the distribution of segment lengths.
Four Thousand six hundred and forty five seg-ments in Sp are 10–29 AAs in length, and they canbe located at the tail end of a protein. The diversityof their 3D-structures is largely due to the fact that
it is not always possible to exactly determine thecoordinates of the AAs at the head (N-terminus)and tail (C-terminus) ends of protein. Hence thelocation of the segments in Sp is quite important. InFig. 2 we show the distribution of the segments thatconstitute the tail ends of proteins.
2.2. The Causes of the Emergence of Multi-
structural Segments
The differences between the individual struc-tures of a multiple-structure protein are due to thepresence of special segments with multiple-struc-tures. A protein chain can be also seen as a seg-ment of the protein. By aligning the high-levelstructures of segments in Sp, we find numeroussegments occurring naturally, except the tail seg-ments with various structures resulting often fromhuman error. While the diversity of the structuresof segments is natural, it arises only as a result ofthe following three causes.
First, a large number of multiple-structure pro-teins are domain-swapped dimers that are linkeddifferently and which exhibit a rotation around thehinge region (Barrientos et al., 2002). Typically, asis the case with calmodulin, different structures arefound by making a rotation at its hinge region,while the structure of every single domain is invari-ant (Toyoshima and Nomura, 2002; Xu et al., 2002)as is shown as Fig. 3(a–c).
For each of these segments, its secondarystructure is invariant, but the differences betweenpairs of 3D structures of the multi-structural seg-ment are very large. Generally, all multi-structuralsegments occurring for this reason are called rotat-ing segments.
Fig. 1. Histogram showing the number of segments for a given
length in the sponge set. Amongst the 9297 segments, there are
4645 segments whose lengths are between 10 and 29 residues;
2790 segments whose lengths are between 30 and 99 residues;
1550 segments whose lengths range between 100 and 299 resi-
dues; 249 segments whose lengths range between 300 and 499;
and only 63 segments whose lengths are more than 500 residues,
the longest segment consists of 1524 residues.
Fig. 2. Histogram showing the distribution of the tail segments
according to their length in the sponge set. The particular num-
bers are 483 for the tail segments with 10–29 AAs, 407 for the
tail segments with 30–99 AAs, and 133 for the tail segments with
30–99 AAs.
303Conservation of the Tertiary Structure of Protein Segments

Second, some segments often lose a helix or asheet, which may change their 3D-structures tosome degree. That is, a given segment occurs in atleast two proteins; it forms a helix or a sheet in oneprotein but forms no particular motif (other than arandom coil) in another protein. In this case, we mayconclude that the latter protein misses a secondarystructure. For example, the segment (LEU214 toLEU279) occurs in both proteins 2HMI (Ding et al.,1998) and 1IKX (Lingberg, et al., 2002). Observingthe blue (dark) part in Fig. 4(a, b), we may find that2HMI misses a sheet.
Again, the segment (VAL33 to LYS76) occursin both 1I87 (Falzone et al., 2001) and 1WDB(Muskett and Whitford, to be published) proteins.Comparing Fig. 5(a, b) we find that it misses threehelices in 1I87.
In general, all of these segments that miss theirsecondary structure are called missing segments.
Third, segments are called disarranging whentheir 3D-conformations are similar and secondarystructures are the same, but different residues in dif-ferent regions form similar conformations. Forexample, the two loops of the same segment(GLU47 to VAL80) that occur in both 1IW7 (Ber-man et al., 2000) and 1L9U (Chew et al., 1999) aresimilar, but are formed by different residue pieces.For illustration compare the blue, green and yellowparts in Fig. 6(a, b).
In addition to the three main sources above, wefound only seven multi-structural segments, i.e.1FJI, 3ITS, 1DL9, 1LQN, 1ITN, 1B29 and 1B61(Bamborough et al., 1994; Brody et al., 1999; Hans-son et al., 1997; Tiraboshi et al., 1999; Veerapan-dian, 1992), which arise due to other causes. Thedifferences between their 3D structures are due tothe fact that each of these seven segments has a pairof 3D structures, one is given by a theoretical model
Fig. 4. The LEU214 to LEU279 segment from (a) 2HMI and (b) 1IKX.
Fig. 3. Example domain-swapped dimmers; domains 1 (residues 1–75; in blue) and 2 (residues 81–147; in yellow), which are connected by
the link (residues 76–80; in green) are invariant in the three cases shown even though the shapes of the corresponding 3D-structures are
quite different.
304 Ruan, Chen, Tuszynski, and Kurgan

while the other is found empirically. The referencesgiven above indicate that these theoretical modelsmay be fraught with some problems hence we ignorethese cases as we have reason to believe that the dif-ferences are due to a human error. That is, we onlyconsider the 9290 segments in the sponge set.
3. METHODS
3.1. The Measurement Method
In order to compare two distinct protein struc-tures, we must ignore the rigid translational androtational transforms that leave the structure invari-ant. Thus, we translate each 3D-structure of a mul-ti-structural segment into a sequence consisting ofunit vectors in R3. An ideal measure for this is theso-called URMSD which stands for the Root MeanSquare Distance for Unit Vectors proposed by
Chew et al. (1999) for detecting the common geo-metric substructure in proteins.
URMSD is a variant of the RMS distance, inwhich instead of comparing residue positions wecompare the corresponding unit vectors. The ter-tiary protein structure is represented by a set ofcoordinates of the Ca-atoms, {Ca(i), which becomeinputs for the root mean square distance (RMSD)(Kabsch, 1978). Given two n residues long struc-tures, A and B, and the corresponding two sets ofcoordinates {Ca(i)} denoted as ðxAðiÞ; yAðiÞ; zAðiÞÞand ðxBðiÞ; yBðiÞ; zBðiÞÞ, the RMSD is defined as
RMSDðA;BÞ ¼ RMSðfxAðiÞ; yAðiÞ; zAðiÞg;fxBðiÞ; yBðiÞ; zBðiÞg; i ¼ 1; 2; . . . ; nÞ
URMSD is defined as the minimal RMS distancebetween the corresponding unit vectors. Let Vi andWi be the vectors from atom Ca(i + 1) to Ca(i) instructure A and B, respectively:
Fig. 5. The VAL33 to LYS76 segment from (a) 1WDB and (b) 1I87.
Fig. 6. The GLU47 to VAL80 segment from (a) 1IW7 and (b) 1L9U.
305Conservation of the Tertiary Structure of Protein Segments
Vi ¼ ðvi1; vi2; vi3Þ ¼ ðxAðiþ 1Þ; yAðiþ 1Þ;zAðiþ 1ÞÞ � ðxAðiÞ; yAðiÞ; zAðiÞÞ
Wi ¼ ðwi1;wi2;wi3Þ ¼ ðxBðiþ 1Þ; yBðiþ 1Þ;zBðiþ 1ÞÞ � ðxBðiÞ; yBðiÞ; zBðiÞÞ
The sets of the two vectors {Vi} and {Wi}, i =1, 2, ..., n, can be used to represent the struc-tures of A and B, respectively. For proteins, {Vi}and {Wi} can be normalized to ‘‘unit vector’’since their lengths have almost the same value of3:8 _A.
Ti ¼ ðti1; ti2; ti3Þ ¼Vi
Vik k; Ui ¼ ðui1; ui2; ui3Þ ¼
Wi
Wik k
where Vik k ¼ Wik k � 3:8. The URMSD of struc-ture A and B is defined as:
URMSDðA;BÞ ¼ RMSðfti1; ti2; ti3g;fui1; ui2; ui3g; i ¼ 1; 2; . . . n� 1Þ
The above formula shows that URMSD is com-puted in the same way as the RMSD, but it usesdifferent inputs, i.e. unit vectors. Therefore, UR-MSD is defined as follows:
URMSDðA;BÞ ¼ffiffiffiffiffiffiffiffiffiffiffiffiffiffiffiffiffiffiffiffiffiffiffiffiffiffiffiffiffiffiffiffiffiffiffiffiffiffiffiffiffiffiffi2n� 2 � traceðsvd CÞ
n
r
where C is the autocorrelation matrix between theunit vectors for A and B, svd C denotes diagonalmatrix in the singular value decomposition of C,and trace denotes the sum of the diagonal terms ofthe svd C matrix.
Figure 7 shows an example calculation of UR-MSD between the 4-residue segment from Gln28 to
Lys31 in chain A of 1F0V and chain E of 1RTA(we follow up on this example later in the text):
Step1: Transform the Ca-atoms coordinates intovectors {Vi} and {Wi}.Step2: Normalize the vectors to unit vectors {Ti}and {Ui}.Step3: Calculate the autocorrelation matrix Cbetween the two groups of unite vectors; cell val-ues in column p and row q are defined as
cpq ¼Pn�1
i¼1tipuiq.
Step4: Compute singular value decomposition ofC denoted as svd C.Step5: CalculateURMSDðA;BÞ ¼
ffiffiffiffiffiffiffiffiffiffiffiffiffiffiffiffiffiffiffiffiffiffiffiffiffiffiffiffiffiffi2n�2�traceðsvd AÞ
n
q
.
URMSD is superior to the RMSD since:
• URMSD is not overly sensitive to thechange of the protein’s outliers. The struc-tural differences of just a few AAs in a longsequence can induce a large value ofRMSD, which is not the case for URMSD.For example, chain A of 1F0V and chain Eof 1RTA share a sequence segment rangingbetween GLN28 and SER 123. The RMSDdistance between the two structures equals9:635 _A, while the URMSD equals 0:435 _A.In fact, almost 90% of the two structuresare essentially the same, see Figure 8, andlarger RMSD is due to the tail of segmentin 1FOV which protrudes from the center ofthe structure and forms an outlier. At thesame time, two structures of about 100 AAsare assumed different when the correspond-ing RMSD is about 9 _A. Therefore, RMSD
Fig. 7. An example calculation of the URMSD from coordinates for 4-residue segment from Gln28 to Lys31 in chain A of 1F0V and
chain E of 1RTA.
306 Ruan, Chen, Tuszynski, and Kurgan

should not be used to compare structuresthat have outliers.
• URMSD weighs all portions of the proteinequally, while in RMSD portions far fromthe center of mass are weighted more heavily.
• RMSD usually increases with the length ofthe segment while URMSD has an upperbound of 2:0 _A and is not sensitive to the in-crease of the length of the segment. Forevery pair of random unit sequences withthe same length n, the expected upper bound
is aboutffiffiffiffiffiffiffiffiffiffiffiffiffiffiffi2� 2:82ffiffi
np
q.
• Finally, URMSD has the same computa-tional complexity as the RMSD.
3.2. The Threshold
RMSD is a popular measure used to determinestructural similarity. It is generally believed that twostructures can be regarded as the same if theirRMSD is less than 3 _A. On the other hand, UR-MSD is not as popular, but we believe that it ismore appropriate in case of our investigation. In arecent study, Yona and Kedem suggested URMSDthreshold equal to 0.6 to differentiate between simi-lar and dissimilar structures for 8-residue segments(Yona and Kedem, 2005). Using thresholds of 0.6and 0.5, more than 80% and 85% of the fragmentpairs from the sponge set will be assumed to havethe same structure, respectively. Although there isno direct mapping that would transfer a RMSDthreshold into the corresponding URMSD value,we show that the URMSD threshold of 0.5 shouldbe used by comparing it to using RMSD of 3 _A.
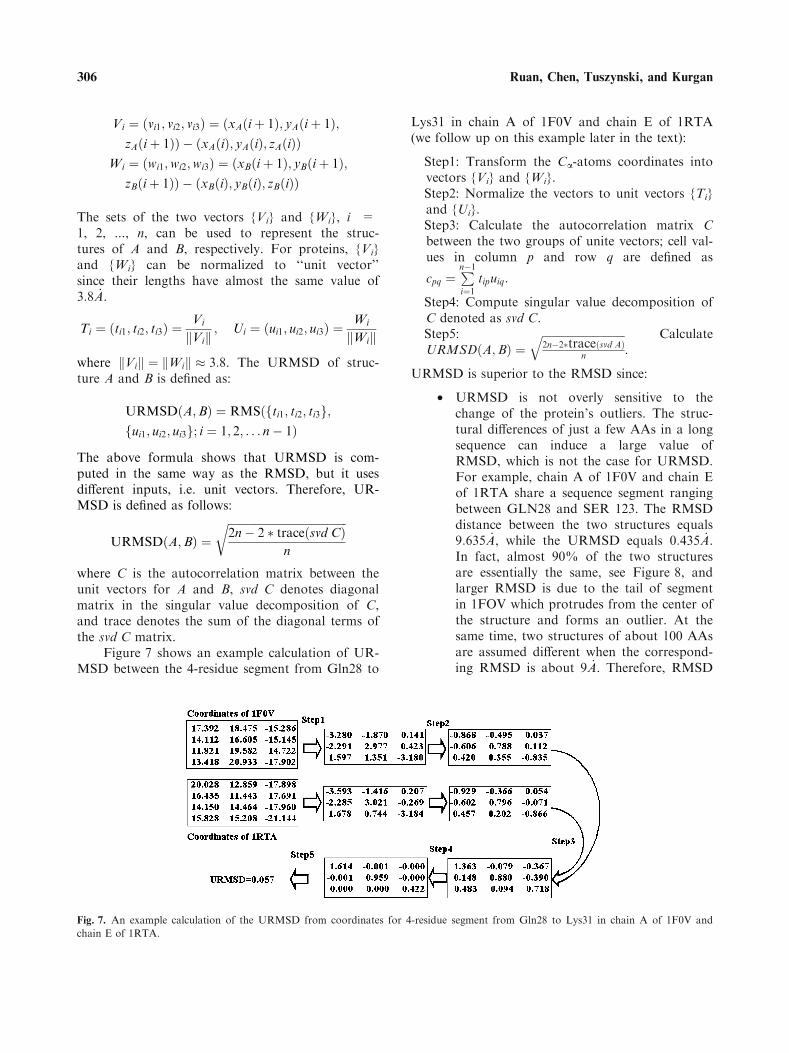
Assuming that a given sequence segment has ndifferent 3D-structures we need to compute UR-MSD for each pair of the different 3D-structures.Therefore, n(n) 1)/2 URMSD values must be com-puted to consider all pairs and the maximal UR-MSD is the maximum among the n(n) 1)/2URMSD values. Among 9297 segments from thesponge set, 8486 segments have maximalURMSD � 0:5 _A and the remaining 811 segmentshave maximal URMSD[0:5 _A. The distribution ofthe segments as a function of the maximal UR-MSD is illustrated in Fig. 9.
One hundred and forty seven of the 9297 seg-ments from the sponge set have maximalURMSD<0.5 and corresponding maximalRMSD[ 3 _A. Thus, only about 1.58% of thesegments would be incorrectly classified as structur-ally similar based on URMSD, when compared tothe classification using RMSD. At the same time,257 of the 9297 segments have maximalURMSD>0.5 and maximal RMSD\ 3 _A. Again,only about 2.76% of the segments that URMSDwould classify as dissimilar are in fact similaraccording to the RMSD. Similarly, for the 8,486segments we found that only about 1.78% ofthem have maximal RMSDs\ 3 _A. The maximalRMSDs for most of the remaining 811 segments aregreater than 3 _A, which is shown in detail later inthe paper. Assuming that 811 segments are in factstructurally dissimilar, the probability of an errordue to using URMSD instead of RMSD can beestimated as 1:78� 8486
9297 ¼ 1:62%. The above discus-sion implies that 0.5 is a suitable threshold for UR-MSD to decide if a given segment is structurallyconserved.
Fig. 8. The GLN28 to SER123 segment from (a) chain A of 1F0V and (b) chain E of 1RTA. The yellow segment (GLN28 to ASN113)
corresponds to common structure in the two chains, while the blue segment (PRO114 to SER 123) correspond to the different structure,
which results in RMSD ¼ 9:635 _A. The common, yellow segment covers 89.6% of the two structures.
307Conservation of the Tertiary Structure of Protein Segments
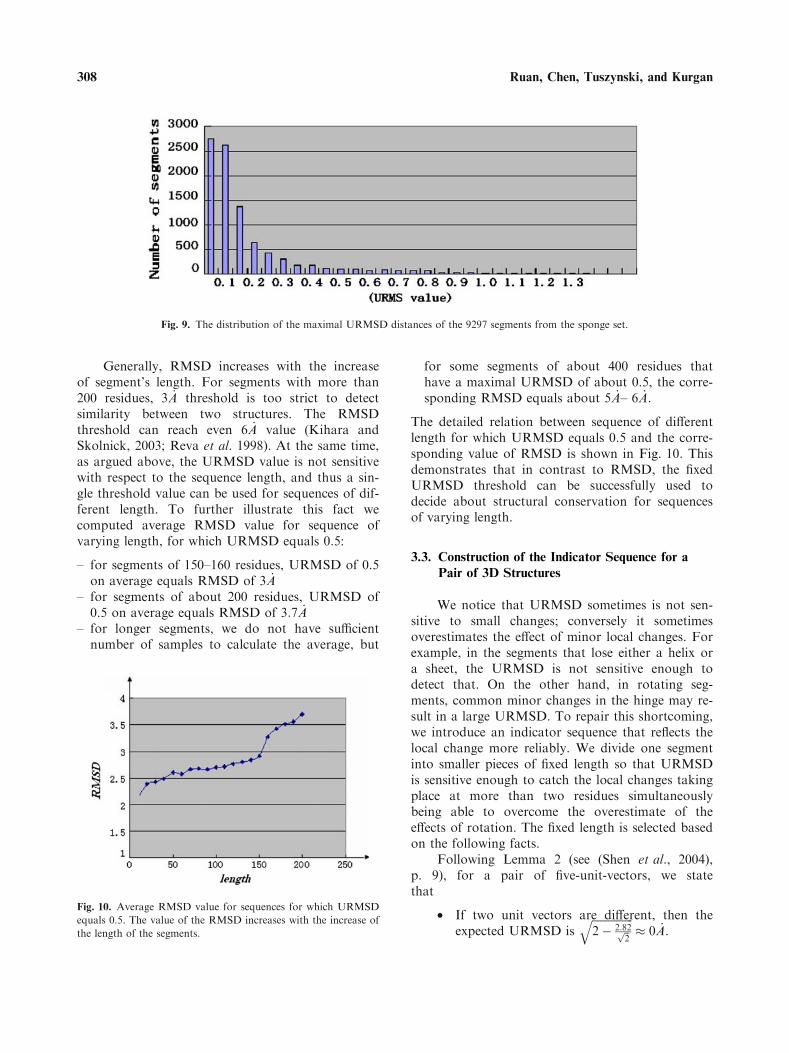
Generally, RMSD increases with the increaseof segment’s length. For segments with more than200 residues, 3 _A threshold is too strict to detectsimilarity between two structures. The RMSDthreshold can reach even 6 _A value (Kihara andSkolnick, 2003; Reva et al. 1998). At the same time,as argued above, the URMSD value is not sensitivewith respect to the sequence length, and thus a sin-gle threshold value can be used for sequences of dif-ferent length. To further illustrate this fact wecomputed average RMSD value for sequence ofvarying length, for which URMSD equals 0.5:
– for segments of 150–160 residues, URMSD of 0.5on average equals RMSD of 3 _A
– for segments of about 200 residues, URMSD of0.5 on average equals RMSD of 3:7 _A
– for longer segments, we do not have sufficientnumber of samples to calculate the average, but
for some segments of about 400 residues thathave a maximal URMSD of about 0.5, the corre-sponding RMSD equals about 5 _A– 6 _A.
The detailed relation between sequence of differentlength for which URMSD equals 0.5 and the corre-sponding value of RMSD is shown in Fig. 10. Thisdemonstrates that in contrast to RMSD, the fixedURMSD threshold can be successfully used todecide about structural conservation for sequencesof varying length.
3.3. Construction of the Indicator Sequence for a
Pair of 3D Structures
We notice that URMSD sometimes is not sen-sitive to small changes; conversely it sometimesoverestimates the effect of minor local changes. Forexample, in the segments that lose either a helix ora sheet, the URMSD is not sensitive enough todetect that. On the other hand, in rotating seg-ments, common minor changes in the hinge may re-sult in a large URMSD. To repair this shortcoming,we introduce an indicator sequence that reflects thelocal change more reliably. We divide one segmentinto smaller pieces of fixed length so that URMSDis sensitive enough to catch the local changes takingplace at more than two residues simultaneouslybeing able to overcome the overestimate of theeffects of rotation. The fixed length is selected basedon the following facts.
Following Lemma 2 (see (Shen et al., 2004),p. 9), for a pair of five-unit-vectors, we statethat
• If two unit vectors are different, then theexpected URMSD is
ffiffiffiffiffiffiffiffiffiffiffiffiffiffiffi2� 2:82ffiffi
2p
q� 0 _A.
Fig. 10. Average RMSD value for sequences for which URMSD
equals 0.5. The value of the RMSD increases with the increase of
the length of the segments.
Fig. 9. The distribution of the maximal URMSD distances of the 9297 segments from the sponge set.
308 Ruan, Chen, Tuszynski, and Kurgan

• If three vectors are different, the expectedURMSD is
ffiffiffiffiffiffiffiffiffiffiffiffiffiffiffi2� 2:82ffiffi
3p
q¼ 0:61 _A.
• If four vectors are different, then the ex-pected URMSD is
ffiffiffiffiffiffiffiffiffiffiffiffiffiffiffi2� 2:82ffiffi
4p
q¼ 0:77 _A.
• If all five vectors are random variables, thenthe expected URMSD is
ffiffiffiffiffiffiffiffiffiffiffiffiffiffiffi2� 2:82ffiffi
5p
q¼ 0:86 _A.
Therefore, the threshold of 0:5 _A is sensitive enoughto catch these changes at each location where atleast three vectors in each five-unit-vector are chan-ged. On the other hand, for every pair of 3D-struc-tures corresponding to a multi-structural segment,we have a pair of Ca-atom sequences.
• If 2 coordinates of the Ca-atoms are differ-ent, then at least 3 unit vectors in the pairof the corresponding unit vector sequencesare different.
• If 3 coordinates of the Ca-atoms are differ-ent, then at least 4 unit vectors are different.
• If 4 coordinates of the Ca-atoms are differ-ent, then at least 5 unit vectors are different.
Since the average length of a strand is about 2.3AAs and the average length of a helix is 3.6 AAs, itimplies that this will result in at least three vectorsbeing changed in a five-unit-vector. Therefore, 0:5 _Aused as the threshold for the URMSD offers suffi-cient sensitivity to catch these changes for a strandor a helix but it will allow only one coordinate of aCa-atom to be given incorrectly. Thus, choosing thefixed length of 6 AAs is appropriate.
In general, a segment that consists of N resi-dues has N) 6 six-residue pieces:
1st to 6th Ca;2nd to 7thCa; . . .; andN�5th toNth Ca:
They correspond to N) 6 five-unit-vectors. If morethan two coordinates of Ca-atoms are different inevery pair of 6-residue pieces, then in the corre-sponding pair of five-unit-vectors at least three vec-tors are not the same. This difference will bedetected by URMSD with the threshold of 0:5 _A.
A piece is called active if its maximal URMSDis greater than 0:5 _A, and we assign its correspond-ing region a label ‘a’. Otherwise, we say it isconserved, and assign its corresponding region a la-bel ‘c’. Of course, the state of the last 4 portions
corresponding to the front five-unit-vector will becovered by the state of the first 4 portions corre-sponding to the next five-unit-vector. Finally, wehave an indicator sequence that indicates the stateof activity or conservation, which is illustrated inFig. 11.
If for a given residue the result is a, we say thenth residue is ‘‘a’’-type, then there is at least onepair of five-unit vectors, say, vn; vnþ1; . . .; vnþ4 andwn;wnþ1; . . .;wnþ4 such that the URMSD betweenvn; vnþ1; . . .; vnþ4 and wn;wnþ1; . . .;wnþ4 is greaterthan 0:5 _A. Using the coordinates of Ca-atoms todescribe this difference, the RMSD between thecoordinates of Ca-atoms, say, Ca,n-1, Ca ,n, ..., Ca
,n+4 and Cv¢a,n-1, Cv¢a ,n, ..., Cv¢a,n+4, would begreater than 3 _A. If the nth residue is ‘‘a’’-typealone, then it means the difference between Ca ,n-1,Ca ,n and Cv¢a ,n-1, Cv¢a,n is very large, but that dif-ference between
Ca;nþ1; . . .;Ca;nþ4; . . . and C0a;nþ1; . . .;C0a;nþ4; . . .
is small. In general, there is no ‘‘a’’-type residuestanding alone in a sequence.
3.4. Classification of the Benchmark Set
Combining with the indicator sequence, weclassify the segments in the benchmark set as fol-lows. We regard a segment as
1. invariant, if it has a unique 3D-structure.2. absolutely conserved, if its indicator sequence
consists purely of ‘c’-type residues.3. conserved, if its maximal URMSD is less than
0:5 _A.4. missing, if it is conserved but not absolutely con-
served.5. rotating, if it is not conserved and there is a
small region in the middle of the segment, inwhich, the indicator sequence is of ‘a’-type.
6. disarranging, if it not conserved and there is atleast one bigger region, in which, almost all theindicator states are of ‘a’-type, but if we allowa shift, then the number of ‘a’-type residues islower.
Fig. 11. Example indicator sequence; the first row is the sequence of AAs represented by single-letters. The second row is the indicator
sequence for conservation (‘a’ means active and ‘c’ means conserved).
309Conservation of the Tertiary Structure of Protein Segments

Note that the definitions of rotating, missing anddisarranging segments are the same as those givenin Section 2.2. However, this definition does notcover all segments in the benchmark set. Typically,for all 9290 segments in the sponge set studied,there are 652 segments that cannot be included inany of the above six classes due to the fact that0:5 _A gives too strict a condition. However, if weraise the threshold from 0:5 _A to 0:6 _A or 0:7 _A, thenthe 645 segments will uniquely belong to the ‘‘gen-eralized conservation class’’. This is discussed inSection 4.3.
4. RESULTS
The above classification was applied to theentire benchmark set and the results are summa-rized in this section. We start by clarifying the rela-tion between the missing, rotating and disarrangingsegments and the segment conservation, and nextwe estimate number of segments in the benchmarkset that are not conserved.
It is clear that an invariant segment must beabsolutely conserved. In the Appendix 1 a mathe-matical proof is given that an absolutely conservedsegment must be conserved. That is, for a segment,if its indicator sequence is purely a ‘‘c’’-sequence,then its maximal URMSD must be less than 0:5 _A.But the inverse is not true. In fact, we have poin-ted out that 8486 segments in the sponge set areconserved. The remaining 811 segments include therotating, disarranging and other 645 segments (seeSections 4.1 and 4.2). However, amongst the 8486segments, only 6222 segments are absolutely con-served, and 2264 segments are not absolutely con-served.
Intuitively, the missing segments should belongto the set consisting of all conserved segmentsbecause the operation of segment removal does notchange the shape of the corresponding 3D-struc-ture. But these must not be absolutely conservedsegments because the missing helices or strandssurely result in the corresponding five-unit-vectorbeing changed largely since the average length ofthe strands is 2.3 AAs while that of the helices 3.6AAs. So, the indicator sequence will catch the miss-ing ones. Since the missing ones mainly affect thesecondary structure of the protein rather than its3D-shape, we can ignore this case if we predict thecoordinates of the Ca-atoms.
It is clear that a rotating segment should notbe conserved because rotation causes the hinge tochange, which usually increases the URMSD of thewhole segment by more than 0:5 _A while the indica-tor sequence in the hinge region is also greater than0:5 _A because every five-unit-vector in this regionchanges significantly. For the disarranging segment,both the global URMSD and local URMSD arelarger unless we compare them accounting for ashift. Hence the AAs are active in the indicator se-quence and almost all of them are of the ‘a’ type.However, in this region, if we permit each piece toshift freely, every piece will find its best match.
4.1. Estimating the Number of Rotating Segments
Rotating segments are those segments, inwhich backbones in the hinge regions are rotated,while the domains are structure-conserving. Theserotations will make the URMSD of a whole seg-ment large and its indicator sequence will be of‘a’-type in the middle region corresponding to ahinge. On the one hand, a rotating segment usu-ally has a large URMSD as a whole, which isusually larger than 0:8 _A. For example, the longestrotating segment is GLN238 to GLU993 as foundin chain A of 1EUL (Toyoshima et al., 2000) andchain B of 1IWO (Toyoshima and Nomura,2002). Figure 12(a, b) shows the conformations ofthe same segment GLY88 to ARG537 found inchain A and chain B of 1UAA (Korolev et al.,1997); the URMSD is 0:84 _A. On the other hand,the rate defined as the length of hinge regions di-vided by the length of the segment, is much smal-ler than 20% AAs. Moreover, all ‘a’-typesequences should be located in the middle region.
We can estimate the upper bound on the totalnumber of rotating segments using the followingprocedure:
• First, calculate the URMSD between everypair of 3D-structures of one n-lengthsegment and denote its maximal URMSDby D.
• Second, make the indicator sequence of thesegment.
• Third, if D>0.5 and the rate of ‘a’-typesequences in its indicator sequence is lessthan 20%, we regard this segment as a pos-sible rotating segment.
310 Ruan, Chen, Tuszynski, and Kurgan

After checking the segments acquired by the abovesteps, among all of the 9290 segments, only 66 seg-ments have been found to be rotating segments.That is, at most 0.71% of the sponge set would berotating segments.
4.2. Estimating the Number of Disarranging
Segments
For most of these segments, amongst all of its3D-comformations, the maximal similarity is not asgood as for the conserved segments. Moreover, inits indicator sequence, the rate of ‘a’-type sequencesis very high. To detect disarranging characteristics,we use a method that is similar to the cycle-convo-lution used in Signal Processing. We let u1; . . .; unand v1; . . .; vn be unit vector sequences that are cal-culated from a pair of 3D-structures of a segment,for a shift l ¼ 0; 1; 2; . . .; n� 1. We then haveorderly permutation sequences induced by v1; . . .; vnas shown in Table 1.
Then, z ¼ ðz1; . . . ; znÞ, where zl ¼Pn
m¼1um�
pl�1ðfvkgÞðmÞ and um � pl�1ðfvkgÞmÞ is the pointproduct of two unit vectors. We formally say it isthe cycle-convolution of u1; . . .; un and v1; . . .; vn. If
there is an l>1 such that jzlj[jz1j, we concludethat the segment is a disarranging segment. Inshort, the procedure is as follows:
• If there is a pair of unit vector sequencesu1; . . .; un and v1; . . .; vn such that the UR-MSD greater than 0:5 _A
• If the indicator sequence produced byu1; . . .; un and v1; . . .; vn has a region that therate of ‘a’-type residues is greater than 50%.
• In the region, the corresponding pair of unitvector sub-sequences is given by um; . . .; umþpand vm; . . .; vmþp, If there is a shift l>1 suchthat the similarity coefficient between {vi(l)}and u1; . . .; un is strictly larger than that be-tween {vi(0)} and u1; . . .; un.
Then we regard this segment as a disarrangingsegment.
Using this procedure, we obtained 93 segmentsamong all of the 9290 segments as possible disar-ranging segments, which is about 1% of the size ofthe sponge set.
4.3. Analysis of the Remaining 652 Segments
The remaining 652 segments, which cannot beincluded in any of the six classes defined in the Sec-tion 3.4 due to the fact that 0:5 _A gives too strict acondition, have been checked manually and theresult is as follows:
• 3D-structures of each segment within the645 segment set are almost the same, eventhough its whole URMSD is greater than0:5 _A (the corresponding RMSD may be
Table 1. Permutation Sequences Where plðfvkgÞðmÞ Correspondsto the Unit Vector in the ith row and mth Vector
Shift Abbreviation Complete form
l = 0 p0ðfvigÞ v1; v2; v3; . . .; vn
l = 1 p1ðfvigÞ v2; v3; v4; . . .; vn; v1l = 2 p2ðfvigÞ v3; v4; v5; . . .; vn; v1; v2... ... ...
l = n) 1 pn�1ðfvigÞ vn; v1; v2; v3; v4; v5; . . .; vn�1
Fig. 12. The 3D-structures of the same segment occurring in (a) chain A of 1UAA, and (b) chain B of 1UAA; the segments consist of
two structure-conserved parts (residues 88–371 in red and residues 378–537 in green), and link part (residues 373–377 in black).
311Conservation of the Tertiary Structure of Protein Segments

greater than 3 _A). Since the threshold (3 _A)in terms of the RMSD is too strict, it isrelaxed somewhat in practice. There is a sta-tistical relationship between the URMSDand RMSD for the 652 segment as can beseen in Table 2. If we relax the thresholdslightly, then most of the 645 segments willbe classified as conserved segments, whichagrees with our manual inspection.
• There are 7 segments: 1FJI, 3ITS, 1DL9,1LQN, 1ITN, 1B29 and 1B61 (see Section2.2) which are exceptions, each of which hasa pair of 3D-structures that are quite differ-ent. However, all of these exceptions aredue to one given by a theoretical model andthe other given by an experimental method.So we suspect that these exceptions are notreliable and ignore them.
The missing segments are included in the set thathas conserved but not absolutely conservedsequences, and their total number is less than 2264.Since the 3D-configurations of each missing seg-ment show no significant differences, we do notpresent it as an independent subsection.
5. SUMMARY AND CONCLUSIONS
Below, we give the summary of our findings asfollows:
• For a possible multi-structural segment thatbelongs to one of the invariant segments,absolutely conserved segments, or conservedsegments, its 3D structures always seem tobe unique structurally.
• For each segment that is not conservedand also not the rotating and the disarrangingsegment, its 3D-structures have very smallstructural differences. Therefore these segmentscan be regarded as structurally conserved.
• Only for all rotating segments and disarrang-ing segments, their maximal RMSD may besignificant indicating variability of theirstructure. However, the number of the rotat-ing segments divided by the size of thesponge set that is less than 0.71%, and thesame number for the disarranging segmentsis less than 1%. Furthermore, the total num-ber of all possible rotating segments and dis-arranging segments divided by the number ofsequences in the benchmark set, which repre-sents sequences in PDB, is less than 0.085%.
The ‘‘uniqueness’’ (conservation) of the 3D-struc-tures of segments is a strong property that allows topredict 3D-structures based on alignment of the pri-mary sequences given that sufficient level ofsequence homology is present. At the same time,1.71% of segments, which account for the rotatingand disarranging cases, exhibit variability in thestructure despite having identical sequences. Thesesegments may results in inaccuracies for thesequences alignment based methods for both 3D-structure and secondary structure predictions. Wealso conclude that the prediction accuracy of thesecondary structure will suffer bigger loses in com-parison with the 3D structure. The 2264 conservedbut not absolutely conserved segments, which con-stitute about 25% of the sponge set, may lead towrong secondary structure prediction result.
The indicator sequence, which is proposed inthis paper, plays an important role in distinguishingrotating, missing and disarranging segments. Thisknowledge can be used to find the active and the con-served regions for a segment. The absolutely con-served segments of length more than 10 residues formthe most useful class, in which each segment is con-served if we ignore the change of the coordinate of asingle Ca-atom per 6-residue segment. The mathe-matical proof given in the Appendix 1 shows that forany multi-structure segment of length greater than10, if it is an absolutely conserved segment, then itmust be a conserved segment. The inverse is not true.
The sponge set Sp defined in this paper is anunexpected result. All chains in the PDB database canbe covered by the 17,494 segments drawn from thesponge set consisting of the 9297 protein segments andthe signature set that includes 8197 protein chains.This shows that space of valid AA sequences that canbe used to assemble the structural information is sig-nificantly smaller than the source protein set of 53,000collected from PDB and the set of all possible AA
Table 2. The Statistical Correspondence between URMSD and
RMSD for the Set of 652 Segments
The set for which URMSD
<the given threshold
0:6 _A 0:7 _A 0:8 _A
The mean RMSD for
the given set
2:913 _A 3:405 _A 4:696 _A
The maximum RMSD
for the given set
11:065 _A 15:366 _A 19:851 _A
The number the segments
that RMSD [ 4 _A20 32 36
312 Ruan, Chen, Tuszynski, and Kurgan

sequences, i.e., assuming the segment length of 10,which was the minimum length of segments in thesponge set, there are 2010 ¼ 10; 240; 000; 000; 000 pos-sible sequences.
APPENDIX 1
For proving that an absolutely conserved seg-ment must be a conserved segment, we first considerthe definition of URMSD. We need to prove thefollowing statement mathematically.
Let
dðfvig; fwigÞ ¼ min/
ffiffiffiffiffiffiffiffiffiffiffiffiffiffiffiffiffiffiffiffiffiffiffiffiffiffiffiffiffiffiffiffiffiffiffiffiffiffiffi1
n
Xn
i¼1jjvi � /ðwiÞjj2
s( )
be the URMSD between the two unit vectorsequences vif gni¼1 and wif gni¼1, and let di be the UR-MSD between the pair of viþ1; . . . ; viþ5 and/ðwiþ1Þ; . . . ;/ðwiþ5Þ.
Then dðfvig; fwigÞ � maxfdi j i ¼ 0; 1; 2; . . . ;n� 5g for all n � 10.
Proof. It is easily followed that
min/
ffiffiffiffiffiffiffiffiffiffiffiffiffiffiffiffiffiffiffiffiffiffiffiffiffiffiffiffiffiffiffiffiffiffiffiffiffiffiffi1
n
Xn
i¼1jjvi � /ðwiÞjj2
s( )
¼yi¼/ðwiÞminf/g
ffiffiffiffiffiffiffiffiffiffiffiffiffiffiffiffiffiffiffiffiffiffiffiffiffiffiffiffiffiffiffiffiffiffiffiffiffiffiffi1
n
Xn
i¼1jjvi � /ðwiÞjj2
s( )
¼ minf/g
ffiffiffiffiffiffiffiffiffiffiffiffiffiffiffiffiffiffiffiffiffiffiffiffiffiffiffiffiffiffiffiffiffiffiffiffiffiffiffiffiffiffiffiffiffiffiffiffiffiffiffiffiffiffiffiffiffiffiffiffiffiffiffiffiffiffiffiffiffiffiffiffiffiffi1
n
Xn
i¼1jjvijj2 þ jj/ðwiÞjj2 � 2ðvi;/ðwiÞÞ
s( )
¼ minf/g
ffiffiffiffiffiffiffiffiffiffiffiffiffiffiffiffiffiffiffiffiffiffiffiffiffiffiffiffiffiffiffiffiffiffiffiffiffiffiffiffiffiffiffiffiffi1
n
Xn
i¼1½2� 2ðvi;/ðwiÞÞ�
s( )
¼ minf/g
ffiffiffiffiffiffiffiffiffiffiffiffiffiffiffiffiffiffiffiffiffiffiffiffiffiffiffiffiffiffiffiffiffiffiffiffiffiffiffiffi
2� 2
n
Xn
i¼1ðvi;/ðwiÞÞ
s( )
We can regard thatPn
i¼1ðvi;/ðwiÞÞ as the trace of the
correlation matrix R(n), where
Rðn;/Þ ¼
ðv1;/ðw1ÞÞ ðv1;/ðw2ÞÞ . . . ðv1;/ðwnÞÞðv2;/ðw1ÞÞ ðv2;/ðw2ÞÞ . . . ðv2;/ðwnÞÞ
. . . . . .ðvn;/ðw1ÞÞ ðvn;/ðw2ÞÞ . . . ðvn;/ðwnÞÞ
0
BB@
1
CCA:
That is, we have
dðfvig; fwigÞ ¼ minf/g
ffiffiffiffiffiffiffiffiffiffiffiffiffiffiffiffiffiffiffiffiffiffiffiffiffiffiffiffiffiffiffiffiffiffiffiffiffiffiffiffiffiffiffiffiffiffiffiffi2n� 2� traceðRðn;/ÞÞ
n
r
For a fixed / and every pair of five-unit-vectorviþ1; . . . ; viþ5 and /ðwiþ1Þ; . . . ;/ðwiþ5Þ, we have acorrelation matrix
Rið5Þ¼
ðviþ1;/ðwiþ1ÞÞðviþ1;/ðwiþ2ÞÞ...ðviþ1;/ðwiþ5ÞÞðviþ2;/ðwiþ1ÞÞðviþ2;/ðwiþ2ÞÞ...ðviþ2;/ðwiþ5ÞÞ
......:ðviþ5;/ðwiþ1ÞÞðviþ5;/ðwiþ2ÞÞ...ðviþ5;/ðwiþ5ÞÞ
0
BB@
1
CCA
Let di ¼ffiffiffiffiffiffiffiffiffiffiffiffiffiffiffiffiffiffiffiffiffiffiffiffiffiffiffiffiffiffiffiffiffiffiffiffiffitraceðRið5Þ0Rið5ÞÞ
qfor i ¼ 0; 1; 2; . . . ; n� 5.
For convenience, then we may assumed0 ¼ maxfdi j i ¼ 0; 1; 2; . . . ; n� 5g, then
ffiffiffiffiffiffiffiffiffiffiffiffiffiffiffiffiffiffiffiffiffiffiffiffiffiffiffiffiffiffiffiffiffiffiffiffiffiX5
j¼1
X5
j¼1ðvi;/ðwjÞÞ2
vuut �
ffiffiffiffiffiffiffiffiffiffiffiffiffiffiffiffiffiffiffiffiffiffiffiffiffiffiffiffiffiffiffiffiffiffiffiffiffiffiffiffiffiffiffiffiffiffiX5
j¼1
X5
j¼1ðviþk;/ðwjþkÞÞ2
vuut
for all k � 1:
Considering the relationship
ffiffiffiffiffiffiffiffiffiffiffiffiffiffiffiffiffiffiffiffiffiffiffiffiffiffiffiffitrðRðnÞ0RðnÞÞ
q¼
ffiffiffiffiffiffiffiffiffiffiffiffiffiffiffiffiffiffiffiffiffiffiffiffiffiffiffiffiffiffiffiffiffiffiffiPn
j¼1
Pn
i¼1ðvi;/ðwjÞÞ2
s
¼ffiffiffiffiffiffiffiffiffiffiffiffiffiffiffiffiffiffiffiffiffiffiffiffiffiffiffiffiffiffiffiffiffiffiffiffiffiffiffiffiffiffiffiffiffiffiffiffiffiffiffiffiffiffiffiffiffiffiffiffiffiffiffiffiffiffiffiffiffiffiPn
j¼1ðP5
i¼1ðvi;/ðwjÞÞ2 þ
Pn
i¼5ðvi;/ðwjÞÞ2Þ
s
¼ffiffiffiffiffiffiffiffiffiffiffiffiffiffiffiffiffiffiffiffiffiffiffiffiffiffiffiffiffiffiffiffiffiffiffiffiffiffiffiffiffiffiffiffiffiffiffiffiffiffiffiffiffiffiffiffiffiffiffiffiffiffiffiffiffiffiffiffiffiffiffiffiffiffiffiffiffiffiffiffiffiffiffiffiffiffiffiffiffiffiffiffiffiffiffiffiffiffiffiffiffiffiffiffiffiffiffiffiffiffiffiffiffiffiffiffiffiffiffiffiffiffiffiffiffiffiffiffiffiffiffiffiffiffiffiffiffiffiffiffiffiffiffiffiffiffiffiffiffiffiffiffiffiP5
j¼1
P5
i¼1ðvi;/ðwjÞÞ2þ
Pn
j¼6
P5
i¼1ðvi;/ðwjÞÞ2 þ
P5
j¼1
Pn
i¼6ðvi;/ðwjÞÞ2 þ
Pn
j¼6
Pn
i¼6ðvi;/ðwjÞÞ2
s
313Conservation of the Tertiary Structure of Protein Segments

By ordinary fact of structure of protein: formost AAs, the state at site i is not more frequentlycorrelated to the state at site j if the distance be-tween the two sites is greater than 5 AAs. That is,we may assume that RðnÞ0RðnÞ has the followingrelations mathematically:
• The number of the set
k jP5
j¼1
P5
i¼1ðvi;/ðwjÞÞ2\
P5
j¼1
P5
i¼1ðviþk;/ðwjÞÞ2
( )
related to n) 5 is very small.
• The number of the set
k jP5
i¼1
P5
j¼1
(
ðvi;/ðwjÞÞ2\P5
i¼1
P5
j¼1ðvi;/ðwjþkÞÞ2g
is also very small related to n) 5.
• ðvi;/ðwjÞÞ2[ðviþk;/ðwjÞÞ2 and ðvi;/ðwjÞÞ2[ðvi;/ðwjþkÞÞ2 for all i; j � 5 and almost allk>6.
Then let yi ¼ /ðwiÞ, we have
•P5
j¼1
P5
i¼1ðvi; yjÞ2 �
P5
j¼5
P5
i¼1ðviþk; yjÞ2,
•P5
i¼1
P5
j¼1ðvi; yjÞ2 �
P5
i¼1
P5
j¼1ðvi; yjþkÞ2
•P5
i¼1
P5
j¼1ðvi; yjÞ2 �
P5
i¼1
P5
j¼1ðviþk; yjþkÞ2
for all k>6. Without lost the generality, wemay assume that n ¼ 0 ðmod5Þ, and then wehave
That is, we have proved that
ffiffiffiffiffiffiffiffiffiffiffiffiffiffiffiffiffiffiffiffiffiffiffiffiffiffiffiffiffiffiffiffiffiffiffiffiffiffiffiffiffiffiffiffiffiffiffiffiffiffiffiffiffiffiffiffiffiffiffiffiffi
r1ðnÞ2 þ r2ðnÞ2 þ þ rnðnÞ2q
n
\
ffiffiffiffiffiffiffiffiffiffiffiffiffiffiffiffiffiffiffiffiffiffiffiffiffiffiffiffiffiffiffiffiffiffiffiffiffiffiffiffiffiffiffiffiffiffiffiffiffiffiffiffiffiffiffiffiffiffiffiffiffi
r1ð5Þ2 þ r2ð5Þ2 þ þ r5ð5Þ2q
5if n � 10:
where riðjÞ for j ¼ 5; n and i � j, are the singularvalue of R(5) and R(n) respectively. Replacing R(n)and R(5) by their ‘‘squared root’’:
R12ðnÞ ¼
ffiffiffiffiffiffiffiffiffiffiffiffiffiffiffiffiffijðv1; y1Þj
p ffiffiffiffiffiffiffiffiffiffiffiffiffiffiffiffiffijðv1; y2Þj
p. . . :
ffiffiffiffiffiffiffiffiffiffiffiffiffiffiffiffiffijðv1; ynÞj
p
ffiffiffiffiffiffiffiffiffiffiffiffiffiffiffiffiffijðv2; y1Þj
p ffiffiffiffiffiffiffiffiffiffiffiffiffiffiffiffiffijðv2; y2Þj
p. . . :
ffiffiffiffiffiffiffiffiffiffiffiffiffiffiffiffiffijðv2; ynÞj
p
. . . : . . . :ffiffiffiffiffiffiffiffiffiffiffiffiffiffiffiffiffijðvn; y1Þj
p ffiffiffiffiffiffiffiffiffiffiffiffiffiffiffiffiffijðvn; y2Þj
p. . . :
ffiffiffiffiffiffiffiffiffiffiffiffiffiffiffiffiffijðvn; ynÞj
p
0
BB@
1
CCA
and with the same argument, we have
r1ðnÞ þ r2ðnÞ þ þ rnðnÞn
\r1ð5Þ þ r2ð5Þ þ þ r5ð5Þ
5if n � 10:
That is, traceðsvd Rð5ÞÞ5 [traceðsvd RðnÞÞ
n for n � 10.
Therefore, the maximal URMD among the allfive-unit-vectors is greater than the URMSD for thewhole segment. This ends the proof.
1n
ffiffiffiffiffiffiffiffiffiffiffiffiffiffiffiffiffiffiffiffiffiffiffiffiffiffiffiffitrðRðnÞ0RðnÞÞ
q¼
ffiffiffiffiffiffiffiffiffiffiffiffiffiffiffiffiffiffiffiffiffiffiffiffiffiffiffiffiffiffiffi
1n2
Pn
j¼1
Pn
i¼1ðvi; yjÞ2
s
¼
ffiffiffiffiffiffiffiffiffiffiffiffiffiffiffiffiffiffiffiffiffiffiffiffiffiffiffiffiffiffiffiffiffiffiffiffiffiffiffiffiffiffiffiffiffiffiffiffiffiffiffiffiffiffiffiffiffiffiffiffiffiffiffiffiffiffiffiffiffiffiffiffiffiffiffiffiffiffiffiffiffiffiffiffiffiffiffiffiffiffiffiffiffiffiffiffiffiffiffiffiffiffiffiffiffiffiffiffiffiffiffiffiffiffiffiffiffiffiffiffiffiffiffiffiffiffiffiffiffiffiffiffiffiffi
1n2
P5
j¼1
P5
i¼1ðvi; yjÞ2þ
Pn
j¼6
P5
i¼1ðvi; yjÞ2 þ
P5
j¼1
Pn
i¼6ðvi; yjÞ2 þ
Pn
j¼6
Pn
i¼6ðvi; yjÞ2
!vuut
¼
ffiffiffiffiffiffiffiffiffiffiffiffiffiffiffiffiffiffiffiffiffiffiffiffiffiffiffiffiffiffiffiffiffiffiffiffiffiffiffiffiffiffiffiffiffiffiffiffiffiffiffiffiffiffiffiffiffiffiffiffiffiffiffiffiffiffiffiffiffiffiffiffiffiffiffiffiffiffiffiffiffiffiffiffiffiffiffiffiffiffiffiffiffiffiffiffiffiffiffiffiffiffiffiffi
1n2
n5
P5
j¼1
P5
i¼1ðvi; yjÞ2þ
Pn
j¼6
P5
i¼1ðvi; yjÞ2 þ
P5
j¼1
Pn
i¼6ðvi; yjÞ2
!vuut
�
ffiffiffiffiffiffiffiffiffiffiffiffiffiffiffiffiffiffiffiffiffiffiffiffiffiffiffiffiffiffiffiffiffiffiffiffiffiffiffiffiffiffiffiffiffiffiffiffiffiffiffiffiffiffiffiffiffiffiffiffiffiffiffiffiffiffiffiffiffiffiffiffiffiffiffiffiffiffiffiffiffiffiffiffiffiffiffiffiffiffiffiffiffiffiffiffiffiffiffiffiffiffiffiffiffiffi
1n2
n5
P5
j¼1
P5
i¼1ðvi; yjÞ2þ n�5
5
P5
i¼1ðvi; yjÞ2 þ n�5
5
P5
j¼1ðvi; yjÞ2
!vuut
�
ffiffiffiffiffiffiffiffiffiffiffiffiffiffiffiffiffiffiffiffiffiffiffiffiffiffiffiffiffiffiffiffiffiffiffiffiffiffiffiffiffiffiffiffiffiffiffiffiffiffiffiffiffiffiffiffiffiffiffiffiffiffiffiffiffiffiffiffiffiffiffiffiffiffiffiffiffiffiffi
1n2
n5
P5
j¼1
P5
i¼1ðvi; yjÞ2þ n�5
5
P5
i¼1
P5
j¼1ðvi; yjÞ2
!vuut
¼
ffiffiffiffiffiffiffiffiffiffiffiffiffiffiffiffiffiffiffiffiffiffiffiffiffiffiffiffiffiffiffiffiffiffiffiffiffiffiffiffiffiffiffi
2n�55n2
P5
j¼1
P5
i¼1ðvi; yjÞ2
!vuut \
ffiffiffiffiffiffiffiffiffiffiffiffiffiffiffiffiffiffiffiffiffiffiffiffiffiffiffiffiffiffiffiffiffiffiffiffiffiffiffi
25n
P5
j¼1
P5
i¼1ðvi; yjÞ2
!vuut hop�n�10 1
5
ffiffiffiffiffiffiffiffiffiffiffiffiffiffiffiffiffiffiffiffiffiffiffiffiffiffiffiffiffiffiffiffiffitraceðRð5Þ0Rð5Þ
q
314 Ruan, Chen, Tuszynski, and Kurgan

REFERENCES
Anfinsen, C. B. (1973) Science 81: 223–233.Barrientos, L. G., Louis, J. M., Botos, I., Mori, T., Han, Z.,
O’Keefe, B. R., Boyd, M. R., Wlodawer, A., andGronenborn, A. M. (2002). Structure 10:(5), 673–686.
Bamborough, P., Duncan, D., and Richards, W. G. (1994).Protein Eng. 7:(9), 1077–1082.
Berman, H. M., Westbrook, J., Feng, Z., Gilliland, G., Bhat, T.N., Weissig, H., Shindyalov, I. N., and Bourne, P. E. (2000).Nucleic Acids Res. 28: 235–242.
Brody, S. S., Gough, S. P., and Kannangara, C. G. (1999).Proteins 37:(3), 485–493.
Chen, K., Ruan, J., and Kurgan, L. A. (2006). The Protein J.25:(1), 57–70.
Chew, L. P., Huttenlocher, D., Kedem, K., and Kleinberg, J.(1999). J. Comput. Biol. 6:(3–4), 313–325.
Ding, J., Das, K., Hsiou, Y., Sarafianos, S. G., Clark, A. D.,Jacobo-Molina, A., Tantillo, C., Hughes, S. H., and Arnold,E. (1998). J. Mol. Biol. 284:(4), 1095–1111.
Drum, C. L., Yan, S.-Z., Bard, J., Shen, Y.-Q., Lu, D.,Soelaiman, S., Grabarek, Z., Bohm, A., and Tang, W. J.(2002). Nature 415: 396–402.
Elshorst, B., Hennig, M., Forsterling, H., Diener, A., Maurer,M., Schulte, P., Schwalbe, H., Griesinger, C., Krebs, J.,Schmid, H., Vorherr, T., and Carafoli, E. (1999). Biochem-istry 38:(38), 12320–12332.
Falzone, C. J., Wang, Y., Vu, B. C., Scott, N. L., Bhattacharya,S., and Lecomte, J. T. (2001). Biochemistry 40: 4879–4891.
Hansson, M., Gough, S. P., and Brody, S. S. (1997). Proteins27:(4), 517–522.
Kabsch, W. (1978) Acta Crystallogr. A34: 827–828.Kihara, D., and Skolnick, J. (2003). J. Mol. Biol. 334: 793–802.Korolev, S., Hsieh, J., Gauss, G. H., Lohman, T. M., and
Waksman, G. (1997). Cell 90:(4), 635–647.Lindberg, J., Sigurdsson, S., Lowgren, S., Andersson, H. O.,
Sahlberg, C., Noreen, R., Fridborg, K., Zhang, H., andUnge, T. (2002). Eur. J. Biochem. 269:(6), 1670–1677.
Meador, W. E., Means, A. R., and Quiocho, F. A. (1992). Science257:(5074), 1251–1255.
Reva, B. A., Finkelstein, A. V., and Skolnick, J. (1998). Fold Des.3:(2), 141–147.
Schumacher, M. A., Crum, M., and Miller, M. C. (2004).Structure (Camb) 12:(5), 849–860.
Shen, S. Y., Yu, T., Kai, B., Ruan, J. S. (2004). J. Eng. Math.21:(6), 862–870 (in Chinese).
Tiraboschi, G., Jullian, N., Thery, V., Antonczak, S., Fournie-Zaluski, M. C., and Roques, B. P. (1999). Protein Eng. 12:(2),141–149.
Toyoshima, C., Nakasako, M., Nomura, H., and Ogawa, H.(2000). Nature 405:(6787), 647–655.
Toyoshima, C., and Nomura, H. (2002). Nature 418:(6898), 605–611.
Veerapandian, B. (1992) Biophys. J. 62:(1), 112–115.Xu, C., Rice, W. J., He, W., and Stokes, D. L. (2002). J. Mol.
Biol. 316:(1), 201–211.Yap, K. L., Yuan, T., Mal, T. K., Vogel, H. J., and Ikura, M.
(2003). J. Mol. Biol. 328:(1), 193–204.Yona, G., and Kedem, K. (2005). J. Comput. Biol. 12:(1), 12–32.
315Conservation of the Tertiary Structure of Protein Segments