Quantitative analysis of hydrogen in chemical vapor deposited diamond films
6
Quantitative analysis of hydrogen in chemical vapor deposited diamond films E. Titus a, * , D.S. Misra b , A.K. Sikder c , P.K. Tyagi b , M.K. Singh b , Abha Misra b , N. Ali a , G. Cabral a , V.F. Neto a , J. Gracio a a Department of Mechanical Engineering, University of Aveiro, 3810-193 Aveiro, Portugal b Department of Physics, Indian Institute of Technology, Bombay 400076, India c GE, Bangalore, India Available online 8 January 2005 Abstract In this investigation, diamond sheets have been deposited using chemical vapor deposition. The as-grown diamond sheets were characterized for hydrogen content using detailed infrared analysis. The deconvolution of the spectra in the three-phonon region (2700–3150 cm 1 ) showed a number of vibration modes corresponding to sp m CH n phase of carbon. The spectra representing (100) and (111) textured diamond sheets, grown under different conditions, was compared. The (100) textured sheets contained two dominant peaks centred at 2860 cm 1 and 2930 cm 1 , which correspond to the symmetric and asymmetric stretch bands of CH 2 group. However, the sheet with (111) texture displayed multiple CH, CH 2 and CH 3 peaks on the spectra. Using a standard sample called polymethyl methacrylate with known concentration, H content associated with various modes was evaluated in the diamond sheets. IR active hydrogen in the CVD diamond sheets was also calculated by evaluating the area of the IR band. Using these measurements we suggest that the oscillator strength of the different IR modes varies depending upon the structure and H content of CVD diamond sheets. D 2004 Elsevier B.V. All rights reserved. Keywords: CVD diamond; FTIR; Characterisation 1. Introduction The ability to produce diamond thin films at sub- atmospheric pressure and low temperature in the laboratory using chemical vapor deposition (CVD) has stimulated enormous research interest [1–5], since the properties of these deposits appear to match natural diamond crystals. The interest in CVD diamond arises mainly due to the enormous potentials of this material for use in numerous application areas. For example, the transparency of diamond to a wide range of electromagnetic spectrum makes it an ideal material for producing IR windows and optical coatings. Polycrystal- line diamond films, however, contain grain boundaries, which results in the presence of impurities. The impurities and defects in CVD diamond can induce significant amount of absorption that renders these less perfect diamond useless as IR windows. The elemental impurities include hydrogen, nitrogen, oxygen, etc. The source of hydrogen in CVD diamond lattice comes mainly from the high concentration (z99% by vol.) of H 2 gas present in the gas mixture during the growth process. Such large concentration of H 2 is required to generate high concentration of atomic hydrogen (H) during growth that is essential for the synthesis of diamond via CVD routes [6–10]. The presence of H in diamond lattice has serious repercussion for its character- istics. In spite of this, there have been very few attempts to measure the concentration and the bonding of H in CVD diamond lattice [11–15]. Fourier Transform Infrared (FTIR) spectroscopy has proved to be a powerful and a non- destructive technique for studying various optical centers in natural and CVD diamond. 0925-9635/$ - see front matter D 2004 Elsevier B.V. All rights reserved. doi:10.1016/j.diamond.2004.12.001 * Corresponding author. Tel.: +351 234378177; fax: +351 234234370953. E-mail addresses: [email protected] (E. Titus)8 [email protected] (D.S. Misra). Diamond & Related Materials 14 (2005) 476 – 481 www.elsevier.com/locate/diamond
-
Upload
independent -
Category
Documents
-
view
0 -
download
0
Transcript of Quantitative analysis of hydrogen in chemical vapor deposited diamond films
www.elsevier.com/locate/diamond
Diamond & Related Materia
Quantitative analysis of hydrogen in chemical
vapor deposited diamond films
E. Titusa,*, D.S. Misrab, A.K. Sikderc, P.K. Tyagib, M.K. Singhb, Abha Misrab,
N. Alia, G. Cabrala, V.F. Netoa, J. Gracioa
aDepartment of Mechanical Engineering, University of Aveiro, 3810-193 Aveiro, PortugalbDepartment of Physics, Indian Institute of Technology, Bombay 400076, India
cGE, Bangalore, India
Available online 8 January 2005
Abstract
In this investigation, diamond sheets have been deposited using chemical vapor deposition. The as-grown diamond sheets were
characterized for hydrogen content using detailed infrared analysis. The deconvolution of the spectra in the three-phonon region (2700–3150
cm�1) showed a number of vibration modes corresponding to spm CHn phase of carbon. The spectra representing (100) and (111) textured
diamond sheets, grown under different conditions, was compared. The (100) textured sheets contained two dominant peaks centred at 2860
cm�1 and 2930 cm�1, which correspond to the symmetric and asymmetric stretch bands of CH2 group. However, the sheet with (111) texture
displayed multiple CH, CH2 and CH3 peaks on the spectra. Using a standard sample called polymethyl methacrylate with known
concentration, H content associated with various modes was evaluated in the diamond sheets. IR active hydrogen in the CVD diamond sheets
was also calculated by evaluating the area of the IR band. Using these measurements we suggest that the oscillator strength of the different IR
modes varies depending upon the structure and H content of CVD diamond sheets.
D 2004 Elsevier B.V. All rights reserved.
Keywords: CVD diamond; FTIR; Characterisation
1. Introduction
The ability to produce diamond thin films at sub-
atmospheric pressure and low temperature in the laboratory
using chemical vapor deposition (CVD) has stimulated
enormous research interest [1–5], since the properties of
these deposits appear to match natural diamond crystals. The
interest in CVD diamond arises mainly due to the enormous
potentials of this material for use in numerous application
areas. For example, the transparency of diamond to a wide
range of electromagnetic spectrum makes it an ideal material
for producing IR windows and optical coatings. Polycrystal-
line diamond films, however, contain grain boundaries,
0925-9635/$ - see front matter D 2004 Elsevier B.V. All rights reserved.
doi:10.1016/j.diamond.2004.12.001
* Corresponding author. Tel.: +351 234378177; fax: +351
234234370953.
E-mail addresses: [email protected] (E. Titus)8 [email protected]
(D.S. Misra).
which results in the presence of impurities. The impurities
and defects in CVD diamond can induce significant amount
of absorption that renders these less perfect diamond useless
as IR windows. The elemental impurities include hydrogen,
nitrogen, oxygen, etc. The source of hydrogen in CVD
diamond lattice comes mainly from the high concentration
(z99% by vol.) of H2 gas present in the gas mixture during
the growth process. Such large concentration of H2 is
required to generate high concentration of atomic hydrogen
(H) during growth that is essential for the synthesis of
diamond via CVD routes [6–10]. The presence of H in
diamond lattice has serious repercussion for its character-
istics. In spite of this, there have been very few attempts to
measure the concentration and the bonding of H in CVD
diamond lattice [11–15]. Fourier Transform Infrared (FTIR)
spectroscopy has proved to be a powerful and a non-
destructive technique for studying various optical centers in
natural and CVD diamond.
ls 14 (2005) 476–481
E. Titus et al. / Diamond & Related Materials 14 (2005) 476–481 477
In CVD diamond, hydrogen plays a major role in
controlling various characteristics of the material. IR
absorption in the C–H stretch region is important not only
for identifying various possible modes of vibration, but also
for the quantitative estimation of hydrogen bonded to the
diamond lattice. As the absorption is due to the super-
position of vibrations from different modes where carbon is
in different configuration, the quantitative calculation of H
content using a unique value of the oscillator strength often
prove erroneous. Jacob and Unger [16] suggested that the
constant proportional (An) to the oscillator strength does not
have a unique value and depends upon the structure of the
C:H films. An for polymer-like films with H/C ratio around
1 increases by a factor of 4 with a decreasing H/C ratio.
Hence for the determination of An, the exact concentration
of H atoms bonded to carbon using an independent method
is required.
In this paper, we present results obtained from FTIR
spectroscopy where the samples characterised were self-
standing diamond sheets, which were grown under different
conditions. A simple and reliable method of the determi-
nation of the H content is proposed and presented in this
paper. The results are compared with the H content obtained
using standard and integration methods on the same set of
samples The amount of hydrogen present in (111) and (100)
textured films are also compared.
2. Experimental
Diamond sheets with thickness values in the range 40–50
Am were deposited using a hot filament CVD (HFCVD)
system, which has been described elsewhere [17]. Silicon
wafers with (100) orientation were used as substrates for the
deposition of the diamond films. Methane (CH4) and
hydrogen (H2) were used as process gases. The deposition
pressure in the chamber was varied from 20 to 120 Torr in
order to grow the samples of desired quality. The temper-
ature of the substrates (880 8C) was measured using a tiny
thermocouple and an optical pyrometer. (100) textured
samples were obtained only by applying a gradient across
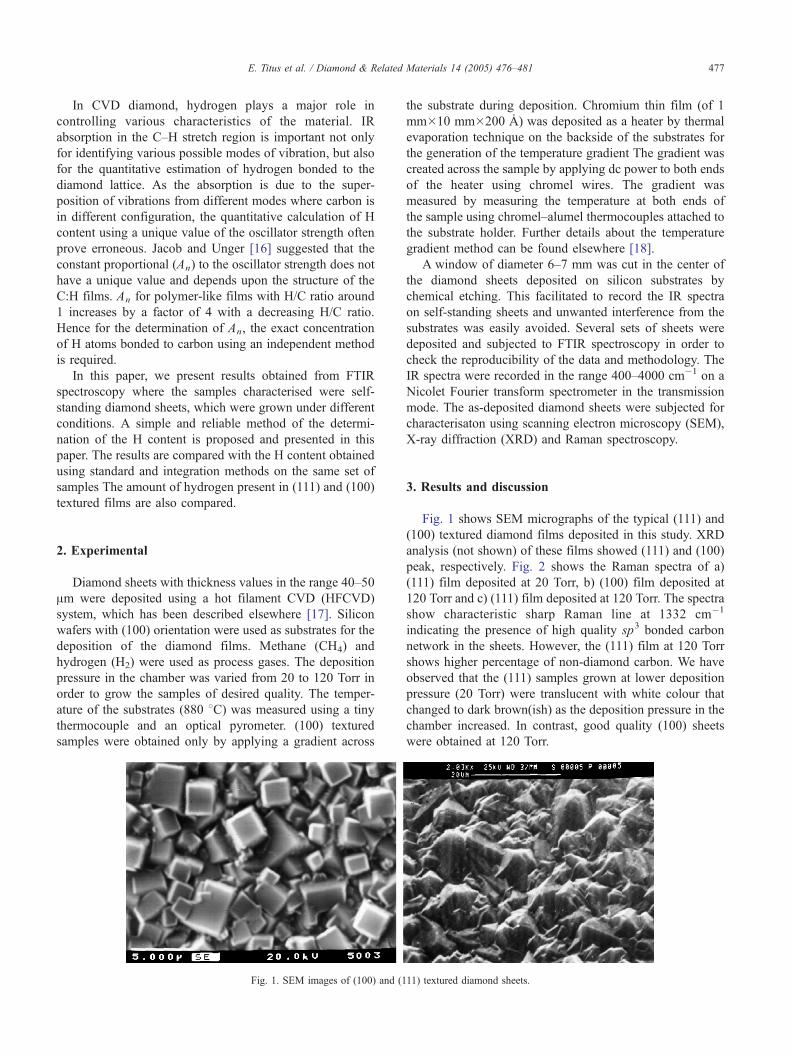
Fig. 1. SEM images of (100) and (1
the substrate during deposition. Chromium thin film (of 1
mm�10 mm�200 2) was deposited as a heater by thermal
evaporation technique on the backside of the substrates for
the generation of the temperature gradient The gradient was
created across the sample by applying dc power to both ends
of the heater using chromel wires. The gradient was
measured by measuring the temperature at both ends of
the sample using chromel–alumel thermocouples attached to
the substrate holder. Further details about the temperature
gradient method can be found elsewhere [18].
A window of diameter 6–7 mm was cut in the center of
the diamond sheets deposited on silicon substrates by
chemical etching. This facilitated to record the IR spectra
on self-standing sheets and unwanted interference from the
substrates was easily avoided. Several sets of sheets were
deposited and subjected to FTIR spectroscopy in order to
check the reproducibility of the data and methodology. The
IR spectra were recorded in the range 400–4000 cm�1 on a
Nicolet Fourier transform spectrometer in the transmission
mode. The as-deposited diamond sheets were subjected for
characterisaton using scanning electron microscopy (SEM),
X-ray diffraction (XRD) and Raman spectroscopy.
3. Results and discussion
Fig. 1 shows SEM micrographs of the typical (111) and
(100) textured diamond films deposited in this study. XRD
analysis (not shown) of these films showed (111) and (100)
peak, respectively. Fig. 2 shows the Raman spectra of a)
(111) film deposited at 20 Torr, b) (100) film deposited at
120 Torr and c) (111) film deposited at 120 Torr. The spectra
show characteristic sharp Raman line at 1332 cm�1
indicating the presence of high quality sp3 bonded carbon
network in the sheets. However, the (111) film at 120 Torr
shows higher percentage of non-diamond carbon. We have
observed that the (111) samples grown at lower deposition
pressure (20 Torr) were translucent with white colour that
changed to dark brown(ish) as the deposition pressure in the
chamber increased. In contrast, good quality (100) sheets
were obtained at 120 Torr.
11) textured diamond sheets.
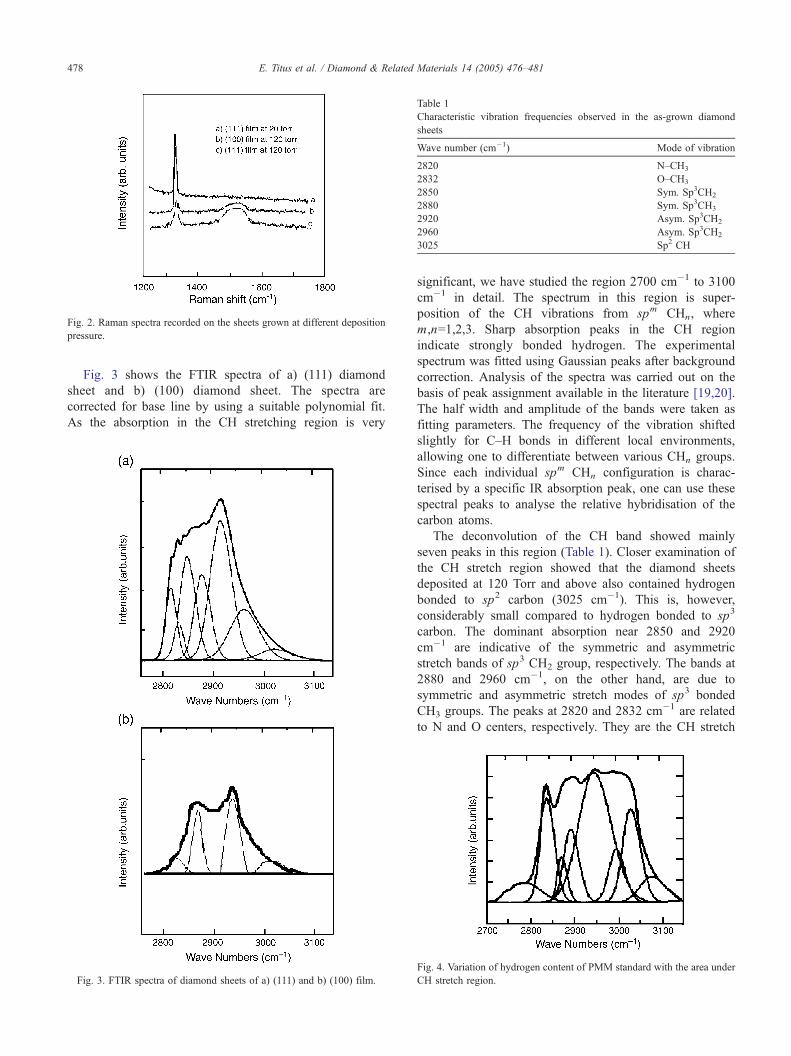
Table 1
Characteristic vibration frequencies observed in the as-grown diamond
sheets
Wave number (cm�1) Mode of vibration
2820 N–CH3
2832 O–CH3
2850 Sym. Sp3CH2
2880 Sym. Sp3CH3
2920 Asym. Sp3CH2
2960 Asym. Sp3CH2
3025 Sp2 CH
Fig. 2. Raman spectra recorded on the sheets grown at different deposition
pressure.
E. Titus et al. / Diamond & Related Materials 14 (2005) 476–481478
Fig. 3 shows the FTIR spectra of a) (111) diamond
sheet and b) (100) diamond sheet. The spectra are
corrected for base line by using a suitable polynomial fit.
As the absorption in the CH stretching region is very
Fig. 3. FTIR spectra of diamond sheets of a) (111) and b) (100) film.
significant, we have studied the region 2700 cm�1 to 3100
cm�1 in detail. The spectrum in this region is super-
position of the CH vibrations from spm CHn, where
m,n=1,2,3. Sharp absorption peaks in the CH region
indicate strongly bonded hydrogen. The experimental
spectrum was fitted using Gaussian peaks after background
correction. Analysis of the spectra was carried out on the
basis of peak assignment available in the literature [19,20].
The half width and amplitude of the bands were taken as
fitting parameters. The frequency of the vibration shifted
slightly for C–H bonds in different local environments,
allowing one to differentiate between various CHn groups.
Since each individual spm CHn configuration is charac-
terised by a specific IR absorption peak, one can use these
spectral peaks to analyse the relative hybridisation of the
carbon atoms.
The deconvolution of the CH band showed mainly
seven peaks in this region (Table 1). Closer examination of
the CH stretch region showed that the diamond sheets
deposited at 120 Torr and above also contained hydrogen
bonded to sp2 carbon (3025 cm�1). This is, however,
considerably small compared to hydrogen bonded to sp3
carbon. The dominant absorption near 2850 and 2920
cm�1 are indicative of the symmetric and asymmetric
stretch bands of sp3 CH2 group, respectively. The bands at
2880 and 2960 cm�1, on the other hand, are due to
symmetric and asymmetric stretch modes of sp3 bonded
CH3 groups. The peaks at 2820 and 2832 cm�1 are related
to N and O centers, respectively. They are the CH stretch
Fig. 4. Variation of hydrogen content of PMM standard with the area under
CH stretch region.
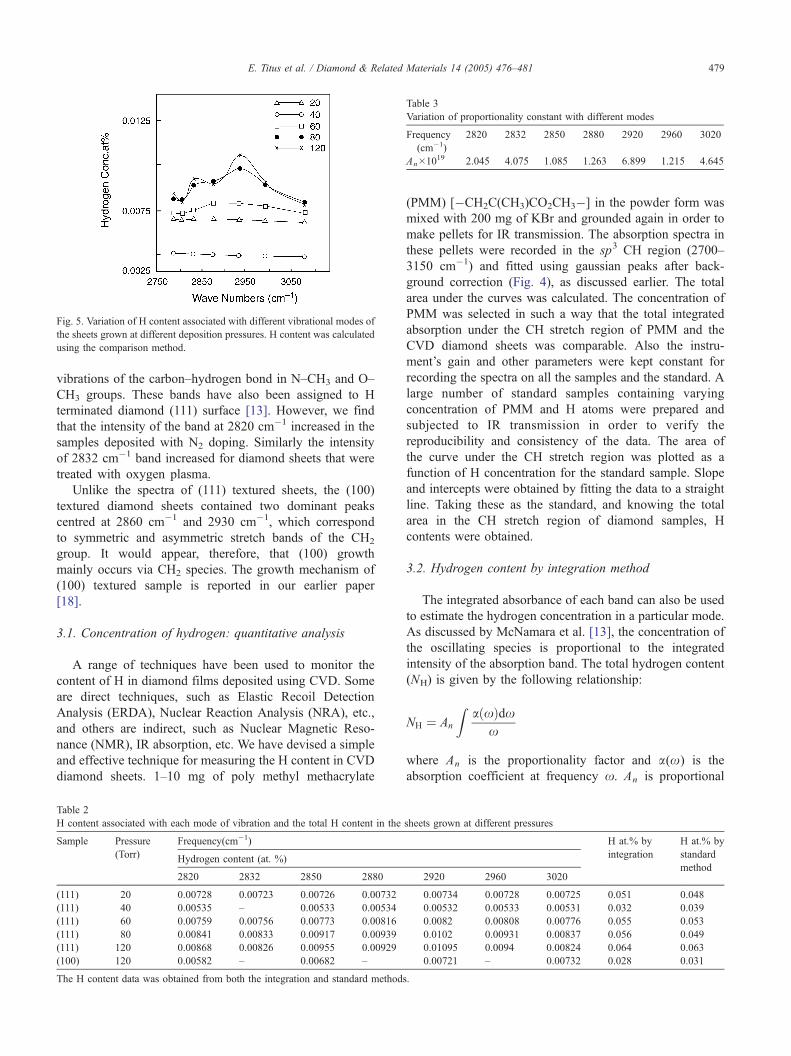
Fig. 5. Variation of H content associated with different vibrational modes of
the sheets grown at different deposition pressures. H content was calculated
using the comparison method.
Table 3
Variation of proportionality constant with different modes
Frequency
(cm�1)
2820 2832 2850 2880 2920 2960 3020
An�1019 2.045 4.075 1.085 1.263 6.899 1.215 4.645
E. Titus et al. / Diamond & Related Materials 14 (2005) 476–481 479
vibrations of the carbon–hydrogen bond in N–CH3 and O–
CH3 groups. These bands have also been assigned to H
terminated diamond (111) surface [13]. However, we find
that the intensity of the band at 2820 cm�1 increased in the
samples deposited with N2 doping. Similarly the intensity
of 2832 cm�1 band increased for diamond sheets that were
treated with oxygen plasma.
Unlike the spectra of (111) textured sheets, the (100)
textured diamond sheets contained two dominant peaks
centred at 2860 cm�1 and 2930 cm�1, which correspond
to symmetric and asymmetric stretch bands of the CH2
group. It would appear, therefore, that (100) growth
mainly occurs via CH2 species. The growth mechanism of
(100) textured sample is reported in our earlier paper
[18].
3.1. Concentration of hydrogen: quantitative analysis
A range of techniques have been used to monitor the
content of H in diamond films deposited using CVD. Some
are direct techniques, such as Elastic Recoil Detection
Analysis (ERDA), Nuclear Reaction Analysis (NRA), etc.,
and others are indirect, such as Nuclear Magnetic Reso-
nance (NMR), IR absorption, etc. We have devised a simple
and effective technique for measuring the H content in CVD
diamond sheets. 1–10 mg of poly methyl methacrylate
Table 2
H content associated with each mode of vibration and the total H content in the
Sample Pressure
(Torr)
Frequency(cm�1)
Hydrogen content (at. %)
2820 2832 2850 2880
(111) 20 0.00728 0.00723 0.00726 0.00732
(111) 40 0.00535 – 0.00533 0.00534
(111) 60 0.00759 0.00756 0.00773 0.00816
(111) 80 0.00841 0.00833 0.00917 0.00939
(111) 120 0.00868 0.00826 0.00955 0.00929
(100) 120 0.00582 – 0.00682 –
The H content data was obtained from both the integration and standard methods
(PMM) [�CH2C(CH3)CO2CH3�] in the powder form was
mixed with 200 mg of KBr and grounded again in order to
make pellets for IR transmission. The absorption spectra in
these pellets were recorded in the sp3 CH region (2700–
3150 cm�1) and fitted using gaussian peaks after back-
ground correction (Fig. 4), as discussed earlier. The total
area under the curves was calculated. The concentration of
PMM was selected in such a way that the total integrated
absorption under the CH stretch region of PMM and the
CVD diamond sheets was comparable. Also the instru-
ment’s gain and other parameters were kept constant for
recording the spectra on all the samples and the standard. A
large number of standard samples containing varying
concentration of PMM and H atoms were prepared and
subjected to IR transmission in order to verify the
reproducibility and consistency of the data. The area of
the curve under the CH stretch region was plotted as a
function of H concentration for the standard sample. Slope
and intercepts were obtained by fitting the data to a straight
line. Taking these as the standard, and knowing the total
area in the CH stretch region of diamond samples, H
contents were obtained.
3.2. Hydrogen content by integration method
The integrated absorbance of each band can also be used
to estimate the hydrogen concentration in a particular mode.
As discussed by McNamara et al. [13], the concentration of
the oscillating species is proportional to the integrated
intensity of the absorption band. The total hydrogen content
(NH) is given by the following relationship:
NH ¼ An
Za xð Þdx
x
where An is the proportionality factor and a(x) is the
absorption coefficient at frequency x. An is proportional
sheets grown at different pressures
H at.% by
integration
H at.% by
standard
method2920 2960 3020
0.00734 0.00728 0.00725 0.051 0.048
0.00532 0.00533 0.00531 0.032 0.039
0.0082 0.00808 0.00776 0.055 0.053
0.0102 0.00931 0.00837 0.056 0.049
0.01095 0.0094 0.00824 0.064 0.063
0.00721 – 0.00732 0.028 0.031
.
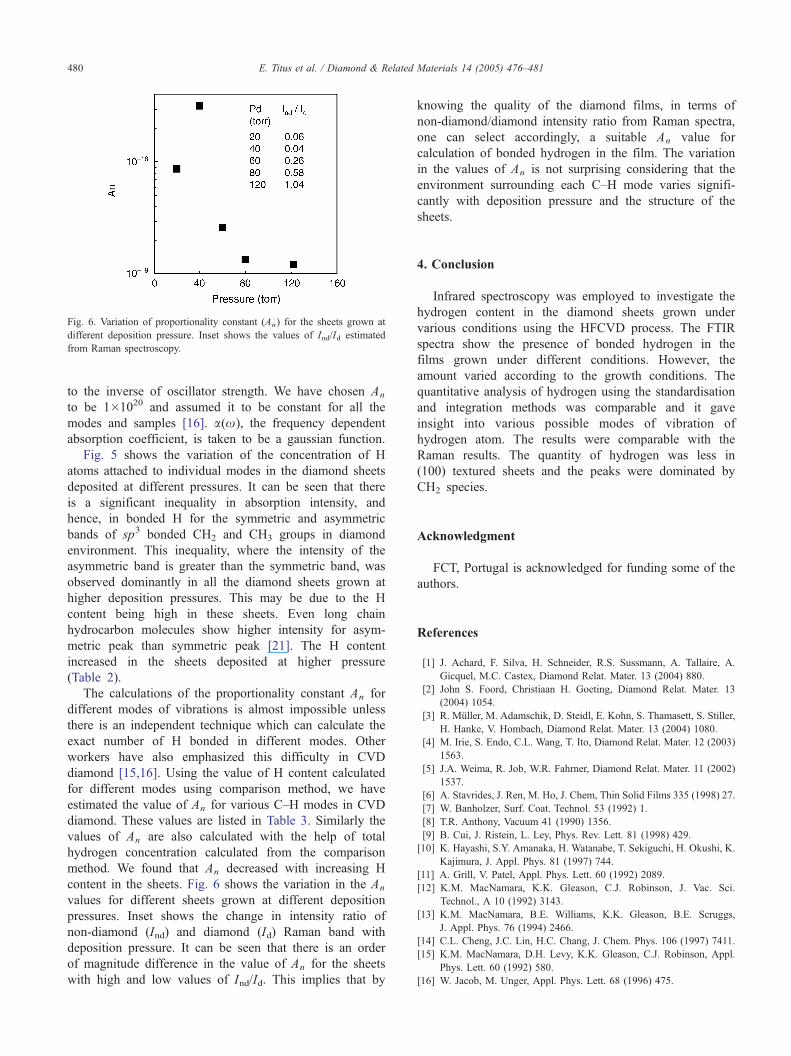
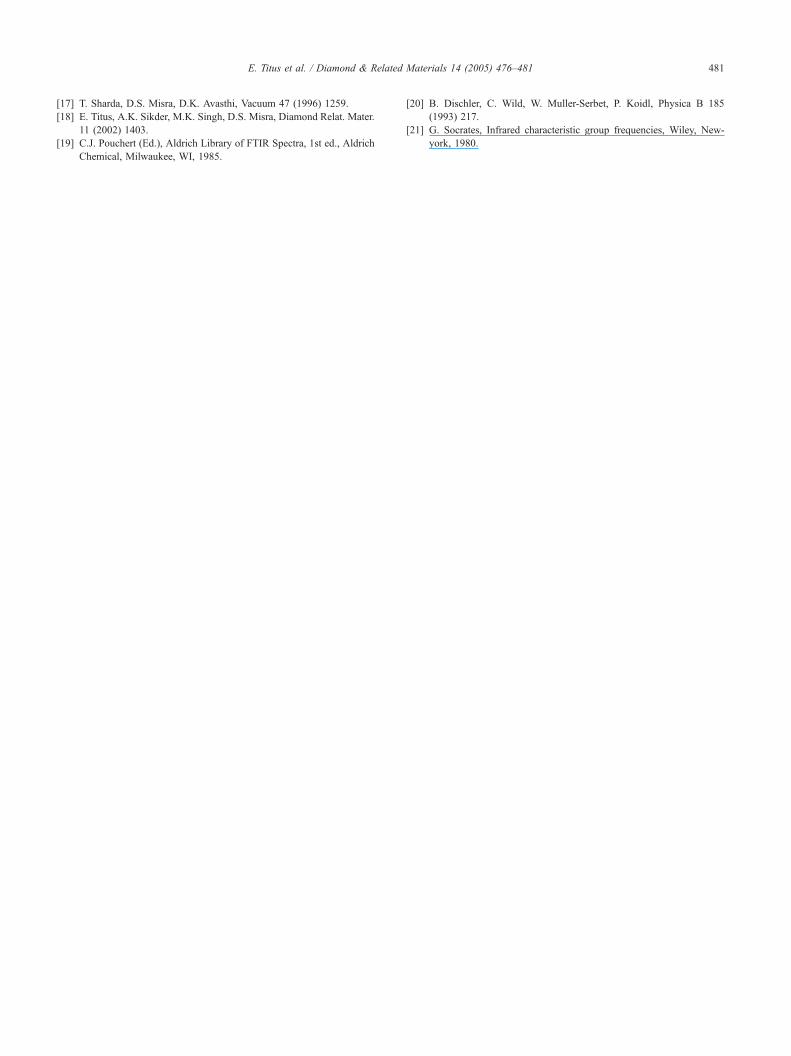
Fig. 6. Variation of proportionality constant (An) for the sheets grown at
different deposition pressure. Inset shows the values of Ind/Id estimated
from Raman spectroscopy.
E. Titus et al. / Diamond & Related Materials 14 (2005) 476–481480
to the inverse of oscillator strength. We have chosen An
to be 1�1020 and assumed it to be constant for all the
modes and samples [16]. a(x), the frequency dependent
absorption coefficient, is taken to be a gaussian function.
Fig. 5 shows the variation of the concentration of H
atoms attached to individual modes in the diamond sheets
deposited at different pressures. It can be seen that there
is a significant inequality in absorption intensity, and
hence, in bonded H for the symmetric and asymmetric
bands of sp3 bonded CH2 and CH3 groups in diamond
environment. This inequality, where the intensity of the
asymmetric band is greater than the symmetric band, was
observed dominantly in all the diamond sheets grown at
higher deposition pressures. This may be due to the H
content being high in these sheets. Even long chain
hydrocarbon molecules show higher intensity for asym-
metric peak than symmetric peak [21]. The H content
increased in the sheets deposited at higher pressure
(Table 2).
The calculations of the proportionality constant An for
different modes of vibrations is almost impossible unless
there is an independent technique which can calculate the
exact number of H bonded in different modes. Other
workers have also emphasized this difficulty in CVD
diamond [15,16]. Using the value of H content calculated
for different modes using comparison method, we have
estimated the value of An for various C–H modes in CVD
diamond. These values are listed in Table 3. Similarly the
values of An are also calculated with the help of total
hydrogen concentration calculated from the comparison
method. We found that An decreased with increasing H
content in the sheets. Fig. 6 shows the variation in the An
values for different sheets grown at different deposition
pressures. Inset shows the change in intensity ratio of
non-diamond (Ind) and diamond (Id) Raman band with
deposition pressure. It can be seen that there is an order
of magnitude difference in the value of An for the sheets
with high and low values of Ind/Id. This implies that by
knowing the quality of the diamond films, in terms of
non-diamond/diamond intensity ratio from Raman spectra,
one can select accordingly, a suitable An value for
calculation of bonded hydrogen in the film. The variation
in the values of An is not surprising considering that the
environment surrounding each C–H mode varies signifi-
cantly with deposition pressure and the structure of the
sheets.
4. Conclusion
Infrared spectroscopy was employed to investigate the
hydrogen content in the diamond sheets grown under
various conditions using the HFCVD process. The FTIR
spectra show the presence of bonded hydrogen in the
films grown under different conditions. However, the
amount varied according to the growth conditions. The
quantitative analysis of hydrogen using the standardisation
and integration methods was comparable and it gave
insight into various possible modes of vibration of
hydrogen atom. The results were comparable with the
Raman results. The quantity of hydrogen was less in
(100) textured sheets and the peaks were dominated by
CH2 species.
Acknowledgment
FCT, Portugal is acknowledged for funding some of the
authors.
References
[1] J. Achard, F. Silva, H. Schneider, R.S. Sussmann, A. Tallaire, A.
Gicquel, M.C. Castex, Diamond Relat. Mater. 13 (2004) 880.
[2] John S. Foord, Christiaan H. Goeting, Diamond Relat. Mater. 13
(2004) 1054.
[3] R. Mqller, M. Adamschik, D. Steidl, E. Kohn, S. Thamasett, S. Stiller,
H. Hanke, V. Hombach, Diamond Relat. Mater. 13 (2004) 1080.
[4] M. Irie, S. Endo, C.L. Wang, T. Ito, Diamond Relat. Mater. 12 (2003)
1563.
[5] J.A. Weima, R. Job, W.R. Fahrner, Diamond Relat. Mater. 11 (2002)
1537.
[6] A. Stavrides, J. Ren, M. Ho, J. Chem, Thin Solid Films 335 (1998) 27.
[7] W. Banholzer, Surf. Coat. Technol. 53 (1992) 1.
[8] T.R. Anthony, Vacuum 41 (1990) 1356.
[9] B. Cui, J. Ristein, L. Ley, Phys. Rev. Lett. 81 (1998) 429.
[10] K. Hayashi, S.Y. Amanaka, H. Watanabe, T. Sekiguchi, H. Okushi, K.
Kajimura, J. Appl. Phys. 81 (1997) 744.
[11] A. Grill, V. Patel, Appl. Phys. Lett. 60 (1992) 2089.
[12] K.M. MacNamara, K.K. Gleason, C.J. Robinson, J. Vac. Sci.
Technol., A 10 (1992) 3143.
[13] K.M. MacNamara, B.E. Williams, K.K. Gleason, B.E. Scruggs,
J. Appl. Phys. 76 (1994) 2466.
[14] C.L. Cheng, J.C. Lin, H.C. Chang, J. Chem. Phys. 106 (1997) 7411.
[15] K.M. MacNamara, D.H. Levy, K.K. Gleason, C.J. Robinson, Appl.
Phys. Lett. 60 (1992) 580.
[16] W. Jacob, M. Unger, Appl. Phys. Lett. 68 (1996) 475.
E. Titus et al. / Diamond & Related Materials 14 (2005) 476–481 481
[17] T. Sharda, D.S. Misra, D.K. Avasthi, Vacuum 47 (1996) 1259.
[18] E. Titus, A.K. Sikder, M.K. Singh, D.S. Misra, Diamond Relat. Mater.
11 (2002) 1403.
[19] C.J. Pouchert (Ed.), Aldrich Library of FTIR Spectra, 1st ed., Aldrich
Chemical, Milwaukee, WI, 1985.
[20] B. Dischler, C. Wild, W. Muller-Serbet, P. Koidl, Physica B 185
(1993) 217.
[21] G. Socrates, Infrared characteristic group frequencies, Wiley, New-
york, 1980.