
Quantified scenarios analysis of drivers and impacts of changing flood risk in England and Wales:...
15
Environmental Hazards 5 (2003) 51–65 Quantified scenarios analysis of drivers and impacts of changing flood risk in England and Wales: 2030–2100 Jim W. Hall a, *, Edward P. Evans b , Edmund C. Penning-Rowsell c , Paul B. Sayers d , Colin R. Thorne e , Adrian J. Saul f a Department of Civil Engineering, University of Bristol, Queens Building, University Walk, Bristol BS8 1TR, UK b Bevis, Great Somerford, Chippenham, Wiltshire, SN15 5JA, UK c Flood Hazard Research Centre, Middlesex University, Queensway, Enfield, Middlesex, EN3 4SF, UK d HR Wallingford, Howbery Park, Wallingford, Oxfordshire, OX10 8BA, UK e School of Geography, University of Nottingham, University Park, Nottingham, NG7 2RD, UK f Department of Civil and Structural Engineering, Sir Frederick Mappin Building, Mappin Street, Sheffield, S1 3JD, UK Received 17 October 2003; received in revised form 30 March 2004; accepted 23 April 2004 Abstract Flood risk to the economy, society and the environment reflects the cumulative effects of environmental and socio-economic change over decades. Long-term scenarios are therefore required in order to develop robust and sustainable flood risk management policies. Quantified national-scale flood risk analysis and expert appraisal of the mechanisms causing change in flood risk have been used to assess flood risk in England and Wales over the period 2030–2100. The assessment involved the use of socio-economic and climate change scenarios. The analysis predicts increasing flood risk unless current flood management policies, practices and investment levels are changed—up to 20-fold increase in economic risk by the 2080s in the scenario with highest economic growth. The increase is attributable to a combination of climate change (in particular increasing precipitation and relative sea level rise in parts of the UK) and increasing socio-economic vulnerability, particularly in terms of household/industrial contents and infrastructure vulnerability. The policy implications of these findings are discussed. r 2004 Elsevier Ltd. All rights reserved. Keywords: Flood risk; Vulnerability; Climate change; Socio-economic scenarios 1. Introduction Recent flooding in the UK has illustrated the potential impact of floods not only on the UK economy but also on the health and well-being of communities. This pattern of increasing flood damage is repeated worldwide. 1 Concerns persist about the potential for climate change to increase the frequency of flooding in the 21st Century (Doornkamp, 1998; Dorland, 1999; Smith, 1999; Schreider, 2000; Frei, 2000; Palmer and R . ais . anen, 2002; Milly et al., 2002). The study described in this paper was a systematic attempt to understand and where possible quantify the extent and scale of risks from flooding in England and Wales over a time-scale of 30–100 years in the future. The purpose of analysis was to (i) establish the potential scale of the flooding problem (ii) identify the processes that are driving future flood risk and the approximate magnitude of their contribution to risk, and (iii) identify limitations to the current flood management policy and practice. By doing so, the analysis is intended to provide the basis for identification and analysis of policy responses to future risks, in particular those whose implementation may take several decades. Previously, attempts have been made to quantify specific aspects of long-term change in flood risk, in particular the potential change in flood frequency in the UK due to climate change (Arnell and Reynard, 1996; ARTICLE IN PRESS *Corresponding author. Tel.: +44-117-928-9763; fax: +44-117-928- 7783. E-mail address: [email protected] (J.W. Hall). 1 See for example Mileti (1999) for an account of increasing damage from natural hazards, including flooding, in the USA. 1464-2867/$ - see front matter r 2004 Elsevier Ltd. All rights reserved. doi:10.1016/j.hazards.2004.04.002
Transcript of Quantified scenarios analysis of drivers and impacts of changing flood risk in England and Wales:...

Environmental Hazards 5 (2003) 51–65
ARTICLE IN PRESS
*Correspondi
7783.
E-mail addre1See for exam
from natural ha
1464-2867/$ - see
doi:10.1016/j.ha
Quantified scenarios analysis of drivers and impacts of changing floodrisk in England and Wales: 2030–2100
Jim W. Halla,*, Edward P. Evansb, Edmund C. Penning-Rowsellc, Paul B. Sayersd,Colin R. Thornee, Adrian J. Saulf
aDepartment of Civil Engineering, University of Bristol, Queens Building, University Walk, Bristol BS8 1TR, UKbBevis, Great Somerford, Chippenham, Wiltshire, SN15 5JA, UK
cFlood Hazard Research Centre, Middlesex University, Queensway, Enfield, Middlesex, EN3 4SF, UKdHR Wallingford, Howbery Park, Wallingford, Oxfordshire, OX10 8BA, UK
eSchool of Geography, University of Nottingham, University Park, Nottingham, NG7 2RD, UKfDepartment of Civil and Structural Engineering, Sir Frederick Mappin Building, Mappin Street, Sheffield, S1 3JD, UK
Received 17 October 2003; received in revised form 30 March 2004; accepted 23 April 2004
Abstract
Flood risk to the economy, society and the environment reflects the cumulative effects of environmental and socio-economic
change over decades. Long-term scenarios are therefore required in order to develop robust and sustainable flood risk management
policies. Quantified national-scale flood risk analysis and expert appraisal of the mechanisms causing change in flood risk have been
used to assess flood risk in England and Wales over the period 2030–2100. The assessment involved the use of socio-economic and
climate change scenarios. The analysis predicts increasing flood risk unless current flood management policies, practices and
investment levels are changed—up to 20-fold increase in economic risk by the 2080s in the scenario with highest economic growth.
The increase is attributable to a combination of climate change (in particular increasing precipitation and relative sea level rise in
parts of the UK) and increasing socio-economic vulnerability, particularly in terms of household/industrial contents and
infrastructure vulnerability. The policy implications of these findings are discussed.
r 2004 Elsevier Ltd. All rights reserved.
Keywords: Flood risk; Vulnerability; Climate change; Socio-economic scenarios
1. Introduction
Recent flooding in the UK has illustrated thepotential impact of floods not only on the UK economybut also on the health and well-being of communities.This pattern of increasing flood damage is repeatedworldwide.1 Concerns persist about the potential forclimate change to increase the frequency of flooding inthe 21st Century (Doornkamp, 1998; Dorland, 1999;Smith, 1999; Schreider, 2000; Frei, 2000; Palmer andR.ais.anen, 2002; Milly et al., 2002).
ng author. Tel.: +44-117-928-9763; fax: +44-117-928-
ss: [email protected] (J.W. Hall).
ple Mileti (1999) for an account of increasing damage
zards, including flooding, in the USA.
front matter r 2004 Elsevier Ltd. All rights reserved.
zards.2004.04.002
The study described in this paper was a systematicattempt to understand and where possible quantify theextent and scale of risks from flooding in England andWales over a time-scale of 30–100 years in the future.The purpose of analysis was to (i) establish the potentialscale of the flooding problem (ii) identify the processesthat are driving future flood risk and the approximatemagnitude of their contribution to risk, and (iii) identifylimitations to the current flood management policy andpractice. By doing so, the analysis is intended to providethe basis for identification and analysis of policyresponses to future risks, in particular those whoseimplementation may take several decades.Previously, attempts have been made to quantify
specific aspects of long-term change in flood risk, inparticular the potential change in flood frequency in theUK due to climate change (Arnell and Reynard, 1996;
ARTICLE IN PRESSJ.W. Hall et al. / Environmental Hazards 5 (2003) 51–6552
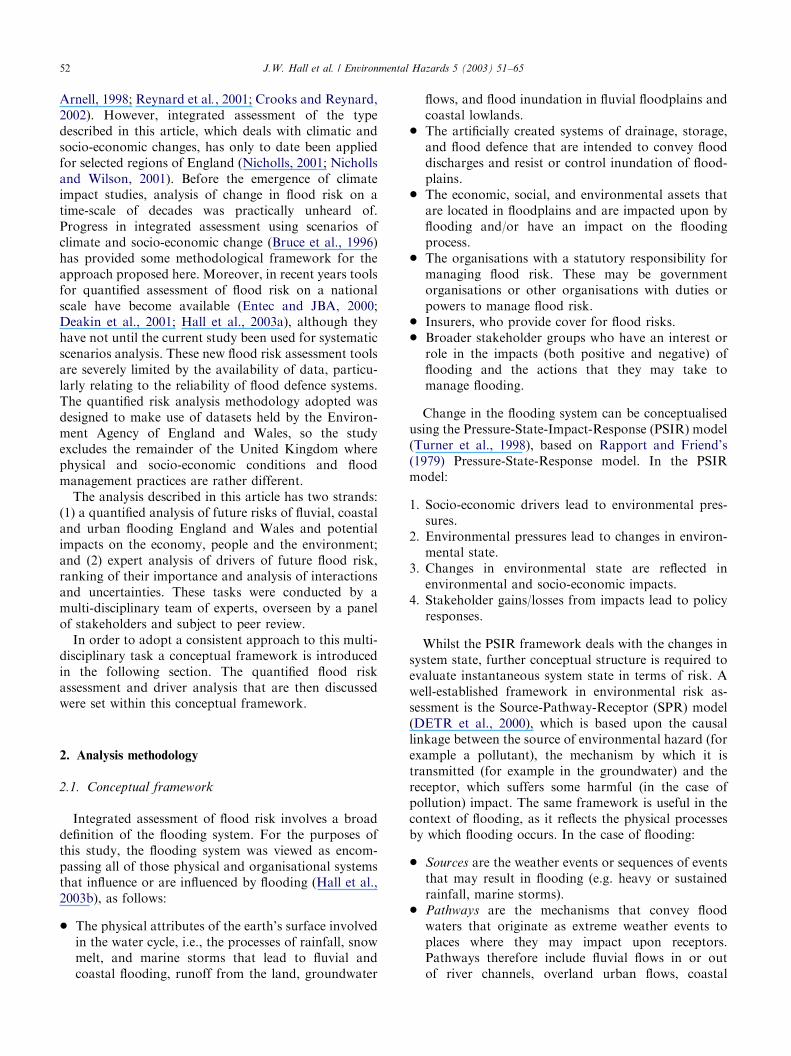
Arnell, 1998; Reynard et al., 2001; Crooks and Reynard,2002). However, integrated assessment of the typedescribed in this article, which deals with climatic andsocio-economic changes, has only to date been appliedfor selected regions of England (Nicholls, 2001; Nichollsand Wilson, 2001). Before the emergence of climateimpact studies, analysis of change in flood risk on atime-scale of decades was practically unheard of.Progress in integrated assessment using scenarios ofclimate and socio-economic change (Bruce et al., 1996)has provided some methodological framework for theapproach proposed here. Moreover, in recent years toolsfor quantified assessment of flood risk on a nationalscale have become available (Entec and JBA, 2000;Deakin et al., 2001; Hall et al., 2003a), although theyhave not until the current study been used for systematicscenarios analysis. These new flood risk assessment toolsare severely limited by the availability of data, particu-larly relating to the reliability of flood defence systems.The quantified risk analysis methodology adopted wasdesigned to make use of datasets held by the Environ-ment Agency of England and Wales, so the studyexcludes the remainder of the United Kingdom wherephysical and socio-economic conditions and floodmanagement practices are rather different.The analysis described in this article has two strands:
(1) a quantified analysis of future risks of fluvial, coastaland urban flooding England and Wales and potentialimpacts on the economy, people and the environment;and (2) expert analysis of drivers of future flood risk,ranking of their importance and analysis of interactionsand uncertainties. These tasks were conducted by amulti-disciplinary team of experts, overseen by a panelof stakeholders and subject to peer review.In order to adopt a consistent approach to this multi-
disciplinary task a conceptual framework is introducedin the following section. The quantified flood riskassessment and driver analysis that are then discussedwere set within this conceptual framework.
2. Analysis methodology
2.1. Conceptual framework
Integrated assessment of flood risk involves a broaddefinition of the flooding system. For the purposes ofthis study, the flooding system was viewed as encom-passing all of those physical and organisational systemsthat influence or are influenced by flooding (Hall et al.,2003b), as follows:
* The physical attributes of the earth’s surface involvedin the water cycle, i.e., the processes of rainfall, snowmelt, and marine storms that lead to fluvial andcoastal flooding, runoff from the land, groundwater
flows, and flood inundation in fluvial floodplains andcoastal lowlands.
* The artificially created systems of drainage, storage,and flood defence that are intended to convey flooddischarges and resist or control inundation of flood-plains.
* The economic, social, and environmental assets thatare located in floodplains and are impacted upon byflooding and/or have an impact on the floodingprocess.
* The organisations with a statutory responsibility formanaging flood risk. These may be governmentorganisations or other organisations with duties orpowers to manage flood risk.
* Insurers, who provide cover for flood risks.* Broader stakeholder groups who have an interest or
role in the impacts (both positive and negative) offlooding and the actions that they may take tomanage flooding.
Change in the flooding system can be conceptualisedusing the Pressure-State-Impact-Response (PSIR) model(Turner et al., 1998), based on Rapport and Friend’s(1979) Pressure-State-Response model. In the PSIRmodel:
1. Socio-economic drivers lead to environmental pres-sures.
2. Environmental pressures lead to changes in environ-mental state.
3. Changes in environmental state are reflected inenvironmental and socio-economic impacts.
4. Stakeholder gains/losses from impacts lead to policyresponses.
Whilst the PSIR framework deals with the changes insystem state, further conceptual structure is required toevaluate instantaneous system state in terms of risk. Awell-established framework in environmental risk as-sessment is the Source-Pathway-Receptor (SPR) model(DETR et al., 2000), which is based upon the causallinkage between the source of environmental hazard (forexample a pollutant), the mechanism by which it istransmitted (for example in the groundwater) and thereceptor, which suffers some harmful (in the case ofpollution) impact. The same framework is useful in thecontext of flooding, as it reflects the physical processesby which flooding occurs. In the case of flooding:
* Sources are the weather events or sequences of eventsthat may result in flooding (e.g. heavy or sustainedrainfall, marine storms).
* Pathways are the mechanisms that convey floodwaters that originate as extreme weather events toplaces where they may impact upon receptors.Pathways therefore include fluvial flows in or outof river channels, overland urban flows, coastal

ARTICLE IN PRESS
SYSTEM STATE VARIABLESPathwaysurban surfaces
fields drains
channels flood storage
flood defencesfloodplains
RISK ESTIMATE (on multiple dimensions e.g.
economics, health/social,natural environment)
Receptorspeoplehouses
industries infrastructures
ecosystems
Sources rainfall
snow melt marine storms
etc.
DRIVERS
Processes that change the state of the system
Risk model
Fig. 2. Summary of conceptual framework.
J.W. Hall et al. / Environmental Hazards 5 (2003) 51–65 53
processes, and failure of fluvial and sea defencestructures or urban drainage systems.
* Receptors are the people, industries, and built andnatural environments that may be impacted upon byflooding.
The division between sources, pathways, and receptorsis not crisp and depends upon the context of theanalysis, though this indeterminacy should not, inprinciple, be problematic.The instantaneous flooding system state can be
captured in terms of a set of state variables thatcharacterise flooding sources, pathways, receptors, or acombination thereof. Typical state variables might beflood defence levels, numbers of properties in thefloodplain, etc. Some state variables may be naturallyfluctuating, for example rainfall intensity or tide level inan estuary, so will be characterised by probabilitydistributions representing (stationary) time-averagedbehaviour.The changes in the flooding system captured in the
PSIR model are reflected in changes in the statevariables over a range of time scales. Any phenomenonthat may change the time-averaged state of the floodingsystem is referred to as a driver. Some of these driverswill be under the control of flood managers, e.g.construction and operation of flood defence systems,or use of flood warning systems to reduce theconsequences of flooding (i.e., reduce the number ofhuman receptors). Many other drivers, e.g. rainfallseverity, or increasing values of house contents, areoutside the control of flood managers and evengovernment in general. The distinction between thesetwo types of drivers is not crisp and in terms of policyrelates to the extent to which government has power toinfluence change and the level of government at whichpower is exercised (Fig. 1). For example, decisionsregarding local flood defence improvements decisionsare devolved to local decision-makers, whereas decisionsto limit emissions of greenhouse gasses are taken at anational and international level.
No control High control
Earth’s orbit
Global values
Globalprosperity
Globalgreenhouse gasemissions
European policy and regulation
National prosperity
Publicperceptions
Insurance industry
Urban and rural land use
Building practices
Flood defences
Floodforecasting andwarning
DRIVERS
Fig. 1. Example drivers classified according to degree of control.
The conceptual framework introduced above issummarised in Fig. 2. The flooding system is describedin terms of a set of state variables that characteriseflooding sources, pathways, receptors, or a combinationthereof. A multi-attribute risk measure is used tocharacterise flood system behaviour with respect tostakeholder values. Future changes in risk (due to theinfluence of drivers) are estimated by making appro-priate changes to state variables and estimating theconsequent change in risk.There may be feedback in the flooding system,
particularly as the consequences of an impact on theenvironment may result in an alteration of the floodingpathways (and potentially sources) that then influencefuture SPR relationships. This is particularly importantfor climate change where long-term impacts are likely toresult from interaction of earth surface and socio-economic processes perhaps leading to wholesalechanges in land use, aquatic character, etc. It isconceivable that these interactions may represent someof the greatest threats and opportunities for floodmanagement in the long term. It is argued that thesecomplex interactions over timescales of decades do notsuccumb to conventional quantified risk analysis (IPCC,2000) so a scenarios-based approach has been adopted.
2.2. Scenarios analysis
The use of scenarios for policy analysis far into thefuture has been stimulated by the long-term nature ofclimate change and the socio-economic uncertaintiessurrounding greenhouse gas emissions and projectionsof societal vulnerability. Flood defence is an interestingapplication of the scenarios-based approach because itinvolves integrated use of two different types ofscenarios:
* Climate change projections are based on emissions
scenarios. Climate change is the key driver relating tothe flooding ‘source’ variables in the SPR model.
* Socio-economic scenarios provide the context inwhich flood management policy and practice will be

ARTICLE IN PRESSJ.W. Hall et al. / Environmental Hazards 5 (2003) 51–6554
enacted and relate to the extent to which society maybe impacted upon by flooding.
The UKCIP02 climate scenarios for the UK (Hulmeet al., 2002) have been used. These scenarios are basedon four emissions scenarios: Low emissions; Medium-Low emissions; Medium-High emissions; and Highemissions, corresponding to the IPCC’s SRES (IPCC,2000) scenarios B1, B2, A2, and A1F1, respectively. TheUKCIP02 scenarios predict that annual average pre-cipitation across the UK may decrease slightly, bybetween 0% and 15% by the 2080s depending onscenario. The seasonal distribution of precipitation willchange, with winters becoming wetter and summersbecoming drier, the biggest relative changes being in the
Fig. 3. Foresight Futures (SPRU et al., 1999; OST 2002).
Table 1
Summary of Foresight Futures (OST 2002)
World markets National enterprise
Social values Internationalist, libertarian Nationalist, individualis
Governance
structures
Weak, dispersed, consultative Weak, national, closed
Role of policy Minimal, enabling markets State-centred, market
regulation to protect key
sectors
Economic
development
High growth, high
innovation, capital
productivity
Medium-low growth, Lo
innovation, Maintenanc
economy
Structural
change
Rapid, towards services More stable economic
structure
Fast-growing
sectors
Health & leisure, media &
information, financial
services, biotechnology,
nanotechnology
Private health and educa
Domestic and personal
services, Tourism, Retai
Defence
Declining
sectors
Manufacturing, agriculture Public services, civil
engineering
Unemployment Medium-low Medium-high
Income High Medium-low
Equity Strong decline Decline
South and East. Under the High Emissions scenariowinter precipitation in the South and East may increaseby up to 30% by the 2080s. By the 2080s the dailyprecipitation intensities that are experienced once every2 years on average may become up to 20% heavier.By the 2080s and depending on scenario relativesea level may be between 2 cm below and 58 cmabove the current level in western Scotland and between26 and 86 cm above the current level in South EastEngland. For some coastal locations a water level that atpresent has a 2% annual probability of occurrence mayhave an annual occurrence probability of 33% by the2080s for Medium-High emissions. The climate changescenarios included within UKCIP02 do not includeallowance for model error and do not thereforerepresent the maximum potential range of climatechange effects.The Foresight Futures socio-economic scenarios
(SPRU et al., 1999; OST, 2002) are intended to suggestpossible long-term futures, exploring alternative direc-tions in which social, economic, and technologicalchanges may evolve over coming decades. The scenariosare represented on a two-dimensional grid (Fig. 3). Onthe vertical dimension is the system of governance,ranging from autonomy where power remains at thenational level, to interdependence where power increas-ingly moves to other institutions, for example theEuropean Union or regional government. On thehorizontal dimension are social values, ranging fromindividualistic values to community-oriented values.The four Foresight Futures that occupy this grid aresummarised in Tables 1 and 2.
Global sustainability Local stewardship
t Internationalist,
communitarian
Localist, co-operative
Strong, co-ordinated,
consultative
Strong, local, participative
Corporatist, political, social
and environmental goals
Interventionist, social and
environmental
w
e
Medium-high growth, high
innovation, resource
productivity
Low growth, low innovation,
modular and sustainable
Fast, towards services Moderate, towards regional
systems
tion,
ling,
Education and training,
Large systems engineering,
New and renewable energy,
Information services
Small-scale manufacturing,
Food and organic farming,
Local services
Fossil fuel energy,
Traditional manufacturing
Retailing, tourism, financial
services
Low Medium-low (large voluntary
sector)
Medium-high Low
Improvement Strong improvement
ARTICLE IN PRESS
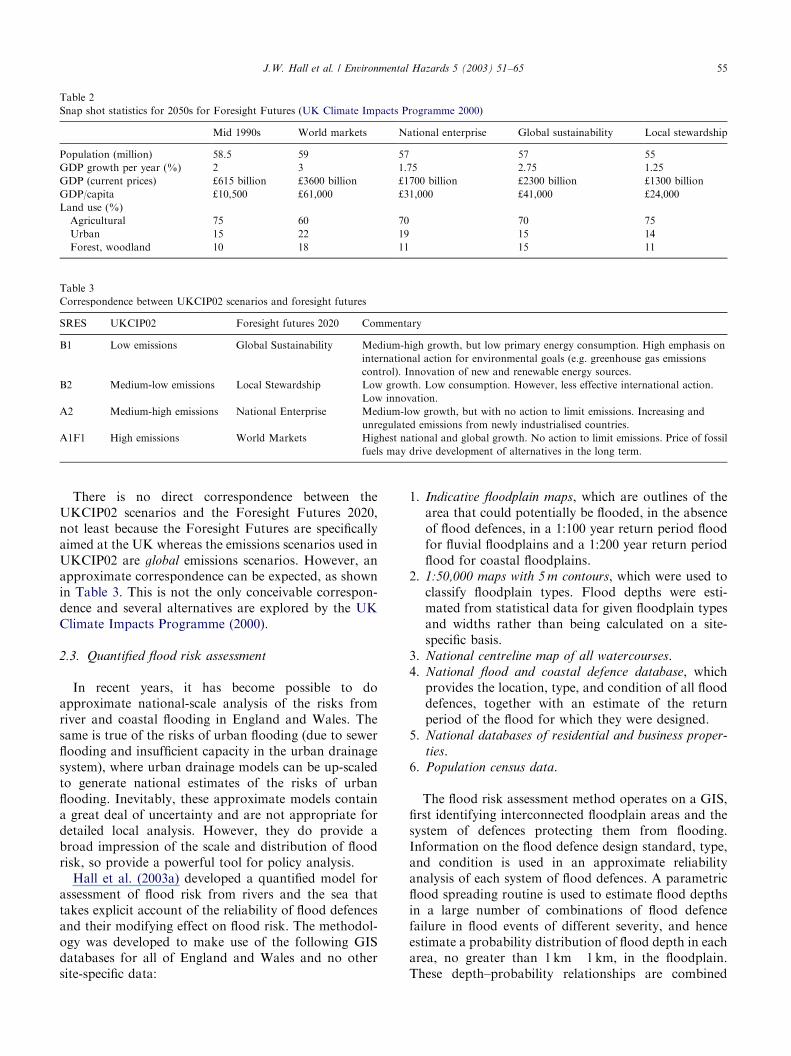
Table 3
Correspondence between UKCIP02 scenarios and foresight futures
SRES UKCIP02 Foresight futures 2020 Commentary
B1 Low emissions Global Sustainability Medium-high growth, but low primary energy consumption. High emphasis on
international action for environmental goals (e.g. greenhouse gas emissions
control). Innovation of new and renewable energy sources.
B2 Medium-low emissions Local Stewardship Low growth. Low consumption. However, less effective international action.
Low innovation.
A2 Medium-high emissions National Enterprise Medium-low growth, but with no action to limit emissions. Increasing and
unregulated emissions from newly industrialised countries.
A1F1 High emissions World Markets Highest national and global growth. No action to limit emissions. Price of fossil
fuels may drive development of alternatives in the long term.
Table 2
Snap shot statistics for 2050s for Foresight Futures (UK Climate Impacts Programme 2000)
Mid 1990s World markets National enterprise Global sustainability Local stewardship
Population (million) 58.5 59 57 57 55
GDP growth per year (%) 2 3 1.75 2.75 1.25
GDP (current prices) £615 billion £3600 billion £1700 billion £2300 billion £1300 billion
GDP/capita £10,500 £61,000 £31,000 £41,000 £24,000
Land use (%)
Agricultural 75 60 70 70 75
Urban 15 22 19 15 14
Forest, woodland 10 18 11 15 11
J.W. Hall et al. / Environmental Hazards 5 (2003) 51–65 55
There is no direct correspondence between theUKCIP02 scenarios and the Foresight Futures 2020,not least because the Foresight Futures are specificallyaimed at the UK whereas the emissions scenarios used inUKCIP02 are global emissions scenarios. However, anapproximate correspondence can be expected, as shownin Table 3. This is not the only conceivable correspon-dence and several alternatives are explored by the UKClimate Impacts Programme (2000).
2.3. Quantified flood risk assessment
In recent years, it has become possible to doapproximate national-scale analysis of the risks fromriver and coastal flooding in England and Wales. Thesame is true of the risks of urban flooding (due to sewerflooding and insufficient capacity in the urban drainagesystem), where urban drainage models can be up-scaledto generate national estimates of the risks of urbanflooding. Inevitably, these approximate models containa great deal of uncertainty and are not appropriate fordetailed local analysis. However, they do provide abroad impression of the scale and distribution of floodrisk, so provide a powerful tool for policy analysis.Hall et al. (2003a) developed a quantified model for
assessment of flood risk from rivers and the sea thattakes explicit account of the reliability of flood defencesand their modifying effect on flood risk. The methodol-ogy was developed to make use of the following GISdatabases for all of England and Wales and no othersite-specific data:
1. Indicative floodplain maps, which are outlines of thearea that could potentially be flooded, in the absenceof flood defences, in a 1:100 year return period floodfor fluvial floodplains and a 1:200 year return periodflood for coastal floodplains.
2. 1:50,000 maps with 5 m contours, which were used toclassify floodplain types. Flood depths were esti-mated from statistical data for given floodplain typesand widths rather than being calculated on a site-specific basis.
3. National centreline map of all watercourses.4. National flood and coastal defence database, which
provides the location, type, and condition of all flooddefences, together with an estimate of the returnperiod of the flood for which they were designed.
5. National databases of residential and business proper-
ties.6. Population census data.
The flood risk assessment method operates on a GIS,first identifying interconnected floodplain areas and thesystem of defences protecting them from flooding.Information on the flood defence design standard, type,and condition is used in an approximate reliabilityanalysis of each system of flood defences. A parametricflood spreading routine is used to estimate flood depthsin a large number of combinations of flood defencefailure in flood events of different severity, and henceestimate a probability distribution of flood depth in eacharea, no greater than 1 km� 1 km, in the floodplain.These depth–probability relationships are combined

ARTICLE IN PRESSJ.W. Hall et al. / Environmental Hazards 5 (2003) 51–6556
with census data and commercial databases of propertyand population location, together with relationshipsbetween flood depth and economic damage that havebeen developed from empirical analysis of past floodingevents (Penning–Rowsell et al., 2003). No discounting orinflation is applied to economic risks. Risk is estimatedat time points in the future using today’s prices. Theresults have been aggregated and are reported nation-ally, regionally and on a 10 km� 10 km grid. Anestimate of the risk to lives, health, and communitieswas obtained by analysing population density andcensus data indicating the potential vulnerability ofdifference sectors of the community to flooding (Tapsellet al., 2002).The flood risk assessment model has been used for a
national assessment of the risk from flooding in 2002(HR Wallingford, 2003; Sayers et al., 2003), and this2002 analysis was used as a basis for comparison withfuture changes. The 2002 analysis has been comparedwith recent flood events to assess the dependability anduncertainties in the methodology (HR Wallingford,2003). The annual average flood damage estimate ofroughly £1billion is of the same order to, but somewhatlarger than, annual losses due to flooding averaged overrecent years. Some of the inconsistency is explained byreporting of recent flood events and by assumptions inthe model (particularly the exclusion of emergencyrepair works). The reasonably good correspondencebetween model and observations indicates that themodel does provide a sound basis for comparativeevaluation of future scenarios.The method is computer-intensive, and 2002 analysis
took several weeks to compute, with separate computersbeing dedicated to each region of the EnvironmentAgency of England and Wales. The computationalaspects, in particular the interaction with the GISdatabase, have since been refined, so that each scenarioanalysis reported here took about a week to compute.In addition to the national-scale risk modelling of
flooding from rivers and the sea, quantified analysis wasmade of the effects of long-term change on thefrequency of urban flooding. The approach adoptedwas based on analysis of three typical cities: a markettown in northern England, and inland city with majorwatercourses in Scotland and a coastal city in Wales.Results from these locations were then up-scaled basedon asset data from water service providers. This present-day analysis was combined with scenarios of rainfalldepth, duration, and frequency; asset deterioration;urbanization; and changing vulnerability.The models outlined above were used to analyse the
long-term change by making appropriate changes to themodel parameters to reflect the time and scenario underconsideration. The four scenarios listed in Table 3 wereanalysed for the 2080s and chosen to coincide withthe years for which climate scenarios were available
(Hulme et al., 2002). The input data required by the riskassessment models do not correspond exactly to theinformation provided in either in climate change orsocio-economic scenarios. It was therefore necessary toconstruct approximate relationships between the vari-ables for which scenarios information was available andthe variables required for flood risk analysis. Asummary of the relationships adopted in the analysisof risks from river and coastal flooding is provided inTable 4. A quantified estimate was made of the effect ineach scenario that a given change, for exampleurbanisation, would have on the relevant variables inthe risk model (Table 4). The cumulative effect of eachof the changes in the given scenario was then calculated.Where feasible, regional variation was applied to theseadjustments in order to take account of, for example,regional differences in climate or demographic projec-tions. There is no unique mapping between a scenario,which is an inherently vague entity, and a realization ofthe risk model. In other words, there is not a uniquerepresentation of the scenario in the risk model. Thequantified analysis presented here is one of manyequally plausible representations of the same fourscenarios. Whilst no claim is made to the uniquenessof these results, they do illustrate some striking contrastsbetween different scenarios of change and provide thebasis for exploring responses to flood risk that arerobust across plausible futures. The approach issummarised in Fig. 4. The final step in Fig. 4 representsa cross-check with the expert analysis of driversdescribed below.Future flood risk is greatly influenced by flood
management policy and practice, perhaps more so thanit is by changes outside the control of the flood manager,such as climate change or economic growth. However,in the analysis described here, current flood dikealignment and levels of investment in maintenance andrenewal were kept the same across all scenarios. Clearly,flood management policy will change in the future andwill tend to reflect the nature and public expectations offuture society, i.e., flood management is scenario-dependent. However, the aim of the current study wasto inform present-day policy makers and, in order to dothat, the present day flood management policy wassubjected to particular scrutiny by analysing its effec-tiveness in a range of scenarios. Changing scenarioswere super-imposed on this fixed flood managementpolicy (including the current pattern of expenditure andtechnical approach), in order to assess the capacity ofthe current policy to cope with long-term changes.
2.4. Expert analysis of drivers
The quantified analysis of future flood risk describedabove provides an impression of how risk may change infuture under a range of different climate change and

ARTICLE IN PRESS
Table 4
Representation of risk drivers in quantified analysis
Variable used risk model Explanation Changes that may be represented with this variable
Standard of Protection
(SoP) of flood defences
The return period at which the flood defence (or where
none exists the river bank) is expected to overtop.
Climate changea
Changes in land use management (which may change
run-off and hence river flows and water levels)
Morphological change (that may also influence the
conveyance of the river and hence water levels)
Condition grade of flood
defences
An indicator of the robustness of the defences and
their likely performance when subjected to storm load
Morphological changes
Maintenance regimes
Location of people and
properties in the floodplain
Spatially referenced database of domestic and
commercial properties.
Demographic changes
Urbanisation
Census data on occupancy, age, etc. Commercial development
Flood depth–damage
relationships
Estimated flood damage (in £ per house or commercial
property) for a range of flood depths
Changes in building contents
Changes in construction practices
Social flood vulnerability
indicesbAn aggregate measure of population vulnerability to
flooding, based on census data
Changes in demographics (e.g. age)
Changes in equity
Agricultural land use
classification in the
floodplain
Agricultural land grade from 1 (primearable) to 5 (no
agricultural use)
Changed agricultural practices
Agricultural land being taken out of use
Reduction factors Measures that will reduce total flood damage, e.g.
flood warning and evacuation can be reflected by
factoring the estimated annual average damage
Flood warning (including communications
technologies) and public response to warning
Evacuation
Community self-help
aFor example a scenario in which if climate change is expected to increase water levels by 20% is represented by reducing the SoP of flood defences
by an appropriate increment.bTapsell et al. (2002).
Quantified estimates of changes tosystem state variables under differentscenarios (from the literature wheneveravailable)
Map changes in system state variables(v1, v2, …, vn) onto changes in riskmodel parameters (r1, r2, …, rm) : n >>>m.
Run risk model to estimate flood risk(economic and social impact) at 2050and 2080 for four Foresight scenarios
Interpret risk model results and comparewith expert estimates of changes in riskdue to individual and combinations ofdrivers.
Fig. 4. Overview of methodology for implementation and interpreta-
tion of national-scale flood risk analysis.
J.W. Hall et al. / Environmental Hazards 5 (2003) 51–65 57
socio-economic scenarios. However, it does not providespecific insights into the contribution that differentdrivers of change make to the total risk. To do so would
require a large number of sensitivity runs, which werenot feasible in the context of the present study given theconsiderable computational expense of each national-scale flood risk assessment model run. Moreover, theapproximate risk analysis tools described above couldnot resolve the effects of all of the potential drivers ofchange.In order to provide an insight into the importance of
individual drivers to the overall flood risk, a rankingmethodology, based on expert judgement, was em-ployed. First, the drivers of changing flood risk wereidentified in a brainstorming session and clustered into amanageable number of driver sets (Table 5). The futurechange in each driver was described and, where possible,quantified using evidence from the literature. As in thequantified flood risk analysis described above, floodmanagement activities were assumed to remain constantand were excluded from the analysis.Drivers were ranked according to an expert assess-
ment of their impact on total flood risk in England andWales at two specified times in the future (2050s and2080s) under four scenarios, relative to present day floodrisk. For the purposes of this analysis, flood risk wasdefined as the product of the likelihood and conse-quences of flooding, and an aggregate measure of
ARTICLE IN PRESS
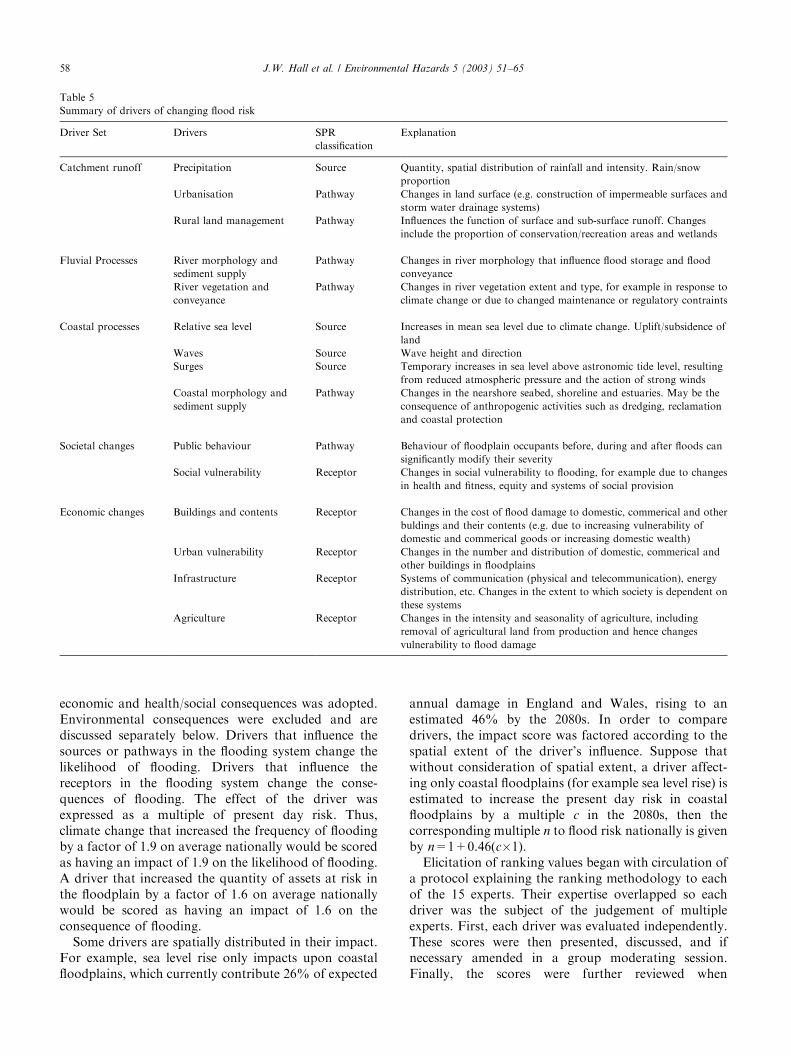
Table 5
Summary of drivers of changing flood risk
Driver Set Drivers SPR
classification
Explanation
Catchment runoff Precipitation Source Quantity, spatial distribution of rainfall and intensity. Rain/snow
proportion
Urbanisation Pathway Changes in land surface (e.g. construction of impermeable surfaces and
storm water drainage systems)
Rural land management Pathway Influences the function of surface and sub-surface runoff. Changes
include the proportion of conservation/recreation areas and wetlands
Fluvial Processes River morphology and
sediment supply
Pathway Changes in river morphology that influence flood storage and flood
conveyance
River vegetation and
conveyance
Pathway Changes in river vegetation extent and type, for example in response to
climate change or due to changed maintenance or regulatory contraints
Coastal processes Relative sea level Source Increases in mean sea level due to climate change. Uplift/subsidence of
land
Waves Source Wave height and direction
Surges Source Temporary increases in sea level above astronomic tide level, resulting
from reduced atmospheric pressure and the action of strong winds
Coastal morphology and
sediment supply
Pathway Changes in the nearshore seabed, shoreline and estuaries. May be the
consequence of anthropogenic activities such as dredging, reclamation
and coastal protection
Societal changes Public behaviour Pathway Behaviour of floodplain occupants before, during and after floods can
significantly modify their severity
Social vulnerability Receptor Changes in social vulnerability to flooding, for example due to changes
in health and fitness, equity and systems of social provision
Economic changes Buildings and contents Receptor Changes in the cost of flood damage to domestic, commerical and other
buldings and their contents (e.g. due to increasing vulnerability of
domestic and commerical goods or increasing domestic wealth)
Urban vulnerability Receptor Changes in the number and distribution of domestic, commerical and
other buildings in floodplains
Infrastructure Receptor Systems of communication (physical and telecommunication), energy
distribution, etc. Changes in the extent to which society is dependent on
these systems
Agriculture Receptor Changes in the intensity and seasonality of agriculture, including
removal of agricultural land from production and hence changes
vulnerability to flood damage
J.W. Hall et al. / Environmental Hazards 5 (2003) 51–6558
economic and health/social consequences was adopted.Environmental consequences were excluded and arediscussed separately below. Drivers that influence thesources or pathways in the flooding system change thelikelihood of flooding. Drivers that influence thereceptors in the flooding system change the conse-quences of flooding. The effect of the driver wasexpressed as a multiple of present day risk. Thus,climate change that increased the frequency of floodingby a factor of 1.9 on average nationally would be scoredas having an impact of 1.9 on the likelihood of flooding.A driver that increased the quantity of assets at risk inthe floodplain by a factor of 1.6 on average nationallywould be scored as having an impact of 1.6 on theconsequence of flooding.Some drivers are spatially distributed in their impact.
For example, sea level rise only impacts upon coastalfloodplains, which currently contribute 26% of expected
annual damage in England and Wales, rising to anestimated 46% by the 2080s. In order to comparedrivers, the impact score was factored according to thespatial extent of the driver’s influence. Suppose thatwithout consideration of spatial extent, a driver affect-ing only coastal floodplains (for example sea level rise) isestimated to increase the present day risk in coastalfloodplains by a multiple c in the 2080s, then thecorresponding multiple n to flood risk nationally is givenby n=1+0.46(c�1).Elicitation of ranking values began with circulation of
a protocol explaining the ranking methodology to eachof the 15 experts. Their expertise overlapped so eachdriver was the subject of the judgement of multipleexperts. First, each driver was evaluated independently.These scores were then presented, discussed, and ifnecessary amended in a group moderating session.Finally, the scores were further reviewed when

ARTICLE IN PRESSJ.W. Hall et al. / Environmental Hazards 5 (2003) 51–65 59
compared with the results of the quantified risk analysisintroduced above and then subjected to wider peerreview via two workshops with 21 and 34 attendees, oneopen meeting attended by 131 people, and electronicpublication of draft results.
3. Results and discussion
3.1. Quantified flood risk assessment
The results of national-scale flood risk assessment aresummarised in Table 6. Large increases in the number ofpeople occupying the floodplain in the UK are envisagedin the relatively loosely regulated World Markets andNational Enterprise scenarios. Floodplain occupancy iskept stable in the Global Sustainability and LocalStewardship scenarios. However, increasing flood fre-quency, primarily due to climate change means that evenwith stable numbers of people in the floodplain, thenumber of people at risk from flooding more frequentlythan 1:75 years will increase in all scenarios, assumingthat current flood defence systems are continued into thefuture. Greater climate change by the 2080s, togetherwith the increased floodplain occupancy noted abovemeans that the World Markets and National Enterprisescenarios will see more than twice the number of peopleat risk from flooding more frequently than 1:75 years.In all scenarios other than the relatively low growth
Local Stewardship scenario, annual economic flooddamage is expected to increase considerably over thenext century assuming the current flood defence policiesare continued into the future. A roughly 20-fold increaseby the 2080s is predicted in the World Markets scenario,which is attributable to a combination of muchincreased economic vulnerability (higher floodplainoccupancy, increased value of household/industrialcontents, increasing infrastructure vulnerability) to-gether with increasing flood frequency.Change in the ratio of flood risk to per capita GDP
provides an indication of how severe or harmful (ineconomic terms) flooding will be when compared with
Table 6
Summary of flood risk assessment for England and Wales (excluding sewer
2002
Number of people within the indicative floodplain (millions) 4.5
Number of people exposed to flooding (depth>0m) with a
frequency>1:75 years (millions)
1.6
Expected annual economic damage (residential and commercial
properties) (£billions)
1.0
Annual economic damage relative to GDP (%) 0.10
Expected annual economic damage (agricultural production)
(£millions)
5.9
economic growth over the next century. In the WorldMarkets and National Enterprise scenarios, flooding isexpected to remove a greater proportion of nationalwealth than it currently does (and thus merit a greaterinvestment to reduce risk). In the Local Stewardship andGlobal Sustainability scenarios, flooding is predicted toremove a lesser proportion of national wealth since thesescenarios tend to be less vulnerable to flood damage andare expected to be subject to somewhat less climatechange.The pattern for flood damage to agriculture is rather
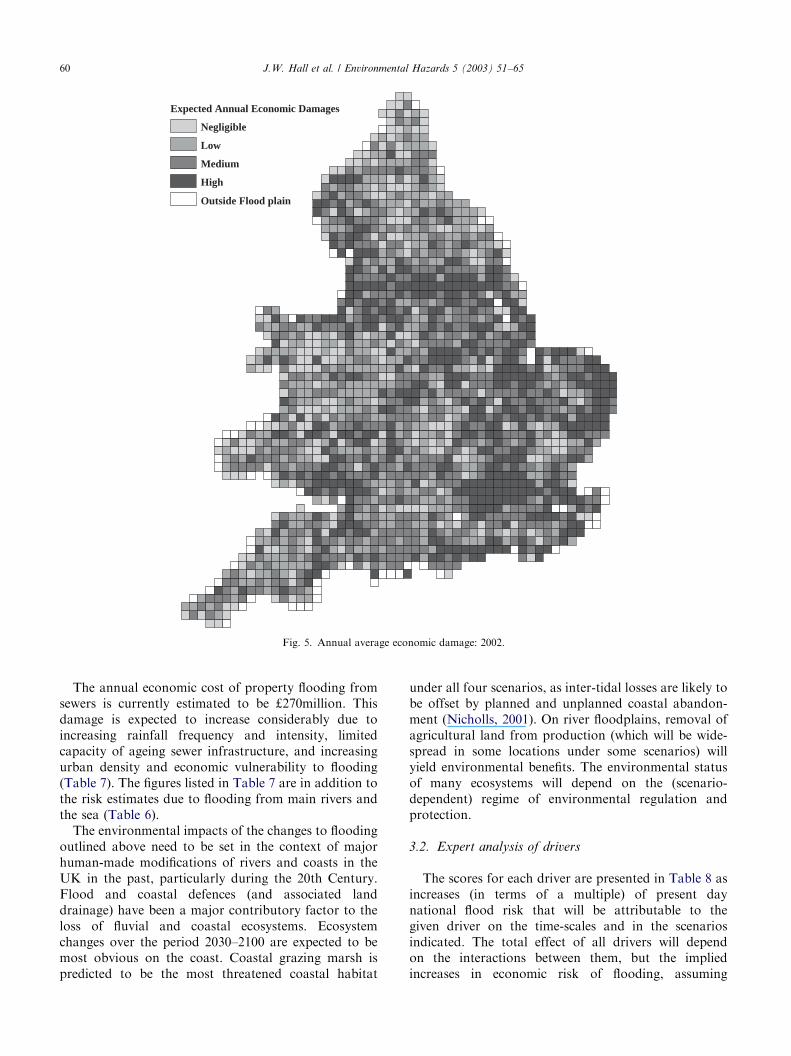
different to the pattern from economic damage as awhole. At present, agricultural losses account for onlyabout 0.5% of economic damage due to flooding. Thisloss is very small in economic terms, but can representconsiderable impact on the rural economy. In theglobalized World Markets scenario, the proportion ofagricultural losses is projected to decrease, since agreater proportion of agricultural products are beingimported (though the effect of climate change onagriculture globally has not been considered) and low-grade agricultural land is being taken out of production.Agricultural damage in the more self-sufficient NationalEnterprise and Local Stewardship scenarios is expectedto be more significant.By way of baseline, the spatial distribution of flood
risk based on 2002 data is presented in Fig. 5. Highesteconomic risk is located in floodplain areas of higheconomic value, notably Greater London despite veryhigh standards of flood protection. A number of areas ofhigh coastal flood risk are located along the South, East,and North-West coasts of England. The distribution ofthe increase in expected annual economic damage forthe World Markets 2080s scenario, relative to 2002, isillustrated in Fig. 6. Increasing risk is predicted to beconcentrated in broadly the same areas as where it iscurrently highest. London and the Thames Estuary (dueto rapid urbanisation), the South East coast (due torising relative sea levels), and urban areas of NorthernEngland (due to high predicted increases in intenserainfall) stand out as areas where the growth ineconomic risk will be greatest.
flooding)
World
markets
2080s
National
enterprise
2080s
Global
sustainability
2080s
Local
stewardship
2080s
6.9 6.3 4.6 4.5
3.5 3.6 2.4 2.3
20.5 15.0 4.9 1.5
0.14 0.31 0.06 0.05
34.4 41.3 43.9 63.5
ARTICLE IN PRESS
Expected Annual Economic Damages
Negligible
Low
Medium
High
Outside Flood plain
Fig. 5. Annual average economic damage: 2002.
J.W. Hall et al. / Environmental Hazards 5 (2003) 51–6560
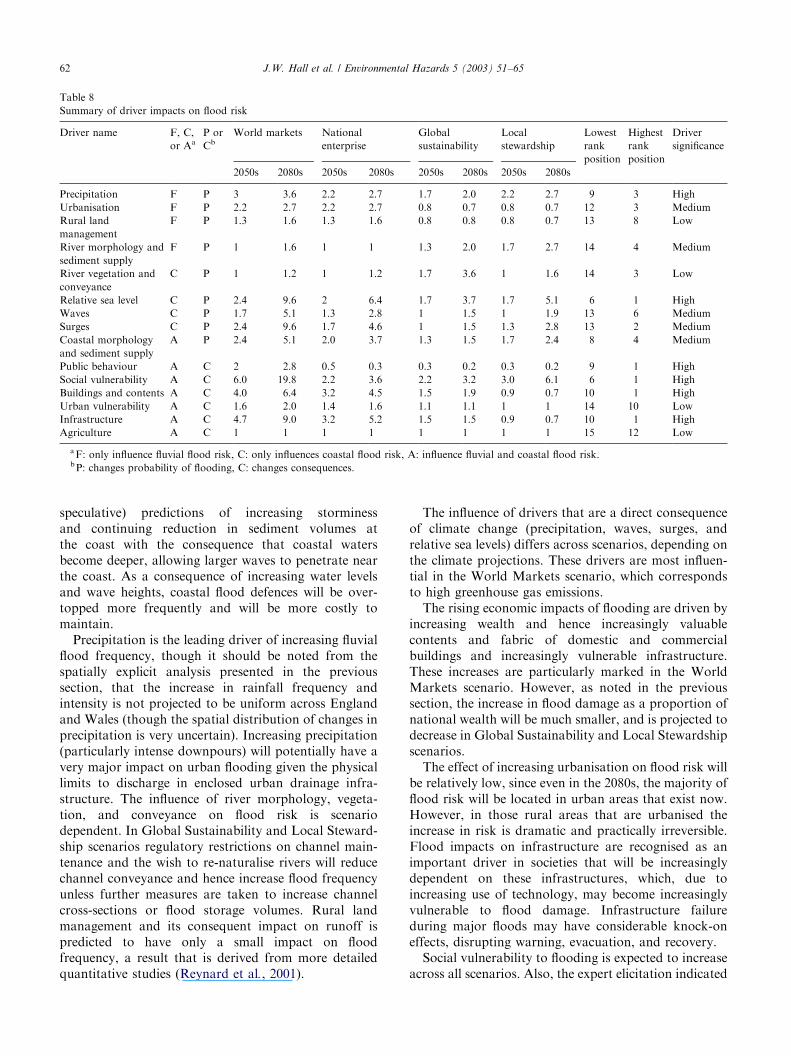
The annual economic cost of property flooding fromsewers is currently estimated to be £270million. Thisdamage is expected to increase considerably due toincreasing rainfall frequency and intensity, limitedcapacity of ageing sewer infrastructure, and increasingurban density and economic vulnerability to flooding(Table 7). The figures listed in Table 7 are in addition tothe risk estimates due to flooding from main rivers andthe sea (Table 6).The environmental impacts of the changes to flooding
outlined above need to be set in the context of majorhuman-made modifications of rivers and coasts in theUK in the past, particularly during the 20th Century.Flood and coastal defences (and associated landdrainage) have been a major contributory factor to theloss of fluvial and coastal ecosystems. Ecosystemchanges over the period 2030–2100 are expected to bemost obvious on the coast. Coastal grazing marsh ispredicted to be the most threatened coastal habitat
under all four scenarios, as inter-tidal losses are likely tobe offset by planned and unplanned coastal abandon-ment (Nicholls, 2001). On river floodplains, removal ofagricultural land from production (which will be wide-spread in some locations under some scenarios) willyield environmental benefits. The environmental statusof many ecosystems will depend on the (scenario-dependent) regime of environmental regulation andprotection.
3.2. Expert analysis of drivers
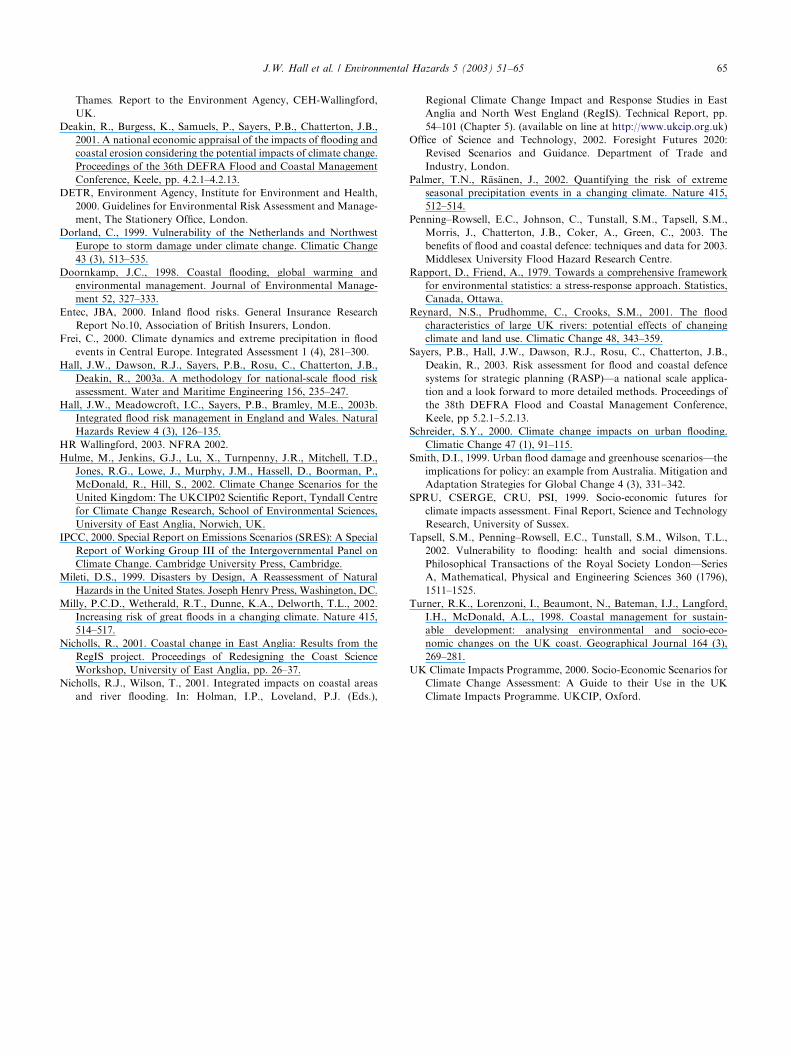
The scores for each driver are presented in Table 8 asincreases (in terms of a multiple) of present daynational flood risk that will be attributable to thegiven driver on the time-scales and in the scenariosindicated. The total effect of all drivers will dependon the interactions between them, but the impliedincreases in economic risk of flooding, assuming
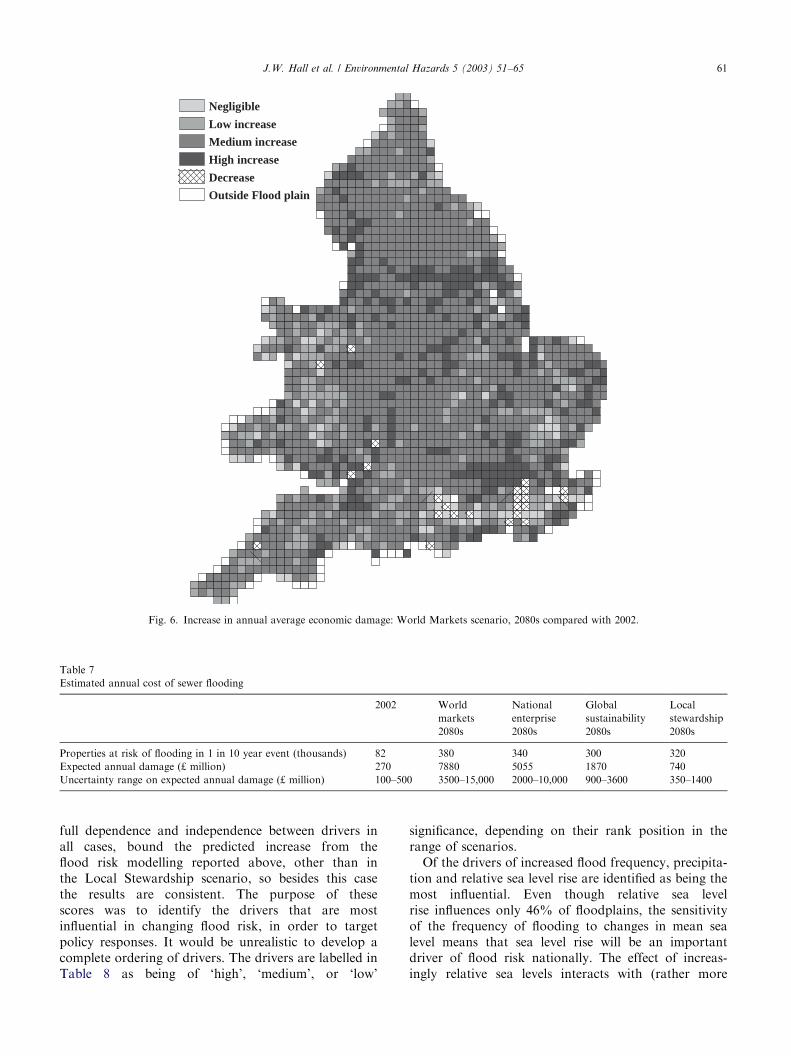
ARTICLE IN PRESS
Negligible
Low increase
Medium increase
High increase
Decrease
Outside Flood plain
Fig. 6. Increase in annual average economic damage: World Markets scenario, 2080s compared with 2002.
Table 7
Estimated annual cost of sewer flooding
2002 World
markets
2080s
National
enterprise
2080s
Global
sustainability
2080s
Local
stewardship
2080s
Properties at risk of flooding in 1 in 10 year event (thousands) 82 380 340 300 320
Expected annual damage (£ million) 270 7880 5055 1870 740
Uncertainty range on expected annual damage (£ million) 100–500 3500–15,000 2000–10,000 900–3600 350–1400
J.W. Hall et al. / Environmental Hazards 5 (2003) 51–65 61
full dependence and independence between drivers inall cases, bound the predicted increase from theflood risk modelling reported above, other than inthe Local Stewardship scenario, so besides this casethe results are consistent. The purpose of thesescores was to identify the drivers that are mostinfluential in changing flood risk, in order to targetpolicy responses. It would be unrealistic to develop acomplete ordering of drivers. The drivers are labelled inTable 8 as being of ‘high’, ‘medium’, or ‘low’
significance, depending on their rank position in therange of scenarios.Of the drivers of increased flood frequency, precipita-
tion and relative sea level rise are identified as being themost influential. Even though relative sea levelrise influences only 46% of floodplains, the sensitivityof the frequency of flooding to changes in mean sealevel means that sea level rise will be an importantdriver of flood risk nationally. The effect of increas-ingly relative sea levels interacts with (rather more
ARTICLE IN PRESS
Table 8
Summary of driver impacts on flood risk
Driver name F, C,
or AaP or
CbWorld markets National
enterprise
Global
sustainability
Local
stewardship
Lowest
rank
position
Highest
rank
position
Driver
significance
2050s 2080s 2050s 2080s 2050s 2080s 2050s 2080s
Precipitation F P 3 3.6 2.2 2.7 1.7 2.0 2.2 2.7 9 3 High
Urbanisation F P 2.2 2.7 2.2 2.7 0.8 0.7 0.8 0.7 12 3 Medium
Rural land
management
F P 1.3 1.6 1.3 1.6 0.8 0.8 0.8 0.7 13 8 Low
River morphology and
sediment supply
F P 1 1.6 1 1 1.3 2.0 1.7 2.7 14 4 Medium
River vegetation and
conveyance
C P 1 1.2 1 1.2 1.7 3.6 1 1.6 14 3 Low
Relative sea level C P 2.4 9.6 2 6.4 1.7 3.7 1.7 5.1 6 1 High
Waves C P 1.7 5.1 1.3 2.8 1 1.5 1 1.9 13 6 Medium
Surges C P 2.4 9.6 1.7 4.6 1 1.5 1.3 2.8 13 2 Medium
Coastal morphology
and sediment supply
A P 2.4 5.1 2.0 3.7 1.3 1.5 1.7 2.4 8 4 Medium
Public behaviour A C 2 2.8 0.5 0.3 0.3 0.2 0.3 0.2 9 1 High
Social vulnerability A C 6.0 19.8 2.2 3.6 2.2 3.2 3.0 6.1 6 1 High
Buildings and contents A C 4.0 6.4 3.2 4.5 1.5 1.9 0.9 0.7 10 1 High
Urban vulnerability A C 1.6 2.0 1.4 1.6 1.1 1.1 1 1 14 10 Low
Infrastructure A C 4.7 9.0 3.2 5.2 1.5 1.5 0.9 0.7 10 1 High
Agriculture A C 1 1 1 1 1 1 1 1 15 12 Low
aF: only influence fluvial flood risk, C: only influences coastal flood risk, A: influence fluvial and coastal flood risk.bP: changes probability of flooding, C: changes consequences.
J.W. Hall et al. / Environmental Hazards 5 (2003) 51–6562
speculative) predictions of increasing storminessand continuing reduction in sediment volumes atthe coast with the consequence that coastal watersbecome deeper, allowing larger waves to penetrate nearthe coast. As a consequence of increasing water levelsand wave heights, coastal flood defences will be over-topped more frequently and will be more costly tomaintain.Precipitation is the leading driver of increasing fluvial
flood frequency, though it should be noted from thespatially explicit analysis presented in the previoussection, that the increase in rainfall frequency andintensity is not projected to be uniform across Englandand Wales (though the spatial distribution of changes inprecipitation is very uncertain). Increasing precipitation(particularly intense downpours) will potentially have avery major impact on urban flooding given the physicallimits to discharge in enclosed urban drainage infra-structure. The influence of river morphology, vegeta-tion, and conveyance on flood risk is scenariodependent. In Global Sustainability and Local Steward-ship scenarios regulatory restrictions on channel main-tenance and the wish to re-naturalise rivers will reducechannel conveyance and hence increase flood frequencyunless further measures are taken to increase channelcross-sections or flood storage volumes. Rural landmanagement and its consequent impact on runoff ispredicted to have only a small impact on floodfrequency, a result that is derived from more detailedquantitative studies (Reynard et al., 2001).
The influence of drivers that are a direct consequenceof climate change (precipitation, waves, surges, andrelative sea levels) differs across scenarios, depending onthe climate projections. These drivers are most influen-tial in the World Markets scenario, which correspondsto high greenhouse gas emissions.The rising economic impacts of flooding are driven by
increasing wealth and hence increasingly valuablecontents and fabric of domestic and commercialbuildings and increasingly vulnerable infrastructure.These increases are particularly marked in the WorldMarkets scenario. However, as noted in the previoussection, the increase in flood damage as a proportion ofnational wealth will be much smaller, and is projected todecrease in Global Sustainability and Local Stewardshipscenarios.The effect of increasing urbanisation on flood risk will
be relatively low, since even in the 2080s, the majority offlood risk will be located in urban areas that exist now.However, in those rural areas that are urbanised theincrease in risk is dramatic and practically irreversible.Flood impacts on infrastructure are recognised as animportant driver in societies that will be increasinglydependent on these infrastructures, which, due toincreasing use of technology, may become increasinglyvulnerable to flood damage. Infrastructure failureduring major floods may have considerable knock-oneffects, disrupting warning, evacuation, and recovery.Social vulnerability to flooding is expected to increase
across all scenarios. Also, the expert elicitation indicated

ARTICLE IN PRESSJ.W. Hall et al. / Environmental Hazards 5 (2003) 51–65 63
that certain public behaviours may have a considerableimpact on flood risk.In keeping with the results presented in the previous
section, agricultural impacts are predicted to benegligible in national economic or social terms (thoughtheir local impacts will be significant).
4. Policy implications
The quantified analysis of flood risk has demonstratedthat if the current flood defence policy is continuedunchanged in the future, there will be very significantincreases in the frequency with which people andproperty suffer flooding with potentially very largeimpacts in economic and social terms. Whilst somedrivers of increasing flood risk stand out as beingparticularly influential, on the whole, the projectedincreases in flood risk for all scenarios depends onthe cumulative and interacting affect of multipledrivers influencing both the probability and the con-sequences of flooding. Attempts to control the increasein flood risk (if it is deemed to be desirable to do so) willneed to address these multiple drivers in an integratedmanner. There are clear spatial patterns to the distribu-tion of flood risk and the location of its projectedincreases. Packages of policy response need to betailored to reflect the characteristics of particularlocalities.Coastal flooding makes an increasing contribution to
total flood risk, increasing from 26% in 2002, to 46% inthe 2080s. The increasing probability of overtopping theThames Barrier and adjoining dikes that protect centralLondon makes a significant contribution to this increasein risk. At many coastal sites (including major industrialand infrastructure facilities), there is very limited scopeto retreat inland without major economic and/or socialimplications. The increasing frequency and severity ofloading of coastal flood defences means that they will beincreasingly costly to repair or replace. Continuedreduction in sediment supply to coasts will be reflectedin a narrowing of beaches and deterioration in amenityand ecological value of coasts.Urban flooding makes a significant contribution to
the economic impacts of flooding and it is the floodingthat members of the public experience most frequently.The finite capacity and ageing condition of much urbandrainage and sewer infrastructure is at odds with policycommitments to increase the density of urban habitationin England.Analysis of fluvial flooding processes has indicated
that regulatory pressure to restore river habitats undersome scenarios will reduce channel conveyance and leadto increasing flood risk. This effect may be mitigated byretreat from current flood dike alignment and restoringlarger areas of the floodplain to their natural state—
a policy with both flood management and ecologicalbenefits.Other than specific areas of particularly rapid
projected development in South East England, themajority of vulnerable buildings are a legacy of existingrather than future development. Thus, urbanisationmakes a fairly modest contribution to increases in floodrisk nationally. However, there are still considerablebenefits to be gained locally in avoiding the increase invulnerability that is brought about by floodplainurbanisation.The agricultural impacts of flooding are very small in
economic terms and are projected to decrease underscenarios where support for agricultural production isexpected to decrease. Measures to protect agriculturalland from flooding will be a reducing economic priority.However, some farming communities will be veryvulnerable. Measures to reduce flood risk by bettermanaging runoff from agricultural land are onlyprojected to have a small impact on total flood risk.Calculated in real terms, a major driver of increasing
flood risk is the increasing value of domestic andcommercial buildings and their contents. However, allof this loss may not be perceived to be real, in thatdamage due to flooding as a proportion of total wealthwill grow much more slowly. The extent to which lossesare perceived to be harmful will determine willingness topay to reduce risk through taxation or measuresprovided by the market (insurance, subscription flooddefence, flood proofing, etc.). The effects of flooddamage and disruption to infrastructure are difficult toestimate. However, it is projected that unless specificmeasures are taken to reduce the vulnerability ofexisting and in particular new high technology infra-structures, then flood damage will be significant andcould impact upon a large proportion of the population,including many who do not live in floodplains. Changesin social vulnerability to flooding and the potentialimpacts of public behaviour on modulating flood risk,signal a need to attend to these social issues.The risk analysis described in this paper has not
estimated the risks of loss of life due to flooding. Theincreasing economic risks estimated here are likely to beaccompanied by increasing risk of loss of life, thoughthis will be mitigated depending on the effectiveness offlood warning and evacuation measures.
5. Conclusions
The purpose of the analysis described in this articlewas to form a basis for long-term flood risk manage-ment policy by assessing the scale and drivers of floodrisk over a period of 30–100 years. The analysis focussedupon current flood management policy, projectedunaltered into the future, in order to identify strengths,

ARTICLE IN PRESSJ.W. Hall et al. / Environmental Hazards 5 (2003) 51–6564
weaknesses, and particular areas of vulnerability. Tothis end, a risk-based analysis framework has beenestablished within which two separate types of analysisfit coherently: spatially explicit quantified flood riskanalysis, and expert appraisal and ranking of the driversof changing future flood risk. In both cases change inrisk was analysed by (implicit or explicit) considerationof the influence that projected climate and socio-economic change would have on the state variablesdescribing the flooding system and the impact thatchanges in state variables would have on risk in aSource-Pathway-Receptor framework.The expert analysis provided an assessment of the
relative contribution of different drivers to overallchange in flood risk, without having to resort toexhaustive sensitivity analysis within the quantified riskmodel, which would have been prohibitively expensive.The expert ranking indicated that in the absence ofchanges to flood management policy, climate changewould be the main driver of changing flood frequency.However, overall, increase in risk is influenced more bysocio-economic drivers than by climate change.Socio-economic and climate scenarios have been used
in combination in order to generate self-consistentprojections of potential future variation in flood risk,assuming stable flood management policy. In allscenarios the frequency of flooding is projected toincrease, more so on the coast than on rivers. Theincrease is greatest in High-emission scenarios, particu-larly in the latter half of the 21st century. The risk offlooding is strongly modified by societal vulnerabilityand the scenarios analysis demonstrates how widely thatvulnerability may vary according to the trajectory ofsocio-economic change. The risk that actually prevails inthe future will be further modified by flood managementactivity, which will itself be a reflection of society’svalues and expectations.Analysis of environmental and socio-economic phe-
nomena over a timescale of 30–100 years in the futureinvolves formidable uncertainties. Model uncertaintiesin climate projections up to the 2050s exceed thedifferences between emissions scenarios. There is con-siderable disagreement about the spatial patterns ofclimate change down-scaled to the UK. Changes insome climate variables, for example extreme sea levelsand short, high intensity rainfall events are particularlydifficult to predict. Socio-economic change, which on aglobal scale leads to changing greenhouse gas emissionstrajectories and, on the UK scale, also determineseconomic and social vulnerability to flooding, is evenmore difficult to predict and, it is argued, succumbs onlyto a scenarios-based approach that can merely illustratesome of the potential range of variation betweendifferent futures. The uncertainty is reflected in thisanalysis in that we have only proposed a partial rankingof drivers, rather than a complete ranking. Precise
results have been quoted for the quantified risk analysisbut they have been interpreted merely as providingan indication of the magnitude, rate, and spatialdistribution of potential change rather than being firmpredictions.Notwithstanding the uncertainties in the analysis, it
provides important new insights for policy-makers.‘Business as usual’ in flood risk management over thenext century will be accompanied by large increases inflood damage, the magnitude of which will depend onthe trajectory broader socio-economic change. Theanalysis demonstrates how the increase in flood riskwill be a function of multiple interacting drivers.Climate change makes a contribution to this processbut the severity of its impacts are modulated by socio-economic context, not to mention adaptive capacity,which has not featured in the current analysis. Thesituation is particularly severe on the coast, where theproportion of flood losses, relative to fluvial flooding, isprojected to increase in the future.Policy response will need to involve packages of
measures, tailored to specific localities. Flood risk on thecoast and in urban areas presents a particular challenge,though the uncertainties associated with these twosectors are high. Changes in the economics of agricul-ture represent an opportunity in flood managementterms. Increasing dependence on technology will makesociety more vulnerable to damage by flooding but alsopresents the potential for innovative flood managementsolutions.
Acknowledgements
The research described in this paper was funded bythe UK Office of Science and Technology as part of theForesight Flood and Coastal Defence project. The paperexpresses the views of the authors and not the UKGovernment. Dr. Hall’s research is funded by RoyalAcademy of Engineering post-doctoral research fellow-ship. The figures were skilfully generated by MikePanzeri of HR Wallingford.
References
Arnell, N.W., 1998. Climate change and water resources in Britain.
Climatic Change 39 (1), 83–110.
Arnell, N.W., Reynard, N.S., 1996. The effects of climate change due
to global warming on river flows in Great Britain. Journal of
Hydrology 183, 397–424.
Bruce, J.P., Lee, H., Haites, E.F. (Eds.), 1996. Climate Change 1995:
Economic and Social Dimensions of Climate Change. Contribution
of Working Group III to the Second Assessment Report of the
Intergovernmental Panel on Climate Change. Cambridge Uni-
versity Press, Cambridge, UK.
Crooks, S.M., Reynard, N.S., 2002. Initial assessment of the impact of
UKCIP02 climate change scenarios on flood frequency for the
ARTICLE IN PRESSJ.W. Hall et al. / Environmental Hazards 5 (2003) 51–65 65
Thames. Report to the Environment Agency, CEH-Wallingford,
UK.
Deakin, R., Burgess, K., Samuels, P., Sayers, P.B., Chatterton, J.B.,
2001. A national economic appraisal of the impacts of flooding and
coastal erosion considering the potential impacts of climate change.
Proceedings of the 36th DEFRA Flood and Coastal Management
Conference, Keele, pp. 4.2.1–4.2.13.
DETR, Environment Agency, Institute for Environment and Health,
2000. Guidelines for Environmental Risk Assessment and Manage-
ment, The Stationery Office, London.
Dorland, C., 1999. Vulnerability of the Netherlands and Northwest
Europe to storm damage under climate change. Climatic Change
43 (3), 513–535.
Doornkamp, J.C., 1998. Coastal flooding, global warming and
environmental management. Journal of Environmental Manage-
ment 52, 327–333.
Entec, JBA, 2000. Inland flood risks. General Insurance Research
Report No.10, Association of British Insurers, London.
Frei, C., 2000. Climate dynamics and extreme precipitation in flood
events in Central Europe. Integrated Assessment 1 (4), 281–300.
Hall, J.W., Dawson, R.J., Sayers, P.B., Rosu, C., Chatterton, J.B.,
Deakin, R., 2003a. A methodology for national-scale flood risk
assessment. Water and Maritime Engineering 156, 235–247.
Hall, J.W., Meadowcroft, I.C., Sayers, P.B., Bramley, M.E., 2003b.
Integrated flood risk management in England and Wales. Natural
Hazards Review 4 (3), 126–135.
HR Wallingford, 2003. NFRA 2002.
Hulme, M., Jenkins, G.J., Lu, X., Turnpenny, J.R., Mitchell, T.D.,
Jones, R.G., Lowe, J., Murphy, J.M., Hassell, D., Boorman, P.,
McDonald, R., Hill, S., 2002. Climate Change Scenarios for the
United Kingdom: The UKCIP02 Scientific Report, Tyndall Centre
for Climate Change Research, School of Environmental Sciences,
University of East Anglia, Norwich, UK.
IPCC, 2000. Special Report on Emissions Scenarios (SRES): A Special
Report of Working Group III of the Intergovernmental Panel on
Climate Change. Cambridge University Press, Cambridge.
Mileti, D.S., 1999. Disasters by Design, A Reassessment of Natural
Hazards in the United States. Joseph Henry Press, Washington, DC.
Milly, P.C.D., Wetherald, R.T., Dunne, K.A., Delworth, T.L., 2002.
Increasing risk of great floods in a changing climate. Nature 415,
514–517.
Nicholls, R., 2001. Coastal change in East Anglia: Results from the
RegIS project. Proceedings of Redesigning the Coast Science
Workshop, University of East Anglia, pp. 26–37.
Nicholls, R.J., Wilson, T., 2001. Integrated impacts on coastal areas
and river flooding. In: Holman, I.P., Loveland, P.J. (Eds.),
Regional Climate Change Impact and Response Studies in East
Anglia and North West England (RegIS). Technical Report, pp.
54–101 (Chapter 5). (available on line at http://www.ukcip.org.uk)
Office of Science and Technology, 2002. Foresight Futures 2020:
Revised Scenarios and Guidance. Department of Trade and
Industry, London.
Palmer, T.N., R.as.anen, J., 2002. Quantifying the risk of extreme
seasonal precipitation events in a changing climate. Nature 415,
512–514.
Penning–Rowsell, E.C., Johnson, C., Tunstall, S.M., Tapsell, S.M.,
Morris, J., Chatterton, J.B., Coker, A., Green, C., 2003. The
benefits of flood and coastal defence: techniques and data for 2003.
Middlesex University Flood Hazard Research Centre.
Rapport, D., Friend, A., 1979. Towards a comprehensive framework
for environmental statistics: a stress-response approach. Statistics,
Canada, Ottawa.
Reynard, N.S., Prudhomme, C., Crooks, S.M., 2001. The flood
characteristics of large UK rivers: potential effects of changing
climate and land use. Climatic Change 48, 343–359.
Sayers, P.B., Hall, J.W., Dawson, R.J., Rosu, C., Chatterton, J.B.,
Deakin, R., 2003. Risk assessment for flood and coastal defence
systems for strategic planning (RASP)—a national scale applica-
tion and a look forward to more detailed methods. Proceedings of
the 38th DEFRA Flood and Coastal Management Conference,
Keele, pp 5.2.1–5.2.13.
Schreider, S.Y., 2000. Climate change impacts on urban flooding.
Climatic Change 47 (1), 91–115.
Smith, D.I., 1999. Urban flood damage and greenhouse scenarios—the
implications for policy: an example from Australia. Mitigation and
Adaptation Strategies for Global Change 4 (3), 331–342.
SPRU, CSERGE, CRU, PSI, 1999. Socio-economic futures for
climate impacts assessment. Final Report, Science and Technology
Research, University of Sussex.
Tapsell, S.M., Penning–Rowsell, E.C., Tunstall, S.M., Wilson, T.L.,
2002. Vulnerability to flooding: health and social dimensions.
Philosophical Transactions of the Royal Society London—Series
A, Mathematical, Physical and Engineering Sciences 360 (1796),
1511–1525.
Turner, R.K., Lorenzoni, I., Beaumont, N., Bateman, I.J., Langford,
I.H., McDonald, A.L., 1998. Coastal management for sustain-
able development: analysing environmental and socio-eco-
nomic changes on the UK coast. Geographical Journal 164 (3),
269–281.
UK Climate Impacts Programme, 2000. Socio-Economic Scenarios for
Climate Change Assessment: A Guide to their Use in the UK
Climate Impacts Programme. UKCIP, Oxford.