Quality-oriented technical change in Japanese wheat breeding
44
Instructions for use Title Quality-oriented technical change in Japanese wheat breeding Author(s) Saito, Yoko; Saito, Hisamitsu; Kondo, Takumi; Osanami, Fumio Citation Research Policy, 38(8): 1365-1375 Issue Date 2009-10 Doc URL http://hdl.handle.net/2115/42546 Right Type article (author version) Additional Information Hokkaido University Collection of Scholarly and Academic Papers : HUSCAP
Transcript of Quality-oriented technical change in Japanese wheat breeding

Instructions for use
Title Quality-oriented technical change in Japanese wheat breeding
Author(s) Saito, Yoko; Saito, Hisamitsu; Kondo, Takumi; Osanami,Fumio
Citation Research Policy, 38(8): 1365-1375
Issue Date 2009-10
Doc URL http://hdl.handle.net/2115/42546
Right
Type article (author version)
AdditionalInformation
Hokkaido University Collection of Scholarly and Academic Papers : HUSCAP
1
Quality-Oriented Technical Change in Japanese Wheat Breeding
Yoko Saito* Hisamitsu Saito Takumi Kondo Fumio Osanami
Abstract: The article presents a productivity analysis of Japanese wheat breeding research. We first estimate an hedonic function to determine the marginal implicit values of Japanese wheat characteristics and find that protein contributes substantially to millers’ price offers to farmers. Induced innovation theory implies breeders thus should be responding to new protein-oriented price policies by developing high-protein wheat varieties. We test this hypothesis by estimating a distance function relating breeding resources – including what we call gene-recharge rates – to the yield and protein characteristics of discovered varieties. New varieties indeed have been protein-favoring and yield-disfavoring, suggesting government research programs have been market-oriented. Key Words: Wheat Breeding Research, Induced Innovation, Wheat Quality, Gene Recharge JEL codes: Q16, O32, O13 Yoko Saito is assistant professor and Hisamitsu Saito is research associate at the Obihiro University of Agriculture and Veterinary Medicine, Inadacho Nishi 2 Sen 11, Obihiro, 0808555, Japan. Takumi Kondo is associate professor and Fumio Osanami is professor in the Research Faculty of Agriculture, Hokkaido University, Kita 9 Nishi 9, Sapporo, 0608589, Japan. *Correspondence to [email protected], Phone and Fax: +81-155-49-5440 We thank Dr. Steve Buccola at Oregon State University for his helpful comments and Tadashi Tabiki, National Agricultural Research Center for Hokkaido Region, for assistance in obtaining wheat breading data.

2
Quality-Oriented Technical Change in Japanese Wheat Breeding
1. Introduction
The induced-innovation hypothesis – that the direction of invention is influenced by
the relative values of the potentially innovated characteristics – usually is expressed in
terms of the invention-adopter’s total factor employment. Innovators seek to reduce the
adopter’s total cost by improving one of the adopter’s factors in a way that comparatively
saves the higher priced of its other inputs (Binswanger, 1978a; Ruttan et al., 1978). Rising
relative labor wages, for example, induced discovery of the mechanical harvester, in turn
boosting the quantity of farm capital relative to labor and the amount of labor for which a
unit of capital could substitute.
With many inventions, especially mechanical and logistical ones intended to reduce
cost at given output, such focus on the adopter’s relative factor employment is useful. With
other inventions, particularly of a material input intended to improve the quality of the
adopter’s outputs, it is, as Evenson (1998) shows, more insightful to express innovation
incentives in terms of the inventor’s own technology. Inventors in such a framework seek
to boost the demand for the adopter’s products by enhancing in a key material input the
characteristics the adopter’s customers value most highly. Thus, breeders develop banana
rootstock yielding larger rather than sweeter bananas if farmers’ customers reveal, in the
prices they pay, a preference for size over sweetness. Testing the induced innovation
hypothesis in this latter context involves observing the rootstock characteristics which
breeders try to or succeed in developing with given breeding resources, then matching such
characteristics to those for which food consumers are willing to pay.

3
In the present paper we consider a remarkable instance of the latter, quality-oriented
technical change: improvements in Japanese wheat strains. We first assess changes in
consumers’ effective demands for wheat characteristics, then match them to changes in the
combinations of wheat seed characteristics that Japanese breeders have, with given research
resources, succeeded in offering to farmers. Broadly speaking, the induced innovation
hypothesis is satisfied to the extent breeders’ resource-constrained successes are consistent
with wheat consumers’ tastes. However, demonstrating such correlations for quality-
enhancing innovations is not as straightforward as it is for cost-reducing ones, a fact likely
responsible for the far greater frequency of cost-type than quality-type innovation studies.
In the former, the analyst looks for signs that, for example, farm capital-labor quantity
ratios are caused by capital-labor price ratios, controlling for substitutions farmers could
effect through management practices alone, that is in the absence of technical innovation
(e.g., Thirtle, et al., 2002). Data of that sort are readily available in capital and labor
markets. In contrast, consumer preferences for product quality, and associated seed
characteristics which breeders can offer given their resource constraints, are virtual and can
be assessed only hedonically.
In the Japanese wheat industry, a natural experiment fortunately is available for the
latter purposes. Until 2000, the Japanese General Food Policy Bureau paid Japanese
farmers a single price per ton regardless of grain quality, and domestic millers were
required to accept those wheats regardless of their disfavored qualities. Since then, premia
and discounts have been incorporated for certain quality characteristics in order to provide
farmers an incentive to produce wheat with the preferred characteristics. Yet wheat quality
enhancements, such as protein enrichment, are determined largely by genetic rather than

4
farm management practices. Farmers as well as millers, therefore, have had an incentive to
lobby the Japanese government’s wheat research program to breed for the higher-valued
characteristics. If government breeders have responded adequately to this pressure, we
should observe their new varieties to embed comparatively higher amounts of the preferred
characteristics than did the older varieties. Furthermore, because virtual prices of the newly
favored characteristics have risen relative to those of the newly disfavored ones, we should
find that breeders are allocating resources in such a way that more of the disfavored
characteristic is given up per unit of the favored characteristic than was the case in 2000
(Binswanger, 1978b, p. 109).1 Klerkx and Leeuwis (2008) investigate the extent to which
farmers’ research demands are reflected in the science projects funded through farmer
levies. They conclude that, because of the involvement of multiple stakeholders, farmer
interests are inadequately taken into consideration.
Most studies of breeding success have been conducted in terms of a single
characteristic, such as yield response to nitrogen application (Traxler and Byerlee, 1993;
Sakiura, 1984). Our own focus will be on two important wheat characteristics: protein
percentage and mean per-hectare yield, the former influencing product quality and thus
consumer price, and the latter influencing per-ton farm cost. The virtual price farmers are
willing to pay for either of these wheat-seed characteristics is the premium they will pay for
a variety that contains one unit more of it but that in all other respects is identical to a base
variety. Yield characteristics were important to farmers well before the 2000 price-policy
reform, while protein percentage could become important only after the premium/discount
system was introduced. Thus, the virtual price of protein should after 1999 have risen

5
relative to the virtual price of per-hectare yield, redirecting breeding resources toward
protein-rich varieties and thus toward protein-favoring technical change.
To examine this hypothesis, we specify breeding research as a knowledge-based
production process in which each new variety is the result of a development program.
Because breeding is productive, it is itself subject to technical change. A useful way of
testing for price-induced varietal innovation therefore is to characterize technical progress
as shifts in breeders’ innovation possibility curves, namely combinations of – in the present
case – protein and mean yield which breeders can achieve with a fixed endowment of
breeding resources. Breeders move from one variety, and thus one protein-yield
combination, to another along an innovation possibility curve by launching new
development programs and dropping old ones. Curves shift outward if breeding technology
is improved, for example through new methods of inserting genetic material (Evenson,
1998). Tradeoff rates between protein content and mean-yield can, in response to changes
in their virtual prices, be influenced by the direction of the laboratory’s overall development
strategy. Both the level and the tradeoff rates of an innovation possibilities set depend
greatly on the genetic information breeders employ, especially from novel sources.
Evenson (1998) has used “recharge,” and Simpson and Sedjo (1998) and others
“biodiversity,” to describe the quantity and quality of such newly introduced genetic
material. We develop a new metric for the recharge rate and gauge its impacts on Japanese
wheat breeding.
We find that effective Japanese demand for wheat protein has risen substantially in
recent years and that Japanese wheat breeders have responded by developing protein-rich
varieties. Productivity in the use of given breeding resources has been rising, and in ways

6
that, comparatively speaking, are protein-favoring and yield-disfavoring. The mean per-
hectare yield given up on Japan’s innovation possibility frontier to achieve an additional
unit of wheat protein also has been rising, consistent with a revenue-maximizing breeder
faced with rising relative protein prices. Japan’s National Agricultural Research Center has,
despite its public status, therefore responded to price changes in ways consistent with
market forces. Salter and Martin (2001) review econometric evidence of the economic
benefits of publicly funded basic research, concluding that benefits in the form of new
knowledge, methods, and problem-solving are substantial.
2. Policy History
On account of the popularity of western-style eating habits, Japanese wheat
consumption has been rising and rice consumption falling for the past 40 years. Eighty-five
percent of the wheat consumed in Japan is now from foreign sources. Yet domestic wheat
remains important both in the consumer food mix and in the farm economy.
The Standard wheat category, used mainly in udon noodles, includes many local
varieties that farmers began breeding long before 1926, when government breeding
programs were launched. The consequently rich local variety stock has contributed greatly
to state breeding successes. Hard wheats, used primarily in bread, instead were introduced
from outside Japan and national breeding efforts in their direction first launched in
Hokkaido. The first hard or bread wheat was released in Hokkaido in 1930, but its
development was then discontinued until the1960’s. Breeding of hard wheats in Japan’s
Fuken (non-Hokkaido) regions began only in the 1990’s, employing both Hokkaido and
foreign parents. Because Fuken laboratories have been able to exploit earlier Hokkaido
stocks, their hard wheats have improved more rapidly than have Hokkaido’s hard wheats.

7
The institutional history of Japan’s wheat breeding is similar to that of its rice
breeding (Akino and Hayami, 1975). The scientific breeding era, launched in 1926, can be
divided into two periods. During the first, 1926 to 1950, crossbreeding methods were
newly introduced into the country. Wheat strains were first crossed at the central
government breeding station, then distributed to regional stations for adaptation to local
agronomic environments. As cross-breeding skills accumulated and diffused, regional
stations began creating their own crosses. Seventy new wheat varieties were developed
during this first period despite the infancy of Japan’s cross-breeding technology.
During the second period, 1951 to the present, eight national breeding research
stations (later integrated into five) and two local government experiment stations were
developed and 90 new wheat varieties introduced. The first three decades of this period
corresponded to the era of modern Japanese economic growth. The government’s main
breeding goal was to produce strains complementing the rapid farm mechanization which
then was substituting machinery for labor. Emphasis was placed on, for example, a
variety’s adaptability to machine planting and harvesting, lodging tolerance, and disease
resistance. In the early 1980’s, farmers were shifting from rice to wheat in response to the
rice acreage restriction program launched in 1970. Although domestic wheat production
rose dramatically, its quality was much less suitable to Japan’s principal demand – for
noodles and bread – than were foreign wheats. Japanese grain millers began urging
domestic breeders and farmers to produce wheats with protein, amylo, and other
characteristics equivalent to the foreign product. The emphasis on wheat quality had begun.
In addition to millers’ appeals, the government began in 2000 to exert its own
wheat-quality pressure through the schedule of prices that millers were permitted to pay

8
farmers. Until 2000, wheat prices at the miller level were determined entirely by
government. A bid system was then introduced allowing millers to offer their own prices
based on quality, subject to remaining within 95% and 105% of the previous year’s price.
(The permissible range was widened in 2005 to 93% and 107%.) As Figure 1 shows,
miller wheat prices began immediately to diverge according to variety, reflecting the
milling and baking characteristics those varieties typically provided. Hokkaido wheat
varieties, represented in Figure 1 by the broken lines, have increasingly brought the highest
prices on account of their high protein. Farmer revenues now are influenced by the variety
and quality of the wheat produced, so that quality, and particularly protein content, appears
to be the critical breeding goal. Our analysis focuses on this increasingly quality-oriented
period.
[Figure 1]
3. Analytical Framework
To document the rising Japanese preference for wheat protein, we first fit a hedonic
function to post-1999 wheat prices. The hedonic model takes the form (Ladd and Martin,
1976; Stiegert and Blanc, 1997)
(1) 0 1 2 3
4 5 6
ln ln ln ln
ln ln .jrt jrt jrt jrt
jrt jrt j jrt
w pro ash clr
aml wgt hard
β β β β
β β β ε
= + + +
+ + + +
where j refers to variety, r to region, and t to year; jrtw is wheat price, pro is protein
percentage, ash is ash percentage (related to flour color), clr is color grader value (in which
a lower value indicates a higher flour brightness), aml is an indicator of flour stickiness, wgt

9
is weight or kernel solidity, hard indicates whether the wheat is a hard variety, and jrtε is
the residual. 2 Planted-year dummies also are incorporated to take weather conditions into
account. Wheat quality and thus post-2000 price are expected to be related positively to
protein, amylo, and hardness, and negatively to ash content and color.
If wheat innovation has been price-induced, it should not only have produced
higher-protein strains but boosted the tradeoff between protein-oriented and yield-oriented
characteristics. Price-responsive shifts in breeding innovation possibility frontiers (IPFs)
are depicted in Figure 2, where wheat quality (represented by protein content) and wheat
quantity (per-hectare yield) are indicated on the two axes. 0T , PT , and YT are alternative
IPFs, and 0P , 1P , 1PP , and 1
YP are alternative ratios of the virtual price of a given quality
characteristic to the virtual price of quantity or per-hectare yield. Points on IPFs assume
particular farm management regimes, such as planting times and fertilizer rates. Tangent to
these points, and on the interiors of and more convex than the IPFs, are what may be called
management possibility curves, representing characteristics combinations produced with a
given wheat variety and given management program.
At original characteristics price ratio 0P , where grain quality is relatively weakly
valued in the grower’s wheat price schedule and hence in the demand for varietal
characteristics, breeders optimally develop the high-yielding (HYV) strains indicated at
point a on 0T . Grower lobbying would, in the face of the post-1999 wheat price schedule
providing an increasing reward for protein content, have shifted the virtual price ratio to 1P ,
that is in which the value of the protein characteristic rises relative to the quantity
characteristic. In the short run, that is under original research technology 0T , revenue-

10
maximizing breeders would have redirected their search efforts toward the varietal
characteristics at point b. In the longer run, research technology can be changed by, for
example, introducing exotic genetic material boosting the varietal potential at breeders’
disposal.
The long-run change can be non-neutral, shifting the IPF in a biased or nonparallel
way. Two biases are alternatively possible: toward a quantity-favoring IPF ( YT ) or a
quality-favoring ( PT ) one. As long as the post-1999 wheat price structure is maintained,
maximum breeder revenues lie along 1YP if research technology shifts in the quantity-
oriented direction, and along 1PP if it shifts in the quality-oriented direction. Because 1
PP
revenues exceed 1YP revenues, the rational choice is to develop the high-quality varieties
(HQVs) shown on Figure 2’s dot-dashed line. That is, research resources are allocated
efficiently only if the technical change bias moves in the direction of the characteristic with
the rising relative price (Binswanger, 1978a, p. 109).
3.1. Modeling Breeding Technology
The breeding research transformation functions depicted in Figure 2 might generally
be specified as
(2) ( ), , , , 0Hum GenG t =C K K M
where C is the output vector of the relevant varietal characteristics; HumK is the vector of
human capital available at breeding laboratories during the time interval in which the
variety was being developed, and hence reflecting the lag between the variety’s
development and its registration; GenK is the genetic information available to breeders; M
11
the farm management practices employed in producing the grain; and t is the year of the
variety’s registration, reflecting technology shifts not captured in HumK and GenK .3 HumK
Rather than estimate the transformation functions themselves, we follow the normal
practice of casting technology in terms of the proportional distance to frontier (2) from a
given varietal discovery, then restricting the distance to unity so that the variety’s
characteristics lie on frontier (2) itself. 4 Such a distance function is an output version of,
for example, the one in Irz and Thirtle (2004).
In particular, let characteristics vector C in equation (1) be comprised of {P, Y},
where P is the wheat’s percentage protein content and Y its mean per-hectare yield, and let
x represent input vector { , ,Hum GenK K M }. For given inputs x, the output distance OD of
a given wheat characteristics combination C is
(3) ( ) ( ) ( ){ }, , inf 0 : ,OD t P tθ θ= > ∈C x C x = ( ){ }sup / , ,R tr rC x r
where r is the 2 x 1 vector of virtual prices of characteristics {P, Y}, ( , )P tx is the
producible output set corresponding to equation (2), and ( , , )R tr x is the revenue function.
Maximizing C’s distance, at given factor levels and breeding technology, maximizes the
breeder’s virtual revenue at given virtual prices r (Färe and Primont, 1995). Setting
( ), , 1OD t ε =C x , whereε is a multiplicative error, depicts situations in which
laboratories are technically efficient, that is operate at the characteristics boundary G at
their disposal given resources x and breeding technology t.
The percentage rate of technical change is found by log-differentiating (3) with
respect to t :

12
(4) ( ) ( ),
ln , , ln , ,O
OD t
D t R tt t
ε∂ ∂
= = −∂ ∂
C x r x.
The proportional distance change is the negative of the proportional revenue change
because, when a given variety occupies a successively smaller portion of the distance to the
characteristics frontier, that frontier must be expanding and maximal revenues therefore
rising. The technical change elasticity thus is negative (positive) if technology change is
progressive (regressive).
The revenue maximization problem implies that, if the mth characteristic’s market
price is mr , its corresponding shadow price – namely its opportunity cost in terms of other
characteristics impaired or additional inputs required – can be written as (Irz and Thirtle,
2004; Färe and Primont, 1995)
(5) ( )
( )
* , , , ,, ,
o m
m
D t t rC R t
⎡ ⎤∂ ⎣ ⎦ =∂
C r x xr x
In the revenue-maximizing solution, characteristic mC ’s shadow price is equated to its
revenue-deflated market price. Because Japanese wheat breeding is conducted in
government laboratories, so that characteristics do not have market prices at the breeder
level, we will be particularly interested in the ratio of two characteristics’ shadow prices:
(6) ( )( )' '
, , /, '
, , /O mm
m O m
D t Cr m mr D t C
∂ ∂= ≠
∂ ∂C xC x
The elasticity form of shadow price (5),
(7) ( ),
lnln , ,O m
O m mD C m
m
D r C SC R t
ε ∂= = =
∂ r x ,
13
is especially useful, as log-differentiating (7) with respect to t gives a measure of technical
change bias (Antle and Capalbo, 1998, p.48):
(8) 1
ln ln ln lnln ln
m mmt
j j j
S S R RBt x x t
−⎡ ⎤⎛ ⎞⎛ ⎞∂ ∂ ∂ ∂⎢ ⎥= − ⎜ ⎟⎜ ⎟⎜ ⎟⎜ ⎟∂ ∂ ∂ ∂⎢ ⎥⎝ ⎠⎝ ⎠⎣ ⎦∑ .
Equation (8) signifies the extent to which, at given characteristics price ratios, technical
improvement tilts the innovation possibility frontier, moving the laboratory’s discoveries to
a new expansion path so that the characteristics’ revenue shares are altered (Figure 2).
The first term in (8) is the gross effect, reflecting (a) the revenue-share change plus
(b) any movement, associated with nonhomotheticity, along the expansion path. The
second term deducts the latter scale effect, leaving the pure revenue-share or bias effect. It
is the pure bias that, under the induced innovation hypothesis, is influenced by
characteristics’ price ratios. If mtB is positive (negative), the IPF tilts toward (away from)
characteristic mC and technical change is mC - favoring (-disfavoring) (Antle and Capalbo,
1988).
The Lagrangian of the revenue maximization problem can be used to express the
scale (second right-hand side) portion of output bias (8) in a way that is computable from a
distance rather than revenue function. Noting, in addition to (4), that ln / lnm mS D C= ∂ ∂
(the mth wheat characteristic’s revenue share is the derivative of the distance function with
respect to the quantity of that characteristic), we can write the scale portion as
(9) 1
2 ln 1 ln lnln ln ln
scale
j m j m j
D D DBC x S x t
−⎡ ⎤⎛ ⎞ ⎛ ⎞∂ ∂ ∂⎛ ⎞⎢ ⎥= ⋅ − ⋅ −⎜ ⎟ ⎜ ⎟ ⎜ ⎟⎜ ⎟ ⎜ ⎟∂ ∂ ∂ ∂⎢ ⎥ ⎝ ⎠⎝ ⎠ ⎝ ⎠⎣ ⎦∑ .
The derivation of (9) is provided in the Appendix A.

14
[Figure 2]
4. Wheat Breeding Considerations
The Japanese Government operates six major wheat breeding stations, including one
that is local-government owned: Hokkaido, Tohoku, Hokuriku, Kanto, Chugoku, and
Kyushu. Released wheat varieties are filed by year of registration, each accompanied with
management details, such as nitrogen application methods and rates, used in its
experimental trials (Experimental Data for Norin Registration, Ministry of Agriculture,
Forestry, and Fisheries). The annually observed characteristics of each new variety; along
with the scientific, genetic, and managerial resources annually allocated to its development;
the locational and wheat-type varietal class to which it belongs; and the variety’s
registration and planting date and station constitute our sample data. Descriptive statistics
for each variety are given in Table 1. Standard wheat varieties bring higher yields than do
hard varieties but tend to have less protein. Larger grain kernels provide a lower protein
percentage than do smaller kernels.
4.1. Gene Resources and Breeding Productivity
Breeding research involves a consecutive introduction of new genetic material. An
important way, therefore, to shift an innovation possibility frontier is to introduce new
genes, in what is sometimes called recharge (Evenson, 1998). Effects of genetic resources
or diversity on agricultural production, and in particular on yield stability, have been
assessed in several studies (Evenson and Gollin, 1997; Smale et al., 1998). Genetic
diversity tends to enhance yield mean while stabilizing yield variance. Gene recharge is the
key element in this gene diversification process and thus in technological improvement.

15
Hence, focusing on the gene recharge rate is an important way to represent gene resources
in the laboratory.
A number of approaches have been taken to model the impacts of genetic
inheritance (Evenson et al., 1998; Smale et al., 1998). Parent wheats vary in their genetic
relatedness or similarity, depending greatly on the geographic areas from which the strains
have been introduced. For instance, some parent genes are drawn from foreign countries,
others from neighboring Japanese research stations or from the researcher’s own station.
We assume, consistent with the literature, a one-one relationship between locational and
genetic dissimilarity. In particular, two strains genetically close to one another are regarded
here as non-identical if developed at different breeding stations.
To estimate genes’ effects on wheat breeding research, we constructed a gene
recharge rate for each historical variety. We first defined a variety’s historical gene
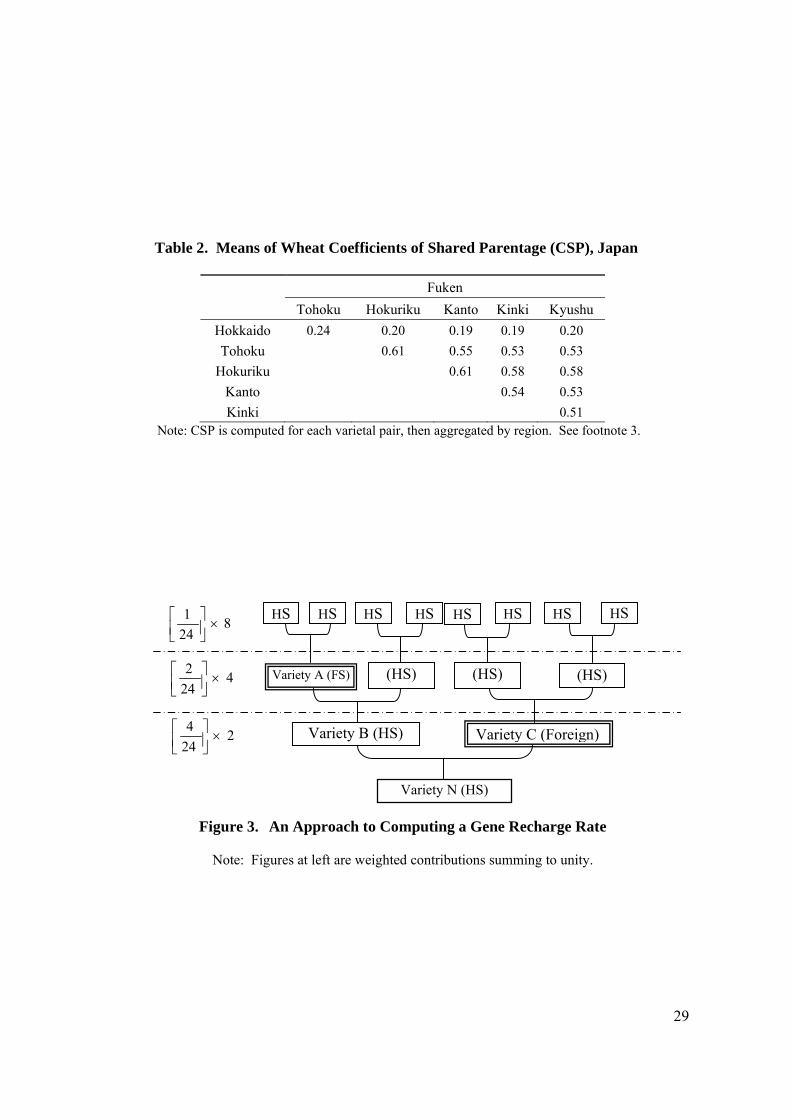
exchange area by examining the coefficient of shared parentage (CSP) of each variety pair
(Table 2). 5 Pedigree data used for the CSP calculations are, for calculation ease,
constructed by replacing varieties’ names with their breeding stations’ names. CSPs based
on breeding station identities tend to be higher than those based on varieties’ identities.
Table 2 shows that Hokkaido varieties share, on average, less than 20% of their parentage
with varieties developed at Fuken stations, while Fuken varieties share from 51% to 61% of
their parentage with those developed at other Fuken stations. Fuken varieties, that is, have
highly similar parentages. On that basis, we specified four gene-exchange classes in Japan:
Hokkaido Standard (HS), Hokkaido Hard (HH), Fuken Standard (FS), and Fuken Hard
(FH). 6 Genes introduced into each of these classes from one of the other three, or from
foreign countries, are considered to contribute to recharge.

16
The recharge (“gene”) variable itself is constructed by considering each variety’s
three preceding generations. An example of a weighting scheme employed in such
construction is shown in Figure 3. Weights are doubled as one moves to a younger (thus
more proximate) generation. The sum of the weights assigned to the genetic material drawn
from outside a given variety’s gene exchange class constitutes that variety’s recharge rate.
In Figure 3, genes from domestic Variety A and foreign Variety C have been introduced
from outside Variety N’s exchange class, namely HS. Variety N’s recharge rate therefore is
the sum of the weights on Varieties A and C: 2 24 4 24 0.25+ = . Gene recharge rates thus
also range between zero and one. Sample means of Japanese wheat varieties’ gene recharge
rates are presented in Table 1.
[Figure 3, Table 1, Table 2]
5. Empirical Specification
With these observations in mind, we consider a variety’s characteristics C in terms of
its per-hectare mean yield (Y) and protein content (P). Human capital vector HumK is
represented by the number of scientist-years (S) that were engaged in research on the ith
variety prior to its registration. Genetic information GenK is represented by the rate of
recharge G of novel genetic material and by indicator variables for the four principal
varietal classes in Japan: Hokkaido Hard (HHD ), Hokkaido Standard (
SHD ), Fuken Hard
(HFD ), and Fuken Standard (
SFD ). Management vector M consists of the per-hectare
quantity N of nitrogen applied and zero/one variables indicating whether wide or narrow
ridging was employed ( NRD ) or late-season nitrogen added ( AND ). Residual shift factor t
17
corresponds to the year in which the variety was registered and reflects such breeding
technologies as DNA markers not subsumed under human capital vector HumK or genetic
information GenK . In Table 1, for example, the oldest registered variety is Norin 104,
registered in 1965 and corresponding to t = 1.
A translog functional form, desirable not only for its interpretational ease but the
generality with which output linear homogeneity can be maintained, is used for the distance
function. It is the most common form in empirical work (e.g., Grosskopf et al., 1995;
Coelli and Perelman, 1999; Brümmer et al., 2002). For notational simplicity, let { ,l my y }
represent the vector C of output characteristics (Y = yield in kilograms per hectare, P =
percent protein content); { jz , kz } refer to scientist years (S) allocated to the given variety
and to the quantity of nitrogen (N) applied to it in kilograms per hectare; t be the year
registered as a Norin variety, and indicator variables iD , , , ,i HH HS FH FS= ,
represent the four varietal classes. 7 We then have the output distance function
(10)
2 2 2 2
01 1 1 1
2 2 2 2
1 1 1 1
4 4 3 42
1 1 1 1
1ln ln ln ln ln ln2
1 1ln ln ln ln2 2
1ln2
O m m lm l m k k Rm l m k
jk j k NR NR AN AN mk m kj k m k
it i imt m i i tt ii i m i
D y y y z G
z z D D y z
t D y t D t D
α α α β δ
β β β γ
δ δ δ
= = = =
= = = =
= = = =
= + + + +
+ + + +
+ + +
∑ ∑∑ ∑
∑∑ ∑∑
∑ ∑∑ ∑
where δγβα ,,, are estimated parameters. Equation (10) must be linearly homogeneous in
outputs, convex in outputs, and monotonic in inputs and outputs. Linear homogeneity in
wheat characteristics is imposed by requiring that 2
11mm
α=
=∑ , 2
1 lmmα
=∑ = 2
1 mkmγ
=∑ =
2
1 imtmδ
=∑ = 0, and quadratic symmetry by lm mlα α= , jk kjβ β= . The distance function is
18
convex in outputs (Färe and Primont, 1995; O’Donnell and Coelli, 2005) if, with present
breeding resources, a laboratory can develop convex combinations of current varieties’
characteristics. Monotonicity requires that the distance function’s derivative with respect to
an output [equation (7)] and an input be respectively positive and negative. 8
Hedonic equation (1) was estimated by ordinary least squares. Annual data from
2000 to 2006 were drawn for it from the Japanese Milling Industry Association’s annual
Quality Assessment of Domestic Wheat and from the Japanese Rice, Wheat, and Barley
Improvement Association’s annual reports on miller-level wheat prices. Descriptive
statistics from the hedonic estimation are presented in Table 3. Sample size was 200.
Annual experimental-trial data for estimating distance function (10) were taken
from Experimental Data for Norin Registration, summarized in Table 1. Total sample size
was 436, the number of observations varying by variety. 9 Of this total, 92 corresponded to
Hokkaido Hard varieties, 190 to Hokkaido Standard, 38 to Fuken Hard, and 116 to Fuken
Standard. Following Grosskopf et al. (1995), 0D is set at unity, implying Japanese wheat
research laboratories operate on the boundary of their technical opportunities. Restricted
OLS is employed to maintain the unity requirement.10
[Table 3]
6. Results
Results of the hedonic analysis of Japanese wheat prices are shown in Table 4. The
government’s restriction on the range of a one-year price change implies that prices are not,
in any given year, necessarily at equilibrium, but instead converge only gradually. We
therefore estimate two alternative hedonic models. The first employs every sample point,

19
while the second excludes those in which price reached either the upper or lower
government-permitted price bound. The first column of Table 4 provides results for all
sample points; the second column excludes those in which price reached the upper or lower
bound. In both models, all statistically significant parameters take the expected signs.
Protein percentage and hardness boost wheat prices, while ash content and color grader
value (clr) reduce prices. Indeed, the statistically significant parameters are nearly identical
in the two models, suggesting the presence of the government’s price band does little to
alter our estimates of wheat characteristics’ virtual prices.
Model (1) estimates in Table 4 indicate that a one-percent wheat protein increase
brings a 0.22% price increase, while a one-percent decrease in ash content raises wheat
price by 0.42%. Protein’s and ash’s marginal implicit values, evaluated at sample means,
are respectively $7.70 and $91.20. This result is similar to Stiegert and Blanc’s (1997),
who derived marginal implicit protein values of Japanese imported wheat at between $4.75
and $5.75.
A marginal implicit value shows the effect on wheat price of a one-unit change in a
given quality characteristic. To provide an idea of each characteristic’s percentage
contribution to wheat price, we decompose the logs of wheat-price ratios into the logs of
the characteristics ratios, using Haruyokoi – a Hokkaido hard wheat – as the base variety
(B) because its average price, wB, is the highest in the sample. The decomposition is
(11)
( )
1 2 3 4 5
6
ˆ ˆ ˆ ˆ ˆln ln ln ln ln ln
ˆ .
j j j j j j
B B B B B j
j B j B
w pro ash clr aml wgtw pro ash clr aml wgt
hard hard e e
β β β β β
β
= + + + +
+ − + −

20
where j refers to the jth variety. Results in Table 5 show on average that a wheat’s hardness
provides, at 74%, the greatest percentage contribution to price. At 17%, protein content
provides the next-highest mean price contribution. These contributions are robust to the
elimination of boundary, that is presumably non-equilibrium, price levels.
[Table 4, Table 5]
6.1. Wheat Breeding Technology
A naïve government breeding establishment would have regarded each year’s
varietal price change in Figure 1 as a new revelation of protein’s and other wheat
characteristics’ relative values. A more informed establishment would have recognized that
price changes are annually constrained and represent adjustments toward long-run
preferences that already are in millers’ minds. Because the 2000 price reform likely was
well anticipated, breeders presumably have, either way, long developed an expectation of
continually rising protein value, an expectation intensified by miller lobbying. Have they
responded to this expectation by allocating breeding resources in a way favoring the
discovery of protein-rich varieties? Substantial investment and between 10 and 15 years of
development are required to bring a new wheat strain on the market. If breeding has been
price-sensitive, we therefore expect to observe gradually rising protein content and protein
shadow prices in recent innovation possibility frontiers.
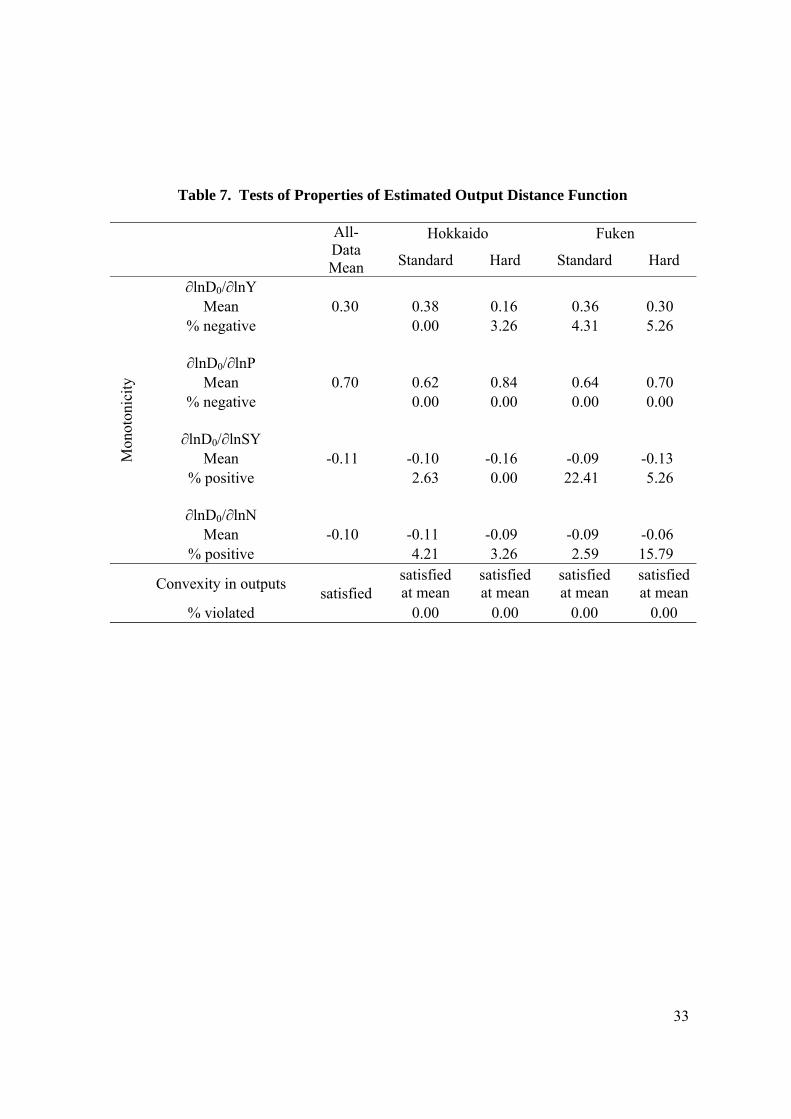
Our estimate of that family of frontiers, controlling for on-farm management
practices, is shown in Table 6. Statistical significance, reflected in Table 6’s t-values, is
high considering the moderate collinearity expected in any quadratic model. Table 7
summarizes the associated regularity tests. Both at the grand sample mean and at variety-
class-specific means, the innovation possibility frontiers are monotonic – that is are

21
negatively sloped and shift outward as inputs rise (as in Figure 2). IPFs also are convex at
these same means, and percentages of observations deviating from monotonicity and
convexity are mostly low.
6.2. Wheat Breeding Innovation
The coefficient of Rδ , showing the negative of the gene recharge rate’s proportional
impact on the wheat characteristics producible with given non-gene and local-gene research
inputs, is -0.029 in Table 6 and statistically significant at the 5% level. Boosting the
inventory of foreign and non-local genetic material by one percent has enhanced the protein
and per-hectare yield possibilities in wheat strains by 2.9%. Maintaining easy access to
external gene sources has been critical to Japanese wheat breeding progress.
Technical change rates computed from equation (4) – and indicated in Table 8 –
indicate the negatives of the mean annual proportional expansions in protein and yield
possibilities producible with given scientist-year and external-gene resources. That is, they
correspond to the Solow-residual notion of technical progress. In the present analysis, they
presumably largely reflect qualitative improvements in scientist human capital and
expansions in such physical capital as laboratory equipment, neither of which are
represented among the equation (10) and Table 6 inputs. As Table 8 shows, characteristics
possibilities have expanded more rapidly in Fuken (non-Hokkaido) than in Hokkaido
varieties. That is consistent with the availability of old Hokkaido genetic material for
Fuken hardwheat breeding purposes, a reciprocal advantage Hokkaido strains do not enjoy
from Fuken material. Protein-yield combinations achievable in Fuken Standard varieties
with given non-local-gene inputs have expanded an average 2.4% per year, compared with

22
1.75% per year in Hokkaido Standard varieties. Technical improvement has been nearly
the same in Hard as in Standard strains.
Especially important for our purposes are the technical change biases and shadow
price ratios implied in the Table 6 regressions. Estimated gross, net, and scale-effect
technical change biases [equation (8)], evaluated at each of the four varietal classes’ sample
means, are given in Table 9. Consistent with the significant rise we have observed in the
effective relative value of wheat protein, technical improvement in Japanese wheat breeding
laboratories has been protein-favoring and yield-disfavoring. For example, controlling for
mean laboratory resources and the characteristics prices themselves, protein’s share of
virtual breeder revenue has risen an average 3.7% per year among Hokkaido Standard
varieties and 3.3% per year among Fuken Standard varieties, moving breeders onto more
protein-favoring expansion paths. Mean per-hectare yields in the Hokkaido Standards
correspondingly have fallen 6.1% per year, and in the Fuken Standards 5.8% per year.
Similar though generally smaller shifts have been present in the Hokkaido Hard varieties.
Only in Fuken Hard varieties is a (small) net bias evident toward per-hectare yield and
against protein, owing to the excess of the scale effect over the gross effect. Japanese
Government wheat breeding laboratories have, despite their not-for-profit status, therefore
been responding to expected increases in the relative value of protein by largely allocating
scientific resources toward the discovery of protein-rich varieties.
Such argument is reinforced by observing how the shadow prices of protein have
changed relative to those of per-hectare yield, since these shadow-price ratios reflect the
very IPF slopes that, on the evidence of the Table 9 bias measures, have tilted toward
protein. Our earlier discussion of induced innovation theory suggests that observed

23
technical change biases should respond to increases in the relative implicit price of protein.
That hypothesis is confirmed in the shadow price ratios ( /Y Pr r ) computed from equation
(6) and shown in Table 10. These ratios are plotted in Figure 4 by wheat type. Consistent
with protein-favoring technological bias, yield-to-protein shadow price ratios have, except
in Fuken Hards, trended downward during the 32-year sample period. Fitting a trend to the
non-Fuken-Hard shadow price ratios in Table 10 gives ln( / )y pr r = 1.753− 0.025t− ,
with t-values -8.26 and -3.22. The significant negative slope indicates a downward trend in
the shadow price ratio, that is a relative increase in protein’s shadow price. Furthermore,
the fact that technical change in Fuken Hard varieties has been slightly protein-disfavoring
is consistent with the absence of such a downward trend in its shadow price ratio.11 In other
words, changes in Japanese wheat breeding strategy again appear to have been consistent
with market demand changes.
[Figure 4, Table 6, Table 7, Table 8, Table 9, Table 10]
7. Conclusions
Recent Japanese Government policy changes permitting millers to link wheat prices
to grain quality are turning wheat breeders’ attention to quality characteristics. An output
version of induced innovation theory would suggest that breeding successes shift toward the
quality characteristics whose relative prices have been permitted to rise. To examine such
an hypothesis, we have exploited the fact that an output distance function may be used to
represent the wheat characteristics combinations that Japanese breeding programs can
achieve with given technical resources. Rates at which wheat characteristics are traded off
on the frontier of this set ought, for a revenue-maximizing breeding program, to be equated

24
to the corresponding ratios of the wheat characteristics’ actual or implicit market prices.
Thus, if observed shadow prices are shifting in the same direction as relative market prices,
we will have evidence that breeding programs in Japanese laboratories are responding to
market forces, and in a way consistent with maximizing the revenues achievable with a
given set of breeding resources.
In order to test whether this has in fact been occurring, it is important to control in
an explicit way for the effects of laboratories’ gene resources on breeding success. We
have done so by employing what we call the gene recharge rate, namely the rate at which
genes from non-traditional locations are introduced into Japanese breeding programs. We
find that higher gene recharge rates significantly enhance technological change in wheat
breeding. That is, external gene pools substantially boost the growth rate of wheat
characteristics combinations achievable with a given set of non-gene research resources. It
is particularly important for Japanese wheat breeders, therefore, to maintain wide gene-
recharge areas, a goal best met if access to new genetic material is facilitated and research
exemptions provided for gene property rights.
Parametric results drawn from a translog output distance function, and controlling
for genetic resources, show that technical change in Japanese breeding has in recent years
indeed favored protein over other wheat characteristics. Responding rationally to
government price-policy changes, breeders have reallocated scientific resources in a way
that shifts wheat characteristics’ transformation curves toward grain protein and,
proportionally speaking, away from per-hectare yield performance. Although Japanese
wheat breeding laboratories operate in the public sector and are thus insulated from profit
incentives, their research resource allocations are demonstrably price sensitive.

25
Japanese wheat markets recently have been even further liberalized. Beginning in
2007, miller-level prices of imported wheat were permitted to fluctuate with international
prices, suggesting the implicit price of protein and of other market-desired characteristics
will continue to rise. That in turn implies domestic Japanese wheats will confront even
greater international competition than in the past, and that pressure for Japanese wheat
breeders to develop higher-quality wheat strains will continue to grow.

26
30,000
35,000
40,000
45,000
50,000
55,000
60,000
65,000
1999 2000 2001 2002 2003 2004 2005 2006 2007
Price (Yen/ton)
YEAR
Haruyutaka (HH, 12.9%)
Haruyokoi(HH, 13.1%)
Chihoku (HS, 10.6%)
Hokushin (HS, 11.0%)
NORIN61(FS, 9.4%)
Chikugoizumi (FS, 8.7%) Shirogane(FS, 9.7%)
Figure 1. Japanese Miller-Level Wheat Prices, by Varietal Class.
Note: Numbers in parentheses indicate varietal class (HS, HH, FS, and FH) and protein percentage.

27
Figure 2. An Innovation Possibility Frontier View of Technical Change
in Wheat Breeding Research
Quality(Protein)
T0 TP TY
P1P
P1
P1Y
P0
a
b
Quantity (Yield)

28
Table 1. Means of Wheat Breeding Variables, by Variety
Note: “Sample means” in the OBS column refer to total numbers of observations in the varietal class. Source: Experimental Data for Norin Registration
Region Type Norin
number
Registered
Year t Variety
Name OBSGene
Recharge Rate
Nitrogen (kg/ha)
Scientist Years
Yield (kg/ha)
Protein content
(%)
Hok
kaid
o
Stan
dard
(HS)
108 1968 4 Muka 16 0.62 53.3 35 4,296 9.1 114 1974 10 Horoshiri 52 0.54 97.5 52 5,743 10.4 115 1974 10 Takune 19 0.67 98.5 40 5,168 12.1 126 1981 17 Chihoku 49 0.29 111.8 44 5,828 9.2 136 1990 26 Taisetsu 12 0.50 122.5 58 7,115 9.8 142 1995 31 Hokushin 27 0.21 118.1 69 6,125 9.7 149 2000 36 Kitamoe 15 0.08 112.7 77 5,721 9.7
Sample Means 190 0.41 103.3 52.1 5,725 9.9
Har
d (H
H) 104 1965 1 Haruhikari 17 0.71 74.7 57 3,486 13.2
130 1985 21 Haruyutaka 35 0.50 109.1 56 4,123 13.1 139 1993 29 Haruno akebono 30 0.25 118.3 65 4,162 12.1 150 2000 36 Haruhinode 10 0.25 115.0 72 4,026 12.9
Sample Means 92 0.43 106.4 60.9 4,008 12.8
Fuke
n St
anda
rd (F
S)
119 1975 11 Toyoho 4 0.83 45.0 113 3,783 8.0 128 1983 19 Fukuwase 1 0.08 127.0 47 4,460 10.0 132 1988 24 Aira 14 0.33 54.6 67 5,257 9.3 133 1988 24 Koyuki 7 0.67 102.0 66 3,980 14.0 134 1989 25 Daichino minori 4 0.21 119.0 36 4,743 8.3 135 1990 26 Bandou 16 0.25 51.6 76 5,189 9.7 137 1992 28 Akitakko 6 0.08 107.0 72 4,200 11.4 138 1992 28 Abukuma wase 7 0.12 118.2 69 3,619 8.9 140 1993 29 Kinuiroha 7 0.37 117.1 45 3,874 8.7 141 1993 29 Chikugoizumi 4 0.08 116.8 23 4,998 7.7 144 1995 31 Nishihonami 5 0.17 84.4 29 4,348 8.4 145 1999 35 Iwaino daichi 5 0.08 110.2 41 4,924 8.5 147 1999 35 Ayahikari 10 0.17 41.4 42 5,882 10.1 152 2000 36 Nebarigoshi 8 1.00 76.0 48 3,780 11.3 156 2002 38 Fukusayaka 7 0.46 92.8 47 4,707 8.0 163 2005 41 Uraramochi 6 0.04 45.0 36 5,893 10.8 164 2005 41 Fukuhonoka 5 0 98.6 43 5,038 7.7
Sample Means 116 0.31 79.8 56.0 4738 9.6
Har
d (F
H)
146 1999 35 Nishinokaori 5 0.50 111.6 52 3,902 11.0 153 2001 37 Haruibuki 10 0.67 78.0 47 4,800 14.3 155 2002 38 Tamaizumi 12 0 40.5 45 4,338 12.8 157 2002 38 Yukichikara 7 0.12 79.0 106 4,210 13.0 160 2003 39 Minamino kaori 4 0.54 117.0 53 3,943 10.8
Sample Means 38 0.32 74.9 58.5 4338 12.8
29
Table 2. Means of Wheat Coefficients of Shared Parentage (CSP), Japan
Fuken Tohoku Hokuriku Kanto Kinki Kyushu
Hokkaido 0.24 0.20 0.19 0.19 0.20 Tohoku 0.61 0.55 0.53 0.53
Hokuriku 0.61 0.58 0.58 Kanto 0.54 0.53 Kinki 0.51
Note: CSP is computed for each varietal pair, then aggregated by region. See footnote 3.
Figure 3. An Approach to Computing a Gene Recharge Rate
Note: Figures at left are weighted contributions summing to unity.
Variety N (HS)
Variety B (HS) Variety C (Foreign)
(HS) (HS)
2244
×⎥⎦⎤
⎢⎣⎡
4242
×⎥⎦⎤
⎢⎣⎡
8241
×⎥⎦⎤
⎢⎣⎡
(HS) Variety A (FS)
HS HS HS HS HS HS HS HS

30
Table 3. Japanese Wheat Price and Quality, Descriptive Statistics
Variable Mean St.dev Min. Max. price (yen) 37,390 5,141 29,108 59,919 protein content rate 9.68 1.17 7.90 13.40 ash content 1.55 0.08 1.31 1.79 color (volor grader value) -1.25 0.68 -3.00 0.50 amylo(B.U.) 885 203 330 1435 weight(kg/l) 809.4 16.4 766.0 854.0
Source: Quality Assessment of Domestic Wheat Japanese Milling Industry Association Annual reports on miller-level wheat prices, Japanese Rice, Wheat, and Barley Improvement
Association
Table 4. Hedonic Japanese Wheat Price Regressions, Parameter Estimates
Variable Model (1) Parameter t-value
Model (2) Parameter t-value
lnpro 0.218** 2.53 0.238*** 2.8 lnash -0.415*** -2.94 -0.433*** -3.03 lnclr -0.077** -2.33 -0.073** -2.35 lnaml 0.022 0.43 0.045 0.94 lnwgt 0.684 1.47 0.294 0.62 hard 0.311*** 6.91 0.280*** 3.73 Year dummy Yes Yes Boundary prices included Yes No
OBS 200 188 2R 0.54 0.43
Note: **,***indicate statistical significance at 5% and 1%, respectively.

31
Table 5. Characteristics Decomposition of Japanese Wheat Prices (percentages)
Variety Name
Price Difference Protein Ash Color Amylo Hardness Weight Residual
Haruyutaka -5.4 -4.9 0.6 -7.7 -18.1 0.0 12.0 -81.9 Horoshiri -18.6 -26.7 11.7 -10.2 -11.2 -167.7 -8.4 112.6 W8 -21.5 -11.5 10.1 3.3 -2.6 0.0 -12.8 -86.6 Chihoku -22.4 -20.4 22.5 0.4 -4.9 -138.9 -11.9 53.1 Taisetsu -22.9 -31.1 26.9 1.7 -3.7 -135.9 -7.6 49.7 Kinunonami -26.7 -36.6 19.1 15.1 2.2 -116.7 -10.5 27.2 Ayahikari -34.0 -20.5 9.7 -3.5 1.0 -91.6 -4.4 9.3 Tsurupikari -36.2 -25.1 5.5 3.1 0.8 -86.1 -7.4 9.2 Kitanokaori -36.4 -2.3 0.9 -5.7 -4.1 0.0 1.7 -90.4 Hokushin -39.4 -10.3 9.6 -2.8 -0.8 -78.9 -3.1 -13.6 Bandowase -41.2 -17.5 8.6 -4.8 -2.9 -75.5 -12.5 4.7 Shirogane -46.1 -11.4 -3.6 -1.6 -0.4 -67.6 -6.8 -8.7 Nambu -46.4 -15.1 8.4 6.0 -1.1 -67.1 -6.0 -25.0 Norin61 -47.8 -15.7 1.1 -1.5 -0.9 -65.1 -6.7 -11.2 Chikugo -48.5 -18.2 7.0 -1.6 0.1 -64.1 -6.2 -16.9 Kitamoe -49.7 -9.3 5.2 0.2 -2.1 -62.6 -1.7 -29.8 Iwainodaichi -51.3 -18.3 12.7 4.1 0.5 -60.6 -2.9 -35.5 Nebarigoshi -58.6 -10.8 9.6 -4.6 -0.3 -53.1 -2.4 -38.4
Average -36.3 -17.0 9.2 -0.6 -2.7 -74.0 -5.4 -9.6 Note: Numbers in columns (3) through (9) sum to -100%.

32
Table 6. Output Distance Function Parameter Estimates, Japanese Wheat Breeding
Parameter Estimate t-ratio Parameter Estimate t-ratio
0α 0.327 0.23 ,HSD tδ 0.019 *** 2.59
Yα -0.722 -1.72 , ,HSD Y tδ -0.011 *** -2.66
Pα 1.722 *** 4.11 , ,HSD P tδ 0.011 *** 2.66
Nβ 0.439 1.31 , ,HSD t tδ 0.000 0.04
Sβ -1.055 -1.64 ,HHD tδ 0.005 0.86
YYα 0.437 *** 6.20 , ,HHD Y tδ -0.008 * -1.91
YPα -0.437 *** -6.20 , ,HHD P tδ 0.008 * 1.91
PPα 0.437 *** 6.20 , ,HHD t tδ 0.000 1.32
NNβ -0.059 -1.06 ,FS tDδ 0.002 0.50
NSβ -0.108 -1.40 , ,FS Y tDδ -0.005 *** -2.71
SSβ 0.181 1.19 , ,FS P tDδ 0.005 *** 2.71
YNγ -0.154 -1.56 , ,FS t tDδ 0.000 0.72
PNγ 0.154 1.56 ,FH tDδ -0.012 -0.60
YSγ 0.271 1.45 , ,FH Y tDδ -0.002 -0.75
PSγ -0.271 -1.45 , ,FH P tDδ 0.002 0.75
, ,FH t tDδ 0.000 0.47
GDδ -0.029 ** -2.01
ANDδ -0.060
*** -2.67
NRDδ -0.194 *** -7.09
OBS = 436 Note:*** , ** , and * indicate statistical significance at 1%, 5% and 10%, respectively.
33
Table 7. Tests of Properties of Estimated Output Distance Function All-
Data Mean
Hokkaido Fuken
Standard Hard Standard Hard
Mon
oton
icity
∂lnD0/∂lnY Mean 0.30 0.38 0.16 0.36 0.30
% negative 0.00 3.26 4.31 5.26
∂lnD0/∂lnP Mean 0.70 0.62 0.84 0.64 0.70
% negative 0.00 0.00 0.00 0.00
∂lnD0/∂lnSY Mean -0.11 -0.10 -0.16 -0.09 -0.13
% positive 2.63 0.00 22.41 5.26
∂lnD0/∂lnN Mean -0.10 -0.11 -0.09 -0.09 -0.06
% positive 4.21 3.26 2.59 15.79
Convexity in outputs satisfied
satisfied at mean
satisfied at mean
satisfied at mean
satisfied at mean
% violated 0.00 0.00 0.00 0.00

34
Table 8. Technological Change Rates in Japanese Wheat Breeding
Location Wheat type 0 ,D tε
HokkaidoStandard ( SH ) -0.0175
Hard ( HH ) -0.0168
Fuken Standard ( SF ) -0.0240
Hard ( HF ) -0.0244
Note: Computed from equation (4).
Table 9. Bias of Technological Change in Japanese Wheat Breeding
Location Wheat type Yield (Y) Protein Content (P)
,Y tB ,grossY tB ,
scaleY tB ,P tB ,
grossP tB ,
scaleP tB
Hokkaido Standard ( SH ) -0.061 -0.030 0.031 0.037 0.018 -0.018
Hard ( HH ) -0.045 -0.046 -0.001 0.009 0.009 0.0002
Fuken Standard ( SF ) -0.058 -0.015 0.043 0.033 0.009 -0.024
Hard ( HF ) 0.008 -0.006 -0.015 -0.003 0.003 0.006 Note: Computed from equation (8).

35
Table 10. Estimated Protein/Yield
Shadow Price Ratios Registered
Year Variety Number
and Name /Y Pr r Registered
Year Variety Number
and Name /Y Pr r
Hokkaido Standard Fuken Standard 1968 108 Muka 0.173 1975 119 Toyoho 0.306 1974 114 Horoshiri 0.148 1983 128 Fukuwase 0.111 1974 115 Takune 0.103 1988 132 Aira 0.183 1981 126 Chihoku 0.102 1988 133 Koyuki 0.068 1990 136 Taisetsu 0.085 1989 134 Daichino minori 0.104 1995 142 Hokushin 0.066 1990 135 Bandou 0.187 2000 149 Kitamoe 0.050 1992 137 Akitakko 0.098
Hokkaido Hard 1992 138 Abukuma wase 0.072 1965 104 Haruhikari 0.127 1993 140 Kinuiroha 0.081 1985 130 Haruyutaka 0.059 1993 141 Chikugoizumi 0.078 1993 139 Haruno akebono 0.053 1995 144 Nishihonami 0.078 2000 150 Haruhinode 0.025 1999 145 Iwaino daichi 0.091
Fuken Hard 1999 147 Ayahikari 0.123 1999 146 Nishinokaori 0.116 2000 152 Nebarigoshi 0.048 2001 153 Haruibuki 0.109 2002 156 Fukusayaka 0.099 2002 155 Tamaizumi 0.122 2005 163 Uraramochi 0.093 2002 157 Yukichikara 0.158 2005 164 Fukuhonoka 0.095 2003 160 Minamino kaori 0.117
Note: Computed from equation (6). Shadow price is evaluated at the mean of the indicated variety number.

36
0
0.05
0.1
0.15
0.2
0.25
0.3
0.35
1960 1965 1970 1975 1980 1985 1990 1995 2000 2005 2010
◆Fuken Standard△Fuken Hard×Hokkaido Standard□Hokkaido Hard
Shadow price ratio (rY/rP)
Year
Figure 4. Protein/Yield Shadow Price Ratios, by Wheat Type
Note: Shadow price ratios are given in Table 10.

37
Appendix A
Given equation (7), ln / lnm mS D C= ∂ ∂ , the second derivative of the output distance
function with respect to input j is
(A.1) 2 ln
ln ln lnm
j m j
S Dx C x
∂ ∂=
∂ ∂ ∂.
Multiplying both sides by 1
mS, we have the first term in equation (8):
(A.2) 2ln ln 1
ln ln lnm
j m j m
S Dx C x S
∂ ∂=
∂ ∂ ∂
Applying the envelope theorem to the Lagrangian of the revenue maximization problem
(Färe and Primont, 1995, p.53, equation 3.2.10), we obtain
(A.3) lnlnj j
R Dx x
θ∂= − ⋅
∂.
Noting that ( )( , ) ,R θ=r x r x (Färe and Primont, 1995, p.54), and multiplying both sides
of (A.3) by xj , gives
(A.4) ln lnln lnj j
R Dx x
∂ ∂= −
∂ ∂.
That is, the derivative of the revenue function with respect to an input is equivalently the
derivative of the distance function with respect to that same input. Substituting equations
(4), (7), and (A.4) into equation (8) gives equation (9).
38
Footnotes 1 Binswanger (1978) expresses this by observing that research resources can be allocated
efficiently only if the bias of technological change favors the good with the higher
relative price.
2 Standard and Hard wheats are distinguished by their protein percentages, the former
containing less protein. The quality of protein also differs in them.
3 The role of human capital in productivity growth has been analyzed extensively. Dietz
and Bozeman (2005) consider human capital as an input to publication and patent
productivity. Their examination of researcher careers shows that career transitions,
such as from industry to academia, boost research productivity.
4 The popularity of distance functions in empirical work likely owes to the fact that
convexity and other regularity properties are better understood in distance than in
transformation functions.
5 The CSP – sometimes called a Coefficient of Parentage (COP) – between varieties A and
B can be found as ( )0.5 A Bj jk n n
jABCSP+
= ∑ , where j is the parent variety
common to varieties A and B, k is the total number of common parents, and n is the
number of generations to the corresponding common parents. (1 - CSP) is often
used as an indicator of biodiversity (Meng, E. C. H, et al., 1998).
6 Standard wheat and hard wheat are biologically impossible to crossbreed.
7 Hokkaido is located in the far north of Japan. Fuken represents all remaining regions
except Tokyo.
39
8 That is, monotonicity requires 0 0 00, 0, 0D P D Y D x∂ ∂ > ∂ ∂ > ∂ ∂ < .
9 A given variety’s trial data, which begin to be available several years prior to the variety’s
registration, correspond to alternative fertilizer (nitrogen) applications rates and
management practices. In addition to those pre-registration records, annual data
often are available for some years after registration, as they are used for comparison
to subsequent varieties.
10 We earlier estimated the model with stochastic frontier analysis (SFA), permitting
research technologies to be inefficient. However, results seriously violated
regularity conditions such as input monotonicity and convexity in outputs.
11 A possible reason for Fuken Hard varieties’ departure from the generally protein-
favoring bias in Japanese wheat breeding is that these varieties have been released
only recently, so that laboratories may not yet have discovered a firm breeding
objective.
38
References
Akino, M., Hayami, Y., 1975. Efficiency and equity in public research: rice breeding in
Japan’s economic development. American Journal of Agricultural Economics 57,
1-10.
Antle, J.M., Capalbo, S.M., 1998. An Introduction to Recent Developments in Production
Theory and Productivity Measurement. In: Capalbo, S.M., Antle, J.M. (Ed.),
Agricultural Productivity Measurement and Explanation. Resources for the Future,
Washington, D.C., pp.17-95.
Binswanger, H.P., 1978a. The Microeconomics of Induced Technical Change. In:
Binswanger, H.P., Ruttan, V. W. (Ed.), Induced Innovation - Technology,
Institutions, and Development. Johns Hopkins University Press, pp. 91 – 127.
Binswanger, H.P. 1978b. Induced Technical Change: Evolution of Thought. In:
Binswanger, H.P., Ruttan, V. W. (Ed.), Induced Innovation - Technology,
Institutions, and Development. Johns Hopkins University Press, pp. 13 – 43.
Brümmer, B., Glauben, T., Thijssen, G., 2002. Decomposition of Productivity Growth
Using Distance Functions: The Case of Dairy Farms in Three European Countries.
American Journal of Agricultural Economics 84(3), 628 - 644.
Coelli T., Perelman, S., 1999. A Comparison of Parametric and Nonparametric Distance
Functions: With Application to European Railways. European Journal of
Operational Research 117, 326 - 339.
Dietz, J. S., Bozeman, B., 2005. Academic careers, patents, and productivity: industry
experience as scientific and technical human capital. Research Policy 34, 349-367.
39
Evenson, R.E., Gollin, D., 1997. Genetic Resources, International Organizations, and
Improvement in Rice Varieties. Economic Development and Cultural Change
45(3), 471 - 500.
Evenson, R.E., 1998. Plant Breeding: A Case of Induced Innovation. In: Evenson, R. E.,
Gollin, D., Santaniello, V. (Ed.), Agricultural Values of Plant Genetic Resources.
CABI Publishing, Wallingford, UK, pp.29 - 42.
Färe, R., Primont, D., 1995. Multi-Output Production and Duality: Theory and Applications.
Kluwer Academic Publishers, Boston.
Grosskopf, S., Hayes, K., Hirschberg, J., 1995. Fiscal Stress and the Production of Public
Safety: A Distance Function Approach. Journal of Public Economics 57, 277 - 296.
Grosskopf, S., Margaritis, D., Valdmanis, V., 1995. Estimating Output Substitutability of
Hospital Services: A Distance Function Approach. European Journal of
Operational Research 80, 575 - 587.
Irz, X., Thirtle, C., 2004. Dual Technological Development in Botswana Agriculture: A
Stochastic Input Distance Function Approach. Journal of Agricultural Economics
55, 455 - 478.
Japanese Milling Industry Association. Quality Assessment of Domestic Wheat, annual
reports.
Japanese Rice, Wheat, and Barley Improvement Association. Miller Wheat Prices, annual
reports.
Klerkx, L., Leeuwis, C., 2008. Institutionalizing end-use demand steering in agricultural
R&D: Farmer levy funding of R&D in The Netherlands. Research Policy 37, 460-
472.

40
Ladd, G., Martin, M., 1976. Prices and Demands for Input Characteristics. American
Journal of Agricultural Economics 58, 21-30.
Meng, E.C.H, Smale, M., Bellon, M. R., Grimanelli, D., 1998. Definition and
Measurement of Crop Diversity for Economic Analysis. In: Smale, M., (Ed.),
Farmers, Gene Banks and Crop Breeding: Economic Analysis of Diversity in
Wheat, Maize, and Rice. Kluwer Academic Publishers, Massachusetts, pp.19-32.
Ministry of Agriculture, Forestry, and Fisheries. Experimental data for Norin Registration
(Shinhinshu Kettei Ni Kansuru Sankou Seisekisho), various varieties.
Nonaka, S., 1985. Breeding of Semi-Dwarf Wheat” and “Recent Progress in Breeding.
Twenty-seventh Symposium on Japanese Society of Breeding. Keigaku
Publishing, Tokyo (Japanese), pp.69-88.
O'Donnell, C. J., Coelli, T. J., 2005. A Bayesian Approach to Imposing Curvature on
Distance Functions. Journal of Econometrics 126, 493 - 523.
Ruttan, V.W., Binswanger, H.P., Hayami, Y., Wade, W.W., Weber, A., 1978. Factor
Productivity and Growth: A Historical Interpretation. In: Binswanger, H.P., Ruttan,
V. W. (Ed.), Induced Innovation - Technology, Institutions, and Development.
Johns Hopkins University Press, pp. 44 - 87.
Sakiura, S., 1984. Economic Analysis of Rice Breeding Research (Ine Hinshu Kairyo No
Keizai Bunseki) Yokendo Publishing, Tokyo (Japanese), pp.32-80.
Salter, A. J., Martin, B. R., 2001. The economic benefits of publicly funded basic research:
a critical review. Research Policy 30, 509-532.
41
Simpson, R.D., Sedjo, R.A., 1998. The Value of Genetic Resources for Use in Agricultural
Improvement. In: Evenson, R. E., Gollin, D., Santaniello, V. (Ed.), Agricultural
Values of Plant Genetic Resources. CABI Publishing, Wallingford, UK, pp.55 - 66.
Smale, M., Hartell, J. H., Heisey, P. W., Senauer, B., 1998. The Contribution of Genetic
Resources and Diversity to Wheat Production in the Punjab of Pakistan. American
Journal of Agricultural Economics 80, 482 - 493.
Stiegert, K., Blanc, J., 1997. Japanese Demand for Wheat Protein Quantity and Quality.
Journal of Agricultural and Resource Economics 22(1), 105-119.
Thirtle, C.G., Schimmelpfennig, D.E., Townsend, R.F., 2002. Induced Innovation in
United States Agriculture, 1880 – 1990: Time Series Tests and an Error Correction
Model. American Journal of Agricultural Economics 84, 598 – 614.
Traxler, G., Byerlee, D., 1993. A Joint-Product Analysis of the Adoption of Modern Cereal
Varieties in Developing Countries. American Journal of Agricultural Economics
75, 981 - 989.