Quality of experience of multiparty conferencing and ...
460
JANTO SKOWRONEK QUALITY OF EXPERIENCE OF MULTIPARTYCONFERENCING AND TELEMEETING SYSTEMS METHODS AND MODELS FOR ASSESSMENT AND PREDICTION TECHNISCHE UNIVERSITÄT BERLIN
-
Upload
khangminh22 -
Category
Documents
-
view
0 -
download
0
Transcript of Quality of experience of multiparty conferencing and ...

J A N T O S K O W R O N E K
Q U A L I T Y O F E X P E R I E N C E O FM U LT I PA R T Y C O N F E R E N C I N GA N D T E L E M E E T I N G S Y S T E M S
M E T H O D S A N D M O D E L S F O RA S S E S S M E N T A N D P R E D I C T I O N
T E C H N I S C H E U N I V E R S I TÄT B E R L I N

Quality of Experience of MultipartyConferencing and Telemeeting Systems
Methods and Models forAssessment and Prediction
vorgelegt von
Dipl.-Ing.
Janto Skowronek
geb. in Herdecke
von der Fakultät IV - Elektrotechnik und Informatik
der Technischen Universität Berlin
zur Erlangung des akademischen Grades
Doktor der Ingenieurwissenschaften
— Dr.-Ing. —
genehmigte Dissertation
Promotionsausschuss
Vorsitzender: Prof. Dr. Jean-Pierre Seifert
Gutachter: Prof. Dr.-Ing. Alexander Raake
Gutachter: Prof. Dr.-Ing. Sebastian Möller
Gutachter: Prof. Patrick Le Callet
Tag der wissenschaftlichen Aussprache: 09. Dezember 2016
Berlin 2017

Brief Contents
Preface 11
Zusammenfassung 13
Summary 15
I General Introduction 17
1 General Introduction 18
II Background 26
2 Human Communication via Telemeetings 27
3 Telemeeting Technologies 51
4 Quality Assessment in Telecommunication 73
III Contribution 88
5 Conceptual Model of Telemeeting Quality 89
6 Methodology for the Perceptual Assessment of Telemeeting Quality 120
7 Perception of Telemeeting Quality with focus on Group-Communication Aspects 153
8 Perception of Telemeeting Quality with focus on Telecommunication Aspects 204
9 Perceptual Models of Telemeeting Quality 256
IV Summary and Conclusions 290
10 Summary and Conclusions 291
V Appendices 300
A Overview of Conducted Studies and Documents that Contributed to this Thesis 301
B Detailed Results: Deep Dive Analysis of Research on Group-Communication 305

4
C Detailed Results: Study on Impact of Communication Complexity 329
D Detailed Results: Study on Impact of Involvement 353
E Detailed Results: Study on Impact of Audio-Only Telemeeting - Conversation Tests 363
F Detailed Results: Study on Impact of Audio-Only Telemeeting - Listening-Only Tests 371
G Detailed Results: Study on Impact of Audiovisual Telemeeting - Conversation Tests 380
H Detailed Results: Model Performance 389
Bibliography 442

Detailed Contents
Preface 11
Zusammenfassung 13
Summary 15
I General Introduction 17
1 General Introduction 18What this chapter is about . . . . . . . . . . . . . . . . . . . . . . . . . . . . . . . . . . . . . . . . . . 18
1.1 Motivation, Problem Statement, and Main Research Goal . . . . . . . . . . . . . . . . . . . . . 18
1.2 Research Scenario . . . . . . . . . . . . . . . . . . . . . . . . . . . . . . . . . . . . . . . . . . . . 19
1.3 Research Objectives . . . . . . . . . . . . . . . . . . . . . . . . . . . . . . . . . . . . . . . . . . . 22
1.4 Research Method . . . . . . . . . . . . . . . . . . . . . . . . . . . . . . . . . . . . . . . . . . . . 23
II Background 26
2 Human Communication via Telemeetings 27What this chapter is about . . . . . . . . . . . . . . . . . . . . . . . . . . . . . . . . . . . . . . . . . . 27
2.1 Introduction . . . . . . . . . . . . . . . . . . . . . . . . . . . . . . . . . . . . . . . . . . . . . . . 27
2.2 A Characterization of Group-Communication . . . . . . . . . . . . . . . . . . . . . . . . . . . 28
2.2.1 Group-Communication Purposes . . . . . . . . . . . . . . . . . . . . . . . . . . . . . . 28
2.2.2 Group-Communication Processes . . . . . . . . . . . . . . . . . . . . . . . . . . . . . . 29
2.2.3 Communication Modes in Group-Communication . . . . . . . . . . . . . . . . . . . . 36
2.2.4 Shared-Work-Spaces in Group-Communication . . . . . . . . . . . . . . . . . . . . . . 36
2.3 Overview of Research on Face-To-Face and Mediated Group-Communication . . . . . . . . . 38
2.3.1 Goals . . . . . . . . . . . . . . . . . . . . . . . . . . . . . . . . . . . . . . . . . . . . . . . 38
2.3.2 Method . . . . . . . . . . . . . . . . . . . . . . . . . . . . . . . . . . . . . . . . . . . . . . 38
2.3.3 Results and Re-Interpretation . . . . . . . . . . . . . . . . . . . . . . . . . . . . . . . . . 38
2.3.4 Discussion and Conclusions . . . . . . . . . . . . . . . . . . . . . . . . . . . . . . . . . 40
2.4 Deep-Dive Analysis of Research on Face-To-Face and Mediated Group-Communication . . . 41
2.4.1 Motivation and Approach . . . . . . . . . . . . . . . . . . . . . . . . . . . . . . . . . . . 41
2.4.2 Method . . . . . . . . . . . . . . . . . . . . . . . . . . . . . . . . . . . . . . . . . . . . . . 42
2.4.3 Data . . . . . . . . . . . . . . . . . . . . . . . . . . . . . . . . . . . . . . . . . . . . . . . 45
2.4.4 Results . . . . . . . . . . . . . . . . . . . . . . . . . . . . . . . . . . . . . . . . . . . . . . 45
2.4.5 Discussion and Conclusions . . . . . . . . . . . . . . . . . . . . . . . . . . . . . . . . . 47
Summary . . . . . . . . . . . . . . . . . . . . . . . . . . . . . . . . . . . . . . . . . . . . . . . . . . . . 49

6
3 Telemeeting Technologies 51What this chapter is about . . . . . . . . . . . . . . . . . . . . . . . . . . . . . . . . . . . . . . . . . . 51
3.1 Introduction and Scope . . . . . . . . . . . . . . . . . . . . . . . . . . . . . . . . . . . . . . . . 51
3.2 Main Components . . . . . . . . . . . . . . . . . . . . . . . . . . . . . . . . . . . . . . . . . . . 52
3.3 Central-Bridge and Peer-to-Peer Topologies . . . . . . . . . . . . . . . . . . . . . . . . . . . . . 53
3.4 End Devices . . . . . . . . . . . . . . . . . . . . . . . . . . . . . . . . . . . . . . . . . . . . . . . 53
3.4.1 End Devices for Audio . . . . . . . . . . . . . . . . . . . . . . . . . . . . . . . . . . . . . 54
3.4.2 End Devices for Video . . . . . . . . . . . . . . . . . . . . . . . . . . . . . . . . . . . . . 57
3.5 Transmission over the Network . . . . . . . . . . . . . . . . . . . . . . . . . . . . . . . . . . . . 59
3.5.1 Codecs . . . . . . . . . . . . . . . . . . . . . . . . . . . . . . . . . . . . . . . . . . . . . . 59
3.5.2 Packetization and Transmission . . . . . . . . . . . . . . . . . . . . . . . . . . . . . . . 62
3.5.3 Buffering and Packet Error Handling . . . . . . . . . . . . . . . . . . . . . . . . . . . . 64
3.5.4 Audio-Video Synchronization . . . . . . . . . . . . . . . . . . . . . . . . . . . . . . . . 64
3.6 Bridges . . . . . . . . . . . . . . . . . . . . . . . . . . . . . . . . . . . . . . . . . . . . . . . . . . 65
3.7 Spatial audio . . . . . . . . . . . . . . . . . . . . . . . . . . . . . . . . . . . . . . . . . . . . . . . 69
Summary . . . . . . . . . . . . . . . . . . . . . . . . . . . . . . . . . . . . . . . . . . . . . . . . . . . . 71
4 Quality Assessment in Telecommunication 73What this chapter is about . . . . . . . . . . . . . . . . . . . . . . . . . . . . . . . . . . . . . . . . . . 73
4.1 Introduction . . . . . . . . . . . . . . . . . . . . . . . . . . . . . . . . . . . . . . . . . . . . . . . 73
4.2 Notion of Quality and Different Perspectives . . . . . . . . . . . . . . . . . . . . . . . . . . . . 74
4.2.1 User-centric and Technology-Oriented Perspectives on Quality . . . . . . . . . . . . . 74
4.2.2 A Hierarchical Perspective on Quality . . . . . . . . . . . . . . . . . . . . . . . . . . . . 75
4.2.3 A Process-Oriented Perspective on Quality . . . . . . . . . . . . . . . . . . . . . . . . . 75
4.3 Characterizing Quality: Quality Elements and Quality Features . . . . . . . . . . . . . . . . . 76
4.3.1 Quality Features . . . . . . . . . . . . . . . . . . . . . . . . . . . . . . . . . . . . . . . . 76
4.3.2 Quality Elements . . . . . . . . . . . . . . . . . . . . . . . . . . . . . . . . . . . . . . . . 78
4.4 Perceptual Assessment of Quality . . . . . . . . . . . . . . . . . . . . . . . . . . . . . . . . . . 79
4.5 Instrumental Assessment and Prediction of Quality . . . . . . . . . . . . . . . . . . . . . . . . 80
Summary . . . . . . . . . . . . . . . . . . . . . . . . . . . . . . . . . . . . . . . . . . . . . . . . . . . . 87
III Contribution 88
5 Conceptual Model of Telemeeting Quality 89What this chapter is about . . . . . . . . . . . . . . . . . . . . . . . . . . . . . . . . . . . . . . . . . . 89
5.1 Introduction . . . . . . . . . . . . . . . . . . . . . . . . . . . . . . . . . . . . . . . . . . . . . . . 89
5.2 Telemeeting Quality Formation Process . . . . . . . . . . . . . . . . . . . . . . . . . . . . . . . 90
5.2.1 Basic principle . . . . . . . . . . . . . . . . . . . . . . . . . . . . . . . . . . . . . . . . . 90
5.2.2 Reflection and Attribution . . . . . . . . . . . . . . . . . . . . . . . . . . . . . . . . . . . 93
5.2.3 A more detailed process of perception . . . . . . . . . . . . . . . . . . . . . . . . . . . 94
5.2.4 Quality Awareness and Quality Attention Focus . . . . . . . . . . . . . . . . . . . . . . 96
5.2.5 Summary of process model . . . . . . . . . . . . . . . . . . . . . . . . . . . . . . . . . . 99
5.3 Different Aggregation Levels of Telemeeting Quality . . . . . . . . . . . . . . . . . . . . . . . 100
5.3.1 Concept of Individual Connections and Individual Connection Quality . . . . . . . . 101
5.3.2 Mutual Influence of Individual Connection Qualities . . . . . . . . . . . . . . . . . . . 101
5.3.3 Signal-based and Cue-based Quality Features . . . . . . . . . . . . . . . . . . . . . . . 102
5.3.4 Interpretations of Individual Connection Quality Qij . . . . . . . . . . . . . . . . . . . 102
5.3.5 Single-Perspective Telemeeting Quality Qi . . . . . . . . . . . . . . . . . . . . . . . . . 104
5.3.6 Group-Perspective Telemeeting Quality Qall . . . . . . . . . . . . . . . . . . . . . . . . 105

7
5.3.7 Extension of the Quality Formation Process Model . . . . . . . . . . . . . . . . . . . . 105
5.4 Telecommunication and Group-Communication Components of Telemeeting Quality . . . . 110
5.4.1 Characterization of the Telecommunication and Group-Communication Components 110
5.4.2 Influencing the Quality Attention Focus . . . . . . . . . . . . . . . . . . . . . . . . . . 111
5.4.3 Quality Attention Focus in Assessment Tests . . . . . . . . . . . . . . . . . . . . . . . . 111
5.4.4 Extension of the Quality Formation Process Model . . . . . . . . . . . . . . . . . . . . 114
Summary . . . . . . . . . . . . . . . . . . . . . . . . . . . . . . . . . . . . . . . . . . . . . . . . . . . . 117
6 Methodology for the Perceptual Assessment of Telemeeting Quality 120What this chapter is about . . . . . . . . . . . . . . . . . . . . . . . . . . . . . . . . . . . . . . . . . . 120
6.1 Introduction . . . . . . . . . . . . . . . . . . . . . . . . . . . . . . . . . . . . . . . . . . . . . . . 121
6.2 ITU-T Recommendation P.1301 . . . . . . . . . . . . . . . . . . . . . . . . . . . . . . . . . . . . 121
6.2.1 Overview of ITU-T Recommendation P.1301 . . . . . . . . . . . . . . . . . . . . . . . . 121
6.2.2 Selection of a Basic Test Method according to ITU-T Rec. P.1301 . . . . . . . . . . . . 123
6.2.3 Modification and Application of a Basic Test Method according to ITU-T Rec. P.1301 124
6.2.4 Test Aspects beyond ITU-T Recommendation P.1301 . . . . . . . . . . . . . . . . . . . 125
6.3 Analysis Method to translate Technical Degradations into Possible Perceptual Impairments 125
6.3.1 Motivation and Basic Principle . . . . . . . . . . . . . . . . . . . . . . . . . . . . . . . . 125
6.3.2 Step 1: Description of the Multiparty Situation . . . . . . . . . . . . . . . . . . . . . . . 126
6.3.3 Step 2: Identification of Degradation-Types and Degradation-Points . . . . . . . . . . 127
6.3.4 Step 3: Analysis of Signal Paths and Deduction of Possible Perceptual Impairments . 133
6.3.5 Step 4: Generation of a Comprehensive Representation for all Interlocutors . . . . . . 134
6.3.6 Limitations . . . . . . . . . . . . . . . . . . . . . . . . . . . . . . . . . . . . . . . . . . . 134
6.4 Experimental Design Method distributing Possible Perceptual Impairments instead of Tech-nical Degradations . . . . . . . . . . . . . . . . . . . . . . . . . . . . . . . . . . . . . . . . . . . 139
6.4.1 Motivation . . . . . . . . . . . . . . . . . . . . . . . . . . . . . . . . . . . . . . . . . . . . 139
6.4.2 Application . . . . . . . . . . . . . . . . . . . . . . . . . . . . . . . . . . . . . . . . . . . 139
6.5 Method to organize Perceptual Data to account for the Individual Perspectives of Interlocutors140
6.5.1 Motivation and Basic Principle . . . . . . . . . . . . . . . . . . . . . . . . . . . . . . . . 140
6.5.2 Application by means of an Algorithm . . . . . . . . . . . . . . . . . . . . . . . . . . . 143
Summary . . . . . . . . . . . . . . . . . . . . . . . . . . . . . . . . . . . . . . . . . . . . . . . . . . . . 151
7 Perception of Telemeeting Quality with focus on Group-Communication Aspects 153What this chapter is about . . . . . . . . . . . . . . . . . . . . . . . . . . . . . . . . . . . . . . . . . . 153
7.1 Introduction . . . . . . . . . . . . . . . . . . . . . . . . . . . . . . . . . . . . . . . . . . . . . . . 154
7.2 Experimental Variables on a Conceptual Level . . . . . . . . . . . . . . . . . . . . . . . . . . . 155
7.2.1 Manipulated Variable: Communication Complexity . . . . . . . . . . . . . . . . . . . . 155
7.2.2 Manipulated Variable: Involvement . . . . . . . . . . . . . . . . . . . . . . . . . . . . . 157
7.2.3 Manipulated Variable: Technical System Capability . . . . . . . . . . . . . . . . . . . . 158
7.2.4 Measured Variable: Cognitive Load . . . . . . . . . . . . . . . . . . . . . . . . . . . . . 158
7.2.5 Measured Variables: Speech Communication Quality and Quality of Experience . . . 159
7.3 Quality Impact of Communication Complexity . . . . . . . . . . . . . . . . . . . . . . . . . . . 159
7.3.1 Goals . . . . . . . . . . . . . . . . . . . . . . . . . . . . . . . . . . . . . . . . . . . . . . . 160
7.3.2 Experimental Factors . . . . . . . . . . . . . . . . . . . . . . . . . . . . . . . . . . . . . . 161
7.3.3 Method . . . . . . . . . . . . . . . . . . . . . . . . . . . . . . . . . . . . . . . . . . . . . . 166
7.3.4 Data Acquisition . . . . . . . . . . . . . . . . . . . . . . . . . . . . . . . . . . . . . . . . 167
7.3.5 Results Experiment CC1 . . . . . . . . . . . . . . . . . . . . . . . . . . . . . . . . . . . . 175
7.3.6 Results Experiment CC2 . . . . . . . . . . . . . . . . . . . . . . . . . . . . . . . . . . . . 179
7.3.7 Discussion . . . . . . . . . . . . . . . . . . . . . . . . . . . . . . . . . . . . . . . . . . . . 183

8
7.4 Quality Impact of Involvement . . . . . . . . . . . . . . . . . . . . . . . . . . . . . . . . . . . . 187
7.4.1 Goals . . . . . . . . . . . . . . . . . . . . . . . . . . . . . . . . . . . . . . . . . . . . . . . 187
7.4.2 Experimental Factors . . . . . . . . . . . . . . . . . . . . . . . . . . . . . . . . . . . . . . 189
7.4.3 Method . . . . . . . . . . . . . . . . . . . . . . . . . . . . . . . . . . . . . . . . . . . . . . 191
7.4.4 Data Acquisition . . . . . . . . . . . . . . . . . . . . . . . . . . . . . . . . . . . . . . . . 192
7.4.5 Results Experiment INV . . . . . . . . . . . . . . . . . . . . . . . . . . . . . . . . . . . . 196
7.4.6 Discussion . . . . . . . . . . . . . . . . . . . . . . . . . . . . . . . . . . . . . . . . . . . . 199
Summary . . . . . . . . . . . . . . . . . . . . . . . . . . . . . . . . . . . . . . . . . . . . . . . . . . . . 202
8 Perception of Telemeeting Quality with focus on Telecommunication Aspects 204What this chapter is about . . . . . . . . . . . . . . . . . . . . . . . . . . . . . . . . . . . . . . . . . . 204
8.1 Introduction . . . . . . . . . . . . . . . . . . . . . . . . . . . . . . . . . . . . . . . . . . . . . . . 205
8.2 Experimental Variables on a Conceptual Level . . . . . . . . . . . . . . . . . . . . . . . . . . . 206
8.2.1 Focus on Technical System Capability and Speech Communication Quality . . . . . . 206
8.2.2 Quality Aggregation Levels as Measured Variables . . . . . . . . . . . . . . . . . . . . 206
8.2.3 Involvement as Manipulated Variable across Experiments . . . . . . . . . . . . . . . . 207
8.3 Quality Impact of an Audio-Only Telemeeting System - Conversation Tests . . . . . . . . . . 207
8.3.1 Goals . . . . . . . . . . . . . . . . . . . . . . . . . . . . . . . . . . . . . . . . . . . . . . . 207
8.3.2 Experimental Factors . . . . . . . . . . . . . . . . . . . . . . . . . . . . . . . . . . . . . . 210
8.3.3 Method . . . . . . . . . . . . . . . . . . . . . . . . . . . . . . . . . . . . . . . . . . . . . . 213
8.3.4 Data Acquisition . . . . . . . . . . . . . . . . . . . . . . . . . . . . . . . . . . . . . . . . 216
8.3.5 Results of Experiment ACT1 . . . . . . . . . . . . . . . . . . . . . . . . . . . . . . . . . 222
8.3.6 Results of Experiment ACT2 . . . . . . . . . . . . . . . . . . . . . . . . . . . . . . . . . 223
8.3.7 Results of Experiment ACT3 . . . . . . . . . . . . . . . . . . . . . . . . . . . . . . . . . 224
8.3.8 Discussion . . . . . . . . . . . . . . . . . . . . . . . . . . . . . . . . . . . . . . . . . . . . 226
8.4 Quality Impact of an Audio-Only Telemeeting System - Listening-Only Tests . . . . . . . . . 227
8.4.1 Goals . . . . . . . . . . . . . . . . . . . . . . . . . . . . . . . . . . . . . . . . . . . . . . . 227
8.4.2 Experimental Factors . . . . . . . . . . . . . . . . . . . . . . . . . . . . . . . . . . . . . . 228
8.4.3 Method . . . . . . . . . . . . . . . . . . . . . . . . . . . . . . . . . . . . . . . . . . . . . . 230
8.4.4 Data Acquisition . . . . . . . . . . . . . . . . . . . . . . . . . . . . . . . . . . . . . . . . 232
8.4.5 Results of Experiment LOT1 . . . . . . . . . . . . . . . . . . . . . . . . . . . . . . . . . 234
8.4.6 Results of Experiment LOT2 . . . . . . . . . . . . . . . . . . . . . . . . . . . . . . . . . 235
8.4.7 Discussion . . . . . . . . . . . . . . . . . . . . . . . . . . . . . . . . . . . . . . . . . . . . 238
8.5 Quality Impact of an Audiovisual Telemeeting System - Conversation Tests . . . . . . . . . . 240
8.5.1 Goals . . . . . . . . . . . . . . . . . . . . . . . . . . . . . . . . . . . . . . . . . . . . . . . 240
8.5.2 Experimental Factors . . . . . . . . . . . . . . . . . . . . . . . . . . . . . . . . . . . . . . 241
8.5.3 Method . . . . . . . . . . . . . . . . . . . . . . . . . . . . . . . . . . . . . . . . . . . . . . 243
8.5.4 Data Acquisition . . . . . . . . . . . . . . . . . . . . . . . . . . . . . . . . . . . . . . . . 246
8.5.5 Results of Experiment AVCT1 . . . . . . . . . . . . . . . . . . . . . . . . . . . . . . . . 249
8.5.6 Results of Experiment AVCT2 . . . . . . . . . . . . . . . . . . . . . . . . . . . . . . . . 250
8.5.7 Discussion . . . . . . . . . . . . . . . . . . . . . . . . . . . . . . . . . . . . . . . . . . . . 252
Summary . . . . . . . . . . . . . . . . . . . . . . . . . . . . . . . . . . . . . . . . . . . . . . . . . . . . 254
9 Perceptual Models of Telemeeting Quality 256What this chapter is about . . . . . . . . . . . . . . . . . . . . . . . . . . . . . . . . . . . . . . . . . . 256
9.1 Introduction . . . . . . . . . . . . . . . . . . . . . . . . . . . . . . . . . . . . . . . . . . . . . . . 256
9.2 Modeling Algorithms . . . . . . . . . . . . . . . . . . . . . . . . . . . . . . . . . . . . . . . . . . 257
9.2.1 Fundamental Modeling Ideas . . . . . . . . . . . . . . . . . . . . . . . . . . . . . . . . . 257
9.2.2 Modeling Functions . . . . . . . . . . . . . . . . . . . . . . . . . . . . . . . . . . . . . . 262

9
9.2.3 Modeling Factors . . . . . . . . . . . . . . . . . . . . . . . . . . . . . . . . . . . . . . . . 264
9.3 Model Training and Evaluation Procedure . . . . . . . . . . . . . . . . . . . . . . . . . . . . . 266
9.3.1 Motivation and Basic Principle . . . . . . . . . . . . . . . . . . . . . . . . . . . . . . . . 266
9.3.2 Performance Measures . . . . . . . . . . . . . . . . . . . . . . . . . . . . . . . . . . . . . 267
9.3.3 Selection of the Number of Bootstrap Repetitions . . . . . . . . . . . . . . . . . . . . . 267
9.3.4 Algorithm to Split the Data into Training and Test Sets . . . . . . . . . . . . . . . . . . 273
9.3.5 Selection of Proportion of Training and Test Data . . . . . . . . . . . . . . . . . . . . . 273
9.4 Model Performance . . . . . . . . . . . . . . . . . . . . . . . . . . . . . . . . . . . . . . . . . . . 276
9.5 Discussion . . . . . . . . . . . . . . . . . . . . . . . . . . . . . . . . . . . . . . . . . . . . . . . . 283
9.5.1 Review of Results . . . . . . . . . . . . . . . . . . . . . . . . . . . . . . . . . . . . . . . . 283
9.5.2 Review of the Approach and Open Questions for Future Work . . . . . . . . . . . . . 285
Summary . . . . . . . . . . . . . . . . . . . . . . . . . . . . . . . . . . . . . . . . . . . . . . . . . . . . 287
IV Summary and Conclusions 290
10 Summary and Conclusions 291What this chapter is about . . . . . . . . . . . . . . . . . . . . . . . . . . . . . . . . . . . . . . . . . . 291
10.1 Research Objectives Revisited . . . . . . . . . . . . . . . . . . . . . . . . . . . . . . . . . . . . . 291
10.1.1 Conceptual Model of Telemeeting Quality – Chapter 5 . . . . . . . . . . . . . . . . . . 291
10.1.2 Methodology for the Perceptual Assessment of Telemeeting Quality – Chapter 6 . . . 292
10.1.3 Perception of Telemeeting Quality with focus on Group-Communication Aspects –Chapter 7 . . . . . . . . . . . . . . . . . . . . . . . . . . . . . . . . . . . . . . . . . . . . 293
10.1.4 Perception of Telemeeting Quality with focus on Telecommunication Aspects – Chap-ter 8 . . . . . . . . . . . . . . . . . . . . . . . . . . . . . . . . . . . . . . . . . . . . . . . . 295
10.1.5 Perceptual Models of Telemeeting Quality – Chapter 9 . . . . . . . . . . . . . . . . . . 296
10.2 Final Conclusions . . . . . . . . . . . . . . . . . . . . . . . . . . . . . . . . . . . . . . . . . . . . 298
V Appendices 300
A Overview of Conducted Studies and Documents that Contributed to this Thesis 301What this chapter is about . . . . . . . . . . . . . . . . . . . . . . . . . . . . . . . . . . . . . . . . . . 301
A.1 Document Overview . . . . . . . . . . . . . . . . . . . . . . . . . . . . . . . . . . . . . . . . . . 302
B Detailed Results: Deep Dive Analysis of Research on Group-Communication 305What this chapter is about . . . . . . . . . . . . . . . . . . . . . . . . . . . . . . . . . . . . . . . . . . 305
B.1 Analysis Results . . . . . . . . . . . . . . . . . . . . . . . . . . . . . . . . . . . . . . . . . . . . . 306
C Detailed Results: Study on Impact of Communication Complexity 329What this chapter is about . . . . . . . . . . . . . . . . . . . . . . . . . . . . . . . . . . . . . . . . . . 329
C.1 Experiment CC1 . . . . . . . . . . . . . . . . . . . . . . . . . . . . . . . . . . . . . . . . . . . . . 330
C.2 Experiment CC2 . . . . . . . . . . . . . . . . . . . . . . . . . . . . . . . . . . . . . . . . . . . . . 341
D Detailed Results: Study on Impact of Involvement 353What this chapter is about . . . . . . . . . . . . . . . . . . . . . . . . . . . . . . . . . . . . . . . . . . 353
D.1 Experiment INV . . . . . . . . . . . . . . . . . . . . . . . . . . . . . . . . . . . . . . . . . . . . . 354
E Detailed Results: Study on Impact of Audio-Only Telemeeting - Conversation Tests 363What this chapter is about . . . . . . . . . . . . . . . . . . . . . . . . . . . . . . . . . . . . . . . . . . 363
E.1 Experiment ACT1 . . . . . . . . . . . . . . . . . . . . . . . . . . . . . . . . . . . . . . . . . . . . 364

10
E.2 Experiment ACT2 . . . . . . . . . . . . . . . . . . . . . . . . . . . . . . . . . . . . . . . . . . . . 366
E.3 Experiment ACT3 . . . . . . . . . . . . . . . . . . . . . . . . . . . . . . . . . . . . . . . . . . . . 367
F Detailed Results: Study on Impact of Audio-Only Telemeeting - Listening-Only Tests 371What this chapter is about . . . . . . . . . . . . . . . . . . . . . . . . . . . . . . . . . . . . . . . . . . 371
F.1 Experiment LOT1 . . . . . . . . . . . . . . . . . . . . . . . . . . . . . . . . . . . . . . . . . . . . 372
F.2 Experiment LOT2 . . . . . . . . . . . . . . . . . . . . . . . . . . . . . . . . . . . . . . . . . . . . 374
G Detailed Results: Study on Impact of Audiovisual Telemeeting - Conversation Tests 380What this chapter is about . . . . . . . . . . . . . . . . . . . . . . . . . . . . . . . . . . . . . . . . . . 380
G.1 Experiment AVCT1 . . . . . . . . . . . . . . . . . . . . . . . . . . . . . . . . . . . . . . . . . . . 381
G.2 Experiment AVCT2 . . . . . . . . . . . . . . . . . . . . . . . . . . . . . . . . . . . . . . . . . . . 384
H Detailed Results: Model Performance 389What this chapter is about . . . . . . . . . . . . . . . . . . . . . . . . . . . . . . . . . . . . . . . . . . 389
H.1 Experiment ACT1 . . . . . . . . . . . . . . . . . . . . . . . . . . . . . . . . . . . . . . . . . . . . 390
H.1.1 Performance across technical conditions . . . . . . . . . . . . . . . . . . . . . . . . . . 390
H.1.2 Performance per technical condition . . . . . . . . . . . . . . . . . . . . . . . . . . . . . 391
H.2 Experiment ACT2 . . . . . . . . . . . . . . . . . . . . . . . . . . . . . . . . . . . . . . . . . . . . 395
H.2.1 Performance across technical conditions . . . . . . . . . . . . . . . . . . . . . . . . . . 395
H.2.2 Performance per technical condition . . . . . . . . . . . . . . . . . . . . . . . . . . . . . 396
H.3 Experiment ACT3 . . . . . . . . . . . . . . . . . . . . . . . . . . . . . . . . . . . . . . . . . . . . 398
H.3.1 Performance across technical conditions . . . . . . . . . . . . . . . . . . . . . . . . . . 398
H.3.2 Performance per technical condition . . . . . . . . . . . . . . . . . . . . . . . . . . . . . 399
H.4 Experiment LOT1 . . . . . . . . . . . . . . . . . . . . . . . . . . . . . . . . . . . . . . . . . . . . 408
H.4.1 Performance across technical conditions . . . . . . . . . . . . . . . . . . . . . . . . . . 408
H.4.2 Performance per technical condition . . . . . . . . . . . . . . . . . . . . . . . . . . . . . 409
H.5 Experiment LOT2 . . . . . . . . . . . . . . . . . . . . . . . . . . . . . . . . . . . . . . . . . . . . 414
H.5.1 Performance across technical conditions . . . . . . . . . . . . . . . . . . . . . . . . . . 414
H.5.2 Performance per technical condition . . . . . . . . . . . . . . . . . . . . . . . . . . . . . 415
H.6 Experiment AVCT1 . . . . . . . . . . . . . . . . . . . . . . . . . . . . . . . . . . . . . . . . . . . 427
H.6.1 Performance across technical conditions . . . . . . . . . . . . . . . . . . . . . . . . . . 427
H.6.2 Performance per technical condition . . . . . . . . . . . . . . . . . . . . . . . . . . . . . 428
H.7 Experiment AVCT2 . . . . . . . . . . . . . . . . . . . . . . . . . . . . . . . . . . . . . . . . . . . 433
H.7.1 Performance across technical conditions . . . . . . . . . . . . . . . . . . . . . . . . . . 433
H.7.2 Performance per technical condition . . . . . . . . . . . . . . . . . . . . . . . . . . . . . 434
Bibliography 442

Preface
Many people had an influence on this PhD thesis; and for expressingmy gratitude to those people, I would like to play with analogies andborrow four influencing factors from the quality research domain: theprocessing chain, the personal experience in the past, the context, andthe personal state.
In terms of the processing chain, i.e. the thesis supervision andreview, my first and foremost “thank you” goes to Alexander Raake,who – among many other things – suggested to me this fascinatingtopic, provided me with inspiring ideas, fought for financial support,and delved with me into deep discussions about multiparty telemeet-ing quality. Next, many many thanks go to Sebastian Möller andPatrick Le Callet, who were so kind to review this thesis, or in otherwords, who took on the laborious task of ensuring its quality.
In terms of past experience, i.e. my time at Philips Research beforestarting the PhD research, I want to thank Armin Kohlrausch, Stevenvan de Par, Martin McKinney and Jeroen Breebaart, who all taught meto do scientific research in an industrial environment. Furthermore,my decision to go for a PhD training was strongly triggered by havingworked with people like Othmar Schimmel, Tom Goossens, StefanBorchert, Michael Bruderer, Alberto Novello, Nicolas Le Goff, TobiasMay, and many others at Philips Research.
In terms of context, in which this research took place at T-Labs,the list of people is long: Katrin Schoenenberg for her inspiringmultidisciplinary perspective on quality, for many discussions onmany details, and for being just the peer colleague that one needsas a PhD student. Mathis Schmieder and Julian Herlinghaus fortheir tremendous help in the technical setups of Asterisk, Netemand Co. Falk Schiffner and Maxim Spur for their support in theoptimization of the different test scenarios, their help in the testconduction, and their vast endurance to run the scenarios dozensof times as a confederate subject. Hagen Wierstorf for the manydiscussions related with writing up my research and for showingme this amazing Tufte-style Latex template. Markus Vaalgaama andMattias Nilsson from Skype for their support in the technical setup ofthe Skype test client and for the many discussions on the test designand the results. Adriana Dumitras and Bernhard Feiten for joiningthose discussions and for providing the financial support of Skype(Microsoft) and T-Labs (Deutsche Telekom). Marcel Wältermann andMarie-Neige Garcia for sharing their knowledge about the many tiny

12
details of running quality tests properly and for their inspiring PhDtheses. Christine Kluge for helping in all kinds of administrativethings and problems and for all the fun when we were joking around.The many present and former colleagues of the AIPA, QU, T-Labsand IMT teams as well as the ITU-T SG12 colleagues for enablingsuch a great working context, among them Sandra Wild, Dennis Guse,Michal Soloducha, Pierre Lebreton, Miguel Rios-Quintero, SavvasArgyropoulus, Werner Robitza, David Roegiers, Angelo De Silva,Christoph Hold, Eckhardt Schön, Stephan Werner, Judith Köppe,Anne Keller-Marz, Irene Huber-Achter, Friedemann Köster, BenjaminWeiss, Ulf Wüstenhagen, Matthias Geier, Stefan Hillmann, MattiasSchulz, Peter Hughes and Gunilla Berndtsson.
Finally, in terms of personal state, nothing of this would havebeen possible without the continuous, fundamental, emotional andpractical support of my parents, my parents-in-law and – foremost –my wife: Barbara, grazie mille!
Janto Skowronek, March 2017

Zusammenfassung
Die vorliegende Dissertation behandelt die Qualitätswahrnehmungvon Telemeetingsystemen, d.h. audiovisuellen Telekonferenzsystemen,bei denen mehr als zwei Gesprächspartner miteinander verbundensind. Die Dissertation legt den Schwerpunkt auf zwei Aspekte, die einTelemeeting, d.h. Mehrpersonengespräch über ein Telemeetingsystem,von einem konventionellen (Video-)Telefonat zwischen zwei Teilneh-mer unterscheiden. Der erste Aspekt ist die besondere kommunikativeSituation, die sich dadurch hervorhebt, dass sie ein Gruppengesprächdarstellt, welches über ein Telekommunikationssystem stattfindet.Der zweite Aspekt ist die Möglichkeit, dass die Nutzer asymmetri-sche Verbindungen antreffen können, d.h. dass die Gesprächspartnermit unterschiedlichen Geräten und Leitungseigenschaften verbun-den sind. Das wiederum ermöglicht es, verschiedene Niveaus einerTelemeetingqualität erfahren zu können, nämlich die Qualität desgesamten Telemeetings und der Qualität der einzelnen Verbindungender Teilnehmer.
Zunächst wird in dieser Dissertation ein konzeptionelles Modelentwickelt, welches as theoretische Grundlage dient. Danach wirdeine Methode zur Durchführung von Qualitätstest für Mehrperso-nengespräche beschrieben. Anschließend werden drei Experimentevorgestellt und analysiert, welche den Einfluss von kommunikativenAspekten, genauer der Komplexität der Kommunikationssituationund der Anteilnahme am Gespräch, untersuchen. Danach werdensieben auditive und audiovisuelle Experimente vorgestellt und analy-siert, welche den Einfluss der technischen Systemeigenschaften auf dieoben genannten verschiedenen Qualitätsniveaus untersuchen. Zuletztwerden in dieser Dissertation Modelle entwickelt, welche Urteile derGesamtqualität anhand von Qualitätsurteilen der Einzelverbindun-gen schätzen. Da Eingangs- und Ausgangsgrößen der vorgestelltenModelle perzeptive Nutzerurteile und nicht instrumentelle Qualitäts-schätzungen sind, liefern die Modelle eine konzeptionelle Basis fürdie Entwicklung technischer Lösungen.
Die wesentlichen Erkenntnisse dieser Arbeit sind:
1. Eine komplexere Kommunikationssituation kann unter denselbentechnischen Bedingungen zu niedrigeren Qualitätsurteilen führenals eine weniger komplexe Kommunikationssituation.
2. Der Einfluss der Anteilnahme am Gespräch in einem Qualitäts-test kann größer sein als der Effekt der getesteten technischen

14
Bedingungen.
3. Es existiert eine gegenseitige Beeinflussung der Qualitätsurteile derEinzelverbindungen in einem Gespräch, wobei diese Beeinflussungvon den technischen Bedingungen abhängt.
4. Das Qualitätsurteil des gesamten Systems kann in vielen Fällen alseinfacher Mittelwert der Qualitätsurteile der Einzelverbindungengeschätzt werden. Jedoch für mehrere technische Bedingungenliefern komplexere Schätzmodelle bessere Ergebnisse.
5. Die besten Modelle ereichen Korrelationskoeffizienten von bis zu0.95 und RMSE-Werte (Wurzel des Mittleren Quadratischen Feh-lers) von 0.45 auf der 5-Punkte Absolute-Category-Rating-Skala.Das zeigt, dass es möglich ist, die Gesamtqualität anhand derEinzelverbindungsqualitäten angemessen schätzen zu können.
6. Es hat sich keine Modellfunktion herausgestellt, die als einzigealle anderen untersuchten Funktionen signifikant übertrifft. Jedochzeigte eine der Funktionen den besten Kompromiss zwischen zweigrundsätzlichen Trends: Ist die Gesamtqualität gut, dann liegtder Mittelwert der Einzelverbindungsurteile sehr nahe an demGesamturteil; ist die Gesamtqualität schlecht, dann liegt das Mini-mum der Einzelverbindungsurteile sehr nahe an dem Gesamturteil.Demnach berechnet sich die meist versprechendste Modellierungs-funktion als eine gewichtete Kombination aus Mittelwert und Mi-nimum der Einzelverbindungsurteile, wobei die Gewichtung selbstwiederum vom Mittelwert abhängt.
7. Einzelne Details bei Design und Durchführung der Qualitätstestszeigten unterschiedliche Messempfindlichkeiten hinsichtlich derdrei Punkte Detektion der gegenseitigen Beeinflussung der Einzel-verbindugen, Aufspüren von Belegen, dass eine einfache Mittelungnicht ausreicht, und Nachweisen des Zugewinns durch Verwen-dung komplexerer Schätzmodelle.
Als nächste Schritte für weitere Arbeiten bietet sich die Umsetzungder gewonnenen Erkenntnisse in technische Lösungen an. Dieses wür-de zunächst eine Nachbildung der Modellierung beinhalten, in derdie perzeptiven Qualitätsurteile der Einzelverbindungen durch instru-mentelle Qualitätsschätzungen ersetzt werden. Später könnten dannsolche Modelle durch das Einbinden der kommunikativen Aspekteverbessert werden. Dieses wiederum erfordert die Entwicklung tech-nischer Ansätze zur Schätzung derartiger kommunikativer Aspektewie der hier untersuchten Komplexität der Kommunikationssituationoder der Anteilnahme am Gespräch.

Summary
This thesis investigates quality perception of multiparty audio andvideo conferencing systems, in short telemeeting systems. It is builtaround two aspects that differentiate a multiparty telemeeting from aconventional two-party (video) telephony call. The first aspect is thespecial communicative situation, that is, having a group conversationover a telecommunication system. The second aspect is the possibilityof encountering asymmetric connections, that is, participants areconnected with different equipment or connection properties. This inturn leads to the possibility to perceive different levels of telemeetingquality, i.e. the quality of the whole telemeeting and the quality of theindividual connections of participants.
First, this thesis develops a conceptual model that serves as a theo-retical foundation. Then it describes a methodology to conduct multi-party quality assessment tests. Next it analyzes three experiments onthe impact of the communicative aspects (i.e. communication complex-ity and involvement) on telemeeting quality. Then it analyzes sevenaudio-only and audiovisual experiments on the impact of technicalconditions on the different levels of telemeeting quality. And finallyit develops models that predict overall telemeeting quality scoresbased on the quality scores of the individual connections. Since allconsidered scores are perceptual ratings and not estimations obtainedfrom instrumental methods, these models are conceptual ones, whichserve as the foundation for developing technical solutions.
The main findings of the experimental chapters are:
1. An increased communication complexity can lead to lower qualityratings for the same technical conditions.
2. The effect of involvement in a quality assessment test can be largerthan that due to the tested technical conditions.
3. There exists a mutual influence on the quality scores of individualconnections, whereas this depends on the character of the actualtechnical conditions.
4. The overall telemeeting quality can be expressed as a simple meanof the individual connection quality scores. However, for sometechnical conditions, more complex models achieve better results.
5. With correlation coefficients up to 0.95 and root mean square errorsdown to 0.45 on the absolute category rating scale, it is possible

16
to adequately model the overall telemeeting quality based on theindividual connection quality scores.
6. No single modeling function is the winning function in termsof significantly outperforming all other functions. However, oneadvanced modeling function appeared to provide the best compro-mise between two fundamental trends: if the telemeeting qualityscore is high, then the mean of individual connection quality scoresis close to that score, if the telemeeting quality score is low, thenthe minimum of the individual connection quality scores is close.Accordingly, the most promising modeling function is computedas the weighted combination of the mean and the minimum valueof the individual connection quality scores, whereas this weightingdepends again on the mean of the individual connection qualityscores.
7. Specific design details of the experimental methods distinguishedthe achieved sensitivity of the experiments in terms of their abilityto detect the mutual influence of individual connections, to provideevidence that a simple mean is not always sufficient, and to showthe added value of using advanced modeling functions.
The next steps will be to transfer the found knowledge to technicalapplications. Foremost, this requires to repeat the modeling workwith replacing the perceptual quality ratings of the individual connec-tions with instrumental estimations. Later on, such models could befurther improved by including the impact of the communication as-pects, which will require the development of technical approaches toestimate aspects such as communication complexity or involvement.

Part I
General Introduction

1General Introduction
What this chapter is about
This chapter provides a general introduction to the research, it speci-fies the research scenario and research objectives, and it outlines theresearch process that the author applied.
1.1 Motivation, Problem Statement, and Main Research Goal
One key factor for any successful telecommunication service is tosatisfy users while optimizing the use of technological and financialresources. This requires methods to assess or predict the Quality ofExperience that the service is able to provide and to link this qualitywith the technical parameters of the service.
Such methods exist and are continuously improved for traditionaltwo-party (video) telephony services and they are employed by net-work providers and end device manufacturers. However, very littleis known about the applicability of such methods for multipartytelemeeting solutions. Concerning quality assessment by means ofperception tests, proposals exist to modify and apply existing per-ceptual quality test methods to multiparty telemeetings, but practicalexperience with such modified methods is still limited. Concerningquality prediction by means of algorithmic models, to the best ofthe author’s knowledge, no work has been reported so far on theapplication of existing models to multiparty situations.
An alternative to applying existing methods – with or without mod-ifications – to multiparty telemeetings is to develop new multiparty-specific methods from scratch. However, also here there are, to thebest of the author’s knowledge, no reports on such new methods.
One requirement common for both approaches, application of(modified) existing methods or development of new methods, is tohave sufficient knowledge about the quality perception of multipartytelemeetings. Apparently there is a lot of knowledge available onQuality of Experience, but this knowledge has not been explicitlytransferred to the multiparty case yet. Furthermore, there is alsolot of knowledge available on group communication via telemeetingsystems, but the link to Quality of Experience has not been studied inmore detail either.

general introduction 19
To conclude, it is essential to further investigate the fundamentalsof multiparty telemeeting quality and to fill the apparent knowl-edge gaps on the corresponding assessment and prediction methods.This knowledge could then be exploited to improve the Quality ofExperience of existing or future multiparty telemeeting systems.
To this aim, the present thesis will investigate two main aspectsthat differentiate a multiparty telemeeting from a conventional two-party (video) telephony call. One aspect is the special communicativesituation, that is, having a group conversation over a telecommuni-cation system. The other aspect is the possibility of encounteringasymmetric connections, that is, participants are connected with dif-ferent equipment or connection properties. These two aspects willform the basis for the present research and they will be referred tothroughout the whole text.
1.2 Research Scenario
The research scenario is best described with an explanation of thekeywords used in the title: Quality of Experience, Multiparty, Confer-encing and Telemeeting Systems, Methods, Models, Assessment, andPrediction. Furthermore, there are additional aspects of telemeetingsthat further specify the research scenario. Those are the communica-tion modes, the conversation scenarios, and the combination of thenumber of interlocutors and number of sites.
Conferencing and Telemeeting Systems The present work considershuman-to-human communication via so-called conferencing or tele-meeting systems. Such systems connect multiple participants atdistant locations to join the same call.
Commonly used names of such systems, which have been tradition-ally used in business environments, are telephone conference systems,audio conferencing systems, video conferencing systems, or simplyteleconferencing systems. Furthermore, high-end video conferencingsystems that aim to enable the feeling of a virtual meeting are calledtelepresence systems. Nowadays, however, modern conferencingsystems gain also more importance in private life and such systemsare striving for higher levels of interactivity than the traditional sys-tems did. To account for such societal and technological trends, theterm telemeeting is proposed by the International TelecommunicationUnion (ITU). Work group “Studygroup 12 - Question 10” uses in itstask description 1 the term telemeeting 1 ITU-T. Question 10/12 - Conferencing
and telemeeting assessment. retrieved onAugust 19, 2015. International Telecom-munication Union. 2015. url: http://www.itu.int/en/ITU-T/studygroups/
2013-2016/12/pages/q10.aspx
to cover with one term all means of audio or audio-visual communica-tion between distant locations.
Concerning the title, using both terms conferencing and telemeetingappeared to be most appropriate due to the use cases that are con-sidered in the present work: Conferencing, because the conventionalbusiness scenarios play an important role in the present research;telemeeting because some of the applied technical scenarios may be

20 quality of experience of multiparty conferencing and telemeeting systems
better described with the new term telemeeting systems. However,for the sake of brevity and due to the lack of a formally defineddistinction between both terms, the present text will use the termtelemeeting only.
Multiparty The term multiparty further specifies the research sce-nario to telecommunication situations, in which actually more thantwo interlocutors are participating in a call. This is necessary becausethe terms conferencing and telemeeting are not exclusively reservedfor multiparty situations. For instance, the term video conferencing isvery common in literature to describe two-party telecommunicationusing an audiovisual system.
Quality of Experience A precise definition for Quality of Experienceis given by Qualinet 2: 2 European Network on Quality of Ex-
perience in Multimedia Systems and Ser-vices. Qualinet White Paper on Definitionsof Quality of Experience. White Paper. Ver-sion Version 1.2. Patrick Le Callet, Se-bastian Möller and Andrew Perkis (Eds.)Lausanne, Switzerland: (COST ActionIC 1003), Mar. 2013
Quality of Experience (QoE) is the degree of delight or annoyance ofthe user of an application or service. It results from the fulfillment ofhis or her expectations with respect to the utility and / or enjoymentof the application or service in the light of the user’s personality andcurrent state.
According to this definition, the research presented here will inves-tigate how users assess the quality of telemeeting systems. Morespecifically, all quality judgments used in this work are collectedfrom users, who are not technical experts of telemeeting technology.Nevertheless, the perspective of a technical expert plays an importantrole in this work, especially when it comes to linking technical systemparameters with the user quality judgments or when it comes toderiving development guidelines for improved telemeeting systemsin the future.
Assessment The term quality assessment means in this work the actof collecting quality judgments from human raters who participatedin a quality assessment test. During such a test, participants have beenexposed either to a running test system in the context of a so-calledconversation test or to stimuli that represent such a system in thecontext of a so-called non-interactive test.
Prediction The term quality prediction means in related literature typ-ically the act of algorithmically computing quality judgments basedon technical characteristics without conducting a quality assessmenttest with human participants. Nevertheless, those predicted qualityjudgments should represent as best as possible quality judgmentsthat human test participants give to a system of the same technicalconditions.
In this work, however, the meaning of the term prediction is slightlybroader. It refers to the act of algorithmically computing qualityjudgments based on individual aspects of quality, which can comprisetechnical information about or human ratings on those individualaspects.

general introduction 21
Methods In this work, the term methods refers to formalized proce-dures to prepare, conduct and analyze quality assessment tests. Inparticular, this work will put a strong emphasis on the details of suchexperimental methods. This is motivated by the knowledge in thefield that quality perception is context-dependent, emphasizing theneed for systematic and well-defined experimental methods.
Models In this work, the term models refers to descriptions of therelation between a set of input and output variables. More specifically,the input variables here describe different aspects of a telemeeting,and the output variables describe different aspects of quality.
Communication Modes Many telemeeting systems provide differentmeans to communicate, ranging from audio-only to audiovisual com-munication, potentially augmented with additional features such astext chat, screen sharing, or joint editing of documents. In this work,the focus here lies on audio-only and audiovisual communicationwithout any additional communication means.
Conversation Scenarios Nowadays the use cases for telemeetings canvary widely, ranging from the classical pre-scheduled business tele-conference scenario following a predefined agenda to spontaneousgroup calls between friends. That means, the communication in tele-meetings can differ in numerous aspects such as topic and purpose,roles of and relations between the interlocutors, communication be-havior of interlocutors, structure of the conversation and so on. In thiswork, well-defined and structured conversation scenarios are used fortriggering conversations, which follow a rather fixed structure adress-ing similar topics between interlocutors who take upfront-determinedroles. This allows a sufficient comparability for proper analysis of thecollected results, as it controls – at least to a certain extent – for thosedifferent influencing aspects.
Number of Interlocutors and Number of Sites The combination of num-ber of interlocutors and number of sites can have an impact on thequality perception of a multiparty telemeeting. The reason is that theparticular setting influences the communicative situation in terms ofpossible mixtures of face-to-face conversations and conversations viathe telecommunication system.
To illustrate this consider two examples: In one telemeeting, tworemote sites are connected. At one site two persons are located inthe same room, while at the other site one person is alone in his orher room. Such a telemeeting is typially characterized by a mix of aface-to-face conversation between the two interlocutors at the one siteand a conversation via a telecommunication system to the interlocutorat the other site.
In another telemeeting using the same system, three remote sitesare connected while one person is located at every site. Such a tele-meeting is actually a “pure” multiparty conference via a telecommu-

22 quality of experience of multiparty conferencing and telemeeting systems
nication system. As a result, the quality perception of the telemeetingsystem in both examples can differ due to the different communicativesituations (face-to-face vs. telecommunication).
In this work, the focus lies on the latter type of situations that avoidany face-to-face communication in the telemeeting.
1.3 Research Objectives
The overall research objective is to investigate the fundamentals ofmultiparty telemeeting quality and to fill a number of knowledgegaps on the corresponding assessment and prediction methods. Inparticular, the goal is to provide a set of prototypical methods andmodels for the quality assessment and prediction of multiparty tele-meeting systems. This set of methods and models shall serve as afoundation for further research on the Quality of Experience (QoE)of multiparty telemeetings and they shall be directly applicable forpractitioners in the field.
For that purpose, this thesis shall develop conceptual approachesto address the fundamentals of multiparty telemeeting QoE and prac-tical approaches to prove the feasibility of assessing and predictingmultiparty telemeeting QoE. More precisely, the present text will firstprovide appropriate background knowledge on the communicationaspects (Chapter 2) and technical aspects (Chapter 3) of telemeetingsas well as quality assessment (Chapter 4). Then the text will report inindividual chapters on the research results for the following detailedobjectives.
Conceptual Model of Telemeeting Quality – Chapter 5 The objective isto derive from existing taxonomies of quality perception a generaloverview of aspects and processes that may play a role when test par-ticipants form a quality judgment of telemeeting systems. Since thiswork will be based on a literature review and theoretical reasoning,the result is of a descriptive conceptual nature. The intention of sucha conceptual model is two-fold. On the one hand it summarizes theknown fundamentals of telemeeting quality perception and can thushelp to identify open issues and questions for future research. On theother hand it serves as a tool to put individual research activities ontelemeeting quality assessment into a broader context, which wouldhelp to interpret results and properly draw conclusions.
Methodology for the Perceptual Assessment of Telemeeting Quality – Chap-ter 6 When starting the research for this thesis, there were no stan-dardized multiparty-specific methods available for conducting qualitytests with test participants. Hence, the objective was to develop a setof such testing methods and synthesize them into a set of recommen-dations that can be used by practitioners in the field. The chapterprovides an overview of these methods and recommendations.

general introduction 23
Perception of Telemeeting Quality with focus on Group-CommunicationAspects – Chapter 7 The objective is to investigate the impact of anumber of communicative aspects on quality ratings in the contextof multiparty telemeetings. This refers to the first of the two maindifferentiators between two-party (video) telephony and multipartytelemeetings, the special communicative situation. More specifically,a set of experimental studies shall provide empirical results on therelation between relevant communication aspects and the perceivedquality.
Perception of Telemeeting Quality with focus on Telecommunication Aspects– Chapter 8 The objective is to investigate the impact of varioustechnical system characteristics on quality ratings in the context ofmultiparty telemeetings. This refers to the second of the two maindifferentiators between two-party (video) telephony and multipartytelemeetings, the possibility of perceiving asymmetric conditions.More specifically, a set of experimental studies shall provide empiricalresults on the relation between the individual connections betweenthe interlocutors and the perceived quality of the whole telemeeting.
Perceptual Model of Telemeeting Quality – Chapter 9 While the previ-ous objectives addressed conceptual and methodological aspects oftelemeeting quality, tangible results in form of computational modelsare also required as a proof-of-concept in two aspects. First, suchcomputational models, if successful, can serve as algorithmic im-plementation of the gained knowledge on certain aspects of qualityformation, providing thus evidence for the conceptual work done be-forehand. Second, they could serve as basis for developing technicalsolutions for quality monitoring or planning, providing thus evidencefor their usefulness. For that reason, the objective is to develop aset of perceptual models, which predict how test participants form aquality judgment on individual aspects that they perceive.
1.4 Research Method
Motivation and Basic Approach The two aspects that differentiate mul-tiparty telemeeting from two-party (video) telephony, i.e. specialcommunicative situation and possible asymmetry of connections, sug-gest that telemeeting quality is a complex construct of communicativeand technical aspects. At the time of starting the present research,there were different approaches to decompose the complexity of qual-ity perception, e.g. the taxonomy of Möller 3, but it has, to the best of 3 Sebastian Möller. Assessment and Pre-
diction of Speech Quality in Telecommuni-cations. Kluwer Academic publishers,2000
the author’s knowledge, not been attempted for the specific situationof multiparty telemeetings. Furthermore, it is known in the field thatquality perception can be influenced by the context, which means thatthe quality assessment of telemeetings needs to follow well-definedtest protocols in order to provide reproducible results. Again, at thetime of starting the present research, individual proposals for thespecific situation of multiparty telemeetings have been made, see

24 quality of experience of multiparty conferencing and telemeeting systems
e.g. Baldis 4, Raake 5 or Berndtsson 6, but a standardized method was 4 Jessica J. Baldis. “Effects of Spa-tial Audio on Memory, Comprehension,and Preference during Desktop Confer-ences”. In: Proceedings of the ACM CHI2001 Human Factors in Computing SystemsConference. Ed. by Michel Beaudouin-Lafon and Robert J. K. Jacob. Vol. 3. 1.2001, pp. 166–173
5 Alexander Raake et al. “Listening andconversational quality of spatial audioconferencing”. In: Proceedings of the AES40th International Conference. Tokyo, Oct.2010
6 Gunilla Berndtsson, Mats Folkesson,and Valentin Kulyk. “Subjective qual-ity assessment of video conferences andtelemeetings”. In: 19th InternationalPacket Video Workshop. 2012
not developed yet. For that reason, the research activities conductedthroughout this thesis have a highly iterative character, specificallyaddressing the two mentioned aspects complexity and methodology.
Concerning the methodology, the experimental work comprises(in most cases) two similar experiments for a given research task,e.g. two listening-only tests for investigating the impact of numberof interlocutors. The first experiment serves as a pilot experimentfor a second full-scale experiment, with the idea that the first testproves the general feasibility of the particular method and identifiesimprovement points, which are then applied in the second test. Here,the pilot experiments should not be misunderstood as some informaltrying-out; they are conducted as formal tests like the correspondingfull-scale experiments.
Concerning the complexity, many aspects are expected to influencethe results, meaning that the experimental work should address anumber of those aspects individually in an iterative manner. Thatmeans the individual aspects are not only investigated separately bykeeping the other aspects as constant as possible – which is obviouslythe usual scientific approach – but when proceeding to the nextexperimental phase, the knowledge gained from the first experimentalphase should be incorporated to better specify the research contextof the second experimental phase. More specifically, a first set ofexperiments is intended to investigate the communicative aspectsof telemeeting quality, while not being too stringent concerning thechoice of the technical aspects. Then a second set of experiments isintended to investigate technical aspects of telemeeting quality, inwhich the gained knowledge on the communicative aspects is used tobetter specify the considered use cases and target variables.
Visualization of Research Process Figure 1.1 summarizes the iterativeresearch process. First, it shows a number of aspects that constitute anexperimental study: concept, method, experiment, data, and results.Then, it shows a number of stages (black blocks) that a researchergoes through when conducting an experimental study: develop, use,prepare, do, get, analyze, and interpret. Furthermore, it shows also anumber of stages (red blocks) that were gone through when extractingknowledge from an experimental study: review, report, and feedback.Finally, it also shows the iterative character (blue paths) in whicha new study is conducted based on the lessons learned from theprevious study.
Concerning the feedback paths, the insights can stem from the ownreview, the external feedback or both. Then, those insights can beused to improve the concept (e.g. when conducting a full study basedon a pilot study) or develop a new concept (e.g. when addressing anew research question, i.e. a new aspect of telemeeting quality withthe next study). However, the insights can also be used to directlyupdate the experimental method and the practical preparation andconduction of the experiment.

general introduction 25
Figure 1.1: Visualization of the researchprocess, defining the progress of activi-ties through a number of stages per ex-perimental study.
The approach in the present research project is to consider – when-ever possible – all five aspects during the review and feedback stagesand to integrate the obtained insights – whenever applicable – intoall three aspects (concept, method, and experiment) when continuingfrom one experiment to the next.
Synthesis of Results for the Present Text The iterative character of theindividual studies led to a number of individual documents in formof publications, technical reports and one patent application (seeAppendix A for the full list). The present text, however, is actuallybased on an additional iteration, in which the author revisited and –whenever it deemed necessary – re-analyzed and re-interpreted theresults of the individual documents.

Part II
Background

2Human Communication via Telemeetings
What this chapter is about
The present text is built around two aspects that differentiate a multi-party telemeeting from a conventional two-party (video) telephonycall. One aspect is the special communicative situation, that is, havinga group conversation over a telecommunication system. Bearing thisin mind, the present chapter provides background knowledge on thecommunicative aspects that characterize two-party and multipartycommunication. Both face-to-face communication and mediated com-munication, that is communication via a telecommunication system,are considered.
2.1 Introduction
There is a vast amount of literature on human communication andin particular on mediated communication, that is communication viaa telecommunication system. This amount of publications is writtenfrom different perspectives and research disciplines and inherentlyshowing the complexity of this process.
On the one hand, this chapter aims to provide a concise overview ofthe existing literature, covering two-party and multiparty situations.On the other hand, this chapter also aims to cover a number ofdifferent perspectives that are taken in the literature. For that purpose,the present text approaches in three sections the literature from threedifferent perspectives and following two different reviewing methods:
1. Section 2.2 will provide an overview about aspects described inliterature that can be used to characterize human communicationin general, independently from the question whether it is a face-to-face or mediated communication. In terms of Light & Pillemer 1,
1 Richard J. Light and David B. Pille-mer. Summing Up. Cambridge, MA,USA: Harvard University Press, 1984
this overview is a narrative literature review.
2. Section 2.3 will discuss the results of a series of literature reviews byFjermestad & Hiltz 2, who investigated the differences between face-
2 Jerry Fjermestad and Starr RoxanneHiltz. “Experimental studies of groupdecision support systems: an assess-ment of variables studied and method-ology”. In: Proceedings of the 30th AnnualHawaii International Conference on SystemSciences. Vol. 2. IEEE. 1997, pp. 45–65
Jerry Fjermestad and Starr RoxanneHiltz. “An Assessment of Group Sup-port Systems Experimental Research:Methodology and Results”. In: Journalof Management Information Systems 15.3(1999), pp. 7–149
Jerry Fjermestad and Starr RoxanneHiltz. “Case and field studies of groupsupport systems: an empirical assess-ment”. In: Proceedings of the 33rd AnnualHawaii International Conference onSystemSciences. IEEE. 2000, pp. 10–19
Jerry Fjermestad. “An analysis ofcommunication mode in group supportsystems research”. In: Decision SupportSystems 37 (2004), pp. 239–263
to-face and mediated communication. In terms of Light & Pillemer,the reviews of Fjermestad & Hiltz are quantitative, i.e. data-driven,reviews. Such reviews are based on a quantitative analysis of dataextracted from the literature.

28 quality of experience of multiparty conferencing and telemeeting systems
3. Section 2.4 will present an own literature analysis on similar lit-erature with the focus on identifying potential measurable as-pects that can characterize mediated communication. In termsof Light & Pillemer, this review belongs also to the data-drivenreviews.
2.2 A Characterization of Group-Communication
This section provides some fundamental knowledge on group-com-munication (including a group size of two) that can be found in litera-ture. The aim is to decompose the complexity of group-communicationby providing a systematic characterization. The chosen approach is aseparation of communication into purpose, process (with six promi-nent aspects), modes (also referred to as media), and the aspect of ashared work space.
2.2.1 Group-Communication Purposes
Group-communication is considered here as a means to serve a certainset of purposes, i.e. achieve certain goals or fulfill certain needs.Different communication purposes are possible and can be roughlycategorized in accomplishing tasks, socializing, and exchange ofinformation.
Concerning the accomplishment of tasks, an often cited categoriza-tion of group tasks is McGrath’s task circumplex 3, which was in parts
3 Joseph Edward McGrath. Groups: In-teraction and performance. Prentice-HallEnglewood Cliffs, NJ, 1984
empirically evaluated by Straus 4. This circumplex model categorizes
4 Susan G. Straus. “Testing a Typol-ogy of Tasks: An Empirical Validationof McGrath’s (1984) Group Task Cir-cumplex”. In: Small Group Research30 (1999), pp. 166–187. doi: 0.1177/
104649649903000202
group tasks in four categories and eight subcategories and organizesthem along two dimensions, see Figure 2.1.
Figure 2.1: Two-dimensional circumplexmodel of tasks – adapted from McGrath.
Joseph Edward McGrath. Groups: In-teraction and performance. Prentice-HallEnglewood Cliffs, NJ, 1984
With the term socializing the present text refers to those group-communications that serve the social needs of group members to feel

human communication via telemeetings 29
connected, to belong to the same group, etc. Examples for interlocu-tors who know each other are telling about the state of mood, health,and recent daily-life events. An example for interlocutors who donot know each other is getting acquainted with each other, whichessentially means telling – to a certain degree – about personality, lifeexperience and opinions.
With the term exchange of information the present text refers tothose group-communications that solely serve the purpose of bringingeach group member up-to-date on a specific topic. Examples areannouncements, news, or useful information for group members incase of something specific is happening in the foreseeable future,e.g. who would act as sick leave cover.
With such a categorization of communication purposes, it is pos-sible to characterize group communication in a formal systematicway. In turn, when it comes to the interpretation of experimentalresults, this enables to consider the group-communication purpose asa possible mediating factor that might explain certain results.
2.2.2 Group-Communication Processes
In the literature, a number of approaches are described to charac-terize group-communication processes from different perspectives.Six prominent approaches are Turn-Taking, Listener Feedback Signals,Conversational Surface Structure, Grounding, Conversational Games andConversational Moves. As a way to describe the perspectives and thusto relate the approaches to each other, the author chose to use fiveaspects: (1) the temporal granularity, i.e. a microscopic moment-by-moment perspective vs. a macroscopic in-retrospect perspective; (2)the level of organization, i.e. focus on organizing speaker changesvs. focus on ensuring that content is properly conveyed; (3) the charac-terization power, i.e. intrinsic property of communication vs. measureto characterize communication; (4) the reliance on the semantic con-tent, i.e. requiring semantic analysis of the utterances vs. semantics-independent characterization; and (5) the focus on the interlocutors’contributions to the communication, i.e. focus on speaker vs. focus onlistener vs. considering both. Table 2.1 categorizes the six approachesaccordingly to the five aspects, while the following paragraphs de-scribe each aspect in more detail and motivate the categorization.
Aspect TemporalGranularity
Level of Organization Characterization Power Reliance onSemantics
Focus onInterlocutor
Turn-Taking microscopic speaker changes intrinsic property yes both
Listener FeedbackSignals
microscopic speaker changes &conveying content
intrinsic property yes listener
ConversationalSurface Structure
microscopic& macroscopic
speaker changes measure to characterize no both
Grounding macroscopic conveying content intrinsic property yes both
ConversationalGames
macroscopic conveying content intrinsic property yes both
ConversationalMoves
microscopic& macroscopic
conveying content intrinsic property yes speaker
Table 2.1: Overview of six approaches(Column 1) characterizing communica-tion processes from different perspec-tives, each perspective described alongfive dimensions (Columns 2 to 6).

30 quality of experience of multiparty conferencing and telemeeting systems
Turn-Taking Turn-taking refers to the temporal organization of andtransitions between speech utterances of each interlocutor; in otherwords it describes who is speaking when and how a change ofspeakers is accomplished. Probably the most cited publication onturn-taking is a model proposed by Sacks et al. 5. This model de- 5 Harvey Sacks, Emanuel A. Schegloff,
and Gain Jefferson. “A Simplest System-atics for the Organisation of Turn-Takingfor Conversation”. In: Language 50 (4Dec. 1974), pp. 696–735
scribes turns to be composed of turn construction units (e.g. sentential,clausal, phrasal and lexical constructions). At the end of each suchunit, there is a so-called transition-relevance place, which may leadto a continuation of the current turn or to a speaker change. Further-more, the model provides a set of four if-then rules that determinethe outcome of each transition-relevance place. Thus, the model es-sentially describes turn-taking to take place on a moment-by-momentbasis: at the end of each turn construction unit a decision is made foreither turn-keeping or turn-taking.
The model of Sacks et al. focuses on turn-taking behavior basedon verbal information provided by the speaker. However, speakersalso use non-verbal signals to manage turn-taking. For instance,speakers (and listeners) use eye movements to indicate when it istime to change a turn 6. In addition, speakers can use gestures to 6 Mark L. Knapp and Judith A. Hall.
Nonverbal communication in human in-teraction. 7th edition. Boston, USA:Wadsworth, Cengage Learning, 2010
deter listeners to make a turn-taking attempt, or they can send turnsurrendering signals by ceasing to gesticulate 7.
7 Owen Daly-Jones, Andrew Monk,and Leon Watts. “Some advantages ofvideo conferencing over high-quality au-dio conferencing: fluency and aware-ness of attentional focus”. In: Interna-tional Journal of Human-Computer Studies49 (1998), pp. 21–58
Regarding the categorization in Table 2.1, turn-taking concerns theorganization of speaker changes, whereas the process, i.e. decision tokeep or change a turn, relies on the semantical meaning of the sharedinformation, both verbally and non-verbally. Since turn-taking refersto a process that interlocutors actually use, it can be considered asan intrinsic property of communication. Furthermore, turn-taking,and especially the model of Sacks et al., looks at communication ona moment-by-moment and thus microscopic time scale. And finally,turn-taking focuses on both the speaker and the listener, since turnscan be allocated by speaker selection or self-selection, and the decisionto keep or change a turn can be taken by both, speaker and listener.
Listener feedback signals Listener feedback signals – also referred to asbackchannels 8 or listener responses 9 – are short signals to the speaker
8 Brid O’Conaill, Steve Whittaker, andSylvia Wilbur. “Conversations OverVideo Conferences: An Evaluation ofthe Spoken Aspects of Video-MediatedCommunication”. In: Human-ComputerInteraction 8 (1993), pp. 389–428
Owen Daly-Jones, Andrew Monk,and Leon Watts. “Some advantages ofvideo conferencing over high-quality au-dio conferencing: fluency and aware-ness of attentional focus”. In: Interna-tional Journal of Human-Computer Studies49 (1998), pp. 21–58
9 Mark L. Knapp and Judith A. Hall.Nonverbal communication in human in-teraction. 7th edition. Boston, USA:Wadsworth, Cengage Learning, 2010
indicating the listener’s degree of attention, understanding, and accep-tance of the communicated message. Those signals may be producedvocally, e.g. “mm”, “uh uh”, “right”, “okay”, and “yes”, or by meansof facial expressions, gestures and posture changes, e.g. straighteningupper body part, head nods, and establishing mutual eye gaze.
While listener feedback signals mainly refer to the listener’s under-standing of the speakers’ messages, it can also serve the organizationof speaker changes as part of the turn-taking processes. For instance,the listener may use such signals to approve or disapprove that thecurrent speaker took the turn, to show satisfaction with the currentturn so far, i.e. to encourage the current speaker to continue, or toindicate the need for repairing or re-initiating a turn-taking process 10.
10 Owen Daly-Jones, Andrew Monk,and Leon Watts. “Some advantages ofvideo conferencing over high-quality au-dio conferencing: fluency and aware-ness of attentional focus”. In: Interna-tional Journal of Human-Computer Studies49 (1998), pp. 21–58
Regarding the categorization in Table 2.1, listener feedback signalsconcern both the organization of speaker changes and the conveyance
human communication via telemeetings 31
of content. The process, i.e. the listeners’ choices of the feedback sig-nal, relies on the semantic meaning of the shared information. Sinceinterlocutors actually use feedback signals, they can be consideredas an intrinsic property of communication. Furthermore, listenerfeedback signals are produced on a moment-by-moment and thusmicroscopic time scale and they focus on the listener, obviously.
Conversational surface structure Conversational surface structure de-scribes the organization of speaker changes from a semantics-indepen-dent perspective by means of employing a probabilistic state model,an idea introduced by Brady 11. The basic concept encompasses three 11 Paul T. Brady. “A technique for in-
vestigating on-off patterns of speech”.In: Bell Syst. Tech. J. 44.1 (1965), pp. 1–22
Paul T. Brady. “A statistical analysisof on-off patterns in 16 conversations”.In: Bell Syst. Tech. J. 47.1 (1968), pp. 73–99
Paul T. Brady. “Effects of transmis-sion delay on conversational behavioron echo-free telephone circuits”. In: BellSyst. Tech. J. 50.1 (1971), pp. 115–134
steps. The first step is to define all combinations of talking andnon-talking interlocutores as so called states: no-one is talking (onesilence state), each speaker is talking alone (N single-talk states), twospeakers are talking simultaneously (∑N−1
i=1 (N− i) double-talk states),up to all N speakers are talking simultaneously (one N-talk state).This is done for the perspective or – as Schoenenberg 12 writes – per-
12 Katrin Schoenenberg. “The Qualityof Mediated-Conversations under Trans-mission Delay”. PhD Thesis. TechnischeUniversität Berlin, Germany, 2016
ceptual reality of each interlocutor, as those states can be different foreach interlocutors when there is transmission delay on the connection.The second step is to employ a Markov-Chain model by heuristicallydetermining for each state the probability to remain in that state(sojourn probability), and the probabilities to move to one of theother states (transition probabilities). Figure 2.2 gives visual examplesfor a two-party and a three-party conversation. The third step is tocharacterize a conversation by directly using those state probabilities,or by extracting from those state probabilities a number of secondaryparameters. Such secondary parameters can transform the state prob-abilities to temporal variables by including the timing informationabout when the conversation was in which state. Or they reflectsimple statistics on specific state walks during a conversation, againrelated to timing information. An example for the former parametertype is the State Sojourn Time per state 13 (mean time of staying in
13 Paul T. Brady. “A technique for in-vestigating on-off patterns of speech”.In: Bell Syst. Tech. J. 44.1 (1965), pp. 1–22
Paul T. Brady. “A statistical analysisof on-off patterns in 16 conversations”.In: Bell Syst. Tech. J. 47.1 (1968), pp. 73–99
Paul T. Brady. “Effects of transmis-sion delay on conversational behavioron echo-free telephone circuits”. In: BellSyst. Tech. J. 50.1 (1971), pp. 115–134that state); examples for the latter parameter type are the Speaker
Alternation Rate 14 (mean rate at which speaker changes occurred) or14 Florian Hammer, Peter Reichl, andAlexander Raake. “Elements of interac-tivity in telephone conversations”. In:Proceedings of the 8th International Confer-ence on Spoken Language Processing (In-terspeech 2004). Jeju Island, Korea, 2004,pp. 1741–1744
Sebastian Egger, Raimund Schatz,and Stefan Scherer. “It takes two totango – assessing the impact of delayon conversational interactivity on per-ceived speech quality”. In: Proceedingsof the 11th Annual Conference of the In-ternational Speech Communication Associa-tion (Interspeech 2010). Makuhari, Japan,2010, pp. 1321–1324
Utterance Rhythm 15 (mean time from one utterance of a speaker to
15 Katrin Schoenenberg et al. “On in-teraction behaviour in telephone conver-sations under transmission delay”. In:Speech Communication 63 (2014), pp. 1–14
his or her next utterance).Regarding the categorization in Table 2.1, conversational surface
structure concerns the organization of speaker changes. It representsa way of characterizing (measuring) communication that does notrely on the semantic meaning of the shared information; however, it isnot an intrinsic property of communication as such. Furthermore, theunderlying state model means that conversational surface structureworks on a moment-by-moment and thus microscopic time scale.However, it can be argued that some of the parameters representstatistics of a whole conversation, meaning that conversational surfacestructure can apply also an in-retrospect and thus macroscopic timescale. And finally, conversational surface structure focuses on onehand on the speaker, since it analyzes speaker state probabilities, onthe other hand also on the listener as it refers to the perceptual reality

32 quality of experience of multiparty conferencing and telemeeting systems
Remarks:Each state Sx (with indices x ∈ [0, 1, 2, 12] for two-party and x ∈[0, 1, 2, 3, 12, 13, 23, 123] for three-party conversation) is visualized by a circle.The sojourn probabilities px,x and transition probabilities px,y (read: p fromstate x to state y) are indicated by arrows. To simplify the visualization, thetwo possible transitions between each state pair – from x to y and from y tox – are merged into one double-headed arrow, and the nomenclature px,y isonly shown for the two-party case.
Figure 2.2: Visualization of MarkovChain models for a two-party (top panel)and three-party conversation (bottompanel).

human communication via telemeetings 33
of each listener.
Grounding Grounding, introduced as a term by Clark & Brennan 16, 16 Herbert H. Clark and Susan E. Bren-nan. “Grounding in Communication”.In: Perspectives on socially shared cogni-tion. Ed. by Lauren B. Resnick, John M.Levine, and Stephanie D. Teasley. Amer-ican Psychological Association, 1991,pp. 127–149
refers to the process of establishing a mutual believe between speakerand listeners that the message or – in the terms used by Clark & Bren-nan – a contribution has been correctly understood. This means, turntaking behavior as described by Sacks et al. 17 is driven by the attempt
17 Harvey Sacks, Emanuel A. Schegloff,and Gain Jefferson. “A Simplest System-atics for the Organisation of Turn-Takingfor Conversation”. In: Language 50 (4Dec. 1974), pp. 696–735
of interlocutors to reach this mutual understanding, this commonground. Clark & Brennan describe that the understanding of a contri-bution consists of a presentation phase (speaker presents an utterance)and an acceptance phase (listener give evidence that they believe theyunderstood the utterance). Thus, the grounding process can coverone to several turns: one turn – the oririnal utterance as such – if theutterance was positively acknowledged by listener feedback signals(which do not lead to a turn change); more than one turn if listenersrequest clarification.
Regarding the categorization in Table 2.1, grounding concerns theconveyance of content and is, obviously, relying on a semantic analysisof the information shared. Furthermore, grounding is a processthat establishes mutual understanding of the previous episodes ofa conversation; hence it can be seen as an in-retrospect process andas an intrinsic property of communication. Thus it rather refers toa macroscopic time scale, not in the sense of a whole conversationbut of individual parts. And finally, since grounding is about mutualunderstanding, it requires consideration of both, speaker and listener.
Conversational games and moves Conversational games and movesrefer – as Doherty-Sneddon et al. 18 describe – to the “pragmatic
18 Gwyneth Doherty-Sneddon et al.“Face-to-Face and Video-Mediated Com-munication: A Comparison of DialogueStructure and Task Performance”. In:Journal of Experimental Psychology: Ap-plied 3.2 (1997), pp. 105–125
functions of utterances with respect to achieving speakers’ goals”.That means, a conversational game is a unit of a conversation thatencompasses a set of utterances that serves the accomplishment or,alternatively, the abandonment of a certain goal 19. In that respect, 19 Jean Carletta et al. HCRC dialogue
structure coding manual. Report. Uni-versity of Edinburgh, UK, 1996. url:http://www.lancaster.ac.uk/fass/
projects/eagles/maptask.htm
Jean Carletta et al. “The reliabilityof a dialogue structure coding scheme”.In: Computational Linguistics 23.1 (1997),pp. 13–31
grounding, as discussed above, can be seen as one such type ofconversational games, while an example for other conversationalgames is to ask someone to perform a certain action and making surethat this instruction is correctly understood.
Each conversational game can consist of one or more conversa-tional moves, which are utterances that can be classified according totheir purpose, such as initiating a conversational game or acknowl-edging understanding. Different coding schemes for conversationalmoves have been used in a number of studies using different conver-sation tasks. Carletta et al. proposed and evaluated such a codingscheme that was especially tailored to the map task 20. While that
20 Anne H. Anderson et al. “The HCRCMap Task Corpus”. In: Language andSpeech 34.4 (1991), pp. 351–366
scheme consists of 12 categories of conversational moves, alterna-tive coding schemes have been used in the literature as well. Forinstance, Veinott et al. 21 used – again for the map task – a slightly
21 Elizabeth S. Veinott et al. “VideoHelps Remote Work: Speakers WhoNeed to Negotiate Common GroundBenefit from Seeing Each Other”. In:Proceedings of CHI 1999. 1999
modified version of that scheme, essentially merging some categoriesand introducing two additional categories for utterances not directlyrelated to the task at hand. Furthermore, Kraut et al. 22 tailored their
22 Robert E. Kraut, Susan R. Fussell,and Jane Siegel. “Visual Informationas a Conversational Resource in Col-laborative Physical Tasks”. In: Human-Computer Interaction 18 (2003), pp. 13–49

34 quality of experience of multiparty conferencing and telemeeting systems
coding scheme to the helper-worker-task (bicycle repair task) that theyused. However, Kraut’s categories can be reinterpreted as mergedcategories from the coding scheme of Carletta et al. This means, thecombined coding schemes of Carletta et al. and Veinott et al. appearto form a representative and hierarchical set of definitions for conver-sational moves. Figure 2.3 provides the definition of the 14 resultingconversational moves.
Regarding the categorization in Table 2.1, conversational gamesand moves concern the conveyance of content and are, obviously,relying on a semantic analysis of the information shared. Further-more, as conversational moves and games build on grounding to acertain extent, they represent intrinsic properties of communication.In terms of the time scale, conversational games refer to the functionof episodes of a conversation and therefore look at conversation ona rather macroscopic time scale. The time scale for conversationalmoves, however, is ambiguous. On the one hand, conversationalmoves are categorized by the function of utterances in light of the con-versation goals, which suggests a macroscopic time scale. On the otherhand, conversational moves are determined per utterances, whichsuggests the same microscopic time scale as defined for turn-taking.And finally, conversational games refer to the mutual achievementor abandonment of goals, which means they concern both speakerand listener, while conversational moves is a categorization of spokenturns, which means they concern the speaker.

human communication via telemeetings 35
Is the utterance an initiation, response, preparation, or another type of utterance?(1)
Initiation(1)
Is the utterance a command, statement, or question?
CommandInstruct
StatementExplain
QuestionIs the person who is transferring information asking the question in an attempt to get evidence that thetransfer was successful, so they can move on?
YesAlign
NoDoes the question ask for confirmation of material which the speaker believes might be inferred,given the dialogue context?
YesCheck
NoDoes the question ask for a yes-no answer, or something more complex?
Yes-NoQuery-YN
ComplexQuery-W
Response(1)
Does the response contribute to task/domain information, or does it only show evidence that communication
has been successful?Communication
Acknowledgement
InformationDoes the response contain just the information requested, or is it amplified?
Amplified
Clarify
Info RequestedDoes the response mean yes, no, or something more complex?
YesReply-Y
NoReply-N
Complex
Reply-WPreparation(1)
Ready
Other Type(2)
Is the utterance a statement that orchestrate the overall activity, move things ahead, etc.?
YesMeeting management
NoIs the utterance a statement not related to the task or progress, usually humor or side topics?
YesDigression
No(3)
Unspecified
Notes:(1): Coding branches according to Carletta et al., with literal wording of the definitions.(2): Coding branches according to Veinott et al.; the original definitions are rephrased asquestions with minimum modifications, to achieve consistency in the combined scheme.(3): Additional branch to account for utterances that do not fit any of the categories.
Figure 2.3: Coding scheme for con-versational moves, combination of theschemes from Carletta et al.(1996) andVeinott et al.(1999)

36 quality of experience of multiparty conferencing and telemeeting systems
2.2.3 Communication Modes in Group-Communication
Communication Mode – also referred to as Communication Modalityor Communication Media – describes the medium over which inter-locutors are conversing 23. On a high level, communication mode 23 ITU-T. Recommendation P.1301 - Sub-
jective quality evaluation of audio and au-diovisual telemeetings. International Stan-dard. Geneva, Switzerland: Interna-tional Telecommunication Union, 2012
refers to the communication modalities in terms of face-to-face, au-diovisual, audio-only, and text-only communication. On a finer level,there are many different instantiations possible, depending on theactual technical implementation. For instance, audio-only communica-tion can be realized as full-duplex (both sides can simultaneously talk)or half-duplex (only one side can talk at a time), audiovisual commu-nication can use different video frame rates, and text-only communi-cation can be realized as real-time synchronous chat or message-basedasynchronous email. Furthermore, another very important aspect ofgroup-communication is the availability of a shared-workspace aspart of the communication mode, which will be discussed next.
2.2.4 Shared-Work-Spaces in Group-Communication
The term shared work space is usually used in the context of task-driven communication. Shared work space refers to a physical orvirtual space that allows the interlocutors to share information andobjects, which supports achieving the task goals at hand. In terms ofBuxton 24, a shared work space – or task space – refers to a “copres- 24 William A. S. Buxton. “Telepres-
ence: integrating shared task and per-son spaces”. In: Proceedings of GraphicsInterface ’92. Amsterdam, The Nether-lands, Oct. 1992, pp. 123–129
ence in the domain of the task being undertaken”. A typical examplefor a physical, also often referred to as co-located, shared work spaceis a whiteboard in a meeting room, which serves the interlocutorsto visualize (draw and write) all relevant information currently dis-cussed about. An example for a virtual, also often referred to asdistributed, shared work space is given by Buxton: a data spreadsheetpresented on networked computers at different physical sites, whereaseach interlocutor can assess, mark and edit the spreadsheet, visibly tothe others. Another example for a virtual shared work space that iscommon in today’s computer-based conferencing solutions is screensharing, in which one interlocutor sends a visual representation ofhis or her computer desktop to the remote participants.
Since shared work spaces can be realized in quite different ways, asystematic approach to characterize the essential features of sharedwork spaces is beneficial. A first such feature obvisously is the dis-tinction between physical/co-located and virtual/distributed sharedwork spaces. Two more such features are introduced by Park 25, who 25 Kyoung Shin Park. “Enhancing Co-
operative Work in Amplified Collabora-tion Environments”. PhD Thesis. Grad-uate College of the University of Illinoisat Chicago, 2003
provides a categorization of co-located and distributed variations ofshared work spaces by examining two dimensions: visibility andcontrolability. Visibility means the extent to which an owner of in-formation is sharing the view with interlocutors, and controlabilitymeans the extent to which an owner of information is sharing thecontrol with interlocutors. Both dimensions range from private (nevershare) via mixed (partially share) to public (always share).
Relating the concept of shared work space to group communication,it is intuitive that the absence or presence of a shared work space

human communication via telemeetings 37
can influence the communication. This assumption is supported byGergle et al. 26, Kraut et al. 27 and Whittaker et al. 28, but it should be 26 Darren Gergle, Robert E. Kraut, and
Susan R. Fussell. “Language Efficiencyand Visual Technology – MinimizingCollaborative Effort with Visual Infor-mation”. In: Journal of Language and So-cial Psychology 23.4 (Dec. 2004), pp. 1–27
27 Robert E. Kraut, Susan R. Fussell,and Jane Siegel. “Visual Informationas a Conversational Resource in Col-laborative Physical Tasks”. In: Human-Computer Interaction 18 (2003), pp. 13–49
28 Steve Whittaker and Brid O’Conaill.“An Evaluation of Video Mediated Com-munication”. In: INTERACT ’93 and CHI’93 Conference Companion on Human Fac-tors in Computing Systems. ACM. 1993,pp. 73–74
further validated in the light of the vast amount of existing relatedliterature (for example, ≥ 200 relevant studies were identified in tworeviews by Fjermestad & Hiltz 29).
29 Jerry Fjermestad and Starr RoxanneHiltz. “An Assessment of Group Sup-port Systems Experimental Research:Methodology and Results”. In: Journalof Management Information Systems 15.3(1999), pp. 7–149
Jerry Fjermestad. “An analysis ofcommunication mode in group supportsystems research”. In: Decision SupportSystems 37 (2004), pp. 239–263
Regardless of the empirical evidence, from a theoretical and method-ological perspective, the present text advocates a distinction betweencommunication with and without shared work space. Buxton 30, for
30 William A. S. Buxton. “Telepres-ence: integrating shared task and per-son spaces”. In: Proceedings of GraphicsInterface ’92. Amsterdam, The Nether-lands, Oct. 1992, pp. 123–129
instance, introduced a formal distinction between the shared workspace and a person space, which refers to the perceived co-presence ofthe interlocutors. Along that line of thought, Masoodian 31 proposed
31 Masood Masoodian. “Human-to-Human Communication Support forComputer-Based Shared Workspace Col-laboration”. PhD Thesis. Departmentof Computer Science, The University ofWaikato, Hamilton, New Zealand, 1996
to categorize the experimental studies of face-to-face and mediatedcommunication into four categories:
• Studies that investigated the person space, by changing the commu-nication medium but keeping the shared workspace unchanged.
• Studies that investigated the shared work space, by changing theshared work space but keeping the communication medium un-changed.
• Studies that investigated person and shared work space.
• Studies that investigated other aspects.
Buxton discussed that depending on the task at hand, the separationof person and shared work space can differ from none at all to distinct.His examples for the former case are negotiation or counseling, hisexample for the latter case is working with a shared data spreadsheet.Given this continuum between shared work space and person space,this concept of the two spaces suggests to consider the two spacesnot as two distinct categories, but as two dimensions along whichcommunication scenarios can be characterized: to what extent is thecommunication concerned with or focusing on the person space, towhat extent with shared work. Such characterization can, for instance,be done by developing a corresponding conversational coding scheme.A starting point for such a scheme could be the coding scheme fromKraut et al. 32 defining six types of messages, which can be grouped 32 Robert E. Kraut, Susan R. Fussell,
and Jane Siegel. “Visual Informationas a Conversational Resource in Col-laborative Physical Tasks”. In: Human-Computer Interaction 18 (2003), pp. 13–49
into shared work space related messages (procedural, task status, andreferential utterances) and person space related messages (internalstate, acknowledgments, and other utterances). A complementarycoding scheme from Gergle et al. 33 examines the use of deictic 33 Darren Gergle, Robert E. Kraut, and
Susan R. Fussell. “Language Efficiencyand Visual Technology – MinimizingCollaborative Effort with Visual Infor-mation”. In: Journal of Language and So-cial Psychology 23.4 (Dec. 2004), pp. 1–27
expressions (e.g., “that left one”) when referring to the task object.

38 quality of experience of multiparty conferencing and telemeeting systems
2.3 Overview of Research on Face-To-Face and Mediated Group-Communication
There is a vast amount of literature on Face-To-Face and MediatedGroup-Communication, mainly in the context of collaborative work-ing. In a series of reviews, Fjermestad & Hiltz 34, have examined more 34 Jerry Fjermestad and Starr Roxanne
Hiltz. “Experimental studies of groupdecision support systems: an assess-ment of variables studied and method-ology”. In: Proceedings of the 30th AnnualHawaii International Conference on SystemSciences. Vol. 2. IEEE. 1997, pp. 45–65
Jerry Fjermestad and Starr RoxanneHiltz. “An Assessment of Group Sup-port Systems Experimental Research:Methodology and Results”. In: Journalof Management Information Systems 15.3(1999), pp. 7–149
Jerry Fjermestad and Starr RoxanneHiltz. “Case and field studies of groupsupport systems: an empirical assess-ment”. In: Proceedings of the 33rd AnnualHawaii International Conference onSystemSciences. IEEE. 2000, pp. 10–19
Jerry Fjermestad. “An analysis ofcommunication mode in group supportsystems research”. In: Decision SupportSystems 37 (2004), pp. 239–263
than 200 relevant studies published in journals and peer-reviewedconferences. Considering that they excluded other publication typessuch as PhD theses or book chapters, that they focused on studieswith at least three interlocutors, and that their last review is alreadyten years old, today’s real number of relevant studies will be muchhigher. Nevertheless, since these reviews provide – to the author’sknowledge – the most comprehensive overview of studies, the presentsection will be based on these review articles.
2.3.1 Goals
The main goal of Fjermestad & Hiltz was to provide a systematic andgraspable overview of the vast amount of literature in the contextof collaborative working. More specifically, they examined existingresearch from the perspective of a potential added value of collabora-tive working tools, which they call Group Support Systems, comparedto face-to-face collaboration.
In terms of the present text, on the one hand, they analyzed collab-orative working for different communication modes, thus includingboth face-to-face and mediated communication. On the other handthey analyzed collaborative working with and without providing ashared work space, which they refer to as Task Support Tools.
2.3.2 Method
The analysis is based on a framework that allows a systematic char-acterization of the vast amount of experimental input and outputvariables. The framework defines four variable categories: contextualfactors (i.e. independent variables); intervening factors; adaptationfactors; and outcome factors. Table 2.2 provides a short overview ofthose four types, for the full description the present text refers to theoriginal papers 35. 35 Jerry Fjermestad and Starr Roxanne
Hiltz. “An Assessment of Group Sup-port Systems Experimental Research:Methodology and Results”. In: Journalof Management Information Systems 15.3(1999), pp. 7–149
Jerry Fjermestad. “An analysis ofcommunication mode in group supportsystems research”. In: Decision SupportSystems 37 (2004), pp. 239–263
In order to extract numerical results from the individual studies,Fjermestad & Hiltz first coded all located studies according to theirframework and put them into a database. Then they computed simplestatistics in terms of counts, i.e. how many experiments studied certainvariables or variable combinations (“What has been studied”) andhow often an effect of the system was observed (“Face-to-face isbetter/equal/worse than system-based”).
2.3.3 Results and Re-Interpretation
Here the author summarizes and re-interprets the main results re-ported in the two main publications of the four found reviews from

human communication via telemeetings 39
Contextual Factors
Technology:e.g. Communication Mode, Task Support Tools, Process Struc-tureGroup:e.g. Group Characteristics, Leadership, Member Characteris-tics, Meeting StructureTask:e.g. Task Type, Structure, Equivocality, ComplexityContext:e.g. Environment, Organizational, Cultural
Intervening Factors
Methods:e.g. Experimental Design, Task Implementation, TrainingCommunication Dimensions:e.g. bandwidth, media richness, social presenceGroup Member Perception & Problem Solving:Task Performance Strategies, Member Knowledge and Skill,Commitment, Level of Interest, BiasesOrganizing Concepts:e.g. Information Processing System, Consensus GeneratingSystem, Behavior Motivation & RegulationOperating Conditions:e.g. Available Modalities, Changes in Task, Divisions of Labor
Adaptation Factors
Group Adaptation Factors:Structural Features, Process Variables, Process IssuesProcess Gains/Losses:e.g. Synergy, Learning, Attenuation Blocking, InformationOverloadIntermediate Role Outcomes:e.g. Role Assumption by Technology, Actual Roles of Partici-pants, Values
Outcome Factors
Consensus:e.g. Decision Agreement, CommitmentEfficiency Measures:e.g. Decision Time, Number of Decision CyclesEffectiveness Measures:Decision Quality, Process Quality, Level of Understanding,Task FocusSatisfaction Measures:e.g. participation, Confidence, Attitude, General SatisfactionUsability Measures:e.g. Learning Time, Willingness to work together again, De-sign Preference
Table 2.2: Short overview of a frame-work to characterize studies on collab-orative working, according to Fjermes-tad & Hiltz.Fjermestad & Hiltz. One review 36 was conducted in 1998 and con-
36 Jerry Fjermestad and Starr RoxanneHiltz. “An Assessment of Group Sup-port Systems Experimental Research:Methodology and Results”. In: Journalof Management Information Systems 15.3(1999), pp. 7–149
cerns the full set of studies located at that time. The other review 37
37 Jerry Fjermestad. “An analysis ofcommunication mode in group supportsystems research”. In: Decision SupportSystems 37 (2004), pp. 239–263
was conducted in 2000 and provides a more detailed analysis forthose studies that examined the impact of communication mode,thus excluding all studies that manipulated only the other contextualfactors (see Table 2.2).
Fjermestad & Hiltz found that in the majority of studies no signif-icant effect between mediated and face-to-face communication wasfound, and that for the remaining studies the ratio of positive andnegative effects, i.e. mediated communication is better/worse thanface-to-face, is almost equal to one. The counts in terms of testedhypotheses across all studies in the 1998-review were 628 for no effect,158 for mediated being better than face-to-face, and 164 for mediatedbeing worse than face-to-face. The corresponding counts in the 2000-review were 239 with no effect, 177 for mediated being better, and191 for mediated being worse.
Looking at the results for the individual variables, again no sig-nificant effect could be found for most variables. While Fjermes-tad & Hiltz present a comprehensive analysis of the many variablesconsidered, the author decided to focus here only on three dependentvariables that appear to be most relevant for the present chapter:Efficiency, Effectiveness and Satisfaction. The results for these outcomevariables are shown in Table2.3. Here, interesting observations canbe made with respect to the typical assumptions about the added

40 quality of experience of multiparty conferencing and telemeeting systems
value of mediated communication, considering that two contradictingassumptions are reasonable: face-to-face communication is better,given the richness and naturalness of the communication mode withits potential for fast interaction and turn-taking behavior; or mediatedcommunication is better, as the restrictions on the communicationmode force people to focus on the task and to minimize non-taskrelated conversations.
Outcome Total No Pos. Neg. Other
Factor Count Effect Effect Effect Effect
1998-Review
Efficiency 97 22 10 26 39
Effectiveness 617 230 73 44 270
Satisfaction 280 133 18 29 100
2000-Review
Efficiency 49 4 11 29 5
Effectiveness 259 89 72 57 41
Satisfaction 126 54 24 25 24
Table 2.3: Results from Fjermes-tad & Hiltz for a selection of consid-ered outcome variables. The numbersshow the counts in terms of observedeffects over all considered experiments.Pos. Effect means mediated communica-tion better than face-to-face communica-tion, Neg. Effect the opposite, and Otherrefers to cases without measured maineffects or with significant interaction ef-fects only.
Concerning Efficiency, the data from Fjermestad & Hiltz shows aclear tendency for the naturalness argument preferring face-to-facecommunication. Concerning Effectiveness, the data suggests that inmost cases no significant effect can be found, but if there is an effect,then the mediated communication reaches more often higher Effective-ness. This would support the argument that participants focus moreon mediated communication. Concerning Satisfaction, face-to-faceis more preferred than mediated communication in those cases inwhich there is an effect, again supporting the naturalness argument.However, the vast majority of studies showed no effect at all, whichsuggest that other aspects than naturalness and media richness con-tribute to Satisfaction, such as the Effectiveness. In the author’s view,an alternative explanation could be that participants are used to thenecessity of assuming a different communication behavior in medi-ated communication, which is therefore not decreasing satisfaction inmost cases.
2.3.4 Discussion and Conclusions
Although the reviews of Fjermestad & Hiltz were very comprehensive,i.e. covering more than 200 experiments, they were conducted from avery specific perspective: evaluate the added value of what they callGroup Support Systems compared to face-to-face communication.
However, looking at Fjermestad & Hiltz’ descriptions of GroupSupport Systems, a substantial number of those systems providedmixed mediated and face-to-face communication, the so-called De-cision Room systems (related to 347 out of 705 variables in the 2000-review). Furthermore, a second group of systems (related to 268 out

human communication via telemeetings 41
of 705 variables in the 2000-review) were called Computer-Mediated-Communication systems, which are primarily providing text-basedcommunication, i.e. chat and email, even though they may includeaudio or audiovisual communication channels as well. This meansthat the body of tested systems was beyond the scope of the presentwork, which considers audio and audiovisual communication only,and only between remote interlocutors, i.e. excluding combinationsof mediated and face-to-face communication. As a consequence, theresults of Fjermestad & Hiltz may not be perfectly evaluating theeffect of “purely” mediated group-communication vs. face-to-facecommunication.
Nevertheless, given the comprehensiveness of the reviews, it can beconcluded that the effect of mediated group-communication vs. face-to-face communication is overall highly ambiguous, since roughlyone-third of the studies showed no effect, one-third of the studies aneffect favoring mediated communication and one-third of the studiesfavoring face-to-face communication. This result, however, does notmean that the communication behavior of the interlocutors is notaffected, it only means that the measurable aspects of the communi-cation processes and their outcomes did not differ. In other words,it is likely that people assume a different communication behaviorwhen conversing over a telecommunication system in order to reachthe communication goals despite the limitations of the particularcommunication channel, whereas those changes in communicationbehavior could not be consistently measured across studies.
2.4 Deep-Dive Analysis of Research on Face-To-Face and Me-diated Group-Communication
2.4.1 Motivation and Approach
Despite the comprehensiveness of the reviews by Fjermestad & Hiltz(see previous section), the author decided to conduct an own deep-dive analysis of research on face-to-face and mediated group-com-munication. The motivation was to obtain a complementary pictureof existing literature from a different perspective than the typicalresearch question “Is face-to-face communication better or worsethan mediated communication?”. Instead the goal was to obtaininsights which variables might explain differences in the communica-tion media for the purpose of characterizing human communicationvia telemeetings.
Emphasizing the aspect of obtaining complementary results toFjermestad & Hiltz, the present deep-dive literature analysis includescomplementary literature, i.e. including publications later than 2000,including two-party studies, including studies investigating only me-diated communication, and including non-article style publicationssuch as PhD theses. While increasing the broadness of includedstudies, the present analysis focused on much less studies, i.e. 44 ex-periments described in 42 publications, noting that some publications

42 quality of experience of multiparty conferencing and telemeeting systems
covered multiple experiments, some experiments were covered bymultiple publications. The motivation for this trade-off was to be ableto conduct a detailed analysis of individual variables in light of theavailable resources.
2.4.2 Method
The present analysis is a cross-study analysis and looks at the effectsof communication media on different dependent variables. Sincethose studies did not use standardized protocols, measures, or otheranchors allowing cross-study comparisons, it is not possible to ex-press the results of individual experiments on one common scale interms of quantitative values. For that reason, the author opted fora qualitative analysis, using a visualization method that essentiallyproduces a ranking of communication media. The idea is to visualizeper study which communication media were found to be statisticallysignificantly different, and then to combine those visualizations acrossstudies.
Concerning the visualization per study, the number of ranks shownin each plot represents the number of communication media thatstatistically differed. In addition, the visualization method also il-lustrates whether the media significantly differed in a study or notby means of hypothetical errorbars: overlapping errorbars representnon-significant differences, adjacent errorbars represent significantdifferences. This means, even though the ranking and sizes of thoseerrorbars are based on the quantitative results of a study, those er-rorbars are a qualitative visualization and do not represent the realstudy data.
Furthermore, the ranking, expressed by the middle points of theerrorbars, and the width of the errorbars needed to be constructedsuch that a proper across-study comparison is possible. This is nottrivial since different studies tested different combinations of commu-nication media. The chosen approach was to normalize per individualstudy the position and widths of the errorbars to the number of ranksthat were found.
Figure 2.4 shows five representative hypothetical examples forstudies that investigated three communication media. Furthermore, itexplains per example how the visualization is constructed.
The plots in Figure 2.4 are examples for individual studies. Thenext step is to combine such plots across studies in one figure suchthat the impact of individual communication media across studies isvisible. For that reason the errorbars are grouped per communicationmedium, Figure 2.5 gives an example combining three hypotheticalstudies, and provides an explanation how to interpret such a plot.Furthermore, the analysis was conducted separately for studies thatinvestigated two-party communication and studies that investigatedmultiparty communication.

human communication via telemeetings 43
Example 1 Example 2 Example 3 Example 4 Example 5
Study Result: Study Result: Study Result: Study Result: Study Result:
All three media are sig-nificantly different fromeach other.
Media M1 and M3
are significantly differ-ent, but medium M2 isnot significantly differ-ent from the other two.
Media M1 and M2 arenot significantly differ-ent from each other, butboth are significantlyhigher than mediumM3.
Medium M1 is signifi-cantly higher than me-dia M2 and M3. Thosetwo are not significantlydifferent.
All media are not signif-icantly different.
Construction oferrorbars:
Construction oferrorbars:
Construction oferrorbars:
Construction oferrorbars:
Construction oferrorbars:
No. of ranks to plot: 3 No. ranks to plot: 2 No. ranks to plot: 2 No. ranks to plot: 2 No. ranks to plot: 1
Positioning: Everymedium occupies onerank
Positioning: M1 and M3
occupy each one rank,M2 is positioned be-tween
Positioning: M1 and M2
occupy same rank, M3
the other rank
Positioning: M2 and M3
occupy same rank, M1
the other rank
Positioning: All occupythe same rank
Width: Whole range di-vided by 3
Width: Whole range di-vided by 2
Width: Whole range di-vided by 2
Width: Whole range di-vided by 2
Width: Whole range di-vided by 1
Figure 2.4: Hypothetical examples tovisualize the impact of communicationmedia on experimental results.

44 quality of experience of multiparty conferencing and telemeeting systems
Combination of the results of studies “Blue”, “Red”, and “Black”:Study “Blue” investigated media M1, M2, and M3, and it showed a pattern corresponding to Example 1 in Figure 2.4.Study “Red” investigated media M1, M4, and M5, and it showed a pattern corresponding to Example 3 in Figure 2.4.Study “Black” investigated media M2, M3, and M4, and it showed a pattern corresponding to Example 5 in Figure 2.4.
Interpretation Method:1. Look at the positions and sizes of the errorbars per medium Mx.2. The more the errorbars for the medium Mx are clustered towards the upper end, the more likely Mx leads to an increased value ofthe current measure (e.g. collaboration performance) compared to other media. Example: M1.3. The more the errorbars are clustered toward the lower end, the more likely Mx leads to a decreased value of the current measure(e.g. collaboration performance). Example: If there were more studies with a pattern as study “Red”, then M5.4. The more centrally positioned and at the same time the smaller the errorbars are for the medium Mx, the more likely Mx has anaverage value of the current measure (e.g. collaboration performance) compared to other media. Example: If there were more studieswith a pattern as study “Blue”, then M2.5. The more centrally positioned and at the same time the wider the errorbars are for the medium Mx, the more likely Mx does notdiffer in the current measure (e.g. collaboration performance) compared to other media. Example: If there were more studies with apattern as study “Black”, then M2.6. The more the errorbars of individual studies are spread for medium Mx, the more likely the impact of Mx on the current measure(e.g. collaboration performance) depends on the specific characteristics of the corresponding studies. Example: If M2, M3, and M4would represent three technical implementations of the same medium, then this combination would be an example.
Figure 2.5: Hypothetical example tocombine results of different studies inone plot.

human communication via telemeetings 45
2.4.3 Data
The analysis comprised 44 experiments from 42 publications; seeTable 2.4 for the bibliographic details. In those experiments 45 dif-ferent instantiations of communication media were tested, coveringface-to-face, audiovisual, audio-only, text-only communication, withand without shared workspace, covering different technical versionsper communication medium, and including special conditions suchas video only, virtual avatar and even no communication38. In total, 38 In such conditions, participants saw
each other shortly before the task, andthen did the task individually.
253 measures (dependent variables) were collected across the studies,whereas just two measures were used in more than 10 experiments:discussion or completion time in 17 studies, and number of turnsor utterances in 13 studies. Fourteen further measures were used intwo to seven experiments, and all remaining measures were used inone study only. For that reason, the present analysis grouped themeasures into 24 categories of related measures, which cover fourprinciple measurement paradigms:
A: task performance in terms of outcome, quality and efficiency,
B: conversational statistics not relying on analysis of content andfunction,
C: conversational coding relying on analysis of content and function,and
D: questionnaire answers, i.e. perceived aspects.
In order to avoid skewed visualizations, this categorization requiredsome care not only in terms of assigning which individual measuresto which group but also in terms of correctly interpreting the directionof such related measures, i.e. when one measure reflects the inverseor opposite of another measure. For that reason, the visualizationsaim for maximum transparency by including a list of the currentindividual measures and by marking those measures that are invertedfor the plot.
2.4.4 Results
Overview The full analysis resulted in 46 plots that are presented in23 figures in Appendix B, noting that
(a) there were in total 24 groups of measures,
(b) the results for the first category Task Outcome was split into fourplots, each comprising related tasks that were used,
(c) not all categories were tested in both, two-party and multipartystudies,
(d) each figure has comprehensive legends providing identifiers of theexperiments ([Author_Year_ExperimentInPublication]), the shownmeasures, and the individual communication media, and

46 quality of experience of multiparty conferencing and telemeeting systems
Anne H. Anderson et al. “Virtual team meetings: An analysis of com-munication and context”. In: Computers in Human Behavior 23 (2007),pp. 2558–2580
Mark Apperley and Masood Masoodian. “An Experimental Evaluationof Video Support for Shared Work-Space Interaction”. In: Proceedings ofCHI 1995. 1995
Jennifer L. Blaskovich. “Exploring the Effect of Distance: An Experimen-tal Investigation of Virtual Collaboration, Social Loafing, and Group De-cisions”. In: Journal of Information Systems 22.1 (2008), pp. 27–46
Erin Bradner and Gloria Mark. “Why Distance Matters: Effects on Coop-eration, Persuasion and Deception”. In: Proceedings of CSCW 2002. 2002
Jeannette Brosig, Joachim Weimann, and Axel Ockenfels. “The Effect ofCommunication Media on Cooperation”. In: German Economic Review 4.2(2003), pp. 217–241
Judee K. Burgoon et al. “Trust and Deception in Mediated Communica-tion”. In: Proceedings of the 36th Hawaii International Conference on SystemSciences. 2003
Milton Chen. “Conveying Conversational Cues Through Video”. PhDThesis. Stanford University, 2003
Joanie B. Connell et al. “Effects of communication medium on interper-sonal perceptions”. In: Proceedings of the 2001 International ACM SIG-GROUP Conference on Supporting Group Work. ACM. 2001, pp. 117–124
Marcus Crede and Janet A. Sniezek. “Group judgment processes and out-comes in video-conferencing versus face-to-face groups”. In: InternationalJournal of Human-Computer Studies 59 (2003), pp. 875–897
Owen Daly-Jones, Andrew Monk, and Leon Watts. “Some advantagesof video conferencing over high-quality audio conferencing: fluencyand awareness of attentional focus”. In: International Journal of Human-Computer Studies 49 (1998), pp. 21–58
Gwyneth Doherty-Sneddon et al. “Face-to-Face and Video-MediatedCommunication: A Comparison of Dialogue Structure and Task Perfor-mance”. In: Journal of Experimental Psychology: Applied 3.2 (1997), pp. 105–125
Eckehard Doerry. “An Empirical Comparison of Copresent andTechnologically-Mediated Interaction based on Communicative Break-down”. PhD Thesis. Department of Computer and Information Science,Graduate School of the University of Oregon, 1995
Thomas Erickson et al. “Telepresence in Virtual Conferences: An Empiri-cal Comparison of Distance Collaboration Technologies”. In: Proceedingsof CSCW 2010. 2010
Susan R. Fussell, Robert E. Kraut, and Jane Siegel. “Coordination of Com-munication: Effects of Shared Visual Context on Collaborative Work”. In:Proceedings of the 2000 ACM conference on Computer supported cooperativework. 2000
Susan R. Fussell, Leslie D. Setlock, and Robert E. Kraut. “Effects of Head-Mounted and Scene-Oriented Video Systems on Remote Collaborationon Physical Tasks”. In: Proceedings of the Conference on human factors incomputing systems CHI 03. 2003
Darren Gergle, Robert E. Kraut, and Susan R. Fussell. “Language Effi-ciency and Visual Technology – Minimizing Collaborative Effort with Vi-sual Information”. In: Journal of Language and Social Psychology 23.4 (Dec.2004), pp. 1–27
Michel J. J. Handgraaf et al. “Web-conferencing as a viable method forgroup decision research”. In: Judgment and Decision Making 7.5 (2012),pp. 659–668
Matthew Jackson et al. “Impact of video frame rate on communicativebehaviour in two and four party groups”. In: Proceedings of the 2000 ACMconference on Computer Supported Cooperative Work. ACM. 2000, pp. 11–20
Robert E. Kraut, Susan R. Fussell, and Jane Siegel. “Visual Information asa Conversational Resource in Collaborative Physical Tasks”. In: Human-Computer Interaction 18 (2003), pp. 13–49
Andreas Löber, Sibylle Grimm, and Gerhard Schwabe. “Audio vs. chat:Can media speed explain the differences in productivity?” In: Proceedingsof the European Conference on Information Systems. 2006, pp. 2172–2183
Andreas Löber, Gerhard Schwabe, and Sibylle Grimm. “Audio vs. chat:The effects of group size on media choice”. In: Proceedings of the 40th An-nual Hawaii International Conference on System Sciences. IEEE. 2007, pp. 41–41
Masood Masoodian, Mark Apperley, and Lesley Frederickson. “Videosupport for shared work-space interaction: an empirical study”. In: Inter-acting with Computers 7.3 (1995), pp. 237–253
Masood Masoodian and Mark Apperley. “User perceptions of human-to-human communication modes in CSCW environments”. In: Proceedingsof ED-MEDIA’95. 1995, pp. 17–21
Masood Masoodian. “Human-to-Human Communication Support forComputer-Based Shared Workspace Collaboration”. PhD Thesis. Depart-ment of Computer Science, The University of Waikato, Hamilton, NewZealand, 1996
Giacinto Matarazzo. “The effects of video quality and task on remotecollaboration: a laboratory experiment”. In: 17th International Symposiumon Human Factors in Telecommunication. Copenhagen, Denmark, May 1999
Poppy Lauretta McLeod et al. “The Eyes Have It: Minority Influence inFace-To-Face and Computer-Mediated Group Discussion”. In: Journal ofApplied Psychology 82.5 (1997), pp. 706–718
David Nguyen and John Canny. “MultiView: Spatially Faithful GroupVideo Conferencing”. In: Proceedings of CHI 2005. 2005
Brid O’Conaill, Steve Whittaker, and Sylvia Wilbur. “ConversationsOver Video Conferences: An Evaluation of the Spoken Aspects of Video-Mediated Communication”. In: Human-Computer Interaction 8 (1993),pp. 389–428
Claire O’Malley et al. “Comparison of face-to-face and video-mediatedinteraction”. In: Interacting with Computers 8.2 (1996), pp. 177–192
Alison Sanford, Anne H. Anderson, and Jim Mullin. “Audio channelconstraints in video-mediated communication”. In: Interacting with Com-puters 16 (2004), pp. 1069–1094
Abigail J. Sellen. “Speech Patterns in Video-Mediated Conversations”. In:Proceedings of CHI 1992. 1992
Diane H. Sonnenwald, Mary C. Whitton, and Kelly L. Maglaughlin.“Evaluating a scientific collaboratory: Results of a controlled experiment”.In: ACM Transactions on Computer-Human Interaction (TOCHI) 10.2 (2003),pp. 150–176
Diane H. Sonnenwald, Kelly L. Maglaughlin, and Mary C. Whitton. “De-signing to support situation awareness across distances: an example froma scientific collaboratory”. In: Information Processing and Management 40
(2004), pp. 989–1011
Susan G. Straus and Joseph E. McGrath. “Does the Medium Matter?The Interaction of Task Type and Technology on Group Performance andMember Reactions”. In: Journal of Applied Psychology 79.1 (1994), pp. 87–97
Kil Soo Suh. “Impact of communication medium on task performanceand satisfaction: an examination of media-richness theory”. In: Informa-tion & Management 35 (1999), pp. 295–312
Federico Tajariol, Jean-Michel Adam, and Michel Dubois. “Seeing theFace and Observing the Actions: the Effects of Nonverbal Cues on Medi-ated Tutoring Dialogue”. In: Intelligent tutoring systems. Vol. 5091. LectureNotes in Computer Science. Springer, 2008, pp. 480–489
Lori Foster Thompson and Michael D. Coovert. “Teamwork Online: TheEffects of Computer Conferencing on Perceived Confusion, Satisfaction,and Postdiscussion Accuracy”. In: Group Dynamics: Theory, Research, andPractice 7.2 (2003), pp. 135–151
Lori Foster Thompson and Michael D. Coovert. “Stepping Up to the Chal-lenge: A Critical Examination of Face-to-Face and Computer-MediatedTeam Decision Making”. In: Group Dynamics: Theory, Research, and Prac-tice 6.1 (2002), pp. 52–64
Elizabeth S. Veinott et al. “Video Helps Remote Work: Speakers WhoNeed to Negotiate Common Ground Benefit from Seeing Each Other”.In: Proceedings of CHI 1999. 1999
Peter J. Werkhoven, Jan Maarten Schraagen, and Patrick A.J. Punte. “See-ing is believing: communication performance under isotropic teleconfer-encing conditions”. In: Displays 22 (2001), pp. 137–149
Steve Whittaker and Brid O’Conaill. “An Evaluation of Video MediatedCommunication”. In: INTERACT ’93 and CHI ’93 Conference Companion onHuman Factors in Computing Systems. ACM. 1993, pp. 73–74
Wanmin Wu et al. “Quality of Experience in Distributed Interactive Multi-media Environments: Toward a Theoretical Framework”. In: Proceedingsof the 17th ACM international conference on Multimedia. 2009
Table 2.4: Bibliographic details of the 42
publications included in the literatureanalysis.

human communication via telemeetings 47
(e) each figure includes the main finding based on the interpretationmethod of Figure 2.5.
Table 2.5 summarizes those detailed results.
Measures that characterize communication If a category of measuresshows strong and consistent trends in terms of significantly differentresults for different communication media, than it can be concludedthat this type of measures is characterizing communication. However,none of the categories shows such trends for both two-party andmultiparty situations, which means that the literature sample doesnot allow to identify a generally valid type of measures. Instead,some types of measures do characterize either two-party or multipartysituations. This means that the literature sample is not sufficient toshow consistent trends for both situations, which is likely since theamount of data did not allow for proper conclusions in many cases.It can also mean that two-party and multiparty communication aresuch different that different aspects of communication (i.e. differenttypes of measures) are influenced, which is also likely since somemeasures, e.g. Category B.2, show an effect for one situation but notfor the other.
A further aspect that complicates the picture is that in those casesin which an effect of medium was found, not all tested media showedthat effect, e.g. Category B.3 for multiparty situations. That meansthere is likely some interaction between actual measures and testedcommunication medium.
Finally, Table 2.5 reveals a further aspect that is that results are –unfortunately – ambiguous to a certain extent. In several cases someevidence for an effect could be found, while in detail those effectsare accompanied with inconsistent results, e.g. Category A.2 for two-party situations. Similarly, in several cases the evidence against aneffect is also compromised by inconsistent results, e.g. Category B.1for two-party situations.
2.4.5 Discussion and Conclusions
The results of the literature analysis are discouraging as they did notshow a clear result of the form: “measures x, y and z are consistentlyinfluenced by the communication medium, hence these measures docharacterize group communication”. On the one hand, this can be inparts explained by the size of the literature sample, which resultedin small numbers of studies per such group of measures that did notallow to draw proper conclusions. On the other hand, this can be alsoexplained by strong inconsistencies of results across studies, whichcould be observed for many cases that have sufficient data for properanalysis.
Looking at this from an engineering perspective, the two aspectssample size and amount of inconsistencies suggest that there is a verylarge amount of measurement noise. This means a vast amount ofdata is necessary to identify a small set of generally characteristic

48 quality of experience of multiparty conferencing and telemeeting systems
Measures Two-Party Studies Multiparty Studies
Result Comments Result Comments
A.1.1) Positive task outcomefor collaboration andsurvival tasks
? Insufficient data for proper interpretation X Trend: f2f differs from audiovisual
A.1.2) Positive task outcome fordesign, decision, minor-ity opinion, mystery, andestimation task
? Insufficient data for proper interpretation (X) Trend: f2f differs from text-onlybut not consistent: often no differences,or differences not in all studies
A.1.3) Positive task outcome formap task
(×) Not consistent: often no differences, or differences not in allstudies, or contrary differences between studies
? No data
A.1.4) Positive task outcome forhelper-worker tasks
(×) Not consistent: often no differences, or differences not in allstudies, or contrary differences between studies
? No data
A.2) Task completion time (X) Trend: f2f < audiovisual < text-only, no trend for audio-onlybut not consistent: often no differences, or differences not inall studies
× No effect
B.1) Turn-taking rate and re-lated measures
(×) Not consistent: often no differences, or differences not in allstudies, or contrary differences between studies
(×) Not consistent: often no differences, ordifferences not in all studies, or contrarydifferences between studies
B.2) Word rate and relatedmeasures
X Trend: f2f < audiovisual, no trend for audio-only × No effect
B.3) Amount of overlap andspeaker-state measures
× No effect X Trend: f2f > audio-only, no trend for au-diovisual
B.4) Amount of speakerchanges
× No effect (×) Not consistent: contrary differences be-tween studies
C.1) Amount of back channels ? Insufficient data for proper interpretation ? Insufficient data for proper interpretation
C.2) Amount of instruction X Trend: interaction of medium and availability of shared-workspace: audiovisual with shared workspace > audio-only with shared workspace, but audiovisual without sharedworkspace ≈ audio-only with shared workspace
? No data
C.3) Amount of aligns andchecks
(X) Trend: f2f requires relative consistently a smaller amountof aligns and checks while other media require sometimeshigher, sometimes smaller amount of aligns and checksbut not consistent: often no differences, or contrary differ-ences between studies
? No data
C.4) Amount of explanations × No effect ? Insufficient data for proper interpretation
C.5) Amount of questions (X) Trend: f2f requires relative consistently a smaller amount ofquestions while other media require sometimes higher, some-times smaller amount of questionsbut not consistent: often no differences, or differences not inall studies, or contrary differences between studies
? Insufficient data for proper interpretation
C.6) Amount of acknowledg-ments
(×) Not consistent: often no differences, or differences not in allstudies
? No data
C.7) Amount of object, pro-cess and status utterances
(×) Not consistent: often differences not in all studies, or contrarydifferences between studies
? No data
C.8) Amount of attempts tomanage the conversationor amount of conversa-tion failures
? Insufficient data for proper interpretation ? Insufficient data for proper interpretation
D.1) Satisfaction (×) Not consistent: often no differences, or differences not in allstudies, or contrary differences between studies
X Trend: f2f and audiovisual higher satis-faction than audio-only and text-only
D.2) Perceived media richness ? Insufficient data for proper interpretation ? No data
D.3) Amount of modificationsand exchange of opinions
? No data × No effect
D.4) Perception of positivework process and collab-oration
? Insufficient data for proper interpretation (×) Not consistent: often differences not inall studies, or contrary differences be-tween studies
D.5) Perception of positivegrounding processes
? Insufficient data for proper interpretation ? Insufficient data for proper interpretation
D.6) Perception of interlocu-tors
? Insufficient data for proper interpretation X Trend: interlocutors are more posi-tively perceived for f2f communication vs.audio-only and other media, with audio-visual in-between
D.7) Perception of engage-ment
? Insufficient data for proper interpretation ? Insufficient data for proper interpretation
D.8) Perception of trust ? Insufficient data for proper interpretation ? Insufficient data for proper interpretation
D.9) Perception of positiveturn-taking processes
? Insufficient data for proper interpretation (×) Not consistent: often differences not inall studies, or contrary differences be-tween studies
D.10) Positive perception of vi-sual cues
? Insufficient data for proper interpretation ? Insufficient data for proper interpretation
Legend: X: communication media show a trend for an impact on a type of measures; (X): weak trend; (×): non-consistent behavior; ×: no effect; ?: noresults/conclusions possible
Table 2.5: Summary of literature analy-sis, based on detailed results shown inAppendix B.

human communication via telemeetings 49
measures, if such a set actually exists.With regard to the literature reviews of Fjermestad & Hiltz (see
previous section), two observations can be made here: First, eventhough the goal of the present literature review – identify measuresthat characterize communication – differed from the goals of Fjermes-tad & Hiltz – investigate added value of mediated communicationversus face-to-face communication – the fundamental result is quitesimilar: no consistent effect of communication medium for most partsof the considered data. Second, the reviews of Fjermestad & Hiltzcovered about 200 studies, which can be considered as quite exhaus-tive, and they still found no strong effects favoring either mediated orface-to-face communication.
This suggests that simply increasing the sample of the currentliterature review may also not be enough to reduce the measurementnoise for the present goal as well. Instead, it may be necessary todevelop a more comprehensive framework that provides a list of thedesired characteristic measures together with a systematic descriptionof the context (e.g. communication medium, two-party vs. multiparty,tasks) for which those measures work. The overview in Table 2.5 aswell as the detailed results in Appendix B may be used as a startingpoint for such a project, which is out of scope of the present thesis.
Summary
One way to characterize group-communication (including a groupsize of two) is to address its purpose, the processes involved, and themedium used. The purpose can be focussed on accomplishing tasks,socializing, or exchange of information, and a widely used approachfor finer distinction of task-oriented communication is McGrath’s taskcircumplex. Communication processes can be characterized by fiveprominent aspects: turn-taking, listener feedback signals, conversa-tional surface structure, grounding, and conversational games andmoves. These aspects of analysis address communication from differ-ent perspectives, which the present chapter categorized along five di-mensions: temporal granularity (moment-by-moment, in retrospect),organizational focus (temporal order of contributions, organizationof content), reliance on the content (yes, no), characterization depth(describing intrinsic property, providing measurement tool), and fo-cus on the persons (speaker, listener, both). Communication mediaare determined by the modality in terms of face-to-face, audiovisual,audio-only, and text-only, as well as on the technical realization. Fur-thermore, the availability of a shared workspace has a crucial impacton communication and therefore constitutes an important aspect ofthe communication medium.
Comparing face-to-face and mediated communication, an extensiveliterature review by Fjermestad & Hiltz revealed that reviewed stud-ies can be roughly equally divided into studies favoring face-to-face,studies favoring mediated communication, and studies showing nosignificant effects. This means that the measurable aspects of the com-

50 quality of experience of multiparty conferencing and telemeeting systems
munication processes and their outcomes did not differ consistentlyenough to give a clear picture. However, it is still likely that peopleassume a different communication behavior when conversing overa telecommunication system in order to reach the communicationgoals despite the limitations of the particular communication chan-nel, whereas those changes in communication behavior could not beconsistently measured across studies.
An own literature analysis did not lead to a result of the form:“measures x, y and z are consistently influenced by the communicationmedium, hence these measures do characterize group communica-tion”. Instead, the analysis revealed that the sample size, i.e. numberof reviewed studies, must be sufficiently large and that there is a largeamount of inconsistencies in those cases for which the sample waslarge enough. This suggests that there is a large amount of measure-ment noise that needs to be properly addressed in order to identifysuch a set of generally characteristic measures. In future work, whichis outside the scope of this thesis, it may be necessary to develop amore comprehensive framework that provides a list of the desiredcharacteristic measures together with a systematic description of theirmutual interaction and the context for which those measures work.
Concering the present thesis, one of its objectives is to investigatethe relation between communication aspects and quality perceptionin the context of multiparty telemeetings. To this aim, this thesis willnot develop new approaches or measures to characterize mediatedgroup-communication. Instead, two experimental studies will beconducted, in which participants judge the quality of telemeetingsystems for few specifc communication scenarios. For that purpose,the background knowledge presented in this chapter will be used todefine those communication scenarios and the experimental variables.

3Telemeeting Technologies
What this chapter is about
The present text is built around two aspects that differentiate a multi-party telemeeting from a conventional two-party (video) telephonycall. One aspect is the possibility of encountering asymmetric con-nections, that is, participants are connected with different equipmentor connection properties. Bearing this in mind, the present chap-ter provides background knowledge on the technical aspects andcomponents that constitute a telemeeting system.
3.1 Introduction and Scope
Today’s technology allows to establish multiparty communicationbetween distant locations by very different means. Those are rangingfrom the traditional telephone conference bridges over mobile orPC-based audiovisual solutions to high-end telepresence rooms.
To organize this variety of possible systems, the present text startswith defining some coarse categories along two characteristics: com-munication modality and system size. Concerning the first characteristic,ITU-T Recommendation P.1301
1 defines five types of communication 1 ITU-T. Recommendation P.1301 - Subjec-tive quality evaluation of audio and audio-visual telemeetings. International Stan-dard. Geneva, Switzerland: Interna-tional Telecommunication Union, 2012
modalities: audio-only, video-only (i.e. for hearing-impaired people),audiovisual, text (i.e. chat), graphical (i.e. slide/screen sharing, refer-ring to the concept of shared work space described in Section 2.2).Concerning the second characteristic, the term system size refers to thephysical size and setup complexity of the end device(s) that the userneeds for connecting to the telemeeting. Thus, it does not refer toany central or network components of the telemeeting system. In thatline of thought, the present text distinguishes between single-device,small-size and large-size setups.
Single-device setups are those for which the user is just usingone physical device: telephone, mobile phone, tablet, laptop etc.Small-size setups require more than one physical device, but whichoccupy only a rather small amount of space, i.e. work desk, part ofsmall office or living room. The typical example is a computer-basedsetup with connections to external camera, microphone(s), display,and loudspeakers. Large-size setups require more than one physicaldevice and occupy a large amount of space, i.e. a dedicated room. The

52 quality of experience of multiparty conferencing and telemeeting systems
typical example is a high-end telepresence room with multiple large-size displays, microphone and loudspeaker arrays, and dedicatedfurniture arrangement.
Obviously, those categories are not exhaustive, since there arefurther types of telemeeting systems that do not fit exactly into thosecategories. Two examples are mobile telepresence systems using robotavatars (see for instance Paepcke et al. 2), and telemedicine systems
2 Andreas Paepcke et al. “Yelling in thehall: using sidetone to address a prob-lem with mobile remote presence sys-tems”. In: Proceedings of the 24th annualACM symposium on User interface softwareand technology. ACM. 2011, pp. 107–116
(see for instance Kyriacou et al. 3). 3 E.C. Kyriacou, C.S. Pattichis, and M.S.Pattichis. “An overview of recent healthcare support systems for eEmergencyand mHealth applications”. In: AnnualInternational Conference of the IEEE En-gineering in Medicine and Biology Society(EMBC 2009). IEEE. 2009, pp. 1246–1249
Nevertheless, with these three categories it is possible to definethe scope of the present text: The following sections will provide anoverview of the technical components of audio-only and audiovisual,single-device and small-size telemeeting systems.
3.2 Main Components
A multiparty telemeeting system connects multiple interlocutors,who are situated in at least two distant locations. The left panelof Figure 3.1 visualizes a situation for three interlocutors (IL1, IL2,IL3), in which every interlocutor is located in a different physicalenvironment and all are connected via the same telemeeting system.
Going into more details, the right panel of Figure 3.1 adds thethree main system components: the end device(s), the bridge (oftencalled conferencing bridge), and the network. The end devices trans-duce the sound and light waves into electrical signals and preparethem for digital transmission over the network and vice versa. Thebridge provides the multiparty functionality, i.e. it realizes for everyinterlocutor the mixing of the audio and video signals coming fromthe other interlocutors. The following sections describe those threecomponents in more detail, starting with a description of differentsystem topologies.
General situation System Main system components
Figure 3.1: Example setting of a three-party telemeeting and main componentsof the telemeeting system.

telemeeting technologies 53
3.3 Central-Bridge and Peer-to-Peer Topologies
Telemeeting systems can be categorized into two main topologies:central-bridge and peer-to-peer. The two topologies are characterizedby the location of the bridge, as visualized in Figure 3.2.
In a central-bridge topology, the telemeeting system uses onebridge which is located somewhere in the network. The end de-vices at the user side – henceforth referred to as client side – aresending the audiovisual data streams to that central bridge. Thebridge generates the mixed signals for every interlocutor and sendsthem to the corresponding end devices.
In a peer-to-peer topology, every client side has an own bridgewhich is directly connected or even integrated into the end device.Each bridge ensures that the own audiovisual data is sent to allinterlocutors and it processes (mixes) all incoming data streams forpresentation via the end device.
The disadvantage of a peer-to-peer topology is the extra com-putational load for client side devices due to the bridge and theextra network traffic load due to the multiple data streams. Here, acentral-bridge topology with dedicated servers has a clear advantage.However, operating central-bridge servers requires resources, whicheventually increase the service subscription costs for the users.
While these two topologies describe the two main types of tele-meeting architectures, hybrid solutions are also possible. Examplesare peer-to-peer systems in which one client bridge serves also as asub-bridge for further end devices that are not peer-to-peer-capable,or mixed systems in which the computational load is distributedbetween central and client-side bridges.
Central-Bridge topology Peer-To-Peer topology
Figure 3.2: Visualization of the two maintopologies for telemeeting systems.
3.4 End Devices
The variety of end devices used for audio and video capture at thesend-side and reproduction at the receive-side is vast. Devices can

54 quality of experience of multiparty conferencing and telemeeting systems
differ in terms of their form factors, the sound and video transductionprinciples, and the signal processing implemented in those devicesfor the purpose of signal enhancement.
3.4.1 End Devices for Audio
Form factor There are two general types of end devices: those whichcombine both sound capture and reproduction in one physical device,and those which require separate microphones and loudspeakers.Examples for the first type are telephones, mobile phones, tablets orlaptops with integrated microphones and loudspeakers. Examples forthe second type are computer-based setups that do not have integratedloudspeakers or microphones at all or only with an unsatisfactoryquality.
End devices of the first type can be further categorized into threegroups: handsets, headsets, hands-free terminals. Each of thosetypes has advantages and disadvantages in terms of comfort and thepossible signal quality. Typical comfort aspects comprise wearingcomfort (of handsets and headsets) and setup complexity (e.g. cableconnections, placement of devices).
Concerning the possible signal quality, the form factor influencesthe impact of the distance between mouth and microphone: thesmaller the distance, the lower the acoustic problems such as environ-mental noise, room reverberation and echo. If the form factor doesnot allow for small mouth-to-microphone distances, as it is the casefor modern mobile phones or hands-free terminals, then heavy signalenhancement (see below) is usually necessary.
It can be expected that different users have different preferencesfor either type, which may also depend on the actual situation. Toaccount for this, modern telephone devices often combine all threeform factors: they can be conventionally used as handsets, they areequipped with additional microphones and loudspeakers to enable ahandsfree mode, and they provide connectors for a suitable headset.
Concerning the second type of devices, those that require separatemicrophones and loudspeakers, the complexity of the technical setupin terms of cables and software installation may become a comfortissue. In addition, the available degree of freedom in placing themicrophones and loudspeakers can also impact signal quality.
In the context of the present research, the form factor plays a rolewhen it comes to the assessment of the Quality of Experience beyondthe assessment of pure signal quality. Referring to the book chapterby Reiter et al. 4, there are many influencing factors, and it is straight- 4 Ulrich Reiter et al. “Factors Influenc-
ing Quality of Experience”. In: Qualityof Experience - Advanced Concepts, Appli-cations, Methods. Ed. by Sebastian Möllerand Alexander Raake. Springer, 2014,pp. 55–72
forward to argue that the form factor belongs to such factors, given thediscussed implications for comfort and signal quality. Furthermore, incase of using headsets, the form factor also plays a practical role whenit comes to the technical setup of a laboratory experiment. If no echocancellation is desired or available, an acoustic feedback from theheadphones to the microphones needs to be avoided. Then headsetswith close-talking microphones and closed headsets are the preferred

telemeeting technologies 55
choice.
Transducer Types There are different principles to transduce soundwaves to electric signals (microphones) and vice versa (loudspeakers).In the context of the present research, the transduction principle playsa role, if the transducer needs electric power supply. This can becomea non-trivial issue when it comes to the technical setup of a laboratoryexperiment, in which different end devices shall be tested. As anexample, high-end studio sound cards, which are the preferred choiceto avoid any influence of the sound card, and consumer headsets areoften not compatible: Most electret microphones integrated in theconsumer market computer headsets require a small power supply of1 - 10 Volt 5, not for polarizing their membrane, but for an internal 5 Tomi Engdahl. Powering Microphones.
retrieved on: August 13, 2015. 2012. url:http://www.epanorama.net/circuits/
microphone_powering.html
preamplifier. While on-board laptop sound cards usually provide thisvoltage, high-end studio sound cards do not provide it as they arecompliant to other standards (+48 V phantom power for condensermicrophones).
Signal processing In most modern audio end devices different sig-nal processing algorithms are implemented for signal enhancementpurposes. Table 3.1 lists some of the most common processing al-gorithms including a short description of their main characteristics.To summarize this table, the algorithms presented here are mainlyconcerned with the enhancement of the microphone signals, and mostalgorithms apply highly non-linear, non-standardized or even undis-closed processing stages. In the context of the present research, suchsignal processing plays a role when it comes to the technical setupof laboratory experiments in which the lack of control can becomean issue, or when it comes to instrumental assessment of quality, inwhich the lack of standardization or available information on theprocessing can become an issue.

56 quality of experience of multiparty conferencing and telemeeting systems
AlgorithmPurpose Basic Idea Further Reading
Acoustic Echo Cancellation
Cancel echo caused by acousticfeedback from the loudspeaker tothe microphone.
Estimate the echo signal, which isthe loudspeaker signal, delayed andmodified by the electro-acoustic pathfrom loudspeaker to microphone,and subtract this from the micro-phone signal. Typical method: adap-tive filters.
Peter Vary and Rainer Martin. Digi-tal Speech Transmission – Enhancement,coding and Error Concealment. Chich-ester, West Sussex, UK: Wiley, 2006
Noise Reduction
Reduce unwanted environmentalnoise which interferes with the de-sired speech signal.
Estimate the noise components inthe microphone signal and subtractthem from the microphone signal.Typical method: spectral subtraction.The estimation of the noise compo-nents can be based on measuringthe noise floor during speech pausesor by employing additional micro-phones directed to another direction.
Peter Vary and Rainer Martin. Digi-tal Speech Transmission – Enhancement,coding and Error Concealment. Chich-ester, West Sussex, UK: Wiley, 2006
De-reverberation
Reduce reverberation in the micro-phone signal caused by acousticroom reflections.
Estimate the reverb components inthe microphone signal and substractthem from the microphone signal.There are various approaches, ex-ploiting one single or multiple micro-phone signals.
Patrick A. Naylor and Nikolay D.Gaubitch, eds. Speech Dereverberation.Berlin, Germany: Springer, 2010
Automatic Gain Control (Dynamic Range Control)
Adjust too low, too high or varyingspeech levels to a comfortable andunderstandable level.
Estimate the speech signal level,e.g. average over a limited amountof time, and adjust the signal gain tothe desired level.
Udo Zölzer. Digital Audio Signal Pro-cessing. 2nd ed. Chichester,West Sus-sex, UK: Wiley, 2006
Side Tone Generation
Simulate talker side tone, i.e. thenormal acoustic feedback pathfrom own mouth to own ear incase the acoustic interface is shield-ing one or both ears, such asfor handsets or closed headphones.In addition, simulate listener sidetone, i.e. the path for environmen-tal sound into that ear that isshielded by the device.
One approach is to filter the mi-crophone signal and add it to theloudspeaker signal. The filter re-sembles the frequency weighting ofthe acoustic paths (air and bone con-duction) from own mouth to ownear. Other approaches are realizedacoustically/mechanically by meansof specific mechanical handset de-signs.
Numerous Patents
Voice Activity Detection
Avoid transmission of unnecessarydata in time intervals in which thespeaker does not talk by sendingdata only in case of active speech.
Typical approaches estimate activespeech and speech pauses based onsignal levels, spectral shape and pe-riodicity of speech. More advancedapproaches extract per signal framea set of features and use statisti-cal / machine learning methods toclassify the frame as speech or non-speech.
Antti Vähätalo and Ingemar Jo-hansson. “Voice activity detectionfor GSM adaptive multi-rate codec”.In: Proceedings of IEEE Workshop onSpeech Coding. 1999, pp. 55–57
Javier Ramirez, Juan Manuel Görriz,and Josë Carlos Segura. “Voice Ac-tivity Detection - Fundamentals andSpeech Recognition System Robust-ness”. In: Robust Speech Recognitionand Understanding. Ed. by MichaelGrimm and Kristian Kroschel. In-Tech Education and Publishing, 2007
Artificial Bandwidth Extension
Increase sound experience forspeech transmitted at low band-width.
Artificially generate high frequencysound based on the input sound.Typical method: Copy (a modifiedversion of) the limited spectrum tohigher frequency range.
Peter Vary and Rainer Martin. Digi-tal Speech Transmission – Enhancement,coding and Error Concealment. Chich-ester, West Sussex, UK: Wiley, 2006
Beam-forming
Reduce unwanted environmentalnoise which interferes with the de-sired speech signal.
Estimate the location of activespeaker and then superimpose (de-lay, filter, & sum) multiple direc-tional microphone signals to in-crease the sound capturing sensitiv-ity coming from that direction.
Peter Vary and Rainer Martin. Digi-tal Speech Transmission – Enhancement,coding and Error Concealment. Chich-ester, West Sussex, UK: Wiley, 2006
Table 3.1: Overview of most commonaudio signal enhancement algorithmsused in end devices.

telemeeting technologies 57
3.4.2 End Devices for Video
Form factor Similar to audio devices, end devices for video have bothvideo capture and reproduction in one physical device (e.g. mobilephones, tablets, laptops) or they require separate cameras and displays(e.g. desktop-computer-based setups). Accordingly, similar comfortand placement aspects apply as in the audio case.
However, the most important form factor aspect for both types ofvideo devices is the issue of unnatural eye gaze, which is determinedby the distance between camera and display. Since users usually lookat the display and not directly into the camera, the other interlocutorsget the impression that the user is looking somewhere else. Whilethere is a lot of literature on the issue of eye gaze, Grayson and Monk 6 6 David M. Grayson and Adrew F.
Monk. “Are You Looking at Me?Eye Contact and Desktop Video Con-ferencing”. In: ACM Transactions onComputer-Human Interaction 10.3 (Sept.2003), pp. 221–243
argue that users are able to learn to interpret if the interlocutor islooking at him or her. However, the data of Grayson and Monk alsoshow that this has some limitations, especially in case of horizontaldisparity of camera and display. Concerning the form factor discussedhere, this means that if the distance between camera and display is toostrong, then eye gaze becomes an issue despite this learning ability ofusers, and thus Quality of Experience can be affected.
Signal processing In most modern video end devices signal process-ing algorithms are implemented for signal enhancement purposes.Table 3.2 lists some of the most common processing algorithms in-cluding a short description of their main characteristics.
To summarize this table, the algorithms presented here are mainlyconcerned with the enhancement of the camera signals and optimiz-ing them for coding, either by directly processing the signals or bycontrolling the camera. In the context of the present research, suchsignal processing plays a role when it comes to the technical setup oflaboratory experiments in cases in which the signal enhancement cannot be controlled as desired.

58 quality of experience of multiparty conferencing and telemeeting systems
AlgorithmPurpose Basic Idea Further Reading
Auto FocusAutomatically adjust the camerafocus to obtain sharp pictures.
Iteratively change the camera focus and estimate the picture’ssharpness until that sharpness is maximized. Typical methodsfor estimating sharpness: contrast detection or phase detec-tion.
Junichi Nakamura, ed. Image Sensorsand Signal Processing for Digital StillCameras. Boca Raton, Florida, USA:Taylor & Francis Group, 2006
Auto ExposureAutomatically adjust the cameraexposure (aperture and shutter)time to let a proper amount of inci-dent light falling onto the sensor.
Measure the amount of light falling onto the light sensor, doneusually just before taking the real picture, and calculate the de-sired exposure time to allow an optimal usage of the camera’sdynamic range.
Junichi Nakamura, ed. Image Sensorsand Signal Processing for Digital StillCameras. Boca Raton, Florida, USA:Taylor & Francis Group, 2006
Auto White BalanceProvide the camera with a refer-ence point for white to accountfor the fact that the human visionsystem adapts this white point de-pending on the context/scene.
Estimate from the picture the white point and then transformthe RGB color data accordingly. Typical method for estimation:Combination of average of the scene (assumed to be middlegray), brightest color (asumed to be white), and color gamutof the scene (based on distribution of colors in the scene). Typ-ical methods for adaptation: chromatic adaptation, color colorconstancy.
Junichi Nakamura, ed. Image Sensorsand Signal Processing for Digital StillCameras. Boca Raton, Florida, USA:Taylor & Francis Group, 2006
Automatic Gain ControlImprove the picture’s contrast bymodifying the pixel intensities.
Compute the pixel intensity histogram of the image and ap-ply a transformation to achieve a desired histogram. Typicalmethods: full-scale histogram stretch / contrast stretch
Al Bovik, ed. The Essential Guide toImage Processing. London, UK: Else-vier Inc., 2009
Noise ReductionReduce unwanted noise in the pic-ture caused by the electronic com-ponents, often triggered by lowlight conditions.
Apply linear or non-linear processing to smooth the effect ofnoisy pixels. Typical methods: linear filters (e.g. moving aver-age, lowpass, gaussian, multiscale approaches), non-linear fil-ters (e.g. weighted median smoothers), processing combinedwith dedicated edge detection algorithms.
Al Bovik, ed. The Essential Guide toImage Processing. London, UK: Else-vier Inc., 2009
Image StabilizerRemove motion blur caused by un-wanted camera movements.
Use mechanical or optical stabilization (e.g. using floating lenscontrolled by gyroscopic sensors), or apply digital signal pro-cessing comprising the two main steps Motion Estimation andMotion Compensation.
Mohammad Javad Tanakian, MehdiRezaei, and Farahnaz Mohanna.“Digital Video Stabilization Systemby Adaptive Fuzzy Kalman Filter-ing”. In: Information Systems andTelecommunication 1.4 (Oct. 2013),pp. 223–232
Paresh Rawat and Jyoti Singhai.“Review of Motion Estimation andVideo Stabilization techniques Forhand held mobile video”. In: Sig-nal and Image Processing : An Interna-tional Journal (SIPIJ) 2.2 (June 2011),pp. 159–168
Color Space Transformation and Chroma SubsamplingOptimize color representation forefficient coding by exploiting thatthe human visual system is lesssensitive to color than to lumi-nance.
Transform the incoming RGB data into another color space sep-arating the luminance component from the chroma (i.e. colordifference) components, and then store the chroma compo-nents with a lower number of bits. Typical method: Computa-tion according to ITU-R Recommendation BT.601.
Iain E. G. Richardson. H.264 andMPEG-4 Video Compression – VideoCoding for Next-generation Multimedia.Chichester, West Sussex, UK: Wiley,2003
ITU-R. Recommendation BT.601-7 -Studio encoding parameters of digitaltelevision for standard 4:3 and widescreen 16:9 aspect ratios. Interna-tional Standard. Geneva, Switzer-land: International Telecommunica-tion Union, 2011
De-blocking and De-ringing filterReduce the impact of some typicialcoding artefacts, i.e. pixel blocksand edge distortions (ringing).
Apply linear or non-linear filters to smooth the effect of block-ing and ringing, which can be put as post-processor after thedecoder or inside the encoding and decoding scheme. Exam-ple methods: Computation according to MPEG4-2 Visual (for-merly ISO/IEC14496-2) or ITU-R Recommendation H.264
Iain E. G. Richardson. H.264 andMPEG-4 Video Compression – VideoCoding for Next-generation Multimedia.Chichester, West Sussex, UK: Wiley,2003
ISO/IEC. ISO/IEC 14496-2:2004 - In-formation technology – Coding of audio-visual objects – Part 2: Visual. Inter-national Standard. International Or-ganization for Standardization & In-ternational Electrotechnical Commis-sion, 2004
ITU-T. Recommendation H.264 - Ad-vanced video coding for generic audiovi-sual services. International Standard.Geneva, Switzerland: InternationalTelecommunication Union, 2014
Table 3.2: Overview of most commonvideo signal enhancement algorithmsused in end devices.
telemeeting technologies 59
3.5 Transmission over the Network
The principle process of transmission over an IP-based network is toencode and packetize the captured and enhanced audio and videosignals at the send side (usually done in the end device), to send thedata packets over the network, and to depacketize and decode thedata streams at the receive side in order to obtain the audio and videosignals for reproduction.
3.5.1 Codecs
The purpose of the audio and video codecs is to reduce the amount ofdata, i.e. number of bits, that are needed for transmission. There is avast amount of codecs for speech, general audio and video available;descriptions of the most relevant codecs for telemeetings can be foundin the G- and H-Series of the ITU-T 7 and MPEG1 and MPEG4 of the
7 ITU-T. ITU-T Recommendations by se-ries. retrieved on August 19, 2015. In-ternational Telecommunication Union.2015. url: http://www.itu.int/ITU-
T/recommendations/index.aspx
Moving Pictures Experts Group 8.
8 Moving Pictures Expert Group.MPEG Standards. retrieved on Au-gust 19, 2015. International Organiza-tion for Standardization & InternationalElectrotechnical Commission (ISO/IEC).2013. url: http://mpeg.chiariglione.org/standards
This section text will focus on the most relevant codecs for thepresent research context of telemeeting quality, and refers to Raake 9,
9 Alexander Raake. Speech Quality ofVoIP – Assessment and Prediction. Chich-ester, West Sussex, UK: Wiley, 2006
Wältermann 10, Belmudez 11 and Garcia 12 for further reading on
10 Marcel Wältermann. Dimension-basedQuality Modelling of Transmitted Speech.Springer, 2013
11 Benjamin Belmudez. Assessmentand Prediction of Audiovisual Quality forVideotelephony. Springer, 2009
12 Marie-Neige Garcia. ParametricPacket-based Audiovisual Quality model forIPTV services. Springer, 2014
existing codecs in the context of quality assessment for IP-basedsolutions, and to Chu 13, Vary and Martin 14, Richardson 15, and
13 Wai C. Chu. Speech Coding Algorithms- Foundation and Evolution of StandardizedCoders. Hoboken, New Jersey, USA: Wi-ley, 2014
14 Peter Vary and Rainer Martin. DigitalSpeech Transmission – Enhancement, cod-ing and Error Concealment. Chichester,West Sussex, UK: Wiley, 2006
15 Iain E. G. Richardson. H.264 andMPEG-4 Video Compression – Video Cod-ing for Next-generation Multimedia. Chich-ester, West Sussex, UK: Wiley, 2003
Hanzo et al. 16 for further reading on the technologies.
16 Lajos Hanzo, Peter J. Cherriman, andJürgen Streit. Video Compression and Com-munications – From Basics to H.261, H.263,H.264, MPEG4 for DVB and HSDPA-StyleAdaptive Turbo-Transceivers. Chichester,West Sussex, UK: Wiley, 2007
Speech Codecs The basic principle of speech codecs is to exploit char-acteristics of the speech signal or human speech production process.Conceptually, this aspect separates speech codecs from the codecs formusic and general audio, such as MPEG-1 Layer 3 (mp3) 17 or Ad-
17 ISO/IEC. ISO/IEC 11172-3:1993 - In-formation technology – Coding of movingpictures and associated audio for digital stor-age media at up to about 1.5 Mbit/s – Part3: Audio. International Standard. In-ternational Organization for Standard-ization & International ElectrotechnicalCommission, 1993
ISO/IEC. ISO/IEC 13818-7:1995 - In-formation technology – Generic coding ofmoving pictures and associated audio infor-mation – Part 3: Audio. InternationalStandard. International Organizationfor Standardization & International Elec-trotechnical Commission, 1995
vanced Audio Coding (AAC) 18, which in turn exploit characteristics
18 ISO/IEC. ISO/IEC 13818-7:2006 - In-formation technology – Generic coding ofmoving pictures and associated audio infor-mation – Part 7: Advanced Audio Coding(AAC). International Standard. Interna-tional Organization for Standardization& International Electrotechnical Com-mission, 2006
of the human auditory system. Since music transmission is out ofscope, the present text focuses on a brief introduction to the principlesused in speech codecs.
The simplest approach used for speech coding is to optimize thequantization steps according to the non-uniform amplitude histogramof the speech signal, which is done for example by the ITU-T G.711
codec 19.
19 ITU-T. Recommendation G.711 - PulseCode Modulation (PCM) of voice frequen-cies. International Standard. Geneva,Switzerland: International Telecommu-nication Union, 1988
More advanced approaches apply the technique of linear predic-tion, which is used in three categories of speech codecs: waveformcodecs, parametric codecs, and hybrid codecs. Common to all threetypes is to represent at encoder side each input speech sample as alinear combination of its past samples plus a residual part. Technicallythis leads to the computation of a set of filter coefficients representingthe linear weighting, and the construction of a residual signal. Thendata reduction is possible by exploiting the reduced dynamic rangeof the residual signal, as this is essentially a difference signal whichhas much lower amplitudes than the original speech signal.
For the first category, the waveform codecs, the processing stepscomprise at encoder side the computation of the residual signal basedon linear prediction and its quantization, on the channel the trans-

60 quality of experience of multiparty conferencing and telemeeting systems
mission of the quantized residual signal, and at decoder side thereconstruction of the output signal from the residual signal againby linear prediction. The predominant waveform codec is adaptivedifferential pulse code modulation (ADPCM) which computes asthe residual signal the simple difference between two consecutivesamples and applies adaptive, i.e. signal-dependent, quantizationof that signal. Common codecs using ADPCM are the ITU-T G.726
codec 20, which is typically applied in DECT (Digital Enhance Cord- 20 ITU-T. Recommendation G.726 - 40,32, 24, 16 kbit/s Adaptive Differential PulseCode Modulation (ADPCM). InternationalStandard. Geneva, Switzerland: Interna-tional Telecommunication Union, 1990
less Telecommunications) telephones, and the ITU-T G.72221, which
21 ITU-T. Recommendation G.722 - 7kHz audio-coding within 64 kbit/s. Inter-national Standard. Geneva, Switzerland:International Telecommunication Union,2012
is typically applied in Voice-over-IP (VoIP) telephony.For the second category, the parametric codecs, the input signal is
completely replaced by a parametric representation. For this purpose,the source-filter-model of human speech production is exploited: asource/excitation signal is produced by the human glottis and thenfiltered by the human vocal tract. There are different technical im-plementations possible 22, such as channel vocoders and the LCP
22 Peter Vary and Rainer Martin. DigitalSpeech Transmission – Enhancement, cod-ing and Error Concealment. Chichester,West Sussex, UK: Wiley, 2006
vocoder. Focussing on the LPC vocoder, the encoder first applieslinear prediction to model the vocal tract, which is parameterized bythe set of the computed filter coefficients. Then the encoder extractsa parametric description of the residual signal, which represents theexcitation signal, by detecting whether the current input signal is avoiced or unvoiced signal, and estimates gain factors as well as forthe voiced signal the pitch period. With this approach, only the pa-rameters (LP filter coefficients, excitation parameters) are transmitted.At the decoder side, the excitation signal is first constructed usingnoise for unvoiced or pulse trains for voiced signal frames, which isthen fed into a linear prediction stage to construct the output signal.
For the third category, the hybrid codecs, combine both principlesby transmitting linear prediction coefficients as side information aswell as the residual signal. Of the many possible variants, one im-portant approach is to replace the residual signal by a sequence ofpreset signals taken from a code book (referred to as CELP: code-excited linear prediction), whereas this replacement is based on asearch procedure finding those code book entries that minimize theperceptual error of the synthesized signal (therefore also referred toas Analysis-by-Synthesis coding). A common codec using CELP isthe ITU-T G.729 codec 23, which is applied in VoIP telephony.
23 ITU-T. Recommendation G.729 - Cod-ing of speech at 8 kbit/s using conjugate-structure algebraic-code-excited linear pre-diction (CS-ACELP). International Stan-dard. Geneva, Switzerland: Interna-tional Telecommunication Union, 2012
Another very relevant codec for VoIP telephony is SILK 24, which
24 Koen Vos, Søren Skak Jensen, andKarsten Vandborg Sørensen. SILK speechcodec. International Standard. Inter-net Engineering Task Force (IETF), 2010.url: https://tools.ietf.org/id/
draft-vos-silk-02.txtis also based on the CELP approach, but extended with a numberof optimizations such as, for example, a noise shaping algorithm tominimize the audibility of the quantization noise. One of the keyfeatures of SILK is to provide speech transmission at different audiosignal bandwidth, ranging from narrowband (NB: 300 Hz - 3400 Hz)to superwideband (SWB: 20 Hz - 12 kHz). A successor of SILK isOPUS 25, which is extended with an additional coding scheme 26 that
25 Koen Vos et al. “Voice Coding withOPUS”. in: Proceedings of the 135th AESConvention. New York, USA, Oct. 2013
26 Jean-Marc Vallin et al. “High-Quality,Low-Delay Music Coding in the OPUSCodec”. In: Proceedings of the 135th AESConvention. New York, USA, Oct. 2013is more suited for music and general audio signals.
Another variation of the CELP approach is ACELP, algebraiccode-excited linear prediction, which extends CELP with a patentedmethod 27 to optimize the code book structure. Common codecs
27 Claude Lamblin. “Algebraic code-excited linear prediction speech cod-ing method”. Pat. US 5717825 A (US).France Telecom. Feb. 10, 1995

telemeeting technologies 61
using ACELP are 3GPP’s AMR 28 (Adaptive Multi Rate) and ITU 283GPP. TS 26.071 version 12.0.0 Re-
lease 12 - Mandatory speech CODEC speechprocessing functions; AMR speech CODEC,General description. Standard. SophiaAntipolis Cedex, France: 3rd GenerationPartnership Project, 2014
G.722.2 29 (AMR - Wideband), both the defacto standard codecs for
29 ITU-T. Recommendation G.722.2 -Wideband coding of speech at around 16kbit/s using Adaptive Multi-Rate Wide-band (AMR-WB). International Stan-dard. Geneva, Switzerland: Interna-tional Telecommunication Union, 2003
mobile telephony.
Video Codecs The basic principle of video codecs is to exploit thespatial similarity within frames and temporal similarity betweenframes. Spatial similarity refers to the observation that in a singlevideo frame, a still picture, neighboring pixels are rather similar aslong as there is no sudden transition between two areas in the picture,such as a sharp edge of an object. Temporal similarity refers to theobservation that in a sequence of video frames, the pictures as suchare rather similar as long as there is no sudden change of the picture,such as a sharp scene cut. Bearing this in mind, the most commonvideo codecs, MPEG2
30, ITU-T H.26331, ITU-T H.264
32 and ITU-T 30 ISO/IEC. ISO/IEC 13818-7:1995 - In-formation technology – Generic coding ofmoving pictures and associated audio in-formation – Part 2: Video. InternationalStandard. International Organizationfor Standardization & International Elec-trotechnical Commission, 2013
31 ITU-T. Recommendation H.263 - Videocoding for low bit rate ccommunication. In-ternational Standard. Geneva, Switzer-land: International TelecommunicationUnion, 2005
32 ITU-T. Recommendation H.264 - Ad-vanced video coding for generic audiovisualservices. International Standard. Geneva,Switzerland: International Telecommu-nication Union, 2014
H.26533, apply both strategies by assigning a sequence of video
33 ITU-T. Recommendation H.265 - Highefficiency video coding. International Stan-dard. Geneva, Switzerland: Interna-tional Telecommunication Union, 2015
frames (also called Group-Of-Pictures) to four categories: I-frames forintra-frame coding, and P-, reference B-, and non-reference B-framesfor inter-frame coding.
In intra-frame coding, the I-frame picture is first split into so-called macroblocks of pixels, typically 16x16, 8x8 or 4x4 pixels. Thentwo processes are applied, spatial prediction and transform coding,whereas the order of those two may depend on the actual codec 34.
34 Thomas Wiegand et al. “Overviewof the H.264/AVC Video Coding Stan-dard”. In: IEEE Transactions On CircuitsAnd Systems For Video Technology 7 (July2003), pp. 560–576
For H.264, first the spatial prediction is applied, which means thateach macroblock is represented as a combination of neighboringmacroblocks and a residual, i.e. the difference of the real and thepredicted macroblock. Since the overall codec applies lossy coding,i.e. quantization of the residual signal, error propagation problemsmay occur if the prediction is based on the original input signal andnot on the quantized signal. For this reason, the encoder incorporatesalso a decoder, whose output is then used for the prediction. Thenext stage in H.264 is then transform coding by means of a separableinteger transform. With similar properties as the Discrete CosineTransform, this transform computes per residual macroblock a blockof coefficients that represent spatial frequencies. For typical videosignals, this leads to a better energy compaction towards lower spatialfrequencies, i.e. less energy in high spatial frequencies. This enables ahigher quantization efficiency by treating different spatial frequencieswith different quantization steps.
In inter-frame coding, the P-frames are predicted from the previousI-frame, and the reference B-frames are predicted from the previousand next I- or P-frames, and the non-reference B-frames are predictedfrom the previous and next I-, P- or reference B-frame. The principleis essentially the same for both unidirectional (P-frames) and bidirec-tional (B-frames) prediction: The codec computes a prediction of eachmacroblock from other frames, thus it essentially applies a tempo-ral prediction and not a spatial prediction as in intra-frame coding.Then the prediction residual is encoded using transform coding. Thistemporal prediction is realized in two steps. First, the codec searchesfor the most similar macroblocks between the current frame (P-, B-

62 quality of experience of multiparty conferencing and telemeeting systems
frame) and the one serving as reference (I-, P- or reference B-frame).Second, the codec computes so-called motion vectors, which describethe displacement between the identified pairs of macroblocks. Atthe decoder side, the frames are then restored by reconstructing theprediction and correcting that prediction by decoding the residualmacroblocks.
In ITU-T H.264, this principle of different frame types and mac-roblocks is further extended by introducing slices: instead of applyingthe intra- and intercoding strategies on whole frames, i.e. whole videopictures, H.264 allows to apply these two strategies on parts of thepicture, the slices.
3.5.2 Packetization and Transmission
In recent years, the traditional Public Switched Telephony Network(PSTN) is more and more replaced by packet-based transmissiontechniques, which are in turn predominantly built upon the InternetProtocol (IP). For that reason, the present paragraph limits to a briefdescription of the IP-based mechanisms that are used for audio-onlyand audiovisual communication.
The basic approach is to use the mechanisms of the InternetModel 35, also referred to the TCP/IP model, which is similar to
35 R. Braden. Requirements for InternetHosts – Communication Layers. Interna-tional Standard. Internet EngineeringTask Force (IETF), 1989. url: https :
//tools.ietf.org/rfc/rfc1122.txt
the Open Systems Interconnection (OSI) reference model 36. The Inter-
36 ISO/IEC. ISO/IEC 7498-1:1994 - In-formation technology – Open Systems In-terconnection – Basic Reference Model: TheBasic Model. International Standard. In-ternational Organization for Standard-ization & International ElectrotechnicalCommission, 1994net model defines a set of four different layers; the OSI model defines
seven layers. Each layer in either model takes care of one specificaspect of the data transmission by building on the services providedby the next lower layer and by hiding the details of the current func-tionality from the next higher layer. This encapsulation of hierarchicallayers allows an essentially unlimited flexibility with respect to the ac-tual transmission technologies, given that the communication betweenlayers is well defined by protocols.
According to this model, the transmission of data from sender toreceiver is a process of going down the layers at the send side, usingthe lowest layer to access the actual transmission medium, and goingup the layers at receive side. For IP-based audiovisual transmissionusing the Internet model, this process is described in Figure 3.3.

telemeeting technologies 63
Step Where Layer Action
1 Send side Application The output of the audio and video encoders is put into RTP packets (Real-Time TransportProtocol). Each RTP packet consists of the payload, i.e. the encoded signal frames, anda header. The header contains the information that is required for proper decoding andplayback at the receive side: a timestamp, a sequence number, and the payload type (e.g. typeof used codec).
2 Transport The RTP packet is inserted as the payload of UDP packets (User Datagram Protocol). Theheader of each UDP packet contains information about the sending and receiving application,such as source port number and destination port number.
3 Internet The UDP packet is inserted as payload of an IP packet (Internet Protocol). The header ofeach IP packet contains the information that is required for the packet routing, such as sourceaddress and destination address.
4 Link The IP packet is inserted into a packet defined by the link layer protocol, e.g. Ethernet orWLAN/WiFi, which controls the media access of the current physical link.
5 Connection Link The packet is sent over the physical medium to the receiver.
6 - 9 Receive side Link toApplication
In each level, the payloads are extracted from the packets and given to the next higher levels.
Figure 3.3: Outline of the IP-based pack-etization and transport process for anaudio-only or audiovisual communica-tion link.

64 quality of experience of multiparty conferencing and telemeeting systems
3.5.3 Buffering and Packet Error Handling
One key characteristic of IP-based transmission over the network isthat packets are transported independently from each other. Thismeans that individual packets from the same sender to the samereceiver can actually take different routes through the network. There-fore, packets can reach the receiver with different transmission delays,which is referred to as jitter, and they can even arrive out of order.For that reason, a jitter buffer is installed in the receiver, which isholding packets for some constant or adaptive time in order to sortthem back in the right order and to play them out in equidistant timeintervals. The leads to additional transmission delay. Typical networktransmission delays are, according to Thomsen and Jani 37, in the 37 G. Thomsen and Y. Jani. “Internet
telephony: Going like crazy”. In: IEEESpectrum 37.5 (2000), pp. 52–58
order of 50 - 200 ms.There are three different problems possible that eventually lead to
the same error: packet loss. First, when network congestion occurs,i.e. too many data packets shall be send over a network link, thecorresponding network router needs to drop packets. Second, ifpackets arrive the receiver at a later moment in time than the jitterbuffer length allows for, they are dropped by the receiver. Third, ifpackets are corrupted, then they are also dropped, whereas correctedpackets are usually detected by verifying whether checksums storedin the media access protocol header (e.g. Ethernet), the IP header andthe UDP header correspond to the actual header or payload sizes.
In order to deal with lost packets, there are two different op-tions: sender-based and receiver-based loss recovery. Sender-basedtechniques such as Forward Error Correction (FEC) or Low-BitrateRedundancy (LBR) send redundant duplicates of packets (FEC) orredundant versions which were encoded at a lower bitrate (LBR) overthe network. Those techniques allow to restore the lost data to acertain amount, depending on the amount of redundant data sent,but they also lead to a further increase of network traffic and delay.
Receiver-based techniques, referred to as Packet Loss Concealment,attempt to restore the missing signal parts at receiver side. Variousapproaches are possible, ranging from zero or noise insertion, overrepetition of the previous frame, to more advanced methods usingtime stretching or interpolation.
A typical strategy is to use a combination of both options, that issender-based techniques are applied in any case, and if they fail, thereceiver-based techniques will further minimize the effects. For moredetails the present text refers to Perkins et al. 38, Korhonen 39 and
38 C. Perkins, O. Hodson, and V. Hard-man. “A survey of packet loss recov-ery techniques for streaming audio”.In: IEEE Network Magazine 11.5 (1998),pp. 40–48
39 Jari Korhonen. “New methods forrobust audio streaming in a wireless en-vironment”. PhD Thesis. Tampere Uni-versity of Technology, Finnland, 2006
Raake 40, focusing on audio transmission, and Garcia 41 addressing
40 Alexander Raake. Speech Quality ofVoIP – Assessment and Prediction. Chich-ester, West Sussex, UK: Wiley, 2006
41 Marie-Neige Garcia. ParametricPacket-based Audiovisual Quality model forIPTV services. Springer, 2014
also video transmission.
3.5.4 Audio-Video Synchronization
Since the audio and video data is encoded and decoded in separatecodecs, measures need to be taken to synchronize both signal streams.There are two options for this and both can be found in real-lifeapplications.

telemeeting technologies 65
The first option is to insert a multiplexer between the encoderoutputs and the packetizer, which puts encoded audio and videoframes that belong to the same period of time into one RTP packet.At receiver side, a de-multiplexer separates again the audio and videodata and sends it to the corresponding decoder. The advantage is thatboth streams are automatically synchronized, as both arrive with thesame data packet; the disadvantage is that if this packet is lost, bothaudio and video channels are degraded.
The second option is to put the audio and video data into sepa-rate RTP packets, and then use in the receive-side jitter buffer thetimestamp and sequence number information of the RTP header tosynchronize the arriving audio and video packets. The advantageis that if one packet is lost, only one of the two modalities, audio orvideo, is affected; the disadvantage is that more processing is requiredin the recevier.
3.6 Bridges
The purpose of a conference bridge is to establish the connectionsbetween the multiple interlocutors, which means, to mix and transferthe audio and video signals in an appropriate manner. There arevarious possibilities that allow to optimally implement the bridgefor the specific scenario, ranging from central-bridges on dedicatedservers to client-side bridges on the end devices. This section givesa brief overview of typical approaches that can be found in existingsystems.
Audio Signal Mixing on Central Bridges The most straight-forwardapproach is to decode all transmitted audio signals and to generatefor every interlocutor an individual mix excluding the own inputsignal, which is necessary to avoid audible echo. A convenient wayto implement this is a matrix computation as shown in Table 3.3.
IN1 IN2 · · · INN
OUT1 0 1 · · · 1
OUT2 1 0 · · · 1...
......
. . ....
OUTN 1 1 · · · 0
Table 3.3: Mixing matrix for audio con-ferencing bridge: basic approach.
This implementation, however, does not scale well with an increas-ing number of interlocutors N. The number of required operations,i.e. the number of matrix elements, is N2, or N2 − N when excludingthe zero-elements on the diagonal.
For that reason, the audio mixing is usually implemented dif-ferently; two typical improvements are presented here. The firstimprovement, see for example Singh and Schulzrinne 42, is to first 42 Kundan Singh, Gautam Nair, and
Henning Schulzrinne. “Centralized con-ferencing using SIP”. in: Internet Tele-phony Workshop. Vol. 7. 2001, pp. 57–63
generate a submix of all input streams, and then to subtract for each

66 quality of experience of multiparty conferencing and telemeeting systems
output from this mix the corresponding input. This leads to a matrixas shown in Table 3.4.
IN1 IN2 · · · INN IN1 + · · ·+ INN
OUT1 −1 0 · · · 0 1
OUT2 0 −1 · · · 0 1...
......
. . .... 1
OUTN 0 0 · · · −1 1
Table 3.4: Mixing matrix for audio con-ferencing bridge: advanced approachusing a submix and subtraction.
With the expense of computing a submix containing all inputs (Noperations) and inserting this as an additional input to the mixer,and with the number of non-zero matrix entries being now 2 · N, theoverall number of operations is now 3 · N instead of N2 − N, whichleads to reduced computation already for N = 5.
Another optimization, see for example Firestone et al. 43, is to use 43 Scott Firestone, Thiya Ramalingam,and Steve Fry. Voice and Video Conferenc-ing Fundamentals. Cisco Press, 2007
voice activity detection (VAD) on each input channel, and allow onlythe active speech signals in the mix. This can be further restricted toallow only the x loudest speech signals. This leads to a matrix shownin Table 3.5, assuming that the first x inputs are the ones chosen bythe VAD mechanism.
IN1 IN2 · · · INx INx+1 · · · INN
OUT1 0 1 · · · 1 0 · · · 0
OUT2 1 0 · · · 1 0 · · · 0...
......
. . ....
... · · · 0
OUTx 1 1 · · · 0 0 · · · 0
OUTx+1 1 1 · · · 1 0 · · · 0...
......
. . .... 0 · · · 0
OUTN 1 1 · · · 1 0 · · · 0
Table 3.5: Mixing matrix for audio con-ferencing bridge: advanced approachusing voice activity detection.
With the expense of having VAD in the signal paths, now thenumber of operations is down to x2 − x + (N − x) · x, or even x2 −x + 1 · x if one considers that the channels OUTx+1 to OUTN haveexactly the same signal. Furthermore, if VAD is implemented inthe end devices, the extra computation for VAD on the bridge inputcan be omitted for those end devices, which further reduces thecomputational requirements for the bridge. Another advantage ofthis approach is to improve the signal-to-noise ratio as this avoidsan unnecessary accumulation of any background noise from all non-relevant channels.
Finally, both improvements can be combined, leading to a matrixshown in Table 3.6, with 3 · x + 1 operations for the matrix and thesubmix, including the optimization that channels OUTx+1 to OUTN
contain the same signal.

telemeeting technologies 67
IN1 IN2 · · · INx INx+1 · · · INN IN1 + · · ·+ INx
OUT1 −1 0 · · · 0 0 · · · 0 1
OUT2 0 −1 · · · 0 0 · · · 0 1
......
.... . .
...... · · · 0 1
OUTx 0 0 · · · −1 0 · · · 0 1
OUTx+1 0 0 · · · 0 0 · · · 0 1
......
.... . .
... 0 · · · 0 1
OUTN 0 0 · · · 0 0 · · · 0 1
Table 3.6: Mixing matrix for audio con-ferencing bridge: advanced approachusing both submix with subtraction andvoice activity detection.
Audio Signal Mixing for Peer-to-Peer Topologies In case of a straight-forward peer-to-peer system, each client side receives the incomingstreams from the other interlocutors, decodes those streams and gener-ates an own mix of the audio signals. That means, the computationalload for a central-bridge is distributed among the clients, i.e. thematrices in Tables 3.3 and 3.5 are reduced to single rows, while theapproaches using submix and subtraction (Tables 3.4 and 3.6) are notmeaningful.
Audio Packet-Stream Mixing With the packet-based transmission con-sidered in this text, the above described audio signal mixing ap-proaches require to decode all incoming audio packets and, in case ofcentral-bridges, also the re-encoding of the mixed signals. There area number of approaches that aim at avoiding unnecessary decodingand re-encoding, which are subsumed here under the term audiopacket-stream mixing.
The first approach is applicable for the ITU-T G.711 codec, whoseencoded data essentially reflects a compressed version of the signal.The idea is to avoid the decoding, i.e. the decompression, by integrat-ing corresponding level-dependent gain factors into the bridge anddo operations in the bitstream domain, see for instance Singh andSchulzrinne 44.
44 Kundan Singh, Gautam Nair, andHenning Schulzrinne. “Centralized con-ferencing using SIP”. in: Internet Tele-phony Workshop. Vol. 7. 2001, pp. 57–63
The next approach is to exploit VAD-based transmission from theend device, i.e. only packets with active streams are transmitted,which is for instance implemented in the AMR 45 and ITU-T G.729
453GPP. TS 26.071 version 12.0.0 Re-
lease 12 - Mandatory speech CODEC speechprocessing functions; AMR speech CODEC,General description. Standard. SophiaAntipolis Cedex, France: 3rd GenerationPartnership Project, 2014
Annex B 46 codecs. Here the number of channels that need to be de-
46 ITU-T. Recommendation G.729 - Cod-ing of speech at 8 kbit/s using conjugate-structure algebraic-code-excited linear pre-diction (CS-ACELP). International Stan-dard. Geneva, Switzerland: Interna-tional Telecommunication Union, 2012
coded is automatically limited to the number of actually transmittingdevices.
If VAD-based transmission is not supported by the end devices,then all input channels require decoding. However, proposals exist toestimate the signal energy in incoming packets without fully decodingthe data 47, which, however, is only possible if the coding principle
47 Dror Nahumi. “Conferencing ar-rangement for compressed informationsignals”. Pat. US 5390177 A (US). At&TCorp. Feb. 14, 1993
allows such “partial decoding” 48.
48 Paxton J. Smith, Peter Kabal, andRafi Rabipour. “Speaker Selectionfor Tandem-Free Operation VoIP Con-ference Bridges”. In: Proceedings ofIEEE Workshop on Speech Coding. IEEE.Tsukuba, Japan, Oct. 2002, pp. 120–122
Another related approach using VAD is to apply “speaker selectionand forward” schemes, see for instance Smith et al. 49. Such methods 49 Paxton J. Smith et al. “Tandem-free
VoIP conferencing: A bridge to next-generation networks”. In: IEEE Commu-nications Magazine 41.5 (2003), pp. 136–145
use a mixture of directly forwarding individual streams in single-talkstates (only one speaker is talking) and generating mixes only in multi-

68 quality of experience of multiparty conferencing and telemeeting systems
talk states (multiple speakers are talking). In case the end devicescan perform the decoding and mixing of multiple incoming streams,the central-bridge only takes care of selecting the required streamsand leaves decoding and mixing to the end device. Obviously, suchapproaches reflect hybrid versions of central-bridge and peer-to-peertechnology.
Video Mixing The most straight-forward approach is to decode allincoming video streams and to generate a new video stream in whichthe pictures from all interlocutors are visible, also called ContinuousPresence Conferences 50. There are various layouts possible to arrange 50 Scott Firestone, Thiya Ramalingam,
and Steve Fry. Voice and Video Conferenc-ing Fundamentals. Cisco Press, 2007
the individual video pictures, such as all are shown in equally sizedframes, or the active speaker is shown in a larger frame, or the ownpicture is separated and presented smaller, and so forth.
In contrast to the audio domain, in which echo needs to be avoided,it is not necessary per se to remove the own video stream from thisnew compiled video. This simplifies matters at first glance, sinceno individual video mixes per interlocutor are necessary. However,actually a mirrored version of the own picture should be presented,in order to show any own movements in those directions that one isused to from a real mirror. This, in turn, requires the generation ofindividual video mixes per interlocutor. Furthermore, more advancedvideo conferencing systems allow the users to select an own layout,which again requires individual video mixes.
There are a number of possibilities to reduce the computationalload that video mixing requires. A few are presented here, acknowl-edging that this list is non-exhaustive. The first approach concerns thepresentation of the own picture. Instead of having a central-bridgeinserting the own picture into the video mix, the (mirrored versionof the) own picture may be directly played back on the end devicewithout any encoding or transmission. While this does not reduce thenumber of required video mixes, it reduces the number of picturesthat need to be mixed per interlocutor on the central-bridge.
The next approach is to exchange the Continuous Presence paradigm(all interlocutors are visible) with a Voice-Activated Switched videomode 51. The idea is to use VAD that determines the current speaker, 51 Scott Firestone, Thiya Ramalingam,
and Steve Fry. Voice and Video Conferenc-ing Fundamentals. Cisco Press, 2007
and the system is only showing the video stream of that active speaker.While this greatly reduces the computational load down to one videostream in total, this has some strong impact on the audiovisual com-munication experience: it does not show the whole group, so one cannot see for instance the non-verbal feedback channels of the otherinterlocutors (see Section 2.2), and it does not support multi-talkstates as only one speaker is visible at a time. For that reason, such aVoice-Activated Switched paradigm can be likely found only in oldersystems, the services on today’s market do provide the ContinuousPresence paradigm.
A final approach in this list concerns peer-to-peer topologies andaddresses the problem of limited processing power on the end de-vices, such as mobile phones. Wu et al. 52 propose a peer-to-peer
52 Yu Wu et al. “vSkyConf: Cloud-assisted multi-party mobile video con-ferencing”. In: Proceedings of the sec-ond ACM SIGCOMM workshop on Mobilecloud computing. ACM. 2013, pp. 33–38

telemeeting technologies 69
architecture in which the heavy video processing is not done onthe end device but on a number of virtual machines running on in-ternet servers (in the “cloud”), which act as surrogates for the enddevices. Obviously, such an approach reflects a hybrid version ofcentral-bridge and peer-to-peer technology.
3.7 Spatial audio
Spatial audio reproduction is of particular interest for telemeetingsystems, since a number of studies have shown a benefit of spatialsound reproduction 53 in terms of reducing the mental effort for 53 Jessica J. Baldis. “Effects of Spa-
tial Audio on Memory, Comprehension,and Preference during Desktop Confer-ences”. In: Proceedings of the ACM CHI2001 Human Factors in Computing SystemsConference. Ed. by Michel Beaudouin-Lafon and Robert J. K. Jacob. Vol. 3. 1.2001, pp. 166–173
Ryan Kilgore, Mark Chignell, andPaul Smith. “Spatialized audioconfer-encing: what are the benefits?” In: Pro-ceedings of the 2003 conference of the Cen-tre for Advanced Studies on Collaborativeresearch CASCON ’03. IBM Press, 2003,pp. 135–144
Alexander Raake et al. “Listening andconversational quality of spatial audioconferencing”. In: Proceedings of the AES40th International Conference. Tokyo, Oct.2010
separating all speakers in a telemeeting. For that reason, the keyconcepts and their application in telemeeting systems are presentedin this section.
Background The term spatial audio refers to sound reproductiontechniques that exploit characteristics of the human auditory systemto render a sound field in which sound sources are perceived fromcertain spatial locations. The idea is to generate sound such that theauditory system is able to extract a number of cues that determinethe perceived location.
The most important cues for the location in the horizontal plane areInteraural Time Difference (ITD) and Interaural Level Difference (ILD),that are the time and level differences occurring between the two earsignals, as well as interaural coherence, which describes the similaritybetween the two ear signals. Concerning sound localization in closedrooms another important cue is the ability of the auditory system todissolve the direction of the source from the room reflections whichare coming from all directions. Here, the precedence effect – or law ofthe first wavefront – is mainly responsible to determine the directionof the source.
The cues for the location in the median plane are a direction-dependent perceived frequency weighting with specific resonances inthe ear canal (Blauert’s directional bands) combined with direction-dependent reflections from ear, head and torso, expressed as Head-Related Transfer Functions (HRTF). In addition, tiny unconscious headmovements with the resulting changes of ITD and ILD contribute tothe localization in the median plane. The most important cues fordistance perception are level, frequency weighting and the ratio ofdirect to reverberated sound waves. For more details on the vast fieldof spatial hearing, the author refers to Blauert 54, Moore 55 and Pulkki
54 Jens Blauert. Spatial Hearing – The Psy-chophysics of Human Sound Localization –Revised edition. Harvard, MA, USA: TheMIT Press, 1997
Jens Blauert, ed. The Technology ofBinaural Listening. Berlin, Germany:Springer, 2013
55 Brian C. J. Moore. Introduction tothe Psychology of Hearing. 6th ed. Leiden,The Netherlands: Brill, 2013
and Karjalainen 56.
56 Ville Pulkki and Matti Karjalainen.Communication Acoustics: An Introduc-tion to Speech, Audio and Psychoacoustics.Chichester,West Sussex, UK: The MITPress, 2015
There are a number of techniques to realize spatial sound, rang-ing from traditional stereo reproduction over commercial multichan-nel reproduction (e.g. “5.1 surround sound”) to very advanced ap-proaches using large numbers of loudspeakers (e.g. Wave-Field Syn-thesis, Higher-Order Ambisonics). For headphones reproduction,another technique is available, commonly known as Binaural SoundReproduction. Since this technique is applied in the present research,
70 quality of experience of multiparty conferencing and telemeeting systems
a few more details are provided here.The principle of binaural sound reproduction is to convolve the
monotic and dry source signals, i.e. single-channel signals without anyspatial cues, with Head-Related Impulse Responses HRIR (the inverseFourier transform of above mentioned HRTFs), which then introducethe spatial cues. HRIRs have a very complex structure, which changesfor every direction. For that reason, binaural sound reproductionmeans that for every direction another set of HRIRs (for left and rightear) must be used during rendering, requiring even real-time headtracking and on-the-fly switching of HRIRs if maximum possiblenaturalness is desired. Furthermore, HRIRs are not synthesized fromscratch, but acoustically measured for a certain number of directions,and – if necessary – interpolated during playback for directions whichhave not been measured.
HRIRs describe in the time domain the direction-dependent modifi-cation of sound that reaches the ear in the free-field scenario, i.e. with-out any room reflections. Usually HRIRs are measured in anechoicchambers producing nearly no reflections from floor, walls and ceil-ing, since true free-field measurements would contain ambient back-ground noise. Binaural Room Impulse Responses (BRIR) are analternative in which the impulse response incorporates also the re-flections of a room, thus BRIRs are measurements of an acousticimpulse played back in a real and enclosed space. Thus, recordingswith HRIRs sound “dry” while recordings with BRIRs contain somereverberation that gives the listener some impression of being in aroom.
Concerning the practical realization, a common approach is tomeasure HRIRs with a dummy head for as many positions of theimpulse source as desired. A drawback of this approach is that everyhuman has a different physiology/anatomy of the ear and thus adifferent set of HRIRs, which means that dummy head recordings arejust an approximation. Especially, one common problem with binauralsound reproduction using dummy head recordings is the perceptionof an unwanted elevation (the sound source is perceived to come froma higher or lower position than intended), which can even lead to theso-called front-back confusions. Alternatively, individual HRIRs canbe measured per individual listener by placing small microphonesinto the ear canal, a procedure that is usually not applied given therequired effort.
Application in telmeetings The technical principle is rather straight-forward: the microphone signal of every interlocutor is rendered witha set of HRIRs belonging to a certain position in the virtual acousticalspace and every interlocutor is assigned to another position in thatspace. The practical realization in real life, however, is not trivial:First, a system needs to decide, where to place all interlocutors in thevirtual acoustic space. Some guidance can be for instance found inHyder et al. 57, who suggest that sound sources should be presented
57 Mansoor Hyder, Michael Haun, andChristian Hoene. “Placing the partici-pants of a spatial audio conference call”.In: Proceedings of the 7th IEEE ConsumerCommunications and Networking Confer-ence (CCNC). IEEE. 2010, pp. 1–7
at the same height, but those are applicable for cases in which the

telemeeting technologies 71
number of interlocutors is fixed and known upfront. Roegiers 58 on 58 David Roegiers. “Dynamical Aspectsof Spatial-Audio in Multi-participantTeleconferences”. Master Thesis. Uni-versiteit Gent, Belgium, 2013
the contrary explored, how a system could adapt the positioning ofinterlocutors, when new interlocutors join the telemeeting, and heproposed four algorithms that were positively perceived by subjects.
Second, little is known on the possible interaction of typical trans-mission impairments, pre-dominantly packet loss, and spatial audio;two example studies were conducted by Bachl 59 and Spur 60. The 59 Maximilian Bachl. “Impact of packet
loss on localization and subjective qual-ity in 3D-telephone calls”. Bachelor The-sis. Quality and Usability Lab, Technis-che Universität Berlin, Germany, 2014
60 Maxim Spur. “Implementation of aSpatial VoIP Conferencing Demonstra-tor”. Master Thesis. Quality and Usabil-ity Lab, Technische Universität Berlin,Germany, 2015
former study suggested that audio frames of both channels shouldbe put into the same packets, as packet loss on one side yields strongnegative effects. The latter study suggested that packet loss in aspatial audio conferencing system can be perceived by test subjectssimilar to packet loss in non-spatial context, i.e. perceived qualitydegrades with increasing amount of packet loss.
Third, the added value of spatial audio has been mainly shown forcases in which interlocutors used close-talk microphones, hands-freecases were out of scope. However, such cases are highly relevantand technically challenging: On the one hand, the system is facedwith additional acoustical distortions (reverb, noise, echo), whereasthe effects on spatial audio have – to the author’s knowledge – notbeen investigated. On the other hand, the system is faced withmultiple speakers in the same room, which would require for aspatial separation per speaker an extra sound source separation andchannel assignment module 61.
61 Martin Rothbucher et al. “3D AudioConference System with Backward Com-patible Conference Server using HRTFSynthesis”. In: Journal of Multimedia Pro-cessing and Technologies 2 (4 Dec. 2011),pp. 159–175
Summary
One way to address the various possibilities for implementing tele-meeting systems is to characterize the technology in terms of the threemain components: End Device(s), Bridge(s), and Network. Those compo-nents are connected in either a central-bridge topology, a peer-to-peertopology, or hybrid topologies mixing the former two, depending onthe physical location of the bridges (central servers in the network oron each client side).
Concerning end devices, various technical properties, such as hard-ware design (i.e. form factor) and built-in signal enhancement algo-rithms can influence the quality of the overall system. Regarding theform factor, two quality-relvant examples are the distance betweenmouth and microphone, which influences the speech signal quality,and the disparity of camera and display, which influences the percep-tion of eye gaze. Regarding the signal enhancement algorithms, thecomplexity and non-linearity of many of those algorithms makes itoften difficult to analytically characterize or even to control for theirimpact on the signal quality.
Concerning the network, packet-based transmission over the inter-net is increasingly used. For this purpose, first the audio and videosignals are encoded using dedicated speech and video codecs, thenthe endoced audio and video frames are packetized and sent over thenetwork, using the Internet Protocol stack model. Quality-relevant as-pects are the data compression techniques of the different speech and

72 quality of experience of multiparty conferencing and telemeeting systems
video codecs, which can lead to differnt types of signal distortions,the packet-based transmission paradigm, which can lead to differenttransmission delays for individual packets and even packet loss, andthe design of jitter buffers and packet error handling mechanisms,which mitigate such transmission errors.
The key functionality of multiparty telemeetings is provided bythe bridges, which provide for each interlocutor appropriate mixes ofthe audio and video signals. The quality of the audio mixes may beinfluenced by different techniques which minimize scalability issuesin terms of the required number of individual mixes, ranging fromsubtraction of the own signal to limiting the number of input signalsby means of voice activity detection. Furthermore, conventionalcentral-bridges usually require extra decoding and encoding of thesignals, which can additionally impact the signal quality. In caseof packet-based transmission, however, alternative techniques apply“speaker selection and forward” schemes, which use voice activitydetection or partial decoding, to pass only packets with active speechto the clients. Concerning the mixing of video, even with today’stechnology the required computational load needs to be properlyaddressed. Typical solutions range from dedicated powerful central-bridge servers to peer-to-peer solutions that use virtual machines inthe network cloud as surrogates.
Next to those components, spatial audio reproduction is of partic-ular interest for modern telemeeting systems. This is motivated bythe benefit of spatial sound reproduction in terms of reducing themental effort for separating all speakers in a telemeeting. The idea isto render the microphone signals of each interlocutor with differentsets of Head-Related Impulse Responses such that every interlocutoris assigned to another position in the virtual acoustic space.

4Quality Assessment in Telecommunication
What this chapter is about
The present text concerns the quality assessment of multiparty tele-meeting systems. This chapter provides a concise recapitulation ofthe most important conceptual aspects of quality and it provides anoverview of the most common perceptual and instrumental assess-ment methods for telecommunication systems. In that respect, thepresent chapter limits to existing literature on quality assessment thatpredominantly concerns conventional two-party (video-) telephonysystems and related services. More in-depth discussions on conceptsand assessment methods for the multiparty scenario are addressed inthe following chapters.
4.1 Introduction
There are various aspects that influence the success of a certaintelecommunication service or product. Certainly, economic-relatedaspects, ranging from the manufacturer’s brand image to the requiredcosts for the end user, play an important role. However, anotheraspect that should not be neglected is the quality of the service orproduct. The argumentation here is twofold: first, if the quality is notsufficient, then the end user will not accept the system; second, if twocompeting systems share the same economical characteristics, it ismost likely that user favors the system with the better quality.
At this point it needs to be emphasized that quality refers to thequality as it is perceived by the end user. Obviously, this is linked tothe technical performance of the system, but it is not the same. In thisline of thought, there exist a number of definitions of quality in theliterature, each formulated from different perspectives and discussedin Section 4.2. Continuing from such definitions, it is further possibleto characterize quality more specifically; one approach that can befound in the literature is presented in Section 4.3.
Once the target “quality” is properly defined, researchers andpractitioners can decide on an adequate method to assess the qualityof the system. Here a comprehensive set of perceptual and instru-mental methods are available. The former type of methods requiresthe conduction of perceptual tests in which human participants rate

74 quality of experience of multiparty conferencing and telemeeting systems
the system under test, either by directly communicating over thesystem or by rating the system’s output signals. The latter type ofmethods requires an algorithm that computes for the system undertest estimations of quality, which should represent as best as possiblequality judgments that human test participants would have given forthat system. Section 4.4 provides an overview of the most commonperceptual assessment methods, Section 4.5 of the most commoninstrumental methods.
4.2 Notion of Quality and Different Perspectives
There are various definitions for and interpretations of the conceptof quality in the context of Information and Communication Tech-nology. Garcia 1 extensively discusses those different definitions, and 1 Marie-Neige Garcia. Parametric Packet-
based Audiovisual Quality model for IPTVservices. Springer, 2014
Möller and Raake 2 give a nice and compact overview on how these
2 Sebastian Möller and AlexanderRaake. “Motivation and Introduction”.In: Quality of Experience - Advanced Con-cepts, Applications, Methods. Ed. by Se-bastian Möller and Alexander Raake.Springer, 2014, pp. 3–9
definitions evolved over the last decades, starting from the technicalperspective of telephone service providers towards a user-centric per-spective. One result of these developments is the definition of theterm Quality of Experience, provided by Qualinet 3:
3 European Network on Quality of Ex-perience in Multimedia Systems and Ser-vices. Qualinet White Paper on Definitionsof Quality of Experience. White Paper. Ver-sion Version 1.2. Patrick Le Callet, Se-bastian Möller and Andrew Perkis (Eds.)Lausanne, Switzerland: (COST ActionIC 1003), Mar. 2013
“Quality of Experience (QoE) is the degree of delight or annoyance ofthe user of an application or service. It results from the fulfillment ofhis or her expectations with respect to the utility and / or enjoymentof the application or service in the light of the user’s personality andcurrent state.”
This term serves as the fundamental concept for the present work.
4.2.1 User-centric and Technology-Oriented Perspectives on Quality
The definition of QoE emphasizes the user’s perspective: it refers towhat a user perceives from a system, it does not necessarily refer tothe technical performance of a system. For the second perspective,the term Quality of Service (QoS) is typically used, which is defined inITU Recommendation E.800
4 as 4 ITU-T. Recommendation E.800 - Defi-nitions of terms related to quality of service.International Standard. Geneva, Switzer-land: International TelecommunicationUnion, 2008
“The totality of characteristics of a telecommunications service thatbear on its ability to satisfy stated and implied needs of the user of theservice.”
Obviously, there is some natural relation between technical perfor-mance of a system and user perception, and between QoS and QoE.However, many research studies on quality perception and qualitymodeling in the past have shown that this link is not a simple one-to-one relation. Varela et al. 5 discuss in more detail the differences 5 Martín Varela, Lea Skorin-Kapov, and
Touradj Ebrahimi. “Quality of ServiceVersus Quality of Experience”. In: Qual-ity of Experience - Advanced Concepts, Ap-plications, Methods. Ed. by SebastianMöller and Alexander Raake. Springer,2014, pp. 85–96
between QoS and QoE, emphasizing that both concepts differ in theirconceptual scope (utilitarian vs. utilitarian & hedonic), applicationscope (telecommunication services vs. all ICT and not-necessarily net-worked based services), perspective (system vs. user), and assessmentmethods (technology-oriented vs. multi-disciplinary).

quality assessment in telecommunication 75
4.2.2 A Hierarchical Perspective on Quality
Another property of the definition of QoE is that it looks at qualityfrom a holistic perspective, which in turn means that QoE can beactually considered as a construct of a number of individual aspects.There are a number of taxonomies 6 that identify those individual
6 Sebastian Möller. Assessment and Pre-diction of Speech Quality in Telecommuni-cations. Kluwer Academic publishers,2000
Sebastian Möller. Quality of Telephone-Based Spoken Dialogue Systems. NewYork, USA: Springer, 2005
Andreas Silzle. “Quality Taxonomiesfor Auditory Virtual Environments”. In:Proceedings of the 122nd AES Convention.May 2007
Sebastian Möller et al. “A Taxon-omy of Quality of Service and Qualityof Experience of Multimodal Human-Machine-Interaction”. In: Proceedings ofthe International Workshop on Quality ofMultimedia Experience QoMEX. 2009
aspects and put them into relation for different services. The mostrelevant individual aspect for the present research is the conceptof Speech Communication Quality by Möller 7, which can be further
7 Sebastian Möller. Assessment and Pre-diction of Speech Quality in Telecommuni-cations. Kluwer Academic publishers,2000
separated into Voice Transmission Quality, Ease of Communication, andConversation Effectiveness. According to the elaborations of Möller aswell as Raake 8, Voice Transmission Quality refers to the quality of the
8 Alexander Raake. Speech Quality ofVoIP – Assessment and Prediction. Chich-ester, West Sussex, UK: Wiley, 2006
speech signal in terms of perceivable signal distortions, stemmingfrom the technical system (e.g. packet loss) or the environment inwhich the interlocutor uses the system (e.g. background noise). Totransfer this term to audiovisual communication, the present text usesthe term Media Transmission Quality, whereas synonyms in relevantliterature are Media Quality 9, or Multimedia Quality 10. Furthermore,
9 Martín Varela, Lea Skorin-Kapov, andTouradj Ebrahimi. “Quality of ServiceVersus Quality of Experience”. In: Qual-ity of Experience - Advanced Concepts, Ap-plications, Methods. Ed. by SebastianMöller and Alexander Raake. Springer,2014, pp. 85–96
Benjamin Weiss et al. “Temporal De-velopment of Quality of Experience”. In:Quality of Experience - Advanced Concepts,Applications, Methods. Ed. by SebastianMöller and Alexander Raake. Springer,2014, pp. 133–147
10 Markus Vaalgamaa and BenjaminBelmudez. “Audiovisual Communica-tion”. In: Quality of Experience - AdvancedConcepts, Applications, Methods. Ed. bySebastian Möller and Alexander Raake.Springer, 2014, pp. 195–212
Media Transmission Quality refers to the quality that can be perceivedin a pure listening-only or viewing-only situation, whereas the othertwo aspects Ease of Communication and Conversation Effectiveness canbe perceived only in a conversational situation. Ease of Communi-cation refers to the system’s capability of enabling a conversation,Conversation Effectiveness refers to the communication partners. An-other term that essentially combines both aspects is ConversationalQuality, a term that can often be found in relevant literature suchas in ITU-T Recommendation P.805
11 or in Guéguin 12. This set of
11 ITU-T. Recommendation P.805 - Sub-jective evaluation of conversational quality.International Standard. Geneva, Switzer-land: International TelecommunicationUnion, 2007
12 Marie Guéguin et al. “On the evalua-tion of the conversational speech qualityin telecommunications”. In: Eurasip Jour-nal on Applied Signal Processing (2008),pp. 185–248
different aspects of quality and the hierarchical interpretation from aholistic QoE down to Media Transmission Quality is highly relevantfor the present research, in particular for Chapters 7 and 8, whichstrongly rely on a proper separation of the different aspects.
4.2.3 A Process-Oriented Perspective on Quality
Coming back to the definition of QoE, the second sentence in thatdefinition implies that quality is a result the user’s perception of thesystem with respect to his or her expectations. This perspective hasbeen formulated by Jekosch 13, who defined quality as the
13 Ute Jekosch. Voice and Speech QualityPerception – Assessment and Evaluation.Berlin, Germany: Springer, 2005
“result of [the] judgment of the perceived composition of an entity withrespect to its desired composition.”
This implies that quality is the outcome of a perception and a com-parison & judgment process. Jekosch developed a correspondingconceptual model, which has been further refined by Raake 14, and
14 Alexander Raake. Speech Quality ofVoIP – Assessment and Prediction. Chich-ester, West Sussex, UK: Wiley, 2006
Alexander Raake and Sebastian Egger.“Quality and Quality of Experience”. In:Quality of Experience - Advanced Concepts,Applications, Methods. Ed. by SebastianMöller and Alexander Raake. Springer,2014, pp. 11–34
which will be extensively discussed and adapted to the multipartytelemeeting scenario in Chapter 5.

76 quality of experience of multiparty conferencing and telemeeting systems
4.3 Characterizing Quality: Quality Elements and QualityFeatures
The different approaches to define quality are of a rather abstractand conceptual nature. To transfer those conceptual considerationsinto a more concrete characterization of quality, the notion of QualityElements and Quality Features is in the author’s view a useful tool forthat purpose.
4.3.1 Quality Features
According to Jekosch 15, Quality Features constitute the Perceived and 15 Ute Jekosch. “Sprache hörenund beurteilen: Ein Ansatz zurGrundlegung der Sprachqualitäts-beurteilung”. Habilitation thesis.Universität/Gesamthochschule Essen,Germany, 2003
Ute Jekosch. Voice and Speech QualityPerception – Assessment and Evaluation.Berlin, Germany: Springer, 2005
Desired Compositions of the entity that she is referring to in her def-inition of quality. In that sense, Jekosch defined a Quality Featureas a “recognizable and nameable characteristic of an entity that isrelevant to the entity’s quality.” Bearing in mind Jekosch’s basic qual-ity formation process and applying this to the telemeeting context,Quality Features are those characteristics of a telemeeting that a user isconsidering when forming a quality judgment about the telemeeting.In that respect, Quality Features reflect the user-centric perspective ofquality, and they provide a means to characterize individual aspectsof quality, or – as Jekosch formulated it – “a quality feature is theanalyzed result of the perceived, designed entity and is therefore thebasis of any description of its quality.”
The list of possible Quality Features is vast. Möller et al. 16 propose 16 Sebastian Möller, Marcel Wälter-mann, and Marie-Neige Garcia. “Fea-tures of Quality of Experience”. In:Quality of Experience - Advanced Concepts,Applications, Methods. Ed. by SebastianMöller and Alexander Raake. Springer,2014, pp. 73–84
to organize the features according to five levels and provide corre-sponding example features, shown in Table 4.1. In addition, Garcia 17
17 Marie-Neige Garcia. ParametricPacket-based Audiovisual Quality model forIPTV services. Springer, 2014
compiled a comprehensive list of Quality Features that are relevantfor IP-based television services but which are also applicable for au-diovisual communication; Belmudez 18 described the most relevant
18 Benjamin Belmudez. Assessmentand Prediction of Audiovisual Quality forVideotelephony. Springer, 2009
Quality Features for video telephony; Raake 19 discussed in detail the
19 Alexander Raake. Speech Quality ofVoIP – Assessment and Prediction. Chich-ester, West Sussex, UK: Wiley, 2006
different Quality Features for Voice over IP telephony; and Wälter-mann 20 identified from a multidimensional perspective of quality
20 Marcel Wältermann. Dimension-basedQuality Modelling of Transmitted Speech.Springer, 2013
further Quality Features – or in this case Quality Dimensions, see below– of transmitted speech. All those features are added in Table 4.1 aswell, to give an overview about the variety of individual perceivedaspects that can constitute a quality judgment.
A note on Quality Dimensions Next to Quality Features, the concept ofQuality Dimensions is an additional method to describe the individualaspects of quality from a perceptual perspective. The idea is todescribe quality as a multidimensional construct, consisting of anumber of perceptual dimensions.
In the author’s view, one can argue about the boundary betweenQuality Features and Quality Dimensions, as both refer to individualaspects of quality from a perceptual perspective. For that reason,Table 4.1 is further extended with additional examples, which wereoriginally labeled as Quality Dimensions. Those features (dimensions)stem from a literature overview by Wältermann 21, who updated an
21 Marcel Wältermann. Dimension-basedQuality Modelling of Transmitted Speech.Springer, 2013

quality assessment in telecommunication 77
Feature category Modality Example features
level of direct perception audio & speech localization1(blurred spatial position, i.e. loss of stereo image)2, timbre1,4 (tim-bre distortion, i.e. birdies)2, coloration1,4 (muffled audio, band-limited artifacts)2,5,loudness1,4,5, continuity1, smoothness5, interruptions2,5, quantization artifacts2, pre-echo2, aliasing artifacts2, binaural-unmasking distortion2, tone-trembling/sparking2,tone-shift2, noise overflow2, tone spike2, sawtooth2, beat-artifact2, tone leakage2,clicking2, frame repetition2, spatial-fidelity- and timbral-fidelity- related-attributes2,background noise and noise reduction artifacts4, clipping4, clearness (orintelligibility)4, color of sound (attributes related to brightness, sharpness andfullness)4,5, naturalness4, noisiness1, 5 (uncorrelated and correlated with speech,background noise, residual noise, i.e. musical tones)4, amount of low frequency-components4,5, amount of high-frequency components5, listener echo4, residualecho4, non-linear distortion4, clipping/switching4, bubbling5, diffusity5, signal ver-sus background distortion5
video sharpness1,2, darkness1,2, brightness1,2, contrast1,2, flicker1,2, distortion1
(smear/geometrical distortion for CRT displays)2, color perception1 (colorbleeding2,3, color space conversion artifacts2,3, chroma subsampling artefacts3, lack ofdeep black2, color naturalness2), smearing2,3, jerkiness2,3, motion blur2, noisiness2,3,camera shake3, blockiness2,3, blurriness2,3, quantization noise2, mosquito effect2,3,staircase effect2,3, ringing3, mosaic pattern effect2,3, DCT bases-image effect2, slicing2,freezing2, ghosting2,3, combing effect (de-interlacing artifacts)2, trade-off imagesize/compression artifacts2, motion blur2, no depth feel (for LCD displays)2
audiovisual balance and synchronism1 (audio-video asynchrony, lip-synchronization)2
level of action audio & speech perception of sidetone1,4, echo1, double-talk degradations1, talker echo4
video involvement and immersion1, perception of space1, perception of own motions1
level of interaction all responsiveness1, naturalness of interaction1, communication efficiency1, conversa-tion effectiveness1, communicability4, perception of lack of attention4, decreasedinterruptability4
level of the usage instance all learnability1, intuitivity1, effectiveness and efficiency for reaching a particular goal1,amount of misunderstanding 4, ease of use1, non-functional features such as thepersonality of the interaction partner (human or machine)1, aesthetics1
Notes: Quality Features mentioned in:1: Sebastian Möller, Marcel Wältermann, and Marie-Neige Garcia. “Features of Quality of Experience”. In: Quality of Experience -Advanced Concepts, Applications, Methods. Ed. by Sebastian Möller and Alexander Raake. Springer, 2014, pp. 73–84
2: Marie-Neige Garcia. Parametric Packet-based Audiovisual Quality model for IPTV services. Springer, 2014
3: Benjamin Belmudez. Assessment and Prediction of Audiovisual Quality for Videotelephony. Springer, 2009
4: Alexander Raake. Speech Quality of VoIP – Assessment and Prediction. Chichester, West Sussex, UK: Wiley, 2006
5: Marcel Wältermann. Dimension-based Quality Modelling of Transmitted Speech. Springer, 2013
Table 4.1: List of example quality fea-tures for the categories according toMöller et al., extended with featuresmentioned in Garcia, Belmudez, Raake,and Wältermann.

78 quality of experience of multiparty conferencing and telemeeting systems
earlier list originally compiled by Raake 22. 22 Alexander Raake. Speech Quality ofVoIP – Assessment and Prediction. Chich-ester, West Sussex, UK: Wiley, 2006
Despite including Quality Dimensions into the list of Quality Features,the author emphasizes that three aspects can be used to – at leastroughly – differentiate these two concepts. First, research on QualityDimensions is concerned with identifying the smallest appropriatenumber of dimensions. This means, Quality Dimensions represent adecomposition of Quality Features into a reduced number of dimen-sions. In other words, Quality Dimensions and Quality Features – andactually also Quality Elements, see below – can be considered to havea hierarchical relation to each other. This approach – from qualityelements to quality features to quality dimensions – is for instancevery thoroughly presented in Garcia 23. 23 Marie-Neige Garcia. Parametric
Packet-based Audiovisual Quality model forIPTV services. Springer, 2014
Second, Quality Dimensions are considered to be orthogonal, whereasQuality Features do not need to fulfill this requirement. This perspec-tive is for instance taken in Wältermann 24. 24 Marcel Wältermann. Dimension-based
Quality Modelling of Transmitted Speech.Springer, 2013
Third, Quality Features are for the user nameable aspects of theperceived quality, which means that users are able to describe them,while Quality Dimensions do not necesarily need to be nameableby the users. This refers to the two typical methodologies appliedin the relevant research. In one method, the Quality Dimensionsare extracted from a list of attributes or attribute pairs (semanticdifferentials) by means of principle component or factor analysis.Here, users usually do not rate the dimensions directly, except if theused attributes already represent the dimensions, as it was done forinstance in Wältermann. In the other method, the Quality Dimensionsare extracted from distance ratings between pairs of stimuli, whichrequire no attributes at all.
4.3.2 Quality Elements
According to Jekosch 25, Quality Elements refer to the technical charac- 25 Ute Jekosch. “Sprache hörenund beurteilen: Ein Ansatz zurGrundlegung der Sprachqualitäts-beurteilung”. Habilitation thesis.Universität/Gesamthochschule Essen,Germany, 2003
Ute Jekosch. Voice and Speech QualityPerception – Assessment and Evaluation.Berlin, Germany: Springer, 2005
teristics of an ICT system that contribute to a certain level of quality.In that sense, Jekosch defined a Quality Element as a “contributionto the quality” whereas this contribution is “of an immaterial or amaterial product as the result of an action/activity or a process inone of the planning, execution or usage phases” and/or this contri-bution is “of an action or of a process as the result of an elementin the course of this action or process.” Quality Elements reflect thetechnology-oriented perspective of the service provider or systemmanufacturer, and they provide a means to characterize individualaspects of quality, or – as Jekosch formulated it – “[a quality element]is the building block for designing an entity.”
Similar to the Quality Features, the list of possible Quality Elementsis vast, especially when considering the technical complexity of ICTsystems. One typical approach followed by authors such as Möller,Raake, Wältermann, Garcia, or Belmudez is to identify as Quality Ele-ments all system stages, signal operations and environmental factorsthat can alter the audio and video signals, as well as source signalcharacteristics that can interact with the technology. In that line of

quality assessment in telecommunication 79
thought, the telemeeting components described in Chapter 3 can beseen as Quality Elements of a telemeeting system.
Using a different terminology stemming from the Qualinet group 26, 26 European Network on Quality of Ex-perience in Multimedia Systems and Ser-vices. Qualinet White Paper on Definitionsof Quality of Experience. White Paper. Ver-sion Version 1.2. Patrick Le Callet, Se-bastian Möller and Andrew Perkis (Eds.)Lausanne, Switzerland: (COST ActionIC 1003), Mar. 2013
Reiter et al. 27 give an overview of Influence Factors, which “have an
27 Ulrich Reiter et al. “Factors Influenc-ing Quality of Experience”. In: Qualityof Experience - Advanced Concepts, Appli-cations, Methods. Ed. by Sebastian Möllerand Alexander Raake. Springer, 2014,pp. 55–72
influence on the Quality of Experience for the user.” More specifically,the Qualinet group and Reiter et al. consider three types of InfluenceFactors: Human, System and Context Influence Factors. In that concept,Quality Elements comprise the System Influence Factors as well as onepart of the Context Influence Factors that Reiter et al. refer to as PhysicalContext.
4.4 Perceptual Assessment of Quality
It is known in the field that the perception of quality can be in-fluenced by various factors, which are for instance summarized byReiter et al. 28. One consequence for the perceptual assessment of qual- 28 Ulrich Reiter et al. “Factors Influenc-
ing Quality of Experience”. In: Qualityof Experience - Advanced Concepts, Appli-cations, Methods. Ed. by Sebastian Möllerand Alexander Raake. Springer, 2014,pp. 55–72
ity by means of experiments is that the experimental setup in termsof instructions, conditions, questionnaires, and general context, caninfluence results. In order to nevertheless achieve a high reproducibil-ity and comparability of results, the common approach is to conductstandardized quality assessment tests following agreed-upon proto-cols. The International Telecommunication Union (ITU), and otherstandardization bodies, such as European Broadcast Union (EBU)or European Telecommunications Standards Institute (ETSI), havedeveloped such test protocols for various ICT applications, systemsand services.
Overview of Test Methods The existing standardized test methodsdiffer in a number of aspects, each method optimally designed fora specific test purpose. Table 4.2 gives an overview of the maincharacteristics for the most common test protocols.
In that table, Test Modality refers to the modality under test, i.e. au-dio quality, video quality or audiovisual quality. Test Paradigm refersto the interactivity of the test participants during the test, definingtwo levels: non-interactive tests in which test participants rate teststimuli in a listening-only or viewing-only task, and conversationtests, in which participants perform a conversation task via the sys-tem under test. Presentation Mode refers to the number of stimuli thatis presented per assessment trial and the manner in which the stimuliare presented. In this context, assessment trial is one individual unitwithin a test, in which a certain stimulus or stimulus combination ispresented and the subject is asked to give a rating for this unit. Thus,a whole test session per participants usually consists of a numberof such test trials. The most common methods differentiate betweenthree Presentation Modes: single stimulus, in which the participantrates directly the stimulus under test; multiple stimuli in temporalsequence, in which the participant gives ratings for (part of) themultiple stimuli or in which the participant judges one stimulus inlight of the other stimuli; multiple stimuli simultaneously presented,

80 quality of experience of multiparty conferencing and telemeeting systems
which differs from above by presenting the multiple stimuli simul-taneously and the participant can switch between those during atrial (for audio & video) or can see all spatially separated (for video).Reference Presentation refers to the aspect whether the test methodrequires an explicit reference, and whether participants are awarewhich stimuli are the reference (“known”) or not (“hidden”). Thisdoes not mean that other methods may not include stimuli that theexperimenter considers – from his or her expert perspective – as areference, but those methods do not require the inclusion of theminto the test protocol. Rating Mode refers to the manner in whichparticipants rate the stimuli: retrospective, i.e. the participants givea rating directly after the stimulus, retrospective (but during stimulipresentation), i.e. the participants are rating the whole stimulus butare allowed to enter the ratings already during the presentation; andinstantaneous/continuous, i.e. the participants give ratings all thetime, usually realized by a slider. Rating Scale Type refers to the aspectwhether the test method asks for quality (e.g. from bad to excellent),for quality impairments (e.g. not perceivable to perceivable and veryannyoing), or for other rating attributes. Rating Scale Values refer tothe granularity of the ratings, separating discrete categorial scalesand continuous scales. Rating Scale Labels refers to the aspect whetherthe used scale employs textual labels at intermediate points on thescale or not. Rating Scale Numbers refers to the aspect, whether theused scale employs numbers as numerical labels, alternatively or inaddition to any textual labels.
Further Aspects of Test Methods Table 4.2 intends to provide a firstoverview of the most relevant test methods for the present research; itis not exhaustive in two aspects. First, there are more characteristicsthat differentiate test methods: experimental design, stimuli character-istics, test environment, subject profiles, etc. For those characteristics,the author refers to the individual standard documents. Second, thereare many more standardized test methods for additional test scenariossuch as noise suppression algorithms 29, spoken dialogue systems 30,
29 ITU-T. Recommendation P.835 - Subjec-tive test methodology for evaluating speechcommunication systems that include noisesuppression algorithm. International Stan-dard. Geneva, Switzerland: Interna-tional Telecommunication Union, 2003
30 ITU-T. Recommendation P.851 - Subjec-tive quality evaluation of telephone servicesbased on spoken dialogue systems. Interna-tional Standard. Geneva, Switzerland:International Telecommunication Union,2003
or HD television 31. As starting point for further standardized as-
31 ITU-R. Recommendation BT.710-4 -Subjective assessment methods for imagequality in high-definition television. Inter-national Standard. Geneva, Switzerland:International Telecommunication Union,1998
sessment test methods, the author refers to ITU-T RecommendationG.1011
32 as well as to the P-Series 33, BS-Series 34, and BT-Series 35 of
32 ITU-T. Recommendation G.1011 - Ref-erence guide to quality of experience assess-ment methodologies. International Stan-dard. Geneva, Switzerland: Interna-tional Telecommunication Union, 2015
33 ITU-T. ITU-T Recommendations – P-Series: Terminals and subjective and objec-tive assessment methods. retrieved on Au-gust 19, 2015. International Telecom-munication Union. 2015. url: https:
//www.itu.int/rec/T-REC-P/en
34 ITU-T. ITU-R Recommendations – BS-Series: Broadcasting service (sound). re-trieved on August 19, 2015. Interna-tional Telecommunication Union. 2015.url: https://www.itu.int/rec/R-REC-BS/en
35 ITU-T. ITU-R Recommendations – BT-Series: Broadcasting service (television). re-trieved on August 19, 2015. Interna-tional Telecommunication Union. 2015.url: https://www.itu.int/rec/R-REC-BT/en
the International Telecommunication Union.
4.5 Instrumental Assessment and Prediction of Quality
The term Instrumental Assessment refers to the algorithmic estimationof quality scores without the need to conduct a perceptual test; com-mon synonyms for Instrumental Assessment are Quality Prediction orObjective Models. As many authors emphasize, such quality predic-tion models provide only a rough estimate of the quality that realtest participants would perceive, and such models should be appliedwith care. The reason is that quality perception is known to be in-fluenced by the participant’s personality and internal state as well

quality assessment in telecommunication 81
Test Characteristic Common Test Methods
P.800 P.805 P.910 P.911 P.920 BS.1435 BS.1116 BT.500 BT.1788
Test Modality Audio X X X X
Video X X X
Audiovisual X X
Test Paradigm Non-interactive(listening-only,viewing-only)
X in AnnexB
X X X X X X
Conversation X in AnnexA
X X
PresentationMode
Single stimulus X in AnnexA, B
X X in Clause6.1, 6.2
X in Clause6.1, 6.4
X X in Clause6.1, 6.3
Multiple stimuli intemporal sequence
X in AnnexD
X in Clause6.3, 6.4
X in Clause6.2, 6.3
X in Clause 4,(6.2)
Multiple stimuli pre-sented simultaneously
X in AnnexC
X X X in Clause 5,(6.2), 6.4
X
ReferencePresentation
None X in AnnexA, B
X X in Clause6.1, 6.4
X in Clause6.1, 6.3, 6.4
X X in Clause6.1
Hidden X in AnnexE
X in Clause6.2
X in Clause6.2
X X X in Clause 5 X
Known X in AnnexD
X in Clause6.3
X X X in Clause 4,6.4
X
Rating Mode Retrospective (afterstimuli presentation)
X X X X in Clause6.1, 6.2, 6.3
X
Retrospective (but dur-ing presentation)
X X X in Clause 4,5, 6.1
X
Instantaneous / con-tinuous (during pre-sentation)
X in Clause6.4
X in Clause6.1, 6.4
Rating Scale:Type
Quality X in AnnexA, B
X X in Clause6.1, 6.2
X in Clause6.1, 6.4
(X) X X in Clause 5,6.1, 6.3, 6.4
X
Impairment X in AnnexD, E
X X in Clause6.2, 6.3
X X in Clause 4,6.1
Other X X in Clause6.2
Rating Scale:Values
Discrete / Categorial X X X in Clause6.1, 6.2, 6.3
(X) X X in Clause 4
Continuous X in AnnexB
X in Clause6.4
X X in Clause 5,6.3, 6.4
X
Rating Scale:Labels
No (X in Clause6.1)
Yes X X X (X) X X X in Clause 4,5, (6.1)
X
Rating Scale:Numbers
No (X in Clause6.1)
Yes X X X (X) X X X in Clause 4,5, (6.1), 6.3, 6.4
X
Bibliographic details of test methods:
ITU-T. Recommendation P.800 - Methods for objective and subjective assessment of quality. International Standard. Geneva, Switzerland: InternationalTelecommunication Union, 1996
ITU-T. Recommendation P.805 - Subjective evaluation of conversational quality. International Standard. Geneva, Switzerland: International Telecommunica-tion Union, 2007
ITU-T. Recommendation P.910 - Subjective video quality assessment methods for multimedia applications. International Standard. Geneva, Switzerland:International Telecommunication Union, 2008
ITU-T. Recommendation P.911 - Subjective audiovisual quality assessment methods for multimedia applications. International Standard. Geneva, Switzerland:International Telecommunication Union, 1998
ITU-T. Recommendation P.920 - Interactive test methods for audiovisual communications. International Standard. Geneva, Switzerland: InternationalTelecommunication Union, 2000
ITU-R. Recommendation BS.1534-1 - Method for the subjective assessment of intermediate quality levels of coding systems. International Standard. Geneva,Switzerland: International Telecommunication Union, 2003
ITU-R. Recommendation BS.1116-1 - Methods for the subjective assessment of small impairments in audio systems including multichannel sound systems. Interna-tional Standard. Geneva, Switzerland: International Telecommunication Union, 1997
ITU-R. Recommendation BT.500-13 - Methodology for the subjective assessment of the quality of television pictures. International Standard. Geneva, Switzerland:International Telecommunication Union, 2012
ITU-R. Recommendation BT.1788 - Methodology for the subjective assessment of video quality in multimedia applications. International Standard. Geneva,Switzerland: International Telecommunication Union, 2007
Table 4.2: Overview of the main char-acteristics for the most common percep-tual quality assessment methods.

82 quality of experience of multiparty conferencing and telemeeting systems
as the context. This is already accounted for in the definition forQuality of Experience 36, and Reiter et al. 37 for instance elaborate on 36 European Network on Quality of Ex-
perience in Multimedia Systems and Ser-vices. Qualinet White Paper on Definitionsof Quality of Experience. White Paper. Ver-sion Version 1.2. Patrick Le Callet, Se-bastian Möller and Andrew Perkis (Eds.)Lausanne, Switzerland: (COST ActionIC 1003), Mar. 2013
37 Ulrich Reiter et al. “Factors Influenc-ing Quality of Experience”. In: Qualityof Experience - Advanced Concepts, Appli-cations, Methods. Ed. by Sebastian Möllerand Alexander Raake. Springer, 2014,pp. 55–72
the relevant Human Influence Factors and Context Influence Factors. Asa first consequence, the typical approach is to circumvent individualinfluences by estimating a quality score averaged over a population oftest participants, referred to as Mean Opinion Score (MOS). In otherwords, common quality prediction models do not consider individ-ual participants or internal aspects such as the personal state. As asecond consequence, the typical approach is to address the contextdependency by developing quality prediction models for well-definedand rather specific test purposes, and to standardize those models toensure proper implementation and application across test laboratories.In other words, a quality prediction model is strongly linked to aspecific perceptual test protocol or set of test protocols described inthe previous section.
Overview of Quality Prediction Models In order to select an appropriatequality prediction model, the key characteristics of the model needto match the test goals. For that purpose, Table 4.3 provides anoverview of such key characteristics for the most common modelsstandardized by the ITU. This table is inspired by two overviewarticles by Möller et al. 38 and Raake et al. 39. 38 Sebastian Möller et al. “Speech Qual-
ity Estimation”. In: IEEE Signal Process-ing Magazine 28.6 (Nov. 2011), pp. 18–28
39 Alexander Raake et al. “IP-Based Mo-bile and Fixed Network Audiovisual Me-dia Services”. In: IEEE Signal ProcessingMagazine 28.6 (Nov. 2011), pp. 68–79
In that table, Test Protocol refers to the perceptual test method thatserved as the basis for the model development. Usually, the stan-dards describing the model explicitly refer to the test method withphrases such as “the model predicts quality in terms of Mean Opin-ion Scores, see Recommendation XYZ”. However, some standardsdo not explicitly mention a particular test method; here Table 4.3shows the most obvious methods and provides a corresponding re-mark. Prediction Modality refers to the modality that is predicted,and refers thus to the test modality of the corresponding perceptualtest, i.e. audio quality, video quality or audiovisual quality. PredictionParadigm refers to the type of quality in terms of the interactivityof users, and refers thus to the interactivity of test participants inthe corresponding perceptual test. The Prediction Paradigm definestwo levels: non-interactive, in which test participants rate test stimulia listening-only or viewing-only task, and conversation, in whichparticipants perform a conversation task via the system under test.Reference Type defines whether the model requires a reference signal ornot: defining Full-Reference, Reduced-Reference, and No-Referencemodels. In case of a Full-Reference model, the reference is the originalinput signal to the system under test. In case of a Reduced-Referencemodel, features extracted from the original input signal serve as ref-erence. Input Source refers to the source and the type of informationthat the model is using as input. Figure 4.1 visualizes seven differentcombinations of Input Source and Reference Type that are applied inexisting standardized models. The model input can stem from thesystem as such, from the packet data stream or the audio/videosignals. In case of the system as source, the model input consists of

quality assessment in telecommunication 83
parameters that are either assumed in case the model is applied in theplanning/design phase or measured for an existing system. In caseof the signals as source, the model input consists of the raw outputand – in case of Full-Reference models – also the input signals. Incase of Reduced-Reference video quality models, i.e. ITU-T J.246
40, 40 ITU-T. Recommendation J.246 - Percep-tual visual quality measurement techniquesfor multimedia services over digital cabletelevision networks in the presence of a re-duced bandwidth reference. InternationalStandard. Geneva, Switzerland: Interna-tional Telecommunication Union, 2008
not the raw input reference signal but features from that referenceare used as input. However, that means that the model requires stillthe signal, hence it is included in Table 4.3 as a special case of theSignal category. Furthermore, there are No-Reference video qualitymodels that use an own internal decoder and not the decoder of theoriginal transmission path, i.e. ITU-T P.1202 (Mode 2) 41, which means 41 ITU-T. Recommendation P.1202 - Para-
metric non-intrusive bitstream assessmentof video media streaming quality. Interna-tional Standard. Geneva, Switzerland:International Telecommunication Union,2012
they use video signals as input, which are not necessarily the videosignals that the end user is receiving. For that reason, Raake et al. 42
42 Alexander Raake et al. “IP-Based Mo-bile and Fixed Network Audiovisual Me-dia Services”. In: IEEE Signal ProcessingMagazine 28.6 (Nov. 2011), pp. 68–79
refer to such models as bit-stream models and not as signal-basedmodels, even if the model input is essentially a signal and accordinglyincluded in Table 4.3 as a special case of the Signal category. In caseof the packet data stream as source, the model input can consist ofpacket header information or packet payload information (withoutfully decoding the payload).

84 quality of experience of multiparty conferencing and telemeeting systems
Model Characteristic Standardized Models
BS.1
387
G.1
07
G.1
07.1
G.1
070
J.144
J.246
J.247
J.341
P.56
2
P.56
3
P.56
4
P.86
2
P.86
2.2
P.86
3
P.12
01
P.12
02
Test Protocol BS.1116 X
BT.500 X
P.800 X X X2 X3 X X X X X
P.805 X X X2 X3
P.910 X2 X X X X X
P.911 X
P.920 X X X2
Prediction Speech X X X X X X X X
Modality Audio X X
Video X X X X X X
Audiovisual X X
Prediction Non-interactive X X1 X1 X1 X X X X X X X X X X X
Paradigm Conversation X X X X
Reference Full-Reference X X X X X X X
Type Reduced-Reference X
No-Reference X X X X X X X X
Input Source System Parameters X X X
Data Packet Header X X
Packet Payload X
Signal Raw Signal X X X X X X X X X X
Features X
Model Internal Signal X
Remarks:
X1: Even though G.107, G.107.1 & G.1070 address Conversational Quality, it is possible to conduct Listening-Only Tests for deriving some of theparameters, i.e. equipment impairment factors, by following the dedicated protocols P.833 & P.833.1, which in turn are based on P.800
ITU-T. Recommendation P.833 - Methodology for derivation of equipment im-pairment factors from subjective listening-only tests. International Standard.Geneva, Switzerland: International Telecommunication Union, 2001
ITU-T. Recommendation P.833.1 - Methodology for the derivation of equip-ment impairment factors from subjective listening-only tests for wideband speechcodecs. International Standard. Geneva, Switzerland: InternationalTelecommunication Union, 2009
X2: G.1070 is not specific on the actual test paradigm. For speech G.1070 is essentially a part of G.107 and is thus based on the same procedures;the video part follows the idea of equipment impairment factors, which may be derived from non-interactive tests such as P.910, and the video partincludes the impact of delay, which may be derived from a conversational test such as P.920.
X3: Actually, P.562 mentions P.800 only in terms of the quality scale on which the model produces an output, making P.800 the preferable test method.Since this model is used for conversational quality, P.805 may be used as well.
Bibliographic details of models:
ITU-R. Recommendation BS.1387-1 - Method for objective measurements ofperceived audio quality. International Standard. Geneva, Switzerland: In-ternational Telecommunication Union, 2001
ITU-T. Recommendation G.107 - The E-model: a computational model for usein transmission planning. International Standard. Geneva, Switzerland:International Telecommunication Union, 2014
ITU-T. Recommendation G.107.1 - Wideband E-model. International Stan-dard. Geneva, Switzerland: International Telecommunication Union,2015
ITU-T. Recommendation G.1070 - Opinion model for video-telephony appli-cations. International Standard. Geneva, Switzerland: InternationalTelecommunication Union, 2012
ITU-T. Recommendation J.144 - Objective perceptual video quality measurementtechniques for digital cable television in the presence of a full reference. Interna-tional Standard. Geneva, Switzerland: International TelecommunicationUnion, 2004
ITU-T. Recommendation J.246 - Perceptual visual quality measurement tech-niques for multimedia services over digital cable television networks in the pres-ence of a reduced bandwidth reference. International Standard. Geneva,Switzerland: International Telecommunication Union, 2008
ITU-T. Recommendation J.247 - Objective perceptual multimedia video qual-ity measurement in the presence of a full reference. International Standard.Geneva, Switzerland: International Telecommunication Union, 2008
ITU-T. Recommendation J.341 - Objective perceptual multimedia video qualitymeasurement of HDTV for digital cable television in the presence of a full refer-ence. International Standard. Geneva, Switzerland: International Telecom-munication Union, 2011
ITU-T. Recommendation P.562 - Analysis and interpretation of INMD voice-service measurements. International Standard. Geneva, Switzerland: Inter-national Telecommunication Union, 2004
ITU-T. Recommendation P.563 - Single-ended method for objective speech qual-ity assessment in narrow-band telephony applications. International Standard.Geneva, Switzerland: International Telecommunication Union, 2004
ITU-T. Recommendation P.564 - Conformance testing for voice over IP trans-mission quality assessment models. International Standard. Geneva, Switzer-land: International Telecommunication Union, 2007
ITU-T. Recommendation P.862 - Perceptual evaluation of speech quality(PESQ): An objective method for end-to-end speech quality assessment of narrow-band telephone networks and speech codecs. International Standard. Geneva,Switzerland: International Telecommunication Union, 2001
ITU-T. Recommendation P.862.2 - Wideband extension to RecommendationP.862 for the assessment of wideband telephone networks and speech codecs. In-ternational Standard. Geneva, Switzerland: International Telecommuni-cation Union, 2007
ITU-T. Recommendation P.863 - Perceptual objective listening quality as-sessment. International Standard. Geneva, Switzerland: InternationalTelecommunication Union, 2014
ITU-T. Recommendation P.1201 - Parametric non-intrusive assessment of au-diovisual media streaming quality. International Standard. Geneva, Switzer-land: International Telecommunication Union, 2012
ITU-T. Recommendation P.1202 - Parametric non-intrusive bitstream assess-ment of video media streaming quality. International Standard. Geneva,Switzerland: International Telecommunication Union, 2012
Table 4.3: Overview of the main charac-teristics for the most common standard-ized instrumental quality models.

quality assessment in telecommunication 85
Model Type A Model Type B Model Type C
Input Source: System Parameters Input Source: Data – Packet Header Input Source: Data – Packet Payload
Reference Type: No-Reference Reference Type: No-Reference Reference Type: No-Reference
Model Type D Model Type E
Input Source: Raw Signal Input Source: Model Internal Signal
Reference Type: No-Reference Reference Type: No-Reference
Model Type F Model Type G
Input Source: Signal Featuresand Raw Signal
Input Source: Raw Signal
Reference Type: Reduced-Reference Reference Type: Full-Reference
Figure 4.1: Block-diagrams visualizingthe different types of information thatare used by quality models.

86 quality of experience of multiparty conferencing and telemeeting systems
Further Aspects of Quality Prediction Models Table 4.3 intends to pro-vide a first overview of the most relevant quality prediction modelsfor the present research; it is not exhaustive in two aspects. First, thereare more characteristics that differentiate quality prediction models:impairment sets, output variables, and ground truth data.
Impairment sets refers to the list of impairments that the model canhandle. Here, each model was developed and evaluated only for aspecific set of different impairments, and the standard documentsusually list those impairment sets, sometimes labeled as test factors,and sometimes augmented with explicit impairment sets for whichthe models are not working properly.
Output variables refers to the type of quality score that the model isactually computing. Most models estimate Mean Opinion Scores interms of the 5-point Absolute Category Rating Scale defined in ITU-TP.800
43 and P.91044. Other models compute quality-related scores
43 ITU-T. Recommendation P.800 - Meth-ods for objective and subjective assessment ofquality. International Standard. Geneva,Switzerland: International Telecommu-nication Union, 1996
44 ITU-T. Recommendation P.910 - Sub-jective video quality assessment methodsfor multimedia applications. InternationalStandard. Geneva, Switzerland: Interna-tional Telecommunication Union, 2008
which can be transformed into Mean Opinion Score, such as theTransmission Rating Factor computed in ITU-T G.107
45, G.107.1 46, &
45 ITU-T. Recommendation G.107 - TheE-model: a computational model for usein transmission planning. InternationalStandard. Geneva, Switzerland: Interna-tional Telecommunication Union, 2014
46 ITU-T. Recommendation G.107.1 -Wideband E-model. International Stan-dard. Geneva, Switzerland: Interna-tional Telecommunication Union, 2015
G.107047. Further models compute alternative quality scores which
47 ITU-T. Recommendation G.1070 - Opin-ion model for video-telephony applications.International Standard. Geneva, Switzer-land: International TelecommunicationUnion, 2012rely on explicit comparisons to a reference, such as the 5-grade Im-
pairment Scale defined in ITU-R BS.128448, which is for instance 48 ITU-R. Recommendation BS.1284-1 -
General methods for the subjective assess-ment of sound quality. International Stan-dard. Geneva, Switzerland: Interna-tional Telecommunication Union, 2003
computed in BS.138749.
49 ITU-R. Recommendation BS.1387-1 -Method for objective measurements of per-ceived audio quality. International Stan-dard. Geneva, Switzerland: Interna-tional Telecommunication Union, 2001
Ground truth data refers to the question, whether the model isdirectly estimating perceptual quality ratings, or whether the modelis actually estimating quality scores computed by another model,which is deemed as sufficiently correct to serve as a reference model.The motivation for this intermediate step of using predictions froman instrumental reference model as ground truth is to circumventfor the new model the need of extensive perceptual tests, while thenew model is supposed to circumvent certain principle limitations ofthe reference model. The prominent example for such an approachis P.564
50, which uses P.86251 predictions as ground-truth, whereas
50 ITU-T. Recommendation P.564 - Confor-mance testing for voice over IP transmissionquality assessment models. InternationalStandard. Geneva, Switzerland: Interna-tional Telecommunication Union, 2007
51 ITU-T. Recommendation P.862 - Per-ceptual evaluation of speech quality (PESQ):An objective method for end-to-end speechquality assessment of narrow-band telephonenetworks and speech codecs. InternationalStandard. Geneva, Switzerland: Interna-tional Telecommunication Union, 2001
P.564 is a No-Reference model and does not have the limitation ofrequiring the reference signal.
Second, there are more standardized and non-standardized qualityprediction models, such as dimension-based approaches or modelsfor speech and noise quality. For more details on those characteristicsand pointers for further models, the author refers to the individualstandard documents, to ITU-T Recommendation G.1011
52, as well as
52 ITU-T. Recommendation G.1011 - Ref-erence guide to quality of experience assess-ment methodologies. International Stan-dard. Geneva, Switzerland: Interna-tional Telecommunication Union, 2015
the overview articles of Möller et al. 53 and Raake et al. 54.
53 Sebastian Möller et al. “Speech Qual-ity Estimation”. In: IEEE Signal Process-ing Magazine 28.6 (Nov. 2011), pp. 18–28
54 Alexander Raake et al. “IP-Based Mo-bile and Fixed Network Audiovisual Me-dia Services”. In: IEEE Signal ProcessingMagazine 28.6 (Nov. 2011), pp. 68–79
A note on Quality Prediction Models for Multiparty Telemeetings To theauthor’s knowledge, no quality prediction model for the specific pur-pose of multiparty telemeetings has been standardized or publishedyet. There is one publication by Adel et al. 55, however, that goes into
55 Mohamed Adel et al. “Improved E-Model for Monitoring Quality of Multi-Party VoIP communications”. In: Pro-ceedings of the IEEE Globecom Workshops.Atlanta, USA, 2013, pp. 1180–1185
the direction of a multiparty telemeeting quality model. Adel et al.validated the performance of the E-Model (i.e. ITU-T G.107) againstPESQ (i.e. ITU-T P.862) predictions for system configurations thatoccur in telemeetings, and they proposed an update of the E-Model.
Unfortunately, the study did not address the multiparty aspect

quality assessment in telecommunication 87
as only the connection from one speaker to one listener was evalu-ated. Instead, the study essentially investigated the quality impactof a tandem of two links that occur between two interlocutors in acentral-bridge topology: one link from speaker to bridge and one linkfrom bridge to listener. The test conditions comprised different packetloss rates on each link, and this was tested for three different codecsand for two bridging processes audio signal mixing and packet streammixing (see Section 3.6), which means conditions with and withoutadditional decoding and encoding inside the bridge. In that respect,the proposed update of the E-Model is not a true multiparty telemeet-ing quality model, but it presents a first step towards such a model asit considers tandem-effects that occur in telemeeting scenarios.
Summary
The concept of quality can be defined from different perspectives.The complementary approaches are to take a user’s perspective anda technical perspective; the first perspective leading to the conceptsof Quality of Experience and Quality Features, the second to theconcepts of Quality of Service and Quality Elements. Another per-spective on quality is to consider quality from a holistic perspectiveor from a more analytical perspective in which quality is consideredas a construct of individual aspects, such as Speech CommunicationQuality. Furthermore, a process-oriented perspective is to considerquality as a result of the user’s perception of the system with respectto his or her expectations.
Since quality perception can be influenced by various factors, atypical approach in literature is to apply standardized assessmentmethods. Those methods can be categorized into perceptual assess-ment methods and instrumental assessment methods.
Perceptual assessment methods, that is the assessment of a system’squality by means of human ratings, follow stringent and standardizedtest protocols. Those protocols can be distinguished by a numberof aspects. The most important aspects are Test Modality (audio,video, audiovisual), Test Paradigm (non-interactive, conversation), Pre-sentation Mode (single or multiple stimuli per rating), Presentation ofReference (none, hidden or known to participant), Rating Mode (retro-spective, instantaneous), Rating Scale Type (quality, impairment, other),Rating Scale Values (discrete, continuous), and usage of Labels andNumbers on the Rating Scales.
Instrumental assessment methods, that is the estimation of a sys-tem’s quality by means of a computational model, are limited to acertain number of test cases. For that reason, the key characteris-tics of such models need to match the test case at hand. The mostimportant characteristics are Test Protocol, which served as the basisfor the model development, Prediction Modality (audio, video, audio-visual), Prediction Paradigm (non-interactive, conversation), ReferenceType (Full-Reference, Reduced-Reference, No-Reference), and InputSource (system parameters, signals, packet data stream).

Part III
Contribution

5Conceptual Model of Telemeeting Quality
This chapter contains text passages that either stem from previous texts of the author or that are based on such source texts. Forreadability purposes those passages are not marked as quotations. The main source documents used for this chapter are:
- Janto Skowronek, Katrin Schoenenberg, and Gunilla Berndtsson. “Multimedia Conferencing and Telemeetings”. In: Quality of Experience - AdvancedConcepts, Applications, Methods. Ed. by Sebastian Möller and Alexander Raake. Springer, 2014, pp. 217–228
- Janto Skowronek et al. “Method and Apparatus for Computing the Perceived Quality of a Multiparty Audio or Audiovisual TelecommunicationService or System”. Patent application WO/2016/041593 (EP). Deutsche Telekom AG. Mar. 2016
- Janto Skowronek and Alexander Raake. “Conceptual model of multiparty conferencing and telemeeting quality”. In: Proceedings of the 7thInternational Workshop on Quality of Multimedia Experience (QoMEX 2015). Pilos, Greece, May 2015, pp. 1–6
Since additional documents served as further background material, see Appendix A for the full list of source documents and theircontributions to this chapter.
What this chapter is about
When it comes to the assessment of telemeeting quality, a number ofambiguities inherent in this task can cause misinterpretation of results.The goal of this chapter is to dissolve such ambiguities by providinga conceptual model for telemeeting quality. This conceptual modelcould serve as a tool to precisely specify all those aspects of telemeet-ing quality that a researcher or practitioner plans to investigate. Forthe present text, it will serve as a theoretical basis for the empiricalresearch described in the next chapters.
5.1 Introduction
Quality of Experience is apparently a non-trivial issue because theprocess from perception to quality judgment inside a user appears tobe rather complex, which is, in addition, influenced by many factors.In order to structure and explain this complex matter, conceptualmodels of the quality formation process have been developed in theliterature, which can be more specifically described as taxonomies 1,
1 Sebastian Möller. Assessment and Pre-diction of Speech Quality in Telecommuni-cations. Kluwer Academic publishers,2000
Sebastian Möller. Quality of Telephone-Based Spoken Dialogue Systems. NewYork, USA: Springer, 2005
Alexander Raake. Speech Quality ofVoIP – Assessment and Prediction. Chich-ester, West Sussex, UK: Wiley, 2006
Andreas Silzle. “Quality Taxonomiesfor Auditory Virtual Environments”. In:Proceedings of the 122nd AES Convention.May 2007
Sebastian Möller et al. “A Taxon-omy of Quality of Service and Qualityof Experience of Multimodal Human-Machine-Interaction”. In: Proceedings ofthe International Workshop on Quality ofMultimedia Experience QoMEX. 2009
categorizations 2 and process models 3. Quality of Experience of a
2 Sebastian Möller, Marcel Wältermann,and Marie-Neige Garcia. “Features ofQuality of Experience”. In: Quality ofExperience - Advanced Concepts, Applica-tions, Methods. Ed. by Sebastian Möllerand Alexander Raake. Springer, 2014,pp. 73–84
Ulrich Reiter et al. “Factors Influenc-ing Quality of Experience”. In: Qualityof Experience - Advanced Concepts, Appli-cations, Methods. Ed. by Sebastian Möllerand Alexander Raake. Springer, 2014,pp. 55–72
3 Alexander Raake. Speech Quality ofVoIP – Assessment and Prediction. Chich-ester, West Sussex, UK: Wiley, 2006
Alexander Raake and Sebastian Egger.“Quality and Quality of Experience”. In:Quality of Experience - Advanced Concepts,Applications, Methods. Ed. by SebastianMöller and Alexander Raake. Springer,2014, pp. 11–34
telemeeting – in short telemeeting quality – is even more complexbecause there are a number of ambiguities when it comes to theproper interpretation of telemeeting quality.
One such ambiguity is that telemeeting quality can refer to thequality perceived by each individual telemeeting participant, or tothe quality perceived by the whole group of telemeeting participants.

90 quality of experience of multiparty conferencing and telemeeting systems
Focusing on the perspective of an individual participant, telemeetingquality can refer either to the quality of the whole telemeeting or tothe quality of the individual connections between participants. Noticethat in the following these related ambiguities are addressed as theDifferent Aggregation Levels of Telemeeting Quality.
Another ambiguity is that telemeeting quality can focus on mediatransmission quality, e.g. perception of speech or video signal distor-tions, on group communication aspects, e.g. perceived conversationflow or comfort, or on both. Notice that in the following these differentfoci are addressed as the Telecommunication & Group-CommunicationComponents of Telemeeting Quality.
Apparently, there are different facets of telemeeting quality whichrequire a solid description in order to avoid misinterpretation ofresearch results. For that purpose, the following sections will de-scribe how the aforementioned telemeeting specific concepts QualityAggregation Levels and Telecommunication & Group-Communication Com-ponents influence the perception of telemeeting quality. To this aim,Section 5.2 will re-synthesize and extend an existing model of thequality formation process inside a person; while Sections 5.3 to 5.4will each describe one of the telemeeting specific concepts in moredetail and will then include them into the process model.
5.2 Telemeeting Quality Formation Process
This section describes a conceptual model of the quality formationprocess inside a telemeeting participant. The model is based on acomprehensive model of the quality formation process proposed byRaake & Egger 4, which in turn builds on a prior model developed by 4 Alexander Raake and Sebastian Egger.
“Quality and Quality of Experience”. In:Quality of Experience - Advanced Concepts,Applications, Methods. Ed. by SebastianMöller and Alexander Raake. Springer,2014, pp. 11–34
Raake 5 and the concepts of Jekosch 6.
5 Alexander Raake. Speech Quality ofVoIP – Assessment and Prediction. Chich-ester, West Sussex, UK: Wiley, 2006
6 Ute Jekosch. “Sprache hörenund beurteilen: Ein Ansatz zurGrundlegung der Sprachqualitäts-beurteilung”. Habilitation thesis.Universität/Gesamthochschule Essen,Germany, 2003
Ute Jekosch. Voice and Speech QualityPerception – Assessment and Evaluation.Berlin, Germany: Springer, 2005
While the model of Raake & Egger is a very generic model thatcovers various aspects of the quality formation process inside a person,the present text will re-synthesize that model for the specific case oftelemeetings. To this aim, the model presented here will focus on alimited number of parts of the Raake & Egger model that are essentialin the telemeeting context. In addition, the telemeeting-specific modelwill elaborate on a number of those essential parts in more detail thanit has been done for the Raake & Egger model. Given the complexityof the process model, the present text will explain step-by-step theindividual model components, starting from the basic principle andending at a detailed level sufficient to include later the telemeetingspecific aspects Quality Aggregation Levels and Telecommunication &Group-Communication Components.
5.2.1 Basic principle
Starting from the definitions of Jekosch, Figure 5.1 visualizes the basicprinciple of the quality formation process: Telemeeting quality is theresult of a judgment process in which the perceived composition ofthe telemeeting is compared against its desired composition. In this

conceptual model of telemeeting quality 91
process, the perceived composition is the totality of quality-relevantfeatures that are perceived from the telemeeting, which requires aperception process in the model.
Furthermore, it is known that various influencing factors have animpact on the quality formation process, e.g. Reiter et al. 7, as well 7 Ulrich Reiter et al. “Factors Influenc-
ing Quality of Experience”. In: Qualityof Experience - Advanced Concepts, Appli-cations, Methods. Ed. by Sebastian Möllerand Alexander Raake. Springer, 2014,pp. 55–72
as the perception process, e.g. Raake & Egger 8. Such factors can be
8 Alexander Raake and Sebastian Egger.“Quality and Quality of Experience”. In:Quality of Experience - Advanced Concepts,Applications, Methods. Ed. by SebastianMöller and Alexander Raake. Springer,2014, pp. 11–34
organized in three categories:
1. Human Influencing Factors, some of them are stemming frominside the person, such as the persons’ emotional state or atti-tude, others are stemming from outside the person, such as thepersonality or interaction behavior of the other interlocutors 9.
9 Janto Skowronek, Katrin Schoenen-berg, and Gunilla Berndtsson. “Multi-media Conferencing and Telemeetings”.In: Quality of Experience - Advanced Con-cepts, Applications, Methods. Ed. by Se-bastian Möller and Alexander Raake.Springer, 2014, pp. 217–228
2. System Influencing Factors, covering essentially all technical as-pects of the system that contribute to the quality judgment.
3. Context Influencing Factors, covering all contextual aspects ofthe situation in which a quality judgment is made, including theenvironment, use case, tasks, social context, economic context.
Now, considering the specific case of a quality assessment test, thisprinciple can be extended in four aspects according to Figure 5.1: First,a coding process is included in which the person is transforming hisor her internal quality judgment into a description that is available tothe outside world, i.e. the investigator. Second, such descriptions areusually ratings on a scale provided to the person during the assess-ment test, but they can in principle also be of a verbal nature. In otherwords that quality assessment test is directly influencing the codingprocess. Third, the fact that a quality assessment test is taking placedetermines the influencing factors, e.g. the person as a test participantis in a certain state, the system properties are defined in form ofdifferent conditions, and the contextual situation is determined bytest environment, tasks and so forth. Fourth, Jekosch discussed thatthe person is performing a “controlled quality evaluation”, thus thequality assessment test as such can also directly trigger the qualityformation process.

92 quality of experience of multiparty conferencing and telemeeting systems
Figure 5.1: Quality formation processinside a telemeeting participant: Basicprocess model according to the principleconcept of Jekosch for the situation of aquality assessment test.
Ute Jekosch. Voice and Speech QualityPerception – Assessment and Evaluation.Berlin, Germany: Springer, 2005

conceptual model of telemeeting quality 93
5.2.2 Reflection and Attribution
Raake 10 specified the principle of Jekosch in more detail by introduc- 10 Alexander Raake. Speech Quality ofVoIP – Assessment and Prediction. Chich-ester, West Sussex, UK: Wiley, 2006
ing an additional reflection stage: This stage emphasizes that fromthe totality of all characteristics of an item, only those characteristicsare used in the judgment process that are quality relevant. Further-more, the more recent version by Raake & Egger 11 calls this stage 11 Alexander Raake and Sebastian Eg-
ger. “Quality and Quality of Experi-ence”. In: Quality of Experience - Ad-vanced Concepts, Applications, Methods.Ed. by Sebastian Möller and AlexanderRaake. Springer, 2014, pp. 11–34
reflection and attribution in order to account for the possibility thatany quality-relevant features are also actually attributed to the itemunder consideration and not to something else such as the environ-ment or the interlocutors12. Figure 5.2 visualizes that additional stage,
12 This aspect of attribution is particu-larly important in the context of delay,as Raake for instance discusses that un-der certain conditions delay may be at-tributed to the interlocutors and not tothe system.
Alexander Raake. Speech Quality ofVoIP – Assessment and Prediction. Chich-ester, West Sussex, UK: Wiley, 2006
whereas the two aspects reflection and attribution are drawn as sepa-rate processing blocks: The combination of both blocks separate fromthe perceived character, i.e. totality of all perceived features, only theperceived quality features, i.e. those features that are quality-relevantand attributed to the telemeeting. In other words, these stages can beinterpreted as a selection process. Similarly to the perceived character,also the desired character, i.e. the totality of features that characterizethe quality reference, is filtered, leading to a set of relevant desiredquality features.
Figure 5.2: Quality formation processinside a telemeeting participant: Exten-sion of the process model with a reflec-tion and attribution stage, according tothe models from Raake and Raake & Eg-ger.

94 quality of experience of multiparty conferencing and telemeeting systems
5.2.3 A more detailed process of perception
The model of Raake & Egger 13 provides more details of the perception 13 Alexander Raake and Sebastian Eg-ger. “Quality and Quality of Experi-ence”. In: Quality of Experience - Ad-vanced Concepts, Applications, Methods.Ed. by Sebastian Möller and AlexanderRaake. Springer, 2014, pp. 11–34
process, from which some aspects will be relevant later when it comesto the multiparty-specific extensions. For that reason, Figure 5.3visualizes the relevant details of perception.
First, Raake & Egger distinguish between perception and experi-encing by inserting an experiencing stage as a subsequent process tothe perception stage. This extra stage reflects the view of Raake & Eg-ger that a quality judgment is made on experiencing the item underconsiderations, whereas the authors define experience as the one“individual stream of perceptions (of feelings, sensory percepts andconcepts) that occurs in a particular situation of reference.” In otherwords, experiencing refers on the one hand to a subset of all objects inthe perceptual world of a person (i.e. individual stream); on the otherhand it refers to a certain encounter with the item under consideration(i.e. situation of reference).
Second, Raake & Egger describe that perception is actually aniterative process combining bottom-up and top-down processes: Thephysical input from the person’s sensory organs is processed and sentinto higher cognitive processes to form perceptual events. Then thoseevents are matched against anticipated hypotheses, which are gener-ated in a top-down manner based on internal perceptual references.
Third, Raake & Egger suggest that the perceptual references arealso used as input for the reflection and the subsequent attributionstage, which essentially determines the desired character.

conceptual model of telemeeting quality 95
Figure 5.3: Quality formation processinside a telemeeting participant: Exten-sion of the process model with a moredetailed description of the perceptionand experiencing process, according tothe model from Raake & Egger.
Alexander Raake and Sebastian Egger.“Quality and Quality of Experience”. In:Quality of Experience - Advanced Concepts,Applications, Methods. Ed. by SebastianMöller and Alexander Raake. Springer,2014, pp. 11–34

96 quality of experience of multiparty conferencing and telemeeting systems
5.2.4 Quality Awareness and Quality Attention Focus
Another process block proposed by Raake & Egger 14 is a quality 14 Alexander Raake and Sebastian Eg-ger. “Quality and Quality of Experi-ence”. In: Quality of Experience - Ad-vanced Concepts, Applications, Methods.Ed. by Sebastian Möller and AlexanderRaake. Springer, 2014, pp. 11–34
awareness stage, which is introduced as a trigger mechanism toactually start a quality formation process of an experience. Figure 5.4visualizes the triggering character of this quality awareness stage bymeans of switches placed before the reflection process stage. Thisemphasizes that a quality judgment takes only place if certain internalor external triggers are activated. An internal trigger would be thatcertain assumptions that the person has of the perceived object arenot met, for example when the character of speech signals in thetelemeeting is different than what the person is used to. This actuallymeans that the results of the “Anticipation and Matching” stageare examined to trigger the quality formation process. An externaltrigger would be an instruction given to the person to make a qualityjudgment, for example in case of a quality assessment test. Thus,the quality assessment test as such can control the quality awarenessstage. Correspondingly, Figure 5.4 visualizes the two possible inputpaths to the quality awareness stage.
A new refinement to the process model is to insert an additionalstage representing the quality attention focus (see Figure 5.4). Qualityattention focus is a term introduced here to describe a cognitiveprocess that focuses the attention to a limited number of qualityrelevant aspects, i.e. the set of quality features, that a user is actuallyconsidering when making the quality judgment. Quality attentionfocus15 refers to what is focused on during the quality judgment 15 Attention is a term widely used to
describe the human ability to concen-trate on a limited set of informationto perform a certain task. More pre-cisely, in psychology, attention can referto sensory perception or to higher cog-nitive processes and motor control andcan be related to working memory andlearning. For a comprehensive overviewof these different facets, the interestedreader may be referred to the work ofPashler. However, for the present text,the interpretation of the term as a gen-eral concept is sufficient.
Harold E. Pashler. The psychology of at-tention. Cambridge, MA, USA: The MITPress, 1998
process, while quality awareness refers to the act of triggering thequality judgment process.
While such a stage could be simply seen as part of the reflectionand attribution stage, the introduction as an extra stage emphasizesthat the interpretation of the reflection and attribution stage as aselection process requires two inputs: on the one hand a mechanismto trigger the selection (“when to select”), as it is represented by thequality awareness stage; on the other hand a mechanism to define theselection (“what to select”), as it is presented by the new stage.
As for the quality awareness stage, the quality attention focusstage uses as input either internal or external information in order todefine which set of quality features shall be selected. The externalinput would be again the instructions given in a quality assessmenttest, as shown in Figure 5.4. Concerning the internal input, thosecharacteristics of the perceptual object that are different from theassumptions and that are actually triggering the quality awarenesswould be the primary set of characteristics that shall be reflected upon.However, the quality attention focus may be more complex by alsoidentifying additional characteristics that should be reflected upon.This accounts for the author’s view that single characteristics can besufficient to trigger a quality judgment, while the quality judgment assuch can be nevertheless a multidimensional construct. An exampleto explain this perspective: The perception of a clearly audible speech

conceptual model of telemeeting quality 97
distortion during the telemeeting triggers the participant to reflecton quality. Then it might happen of course that only this distortionwould be used in the judgment process, independently from whetheradditional aspects of the telemeeting, such as conversational flow orintelligibility, are affected by that distortion or not (“I heard that cleardistortion, so the telemeeting is just bad”). However, it might alsohappen that the other aspects are taken into account as well (“I heardthat distortion, but I still could understand and follow the discussion,so it was not too bad”), even if those aspects alone would not triggera quality judgment (“Conversational flow and intelligibility are asalways, so no need to judge the quality”). In order to allow the processmodel to use additional perceptual characteristics than those usedto trigger quality awareness, Figure 5.4 shows that the input of thequality attention stage is not stemming from the quality awarenessstage but directly from the perception process.

98 quality of experience of multiparty conferencing and telemeeting systems
Figure 5.4: Quality formation processinside a telemeeting participant: Exten-sion of process model with a qualityawareness stage, according to the modelfrom Raake & Egger, and a newly intro-duced quality attention focus stage.
Alexander Raake and Sebastian Egger.“Quality and Quality of Experience”. In:Quality of Experience - Advanced Concepts,Applications, Methods. Ed. by SebastianMöller and Alexander Raake. Springer,2014, pp. 11–34

conceptual model of telemeeting quality 99
5.2.5 Summary of process model
Figure 5.4 visualizes the whole process model developed in the pre-vious sections. This model version does not include the multiparty-specific concepts Quality Aggregation Levels and Telecommunication &Group-Communication Components. Those will be included in the nextsections, after the concepts have been discussed in more detail.
Figure 5.5: Quality formation processinside a telemeeting participant: Sum-mary of the process model.

100 quality of experience of multiparty conferencing and telemeeting systems
5.3 Different Aggregation Levels of Telemeeting Quality
A telemeeting system essentially provides a set of individual but si-multaneous communication channels between multiple interlocutors,henceforth referred to as individual connections. The possibility toencounter asymmetric conditions, i.e. interlocutors are connected withdifferent equipment and connection properties, raises the questionto which extent the individual connections contribute to the overallsystem quality. This refers to the mental models that interlocutorsform about the telemeeting system while communicating over thosesystems16. An example in which interlocutors may become aware 16 According to Norman, mental mod-
els are considered to be generated andmodified during the interaction with asystem; they are functional but need notbe technically correct; and they dependon the user’s technical background andexperience with similar systems.
Donald A. Norman. “Some Observa-tions on Mental Models”. In: MentalModels. Ed. by Dedre Genter and Al-bert L. Stevens. Psychology Press, 1983,pp. 7–14
of the individual connections is an asymmetric setting with strongquality impairments for one single interlocutor and no impairmentsfor the other interlocutors. An example in which interlocutos may notconsider individual connections is a symmetric setting in which noparticular differences between interlocutors are perceived.
As a tool to investigate such potential differences between asym-metric and symmetric conditions, the present section introduces threedifferent quality aggregation levels of telemeeting quality. The firstlevel reflects how each interlocutor perceives the quality of theseindividual connections, henceforth referred to as Individual ConnectionQuality and abbreviated as Qij. The second level reflects how eachinterlocutor perceives the quality of the overall telemeeting, i.e. thecomposition of the individual connections, henceforth referred to asSingle-perspective Telemeeting Quality and abbreviated as Qi. The thirdlevel reflects how the whole group of interlocutors perceives the qual-ity of the overall telemeeting, i.e. the combination of the judgments ofall interlocutors, henceforth referred to as Group-perspective TelemeetingQuality and abbreviated as Qall .
These three aggregation levels show that telemeeting quality is afunction of perspective (perspective of individual interlocutors or ofthe whole group) and focus (focusing on the whole telemeeting, oron individual connections). This does not only concern the reportingand interpretation of results, it has also some non-trivial implica-tions for the conduction of perceptual quality assessment tests: testmethods need to be appropriate to collect the quality judgments fromthe right perspective, i.e. the perspective of the whole group or ofindividual participants; and test instructions need to be formulatedin such a way that the subjects’ focus is triggered as desired, i.e. fo-cusing on individual connections or the overall composition of thoseconnections.
This is especially relevant for Chapter 8, in which both symmetricand asymmetric conditions will be investigated and in which testparticipants will be explicitly asked to rate Single-perspective Telemeet-ing Quality Qi and Individual Connection Quality Qij. For that reason,the remainder of this section provides a precise specification of thetargeted quality aggregation levels.

conceptual model of telemeeting quality 101
5.3.1 Concept of Individual Connections and Individual ConnectionQuality
Figure 5.6 illustrates the individual connections in the form of signalpaths between three interlocutors (IL1, IL2, IL3) who are connectedvia a telemeeting system. As the figure shows for such a three-partycall, audio and video signals are sent from every interlocutor toeach other interlocutor. In addition, each interlocutor may also getback some feedback signals, that are possibly altered versions of theaudio or video signals that he or she is sending into the telemeeting.Examples from the audio domain are the presence of side tones orechoes, an example from the video domain is a window on the videoscreen showing the own camera picture.
Pi→j: Audiovisual signal pathsfrom ILi to ILj.
Pi→i : “Feedback” signal pathsfrom ILi back to ILi .
Figure 5.6: Concept of individual con-nections between telemeeting partici-pants on the example of three partici-pants. The individual connections areexpressed by audiovisual signal pathsbetween the interlocutors.
As Figure 5.6 suggests, the exact interpretation of individual connec-tions may focus on each individual signal path per direction betweentwo interlocutors, may include both directions, and may include orexclude those feedback signal paths. An additional interpretationpossibility is to consider an individual connection not between twointerlocutors, but between an interlocutor and the telemeeting. Thismeans that the concept of Individual Connection Quality is subject todifferent interpretations, which needs to be reflected by the employedtest method, e.g. by proper test instructions. However, before theseinterpretations are explained in more detail, two aspects will be men-tioned first, namely the notion that there exists a mutual influence ofindividual connection qualities and that two different categories ofquality features may be distinguished.
5.3.2 Mutual Influence of Individual Connection Qualities
There is one additional aspect concerning Individual Connection QualityQij that requires some clarification. At first glance, Qij appears tocorrespond to the quality of a conventional two-party connection.However, in Skowronek et al. 17 we discussed that 17 Janto Skowronek, Katrin Schoenen-
berg, and Gunilla Berndtsson. “Multi-media Conferencing and Telemeetings”.In: Quality of Experience - Advanced Con-cepts, Applications, Methods. Ed. by Se-bastian Möller and Alexander Raake.Springer, 2014, pp. 217–228
...both from a technical and a perceptual point of view, this is notentirely true. Technically it is possible that a degradation occurringin one connection can also affect the other connections. For example,an acoustic echo at the device of one interlocutor does not only meanthat the other interlocutors hear an echo of their own voices (i.e. talkerecho), but they also hear the echoed voices of all other interlocutorsthat are also fed back via that one echo-causing device (i.e. listenerecho). Perceptually it is known that the context can influence qualityjudgments; hence it cannot be assumed that the quality perceptionof the considered individual connection in the multiparty call will bethe same as the perception of the technically same connection in atwo-party call.
That means, there is some mutual influence of individual connectionstaking place in a multiparty setting, which would not be there in atwo-party setting. In the following sections, this mutual influence isinherently taken into account by analyzing the contributions of theindividual signal paths to Qij directly in the multiparty context.

102 quality of experience of multiparty conferencing and telemeeting systems
5.3.3 Signal-based and Cue-based Quality Features
A quality rating is the outcome of a comparison process, in which theperceived quality features of the item are compared with its desiredquality features. Those quality features can be grouped into differentcategories, see Section 4.3. In this context of Individual ConnectionQuality, however, the author defines two categories of quality featuresfrom a slightly different perspective: quality features extracted fromthe audio and video signals on that connection, here referred to assignal-based features, and quality features inferred from non-signalcues about that connection such as content or auxiliary information,here referred to as cue-based features. Examples for the first categoryare to hear or see distortions in the audio or video signal; examplesfor the second category are comments made by the other interlocutorssuch as “I can’t see you well”, “I do hear my own voice” or “Couldyou repeat, please?”
Which combination of those two categories of quality features willbe used in the judgment process, especially in the experiments inChapter 8, depends on two constraints. The first constraint is thequestion which individual connection is assessed by which interlocu-tor. The signal-based features can only be extracted from those signalsthat an interlocutor is actually receiving; for all other signal paths, heor she may consider only cue-based quality features. Figure 5.7 illus-trates this on the situation for interlocutor IL1. The second constraintis the question if there is any quality relevant information available atall. Regarding the signal-based features, this concerns the feedbacksignals as they may or may not bear information that a participantcan use, e.g. presence or absence of echo. Regarding to the cue-basedfeatures, interlocutors may or may not say something from which theassessing participant can infer such cues. Thus, the former type ofquality features depends on the technical conditions, the latter typedepends on the technical condition and the behavior of interlocutors.
Quality features based on per-ception of signal characteristics:Si→j = signal-based qualityfeatures from ILi to ILj.Quality features inferred fromnon-signal cues (e.g. content,other information):Ci→j = cue-based qualityfeatures from ILi to ILj.
Figure 5.7: Concept of two types of qual-ity features on the example of interlocu-tor IL1.
5.3.4 Interpretations of Individual Connection Quality Qij
There are eight different possibilities to interpret the signal pathsfrom Figure 5.6 as individual connections, given the three combina-tory variables discussed above: one direction vs. two directions, withfeedback signals vs. without feedback signals, and connection between twointerlocutors vs. connection between interlocutor and the system. As aconsequence, participants in a quality assessment test may have adifferent understanding of Individual Connection Quality Qij thanthe researcher. This could lead to an increased measurement noise oreven to misinterpretation of results by the researcher.
To minimize such risks, a researcher may take two measures: First,proper test instructions and experimental designs may increase theprobability that a certain interpretation is – at least predominantly –used by participants. Second, the interpretation of results acknowl-edges that different interpretations of an Individual Connection Qual-ity Qij are possible and it includes a discussion, which interpretation

conceptual model of telemeeting quality 103
or mixture of interpretations were most likely used by participants,or which were at least intended in light of the actual experimentalsetup. To facilitate such interpretations of results, the following willexamine in more detail those two of the eight different interpretationsin which both directions and the feedback signals are included.
Interpretation 1: Qa,ij Quality of the connection in both directionsbetween ILi and ILj, seen from the perspective of ILa.The contributing paths are the two going from one interlocutor to theother and the feedback paths of the two interlocutors. Thus, Qa,ij is afunction of the relevant quality features on those four paths.
Figure 5.8 visualizes two examples from the perspective of IL1 thatexemplarily show the relevant paths and quality features. From theseexamples the following generic rules can be extracted:
Ifa = i (observer is part of the connection),thenQa,ij = Qa,aj = f (Sj→a, Sa→a, Ca→j, Cj→j).
Ifa 6= i 6= j (observer is not part of the connection),thenQa,ij = f (Ci→j, Cj→i, Ci→i, Cj→j).
Example 1: Quality of the connectionin both directions between IL1 andIL2, seen from the perspective of IL1:Q1,21 = f (S2→1, C1→2, S1→1, C2→2)
Example 2: Quality of the connectionin both directions between IL2 andIL3, seen from the perspective of IL1:Q1,23 = f (C2→3, C3→2, C2→2, C3→3)
Figure 5.8: Qa,ij: Quality of the connec-tion in both directions between ILi andILj, seen from the perspective of ILa.Two examples from the perspective ofinterlocutor IL1.
Interpretation 2: Qa,iT Quality of the connection in both directionsbetween an interlocutor ILi and the telemeeting T, seen from theperspective of ILa. The contributing paths for Qa,iT are all outgoingpaths from ILi, all incoming paths to ILi, and the feedback pathsof all interlocutors. Thus Qa,iT is a function of the relevant qualityfeatures on those seven paths.
Figure 5.9 visualizes two examples from the perspective of IL1 thatexemplarily show the relevant paths and quality features. From theseexamples the following generic rules can be extracted:
Ifa = i (observer is part of the connection),thenQa,iT = Qa,aT = f (Ca→j, Ca→k, Sj→a, Sk→a, Sa→a, Cj→j, Ck→k).
Ifa 6= i (observer is not part of the connection),thenQa,iT = f (Si→a, Ci→j, Ca→i, Cj→i, Sa→a, Ci→i, Cj→j).

104 quality of experience of multiparty conferencing and telemeeting systems
Example 1: Quality of the connectionin both directions between an inter-locutor IL2 and the telemeeting T, seenfrom the perspective of IL1: Q1,2T =f (S2→1, C1→2, C2→3, C3→2, S1→1, C2→2, C3→3)
Example 2: Quality of the connectionin both directions between an inter-locutor IL1 and the telemeeting T, seenfrom the perspective of IL1: Q1,1T =f (S2→1, C1→2, S3→1, C1→3, S1→1, C2→2, C3→3)
Figure 5.9: Qa,ij: Quality of the connec-tion in both directions between ILi andILj, seen from the perspective of ILa.Two examples from the perspective ofinterlocutor IL1.
Implication for this work The experimental studies in Chapter 8 targetInterpretation 2 by means of dedicated instructions and correspondingphrasing of the questions in the questionnaire (see Chapter 8 fordetails).
5.3.5 Single-Perspective Telemeeting Quality Qi
The second level of telemeeting quality – the Single-Perspective Tele-meeting Quality Qi – refers to the quality that a participant perceivesfrom the whole telemeeting as such. In terms of quality aggregation,two concepts are possible, depending on the mental model that aparticipant has formed about the telemeeting system. One conceptis that Qi is a function of the Individual Connection Qualities Qij. Thismeans that participants are first forming quality judgments of theindividual connections and then combine them to an overall judg-ment. The other concept is that Qi is a function of the individualsignal-based or cue-based quality features that participants extractfrom the individual connections.
The difference between the two processes relates to whether eitherthe quality features are first transformed into quality judgments andthose are then aggregated over the individual connections, or whetherthe quality features are first aggregated over the individual connec-tions and then transformed into one quality judgment. Although thedifference between both processes may be rather small, it has someimplications in many practical contexts, both from a perceptual andan engineering perspective.
From a perceptual perspective, the first concept presumes thatparticipants have indeed a mental model of the individual connectionsin mind; otherwise they could not form a quality judgment of thoseindividual connections first. The second concept does not requiresuch a mental model of individual connections as participants maydirectly form one quality judgment for the whole telemeeting basedon all quality features that they perceive, without the need to firstassign those quality features to individual connections.

conceptual model of telemeeting quality 105
From an engineering perspective, both concepts would lead to dif-ferent modeling approaches. The first concept suggests to model firstthe Individual Connection Qualities Qij based on existing modeling ap-proaches for one-to-one conversations, and then the Single-PerspectiveQuality Qi from the predictions of Qij by means of an appropriateaggregation function. The second concept suggests to directly modelSingle-Perspective Telemeeting Quality Qi from the available input in-formation representing the quality features. This means to calculatethe aggregation of quality features by directly changing the internalcomputations of existing models or developing new models fromscratch.
5.3.6 Group-Perspective Telemeeting Quality Qall
The third level of telemeeting quality – the Group-Perspective Tele-meeting Quality Qall – refers to the quality that the whole group ofparticipants is perceiving from the telemeeting. In terms of qualityaggregation, Qall is a function that represents a joint quality judgmentfrom all participants. For modeling, Qall can be calculated eitherfrom the Single-Perspective Qualities Qi, from the Individual ConnectionsQualities Qij, directly from the quality features or from a combinationof any of these three types of information.
Independently from the exact modeling approach, there is a con-ceptual difference between modeling the Group-Perspective TelemeetingQuality Qall and modeling the Single-Perspective Telemeeting QualityQi. The computation of Qi, which is a quality judgment of a singleparticipant, is based on information from the perspective of that singleparticipant (Qij, quality features). Extending a corresponding discus-sion in Skowronek et.al 18, this means that the relation between Qi
18 Janto Skowronek, Katrin Schoenen-berg, and Gunilla Berndtsson. “Multi-media Conferencing and Telemeetings”.In: Quality of Experience - Advanced Con-cepts, Applications, Methods. Ed. by Se-bastian Möller and Alexander Raake.Springer, 2014, pp. 217–228
and Qij or the quality features, respectively, can be determined froma perspective from inside the telemeeting. The computation of Qall ,which represents a joint quality judgment of a group of participants,is based on information from different participants. Thus determiningQall requires a perspective outside of the telemeeting, as now differentperceptions of the same system need to be integrated.
Here the term outside does not necessarily mean that Qall is deter-mined by someone who was not part of the telemeeting. Instead itmeans that determining Qall is a process, in which all participantscome to that joint quality judgment by changing from their personalperspective to a joint perspective. Such a process could be for instancethat all are describing their personal experiences and then discussingthe common experience. However, Qall may be also determined bysomeone who was indeed not part of the telemeeting, such as theservice provider who could consider Qall as an abstract measure forbenchmarking or optimization.
5.3.7 Extension of the Quality Formation Process Model
This section will describe how the concept of Quality AggregationLevels relates to the quality formation process within a telemeeting

106 quality of experience of multiparty conferencing and telemeeting systems
participant by extending the process model from Section 5.2. To bemore precise, only the two levels Single-Perspective Telemeeting QualityQi and the Individual Connection Quality Qij are incorporated, sincethe model concerns the process inside an individual interlocutor.
The model extension has three main components: (1) a process thatdecides which aggregation level is actually considered, henceforthreferred to as Quality Aggregation Level Selection; (2) a process thatdecomposes the quality perception of the telemeeting into quality per-ception of individual connections, henceforth referred to as MultipartyDecomposition; and (3) a process that aggregates the quality perceptionof individual connections to a telemeeting quality perception, hence-forth referred to as Multiparty Aggregation. This approach with threestages provides the flexibility required to account for the fact thatthere are four different scenarios possible in which the aggregationlevels contribute to the quality formation process. The four scenariosmay differ from person to person and even case-by-case, and theydiffer in the questions whether a decomposition takes place at all,whether an aggregation takes place at all, and in case it takes place,whether the aggregation is actually happening before or after forminga quality judgment. The scenarios are characterized in more detail asfollows:
1. The person is judging the Single-Perspective Telemeeting Quality Qi
without decomposing the telemeeting into individual connections.In this scenario, the person has no need, possibility or capability toidentify individual connections, and is forming a quality judgmentusing directly all quality features (“I perceive some slight distor-tions. Thus, the overall quality is moderate”). In mathematicalterms this means:
Q = Qai = Da(
−−→Xa
des,−−→Xa
per) (5.1)
with Da : quality judgment function comparing the desired qualityfeature vector
−−→Xa
des and the perceived quality feature vector−−→Xa
per.
2. The person is judging the Single-Perspective Telemeeting Quality Qi
by decomposing the telemeeting into individual connections on aquality-feature level and aggregating those features without form-ing explicit judgments on the Individual Connection Quality Qij. Inthis scenario, the person indeed identifies the quality features ofindividual connections, but will form a quality judgment directlyusing all those quality features (“I perceive one participant dis-torted and the others without distortions. Thus the overall qualityis moderate”). In mathematical terms this means:
Q = Qbi = Db(Ab(
−−−→Xb
des,ij), Ab(−−−→Xb
per,ij)) (5.2)
with Ab an aggregation function over the individual connections
of the quality feature vectors−−−→Xb
des,ij and−−−→Xb
per,ij per individual con-nection. The difference to the previous scenario is that the personmight now focus on a different set of quality features, might weight

conceptual model of telemeeting quality 107
the quality features of the individual connections differently andmight perform a certain probably non-linear aggregation opera-tion. In mathematical terms, this difference can be expressed by−−→Xa
des 6= Ab(−−−→Xb
des,ij) and−−→Xa
per 6= Ab(−−−→Xb
per,ij).
3. The person is judging the Single-Perspective Telemeeting QualityQi by decomposing the telemeeting into individual connections,forming judgments on the Individual Connection Quality Qij for eachconnection and then aggregating those judgments. In this scenario,the person forms quality judgments of the individual connectionsand then aggregates them into an overall judgment (“I perceive oneparticipant distorted – so he has a bad connection – and the otherswithout distortions – so they have good connections. Thus, theoverall quality is moderate”). In mathematical terms this means:
Q = Qci = Ac(Dc(
−−−→Xb
des,ij,−−−→Xb
per,ij)) (5.3)
with Ac an aggregation function over the Individual ConnectionQuality scores Qij. The difference to the previous scenario is thatthe person might now use a different aggregation function overindividual connections, or that the judgment function is actuallydifferent for individual connections and for the whole telemeeting.In mathematical terms, this can be expressed by Ac 6= Ab andDc 6= Db.
4. The person is judging an Individual Connection Quality Qij, meaningthat no aggregation across individual connections takes place. Inthis scenario, the person is directly focusing on one individualconnection (“I perceive one participant distorted – so she has a badconnection”). In mathematical terms this means:
Q = Qij = Dd(−−−→Xd
des,ij,−−−→Xd
per,ij)) (5.4)
With these four scenarios in mind, the inclusion of the three stagesQuality Aggregation Level Selection, Multiparty Decomposition, and Mul-tiparty Aggregation into the process model can now be motivated anddescribed, see also Figure 5.10.
Multiparty Decomposition and Multiparty Aggregation stages The fourscenarios suggest that the activation of these stages and their exactlocation in the process model depends on each scenario. For Scenario 1
both stages need to be deactivated; Scenario 2 requires the aggregationprocess before the Comparison & Judgment process; Scenario 3 requiresthe aggregation process after the Comparison & Judgment process;and for Scenario 4 the aggregation process needs to be deactivated.In order to have only one common visualization for these differentcases, Figure 5.10 indicates the two stages as sub-processes: theMultiparty Decomposition is considered as part of the Attribution stage,the Multiparty Aggregation as part of the Comparison & Judgment stage.
The argumentation for including the Multiparty Decomposition intothe Attribution stage is as follows: In the Attribution stage, the person

108 quality of experience of multiparty conferencing and telemeeting systems
is judging whether the perceived quality-relevant features comingfrom the Reflection stage are subject to the item under consideration,i.e. the telemeeting. This means the person is comparing the perceivedquality-relevant features with a mental model of the telemeetingsystem. Now, if the person is considering individual connections ofthe telemeeting, then those individual connections will constitute – orat least become part of – that mental model. In particular, the personis – more or less subconsciously – answering the question for himselfor herself whether the perceived quality-relevant features could beattributed to the individual connections, to the overall system or tosomething else, such as the interlocutors, environments etc. Hence,the Attribution process appears to be the appropriate place to integratethe Multiparty Decomposition stage.
The argumentation for including the Multiparty Aggregation intothe Comparison & Judgment stage is as follows: During the Compari-son & Judgment process, the desired and perceived quality featuresare compared and transformed into a quality judgment. Consideringthat the sets of desired and perceived quality features are assumed toconsist of more than one individual feature, quality judgments can beconsidered as multi-dimensional constructs (see for instance Wälter-mann 19 for a more in-depth discussion on dimensions of quality). 19 Marcel Wältermann. Dimension-based
Quality Modelling of Transmitted Speech.Springer, 2013
However, quality judgments are often – for instance in a qualityassessment test – expressed in a single-dimensional manner, alsoreferred to as Integral Quality 20. That means, some aggregation across 20 Sebastian Möller. Assessment and Pre-
diction of Speech Quality in Telecommuni-cations. Kluwer Academic publishers,2000
Marcel Wältermann. Dimension-basedQuality Modelling of Transmitted Speech.Springer, 2013
quality dimensions may take place during the Comparison & Judgmentstage. Now, considering the quality features of the individual con-nections as a number of such dimensions, the multiparty aggregationessentially represents such a similar mapping of dimensions onto asingle-dimensional scale. Hence, from a mathematical perspective,there is no conceptual difference between the aggregation of individ-ual features when forming a single-dimensional quality judgment,and the aggregation of features over individual connections. Thus,the Comparison & Judgment stage appears to be the appropriate placeto integrate the Multiparty Aggregation stage.
Quality Aggregation Level Selection stage The four scenarios suggesta process to control the other two stages in terms of activation anddeactivation and in terms of interaction with their higher-level pro-cesses Attribution and Comparison & Judgment. To this aim, a QualityAggregation Level Selection stage essentially defines which Quality Ag-gregation Level shall be used, or in other words, which level the personis focusing on. For that reason, this stage is included into the modelas a subprocess of the Quality Attention Focus stage, as it covers amultiparty-specific aspect of the person’s attention focus. Further-more, being part of the Quality Attention Focus, the Quality AggregationLevel Selection is essentially using the same input information, whicheither stems from the Anticipation & Matching stage or from the qualityassessment test. However, the path in Figure 5.10 from the qualityassessment test is directly drawn to the Quality Aggregation Level

conceptual model of telemeeting quality 109
Selection stage, and not to its superordinate stage Quality AttentionFocus. This is done to emphasize that a telemeeting quality assessmenttest can particularly be designed to assess a specific Quality Aggrega-tion Level, as this is addressed in the empirical research described inChapter 8.
Figure 5.10: Quality formation processinside a telemeeting participant: Ex-tension of process model with the con-cept of Quality Aggregation Levels, re-alized in three stages. One stage de-composes the telemeeting into individ-ual connections, which is considered asa sub-process of the Attribution stage;one stage aggregates the individual con-nections, which is considered as a sub-process of the Comparison & Judgmentstage; and one stage to control the de-composition and aggregation. See textfor further details.
110 quality of experience of multiparty conferencing and telemeeting systems
5.4 Telecommunication and Group-Communication Compo-nents of Telemeeting Quality
A telemeeting system enables a communication between a group ofusually more than two interlocutors who are located at physicallyremote locations. Thus, on the one hand a telemeeting is a groupconversation, on the other hand it is a conversation over a telecom-munication system. With regard to a conceptual telemeeting qualitymodel, the author proposes to consider these two aspects as twocomponents of telemeeting quality: a Telecommunication Componentand a Group-Communication Component. The term TelecommunicationComponent refers to the user’s perception of the system’s performancein transmitting information such as audio and video signals. Theterm Group-Communication Component refers to the user’s perceptionof the system’s performance in facilitating a group conversation.
5.4.1 Characterization of the Telecommunication and Group-Com-munication Components
The two components can more precisely be defined by the qualityfeatures that are used in the quality judgment process. The Telecom-munication Component refers to features that can directly be perceivedfrom impairments of the audio and video signals, whereas such im-pairments may be perceived when listening or viewing but also whentalking and gesticulating. In terms of the quality feature categoriza-tion proposed in Möller et al. 21, such features encompass the feature 21 Sebastian Möller, Marcel Wälter-
mann, and Marie-Neige Garcia. “Fea-tures of Quality of Experience”. In:Quality of Experience - Advanced Concepts,Applications, Methods. Ed. by SebastianMöller and Alexander Raake. Springer,2014, pp. 73–84
levels of direct perception and action.The Group-Communication Component refers to features that can be
perceived from impairments of the group conversation as such. Interms of the quality feature categorization proposed in Möller et al.,such features encompass the feature levels of interaction (e.g. conver-sational aspects) and usage instance (e.g. effectiveness and efficiencyin reaching a certain goal or aesthetics). Additional features proposedby the author are inspired by the exhaustive literature on humangroup-communication (see Chapter 2). Those features address group-communication aspects such as the perceived effort to establish acommon ground (e.g. speaker identification effort, focal assurance,perception of non-verbal feedback signals, and topic comprehensioneffort), the perception of group-conversation dynamics (e.g. negoti-ating of who’s turn is next), and the perception of cognitive load(e.g. concentration effort and fatigue).
Möller et al. provide for each of their categories an example listof quality features. Table 5.1 assigns that list of examples to the twocategories discussed here, augmented with the proposed additionalfeatures addressing group-communication aspects.

conceptual model of telemeeting quality 111
Quality Features that constitute the Telecommunication Component
Feature category Modality Example features
level of direct perception1 audio & speech localization, timbre, coloration, noisiness, loudness, continuity
video sharpness, darkness, brightness, contrast, flicker, distortion, colorperception
audiovisual balance and synchronism
level of action1 audio & speech perception of sidetone, echo, or double-talk degradations
video involvement and immersion, perception of space, perception ofown motions
Quality Features that constitute the Group-Communication Component
Feature category Modality Example features
level of interaction1 all responsiveness, naturalness of interaction, communication effi-ciency, and conversation effectiveness
level of the usage instance1 all learnability, intuitivity, effectiveness and efficiency for reachinga particular goal, ease of use, non-functional features such asthe personality of the interaction partner (human or machine) oraesthetics
level of establishing common ground2 all speaker identification effort, focal assurance, perception of non-verbal feedback signals, topic comprehension effort
level of group-conversation dynamics2 all negotiation of who’s turn is next
level of cognitive load2 all concentration effort, fatigue
Remarks:1: Feature category according to Möller et al.:
Sebastian Möller, Marcel Wältermann, and Marie-Neige Garcia. “Features of Quality of Experience”. In: Quality of Experience -Advanced Concepts, Applications, Methods. Ed. by Sebastian Möller and Alexander Raake. Springer, 2014, pp. 73–84
2: Additional feature category specific to multiparty communication, see Chapter 2.
Table 5.1: List of example qual-ity features for the two categoriestransmission-related and group-conversation-related features.5.4.2 Influencing the Quality Attention Focus
Whether a user is concerned about the telecommunication component,the group-communication component, or a mixture of both, plays animportant role in telemeeting quality assessment. The reason is thatthis question influences the quality formation process inside a user.More specifically, the two components influence the Quality AttentionFocus, which has been introduced in Section 5.2 as that cognitiveprocess that focuses the attention to a limited number of quality-relevant aspects, i.e. the set of quality features, that a user is actuallyconsidering when making the quality judgment. This influence willbe now explained in more detail for the specific scenario of a qualityassessment test.
5.4.3 Quality Attention Focus in Assessment Tests
This section discusses a number of aspects that can influence theQuality Attention Focus of persons taking part in a quality assessmenttest. While the list of those aspects stems from the more generalconsiderations made in Skowronek et al. 22 on the conduction of mul-
22 Janto Skowronek, Katrin Schoenen-berg, and Gunilla Berndtsson. “Multi-media Conferencing and Telemeetings”.In: Quality of Experience - Advanced Con-cepts, Applications, Methods. Ed. by Se-bastian Möller and Alexander Raake.Springer, 2014, pp. 217–228tiparty quality assessment tests, the discussion here will concentrate

112 quality of experience of multiparty conferencing and telemeeting systems
on the influence of those aspects on the Quality Attention Focus.Before going into the details, two aspects should be mentioned
here. First, the investigator needs to decide to which extent he orshe wants to control for the Quality Attention Focus, depending onthe actual quality assessment goals. That means that the followingdiscussions are intended to provide an overview of the possibilities(“can do”) and should not be interpreted as strict requirements (“mustdo”). Second, reviewing the approaches presented below, the criticalreader will note that an exact control of the Quality Attention Focus isnevertheless very limited, because the mentioned effects of the aspectson the Quality Attention Focus are hard to formally validate. Therefore,great care must be taken when designing the quality assessmenttest, either by attempting to control for the Quality Attention Focus,or at least by properly considering the Quality Attention Focus whenreporting and interpreting the results.
Questionnaire The probably most important aspect is the question-naire, more specifically the choice of measurement variables and theexact wording of the corresponding questions or scale labels. One ap-proach to control the Quality Attention Focus is to choose measurementvariables that are directly referring to individual quality features, andto phrase the corresponding questions or scale labels such that the testparticipants understand those quality features. While this appearsto be a straight-forward approach, the practical implementation isnot trivial; a matter well known in the research field of multidimen-sional quality assessment, which essentially seeks to assess quality interms of individual quality features. As an example, Wältermann 23
23 Marcel Wältermann. Dimension-basedQuality Modelling of Transmitted Speech.Springer, 2013
describes a thorough process of refining and simplifying the choiceof measurement variables and rating labels. Transferring this to thetelemeeting case, the approach of asking directly for individual qual-ity features appears to be feasible due to the existing methods 24 on
24 Marcel Wältermann. Dimension-basedQuality Modelling of Transmitted Speech.Springer, 2013
ITU-T. Recommendation P.806 - A Sub-jective Quality Test Methodology using Mul-tiple Rating Scales. International Stan-dard. Geneva, Switzerland: Interna-tional Telecommunication Union, 2014
Friedemann Köster and SebastianMöller. “Perceptual Speech Quality Di-mensions in a Conversational Situation”.In: Proceedings of the 16th Annual Confer-ence of the Speech Communication Associ-ation (Interspeech). Dresden, Germany,Sept. 2015, pp. 2544–2548
multidimensional quality assessment.Another approach to control the Quality Attention Focus is necessary
when the desired measurement variables should cover quality ina more holistic or utilitarian sense, which is often referred to asoverall quality25. If a simple question such as “What was the overall
25 The terms mouth-to-ear quality orend-to-end quality are often used as syn-onyms for overall quality in order toemphasize that the whole transmissionpath is considered.
The term integral quality is used whensuch overall quality is considered asthe composition of individual qualitydimensions. For more details, see:
Sebastian Möller. Assessment and Pre-diction of Speech Quality in Telecommuni-cations. Kluwer Academic publishers,2000
Alexander Raake. Speech Quality ofVoIP – Assessment and Prediction. Chich-ester, West Sussex, UK: Wiley, 2006
Marcel Wältermann. Dimension-basedQuality Modelling of Transmitted Speech.Springer, 2013
quality?” is asked in a telemeeting quality assessment test, then thereis the possibility that test participants interpret this question quitedifferently, depending on the Quality Attention Focus that each testparticipant has. If the researcher wants to limit the interpretation ofthe overall quality question to a certain Quality Attention Focus, thereare two possibilities, which can be also combined.
First, a more specific phrasing of the question could steer the Qual-ity Attention Focus. For example, instead of “What was the overallquality?” one could ask “What was the overall quality of the sys-tem’s technical condition?” or ”What was the overall quality of thetelemeeting in terms of facilitating the communication?”. The firstalternative would likely steer the Quality Attention Focus to the Telecom-munication Component, due to the keyword “technical condition”; the

conceptual model of telemeeting quality 113
second alternative would likely steer the Quality Attention Focus tothe Group-Communication Component, due to the keyword “commu-nication”. However, there is a disadvantage to this approach: usingself-defined questions bears the danger that different researchers areactually measuring something different, even though they might re-port results under the same term overall quality. Unfortunately, thereis no well-defined and validated set of such questions specifically forthe telemeeting context available yet. As an alternative to phrasingown questions, one could use the available standardized mean opin-ion scores (MOS) according to ITU-T Rec. P.800
26 for listening-only 26 ITU-T. Recommendation P.800 - Meth-ods for objective and subjective assessment ofquality. International Standard. Geneva,Switzerland: International Telecommu-nication Union, 1996
tests (“Quality of the speech”) and conversation tests (“What is youropinion of the connection you have just been using?”). However,then it is necessary to consider how these questions would deter-mine the Quality Attention Focus in terms of the Telecommunication andGroup-Communication Components, in order to appropriately reportand interpret the results.
A second possibility to limit the interpretation of the overall qualityquestion to a certain Quality Attention Focus is the presentation of asmall set of additional questions, each asking for different individualaspects of quality. Such an approach is also known in the field;for instance, the standards ITU-T Rec. P.800
27 and especially ITU- 27 ITU-T. Recommendation P.800 - Meth-ods for objective and subjective assessment ofquality. International Standard. Geneva,Switzerland: International Telecommu-nication Union, 1996
T Rec. P.80528 propose to ask additional questions in order to cover
28 ITU-T. Recommendation P.805 - Sub-jective evaluation of conversational quality.International Standard. Geneva, Switzer-land: International TelecommunicationUnion, 2007
different quality aspects. While the idea to use such more detailedquestions essentially represents the approach of asking for individualquality features, the argumentation here in terms of overall qualityis the following: If the questionnaire contains both a more looselydefined question asking for overall quality and a number of dedicatedquestions asking for individual quality features, then it is likely thatparticipants form their overall judgment on the basis of the individualquestions: not necessarily in a strictly mathematical sense, but atleast participants will consider those individual aspects. In such acase, the ratio between questions on quality features targeting theTelecommunication Component and the Group-Communication Componentcan influence the Quality Attention Focus, when subjects answer theoverall quality question.
Test instructions Next to the questionnaire, the test instructions –both verbal and written – can be explicitly designed to influence theQuality Attention Focus. If the test instructions clearly explain that testparticipants should focus on the transmission characteristics or on thecommunication as such, or even on both, the Quality Attention Focuswill be steered accordingly. However, two aspects should be consid-ered in such an approach. First, the instructions should be formulatedsuch that subjects are able to understand what they should focus on;using examples might be useful here. Second, the instructions shouldbe supported by a proper choice and wording of the questions asdiscussed above; otherwise test participants start to forget the exactinstructions throughout the test.

114 quality of experience of multiparty conferencing and telemeeting systems
Stimuli and choice of conditions Another aspect that can influence theQuality Attention Focus is the choice of test stimuli in listening-only orviewing-only tests, or the choice of system conditions in conversationtests. More precisely, the type of degradations and the strength ofthose degradations need to be carefully chosen, if it is desired tocontrol the Quality Attention Focus in the experiment. Alternatively,the type and strength of degradations should at least be reviewed interms of their potential influence on the Quality Attention Focus, inorder to properly report and interpret results.
An example for the impact of the strength of a degradation ispacket loss. If the signal distortions are minor due to a ratherlow loss rate, then the Quality Attention Focus will likely be on thetelecommunication-related features (perception of some temporal dis-continuity). If the signal distortions are more severe due to a ratherhigh loss rate and affect speech intelligibility or even speaker identi-fication, then the focus will likely be on the group-communication-related features. An example for the impact of the choice of degra-dations is delay, see for instance Schoenenberg 29. Delay is known 29 Katrin Schoenenberg. “The Quality
of Mediated-Conversations under Trans-mission Delay”. PhD Thesis. TechnischeUniversität Berlin, Germany, 2016
to affect the conversation, as it triggers changes and interruptions ofthe conversation, while it is not perceived as a signal distortion, asthe speech signal as such is not degraded. Thus, judging the qualityof delay in a telemeeting context requires that the Quality AttentionFocus is on the group-communication-related features.
Conversation task If the telemeeting quality test shall consist of aconversation test, the considerations and recommendations on con-ducting such tests in Skowronek et al. 30 and ITU-T Rec. P.1301
31 30 Janto Skowronek, Katrin Schoenen-berg, and Gunilla Berndtsson. “Multi-media Conferencing and Telemeetings”.In: Quality of Experience - Advanced Con-cepts, Applications, Methods. Ed. by Se-bastian Möller and Alexander Raake.Springer, 2014, pp. 217–228
31 ITU-T. Recommendation P.1301 - Sub-jective quality evaluation of audio and au-diovisual telemeetings. International Stan-dard. Geneva, Switzerland: Interna-tional Telecommunication Union, 2012
emphasize the need for a deliberate choice of the conversation task. Interms of the Quality Attention Focus, this means that the investigatorshould consider, how critical the chosen conversation task is for theperception of telecommunication-related and group-communication-related quality features. This is actually strongly linked with theabove mentioned choice of the conditions. For example, if a testcontains only rather minor distortions in order to limit the QualityAttention Focus towards the Telecommunication Component, then the in-vestigator might want to choose the conversation task such that thoseminor distortions are actually perceived, i.e. the conversation taskshould not be too cognitively demanding. As another example, if thetest contains rather strong distortions affecting speech intelligibilityor speaker identification in order to steer the Quality Attention Focustowards the Group-Communication Component, then the investigatormight want to choose the conversation task such that test participantsstrongly rely on intelligibility and speaker identification.
5.4.4 Extension of the Quality Formation Process Model
This section describes how the concept of Telecommunication and Group-Communication Components relates to the quality formation processin the mind of a telemeeting participant by extending the process

conceptual model of telemeeting quality 115
model from Section 5.2. The model extension consists of a processthat decides which weighting of the two components is actually used,see also Figure 5.11. This Telecommunication & Group-CommunicationComponent Weighting stage is integrated into the process model as asub-process of the Quality Attention Focus stage.
The argumentation for this way of including the new stage is asfollows: The previous sections discussed in detail how the concept ofTelecommunication and Group-Communication Components is influencingthe Quality Attention Focus, suggesting to place the new process as anextra stage before the Quality Attention Focus stage. However, in theauthor’s view it is difficult to coherently separate these two processes.The Quality Attention Focus stage was introduced in Section 5.2 asa process to control which quality features shall be selected fromall incoming features during the Reflection process. Now, the newTelecommunication & Group-Communication Component Weighting stageessentially determines as well, which quality features shall be selected.For that reason, the inclusion of the new stage as a sub-processappears to be more appropriate.
Furthermore the path in Figure 5.11 from the quality assessmenttest is directly drawn to the Quality Attention Focus stage. Similarto the Quality Aggregation Level Selection stage, this emphasizes therelevance of the assessment test design for the empirical researchdescribed in Chapter 7.

116 quality of experience of multiparty conferencing and telemeeting systems
Figure 5.11: Quality formation processinside a telemeeting participant: Exten-sion of process model with the con-cept of Telecommunication & Group-Communication Components, realizedas a sub-process of the Quality AttentionFocus stage.

conceptual model of telemeeting quality 117
Summary
There are different facets of telemeeting quality that require a soliddescription in order to avoid misinterpretation of research results.Two such aspects are the concepts of Quality Aggregation Levels andTelecommunication & Group-Communication Components, which play animportant role in the quality perception process.
Quality Aggregation Levels refer, on the one hand, to the perspectiveof either individual interlocutors or of the whole group. On the otherhand, they refer to the focus on either the whole telemeeting or onindividual connections. Therefore, this chapter defined three QualityAggregation Levels:
1. Individual Connection Quality Qij: This reflects how each interlocutorperceives the quality of the individual connections between allinterlocutors.
2. Single-perspective Telemeeting Quality Qi: This reflects how eachsingle interlocutor perceives the quality of the overall telemeeting.
3. Group-perspective Telemeeting Quality Qall : This reflects how thewhole group of interlocutors perceives the quality of the over-all telemeeting, and may be used as an abstract tool for systemdesigners.
In that context the exact interpretation of individual connections mayfocus on each individual signal path per direction between two inter-locutors, may include both directions, and may include or excludefeedback signal paths (i.e. sidetone, echo, own camera picture). Anadditional interpretation possibility is to consider an individual con-nection not between two interlocutors, but between an interlocutorand the telemeeting. This means, also the concept of Individual Con-nection Quality is subject to different interpretations, which requiresproper test instructions and reporting of results. Concerning theSingle-perspective Telemeeting Quality Qi, two principles of quality ag-gregation are possible. Either Qi is an aggregation of the IndividualConnection Quality scores Qij, which means that participants are firstforming quality judgments of the individual connections and thencombine them to an overall judgment. Or Qi is an aggregation ofthe individual quality features that participants extract from the indi-vidual connections, without consciously forming a quality judgmentabout those individual connections.
The Telecommunication & Group-Communication Components of Tele-meeting Quality reflect the duality that a telemeeting is, on the onehand, a group conversation, and, on the other hand, a conversationover a telecommunication system. In that respect, the Telecommu-nication Component refers to the user’s perception of the system’sperformance in transmitting information such as audio and video sig-nals; the Group-Communication Component refers to the user’s percep-tion of the system’s performance in facilitating a group conversation.More specifically, the two components are constituted by the set of

118 quality of experience of multiparty conferencing and telemeeting systems
quality features that the participant is using when forming a qualityjudgment. Furthermore, the two components influence the QualityAttention Focus, a term introduced here as a cognitive process thatfocuses the attention to a limited number of quality-relevant aspects,i.e. the set of quality features.
The impact of the Quality Aggregation Levels and the Telecommuni-cation & Group-Communication Components on quality perception canbest be characterized by adapting an existing model of the qualityformation process in the person’s mind. The model describes qualityperception as a multi-stage process and is presented in Figure 5.12
as a block diagram with a signal flow from the bottom to the top:Sensory information is perceived using bottom-up and top-down pro-cesses (Perception) leading to a perceived character of the telemeeting.Then, during the act of Experiencing, and being triggered by someQuality Awareness, the person reflects on the perceived character andits desired character (Reflection) and then the person attributes thedifferent features to either the system or to something else, such asthe conversation partners or their environments (Attribution). Theresult of these processes is a set of quality-relevant aspects, i.e. Qual-ity Features, for the perceived and desired nature of the telemeeting,which the person is then comparing against each other to form aquality judgment (Comparison & Judgment). Finally, an encoding pro-cess enables to describe the person’s internal quality judgment to theoutside world, e.g. by means of a rating on a scale.
To integrate the Quality Aggregation Levels and the Telecommuni-cation & Group-Communication Components, the model is extendedfirst by inserting the above mentioned process of Quality AttentionFocus with two sub-processes Quality Level Aggregation Selection andTelecommunication & Group-Communication Component Weighting. Thenthe model is extended with two further sub-processes, a MultipartyDecomposition process as part of the Attribution stage, and a MultipartyAggregation process as part of the Comparison & Judgment stage. Inthis framework, the Quality Level Aggregation Selection sub-processdetermines whether the person is focusing on individual connectionsand how they contribute in the person’s mental model to the overalltelemeeting system. This in turn means that the Quality AggregationLevel Selection controls the Multiparty Decomposition and MultipartyAggregation processes. The Telecommunication & Group-CommunicationComponent Weighting sub-process determines whether the person ismore concerned about quality aspects of signal transmission or group-communication, meaning that it controls the Reflection stage.

conceptual model of telemeeting quality 119
Figure 5.12: Full model of the qualityformation process inside a telemeetingparticipant.

6Methodology for the Perceptual Assessment of Telemeet-ing Quality
This chapter contains text passages that either stem from previous texts of the author or that are based on such source texts. Forreadability purposes those passages are not marked as quotations. The main source documents used for this chapter are:
- Janto Skowronek, Julian Herlinghaus, and Alexander Raake. “Quality Assessment of Asymmetric Multiparty Telephone Conferences: A Sys-tematic Method from Technical Degradations to Perceived Impairments”. In: Proceedings of the 14th Annual Conference of the International SpeechCommunication Association (Interspeech 2013). International Speech Communication Association. Lyon, France, Aug. 2013, pp. 2604–2608
- Janto Skowronek, Katrin Schoenenberg, and Alexander Raake. “Experience with and insights about the new ITU-T standard on quality assessmentof conferencing systems”. In: Proceedings of the international conference of acoustics (AIA-DAGA 2013). Merano, Mar. 2013, pp. 444–447
- Janto Skowronek and Alexander Raake. “Conceptual model of multiparty conferencing and telemeeting quality”. In: Proceedings of the 7thInternational Workshop on Quality of Multimedia Experience (QoMEX 2015). Pilos, Greece, May 2015, pp. 1–6
- Janto Skowronek et al. Proposed main body and normative annex for draft recommendation P.AMT. ITU-T Contribution COM 12 - C318 - E. Geneva,Switzerland: International Telecommunication Union, May 2012
- Janto Skowronek et al. Proposed non-normative appendices for draft recommendation P.AMT. ITU-T Contribution COM 12 - C319 - E. Geneva, Switzer-land: International Telecommunication Union, May 2012
- Janto Skowronek and Alexander Raake. Report on a study on asymmetric multiparty telephone conferences for a future update of P.1301. ITU-T Contribu-tion COM 12 - C134 - E. Geneva, Switzerland: International Telecommunication Union, Dec. 2013
- Janto Skowronek. Document describing scenarios. Project Report “Quality of Multiparty Audio-Video Communication” (Unpublished). Assessmentof IP-based Applications, Technische Universität Berlin, Germany, Apr. 2013
- Janto Skowronek. Improved model for audio-only communication. Project Report “Quality of Multiparty Audio-Video Communication” (Unpublished).Assessment of IP-based Applications, Technische Universität Berlin, Germany, Dec. 2013
- Janto Skowronek. Improved model for audiovisual communication. Project Report “Quality of Multiparty Audio-Video Communication” (Unpublished).Assessment of IP-based Applications, Technische Universität Berlin, Germany, Nov. 2014
- Janto Skowronek. Final Project Report – Quality of Multiparty Audio-Video Communication. Project Report “Quality of Multiparty Audio-VideoCommunication” (Unpublished). Assessment of IP-based Applications, Technische Universität Berlin, Germany, Dec. 2014
Since additional documents served as further background material, see Appendix A for the full list of source documents and theircontributions to this chapter.
What this chapter is about
This chapter presents the fundamental test methodology that has beenused to design and conduct perceptual multiparty quality assessmenttests and to prepare the collected perceptual ratings for efficientstatistical analysis and modeling. Further, this chapter provides ageneral guideline to conduct such multiparty tests and is writtenindependently from the actual experiments reported in the followingchapters.

methodology for the perceptual assessment of telemeeting quality 121
6.1 Introduction
As already discussed in Chapter 5, the experimental setup in termsof instructions, conditions, questionnaires, and general context caninfluence results. In order to achieve a high reproducibility andcomparability of results, the common approach is to conduct stan-dardized quality assessment tests following agreed-upon protocols(see Section 4.4 for an overview). However, such protocols have beendeveloped for specific evaluation scenarios, i.e. the systems under testand the evaluation goals, and may not be blindly used for new eval-uation scenarios. Instead, the appropriateness of existing protocolsfor a new evaluation scenario needs to be verified and, if necessary,modified or even replaced.
In that line of thought, the quality assessment of telemeetingsshould be considered as such a new evaluation scenario given the twomain differentiators between multiparty telemeetings and two-partyaudio or audiovisual telecommunication: special communicative situ-ation and importance of asymmetric conditions. For that reason, theITU-T as one major standardization body dealing with the qualityassessment of telecommunication systems has – with contributionsfrom the author – developed Recommendation P.1301
1 as a new
1 ITU-T. Recommendation P.1301 - Subjec-tive quality evaluation of audio and audio-visual telemeetings. International Stan-dard. Geneva, Switzerland: Interna-tional Telecommunication Union, 2012
test protocol specifically for the multiparty telemeeting scenario. Ac-cordingly, this chapter will present the essential aspects of ITU-TRecommendation P.1301 and provide guidance on how to apply thismethod (Section 6.2).
While ITU-T Recommendation P.1301 is the first standard docu-ment on testing multiparty scenarios, this document is faced withthe fact that a number of aspects on multiparty quality assessmenthave not yet been fully investigated. For such cases ITU-T Recom-mendation P.1301 can only give general advices and relies on moreresearch and future updates of this standard. For that purpose, laterparts of this chapter will address in more detail three such aspectsthat go beyond Recommendation P.1301: (1) the issue that in a mul-tiparty setting different interlocutors may have different individualperspectives from the same technical degradations (Section 6.3); (2)the possibility to optimize the test design by focusing on those indi-vidual perspectives of the interlocutors (Section 6.4); and (3) the issueof efficiently structuring the perceptual data for proper analysis, inparticular accounting for those individual perspectives (Section 6.5).
6.2 ITU-T Recommendation P.1301
6.2.1 Overview of ITU-T Recommendation P.1301
ITU-T Recommendation P.1301 has been developed with significantcontributions from the author 2 and it describes a methodology to
2 Janto Skowronek et al. Proposed mainbody and normative annex for draft recom-mendation P.AMT. ITU-T ContributionCOM 12 - C318 - E. Geneva, Switzer-land: International TelecommunicationUnion, May 2012
Janto Skowronek et al. Proposed non-normative appendices for draft recommen-dation P.AMT. ITU-T Contribution COM12 - C319 - E. Geneva, Switzerland: In-ternational Telecommunication Union,May 2012
conduct perceptual quality evaluation tests for multiparty telemeetingsystems. It consists of a main body and eight normative annexes,as well as seven informational appendixes and a bibliography. Fur-

122 quality of experience of multiparty conferencing and telemeeting systems
thermore, the recommendation is augmented by an extra document 3 3 ITU-T. P-Series Supplement P.Sup26- Scenarios for the subjective quality eval-uation of audio and audiovisual multi-party telemeetings. International Stan-dard. Geneva, Switzerland: Interna-tional Telecommunication Union, 2012
providing example conversation test scenarios.At the beginning of writing ITU-T Recommendation P.1301, the re-
sponsible work group inside the ITU-T, Study Group 12 - Question 10,faced both challenges and opportunities. In Skowronek et al. 4 we
4 Janto Skowronek, Katrin Schoenen-berg, and Alexander Raake. “Experi-ence with and insights about the newITU-T standard on quality assessment ofconferencing systems”. In: Proceedingsof the international conference of acoustics(AIA-DAGA 2013). Merano, Mar. 2013,pp. 444–447
discussed that
... [o]ne challenging aspect was that there is a huge variety of telemeet-ing systems such as high-end telemeeting rooms, classical telephoneconference bridges, low-cost Voice over IP solutions, web conferencingapplications, mobile solutions, etc. Obviously, such a variety makesit difficult to write a standard assessment method valid for all cases.Another challenging aspect was that many aspects of multiparty qualitywere and are still unknown, even though a number of published andITU-T internal studies on the quality assessment of multiparty wereavailable to serve as input for the new recommendation. ... One encour-aging aspect was that the new recommendation could potentially buildon the comprehensive amount of quality assessment methods that wereavailable either for one-to-one telecommunication scenarios or for theindividual components of telemeeting systems.
Due to this mixture of challenges and opportunities, the philosophyof ITU-T Recommendation P.1301 is three-fold. First, the recommen-dation is based on a set of twelve existing standardized test methodspublished by the ITU (see Table 6.1), which on the one hand exploitsthe existing knowledge in the field and on the other hand allows toaddress the vast variety of telemeeting systems. Second, the recom-mendation provides guidance to the methods by means of decisioncriteria and flowcharts, and it provides information about how theexisting methods should be modified – if necessary – and appliedto multiparty scenarios. Third, the recommendation gives specificadvices whenever sufficient knowledge about a certain aspect is avail-able and limits to more general suggestions if a certain aspect requiresfurther study.
Due to this philosophy, the application of ITU-T RecommendationP.1301 consists of two main steps: (1) select an appropriate existingtest method as the basic test method, (2) modify and apply this basictest method to the multiparty case. Both steps are explained in moredetail in the next two paragraphs.

methodology for the perceptual assessment of telemeeting quality 123
ITU-T. Recommendation P.800 - Methods for objective and subjectiveassessment of quality. International Standard. Geneva, Switzerland:International Telecommunication Union, 1996
ITU-T. Recommendation P.805 - Subjective evaluation of conversationalquality. International Standard. Geneva, Switzerland: Interna-tional Telecommunication Union, 2007
ITU-T. Recommendation P.880 - Continuous evaluation of time-varying speech quality. International Standard. Geneva, Switzer-land: International Telecommunication Union, 2004
ITU-T. Recommendation P.910 - Subjective video quality assess-ment methods for multimedia applications. International Standard.Geneva, Switzerland: International Telecommunication Union,2008
ITU-T. Recommendation P.911 - Subjective audiovisual quality assess-ment methods for multimedia applications. International Standard.Geneva, Switzerland: International Telecommunication Union,1998
ITU-T. Recommendation P.920 - Interactive test methods for audiovi-sual communications. International Standard. Geneva, Switzerland:International Telecommunication Union, 2000
ITU-R. Recommendation BS.1116-1 - Methods for the subjective assess-ment of small impairments in audio systems including multichannelsound systems. International Standard. Geneva, Switzerland:International Telecommunication Union, 1997
ITU-R. Recommendation BS.1285 - Pre-selection methods for the subjec-tive assessment of small impairments in audio systems. InternationalStandard. Geneva, Switzerland: International Telecommunica-tion Union, 1997
ITU-R. Recommendation BS.1534-1 - Method for the subjective assess-ment of intermediate quality levels of coding systems. InternationalStandard. Geneva, Switzerland: International Telecommunica-tion Union, 2003
ITU-R. Recommendation BT.500-13 - Methodology for the subjectiveassessment of the quality of television pictures. International Standard.Geneva, Switzerland: International Telecommunication Union,2012
ITU-R. Recommendation BT.710-4 - Subjective assessment methods forimage quality in high-definition television. International Standard.Geneva, Switzerland: International Telecommunication Union,1998
ITU-R. Recommendation BT.1788 - Methodology for the subjectiveassessment of video quality in multimedia applications. InternationalStandard. Geneva, Switzerland: International TelecommunicationUnion, 2007
Table 6.1: List of ITU Recommendationsused as basic test methods for ITU-TRecommendation P.1301.6.2.2 Selection of a Basic Test Method according to ITU-T Rec.
P.1301
In order to select the most appropriate basic test method for theevaluation task at hand, ITU-T Recommendation P.1301 providesflow charts that guide to the corresponding standard documents. Animportant aspect here is that the flow charts utilize decision criteriasince there are different methods available for different evaluationscenarios.
While the recommendation text lists and explains those criteria, theinvestigator still needs to make the corresponding decisions accordingto the evaluation task at hand. This requires from the investigator acertain amount of understanding of the actual underlying problem,which motivates the need to conduct such a perceptual quality eval-uation. Furthermore, a certain amount of experience in conductingquality assessment tests is beneficial, since the nature of the problem –being of a technical, conceptual or even economic nature – needs to bealigned with the different characteristics of the different possible testmethods. This reflects also the conclusions by Möller 5, who wrote: 5 Sebastian Möller. Assessment and Pre-
diction of Speech Quality in Telecommuni-cations. Kluwer Academic publishers,2000
It is very difficult to give general guidance on which assessment methodor methodology is adequate for a specific quality assessment problem.[...] The main conclusion drawn is that there is no general best as-sessment method or methodology independent of the test task. Theoptimum method has to be found for each specific task by an experi-enced test designer.
Once the investigator has made the corresponding decisions, fol-lowing the flow charts in the recommendation is straight-forward.If appropriate methods do not exist for the actual evaluation task,

124 quality of experience of multiparty conferencing and telemeeting systems
then the flowcharts will terminate with the statement that a dedicatedmethod needs to be developed. If appropriate methods exist for theactual evaluation task, then the flowcharts will point to the corre-sponding ITU recommendations. Furthermore, the flowcharts willalso point to the relevant annexes of ITU-T Recommendation P.1301,in order to provide information about how the selected methods maybe modified and applied in a multiparty context.
6.2.3 Modification and Application of a Basic Test Method accordingto ITU-T Rec. P.1301
Once the basic test method is chosen with the flowcharts of ITU-TRecommendation P.1301, the next step is to apply this method in amultiparty context, whereas modifications of the basic method mightbe necessary. For that purpose, the flowcharts also point to thoseannexes of ITU-T Recommendation P.1301 that are relevant for theevaluation task at hand.
Always among those referred annexes is “Annex A - Set up ofa multiparty telemeeting assessment test”. This Annex A providesdetailed information about test facilities, tasks and stimuli, experimentdesign, test subject profiles, rating scales, test instructions, trainingphases, data collection, and data analysis. Important here is thatthis Annex A addresses only the multiparty-specific aspects, while itrefers to the corresponding basic test method for any non-multipartyspecific aspects. This essentially means that the investigator needsto go through the details of the basic test method and comparesthem with the details in Annex A in order to identify which testdetails need to be modified and which details can directly be applied.Similarly, the investigator needs to repeat this for any annexes ofITU-T Recommendation P.1301 that the flowcharts are additionallyreferring to, which happens in case of specific evaluation scenariossuch as, spatial audio, 3D video, web conferencing functionalities,asymmetric conditions, etc.
At this stage, the investigator should act with caution given thatin a number of cases ITU-T Recommendation P.1301 can give onlygeneral suggestions instead of detailed advices, which is due tothe fact that for many detailed aspects of multiparty testing theamount of available knowledge and experience is still limited. Thismeans, ITU-T Recommendation P.1301 permits the investigator acertain degree of freedom – which can even vary between differentevaluation scenarios – in realizing the actual test protocol. For thatreason, ITU-T Recommendation P.1301 suggests at various placesthat the investigator should conduct pilot tests in order to verify theappropriateness of the test protocol, and should properly documentthe actual test procedure in order to avoid false comparisons withother studies and corresponding misinterpretations of results.

methodology for the perceptual assessment of telemeeting quality 125
6.2.4 Test Aspects beyond ITU-T Recommendation P.1301
ITU-T Recommendation P.1301 provides guidance on the implemen-tation of a test protocol as precisely as possible given the currentstate of the art. However, there are a number of aspects in multipartytelemeeting quality that are not addressed in more detail in ITU-TRecommendation P.1301.
One aspect is that a degradation can have different effects for theindividual interlocutors. Thus the individual perspectives of interlocu-tors need to be taken into account. This is especially important in thecase of asymmetric conditions, i.e. interlocutors are connected withdifferent equipment or different network conditions. While ITU-TRecommendation P.1301 has an Annex F dedicated to asymmetricconditions, the advices given in that annex are of a rather generalnature. In particular, no systematic approach is described that allowsto systematically analyze how the occurrence of technical degrada-tions relates to perceptual impairments in terms of the individualperspectives of the interlocutors. Furthermore, no specific approachis described in more detail on the test design, i.e. assignment of con-ditions among interlocutors, except the advice to aim for a design inwhich every test participant should ideally be rating every technicalcondition. And finally, no specific approach on the data analysis isgiven either, except the advice to ask for both an overall judgment,i.e. Single-Perspective Telemeeting Quality Qi from Chapter 5, and forjudgments about the individual connections between interlocutors,i.e. Individual Connection Quality Qij. For that reason, the Sections 6.3to 6.5 will complement the test methodology by addressing each ofthose three aspects.
6.3 Analysis Method to translate Technical Degradations intoPossible Perceptual Impairments
6.3.1 Motivation and Basic Principle
In multiparty telemeetings, the perceptual impact of technical degra-dations can be quite complex, since it is possible that a degradationhas different effects for the individual interlocutors. Whether suchdifferences of the perceived impairments occur, depends on a numberof factors, such as the type and strength of the degradations, thesystem topology, the number of interlocutors, and the locations in thedifferent end-to-end paths where the degradations occur.
To explain this, consider two examples for a three-party telemeet-ing, which are visualized in Figure 6.1. Figure 6.1: Examples of technical degra-
dations in a three-party telemeeting. Toppanel: Degradation occurs in the end de-vice of interlocutor IL2 in send-direction,thus all outgoing signal-paths are de-graded. Bottom panel: Degradation oc-curs in the end device of interlocutorIL2 in receive-direction, thus all ingoingsignal-paths are degraded.
In the first example, a technical degradation in the end device ofinterlocutor IL2 occurs in send-direction, for example packet loss onthe uplink to the network. Thus all outgoing signal-paths for thisone interlocutor are degraded. Following the signal paths showsthat interlocutor’s IL1 and IL3 receive one degraded signal from IL2,but no degradations from each other, while IL2 does not receive any

126 quality of experience of multiparty conferencing and telemeeting systems
degraded signals at all. Concerning the possible perceptual impactfor each interlocutor, this means, the perception of IL2 differs fromthe perceptions of IL1 and IL3: IL2 perceives no impairments atall; IL1 and IL3 perceive an impairment for one interlocutor and noimpairment for the other interlocutor, which means IL1 and IL3 per-ceive an asymmetric impairment. In the second example, a technicaldegradation in the end device of interlocutor IL2 occurs in receive-direction, for example connection problems to external loudspeakersor an external video screen. Thus all incoming signal-paths for thisone interlocutor are degraded. Following the signal paths showsthat interlocutors IL1 and IL3 receive all signals without any degra-dations, and IL2 receives all signals with degradation. This means,the perception of IL2 differs again from the perceptions of IL1 andIL3: IL1 and IL3 perceive no impairments at all; IL2 perceives thesame impairment for all interlocutors, which means IL2 perceives asymmetric impairment.
Apparently, a proper quality assessment method for multipartytelemeetings requires as a first step an analysis that translates theoccurrence of technical degradations into the different possible per-ceptual impairments for each interlocutor. In order to facilitate suchan analysis for a wide range of situations, it would be beneficial tohave an approach available that is as systematic and as generic aspossible. For that purpose, the following sections will present such asystematic method, which essentially performs an analysis of signalpaths, in the form of a four-step approach6:
6 An earlier version of this approach hasbeen presented in:
Janto Skowronek, Julian Herlinghaus,and Alexander Raake. “Quality As-sessment of Asymmetric MultipartyTelephone Conferences: A SystematicMethod from Technical Degradationsto Perceived Impairments”. In: Pro-ceedings of the 14th Annual Conference ofthe International Speech CommunicationAssociation (Interspeech 2013). Interna-tional Speech Communication Associa-tion. Lyon, France, Aug. 2013, pp. 2604–2608
1. Description of the multiparty situation
2. Identification of Degradation-Types and Degradation-Points
3. Analysis of signal paths and deduction of possible perceptualimpairments
4. Generation of a comprehensive representation for all interlocutors
6.3.2 Step 1: Description of the Multiparty Situation
The first step is to describe the multiparty situation in such a waythat an appropriate signal path analysis is possible. In order to beas systematic and generic as possible, the proposal here is to use agraphical representation in a specific format that can easily be appliedto different technical scenarios.
Graphical representation The previous section and its examples showedthat the perceived impairments differ for degradations occurring onthe send- or receive-side of an interlocutor. For that reason, the firstrequirement of the graphical representation is to facilitate a visuallyclear representation of the send- and receive-sides of the interlocutors,which, in addition, can easily be applied to an arbitrary number ofinterlocutors. This is achieved by replacing the more conventionalillustration style shown in Figure 6.1 with a more signal-processing

methodology for the perceptual assessment of telemeeting quality 127
oriented style. Each interlocutor is shown twice, on the one side ofthe graph as sender, and on the other side as receiver.
Figure 6.2: Principle of the graphicaldescription of the multiparty situation:Each interlocutor is shown twice, assender and as receiver. Top panel: Sit-uation for three interlocutors. Bottompanel: Situation for four interlocutors.
Figure 6.2 shows this for a three- and four-interlocutor scenario.This representation can be read as a signal-flow diagram from leftto right: Every interlocutor is in a certain environment (illustratedas dashed rectangle); he or she communicates via an end device(illustrated with a telephone handset), which sends the audio andvideo signals to the other interlocutors (illustrated as lines); on the re-ceive side, every interlocutor is still in the same environment (dashedrectangle) using the same device (telephone handset).
Extension with topologies Since telemeeting systems can have differenttopologies, i.e. central bridge, peer-to-peer, or hybrid topologies, itwould be beneficial for the further analysis to extend the graphicalrepresentation such that the topology is visualized as well. The ap-proach chosen here is to use background shading to indicate whichparts of the signal paths belong to the different main devices thatconstitute each topology (end devices, conference bridges, networklinks), while changing the signal paths as little as possible. Figure 6.3shows this for a four-interlocutor scenario for the three topologiescentral-bridge, peer-to-peer, and hybrid. In the central-bridge topol-ogy (Figure 6.3, top panel), each end device (illustrated by a grey boxaround the telephone handset) sends the audio and video signals toone single point in the network, the central bridge (illustrated by agrey box around the mesh of signal paths), and each end device isreceiving the signals from that single point in the network. In thepeer-to-peer topology (Figure 6.3, middle panel), each end device assender is responsible for duplicating the signals and sending them toall other end devices (illustrated by a grey box around the telephonehandset and the lines until a duplication of the lines takes place).Similarly, each end device needs to mix all incoming signals togetherbefore the playback to the interlocutors (illustrated by a grey boxincluding the telephone handset and the junction point of incominglines). In the shown example of a hybrid topology (Figure 6.3, bottompanel), IL2 to IL4 are connected in a peer-to-peer topology, and theend device of IL2 acts as “central bridge” – or better say sub-bridge –for IL1, which is not peer-to-peer capable.
6.3.3 Step 2: Identification of Degradation-Types and Degradation-Points
The second step is to identify which kind of degradations, i.e. Degra-dation-Types, are occurring and to identify those points in the signalpaths from sender to receiver in which the degradations are impactingthe audio and video signals, i.e. Degradation-Points. The complexity ofthis identification step depends on the actual use case. In case of mon-itoring a system in real-life operation, a technical method is requiredthat is capable to measure the occurrence of any such degradationsat different points in the transmission chain from sender to receiver.

128 quality of experience of multiparty conferencing and telemeeting systems
Figure 6.3: Representation of differ-ent telemeeting topologies using back-ground shading to indicate, which partsof the signal paths are inside the maindevices constituting the topology (enddevices, conference bridges). Top panel:Central-bridge topology. Middle panel:Peer-to-peer topology. Bottom panel: Ex-ample of hybrid topology, a peer-to-peertopology between IL2, IL3 & IL4, withthe end device of IL2 acting as “centralbridge” for IL1, which is not peer-to-peer capable.

methodology for the perceptual assessment of telemeeting quality 129
In case of planning a system or in case of a controlled quality assess-ment test, this step is simplified to selecting the Degradation-Types anddeciding on the Degradation-Points.
Definition of Degradation-Points In order to be as generic as possible,the present approach defines the Degradation-Points on a more ab-stract level, independent from actual implementations. For example,in case of packet loss occurring in the network due to a certain routerdiscarding packets due to traffic congestion, the approach does notconsider that actual router as the Degradation-Point, but it consid-ers the network connection as such as the Degradation-Point. Whilesuch an abstraction makes the analysis approach quite generic, aset of well-defined rules to construct such an abstraction improvesthe methodological soundness of the approach in terms of meaning-fulness, reproducibility, and comparability of analysis results. Forthat reason, the present method uses the following well-defined setof Degradation-Points along the signal paths from sender to receiver,including a corresponding systematic notation scheme:
• Des,x: Degradation D in the environment e in send-side direction sof interlocutor x (x ∈N)
• Dds,x: Degradation D in the end device d in send-side direction sof interlocutor x (x ∈N)
• Dc,x,y: Degradation D on the connection c from x to y, whereas xand y may refer to the interlocutors (x, y ∈ N) and to the centralconference bridge (x, y ∈ [0])
• Dbi,x,y: Degradation D at the input bi of bridge x, with the signalcoming from y, whereas x ∈N refers to bridges integrated insidethe end devices of the interlocutors (peer-to-peer & hybrid topol-ogy), x ∈ [0] refers to the central bridge, and y ∈N0 may refer tothe interlocutors or to the central bridge
• Dbo,x,y: Degradation D at the output bo of bridge x, with the signalgoing to y, whereas x ∈N refers to bridges integrated inside theend devices of the interlocutors (peer-to-peer & hybrid topology),x ∈ [0] refers to the central bridge, and y ∈ N0 may refer to theinterlocutors or to the central bridge
• Ddr,x: Degradation D in the end device d in receive-side directionr of interlocutor x (x ∈N)
• Der,x: Degradation D in the environment e in receive-side directionr of interlocutor x (x ∈N)
Figure 6.4 shows three example situations for the three topologiescentral-bridge, peer-to-peer and hybrid.
Special cases: Acoustic echo, side-tone and camera-preview paths There arethree types of degradations that require an extension of the approach,as the signal paths for these degradations differ from the ones covered

130 quality of experience of multiparty conferencing and telemeeting systems
Examples of Degradation-Points for central-bridge topology:Des,x = Des,1: send-side-relevant degradation
(degr.) in the environment ofIL1
Dds,x = Dds,1: degr. in the end device of IL1 insend-side direction
Dc,x,y = Dc,1,0: degr. on the connection fromIL1 to the central bridge
Dc,x,y = Dc,0,1: degr. on the connection fromthe central bridge to IL1
Dbi,x,y = Dbi,0,1: degr. in the central bridge input,processing the stream of IL1
Dbo,x,y = Dbo,0,1: degr. in the central bridge out-put to IL1
Ddr,x = Ddr,1: degr. in the end device of IL1 inreceive-side direction
Des,x = Des,1: receive-side-relevant degr. inthe environment of IL1
Examples of Degradation-Points for peer-to-peertopology:Dds,x = Dds,1: degr. in the end device of IL1 in
send-side direction before theinternal conference bridge
Dbi,x,y = Dbi,1,1: on the send-side of the inte-grated bridge of IL1, degr. inthe bridge input processing thestream of IL1
Dbo,x,y = Dbo,1,3: on the send-side of the bridge ofIL1, degr. in the bridge outputto IL3
Dc,x,y = Dc,1,2: degr. on the connection fromIL1 to IL2
Dbi,x,y = Dbi,1,4: on the receive-side of the bridgeof IL1, degr. on the bridge inputprocessing the stream from IL4
Dbo,x,y = Dbo,1,1: on the receive-side of the bridgeof IL1, degr. on the bridge out-put to IL1
Ddr,x = Ddr,1: degr. in the end device of IL1 inreceive-side direction after theinternal bridge
Examples of Degradation-Points for hybridtopology:Dc,x,y = Dc,1,2: degr. on the connection from
IL1 to the integrated bridge ofIL2
Dbi,x,y = Dbi,2,1: on the send-side of the bridgeof IL2, degr. in the bridge inputprocessing the stream of IL1
Dbo,x,y = Dbo,2,3: on the send-side of the bridge ofIL2, degr. in the bridge outputto IL3
Dc,x,y = Dc,2,4: degr. on the connection fromIL2 to IL4
Dbo,x,y = Dbo,2,1: on the receive-side of the bridgeof IL2, degr. on the bridge out-put to IL1
Dc,x,y = Dc,2,1: degr. on the connection fromthe integrated bridge of IL2 toIL1
Figure 6.4: Example visualization ofDegradation-Points.

methodology for the perceptual assessment of telemeeting quality 131
by the graphical representation so far: acoustic echo, distorted or non-optimal side-tone, and – for audiovisual communication – distortedcamera-preview.
Acoustic echo is caused at the junction between end device and theenvironment of an interlocutor by a coupling of the loudspeaker audiosignals into the microphone. In terms of the graphical representationused here, the audio signals at the receive-side of one interlocutor arecoupled back into the send-side of that interlocutor, see Figure 6.5,top panel. Side-tone is a direct feedback of the microphone signal tothe loudspeaker and is inserted into traditional telephone handsetsto account for the fact that the handset is covering the ear and thusreducing the level of speech that a person is acoustically hearing fromhimself or herself. In terms of the graphical representation, the audiosignal at the send-side of one interlocutor is coupled back into thereceive-side of that interlocutor, see Figure 6.5, middle panel. Camera-preview is a feature often applied in audiovisual communicationsystems, in which the own picture taken by the camera is shownon the screen. In terms of the graphical representation, this case isessentially identical to the side-tone, since the video signal at thesend-side is coupled back into the receive-side of that interlocutor.
This means, the graphical representation requires additional pathsdirectly connecting the send- and receive-sides of the same interlocu-tor in both directions. This is realized in Figure 6.5, bottom panel,by the dotted line between send- and receive-side. Furthermore, theDegradation-Points for these two cases – echo on the one hand, andside-tone and camera-preview on the other hand – need to be definedas well. The decision is to define the Degradation-Points at those pointsin which the distorted signals would be added to the undistortedsignals. In case of echo, this is the end device on the send-side; incase of side-tone and camera-preview, this is the end device on thereceive-side; see Figure 6.5, bottom panel.
Figure 6.5: Special Degradation-Pointsfor acoustic echo, side-tone and camera-preview. Top panel: The signal pathfor acoustic echo, which is a couplingfrom the receive-side to send-side ofan interlocutor. Middle panel: Thesignal path for side-tone and camera-preview, which is a coupling from thesend-side to the receive-side of an in-terlocutor. Bottom panel: Extension ofgraphical representation with a bidirec-tional coupling path and definition ofDegradation-Points for Echo Decho,x andSide-Tone & Camera-Preview Dside,x .

132 quality of experience of multiparty conferencing and telemeeting systems
Full set of Degradation-Points The full set for the four-interlocutorscenario for the three topologies is shown in Figure 6.6.
Figure 6.6: Full set of degradation pointsfor the four-interlocutor scenario for thethree topologies. Top panel: Central-bridge topology. Middle panel: Peer-to-peer topology. Bottom panel: Exampleof hybrid topology.

methodology for the perceptual assessment of telemeeting quality 133
6.3.4 Step 3: Analysis of Signal Paths and Deduction of PossiblePerceptual Impairments
The third step is to conduct the actual path analysis, whereas theprocedure consists of two parts. The first part (Step 3.a) is to follow thesignal paths from the send-side to the receive-side of each interlocutorand to identify any degradations on the individual signals. This isdone by checking which Degradation-Points the signals are passingby and by employing technical knowledge to characterize how thedegradation is affecting the signal. The second part (Step 3.b) is todetermine for all combinations of sending and receiving interlocutorsthe possible perceptual impairments Ix,y, whereas Ix,y denotes thatinterlocutor x perceives at the receive-side an impairment of the audioor video signals coming from the send-side of interlocutor y. This isdone by identifying which signals arriving at the receive side of eachinterlocutor are degraded or not (i.e. determine if Ix,y 6= 0 or Ix,y = 0),and – if possible – to employ technical and perceptual knowledge tocharacterize how those signal degradations are perceived (i.e. assigncodes – short descriptors – to Ix,y 6= 0 which allow to discriminatedifferent degradations).
Path analysis of individual degradations Figures 6.7 to 6.9 provide a rep-resentative set of example path analyses that describe the translationof individual degradations D to the possible perceptual impairmentsIx,y in more detail. For the purpose of explaining the method, thefocus of the examples lies on the path analysis as such, that is thetransmission of degradations from different Degradation-Points to theindividual interlocutors. For that reason, the examples do not limitto certain actual Degradation-Types and therefore omit the aspects ofhow the effect of degradations on the signals can be characterizedand how the identified impairments Ix,y 6= 0 can be coded.
Path analysis of multiple simultaneous degradations The example pathanalyses in Figures 6.7 to 6.9 concern situations in which only onedegradation occurs in the telemeeting. If multiple degradations occursimultaneously, the straight-forward approach is to conduct the anal-ysis for each path between the interlocutors separately and then addthe corresponding impairments at the receive-side. However, thereare two aspects that require some caution.
The first, and more important, aspect is to consider that multipledegradations on the same signal path usually interact with each other,which in turn depends also on the order in which the degradations areaffecting the signals. Consider as hypothetic example the combinationof a coding artifact (some bandwidth limitation) and a packet lossartifact (some high-frequency distortions) on the path from IL1 toIL2. If the coding artifact occurs before the packet loss artifact, thenthe bandwidth limitation affects the original voice signal, but notthe high-frequency distortions. If the coding artifact occurs afterthe packet loss artifact, then the bandwidth limitation also affects,

134 quality of experience of multiparty conferencing and telemeeting systems
i.e. reduces, the high-frequency distortions. This means the strengthof the high-frequency distortions is larger in one case than in the other.Concerning the analysis method, this means that while the analysismay be done for each individual path between the interlocutors, itmay not be done separately for the individual degradations.
The second aspect refers to the possibility that non-linear signalprocessing is involved, which leads to non-linearities in the summa-tion of individual signal streams. In such cases, the analysis of asummation of two signals, each with different signal degradations,may lead to different results than the separate analysis of each sig-nal. However, to assess if this aspect is relevant requires an in-depthknowledge of the actual implementation of the system under consid-eration; no generally valid examples can be given here. Concerningthe analysis method, this means that if such knowledge is availableand demands an adjustment of the approach, then the analysis needsto be done for the relevant signal paths simultaneously. However, ifsuch knowledge is not available, then the approach to conduct theanalysis per individual path serves as an appropriate approximationof the reality.
6.3.5 Step 4: Generation of a Comprehensive Representation for allInterlocutors
The fourth step is to generate a representation that summarizes thepath analyses for all interlocutors. Ideally this representation shouldvisualize the expected perceptual impairments for each consideredtechnical degradation in a convenient format, such as, for instance,a table. Using an appropriate coding of the impairments and usingZero when no impairments are expected, such a table immediatelyvisualizes the dependency of impairments and Degradation-Points. Asexamples, Figures 6.7 to 6.9 show such tables next to the correspond-ing path analyses.
6.3.6 Limitations
The method presented here translates the occurrence of technicaldegradations into possible perceptual impairments, depending onthe type and, predominantly, the location in which the degradationsaffect the signal paths between the interlocutors. The method’s mainlimitation is inherently mentioned in the term “possible perceptualimpairments”: it determines whether impairments are theoreticallypossible at all, but it does not automatically provide the means toverify whether such impairments are actually perceived by the in-terlocutors. Such a verification can be done by either conductingcorresponding perception tests or by applying instrumental modelsthat predict in how far the degradations are actually perceived asimpairments. The most appropriate place to insert this verificationinto the method is the path analysis in Step 3 in which technical andperceptual knowledge is already used to characterize how the signal

methodology for the perceptual assessment of telemeeting quality 135
Analysis Step 1 & Step 2: Graphical description of the situation.
Analysis Step 3: Path analyses, assuming that only one degradation is occurring at a time.Des,1: Degradation in environment of IL1 that is picked up by the end device (microphone/camera) and is transmitted to
IL2, IL3 and IL4. ⇒ IL1 does not perceive any impairments (I1,x = 0, with x ∈ [1 . . . 4]). IL2, IL3 and IL4 perceive animpairment “env1” from IL1 (Ix,1 = env1, with x ∈ [2 . . . 4]). They do not perceive any impairments from their own side(Ix,x = 0, with x ∈ [2 . . . 4]), and they do not perceive any impairments from each other (Ix,y = 0, with x, y ∈ [2 . . . 4] andx 6= y).
Dds,1: Degradation in end device in send-direction that is transmitted to IL2, IL3 and IL4.⇒ Same situation as for Des,1, exceptthat IL2, IL3 and IL4 perceive an impairment “dev1” instead of env1 (Ix,1 = dev1, with x ∈ [2 . . . 4]).
Decho,1: The signals arriving the receive-side of IL1 are fed back into the send-side of IL1. ⇒ IL1 does not perceive anyimpairments (I1,y = 0, with y ∈ [1 . . . 4]). IL2, IL3 and IL4 hear their own voices, i.e. talker echo “te1” (Ix,x = te1, withx ∈ [2 . . . 4]), they hear each other multiple times, i.e. listener echo “le1” (Ix,y = le1, with x, y ∈ [2 . . . 4] and x 6= y), andthey hear IL1 unimpaired (Ix,1 = 0, with x ∈ [2 . . . 4]).
Dc,1,0: Degradation on the connection from IL1 to the central-bridge, which is transmitted to IL2, IL3 and IL4.⇒ Same situationas for Des,1, except that IL2, IL3 and IL4 perceive an impairment “con1” instead of env1 (Ix,1 = con1, with x ∈ [2 . . . 4]).
Dbi,0,1: Degradation on the input-side of the central-bridge processing the stream from IL1, which is transmitted to IL2, IL3 andIL4.⇒ Same situation as for Des,1, except that IL2, IL3 and IL4 perceive an impairment “bri1” instead of env1 (Ix,1 =bri1, with x ∈ [2 . . . 4]).
Dbo,0,1: Degradation on the output-side of the central-bridge to IL1, affecting the streams from IL2, IL3 and IL4 that aretransmitted to IL1.⇒ IL1 does not perceive any impairment from his/her own side (I1,1 = 0), and perceives the sameimpairment “bri2” for all streams coming from IL2, IL3 and IL4 (I1,y = bri2, with y ∈ [2 . . . 4]). IL2, IL3 and IL4 do notperceive any impairments (Ix,y = 0, with x ∈ [2 . . . 4] and y ∈ [1 . . . 4]).
Dc,0,1: Degradation on the connection from the central-bridge to IL1, affecting the streams from IL2, IL3 and IL4 that aretransmitted to IL1. ⇒ Same situation as for Dbo,0,1, except that IL1 perceives an impairment “con2” instead of bri2(I1,y = con2, with y ∈ [2 . . . 4]).
Dside,1: Degradation on the sidetone/camera-preview path that is affecting only the stream from IL1 to IL1.⇒ IL1 perceives animpairment “sid1” from his/her own side (I1,1 = sid1), and does not perceive any impairments from the others (I1,y = 0,with y ∈ [2 . . . 4]). IL2, IL3 and IL4 do not perceive any impairments (Ix,y = 0, with x ∈ [2 . . . 4] and y ∈ [1 . . . 4]). Specialtreatment: If a send-side degradation (Des,1 & Dds,1 & Decho,1) is also coupled into the sidetone/camera-preview path,then it is considered as Dside,1 and not as the original send-side degradation.
Ddr,1: Degradation in the end device of IL1 in receive-side direction that is equally affecting the streams from IL2, IL3 andIL4.⇒ Same situation as for Dbo,0,1, except that IL1 perceives an impairment “dev2” instead of bri2 (I1,y = dev2, withy ∈ [2 . . . 4]).
Der,1: Degradation in environment of IL1 directly affecting the perception of IL1.⇒ IL1 perceives an impairment “env2” of theown environment (I1,1 = env2), and does not perceive any impairments from the others (I1,y = 0, with y ∈ [2 . . . 4]). IL2,IL3 and IL4 do not perceive any impairments (Ix,y = 0, with x ∈ [2 . . . 4] and y ∈ [1 . . . 4]). Remark: Usually both Des,1 &Der,1 are simultaneously present due to the same environmental situation (e.g. background noise, lighting condition), buttheir relevance for the send- and receive-side may be still different.
Analysis Step 4: Summary of the Step 3 results, using the descriptors for the different impairments that were chosen in Step 3
(dev1, dev2, env1, env2, te1, le1, con1, con2, bri1, bri2, sid1)
Degr. I1,1 I1,2 I1,3 I1,4 I2,1 I2,2 I2,3 I2,4 I3,1 I3,2 I3,3 I3,4 I4,1 I4,2 I4,3 I4,4Des,1 0 0 0 0 env1 0 0 0 env1 0 0 0 env1 0 0 0Decho,1 0 0 0 0 0 te1 le1 le1 0 le1 te1 le1 0 le1 le1 te1
Dds,1 0 0 0 0 dev1 0 0 0 dev1 0 0 0 dev1 0 0 0Dc,1,0 0 0 0 0 con1 0 0 0 con1 0 0 0 con1 0 0 0Dbi,0,1 0 0 0 0 bri1 0 0 0 bri1 0 0 0 bri1 0 0 0Db0,0,1 0 bri2 bri2 bri2 0 0 0 0 0 0 0 0 0 0 0 0Dc,0,1 0 con2 con2 con2 0 0 0 0 0 0 0 0 0 0 0 0Dside,1 sid1 0 0 0 0 0 0 0 0 0 0 0 0 0 0 0Ddr,1 0 dev2 dev2 dev2 0 0 0 0 0 0 0 0 0 0 0 0Der,1 env2 0 0 0 0 0 0 0 0 0 0 0 0 0 0 0
Figure 6.7: Example path analyses forcentral-bridge topology.

136 quality of experience of multiparty conferencing and telemeeting systems
Analysis Step 1 & Step 2: Graphical description of the situation.
Analysis Step 3: Path analyses, assuming that only one degradation is occurring at a time.Dbi,1,1: Degradation on the send-side input of the internal bridge of IL1 processing the stream from IL1, which is transmitted to
IL2, IL3, and IL4.⇒ IL1 perceives no impairments at all (I1,y = 0, with y ∈ [1 . . . 4]). IL2, IL3 and IL4 perceive from IL1
an impairment “bri1” (Ix,1 =bri1, with x ∈ [2 . . . 4]). They do not perceive any impairment from their own side (Ix,x = 0,with x ∈ [2 . . . 4]), and they do not perceive any impairment from each other (Ix,y = 0, with x, y ∈ [2 . . . 4] and x 6= y).
Dbo,1,2: Degradation on the send-side output of the bridge of IL1 towards IL2, which is only transmitted to IL2. ⇒ IL1, IL3
and IL4 do not perceive any impairments (Ix,y = 0, with x ∈ [1, 3, 4] and y ∈ [1 . . . 4]). IL2 perceives an impairment“bri2” of IL1 (I2,1 = bri2), does not perceive any impairment from his/her own side (I2,2 = 0), and does not perceive anyimpairment from IL3 and IL4 (I2,y = 0, with y ∈ [3, 4])
Dc,1,2: Degradation on the connection from IL1 towards IL2, which is only transmitted to IL2.⇒ Same situation as for Dbo,1,2,except that IL2 perceives an impairment “con1” instead of bri1 (I2,1 = con1).
Dbi,1,2: Degradation on the receive-side input of the internal bridge of IL1 processing the stream from IL2. ⇒ IL1 does notperceive any impairment from his/her own side (I1,1 = 0), perceives an impairment “bri3” from IL2 (I1,2 = bri3), anddoes not perceive any impairments from IL3 and IL4 (I1,y = 0, with y ∈ [3, 4]). IL2, IL3 and IL4 do not perceive anyimpairments (Ix,y = 0, with x ∈ [2 . . . 4] and y ∈ [1 . . . 4]).
Dbo,1,1: Degradation on the receive-side output of the internal bridge of IL1 processing all streams from IL2, IL3, and IL4.⇒ IL1
does not perceive any impairment from his/her own side (I1,1 = 0), and perceives the same impairment “bri4” for allstreams coming from IL2, IL3 and IL4 (I1,y = bri4, with y ∈ [2 . . . 4]). IL2, IL3 and IL4 do not perceive any impairments(Ix,y = 0, with x ∈ [2 . . . 4] and y ∈ [1 . . . 4]).
Analysis Step 4: Summary of the Step 3 results, using the descriptors for the different impairments that were chosen in Step 3
(bri1, bri2, bri3, bri4, con1)
Degr. I1,1 I1,2 I1,3 I1,4 I2,1 I2,2 I2,3 I2,4 I3,1 I3,2 I3,3 I3,4 I4,1 I4,2 I4,3 I4,4Dbi,1,1 0 0 0 0 bri1 0 0 0 bri1 0 0 0 bri1 0 0 0Dbo,1,2 0 0 0 0 bri2 0 0 0 0 0 0 0 0 0 0 0Dc,1,2 0 0 0 0 con1 0 0 0 0 0 0 0 0 0 0 0Dbi,1,2 0 bri3 0 0 0 0 0 0 0 0 0 0 0 0 0 0Dbo,1,1 0 bri4 bri4 bri4 0 0 0 0 0 0 0 0 0 0 0 0
Figure 6.8: Example path analyses forpeer-to-peer topology.

methodology for the perceptual assessment of telemeeting quality 137
Analysis Step 1 & Step 2: Graphical description of the situation.
Analysis Step 3: Path analyses, assuming that only one degradation is occurring at a time.Dc,1,2: Degradation on the connection from IL1 towards the internal bridge of IL2, which is transmitted directly to IL2, and via
the internal bridge also to IL3 and IL4.⇒ IL1 does not perceive any impairments (I1,x = 0, with x ∈ [1 . . . 4]). IL2, IL3
and IL4 perceive from IL1 an impairment “con1” (Ix,1 = con1, with x ∈ [2 . . . 4]). They do not perceive any impairmentsfrom their own sides (Ix,x = 0, with x ∈ [2 . . . 4]), and they don not perceive any impairments from each other (Ix,y = 0,with x, y ∈ [2 . . . 4] and x 6= y).
Dbi,2,1: Degradation on the send-side input of the internal bridge of IL2 processing the stream from IL1, which is directlytransmitted to IL2 and via the internal bridge also to IL3 and IL4.⇒ Same situation as for Dc,1,2, except that IL2, IL3,and IL4 perceive an impairment “bri1” instead of con1 (Ix,1 = bri1, with x ∈ [2 . . . 4]).
Dbo,2,3: Degradation on the send-side output of the bridge of IL2 towards IL3 processing the streams from IL1 and IL2, whichis transmitted only to IL3. ⇒ IL3 does not perceive any impairments from his/her own side (I3,3 = 0), perceives thesame impairment “bri2” for the streams coming from IL1 and IL2 (I3,x bri2, with x ∈ [1, 2]), and does not perceive anyimpairments from IL4 (I3,4 = 0). IL1, IL2 and IL4 do not perceive any impairments (Ix,y = 0, with x, y ∈ [1, 2, 4]).
Dbi,2,3: Degradation on the receive-side input of the internal bridge of IL2 processing the stream from IL3, which is directlytransmitted to IL2 and via the internal bridge also to IL1.⇒ IL1 and IL2 do not perceive any impairments from theirown sides (Ix,x = 0, with x ∈ [1 . . . 2]), they do not perceive any impairments from each other (Ix,y = 0, with x, y ∈ [1 . . . 2]and x 6= y), they do not perceive any impairments from IL4 (Ix,4 = 0, with x ∈ [1 . . . 2]), and they perceive an impairment“bri3” from IL3 (Ix,3 = bri3, with x ∈ [1, 2]). IL3 and IL4 perceive no impairments at all (Ix,y = 0, with x ∈ [3 . . . 4] andy ∈ [1, 2]).
Dbo,2,1: Degradation on the receive-side output of the internal bridge of IL2 processing all streams from IL3 and IL4, which istransmitted only to IL1.⇒ IL1 does not perceive any impairments from his/her own side (I1,1 = 0), and perceives thesame impairment “bri4” for the streams coming from IL2, IL3, and IL4 (I1,x =bri4, with x ∈ [2 . . . 4]). IL2, IL3 and IL4 donot perceive any impairments (Ix,y = 0, with x ∈ [2 . . . 4] and y ∈ [1 . . . 4]).
Dc,2,1: Degradation on the connection from the internal bridge of IL2 towards IL1, which is only transmitted to IL1.⇒ Samesituation as for Dbo,2,1, except that IL1 perceives an impairment “con2” instead of bri4 (I1,x = con2, with x ∈ [2 . . . 4]).
Analysis Step 4: Summary of the Step 3 results, using the descriptors for the different impairments that were chosen in Step 3
(bri1, bri2, bri3, bri4, con1, con2)
Degr. I1,1 I1,2 I1,3 I1,4 I2,1 I2,2 I2,3 I2,4 I3,1 I3,2 I3,3 I3,4 I4,1 I4,2 I4,3 I4,4Dc,1,2 0 0 0 0 con1 0 0 0 con1 0 0 0 con1 0 0 0Dbi,2,1 0 0 0 0 bri1 0 0 0 bri1 0 0 0 bri1 0 0 0Dbo,2,3 0 0 0 0 0 0 0 0 bri2 bri2 0 0 0 0 0 0Dbi,2,3 0 0 bri3 0 0 0 bri3 0 0 0 0 0 0 0 0 0Dbo,2,1 0 bri4 bri4 bri4 0 0 0 0 0 0 0 0 0 0 0 0Dc,2,1 0 con2 con2 con2 0 0 0 0 0 0 0 0 0 0 0 0
Figure 6.9: Example path analyses forhybrid topology.

138 quality of experience of multiparty conferencing and telemeeting systems
degradations arriving at the receive-side are – at least theoretically –perceived.
The study described in Skowronek et al. 7 is an example for con- 7 Janto Skowronek, Julian Herling-haus, and Alexander Raake. “QualityAssessment of Asymmetric MultipartyTelephone Conferences: A SystematicMethod from Technical Degradationsto Perceived Impairments”. In: Pro-ceedings of the 14th Annual Conference ofthe International Speech CommunicationAssociation (Interspeech 2013). Interna-tional Speech Communication Associa-tion. Lyon, France, Aug. 2013, pp. 2604–2608
ducting a corresponding perception test; the key facts are summarizedin Table 6.2. This study revealed that such a verification is indeednecessary, as not all impairments were rated as the theoretical analysissuggested. In particular, the results for the tested background noisecondition suggested that degradations need to be beyond a certainthreshold in order to be perceived as quality-relevant impairments.
For that reason, possible first steps to realize such a verificationis to develop for a sufficiently comprehensive set of degradations afull set of such perception thresholds in form of look-up tables. Analternative option is to develop dedicated instrumental models thatapply corresponding thresholding operations.
Study set up:- Three-party conversation test, asking for quality ratings- 47 test participants- Three-party conversation scenarios, modified versions based on ITU-T
P-supplement 26
Janto Skowronek. 3SCT - 3-party Short Conversation Test scenariosfor conferencing assessment (Version 01). 2013. doi: 10.5281/zenodo.16134
ITU-T. P-Series Supplement P.Sup26 - Scenarios for the subjective qualityevaluation of audio and audiovisual multiparty telemeetings. InternationalStandard. Geneva, Switzerland: International TelecommunicationUnion, 2012
- Rating scale: 5-point Absolute Category Rating scale according toP.800
ITU-T. Recommendation P.800 - Methods for objective and subjectiveassessment of quality. International Standard. Geneva, Switzerland:International Telecommunication Union, 1996
- Test system: VoIP telephones, central-bridge- Tested conditions: unimpaired (G.711, 150 ms one-way delay), loud-
ness loss (20 dB SPL), background noise (65 dB SPL), echo (echoattenuation 10 dB SPL), packet loss (10% random loss)
- Further details: see Section 8.3, Experiment ACT1
Summary of results:- Quotation: “In summary, the degradations were often judged in the
way the structured technical analysis suggested, but some detailedfindings were contrary to these expectations.”
- Examples of such detailed findings:- Loudness loss on another connection affected own connection rating.- Ratings for listener echo (hearing voice of one interlocutor twice)
are not affected in the presence of talker echo (hearing echo of ownvoice).
- In case of packet loss, also the unimpaired connection was affected,that is, was judged worse.
- Quotation: “Apparently, some degradations have to be above a certainthreshold, e.g. the level of transmitted background noise, before theyare included in quality ratings.”
Table 6.2: Key facts of the study de-scribed in
Janto Skowronek, Julian Herlinghaus,and Alexander Raake. “Quality As-sessment of Asymmetric MultipartyTelephone Conferences: A SystematicMethod from Technical Degradationsto Perceived Impairments”. In: Pro-ceedings of the 14th Annual Conference ofthe International Speech CommunicationAssociation (Interspeech 2013). Interna-tional Speech Communication Associa-tion. Lyon, France, Aug. 2013, pp. 2604–2608

methodology for the perceptual assessment of telemeeting quality 139
6.4 Experimental Design Method distributing Possible Per-ceptual Impairments instead of Technical Degradations
6.4.1 Motivation
Usually investigators choose first a set of conditions and then adesign that ensures that all conditions are distributed across test calls,using one of various well-known design techniques (examples: fullfactorial design, balanced incomplete block design, within-subjectdesign and across-subject design). This means, investigators assumein this process a technical or expert perspective: they define firstthe conditions in terms of the technical system properties and thendistribute them across test calls according to the chosen design; inother words they ensure that the technical system properties arepresented according to the chosen design.
When it comes to multiparty quality tests, however, this results ina non-optimal design because a certain technical condition can leadto the situation that at least one test participant does not perceive anyimpairment at all. Referring to the path analyses in Figures 6.7 to 6.9in the previous section, consider the two following examples: First,if in one test call, one participant has significant packet loss in senddirection, then the other interlocutors will perceive signal distortionsfor this one participant and no impairments for all other interlocutors.However, that one participant will perceive all interlocutors withoutany impairment. Second, if in another test call, one participant hassignificant packet loss in receive-side direction, then that one partici-pant will perceive signal distortions from all interlocutors. However,the other interlocutors will perceive no impairments at all.
6.4.2 Application
To overcome such design inefficiencies, the novel design paradigmis not to distribute the technical conditions according to the design,e.g. have x calls with send side packet loss and y calls with receive sidepacket loss, but to distribute the perceptions according to the design,e.g. have x cases in which participants perceive packet loss distortionsfor one interlocutor and y cases in which participants perceive packetloss distortions for all interlocutors. This new paradigm means toshift the investigator’s perspective from the technical towards theperceptual point of view.
The advantage is that this new perspective allows to come up withsmart combinations of technical properties for individual participantsin order to avoid unnecessary calls for participants without any im-pairment. An example showing the difference between these twodesign paradigms is visualized in Table 6.3. While the given examplesuggests a large room for optimizations in the order of 50% (threeinstead of six test calls), the actual amount of reduction of requiredtest calls is usually lower and depends on two aspects: a) if the setof target impairments actually allows for combinations of differentimpairments into a single call without mutually influencing each

140 quality of experience of multiparty conferencing and telemeeting systems
other, and b) if the actual test system is technically allowing to realizesuch combinations.
a) The conventional design paradigm, i.e. design technical degradation and obtain perceptual impairments, requires six test calls(table rows 1 to 6) to expose all interlocutors to each impairment. The disadvantage is that in every call, at least one interlocutor doesnot perceive any impairments.
Technical Degradations Dx
⇒
Perceptual Impairments Ix,y,for Interlocutor x from the perspective of Interlocutor x with regard to Interlocutor y
D1 D2 D3 I1,1 I1,2 I1,3 I2,1 I2,2 I2,3 I3,1 I3,2 I3,3Decho,1 0 0 0 0 0 0 te1 le1 0 le1 te1
0 Decho,2 0 te1 0 le1 0 0 0 le1 0 te1
0 0 Decho,3 te1 le1 0 le1 te1 0 0 0 0Ddr,1 0 0 0 dev2 dev2 0 0 0 0 0 0
0 Ddr,2 0 0 0 0 dev2 0 dev2 0 0 00 0 Ddr,3 0 0 0 0 0 0 dev2 dev2 0
b) Applying the inverted design paradigm, i.e. design perceptual impairments and obtain technical degradations, allows to merge testcases such that the same impairments are covered with only three test calls (table rows 1 to 3).
Technical Degradations Dx
⇐
Perceptual Impairments Ix,y,for Interlocutor x from the perspective of Interlocutor x with regard to Interlocutor y
D1 D2 D3 I1,1 I1,2 I1,3 I2,1 I2,2 I2,3 I3,1 I3,2 I3,3Decho,1 + Ddr,1 0 0 0 dev2 dev2 0 te1 le1 0 le1 te1
0 Decho,2 + Ddr,2 0 te1 0 le1 dev2 0 dev2 le1 0 te1
0 0 Decho,3 + Ddr,3 te1 le1 0 le1 te1 0 dev2 dev2 0
c) Explanation of table entries following the path analysis according to Section 6.3:Decho,x inserted at Interlocutor x means that Interlocutor x does not perceive any impairments, while the other two interlocutorsperceived talker echo (te1), i.e. echo of own voice, and listener echo (le1), i.e. echo of the other interlocutor’s voice.Ddr,x inserted at Interlocutor x means that Interlocutor x perceives impairments of all received signals (dev2), i.e. of the other twointerlocutors, while those interlocutors do not perceive any impairments.
Table 6.3: Examples of applying aconventional design paradigm and thenovel design paradigm for a three inter-locutor setting for two technical degra-dations: Echo Decho,x , and Terminal De-vice Degradation at receive-side Ddr,x .
6.5 Method to organize Perceptual Data to account for theIndividual Perspectives of Interlocutors
6.5.1 Motivation and Basic Principle
Since telemeeting participants can have different perceptions of thesame call, not only the experimental design but also the data analysisneeds to properly take these individual perspectives into account. Thetask is to organize the perceptual data according to the test conditionssuch that a statistical analysis is reasonable. Simply taking the ratingsfrom all participants per test call and then grouping all test calls withthe same technical degradation is not reasonable, as such sets couldmix ratings referring to different perceptions of the same call. Instead,the quality ratings need to be grouped into individual sets sharingthe same possible perceptual impairments.
The basic principle of such impairment-based grouping consists oftwo steps:
1. Starting from the actual experiment design, the sets are definedby the respective combinations of impairments on the individualconnections. Those set definitions can be expressed in terms of

methodology for the perceptual assessment of telemeeting quality 141
“Set x is defined by the fact that one connection has ImpairmentIa, one connection Impairment Ib, and so on”. However, the actualdefinition of sets depends on the quality aggregation level (seeChapter 5), i.e. if the quality ratings refer to the Individual ConnectionQuality scores Qij or to the Single-Perspective Telemeeting Quality Qi.For grouping the ratings of Qi, each set of ratings is defined by thespecific combination of impairments on the individual connections,i.e. how many individual connections have which impairments.For grouping the ratings of Qij, each set of ratings is defined bythe specific impairment on that individual connection under theconstraint of a specific combination of impairments on the otherindividual connections.
2. Then the ratings (per test participant and test call) can be assignedto the groups by applying selection criteria that match the setdefinitions. Such assignment can be expressed in terms of “Assignrating R to set x, if in the call the test participant had on oneconnection Impairment Ia, on one connection Impairment Ib, andso on”.
An example to explain the basic principle for ratings of Qi and Qij isgiven in Table 6.4.
Next to enable a proper statistical analysis, it will be beneficial toextend the data organization to facilitate the modeling approachesthat will be described in Chapter 9. The main goal of those modelingapproaches is to estimate the Single-Perspective Telemeeting Quality Qi
based on the Individual Connection Quality Qij. For that reason thedata organization needs to be extended such that when assigning thedata into the different sets, the link between ratings of Qi and Qij
are maintained. This is done by forming additional groups that aredefined in the same way as the groups for the Qi ratings, but thatcontain the Qi ratings and the corresponding Qij ratings of the sametest participant for the same test call.

142 quality of experience of multiparty conferencing and telemeeting systems
1. Example test design (one call per table row) for a three-interlocutor setting for two technical degradations: Echo Decho,i , leadingto the perceived impairments “te1” (talker echo) and “le1” (listener echo); and Terminal Device Degradation at receive-side Ddr,i ,leading to the perceived impairment “dev2”. In case of evaluating the Single-Perspective Telemeeting Quality Qi , one rating Ri percall per participant is collected. In case of evaluating the Individual Connection Quality Qij, one rating Rij per connection and thusthree ratings per call per participant are collected.
Technical Degradations Di Perceptual Impairments Ii,j,for Interlocutor i from the perspective of Interlocutor i with regard to Interlocutor j
D1 D2 D3 I1,1 I1,2 I1,3 I2,1 I2,2 I2,3 I3,1 I3,2 I3,3Decho,1 + Ddr,1 0 0 0 dev2 dev2 0 te1 le1 0 le1 te1
0 Decho,2 + Ddr,2 0 te1 0 le1 dev2 0 dev2 le1 0 te1
0 0 Decho,3 + Ddr,3 te1 le1 0 le1 te1 0 dev2 dev2 0
2. Grouping principle for Qi : each set of ratings is defined by the specific combination of impairments on the individualconnections. For the given example this leads to the following two sets.
Set Selection Criterion Interpretation1 Ri |Ii,a=0∧ Ii,b=dev2∧ Ii,c=dev2
with a = i: own connection, [b, c] 6= i connec-tions to interlocutors
all ratings in which an interlocutor perceivedno impairment of the own connection and theterminal-related impairment for the two inter-locutors
2 Ri |Ii,a=te1∧ Ii,b=0∧ Ii,c=le1with a = i: own connection, [b, c] 6= i connec-tions to interlocutors
all ratings in which an interlocutor perceives thecombination of talker echo, listener echo for oneinterlocutor and no echo for the other interlocu-tor
3. Grouping principle for Qij: each set of ratings is defined by the specific impairment of the currently considered connectionunder the constraint of a specific combination of impairments on the other individual connections. For the given example thisleads to the following five sets.
Set Selection Criterion Interpretation1a Ria|Ii,a=0∧ Ii,b=dev2∧ Ii,c=dev2
with a = i: currently considered own connec-tion, [b, c] 6= i connections to interlocutors
all ratings of the own unimpaired connection, un-der the constraints that the other two connectionshave the impairment dev2
1b Ria|Ii,a=dev2∧ Ii,b=0∧ Ii,c=dev2with a 6= i: connection of currently consid-ered interlocutor, b = i: own connection,c 6= i connection to remaining interlocutor
all ratings of a connection with the impairmentdev2, under the constraints that the own connec-tion has no impairment and the other connectionhas the impairment dev2
2a Ria|Ii,a=te1∧ Ii,b=0∧ Ii,c=le1with a = i: currently considered own connec-tion, [b, c] 6= i connections to interlocutors
all ratings of the own connection with talker echote1, under the constraints that one connectionhas no impairment and the other connection haslistener echo le1
2b Ria|Ii,a=0∧ Ii,b=te1∧ Ii,c=le1with a 6= i: connection of currently consid-ered interlocutor, b = i: own connection,c 6= i connection to remaining interlocutor
all ratings of a connection with no impairment,under the constraints that the own connectionhas talker echo te1 and the other connection haslistener echo le1
2c Ria|Ii,a=le1∧ Ii,b=te1∧ Ii,c=0 with a 6= i: connection of currently consid-ered interlocutor, b = i: own connection,c 6= i connection to remaining interlocutor
all ratings of a connection with listener echo le1,under the constraints that the own connectionhas talker echo te1 and the other connection hasno impairment
4. This procedure results in the following assignments of the ratings into the different sets (each table row representing one set).
Sets of Telemeeting Quality Ratings Ri Sets of Individual Connection Quality Ratings Ri,j,for Interlocutor i from the perspective of Interlocutor i with regard to Interlocutor j
R1 R2 R3 R1,1 R1,2 R1,3 R2,1 R2,2 R2,3 R3,1 R3,2 R3,31 2 2 1a 1b 1b 2b 2a 2c 2b 2c 2a2 1 2 2a 2b 2c 1b 1a 1b 2c 2b 2a2 2 1 2a 2c 2b 2c 2a 2b 1b 1b 1a
Table 6.4: Example for the basic prin-ciple to organize the perceptual data:starting from the experimental design,the sets of ratings are defined by thecombinations of the impairments on theindividual connections.

methodology for the perceptual assessment of telemeeting quality 143
6.5.2 Application by means of an Algorithm
At first glance the two steps, definition of sets and assignment of data,appear to be straight-forward. However, going trough the examplein Table 6.4 suggests that conducting the data organization manuallycan become quite laborious and errorprone. For that reason, the nextparagraphs describe an algorithm that automatically performs thedata organization, whereas the presentation of the algorithm aims tobe as generic as possible by means of an implementation-independentdescription.
Specification of task, input and output To enable a statistical analysis,the first and second tasks of the algorithm are to automatically con-duct the two steps explained in the basic principle: the definitionof sets and the corresponding assignment of the ratings for Qi andQij. To enable a modeling of Qi as function of Qij, the third task ofthe algorithm is to maintain during the grouping process the linkbetween ratings of Qi and Qij per test participant and test call.
The input will be a data set that contains the information in whichtest calls which interlocutors rated which combination of impairmentson individual connections with which ratings for Qi and Qij. Whilethe actual data format may be defined in another way, the proposalhere is to use as input a data matrix with one row per test call. Theformat of that input data matrix and a corresponding example aregiven in Table 6.5.
The output will be a data set that contains the information whichratings of Qi and Qij belong to which of the defined sets. Whilethe actual data format may be defined in another way, the proposalhere is to generate four data matrices: one with ratings of Qi, onewith ratings of the own connection Qij with i = j, one with ratingsof the connections to the interlocutors Qij with i 6= j, and one withthe linked ratings of Qi and Qij used for modeling. The format ofeach output data matrix and corresponding examples are given inTable 6.6.
Challenges for automatic definition of impairment sets Concerning theautomatic definition of the impairment sets, the algorithm needs toaddress three aspects that complicate the implementation, which willbe explained in the following: treatment of own connections, sortingof connections to interlocutors, and identification of permutations.
Concerning own connections, the algorithm should apply a specialtreatment of those connections. This is motivated by the type ofinformation, i.e. the type of quality features, that is available for atest subject to give a judgment about the own connection. It can beargued that ratings of the own connection are of a more hypotheticalnature, as they rely in most cases only on cue-based quality features,compared to ratings of the connections of the other interlocutors,which rely in most cases on signal-based features, see the discussionsin Section 5.3. For that reason, it could be beneficial for modeling

144 quality of experience of multiparty conferencing and telemeeting systems
Row definition:per row all data of one test call
Column definition:Column number Example for
#IL = 5
Inputvariable
Description of input variable
1 1 Call ID Identifier for test call1 + 1 to 1 + 1 · #IL 2 to 6 I1j Impairment identifiers from the perspec-
tive of Interlocutor 1 with regard to Inter-locutor j, with j ∈ [1 . . . #IL]
1 + 1 + 1 · #IL to 1 + 2 · #IL 7 to 11 I2j Impairment identifiers from the perspec-tive of Interlocutor 2 with regard to Inter-locutor j, with j ∈ [1 . . . #IL]
1 + 1 + 2 · #IL to 1 + 3 · #IL 12 to 16 I3j Impairment identifiers from the perspec-tive of Interlocutor 3 with regard to Inter-locutor j, with j ∈ [1 . . . #IL]
......
... 17 to 21
...Corresponding impairment identifiersfrom the perspectives of Interlocutors4 . . . #IL− 1
1 + 1 + (#IL− 1) · #IL to 1 + #IL · #IL 22 to 26 I2j Impairment identifiers from the perspec-tive of Interlocutor #IL with regard to In-terlocutor j, with j ∈ [1 . . . #IL]
1 + #IL2 + 1 to 1 + #IL2 + #IL 27 to 31 Ri Ratings of Qi of Interlocutors i, with i ∈[1 . . . #IL]
1 + #IL2 + #IL + 1 + 0 · #IL to 1 + #IL2 + #IL + 1 · #IL 32 to 36 I1j Ratings of Qij from the perspective of In-terlocutor 1 with regard to Interlocutor j,with j ∈ [1 . . . #IL]
1 + #IL2 + #IL + 1 + 1 · #IL to 1 + #IL2 + #IL + 2 · #IL 37 to 41 I2j Ratings of Qij from the perspective of In-terlocutor 2 with regard to Interlocutor j,with j ∈ [1 . . . #IL]
1 + #IL2 + #IL + 1 + 2 · #IL to 1 + #IL2 + #IL + 3 · #IL 42 to 46 I3j Ratings of Qij from the perspective of In-terlocutor 3 with regard to Interlocutor j,with j ∈ [1 . . . #IL]
......
... 47 to 51
... Corresponding ratings of Qij of from theperspectives of Interlocutors 4 . . . #IL− 1
(1) + 1 + (#IL− 1) · #IL to 1 + #IL2 + #IL + #IL · #IL 52 to 56 I2j Ratings of Qij from the perspective of In-terlocutor #IL with regard to Interlocutor j,with j ∈ [1 . . . #IL]
Call ID I11 I12 I13 I21 I22 I23 I31 I32 I33 R1R2R3 R11R12R13 R21R22R23 R31R32R33
1 0 dev2dev2 0 te1 le1 0 le1 te1 4 2 2 5 3 3 5 1 2 5 2 1
2 te1 0 le1 dev2 0 dev2 le1 0 te1 2 4 2 1 5 5 3 5 3 2 5 1
3 te1 le1 0 le1 te1 0 dev2dev2 0 2 2 4 1 2 2 2 1 5 3 3 5
Table 6.5: Input specification for the dataorganization algorithm. Top table: defi-nition of the input format for #IL inter-locutors. Bottom table: correspondingdata example for #IL = 3.

methodology for the perceptual assessment of telemeeting quality 145
Output data matrix for Qi :setID set definition using Iij Call ID i =
SubjIDRi
1 0 dev2 dev2 1 1 4
1 0 dev2 dev2 2 2 4
1 0 dev2 dev2 3 3 4
2 te1 0 le1 1 2 2
2 te1 0 le1 1 3 2
2 te1 0 le1 2 1 2
2 te1 0 le1 2 3 2
2 te1 0 le1 3 1 2
2 te1 0 le1 3 2 2
Output data matrix for Qii (own connection):setID set definition using Iij Call ID i =
SubjIDRii
1a 0 dev2 dev2 1 1 5
1a 0 dev2 dev2 2 2 5
1a 0 dev2 dev2 3 3 5
2a te1 0 le1 1 2 1
2a te1 0 le1 1 3 1
2a te1 0 le1 2 1 1
2a te1 0 le1 2 3 1
2a te1 0 le1 3 1 1
2a te1 0 le1 3 2 1
Output data matrix for Qij (excluding own connection):setID set definition using Iij Call ID i = SubjID j 6= i Rij
1b dev2 0 dev2 1 1 2 3
1b dev2 0 dev2 1 1 3 3
1b dev2 0 dev2 2 2 1 3
1b dev2 0 dev2 2 2 3 3
1b dev2 0 dev2 3 3 1 3
1b dev2 0 dev2 3 3 2 3
2b 0 te1 le1 1 2 1 5
2b 0 te1 le1 1 3 1 5
2b 0 te1 le1 2 1 2 5
2b 0 te1 le1 2 3 2 5
2b 0 te1 le1 3 1 3 5
2b 0 te1 le1 3 2 3 5
2c le1 te1 0 1 2 3 2
2c le1 te1 0 1 3 2 2
2c le1 te1 0 2 1 3 2
2c le1 te1 0 2 3 1 2
2c le1 te1 0 3 1 2 2
2c le1 te1 0 3 2 1 2
Output data matrix for modeling, linking QiandQij:setID set definition using Iij Call ID i =
SubjIDRi Rii Rij with sorting based on the
values of Iij withj ∈ [1 . . . i− 1, i + 1 . . . #IL]
1 0 dev2 dev2 1 1 4 5 3 3
1 0 dev2 dev2 2 2 4 5 3 3
1 0 dev2 dev2 3 3 4 5 3 3
2 te1 0 le1 1 2 2 1 5 2
2 te1 0 le1 1 3 2 1 5 2
2 te1 0 le1 2 1 2 1 5 2
2 te1 0 le1 2 3 2 1 5 2
2 te1 0 le1 3 1 2 1 5 2
2 te1 0 le1 3 2 2 1 5 2
Table 6.6: Output specification of thedata organization algorithm. Each ta-ble represents one of four data matricesthat are generated; the first three ma-trices (Qi , Qii , Qij) facilitate statisticalanalysis; the fourth matrix is used formodeling. Table headings: definitionof the output format for #IL interlocu-tors. Table bodies: corresponding dataexamples for #IL = 3.

146 quality of experience of multiparty conferencing and telemeeting systems
purposes, if the ratings of the own connections are treated differently,meaning that the data format should support an easy addressingof those ratings. This is realized here by fixed positions of the ownconnections in the definitions of the impairment sets: In the defi-nition of impairment sets of Qi (ratings of whole telemeeting) andQii (ratings of own individual connection into the telemeeting), theown connection is always put at the first position; in the definition ofimpairment sets of Qij (ratings of individual connection of the otherinterlocutors into the telemeeting), the own connection is always putat the second position. This can be found in the selection criteria usedin Table 6.4 as well as in the definition of the output data format inTable 6.6.
Concerning the connections to the interlocutors, the definition ofimpairment sets is ill-defined, if no countermeasures are taken bythe algorithm. A telemeeting with #IL interlocutors means that eachinterlocutor i is rating the own connection (Iii) plus #IL− 1 connec-tions of the other interlocutors (Iij with j ∈ [l . . . i− 1, i + 1 . . . #IL]).Thus there are (#IL− 1)! = 1 · 2 · . . . · (#IL− 1) possibilities to placethose connections in the definition of such an impairment set, giventhat the own connection Iii shall have a fixed position. In order toobtain just one unique definition for each set, the algorithm needs tochoose one such combination by means of sorting the impairments.For that purpose, the sorting could follow the alphabetical order if theindividual impairments are defined by strings, or the sorting couldbe based on ranking numerical values if the impairments are definedby such values. While this is straight-forward to implement for theoutput data sets for the statistical analysis, the generation of the out-put data for the modeling, i.e. estimating Qi based on Qij, needs tospecifically address the cases when multiple connections have thesame impairment. In such a case, there are multiple possibilities forplacing those individual connections into the columns of the outputmatrix, while they still fulfill the alphabetical or numerical ordering ofthe impairment identifiers. This results in an ill-defined assignmentof the corresponding ratings, as those ratings would be arbitrarilyassigned to the different possible columns in the output data matrix,which would create noise in the modeling results. Table 6.7 clarifiesthis with a specific example. To avoid such problems, the data or-ganization algorithm needs to be extended to sort the ratings basedon additional criteria. Examples proposed by Skowronek et al. 8 are
8 Janto Skowronek et al. “Methodand Apparatus for Computing the Per-ceived Quality of a Multiparty Au-dio or Audiovisual TelecommunicationService or System”. Patent applica-tion WO/2016/041593 (EP). DeutscheTelekom AG. Mar. 2016
to sort those connections according to the actual rating values oraccording to auxiliary information such as amount of contribution ofthe interlocutors to the conversation or their importance (social status,role) for the telemeeting.
Concerning permutations, the algorithm needs to be able to identifyin the input data permutations of the same impairment sets. Asan example, Table 6.8 shows that combinations of impairments indifferent calls for different interlocutors are actually permutations ofthe same impairment set.

methodology for the perceptual assessment of telemeeting quality 147
1. Consider the following input data set of Interlocutor 1 for a four-interlocutors telemeeting, in which Interlocutor 1 perceives thesame impairment dev2 on the connections of all participants, but assigns different ratings to each connection.
Call ID I1,1 I1,2 I1,3 I1,4 R1 R1,1 R1,2 R1,3 R1,4
1 0 dev2 dev2 dev2 4 5 3 4 2
2. Concerning the connections to the other interlocutors, a sorting in terms of the impairment identifiers Iij alone still allows sixpossibilities to assign the ratings R1,2 to R1,4 to the columns in the output data matrix.
Output data matrix for modeling, linking QiandQij:
possibility set definition using Iij Call ID i =SubjectID
Ri Rii Rij with j 6= i, differentsortings based on the
values of Iij
a 0 dev2 dev2 1 1 4 5 2 3 4
b 0 dev2 dev2 1 1 4 5 2 4 3
c 0 dev2 dev2 1 1 4 5 3 2 4
d 0 dev2 dev2 1 1 4 5 3 4 2
e 0 dev2 dev2 1 1 4 5 4 2 3
f 0 dev2 dev2 1 1 4 5 4 3 2
Table 6.7: Example of a data set as inputto the data organization algorithm forthree interlocutors.
CallID
SubjectID
Impairment Combination
1 1 [I1,1 I1,2 I1,3] = [ 0 dev2 dev2 ]
2 2 [I2,1 I2,2 I2,3] = [ dev2 0 dev2 ]
3 3 [I3,1 I3,2 I3,3] = [ dev2 dev2 0 ]
⇒ are permutations of
SetID for Qi Set definition
1 [ 0 dev2 dev2 ]
Table 6.8: Example of permutations ofimpairment combinations in the inputdata belonging to the same impairmentset defined for Qi .

148 quality of experience of multiparty conferencing and telemeeting systems
Outline of Processing Steps and Detailed Realization With the specifi-cation of tasks, input, and output, as well as the identification ofchallenges, the individual processing steps can be defined as follows:
1. Generate templates, i.e. set definitions based on combinations ofimpairments
(a) Go through input data
i. Take every combination of impairments per call and inter-locutors, i.e. tuples of impairment identifiers Ii,1 . . . Ii,#IL
ii. Sort tuples to account for permutations, including treatmentof own connections and sorting of connections to other inter-locutors
iii. Add to lists with templates
(b) Remove double entries from lists
2. Assign ratings to sets
(a) Go through input data and do per call and subject
i. Take tuple of impairment identifiers Iij
ii. Sort tuple to account for permutations
iii. Get tuple of corresponding ratings Rij, in same order ofimpairment identifiers
iv. Get corresponding rating of Ri
v. Compare sorted tuple with templates
vi. If a tuple matches a templateAdd to four output matrices: call and interlocutor identifier,tuple of Iij, Ri, tuple of Rij
A more detailed realization of the algorithm is described by means ofpseudo code: Table 6.9 shows the first part on template generation,Table 6.10 the second part on data assignment.

methodology for the perceptual assessment of telemeeting quality 149
01 /* automatic generation of templates defining all possible sets */02 begin03 for all callID do04 for all subjectID do05 /* get tuple of impairments Iij */06 curTuple = data(call ID, impairments belonging to subjectID)
07 /* do reordering to get templates Ti & Tii for Qi and Qii (own connections) */08 Iii = curTuple(subjectID)
09 Iij . . . IjN = curTuple(all except subjectID)
10 Ti = [Iii sort (Iij Iik . . . IiN ] with i 6= j 6= k ∈ [1...N]
11 Tii = Ti12 /* add to output: list of templates Ti */13 add Ti to templateList_Ti14 /* add to output: list of templates Tii */15 add Tii to templateList_Tii16 /* do reordering to get templates Tij for Qij by running through all except own connection */17 for all connectionID 6= subjectID do18 Iii = curTuple(subjectID)
19 Iij = curTuple(connectionID)
20 Iik . . . IjN = curTuple(all except subjectID & connectionID)
21 Tij = [Iij Iii sort(Iik . . . IiN)] with i 6= j 6= k ∈ [1...N]
22 /* add to output: list of Tij templates */23 add Tij to templateList_Tij24 remove double entries from templateList_Ti25 remove double entries from templateList_Tii26 remove double entries from templateList_Tij27 end
Table 6.9: Pseudocode of the data organi-zation algorithm: First algorithm part toautomatically generate from the percep-tual data the definition of sets of sameimpairments.

150 quality of experience of multiparty conferencing and telemeeting systems
01 /* automatic assignment of data into sets by matching with templates */02 begin03 for all call ID do04 for all subjectID do05 /* get tuple of impairments Iij */06 curTuple = data(call ID, impairments belonging to subjectID)
07 /* do reordering to match data with template formats for Qi and Qii (own connections) */08 Iii = curTuple(subjectID)
09 Iij . . . IjN = curTuple(all except subjectID)
10 Ti = [Iii sort(Iij Iik . . . IiN)] with i 6= j 6= k ∈ [1...N]
11 Tii = Ti12 /* get indices pointing to reordered impairment tuples */13 Ti_idx = [idxTo_Iii in_order_of_sorting_above(idxTo_Iij . . . idxTo_IiN)]
14 Tii_idx = Ti_idx15 /* get index pointing to corresponding Ri rating of current subjectID */16 Ri_idx = idxTo_Ri17 /* get indices pointing to reordered Rij rating tuples */18 Rii_idx = [idxTo_Rij idxTo_Rii in_order_of_sorting_above(idxTo_Rik . . . idxTo_RiN)]
19 /* match current tuple with templates for Qi and Qii and save corresponding indices */20 for all entries in templateList_Ti do21 get currentTemplate from templateList_Ti22 if currentTemplate == Ti then23 /* add to output: list of pointers to all data entries needed for the statistical analysis of Ri
ratings */24 add [call ID Ri_idx Ii_idx] to pointerList_Ri25 /* add to output: list of pointers to all data entries needed for the modelling of Ri ratings
based on Rij ratings */26 add [call ID Ri_idx Rii_idx Ii_idx Iii_idx] to pointerList_Ri_Rij27 for all entries in templateList_Tii do28 get currentTemplate from templateList_Tii29 if currentTemplate == Ti then30 /* add to output: list of pointers to all data entries needed for the statistical analysis of Rii
ratings */31 add [call ID Rii_idx Iii_idx] to pointerList_Rii32 /* do reordering to match data with template format for Qij by running through all except own
connection */33 for all connectionID 6= subjectID do34 Iii = curTuple(subjectID)
35 Iij = curTuple(connectionID)
36 Iik . . . IjN = curTuple(all except subjectID & connectionID)
37 Tij = [Iij Iii sort(Iik . . . IiN)] with i 6= j 6= k ∈ [1...N]
38 /* get indices pointing to reordered Rij rating tuples39 Rij_idx = [idxTo_Rij idxTo_Rii in_order_of_sorting_above(idxTo_Rik . . . idxTo_RiN)]
40 /* match current tuple with templates for Qi and Qii and save corresponding indices41 for all entries in templateList_Tii do42 get currentTemplate from templateList_Tii43 if currentTemplate == Ti then44 /* add to output: list of pointers to all data entries needed for the statistical analysis of Rij
ratings */45 add [call ID Rij_idx Iij_idx] to pointerList_Rij46 end
Table 6.10: Pseudocode of the data or-ganization algorithm: Second algorithmpart to automatically assign the percep-tual data to the defined sets of sameimpairments.

methodology for the perceptual assessment of telemeeting quality 151
Summary
Since experimental details can influence results, a perceptual qualityassessment method for multiparty telemeetings needs to consist of astringent and ideally standardized test protocol. A first standardizeddocument for this purpose is ITU-T Recommendation P.1301. Onthe one hand, P.1301 is based on a set of existing test protocols fornon-multiparty situations and provides guidance to those methods;on the other hand, P.1301 provides advices how to apply and modifysuch protocols for the multiparty case.
Since a number of aspects of multiparty quality assessment arestill under study, P.1301 needs to be augmented with additionalcurrently non-standardized methods. One such aspect relevant for thepresent research is the multiparty quality assessment of asymmetricconditions, in which interlocutors participate in a telemeeting withdifferent connection characteristics or equipment. In such asymmetriccases, interlocutors can have different perceptual experiences of thesame telemeeting.
For that reason, this chapter presented a methodology that al-lows to translate the technical condition of a telemeeting system intosuch individual perceptual perspectives. The approach is a four-stepprocedure: (1) description of the multiparty situation, using a struc-tured graphical representation of the end-to-end signal paths fromall senders to all receivers; (2) identification of Degradation-Types andDegradation-Points, defining which types of degradations are undertest and where they technically affect the signals; (3) analysis of sig-nal paths and deduction of possible perceptual impairments; and (4)generation of a comprehensive representation for all interlocutors,presented in a convenient format such as a table. This method is asystematic approach to deduct the potential perceptual impairmentsfrom the technical system conditions, which provides all informa-tion to properly design, conduct and analyze a multiparty qualityassessment test. However, it needs to be clarified that this methoddoes not allow to verify if such impairments are actually perceivedby participants.
Furthermore, the focus on perceptual impairments instead of tech-nical degradations allows to optimize the experimental design interms of the number of necessary test calls. Here the idea is tosmartly combine technical conditions for the individual interlocutorsinto the same call in order to reduce the necessary number of testcalls. Although the optimization potential depends on the actual setof considered degradations and impairments, and on the technicalpossibilities of the actual test system, this approach is a useful tool tooptimize the amount of experimental effort.
Finally, when considering asymmetric conditions, the data sets col-lected in perceptual assessment tests can become quite complex giventhat individual interlocutors have different perspectives of the sametelemeeting call. Here, a sorting of the data is necessary, which con-sists of two principle steps: (1) definition of data subsets sharing the

152 quality of experience of multiparty conferencing and telemeeting systems
same perceptual impairments, and (2) grouping of data observationsto those sets by applying selection criteria that match the definitionof the sets. The actual definitions of the data subsets depend on thequality aggregation levels Single-Perspective Telemeeting Quality Qi andIndividual Connection Quality Qij. For ratings of Qi, each set of ratingsis defined by the specific combination of impairments on the individ-ual connections. For ratings of Qij, each set of ratings is defined bythe specific impairment of the corresponding individual connectionunder the constraint of a specific combination of impairments on theother individual connections. Since this sorting can be quite laboriousand error-prone when performed manually, an algorithm is proposedand described to automate this sorting.

7Perception of Telemeeting Quality with focus on Group-Communication Aspects
This chapter contains text passages that either stem from previous texts of the author or that are based on such source texts. Forreadability purposes those passages are not marked as quotations. The main source documents used for this chapter are:
- Janto Skowronek et al. “Speech recordings for systematic assessment of multi-party conferencing”. In: Proceedings of Forum Acusticum 2011. Aalborg,Denmark: European Acoustical Society, June 2011
- Janto Skowronek and Alexander Raake. “Einfluss von Bandbreite und räumlicher Sprachwiedergabe auf die kognitive Anstrengung bei Telefonkon-ferenzen in Abhängigkeit von der Teilnehmeranzahl”. In: Fortschritte der Akustik (DAGA2011) - 37. Deutsche Jahrestagung für Akustik. DeutscheGesellschaft für Akustik. Düsseldorf, Germany, Mar. 2011, pp. 873–874
- Janto Skowronek and Alexander Raake. “Investigating the effect of number of interlocutors on the quality of experience for multi-party audioconferencing”. In: Proceedings of the 12th Annual Conference of the International Speech Communication Association (Interspeech2011). InternationalSpeech Communication Association. Florence, Italy, Aug. 2011, pp. 829–832
- Janto Skowronek, Falk Schiffner, and Alexander Raake. “On the influence of involvement on the quality of multiparty conferencing”. In: 4thInternational Workshop on Perceptual Quality of Systems (PQS 2013). International Speech Communication Association. Vienna, Austria, Sept. 2013,pp. 141–146
- Janto Skowronek and Alexander Raake. “Assessment of Cognitive Load, Speech Communication Quality and Quality of Experience for spatialand non-spatial audio conferencing calls”. In: Speech Communication (2015), pp. 154–175. doi: 10.1016
- Janto Skowronek and Alexander Raake. Development of scalable conversation test scenarios for multi-party telephone conferences. ITU-T ContributionCOM 12 - C187 - E. Geneva, Switzerland: International Telecommunication Union, Jan. 2011
- Janto Skowronek and Alexander Raake. Listening test stimuli using scalable multiparty conversation test scenarios. ITU-T Contribution COM 12 - C 286
- E. Geneva, Switzerland: International Telecommunication Union, Oct. 2011
- Janto Skowronek and Alexander Raake. Number of interlocutors and QoE in multiparty telephone conferences. ITU-T Contribution COM 12 - C 287 - E.Geneva, Switzerland: International Telecommunication Union, Oct. 2011
- Janto Skowronek and Alexander Raake. Update on number of Interlocutors and QoE in multiparty telephone conferences. ITU-T Contribution COM 12 -C035 - E. Geneva, Switzerland: International Telecommunication Union, Mar. 2013
Since additional documents served as further background material, see Appendix A for the full list of source documents and theircontributions to this chapter.
What this chapter is about
The present text is built around two aspects that differentiate a multi-party telemeeting from a conventional two-party (video) telephonycall. One aspect is addressed in this chapter: the special communica-tive situation, that is, having a group conversation over a telecommu-nication system.
More specifically, this chapter reports on two studies that investi-gated the impact of different communicative situations on differentaspects of quality perception. Moreover, in order to get a more com-plete picture, the studies considered also the interaction betweensuch communicative situations and a number of technical systemproperties.
The first study investigated in two experiments the impact of the

154 quality of experience of multiparty conferencing and telemeeting systems
interaction between technical characteristics of the system, expressedas Technical System Capability, and the communicative situation, ex-pressed as Communication Complexity. The second study investigatedin one experiment the impact of the interaction between TechnicalSystem Capability and the degree to which a single interlocutor takespart in the conversation, expressed as Involvement. In both studies,the impact was investigated on three aspects of quality perception:the perceived system performance, expressed as Speech Communica-tion Quality; the perceived effort to follow the group communication,expressed as Cognitive Load, and the overall experience as such, ex-pressed as Quality of Experience.
7.1 Introduction
Assuming a process-oriented perspective, which is here a simplifiedview on perception, quality perception can be regarded as a processin which an input – the telemeeting – is transformed into an output– the quality judgment. Concerning the input, two different prin-ciple aspects of telemeetings can influence quality perception: thetechnical system properties and the special communicative situation.Concerning the output, the conceptual model described in Chapter 5
considers Telemeeting Quality as a construct of two components, aTelecommunication Component and a Group-Communication Component.
Based on these considerations, telemeeting quality perception canbe considered as a two-in three-out process: it takes two inputs (tech-nology and communicative situation) and it generates three relatedoutputs (Telemeeting Quality, Telecommunication Component, Group-Communication Component). Looking at telemeeting quality perceptionfrom this perspective, the research question arises how these multipleinputs and outputs are related to each other and to what extent thiscomplexity can be decomposed. Such knowledge can be beneficialin different aspects: first, it can contribute to a better understandingof the contextual influences on quality perception in general; second,it can allow to draw proper conclusions from the results of a qualityassessment test in light of the applied experimental details; and third,it can provide empirical evidence for the conceptual model with itstwo components, supporting the practical relevance of those concepts.
To investigate the relation between those multiple inputs and out-puts, the two studies reported in this chapter considered both thecommunicative situation as well as technical system properties. Here,the communicative situation was further decomposed into the effectof Communication Complexity in one study and the effect of Involvementin another study. Furthermore, both studies aimed at measuring thethree outputs Telemeeting Quality, Telecommunication Component, andGroup-Communication Component separately.
In the following, the present chapter will first describe those con-ceptual input and output variables in more detail. Then it will reporton the conduction and results of the individual studies.

perception of telemeeting quality with focus on group-communication aspects 155
7.2 Experimental Variables on a Conceptual Level
The present text considers the conduction of an experiment as a pro-cess transforming an input to an output. The input is called here theManipulated Variables, the output is called Measured Variables. Manipu-lated Variables are those aspects of an experiment that are controlledby the investigator, and Measured Variables are those extracted fromthe experimental outcome, here the test participants’ answers. Thepresent section defines the Manipulated and Measured Variables on aconceptual level, while the detailed descriptions of the experimentslater on will define more concrete individual measures for each ofthose conceptual variables. The motivation for this approach is tobe able to group multiple but similar measures according to theircommon conceptual meaning.
The Manipulated Variables are Communication Complexity, Involve-ment and Technical System Capability. Communication Complexity refersto the communicative aspects of a telemeeting, concerning the in-terlocutors’ contributions to a telemeeting, and is controlled hereby simultaneously manipulating the number of interlocutors, theamount of information and the conversational structure. Involvementalso refers to the communicative aspects of a telemeeting, focusingon the test participant’s role as an interlocutor in a telemeeting, andis controlled here by different tasks for the test participants. TechnicalSystem Capability refers to the telemeeting system, and is manipu-lated here by applying different sound transmission and reproductionmethods.
The Measured Variables are Cognitive Load, Speech CommunicationQuality, and Quality of Experience. Cognitive Load refers to the difficultyinvolved in following the conversation and represents the Group-communication Component of telemeeting quality. Speech CommunicationQuality refers to the telemeeting system as such and is thus focusingon the Telecommunication Component of telemeeting quality. Quality ofExperience refers to the overall telemeeting quality, i.e. covering bothcomponents.
7.2.1 Manipulated Variable: Communication Complexity
Communication Complexity refers to the structure of the conversationin terms of who is contributing to the discussion at which pointin time. Aspects that differentiate conversational structures are thenumber of speaker changes, interruptions, monologues, longer speechpauses etc. How these aspects differ between multiparty conferencesdepends on how the interlocutors contribute to the conversation.It is assumed in this work, that an interlocutor’s contribution tothe conversation depends on how he or she is able to perform fourmental tasks: (1) understanding the speech signals from the others,(2) identifying speakers and their roles, (3) processing the informationshared during the conference and extracting its implications, and (4)formulating adequate responses. Note that this is a simplified model

156 quality of experience of multiparty conferencing and telemeeting systems
of the cognitive processes inside an interlocutor and should not beinterpreted as a comprehensive cognitive model of human-to-humancommunication. Nevertheless, one can reasonably assume that thosefour mental tasks do take place, due to the following reasoning.
It is a straight-forward observation that participants perform thefirst task, and that its difficulty is determined by the speech trans-mission chain from mouth to ear (e.g. signal quality), the speakingbehavior of the interlocutors (e.g. pronunciation), and language as-pects (e.g. language fluency). The observation that participants alsoperform the other three tasks is based on knowledge from the litera-ture on computer-mediated group-communication, see also Chapter 2.For example, Olson & Olson 1 discuss the importance for the interlocu- 1 Gary M. Olson and Judith S. Olson.
“Distance Matters”. In: Human-ComputerInteraction 15 (2000), pp. 139–178
tors to create a common ground, by adapting to what they perceivefrom the other interlocutors. Other studies (e.g., Sanford et al. 2, Daly-
2 Alison Sanford, Anne H. Anderson,and Jim Mullin. “Audio channel con-straints in video-mediated communica-tion”. In: Interacting with Computers 16
(2004), pp. 1069–1094
Jones et al. 3, Masoodian 4) also stress the importance of creating such
3 Owen Daly-Jones, Andrew Monk,and Leon Watts. “Some advantages ofvideo conferencing over high-quality au-dio conferencing: fluency and aware-ness of attentional focus”. In: Interna-tional Journal of Human-Computer Studies49 (1998), pp. 21–58
4 Masood Masoodian. “Human-to-Human Communication Support forComputer-Based Shared Workspace Col-laboration”. PhD Thesis. Departmentof Computer Science, The University ofWaikato, Hamilton, New Zealand, 1996
common ground in computer-mediated communication by referringto the work of Clark & Brennan 5. Similarly, Fussell & Benimoff 6
5 Herbert H. Clark and Susan E. Bren-nan. “Grounding in Communication”.In: Perspectives on socially shared cogni-tion. Ed. by Lauren B. Resnick, John M.Levine, and Stephanie D. Teasley. Amer-ican Psychological Association, 1991,pp. 127–149
6 Susan R. Fussell and Nicholas I. Ben-imoff. “Social and Cognitive Processesin Interpersonal Communication: Imli-cations for advanced telecommunicati-nos technologies”. In: Human Factors 37
(1995), pp. 228–250
discuss that interlocutors “... strive for a shared understanding ofthe situation, the task, and of one another’s background knowledge,expectations, beliefs, attitudes, and the like. They also construct abody of shared knowledge and understanding (common ground)which they can draw upon in their subsequent communications ...”
In terms of using Communication Complexity as a Manipulated Vari-able in an experiment, a number of aspects can change CommunicationComplexity by increasing or decreasing the difficulty of accomplishingthe four mental tasks. A first aspect is the number of interlocutors. Asparticipants will attempt to understand who the other interlocutorsare, and try to adapt their responses, the number of interlocutors willinfluence the difficulty to identify speakers and formulate responses.
A second aspect is the amount of information shared during atelephone conference. Obviously the more information is shared, thehigher is the effort to perform the task of information processing.
A third aspect is the conversational structure in terms of who iscontributing to a conversation at which point in time. An increasingcomplexity in the conversational structure will increase the difficultyof the tasks of speaker identification and information processing,as the order in which people contribute and the order in whichinformation is shared becomes less predictable.
There are more aspects that contribute to the complexity of atelephone conference conversation: the behavior of participants, thetopic of the conference, different cultural, language or professionalbackgrounds, et cetera. However, to limit the scope of this work,the present text will focus on the three aspects directly related toCommunication Complexity: the number of interlocutors, the amountof information to be exchanged and the conversational structure.

perception of telemeeting quality with focus on group-communication aspects 157
7.2.2 Manipulated Variable: Involvement
The term Involvement is considered here as the degree to which asingle interlocutor takes part in the conversation, that is in terms ofMerriam-Webster 7 “to engage as a participant”. 7 Merriam-Webster. Dictionary and The-
saurus. retrieved on August 19, 2015.Merriam-Webster Incorporated, Spring-field, MA. 2015. url: http : / / www .
merriam-webster.com/
A synonym is Engagement, a term which, however, is usually ap-plied in the user experience domain in the context of user-systeminteraction. According to O’Brien & Toms 8, Engagement is defined as
8 Heather L. O’Brien and Elaine G.Toms. “What is user engagement? Aconceptual framework for defining userengagement with technology”. In: Jour-nal of the American Society for InformationScience & Technology 59.6 (2008), pp. 938–955
“a category of user experience characterized by attributes of challenge,positive affect, endurability, aesthetic and sensory appeal, attention,feedback, variety/novelty, interactivity, and perceived user control.”Transferring this concept to the case of a group-communication viaa telemeeting system, and labeling it here Involvement, the presenttext considers only those aspects that would fit also to a human tohuman communication: positive affect, sensory appeal, attention,variety/novelty, and interactivity.
In terms of using Involvement as a Manipulated Variable in an ex-periment, two aspects of the experimental task can change an inter-locutor’s Involvement. The first aspect is the degree to which the taskrequires a test participant to contribute to the conversation; in otherwords, to which extent the task is imposing an Involvement on thetest participant from a necessity point of view. Obviously, the twofundamentally different cases are to conduct either conversation testsor listening-only tests; the former requiring the test participant tofully engage into the conversation, the latter excluding the test par-ticipant from the conversation. Within each of these test paradigms,special test instructions and dedicated side-tasks can – potentially –also change the interlocutor’s Involvement. In the conversation testparadigm, the degree of freedom that is given to the test participantsto formulate their contribution can play a role: if the task gives hardlyany freedom, then the test participants might feel less involved, asthey are then just following instructions; if the task gives full free-dom, then the test participants might feel fully involved as it is areal natural conversation. In the listening-only test paradigm, side-tasks concerning the content of the material can play a role: if thetask is just to listen to the stimuli and assess their quality, then thetest participants might feel less involved, as they are not interestedin what is being said; if the task has also a side-task that requiresto follow closely the conversation, then the participant might feelmore involved, as they are more interested in what is being said. Interms of O’Brien & Toms 9, such tasks would address the aspects of 9 Heather L. O’Brien and Elaine G.
Toms. “What is user engagement? Aconceptual framework for defining userengagement with technology”. In: Jour-nal of the American Society for InformationScience & Technology 59.6 (2008), pp. 938–955
interactivity and attention.The second aspect is the degree to which the task influences Involve-
ment by triggering a positive emotional affect and sensory appeal, ora certain amount of variety/novelty; in other words, to which extentthe task is stimulating a participant-internal motivation to engage.Thus, a task that is perceived as a pleasurable, interesting and moti-vating experience can lead to a higher Involvement than a task that isperceived as less pleasant, less interesting and less motivating.

158 quality of experience of multiparty conferencing and telemeeting systems
7.2.3 Manipulated Variable: Technical System Capability
The term Technical System Capability refers to those technical propertiesof the considered system that influence its quality. Technical SystemCapability is introduced here as a term to differentiate between thetechnical quality provided by the system, and the quality judgmentgiven by the user.
Apparently there is a link between the Technical System Capabilityand the perceived quality of a system in the sense that a low TechnicalSystem Capability would reflect low perceived quality, and a high Tech-nical System Capability would reflect high perceived quality. However,it is known in the field that the mapping of technical system propertiesor system behavior to perceived quality is not straight-forward, whichin turn requires to distinguish between the technical and perceptualside of quality.
In terms of using Technical System Capability as a Manipulated Vari-able in an experiment, audiovisual telemeetings can differ in theirTechnical System Capability in terms of numerous technical propertiesof the whole chain, from speech and video capture via data transmis-sion to sound and video reproduction, see also Chapter 3. Differentdegradation types can lead to different perceptual quality dimen-sions 10 in the sense of the Telecommunication Component. Similarly
10 Marcel Wältermann. Dimension-basedQuality Modelling of Transmitted Speech.Springer, 2013
different degradation types can influence communicative aspects 11
11 Jessica J. Baldis. “Effects of Spa-tial Audio on Memory, Comprehension,and Preference during Desktop Confer-ences”. In: Proceedings of the ACM CHI2001 Human Factors in Computing SystemsConference. Ed. by Michel Beaudouin-Lafon and Robert J. K. Jacob. Vol. 3. 1.2001, pp. 166–173
Alexander Raake et al. “Listening andconversational quality of spatial audioconferencing”. In: Proceedings of the AES40th International Conference. Tokyo, Oct.2010
in the sense of the Group-Communication Component.To limit the scope of this work, the present text covers each compo-
nent with one technical property, but with different instances of thatproperty. More specifically, the study on the impact of CommunicationComplexity addresses both components; thus it uses combinations oftwo technical properties. The study on the impact of Involvement,however, focuses only on the Telecommunication Component; thus ituses one technical property.
7.2.4 Measured Variable: Cognitive Load
Cognitive Load is a concept in cognitive psychology in the contextof learning, and refers to the human working memory, which hasa limited capacity for processing information per instance of time.When performing a task, this capacity is shared by the intrinsic natureof the task (intrinsic load), the instructions of the task (extraneousload) and some amount used for building up cognitive schemata forthe task (germane load). More details about the individual aspects ofCognitive Load are given for example in Schnotz & Kuerschner 12 and 12 Wolfgang Schnotz and Christian
Kuerschner. “A Reconsideration of Cog-nitive Load Theory”. In: Educational Psy-chology Review 19.4 (2007), pp. 469–508
Bruenken et al. 13
13 Roland Bruenken, Jan L. Plass, andDetlev Leutner. “Direct Measurementof Cognitive Load in Multimedia Learn-ing”. In: Educational Psychologist 38.1(2003), pp. 53–61
Concerning typical multiparty telemeeting situations, the presenttext argues that interlocutors experience fatigue due to a high Cog-nitive Load. In the context of learning, the difficulty of a learningtask and its instruction material is determining Cognitive Load, seee.g. Bruenken et al. Similarly, the difficulty for a participant to followand contribute to a telemeeting will influence Cognitive Load. Thatmeans, the difficulty to perform the four mental tasks of speech under-

perception of telemeeting quality with focus on group-communication aspects 159
standing, speaker identification, information processing, and responseformulation will constitute Cognitive Load. In this respect, CognitiveLoad is a Measured Variable that refers to the Group-CommunicationComponent of Telemeeting Quality.
7.2.5 Measured Variables: Speech Communication Quality andQuality of Experience
Various aspects contribute to telemeeting quality, see Chapters 4 & 5,and Möller and colleagues proposed to organize these aspects alongtaxonomies for different telecommunication services such as tele-phone connections 14, spoken-dialogue systems 15 or multi-modal 14 Sebastian Möller. Assessment and Pre-
diction of Speech Quality in Telecommuni-cations. Kluwer Academic publishers,2000
15 Sebastian Möller. Quality of Telephone-Based Spoken Dialogue Systems. NewYork, USA: Springer, 2005
human-machine interaction systems 16. Inspired by Möller’s taxon-
16 Sebastian Möller et al. “A Taxon-omy of Quality of Service and Qualityof Experience of Multimodal Human-Machine-Interaction”. In: Proceedings ofthe International Workshop on Quality ofMultimedia Experience QoMEX. 2009
omy for telephone connections, this work considers two groups ofquality aspects. The first group is directly related to how well thesystem enables speech communication: (one-way) voice transmissionquality, ease of communication, and conversation effectiveness. Interms of Möller, these aspects are subsumed under the term SpeechCommunication Quality. The second group reflects the perceived qual-ity of a service in a more general view: overall impression, pleas-antness, satisfaction, and acceptance. As these aspects address thedelight of the user of the service, the present text subsumes them hereunder the term Quality of Experience.
Defining two such levels of perceived quality in this work helpsto distinguish how participants perceive the performance of a tele-meeting system and how participants experience a telemeeting assuch. In this way a terminology is available that allows to describe thequality with a focus on the system performance perceived by the user(Speech Communication Quality), and in a wider sense incorporatingalso aspects of using the system in the context of the communicationsituation at large (Quality of Experience).
In this respect, Quality of Experience is a Measured Variable that coversboth the Telecommunication and the Group-Communication Componentof telemeeting quality. Similarly, Speech Communication Quality coversboth components as well, since it subsumes quality features of percep-tion and action as well as interaction. However, in the present context,Speech Communication Quality is intended to have either a strong focuson the Telecommunication Component or on the Group-CommunicationComponent. This is possible, if the test protocol triggers test partic-ipants to interpret the questions on Speech Communication Qualityaccordingly, for instance by the actual wording of the questions (seeSection 5.4 for details).
7.3 Quality Impact of Communication Complexity
This section reports on two experiments investigating the qualityimpact of Communication Complexity, henceforth referred to as Experi-ments CC1 and CC2 (CC standing for Communication Complexity).

160 quality of experience of multiparty conferencing and telemeeting systems
7.3.1 Goals
Motivation One of the two main differentiators between a multipartytelemeeting and a conventional two-party call is the special commu-nicative situation. In this line of thought, the most obvious differencebetween multiparty and two-party calls in terms of communicativeaspects is the Communication Complexity. For that reason, the presentstudy investigates the impact of Communication Complexity on theperception of telemeeting quality.
Approach The present study aims at investigating the impact ofCommunication Complexity in the context of different Technical SystemCapabilities. This leads to a two-factorial study using both Commu-nication Complexity and Technical System Capabilities as ManipulatedVariables.
Communication Complexity is controlled by simultaneously manip-ulating the number of interlocutors, the amount of information andthe conversational structure. Note that the number of interlocutors –henceforth abbreviated as #IL – is representatively used as an iden-tifier for the different levels of Communication Complexity. TechnicalSystem Capability is manipulated by applying different sound repro-duction methods – henceforth abbreviated as SndRepr. Concerningthe Measured Variables, the study used three variables: Cognitive Load,Speech Communication Quality and Quality of Experience.
According to the iterative research method (Section 1.4), the studyconsisted of two experiments, CC1
17 and CC218. Conducting two 17 Janto Skowronek and Alexander
Raake. “Investigating the effect of num-ber of interlocutors on the quality ofexperience for multi-party audio con-ferencing”. In: Proceedings of the 12thAnnual Conference of the InternationalSpeech Communication Association (Inter-speech2011). International Speech Com-munication Association. Florence, Italy,Aug. 2011, pp. 829–832
18 Janto Skowronek and AlexanderRaake. “Assessment of Cognitive Load,Speech Communication Quality andQuality of Experience for spatial andnon-spatial audio conferencing calls”.In: Speech Communication (2015), pp. 154–175. doi: 10.1016
experiments allowed to improve the experimental method in thesecond experiment CC2 based on the insights gained in the first ex-periment CC1. Concerning the test methodology, both experimentsfocused on audio-only communication and applied a listening-onlytest paradigm. Focusing on audio-only was motivated by the assump-tion that the effect of Communication Complexity on Cognitive Loadmight be stronger for an audio-only than an audiovisual telemeeting,especially when it comes to aspects such as speaker identificationeffort. The decision to conduct a listening-only test was based on thefollowing reasoning: in order to obtain properly interpretable results,the conversation scenarios needed to be highly comparable, and thiscan be best achieved by generating recordings of highly structuredconversations and presenting them to the test participants.
Hypotheses The two experiments actually investigated slightly dif-ferent hypotheses due to differences in the Measured Variables andthe questionnaires. These variables, however, can be put into theframework of the Measured Variables described in Section 7.2, which inturn allows a common definition of hypotheses for both experiments.For that purpose, this paragraph will first describe the mapping ofthe original Measured Variables to the common conceptual framework.Then this paragraph will formulate a corresponding set of hypothesesthat are tested in this work.

perception of telemeeting quality with focus on group-communication aspects 161
At the time of preparing the first experiment CC1, the MeasuredVariables were defined as Cognitive Load and Quality, whereas Qual-ity was not as precisely defined as it is described in Section 7.2.The reason is that the concept of the Telecommunication and Group-Communication Components were not yet developed at a stage as pre-sented in Section 5.4 and the differentiation between Speech Commu-nication Quality and Quality of Experience were not yet considered ata stage as presented in Section 7.2. Instead, the different employedmeasures were chosen to cover different aspects of Quality without astrict link to the aspects of Speech Communication Quality vs. Quality ofExperience and Telecommunication vs. Group-Communication Components.However, by re-considering the actual wordings of the employedquestions, it is possible to split in retrospect the variable Quality intothree more specific Measured Variables: one variable reflecting SpeechCommunication Quality with a focus on the Telecommunication Compo-nent, a second variable reflecting Speech Communication Quality witha focus on the Group-Communication Component, and a third variablereflecting quality in a broader sense, whereas a more precise assign-ment to either Speech Communication Quality or Quality of Experience isnot possible.
The second experiment CC2, however, already introduced thedistinction between Speech Communication Quality and Quality of Ex-perience, but it did not consider the Telecommunication and Group-Communication Components. Again, by re-considering the actual word-ings of the employed questions, a weighting of Speech CommunicationQuality towards a focus on the Telecommunication Component can beidentified.
Moving forward to formulating a set of hypotheses, conceptuallytwo Manipulated Variables (SndRepr & #IL) and three Measured Variables(Cognitive Load, Speech Communication Quality, & Quality of Experience)were used in the two experiments. This allows to define six hypothe-ses of the form “[Manipulation Variable] has an impact on [MeasuredVariable]”. With the more precise definitions of the Measured Variablesdescribed above, it is possible to refine the set of hypotheses for eachexperiment as it is shown in Table 7.1. All resulting hypotheses willbe tested in this chapter.
7.3.2 Experimental Factors
Test Tasks In both experiments the task for test participants was aconventional listening-only assessment task (“Listen to the conversa-tion, and give ratings afterwards”), augmented with a memory test asa side task (“Memorize who said what during the conversation, andanswer a memory test afterwards”).
Conversation Scenarios To achieve different levels of CommunicationComplexity, dedicated conversation scenarios needed to be developed.The main challenge for the scenarios was to be as comparable as pos-sible while at the same time differing in the Communication Complexity.

162 quality of experience of multiparty conferencing and telemeeting systems
Measured Variables Manipulated VariablesCommunication Complexity Technical System Capability
(i.e. Number of Interlocutors #IL) (i.e. Sound Reproduction Method SndRepr)
Experiment CC1
Cognitive Load Hypothesis H1 Hypothesis H2
Speech Communication Quality with focus onTelecommunication Component
Hypothesis H3.1 Hypothesis H4.1
Speech Communication Quality with focus onGroup-Communication Component
Hypothesis H3.2 Hypothesis H4.2
Speech Communication Quality and/or Qualityof Experience
Hypothesis H5 Hypothesis H6
Experiment CC2
Cognitive Load Hypothesis H1 Hypothesis H2
Speech Communication Quality with focus onTelecommunication Component
Hypothesis H3 Hypothesis H4
Quality of Experience Hypothesis H5 Hypothesis H6
Table 7.1: Overview of the Manipulatedand Measured Variables and definition ofthe resulting hypotheses for the exper-iments CC1 and CC2. Each hypothesiscan be phrased as “[Manipulated Vari-able] has an impact on [Measured Vari-able]”.
The following descriptions outline, how this was achieved.The scenario topics were business-related and varied from aligning
a meeting date to preparing the steps for publishing a music CD.All scenarios had a common underlying conversational structure,consisting of four conversation phases: a welcome phase; a problemsolving phase, in which a number of agenda items are discussed;an information exchange phase, in which information items such asemail addresses are shared; and a farewell phase. We realized theincreasing Communication Complexity in a two-stage approach. First,with each new interlocutor, a new agenda item consisting of fourcontributions (question, constraint, conflict, solution) was added tothe problem solving phase. Second, the previous distribution of con-versation contributions across interlocutors was maintained when anew interlocutor and new contributions were added. For example,this means that in a two-interlocutor scenario, all contributions ofthe first (and only) agenda item are distributed across the two inter-locutors. When extending this to a three-interlocutor scenario, thetwo original interlocutors remained the ones contributing to the firstagenda item; the new third interlocutor was involved only in theadded second agenda item. This resulted into a scaling scheme asshown in Figure 7.1.
The scenarios were realized in form of scripts, providing the con-tent in bullet points and pictographs to facilitate more natural conver-sations. In Skowronek et al. 19, we decided to implement scenarios 19 Janto Skowronek et al. “Speech
recordings for systematic assessment ofmulti-party conferencing”. In: Proceed-ings of Forum Acusticum 2011. Aalborg,Denmark: European Acoustical Society,June 2011
with two, three, four and six interlocutors. The two-interlocutorscenarios served as anchor points; the three- and four-interlocutorscenarios represented typical real-life telephone conferences; the six-interlocutor scenarios represented more extreme cases in terms ofCommunication Complexity. The total number of scenarios createdby the author was 13: three scenarios for each number of interlocu-tors (#IL ∈ [2, 3, 4, 6]) and one additional three-interlocutor scenarioreserved for training test participants. The full scenario scripts areelectronically available 20.
20 Janto Skowronek. xCT - Scalable Mul-tiparty Conversation Test scenarios for con-ferencing assessment (Version 01). 2015.doi: 10.5281/zenodo.16138

perception of telemeeting quality with focus on group-communication aspects 163
With each new interlocutor (P1 to P6), a new agenda item (1 to 5) with four contributions – Demand, Constraint, Conflict,Solution – is added (dark gray). The distribution of previous contributions remains unchanged, except in some cases in whichminor deviations were used to better balance the number of contributions per interlocutor (light gray arrows), and respectivecontributions were shifted to another interlocutor.
Figure 7.1: Scaling scheme to increasethe Communication Complexity from atwo-interlocutor to a six-interlocutor sce-nario. Previously presented in
Janto Skowronek et al. “Speech record-ings for systematic assessment of multi-party conferencing”. In: Proceedings ofForum Acusticum 2011. Aalborg, Den-mark: European Acoustical Society, June2011

164 quality of experience of multiparty conferencing and telemeeting systems
Recording of Speech Material To obtain the speech material for thelistening-only test, six male German professional speakers played the13 scenarios via a simulated telemeeting system, consisting of high-quality headsets (Sennheiser HMD-410 & HME-46-3-6), a low-latencyfullband audio transmission path (44100 kHz sampling frequency)using the direct monitoring capabilities of the computer audio cards(RME Multiface II). Spatial sound reproduction using a binaural ren-dering software referred to as SoundScapeRenderer 21 was employed 21 Matthias Geier, Jens Ahrens, and
Sascha Spors. “The soundscape ren-derer: A unified spatial audio repro-duction framework for arbitrary render-ing methods”. In: Proceedings of theAES 124th Convention. Amsterdam, TheNetherlands, 2008
to provide optimal reproduction conditions during the conferencecalls. In an editing process of the resulting recordings, the authoroptimized the fit between the recordings and the intended conver-sation structure defined by the scenario scripts. For example, theauthor deleted deviating and unnecessary portions of the conferencecall without affecting the naturalness of the resulting recordings. Thenaturalness has been checked afterwards by a listener who was notinvolved in the recording or editing process. Furthermore, the au-thor performed a structural analysis using annotations as well asa conversational analysis based on computed speaker state proba-bilities (see Hoeldtke and Raake 22 for further details) in order to 22 Katrin Hoeldtke and Alexander
Raake. “Conversation analysis of multi-party conferencing and its relation toperceived quality”. In: Proceedings of theIEEE International Conference on Commu-nications ICC. Kyoto, Japan, June 2011
verify the comparability between the recordings. The outcome of thatprocess was 13 recordings with a total length of 97 minutes and anoptimized comparability between individual calls. For more detailson the recording session, the editing process and the evaluation, seethe report in Skowronek et al 23. 23 Janto Skowronek et al. “Speech
recordings for systematic assessment ofmulti-party conferencing”. In: Proceed-ings of Forum Acusticum 2011. Aalborg,Denmark: European Acoustical Society,June 2011
Technical Conditions From the many possible options to vary TechnicalSystem Capability by means of varying the sound reproduction method(SndRepr), the choice fell on two system parameters: bandwidth andspatial sound reproduction. These two parameters appeared to beimportant aspects with regard to Cognitive Load and Speech Communica-tion Quality. Some studies 24 showed that spatial sound reproduction 24 Jessica J. Baldis. “Effects of Spa-
tial Audio on Memory, Comprehension,and Preference during Desktop Confer-ences”. In: Proceedings of the ACM CHI2001 Human Factors in Computing SystemsConference. Ed. by Michel Beaudouin-Lafon and Robert J. K. Jacob. Vol. 3. 1.2001, pp. 166–173
Alexander Raake et al. “Listening andconversational quality of spatial audioconferencing”. In: Proceedings of the AES40th International Conference. Tokyo, Oct.2010
can reduce Cognitive Load in conferencing scenarios. Bandwidth, espe-cially narrowband vs. wideband speech, is known to have a significantimpact on speech quality 25 and speech intelligibility 26. To achieve
25 Alexander Raake. Speech Quality ofVoIP – Assessment and Prediction. Chich-ester, West Sussex, UK: Wiley, 2006
26 Hans W. Gierlich. “Wideband SpeechCommunication – The Quality Parame-ters as Perceived by the User”. In: Pro-ceedings of Forum Acusticum 2005. 2005
clearly perceivable quality differences, the bandwidth was variedfrom narrowband (NB) to fullband (FB) and spatial sound repro-duction varied from non-spatial to spatial (i.e. binaural) includinghead-tracking.
From the four possible combinations of bandwidth and spatialsound reproduction, the author selected three: NB/non-spatial(SndRepr = 1), FB/non-spatial (SndRepr = 2), FB/spatial (SndRepr =3). This decision was driven by practical and theoretical limitations.The practical limitation was the fact that only three recordings pernumber of interlocutors (#IL) were available. Hence, for two reasons,only three technical conditions could be tested: first, aiming for awithin-subject design, all test participants should judge all presentedcombinations of #IL and SndRepr; second, it was necessary to avoidthat test participants listen to the same recordings multiple timesas the questionnaire also contained a memory test. The theoretical

perception of telemeeting quality with focus on group-communication aspects 165
limitation was to avoid an unclear ranking of different instances ofthe Technical System Capability, which would have been the case forthe combinations FB/non-spatial and NB/spatial. The motivationfor avoiding such unclear ranking is to be able to draw valid conclu-sions due to the following reasoning: In order to study the effect ofdifferent levels of Technical System Capability, it would be necessaryto be able to determine upfront the difference in the Technical SystemCapability between FB/non-spatial and NB/spatial. This, however, isnot possible without a work-around in form of a pre-study to identifythis ranking experimentally. Since such a pre-study would need tobe rather comprehensive, as it requires a valid link between TechnicalSystem Capability and the pre-study results, the author refrained fromfurther following this approach and decided to focus on technicalconditions that can be properly interpreted.
To realize the three sound reproduction conditions, test partici-pants were seated in a sound-proof room and listened to the stimulivia AKG K601 headphones equipped with a FastTrak headtracker ata listening level of 79 dB SPL. To this aim, the SoundScapeRenderersoftware 27 was used for replaying the different stimuli either dioti- 27 Matthias Geier, Jens Ahrens, and
Sascha Spors. “The soundscape ren-derer: A unified spatial audio repro-duction framework for arbitrary render-ing methods”. In: Proceedings of theAES 124th Convention. Amsterdam, TheNetherlands, 2008
cally (non-spatial conditions SndRepr = 1 & 2) or dichotically (spatialcondition SndRepr = 3). The computer running the rendering softwarewas placed outside the listening room. In the spatial condition, theinterlocutors No. 1 to 6 were distributed in the virtual acoustic spaceas shown in Figure 7.2. For the FB-conditions, the recordings wereused as is. For the NB-conditions, the author filtered the signals usinga telephone bandpass tool (called c712demo.exe, bandpass cutoff fre-quencies at 230 & 3530 Hz) available from the ITU 28. Table 7.2 gives
28 ITU-T. Recommendation G.191 -Software tools for speech and audio cod-ing standardization. International Stan-dard. Geneva, Switzerland: Interna-tional Telecommunication Union, 2010an overview of the three realized sound reproduction conditions.
Figure 7.2: Spatial sound rendering usedin the listening test: Positioning of theinterlocutors IL1 to IL6 in the virtualacoustic space in front of the listener.Note: As head tracking was deployed,the given angles assume that the listenerlooks straight ahead.
Reproduction SndRepr = 1: SndRepr = 2: SndRepr = 3:method NB non-spatial FB non-spatial FB spatial
Frequency bandwidth 300-3400 Hz 0-20050 Hz 0-20050 HzAudio reproduction diotic diotic dichoticSpeaker location angles all at 0◦ all at 0◦ ±18◦, ±54◦, ±90◦
Head-tracking no no yes
Table 7.2: Specifications of the soundreproduction conditions used in the lis-tening test.

166 quality of experience of multiparty conferencing and telemeeting systems
7.3.3 Method
Design The design was driven by the following constraints in termsof temporal order of stimuli, scenarios, number of interlocutors #IL,and sound reproduction methods SndRepr:
1. Three scenario recordings per #IL were available.
2. Four different #IL and three SndRepr, thus 12 possible combinationsin total, needed to be tested.
3. All scenarios should be presented with all three SndRepr.
4. Each test participant should listen to a scenario recording onlyonce.
5. Overall test time per subject was estimated to be 180 minutes, thisneeded to be split into smaller sessions to account for fatigue.
For Experiment CC1, the choice fell on a test with two 90-minutessessions per test participant, with at least one day in-between sessions.The design uses a 12th-order latin square design to balance the tem-poral order of the 12 possible combinations of #IL and SndRepr, and athird-order latin square design repeated every three test participantsto balance per #IL the assignment of the three scenarios to the threeSndRepr.
For Experiment CC2, the outcome of Experiment 1 suggested tohave separate sessions per #IL; thus the test comprised four sessionsper test participant, with at least one day in-between sessions. Thedesign uses a third-order greco-latin square design to balance for eachsession the temporal order of scenarios and sound reproduction meth-ods, and a fourth-order latin square design to balance the temporalorder of sessions, i.e. the order of number of interlocutors.
Test participants The characteristics of the invited test participantsare given in Table 7.3.
Participant characteristics Experiment CC1 Experiment CC2
Number of participants 13 25
Age: mean / minimum / maximum 31.3 / 26 / 40 28.8 / 23 / 43
Gender: female / male, in percent (absolute num-bers)
38% / 62% (5 / 8) 40% / 60% (10 / 15)
Multiparty experience in professional or private life 100% 100%Recruitment area from same laboratory university area, outside laboratoryBackground / profession researchers, not working on
telephone qualityresearchers, students, staff, alumni
Hearing impairments (self-reported) none none
Table 7.3: Test participant statistics forthe two listening-only tests on Commu-nication Complexity, CC1 and CC2.Procedure In Experiment CC1, participants came to two sessions,
each lasting around 90 minutes, with a short break after 45 minutes.In Experiment CC2, participants came to four sessions; each ses-sion lasted between 30 and 60 minutes, depending on the recordinglength of the test stimuli, which were determined by the number of

perception of telemeeting quality with focus on group-communication aspects 167
interlocutors. In each session, test participants listened to the teststimuli and filled in a questionnaire after each stimulus. The testparticipants were not allowed to take any notes while listening to therecordings. However, for each stimulus, they got one paper sheetwith basic information about the interlocutors (name, affiliation, role).In the first session, the author explained the task to the subjects in anintroduction phase, followed by a training phase. During the training,test participants were listening to a three-interlocutor conference thatwas split up into three equally long parts, each presented with one ofthe three sound reproduction methods, and the test participants hadto fill in a trial questionnaire. At the end of the last session the authorconducted a short outtake interview with the test participants.
7.3.4 Data Acquisition
Questionnaires and Measures The questionnaires used in the two ex-periments were designed such that we extracted for each MeasuredVariable multiple measures from the test participants’ answers. Thiswas motivated by the fact that there was no agreed-upon question-naire available for the present specific purpose. The use of suchredundancy enables to cover individual facets of the Measured Vari-ables, which would in turn enable to identify, which of those measureswould be appropriate for a future standardized questionnaire.
The selection of the different measures and the correspondingquestionnaire design was inspired by previous similar research 29,
29 Jessica J. Baldis. “Effects of Spa-tial Audio on Memory, Comprehension,and Preference during Desktop Confer-ences”. In: Proceedings of the ACM CHI2001 Human Factors in Computing SystemsConference. Ed. by Michel Beaudouin-Lafon and Robert J. K. Jacob. Vol. 3. 1.2001, pp. 166–173
Alexander Raake et al. “Listening andconversational quality of spatial audioconferencing”. In: Proceedings of the AES40th International Conference. Tokyo, Oct.2010
standard quality assessment methods 30, and Möller’s taxonomy for 30 ITU-T. Recommendation P.800 - Meth-ods for objective and subjective assessment ofquality. International Standard. Geneva,Switzerland: International Telecommu-nication Union, 1996
ITU-T. Recommendation P.851 - Subjec-tive quality evaluation of telephone servicesbased on spoken dialogue systems. Interna-tional Standard. Geneva, Switzerland:International Telecommunication Union,2003
the quality of communication services 31. Furthermore, the ques-
31 Sebastian Möller. Assessment and Pre-diction of Speech Quality in Telecommuni-cations. Kluwer Academic publishers,2000
tionnaire of Experiment CC2 was modified based on the insights ofExperiment CC1.
The questionnaire of Experiment CC1 consisted of four main parts:quality judgment (question Q1.1), recall in terms of the topics dis-cussed during the conversation (questions Q2.1a – Q2.3a, Q2.1b –Q2.3b), a memory test in terms of “who said what” with ten quota-tions per conversation (questions Q3.1a – Q3.10a, Q3.1b – Q3.10b),and judgments of speech communication quality and cognitive load(questions Q4.1 – Q4.6). The questionnaire of Experiment CC2 con-sisted of five main parts: judgment of overall impression (questionQ1.1), recall in terms of focal assurance (questions Q2.1a – Q2.4a,Q2.1b – Q2.4b), a memory test in terms of “who said what” with16 quotations per conversation (questions Q3.1a – Q3.16a, Q3.1b –Q3.16b), judgments of speech communication quality and cognitiveload (questions Q4.1 – Q4.5), and judgments of service satisfaction(questions Q5.1 – Q5.3). Table 7.4 provides English translations of thequestions as well as the German originals.
The judgments were obtained using a continuous rating scale(developed by Bodden and Jekosch 32, recommended by the ITU-T
32 Markus Bodden and Ute Jekosch.Entwicklung und Durchführung von Testsmit Versuchspersonen zur Verifizierung vonModellen zur Berechnung der Sprachüber-tragungsqualität. Project Report (unpub-lished). Institute of CommunicationAcoustics, Ruhr-University Bochum,Germany, 1996
as standardized scales for testing spoken dialogue systems 33). An
33 ITU-T. Recommendation P.851 - Subjec-tive quality evaluation of telephone servicesbased on spoken dialogue systems. Interna-tional Standard. Geneva, Switzerland:International Telecommunication Union,2003
example extract from the questionnaires is given in Figure 7.3.Table 7.5 gives an overview of the link between the Measured Vari-

168 quality of experience of multiparty conferencing and telemeeting systems
ables, the actual measures used, and descriptions on how they wereextracted from the questionnaires. The following paragraphs providedetailed explanations of the links between measured variable, actualmeasures and questionnaires.
Figure 7.3: Example extract from theused questionnaire (in German): ques-tion Q1.1 “What was your overall im-pression of this telephone conference? –extremely bad ... ideal”
Cognitive Load The most direct measure for Cognitive Load is Concen-tration Effort, obtained from participants’ ratings of questions Q4.3in Experiment CC1 and Q4.4 in Experiment CC2. Four additionalmeasures addressed the effort to identify speakers and their roles,one of the mental tasks discussed in Section 7.2. The first measureis Speaker Recognition Effort, obtained from participants’ ratings ofquestions Q4.1 in Experiment CC1 and Q4.2 in Experiment CC2. Thenext two measures, Speaker Recognition Performance and Speaker Recog-nition Confidence, are extracted from the memory tests. The memorytest of Experiment CC1 consisted of ten questions (Q3.1a – Q3.10a)referring to ten transcribed quotes from the conversation. For eachquote, test participants could answer who of the interlocutors hadmade that statement, or they could choose the option “I don’t know”.Furthermore, ten additional questions (Q3.1b – Q3.10b) were askingfor each quote how confident test participants were in their judgment,expressed in percent. Speaker Recognition Performance is computedas the percentage of correctly identified speakers per quote (Q3.1a –Q3.10a); Speaker Recognition Confidence is computed as the mean ofthe confidence ratings (Q3.1b – Q3.10b). Similarly, Experiment CC2
applied the same memory test, but now with 16 quotations in orderto increase the number of available data points and thus to increasethe noise robustness of the two measures.
A crucial note on the memory task should be inserted here: Whilethe memory test followed the method in previous research 34, the
34 Jessica J. Baldis. “Effects of Spa-tial Audio on Memory, Comprehension,and Preference during Desktop Confer-ences”. In: Proceedings of the ACM CHI2001 Human Factors in Computing SystemsConference. Ed. by Michel Beaudouin-Lafon and Robert J. K. Jacob. Vol. 3. 1.2001, pp. 166–173
Ryan Kilgore, Mark Chignell, andPaul Smith. “Spatialized audioconfer-encing: what are the benefits?” In: Pro-ceedings of the 2003 conference of the Cen-tre for Advanced Studies on Collaborativeresearch CASCON ’03. IBM Press, 2003,pp. 135–144
Alexander Raake et al. “Listening andconversational quality of spatial audioconferencing”. In: Proceedings of the AES40th International Conference. Tokyo, Oct.2010
author carefully treated the varying number of interlocutors, rang-ing from two to six. The motivation was to measure the intrinsiccognitive load, i.e. the cognitive load inherent in the memory task,while keeping the extraneous cognitive load, i.e. the cognitive loadinherent in the instructions of the task, constant. To achieve this, testparticipants always had to choose between only two possible inter-locutors per quote, independently from the number of interlocutorsin a conversation. In this way the questionnaire kept the task “decidebetween two interlocutors” (extraneous cognitive load) constant forall stimuli; but measured the cognitive load for the task “rememberfor all interlocutors who said what” (intrinsic cognitive load), whichvaried with the different number of interlocutors.
Coming back to the measurement of the effort to identify speakers

perception of telemeeting quality with focus on group-communication aspects 169
Experiment CC1
Part Question ID Wording / Description, EN: English translation, DE: German original1 Q1.1 EN: “What was your overall quality impression of the connection? – extremely bad ... ideal”
DE: “Wie war Ihr persönlicher Gesamteindruck von der Qualität der Verbindung? – extrem schlecht ... ideal”2 Q2.1a ... Q2.2a EN: “Which opinion or information shared Mr. X during the conference? – Option A, Option B, I don’t know”
DE: “Welche Meinung vertrat bzw. welche Information gab Herr X in dem Gespräch? – Option A, Option B, Ichweiß nicht”
Q2.3a EN: “Which topics, among others, have been addressed during the conference? – Option A, Option B, I don’t know”DE: “Welche Themen wurden u.a. in dem Gespräch angesprochen? – Option A, Option B, Ich weiß nicht”
Q2.1b ... Q2.3b EN: “I am xxx % sure of my answer.”DE: “Ich bin mir meiner Antwort zu xxx % sicher.”
3 Q3.1a ... Q3.10a EN: per Quotation from transcript: “Who said what? – Mr.X, Mr.Y, I don’t know”DE: “Wer sagte was?” – Herr X, Herr Y, Ich weiß nicht”
Q3.1b ... Q3.10b EN: “I am xxx % sure of my answer.”DE: “Ich bin mir meiner Antwort zu xxx % sicher.”
4 Q4.1 EN: “During the conference, it was extremely difficult ... extremely easy to recognize who was speaking.”DE: “Es viel mir extrem schwer ... extrem leicht um während der Konferenz zu erkennen, welcher Gesprächspartner
gerade spricht.”Q4.2 EN: “It was extremely difficult ... extremely easy to follow which opinions were exchanged during the conference”
DE: “Es viel mir extrem schwer ... extrem leicht um während der Konferenz zu folgen, welche Meinungen vertretenwurden.”
Q4.3 EN: “It required extremely much ... extremely little concentration to follow the conference”DE: “Es erforderte extrem viel ... extrem wenig Konzentration um der Konferenz zu folgen.”
Q4.4 EN: “The speech intelligibility during the conference was extremely bad ... ideal”DE: “Die Sprachverständlichkeit in der Konferenz war extrem schlecht ... ideal”
Q4.5 EN: “The naturalness of the conversation was extremely bad ... ideal”DE: “Die Natürlichkeit des Gesprächablaufes war extrem schlecht ... ideal”
Q4.6 EN: “The efficiency of the conversation was extremely bad ... ideal”DE: “Die Effizienz des des Gesprächablaufes war extrem schlecht ... ideal”
Experiment CC2
Part Question ID Wording / Description, EN: English translation, DE: German original1 Q1.1 EN: “What was your overall impression of the telephone conference? – extremely bad ... ideal”
DE: “Wie war ihr persönlicher Gesamteindruck von dieser Telefonkonferenz? – extrem schlecht ... ideal.”2 Q2.1a EN: “In your opinion, who spoke more? – Mr.X, Mr.Y, Both equally”
DE: “Ihrer Meinung nach, welcher Gesprächspartner sprach mehr? – Herr X, Herr Y, Beide gleich”Q2.2a EN: “In your opinion, who interrupted more? – Mr.X, Mr.Y, Both equally”
DE: “Ihrer Meinung nach, welcher Gesprächspartner unterbrach mehr? – Herr X, Herr Y, Beide gleich”Q2.3a EN: “In your opinion, who made more constructive proposals? – Mr.X, Mr.Y, Both equally”
DE: “Ihrer Meinung nach, welcher Gesprächspartner machte mehr konstruktive Vorschläge? – Herr X, Herr Y, Beidegleich”
Q2.4a EN: “In your opinion, who criticized more? – Mr.X, Mr.Y, Both equally”DE: “Ihrer Meinung nach, welcher Gesprächspartner äußerte mehr Kritikpunkte? – Herr X, Herr Y, Beide gleich”
Q2.1b ... Q2.3b EN: “I am xxx % sure of my answer.”DE: “Ich bin mir meiner Antwort zu xxx % sicher.”
3 Q3.1a ... Q3.16a EN: per Quotation from transcript: “Who said what? – Mr.X, Mr.Y, I don’t know”DE: “Wer sagte was?” – Herr X, Herr Y, Ich weiß nicht”
Q3.1b ... Q3.16b EN: “I am xxx % sure of my answer.”DE: “Ich bin mir meiner Antwort zu xxx % sicher.”
4 Q4.1 EN: “My personal impression of the quality of the connection is extremely bad ... ideal.”DE: “Mein persönlicher Eindruck von der Qualität der Verbinding ist extrem schlecht ... ideal”
Q4.2 EN: “During the conference, it was extremely difficult ... extremely easy to recognize who was speaking”.DE: “Es viel mir extrem schwer ... extrem leicht während der Konferenz zu erkennen, welcher Gesprächspartner
gerade spricht.”Q4.3 EN: “It was extremely difficult ... extremely easy to follow which opinions were exchanged during the conference”.
DE: “Es viel mir extrem schwer ... extrem leicht während der Konferenz zu folgen, welche Meinungen vertretenwurden.”
Q4.4 EN: “It required extremely much ... extremely little concentration to follow the conference”.DE: “Es erforderte extrem viel ... extrem wenig Konzentration um der Konferenz zu folgen.”
Q4.5 EN: “The speech intelligibility during the conference was extremely bad ... ideal”DE: “Die Sprachverständlichkeit in der Konferenz war extrem schlecht ... ideal”
5 Q5.1 EN: “Attending a telephone conference with such a system would be extremely unsatisfactory ... extremely satisfac-tory”)
DE: “Mit einem solchen System einer Telefonkonferenzschaltung beizuwohnen würde mich extrem unzufrieden ... ex-trem zufrieden stellen.”
Q5.2 EN: “Attending a telephone conference with such a system would be extremely unpleasant ... extremely pleasant”DE: “Mit einem solchen System einer Telefonkonferenz beizuwohnen würde ich als extrem unangenehm ... extrem
angenehm empfinden.”Q5.3 EN: “Attending a telephone conference with such a system would be extremely unacceptable ... extremely unacceptable”
DE: “Mit einem solchen System einer Telefonkonferenz beizuwohnen würde ich extrem inakzeptabel ... extrem akzept-abel finden.”
Table 7.4: Summary of the question-naires used in the two listening-onlytests Exp1 & Exp2.

170 quality of experience of multiparty conferencing and telemeeting systems
Experiment CC1
Measured Variable Measure Extraction from questionnaire
Cognitive Load Concentration Effort Directly measured with Q4.3Speaker Recognition Effort Directly measured with Q4.1Speaker Recognition Performance Percentage of correct answers to Ques-
tions Q3.1a – Q3.10aSpeaker Recognition Confidence Average percentage of answers to Ques-
tions Q3.1b – Q3.10bTopic Comprehension Effort Directly measured with Q4.2Topic Recognition Performance Percentage of correct answers to Ques-
tions Q2.1a – Q2.3aTopic Recognition Confidence Average percentage of answers to Ques-
tions Q2.1b – Q2.3bSpeech Communication Quality with focuson Telecommunication Component
Speech Intelligibility Directly measured with Q4.4
Speech Communication Quality with focuson Group-Communication Component
Conversation Naturalness Directly measured with Q4.5Conversation Efficiency Directly measured with Q4.6
Speech Communication Quality and/orQuality of Experience1
Quality Directly measured with Q1.1
Remarks: 1 In retrospect, the wording of question Q1.1 allows both interpretations. Hence a unique assignment to either MeasuredVariable is not possible.
Experiment CC2
Measured Variable Measure Extraction from questionnaire
Cognitive Load Concentration Effort Directly measured with Q4.4Speaker Recognition Effort Directly measured with Q4.2Speaker Recognition Performance Percentage of correct answers to Ques-
tions Q3.1a – Q3.16aSpeaker Recognition Confidence Average percentage of answers to Ques-
tions Q3.1b – Q3.16bFocal Assurance Average percentage of answers to Ques-
tions Q2.1b – Q2.4bTopic Comprehension Effort Directly measured with Q4.3
Speech Communication Quality with focuson Telecommunication Component
Connection Quality Directly measured with Q4.1Speech Intelligibility Directly measured with Q4.5
Quality of Experience Overall Quality Directly measured with Q1.1Satisfaction Directly measured with Q5.1Pleasantness Directly measured with Q5.2Acceptance Directly measured with Q5.3
Table 7.5: Relation between the Mea-sured Variables (on their conceptuallevel), the actual measures used for ob-taining respective quantitative data, andextraction of the measures from thequestionnaire answers.

perception of telemeeting quality with focus on group-communication aspects 171
and their roles, another measure is Focal Assurance, which was appliedin Experiment CC2. Four questions (Q2.1a – Q2.4a) referred to whoof the interlocutors spoke more, who interrupted more, who mademore constructive proposals, and who was more criticizing. Eachof these questions was followed by a question asking how confidenttest participants were in their judgment (Questions Q2.1b – Q2.4b),expressed in percent. These questions about the confidence ask forfocal assurance ratings 35, that is, the strength of cues helping test 35 Jessica J. Baldis. “Effects of Spa-
tial Audio on Memory, Comprehension,and Preference during Desktop Confer-ences”. In: Proceedings of the ACM CHI2001 Human Factors in Computing SystemsConference. Ed. by Michel Beaudouin-Lafon and Robert J. K. Jacob. Vol. 3. 1.2001, pp. 166–173
subjects to assess the involvement of individual interlocutors, andhelping to form a sense of who the interlocutors are. Focal Assurancewas then computed as the mean of the four confidence ratings.
Another facet of cognitive load is the mental task of informationprocessing, discussed in Section 7.2. Experiment CC1 employed threemeasures. The first measure is Topic Comprehension Effort, obtainedfrom test participants’ ratings of question Q4.2, and question Q4.3in Experiment CC2, respectively. The other two measures, TopicRecognition Performance and Topic Recognition Confidence, are extractedsimilarly to the speaker recognition performance measures. Threequestions (Q2.1a – Q2.3a) referred to three pairs of statements con-cerning the topics discussed in the conversation. In each pair ofstatements, one statement concerned a topic that was indeed dis-cussed in the conversation, the other statement concerned a topic thatwas not discussed at all. For each pair of statements, test participantscould answer which statement was discussed in the conversation, orthey could choose the option “I don’t know”. Furthermore, threeadditional questions (Q2.1b – Q2.3b) asked for each pair of statement,how confident test participants were in their judgment, expressed inpercent. Topic Recognition Performance is computed as the percentageof correctly identified statements (Q2.1a – Q2.3a); Speaker RecognitionConfidence is computed as the mean of the confidence ratings (Q2.1b– Q2.3b). For Experiment CC2, the author decided to skip the mea-sures Topic Recognition Performance and Speaker Recognition Confidence,in order to include the above described measure of Focal Assurancewithout lengthening the questionnaire.
Speech Communication Quality As described in the hypotheses defi-nitions, the variable Speech Communication Quality has different em-phases depending on the actual questions used in the two experi-ments.
In Experiment CC1, two measures focused on the Group-Com-munication Component of Speech Communication Quality. The firstmeasure is Conversation Naturalness, obtained from test participants’ratings of question Q4.5; the second measure is Conversation Efficiency,obtained from ratings of question Q4.6.
Next, two further measures focused on the Telecommunication Com-ponent of Speech Communication Quality. The first measure is ConnectionQuality, applied in Experiment CC2, and obtained from ratings ofquestion Q4.1. The assignment of this question to the Telecommuni-cation Component is motivated by the specific wording of question

172 quality of experience of multiparty conferencing and telemeeting systems
Q4.1, which highlighted the keyword quality of the connection. Thesecond measure is Speech Intelligibility, obtained from test partici-pants’ ratings of question Q4.4 in Experiment CC1 and question Q4.5in Experiment CC2. The assignment of this question to either theTelecommunication Component or the Group-Communication Componentis not straight-forward. On the one hand speech intelligibility relatesto the speech signal’s quality in terms of distorted parts of speech,on the other hand it relates to the ability to communicate over thesystem. To disambiguate this, the author applies the terminology thatRaake 36 extracted from related literature 37, distinguishing between 36 Alexander Raake. Speech Quality of
VoIP – Assessment and Prediction. Chich-ester, West Sussex, UK: Wiley, 2006
37 Ute Jekosch. “Sprache hörenund beurteilen: Ein Ansatz zurGrundlegung der Sprachqualitäts-beurteilung”. Habilitation thesis.Universität/Gesamthochschule Essen,Germany, 2003
Ute Jekosch. Voice and Speech QualityPerception – Assessment and Evaluation.Berlin, Germany: Springer, 2005
Sebastian Möller. Assessment andPrediction of Speech Quality in Telecommu-nications. Kluwer Academic publishers,2000
Comprehensibility, Intelligibility, and Communicability. In this terminol-ogy, Intelligibility “refers to how well the content of an utterance [...]can be identified on the basis of the form”, which in turn is separatedfrom Communicability, which “means that a speech message is suchthat it can serve to communicate”. Considering this, the author seesSpeech Intelligibility as a measure focusing on the TelecommunicationComponent, acknowledging that test participants are not aware ofsuch fine distinctions and might also take communicative aspects intoaccount when answering the corresponding question.
Quality of Experience As already mentioned, Experiment CC1 didnot specifically aim at distinguishing between the two layers SpeechCommunication Quality and Quality of Experience. The experimentapplied one measure Quality, obtained from participants’ ratings ofquestion Q1.1. The wording of that question (“overall impression ofthe connection”) actually allows an interpretation in terms of SpeechCommunication Quality due to the keyword connection or in termsof Quality of Experience due to the keyword overall impression. Forthat reason, the corresponding hypothesis for Experiment CC1 doesnot distinguish between Speech Communication Quality and Quality ofExperience, see Table 7.1.
Experiment CC2, however, aimed at a more precise distinctionbetween these two layers of quality. For that reason, the questionwas rephrased such that the emphasis was now on quality in thebroader sense of Quality of Experience, by using “overall impressionof the telephone conference”. Thus, Experiment CC2 used a measureOverall Quality, obtained from participants’ ratings of the updatedquestion Q1.1, which differs from the measure of Connection Quality(question Q4.5) described in the previous paragraph.
Given the remaining risk that test subjects interpret this questionnevertheless as Speech Communication Quality, the author includedthree more measures addressing service satisfaction: Satisfaction, ob-tained from participants’ ratings of question Q5.1; Pleasantness, ob-tained from ratings of question Q5.2; and Acceptance, obtained fromratings of question Q5.3.
Data Processing All measures were represented in such a way thathigh values reflect something positive, that is high quality or lowcognitive load. This representation is straight-forward for the con-

perception of telemeeting quality with focus on group-communication aspects 173
cepts related with most measures (Overall Quality, Quality, ConnectionQuality, Speech Intelligibility, Speaker Recognition Performance, SpeakerRecognition Confidence, Topic Recognition Performance, Topic Recogni-tion Confidence, Focal Assurance, Conversation Naturalness, ConversationEfficiency, Satisfaction, Pleasantness, Acceptance). However, it is lessintuitive for the effort-related measures (Speaker Recognition Effort,Topic Comprehension Effort, Concentration Effort), as the ratings are nowinverted: a high effort, meaning a high cognitive load, is coded witha low value.
Data Validation A proper choice of quotations used in the memorytests (Q3.1a to Q3.10a in Experiment CC1, Q3.1a to Q3.16a in Ex-periment CC2) is necessary in order to avoid that any systematicinfluences skew the results. For that reason, the author inspectedthe data for quotations with small or zero deviation in the recallperformance across subjects. Table 7.6 shows the statistics of thatinspection.
Concerning questions with correct answers in almost all casesfor Experiment CC1, i.e. 12 or 13 participants were correct, the ta-ble shows that most of those questions belong to the two- or three-interlocutor scenarios. Similarly, for Experiment CC2, i.e. 24 or 25
participants were correct, almost all of those questions belong to thetwo-interlocutor scenarios. Apparently, this can be explained by theexpected easiness of memorizing the least complex two-interlocutorscenarios, and – for the participants of Experiment CC1 – also thethree-interlocutor scenarios. Concerning the remaining questionsthat were almost always correctly answered, an analysis in terms ofthe meaningfulness of these quotations did not reveal any error orinsight into why this happened. The same holds for the questionswith incorrect answers in almost all cases, i.e. 12 or 13 participantswere incorrect in Experiment CC1, 24 or 25 participants were incorrectin Experiment CC2. From these results the author concluded that theused quotations did not introduce any systematic errors.
Furthermore, inspecting the other questions (Q1.1, Q2.x, Q4.x, Q5.x)did not reveal any specific outliers in terms of individual ratings ortest participants. Hence none of the data points were excluded fromthe further analysis.
Data Analysis and Presentation Since the experiments had two testfactors, number of interlocutors #IL and sound reproduction methodSndRepr, the analysis comprises two levels. The first analysis levelconcerns the main effects; that means the effect of #IL if all data overSndRepr is compiled and the effect of SndRepr if all data over #IL iscompiled. The second analysis level concerns the individual effects;that means the effect of #IL per SndRepr and the effect of SndRepr per#IL. As analysis methods, the author conducted repeated-measuresANOVAs with Greenhouse-Geisser correction when the sphericitycondition was violated 38 to check for significant differences of the
38 Andy Field. Discovering Statistics us-ing SPSS. 3rd ed. SAGE publications,2009
Manipulated Variables #IL and SndRepr on the different Measured Vari-

174 quality of experience of multiparty conferencing and telemeeting systems
Experiment 1, 120 questions in total (12 scenarios × 10 quotes), 13 participantsCase # Questions in Scenarios with #IL equal to
2 3 4 6 total
13 participants correct 5 3 1 1 10
12 participants correct and 1 participant wrong 2 4 1 2 9
12 participants correct and 1 participant “I don’t know” 0 0 0 0 0
total of almost always correct answers 7 7 2 3 19 (16%)
12 participants wrong or “I don’t know” and 1 participant correct 0 0 0 1 1
13 participants wrong or “I don’t know” 0 0 0 1 1
total of almost always incorrect answers 0 0 0 1 2 (<1%)
Experiment 2, 192 questions in total (12 scenarios × 16 quotes), 25 participantsCase # Questions in Scenarios with #IL equal to
2 3 4 6 total
25 participants correct 2 0 0 1 3
24 participants correct and 1 participant wrong 6 1 0 0 7
24 participants correct and 1 participant “I don’t know” 4 0 0 2 6
total of almost always correct answers 12 1 0 3 16 (8%)
24 participants wrong or “I don’t know” and 1 participant correct 0 0 0 1 1
25 participants wrong or “I don’t know” 0 0 0 0 0
total of almost always incorrect answers 0 0 0 1 1 (<1%)
Table 7.6: Statistics on quotations withsmall or zero deviation in performanceacross subjects.
ables. Then the author conducted PostHoc tests (estimated marginalmeans) with Sidak correction to identify between which pairs of Ma-nipulated Variables significant differences can be observed. And theauthor generated errorbar plots, showing the mean values and 95%confidence intervals, to visualize the effects. Thus, the analysis con-sisted of nine steps per measure: ANOVA, PostHoc and Errorbar forthe main effects, for the individual effect of #IL and for the individualeffect of SndRepr.
The next two sections present a summary of the results for the twoexperiments CC1 and CC2, focusing on explaining the main conclu-sions from the analysis, and visualizing the data with the errorbarplots. The full analysis details with all ANOVA and PostHoc resultsare presented in Appendix C.1 for Experiment CC1 and Appendix C.2for Experiment CC2.

perception of telemeeting quality with focus on group-communication aspects 175
7.3.5 Results Experiment CC1
Quality
1. Errorbars (mean & 95% confidence interval)
Main Effect of #IL Individual Effects of #ILper SndRepr
Main Effect of SndRepr Individual Effects of SndRepr per #IL
2. Effect of #IL 3. Effect of SndReprHypothesis Main effect Effect per SndRepr
H5 × ×Hypothesis Main effect Effect per #IL
H6 X X
Concentration Effort
1. Errorbars (mean & 95% confidence interval)
Main Effect of #IL Individual Effects of #ILper SndRepr
Main Effect of SndRepr Individual Effects of SndRepr per #IL
2. Effect of #IL 3. Effect of SndReprHypothesis Main effect Effect per SndRepr
H1 X X (#IL= 2,3 vs. #IL = 4,6)
Hypothesis Main effect Effect per #ILH2 X (SndRepr = 1,2 vs. = 3) X (SndRepr = 1,2 vs. =3)
Figure 7.4: Analysis summary for Ex-periment 1 for the measures Quality andConcentration Effort.

176 quality of experience of multiparty conferencing and telemeeting systems
Speaker Recognition Effort
1. Errorbars (mean & 95% confidence interval)
Main Effect of #IL Individual Effects of #ILper SndRepr
Main Effect of SndRepr Individual Effects of SndRepr per #IL
2. Effect of #IL 3. Effect of SndReprHypothesis Main effect Effect per SndRepr
H1 X X (#IL = 2,3 vs. #IL = 4,6)
Hypothesis Main effect Effect per #ILH2 X (SndRepr = 1,2 vs. 3) X (SndRepr = 1,2 vs. 3)
Speaker Recognition Performance
1. Errorbars (mean & 95% confidence interval)
Main Effect of #IL Individual Effects of #ILper SndRepr
Main Effect of SndRepr Individual Effects of SndRepr per #IL
2. Effect of #IL 3. Effect of SndReprHypothesis Main effect Effect per SndRepr
H1 X X (#IL = 2 vs. #IL ≥ 3)
Hypothesis Main effect Effect per #ILH2 × ×
Speaker Recognition Confidence
1. Errorbars (mean & 95% confidence interval)
Main Effect of #IL Individual Effects of #ILper SndRepr
Main Effect of SndRepr Individual Effects of SndRepr per #IL
2. Effect of #IL 3. Effect of SndReprHypothesis Main effect Effect per SndRepr
H1 X X (#IL = 2 vs. #IL ≥ 3)
Hypothesis Main effect Effect per #ILH2 X (SndRepr = 1,2 vs. 3) X (SndRepr = 2 vs. 3, for
#IL=6)
Figure 7.5: Analysis summary for Ex-periment 1 for the measures SpeakerRecognition Effort, Speaker Recognition Per-formance, and Speaker Recognition Confi-dence.

perception of telemeeting quality with focus on group-communication aspects 177
Topic Comprehension Effort
1. Errorbars (mean & 95% confidence interval)
Main Effect of #IL Individual Effects of #ILper SndRepr
Main Effect of SndRepr Individual Effects of SndRepr per #IL
2. Effect of #IL 3. Effect of SndReprHypothesis Main effect Effect per SndRepr
H1 X (#IL = 2 vs. 6) X
Hypothesis Main effect Effect per #ILH2 X ×
Topic Recognition Performance
1. Errorbars (mean & 95% confidence interval)
Main Effect of #IL Individual Effects of #ILper SndRepr
Main Effect of SndRepr Individual Effects of SndRepr per #IL
2. Effect of #IL 3. Effect of SndReprHypothesis Main effect Effect per SndRepr
H1 × ×Hypothesis Main effect Effect per #IL
H2 X ×
Topic Recognition Confidence
1. Errorbars (mean & 95% confidence interval)
Main Effect of #IL Individual Effects of #ILper SndRepr
Main Effect of SndRepr Individual Effects of SndRepr per #IL
2. Effect of #IL 3. Effect of SndReprHypothesis Main effect Effect per SndRepr
H1 X X (for SndRepr = 1)
Hypothesis Main effect Effect per #ILH2 X (SndRepr = 2 vs. 3) ×
Figure 7.6: Analysis summary for Ex-periment 1 for the measures Topic Com-prehension Effort, Topic Recognition Perfor-mance, and Topic Recognition Confidence.

178 quality of experience of multiparty conferencing and telemeeting systems
Speech Intelligibility
1. Errorbars (mean & 95% confidence interval)
Main Effect of #IL Individual Effects of #ILper SndRepr
Main Effect of SndRepr Individual Effects of SndRepr per #IL
2. Effect of #IL 3. Effect of SndReprHypothesis Main effect Effect per SndRepr
H3.1 × ×Hypothesis Main effect Effect per #IL
H4.1 X X
Conversation Naturalness
1. Errorbars (mean & 95% confidence interval)
Main Effect of #IL Individual Effects of #ILper SndRepr
Main Effect of SndRepr Individual Effects of SndRepr per #IL
2. Effect of #IL 3. Effect of SndReprHypothesis Main effect Effect per SndRepr
H3.2 × ×Hypothesis Main effect Effect per #IL
H4.2 × ×
Conversation Efficiency
1. Errorbars (mean & 95% confidence interval)
Main Effect of #IL Individual Effects of #ILper SndRepr
Main Effect of SndRepr Individual Effects of SndRepr per #IL
2. Effect of #IL 3. Effect of SndReprHypothesis Main effect Effect per SndRepr
H3.2 X (not PostHoc) X (for SndRepr = 2, notPostHoc)
Hypothesis Main effect Effect per #ILH4.2 X (SndRepr = 2 vs. 3, not
PostHoc)×
Figure 7.7: Analysis summary for Ex-periment 1 for the measures Speech In-telligibility, Conversation Naturalness, andConversation Efficiency.

perception of telemeeting quality with focus on group-communication aspects 179
7.3.6 Results Experiment CC2
Overall Quality
1. Errorbars (mean & 95% confidence interval)
Main Effect of #IL Individual Effects of #ILper SndRepr
Main Effect of SndRepr Individual Effects of SndRepr per #IL
2. Effect of #IL 3. Effect of SndReprHypothesis Main effect Effect per SndRepr
H5 X (#IL = 2 vs. 6) X (for SndRepr = 2)
Hypothesis Main effect Effect per #ILH6 X (SndRepr = 1,2 vs. 3) X (SndRepr = 1,2 vs. 3)
Connection Quality
1. Errorbars (mean & 95% confidence interval)
Main Effect of #IL Individual Effects of #ILper SndRepr
Main Effect of SndRepr Individual Effects of SndRepr per #IL
2. Effect of #IL 3. Effect of SndReprHypothesis Main effect Effect per SndRepr
H3 × ×Hypothesis Main effect Effect per #IL
H4 X X
Intelligibility
1. Errorbars (mean & 95% confidence interval)
Main Effect of #IL Individual Effects of #ILper SndRepr
Main Effect of SndRepr Individual Effects of SndRepr per #IL
2. Effect of #IL 3. Effect of SndReprHypothesis Main effect Effect per SndRepr
H3 × ×Hypothesis Main effect Effect per #IL
H4 X X
Figure 7.8: Analysis summary for Exper-iment 2 for the measures Overall Quality,Connection Quality, and Intelligibility.

180 quality of experience of multiparty conferencing and telemeeting systems
Satisfaction
1. Errorbars (mean & 95% confidence interval)
Main Effect of #IL Individual Effects of #ILper SndRepr
Main Effect of SndRepr Individual Effects of SndRepr per #IL
2. Effect of #IL 3. Effect of SndReprHypothesis Main effect Effect per SndRepr
H5 X (#IL = 2 vs. #IL ≥ 3) X (#IL = 2 vs. #IL ≥ 3, forSndRepr = 1,2)
Hypothesis Main effect Effect per #ILH6 X X
Pleasantness
1. Errorbars (mean & 95% confidence interval)
Main Effect of #IL Individual Effects of #ILper SndRepr
Main Effect of SndRepr Individual Effects of SndRepr per #IL
2. Effect of #IL 3. Effect of SndReprHypothesis Main effect Effect per SndRepr
H5 X (#IL = 2 vs. #IL ≥ 3) X (#IL = 2 vs. #IL ≥ 3, forSndRepr = 2)
Hypothesis Main effect Effect per #ILH6 X X
Acceptance
1. Errorbars (mean & 95% confidence interval)
Main Effect of #IL Individual Effects of #ILper SndRepr
Main Effect of SndRepr Individual Effects of SndRepr per #IL
2. Effect of #IL 3. Effect of SndReprHypothesis Main effect Effect per SndRepr
H5 X (#IL = 2 vs. #IL ≥ 3) X (#IL = 2 vs. #IL ≥ 3, forSndRepr = 1,2)
Hypothesis Main effect Effect per #ILH6 X X
Figure 7.9: Analysis summary for Ex-periment 2 for the measures Satisfaction,Pleasantness, and Acceptance.

perception of telemeeting quality with focus on group-communication aspects 181
Concentration Effort
1. Errorbars (mean & 95% confidence interval)
Main Effect of #IL Individual Effects of #ILper SndRepr
Main Effect of SndRepr Individual Effects of SndRepr per #IL
2. Effect of #IL 3. Effect of SndReprHypothesis Main effect Effect per SndRepr
H1 X X
Hypothesis Main effect Effect per #ILH2 X (SndRepr = 1,2 vs. 3) X (SndRepr = 1,2 vs. 3)
Topic Comprehension Effort
1. Errorbars (mean & 95% confidence interval)
Main Effect of #IL Individual Effects of #ILper SndRepr
Main Effect of SndRepr Individual Effects of SndRepr per #IL
2. Effect of #IL 3. Effect of SndReprHypothesis Main effect Effect per SndRepr
H1 X X
Hypothesis Main effect Effect per #ILH2 X (SndRepr = 1,2 vs. 3) X (SndRepr = 1,2 vs. 3)
Focal Assurance
1. Errorbars (mean & 95% confidence interval)
Main Effect of #IL Individual Effects of #ILper SndRepr
Main Effect of SndRepr Individual Effects of SndRepr per #IL
2. Effect of #IL 3. Effect of SndReprHypothesis Main effect Effect per SndRepr
H1 X (#IL = 2 vs. #IL = 4,6) X
Hypothesis Main effect Effect per #ILH2 × ×
Figure 7.10: Analysis summary for Ex-periment 2 for the measures Concen-tration Effort, Topic Comprehension Effort,and Focal Assurance.

182 quality of experience of multiparty conferencing and telemeeting systems
Speaker Recognition Effort
1. Errorbars (mean & 95% confidence interval)
Main Effect of #IL Individual Effects of #ILper SndRepr
Main Effect of SndRepr Individual Effects of SndRepr per #IL
2. Effect of #IL 3. Effect of SndReprHypothesis Main effect Effect per SndRepr
H1 X (#IL = 2 vs. #IL ≥ 3) X (#IL = 2 vs. #IL = 4,6)
Hypothesis Main effect Effect per #ILH2 X (SndRepr = 1,2 vs. 3) X (SndRepr = 1,2 vs. 3)
Speaker Recognition Performance
1. Errorbars (mean & 95% confidence interval)
Main Effect of #IL Individual Effects of #ILper SndRepr
Main Effect of SndRepr Individual Effects of SndRepr per #IL
2. Effect of #IL 3. Effect of SndReprHypothesis Main effect Effect per SndRepr
H1 X (#IL = 2 vs. #IL ≥ 3) X (#IL = 2 vs. #IL ≥ 3)
Hypothesis Main effect Effect per #ILH2 X (SndRepr = 1,2 vs. 3) X (SndRepr = 1,2 vs. 3)
Speaker Recognition Confidence
1. Errorbars (mean & 95% confidence interval)
Main Effect of #IL Individual Effects of #ILper SndRepr
Main Effect of SndRepr Individual Effects of SndRepr per #IL
2. Effect of #IL 3. Effect of SndReprHypothesis Main effect Effect per SndRepr
H1 X (#IL = 2 vs. #IL ≥ 3) X (#IL = 2 vs. #IL = 4,6)
Hypothesis Main effect Effect per #ILH2 X (SndRepr = 1,2 vs. 3) X (SndRepr = 2 vs. 3, for
#IL=6)
Figure 7.11: Analysis summary for Ex-periment 2 for the measures SpeakerRecognition Effort, Speaker Recognition Per-formance, and Speaker Recognition Confi-dence.

perception of telemeeting quality with focus on group-communication aspects 183
7.3.7 Discussion
Review of Results Table 7.7 summarizes the main findings, which willbe discussed now.
Exp. Measured Variables Manipulated VariablesCommunication Complexity Technical System Capability
(i.e. Number of Interlocutors #IL) (i.e. Sound Reproduction MethodSndRepr)
CC1 Cognitive Load Hypothesis H1 X Hypothesis H2 X1
Speech Communication Quality with focus onTelecommunication Component
Hypothesis H3.1 × Hypothesis H4.1 ×
Speech Communication Quality with focus onGroup-Communication Component
Hypothesis H3.2 ×3 Hypothesis H4.2 ×3
Speech Communication Quality and/or Qual-ity or Experience
Hypothesis H5 × Hypothesis H6 X
CC2 Cognitive Load Hypothesis H1 X Hypothesis H2 X1
Speech Communication Quality Hypothesis H3 × Hypothesis H4 X
Quality of Experience Hypothesis H5 X2 Hypothesis H6 X
Remarks:X1 hypothesis confirmed for comparison spatial audio vs. non-spatial audio condition, not for narrowband vs. fullband.X2 confirmed for comparison pairs #IL =2 vs. #IL ≥ 3 in case of non-spatial sound reproduction.×3 inconsistent results, as only a part of the measures showed effects
Table 7.7: Overview of the Manipulatedand Measured Variables and the resultsfor the six hypotheses H1 to H6. Con-firmed hypotheses are denoted with aX, rejected hypotheses with a ×.
Hypotheses H1 is confirmed in both experiments, which meansthat the experimental manipulation concerning the CommunicationComplexity was successful, as the recordings with different degrees ofCommunication Complexity changed the Cognitive Load as intended. Inother words, H1 confirmed an expected effect.
Hypothesis H2 is confirmed in both experiments due to the effectof the spatial vs. non-spatial sound reproduction method, but there isno effect due to the signal bandwidth (narrow-band vs. full-band con-ditions). Two conclusions can be drawn from this finding. First, thisstudy contributes to the discussion in the literature on the potentialbenefit of spatial sound reproduction for multiparty teleconferencingin terms of cognitive load, that is beyond quality. This study sup-ports findings in related work 39 that there is such a benefit, although
39 Jessica J. Baldis. “Effects of Spa-tial Audio on Memory, Comprehension,and Preference during Desktop Confer-ences”. In: Proceedings of the ACM CHI2001 Human Factors in Computing SystemsConference. Ed. by Michel Beaudouin-Lafon and Robert J. K. Jacob. Vol. 3. 1.2001, pp. 166–173
Alexander Raake et al. “Listening andconversational quality of spatial audioconferencing”. In: Proceedings of the AES40th International Conference. Tokyo, Oct.2010
sometimes this could be confirmed only for self-reported measures,but not for the memory test results 40. Second, this study shows that
40 Ryan Kilgore, Mark Chignell, andPaul Smith. “Spatialized audioconfer-encing: what are the benefits?” In: Pro-ceedings of the 2003 conference of the Cen-tre for Advanced Studies on Collaborativeresearch CASCON ’03. IBM Press, 2003,pp. 135–144
only certain system characteristics (here spatial sound reproduction)can lead to a significant change of Cognitive Load. In fact the authorexpected that also bandwidth would have an influence, arguing thatfullband signals should – with their larger frequency range – providemore cues to identify speakers and to better understand speech thannarrowband signals, which in turn would have an effect on the Cog-nitive Load. If such an effect of audio bandwidth exists, it was notsignificant in these experiments.
Hypothesis H3.1 is rejected in Experiment CC1, H3.2 could notbe consistently verified in Experiment CC1 but it is in parts rejected,and H3 is rejected in Experiment CC2. This means, people were

184 quality of experience of multiparty conferencing and telemeeting systems
able to form a judgment about the system’s technical quality (giventhe emphasis on Speech Communication Quality) independently fromCommunication Complexity, and – given the confirmation of H4 (seebelow) – rather independently from the Cognitive Load that the peopleexperienced.
Hypothesis H4.1 and in parts H4.2 are rejected in Experiment CC1,but H4 is confirmed in Experiment CC2. The confirmation in Ex-periment CC2 means that the experimental manipulation concerningthe Technical System Capability was successful, as the applied soundreproduction methods changed the perceived system quality as in-tended. Correspondingly, the rejection in Experiment CC1 means atfirst glance that the experimental manipulation was not successful.However, a more likely reason for rejecting H4.1 and in parts H4.2is not the experimental manipulation but the non-optimal measure-ment: the fact that the hypotheses H4.1 and H4.2 were constructedin-retrospect for the present analysis suggests that the chosen measuresmight not be sufficient to confirm H4.1 and H4.2.
Hypothesis H5 is rejected in Experiment CC1 and confirmed inExperiment CC2. Confirmation of H5 in Experiment CC2 can beconsidered as the major finding of this study, because it says thatCommunication Complexity has an influence on Quality of Experience, atleast in case of comparing two-interlocutor scenarios against scenarioswith three or more interlocutors, and if no spatial audio is available.In light of a rejected H3, this has two implications. First, the ques-tions in CC2 addressing Speech Communication Quality and Quality ofExperience appear to be understood by the subjects as intended: theSpeech Communication Quality questions focus on the technical qualitythat people experienced, while the Quality of Experience questionshave a broader view addressing the conference as such. Second, thisresult provides one possible explanation for a typical observationfrom real-life, in which participants are often dissatisfied with tele-phone conferences, even if they used ordinary equipment: in suchsituations the communicative situation as such could also contributeto dissatisfaction, independently of the technical quality, as confirmedby the present study.
The rejection of H5 in Experiment CC1 is likely caused by the lackof distinction between Speech Communication Quality and Quality ofExperience due to the actual wording of the question. Apparently,rejecting H5 in Experiment CC1 suggests that test participants in-terpreted the corresponding question with a focus on the technicalquality and not quality in a broader sense. This means that an inter-pretation in terms of Speech Communication Quality and not in termsof Quality of Experience was likely used by the test participants, whichin turn would then mean again a rejection of Hypothesis H3.
Hypothesis H6 is confirmed in both experiments, which clarifiesthe discussions concerning H5 and also H4. In Experiment CC1, con-firmation of H6 allows an interpretation of the corresponding questionas Speech Communication Quality instead of Quality of Experience. This,however, actually means a confirmation of H4 for Experiment CC1,

perception of telemeeting quality with focus on group-communication aspects 185
which in turn suggests that the experimental manipulation of CC1
was successful and that the measures for H4.1 and H4.2 were notoptimal.
In Experiment CC2, confirmation of H6 is in line with an inter-pretation of Quality of Experience as it was intended: it is not onlyinsufficient Technical System Capability that can contribute to dissat-isfaction concerning Quality of Experience (H5 in Experiment CC2);Communication Complexity can also contribute to Quality of Experience.
In summary, these findings show that – given the optimized testprotocol of Experiment CC2 – not only Communication Complexity butalso Technical System Capability can influence Cognitive Load, and thatnot only Technical System Capability but also Communication Complexitycan influence Quality of Experience.
Review of the Approach and Open Questions for Future Work Concerningthe approach in Experiment CC1, the earlier analysis conductedin Skowronek & Raake 41, revealed possibilities for improving the 41 Janto Skowronek and Alexander
Raake. “Investigating the effect of num-ber of interlocutors on the quality ofexperience for multi-party audio con-ferencing”. In: Proceedings of the 12thAnnual Conference of the InternationalSpeech Communication Association (Inter-speech2011). International Speech Com-munication Association. Florence, Italy,Aug. 2011, pp. 829–832
experimental methodology, which were then implemented in the testprotocol of Experiment CC2. For the purpose of sharing the lessonslearned, those aspects are briefly reviewed here: First, the sensitivityof the memory test turned out to be limited. While the self-reportedquestions regarding Cognitive Load showed a significant influenceof both the number of interlocutors and the system conditions, thememory test revealed only a statistically significant effect for thenumber of interlocutors. Second, due to the experimental design, thevariables number of interlocutors and system condition were mixed inone session. The analysis in Skowronek & Raake 42, however, showed 42 Janto Skowronek and Alexander
Raake. “Investigating the effect of num-ber of interlocutors on the quality ofexperience for multi-party audio con-ferencing”. In: Proceedings of the 12thAnnual Conference of the InternationalSpeech Communication Association (Inter-speech2011). International Speech Com-munication Association. Florence, Italy,Aug. 2011, pp. 829–832
a dominant effect of the number of interlocutors. Hence, it can beconcluded that the sensitivity of test subjects regarding the systemquality seems to be reduced by the strong effect due to the number ofinterlocutors. Third, the number of participants was 13 and thus quitelow. Usually the ITU recommends 24 or 32 subjects as an adequatenumber of test subjects in quality assessment experiments accordingto protocols as applied here (see for example ITU-T Rec. P.800
43).43 ITU-T. Recommendation P.800 - Meth-ods for objective and subjective assessment ofquality. International Standard. Geneva,Switzerland: International Telecommu-nication Union, 1996
With respect to the lessons learned from the re-analysis for thepresent text, another weakness of the test protocol of Experiment CC1
is that the Measured Variables were not yet as precisely defined asintroduced in Section 7.2. This can be seen in the partly inconsistentand mutually overlapping results for hypotheses H3, H4, H5 and H6.
Concerning the approach in Experiment CC2, we discussed inSkowronek and Raake 44 that most decisions concerning the applied 44 Janto Skowronek and Alexander
Raake. “Assessment of Cognitive Load,Speech Communication Quality andQuality of Experience for spatial andnon-spatial audio conferencing calls”.In: Speech Communication (2015), pp. 154–175. doi: 10.1016
experimental method were driven by the uncertainty whether anyeffects could be observed at all. Hence, the paradigm was to aimfor rather strong differences between experimental conditions. Asa consequence, the results of this study should be treated with carewhen adopting them to real-life scenarios, as there are a number ofopen questions that will be addressed now.
First, one choice fell on conducting a listening-only test paradigm,as those tests are known to be more sensitive than conversational

186 quality of experience of multiparty conferencing and telemeeting systems
tests. However, conversational tests are known to be more realisticthan listening-only tests. Hence, future work could investigate ifthe observed effects can be found in conversation tests as well. Inparticular, such conversation tests should study if there are scalingeffects with regard to Communication Complexity.
Second, to maximize comparability of the recordings, the cor-responding scenario instructions used here were rather strict andrequired quite some concentration from the speakers. Concerningfuture conversation tests, a revision of those scenarios might be neces-sary to simplify the task for test subjects. Although this could reducethe comparability between scenarios, it might help test subjects tofocus not only on the scenario but also on the system’s quality.
Third, to avoid that test subjects were overwhelmed by listeningto conversations with up to six interlocutors, the author deliberatelysearched for test participants with experience in multiparty conversa-tions via telecommunication services. As this profile already limitedthe choice of potential subjects, no further selection criteria wereapplied. As a consequence, test participants had no experience withspatial sound reproduction. The post-interviews in Experiment CC2
revealed that all 25 test participants noticed the differences betweenspatial and non-spatial sound reproduction, but six test participantsdid not notice any difference in bandwidth. Furthermore, even whentest participants noticed the different bandwidths, it did not help themmuch in their memory task, as opposed to the spatial audio reproduc-tion. This strong effect of spatial sound reproduction compared tobandwidth might explain, why no significant difference in CognitiveLoad between narrowband and fullband conditions could be found.Another possible explanation is that audio bandwidth and spatial-audio representation are likely affecting two different processes in thehuman working memory: the visuo-spatial sketch pad, processingvisual and spatial information, and the phonological loop, processingverbal material and semantic meaning. Baldis 45 discussed that spatial 45 Jessica J. Baldis. “Effects of Spa-
tial Audio on Memory, Comprehension,and Preference during Desktop Confer-ences”. In: Proceedings of the ACM CHI2001 Human Factors in Computing SystemsConference. Ed. by Michel Beaudouin-Lafon and Robert J. K. Jacob. Vol. 3. 1.2001, pp. 166–173
audio sound reproduction reduces Cognitive Load as spatial audio isactually using both memory mechanisms while non-spatial audiowould be solely processed in the phonological loop. According tothis memory-related considerations, non-spatial audio signals willbe solely processed in the phonological loop, irrespectively of thebandwidth, and might therefore have hardly any effect on CognitiveLoad. Future experiments could check for effects of bandwidth orother technical parameters on the Cognitive Load, either by invitingsubjects with experience in listening to spatial audio if spatial audioconditions will be used as well or by avoiding spatial audio in the testconditions.
Fourth, the questionnaire was on purpose rather long in order tosufficiently cover the variables Cognitive Load, Speech CommunicationQuality, and Quality of Experience. Concerning Cognitive Load, both themethod of obtaining a performance-based measure by a memory testand the method of obtaining self-reported measures by assessmentquestions have some disadvantages. The memory test requires quite

perception of telemeeting quality with focus on group-communication aspects 187
some data points in order to provide significant results 46. The dis- 46 The data set in Experiment CC1 (13
subjects, 10 quotations per question-naire) was too small to provide signifi-cant results; the data set in ExperimentCC2 (25 subjects, 16 quotations) was ap-parently sufficient.
advantage of the self-reported measures is that it is unclear if suchquestions are actually reflecting the Cognitive Load, even if they areaccepted to measure the subjective perception of the mental effort 47.
47 Roland Bruenken, Jan L. Plass, andDetlev Leutner. “Direct Measurementof Cognitive Load in Multimedia Learn-ing”. In: Educational Psychologist 38.1(2003), pp. 53–61
For future experiments, it may be preferable to increase the practicalfeasibility by limiting the experimental effort for test participants.Furthermore, given the rather consistent results obtained in this study,the self-report questions, or even a subset, might be a preferablealternative for the memory test. However, more experience should begained before a definite set of questions can be recommended.
Fifth and finally, the tested technical conditions are quite idealizedcompared to real life. Spatial sound reproduction and full-bandchannels are not yet fully established in the market and existingsolutions face various impairments not tested here (coding artifacts,network conditions and packet loss, echo and delay, backgroundnoise etc.) In this context, also the combination of spatial soundreproduction and narrow-band, which was not tested here, could bea very relevant test scenario, given that spatial audio systems stillneed to cope with band-limited audio signals, e.g. if participants areconnected with traditional equipment. Hence, another direction offuture work can be to verify the found effects in test contexts that arecloser to real-life scenarios.
7.4 Quality Impact of Involvement
This section reports on an experiment investigating the quality im-pact of Involvement, henceforth referred to as Experiment INV (INVstanding for involvement).
7.4.1 Goals
Motivation One of the two main differentiators between a multipartytelemeeting and a conventional two-party audiovisual call is the spe-cial communicative situation. Next to the Communication Complexityinvestigated in the previous section, Involvement is a second aspectthat potentially influences the perception of telemeeting quality. Es-pecially in the context of conducting quality assessment tests it canbe reasonably assumed that the more a test participant is feeling tobe involved in a conversation, the more the test participant’s qualityperception will be based on the conversational situation, and thus thebetter the quality rating will reflect the multiparty experience. For thatreason the present study will investigate the impact of Involvement onthe perception of telemeeting quality.
Approach As for the study on Communication Complexity, the presentstudy aims at investigating the impact of Involvement in the contextof different Technical System Capabilities. This again leads to a two-factorial experiment, this time using Involvement and Technical SystemCapabilities as Manipulated Variables.

188 quality of experience of multiparty conferencing and telemeeting systems
Involvement is manipulated by giving different tasks to the testparticipants, whereas the test tasks comprise listening-only and con-versation tasks. Technical System Capability is manipulated by applyingdifferent technical conditions of the sound transmission chain – hence-forth abbreviated as SndTrans – used for both listening-only andconversation tasks.
Concerning the Measured Variables, the study used three variables:Cognitive Load, Speech Communication Quality and Quality of Experience.Furthermore, the study used an additional Measured Variable, calledMeasured Involvement, which primarily served as a means to be ableto check for the success of the experimental manipulation.
Hypotheses At the time of preparing the experiment 48, the three 48 Janto Skowronek, Falk Schiffner, andAlexander Raake. “On the influence ofinvolvement on the quality of multipartyconferencing”. In: 4th International Work-shop on Perceptual Quality of Systems (PQS2013). International Speech Communica-tion Association. Vienna, Austria, Sept.2013, pp. 141–146
Measured Variables were defined as Measured Involvement, CognitiveLoad and Quality, whereas Quality was not as precisely defined asit is described in Section 7.2. The reason is that the concept of theTelecommunication and Group-Communication Components were not yetdeveloped to a degree as presented in Section 5.4 and the differen-tiation between Speech Communication Quality and Quality of Experi-ence were not yet considered at a stage as presented in Section 7.2.Instead, the different employed measures were chosen to cover dif-ferent aspects of Quality without a strict link to the aspects of SpeechCommunication Quality vs. Quality of Experience and Telecommunica-tion vs. Group-Communication Components. Thus, two Manipulated andthree Measured Variables were available, allowing to define six hypothe-ses of the form “[Manipulation Variable] has an impact on [MeasuredVariable]”.
However, by re-considering the actual wordings of the employedquestions, it is possible to split in retrospect the variable Quality intotwo Measured Variables: one variable targeting Speech CommunicationQuality with a focus on the Group-Communication Component, theother variable targeting quality in a broader sense, whereas a moreprecise assignment to either Speech Communication Quality or Qualityof Experience is not possible. Accordingly, the hypothesis concerningQuality can be split into two parts.
Thus, with two Manipulated and four Measured Variables, it is possi-ble to define eight hypotheses; Table 7.12 gives the respective overview.All eight hypotheses will be tested in this work.
Measured Variables Manipulated VariablesInvolvement Technical System Capability
(i.e. Task) (i.e. Sound Transmission Method SndTrans)
Measured Involvement Hypothesis H1 Hypothesis H2
Cognitive Load Hypothesis H3 Hypothesis H4
Speech Communication Quality with focus onGroup-Communication Component
Hypothesis H5 Hypothesis H6
Speech Communication Quality and/or Qualityof Experience
Hypothesis H7 Hypothesis H8
Table 7.8: Overview of the Manipulatedand Measured Variables and definition ofthe resulting hypotheses for ExperimentINV. Each hypothesis can be phrased as“[Manipulated Variable] has an impacton [Measured Variable]”.

perception of telemeeting quality with focus on group-communication aspects 189
7.4.2 Experimental Factors
Tasks and Conversation Scenarios Each task aimed at a different levelof involvement, while the test conduction was specifically designed tomaintain an optimal comparability between those tasks. The decisionwas to have two tasks per test paradigm (listening-only test andconversation test). The four resulting tasks can be characterized asfollows:
Task 1 (T1) “passive listening”: The test participant is just listeningto recorded telephone conferences. After listening, the test participantfills in a quality assessment questionnaire.
Task 2 (T2) “listening with writing minutes”: While listening, thetest participant is asked to write down minutes of the conversation.After listening, the test participant fills in a quality assessment ques-tionnaire and a questionnaire about the minutes-writing task.
Task 3 (T3) “conversation according to sequential script”: The testsubject participates in a conversation with two other interlocutors us-ing a script. The script triggers a fixed sequence of contributions fromthe interlocutors by stating who will add what type of information inwhich order. However, the script gives freedom concerning the exactwording, as it does not contain fully formulated sentences. The fullscenario scripts are electronically available 49. 49 Falk Schiffner and Janto Skowronek.
3seqCT - 3-party Sequential ConversationTest scenarios for conferencing assessment.2013. doi: 10.5281/zenodo.16137
Task 4 (T4) “conversation according to scenario description”: Thetest subject participates in a conversation with two other interlocu-tors using a script that provides information in the form of bulletpoints, tables and pictographs. It allows for more freedom in theorder of contribution and the interaction between people as the T3
script does. However, some underlying structure is given by theway information is distributed among the participants (e.g. one has aquestion and the others have information concerning that question).In fact, these scenarios are shortened versions of the multiparty testscenarios used in Raake et al. 50. The full scenario scripts are electron- 50 Alexander Raake et al. “Listening
and conversational quality of spatial au-dio conferencing”. In: Proceedings of theAES 40th International Conference. Tokyo,Oct. 2010
Alexander Raake and ClaudiaSchlegel. 3CT - 3-party Conversation Testscenarios for conferencing assessment. 2010.doi: 10.5281/zenodo.16129
ically available 51 and have been originally developed for the study in
51 Janto Skowronek. 3SCT - 3-partyShort Conversation Test scenarios for confer-encing assessment (Version 01). 2013. doi:10.5281/zenodo.16134
Skowronek et al. 52.
52 Janto Skowronek, Julian Herling-haus, and Alexander Raake. “QualityAssessment of Asymmetric MultipartyTelephone Conferences: A SystematicMethod from Technical Degradationsto Perceived Impairments”. In: Pro-ceedings of the 14th Annual Conference ofthe International Speech CommunicationAssociation (Interspeech 2013). Interna-tional Speech Communication Associa-tion. Lyon, France, Aug. 2013, pp. 2604–2608
Recording of Speech Material To keep the technical setup essentiallythe same for both the listening-only and conversation tasks, the record-ings for the listening-only tasks were made with the same telephonysetup used in the experiment. This test system comprised a centralconference bridge using Asterisk and off-the-shelf VoIP telephones(SNOM870), which were connected in a local network (all via onerouter) and communicated via the G.711 A-law codec. To obtain therecordings, three speakers conversed over this telephony setup andthe used conference bridge wrote the speech signals directly to theharddisk. In the listening-only tasks, the conference bridge playedback the recordings and the test participants were thus listening tothem using the same hardware (SNOM870) as they used for theconversation tasks.

190 quality of experience of multiparty conferencing and telemeeting systems
Optimal Comparability of Tasks, Scenarios and Speech Material Whilethe tasks should invoke different levels of involvement, they alsoneeded to be as comparable as possible. For that purpose, a num-ber of measures minimized the variation between the different tasks:First, the T4 scenarios had the same underlying conversational struc-ture 53 while the actual content differs between those scenarios 54. By
53 Alexander Raake et al. “Listeningand conversational quality of spatial au-dio conferencing”. In: Proceedings of theAES 40th International Conference. Tokyo,Oct. 2010
54 Subjects should not have exactly thesame content in all tasks in order toavoid any effects due to such repetitions(e.g. learning, annoyance).
removing the open discussion part from the original scenarios, thecomparability was further increased. The T3 scripts were based onthose same scenarios, and the recordings used for T1 and T2 weremade according to the script of T3. Second, in all stimuli, two of thethree interlocutors were always the same speakers: Two confederates(the first two authors of Skowronek et al. 55) acted as interlocutors 55 Janto Skowronek, Falk Schiffner, and
Alexander Raake. “On the influence ofinvolvement on the quality of multipartyconferencing”. In: 4th International Work-shop on Perceptual Quality of Systems (PQS2013). International Speech Communica-tion Association. Vienna, Austria, Sept.2013, pp. 141–146
both in the conversation tasks (T3 & T4) and in the recordings for thelistening tasks (T1 & T2). Third, the roles of the confederates in thescenario was always the same (one having a question, one a solution);the third role (having a constraint) was either assumed by the thirdspeaker in case of the listening tasks or by the test subject in case ofthe conversation tasks. Fourth, by means of exercising beforehand,the confederates aimed for the same interaction behavior throughoutall scenarios and test sessions. Fifth, the confederates also developedbeforehand strategies (e.g. waiting, directly addressing, interrupting)to get more passive, hesitant test subjects involved in the conversationin the same way than more active, talkative test subjects.
Technical Conditions In Skowronek et al. 56, we decided to limit the 56 Janto Skowronek, Falk Schiffner, andAlexander Raake. “On the influence ofinvolvement on the quality of multipartyconferencing”. In: 4th International Work-shop on Perceptual Quality of Systems (PQS2013). International Speech Communica-tion Association. Vienna, Austria, Sept.2013, pp. 141–146
technical conditions to one type of degradation, but having differ-ent levels of that degradation. The disadvantage of this decision isthat any results of this study cannot easily be generalized for otherdegradations. One advantage, however, is to not introduce additionalexperimental variables in terms of the perceptual and conversationalnature of different degradation types, i.e. different degradation typescan lead to different perceptual dimensions 57 and they can lead to dif- 57 Marcel Wältermann. Dimension-based
Quality Modelling of Transmitted Speech.Springer, 2013
ferent conversational behavior (e.g. effect of speech signal distortionsvs. effect of echo or delay). A second advantage is that one can betterquantify any observed effects, as multiple data points for that degra-dation are available, without the need to extend the experimentaleffort for test participants.
The choice fell on packet loss, as it is one of the most prominentdegradations in today’s telecommunication systems. By testing differ-ent packet loss rates with the test system, the aim was to cover a ratherbroad quality range from imperceptible to perceptible and very annoying,while limiting the upper loss rate in order to avoid negative effects onthe conversation flow. Eventually, in Skowronek et al., we opted forrandom packet loss at loss rates of 0, 5, 10 and 15%, which introducedsome temporally relative constant noise-like distortions of speechsignals. The telephones used apply as packet loss concealment theG.711 Appendix I standard, which is known to show a high qualityrobustness against packet loss 58, explaining why it was possible to go 58 ITU-T. Recommendation G.113 - Trans-
mission impairments due to speech process-ing. International Standard. Geneva,Switzerland: International Telecommu-nication Union, 2007
up to 15% loss rate without having extreme distortions. Furthermore,

perception of telemeeting quality with focus on group-communication aspects 191
the decision not to use more realistic burst-like packet loss behaviorwas deliberately made in order to avoid any temporal interactionbetween bursts of lost packets and possible important parts of anyinformation, e.g. to avoid that whole digits of a telephone numberare disturbed in one session but not in another. Finally, packet losssimulation was realized with the TC filter and Netem software pack-ages, and the packet loss was introduced in receiving direction of testparticipants; thus test participants heard all other interlocutors withthe same degradation.
7.4.3 Method
Design The design was driven by the following constraints in termsof temporal order of stimuli, scenarios, tasks, and technical conditions:
1. Number of available scenarios and corresponding recordings: 4
2. Number of tasks: 4
3. Number of technical conditions: 4
4. All combinations of scenarios, tasks and technical conditions shouldbe tested at least once.
5. Each test participant should listen to or play a scenario recordingonly once.
The choice fell on a fourth-order Hyper-Greco-Latin square, repeatedmultiple times to cover the targeted number of test participants.
Test Participants The characteristics of the invited test participantsare given in Table 7.9.
Participant characteristics Statistics
Number of test participants 20
Age: mean / minimum / maximum 29.4 / 19 / 45
Gender: female / male, in percent (absolute num-bers)
55% / 45% (11 / 20)
Multiparty experience in professional or private life 60% (12 of 20)Recruitment area university area, outside
laboratoryBackground / profession researchers, students, staff,
alumniHearing impairments (self-reported) none
Table 7.9: Test participant statistics forthe study on involvement.
Procedure The test participants came to the laboratory for a singleone-hour session. After a general introduction, the test participantswent through the four different tasks in an order according to theexperimental design. Just before each task, the test participants got thecorresponding individual test instructions in written and oral form,and had also a short training call before each of the conversation tasks.The test participants filled in a questionnaire after each call and at theend of the experiment.

192 quality of experience of multiparty conferencing and telemeeting systems
7.4.4 Data Acquisition
Questionnaires and Measures The questionnaires were designed toextract for most Measured Variables one measure, for some how-ever, multiple measures from the test participants’ answers. InSkowronek et al. 59 our motivation for this was two-fold: on the 59 Janto Skowronek, Falk Schiffner, and
Alexander Raake. “On the influence ofinvolvement on the quality of multipartyconferencing”. In: 4th International Work-shop on Perceptual Quality of Systems (PQS2013). International Speech Communica-tion Association. Vienna, Austria, Sept.2013, pp. 141–146
one hand to limit the number of questions; one the other hand tocover multiple facets of a Measured Variable where it deemed appro-priate. The selection of the different measures and the correspondingquestionnaire design was inspired by the first experiment on Commu-nication Complexity CC1, standard quality assessment methods 60, and
60 ITU-T. Recommendation P.800 - Meth-ods for objective and subjective assessment ofquality. International Standard. Geneva,Switzerland: International Telecommu-nication Union, 1996
ITU-T. Recommendation P.805 - Sub-jective evaluation of conversational quality.International Standard. Geneva, Switzer-land: International TelecommunicationUnion, 2007
ITU-T. Recommendation P.851 - Subjec-tive quality evaluation of telephone servicesbased on spoken dialogue systems. Interna-tional Standard. Geneva, Switzerland:International Telecommunication Union,2003
Möller’s taxonomy for the quality of communication services 61.
61 Sebastian Möller. Assessment and Pre-diction of Speech Quality in Telecommuni-cations. Kluwer Academic publishers,2000
There were in total four questionnaires A to D. QuestionnaireA was given to subjects after each call and consisted of four mainparts: self-reported involvement (question QA.1), quality judgment(question QA.2), effort ratings (questions QA3.1, QA3.2a, QA3.2b,QA3.3), and judgments of task impact on quality ratings (questionsQA4.1, QA4.2).
Questionnaire B was given to subjects only after each T2 call (“lis-tening with writing minutes”) and after they answered QuestionnaireA. This questionnaire was used to get more insights on the potentialdifference between T1 (“passive listening”) and T2. Since the answerswere in retrospect not very conclusive, this questionnaire will not befurther presented and analyzed in this work.
Questionnaire C essentially resembled the writing minutes taskand subjects answered it during every T2 call: it comprised a numberof specific questions about the actual content of the call, guidingsubjects in their minutes writing task. In Skowronek et al. 62, we 62 Janto Skowronek, Falk Schiffner, and
Alexander Raake. “On the influence ofinvolvement on the quality of multipartyconferencing”. In: 4th International Work-shop on Perceptual Quality of Systems (PQS2013). International Speech Communica-tion Association. Vienna, Austria, Sept.2013, pp. 141–146
did not further analyze the answers of this questionnaire, e.g. if theyfound all wanted information; but we checked, if they have done thetask at all.
Questionnaire D was given to subjects at the end of the experiment.It repeated question QA.1 for all four tasks, i.e. it asked for the degreeof involvement for the individual tasks in retrospect, after the subjectshad experienced all four tasks. By assigning these questions to theindividual experimental stimuli (Task & SndTrans), we generated onequestion QD that can be analyzed in the same way as its counterpartQA.1.
Most questions had to be answered on the same 7-point continu-ous scale used in the previous experiments CC1 and CC2 (see alsoFigure 7.3), some questions had to be answered with yes or no, andsome by free text. Table 7.10 provides English translations of thequestions as well as the German originals.
Table 7.11 gives an overview of the link between the MeasuredVariables, the actual measures used, and descriptions on how theywere extracted from the questionnaires, and the following paragraphsprovide detailed explanations of those links.

perception of telemeeting quality with focus on group-communication aspects 193
Questionnaire APart Question ID Wording / Description, EN: English translations, DE: German original1 QA1.1 EN: “If this was a real call, in how far would you have felt as part of that telephone conference? – extremely much ... ex-
tremely little”DE: “Wenn es sich um ein echtes Telefonat gehandelt hätte, in wie weit fühlten Sie sich als Teil der Konferenz? – extrem
viel ... extrem wenig”2 QA2.1 EN: “What was your overall quality impression of the connection? – extremely bad ... ideal”
DE: “Wie is Ihrer Meinung nach die Gesamtqualität der Verbindung, die Sie gerade benutzt haben? – extremschlect ... ideal”
3 QA3.1 EN: “Did you have any difficulty in talking or hearing over the connection? – yes, no”DE: “Hatten Sie Schwierigkeiten beim Sprechen oder Hören während dieser Verbindung? – ja, nein”
QA3.2a EN: “Did your partners have any difficulty in talking or hearing over the connection? – yes, no”DE: “Hatten Ihre Partner Schwierigkeiten beim Sprechen oder Hören während dieser Verbindung? – ja, nein”
QA3.2b EN: “I am xxx % sure of my answer.”DE: “Ich bin mir meiner Antwort zu xxx % sicher.”
QA3.3 EN: “What was your level of effort to follow the conversation? – extremely much ... extremely little”DE: “Bitte bewerten Sie die Anstrengung um der Konversation zu folgen? – extrem viel ... extrem wenig”
4 QA4.1 EN: “How difficult was it for you to give a rating for the overall quality impression and the effort? – extremely diffi-cult ... extremely easy”
DE: ”Wie war es für Sie eine Bewertung zur Gesamtqualität und zur Anstrengung abzugeben? – extrem schwer ... extremleicht”
QA4.2 EN: “In how far did the conversation (in terms of content and flow) influence your answers? – extremely much ... extremelylittle”
DE: “In wie weit spielte das Gespräch (Inhalt und Ablauf) bei Ihren Urteilen eine Rolle. – extrem viel ... extrem wenig”
Questionnaire DPart Question ID Wording / Description, EN: English translations, DE: German original1 QD1.1 ... QD1.4 EN: “For task XXX: If this was a real call, in how far would you have felt as part of that telephone conference? –
extremely much ... extremely little”DE: “Für Aufgabe XXX: Wenn es sich um ein echtes Telefonat gehandelt hätte, in wie weit fühlten Sie sich als Teil der
Konferenz? – extrem viel ... extrem wenig”
Table 7.10: Summary of the question-naires used in the study on involvement.
Measured Variable Measure Extraction from questionnaire
Measured Involvement Perceived Involvement Directly measured with QA1.1Perceived Involvement In Retrospect Measured with QD1.1 ... QD1.4, after
assignment to experimental conditionInfluence Of Content Directly measured with QA4.2
Measured Involvement and/or CognitiveLoad1
Rating Difficulty Directly measured with QA4.1
Speech Communication Quality and/orQuality of Experience2
Quality Directly measured with QA2.1
Speech Communication Quality with focuson Group-Communication Component
Own Conversation Effort Directly measured with QA3.1Partners Conversation Effort Directly measured with QA3.2aPartners Conversation Effort Confidence Directly measured with QA3.2b
Cognitive Load Perceived Effort Directly measured with QA3.3
Remarks:1 In retrospect, any difficulty can be caused by a high cognitive load and/or by a strong distraction due to involvement. Hence aunique assignment to either Measured Variable is not possible.2 In retrospect, the wording of question QA2.1 allows both interpretations. Hence a unique assignment to either MeasuredVariable is not possible.
Table 7.11: Relation between the Mea-sured Variables (on their conceptuallevel), the actual measures used for ob-taining respective quantitative data, andextraction of the measures from thequestionnaire answers.

194 quality of experience of multiparty conferencing and telemeeting systems
Measured Involvement Two measures were used that directly targetMeasured Involvement. The first measure is Perceived Involvement, ob-tained from question QA.1, which participants rated after each call.The second measure is Perceived Involvement in Retrospect, obtainedfrom question QD, which participants answered “in retrospect” at theend of the experiment.
Furthermore, two additional measures were used that concern thetask impact on quality ratings, which indirectly indicate the levelof Measured Involvement, due to the design of the tasks to triggerdifferent levels of involvement. The first measure is Influence of Content,obtained from participants’ ratings of question QA4.2. The underlyingassumption is that the larger the Influence of Content, the more the testparticipant was concerned with the content and thus the more theparticipant was involved in the conversation. The second measureis Rating Difficulty, obtained from ratings of question QA4.1. Whilethe underlying assumption is the same as for Influence of Content,a reconsideration of this question in retrospect revealed that anydifficulty can be caused by a strong distraction due to involvement,but it can also be caused by a high cognitive load. Hence a uniqueassignment to either Measured Involvement or Cognitive Load is notpossible, which is also accounted for in Table 7.11.
Cognitive Load Next to above mentioned Rating Quality, a second andactually more direct measure for Cognitive Load is the Perceived Effort(to follow the conference), obtained from test participants’ ratings ofquestion QA3.3.
Speech Communication Quality and Quality of Experience As alreadymentioned, the experiment did not specifically aim at distinguishingbetween the two layers Speech Communication Quality and Quality ofExperience. The experiment applied one measure Quality, obtainedfrom participants’ ratings of question QA2.1. The wording of thatquestion (“overall impression of the connection”) actually allowsan interpretation in terms of Speech Communication Quality due tothe keyword connection or in terms of Quality of Experience due tothe keyword overall impression. For that reason, the correspondinghypothesis does not distinguish between Speech Communication Qualityand Quality of Experience, see Table 7.12.
Next to the Quality measure, three additional measures specificallyaddressed the Group-Communication Component of Speech Communica-tion Quality. Those measures are the Own Conversation Effort, obtainedfrom participants’ ratings of question QA3.1; the Partners ConversationEffort, obtained from participants’ ratings of question QA3.2a, andthe Partners Conversation Effort Confidence, obtained from participants’ratings of question QA3.2b. While it could be argued that thosemeasures also refer to Cognitive Load, as they ask for effort, the au-thor assigned those measures to Speech Communication Quality due tothe fact that the questions are minor modifications of standardizedquestions of conversational quality, i.e. the conversation effort scale

perception of telemeeting quality with focus on group-communication aspects 195
proposed by the ITU 63. 63 ITU-T. Recommendation P.805 - Sub-jective evaluation of conversational quality.International Standard. Geneva, Switzer-land: International TelecommunicationUnion, 2007
Data Processing All measures were represented in such a way thathigh values reflect something positive, that is high quality, highinvolvement, or low cognitive load. This representation is straight-forward for the concepts related with four measures (Perceived Involve-ment, Perceived Involvement In Retrospect, Quality, Partners ConversationEffort Confidence). However, it is less intuitive for the five effort- andinfluence-related measures (Influence Of Content, Rating Difficulty, OwnConversation Effort, Partners Conversation Effort, Perceived Effort), as theratings are now inverted: a high effort or influence, meaning a highcognitive load, is coded with a low value.
Data Validation Inspecting the questions did not reveal any specificoutliers in terms of individual ratings or test participants. Hence noneof the data points was excluded from the further analysis.
Data Analysis and Presentation As the experiments on CommunicationComplexity, also this experiment on Involvement had two test factors,Task and sound transmission method SndTrans, again requiring ananalysis on two levels. The first analysis level concerns the maineffects; that means the effect of Task if all data over SndTrans is com-piled and the effect of SndTrans if all data over Task is compiled. Thesecond analysis level concerns the individual effects; that means theeffect of Task per SndTrans and the effect of SndTrans per Task. Asanalysis methods, the author conducted one-way ANOVAs 64 to check 64 Due to the experimental design
(hyper-greco-latin design), repeated-measures ANOVAs as used in the exper-iments on Communication Complexitywere only possible here for investigatingindividual effects, but not for investigat-ing the main effects. For that reason,simple one-way ANOVAs were used in-stead.
for significant effects of the Manipulated Variables, i.e. Task and Snd-Trans, on the different Measured Variables. Then the author conductedPostHoc tests with Sidak correction to identify for which pairs ofManipulated Variables significant differences can be observed. Andthe author generated errorbar plots, showing the mean values and95% confidence intervals, to visualize the effects. Thus, the analysisconsisted – as for the experiments on Communication Complexity – ofnine steps per measure: ANOVA, PostHoc and Errorbar for the MainEffects, for the Individual Effect of Task and for the Individual Effectof SndTrans.
The next section presents a summary of the results, focusing on themain conclusions from the analysis, and visualizing the data with theerrorbar plots. The full analysis details with all ANOVA and PostHocresults are presented in Appendix D.

196 quality of experience of multiparty conferencing and telemeeting systems
7.4.5 Results Experiment INV
Quality
1. Errorbars (mean & 95% confidence interval)
Main Effect of Task Individual Effects of Task per SndTrans Main Effect of SndTrans Individual Effects of SndTrans per Task
2. Effect of TaskQuality is significantly influenced by the principle test paradigmslistening-only tasks (1 & 2) vs. conversation tasks (3 & 4). Thereare deviations from this observation for individual SndTrans, whichare, however, non-systematic.⇒ Support for Hypotheses H7, but only for comparison listening-only vs. conversation tasks.
3. Effect of SndTransThere is an effect of SndTrans on Quality: with increasing packet loss rate(from SndTrans = 1 to 4), Quality is decreasing, whereas the differencesare only significant between the two extreme cases SndTrans = 1 and 4.There are deviations from this observation for individual Tasks, whichare, however, non-systematic.⇒ Support for Hypotheses H8.
Perceived Involvement
1. Errorbars (mean & 95% confidence interval)
Main Effect of Task Individual Effects of Task per SndTrans Main Effect of SndTrans Individual Effects of SndTrans per Task
2. Effect of TaskPerceived Involvement is significantly influenced by the principle testparadigms listening-only tasks (1 & 2) vs. conversation tasks (3 & 4).There are deviations from this observation for individual SndTrans,which are, however, non-systematic.⇒ Support for Hypothesis H1, but only for comparison listening-only vs. conversation tasks.
3. Effect of SndTransThere is no effect of SndTrans on Perceived Involvement. There are devia-tions from this observation for individual Tasks, which are, however, non-systematic.⇒ No support for Hypothesis H2.
Perceived Involvement in Retrospect
1. Errorbars (mean & 95% confidence interval)
Main Effect of Task Individual Effects of Task per SndTrans Main Effect of SndTrans Individual Effects of SndTrans per Task
2. Effect of TaskPerceived Involvement in Retrospect is significantly influenced by theprinciple test paradigms listening-only tasks (1 & 2) vs. conversationtasks (3 & 4). There are deviations from this observation for individ-ual SndTrans, which are, however, non-systematic.⇒ Support for Hypothesis H1, but only for comparison listening-only vs. conversation tasks.
3. Effect of SndTransThere is an effect of SndTrans on Perceived Involvement in Retrospect, agrouping of SndTrans = 1 & 3, i.e. 0% & 10% packets loss rate, and agrouping of SndTrans = 2 & 4, i.e. 0% & 10% packets loss rate. No reason-able explanation could be found, except that the data appears to be rathernoisy, especially when considering the data for individual SndTrans.⇒ No “interpretable” support for Hypothesis H2.
Figure 7.12: Analysis summary for themeasures Quality, Perceived Involvement,and Perceived Involvement in Retrospect.

perception of telemeeting quality with focus on group-communication aspects 197
Rating Difficulty
1. Errorbars (mean & 95% confidence interval)
Main Effect of Task Individual Effects of Task per SndTrans Main Effect ofSndTrans
Individual Effects of SndTrans per Task
2. Effect of TaskThere is no effect of Task on Rating Difficulty. There are deviationsfrom this observation for individual SndTrans, which are, however,non-systematic.⇒ No support for Hypotheses H1 & H3.
3. Effect of SndTransThere is no effect of SndTrans on Rating Difficulty. There are deviationsfrom this observation for individual Tasks, which are, however, non-systematic.⇒ No support for Hypotheses H2 & H4.
Influence of Content
1. Errorbars (mean & 95% confidence interval)
Main Effect of Task Individual Effects of Task per SndTrans Main Effect ofSndTrans
Individual Effects of SndTrans per Task
2. Effect of TaskThere is no effect of Task on Influence of Content. There are deviationsfrom this observation for individual SndTrans, which are, however,non-systematic. .⇒ No support for Hypothesis H1.
3. Effect of SndTransThere is no effect of SndTrans on Influence of Content. There are devia-tions from this observation for individual Tasks, which are, however, non-systematic.⇒ No support for Hypothesis H2.
Perceived Effort
1. Errorbars (mean & 95% confidence interval)
Main Effect of Task Individual Effects of Taskper SndTrans
Main Effect ofSndTrans
Individual Effects of SndTrans per Task
2. Effect of TaskPerceived Effort is influenced by the principle test paradigms listening-only tasks (1 & 2) vs. conversation tasks (3 & 4), whereas the differ-ence is only significant between Tasks 2 & 3. There are deviationsfrom this observation for individual SndTrans, which are, however,non-systematic.⇒ Support for Hypothesis H3, but only for comparison of Listening-only Task 2 vs. Conversation Task 3.
3. Effect of SndTransThere is no effect of SndTrans on Perceived Effort. There are deviations fromthis observation for individual Tasks, which are, however, non-systematic.⇒ No support for Hypothesis H4.
Figure 7.13: Analysis summary for themeasures Rating Difficulty, Influence ofContent, and Perceived Effort.

198 quality of experience of multiparty conferencing and telemeeting systems
Own Conversation Effort
1. Errorbars (mean & 95% confidence interval)
Main Effect of Task Individual Effects of Task per SndTrans Main Effect ofSndTrans
Individual Effects of SndTrans per Task
2. Effect of TaskOwn Conversation Effort is influenced by the principle test paradigmslistening-only tasks (1 & 2) vs. conversation tasks (3 & 4), whereasthe difference is only significant between Tasks 2 & 3. There aredeviations from this observation for individual SndTrans, which are,however, non-systematic.⇒ Support for Hypothesis H5, but only for comparison of Listening-only Task 2 vs. Conversation Task 3.
3. Effect of SndTransThere is an effect of SndTrans on Own Conversation Effort: with increas-ing packet loss rate (from SndTrans = 1 to 4), Own Conversation Effort isincreasing (i.e. decreasing values), whereas the differences are only sig-nificant between the two extreme cases SndTrans = 1 and 4. There aredeviations from this observation for individual Tasks, which are, however,non-systematic.⇒ Support for Hypotheses H6.
Partners Conversation Effort
1. Errorbars (mean & 95% confidence interval)
Main Effect of Task Individual Effects of Task per SndTrans Main Effect ofSndTrans
Individual Effects of SndTrans per Task
2. Effect of TaskThere is no effect of Task on Partners Conversation Effort. There aredeviations from this observation for individual SndTrans, which are,however, non-systematic.⇒ No support for Hypothesis H5.
3. Effect of SndTransThere is no effect of SndTrans on Partners Conversation Effort. There aredeviations from this observation for individual Tasks, which are, however,non-systematic.⇒ No support for Hypothesis H6.
Partners Conversation Effort Confidence
1. Errorbars (mean & 95% confidence interval)
Main Effect of Task Individual Effects of Taskper SndTrans
Main Effect ofSndTrans
Individual Effects of SndTrans per Task
2. Effect of TaskThere is no effect of Task on Partners Conversation Effort Confidence.There are deviations from this observation for individual SndTrans,which are, however, non-systematic.⇒ No support for Hypothesis H5.
3. Effect of SndTransThere is no effect of SndTrans on Partners Conversation Effort Confidence.There are deviations from this observation for individual Tasks, whichare, however, non-systematic.⇒ No support for Hypothesis H6.
Figure 7.14: Analysis summary for themeasures Own Conversation Effort, Part-ners Conversation Effort, and Partners Con-versation Effort Confidence.

perception of telemeeting quality with focus on group-communication aspects 199
7.4.6 Discussion
Review of Results Table 7.12 summarizes the main findings, whichwill be discussed now.
Measured Variables Manipulated VariablesInvolvement Technical System Capability
(i.e. Task) (i.e. Sound Transmission Method SndTrans)
Measured Involvement Hypothesis H1 X1 Hypothesis H2 ×2
Cognitive Load Hypothesis H3 X3 Hypothesis H4 ×Speech Communication Quality with focus on
Group-Communication ComponentHypothesis H5 X4 Hypothesis H6 X5
Speech Communication Quality and/or Qualityof Experience
Hypothesis H7 X6 Hypothesis H8 X
Remarks:X1 Hypothesis confirmed for measures Involvement & Involvement in Retrospect for comparison listening-only tasks (T1 & T2)vs. conversation tasks (T3 & T4), but not between the two listening-only tasks (T1 vs. T2) or between the two conversation tasks(T3 vs. T4). Measures Rating Difficulty & Influence of Content showed no effects.×2 Hypothesis rejected for Perceived Involvement, though there are some non-reasonable (i.e. differences between 0% and 10% vs.5% and 15% packet loss rate) for Perceived Involvement in Retrospect. Measures Rating Difficulty & Influence of Content showed noeffects.X3 Hypothesis confirmed for measure Perceived Effort for comparison T2 vs. T3. Measure Rating Difficulty showed no effects.X4 Hypothesis confirmed for measure Own Conversation Effort for comparison T2 vs. T3. Measures Partners Conversation Effort &Partners Conversation Effort Confidence showed no effects.X5 Hypothesis confirmed for measure Own Conversation Effort for comparison SndTrans = 1 vs. 4. Measures Partners ConversationEffort & Partners Conversation Effort Confidence showed no effects.X6 Hypothesis confirmed for comparison listening-only tasks (T1 & T2) vs. conversation tasks (T3 & T4), but not between the twolistening-only tasks (T1 vs. T2) or between the two conversation tasks (T3 vs. T4).
Table 7.12: Overview of the Manipulatedand Measured Variables and definition ofthe resulting eight hypotheses H1 to H8.Each hypothesis can be phrased as “[Ma-nipulated Variable] has an impact on[Measured Variable]”.
Hypothesis H1 is confirmed due to the differences between listening-only and conversation tests. This means, the experimental manipula-tion in terms of triggering different levels of involvement was onlypartially successful, since the original intention was to trigger not onlydifferences in involvement between listening-only and conversationtests, but also between the two variations of a listening-only test andconversation test, respectively. Furthermore, this finding holds onlyfor the two measures directly asking about involvement (PerceivedInvolvement and Perceived Involvement in Retrospect). The other twomeasures (Rating Difficulty & Influence of Content), which are asking –in a manner of speaking – indirectly about involvement, are appar-ently not suited to reveal significant differences in involvement fordifferent tasks.
Hypothesis H2 is rejected, if one interprets the non-reasonableresult for Perceived Involvement in Retrospect as a measurement error.This means, people do not experience a change in Involvement whenthe Technical System Capability is changing, at least for the presentrange of degradations. Again, the two measures Rating Difficultyand Influence of Content are apparently not suited to reveal significantdifferences in involvement for different degradations.
Hypothesis H3 is confirmed due to the difference between listening-only and conversation tests, whereas this is limited to the two tasksT2 and T3. This means, a change in Involvement has an effect on theCognitive Load. Looking at the direction of that effect, i.e. the error

200 quality of experience of multiparty conferencing and telemeeting systems
bar plots for Perceived Effort in Figure 7.13 and considering the inversecoding of values for this measure, test participants appear to actuallyperceive a lower Cognitive Load when they feel more involved. Thisfinding is contrary to the expectations, as it is more straight-forwardto assume in a quality assessment test that a stronger involvementrequires more cognitive resources from a test participant, given thatthe participant needs also cognitive resources for the judgment task.One explanation for this finding could be that feeling more involvedmakes the assessment task more interesting for test participants. Thisin turn means that their need to force themselves to stay concen-trated throughout the test is reduced, which would then explain thereduction in Perceived Effort.
Hypothesis H4 is rejected. This means, the applied degradationsdo not affect Cognitive Load, which is in line with the results of theprevious study, in which only spatial audio, but not bandwidth, werefound to influence Cognitive Load.
Hypothesis H5 is confirmed for one measure (Own ConversationEffort) due to the difference between listening-only and conversationtests, whereas this is limited to the two tasks T2 and T3. This sug-gests that a change in Involvement has an effect on the communicativeaspects of Speech Communication Quality. However, it is very likelythat Own Conversation Effort as the one measure showing this effectis highly correlated with Perceived Effort, which in turn explains thesame result as for Hypothesis H3. Concerning the other two relatedmeasures (Partners Conversation Effort, Partners Conversation Effort Con-fidence), it appears that those are not suitable for revealing significantdifferences for different test tasks.
Hypothesis H6 is confirmed for the difference between the twomost extreme conditions (0% and 15% packet loss rate) for the mea-sure Own Conversation Effort. This means, Technical System Capabilitycan influence the Group-Communication Component of Speech Commu-nication Quality, suggesting that the Group-Communication Componentof telemeeting quality is relevant also from a technological perspec-tive. Furthermore, this also supports the validity of that measure,which is not surprising, as it is essentially the conversation effort scaleproposed in ITU-T Recommendation P.805
65. 65 ITU-T. Recommendation P.805 - Sub-jective evaluation of conversational quality.International Standard. Geneva, Switzer-land: International TelecommunicationUnion, 2007
Hypothesis H7 is confirmed due to the difference between listening-only and conversation tests. This is the main finding of the study,and has implications regarding two aspects. First, confirmation of H7
contributes to the discussion about the impact of the two differenttest paradigms listening-only test and conversation test. The presentresults obtained for a multiparty setting are in line with existingresults for two-party telephony discussed in Möller 66, who showed 66 Sebastian Möller. Assessment and Pre-
diction of Speech Quality in Telecommuni-cations. Kluwer Academic publishers,2000
that a difference between the two test paradigms exists and that nosingle generic transformation law between the outcomes of both testparadigms can be found. Second, confirmation of H7 emphasizesthat the choice of either listening-only test or conversation test shouldbe taken with great care, as this choice alone is already influencingresults. Since the ratings for the corresponding measure Quality in

perception of telemeeting quality with focus on group-communication aspects 201
Figure 7.12 are lower for the listening-only tests, test participants wereapparently more critical in the listening-only tests. Thus, the widelyused approach for two-party settings can also be applied here formultiparty settings: use listening-only tests, if a high sensitivity oftest participants is required, use conversational tests, if sensitivity isnot an issue but other aspects such as naturalness or interactivity.
Hypothesis H8 is confirmed, which means the experimental manip-ulation regarding the technical degradation was successful: a strongerdegradation (packet loss rate) leads to significantly lower qualityscores.
Another important result can be found when comparing the resultsfor H7 and H8, i.e. the impact of tasks and technical degradation onthe measure Quality. As already discussed in Skowronek et al. 67, the 67 Janto Skowronek, Falk Schiffner, and
Alexander Raake. “On the influence ofinvolvement on the quality of multipartyconferencing”. In: 4th International Work-shop on Perceptual Quality of Systems (PQS2013). International Speech Communica-tion Association. Vienna, Austria, Sept.2013, pp. 141–146
largest difference of the mean score of Quality between two tasks was1.680 points on the used 7-point continuous scale, while the largestdifference between two technical conditions was 0.975. This means,the impact of the test paradigm (listening-only vs. conversation test)can be stronger than the impact of the technical conditions undertest, even if those condition differences are strong enough to reachstatistical significance, which was the case here.
Review of the Approach and Open Questions for Future Work Whilethe present experiment delivered significant results on the impactof Involvement on different aspects of telemeeting quality, the resultsreveal some room for improving the test methodology as well as posesome general questions for future work.
First, the questionnaire contained four questions/measures thatwere not sensitive to measure significant effects: Rating Difficulty,Influence of Content, Partners Conversation Effort, and Partners Conver-sation Effort Confidence. Hence, the added value of those questionsneeds to be further validated, e.g. in another study with more datapoints, to determine whether those questions are useful to keep orwhether they can be removed.
Second, the questionnaire was designed before the present frame-work of Telecommunication and Group-Communication Components wasdeveloped to a degree as presented in Section 5.4 and the differ-entiation between Speech Communication Quality and Quality ofExperience were not yet considered at a stage as presented in Sec-tion 7.2. Despite the approach to re-visit the applied questions andto construct in retrospect hypotheses according to that framework, theresults of H3 and H5 suggest that the questions are strongly interre-lated and thus less suitable to really distinguish between the differentaspects of telemeeting quality.
Third, the experimental design was a hyper-greco-latin square bal-ancing two test factors (task & technical condition) with the availablescenarios and the stimulus order. The advantage of this design is thelimited number of test trials (i.e total number of stimuli) required toconduct a study with multiple factors. This was an essential advan-tage with respect to the test protocol, which required introductions

202 quality of experience of multiparty conferencing and telemeeting systems
and training calls per task. One disadvantage of this design, however,is that the number of data points per combination of each factor isvery low. For the present data, this means that there were only sixratings per combination of task and technical condition, despite theuse of 24 test subjects. Accordingly, the detailed results on the effectof task per condition and on the effect of condition per task is quitenoisy (see Figures 7.12 to 7.14). That means to obtain more stableresults also on the level of those individual effects, the repetition ofthe study with another design or with more test sessions is necessary.
Next to these suggestions for improving the methodology, twomore general questions for future work emerge from the presentresults. First, the study focused on one type of degradation, randompacket loss, and future work could verify the found effects for otherdegradations.
Second, despite the effort in the task design, the study did not suc-ceed to trigger different degrees of involvement within the listening-only or within the conversation test paradigms. Future work couldattempt to define different tasks that are more likely to succeed. Orfuture work could further validate the present or new tasks withoutmixing listening-only and conversation tests, which could increaseparticipants’ sensitivity for rating the perceived involvement by re-moving any dominating effect of the two fundamental test paradigms.Alternatively, future work should investigate other methods for mea-suring involvement, e.g. physiological, that augment or even replacethe employed self-reported measures.
Summary
The goal of the research presented here was to obtain more insightsabout the influence of communicative aspects on telemeeting quality,whereas the potential interaction of those aspects with the technologywas considered as well. For that purpose two studies investigated theinfluence of Communication Complexity and Involvement in combinationwith different Technical System Capabilities on telemeeting quality. Here,individual aspects of telemeeting quality are considered by meansof five conceptual variables: Quality of Experience, referring to theoverall telemeeting quality experience in a more general view and in-cluding aspects such as overall impression, pleasantness, satisfactionand acceptance; Speech Communication Quality, directly related to howwell the system enables speech communication and including aspectssuch as (one-way) voice transmission quality, ease of communication,and conversation effectiveness; Speech Communication Quality with afocus on the Telecommunication Component by considering questionsasking about the (one-way) voice transmission quality; Speech Commu-nication Quality with a focus on the Group-Communication Componentby considering questions asking about ease of communication andconversation effectiveness; and Cognitive Load, which represents theGroup-Communication Component, as it refers to the mental effort tocommunicate.

perception of telemeeting quality with focus on group-communication aspects 203
Concerning the study on the impact of Communication Complex-ity, two experiments were conducted in which the test methodologyof the second experiment was improved based on the first experi-ment. Focusing on the second experiment, three different aspectsof telemeeting quality were considered: Quality of Experience, SpeechCommunication Quality with focus on the Telecommunication Compo-nent, and Cognitive Load. Here, the following results were found: Asexpected, Communication Complexity showed a significant impact onCognitive Load; Technical System Capability showed a significant impacton Speech Communication Quality. Furthermore, an additional crosseffect could be observed, as Technical System Capability showed alsosignificant impact on Cognitive Load. This means, a technically moreadvanced system (here spatial sound reproduction) can reduce cog-nitive load under certain conditions. The main finding, however, isthe result that both Communication Complexity and Technical SystemCapability showed an effect on Quality of Experience. This means, notonly a technically more advanced system, but also a less complexcommunicative situation can improve quality experience.
Concerning the study on the impact of Involvement, one experimentwas conducted, in which three slightly different aspects were consid-ered: Quality of Experience, Speech Communication Quality with focuson the Group-Communication Component, and Cognitive Load. Here,the following results were found: As expected, Involvement has asignificant impact on Cognitive Load. However the direction of thateffect was unexpected, as test participants appear to perceive actuallya lower Cognitive Load when they feel more involved. One explanationcould be that feeling more involved makes the assessment task moreinteresting for test participants. This in turn means that their need toforce themselves to stay concentrated throughout the test is reduced,which would then explain the reduction in the perceived effort. Themain finding, however, is the result that Involvement has an impacton Quality of Experience, which was visible when comparing the twofundamental test paradigms listening-only and conversation test. Thismeans that the choice of conducting either a listening-only test ora conversation test should be taken with great care, as this choicealone is already influencing results. Another important finding isthat the impact of the test paradigm (listening-only vs. conversationtest) can be stronger than the impact of the technical conditions undertest, even if those condition differences are strong enough to reachstatistical significance.

8Perception of Telemeeting Quality with focus on Telecom-munication Aspects
This chapter contains text passages that either stem from previous texts of the author or that are based on such source texts. Forreadability purposes those passages are not marked as quotations. The main source documents used for this chapter are:
- Janto Skowronek, Julian Herlinghaus, and Alexander Raake. “Quality Assessment of Asymmetric Multiparty Telephone Conferences: A Sys-tematic Method from Technical Degradations to Perceived Impairments”. In: Proceedings of the 14th Annual Conference of the International SpeechCommunication Association (Interspeech 2013). International Speech Communication Association. Lyon, France, Aug. 2013, pp. 2604–2608
- Janto Skowronek, Anne Weigel, and Alexander Raake. “Quality of Multiparty Telephone Conferences from the Perspective of a Passive Listener”.In: Fortschritte der Akustik - 41. Jahrestagung für Akustik (DAGA). Nürnberg, Germany, Mar. 2015
- Janto Skowronek and Alexander Raake. Report on a study on asymmetric multiparty telephone conferences for a future update of P.1301. ITU-T Contribu-tion COM 12 - C134 - E. Geneva, Switzerland: International Telecommunication Union, Dec. 2013
- Janto Skowronek. Documentation on system setup. Project Report “Quality of Multiparty Audio-Video Communication” (Unpublished). Assessmentof IP-based Applications, Technische Universität Berlin, Germany, June 2013
- Janto Skowronek. Improved model for audio-only communication. Project Report “Quality of Multiparty Audio-Video Communication” (Unpublished).Assessment of IP-based Applications, Technische Universität Berlin, Germany, Dec. 2013
- Janto Skowronek. Pilot test for audiovisual communication. Project Report “Quality of Multiparty Audio-Video Communication” (Unpublished).Assessment of IP-based Applications, Technische Universität Berlin, Germany, Feb. 2014
- Janto Skowronek. Second test for audiovisual communication. Project Report “Quality of Multiparty Audio-Video Communication” (Unpublished).Assessment of IP-based Applications, Technische Universität Berlin, Germany, Oct. 2014
- Janto Skowronek. Final Project Report – Quality of Multiparty Audio-Video Communication. Project Report “Quality of Multiparty Audio-VideoCommunication” (Unpublished). Assessment of IP-based Applications, Technische Universität Berlin, Germany, Dec. 2014
Since additional documents served as further background material, see Appendix A for the full list of source documents and theircontributions to this chapter.
What this chapter is about
The present text is built around two aspects that differentiate a multi-party telemeeting from a conventional two-party (video) telephonycall. One aspect is addressed in this chapter: the possibility of encoun-tering asymmetric connections, that is, participants are connectedwith different equipment or connection properties.
More specifically, the present chapter reports on three studies thatinvestigated the impact of different symmetric and asymmetric con-nections on quality perception. Considering that quality comprisesdifferent aspects, the focus here lies on the perceived system perfor-mance, expressed as Speech Communication Quality with a focus on theTelecommunication Component of telemeeting quality.

perception of telemeeting quality with focus on telecommunication aspects 205
8.1 Introduction
Assuming a process-oriented perspective, which is here a simplifiedview on perception, as it was also done in the previous chapter,telemeeting quality perception can be regarded as a process thattransforms an input – the telemeeting – into an output – the qualityjudgment. The previous chapter considered two inputs – the technicalsystem properties and the special communicative situation – andthree outputs – Telemeeting Quality in a more general view and itstwo aspects Telecommunication and Group-Communication Component.The present chapter, however, focuses on one input, the technicalsystem properties and one output, the Telecommunication Component.Limiting to one input allows for a deeper investigation of the impactof technical conditions, and especially of asymmetric conditions, onthe perceived quality. Limiting to one output allows later, that is inthe next chapter, a more precise definition of the target variable whendeveloping multiparty quality models.
Looking at the special aspect of asymmetric conditions, the researchquestion arises how the combination of different technical conditionson the individual connections between interlocutors contribute to theoverall telemeeting quality. Such knowledge would be beneficial indifferent aspects: first, it contributes to a better understanding of the– potentially mutually influencing – impact of different connectionson telemeeting quality perception; second, it can provide empiricalevidence for the conceptual model in Chapter 5 with its definition ofdifferent quality aggregation levels, supporting the practical relevanceof those concepts; third, it helps to develop quality prediction modelsfor telemeeting systems that allow to either plan new systems or tomonitor systems in operation; and fourth,it would help to developstrategies to improve the quality perception in case of asymmetricconditions with an optimal resource allocation.
To investigate the impact of asymmetric conditions, the studiesaimed at measuring the two different aggregation levels of telemeetingquality from the perspective of individual interlocutors: the Single-Perspective Telemeeting Quality Qi and the Individual Connection QualityQij. Furthermore, to obtain a more complete picture due to thepossible impact of the communicative situation, the different studiesinvestigated the quality perception using different test paradigms:the first study (consisting of three experiments) applied an audio-only conversation test paradigm, the second study (consisting oftwo experiments) applied a listening-only test paradigm, and thethird study (consisting of two experiments) applied an audiovisualconversation test paradigm.
In the following, the present chapter will first re-capitulate theconceptual input and output variables. Then it will report on theconduction and results of the individual studies.

206 quality of experience of multiparty conferencing and telemeeting systems
8.2 Experimental Variables on a Conceptual Level
To briefly recapitulate the elaborations in Section 7.2, the present textconsiders Manipulated Variables as those aspects of an experiment thatare controlled by the investigator, and it considers Measured Variablesas those aspects that are extracted from the experimental outcome,here the test participants’ answers.
In the present chapter, a limited set of the experimental variablesfrom Section 7.2 is used, which are Technical System Capability andSpeech Communication Quality. In addition, the concept of QualityAggregation Levels (see Section 5.3) is included as an additional typeof Measured Variables. Furthermore, the test paradigm (listening-onlyvs. conversation test) with its related variable Involvement will beconsidered as a Manipulated Variable that is varied across individualexperiments.
8.2.1 Focus on Technical System Capability and Speech Communi-cation Quality
From the different experimental variables that were investigated inChapter 7, the present chapter limits to the Technical System Capabilityas the Manipulated Variable and Speech Communication Quality as theMeasured Variables. This is motivated by the goal to use the collecteddata also for modeling purposes, as described in Chapter 9. Inparticular, the focus on one Manipulated Variable allows to investigatea broader set of instantiations of this variable, which means herethe possibility to test a broader set of Technical System Capabilities,which in turn provides more data points for modeling. The focuson one Measured Variable allows to confine the set of consideredquality aspects, which means to obtain a more precise definitionof the target variable to be modeled. In addition, the choice forSpeech Communication Quality means that the target variable is morefocused on the technical aspects of a telemeeting. This in turn confinesthe modeling goal, as the impact of non-technical communicativeaspects are minimized in the target variable, especially when thecorresponding questions are designed such that they focus on theTelecommunication Component.
8.2.2 Quality Aggregation Levels as Measured Variables
With the overall intention to investigate the impact of Technical SystemCapability on Speech Communication Quality, the present chapter hasa strong focus on the impact of technical aspects on the perceptionof telemeeting quality. Since a telemeeting is essentially providing aset of individual but simultaneous communication channels betweenmultiple interlocutors, the impact of individual connections on qualityperception is of primary interest. Especially since the role of individ-ual connections is emphasized when it comes to the perception ofasymmetric conditions, which is one of the two main differentiatorsbetween a multiparty telemeeting and a conventional two-party call.

perception of telemeeting quality with focus on telecommunication aspects 207
In that line of thought, the present chapter describes an investi-gation of the perception of Speech Communication Quality in terms ofthe two quality aggregation levels Individual Connection Quality andSingle-Perspective Telemeeting Quality. In other words, these two qualityaggregation levels define the Measured Variables of the experimentsdescribed in the next sections.
To briefly restate the concepts of the two quality aggregation levels,Individual Connection Quality refers to the quality that a telemeetingparticipant perceives of an individual connection between two inter-locutors, or alternatively between an interlocutor and the telemeetingsystem. Single-Perspective Telemeeting Quality refers to the quality thata telemeeting participant perceives from the whole telemeeting sys-tem. For more detailed elaborations on the two quality aggregationlevels see Section 5.3.
8.2.3 Involvement as Manipulated Variable across Experiments
The study on the quality impact of Involvement (Section 7.4) showedthat the test paradigm, i.e. listening-only test vs. conversation test,can have a significant influence, which may be even larger than theimpact of the tested technical conditions. For that reason, the impactof Technical System Capability on Speech Communication Quality is likelyinfluenced by the test paradigm, and with that also influenced – atleast in parts – by the degree of Involvement.
Thus, to account for the influence of Involvement in terms of theinfluence of the test paradigm, the present chapter will use bothlistening-only and conversation tests, in order to obtain a broaderpicture. In that respect, Involvement can be regarded as a ManipulatedVariable that is varied across individual experiments.
8.3 Quality Impact of an Audio-Only Telemeeting System -Conversation Tests
This section reports on three experiments investigating the qualityimpact of Technical System Capability by means of audio-only conver-sation tests, henceforth referred to as Experiments ACT1, ACT2, andACT3.
8.3.1 Goals
Motivation The choice of audio-only as the communication modalityis motivated by the observation that audio-only telemeetings – usuallyreferred to as telephone conferences – are probably the most oftenused form of telemeetings. The choice of conversation tests as thetest paradigm is motivated by the fact that conversation tests put testparticipants into that special communicative situation that has beenobserved as one main differentiator from two-party calls.

208 quality of experience of multiparty conferencing and telemeeting systems
Approach According to the iterative research method (Section 1.4),the study consists of two main experiments ACT1 & ACT3, aug-mented by one additional side experiment ACT2. Conducting twomain experiments ACT1 &ACT3 allowed to improve the experimentalmethod in the second experiment based on the insights gained inthe first experiment. The side experiment ACT2, applied the samemethodology as experiment ACT1 and was investigating the specificaspect of loudness 1. 1 Maxim Spur. “Influences of Loud-
ness Differences in Multiparty Confer-encing Quality”. Bachelor Thesis. As-sessment of IP-based Applications, Tech-nische Universität Berlin, Germany, 2012
Hypotheses The research goal is to investigate the relation betweenthe Individual Connection Quality scores Qij, and their relation to theSingle-Perspective Telemeeting Quality Qi. To transform this into a setof concrete hypotheses that can be tested with empirical data, thepresent text refers to the discussions in Chapter 5 on the potentialmutual influence of individual connections and the possible qualityaggregation processes.
A first hypothesis concerns the potential mutual influence of theco-present individual connections. Section 5.3 argues that there issuch a potential mutual influence both in terms of physical andperceptual impact: a physical mutual influence as the co-presenceallows new types of degradations that are not possible in two-partysituations (example of echo); a perceptual mutual influence as the co-presence sets a different context than two-party situations and qualityperception is known to be context-dependent. While the physicalinfluence can be taken into account when conducting the technicalsignal path analysis described in Section 6.3, the perceptual mutualinfluence needs to experimentally be investigated. If such an influencecan indeed be observed in empirical data, then it is straight-forwardto assume that this influence is not constant across different contexts,i.e. different test conditions. Thus, a first main hypothesis is
H1: There is a mutual influence of individual connections on the per-ception of Individual Connection Quality Qij, whereas this mutualinfluence is not constant, i.e. it depends on the actual test condition.
In order to be able to test this hypothesis, it is necessary to definecriteria which allow to validate if such a mutual influence exists ornot. Those criteria can be found by considering the different possi-ble distributions of impairments across the individual connections.Impairments can be for example on the own connection, on one ofthe interlocutors’ connections, or on both of the interlocutors’ con-nections. With three interlocutors and removing any permutations,eleven combinations are in theory possible. Table 8.1 shows the differ-ent combinations and marks those cases with a X that were actuallyused in the present research. With this set of expected behavior it ispossible to test H1 by verifying if the observed data is significantlydifferent from this behavior (H1 rejected) or not (H1 confirmed). Inpractice that means to check if ratings for not impaired individualconnections (Ii,x = 0) are equal to the reference condition (H1 rejected)or not (H1 confirmed) and to check if ratings for connections with

perception of telemeeting quality with focus on telecommunication aspects 209
Impairment distribution Expected behavior Used in presentIi,i Ii,j Ii,k research
0 0 0 no impairment at all (reference condition) X
0 0 1 impairment on one of the interlocutor’s connections X
0 1 1 same impairments on both of the interlocutor’s connections X
0 1 2 different impairments on each of the interlocutor’s connections1 0 1 impairment on one of the interlocutor’s connections and same impairment
on the own connection1 1 1 same impairments on both of the interlocutor’s connections and same im-
pairment on the own connection1 1 2 different impairments on each of the interlocutor’s connections and impair-
ment on the own connection is same as one of the two3 0 0 no impairment on any of the interlocutor’s connections and impairment on
the own connection3 0 1 impairment on one of the interlocutor’s connections and different impairment
on the own connectionX
3 1 1 same impairments on both of the interlocutor’s connections and differentimpairment on the own connection
3 1 2 different impairments on each of the interlocutor’s connections and differentimpairment on the own connection
Table 8.1: Possible distributions of im-pairments (from the perspective of oneinterlocutor ILi) across individual con-nections for the case of three interlocu-tors.
the same impairments (Ii,x = Ii,y) are equal (H1 rejected) or not (H1
confirmed).A second hypothesis concerns the possible relation between the
two quality aggregation levels. Section 5.3 argues that there are dif-ferent possibilities to aggregate the perception of the characteristicsof individual connections into a quality judgment of the whole tele-meeting. One such discussed possibility is that participants formjudgments of Individual Connection Quality Qij and then aggregatethem into a judgment of Single-Perspective Telemeeting Quality Qi (“Iperceive one participant distorted – so he/she has a bad connection –and the others without distortions – so they have good connections.Thus, the overall quality is moderate”). However, another possibilityis that a person is forming a judgment of Qi directly on the basis of thecharacteristics that the person perceives from the telemeeting, with-out forming explicit Qij judgments of the individual connections (“Iperceive one participant distorted and the others without distortions.Thus the overall quality is moderate”) or even without decomposingthe telemeeting into individual connections at all (“I perceive somedistortions. Thus, the overall quality is moderate”).
Apparently it is not possible to directly test which of these pro-cesses are really taking place in the mind of a person. However, it ispossible to test for evidence whether the Single-Perspective TelemeetingQuality Qi can be expressed as a function of the Individual ConnectionQualities Qij and whether this function shows a consistent behavioracross different contexts, i.e. different test conditions. In other words,a second hypothesis tests for evidence that Qi can be modeled as afunction of Qij. While Chapter 9 investigates a number of possiblemodeling functions, the present chapter focuses on providing first ev-idence that motivates the modeling attempts later on. For that reason,the present chapter is limited to the simplest possible aggregation

210 quality of experience of multiparty conferencing and telemeeting systems
function, a simple average (arithmetic mean). Thus, a second mainhypothesis is
H2: An aggregation of Individual Connection Quality Qij to Single-Perspec-tive Telemeeting Quality Qi takes place, whereas this aggregation canbe modeled as a simple average operation: Qi = 1/N ·∑N
j=1(Qij).
8.3.2 Experimental Factors
Test Tasks In all three experiments the task for test participants wasa conversation test task (“Have a conversation over the test system,and give ratings after each conversation”).
Conversation Scenarios The three-party conversation test scenariosproposed by Raake et al. 2 served as basis for the conversation sce-
2 Alexander Raake et al. “Listening andconversational quality of spatial audioconferencing”. In: Proceedings of the AES40th International Conference. Tokyo, Oct.2010
Alexander Raake and ClaudiaSchlegel. 3CT - 3-party Conversation Testscenarios for conferencing assessment. 2010.doi: 10.5281/zenodo.16129
narios. Experiments ACT1 and ACT2 used shortened versions ofthose scenarios 3 which essentially removed the open discussion part
3 Janto Skowronek, Julian Herling-haus, and Alexander Raake. “QualityAssessment of Asymmetric MultipartyTelephone Conferences: A SystematicMethod from Technical Degradationsto Perceived Impairments”. In: Pro-ceedings of the 14th Annual Conference ofthe International Speech CommunicationAssociation (Interspeech 2013). Interna-tional Speech Communication Associa-tion. Lyon, France, Aug. 2013, pp. 2604–2608
Maxim Spur. “Influences of Loud-ness Differences in Multiparty Confer-encing Quality”. Bachelor Thesis. As-sessment of IP-based Applications, Tech-nische Universität Berlin, Germany, 2012
of the original scenarios. This served the purpose of reducing thetime needed to complete a conversation, which means increasing thepossible number of conditions per test, and also increasing the com-parability of the conversations. Furthermore, based on the practicalexperience in using those scenarios, ACT3 used a modified versionin which details were optimized to reduce some confusing and un-necessary information for the test participants. Finally, three morescenarios were added to the new scenario set. Both versions of thescenario sets are electronically available 4. 4 Janto Skowronek. 3SCT - 3-party Short
Conversation Test scenarios for conferenc-ing assessment (Version 01). 2013. doi:10.5281/zenodo.16134
Janto Skowronek and Falk Schiffner.3SCT - 3-party Short Conversation Test sce-narios for conferencing assessment (Version02). 2015. doi: 10.5281/zenodo.16135
Confederate as test participant In Experiment ACT1 a female confeder-ate and in Experiment ACT2 a male confederate complemented theparticipant groups in case of no-shows of individual test participants;this was necessary four times in ACT1 and twice in ACT2. In Ex-periment ACT3, however, a male confederate was always acting asone of the interlocutors. The intension of this systematic modificationof the test protocol was to further increase the comparability of thetest calls across test participant groups. This was triggered by thepractical experience in running the experiments of ACT1 and ACT2,which showed strong variations in the conversations between differentgroups, an effect that was also formally measured by Raake et al. 5. 5 Alexander Raake et al. “Listening and
conversational quality of spatial audioconferencing”. In: Proceedings of the AES40th International Conference. Tokyo, Oct.2010
The confederate’s task in ACT3 was to ensure a smooth conversationand to aim at an equal amount of contributions from all interlocutors.In particular the confederate guided the conversation along the under-lying scenario structure, solved misunderstandings, and minimizednon-intended discourses. The test participants were informed aboutthe confederate with the information that he was there to help playthe scenarios.
Test Systems Given the test paradigm of conversation tests, the testsystems needed to provide on the one hand a full-working audio-onlymultiparty communication and on the other hand a full control ofthat system and easy handling during the experiment sessions. As

perception of telemeeting quality with focus on telecommunication aspects 211
described in Skowronek et al. 6, Experiment ACT1 used a telephony 6 Janto Skowronek, Julian Herling-haus, and Alexander Raake. “QualityAssessment of Asymmetric MultipartyTelephone Conferences: A SystematicMethod from Technical Degradationsto Perceived Impairments”. In: Pro-ceedings of the 14th Annual Conference ofthe International Speech CommunicationAssociation (Interspeech 2013). Interna-tional Speech Communication Associa-tion. Lyon, France, Aug. 2013, pp. 2604–2608
setup using off-the-shelf VoIP-telephones (SNOM870) connected viaa local router to a conference bridge (Asterisk) running on a Linuxlaptop. Using an Asterisk plugin, the speech signals were routedvia the Jack Audio Connection Kid (JACK) to an audio processingsoftware (PureData). All connections used the G.711 A-law codec andthe minimum oneway delay of this test system was 150ms (referencecondition). Furthermore, packet loss was realized by applying theTC Filter and Netem softwares to manipulate the packet streams. Allsignal levels were calibrated with an head and torso simulator (HATS).As described by Spur 7, Experiment ACT2 applied in addition an 7 Maxim Spur. “Influences of Loud-
ness Differences in Multiparty Confer-encing Quality”. Bachelor Thesis. As-sessment of IP-based Applications, Tech-nische Universität Berlin, Germany, 2012
automatic gain control inside the PureData software “in order to createa controlled and level environment for testing loudness differencesindependently from participant or hardware characteristics.”
In contrast to these two experiments using hardware telephones,ACT3 applied a proprietary test version of a PC-based VoIP client,provided by Skype (Microsoft), and henceforth referred to as SkypeTesting Client. The test client allowed to provide different codecs(SILK, G.711) and audio bandwidths (narrowband, wideband, &super-wideband), and test participants used closed headsets (Beyerdy-namic DT790) as end devices, which were connected to the computervia RME sound cards. Again PureData was inserted in the audio pathfor introducing acoustic distortions, Netem was used for introducingpacket loss. The overall oneway delay was 350ms, a value that is abovethe typically recommended threshold of 150ms according to ITU-TRecommendation G.114
8, but which is below 400ms, a value that 8 ITU-T. Recommendation G.114 - One-way transmission time. International Stan-dard. Geneva, Switzerland: Interna-tional Telecommunication Union, 2003
was not critical for the laboratory tests of Schoenenberg 9 using the
9 Katrin Schoenenberg. “The Qualityof Mediated-Conversations under Trans-mission Delay”. PhD Thesis. TechnischeUniversität Berlin, Germany, 2016
same type of conversation scenarios. Using head and torso simulator(HATS), the sound reproduction levels were calibrated to 73dB SPL atear reference point for microphone signals that had a -26dBov digitallevel for an acoustic sound pressure level of 89dB SPL at the HATSmouth reference point.
Technical Test Conditions In light of the fact that a degradation canhave different effects for the individual interlocutors (Section 6.3), thetechnical conditions tested in the experiments are actually determinedby two aspects: the technical system characteristics as such and thedistribution of those characteristics among the individual connections.Table 8.2 provides a respective overview of all test conditions. Eachcondition is specified
(a) in terms of the combination of impairments that participants canperceive from the individual connections (Impairment Definition &Impairment Description), using the notation of the method describedin Section 6.3, and
(b) in terms of the technical system characteristics, expressed by meansof short descriptions of the technical parameters or, when applica-ble, by means of the transmission parameters of the E-Model 10.
10 ITU-T. Recommendation G.107 - TheE-model: a computational model for usein transmission planning. InternationalStandard. Geneva, Switzerland: Interna-tional Telecommunication Union, 2014

212 quality of experience of multiparty conferencing and telemeeting systems
In addition, the table shows the number of collected observations percondition; a number determined by the applied experimental designcorrected by the number of actually observed and valid data points(see later paragraphs for more details).
Motivating the selection of the conditions given in Table 8.2, thecommon goal for all three experiments was to aim for an optimalbalance between number of representative technical characteristics,number of observations per condition, the test effort for participantsand the available resources. The motivations for individual choicesdiffered between the three experiments ACT1 to ACT3.
In Experiment ACT1, the decision was to test a representative butsmall set of technical conditions for two reasons. First, the originalfocus of that study 11 was actually more on the perceptual validation 11 Janto Skowronek, Julian Herling-
haus, and Alexander Raake. “QualityAssessment of Asymmetric MultipartyTelephone Conferences: A SystematicMethod from Technical Degradationsto Perceived Impairments”. In: Pro-ceedings of the 14th Annual Conference ofthe International Speech CommunicationAssociation (Interspeech 2013). Interna-tional Speech Communication Associa-tion. Lyon, France, Aug. 2013, pp. 2604–2608
of the technical path analysis described in Section 6.3 than on col-lecting data for testing the two hypotheses considered here. Second,the boundary constraints in terms of time effort for test participantsand available resources was a strong limiting factor, especially sincethe approach was to let every participant experience every test con-dition according to ITU-T Recommendation P.1301 Annex F 12. The
12 ITU-T. Recommendation P.1301 - Sub-jective quality evaluation of audio and au-diovisual telemeetings. International Stan-dard. Geneva, Switzerland: Interna-tional Telecommunication Union, 2012
optimized experimental design method described in Section 6.4 wasnot yet developed at that time.
In Experiment ACT2, the choice of technical conditions was deter-mined by the specific focus of that study on the impact of loudnessdifferences 13.
13 Maxim Spur. “Influences of Loud-ness Differences in Multiparty Confer-encing Quality”. Bachelor Thesis. As-sessment of IP-based Applications, Tech-nische Universität Berlin, Germany, 2012
In Experiment ACT3, the goal was to test as many technical condi-tions as possible with the available resources, noting that the authorhad then worked out the optimized experimental design described inSection 6.4. In addition, the technical characteristics should be rep-resentative according to three factors. First, different types of degra-dations in terms of the end-to-end transmission should be covered,i.e. impairments coming from the acoustic environment (i.e. back-ground noise), from the end device (i.e. signal filtering and echo) andfrom the network connection (i.e. codecs and packet loss). Second,two instances of each impairment type should be used in order toat least roughly cover the behavior of each impairment type in thequality space. Third, the final choice should be on the one handrelevant for real-life scenarios, i.e. avoiding extremely strong impair-ments, while on the other hand they should be strong enough totrigger different quality ratings, i.e. allowing for impairments that areslightly stronger than in typical real-life scenarios.
Furthermore, the final choice of conditions, especially in Experi-ments ACT1 and ACT3, was also dependent on the technical feasi-bility, i.e. if the test systems actually allowed to realize the differentdesired conditions. This required some experimentation upfront,given the complexity of the test systems (hardware, software andnetwork), fundamental limits (e.g. computational power, minimumsystem delay, network bandwidth), and any limitations of the con-trol possibilities (e.g. balancing between the possibility of full-controlvs. ensuring a real-time capable communication mode, default behav-

perception of telemeeting quality with focus on telecommunication aspects 213
Experiment ACT1: Audio-Only Conversation Test, Handsets (monotic), Narrowband codecCondition Impairment combination Impairment description Technical parameters #ObsRe f 1 0 0 0 0: no impairments Reference: G.711, Ta = 150ms,
OLR = 10dB97
L3 0 0 L3 L3: loudness attenuation OLR = (10 + 10)dB 52EN3 EN3 0 0 EN3: noise in own environment Pr = 65dB SPL 29TN3 0 0 TN3 TN3: transmitted noise Ps = 65dB SPL 59Dsym 0 D D D: delay Ta = (150 + 75)ms 25E1 TE1 D LE1 TE1: talker echo, LE1: listener echo,
D: delayTELR = 10dB, WEPL′ = 10dB,Ta = (150 + 75)ms
48
P1 0 0 P1 P1: packet loss Ppl = 10% µ10 = 1 (=sparse PL) 54
Experiment ACT2: Audio-Only Conversation Test, Handsets (monotic), Narrowband codecCondition Impairment combination Impairment description Technical parameters #ObsRe f 2 0 0 0 0: no impairments Reference: G.711, Ta = 150ms,
OLR = 10dB, AGC91
L2 0 0 L2 L2: loudness attenuation OLR = (10 + 7)dB 44L4 0 0 L4 L4: loudness attenuation OLR = (10 + 14)dB 41L1 0 0 L1 L1: loudness gain OLR = (10− 7)dB 48
Experiment ACT3: Audio-Only Conversation Test, Headsets (diotic), Superwideband codecCondition Impairment combination Impairment description Technical parameters #ObsRe f 3 0 0 0 0: no impairments Reference: SILKSWB, Ta = 350ms,
OLR = 10dB58
B1 0 0 B1 B1: wideband codec SILKWB 48B2 0 0 B2 B2: narrowband codec G711 46B2sym 0 B2 B2 B2: narrowband codec G711 62FM1 0 0 FM1 FM1: bandpass filtered speech microphone bandpass 200 Hz - 7000
Hz45
FL3sym 0 FL3 FL3 FL3: bandpass filtered speech loudspeaker bandpass 400 Hz - 5000Hz
47
FM2 0 0 FM2 FM2: bandpass filtered speech microphone bandpass 400 Hz - 7000Hz
47
FL4sym 0 FL4 FL4 FL4: bandpass filtered speech loudspeaker bandpass 800 Hz - 5000Hz
46
TN1 0 0 TN1 TN1: transmitted noise Ps = 60dB(A) 21TN2 0 0 TN2 TN2: transmitted noise Ps = 65dB(A) 22E2 TE2 0 LE2 TE2: talker echo, LE2: listener echo TELR = 20dB, WEPL′ = 20dB 48E3 TE3 0 LE3 TE3: talker echo, LE3: listener echo TELR = 30dB, WEPL′ = 30dB 47P1 0 0 P1 P1: packet loss Ppl = 10% µ10 = 1 (=sparse PL) 62P2 0 0 P2 P2: packet loss Ppl = 5% µ10 = 2 (=bursty PL) 61P3 0 0 P3 P3: packet loss Ppl = 15% µ10 = 1 (=sparse PL) 57P4 0 0 P4 P4: packet loss Ppl = 10% µ10 = 2 (=bursty PL) 57
Table 8.2: Test conditions for the threeaudio-only conversation tests ACT1 toACT3. The conditions are defined by theshown combinations of the impairmentsthat each interlocutor perceives from thethree individual connections.
ior of the test client, fixed settings of VoIP telephones).
8.3.3 Method
Design The design was driven by a number of constraints in terms oftemporal order of stimuli, scenarios, number of technical conditionswithin a test session, number of observations per condition, overallexperimental time per subject and overall test time.
Concerning the scenarios, each scenario should be played only

214 quality of experience of multiparty conferencing and telemeeting systems
once per test group. Eleven scenarios were available for ACT1 &ACT2, 14 scenarios were available for ACT3.
Concerning the number of technical conditions within a test session,the design should provide an optimum possible overlap of conditionsbetween subject groups. This is motivated by the following reasoning.It is known in quality research that the experimental context in generalhas an effect on the test participants’ ratings. This is accountedfor by various methodological measures such as following standardprotocols, having training/familiarization phases, anchor conditionsand the like. However, one such context aspect relevant here isthe variation of conditions presented during the experiment. If thisvariation is too low, i.e. not many different conditions are tested, thentest participants start to become oversensitive to those few conditions.This could skew results in case of between-subject designs in whichsubject groups are exposed to different subsets of conditions, an effectthat is also referred to as Range Equalization BiasSlawomir Zielinski,Francis Rumsey, and Soren Bech. “On Some Biases Encountered inModern Audio Quality Listening Tests – A Review”. In: Journal of theAudio Engineering Society 56.6 (2008), pp. 427–451.
Concerning the number of observations per condition, a typicalnumber used in quality assessment tests is to have 24 or 32 obser-vations per condition; in their handbook on telephonometry 14 the 14 ITU-T. Handbook on Telephonome-
try. Geneva, Switzerland: InternationalTelecommunication Union, 1992
ITU-T mentions a number of 30 test participants as rough guidance.However, bearing in mind that one goal of the experiments was toobtain data for modeling purposes, as many data points as feasiblewould be beneficial. For this purpose, the experimental designs ofexperiments ACT1 to ACT3 should aim for a number of observationsin the order of 48 to 64, which is twice the typical range of 24 to 32.
Concerning the overall experimental time per test participant, thistime should be limited in order to avoid negative effects due tofatigue, boredom or learning. For that purpose the maximum testtime per participant was limited to 70 to 90 minutes in all threeexperiments. This allowed between nine and 13 test calls given theused conversation scenarios, which also nicely fitted the additionalrequirement that each scenario is only used once per participantgroup.
Concerning the overall test time, the time and budget constraintsallowed to aim for 20 groups in ACT1 (maximum 60 observations percondition due to three test participants), nine groups in ACT2 (max-imum 27 observations per condition due to three test participants),and 32 groups in ACT3 (maximum 64 observations per condition dueto two test participants and one confederate).
With these different constraints in mind, ACT1 used a tenth-ordergreco-latin design to balance order of conditions, test condition andscenario, repeated twice to cover 20 groups, from which 17 groupswere actually conducted. ACT2 used a ninth-order greco-latin design,repeated once, to cover nine groups, meaning 27 test participants.ACT3 used a more complex design in which a number of condi-tions were judged by all test participants (within-subject design),

perception of telemeeting quality with focus on telecommunication aspects 215
and other conditions were judged only by subsets of the test par-ticipants (between-subject design). The choice of conditions for thewithin-subject or between-subject design part was based on to theirpractical relevance from the perspective of the project under whichACT3 was conducted. The conditions for the within-subject partwere the reference condition as well as the different codec and packetloss conditions; the conditions for the between-subject part were themicrophone filter, loudspeaker filter, background noise and echoconditions.
Test participants The characteristics of the invited test participantsare given in Table 8.3.
Participant characteristics ACT1 ACT2 ACT3
Number of participants (without confederate and any removedsubjects)
47 24 63
Age: mean / minimum / maximum 30.5 / 16 / 69 26.6 / 18 / 31 29.7 / 20 / 57
Gender: female / male, in percent (absolute numbers) 72% / 28% (34 / 13) 38% / 62% (9 / 15) 55% / 45% (35 / 28)Number female / male / mixed gender groups (not consideringconfederates)
8 / 2 / 7 1 / 2 / 6 8 / 5 / 19
Multiparty experience in professional life (working, studying) 23% (11 of 47) 67% (16 of 24) 56% (35 of 63)Multiparty experience in private life 19% (9 of 47) 29% (7 of 24) 30% (19 of 63)Groups with subjects knowing each other (all or some) 8 7 7
Groups with subjects knowing the confederates 0 0 0
Number of subjects with experience with similar listening ortelephony experiments
n.a. 50% (12 of 24) 30% (19 of 63)
Hearing impairments (self-reported) none none none
Table 8.3: Test participant statistics forthe three audio-only conversation testsACT1 to ACT3.
Procedure In experiment ACT1 and ACT3, participants came for asingle 90 minutes session, in experiment ACT2 for a single 70 minutessession. After a general introduction, the test participants conductedfirst a “Get to know” call, in which the test supervisor participated aswell, and everybody introduced themselves to the others accordingto a number of questions asked by the test supervisor. In ACT3 ex-ample degradations were presented during that first call to limit thepotential noise in the collected data by priming the expectations ofthe test participants with these example degradations. After the “Getto know” call, the test participants had a training call under referencecondition without the test supervisor, in which the participants couldget used to playing through the conversation scenarios and afterwhich they answered a trial questionnaire. After that training call, thetest participants conducted the test calls according to the conversa-tion scenarios under different technical conditions and answered aquestionnaire after each call. According to the different experimentaldesigns, experiment ACT1 comprised ten test calls, ACT2 nine testcalls, and ACT3 thirteen test calls. After roughly half the test calls,test participants had a short break of two to five minutes. At the endof the session, the test supervisor conducted a short outtake interviewwith the test participants.

216 quality of experience of multiparty conferencing and telemeeting systems
8.3.4 Data Acquisition
Questionnaires and Measures According to the iterative research method(Section 1.4), the questionnaire design of ACT3 was updated com-pared to ACT1 and ACT2. At the time of conducting the first twoexperiments 15 a formal categorization of the Measured Variables as 15 Janto Skowronek, Julian Herling-
haus, and Alexander Raake. “QualityAssessment of Asymmetric MultipartyTelephone Conferences: A SystematicMethod from Technical Degradationsto Perceived Impairments”. In: Pro-ceedings of the 14th Annual Conference ofthe International Speech CommunicationAssociation (Interspeech 2013). Interna-tional Speech Communication Associa-tion. Lyon, France, Aug. 2013, pp. 2604–2608
Maxim Spur. “Influences of Loud-ness Differences in Multiparty Confer-encing Quality”. Bachelor Thesis. As-sessment of IP-based Applications, Tech-nische Universität Berlin, Germany, 2012
described in Sections 7.2 and 8.2 in terms of Speech Communica-tion Quality, Quality of Experience, and Telecommunication and Group-Communication Components was not yet developed. At the time ofconducting Experiment ACT3, however, these distinctions were fullyconsidered, which was then used for optimizing the wording of thequestions.
In ACT1 & ACT2 the questionnaire was inspired by the first ex-periment on Communication Complexity CC1 (Section 7.3), as wellas standard assessment questionnaires according to the ITU 16. The
16 ITU-T. Recommendation P.800 - Meth-ods for objective and subjective assessment ofquality. International Standard. Geneva,Switzerland: International Telecommu-nication Union, 1996
ITU-T. Recommendation P.805 - Sub-jective evaluation of conversational quality.International Standard. Geneva, Switzer-land: International TelecommunicationUnion, 2007
questionnaire consisted of four main parts, covering different aspectsof quality: telemeeting quality judgment (question Q1.1), judgmentof cognitive load (question Q2.1), individual connection quality judg-ments (questions Q3.1 to Q3.3), and judgments of Speech Commu-nication Quality and service satisfaction (questions Q4.1 and Q4.2).In ACT3, however, the questionnaire was optimized to focus morespecifically on the Speech Communication Quality with focus on theTelecommunication Component. For that purpose, all redundant ques-tions and all questions concerning the communicative aspects wereremoved, and the quality questions were rephrased such that test par-ticipants interpret them more as questions concerning the technicalquality they perceive. The resulting questionnaire consisted of threemain parts: overall telemeeting quality judgment (question Q1.1),individual connection quality judgments (questions Q2.1 to Q2.3),and a free text field for any additional comments (question Q3.1).
Table 8.4 provides English translations of the questions as well asthe original German texts.
Table 8.5 gives an overview of the link between the Measured Vari-ables, the actual measures used, and descriptions on how they wereextracted from the questionnaires, while the following two paragraphsprovide detailed explanations of these links.
Individual Connection Quality In both questionnaires the wording ofthe questions about the quality of the individual connections had afocus on the technical aspects of quality due to the keyword “connec-tion”. For that reason, it can be assumed that these questions measureSpeech Communication Quality with focus on the TelecommunicationComponent.
Single-Perspective Telemeeting Quality As mentioned above, the ques-tionnaire of ACT1 & ACT2 covered different aspects of quality, whereasthe framework of the Measured Variables described in Sections 7.2and 8.2 was not fully developed. Now, with this framework available,the questions can be assigned in retrospect to the different Measured

perception of telemeeting quality with focus on telecommunication aspects 217
Experiment ACT1 & ACT2
Part Question ID Wording / Description, EN: English translation, DE: German original
1 Q1.1 EN: “What was your personal intuitive overall impression of this telephone conference? – bad ... excellent”
DE: “Wie war ihr persönlicher intuitiver Gesamteindruck von dieser Telefonkonferenz? – schlecht ... ausgezeichnet”
2 Q2.1 EN: “It required very much ... very little concentration to follow the conference.”
DE: “Es erforderte sehr viel ... sehr wenig Konzentration um der Konferenz zu folgen.”
3 Q3.1 EN: “The quality of the own connection was bad ... excellent.”
DE: “Die Qualität der eigenen Verbindung war schlecht ... ausgezeichnet.”
Q3.2 EN: “The quality of the connection of Mr./Ms. X was bad ... excellent.”
DE: “Die Qualität der Verbindung von Herrn/Frau X war schlecht ... ausgezeichnet.”
Q3.3 EN: “The quality of the connection of Mr./Ms. Y was bad ... excellent.”
DE: “Die Qualität der Verbindung von Herrn/Frau Y war schlecht ... ausgezeichnet”
4 Q4.1 EN: “It required very much ... very little effort to communicate with the other participants.”
DE: “Es erforderte sehr viel ... sehr wenig Aufwand um mit den Gesprächspartnern kommunizieren zu können.”
Q4.2 EN: “I would find it very unacceptable ... very acceptable to attend a telephone conference with such a system.”
DE: “Mit einem solchen System einer Telefonkonferenz beizuwohnen würde ich sehr inakzeptabel ... sehr akzeptabel finden.”
Experiment ACT3
Part Question ID Wording / Description, EN: English translation, DE: German original
1 Q1.1 EN: “What was your personal intuitive overall impression of the system’s quality? – extremely bad ... ideal”
DE: “Wie war Ihr persönlicher intuitiver Gesamteindruck von der Qualität des Systems? – schlecht ... ausgezeichnet”
2 Q2.1 EN: “Your own connection into the conference was bad ... excellent.”
DE: “Ihre eigene Verbindung in die Konferenzschaltung war schlecht ... ausgezeichnet.”
Q2.2 EN: “The connection of Mr./Ms. X was bad ... excellent.”
DE: “Die Verbindung von Herrn/Frau X in die Konferenzschaltung war schlecht ... ausgezeichnet.”
Q2.3 EN: “The connection of Mr./Ms. Y was bad ... excellent.”
DE: “Die Verbindung von Herrn/Frau Y in die Konferenzschaltung war schlecht ... ausgezeichnet.”
3 Q3.1 EN: “Please describe, if and which degradations or special characteristics you perceived. If you have other remarks,pleasewrite them down here as well. – Free text”
DE: “Bitte beschreiben Sie kurz, ob und welche Störungen oder Besonderheiten Ihnen aufgefallen sind. Wenn Sie sonstigeAnmerkungen haben, schreiben Sie diese bitte auch hier auf.”
Table 8.4: Summary of the question-naires used in the three audio-only con-versation tests ACT1, ACT2 & ACT3.
Variables as follows: the question Q1.1 on Quality used the phrase“overall impression of this telephone conference” which refers to thequality experience in a wider sense and is therefore assigned to Qual-ity of Experience; the question Q2.1 on Concentration Effort is accordingto Chapter 7 a direct self-reported measure of Cognitive Load; thequestion Q4.1 on Conversation Effort addresses Speech CommunicationQuality with a focus on the Group-Communication Component 17; and
17 Similar to the discussion in Section 7.4,Conversation Effort is not assigned to Cog-nitive Load but to Speech CommunicationQuality since the origin of this questionis a standardized question of conversa-tional quality proposed by the ITU
ITU-T. Recommendation P.805 - Subjec-tive evaluation of conversational quality. In-ternational Standard. Geneva, Switzer-land: International TelecommunicationUnion, 2007
the question Q4.2 on Acceptance addresses service satisfaction, whichcovers quality aspects beyond signal transmission and is thereforeassigned to Quality of Experience.
As mentioned above, the questionnaire for ACT3 asked only forquality, whereas the wording was modified to “overall impression ofthe system’s quality” in order to change the focus to Speech Communi-cation Quality with an emphasis on the Telecommunication Component.The motivation was to increase the comparability of the questionson Single-Perspective Telemeeting Quality (Q1.1) and Individual Connec-tion Quality (Q3.1 to Q3.3) by ensuring that both types focus on thetechnical aspects of quality.
Rating scales Experiments ACT1 and ACT2 used the 5-point Ab-solute Category Scale (ACR) for all questions. The motivation was

218 quality of experience of multiparty conferencing and telemeeting systems
Experiments ACT1 & ACT2
Measured Variable Measure Extraction from questionnaire
Individual Connection Quality
Speech Communication Quality with focus on TelecommunicationComponent
Connection Quality Directly measured with Q3.1, Q3.2, & Q3.3
Single-Perspective Telemeeting Quality
Cognitive Load Concentration Effort Directly measured with Q2.1
Speech Communication Quality with focus on Group-Communication Component
Conversation Effort Directly measured with Q4.1
Quality of Experience Quality Directly measured with Q1.1
Acceptance Directly measured with Q4.2
Experiment ACT3
Measured Variable Measure Extraction from questionnaire
Individual Connection Quality
Speech Communication Quality with focus on TelecommunicationComponent
Connection Quality Directly measured with Q2.1, Q2.2, & Q2.3
Single-Perspective Telemeeting Quality
Speech Communication Quality with focus on TelecommunicationComponent
System’s Quality Directly measured with Q1.1
Table 8.5: Relation between the Mea-sured Variables (on their conceptuallevel), the actual measures used for ob-taining respective quantitative data, andextraction of the measures from thequestionnaire answers.
to collect the data, especially the quality judgments, according toexisting standards 18. This would facilitate future modeling attempts
18 ITU-T. Recommendation P.800 - Meth-ods for objective and subjective assessment ofquality. International Standard. Geneva,Switzerland: International Telecommu-nication Union, 1996
using existing standardized models, which in turn are also based onthe ACR scale. In ACT3, however, test participants rated the questionon Single-Perspective Telemeeting Quality Qi with the 5-point ACR scale,while they rated the questions for the individual connections Qij usingthe extended continuous (EC) rating scale 19, which was also used for
19 Markus Bodden and Ute Jekosch.Entwicklung und Durchführung von Testsmit Versuchspersonen zur Verifizierung vonModellen zur Berechnung der Sprachüber-tragungsqualität. Project Report (unpub-lished). Institute of CommunicationAcoustics, Ruhr-University Bochum,Germany, 1996
ITU-T. Recommendation P.851 - Subjec-tive quality evaluation of telephone servicesbased on spoken dialogue systems. Interna-tional Standard. Geneva, Switzerland:International Telecommunication Union,2003
the experiments in Chapter 7. The motivation was to use this changeof the visual representation for reducing the chance that test subjectsconsider the questions concerning the Single-Perspective TelemeetingQuality and the Individual Connection Quality as essentially the same.The disadvantage of this approach, however, is that a scale transfor-mation is necessary in order to properly compare the ACR ratingsof the Single-Perspective Telemeeting Quality Qi and the EC ratings ofthe Individual Connection Quality Qij. Such a scale transformation hasbeen developed by Wältermann et al. 20 and made publicly available
20 Marcel Wältermann, AlexanderRaake, and Sebastian Möller. Compar-ison between the discrete ACR scale andan extended continuous scale for the qual-ity assessment of transmitted speech. ITU-TContribution COM 12 - C 39 - E. Geneva,Switzerland: International Telecommu-nication Union, Feb. 2009
by Köster et al. 21:
21 Friedemann Köster et al. “Compar-ison between the Discrete ACR Scaleand an Extended Continuous Scalefor the Quality Assessment of Trans-mitted Speech”. In: Fortschritte derAkustik (DAGA2015) - 41. Jahrestagungfür Akustik. Nürnberg, Germany, Mar.2015
Q̂ACR = −0.0262 ·Q3EC + 0.2368 ·Q2
EC + 0.1907 ·QEC + 1 (8.1)
Data Processing All measures were represented in such a way thathigh values reflect something positive, that is high quality or lowcognitive load. This representation is straight-forward for the qualityand acceptance measures, but it is less intuitive for the effort-relatedmeasures, as the ratings are now inverted: a high effort, meaning ahigh cognitive load, is coded with a low value.
Data Validation The data was inspected for any necessary exclusiondue to either technical reasons or the participants’ rating behavior.Concerning technical reasons, the technical complexity of the testsystems was rather high and involved a number of manual operations

perception of telemeeting quality with focus on telecommunication aspects 219
of the test supervisor between calls. This means, there was a residualchance for operation errors (< 10% of the cases), despite the effortsmade to automate as much as possible by means of scripts and presets.If the test supervisor observed such errors at the very beginning ofa call, i.e. before test participants started to speak, then the callwas interrupted and re-initiated. In most cases, however, the errorcould often be detected at earliest when the test participants werealready engaged in a call. In such situations interrupting and re-initiating a call is experienced by the test participants as a strongdisturbance, which may bias any judgments that the participantswould make about the re-initiated call. For that reason, the supervisorlet participants continue the call, even though this in turn required toexclude those calls from the data afterwards.
Concerning the rating behavior, inspecting the data for ACT1 didnot reveal any specific outliers in terms of individual ratings or testparticipants. Hence none of the test participant ratings were excludedfrom the further analysis. Inspecting the data for ACT2, Spur 22 found 22 Maxim Spur. “Influences of Loud-
ness Differences in Multiparty Confer-encing Quality”. Bachelor Thesis. As-sessment of IP-based Applications, Tech-nische Universität Berlin, Germany, 2012
that one test participant gave all questions in all test calls the samerating, suggesting a strong lack of involvement of that test participantor a strong misunderstanding of the rating task. For that reason,the data of that one test participant was removed from the furtheranalysis. Inspecting the data for ACT3 did not reveal any specificrating outliers. However, one test participant was excluded since theparticipants’ language skill was not reaching mother-tongue level,and the ratings were nearly constant for all calls. And from anotherparticipant, all calls after the break were excluded, since the doorof that participant’s test room was, as found out after the calls, notproperly closed.
Furthermore, sometimes (< 5% of the cases) test participants forgotto answer one individual question from the questionnaires. Such callsneed to be completely excluded for the modeling attempts describedin Chapter 9. However, to be consistent, those calls were also excludedfrom the further analysis in the present chapter.
Data Analysis and Presentation The first data analysis step was toorganize the collected data according to the algorithm described inSection 6.5. To remember, the purpose of that algorithm is to accountfor the fact that telemeeting participants can have different perceptionsof the same call. In other words, the algorithm sorts the collected datasuch that all calls from all test participants are grouped according tothe conditions defined in Table 8.2.
The second and most important analysis step was to determine theexpected relations between the Single-Perspective Telemeeting Qualityscore Qi and the Individual Connection Quality scores Qii, Qij, & Qik.This is necessary to be able to test the two hypotheses H1 (mutualinfluence of individual connections exists) and H2 (aggregation isa simple average). The relations between Qi, Qii, Qij, and Qik canbe determined by considering the different possible distributions ofimpairments across the individual connections shown in Table 8.1,

220 quality of experience of multiparty conferencing and telemeeting systems
and by including the hypothesis H2 into the considerations. Figure 8.1explains this process by means of representative hypothetic exam-ples and provides a corresponding visualization of those expectedrelations.
The third analysis step was to apply one-sample t-tests per con-dition in order to verify whether the observed scores of Qi, Qii, Qij,and Qik are significantly different from their expected values. Asvisualization, the author generated errorbar plots showing the meanvalues and 95% confidence intervals of the observed data, and in-serted into the plots the expected values according to the methodshown in Figure 8.1. In this visualization, significant differences corre-spond to cases in which the expected values lie outside the confidenceintervals.
Finally, the fourth analysis step was to determine for which condi-tions the two hypotheses H1 and H2 are confirmed or rejected.

perception of telemeeting quality with focus on telecommunication aspects 221
1. Hypothetic examples of the relations between Single-Perspective Telemeeting Quality score Qi and the IndividualConnection Quality scores Qii , Qij, & Qik . The examples cover eight possible cases (Ref, X, Xsym, Y, dashed and dottedlines) as outlined below.
The y-axis reflects a typical 5-point quality scale. The x-axis indicates the different ratings, i.e. Qi , Qii , Qij, and Qik . Thered crosses at the x-axis indicate which individual connections are impaired.
2. The dashed and dotted lines refer to different cases concerning the hypotheses H1 and H2.
Dashed lines:
H1 holds (mutual influence exist) & H2 holds (aggregation is simple average: Qi = 1/3 · (Qii + Qij + Qik))
Dotted lines:
H1 does not hold (no mutual influence exist) & H2 holds (aggregation is simple average: Qi = 1/3 · (Qii + Qij + Qik))
3. The cases Ref, X, Xsym, and Y are defined by the different possible distributions of impairments across the individualconnections ii, ij, & ik.
Ref: Reference condition [Ii,i Ii,j Ii,k ] := [0 0 0]
All individual connections and the overall telemeeting should be equal and optimal, independently from the twohypotheses H1 and H2. ⇒ Qi , Qii , Qij, and Qik are equal and high (here assumed to have a value of 4.0).
X: Asymmetric conditions without an impairment on own connection [Ii,i Ii,j Ii,k ] := [0 0 x1]
Impairment x1 on connection ik ⇒ Qik lower than the reference value (here assumed to have a value of 1.5)
If H1 does not hold (dotted line), then:
- No impairment on own connection ii ⇒ Qii equal to the reference value
- No impairment on connection ij ⇒ Qij equal to the reference value
If H1 holds (dashed line), then: Qii & Qij are different from reference value (here assumed to have a value of 3.0)
Xsym: Symmetric conditions without an impairment on own connection [Ii,i Ii,j Ii,k ] = [0 x1 x1]
Same impairments x1 on connections ij & ik ⇒ Qij & Qik lower than the reference value
If H1 does not hold (dotted line), then: No impairment on own connection ii ⇒ Qii equal to the reference value
If H1 holds (dashed line), then: Qii is different from the reference value (here assumed to have a value of 2
Y: Asymmetric conditions with an impairment on own connection [Ii,i Ii,j Ii,k ] = [x2 0 x1]
Impairment x2 on connection ii ⇒ Qii lower than the reference value
Impairment x1 on connection ik ⇒ Qik lower than the reference value
If H1 does not hold (dotted line), then: no impairment on connection ij ⇒ Qij equal to the reference value
If H1 holds (dashed line), then: Qij is different from reference value
4. In all shown cases, it is assumed that H2 holds. Thus, the shown values for Qi are the computed mean values for thehypothetical values of Qii , Qij, and Qik . If H2 does not hold, then Qi has different values than the ones shown.
Figure 8.1: Visualization of expected re-lations between the Single-PerspectiveTelemeeting Quality score Qi and the In-dividual Connection Quality scores Qii ,Qij, and Qik .

222 quality of experience of multiparty conferencing and telemeeting systems
8.3.5 Results of Experiment ACT1
Figure 8.2 shows the visualization of the results and provides asummary of the analysis; the analysis in full detail is given in Ap-pendix E.1.
1. Visualization of Results and Expectations
The errorbars show the mean values and 95% confidence intervals for the obtained ratings of Qi , Qii , Qij, and Qik. The redcrosses at the x-axis indicate which individual connections are impaired. The dashed lines reflect the expectations whenHypothesis 1 (mutual influence) holds, the dotted lines when Hypothesis 1 does not hold. Both dashed and dotted lines assumethat Hypothesis 2 (mean function) holds. The reference condition Ref1 is repeated in each plot for better visual comparison.
Brief explanation of shown condition names (for full details see Table 8.2):
Ref1 = reference condition. L3 = loudness impairment. En3 = noise in own environment. TN3 = transmitted noise. Dsym = delay(symmetric). E1 = echo. P1 = packet loss.
2. Analysis Summary
Result for reference condition:
Qi , Qii , Qij, Qik are all essentially equal and optimal. ⇒ Ref1 serves as reference condition for this test.
Results concerning Hypothesis H1 (mutual influence), see dotted lines.
Condition Result Rationale
EN3,Dsym × Qij = Qik are not significantly different from the expected value.
TN3 × Qii & Qij are not significantly different from the expected value.
L3, P1 X Qii & Qij are significantly different from the expected values.
E1 X Qij is significantly different from the expected value.
Results concerning Hypothesis H2 (mean function), see dashed lines.
Condition Result Rationale
All X Qi is not significantly different from the expected value.
Figure 8.2: Results for ExperimentACT1.

perception of telemeeting quality with focus on telecommunication aspects 223
8.3.6 Results of Experiment ACT2
Figure 8.3 shows the visualization of the results and provides asummary of the analysis; the analysis in full detail is given in Ap-pendix E.2.
1. Visualization of Results and Expectations
The errorbars show the mean values and 95% confidence intervals for the obtained ratings of Qi , Qii , Qij, and Qik. The redcrosses at the x-axis indicate which individual connections are impaired. The dashed lines reflect the expectations whenHypothesis 1 (mutual influence) holds, the dotted lines when Hypothesis 1 does not hold. Both dashed and dotted lines assumethat Hypothesis 2 (mean function) holds.
Brief explanation of shown condition names (for full details see Table 8.2):
Ref2 = reference condition. L1, L2, L4 = loudness impairments.
2. Analysis Summary
Result for reference condition:
Qi , Qii , Qij, Qik are all essentially equal and optimal. ⇒ Ref2 serves as reference condition for this test.
Results concerning Hypothesis H1 (mutual influence), see dotted lines.
Condition Result Rationale
L1 × Qii & Qij are not significantly different from the expected values.
L2 X Qij is significantly different from the expected value.
L4 X Qii is significantly different from the expected value.
Results concerning Hypothesis H2 (mean function), see dashed lines.
Condition Result Rationale
All X Qi is not significantly different from the expected value.
Figure 8.3: Results for ExperimentACT2.

224 quality of experience of multiparty conferencing and telemeeting systems
8.3.7 Results of Experiment ACT3
Figures 8.4 and 8.5 show the visualization of the results and providesummaries of the analysis; the analysis in full detail is given inAppendix E.3.
1. Visualization of Results and Expectations
The errorbars show the mean values and 95% confidence intervals for the obtained ratings of Qi , Qii , Qij, and Qik. The redcrosses at the x-axis indicate which individual connections are impaired. The dashed lines reflect the expectations whenHypothesis 1 (mutual influence) holds, the dotted lines when Hypothesis 1 does not hold. Both dashed and dotted lines assumethat Hypothesis 2 (mean function) holds. The reference condition Ref3 is repeated in each plot for better visual comparison.
Brief explanation of shown condition names (for full details see Table 8.2):
Ref3 = reference condition. B1, B2, B2sym = audio bandwidth limitation of codecs (“sym” = symmetric). FM1, FM2 = bandpassfiltered microphone signal. FL3sym, FL4sym bandpass filtered loudspeaker signal (“sym” = symmetric).
2. Analysis Summary
Result for reference condition:
Qi , Qii , Qij, Qik are all essentially equal and optimal. ⇒ Ref3 serves as reference condition for this test.
Results concerning Hypothesis H1 (mutual influence), see dotted lines.
Condition Result Rationale
B1, FM1 × Qii & Qij are not significantly different from the expected values.
B2,FL3sym,FL4sym X Qii is significantly different from the expected value.
B2sym, FM2 X Qii & Qij are significantly different from the expected values.
Results concerning Hypothesis H2 (mean function), see dashed lines.
Condition Result Rationale
All X Qi is not significantly different from the expected value.
Figure 8.4: Results for ExperimentACT3, Part 1.

perception of telemeeting quality with focus on telecommunication aspects 225
1. Visualization of Results and Expectations
The errorbars show the mean values and 95% confidence intervals for the obtained ratings of Qi , Qii , Qij, and Qik. The redcrosses at the x-axis indicate which individual connections are impaired. The dashed lines reflect the expectations whenHypothesis 1 (mutual influence) holds, the dotted lines when Hypothesis 1 does not hold. Both dashed and dotted lines assumethat Hypothesis 2 (mean function) holds. The reference condition Ref3 is repeated in each plot for better visual comparison.
Brief explanation of shown condition names (for full details see Table 8.2):
Ref3 = reference condition. P1, P2, P3, P4 = packet loss. TN1, TN2 = transmitted noise. E2, E3 = echo.
2. Analysis Summary
Result for reference condition:
Qi , Qii , Qij, Qik are all essentially equal and optimal. ⇒ Ref3 serves as reference condition for this test.
Results concerning Hypothesis H1 (mutual influence), see dotted lines.
Condition Result Rationale
P1, P2 × Qii & Qij are not significantly different from the expected values.
P3, P4, TN1, TN2 X Qii & Qij are significantly different from the expected values.
E2, E3 X Qij is significantly different from the expected value.
Results concerning Hypothesis H2 (mean function), see dashed lines.
Condition Result Rationale
P1, P2 X Qi is not significantly different from the expected value.
P3, P4, TN1, TN2, E2, E3 × Qi is significantly different from the expected value.
Figure 8.5: Results for ExperimentACT3, Part 2.

226 quality of experience of multiparty conferencing and telemeeting systems
8.3.8 Discussion
Review of Results Table 8.6 summarizes the main findings for thethree audio-only conversation tests ACT1, ACT2, and ACT3.
Experiment Conditions Hypothesis H1 Hypothesis H2
Asymmetric Symmetric
ACT1 TN3 EN3, Dsym × X
L3, P1, E1 – X X
ACT2 L1 – × X
L2, L4 – X X
ACT3 B1, FM1, P1, P2 – × X
B2, FM2 FL3sym, FL4sym, B2sym X X
P3, P4, TN1, TN2, E2, E3 – X ×
Table 8.6: Overview of the results forthe audio-only conversation tests ACT1,ACT2, & ACT3, concerning the two hy-potheses H1 & H2. Confirmed hypothe-ses are denoted with a X, rejected hy-potheses with a ×.
Hypothesis H1 is confirmed in 16 out of 24 tested cases, andrejected in eight cases. This means that a clear evidence is found thata mutual influence of the individual connections exists, while suchinfluence depends on the actual technical condition. Searching for asystematic behavior that could explain when a condition shows thatinfluence or not, the Table 8.6 shows that the type of impairment maybe a reason, as all noise and echo conditions show a mutual influence.However, the type of impairment is most likely not the only reason,since different conditions of other types, e.g. packet loss P1 to P4
or loudness impairments L1 to L4, sometimes show that influenceand sometimes not. Apparently, also the strength of the impairmentscorrelates with the existence of a mutual influence of individualconnections. This can be seen in the visualizations in Figures 8.2to 8.5: those conditions with quality scores closer to the referencecondition do not show the mutual influence, those conditions withquality scores further away from the reference condition do show themutual influence. However, it is not clearly visible whether a strongerimpairment necessarily means a stronger mutual impact.
Hypothesis H2 is confirmed in 18 of 24 tested cases, and rejected insix cases. This means that the Single-Perspective Telemeeting Quality Qi
can be expressed in many cases as a simple average of the IndividualConnection Quality scores Qij of the individual connections. However,there are technical conditions in which this simple relation does nothold. As for the mutual influence, next to some specific impairmenttypes (noise and echo), the strength of an impairment appears tocorrelate with the need to express the relation between Qi and Qij
with a more sophisticated function.
Review of the Approach and Open Questions for Future Work There area number of open questions concerning the experimental methodthat this section will address now: the limitation in terms of commu-nicative aspects, the potential effects of changing the experimentalmethod, and rating on multiple scales.
Concerning the limitation of communicative aspects, the experi-ments considered one degree of communication complexity, as theexperiments considered only three-party communication using sce-

perception of telemeeting quality with focus on telecommunication aspects 227
narios with the same structure and with similar cognitive demand(except for possible minor differences between the scenarios of ACT1
and ACT2 and the scenarios of ACT3). Hence, future work couldrepeat these experiments with a different number of interlocutors,different conversation test scenarios or a different test paradigm (con-versation test vs. listening-only test). The latter two aspects will beaddressed in Sections 8.4 and 8.5.
Concerning the changes of the experimental method, the results ofexperiments ACT1 and ACT2 revealed only cases in which Hypothesis2 is confirmed, i.e. Qi can be expressed as a simple mean of Qij. Thistriggered a review and modification of the experimental method inexperiment ACT3, which eventually revealed a few cases (6 of 24
over all three experiments) in which Hypothesis H2 was rejected.The changes from ACT1 & ACT2 to ACT3 targeted a reduction ofany measurement noise (conversation scenarios, confederate as testparticipant, example impairments in training call) and an increase ofthe number of test conditions per experiment (design method), andthe chosen conditions as such. Since there were multiple changesbetween the two test methods, it is not possible to identify individualaspects of the method that may have caused the differences in theresults. This would require dedicated experiments in future work.Instead, one can conclude that applying the whole package of changeswas sufficient to detect those few conditions in which the Single-Perspective Telemeeting Quality Qi is more than a simple mean of theIndividual Connection Quality scores Qij.
Concerning the rating on multiple scales, the applied question-naires asked questions on both aggregation levels Qi and Qij on thesame questionnaire. Here, it might be that test participants do formsome average of Qij simply due to the presentation of both Qi andQij on the same questionnaire, despite the usage of different scaledesigns and questions. To investigate this aspect, future work couldapply a different experimental method in which participants rate pertest call or stimuli either Qi or Qij. This could be achieved by usinga between-subject design in which the two questions are split acrosstest participants, or a within-subject design using multiple sessions,one per question.
8.4 Quality Impact of an Audio-Only Telemeeting System -Listening-Only Tests
This section reports on two experiments investigating the qualityimpact of Technical System Capability by means of listening-only tests,henceforth referred to as Experiments LOT1 and LOT2.
8.4.1 Goals
Motivation In Skowronek et al. 23 we discussed two motivations for 23 Janto Skowronek, Anne Weigel, andAlexander Raake. “Quality of Multi-party Telephone Conferences from thePerspective of a Passive Listener”. In:Fortschritte der Akustik - 41. Jahresta-gung für Akustik (DAGA). Nürnberg, Ger-many, Mar. 2015
conducting listening-only tests in addition to the audio-only conver-sation tests described in the previous section. First, in real-life, it

228 quality of experience of multiparty conferencing and telemeeting systems
is often the case that only a few persons are actively contributingwhile a number of participants are just listening to the conversation.Conversation tests are less suited for such a use case if they are notspecifically designed to put participants into such a passive listenerrole. Second, it is known in the field that test subjects are less sensitiveto quality impairments in conversation tests than in listening-onlytests 24, which was also shown for multiparty scenarios in Section 7.4. 24 Sebastian Möller. Assessment and Pre-
diction of Speech Quality in Telecommuni-cations. Kluwer Academic publishers,2000
ITU-T. Recommendation P.805 - Sub-jective evaluation of conversational quality.International Standard. Geneva, Switzer-land: International TelecommunicationUnion, 2007
A third motivation refers to the modeling described in Chapter 9.Since typical listening-only tests usually apply stimuli that are shorterthan full conversations, more technical conditions can be tested in alistening-only test than in a corresponding conversation test. Fromthe modeling perspective this means that listening-only tests have theadvantage to obtain more data with the same amount of resourcescompared to conversation tests.
Approach According to the iterative research method (Section 1.4),the study consists of two experiments LOT1 and LOT2, allowingto improve the experimental and analysis method in the secondexperiment based on the insights gained in the first experiment. Thefocus of the first experiment was to gain experience in the generationof proper listening test stimuli for multiparty telemeetings 25 and to
25 Anne Weigel. “Beurteilung der Qual-ität von Telefonkonferenzen mit asym-metrischen Verbindungen aus der Per-spektive eines passiven Zuhörers”. Bach-elor Thesis. Assessment of IP-based Ap-plications, Technische Universität Berlin,Germany, 2014
gain first insights on the quality perception from the perspective of apassive participant 26. The focus of the second experiment was to test
26 Janto Skowronek, Anne Weigel, andAlexander Raake. “Quality of Multi-party Telephone Conferences from thePerspective of a Passive Listener”. In:Fortschritte der Akustik - 41. Jahresta-gung für Akustik (DAGA). Nürnberg, Ger-many, Mar. 2015
a large number of technical conditions, which partly have also beenused in the conversation tests, in order to increase the knowledgeon multiparty perception comparing listening-only and conversationtests, and to further facilitate the modeling attempts described inChapter 9 by including additional technical conditions.
Hypotheses The hypotheses are the same two investigated in theprevious section:
H1: There is a mutual influence of individual connections on the per-ception of Individual Connection Quality Qij, whereas this mutualinfluence is not constant, i.e. it depends on the actual test condition.
H2: An aggregation of Individual Connection Quality Qij to Single-Per-spective Telemeeting Quality Qi takes place, whereas this aggregationa simple average operation: Qi = 1/N ·∑N
j=1(Qij).
8.4.2 Experimental Factors
Test Tasks The task for test participants was in all three experimentsa listening-only test task (“Listen to the test stimuli and give ratingsafter each stimulus”).
Speech Material To account for the special communicative situa-tion as one main differentiator between multiparty and two-partycalls, ITU Recommendation P.1301 advises to use stimuli that “suf-ficiently resemble the conversational situation.” 27 Bearing this in
27 ITU-T. Recommendation P.1301 - Sub-jective quality evaluation of audio and au-diovisual telemeetings. International Stan-dard. Geneva, Switzerland: Interna-tional Telecommunication Union, 2012

perception of telemeeting quality with focus on telecommunication aspects 229
mind, Weigel 28 generated the speech stimuli with a length of about 28 Anne Weigel. “Beurteilung der Qual-ität von Telefonkonferenzen mit asym-metrischen Verbindungen aus der Per-spektive eines passiven Zuhörers”. Bach-elor Thesis. Assessment of IP-based Ap-plications, Technische Universität Berlin,Germany, 2014
40s, each containing a meaningful excerpt of a longer three-partyconversation, whereas each excerpt featured only two interlocutors.The speech material was taken from recordings from ExperimentACT3 for which the test participants gave their written consent inreusing those recordings in other tests. Thus, the speech material isbased on the same scenarios used in ACT3.
The result of the selection and editing process were 43 recordingswith relatively equal amount of contributions from both speakers.One speaker in each recording was always the male confederate ofACT3; this was motivated by making it easier for test participantsto assign the questions on the individual connections to the rightspeaker. The second speaker was a male test participant from ACT3
in 80% and a female test participant in 20% of the cases.Concerning the technical realization of the recordings during ACT3,
the headset microphone signals were digitally recorded in Puredatabefore any further processing (degradations, coding, transmission)was applied. Thus, the recordings consisted of individual tracks ofeach interlocutor at the best possible quality provided by the usedtest system: high-quality microphone characteristics of the headsets(Beyerdynamic DT790), high-quality AD conversion (RME Multiface)at 44100kHz / 16 bit. The loudspeaker signals, i.e. the speech signalsafter all processing was applied, were recorded as well. Since therecordings were made on three individual computers – one per inter-locutor in ACT3 – the author synchronized those recordings by meansof an algorithm based on the correlation function and exploiting boththe microphone and loudspeaker signals.
Concerning the technical realization of the stimuli for LOT1, thestimuli were processed by Weigel 29, who used a professional audio 29 Anne Weigel. “Beurteilung der Qual-
ität von Telefonkonferenzen mit asym-metrischen Verbindungen aus der Per-spektive eines passiven Zuhörers”. Bach-elor Thesis. Assessment of IP-based Ap-plications, Technische Universität Berlin,Germany, 2014
production software (ProTools) for the electro-acoustic degradationsand an ITU software toolbox 30 for the codec and packet loss degra-
30 ITU-T. Recommendation G.191 -Software tools for speech and audio cod-ing standardization. International Stan-dard. Geneva, Switzerland: Interna-tional Telecommunication Union, 2010
dations.Concerning the technical realization of the stimuli for LOT2, the
stimuli were processed with the same test system as ACT3 (Beyerdy-namic Headsets, RME soundcards, Puredata, Skype Testing Client,Netem, see Section 8.3). However, to reduce the risk of technical prob-lems during the test, the author processed with the help of a studentco-worker the recordings offline as follows: The edited recordingswere inserted at send-side in Puredata into the digital signal at thesame position in the signal path used for recording, then transmittedover the test system, and then recorded in Puredata before sendingthem to the loudspeaker outputs. During the test, the processedrecordings were played back to the test participants via the earphonesof the Beyerdynamics headsets, whereas playback signal levels werecalibrated to match those applied in the conversation test. That means,the speech material is processed with the exact same technical pro-cessing chain from microphones to earphones as it was used in theconversation test.

230 quality of experience of multiparty conferencing and telemeeting systems
Technical Conditions As for the audio-only conversation tests, thetechnical conditions are determined by the two aspects combinationof impairments on the individual connections and the technical systemcharacteristics as such. Table 8.7 provides a respective overview of alltest conditions, the technical characteristics expressed as E-model 31 31 ITU-T. Recommendation G.107 - The
E-model: a computational model for usein transmission planning. InternationalStandard. Geneva, Switzerland: Interna-tional Telecommunication Union, 2014
or ProTools parameters.Motivating the selection of the conditions, the common goal was
– as for the conversation tests – to optimally balance the number oftechnical characteristics and observations per condition and the testeffort. The motivations for certain choices though differed between thetwo experiments LOT1 to LOT2. In Experiment LOT1, the decisionwas to test a representative but small set of technical conditions,given that the experiment’s primary goal was to gain first experiencein conducting a multiparty-relevant listening-test. In ExperimentLOT2, the decision was to cover as many conditions of ACT3 asthe experimental design would allow, whereas each tested technicalsystem characteristic was to be tested in an asymmetric configuration,i.e. one connection with impairment and one connection withoutimpairment, and in a symmetric configuration, i.e. both connectionswith impairment.
8.4.3 Method
Design With 43 recordings of about 40s, and a typical listening-onlytest time of one hour, it was possible to fit all recordings into onetest session per participant. This allowed to choose a within-subjectdesign, i.e. all conditions are presented to all test participants.
In LOT1, three recordings were used as sources for the trainingstimuli and 32 recordings were used as sources for the test stimuli.In Skowronek. et al. 32 we described the distribution of the nine
32 Janto Skowronek, Anne Weigel, andAlexander Raake. “Quality of Multi-party Telephone Conferences from thePerspective of a Passive Listener”. In:Fortschritte der Akustik - 41. Jahresta-gung für Akustik (DAGA). Nürnberg, Ger-many, Mar. 2015
technical conditions across the 32 stimuli: “Per asymmetric condition,each technical impairment was applied four times, twice on theconfederate (the one speaker present in all recordings), twice on theother speakers. Per symmetric condition, each technical impairmentwas applied twice, since the confederate and the other speakers areaffected simultaneously. The reference condition was applied fourtimes in order to have roughly 10% of the stimuli processed with thereference condition.”
In LOT2, the author chose a different approach to distribute tech-nical conditions across the speakers. Instead of testing few technicalconditions and repeating them in one test session with differentspeakers, each technical condition was presented only once, whichallowed for a set of 37 technical conditions per session, plus fivestimuli for training. However, this could lead to interaction effectsfor particular combinations of technical condition and speakers, ifall test participants are exposed to the same set of condition-speakercombinations. To reduce such effects, two such sets of combinationswere distributed across the test participants. Those sets were basedon a pseudo-random assignment of technical condition to speaker,

perception of telemeeting quality with focus on telecommunication aspects 231
Experiment LOT1: Listening-Only Test, Headphones (diotic), Wideband codecCondition Impairment combination Impairment description Technical parameters #ObsRe f 5 — 0 0 0: no impairments Reference: G722, OLR = 10dB 192B2 — 0 B2 B2: narrowband codec G711 96B2sym — B2 B2 B2: narrowband codec G711 48P6 — 0 P5 P5: packet loss Ppl = 5% µ10 = 1 (=random PL) 95B2symP5 — B2 B2P5 B2: narrowband codec, P5: packet loss G711,
Ppl = 5% µ10 = 1 (=random PL)96
E4 — 0 LE4 LE4: listener echo (ProTools:) Echo Gain = 8%,Ta = 245ms
95
E4sym — LE4 LE4 LE4: listener echo (ProTools:) Echo Gain = 8%,Ta = 245ms
48
R — 0 R R: reverb (ProTools:) Small room, Pre-delay= 33ms, Decay = 82ms
96
CN — 0 CN CN: speech correlated noise (ProTools:) Pink noise −20dB, gateparameters: threshold = −47.1dB, at-tack = 33.4ms, hold = 1200ms, release= 799.8ms
95
Experiment LOT2: Listening-Only Test, Headphones (diotic), Superwideband codecCondition Impairment combination Impairment description Technical parameters #ObsRe f 3 — 0 0 0: no impairments Reference: SILKSWB, Ta = 350ms,
OLR = 10dB75
TN1 — 0 TN1 TN1: transmitted noise Ps = 60dB(A) 25TN2 — 0 TN2 TN2: transmitted noise Ps = 65dB(A) 25B2 — 0 B2 B2: narrowband codec G711 50B2sym — B2 B2 B2: narrowband codec G711 25FL4sym — FL4 FL4 FL4: bandpass filtered speech loudspeaker bandpass 800− 5000Hz 25FM1 — 0 FM1 FM1: bandpass filtered speech microphone bandpass 200− 7000Hz 50FM1sym — FM1 FM1 FM1: bandpass filtered speech microphone bandpass 200− 7000Hz 25FM2 — 0 FM2 FM2: bandpass filtered speech microphone bandpass 400− 7000Hz 50FM2sym — FM2 FM2 FM2: bandpass filtered speech microphone bandpass 400− 7000Hz 25FM4 — 0 FM4 FM4: bandpass filtered speech microphone bandpass 800− 5000Hz 50FM4sym — FM4 FM4 FM4: bandpass filtered speech microphone bandpass 800− 5000Hz 25FM4P3 — 0 FM4P3 FM4: bandpass filtered speech,
P3: packet lossmicrophone bandpass 800− 5000Hz,Ppl = 15% µ10 = 1 (=random PL)
50
FM4P3sym — FM4P3 FM4P3 FM4: bandpass filtered speech,P3: packet loss
microphone bandpass 800− 5000Hz,Ppl = 15% µ10 = 1 (=random PL)
50
E2 — 0 LE2 LE2: listener echo WEPL′ = 20dB 50E2sym — LE2 LE2 LE2: listener echo WEPL′ = 20dB 25E3 — 0 LE3 LE3: listener echo WEPL′ = 30dB 50E3sym — LE3 LE3 LE3: listener echo WEPL′ = 30dB 25P1 — 0 P1 P1: packet loss Ppl = 10% µ10 = 1 (=sparse PL) 50P1syn — P1 P1 P1: packet loss Ppl = 10% µ10 = 1 (=sparse PL) 25P3 — 0 P3 P3: packet loss Ppl = 15% µ10 = 1 (=sparse PL) 50P3sym — P3 P3 P3: packet loss Ppl = 15% µ10 = 1 (=sparse PL) 25P4 — 0 P4 P4: packet loss Ppl = 10% µ10 = 2 (=bursty PL) 50P4sym — P4 P4 P4: packet loss Ppl = 10% µ10 = 2 (=bursty PL) 25
Table 8.7: Test conditions for the twolistening-only tests LOT1 and LOT2.The conditions are defined by the showncombinations of the impairments thateach interlocutor perceives from thethree individual connections.
whereas it was avoided that the same condition-speaker combinationsoccur in both sets.
Test participants The characteristics of the invited test participantsare given in Table 8.8.

232 quality of experience of multiparty conferencing and telemeeting systems
Participant characteristics LOT1 LOT2
Number of participants 24 25
Age: mean / minimum / maximum 31 / 19 / 52 33.6 / 22 / 54
Gender: female / male, in percent (absolute numbers) 50% / 50% (12 / 12) 72% / 28% (18 / 7)Multiparty experience in professional or private life 29% (7 of 24) n.a.Number of subjects with experience with similar listening ortelephony experiments
70% (17 of 24) n.a.
Hearing impairments (self-reported) none none
Table 8.8: Test participant statistics forthe two listening-only tests LOT1 &LOT2.
Procedure In both tests, participants came for a single 60 minutessession. After a general introduction, the test participants had atraining of three stimuli in LOT1 and five stimuli in LOT2, in whicha subset of the technical conditions were presented, and in whichthe participants answered trial questionnaires. Then the participantslistened to the test stimuli and answered after each stimulus thequestionnaire. To avoid fatigue, the test participants had a shortbreak after half of the stimuli: Weigel 33 opted for a fixed duration
33 Anne Weigel. “Beurteilung der Qual-ität von Telefonkonferenzen mit asym-metrischen Verbindungen aus der Per-spektive eines passiven Zuhörers”. Bach-elor Thesis. Assessment of IP-based Ap-plications, Technische Universität Berlin,Germany, 2014
of 10 minutes in LOT1; the author opted for a minimum durationof 2 minutes in LOT2. At the end of the session, the test supervisorconducted a short outtake interview with the test participants.
8.4.4 Data Acquisition
Questionnaires and Rating Scales Both listening-only tests appliedthe same questionnaire used in the conversation test ACT3. Thusboth tests measured Speech Communication Quality with focus on theTelecommunication Component for both Single-Perspective TelemeetingQuality Qi and Individual Connection Quality Qij; and both tests appliedtwo different rating scales: Absolute Category Rating (ACR) scale forQi and Extended Continuous (EC) scale for Qij. See Section 8.3 formore details, in particular Tables 8.4 and Table 8.5 on the questionsand Equation 8.1 on the scale transformation that was applied to mapthe EC scale to the ACR scale.
However, there is one substantial change compared to the conver-sation test. The question on the own connection was deleted, sincethis question is very hard to answer in a listening-only test. Referringback to the discussions in Sections 5.3 and 6.5, even in conversationtests quality judgments on the own connection are in most casesrather hypothetical and rely on indirect cue-based quality features(e.g. conversation flow, remarks of interlocutors), at least if there areno impaired feedback signals (e.g. side tone degradations, talker echo).In case of a listening-only test, this hypothetical character would beeven stronger, which makes such a question even more abstract fortest participants.
Data Processing and Validation All measures were represented in sucha way that high values reflect high quality. Furthermore, inspectingthe questions did not reveal any specific outliers in terms of unusualrating behavior of test participants. Hence none of the test participantswere excluded from the further analysis. Concerning the removal of

perception of telemeeting quality with focus on telecommunication aspects 233
data points in case a test participant forgot to answer all questions –an effect that happened in <5% of the conversation test questionnaires– this was only necessary in two cases for LOT1. In LOT2, the paperquestionnaire was replaced by an electronic questionnaire 34 running 34 The electronic questionnaire was
kindly prepared by D. Guse and col-leagues from the Quality and UsabilityLab of the Technische Universität Berlin.
on a tablet, which had nearly the same visual design, but forced testparticipants to answer all questions before continuing with the nextstimulus.
Data Analysis and Presentation The data analysis comprised the samefour steps conducted for the audio-only conversation tests: (a) or-ganize the collected data according to the algorithm described inSection 6.5; (b) determine the expected relations between the Single-Perspective Telemeeting Quality score Qi and the Individual ConnectionQuality scores Qij and Qik, noting that the quality Qii of the ownconnection was excluded from the questionnaires and thus also fromthe respective expectations; (c) apply one-sample t-tests to check forsignificant deviations between expected and observed values; and(d) verify per condition the hypotheses H1 and H2. For details seeSection 8.3, in particular Figure 8.1 on the expected relations betweenQi, Qij and Qik.

234 quality of experience of multiparty conferencing and telemeeting systems
8.4.5 Results of Experiment LOT1
Figure 8.6 shows the visualization of the results and provides asummary of the analysis; the analysis in full detail is given in Ap-pendix F.1.
1. Visualization of Results and Expectations
The errorbars show the mean values and 95% confidence intervals for the obtained ratings of Qi , Qii , Qij, and Qik . The red crossesat the x-axis indicate which individual connections are impaired. The dashed lines reflect the expectations when Hypothesis 1
(mutual influence) holds, the dotted lines when Hypothesis 1 does not hold. Both dashed and dotted lines assume that Hypothesis2 (mean function) holds. The reference condition Ref5 is repeated in each plot for better visual comparison.
Brief explanation of shown condition names (for full details see Table 8.7):Ref5 = reference condition. P5 = packet loss impairment. B2, B2sym = narrow-band codec (“sym” = symmetric). B2symP5
= narrow-band codec (symmetric) and packet loss (asymmetric). E4, E4sym = listener echo (“sym” = symmetric). R = roomreverberation. CN = speech-correlated noise.
2. Analysis Summary
Result for reference condition:Qi , Qij, Qik are all essentially equal and optimal. ⇒ Ref5 serves as reference condition for this test.
Results concerning Hypothesis H1, see dotted lines.Conditions Result Rationale
P5, E4, R, CN X Qij is significantly different from the expected value.B2, B2sym, B2symP5, E4sym × Qij is not significantly different from the expected value.
Results concerning Hypothesis H2, see dashed lines.Conditions Result Rationale
B2, B2sym, E4sym X Qi is not significantly different from the expected value.P5, B2symP5, E4, R, CN × Qi is significantly different from the expected value.
Figure 8.6: Results for ExperimentLOT1.

perception of telemeeting quality with focus on telecommunication aspects 235
8.4.6 Results of Experiment LOT2
Figures 8.7 to 8.9 show the visualization of the results and providesummaries of the analysis; the analysis in full detail is given inAppendix F.2.
1. Visualization of Results and Expectations
The errorbars show the mean values and 95% confidence intervals for the obtained ratings of Qi , Qii , Qij, and Qik. The redcrosses at the x-axis indicate which individual connections are impaired. The dashed lines reflect the expectations whenHypothesis 1 (mutual influence) holds, the dotted lines when Hypothesis 1 does not hold. Both dashed and dotted lines assumethat Hypothesis 2 (mean function) holds. The reference condition Ref3 is repeated in each plot for better visual comparison.
Brief explanation of shown condition names (for full details see Table 8.7):Ref3 = reference condition. E2, E2sym, E3, E3sym = listener echo (“sym” = symmetric). TN1, TN2 = transmitted noise. B2, B2sym= narrow-band codec (“sym” = symmetric).
2. Analysis Summary
Result for reference condition:Qi , Qij, Qik are all essentially equal and optimal. ⇒ Ref3 serves as reference condition for this test.
Results concerning Hypothesis H1, see dotted lines.Condition Result Rationale
E2, E3sym, TN1, TN2, B2sym X Qij is significantly different from the expected value.E2sym, E3, B2 × Qij is not significantly different from the expected value.
Results concerning Hypothesis H2, see dashed lines.Condition Result Rationale
E2sym, B2, B2sym X Qi is not significantly different from the expected value.E2,E3,E3sym,TN1,TN2 × Qi is significantly different from the expected value.
Figure 8.7: Results for Experiment LOT2,Part 1.

236 quality of experience of multiparty conferencing and telemeeting systems
1. Visualization of Results and Expectations
The errorbars show the mean values and 95% confidence intervals for the obtained ratings of Qi , Qii , Qij, and Qik. The redcrosses at the x-axis indicate which individual connections are impaired. The dashed lines reflect the expectations whenHypothesis 1 (mutual influence) holds, the dotted lines when Hypothesis 1 does not hold. Both dashed and dotted lines assumethat Hypothesis 2 (mean function) holds. The reference condition Ref3 is repeated in each plot for better visual comparison.
Brief explanation of shown condition names (for full details see Table 8.7):
Ref3 = reference condition. FM1, FM1sym, FM2, FM2sym, FM4, FM4sym = bandbass filtered microphone signal (“sym” =symmetric). FL4sym = bandpass filtered loudspeaker signal (symmetric).
2. Analysis Summary
Result for reference condition:
Qi , Qij, Qik are all essentially equal and optimal. ⇒ Ref3 serves as reference condition for this test.
Results concerning Hypothesis H1, see dotted lines.
Condition Result Rationale
FM1, FM1sym, FM2, FM2sym,FM4 FM4sym, FL4sym
× Qij is not significantly different from the expected value.
Results concerning Hypothesis H2, see dashed lines.
Condition Result Rationale
FM1, FM1sym, FM2, FM2sym,FM4, FM4sym, FL4sym
X Qi is not significantly different from the expected value.
Figure 8.8: Results for Experiment LOT2,Part 2.

perception of telemeeting quality with focus on telecommunication aspects 237
1. Visualization of Results and Expectations
The errorbars show the mean values and 95% confidence intervals for the obtained ratings of Qi , Qii , Qij, and Qik. The redcrosses at the x-axis indicate which individual connections are impaired. The dashed lines reflect the expectations whenHypothesis 1 (mutual influence) holds, the dotted lines when Hypothesis 1 does not hold. Both dashed and dotted lines assumethat Hypothesis 2 (mean function) holds. The reference condition Ref3 is repeated in each plot for better visual comparison.
Brief explanation of shown condition names (for full details see Table 8.7):
Ref3 = reference condition. P1, P1sym, P3, P3sym, P4, P4sym = packet loss (“sym” = symmetric). FM4P3, FM4P3sym = bandpassfiltered microphone signal and packet loss (“sym” = symmetric).
2. Analysis Summary
Result for reference condition:
Qi , Qij, Qik are all essentially equal and optimal. ⇒ Ref3 serves as reference condition for this test.
Results concerning Hypothesis H1, see dotted lines.
Condition Result Rationale
P3, P4, P4sym, FM4P3,FM4P3sym
X Qij is significantly different from the expected value.
P1, P1sym, P3sym × Qij is not significantly different from the expected value.
Results concerning Hypothesis H2, see dashed lines.
Condition Result Rationale
P1, P1sym, P3sym, P4sym X Qi is not significantly different from the expected value.
P3, P4, FM4P3, FM4P3sym × Qi is significantly different from the expected value.
Figure 8.9: Results for Experiment LOT2,Part 3.

238 quality of experience of multiparty conferencing and telemeeting systems
8.4.7 Discussion
Review of Results Table 8.9 summarizes the main findings for the twolistening-only tests LOT1 and LOT2.
Experiment Conditions Hypothesis H1 Hypothesis H2
Asymmetric Symmetric
LOT1 B2 B2sym, E4sym × X
P5, E4, R, CN – X ×– B2symP5 × ×
LOT2 B2, FM1, FM2, FM4, P1 E2sym, FM1sym, FM2sym, FM4sym, FL4sym,P1sym, P3sym
× X
– B2sym, P4sym X X
E2, TN1, TN2, P3, P4, FM4P3 E3sym, FM4P3sym X ×E3 – × ×
Table 8.9: Overview of the results forthe listening-only tests LOT1 & LOT2,concerning the two hypotheses H1 & H2.Confirmed hypotheses are denoted witha X, rejected hypotheses with a ×.
Hypothesis H1 is confirmed in 14 out of 31 tested cases, andrejected in 17 cases. This means that a clear evidence is found thata mutual influence of the individual connections exists, while suchinfluence depends on the actual technical condition. Concerning asystematic behavior that could explain when a condition shows thatinfluence or not, Table 8.9 shows that it is most likely not a function ofthe type of impairment, since conditions of the same type, e.g. packetloss P1 to P4 or echo E2 to E4, sometimes show that influence andsometimes not. The strength of an impairment, a possible explanationfound for the audio-only conversation tests, is only partially sufficientto explain the mutual influence. This can be seen on the visualizationsin Figures 8.2 to 8.5: Those conditions with quality scores closer tothe reference condition do not show the mutual influence; and whilethere are also conditions with lower quality scores that do show themutual influence (e.g. LOT1: E4, R, LOT2: P3, P4), other conditionswith lower quality scores do not (e.g. LOT1: B2symP5, E4sym, LOT2:E3), or do show the mutual influence (e.g. LOT1: E4, R, LOT2: P3,P4). Furthermore, the selection of conditions allows to investigatesymmetry effects in terms of differences between asymmetric andsymmetric configurations. Thus, it is possible to check, if symmetrycan explain the influence. However, symmetry does not do this, sinceTable 8.9 shows that impairments in both symmetric and asymmetricconfigurations are distributed among both cases H1 confirmed andH1 rejected.
Hypothesis H2 is confirmed in 17 of 31 tested cases, and rejected in14 cases. This means that the Single-Perspective Telemeeting Quality Qi
can be expressed in many cases as a simple average of the IndividualConnection Quality scores Qij of the individual connections. However,there are also many technical conditions in which this simple relationdoes not hold. In case of asymmetric configurations, the strengthof an impairment appears to correlate with the need to express therelation between Qi and Qij with a more sophisticated function, sinceFigures 8.2 to 8.5 show that conditions with Single-Perspective Telemeet-ing Quality scores Qi < 3 differ from the expected values. However,this behavior is not linked with the existence of a mutual influence,

perception of telemeeting quality with focus on telecommunication aspects 239
since Table 8.6 shows that the conditions cover all combinations of aconfirmed or rejected hypothesis H1 and H2. Concerning symmetryas a further possible explanation, no consistent trend is visible: Someimpairments in asymmetric and symmetric conditions do not supporta symmetry effect, as either both confirm or reject H2 (LOT1: B2 vs.B2sym, LOT2: FM1 vs. FM1sym, FM2 vs. FM2sym, FM4 vs. FM4sym,P1 vs. P1sym, FM4P3sym vs. FM4P3sym). Other impairments dosupport a symmetry effect as they are distributed across the two casesH2 confirmed and H2 rejected (LOT2: B2 vs. B2sym, P3 vs. P3sym).
Review of the Approach and Open Questions for Future Work There area number of open questions concerning the experimental methodthat this section will address now: rating on multiple scales and thelimitation in terms of communicative aspects.
The aspect of multiple rating scales has been discussed in Sec-tion 8.3 for the audio-only conversation tests, and the same discussionapplies here: it might be that test participants do form some averageof Qij simply due to the presentation of both Qi and Qij on the samequestionnaire, despite the usage of different scale designs and ques-tions; and future studies could validate this by different experimentalapproaches (e.g. split sessions, between-subject designs).
The aspect of communicative aspects is a non-trivial issue in thecontext of a listening-only test. One motivation for conducting alistening-only test is to simulate a situation in which the test par-ticipant is taking the role of a passive listener, a typical situation inreal-life scenarios. However, this simulation only partially reflectsthe real-world case, given that the test participants are not reallyinterested in the actual information shared in the recordings. Whilethis potentially puts test participants into an analytic listening andrating mode, meaning they might be more critical about impairments,it also reduces the potential impact of the communicative situationon the quality rating. On the one hand, this means test participantsmight focus even more on the desired Telecommunication Component ofTelemeeting Quality. On the other hand, this means the test is gettingcloser to a conventional listening-only test for traditional telephonyscenarios, meaning that the contribution of any multiparty-specificaspects to the quality rating is reduced. In other words, the listening-only test potentially leads to a stronger focus on technical quality witha potentially reduced focus on multiparty aspects of quality. For fu-ture work, it may be difficult to empirically prove such considerations,even with dedicated experiments. For that reason, the proposal forfirst steps for future work is to conduct more listening-only tests bydifferent laboratories. This would allow to exchange different resultsand interpretations between researchers and practitioners in the fieldin order to assess the practical relevance of these considerations.

240 quality of experience of multiparty conferencing and telemeeting systems
8.5 Quality Impact of an Audiovisual Telemeeting System -Conversation Tests
This section reports on two experiments investigating the qualityimpact of Technical System Capability by means of audiovisual con-versation tests, henceforth referred to as Experiments AVCT1 andAVCT2.
8.5.1 Goals
Motivation The choice of investigating also the audiovisual com-munication modality is motivated by the observation that more andmore PC-based and mobile-phone-based solutions for audiovisualtelemeetings are available on the mass market. Thus, audiovisualtelemeetings are – after audio-only telemeetings – the second mostused form of telemeetings.
Approach According to the iterative research method (Section 1.4),the study consists of two experiments AVCT1 and AVCT2. Conduct-ing two experiments allowed to improve the experimental methodin the second experiment based on the insights gained in the firstexperiment. The focus of the first experiment was to gain experiencein the conduction of a multiparty audiovisual test and to obtain firstinsights into the quality perception of audiovisual telemeetings. Thefocus of the second experiment was to reach a good balance betweenthe strength of audio-only and video-only degradations in the test.
Furthermore, the scope of the experiments was to investigate qual-ity aggregation in terms of multiparty aggregation, i.e. Qi as functionof Qij. The scope was not do investigate quality aggregation in termsof modality aggregation, i.e. audiovisual quality as function of audioquality and video quality. For that reason, the approach was to asktest participants only for audiovisual quality, and not to collect ratingsfor audio-only and audio-video quality. This had the advantage tonot confuse or even overwhelm test participants, which would bethe case when asking them to judge quality for all three modalities(audio-only, video-only, audiovisual) for each of the two multipartyaggregation levels (Qi, Qij). Nevertheless, focusing on audiovisualquality still allowed to investigate the combination of audio-only andvideo-only impairments to audiovisual impairments to a certain ex-tent by comparing the quality ratings for the corresponding technicalaudio-only, video-only and audiovisual degradations.
Hypotheses The hypotheses are the same two investigated in theprevious sections:
H1: There is a mutual influence of individual connections on the per-ception of Individual Connection Quality Qij, whereas this mutualinfluence is not constant, i.e. it depends on the actual test condition.
H2: An aggregation of Individual Connection Quality Qij to Single-Per-spective Telemeeting Quality Qi takes place, whereas this aggregation

perception of telemeeting quality with focus on telecommunication aspects 241
a simple average operation: Qi = 1/N ·∑Nj=1(Qij).
8.5.2 Experimental Factors
Test Tasks The task for test participants was in all two experimentsa conventional conversation test task (“Have a conversation over thetest system, and give ratings after each conversation”).
Conversation Scenarios Two types of conversation scenarios wereused: a survival task game and a celebrity name guessing game. Orig-inally coming from team building domain, survival tasks have beenused in studies on face-to-face and mediated group communication.In this task, test participants are supposed to be in a survival scenariowhich resulted from an accident-like event, e.g. a plain crash in thedesert. The participants’ task is to rank for a list of 12 to 15 items thatare found in the debris how important those items are for survivingthe scenario. Typical durations to complete that task are one to twohours, Thompson & Coovert 35 for instance allowed test participants
35 Lori Foster Thompson and MichaelD. Coovert. “Teamwork Online: TheEffects of Computer Conferencing onPerceived Confusion, Satisfaction, andPostdiscussion Accuracy”. In: GroupDynamics: Theory, Research, and Practice7.2 (2003), pp. 135–151
to complete the survival task within 77 minutes. A modified ver-sion featuring four scenarios (desert & winter, sea, and moon) wasproposed and validated by Gros & Filandre 36 for the purpose of qual-
36 Laetitia Gros and Gontran Filandre.A study on tasks for assessing audiovisualquality of videoconferencing systems in mul-tipoint conversation tests. ITU-T Contri-bution COM 12 - C 259 - E. Geneva,Switzerland: International Telecommu-nication Union, Oct. 2011
ity assessment tests for audiovisual multiparty telemeeting systems,which was also included into the ITU-T Recommendation P.1301
37.
37 ITU-T. Recommendation P.1301 - Sub-jective quality evaluation of audio and au-diovisual telemeetings. International Stan-dard. Geneva, Switzerland: Interna-tional Telecommunication Union, 2012
One modification was to distribute the items among the participants,i.e. each participant found different items in that scenario, forcingeach participant to contribute to the conversation. Another modifi-cation was to agree on six items useful for survival, shortening thetask duration down to roughly four to five minutes 38. In order to test 38 Laetitia Gros and Gontran Filandre.
A study on tasks for assessing audiovisualquality of videoconferencing systems in mul-tipoint conversation tests. ITU-T Contri-bution COM 12 - C 259 - E. Geneva,Switzerland: International Telecommu-nication Union, Oct. 2011
more than four conditions with such scenarios, Skowronek & Spur 39
39 Janto Skowronek and Maxim Spur.3SurvivalCT - 3-party Survival task Con-versation Test scenarios for conferencing as-sessment. 2017. doi: 10.5281/zenodo.
345837
extended this set with three more scenarios (mountains, swamp, cave),and made minor adjustments to the original scenarios after a smallpilot test with six participant groups. The full set of scenarios iselectronically available.
The second task, a celebrity name guessing game, was proposed bySchoenenberg et al. 40 as a delay sensitive conversation task for two-
40 Katrin Schoenenberg, AlexanderRaake, and Pierre Lebreton. “On inter-action behaviour in telephone conver-sations under transmission delay”. In:Proceedings of the 6th International Work-shop on Quality of Multimedia ExperienceQoMEX. Sept. 2014, pp. 31–36
party video-telephony, and the author adapted this game to the threeparty case as follows: In each round of this game, test participants aresupposed to be a celebrity, and the task is to guess their own name.For that purpose, a test participant may ask only questions that canbe answered by the other two interlocutors with yes or no, e.g. “Am Ifemale?” or “Am I an actor?”. Furthermore, the asking test participanthad a paper card with the celebrity’s initials, which he or she clippedto his or her shirt. The other interlocutors had the corresponding fullname on a paper card that they were not allowed to hold into thecamera. The initials helped the asking participant in guessing thename and helped all interlocutors to keep track of which celebrityis to be guessed; small numbers that were also written on the cardsuniquely identified the paper cards with the solution. Participantstake turns in asking the questions and may continue as long as the

242 quality of experience of multiparty conferencing and telemeeting systems
answers are “yes”, while both interlocutors were allowed to answerthe questions. In case of a “no” answer, the next interlocutor has theturn in asking questions. In case the name was correctly guessed,the participant could choose the next card with initials, the otherslooked for the corresponding solutions on the hidden cards, and thegame continued with the next participant. This was continued untileach call reached a duration of four to five minutes, then the testsupervisor interrupted the game round and stopped the call. TheGerman instructions (game rules) and the full list of celebrities forthe German cultural context are electronically available 41. 41 Janto Skowronek and Katrin Schoe-
nenberg. 3CNG - 3-party Celebrity NameGuessing task for Conferencing Assessment.2017. doi: 10.5281/zenodo.345834
Test participants conduced the two types of conversation scenariosin interleaved order, i.e. changing the scenario type after each test call.The motivation was that the above mentioned small pilot test withsix participant groups suggested negative effects on the participants’mood if seven calls of the same scenario type were made in one block.Having seven survival tasks games in sequence started to get boringand partially even depressing; having seven celebrity name guess-ing rounds in sequence started to get frustrating if test participantswere not particularly good in guessing the names. In contrast, theinterleaved order of the two scenario types was experienced quitepositively by the participants.
Confederate as test participant Due to the good practical experiencein Experiment ACT3, a confederate was also present in the two au-diovisual experiments AVCT1 and AVCT2. The confederate’s taskwas to guide through the games and to aim at an equal amount ofcontribution of all interlocutors. In particular the confederate solvedmisunderstandings and minimized non-intended discourses. To opti-mize the naturalness and balance of the conversations, especially ofthe name guessing game, also the confederate did not know the fullnames of the celebrities and always got new celebrity names to guess.The test participants were informed about the confederate with theinformation that he was there to help play the games.
Test System The audio part of the test system was the same as inExperiment ACT3: The Skype Testing Client allowed to use differentcodecs (SILK, G.711) and audio bandwidths (narrowband, wideband,& super-wideband), test participants used closed headsets (Beyer-dynamic DT790) as audio end devices, which were connected tothe computer via RME sound cards, PureData was inserted in theaudiopath for introducing acoustic distortions, and the oneway end-to-end audio delay was 350ms. The sound reproduction levels werecalibrated with an head and torso simulator (HATS) to 73dB SPL,the microphone signals were adjusted to -26dBov digital level for anacoustic sound pressure level of 89dB SPL at the HATS mouth refer-ence point. Concerning the video part of the test system, the SkypeTesting Client applied the H264 video codec, allowed to set differentdata bitrates, video resolutions and frame rates. The oneway end-to-end video delay was 200 ± 2 ms, which means that the system’s

perception of telemeeting quality with focus on telecommunication aspects 243
audiovisual asynchrony was 150ms with lagging audio. Depend-ing on different studies (see for instance Vatakis and Spence 42 or 42 Argiro Vatakis and Charles Spence.
“Audiovisual synchrony perception forspeech and music assessed using a tem-poral order judgment task”. In: Neuro-science Letters 393 (2006), pp. 40–44
Eg et al. 43 for corresponding overviews), this value is below or just
43 Ragnhild Eg et al. “Audiovisual ro-bustness: exploring perceptual toleranceto asynchrony and quality distortion”.In: Multimedia Tools and Applications 74
(2015), pp. 345–365
above the observed detection thresholds for audiovisual asynchrony.Logitec Pro9000 Webcams served as cameras, participants saw thevideo directly on the laptop screens (Fujitsu Siemens S Series) at aviewing distance of 3.4 times the screen height 44, and the display
44 Since participants could have differ-ent body positions, the viewing distancehere was defined as the distance be-tween the front border of the table andthe laptop screen
peak luminance was set to the maximum, which was about 100 ± 10
cd/m2, using the white area of the test picture in Figure 8.10. Theroom lighting (D65, 6504 K) was set such that 34 lux of incident lightwere measured at face position and 24cd/m2 of reflected light behindthe screens. All light calibrations were done with a Sekonic L-758 Cinelight meter. Finally, Netem was again used for introducing packetloss.
Figure 8.10: Test picture used for displaycalibration, provided by Garcia:
Marie-Neige Garcia. Parametric Packet-based Audiovisual Quality model for IPTVservices. Springer, 2014
Technical Conditions As for the audio-only tests, the technical condi-tions are determined by the two aspects combination of impairments onthe individual connections and the technical system characteristics as such.Table 8.10 provides a respective overview of all test conditions.
Motivating the selection of the conditions, the common goal was– as for the audio-only tests – to optimally balance the number oftechnical characteristics and observations per condition and the testeffort. The motivations for certain choices though differed betweenthe two experiments AVCT1 to AVCT2. In Experiment AVCT1, thedecision was to test a representative but small set of technical con-ditions, given that the experiment’s primary goal was to gain firstexperience in conducting a multiparty-relevant audiovisual test. Thechoice fell on testing two audio-only and two video-only impairmentsas well as their combinations to form respective audiovisual impair-ments, all in an asymmetric configuration (only one interlocutor isimpaired). In Experiment AVCT2, the decision was to test again con-ditions that are constructed from two audio-only and two video-onlyimpairments. This time, however, those impairments were tested inboth an asymmetric (only one interlocutor is impaired) and symmet-ric configuration (both interlocutors are impaired), as well as theircombination to an audiovisual impairment in an asymmetric config-uration. Furthermore, bearing the results of the first experiment inmind, the selection of conditions specifically aimed at impairmentsthat are clearly perceived and that show a rather good balance be-tween the strengths of audio-only and video-only impairments. Thiswas achieved by running a small pilot test with four subject groups.In addition, echo and audiovisual packet loss were selected due totheir practical relevance from the perspective of the project underwhich the tests were conducted.
8.5.3 Method
Design Similarly to Experiment ACT3, both audiovisual experimentsused a mixed design, in which a number of technical conditions were

244 quality of experience of multiparty conferencing and telemeeting systems
Experiment AVCT1: Audiovisual Conversation Test, Headphones (diotic), Superwideband codecCondition Impairment combination Impairment description Technical parameters #ObsAVRe f 0 0 0 0: no impairments Reference: SILKSWB, Ta = 350ms,
OLR = 10dB, Tv = 200ms,H264@500kbit/s,FR = 30 f ps, RES = 640x480
41
VF1 0 0 VF1 VF1: reduced frame rate FR = 15 f ps 66VR 0 0 VR VR: reduced resolution RES = 160x120 67FM2 0 0 FM2 FM2: bandpass filtered speech microphone bandpass 400− 7000Hz 63E2 TE2 0 LE2 TE2: talker echo, LE2: listener echo TELR = 20dB, WEPL′ = 20dB 65FM2−VF1 0 0 FM2−VF1 FM2: bandpass filtered speech,
VF1: reduced frame ratemicrophone bandpass 400− 7000Hz,FR = 15 f ps
18
E2−VF1 TE2 0 LE2−VF1 TE2: talker echo, LE2: listener echoVF1: reduced frame rate
TELR = 20dB, WEPL′ = 20dB,FR = 15 f ps
23
FM2−VR 0 0 FM2−VR FM2: bandpass filtered speech,VF1: reduced resolution
microphone bandpass 400− 7000Hz,RES = 160x120
23
E2−VR TE2 0 LE2−VR TE2: talker echo, LE2: listener echoVF1: reduced resolution
TELR = 20dB, WEPL′ = 20dB,RES = 160x120
22
Experiment AVCT2: Audiovisual Conversation Test, Headphones (diotic), Superwideband codecCondition Impairment combination Impairment description Technical parameters #ObsAVRe f 0 0 0 0: no impairments SILKSWB, Ta = 350ms, OLR = 10dB,
Tv = 200ms, H264 @ 500kbit/s,FR = 30 f ps, RES = 640x480
41
VF2 0 0 VF2 VF2: reduced frame rate FR = 2 f ps 43VF2sym 0 VF2 VF2 VF2: reduced frame rate FR = 2 f ps 34VB 0 0 VB VB: reduced bit rate H264@10kbit/s, FR = 15 f ps, RES =
160x12045
VBsym 0 VB VB VB: reduced bit rate H264@10kbit/s, FR = 15 f ps, RES =160x120
35
E2 TE2 0 LE2 TE2: talker echo, LE2: listener echo TELR = 20dB, WEPL′ = 20dB 45FM4 0 0 FM4 FM4: bandpass filtered speech microphone bandpass 800− 5000Hz 50FM4sym 0 FM4 FM4 FM4: bandpass filtered speech microphone bandpass 800− 5000Hz 31FM4P3 0 0 FM4P3 FM4: bandpass filtered speech,
P3: audio packet lossmicrophone bandpass 800− 5000Hz,Ppl = 15% µ10 = 1 (=random PL)
45
FM4P3sym 0 FM4P3 FM4P3 FM4: bandpass filtered speech,P3: audio packet loss
microphone bandpass 800− 5000Hz,Ppl = 15% µ10 = 1 (=random PL)
36
FM4− AVP3 0 0 FM4− AVP3 FM4: bandpass filtered speech,AVP3: audiovisual packet loss
microphone bandpass 800− 5000Hz,Ppl = 15% µ10 = 1 (=random PL)
35
FM4−VF2 0 0 FM4−VF2 FM4: bandpass filtered speech,VF2: reduced frame rate
microphone bandpass 800− 5000Hz,FR = 2 f ps
19
FM4P3−VF2 0 0 FM4P3−VF2 FM4: bandpass filtered speech,P3: audio packet lossVF2: reduced frame rate
microphone bandpass 800− 5000Hz,Ppl = 15% µ10 = 1 (=random PL),FR = 2 f ps
17
FM4−VB 0 0 FM4−VB FM4: bandpass filtered speech,VB: reduced bit rate
microphone bandpass 800− 5000Hz,H264@10kbit/s, FR = 15 f ps, RES =160x120
24
FM4P3−VB 0 0 FM4P3−VB FM4: bandpass filtered speech,P3: audio packet lossVB: reduced bit rate
microphone bandpass 800− 5000Hz,Ppl = 15% µ10 = 1 (=random PL),H264@10kbit/s, FR = 15 f ps, RES =160x120
23
Table 8.10: Test conditions for the twoaudio-visual conversation tests AVCT1
and AVCT2. The conditions are de-fined by the shown combinations of theimpairments that each interlocutor per-ceives from the three individual connec-tions.
judged by all test participants (within-subject design) and other con-ditions were judged only by subsets of the test participants (between-subject design). This allowed to balance the overall number of con-ditions and the overlap of conditions between test participants (seecorresponding discussion in Section 8.3). In AVCT1, the conditions

perception of telemeeting quality with focus on telecommunication aspects 245
for the within-subject part were the reference condition as well as thetwo audio-only and two video-only impairments; the conditions forthe between-subject part were the audiovisual conditions created bycombining each audio-only and video-only impairment. In AVCT2,the conditions for the within-subject part were the reference, theecho and the audiovisual packet loss condition, as well as the twoaudio-only and two video-only impairments in asymmetric configura-tions; the conditions for the between-subject part were the audio-onlyand video-only impairments in symmetric configurations and theaudiovisual conditions.
Concerning the number of conditions per test session, the goodexperience with 90 minutes test time from the audio-only tests andthe conversation scenarios (four to five minutes per survival task andname guessing game) allowed for twelve test calls (six per task) andtwo training calls (one per task). Concerning the overall test time,the time and budget constraints allowed to aim for 24 groups (maxi-mum 48 observations per condition due to two test participants andone confederate) in both experiments, from which 19 were actuallyconducted in Experiment AVCT1 and all 24 in Experiment AVCT2.
Test participants The characteristics of the invited test participantsare given in Table 8.11.
Participant characteristics AVCT1 AVCT2
Number of participants (without confederate and any removedsubjects)
38 49
Age: mean / minimum / maximum 30.8 / 22 / 58 26.7 / 19 / 54
Gender: female / male, in percent (absolute numbers) 63% / 37% (24 / 14) 53% / 47% (26 / 23)Number female / male / mixed gender groups (not consideringmale confederate subject)
9 / 4 / 6 6 / 4 / 16
Multiparty experience in professional life (working, studying) 32% (12 of 38) 20% (10 of 49)Multiparty experience in private life 13% (5 of 38) 39% (19 of 49)Experience with video telephony 48% (17 of 38) 76% (37 of 49)Groups with subjects knowing each other 2 2
Groups with subjects knowing the student co-worker 1 2
Number of subjects with experience with similar listening ortelephony experiments
61% (23 of 38) 51% (25 of 49)
Hearing impairments (self-reported) none noneVisual impairments (self-reported) none none
Table 8.11: Test participant statistics forthe two audiovisual conversation testsAVCT1 & AVCT2.Procedure In both experiments, participants came for a single 90
minutes session. After a general introduction, the test participantsconducted first a “Get to know” call under reference condition, andeverybody (confederate and test participants) introduced themselvesto the others according to a number of questions asked by the con-federate. After the “Get to know” call, the test participants had twotraining calls, in which the participants could get used to playingthe two games and after which they answered a trial questionnaire.In both experiments, those training calls were conducted under thelimited resolution condition RES and the echo condition E2 (see Ta-ble 8.10). After the training calls, the test participants conducted

246 quality of experience of multiparty conferencing and telemeeting systems
Experiments AVCT1 & AVCT2
Part Question ID Wording / Description, EN: English translation, DE: German original
1 Q1.1 EN: “What was your personal intuitive overall impression (audio and video) of the system’s quality? – extremelybad ... ideal”
DE: “Wie war Ihr persönlicher intuitiver Gesamteindruck (Bild und Ton) von der Qualität des Systems? – schlecht ... aus-gezeichnet”
2 Q2.1 EN: “Your own audiovisual connection into the conference was bad ... excellent.”
DE: “Ihre eigene audiovisuelle Verbindung in die Konferenzschaltung war schlecht ... ausgezeichnet.”
Q2.2 EN: “The audiovisual connection of Mr./Ms. Client X was bad ... excellent.”
DE: “Die audiovisuelle Verbindung von Herrn/Frau Client X in die Konferenzschaltung war schlecht ... ausgezeichnet.”
Q2.3 EN: “The audiovisual connection of Mr./Ms. Client Y was bad ... excellent.”
DE: “Die audiovisuelle Verbindung von Herrn/Frau Client Y in die Konferenzschaltung war schlecht ... ausgezeichnet.”
3 Q3.1 EN: “Please describe, if and which degradations or special characteristics you perceived. If you have other remarks,pleasewrite them down here as well. – Free text”
DE: “Bitte beschreiben Sie kurz, ob und welche Störungen oder Besonderheiten Ihnen aufgefallen sind. Wenn Sie sonstigeAnmerkungen haben, schreiben Sie diese bitte auch hier auf.”
Table 8.12: Summary of the question-naires used in the two audiovisual con-versation tests AVCT1 & AVCT2.
twelve test calls under different technical conditions according to theconversation scenarios (the two games) and answered a questionnaireafter each call. Contrary to the audio-only conversation tests, nobreak was necessary, since the two games were cognitively much lessdemanding than the audio-only conversation scenarios. At the end ofthe session, the test supervisor conducted a short outtake interviewwith the test participants.
8.5.4 Data Acquisition
Questionnaires and Rating Scales The questionnaire was with minormodifications essentially the same questionnaire used in ExperimentACT3. One modification emphasized that test participants shouldrate audiovisual quality, i.e. “audio and video”, another modificationaddressed the interlocutors by the artificial account names of eachtest client that were visible on the screen.
Thus both tests measured Speech Communication Quality with focuson the Telecommunication Component for both Single-Perspective Telemeet-ing Quality Qi and Individual Connection Quality Qij.
Table 8.12 provides English translations of the questions as well asthe original German texts.
Table 8.13 gives an overview of the link between the MeasuredVariables, the actual measures used, and descriptions on how theywere extracted from the questionnaires. For detailed explanation ofthese links see Section 8.3.
Furthermore, both tests also applied the two different rating scales:Absolute Category Rating (ACR) scale for Qi and Extended Contin-uous (EC) scale for Qij, which required a scale transformation fromthe EC scale to the ACR scale according to Equation 8.1.

perception of telemeeting quality with focus on telecommunication aspects 247
Experiments AVCT1 & AVCT2
Measured Variable Measure Extraction from questionnaire
Individual Connection Quality
Speech Communication Quality with focus on TelecommunicationComponent
Connection Quality Directly measured with Q2.1, Q2.2, & Q2.3
Single-Perspective Telemeeting Quality
Speech Communication Quality with focus on Group-Communication Component
System’s Quality Directly measured with Q1.1
Table 8.13: Relation between the Mea-sured Variables (on their conceptuallevel), the actual measures used for ob-taining respective quantitative data, andextraction of the measures from thequestionnaire answers.
Data Processing and Validation All measures were represented in sucha way that high values reflect high quality. Furthermore, inspectingthe questions did not reveal any specific outliers in terms of unusualrating behavior of test participants, except in one case in ExperimentAVCT2, in which one participant was constantly rating all conditionsand all questions as good. While this participant was removed fromthe data, an additional session could be scheduled, meaning thatthe data set actually contained 24 full groups plus one single testparticipant. Concerning the removal of data points in case a testparticipant forgot to answer all questions – an effect that happened in<5% in the audio-only conversation tests – this was only necessary in2% of the cases for AVCT1 and in 1% of the cases for AVCT2.
Concerning the removal of data due to technical reasons, i.e. thehigh complexity of the system and the required amount of manualoperations from the test supervisor between calls (see Section 8.3 fordetails), about 3% of the calls needed to be removed from the data. Inaddition, some of the data for two participants in Experiment AVCT1
and one participant in Experiment AVCT2 needed to be removed aswell: Those participants reported in the open text field that they sawa bad quality of the own video picture, even though the own camerapicture was displayed without any induced impairments. While itwas not possible to reproduce a technical error in the system to verifythat this perception stems from a technical error, the data in which theparticipants reported such an impairment was removed nevertheless.
Impact of Conversation Scenarios Since test participants conductedtwo different types of conversation scenarios, it is possible that thedifferent types of content and the different conversational structuremight have a significant influence on the quality ratings. To checkfor this, the author conducted per technical condition independentT-tests between the observations of the two scenario types.
For Experiment AVCT1 no significant impact of the conversationscenario was found; see Table G.1 in Appendix G for details. ForExperiment AVCT2 a significant impact of the conversation scenarioswas found for four out of 55 tested conditions, i.e. 7%; see Table G.2for details. In two cases (conditions FM4 and FM4P3sym), the qualityof the own connection Qii, which was technically not impaired, wasaffected. In the other two cases (conditions VB and FM4P3−VF2),the quality of the unimpaired connection to an interlocutor was af-fected. In all four cases the name guessing game showed significantlylower ratings than the survival task.

248 quality of experience of multiparty conferencing and telemeeting systems
At first glance, this suggests that the name guessing game allowstest participants to be more critical than the survival task. However,the impact was found actually for unimpaired connections and only invery few cases. Such unsystematic occurrence suggests that any suchimpact of the conversation scenarios is – at least for the present data –practically negligible. For that reason, all further analysis is conductedwith the data of both conversation scenario types combined.
Data Analysis and Presentation The data analysis comprised the samefour steps conducted for the audio-only conversation tests: (a) or-ganize the collected data according to the algorithm described inSection 6.5; (b) determine the expected relations between the Single-Perspective Telemeeting Quality score Qi and the Individual Con-nection Quality scores Qii, Qij and Qik; (c) apply one-sample t-teststo check for significant deviations between expected and observedvalues; and (d) verify per condition the hypotheses H1 and H2. Fordetails see Section 8.3, and in particular Figure 8.1 on the expectedrelations between Qi, Qii, Qij and Qik.

perception of telemeeting quality with focus on telecommunication aspects 249
8.5.5 Results of Experiment AVCT1
Figure 8.11 shows the visualization of the results and provides asummary of the analysis; the analysis in full detail is given in Ap-pendix G.1.
1. Visualization of Results and Expectations
The errorbars show the mean values and 95% confidence intervals for the obtained ratings of Qi , Qii , Qij, and Qik . The red crossesat the x-axis indicate which individual connections are impaired. The dashed lines reflect the expectations when Hypothesis 1
(mutual influence) holds, the dotted lines when Hypothesis 1 does not hold. Both dashed and dotted lines assume that Hypothesis2 (mean function) holds. The reference condition AVRef is repeated in each plot for better visual comparison.
Brief explanation of shown condition names (for full details see Table 8.10):AVRef = reference condition. VF1 = reduced video frame rate. VR = reduced video resolution. FM2 = bandpass filteredmicrophone signal. E2 = echo. FM2-VF1, E2-VF1, FM2-VR, E2-VR = audiovisual impairments, combinations of VF1, VR, FM2, E2.
2. Analysis Summary
Result for reference condition:Qi , Qii , Qij, Qik are all essentially equal and optimal. ⇒ AVRef serves as reference condition for this test.
Results concerning Hypothesis H1, see dotted lines.Condition Result Rationale
VF1, FM2, FM2-VF1, FM2-VR × Qii & Qij are not significantly different from the expected value.E2, E2-VF1, VR X Qij is significantly different from the expected value.E2-VR × Qij is not significantly different from the expected value.
Results concerning Hypothesis H2, see dashed lines.Condition Result Rationale
VF1, VR, FM2, E2-VF1, FM2-VR, E2-VR X Qi is not significantly different from the expected value.E2, FM2-VF1 × Qi is significantly different from the expected value.
Figure 8.11: Results for ExperimentAVCT1.

250 quality of experience of multiparty conferencing and telemeeting systems
8.5.6 Results of Experiment AVCT2
Figures 8.12 and 8.13 show the visualization of the results and providesummaries of the analysis; the analysis in full detail is given inAppendix G.2.
1. Visualization of Results and Expectations
The errorbars show the mean values and 95% confidence intervals for the obtained ratings of Qi , Qii , Qij, and Qik. The redcrosses at the x-axis indicate which individual connections are impaired. The dashed lines reflect the expectations whenHypothesis 1 (mutual influence) holds, the dotted lines when Hypothesis 1 does not hold. Both dashed and dotted lines assumethat Hypothesis 2 (mean function) holds. The reference condition AVRef is repeated in each plot for better visual comparison.
Brief explanation of shown condition names (for full details see Table 8.10):
AVRef = reference condition. VF2, VF2sym = reduced video frame rate (“sym” = symmetric). VB, VBsym = reduced video bitrate(“sym” = symmetric). FM4, FM4sym = bandpass filtered microphone signal (“sym” = symmetric). FM4P3, FM4P3sym = bandpassfiltered microphone signal and packet loss on audio signal (“sym” = symmetric).
2. Analysis Summary
Result for reference condition:
Qi , Qii , Qij, Qik are all essentially equal and optimal. ⇒ AVRef serves as reference condition for this test.
Results concerning Hypothesis H1, see dotted lines.
Condition Result Rationale
VF2, VF2sym, VB, FM4 × Qii & Qij are not significantly different from the expected value.
FM4-P3 X Qii is significantly different from the expected value.
VBsym, FM4sym X Qij is significantly different from the expected value.
FM4-P3sym X Qii & Qij are significantly different from the expected value.
Results concerning Hypothesis H2, see dashed lines.
Condition Result Rationale
VF2, VF2sym, FM4, FM4sym X Qi is not significantly different from the expected value.
VB, VBsym, FM4-P3, FM4-P3sym × Qi is significantly different from the expected value.
Figure 8.12: Results for ExperimentAVCT2, Part 1.

perception of telemeeting quality with focus on telecommunication aspects 251
1. Visualization of Results and Expectations
The errorbars show the mean values and 95% confidence intervals for the obtained ratings of Qi , Qii , Qij, and Qik. The redcrosses at the x-axis indicate which individual connections are impaired. The dashed lines reflect the expectations whenHypothesis 1 (mutual influence) holds, the dotted lines when Hypothesis 1 does not hold. Both dashed and dotted lines assumethat Hypothesis 2 (mean function) holds. The reference condition AVRef is repeated in each plot for better visual comparison.
Brief explanation of shown condition names (for full details see Table 8.10):
AVRef = reference condition. FM4-VF2, FM4-P3-VF2, FM4-VB, FM4-P3-VB = audiovisual impairments, combinations of FM4,FM4-P3, VF2, VB. E2 = echo. FM4-AVP3 = bandpass filtered speech and packet loss on audio and video signal.
2. Analysis Summary
Result for reference condition:
Qi , Qii , Qij, Qik are all essentially equal and optimal. ⇒ AVRef serves as reference condition for this test.
Results concerning Hypothesis H1, see dotted lines.
Condition Result Rationale
FM4-VF2, FM4-P3-VF2, FM4-VB, FM4-AVP3 × Qii & Qij are not significantly different from the expected value.
FM4-P3-VB X Qii is significantly different from the expected value.
E2 X Qij is significantly different from the expected value.
Results concerning Hypothesis H2, see dashed lines.
Condition Result Rationale
FM4-VF2 X Qi is not significantly different from the expected value.
FM4-P3-VF2, FM4-VB, FM4-P3-VB, E2, FM4-AVP3
× Qi is significantly different from the expected value.
Figure 8.13: Results for ExperimentAVCT2, Part 2.

252 quality of experience of multiparty conferencing and telemeeting systems
8.5.7 Discussion
Review of Results Table 8.14 summarizes the main findings for thetwo audiovisual conversation tests AVCT1 and AVCT2.
Experiment Conditions Hypothesis H1 Hypothesis H2
Audio-only Video-only Audiovisual
Asymmetric Symmetric Asymmetric Symmetric Asymmetric
AVCT1 FM2 – VF1 – FM2-VR, E2-VR × X
– – – – FM2-VF1 × ×
– – VR – E2-VF1 X X
E2 – – – – X ×
AVCT2 FM4 – VF2 VF2sym FM4-VF2 × X
– – VB – FM4-P3-VF2,FM4-VB,FM4-AVP3
× ×
E2, FM4-P3 FM4sym,FM4-P3sym
– VBsym FM4-P3-VB X ×
Table 8.14: Overview of the resultsfor the audiovisual conversation testsAVCT1 & AVCT2, concerning the twohypotheses H1 & H2. Confirmed hy-potheses are denoted with a X, rejectedhypotheses with a ×.
Hypothesis H1 is confirmed in nine out of 22 tested cases, andrejected in 13 cases. This means that a clear evidence is found for amutual influence of the individual connections, while such influencedepends on the actual technical condition. Concerning a systematicbehavior that could explain when a condition shows that influence ornot, it is helpful to first recapitulate the results of the audio-only tests.The audio-only conversation tests and listening-only tests showedthat the impairment type most likely does not explain the influence,while the strength of an impairment – at least partially – does. Thiscould be verified since in the audio-only tests, multiple instantiationsof the same impairment type at different strengths were tested. Nowlooking at the audiovisual tests here, however, only few such multipleinstantiations were tested. For that reason, there is some evidencethat the impairment type explains the mutual influence, but this iscontradictory, according to Table 8.14: Those cases with differentinstantiations of the same impairment type (i.e. VF1 and VF2) showconsistently no mutual influence, which does not reject the impair-ment type as a possible explanation. However, considering cases withsimilar impairment types (i.e. VR and VB, both essentially causinglower video resolution) show either a mutual influence or not, whichrejects the impairment type as a possible explanation. Concerningthe strength of an impairment as explanation for a mutual influence,again the evidence is contradictory: Figure 8.11 supports this forthe audio-only and video-only impairments in Experiment AVCT1
(FM2 vs. E2, VF1 vs. VR), but not for the audiovisual impairments;Figures 8.12 and 8.13 support this only for the asymmetric audio-onlyimpairments (FM4 vs. FM4-P3), but not for the other impairments.Furthermore, the selection of conditions was specifically intended toinvestigate modality effects in terms of audio-only and video-onlyimpairments as well as symmetry effects in terms of differences be-tween asymmetric and symmetric configurations. Thus, it is possible

perception of telemeeting quality with focus on telecommunication aspects 253
to check, if modality or symmetry can explain the influence. However,neither modality nor symmetry do this, since Table 8.14 shows thatimpairments from all modalities and impairments in both symmetricand asymmetric configurations are distributed among both cases H1confirmed and H1 rejected.
Hypothesis H2 is confirmed in ten of 22 tested cases, and rejectedin twelve cases. This means that in many cases the Single-PerspectiveTelemeeting Quality Qi can be expressed as a simple average of the In-dividual Connection Quality Scores Qij of the individual connections.However, there are also many technical conditions for which thissimple relation does not hold. As for the mutual influence, neitherthe type nor the strength of an impairment are sufficient to explainthe need to express the relation between Qi and Qij with a moresophisticated function. Conditions that require a more sophisticatedfunction (E2, FM2-VF1, VB, VBsym, FM4-P3, FM4-P3sym) are ofdifferent impairment types (Table 8.14) and have quality scores dis-tributed across the whole range (Figures 8.11 to 8.13). Similarly, alsono consistent trend in terms of symmetry is visible, as impairmentsin asymmetric and symmetric conditions do either both confirm orreject H2 (FM4-P3 vs. FM-P3sym, VF2 vs. VF2sym, VB vs. VBsym), orthey are distributed across the two cases H2 confirmed and H2 rejected(FM4 vs. FM4sym). Also no consistent trend in terms of modalityis visible, as impairments from all modalities are distributed amongboth cases H2 confirmed and H2 rejected.
Review of the Approach and Open Questions for Future Work There area number of open questions concerning the experimental methodthat this section will address now: rating on multiple scales and thelimitation in terms of communicative aspects.
The aspect of multiple rating scales has been discussed in Sec-tion 8.3 for the audio-only conversation tests and Section 8.4 for thelistening-only tests, and the same discussion (in short) applies here:it might be that test participants do form some average of Qij simplydue to the presentation of both Qi and Qij on the same questionnaire,despite the usage of different scale designs and questions; and fu-ture studies could validate this by different experimental approaches(e.g. split sessions, between-subject designs).
Also the aspect of the communicative situation was discussedin Section 8.3 for the audio-only conversation tests, and a similardiscussion applies here: the experiments considered one degree ofcommunication complexity in terms of the number of interlocutors,and future work could repeat this experiments with a different num-ber of interlocutors. However, contrary to the audio-only conversationtests, test participants had to perform two different conversation tasksthroughout a session, whereas those tasks are different in their con-versational structure: in one task participants have a discussion, inthe other task participants exchange questions and short yes-no an-swers. This means that the experiments considered two degrees ofcommunication complexity in terms of the conversational structure.

254 quality of experience of multiparty conferencing and telemeeting systems
Interestingly, the impact of those two tasks on the quality ratings wasfound to be non-significant for the present data, despite the conver-sational differences. Here, future work could apply conversationalanalysis methods (see Section 2.2) and correlate those results with thequality ratings to better investigate the impact of conversation tasksand quality perception, similar to the work by Schoenenberg 45, who 45 Katrin Schoenenberg. “The Quality
of Mediated-Conversations under Trans-mission Delay”. PhD Thesis. TechnischeUniversität Berlin, Germany, 2016
did such analysis for delay impairments.
Summary
The goal of the research presented here was to obtain more insightsinto the influence of telecommunication aspects on telemeeting qual-ity, more specifically the perceived system performance, expressedas Speech Communication Quality with a focus on the Telecommunica-tion Component. In particular, the quality aggregation process fromIndividual Connection Quality scores Qij to the Single-Perspective Tele-meeting Quality score Qi was in focus of the investigations. Thecommunicative aspects were indirectly considered in the tests as wellby simulating three different types of communication scenarios: anaudio-only telemeeting from the perspective of an active participant,simulated by means of an audio-only conversation test, an audio-onlytelemeeting from the perspective of a passive participant, simulatedby means of an listening-only test, and an audiovisual telemeetingfrom the perspective of an active participant, simulated by means ofan audiovisual conversation test.
Concerning the audio-only conversation tests, three experimentswere conducted in which the experimental methodology of the thirdexperiment was improved after the first two experiments. Here thefollowing results were found: First, there is evidence for a mutualinfluence of the individual connections on the Individual ConnectionQuality scores Qij, whereas this influence is visible only for a limitednumber of the tested conditions. Second, for most conditions, theaverage of Individual Connection Quality scores Qij is sufficient toestimate the Single-Perspective Telemeeting Quality score Qi, whereasthere also are a number of conditions for which a more sophisticatedaggregation than a simple mean is necessary. Third, the strength ofan impairment appears to explain – at least partially – whether thetwo effects (mutual influence of connections and need for a moresophisticated aggregation) occur or not: the stronger the impairment,the more likely the effects occur. Fourth, improving the experimentalmethodology, which also allowed to increase the number of testedconditions, paid off in the sense that only the third experiment wassufficiently sensitive to detect that a simple average of Qij is notalways sufficient to estimate Qi. The main finding from those audio-only conversation tests can be formulated as follows: the relationbetween the two aggregation levels is a rather complex construct,which appears to depend on the strength of impairments or the levelof quality, respectively.
Concerning the listening-only conversation tests, two experiments

perception of telemeeting quality with focus on telecommunication aspects 255
were conducted in which the experimental methodology was im-proved after the first experiment. Here the following results werefound: First, as for the audio-only conversation tests, part of the testedconditions showed a mutual influence of individual connections and aneed for a more sophisticated aggregation, while other conditions didnot show those effects. Second, slightly different from the audio-onlyconversation tests, the strength of an impairment is not sufficient toexplain when such effects occur, as results are less consistent in thatrespect. Third, the presence of asymmetry appears to partially ex-plain those effects as well, whereas here again the results are not veryconsistent either. The main finding from those listening-only tests canbe formulated as follows: the relation between the two aggregationlevels is a rather complex construct, which appears to depend on theone hand on the strength of impairments or the level of quality, andon the other hand on the presence of asymmetry.
Concerning the audiovisual conversation tests, two experimentswere conducted in which the experimental methodology was – asbefore – improved after the first experiment. Here the followingresults were found: First, as for the audio-only conversation tests,part of the tested conditions showed a mutual influence of individualconnections and a need for a more sophisticated aggregation, whileother conditions did not show those effects. Second, slightly differentfrom the audio-only conversation tests, neither the strength of animpairment nor the presence of asymmetry are sufficient to explainwhen such effects occur, as results are less consistent in that respect.Third, the modality of an impairment appears to partially explainthose effects as well, whereas here again the results are not veryconsistent either. The main finding from those audiovisual conver-sation tests can be formulated as follows: the relation between thetwo aggregation levels is a rather complex construct, which appearsto depend – at least partially – on the strength of impairments, thepresence of asymmetry, and the modality of impairments, whereasno individual aspect alone is sufficient to explain the aggregationconsistently.

9Perceptual Models of Telemeeting Quality
This chapter contains text passages that either stem from previous texts of the author or that are based on such source texts. Forreadability purposes those passages are not marked as quotations. The main source documents used for this chapter are:
- Janto Skowronek et al. “Method and Apparatus for Computing the Perceived Quality of a Multiparty Audio or Audiovisual TelecommunicationService or System”. Patent application WO/2016/041593 (EP). Deutsche Telekom AG. Mar. 2016
- Janto Skowronek. Initial model for audio-only communication based on available data. Project Report “Quality of Multiparty Audio-Video Communica-tion” (Unpublished). Assessment of IP-based Applications, Technische Universität Berlin, Germany, June 2013
- Janto Skowronek. Improved model for audio-only communication. Project Report “Quality of Multiparty Audio-Video Communication” (Unpublished).Assessment of IP-based Applications, Technische Universität Berlin, Germany, Dec. 2013
- Janto Skowronek. Pilot test for audiovisual communication. Project Report “Quality of Multiparty Audio-Video Communication” (Unpublished).Assessment of IP-based Applications, Technische Universität Berlin, Germany, Feb. 2014
- Janto Skowronek. Second test for audiovisual communication. Project Report “Quality of Multiparty Audio-Video Communication” (Unpublished).Assessment of IP-based Applications, Technische Universität Berlin, Germany, Oct. 2014
- Janto Skowronek. Final Project Report – Quality of Multiparty Audio-Video Communication. Project Report “Quality of Multiparty Audio-VideoCommunication” (Unpublished). Assessment of IP-based Applications, Technische Universität Berlin, Germany, Dec. 2014
Since additional documents served as further background material, see Appendix A for the full list of source documents and theircontributions to this chapter.
What this chapter is about
This chapter reports on the development and evaluation of a set ofalgorithms that model the quality aggregation process that was ex-perimentally investigated in the previous chapter. In other words, thegoal is to estimate by means of mathematical algorithmic operationsthe Single-Perspective Telemeeting Quality Qi based on the IndividualConnection Quality scores Qij.
9.1 Introduction
Motivation The motivation for the intended models is to obtain in-sights on how the individual connections contribute to the overalltelemeeting experience. From a theoretical perspective, this providesevidence for the quality aggregation processes discussed in the con-ceptual model in Chapter 5. From an engineering perspective, thisprovides the basis for a future instrumental modeling framework.In such a framework the quality of individual connections Qij canbe estimated with instrumental methods and then the telemeetingquality Qi is computed based on those estimations.

perceptual models of telemeeting quality 257
Approach The approach is to develop and evaluate a set of compu-tational models, which use as input the Qij ratings obtained in theperception experiments of the previous Chapter 8, and which com-pute estimations of the Qi ratings obtained from said experiments.Since these models rely on perceptual data as input, they are calledhere Perceptual Quality Models, in order to differentiate them from theso-called Instrumental Quality Models, in which technical informationor the signals are used as input (Section 4.5).
Hypothesis The presented modeling work is build around a funda-mental modeling hypothesis, which can be formulated as:
H1: There exists a set of advanced models that outperform the sim-ple mean operation, whereas the added value of those advancedmodels holds only for a subset of conditions.
This hypothesis is motivated by the results of Chapter 8, whichsuggest that in many cases, i.e. technical conditions, it is sufficientto estimate the Single-Perspective Telemeeting Quality Qi as a simplemean of the Individual Connection Quality scores Qij, while for otherconditions this mean operation is clearly not sufficient. Thus, thepresent modeling work is focused on finding a set of appropriateadvanced models and on evaluating their performance with respectto the performance of a simple mean operation and to the potentialdependency on the technical conditions.
9.2 Modeling Algorithms
In this work, the author developed and evaluated different modelingalgorithms. Those algorithms are first inspired by three fundamentalmodeling ideas, then translated into a set of eight modeling functions,i.e. mathematical operations to estimate Qi scores based on Qij scores,and finally further specified by a set of additional modeling factors,which essentially resemble a number of processing variations.
9.2.1 Fundamental Modeling Ideas
The first two fundamental modeling ideas (MI1 & MI2) can be formu-lated as:
MI1: The Single-Perspective Telemeeting Quality Qi is a simple mean ofthe Individual Connection Qualities Qij.
MI2: The Single-Perspective Telemeeting Quality Qi is the minimumvalue of the Individual Connection Qualities Qij.
These ideas are motivated by the observation that for almost allconditions Qi lies between the mean value and the minimum value ofQij. As Figures 9.1 to 9.3 show, in most of those conditions the meanof the Qij is closer to Qi, but for some conditions the minimum valueof Qij is closer to Qi. In that respect, MI1 and MI2 can be regarded

258 quality of experience of multiparty conferencing and telemeeting systems
as the baseline models due to their simplicity and the fact that theyconstitute for most conditions the upper and lower boundaries.
However, the noise conditions TN1 and TN2 in ACT3 and LOT2
and the echo conditions E2 and E3 in ACT3 deviate from this; here Qi
is even lower than the minimum value of Qij. Looking more closelyat the noise conditions in ACT3 and LOT2, the individual connectioncausing the impairment can not be identified by the test participantsas the noise is additive and does not provide any cues from whichinterlocutor it stems. This in turn suggests an inverse quality aggre-gation paradigm: instead of aggregating Qij to Qi, participants forma judgment of Qi and then distribute this judgment, or more preciselythe quality impairment leading to this judgment, across the individualconnections. Turning this relation around, a third modeling idea canbe extracted as follows:
MI3: The Single-Perspective Telemeeting Quality Impairment QIi is the sumof the Individual Connection Quality Impairments QIij, whereas QIi
can be expressed as the difference between a maximum possiblequality Qmax and the Single-Perspective Telemeeting Quality Qi andQIij as the difference between Qmax and the Individual ConnectionQuality Qij.
In other words, MI3 assumes that not an aggregation of the actualquality values but an aggregation of quality impairments is takingplace, which then lead to quality values.

perceptual models of telemeeting quality 259
(a) Experiment ACT1: mean(Qij) is closer to Qi than min(Qij) for: L3 (loudness), TN3 (transmitted noise), Dsym (delay), E1
(echo), P1 (packet loss). min(Qij) is closer to Qi for: EN3 (noise in environment). Both are equally close for: Ref1 (reference).
(b) Experiment ACT2: mean(Qij) is closer to Qi than min(Qij) for: Ref2 (reference), L1, L2, L4 (loudness). min(Qij) is never closerto Qi .
(c) Experiment ACT3: mean(Qij) is closer to Qi than min(Qij) for: B2, B2sym (narrow band codec), FM1, FL3sym, FM2, FL4sym(bandpass filtered speech), P1, P2, P3, P4 (packet loss). min(Qij) is closer to Qi for: Ref3 (reference), B1 (wide band codec), TN1,TN2 (transmitted noise), E2, E3 (echo).
Figure 9.1: Motivation for the two funda-mental modeling ideas MI1 (Qi is meanof Qij) and MI2 (Qi is minimum valueof Qij), data of audio-only conversationtests.

260 quality of experience of multiparty conferencing and telemeeting systems
(d) Experiment LOT1: mean(Qij) is closer to Qi than min(Qij) for: B2, B2sym (narrow band codec), P5 (packet loss), B2symP5
(narrow band codec & packet loss), E4, E4sym (echo), R (reverberation), CN (speech correlated noise). min(Qij) is closer to Qi for:Ref5 (reference).
(e) Experiment LOT2: mean(Qij) is closer to Qi than min(Qij) for: Ref3 (reference), FM1, FM1sym, FM2, FM2sym, FM4, FL4sym(bandpass filtered speech), P1, P1sym, P3, P3sym, P4, P4sym (packet loss), FM4P3, FM4P3sym (bandpass filtered speech & packetloss), B2, B2sym (narrow band codec), E2, E2sym, E3, E3sym (echo). min(Qij) is closer to Qi for: FM4sym (bandpass filteredspeech), TN1, TN2 (transmitted noise).
Figure 9.2: Motivation for the two funda-mental modeling ideas MI1 (Qi is meanof Qij) and MI2 (Qi is minimum valueof Qij), data of listening-only tests.

perceptual models of telemeeting quality 261
(f) Experiment AVCT1: mean(Qij) is closer to Qi than min(Qij) for: AVref (reference), VF1 (reduced frame rate), VR (reducedresolution), FM2 (bandpass filtered speech), E2 (echo), E2-VF1, FM2-VR, E2-VR (audiovisual combinations). min(Qij) is closer toQi for: FM2-VF1 (bandpass filtered speech & reduced frame rate).
(g) Experiment AVCT2: mean(Qij) is closer to Qi than min(Qij) for: AVref (reference), VF2, VF2sym (reduced video frame rate),VB, VBsym (reduced bit rate), E2 (echo), FM4 (bandpass filtered speech), FM4-P3 (bandpass filtered speech & packet loss onaudio stream), FM4-AVP3 (bandpass filtered speech & packet loss on audio & video stream), FM4-VF2 (bandpass filtered speech& reduced frame rate), FM4-P3-VF2 (bandpass filtered speech & packet loss on audio stream & reduced frame rate), FM4-VB(bandpass filtered speech & reduced bit rate), FM4-P3-VB (bandpass filtered speech & packet loss on audio stream & reduced bitrate). min(Qij) is closer to Qi for: FM4sym, FM4-P3sym.
Figure 9.3: Motivation for the two funda-mental modeling ideas MI1 (Qi is meanof Qij) and MI2 (Qi is minimum valueof Qij), data of audiovisual conversationtests.

262 quality of experience of multiparty conferencing and telemeeting systems
9.2.2 Modeling Functions
Based on the fundamental modeling ideas and inspired by sugges-tions from the team members of the project under which the presentwork was conducted 1, the author developed and tested eight dif- 1 Janto Skowronek et al. “Method
and Apparatus for Computing the Per-ceived Quality of a Multiparty Au-dio or Audiovisual TelecommunicationService or System”. Patent applica-tion WO/2016/041593 (EP). DeutscheTelekom AG. Mar. 2016
ferent modeling functions F1 to F8. These functions estimate theSingle-Perspective Telemeeting Quality score Q̂i based on the IndividualConnection Quality scores Qij. Table 9.1 shows an overview of thesefunctions, while the following text will provide the correspondingrationale for selecting these functions.
Function Computation Parameter Constraints
F1 “baseline mean” Q̂i = mean(Qix) = 1/3 · (Qii + Qij + Qik)
F2 “weighted mean” Q̂i = wii ·Qii + wij ·Qij + wik ·Qik wii + wij + wik = 1
F3 “mutual influence” Q̂i = σij(Qij) · σik(Qik) ·Qii
+σii(Qii) · σik(Qik) ·Qij
+σii(Qii) · σij(Qij) ·Qik
with σix(Qix) =1
1 + e−six ·(Qix−oix), x ∈ [i, j, k]
six ∈ [0...10] and oix ∈ [0...10]
F4 “quality dependentinfluence”
Q̂i = w1 ·mean(Qix) · σ1(mean(Qix))
+w2 ·min(Qix) · σ2(mean(Qix))
with σ1(Qix) =1
1 + e−s1 ·(Qix−o1)
with σ2(Qix) =1
1 + e+s2 ·(Qix−o2)
[w1, w2, s1, s2, o1, o2] > 0
F5 “influence of outliers” Q̂i = wii,n · wii,s ·Qii + wij,n · wij,s ·Qij + wik,n · wik,s ·Qik
with wix,n =
1−β
#IL−1 · #outliers + #IL·β#IL−1 , if Qix is outlier
1, if Qix is not an outlier
with wix,s =
1−δγ · std(Qix) + δ, if Qix is outlier
1, if Qix is not an outlier
with Qix is outlierif Qix < mean(Qix)− α · std(Qix)or Qix > mean(Qix) + α · std(Qix)
[α, β, γ, δ] > 0
F6 “weighted minimum” Q̂i = w ·min(Qix) + C w > 0, C ∈ R
F7 “baseline minimum” Q̂i = min(Qix)
F8 “weighted mean of im-pairments”
Q̂i = wii ·Qii + wij ·Qij + wik ·Qik + wmax ·Qmaxwith Qmax = maximum quality score in whole data set
[wii , wij, wik ] > 0, wmax ≤ 0
Table 9.1: Modeling functions F1 to F7.
Functions F1 and F7 The rationale for F1 and F7 is straight forward:they realize the first two fundamental modeling ideas simple mean ofQij and simple minimum value of Qij.
Functions F2 and F6 The rationale for F2 and F6 is to extend F1
and F7 with parameters that can be chosen to improve prediction

perceptual models of telemeeting quality 263
performance. Thus, F2 is a weighted mean of Qij and F6 a weightedminimum value of Qij with an additional offset parameter. Further-more, F2 is also interesting from a conceptual perspective, as thesingle weightings per individual connection resemble the relativeimportance of the individual connections. This actually means thatF2 allows to include inherently the mutual influence of individualconnections that was observed in Chapter 8.
Figure 9.4: Visualization of the σ func-tion for different values of six and oix .
Function F3 The rationale for F3 is to explicitly model that mutualinfluence: each Qij score is weighted with a term which is in turn afunction of the Qij scores of the respective other individual connec-tions. The idea for this function is to model that strong impairments,i.e. connections with low quality scores, negatively effect the other con-nections. In other words, the contribution of a Qij score to the overallQi score is reduced when the other Qij scores are low, and vice versa.The choice fell on the sigmoid function σix(Qix) = 1
1+e−six ·(Qix−oix),
x ∈ [i, j, k], with one parameter six describing the steepness and oneparameter oix describing the zero-crossing point. Figure 9.4 visualizesthe σ function for different values of six and oix.
Figure 9.5: Visualization of the σ func-tion with inverse orientations by invert-ing the sign of six .
Function F4 The rationale for F4 is to combine the two modelingfunctions F1 and F7. The idea is to exploit the observation that inmany cases in Figures 9.1 to 9.3 the mean of Qij is close to Qi whenQi is high and the minimum value is close when Qi is low. This leadsto a quality dependent weighting of the mean and the minimumvalue, whereas this quality dependency is realized as a function of apre-estimation of Qi, favoring the mean of Qij for higher values of thepre-estimate and the minimum value of Qij for lower values of thepre-estimate. This in turn is realized by using two sigmoid functionsσ1 and σ2 with inverse orientations (see Figure 9.5 for a visualization),and by using the simple mean of Qij as pre-estimation of Qi.
Function F5 The rationale for F5 is to model the mutual influenceof individual connections as a function of outliers: If an IndividualConnection Quality score is an outlier, i.e. the score is substantiallydifferent from the other individual connections, then this outlier getsa reduced weighting. From a conceptual perspective, this reflects thepossibility that when participants perceive one particularly differentconnection, he or she will tend to attribute the quality to the corre-sponding interlocutors or the corresponding device or environment.This means that the participant does not or just in parts attributethe quality to the system, which in turn means, the contributionof that connection has a lower contribution to the Single-PerspectiveTelemeeting Quality score. Hence, the weighting of that connection isreduced.
The implementation chosen here is first to detect an outlier bythreshold operation: Qij is an outlier if it lies outside the standarddeviation around the mean of all Qij scores of that participant and call.Then, the effect of outliers is realized such that two aspects are covered.

264 quality of experience of multiparty conferencing and telemeeting systems
The first aspect is that the more outliers are in a telemeeting, the loweris the effect of outliers. This is modeled here as a linearly increasingfunction of number of detected outliers: 1−β
#IL−1 · #outliers + #IL·β#IL−1 ,
with β determining the minimum possible weight in case that thereis only one outlier, and #IL being the total number of interlocutorsor connections, respectively. This particular realization converges toa weight of one in case that all connections are outliers and in casethat the number of interlocutors is large; both cases meaning that theimpact of a single outlier becomes negligible. The second aspect isthat the more the different Qij are spread across the quality range,the lower is the effect of outliers. This is modeled here as a linearlyincreasing function of the spread, here expressed by the standarddeviation, of all Qij scores of that participant and call: 1−δ
γ · std(Qix) +
δ, with γ determining the value of the standard deviation for whichthe weight should be equal to one, and δ determining the minimumweight in case that the standard deviation is equal to zero.
Function F8 The rationale for F8 is the third fundamental modelingidea, i.e. Qi is a weighted mean of the quality impairments on theindividual connections instead of the plain quality scores of thoseconnections. Function F8, which expresses this relation in terms ofplain quality scores, can be derived from this as follows. Startingpoint is the weighted sum of quality impairments:
QIi = wii ·QIii + wij ·QIij + wik ·QIik (9.1)
Then, quality impairments can be described as the difference of themaximum possible quality and the observed quality:
QIx = Qmax −Qx (9.2)
Substituting the terms in Equation 9.1 with Equation 9.2 leads to:
Qmax −Qi = wii · (Qmax −Qii) + wij · (Qmax −Qij) + wik · (Qmax −Qik)
Qi = Qmax − wii ·Qmax − wij ·Qmax − wik ·Qmax + wii ·Qii + wij ·Qij + wik ·Qik
Qi = (1− wii − wij − wik) ·Qmax + wii ·Qii + wij ·Qij + wik ·Qik(9.3)
Finally, Function F8 is then realized by allowing for an additionaldegree of freedom by replacing (1− wii − wij − wik) with a free pa-rameter wmax, which, however, is limited to negative values or zero.Setting wmax ≤ 0 allows F8 to compute predictions of Qi that aresmaller than the minimum of Qij, a behavior that was found for someof the noise and echo conditions in ACT3 and LOT2.
9.2.3 Modeling Factors
While the modeling functions constitute in a manner of speaking thecore of the modeling algorithms, the following number of furtheraspects, here called modeling factors, differentiate the individualmodeling algorithms that have been implemented in this work.

perceptual models of telemeeting quality 265
Raw scores vs. mean opinion scores The first modeling factor concernsthe question, whether the raw Single-Perspective Telemeeting Qualityscores Qi per participant and call are predicted based on the Indi-vidual Connection Quality scores Qij, or whether the mean opinionscores (MOS) of the Single-Perspective Telemeeting Quality MOS(Qi)
are predicted based on the MOS of the Individual Connection Qualityscores MOS(Qij), whereas MOS are computed as the mean of ratingsacross all participants and calls per technical condition. The presentwork focuses only on the raw quality scores, since the number ofconditions per experiment is rather low, which in turn can lead toovertraining effects if MOS are used (see also Section 9.5.2 for a moredetailed discussion on this).
Training and testing on whole data, per subset or per technical conditionAnother modeling factor concerns the model training and evaluationprocedure explained in the next section. Considering that somemodeling functions have free parameters that can be trained, such atraining is possible for four different subsets of the data:
• Training on the whole data.
• Training per technical condition. This is useful for modeling at-tempts in which the ground-truth data (here the Qi ratings) showsdifferent behavior between technical conditions.
• Training per subset of the data, whereas a subset is freely definableand does not need to be the same than a technical condition.This is useful for modeling attempts in which subsets can containmultiple technical conditions, such as audio-only, video-only, andaudiovisual impairments.
• Training per combination of technical condition and subset.
Similarly, model performance can be tested on the same four levels;thus 16 combinations of training and test levels are possible. Thepresent work, however, focuses only on the two levels whole data andper condition, leading to four combinations of training and test levels.
Assignment of scores to weights Since the modeling functions F2, F3
and F8 use weights that are (per training data set) constant but notequal for all individual connections, a well-defined way to assignthe Individual Connection Quality scores to the individual weights isrequired. In Skowronek et al. 2, we explained this need with the 2 Janto Skowronek et al. “Method
and Apparatus for Computing the Per-ceived Quality of a Multiparty Au-dio or Audiovisual TelecommunicationService or System”. Patent applica-tion WO/2016/041593 (EP). DeutscheTelekom AG. Mar. 2016
following example of Function F2: “Suppose that the computationof Q for a conference call with three participants is Q = wA ∗ QA +
wB ∗ QB + wC ∗ QC, where wA, wB, and wC are three different fixedweights, and QA, QB and QC are the individual connection qualityscores. In order to run this computation, there must be a method thatdetermines which of the three individual connection quality scoresis actually QA, which is QB, and which is QC, and hence which areassigned the respective weights wA, wB, and wC.”

266 quality of experience of multiparty conferencing and telemeeting systems
In this work, two alternatives for this assignment are considered.The first alternative is essentially a rule-based approach. It followsthe systematic method for defining technical conditions by means ofthe impairments perceived by each interlocutor (see Chapter 8) andthe corresponding technical analysis and data organization algorithm(see Sections 6.3 & 6.5). Applying this systematic method here means
a) to always assign the quality scores of the own connection to thefirst variable Qii,
b) to assign – in case of asymmetric configurations with an unim-paired connection – the unimpaired connection to the second vari-able Qij and the impaired connection to the third variable Qik,
c) to assign – in case of asymmetric configurations with two differentimpairments – the presumably weaker impairment to the secondvariable Qij and the presumably stronger impairment to the thirdvariable Qik, and
d) to arbitrarily assign – in case of symmetric configurations includingthe reference condition – one of the two connections to the secondvariable Qij and the other connection to the third variable Qik.
This assignment is inherently conducted when applying the dataorganization algorithm of Section 6.5.
The second alternative is to always assign the quality scores ofthe own connection to the first variable Qii, and to assign the other(here: two) connections to the remaining variables by sorting thecorresponding quality scores in ascending order. This means here, theminimum value of those two scores is assigned to the second variableQij and the maximum value is assigned to the third variable Qik.
9.3 Model Training and Evaluation Procedure
9.3.1 Motivation and Basic Principle
Some model functions have parameters that can freely be set toprovide optimal model performance, which means, those modelingfunctions can be trained by means of data fitting or machine learningapproaches. The approach used here is to apply a parameter trainingand model performance procedure that applies a three step approachtypically used in the machine learning domain: first, split the data intotraining and test sets; second optimize the parameters for the trainingset; and third, evaluate the performance of those trained modelswith the test set, using appropriate performance measures. Sincetraining and test results depend on the actual splitting of the datainto the training and test sets, the common approach is to conductrepetitions of this procedure to obtain a more stable estimate of thetrue model performance. In the data fitting and machine learningdomain, multiple alternatives are known to realize this repetition:for instance k-fold cross validation, leave-one-out validation, andbootstrapping. The author opted for the bootstrap method, which

perceptual models of telemeeting quality 267
has been developed by Efron 3. The motivation is that the present 3 Bradley Efron. “Bootstrap Methods:Another Look at the Jackknife”. In: TheAnnals of Statistics 7.1 (1979), pp. 1–26
data sets are quite small for robust model fitting procedures; and thebootstrap method is specifically suitable for estimating the true valueof a statistical estimate, which is here the true mean of the modelperformance, for small sample sizes. While Zoubir 4 for instance 4 A.M. Zoubier and B. Boashash. “The
Bootstrap and its Application in SignalProcessing”. In: IEEE Signal ProcessingMagazine (Jan. 1998), pp. 56–76
provides a more extensive introduction of the bootstrap method, thebasic idea of this method is to construct many variations of a datasample (typically in the order of 100 to 1000) by randomly drawingindividual observations of that original sample, whereas individualobservations may be drawn multiple times for each new data sample.In order to apply this method for the model evaluation task at hand,the author opted for a modification5 as follows: The approach is to 5 This modification has been used in the
literature by others as well as by the au-thor, e.g.:
Catherine Champagne et al. “A boot-strap method for assessing classificationaccuracy and confidence for agriculturalland use mapping in Canada”. In: Inter-national Journal of Applied Earth Observa-tion and Geoinformation 29 (2014), pp. 44–52
Janto Skowronek, Martin McKinney,and Steven van de Par. “A demonstratorfor automatic music mood estimation”.In: Proceedings of the 8th International Con-ference on Music Information Retrieval (IS-MIR). 2007
conduct many repetitions in which the data is randomly split intotraining or test sets, whereas the split is – in contrast to k-fold crossvalidation or leave-one-out method – done independently from theprevious iteration. This allows that the training and test sets in eachiteration may include again some of the observations of the previousiteration, which resembles the idea of bootstrapping. At the sametime this ensures in each iteration that no individual observations arepresent in both training and test sets.
9.3.2 Performance Measures
Two well known measures are used to assess the performance of thedifferent modeling functions: the Pearson correlation coefficient Rhoand the root mean square error RMSE, both computed between theestimated and true scores of the Single-Perspective Telemeeting QualityQi. Furthermore, since the bootstrap repetition procedure is usedto obtain a good estimate of the true modeling performance, whichmeans the two performance measures are computed per repetition,it is possible to compute for both measures mean values (meanRho,meanRMSE) and 95% confidence intervals (ci95Rho, ci95RMSE). Themean values give an estimation of the expected performance, theconfidence interval provides insights how stable this estimation is. Tocompare the performance of the eight different modeling functionsF1 to F8, the author used errorbar plots (mean values and confidenceintervals) to visualize differences in the performance of the func-tions, and formal statistical analysis (ANOVA and PostHoc tests) todetermine whether differences are significant.
9.3.3 Selection of the Number of Bootstrap Repetitions
Motivation The number of bootstrap repetitions is a free parameterin the model evaluation procedure, which needs to be carefully cho-sen for two reasons. The first reason concerns practical issues: In theliterature typical values for this number range between 100 and 1000,whereas it depends on the actual data, whether this number of repe-titions is sufficient to estimate the true value. However, consideringthat for six of the eight modeling functions each bootstrap repetitionrequires a training, which in turn is calling a parameter search routine,

268 quality of experience of multiparty conferencing and telemeeting systems
computation times for such large numbers of repetitions can becomevery long. For that reason, a good balance between the accuracy ofthe performance estimate and the computation time is desired.
The second reason concerns methodological issues: While a largernumber of bootstrap repetitions means to obtain a more stable es-timate of the model performance, i.e. the mean of the performancemeasures Rho and RMSE, it also means that any desired sensitivityto differentiate between the modeling functions can be achieved, aslong as the number of repetitions is large enough. The reason isthat the confidence interval, which is used to distinguish betweenthe performance of the different modeling functions, is per definitionmonotonically decreasing with an increasing number of observationsN, due to the following relation 6: 6 Andy Field. Discovering Statistics us-
ing SPSS. 3rd ed. SAGE publications,2009CI = tn−1 · SE
= tn−1 · STD√N
= tn−1 ·
√∑(x−x)2
N−1√N
= tn−1 ·√
∑(x−x)2√
N−1·√
N
(9.4)
with SE standard error, STD standard deviation, and tn−1 the valueof the t-distribution for a degree of freedom of n− 1.
For that reason, limiting the number of repetitions N would lead tomore conservative results, as confidence intervals are larger and thusthe performance of different modeling functions must differ morebefore significant differences can be observed.
Selection Process and Criteria To make an informed selection of thenumber of bootstrap repetitions, the author computed the perfor-mance measures for the two functions F1 and F7 from one up to1000 repetitions. The two functions do not require training, whichmakes it feasible to run large numbers of repetitions. Furthermore,the estimated telemeeting quality scores Q̂i of these two functionsrepresent for most technical conditions the upper and lower bound-aries of the true Single-Perspective Telemeeting Quality scores Qi (seeFigures 9.1 to 9.3). Thus, the relation between modeling performanceand number of bootstrap conditions for F1 and F7 is representativefor this relation for all modeling functions.
The selection of the number of bootstrap repetitions is based onanalyzing two aspects: the stability of estimating the true mean per-formance values, and the sensitivity to differentiate the modelingfunctions. Concerning the stability, the deviation of the mean perfor-mance values between the chosen and the maximum tested number ofrepetitions should be acceptable. This is the case when the deviationis in the order of the confidence intervals around the correspondingmean performance values. Concerning the sensitivity, the mean per-formance values of each function should not lie inside the confidenceintervals of the respective other function, as this indicates significantlydifferent modeling performance between the two functions.

perceptual models of telemeeting quality 269
Selection Result Figures 9.6 to 9.8 provide the detailed analysis forthe seven experiments ACT1 to AVCT2. Based on these figures, thenumber of bootstrap repetitions is set to 20, as this value fulfills theselection criteria for all except two cases.

270 quality of experience of multiparty conferencing and telemeeting systems
1. Visualization:The plots show the two performance measures Rho and RMSE as a function of the number of bootstrap repetitions. The resultsare shown for the two baseline modeling functions F1 “simple mean” and F7 “simple minimum value”. The solid lines show themean values of each performance measure, the shaded areas indicate the 95% confidence intervals around the mean values. Thered circles indicate the mean values for 20, 50 and 100 bootstrap repetitions.
2.1 Results Experiment ACT1.
2.2 Results Experiment ACT2.
2.3 Results Experiment ACT3.
3.1 Analysis concerning stable estimates of the true mean values:The mean values beyond 100 repetitions slightly change with increasing number of repetitions, which indicates that 100 repetitionsalready provide stable estimates. However, the mean values for 50 and 20 repetitions are also relatively close; the differences arein the order of the respective confidence intervals. Thus, the number of repetitions can be reduced down to 20 with acceptabledeviations from the true mean.
3.2 Analysis concerning sensitivity to differentiate the modeling functions:With the exception of Rho in Experiment ACT2, the mean values of each modeling function do not lie within the confidenceinterval of the respective other modeling function for neither 20, 50 or 100 repetitions. Thus, significant differences between thetwo modeling functions can be expected. This means that already 20 repetitions provide in most cases a sufficient sensitivity todifferentiate the modeling functions. In the case of Rho in Experiment ACT2, about 300 repetitions would be necessary; a valuethat is too large to be practically feasible.
Figure 9.6: Analysis for selecting thenumber of bootstrap repetitions, resultsof audio-only conversation tests.

perceptual models of telemeeting quality 271
1. Visualization:The plots show the two performance measures Rho and RMSE as a function of the number of bootstrap repetitions. The resultsare shown for the two baseline modeling functions F1 “simple mean” and F7 “simple minimum value”. The solid lines show themean values of each performance measure, the shaded areas indicate the 95% confidence intervals around the mean values. Thered circles indicate the mean values for 20, 50 and 100 bootstrap repetitions.
2.1 Results Experiment LOT1.
2.2 Results Experiment LOT2.
3.1 Analysis concerning stable estimates of the true mean values:The mean values beyond 100 repetitions slightly change with increasing number of repetitions, which indicates that 100 repetitionsalready provide stable estimates. However, the mean values for 50 and 20 repetitions are also relatively close; the differences arein the order of the respective confidence intervals. Thus, the number of repetitions can be reduced down to 20 with acceptabledeviations from the true mean.
3.2 Analysis concerning sensitivity to differentiate the modeling functions:With the exception of Rho in Experiment LOT2, the mean values of each modeling function do not lie within the confidenceinterval of the respective other modeling function for neither 20, 50 or 100 repetitions. Thus, significant differences between thetwo modeling functions can be expected. This means that already 20 repetitions provide in most cases a sufficient sensitivity todifferentiate the modeling functions. In the case of Rho in Experiment LOT2, about 60 repetitions would be necessary, while for20 repetitions only the mean value of F1 lies in the confidence intervals of F7, but not the mean value of F7 in the confidenceinterval of F1.
Figure 9.7: Analysis for selecting thenumber of bootstrap repetitions, resultsof listening-only tests.

272 quality of experience of multiparty conferencing and telemeeting systems
1. Visualization:The plots show the two performance measures Rho and RMSE as a function of the number of bootstrap repetitions. The resultsare shown for the two baseline modeling functions F1 “simple mean” and F7 “simple minimum value”. The solid lines show themean values of each performance measure, the shaded areas indicate the 95% confidence intervals around the mean values. Thered circles indicate the mean values for 20, 50 and 100 bootstrap repetitions.
2.1 Results Experiment AVCT1.
2.2 Results Experiment AVCT2.
3.1 Analysis concerning stable estimates of the true mean values:The mean values beyond 100 repetitions slightly change with increasing number of repetitions, which indicates that 100 repetitionsalready provide stable estimates. However, the mean values for 50 and 20 repetitions are also relatively close; the differences arein the order of the respective confidence intervals. Thus, the number of repetitions can be reduced down to 20 with acceptabledeviations from the true mean.
3.2 Analysis concerning sensitivity to differentiate the modeling functions:With the exception of Rho in Experiment AVCT2, the mean values of each modeling function do not lie within the confidenceinterval of the respective other modeling function for neither 20, 50 or 100 repetitions. Thus, significant differences between thetwo modeling functions can be expected. This means that already 20 repetitions provide in most cases a sufficient sensitivity todifferentiate the modeling functions. In the case of Rho in Experiment AVCT2, about 40 repetitions would be necessary, while at20 repetitions the mean values of each function are just touching the confidence intervals of the other function.
Figure 9.8: Analysis for selecting thenumber of bootstrap repetitions, resultsof audiovisual conversation tests.

perceptual models of telemeeting quality 273
9.3.4 Algorithm to Split the Data into Training and Test Sets
Within each bootstrap repetition, the data is randomly split into train-ing and test sets. To do this, the author implemented an algorithmthat splits the data according to three boundary conditions:
1. It tries to achieve the target ratio between training and test set forthe individual technical conditions represented in the data.
2. It tries to achieve the target ratio between training and test set forindividual subsets of the data, whereas those subsets are freelydefinable and do not need to be the same than the technical condi-tions.
3. It allows to link individual observations independently from sub-sets of technical conditions such that all observations linked bysuch a variable are either assigned to the training or to the testset. The foremost and actually applied use case is to consider thetest subjects as the linking variable, which means all observationsbelonging to one subject are either assigned to the training or testdata.
Given this approach, the modeling framework allows to run all 16
combinations of the four training and test levels mentioned in Sec-tion 9.2: the whole data set, per subset, per condition and per combi-nation of subset and condition.
9.3.5 Selection of Proportion of Training and Test Data
Motivation Similar to the number of bootstrap repetitions, the pro-portion between the sizes of the training and test sets can influencethe modeling performance. Usually the larger the amount of trainingdata is, the higher the modeling performance – on average – gets.However, increasing the size of the training data means reducingthe size of the test data, which in turns increases the confidence in-tervals. Thus a good balance needs to be found in improving theaverage performance and limiting the uncertainty – the confidenceintervals – around this. Typical values for this proportion are 70%or 80% training data; and the author also opted for a proportion of80%. Nevertheless, it would be good to validate, if this value is alsoappropriate for the present data.
Validation Process To validate the selection of a proportion of 80%,the author computed the performance measures for the two functionsF2 and F6 from proportion values between 0.1 and 0.9. These twofunctions are the closest alternatives to the baseline functions F1
and F7 that require training. A candidate proportion is appropriatewhen it provides a good balance between achieving optimal meanperformance and limiting the uncertainty around them. Concerningthe optimal performance, this is considered here to be the case whenthe mean performance is among the best performing values acrossthe seven studies. Concerning the limitation of uncertainty, this is

274 quality of experience of multiparty conferencing and telemeeting systems
considered here to be the case when the mean performance valuesof each function do not lie inside the confidence intervals of therespective other function.
Selection Result Figures 9.9 and 9.10 provide the detailed analysisfor the seven experiments ACT1 to AVCT2. Based on these figures, aproportion of 80% training data is considered here to be appropriate,as this value achieves the desired balance for all but one experiment(ACT2).
1. Visualization:The plots show the two performance measures Rho and RMSE as a function of the number of bootstrap repetitions. The resultsare shown for the two baseline modeling functions F2 “weighted mean” and F6 “weighted minimum value”. The solid lines showthe mean values of each performance measure, the shaded areas indicate the 95% confidence intervals around the mean values.The red circles indicate the mean values for a proportion of 80% training data.
2.1 Results Experiment ACT1. 2.2 Results Experiment ACT2.
2.3 Results Experiment ACT3.
3. AnalysisFor Experiments ACT1 and ACT3, a proportion of 80% gives for both functions F2 and F6 and both measures Rho and RMSE theoptimal results, and the mean performance values of each function are outside the confidence intervals of the respective otherfunction.For Experiment ACT2, the results concerning the mean performance are inconsistent, as Rho is best for small proportions andRMSE is best for large proportions, and there is in almost all cases a overlap of the mean performance values of each functionwith the confidence intervals of the respective other function.
Figure 9.9: Analysis for selecting theproportion of training data, results ofaudio-only conversation tests.

perceptual models of telemeeting quality 275
1. Visualization:The plots show the two performance measures Rho and RMSE as a function of the number of bootstrap repetitions. The resultsare shown for the two baseline modeling functions F2 “weighted mean” and F6 “weighted minimum value”. The solid lines showthe mean values of each performance measure, the shaded areas indicate the 95% confidence intervals around the mean values.The red circles indicate the mean values for a proportion of 80% training data.
2.1 Results Experiment LOT1. 2.2 Results Experiment LOT2.
2.1 Results Experiment AVCT1. 2.2 Results Experiment AVCT2.
3. AnalysisFor all four experiments, a proportion of 80% gives for both functions F2 and F6 and both measures Rho and RMSE the optimalresults, and the mean performance values of each function are outside – or in case of LOT2 at the border of – the confidenceintervals of the respective other function.
Figure 9.10: Analysis for selecting theproportion of training data, results oflistening-only and audiovisual conversa-tion tests.

276 quality of experience of multiparty conferencing and telemeeting systems
9.4 Model Performance
Figures 9.11 to 9.17 show per experiment the visualization of themodel performance across the technical conditions. The figures alsoprovide summaries of the statistical analysis conducted to identify sig-nificant differences between the modeling functions (F1 – F8) and themodeling factors (Section 9.2.3): training on whole data vs. trainingper condition, rule-based vs. sorting-based assignment of weightingparameters for functions F2, F3 & F8. Furthermore, the figures alsoprovide summaries of the analysis results conducted per technicalcondition, in order to verify if individual functions perform differentlyfor individual technical conditions. The analysis in full detail is givenin Figures H.1 to H.52 in Appendix H.
1. Results across technical conditions
1.1 Visualizing the results: Errorbar plots showing the mean values & 95% confidence intervals.
1.2 Observations and Conclusions:Based on detailed analysis in Figure H.1, for A & B using ANOVAs & PostHoc tests, for C using t-Tests.
A) No advanced model significantly outperforms the baseline mean F1.
B) Equal performance for sorting-based (F2s, F3s, F8s) and rule-based (F2, F3, F8) assignment of Qij.
C) Training per condition reduces performance for F4 for Rho.
2. Results per technical condition:Based on detailed analysis in Figures H.2 to H.5, for A & B using ANOVAs & PostHoc tests, for C using t-Tests.
Effects Condition(s)
A) No advanced model significantly outperforms the baseline mean F1. All (Ref1, L3, EN3, TN3, Dsym, E1, P1)
B) Equal performance for sorting-based and rule-based assignment of Qij. All
C.1) Training per condition reduces performance for F4. Dsym
C.2) Training per condition does not improve performance. All other
Figure 9.11: Modeling performanceacross all technical conditions of Experi-ment ACT1.

perceptual models of telemeeting quality 277
1. Results across technical conditions
1.1 Visualizing the results: Errorbar plots showing the mean values & 95% confidence intervals.
1.2 Observations and Conclusions:Based on detailed analysis in Figure H.6, for A & B using ANOVAs & PostHoc tests, for C using t-Tests.
A) No advanced model outperforms the baseline mean F1.
B) Equal performance for sorting-based (F2s, F3s, F8s) and rule-based (F2, F3, F8) assignment of Qij.
C) Training per condition leads for F4 to reduced and instable (large confidence intervals) performance.
2. Results per technical condition:Based on detailed analysis in Figures H.7 to H.8, for A & B using ANOVAs & PostHoc tests, for C using t-Tests.
Effects Condition(s)
A) No advanced model significantly outperforms the baseline mean. All (Ref2, L1, L2, L4)
B) Equal performance for sorting-based and rule-based assignment of Qij. All
C.1) Training per condition destabilizes performance (large confidence intervals) for F4. L1
C.2) Training per condition does not improve performance. All other
Figure 9.12: Modeling performanceacross all technical conditions of Experi-ment ACT2.

278 quality of experience of multiparty conferencing and telemeeting systems
1. Results across technical conditions
1.1 Visualizing the results: Errorbar plots showing the mean values & 95% confidence intervals.
1.2 Observations and Conclusions:Based on detailed analysis in Figure H.9, for A & B using ANOVAs & PostHoc tests, for C using t-Tests.
A) Six advanced models (F2s, F4 & F8 for both training modes, F8s & F2 trained on whole data and F6 trained per condition)outperform the baseline mean F1. F4 is the best, though not sig. different from the other five.
B) Equal performance for sorting-based (F2s, F3s, F8s) and rule-based (F2, F3, F8) assignment of Qij.
C) Training per condition improves performance only for F6.
2. Results per technical condition:Based on detailed analysis in Figures H.10 to H.18, for A & B using ANOVAs & PostHoc tests, for C using t-Tests.
Effects Condition(s)
A.1) No advanced model significantly outperforms the baseline mean. Ref3, B1, B2, B2sym, FM1, FL3sym, FM2,FL4sym, P1, P2, P3
A.2) No advanced model significantly outperforms the baseline mean. F2 is slightlybetter (not sig.)
P4
A.3) F3, F6 & F8 all trained per condition outperform the baseline mean F1 but notthe baseline minimum F7.
TN1
A.4) F3, F3s, F6 & F8 (all trained per condition) outperform the baseline mean F1 butnot the baseline minimum F7.
TN2
A.5) F2s, F3, F3s, F4, F6, F8 & F8s outperform the baseline mean F1 but not the baselineminimum F7.
E2
A.6) F2, F2s, F3, F3s, F4, F6, F8 & F8s outperform the baseline mean F1 but not thebaseline minimum F7.
E3
B) Equal performance for sorting-based and rule-based assignment of Qij. All
C.1) Training per condition reduces performance for F3. B2
C.2) Training per condition improves performance for F3. P1
C.3) Training per condition improves performance for F3, F6 & F8. TN1
C.4) Training per condition improves performance for F6, F8 & F8s. TN2
C.5) Training per condition improves performance for F2, F3s, F6 & F8. E3
C.6) Training per condition does not improve performance. All other
Figure 9.13: Modeling performanceacross all technical conditions of Experi-ment ACT3.

perceptual models of telemeeting quality 279
1. Results across technical conditions
1.2 Visualizing the results: Errorbar plots showing the mean values & 95% confidence intervals.
1.2 Observations and Conclusions:Based on detailed analysis in Figure H.19, for A & B using ANOVAs & PostHoc tests, for C using t-Tests.
A) Three advanced models (F2s, F4 & F8s for both training modes) significantly outperform the baseline mean F1. F4 is the best,though not sig. different from the other two. Furthermore, F2 & F8 are slightly better than F1, though not significantly.
B) Equal performance for sorting-based (F2s, F3s, F8s) and rule-based (F2, F3, F8) assignment of Qij.
C) Training per condition reduces performance or F3s & F4.
2. Results per technical condition:Based on detailed analysis in Figures H.20 to H.24, for A & B using ANOVAs & PostHoc tests, for C using t-Tests.
Effects Condition(s)
A.1) No advanced model significantly outperforms the baseline mean F1. Ref5, B2, B2sym, P5, B2symP5,E4, E4sym, CN
A.2) F2, F2s, F3, F3s, F4, F6, F8 & F8s significantly outperform the baseline mean F1. R
B) Equal performance for sorting-based and rule-based assignment of Qij. All
C.1) Training per condition destabilizes performance (large confidence intervals) for F4. Ref5, E4sym
C.2) Training per condition does not improve performance. All other
Figure 9.14: Modeling performanceacross all technical conditions of Experi-ment LOT1.

280 quality of experience of multiparty conferencing and telemeeting systems
1. Results across technical conditions
1.1 Visualizing the results: Errorbar plots showing the mean values & 95% confidence intervals.
1.2 Observations and Conclusions:Based on detailed analysis in Figure H.25, for A & B using ANOVAs & PostHoc tests, for C using t-Tests.
A) Seven advanced models (F2 & F8 all trained per condition, F4 trained on whole data, and F2s, F3, F3s, F8s for both trainingmodes) outperform the baseline mean F1 and the baseline minimum F7. F4 (trained on whole data) is the best, though notsignificantly different from the other six.
B) Equal performance for sorting-based (F2s, F3s, F8s) and rule-based (F2, F3, F8) assignment of Qij.
C) Training per condition does not improve performance.
2. Results per technical condition:Based on detailed analysis in Figures H.26 to H.37, for A & B using ANOVAs & PostHoc tests, for C using t-Tests.
Effects Condition(s)
A.1) No advanced model significantly outperforms the baseline mean F1. Ref3, TN1, TN2, B2, B2sym, FL4sym,FM1, FM1sym, FM2, FM2sym, FM4,FM4sym, FM4P3sym, E2sym, E3,E3sym, P1, P1sym, P3sym
A.2) F2s, F3, F3s, F4, F6, F8 & F8s significantly outperform the baseline mean F1. F4 & F6
(trained on whole data), F3 (trained per condition) and F2s, F3s & F8s outperformthe baseline minimum F7.
FM4P3
A.3) F3s (trained on whole data) and F2, F2s, F3, F4, F8 & F8s significantly outperform thebaseline mean F1.
E2
A.4) F2, F2s, F3, F3s, F4, F6, F8 & F8s significantly outperform the baseline mean F1. F2
(trained per condition) and F3, F3s & F4 (all trained on whole data) significantlyoutperform the baseline minimum F7.
P3
A.5) F2, F2s, F3, F3s, F4, F6, F8 & F8s significantly outperform the baseline mean F1. P4
A.6) F3s & F4 (both trained on whole data) outperform the baseline mean F1, but not thebaseline minimum F7.
P4sym
B.1) Sorting-based assignment of Qij outperforms rule-based assignment for one function(F2s better than F2).
FM4P3
B.2) Equal performance for sorting-based and rule-based assignment of Qij. All other
C.1) Training per condition destabilizes performance (large confidence intervals) for F4. E2sym, E3
C.2) Training per condition reduces performance for F4. FM4symC.3) Training per condition improves performance for F2. TN1
C.4) Training per condition improves performance for F3. FM2sym, P3symC.5) Training per condition improves performance for F3s. B2symC.6) Training per condition improves performance for F3, F3s, F8 & F8s. FM2
C.7) Training per condition improves performance for F6. FL4sym, FM4P3sym, P4symC.8) Training per condition improves performance for F6, but destabilizes performance
(large confidence intervals) for F3.E3sym
C.9) Training per condition improves performance for F8. FM4P3
c.10) Training per condition does not improve performance. Ref3, TN2, B2, FM1, FM1sym, FM4,E2, P1, P1sym, P3, P4
Figure 9.15: Modeling performanceacross all technical conditions of Experi-ment LOT2.

perceptual models of telemeeting quality 281
1. Results across technical conditions
1.1 Visualizing the results: Errorbar plots showing the mean values & 95% confidence intervals.
1.2 Observations and Conclusions:Based on detailed analysis in Figure H.38, for A & B using ANOVAs & PostHoc tests, for C using t-Tests.
A) No advanced model outperforms the baseline mean.
B) Equal performance for sorting-based (F2s, F3s, F8s) and rule-based (F2, F3, F8) assignment of Qij.
C) Training per condition reduces performance for F3s.
2. Results per technical condition:Based on detailed analysis in Figures H.39 to H.43, for A & B using ANOVAs & PostHoc tests, for C using t-Tests.
Effects Condition(s)
A) No advanced model significantly outperforms the baseline mean F1. All (AVRef, VF1, VR, FM2, E2,FM2-VF1, E2-VF1, FM2-VR, E2-VR)
B) Equal performance for sorting-based and rule-based assignment of Qij. All
C.1) Training per condition destabilizes performance (large confidence intervals) for F3 & F3s. VR, E2-VR
C.2) Training per condition destabilizes performance (large confidence intervals) for F4. FM2-VF1
C.3) Training per condition reduces performance for F3s. FM2
C.4) Training per condition reduces performance for F3 & F3s. E2-VF1
C.5) Training per condition does not improve performance. AVRef, VF1, E2, FM2-VR
Figure 9.16: Modeling performanceacross all technical conditions of Experi-ment AVCT1.

282 quality of experience of multiparty conferencing and telemeeting systems
1. Results across technical conditions
1.1 Visualizing the results: Errorbar plots showing the mean values & 95% confidence intervals.
1.2 Observations and Conclusions:Based on detailed analysis in Figure H.44, for A & B using ANOVAs & PostHoc tests, for C using t-Tests.
A) Six advanced models (F2, F2s, F4, F8 & F8s for both training modes and F6 trained per condition) outperform the baselinemean F1.
B) Equal performance for sorting-based (F2s, F3s, F8s) and rule-based (F2, F3, F8) assignment of Qij.
C) Training per condition improves performance for F6 and reduces performance for F4.
2. Results per technical condition:Based on detailed analysis in Figures H.45 to H.52, for A & B using ANOVAs & PostHoc tests, for C using t-Tests.
Effects Condition(s)
A.1) No advanced model significantly outperforms the baseline mean F1. AVRef, VF2sym, E2, FM4sym,FM4P3sym, FM4-VF2, FM4-VB
A.2) No advanced model significantly outperforms the baseline mean F1. F2, F2s, F4, F6, F8 &F8s are slightly better (not sig.) than F1.
VF2
A.3) No advanced model significantly outperforms the baseline mean F1. F2, F2s, F4, F8 & F8sare slightly better (not sig.) than F1.
FM4P3
A.4) F8 significantly outperforms the baseline mean F1, but not the baseline minimum F7. F2,F2s, F4, F8 & F8s are slightly better (not sig.) than F1, but not F7.
VBsym
A.5) F2, F2s, F3, F4, F6, F8 & F8s significantly outperform the baseline mean F1 and minimumF7.
VB
A.6) F2, F2s, F4, F6, F8 & F8s significantly outperform the baseline mean F1 and minimum F7. FM4-AVP3
A.7) F2s significantly outperforms the baseline mean F1 and minimum F7. F2, F4, F8 & F8sare slightly better (not sig.) than F1 and F7.
FM4
A.8) F2, F2s, F4, F8 & F8s (all trained on whole data) significantly outperform the baselinemean F1 and minimum F7.
FM4P3-VB
A.9) F2, F2s, F4, F8 & F8s (all trained per condition) and F6 significantly outperform thebaseline mean F1, but not the minimum F7.
VB
B) Equal performance for sorting-based and rule-based assignment of Qij. All
C.1) Training per condition destabilizes performance (large confidence intervals) for F3 & F3s. FM4-VF2
C.2) Training per condition destabilizes performance (large confidence intervals) for F4. FM4P3-VBC.3) Training per condition stabilizes performance (small confidence intervals) for F3. FM4P3-VF2
C.4) Training per condition destabilizes performance for F3s and stabilizes performance forF3.
FM4
C.5) Training per condition destabilizes Rho but stabilizes RMSE for F3s, improves perfor-mance for F6, and reduces performance for F4.
FM4-VB
C.6) Training per condition does reduces performance for F4. VBC.7) Training per condition improves performance for F3. AVRefC.8) Training per condition improves performance for F3s. FM4P3
C.9) Training per condition improves performance for F6. VBsymC.10 Training per condition does not improve performance. VF2, VF2sym, E2, FM4sym,
FM4P3sym, FM4AVP3
Figure 9.17: Modeling performanceacross all technical conditions of Experi-ment AVCT2.

perceptual models of telemeeting quality 283
9.5 Discussion
9.5.1 Review of Results
Model performance With correlation coefficients up to 0.95 and rootmean square errors (RMSE) down to 0.45 on the five-point absolutecategory rating scale, the author concludes that it is possible to ade-quately model the Single-Perspective Telemeeting Quality Qi basedon the Individual Connection Quality scores Qij. This conclusion isbased on the fact that the models aim at predicting the raw qualityscores and not Mean Opinion Scores, meaning that the target valuesfor prediction are noisy to a certain extent. More precisely, the confi-dence intervals for Qi in Figures 9.1 to 9.3 are for most conditions inthe order of 0.3 to 0.7 points on that five-point scale; and the achievedmodel RMSE values are in that same range. Concerning future work,however, in which such models would be applied for the prediction ofMean Opinion Scores, smaller RMSE values are necessary; especiallywhen considering that a deviation of 0.5 points on the MOS scale isin practice considered as a substantial difference.
Modeling Hypothesis Table 9.2 provides an overview that shows forwhich conditions at least one advanced model could significantlyoutperform the baseline mean and/or the baseline minimum.The results confirm the modeling hypothesis since there indeed existsa set of advanced models that outperform the simple mean operation.In addition, the added value of those advanced models indeed holdsonly for a subset of conditions, since the added value was found foronly a limited number of conditions and in only four of the sevenconsidered experiments: ACT3 , LOT1, LOT2 & AVCT2.
Furthermore, the errorbar visualization of the results showed thatin several instances, advanced models performed better than thebaseline models (confidence intervals were just not overlapping), butmissed the significance thresholds when conducting the PostHoc tests.Those cases are also included in Table 9.2. This accounts for thepossibility that those cases could have been significant if the settingsof the performance training and evaluation procedure, i.e. number ofbootstrap repetitions and training-test ratio, would have been chosendifferently (see Section 9.3).
Modeling factor: Training mode From the t-Tests comparing the twotraining modes per condition (results C in Figures 9.11 to 9.17) it canbe concluded that the added value of training per technical condi-tion is not consistent. The reason is that across technical conditions,training per condition has for most functions no significant effect.Exceptions are: Function F4, which is negatively affected in Exper-iment ACT1, ACT2, LOT1, AVCT2, and in tendency also in LOT2;Function F3s, which is negatively affected in Experiment LOT1 andAVCT1; and Function F6, which is positively affected in ExperimentACT3 and AVCT2. And also looking at the t-Test results per technical

284 quality of experience of multiparty conferencing and telemeeting systems
Exp. Conditions Function (Training Mode) sig. outperform
(b)=both, (c)=per condition, (w) = whole data F1 F7
ACT3 across all F2(w), F2s(b), F4(b), F6(c), F8(b), F8s(w) X X
P4 F2(w) × ×
TN1 F3(c), F6(c), F8(c) X ×
TN2 F3(c), F3s(c), F6(c), F8(c) X ×
E2 F2s(b), F3(b), F3s(b), F4(b), F6(b), F8(b), F8s(b) X ×
E2 F2(b), F2s(b), F3(b), F3s(b), F4(b), F6(b), F8(b), F8s(b) X ×
LOT1 across all F2s(b), F4(b), F8s(b) X X
R F2(b), F2s(b), F3(b), F3s(b), F4(b), F6(b), F8(b), F8s(b) X X
LOT2 across all F2(c), F2s(b), F3(b), F3s(b), F4(w), F8(c), F8s(b) X X
FM4P3 F2s(b), F3(c), F3s(b), F4(w), F6(w), F8s(b) X X
F3(w), F4(c), F6(c), F8(b) X ×
E2 F2(b), F2s(b), F3(b), F3s(c), F4(b), F8(b), F8s(b) X X
P3 F3(w), F3s(w), F4(w) X X
F2(b), F2s(b), F3(c), F3s(c), F4(c), F6(b), F8(b), F8s(b) X ×
P4 F2(b), F2s(b), F3(b), F3s(b), F4(b), F6(b), F8(b), F8s(b) X X
P4sym F3s(w), F4(w) X ×
AVCT2 across all F2(b), F2s(b), F4(b), F6(c), F8(b), F8s(b) X X
VF2 F2(b), F2s(b), F4(b), F6(b), F8(b), F8s(b) × ×
FM4P3 F2(b), F2s(b), F4(b), F8(b), F8s(b) × ×
VBsym F8(b) X ×
F2(b), F2s(b), F4(b), F8(b), F8s(b) × ×
VB F2(b), F2s(b), F3(b), F4(b), F6(b), F8(b), F8s(b) X X
FM4-AVP3 F2(b), F2s(b), F4(b), F8(b), F8s(b) X X
FM4 F2(b), F4(b), F8(b), F8s(b) × ×
FM4P3-VB F2(w), F2s(w), F4(w), F8(w), F8s(w) X X
VB F2(c), F2s(c), F4(c), F6(b), F8(c), F8s(c) X ×
Table 9.2: Data sets in which advancedmodeling functions outperform, eithersignificantly or in tendency (i.e. not sig.),the baseline models.
condition, the effect of training per condition has for the vast majorityof combinations of function and condition no significant effect either.The few exceptions, which are given in Table 9.3, show in addition amix of positive and negative effects.
Effect No. of Conditions in Experiment
ACT1
ACT2
ACT3
LOT1
LOT2
AVCT1
AVCT2
F4 ↓ 1 1 1 2 1 3
F3s ↓ 4 2
↑ 1 2 1
F3 ↓ 1 1 3 2
↑ 2 2 2
F6 ↑ 3 2 1
F2 ↑ 1 2
F8 ↑ 3 2
F8s ↑ 1
Table 9.3: Effect of training mode onindividual conditions.
While these results do not justify the added value of a trainingper condition, a training per condition can still be useful for tuningindividual modeling functions. Referring to the results concerningthe added value of the advanced models, i.e. Table 9.2, the slightperformance differences caused by the condition-specific training canpush the performance of an advanced model beyond the significancethreshold, which was often the case for Function F6.
Modeling factor: Assignment of Weights to Qij scores The results B inFigures 9.11 to 9.17 show that the performance of the two assignmentstrategies are essentially equal in almost all cases. Only in one case,condition FM4P3 in Experiment LOT2, the sorting-based assignmentof Qij outperforms rule-based assignment for Function F2 (i.e. F2s

perceptual models of telemeeting quality 285
better than F2). From an engineering perspective, this is a verypositive result. It means that a sophisticated pre-analysis of theindividual connections, which is required to apply the rule-basedassignment, is not – at least for the present data – necessary, as itcan be replaced with the sorting-based assignment strategy, which istechnically easy to implement.
Recommendation for an Optimal Model The data confirmed the hypoth-esis that advanced models can outperform a simple mean, while thisholds – as expected – for a limited number of cases. Furthermore,there is not one single model that shows consistently the best perfor-mance. This leads to the unsatisfactory situation that a practitionerwould need to try out the different models for each application sce-nario. However, if resources do not allow a practitioner to do this, arecommendation for a single model would be helpful.
For that purpose, the author recommends Modeling Function F4
“quality dependent influence”, for two reasons: first, F4 is often thebest or at least among the best performing models, although thedifferences to other functions are not significant; second, and mostimportantly, F4 essentially represents a compromise between the twobaseline functions F1 and F7, which in turn were found to mark theupper and lower boundaries for the target values Qi (see Figures 9.1to 9.3) in the most cases. Concerning the training mode, F4 shouldnot be trained on individual conditions, as this either reduced theperformance of F4 (larger mean values of RMSE) or even destabilizedthe performance (larger confidence intervals of RMSE and RHO).
9.5.2 Review of the Approach and Open Questions for Future Work
There are a number of open questions that this section will addressnow: the aspect of predicting Mean Opinion Scores (MOS) per condi-tion instead of raw scores, the impact of the training and test proce-dure, and the aspect of using closed-form and rule-based modelingapproaches.
Prediction of MOS per condition instead of raw scores In the presentwork, the models attempted to predict the raw quality scores of allindividual observations. An alternative that is usually applied inquality modeling is not to predict such raw scores but Mean OpinionScores (MOS) computed per technical condition. The main advantageof such a modeling approach is its potential to stabilize and improveresults, as the averaging of raw scores per condition reduces thenoise caused by individual differences between test participants interms of their rating behavior. The disadvantage is the danger ofovertraining effects leading to too optimistic average results, whichcan be accompanied by increased performance variation around thataverage performance.
Such overtraining effects occur if the amount of data is small withrespect to the number of model parameters to be trained. The mini-

286 quality of experience of multiparty conferencing and telemeeting systems
mum requirement for any reasonable modeling is that the numberof data points available for training must not be smaller than theamount of model parameters. Otherwise the task of the parameterfitting procedure to determine the values of the model parameters isill-defined. Similarly, if the amount of data is equal or only slightlylarger than the number of parameters, then the model parametersmight very well reflect the actual data points and show excellentperformance for test data that is similar to the training data available,causing an optimistic average performance. However, if the test dataconsists of data points that are dissimilar to the training data, thenthe performance of the model will break down, causing an increasedvariation around the optimistic performance.
Coming back to the idea of computing MOS per condition, thepresent data sets would be reduced in most cases to quite low numbersof data points, see Table 9.4. Given that the degree of freedom(number of free model parameters) ranges from 2 for Function F2 to6 for Functions F3 and F4, the number of available data points perexperiment is small enough to cause overtraining effects.
Experiment No.conditions
ACT1 7
ACT2 4
ACT3 16
LOT1 9
LOT2 24
AVCT1 9
AVCT2 15
Table 9.4: Number of conditions for theseven experiments ACT1 to AVCT2.
Future work could test the performance of the modeling functionsproposed here for MOS by conducting large scale studies coveringmany more conditions to avoid the danger of overtraining. However,those studies need to be distributed across individual experiments,in order to limit effort for test participants, which in turn requirestechniques that allow a combination of data across experiments. Onepossible approach is presented in Garcia 7, which uses a number
7 Marie-Neige Garcia. Parametric Packet-based Audiovisual Quality model for IPTVservices. Springer, 2014
of anchor conditions throughout all experiments. In this approach,the results are transformed per experiment such that the anchorconditions are equal to the quality scores obtained in a so-calledreference test, which in turn was specifically designed to cover thewhole expected range of impairments. Another approach is presentedin Pinson & Wolf 8, which also uses a number of anchor conditions 8 Margaret Pinson and Stephen Wolf.
Techniques for evaluating objective videoquality models using overlapping subjec-tive data sets. Technical Report TR-09-457. US Department of Commerce, Na-tional Telecommunications and Informa-tion Administration (NTIA), 2008
throughout all experiments. In this approach, however, the results arenot mapped to a reference test, but to a grand mean that is computedfrom the anchor conditions across all experiments.
Impact of the training and evaluation procedure The discussions in Sec-tion 9.3 showed that differences in the results can be expected if an-other training and evaluation procedure is used. Obviously, one possi-ble direction of future work is to evaluate such procedure-dependenteffects, for instance by using a different repetition method than themodified bootstrap approach used here, or by using a different num-ber of iterations, or by using a different ratio of training and testdata.
On the one hand, following this direction of optimizing the trainingand test procedure might help in increasing the sensitivity to betterdifferentiate between the individual modeling functions. On theother hand, it might be good to decide on the amount of effort tobe spent on the optimization of the procedure after more knowledgeon the relation between technical conditions and the performance

perceptual models of telemeeting quality 287
differences is available. This is motivated by the observation thatthe results of the present and the previous chapter show strongbut complex dependencies of the technical conditions, suggestingthat those dependencies might impact the results more than anyoptimizations of the training and test procedure.
Closed-form and rule-based modeling approaches The individual model-ing functions investigated can be considered as closed-form modelingapproaches, as each function uses one single closed-form mathemati-cal operation. However, this approach might not be optimal, given thecondition dependency of the model performance, i.e. different mod-eling functions show optimal performance for different conditions,although performance differences are often small or even marginal.For that reason, future work may investigate rule-based approaches,in which a set of rules may be used for predicting Qi based on Qij.Such approaches could for instance use such rules to choose theoptimum closed-form modeling functions for different technical con-ditions or for different other aspects that characterize telemeetingssuch as usage scenario, number of interlocutors, or communicationmodality. Alternatively, truly rule-based approaches could predict Qi
from tables with stored values, whereas those values are chosen bya set of rules that analyze the actual combination of the Qij ratings.There are approaches to automatically generate such if-then rulesfrom data; the introduction by Chiu 9 could serve as a starting point 9 Stephen Chiu. “Extracting fuzzy rules
from data for function approximationand pattern classification”. In: FuzzyInformation Engineering: A Guided Tourof Applications. Ed. by Didier Dubois,Henri Prade, and Ronald R. Yager. JohnWiley&Sons, 1997
for future work in that direction.
Summary
The goal of the research presented here was to develop and evaluatea model that estimates the perceptual ratings of Single-PerspectiveQuality Qi based on the perceptual ratings of the Individual ConnectionQualities Qij. The data sets stem from the seven experiments ofChapter 8: ACT1, ACT2, ACT3, LOT1, LOT2, AVCT1, AVCT2.
Motivated by the results of Chapter 8 the modeling work wasdriven by the following underlying hypothesis: There exists a setof advanced models that outperform the simple mean operation,whereas the added value of those advanced models holds only for asubset of conditions.
Furthermore, revisiting the perceptual data sets revealed threedifferent behaviors, leading to three fundamental modeling ideas:
1. The Single-Perspective Telemeeting Quality Qi is a simple mean of theIndividual Connection Qualities Qij;
2. the Single-Perspective Telemeeting Quality Qi is the minimum valueof the Individual Connection Qualities Qij;
3. the Single-Perspective Telemeeting Quality Impairment QIi is the sumof the Individual Connection Quality Impairments QIij, whereas QIi
can be expressed as the difference between a maximum possible

288 quality of experience of multiparty conferencing and telemeeting systems
quality Qmax and the Single-Perspective Telemeeting Quality Qi andQIij as the difference between Qmax and the Individual ConnectionQuality Qij.
Based on those basic ideas, eight modeling functions were developedand tested: F1 “baseline mean”, F2 “weighted mean”, F3 “mutual in-fluence”, F4 “quality dependent influence”, F5 “influence of outliers”,F6 “weighted minimum”, F7 “baseline minimum”, and F8 “weightedmean of impairments”. Here, Functions F1 and F7 were considered asbaseline functions as they do not contain any parameters that can befitted, and the remaining Functions F2 to F6 and F8 were consideredas advanced modeling functions as they contained parameters thatcan be fitted.
Furthermore, a number of algorithmic variants were investigatedas well: Concerning a first set of variants, Functions F2, F3, and F8
essentially represented weighted sums of Qij and required a methodto decide which Qij are assigned to which weights. Here two methodswere tested, a rule-based assignment based on the methodology inChapter 6, and a ranking-based assignment exploiting a sorting ofthe Qij values. Concerning a second set of variants, all modelingfunctions were trained and tested either across the whole data set foreach of the seven experiments, or per technical condition.
The used model training and evaluation procedure stems from themachine learning domain and is based on the bootstrap method; amethod that is known to work well for small data sets, which is thecase here. The method applied here is a modification of the bootstrapmethod, in which the available data is randomly split into trainingand test data (here: 80% training, 20% test), the training data is usedfor fitting the model parameters, and the test data to evaluate themodel performance. This is done for a number of repetitions (here:20), and the performance of each iteration is stored. Two performancemeasures were used: the Pearson correlation coefficient Rho and theroot mean square error RMSE between estimated and true values ofQi. Since Rho and RMSE were computed per iteration, the resultswere aggregated across the iterations by computing simple statistics:mean and 95% confidence intervals.
The following results were found: First, the underlying modelinghypothesis is confirmed, as the advanced modeling functions outper-form the baseline modeling functions for a limited number of datasets and conditions.
Second, no single winning function could be identified, as differentfunctions showed optimal performance in different cases.
Third, nevertheless, modeling function F4 “quality dependent in-fluence” can be recommended as the best compromise, as it was oftenthe best or among the best functions and it combines the two funda-mental trends that Qi is either close to the mean or to the minimumvalue of Qij. Function F4 is computed as the weighted combinationof the mean and the minimum value of Qij, whereas this weightingdepends on a pre-estimation of Qi based again on the mean of Qij.
Fourth, the method of assigning the weights had hardly any impact,

perceptual models of telemeeting quality 289
which means for real-life applications that a complicated rule-basedassignment is not necessary and that the easy-to-implement sorting-based assignment is sufficient.
Fifth, training per technical condition had hardly any impact, whichmeans for real-life applications that a complicated estimation of thetechnical conditions for optimal training is not justified.
Sixth, the effort of improving the experimental methods betweenthe different perception tests paid off in the sense that the advantageof advanced modeling functions was increased. More precisely, thenumber of advanced modeling functions that outperformed the base-line functions was higher for experiments with an improved method(ACT3, LOT2, AVCT2) compared to the corresponding experimentwith the non-optimal method (ACT1, ACT2, LOT1, AVCT1).

Part IV
Summary and Conclusions

10Summary and Conclusions
What this chapter is about
This chapter reflects on the individual research objectives in light ofthe results presented in the previous chapters; and it concludes witha high-level discussion of the main findings.
10.1 Research Objectives Revisited
This section describes how the results presented in Chapters 5 to 9
met the individual research objectives that have been defined inSection 1.3. Due to the alignment of individual research objectivesand chapters, the main results of each chapter are briefly restated andput into relation to the corresponding originally formulated objective.Furthermore, a critical review of the achieved results and proposalsfor future work per objective conclude each discussion.
10.1.1 Conceptual Model of Telemeeting Quality – Chapter 5
Objective Restated and Results Achieved The objective was to derivean overview of aspects and processes that may play a role when testparticipants form a quality judgment of telemeeting systems. Morespecifically, the model should summarize the known fundamentalsof telemeeting quality perception and should help to identify openissues and research questions for future research. Furthermore, themodel should serve as a tool to put individual research activities ontelemeeting quality assessment into a broader context which wouldhelp to interpret results and draw conclusions properly.
The developed conceptual model describes quality perception asa multi-stage process, in which the individual stages represent dif-ferent perceptual and cognitive processes from sensory input to thedescription of the perceived quality. In this model, most aspects havebeen introduced in prior work and reflect the fundamental percep-tion process perspective of quality by Jekosch, here rephrased fortelemeetings: telemeeting quality is the result of a comparison betweenthe perceived and desired character of a telemeeting.
Starting from this, the model proposes a number of new modelstages that reflect the two main aspects investigated throughout the

292 quality of experience of multiparty conferencing and telemeeting systems
present thesis: the aspect of the special communicative situation,i.e. to have a group conversation over a telecommunication system;and the aspect of the possibility to perceive asymmetric conditions,i.e. individual interlocutors are connected with different equipmentand connection characteristics. To this aim, the model introducedon the one hand the concepts of a Telecommunication and Group-Communication Component, and on the other hand, the concepts ofdifferent Quality Aggregation Levels differentiating between individualconnections and the whole telemeeting.
With these concepts and the corresponding processing stages, theconceptual model indeed provides an overview of the relevant aspectsand processes. In addition, this model also helps to identify openquestions for future work in two directions: the first direction is tofurther investigate the validity and practical relevance of the model’sprocessing stages; the second direction is to dive into the details ofthe presented concepts and to investigate various individual researchquestions that are relevant in practice. One example is to investigatethe impact of the experimental methodology (test instructions, ques-tionnaire, test design, etc.) on the perception of the two components;another example is to investigate the relation between the differentquality aggregation levels.
Furthermore, the model puts individual research activities intoa broader context, as it allows to decouple the interaction betweentechnical and communicative aspects of quality. Using the providedconcepts and nomenclature, researchers can be very specific whenconducting, analyzing and interpreting telemeeting quality experi-ments: Will test participants actually judge an individual connectionthat is particularly different from the others or will they judge thewhole system? Will test participants actually focus on technical as-pects, i.e. audio and video signal quality, or will they judge how thesystem facilitates group-communication?
Limitations and Future Work A first limitation of the model is itsalready mentioned conceptual nature. Here, more insights on thepractical relevance beyond the scope of the present text are needed. Asecond limitation is that the model currently excludes one importantaspect of the user’s satisfaction with today’s telemeeting systems:the usability and here especially the call setup phase. Here, thepossible complexity and often occurring problems during call setupcan substantially contribute to the perceived quality of a system.Hence future work should specifically investigate this aspect andcorrespondingly extend the conceptual model.
10.1.2 Methodology for the Perceptual Assessment of TelemeetingQuality – Chapter 6
Objective Restated and Results Achieved The objective was to developa set of multiparty specific test methods for conducting quality ex-periments with test participants and synthesize them into a set of

summary and conclusions 293
recommendations that can be used by practitioners in the field.One major part of this objective has been addressed with the
development of the ITU-T Recommendation P.1301. While the authorsubstantially contributed to this document by a series of contributions(see Appendix A), the recommendation was a joint effort of variousexperts from different laboratories. In that respect, the objective wasmet in the sense that the present research activities contributed to thisrecommendation, and the present text provides a guideline on howto use this recommendation.
Furthermore, given that Recommendation P.1301 has some lim-itations when it comes to detailed aspects (for example treatmentand analysis of asymmetric conditions), another part of the presentobjective was to extend the methodology beyond the recommendation.Here, the present text provides a detailed guideline on how to effi-ciently design and conduct quality assessment tests with asymmetricconditions and how to systematically structure the data for properanalysis.
Limitations and Future Work A first limitation concerning the exper-imental method can be derived by revisiting the results of the per-ception and modeling experiments. Here, the comparisons betweenthe individual experiments with their slightly modified experimentalmethods suggest that experimental details on a rather fine level ap-pear to have a strong impact on the results. Related to this, a secondlimitation is that the present results do not allow to specify the impactof individual experimental details, as the experiments usually differedin a number of aspects simultaneously. That means, future work isnecessary to obtain more empirical results in order to further verifythe experimental methods presented here, and – ideally – to identifywhich individual methodological aspects are really crucial and whichcan be chosen more freely.
10.1.3 Perception of Telemeeting Quality with focus on Group-Communication Aspects – Chapter 7
Objective Restated and Results Achieved The objective was to investi-gate the impact of a number of communicative aspects on multipartytelemeeting quality. More specifically, empirical results should pro-vide knowledge on the relation between relevant communicationaspects and the perceived quality.
In one study the author investigated the impact of CommunicationComplexity in interaction with the Technical System Capabilities onthree aspects of quality perception: Quality of Experience, representingthe overall experience; Speech Communication Quality focusing onthe Telecommunication Component; and Cognitive Load, representingthe Group-Communication Component. The first finding of that studywas that Technical System Capability showed a significant impact onCognitive Load. This means, a technically more advanced systemcan reduce cognitive load under certain conditions, which was in

294 quality of experience of multiparty conferencing and telemeeting systems
this study the presence of spatial audio sound reproduction. Thesecond and more important finding was that both CommunicationComplexity and Technical System Capability showed an effect on Qualityof Experience. This means, not only a technically more advancedsystem, but also a less complex communicative situation can improvequality perception.
In a second study the author investigated the impact of Involvementon three slightly different aspects of quality perception: Quality ofExperience, Cognitive Load, and Speech Communication Quality, this timefocusing on the Group-Communication Component. The first findingwas that the impact of Involvement on Cognitive Load has an unex-pected direction: test participants appear to perceive actually a lowerCognitive Load when they feel more involved. One explanation couldbe that feeling more involved makes the assessment task more inter-esting for test participants, which in turn means that their need toforce themselves to stay concentrated throughout the test is reduced.The second and more important finding was that Involvement has animpact on Quality of Experience, which was visible when comparingthe two fundamental test paradigms listening-only and conversationtests. While the impact of the two test paradigms on quality ratingsis known, this study helps to better explain this effect in terms ofthe Involvement of test participants. Furthermore, the choice of eitherlistening-only or conversation tests should be taken with great caregiven its impact on results. This is even more emphasized by anotherimportant finding, which was that the impact of the test paradigm(listening-only vs. conversation test) can be stronger than the im-pact of the technical conditions under test (here packet loss), evenif those condition differences are strong enough to reach statisticalsignificance.
Limitations and Future Work A first limitation of the study on Commu-nication Complexity is that it followed a listening-only test paradigm.Here, future work is necessary to evaluate if the found effects can bereproduced with a conversation test paradigm, as conversation testsare known to be closer to real communication scenarios. Anotherlimitation of this study was that the tested technical conditions arequite idealized compared to real life. Spatial sound reproduction andfull-band channels are not yet fully established in the market andexisting solutions face various impairments not tested here. Here,future work should verify the found effects in test contexts that arecloser to real-life scenarios. A limitation of the study on Involvementis that it focused on one type of degradation, i.e. packet loss. Here,future work should verify the found effects for other degradations aswell.

summary and conclusions 295
10.1.4 Perception of Telemeeting Quality with focus on Telecommu-nication Aspects – Chapter 8
Objective Restated and Results Achieved The objective is to investi-gate the impact of various technical system characteristics on multi-party telemeeting quality. More specifically, empirical results shouldprovide knowledge on the quality relation between the individualconnections and the whole telemeeting.
The results of a series of seven experiments confirmed two hypothe-ses concerning the Single-Perspective Telemeeting Quality, referring tothe whole telemeeting, and the Individual Connection Quality, referringto the individual connections. The first hypothesis was that thereexists a mutual influence of the individual connections on qualityperception, whereas this influence holds only for a limited number oftechnical conditions. The second hypothesis was that for most condi-tions the Single-Perspective Telemeeting Quality is an average (arithmeticmean) of the Individual Connection Quality scores, whereas there is alimited number of technical conditions for which such a simple meanis not sufficient.
Interestingly, these results were found for all three different test sce-narios that were applied across the seven experiments, i.e. audio-onlyconversation test, listening-only test, and audiovisual conversationtest. Differences between those test scenarios, however, could be foundwhen it comes to the potential explanation on whether a technicalcondition confirms or rejects the two hypotheses. For the audio-onlyconversation tests, the strength of an impairment appears to con-tribute to the found effects. For the listening-only tests, the strengthof an impairment and, in addition, the presence of asymmetry appearto contribute to the found effects. For the audiovisual conversationtests, impairment strength and asymmetry are not sufficient to ex-plain the found effects; here the modality of the impairment appearsto contribute as well.
In summary, the mutual relation between Individual ConnectionQuality scores and their relation to the Single-Perspective Quality are arather complex construct. Looking across the different test paradigms,it appears to depend – at least partially – on the strength of impair-ments, the presence of asymmetry, and the modality of impairments,whereas no individual aspect alone is sufficient to explain the relationsconsistently.
Limitations and Future Work A first limitation of the studies concernsthe experimental methodology, more specifically the fact of asking forboth Single-Perspective Telemeeting Quality Qi and Individual ConnectionQuality Qij on the same questionnaire. Here, it might be that testparticipants form some average of the Individual Connection Qualityscores simply due to the presentation of both Qi and Qij on thesame questionnaire, despite the usage of different scale designs andquestions. Here, future studies should validate this by differentexperimental approaches.

296 quality of experience of multiparty conferencing and telemeeting systems
A second limitation concerns the communicative situation. Despitethe simulation of three different test scenarios, i.e. audio-only com-munication, passive listening, and audiovisual communication, thenumber of interlocutors was kept constant at a value of three, andthe number of conversation scenario types was one in the audio-onlyconversation tests, and listening-only tests and two in the audiovisualtests. Here, future work would be needed to further validate thefound results for a different number of interlocutors and differentconversation scenario types.
10.1.5 Perceptual Models of Telemeeting Quality – Chapter 9
Objective Restated and Results Achieved The objective was to developa set of perceptual models which predict how test participants form aquality judgment on individual aspects that they perceive. In addition,the model should provide tangible results beyond the conceptual workdone beforehand, and it should provide empirical evidence for thepractical relevance of the conceptual model. Furthermore, by showingpositive performance, the model should serve as indication for thevalidity of the experimental test methods, which are used to obtainthe data for modeling.
The developed computational models computed an estimationof the Single-Perspective Telemeeting Quality scores based on the In-dividual Connection Quality scores. The models showed promisingperformance in terms of the Pearson correlation coefficient and theroot mean square error between predicted and true Single-PerspectiveTelemeeting Quality scores. However, these results strongly dependon the individual experiments, and even individual conditions andmodeling functions, as the correlation values were in a range of ap-proximately 0.7 to 0.95 and root mean square errors in a range ofapproximately 0.45 to 0.7 on a five-point scale. Despite such depen-dencies, one modeling function (F4 “quality dependent influence”)appeared to provide the best compromise: This function is computedas the weighted combination of the mean and the minimum value ofthe Individual Connection Quality scores, whereas this weighting de-pends on a pre-estimation of the Single-Perspective Telemeeting Qualityscore, based again on the mean of the Individual Connection Qualityscores.
Concerning the link to the conceptual model, the computationalmodels show that it is possible to estimate, with a promising perfor-mance, the Single-Perspective Telemeeting Quality score based on theIndividual Connection Quality scores. This supports the idea of havinga multiparty decomposition stage in the conceptual model, which en-ables a person to consider the quality of individual connections, anda multiparty aggregation stage, which enables a person to combinethe quality of individual connections.
Concerning the validity of the experimental methods, the model-ing results strongly support the necessity of optimized experimentalmethods. Here, the effort of improving the experimental methods

summary and conclusions 297
between the different perception tests increased the advantage of theinvestigated advanced modeling functions compared to the investi-gated baseline modeling functions (mean and minimum value). Moreprecisely, the number of advanced modeling functions that outper-formed the baseline functions was higher for each experiment withan improved method (ACT3, LOT2, AVCT2) compared to the corre-sponding experiment with the non-optimized method (ACT1/ACT2,LOT1, AVCT1).
Limitations and Future Work A first limitation concerns the data char-acteristics used for modeling. Typical approaches in the qualitymodeling domain first compute per technical condition a Mean Opin-ion Score (MOS) across all observations of that condition, before thoseMOS values are fed into the quality model. The motivation is todecrease the noise inherent in the model input by averaging overthe ratings of test participants. In the present research, however, theamount of data was rather small in terms of the number of condi-tions covered, despite its substantial size in terms of the number ofobservations per condition and the overall effort to run the complextests. This means that the approach of computing MOS upfront wasnot reasonable in most cases, as the number of conditions in mostexperiments was in the order of the number of parameters for somemodels. This in turn would lead to too small data sets for propermodel training. Here, future work should check the performance ofMOS-based modeling, suggesting a two stage procedure. The firststage will be to work with those combinations of the present datasets and model functions, for which a MOS-based approach can beconsidered as reasonable. The second stage will be to conduct newexperiments in which the number of covered conditions is sufficientlylarge for robust MOS-based modeling approaches.
A second limitation concerns the approach of applying closed-formmathematical operations to compute the Single-Perspective TelemeetingQuality scores. This approach appeared to be limited, given themutual dependency on the data sets, the technical conditions in thosesets, and the actual modeling functions used. Here, future workshould investigate alternative rule-based approaches, whereas twodirections are possible. The first direction is to manually define a setof rules based on the available knowledge gained in this or similarresearch projects. However, such an approach might still show similarlimitations in the model performance, especially when consideringthe difficulties of explaining the results of the perception experimentsin Chapter 8 by straight-forward aspects such as the type, strength ormodality of impairments, or the presence of symmetric or asymmetricconditions. The second direction is to investigate data-driven rule-based approaches, which might improve model performance butwhich might also reduce the interpretability of the rules.

298 quality of experience of multiparty conferencing and telemeeting systems
10.2 Final Conclusions
The overall research goal was to investigate the fundamentals ofmultiparty telemeeting quality and to provide a set of prototypicalmethods and models for the quality assessment and prediction ofmultiparty telemeeting systems. To this aim, the individual researchobjectives and corresponding chapters investigated telemeeting qual-ity from different perspectives: The work on the conceptual modelin Chapter 5 provides a theoretical framework for the fundamentalsof multiparty telemeeting quality, and the experiments in Chapters 7
and 8 provide empirical results for a number of individual aspectsof telemeeting quality and their mutual interaction. The work onthe more general experimental method in Chapter 6 and the detailedimprovements of the actual experiments in Chapters 7 and 8 providea set of prototypical methods which showed good sensitivity to inves-tigate individual aspects of multiparty telemeeting quality. The workon the development of perceptual models in Chapter 9 and in partsalso the results in Chapter 8 provide a set of prototypical approachesto computationally estimate telemeeting quality based on individualaspects, here the impact of the individual connections.
Furthermore, the set of methods and models shall serve as a foun-dation for further research on the Quality of Experience (QoE) ofmultiparty telemeetings. To this aim, the present text discussed bothpromising results and limitations of the individual achievements andsuggested directions for future work. Focusing on potential common-alities among those discussions, one general underlying conclusioncan be formulated that holds independently of the actual directionsthat future studies would follow: The present research representsan example of an iterative approach in which – step by step – thehighly complex construct of multiparty telemeeting quality has beendecomposed as far as it was possible in the course of this researchproject. In that respect, the present research can indeed serve as aprototypical foundation for future work on the QoE of multipartytelemeetings or on similarly complex QoE research topics for noveltelecommunication and multimedia systems.
Finally, the set of methods and models shall directly be applicablefor practitioners in the field. Concerning the applicability of methods,the present text provided both general guidelines on the methodolo-gies and detailed descriptions on the actually conducted experiments.This gives practitioners a starting point for conducting experimen-tal studies on the perception of multiparty telemeeting quality. Thepresent research also emphasizes that experimental details can in-fluence results, meaning that the presented methods should not beapplied to other test cases without prior validation.
Concerning the applicability of models, and in particular the com-putational algorithms, a distinction must be made between applicationin research scenarios and application in operating telemeeting ser-vices. Such a distinction is necessary as the computational algorithmsrepresented perceptual models in the sense that they used perceptual

summary and conclusions 299
ratings on individual aspects of a telemeeting, here the individualconnections, as input in order to estimate perceptual ratings of overalltelemeeting quality. Such models can in principle directly be usedin research scenarios for the purpose of further investigating thequality relationships between individual connections and the wholetelemeeting. However, such models can – by definition – not directlybe applied to quality modeling in operating telemeeting systems, asthese models are not instrumental models that take technical or signalinformation as inputs. Instead, the perceptual models developed inthis thesis can serve as the foundation for the development of instru-mental models, in which the current input, the perceptual ratings, arereplaced by technical or signal information.
As the very final remark, of all possible directions of future work,the most logical next step in the author’s view is to develop a setof instrumental quality models which transfer the knowledge ofthe present research to the technical application. Later on, suchmodels could be further improved by including the impact of thecommunication aspects, which would require the development oftechnical approaches to estimate aspects such as communicationcomplexity or involvement.

Part V
Appendices

AOverview of Conducted Studies and Documents thatContributed to this Thesis
What this chapter is about
This appendix gives an overview on all documents (published, pub-lished with limited access, and unpublished), that report on interme-diate results of the present research. To this aim, three tables showwhich document contributes to which chapter of the present text towhich extent. The extent of each contribution is coded as either Major,Aspects, or Background. Major means, the document has a major anddirect contribution to the chapter, or is highly relevant for the chapter,or substantial parts of the original texts are reused in the chapter;Aspects means, the document addresses individual or minor aspects ofa chapter, or some minor parts of the original texts are reused in thechapter; and Background means, the document served as backgroundknowledge for a chapter.

302 quality of experience of multiparty conferencing and telemeeting systems
A.1 Document Overview
Document Chapter 5 Chapter 6 Chapter 7 Chapter 8 Chapter 9
ConceptualModel
Methodology PerceptionGroup-
CommunicationAspects
PerceptionTelecommunica-
tionAspects
PerceptualModels
Janto Skowronek et al. “Speech recordings for systematic assess-ment of multi-party conferencing”. In: Proceedings of Forum Acus-ticum 2011. Aalborg, Denmark: European Acoustical Society,June 2011
— Background Aspects — —
Janto Skowronek and Alexander Raake. “Einfluss vonBandbreite und räumlicher Sprachwiedergabe auf die kognitiveAnstrengung bei Telefonkonferenzen in Abhängigkeit von derTeilnehmeranzahl”. In: Fortschritte der Akustik (DAGA2011) -37. Deutsche Jahrestagung für Akustik. Deutsche Gesellschaft fürAkustik. Düsseldorf, Germany, Mar. 2011, pp. 873–874
— — Aspects — —
Janto Skowronek and Alexander Raake. “Investigating the effectof number of interlocutors on the quality of experience for multi-party audio conferencing”. In: Proceedings of the 12th Annual Con-ference of the International Speech Communication Association (Inter-speech2011). International Speech Communication Association.Florence, Italy, Aug. 2011, pp. 829–832
— — Major — —
Janto Skowronek. “Internetumfrage zur Wahrnehmung heutigerTelefonkonferenzen im geschäftlichen Umfeld”. In: Fortschritteder Akustik (DAGA2012) - 38. Deutsche Jahrestagung für Akustik.Darmstadt: Deutsche Gesellschaft für Akustik, 2012, pp. 899–900
Background — Background Background —
Janto Skowronek, Julian Herlinghaus, and Alexander Raake.“Quality Assessment of Asymmetric Multiparty Telephone Con-ferences: A Systematic Method from Technical Degradations toPerceived Impairments”. In: Proceedings of the 14th Annual Con-ference of the International Speech Communication Association (Inter-speech 2013). International Speech Communication Association.Lyon, France, Aug. 2013, pp. 2604–2608
— Major — Major —
Janto Skowronek, Katrin Schoenenberg, and Alexander Raake.“Experience with and insights about the new ITU-T standard onquality assessment of conferencing systems”. In: Proceedings ofthe international conference of acoustics (AIA-DAGA 2013). Merano,Mar. 2013, pp. 444–447
— Major — — —
Janto Skowronek, Falk Schiffner, and Alexander Raake. “Onthe influence of involvement on the quality of multiparty con-ferencing”. In: 4th International Workshop on Perceptual Quality ofSystems (PQS 2013). International Speech Communication Asso-ciation. Vienna, Austria, Sept. 2013, pp. 141–146
— — Major — —
Janto Skowronek, Katrin Schoenenberg, and Gunilla Berndtsson.“Multimedia Conferencing and Telemeetings”. In: Quality of Ex-perience - Advanced Concepts, Applications, Methods. Ed. by Sebas-tian Möller and Alexander Raake. Springer, 2014, pp. 217–228
Aspects Background — — —
Janto Skowronek and Alexander Raake. “Assessment of Cogni-tive Load, Speech Communication Quality and Quality of Expe-rience for spatial and non-spatial audio conferencing calls”. In:Speech Communication (2015), pp. 154–175. doi: 10.1016
— — Major — —
Janto Skowronek, Anne Weigel, and Alexander Raake. “Qualityof Multiparty Telephone Conferences from the Perspective of aPassive Listener”. In: Fortschritte der Akustik - 41. Jahrestagungfür Akustik (DAGA). Nürnberg, Germany, Mar. 2015
— — — Major —
Janto Skowronek and Alexander Raake. “Conceptual model ofmultiparty conferencing and telemeeting quality”. In: Proceed-ings of the 7th International Workshop on Quality of Multimedia Ex-perience (QoMEX 2015). Pilos, Greece, May 2015, pp. 1–6
Major Aspects — — —
Figure A.1: Overview of conducted stud-ies and documents that contributed tothis thesis. Part 1 – Publications.

overview of conducted studies and documents that contributed to this thesis 303
Document Chapter 5 Chapter 6 Chapter 7 Chapter 8 Chapter 9
ConceptualModel
Methodology PerceptionGroup-
CommunicationAspects
PerceptionTelecommunica-
tionAspects
PerceptualModels
Janto Skowronek and Alexander Raake. Development of scalableconversation test scenarios for multi-party telephone conferences. ITU-T Contribution COM 12 - C187 - E. Geneva, Switzerland: Inter-national Telecommunication Union, Jan. 2011
— — Aspects — —
Janto Skowronek et al. Initial insights for P.AMT based on reviewingexisting recommendations. ITU-T Contribution COM 12 - C 284 - E.Geneva, Switzerland: International Telecommunication Union,Oct. 2011
— Background Background Background —
Janto Skowronek. Topics for Question 18/12 in view of insights froma field survey. ITU-T Contribution COM 12 - C 285 - E. Geneva,Switzerland: International Telecommunication Union, Oct. 2011
Background Background — — —
Janto Skowronek and Alexander Raake. Listening test stimuli us-ing scalable multiparty conversation test scenarios. ITU-T Contribu-tion COM 12 - C 286 - E. Geneva, Switzerland: InternationalTelecommunication Union, Oct. 2011
— Background Aspects — —
Janto Skowronek and Alexander Raake. Number of interlocutorsand QoE in multiparty telephone conferences. ITU-T ContributionCOM 12 - C 287 - E. Geneva, Switzerland: International Telecom-munication Union, Oct. 2011
— — Aspects — —
Janto Skowronek et al. Proposed main body and normative annexfor draft recommendation P.AMT. ITU-T Contribution COM 12 -C318 - E. Geneva, Switzerland: International TelecommunicationUnion, May 2012
Background Major Background Background —
Janto Skowronek et al. Proposed non-normative appendices for draftrecommendation P.AMT. ITU-T Contribution COM 12 - C319 - E.Geneva, Switzerland: International Telecommunication Union,May 2012
Background Major Background Background —
Janto Skowronek and Alexander Raake. Update on number of In-terlocutors and QoE in multiparty telephone conferences. ITU-T Con-tribution COM 12 - C035 - E. Geneva, Switzerland: InternationalTelecommunication Union, Mar. 2013
— — Aspects — —
Janto Skowronek and Alexander Raake. Report on a study onasymmetric multiparty telephone conferences for a future update ofP.1301. ITU-T Contribution COM 12 - C134 - E. Geneva, Switzer-land: International Telecommunication Union, Dec. 2013
— Major — Major —
Janto Skowronek et al. “Method and Apparatus for Comput-ing the Perceived Quality of a Multiparty Audio or Audiovi-sual Telecommunication Service or System”. Patent applicationWO/2016/041593 (EP). Deutsche Telekom AG. Mar. 2016
Aspects — — — Major
Figure A.2: Overview of conducted stud-ies and documents that contributed tothis thesis. Part 2 – Documents withlimited access: ITU Contributions andPatent Application.

304 quality of experience of multiparty conferencing and telemeeting systems
Document Chapter 5 Chapter 6 Chapter 7 Chapter 8 Chapter 9
ConceptualModel
Methodology PerceptionGroup-
CommunicationAspects
PerceptionTelecommunica-
tionAspects
PerceptualModels
Janto Skowronek. Document summarizing model review. ProjectReport “Quality of Multiparty Audio-Video Communication”(Unpublished). Assessment of IP-based Applications, Technis-che Universität Berlin, Germany, Apr. 2013
— — — — Background
Janto Skowronek. Document describing scenarios. Project Report“Quality of Multiparty Audio-Video Communication” (Unpub-lished). Assessment of IP-based Applications, Technische Uni-versität Berlin, Germany, Apr. 2013
— Major — — —
Janto Skowronek. Initial model for audio-only communication basedon available data. Project Report “Quality of Multiparty Audio-Video Communication” (Unpublished). Assessment of IP-basedApplications, Technische Universität Berlin, Germany, June 2013
— — — — Aspects
Janto Skowronek. Documentation on system setup. Project Report“Quality of Multiparty Audio-Video Communication” (Unpub-lished). Assessment of IP-based Applications, Technische Uni-versität Berlin, Germany, June 2013
— — — Aspects —
Janto Skowronek. Improved model for audio-only communication.Project Report “Quality of Multiparty Audio-Video Communi-cation” (Unpublished). Assessment of IP-based Applications,Technische Universität Berlin, Germany, Dec. 2013
— Aspects — Major Major
Janto Skowronek. Pilot test for audiovisual communication.Project Report “Quality of Multiparty Audio-Video Communi-cation” (Unpublished). Assessment of IP-based Applications,Technische Universität Berlin, Germany, Feb. 2014
— — — Major —
Janto Skowronek. Initial model for audiovisual communication.Project Report “Quality of Multiparty Audio-Video Communi-cation” (Unpublished). Assessment of IP-based Applications,Technische Universität Berlin, Germany, May 2014
— — — — Major
Janto Skowronek. Second test for audiovisual communication.Project Report “Quality of Multiparty Audio-Video Communi-cation” (Unpublished). Assessment of IP-based Applications,Technische Universität Berlin, Germany, Oct. 2014
— — — Major —
Janto Skowronek. Improved model for audiovisual communication.Project Report “Quality of Multiparty Audio-Video Communi-cation” (Unpublished). Assessment of IP-based Applications,Technische Universität Berlin, Germany, Nov. 2014
— Aspects — — Major
Janto Skowronek. Focus groups on quality perception and attribu-tion. Project Report “Quality of Multiparty Audio-Video Com-munication” (Unpublished). Assessment of IP-based Applica-tions, Technische Universität Berlin, Germany, Nov. 2014
Background — — — —
Janto Skowronek. Final Project Report – Quality of MultipartyAudio-Video Communication. Project Report “Quality of Mul-tiparty Audio-Video Communication” (Unpublished). Assess-ment of IP-based Applications, Technische Universität Berlin,Germany, Dec. 2014
— Aspects — Major Major
Figure A.3: Overview of conducted stud-ies and documents that contributed tothis thesis. Part 3 – Unpublished docu-ments: Project Reports.

BDetailed Results: Deep Dive Analysis of Research onGroup-Communication
What this chapter is about
The present appendix presents the detailed results of the literaturereview about research on group-communication. Each figure showsfirst a visualization of the effects of communication media on the dif-ferent measures, using the graphical method described in Section 2.4.Then, each figure provides an explanation on how to interpret thevisualization. Finally, each figure presents the main findings that canbe extracted from the current visualization. The individual results arethen compiled in the main text in Section 2.4.

306 quality of experience of multiparty conferencing and telemeeting systems
B.1 Analysis Results
Interpretation Method:1. Look at the positions and sizes of the errorbars per medium Mx.2. The more the errorbars for the medium Mx are clustered towards the upper end, the more likely Mx leads to an increased collaboration performancecompared to other media. Example: M2 for the multiparty studies.3. The more the errorbars are clustered toward the lower end, the more likely Mx leads to a decreased collaboration performance. Example: M4.02 forthe multiparty studies.4. The more centrally positioned and at the same time the smaller the errorbars are for the medium Mx, the more likely Mx has an average collaborationperformance compared to other media. Example: none in this plot.5. The more centrally positioned and at the same time the wider the errorbars are for the medium Mx, the more likely Mx does not differ in thecollaboration performance compared to other media. Example: none in this plot.6. The more the errorbars of individual studies are spread for medium Mx, the more likely the impact of Mx on collaboration performance dependson the specific characteristics of the corresponding studies. Example: M4.01 for the multiparty studies.
Main finding for two-party studies:None since there is too little data, i.e. just one data point per medium, to draw proper conclusions.
Main finding for multiparty studies:Extracting a systematic ranking is difficult since hardly any medium was used in more than one study. Nevertheless, there is a tendency that f2f (M2)leads to better collaboration performance than audiovisual, especially when there is no directional view of interlocutors provided (M4.02).
Figure B.1: Impact of communicationmedia on measures of positive task out-come across studies with collaborationgame and survival tasks: Higher val-ues represent higher collaboration per-formance.

detailed results: deep dive analysis of research on group-communication 307
Interpretation Method:1. Look at the positions and sizes of the errorbars per medium Mx.2. The more the errorbars for the medium Mx are clustered towards the upper end, the more likely Mx leads to better task results compared to othermedia. Example: M1 for multiparty studies, in tendency.3. The more the errorbars are clustered toward the lower end, the more likely Mx leads to worse task results. Example: M7 for multiparty studies, intendency.4. The more centrally positioned and at the same time the smaller the errorbars are for the medium Mx, the more likely Mx leads to average taskresults compared to other media. Example: none in this plot.5. The more centrally positioned and at the same time the wider the errorbars are for the medium Mx, the more likely Mx does not differ in the taskresults compared to other media. Example: M2 for multiparty studies, in tendency.6. The more the errorbars of individual studies are spread for medium Mx, the more likely the impact of Mx on task results depends on the specificcharacteristics of the corresponding studies. Example: M5 for multiparty studies, in tendency.
Main finding for two-party studies:None since there is too little data, i.e. just one variable and study per medium, to draw proper conclusions.
Main finding for multiparty studies:There is no simple ranking of media across studies in terms of completion time. Either no significant differences were found (large errorbars withina medium) or any significant rankings within certain studies were not found in other studies (mix of small and large errorbars within a medium).Filtering out non-significant differences (disregard all large errorbars), and grouping the media into rough categories, i.e. f2f (M1, M2), audiovisual(M3.x, M4.x), audio-only (M5.x, M.6x), and text-only (M7.x, M8.x), some trend is visible though:F2f leads to better task results than text-only. Audiovisual and audio-only can not be reasonably interpreted.
Figure B.2: Impact of communicationmedia on measures of positive task out-come across studies with design, deci-sion, minority opinion, mystery, and es-timation tasks: Higher values representbetter task results.

308 quality of experience of multiparty conferencing and telemeeting systems
Interpretation Method:1. Look at the positions and sizes of the errorbars per medium Mx.2. The more the errorbars for the medium Mx are clustered towards the upper end, the more likely Mx leads to better task results compared to othermedia. Example: none in this plot.3. The more the errorbars are clustered toward the lower end, the more likely Mx leads to worse task results. Example: M4 for map task studies (twotop panels), in tendency.4. The more centrally positioned and at the same time the smaller the errorbars are for the medium Mx, the more likely Mx leads to average taskresults compared to other media. Example: none in this plot.5. The more centrally positioned and at the same time the wider the errorbars are for the medium Mx, the more likely Mx does not differ in the taskresults compared to other media. Example: M4.07 for map task studies (top two panels).6. The more the errorbars of individual studies are spread for medium Mx, the more likely the impact of Mx on task results depends on the specificcharacteristics of the corresponding studies. Example: none in this plot.
Main finding for two-party studies:No clear tendency is visible. Either no significant differences were found (large errorbars within a medium), or any significant rankings within certainstudies were not found in other studies or were contrary between studies (mix of small and large errorbars within a medium, and small errorbars arespread within a medium).
Main finding for multiparty studies:None, as none of the reviewed multiparty study used the current variables.
Figure B.3: Impact of communicationmedia on measures of positive task out-come across studies with map task (twotop panels) and helper-worker & othertasks (two bottom panels): Higher val-ues represent better task results.

detailed results: deep dive analysis of research on group-communication 309
Interpretation Method:1. Look at the positions and sizes of the errorbars per medium Mx.2. The more the errorbars for the medium Mx are clustered towards the upper end, the more likely Mx leads to an increased task completion timecompared to other media. Example: M8 for two-party studies.3. The more the errorbars are clustered toward the lower end, the more likely Mx leads to a decreased task completion time. Example: M1 for two-partystudies, in tendency.4. The more centrally positioned and at the same time the smaller the errorbars are for the medium Mx, the more likely Mx has an average taskcompletion time compared to other media. Example: M4 for two-party studies, in tendency.5. The more centrally positioned and at the same time the wider the errorbars are for the medium Mx, the more likely Mx does not differ in taskcompletion time compared to other media. Example: all media for multiparty studies.6. The more the errorbars of individual studies are spread for medium Mx, the more likely the impact of Mx on task completion time depends on thespecific characteristics of the corresponding studies. Example: M5.1 for two-party studies.
Main finding for two-party studies:There is no simple ranking of media across studies in terms of completion time. Either no significant differences were found (large errorbars withina medium) or any significant rankings within certain studies were not found in other studies (mix of small and large errorbars within a medium).Filtering out non-significant differences (disregard all large errorbars), and grouping the media into rough categories, i.e. f2f (M1, M2), audiovisual(M3.x, M4.x), audio-only (M5.x, M.6x), and text-only (M7, M8), there is some tendency of a ranking: f2f (M1, M2) < audiovisual (M3.x, M4.x) <text-only (M7.x, M8.x). However, audio-only (M5.x, M6.x) does not show a systematic tendency.
Main finding for multiparty studies:No differences of media in terms of completion time could be found.
Figure B.4: Impact of communicationmedia on measures of task completiontime across studies: Higher values rep-resent higher task completion time.

310 quality of experience of multiparty conferencing and telemeeting systems
Interpretation Method:1. Look at the positions and sizes of the errorbars per medium Mx.2. The more the errorbars for the medium Mx are clustered towards the upper end, the more likely Mx leads to an increased turn-taking rate comparedto other media. Example: M3 for multiparty studies.3. The more the errorbars are clustered toward the lower end, the more likely Mx leads to a decreased turn-taking rate. Example: M8.x for multipartystudies.4. The more centrally positioned and at the same time the smaller the errorbars are for the medium Mx, the more likely Mx has an average turn-takingrate compared to other media. Example: None in this plot.5. The more centrally positioned and at the same time the wider the errorbars are for the medium Mx, the more likely Mx does not differ in turn-takingrate compared to other media. Example: M4.x for multiparty studies.6. The more the errorbars of individual studies are spread for medium Mx, the more likely the impact of Mx on turn-taking rate depends on thespecific characteristics of the corresponding studies. Example: M6 for two-party studies.
Main finding for two-party studies:There is no simple ranking of media across studies in terms of turn-related measures. Either no significant differences were found (large errorbarswithin a medium), or any significant rankings within certain studies were not found in other studies (mix of small and large errorbars within a medium),or any significant rankings were contrary between studies (small errorbars are spread within a medium).Even filtering out non-significant differences (disregard all large errorbars), and grouping the media into rough categories, i.e. f2f (M1, M2), audiovisual(M3.x, M4.x), audio-only (M5.x, M.6x), and text-only (M8.x), no systematic tendency of a ranking is visible.
Main finding for multiparty studies:Same as main finding for two-party studies.
Figure B.5: Impact of communicationmedia on turn-related measures acrossstudies: Higher values represent ahigher turn-taking rate, i.e. larger num-ber of turns and shorter length of turns.

detailed results: deep dive analysis of research on group-communication 311
Interpretation Method:1. Look at the positions and sizes of the errorbars per medium Mx.2. The more the errorbars for the medium Mx are clustered towards the upper end, the more likely Mx leads to an increased relative word ratecompared to other media. Example: M3.1 for two-party studies.3. The more the errorbars are clustered toward the lower end, the more likely Mx leads to a decreased relative word rate. Example: M1 for two-partystudies.4. The more centrally positioned and at the same time the smaller the errorbars are for the medium Mx, the more likely Mx has an average relativeword rate compared to other media. Example: M5.2 for two-party studies.5. The more centrally positioned and at the same time the wider the errorbars are for the medium Mx, the more likely Mx does not differ in relativeword rate compared to other media. Example: M3.x for multiparty studies.6. The more the errorbars of individual studies are spread for medium Mx, the more likely the impact of Mx on relative word rate depends on thespecific characteristics of the corresponding studies. Example: M6 for two-party studies.
Main finding for two-party studies:Extracting a systematic ranking is difficult since hardly any medium was used in more than one study. Grouping the media into rough categories,i.e. f2f (M1, M2), audiovisual (M3.x, M4.x), and audio-only (M5.x, M.6x), some trend is visible though: f2f leads to lower relative word rate thanaudiovisual (most errorbars, but not all, in higher range), while audio-only shows no systematic behavior (errorbars spread across whole range).
Main finding for multiparty studies:Essentially no differences of media in terms of relative word rate could be found.
Figure B.6: Impact of communicationmedia on word-related measures acrossstudies: Higher values represent ahigher relative word rate, i.e. larger num-ber of words and higher values of wordrate.

312 quality of experience of multiparty conferencing and telemeeting systems
Interpretation Method:1. Look at the positions and sizes of the errorbars per medium Mx.2. The more the errorbars for the medium Mx are clustered towards the upper end, the more likely Mx leads to an increased amount of overlapcompared to other media. Example: M2 for multiparty studies.3. The more the errorbars are clustered toward the lower end, the more likely Mx leads to a decreased amount of overlap. Example: M5 for multipartystudies.4. The more centrally positioned and at the same time the smaller the errorbars are for the medium Mx, the more likely Mx has an average amount ofoverlap compared to other media. Example: None in this plot.5. The more centrally positioned and at the same time the wider the errorbars are for the medium Mx, the more likely Mx does not differ in amountof overlap compared to other media. Example: all media for two-party studies.6. The more the errorbars of individual studies are spread for medium Mx, the more likely the impact of Mx on amount of overlap depends on thespecific characteristics of the corresponding studies. Example: Example: M4.05 for multiparty studies.
Main finding for two-party studies:No differences of media in terms of amount of overlap could be found.
Main finding for multiparty studies:Extracting a systematic ranking is difficult since hardly any medium was used in more than one study. Grouping the media into rough categories,i.e. f2f (M1, M2), audiovisual (M3.x, M4.x), and audio-only (M5.x), some trend is visible though: f2f leads to higher amount of overlap (most errorbars,but not all, in higher range) than audio-only (most errorbars, but not all, in lower range), while audiovisual shows no systematic behavior (errorbarsspread across whole range).
Figure B.7: Impact of communicationmedia on speaker-state-related mea-sures across studies: Higher values rep-resent higher speaker-state probabili-ties for silence, single-talk and multi-talk. Most measures refer to multi-talk,i.e. amount of overlap.

detailed results: deep dive analysis of research on group-communication 313
Interpretation Method:1. Look at the positions and sizes of the errorbars per medium Mx.2. The more the errorbars for the medium Mx are clustered towards the upper end, the more likely Mx leads to an increased amount of speakerchanges compared to other media. Example: M2 for multiparty studies.3. The more the errorbars are clustered toward the lower end, the more likely Mx leads to a decreased amount of speaker changes. Example: M4.03for multiparty studies.4. The more centrally positioned and at the same time the smaller the errorbars are for the medium Mx, the more likely Mx has an average amount ofspeaker changes compared to other media. Example: None in this plot.5. The more centrally positioned and at the same time the wider the errorbars are for the medium Mx, the more likely Mx does not differ in amountof speaker changes compared to other media. Example: most media for two-party studies.6. The more the errorbars of individual studies are spread for medium Mx, the more likely the impact of Mx on amount of speaker changes dependson the specific characteristics of the corresponding studies. Example: Example: M6 for two-party studies.
Main finding for two-party studies:Essentially, no differences of media in terms of amount of speaker changes could be found.
Main finding for multiparty studies:Extracting a systematic ranking is difficult since hardly any medium was used in more than one study. Even grouping the media into rough categories,i.e. f2f (M1, M2) and audiovisual (M3.x, M4.x), does not reveal a systematic trend: for both, f2f and audiovisual, errorbars are spread across wholerange.
Figure B.8: Impact of communicationmedia on speaker-change-related mea-sures across studies: Higher values rep-resent larger amount of speaker changesin terms of handovers and interruptions.

314 quality of experience of multiparty conferencing and telemeeting systems
Interpretation Method:1. Look at the positions and sizes of the errorbars per medium Mx.2. The more the errorbars for the medium Mx are clustered towards the upper end, the more likely Mx leads to an increased amount of backchannelscompared to other media. Example: none in this plot, too little data.3. The more the errorbars are clustered toward the lower end, the more likely Mx leads to a decreased amount of backchannels. Example: none in thisplot, too little data.4. The more centrally positioned and at the same time the smaller the errorbars are for the medium Mx, the more likely Mx has an average amount ofbackchannels compared to other media. Example: none in this plot, too little data.5. The more centrally positioned and at the same time the wider the errorbars are for the medium Mx, the more likely Mx does not differ in amountof backchannels compared to other media. Example: none in this plot, too little data.6. The more the errorbars of individual studies are spread for medium Mx, the more likely the impact of Mx on amount of backchannels depends onthe specific characteristics of the corresponding studies. Example: none in this plot, too little data.
Main finding for two-party studies:None since there is too little data, i.e. just one or two data points per medium, to draw proper conclusions.
Main finding for multiparty studies:None since there is too little data, i.e. just one or two data points per medium, to draw proper conclusions. However, the few data points suggest thehypothesis that the higher the media richness is, the higher is the amount of backchannels (within each study a corresponding ranking is visible).
Figure B.9: Impact of communicationmedia on backchannel-related measuresacross studies: Higher values representhigher amount of backchannels.

detailed results: deep dive analysis of research on group-communication 315
Interpretation Method:1. Look at the positions and sizes of the errorbars per medium Mx.2. The more the errorbars for the medium Mx are clustered towards the upper end, the more likely Mx leads to an increased amount of instructionscompared to other media. Example: M3 for the studies concerning amount of instructions (two top panels).3. The more the errorbars are clustered toward the lower end, the more likely Mx leads to a decreased amount of instructions. Example: M6 for thestudies concerning amount of instructions (two top panels), in tendency.4. The more centrally positioned and at the same time the smaller the errorbars are for the medium Mx, the more likely Mx has an average amount ofinstructions compared to other media. Example: none in this plot.5. The more centrally positioned and at the same time the wider the errorbars are for the medium Mx, the more likely Mx does not differ in amountof instructions compared to other media. Example: M3 for the studies concerning amount of aligns and checks (two bottom panels).6. The more the errorbars of individual studies are spread for medium Mx, the more likely the impact of Mx on amount of instructions depends onthe specific characteristics of the corresponding studies. Example: M6 for the studies concerning amount of aligns and checks (two bottom panels).
Main finding for two-party studies concerning amount of instructions (two top panels):Focusing on the media audiovisual with shared workspace (M3, M3.1), audiovisual without shared workspace (M4), audio-only with shared workspace(M5), and audio-only without share workspace (M6, M6.1, M6.2), some interaction between the communication modality (audiovisual vs. audio-only)and the availability of a shared workspace is visible. Audiovisual with shared workspace leads to more instructions than audio-only without sharedworkspace. For audiovisual without shared workspace and audio-only with shared workspace, the amount of instructions is spread.Main finding for two-party studies concerning amount of aligns and checks (two bottom panels):There is no simple ranking of media across studies in terms of aligns and checks. Either any significant rankings within certain studies were not foundin other studies (mix of small and large errorbars within a medium) or any significant rankings were contrary between studies (small errorbars arespread within a medium). Even filtering out non-significant differences (disregard all large errorbars), and grouping the media into rough categories,i.e. f2f (M2), audiovisual (M3.x, M4.x), and audio-only (M5.x, M.6x), no systematic tendency of a ranking is visible, except that f2f requires a smalleramount of aligns and checks, while the other media sometimes require smaller, sometimes larger amount of aligns and checks.
Main finding for multiparty studies:None, as none of the reviewed multiparty study used the current variables.
Figure B.10: Impact of communicationmedia on instruction measures (twotop panels) and align and check mea-sures (two bottom panels) across stud-ies: Higher values represent higherlarger amount of instructions, aligns andchecks.

316 quality of experience of multiparty conferencing and telemeeting systems
Interpretation Method:1. Look at the positions and sizes of the errorbars per medium Mx.2. The more the errorbars for the medium Mx are clustered towards the upper end, the more likely Mx leads to an increased amount of explanationscompared to other media. Example: none in this plot.3. The more the errorbars are clustered toward the lower end, the more likely Mx leads to a decreased amount of explanations. Example: none in thisplot.4. The more centrally positioned and at the same time the smaller the errorbars are for the medium Mx, the more likely Mx has an average amount ofexplanations compared to other media. Example: none in this plot.5. The more centrally positioned and at the same time the wider the errorbars are for the medium Mx, the more likely Mx does not differ in amountof explanations compared to other media. Example: essentially all media in this plot.6. The more the errorbars of individual studies are spread for medium Mx, the more likely the impact of Mx on amount of explanations depends onthe specific characteristics of the corresponding studies. Example: none in this plot.
Main finding for two-party studies:There is essentially no influence of the media on the amount of explanations.
Main finding for multiparty studies:None since there is too little data, i.e. just one or two data points per medium, to draw proper conclusions.
Figure B.11: Impact of communicationmedia on explanation measures acrossstudies: Higher values represent largeramount of explanations.

detailed results: deep dive analysis of research on group-communication 317
Interpretation Method:1. Look at the positions and sizes of the errorbars per medium Mx.2. The more the errorbars for the medium Mx are clustered towards the upper end, the more likely Mx leads to more questions compared to othermedia. Example: none in this plot.3. The more the errorbars are clustered toward the lower end, the more likely Mx leads to fewer questions. Example: M2 for two-party studies.4. The more centrally positioned and at the same time the smaller the errorbars are for the medium Mx, the more likely Mx has an average amount ofquestions compared to other media. Example: none in this plot.5. The more centrally positioned and at the same time the wider the errorbars are for the medium Mx, the more likely Mx does not differ in amountof questions compared to other media. Example: none in this plot.6. The more the errorbars of individual studies are spread for medium Mx, the more likely the impact of Mx on amount of questions depends on thespecific characteristics of the corresponding studies. Example: M6 for two-party studies.
Main finding for two-party studies:There is no simple ranking of media across studies in terms of amount of questions. Either no significant differences were found (large errorbars withina medium), or any significant rankings within certain studies were not found in other studies (mix of small and large errorbars within a medium), orany significant rankings were contrary between studies (small errorbars are spread within a medium).However, there is the tendency that f2f requires a smaller amount of questions, while the other media require sometimes a smaller, sometimes a largeramount of questions.
Main finding for multiparty studies:None since there is too little data, i.e. just one or two data points per medium, to draw proper conclusions.
Figure B.12: Impact of communica-tion media on question measures acrossstudies: Higher values represent largeramount of questions.

318 quality of experience of multiparty conferencing and telemeeting systems
Interpretation Method:1. Look at the positions and sizes of the errorbars per medium Mx.2. The more the errorbars for the medium Mx are clustered towards the upper end, the more likely Mx leads to an increased amount of acknowledg-ments compared to other media. Example: M6.1 for two-party studies.3. The more the errorbars are clustered toward the lower end, the more likely Mx leads to a decreased amount of acknowledgments. Example: M5.1for two-party studies, in tendency.4. The more centrally positioned and at the same time the smaller the errorbars are for the medium Mx, the more likely Mx has an average amount ofacknowledgments compared to other media. Example: none in this plot.5. The more centrally positioned and at the same time the wider the errorbars are for the medium Mx, the more likely Mx does not differ in amountof acknowledgments compared to other media. Example: M3 for two-party studies.6. The more the errorbars of individual studies are spread for medium Mx, the more likely the impact of Mx on amount of acknowledgments dependson the specific characteristics of the corresponding studies. Example: M5.2 for two-party studies, in tendency.
Main finding for two-party studies concerning amount of acknowledgments:There is no simple ranking of media across studies. In most cases no significant differences were found (large errorbars within a medium), or anysignificant rankings within certain studies were not found in other studies (mix of small and large errorbars within a medium).
Main finding for two-party studies concerning amount of object, process and status utterances:There is no simple ranking of media across studies, even after grouping into rough categories, i.e. f2f (M1), audiovisual (M3.x, M4.x), and audio-only(M5.x, M6.x): Either any significant rankings within certain studies were not found in other studies (mix of small and large errorbars within a medium),or any significant rankings were contrary between studies (small errorbars are spread within a medium).Main finding for multiparty studies:None, as none of the reviewed multiparty study used the current variables.
Figure B.13: Impact of communicationmedia on acknowledgment measures(two top panels) and measures on refer-ences on object, process and status (twobottom panels) across studies: Highervalues represent higher larger amount ofacknowledgments and of object, processand status utterances.

detailed results: deep dive analysis of research on group-communication 319
Interpretation Method:1. Look at the positions and sizes of the errorbars per medium Mx.2. The more the errorbars for the medium Mx are clustered towards the upper end, the more likely Mx leads to an increased amount of conversationmanagement & failures compared to other media. Example: M5 for the two-party and multiparty studies.3. The more the errorbars are clustered toward the lower end, the more likely Mx leads to a decreased amount of conversation management & failures.Example: M7 for multiparty studies.4. The more centrally positioned and at the same time the smaller the errorbars are for the medium Mx, the more likely Mx has an average amount ofconversation management & failures compared to other media. Example: none in this plot.5. The more centrally positioned and at the same time the wider the errorbars are for the medium Mx, the more likely Mx does not differ in amountof conversation management & failures compared to other media. Example: M3.x for multiparty studies.6. The more the errorbars of individual studies are spread for medium Mx, the more likely the impact of Mx on amount of conversation management& failures depends on the specific characteristics of the corresponding studies. Example: none in this plot.
Main finding for two-party studies:None since there is too little data, i.e. just one or two data points per medium, to draw proper conclusions.
Main finding for multiparty studies:None since there is too little data, i.e. just one or two data points per medium, to draw proper conclusions.
Figure B.14: Impact of communicationmedia on conversation managementand conversation breakdown measuresacross studies: Higher values representlarger amount of attempts to manage theconversation or larger amount of conver-sation failures.

320 quality of experience of multiparty conferencing and telemeeting systems
Interpretation Method:1. Look at the positions and sizes of the errorbars per medium Mx.2. The more the errorbars for the medium Mx are clustered towards the upper end, the more likely Mx leads to an increased satisfaction compared toother media. Example: M1 for multiparty studies.3. The more the errorbars are clustered toward the lower end, the more likely Mx leads to a decreased satisfaction. Example: M5 for multiparty studies.4. The more centrally positioned and at the same time the smaller the errorbars are for the medium Mx, the more likely Mx has an average satisfactioncompared to other media. Example: none in this plot.5. The more centrally positioned and at the same time the wider the errorbars are for the medium Mx, the more likely Mx does not differ in satisfactioncompared to other media. Example: M3.03 for two-party studies.6. The more the errorbars of individual studies are spread for medium Mx, the more likely the impact of Mx on satisfaction depends on the specificcharacteristics of the corresponding studies. Example: M7 for multiparty studies.
Main finding for two-party studies:There is no simple ranking of media across studies, even after grouping into rough categories, i.e. f2f (M1, M2), audiovisual (M3.x, M4.x), audio-only(M5.x, M6.x), and text-based (M7, M8): Either no significant differences were found (large errorbars within a medium), or any significant rankingswithin certain studies were not found in other studies (mix of small and large errorbars within a medium), or any significant rankings were contrarybetween studies (small errorbars are spread within a medium).
Main finding for multiparty studies:Although the amount of data is small, some trend is visible: f2f and audiovisual leads, with some deviations, to higher satisfaction than audio-onlyand text-only.
Figure B.15: Impact of communicationmedia on satisfaction measures acrossstudies: Higher values represent highersatisfaction.

detailed results: deep dive analysis of research on group-communication 321
Interpretation Method:1. Look at the positions and sizes of the errorbars per medium Mx.2. The more the errorbars for the medium Mx are clustered towards the upper end, the more likely Mx leads to an increased media richness andopinion exchange compared to other media. Example: none in this plot, too little data.3. The more the errorbars are clustered toward the lower end, the more likely Mx leads to a decreased media richness and opinion exchange. Example:none in this plot, too little data.4. The more centrally positioned and at the same time the smaller the errorbars are for the medium Mx, the more likely Mx has an average mediarichness and opinion exchange compared to other media. Example: none in this plot, too little data.5. The more centrally positioned and at the same time the wider the errorbars are for the medium Mx, the more likely Mx does not differ in mediarichness and opinion exchange compared to other media. Example: essentially all media for the two-party and multiparty studies.6. The more the errorbars of individual studies are spread for medium Mx, the more likely the impact of Mx on media richness and opinion exchangedepends on the specific characteristics of the corresponding studies. Example: none in this plot, too little data.
Main finding for two-party studies concerning media richness:None since there is too little data, i.e. just one or two data points (studies) per medium and variable, to draw proper conclusions.
Main finding for multiparty studies concerning opinion-related measures:There is very little data, i.e. three data points (studies) per medium or per rough category of media (f2f, audiovisual, text), but these suggest no effectof the communication medium.
Figure B.16: Impact of communicationmedia on media richness measures (twotop panels) and opinion-related mea-sures (two bottom pannels) across stud-ies: Higher values represent higher me-dia richness and higher change and ex-change of opinions.

322 quality of experience of multiparty conferencing and telemeeting systems
Interpretation Method:1. Look at the positions and sizes of the errorbars per medium Mx.2. The more the errorbars for the medium Mx are clustered towards the upper end, the more likely Mx leads to an increased collaboration comparedto other media. Example: M1 for multiparty studies, in tendency.3. The more the errorbars are clustered toward the lower end, the more likely Mx leads to a decreased collaboration. Example: M7 for multipartystudies, in tendency.4. The more centrally positioned and at the same time the smaller the errorbars are for the medium Mx, the more likely Mx has an average collaborationcompared to other media. Example: none in this plot.5. The more centrally positioned and at the same time the wider the errorbars are for the medium Mx, the more likely Mx does not differ incollaboration compared to other media. Example: none in this plot.6. The more the errorbars of individual studies are spread for medium Mx, the more likely the impact of Mx on collaboration depends on the specificcharacteristics of the corresponding studies. Example: M3 for multiparty studies.
Main finding for two-party studies:None since there is too little data, i.e. just one or two data points (studies) per medium and variable, to draw proper conclusions.
Main finding for multiparty studies:There is very little data, i.e. three data points (studies) per medium or per rough category of media (f2f, audiovisual, audio-only, text, avatar). Further-more, no clear ranking of media across studies is visible: Either any significant rankings within certain studies were not found in other studies (mix ofsmall and large errorbars within a medium), or any significant rankings were contrary between studies (small errorbars are spread within a medium).
Figure B.17: Impact of communica-tion media on work process measuresacross studies: Higher values repre-sent more positive work processes andhigher amount of collaboration.

detailed results: deep dive analysis of research on group-communication 323
Interpretation Method:1. Look at the positions and sizes of the errorbars per medium Mx.2. The more the errorbars for the medium Mx are clustered towards the upper end, the more likely Mx leads to an increased grounding compared toother media. Example: M1 for multiparty studies.3. The more the errorbars are clustered toward the lower end, the more likely Mx leads to a decreased grounding. Example: M5 for multiparty studies.4. The more centrally positioned and at the same time the smaller the errorbars are for the medium Mx, the more likely Mx has an average groundingcompared to other media. Example: M3 for multiparty studies.5. The more centrally positioned and at the same time the wider the errorbars are for the medium Mx, the more likely Mx does not differ in groundingcompared to other media. Example: none in this plot.6. The more the errorbars of individual studies are spread for medium Mx, the more likely the impact of Mx on grounding depends on the specificcharacteristics of the corresponding studies. Example: M4 for two-party studies.
Main finding for two-party studies:None since there is too little data, i.e. just one data point (study) to draw proper conclusions.
Main finding for multiparty studies:None since there is very little data, i.e. just one to three data points (studies) per medium and no clear ranking of media across studies is visible.
Figure B.18: Impact of communicationmedia on grounding-related measuresacross studies: Higher values representpositive aspects of grounding, except forone variable (Perceived Discussion Confu-sion).

324 quality of experience of multiparty conferencing and telemeeting systems
Interpretation Method:1. Look at the positions and sizes of the errorbars per medium Mx.2. The more the errorbars for the medium Mx are clustered towards the upper end, the more likely Mx leads to an increased impression of theinterlocutor compared to other media. Example: M2 for multiparty studies.3. The more the errorbars are clustered toward the lower end, the more likely Mx leads to a decreased impression of the interlocutor. Example: M5 formultiparty studies, in tendency.4. The more centrally positioned and at the same time the smaller the errorbars are for the medium Mx, the more likely Mx has an average impressionof the interlocutor compared to other media. Example: M6 for multiparty studies.5. The more centrally positioned and at the same time the wider the errorbars are for the medium Mx, the more likely Mx does not differ in impressionof the interlocutor compared to other media. Example: M2 for two-party studies.6. The more the errorbars of individual studies are spread for medium Mx, the more likely the impact of Mx on impression of the interlocutor dependson the specific characteristics of the corresponding studies. Example: M3 for multiparty studies, in tendency.
Main finding for two-party studies:None since there is too little data, i.e. just one data point (study) to draw proper conclusions.
Main finding for multiparty studies:There is some trend that the interlocutors are more positively perceived by study participants for f2f communication vs. audio-only and other media,with audiovisual communication in-between.
Figure B.19: Impact of communicationmedia on measures of interlocutor be-havior across studies: Higher valuesrepresent higher amount of attention,awareness and impression of the inter-locutor.

detailed results: deep dive analysis of research on group-communication 325
Interpretation Method:1. Look at the positions and sizes of the errorbars per medium Mx.2. The more the errorbars for the medium Mx are clustered towards the upper end, the more likely Mx leads to an increased engagement compared toother media. Example: M1 for multiparty studies.3. The more the errorbars are clustered toward the lower end, the more likely Mx leads to a decreased engagement. Example: M5 for multipartystudies.4. The more centrally positioned and at the same time the smaller the errorbars are for the medium Mx, the more likely Mx has an average engagementcompared to other media. Example: M3 for multiparty studies.5. The more centrally positioned and at the same time the wider the errorbars are for the medium Mx, the more likely Mx does not differ in engagementcompared to other media. Example: M2 for two-party and multiparty studies.6. The more the errorbars of individual studies are spread for medium Mx, the more likely the impact of Mx on engagement depends on the specificcharacteristics of the corresponding studies. Example: M4 for two-party studies, in tendency.
Main finding for two-party studies:None since there is too little data, i.e. just one data point (study) to draw proper conclusions.
Main finding for multiparty studies:None since there is very little data, i.e. just one to three data points (studies) per medium and no clear ranking of media across studies is visible.
Figure B.20: Impact of communicationmedia on engagement measures acrossstudies: Higher values represent engage-ment.

326 quality of experience of multiparty conferencing and telemeeting systems
Interpretation Method:1. Look at the positions and sizes of the errorbars per medium Mx.2. The more the errorbars for the medium Mx are clustered towards the upper end, the more likely Mx leads to an increased trust compared to othermedia. Example: none in this plot.3. The more the errorbars are clustered toward the lower end, the more likely Mx leads to a decreased trust. Example: M1 for two-party studies, intendency.4. The more centrally positioned and at the same time the smaller the errorbars are for the medium Mx, the more likely Mx has an average trustcompared to other media. Example: none in this plot.5. The more centrally positioned and at the same time the wider the errorbars are for the medium Mx, the more likely Mx does not differ in trustcompared to other media. Example: M2 for two-party studies.6. The more the errorbars of individual studies are spread for medium Mx, the more likely the impact of Mx on trust depends on the specificcharacteristics of the corresponding studies. Example: M8 for two-party studies.
Main finding for two-party studies:None since there is too little data, i.e. just one or two data points (studies) to draw proper conclusions.
Main finding for multiparty studies:None since there is too little data, i.e. just one data point (study) to draw proper conclusions.
Figure B.21: Impact of communicationmedia on trust-related measures acrossstudies: Higher values represent higheramount of trust.

detailed results: deep dive analysis of research on group-communication 327
Interpretation Method:1. Look at the positions and sizes of the errorbars per medium Mx.2. The more the errorbars for the medium Mx are clustered towards the upper end, the more likely Mx leads to an increased turn-taking compared toother media. Example: M1 for multiparty studies.3. The more the errorbars are clustered toward the lower end, the more likely Mx leads to a decreased turn-taking. Example: M11 for multipartystudies.4. The more centrally positioned and at the same time the smaller the errorbars are for the medium Mx, the more likely Mx has an average turn-takingcompared to other media. Example: none in this plot.5. The more centrally positioned and at the same time the wider the errorbars are for the medium Mx, the more likely Mx does not differ in turn-takingcompared to other media. Example: none in this plot.6. The more the errorbars of individual studies are spread for medium Mx, the more likely the impact of Mx on turn-taking depends on the specificcharacteristics of the corresponding studies. Example: M6 for two-party studies.
Main finding for two-party studies:None since there is too little data, i.e. just one or two data points (studies) to draw proper conclusions.
Main finding for multiparty studies:There is no simple ranking of media across studies, even after grouping into rough categories, i.e. f2f (M1, M2), audiovisual (M3.x, M4.x), audio-only(M5, M6), and other (M11): Either any significant rankings within certain studies were not found in other studies (mix of small and large errorbarswithin a medium), or any significant rankings were contrary between studies (small errorbars are spread within a medium).
Figure B.22: Impact of communicationmedia on turn-taking-related measuresacross studies: Higher values representmore positive perception of turn-taking.

328 quality of experience of multiparty conferencing and telemeeting systems
Interpretation Method:1. Look at the positions and sizes of the errorbars per medium Mx.2. The more the errorbars for the medium Mx are clustered towards the upper end, the more likely Mx leads to an increased benefit of visual cuescompared to other media. Example: M4.01 for multiparty studies, in tendency.3. The more the errorbars are clustered toward the lower end, the more likely Mx leads to a decreased benefit of visual cues. Example: M4.02 formultiparty studies, in tendency.4. The more centrally positioned and at the same time the smaller the errorbars are for the medium Mx, the more likely Mx has an average benefit ofvisual cues compared to other media. Example: none in this plot.5. The more centrally positioned and at the same time the wider the errorbars are for the medium Mx, the more likely Mx does not differ in benefit ofvisual cues compared to other media. Example: none in this plot.6. The more the errorbars of individual studies are spread for medium Mx, the more likely the impact of Mx on benefit of visual cues depends on thespecific characteristics of the corresponding studies. Example: none in this plot.
Main finding for two-party studies:None since there is too little data, i.e. just one data point (study) to draw proper conclusions.
Main finding for multiparty studies:None since there is too little data, i.e. just two data points (studies) to draw proper conclusions.
Figure B.23: Impact of communicationmedia on measures concerning visualcues across studies: Higher values repre-sent a larger perceived benefit of visualcues.

CDetailed Results: Study on Impact of CommunicationComplexity
What this chapter is about
The present appendix presents per employed measure the detailedresults of the two experiments CC1 & CC2 on the impact of commu-nication complexity on quality perception. First, each figure providesan explanation of the analysis steps conducted. Then, each figureshows the results for two analysis levels: a) the main effects (i.e. effectof #IL across all SndRepr, effect of SndRepr across all #IL), and (b) theindividual effects (effect of #IL per SndRepr, effect of SndRepr per #IL).Finally, each figure discusses how the current results relate to thedifferent hypotheses formulated in Section 7.3. The individual resultsare then compiled in the main text in Section 7.3.

330 quality of experience of multiparty conferencing and telemeeting systems
C.1 Experiment CC1
1. Analysis StepsThe present figure shows the data analysis for the measure Quality in nine steps (a) to (i). Steps (a) to (c) concern the main effects; that means theeffect of #IL if all data over SndRepr is compiled and the effect of SndRepr if all data over #IL is compiled. Steps (d) to (f) concern the individualeffect of #IL analyzed per SndRepr. Steps (g) to (i) concern the individual effect of SndRepr analyzed per #IL.Steps (a), (d), & (g): errorbar plots, showing the mean values and 95% confidence intervals per #IL and SndRepr. Steps (b), (e), & (h): results ofrepeated-measures ANOVAs with #IL ∈ [2, 3, 4, 6] and SndRepr ∈ [1 = NB/non-spatial, 2 = FB/non-spatial, 3 = FB/spatial] as input, expressed bythe F-measure and significance level p, and using the Greenhouse-Geisser correction when the sphericity criterion for repeated-measures ANOVAsis violated. Steps (c), (f), & (i): results of PostHoc tests (estimated marginal means) with Sidak correction for pairwise comparisons between allpairs of #IL or SndRepr, expressed by the significance level p; Significant differences (p ≤ 0.05) are indicated with an asterisk (*).
2.1 Main Effects
(a) Errorbars
(b) ANOVA
F p#IL 0.147 0.790
SndRepr 22.592 0.000*Interaction 2.125 0.067
(c) PostHoc tests
SndRepr p #IL p1 vs. 2 0.127 2 vs. 3 1.000
1 vs. 3 0.001* 2 vs. 4 1.000
2 vs. 3 0.004* 2 vs. 6 0.998
3 vs. 4 1.000
3 vs. 6 0.999
4 vs. 6 0.788
2.2 Individual Effect of SndRepr per #IL
(d) Errorbars
(e) ANOVA per #IL
#IL F p2 4.576 0.025*3 34.681 0.000*4 10.376 0.001*6 10.628 0.001*
(f) PostHoc tests per #IL
#IL SndRepr p2 1 vs. 2 0.951
1 vs. 3 0.021*2 vs. 3 0.088
3 1 vs. 2 0.005*1 vs. 3 0.000*2 vs. 3 0.000*
4 1 vs. 2 0.448
1 vs. 3 0.005*2 vs. 3 0.009*
6 1 vs. 2 0.172
1 vs. 3 0.004*2 vs. 3 0.056
2.3 Individual Effect of #IL per SndRepr
(g) Errorbars
(h) ANOVA per SndRepr
SndRepr F p1 2.595 0.071
2 1.405 0.259
3 0.839 0.484
(i) PostHoc tests per SndRepr
SndRepr #IL p1 2 vs. 3 0.104
2 vs. 4 0.993
2 vs. 6 0.999
3 vs. 4 0.613
3 vs. 6 0.342
4 vs. 6 0.997
2 2 vs. 3 0.509
2 vs. 4 0.998
2 vs. 6 0.904
3 vs. 4 0.336
3 vs. 6 0.999
4 vs. 6 0.841
3 2 vs. 3 0.281
2 vs. 4 0.980
2 vs. 6 0.709
3 vs. 4 0.999
3 vs. 6 1.000
4 vs. 6 1.000
3. Analysis Results:
3.1 Hypothesis H5 (Communication Complexity has an impact on Speech Communication Quality / Quality of Experience) is not supported, as#IL has no significant impact on Quality.Rationale – main effect: Although values show a slight tendency to increase with increasing #IL (Step a), this unexpected effect is not significant(Steps b & c).Rationale – effect per SndRepr: Although values show a slight tendency to increase with increasing #IL for all three SndRepr (Step g), this unexpectedeffect is not significant (Steps h & i).3.2 Hypothesis H6 (Technical System Capability has an impact on Speech Communication Quality /Quality of Experience) is supported, as SndReprhas a significant impact on Quality.Rationale – main effect: Values increase with increasing SndRepr (Step a). This effect is significant (Step b) and explained by significant differencesbetween non-spatial and spatial sound reproduction (Step c).Rationale – effect per #IL: Values increase for all four #IL (Step d). This is significant (Step e) explained by significant differences between almostall SndRepr, most often between non-spatial and spatial round reproduction (Step f).
Figure C.1: Results for the measureQuality.

detailed results: study on impact of communication complexity 331
1. Analysis StepsThe present figure shows the data analysis for the measure Topic Recognition Performance in nine steps (a) to (i). Steps (a) to (c) concern the maineffects; that means the effect of #IL if all data over SndRepr is compiled and the effect of SndRepr if all data over #IL is compiled. Steps (d) to (f)concern the individual effect of #IL analyzed per SndRepr. Steps (g) to (i) concern the individual effect of SndRepr analyzed per #IL.Steps (a), (d), & (g): errorbar plots, showing the mean values and 95% confidence intervals per #IL and SndRepr. Steps (b), (e), & (h): results ofrepeated-measures ANOVAs with #IL ∈ [2, 3, 4, 6] and SndRepr ∈ [1 = NB/non-spatial, 2 = FB/non-spatial, 3 = FB/spatial] as input, expressed bythe F-measure and significance level p, and using the Greenhouse-Geisser correction when the sphericity criterion for repeated-measures ANOVAsis violated. Steps (c), (f), & (i): results of PostHoc tests (estimated marginal means) with Sidak correction for pairwise comparisons between allpairs of #IL or SndRepr, expressed by the significance level p; Significant differences (p ≤ 0.05) are indicated with an asterisk (*).
2.1 Main Effects
(a) Errorbars
(b) ANOVA
F p#IL 2.862 0.081
SndRepr 2.995 0.046*Interaction 0.738 0.492
(c) PostHoc tests
SndRepr p #IL p1 vs. 2 0.889 2 vs. 3 0.629
1 vs. 3 0.346 2 vs. 4 0.279
2 vs. 3 0.023* 2 vs. 6 0.985
3 vs. 4 0.949
3 vs. 6 0.687
4 vs. 6 0.207
2.2 Individual Effect of SndRepr per #IL
(d) Errorbars
(e) ANOVA per #IL
#IL F p2 0.478 0.626
3 0.865 0.402
4 0.517 0.604
6 1.733 0.202
(f) PostHoc tests per #IL
#IL SndRepr p2 1 vs. 2 0.711
1 vs. 3 1.000
2 vs. 3 0.711
3 1 vs. 2 0.711
1 vs. 3 0.929
2 vs. 3 0.711
4 1 vs. 2 0.823
1 vs. 3 0.979
2 vs. 3 0.814
6 1 vs. 2 0.979
1 vs. 3 0.473
2 vs. 3 0.110
2.3 Individual Effect of #IL per SndRepr
(g) Errorbars
(h) ANOVA per SndRepr
SndRepr F p1 1.000 0.405
2 1.892 0.152
3 1.774 0.171
(i) PostHoc tests per SndRepr
SndRepr #IL p1 2 vs. 3 0.916
2 vs. 4 0.720
2 vs. 6 0.916
3 vs. 4 0.995
3 vs. 6 0.995
4 vs. 6 0.916
2 2 vs. 3 0.279
2 vs. 4 0.400
2 vs. 6 0.722
3 vs. 4 1.000
3 vs. 6 0.985
4 vs. 6 0.722
3 2 vs. 3 0.995
2 vs. 4 0.916
2 vs. 6 0.664
3 vs. 4 0.999
3 vs. 6 0.401
4 vs. 6 0.211
3. Analysis Results:
3.1 Hypothesis H1 (Communication Complexity has an impact on Cognitive Load) is not supported, as #IL has no significant impact on TopicRecognition Performance.Rationale – main effect: With the exception of #IL = 6, values decrease with increasing #IL (Step a). This unexpected effect is not significant (Stepsb & c).Rationale – effect per SndRepr: With the exception of #IL = 6, values decrease with increasing #IL for all three SndRepr (Step g). However, this isnot significant (Steps h & i).3.2 Hypothesis H2 (Technical System Capability has an impact on Cognitive Load) is supported, as SndRepr has a significant impact on TopicRecognition Performance.Rationale – main effect: Values for spatial sound reproduction are higher than non-spatial reproduction (Step a). This effect significant (Step b),but only between SndRepr = 2 & 3 (Step c).Rationale – effect per #IL: No clear pattern is visible (Step d), and no significant differences can be found (Steps e & f).
Figure C.2: Results for the measureTopic Recognition Performance.

332 quality of experience of multiparty conferencing and telemeeting systems
1. Analysis StepsThe present figure shows the data analysis for the measure Topic Recognition Confidence in nine steps (a) to (i). Steps (a) to (c) concern the maineffects; that means the effect of #IL if all data over SndRepr is compiled and the effect of SndRepr if all data over #IL is compiled. Steps (d) to (f)concern the individual effect of #IL analyzed per SndRepr. Steps (g) to (i) concern the individual effect of SndRepr analyzed per #IL.Steps (a), (d), & (g): errorbar plots, showing the mean values and 95% confidence intervals per #IL and SndRepr. Steps (b), (e), & (h): results ofrepeated-measures ANOVAs with #IL ∈ [2, 3, 4, 6] and SndRepr ∈ [1 = NB/non-spatial, 2 = FB/non-spatial, 3 = FB/spatial] as input, expressed bythe F-measure and significance level p, and using the Greenhouse-Geisser correction when the sphericity criterion for repeated-measures ANOVAsis violated. Steps (c), (f), & (i): results of PostHoc tests (estimated marginal means) with Sidak correction for pairwise comparisons between allpairs of #IL or SndRepr, expressed by the significance level p; Significant differences (p ≤ 0.05) are indicated with an asterisk (*).
2.1 Main Effects
(a) Errorbars
(b) ANOVA
F p#IL 3.114 0.039*SndRepr 3.877 0.036*Interaction 0.724 0.521
(c) PostHoc tests
SndRepr p #IL p1 vs. 2 0.680 2 vs. 3 0.344
1 vs. 3 0.310 2 vs. 4 0.639
2 vs. 3 0.018* 2 vs. 6 0.128
3 vs. 4 0.993
3 vs. 6 0.899
4 vs. 6 0.675
2.2 Individual Effect of SndRepr per #IL
(d) Errorbars
(e) ANOVA per #IL
#IL F p2 0.139 0.871
3 1.212 0.317
4 3.341 0.085
6 1.583 0.228
(f) PostHoc tests per #IL
#IL SndRepr p2 1 vs. 2 1.000
1 vs. 3 0.963
2 vs. 3 0.876
3 1 vs. 2 0.771
1 vs. 3 0.710
2 vs. 3 0.575
4 1 vs. 2 0.200
1 vs. 3 0.998
2 vs. 3 0.264
6 1 vs. 2 1.000
1 vs. 3 0.298
2 vs. 3 0.409
2.3 Individual Effect of #IL per SndRepr
(g) Errorbars
(h) ANOVA per SndRepr
SndRepr F p1 3.076 0.041*2 1.814 0.164
3 0.430 0.733
(i) PostHoc tests per SndRepr
SndRepr #IL p1 2 vs. 3 0.731
2 vs. 4 1.000
2 vs. 6 0.241
3 vs. 4 0.884
3 vs. 6 0.355
4 vs. 6 0.170
2 2 vs. 3 0.407
2 vs. 4 0.188
2 vs. 6 0.162
3 vs. 4 1.000
3 vs. 6 1.000
4 vs. 6 1.000
3 2 vs. 3 0.972
2 vs. 4 0.774
2 vs. 6 0.851
3 vs. 4 1.000
3 vs. 6 1.000
4 vs. 6 0.998
3. Analysis Results:
3.1 Hypothesis H1 (Communication Complexity has an impact on Cognitive Load) is supported, as #IL has a significant impact on Topic RecognitionConfidence.Rationale – main effect: Values decrease with increasing #IL (Step a). This effect is significant (Step b), but not strong enough to be detected by thePostHoc tests (Step c).Rationale – effect per SndRepr: Values decrease with increasing #IL for all three SndRepr (Step g). This is significant only for SndRepr = 1 (Step h),but it can not be detected by the PostHoc tests (Step i).3.2 Hypothesis H2 (Technical System Capability has an impact on Cognitive Load) is supported, as SndRepr has a significant impact on TopicRecognition Confidence.Rationale – main effect: Values for spatial sound reproduction are higher than non-spatial reproduction (Step a). This effect significant (Step b),but only between SndRepr = 2 & 3 (Step c).Rationale – effect per #IL: No clear pattern is visible (Step d), and no significant differences can be found (Steps e & f).
Figure C.3: Results for the measureTopic Recognition Confidence.

detailed results: study on impact of communication complexity 333
1. Analysis StepsThe present figure shows the data analysis for the measure Speaker Recognition Performance in nine steps (a) to (i). Steps (a) to (c) concern the maineffects; that means the effect of #IL if all data over SndRepr is compiled and the effect of SndRepr if all data over #IL is compiled. Steps (d) to (f)concern the individual effect of #IL analyzed per SndRepr. Steps (g) to (i) concern the individual effect of SndRepr analyzed per #IL.Steps (a), (d), & (g): errorbar plots, showing the mean values and 95% confidence intervals per #IL and SndRepr. Steps (b), (e), & (h): results ofrepeated-measures ANOVAs with #IL ∈ [2, 3, 4, 6] and SndRepr ∈ [1 = NB/non-spatial, 2 = FB/non-spatial, 3 = FB/spatial] as input, expressed bythe F-measure and significance level p, and using the Greenhouse-Geisser correction when the sphericity criterion for repeated-measures ANOVAsis violated. Steps (c), (f), & (i): results of PostHoc tests (estimated marginal means) with Sidak correction for pairwise comparisons between allpairs of #IL or SndRepr, expressed by the significance level p; Significant differences (p ≤ 0.05) are indicated with an asterisk (*).
2.1 Main Effects
(a) Errorbars
(b) ANOVA
F p#IL 27.750 0.000*SndRepr 2.717 0.088
Interaction 0.842 0.542
(c) PostHoc tests
SndRepr p #IL p1 vs. 2 1.000 2 vs. 3 0.000*1 vs. 3 0.033* 2 vs. 4 0.000*2 vs. 3 0.320 2 vs. 6 0.000*
3 vs. 4 0.025*3 vs. 6 0.003*4 vs. 6 1.000
2.2 Individual Effect of SndRepr per #IL
(d) Errorbars
(e) ANOVA per #IL
#IL F p2 0.064 0.938
3 2.130 0.168
4 0.733 0.492
6 1.917 0.171
(f) PostHoc tests per #IL
#IL SndRepr p2 1 vs. 2 0.999
1 vs. 3 0.994
2 vs. 3 0.982
3 1 vs. 2 0.915
1 vs. 3 0.175
2 vs. 3 0.140
4 1 vs. 2 0.998
1 vs. 3 0.801
2 vs. 3 0.567
6 1 vs. 2 0.694
1 vs. 3 0.228
2 vs. 3 0.741
2.3 Individual Effect of #IL per SndRepr
(g) Errorbars
(h) ANOVA per SndRepr
SndRepr F p1 6.103 0.002*2 6.455 0.001*3 5.845 0.003*
(i) PostHoc tests per SndRepr
SndRepr #IL p1 2 vs. 3 0.646
2 vs. 4 0.003*2 vs. 6 0.013*3 vs. 4 0.612
3 vs. 6 0.363
4 vs. 6 0.970
2 2 vs. 3 0.233
2 vs. 4 0.002*2 vs. 6 0.048*3 vs. 4 0.941
3 vs. 6 0.999
4 vs. 6 0.979
3 2 vs. 3 0.998
2 vs. 4 0.140
2 vs. 6 0.109
3 vs. 4 0.039*3 vs. 6 0.055
4 vs. 6 0.987
3. Analysis Results:
3.1 Hypothesis H1 (Communication Complexity has an impact on Cognitive Load) is supported, as #IL has a significant impact on SpeakerRecognition Performance.Rationale – main effect: Values decrease with increasing #IL (Step a). This effect is significant (Step b), and explained by significant differencesbetween all expect one pair of #IL (Step c).Rationale – effect per SndRepr: Values decrease with increasing #IL for all three SndRepr (Step g). This is significant (Step h), and is mainlyexplained by significant differences between #IL =2 and #IL > 3, i.e. two-party and medium-large multiparty party groups (Step i).3.2 Hypothesis H2 (Technical System Capability has an impact on Cognitive Load) is not supported, as SndRepr has no significant impact on SpeakerRecognition Performance.Rationale – main effect: Although values for spatial sound reproduction are higher than non-spatial reproduction (Step a). This effect is overallnot significant (Step b), even if the PostHoc tests found a single pair to be significantly different (Step c).Rationale – effect per #IL: Some slight tendency of increasing values is visible (Step d), but no significant differences can be found (Steps e & f).
Figure C.4: Results for the measureSpeaker Recognition Performance.

334 quality of experience of multiparty conferencing and telemeeting systems
1. Analysis StepsThe present figure shows the data analysis for the measure Speaker Recognition Confidence in nine steps (a) to (i). Steps (a) to (c) concern the maineffects; that means the effect of #IL if all data over SndRepr is compiled and the effect of SndRepr if all data over #IL is compiled. Steps (d) to (f)concern the individual effect of #IL analyzed per SndRepr. Steps (g) to (i) concern the individual effect of SndRepr analyzed per #IL.Steps (a), (d), & (g): errorbar plots, showing the mean values and 95% confidence intervals per #IL and SndRepr. Steps (b), (e), & (h): results ofrepeated-measures ANOVAs with #IL ∈ [2, 3, 4, 6] and SndRepr ∈ [1 = NB/non-spatial, 2 = FB/non-spatial, 3 = FB/spatial] as input, expressed bythe F-measure and significance level p, and using the Greenhouse-Geisser correction when the sphericity criterion for repeated-measures ANOVAsis violated. Steps (c), (f), & (i): results of PostHoc tests (estimated marginal means) with Sidak correction for pairwise comparisons between allpairs of #IL or SndRepr, expressed by the significance level p; Significant differences (p ≤ 0.05) are indicated with an asterisk (*).
2.1 Main Effects
(a) Errorbars
(b) ANOVA
F p#IL 54.634 0.000*SndRepr 8.181 0.002*Interaction 0.450 0.843
(c) PostHoc tests
SndRepr p #IL p1 vs. 2 0.948 2 vs. 3 0.001*1 vs. 3 0.020* 2 vs. 4 0.000*2 vs. 3 0.015* 2 vs. 6 0.000*
3 vs. 4 0.007*3 vs. 6 0.002*4 vs. 6 1.000
2.2 Individual Effect of SndRepr per #IL
(d) Errorbars
(e) ANOVA per #IL
#IL F p2 1.385 0.271
3 2.078 0.149
4 3.029 0.069
6 6.439 0.006*
(f) PostHoc tests per #IL
#IL SndRepr p2 1 vs. 2 1.000
1 vs. 3 0.513
2 vs. 3 0.298
3 1 vs. 2 0.956
1 vs. 3 0.374
2 vs. 3 0.135
4 1 vs. 2 0.515
1 vs. 3 0.685
2 vs. 3 0.057
6 1 vs. 2 0.796
1 vs. 3 0.020*2 vs. 3 0.046*
2.3 Individual Effect of #IL per SndRepr
(g) Errorbars
(h) ANOVA per SndRepr
SndRepr F p1 7.237 0.001*2 8.930 0.000*3 13.401 0.000*
(i) PostHoc tests per SndRepr
SndRepr #IL p1 2 vs. 3 0.691
2 vs. 4 0.014*2 vs. 6 0.002*3 vs. 4 0.712
3 vs. 6 0.231
4 vs. 6 0.664
2 2 vs. 3 0.290
2 vs. 4 0.002*2 vs. 6 0.011*3 vs. 4 0.152
3 vs. 6 0.790
4 vs. 6 0.977
3 2 vs. 3 0.227
2 vs. 4 0.002*2 vs. 6 0.003*3 vs. 4 0.037*3 vs. 6 0.184
4 vs. 6 0.899
3. Analysis Results:
3.1 Hypothesis H1 (Communication Complexity has an impact on Cognitive Load) is supported, as #IL has a significant impact on SpeakerRecognition Confidence.Rationale – main effect: Values decrease with increasing #IL (Step a). This effect is significant (Step b), and explained by significant differencesbetween all expect one pair of #IL (Step c).Rationale – effect per SndRepr: Values decrease with increasing #IL for all three SndRepr (Step g). This is significant (Step h), and is mainlyexplained by significant differences between #IL =2 and #IL > 3, i.e. two-party and medium-large multiparty party groups (Step i).3.2 Hypothesis H2 (Technical System Capability has an impact on Cognitive Load) is supported, as SndRepr, more specifically spatial soundreproduction, has a significant impact on Speaker Recognition Confidence.Rationale – main effect: Values for spatial sound reproduction are higher than non-spatial reproduction (Step a). This effect is significant (Step b),and confirmed by significant differences between the respective pairs of SndRepr (Step c).Rationale – effect per #IL: Some slight tendency of increasing values is visible (Step d), but significant differences can be found only for #IL = 6,i.e. large groups (Step e), and there between non-spatial and spatial sound reproduction.
Figure C.5: Results for the measureSpeaker Recognition Confidence.

detailed results: study on impact of communication complexity 335
1. Analysis StepsThe present figure shows the data analysis for the measure Speaker Recognition Effort in nine steps (a) to (i). Steps (a) to (c) concern the main effects;that means the effect of #IL if all data over SndRepr is compiled and the effect of SndRepr if all data over #IL is compiled. Steps (d) to (f) concernthe individual effect of #IL analyzed per SndRepr. Steps (g) to (i) concern the individual effect of SndRepr analyzed per #IL.Steps (a), (d), & (g): errorbar plots, showing the mean values and 95% confidence intervals per #IL and SndRepr. Steps (b), (e), & (h): results ofrepeated-measures ANOVAs with #IL ∈ [2, 3, 4, 6] and SndRepr ∈ [1 = NB/non-spatial, 2 = FB/non-spatial, 3 = FB/spatial] as input, expressed bythe F-measure and significance level p, and using the Greenhouse-Geisser correction when the sphericity criterion for repeated-measures ANOVAsis violated. Steps (c), (f), & (i): results of PostHoc tests (estimated marginal means) with Sidak correction for pairwise comparisons between allpairs of #IL or SndRepr, expressed by the significance level p; Significant differences (p ≤ 0.05) are indicated with an asterisk (*).
2.1 Main Effects
(a) Errorbars
(b) ANOVA
F p#IL 25.332 0.000*SndRepr 31.751 0.000*Interaction 1.360 0.244
(c) PostHoc tests
SndRepr p #IL p1 vs. 2 0.988 2 vs. 3 0.003*1 vs. 3 0.000* 2 vs. 4 0.001*2 vs. 3 0.000* 2 vs. 6 0.000*
3 vs. 4 0.041*3 vs. 6 0.009*4 vs. 6 0.506
2.2 Individual Effect of SndRepr per #IL
(d) Errorbars
(e) ANOVA per #IL
#IL F p2 5.513 0.011*3 13.504 0.000*4 16.983 0.000*6 13.462 0.000*
(f) PostHoc tests per #IL
#IL SndRepr p2 1 vs. 2 0.816
1 vs. 3 0.020*2 vs. 3 0.086
3 1 vs. 2 1.000
1 vs. 3 0.001*2 vs. 3 0.000*
4 1 vs. 2 0.963
1 vs. 3 0.000*2 vs. 3 0.002*
6 1 vs. 2 0.918
1 vs. 3 0.014*2 vs. 3 0.001*
2.3 Individual Effect of #IL per SndRepr
(g) Errorbars
(h) ANOVA per SndRepr
SndRepr F p1 4.924 0.006*2 12.720 0.000*3 10.318 0.000*
(i) PostHoc tests per SndRepr
SndRepr #IL p1 2 vs. 3 0.353
2 vs. 4 0.029*2 vs. 6 0.011*3 vs. 4 0.694
3 vs. 6 0.881
4 vs. 6 1.000
2 2 vs. 3 0.118
2 vs. 4 0.009*2 vs. 6 0.000*3 vs. 4 0.675
3 vs. 6 0.220
4 vs. 6 0.786
3 2 vs. 3 1.000
2 vs. 4 0.282
2 vs. 6 0.008*3 vs. 4 0.060
3 vs. 6 0.008*4 vs. 6 0.205
3. Analysis Results:
3.1 Hypothesis H1 (Communication Complexity has an impact on Cognitive Load) is supported, as #IL has a significant impact on SpeakerRecognition Effort.Rationale – main effect: Values decrease with increasing #IL (Step a). This effect is significant (Step b), and explained by significant differencesbetween all expect one pair of #IL (Step c).Rationale – effect per SndRepr: Values decrease with increasing #IL for all three SndRepr (Step g). This is significant (Step h), and is mainlyexplained by significant differences between #IL =2 and #IL > 3, i.e. two-party and medium-large multiparty party groups (Step i).3.2 Hypothesis H2 (Technical System Capability has an impact on Cognitive Load) is supported, as SndRepr, more specifically spatial soundreproduction, has a significant impact on Speaker Recognition Effort.Rationale – main effect: Values for spatial sound reproduction are higher than non-spatial reproduction (Step a). This effect is significant (Step b),and confirmed by significant differences between the respective pairs of SndRepr (Step c).Rationale – effect per #IL: Values for spatial sound reproduction are higher than non-spatial reproduction for all #IL (Step c). This effect is significant(Step d), and mainly explained by significant differences between non-spatial and spatial sound reproduction (Step f).
Figure C.6: Results for the measureSpeaker Recognition Effort.

336 quality of experience of multiparty conferencing and telemeeting systems
1. Analysis StepsThe present figure shows the data analysis for the measure Topic Comprehension Effort in nine steps (a) to (i). Steps (a) to (c) concern the main effects;that means the effect of #IL if all data over SndRepr is compiled and the effect of SndRepr if all data over #IL is compiled. Steps (d) to (f) concernthe individual effect of #IL analyzed per SndRepr. Steps (g) to (i) concern the individual effect of SndRepr analyzed per #IL.Steps (a), (d), & (g): errorbar plots, showing the mean values and 95% confidence intervals per #IL and SndRepr. Steps (b), (e), & (h): results ofrepeated-measures ANOVAs with #IL ∈ [2, 3, 4, 6] and SndRepr ∈ [1 = NB/non-spatial, 2 = FB/non-spatial, 3 = FB/spatial] as input, expressed bythe F-measure and significance level p, and using the Greenhouse-Geisser correction when the sphericity criterion for repeated-measures ANOVAsis violated. Steps (c), (f), & (i): results of PostHoc tests (estimated marginal means) with Sidak correction for pairwise comparisons between allpairs of #IL or SndRepr, expressed by the significance level p; Significant differences (p ≤ 0.05) are indicated with an asterisk (*).
2.1 Main Effects
(a) Errorbars
b) ANOVA
F p#IL 7.718 0.000*SndRepr 2.399 0.114
Interaction 3.194 0.008*
(c) PostHoc tests
SndRepr p #IL p1 vs. 2 0.972 2 vs. 3 0.705
1 vs. 3 0.193 2 vs. 4 0.052
2 vs. 3 0.114 2 vs. 6 0.011*3 vs. 4 0.653
3 vs. 6 0.136
4 vs. 6 0.265
2.2 Individual Effect of SndRepr per #IL
(d) Errorbars
(e) ANOVA per #IL
#IL F p2 1.146 0.336
3 9.216 0.001*4 0.332 0.721
6 3.568 0.045*
(f) PostHoc tests per #IL
#IL SndRepr p2 1 vs. 2 0.595
1 vs. 3 0.999
2 vs. 3 0.391
3 1 vs. 2 0.084
1 vs. 3 0.012*2 vs. 3 0.131
4 1 vs. 2 0.927
1 vs. 3 0.841
2 vs. 3 1.000
6 1 vs. 2 0.886
1 vs. 3 0.304
2 vs. 3 0.015*
2.3 Individual Effect of #IL per SndRepr
(g) Errorbars
(h) ANOVA per SndRepr
SndRepr F p1 3.934 0.017*2 6.576 0.001*3 12.030 0.000*
(i) PostHoc tests per SndRepr
SndRepr #IL p1 2 vs. 3 0.060
2 vs. 4 0.078
2 vs. 6 0.095
3 vs. 4 1.000
3 vs. 6 0.996
4 vs. 6 0.962
2 2 vs. 3 1.000
2 vs. 4 0.912
2 vs. 6 0.010*3 vs. 4 0.964
3 vs. 6 0.048*4 vs. 6 0.047*
3 2 vs. 3 0.907
2 vs. 4 0.043*2 vs. 6 0.010*3 vs. 4 0.008*3 vs. 6 0.003*4 vs. 6 0.941
3. Analysis Results:
3.1 Hypothesis H1 (Communication Complexity has an impact on Cognitive Load) is supported, as #IL has a significant impact on Topic Compre-hension Effort.Rationale – main effect: Values decrease with increasing #IL (Step a). This effect is significant (Step b), and explained by significant differencebetween #IL = 2 & 6, i.e. two-party vs. large multiparty groups (Step c).Rationale – effect per SndRepr: Values decrease with increasing #IL for all three SndRepr (Step g). This is significant (Step h) for all three SndRepr(Step i). The PostHoc tests can identify an increasing number of respective significant pairs of #IL for an increasing SndRepr.3.2 Hypothesis H2 (Technical System Capability has an impact on Cognitive Load) is not supported, as SndRepr has no significant impact on TopicComprehension Effort, except in few subsets of the data.Rationale – main effect: Values for spatial sound reproduction are higher than non-spatial reproduction (Step a). However, this effect is notsignificant (Steps b& c).Rationale – effect per #IL: No consistent tendency is visible (Step c). There are significant effects for #IL = 3 & 6 (Step d), explained by significantdifferences between some single pairs of SndRepr (Step f).
Figure C.7: Results for the measureTopic Comprehension Effort.

detailed results: study on impact of communication complexity 337
1. Analysis StepsThe present figure shows the data analysis for the measure Concentration Effort in nine steps (a) to (i). Steps (a) to (c) concern the main effects; thatmeans the effect of #IL if all data over SndRepr is compiled and the effect of SndRepr if all data over #IL is compiled. Steps (d) to (f) concern theindividual effect of #IL analyzed per SndRepr. Steps (g) to (i) concern the individual effect of SndRepr analyzed per #IL.Steps (a), (d), & (g): errorbar plots, showing the mean values and 95% confidence intervals per #IL and SndRepr. Steps (b), (e), & (h): results ofrepeated-measures ANOVAs with #IL ∈ [2, 3, 4, 6] and SndRepr ∈ [1 = NB/non-spatial, 2 = FB/non-spatial, 3 = FB/spatial] as input, expressed bythe F-measure and significance level p, and using the Greenhouse-Geisser correction when the sphericity criterion for repeated-measures ANOVAsis violated. Steps (c), (f), & (i): results of PostHoc tests (estimated marginal means) with Sidak correction for pairwise comparisons between allpairs of #IL or SndRepr, expressed by the significance level p; Significant differences (p ≤ 0.05) are indicated with an asterisk (*).
2.1 Main Effects
(a) Errorbars
(b) ANOVA
F p#IL 24.601 0.000*SndRepr 15.067 0.000*Interaction 0.279 0.945
(c) PostHoc tests
SndRepr p #IL p1 vs. 2 0.944 2 vs. 3 0.605
1 vs. 3 0.006* 2 vs. 4 0.001*2 vs. 3 0.002* 2 vs. 6 0.000*
3 vs. 4 0.038*3 vs. 6 0.000*4 vs. 6 0.093
2.2 Individual Effect of SndRepr per #IL
(d) Errorbars
(e) ANOVA per #IL
#IL F p2 7.548 0.003*3 4.682 0.020*4 6.491 0.006*6 9.447 0.001*
(f) PostHoc tests per #IL
#IL SndRepr p2 1 vs. 2 0.999
1 vs. 3 0.043*2 vs. 3 0.016*
3 1 vs. 2 0.969
1 vs. 3 0.094
2 vs. 3 0.032*4 1 vs. 2 0.727
1 vs. 3 0.028*2 vs. 3 0.075
6 1 vs. 2 0.922
1 vs. 3 0.068
2 vs. 3 0.000*
2.3 Individual Effect of #IL per SndRepr
(g) Errorbars
(h) ANOVA per SndRepr
SndRepr F p1 7.430 0.001*2 15.709 0.000*3 9.510 0.000*
(i) PostHoc tests per SndRepr
SndRepr #IL p1 2 vs. 3 0.925
2 vs. 4 0.027*2 vs. 6 0.023*3 vs. 4 0.088
3 vs. 6 0.073
4 vs. 6 0.964
2 2 vs. 3 0.945
2 vs. 4 0.026*2 vs. 6 0.000*3 vs. 4 0.416
3 vs. 6 0.002*4 vs. 6 0.118
3 2 vs. 3 0.880
2 vs. 4 0.153
2 vs. 6 0.008*3 vs. 4 0.231
3 vs. 6 0.001*4 vs. 6 0.324
3. Analysis Results:
3.1 Hypothesis H1 (Communication Complexity has an impact on Cognitive Load) is supported, as #IL has a significant impact on ConcentrationEffort.Rationale – main effect: Values decrease with increasing #IL (Step a). This effect is significant (Step b), and explained by significant differencesbetween almost all pairs of #IL (Step c).Rationale – effect per SndRepr: Values decrease with increasing #IL for all three SndRepr (Step g). This is significant (Step h), and is mainlyexplained by significant differences between #IL = 2 & 3 vs. #IL = 4 & 6, i.e. groups sizes need to differ substantially (Step i).3.2 Hypothesis H2 (Technical System Capability has an impact on Cognitive Load) is supported, as SndRepr, more specifically spatial soundreproduction, has a significant impact on Concentration Effort.Rationale – main effect: Values for spatial sound reproduction are higher than non-spatial reproduction (Step a). This effect is significant (Step b),and confirmed by significant differences between the respective pairs of SndRepr (Step c).Rationale – effect per #IL: Values for spatial sound reproduction are higher than non-spatial reproduction for all #IL (Step c). This effect is significant(Step d), and mainly explained by significant differences between non-spatial and spatial sound reproduction (Step f).
Figure C.8: Results for the measureConcentration Effort.

338 quality of experience of multiparty conferencing and telemeeting systems
1. Analysis StepsThe present figure shows the data analysis for the measure Speech Intelligibility in nine steps (a) to (i). Steps (a) to (c) concern the main effects; thatmeans the effect of #IL if all data over SndRepr is compiled and the effect of SndRepr if all data over #IL is compiled. Steps (d) to (f) concern theindividual effect of #IL analyzed per SndRepr. Steps (g) to (i) concern the individual effect of SndRepr analyzed per #IL.Steps (a), (d), & (g): errorbar plots, showing the mean values and 95% confidence intervals per #IL and SndRepr. Steps (b), (e), & (h): results ofrepeated-measures ANOVAs with #IL ∈ [2, 3, 4, 6] and SndRepr ∈ [1 = NB/non-spatial, 2 = FB/non-spatial, 3 = FB/spatial] as input, expressed bythe F-measure and significance level p, and using the Greenhouse-Geisser correction when the sphericity criterion for repeated-measures ANOVAsis violated. Steps (c), (f), & (i): results of PostHoc tests (estimated marginal means) with Sidak correction for pairwise comparisons between allpairs of #IL or SndRepr, expressed by the significance level p; Significant differences (p ≤ 0.05) are indicated with an asterisk (*).
2.1 Main Effects
(a) Errorbars
(b) ANOVA
F p#IL 0.304 0.822
SndRepr 25.807 0.000*Interaction 2.696 0.060
(c) PostHoc tests
SndRepr p #IL p1 vs. 2 0.028* 2 vs. 3 0.920
1 vs. 3 0.000* 2 vs. 4 0.996
2 vs. 3 0.004* 2 vs. 6 0.998
3 vs. 4 1.000
3 vs. 6 0.999
4 vs. 6 1.000
2.2 Individual Effect of SndRepr per #IL
(d) Errorbars
(e) ANOVA per #IL
#IL F p2 10.202 0.001*3 20.956 0.000*4 11.392 0.000*6 9.004 0.001*
(f) PostHoc tests per #IL
#IL SndRepr p2 1 vs. 2 0.202
1 vs. 3 0.000*2 vs. 3 0.155
3 1 vs. 2 0.008*1 vs. 3 0.000*2 vs. 3 0.094
4 1 vs. 2 0.983
1 vs. 3 0.003*2 vs. 3 0.001*
6 1 vs. 2 0.048*1 vs. 3 0.005*2 vs. 3 0.786
2.3 Individual Effect of #IL per SndRepr
(g) Errorbars
(h) ANOVA per SndRepr
SndRepr F p1 1.031 0.392
2 2.707 0.061
3 2.360 0.118
(i) PostHoc tests per SndRepr
SndRepr #IL p1 2 vs. 3 0.921
2 vs. 4 0.994
2 vs. 6 1.000
3 vs. 4 0.731
3 vs. 6 0.795
4 vs. 6 0.991
2 2 vs. 3 0.743
2 vs. 4 0.829
2 vs. 6 0.845
3 vs. 4 0.152
3 vs. 6 1.000
4 vs. 6 0.374
3 2 vs. 3 0.850
2 vs. 4 0.793
2 vs. 6 0.976
3 vs. 4 1.000
3 vs. 6 0.362
4 vs. 6 0.036*
3. Analysis Results:
3.1 Hypothesis H3.1 (Communication Complexity has an impact on Speech Communication Quality with focus on Telecommunication Component)is not supported, as #IL has no significant impact on Speech Intelligibility.Rationale – main effect: Values are relatively constant with increasing #IL (Step a), and no significant effects can be found (Steps b & c).Rationale – effect per SndRepr: Values are relatively constant with increasing #IL for all three SndRepr (Step g), and no significant effects can befound (Step h), except for one single pair (Step i).3.2 Hypothesis H4.1 (Technical System Capability has an impact on Speech Communication Quality with focus on Telecommunication Component)is supported, as SndRepr has a significant impact on Speech Intelligibility.Rationale – main effect: Values increase with increasing SndRepr (Step a). This effect is significant (Step b), and confirmed by significant differencesbetween all pairs of SndRepr (Step c).Rationale – effect per #IL: Values increase with increasing SndRepr for all #IL (Step d). This effect is significant (Step e), and confirmed by significantdifferences between almost all pairs of SndRepr (Step f).
Figure C.9: Results for the measureSpeech Intelligibility.

detailed results: study on impact of communication complexity 339
1. Analysis StepsThe present figure shows the data analysis for the measure Conversation Naturalness in nine steps (a) to (i). Steps (a) to (c) concern the main effects;that means the effect of #IL if all data over SndRepr is compiled and the effect of SndRepr if all data over #IL is compiled. Steps (d) to (f) concernthe individual effect of #IL analyzed per SndRepr. Steps (g) to (i) concern the individual effect of SndRepr analyzed per #IL.Steps (a), (d), & (g): errorbar plots, showing the mean values and 95% confidence intervals per #IL and SndRepr. Steps (b), (e), & (h): results ofrepeated-measures ANOVAs with #IL ∈ [2, 3, 4, 6] and SndRepr ∈ [1 = NB/non-spatial, 2 = FB/non-spatial, 3 = FB/spatial] as input, expressed bythe F-measure and significance level p, and using the Greenhouse-Geisser correction when the sphericity criterion for repeated-measures ANOVAsis violated. Steps (c), (f), & (i): results of PostHoc tests (estimated marginal means) with Sidak correction for pairwise comparisons between allpairs of #IL or SndRepr, expressed by the significance level p; Significant differences (p ≤ 0.05) are indicated with an asterisk (*).
2.1 Main Effects
(a) Errorbars
(b) ANOVA
F p#IL 1.865 0.190
SndRepr 1.903 0.173
Interaction 0.272 0.948
(c) PostHoc tests
SndRepr p #IL p1 vs. 2 0.925 2 vs. 3 0.994
1 vs. 3 0.557 2 vs. 4 0.857
2 vs. 3 0.171 2 vs. 6 0.977
3 vs. 4 0.864
3 vs. 6 0.339
4 vs. 6 0.145
2.2 Individual Effect of SndRepr per #IL
(d) Errorbars
(e) ANOVA per #IL
#IL F p2 0.689 0.513
3 0.533 0.594
4 0.680 0.517
6 0.964 0.397
(f) PostHoc tests per #IL
#IL SndRepr p2 1 vs. 2 0.771
1 vs. 3 1.000
2 vs. 3 0.377
3 1 vs. 2 0.899
1 vs. 3 0.752
2 vs. 3 0.955
4 1 vs. 2 1.000
1 vs. 3 0.613
2 vs. 3 0.526
6 1 vs. 2 0.910
1 vs. 3 0.754
2 vs. 3 0.632
2.3 Individual Effect of #IL per SndRepr
(g) Errorbars
(h) ANOVA per SndRepr
SndRepr F p1 0.674 0.574
2 1.258 0.305
3 0.684 0.568
(i) PostHoc tests per SndRepr
SndRepr #IL p1 2 vs. 3 0.997
2 vs. 4 1.000
2 vs. 6 0.692
3 vs. 4 0.999
3 vs. 6 0.948
4 vs. 6 0.809
2 2 vs. 3 0.737
2 vs. 4 0.812
2 vs. 6 0.999
3 vs. 4 1.000
3 vs. 6 0.671
4 vs. 6 0.641
3 2 vs. 3 1.000
2 vs. 4 0.961
2 vs. 6 0.999
3 vs. 4 0.959
3 vs. 6 0.899
4 vs. 6 0.490
3. Analysis Results:
3.1 Hypothesis H3.2 (Communication Complexity has an impact on Speech Communication Quality with focus on Group-Communication Com-ponent) is not supported, as #IL has no significant impact on Conversation Naturalness.Rationale – main effect: Values are relatively constant with increasing #IL (Step a), and no significant effects can be found (Steps b & c).Rationale – effect per SndRepr: Values are relatively constant with increasing #IL for all three SndRepr (Step g), and no significant effects can befound (Steps h & i).3.2 Hypothesis H4.2 (Technical System Capability has an impact on Speech Communication Quality with focus on Group-Communication Com-ponent) is not supported, as SndRepr has no significant impact on Conversation Naturalness.Rationale – main effect: Values are relatively constant with increasing SndRepr (Step a), and no significant effects can be found (Steps b & c).Rationale – effect per #IL: Values are relatively constant with increasing SndRepr for all four #IL (Step g), and no significant effects can be found(Steps e & f).
Figure C.10: Results for the measureConversation Naturalness.

340 quality of experience of multiparty conferencing and telemeeting systems
1. Analysis StepsThe present figure shows the data analysis for the measure Conversation Efficiency in nine steps (a) to (i). Steps (a) to (c) concern the main effects;that means the effect of #IL if all data over SndRepr is compiled and the effect of SndRepr if all data over #IL is compiled. Steps (d) to (f) concernthe individual effect of #IL analyzed per SndRepr. Steps (g) to (i) concern the individual effect of SndRepr analyzed per #IL.Steps (a), (d), & (g): errorbar plots, showing the mean values and 95% confidence intervals per #IL and SndRepr. Steps (b), (e), & (h): results ofrepeated-measures ANOVAs with #IL ∈ [2, 3, 4, 6] and SndRepr ∈ [1 = NB/non-spatial, 2 = FB/non-spatial, 3 = FB/spatial] as input, expressed bythe F-measure and significance level p, and using the Greenhouse-Geisser correction when the sphericity criterion for repeated-measures ANOVAsis violated. Steps (c), (f), & (i): results of PostHoc tests (estimated marginal means) with Sidak correction for pairwise comparisons between allpairs of #IL or SndRepr, expressed by the significance level p; Significant differences (p ≤ 0.05) are indicated with an asterisk (*).
2.1 Main Effects
(a) Errorbars
(b) ANOVA
F p#IL 5.659 0.016*SndRepr 5.506 0.012*Interaction 0.581 0.596
(c) PostHoc tests
SndRepr p #IL p1 vs. 2 0.168 2 vs. 3 0.284
1 vs. 3 0.939 2 vs. 4 0.997
2 vs. 3 0.012* 2 vs. 6 0.107
3 vs. 4 0.191
3 vs. 6 0.061
4 vs. 6 0.300
2.2 Individual Effect of SndRepr per #IL
(d) Errorbars
(e) ANOVA per #IL
#IL F p2 0.369 0.696
3 0.616 0.549
4 0.620 0.547
6 2.888 0.110
(f) PostHoc tests per #IL
#IL SndRepr p2 1 vs. 2 0.853
1 vs. 3 1.000
2 vs. 3 0.906
3 1 vs. 2 0.716
1 vs. 3 0.996
2 vs. 3 0.797
4 1 vs. 2 0.913
1 vs. 3 0.943
2 vs. 3 0.641
6 1 vs. 2 0.321
1 vs. 3 0.994
2 vs. 3 0.264
2.3 Individual Effect of #IL per SndRepr
(g) Errorbars
(h) ANOVA per SndRepr
SndRepr F p1 1.134 0.349
2 3.443 0.028*3 0.789 0.441
(i) PostHoc tests per SndRepr
SndRepr #IL p1 2 vs. 3 0.856
2 vs. 4 1.000
2 vs. 6 0.976
3 vs. 4 0.731
3 vs. 6 0.483
4 vs. 6 0.987
2 2 vs. 3 0.741
2 vs. 4 1.000
2 vs. 6 0.548
3 vs. 4 0.786
3 vs. 6 0.190
4 vs. 6 0.385
3 2 vs. 3 0.930
2 vs. 4 0.999
2 vs. 6 0.988
3 vs. 4 0.963
3 vs. 6 0.720
4 vs. 6 0.968
3. Analysis Results:
3.1 Hypothesis H3.2 (Communication Complexity has an impact on Speech Communication Quality with focus on Group-Communication Com-ponent) is weakly supported, as #IL has a significant impact on Conversation Efficiency, but can not be detected by the PostHoc tests.Rationale – main effect: With the expection of #IL = 2, values are decreasing with increasing #IL (Step a). This effect is significant (Step b), butrespective significantly different pairs can not be detected by the PostHoc tests (Step c).Rationale – effect per SndRepr: With the expection of #IL = 2, values tend to decrease with increasing #IL for all three SndRepr(Step g). This effect,however, is only significant for SndRepr = 2 (Step h), but respective significantly different pairs can not be detected by the PostHoc tests (Step i).3.2 Hypothesis H4.2 (Technical System Capability has an impact on Speech Communication Quality with focus on Group-Communication Com-ponent) is weakly supported, as SndRepr has a significant impact on Conversation Efficiency, but only in one subset of the data.Rationale – main effect: Values for wideband non-spatial sound reproduction are lower than for the other SndRepr (Step a). This effect is significant(Step b), but respective significantly different pairs can not be detected by the PostHoc tests (Step c).Rationale – effect per #IL: No consistent trend is visible (Step g), and no significant effects can be found (Steps e & f).
Figure C.11: Results for the measureConversation Efficiency.

detailed results: study on impact of communication complexity 341
C.2 Experiment CC2
1. Analysis StepsThe present figure shows the data analysis for the measure Concentration Effort in nine steps (a) to (i). Steps (a) to (c) concern the main effects; thatmeans the effect of #IL if all data over SndRepr is compiled and the effect of SndRepr if all data over #IL is compiled. Steps (d) to (f) concern theindividual effect of #IL analyzed per SndRepr. Steps (g) to (i) concern the individual effect of SndRepr analyzed per #IL.Steps (a), (d), & (g): errorbar plots, showing the mean values and 95% confidence intervals per #IL and SndRepr. Steps (b), (e), & (h): results ofrepeated-measures ANOVAs with #IL ∈ [2, 3, 4, 6] and SndRepr ∈ [1 = NB/non-spatial, 2 = FB/non-spatial, 3 = FB/spatial] as input, expressed bythe F-measure and significance level p, and using the Greenhouse-Geisser correction when the sphericity criterion for repeated-measures ANOVAsis violated. Steps (c), (f), & (i): results of PostHoc tests (estimated marginal means) with Sidak correction for pairwise comparisons between allpairs of #IL or SndRepr, expressed by the significance level p; Significant differences (p ≤ 0.05) are indicated with an asterisk (*).
2.1 Main Effects
(a) Errorbars
(b) ANOVA
F pSndRepr 17.712 0.000*#IL 33.039 0.000*Interaction 1.038 0.394
(c) PostHoc tests
SndRepr p #IL p1 vs. 2 0.375 2 vs. 3 0.000*1 vs. 3 0.000* 2 vs. 4 0.000*2 vs. 3 0.002* 2 vs. 6 0.000*
3 vs. 4 0.102
3 vs. 6 0.001*4 vs. 6 0.024*
2.2 Individual Effect of SndRepr per #IL
(d) Errorbars
(e) ANOVA per #IL
#IL F p2 7.373 0.002*3 7.933 0.004*4 15.950 0.000*6 9.893 0.003*
(f) PostHoc tests per #IL
#IL SndRepr p2 1 vs. 2 0.637
1 vs. 3 0.008*2 vs. 3 0.023*
3 1 vs. 2 0.853
1 vs. 3 0.012*2 vs. 3 0.030*
4 1 vs. 2 0.639
1 vs. 3 0.001*2 vs. 3 0.001*
6 1 vs. 2 0.405
1 vs. 3 0.002*2 vs. 3 0.035*
2.3 Individual Effect of #IL per SndRepr
(g) Errorbars
(h) ANOVA per SndRepr
SndRepr F p1 20.887 0.000*2 25.896 0.000*3 12.750 0.000*
(i) PostHoc tests per SndRepr
SndRepr #IL p1 2 vs. 3 0.005*
2 vs. 4 0.000*2 vs. 6 0.000*3 vs. 4 0.070*3 vs. 6 0.006*4 vs. 6 0.186
2 2 vs. 3 0.012*2 vs. 4 0.000*2 vs. 6 0.000*3 vs. 4 0.031*3 vs. 6 0.000*4 vs. 6 0.241
3 2 vs. 3 0.028*2 vs. 4 0.007*2 vs. 6 0.000*3 vs. 4 1.000
3 vs. 6 0.011*4 vs. 6 0.090
3. Analysis Results:
3.1 Hypothesis H1 (Communication Complexity has an impact on Cognitive Load) is supported, as #IL has a significant impact on ConcentrationEffort.Rationale – main effect: Values decrease (i.e. increasing Concentration Effort) with increasing #IL (Step a). This effect is significant (Step b) andexplained by significant differences between all expect one pair of #IL (Step c).Rationale – effect per SndRepr: Values decrease for all three SndRepr (Step g). This is significant (Step h) and almost all steps between #IL are largeenough to be significant as well (Step i).3.2 Hypothesis H2 (Technical System Capability has an impact on Cognitive Load) is supported, as SndRepr, more specifically the spatial soundreproduction, has a significant impact on Concentration Effort.Rationale – main effect: Values increase (i.e. decreasing Concentration Effort) with increasing SndRepr (Step a). This effect is significant (Step b) andexplained by significant differences between spatial and non-spatial sound reproduction, but not between the two non-spatial conditions (Step c).Rationale – effect per #IL: Values increase for all four #IL (Step d). This is significant (Step e) and is always explained by significant differencesbetween spatial and non-spatial sound reproduction, but not between the two non-spatial conditions (Step f).
Figure C.12: Results for the measureConcentration Effort.
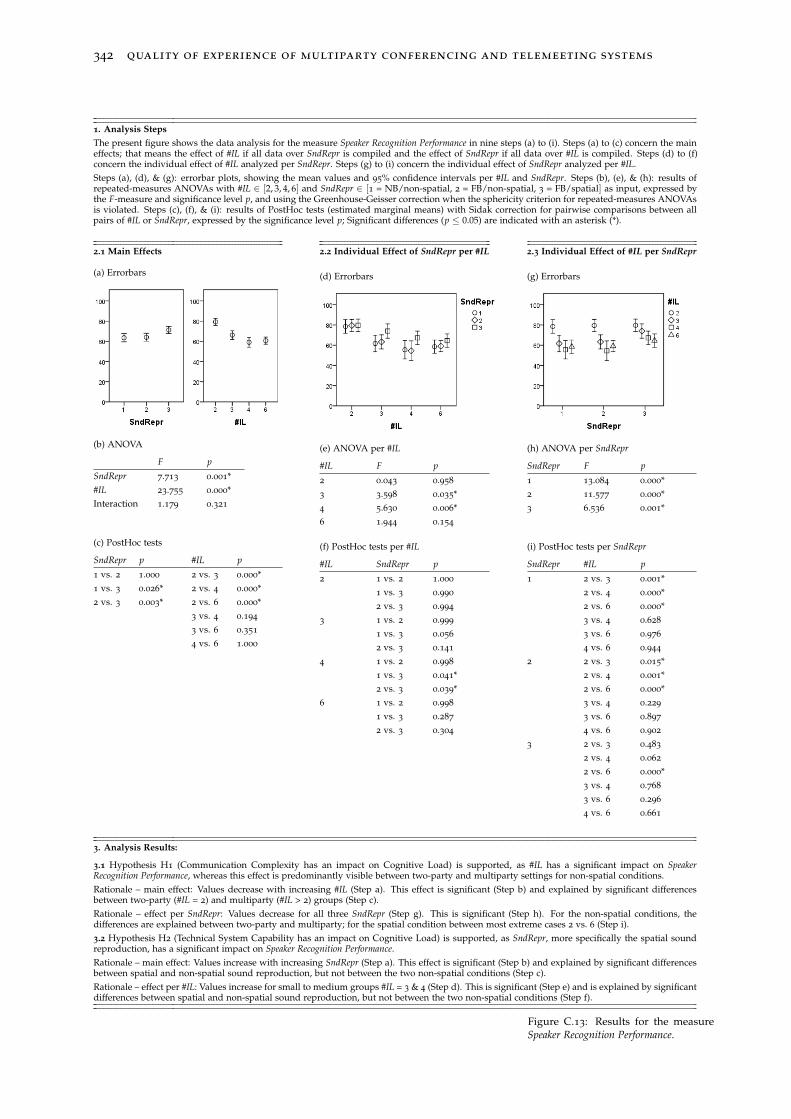
342 quality of experience of multiparty conferencing and telemeeting systems
1. Analysis StepsThe present figure shows the data analysis for the measure Speaker Recognition Performance in nine steps (a) to (i). Steps (a) to (c) concern the maineffects; that means the effect of #IL if all data over SndRepr is compiled and the effect of SndRepr if all data over #IL is compiled. Steps (d) to (f)concern the individual effect of #IL analyzed per SndRepr. Steps (g) to (i) concern the individual effect of SndRepr analyzed per #IL.Steps (a), (d), & (g): errorbar plots, showing the mean values and 95% confidence intervals per #IL and SndRepr. Steps (b), (e), & (h): results ofrepeated-measures ANOVAs with #IL ∈ [2, 3, 4, 6] and SndRepr ∈ [1 = NB/non-spatial, 2 = FB/non-spatial, 3 = FB/spatial] as input, expressed bythe F-measure and significance level p, and using the Greenhouse-Geisser correction when the sphericity criterion for repeated-measures ANOVAsis violated. Steps (c), (f), & (i): results of PostHoc tests (estimated marginal means) with Sidak correction for pairwise comparisons between allpairs of #IL or SndRepr, expressed by the significance level p; Significant differences (p ≤ 0.05) are indicated with an asterisk (*).
2.1 Main Effects
(a) Errorbars
(b) ANOVA
F pSndRepr 7.713 0.001*#IL 23.755 0.000*Interaction 1.179 0.321
(c) PostHoc tests
SndRepr p #IL p1 vs. 2 1.000 2 vs. 3 0.000*1 vs. 3 0.026* 2 vs. 4 0.000*2 vs. 3 0.003* 2 vs. 6 0.000*
3 vs. 4 0.194
3 vs. 6 0.351
4 vs. 6 1.000
2.2 Individual Effect of SndRepr per #IL
(d) Errorbars
(e) ANOVA per #IL
#IL F p2 0.043 0.958
3 3.598 0.035*4 5.630 0.006*6 1.944 0.154
(f) PostHoc tests per #IL
#IL SndRepr p2 1 vs. 2 1.000
1 vs. 3 0.990
2 vs. 3 0.994
3 1 vs. 2 0.999
1 vs. 3 0.056
2 vs. 3 0.141
4 1 vs. 2 0.998
1 vs. 3 0.041*2 vs. 3 0.039*
6 1 vs. 2 0.998
1 vs. 3 0.287
2 vs. 3 0.304
2.3 Individual Effect of #IL per SndRepr
(g) Errorbars
(h) ANOVA per SndRepr
SndRepr F p1 13.084 0.000*2 11.577 0.000*3 6.536 0.001*
(i) PostHoc tests per SndRepr
SndRepr #IL p1 2 vs. 3 0.001*
2 vs. 4 0.000*2 vs. 6 0.000*3 vs. 4 0.628
3 vs. 6 0.976
4 vs. 6 0.944
2 2 vs. 3 0.015*2 vs. 4 0.001*2 vs. 6 0.000*3 vs. 4 0.229
3 vs. 6 0.897
4 vs. 6 0.902
3 2 vs. 3 0.483
2 vs. 4 0.062
2 vs. 6 0.000*3 vs. 4 0.768
3 vs. 6 0.296
4 vs. 6 0.661
3. Analysis Results:
3.1 Hypothesis H1 (Communication Complexity has an impact on Cognitive Load) is supported, as #IL has a significant impact on SpeakerRecognition Performance, whereas this effect is predominantly visible between two-party and multiparty settings for non-spatial conditions.Rationale – main effect: Values decrease with increasing #IL (Step a). This effect is significant (Step b) and explained by significant differencesbetween two-party (#IL = 2) and multiparty (#IL > 2) groups (Step c).Rationale – effect per SndRepr: Values decrease for all three SndRepr (Step g). This is significant (Step h). For the non-spatial conditions, thedifferences are explained between two-party and multiparty; for the spatial condition between most extreme cases 2 vs. 6 (Step i).3.2 Hypothesis H2 (Technical System Capability has an impact on Cognitive Load) is supported, as SndRepr, more specifically the spatial soundreproduction, has a significant impact on Speaker Recognition Performance.Rationale – main effect: Values increase with increasing SndRepr (Step a). This effect is significant (Step b) and explained by significant differencesbetween spatial and non-spatial sound reproduction, but not between the two non-spatial conditions (Step c).Rationale – effect per #IL: Values increase for small to medium groups #IL = 3 & 4 (Step d). This is significant (Step e) and is explained by significantdifferences between spatial and non-spatial sound reproduction, but not between the two non-spatial conditions (Step f).
Figure C.13: Results for the measureSpeaker Recognition Performance.

detailed results: study on impact of communication complexity 343
1. Analysis StepsThe present figure shows the data analysis for the measure Speaker Recognition Confidence in nine steps (a) to (i). Steps (a) to (c) concern the maineffects; that means the effect of #IL if all data over SndRepr is compiled and the effect of SndRepr if all data over #IL is compiled. Steps (d) to (f)concern the individual effect of #IL analyzed per SndRepr. Steps (g) to (i) concern the individual effect of SndRepr analyzed per #IL.Steps (a), (d), & (g): errorbar plots, showing the mean values and 95% confidence intervals per #IL and SndRepr. Steps (b), (e), & (h): results ofrepeated-measures ANOVAs with #IL ∈ [2, 3, 4, 6] and SndRepr ∈ [1 = NB/non-spatial, 2 = FB/non-spatial, 3 = FB/spatial] as input, expressed bythe F-measure and significance level p, and using the Greenhouse-Geisser correction when the sphericity criterion for repeated-measures ANOVAsis violated. Steps (c), (f), & (i): results of PostHoc tests (estimated marginal means) with Sidak correction for pairwise comparisons between allpairs of #IL or SndRepr, expressed by the significance level p; Significant differences (p ≤ 0.05) are indicated with an asterisk (*).
2.1 Main Effects
(a) Errorbars
(b) ANOVA
F pSndRepr 7.463 0.002*#IL 20.448 0.000*Interaction 0.497 0.809
(c) PostHoc tests
SndRepr p #IL p1 vs. 2 0.985 2 vs. 3 0.005*1 vs. 3 0.005* 2 vs. 4 0.000*2 vs. 3 0.026* 2 vs. 6 0.000*
3 vs. 4 0.066
3 vs. 6 0.012*4 vs. 6 0.775
2.2 Individual Effect of SndRepr per #IL
(d) Errorbars
(e) ANOVA per #IL
#IL F p2 0.741 0.482
3 2.088 0.136
4 4.074 0.034*6 7.667 0.001*
(f) PostHoc tests per #IL
#IL SndRepr p2 1 vs. 2 0.999
1 vs. 3 0.706
2 vs. 3 0.483
3 1 vs. 2 1.000
1 vs. 3 0.238
2 vs. 3 0.341
4 1 vs. 2 0.695
1 vs. 3 0.059
2 vs. 3 0.071
6 1 vs. 2 0.867
1 vs. 3 0.006*2 vs. 3 0.030*
2.3 Individual Effect of #IL per SndRepr
(g) Errorbars
(h) ANOVA per SndRepr
SndRepr F p1 8.464 0.000*2 10.804 0.000*3 7.141 0.000*
(i) PostHoc tests per SndRepr
SndRepr #IL p1 2 vs. 3 0.301
2 vs. 4 0.017*2 vs. 6 0.001*3 vs. 4 0.752
3 vs. 6 0.123
4 vs. 6 0.322
2 2 vs. 3 0.045*2 vs. 4 0.001*2 vs. 6 0.000*3 vs. 4 0.069
3 vs. 6 0.404
4 vs. 6 1.000
3 2 vs. 3 0.619
2 vs. 4 0.005*2 vs. 6 0.000*3 vs. 4 0.415
3 vs. 6 0.174
4 vs. 6 0.998
3. Analysis Results:
3.1 Hypothesis H1 (Communication Complexity has an impact on Cognitive Load) is supported, as #IL has a significant impact on SpeakerRecognition Confidence, whereas this effect is predominantly visible between two-party and multiparty settings.Rationale – main effect: Values decrease with increasing #IL (Step a). This effect is significant (Step b) and explained mainly by significantdifferences between two-party (#IL = 2) and multiparty (#IL > 2) groups (Step c).Rationale – effect per SndRepr: Values decrease for all three SndRepr (Step g). This is significant (Step h). The differences are mainly explainedbetween two-party and larger multiparty groups, i.e. 2 vs. 4 & 6 (Step i).3.2 Hypothesis H2 (Technical System Capability has an impact on Cognitive Load) is supported, as SndRepr, more specifically the spatial soundreproduction, has a significant impact on Concentration Effort.Rationale – main effect: Values increase with increasing SndRepr (Step a). This effect is significant (Step b) and explained by significant differencesbetween spatial and non-spatial sound reproduction, but not between the two non-spatial conditions (Step c).Rationale – effect per #IL: Values increase for medium to large groups #IL = 4 & 6 (Step d). This is significant (Step e) and is explained by significantdifferences between spatial and non-spatial sound reproduction, whereas the effect is only for large groups (#IL = 6) strong enough to be detectedby the PostHoc tests (Step f).
Figure C.14: Results for the measureSpeaker Recognition Confidence.

344 quality of experience of multiparty conferencing and telemeeting systems
1. Analysis StepsThe present figure shows the data analysis for the measure Focal Assurance in nine steps (a) to (i). Steps (a) to (c) concern the main effects; thatmeans the effect of #IL if all data over SndRepr is compiled and the effect of SndRepr if all data over #IL is compiled. Steps (d) to (f) concern theindividual effect of #IL analyzed per SndRepr. Steps (g) to (i) concern the individual effect of SndRepr analyzed per #IL.Steps (a), (d), & (g): errorbar plots, showing the mean values and 95% confidence intervals per #IL and SndRepr. Steps (b), (e), & (h): results ofrepeated-measures ANOVAs with #IL ∈ [2, 3, 4, 6] and SndRepr ∈ [1 = NB/non-spatial, 2 = FB/non-spatial, 3 = FB/spatial] as input, expressed bythe F-measure and significance level p, and using the Greenhouse-Geisser correction when the sphericity criterion for repeated-measures ANOVAsis violated. Steps (c), (f), & (i): results of PostHoc tests (estimated marginal means) with Sidak correction for pairwise comparisons between allpairs of #IL or SndRepr, expressed by the significance level p; Significant differences (p ≤ 0.05) are indicated with an asterisk (*).
2.1 Main Effects
(a) Errorbars
(b) ANOVA
F pSndRepr 2.691 0.079
#IL 8.779 0.000*Interaction 0.855 0.530
(c) PostHoc tests
SndRepr p #IL p1 vs. 2 0.645 2 vs. 3 0.109
1 vs. 3 0.133 2 vs. 4 0.000*2 vs. 3 0.395 2 vs. 6 0.000*
3 vs. 4 0.967
3 vs. 6 0.363
4 vs. 6 0.427
2.2 Individual Effect of SndRepr per #IL
(d) Errorbars
(e) ANOVA per #IL
#IL F p2 0.036 0.964
3 2.019 0.145
4 1.398 0.257
6 1.174 0.307
(f) PostHoc tests per #IL
#IL SndRepr p2 1 vs. 2 0.999
1 vs. 3 0.999
2 vs. 3 0.987
3 1 vs. 2 0.376
1 vs. 3 0.303
2 vs. 3 0.894
4 1 vs. 2 0.456
1 vs. 3 0.416
2 vs. 3 0.995
6 1 vs. 2 0.919
1 vs. 3 0.833
2 vs. 3 0.144
2.3 Individual Effect of #IL per SndRepr
(g) Errorbars
(h) ANOVA per SndRepr
SndRepr F p1 5.008 0.008*2 6.177 0.001*3 2.923 0.041*
(i) PostHoc tests per SndRepr
SndRepr #IL p1 2 vs. 3 0.027*
2 vs. 4 0.011*2 vs. 6 0.013*3 vs. 4 1.000
3 vs. 6 0.999
4 vs. 6 1.000
2 2 vs. 3 0.532
2 vs. 4 0.117
2 vs. 6 0.000*3 vs. 4 0.999
3 vs. 6 0.166
4 vs. 6 0.236
3 2 vs. 3 0.959
2 vs. 4 0.305
2 vs. 6 0.138
3 vs. 4 0.825
3 vs. 6 0.180
4 vs. 6 0.963
3. Analysis Results:
3.1 Hypothesis H1 (Communication Complexity has an impact on Cognitive Load) is supported, as #IL has a significant impact on Focal Assurance,whereas this effect is predominantly visible between two-party and larger multiparty groups, and decreases with improving sound reproductionmethod.Rationale – main effect: Values decrease with increasing #IL (Step a). This effect is significant (Step b) and explained by significant differencesbetween two-party (#IL = 2) and medium to large multiparty groups (#IL = 4 & 6) (Step c).Rationale – effect per SndRepr: Values decrease for all three SndRepr (Step g). This is significant (Step h). The number of pairs per condition thatexplain the differences is decreasing with increasing SndRepr (Step i).3.2 Hypothesis H2 (Technical System Capability has an impact on Cognitive Load) is not supported, as SndRepr has no significant impact onConcentration Effort.Rationale – main effect: Although values increase with increasing SndRepr (Step a), this effect is not significant (Steps b & c).Rationale – effect per #IL: Although values tend to increase with increasing SndRepr for all #IL (Step d), this effect is not significant (Steps e & f).
Figure C.15: Results for the measureFocal Assurance.

detailed results: study on impact of communication complexity 345
1. Analysis StepsThe present figure shows the data analysis for the measure Speaker Recognition Effort in nine steps (a) to (i). Steps (a) to (c) concern the main effects;that means the effect of #IL if all data over SndRepr is compiled and the effect of SndRepr if all data over #IL is compiled. Steps (d) to (f) concernthe individual effect of #IL analyzed per SndRepr. Steps (g) to (i) concern the individual effect of SndRepr analyzed per #IL.Steps (a), (d), & (g): errorbar plots, showing the mean values and 95% confidence intervals per #IL and SndRepr. Steps (b), (e), & (h): results ofrepeated-measures ANOVAs with #IL ∈ [2, 3, 4, 6] and SndRepr ∈ [1 = NB/non-spatial, 2 = FB/non-spatial, 3 = FB/spatial] as input, expressed bythe F-measure and significance level p, and using the Greenhouse-Geisser correction when the sphericity criterion for repeated-measures ANOVAsis violated. Steps (c), (f), & (i): results of PostHoc tests (estimated marginal means) with Sidak correction for pairwise comparisons between allpairs of #IL or SndRepr, expressed by the significance level p; Significant differences (p ≤ 0.05) are indicated with an asterisk (*).
2.1 Main Effects
(a) Errorbars
(b) ANOVA
F pSndRepr 28.399 0.000*#IL 30.949 0.000*Interaction 1.191 0.315
(c) PostHoc tests
SndRepr p #IL p1 vs. 2 0.841 2 vs. 3 0.000*1 vs. 3 0.000* 2 vs. 4 0.000*2 vs. 3 0.000* 2 vs. 6 0.000*
3 vs. 4 0.903
3 vs. 6 0.059
4 vs. 6 0.177
2.2 Individual Effect of SndRepr per #IL
(d) Errorbars
(e) ANOVA per #IL
#IL F p2 18.192 0.000*3 12.897 0.000*4 16.289 0.000*6 23.418 0.000*
(f) PostHoc tests per #IL
#IL SndRepr p2 1 vs. 2 0.952
1 vs. 3 0.000*2 vs. 3 0.000*
3 1 vs. 2 0.532
1 vs. 3 0.000*2 vs. 3 0.011*
4 1 vs. 2 1.000
1 vs. 3 0.001*2 vs. 3 0.001*
6 1 vs. 2 0.430
1 vs. 3 0.000*2 vs. 3 0.000*
2.3 Individual Effect of #IL per SndRepr
(g) Errorbars
(h) ANOVA per SndRepr
SndRepr F p1 18.616 0.000*2 17.229 0.000*3 11.584 0.000*
(i) PostHoc tests per SndRepr
SndRepr #IL p1 2 vs. 3 0.000*
2 vs. 4 0.000*2 vs. 6 0.000*3 vs. 4 0.998
3 vs. 6 0.300
4 vs. 6 0.279
2 2 vs. 3 0.024*2 vs. 4 0.000*2 vs. 6 0.000*3 vs. 4 0.250
3 vs. 6 0.034*4 vs. 6 0.824
3 2 vs. 3 0.007*2 vs. 4 0.001*2 vs. 6 0.000*3 vs. 4 0.998
3 vs. 6 0.549
4 vs. 6 0.662
3. Analysis Results:
3.1 Hypothesis H1 (Communication Complexity has an impact on Cognitive Load) is supported, as #IL has a significant impact on SpeakerRecognition Effort, whereas this effect is visible between two-party and multiparty settings.Rationale – main effect: Values decrease with increasing #IL (Step a). This effect is significant (Step b) and explained by significant differencesbetween two-party (#IL = 2) and multiparty (#IL > 2) groups (Step c).Rationale – effect per SndRepr: Values decrease for all three SndRepr (Step g). This is significant (Step h)and explained between two-party andmultiparty groups (Step i).3.2 Hypothesis H2 (Technical System Capability has an impact on Cognitive Load) is supported, as SndRepr, more specifically the spatial soundreproduction, has a significant impact on Speaker Recognition Effort.Rationale – main effect: Values increase with increasing SndRepr (Step a). This effect is significant (Step b) and explained by significant differencesbetween spatial and non-spatial sound reproduction, but not between the two non-spatial conditions (Step c).Rationale – effect per #IL: Values increase for all #IL (Step d). This is significant (Step e) and is explained by significant differences between spatialand non-spatial sound reproduction, but not between the two non-spatial conditions (Step f).
Figure C.16: Results for the measureSpeaker Recognition Effort.

346 quality of experience of multiparty conferencing and telemeeting systems
1. Analysis StepsThe present figure shows the data analysis for the measure Topic Comprehension Effort in nine steps (a) to (i). Steps (a) to (c) concern the main effects;that means the effect of #IL if all data over SndRepr is compiled and the effect of SndRepr if all data over #IL is compiled. Steps (d) to (f) concernthe individual effect of #IL analyzed per SndRepr. Steps (g) to (i) concern the individual effect of SndRepr analyzed per #IL.Steps (a), (d), & (g): errorbar plots, showing the mean values and 95% confidence intervals per #IL and SndRepr. Steps (b), (e), & (h): results ofrepeated-measures ANOVAs with #IL ∈ [2, 3, 4, 6] and SndRepr ∈ [1 = NB/non-spatial, 2 = FB/non-spatial, 3 = FB/spatial] as input, expressed bythe F-measure and significance level p, and using the Greenhouse-Geisser correction when the sphericity criterion for repeated-measures ANOVAsis violated. Steps (c), (f), & (i): results of PostHoc tests (estimated marginal means) with Sidak correction for pairwise comparisons between allpairs of #IL or SndRepr, expressed by the significance level p; Significant differences (p ≤ 0.05) are indicated with an asterisk (*).
2.1 Main Effects
(a) Errorbars
(b) ANOVA
F pSndRepr 16.847 0.000*#IL 37.005 0.000*Interaction 0.715 0.562
(c) PostHoc tests
SndRepr p #IL p1 vs. 2 0.137 2 vs. 3 0.000*1 vs. 3 0.000* 2 vs. 4 0.000*2 vs. 3 0.006* 2 vs. 6 0.000*
3 vs. 4 0.039*3 vs. 6 0.000*4 vs. 6 0.222
2.2 Individual Effect of SndRepr per #IL
(d) Errorbars
(e) ANOVA per #IL
#IL F p2 10.172 0.000*3 8.742 0.003*4 7.722 0.001*6 11.266 0.001*
(f) PostHoc tests per #IL
#IL SndRepr p2 1 vs. 2 0.602
1 vs. 3 0.000*2 vs. 3 0.012*
3 1 vs. 2 0.023*1 vs. 3 0.003*2 vs. 3 0.157
4 1 vs. 2 1.000
1 vs. 3 0.005*2 vs. 3 0.025*
6 1 vs. 2 0.721
1 vs. 3 0.001*2 vs. 3 0.016*
2.3 Individual Effect of #IL per SndRepr
(g) Errorbars
(h) ANOVA per SndRepr
SndRepr F p1 17.689 0.000*2 22.197 0.000*3 19.342 0.000*
(i) PostHoc tests per SndRepr
SndRepr #IL p1 2 vs. 3 0.000*
2 vs. 4 0.000*2 vs. 6 0.000*3 vs. 4 0.891
3 vs. 6 0.031*4 vs. 6 0.308
2 2 vs. 3 0.072
2 vs. 4 0.000*2 vs. 6 0.000*3 vs. 4 0.002*3 vs. 6 0.000*4 vs. 6 0.415
3 2 vs. 3 0.002*2 vs. 4 0.000*2 vs. 6 0.000*3 vs. 4 0.312
3 vs. 6 0.013*4 vs. 6 0.592
3. Analysis Results:
3.1 Hypothesis H1 (Communication Complexity has an impact on Cognitive Load) is supported, as #IL has a significant impact on Topic Compre-hension Effort.Rationale – main effect: Values decrease with increasing #IL (Step a). This effect is significant (Step b) and explained by significant differencesbetween all expect one pair of #IL (Step c).Rationale – effect per SndRepr: Values decrease for all three SndRepr (Step g). This is significant (Step h) and almost all steps between #IL are largeenough to be significant as well (Step i).3.2 Hypothesis H2 (Technical System Capability has an impact on Cognitive Load) is supported, as SndRepr, more specifically the spatial soundreproduction, has a significant impact on Topic Comprehension Effort.Rationale – main effect: Values increase with increasing SndRepr (Step a). This effect is significant (Step b) and explained by significant differencesbetween spatial and non-spatial sound reproduction, but not between the two non-spatial conditions (Step c).Rationale – effect per #IL: Values increase for all four #IL (Step d). This is significant (Step e) and is in most cases explained by significant differencesbetween spatial and non-spatial sound reproduction, but not between the two non-spatial conditions (Step f).
Figure C.17: Results for the measureTopic Comprehension Effort.

detailed results: study on impact of communication complexity 347
1. Analysis StepsThe present figure shows the data analysis for the measure Connection Quality in nine steps (a) to (i). Steps (a) to (c) concern the main effects; thatmeans the effect of #IL if all data over SndRepr is compiled and the effect of SndRepr if all data over #IL is compiled. Steps (d) to (f) concern theindividual effect of #IL analyzed per SndRepr. Steps (g) to (i) concern the individual effect of SndRepr analyzed per #IL.Steps (a), (d), & (g): errorbar plots, showing the mean values and 95% confidence intervals per #IL and SndRepr. Steps (b), (e), & (h): results ofrepeated-measures ANOVAs with #IL ∈ [2, 3, 4, 6] and SndRepr ∈ [1 = NB/non-spatial, 2 = FB/non-spatial, 3 = FB/spatial] as input, expressed bythe F-measure and significance level p, and using the Greenhouse-Geisser correction when the sphericity criterion for repeated-measures ANOVAsis violated. Steps (c), (f), & (i): results of PostHoc tests (estimated marginal means) with Sidak correction for pairwise comparisons between allpairs of #IL or SndRepr, expressed by the significance level p; Significant differences (p ≤ 0.05) are indicated with an asterisk (*).
2.1 Main Effects
(a) Errorbars
(b) ANOVA
F pSndRepr 24.731 0.000*#IL 2.553 0.063
Interaction 0.468 0.831
(c) PostHoc tests
SndRepr p #IL p1 vs. 2 0.003* 2 vs. 3 0.300
1 vs. 3 0.000* 2 vs. 4 0.631
2 vs. 3 0.002* 2 vs. 6 0.119
3 vs. 4 0.955
3 vs. 6 0.998
4 vs. 6 0.845
2.2 Individual Effect of SndRepr per #IL
(d) Errorbars
(e) ANOVA per #IL
#IL F p2 12.244 0.000*3 22.546 0.000*4 9.136 0.000*6 17.043 0.000*
(f) PostHoc tests per #IL
#IL SndRepr p2 1 vs. 2 0.045*
1 vs. 3 0.001*2 vs. 3 0.038*
3 1 vs. 2 0.001*1 vs. 3 0.000*2 vs. 3 0.009*
4 1 vs. 2 0.188
1 vs. 3 0.001*2 vs. 3 0.067
6 1 vs. 2 0.017*1 vs. 3 0.000*2 vs. 3 0.016*
2.3 Individual Effect of #IL per SndRepr
(g) Errorbars
(h) ANOVA per SndRepr
SndRepr F p1 2.533 0.064
2 2.082 0.110
3 0.294 0.829
(i) PostHoc tests per SndRepr
SndRepr #IL p1 2 vs. 3 0.065
2 vs. 4 0.998
2 vs. 6 0.073
3 vs. 4 0.826
3 vs. 6 0.995
4 vs. 6 0.416
2 2 vs. 3 0.411
2 vs. 4 0.789
2 vs. 6 0.157
3 vs. 4 0.974
3 vs. 6 0.998
4 vs. 6 0.886
3 2 vs. 3 0.982
2 vs. 4 0.922
2 vs. 6 0.970
3 vs. 4 1.000
3 vs. 6 1.000
4 vs. 6 1.000
3. Analysis Results:
3.1 Hypothesis H3 (Communication Complexity has an impact on Speech Communication Quality) is not supported, as #IL has no significantimpact on Connection Quality.Rationale – main effect: Although values decrease with increasing #IL (Step a), this effect is not significant (Steps b & c).Rationale – effect per SndRepr: Although values decrease with increasing #IL for all three SndRepr (Step g), this effect is not significant (Steps h &i).3.2 Hypothesis H4 (Technical System Capability has an impact on Speech Communication Quality) is supported, as SndRepr has a significantimpact on Connection Quality.Rationale – main effect: Values increase with increasing SndRepr (Step a). This effect is significant (Step b) and explained by significant differencesbetween all sound reproduction methods (Step c).Rationale – effect per #IL: Values increase for all four #IL (Step d). This is significant (Step e) and all steps except one between SndRepr are largeenough to be significant as well (Step f).
Figure C.18: Results for the measureConnection Quality.

348 quality of experience of multiparty conferencing and telemeeting systems
1. Analysis StepsThe present figure shows the data analysis for the measure Speech Intelligibility in nine steps (a) to (i). Steps (a) to (c) concern the main effects; thatmeans the effect of #IL if all data over SndRepr is compiled and the effect of SndRepr if all data over #IL is compiled. Steps (d) to (f) concern theindividual effect of #IL analyzed per SndRepr. Steps (g) to (i) concern the individual effect of SndRepr analyzed per #IL.Steps (a), (d), & (g): errorbar plots, showing the mean values and 95% confidence intervals per #IL and SndRepr. Steps (b), (e), & (h): results ofrepeated-measures ANOVAs with #IL ∈ [2, 3, 4, 6] and SndRepr ∈ [1 = NB/non-spatial, 2 = FB/non-spatial, 3 = FB/spatial] as input, expressed bythe F-measure and significance level p, and using the Greenhouse-Geisser correction when the sphericity criterion for repeated-measures ANOVAsis violated. Steps (c), (f), & (i): results of PostHoc tests (estimated marginal means) with Sidak correction for pairwise comparisons between allpairs of #IL or SndRepr, expressed by the significance level p; Significant differences (p ≤ 0.05) are indicated with an asterisk (*).
2.1 Main Effects
(a) Errorbars
(b) ANOVA
F pSndRepr 34.656 0.000*#IL 2.716 0.952
Interaction 1.130 0.348
(c) PostHoc tests
SndRepr p #IL p1 vs. 2 0.000* 2 vs. 3 0.562
1 vs. 3 0.000* 2 vs. 4 0.167
2 vs. 3 0.001* 2 vs. 6 0.077
3 vs. 4 1.000
3 vs. 6 0.850
4 vs. 6 0.970
2.2 Individual Effect of SndRepr per #IL
(d) Errorbars
(e) ANOVA per #IL
#IL F p2 15.357 0.000*3 25.790 0.000*4 24.479 0.000*6 14.623 0.000*
(f) PostHoc tests per #IL
#IL SndRepr p2 1 vs. 2 0.326
1 vs. 3 0.000*2 vs. 3 0.000*
3 1 vs. 2 0.000*1 vs. 3 0.000*2 vs. 3 0.072
4 1 vs. 2 0.000*1 vs. 3 0.000*2 vs. 3 0.085
6 1 vs. 2 0.036*1 vs. 3 0.000*2 vs. 3 0.010*
2.3 Individual Effect of #IL per SndRepr
(g) Errorbars
(h) ANOVA per SndRepr
SndRepr F p1 2.316 0.103
2 0.862 0.465
3 2.011 0.138
(i) PostHoc tests per SndRepr
SndRepr #IL p1 2 vs. 3 0.118
2 vs. 4 0.179
2 vs. 6 0.366
3 vs. 4 1.000
3 vs. 6 1.000
4 vs. 6 0.999
2 2 vs. 3 1.000
2 vs. 4 1.000
2 vs. 6 0.726
3 vs. 4 1.000
3 vs. 6 0.856
4 vs. 6 0.741
3 2 vs. 3 0.704
2 vs. 4 0.302
2 vs. 6 0.197
3 vs. 4 1.000
3 vs. 6 0.941
4 vs. 6 0.932
3. Analysis Results:
3.1 Hypothesis H3 (Communication Complexity has an impact on Speech Communication Quality) is not supported, as #IL has no significantimpact on Speech Intelligibility.Rationale – main effect: Although values decrease with increasing #IL (Step a), this effect is not significant (Steps b & c).Rationale – effect per SndRepr: Although values decrease with increasing #IL for all three SndRepr (Step g), this effect is not significant (Steps h &i).3.2 Hypothesis H4 (Technical System Capability has an impact on Speech Communication Quality) is supported, as SndRepr has a significantimpact on Speech Intelligibility.Rationale – main effect: Values increase with increasing SndRepr (Step a). This effect is significant (Step b) and explained by significant differencesbetween all sound reproduction methods (Step c).Rationale – effect per #IL: Values increase for all four #IL (Step d). This is significant (Step e) and almost all steps between SndRepr are large enoughto be significant as well (Step f).
Figure C.19: Results for the measureSpeech Intelligibility.

detailed results: study on impact of communication complexity 349
1. Analysis StepsThe present figure shows the data analysis for the measure Overall Quality in nine steps (a) to (i). Steps (a) to (c) concern the main effects; thatmeans the effect of #IL if all data over SndRepr is compiled and the effect of SndRepr if all data over #IL is compiled. Steps (d) to (f) concern theindividual effect of #IL analyzed per SndRepr. Steps (g) to (i) concern the individual effect of SndRepr analyzed per #IL.Steps (a), (d), & (g): errorbar plots, showing the mean values and 95% confidence intervals per #IL and SndRepr. Steps (b), (e), & (h): results ofrepeated-measures ANOVAs with #IL ∈ [2, 3, 4, 6] and SndRepr ∈ [1 = NB/non-spatial, 2 = FB/non-spatial, 3 = FB/spatial] as input, expressed bythe F-measure and significance level p, and using the Greenhouse-Geisser correction when the sphericity criterion for repeated-measures ANOVAsis violated. Steps (c), (f), & (i): results of PostHoc tests (estimated marginal means) with Sidak correction for pairwise comparisons between allpairs of #IL or SndRepr, expressed by the significance level p; Significant differences (p ≤ 0.05) are indicated with an asterisk (*).
2.1 Main Effects
(a) Errorbars
(b) ANOVA
F pSndRepr 13.474 0.000*#IL 3.853 0.014*Interaction 0.115 0.994
(c) PostHoc tests
SndRepr p #IL p1 vs. 2 0.154 2 vs. 3 0.184
1 vs. 3 0.001* 2 vs. 4 0.178
2 vs. 3 0.018* 2 vs. 6 0.029*3 vs. 4 0.842
3 vs. 6 1.000
4 vs. 6 0.806
2.2 Individual Effect of SndRepr per #IL
(d) Errorbars
(e) ANOVA per #IL
#IL F p2 10.400 0.000*3 9.715 0.000*4 13.527 0.000*6 9.654 0.000*
(f) PostHoc tests per #IL
#IL SndRepr p2 1 vs. 2 0.230
1 vs. 3 0.002*2 vs. 3 0.007*
3 1 vs. 2 0.314
1 vs. 3 0.002*2 vs. 3 0.033*
4 1 vs. 2 0.155
1 vs. 3 0.000*2 vs. 3 0.021*
6 1 vs. 2 0.218
1 vs. 3 0.001*2 vs. 3 0.062
2.3 Individual Effect of #IL per SndRepr
(g) Errorbars
(h) ANOVA per SndRepr
SndRepr F p1 2.399 0.076
2 4.481 0.006*3 1.639 0.202
(i) PostHoc tests per SndRepr
SndRepr #IL p1 2 vs. 3 0.341
2 vs. 4 0.551
2 vs. 6 0.157
3 vs. 4 0.992
3 vs. 6 1.000
4 vs. 6 0.833
2 2 vs. 3 0.049*2 vs. 4 0.199
2 vs. 6 0.018*3 vs. 4 0.961
3 vs. 6 1.000
4 vs. 6 0.757
3 2 vs. 3 0.868
2 vs. 4 0.893
2 vs. 6 0.224
3 vs. 4 0.979
3 vs. 6 0.983
4 vs. 6 0.712
3. Analysis Results:
3.1 Hypothesis H5 (Communication Complexity has an impact on Quality of Experience) is supported, as #IL has a significant impact on OverallQuality, noting that the group sizes must differ substantially to explain this impact.Rationale – main effect: Values decrease with increasing #IL (Step a). This effect is significant (Steps b), but only between the most extreme cases#IL = 2 vs. #IL = 6 (Step 6).Rationale – effect per SndRepr: While values decrease with increasing #IL for all three SndRepr (Step g), this effect is only significant for non-spatialwideband sound reproduction (Step h) between a few pairs of SndRepr (Step i).3.2 Hypothesis H6 (Technical System Capability has an impact on Quality of Experience) is supported, more specifically the spatial sound repro-duction, as SndRepr has a significant impact on Overall Quality.Rationale – main effect: Values increase with increasing SndRepr (Step a). This effect is significant (Step b) and explained by significant differencesbetween spatial and non-spatial sound reproduction, but not between the two non-spatial conditions (Step c).Rationale – effect per #IL: Values increase for all four #IL (Step d). This is significant (Step e) and is in mainly explained by significant differencesbetween spatial and non-spatial sound reproduction (Step f).
Figure C.20: Results for the measureOverall Quality.

350 quality of experience of multiparty conferencing and telemeeting systems
1. Analysis StepsThe present figure shows the data analysis for the measure Satisfaction in nine steps (a) to (i). Steps (a) to (c) concern the main effects; that meansthe effect of #IL if all data over SndRepr is compiled and the effect of SndRepr if all data over #IL is compiled. Steps (d) to (f) concern the individualeffect of #IL analyzed per SndRepr. Steps (g) to (i) concern the individual effect of SndRepr analyzed per #IL.Steps (a), (d), & (g): errorbar plots, showing the mean values and 95% confidence intervals per #IL and SndRepr. Steps (b), (e), & (h): results ofrepeated-measures ANOVAs with #IL ∈ [2, 3, 4, 6] and SndRepr ∈ [1 = NB/non-spatial, 2 = FB/non-spatial, 3 = FB/spatial] as input, expressed bythe F-measure and significance level p, and using the Greenhouse-Geisser correction when the sphericity criterion for repeated-measures ANOVAsis violated. Steps (c), (f), & (i): results of PostHoc tests (estimated marginal means) with Sidak correction for pairwise comparisons between allpairs of #IL or SndRepr, expressed by the significance level p; Significant differences (p ≤ 0.05) are indicated with an asterisk (*).
2.1 Main Effects
(a) Errorbars
(b) ANOVA
F pSndRepr 32.805 0.000*#IL 10.310 0.000*Interaction 1.339 0.262
(c) PostHoc tests
SndRepr p #IL p1 vs. 2 0.009* 2 vs. 3 0.016*1 vs. 3 0.000* 2 vs. 4 0.001*2 vs. 3 0.000* 2 vs. 6 0.003*
3 vs. 4 0.845
3 vs. 6 0.187
4 vs. 6 0.535
2.2 Individual Effect of SndRepr per #IL
(d) Errorbars
(e) ANOVA per #IL
#IL F p2 12.602 0.000*3 24.732 0.000*4 18.983 0.000*6 23.676 0.000*
(f) PostHoc tests per #IL
#IL SndRepr p2 1 vs. 2 0.260
1 vs. 3 0.000*2 vs. 3 0.001*
3 1 vs. 2 0.018*1 vs. 3 0.000*2 vs. 3 0.001*
4 1 vs. 2 0.495
1 vs. 3 0.000*2 vs. 3 0.001*
6 1 vs. 2 0.040*1 vs. 3 0.000*2 vs. 3 0.000*
2.3 Individual Effect of #IL per SndRepr
(g) Errorbars
(h) ANOVA per SndRepr
SndRepr F p1 6.652 0.003*2 12.468 0.000*3 2.010 0.138
(i) PostHoc tests per SndRepr
SndRepr #IL p1 2 vs. 3 0.034*
2 vs. 4 0.075
2 vs. 6 0.010*3 vs. 4 1.000
3 vs. 6 0.498
4 vs. 6 0.126
2 2 vs. 3 0.023*2 vs. 4 0.000*2 vs. 6 0.001*3 vs. 4 0.088
3 vs. 6 0.152
4 vs. 6 0.998
3 2 vs. 3 0.945
2 vs. 4 0.917
2 vs. 6 0.324
3 vs. 4 1.000
3 vs. 6 0.465
4 vs. 6 0.823
3. Analysis Results:
3.1 Hypothesis H5 (Communication Complexity has an impact on Quality of Experience) is supported, as #IL has a significant impact on Satisfactionbetween two-party and multiparty groups.Rationale – main effect: Values decrease with increasing #IL (Step a). This effect is significant (Step b) and explained by significant differencesbetween two-party (#IL = 2) and multiparty (#IL > 2) groups (Step c).Rationale – effect per SndRepr: While values decrease with increasing #IL for all three SndRepr (Step g), this effect is only significant for non-spatialsound reproduction (Step h). It is mainly explained by significant differences between two-party and multiparty groups (Step i).3.2 Hypothesis H6 (Technical System Capability has an impact on Quality of Experience) is supported, as SndRepr has a significant impact onSatisfaction.Rationale – main effect: Values increase with increasing SndRepr (Step a). This effect is significant (Step b) and is explained by significant differencesbetween all pairs of SndRepr (Step c).Rationale – effect per #IL: Values increase for all four #IL (Step d). This is significant (Step e) and is explained by significant differences betweenalmost all pairs of SndRepr (Step f).
Figure C.21: Results for the measureSatisfaction.

detailed results: study on impact of communication complexity 351
1. Analysis StepsThe present figure shows the data analysis for the measure Pleasantness in nine steps (a) to (i). Steps (a) to (c) concern the main effects; that meansthe effect of #IL if all data over SndRepr is compiled and the effect of SndRepr if all data over #IL is compiled. Steps (d) to (f) concern the individualeffect of #IL analyzed per SndRepr. Steps (g) to (i) concern the individual effect of SndRepr analyzed per #IL.Steps (a), (d), & (g): errorbar plots, showing the mean values and 95% confidence intervals per #IL and SndRepr. Steps (b), (e), & (h): results ofrepeated-measures ANOVAs with #IL ∈ [2, 3, 4, 6] and SndRepr ∈ [1 = NB/non-spatial, 2 = FB/non-spatial, 3 = FB/spatial] as input, expressed bythe F-measure and significance level p, and using the Greenhouse-Geisser correction when the sphericity criterion for repeated-measures ANOVAsis violated. Steps (c), (f), & (i): results of PostHoc tests (estimated marginal means) with Sidak correction for pairwise comparisons between allpairs of #IL or SndRepr, expressed by the significance level p; Significant differences (p ≤ 0.05) are indicated with an asterisk (*).
2.1 Main Effects
(a) Errorbars
(b) ANOVA
F pSndRepr 26.049 0.000*#IL 8.453 0.000*Interaction 1.013 0.419
(c) PostHoc tests
SndRepr p #IL p1 vs. 2 0.007* 2 vs. 3 0.008*1 vs. 3 0.000* 2 vs. 4 0.007*2 vs. 3 0.001* 2 vs. 6 0.005*
3 vs. 4 1.000
3 vs. 6 0.672
4 vs. 6 0.274
2.2 Individual Effect of SndRepr per #IL
(d) Errorbars
(e) ANOVA per #IL
#IL F p2 13.679 0.000*3 16.131 0.000*4 17.318 0.000*6 21.368 0.000*
(f) PostHoc tests per #IL
#IL SndRepr p2 1 vs. 2 0.129
1 vs. 3 0.000*2 vs. 3 0.003*
3 1 vs. 2 0.016*1 vs. 3 0.000*2 vs. 3 0.017*
4 1 vs. 2 0.573
1 vs. 3 0.000*2 vs. 3 0.002*
6 1 vs. 2 0.012*1 vs. 3 0.000*2 vs. 3 0.002*
2.3 Individual Effect of #IL per SndRepr
(g) Errorbars
(h) ANOVA per SndRepr
SndRepr F p1 2.399 0.076
2 4.481 0.006*3 1.639 0.202
(i) PostHoc tests per SndRepr
SndRepr #IL p1 2 vs. 3 0.019*
2 vs. 4 0.316
2 vs. 6 0.008*3 vs. 4 0.999
3 vs. 6 0.744
4 vs. 6 0.153
2 2 vs. 3 0.026*2 vs. 4 0.005*2 vs. 6 0.001*3 vs. 4 0.873
3 vs. 6 0.312*4 vs. 6 0.926
3 2 vs. 3 0.368
2 vs. 4 0.886
2 vs. 6 0.328
3 vs. 4 0.959
3 vs. 6 0.964
4 vs. 6 0.770
3. Analysis Results:
3.1 Hypothesis H5 (Communication Complexity has an impact on Quality of Experience) is supported, as #IL has a significant impact on Pleasantnessbetween two-party and multiparty groups.Rationale – main effect: Values decrease with increasing #IL (Step a). This effect is significant (Step b) and explained by significant differencesbetween two-party (#IL = 2) and multiparty (#IL > 2) groups (Step c).Rationale – effect per SndRepr: While values decrease with increasing #IL for all three SndRepr (Step g), this effect is only significant for non-spatialwideband sound reproduction (Step h). It is mainly explained by significant differences between two-party and multiparty groups (Step i). Thereis a tendency that this holds also for non-spatial narrowband sound reproduction, but results are inconsistent (Steps h & i).3.2 Hypothesis H6 (Technical System Capability has an impact on Quality of Experience) is supported, as SndRepr has a significant impact onPleasantness.Rationale – main effect: Values increase with increasing SndRepr (Step a). This effect is significant (Step b) and is explained by significant differencesbetween all pairs of SndRepr (Step c).Rationale – effect per #IL: Values increase for all four #IL (Step d). This is significant (Step e) and is explained by significant differences betweenalmost all pairs of SndRepr (Step f).
Figure C.22: Results for the measurePleasantness.

352 quality of experience of multiparty conferencing and telemeeting systems
1. Analysis StepsThe present figure shows the data analysis for the measure Acceptance in nine steps (a) to (i). Steps (a) to (c) concern the main effects; that meansthe effect of #IL if all data over SndRepr is compiled and the effect of SndRepr if all data over #IL is compiled. Steps (d) to (f) concern the individualeffect of #IL analyzed per SndRepr. Steps (g) to (i) concern the individual effect of SndRepr analyzed per #IL.Steps (a), (d), & (g): errorbar plots, showing the mean values and 95% confidence intervals per #IL and SndRepr. Steps (b), (e), & (h): results ofrepeated-measures ANOVAs with #IL ∈ [2, 3, 4, 6] and SndRepr ∈ [1 = NB/non-spatial, 2 = FB/non-spatial, 3 = FB/spatial] as input, expressed bythe F-measure and significance level p, and using the Greenhouse-Geisser correction when the sphericity criterion for repeated-measures ANOVAsis violated. Steps (c), (f), & (i): results of PostHoc tests (estimated marginal means) with Sidak correction for pairwise comparisons between allpairs of #IL or SndRepr, expressed by the significance level p; Significant differences (p ≤ 0.05) are indicated with an asterisk (*).
2.1 Main Effects
(a) Errorbars
(b) ANOVA
F pSndRepr 27.689 0.000*#IL 9.588 0.000*Interaction 0.605 0.726
(c) PostHoc tests
SndRepr p #IL p1 vs. 2 0.004* 2 vs. 3 0.101
1 vs. 3 0.000* 2 vs. 4 0.001*2 vs. 3 0.000* 2 vs. 6 0.002*
3 vs. 4 0.976
3 vs. 6 0.154
4 vs. 6 0.213
2.2 Individual Effect of SndRepr per #IL
(d) Errorbars
(e) ANOVA per #IL
#IL F p2 15.541 0.000*3 18.022 0.000*4 19.431 0.000*6 18.457 0.000*
(f) PostHoc tests per #IL
#IL SndRepr p2 1 vs. 2 0.212
1 vs. 3 0.000*2 vs. 3 0.002*
3 1 vs. 2 0.009*1 vs. 3 0.000*2 vs. 3 0.012*
4 1 vs. 2 0.109
1 vs. 3 0.000*2 vs. 3 0.002*
6 1 vs. 2 0.030*1 vs. 3 0.000*2 vs. 3 0.003*
2.3 Individual Effect of #IL per SndRepr
(g) Errorbars
(h) ANOVA per SndRepr
SndRepr F p1 7.388 0.001*2 7.322 0.000*3 4.136 0.010*
(i) PostHoc tests per SndRepr
SndRepr #IL p1 2 vs. 3 0.025*
2 vs. 4 0.015*2 vs. 6 0.002*3 vs. 4 0.997
3 vs. 6 0.490
4 vs. 6 0.315
2 2 vs. 3 0.322
2 vs. 4 0.012*2 vs. 6 0.001*3 vs. 4 0.858
3 vs. 6 0.106
4 vs. 6 0.835
3 2 vs. 3 0.814
2 vs. 4 0.981
2 vs. 6 0.061
3 vs. 4 1.000
3 vs. 6 0.214
4 vs. 6 0.287
3. Analysis Results:
3.1 Hypothesis H5 (Communication Complexity has an impact on Quality of Experience) is supported, as #IL has a significant impact on Acceptancebetween two-party and multiparty groups.Rationale – main effect: Values decrease with increasing #IL (Step a). This effect is significant (Step b) and explained by significant differencesbetween two-party (#IL = 2) and multiparty (#IL > 2) groups (Step c).Rationale – effect per SndRepr: While values decrease with increasing #IL for all three SndRepr (Step g), this effect is only significant for non-spatialsound reproduction (Step h). It is mainly explained by significant differences between two-party and multiparty groups (Step i).3.2 Hypothesis H6 (Technical System Capability has an impact on Quality of Experience) is supported, as SndRepr has a significant impact onAcceptance.Rationale – main effect: Values increase with increasing SndRepr (Step a). This effect is significant (Step b) and is explained by significant differencesbetween all pairs of SndRepr (Step c).Rationale – effect per #IL: Values increase for all four #IL (Step d). This is significant (Step e) and is explained by significant differences betweenalmost all pairs of SndRepr (Step f).
Figure C.23: Results for the measureAcceptance.

DDetailed Results: Study on Impact of Involvement
What this chapter is about
The present appendix presents per employed measure the detailedresults of the experiment INV on the impact of involvement on qualityperception. First, each figure provides an explanation of the analysissteps conducted. Then, each figure shows the results for two analysislevels: a) the main effects (i.e. effect of Task across all SndTrans, effectof SndTrans across all Tasks), and (b) the individual effects (effect ofTask per SndTrans, effect of SndTrans per Tasks). Finally, each figurediscusses how the current results relate to the different hypothesesformulated in Section 7.4. The individual results are then compiledin the main text in Section 7.4.

354 quality of experience of multiparty conferencing and telemeeting systems
D.1 Experiment INV
1. Analysis StepsThe present figure shows the data analysis forthe measure Perceived Involvement in nine steps(a) to (i). Steps (a) to (c) concern the main effects;that means the effect of Task if all data over Snd-Trans is compiled and the effect of SndTrans if alldata over Task is compiled. Steps (d) to (f) con-cern the individual effect of Task analyzed perSndTrans. Steps (g) to (i) concern the individualeffect of SndTrans analyzed per Task.Steps (a), (d), & (g): errorbar plots, showing themean values and 95% confidence intervals perTask and SndTrans. Steps (b), (e), & (h): resultsof one-way ANOVAs with Task ∈ [1...4] and Snd-Trans ∈ [1 = 0%, 2 = 5%, 3 = 10%, 4 = 15% packetloss rate] as input, expressed by the F-measureand significance level p. Steps (c), (f), & (i): re-sults of PostHoc tests with Sidak correction forpairwise comparisons between all pairs of Taskor SndTrans, expressed by the significance levelp. Significant differences (p ≤ 0.05) are indicatedwith an asterisk (*).
2.1 Main Effects(a) Errorbars
(b) ANOVAF p
Task 19.354 0.000*SndTrans 1.014 0.392
Interaction 3.577 0.001*
(c) PostHoc testsSndTrans p Task p1 vs. 2 0.876 1 vs. 2 0.973
1 vs. 3 0.540 1 vs. 3 0.000*1 vs. 4 0.634 1 vs. 4 0.000*2 vs. 3 0.997 2 vs. 3 0.000*2 vs. 4 0.999 2 vs. 4 0.000*3 vs. 4 1.000 3 vs. 4 0.940
2.2 Individual Effect of SndTrans perTask
(d) Errorbars
(e) ANOVA per Task
Task F p1 2.263 0.120
2 4.263 0.022*3 1.696 0.208
4 3.598 0.037*
(f) PostHoc tests per Task
Task SndTrans p1 1 vs. 2 0.974
1 vs. 3 0.472
1 vs. 4 0.977
2 vs. 3 0.921
2 vs. 4 0.623
3 vs. 4 0.138
2 1 vs. 2 0.019*1 vs. 3 0.142
1 vs. 4 0.242
2 vs. 3 0.913
2 vs. 4 0.766
3 vs. 4 1.000
3 1 vs. 2 0.973
1 vs. 3 0.914
1 vs. 4 0.809
2 vs. 3 0.457
2 vs. 4 0.329
3 vs. 4 1.000
4 1 vs. 2 1.000
1 vs. 3 0.430
1 vs. 4 0.650
2 vs. 3 0.529
2 vs. 4 0.546
3 vs. 4 0.028*
2.3 Individual Effect of Task per Snd-Trans
(g) Errorbars
(h) ANOVA per SndTrans
SndTrans F p1 7.506 0.002*2 10,827 0.000*3 1.677 0.212
4 12.599 0.000*
(i) PostHoc tests per SndTrans
SndTrans Task p1 1 vs. 2 0.026*
1 vs. 3 0.003*1 vs. 4 0.014*2 vs. 3 0.884
2 vs. 4 1.000
3 vs. 4 0.975
2 1 vs. 2 0.653
1 vs. 3 0.010*1 vs. 4 0.217
2 vs. 3 0.000*2 vs. 4 0.011*3 vs. 4 0.606
3 1 vs. 2 0.741
1 vs. 3 0.947
1 vs. 4 1.000
2 vs. 3 0.223
2 vs. 4 0.900
3 vs. 4 0.824
4 1 vs. 2 0.524
1 vs. 3 0.009*1 vs. 4 0.000*2 vs. 3 0.239
2 vs. 4 0.005*3 vs. 4 0.372
3. Analysis Results:
3.1 Hypothesis H1 (Involvement has an impact on Measured Involvement) is supported, as Task has a significant impact on Perceived Involvement,noting that the difference between conversation and listening-only tasks explains this effect.Rationale – main effect: Values for the conversation tasks T3 & T4 are higher than the values for the listening-only tasks T1 & T2 (Step a). Thiseffect is significant (Step b) and the PostHoc tests confirm the differences between conversation and listening-only tasks (Step c).Rationale – effect per SndTrans: Values increase with increasing task number in three of the four SndTrans (Step g). These effects are significant(Step h), whereas the task pairs showing those differences are not the same across the three SndTrans (Step i), i.e. the clear distinction seen for themain effect between conversation and listening-only tasks is only visible for SndTrans = 2.3.2 Hypothesis H2 (Technical System Capability has an impact on Measured Involvement) is not supported, as SndTrans has no consistent significantimpact on Perceived Involvement.Rationale – main effect: Values do not change with changing SndTrans (Step a) and no significant differences are found (Steps b & c).Rationale – effect per Task: No consistent trend is visible (Step g), while significant effects can be found (Step e), which, however, are very few(i.e. 2 of 18 cases) and not consistent across Tasks (Step f).
Figure D.1: Results for the measurePerceived Involvement.

detailed results: study on impact of involvement 355
1. Analysis StepsThe present figure shows the data analysis forthe measure Perceived Involvement in Retrospectin nine steps (a) to (i). Steps (a) to (c) concernthe main effects; that means the effect of Taskif all data over SndTrans is compiled and theeffect of SndTrans if all data over Task is com-piled. Steps (d) to (f) concern the individualeffect of Task analyzed per SndTrans. Steps (g)to (i) concern the individual effect of SndTransanalyzed per Task.Steps (a), (d), & (g): errorbar plots, showingthe mean values and 95% confidence intervalsper Task and SndTrans. Steps (b), (e), & (h): re-sults of one-way ANOVAs with Task ∈ [1...4]and SndTrans ∈ [1 = 0%, 2 = 5%, 3 = 10%, 4
= 15% packet loss rate] as input, expressed bythe F-measure and significance level p. Steps(c), (f), & (i): results of PostHoc tests withSidak correction for pairwise comparisons be-tween all pairs of Task or SndTrans, expressedby the significance level p. Significant differ-ences (p ≤ 0.05) are indicated with an asterisk(*).
2.1 Main Effects
(a) Errorbars
(b) ANOVA
F pTask 22.770 0.000*SndTrans 4.454 0.009*Interaction 3.586 0.002*
(c) PostHoc tests
SndTrans p Task p1 vs. 2 0.156 1 vs. 2 0.972
1 vs. 3 0.996 1 vs. 3 0.000*1 vs. 4 0.092 1 vs. 4 0.000*2 vs. 3 0.046* 2 vs. 3 0.000*2 vs. 4 1.000 2 vs. 4 0.000*3 vs. 4 0.025* 3 vs. 4 1.000
2.2 Individual Effect of SndTrans perTask
(d) Errorbars
(e) ANOVA per Task
Task F p1 9.300 0.003*2 5.494 0.017*3 0.148 0.929
4 0.243 0.864
(f) PostHoc tests per Task
Task SndTrans p1 1 vs. 2 1.000
1 vs. 3 0.030*1 vs. 4 0.854
2 vs. 3 0.018*2 vs. 4 0.820
3 vs. 4 0.004*2 1 vs. 2 0.032*
1 vs. 3 0.246
1 vs. 4 0.041*2 vs. 3 0.841
2 vs. 4 0.999
3 vs. 4 0.957
3 1 vs. 2 1.000
1 vs. 3 0.997
1 vs. 4 0.991
2 vs. 3 1.000
2 vs. 4 1.000
3 vs. 4 1.000
4 1 vs. 2 1.000
1 vs. 3 0.988
1 vs. 4 0.997
2 vs. 3 0.987
2 vs. 4 0.996
3 vs. 4 1.000
2.3 Individual Effect of Task per Snd-Trans
(g) Errorbars
(h) ANOVA per SndTrans
SndTrans F p1 5.576 0.016*2 9.734 0.003*3 3.143 0.074
4 15.703 0.000*
(i) PostHoc tests per SndTrans
SndTrans Task p1 1 vs. 2 0.048*
1 vs. 3 0.027*1 vs. 4 0.052
2 vs. 3 0.993
2 vs. 4 1.000
3 vs. 4 0.989
2 1 vs. 2 0.999
1 vs. 3 0.014*1 vs. 4 0.044*2 vs. 3 0.011*2 vs. 4 0.033*3 vs. 4 0.999
3 1 vs. 2 0.214
1 vs. 3 1.000
1 vs. 4 0.995
2 vs. 3 0.172
2 vs. 4 0.119
3 vs. 4 0.999
4 1 vs. 2 0.743
1 vs. 3 0.004*1 vs. 4 0.001*2 vs. 3 0.020*2 vs. 4 0.005*3 vs. 4 0.998
3. Analysis Results:
3.1 Hypothesis H1 (Involvement has an impact on Measured Involvement) is supported, as Task has a significant impact on Perceived Involvementin Retrospect, noting that the difference between conversation and listening-only tasks explains this effect.Rationale – main effect: Values for the conversation tasks T3 & T4 are higher than the values for the listening-only tasks T1 & T2 (Step a). Thiseffect is significant (Step b) and the PostHoc tests confirm the differences between conversation and listening-only tasks (Step c).Rationale – effect per SndTrans: Values increase with increasing task number in three of the four SndTrans (Step g). These effects are significant(Step h), whereas the task pairs showing those differences are not the same across the three SndTrans (Step i), i.e. the clear distinction seen for themain effect between conversation and listening-only tasks is only visible for SndTrans = 2 & 4.3.2 Hypothesis H2 (Technical System Capability has an impact on Measured Involvement) is not supported, as SndTrans has no consistent significantimpact on Perceived Involvement in Retrospect.Rationale – main effect: Values do change with changing SndTrans (Step a) but are not consistent with increasing impairment, i.e. SndTrans = 2 (5%Packet loss) is worse than SndTrans = 3 (10% packet loss). Significant effects are found (Step b) and are explained by differences between SndTrans= 1 & 3 vs. SndTrans = 2 & 4 (Step c).Rationale – effect per Task: No consistent trend is visible (Step g), while significant effects can be found for the listening-only tasks(Step e), which,however, are very few and not consistent across Tasks (Step f).
Figure D.2: Results for the measurePerceived Involvement in Retrospect.

356 quality of experience of multiparty conferencing and telemeeting systems
1. Analysis StepsThe present figure shows the data analysisfor the measure Influence of Content in ninesteps (a) to (i). Steps (a) to (c) concern themain effects; that means the effect of Task ifall data over SndTrans is compiled and the ef-fect of SndTrans if all data over Task is com-piled. Steps (d) to (f) concern the individualeffect of Task analyzed per SndTrans. Steps (g)to (i) concern the individual effect of SndTransanalyzed per Task.Steps (a), (d), & (g): errorbar plots, showingthe mean values and 95% confidence intervalsper Task and SndTrans. Steps (b), (e), & (h): re-sults of one-way ANOVAs with Task ∈ [1...4]and SndTrans ∈ [1 = 0%, 2 = 5%, 3 = 10%, 4
= 15% packet loss rate] as input, expressed bythe F-measure and significance level p. Steps(c), (f), & (i): results of PostHoc tests withSidak correction for pairwise comparisons be-tween all pairs of Task or SndTrans, expressedby the significance level p. Significant differ-ences (p ≤ 0.05) are indicated with an asterisk(*).
2.1 Main Effects
(a) Errorbars
(b) ANOVA
F pTask 0.594 0.621
SndTrans 1.605 0.197
Interaction 1.689 0.110
(c) PostHoc tests
SndTrans p Task p1 vs. 2 0.850 1 vs. 2 0.823
1 vs. 3 0.876 1 vs. 3 0.995
1 vs. 4 0.177 1 vs. 4 0.850
2 vs. 3 1.000 2 vs. 3 0.991
2 vs. 4 0.863 2 vs. 4 1.000
3 vs. 4 0.837 3 vs. 4 0.994
2.2 Individual Effect of SndTrans perTask
(d) Errorbars
(e) ANOVA per Task
Task F p1 1.057 0.395
2 2.917 0.066
3 2.215 0.126
4 0.557 0.651
(f) PostHoc tests per Task
Task SndTrans p1 1 vs. 2 0.801
1 vs. 3 0.997
1 vs. 4 1.000
2 vs. 3 0.479
2 vs. 4 0.903
3 vs. 4 0.982
2 1 vs. 2 1.000
1 vs. 3 0.875
1 vs. 4 0.132
2 vs. 3 0.838
2 vs. 4 0.114
3 vs. 4 0.686
3 1 vs. 2 0.987
1 vs. 3 0.173
1 vs. 4 0.499
2 vs. 3 0.499
2 vs. 4 0.898
3 vs. 4 0.987
4 1 vs. 2 0.999
1 vs. 3 0.961
1 vs. 4 1.000
2 vs. 3 0.784
2 vs. 4 0.999
3 vs. 4 0.961
2.3 Individual Effect of Task per Snd-Trans
(g) Errorbars
(h) ANOVA per SndTrans
SndTrans F p1 1.083 0.384
2 1.813 0.185
3 2.253 0.122
4 0.652 0.593
(i) PostHoc tests per SndTrans
SndTrans Task p1 1 vs. 2 0.714
1 vs. 3 0.696
1 vs. 4 1.000
2 vs. 3 1.000
2 vs. 4 0.859
3 vs. 4 0.845
2 1 vs. 2 0.225
1 vs. 3 0.587
1 vs. 4 0.957
2 vs. 3 0.989
2 vs. 4 0.720
3 vs. 4 0.981
3 1 vs. 2 1.000
1 vs. 3 0.424
1 vs. 4 0.983
2 vs. 3 0.661
2 vs. 4 0.886
3 vs. 4 0.129
4 1 vs. 2 0.923
1 vs. 3 1.000
1 vs. 4 0.999
2 vs. 3 0.982
2 vs. 4 0.725
3 vs. 4 0.989
3. Analysis Results:
3.1 Hypothesis H1 (Involvement has an impact on Measured Involvement) is not supported, as Task has a no significant impact on Influence ofContent.Rationale – main effect: Values slightly increase with increasing Task number (Step a), but no significant effects can be found (Steps b & c).Rationale – effect per SndTrans: Values do not change with changing Tasks (Step g), and no significant differences are found (Steps h & i).3.2 Hypothesis H2 (Technical System Capability has an impact on Measured Involvement) is not supported, as SndTrans has no significant impacton Influence of Content.Rationale – main effect: Values slightly decrease with increasing Tasks, i.e. increasing impairment (Step a), but no significant differences are found(Steps b & c).Rationale – effect per Task: Values do not change with changing Tasks (Step d), and no significant differences are found (Steps e & f).
Figure D.3: Results for the measureInfluence of Content.

detailed results: study on impact of involvement 357
1. Analysis StepsThe present figure shows the data analysis forthe measure Rating Difficulty in nine steps (a)to (i). Steps (a) to (c) concern the main effects;that means the effect of Task if all data overSndTrans is compiled and the effect of Snd-Trans if all data over Task is compiled. Steps(d) to (f) concern the individual effect of Taskanalyzed per SndTrans. Steps (g) to (i) concernthe individual effect of SndTrans analyzed perTask.Steps (a), (d), & (g): errorbar plots, showingthe mean values and 95% confidence intervalsper Task and SndTrans. Steps (b), (e), & (h): re-sults of one-way ANOVAs with Task ∈ [1...4]and SndTrans ∈ [1 = 0%, 2 = 5%, 3 = 10%, 4
= 15% packet loss rate] as input, expressed bythe F-measure and significance level p. Steps(c), (f), & (i): results of PostHoc tests withSidak correction for pairwise comparisons be-tween all pairs of Task or SndTrans, expressedby the significance level p. Significant differ-ences (p ≤ 0.05) are indicated with an asterisk(*).
2.1 Main Effects
(a) Errorbars
(b) ANOVA
F pTask 1.078 0.365
SndTrans 0.241 0.868
Interaction 4.646 0.000*
(c) PostHoc tests
SndTrans p Task p1 vs. 2 0.997 1 vs. 2 0.419
1 vs. 3 1.000 1 vs. 3 0.774
1 vs. 4 0.996 1 vs. 4 0.845
2 vs. 3 0.986 2 vs. 3 0.997
2 vs. 4 1.000 2 vs. 4 0.990
3 vs. 4 0.984 3 vs. 4 1.000
2.2 Individual Effect of SndTrans perTask
(d) Errorbars
(e) ANOVA per Task
Task F p1 4.731 0.015*2 3.221 0.051
3 3.746 0.033*4 3.123 0.055
(f) PostHoc tests per Task
Task SndTrans p1 1 vs. 2 0.023*
1 vs. 3 1.000
1 vs. 4 0.488
2 vs. 3 0.046*2 vs. 4 0.524
3 vs. 4 0.708
2 1 vs. 2 1.000
1 vs. 3 1.000
1 vs. 4 0.174
2 vs. 3 1.000
2 vs. 4 0.105
3 vs. 4 0.112
3 1 vs. 2 0.996
1 vs. 3 0.161
1 vs. 4 0.962
2 vs. 3 0.390
2 vs. 4 0.729
3 vs. 4 0.031*4 1 vs. 2 0.471
1 vs. 3 0.056
1 vs. 4 0.232
2 vs. 3 0.817
2 vs. 4 0.998
3 vs. 4 0.977
2.3 Individual Effect of Task per Snd-Trans
(g) Errorbars
(h) ANOVA per SndTrans
SndTrans F p1 5.283 0.010*2 2.648 0.084
3 4.353 0.020*4 3.854 0.030*
(i) PostHoc tests per SndTrans
SndTrans Task p1 1 vs. 2 0.991
1 vs. 3 1.000
1 vs. 4 0.059
2 vs. 3 1.000
2 vs. 4 0.017*3 vs. 4 0.034*
2 1 vs. 2 0.080
1 vs. 3 0.438
1 vs. 4 0.459
2 vs. 3 0.923
2 vs. 4 0.911
3 vs. 4 1.000
3 1 vs. 2 0.922
1 vs. 3 0.256
1 vs. 4 0.908
2 vs. 3 0.040*2 vs. 4 1.000
3 vs. 4 0.037*4 1 vs. 2 0.897
1 vs. 3 0.252
1 vs. 4 0.826
2 vs. 3 0.034*2 vs. 4 0.222
3 vs. 4 0.924
3. Analysis Results:
3.1 Hypothesis H1 (Involvement has an impact on Measured Involvement and/or Cognitive Load) is not supported, as Task has no significantimpact on Rating Difficulty.Rationale – main effect: Values do not change with changing Tasks (Step a), and no significant differences are found (Steps b & c).Rationale – effect per SndTrans: No consistent trend is visible (Step g), while significant effects can be found (Step h), which, however, are few (i.e. 5
of 18 cases) and not consistent across Tasks (Step f).3.2 Hypothesis H2 (Technical System Capability has an impact on Measured Involvement and/or Cognitive Load) is not supported, as SndTranshas no significant impact on Rating Difficulty.Rationale – main effect: Values do not change with changing Tasks (Step a), and no significant differences are found (Steps b & c).Rationale – effect per Task: No consistent trend is visible (Step g), while significant effects can be found for the listening-only tasks(Step e), which,however, are very few (i.e. 3 of 18 cases) and not consistent across Tasks (Step f).
Figure D.4: Results for the measureRating Difficulty.

358 quality of experience of multiparty conferencing and telemeeting systems
1. Analysis StepsThe present figure shows the data analysis forthe measure Quality in nine steps (a) to (i).Steps (a) to (c) concern the main effects; thatmeans the effect of Task if all data over Snd-Trans is compiled and the effect of SndTrans ifall data over Task is compiled. Steps (d) to (f)concern the individual effect of Task analyzedper SndTrans. Steps (g) to (i) concern the indi-vidual effect of SndTrans analyzed per Task.Steps (a), (d), & (g): errorbar plots, showingthe mean values and 95% confidence intervalsper Task and SndTrans. Steps (b), (e), & (h): re-sults of one-way ANOVAs with Task ∈ [1...4]and SndTrans ∈ [1 = 0%, 2 = 5%, 3 = 10%, 4
= 15% packet loss rate] as input, expressed bythe F-measure and significance level p. Steps(c), (f), & (i): results of PostHoc tests withSidak correction for pairwise comparisons be-tween all pairs of Task or SndTrans, expressedby the significance level p. Significant differ-ences (p ≤ 0.05) are indicated with an asterisk(*).
2.1 Main Effects
(a) Errorbars
(b) ANOVA
F pTask 12.047 0.000*SndTrans 3.211 0.029*Interaction 1.528 0.157
(c) PostHoc tests
SndTrans p Task p1 vs. 2 0.998 1 vs. 2 0.859
1 vs. 3 0.458 1 vs. 3 0.000*1 vs. 4 0.039* 1 vs. 4 0.000*2 vs. 3 0.776 2 vs. 3 0.004*2 vs. 4 0.121 2 vs. 4 0.003*3 vs. 4 0.844 3 vs. 4 1.000
2.2 Individual Effect of SndTrans perTask
(d) Errorbars
(e) ANOVA per Task
Task F p1 1.492 0.255
2 3.364 0.045*3 2.500 0.097
4 0.634 0.604
(f) PostHoc tests per Task
Task SndTrans p1 1 vs. 2 0.405
1 vs. 3 0.932
1 vs. 4 0.455
2 vs. 3 0.941
2 vs. 4 1.000
3 vs. 4 0.962
2 1 vs. 2 0.866
1 vs. 3 0.214
1 vs. 4 0.055
2 vs. 3 0.851
2 vs. 4 0.408
3 vs. 4 0.982
3 1 vs. 2 0.982
1 vs. 3 0.935
1 vs. 4 0.397
2 vs. 3 0.538
2 vs. 4 0.117
3 vs. 4 0.935
4 1 vs. 2 0.728
1 vs. 3 0.987
1 vs. 4 0.946
2 vs. 3 0.984
2 vs. 4 0.998
3 vs. 4 1.000
2.3 Individual Effect of Task per Snd-Trans
(g) Errorbars
(h) ANOVA per SndTrans
SndTrans F p1 0.874 0.475
2 9.877 0.001*3 4.314 0.021*4 3.589 0.037*
(i) PostHoc tests per SndTrans
SndTrans Task p1 1 vs. 2 0.974
1 vs. 3 0.590
1 vs. 4 0.999
2 vs. 3 0.969
2 vs. 4 1.000
3 vs. 4 0.851
2 1 vs. 2 0.356
1 vs. 3 0.001*1 vs. 4 0.004*2 vs. 3 0.057
2 vs. 4 0.209
3 vs. 4 0.986
3 1 vs. 2 1.000
1 vs. 3 0.271
1 vs. 4 0.119
2 vs. 3 0.145
2 vs. 4 0.059
3 vs. 4 0.998
4 1 vs. 2 1.000
1 vs. 3 0.689
1 vs. 4 0.082
2 vs. 3 0.640
2 vs. 4 0.071
3 vs. 4 0.737
3. Analysis Results:
3.1 Hypothesis H5b (Involvement has an impact on Speech Communication Quality and/or Quality of Experience) is supported, as Task has asignificant impact on Quality, noting that the difference between conversation and listening-only tasks explains this effect.Rationale – main effect: Values for the conversation tasks T3 & T4 are higher than the values for the listening-only tasks T1 & T2 (Step a). Thiseffect is significant (Step b) and the PostHoc tests confirm the differences between conversation and listening-only tasks (Step c).Rationale – effect per SndTrans: Values increase with increasing task number in three of the four SndTrans (Step g). These effects are significant forthree of the four SndTrans (Step h), whereas differences are strong enough to be detected by the PostHoc tests in only two cases.3.2 Hypothesis H6b (Technical System Capability has an impact on Speech Communication Quality and/or Quality of Experience) is supported,as SndTrans has a significant impact on Quality, noting that this support can only be found in the main effects between the most extreme cases.Rationale – main effect: Values decrease with increasing SndTrans, i.e. increasing packet loss rate (Step a). This effect is significant (Step b) and isexplained by a significant difference between the two most extreme SndTrans.Rationale – effect per Task: No consistent trend is visible (Step g), while significant effects can be found for one task (Step e), which, however, isnot strong enough to be detected by the PostHoc tests (Step f).
Figure D.5: Results for the measureQuality.

detailed results: study on impact of involvement 359
1. Analysis StepsThe present figure shows the data analysis forthe measure Own Conversation Effort in ninesteps (a) to (i). Steps (a) to (c) concern themain effects; that means the effect of Task if alldata over SndTrans is compiled and the effectof SndTrans if all data over Task is compiled.Steps (d) to (f) concern the individual effectof Task analyzed per SndTrans. Steps (g) to(i) concern the individual effect of SndTransanalyzed per Task.Steps (a), (d), & (g): errorbar plots, showingthe mean values and 95% confidence intervalsper Task and SndTrans. Steps (b), (e), & (h): re-sults of one-way ANOVAs with Task ∈ [1...4]and SndTrans ∈ [1 = 0%, 2 = 5%, 3 = 10%, 4
= 15% packet loss rate] as input, expressed bythe F-measure and significance level p. Steps(c), (f), & (i): results of PostHoc tests withSidak correction for pairwise comparisons be-tween all pairs of Task or SndTrans, expressedby the significance level p. Significant differ-ences (p ≤ 0.05) are indicated with an asterisk(*).
2.1 Main Effects
(a) Errorbars
(b) ANOVA
F pTask 4.711 0.005*SndTrans 3.111 0.032*Interaction 0.681 0.723
(c) PostHoc tests
SndTrans p Task p1 vs. 2 0.620 1 vs. 2 0.977
1 vs. 3 0.178 1 vs. 4 0.075
1 vs. 4 0.029* 1 vs. 3 0.364
2 vs. 3 0.977 2 vs. 3 0.010*2 vs. 4 0.620 2 vs. 4 0.075
3 vs. 4 0.977 3 vs. 4 0.977
2.2 Individual Effect of SndTrans perTask
(d) Errorbars
(e) ANOVA per Task
Task F p1 1.267 0.319
2 1.267 0.319
3 2.667 0.083
4 0.762 0.532
(f) PostHoc tests per Task
Task SndTrans p1 1 vs. 2 0.990
1 vs. 3 0.990
1 vs. 4 0.378
2 vs. 3 1.000
2 vs. 4 0.782
3 vs. 4 0.782
2 1 vs. 2 0.782
1 vs. 3 0.378
1 vs. 4 0.782
2 vs. 3 0.990
2 vs. 4 1.000
3 vs. 4 0.990
3 1 vs. 2 1.000
1 vs. 3 1.000
1 vs. 4 0.190
2 vs. 3 1.000
2 vs. 4 0.190
3 vs. 4 0.190
4 1 vs. 2 0.975
1 vs. 3 0.623
1 vs. 4 0.975
2 vs. 3 0.975
2 vs. 4 1.000
3 vs. 4 0.975
2.3 Individual Effect of Task per Snd-Trans
(g) Errorbars
(h) ANOVA per SndTrans
SndTrans F p1 0.667 0.585
2 1.667 0.214
3 2.667 0.083
4 1.333 0.299
(i) PostHoc tests per SndTrans
SndTrans Task p1 1 vs. 2 1.000
1 vs. 3 0.911
1 vs. 4 0.911
2 vs. 3 0.911
2 vs. 4 0.911
3 vs. 4 1.000
2 1 vs. 2 0.982
1 vs. 3 0.688
1 vs. 4 0.982
2 vs. 3 0.264
2 vs. 4 0.688
3 vs. 4 0.982
3 1 vs. 2 0.688
1 vs. 3 0.688
1 vs. 4 1.000
2 vs. 3 0.070
2 vs. 4 0.688
3 vs. 4 0.688
4 1 vs. 2 0.990
1 vs. 3 0.782
1 vs. 4 0.378
2 vs. 3 0.990
2 vs. 4 0.782
3 vs. 4 0.990
3. Analysis Results:
3.1 Hypothesis H5b (Involvement has an impact on Speech Communication Quality with focus on Group-Communication Component) is sup-ported, as Task has a significant impact on Own Conversation Effort, noting that the difference between conversation and listening-only tasksexplains this effect.Rationale – main effect: Values for the conversation tasks T3 & T4 are higher than the values for the listening-only tasks T1 & T2 (Step a). Thiseffect is significant (Step b) and the PostHoc tests confirm the differences between conversation and listening-only tasks (Step c).Rationale – effect per SndTrans: No consistent trend is visible (Step g), and no significant effects are found (Steps h & i).3.2 Hypothesis H6b (Technical System Capability has an impact on Speech Communication Quality with focus on Group-Communication Compo-nent) is supported, as SndTrans has a significant impact on Own Conversation Effort, noting that this support can only be found in the main effectsbetween the most extreme cases.Rationale – main effect: Values decrease with increasing SndTrans, i.e. increasing packet loss rate (Step a). This effect is significant (Step b) and isexplained by a significant difference between the two most extreme SndTrans.Rationale – effect per Task: No consistent trend is visible (Step d), and no significant effects are found (Steps e & f).
Figure D.6: Results for the measureOwn Conversation Effort.

360 quality of experience of multiparty conferencing and telemeeting systems
1. Analysis StepsThe present figure shows the data analysisfor the measure Partners Conversation Effort innine steps (a) to (i). Steps (a) to (c) concernthe main effects; that means the effect of Taskif all data over SndTrans is compiled and theeffect of SndTrans if all data over Task is com-piled. Steps (d) to (f) concern the individualeffect of Task analyzed per SndTrans. Steps (g)to (i) concern the individual effect of SndTransanalyzed per Task.Steps (a), (d), & (g): errorbar plots, showingthe mean values and 95% confidence intervalsper Task and SndTrans. Steps (b), (e), & (h): re-sults of one-way ANOVAs with Task ∈ [1...4]and SndTrans ∈ [1 = 0%, 2 = 5%, 3 = 10%, 4
= 15% packet loss rate] as input, expressed bythe F-measure and significance level p. Steps(c), (f), & (i): results of PostHoc tests withSidak correction for pairwise comparisons be-tween all pairs of Task or SndTrans, expressedby the significance level p. Significant differ-ences (p ≤ 0.05) are indicated with an asterisk(*).
2.1 Main Effects
(a) Errorbars
(b) ANOVA
F pTask 1.143 0.339
SndTrans 1.905 0.138
Interaction 1.016 0.437
(c) PostHoc tests
SndTrans p Task p1 vs. 2 0.996 1 vs. 2 0.871
1 vs. 3 0.871 1 vs. 3 0.515
1 vs. 4 0.515 1 vs. 4 0.515
2 vs. 3 0.515 2 vs. 3 0.996
2 vs. 4 0.199 2 vs. 4 0.996
3 vs. 4 0.996 3 vs. 4 1.000
2.2 Individual Effect of SndTrans perTask
(d) Errorbars
(e) ANOVA per Task
Task F p1 0.762 0.532
2 2.667 0.083
3 1.000 0.418
4 1.000 0.418
(f) PostHoc tests per Task
Task SndTrans p1 1 vs. 2 0.975
1 vs. 3 1.000
1 vs. 4 0.975
2 vs. 3 0.975
2 vs. 4 0.623
3 vs. 4 0.975
2 1 vs. 2 1.000
1 vs. 3 0.190
1 vs. 4 1.000
2 vs. 3 0.190
2 vs. 4 1.000
3 vs. 4 0.190
3 1 vs. 2 1.000
1 vs. 3 1.000
1 vs. 4 0.688
2 vs. 3 1.000
2 vs. 4 0.688
3 vs. 4 0.688
4 1 vs. 2 1.000
1 vs. 3 1.000
1 vs. 4 0.688
2 vs. 3 1.000
2 vs. 4 0.688
3 vs. 4 0.688
2.3 Individual Effect of Task per Snd-Trans
(g) Errorbars
(h) ANOVA per SndTrans
SndTrans F p1 1.000 0.418
2 – –3 1.467 0.261
4 0.762 0.532
(i) PostHoc tests per SndTrans
SndTrans Task p1 1 vs. 2 0.688
1 vs. 3 0.688
1 vs. 4 0.688
2 vs. 3 1.000
2 vs. 4 1.000
3 vs. 4 1.000
2 1 vs. 2 –1 vs. 3 –1 vs. 4 –2 vs. 3 –2 vs. 4 –3 vs. 4 –
3 1 vs. 2 0.946
1 vs. 3 0.946
1 vs. 4 0.946
2 vs. 3 0.442
2 vs. 4 0.442
3 vs. 4 1.000
4 1 vs. 2 0.623
1 vs. 3 0.975
1 vs. 4 0.975
2 vs. 3 0.975
2 vs. 4 0.975
3 vs. 4 1.000
3. Analysis Results:
3.1 Hypothesis H5b (Involvement has an impact on Speech Communication Quality with focus on Group-Communication Component) is notsupported, as Task has no significant impact on Partners Conversation Effort.Rationale – main effect: Values slightly increase with increasing Task number (Step a), but no significant effects can be found (Steps b & c).Rationale – effect per SndTrans: Values are in many cases equal across Tasks (Step g), and no significant effects are found (Steps h & i).3.2 Hypothesis H6b (Technical System Capability has an impact on Speech Communication Quality with focus on Group-Communication Compo-nent) is not supported, as SndTrans has no significant impact on Partners Conversation Effort.Rationale – main effect: Values slightly decrease with increasing SndTrans, i.e. increasing packet loss rate (Step a), but no significant effects can befound (Steps b & c).Rationale – effect per Task: Values are in many cases equal across SndTrans (Step d), and no significant effects are found (Steps e & f).
Figure D.7: Results for the measurePartners Conversation Effort.

detailed results: study on impact of involvement 361
1. Analysis StepsThe present figure shows the data analysis forthe measure Partners Conversation Effort Con-fidence in nine steps (a) to (i). Steps (a) to (c)concern the main effects; that means the effectof Task if all data over SndTrans is compiledand the effect of SndTrans if all data over Taskis compiled. Steps (d) to (f) concern the in-dividual effect of Task analyzed per SndTrans.Steps (g) to (i) concern the individual effect ofSndTrans analyzed per Task.Steps (a), (d), & (g): errorbar plots, showingthe mean values and 95% confidence intervalsper Task and SndTrans. Steps (b), (e), & (h): re-sults of one-way ANOVAs with Task ∈ [1...4]and SndTrans ∈ [1 = 0%, 2 = 5%, 3 = 10%, 4
= 15% packet loss rate] as input, expressed bythe F-measure and significance level p. Steps(c), (f), & (i): results of PostHoc tests withSidak correction for pairwise comparisons be-tween all pairs of Task or SndTrans, expressedby the significance level p. Significant differ-ences (p ≤ 0.05) are indicated with an asterisk(*).
2.1 Main Effects
(a) Errorbars
(b) ANOVA
F pTask 0.104 0.957
SndTrans 0.875 0.460
Interaction 1.290 0.265
(c) PostHoc tests
SndTrans p Task p1 vs. 2 0.999 1 vs. 2 1.000
1 vs. 3 0.976 1 vs. 3 0.995
1 vs. 4 0.586 1 vs. 4 0.982
2 vs. 3 1.000 2 vs. 3 1.000
2 vs. 4 0.853 2 vs. 4 1.000
3 vs. 4 0.968 3 vs. 4 1.000
2.2 Individual Effect of SndTrans perTask
(d) Errorbars
(e) ANOVA per Task
Task F p1 0.295 0.828
2 0.803 0.516
3 2.512 0.104
4 1.866 0.185
(f) PostHoc tests per Task
Task SndTrans p1 1 vs. 2 1.000
1 vs. 3 0.972
1 vs. 4 1.000
2 vs. 3 0.993
2 vs. 4 1.000
3 vs. 4 0.947
2 1 vs. 2 0.994
1 vs. 3 0.689
1 vs. 4 0.907
2 vs. 3 0.917
2 vs. 4 0.995
3 vs. 4 1.000
3 1 vs. 2 1.000
1 vs. 3 1.000
1 vs. 4 0.203
2 vs. 3 0.997
2 vs. 4 0.172
3 vs. 4 0.380
4 1 vs. 2 0.693
1 vs. 3 0.989
1 vs. 4 0.958
2 vs. 3 0.958
2 vs. 4 0.220
3 vs. 4 0.611
2.3 Individual Effect of Task per Snd-Trans
(g) Errorbars
(h) ANOVA per SndTrans
SndTrans F p1 1.309 0.313
2 1.378 0.290
3 0.955 0.443
4 0.833 0.501
(i) PostHoc tests per SndTrans
SndTrans Task p1 1 vs. 2 0.462
1 vs. 3 0.608
1 vs. 4 0.899
2 vs. 3 0.999
2 vs. 4 0.970
3 vs. 4 0.999
2 1 vs. 2 0.986
1 vs. 3 0.660
1 vs. 4 0.996
2 vs. 3 0.962
2 vs. 4 0.832
3 vs. 4 0.382
3 1 vs. 2 0.644
1 vs. 3 1.000
1 vs. 4 0.983
2 vs. 3 0.750
2 vs. 4 0.941
3 vs. 4 0.998
4 1 vs. 2 1.000
1 vs. 3 0.976
1 vs. 4 0.945
2 vs. 3 0.978
2 vs. 4 0.982
3 vs. 4 0.597
3. Analysis Results:
3.1 Hypothesis H5b (Involvement has an impact on Speech Communication Quality with focus on Group-Communication Component) is notsupported, as Task has no significant impact on Partners Conversation Effort Confidence.Rationale – main effect: Values increase very slightly with increasing Task number (Step a), but no significant effects can be found (Steps b & c).Rationale – effect per SndTrans: No consistent trend is visible (Step g), and no significant effects are found (Steps h & i).3.2 Hypothesis H6b (Technical System Capability has an impact on Speech Communication Quality with focus on Group-Communication Compo-nent) is not supported, as SndTrans has no significant impact on Partners Conversation Effort Confidence.Rationale – main effect: Values decrease very slightly with increasing SndTrans, i.e. increasing packet loss rate (Step a), but no significant effectscan be found (Steps b & c).Rationale – effect per Task: No consistent trend is visible (Step d), and no significant effects are found (Steps e & f).
Figure D.8: Results for the measurePartners Conversation Effort Confidence.

362 quality of experience of multiparty conferencing and telemeeting systems
1. Analysis StepsThe present figure shows the data analysis forthe measure Perceived Effort in nine steps (a)to (i). Steps (a) to (c) concern the main effects;that means the effect of Task if all data overSndTrans is compiled and the effect of Snd-Trans if all data over Task is compiled. Steps(d) to (f) concern the individual effect of Taskanalyzed per SndTrans. Steps (g) to (i) concernthe individual effect of SndTrans analyzed perTask.Steps (a), (d), & (g): errorbar plots, showingthe mean values and 95% confidence intervalsper Task and SndTrans. Steps (b), (e), & (h): re-sults of one-way ANOVAs with Task ∈ [1...4]and SndTrans ∈ [1 = 0%, 2 = 5%, 3 = 10%, 4
= 15% packet loss rate] as input, expressed bythe F-measure and significance level p. Steps(c), (f), & (i): results of PostHoc tests withSidak correction for pairwise comparisons be-tween all pairs of Task or SndTrans, expressedby the significance level p. Significant differ-ences (p ≤ 0.05) are indicated with an asterisk(*).
2.1 Main Effects
(a) Errorbars
(b) ANOVA
F pTask 3.679 0.016*SndTrans 1.830 0.151
Interaction 3.353 0.002*
(c) PostHoc tests
SndTrans p Task p1 vs. 2 0.801 1 vs. 2 0.892
1 vs. 3 0.716 1 vs. 4 0.351
1 vs. 4 0.129 1 vs. 3 0.528
2 vs. 3 1.000 2 vs. 3 0.033*2 vs. 4 0.834 2 vs. 4 0.066
3 vs. 4 0.898 3 vs. 4 1.000
2.2 Individual Effect of SndTrans perTask
(d) Errorbars
(e) ANOVA per Task
Task F p1 2.834 0.071
2 2.173 0.131
3 1.879 0.174
4 5.650 0.008*
(f) PostHoc tests per Task
Task SndTrans p1 1 vs. 2 1.000
1 vs. 3 1.000
1 vs. 4 0.219
2 vs. 3 1.000
2 vs. 4 0.209
3 vs. 4 0.113
2 1 vs. 2 0.285
1 vs. 3 0.947
1 vs. 4 1.000
2 vs. 3 0.826
2 vs. 4 0.196
3 vs. 4 0.867
3 1 vs. 2 1.000
1 vs. 3 0.818
1 vs. 4 0.833
2 vs. 3 0.818
2 vs. 4 0.833
3 vs. 4 0.169
4 1 vs. 2 1.000
1 vs. 3 0.013*1 vs. 4 0.573
2 vs. 3 0.020*2 vs. 4 0.723
3 vs. 4 0.286
2.3 Individual Effect of Task per Snd-Trans
(g) Errorbars
(h) ANOVA per SndTrans
SndTrans F p1 1.261 0.321
2 4.832 0.014*3 4.817 0.014*4 2.664 0.083
(i) PostHoc tests per SndTrans
SndTrans Task p1 1 vs. 2 1.000
1 vs. 3 0.999
1 vs. 4 0.605
2 vs. 3 0.984
2 vs. 4 0.435
3 vs. 4 0.868
2 1 vs. 2 0.164
1 vs. 3 0.999
1 vs. 4 0.798
2 vs. 3 0.078
2 vs. 4 0.013*3 vs. 4 0.956
3 1 vs. 2 0.555
1 vs. 3 0.784
1 vs. 4 0.255
2 vs. 3 0.064
2 vs. 4 0.996
3 vs. 4 0.022*4 1 vs. 2 0.170
1 vs. 3 0.524
1 vs. 4 0.129
2 vs. 3 0.982
2 vs. 4 1.000
3 vs. 4 0.955
3. Analysis Results:
3.1 Hypothesis H3 (Involvement has an impact on Cognitive Load) is supported, as Task has a significant impact on Quality, noting that thedifference between conversation and listening-only tasks explains this effect.Rationale – main effect: Values for the conversation tasks T3 & T4 are higher than the values for the listening-only tasks T1 & T2 (Step a). Thiseffect is significant (Step b), but the PostHoc tests confirm the differences only between tasks T2 and T3 (Step c).Rationale – effect per SndTrans: No consistent trend is visible SndTrans (Step g). Significant are found for two of the four SndTrans (Step h), whereasdifferences are strong enough to be detected by the PostHoc tests in only two cases (Step i).3.2 Hypothesis H4 (Technical System Capability has an impact on Cognitive Load) is not supported, as SndTrans has no significant impact onPartners Conversation Effort Confidence.Rationale – main effect: Values slightly decrease with increasing SndTrans, i.e. increasing packet loss rate (Step a), but no significant effects can befound (Steps b & c).Rationale – effect per Task: No consistent trend is visible (Step d), and no significant effects are found except in two cases for SndTrans = 4 (Steps e& f).
Figure D.9: Results for the measurePerceived Effort.

EDetailed Results: Study on Impact of Audio-Only Tele-meeting - Conversation Tests
What this chapter is about
The present appendix presents the detailed results of the three audio-only conversation tests ACT1, ACT2 & ACT3 on the impact of tech-nical conditions on quality perception. First, each figure shows avisualization of the obtained data and the expectations according toSection 8.3. Then, each figure discusses per technical condition, inhow far the expectations are fulfilled and how the current resultsrelate to the different hypotheses formulated in Section 8.3. Theindividual results are then compiled in the main text in Section 8.3.

364 quality of experience of multiparty conferencing and telemeeting systems
E.1 Experiment ACT1
1. Visualization of Results and Expectations
2. Detailed Analysis
Ref1 All expected values lie within confidence intervals of Qi, Qii, & Qij=Qik, and all observed values are notsignificantly different from maximum value of whole test (3.8557, Qii of Ref1).⇒ Ref1 is confirmed as reference condition for this test.
L3 Expectations: No impairment on own connection, asymmetric condition concerning other connections.⇒ Qik determines lowest value, Qii & Qij should be equal to reference value Qik of Ref1.
Testing Hypothesis H1 (dotted line): Qii & Qij are significantly different (Qii: p=0.001, Qij: p=0.007) from theexpected values.⇒ Support for H1.
Testing Hypothesis H2 (dashed line, since this is independent from H1): Qi is not significantly different from theexpected value (p=0.572).⇒ Support for H2.
EN3 Expectations: Impairment on own connection, no impairments on other connections.⇒ Qii determines lowest value, Qij = Qik should be equal to reference value Qik of Ref1.
Testing Hypothesis H1 (dotted line): Qij = Qik are not significantly different from the expected value (p=0.071).⇒ No support for H1.
Testing Hypothesis H2 (dashed line, since this is independent from H1): Qi is not significantly different from theexpected value (p=0.221).⇒ Support for H2.
TN3 Expectations: No impairment on own connection, asymmetric condition concerning other connections.⇒ Qik determines lowest value, Qii & Qij should be equal to reference value Qik of Ref1.
Testing Hypothesis H1 (dotted line): Qii & Qij are not significantly different (Qii: p=0.894, Qij: p=0.389) from theexpected values.⇒ No support for H1.
Testing Hypothesis H2 (dashed line, since this is independent from H1): Qi is not significantly different from theexpected value (p=0.824).⇒ Support for H2.
Special observation: All values are essentially equal to reference condition. ⇒ Impairment not strong enough toelicit effect in quality ratings.
Figure E.1: Detailed results for Experi-ment ACT1, Part 1.

detailed results: study on impact of audio-only telemeeting - conversation tests 365
1. Visualization of Results and Expectations
Note: The reference condition Ref1 is repeated in this plot for better visual comparison.
2. Detailed Analysis
Dsym Expectations: No impairment on own connection, symmetric condition concerning other connections.⇒ Qij = Qik determine lowest value, Qii should be equal to reference value (Qik of Ref1).
Testing Hypothesis H1 (dotted line): Qii is not significantly different from the expected value (p=0.775).⇒ No support for H1.
Testing Hypothesis H2 (dashed line, since this is independent from H1): Qi is not significantly different from theexpected value (p=0.483).⇒ Support for H2.
Special observation: All values are essentially equal to reference condition. ⇒ Impairment not strong enough toelicit effect in quality ratings.
E1 Expectations: Impairment on own connection, asymmetric condition concerning other connections.⇒ Qii & Qik are lower than reference value Qik of Ref1, Qij should be equal to reference value (Qik of Ref1).
Testing Hypothesis H1 (dotted line): Qij is significantly different from the expected value (p=0.002).⇒ Support for H1.
Testing Hypothesis H2 (dashed line, since this is independent from H1): Qi is not significantly different from theexpected value (p=0.919).⇒ Support for H2.
P1 Expectations: No impairment on own connection, asymmetric condition concerning other connections.⇒ Qik determines lowest value, Qii & Qij should be equal to reference value (Qik of Ref1).
Testing Hypothesis H1 (dotted line): Qii & Qij are significantly different (Qii: p=0.005, Qij: p=0.000) from expectedvalues for dotted line.⇒ Support for H1.
Testing Hypothesis H2 (dashed line, since this is independent from H1): Qi is not significantly different from theexpected value (p=0.676).⇒ Support for H2.
Figure E.2: Detailed results for Experi-ment ACT1, Part 2.

366 quality of experience of multiparty conferencing and telemeeting systems
E.2 Experiment ACT2
1. Visualization of Results and Expectations
2. Detailed Analysis
Ref1 All expected values lie within confidence intervals of Qi, Qii, & Qij=Qik, and all observed values are notsignificantly different from maximum value of whole test (3.8557, Qii of Ref1).⇒ Ref1 is confirmed as reference condition for this test.
L1 Expectations: No impairment on own connection, asymmetric condition concerning other connections.⇒ Qik determines lowest value, Qii & Qij should be equal to reference value (Qik of Ref1).
Testing Hypothesis H1 (dotted line): Qii & Qij are not significantly different (Qii: p=0.526, Qij: p=0.111) from theexpected values.⇒ No support for H1.
Testing Hypothesis H2 (dashed line, since this is independent from H1): Qi is not significantly different from theexpected value (p=0.285).⇒ Support for H2.
L2 Expectations: No impairment on own connection, asymmetric condition concerning other connections.⇒ Qik determines lowest value, Qii & Qij should be equal to reference value (Qik of Ref1).
Testing Hypothesis H1 (dotted line): Qii is not significantly different (Qii: p=0.550) from the expected value, Qij issignificantly different (p=0.046) from the expected value.⇒ Support for H1.
Testing Hypothesis H2 (dashed line, since this is independent from H1): Qi is not significantly different from theexpected value (p=0.637).⇒ Support for H2.
L4 Expectations: No impairment on own connection, asymmetric condition concerning other connections.⇒ Qik determines lowest value, Qii & Qij should be equal to reference value (Qik of Ref1).
Testing Hypothesis H1 (dotted line): Qii is significantly different (Qii: p=0.024) from the expected value, Qij issignificantly different (p=0.113) from the expected value.⇒ No support for H1.
Testing Hypothesis H2 (dashed line, since this is independent from H1): Qi is not significantly different from theexpected value (p=0.617).⇒ Support for H2.
Figure E.3: Detailed results for Experi-ment ACT2.

detailed results: study on impact of audio-only telemeeting - conversation tests 367
E.3 Experiment ACT3
1. Visualization of Results and Expectations
2. Detailed Analysis
Ref3 All expected values lie within confidence intervals of Qi, Qii, & Qij=Qik, the observed values for Qii & Qij=Qikare not significantly different from maximum value of whole test (4.2036, Qij of FM1), and the observed valuefor Qi is close but significantly different from that maximum value, but it is not significantly different from themaximum value for Qi (4.1250, Qi of B1).⇒ Ref3 is confirmed as reference condition for this test.
B1 Expectations: No impairment on own connection, asymmetric condition concerning other connections.⇒ Qik determines lowest value, Qii & Qij should be equal to reference value (Qik of Ref1).
Testing Hypothesis H1 (dotted line): Qii & Qij are not significantly different (Qii: p=0.753, Qij: p=0.388) from theexpected values.⇒ No support for H1.
Testing Hypothesis H2 (dashed line, since this is independent from H1): Qi is not significantly different from theexpected value (p=0.854).⇒ Support for H2.
Special observation: All values are essentially equal to reference condition. ⇒ Impairment not strong enough toelicit effect in quality ratings.
B2 Expectations: No impairment on own connection, asymmetric condition concerning other connections.⇒ Qik determines lowest value, Qii & Qij should be equal to reference value (Qik of Ref1).
Testing Hypothesis H1 (dotted line): Qii is significantly different (Qii: p=0.001) from the expected value, Qij is notsignificantly different (p=0.081) from the expected value.⇒ Support for H1.
Testing Hypothesis H2 (dashed line, since this is independent from H1): Qi is not significantly different from theexpected value (p=0.141).⇒ Support for H2.
B2sym Expectations: No impairment on own connection, symmetric condition concerning other connections.⇒ Qij = Qik should be equal to corresponding value of asymmetric condition (Qik of B2), Qii should be equal toreference value (Qik of Ref1).
Testing Hypothesis H1 (dotted line): Qii & Qij are significantly different (Qii: p=0.000, Qij: p=0.000) from theexpected values.⇒ Support for H1.
Testing Hypothesis H2 (dashed line, since this is independent from H1): Qi is not significantly different from theexpected value (p=0.480).⇒ Support for H2.
Figure E.4: Detailed results for Experi-ment ACT3, Part 1.

368 quality of experience of multiparty conferencing and telemeeting systems
1. Visualization of Results and Expectations
Note: The reference condition Ref3 is repeated in this plot for better visual comparison.
2. Detailed Analysis
FM1 Expectations: No impairment on own connection, asymmetric condition concerning other connections.⇒ Qik determines lowest value, Qii & Qij should be equal to reference value (Qik of Ref1).
Testing Hypothesis H1 (dotted line): Qii & Qij are not significantly different (Qii: p=0.770, Qij: p=0.370) from theexpected values.⇒ No support for H1.
Testing Hypothesis H2 (dashed line, since this is independent from H1): Qi is not significantly different from theexpected value (p=0.909).⇒ Support for H2.
Special observation: All values are essentially equal to reference condition. ⇒ Impairment not strong enough toelicit effect in quality ratings.
FL3sym Expectations: No impairment on own connection, symmetric condition concerning other connections.⇒ Qij = Qik determine the lowest value, Qii should be equal to reference value (Qik of Ref1).
Testing Hypothesis H1 (dotted line): Qii is significantly different from the expected value (p=0.002).⇒ Support for H1.
Testing Hypothesis H2 (dashed line, since this is independent from H1): Qi is not significantly different from theexpected value (p=0.333).⇒ Support for H2.
FM2 Expectations: No impairment on own connection, asymmetric condition concerning other connections.⇒ Qik determines lowest value, Qii & Qij should be equal to reference value (Qik of Ref1).
Testing Hypothesis H1 (dotted line): Qii & Qij are significantly different (Qii: p=0.029, Qij: p=0.011) from theexpected values.⇒ Support for H1.
Testing Hypothesis H2 (dashed line, since this is independent from H1): Qi is not significantly different from theexpected value (p=0.103).⇒ Support for H2.
FL3sym Expectations: No impairment on own connection, symmetric condition concerning other connections.⇒ Qij = Qik determine the lowest value, Qii should be equal to reference value (Qik of Ref1).
Testing Hypothesis H1 (dotted line): Qii is significantly different from the expected value (p=0.000).⇒ Support for H1.
Testing Hypothesis H2 (dashed line, since this is independent from H1): Qi is not significantly different from theexpected value (p=0.136).⇒ Support for H2.
Figure E.5: Detailed results for Experi-ment ACT3, Part 2.

detailed results: study on impact of audio-only telemeeting - conversation tests 369
1. Visualization of Results and Expectations
Note: The reference condition Ref3 is repeated in this plot for better visual comparison.
2. Detailed Analysis
P1 Expectations: No impairment on own connection, asymmetric condition concerning other connections.⇒ Qik determines lowest value, Qii & Qij should be equal to reference value (Qik of Ref1).
Testing Hypothesis H1 (dotted line): Qii & Qij are not significantly different (Qii: p=0.424, Qij: p=0.887) from theexpected values.⇒ No support for H1.
Testing Hypothesis H2 (dashed line, since this is independent from H1): Qi is not significantly different from theexpected value (p=0.240).⇒ Support for H2.
P2 Expectations: No impairment on own connection, asymmetric condition concerning other connections.⇒ Qik determines lowest value, Qii & Qij should be equal to reference value (Qik of Ref1).
Testing Hypothesis H1 (dotted line): Qii & Qij are not significantly different (Qii: p=0.381, Qij: p=0.119) from theexpected values.⇒ No support for H1.
Testing Hypothesis H2 (dashed line, since this is independent from H1): Qi is not significantly different from theexpected value (p=0.107).⇒ Support for H2.
P3 Expectations: No impairment on own connection, asymmetric condition concerning other connections.⇒ Qik determines lowest value, Qii & Qij should be equal to reference value (Qik of Ref1).
Testing Hypothesis H1 (dotted line): Qii & Qij are significantly different (Qii: p=0.000, Qij: p=0.001) from theexpected values.⇒ Support for H1.
Testing Hypothesis H2 (dashed line, since this is independent from H1): Qi is not significantly different from theexpected value (p=0.072).⇒ Support for H2.
P4 Expectations: No impairment on own connection, asymmetric condition concerning other connections.⇒ Qik determines lowest value, Qii & Qij should be equal to reference value (Qik of Ref1).
Testing Hypothesis H1 (dotted line): Qii & Qij are significantly different (Qii: p=0.003, Qij: p=0.000) from theexpected values.⇒ Support for H1.
Testing Hypothesis H2 (dashed line, since this is independent from H1): Qi is significantly different from theexpected value (p=0.040).⇒ No support for H2.
Figure E.6: Detailed results for Experi-ment ACT3, Part 3.

370 quality of experience of multiparty conferencing and telemeeting systems
1. Visualization of Results and Expectations
Note: The reference condition Ref3 is repeated in this plot for better visual comparison.
2. Detailed Analysis
TN1 Expectations: No impairment on own connection, asymmetric condition concerning other connections.⇒ Qik determines lowest value, Qii & Qij should be equal to reference value (Qik of Ref1).
Testing Hypothesis H1 (dotted line): Qii & Qij are significantly different (Qii: p=0.001, Qij: p=0.000) from theexpected values.⇒ Support for H1.
Testing Hypothesis H2 (dashed line, since this is independent from H1): Qi is significantly different from theexpected value (p=0.023).⇒ No support for H2.
TN2 Expectations: No impairment on own connection, asymmetric condition concerning other connections.⇒ Qik determines lowest value, Qii & Qij should be equal to reference value (Qik of Ref1).
Testing Hypothesis H1 (dotted line): Qii & Qij are significantly different (Qii: p=0.000, Qij: p=0.000) from theexpected values.⇒ Support for H1.
Testing Hypothesis H2 (dashed line, since this is independent from H1): Qi is significantly different from theexpected value (p=0.001).⇒ No support for H2.
E1 Expectations: Impairment on own connection, asymmetric condition concerning other connections.⇒ Qii & Qik are lower than reference value Qik of Ref1, Qij should be equal to reference value (Qik of Ref1).
Testing Hypothesis H1 (dotted line): Qij is significantly different from the expected value (p=0.000).⇒ Support for H1.
Testing Hypothesis H2 (dashed line, since this is independent from H1): Qi is significantly different from theexpected value (p=0.000).⇒ No support for H2.
E2 Expectations: Impairment on own connection, asymmetric condition concerning other connections.⇒ Qii & Qik are lower than reference value Qik of Ref1, Qij should be equal to reference value (Qik of Ref1).
Testing Hypothesis H1 (dotted line): Qij is significantly different from the expected value (p=0.000).⇒ Support for H1.
Testing Hypothesis H2 (dashed line, since this is independent from H1): Qi is significantly different from theexpected value (p=0.000).⇒ No support for H2.
Figure E.7: Detailed results for Experi-ment ACT3, Part 4.

FDetailed Results: Study on Impact of Audio-Only Tele-meeting - Listening-Only Tests
What this chapter is about
The present appendix presents the detailed results of the two listening-only tests LOT1 & LOT2 on the impact of technical conditions onquality perception. First, each figure shows a visualization of theobtained data and the expectations according to Section 8.4. Then,each figure discusses per technical condition, in how far the expecta-tions are fulfilled and how the current results relate to the differenthypotheses formulated in Section 8.4. The individual results are thencompiled in the main text in Section 8.4.

372 quality of experience of multiparty conferencing and telemeeting systems
F.1 Experiment LOT1
1. Visualization of Results and Expectations
2. Detailed Analysis
Ref5 All expected values lie within confidence intervals of Qi & Qij=Qik, and the observed values for Qi & Qij=Qik arenot significantly different from maximum value of whole test (3.9792, Qi of Ref5).⇒ Ref5 is confirmed as reference condition for this test.
P5 Expectations: Asymmetric condition.⇒ Qik determines lowest value, Qij should be equal to reference value (Qik of Ref5).
Testing Hypothesis H1 (dotted line): Qij is significantly different (p=0.000) from the expected value.⇒ Support for H1.
Testing Hypothesis H2 (dashed line, since this is independent from H1): Qi is significantly different from theexpected value (p=0.000).⇒ No support for H2.
B2 Expectations: Asymmetric condition.⇒ Qik determines lowest value, Qij should be equal to reference value (Qik of Ref5).
Testing Hypothesis H1 (dotted line): Qij is not significantly different (p=0.145) from the expected value.⇒ No support for H1.
Testing Hypothesis H2 (dashed line, since this is independent from H1): Qi is not significantly different from theexpected value (p=0.408).⇒ Support for H2.
B2sym Expectations: Symmetric condition.⇒ Qij = Qik should be equal to corresponding value of asymmetric condition (Qik of B2).
Testing Hypothesis H1 (dotted line): Qij is not significantly different (p=0.657) from the expected value.⇒ No support for H1.
Testing Hypothesis H2 (dashed line, since this is independent from H1): Qi is not significantly different from theexpected value (p=0.774).⇒ Support for H2.
B2symP5 Expectations: Asymmetric condition concerning P5, symmetric condition concerning B2.⇒ Qij should be equal to corresponding value of asymmetric condition concerning B2 (Qik of B2).
Testing Hypothesis H1 (dotted line): Qij is not significantly different (p=0.360) from the expected value.⇒ No support for H1.
Testing Hypothesis H2 (dashed line, since this is independent from H1): Qi is significantly different from theexpected value (p=0.006).⇒ No support for H2.
Figure F.1: Detailed results for Experi-ment LOT1, Part 1.

detailed results: study on impact of audio-only telemeeting - listening-only tests 373
1. Visualization of Results and Expectations
Note: The reference condition Ref5 is repeated in this plot for better visual comparison.
2. Detailed Analysis
E4 Expectations: Asymmetric condition.⇒ Qik determines lowest value, Qij should be equal to reference value (Qik of Ref5).
Testing Hypothesis H1 (dotted line): Qij is significantly different (p=0.000) from the expected value.⇒ Support for H1.
Testing Hypothesis H2 (dashed line, since this is independent from H1): Qi is significantly different from theexpected value (p=0.000).⇒ No support for H2.
E4sym Expectations: Symmetric condition.⇒ Qij = Qik should be equal to corresponding value of asymmetric condition (Qik of E4).
Testing Hypothesis H1 (dotted line): Qij is not significantly different (p=0.098) from the expected value.⇒ No support for H1.
Testing Hypothesis H2 (dashed line, since this is independent from H1): Qi is not significantly different from theexpected value (p=0.062).⇒ Support for H2.
R Expectations: Asymmetric condition.⇒ Qik determines lowest value, Qij should be equal to reference value (Qik of Ref5).
Testing Hypothesis H1 (dotted line): Qij is significantly different (p=0.001) from the expected value.⇒ Support for H1.
Testing Hypothesis H2 (dashed line, since this is independent from H1): Qi is significantly different from theexpected value (p=0.000).⇒ No support for H2.
CN Expectations: Asymmetric condition.⇒ Qik determines lowest value, Qij should be equal to reference value (Qik of Ref5).
Testing Hypothesis H1 (dotted line): Qij is significantly different (p=0.000) from the expected value.⇒ Support for H1.
Testing Hypothesis H2 (dashed line, since this is independent from H1): Qi is significantly different from theexpected value (p=0.000).⇒ No support for H2.
Figure F.2: Detailed results for Experi-ment LOT1, Part 2.

374 quality of experience of multiparty conferencing and telemeeting systems
F.2 Experiment LOT2
1. Visualization of Results and Expectations
2. Detailed Analysis
Ref3 The expected value for Qij=Qik lies within the confidence interval, the expected value for Qi lies outside theconfidence interval (p=0.034), whereas the observed value is better than the expected one, the observed values forQi=4.1067 and Qij=Qik=3.9499 are the maximum values of the whole test⇒ Ref3 is confirmed as reference condition for this test. However, Qi is significantly better than the individualQij, suggesting some scale interpretation effects.
E2 Expectations: Asymmetric condition.⇒ Qik determines lowest value, Qij should be equal to reference value (Qik of Ref5).
Testing Hypothesis H1 (dotted line): Qij is significantly different (p=0.007) from the expected value.⇒ Support for H1.
Testing Hypothesis H2 (dashed line, since this is independent from H1): Qi is significantly different from theexpected value (p=0.000).⇒ No support for H2.
E2sym Expectations: Symmetric condition.⇒ Qij = Qik should be equal to corresponding value of asymmetric condition (Qik of E2).
Testing Hypothesis H1 (dotted line): Qij is not significantly different (p=0.055) from the expected value.⇒ No support for H1.
Testing Hypothesis H2 (dashed line, since this is independent from H1): Qi is not significantly different from theexpected value (p=0.144).⇒ Support for H2.
E3 Expectations: Asymmetric condition.⇒ Qik determines lowest value, Qij should be equal to reference value (Qik of Ref5).
Testing Hypothesis H1 (dotted line): Qij is not significantly different (p=0.084) from the expected value.⇒ No support for H1.
Testing Hypothesis H2 (dashed line, since this is independent from H1): Qi is significantly different from theexpected value (p=0.000).⇒ No support for H2.
E3sym Expectations: Symmetric condition.⇒ Qij = Qik should be equal to corresponding value of asymmetric condition (Qik of E3).
Testing Hypothesis H1 (dotted line): Qij is significantly different (p=0.004) from the expected value.⇒ Support for H1.
Testing Hypothesis H2 (dashed line, since this is independent from H1): Qi is significantly different from theexpected value (p=0.032).⇒ No support for H2.
Figure F.3: Detailed results for Experi-ment LOT2, Part 1.

detailed results: study on impact of audio-only telemeeting - listening-only tests 375
1. Visualization of Results and Expectations
Note: The reference condition Ref5 is repeated in this plot for better visual comparison.
2. Detailed Analysis
TN1 Expectations: Asymmetric condition.⇒ Qik determines lowest value, Qij should be equal to reference value (Qik of Ref5).
Testing Hypothesis H1 (dotted line): Qij is significantly different (p=0.000) from the expected value.⇒ Support for H1.
Testing Hypothesis H2 (dashed line, since this is independent from H1): Qi is significantly different from theexpected value (p=0.009).⇒ No support for H2.
TN2 Expectations: Asymmetric condition.⇒ Qik determines lowest value, Qij should be equal to reference value (Qik of Ref5).
Testing Hypothesis H1 (dotted line): Qij is significantly different (p=0.000) from the expected value.⇒ Support for H1.
Testing Hypothesis H2 (dashed line, since this is independent from H1): Qi is significantly different from theexpected value (p=0.016).⇒ No support for H2.
B2 Expectations: Asymmetric condition.⇒ Qik determines lowest value, Qij should be equal to reference value (Qik of Ref5).
Testing Hypothesis H1 (dotted line): Qij is not significantly different (p=0.311) from the expected value.⇒ No support for H1.
Testing Hypothesis H2 (dashed line, since this is independent from H1): Qi is not significantly different from theexpected value (p=0.994).⇒ Support for H2.
B2sym Expectations: Symmetric condition.⇒ Qij = Qik should be equal to corresponding value of asymmetric condition (Qik of B2).
Testing Hypothesis H1 (dotted line): Qij is significantly different (p=0.045) from the expected value.⇒ Support for H1.
Testing Hypothesis H2 (dashed line, since this is independent from H1): Qi is not significantly different from theexpected value (p=0.389).⇒ Support for H2.
Figure F.4: Detailed results for Experi-ment LOT2, Part 2.

376 quality of experience of multiparty conferencing and telemeeting systems
1. Visualization of Results and Expectations
Note: The reference condition Ref5 is repeated in this plot for better visual comparison.
2. Detailed Analysis
FM1 Expectations: Asymmetric condition.⇒ Qik determines lowest value, Qij should be equal to reference value (Qik of Ref5).
Testing Hypothesis H1 (dotted line): Qij is not significantly different (p=0.411) from the expected value.⇒ No support for H1.
Testing Hypothesis H2 (dashed line, since this is independent from H1): Qi is not significantly different from theexpected value (p=0.269).⇒ Support for H2.
Special observation: All values are essentially equal to reference condition. ⇒ Impairment not strong enough toelicit effect in quality ratings.
FM1sym Expectations: Symmetric condition.⇒ Qij = Qik should be equal to corresponding value of asymmetric condition (Qik of B2).
Testing Hypothesis H1 (dotted line): Qij is not significantly different (p=0.692) from the expected value.⇒ No support for H1.
Testing Hypothesis H2 (dashed line, since this is independent from H1): Qi is not significantly different from theexpected value (p=0.282).⇒ Support for H2.
Special observation: All values are essentially equal to reference condition. ⇒ Impairment not strong enough toelicit effect in quality ratings.
FM2 Expectations: Asymmetric condition.⇒ Qik determines lowest value, Qij should be equal to reference value (Qik of Ref5).
Testing Hypothesis H1 (dotted line): Qij is not significantly different (p=0.141) from the expected value.⇒ No support for H1.
Testing Hypothesis H2 (dashed line, since this is independent from H1): Qi is not significantly different from theexpected value (p=0.541).⇒ Support for H2.
FM2sym Expectations: Symmetric condition.⇒ Qij = Qik should be equal to corresponding value of asymmetric condition (Qik of B2).
Testing Hypothesis H1 (dotted line): Qij is not significantly different (p=0.563) from the expected value.⇒ No support for H1.
Testing Hypothesis H2 (dashed line, since this is independent from H1): Qi is not significantly different from theexpected value (p=0.891).⇒ Support for H2.
Figure F.5: Detailed results for Experi-ment LOT2, Part 3.

detailed results: study on impact of audio-only telemeeting - listening-only tests 377
1. Visualization of Results and Expectations
Note: The reference condition Ref5 is repeated in this plot for better visual comparison.
2. Detailed Analysis
FM4 Expectations: Asymmetric condition.⇒ Qik determines lowest value, Qij should be equal to reference value (Qik of Ref5).
Testing Hypothesis H1 (dotted line): Qij is not significantly different (p=0.712) from the expected value.⇒ No support for H1.
Testing Hypothesis H2 (dashed line, since this is independent from H1): Qi is not significantly different from theexpected value (p=0.845).⇒ Support for H2.
Special observation: All values are essentially equal to reference condition. ⇒ Impairment not strong enough toelicit effect in quality ratings.
FM4sym Expectations: Symmetric condition.⇒ Qij = Qik should be equal to corresponding value of asymmetric condition (Qik of B2).
Testing Hypothesis H1 (dotted line): Qij is not significantly different (p=0.351) from the expected value.⇒ No support for H1.
Testing Hypothesis H2 (dashed line, since this is independent from H1): Qi is not significantly different from theexpected value (p=0.428).⇒ Support for H2.
Special observation: All values are essentially equal to reference condition. ⇒ Impairment not strong enough toelicit effect in quality ratings.
FL4sym Expectations: Symmetric condition.⇒ Qij = Qik is lower than reference condition. There is no corresponding asymmetric condition to comparedwith.
Testing Hypothesis H1 (dotted line): Can not be tested.⇒ No support for H1.
Testing Hypothesis H2 (dashed line, since this is independent from H1): Qi is not significantly different from theexpected value (p=0.647).⇒ Support for H2.
Figure F.6: Detailed results for Experi-ment LOT2, Part 4.

378 quality of experience of multiparty conferencing and telemeeting systems
1. Visualization of Results and Expectations
Note: The reference condition Ref5 is repeated in this plot for better visual comparison.
2. Detailed Analysis
P1 Expectations: Asymmetric condition.⇒ Qik determines lowest value, Qij should be equal to reference value (Qik of Ref5).
Testing Hypothesis H1 (dotted line): Qij is not significantly different (p=0.335) from the expected value.⇒ No support for H1.
Testing Hypothesis H2 (dashed line, since this is independent from H1): Qi is not significantly different from theexpected value (p=0.220).⇒ Support for H2.
Special observation: All values are essentially equal to reference condition. ⇒ Impairment not strong enough toelicit effect in quality ratings.
P1sym Expectations: Symmetric condition.⇒ Qij = Qik should be equal to corresponding value of asymmetric condition (Qik of B2).
Testing Hypothesis H1 (dotted line): Qij is not significantly different (p=0.441) from the expected value.⇒ No support for H1.
Testing Hypothesis H2 (dashed line, since this is independent from H1): Qi is not significantly different from theexpected value (p=0.813).⇒ Support for H2.
Special observation: All values are essentially equal to reference condition. ⇒ Impairment not strong enough toelicit effect in quality ratings.
P3 Expectations: Asymmetric condition.⇒ Qik determines lowest value, Qij should be equal to reference value (Qik of Ref5).
Testing Hypothesis H1 (dotted line): Qij is significantly different (p=0.024) from the expected value.⇒ Support for H1.
Testing Hypothesis H2 (dashed line, since this is independent from H1): Qi is significantly different from theexpected value (p=0.000).⇒ No support for H2.
P3sym Expectations: Symmetric condition.⇒ Qij = Qik should be equal to corresponding value of asymmetric condition (Qik of B2).
Testing Hypothesis H1 (dotted line): Qij is not significantly different (p=0.099) from the expected value.⇒ No support for H1.
Testing Hypothesis H2 (dashed line, since this is independent from H1): Qi is not significantly different from theexpected value (p=0.271).⇒ Support for H2.
Figure F.7: Detailed results for Experi-ment LOT2, Part 5.

detailed results: study on impact of audio-only telemeeting - listening-only tests 379
1. Visualization of Results and Expectations
Note: The reference condition Ref5 is repeated in this plot for better visual comparison.
2. Detailed Analysis
P4 Expectations: Asymmetric condition.⇒ Qik determines lowest value, Qij should be equal to reference value (Qik of Ref5).
Testing Hypothesis H1 (dotted line): Qij is significantly different (p=0.026) from the expected value.⇒ Support for H1.
Testing Hypothesis H2 (dashed line, since this is independent from H1): Qi is significantly different from theexpected value (p=0.000).⇒ No support for H2.
Special observation: All values are essentially equal to reference condition. ⇒ Impairment not strong enough toelicit effect in quality ratings.
P4sym Expectations: Symmetric condition.⇒ Qij = Qik should be equal to corresponding value of asymmetric condition (Qik of B2).
Testing Hypothesis H1 (dotted line): Qij is significantly different (p=0.000) from the expected value.⇒ Support for H1.
Testing Hypothesis H2 (dashed line, since this is independent from H1): Qi is not significantly different from theexpected value (p=0.284).⇒ Support for H2.
Special observation: All values are essentially equal to reference condition. ⇒ Impairment not strong enough toelicit effect in quality ratings.
FM4P3 Expectations: Asymmetric condition.⇒ Qik determines lowest value, Qij should be equal to reference value (Qik of Ref5).
Testing Hypothesis H1 (dotted line): Qij is significantly different (p=0.000) from the expected value.⇒ Support for H1.
Testing Hypothesis H2 (dashed line, since this is independent from H1): Qi is significantly different from theexpected value (p=0.000).⇒ No support for H2.
FM4P3sym Expectations: Symmetric condition.⇒ Qij = Qik should be equal to corresponding value of asymmetric condition (Qik of B2).
Testing Hypothesis H1 (dotted line): Qij is significantly different (p=0.000) from the expected value.⇒ Support for H1.
Testing Hypothesis H2 (dashed line, since this is independent from H1): Qi is significantly different from theexpected value (p=0.022).⇒ No support for H2.
Figure F.8: Detailed results for Experi-ment LOT2, Part 6.

GDetailed Results: Study on Impact of Audiovisual Tele-meeting - Conversation Tests
What this chapter is about
The present appendix presents the detailed results of the two au-diovisual conversation tests AVCT1 & AVCT2 on the impact of theconversation task and the technical conditions on quality perception.First, each section shows in a table the results of the comparison of thetwo used conversation tasks Survival Task and Celebrity Name GuessingGame. Then, each section shows in a number of figure the impactof the technical conditions. Here, each figure shows a visualizationof the obtained data and the expectations according to Section 8.5.Furthermore, each figure discusses per technical condition, in howfar the expectations are fulfilled and how the current results relate tothe different hypotheses formulated in Section 8.5. The individualresults are then compiled in the main text in Section 8.5.

detailed results: study on impact of audiovisual telemeeting - conversation tests 381
G.1 Experiment AVCT1
Condition Aggregation Impairment definition pLevel Qx
AVRe f Qi 0 0 0 0.921
Qii 0 0 0 0.121
Qij = Qik 0 0 0 0.593
VF1 Qi 0 0 VF1 0.695
Qii 0 0 VF1 0.534
Qij 0 0 VF1 0.612
Qik VF1 0 0 0.416
VR Qi 0 0 VR 0.083
Qii 0 0 VR 0.502
Qij 0 0 Vr 0.066
Qik VR 0 0 0.928
FM2 Qi 0 0 FM2 0.613
Qii 0 0 FM2 0.850
Qij 0 0 FM2 0.608
Qik FM2 0 0 0.534
E2 Qi TE2 0 LE2 0.526
Qii TE2 0 LE2 0.409
Qij 0 TE2 LE2 0.581
Qik LE2 TE2 0 0.167
FM2−VF1 Qi 0 0 FM2−VF1 0.384
Qii 0 0 FM2−VF1 0.124
Qij 0 0 FM2−VF1 0.742
Qik FM2−VF1 0 0 0.118
E2−VF1 Qi TE2 0 LE2−VF2 0.403
Qii TE2 0 LE2−VF2 0.332
Qij 0 TE2 LE2−VF2 0.340
Qik LE2−VF2 TE2 0 0.098
FM2−VR Qi 0 0 FM2−VR 0.933
Qii 0 0 FM2−VR 0.947
Qij 0 0 FM2−VR 0.975
Qik FM2−VR 0 0 0.996
E2−VR Qi TE2 0 LE2−VR 0.114
Qii TE2 0 LE2−VR 0.092
Qij 0 TE2 LE2−VR 0.729
Qik LE2−VR TE2 0 0.089
Table G.1: Independent t-Tests betweenthe two conversation scenarios SurvivalTask and Name Guessing Game, com-puted per condition for the audio-visualconversation test AVCT1.

382 quality of experience of multiparty conferencing and telemeeting systems
1. Visualization of Results and Expectations
2. Detailed Analysis
AVRef All expected values lie within confidence intervals of Qi, Qii, & Qij=Qik, and mean value of Qi=4.1471 is maximumvalue of whole test and observed mean values of Qii & Qij=Qik are not significantly different that value.⇒ AVRef is confirmed as reference condition for this test.
VF1 Expectations: No impairment on own connection, asymmetric condition concerning other connections.⇒ Qik determines lowest value, Qii & Qij should be equal to reference value Qik of AVRef.
Testing Hypothesis H1 (dotted line): Qii & Qij are not significantly different (Qii: p=0.162, Qij: p=0.900) from theexpected values.⇒ No support for H1.
Testing Hypothesis H2 (dashed line, since this is independent from H1): Qi is not significantly different from theexpected value (p=0.413).⇒ Support for H2.
Special observation: All values are essentially equal to reference condition. ⇒ Impairment not strong enough toelicit effect in quality ratings.
VR Expectations: No impairment on own connection, asymmetric condition concerning other connections.⇒ Qik determines lowest value, Qii & Qij should be equal to reference value Qik of AVRef.
Testing Hypothesis H1 (dotted line): Qii is not significantly different (p=0.071) from the expected value, Qij issignificantly different (p=0.038) from the expected value.⇒ Support for H1.
Testing Hypothesis H2 (dashed line, since this is independent from H1): Qi is not significantly different from theexpected value (p=0.142).⇒ Support for H2.
FM2 Expectations: No impairment on own connection, asymmetric condition concerning other connections.⇒ Qik determines lowest value, Qii & Qij should be equal to reference value Qik of AVRef.
Testing Hypothesis H1 (dotted line): Qii & Qij are not significantly different (Qii: p=0.131, Qij: p=0.190) from theexpected values.⇒ No support for H1.
Testing Hypothesis H2 (dashed line, since this is independent from H1): Qi is not significantly different from theexpected value (p=0.656).⇒ Support for H2.
E2 Expectations: Impairment on own connection, asymmetric condition concerning other connections.⇒ Qii & Qik are lower than reference value Qik of Ref1, Qij should be equal to reference value (Qik of Ref1).
Testing Hypothesis H1 (dotted line): Qij is significantly different from the expected value (p=0.000).⇒ Support for H1.
Testing Hypothesis H2 (dashed line, since this is independent from H1): Qi is significantly different from theexpected value (p=0.013).⇒ No support for H2.
Figure G.1: Detailed results for Experi-ment AVCT1, Part 1.
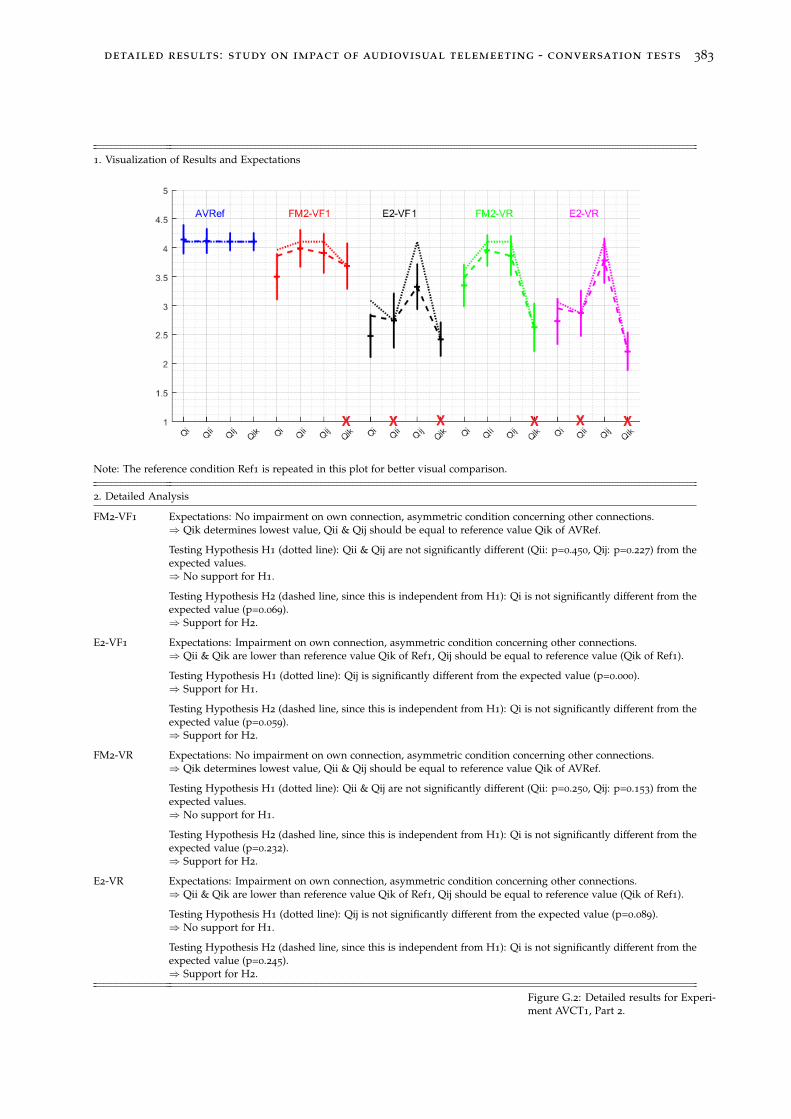
detailed results: study on impact of audiovisual telemeeting - conversation tests 383
1. Visualization of Results and Expectations
Note: The reference condition Ref1 is repeated in this plot for better visual comparison.
2. Detailed Analysis
FM2-VF1 Expectations: No impairment on own connection, asymmetric condition concerning other connections.⇒ Qik determines lowest value, Qii & Qij should be equal to reference value Qik of AVRef.
Testing Hypothesis H1 (dotted line): Qii & Qij are not significantly different (Qii: p=0.450, Qij: p=0.227) from theexpected values.⇒ No support for H1.
Testing Hypothesis H2 (dashed line, since this is independent from H1): Qi is not significantly different from theexpected value (p=0.069).⇒ Support for H2.
E2-VF1 Expectations: Impairment on own connection, asymmetric condition concerning other connections.⇒ Qii & Qik are lower than reference value Qik of Ref1, Qij should be equal to reference value (Qik of Ref1).
Testing Hypothesis H1 (dotted line): Qij is significantly different from the expected value (p=0.000).⇒ Support for H1.
Testing Hypothesis H2 (dashed line, since this is independent from H1): Qi is not significantly different from theexpected value (p=0.059).⇒ Support for H2.
FM2-VR Expectations: No impairment on own connection, asymmetric condition concerning other connections.⇒ Qik determines lowest value, Qii & Qij should be equal to reference value Qik of AVRef.
Testing Hypothesis H1 (dotted line): Qii & Qij are not significantly different (Qii: p=0.250, Qij: p=0.153) from theexpected values.⇒ No support for H1.
Testing Hypothesis H2 (dashed line, since this is independent from H1): Qi is not significantly different from theexpected value (p=0.232).⇒ Support for H2.
E2-VR Expectations: Impairment on own connection, asymmetric condition concerning other connections.⇒ Qii & Qik are lower than reference value Qik of Ref1, Qij should be equal to reference value (Qik of Ref1).
Testing Hypothesis H1 (dotted line): Qij is not significantly different from the expected value (p=0.089).⇒ No support for H1.
Testing Hypothesis H2 (dashed line, since this is independent from H1): Qi is not significantly different from theexpected value (p=0.245).⇒ Support for H2.
Figure G.2: Detailed results for Experi-ment AVCT1, Part 2.

384 quality of experience of multiparty conferencing and telemeeting systems
G.2 Experiment AVCT2
Condition Aggregation Impairment definition pLevel Qx
AVRe f Qi 0 0 0 0.211
Qii 0 0 0 0.189
Qij = Qik 0 0 0 0.086
VF2 Qi 0 0 VF2 0.552
Qii 0 0 VF2 0.246
Qij 0 0 VF2 0.220
Qik VF2 0 0 0.523
VF2sym Qi 0 VF2 VF2 0.511
Qii 0 VF2 VF2 0.276
Qij = Qik VF2 0 VF2 0.062
VB Qi 0 0 VB 0.585
Qii 0 0 VB 0.062
Qij 0 0 VB 0.004*Qik VB 0 0 0.507
VF2sym Qi 0 VB VB 0.573
Qii 0 VB VB 0.827
Qij = Qik VB 0 VB 0.943
E2 Qi TE2 0 LE2 0.882
Qii TE2 0 LE2 0.922
Qij 0 TE2 LE2 0.271
Qik LE2 TE2 0 0.525
FM4 Qi 0 0 FM4 0.511
Qii 0 0 FM4 0.048*Qij 0 0 FM4 0.480
Qik FM4 0 0 0.965
FM4sym Qi 0 FM4 FM4 0.742
Qii 0 FM4 FM4 0.016*Qij = Qik FM4 0 FM4 0.109
FM4P3 Qi 0 0 FM4P3 0.122
Qii 0 0 FM4P3 0.163
Qij 0 0 FM4P3 0.276
Qik FM4P3 0 0 0.102
FM4P3sym Qi 0 FM4P3 FM4P3 0.793
Qii 0 FM4P3 FM4P3 0.897
Qij = Qik FM4P3 0 FM4P3 0.994
FM4− AVP3 Qi 0 0 FM4− AVP3 0.722
Qii 0 0 FM4− AVP3 0.294
Qij 0 0 FM4− AVP3 0.433
Qik FM4− AVP3 0 0 0.380
FM4−VF2 Qi 0 0 FM4−VF2 0.096
Qii 0 0 FM4−VF2 0.467
Qij 0 0 FM4−VF2 0.165
Qik FM4−VF2 0 0 0.250
FM4P3−VF2 Qi 0 0 FM4P3−VF2 0.122
Qii 0 0 FM4P3−VF2 0.066
Qij 0 0 FM4P3−VF2 0.001*Qik FM4P3−VF2 0 0 0.052
FM4−VB Qi 0 0 FM4−VB 0.157
Qii 0 0 FM4−VB 0.494
Qij 0 0 FM4−VB 0.960
Qik FM4−VB 0 0 0.463
FM4P3−VB Qi 0 0 FM4P3−VB 0.930
Qii 0 0 FM4P3−VB 0.156
Qij 0 0 FM4P3−VB 0.058
Qik FM4P3−VB 0 0 0.490
Table G.2: Independent t-Tests betweenthe two conversation scenarios SurvivalTask and Name Guessing Game, com-puted per condition for the audio-visualconversation test AVCT2.

detailed results: study on impact of audiovisual telemeeting - conversation tests 385
1. Visualization of Results and Expectations
2. Detailed Analysis
AVRef All expected values lie within confidence intervals of Qi, Qii, & Qij=Qik, and mean value of Qi=4.1471 is maximumvalue of whole test and all observed mean values are not significantly different from maximum value of wholetest (Qij=4.3429 for VF2).⇒ AVRef is confirmed as reference condition for this test.
VF2 Expectations: No impairment on own connection, asymmetric condition concerning other connections.⇒ Qik determines lowest value, Qii & Qij should be equal to reference value Qik of AVRef.
Testing Hypothesis H1 (dotted line): Qii & Qij are not significantly different (Qii: p=0.418, Qij: p=0.426) from theexpected values.⇒ No support for H1.
Testing Hypothesis H2 (dashed line, since this is independent from H1): Qi is not significantly different from theexpected value (p=0.122).⇒ Support for H2.
VF2sym Expectations: No impairment on own connection, symmetric condition concerning other connections.⇒ Qij = Qik should be equal to corresponding value of asymmetric condition (Qik of VF2), Qii should be equalto reference value (Qik of VF2).
Testing Hypothesis H1 (dotted line): Qii & Qij are not significantly different (Qii: p=0.076, Qij: p=0.164) from theexpected values.⇒ No support for H1.
Testing Hypothesis H2 (dashed line, since this is independent from H1): Qi is not significantly different from theexpected value (p=0.386).⇒ Support for H2.
VB Expectations: No impairment on own connection, asymmetric condition concerning other connections.⇒ Qik determines lowest value, Qii & Qij should be equal to reference value Qik of AVRef.
Testing Hypothesis H1 (dotted line): Qii & Qij are not significantly different (Qii: p=0.600, Qij: p=0.858) from theexpected values.⇒ No support for H1.
Testing Hypothesis H2 (dashed line, since this is independent from H1): Qi is significantly different from theexpected value (p=0.000).⇒ No support for H2.
VBsym Expectations: No impairment on own connection, symmetric condition concerning other connections.⇒ Qij = Qik should be equal to corresponding value of asymmetric condition (Qik of VF2), Qii should be equalto reference value (Qik of VF2).
Testing Hypothesis H1 (dotted line): Qii is not significantly different (p=0.270) from the expected value, Qij issignificantly different (p=0.000) from the expected value.⇒ Support for H1.
Testing Hypothesis H2 (dashed line, since this is independent from H1): Qi is significantly different from theexpected value (p=0.001).⇒ No support for H2.
Figure G.3: Detailed results for Experi-ment AVCT2, Part 1.

386 quality of experience of multiparty conferencing and telemeeting systems
1. Visualization of Results and Expectations
Note: The reference condition AVRef is repeated in this plot for better visual comparison.
2. Detailed Analysis
FM4 Expectations: No impairment on own connection, asymmetric condition concerning other connections.⇒ Qik determines lowest value, Qii & Qij should be equal to reference value Qik of AVRef.
Testing Hypothesis H1 (dotted line): Qii & Qij are not significantly different (Qii: p=0.066, Qij: p=0.206) from theexpected values.⇒ No support for H1.
Testing Hypothesis H2 (dashed line, since this is independent from H1): Qi is not significantly different from theexpected value (p=0.107).⇒ Support for H2.
FM4sym Expectations: No impairment on own connection, symmetric condition concerning other connections.⇒ Qij = Qik should be equal to corresponding value of asymmetric condition (Qik of VF2), Qii should be equalto reference value (Qik of VF2).
Testing Hypothesis H1 (dotted line): Qii is not significantly different (p=0.956) from the expected value, Qij issignificantly different (p=0.000) from the expected value.⇒ No support for H1.
Testing Hypothesis H2 (dashed line, since this is independent from H1): Qi is not significantly different from theexpected value (p=0.114).⇒ Support for H2.
FM4-P3 Expectations: No impairment on own connection, asymmetric condition concerning other connections.⇒ Qik determines lowest value, Qii & Qij should be equal to reference value Qik of AVRef.
Testing Hypothesis H1 (dotted line): Qii is significantly different (p=0.005) from the expected value, Qij is notsignificantly different (p=0.102) from the expected value.⇒ Support for H1.
Testing Hypothesis H2 (dashed line, since this is independent from H1): Qi is significantly different from theexpected value (p=0.028).⇒ No support for H2.
FM4-P3sym Expectations: No impairment on own connection, symmetric condition concerning other connections.⇒ Qij = Qik should be equal to corresponding value of asymmetric condition (Qik of VF2), Qii should be equalto reference value (Qik of VF2).
Testing Hypothesis H1 (dotted line): Qii & Qij are significantly different (Qii: p=0.002, Qij: p=0.031) from theexpected values.⇒ Support for H1.
Testing Hypothesis H2 (dashed line, since this is independent from H1): Qi is significantly different from theexpected value (p=0.036).⇒ No support for H2.
Figure G.4: Detailed results for Experi-ment AVCT2, Part 2.

detailed results: study on impact of audiovisual telemeeting - conversation tests 387
1. Visualization of Results and Expectations
Note: The reference condition AVRef is repeated in this plot for better visual comparison.
2. Detailed Analysis
FM4-VF2 Expectations: No impairment on own connection, asymmetric condition concerning other connections.⇒ Qik determines lowest value, Qii & Qij should be equal to reference value Qik of AVRef.
Testing Hypothesis H1 (dotted line): Qii & Qij are not significantly different (Qii: p=0.372, Qij: p=0.534) from theexpected values.⇒ No support for H1.
Testing Hypothesis H2 (dashed line, since this is independent from H1): Qi is not significantly different from theexpected value (p=0.307).⇒ Support for H2.
FM4-P3-VF2 Expectations: No impairment on own connection, asymmetric condition concerning other connections.⇒ Qik determines lowest value, Qii & Qij should be equal to reference value Qik of AVRef.
Testing Hypothesis H1 (dotted line): Qii & Qij are not significantly different (Qii: p=0.070, Qij: p=0.180) from theexpected values.⇒ No support for H1.
Testing Hypothesis H2 (dashed line, since this is independent from H1): Qi is significantly different from theexpected value (p=0.033).⇒ No support for H2.
FM4-VB Expectations: No impairment on own connection, asymmetric condition concerning other connections.⇒ Qik determines lowest value, Qii & Qij should be equal to reference value Qik of AVRef.
Testing Hypothesis H1 (dotted line): Qii & Qij are not significantly different (Qii: p=0.608, Qij: p=0.861) from theexpected values.⇒ No support for H1.
Testing Hypothesis H2 (dashed line, since this is independent from H1): Qi is significantly different from theexpected value (p=0.020).⇒ No support for H2.
FM4-P3-VB Expectations: No impairment on own connection, asymmetric condition concerning other connections.⇒ Qik determines lowest value, Qii & Qij should be equal to reference value Qik of AVRef.
Testing Hypothesis H1 (dotted line): Qii is significantly different (p=0.037) from the expected value, Qij is notsignificantly different (p=0.490) from the expected value.⇒ No support for H1.
Testing Hypothesis H2 (dashed line, since this is independent from H1): Qi is significantly different from theexpected value (p=0.002).⇒ No support for H2.
Figure G.5: Detailed results for Experi-ment AVCT2, Part 3.

388 quality of experience of multiparty conferencing and telemeeting systems
1. Visualization of Results and Expectations
Note: The reference condition AVRef is repeated in this plot for better visual comparison.
2. Detailed Analysis
E2 Expectations: Impairment on own connection, asymmetric condition concerning other connections.⇒ Qii & Qik are lower than reference value Qik of Ref1, Qij should be equal to reference value (Qik of Ref1).
Testing Hypothesis H1 (dotted line): Qij is significantly different from the expected value (p=0.011).⇒ Support for H1.
Testing Hypothesis H2 (dashed line, since this is independent from H1): Qi is significantly different from theexpected value (p=0.013).⇒ No support for H2.
FM4-AVP3 Expectations: No impairment on own connection, asymmetric condition concerning other connections.⇒ Qik determines lowest value, Qii & Qij should be equal to reference value Qik of AVRef.
Testing Hypothesis H1 (dotted line): Qii & Qij are not significantly different (Qii: p=0.067, Qij: p=0.114) from theexpected values.⇒ No support for H1.
Testing Hypothesis H2 (dashed line, since this is independent from H1): Qi is significantly different from theexpected value (p=0.006).⇒ No support for H2.
Figure G.6: Detailed results for Experi-ment AVCT2, Part 4.

HDetailed Results: Model Performance
What this chapter is about
The present appendix presents the detailed results of the modelingexperiments according to Chapter 9. The modeling experiments wereconducted individually for each data set obtained from the sevenexperiments ACT1, ACT2, ACT3, LOT1, LOT2, AVCT1 & AVCT2 onthe impact of technical conditions on perceived telemeeting quality.
In each section – one section per experiment – the first figureshows the detailed model performance for the whole data set of thatexperiment. Then, the following figures in that section show thedetailed model performance per technical condition.
Each individual figure visualizes first the results of the two em-ployed performance measures Rho and RMSE for the different models.Then, each figure provides explanations of the conducted statisticalanalysis and the corresponding results. Finally, each figure presentsthe main conclusions that can be extracted from the current results.The individual results are then compiled in the main text in Chapter 9.

390 quality of experience of multiparty conferencing and telemeeting systems
H.1 Experiment ACT1
H.1.1 Performance across technical conditions
1. Visualizing the results: Errorbar plots showing the mean values & 95% confidence intervals.
2.1 Testing for significant differences between functions F1 - F8s:Oneway ANOVAs & PostHoc tests with Sidak correction, tests con-ducted separately for two training modes (whole data, per condition),significance level p ≤ 0.05. Significant differences found for:
Measure Training ANOVA PostHoc Functions
Rho per condition p = 0.013 p = 0.041 F6 vs. F1, F5
RMSE whole data p = 0.000 p = 0.000 F7 vs. all other
RMSE per condition p = 0.000 p = 0.000 F7 vs. all other
2.2 Testing for differences between two training modes: T-tests, sig-nificance level p ≤ 0.05. Significant differences found for:
RMSE F4: p = 0.023
3. Behavior of modeling functions
Measure Baseline (F1 & F7) Advanced (F2–F6, F8, F8s)
Rho F1 slightly better than F7
(not sig.)No one outperforms F1.
RMSE F1 sig. better than F7. No one outperforms F1.
4. Observations and Conclusions
A) No advanced model outperforms the baseline mean.
B) Equal performance for sorting-based (F2s, F3s, F8s) and rule-based (F2, F3, F8) assignment of Qij .
C) Training per condition does not improve performance, in case ofRMSE for F4 it even reduces performance.
Figure H.1: Modeling performanceacross all technical conditions of Experi-ment ACT1.

detailed results: model performance 391
H.1.2 Performance per technical condition
1. Visualizing the results: Errorbar plots showing the mean values & 95% confidence intervals.
2.1 Testing for significant differences between functions F1 - F8s: OnewayANOVAs & PostHoc tests with Sidak correction, tests conducted separatelyfor two training modes (whole data, per condition), significance level p ≤ 0.05.Significant differences found for:
Measure Training ANOVA PostHoc Functions
RMSE per condition p = 0.032 p = 0.115
(n.s.)F2s vs. F7
2.2 Testing for differences between two training modes: T-tests, significancelevel p ≤ 0.05. No significant differences found.
3. Behavior of modeling functions
Measure Baseline (F1 & F7) Advanced (F2–F6, F8, F8s)
Rho, RMSE F1 slightly better than F7
(not sig.)No one outperforms F1.
4. Observations and Conclusions
A) No advanced model outperforms the baseline mean.
B) Equal performance for sorting-based (F2s, F3s, F8s) and rule-based (F2, F3, F8) assignment of Qij .
C) Training per condition does not improve performance.
Condition Ref1
1. Visualizing the results: Errorbar plots showing the mean values & 95% confidence intervals.
2.1 Testing for significant differences between functions F1 - F8s: OnewayANOVAs & PostHoc tests with Sidak correction, tests conducted separatelyfor two training modes (whole data, per condition), significance level p ≤ 0.05.Significant differences found for:
Measure Training ANOVA PostHoc Functions
RMSE whole data p = 0.000 p = 0.001 F7 vs. F3sp = 0.000 F7 vs. all other
RMSE per condition p = 0.000 p = 0.000 F7 vs. F1, F2, F2s, F5, F8,F8s
p = 0.001 F7 vs. F4
p = 0.004 F7 vs. F3
2.2 Testing for differences between two training modes: T-tests, significancelevel p ≤ 0.05. Slight (not sig.) differences found for: RMSE F4: p = 0.056
3. Behavior of modeling functions
Measure Baseline (F1 & F7) Advanced (F2–F6, F8, F8s)
Rho F1 slightly better than F7
(not sig.)No one outperforms F1.
RMSE F1 sig. better than F7. No one outperforms F1.
4. Observations and Conclusions
A) No advanced model outperforms the baseline mean.
B) Assignment of Qij to weights of F2, F3, F8 based on sorting ofQij shows equal performance than rule-based assignment.
C) Training per condition does not improve performance.
Condition L3Figure H.2: Modeling performance forconditions Ref1 (top panel) and L3 (bot-tom panel) of Experiment ACT1.

392 quality of experience of multiparty conferencing and telemeeting systems
1. Visualizing the results: Errorbar plots showing the mean values & 95% confidence intervals.
2.1 Testing for significant differences between functions F1 - F8s:Oneway ANOVAs & PostHoc tests with Sidak correction, tests con-ducted separately for two training modes (whole data, per condition),significance level p ≤ 0.05. No significant differences found.
2.2 Testing for differences between two training modes: T-tests, sig-nificance level p ≤ 0.05. No significant differences found.
3. Behavior of modeling functions
Measure Baseline (F1 & F7) Advanced (F2–F6, F8, F8s)
Rho, RMSE F1 slightly better than F7
(not sig.)No one outperforms F1.
4. Observations and Conclusions
A) No advanced model outperforms the baseline mean.
B) Equal performance for sorting-based (F2s, F3s, F8s) and rule-based (F2, F3, F8) assignment of Qij .
C) Training per condition does not improve performance.
Condition EN3
1. Visualizing the results: Errorbar plots showing the mean values & 95% confidence intervals.
2.1 Testing for significant differences between functions F1 - F8s:Oneway ANOVAs & PostHoc tests with Sidak correction, tests con-ducted separately for two training modes (whole data, per condition),significance level p ≤ 0.05. Significant differences found for:
Measure Training ANOVA PostHoc Functions
RMSE whole data p = 0.007 p = 0.017 F7 vs. F4, F8s
p = 0.020 F7 vs. F2s
p = 0.022 F7 vs. F1, F5
p = 0.026 F7 vs. F8
p = 0.033 F7 vs. F2
RMSE per condition p = 0.024 p = 0.031 F7 vs. F1, F5
2.2 Testing for differences between two training modes: T-tests, sig-nificance level p ≤ 0.05. No significant differences found.
3. Behavior of modeling functions
Measure Baseline (F1 & F7) Advanced (F2–F6, F8, F8s)
Rho F1 slightly better than F7
(not sig.)No one outperforms F1.
RMSE F1 sig. better than F7. No one outperforms F1.
4. Observations and Conclusions
A) No advanced model outperforms the baseline mean.
B) Equal performance for sorting-based (F2s, F3s, F8s) and rule-based (F2, F3, F8) assignment of Qij .
C) Training per condition does not improve performance.
Condition TN3Figure H.3: Modeling performance forconditions EN3 (top panel) and TN3
(bottom panel) of Experiment ACT1.

detailed results: model performance 393
1. Visualizing the results: Errorbar plots showing the mean values & 95% confidence intervals.
2.1 Testing for significant differences between functions F1 - F8s:Oneway ANOVAs & PostHoc tests with Sidak correction, tests con-ducted separately for two training modes (whole data, per condition),significance level p ≤ 0.05. Significant differences found for:
Measure Training ANOVA PostHoc Functions
Rho per condition p = 0.000 p = 0.000 F4 vs. all other
RMSE per condition p = 0.038 p = 0.186
(n.s.)F4 vs. F1, F5
2.2 Testing for differences between two training modes: T-tests, sig-nificance level p ≤ 0.05. Significant differences found for:
Measure T-test Functions Measure T-test Functions
Rho p = 0.000 F4 RMSE 0.012 F4
3. Behavior of modeling functions
Measure Baseline (F1 & F7) Advanced (F2–F6, F8, F8s)
Rho, RMSE F1 slightly better than F7
(not sig.)No one outperforms F1.
4. Observations and Conclusions
A) No advanced model outperforms the baseline mean.
B) Equal performance for sorting-based (F2s, F3s, F8s) and rule-based (F2, F3, F8) assignment of Qij .
C) Training per condition does not improve performance, in case ofF4 it even reduces performance substantially.
Condition Dsym
1. Visualizing the results: Errorbar plots showing the mean values & 95% confidence intervals.
2.1 Testing for significant differences between functions F1 - F8s:Oneway ANOVAs & PostHoc tests with Sidak correction, tests con-ducted separately for two training modes (whole data, per condition),significance level p ≤ 0.05. Significant differences found for:
Measure Training ANOVA PostHoc Functions
RMSE whole data p = 0.000 p = 0.036 F7 vs. F3s
p = 0.000 F7 vs. all other
RMSE per condition p = 0.000 p = 0.000 F7 vs.F1, F2, F2s,F4, F5, F6, F8,F8s
2.2 Testing for differences between two training modes: T-tests, sig-nificance level p ≤ 0.05. No significant differences found.
3. Behavior of modeling functions
Measure Baseline (F1 & F7) Advanced (F2–F6, F8, F8s)
Rho F1 essentially equal to F7. No one outperforms F1.
RMSE F1 sig. better than F7. No one outperforms F1.
4. Observations and Conclusions
A) No advanced model outperforms the baseline mean.
B) Equal performance for sorting-based (F2s, F3s, F8s) and rule-based (F2, F3, F8) assignment of Qij .
C) Training per condition does not improve performance.
Condition E1Figure H.4: Modeling performance forconditions Dsym (top panel) and E1
(bottom panel) of Experiment ACT1.

394 quality of experience of multiparty conferencing and telemeeting systems
1. Visualizing the results: Errorbar plots showing the mean values & 95% confidence intervals.
2.1 Testing for significant differences between functions F1 - F8s:Oneway ANOVAs & PostHoc tests with Sidak correction, tests con-ducted separately for two training modes (whole data, per condition),significance level p ≤ 0.05. Significant differences found for:
Measure Training ANOVA PostHoc Functions
RMSE whole data p = 0.000 p = 0.000 F7 vs. F4, F6
p = 0.002 F7 vs. F2s
p = 0.004 F7 vs. F1, F2, F5,F8
p = 0.005 F7 vs. F8s
p = 0.046 F7 vs. F3
RMSE per condition p = 0.000 p = 0.000 F7 vs. F4, F6
p = 0.001 F7 vs. F2, F2s,F8, F8s
p = 0.002 F7 vs. F1, F5
p = 0.034 F7 vs. F3
p = 0.040 F7 vs. F3s
2.2 Testing for differences between two training modes: T-tests, sig-nificance level p ≤ 0.05. No significant differences found.
3. Behavior of modeling functions
Measure Baseline (F1 & F7) Advanced (F2–F6, F8, F8s)
Rho F1 essentially equal to F7. No one outperforms F1.
RMSE F1 sig. better than F7. No one outperforms F1.
4. Observations and Conclusions
A) No advanced model outperforms the baseline mean.
B) Equal performance for sorting-based (F2s, F3s, F8s) and rule-based (F2, F3, F8) assignment of Qij .
C) Training per condition does not improve performance.
Condition P1
Figure H.5: Modeling performance forcondition P1 of Experiment ACT1.

detailed results: model performance 395
H.2 Experiment ACT2
H.2.1 Performance across technical conditions
1. Visualizing the results: Errorbar plots showing the mean values & 95% confidence intervals.
2.1 Testing for significant differences between functions F1 - F8s:Oneway ANOVAs & PostHoc tests with Sidak correction, tests con-ducted separately for two training modes (whole data, per condition),significance level p ≤ 0.05. Significant differences found for:
Measure Training ANOVA PostHoc Functions
RMSE whole data p = 0.000 p = 0.000 F7 vs. all other
RMSE per condition p = 0.000 p = 0.000 F7 vs. F1, F2,F2s, F5, F6, F8s
p = 0.001 F7 vs. F8
p = 0.002 F7 vs. F3s
p = 0.020 F7 vs. F3
2.2 Testing for differences between two training modes: T-tests, sig-nificance level p ≤ 0.05. No significant differences found.
3. Behavior of modeling functions
Measure Baseline (F1 & F7) Advanced (F2–F6, F8, F8s)
Rho F1 essentially equal to F7. No one outperforms F1.
RMSE F1 sig. better than F7. No one outperforms F1.
4. Observations and Conclusions
A) No advanced model outperforms the baseline mean.
B) Equal performance for sorting-based (F2s, F3s, F8s) and rule-based (F2, F3, F8) assignment of Qij .
C) Training per condition does not improve performance, in case ofF4 it leads to reduced and instable (large confidence intervals)performance.
Figure H.6: Modeling performanceacross all technical conditions of Experi-ment ACT2.

396 quality of experience of multiparty conferencing and telemeeting systems
H.2.2 Performance per technical condition
1. Visualizing the results: Errorbar plots showing the mean values & 95% confidence intervals.
2.1 Testing for significant differences between functions F1 - F8s:Oneway ANOVAs & PostHoc tests with Sidak correction, tests con-ducted separately for two training modes (whole data, per condition),significance level p ≤ 0.05. Significant differences found for:
Measure Training ANOVA PostHoc Functions
RMSE whole data p = 0.002 p = 0.011 F7 vs. F2sp = 0.013 F7 vs. F8sp = 0.028 F7 vs. F4
p = 0.031 F7 vs. F1, F5
RMSE per condition p = 0.054
(n.s.)p = 0.045 F7 vs. F1, F5
2.2 Testing for differences between two training modes: T-tests, sig-nificance level p ≤ 0.05. No significant differences found.
3. Behavior of modeling functions
Measure Baseline (F1 & F7) Advanced (F2–F6, F8, F8s)
Rho F1 essentially equal to F7. No one outperforms F1.
RMSE F1 sig. better than F7. No one outperforms F1.
4. Observations and Conclusions
A) No advanced model outperforms the baseline mean.
B) Equal performance for sorting-based (F2s, F3s, F8s) and rule-based (F2, F3, F8) assignment of Qij .
C) Training per condition does not improve performance.
Condition Ref2
1. Visualizing the results: Errorbar plots showing the mean values & 95% confidence intervals.
2.1 Testing for significant differences between functions F1 - F8s:Oneway ANOVAs & PostHoc tests with Sidak correction, tests con-ducted separately for two training modes (whole data, per condition),significance level p ≤ 0.05. No significant differences found.
2.2 Testing for differences between two training modes: T-tests, sig-nificance level p ≤ 0.05. No significant differences found.
3. Behavior of modeling functions
Measure Baseline (F1 & F7) Advanced (F2–F6, F8, F8s)
Rho, RMSE F1 essentially equal to F7. No one outperforms F1.
4. Observations and Conclusions
A) No advanced model outperforms the baseline mean.
B) Equal performance for sorting-based (F2s, F3s, F8s) and rule-based (F2, F3, F8) assignment of Qij .
C) Training per condition does not improve performance, in case ofRMSE for F4 it even leads to reduced and instable (large confi-dence interval) performance.
Condition L1Figure H.7: Modeling performance forconditions Ref2 (top panel) and L1 (bot-tom panel) of Experiment ACT2.

detailed results: model performance 397
1. Visualizing the results: Errorbar plots showing the mean values & 95% confidence intervals.
2.1 Testing for significant differences between functions F1 - F8s:Oneway ANOVAs & PostHoc tests with Sidak correction, tests con-ducted separately for two training modes (whole data, per condition),significance level p ≤ 0.05. Significant differences found for:
Measure Training ANOVA PostHoc Functions
RMSE whole data p = 0.000 p = 0.000 F7 vs. F1, F2,F3s, F5
p = 0.001 F7 vs. F2s, F8sp = 0.002 F7 vs. F8
p = 0.003 F7 vs. F3
p = 0.010 F7 vs. F4
RMSE per condition p = 0.000 p = 0.000 F7 vs. F1, F2,F2s, F5, F8, F8s
p = 0.002 F7 vs. F3sp = 0.008 F7 vs. F4
p = 0.011 F7 vs. F3
2.2 Testing for differences between two training modes: T-tests, sig-nificance level p ≤ 0.05. No significant differences found.
3. Behavior of modeling functions
Measure Baseline (F1 & F7) Advanced (F2–F6, F8, F8s)
Rho F1 slightly better than F7
(not sig.)No one outperforms F1.
RMSE F1 sig. better than F7. No one outperforms F1.
4. Observations and Conclusions
A) No advanced model outperforms the baseline mean.
B) Equal performance for sorting-based (F2s, F3s, F8s) and rule-based (F2, F3, F8) assignment of Qij .
C) Training per condition does not improve performance.
Condition L2
1. Visualizing the results: Errorbar plots showing the mean values & 95% confidence intervals.
2.1 Testing for significant differences between functions F1 - F8s:Oneway ANOVAs & PostHoc tests with Sidak correction, tests con-ducted separately for two training modes (whole data, per condition),significance level p ≤ 0.05. Significant differences found for:
Measure Training ANOVA PostHoc Functions
RMSE whole data p = 0.000 p = 0.000 F7 vs. all other
RMSE per condition p = 0.000 p = 0.000 F7 vs. all other
2.2 Testing for differences between two training modes: T-tests, sig-nificance level p ≤ 0.05. No significant differences found.
3. Behavior of modeling functions
Measure Baseline (F1 & F7) Advanced (F2–F6, F8, F8s)
Rho F1 slightly worse than F7
(not sig.)No one outperforms F1.
RMSE F1 sig. better than F7. No one outperforms F1.
4. Observations and Conclusions
A) No advanced model outperforms the baseline mean.
B) Equal performance for sorting-based (F2s, F3s, F8s) and rule-based (F2, F3, F8) assignment of Qij .
C) Training per condition does not improve performance.
Condition L4Figure H.8: Modeling performance forconditions L2 (top panel) and L4 (bot-tom panel) of Experiment ACT2.

398 quality of experience of multiparty conferencing and telemeeting systems
H.3 Experiment ACT3
H.3.1 Performance across technical conditions
1. Visualizing the results: Errorbar plots showing the mean values & 95% confidence intervals.
2.1 Testing for significant differences between functions F1 - F8s:Oneway ANOVAs & PostHoc tests with Sidak correction, tests con-ducted separately for two training modes (whole data, per condition),significance level p ≤ 0.05. Significant differences found for:
Measure Training ANOVA PostHoc Functions
Rho whole data p = 0.003 p = 0.024 F4 vs. F6, F7
Rho per condition p = 0.050
(n.s.)p = 0.033 F7 vs. F8s
RMSE whole data p = 0.000 p = 0.000 F1, F5 vs. F2s,F4, F8, F8s
p = 0.005 F1, F5 vs. F7
p = 0.012 F1, F5 vs. F2
p = 0.000 F7 vs. F2, F2s,F3, F3s, F4, F6,F8, F8s
p = 0.000 F3 vs. F4
p = 0.004 F3 vs. F8sp = 0.009 F3 vs. F8
p = 0.013 F3 vs. F2sp = 0.000 F6 vs. F4
p = 0.000 F6 vs. F8sRMSE per condition p = 0.000 p = 0.000 F1, F5 vs. F2s,
F4, F6, F8, F8sp = 0.001 F1, F5 vs. F7
p = 0.000 F7 vs. F2, F2s,F3, F3s, F4, F6,F8, F8s
p = 0.013 F8 vs. F3sp = 0.035 F8 vs. F3
p = 0.004 F8s vs. F3sp = 0.011 F8s vs. F3
2.2 Testing for differences between two training modes: T-tests, sig-nificance level p ≤ 0.05. Significant differences found for:
Measure T-test Functions Measure T-test Functions
Rho p = 0.014 F6 RMSE p = 0.001 F6
3. Behavior of modeling functions
Measure Baseline (F1 & F7) Advanced (F2–F6, F8, F8s)
Rho F1 slightly better than F7
(not sig.)No one outperforms F1.
RMSE F1 sig. better than F7. F2s, F4, F8, F8s & F2 (fortraining on whole data) &F6 (for training per condi-tion) sig. outperform F1.
4. Observations and Conclusions
A) Six advanced models outperform the baseline mean. F4 is thebest, though not sig. different from the other five.
B) Equal performance for sorting-based (F2s, F3s, F8s) and rule-based (F2, F3, F8) assignment of Qij .
C) Training per condition improves performance only for F6.
Figure H.9: Modeling performanceacross all technical conditions of Experi-ment ACT3.

detailed results: model performance 399
H.3.2 Performance per technical condition
1. Visualizing the results: Errorbar plots showing the mean values & 95% confidence intervals.
2.1 Testing for significant differences between functions F1 - F8s: OnewayANOVAs & PostHoc tests with Sidak correction, tests conducted separatelyfor two training modes (whole data, per condition), significance level p ≤ 0.05.No significant differences found.
2.2 Testing for differences between two training modes: T-tests, significancelevel p ≤ 0.05. No significant differences found.
3. Behavior of modeling functions
Measure Baseline (F1 & F7) Advanced (F2–F6, F8, F8s)
Rho, RMSE F1 essentially equal to F7. No one outperforms F1.
4. Observations and Conclusions
A) No advanced model outperforms the baseline mean.
B) Equal performance for sorting-based (F2s, F3s, F8s) and rule-based (F2, F3, F8) assignment of Qij .
C) Training per condition does not improve performance.
Condition Ref3
1. Visualizing the results: Errorbar plots showing the mean values & 95% confidence intervals.
2.1 Testing for significant differences between functions F1 - F8s: OnewayANOVAs & PostHoc tests with Sidak correction, tests conducted separatelyfor two training modes (whole data, per condition), significance level p ≤ 0.05.Significant differences found for:
Measure Training ANOVA PostHoc Functions
RMSE whole data p = 0.012 p = 0.028 F7 vs. F1, F5
p = 0.041 F7 vs. F2
RMSE per condition p = 0.031 p = 0.127 (n.s). F7 vs. F1, F5
p = 0.128
(n.s.)F4 vs. F1, F5
2.2 Testing for differences between two training modes: T-tests, significancelevel p ≤ 0.05. No significant differences found.
3. Behavior of modeling functions
Measure Baseline (F1 & F7) Advanced (F2–F6, F8, F8s)
Rho F1 essentially equal to F7. No one outperforms F1.
RMSE F1 sig. better than F7. No one outperforms F1.
4. Observations and Conclusions
A) No advanced model outperforms the baseline mean.
B) Equal performance for sorting-based (F2s, F3s, F8s) and rule-based (F2, F3, F8) assignment of Qij .
C) Training per condition does not improve performance.
Condition B1Figure H.10: Modeling performance forconditions Ref3 (top panel) and B1 (bot-tom panel) of Experiment ACT3.

400 quality of experience of multiparty conferencing and telemeeting systems
1. Visualizing the results: Errorbar plots showing the mean values & 95% confidence intervals.
2.1 Testing for significant differences between functions F1 - F8s: OnewayANOVAs & PostHoc tests with Sidak correction, tests conducted separatelyfor two training modes (whole data, per condition), significance level p ≤ 0.05.Significant differences found for:
Measure Training ANOVA PostHoc Functions
RMSE whole data p = 0.000 p = 0.000 F7 vs. F1, F2, F2s, F3s, F4,F5, F6, F8, F8s
p = 0.014 F7 vs. F3
RMSE per condition p = 0.000 p = 0.000 F3 vs. F1, F2, F2s, F5, F8,F8s
p = 0.001 F3 vs. F6
p = 0.049 F3 vs. F4
p = 0.004 F3s vs. F2sp = 0.005 F3s vs. F1, F2, F5
p = 0.006 F3s vs. F8
p = 0.007 F3s vs. F8sp = 0.013 F3s vs. F6
p = 0.000 F7 vs. F1, F2, F2s, F5, F6,F8, F8s
p = 0.003 F7 vs. F4
2.2 Testing for differences between two training modes: T-tests, sig-nificance level p ≤ 0.05. Significant differences found for:
Measure T-test Functions Measure T-test Functions
RMSE p = 0.043 F3 RMSE p = 0.057
(n.s.)F6
3. Behavior of modeling functions
Measure Baseline (F1 & F7) Advanced (F2–F6, F8, F8s)
Rho F1 essentially equal to F7. No one outperforms F1.
RMSE F1 sig. better than F7. No one outperforms F1.
4. Observations and Conclusions
A) No advanced model outperforms the baseline mean.
B) Equal performance for sorting-based (F2s, F3s, F8s) and rule-based (F2, F3, F8) assignment of Qij .
C) Training per condition does not improve performance, in case ofRMSE it even reduces performance of F3.
Condition B2
1. Visualizing the results: Errorbar plots showing the mean values & 95% confidence intervals.
2.1 Testing for significant differences between functions F1 - F8s: OnewayANOVAs & PostHoc tests with Sidak correction, tests conducted separatelyfor two training modes (whole data, per condition), significance level p ≤ 0.05.Significant differences found for:
Measure Training ANOVA PostHoc Functions
RMSE whole data p = 0.000 p = 0.000 F7 vs. F1, F2,F2s, F4, F5, F8
p = 0.001 F7 vs. F8sp = 0.009 F7 vs. F3
p = 0.022 F7 vs. F6
RMSE per condition p = 0.000 p = 0.000 F7 vs. F1, F2, F4,F5, F8
p = 0.001 F7 vs. F2s, F8s
2.2 Testing for differences between two training modes: T-tests, sig-nificance level p ≤ 0.05. No significant differences found.
3. Behavior of modeling functions
Measure Baseline (F1 & F7) Advanced (F2–F6, F8, F8s)
Rho F1 essentially equal to F7. No one outperforms F1.RMSE F1 sig. better than F7. No one outperforms F1.
4. Observations and Conclusions
A) No advanced model outperforms the baseline mean.B) Equal performance for sorting-based (F2s, F3s, F8s) and rule-
based (F2, F3, F8) assignment of Qij .C) Training per condition does not improve performance.
Condition B2symFigure H.11: Modeling performance forconditions B2 (top panel) and B2sym(bottom panel) of Experiment ACT3.

detailed results: model performance 401
1. Visualizing the results: Errorbar plots showing the mean values & 95% confidence intervals.
2.1 Testing for significant differences between functions F1 - F8s: OnewayANOVAs & PostHoc tests with Sidak correction, tests conducted separatelyfor two training modes (whole data, per condition), significance level p ≤ 0.05.Significant differences found for:
Measure Training ANOVA PostHoc Functions
RMSE whole data p = 0.000 p = 0.014 F3 vs. F1, F5
p = 0.000 F7 vs. F1, F5
p = 0.005 F7 vs. F2
p = 0.006 F7 vs. F2sp = 0.020 f7 vs. F4
p = 0.035 F7 vs. F8sRMSE per condition p = 0.000 p = 0.000 F7 vs. F1, F5
p = 0.003 F7 vs. F2, F2s, F8
p = 0.004 f7 vs. F8
p = 0.024 F7 vs. F6
2.2 Testing for differences between two training modes: T-tests, sig-nificance level p ≤ 0.05. No significant differences found.
3. Behavior of modeling functions
Measure Baseline (F1 & F7) Advanced (F2–F6, F8, F8s)
Rho F1 essentially equal to F7. No one outperforms F1.
RMSE F1 sig. better than F7. No one outperforms F1.
4. Observations and Conclusions
A) No advanced model outperforms the baseline mean.
B) Equal performance for sorting-based (F2s, F3s, F8s) and rule-based (F2, F3, F8) assignment of Qij .
C) Training per condition does not improve performance.
Condition FM1
1. Visualizing the results: Errorbar plots showing the mean values & 95% confidence intervals.
2.1 Testing for significant differences between functions F1 - F8s: OnewayANOVAs & PostHoc tests with Sidak correction, tests conducted separatelyfor two training modes (whole data, per condition), significance level p ≤ 0.05.Significant differences found for:
Measure Training ANOVA PostHoc Functions
RMSE whole data p = 0.000 p = 0.000 F7 vs. F1, F2,F2s, F4, F5, F8,F8s
p = 0.005 F7 vs.F3sp = 0.017 F7 vs. F6
RMSE per condition p = 0.000 p = 0.000 F7 vs. F1, F2s, F5
p = 0.001 F7 vs. F8sp = 0.002 F7 vs. F2
p = 0.003 F7 vs. F8
p = 0.004 F7 vs. F4
2.2 Testing for differences between two training modes: T-tests, sig-nificance level p ≤ 0.05. No significant differences found.
3. Behavior of modeling functions
Measure Baseline (F1 & F7) Advanced (F2–F6, F8, F8s)
Rho F1 slightly better than F7
(not sig.)No one outperforms F1.
RMSE F1 sig. better than F7. No one outperforms F1.
4. Observations and Conclusions
A) No advanced model outperforms the baseline mean.B) Equal performance for sorting-based (F2s, F3s, F8s) and rule-
based (F2, F3, F8) assignment of Qij .C) Training per condition does not improve performance.
Condition FL3symFigure H.12: Modeling performance forconditions FM1 (top panel) and FL3sym(bottom panel) of Experiment ACT3.

402 quality of experience of multiparty conferencing and telemeeting systems
1. Visualizing the results: Errorbar plots showing the mean values & 95% confidence intervals.
2.1 Testing for significant differences between functions F1 - F8s:Oneway ANOVAs & PostHoc tests with Sidak correction, tests con-ducted separately for two training modes (whole data, per condition),significance level p ≤ 0.05. Significant differences found for:
Measure Training ANOVA PostHoc Functions
RMSE whole data p = 0.000 p = 0.000 F7 vs. F1, F2,F2s, F3s, F4, F5,F8, F8s
p = 0.001 F7 vs. F3, F6
RMSE per condition p = 0.000 p = 0.000 F7 vs. F1, F2,F2s, F4, F, F6, F8,F8s
p = 0.008 F7 vs. F3s
2.2 Testing for differences between two training modes: T-tests, sig-nificance level p ≤ 0.05. No significant differences found.
3. Behavior of modeling functions
Measure Baseline (F1 & F7) Advanced (F2–F6, F8, F8s)
Rho F1 essentially equal to F7. No one outperforms F1.
RMSE F1 sig. better than F7. No one outperforms F1.
4. Observations and Conclusions
A) No advanced model outperforms the baseline mean.
B) Equal performance for sorting-based (F2s, F3s, F8s) and rule-based (F2, F3, F8) assignment of Qij .
C) Training per condition does not improve performance.
Condition FM2
1. Visualizing the results: Errorbar plots showing the mean values & 95% confidence intervals.
2.1 Testing for significant differences between functions F1 - F8s:Oneway ANOVAs & PostHoc tests with Sidak correction, tests con-ducted separately for two training modes (whole data, per condition),significance level p ≤ 0.05. No significant differences found.
2.2 Testing for differences between two training modes: T-tests, sig-nificance level p ≤ 0.05. No significant differences found.
3. Behavior of modeling functions
Measure Baseline (F1 & F7) Advanced (F2–F6, F8, F8s)
Rho F1 essentially equal to F7. No one outperforms F1.
RMSE F1 sig. better than F7. No one outperforms F1.
4. Observations and Conclusions
A) No advanced model outperforms the baseline mean.B) Equal performance for sorting-based (F2s, F3s, F8s) and rule-
based (F2, F3, F8) assignment of Qij .C) Training per condition does not improve performance.
Condition FL4symFigure H.13: Modeling performance forconditions FM2 (top panel) and FL4sym(bottom panel) of Experiment ACT3.

detailed results: model performance 403
1. Visualizing the results: Errorbar plots showing the mean values & 95% confidence intervals.
2.1 Testing for significant differences between functions F1 - F8s:Oneway ANOVAs & PostHoc tests with Sidak correction, tests con-ducted separately for two training modes (whole data, per condition),significance level p ≤ 0.05. Significant differences found for:
Measure Training ANOVA PostHoc Functions
RMSE whole data p = 0.001 p = 0.000 F7 vs. F2
p = 0.003 F7 vs. F1, F5
p = 0.010 F7 vs. F2sRMSE per condition p = 0.000 p = 0.000 F1, F5 vs. F6
p = 0.009 F1, F5 vs. F3
p = 0.014 F1, F5 vs. F7
p = 0.022 F1, F5 vs. F8
p = 0.000 F2 vs. F6
p = 0.001 F2 vs. F3, F7
p = 0.002 F2 vs. F8
p = 0.011 F2 vs. F4
p = 0.025 F2 vs. F3sp = 0.000 F2s vs. F6
p = 0.001 F2s vs F3
p = 0.002 F2s vs. F7
p = 0.008 F2s vs. F8
p = 0.015 F2s vs. F4
2.2 Testing for differences between two training modes: T-tests, sig-nificance level p ≤ 0.05. Significant differences found for:
Measure T-test Functions Measure T-test Functions
RMSE p = 0.004 F3 RMSE p = 0.000 F6
RMSE p = 0.011 F8
3. Behavior of modeling functions
Measure Baseline (F1 & F7) Advanced (F2–F6, F8, F8s)
Rho F1 essentially equal to F7. No one outperforms F1.
RMSE F1 sig. worse than F7. F3, F6, & F8 (all trainedper condition) outperformF1, but not F7.
4. Observations and Conclusions
A) Three advanced models (when trained per condition) outper-form the baseline mean, but no one the baseline minimum.
B) Equal performance for sorting-based (F2s, F3s, F8s) and rule-based (F2, F3, F8) assignment of Qij .
C) Training per condition improves performance for F3, F6, & F8.
Condition TN1Figure H.14: Modeling performance forcondition TN1 of Experiment ACT3.

404 quality of experience of multiparty conferencing and telemeeting systems
1. Visualizing the results: Errorbar plots showing the mean values & 95% confidence intervals.
2.1 Testing for significant differences between functions F1 - F8s:Oneway ANOVAs & PostHoc tests with Sidak correction, tests con-ducted separately for two training modes (whole data, per condition),significance level p ≤ 0.05. Significant differences found for:
Measure Training ANOVA PostHoc Functions
RMSE whole data p = 0.012 p = 0.152
(n.s.)F7 vs. F1, F5
RMSE per condition p = 0.000 p = 0.000 F1, F5 vs. F8
p = 0.001 F1, F5 vs. F3
p = 0.004 F1, F5 vs. F3sp = 0.013 F1, F5 vs. F8sp = 0.014 F1, F5 vs. F6
p = 0.048 F1, F5 vs. F7
p = 0.000 F2 vs. F3, F8
p = 0.002 F2 vs. F3sp = 0.006 F2 vs. F6, F8sp = 0.023 F2 vs. F7
p = 0.044 F2 vs. F4
p = 0.000 F2s vs. F3, F8
p = 0.001 F2s vs. F3sp = 0.003 F2s vs. F6, F8sp = 0.012 F2s vs. F7
p = 0.024 F2s vs. F4
2.2 Testing for differences between two training modes: T-tests, sig-nificance level p ≤ 0.05. Significant differences found for:
Measure T-test Functions Measure T-test Functions
RMSE p = 0.017 F6 RMSE p = 0.011 F8
RMSE p = 0.055
(n.s.)F3s RMSE p = 0.024 F8s
3. Behavior of modeling functions
Measure Baseline (F1 & F7) Advanced (F2–F6, F8, F8s)
Rho F1 essentially equal to F7. No one outperforms F1.
RMSE F1 sig. worse than F7. F3, F3s, F6, & F8 (alltrained per condition) out-perform F1, but not F7.
4. Observations and Conclusions
A) Four advanced models (when trained per condition) outperformthe baseline mean, but no one the baseline minimum.
B) Equal performance for sorting-based (F2s, F3s, F8s) and rule-based (F2, F3, F8) assignment of Qij .
C) Training per condition improves performance for F6, F8, & F8s.
Condition TN2Figure H.15: Modeling performance forcondition TN2 of Experiment ACT3.

detailed results: model performance 405
1. Visualizing the results: Errorbar plots showing the mean values & 95% confidence intervals.
2.1 Testing for significant differences between functions F1 - F8s: OnewayANOVAs & PostHoc tests with Sidak correction, tests conducted separatelyfor two training modes (whole data, per condition), significance level p ≤ 0.05.Significant differences found for:
Measure Training ANOVA PostHoc Functions
RMSE whole data p = 0.000 p = 0.000 F1, F5 vs. F4, F6, F8sp = 0.001 F1, F5 vs. F2s, F3s, F8
p = 0.004 F1, F5 vs. F7
p = 0.020 F1, F5 vs. F3
RMSE per condition p = 0.000 p = 0.000 F1, F5 vs. F4, F6
p = 0.001 F1, F5 vs. F3, F8sp = 0.003 F1, F5 vs. F3s, F7
p = 0.006 F1, F5 vs. F2sp = 0.008 F1, F5 vs. F8
p = 0.003 F2 vs. F4
p = 0.020 F2 vs. F6
2.2 Testing for differences between two training modes: T-tests, sig-nificance level p ≤ 0.05. No significant differences found.
3. Behavior of modeling functions
Measure Baseline (F1 & F7) Advanced (F2–F6, F8, F8s)
Rho F1 slightly worse than F7
(not sig.)No one outperforms F1.
RMSE F1 sig. worse than F7. All except F2 & F5 outper-form F1, but not F7.
4. Observations and Conclusions
A) Seven advanced models outperform the baseline mean, but notthe baseline minimum. F4 is the best, though not sig. differentfrom the other six.
B) Equal performance for sorting-based (F2s, F3s, F8s) and rule-based (F2, F3, F8) assignment of Qij .
C) Training per condition does not improve performance.
Condition E2
1. Visualizing the results: Errorbar plots showing the mean values & 95% confidence intervals.
2.1 Testing for significant differences between functions F1 - F8s: OnewayANOVAs & PostHoc tests with Sidak correction, tests conducted separatelyfor two training modes (whole data, per condition), significance level p ≤ 0.05.Significant differences found for:
Measure Training ANOVA PostHoc Functions
RMSE whole data p = 0.000 p = 0.000 F1, F5 vs. all otherp = 0.000 F6 vs. F2s, F3, F7, F8, F8sp = 0.001 F6 vs. F4
p = 0.005 F6 vs. F2
p = 0.009 F6 vs. F3sRMSE per condition p = 0.000 p = 0.000 F1, F5 vs. all other
p = 0.049 F3 vs. F8
2.2 Testing for differences between two training modes: T-tests, significancelevel p ≤ 0.05. Significant differences found for:
RMSE F2: p = 0.004 F3s: p = 0.021 F6: p = 0.000 F8: p = 0.022
3. Behavior of modeling functions
Measure Baseline (F1 & F7) Advanced (F2–F6, F8, F8s)
Rho F1 essentially equal to F7. No one outperforms F1.
RMSE F1 sig. worse than F7. All except F5 outperformF1, but not F7.
4. Observations and Conclusions
A) Eight advanced models outperform the baseline mean, but notthe baseline minimum. F2s is the best, though not sig. differentfrom the other seven.
B) Equal performance for sorting-based (F2s, F3s, F8s) and rule-based (F2, F3, F8) assignment of Qij .
C) Training per condition improves performance for F2, F3s, F6 &F8.
Condition E3Figure H.16: Modeling performance forconditions E2 (top panel) and E3 (bot-tom panel) of Experiment ACT3.

406 quality of experience of multiparty conferencing and telemeeting systems
1. Visualizing the results: Errorbar plots showing the mean values & 95% confidence intervals.
2.1 Testing for significant differences between functions F1 - F8s: OnewayANOVAs & PostHoc tests with Sidak correction, tests conducted separatelyfor two training modes (whole data, per condition), significance level p ≤ 0.05.Significant differences found for:
Measure Training ANOVA PostHoc Functions
RMSE whole data p = 0.000 p = 0.000 F7 vs. F2s, F4, F6, F8, F8sp = 0.001 F7 vs. F2
p = 0.003 F7 vs. F1, F5
p = 0.030 F7 vs. F3sp = 0.004 F3 vs. F4
p = 0.018 F3 vs. F8sp = 0.030 F3 vs. F8
p = 0.040 F3 vs. F2sRMSE per condition p = 0.000 p = 0.000 F7 vs. F2s, F4, F6, F8s
p = 0.003 F7 vs. F1, F5
p = 0.016 F7 vs. F8
p = 0.023 F7 vs. F2
p = 0.46 F7 vs. F3s
2.2 Testing for differences between two training modes: T-tests, sig-nificance level p ≤ 0.05. Significant differences found for:
RMSE F3: p = 0.034
3. Behavior of modeling functions
Measure Baseline (F1 & F7) Advanced (F2–F6, F8, F8s)
Rho F1 slightly worse than F7
(not sig.)No one outperforms F1.
RMSE F1 sig. better than F7. No one outperforms F1.
4. Observations and Conclusions
A) No advanced model outperforms the baseline mean.
B) Equal performance for sorting-based (F2s, F3s, F8s) and rule-based (F2, F3, F8) assignment of Qij .
C) Training per condition improves performance only for F3.
Condition P1
1. Visualizing the results: Errorbar plots showing the mean values & 95% confidence intervals.
2.1 Testing for significant differences between functions F1 - F8s: OnewayANOVAs & PostHoc tests with Sidak correction, tests conducted separatelyfor two training modes (whole data, per condition), significance level p ≤ 0.05.Significant differences found for:
Measure Training ANOVA PostHoc Functions
RMSE whole data p = 0.000 p = 0.000 F7 vs.F2s, F4, F8, F8sp = 0.001 F7 vs. F2, F3sp = 0.003 F7 vs. F1, F5
RMSE per condition p = 0.002 p = 0.001 F7 vs. F2sp = 0.002 F7 vs. F8sp = 0.004 F7 vs. F1, F5
p = 0.013 F7 vs. F8
p = 0.015 F7 vs. F4
p = 0.016 F7 vs. F2
p = 0.041 F7 vs. F3
2.2 Testing for differences between two training modes: T-tests, sig-nificance level p ≤ 0.05. No significant differences found.
3. Behavior of modeling functions
Measure Baseline (F1 & F7) Advanced (F2–F6, F8, F8s)
Rho F1 essentially equal to F7. No one outperforms F1.
RMSE F1 sig. better than F7. No one outperforms F1.
4. Observations and Conclusions
A) No advanced model outperforms the baseline mean.
B) Equal performance for sorting-based (F2s, F3s, F8s) and rule-based (F2, F3, F8) assignment of Qij .
C) Training per condition does not improve performance.
Condition P2Figure H.17: Modeling performance forconditions P1 (top panel) and P2 (bot-tom panel) of Experiment ACT3.
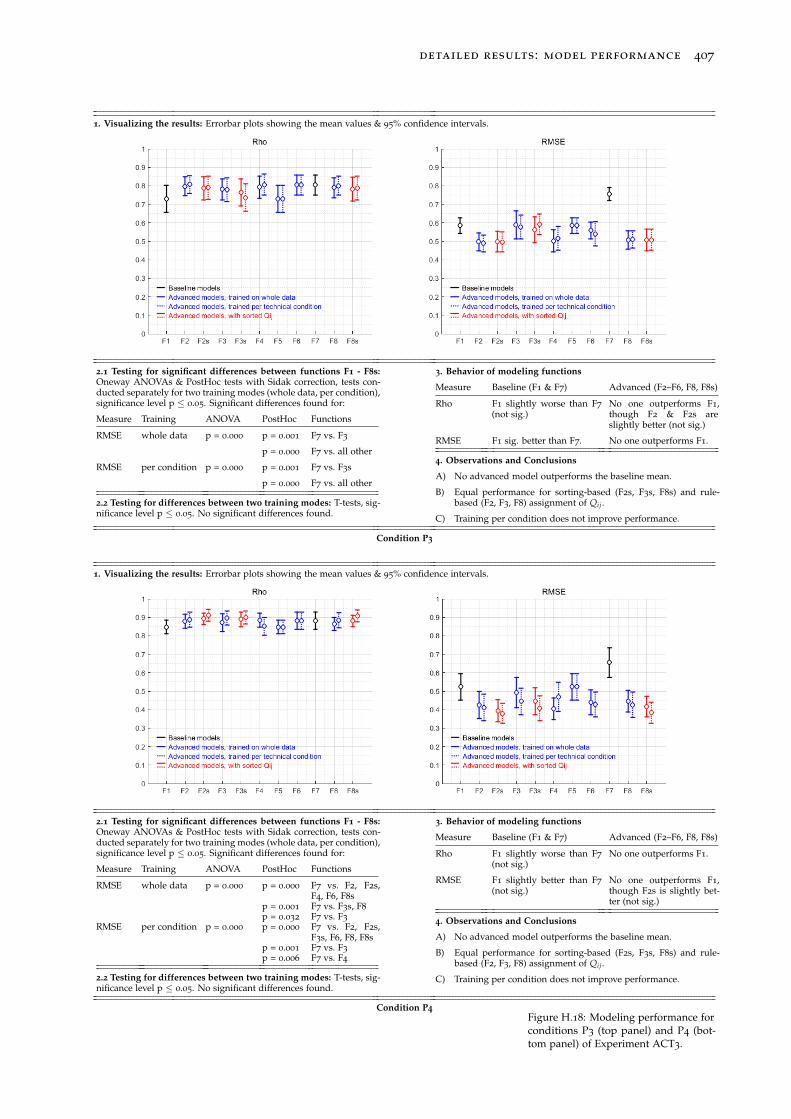
detailed results: model performance 407
1. Visualizing the results: Errorbar plots showing the mean values & 95% confidence intervals.
2.1 Testing for significant differences between functions F1 - F8s:Oneway ANOVAs & PostHoc tests with Sidak correction, tests con-ducted separately for two training modes (whole data, per condition),significance level p ≤ 0.05. Significant differences found for:
Measure Training ANOVA PostHoc Functions
RMSE whole data p = 0.000 p = 0.001 F7 vs. F3
p = 0.000 F7 vs. all other
RMSE per condition p = 0.000 p = 0.001 F7 vs. F3s
p = 0.000 F7 vs. all other
2.2 Testing for differences between two training modes: T-tests, sig-nificance level p ≤ 0.05. No significant differences found.
3. Behavior of modeling functions
Measure Baseline (F1 & F7) Advanced (F2–F6, F8, F8s)
Rho F1 slightly worse than F7
(not sig.)No one outperforms F1,though F2 & F2s areslightly better (not sig.)
RMSE F1 sig. better than F7. No one outperforms F1.
4. Observations and Conclusions
A) No advanced model outperforms the baseline mean.
B) Equal performance for sorting-based (F2s, F3s, F8s) and rule-based (F2, F3, F8) assignment of Qij .
C) Training per condition does not improve performance.
Condition P3
1. Visualizing the results: Errorbar plots showing the mean values & 95% confidence intervals.
2.1 Testing for significant differences between functions F1 - F8s:Oneway ANOVAs & PostHoc tests with Sidak correction, tests con-ducted separately for two training modes (whole data, per condition),significance level p ≤ 0.05. Significant differences found for:
Measure Training ANOVA PostHoc Functions
RMSE whole data p = 0.000 p = 0.000 F7 vs. F2, F2s,F4, F6, F8s
p = 0.001 F7 vs. F3s, F8
p = 0.032 F7 vs. F3
RMSE per condition p = 0.000 p = 0.000 F7 vs. F2, F2s,F3s, F6, F8, F8s
p = 0.001 F7 vs. F3
p = 0.006 F7 vs. F4
2.2 Testing for differences between two training modes: T-tests, sig-nificance level p ≤ 0.05. No significant differences found.
3. Behavior of modeling functions
Measure Baseline (F1 & F7) Advanced (F2–F6, F8, F8s)
Rho F1 slightly worse than F7
(not sig.)No one outperforms F1.
RMSE F1 slightly better than F7
(not sig.)No one outperforms F1,though F2s is slightly bet-ter (not sig.)
4. Observations and Conclusions
A) No advanced model outperforms the baseline mean.
B) Equal performance for sorting-based (F2s, F3s, F8s) and rule-based (F2, F3, F8) assignment of Qij .
C) Training per condition does not improve performance.
Condition P4Figure H.18: Modeling performance forconditions P3 (top panel) and P4 (bot-tom panel) of Experiment ACT3.

408 quality of experience of multiparty conferencing and telemeeting systems
H.4 Experiment LOT1
H.4.1 Performance across technical conditions
1. Visualizing the results: Errorbar plots showing the mean values & 95% confidence intervals.
2.1 Testing for significant differences between functions F1 - F8s:Oneway ANOVAs & PostHoc tests with Sidak correction, tests con-ducted separately for two training modes (whole data, per condition),significance level p ≤ 0.05. Significant differences found for:
Measure Training ANOVA PostHoc Functions
Rho whole data p = 0.000 p = 0.000 F6, F7 vs. allother
Rho per condition p = 0.000 p = 0.000 F7 vs. F2, F2s,F8, F8s
p = 0.001 F7 vs. F1, F5
p = 0.004 F7 vs. F3
p = 0.009 F7 vs. F3s
p = 0.042 F6 vs. F2s
RMSE whole data p = 0.000 p = 0.000 F7 vs. all other
p = 0.000 F6 vs. F2, F2s,F3, F3s, F4, F6,F7, F8, F8s
p = 0.012 F1, F5 vs. F4
p = 0.041 F1, F5 vs. F2s
p = 0.043 F1, F5 vs. F8s
RMSE per condition p = 0.000 p = 0.000 F7 vs. all other
2.2 Testing for differences between two training modes: T-tests, sig-nificance level p ≤ 0.05. Significant differences found for:
Measure T-test Functions Measure T-test Functions
Rho p = 0.033 F4 Rho p = 0.049 F3s
RMSE p = 0.027 F4 RMSE P = 0.036 F3s
3. Behavior of modeling functions
Measure Baseline (F1 & F7) Advanced (F2–F6, F8, F8s)
Rho F1 sig. better than F7. No one outperforms F1.
RMSE F1 sig. better than F7. F2s, F4 & F8s sig. out-perform F1; F2 & F8 areslightly better than F1 (notsig.)
4. Observations and Conclusions
A) Three advanced models outperform the baseline mean. F4 is thebest, though not sig. different from the other two.
B) Equal performance for sorting-based (F2s, F3s, F8s) and rule-based (F2, F3, F8) assignment of Qij .
C) Training per condition does not improve performance, in case ofRMSE for F3s & F4 it even reduces performance.
Figure H.19: Modeling performanceacross all technical conditions of Experi-ment LOT1.

detailed results: model performance 409
H.4.2 Performance per technical condition
1. Visualizing the results: Errorbar plots showing the mean values & 95% confidence intervals.
2.1 Testing for significant differences between functions F1 - F8s: OnewayANOVAs & PostHoc tests with Sidak correction, tests conducted separatelyfor two training modes (whole data, per condition), significance level p ≤ 0.05.No significant differences found.
Measure Training ANOVA PostHoc Functions
RMSE whole data p = 0.000 p = 0.000 F7 vs. F1, F5
p = 0.004 F7 vs. F2sp = 0.005 F7 vs. F4, F8sp = 0.010 F7 vs. F2
p = 0.022 F7 vs. F8
RMSE per condition p = 0.020 p = 0.128 (n.s.) F7 vs. F1, F5
2.2 Testing for differences between two training modes: T-tests, significancelevel p ≤ 0.05. No significant differences found.
3. Behavior of modeling functions
Measure Baseline (F1 & F7) Advanced (F2–F6, F8, F8s)
Rho F1 essentially equal to F7. No one outperforms F1.
RMSE F1 sig. better than F7. No one outperforms F1.
4. Observations and Conclusions
A) No advanced model outperforms the baseline mean.
B) Equal performance for sorting-based (F2s, F3s, F8s) and rule-based (F2, F3, F8) assignment of Qij .
C) Training per condition does not improve performance, in caseof F4 it even leads to unstable performance (large confidenceintervals).
Condition Ref5
1. Visualizing the results: Errorbar plots showing the mean values & 95% confidence intervals.
2.1 Testing for significant differences between functions F1 - F8s: OnewayANOVAs & PostHoc tests with Sidak correction, tests conducted separatelyfor two training modes (whole data, per condition), significance level p ≤ 0.05.Significant differences found for:
Measure Training ANOVA PostHoc Functions
RMSE whole data p = 0.000 p = 0.000 F7 vs. all other
RMSE per condition p = 0.000 p = 0.000 F7 vs. all other
2.2 Testing for differences between two training modes: T-tests, significancelevel p ≤ 0.05. No significant differences found.
3. Behavior of modeling functions
Measure Baseline (F1 & F7) Advanced (F2–F6, F8, F8s)
Rho F1 essentially equal to F7. No one outperforms F1.
RMSE F1 sig. better than F7. No one outperforms F1.
4. Observations and Conclusions
A) No advanced model outperforms the baseline mean.
B) Equal performance for sorting-based (F2s, F3s, F8s) and rule-based (F2, F3, F8) assignment of Qij .
C) Training per condition does not improve performance.
Condition B2Figure H.20: Modeling performance forconditions Ref5 (top panel) and B2 (bot-tom panel) of Experiment LOT1.

410 quality of experience of multiparty conferencing and telemeeting systems
1. Visualizing the results: Errorbar plots showing the mean values & 95% confidence intervals.
2.1 Testing for significant differences between functions F1 - F8s:Oneway ANOVAs & PostHoc tests with Sidak correction, tests con-ducted separately for two training modes (whole data, per condition),significance level p ≤ 0.05. No significant differences found.
Measure Training ANOVA PostHoc Functions
RMSE whole data p = 0.017 p = 0.047 F4 vs. F6
2.2 Testing for differences between two training modes: T-tests, sig-nificance level p ≤ 0.05. No significant differences found.
3. Behavior of modeling functions
Measure Baseline (F1 & F7) Advanced (F2–F6, F8, F8s)
Rho F1 slightly better than F7
(not sig.)No one outperforms F1.
RMSE F1 slightly better than F7
(not sig.)No one outperforms F1.
4. Observations and Conclusions
A) No advanced model outperforms the baseline mean.
B) Equal performance for sorting-based (F2s, F3s, F8s) and rule-based (F2, F3, F8) assignment of Qij .
C) Training per condition does not improve performance.
Condition B2sym
1. Visualizing the results: Errorbar plots showing the mean values & 95% confidence intervals.
2.1 Testing for significant differences between functions F1 - F8s:Oneway ANOVAs & PostHoc tests with Sidak correction, tests con-ducted separately for two training modes (whole data, per condition),significance level p ≤ 0.05. Significant differences found for:
Measure Training ANOVA PostHoc Functions
RMSE whole data p = 0.000 p = 0.001 F7 vs. F6
p = 0.000 F7 vs. all other
RMSE per condition p = 0.000 p = 0.001 F7 vs. F3s
p = 0.007 F7 vs. F6
p = 0.000 F7 vs. all other
2.2 Testing for differences between two training modes: T-tests, sig-nificance level p ≤ 0.05. No significant differences found.
3. Behavior of modeling functions
Measure Baseline (F1 & F7) Advanced (F2–F6, F8, F8s)
Rho F1 slightly better than F7
(not sig.)No one outperforms F1.
RMSE F1 sig. better than F7. No one outperforms F1.
4. Observations and Conclusions
A) No advanced model outperforms the baseline mean.
B) Equal performance for sorting-based (F2s, F3s, F8s) and rule-based (F2, F3, F8) assignment of Qij .
C) Training per condition does not improve performance.
Condition P5Figure H.21: Modeling performance forconditions B2sym (top panel) and P5
(bottom panel) of Experiment LOT1.

detailed results: model performance 411
1. Visualizing the results: Errorbar plots showing the mean values & 95% confidence intervals.
2.1 Testing for significant differences between functions F1 - F8s: OnewayANOVAs & PostHoc tests with Sidak correction, tests conducted separatelyfor two training modes (whole data, per condition), significance level p ≤ 0.05.No significant differences found.
Measure Training ANOVA PostHoc Functions
Rho whole data p = 0.004 p = 0.110 (n.s.) F4 vs. F6, F7
Rho per condition p = 0.036 p = 0.304 (n.s.) F2s vs. F6, F7
RMSE whole data p = 0.000 p = 0.000 F7 vs. all otherp = 0.034 F6 vs. F2
p = 0.037 F6 vs. F8
p = 0.038 F6 vs. F8sp = 0.039 F6 vs. F2sp = 0.042 F6 vs. F4
RMSE per condition p = 0.000 p = 0.018 F7 vs. F6
p = 0.000 F7 vs. all otherp = 0.010 F6 vs. F2sp = 0.011 F6 vs. F2
p = 0.014 F6 vs. F8sp = 0.015 F6 vs. F8
p = 0.026 F6 vs. F4
2.2 Testing for differences between two training modes: T-tests, sig-nificance level p ≤ 0.05. No significant differences found.
3. Behavior of modeling functions
Measure Baseline (F1 & F7) Advanced (F2–F6, F8, F8s)
Rho F1 slightly better than F7
(not sig.)No one outperforms F1.
RMSE F1 sig. better than F7. No one outperforms F1.
4. Observations and Conclusions
A) No advanced model outperforms the baseline mean.
B) Equal performance for sorting-based (F2s, F3s, F8s) and rule-based (F2, F3, F8) assignment of Qij .
C) Training per condition does not improve performance.
Condition B2symP5
1. Visualizing the results: Errorbar plots showing the mean values & 95% confidence intervals.
2.1 Testing for significant differences between functions F1 - F8s: OnewayANOVAs & PostHoc tests with Sidak correction, tests conducted separatelyfor two training modes (whole data, per condition), significance level p ≤ 0.05.Significant differences found for:
Measure Training ANOVA PostHoc Functions
Rho whole data p = 0.016 p = 0.297 (n.s.) F3s vs. F6, F7
RMSE whole data p = 0.000 p = 0.000 F7 vs. all other
RMSE per condition p = 0.000 p = 0.000 F7 vs. all other
2.2 Testing for differences between two training modes: T-tests, significancelevel p ≤ 0.05. No significant differences found.
3. Behavior of modeling functions
Measure Baseline (F1 & F7) Advanced (F2–F6, F8, F8s)
Rho F1 slightly better than F7
(not sig.)No one outperforms F1.
RMSE F1 sig. better than F7. No one outperforms F1.
4. Observations and Conclusions
A) No advanced model outperforms the baseline mean.
B) Equal performance for sorting-based (F2s, F3s, F8s) and rule-based (F2, F3, F8) assignment of Qij .
C) Training per condition does not improve performance.
Condition E4Figure H.22: Modeling performance forconditions B2symP5 (top panel) and E4
(bottom panel) of Experiment LOT1.

412 quality of experience of multiparty conferencing and telemeeting systems
1. Visualizing the results: Errorbar plots showing the mean values & 95% confidence intervals.
2.1 Testing for significant differences between functions F1 - F8s: OnewayANOVAs & PostHoc tests with Sidak correction, tests conducted separatelyfor two training modes (whole data, per condition), significance level p ≤ 0.05.No significant differences found.
Measure Training ANOVA PostHoc Functions
RMSE whole data p = 0.000 p = 0.000 F6 vs. all other
2.2 Testing for differences between two training modes: T-tests, significancelevel p ≤ 0.05. Significant differences found for:
RMSE F6: p = 0.000
3. Behavior of modeling functions
Measure Baseline (F1 & F7) Advanced (F2–F6, F8, F8s)
Rho F1 essentially equal to F7. No one outperforms F1.
RMSE F1 essentially equal to F7. No one outperforms F1,though F3, F3s & F4 areslightly better (not sig.)
4. Observations and Conclusions
A) No advanced model outperforms the baseline mean.
B) Equal performance for sorting-based (F2s, F3s, F8s) and rule-based (F2, F3, F8) assignment of Qij .
C) Training per condition does not improve performance, in case ofRMSE for F4 it even leads to unstable performance (large confi-dence intervals).
Condition E4sym
1. Visualizing the results: Errorbar plots showing the mean values & 95% confidence intervals.
2.1 Testing for significant differences between functions F1 - F8s: OnewayANOVAs & PostHoc tests with Sidak correction, tests conducted separatelyfor two training modes (whole data, per condition), significance level p ≤ 0.05.Significant differences found for:
Measure Training ANOVA PostHoc Functions
RMSE whole data p = 0.000 p = 0.000 F7 vs. F2, F2s, F3, F3s, F4,F6, F8, F8s
p = 0.000 F1, F5 vs. F2, F2s, F3, F3s,F4, F8, F8s
p = 0.017 F1, F5 vs. F6
RMSE per condition p = 0.000 p = 0.000 F7 vs. F2, F2s, F3, F3s, F4,F6, F8, F8s
p = 0.000 F1, F5 vs. F2, F2s, F3, F3s,F4, F6, F8, F8s
2.2 Testing for differences between two training modes: T-tests, sig-nificance level p ≤ 0.05. No significant differences found.
3. Behavior of modeling functions
Measure Baseline (F1 & F7) Advanced (F2–F6, F8, F8s)
Rho F1 essentially equal to F7. No one outperforms F1.
RMSE F1 slightly better than F7
(not sig.)F2, F2s, F3, F3s, F4, F6, F8,& F8s sig. outperform F1.
4. Observations and Conclusions
A) Eight advanced models outperform the baseline mean, seven ofthem with essentially equal performance.
B) Equal performance for sorting-based (F2s, F3s, F8s) and rule-based (F2, F3, F8) assignment of Qij .
C) Training per condition does not improve performance.
Condition RFigure H.23: Modeling performance forconditions E4sym (top panel) and R (bot-tom panel) of Experiment LOT1.

detailed results: model performance 413
1. Visualizing the results: Errorbar plots showing the mean values & 95% confidence intervals.
2.1 Testing for significant differences between functions F1 - F8s:Oneway ANOVAs & PostHoc tests with Sidak correction, tests con-ducted separately for two training modes (whole data, per condition),significance level p ≤ 0.05. Significant differences found for:
Measure Training ANOVA PostHoc Functions
RMSE whole data p = 0.000 p = 0.000 F7 vs. all other
RMSE per condition p = 0.000 p = 0.000 F7 vs. all other
2.2 Testing for differences between two training modes: T-tests, sig-nificance level p ≤ 0.05. No significant differences found.
3. Behavior of modeling functions
Measure Baseline (F1 & F7) Advanced (F2–F6, F8, F8s)
Rho F1 slightly worse than F7
(not sig.)No one outperforms F1.
RMSE F1 sig. better than F7. No one outperforms F1.
4. Observations and Conclusions
A) No advanced model outperforms the baseline mean.
B) Equal performance for sorting-based (F2s, F3s, F8s) and rule-based (F2, F3, F8) assignment of Qij .
C) Training per condition does not improve performance.
Condition CNFigure H.24: Modeling performance forcondition CN of Experiment LOT1.

414 quality of experience of multiparty conferencing and telemeeting systems
H.5 Experiment LOT2
H.5.1 Performance across technical conditions
1. Visualizing the results: Errorbar plots showing the mean values & 95% confidence intervals.
2.1 Testing for significant differences between functions F1 - F8s:Oneway ANOVAs & PostHoc tests with Sidak correction, tests con-ducted separately for two training modes (whole data, per condition),significance level p ≤ 0.05. Significant differences found for:
Measure Training ANOVA PostHoc Functions
Rho whole data p = 0.013 p = 0.223
(n.s.)F4 vs. F6, F7
Rho per condition p = 0.028 p = 0.094
(n.s.)F2s vs. F7
RMSE whole data p = 0.000 p = 0.000 F7 vs. F2s, F3,F3s, F4, F8s
p = 0.002 F7 vs. F8
p = 0.003 F7 vs. F2
p = 0.003 F1, F5 vs. F4
p = 0.016 F1, F5 vs. F3sp = 0.028 F1, F5 vs. F2sp = 0.029 F1, F5 vs. F8sp = 0.046 F1, F5 vs. F3
RMSE per condition p = 0.000 p = 0.000 F7 vs. F2, F2s,F3, F3s, F8, F8s
p = 0.002 F7 vs. F6
p = 0.003 F1, F5 vs. F2s,F8s
p = 0.005 F1, F5 vs. F8
p = 0.037 F1, F5 vs. F2
2.2 Testing for differences between two training modes: T-tests, sig-nificance level p ≤ 0.05. No significant differences found.
3. Behavior of modeling functions
Measure Baseline (F1 & F7) Advanced (F2–F6, F8, F8s)
Rho F1 slightly better than F7
(not sig.)No one outperforms F1.
RMSE F1 slightly better than F7
(not sig.)F2s, F3, F3s, F8s, F2 & F8
trained per condition andF4 trained on whole dataoutperform F1.
4. Observations and Conclusions
A) Seven advanced models outperform the baseline mean. F4
(trained on whole data) is the best, though not sig. differentfrom the other six.
B) Equal performance for sorting-based (F2s, F3s, F8s) and rule-based (F2, F3, F8) assignment of Qij .
C) Training per condition does not improve performance.
Figure H.25: Modeling performanceacross all technical conditions of Experi-ment LOT2.

detailed results: model performance 415
H.5.2 Performance per technical condition
1. Visualizing the results: Errorbar plots showing the mean values & 95% confidence intervals.
2.1 Testing for significant differences between functions F1 - F8s: OnewayANOVAs & PostHoc tests with Sidak correction, tests conducted separatelyfor two training modes (whole data, per condition), significance level p ≤ 0.05.No significant differences found.
Measure Training ANOVA PostHoc Functions
RMSE whole data p = 0.037 p = 0.104 (n.s.) F7 vs. F4
RMSE per condition p = 0.025 p = 0.013 F7 vs. F2
p = 0.016 F7 vs. F3
p = 0.033 F7 vs. F8
2.2 Testing for differences between two training modes: T-tests, significancelevel p ≤ 0.05. Significant differences found for: RMSE F8: p = 0.004
3. Behavior of modeling functions
Measure Baseline (F1 & F7) Advanced (F2–F6, F8, F8s)
Rho F1 essentially equal to F7. No one outperforms F1.RMSE F1 slightly better than F7
(not sig.)No one outperforms F1.
4. Observations and Conclusions
A) No advanced model outperforms the baseline mean.B) Equal performance for sorting-based (F2s, F3s, F8s) and rule-
based (F2, F3, F8) assignment of Qij .C) Training per condition does not improve performance.
Condition Ref3
1. Visualizing the results: Errorbar plots showing the mean values & 95% confidence intervals.
2.1 Testing for significant differences between functions F1 - F8s: OnewayANOVAs & PostHoc tests with Sidak correction, tests conducted separatelyfor two training modes (whole data, per condition), significance level p ≤ 0.05.No significant differences found.
2.2 Testing for differences between two training modes: T-tests, significancelevel p ≤ 0.05. Significant differences found for:
Measure T-test Functions Measure T-test Functions
Rho p = 0.059 (n.s.) F2 RMSE p = 0.028 F2
3. Behavior of modeling functions
Measure Baseline (F1 & F7) Advanced (F2–F6, F8, F8s)
Rho F1 slightly worse than F7
(not sig.)No one outperforms F1.
RMSE F1 slightly worse than F7
(not sig.)No one outperforms F1.
4. Observations and Conclusions
A) No advanced model outperforms the baseline mean.B) Equal performance for sorting-based (F2s, F3s, F8s) and rule-
based (F2, F3, F8) assignment of Qij .C) Training per condition improves performance only for F2.
Condition TN1Figure H.26: Modeling performance forconditions Ref3 (top panel) and TN1
(bottom panel) of Experiment LOT2.

416 quality of experience of multiparty conferencing and telemeeting systems
1. Visualizing the results: Errorbar plots showing the mean values & 95% confidence intervals.
2.1 Testing for significant differences between functions F1 - F8s:Oneway ANOVAs & PostHoc tests with Sidak correction, tests con-ducted separately for two training modes (whole data, per condition),significance level p ≤ 0.05. No significant differences found.
2.2 Testing for differences between two training modes: T-tests, sig-nificance level p ≤ 0.05. No significant differences found.
3. Behavior of modeling functions
Measure Baseline (F1 & F7) Advanced (F2–F6, F8, F8s)
Rho, RMSE F1 essentially equal to F7. No one outperforms F1.
4. Observations and Conclusions
A) No advanced model outperforms the baseline mean.
B) Equal performance for sorting-based (F2s, F3s, F8s) and rule-based (F2, F3, F8) assignment of Qij .
C) Training per condition does not improve performance.
Condition TN2
1. Visualizing the results: Errorbar plots showing the mean values & 95% confidence intervals.
2.1 Testing for significant differences between functions F1 - F8s:Oneway ANOVAs & PostHoc tests with Sidak correction, tests con-ducted separately for two training modes (whole data, per condition),significance level p ≤ 0.05. Significant differences found for:
Measure Training ANOVA PostHoc Functions
Rho whole data p = 0.042 p = 0.247
(n.s.)F1, F5 vs. F6, F7
Rho per condition p = 0.011 p = 0.185
(n.s.)F1, F5 vs. F6, F7
RMSE whole data p = 0.000 p = 0.000 F7 vs. all other
p = 0.000 F6 vs. F1, F5
p = 0.014 F6 vs. F3s
p = 0.033 F6 vs. F3
RMSE per condition p = 0.000 p = 0.000 F7 vs. all other
2.2 Testing for differences between two training modes: T-tests, sig-nificance level p ≤ 0.05. No significant differences found.
3. Behavior of modeling functions
Measure Baseline (F1 & F7) Advanced (F2–F6, F8, F8s)
Rho F1 slightly better than F7
(not sig.)No one outperforms F1.
RMSE F1 sig. better than F7. No one outperforms F1.
4. Observations and Conclusions
A) No advanced model outperforms the baseline mean.
B) Equal performance for sorting-based (F2s, F3s, F8s) and rule-based (F2, F3, F8) assignment of Qij .
C) Training per condition does not improve performance.
Condition B2Figure H.27: Modeling performance forconditions TN2 (top panel) and B2 (bot-tom panel) of Experiment LOT2.

detailed results: model performance 417
1. Visualizing the results: Errorbar plots showing the mean values & 95% confidence intervals.
2.1 Testing for significant differences between functions F1 - F8s:Oneway ANOVAs & PostHoc tests with Sidak correction, tests con-ducted separately for two training modes (whole data, per condition),significance level p ≤ 0.05. No significant differences found.
2.2 Testing for differences between two training modes: T-tests, sig-nificance level p ≤ 0.05. Significant differences found for:
RMSE F3s: p = 0.023
3. Behavior of modeling functions
Measure Baseline (F1 & F7) Advanced (F2–F6, F8, F8s)
Rho F1 slightly better than F7
(not sig.)No one outperforms F1.
RMSE F1 slightly better than F7
(not sig.)No one outperforms F1.
4. Observations and Conclusions
A) No advanced model outperforms the baseline mean.B) Equal performance for sorting-based (F2s, F3s, F8s) and rule-
based (F2, F3, F8) assignment of Qij .C) Training per condition improves performance only for F3s.
Condition B2sym
1. Visualizing the results: Errorbar plots showing the mean values & 95% confidence intervals.
2.1 Testing for significant differences between functions F1 - F8s:Oneway ANOVAs & PostHoc tests with Sidak correction, tests con-ducted separately for two training modes (whole data, per condition),significance level p ≤ 0.05. Significant differences found for:
Measure Training ANOVA PostHoc Functions
RMSE whole data p = 0.000 p = 0.001 F6 vs. F4
p = 0.016 F6 vs. F2
p = 0.019 F6 vs. F8
p = 0.020 F6 vs. F3
p = 0.034 F6 vs. F3sp = 0.037 F6 vs. F1, F5
2.2 Testing for differences between two training modes: T-tests, sig-nificance level p ≤ 0.05. Significant differences found for:
RMSE F6: p = 0.048
3. Behavior of modeling functions
Measure Baseline (F1 & F7) Advanced (F2–F6, F8, F8s)
Rho F1 slightly better than F7
(not sig.)No one outperforms F1.
RMSE F1 sig. better than F7. No one outperforms F1.
4. Observations and Conclusions
A) No advanced model outperforms the baseline mean.
B) Equal performance for sorting-based (F2s, F3s, F8s) and rule-based (F2, F3, F8) assignment of Qij .
C) Training per condition improves performance only for F6.
Condition FL4symFigure H.28: Modeling performancefor conditions B2sym (top panel) andFL4sym (bottom panel) of ExperimentLOT2.

418 quality of experience of multiparty conferencing and telemeeting systems
1. Visualizing the results: Errorbar plots showing the mean values & 95% confidence intervals.
2.1 Testing for significant differences between functions F1 - F8s: OnewayANOVAs & PostHoc tests with Sidak correction, tests conducted separatelyfor two training modes (whole data, per condition), significance level p ≤ 0.05.No significant differences found.
Measure Training ANOVA PostHoc Functions
RMSE whole data p = 0.004 p = 0.002 F7 vs. F2
p = 0.006 F7 vs. F1, F5
p = 0.007 F7 vs. F3
p = 0.011 F7 vs. F4
p = 0.019 F7 vs. F8
p = 0.042 F7 vs. F6
p = 0.045 F7 vs. F2sp = 0.046 F7 vs. F8s
RMSE per condition p = 0.001 p = 0.001 F7 vs. F1, F3s, F5, F8
p = 0.002 F7 vs. F2sp = 0.003 F7 vs. F8sp = 0.004 F7 vs. F2
p = 0.006 F7 vs. F6
p = 0.007 F7 vs. F3
p = 0.028 F7 vs. F4
2.2 Testing for differences between two training modes: T-tests, sig-nificance level p ≤ 0.05. No significant differences found.
3. Behavior of modeling functions
Measure Baseline (F1 & F7) Advanced (F2–F6, F8, F8s)
Rho F1 slightly better than F7
(not sig.)No one outperforms F1.
RMSE F1 sig. better than F7. No one outperforms F1.
4. Observations and Conclusions
A) No advanced model outperforms the baseline mean.
B) Equal performance for sorting-based (F2s, F3s, F8s) and rule-based (F2, F3, F8) assignment of Qij .
C) Training per condition does not improve performance.
Condition FM1
1. Visualizing the results: Errorbar plots showing the mean values & 95% confidence intervals.
2.1 Testing for significant differences between functions F1 - F8s: OnewayANOVAs & PostHoc tests with Sidak correction, tests conducted separatelyfor two training modes (whole data, per condition), significance level p ≤ 0.05.Significant differences found for:
Measure Training ANOVA PostHoc Functions
RMSE whole data p = 0.000 p = 0.000 F7 vs. F4
p = 0.001 F7 vs. F3, F3sp = 0.023 F7 vs. F1, F5
p = 0.024 F7 vs. F2
RMSE per condition p = 0.001 p = 0.000 F7 vs. F3
p = 0.003 F7 vs. F3sp = 0.007 F7 vs. F4, F8sp = 0.009 F7 vs. F1, F5
p = 0.014 F7 vs. F2
p = 0.019 F7 vs. F8
2.2 Testing for differences between two training modes: T-tests, sig-nificance level p ≤ 0.05. Significant differences found for:
RMSE F6: p = 0.035
3. Behavior of modeling functions
Measure Baseline (F1 & F7) Advanced (F2–F6, F8, F8s)
Rho F1 slightly better than F7
(not sig.)No one outperforms F1.
RMSE F1 sig. better than F7. No one outperforms F1.
4. Observations and ConclusionsA) No advanced model outperforms the baseline mean.B) Equal performance for sorting-based (F2s, F3s, F8s) and rule-
based (F2, F3, F8) assignment of Qij .C) Training per condition does not improve performance.
Condition FM1symFigure H.29: Modeling performance forconditions FM1 (top panel) and FM1sym(bottom panel) of Experiment LOT2.

detailed results: model performance 419
1. Visualizing the results: Errorbar plots showing the mean values & 95% confidence intervals.
2.1 Testing for significant differences between functions F1 - F8s: OnewayANOVAs & PostHoc tests with Sidak correction, tests conducted separatelyfor two training modes (whole data, per condition), significance level p ≤ 0.05.No significant differences found.
Measure Training ANOVA PostHoc Functions
RMSE whole data p = 0.000 p = 0.000 F7 vs. F1, F2, F2s, F3s, F5,F6, F8s
p = 0.001 F7 vs. F3, F4, F8
RMSE per condition p = 0.000 p = 0.000 F7 vs. all other
2.2 Testing for differences between two training modes: T-tests, significancelevel p ≤ 0.05. Significant differences found for:
Measure T-test Functions Measure T-test Functions
RMSE p = 0.015 F3 RMSE p = 0.022 F3sRMSE p = 0.004 F8 RMSE p = 0.045 F8s
3. Behavior of modeling functions
Measure Baseline (F1 & F7) Advanced (F2–F6, F8, F8s)
Rho F1 slightly better than F7
(not sig.)No one outperforms F1.
RMSE F1 sig. better than F7. No one outperforms F1.
4. Observations and Conclusions
A) No advanced model outperforms the baseline mean.
B) Equal performance for sorting-based (F2s, F3s, F8s) and rule-based (F2, F3, F8) assignment of Qij .
C) Training per condition improves performance for F3, F3s, F8 &F8s.
Condition FM2
1. Visualizing the results: Errorbar plots showing the mean values & 95% confidence intervals.
2.1 Testing for significant differences between functions F1 - F8s:Oneway ANOVAs & PostHoc tests with Sidak correction, tests con-ducted separately for two training modes (whole data, per condition),significance level p ≤ 0.05. Significant differences found for:
Measure Training ANOVA PostHoc Functions
RMSE per condition p = 0.027 p = 0.047 F7 vs. F1, F5
2.2 Testing for differences between two training modes: T-tests, sig-nificance level p ≤ 0.05. Significant differences found for:
RMSE F3: p = 0.039
3. Behavior of modeling functions
Measure Baseline (F1 & F7) Advanced (F2–F6, F8, F8s)
Rho, RMSE F1 slightly better than F7
(not sig.)No one outperforms F1.
4. Observations and Conclusions
A) No advanced model outperforms the baseline mean.
B) Equal performance for sorting-based (F2s, F3s, F8s) and rule-based (F2, F3, F8) assignment of Qij .
C) Training per condition improves performance only for F3.
Condition FM2symFigure H.30: Modeling performance forconditions FM2 (top panel) and FM2sym(bottom panel) of Experiment LOT2.

420 quality of experience of multiparty conferencing and telemeeting systems
1. Visualizing the results: Errorbar plots showing the mean values & 95% confidence intervals.
2.1 Testing for significant differences between functions F1 - F8s:Oneway ANOVAs & PostHoc tests with Sidak correction, tests con-ducted separately for two training modes (whole data, per condition),significance level p ≤ 0.05. No significant differences found.
Measure Training ANOVA PostHoc Functions
RMSE whole data p = 0.000 p = 0.000 F7 vs. all otherexcept F6
RMSE per condition p = 0.000 p = 0.000 F7 vs. all other
2.2 Testing for differences between two training modes: T-tests, sig-nificance level p ≤ 0.05. No significant differences found.
3. Behavior of modeling functions
Measure Baseline (F1 & F7) Advanced (F2–F6, F8, F8s)
Rho F1 essentially equal to F7. No one outperforms F1.
RMSE F1 sig. better than F7. No one outperforms F1.
4. Observations and Conclusions
A) No advanced model outperforms the baseline mean.
B) Equal performance for sorting-based (F2s, F3s, F8s) and rule-based (F2, F3, F8) assignment of Qij .
C) Training per condition does not improve performance.
Condition FM4
1. Visualizing the results: Errorbar plots showing the mean values & 95% confidence intervals.
2.1 Testing for significant differences between functions F1 - F8s:Oneway ANOVAs & PostHoc tests with Sidak correction, tests con-ducted separately for two training modes (whole data, per condition),significance level p ≤ 0.05. No significant differences found.
2.2 Testing for differences between two training modes: T-tests, sig-nificance level p ≤ 0.05. Significant differences found for:
RMSE F4: p = 0.019
3. Behavior of modeling functions
Measure Baseline (F1 & F7) Advanced (F2–F6, F8, F8s)
Rho, RMSE F1 essentially equal to F7. No one outperforms F1.
4. Observations and Conclusions
A) No advanced model outperforms the baseline mean.
B) Equal performance for sorting-based (F2s, F3s, F8s) and rule-based (F2, F3, F8) assignment of Qij .
C) Training per condition does not improve performance, in case ofRMSE for F4 it even reduces performance.
Condition FM4symFigure H.31: Modeling performance forconditions FM4 (top panel) and FM4sym(bottom panel) of Experiment LOT2.

detailed results: model performance 421
1. Visualizing the results: Errorbar plots showing the mean values & 95% confidence intervals.
2.1 Testing for significant differences between functions F1 - F8s: OnewayANOVAs & PostHoc tests with Sidak correction, tests conducted separatelyfor two training modes (whole data, per condition), significance level p ≤ 0.05.No significant differences found.
Measure Training ANOVA PostHoc Functions
RMSE whole data p = 0.000 p = 0.000 F1, F5 vs. F2s, F3, F3s, F4,F6, F8s
p = 0.020 F1, F5 vs. F8
p = 0.000 F7 vs. F4
p = 0.003 F7 vs. F3sp = 0.007 F7 vs. F2s, F8sp = 0.046 F7 vs. F6
p = 0.003 F2 vs. F4
p = 0.030 F2 vs. F3sRMSE per condition p = 0.000 p = 0.000 F1, F5 vs. F2s, F3, F3s, F4,
F6, F8, F8sp = 0.000 F7 vs. F3
p = 0.001 F7 vs. F3sp = 0.002 F7 vs. F2s, F8sp = 0.001 F2 vs. F3
p = 0.002 F2 vs. F3sp = 0.006 F2 vs. F2s, F8s
2.2 Testing for differences between two training modes: T-tests, sig-nificance level p ≤ 0.05. Significant differences found for:
RMSE F8: p = 0.035
3. Behavior of modeling functions
Measure Baseline (F1 & F7) Advanced (F2–F6, F8, F8s)
Rho F1 slightly better than F7
(not sig.)No one outperforms F1.
RMSE F1 sig. better than F7. F2s, F3, F3s, F4, F6, F8sand F8 trained per condi-tion outperform F1. F2s,F3s, F8s and F4 & F6
trained on whole data andF3 trained per conditionoutperform F7.
4. Observations and Conclusions
A) Seven advanced models outperform the baseline mean, six ofthem the baseline minimum.
B) Sorting-based assignment of Qij outperforms rule-based assign-ment for one function (F2s better than F2).
C) Training per condition improves performance only for F8.
Condition FM4P3
1. Visualizing the results: Errorbar plots showing the mean values & 95% confidence intervals.
2.1 Testing for significant differences between functions F1 - F8s:Oneway ANOVAs & PostHoc tests with Sidak correction, tests con-ducted separately for two training modes (whole data, per condition),significance level p ≤ 0.05. Significant differences found for:
Measure Training ANOVA PostHoc Functions
RMSE whole data p = 0.000 p = 0.000 F6 vs. all other
2.2 Testing for differences between two training modes: T-tests, sig-nificance level p ≤ 0.05. Significant differences found for:
RMSE F6: p = 0.000
3. Behavior of modeling functionsMeasure Baseline (F1 & F7) Advanced (F2–F6, F8, F8s)
Rho F1 essentially equal to F7. No one outperforms F1.RMSE F1 slightly worse than F7
(not sig.)No one outperforms F1.
4. Observations and ConclusionsA) No advanced model outperforms the baseline mean.B) Equal performance for sorting-based (F2s, F3s, F8s) and rule-
based (F2, F3, F8) assignment of Qij .C) Training per condition improves performance only for F6.
Condition FM4P3symFigure H.32: Modeling performancefor conditions FM4P3 (top panel) andFM4P3sym (bottom panel) of Experi-ment LOT2.

422 quality of experience of multiparty conferencing and telemeeting systems
1. Visualizing the results: Errorbar plots showing the mean values & 95% confidence intervals.
2.1 Testing for significant differences between functions F1 - F8s: OnewayANOVAs & PostHoc tests with Sidak correction, tests conducted separatelyfor two training modes (whole data, per condition), significance level p ≤ 0.05.No significant differences found.
Measure Training ANOVA PostHoc Functions
RMSE whole data p = 0.000 p = 0.000 F1, F5 vs. F2, F2s, F3, F3s,F4, F8, F8s
p = 0.000 F7 vs. F2, F2s, F3, F3s, F4,F8, F8s
p = 0.007 F7 vs. F6
RMSE per condition p = 0.000 p = 0.000 F1, F5 vs. F2, F2s, F8
p = 0.001 F1, F5 vs. F8sp = 0.008 F1, F5 vs. F3sp = 0.011 F1, F5 vs. F4
p = 0.000 F7 vs. F2, F2s, F3s, F4, F8,F8s
p = 0.005 F7 vs. F3
p = 0.020 F7 vs. F6
2.2 Testing for differences between two training modes: T-tests, sig-nificance level p ≤ 0.05. No significant differences found.
3. Behavior of modeling functions
Measure Baseline (F1 & F7) Advanced (F2–F6, F8, F8s)
Rho F1 slightly better than F7
(not sig.)No one outperforms F1.
RMSE F1 essentially equal to F7. F2, F2s, F3, F4, F8, F8s andF3s trained on whole dataoutperform F1.
4. Observations and Conclusions
A) Seven advanced models sig. outperform the baseline mean, allwith essentially equal performance.
B) Equal performance for sorting-based (F2s, F3s, F8s) and rule-based (F2, F3, F8) assignment of Qij .
C) Training per condition does not improve performance.
Condition E2
1. Visualizing the results: Errorbar plots showing the mean values & 95% confidence intervals.
2.1 Testing for significant differences between functions F1 - F8s: OnewayANOVAs & PostHoc tests with Sidak correction, tests conducted separatelyfor two training modes (whole data, per condition), significance level p ≤ 0.05.No significant differences found.
2.2 Testing for differences between two training modes: T-tests, significancelevel p ≤ 0.05. No significant differences found.
3. Behavior of modeling functions
Measure Baseline (F1 & F7) Advanced (F2–F6, F8, F8s)
Rho, RMSE F1 essentially equal to F7. No one outperforms F1.
4. Observations and Conclusions
A) No advanced model outperforms the baseline mean.
B) Equal performance for sorting-based (F2s, F3s, F8s) and rule-based (F2, F3, F8) assignment of Qij .
C) Training per condition does not improve performance, for F4 iteven tends to reduce performance.
Condition E2symFigure H.33: Modeling performance forconditions E2 (top panel) and E2sym(bottom panel) of Experiment LOT2.

detailed results: model performance 423
1. Visualizing the results: Errorbar plots showing the mean values & 95% confidence intervals.
2.1 Testing for significant differences between functions F1 - F8s: OnewayANOVAs & PostHoc tests with Sidak correction, tests conducted separatelyfor two training modes (whole data, per condition), significance level p ≤ 0.05.No significant differences found.
Measure Training ANOVA PostHoc Functions
Rho per condition p = 0.006 p = 0.233
(n.s.)F1, F5 vs. F6, F7
RMSE whole data p = 0.000 p = 0.000 F1, F5 vs. F2s, F3, F3s, F4,F6, F7, F8s
p = 0.002 F1, F5 vs. F2, F8
RMSE per condition p = 0.000 p = 0.000 F1, F5 vs. F2, F2s, F8, F8sp = 0.002 F1, F5 vs. F6
p = 0.021 F1, F5 vs. F7
2.2 Testing for differences between two training modes: T-tests, significancelevel p ≤ 0.05. No significant differences found.
3. Behavior of modeling functions
Measure Baseline (F1 & F7) Advanced (F2–F6, F8, F8s)
Rho F1 slightly worse than F7
(not sig.)No one outperforms F1
nor F7.
RMSE F1 sig. worse than F7. No one outperforms F1
nor F7.
4. Observations and Conclusions
A) No advanced model outperforms the baseline mean.
B) Equal performance for sorting-based (F2s, F3s, F8s) and rule-based (F2, F3, F8) assignment of Qij .
C) Training per condition does not improve performance, in case ofRMSE for F4 it even leads to unstable performance (large confi-dence intervals).
Condition E3
1. Visualizing the results: Errorbar plots showing the mean values & 95% confidence intervals.
2.1 Testing for significant differences between functions F1 - F8s: OnewayANOVAs & PostHoc tests with Sidak correction, tests conducted separatelyfor two training modes (whole data, per condition), significance level p ≤ 0.05.Significant differences found for:
Measure Training ANOVA PostHoc Functions
RMSE whole data p = 0.018 p = 0.011 F6 vs. F7
p = 0.013 F6 vs. F3sp = 0.020 F6 vs. F4
p = 0.032 F6 vs. F3
2.2 Testing for differences between two training modes: T-tests, significancelevel p ≤ 0.05. Significant differences found for:
RMSE F6: p = 0.000
3. Behavior of modeling functions
Measure Baseline (F1 & F7) Advanced (F2–F6, F8, F8s)
Rho, RMSE F1 slightly worse than F7
(not sig.)No one outperforms F1
nor F7.
4. Observations and Conclusions
A) No advanced model outperforms the baseline mean.
B) Equal performance for sorting-based (F2s, F3s, F8s) and rule-based (F2, F3, F8) assignment of Qij .
C) Training per condition improves performance only for F6, andleads to unstable performance for F3s (large confidence inter-vals).
Condition E3symFigure H.34: Modeling performance forconditions E3 (top panel) and E3sym(bottom panel) of Experiment LOT2.

424 quality of experience of multiparty conferencing and telemeeting systems
1. Visualizing the results: Errorbar plots showing the mean values & 95% confidence intervals.
2.1 Testing for significant differences between functions F1 - F8s:Oneway ANOVAs & PostHoc tests with Sidak correction, tests con-ducted separately for two training modes (whole data, per condition),significance level p ≤ 0.05. No significant differences found.
Measure Training ANOVA PostHoc Functions
RMSE whole data p = 0.000 p = 0.001 F7 vs. F6
p = 0.000 F7 vs. all other
RMSE per condition p = 0.000 p = 0.000 F7 vs. all other
2.2 Testing for differences between two training modes: T-tests, sig-nificance level p ≤ 0.05. No significant differences found.
3. Behavior of modeling functions
Measure Baseline (F1 & F7) Advanced (F2–F6, F8, F8s)
Rho F1 essentially equal to F7. No one outperforms F1.
RMSE F1 sig. better than F7. No one outperforms F1.
4. Observations and Conclusions
A) No advanced model outperforms the baseline mean.
B) Equal performance for sorting-based (F2s, F3s, F8s) and rule-based (F2, F3, F8) assignment of Qij .
C) Training per condition does not improve performance.
Condition P1
1. Visualizing the results: Errorbar plots showing the mean values & 95% confidence intervals.
2.1 Testing for significant differences between functions F1 - F8s:Oneway ANOVAs & PostHoc tests with Sidak correction, tests con-ducted separately for two training modes (whole data, per condition),significance level p ≤ 0.05. No significant differences found.
2.2 Testing for differences between two training modes: T-tests, sig-nificance level p ≤ 0.05. No significant differences found.
3. Behavior of modeling functions
Measure Baseline (F1 & F7) Advanced (F2–F6, F8, F8s)
Rho F1 essentially equal to F7. No one outperforms F1.
RMSE F1 slightly better than F7
(not sig.)No one outperforms F1.
4. Observations and Conclusions
A) No advanced model outperforms the baseline mean.
B) Equal performance for sorting-based (F2s, F3s, F8s) and rule-based (F2, F3, F8) assignment of Qij .
C) Training per condition does not improve performance.
Condition P1symFigure H.35: Modeling performance forconditions P1 (top panel) and P1sym(bottom panel) of Experiment LOT2.

detailed results: model performance 425
1. Visualizing the results: Errorbar plots showing the mean values & 95% confidence intervals.
2.1 Testing for significant differences between functions F1 - F8s: OnewayANOVAs & PostHoc tests with Sidak correction, tests conducted separatelyfor two training modes (whole data, per condition), significance level p ≤ 0.05.No significant differences found.
Measure Training ANOVA PostHoc Functions
Rho whole data p = 0.006 p = 0.179
(n.s.)F2 vs. F6, F7
RMSE whole data p = 0.000 p = 0.000 F1, F5 vs. F3, F4
p = 0.001 F1, F5 vs. F3sp = 0.003 F1, F5 vs. F2, F2s, F8sp = 0.004 F1, F5 vs. F8
p = 0.038 F1, F5 vs. F6
p = 0.002 F7 vs. F4
p = 0.011 F7 vs. F3
p = 0.027 F7 vs. F3sRMSE per condition p = 0.000 p = 0.003 F1, F5 vs. F2
p = 0.006 F1, F5 vs. F3
p = 0.008 F1, F5 vs. F8
p = 0.025 F1, F5 vs. F2sp = 0.027 F1, F5 vs. F4
p = 0.048 F1, F5 vs. F3sp = 0.048 F7 vs. F2
2.2 Testing for differences between two training modes: T-tests, sig-nificance level p ≤ 0.05. No significant differences found.
3. Behavior of modeling functions
Measure Baseline (F1 & F7) Advanced (F2–F6, F8, F8s)
Rho F1 slightly better than F7
(not sig.)No one outperforms F1.
RMSE F1 slightly worse than F7
(not sig.)F2, F2s, F3, F3s, F4, F8, F8sand F6 trained on wholedata outperform F1. F3,F3s & F4 trained on wholedata and F2 trained percondition outperform F7.
4. Observations and Conclusions
A) Eight advanced models outperform the baseline mean, four thebaseline minimum.
B) Equal performance for sorting-based (F2s, F3s, F8s) and rule-based (F2, F3, F8) assignment of Qij .
C) Training per condition does not improve performance.
Condition P3
1. Visualizing the results: Errorbar plots showing the mean values & 95% confidence intervals.
2.1 Testing for significant differences between functions F1 - F8s: OnewayANOVAs & PostHoc tests with Sidak correction, tests conducted separatelyfor two training modes (whole data, per condition), significance level p ≤ 0.05.Significant differences found for:
Measure Training ANOVA PostHoc Functions
RMSE whole data p = 0.000 p = 0.000 F6 vs. all other
2.2 Testing for differences between two training modes: T-tests, significancelevel p ≤ 0.05. Significant differences found for:
RMSE F6: p = 0.000
3. Behavior of modeling functions
Measure Baseline (F1 & F7) Advanced (F2–F6, F8, F8s)
Rho, RMSE F1 essentially equal to F7. No one outperforms F1.
4. Observations and Conclusions
A) No advanced model outperforms the baseline mean.
B) Equal performance for sorting-based (F2s, F3s, F8s) and rule-based (F2, F3, F8) assignment of Qij .
C) Training per condition improves performance only for F6.
Condition P3symFigure H.36: Modeling performance forconditions P3 (top panel) and P3sym(bottom panel) of Experiment LOT2.

426 quality of experience of multiparty conferencing and telemeeting systems
1. Visualizing the results: Errorbar plots showing the mean values & 95% confidence intervals.
2.1 Testing for significant differences between functions F1 - F8s: OnewayANOVAs & PostHoc tests with Sidak correction, tests conducted separatelyfor two training modes (whole data, per condition), significance level p ≤ 0.05.No significant differences found.
Measure Training ANOVA PostHoc Functions
RMSE whole data p = 0.000 p = 0.000 F1, F5 vs. F2s, F3, F3s, F4,F8s
p = 0.005 F1, F5 vs. F8
p = 0.015 F1, F5 vs. F2
p = 0.000 F7 vs. F2, F2s, F3, F3s, F4,F6, F8, F8s
RMSE per condition p = 0.000 p = 0.000 F1, F5 vs. F2s, F3, F4, F8sp = 0.002 F1, F5 vs. F3sp = 0.003 F1, F5 vs. F8
p = 0.006 F1, F5 vs. F6
p = 0.016 F1, F5 vs. F2
p = 0.000 F7 vs. F2, F2s, F3, F3s, F4,F6, F8, F8s
2.2 Testing for differences between two training modes: T-tests, sig-nificance level p ≤ 0.05. No significant differences found.
3. Behavior of modeling functions
Measure Baseline (F1 & F7) Advanced (F2–F6, F8, F8s)
Rho F1 essentially equal to F7. No one outperforms F1.
RMSE F1 slightly better than F7
(not sig.)All except F5 outperformF1.
4. Observations and Conclusions
A) Eight advanced models outperform the baseline mean, all withnot sig. different performance.
B) Equal performance for sorting-based (F2s, F3s, F8s) and rule-based (F2, F3, F8) assignment of Qij .
C) Training per condition does not improve performance.
Condition P4
1. Visualizing the results: Errorbar plots showing the mean values & 95% confidence intervals.
2.1 Testing for significant differences between functions F1 - F8s: OnewayANOVAs & PostHoc tests with Sidak correction, tests conducted separatelyfor two training modes (whole data, per condition), significance level p ≤ 0.05.Significant differences found for:
Measure Training ANOVA PostHoc Functions
RMSE whole data p = 0.000 p = 0.000 F6 vs. F3, F3s, F7, F8
p = 0.001 F6 vs. F2s, F8sp = 0.003 F6 vs.F2
p = 0.023 F1, F5 vs. F4
p = 0.029 F1, F5 vs. F3s
2.2 Testing for differences between two training modes: T-tests, significancelevel p ≤ 0.05. Significant differences found for:
RMSE F6: p = 0.000
3. Behavior of modeling functions
Measure Baseline (F1 & F7) Advanced (F2–F6, F8, F8s)
Rho F1 slightly worse than F7
(not sig.)No one outperforms F1
nor F7.
RMSE F1 slightly worse than F7
(not sig.)F3s & F4 trained on wholedata outperform F1.
4. Observations and Conclusions
A) Two advanced models (trained on whole data) outperform thebaseline mean, but not the minimum.
B) Equal performance for sorting-based (F2s, F3s, F8s) and rule-based (F2, F3, F8) assignment of Qij .
C) Training per condition improves performance only for F6.
Condition P4symFigure H.37: Modeling performance forconditions P4 (top panel) and P4sym(bottom panel) of Experiment LOT2.

detailed results: model performance 427
H.6 Experiment AVCT1
H.6.1 Performance across technical conditions
1. Visualizing the results: Errorbar plots showing the mean values & 95% confidence intervals.
2.1 Testing for significant differences between functions F1 - F8s:Oneway ANOVAs & PostHoc tests with Sidak correction, tests con-ducted separately for two training modes (whole data, per condition),significance level p ≤ 0.05. Significant differences found for:
Measure Training ANOVA PostHoc Functions
RMSE whole data p = 0.000 p = 0.000 F7 vs. all other
RMSE per condition p = 0.000 p = 0.000 F3s, F7 vs. F1,F2, F2s, F4, F5,F8, F8s
p = 0.001 F3s, F7 vs. F6
p = 0.003 F3s, F7 vs. F3
2.2 Testing for differences between two training modes: T-tests, sig-nificance level p ≤ 0.05. Significant differences found for:
Measure T-test Functions Measure T-test Functions
Rho p = 0.012 F3s RMSE p = 0.001 F3s
3. Behavior of modeling functions
Measure Baseline (F1 & F7) Advanced (F2–F6, F8, F8s)
Rho F1 slightly better than F7
(not sig.)No one outperforms F1.
RMSE F1 sig. better than F7. No one outperforms F1.
4. Observations and Conclusions
A) No advanced model outperforms the baseline mean.
B) Equal performance for sorting-based (F2s, F3s, F8s) and rule-based (F2, F3, F8) assignment of Qij .
C) Training per condition does not improve performance, for F3s iteven reduces performance.
Figure H.38: Modeling performanceacross all technical conditions of Experi-ment AVCT1.

428 quality of experience of multiparty conferencing and telemeeting systems
H.6.2 Performance per technical condition
1. Visualizing the results: Errorbar plots showing the mean values & 95% confidence intervals.
2.1 Testing for significant differences between functions F1 - F8s: OnewayANOVAs & PostHoc tests with Sidak correction, tests conducted separatelyfor two training modes (whole data, per condition), significance level p ≤ 0.05.No significant differences found.
2.2 Testing for differences between two training modes: T-tests, significancelevel p ≤ 0.05. No significant differences found.
3. Behavior of modeling functions
Measure Baseline (F1 & F7) Advanced (F2–F6, F8, F8s)
Rho F1 essentially equal to F7. No one outperforms F1.RMSE F1 slightly better than F7
(not sig.)No one outperforms F1.
4. Observations and Conclusions
A) No advanced model outperforms the baseline mean.B) Equal performance for sorting-based (F2s, F3s, F8s) and rule-
based (F2, F3, F8) assignment of Qij .C) Training per condition does not improve performance.
Condition AVRef
1. Visualizing the results: Errorbar plots showing the mean values & 95% confidence intervals.
2.1 Testing for significant differences between functions F1 - F8s: OnewayANOVAs & PostHoc tests with Sidak correction, tests conducted separatelyfor two training modes (whole data, per condition), significance level p ≤ 0.05.Significant differences found for:
Measure Training ANOVA PostHoc Functions
RMSE whole data p = 0.000 p = 0.000 F7 vs. F1, F2, F5
p = 0.001 F7 vs. F2sp = 0.015 F7 vs. F4
p = 0.031 F7 vs. F8sRMSE per condition p = 0.000 p = 0.000 F7 vs. F1, F5
p = 0.001 F7 vs. F2s, F8, F8sp = 0.005 F7 vs. F2
p = 0.010 F7 vs. F4
p = 0.041 F7 vs. F3s
2.2 Testing for differences between two training modes: T-tests, sig-nificance level p ≤ 0.05. No significant differences found.
3. Behavior of modeling functions
Measure Baseline (F1 & F7) Advanced (F2–F6, F8, F8s)
Rho F1 slightly better than F7
(not sig.)No one outperforms F1.
RMSE F1 sig. better than F7. No one outperforms F1.
4. Observations and Conclusions
A) No advanced model outperforms the baseline mean.B) Equal performance for sorting-based (F2s, F3s, F8s) and rule-
based (F2, F3, F8) assignment of Qij .C) Training per condition does not improve performance.
Condition VF1Figure H.39: Modeling performance forconditions AVRef (top panel) and VF1
(bottom panel) of Experiment AVCT1.

detailed results: model performance 429
1. Visualizing the results: Errorbar plots showing the mean values & 95% confidence intervals.
2.1 Testing for significant differences between functions F1 - F8s: OnewayANOVAs & PostHoc tests with Sidak correction, tests conducted separatelyfor two training modes (whole data, per condition), significance level p ≤ 0.05.Significant differences found for:
Measure Training ANOVA PostHoc Functions
RMSE whole data p = 0.000 p = 0.000 F7 vs. all otherRMSE per condition p = 0.000 p = 0.000 F3s vs. all other
p = 0.001 F7 vs. F1, F2, F2s, F5
p = 0.002 F7 vs. F4, F8, F8sp = 0.007 F7 vs. F3
p = 0.010 F7 vs. F6
2.2 Testing for differences between two training modes: T-tests, significancelevel p ≤ 0.05. Significant differences found for:
RMSE F3s: p = 0.005
3. Behavior of modeling functions
Measure Baseline (F1 & F7) Advanced (F2–F6, F8, F8s)
Rho F1 slightly better than F7
(not sig.)No one outperforms F1.
RMSE F1 sig. better than F7. No one outperforms F1.
4. Observations and Conclusions
A) No advanced model outperforms the baseline mean.
B) Equal performance for sorting-based (F2s, F3s, F8s) and rule-based (F2, F3, F8) assignment of Qij .
C) Training per condition does not improve performance, in case ofRMSE for F3s it even reduces performance.
Condition VR
1. Visualizing the results: Errorbar plots showing the mean values & 95% confidence intervals.
2.1 Testing for significant differences between functions F1 - F8s: OnewayANOVAs & PostHoc tests with Sidak correction, tests conducted separatelyfor two training modes (whole data, per condition), significance level p ≤ 0.05.Significant differences found for:
Measure Training ANOVA PostHoc Functions
RMSE whole data p = 0.000 p = 0.000 F7 vs. F1, F2, F2s, F4, F5,F8, F8s
p = 0.002 F7 vs. F6
p = 0.003 F7 vs. F3sp = 0.040 F7 vs. F3
RMSE per condition p = 0.000 p = 0.000 F7 vs. F1, F5
p = 0.001 F7 vs. F4
p = 0.003 F7 vs. F6
p = 0.004 F7 vs. F2sp = 0.005 F7 vs. F8sp = 0.007 F7 vs. F2
p = 0.008 F7 vs. F8
2.2 Testing for differences between two training modes: T-tests, sig-nificance level p ≤ 0.05. Significant differences found for:
RMSE F3s: p = 0.047
3. Behavior of modeling functions
Measure Baseline (F1 & F7) Advanced (F2–F6, F8, F8s)
Rho F1 slightly better than F7
(not sig.)No one outperforms F1.
RMSE F1 sig. better than F7. No one outperforms F1.
4. Observations and Conclusions
A) No advanced model outperforms the baseline mean.B) Equal performance for sorting-based (F2s, F3s, F8s) and rule-
based (F2, F3, F8) assignment of Qij .C) Training per condition does not improve performance, in case of
RMSE for F3s it even reduces performance.
Condition FM2Figure H.40: Modeling performance forconditions VR (top panel) and FM2 (bot-tom panel) of Experiment AVCT1.

430 quality of experience of multiparty conferencing and telemeeting systems
1. Visualizing the results: Errorbar plots showing the mean values & 95% confidence intervals.
2.1 Testing for significant differences between functions F1 - F8s:Oneway ANOVAs & PostHoc tests with Sidak correction, tests con-ducted separately for two training modes (whole data, per condition),significance level p ≤ 0.05. No significant differences found.
2.2 Testing for differences between two training modes: T-tests, sig-nificance level p ≤ 0.05. No significant differences found.
3. Behavior of modeling functions
Measure Baseline (F1 & F7) Advanced (F2–F6, F8, F8s)
Rho F1 essentially equal to F7. No one outperforms F1.
RMSE F1 sig. better than F7. No one outperforms F1.
4. Observations and Conclusions
A) No advanced model outperforms the baseline mean.
B) Equal performance for sorting-based (F2s, F3s, F8s) and rule-based (F2, F3, F8) assignment of Qij .
C) Training per condition does not improve performance.
Condition E2
1. Visualizing the results: Errorbar plots showing the mean values & 95% confidence intervals.
2.1 Testing for significant differences between functions F1 - F8s:Oneway ANOVAs & PostHoc tests with Sidak correction, tests con-ducted separately for two training modes (whole data, per condition),significance level p ≤ 0.05. No significant differences found.
2.2 Testing for differences between two training modes: T-tests, sig-nificance level p ≤ 0.05. Significant differences found for:
RMSE F4: p = 0.029
3. Behavior of modeling functions
Measure Baseline (F1 & F7) Advanced (F2–F6, F8, F8s)
Rho, RMSE F1 essentially equal to F7. No one outperforms F1.
4. Observations and Conclusions
A) No advanced model outperforms the baseline mean.
B) Equal performance for sorting-based (F2s, F3s, F8s) and rule-based (F2, F3, F8) assignment of Qij .
C) Training per condition does not improve performance, for F4
it leads to reduced and unstable performance (large confidenceintervals).
Condition FM2-VF1Figure H.41: Modeling performance forconditions E2 (top panel) and FM2-VF1
(bottom panel) of Experiment AVCT1.

detailed results: model performance 431
1. Visualizing the results: Errorbar plots showing the mean values & 95% confidence intervals.
2.1 Testing for significant differences between functions F1 - F8s: OnewayANOVAs & PostHoc tests with Sidak correction, tests conducted separatelyfor two training modes (whole data, per condition), significance level p ≤ 0.05.Significant differences found for:
Measure Training ANOVA PostHoc Functions
Rho whole data p = 0.004 p = 0.080
(n.s.)F1, F5 vs. F6, F7
Rho per condition p = 0.001 p = 0.032 F6, F7 vs. F8sp = 0.044 F6, F7 vs. F8
RMSE whole data p = 0.000 p = 0.000 F7 vs. F1, F4, F5, F8, F8sp = 0.001 F7 vs. F2, F3, F3sp = 0.002 F7 vs. F2s
RMSE per condition p = 0.000 p = 0.000 F1, F5 vs. F7
p = 0.003 F1, F5 vs. F3sp = 0.009 F1, F5 vs. F6
p = 0.018 F1, F5 vs. F3
p = 0.014 F7 vs. F8sp = 0.031 F7 vs. F8
2.2 Testing for differences between two training modes: T-tests, sig-nificance level p ≤ 0.05. Significant differences found for:
Measure T-test Functions Measure T-test Functions
RMSE p = 0.003 F3 RMSE p = 0.001 F3s
3. Behavior of modeling functions
Measure Baseline (F1 & F7) Advanced (F2–F6, F8, F8s)
Rho F1 slightly better than F7
(not sig.)No one outperforms F1.
RMSE F1 sig. better than F7. No one outperforms F1.
4. Observations and Conclusions
A) No advanced model outperforms the baseline mean.
B) Equal performance for sorting-based (F2s, F3s, F8s) and rule-based (F2, F3, F8) assignment of Qij .
C) Training per condition does not improve performance, in case ofRMSE for F3 & F3s it even reduces performance.
Condition E2-VF1
1. Visualizing the results: Errorbar plots showing the mean values & 95% confidence intervals.
2.1 Testing for significant differences between functions F1 - F8s: OnewayANOVAs & PostHoc tests with Sidak correction, tests conducted separatelyfor two training modes (whole data, per condition), significance level p ≤ 0.05.Significant differences found for:
Measure Training ANOVA PostHoc Functions
RMSE whole data p = 0.005 p = 0.006 F7 vs. F4
p = 0.008 F7 vs. F2, F2sp = 0.009 F7 vs. F1, F5
p = 0.010 F7 vs. F8, F8sp = 0.011 F7 vs. F3sp = 0.015 F7 vs. F6
RMSE per condition p = 0.016 p = 0.006 F7 vs. F1, F5
p = 0.049 F7 vs. F2s
2.2 Testing for differences between two training modes: T-tests, sig-nificance level p ≤ 0.05. No significant differences found.
3. Behavior of modeling functions
Measure Baseline (F1 & F7) Advanced (F2–F6, F8, F8s)
Rho F1 essentially equal to F7. No one outperforms F1.RMSE F1 sig. better than F7. No one outperforms F1.
4. Observations and Conclusions
A) No advanced model outperforms the baseline mean.B) Equal performance for sorting-based (F2s, F3s, F8s) and rule-
based (F2, F3, F8) assignment of Qij .C) Training per condition does not improve performance.
Condition FM2-VRFigure H.42: Modeling performancefor conditions E2-VF1 (top panel) andFM2-VR (bottom panel) of ExperimentAVCT1.

432 quality of experience of multiparty conferencing and telemeeting systems
1. Visualizing the results: Errorbar plots showing the mean values & 95% confidence intervals.
2.1 Testing for significant differences between functions F1 - F8s:Oneway ANOVAs & PostHoc tests with Sidak correction, tests con-ducted separately for two training modes (whole data, per condition),significance level p ≤ 0.05. Significant differences found for:
Measure Training ANOVA PostHoc Functions
RMSE whole data p = 0.000 p = 0.000 F7 vs. F2, F2s,F3, F3s, F4, F8,F8s
p = 0.002 F7 vs. F1, F5
RMSE per condition p = 0.006 p = 0.013 F7 vs. F2, F2s
p = 0.014 F7 vs. F8s
p = 0.015 F7 vs. F8
p = 0.036 F7 vs. F, F5
2.2 Testing for differences between two training modes: T-tests, sig-nificance level p ≤ 0.05. No significant differences found.
3. Behavior of modeling functions
Measure Baseline (F1 & F7) Advanced (F2–F6, F8, F8s)
Rho F1 slightly better than F7
(not sig.)No one outperforms F1.
RMSE F1 sig. better than F7. No one outperforms F1.
4. Observations and Conclusions
A) No advanced model outperforms the baseline mean.
B) Equal performance for sorting-based (F2s, F3s, F8s) and rule-based (F2, F3, F8) assignment of Qij .
C) Training per condition does not improve performance, for F3
& F3s it even leads to unstable performance (large confidenceintervals).
Condition E2-VRFigure H.43: Modeling performance forcondition E2-VR of Experiment AVCT1.

detailed results: model performance 433
H.7 Experiment AVCT2
H.7.1 Performance across technical conditions
1. Visualizing the results: Errorbar plots showing the mean values & 95% confidence intervals.
2.1 Testing for significant differences between functions F1 - F8s: OnewayANOVAs & PostHoc tests with Sidak correction, tests conducted separatelyfor two training modes (whole data, per condition), significance level p ≤ 0.05.Significant differences found for:
Measure Training ANOVA PostHoc Functions
Rho whole data P = 0.000 p = 0.007 F6, F7 vs. F4
p = 0.010 F6, F7 vs. F8
p = 0.011 F6, F7 vs. F2
p = 0.015 F6, F7 vs. F2sp = 0.017 F6, F7 vs. F8s
Rho per condition p = 0.000 p = 0.024 F7 vs.F2sp = 0.037 F7 vs. F8
RMSE whole data p = 0.000 p = 0.000 F7 vs. all otherp = 0.000 F1, F3s, F5 vs. F2, F2s, F4,
F8, F8sp = 0.001 F3 vs. F4
p = 0.002 F3 vs. F2, F8
p = 0.003 F3 vs. F2s, F8sRMSE per condition p = 0.000 p = 0.000 F7 vs. all other
p = 0.000 F1, F5 vs. F2, F2s, F6, F8,F8s
p = 0.005 F1, F5 vs. F4
p = 0.000 F3s vs. F2, F2s, F8, F8sp = 0.009 F3s vs. F6
p = 0.008 F3 vs- F2sp = 0.011 F3 vs. F8sp = 0.022 F3 vs. F2
p = 0.028 F3 vs. F8
2.2 Testing for differences between two training modes: T-tests, sig-nificance level p ≤ 0.05. Significant differences found for:
Measure T-test Functions Measure T-test Functions
Rho p = 0.007 F4 Rho p = 0.041 F6
RMSE P = 0.000 F4 RMSE p = 0.016 F6
3. Behavior of modeling functions
Measure Baseline (F1 & F7) Advanced (F2–F6, F8, F8s)
Rho F1 slightly better than F7
(not sig.)No one outperforms F1.F2, F2s, F8, F8s and F4
trained on whole data per-form slightly better (notsig.)
RMSE F1 sig. better than F7. F2, F2s, F4, F8, F8s and F6
trained per condition out-perform F1.
4. Observations and Conclusions
A) Six advanced models outperform the baseline mean.
B) Equal performance for sorting-based (F2s, F3s, F8s) and rule-based (F2, F3, F8) assignment of Qij .
C) Training per condition improves performance for F6 and reducesperformance for F4.
Figure H.44: Modeling performanceacross all technical conditions of Experi-ment AVCT2.

434 quality of experience of multiparty conferencing and telemeeting systems
H.7.2 Performance per technical condition
1. Visualizing the results: Errorbar plots showing the mean values & 95% confidence intervals.
2.1 Testing for significant differences between functions F1 - F8s:Oneway ANOVAs & PostHoc tests with Sidak correction, tests con-ducted separately for two training modes (whole data, per condition),significance level p ≤ 0.05. No significant differences found.
Measure Training ANOVA PostHoc Functions
RMSE whole data p = 0.000 p = 0.026 F7 vs. F1, F5
p = 0.002 F3 vs. F1, F5
p = 0.008 F3 vs. F2
p = 0.010 F3 vs. F2sp = 0.034 F3 vs. F8sp = 0.042 F3 vs. F8
RMSE per condition p = 0.007 p = 0.010 F7 vs. F1, F5
p = 0.017 F7 vs. F8
p = 0.026 F7 vs. F8s
2.2 Testing for differences between two training modes: T-tests, significancelevel p ≤ 0.05. Significant differences found for: RMSE F3: p = 0.017
3. Behavior of modeling functions
Measure Baseline (F1 & F7) Advanced (F2–F6, F8, F8s)
Rho F1 essentially equal to F7. No one outperforms F1.RMSE F1 sig. better than F7. No one outperforms F1.
4. Observations and Conclusions
A) No advanced model outperforms the baseline mean.B) Equal performance for sorting-based (F2s, F3s, F8s) and rule-based (F2,
F3, F8) assignment of Qij .C) Training per condition improves performance only for F3.
Condition AVRef
1. Visualizing the results: Errorbar plots showing the mean values & 95% confidence intervals.
2.1 Testing for significant differences between functions F1 - F8s:Oneway ANOVAs & PostHoc tests with Sidak correction, tests con-ducted separately for two training modes (whole data, per condition),significance level p ≤ 0.05. Significant differences found for:
Measure Training ANOVA PostHoc Functions
RMSE whole data p = 0.000 p = 0.000 F7 vs. all otherp = 0.003 F3 vs. F2
p = 0.009 F3 vs. F2sp = 0.024 F3 vs. F8
p = 0.029 F3 vs. F8sp = 0.041 F3 vs. F4
p = 0.002 F3s vs. F2
p = 0.006 F3s vs. F2sp = 0.016 F3s vs. F8
p = 0.019 F3s vs. F8sp = 0.028 F3s vs. F4
RMSE per condition p = 0.000 p = 0.001 F7 vs. F3sp = 0.000 F7 vs. all otherp = 0.029 F3s vs. F2
p = 0.039 F3s vs. F8
2.2 Testing for differences between two training modes: T-tests, significancelevel p ≤ 0.05. No significant differences found.
3. Behavior of modeling functions
Measure Baseline (F1 & F7) Advanced (F2–F6, F8, F8s)
Rho F1 slightly better thanF7 (not sig.)
No one outperforms F1.
RMSE F1 sig. better than F7. No one outperforms F1. F2, F2s, F4,F6, F8 & F8s perform slightly better (notsig.)
4. Observations and Conclusions
A) No advanced model outperforms the baseline mean. Six models areslightly better (not sig.)
B) Equal performance for sorting-based (F2s, F3s, F8s) and rule-based (F2,F3, F8) assignment of Qij .
C) Training per condition does not improve performance, in case of RMSEfor F4 it even reduces performance.
Condition VF2 Figure H.45: Modeling performance forconditions AVRef (top panel) and VF2
(bottom panel) of Experiment AVCT2.

detailed results: model performance 435
1. Visualizing the results: Errorbar plots showing the mean values & 95% confidence intervals.
2.1 Testing for significant differences between functions F1 - F8s: OnewayANOVAs & PostHoc tests with Sidak correction, tests conducted separatelyfor two training modes (whole data, per condition), significance level p ≤ 0.05.Significant differences found for:
Measure Training ANOVA PostHoc Functions
Rho whole data p = 0.009 p = 0.100
(n.s.)F6, F7 vs. F2
Rho per condition p = 0.001 p = 0.016 F6, F7 vs. F2s, F8sRMSE whole data p = 0.000 p = 0.000 F7 vs. F1, F2, F5, F8
p = 0.001 F7 vs. F2s, F8sp = 0.002 F7 vs. F4
RMSE per condition p = 0.000 p = 0.000 F7 vs. F1, F2s, F5, F8sp = 0.001 F7 vs. F4
p = 0.002 F7 vs. F2, F3, F8
p = 0.007 F7 vs. F3s
2.2 Testing for differences between two training modes: T-tests, sig-nificance level p ≤ 0.05. No significant differences found.
3. Behavior of modeling functions
Measure Baseline (F1 & F7) Advanced (F2–F6, F8, F8s)
Rho F1 slightly better than F7
(not sig.)No one outperforms F1.
RMSE F1 sig. better than F7. No one outperforms F1.
4. Observations and Conclusions
A) No advanced model outperforms the baseline mean.
B) Equal performance for sorting-based (F2s, F3s, F8s) and rule-based (F2, F3, F8) assignment of Qij .
C) Training per condition does not improve performance.
Condition VF2sym
1. Visualizing the results: Errorbar plots showing the mean values & 95% confidence intervals.
2.1 Testing for significant differences between functions F1 - F8s: OnewayANOVAs & PostHoc tests with Sidak correction, tests conducted separatelyfor two training modes (whole data, per condition), significance level p ≤ 0.05.Significant differences found for:
Measure Training ANOVA PostHoc Functions
RMSE whole data p = 0.000 p = 0.000 F7 vs. all otherp = 0.000 F1, F5 vs. F2, F2s, F4, F6,
F8, F8sp = 0.002 F1, F5 vs. F3
p = 0.001 F3s vs. F2s, F8sp = 0.002 F3s vs. F4
p = 0.004 F3s vs. F8
p = 0.008 F3s vs. F2
RMSE per condition p = 0.000 p = 0.000 F7 vs. all otherp = 0.000 F1, F5 vs. F2, F2s, F3, F4,
F6, F8, F8sp = 0.002 F1, F5 vs. F3s
2.2 Testing for differences between two training modes: T-tests, significancelevel p ≤ 0.05. Significant differences found for: RMSE F4: p = 0.040
3. Behavior of modeling functions
Measure Baseline (F1 & F7) Advanced (F2–F6, F8, F8s)
Rho F1 essentially equal toF7.
No one outperforms F1.
RMSE F1 sig. better than F7. F2, F2s, F3, F6, F8, F8s andF3s trained per condition out-perform F1.
4. Observations and Conclusions
A) Seven advanced models outperform the baseline mean. F4
(trained on whole data) is the best, though not sig. differentfrom the other six.
B) Equal performance for sorting-based (F2s, F3s, F8s) and rule-based (F2, F3, F8) assignment of Qij .
C) Training per condition does not improve performance, in case ofRMSE for F4 it even reduces performance.
Condition VBFigure H.46: Modeling performance forconditions VF2sym (top panel) and VB(bottom panel) of Experiment AVCT2.

436 quality of experience of multiparty conferencing and telemeeting systems
1. Visualizing the results: Errorbar plots showing the mean values & 95% confidence intervals.
2.1 Testing for significant differences between functions F1 - F8s:Oneway ANOVAs & PostHoc tests with Sidak correction, tests con-ducted separately for two training modes (whole data, per condition),significance level p ≤ 0.05. Significant differences found for:
Measure Training ANOVA PostHoc Functions
RMSE whole data p = 0.000 p = 0.002 F6 vs. F3, F8
p = 0.003 F6 vs. F4
p = 0.005 F6 vs. F8sp = 0.007 F6 vs. F3sp = 0.008 F6 vs. F2
p = 0.015 F6 vs. F2sRMSE per condition p = 0.000 p = 0.039 F1, F5 vs. F8
2.2 Testing for differences between two training modes: T-tests, sig-nificance level p ≤ 0.05. Significant differences found for:
RMSE F6: p = 0.023
3. Behavior of modeling functions
Measure Baseline (F1 & F7) Advanced (F2–F6, F8, F8s)
Rho F1 essentially equal to F7. No one outperforms F1.
RMSE F1 essentially equal to F7. F8 trained per conditionoutperforms F1 but not F7.F2, F2s, F4 & F8s performslightly better than F1 (notsig.)
4. Observations and Conclusions
A) One advanced model (f8 trained on whole data) sig. outper-forms the baseline mean but not the baseline minimum.
B) Equal performance for sorting-based (F2s, F3s, F8s) and rule-based (F2, F3, F8) assignment of Qij .
C) Training per condition improves performance only for F6.
Condition VBsym
1. Visualizing the results: Errorbar plots showing the mean values & 95% confidence intervals.
2.1 Testing for significant differences between functions F1 - F8s:Oneway ANOVAs & PostHoc tests with Sidak correction, tests con-ducted separately for two training modes (whole data, per condition),significance level p ≤ 0.05. Significant differences found for:
Measure Training ANOVA PostHoc Functions
RMSE whole data p = 0.020 p = 0.006 F7 vs. F4
p = 0.046 F7 vs. F8
RMSE per condition p = 0.086
(n.s.)p = 0.017 F7 vs. F4
2.2 Testing for differences between two training modes: T-tests, sig-nificance level p ≤ 0.05. No significant differences found.
3. Behavior of modeling functions
Measure Baseline (F1 & F7) Advanced (F2–F6, F8, F8s)
Rho F1 essentially equal to F7. No one outperforms F1.
RMSE F1 slightly better than F7
(not sig.)No one outperforms F1.
4. Observations and Conclusions
A) No advanced model outperforms the baseline mean.
B) Equal performance for sorting-based (F2s, F3s, F8s) and rule-based (F2, F3, F8) assignment of Qij .
C) Training per condition does not improve performance.
Condition E2Figure H.47: Modeling performance forconditions VBsym (top panel) and E2
(bottom panel) of Experiment AVCT2.

detailed results: model performance 437
1. Visualizing the results: Errorbar plots showing the mean values & 95% confidence intervals.
2.1 Testing for significant differences between functions F1 - F8s:Oneway ANOVAs & PostHoc tests with Sidak correction, tests con-ducted separately for two training modes (whole data, per condition),significance level p ≤ 0.05. Significant differences found for:
Measure Training ANOVA PostHoc Functions
Rho whole data p = 0.029 p = 0.516
(n.s.)F1, F5 vs. F2s
RMSE whole data p = 0.000 p = 0.000 F7 vs. F2, F2s,F3s, F4, F6, F8,F8s
p = 0.040 F1, F5 vs. F2sp = 0.001 F3 vs. F2s, F4
p = 0.002 F3 vs. F8sp = 0.003 F3 vs. F2
p = 0.008 F3 vs. F8
RMSE per condition p = 0.000 p = 0.000 F7 vs. F2, F2s,F4, F8, F8s
p = 0.007 F7 vs. F6
2.2 Testing for differences between two training modes: T-tests, sig-nificance level p ≤ 0.05. No significant differences found.
3. Behavior of modeling functions
Measure Baseline (F1 & F7) Advanced (F2–F6, F8, F8s)
Rho F1 slightly worse than F7
(not sig.)No one outperforms F1.
RMSE F1 sig. better than F7. F2s outperforms F1. F2,F4, F8 & F8s performslightly better than F1 (notsig.)
4. Observations and Conclusions
A) No advanced model outperforms the baseline mean.B) Equal performance for sorting-based (F2s, F3s, F8s) and rule-
based (F2, F3, F8) assignment of Qij .C) Training per condition stabilizes performance of F3 (smaller con-
fidence interval), but destabilizes performance of F3s (large con-fidence interval) .
Condition FM4
1. Visualizing the results: Errorbar plots showing the mean values & 95% confidence intervals.
2.1 Testing for significant differences between functions F1 - F8s:Oneway ANOVAs & PostHoc tests with Sidak correction, tests con-ducted separately for two training modes (whole data, per condition),significance level p ≤ 0.05. No significant differences found.
2.2 Testing for differences between two training modes: T-tests, sig-nificance level p ≤ 0.05. No significant differences found.
3. Behavior of modeling functions
Measure Baseline (F1 & F7) Advanced (F2–F6, F8, F8s)
Rho F1 essentially equal to F7. No one outperforms F1.
RMSE F1 slightly worse than F7
(not sig.)No one outperforms F1
nor F7.
4. Observations and Conclusions
A) No advanced model outperforms the baseline mean nor mini-mum.
B) Equal performance for sorting-based (F2s, F3s, F8s) and rule-based (F2, F3, F8) assignment of Qij .
C) Training per condition does not improve performance.
Condition FM4symFigure H.48: Modeling performance forconditions FM4 (top panel) and FM4sym(bottom panel) of Experiment AVCT2.

438 quality of experience of multiparty conferencing and telemeeting systems
1. Visualizing the results: Errorbar plots showing the mean values & 95% confidence intervals.
2.1 Testing for significant differences between functions F1 - F8s:Oneway ANOVAs & PostHoc tests with Sidak correction, tests con-ducted separately for two training modes (whole data, per condition),significance level p ≤ 0.05. Significant differences found for:
Measure Training ANOVA PostHoc Functions
RMSE whole data p = 0.000 p = 0.000 F7 vs. all otherp = 0.005 F3s vs. F2s, F8sp = 0.007 F3s vs. F4
p = 0.012 F3s vs. F8
p = 0.013 F3s vs. F2
RMSE per condition p = 0.000 p = 0.000 F7 vs. all other
2.2 Testing for differences between two training modes: T-tests, sig-nificance level p ≤ 0.05. Significant differences found for:
RMSE F3s: p = 0.032
3. Behavior of modeling functions
Measure Baseline (F1 & F7) Advanced (F2–F6, F8, F8s)
Rho F1 essentially equal to F7. No one outperforms F1.
RMSE F1 sig. better than F7. No one outperforms F1.F2, F2s, F4, F8, & F8s per-form slightly better thanF1 (not sig.)
4. Observations and Conclusions
A) No advanced model outperforms the baseline mean.
B) Equal performance for sorting-based (F2s, F3s, F8s) and rule-based (F2, F3, F8) assignment of Qij .
C) Training per condition does not improve performance.
Condition FM4P3
1. Visualizing the results: Errorbar plots showing the mean values & 95% confidence intervals.
2.1 Testing for significant differences between functions F1 - F8s:Oneway ANOVAs & PostHoc tests with Sidak correction, tests con-ducted separately for two training modes (whole data, per condition),significance level p ≤ 0.05. No significant differences found.
2.2 Testing for differences between two training modes: T-tests, sig-nificance level p ≤ 0.05. No significant differences found.
3. Behavior of modeling functions
Measure Baseline (F1 & F7) Advanced (F2–F6, F8, F8s)
Rho F1 essentially equal to F7. No one outperforms F1.
RMSE F1 slightly worse than F7
(not sig.)No one outperforms F1
nor F7.
4. Observations and Conclusions
A) No advanced model outperforms the baseline mean nor mini-mum.
B) Equal performance for sorting-based (F2s, F3s, F8s) and rule-based (F2, F3, F8) assignment of Qij .
C) Training per condition does not improve performance, for F3
and F3s it even leads to unstable performance (large confidenceintervals).
Condition FM4P3symFigure H.49: Modeling performancefor conditions FM4P3 (top panel) andFM4P3sym (bottom panel) of Experi-ment AVCT2.

detailed results: model performance 439
1. Visualizing the results: Errorbar plots showing the mean values & 95% confidence intervals.
2.1 Testing for significant differences between functions F1 - F8s: OnewayANOVAs & PostHoc tests with Sidak correction, tests conducted separatelyfor two training modes (whole data, per condition), significance level p ≤ 0.05.Significant differences found for:
Measure Training ANOVA PostHoc Functions
RMSE whole data p = 0.000 p = 0.000 F7 vs. F2, F2s, F3, F3s, F4,F6, F8, F8s
p = 0.000 F1, F5 vs. F2, F2s, F4, F6,F8, F8s
RMSE per condition p = 0.000 p = 0.000 F7 vs. F2, F2s, F3, F3s, F4,F6, F8, F8s
p = 0.000 F1, F5 vs. F6
p = 0.002 F1, F5 vs. F4
p = 0.007 F1, F5 vs. F2, F8
p = 0.013 F1, F5 vs. F2sp = 0.014 F1, F5 vs. F8s
2.2 Testing for differences between two training modes: T-tests, sig-nificance level p ≤ 0.05. No significant differences found.
3. Behavior of modeling functions
Measure Baseline (F1 & F7) Advanced (F2–F6, F8, F8s)
Rho F1 slightly worse than F7
(not sig.)No one outperforms F1
nor F7.
RMSE F1 slightly better than F7
(not sig.)F2, F2s, F4, F6, F8 & F8soutperform F1.
4. Observations and Conclusions
A) Six advanced models outperform the baseline mean. F6 is thebest, though not sig. different from the other five.
B) Equal performance for sorting-based (F2s, F3s, F8s) and rule-based (F2, F3, F8) assignment of Qij .
C) Training per condition does not improve performance.
Condition FM4-AVP3
1. Visualizing the results: Errorbar plots showing the mean values & 95% confidence intervals.
2.1 Testing for significant differences between functions F1 - F8s: OnewayANOVAs & PostHoc tests with Sidak correction, tests conducted separatelyfor two training modes (whole data, per condition), significance level p ≤ 0.05.Significant differences found for:
Measure Training ANOVA PostHoc Functions
RMSE whole data p = 0.000 p = 0.000 F7 vs. F1, F2, F2s, F3, F4,F5, F6, F8, F8s
p = 0.001 F7 vs. F3sRMSE per condition p = 0.000 p = 0.000 F7 vs. F1, F2, F2s, F4, F5,
F6, F8, F8sp = 0.005 F7 vs. F3
p = 0.009 F7 vs. F3s
2.2 Testing for differences between two training modes: T-tests, significancelevel p ≤ 0.05. No significant differences found.
3. Behavior of modeling functions
Measure Baseline (F1 & F7) Advanced (F2–F6, F8, F8s)
Rho F1 slightly worse than F7
(not sig.)No one outperforms F1 orF7.
RMSE F1 sig. better than F7. No one outperforms F1.
4. Observations and Conclusions
A) No advanced model outperforms the baseline mean.
B) Equal performance for sorting-based (F2s, F3s, F8s) and rule-based (F2, F3, F8) assignment of Qij .
C) Training per condition does not improve performance.
Condition FM4-VF2Figure H.50: Modeling performance forconditions FM4-AVP3 (top panel) andFM4-VF2 (bottom panel) of ExperimentAVCT2.

440 quality of experience of multiparty conferencing and telemeeting systems
1. Visualizing the results: Errorbar plots showing the mean values & 95% confidence intervals.
2.1 Testing for significant differences between functions F1 - F8s:Oneway ANOVAs & PostHoc tests with Sidak correction, tests con-ducted separately for two training modes (whole data, per condition),significance level p ≤ 0.05. Significant differences found for:
Measure Training ANOVA PostHoc Functions
RMSE whole data p = 0.000 p = 0.000 F1, F5 vs. F6
RMSE per condition p = 0.000 p = 0.000 F1, F5 vs. F6
p = 0.004 F1, F5 vs. F2, F2sp = 0.005 F1, F5 vs. F8, F8sp = 0.020 F1, F5 vs. F4
2.2 Testing for differences between two training modes: T-tests, sig-nificance level p ≤ 0.05. No significant differences found.
3. Behavior of modeling functions
Measure Baseline (F1 & F7) Advanced (F2–F6, F8, F8s)
Rho F1 slightly worse than F7
(not sig.)No one outperforms F1.
RMSE F1 slightly worse than F7
(not sig.)F2, F2s, F4, F8 & F8s (alltrained per condition) andF6 outperform F1, but noone F7.
4. Observations and Conclusions
A) Six advanced model outperform the baseline mean, but not thebaseline minimum.
B) Equal performance for sorting-based (F2s, F3s, F8s) and rule-based (F2, F3, F8) assignment of Qij .
C) Training per condition does not improve performance, but it sta-bilizes Rho for F3 (smaller confidence interval).
Condition FM4P3-VF2
1. Visualizing the results: Errorbar plots showing the mean values & 95% confidence intervals.
2.1 Testing for significant differences between functions F1 - F8s:Oneway ANOVAs & PostHoc tests with Sidak correction, tests con-ducted separately for two training modes (whole data, per condition),significance level p ≤ 0.05. Significant differences found for:
Measure Training ANOVA PostHoc Functions
RMSE whole data p = 0.000 p = 0.000 F7 vs. all otherRMSE per condition p = 0.000 p = 0.000 F7 vs. all other
p = 0.013 F4 vs. F2, F2s
2.2 Testing for differences between two training modes: T-tests, sig-nificance level p ≤ 0.05. Significant differences found for:
Measure T-test Function Measure T-test Functions
Rho p = 0.050 (n.s) F4 Rho p = 0.029 F3sRMSE p = 0.017 F4 RMSE p = 0.025 F6
3. Behavior of modeling functions
Measure Baseline (F1 & F7) Advanced (F2–F6, F8, F8s)
Rho F1 slightly worse than F7
(not sig.)No one outperforms F1.
RMSE F1 sig. better than F7. No one outperforms F1.
4. Observations and Conclusions
A) No advanced model outperforms the baseline mean.
B) Equal performance for sorting-based (F2s, F3s, F8s) and rule-based (F2, F3, F8) assignment of Qij .
C) Training per condition improves performance for F6 (RMSE), re-duces performance for F4 (RMES) and has a mixed effect on F3s(better RMSE, worse Rho).
Condition FM4-VBFigure H.51: Modeling performance forconditions FM4P3-VF2 (top panel) andFM4-VB (bottom panel) of ExperimentAVCT2.

detailed results: model performance 441
1. Visualizing the results: Errorbar plots showing the mean values & 95% confidence intervals.
2.1 Testing for significant differences between functions F1 - F8s:Oneway ANOVAs & PostHoc tests with Sidak correction, tests con-ducted separately for two training modes (whole data, per condition),significance level p ≤ 0.05. Significant differences found for:
Measure Training ANOVA PostHoc Functions
RMSE whole data p = 0.000 p = 0.000 F7 vs. F2, F2s,F3s, F4, F6, F8,F8s
p = 0.001 F7 vs. F3
p = 0.015 F1, F5 vs. F4
p = 0.026 F1, F5 vs. F2sp = 0.027 F1, F5 vs. F2
p = 0.032 F1, F5 vs. F8sp = 0.034 F1, F5 vs. F8
RMSE per condition p = 0.000 p = 0.000 F7 vs. F2, F2sp = 0.001 F7 vs. F3, F3s,
F8, F8sp = 0.004 F7 vs. F6
p = 0.006 F7 vs. F4
2.2 Testing for differences between two training modes: T-tests, sig-nificance level p ≤ 0.05. No significant differences found.
3. Behavior of modeling functions
Measure Baseline (F1 & F7) Advanced (F2–F6, F8, F8s)
Rho F1 essentially equal to F7. No one outperforms F1.
RMSE F1 slightly better than F7
(not sig.)F2, F2s, F4, F8 & F8s(all trained on whole data)outperform F1.
4. Observations and Conclusions
A) Five advanced models outperform the baseline mean. F4 is thebest, though not sig. different from the other four.
B) Equal performance for sorting-based (F2s, F3s, F8s) and rule-based (F2, F3, F8) assignment of Qij .
C) Training per condition does not improve performance, for F4 iteven leads to unstable performance (large confidence intervals).
Condition FM4P3-VBFigure H.52: Modeling performancefor condition FM4P3-VB of ExperimentAVCT2.

Bibliography
3GPP. TS 26.071 version 12.0.0 Release 12 - Mandatory speech CODECspeech processing functions; AMR speech CODEC, General description.Standard. Sophia Antipolis Cedex, France: 3rd Generation Partner-ship Project, 2014.
Adel, Mohamed et al. “Improved E-Model for Monitoring Qualityof Multi-Party VoIP communications”. In: Proceedings of the IEEEGlobecom Workshops. Atlanta, USA, 2013, pp. 1180–1185.
Anderson, Anne H. et al. “The HCRC Map Task Corpus”. In: Languageand Speech 34.4 (1991), pp. 351–366.
Anderson, Anne H. et al. “Virtual team meetings: An analysis ofcommunication and context”. In: Computers in Human Behavior 23
(2007), pp. 2558–2580.Apperley, Mark and Masood Masoodian. “An Experimental Evalu-
ation of Video Support for Shared Work-Space Interaction”. In:Proceedings of CHI 1995. 1995.
Bachl, Maximilian. “Impact of packet loss on localization and subjec-tive quality in 3D-telephone calls”. Bachelor Thesis. Quality andUsability Lab, Technische Universität Berlin, Germany, 2014.
Baldis, Jessica J. “Effects of Spatial Audio on Memory, Comprehension,and Preference during Desktop Conferences”. In: Proceedings of theACM CHI 2001 Human Factors in Computing Systems Conference. Ed.by Michel Beaudouin-Lafon and Robert J. K. Jacob. Vol. 3. 1. 2001,pp. 166–173.
Belmudez, Benjamin. Assessment and Prediction of Audiovisual Qualityfor Videotelephony. Springer, 2009.
Berndtsson, Gunilla, Mats Folkesson, and Valentin Kulyk. “Subjectivequality assessment of video conferences and telemeetings”. In: 19thInternational Packet Video Workshop. 2012.
Blaskovich, Jennifer L. “Exploring the Effect of Distance: An Experi-mental Investigation of Virtual Collaboration, Social Loafing, andGroup Decisions”. In: Journal of Information Systems 22.1 (2008),pp. 27–46.
Blauert, Jens. Spatial Hearing – The Psychophysics of Human SoundLocalization – Revised edition. Harvard, MA, USA: The MIT Press,1997.
Blauert, Jens, ed. The Technology of Binaural Listening. Berlin, Germany:Springer, 2013.
Bodden, Markus and Ute Jekosch. Entwicklung und Durchführung vonTests mit Versuchspersonen zur Verifizierung von Modellen zur Berech-

BIBLIOGRAPHY 443
nung der Sprachübertragungsqualität. Project Report (unpublished).Institute of Communication Acoustics, Ruhr-University Bochum,Germany, 1996.
Bovik, Al, ed. The Essential Guide to Image Processing. London, UK:Elsevier Inc., 2009.
Braden, R. Requirements for Internet Hosts – Communication Layers.International Standard. Internet Engineering Task Force (IETF),1989. url: https://tools.ietf.org/rfc/rfc1122.txt.
Bradner, Erin and Gloria Mark. “Why Distance Matters: Effects onCooperation, Persuasion and Deception”. In: Proceedings of CSCW2002. 2002.
Brady, Paul T. “A statistical analysis of on-off patterns in 16 conversa-tions”. In: Bell Syst. Tech. J. 47.1 (1968), pp. 73–99.
Brady, Paul T. “A technique for investigating on-off patterns ofspeech”. In: Bell Syst. Tech. J. 44.1 (1965), pp. 1–22.
Brady, Paul T. “Effects of transmission delay on conversational behav-ior on echo-free telephone circuits”. In: Bell Syst. Tech. J. 50.1 (1971),pp. 115–134.
Brosig, Jeannette, Joachim Weimann, and Axel Ockenfels. “The Effectof Communication Media on Cooperation”. In: German EconomicReview 4.2 (2003), pp. 217–241.
Bruenken, Roland, Jan L. Plass, and Detlev Leutner. “Direct Measure-ment of Cognitive Load in Multimedia Learning”. In: EducationalPsychologist 38.1 (2003), pp. 53–61.
Burgoon, Judee K. et al. “Trust and Deception in Mediated Communi-cation”. In: Proceedings of the 36th Hawaii International Conference onSystem Sciences. 2003.
Buxton, William A. S. “Telepresence: integrating shared task andperson spaces”. In: Proceedings of Graphics Interface ’92. Amsterdam,The Netherlands, Oct. 1992, pp. 123–129.
Carletta, Jean et al. HCRC dialogue structure coding manual. Report.University of Edinburgh, UK, 1996. url: http://www.lancaster.ac.uk/fass/projects/eagles/maptask.htm.
Carletta, Jean et al. “The reliability of a dialogue structure codingscheme”. In: Computational Linguistics 23.1 (1997), pp. 13–31.
Champagne, Catherine et al. “A bootstrap method for assessing classi-fication accuracy and confidence for agricultural land use mappingin Canada”. In: International Journal of Applied Earth Observation andGeoinformation 29 (2014), pp. 44–52.
Chen, Milton. “Conveying Conversational Cues Through Video”. PhDThesis. Stanford University, 2003.
Chiu, Stephen. “Extracting fuzzy rules from data for function approxi-mation and pattern classification”. In: Fuzzy Information Engineering:A Guided Tour of Applications. Ed. by Didier Dubois, Henri Prade,and Ronald R. Yager. John Wiley&Sons, 1997.
Chu, Wai C. Speech Coding Algorithms - Foundation and Evolution ofStandardized Coders. Hoboken, New Jersey, USA: Wiley, 2014.
Clark, Herbert H. and Susan E. Brennan. “Grounding in Communi-cation”. In: Perspectives on socially shared cognition. Ed. by Lauren

444 quality of experience of multiparty conferencing and telemeeting systems
B. Resnick, John M. Levine, and Stephanie D. Teasley. AmericanPsychological Association, 1991, pp. 127–149.
Connell, Joanie B. et al. “Effects of communication medium on in-terpersonal perceptions”. In: Proceedings of the 2001 InternationalACM SIGGROUP Conference on Supporting Group Work. ACM. 2001,pp. 117–124.
Crede, Marcus and Janet A. Sniezek. “Group judgment processes andoutcomes in video-conferencing versus face-to-face groups”. In:International Journal of Human-Computer Studies 59 (2003), pp. 875–897.
Daly-Jones, Owen, Andrew Monk, and Leon Watts. “Some advantagesof video conferencing over high-quality audio conferencing: fluencyand awareness of attentional focus”. In: International Journal ofHuman-Computer Studies 49 (1998), pp. 21–58.
Doerry, Eckehard. “An Empirical Comparison of Copresent andTechnologically-Mediated Interaction based on CommunicativeBreakdown”. PhD Thesis. Department of Computer and Informa-tion Science, Graduate School of the University of Oregon, 1995.
Doherty-Sneddon, Gwyneth et al. “Face-to-Face and Video-MediatedCommunication: A Comparison of Dialogue Structure and TaskPerformance”. In: Journal of Experimental Psychology: Applied 3.2(1997), pp. 105–125.
Efron, Bradley. “Bootstrap Methods: Another Look at the Jackknife”.In: The Annals of Statistics 7.1 (1979), pp. 1–26.
Eg, Ragnhild et al. “Audiovisual robustness: exploring perceptualtolerance to asynchrony and quality distortion”. In: MultimediaTools and Applications 74 (2015), pp. 345–365.
Egger, Sebastian, Raimund Schatz, and Stefan Scherer. “It takes twoto tango – assessing the impact of delay on conversational inter-activity on perceived speech quality”. In: Proceedings of the 11thAnnual Conference of the International Speech Communication Associa-tion (Interspeech 2010). Makuhari, Japan, 2010, pp. 1321–1324.
Engdahl, Tomi. Powering Microphones. retrieved on: August 13, 2015.2012. url: http://www.epanorama.net/circuits/microphone_
powering.html.Erickson, Thomas et al. “Telepresence in Virtual Conferences: An
Empirical Comparison of Distance Collaboration Technologies”. In:Proceedings of CSCW 2010. 2010.
European Network on Quality of Experience in Multimedia Systemsand Services. Qualinet White Paper on Definitions of Quality of Experi-ence. White Paper. Version Version 1.2. Patrick Le Callet, SebastianMöller and Andrew Perkis (Eds.) Lausanne, Switzerland: (COSTAction IC 1003), Mar. 2013.
Field, Andy. Discovering Statistics using SPSS. 3rd ed. SAGE publica-tions, 2009.
Firestone, Scott, Thiya Ramalingam, and Steve Fry. Voice and VideoConferencing Fundamentals. Cisco Press, 2007.

BIBLIOGRAPHY 445
Fjermestad, Jerry. “An analysis of communication mode in groupsupport systems research”. In: Decision Support Systems 37 (2004),pp. 239–263.
Fjermestad, Jerry and Starr Roxanne Hiltz. “An Assessment of GroupSupport Systems Experimental Research: Methodology and Re-sults”. In: Journal of Management Information Systems 15.3 (1999),pp. 7–149.
Fjermestad, Jerry and Starr Roxanne Hiltz. “Case and field studies ofgroup support systems: an empirical assessment”. In: Proceedingsof the 33rd Annual Hawaii International Conference onSystem Sciences.IEEE. 2000, pp. 10–19.
Fjermestad, Jerry and Starr Roxanne Hiltz. “Experimental studiesof group decision support systems: an assessment of variablesstudied and methodology”. In: Proceedings of the 30th Annual HawaiiInternational Conference on System Sciences. Vol. 2. IEEE. 1997, pp. 45–65.
Fussell, Susan R. and Nicholas I. Benimoff. “Social and Cognitive Pro-cesses in Interpersonal Communication: Imlications for advancedtelecommunicatinos technologies”. In: Human Factors 37 (1995),pp. 228–250.
Fussell, Susan R., Robert E. Kraut, and Jane Siegel. “Coordination ofCommunication: Effects of Shared Visual Context on Collabora-tive Work”. In: Proceedings of the 2000 ACM conference on Computersupported cooperative work. 2000.
Fussell, Susan R., Leslie D. Setlock, and Robert E. Kraut. “Effectsof Head-Mounted and Scene-Oriented Video Systems on RemoteCollaboration on Physical Tasks”. In: Proceedings of the Conferenceon human factors in computing systems CHI 03. 2003.
Garcia, Marie-Neige. Parametric Packet-based Audiovisual Quality modelfor IPTV services. Springer, 2014.
Geier, Matthias, Jens Ahrens, and Sascha Spors. “The soundscape ren-derer: A unified spatial audio reproduction framework for arbitraryrendering methods”. In: Proceedings of the AES 124th Convention.Amsterdam, The Netherlands, 2008.
Gergle, Darren, Robert E. Kraut, and Susan R. Fussell. “LanguageEfficiency and Visual Technology – Minimizing Collaborative Ef-fort with Visual Information”. In: Journal of Language and SocialPsychology 23.4 (Dec. 2004), pp. 1–27.
Gierlich, Hans W. “Wideband Speech Communication – The QualityParameters as Perceived by the User”. In: Proceedings of ForumAcusticum 2005. 2005.
Grayson, David M. and Adrew F. Monk. “Are You Looking at Me? EyeContact and Desktop Video Conferencing”. In: ACM Transactionson Computer-Human Interaction 10.3 (Sept. 2003), pp. 221–243.
Gros, Laetitia and Gontran Filandre. A study on tasks for assessing au-diovisual quality of videoconferencing systems in multipoint conversationtests. ITU-T Contribution COM 12 - C 259 - E. Geneva, Switzerland:International Telecommunication Union, Oct. 2011.

446 quality of experience of multiparty conferencing and telemeeting systems
Group, Moving Pictures Expert. MPEG Standards. retrieved on Au-gust 19, 2015. International Organization for Standardization &International Electrotechnical Commission (ISO/IEC). 2013. url:http://mpeg.chiariglione.org/standards.
Guéguin, Marie et al. “On the evaluation of the conversational speechquality in telecommunications”. In: Eurasip Journal on Applied SignalProcessing (2008), pp. 185–248.
Hammer, Florian, Peter Reichl, and Alexander Raake. “Elements ofinteractivity in telephone conversations”. In: Proceedings of the 8thInternational Conference on Spoken Language Processing (Interspeech2004). Jeju Island, Korea, 2004, pp. 1741–1744.
Handgraaf, Michel J. J. et al. “Web-conferencing as a viable methodfor group decision research”. In: Judgment and Decision Making 7.5(2012), pp. 659–668.
Hanzo, Lajos, Peter J. Cherriman, and Jürgen Streit. Video Compressionand Communications – From Basics to H.261, H.263, H.264, MPEG4for DVB and HSDPA-Style Adaptive Turbo-Transceivers. Chichester,West Sussex, UK: Wiley, 2007.
Hoeldtke, Katrin and Alexander Raake. “Conversation analysis ofmulti-party conferencing and its relation to perceived quality”. In:Proceedings of the IEEE International Conference on CommunicationsICC. Kyoto, Japan, June 2011.
Hyder, Mansoor, Michael Haun, and Christian Hoene. “Placing theparticipants of a spatial audio conference call”. In: Proceedings ofthe 7th IEEE Consumer Communications and Networking Conference(CCNC). IEEE. 2010, pp. 1–7.
ISO/IEC. ISO/IEC 11172-3:1993 - Information technology – Coding ofmoving pictures and associated audio for digital storage media at up toabout 1.5 Mbit/s – Part 3: Audio. International Standard. InternationalOrganization for Standardization & International ElectrotechnicalCommission, 1993.
ISO/IEC. ISO/IEC 13818-7:1995 - Information technology – Generic codingof moving pictures and associated audio information – Part 2: Video. Inter-national Standard. International Organization for Standardization& International Electrotechnical Commission, 2013.
ISO/IEC. ISO/IEC 13818-7:1995 - Information technology – Generic cod-ing of moving pictures and associated audio information – Part 3: Audio.International Standard. International Organization for Standardiza-tion & International Electrotechnical Commission, 1995.
ISO/IEC. ISO/IEC 13818-7:2006 - Information technology – Generic cod-ing of moving pictures and associated audio information – Part 7: Ad-vanced Audio Coding (AAC). International Standard. InternationalOrganization for Standardization & International ElectrotechnicalCommission, 2006.
ISO/IEC. ISO/IEC 14496-2:2004 - Information technology – Coding ofaudio-visual objects – Part 2: Visual. International Standard. Inter-national Organization for Standardization & International Elec-trotechnical Commission, 2004.

BIBLIOGRAPHY 447
ISO/IEC. ISO/IEC 7498-1:1994 - Information technology – Open SystemsInterconnection – Basic Reference Model: The Basic Model. Interna-tional Standard. International Organization for Standardization &International Electrotechnical Commission, 1994.
ITU-R. Recommendation BS.1116-1 - Methods for the subjective assessmentof small impairments in audio systems including multichannel soundsystems. International Standard. Geneva, Switzerland: InternationalTelecommunication Union, 1997.
ITU-R. Recommendation BS.1284-1 - General methods for the subjectiveassessment of sound quality. International Standard. Geneva, Switzer-land: International Telecommunication Union, 2003.
ITU-R. Recommendation BS.1285 - Pre-selection methods for the subjec-tive assessment of small impairments in audio systems. InternationalStandard. Geneva, Switzerland: International TelecommunicationUnion, 1997.
ITU-R. Recommendation BS.1387-1 - Method for objective measurements ofperceived audio quality. International Standard. Geneva, Switzerland:International Telecommunication Union, 2001.
ITU-R. Recommendation BS.1534-1 - Method for the subjective assess-ment of intermediate quality levels of coding systems. InternationalStandard. Geneva, Switzerland: International TelecommunicationUnion, 2003.
ITU-R. Recommendation BT.1788 - Methodology for the subjective as-sessment of video quality in multimedia applications. InternationalStandard. Geneva, Switzerland: International TelecommunicationUnion, 2007.
ITU-R. Recommendation BT.500-13 - Methodology for the subjective as-sessment of the quality of television pictures. International Standard.Geneva, Switzerland: International Telecommunication Union, 2012.
ITU-R. Recommendation BT.601-7 - Studio encoding parameters of digitaltelevision for standard 4:3 and wide screen 16:9 aspect ratios. Interna-tional Standard. Geneva, Switzerland: International Telecommuni-cation Union, 2011.
ITU-R. Recommendation BT.710-4 - Subjective assessment methods forimage quality in high-definition television. International Standard.Geneva, Switzerland: International Telecommunication Union, 1998.
ITU-T. Handbook on Telephonometry. Geneva, Switzerland: InternationalTelecommunication Union, 1992.
ITU-T. ITU-R Recommendations – BS-Series: Broadcasting service (sound).retrieved on August 19, 2015. International TelecommunicationUnion. 2015. url: https://www.itu.int/rec/R-REC-BS/en.
ITU-T. ITU-R Recommendations – BT-Series: Broadcasting service (televi-sion). retrieved on August 19, 2015. International Telecommunica-tion Union. 2015. url: https://www.itu.int/rec/R-REC-BT/en.
ITU-T. ITU-T Recommendations by series. retrieved on August 19, 2015.International Telecommunication Union. 2015. url: http://www.itu.int/ITU-T/recommendations/index.aspx.
ITU-T. ITU-T Recommendations – P-Series: Terminals and subjective andobjective assessment methods. retrieved on August 19, 2015. Interna-

448 quality of experience of multiparty conferencing and telemeeting systems
tional Telecommunication Union. 2015. url: https://www.itu.int/rec/T-REC-P/en.
ITU-T. P-Series Supplement P.Sup26 - Scenarios for the subjective qualityevaluation of audio and audiovisual multiparty telemeetings. Interna-tional Standard. Geneva, Switzerland: International Telecommuni-cation Union, 2012.
ITU-T. Question 10/12 - Conferencing and telemeeting assessment. re-trieved on August 19, 2015. International Telecommunication Union.2015. url: http://www.itu.int/en/ITU-T/studygroups/2013-2016/12/pages/q10.aspx.
ITU-T. Recommendation E.800 - Definitions of terms related to quality ofservice. International Standard. Geneva, Switzerland: InternationalTelecommunication Union, 2008.
ITU-T. Recommendation G.1011 - Reference guide to quality of experienceassessment methodologies. International Standard. Geneva, Switzer-land: International Telecommunication Union, 2015.
ITU-T. Recommendation G.107 - The E-model: a computational modelfor use in transmission planning. International Standard. Geneva,Switzerland: International Telecommunication Union, 2014.
ITU-T. Recommendation G.1070 - Opinion model for video-telephony appli-cations. International Standard. Geneva, Switzerland: InternationalTelecommunication Union, 2012.
ITU-T. Recommendation G.107.1 - Wideband E-model. International Stan-dard. Geneva, Switzerland: International Telecommunication Union,2015.
ITU-T. Recommendation G.113 - Transmission impairments due to speechprocessing. International Standard. Geneva, Switzerland: Interna-tional Telecommunication Union, 2007.
ITU-T. Recommendation G.114 - One-way transmission time. InternationalStandard. Geneva, Switzerland: International TelecommunicationUnion, 2003.
ITU-T. Recommendation G.191 - Software tools for speech and audio cod-ing standardization. International Standard. Geneva, Switzerland:International Telecommunication Union, 2010.
ITU-T. Recommendation G.711 - Pulse Code Modulation (PCM) of voice fre-quencies. International Standard. Geneva, Switzerland: InternationalTelecommunication Union, 1988.
ITU-T. Recommendation G.722 - 7 kHz audio-coding within 64 kbit/s. In-ternational Standard. Geneva, Switzerland: International Telecom-munication Union, 2012.
ITU-T. Recommendation G.722.2 - Wideband coding of speech at around 16kbit/s using Adaptive Multi-Rate Wideband (AMR-WB). InternationalStandard. Geneva, Switzerland: International TelecommunicationUnion, 2003.
ITU-T. Recommendation G.726 - 40, 32, 24, 16 kbit/s Adaptive DifferentialPulse Code Modulation (ADPCM). International Standard. Geneva,Switzerland: International Telecommunication Union, 1990.
ITU-T. Recommendation G.729 - Coding of speech at 8 kbit/s using conjugate-structure algebraic-code-excited linear prediction (CS-ACELP). Interna-

BIBLIOGRAPHY 449
tional Standard. Geneva, Switzerland: International Telecommuni-cation Union, 2012.
ITU-T. Recommendation H.263 - Video coding for low bit rate ccommuni-cation. International Standard. Geneva, Switzerland: InternationalTelecommunication Union, 2005.
ITU-T. Recommendation H.264 - Advanced video coding for generic audio-visual services. International Standard. Geneva, Switzerland: Inter-national Telecommunication Union, 2014.
ITU-T. Recommendation H.265 - High efficiency video coding. Interna-tional Standard. Geneva, Switzerland: International Telecommuni-cation Union, 2015.
ITU-T. Recommendation J.144 - Objective perceptual video quality measure-ment techniques for digital cable television in the presence of a full ref-erence. International Standard. Geneva, Switzerland: InternationalTelecommunication Union, 2004.
ITU-T. Recommendation J.246 - Perceptual visual quality measurementtechniques for multimedia services over digital cable television networksin the presence of a reduced bandwidth reference. International Standard.Geneva, Switzerland: International Telecommunication Union, 2008.
ITU-T. Recommendation J.247 - Objective perceptual multimedia videoquality measurement in the presence of a full reference. InternationalStandard. Geneva, Switzerland: International TelecommunicationUnion, 2008.
ITU-T. Recommendation J.341 - Objective perceptual multimedia videoquality measurement of HDTV for digital cable television in the pres-ence of a full reference. International Standard. Geneva, Switzerland:International Telecommunication Union, 2011.
ITU-T. Recommendation P.1201 - Parametric non-intrusive assessment ofaudiovisual media streaming quality. International Standard. Geneva,Switzerland: International Telecommunication Union, 2012.
ITU-T. Recommendation P.1202 - Parametric non-intrusive bitstream assess-ment of video media streaming quality. International Standard. Geneva,Switzerland: International Telecommunication Union, 2012.
ITU-T. Recommendation P.1301 - Subjective quality evaluation of audio andaudiovisual telemeetings. International Standard. Geneva, Switzer-land: International Telecommunication Union, 2012.
ITU-T. Recommendation P.562 - Analysis and interpretation of INMD voice-service measurements. International Standard. Geneva, Switzerland:International Telecommunication Union, 2004.
ITU-T. Recommendation P.563 - Single-ended method for objective speechquality assessment in narrow-band telephony applications. InternationalStandard. Geneva, Switzerland: International TelecommunicationUnion, 2004.
ITU-T. Recommendation P.564 - Conformance testing for voice over IP trans-mission quality assessment models. International Standard. Geneva,Switzerland: International Telecommunication Union, 2007.
ITU-T. Recommendation P.800 - Methods for objective and subjective as-sessment of quality. International Standard. Geneva, Switzerland:International Telecommunication Union, 1996.

450 quality of experience of multiparty conferencing and telemeeting systems
ITU-T. Recommendation P.805 - Subjective evaluation of conversationalquality. International Standard. Geneva, Switzerland: InternationalTelecommunication Union, 2007.
ITU-T. Recommendation P.806 - A Subjective Quality Test Methodology us-ing Multiple Rating Scales. International Standard. Geneva, Switzer-land: International Telecommunication Union, 2014.
ITU-T. Recommendation P.833 - Methodology for derivation of equipmentimpairment factors from subjective listening-only tests. InternationalStandard. Geneva, Switzerland: International TelecommunicationUnion, 2001.
ITU-T. Recommendation P.833.1 - Methodology for the derivation of equip-ment impairment factors from subjective listening-only tests for widebandspeech codecs. International Standard. Geneva, Switzerland: Interna-tional Telecommunication Union, 2009.
ITU-T. Recommendation P.835 - Subjective test methodology for evaluat-ing speech communication systems that include noise suppression algo-rithm. International Standard. Geneva, Switzerland: InternationalTelecommunication Union, 2003.
ITU-T. Recommendation P.851 - Subjective quality evaluation of telephoneservices based on spoken dialogue systems. International Standard.Geneva, Switzerland: International Telecommunication Union, 2003.
ITU-T. Recommendation P.862 - Perceptual evaluation of speech quality(PESQ): An objective method for end-to-end speech quality assessmentof narrow-band telephone networks and speech codecs. InternationalStandard. Geneva, Switzerland: International TelecommunicationUnion, 2001.
ITU-T. Recommendation P.862.2 - Wideband extension to RecommendationP.862 for the assessment of wideband telephone networks and speechcodecs. International Standard. Geneva, Switzerland: InternationalTelecommunication Union, 2007.
ITU-T. Recommendation P.863 - Perceptual objective listening quality assess-ment. International Standard. Geneva, Switzerland: InternationalTelecommunication Union, 2014.
ITU-T. Recommendation P.880 - Continuous evaluation of time-varyingspeech quality. International Standard. Geneva, Switzerland: Inter-national Telecommunication Union, 2004.
ITU-T. Recommendation P.910 - Subjective video quality assessment meth-ods for multimedia applications. International Standard. Geneva, Switzer-land: International Telecommunication Union, 2008.
ITU-T. Recommendation P.911 - Subjective audiovisual quality assessmentmethods for multimedia applications. International Standard. Geneva,Switzerland: International Telecommunication Union, 1998.
ITU-T. Recommendation P.920 - Interactive test methods for audiovisualcommunications. International Standard. Geneva, Switzerland: Inter-national Telecommunication Union, 2000.
Jackson, Matthew et al. “Impact of video frame rate on communicativebehaviour in two and four party groups”. In: Proceedings of the 2000ACM conference on Computer Supported Cooperative Work. ACM. 2000,pp. 11–20.

BIBLIOGRAPHY 451
Jekosch, Ute. “Sprache hören und beurteilen: Ein Ansatz zur Grundle-gung der Sprachqualitätsbeurteilung”. Habilitation thesis. Univer-sität/Gesamthochschule Essen, Germany, 2003.
Jekosch, Ute. Voice and Speech Quality Perception – Assessment andEvaluation. Berlin, Germany: Springer, 2005.
Kilgore, Ryan, Mark Chignell, and Paul Smith. “Spatialized audio-conferencing: what are the benefits?” In: Proceedings of the 2003conference of the Centre for Advanced Studies on Collaborative researchCASCON ’03. IBM Press, 2003, pp. 135–144.
Knapp, Mark L. and Judith A. Hall. Nonverbal communication in hu-man interaction. 7th edition. Boston, USA: Wadsworth, CengageLearning, 2010.
Korhonen, Jari. “New methods for robust audio streaming in a wire-less environment”. PhD Thesis. Tampere University of Technology,Finnland, 2006.
Köster, Friedemann and Sebastian Möller. “Perceptual Speech Qual-ity Dimensions in a Conversational Situation”. In: Proceedings ofthe 16th Annual Conference of the Speech Communication Association(Interspeech). Dresden, Germany, Sept. 2015, pp. 2544–2548.
Köster, Friedemann et al. “Comparison between the Discrete ACRScale and an Extended Continuous Scale for the Quality Assess-ment of Transmitted Speech”. In: Fortschritte der Akustik (DAGA2015)- 41. Jahrestagung für Akustik. Nürnberg, Germany, Mar. 2015.
Kraut, Robert E., Susan R. Fussell, and Jane Siegel. “Visual Informa-tion as a Conversational Resource in Collaborative Physical Tasks”.In: Human-Computer Interaction 18 (2003), pp. 13–49.
Kyriacou, E.C., C.S. Pattichis, and M.S. Pattichis. “An overview ofrecent health care support systems for eEmergency and mHealthapplications”. In: Annual International Conference of the IEEE Engi-neering in Medicine and Biology Society (EMBC 2009). IEEE. 2009,pp. 1246–1249.
Lamblin, Claude. “Algebraic code-excited linear prediction speechcoding method”. Pat. US 5717825 A (US). France Telecom. Feb. 10,1995.
Light, Richard J. and David B. Pillemer. Summing Up. Cambridge,MA, USA: Harvard University Press, 1984.
Löber, Andreas, Sibylle Grimm, and Gerhard Schwabe. “Audio vs.chat: Can media speed explain the differences in productivity?” In:Proceedings of the European Conference on Information Systems. 2006,pp. 2172–2183.
Löber, Andreas, Gerhard Schwabe, and Sibylle Grimm. “Audio vs.chat: The effects of group size on media choice”. In: Proceedings ofthe 40th Annual Hawaii International Conference on System Sciences.IEEE. 2007, pp. 41–41.
Masoodian, Masood. “Human-to-Human Communication Supportfor Computer-Based Shared Workspace Collaboration”. PhD The-sis. Department of Computer Science, The University of Waikato,Hamilton, New Zealand, 1996.

452 quality of experience of multiparty conferencing and telemeeting systems
Masoodian, Masood and Mark Apperley. “User perceptions of human-to-human communication modes in CSCW environments”. In:Proceedings of ED-MEDIA’95. 1995, pp. 17–21.
Masoodian, Masood, Mark Apperley, and Lesley Frederickson. “Videosupport for shared work-space interaction: an empirical study”. In:Interacting with Computers 7.3 (1995), pp. 237–253.
Matarazzo, Giacinto. “The effects of video quality and task on re-mote collaboration: a laboratory experiment”. In: 17th InternationalSymposium on Human Factors in Telecommunication. Copenhagen,Denmark, May 1999.
McGrath, Joseph Edward. Groups: Interaction and performance. Prentice-Hall Englewood Cliffs, NJ, 1984.
McLeod, Poppy Lauretta et al. “The Eyes Have It: Minority Influencein Face-To-Face and Computer-Mediated Group Discussion”. In:Journal of Applied Psychology 82.5 (1997), pp. 706–718.
Merriam-Webster. Dictionary and Thesaurus. retrieved on August 19,2015. Merriam-Webster Incorporated, Springfield, MA. 2015. url:http://www.merriam-webster.com/.
Möller, Sebastian. Assessment and Prediction of Speech Quality in Telecom-munications. Kluwer Academic publishers, 2000.
Möller, Sebastian. Quality of Telephone-Based Spoken Dialogue Systems.New York, USA: Springer, 2005.
Möller, Sebastian and Alexander Raake. “Motivation and Introduc-tion”. In: Quality of Experience - Advanced Concepts, Applications,Methods. Ed. by Sebastian Möller and Alexander Raake. Springer,2014, pp. 3–9.
Möller, Sebastian, Marcel Wältermann, and Marie-Neige Garcia. “Fea-tures of Quality of Experience”. In: Quality of Experience - AdvancedConcepts, Applications, Methods. Ed. by Sebastian Möller and Alexan-der Raake. Springer, 2014, pp. 73–84.
Möller, Sebastian et al. “A Taxonomy of Quality of Service and Qualityof Experience of Multimodal Human-Machine-Interaction”. In:Proceedings of the International Workshop on Quality of MultimediaExperience QoMEX. 2009.
Möller, Sebastian et al. “Speech Quality Estimation”. In: IEEE SignalProcessing Magazine 28.6 (Nov. 2011), pp. 18–28.
Moore, Brian C. J. Introduction to the Psychology of Hearing. 6th ed.Leiden, The Netherlands: Brill, 2013.
Nahumi, Dror. “Conferencing arrangement for compressed informa-tion signals”. Pat. US 5390177 A (US). At&T Corp. Feb. 14, 1993.
Nakamura, Junichi, ed. Image Sensors and Signal Processing for DigitalStill Cameras. Boca Raton, Florida, USA: Taylor & Francis Group,2006.
Naylor, Patrick A. and Nikolay D. Gaubitch, eds. Speech Dereverberation.Berlin, Germany: Springer, 2010.
Nguyen, David and John Canny. “MultiView: Spatially Faithful GroupVideo Conferencing”. In: Proceedings of CHI 2005. 2005.

BIBLIOGRAPHY 453
Norman, Donald A. “Some Observations on Mental Models”. In: Men-tal Models. Ed. by Dedre Genter and Albert L. Stevens. PsychologyPress, 1983, pp. 7–14.
O’Brien, Heather L. and Elaine G. Toms. “What is user engagement?A conceptual framework for defining user engagement with tech-nology”. In: Journal of the American Society for Information Science &Technology 59.6 (2008), pp. 938–955.
O’Conaill, Brid, Steve Whittaker, and Sylvia Wilbur. “ConversationsOver Video Conferences: An Evaluation of the Spoken Aspects ofVideo-Mediated Communication”. In: Human-Computer Interaction8 (1993), pp. 389–428.
Olson, Gary M. and Judith S. Olson. “Distance Matters”. In: Human-Computer Interaction 15 (2000), pp. 139–178.
O’Malley, Claire et al. “Comparison of face-to-face and video-mediatedinteraction”. In: Interacting with Computers 8.2 (1996), pp. 177–192.
Paepcke, Andreas et al. “Yelling in the hall: using sidetone to addressa problem with mobile remote presence systems”. In: Proceedingsof the 24th annual ACM symposium on User interface software andtechnology. ACM. 2011, pp. 107–116.
Park, Kyoung Shin. “Enhancing Cooperative Work in Amplified Col-laboration Environments”. PhD Thesis. Graduate College of theUniversity of Illinois at Chicago, 2003.
Pashler, Harold E. The psychology of attention. Cambridge, MA, USA:The MIT Press, 1998.
Perkins, C., O. Hodson, and V. Hardman. “A survey of packet loss re-covery techniques for streaming audio”. In: IEEE Network Magazine11.5 (1998), pp. 40–48.
Pinson, Margaret and Stephen Wolf. Techniques for evaluating objectivevideo quality models using overlapping subjective data sets. TechnicalReport TR-09-457. US Department of Commerce, National Telecom-munications and Information Administration (NTIA), 2008.
Pulkki, Ville and Matti Karjalainen. Communication Acoustics: An Intro-duction to Speech, Audio and Psychoacoustics. Chichester,West Sussex,UK: The MIT Press, 2015.
Raake, Alexander. Speech Quality of VoIP – Assessment and Prediction.Chichester, West Sussex, UK: Wiley, 2006.
Raake, Alexander and Sebastian Egger. “Quality and Quality of Expe-rience”. In: Quality of Experience - Advanced Concepts, Applications,Methods. Ed. by Sebastian Möller and Alexander Raake. Springer,2014, pp. 11–34.
Raake, Alexander and Claudia Schlegel. 3CT - 3-party ConversationTest scenarios for conferencing assessment. 2010. doi: 10.5281/zenodo.16129.
Raake, Alexander et al. “IP-Based Mobile and Fixed Network Audio-visual Media Services”. In: IEEE Signal Processing Magazine 28.6(Nov. 2011), pp. 68–79.
Raake, Alexander et al. “Listening and conversational quality of spa-tial audio conferencing”. In: Proceedings of the AES 40th InternationalConference. Tokyo, Oct. 2010.

454 quality of experience of multiparty conferencing and telemeeting systems
Ramirez, Javier, Juan Manuel Görriz, and Josë Carlos Segura. “VoiceActivity Detection - Fundamentals and Speech Recognition SystemRobustness”. In: Robust Speech Recognition and Understanding. Ed.by Michael Grimm and Kristian Kroschel. In-Tech Education andPublishing, 2007.
Rawat, Paresh and Jyoti Singhai. “Review of Motion Estimation andVideo Stabilization techniques For hand held mobile video”. In:Signal and Image Processing : An International Journal (SIPIJ) 2.2 (June2011), pp. 159–168.
Reiter, Ulrich et al. “Factors Influencing Quality of Experience”. In:Quality of Experience - Advanced Concepts, Applications, Methods. Ed.by Sebastian Möller and Alexander Raake. Springer, 2014, pp. 55–72.
Richardson, Iain E. G. H.264 and MPEG-4 Video Compression – VideoCoding for Next-generation Multimedia. Chichester, West Sussex, UK:Wiley, 2003.
Roegiers, David. “Dynamical Aspects of Spatial-Audio in Multi-participant Teleconferences”. Master Thesis. Universiteit Gent, Bel-gium, 2013.
Rothbucher, Martin et al. “3D Audio Conference System with Back-ward Compatible Conference Server using HRTF Synthesis”. In:Journal of Multimedia Processing and Technologies 2 (4 Dec. 2011),pp. 159–175.
Sacks, Harvey, Emanuel A. Schegloff, and Gain Jefferson. “A SimplestSystematics for the Organisation of Turn-Taking for Conversation”.In: Language 50 (4 Dec. 1974), pp. 696–735.
Sanford, Alison, Anne H. Anderson, and Jim Mullin. “Audio channelconstraints in video-mediated communication”. In: Interacting withComputers 16 (2004), pp. 1069–1094.
Schiffner, Falk and Janto Skowronek. 3seqCT - 3-party Sequential Con-versation Test scenarios for conferencing assessment. 2013. doi: 10.5281/zenodo.16137.
Schnotz, Wolfgang and Christian Kuerschner. “A Reconsiderationof Cognitive Load Theory”. In: Educational Psychology Review 19.4(2007), pp. 469–508.
Schoenenberg, Katrin. “The Quality of Mediated-Conversations underTransmission Delay”. PhD Thesis. Technische Universität Berlin,Germany, 2016.
Schoenenberg, Katrin, Alexander Raake, and Pierre Lebreton. “On in-teraction behaviour in telephone conversations under transmissiondelay”. In: Proceedings of the 6th International Workshop on Quality ofMultimedia Experience QoMEX. Sept. 2014, pp. 31–36.
Schoenenberg, Katrin et al. “On interaction behaviour in telephoneconversations under transmission delay”. In: Speech Communication63 (2014), pp. 1–14.
Sellen, Abigail J. “Speech Patterns in Video-Mediated Conversations”.In: Proceedings of CHI 1992. 1992.
Silzle, Andreas. “Quality Taxonomies for Auditory Virtual Environ-ments”. In: Proceedings of the 122nd AES Convention. May 2007.

BIBLIOGRAPHY 455
Singh, Kundan, Gautam Nair, and Henning Schulzrinne. “Centralizedconferencing using SIP”. In: Internet Telephony Workshop. Vol. 7. 2001,pp. 57–63.
Skowronek, Janto. 3SCT - 3-party Short Conversation Test scenarios forconferencing assessment (Version 01). 2013. doi: 10.5281/zenodo.16134.
Skowronek, Janto. Document describing scenarios. Project Report “Qual-ity of Multiparty Audio-Video Communication” (Unpublished).Assessment of IP-based Applications, Technische Universität Berlin,Germany, Apr. 2013.
Skowronek, Janto. Document summarizing model review. Project Re-port “Quality of Multiparty Audio-Video Communication” (Un-published). Assessment of IP-based Applications, Technische Uni-versität Berlin, Germany, Apr. 2013.
Skowronek, Janto. Documentation on system setup. Project Report “Qual-ity of Multiparty Audio-Video Communication” (Unpublished).Assessment of IP-based Applications, Technische Universität Berlin,Germany, June 2013.
Skowronek, Janto. Final Project Report – Quality of Multiparty Audio-Video Communication. Project Report “Quality of Multiparty Audio-Video Communication” (Unpublished). Assessment of IP-basedApplications, Technische Universität Berlin, Germany, Dec. 2014.
Skowronek, Janto. Focus groups on quality perception and attribution.Project Report “Quality of Multiparty Audio-Video Communica-tion” (Unpublished). Assessment of IP-based Applications, Tech-nische Universität Berlin, Germany, Nov. 2014.
Skowronek, Janto. Improved model for audio-only communication. ProjectReport “Quality of Multiparty Audio-Video Communication” (Un-published). Assessment of IP-based Applications, Technische Uni-versität Berlin, Germany, Dec. 2013.
Skowronek, Janto. Improved model for audiovisual communication. ProjectReport “Quality of Multiparty Audio-Video Communication” (Un-published). Assessment of IP-based Applications, Technische Uni-versität Berlin, Germany, Nov. 2014.
Skowronek, Janto. Initial model for audio-only communication based onavailable data. Project Report “Quality of Multiparty Audio-VideoCommunication” (Unpublished). Assessment of IP-based Applica-tions, Technische Universität Berlin, Germany, June 2013.
Skowronek, Janto. Initial model for audiovisual communication. ProjectReport “Quality of Multiparty Audio-Video Communication” (Un-published). Assessment of IP-based Applications, Technische Uni-versität Berlin, Germany, May 2014.
Skowronek, Janto. “Internetumfrage zur Wahrnehmung heutigerTelefonkonferenzen im geschäftlichen Umfeld”. In: Fortschritte derAkustik (DAGA2012) - 38. Deutsche Jahrestagung für Akustik. Darm-stadt: Deutsche Gesellschaft für Akustik, 2012, pp. 899–900.
Skowronek, Janto. Pilot test for audiovisual communication. Project Re-port “Quality of Multiparty Audio-Video Communication” (Un-

456 quality of experience of multiparty conferencing and telemeeting systems
published). Assessment of IP-based Applications, Technische Uni-versität Berlin, Germany, Feb. 2014.
Skowronek, Janto. Second test for audiovisual communication. ProjectReport “Quality of Multiparty Audio-Video Communication” (Un-published). Assessment of IP-based Applications, Technische Uni-versität Berlin, Germany, Oct. 2014.
Skowronek, Janto. Topics for Question 18/12 in view of insights froma field survey. ITU-T Contribution COM 12 - C 285 - E. Geneva,Switzerland: International Telecommunication Union, Oct. 2011.
Skowronek, Janto. xCT - Scalable Multiparty Conversation Test scenariosfor conferencing assessment (Version 01). 2015. doi: 10.5281/zenodo.16138.
Skowronek, Janto, Julian Herlinghaus, and Alexander Raake. “QualityAssessment of Asymmetric Multiparty Telephone Conferences:A Systematic Method from Technical Degradations to PerceivedImpairments”. In: Proceedings of the 14th Annual Conference of theInternational Speech Communication Association (Interspeech 2013).International Speech Communication Association. Lyon, France,Aug. 2013, pp. 2604–2608.
Skowronek, Janto, Martin McKinney, and Steven van de Par. “Ademonstrator for automatic music mood estimation”. In: Proceed-ings of the 8th International Conference on Music Information Retrieval(ISMIR). 2007.
Skowronek, Janto and Alexander Raake. “Assessment of CognitiveLoad, Speech Communication Quality and Quality of Experiencefor spatial and non-spatial audio conferencing calls”. In: SpeechCommunication (2015), pp. 154–175. doi: 10.1016.
Skowronek, Janto and Alexander Raake. “Conceptual model of mul-tiparty conferencing and telemeeting quality”. In: Proceedings ofthe 7th International Workshop on Quality of Multimedia Experience(QoMEX 2015). Pilos, Greece, May 2015, pp. 1–6.
Skowronek, Janto and Alexander Raake. Development of scalable con-versation test scenarios for multi-party telephone conferences. ITU-TContribution COM 12 - C187 - E. Geneva, Switzerland: Interna-tional Telecommunication Union, Jan. 2011.
Skowronek, Janto and Alexander Raake. “Einfluss von Bandbreite undräumlicher Sprachwiedergabe auf die kognitive Anstrengung beiTelefonkonferenzen in Abhängigkeit von der Teilnehmeranzahl”.In: Fortschritte der Akustik (DAGA2011) - 37. Deutsche Jahrestagung fürAkustik. Deutsche Gesellschaft für Akustik. Düsseldorf, Germany,Mar. 2011, pp. 873–874.
Skowronek, Janto and Alexander Raake. “Investigating the effect ofnumber of interlocutors on the quality of experience for multi-partyaudio conferencing”. In: Proceedings of the 12th Annual Conference ofthe International Speech Communication Association (Interspeech2011).International Speech Communication Association. Florence, Italy,Aug. 2011, pp. 829–832.
Skowronek, Janto and Alexander Raake. Listening test stimuli usingscalable multiparty conversation test scenarios. ITU-T Contribution

BIBLIOGRAPHY 457
COM 12 - C 286 - E. Geneva, Switzerland: International Telecom-munication Union, Oct. 2011.
Skowronek, Janto and Alexander Raake. Number of interlocutors andQoE in multiparty telephone conferences. ITU-T Contribution COM 12
- C 287 - E. Geneva, Switzerland: International TelecommunicationUnion, Oct. 2011.
Skowronek, Janto and Alexander Raake. Report on a study on asymmet-ric multiparty telephone conferences for a future update of P.1301. ITU-TContribution COM 12 - C134 - E. Geneva, Switzerland: Interna-tional Telecommunication Union, Dec. 2013.
Skowronek, Janto and Alexander Raake. Update on number of Interlocu-tors and QoE in multiparty telephone conferences. ITU-T ContributionCOM 12 - C035 - E. Geneva, Switzerland: International Telecom-munication Union, Mar. 2013.
Skowronek, Janto and Falk Schiffner. 3SCT - 3-party Short ConversationTest scenarios for conferencing assessment (Version 02). 2015. doi: 10.5281/zenodo.16135.
Skowronek, Janto, Falk Schiffner, and Alexander Raake. “On theinfluence of involvement on the quality of multiparty conferencing”.In: 4th International Workshop on Perceptual Quality of Systems (PQS2013). International Speech Communication Association. Vienna,Austria, Sept. 2013, pp. 141–146.
Skowronek, Janto and Katrin Schoenenberg. 3CNG - 3-party CelebrityName Guessing task for Conferencing Assessment. 2017. doi: 10.5281/zenodo.345834.
Skowronek, Janto, Katrin Schoenenberg, and Gunilla Berndtsson.“Multimedia Conferencing and Telemeetings”. In: Quality of Expe-rience - Advanced Concepts, Applications, Methods. Ed. by SebastianMöller and Alexander Raake. Springer, 2014, pp. 217–228.
Skowronek, Janto, Katrin Schoenenberg, and Alexander Raake. “Expe-rience with and insights about the new ITU-T standard on qualityassessment of conferencing systems”. In: Proceedings of the interna-tional conference of acoustics (AIA-DAGA 2013). Merano, Mar. 2013,pp. 444–447.
Skowronek, Janto and Maxim Spur. 3SurvivalCT - 3-party Survivaltask Conversation Test scenarios for conferencing assessment. 2017. doi:10.5281/zenodo.345837.
Skowronek, Janto, Anne Weigel, and Alexander Raake. “Qualityof Multiparty Telephone Conferences from the Perspective of aPassive Listener”. In: Fortschritte der Akustik - 41. Jahrestagung fürAkustik (DAGA). Nürnberg, Germany, Mar. 2015.
Skowronek, Janto et al. Initial insights for P.AMT based on reviewingexisting recommendations. ITU-T Contribution COM 12 - C 284 - E.Geneva, Switzerland: International Telecommunication Union, Oct.2011.
Skowronek, Janto et al. “Method and Apparatus for Computing thePerceived Quality of a Multiparty Audio or Audiovisual Telecom-munication Service or System”. Patent application WO/2016/041593
(EP). Deutsche Telekom AG. Mar. 2016.

458 quality of experience of multiparty conferencing and telemeeting systems
Skowronek, Janto et al. Proposed main body and normative annex fordraft recommendation P.AMT. ITU-T Contribution COM 12 - C318 -E. Geneva, Switzerland: International Telecommunication Union,May 2012.
Skowronek, Janto et al. Proposed non-normative appendices for draftrecommendation P.AMT. ITU-T Contribution COM 12 - C319 - E.Geneva, Switzerland: International Telecommunication Union, May2012.
Skowronek, Janto et al. “Speech recordings for systematic assessmentof multi-party conferencing”. In: Proceedings of Forum Acusticum2011. Aalborg, Denmark: European Acoustical Society, June 2011.
Smith, Paxton J., Peter Kabal, and Rafi Rabipour. “Speaker Selectionfor Tandem-Free Operation VoIP Conference Bridges”. In: Proceed-ings of IEEE Workshop on Speech Coding. IEEE. Tsukuba, Japan, Oct.2002, pp. 120–122.
Smith, Paxton J. et al. “Tandem-free VoIP conferencing: A bridge tonext-generation networks”. In: IEEE Communications Magazine 41.5(2003), pp. 136–145.
Sonnenwald, Diane H., Kelly L. Maglaughlin, and Mary C. Whitton.“Designing to support situation awareness across distances: anexample from a scientific collaboratory”. In: Information Processingand Management 40 (2004), pp. 989–1011.
Sonnenwald, Diane H., Mary C. Whitton, and Kelly L. Maglaugh-lin. “Evaluating a scientific collaboratory: Results of a controlledexperiment”. In: ACM Transactions on Computer-Human Interaction(TOCHI) 10.2 (2003), pp. 150–176.
Spur, Maxim. “Implementation of a Spatial VoIP Conferencing Demon-strator”. Master Thesis. Quality and Usability Lab, TechnischeUniversität Berlin, Germany, 2015.
Spur, Maxim. “Influences of Loudness Differences in Multiparty Con-ferencing Quality”. Bachelor Thesis. Assessment of IP-based Appli-cations, Technische Universität Berlin, Germany, 2012.
Straus, Susan G. “Testing a Typology of Tasks: An Empirical Valida-tion of McGrath’s (1984) Group Task Circumplex”. In: Small GroupResearch 30 (1999), pp. 166–187. doi: 0.1177/104649649903000202.
Straus, Susan G. and Joseph E. McGrath. “Does the Medium Matter?The Interaction of Task Type and Technology on Group Perfor-mance and Member Reactions”. In: Journal of Applied Psychology79.1 (1994), pp. 87–97.
Suh, Kil Soo. “Impact of communication medium on task performanceand satisfaction: an examination of media-richness theory”. In:Information & Management 35 (1999), pp. 295–312.
Tajariol, Federico, Jean-Michel Adam, and Michel Dubois. “Seeingthe Face and Observing the Actions: the Effects of NonverbalCues on Mediated Tutoring Dialogue”. In: Intelligent tutoring sys-tems. Vol. 5091. Lecture Notes in Computer Science. Springer, 2008,pp. 480–489.
Tanakian, Mohammad Javad, Mehdi Rezaei, and Farahnaz Mohanna.“Digital Video Stabilization System by Adaptive Fuzzy Kalman

BIBLIOGRAPHY 459
Filtering”. In: Information Systems and Telecommunication 1.4 (Oct.2013), pp. 223–232.
Thompson, Lori Foster and Michael D. Coovert. “Stepping Up to theChallenge: A Critical Examination of Face-to-Face and Computer-Mediated Team Decision Making”. In: Group Dynamics: Theory,Research, and Practice 6.1 (2002), pp. 52–64.
Thompson, Lori Foster and Michael D. Coovert. “Teamwork Online:The Effects of Computer Conferencing on Perceived Confusion,Satisfaction, and Postdiscussion Accuracy”. In: Group Dynamics:Theory, Research, and Practice 7.2 (2003), pp. 135–151.
Thomsen, G. and Y. Jani. “Internet telephony: Going like crazy”. In:IEEE Spectrum 37.5 (2000), pp. 52–58.
Vaalgamaa, Markus and Benjamin Belmudez. “Audiovisual Commu-nication”. In: Quality of Experience - Advanced Concepts, Applications,Methods. Ed. by Sebastian Möller and Alexander Raake. Springer,2014, pp. 195–212.
Vähätalo, Antti and Ingemar Johansson. “Voice activity detection forGSM adaptive multi-rate codec”. In: Proceedings of IEEE Workshopon Speech Coding. 1999, pp. 55–57.
Vallin, Jean-Marc et al. “High-Quality, Low-Delay Music Coding inthe OPUS Codec”. In: Proceedings of the 135th AES Convention. NewYork, USA, Oct. 2013.
Varela, Martín, Lea Skorin-Kapov, and Touradj Ebrahimi. “Qualityof Service Versus Quality of Experience”. In: Quality of Experience -Advanced Concepts, Applications, Methods. Ed. by Sebastian Möllerand Alexander Raake. Springer, 2014, pp. 85–96.
Vary, Peter and Rainer Martin. Digital Speech Transmission – Enhance-ment, coding and Error Concealment. Chichester, West Sussex, UK:Wiley, 2006.
Vatakis, Argiro and Charles Spence. “Audiovisual synchrony per-ception for speech and music assessed using a temporal orderjudgment task”. In: Neuroscience Letters 393 (2006), pp. 40–44.
Veinott, Elizabeth S. et al. “Video Helps Remote Work: Speakers WhoNeed to Negotiate Common Ground Benefit from Seeing EachOther”. In: Proceedings of CHI 1999. 1999.
Vos, Koen, Søren Skak Jensen, and Karsten Vandborg Sørensen. SILKspeech codec. International Standard. Internet Engineering TaskForce (IETF), 2010. url: https://tools.ietf.org/id/draft-vos-silk-02.txt.
Vos, Koen et al. “Voice Coding with OPUS”. In: Proceedings of the 135thAES Convention. New York, USA, Oct. 2013.
Wältermann, Marcel. Dimension-based Quality Modelling of TransmittedSpeech. Springer, 2013.
Wältermann, Marcel, Alexander Raake, and Sebastian Möller. Com-parison between the discrete ACR scale and an extended continuous scalefor the quality assessment of transmitted speech. ITU-T ContributionCOM 12 - C 39 - E. Geneva, Switzerland: International Telecommu-nication Union, Feb. 2009.

460 quality of experience of multiparty conferencing and telemeeting systems
Weigel, Anne. “Beurteilung der Qualität von Telefonkonferenzen mitasymmetrischen Verbindungen aus der Perspektive eines passivenZuhörers”. Bachelor Thesis. Assessment of IP-based Applications,Technische Universität Berlin, Germany, 2014.
Weiss, Benjamin et al. “Temporal Development of Quality of Expe-rience”. In: Quality of Experience - Advanced Concepts, Applications,Methods. Ed. by Sebastian Möller and Alexander Raake. Springer,2014, pp. 133–147.
Werkhoven, Peter J., Jan Maarten Schraagen, and Patrick A.J. Punte.“Seeing is believing: communication performance under isotropicteleconferencing conditions”. In: Displays 22 (2001), pp. 137–149.
Whittaker, Steve and Brid O’Conaill. “An Evaluation of Video Medi-ated Communication”. In: INTERACT ’93 and CHI ’93 ConferenceCompanion on Human Factors in Computing Systems. ACM. 1993,pp. 73–74.
Wiegand, Thomas et al. “Overview of the H.264/AVC Video CodingStandard”. In: IEEE Transactions On Circuits And Systems For VideoTechnology 7 (July 2003), pp. 560–576.
Wu, Wanmin et al. “Quality of Experience in Distributed InteractiveMultimedia Environments: Toward a Theoretical Framework”. In:Proceedings of the 17th ACM international conference on Multimedia.2009.
Wu, Yu et al. “vSkyConf: Cloud-assisted multi-party mobile video con-ferencing”. In: Proceedings of the second ACM SIGCOMM workshopon Mobile cloud computing. ACM. 2013, pp. 33–38.
Zielinski, Slawomir, Francis Rumsey, and Soren Bech. “On SomeBiases Encountered in Modern Audio Quality Listening Tests –A Review”. In: Journal of the Audio Engineering Society 56.6 (2008),pp. 427–451.
Zölzer, Udo. Digital Audio Signal Processing. 2nd ed. Chichester,WestSussex, UK: Wiley, 2006.
Zoubier, A.M. and B. Boashash. “The Bootstrap and its Application inSignal Processing”. In: IEEE Signal Processing Magazine (Jan. 1998),pp. 56–76.