qnb alahli sae
64
QNB ALAHLI S.A.E ( Egyptian Joint Stock Company ) Consolidated Financial Statements Together With Limited Review Report 22 20 , 1 3 March Ended Period For The BDO Khaled & Co. KPMG Hazem Hassan Public Accountants & Advisers Public Accountants & Consultants
-
Upload
khangminh22 -
Category
Documents
-
view
1 -
download
0
Transcript of qnb alahli sae
QNB ALAHLI S.A.E
(Egyptian Joint Stock Company )
Consolidated Financial Statements
Together With Limited Review Report
2220, 13 MarchEnded PeriodFor The
BDO Khaled & Co. KPMG Hazem Hassan
Public Accountants & Advisers Public Accountants & Consultants
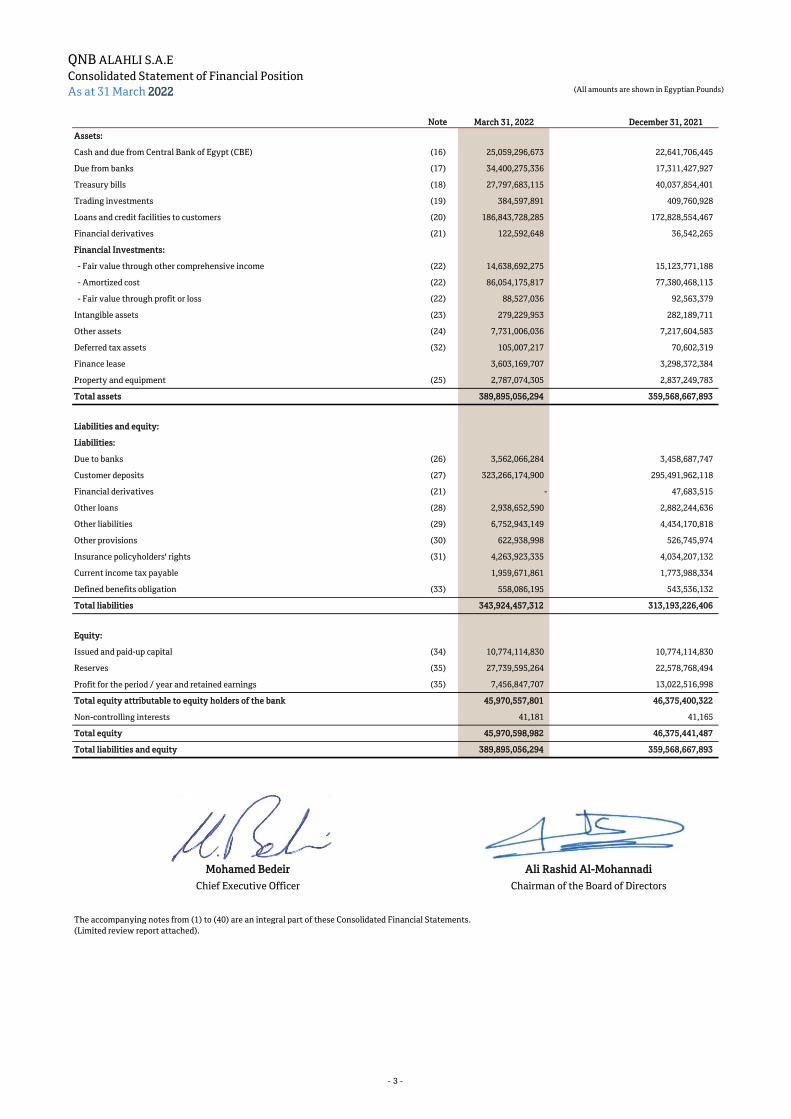
QNB ALAHLI S.A.E
Consolidated Statement of Financial Position
As at 31 March 2022 (All amounts are shown in Egyptian Pounds)
Note March 31, 2022 December 31, 2021
Assets:
Cash and due from Central Bank of Egypt (CBE) (16) 25,059,296,673 22,641,706,445
Due from banks (17) 34,400,275,336 17,311,427,927
Treasury bills (18) 27,797,683,115 40,037,854,401
Trading investments (19) 384,597,891 409,760,928
Loans and credit facilities to customers (20) 186,843,728,285 172,828,554,467
Financial derivatives (21) 122,592,648 36,542,265
Financial Investments:
Fair value through other comprehensive income (22) 14,638,692,275 15,123,771,188
Amortized cost (22) 86,054,175,817 77,380,468,113
Fair value through profit or loss (22) 88,527,036 92,563,379
Intangible assets (23) 279,229,953 282,189,711
Other assets (24) 7,731,006,036 7,217,604,583
Deferred tax assets (32) 105,007,217 70,602,319
Finance lease 3,603,169,707 3,298,372,384
Property and equipment (25) 2,787,074,305 2,837,249,783
Total assets 389,895,056,294 359,568,667,893
Liabilities and equity:
Liabilities:
Due to banks (26) 3,562,066,284 3,458,687,747
Customer deposits (27) 323,266,174,900 295,491,962,118
Financial derivatives (21) - 47,683,515
Other loans (28) 2,938,652,590 2,882,244,636
Other liabilities (29) 6,752,943,149 4,434,170,818
Other provisions (30) 622,938,998 526,745,974
Insurance policyholders' rights (31) 4,263,923,335 4,034,207,132
Current income tax payable 1,959,671,861 1,773,988,334
Defined benefits obligation (33) 558,086,195 543,536,132
Total liabilities 343,924,457,312 313,193,226,406
Equity:
Issued and paid-up capital (34) 10,774,114,830 10,774,114,830
Reserves (35) 27,739,595,264 22,578,768,494
Profit for the period / year and retained earnings (35) 7,456,847,707 13,022,516,998
Total equity attributable to equity holders of the bank 45,970,557,801 46,375,400,322
Non-controlling interests 41,181 41,165
Total equity 45,970,598,982 46,375,441,487
Total liabilities and equity 389,895,056,294 359,568,667,893
Mohamed Bedeir
Chief Executive Officer
. The accompanying notes from (1) to (40) are an integral part of these Consolidated Financial Statements
(Limited review report attached).
Ali Rashid Al-Mohannadi
Chairman of the Board of Directors
- 3 -
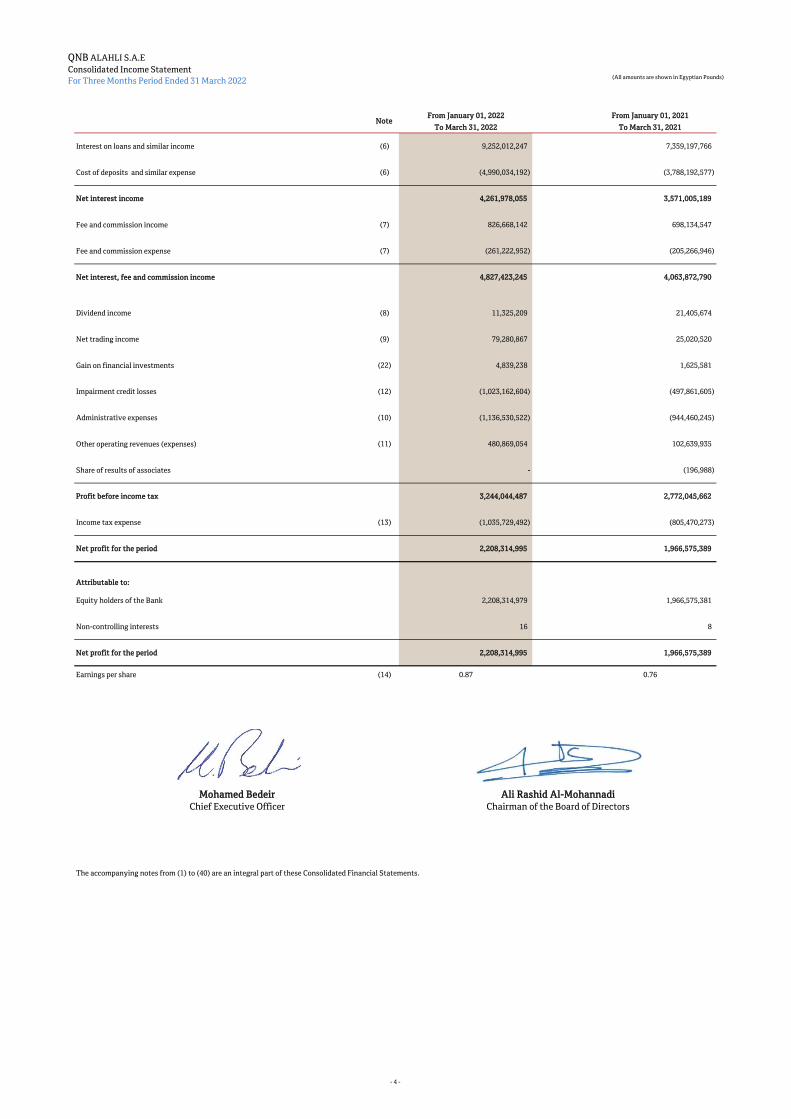
QNB ALAHLI S.A.E
Consolidated Income Statement
For Three Months Period Ended 31 March 2022(All amounts are shown in Egyptian Pounds)
From January 01, 2022 From January 01, 2021
To March 31, 2022 To March 31, 2021
Interest on loans and similar income (6) 9,252,012,247 7,359,197,766
Cost of deposits and similar expense (6) (4,990,034,192) (3,788,192,577)
Net interest income 4,261,978,055 3,571,005,189
Fee and commission income (7) 826,668,142 698,134,547
Fee and commission expense (7) (261,222,952) (205,266,946)
Net interest, fee and commission income 4,827,423,245 4,063,872,790
Dividend income (8) 11,325,209 21,405,674
Net trading income (9) 79,280,867 25,020,520
Gain on financial investments (22) 4,839,238 1,625,581
Impairment credit losses (12) (1,023,162,604) (497,861,605)
Administrative expenses (10) (1,136,530,522) (944,460,245)
Other operating revenues (expenses) (11) 480,869,054 102,639,935
Share of results of associates - (196,988)
Profit before income tax 3,244,044,487 2,772,045,662
Income tax expense (13) (1,035,729,492) (805,470,273)
Net profit for the period 2,208,314,995 1,966,575,389
Attributable to:
Equity holders of the Bank 2,208,314,979 1,966,575,381
Non-controlling interests 16 8
Net profit for the period 2,208,314,995 1,966,575,389
Earnings per share (14) 0.87 0.76
. The accompanying notes from (1) to (40) are an integral part of these Consolidated Financial Statements
Ali Rashid Al-Mohannadi
Note
Chairman of the Board of Directors
Mohamed Bedeir
Chief Executive Officer
- 4 -

QNB ALAHLI S.A.E
Consolidated Statement of Comprehensive Income
For Three Months Period Ended 31 March 2022 (All amounts are shown in Egyptian Pounds)
From January 01, 2022 From January 01, 2021
To March 31, 2022 To March 31, 2021
Net profit for the period 2,208,314,995 1,966,575,389
Other comprehensive income items that will not be reclassified to the Profit or Loss:
Net change in fair value of investments in equity instruments measured at fair value
through other comprehensive income2,331,018 66,349,865
Tax impact related to other comprehensive income that will
not be reclassified to the profit or loss(6,820,565) 88,186
Other comprehensive income items that is or may be reclassified to the profit or loss:
Net change in fair value of debt instruments measured at fair value through other
comprehensive income(160,075,242) (48,752,509)
Tax impact related to other comprehensive income that will be reclassified to the profit
or loss15,822,180 7,964,236
Expected credit loss for fair value of debt instruments measured at fair value through
other comprehensive income54,608 5,998
Total other comprehensive income items for the period net of tax (148,688,001) 25,655,776
Total comprehensive income for the period, net of tax 2,059,626,994 1,992,231,165
Attributable to:
Equity holders of the Bank 2,059,626,978 1,992,231,157
Non-controlling interests 16 8
Total comprehensive income
for the period, net of tax2,059,626,994 1,992,231,165
. The accompanying notes from (1) to (40) are an integral part of these Consolidated Financial Statements
- 5 -
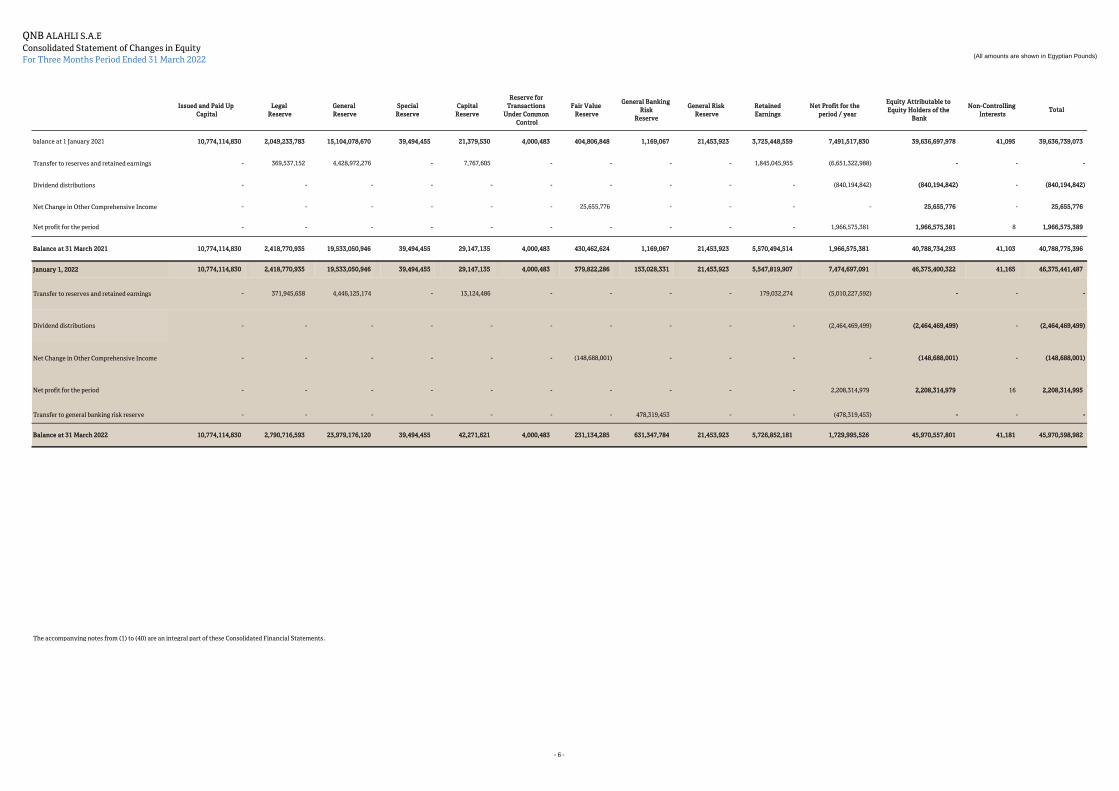
QNB ALAHLI S.A.E
Consolidated Statement of Changes in Equity
For Three Months Period Ended 31 March 2022(All amounts are shown in Egyptian Pounds)
Issued and Paid Up
Capital
Legal
Reserve
General
Reserve
Special
Reserve
Capital
Reserve
Reserve for
Transactions
Under Common
Control
Fair Value
Reserve
General Banking
Risk
Reserve
General Risk
Reserve
Retained
Earnings
Net Profit for the
period / year
Equity Attributable to
Equity Holders of the
Bank
Non-Controlling
InterestsTotal
balance at 1 January 2021 10,774,114,830 2,049,233,783 15,104,078,670 39,494,455 21,379,530 4,000,483 404,806,848 1,169,067 21,453,923 3,725,448,559 7,491,517,830 39,636,697,978 41,095 39,636,739,073
Transfer to reserves and retained earnings - 369,537,152 4,428,972,276 - 7,767,605 - - - - 1,845,045,955 (6,651,322,988) - - -
Dividend distributions - - - - - - - - - - (840,194,842) (840,194,842) - (840,194,842)
Net Change in Other Comprehensive Income - - - - - - 25,655,776 - - - - 25,655,776 - 25,655,776
Net profit for the period - - - - - - - - - - 1,966,575,381 1,966,575,381 8 1,966,575,389
Balance at 31 March 2021 10,774,114,830 2,418,770,935 19,533,050,946 39,494,455 29,147,135 4,000,483 430,462,624 1,169,067 21,453,923 5,570,494,514 1,966,575,381 40,788,734,293 41,103 40,788,775,396
January 1, 2022 10,774,114,830 2,418,770,935 19,533,050,946 39,494,455 29,147,135 4,000,483 379,822,286 153,028,331 21,453,923 5,547,819,907 7,474,697,091 46,375,400,322 41,165 46,375,441,487
Transfer to reserves and retained earnings - 371,945,658 4,446,125,174 - 13,124,486 - - - - 179,032,274 (5,010,227,592) - - -
Dividend distributions - - - - - - - - - - (2,464,469,499) (2,464,469,499) - (2,464,469,499)
Net Change in Other Comprehensive Income - - - - - - (148,688,001) - - - - (148,688,001) - (148,688,001)
Net profit for the period - - - - - - - - - - 2,208,314,979 2,208,314,979 16 2,208,314,995
Transfer to general banking risk reserve - - - - - - - 478,319,453 - - (478,319,453) - - -
Balance at 31 March 2022 10,774,114,830 2,790,716,593 23,979,176,120 39,494,455 42,271,621 4,000,483 231,134,285 631,347,784 21,453,923 5,726,852,181 1,729,995,526 45,970,557,801 41,181 45,970,598,982
. The accompanying notes from (1) to (40) are an integral part of these Consolidated Financial Statements
- 6 -

QNB ALAHLI S.A.E
Consolidated Statement Of Cash Flows
For Three Months Period Ended 31 March 2022(All amounts are shown in Egyptian Pounds)
Note March 31, 2022 March 31, 2021
Cash flows from operating activities
Profit before tax 3,244,044,487 2,772,045,662
Adjusted by:
Property and Equipment depreciation and Intangible assets amortization (10) 110,227,481 92,947,012
Impairment credit losses (12) 1,023,162,604 497,861,605
Loans written off during the period (169,612,152) (70,626,031)
Recovery from loans previously written off 11,210,560 10,194,855
Net formed / (reversed) other provisions 93,595,995 (44,487,943)
Utilized provisions other than loans provision (3,459,947) -
Translation differences of other provisions in foreign currencies 6,056,976 (116,496)
Translation differences resulting from monetary foreign currency investments (328,086,546) 5,250,454
Amortization of premium / discount for bonds (216,917,611) (551,203)
Formed insurance policyholders' rights provisions during the period 229,716,203 118,153,869
(Gain) on sale of Property and Equipment (779,000) (3,868,500)
Dividend income (8) (11,325,209) (21,405,674)
Share of results of associates applying the equity method - 196,988
Gain on financial investments (22) (4,839,238) (1,625,581)
Operating profits before changes in assets and liabilities resulting from operating activities 3,982,994,603 3,353,969,017
Net decrease / increase in assets and liabilities
Due from banks 283,379,354 (303,908,602)
Treasury bills 12,296,948,453 6,764,208,354
Trading investments 25,163,037 15,512,570
Loans and credit facilities to customers (14,829,178,426) (1,269,474,672)
Financial derivatives (133,733,898) 36,576,283
Financial investement recognized at fair value through profit or loss 4,036,343 (1,175,554)
Other assets (502,070,626) (612,620,119)
Due to banks 103,378,537 (287,191,786)
Customer deposits 27,774,212,782 14,341,058,550
Other liabilities 629,781,375 (141,078,914)
Defined benefits obligation 14,550,063 15,878,325
Net change Leased assets (304,797,323) (24,183,857)
Income tax paid (875,449,250) (595,533,480)
Net cash flows resulting from operating activities (1) 28,469,215,024 21,292,036,115
Cash flows from investing activities
Acquisition of Property and Equipment and Intangible assets (57,294,482) (101,697,519)
Proceeds from sale of Property and Equipment 981,237 3,871,698
Proceeds from financial investments other than held for trading investments 4,621,423,840 2,983,066,670
Acquisition of financial investments other than held for trading investments (12,422,375,189) (15,855,893,497)
Net cash flows used in investing activities (2) (7,857,264,594) (12,970,652,648)
Cash flows from financing activities
Other loans 56,407,954 (355,091,126)
Dividends paid (775,478,543) (840,194,842)
Net cash flows used in financing activities (3) (719,070,589) (1,195,285,968)
Net increase in cash and cash equivalents during the period (1+2+3) 19,892,879,841 7,126,097,499
Cash and cash equivalents at the beginning of the period 17,547,190,335 9,185,112,960
Cash and cash equivalents at the end of the period (37) 37,440,070,176 16,311,210,459
Cash and cash equivalents at end of the period are represented in :
Cash and due from Central Bank of Egypt (16) 25,059,296,673 17,474,921,131
Due from banks (17) 34,407,857,171 14,212,355,527
Treasury bills 27,854,007,413 35,246,152,317
Balances with Central Bank of Egypt (mandatory reserve) (21,332,260,269) (13,325,102,586)
Balances Due from banks with maturities more than 3 months (1,002,435,900) (2,148,730,000)
Treasury bills with maturity more than 3 months (27,546,394,912) (35,148,385,930)
Cash and cash equivalents at end of the period 37,440,070,176 16,311,210,459
. The accompanying notes from (1) to (40) are an integral part of these Consolidated Financial Statements
- 7 -
QNB ALAHLI S.A.E
Notes to the Consolidated Financial Statements
For Three Months Period Ended 31 March 2022(All amounts are shown in Egyptian Pounds)
1. Background:
2 Summary of significant accounting policies:-
2.1 Basis of preparation of the consolidated financial statements
2.2.1 Basis of Combinations
• Identifying an acquirer;
• Measuring the cost of the business combination;
• And allocating, at the acquisition date, the cost of the combination to the assets acquired, liabilities and contingent liabilities assumed.
These consolidated financial statements were approved by the Board of Directors on April 11, 2022.
QNB ALAHLI "S.A.E" ("The Bank") was incorporated as an investment and commercial bank on April 13, 1978, in accordance with the provisions of the
Investment Law no 43 of 1974 and its executive regulations and the amendments thereon. The Bank provides all banking services related to its activity,
through its Head Office located in 5 Champlion Street - Downtown - Cairo and its 231 branches served by 6,991 staff at the date of the financial
statements. The Bank is listed on the Egyptian Stock Exchange (EGX).
These consolidated financial statements have been prepared in accordance with the instructions of the Central Bank of Egypt (CBE) rules approved by its
Board of Directors on December 16, 2008; and as per IFRS 9 "Financial Instruments" in accordance with the instructions of the Central Bank of Egypt
(CBE) dated February 26, 2019.
These consolidated financial statements have been prepared in accordance with the applicable laws of Egypt.
When a business combination agreement provides for an adjustment to the cost of the combination contingent on future events, the acquirer includes
the amount of that adjustment in the cost of the combination at the acquisition date if the adjustment is probable and can be measured reliably.
A business combination agreement may allow for adjustments to the cost of the combination that are contingent on one or more future events. The
acquirer usually estimates the amount of any such adjustment at the time of initially accounting for the combination, even though some uncertainty
exists. If the future events do not occur or the estimate needs to be revised, the cost of the business combination is adjusted accordingly.
However, when a business combination agreement provides for such an adjustment, that adjustment is not included in the cost of the combination at the
time of initially accounting for the combination if it either is not probable or cannot be measured reliably. If that adjustment subsequently becomes
probable and can be measured reliably, the additional consideration shall be treated as an adjustment to the cost of the combination.
In case of a business combination - made through step acquisitions for a Group reorganization purposes - involving entities or businesses under common
control in which all of the combining entities or businesses are ultimately controlled by the same party or parties, both before and after the business
combination, the acquirer recognizes the identifiable assets, liabilities and contingent liabilities that meet the recognition criteria at their carrying
amounts previously reported at the books of the Group with common control.
Any difference between the consideration paid or transferred and the carrying amounts of the acquiree’s net assets and contingent liabilities is reflected
within equity as a reserve for transactions under common control. This policy is also applied in case of the groups’ full or partial acquisition of shares
held by the non-controlling interests in a subsidiary or the partial disposition of the Group’s interest in a subsidiary while retaining control over that
subsidiary.
Acquisitions of subsidiaries and businesses are accounted for using the purchase method unless the transaction does not constitute an acquisition in
form or substance. Application of the purchase method involves the following steps:
On acquisition date where control is obtained, the cost of the business combination is measured as the aggregate of the fair values, at the date of
exchange, of assets given, liabilities incurred or assumed, and equity instruments issued by the acquirer in exchange for control of the acquiree, in
addition to any costs directly attributable to the business combination.
Thus, the acquirer recognizes the acquiree’s identifiable assets, liabilities and contingent liabilities that meet the recognition criteria at their fair values
at the acquisition date, except for non-current assets (or disposal groups) that are classified as held for sale, that are recognized and measured at the
lower of their carrying amounts, or fair value less costs to sell.
Goodwill arising on acquisition date is recognized as an asset and initially measured at cost, being the excess of the cost of the business combination over
the net fair value of the identifiable assets, liabilities and contingent liabilities recognized.
If, after reassessment, the Group’s interest in the net fair value of the acquiree’s identifiable assets, liabilities and contingent liabilities exceeds the cost
of the business combination, the excess is recognized immediately in profit or loss.
The non-controlling interest in an acquiree is initially measured at the non-controlling interest proportionate share in the fair value of the assets,
liabilities and contingent liabilities recognized at acquisition date.
- 8 -
QNB ALAHLI S.A.E
Notes to the Consolidated Financial Statements
For Three Months Period Ended 31 March 2022(All amounts are shown in Egyptian Pounds)
2.2.2 Transactions Eliminated on Consolidation
2.2.3 Loss of Control
2.2.4 Basis of presentation of consolidation
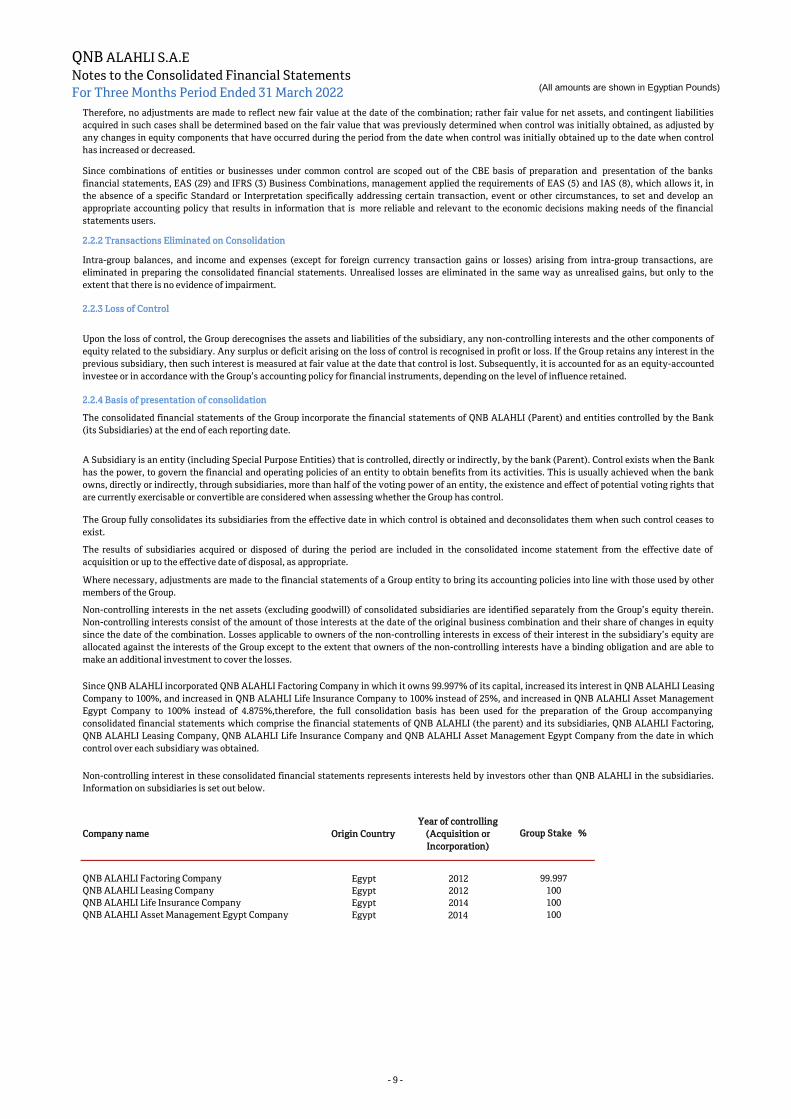
Company name Origin Country
Year of controlling
(Acquisition or
Incorporation)
QNB ALAHLI Factoring Company Egypt 2012
QNB ALAHLI Leasing Company Egypt 2012
QNB ALAHLI Life Insurance Company Egypt 2014
QNB ALAHLI Asset Management Egypt Company Egypt 2014
Since combinations of entities or businesses under common control are scoped out of the CBE basis of preparation and presentation of the banks
financial statements, EAS (29) and IFRS (3) Business Combinations, management applied the requirements of EAS (5) and IAS (8), which allows it, in
the absence of a specific Standard or Interpretation specifically addressing certain transaction, event or other circumstances, to set and develop an
appropriate accounting policy that results in information that is more reliable and relevant to the economic decisions making needs of the financial
statements users.
Group Stake %
99.997
100
100
100
A Subsidiary is an entity (including Special Purpose Entities) that is controlled, directly or indirectly, by the bank (Parent). Control exists when the Bank
has the power, to govern the financial and operating policies of an entity to obtain benefits from its activities. This is usually achieved when the bank
owns, directly or indirectly, through subsidiaries, more than half of the voting power of an entity, the existence and effect of potential voting rights that
are currently exercisable or convertible are considered when assessing whether the Group has control.
Since QNB ALAHLI incorporated QNB ALAHLI Factoring Company in which it owns 99.997% of its capital, increased its interest in QNB ALAHLI Leasing
Company to 100%, and increased in QNB ALAHLI Life Insurance Company to 100% instead of 25%, and increased in QNB ALAHLI Asset Management
Egypt Company to 100% instead of 4.875%,therefore, the full consolidation basis has been used for the preparation of the Group accompanying
consolidated financial statements which comprise the financial statements of QNB ALAHLI (the parent) and its subsidiaries, QNB ALAHLI Factoring,
QNB ALAHLI Leasing Company, QNB ALAHLI Life Insurance Company and QNB ALAHLI Asset Management Egypt Company from the date in which
control over each subsidiary was obtained.
Non-controlling interest in these consolidated financial statements represents interests held by investors other than QNB ALAHLI in the subsidiaries.
Information on subsidiaries is set out below.
The Group fully consolidates its subsidiaries from the effective date in which control is obtained and deconsolidates them when such control ceases to
exist.
The results of subsidiaries acquired or disposed of during the period are included in the consolidated income statement from the effective date of
acquisition or up to the effective date of disposal, as appropriate.
Where necessary, adjustments are made to the financial statements of a Group entity to bring its accounting policies into line with those used by other
members of the Group.
Non-controlling interests in the net assets (excluding goodwill) of consolidated subsidiaries are identified separately from the Group’s equity therein.
Non-controlling interests consist of the amount of those interests at the date of the original business combination and their share of changes in equity
since the date of the combination. Losses applicable to owners of the non-controlling interests in excess of their interest in the subsidiary’s equity are
allocated against the interests of the Group except to the extent that owners of the non-controlling interests have a binding obligation and are able to
make an additional investment to cover the losses.
Intra-group balances, and income and expenses (except for foreign currency transaction gains or losses) arising from intra-group transactions, are
eliminated in preparing the consolidated financial statements. Unrealised losses are eliminated in the same way as unrealised gains, but only to the
extent that there is no evidence of impairment.
Upon the loss of control, the Group derecognises the assets and liabilities of the subsidiary, any non-controlling interests and the other components of
equity related to the subsidiary. Any surplus or deficit arising on the loss of control is recognised in profit or loss. If the Group retains any interest in the
previous subsidiary, then such interest is measured at fair value at the date that control is lost. Subsequently, it is accounted for as an equity-accounted
investee or in accordance with the Group’s accounting policy for financial instruments, depending on the level of influence retained.
The consolidated financial statements of the Group incorporate the financial statements of QNB ALAHLI (Parent) and entities controlled by the Bank
(its Subsidiaries) at the end of each reporting date.
Therefore, no adjustments are made to reflect new fair value at the date of the combination; rather fair value for net assets, and contingent liabilities
acquired in such cases shall be determined based on the fair value that was previously determined when control was initially obtained, as adjusted by
any changes in equity components that have occurred during the period from the date when control was initially obtained up to the date when control
has increased or decreased.
- 9 -
QNB ALAHLI S.A.E
Notes to the Consolidated Financial Statements
For Three Months Period Ended 31 March 2022(All amounts are shown in Egyptian Pounds)
2.2.5 Investments in associates
2.3 Segment reporting
2.4 Foreign currency translation
2.4.1 Functional and presentation currency
2.4.2 Transactions and balances in foreign currencies
• Net trading income from held for trading assets and liabilities;
• Other operating revenues (expenses) from the remaining assets and liabilities;
• Investments in equity instrument recognized at fair value through other comprehensive income in equity.
2.5 Financial assets
According to the equity method, an investment in an associate is initially recognized in the statement of financial position at cost and is subsequently
adjusted to recognize the Group’s share in profit or loss, and other changes in the net assets, of the associate.
An operating segment is a group of assets and operations providing products or services whose risks and benefits are different from those associated
with products or services provided by other operating segments. A geographical segment provides products or services within a specific economic
environment characterized by risks and benefits different from those related to other geographical segments operating in a different economic
environment.
The Bank maintains its accounting records in Egyptian Pounds. Transactions in foreign currencies during the period are translated into the Egyptian
Pounds using the exchange rates prevailing at the date of the transaction. Monetary assets and liabilities denominated in foreign currencies are re-
translated at end of reporting period at the exchange rates then prevailing. Foreign exchange gains and losses resulting from settlement and translation
of such transactions and balances are recognized in the income statement and reported under the following line items:
Changes in the fair value of investments in debt instruments; which represent monetary financial instruments, denominated in foreign currencies and
classified as FVTOCI assets are analyzed into differences resulting from changes in the amortized cost of the instrument, differences resulting from
changes in the applicable exchange rates and differences resulting from changes in the fair value of the instrument. Differences resulting from changes
in the amortized cost are recognized and reported in the income statement in "Interest on loans and similar income" whereas differences resulting from
changes in foreign exchange rates are recognized and reported in "Other operating revenues (expenses)". The remaining differences resulting from
changes in fair value are recognized in equity and accumulated in the "Fair value revaluation reserve" in Other comprehensive income.
Valuation differences arising on the measurement of non-monetary items at fair value include gains or losses resulting from changes in foreign currency
exchange rates used to translate those items. Total fair value changes arising on the measurement of equity instruments classified as at fair value
through the profit or loss are recognized in the income statement, whereas total fair value changes arising on the measurement of equity instruments
classified as FVTOCI are recognized directly in equity in the "Fair value reserve" in Other Comprehensive Income.
Leased assets denominated in foreign currency which the group leases to others are measured at historical cost and translated to Egyptian Pounds using
the exchange rates prevailing at the dates of the initial recognition.
Financial assets are classified at amortized cost, fair value through other comprehensive income (FVTOCI) and fair value through profit or loss (FVTPL).
The classification depends on the business model of the financial assets that are managed with its contractual cash flow and is determined by
management at the time of initial recognition.
An associate is an entity over which the Group has significant influence that is not control or joint control. Significant influence exists where the bank
holds voting rights of 20% to 50% in an entity.
Acquisitions of Associates are accounted for using the purchase method; goodwill arising on acquisition of an associate, if any, is not presented
separately, but is rather included within the carrying amount of the investment. Investments in associates are accounted for subsequently in the
consolidated financial statements using the equity method.
The consolidated financial statements of the Group are presented in the Egyptian Pound which is the Bank’s functional and presentation currency.
The Bank is divided into two main business lines, which are corporate banking and retail banking. In addition, a corporate center acts as a central
funding department for the bank’s core businesses. The dealing room, proprietary activity and other non-core businesses are reported under the
corporate banking business line.
For the purpose of preparation of segment reporting by geographical region, segment profit or loss and assets and liabilities are presented based on the
location of the branches. Given that the bank does not have any entity abroad, and unless otherwise stated in a specific disclosure, all equity and debt
instruments of the bank issued by foreign institutions and credit facilities granted to foreign counterparties are reported based on the location of the
domestic branch where such assets are recorded.
- 10 -
QNB ALAHLI S.A.E
Notes to the Consolidated Financial Statements
For Three Months Period Ended 31 March 2022(All amounts are shown in Egyptian Pounds)
2.5.1 Financial assets classified as amortized cost
• Significant deterioration for the issuer of financial instrument.
• Lowest sales in terms of rotation and value.
• A clear and reliable documentation process for the justification of each sale and its conformity with the requirements of the standard.
2.5.2 Financial assets classified as fair value through other comprehensive income
2.5.3 Financial assets classified as fair value through profit or loss
•
•
• One business model can include sub-business models.
2.6 Offsetting of financial assets and financial liabilities
2.7 Financial derivatives and hedge accounting
•
•
The characteristics of the business model are as follows:
The financial asset is retained in the business model of financial assets held to collect contractual cash flow. The objective from this business model is to
collect contractual cash flow which represented in principal and interest. The sale is an exceptional event for the purpose of this model and under the
terms of the standard represented in following:
Financial assets and liabilities are offset when the group has a legally enforceable right to offset the recognized amounts and it intends to settle these
amounts on a net basis, or realize the asset and settle the liability simultaneously.
Derivatives are initially recognized at fair value on the date on which a derivative contract is entered into and are subsequently measured at fair value.
Fair values are determined based on quoted market prices in active markets, including recent market transactions, or valuation techniques, including
discounted cash flow models and options pricing models, as appropriate. All derivatives are recognized as assets when their fair value is positive and as
liabilities when their fair value is negative.
Hedging instruments of the risks associated with fair value changes of recognized assets or liabilities or firm commitments (fair value hedge);
Hedging of risks relating to future cash flows attributable to a recognized asset or liability or a highly probable forecast transaction (cash flow hedge).
Hedge accounting is used for derivatives designated in a hedging relationship when the following criteria are met. At the inception of the hedging
relationship, the bank documents the relationship between the hedging instrument and the hedged item, along with its risk management objectives and
its strategy for undertaking various hedge transactions. Furthermore, at the inception of the hedge and on an ongoing basis, the bank documents
whether the hedging instrument is highly effective in offsetting changes in fair values or cash flows of the hedged item attributable to the hedged risk.
The financial asset is held in other business models including trading, management of financial assets at fair value, maximization of cash flows through
sale. The objective of the business model is not to retain the financial asset for the collection of contractual or retained cash flows for the collection of
contractual cash flows and sales. Collecting contractual cash flows is an incidental event for the objective of the model.
Embedded derivatives, such as the conversion option in a convertible bond, are treated as separate derivatives if they meet the definition of a financial
derivative, and when their economic characteristics and risks are not closely related to those of the host contract, provided that the host contract is not
classified as at fair value through profit or loss. These embedded derivatives are measured at fair value with changes in fair value recognized in the
income statement "Net trading income" ;unless the group chooses to designate the hybrid contract as a whole as at fair value through profit or loss.
The timing of recognition in profit or loss, of any gains or losses arising from changes in the fair value of derivatives, depends on whether the derivative
is designated as a hedging instrument, and the nature of the item being hedged. The parent bank designates certain derivatives as:
Structuring a set of activities designed to extract specific outputs.
Represents a complete framework for a specific activity (inputs - activities - outputs).
The financial asset is retained in the business model of financial assets held to collect contractual cash flows and sales. Held to collect contractual cash
flows and sales are integrated to achieve the objective of the model. Sales are high in terms of turnover and value as compared to the business model
retained for the collection of contractual cash flows.
- 11 -

QNB ALAHLI S.A.E
Notes to the Consolidated Financial Statements
For Three Months Period Ended 31 March 2022(All amounts are shown in Egyptian Pounds)
2.7.1 Fair value hedge
2.7.2 Cash flow hedge
2.7.3 Derivatives that do not qualify for hedge accounting
2.8 Interest income and expense
1-
2-
For retail loans, personal loans, small and medium business loans, real estate loans for personal housing and small loans for businesses, when interest
income is collected and after recovery of all arrears.
For corporate loans, interest income is recognized on a cash-basis after the bank collects 25% of the rescheduled installments and provided these
installments continue to be paid for at least one year.
If a loan continues to be performing thereafter, interest accrued on the principal then outstanding starts to be recognized as revenues. Interest that is
marginalized prior to the date when the loan becomes performing is not recognized in the profit or loss except when the total balance of loan, prior to that
date, is paid in full.
When the hedging instrument no longer qualifies for hedge accounting, the adjustment to the carrying amount of a hedged item, measured at amortized
cost, arising from the hedged risk is amortized to profit or loss from that date to maturity of the asset using the effective interest method. Adjustment to
the carrying amount of a hedged equity instrument that has been deferred in equity remains in equity until the asset is derecognized.
The effective portion of changes in the fair value of derivatives designated and effective for cash flow hedge is recognized in equity while changes in fair
value relating to the ineffective portion is recognized immediately in the income statement in "Net trading income".
When a hedging item expires or is sold or if hedging instrument no longer qualifies for hedge accounting requirements, gains or losses that have been
previously accumulated in equity remain in equity and are only recognized in profit or loss when the forecast transaction ultimately occurs. If the
forecast transaction is no longer expected to occur any related cumulative gain or loss on the hedging instrument that has been recognized in equity shall
be reclassified immediately to profit or loss.
Where a derivative instrument does not qualify for hedge accounting, changes in fair value of that derivative and related interest are recognized
immediately in the income statement in “Net trading income” line item. However, gains or losses arising from changes in fair value of derivatives that
are managed in conjunction with financial assets or financial liabilities, designated upon initial recognition at fair value through profit or loss, are
included in “net income from financial instruments designated upon initial recognition as at fair value through profit or loss”.
Interest income and expense on all interest-bearing financial instruments are recognized in "Interest income" and "Interest expense" line items in the
income statement using the effective interest rate method.
The effective interest rate is a method of calculating the amortized cost of a debt instrument whether a financial asset or a financial liability and of
allocating its interest income or interest expense over the relevant period. The effective interest rate is the rate that exactly discounts estimated future
cash payments or receipts through the expected life of the financial debt instrument or, when appropriate, a shorter period to the net carrying amount of
the financial asset or financial liability on initial recognition. When calculating the effective interest rate, the Group estimates the future cash flows,
considering all contractual terms of the financial instrument (for example, prepayment options) but does not consider future credit losses. The
calculation includes all fees and points paid or received between parties to the contract that are an integral part of the effective interest rate, transaction
costs and all other premiums or discounts.
Interest income on loans is recognized on an accrual basis except for the interest income on non-performing loans, which ceases to be recognized as
revenue when the recovery of interest or principal is in doubt.
Amounts accumulated in equity are transferred to income statement in the relevant periods when the hedged item affects the income statement. The
effective portion of changes in fair value of interest rate swaps and options are reported in "Net trading income".
Changes in the fair value of derivatives that are designated and qualify as fair value hedges are recognized immediately in the profit or loss, together
with any changes in the fair value of the hedged asset or liability that are attributable to the hedged risk. The effective portion of changes in the fair
value of the interest rate swaps and the changes in the fair value of the hedged item attributable to the hedged risk are recognized in profit or loss.
Additionally, interest differential on interest rate swaps is recognized in profit or loss as part of ‘net interest income’ line item in the income statement.
Any ineffectiveness is recognized in profit or loss in "Net trading income".
Interest income on non-performing or impaired (Stage 3) loans and receivables ceases to be recognized in profit or loss and is rather recorded off balance
sheet in statistical records. Interest income on these loans is recognized as revenue on a cash basis as follows:
- 12 -
QNB ALAHLI S.A.E
Notes to the Consolidated Financial Statements
For Three Months Period Ended 31 March 2022(All amounts are shown in Egyptian Pounds)
2.9 Fees and commission income
Leasing revenues
Insurance revenues
2.10 Dividends income
2.11 Purchase and resale agreements and sale and repurchase agreements (repos and reverse repos)
2.12 Impairment of financial assets
Financial assets are classified at three stages at each reporting date:
-
-
-
Credit losses and impairment losses on the value of financial instruments are measured as follows:
•
•
•
•
2.12.1 Significant increase in credit risk
Dividend income on investments in equity instruments and similar assets, other than investments in subsidiaries and associates, is recognized in the
income statement when the bank’s right to receive payment is established.
Commitment fees received by the bank to originate a loan are deferred if it is probable that the bank will enter into a specific lending arrangement and
are regarded as a compensation for an ongoing involvement with the acquisition of the financial instrument and recognized as an adjustment to the
effective interest rate. If the commitment expires without the bank making the loan, the fees are recognized as revenue on expiry.
Loan syndication fees received by the bank are recognized as revenue when the syndication has been completed, only if the bank arranges the loan and
retains no part of the loan package for itself (or retains a part at the same effective interest rate for comparable risk as other participants).
Fees charged for servicing a loan or facility that is measured at amortized cost, are recognized as revenue as the service is provided. Fees and
commissions on non-performing or impaired loans or receivables cease to be recognized as income and are rather recorded off balance sheet. These are
recognized as revenue - on a cash basis - only when interest income on those loans is recognized in profit or loss, at which time, fees and commissions
that are an integral part of the effective interest rate of a financial asset are treated as an adjustment to the effective interest rate of that financial asset.
Fees and commissions that are earned on negotiating or participating in the negotiation of a transaction in favor of another entity, such as arrangements
for the allotment of shares or another financial instrument or acquisition or sale of an enterprise on behalf of a client, are recognized as revenue when the
transaction has been completed. Administrative consultations and other service fees are usually recognized as revenue on a straight-line basis over the
period in which the service is rendered. Fees from financial planning management and custodian services provided to clients over long periods are
usually recognized as revenue on a straight-line basis over the period in which these services are rendered.
Revenues from lease contracts are recognized based on the interest rate implicit in each contract plus an amount equal to depreciation of the leased
asset. Debit/credit differences between revenue recognized in profit or loss and rental value for each period are recorded in “leased assets – lease
contracts settlement” account in the balance sheet whose balance is to be settled against the carrying amount of leased asset at the end of the contract
period.
Financial instruments sold under repurchase agreements are not derecognized from the statement of financial position and cash receipts are shown in
liability side in the statement of financial position.
The low risk financial instrument is classified at initial recognition in the first stage and credit risk is monitored continuously by the Bank's credit risk
management.
If it is determined that there has been a significant increase in credit risk since the initial recognition, the financial instrument is transferred to the
second stage where it is not yet considered impaired at this stage.
The Group reviews all its financial assets except for financial assets that are measured at fair value through profit or loss to assess the extent of
impairment as described below.
Stage 1 : Financial assets that have not experienced a significant increase in credit risk since the date of initial recognition, and the expected credit loss is
calculated for 12 months.
Stage 2 : Financial assets that have experienced a significant increase in credit risk since the initial recognition or the date on which the investments are
made, and the expected credit loss is calculated over the life of the asset.
Stage 3 :Impairment of financial assets whose expected credit loss is to be recognized over the life of the asset on the basis of the difference between the
carrying amount of the instrument and the present value of expected future cash flows.
The Group considers that the financial instrument has experienced a significant increase in the credit risk when one or more of the following
quantitative and qualitative criteria, as well as the factors relating to default, have been met.
If there are indicators of impairment of the financial instrument, it is transferred to the third stage.
The financial assets created or acquired by the Group and include a high credit risk ratio for the Bank's low risk financial assets are recognized on the
initial recognition of the second stage directly and therefore the expected credit losses are measured on the basis of expected credit losses over the life of
the asset.
Premium income and Claim expense is recognized on accrual basis.
- 13 -
QNB ALAHLI S.A.E
Notes to the Consolidated Financial Statements
For Three Months Period Ended 31 March 2022(All amounts are shown in Egyptian Pounds)
2.12.2 Quantitative Factors
2.12.3 Qualitative Factors
Retail loans,micro and small businesses
•
•
•
•
Corporate loans and Medium businesses
•
•
•
•
•
•
•
Nonpayments
Transfer between the Three stages:
Transfer from second stage to first stage:
Transfer from third stage to second stage:
•
•
•
If the borrower encounters one or more of the following events:
The loans and facilities of institutions, medium, small, micro and retail banking are included in stage two if the period of non-payment is more than 60
days and less than 90 days,(180 days for SME's according to CBE Circular dated 14 December 2021 regarding the temporary amendments of SME's NPL
treatment in IFRS9 regulation) . Note that this period (60 days) will be reduced by (10) days per year to become (30) days during (3) years from the date
of application (Year 2019).
The financial asset shall not be transferred from the second stage to the first stage unless all the quantitative and qualitative elements of the first stage
are met and the full arrears of the financial asset and the proceeds are paid.
The financial asset shall not be transferred from the third stage to the second stage until all the following conditions have been met:
If the borrower has a follow-up list and / or financial instrument faced one or more of the following events:
Cancellation of a direct facility by the bank due to the high credit risk of the borrower.
The borrower submits a request to convert short-term to long-term payments due to negative effects on the borrower's cash flows.
Extension of the deadline for repayment at the borrower's request.
Frequent Past dues over the previous 12 months.
Future adverse economic changes affecting the borrower's future cash flows.
A significant increase in the rate of return on the financial asset as a result of increased credit risk.
Significant negative changes in the activity and physical or economic conditions in which the borrower operates.
Scheduling request as a result of difficulties facing the borrower.
When the probability of default over the remaining life of the instrument is increased from the date of the financial position compared to the probability
of default over the remaining life expected at initial recognition in accordance with the Bank's acceptable risk structure.
Significant negative changes in actual or expected operating results or cash flows.
Future economic changes affecting the borrower's future cash flows.
Early indicators of cash flow / liquidity problems such as delays in servicing creditors / business loans.
Completion of all quantitative and qualitative elements of the second stage;
Repayment of 25% of the balance of the outstanding financial assets, including accrued segregated / statistical interest;
Regularity of payment for at least 12 months.
- 14 -

QNB ALAHLI S.A.E
Notes to the Consolidated Financial Statements
For Three Months Period Ended 31 March 2022(All amounts are shown in Egyptian Pounds)
2.13 Intangible assets
2.13.1 Goodwill
2.13.2 Software (computer programs)
2.14 Property and Equipment
Furniture 10 years
Armored vaults 20-30 years
IT equipment 5 years
Electric appliances 5 years
Vehicles 5 years
The Group’s property and equipment include lands and buildings of the bank which basically comprise the head office premises and branch buildings. All
property and equipment are carried at historical cost net of accumulated depreciation and accumulated impairment losses.
Cost includes expenditure that is directly attributable to the construction or acquisition of the items. Subsequent costs are included in the assets carrying
amount or recognized separately, as appropriate, only when it is probable that future economic benefits associated with the item will flow to the group
and the cost of the item can be measured reliably. Repairs and maintenance expenses are recognized in profit or loss within "other operating costs" line
item during the financial period in which they are incurred.
The recoverable amount of an asset is the higher of the asset’s net realizable value or value in use. Gains or losses on disposals are determined by
comparing proceeds with relevant carrying amount. These are included in the profit or loss in other operating income (expenses) in the income
statement.
Fixtures
Buildings
Goodwill, arising from the acquisition or legal merger of subsidiaries, represents the difference between the cost of the combination and the acquiree
interest in the fair value of the identifiable assets, liabilities and qualifying contingent liabilities of the acquire at the acquisition date. Goodwill is
annually tested for impairment and is written-down to profit or loss at an annual amortization of 20% or impairment loss whichever is higher.
Expenditure on upgrade and maintenance of computer programs is recognized as an expense in the income statement in the period in which it is incurred.
Expenditures directly incurred in connection with specific software are recognized as intangible assets if they are controlled by the group and when it is
probable that they will generate future economic benefits within more than one year that exceed its cost. Direct costs include the cost of the staff
involved in upgrading the software in addition to a reasonable portion of relative overheads.
Upgrade costs are recognized and added to the original cost of the software when it is likely that such costs will increase the efficiency or enhance the
performance of the computers software beyond its original specification.
Cost of computer software recognized as an asset shall be amortized over the year of expected benefits from three to five years except for the core IT
system which is amortized over ten years.
The Group considers the residual value of its property and equipment as insignificant and immaterial in relation to the depreciable amount; therefore, the
depreciable amount of the group’s property and equipment is determined without any deduction for residual values. Depreciation is charged so as to
write off the cost of assets, other than land which is not depreciated, over their estimated useful lives, using the straight-line method based on the
following annual rates:
Depreciation years for property and equipment, other than buildings, depend on their useful lives which are usually estimated as specified below:
The carrying amounts of its depreciable property and equipment are reviewed whenever changes in circumstances or events indicate that the carrying
amounts of those assets may not be recovered. Where the carrying amount of an asset exceeds its recoverable amount, the carrying amount is reduced to
its recoverable amount.
50 years
10 yearsDecoration & installations
Lifts
Electricity & Air conditioning
15 years
10 years
30 years
10 years
10 years
10 years
The shortest of 10 years
or contract periodLeasehold improvements
Generators
Telephone network & CCTV
Firefighting system & Plumbing system
Other installations
- 15 -

QNB ALAHLI S.A.E
Notes to the Consolidated Financial Statements
For Three Months Period Ended 31 March 2022(All amounts are shown in Egyptian Pounds)
2.15 Impairment of non-financial assets
2.16 Leasing
2.16.1 As a lessee
2.16.2 As a lessor
Computers 2-8 years
Equipment 4-10 years
Vehicles 4-5 years
Building 17-50 years
2.17 Cash and cash equivalents
2.18 Other provisions
Maintenance and insurance expenses shall be charged to the income statement when incurred to the extent that they are chargeable to the lessee. If
substantive evidence indicates that the group could not be able to collect all balances due from finance lease debtors, these balance are reduced to their
expected realizable value.
When a provision is wholly or partially no longer required, it is reversed through the profit or loss under "Other Operating Income (expenses)" line item.
Provisions for obligations, other than those for credit risk or employee benefits, due within more than 12 months from the date of consolidated financial
statements are recognized based on the present value of the best estimate of the consideration required to settle the present obligation at the reporting
date. An appropriate pretax discount rate that reflects the time value of money is used to calculate the present value of such provisions.
At the end of each period, the group reviews non-financial assets for which an impairment loss is recognized to assess whether or not all or part of such
impairment losses should be reversed through profit or loss.
Assets leased out under operating lease contracts are reported as part of the fixed assets in the statement of financial position and are depreciated over
the expected useful lives of the assets, on the same basis as other property assets. Lease rental income is recognized in profit or loss, net of any discounts
granted to the lessee, using the straight line method over the contract term.
Assets leased out under finance lease contracts, are reported in the statement of financial position within fixed assets and are depreciated over the
expected useful life of the assets using the same method followed in depreciating similar assets. Lease income is recognized using the rate of return
implicit is each lease contract in addition to an amount equal to depreciation charge for the period. Differences between lease income recognized in the
income statement and rental receivable from lease customers are accumulated and reported in the statement of financial position in a separate account
until duration of the lease contract expires, at which time offset occurs between the account balance and net book value of leased assets.
For obligations due within less than twelve months from the date of consolidated financial statements, provisions are calculated based on undiscounted
expected cash outflows unless the time value of money is material, in which case provisions are measured at present value.
Lease payments made under operating leases, net of any discounts received from the lessor, are recognized as an expense in the profit or loss on a
straight-line basis over the lease term.
Lease contracts are accounted according to Law 95 of 1995 for financial lease. All other lease contracts are recognized as operating leases.
Non-financial assets that do not have definite useful lives, except for goodwill are not amortized. These are annually tested for impairment. Depreciable
property and equipment are tested for impairment whenever changes in circumstances or events indicate that the carrying amounts of those assets may
not be recovered. Impairment loss is recognized and the carrying amount of an asset is reduced to the extent that such carrying amount exceeds the
asset's recoverable amount.
The recoverable amount of an asset is the higher of the asset’s net realizable value or value in use. For the purpose of estimating the impairment loss,
where it is not possible to estimate the recoverable amount of an individual asset,The Group estimates the recoverable amount of the cash-generating
unit to which the asset belongs is estimated.
Assets leased under finance lease arrangements, rentals In arrear and the related impairment loss allowance has been presented in financial position
under the finance lease item.
For the purposes of the cash flow statement, cash and cash equivalents comprise balances due within three months from date of placement or
acquisition. They include cash and balances placed with the Central Bank of Egypt (other than those required under the mandatory reserve), current
accounts with Banks and treasury bills, certificates of deposits and other governmental notes.
Depreciation is charged so as to write off the cost of leased assets, other than land which is not depreciated, over their estimated useful lives, using the
straight-line method based on the following annual rates:
- 16 -
QNB ALAHLI S.A.E
Notes to the Consolidated Financial Statements
For Three Months Period Ended 31 March 2022(All amounts are shown in Egyptian Pounds)
2.19 Insurance activity
2.19.1 Technical reserves
2.19.1.1 Mathematical reserve
2.19.1.2 Provision for outstanding claims
2.19.2 Receivables arising from insurance contracts
2.19.3 Due from insurance and reinsurance companies
2.20 Financial guarantees
(I)
(II)
2.21 Employee benefits
2.21.1 Post-employment benefits (defined benefit plans) and defined contribution plans:
• 10% of the present value of the defined benefit obligation (before deducting plan assets); and
• 10% of the fair value of the plan assets.
A financial guarantee contract is a contract issued by the group as security for loans or overdrafts due from its clients to other entities that requires the
group to make specified payments to reimburse the holder for a loss it incurs because a specified debtor fails to make payment when due in accordance
with the original or modified terms of a debt instrument. Financial guarantees are generally issued by the Bank to beneficiary banks, corporations and
other entities on behalf of the bank’s clients.
Receivables arising from insurance contract either as installments under collection or current accounts of insured parties are carried at amortized cost
which represent nominal balances, net of impairment loss.
Insurance and reinsurance companies stated at amortized cost, which represent its book value, net of allowance for impairment loss.
After initial recognition, a financial guarantee contract issued by the bank is measured at the higher of:
The mathematical reserve is calculated by the actuarial expert according to the technical basis approved by the board of the Egyptian Financial
Supervisory Authority (Formerly Egyptian Insurance Supervisory Authority), in addition to the portion of each certificate from the increase (decrease)
in the capital value resulting from insurance premiums invested in investment portfolio for the account of policyholders.
A provision for outstanding claims is established for life and personal accident insurance policies. Which were reported before the period-end but not
settled at the balance sheet date.
The Bank provides several post-employment benefits to its employees, such as the medical care scheme which qualifies as a defined-benefit plan. A
defined benefit plan commits the Bank, either formally or constructively, to pay a certain amount or level of future benefits and therefore bears the
medium- or long-term risk.
The Bank recognizes the defined benefit obligation as a liability in the statement of financial position under "obligations for post-retirement schemes" to
cover the total value of such obligations. This is assessed regularly by independent actuary using the projected unit credit method. This valuation
technique incorporates assumptions about demographics variables, staff turnover, salary growth rate and discount and inflation rates.
When these plans are financed from external funds classified as plan assets, the fair value of these funds is subtracted from the defined benefit
obligation. Differences arising from changes in the actuarial assumptions and estimates are recognized in the income statement as actuarial gains or
losses to the extent of the higher of the following two amounts as of the end of the previous financial period:
The amount initially recognized less, when appropriate, cumulative amortization of security fees recognized as income in profit or loss using the
straight-line method over the term of the guarantee; and
The best estimate for the payments required to settle any financial obligation resulting from the financial guarantee at the reporting date.
Such estimates are made based on experience in similar transactions and historical losses as supported by management judgment.
Any increase in the obligations resulting from the financial guarantee, is recognized within other operating income (expenses) in the income statement.
The Bank is liable for all obligations arising from its plans for employee benefits which comply, in all material respects, with the principles set out below.
Starting 1 January 2009, the Bank has fully complied with the policy referred to below, and recognized any adjustments, resulting from the first full
implementation of amendments to the CBE rules, directly on retained earnings.
When a financial guarantee is recognized initially, it is measured at its fair value plus, transaction costs that is directly attributable to the issue of such
financial guarantee.
- 17 -
QNB ALAHLI S.A.E
Notes to the Consolidated Financial Statements
For Three Months Period Ended 31 March 2022(All amounts are shown in Egyptian Pounds)
2.22 Income taxes
2.23 Borrowings
2.24 Capital
2.24.1 Capital issuance cost
2.24.2 Dividends
Past service cost is recognized immediately to the extent that the benefits have already vested, and otherwise is amortized on a straight-line basis over
the average period until the benefits become vested. Annual cost of employee benefits plans is reported as part of general and administrative expenses
(employee costs).
The Group’s liability for current tax is calculated using tax rates that have been enacted or substantively enacted by the end of the reporting period, in
addition to income tax differences related to prior years.
Deferred tax is recognized on temporary differences between the carrying amounts of assets and liabilities in the consolidated financial statements and
the corresponding tax bases used in the computation of taxable profit. Deferred tax assets and liabilities are measured at the tax rates that are expected
to apply in the period in which the liability is settled or the asset realized, based on tax rates (and tax laws) that have been enacted or substantively
enacted by the end of the reporting period.
The carrying amount of deferred tax assets is reviewed at the end of each reporting period and reduced to the extent that it is no longer probable that
sufficient taxable profits will be available to allow all or part of the asset to be recovered. However, when it is expected that the tax benefit will increase,
the carrying amount of deferred tax assets shall increase to the extent of previous reduction.
Loans obtained by the bank are initially recognized at fair value net of transaction costs incurred in connection with obtaining the loan. Borrowings are
subsequently measured at amortized cost, with the difference between net proceeds and the value to be paid over the borrowing period, recognized in the
profit or loss using the effective interest rate method.
Actuarial gains and losses that exceed the 10 percent criteria above are amortized to profit or loss over the expected average remaining working lives of
the participating employees.
Dividends on equity instruments issued by the group entities are recognized when the general assembly of the group’s shareholders approves them.
Dividends include the non-controlling interests’ share in the subsidiaries’ dividends, and employees’ profit share and board of directors’ remuneration as
prescribed by the articles of incorporation of the bank and Group entities as well as the corporate law.
Deferred tax assets are generally recognized for all deductible temporary differences to the extent that it is probable that taxable profits will be available
against which those deductible temporary differences can be utilized.
Issued and paid up-capital (i.e. bank's own equity instruments) is initially measured at the cash proceeds received, less transaction costs directly
attributable to the issuance of new shares, issuance of shares to effect business combination, or issue of share options. Transaction costs, net of tax
benefits, are reported as a deduction from equity.
Income tax expense on the period’s profit or loss represents the sum of the tax currently payable and deferred tax and is recognized in the income
statement, except when they relate to items that are recognized directly in equity, in which case the tax is also recognized in equity.
Defined contribution plans are pension schemes whereby the group pays defined contributions to an independent entity. The group shall not be under
legal or constructive obligation to pay more contributions if this entity doesn’t maintain adequate assets to pay-off the employees’ benefits in return for
their service in the current and previous periods.
According to the defined contribution plans, contributions are paid to private sector pension scheme under mandatory or voluntary contractual
arrangement. The group shall be under no additional obligation other than the contribution payments. Contributions to defined contribution retirement
benefit plans are recognized as employee benefits cost when employees have rendered service entitling them to the contributions. Prepaid contributions
shall be recognized as assets to the extent that these contribution payments will reduce future payments or result in cash refunds.
- 18 -
QNB ALAHLI S.A.E
Notes to the Consolidated Financial Statements
For Three Months Period Ended 31 March 2022(All amounts are shown in Egyptian Pounds)
2.25 Fiduciary activities
2.26 Comparative figures
3. Management of financial risks
Risk management strategy
Thus, the primary objectives of the bank’s risk management framework are:
• To contribute to the development of the Bank in various business lines to reach an ideal level of general risk.
• To guarantee the Bank’s sustainability as a going concern, through the implementation of a high-quality risk management infrastructure.
In defining the Bank’s overall risk appetite, the bank management takes various considerations and variables into account, including:
• The relative balance between risk and reward of the bank’s various activities.
• Earnings sensitivity to business, credit and economic cycles.
• The aim of achieving a well-balanced portfolio of earnings streams.
Risk management governance and risk principles
Bank's risk management governance is based on:
i)
ii)
iii)
Risk categories
The following are part of the risks associated with the bank’s Banking activities:
a- Credit risk:
The Bank carries out fiduciary activities that result in ownerships or management of assets on behalf of individuals, trusts, and retirement benefit plans
and other institutions. These assets and income arising thereon are not recognized in the group’s consolidated financial statements, as they are not
assets or income of the Bank or the Group.
For example, the Bank has laid down risk management policies to determine and analyze the risks, set limits to the risks and control them through
reliable methods and up–to–date systems. The Bank regularly reviews the risk management policies and systems and amendments thereto, so that they
reflect the changes in markets, products and services and the best up-to–date applications.
Within the Board, the Risk and Audit Committees are more specifically responsible for examining the consistency of the internal framework for
monitoring risks and compliance.
Comparative figures are reclassified, where necessary, to conform to changes in the current period's financial statements presentation.
The bank operates in business lines, which generate a range of risks whose frequency, severity and volatility can be of different and significant
magnitudes. A greater ability to calibrate its risk appetite and risk parameters, the development of risk management core competencies, as well as the
implementation of a high-performance and efficient risk management structure are therefore critical undertakings for the bank.
A tight framework of internal procedures and guidelines; and
Continuous supervision by business lines and support functions as well as by an independent body to monitor risks and to enforce rules and procedures.
Strong managerial involvement, throughout the entire organization, starting from the Board of Directors down to operational field management teams;
Risks are managed in accordance with pre-approved policies by the board of directors. The risk management department identifies, evaluates and covers
financial risks, in close collaboration with the Bank’s various operating units. The board of directors provides written rules which cover certain risk
areas, such as credit risk, foreign exchange risk, interest rate risk and the use of derivative and non-derivative financial instruments. Moreover, the risk
department is responsible for the periodic review of risk management and the control environment independently.
The Group is exposed to various financial risks, mainly as a result of activities conducted by the Bank and some subsidiaries. Since financial activities
are based on the concept of accepting risks and analyzing and managing individual risks or group of risks altogether, the group aims at achieving a well-
balanced risks and relevant rewards, as appropriate and to reduce the probable adverse effects on the group’s financial performance. The most important
types of risks are credit risk, market risk, liquidity risk and other operating risks. The market risk comprises foreign currency risk, interest rate risk and
other pricing risks.
(Including country risk): represents risk of losses arising from the inability of the Bank’s customers, sovereign issuers or other counterparties to meet
their financial commitments.
Credit risk also includes the replacement risk linked to market transactions. In addition, credit risk may be further increased by a concentration risk,
which arises either from large individual exposures or from groups of counterparties with a high default probability.
- 19 -

QNB ALAHLI S.A.E
Notes to the Consolidated Financial Statements
For Three Months Period Ended 31 March 2022(All amounts are shown in Egyptian Pounds)
b- Market risk:
Represents risk of loss resulting from changes in market prices and interest rates.
c- Operational risk:
d- Structural interest and exchange rate risk:
e- Liquidity risk:
Represents the risk that the bank might not be able to meet its obligations as they become due.
- Full independence of risk assessment departments from the operating divisions; and
- Consistent approach to risk assessment and monitoring applied throughout the Bank.
More specifically, the Risk Division:
•
•
Identifying a frame for all Banks’ operational risks.
The Internal Legal Counsel deals with compliance and legal risks.
This New Product Committee aims at ensuring that, prior to the launch of a new activity or product, all associated risks are fully understood, measured,
approved and subject to adequate procedures and controls, using the available information and processing systems.
On the other hand, the Assets and Liabilities management committee (ALCO) is competent for matters relating to funding and liquidity policymaking
and planning.
All new products and activities or products under development must be submitted to the New Product Committee.
Responsibility for devising the relevant risk management structure and defining risk management operating principles lies mainly with both the Risk
Division and, in particular fields, the assets and liabilities management under Finance Division.
The Bank’s Risk Committee is in charge of reviewing all the bank’s key risk management issues and meets at least on quarterly basis. Risk Committee’s
monthly meetings involve members of the Executive Committee, the heads of the business lines and the Risk Division managers and are used to review
all the core strategic issues: risk-taking policies, assessment methods, material and human resources, analysis of credit portfolios and of the cost of risk,
market and credit concentration limits (by product, country, sector, region, etc.)
Contributes to independent assessment by analyzing transactions implying a credit risk and by providing guidance on transactions proposed by sales
managers.
The Bank dedicates significant resources to constantly adapting its risk management to its activities and ensures that its risk management framework
operates in full compliance with the following fundamental principles of:
The Risk Division is independent from the bank’s operating entities and reports directly to general management. Its role is to contribute to the
development and profitability of the bank by ensuring that the risk management framework in place is both robust and effective. It employs various
teams specializing in the operational management of credit and market risk.
Defines and approves the methods used to analyze, assess, approve and monitor credit risks, countries risks, market risks and operational risks; conducts
a critical review of commercial strategies in high risk areas and continually seeks to improve such risk forecasting and management;
The Assets and Liabilities Unit under the Finance Division, for its part, is entrusted with assessing and managing other major types of risks, namely
liquidity and structural risks (resulting from interest rate, exchange rate and liquidity) as well as the bank’s long term financing, management of capital
requirements and equity structure.
Operational risks, permanent control and audit (periodic) control process are supervised by the Audit and Accounts Committee that meets on a quarterly
basis.
Finally, the Bank’s risk management principles, procedures and infrastructures and their implementation are monitored by the Internal Audit team and
the External Auditors.
(Including legal, compliance, accounting, environmental, reputational risks, etc.): represents risk of loss or fraud or of producing inaccurate financial and
accounting data due to inadequacies or failures in procedures and internal systems, human error or external events. Additionally, operational risks may
also take the form of compliance risk, which is the risk of the bank incurring either legal, administrative or disciplinary sanctions or financial losses due
to failure to comply with relevant rules and regulations.
Represents risk of loss or of residual depreciation in the bank’s balance sheet and off-balance sheet assets arising from changes in interest or exchange
rates. Structural interest and exchange rate risk arises from banking commercial activities and on Corporate Center transactions (operations on equities,
investments and bond issues).
- 20 -

QNB ALAHLI S.A.E
Notes to the Consolidated Financial Statements
For Three Months Period Ended 31 March 2022(All amounts are shown in Egyptian Pounds)
(A) CREDIT RISKS
(A/1) Credit risk management: organization and structure
Within the Risk Division, persons are responsible for:
• Setting credit limits by customer, customer group or transaction type;
• Approving credit score or internal customer rating criteria;
• Monitoring and surveillance of large exposures and various credit portfolios;
• Reviewing specific and general provisioning policies.
The Risk Division also helps define criteria for measuring risk and defining appropriate provisioning practices.
Risk approval
The risk approval process is based on four core principles:
•
• Staff assessing credit risk is fully independent from the decision-making process.
•
•
Risk management and audit
Replacement risk
Replacement risk management
Maintaining comprehensive and efficient management and monitoring of credit risk – which constitutes the bank’s primary source of risk – is vital to
preserving bank financial strength and profitability. As a result, the bank implements a tight credit risk control framework, whose cornerstone is the
Credit Risk Policy and Authorities defined jointly by the Risk Division and the Business Lines, and is subject to periodic review and approval by the Board
of Directors.
In addition, comprehensive portfolio analysis is performed in order to provide guidance to the General Management on the bank’s overall credit risk
exposure as well as reporting to Risk Committee.
Embedded in bank’s credit policy is the concept that approval of any credit risk undertaking must be based on sound knowledge of the client and a
thorough understanding of the client’s business, the purpose, nature and structure of the transaction and the sources of repayment, while bearing in
mind the bank’s risk strategy and risk appetite.
The Bank is exposed to the credit risk which is the risk resulting from failure of the client to meet its contractual obligations towards the bank. The credit
risk is considered to be the most significant risk for the bank, therefore requiring careful management. The credit risk manifests itself in the lending
activities and debt instruments in bank’s assets as well as off balance sheet financial instruments, such as letters of credit and letters of guarantee.
Subject to relevant credit delegations, responsibility for analyzing and approving risk lies with the most appropriate business line or credit risk unit,
which reviews all authorization requests relating to a specific client or client group, to ensure a consistent approach to risk management.
All credit decisions systematically include internal obligor risk ratings, as proposed by business lines and vetted by the Risk Division and approved by
concerned Credit Committee.
Changes in the quality of outstanding commitments are reviewed on a periodic basis and at least once a quarter, as part of the “sensitive names” and
provisioning procedures. This review is based on analyses performed by the business divisions and the risk function. Furthermore, the Internal Audit
also carries out file reviews or risk audits in the bank’s branch groups and reports its findings to the General Management.
Replacement risk provides the measurement of the replacement cost of a transaction in the event of default by the original counterparty and the
necessity to close the ensuing position with counterparty; hence, the replacement cost is the result of the market price between the date on which the
original transaction is entered into and the default date. Transactions giving rise to replacement risk include interest rate swaps and forward FX deals.
The Bank places great emphasis on carefully monitoring its replacement risk exposure in order to minimize its losses in case of default of its
counterparties and counterparty limits are, therefore, assigned to all trading counterparties, irrespective of their status (bank, other financial institution,
corporate and public institutions).
All transactions involving replacement risk must be pre-authorized ,replacement risk is bearing a loss when a bank is forced to replace a contract in case
of breaching the original party's contract (debtor risk, non-settlement or non-delivery risk and issuer risk).
- 21 -

QNB ALAHLI S.A.E
Notes to the Consolidated Financial Statements
For Three Months Period Ended 31 March 2022(All amounts are shown in Egyptian Pounds)
(A/2) Risk measurement and internal ratings
Bank rating system is based on three key pillars:
- The internal ratings models used to measure and quantify counterparty risk.
-
-
Credit risk rating is supported by a set of procedures ensuring reliable, consistent and timely default and loss data detection.
The calculations used to measure and monitor replacement risk include:
-
- Credit value at risk (VAR) is a calculation of the largest loss that would be incurred in 99% of cases.
Following are some risk mitigations methods:
Collaterals
The main types of collaterals for Loans and credit facilities are:
• Real estate mortgage;
• Pledge on business assets like machinery and merchandise;
• Pledge in financial instruments like debt instruments and equity.
Collaterals taken to secure assets other than Loans and credit facilities are identified according to the nature of the instrument.
Debit instruments and treasury bills are often not collaterized.
Derivatives
The long term financing and lending for companies are often collaterized while credit facilities for persons are not collaterized. The bank attempts to
mitigate the credit risk through additional collaterals from the concerned parties immediately on arising of impairment indicators for any of the loans or
facilities.
The Bank doesn’t obtain collaterals for credit risk related to such instruments except for the amounts requested by the bank as marginal deposits from
other parties.
Reliance on human judgment to improve modeling results to include elements outside the scope of rating model.
Rating models are reviewed and developed when necessary. The Bank regularly evaluates performance of credit rating models and their capacity to
predict default cases.
Current Average Risk (CAR) is a calculation of the Average risk of all the future scenarios, excluding the negative scenarios, i.e., when the replacement
makes a gain.
The Bank designs several policies and controls for credit risk mitigation such as collaterals for funds provided. The bank lays down guidelines for specific
categories of the accepted collaterals.
A set of procedures defining guidelines for devising and using ratings (scope, frequency of rating revision, procedure for approving ratings, etc.)
The Bank exercise prudential strict control procedures on net open positions of derivatives. i.e. The difference between sale and purchase agreements at
the level of value and duration. The amount exposed to credit risk at any time is determined at fair value of the instrument that may achieve benefit to
the bank. i.e. any assets with high positive fair value which represents insignificant part of contractual imputed value used to reflect the volume of
existing instruments. This credit risk is managed as part of overall lending limit granted to the customer together with the potential risk as a result of
market changes.
- 22 -
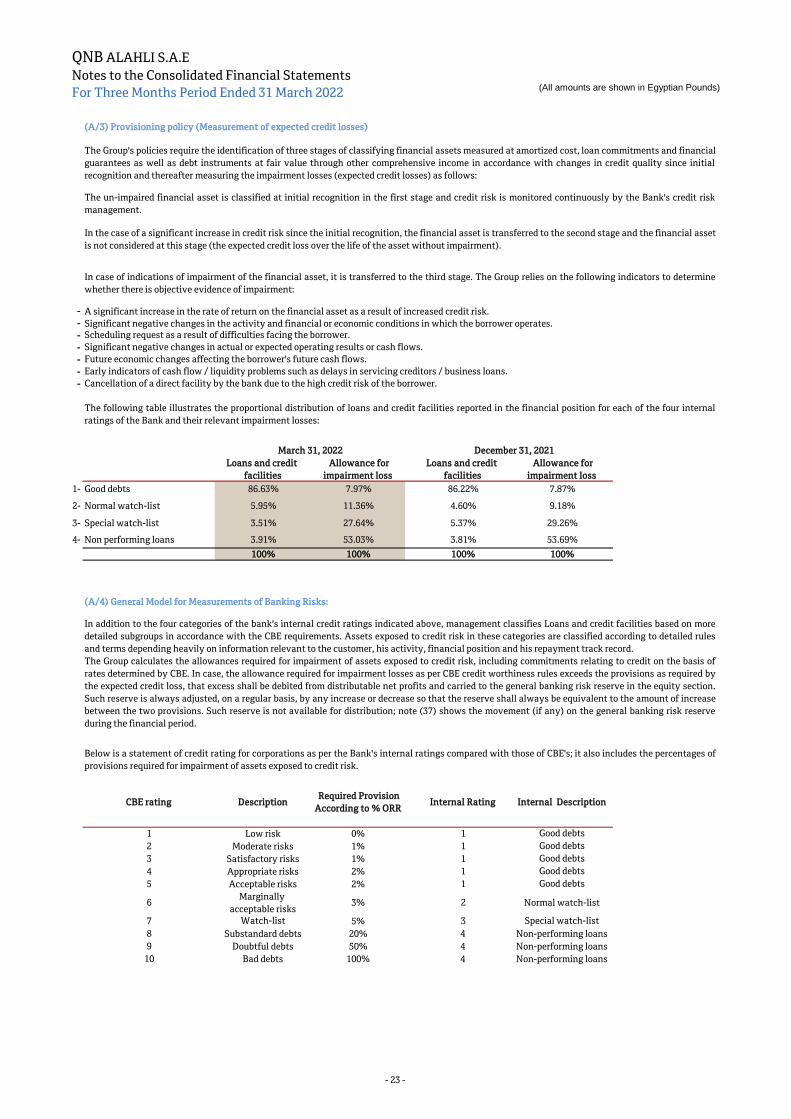
QNB ALAHLI S.A.E
Notes to the Consolidated Financial Statements
For Three Months Period Ended 31 March 2022(All amounts are shown in Egyptian Pounds)
-
-
-
-
-
-
-
Loans and credit
facilities
Allowance for
impairment loss
Loans and credit
facilities
Allowance for
impairment loss
1- Good debts 86.63% 7.97% 86.22% 7.87%
2- Normal watch-list 5.95% 11.36% 4.60% 9.18%
3- Special watch-list 3.51% 27.64% 5.37% 29.26%
4- Non performing loans 3.91% 53.03% 3.81% 53.69%
100% 100% 100% 100%
CBE rating DescriptionRequired Provision
According to % ORRInternal Rating Internal Description
1 Low risk 0% 1 Good debts
2 Moderate risks 1% 1 Good debts
3 Satisfactory risks 1% 1 Good debts
4 Appropriate risks 2% 1 Good debts
5 Acceptable risks 2% 1 Good debts
6Marginally
acceptable risks3% 2 Normal watch-list
7 Watch-list 5% 3 Special watch-list
8 Substandard debts 20% 4 Non-performing loans
9 Doubtful debts 50% 4 Non-performing loans
10 Bad debts 100% 4 Non-performing loans
(A/4) General Model for Measurements of Banking Risks:
In addition to the four categories of the bank's internal credit ratings indicated above, management classifies Loans and credit facilities based on more
detailed subgroups in accordance with the CBE requirements. Assets exposed to credit risk in these categories are classified according to detailed rules
and terms depending heavily on information relevant to the customer, his activity, financial position and his repayment track record.
The Group calculates the allowances required for impairment of assets exposed to credit risk, including commitments relating to credit on the basis of
rates determined by CBE. In case, the allowance required for impairment losses as per CBE credit worthiness rules exceeds the provisions as required by
the expected credit loss, that excess shall be debited from distributable net profits and carried to the general banking risk reserve in the equity section.
Such reserve is always adjusted, on a regular basis, by any increase or decrease so that the reserve shall always be equivalent to the amount of increase
between the two provisions. Such reserve is not available for distribution; note (37) shows the movement (if any) on the general banking risk reserve
during the financial period.
Below is a statement of credit rating for corporations as per the Bank's internal ratings compared with those of CBE's; it also includes the percentages of
provisions required for impairment of assets exposed to credit risk.
The Group's policies require the identification of three stages of classifying financial assets measured at amortized cost, loan commitments and financial
guarantees as well as debt instruments at fair value through other comprehensive income in accordance with changes in credit quality since initial
recognition and thereafter measuring the impairment losses (expected credit losses) as follows:
The un-impaired financial asset is classified at initial recognition in the first stage and credit risk is monitored continuously by the Bank's credit risk
management.
In the case of a significant increase in credit risk since the initial recognition, the financial asset is transferred to the second stage and the financial asset
is not considered at this stage (the expected credit loss over the life of the asset without impairment).
In case of indications of impairment of the financial asset, it is transferred to the third stage. The Group relies on the following indicators to determine
whether there is objective evidence of impairment:
A significant increase in the rate of return on the financial asset as a result of increased credit risk.
The following table illustrates the proportional distribution of loans and credit facilities reported in the financial position for each of the four internal
ratings of the Bank and their relevant impairment losses:
Scheduling request as a result of difficulties facing the borrower.
Significant negative changes in actual or expected operating results or cash flows.
Future economic changes affecting the borrower's future cash flows.
Early indicators of cash flow / liquidity problems such as delays in servicing creditors / business loans.
Cancellation of a direct facility by the bank due to the high credit risk of the borrower.
(A/3) Provisioning policy (Measurement of expected credit losses)
March 31, 2022 December 31, 2021
Significant negative changes in the activity and financial or economic conditions in which the borrower operates.
- 23 -

QNB ALAHLI S.A.E
Notes to the Consolidated Financial Statements
For Three Months Period Ended 31 March 2022(All amounts are shown in Egyptian Pounds)
(A/5) Maximum limit for credit risk before collaterals
Financial position items exposed to credit risks March 31, 2022 December 31, 2021
Treasury bills 27,797,683,115 40,037,854,401
Loans and credit facilities to customers
Retail loans
- Overdrafts 3,435,369,925 3,108,670,785
- Credit cards 1,328,580,167 1,255,853,285
- Personal loans 30,518,052,116 28,326,139,916
- Real estate loans 3,238,386,539 2,745,769,706
Corporate loans
- Overdrafts 74,371,601,415 67,564,096,264
- Direct loans 53,828,531,600 49,986,443,321
- Syndicated loans and facilities 15,495,211,475 15,852,896,168
- Other loans 4,755,977,373 4,126,248,437
Segregated interest , unearned discount and deferred income (127,982,325) (137,563,415)
Financial derivatives 122,592,648 36,542,265
Financial investments
- Debt instrument 100,017,517,400 91,831,219,626
- Other Financial assets 5,294,869,746 5,186,597,136
Total 320,076,391,194 309,920,767,895
Stage 1 Stage 2 Stage 3
12-Months Life time Life time
Credit rating
Good debts 1,105,899,713 228,995,608 - 1,334,895,321
Normal watch-list 20,657,011,572 12,415,950,278 - 33,072,961,850
Special watch-list - - - -
Non performing loan - - - -
21,762,911,285 12,644,945,886 - 34,407,857,171
Allowance for impairment losses (6,598,988) (982,847) - (7,581,835)
Carrying amount 21,756,312,297 12,643,963,039 - 34,400,275,336
Stage 1 Stage 2 Stage 3
12-Months Life time Life time
Credit rating
Good debts 1,227,864,174 151,877,694 - 1,379,741,868
Normal watch-list 12,087,611,100 3,850,162,945 - 15,937,774,045
Special watch-list - - - -
Non performing loan - - - -
13,315,475,274 4,002,040,639 - 17,317,515,913
Allowance for impairment losses (3,246,515) (2,841,471) - (6,087,986)
Carrying amount 13,312,228,759 3,999,199,168 - 17,311,427,927
Stage 1 Stage 2 Stage 3
12-Months Life time Life time
Credit rating
Good debts - - - -
Normal watch-list 27,854,007,413 - - 27,854,007,413
Special watch-list - - - -
Non performing loan - - - -
27,854,007,413 - - 27,854,007,413
Allowance for impairment losses (56,324,298) - - (56,324,298)
Carrying amount 27,797,683,115 - - 27,797,683,115
The following table provides information on the quality of financial assets during the period:
Due from banks Total
Treasury bills Total
December 31, 2021
Due from banks Total
March 31, 2022
March 31, 2022
- 24 -

QNB ALAHLI S.A.E
Notes to the Consolidated Financial Statements
For Three Months Period Ended 31 March 2022(All amounts are shown in Egyptian Pounds)
Stage 1 Stage 2 Stage 3
12-Months Life time Life time
Credit rating
Good debts - - - -
Normal watch-list 40,049,386,865 - - 40,049,386,865
Special watch-list - - - -
Non performing loan - - - -
40,049,386,865 - - 40,049,386,865
Allowance for impairment losses (11,532,464) - - (11,532,464)
Carrying amount 40,037,854,401 - - 40,037,854,401
Stage 1 Stage 2 Stage 3
12-Months Life time Life time
Credit rating
Good debts 36,507,578,922 - - 36,507,578,922
Normal watch-list 1,455,479,745 - - 1,455,479,745
Special watch-list - 648,043,886 - 648,043,886
Non performing loan - - 860,414,646 860,414,646
37,963,058,667 648,043,886 860,414,646 39,471,517,199
Allowance for impairment losses (197,798,622) (103,336,361) (649,993,469) (951,128,452)
Carrying amount 37,765,260,045 544,707,525 210,421,177 38,520,388,747
Stage 1 Stage 2 Stage 3
12-Months Life time Life time
Credit rating
Good debts 33,360,820,542 - - 33,360,820,542
Normal watch-list 1,402,372,504 - - 1,402,372,504
Special watch-list - 711,397,628 - 711,397,628
Non performing loan - - 828,992,081 828,992,081
34,763,193,046 711,397,628 828,992,081 36,303,582,755
Allowance for impairment losses (177,646,277) (95,458,695) (594,044,091) (867,149,063)
Carrying amount 34,585,546,769 615,938,933 234,947,990 35,436,433,692
Stage 1 Stage 2 Stage 3
12-Months Life time Life time
Credit rating
Good debts 132,753,414,343 2,231,701,635 - 134,985,115,978
Normal watch-list 244,431,845 10,080,276,725 - 10,324,708,570
Special watch-list - 6,305,814,152 - 6,305,814,152
Non performing loan - - 6,876,053,995 6,876,053,995
132,997,846,188 18,617,792,512 6,876,053,995 158,491,692,695
Allowance for impairment losses (677,706,614) (4,183,386,976) (5,179,277,242) (10,040,370,832)
Carrying amount 132,320,139,574 14,434,405,536 1,696,776,753 148,451,321,863
Stage 1 Stage 2 Stage 3
12-Months Life time Life time
Credit rating
Good debts 122,581,696,259 1,766,382,227 - 124,348,078,486
Normal watch-list 193,288,721 6,812,318,055 - 7,005,606,776
Special watch-list - 9,107,352,199 - 9,107,352,199
Non performing loan - - 6,148,609,221 6,148,609,221
122,774,984,980 17,686,052,481 6,148,609,221 146,609,646,682
Allowance for impairment losses (629,885,652) (3,703,514,422) (4,746,562,418) (9,079,962,492)
Carrying amount 122,145,099,328 13,982,538,059 1,402,046,803 137,529,684,190
Corporate loans Total
Retail loans Total
March 31, 2022
December 31, 2021
Corporate loans Total
December 31, 2021
Treasury bills Total
March 31, 2022
December 31, 2021
Retail loans Total
- 25 -
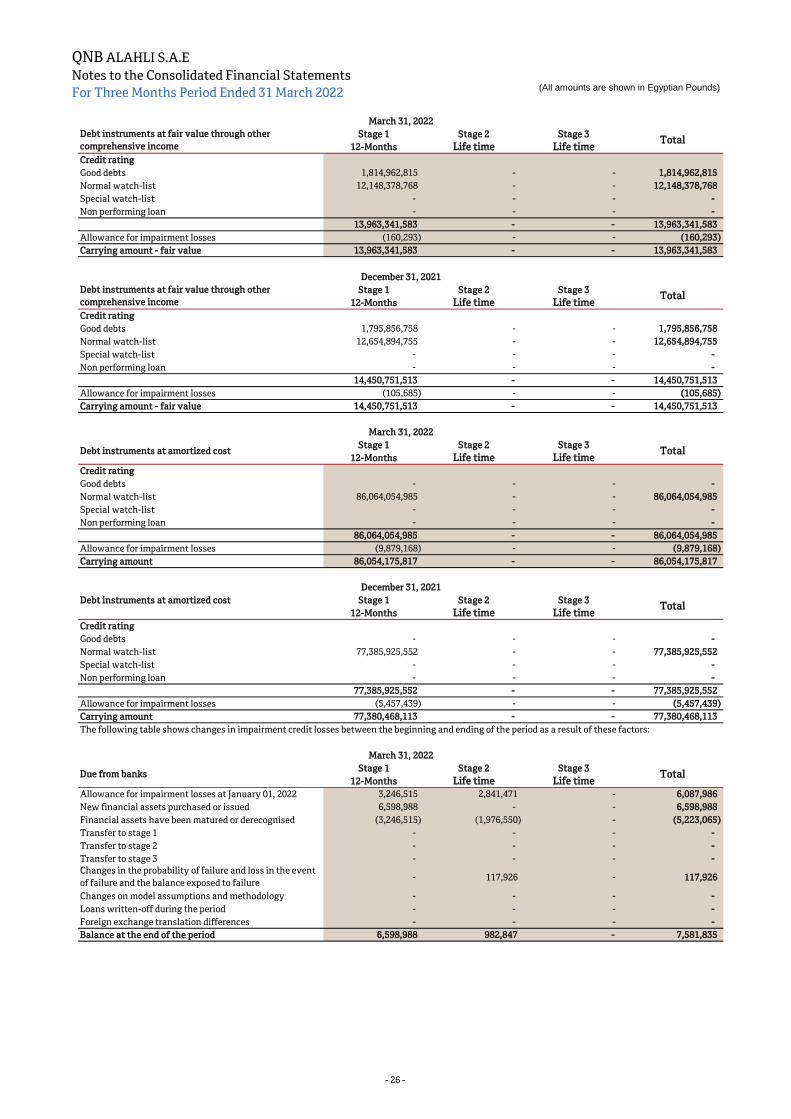
QNB ALAHLI S.A.E
Notes to the Consolidated Financial Statements
For Three Months Period Ended 31 March 2022(All amounts are shown in Egyptian Pounds)
Stage 1 Stage 2 Stage 3
12-Months Life time Life time
Credit rating
Good debts 1,814,962,815 - - 1,814,962,815
Normal watch-list 12,148,378,768 - - 12,148,378,768
Special watch-list - - - -
Non performing loan - - - -
13,963,341,583 - - 13,963,341,583
Allowance for impairment losses (160,293) - - (160,293)
Carrying amount - fair value 13,963,341,583 - - 13,963,341,583
Stage 1 Stage 2 Stage 3
12-Months Life time Life time
Credit rating
Good debts 1,795,856,758 - - 1,795,856,758
Normal watch-list 12,654,894,755 - - 12,654,894,755
Special watch-list - - - -
Non performing loan - - - -
14,450,751,513 - - 14,450,751,513
Allowance for impairment losses (105,685) - - (105,685)
Carrying amount - fair value 14,450,751,513 - - 14,450,751,513
Stage 1 Stage 2 Stage 3
12-Months Life time Life time
Credit rating
Good debts - - - -
Normal watch-list 86,064,054,985 - - 86,064,054,985
Special watch-list - - - -
Non performing loan - - - -
86,064,054,985 - - 86,064,054,985
Allowance for impairment losses (9,879,168) - - (9,879,168)
Carrying amount 86,054,175,817 - - 86,054,175,817
Debt instruments at amortized cost Stage 1 Stage 2 Stage 3
12-Months Life time Life time
Credit rating
Good debts - - - -
Normal watch-list 77,385,925,552 - - 77,385,925,552
Special watch-list - - - -
Non performing loan - - - -
77,385,925,552 - - 77,385,925,552
Allowance for impairment losses (5,457,439) - - (5,457,439)
Carrying amount 77,380,468,113 - - 77,380,468,113
The following table shows changes in impairment credit losses between the beginning and ending of the period as a result of these factors:
Stage 1 Stage 2 Stage 3
12-Months Life time Life time
Allowance for impairment losses at January 01, 2022 3,246,515 2,841,471 - 6,087,986
New financial assets purchased or issued 6,598,988 - - 6,598,988
Financial assets have been matured or derecognised (3,246,515) (1,976,550) - (5,223,065)
Transfer to stage 1 - - - -
Transfer to stage 2 - - - -
Transfer to stage 3 - - - -
Changes in the probability of failure and loss in the event
of failure and the balance exposed to failure - 117,926 - 117,926
Changes on model assumptions and methodology - - - -
Loans written-off during the period - - - -
Foreign exchange translation differences - - - -
Balance at the end of the period 6,598,988 982,847 - 7,581,835
Due from banks Total
Total
March 31, 2022
Debt instruments at fair value through other
comprehensive incomeTotal
March 31, 2022
December 31, 2021
Debt instruments at fair value through other
comprehensive incomeTotal
March 31, 2022
December 31, 2021
Debt instruments at amortized cost Total
- 26 -
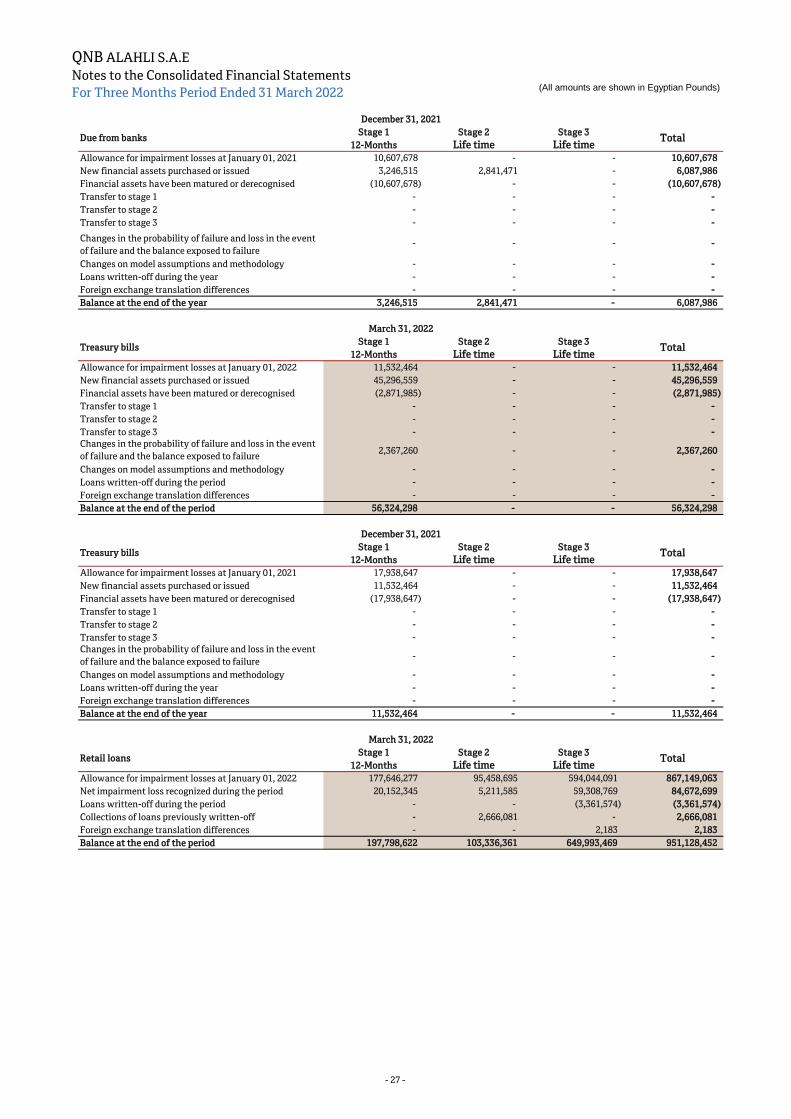
QNB ALAHLI S.A.E
Notes to the Consolidated Financial Statements
For Three Months Period Ended 31 March 2022(All amounts are shown in Egyptian Pounds)
Stage 1 Stage 2 Stage 3
12-Months Life time Life time
Allowance for impairment losses at January 01, 2021 10,607,678 - - 10,607,678
New financial assets purchased or issued 3,246,515 2,841,471 - 6,087,986
Financial assets have been matured or derecognised (10,607,678) - - (10,607,678)
Transfer to stage 1 - - - -
Transfer to stage 2 - - - -
Transfer to stage 3 - - - -
Changes in the probability of failure and loss in the event
of failure and the balance exposed to failure - - - -
Changes on model assumptions and methodology - - - -
Loans written-off during the year - - - -
Foreign exchange translation differences - - - -
Balance at the end of the year 3,246,515 2,841,471 - 6,087,986
Stage 1 Stage 2 Stage 3
12-Months Life time Life time
Allowance for impairment losses at January 01, 2022 11,532,464 - - 11,532,464
New financial assets purchased or issued 45,296,559 - - 45,296,559
Financial assets have been matured or derecognised (2,871,985) - - (2,871,985)
Transfer to stage 1 - - - -
Transfer to stage 2 - - - -
Transfer to stage 3 - - - -
Changes in the probability of failure and loss in the event
of failure and the balance exposed to failure2,367,260 - - 2,367,260
Changes on model assumptions and methodology - - - -
Loans written-off during the period - - - -
Foreign exchange translation differences - - - -
Balance at the end of the period 56,324,298 - - 56,324,298
Stage 1 Stage 2 Stage 3
12-Months Life time Life time
Allowance for impairment losses at January 01, 2021 17,938,647 - - 17,938,647
New financial assets purchased or issued 11,532,464 - - 11,532,464
Financial assets have been matured or derecognised (17,938,647) - - (17,938,647)
Transfer to stage 1 - - - -
Transfer to stage 2 - - - -
Transfer to stage 3 - - - -
Changes in the probability of failure and loss in the event
of failure and the balance exposed to failure - - - -
Changes on model assumptions and methodology - - - -
Loans written-off during the year - - - -
Foreign exchange translation differences - - - -
Balance at the end of the year 11,532,464 - - 11,532,464
Stage 1 Stage 2 Stage 3
12-Months Life time Life time
Allowance for impairment losses at January 01, 2022 177,646,277 95,458,695 594,044,091 867,149,063
Net impairment loss recognized during the period 20,152,345 5,211,585 59,308,769 84,672,699
Loans written-off during the period - - (3,361,574) (3,361,574)
Collections of loans previously written-off - 2,666,081 - 2,666,081
Foreign exchange translation differences - - 2,183 2,183
Balance at the end of the period 197,798,622 103,336,361 649,993,469 951,128,452
Treasury bills Total
December 31, 2021
Due from banks Total
March 31, 2022
Total Retail loans
December 31, 2021
Treasury bills Total
March 31, 2022
- 27 -
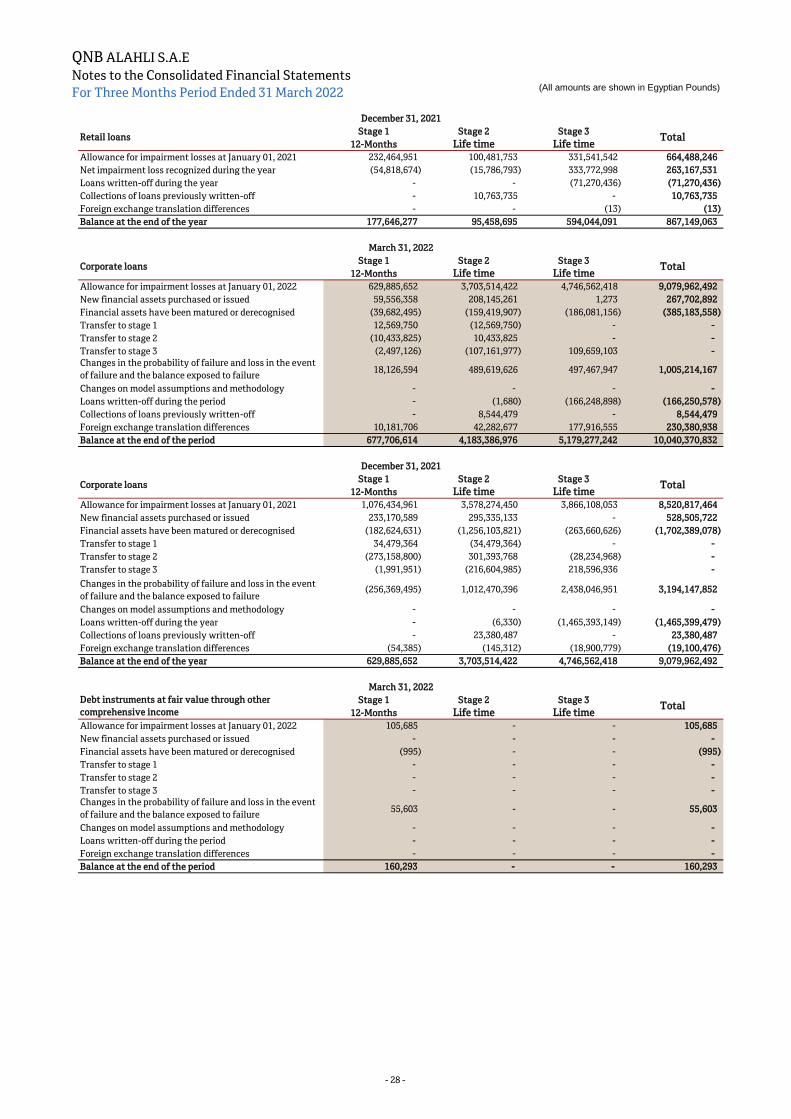
QNB ALAHLI S.A.E
Notes to the Consolidated Financial Statements
For Three Months Period Ended 31 March 2022(All amounts are shown in Egyptian Pounds)
Stage 1 Stage 2 Stage 3
12-Months Life time Life time
Allowance for impairment losses at January 01, 2021 232,464,951 100,481,753 331,541,542 664,488,246
Net impairment loss recognized during the year (54,818,674) (15,786,793) 333,772,998 263,167,531
Loans written-off during the year - - (71,270,436) (71,270,436)
Collections of loans previously written-off - 10,763,735 - 10,763,735
Foreign exchange translation differences - - (13) (13)
Balance at the end of the year 177,646,277 95,458,695 594,044,091 867,149,063
Stage 1 Stage 2 Stage 3
12-Months Life time Life time
Allowance for impairment losses at January 01, 2022 629,885,652 3,703,514,422 4,746,562,418 9,079,962,492
New financial assets purchased or issued 59,556,358 208,145,261 1,273 267,702,892
Financial assets have been matured or derecognised (39,682,495) (159,419,907) (186,081,156) (385,183,558)
Transfer to stage 1 12,569,750 (12,569,750) - -
Transfer to stage 2 (10,433,825) 10,433,825 - -
Transfer to stage 3 (2,497,126) (107,161,977) 109,659,103 -
Changes in the probability of failure and loss in the event
of failure and the balance exposed to failure18,126,594 489,619,626 497,467,947 1,005,214,167
Changes on model assumptions and methodology - - - -
Loans written-off during the period - (1,680) (166,248,898) (166,250,578)
Collections of loans previously written-off - 8,544,479 - 8,544,479
Foreign exchange translation differences 10,181,706 42,282,677 177,916,555 230,380,938
Balance at the end of the period 677,706,614 4,183,386,976 5,179,277,242 10,040,370,832
Stage 1 Stage 2 Stage 3
12-Months Life time Life time
Allowance for impairment losses at January 01, 2021 1,076,434,961 3,578,274,450 3,866,108,053 8,520,817,464
New financial assets purchased or issued 233,170,589 295,335,133 - 528,505,722
Financial assets have been matured or derecognised (182,624,631) (1,256,103,821) (263,660,626) (1,702,389,078)
Transfer to stage 1 34,479,364 (34,479,364) - -
Transfer to stage 2 (273,158,800) 301,393,768 (28,234,968) -
Transfer to stage 3 (1,991,951) (216,604,985) 218,596,936 -
Changes in the probability of failure and loss in the event
of failure and the balance exposed to failure(256,369,495) 1,012,470,396 2,438,046,951 3,194,147,852
Changes on model assumptions and methodology - - - -
Loans written-off during the year - (6,330) (1,465,393,149) (1,465,399,479)
Collections of loans previously written-off - 23,380,487 - 23,380,487
Foreign exchange translation differences (54,385) (145,312) (18,900,779) (19,100,476)
Balance at the end of the year 629,885,652 3,703,514,422 4,746,562,418 9,079,962,492
Stage 1 Stage 2 Stage 3
12-Months Life time Life time
Allowance for impairment losses at January 01, 2022 105,685 - - 105,685
New financial assets purchased or issued - - - -
Financial assets have been matured or derecognised (995) - - (995)
Transfer to stage 1 - - - -
Transfer to stage 2 - - - -
Transfer to stage 3 - - - -
Changes in the probability of failure and loss in the event
of failure and the balance exposed to failure55,603 - - 55,603
Changes on model assumptions and methodology - - - -
Loans written-off during the period - - - -
Foreign exchange translation differences - - - -
Balance at the end of the period 160,293 - - 160,293
March 31, 2022
December 31, 2021
Retail loans Total
March 31, 2022
December 31, 2021
Corporate loans Total
Debt instruments at fair value through other
comprehensive incomeTotal
Corporate loans Total
- 28 -
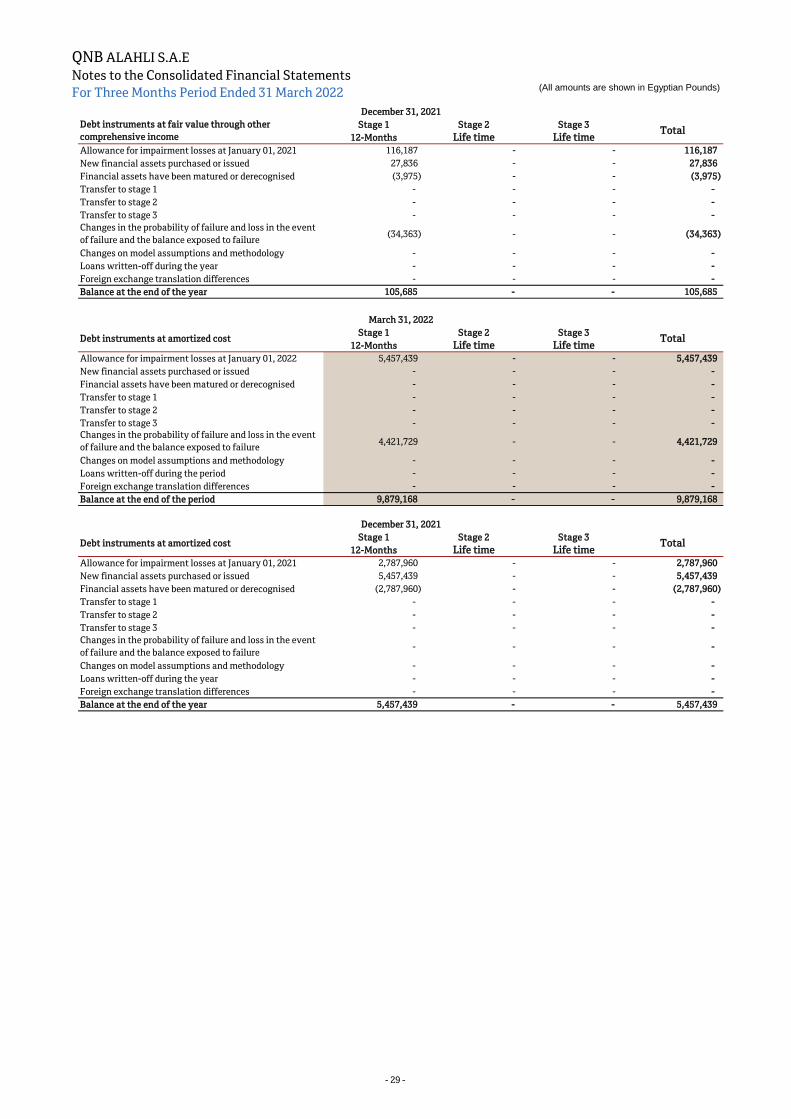
QNB ALAHLI S.A.E
Notes to the Consolidated Financial Statements
For Three Months Period Ended 31 March 2022(All amounts are shown in Egyptian Pounds)
Stage 1 Stage 2 Stage 3
12-Months Life time Life time
Allowance for impairment losses at January 01, 2021 116,187 - - 116,187
New financial assets purchased or issued 27,836 - - 27,836
Financial assets have been matured or derecognised (3,975) - - (3,975)
Transfer to stage 1 - - - -
Transfer to stage 2 - - - -
Transfer to stage 3 - - - -
Changes in the probability of failure and loss in the event
of failure and the balance exposed to failure(34,363) - - (34,363)
Changes on model assumptions and methodology - - - -
Loans written-off during the year - - - -
Foreign exchange translation differences - - - -
Balance at the end of the year 105,685 - - 105,685
Stage 1 Stage 2 Stage 3
12-Months Life time Life time
Allowance for impairment losses at January 01, 2022 5,457,439 - - 5,457,439
New financial assets purchased or issued - - - -
Financial assets have been matured or derecognised - - - -
Transfer to stage 1 - - - -
Transfer to stage 2 - - - -
Transfer to stage 3 - - - -
Changes in the probability of failure and loss in the event
of failure and the balance exposed to failure4,421,729 - - 4,421,729
Changes on model assumptions and methodology - - - -
Loans written-off during the period - - - -
Foreign exchange translation differences - - - -
Balance at the end of the period 9,879,168 - - 9,879,168
Stage 1 Stage 2 Stage 3
12-Months Life time Life time
Allowance for impairment losses at January 01, 2021 2,787,960 - - 2,787,960
New financial assets purchased or issued 5,457,439 - - 5,457,439
Financial assets have been matured or derecognised (2,787,960) - - (2,787,960)
Transfer to stage 1 - - - -
Transfer to stage 2 - - - -
Transfer to stage 3 - - - -
Changes in the probability of failure and loss in the event
of failure and the balance exposed to failure - - - -
Changes on model assumptions and methodology - - - -
Loans written-off during the year - - - -
Foreign exchange translation differences - - - -
Balance at the end of the year 5,457,439 - - 5,457,439
December 31, 2021
Debt instruments at fair value through other
comprehensive incomeTotal
March 31, 2022
December 31, 2021
Debt instruments at amortized cost Total
Debt instruments at amortized cost Total
- 29 -
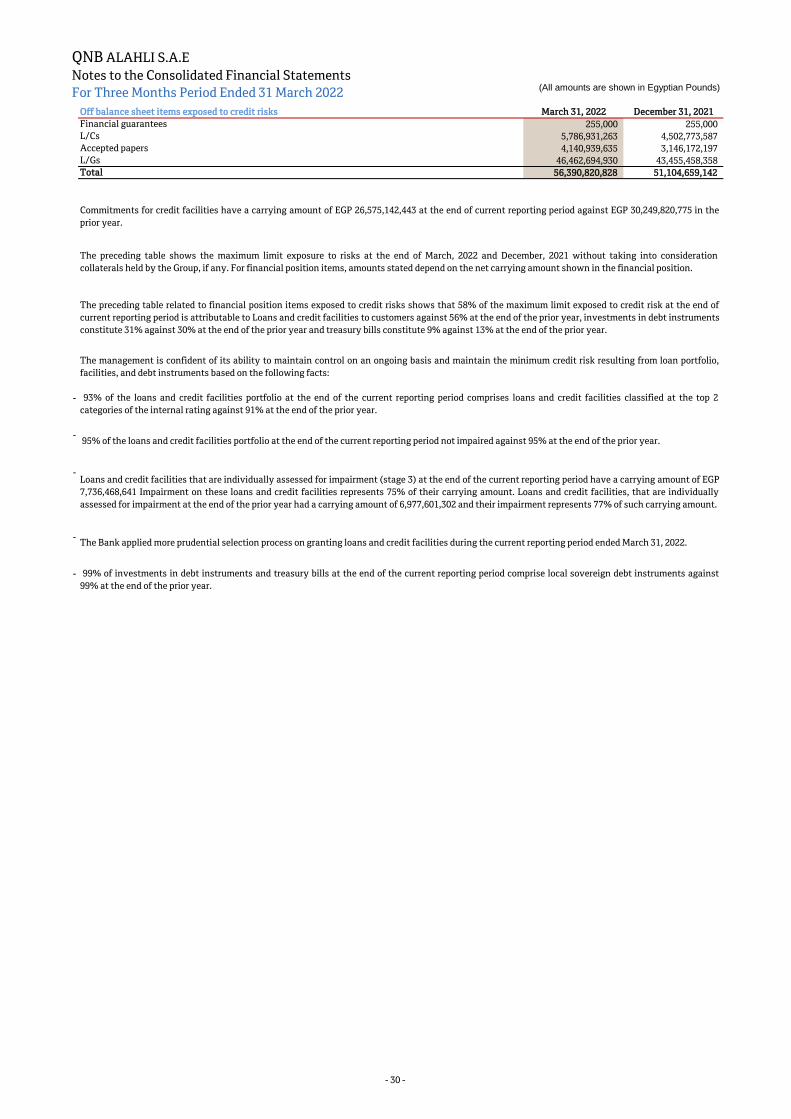
QNB ALAHLI S.A.E
Notes to the Consolidated Financial Statements
For Three Months Period Ended 31 March 2022(All amounts are shown in Egyptian Pounds)
Off balance sheet items exposed to credit risks March 31, 2022 December 31, 2021
Financial guarantees 255,000 255,000
L/Cs 5,786,931,263 4,502,773,587
Accepted papers 4,140,939,635 3,146,172,197
L/Gs 46,462,694,930 43,455,458,358
Total 56,390,820,828 51,104,659,142
-
-
-
-
-
Commitments for credit facilities have a carrying amount of EGP 26,575,142,443 at the end of current reporting period against EGP 30,249,820,775 in the
prior year.
93% of the loans and credit facilities portfolio at the end of the current reporting period comprises loans and credit facilities classified at the top 2
categories of the internal rating against 91% at the end of the prior year.
95% of the loans and credit facilities portfolio at the end of the current reporting period not impaired against 95% at the end of the prior year.
99% of investments in debt instruments and treasury bills at the end of the current reporting period comprise local sovereign debt instruments against
99% at the end of the prior year.
The preceding table shows the maximum limit exposure to risks at the end of March, 2022 and December, 2021 without taking into consideration
collaterals held by the Group, if any. For financial position items, amounts stated depend on the net carrying amount shown in the financial position.
The preceding table related to financial position items exposed to credit risks shows that 58% of the maximum limit exposed to credit risk at the end of
current reporting period is attributable to Loans and credit facilities to customers against 56% at the end of the prior year, investments in debt instruments
constitute 31% against 30% at the end of the prior year and treasury bills constitute 9% against 13% at the end of the prior year.
The management is confident of its ability to maintain control on an ongoing basis and maintain the minimum credit risk resulting from loan portfolio,
facilities, and debt instruments based on the following facts:
Loans and credit facilities that are individually assessed for impairment (stage 3) at the end of the current reporting period have a carrying amount of EGP
7,736,468,641 Impairment on these loans and credit facilities represents 75% of their carrying amount. Loans and credit facilities, that are individually
assessed for impairment at the end of the prior year had a carrying amount of 6,977,601,302 and their impairment represents 77% of such carrying amount.
The Bank applied more prudential selection process on granting loans and credit facilities during the current reporting period ended March 31, 2022.
- 30 -

QNB ALAHLI S.A.E
Notes to the Consolidated Financial Statements
For Three Months Period Ended 31 March 2022(All amounts are shown in Egyptian Pounds)
(A/6) Loans and credit facilities
Balances of loans and credit facilities in terms of credit risk rating are analyzed below:
Loans and credit
facilities to
customers
Loans and credit
facilities to banks
Loans and credit
facilities to
customers
Loans and credit
facilities to banks
Neither have arrears nor impaired 187,273,178,707 - 173,087,975,439 -
Have arrears but not impaired 2,953,562,546 - 2,847,652,696 -
Impaired 7,736,468,641 - 6,977,601,302 -
Total 197,963,209,894 - 182,913,229,437 -
Less: Allowance for impairment losses (10,991,499,284) - (9,947,111,555) -
Less: Segregated interest (205,721) - (205,721) -
Less: Unearned discount & deferred income (127,776,604) - (137,357,694) -
Net 186,843,728,285 - 172,828,554,467 -
Loans and credit facilities which do not have arrears and are not subject to impairment
Rating Overdrafts Credit cards Personal loans Real estate loans Total
Good debts 3,403,722,888 1,214,637,646 28,801,696,299 3,087,522,089 36,507,578,922
Normal watch-list 78,509 - - - 78,509
Special watch-list 30,318 - - - 30,318
Total 3,403,831,715 1,214,637,646 28,801,696,299 3,087,522,089 36,507,687,749
Overdrafts Direct loansSyndicated loans
and facilitiesOther loans Total
Good debts 69,441,145,481 45,672,893,198 14,919,286,340 4,500,903,439 134,534,228,458
Normal watch-list 4,551,033,550 4,799,263,799 707,273,087 60,369,569 10,117,940,005
Special watch-list 1,699,781,206 4,401,614,646 2,039,206 9,887,437 6,113,322,495
Total 75,691,960,237 54,873,771,643 15,628,598,633 4,571,160,445 150,765,490,958
Rating Overdrafts Credit cards Personal loans Real estate loans Total
Good debts 3,109,308,277 1,115,171,874 26,536,346,212 2,599,994,179 33,360,820,542
Normal watch-list 123,554 - - - 123,554
Special watch-list 44,346 - - - 44,346
Total 3,109,476,177 1,115,171,874 26,536,346,212 2,599,994,179 33,360,988,442
Overdrafts Direct loansSyndicated loans
and facilitiesOther loans Total
Good debts 63,066,404,486 42,108,823,159 15,331,684,965 3,624,043,068 124,130,955,678
Normal watch-list 3,714,341,560 2,513,925,961 633,498,692 63,578,746 6,925,344,959
Special watch-list 2,114,487,155 6,289,884,567 2,039,206 264,275,432 8,670,686,360
Total 68,895,233,201 50,912,633,687 15,967,222,863 3,951,897,246 139,726,986,997
Guaranteed loans are not considered subject to impairment for the non-performing category after taking into consideration the collectability of the
guarantees.
Corporate
Loans and credit facilities to customers
December 31, 2021
Retail
March 31, 2022
Guaranteed loans are not considered subject to impairment for the non-performing category after taking into consideration the collectability of the
guarantees.
Retail
Corporate
The credit quality of Loans and credit facilities that not subject to impairment is assessed by reference to the bank’s internal rating.
Note (20-A) includes additional information on the allowance for impairment losses for Loans and credit facilities to customers during the current reporting
period.
Total credit allowance for loans and credit facilities at the end of the current reporting period amounted to EGP 10,991,499,284 (EGP 9,947,111,555 at the end
of the prior year) of which EGP 5,829,270,711 represent impairment in stage three (EGP 5,340,606,509 at the end of the prior year) and EGP 5,162,228,573
represent impairment for stage one and stage two in the credit portfolio (EGP 4,606,505,046 at the end of the prior year).
During the current accounting period, the loans and credit facilities portfolio increase by 8% due to the increase on lending activity.
March 31, 2022 December 31, 2021
- 31 -
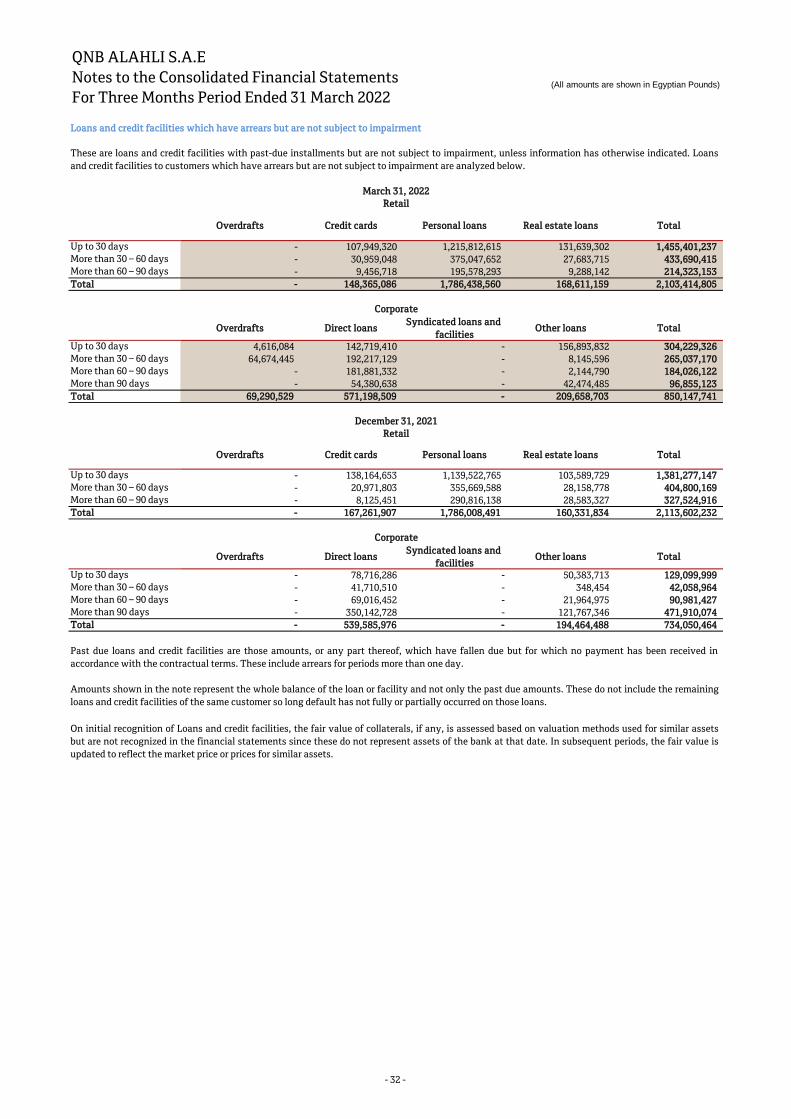
QNB ALAHLI S.A.E
Notes to the Consolidated Financial Statements
For Three Months Period Ended 31 March 2022(All amounts are shown in Egyptian Pounds)
Loans and credit facilities which have arrears but are not subject to impairment
Overdrafts Credit cards Personal loans Real estate loans Total
Up to 30 days - 107,949,320 1,215,812,615 131,639,302 1,455,401,237
More than 30 – 60 days - 30,959,048 375,047,652 27,683,715 433,690,415
More than 60 – 90 days - 9,456,718 195,578,293 9,288,142 214,323,153
Total - 148,365,086 1,786,438,560 168,611,159 2,103,414,805
Overdrafts Direct loansSyndicated loans and
facilitiesOther loans Total
Up to 30 days 4,616,084 142,719,410 - 156,893,832 304,229,326
More than 30 – 60 days 64,674,445 192,217,129 - 8,145,596 265,037,170
More than 60 – 90 days - 181,881,332 - 2,144,790 184,026,122
More than 90 days - 54,380,638 - 42,474,485 96,855,123
Total 69,290,529 571,198,509 - 209,658,703 850,147,741
Overdrafts Credit cards Personal loans Real estate loans Total
Up to 30 days - 138,164,653 1,139,522,765 103,589,729 1,381,277,147
More than 30 – 60 days - 20,971,803 355,669,588 28,158,778 404,800,169
More than 60 – 90 days - 8,125,451 290,816,138 28,583,327 327,524,916
Total - 167,261,907 1,786,008,491 160,331,834 2,113,602,232
Overdrafts Direct loansSyndicated loans and
facilitiesOther loans Total
Up to 30 days - 78,716,286 - 50,383,713 129,099,999
More than 30 – 60 days - 41,710,510 - 348,454 42,058,964
More than 60 – 90 days - 69,016,452 - 21,964,975 90,981,427
More than 90 days - 350,142,728 - 121,767,346 471,910,074
Total - 539,585,976 - 194,464,488 734,050,464
These are loans and credit facilities with past-due installments but are not subject to impairment, unless information has otherwise indicated. Loans
and credit facilities to customers which have arrears but are not subject to impairment are analyzed below.
Past due loans and credit facilities are those amounts, or any part thereof, which have fallen due but for which no payment has been received in
accordance with the contractual terms. These include arrears for periods more than one day.
Amounts shown in the note represent the whole balance of the loan or facility and not only the past due amounts. These do not include the remaining
loans and credit facilities of the same customer so long default has not fully or partially occurred on those loans.
On initial recognition of Loans and credit facilities, the fair value of collaterals, if any, is assessed based on valuation methods used for similar assets
but are not recognized in the financial statements since these do not represent assets of the bank at that date. In subsequent periods, the fair value is
updated to reflect the market price or prices for similar assets.
Retail
Corporate
March 31, 2022
December 31, 2021
Retail
Corporate
- 32 -

QNB ALAHLI S.A.E
Notes to the Consolidated Financial Statements
For Three Months Period Ended 31 March 2022(All amounts are shown in Egyptian Pounds)
Loans and credit facilities which are individually impaired
Loans and credit facilities to customers
Overdrafts Credit cards Personal loans Real estate loans Total
Loans which are individually impaired 59,207,865 27,688,583 694,262,397 79,255,800 860,414,645
Fair value of collaterals - 2,429,991 32,418,754 2,983,805 37,832,550
Overdrafts Direct loansSyndicated loans and
facilitiesOther loans Total
Loans which are individually impaired 366,427,084 6,399,520,852 591,897 109,514,163 6,876,053,996
Fair value of collaterals 11,323,767 59,040,325 - - 70,364,092
Overdrafts Credit cards Personal loans Real estate loans Total
Loans which are individually impaired 7,411,576 30,724,452 705,123,935 85,732,118 828,992,081
Fair value of collaterals - 7,118,275 164,471,071 8,673,950 180,263,296
Overdrafts Direct loansSyndicated loans and
facilitiesOther loans Total
Loans which are individually impaired 200,496,821 5,757,859,693 509,336 189,743,371 6,148,609,221
Fair value of collaterals - 28,353,237 - - 28,353,237
Restructured loans and facilities:
Loans and credit facilities to customers
Corporate loans March 31, 2022 December 31, 2021
Overdrafts 25,249,305 36,050,326
Direct loans 1,677,135,725 1,730,894,076
Total 1,702,385,030 1,766,944,402
(A/7) Debt instruments, treasury bills, and other governmental notes
Rating March 31, 2022 December 31, 2021
Egyptian Treasury Bills B 27,854,007,413 40,049,386,865
Fair value through other
comprehensive income
Other debt instruments unrated 367,579,252 383,442,606
Egyptian Treasury Bonds B 12,148,378,768 12,654,894,755
US Treasury Bonds AA+ 1,447,383,563 1,412,414,152
Amortized cost
Egyptian Treasury Bonds B 86,064,054,985 77,385,925,552
Total 127,881,403,981 131,886,063,930
(A/8) Acquisition of collaterals
Nature of the asset
Building
Assets acquired were classified under other Assets in the financial position. Such Assets shall be sold, if practical.
At the end of the current reporting period, the carrying amount of loans and credit facilities, that are assessed to be individually impaired (Stage 3) excluding any cash flows expected to
arise from the associated guarantees, amounted to EGP 7,736,468,641 against EGP 6,977,601,302 at the end of the prior year.
March 31, 2022
December 31, 2021
Retail
Corporate
The following table provides a breakdown of the balance of such loans and credit facilities which are individually impaired including the fair value of the collaterals shall prevail when
calculating the provisions.
Total renegotiated loans amounted to EGP 1,702,385,030 at the end of the current reporting period against EGP 1,766,944,402 at the end of the prior year. These balances do not include
any amounts whose commercial terms were renegotiated to preserve the quality of the bank’s relationship with its clients, including those terms pertaining to loans interest rates and/or
loans repayment periods .
The Bank practice calls for most clients whose loans have been renegotiated to be maintained in the “non-performing” category, as long as the bank remains uncertain of their ability to
meet their future commitments in accordance with the definition of default under Basel II.
Retail
The Bank applies different types of restructuring policies to its loans and credit facilities, which include extending payment terms, executing forced management programmes and
applying prepayment and extension provisions to the loan. The applied restructuring policies depend on factors or criteria that indicate, in management judgment that the counterparty’s
continuous payment of the loan is unlikely to occur in the absence of such restructuring policies that are subject to ongoing review. Within the bank renegotiated outstanding loans relate
to long-term loans made to any type of clientele (retail and corporate loans clients).
Corporate
During the Piror year, the Bank acquire foreclosed asset as acquisition of guarantees as following:
Book Value109,367,000
The following table shows a breakdown of debt instruments, treasury bills, and other governmental notes (excluding allowances for impairment) per last rating for Standard and Poor's
and its equivalent:
- 33 -
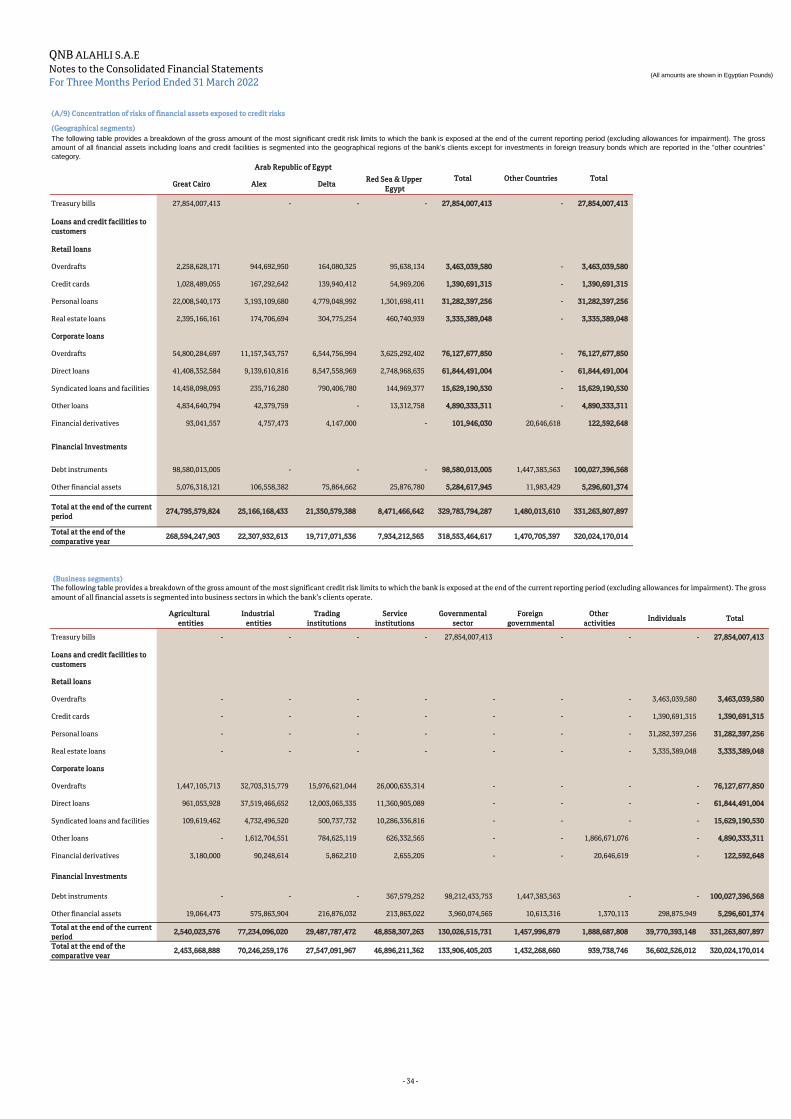
QNB ALAHLI S.A.E
Notes to the Consolidated Financial Statements
For Three Months Period Ended 31 March 2022(All amounts are shown in Egyptian Pounds)
(A/9) Concentration of risks of financial assets exposed to credit risks
(Geographical segments)
Great Cairo Alex DeltaRed Sea & Upper
Egypt
Treasury bills 27,854,007,413 - - - 27,854,007,413 - 27,854,007,413
Loans and credit facilities to
customers
Retail loans
Overdrafts 2,258,628,171 944,692,950 164,080,325 95,638,134 3,463,039,580 - 3,463,039,580
Credit cards 1,028,489,055 167,292,642 139,940,412 54,969,206 1,390,691,315 - 1,390,691,315
Personal loans 22,008,540,173 3,193,109,680 4,779,048,992 1,301,698,411 31,282,397,256 - 31,282,397,256
Real estate loans 2,395,166,161 174,706,694 304,775,254 460,740,939 3,335,389,048 - 3,335,389,048
Corporate loans
Overdrafts 54,800,284,697 11,157,343,757 6,544,756,994 3,625,292,402 76,127,677,850 - 76,127,677,850
Direct loans 41,408,352,584 9,139,610,816 8,547,558,969 2,748,968,635 61,844,491,004 - 61,844,491,004
Syndicated loans and facilities 14,458,098,093 235,716,280 790,406,780 144,969,377 15,629,190,530 - 15,629,190,530
Other loans 4,834,640,794 42,379,759 - 13,312,758 4,890,333,311 - 4,890,333,311
Financial derivatives 93,041,557 4,757,473 4,147,000 - 101,946,030 20,646,618 122,592,648
Financial Investments
Debt instruments 98,580,013,005 - - - 98,580,013,005 1,447,383,563 100,027,396,568
Other financial assets 5,076,318,121 106,558,382 75,864,662 25,876,780 5,284,617,945 11,983,429 5,296,601,374
Total at the end of the current
period274,795,579,824 25,166,168,433 21,350,579,388 8,471,466,642 329,783,794,287 1,480,013,610 331,263,807,897
Total at the end of the
comparative year268,594,247,903 22,307,932,613 19,717,071,536 7,934,212,565 318,553,464,617 1,470,705,397 320,024,170,014
(Business segments)
Agricultural
entities
Industrial
entities
Trading
institutions
Service
institutions
Governmental
sector
Foreign
governmental
Other
activitiesIndividuals Total
Treasury bills - - - - 27,854,007,413 - - - 27,854,007,413
Loans and credit facilities to
customers
Retail loans
Overdrafts - - - - - - - 3,463,039,580 3,463,039,580
Credit cards - - - - - - - 1,390,691,315 1,390,691,315
Personal loans - - - - - - - 31,282,397,256 31,282,397,256
Real estate loans - - - - - - - 3,335,389,048 3,335,389,048
Corporate loans
Overdrafts 1,447,105,713 32,703,315,779 15,976,621,044 26,000,635,314 - - - - 76,127,677,850
Direct loans 961,053,928 37,519,466,652 12,003,065,335 11,360,905,089 - - - - 61,844,491,004
Syndicated loans and facilities 109,619,462 4,732,496,520 500,737,732 10,286,336,816 - - - - 15,629,190,530
Other loans - 1,612,704,551 784,625,119 626,332,565 - - 1,866,671,076 - 4,890,333,311
Financial derivatives 3,180,000 90,248,614 5,862,210 2,655,205 - - 20,646,619 - 122,592,648
Financial Investments
Debt instruments - - - 367,579,252 98,212,433,753 1,447,383,563 - - 100,027,396,568
Other financial assets 19,064,473 575,863,904 216,876,032 213,863,022 3,960,074,565 10,613,316 1,370,113 298,875,949 5,296,601,374
Total at the end of the current
period2,540,023,576 77,234,096,020 29,487,787,472 48,858,307,263 130,026,515,731 1,457,996,879 1,888,687,808 39,770,393,148 331,263,807,897
Total at the end of the
comparative year2,453,668,888 70,246,259,176 27,547,091,967 46,896,211,362 133,906,405,203 1,432,268,660 939,738,746 36,602,526,012 320,024,170,014
The following table provides a breakdown of the gross amount of the most significant credit risk limits to which the bank is exposed at the end of the current reporting period (excluding allowances for impairment). The gross
amount of all financial assets including loans and credit facilities is segmented into the geographical regions of the bank’s clients except for investments in foreign treasury bonds which are reported in the “other countries”
category.
The following table provides a breakdown of the gross amount of the most significant credit risk limits to which the bank is exposed at the end of the current reporting period (excluding allowances for impairment). The gross
amount of all financial assets is segmented into business sectors in which the bank’s clients operate.
Other CountriesTotal Total
Arab Republic of Egypt
- 34 -

QNB ALAHLI S.A.E
Notes to the Consolidated Financial Statements
For Three Months Period Ended 31 March 2022(All amounts are shown in Egyptian Pounds)
-
-
-
-
-
-
-
(B/2) Stress test for foreign exchange risk
CurrencyShort/Long
FX positions
FX short
positions
FX long
positions
Expected loss at
10%
USD 93,877,520 - 93,877,520 9,387,752
EUR 10,154,163 - 10,154,163 1,015,416
GBP 643,165 - 643,165 64,317
JPY 141,774 - 141,774 14,177
CHF 122,467 - 122,467 12,247
DKK 92,369 - 92,369 9,237
NOK 14,799 - 14,799 1,480
SEK 80,924 - 80,924 8,092
CAD 144,418 - 144,418 14,442
AUD 13,854 - 13,854 1,385
AED 29,707 - 29,707 2,971
BHD 61,943 - 61,943 6,194
KWD (135,843) (135,843) - (13,584)
QAR 188,780 - 188,780 18,878
SAR 290,283 - 290,283 29,028
CNY (328) (328) - (33)
EGP (105,719,995) (105,719,995) - -
10,571,999
7,167,272
(B) Market Risk
Open positions must be centrally managed and matched.
Market risk is the risk of losses resulting from unfavorable changes in market parameters. It contains all trading book transactions as well as some
banking book portfolios valued using the mark-to-market approach. The bank's policy on market risk transactions is “Prudent” in that:
Products subject to “market risk” which are offered by the Bank to its customers are restricted to cash and simple financial derivatives such as
interest rate swaps and foreign exchange swap and forward contracts.
The only trading activity conducted by the Bank is over-night foreign exchange position, within a prudent limit that cannot be exceeded.
The front-office managers assume primary responsibility in terms of risk exposure; however, global management lies with an independent structure
being the Market Risk Controller (MRC), within Risk Division. The main function of MRC is the ongoing analysis, independently from the trading
rooms, of the positions and risks linked to the market activities of the bank and the comparison of these positions to the allowed limits. The MRC
carries out the following functions:
Daily and periodic analysis and reporting (independently from the front office) of the exposures, stress tests and risks incurred by the Bank’s market
activities and comparison of said exposure and risks with the pre-set limits.
Definition of the risk-measurement methods and control procedures, approval of the valuation methods used to calculate and monitor risks, including
those made on a gross or nominal basis.
Maximum expected loss at March 31, 2022
Maximum expected loss at December 31, 2021
Management of the approval process for limits.
As a part of managing market risk, the Bank has several hedging strategies and enters into interest rate swaps to balance the risks inherent in debt
instruments and fixed rate long term loans, if the fair value option is applied. The Bank uses a lot of methods to control market risk such as stress
testing "ST".
Stress testing gives indicator of the loss volume expected that may arise from sharp adverse circumstances. Stress testing is designed to match
business using standard analysis for specific scenarios. The Bank sets set a maximum limit of expected losses of 10% from authorized limit according
to internal bank rules.
The following table provides FX position (whether short or long) for all balance sheet items and off balance sheet items.
(B/1) Methods of Measuring Market Risk and Defining Exposure Limits
At the proposal of this MRC and Head of Risk Division, the Board sets the levels of authorized risk by type of market activity and makes the main
decisions concerning Bank’s market risk management.
Reviewing new products or services from market risk aspect under New Product Committee to ensure that market risks are properly identified and
controlled.
- 35 -
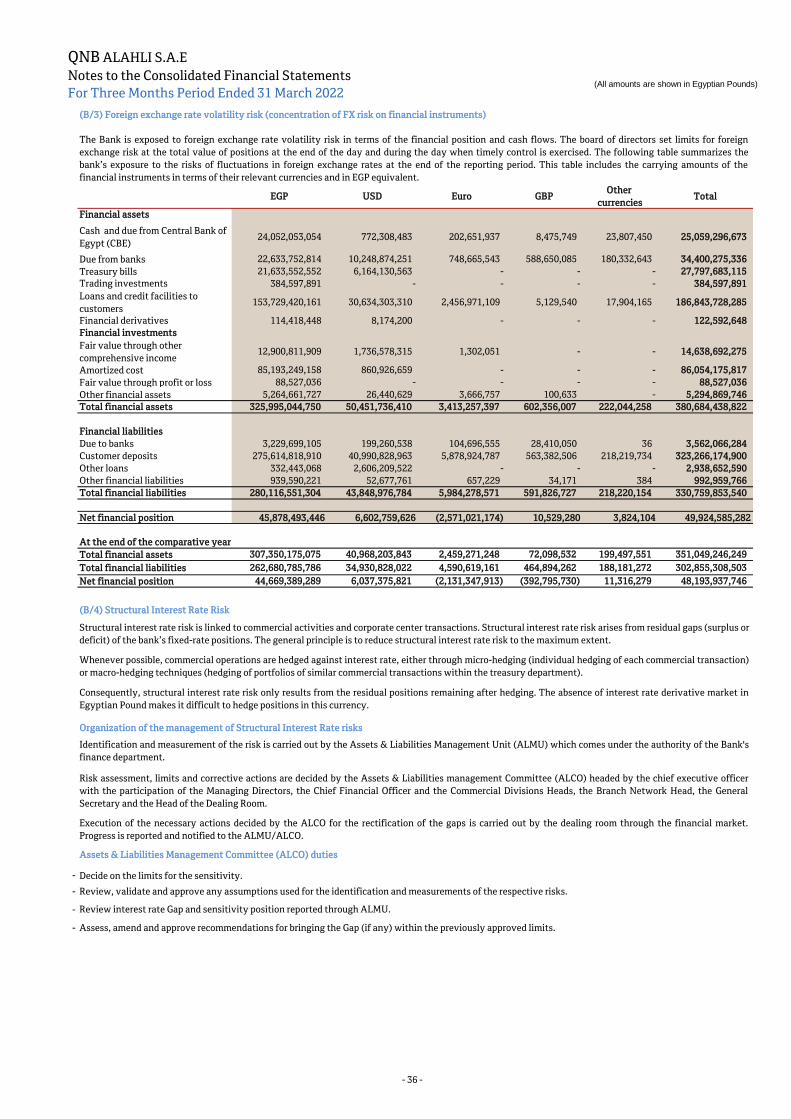
QNB ALAHLI S.A.E
Notes to the Consolidated Financial Statements
For Three Months Period Ended 31 March 2022(All amounts are shown in Egyptian Pounds)
(B/3) Foreign exchange rate volatility risk (concentration of FX risk on financial instruments)
EGP USD Euro GBPOther
currenciesTotal
Financial assets
Cash and due from Central Bank of
Egypt (CBE)24,052,053,054 772,308,483 202,651,937 8,475,749 23,807,450 25,059,296,673
Due from banks 22,633,752,814 10,248,874,251 748,665,543 588,650,085 180,332,643 34,400,275,336
Treasury bills 21,633,552,552 6,164,130,563 - - - 27,797,683,115
Trading investments 384,597,891 - - - - 384,597,891
Loans and credit facilities to
customers153,729,420,161 30,634,303,310 2,456,971,109 5,129,540 17,904,165 186,843,728,285
Financial derivatives 114,418,448 8,174,200 - - - 122,592,648
Financial investments
Fair value through other
comprehensive income 12,900,811,909 1,736,578,315 1,302,051 - - 14,638,692,275
Amortized cost 85,193,249,158 860,926,659 - - - 86,054,175,817
Fair value through profit or loss 88,527,036 - - - - 88,527,036
Other financial assets 5,264,661,727 26,440,629 3,666,757 100,633 - 5,294,869,746
Total financial assets 325,995,044,750 50,451,736,410 3,413,257,397 602,356,007 222,044,258 380,684,438,822
Financial liabilities
Due to banks 3,229,699,105 199,260,538 104,696,555 28,410,050 36 3,562,066,284
Customer deposits 275,614,818,910 40,990,828,963 5,878,924,787 563,382,506 218,219,734 323,266,174,900
Other loans 332,443,068 2,606,209,522 - - - 2,938,652,590
Other financial liabilities 939,590,221 52,677,761 657,229 34,171 384 992,959,766
Total financial liabilities 280,116,551,304 43,848,976,784 5,984,278,571 591,826,727 218,220,154 330,759,853,540
Net financial position 45,878,493,446 6,602,759,626 (2,571,021,174) 10,529,280 3,824,104 49,924,585,282
At the end of the comparative year
Total financial assets 307,350,175,075 40,968,203,843 2,459,271,248 72,098,532 199,497,551 351,049,246,249
Total financial liabilities 262,680,785,786 34,930,828,022 4,590,619,161 464,894,262 188,181,272 302,855,308,503
Net financial position 44,669,389,289 6,037,375,821 (2,131,347,913) (392,795,730) 11,316,279 48,193,937,746
-
-
-
-
Assets & Liabilities Management Committee (ALCO) duties
Decide on the limits for the sensitivity.
The Bank is exposed to foreign exchange rate volatility risk in terms of the financial position and cash flows. The board of directors set limits for foreign
exchange risk at the total value of positions at the end of the day and during the day when timely control is exercised. The following table summarizes the
bank’s exposure to the risks of fluctuations in foreign exchange rates at the end of the reporting period. This table includes the carrying amounts of the
financial instruments in terms of their relevant currencies and in EGP equivalent.
(B/4) Structural Interest Rate Risk
Structural interest rate risk is linked to commercial activities and corporate center transactions. Structural interest rate risk arises from residual gaps (surplus or
deficit( of the bank’s fixed-rate positions. The general principle is to reduce structural interest rate risk to the maximum extent.
Whenever possible, commercial operations are hedged against interest rate, either through micro-hedging (individual hedging of each commercial transaction)
or macro-hedging techniques (hedging of portfolios of similar commercial transactions within the treasury department).
Consequently, structural interest rate risk only results from the residual positions remaining after hedging. The absence of interest rate derivative market in
Egyptian Pound makes it difficult to hedge positions in this currency.
Identification and measurement of the risk is carried out by the Assets & Liabilities Management Unit (ALMU) which comes under the authority of the Bank's
finance department.
Risk assessment, limits and corrective actions are decided by the Assets & Liabilities management Committee (ALCO) headed by the chief executive officer
with the participation of the Managing Directors, the Chief Financial Officer and the Commercial Divisions Heads, the Branch Network Head, the General
Secretary and the Head of the Dealing Room.
Execution of the necessary actions decided by the ALCO for the rectification of the gaps is carried out by the dealing room through the financial market.
Progress is reported and notified to the ALMU/ALCO.
Organization of the management of Structural Interest Rate risks
Review, validate and approve any assumptions used for the identification and measurements of the respective risks.
Review interest rate Gap and sensitivity position reported through ALMU.
Assess, amend and approve recommendations for bringing the Gap (if any) within the previously approved limits.
- 36 -
QNB ALAHLI S.A.E
Notes to the Consolidated Financial Statements
For Three Months Period Ended 31 March 2022(All amounts are shown in Egyptian Pounds)
-
-
-
-
-
-
-
-
Document and maintain the respective risks management policy as approved by the ALCO.
Construct and continuously elaborate on the models used for the identification and measurement of the respective risks.
Report to ALCO on the respective exposures and the evolution of such exposures over time.
Provide recommendations for bringing the gaps within limits.
Follow up and notify ALCO of the progress made in the implementation of the ALCO decisions.
Assets & Liabilities Management Unit (ALMU) duties
Dealing Room duties
Provide frequent updates on markets movements.
Execute and Report progress of ALCO approved recommendations.
Co-ordinate with ALMU on the spontaneous hedging of special transactions according to ALCO approved policy and recommendations.
Once the gaps have been identified for each major currency, the sensitivity is calculated as the variation of the net present value of the fixed rate position of an
instantaneous parallel shift of the 1% in the yield curve of each major currency. The cumulative sensitivity for all currencies as well as for any single currency
should not exceed the above mentioned limit.
Bank's Objective of Interest Rate Risk Management
Measurement and monitoring of structural interest rate risks
The Bank's aim is to reduce exposure to structural interest rate risk as much as possible.
Any residual interest rate risk exposure must comply with the sensitivity limits approved by the ALCO. Sensitivity is defined as the variation in the net present
value of future residual fixed-rate positions for a 1% parallel increase in the yield curve. Adherence to applicable limits is closely monitored.
In order to quantify the Bank's exposure to structural interest rate risks, all fixed rate assets and liabilities on future maturities are analyzed to identify any
gaps.
On a quarterly basis, assets and liabilities are analyzed independently, without any prior matching. Maturities on outstanding positions are determined on the
basis of the contractual terms of the transactions and models of historic client behavior (e.g. saving accounts) as well as conventional assumptions for some
balance sheet items (e.g. equity).
- 37 -
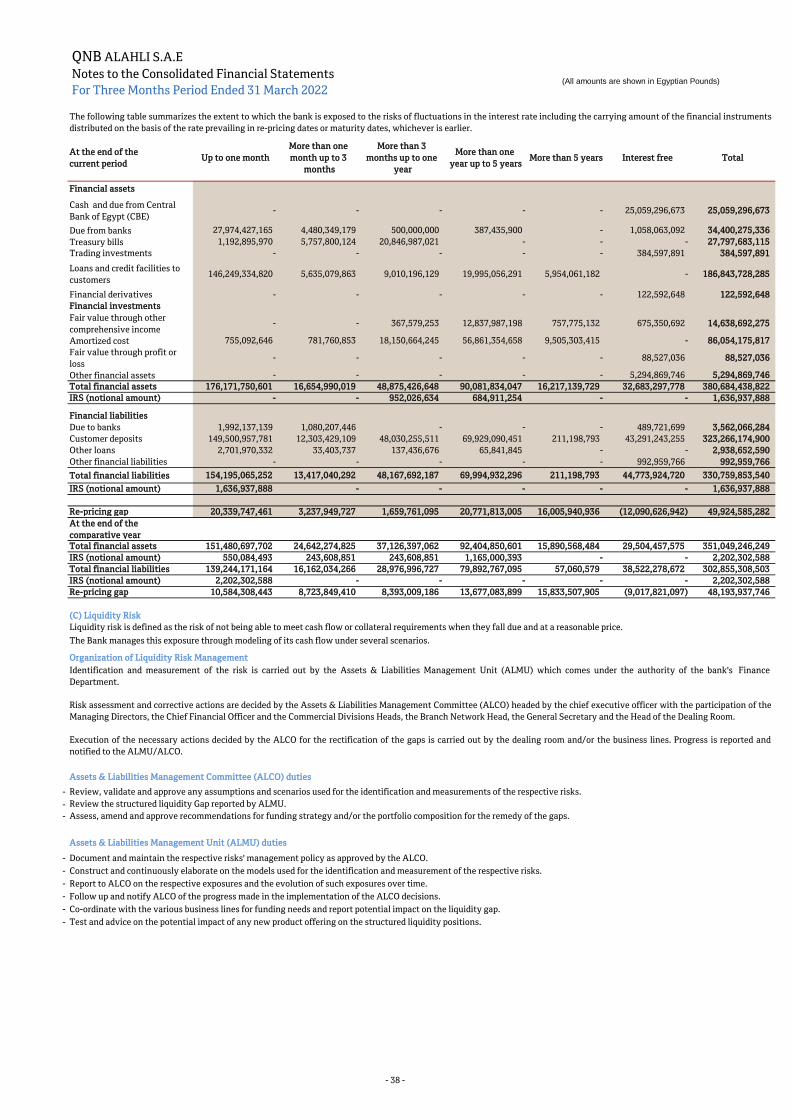
QNB ALAHLI S.A.E
Notes to the Consolidated Financial Statements
For Three Months Period Ended 31 March 2022(All amounts are shown in Egyptian Pounds)
At the end of the
current periodUp to one month
More than one
month up to 3
months
More than 3
months up to one
year
More than one
year up to 5 yearsMore than 5 years Interest free Total
Financial assets
Cash and due from Central
Bank of Egypt (CBE)- - - - - 25,059,296,673 25,059,296,673
Due from banks 27,974,427,165 4,480,349,179 500,000,000 387,435,900 - 1,058,063,092 34,400,275,336
Treasury bills 1,192,895,970 5,757,800,124 20,846,987,021 - - - 27,797,683,115
Trading investments - - - - - 384,597,891 384,597,891
Loans and credit facilities to
customers146,249,334,820 5,635,079,863 9,010,196,129 19,995,056,291 5,954,061,182 - 186,843,728,285
Financial derivatives - - - - - 122,592,648 122,592,648
Financial investments
Fair value through other
comprehensive income - - 367,579,253 12,837,987,198 757,775,132 675,350,692 14,638,692,275
Amortized cost 755,092,646 781,760,853 18,150,664,245 56,861,354,658 9,505,303,415 - 86,054,175,817
Fair value through profit or
loss - - - - - 88,527,036 88,527,036
Other financial assets - - - - - 5,294,869,746 5,294,869,746
Total financial assets 176,171,750,601 16,654,990,019 48,875,426,648 90,081,834,047 16,217,139,729 32,683,297,778 380,684,438,822
IRS (notional amount) - - 952,026,634 684,911,254 - - 1,636,937,888
Financial liabilities
Due to banks 1,992,137,139 1,080,207,446 - - - 489,721,699 3,562,066,284
Customer deposits 149,500,957,781 12,303,429,109 48,030,255,511 69,929,090,451 211,198,793 43,291,243,255 323,266,174,900
Other loans 2,701,970,332 33,403,737 137,436,676 65,841,845 - - 2,938,652,590
Other financial liabilities - - - - - 992,959,766 992,959,766
Total financial liabilities 154,195,065,252 13,417,040,292 48,167,692,187 69,994,932,296 211,198,793 44,773,924,720 330,759,853,540
IRS (notional amount) 1,636,937,888 - - - - - 1,636,937,888
Re-pricing gap 20,339,747,461 3,237,949,727 1,659,761,095 20,771,813,005 16,005,940,936 (12,090,626,942) 49,924,585,282
At the end of the
comparative year
Total financial assets 151,480,697,702 24,642,274,825 37,126,397,062 92,404,850,601 15,890,568,484 29,504,457,575 351,049,246,249
IRS (notional amount) 550,084,493 243,608,851 243,608,851 1,165,000,393 - - 2,202,302,588
Total financial liabilities 139,244,171,164 16,162,034,266 28,976,996,727 79,892,767,095 57,060,579 38,522,278,672 302,855,308,503
IRS (notional amount) 2,202,302,588 - - - - - 2,202,302,588
Re-pricing gap 10,584,308,443 8,723,849,410 8,393,009,186 13,677,083,899 15,833,507,905 (9,017,821,097) 48,193,937,746
-
-
-
-
-
-
-
-
-
The following table summarizes the extent to which the bank is exposed to the risks of fluctuations in the interest rate including the carrying amount of the financial instruments
distributed on the basis of the rate prevailing in re-pricing dates or maturity dates, whichever is earlier.
(C) Liquidity Risk
Construct and continuously elaborate on the models used for the identification and measurement of the respective risks.
Assets & Liabilities Management Committee (ALCO) duties
Assess, amend and approve recommendations for funding strategy and/or the portfolio composition for the remedy of the gaps.
Organization of Liquidity Risk Management
Document and maintain the respective risks' management policy as approved by the ALCO.
Test and advice on the potential impact of any new product offering on the structured liquidity positions.
Review the structured liquidity Gap reported by ALMU.
Report to ALCO on the respective exposures and the evolution of such exposures over time.
Follow up and notify ALCO of the progress made in the implementation of the ALCO decisions.
Co-ordinate with the various business lines for funding needs and report potential impact on the liquidity gap.
Liquidity risk is defined as the risk of not being able to meet cash flow or collateral requirements when they fall due and at a reasonable price.
Assets & Liabilities Management Unit (ALMU) duties
The Bank manages this exposure through modeling of its cash flow under several scenarios.
Identification and measurement of the risk is carried out by the Assets & Liabilities Management Unit (ALMU) which comes under the authority of the bank's Finance
Department.
Risk assessment and corrective actions are decided by the Assets & Liabilities Management Committee (ALCO) headed by the chief executive officer with the participation of the
Managing Directors, the Chief Financial Officer and the Commercial Divisions Heads, the Branch Network Head, the General Secretary and the Head of the Dealing Room.
Execution of the necessary actions decided by the ALCO for the rectification of the gaps is carried out by the dealing room and/or the business lines. Progress is reported and
notified to the ALMU/ALCO.
Review, validate and approve any assumptions and scenarios used for the identification and measurements of the respective risks.
- 38 -
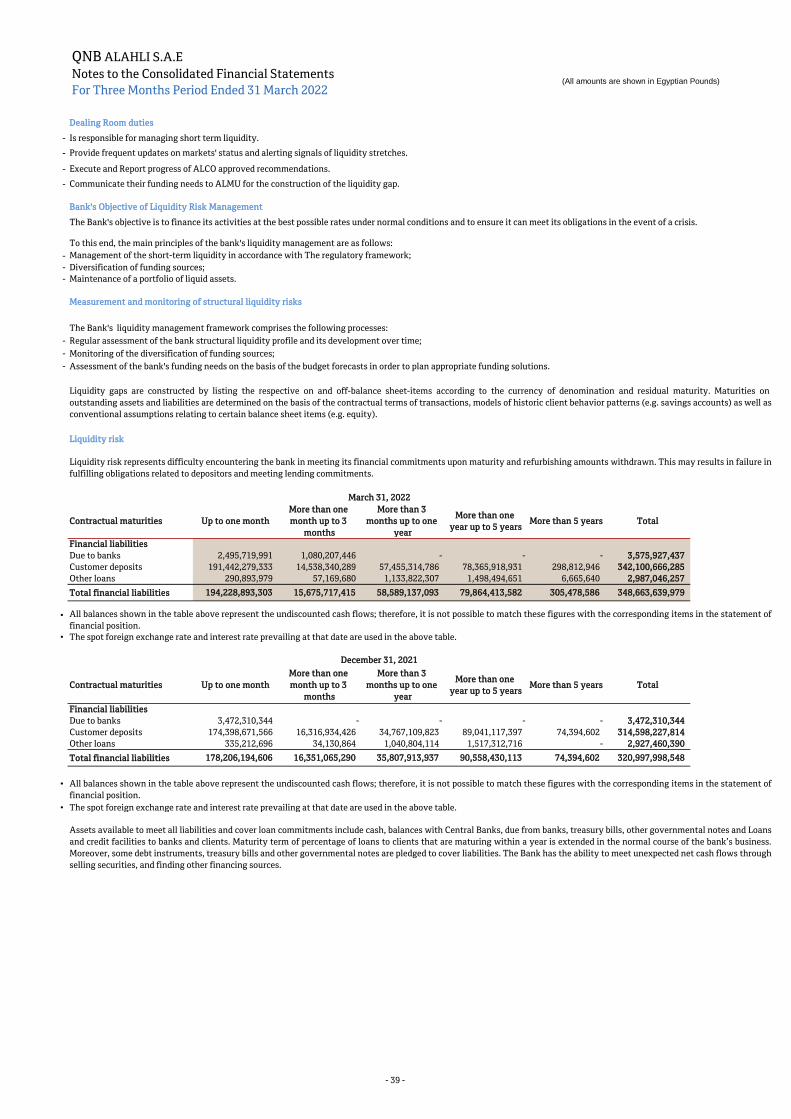
QNB ALAHLI S.A.E
Notes to the Consolidated Financial Statements
For Three Months Period Ended 31 March 2022(All amounts are shown in Egyptian Pounds)
-
-
-
-
-
-
-
-
-
-
Liquidity risk
Contractual maturities Up to one month
More than one
month up to 3
months
More than 3
months up to one
year
More than one
year up to 5 yearsMore than 5 years Total
Financial liabilities
Due to banks 2,495,719,991 1,080,207,446 - - - 3,575,927,437
Customer deposits 191,442,279,333 14,538,340,289 57,455,314,786 78,365,918,931 298,812,946 342,100,666,285
Other loans 290,893,979 57,169,680 1,133,822,307 1,498,494,651 6,665,640 2,987,046,257
Total financial liabilities 194,228,893,303 15,675,717,415 58,589,137,093 79,864,413,582 305,478,586 348,663,639,979
•
• The spot foreign exchange rate and interest rate prevailing at that date are used in the above table.
Contractual maturities Up to one month
More than one
month up to 3
months
More than 3
months up to one
year
More than one
year up to 5 yearsMore than 5 years Total
Financial liabilities
Due to banks 3,472,310,344 - - - - 3,472,310,344
Customer deposits 174,398,671,566 16,316,934,426 34,767,109,823 89,041,117,397 74,394,602 314,598,227,814
Other loans 335,212,696 34,130,864 1,040,804,114 1,517,312,716 - 2,927,460,390
Total financial liabilities 178,206,194,606 16,351,065,290 35,807,913,937 90,558,430,113 74,394,602 320,997,998,548
•
• The spot foreign exchange rate and interest rate prevailing at that date are used in the above table.
Assets available to meet all liabilities and cover loan commitments include cash, balances with Central Banks, due from banks, treasury bills, other governmental notes and Loans
and credit facilities to banks and clients. Maturity term of percentage of loans to clients that are maturing within a year is extended in the normal course of the bank’s business.
Moreover, some debt instruments, treasury bills and other governmental notes are pledged to cover liabilities. The Bank has the ability to meet unexpected net cash flows through
selling securities, and finding other financing sources.
March 31, 2022
All balances shown in the table above represent the undiscounted cash flows; therefore, it is not possible to match these figures with the corresponding items in the statement of
financial position.
All balances shown in the table above represent the undiscounted cash flows; therefore, it is not possible to match these figures with the corresponding items in the statement of
financial position.
Liquidity gaps are constructed by listing the respective on and off-balance sheet-items according to the currency of denomination and residual maturity. Maturities on
outstanding assets and liabilities are determined on the basis of the contractual terms of transactions, models of historic client behavior patterns (e.g. savings accounts) as well as
conventional assumptions relating to certain balance sheet items (e.g. equity).
Assessment of the bank's funding needs on the basis of the budget forecasts in order to plan appropriate funding solutions.
Measurement and monitoring of structural liquidity risks
Execute and Report progress of ALCO approved recommendations.
December 31, 2021
Liquidity risk represents difficulty encountering the bank in meeting its financial commitments upon maturity and refurbishing amounts withdrawn. This may results in failure in
fulfilling obligations related to depositors and meeting lending commitments.
Bank's Objective of Liquidity Risk Management
Communicate their funding needs to ALMU for the construction of the liquidity gap.
Monitoring of the diversification of funding sources;
Maintenance of a portfolio of liquid assets.
To this end, the main principles of the bank's liquidity management are as follows:
Is responsible for managing short term liquidity.
Dealing Room duties
Management of the short-term liquidity in accordance with The regulatory framework;
Diversification of funding sources;
The Bank's liquidity management framework comprises the following processes:
Regular assessment of the bank structural liquidity profile and its development over time;
The Bank's objective is to finance its activities at the best possible rates under normal conditions and to ensure it can meet its obligations in the event of a crisis.
Provide frequent updates on markets' status and alerting signals of liquidity stretches.
- 39 -
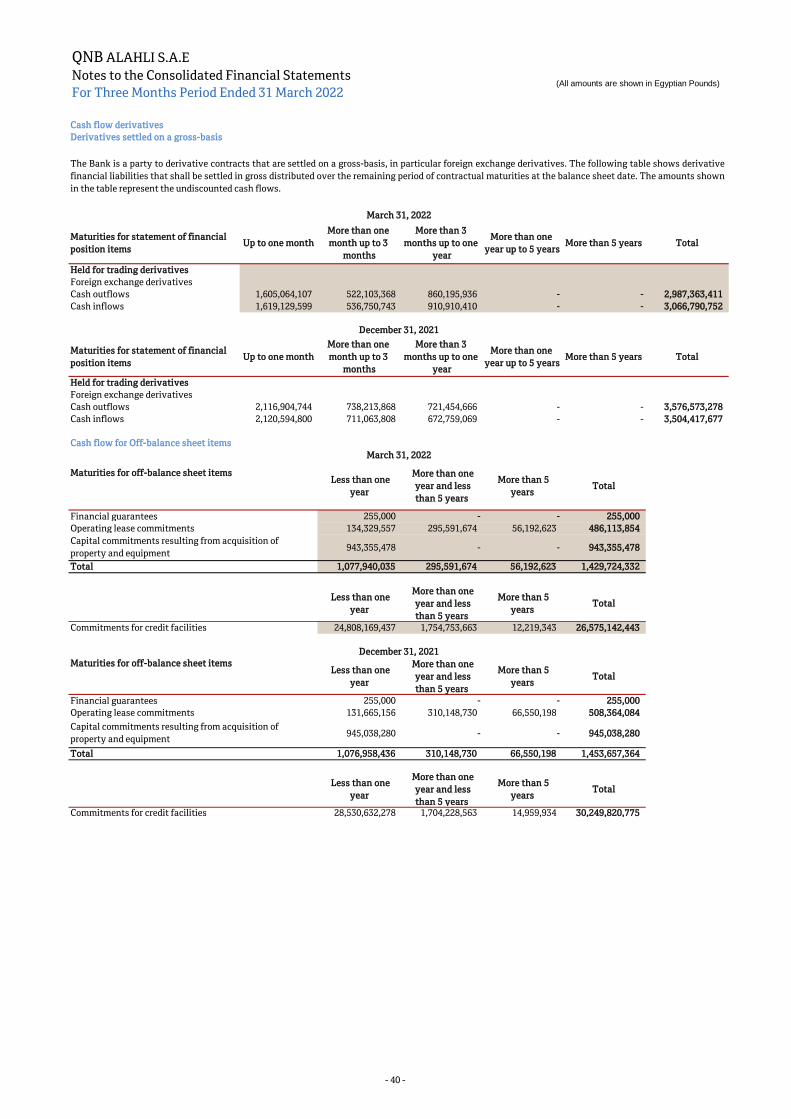
QNB ALAHLI S.A.E
Notes to the Consolidated Financial Statements
For Three Months Period Ended 31 March 2022(All amounts are shown in Egyptian Pounds)
Cash flow derivatives
Derivatives settled on a gross-basis
Maturities for statement of financial
position itemsUp to one month
More than one
month up to 3
months
More than 3
months up to one
year
More than one
year up to 5 yearsMore than 5 years Total
Held for trading derivatives
Foreign exchange derivatives
Cash outflows 1,605,064,107 522,103,368 860,195,936 - - 2,987,363,411
Cash inflows 1,619,129,599 536,750,743 910,910,410 - - 3,066,790,752
Maturities for statement of financial
position itemsUp to one month
More than one
month up to 3
months
More than 3
months up to one
year
More than one
year up to 5 yearsMore than 5 years Total
Held for trading derivatives
Foreign exchange derivatives
Cash outflows 2,116,904,744 738,213,868 721,454,666 - - 3,576,573,278
Cash inflows 2,120,594,800 711,063,808 672,759,069 - - 3,504,417,677
Cash flow for Off-balance sheet items
Less than one
year
More than one
year and less
than 5 years
More than 5
yearsTotal
Financial guarantees 255,000 - - 255,000
Operating lease commitments 134,329,557 295,591,674 56,192,623 486,113,854
943,355,478 - - 943,355,478
Total 1,077,940,035 295,591,674 56,192,623 1,429,724,332
Less than one
year
More than one
year and less
than 5 years
More than 5
yearsTotal
Commitments for credit facilities 24,808,169,437 1,754,753,663 12,219,343 26,575,142,443
Less than one
year
More than one
year and less
than 5 years
More than 5
yearsTotal
Financial guarantees 255,000 - - 255,000
Operating lease commitments 131,665,156 310,148,730 66,550,198 508,364,084
945,038,280 - - 945,038,280
Total 1,076,958,436 310,148,730 66,550,198 1,453,657,364
Less than one
year
More than one
year and less
than 5 years
More than 5
yearsTotal
Commitments for credit facilities 28,530,632,278 1,704,228,563 14,959,934 30,249,820,775
The Bank is a party to derivative contracts that are settled on a gross-basis, in particular foreign exchange derivatives. The following table shows derivative
financial liabilities that shall be settled in gross distributed over the remaining period of contractual maturities at the balance sheet date. The amounts shown
in the table represent the undiscounted cash flows.
March 31, 2022
December 31, 2021
Maturities for off-balance sheet items
March 31, 2022
December 31, 2021
Maturities for off-balance sheet items
Capital commitments resulting from acquisition of
property and equipment
Capital commitments resulting from acquisition of
property and equipment
- 40 -

QNB ALAHLI S.A.E
Notes to the Consolidated Financial Statements
For Three Months Period Ended 31 March 2022(All amounts are shown in Egyptian Pounds)
(D) Fair value of financial assets and liabilities and sources of fair value
(D/1) Financial instruments measured at fair value
Level 1:
Level 2:
Level 3:
Financial Assets Level 1 Level 2 Level 3 Total
US Treasury bonds 1,447,383,563 - - 1,447,383,563
Other debt instruments - 367,579,252 - 367,579,252
Egyptian Treasury Bonds 12,148,378,768 - - 12,148,378,768
Funds at fair value through other comprehensive income 46,970,450 - - 46,970,450
Funds at fair value through profit or loss 88,527,036 - - 88,527,036
Equity Instruments 124,095,030 - 504,285,212 628,380,242
Trading investments 384,597,891 - - 384,597,891
Financial derivatives - 122,592,648 - 122,592,648
Financial Assets Level 1 Level 2 Level 3 Total
US Treasury bonds 1,412,414,152 - - 1,412,414,152
Other debt instruments - 383,442,606 - 383,442,606
Egyptian Treasury Bonds 12,654,894,755 - - 12,654,894,755
Funds at fair value through other comprehensive income 47,163,250 - - 47,163,250
Funds at fair value through profit or loss 92,563,379 - - 92,563,379
Equity Instruments 151,884,836 - 473,971,589 625,856,425
Trading investments 409,760,928 - - 409,760,928
Financial derivatives - 36,542,265 - 36,542,265
March 31, 2022
December 31, 2021
The table below shows the financial assets and liabilities at fair value in the consolidated financial statements within the fair value hierarchy, based on the
levels of inputs that are essential for measuring the fair value as a whole:
The first level inputs are quoted prices (unadjusted) in active markets for identical assets or liabilities that the Bank can access on the measurement date.
The inputs of the second level are all inputs other than quoted prices within the first level and these inputs are observable for the asset or liability, directly or
indirectly.
The third level inputs are the unobservable inputs of the asset or liability.
Financial assets classified as trading financial assets at fair value with changes in fair value are measured in the statement of income under 'Net trading
income'.
Debt instruments classified as financial assets at fair value through other comprehensive income are measured at fair value with changes in fair value
recognized in the other comprehensive income statement under "fair value reserve".
For investments in equity instruments, equity securities listed on the stock exchange are measured at fair value in accordance with quoted market prices on
the date of the consolidated financial statements.
For non-listed shares, except for strategic investments, they are evaluated in one of the accepted techniques: discounted cash flow method Multiples of value
"and the inclusion of the valuation differences in other comprehensive income within the" fair value reserve "; for strategic investments, the nominal cost or
value is the fair value of those investments.
- 41 -
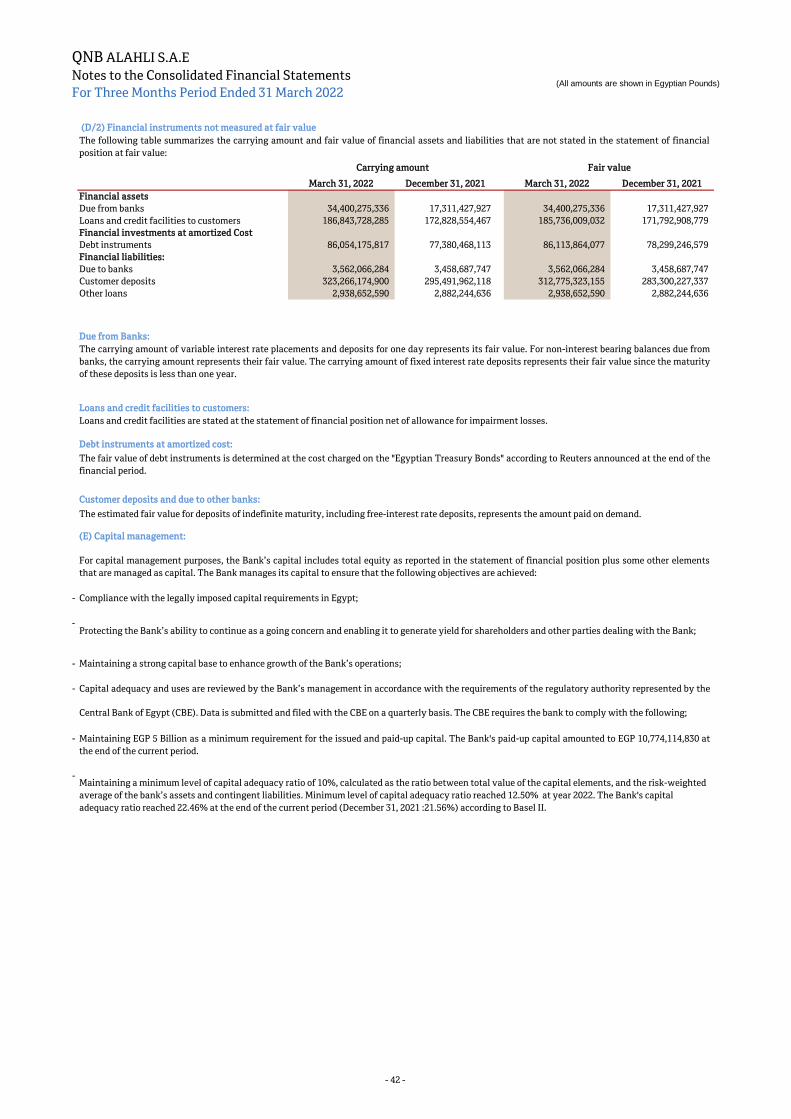
QNB ALAHLI S.A.E
Notes to the Consolidated Financial Statements
For Three Months Period Ended 31 March 2022(All amounts are shown in Egyptian Pounds)
March 31, 2022 December 31, 2021 March 31, 2022 December 31, 2021
Financial assets
Due from banks 34,400,275,336 17,311,427,927 34,400,275,336 17,311,427,927
Loans and credit facilities to customers 186,843,728,285 172,828,554,467 185,736,009,032 171,792,908,779
Financial investments at amortized Cost
Debt instruments 86,054,175,817 77,380,468,113 86,113,864,077 78,299,246,579
Financial liabilities:
Due to banks 3,562,066,284 3,458,687,747 3,562,066,284 3,458,687,747
Customer deposits 323,266,174,900 295,491,962,118 312,775,323,155 283,300,227,337
Other loans 2,938,652,590 2,882,244,636 2,938,652,590 2,882,244,636
Customer deposits and due to other banks:
-
-
-
-
-
-Maintaining a minimum level of capital adequacy ratio of 10%, calculated as the ratio between total value of the capital elements, and the risk-weighted
average of the bank’s assets and contingent liabilities. Minimum level of capital adequacy ratio reached 12.50% at year 2022. The Bank's capital
adequacy ratio reached 22.46% at the end of the current period (December 31, 2021 :21.56%) according to Basel II.
Maintaining a strong capital base to enhance growth of the Bank’s operations;
Capital adequacy and uses are reviewed by the Bank’s management in accordance with the requirements of the regulatory authority represented by the
Central Bank of Egypt (CBE). Data is submitted and filed with the CBE on a quarterly basis. The CBE requires the bank to comply with the following;
Maintaining EGP 5 Billion as a minimum requirement for the issued and paid-up capital. The Bank's paid-up capital amounted to EGP 10,774,114,830 at
the end of the current period.
For capital management purposes, the Bank’s capital includes total equity as reported in the statement of financial position plus some other elements
that are managed as capital. The Bank manages its capital to ensure that the following objectives are achieved:
Compliance with the legally imposed capital requirements in Egypt;
Protecting the Bank’s ability to continue as a going concern and enabling it to generate yield for shareholders and other parties dealing with the Bank;
The estimated fair value for deposits of indefinite maturity, including free-interest rate deposits, represents the amount paid on demand.
(E) Capital management:
(D/2) Financial instruments not measured at fair value
Due from Banks:
Loans and credit facilities to customers:
Debt instruments at amortized cost:
Loans and credit facilities are stated at the statement of financial position net of allowance for impairment losses.
The carrying amount of variable interest rate placements and deposits for one day represents its fair value. For non-interest bearing balances due from
banks, the carrying amount represents their fair value. The carrying amount of fixed interest rate deposits represents their fair value since the maturity
of these deposits is less than one year.
The fair value of debt instruments is determined at the cost charged on the "Egyptian Treasury Bonds" according to Reuters announced at the end of the
financial period.
Carrying amount Fair value
The following table summarizes the carrying amount and fair value of financial assets and liabilities that are not stated in the statement of financial
position at fair value:
- 42 -
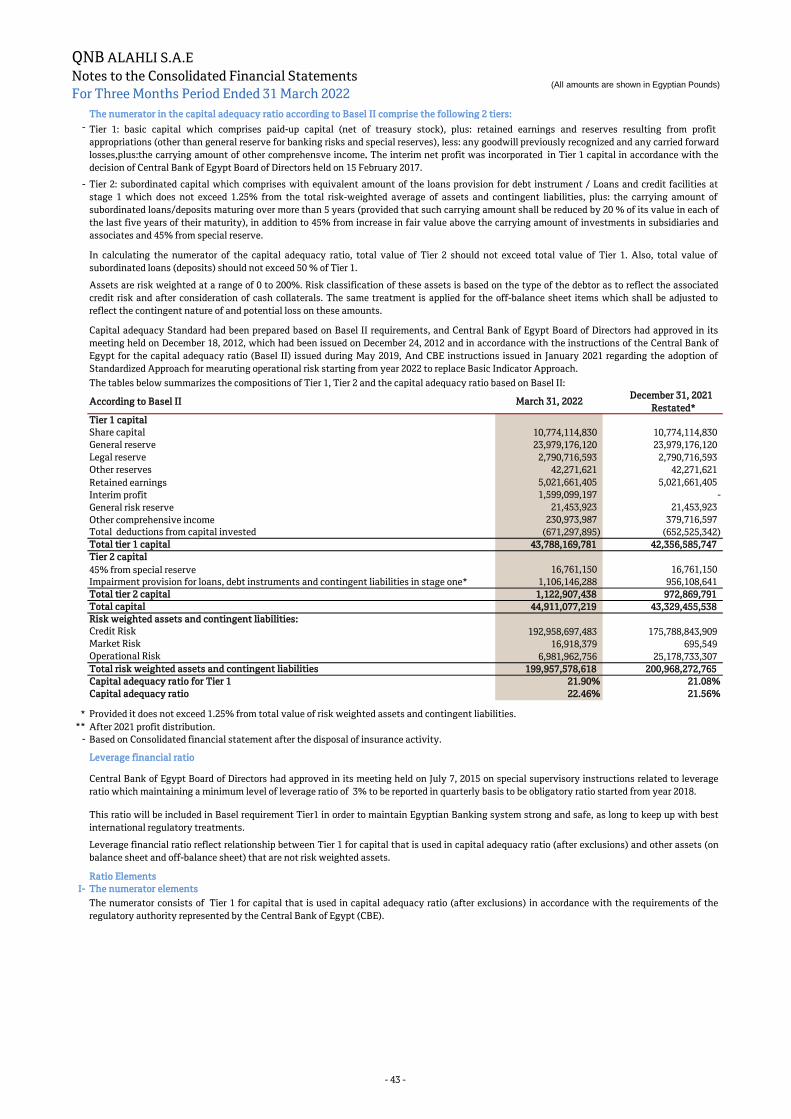
QNB ALAHLI S.A.E
Notes to the Consolidated Financial Statements
For Three Months Period Ended 31 March 2022(All amounts are shown in Egyptian Pounds)
The numerator in the capital adequacy ratio according to Basel II comprise the following 2 tiers:
-
-
According to Basel II March 31, 2022December 31, 2021
Restated*
Tier 1 capital
Share capital 10,774,114,830 10,774,114,830
General reserve 23,979,176,120 23,979,176,120
Legal reserve 2,790,716,593 2,790,716,593
Other reserves 42,271,621 42,271,621
Retained earnings 5,021,661,405 5,021,661,405
Interim profit 1,599,099,197 -
General risk reserve 21,453,923 21,453,923
Other comprehensive income 230,973,987 379,716,597
Total deductions from capital invested (671,297,895) (652,525,342)
Total tier 1 capital 43,788,169,781 42,356,585,747
Tier 2 capital
45% from special reserve 16,761,150 16,761,150
Impairment provision for loans, debt instruments and contingent liabilities in stage one* 1,106,146,288 956,108,641
Total tier 2 capital 1,122,907,438 972,869,791
Total capital 44,911,077,219 43,329,455,538
Risk weighted assets and contingent liabilities:
Credit Risk 192,958,697,483 175,788,843,909
Market Risk 16,918,379 695,549
Operational Risk 6,981,962,756 25,178,733,307
Total risk weighted assets and contingent liabilities 199,957,578,618 200,968,272,765
Capital adequacy ratio for Tier 1 21.90% 21.08%
Capital adequacy ratio 22.46% 21.56%
*
**
-
Leverage financial ratio
Ratio Elements
I- The numerator elements
Central Bank of Egypt Board of Directors had approved in its meeting held on July 7, 2015 on special supervisory instructions related to leverage
ratio which maintaining a minimum level of leverage ratio of 3% to be reported in quarterly basis to be obligatory ratio started from year 2018.
This ratio will be included in Basel requirement Tier1 in order to maintain Egyptian Banking system strong and safe, as long to keep up with best
international regulatory treatments.
Leverage financial ratio reflect relationship between Tier 1 for capital that is used in capital adequacy ratio (after exclusions) and other assets (on
balance sheet and off-balance sheet) that are not risk weighted assets.
The numerator consists of Tier 1 for capital that is used in capital adequacy ratio (after exclusions) in accordance with the requirements of the
regulatory authority represented by the Central Bank of Egypt (CBE).
The tables below summarizes the compositions of Tier 1, Tier 2 and the capital adequacy ratio based on Basel II:
Based on Consolidated financial statement after the disposal of insurance activity.
In calculating the numerator of the capital adequacy ratio, total value of Tier 2 should not exceed total value of Tier 1. Also, total value of
subordinated loans (deposits) should not exceed 50 % of Tier 1.
Capital adequacy Standard had been prepared based on Basel II requirements, and Central Bank of Egypt Board of Directors had approved in its
meeting held on December 18, 2012, which had been issued on December 24, 2012 and in accordance with the instructions of the Central Bank of
Egypt for the capital adequacy ratio (Basel II) issued during May 2019, And CBE instructions issued in January 2021 regarding the adoption of
Standardized Approach for mearuting operational risk starting from year 2022 to replace Basic Indicator Approach.
Provided it does not exceed 1.25% from total value of risk weighted assets and contingent liabilities.
Assets are risk weighted at a range of 0 to 200%. Risk classification of these assets is based on the type of the debtor as to reflect the associated
credit risk and after consideration of cash collaterals. The same treatment is applied for the off-balance sheet items which shall be adjusted to
reflect the contingent nature of and potential loss on these amounts.
Tier 2: subordinated capital which comprises with equivalent amount of the loans provision for debt instrument / Loans and credit facilities at
stage 1 which does not exceed 1.25% from the total risk-weighted average of assets and contingent liabilities, plus: the carrying amount of
subordinated loans/deposits maturing over more than 5 years (provided that such carrying amount shall be reduced by 20 % of its value in each of
the last five years of their maturity), in addition to 45% from increase in fair value above the carrying amount of investments in subsidiaries and
associates and 45% from special reserve.
Tier 1: basic capital which comprises paid-up capital (net of treasury stock), plus: retained earnings and reserves resulting from profit
appropriations (other than general reserve for banking risks and special reserves), less: any goodwill previously recognized and any carried forward
losses,plus:the carrying amount of other comprehensve income. The interim net profit was incorporated in Tier 1 capital in accordance with the
decision of Central Bank of Egypt Board of Directors held on 15 February 2017.
After 2021 profit distribution.
- 43 -
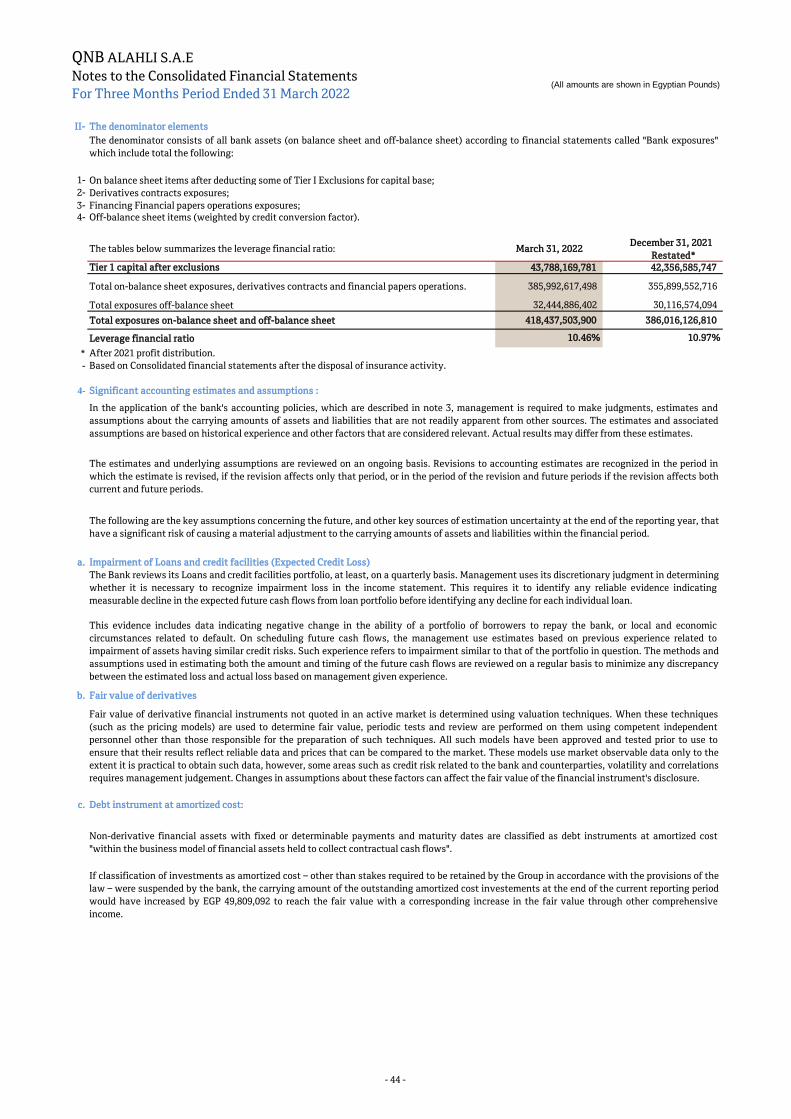
QNB ALAHLI S.A.E
Notes to the Consolidated Financial Statements
For Three Months Period Ended 31 March 2022(All amounts are shown in Egyptian Pounds)
II- The denominator elements
1- On balance sheet items after deducting some of Tier I Exclusions for capital base;
2- Derivatives contracts exposures;
3-
4- Off-balance sheet items (weighted by credit conversion factor).
The tables below summarizes the leverage financial ratio: March 31, 2022December 31, 2021
Restated*
Tier 1 capital after exclusions 43,788,169,781 42,356,585,747
Total on-balance sheet exposures, derivatives contracts and financial papers operations. 385,992,617,498 355,899,552,716
Total exposures off-balance sheet 32,444,886,402 30,116,574,094
Total exposures on-balance sheet and off-balance sheet 418,437,503,900 386,016,126,810
Leverage financial ratio 10.46% 10.97%
*
-
4- Significant accounting estimates and assumptions :
a. Impairment of Loans and credit facilities (Expected Credit Loss)
b. Fair value of derivatives
c. Debt instrument at amortized cost:
Based on Consolidated financial statements after the disposal of insurance activity.
If classification of investments as amortized cost – other than stakes required to be retained by the Group in accordance with the provisions of the
law – were suspended by the bank, the carrying amount of the outstanding amortized cost investements at the end of the current reporting period
would have increased by EGP 49,809,092 to reach the fair value with a corresponding increase in the fair value through other comprehensive
income.
Fair value of derivative financial instruments not quoted in an active market is determined using valuation techniques. When these techniques
(such as the pricing models) are used to determine fair value, periodic tests and review are performed on them using competent independent
personnel other than those responsible for the preparation of such techniques. All such models have been approved and tested prior to use to
ensure that their results reflect reliable data and prices that can be compared to the market. These models use market observable data only to the
extent it is practical to obtain such data, however, some areas such as credit risk related to the bank and counterparties, volatility and correlations
requires management judgement. Changes in assumptions about these factors can affect the fair value of the financial instrument's disclosure.
Non-derivative financial assets with fixed or determinable payments and maturity dates are classified as debt instruments at amortized cost
"within the business model of financial assets held to collect contractual cash flows".
This evidence includes data indicating negative change in the ability of a portfolio of borrowers to repay the bank, or local and economic
circumstances related to default. On scheduling future cash flows, the management use estimates based on previous experience related to
impairment of assets having similar credit risks. Such experience refers to impairment similar to that of the portfolio in question. The methods and
assumptions used in estimating both the amount and timing of the future cash flows are reviewed on a regular basis to minimize any discrepancy
between the estimated loss and actual loss based on management given experience.
Financing Financial papers operations exposures;
After 2021 profit distribution.
In the application of the bank's accounting policies, which are described in note 3, management is required to make judgments, estimates and
assumptions about the carrying amounts of assets and liabilities that are not readily apparent from other sources. The estimates and associated
assumptions are based on historical experience and other factors that are considered relevant. Actual results may differ from these estimates.
The following are the key assumptions concerning the future, and other key sources of estimation uncertainty at the end of the reporting year, that
have a significant risk of causing a material adjustment to the carrying amounts of assets and liabilities within the financial period.
The Bank reviews its Loans and credit facilities portfolio, at least, on a quarterly basis. Management uses its discretionary judgment in determining
whether it is necessary to recognize impairment loss in the income statement. This requires it to identify any reliable evidence indicating
measurable decline in the expected future cash flows from loan portfolio before identifying any decline for each individual loan.
The estimates and underlying assumptions are reviewed on an ongoing basis. Revisions to accounting estimates are recognized in the period in
which the estimate is revised, if the revision affects only that period, or in the period of the revision and future periods if the revision affects both
current and future periods.
The denominator consists of all bank assets (on balance sheet and off-balance sheet) according to financial statements called "Bank exposures"
which include total the following:
- 44 -
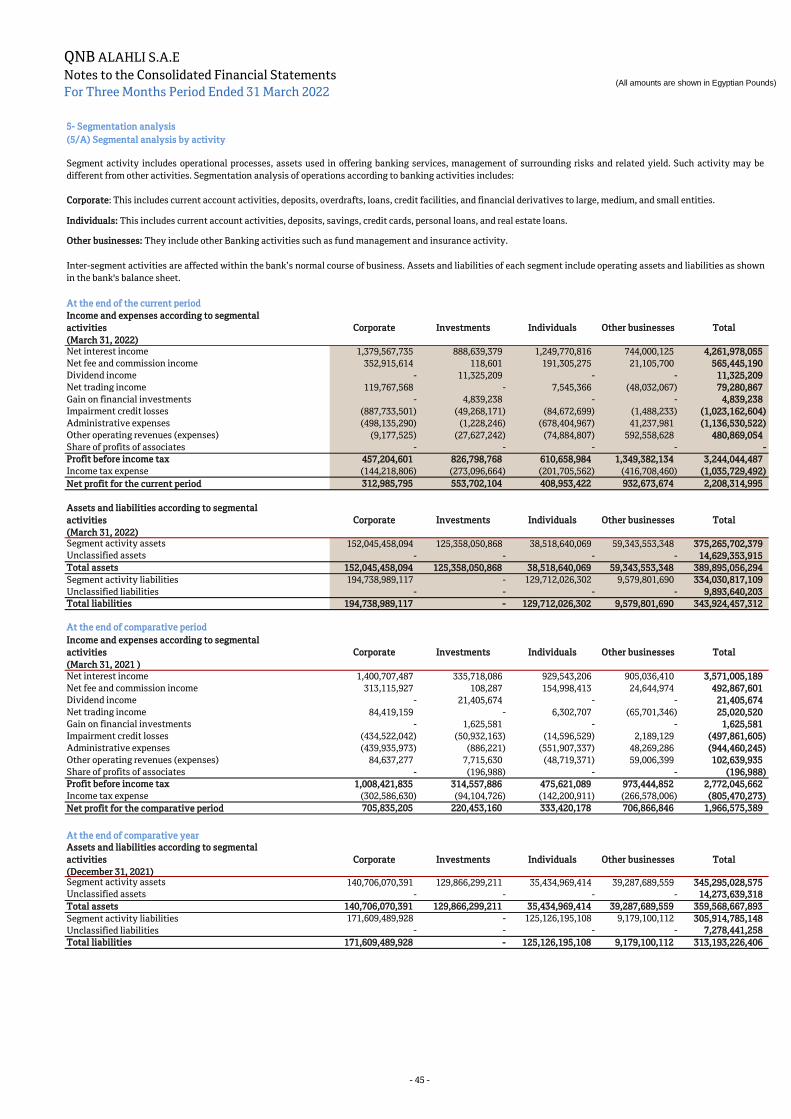
QNB ALAHLI S.A.E
Notes to the Consolidated Financial Statements
For Three Months Period Ended 31 March 2022(All amounts are shown in Egyptian Pounds)
5- Segmentation analysis
(5/A) Segmental analysis by activity
At the end of the current period
Income and expenses according to segmental
activities
(March 31, 2022)
Corporate Investments Individuals Other businesses Total
Net interest income 1,379,567,735 888,639,379 1,249,770,816 744,000,125 4,261,978,055
Net fee and commission income 352,915,614 118,601 191,305,275 21,105,700 565,445,190
Dividend income - 11,325,209 - - 11,325,209
Net trading income 119,767,568 - 7,545,366 (48,032,067) 79,280,867
Gain on financial investments - 4,839,238 - - 4,839,238
Impairment credit losses (887,733,501) (49,268,171) (84,672,699) (1,488,233) (1,023,162,604)
Administrative expenses (498,135,290) (1,228,246) (678,404,967) 41,237,981 (1,136,530,522)
Other operating revenues (expenses) (9,177,525) (27,627,242) (74,884,807) 592,558,628 480,869,054
Share of profits of associates - - - - -
Profit before income tax 457,204,601 826,798,768 610,658,984 1,349,382,134 3,244,044,487
Income tax expense (144,218,806) (273,096,664) (201,705,562) (416,708,460) (1,035,729,492)
Net profit for the current period 312,985,795 553,702,104 408,953,422 932,673,674 2,208,314,995
Assets and liabilities according to segmental
activities
(March 31, 2022)
Corporate Investments Individuals Other businesses Total
Segment activity assets 152,045,458,094 125,358,050,868 38,518,640,069 59,343,553,348 375,265,702,379
Unclassified assets - - - - 14,629,353,915
Total assets 152,045,458,094 125,358,050,868 38,518,640,069 59,343,553,348 389,895,056,294
Segment activity liabilities 194,738,989,117 - 129,712,026,302 9,579,801,690 334,030,817,109
Unclassified liabilities - - - - 9,893,640,203
Total liabilities 194,738,989,117 - 129,712,026,302 9,579,801,690 343,924,457,312
At the end of comparative period
Income and expenses according to segmental
activities
(March 31, 2021 )
Corporate Investments Individuals Other businesses Total
Net interest income 1,400,707,487 335,718,086 929,543,206 905,036,410 3,571,005,189
Net fee and commission income 313,115,927 108,287 154,998,413 24,644,974 492,867,601
Dividend income - 21,405,674 - - 21,405,674
Net trading income 84,419,159 - 6,302,707 (65,701,346) 25,020,520
Gain on financial investments - 1,625,581 - - 1,625,581
Impairment credit losses (434,522,042) (50,932,163) (14,596,529) 2,189,129 (497,861,605)
Administrative expenses (439,935,973) (886,221) (551,907,337) 48,269,286 (944,460,245)
Other operating revenues (expenses) 84,637,277 7,715,630 (48,719,371) 59,006,399 102,639,935
Share of profits of associates - (196,988) - - (196,988)
Profit before income tax 1,008,421,835 314,557,886 475,621,089 973,444,852 2,772,045,662
Income tax expense (302,586,630) (94,104,726) (142,200,911) (266,578,006) (805,470,273)
Net profit for the comparative period 705,835,205 220,453,160 333,420,178 706,866,846 1,966,575,389
At the end of comparative year
Assets and liabilities according to segmental
activities
(December 31, 2021)
Corporate Investments Individuals Other businesses Total
Segment activity assets 140,706,070,391 129,866,299,211 35,434,969,414 39,287,689,559 345,295,028,575
Unclassified assets - - - - 14,273,639,318
Total assets 140,706,070,391 129,866,299,211 35,434,969,414 39,287,689,559 359,568,667,893
Segment activity liabilities 171,609,489,928 - 125,126,195,108 9,179,100,112 305,914,785,148
Unclassified liabilities - - - - 7,278,441,258
Total liabilities 171,609,489,928 - 125,126,195,108 9,179,100,112 313,193,226,406
Segment activity includes operational processes, assets used in offering banking services, management of surrounding risks and related yield. Such activity may be
different from other activities. Segmentation analysis of operations according to banking activities includes:
Corporate: This includes current account activities, deposits, overdrafts, loans, credit facilities, and financial derivatives to large, medium, and small entities.
Inter-segment activities are affected within the bank’s normal course of business. Assets and liabilities of each segment include operating assets and liabilities as shown
in the bank's balance sheet.
Individuals: This includes current account activities, deposits, savings, credit cards, personal loans, and real estate loans.
Other businesses: They include other Banking activities such as fund management and insurance activity.
- 45 -
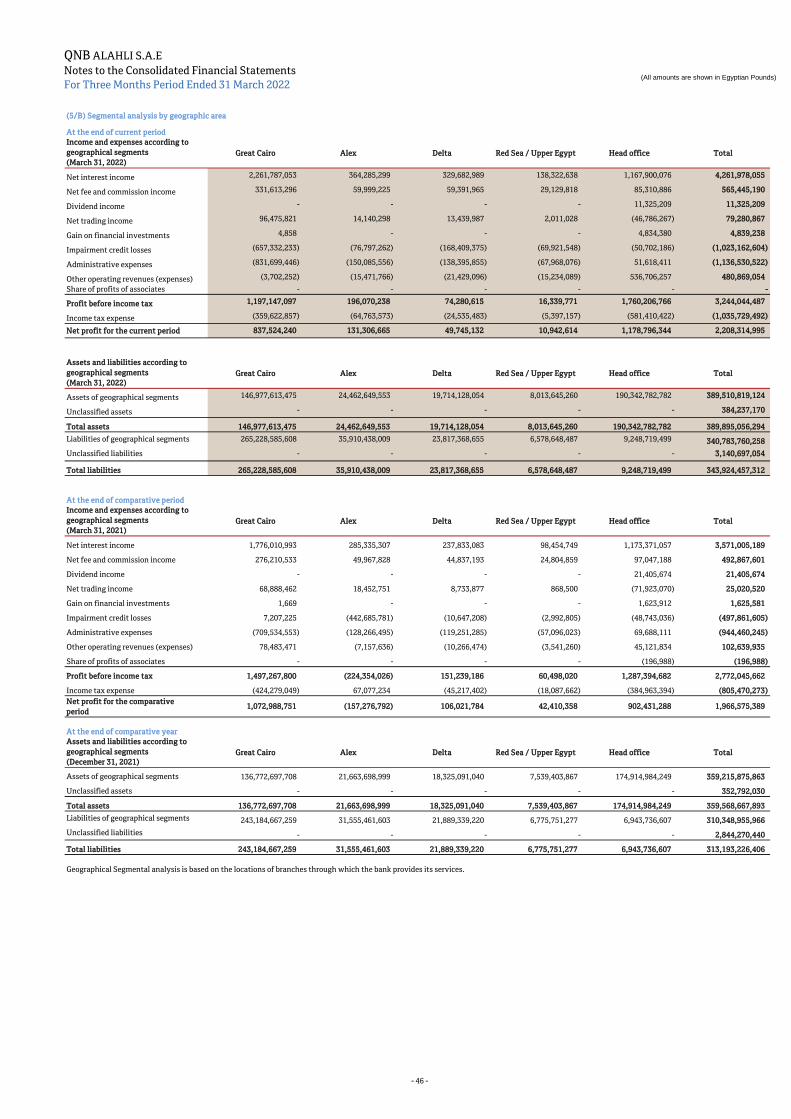
QNB ALAHLI S.A.E
Notes to the Consolidated Financial Statements
For Three Months Period Ended 31 March 2022(All amounts are shown in Egyptian Pounds)
(5/B) Segmental analysis by geographic area
At the end of current period
Income and expenses according to
geographical segments
(March 31, 2022)
Great Cairo Alex Delta Red Sea / Upper Egypt Head office Total
Net interest income 2,261,787,053 364,285,299 329,682,989 138,322,638 1,167,900,076 4,261,978,055
Net fee and commission income 331,613,296 59,999,225 59,391,965 29,129,818 85,310,886 565,445,190
Dividend income - - - - 11,325,209 11,325,209
Net trading income 96,475,821 14,140,298 13,439,987 2,011,028 (46,786,267) 79,280,867
Gain on financial investments 4,858 - - - 4,834,380 4,839,238
Impairment credit losses (657,332,233) (76,797,262) (168,409,375) (69,921,548) (50,702,186) (1,023,162,604)
Administrative expenses (831,699,446) (150,085,556) (138,395,855) (67,968,076) 51,618,411 (1,136,530,522)
Other operating revenues (expenses) (3,702,252) (15,471,766) (21,429,096) (15,234,089) 536,706,257 480,869,054
Share of profits of associates - - - - - -
Profit before income tax 1,197,147,097 196,070,238 74,280,615 16,339,771 1,760,206,766 3,244,044,487
Income tax expense (359,622,857) (64,763,573) (24,535,483) (5,397,157) (581,410,422) (1,035,729,492)
Net profit for the current period 837,524,240 131,306,665 49,745,132 10,942,614 1,178,796,344 2,208,314,995
Assets and liabilities according to
geographical segments
(March 31, 2022)
Great Cairo Alex Delta Red Sea / Upper Egypt Head office Total
Assets of geographical segments 146,977,613,475 24,462,649,553 19,714,128,054 8,013,645,260 190,342,782,782 389,510,819,124
Unclassified assets - - - - - 384,237,170
Total assets 146,977,613,475 24,462,649,553 19,714,128,054 8,013,645,260 190,342,782,782 389,895,056,294
Liabilities of geographical segments 265,228,585,608 35,910,438,009 23,817,368,655 6,578,648,487 9,248,719,499 340,783,760,258
Unclassified liabilities - - - - - 3,140,697,054
Total liabilities 265,228,585,608 35,910,438,009 23,817,368,655 6,578,648,487 9,248,719,499 343,924,457,312
At the end of comparative period
Income and expenses according to
geographical segments
(March 31, 2021)
Great Cairo Alex Delta Red Sea / Upper Egypt Head office Total
Net interest income 1,776,010,993 285,335,307 237,833,083 98,454,749 1,173,371,057 3,571,005,189
Net fee and commission income 276,210,533 49,967,828 44,837,193 24,804,859 97,047,188 492,867,601
Dividend income - - - - 21,405,674 21,405,674
Net trading income 68,888,462 18,452,751 8,733,877 868,500 (71,923,070) 25,020,520
Gain on financial investments 1,669 - - - 1,623,912 1,625,581
Impairment credit losses 7,207,225 (442,685,781) (10,647,208) (2,992,805) (48,743,036) (497,861,605)
Administrative expenses (709,534,553) (128,266,495) (119,251,285) (57,096,023) 69,688,111 (944,460,245)
Other operating revenues (expenses) 78,483,471 (7,157,636) (10,266,474) (3,541,260) 45,121,834 102,639,935
Share of profits of associates - - - - (196,988) (196,988)
Profit before income tax 1,497,267,800 (224,354,026) 151,239,186 60,498,020 1,287,394,682 2,772,045,662
Income tax expense (424,279,049) 67,077,234 (45,217,402) (18,087,662) (384,963,394) (805,470,273)
Net profit for the comparative
period1,072,988,751 (157,276,792) 106,021,784 42,410,358 902,431,288 1,966,575,389
At the end of comparative year
Assets and liabilities according to
geographical segments
(December 31, 2021)
Great Cairo Alex Delta Red Sea / Upper Egypt Head office Total
Assets of geographical segments 136,772,697,708 21,663,698,999 18,325,091,040 7,539,403,867 174,914,984,249 359,215,875,863
Unclassified assets - - - - - 352,792,030
Total assets 136,772,697,708 21,663,698,999 18,325,091,040 7,539,403,867 174,914,984,249 359,568,667,893
Liabilities of geographical segments 243,184,667,259 31,555,461,603 21,889,339,220 6,775,751,277 6,943,736,607 310,348,955,966
Unclassified liabilities - - - - - 2,844,270,440
Total liabilities 243,184,667,259 31,555,461,603 21,889,339,220 6,775,751,277 6,943,736,607 313,193,226,406
Geographical Segmental analysis is based on the locations of branches through which the bank provides its services.
- 46 -

QNB ALAHLI S.A.E
Notes to the Consolidated Financial Statements
For Three Months Period Ended 31 March 2022(All amounts are shown in Egyptian Pounds)
6- Net interest income March 31, 2022 March 31, 2021
Interest from loans and similar income:
Loans and credit facilities:
- Customers 4,455,057,902 4,072,572,870
Total 4,455,057,902 4,072,572,870
Treasury bills and bonds 4,314,909,488 3,133,701,482
Other debt instruments 9,639,011 10,742,143
Deposits and current accounts 462,074,742 123,845,310
Net interest differential on hedging instruments (IRS contracts) 10,331,104 18,335,961
Total 9,252,012,247 7,359,197,766
Cost of deposits and similar expense :
Deposits and current accounts:
- Banks (39,425,594) (41,493,577)
- Customers (4,926,584,534) (3,718,892,026)
Total (4,966,010,128) (3,760,385,603)
Repo arrangements (6,673,296) (9,371,785)
Other loans (17,350,768) (18,435,189)
Total (4,990,034,192) (3,788,192,577)
Net 4,261,978,055 3,571,005,189
7- Net fee and commission income: March 31, 2022 March 31, 2021
Fee and commission income :
Credit fees and commission 479,795,956 392,573,633
Custody fees 13,315,338 15,128,996
Investment commission 7,218,568 6,334,816
Other fees 326,338,280 284,097,102
Total 826,668,142 698,134,547
Fee and commission expense:
Brokerage fees (5,018,848) (5,601,471)
Other fees (256,204,104) (199,665,475)
Total (261,222,952) (205,266,946)
Net 565,445,190 492,867,601
8- Dividend income March 31, 2022 March 31, 2021
Equity instruments at fair value through other comprehensive income 11,325,209 21,405,674
Total 11,325,209 21,405,674
9- Net trading income: March 31, 2022 March 31, 2021
Forex operations:
Foreign exchange trading gains ( loss ) (92,003,894) 36,661,788
Investment funds held for trading 7,488,778 1,279,394
Changes in fair value of currency forward contracts 162,943,783 (12,768,351)
Changes in fair value of currency swap contracts (841,820) (1,873,343)
Changes in fair value IRS contracts 1,694,020 1,721,032
Total 79,280,867 25,020,520
10- Administrative expenses March 31, 2022 March 31, 2021
Staff cost:Salaries and wages 469,054,501 417,246,289Social insurance 30,690,316 25,608,067Pension cost:Defined contribution scheme 24,268,057 22,243,351Other retirement benefits (Defined benefit scheme ) 14,598,322 16,014,478
538,611,196 481,112,185Depreciation and amortization 110,227,481 92,947,012Other administrative expenses 487,691,845 370,401,048Total 1,136,530,522 944,460,245
- 47 -
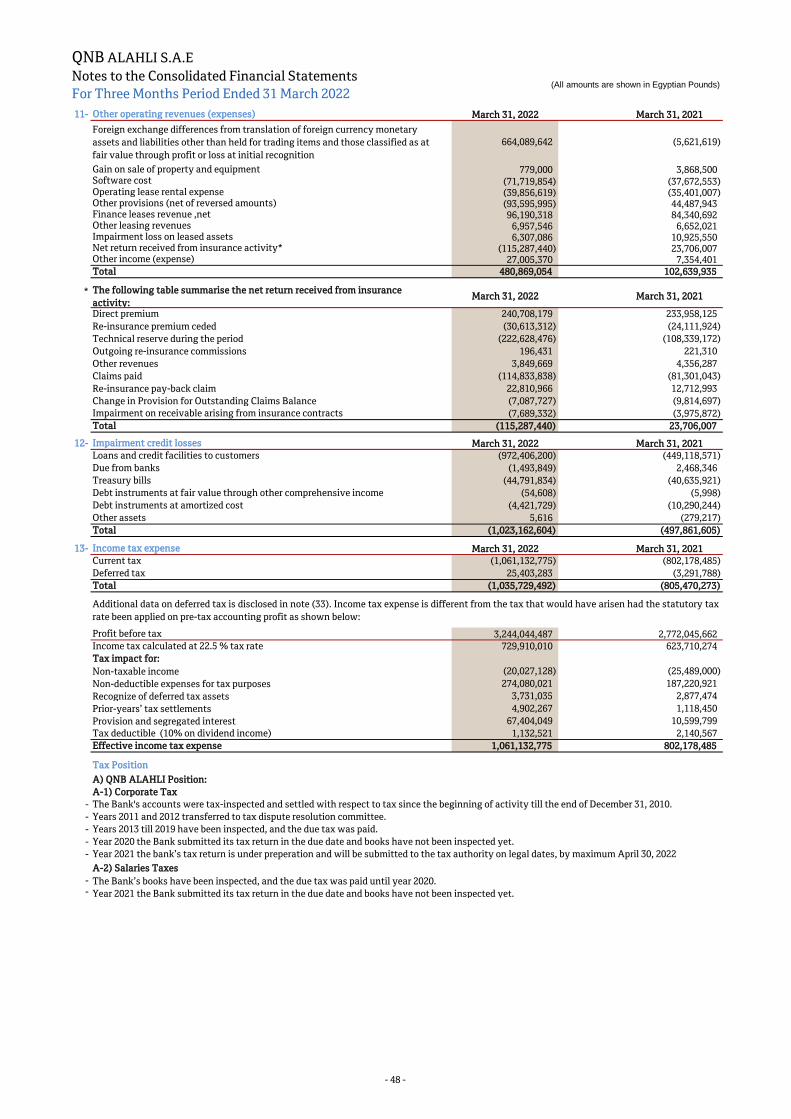
QNB ALAHLI S.A.E
Notes to the Consolidated Financial Statements
For Three Months Period Ended 31 March 2022(All amounts are shown in Egyptian Pounds)
11- Other operating revenues (expenses) March 31, 2022 March 31, 2021
Foreign exchange differences from translation of foreign currency monetary
assets and liabilities other than held for trading items and those classified as at
fair value through profit or loss at initial recognition
664,089,642 (5,621,619)
Gain on sale of property and equipment 779,000 3,868,500Software cost (71,719,854) (37,672,553)Operating lease rental expense (39,856,619) (35,401,007)Other provisions (net of reversed amounts) (93,595,995) 44,487,943Finance leases revenue ,net 96,190,318 84,340,692Other leasing revenues 6,957,546 6,652,021Impairment loss on leased assets 6,307,086 10,925,550Net return received from insurance activity* (115,287,440) 23,706,007Other income (expense) 27,005,370 7,354,401Total 480,869,054 102,639,935
* The following table summarise the net return received from insurance
activity:March 31, 2022 March 31, 2021
Direct premium 240,708,179 233,958,125
Re-insurance premium ceded (30,613,312) (24,111,924)
Technical reserve during the period (222,628,476) (108,339,172)
Outgoing re-insurance commissions 196,431 221,310
Other revenues 3,849,669 4,356,287
Claims paid (114,833,838) (81,301,043)
Re-insurance pay-back claim 22,810,966 12,712,993
Change in Provision for Outstanding Claims Balance (7,087,727) (9,814,697)
(7,689,332) (3,975,872)
Total (115,287,440) 23,706,007
12- Impairment credit losses March 31, 2022 March 31, 2021
Loans and credit facilities to customers (972,406,200) (449,118,571)
Due from banks (1,493,849) 2,468,346
Treasury bills (44,791,834) (40,635,921)
Debt instruments at fair value through other comprehensive income (54,608) (5,998)
Debt instruments at amortized cost (4,421,729) (10,290,244)
Other assets 5,616 (279,217)
Total (1,023,162,604) (497,861,605)
13- Income tax expense March 31, 2022 March 31, 2021
Current tax (1,061,132,775) (802,178,485)
Deferred tax 25,403,283 (3,291,788)
Total (1,035,729,492) (805,470,273)
Profit before tax 3,244,044,487 2,772,045,662
Income tax calculated at 22.5 % tax rate 729,910,010 623,710,274
Tax impact for:
Non-taxable income (20,027,128) (25,489,000)
Non-deductible expenses for tax purposes 274,080,021 187,220,921
Recognize of deferred tax assets 3,731,035 2,877,474
Prior-years’ tax settlements 4,902,267 1,118,450
Provision and segregated interest 67,404,049 10,599,799
Tax deductible (10% on dividend income) 1,132,521 2,140,567
Effective income tax expense 1,061,132,775 802,178,485
Tax Position
A) QNB ALAHLI Position:
A-1) Corporate Tax
-
-
-
-
-
A-2) Salaries Taxes
--
Additional data on deferred tax is disclosed in note (33). Income tax expense is different from the tax that would have arisen had the statutory tax
rate been applied on pre-tax accounting profit as shown below:
Years 2011 and 2012 transferred to tax dispute resolution committee.
Year 2020 the Bank submitted its tax return in the due date and books have not been inspected yet.
Year 2021 the bank’s tax return is under preperation and will be submitted to the tax authority on legal dates, by maximum April 30, 2022
Year 2021 the Bank submitted its tax return in the due date and books have not been inspected yet.
Impairment on receivable arising from insurance contracts
The Bank's accounts were tax-inspected and settled with respect to tax since the beginning of activity till the end of December 31, 2010.
The Bank’s books have been inspected, and the due tax was paid until year 2020.
Years 2013 till 2019 have been inspected, and the due tax was paid.
- 48 -
QNB ALAHLI S.A.E
Notes to the Consolidated Financial Statements
For Three Months Period Ended 31 March 2022(All amounts are shown in Egyptian Pounds)
A-3) Stamp duties
-
-
-
(B) EX-MIBank Position:
B-1) Corporate Tax
-
B-2) Salaries Taxes
-
B-3) Stamp duties
-
-
.(C) QNB ALAHLI Leasing Position (subsidiary company):
C-1) Corporate Tax
-
-
-
C-2) Salary tax
-
-
C-3) Stamp duties
-
-
(D) QNB ALAHLI Factoring Company Position (subsidiary company):
D-1) Corporate Tax
-
-
-
-
D-2) Salary tax
-
D-3) Stamp duties
-
D-4) Withholding tax
-
(E) QNB ALAHLI Life Insurance Company Position (subsidiary company):
E-1) Corporate Tax
-
-
-
-
-
The Company is not abided by deducting and delivering salary taxes, as the company's employees are seconded by QNB ALAHLI (Major
Shareholder),While the company with holds and transfers the tax for the employees appointed to the company .
The Company is committed to withholding tax and delivering it to tax authority on due dates.
Years from 1 July 2008 to 30 June 2012, the tax authority inspection and settlement took place and the final settlement have been made.
The Company has received deemed tax claim from inception till 30 June 2005. The company objected the deemed tax at the due date and
transferred to appeal committee.
Years from 1 July 2012 to 30 June 2016, Tax inspection had taken place and The company approve partially on inspection result and objections
point had been transferred to internal committee.
The Company is not subject to stamp duty tax law No. 111 of 1980 and amended by law 143 of period 2006 and the company have not been
inspected till now.
Period from August 01, 2006 till November 30, 2006 have been inspected, and the due tax was paid.
The Bank's accounts were tax- inspected, and settled since the beginning of activity till November 30, 2006.
The Bank’s books have been inspected, for all branches until July 31, 2006 and all tax was paid.
Period from August 01 ,2006 till December 31, 2019 have been inspected, and the due tax was paid.
Years from 1 July 2005 to 30 June 2008, the company submitted its tax return , no tax inspection has taken place.
Years from 1 July 2016 to 30 June 2021, the company submitted its tax return on the due dates.
Years from start of activity till 2016 ,the Company was tax inspected and the tax assessment was carried out and the payment thereof was made.
The Bank’s books have been inspected, and the due tax was paid till November 30, 2006.
The Bank’s books have been inspected for all branches until July 31, 2006 and all due tax was paid.
Years 2020 and 2021 the Bank submitted its tax return in the due date and books have not been inspected yet.
Years from 2018 to 2021 , no tax inspection has been carried out up till date.
The Company is subject to income tax law No. 91 of 2005 and its executive statute and law No. 44 of 2014.
Years from start of activity till 2017 ,the Company was tax inspected and the tax assessment was carried out and the payment thereof was made.
Year from 2012 till 2020 the company submitted its tax return on the due date.
Years from 2017 to 2020, the company submitted its tax return on the due date and the books are under inspection.
Years from 2017 to 2020,under inspection with the tax authority.
Year 2021 the Company tax return is under preperation and will be submitted to the tax authority on legal dates, by maximum April 30, 2022
Years from start of activity till 2016 ,the Company was tax inspected and the tax assessment was carried out and the payment thereof was made.
Year 2012 till 2016 under inspection with tax authority.
Year 2021, the company submitted its tax return on the due date and the books have not been inspected yet.
Year 2021 the Company tax return is under preperation and will be submitted to the tax authority on legal dates, by maximum April 30, 2022
- 49 -
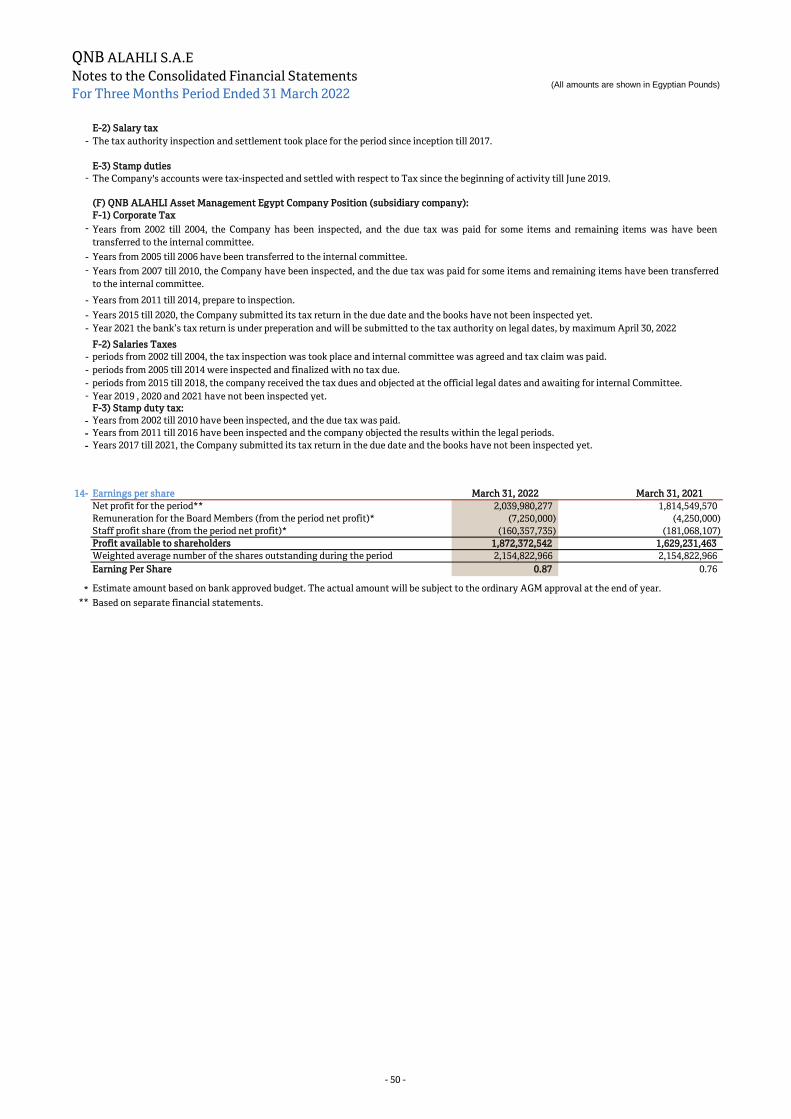
QNB ALAHLI S.A.E
Notes to the Consolidated Financial Statements
For Three Months Period Ended 31 March 2022(All amounts are shown in Egyptian Pounds)
E-2) Salary tax
-
-
(F) QNB ALAHLI Asset Management Egypt Company Position (subsidiary company):
F-1) Corporate Tax
-
-
-
-
-
-
F-2) Salaries Taxes
-
-
-
- Year 2019 , 2020 and 2021 have not been inspected yet.
F-3) Stamp duty tax:
-
-
-
14- Earnings per share March 31, 2022 March 31, 2021
Net profit for the period** 2,039,980,277 1,814,549,570
Remuneration for the Board Members (from the period net profit)* (7,250,000) (4,250,000)
Staff profit share (from the period net profit)* (160,357,735) (181,068,107)
Profit available to shareholders 1,872,372,542 1,629,231,463
Weighted average number of the shares outstanding during the period 2,154,822,966 2,154,822,966
Earning Per Share 0.87 0.76
*
** Based on separate financial statements.
Years from 2005 till 2006 have been transferred to the internal committee.
Years from 2007 till 2010, the Company have been inspected, and the due tax was paid for some items and remaining items have been transferred
to the internal committee.
Years from 2011 till 2014, prepare to inspection.
The tax authority inspection and settlement took place for the period since inception till 2017.
The Company's accounts were tax-inspected and settled with respect to Tax since the beginning of activity till June 2019.
Estimate amount based on bank approved budget. The actual amount will be subject to the ordinary AGM approval at the end of year.
E-3) Stamp duties
Years 2017 till 2021, the Company submitted its tax return in the due date and the books have not been inspected yet.
Years 2015 till 2020, the Company submitted its tax return in the due date and the books have not been inspected yet.
Years from 2002 till 2010 have been inspected, and the due tax was paid.
Years from 2011 till 2016 have been inspected and the company objected the results within the legal periods.
Years from 2002 till 2004, the Company has been inspected, and the due tax was paid for some items and remaining items was have been
transferred to the internal committee.
periods from 2005 till 2014 were inspected and finalized with no tax due.
periods from 2015 till 2018, the company received the tax dues and objected at the official legal dates and awaiting for internal Committee.
Year 2021 the bank’s tax return is under preperation and will be submitted to the tax authority on legal dates, by maximum April 30, 2022
periods from 2002 till 2004, the tax inspection was took place and internal committee was agreed and tax claim was paid.
- 50 -
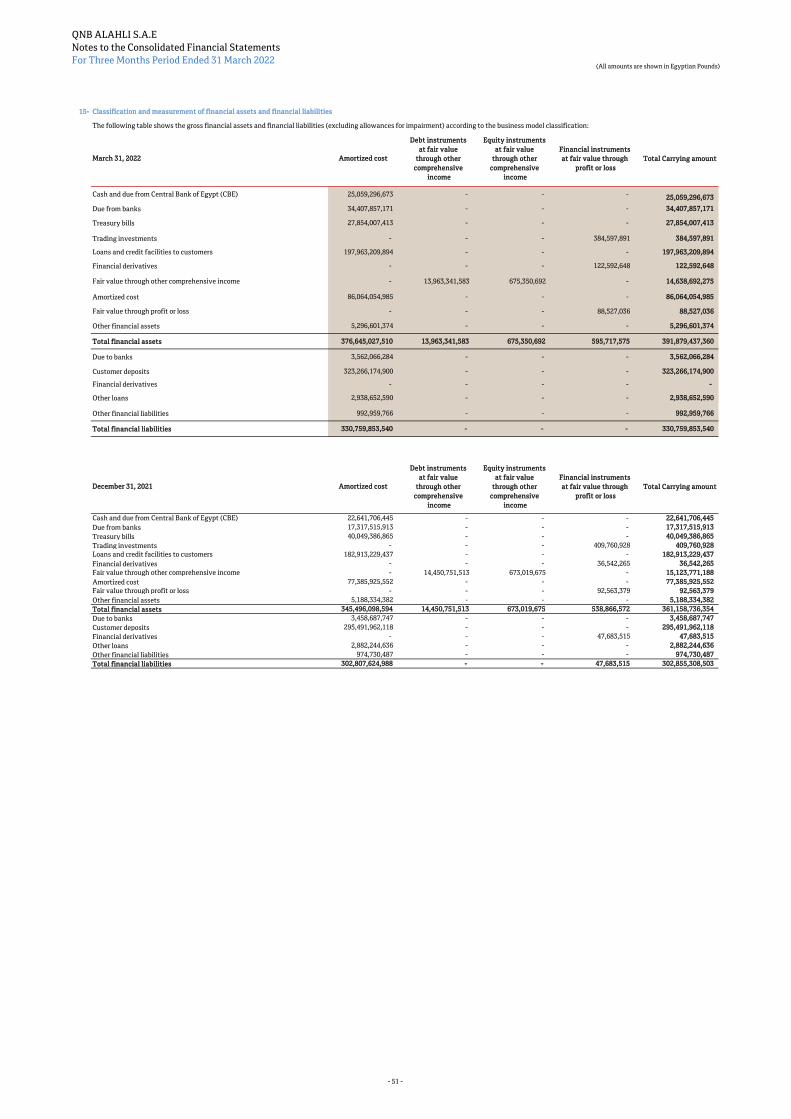
QNB ALAHLI S.A.E
Notes to the Consolidated Financial Statements
For Three Months Period Ended 31 March 2022(All amounts are shown in Egyptian Pounds)
15- Classification and measurement of financial assets and financial liabilities
The following table shows the gross financial assets and financial liabilities (excluding allowances for impairment) according to the business model classification:
March 31, 2022 Amortized cost
Debt instruments
at fair value
through other
comprehensive
income
Equity instruments
at fair value
through other
comprehensive
income
Financial instruments
at fair value through
profit or loss
Total Carrying amount
Cash and due from Central Bank of Egypt (CBE) 25,059,296,673 - - - 25,059,296,673
Due from banks 34,407,857,171 - - - 34,407,857,171
Treasury bills 27,854,007,413 - - - 27,854,007,413
Trading investments - - - 384,597,891 384,597,891
Loans and credit facilities to customers 197,963,209,894 - - - 197,963,209,894
Financial derivatives - - - 122,592,648 122,592,648
Fair value through other comprehensive income - 13,963,341,583 675,350,692 - 14,638,692,275
Amortized cost 86,064,054,985 - - - 86,064,054,985
Fair value through profit or loss - - - 88,527,036 88,527,036
Other financial assets 5,296,601,374 - - - 5,296,601,374
Total financial assets 376,645,027,510 13,963,341,583 675,350,692 595,717,575 391,879,437,360
Due to banks 3,562,066,284 - - - 3,562,066,284
Customer deposits 323,266,174,900 - - - 323,266,174,900
Financial derivatives - - - - -
Other loans 2,938,652,590 - - - 2,938,652,590
Other financial liabilities 992,959,766 - - - 992,959,766
Total financial liabilities 330,759,853,540 - - - 330,759,853,540
December 31, 2021 Amortized cost
Debt instruments
at fair value
through other
comprehensive
income
Equity instruments
at fair value
through other
comprehensive
income
Financial instruments
at fair value through
profit or loss
Total Carrying amount
Cash and due from Central Bank of Egypt (CBE) 22,641,706,445 - - - 22,641,706,445
Due from banks 17,317,515,913 - - - 17,317,515,913
Treasury bills 40,049,386,865 - - - 40,049,386,865
Trading investments - - - 409,760,928 409,760,928
Loans and credit facilities to customers 182,913,229,437 - - - 182,913,229,437
Financial derivatives - - - 36,542,265 36,542,265
Fair value through other comprehensive income - 14,450,751,513 673,019,675 - 15,123,771,188
Amortized cost 77,385,925,552 - - - 77,385,925,552
Fair value through profit or loss - - - 92,563,379 92,563,379
Other financial assets 5,188,334,382 - - - 5,188,334,382
Total financial assets 345,496,098,594 14,450,751,513 673,019,675 538,866,572 361,158,736,354
Due to banks 3,458,687,747 - - - 3,458,687,747
Customer deposits 295,491,962,118 - - - 295,491,962,118
Financial derivatives - - - 47,683,515 47,683,515
Other loans 2,882,244,636 - - - 2,882,244,636
Other financial liabilities 974,730,487 - - - 974,730,487
Total financial liabilities 302,807,624,988 - - 47,683,515 302,855,308,503
- 51 -
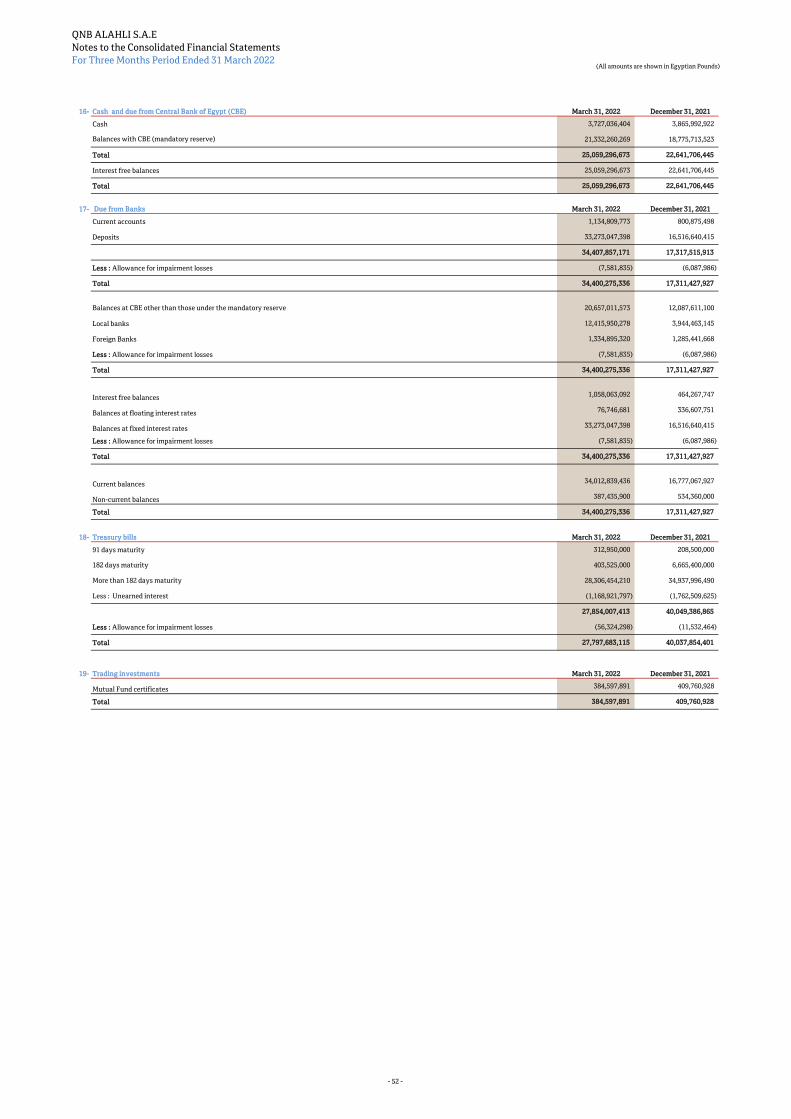
QNB ALAHLI S.A.E
Notes to the Consolidated Financial Statements
For Three Months Period Ended 31 March 2022(All amounts are shown in Egyptian Pounds)
16- Cash and due from Central Bank of Egypt (CBE) March 31, 2022 December 31, 2021
Cash 3,727,036,404 3,865,992,922
21,332,260,269 18,775,713,523
Total 25,059,296,673 22,641,706,445
Interest free balances 25,059,296,673 22,641,706,445
Total 25,059,296,673 22,641,706,445
17- Due from Banks March 31, 2022 December 31, 2021
Current accounts 1,134,809,773 800,875,498
Deposits 33,273,047,398 16,516,640,415
34,407,857,171 17,317,515,913
Less : Allowance for impairment losses (7,581,835) (6,087,986)
Total 34,400,275,336 17,311,427,927
Balances at CBE other than those under the mandatory reserve 20,657,011,573 12,087,611,100
Local banks 12,415,950,278 3,944,463,145
Foreign Banks 1,334,895,320 1,285,441,668
Less : Allowance for impairment losses (7,581,835) (6,087,986)
Total 34,400,275,336 17,311,427,927
Interest free balances 1,058,063,092 464,267,747
Balances at floating interest rates 76,746,681 336,607,751
Balances at fixed interest rates 33,273,047,398 16,516,640,415
Less : Allowance for impairment losses (7,581,835) (6,087,986)
Total 34,400,275,336 17,311,427,927
Current balances 34,012,839,436 16,777,067,927
Non-current balances 387,435,900 534,360,000
Total 34,400,275,336 17,311,427,927
18- Treasury bills March 31, 2022 December 31, 2021
91 days maturity 312,950,000 208,500,000
182 days maturity 403,525,000 6,665,400,000
More than 182 days maturity 28,306,454,210 34,937,996,490
Less : Unearned interest (1,168,921,797) (1,762,509,625)
27,854,007,413 40,049,386,865
Less : Allowance for impairment losses (56,324,298) (11,532,464)
Total 27,797,683,115 40,037,854,401
19- Trading investments March 31, 2022 December 31, 2021
Mutual Fund certificates 384,597,891 409,760,928
Total 384,597,891 409,760,928
Balances with CBE (mandatory reserve)
- 52 -
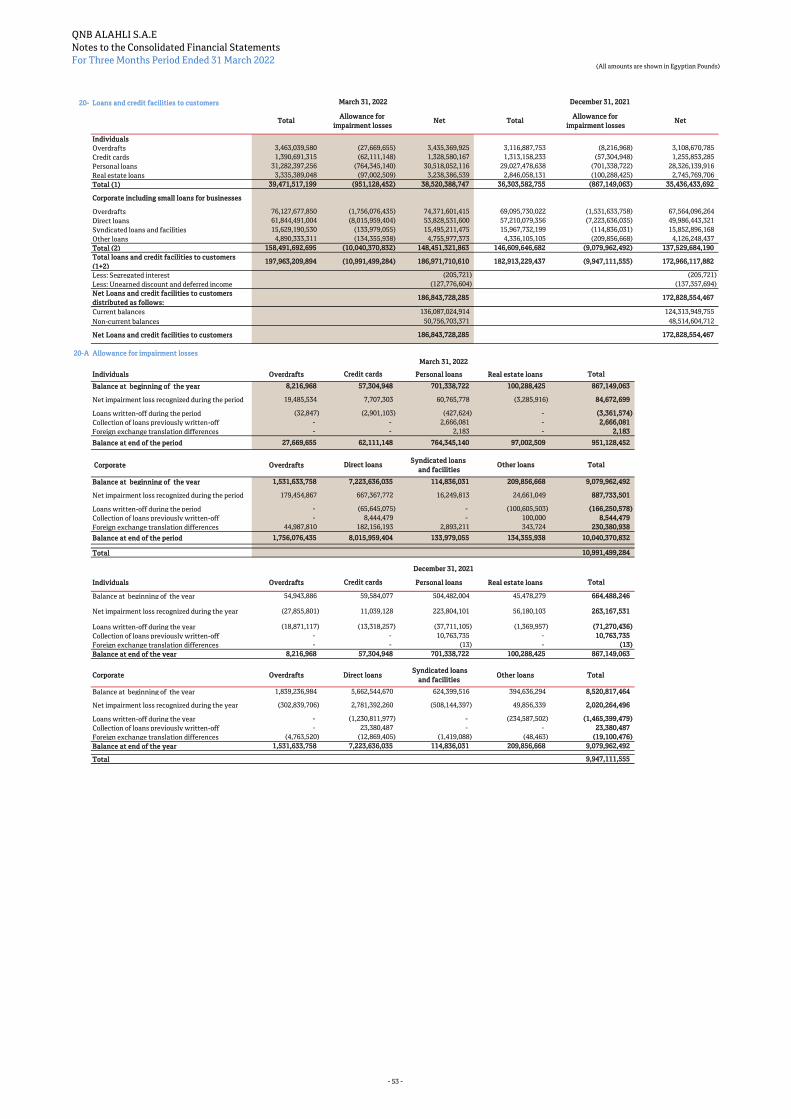
QNB ALAHLI S.A.E
Notes to the Consolidated Financial Statements
For Three Months Period Ended 31 March 2022(All amounts are shown in Egyptian Pounds)
Loans and credit facilities to customers
Total Allowance for
impairment lossesNet Total
Allowance for
impairment lossesNet
Individuals
Overdrafts 3,463,039,580 (27,669,655) 3,435,369,925 3,116,887,753 (8,216,968) 3,108,670,785
Credit cards 1,390,691,315 (62,111,148) 1,328,580,167 1,313,158,233 (57,304,948) 1,255,853,285
Personal loans 31,282,397,256 (764,345,140) 30,518,052,116 29,027,478,638 (701,338,722) 28,326,139,916
Real estate loans 3,335,389,048 (97,002,509) 3,238,386,539 2,846,058,131 (100,288,425) 2,745,769,706
Total (1) 39,471,517,199 (951,128,452) 38,520,388,747 36,303,582,755 (867,149,063) 35,436,433,692
Corporate including small loans for businesses
Overdrafts 76,127,677,850 (1,756,076,435) 74,371,601,415 69,095,730,022 (1,531,633,758) 67,564,096,264
Direct loans 61,844,491,004 (8,015,959,404) 53,828,531,600 57,210,079,356 (7,223,636,035) 49,986,443,321
Syndicated loans and facilities 15,629,190,530 (133,979,055) 15,495,211,475 15,967,732,199 (114,836,031) 15,852,896,168
Other loans 4,890,333,311 (134,355,938) 4,755,977,373 4,336,105,105 (209,856,668) 4,126,248,437
Total (2) 158,491,692,695 (10,040,370,832) 148,451,321,863 146,609,646,682 (9,079,962,492) 137,529,684,190
Total loans and credit facilities to customers
(1+2)197,963,209,894 (10,991,499,284) 186,971,710,610 182,913,229,437 (9,947,111,555) 172,966,117,882
Less: Segregated interest (205,721) (205,721)
Less: Unearned discount and deferred income (127,776,604) (137,357,694)
Net Loans and credit facilities to customers
distributed as follows:186,843,728,285 172,828,554,467
Current balances 136,087,024,914 124,313,949,755
Non-current balances 50,756,703,371 48,514,604,712
Net Loans and credit facilities to customers 186,843,728,285 172,828,554,467
20-A Allowance for impairment losses
Individuals Overdrafts Credit cards Personal loans Real estate loans Total
Balance at beginning of the year 8,216,968 57,304,948 701,338,722 100,288,425 867,149,063
Net impairment loss recognized during the period 19,485,534 7,707,303 60,765,778 (3,285,916) 84,672,699
Loans written-off during the period (32,847) (2,901,103) (427,624) - (3,361,574)
Collection of loans previously written-off - - 2,666,081 - 2,666,081
Foreign exchange translation differences - - 2,183 - 2,183
Balance at end of the period 27,669,655 62,111,148 764,345,140 97,002,509 951,128,452
Corporate Overdrafts Direct loansSyndicated loans
and facilitiesOther loans Total
Balance at beginning of the year 1,531,633,758 7,223,636,035 114,836,031 209,856,668 9,079,962,492
Net impairment loss recognized during the period 179,454,867 667,367,772 16,249,813 24,661,049 887,733,501
Loans written-off during the period - (65,645,075) - (100,605,503) (166,250,578)
Collection of loans previously written-off - 8,444,479 - 100,000 8,544,479
Foreign exchange translation differences 44,987,810 182,156,193 2,893,211 343,724 230,380,938
Balance at end of the period 1,756,076,435 8,015,959,404 133,979,055 134,355,938 10,040,370,832
Total 10,991,499,284
Individuals Overdrafts Credit cards Personal loans Real estate loans Total
Balance at beginning of the year 54,943,886 59,584,077 504,482,004 45,478,279 664,488,246
Net impairment loss recognized during the year (27,855,801) 11,039,128 223,804,101 56,180,103 263,167,531
Loans written-off during the year (18,871,117) (13,318,257) (37,711,105) (1,369,957) (71,270,436)
Collection of loans previously written-off - - 10,763,735 - 10,763,735
Foreign exchange translation differences - - (13) - (13)
Balance at end of the year 8,216,968 57,304,948 701,338,722 100,288,425 867,149,063
Corporate Overdrafts Direct loansSyndicated loans
and facilitiesOther loans Total
Balance at beginning of the year 1,839,236,984 5,662,544,670 624,399,516 394,636,294 8,520,817,464
Net impairment loss recognized during the year (302,839,706) 2,781,392,260 (508,144,397) 49,856,339 2,020,264,496
Loans written-off during the year - (1,230,811,977) - (234,587,502) (1,465,399,479)
Collection of loans previously written-off - 23,380,487 - - 23,380,487
Foreign exchange translation differences (4,763,520) (12,869,405) (1,419,088) (48,463) (19,100,476)
Balance at end of the year 1,531,633,758 7,223,636,035 114,836,031 209,856,668 9,079,962,492
Total 9,947,111,555
20-
March 31, 2022
December 31, 2021
March 31, 2022 December 31, 2021
- 53 -
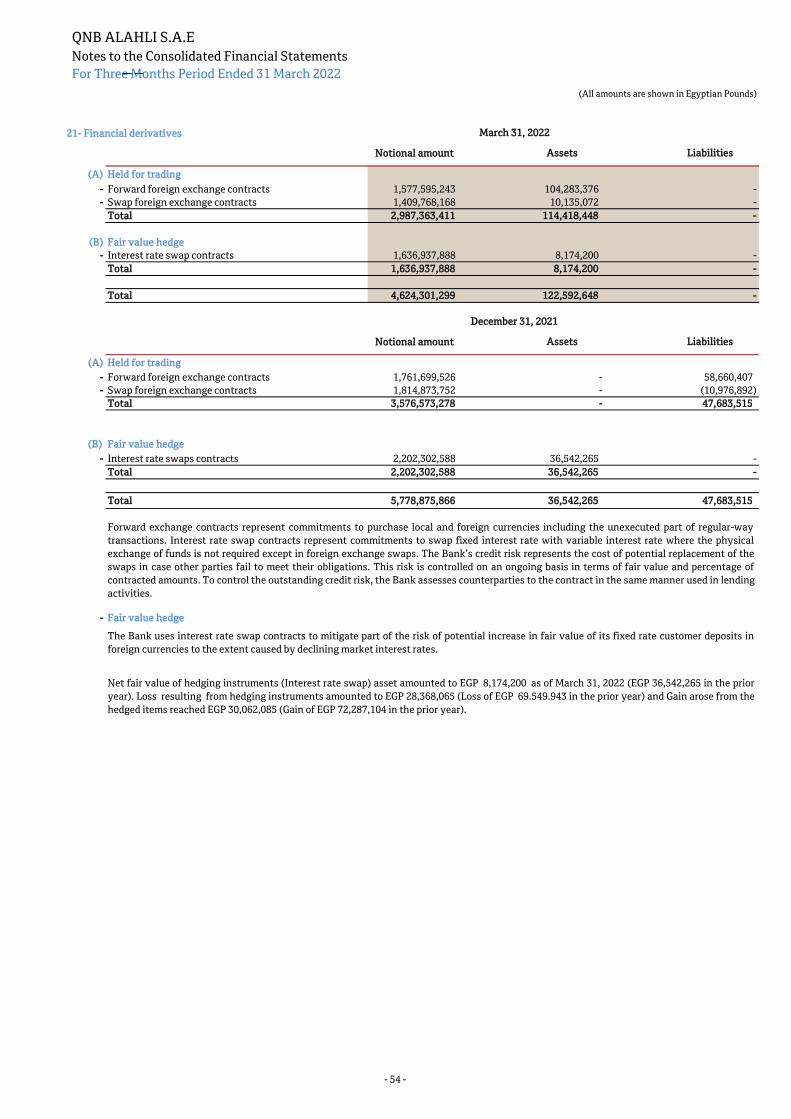
QNB ALAHLI S.A.E
Notes to the Consolidated Financial Statements
For Three Months Period Ended 31 March 2022
21- Financial derivatives
Notional amount Assets Liabilities
(A) Held for trading
- Forward foreign exchange contracts 1,577,595,243 104,283,376 -
- Swap foreign exchange contracts 1,409,768,168 10,135,072 -
Total 2,987,363,411 114,418,448 -
(B) Fair value hedge
- Interest rate swap contracts 1,636,937,888 8,174,200 -
Total 1,636,937,888 8,174,200 -
Total 4,624,301,299 122,592,648 -
Notional amount Assets Liabilities
(A) Held for trading
- Forward foreign exchange contracts 1,761,699,526 - 58,660,407
- Swap foreign exchange contracts 1,814,873,752 - (10,976,892)
Total 3,576,573,278 - 47,683,515
(B) Fair value hedge
- Interest rate swaps contracts 2,202,302,588 36,542,265 -
Total 2,202,302,588 36,542,265 -
Total 5,778,875,866 36,542,265 47,683,515
- Fair value hedge
Net fair value of hedging instruments (Interest rate swap) asset amounted to EGP 8,174,200 as of March 31, 2022 (EGP 36,542,265 in the prior
year). Loss resulting from hedging instruments amounted to EGP 28,368,065 (Loss of EGP 69.549.943 in the prior year) and Gain arose from the
hedged items reached EGP 30,062,085 (Gain of EGP 72,287,104 in the prior year).
(All amounts are shown in Egyptian Pounds)
March 31, 2022
Forward exchange contracts represent commitments to purchase local and foreign currencies including the unexecuted part of regular-way
transactions. Interest rate swap contracts represent commitments to swap fixed interest rate with variable interest rate where the physical
exchange of funds is not required except in foreign exchange swaps. The Bank’s credit risk represents the cost of potential replacement of the
swaps in case other parties fail to meet their obligations. This risk is controlled on an ongoing basis in terms of fair value and percentage of
contracted amounts. To control the outstanding credit risk, the Bank assesses counterparties to the contract in the same manner used in lending
activities.
The Bank uses interest rate swap contracts to mitigate part of the risk of potential increase in fair value of its fixed rate customer deposits in
foreign currencies to the extent caused by declining market interest rates.
December 31, 2021
- 54 -

QNB ALAHLI S.A.E
Notes to the Consolidated Financial Statements
For Three Months Period Ended 31 March 2022(All amounts are shown in Egyptian Pounds)
22- Financial investments
Fair value through other comprehensive income (FVTOCI) March 31, 2022 December 31, 2021
(A) Debt instruments at fair value:
Listed Instruments in Egyptian Stock Exchange Market 12,515,958,020 13,038,337,361
Listed instruments in foreign stock exchange market 1,447,383,563 1,412,414,152
Total debt instruments measured at fair value through
other comprehensive income13,963,341,583 14,450,751,513
(B) Equity instruments at fair value:
Listed instruments in Egyptian stock exchange market 124,095,030 151,884,836
Unlisted instruments in stock exchange market 504,285,212 473,971,589
Total equity instruments measured at fair value through
other comprehensive income628,380,242 625,856,425
(C) Money market funds and balanced funds:
*Unlisted instruments in stock exchange market 46,970,450 47,163,250
Total financial investments measured at fair value through
other comprehensive income (1)14,638,692,275 15,123,771,188
Amortized cost
(A) Debt instruments:
Listed instruments in stock exchange market 85,203,128,326 76,650,980,810
Unlisted instruments in stock exchange market 860,926,659 734,944,742
Less : Allowance for impairment losses (9,879,168) (5,457,439)
Total Debt instruments measured at amortized cost (2) 86,054,175,817 77,380,468,113
Fair value through profit or loss (FVTPL)
(A) Mutual funds:
Unlisted instruments in stock exchange market 88,527,036 92,563,379
Total equity instruments measured at fair value through
profit or loss (3)88,527,036 92,563,379
(Total Financial investments (1+2+3 100,781,395,128 92,596,802,680
Current balances 19,687,517,745 8,149,961,162
Non-current balances 81,093,877,383 84,446,841,518
Total financial investment 100,781,395,128 92,596,802,680
Fixed interest debt instruments 99,649,938,148 91,447,777,020
Variable interest debt instruments 367,579,252 383,442,606
Total debt instruments 100,017,517,400 91,831,219,626
Balance at the beginning of the current year 15,123,771,188 77,380,468,113
Additions 3,675,462,368 8,746,912,821
Amortization of premium / discount (19,752,846) 236,670,457
Disposals (sale/redemption) (4,191,372,602) (425,212,000)
Translation differences resulting from monetary foreign currency denominated assets 208,328,391 119,758,155
Changes in fair value reserve (157,744,224) -
Change in Allowance for impairment during the period - (4,421,729)
Balance at the end of the current period 14,638,692,275 86,054,175,817
:The following table analyzes the movements on financial investments during the comparative year
Fair value through
other comprehensive
income
Amortized cost
Balance at the beginning of the comparative year 2,474,382,352 47,609,791,535
Additions 13,569,506,433 37,063,342,500
Amortization of premium / discount (42,275,391) 223,021,100
Disposals (sale/redemption) (833,106,833) (7,512,183,799)
Translation differences resulting from monetary foreign currency denominated assets (3,395,343) (833,744)
Changes in fair value reserve (40,928,207) -
Re-classification financial investements (411,823) -
Change in Allowance for impairment during the year - (2,669,479)
Balance at the end of the comparative year 15,123,771,188 77,380,468,113
Gain on financial investments March 31, 2022 March 31, 2021
Gain on financial investments at fair value through profit or loss 2,117,263 1,625,581
Gain on Selling Financial Investments at fair value through other comprehensive income 2,721,975 -
Total 4,839,238 1,625,581
*
The following table analyzes the movements on financial investments during the period:
Fair value through
other comprehensive
income
Amortized cost
The Bank’s equity instruments classified in the fair value through other comprehensive income category represent Bank subscribed stake at 5% from the total certificates’ number of
its QNB ALAHLI First Fund with cumulative daily return (THEMAR Money Market Fund) upon its initial offering, in addition to the Bank subscribed stake at 20% from the total
certificates’ number of its QNB ALAHLI Second Fund with yearly / cumulative return (Tawazon Balanced Fund), in addition to the 20% from the total certificates’ number of its QNB
ALAHLI Third Fund with yearly / cumulative return (Tadawol Equity Fund) upon its initial offering. All stakes required to be retained by the Bank until maturity of the funds in
accordance with the provisions of the law, had a nominal value of EGP 5 million each.
- 55 -
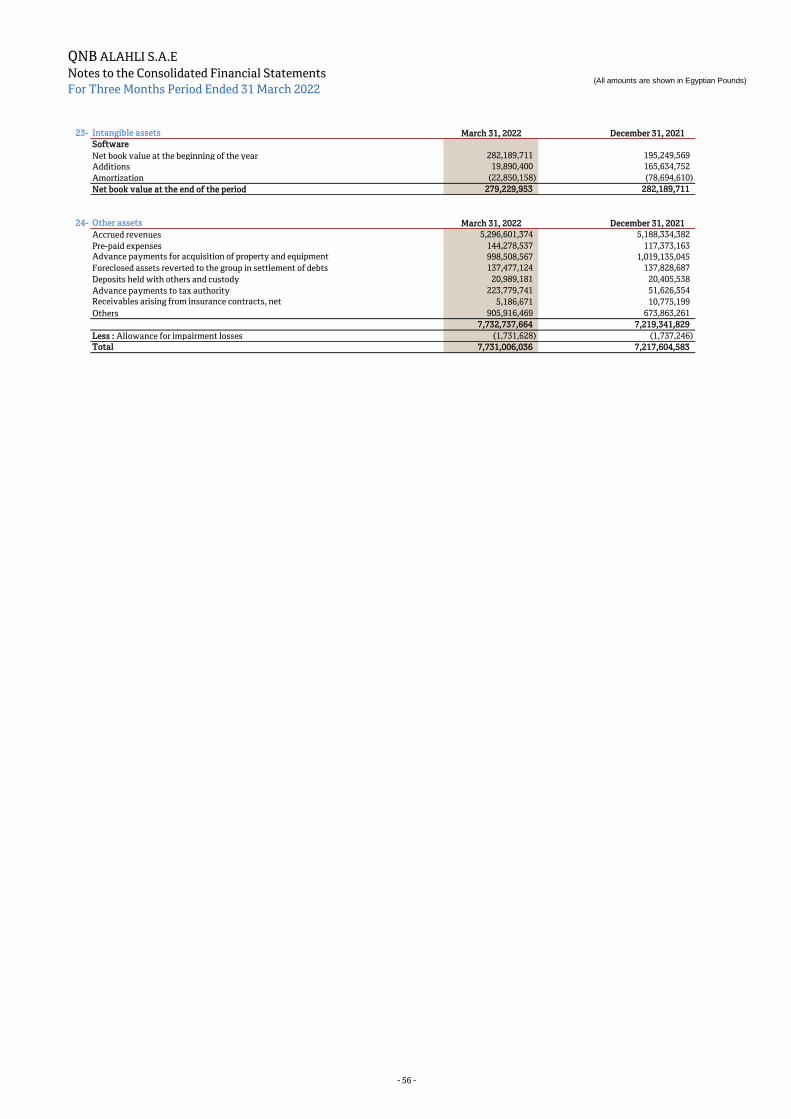
QNB ALAHLI S.A.E
Notes to the Consolidated Financial Statements
For Three Months Period Ended 31 March 2022(All amounts are shown in Egyptian Pounds)
23- Intangible assets March 31, 2022 December 31, 2021
Software
282,189,711 195,249,569
19,890,400 165,634,752
(22,850,158) (78,694,610)
279,229,953 282,189,711
24- Other assets March 31, 2022 December 31, 2021
5,296,601,374 5,188,334,382
144,278,537 117,373,163
998,508,567 1,019,135,045
137,477,124 137,828,687
20,989,181 20,405,538
223,779,741 51,626,554
5,186,671 10,775,199
905,916,469 673,863,261
7,732,737,664 7,219,341,829
Less : Allowance for impairment losses (1,731,628) (1,737,246)
Total 7,731,006,036 7,217,604,583
Net book value at the end of the period
Accrued revenues
Pre-paid expenses
Foreclosed assets reverted to the group in settlement of debts
Receivables arising from insurance contracts, net
Others
Deposits held with others and custody
Advance payments for acquisition of property and equipment
Advance payments to tax authority
Net book value at the beginning of the year
Additions
Amortization
- 56 -
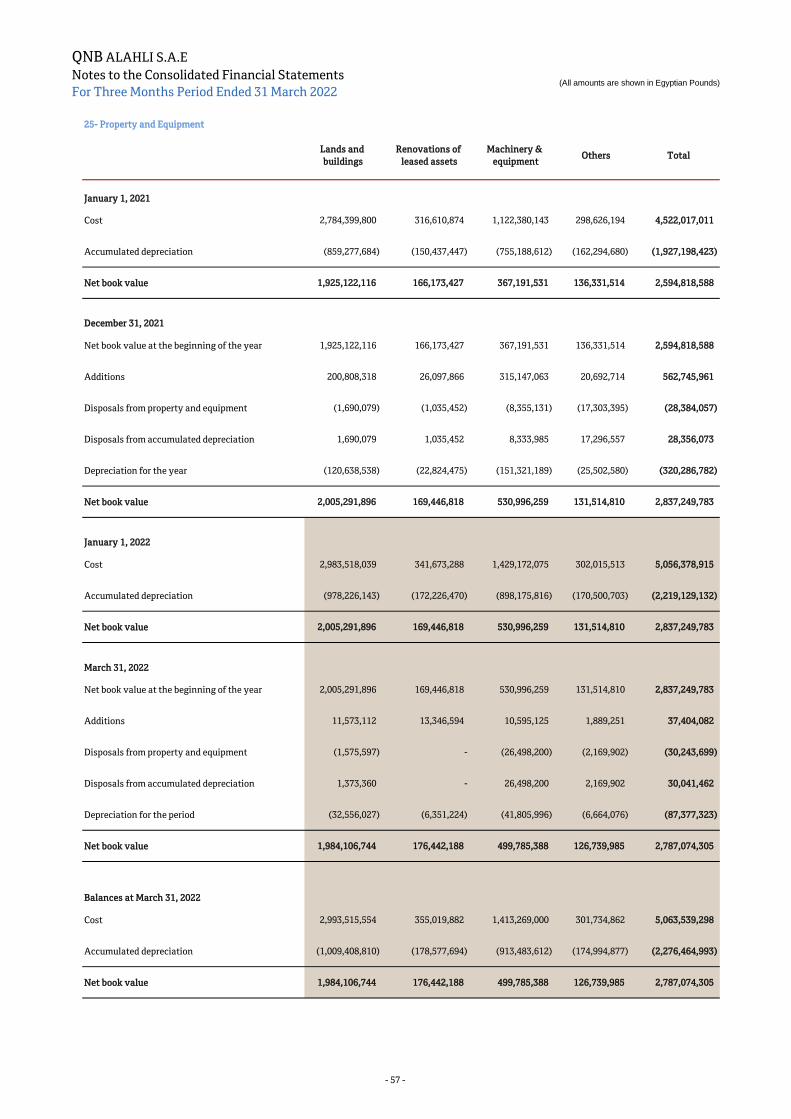
QNB ALAHLI S.A.E
Notes to the Consolidated Financial Statements
For Three Months Period Ended 31 March 2022(All amounts are shown in Egyptian Pounds)
25- Property and Equipment
Lands and
buildings
Renovations of
leased assets
Machinery &
equipmentOthers Total
January 1, 2021
Cost 2,784,399,800 316,610,874 1,122,380,143 298,626,194 4,522,017,011
Accumulated depreciation (859,277,684) (150,437,447) (755,188,612) (162,294,680) (1,927,198,423)
Net book value 1,925,122,116 166,173,427 367,191,531 136,331,514 2,594,818,588
December 31, 2021
Net book value at the beginning of the year 1,925,122,116 166,173,427 367,191,531 136,331,514 2,594,818,588
Additions 200,808,318 26,097,866 315,147,063 20,692,714 562,745,961
Disposals from property and equipment (1,690,079) (1,035,452) (8,355,131) (17,303,395) (28,384,057)
Disposals from accumulated depreciation 1,690,079 1,035,452 8,333,985 17,296,557 28,356,073
Depreciation for the year (120,638,538) (22,824,475) (151,321,189) (25,502,580) (320,286,782)
Net book value 2,005,291,896 169,446,818 530,996,259 131,514,810 2,837,249,783
January 1, 2022
Cost 2,983,518,039 341,673,288 1,429,172,075 302,015,513 5,056,378,915
Accumulated depreciation (978,226,143) (172,226,470) (898,175,816) (170,500,703) (2,219,129,132)
Net book value 2,005,291,896 169,446,818 530,996,259 131,514,810 2,837,249,783
March 31, 2022
Net book value at the beginning of the year 2,005,291,896 169,446,818 530,996,259 131,514,810 2,837,249,783
Additions 11,573,112 13,346,594 10,595,125 1,889,251 37,404,082
Disposals from property and equipment (1,575,597) - (26,498,200) (2,169,902) (30,243,699)
Disposals from accumulated depreciation 1,373,360 - 26,498,200 2,169,902 30,041,462
Depreciation for the period (32,556,027) (6,351,224) (41,805,996) (6,664,076) (87,377,323)
Net book value 1,984,106,744 176,442,188 499,785,388 126,739,985 2,787,074,305
Balances at March 31, 2022
Cost 2,993,515,554 355,019,882 1,413,269,000 301,734,862 5,063,539,298
Accumulated depreciation (1,009,408,810) (178,577,694) (913,483,612) (174,994,877) (2,276,464,993)
Net book value 1,984,106,744 176,442,188 499,785,388 126,739,985 2,787,074,305
- 57 -

QNB ALAHLI S.A.E
Notes to the Consolidated Financial Statements
For Three Months Period Ended 31 March 2022(All amounts are shown in Egyptian Pounds)
26- Due to banks March 31, 2022 December 31, 2021
Current accounts 537,807,825 340,454,143
Deposits 1,944,051,013 1,944,051,013
Repos transactions 1,080,207,446 1,174,182,591
Total 3,562,066,284 3,458,687,747
Central banks 1,080,207,446 1,174,182,591
Local banks 16,117 14,803
Foreign banks 2,481,842,721 2,284,490,353
Total 3,562,066,284 3,458,687,747
Non-interest bearing balances 489,721,699 301,658,920
Variable interest rate balances 48,086,126 38,795,223
Fixed interest rate balances 3,024,258,459 3,118,233,604
Total 3,562,066,284 3,458,687,747
Current balances 3,562,066,284 3,458,687,747
Total 3,562,066,284 3,458,687,747
27- Customer deposits March 31, 2022 December 31, 2021
Demand deposits 108,399,323,291 94,636,481,090
Time deposits and call accounts 103,115,277,520 94,887,104,765
Term saving certificates 73,335,254,193 69,958,154,396
Saving deposits 29,875,638,470 29,555,115,455
Other deposits* 8,540,681,426 6,455,106,412
Total 323,266,174,900 295,491,962,118
Corporate deposits 193,554,148,598 170,365,767,010
Retail deposits 129,712,026,302 125,126,195,108
Total 323,266,174,900 295,491,962,118
Non-interest bearing balances 43,291,243,255 37,198,205,750
Variable interest rate balances 107,322,925,599 98,036,200,965
Fixed interest rate balances 172,652,006,046 160,257,555,403
Total 323,266,174,900 295,491,962,118
Current balances 252,460,083,365 214,767,761,594
Non-current balances 70,806,091,535 80,724,200,524
Total 323,266,174,900 295,491,962,118
*
28- Other loans March 31, 2022 December 31, 2021
National Bank of Egypt 3,136,594 2,440,983
Commercial International Bank 7,505,556 8,394,444
Qatar National Bank 144,287,970 187,028,730
European Bank for Reconstruction and Development 2,458,962,735 2,337,596,368
Banque Misr - 1,680
National Bank of Kuwait 121,407,210 190,797,514
The Micro, Small and Medium Enterprises Development Agency 88,199,067 88,314,067
Société Arabe Internationale de Banque (SAIB) 115,153,458 67,670,850
Total 2,938,652,590 2,882,244,636
Current balances 1,448,419,329 1,381,584,310
Non-current balances 1,490,233,261 1,500,660,326
Total 2,938,652,590 2,882,244,636
29- Other liabilities March 31, 2022 December 31, 2021
Accrued interest 992,959,766 974,730,487
Unearned revenues 127,335,957 114,013,312
Accrued expenses 1,143,683,120 995,801,771
Due to insurance and re-insurance companies 98,350,134 94,190,007
Distirbution creditors (Shareholders) 1,616,117,225 -
Sundry credit balances 2,774,496,947 2,255,435,241
Total 6,752,943,149 4,434,170,818
Other deposits include deposits covering irrevocable letters of credit in the total of EGP 1,305,728,615 as of March 31, 2022 (December 31, 2021
EGP 435,355,323). The fair value of these deposits approximates its carrying amount.
- 58 -
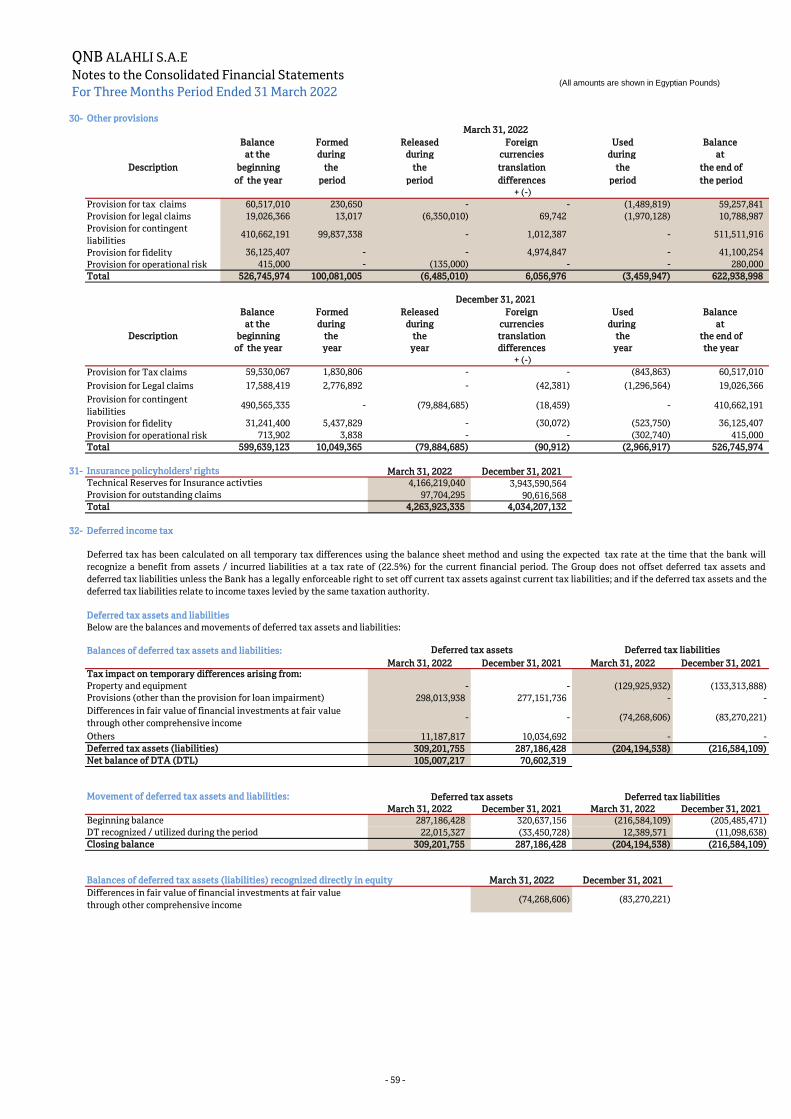
QNB ALAHLI S.A.E
Notes to the Consolidated Financial Statements
For Three Months Period Ended 31 March 2022(All amounts are shown in Egyptian Pounds)
30- Other provisions
Balance Formed Released Foreign Used Balance
at the during during currencies during at
Description beginning the the translation the the end of
of the year period period differences period the period
+ (-)
Provision for tax claims 60,517,010 230,650 - - (1,489,819) 59,257,841
Provision for legal claims 19,026,366 13,017 (6,350,010) 69,742 (1,970,128) 10,788,987
Provision for contingent
liabilities 410,662,191 99,837,338 - 1,012,387 - 511,511,916
Provision for fidelity 36,125,407 - - 4,974,847 - 41,100,254
Provision for operational risk 415,000 - (135,000) - - 280,000
Total 526,745,974 100,081,005 (6,485,010) 6,056,976 (3,459,947) 622,938,998
Balance Formed Released Foreign Used Balance
at the during during currencies during at
Description beginning the the translation the the end of
of the year year year differences year the year
+ (-)
Provision for Tax claims 59,530,067 1,830,806 - - (843,863) 60,517,010
Provision for Legal claims 17,588,419 2,776,892 - (42,381) (1,296,564) 19,026,366
Provision for contingent
liabilities 490,565,335 - (79,884,685) (18,459) - 410,662,191
Provision for fidelity 31,241,400 5,437,829 - (30,072) (523,750) 36,125,407
Provision for operational risk 713,902 3,838 - - (302,740) 415,000
Total 599,639,123 10,049,365 (79,884,685) (90,912) (2,966,917) 526,745,974
31- Insurance policyholders' rights March 31, 2022 December 31, 2021
Technical Reserves for Insurance activties 4,166,219,040 3,943,590,564
Provision for outstanding claims 97,704,295 90,616,568
Total 4,263,923,335 4,034,207,132
32- Deferred income tax
Deferred tax assets and liabilities
Below are the balances and movements of deferred tax assets and liabilities:
March 31, 2022 December 31, 2021 March 31, 2022 December 31, 2021
Property and equipment - - (129,925,932) (133,313,888)
298,013,938 277,151,736 - -
- - (74,268,606) (83,270,221)
11,187,817 10,034,692 - -
Deferred tax assets (liabilities) 309,201,755 287,186,428 (204,194,538) (216,584,109)
Net balance of DTA (DTL) 105,007,217 70,602,319
Movement of deferred tax assets and liabilities:
March 31, 2022 December 31, 2021 March 31, 2022 December 31, 2021
Beginning balance 287,186,428 320,637,156 (216,584,109) (205,485,471)
DT recognized / utilized during the period 22,015,327 (33,450,728) 12,389,571 (11,098,638)
Closing balance 309,201,755 287,186,428 (204,194,538) (216,584,109)
March 31, 2022 December 31, 2021
(74,268,606) (83,270,221)
March 31, 2022
December 31, 2021
Differences in fair value of financial investments at fair value
through other comprehensive income
Tax impact on temporary differences arising from:
Deferred tax liabilities
Deferred tax has been calculated on all temporary tax differences using the balance sheet method and using the expected tax rate at the time that the bank will
recognize a benefit from assets / incurred liabilities at a tax rate of (22.5%) for the current financial period. The Group does not offset deferred tax assets and
deferred tax liabilities unless the Bank has a legally enforceable right to set off current tax assets against current tax liabilities; and if the deferred tax assets and the
deferred tax liabilities relate to income taxes levied by the same taxation authority.
Deferred tax assets Deferred tax liabilities Balances of deferred tax assets and liabilities:
Others
Provisions (other than the provision for loan impairment)
Differences in fair value of financial investments at fair value
through other comprehensive income
Deferred tax assets
Balances of deferred tax assets (liabilities) recognized directly in equity
- 59 -
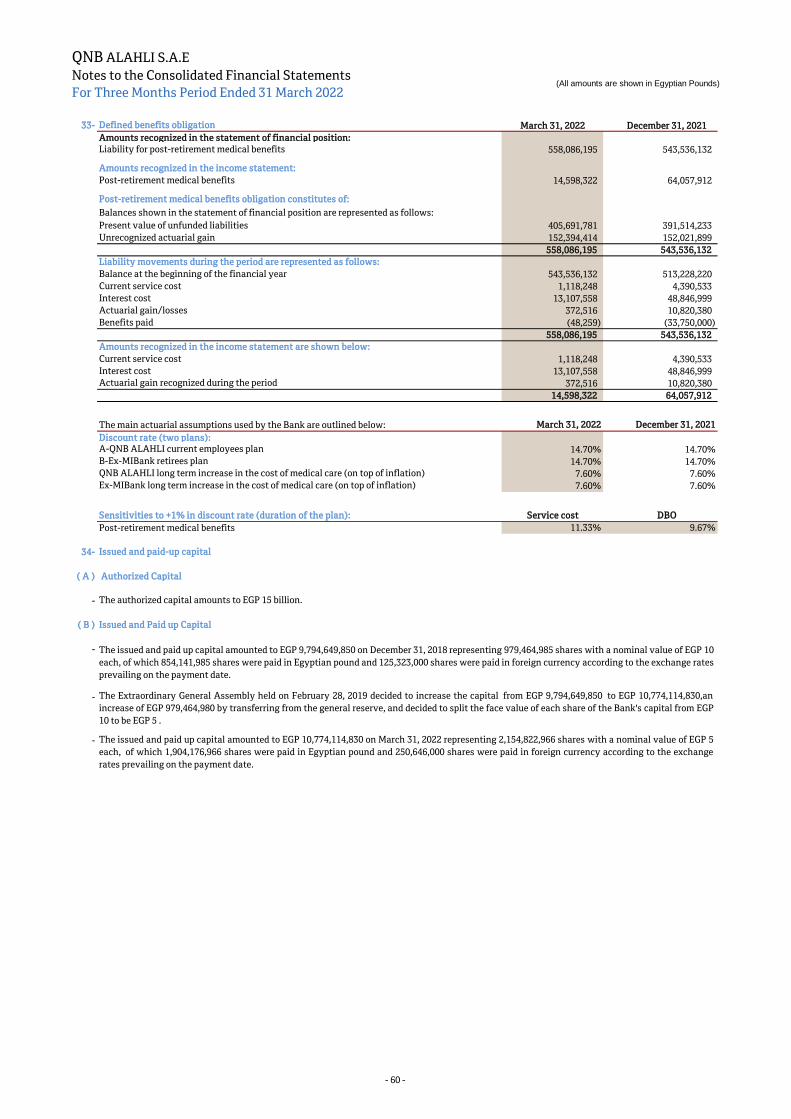
QNB ALAHLI S.A.E
Notes to the Consolidated Financial Statements
For Three Months Period Ended 31 March 2022(All amounts are shown in Egyptian Pounds)
33- Defined benefits obligation March 31, 2022 December 31, 2021
Amounts recognized in the statement of financial position:
Liability for post-retirement medical benefits 558,086,195 543,536,132
Amounts recognized in the income statement:
Post-retirement medical benefits 14,598,322 64,057,912
Post-retirement medical benefits obligation constitutes of:
Balances shown in the statement of financial position are represented as follows:
Present value of unfunded liabilities 405,691,781 391,514,233
Unrecognized actuarial gain 152,394,414 152,021,899
558,086,195 543,536,132
Liability movements during the period are represented as follows:
Balance at the beginning of the financial year 543,536,132 513,228,220
Current service cost 1,118,248 4,390,533
Interest cost 13,107,558 48,846,999
Actuarial gain/losses 372,516 10,820,380
Benefits paid (48,259) (33,750,000)
558,086,195 543,536,132
Amounts recognized in the income statement are shown below:
Current service cost 1,118,248 4,390,533
Interest cost 13,107,558 48,846,999
Actuarial gain recognized during the period 372,516 10,820,380
14,598,322 64,057,912
The main actuarial assumptions used by the Bank are outlined below: March 31, 2022 December 31, 2021
Discount rate (two plans):A-QNB ALAHLI current employees plan 14.70% 14.70%
B-Ex-MIBank retirees plan 14.70% 14.70%
QNB ALAHLI long term increase in the cost of medical care (on top of inflation) 7.60% 7.60%
Ex-MIBank long term increase in the cost of medical care (on top of inflation) 7.60% 7.60%
Sensitivities to +1% in discount rate (duration of the plan): Service cost DBO
Post-retirement medical benefits 11.33% 9.67%
34- Issued and paid-up capital
( A ) Authorized Capital
-
( B ) Issued and Paid up Capital
-
-
-
The authorized capital amounts to EGP 15 billion.
The issued and paid up capital amounted to EGP 9,794,649,850 on December 31, 2018 representing 979,464,985 shares with a nominal value of EGP 10
each, of which 854,141,985 shares were paid in Egyptian pound and 125,323,000 shares were paid in foreign currency according to the exchange rates
prevailing on the payment date.
The Extraordinary General Assembly held on February 28, 2019 decided to increase the capital from EGP 9,794,649,850 to EGP 10,774,114,830,an
increase of EGP 979,464,980 by transferring from the general reserve, and decided to split the face value of each share of the Bank's capital from EGP
10 to be EGP 5 .
The issued and paid up capital amounted to EGP 10,774,114,830 on March 31, 2022 representing 2,154,822,966 shares with a nominal value of EGP 5
each, of which 1,904,176,966 shares were paid in Egyptian pound and 250,646,000 shares were paid in foreign currency according to the exchange
rates prevailing on the payment date.
- 60 -
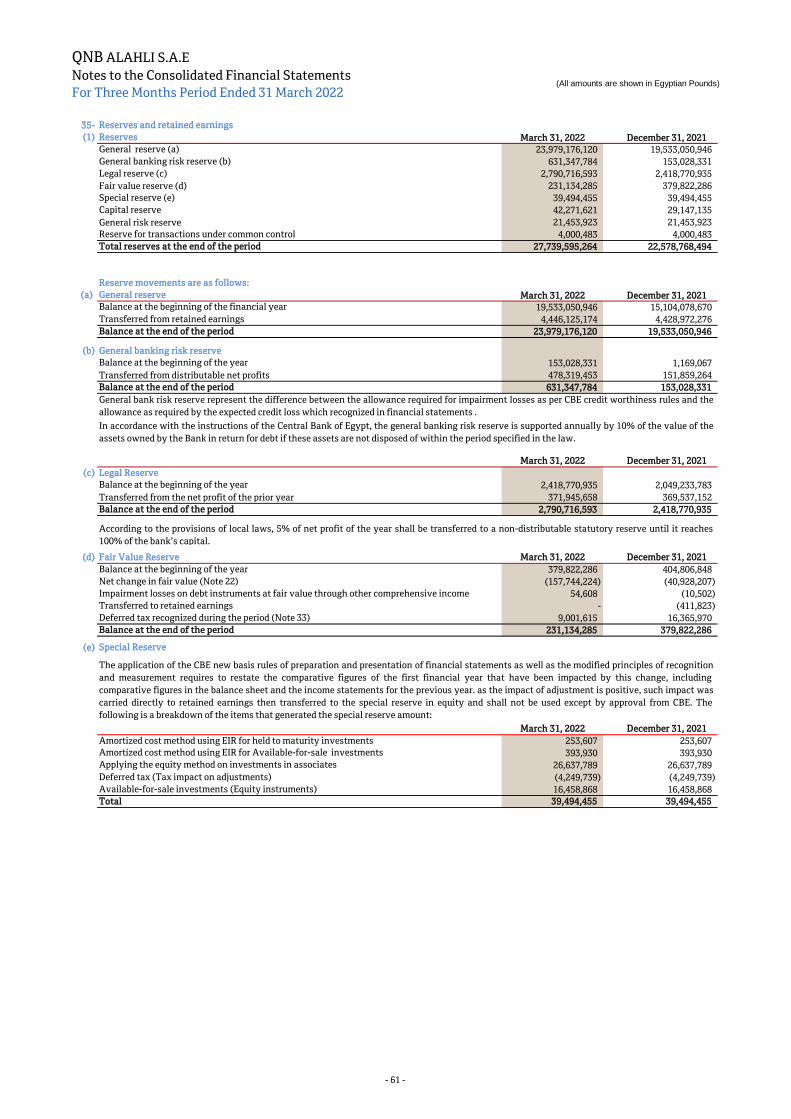
QNB ALAHLI S.A.E
Notes to the Consolidated Financial Statements
For Three Months Period Ended 31 March 2022(All amounts are shown in Egyptian Pounds)
35- Reserves and retained earnings
(1) Reserves March 31, 2022 December 31, 2021
General reserve (a) 23,979,176,120 19,533,050,946
General banking risk reserve (b) 631,347,784 153,028,331
Legal reserve (c) 2,790,716,593 2,418,770,935
Fair value reserve (d) 231,134,285 379,822,286
Special reserve (e) 39,494,455 39,494,455
Capital reserve 42,271,621 29,147,135
General risk reserve 21,453,923 21,453,923
Reserve for transactions under common control 4,000,483 4,000,483
Total reserves at the end of the period 27,739,595,264 22,578,768,494
Reserve movements are as follows:
(a) General reserve March 31, 2022 December 31, 2021Balance at the beginning of the financial year 19,533,050,946 15,104,078,670
Transferred from retained earnings 4,446,125,174 4,428,972,276
Balance at the end of the period 23,979,176,120 19,533,050,946
(b) General banking risk reserve
Balance at the beginning of the year 153,028,331 1,169,067
Transferred from distributable net profits 478,319,453 151,859,264
Balance at the end of the period 631,347,784 153,028,331
March 31, 2022 December 31, 2021
(c) Legal Reserve
Balance at the beginning of the year 2,418,770,935 2,049,233,783
Transferred from the net profit of the prior year 371,945,658 369,537,152
Balance at the end of the period 2,790,716,593 2,418,770,935
(d) Fair Value Reserve March 31, 2022 December 31, 2021
Balance at the beginning of the year 379,822,286 404,806,848
Net change in fair value (Note 22) (157,744,224) (40,928,207)
Impairment losses on debt instruments at fair value through other comprehensive income 54,608 (10,502)
Transferred to retained earnings - (411,823)
Deferred tax recognized during the period (Note 33) 9,001,615 16,365,970
Balance at the end of the period 231,134,285 379,822,286
(e) Special Reserve
March 31, 2022 December 31, 2021
Amortized cost method using EIR for held to maturity investments 253,607 253,607
Amortized cost method using EIR for Available-for-sale investments 393,930 393,930
Applying the equity method on investments in associates 26,637,789 26,637,789
Deferred tax (Tax impact on adjustments) (4,249,739) (4,249,739)
Available-for-sale investments (Equity instruments) 16,458,868 16,458,868
Total 39,494,455 39,494,455
In accordance with the instructions of the Central Bank of Egypt, the general banking risk reserve is supported annually by 10% of the value of the
assets owned by the Bank in return for debt if these assets are not disposed of within the period specified in the law.
According to the provisions of local laws, 5% of net profit of the year shall be transferred to a non-distributable statutory reserve until it reaches
100% of the bank’s capital.
The application of the CBE new basis rules of preparation and presentation of financial statements as well as the modified principles of recognition
and measurement requires to restate the comparative figures of the first financial year that have been impacted by this change, including
comparative figures in the balance sheet and the income statements for the previous year. as the impact of adjustment is positive, such impact was
carried directly to retained earnings then transferred to the special reserve in equity and shall not be used except by approval from CBE. The
following is a breakdown of the items that generated the special reserve amount:
General bank risk reserve represent the difference between the allowance required for impairment losses as per CBE credit worthiness rules and the
allowance as required by the expected credit loss which recognized in financial statements .
- 61 -
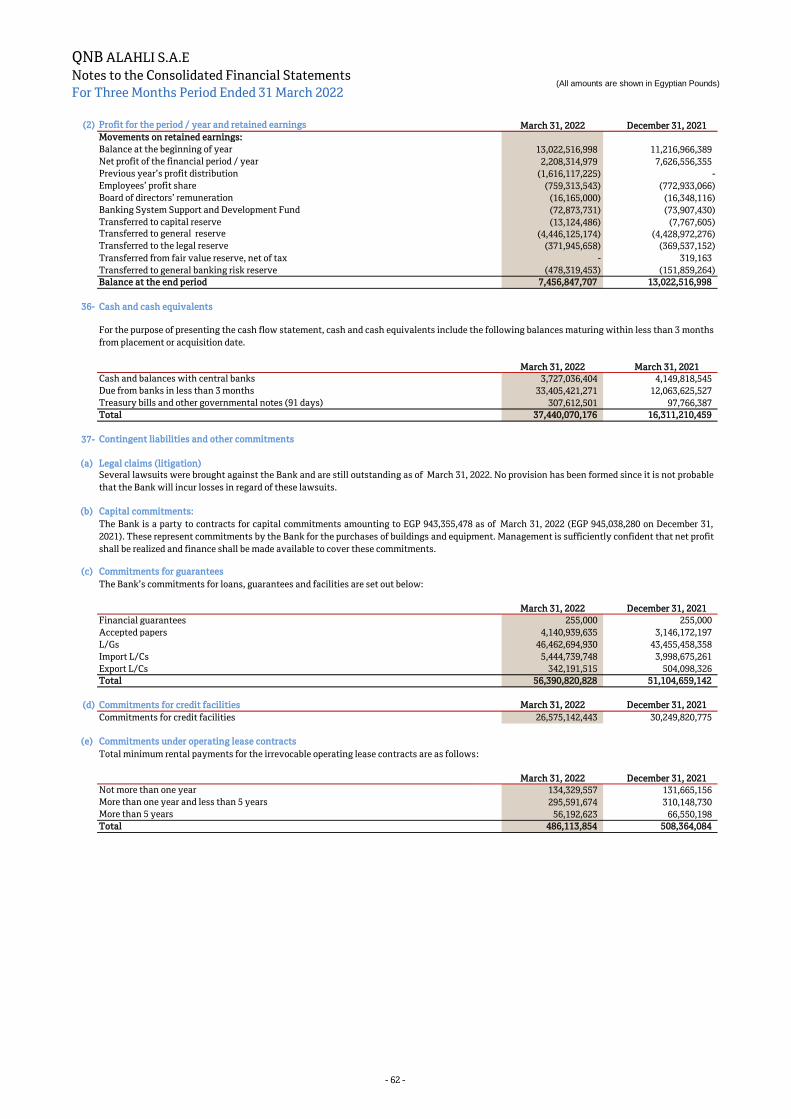
QNB ALAHLI S.A.E
Notes to the Consolidated Financial Statements
For Three Months Period Ended 31 March 2022(All amounts are shown in Egyptian Pounds)
(2) Profit for the period / year and retained earnings March 31, 2022 December 31, 2021
Movements on retained earnings:
Balance at the beginning of year 13,022,516,998 11,216,966,389
Net profit of the financial period / year 2,208,314,979 7,626,556,355
Previous year’s profit distribution (1,616,117,225) -
Employees’ profit share (759,313,543) (772,933,066)
Board of directors’ remuneration (16,165,000) (16,348,116)
Banking System Support and Development Fund (72,873,731) (73,907,430)
Transferred to capital reserve (13,124,486) (7,767,605)Transferred to general reserve (4,446,125,174) (4,428,972,276)
Transferred to the legal reserve (371,945,658) (369,537,152)
Transferred from fair value reserve, net of tax - 319,163
Transferred to general banking risk reserve (478,319,453) (151,859,264)
Balance at the end period 7,456,847,707 13,022,516,998
36- Cash and cash equivalents
March 31, 2022 March 31, 2021
Cash and balances with central banks 3,727,036,404 4,149,818,545
Due from banks in less than 3 months 33,405,421,271 12,063,625,527
307,612,501 97,766,387
Total 37,440,070,176 16,311,210,459
37- Contingent liabilities and other commitments
(a) Legal claims (litigation)
(b) Capital commitments:
(c) Commitments for guarantees
March 31, 2022 December 31, 2021
Financial guarantees 255,000 255,000
Accepted papers 4,140,939,635 3,146,172,197
L/Gs 46,462,694,930 43,455,458,358
Import L/Cs 5,444,739,748 3,998,675,261
Export L/Cs 342,191,515 504,098,326
Total 56,390,820,828 51,104,659,142
(d) Commitments for credit facilities March 31, 2022 December 31, 2021
Commitments for credit facilities 26,575,142,443 30,249,820,775
(e) Commitments under operating lease contracts
March 31, 2022 December 31, 2021
Not more than one year 134,329,557 131,665,156
More than one year and less than 5 years 295,591,674 310,148,730
More than 5 years 56,192,623 66,550,198
Total 486,113,854 508,364,084
:Total minimum rental payments for the irrevocable operating lease contracts are as follows
The Bank’s commitments for loans, guarantees and facilities are set out below:
The Bank is a party to contracts for capital commitments amounting to EGP 943,355,478 as of March 31, 2022 (EGP 945,038,280 on December 31,
2021). These represent commitments by the Bank for the purchases of buildings and equipment. Management is sufficiently confident that net profit
shall be realized and finance shall be made available to cover these commitments.
For the purpose of presenting the cash flow statement, cash and cash equivalents include the following balances maturing within less than 3 months
from placement or acquisition date.
Treasury bills and other governmental notes (91 days)
Several lawsuits were brought against the Bank and are still outstanding as of March 31, 2022. No provision has been formed since it is not probable
that the Bank will incur losses in regard of these lawsuits.
- 62 -
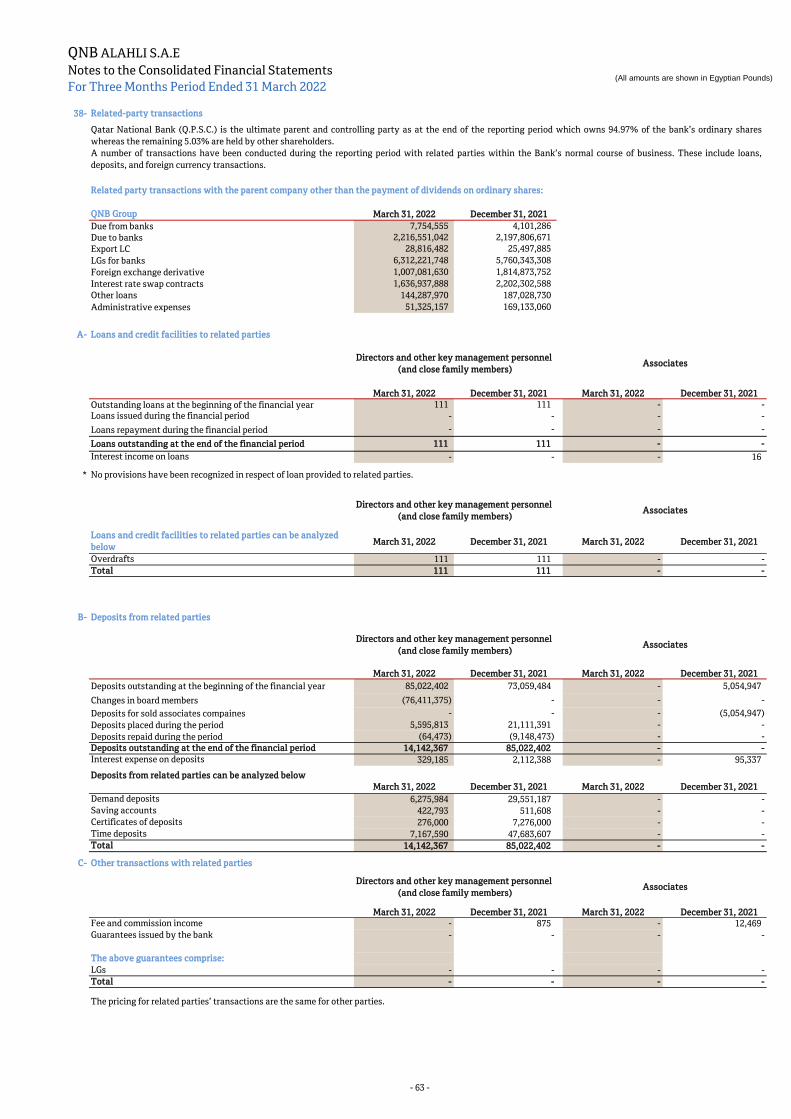
QNB ALAHLI S.A.E
Notes to the Consolidated Financial Statements
For Three Months Period Ended 31 March 2022(All amounts are shown in Egyptian Pounds)
38- Related-party transactions
QNB Group March 31, 2022 December 31, 2021
Due from banks 7,754,555 4,101,286
Due to banks 2,216,551,042 2,197,806,671
Export LC 28,816,482 25,497,885
LGs for banks 6,312,221,748 5,760,343,308
Foreign exchange derivative 1,007,081,630 1,814,873,752
Interest rate swap contracts 1,636,937,888 2,202,302,588
Other loans 144,287,970 187,028,730
Administrative expenses 51,325,157 169,133,060
A- Loans and credit facilities to related parties
March 31, 2022 December 31, 2021 March 31, 2022 December 31, 2021
Outstanding loans at the beginning of the financial year 111 111 - -
Loans issued during the financial period - - - -
Loans repayment during the financial period - - - -
Loans outstanding at the end of the financial period 111 111 - -
Interest income on loans - - - 16
*
Loans and credit facilities to related parties can be analyzed
belowMarch 31, 2022 December 31, 2021 March 31, 2022 December 31, 2021
Overdrafts 111 111 - -
Total 111 111 - -
B- Deposits from related parties
March 31, 2022 December 31, 2021 March 31, 2022 December 31, 2021
Deposits outstanding at the beginning of the financial year 85,022,402 73,059,484 - 5,054,947
Changes in board members (76,411,375) - - -
Deposits for sold associates compaines - - - (5,054,947)
Deposits placed during the period 5,595,813 21,111,391 - -
Deposits repaid during the period (64,473) (9,148,473) - -
Deposits outstanding at the end of the financial period 14,142,367 85,022,402 - -
Interest expense on deposits 329,185 2,112,388 - 95,337
March 31, 2022 December 31, 2021 March 31, 2022 December 31, 2021
Demand deposits 6,275,984 29,551,187 - -
Saving accounts 422,793 511,608 - -
Certificates of deposits 276,000 7,276,000 - -
Time deposits 7,167,590 47,683,607 - -
Total 14,142,367 85,022,402 - -
C- Other transactions with related parties
March 31, 2022 December 31, 2021 March 31, 2022 December 31, 2021
Fee and commission income - 875 - 12,469
Guarantees issued by the bank - - - -
The above guarantees comprise:
LGs - - - -
Total - - - -
Directors and other key management personnel
(and close family members)Associates
Qatar National Bank (Q.P.S.C.) is the ultimate parent and controlling party as at the end of the reporting period which owns 94.97% of the bank’s ordinary shares
whereas the remaining 5.03% are held by other shareholders.
A number of transactions have been conducted during the reporting period with related parties within the Bank’s normal course of business. These include loans,
deposits, and foreign currency transactions.
Related party transactions with the parent company other than the payment of dividends on ordinary shares:
Directors and other key management personnel
(and close family members)Associates
No provisions have been recognized in respect of loan provided to related parties.
The pricing for related parties’ transactions are the same for other parties.
Directors and other key management personnel
(and close family members)Associates
Directors and other key management personnel
(and close family members)Associates
Deposits from related parties can be analyzed below
- 63 -

QNB ALAHLI S.A.E
Notes to the Consolidated Financial Statements
For Three Months Period Ended 31 March 2022(All amounts are shown in Egyptian Pounds)
39- Money Market and balanced Funds
A- QNB ALAHLI First Fund with cumulative daily return (THEMAR Money Market Fund)
B- QNB ALAHLI Second Fund with periodly / cumulative return (Tawazon Balanced Fund)
C- QNB ALAHLI Third Fund with periodly / cumulative return (Tadawol Equity Fund)
40- Important Events
According to the management agreement and the fund’s prospectus, the Bank shall receive fees and commissions for supervising the fund and other
administrative services. Total commissions for the current period amounting to EGP 107,328 have been reported in the “fees and commission
income” line item in the income statement.
Tadawol certificates were offered in a public offering amounting to EGP 25 million distributed over two hundred and fifty thousand certificates with
a nominal value of EGP 100 each, subscriptions have only covered a number of one hundred and twenty five thousand certificates amounting to EGP
12.5 million, of which 50,000 certificates worth of EGP 5 million were subscribed at by the bank at that time. HC Fund Manager Asset Management is
managing this fund.
The Bank has set up an investment fund under the name of Tawazon Fund with periodic income as one of the banking activities authorized in
accordance with the provisions of the Capital Market Law 95 of 1992.
The Bank has set up an investment fund under the name of Tadawol Fund with periodic accumulated income as one of the banking activities
authorized in accordance with the provisions of the Capital Market Law 95 of 1992.
Tawazon initial offering was for two hundred and fifty thousand certificates amounting to EGP 25 million, of which 50,000 certificates worth of EGP
5 million were subscribed by the bank at that time. Beltone Asset Management is managing this fund.
Total number of the outstanding certificates at March 31, 2022 reached 63,778 at a total value of EGP 15,105,768 The Bank currently holds 50,000
certificates worth of EGP 11,842,460 that are classified as fair value through other comprehensve income and represent 20% of the total number of
certificates that were initially issued.
According to the management agreement and the fund’s prospectus, the Bank shall receive fees and commissions for supervising the fund and other
administrative services. Total commissions for the current period amounting to EGP 44,259 have been reported in the “fees and commission income”
line item in the consolidated income statement.
Total number of the outstanding certificates at March 31, 2022 reached 81,322 at a total value of EGP 20,238,834 . The Bank currently holds 50,000
certificates worth of EGP 12,443,640 that are classified as fair value through other comprehensve income and represent 40% from the total number of
certificates that were initially issued.
The Bank has set up an investment fund under the name of "THEMAR" with daily accumulated interest as one of the banking activities authorized in
accordance with the provisions of the Capital Market Law 95 of 1992.
Total number of the outstanding certificates at March 31, 2022 reached 11,245,905 at a total value of EGP 5,102,120,902 The Group currently holds
694,589 certificates worth of EGP 315,126,000 of which EGP 22,684,350 are classified as fair value through other comprehensve income and
represent 5% from the total number of certificates that were initially issued, whereas the remaining value of EGP 88,527,036 are classified as fair
value through profit or loss and EGP 203,914,614 are classified as trading investments.
According to the management agreement and the fund’s prospectus, the Bank shall receive fees and commissions for supervising the fund and other
administrative services. Total commissions for the current period amounting to EGP 7,066,980 have been reported in the “fees and commission
income” line item in the consolidated income statement.
THEMAR initial offering was for one million certificates at nominal value of EGP 100 million, of which 50,000 certificates worth of EGP 5 million were
subscribed by the bank at that time. EFG HERMES is managing this fund.
The coronavirus )“COVID-19”( pandemic is continuing across the various geographies globally, causing disruption to business and economic
activities. Albeit to a lesser degree, by strengthening vaccinations and succeeding to vaccinate citizens in many countries, including Egypt. However,
the continued spread of the Corona virus COVID-19 and the emergence of mutated strains, led to the continuing uncertainty in the global economic
environment . QNBAA is closely monitoring the situation through the business continuity planning and other risk management practices to manage
the business disruption caused by COVID-19 outbreak on its operations and financial performance.
Based on the uncertainties caused by COVID-19 and following the actions taken by the state regarding the co-existence procedures, QNBAA is
closely following up the loan portfolio considering the relevant impact of COVID-19 on the qualitative and quantitative factors where determining
the significant increase in Credit Risk is specifically done for the whole portfolio with its different economic sectors.
The bank is also following up the developments of Russia and Ukraine crisis and the extent of its impact on the Egyptian economy and the
subsequent repercussions on our clients. Accordingly, QNBAA is constantly following and applying its internal protective actions by monitoring and
reviewing the level of provisions as well as the portfolio coverage ratio as a mitigation plan for the impact on the loan portfolio. Further
precautionary actions might be taken progressively in the light of the pandemic as well as the war are not over yet.
- 64 -